Embed Size (px)
Citation preview
BioMed CentralBMC Microbiology
ss
Open AcceResearch articleSequence analysis of percent G+C fraction libraries of human faecal bacterial DNA reveals a high number of ActinobacteriaLotta Krogius-Kurikka1, Anna Kassinen1, Lars Paulin2, Jukka Corander3, Harri Mäkivuokko4,6, Jarno Tuimala5 and Airi Palva*1Address: 1Department of Basic Veterinary Sciences, Faculty of Veterinary Medicine, PO Box 66, FI-00014 University of Helsinki, Finland, 2DNA Sequencing Laboratory, Institute of Biotechnology, University of Helsinki, Finland, 3Department of Mathematics, Åbo Akademi University, Finland, 4Danisco Innovation, Kantvik, Finland, 5CSC – Scientific Computing Ltd, Espoo, Finland and 6The Finnish Red Cross, Blood Service, Helsinki, Finland
Email: Lotta Krogius-Kurikka - [email protected]; Anna Kassinen - [email protected]; Lars Paulin - [email protected]; Jukka Corander - [email protected]; Harri Mäkivuokko - [email protected]; Jarno Tuimala - [email protected]; Airi Palva* - [email protected]
* Corresponding author
AbstractBackground: The human gastrointestinal (GI) tract microbiota is characterised by an abundanceof uncultured bacteria most often assigned in phyla Firmicutes and Bacteroidetes. Diversity of thismicrobiota, even though approached with culture independent techniques in several studies, stillrequires more elucidation. The main purpose of this work was to study whether the genomicpercent guanine and cytosine (%G+C) -based profiling and fractioning prior to 16S rRNA genesequence analysis reveal higher microbiota diversity, especially with high G+C bacteria suggestedto be underrepresented in previous studies.
Results: A phylogenetic analysis of the composition of the human GI microbiota of 23 healthy adultsubjects was performed from a pooled faecal bacterial DNA sample by combining genomic %G+C-based profiling and fractioning with 16S rRNA gene cloning and sequencing. A total of 3199 partial16S rRNA genes were sequenced. For comparison, 459 clones were sequenced from a comparableunfractioned sample. The most important finding was that the proportional amount of sequencesaffiliating with the phylum Actinobacteria was 26.6% in the %G+C fractioned sample but only 3.5%in the unfractioned sample. The orders Coriobacteriales, Bifidobacteriales and Actinomycetalesconstituted the 65 actinobacterial phylotypes in the fractioned sample, accounting for 50%, 47% and3% of sequences within the phylum, respectively.
Conclusion: This study shows that the %G+C profiling and fractioning prior to cloning andsequencing can reveal a significantly larger proportion of high G+C content bacteria within theclones recovered, compared with the unfractioned sample in the human GI tract. Especially theorder Coriobacteriales within the phylum Actinobacteria was found to be more abundant thanpreviously estimated with conventional sequencing studies.
Published: 8 April 2009
BMC Microbiology 2009, 9:68 doi:10.1186/1471-2180-9-68
Received: 16 December 2008Accepted: 8 April 2009
This article is available from: http://www.biomedcentral.com/1471-2180/9/68
© 2009 Krogius-Kurikka et al; licensee BioMed Central Ltd. This is an Open Access article distributed under the terms of the Creative Commons Attribution License (http://creativecommons.org/licenses/by/2.0), which permits unrestricted use, distribution, and reproduction in any medium, provided the original work is properly cited.
Page 1 of 13(page number not for citation purposes)
BMC Microbiology 2009, 9:68 http://www.biomedcentral.com/1471-2180/9/68
BackgroundThe gastrointestinal (GI) microbiota is considered to playan important role in human health and disease via essen-tial metabolic, trophic and protective functions in thehost [1]. Since the majority of the GI bacteria are unculti-vable, molecular biology methods are needed to revealthe detailed composition, diversity and specific role ofthis complex microbial community [2]. The bacterialgroups most often detected in molecular studies of thehealthy human GI tract are phyla Firmicutes (especiallyClostridium clusters XIVa and IV), Bacteroidetes, Proteobacte-ria, Actinobacteria, Fusobacteria and Verrucomicrobia [3].The predominant microbiota in adults is consideredrather stable and host-specific [4,5], but gender, geo-graphic origin, age [6,7], and host genotype [8] may influ-ence its composition. Furthermore, alterations within anindividual's environmental factors, such as diet [9] anddietary supplements [10], intestinal health status [11] andantibiotics [12], may also have a substantial effect on theintestinal microbiota. Therefore, as a reference to alteredconditions, knowledge of the characteristics of a healthyintestinal microbiota is essential.
The proportional amounts of bacterial phyla detected instudies on the GI tract microbiota depend on both thesample handling and DNA extraction methods applied[13] and the analysis [14]. Recent metagenomic and pyro-sequencing studies on the human intestinal microbiotahighlight the potential amount of the yet undiscovereddiversity of phylotypes and reshape the porportionalabundances of the detected phyla, revealing e.g. a higherabundance of Actinobacteria than previously estimated[14-16]. However, the conventional 16S rRNA gene clon-ing and sequencing is still a valuable method, since itgives a relatively high taxonomic resolution due to longerread length [12] and can be targeted to a phylogeneticallyrelevant gene (16S rRNA gene) in comparison with themetagenomic approach. Furthermore, the clone libraryobtained serves as a valuable reference for possible futureuse. To enhance the recovery of phylotypes in bacterialcommunity samples, the genomic %G+C content -basedprofiling and fractioning of DNA can be used [17-20].
In a previous study comparing patients suffering from irri-table bowel syndrome (IBS) with healthy volunteers, thefaecal DNA of 23 healthy donors was pooled and %G+Cprofiled and three selected fractions, covering 34% of thefractioned DNA, were cloned and sequenced [21]. Withthe aim to comprehensively elucidate the bacterial phylo-type diversity of the GI microbiota of healthy subjects, theremaining seven %G+C fractions were cloned andsequenced in this study, to represent the scale of bacterialgenomic %G+C content ranging from 25% to 75% [22].For methodological comparison, a clone library fromunfractioned pooled faecal DNA samples of the same
study subjects was constructed. The results provide moredetailed insight into the human GI microbiota especiallyin the context of the diversity of high %G+C bacteria, i.e.Actinobacteria.
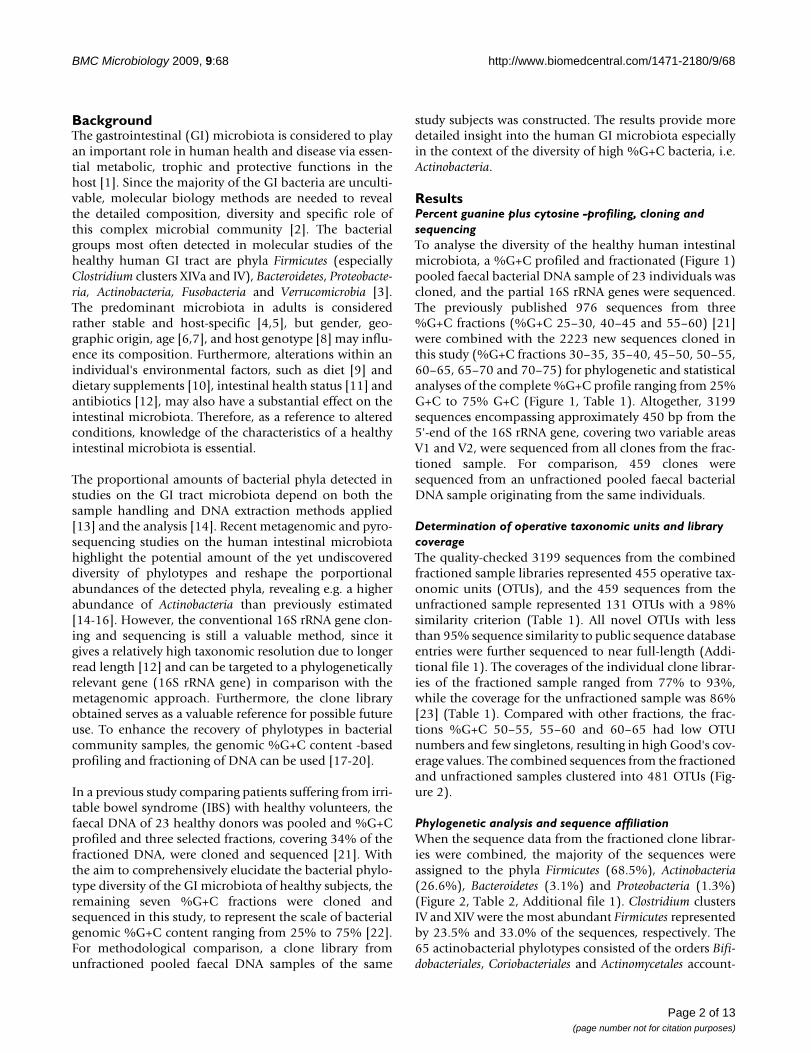
ResultsPercent guanine plus cytosine -profiling, cloning and sequencingTo analyse the diversity of the healthy human intestinalmicrobiota, a %G+C profiled and fractionated (Figure 1)pooled faecal bacterial DNA sample of 23 individuals wascloned, and the partial 16S rRNA genes were sequenced.The previously published 976 sequences from three%G+C fractions (%G+C 25–30, 40–45 and 55–60) [21]were combined with the 2223 new sequences cloned inthis study (%G+C fractions 30–35, 35–40, 45–50, 50–55,60–65, 65–70 and 70–75) for phylogenetic and statisticalanalyses of the complete %G+C profile ranging from 25%G+C to 75% G+C (Figure 1, Table 1). Altogether, 3199sequences encompassing approximately 450 bp from the5'-end of the 16S rRNA gene, covering two variable areasV1 and V2, were sequenced from all clones from the frac-tioned sample. For comparison, 459 clones weresequenced from an unfractioned pooled faecal bacterialDNA sample originating from the same individuals.
Determination of operative taxonomic units and library coverageThe quality-checked 3199 sequences from the combinedfractioned sample libraries represented 455 operative tax-onomic units (OTUs), and the 459 sequences from theunfractioned sample represented 131 OTUs with a 98%similarity criterion (Table 1). All novel OTUs with lessthan 95% sequence similarity to public sequence databaseentries were further sequenced to near full-length (Addi-tional file 1). The coverages of the individual clone librar-ies of the fractioned sample ranged from 77% to 93%,while the coverage for the unfractioned sample was 86%[23] (Table 1). Compared with other fractions, the frac-tions %G+C 50–55, 55–60 and 60–65 had low OTUnumbers and few singletons, resulting in high Good's cov-erage values. The combined sequences from the fractionedand unfractioned samples clustered into 481 OTUs (Fig-ure 2).
Phylogenetic analysis and sequence affiliationWhen the sequence data from the fractioned clone librar-ies were combined, the majority of the sequences wereassigned to the phyla Firmicutes (68.5%), Actinobacteria(26.6%), Bacteroidetes (3.1%) and Proteobacteria (1.3%)(Figure 2, Table 2, Additional file 1). Clostridium clustersIV and XIV were the most abundant Firmicutes representedby 23.5% and 33.0% of the sequences, respectively. The65 actinobacterial phylotypes consisted of the orders Bifi-dobacteriales, Coriobacteriales and Actinomycetales account-
Page 2 of 13(page number not for citation purposes)
BMC Microbiology 2009, 9:68 http://www.biomedcentral.com/1471-2180/9/68
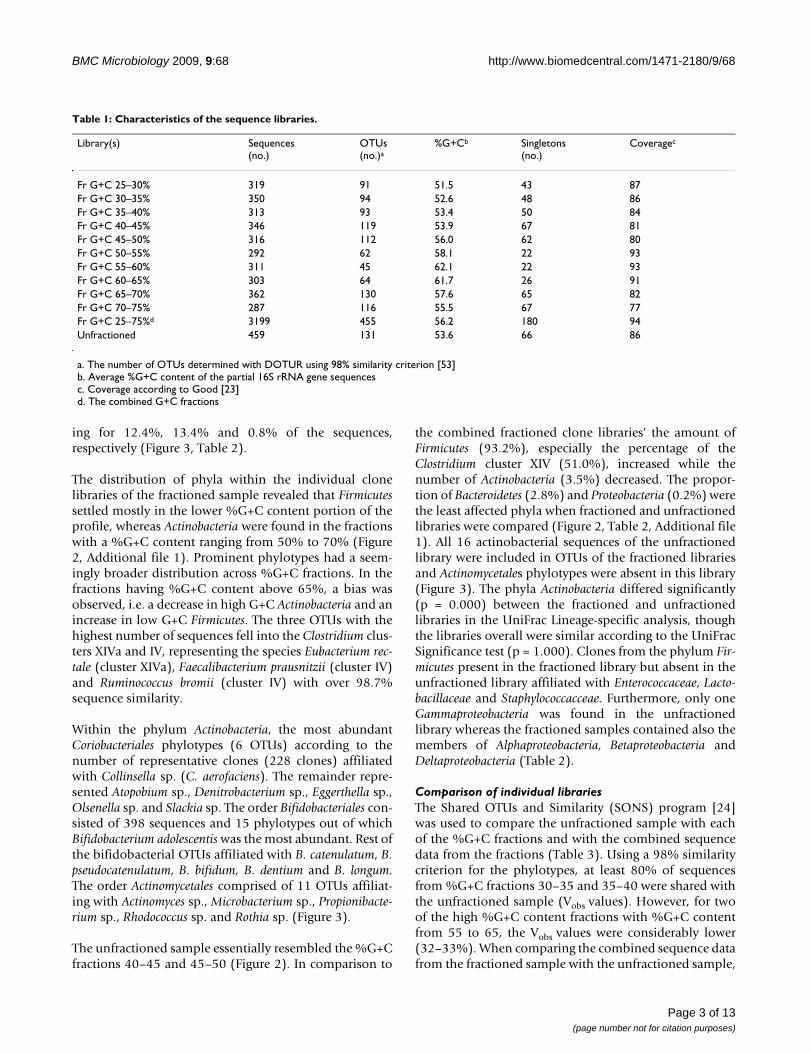
ing for 12.4%, 13.4% and 0.8% of the sequences,respectively (Figure 3, Table 2).
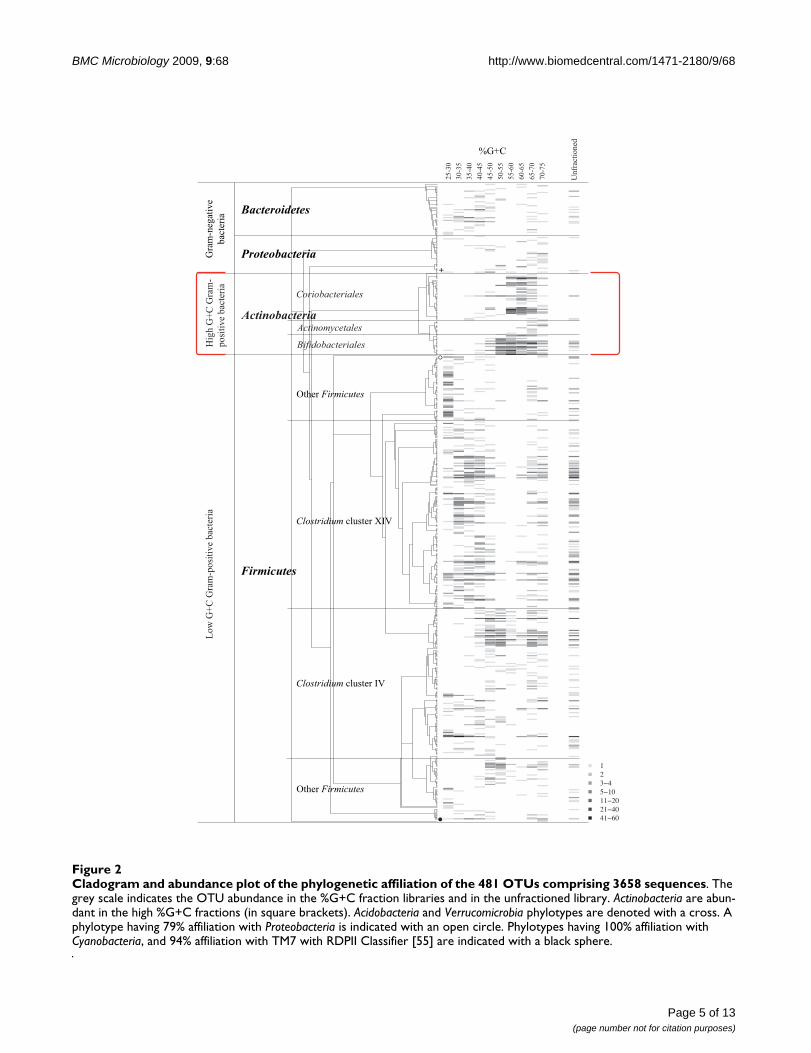
The distribution of phyla within the individual clonelibraries of the fractioned sample revealed that Firmicutessettled mostly in the lower %G+C content portion of theprofile, whereas Actinobacteria were found in the fractionswith a %G+C content ranging from 50% to 70% (Figure2, Additional file 1). Prominent phylotypes had a seem-ingly broader distribution across %G+C fractions. In thefractions having %G+C content above 65%, a bias wasobserved, i.e. a decrease in high G+C Actinobacteria and anincrease in low G+C Firmicutes. The three OTUs with thehighest number of sequences fell into the Clostridium clus-ters XIVa and IV, representing the species Eubacterium rec-tale (cluster XIVa), Faecalibacterium prausnitzii (cluster IV)and Ruminococcus bromii (cluster IV) with over 98.7%sequence similarity.
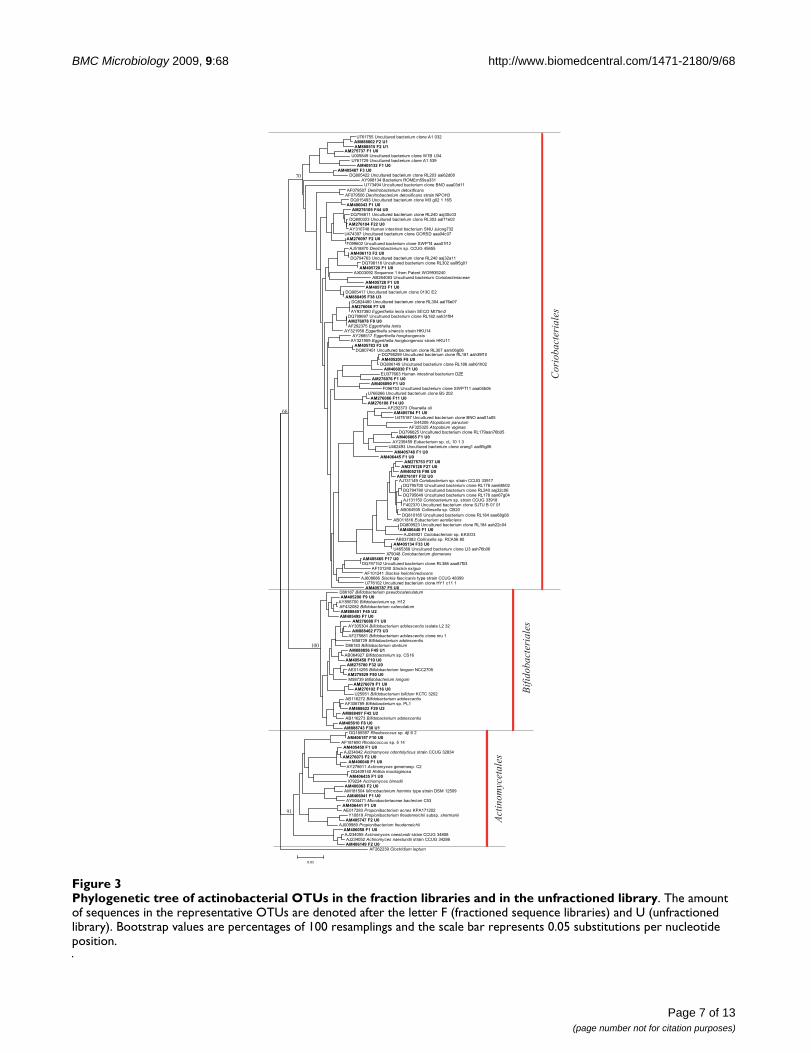
Within the phylum Actinobacteria, the most abundantCoriobacteriales phylotypes (6 OTUs) according to thenumber of representative clones (228 clones) affiliatedwith Collinsella sp. (C. aerofaciens). The remainder repre-sented Atopobium sp., Denitrobacterium sp., Eggerthella sp.,Olsenella sp. and Slackia sp. The order Bifidobacteriales con-sisted of 398 sequences and 15 phylotypes out of whichBifidobacterium adolescentis was the most abundant. Rest ofthe bifidobacterial OTUs affiliated with B. catenulatum, B.pseudocatenulatum, B. bifidum, B. dentium and B. longum.The order Actinomycetales comprised of 11 OTUs affiliat-ing with Actinomyces sp., Microbacterium sp., Propionibacte-rium sp., Rhodococcus sp. and Rothia sp. (Figure 3).
The unfractioned sample essentially resembled the %G+Cfractions 40–45 and 45–50 (Figure 2). In comparison to
the combined fractioned clone libraries' the amount ofFirmicutes (93.2%), especially the percentage of theClostridium cluster XIV (51.0%), increased while thenumber of Actinobacteria (3.5%) decreased. The propor-tion of Bacteroidetes (2.8%) and Proteobacteria (0.2%) werethe least affected phyla when fractioned and unfractionedlibraries were compared (Figure 2, Table 2, Additional file1). All 16 actinobacterial sequences of the unfractionedlibrary were included in OTUs of the fractioned librariesand Actinomycetales phylotypes were absent in this library(Figure 3). The phyla Actinobacteria differed significantly(p = 0.000) between the fractioned and unfractionedlibraries in the UniFrac Lineage-specific analysis, thoughthe libraries overall were similar according to the UniFracSignificance test (p = 1.000). Clones from the phylum Fir-micutes present in the fractioned library but absent in theunfractioned library affiliated with Enterococcaceae, Lacto-bacillaceae and Staphylococcacceae. Furthermore, only oneGammaproteobacteria was found in the unfractionedlibrary whereas the fractioned samples contained also themembers of Alphaproteobacteria, Betaproteobacteria andDeltaproteobacteria (Table 2).
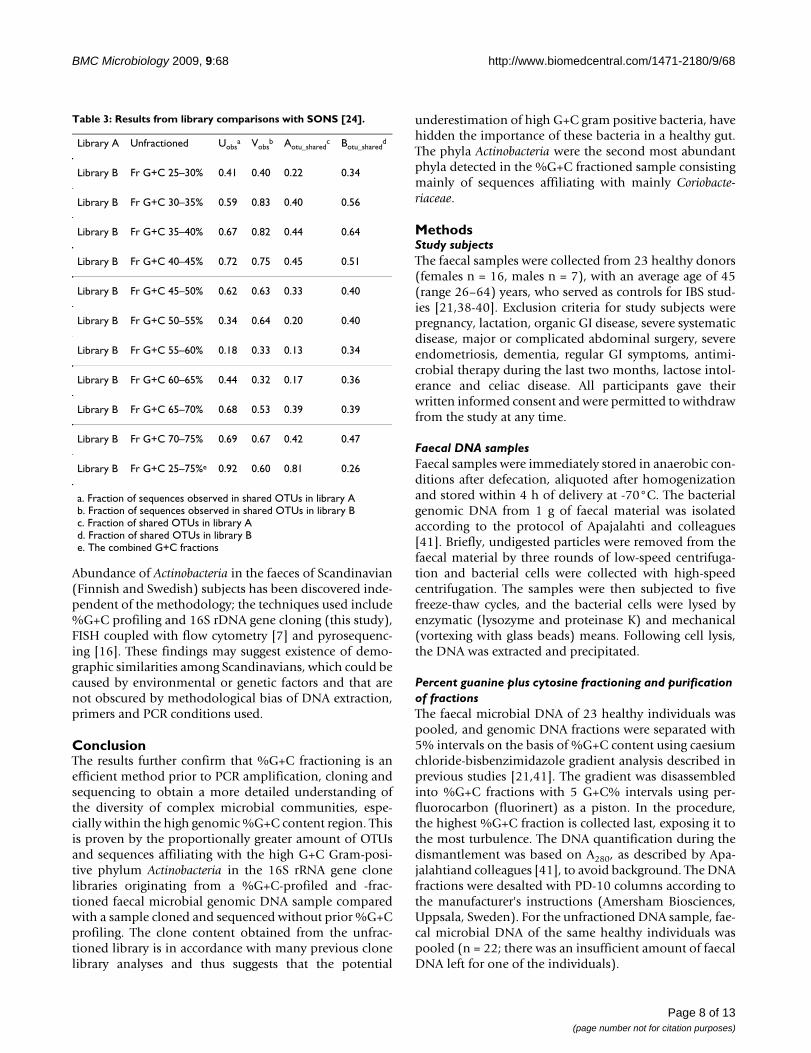
Comparison of individual librariesThe Shared OTUs and Similarity (SONS) program [24]was used to compare the unfractioned sample with eachof the %G+C fractions and with the combined sequencedata from the fractions (Table 3). Using a 98% similaritycriterion for the phylotypes, at least 80% of sequencesfrom %G+C fractions 30–35 and 35–40 were shared withthe unfractioned sample (Vobs values). However, for twoof the high %G+C content fractions with %G+C contentfrom 55 to 65, the Vobs values were considerably lower(32–33%). When comparing the combined sequence datafrom the fractioned sample with the unfractioned sample,
Table 1: Characteristics of the sequence libraries.
Library(s) Sequences(no.)
OTUs(no.)a
%G+Cb Singletons(no.)
Coveragec
Fr G+C 25–30% 319 91 51.5 43 87Fr G+C 30–35% 350 94 52.6 48 86Fr G+C 35–40% 313 93 53.4 50 84Fr G+C 40–45% 346 119 53.9 67 81Fr G+C 45–50% 316 112 56.0 62 80Fr G+C 50–55% 292 62 58.1 22 93Fr G+C 55–60% 311 45 62.1 22 93Fr G+C 60–65% 303 64 61.7 26 91Fr G+C 65–70% 362 130 57.6 65 82Fr G+C 70–75% 287 116 55.5 67 77Fr G+C 25–75%d 3199 455 56.2 180 94Unfractioned 459 131 53.6 66 86
a. The number of OTUs determined with DOTUR using 98% similarity criterion [53]b. Average %G+C content of the partial 16S rRNA gene sequencesc. Coverage according to Good [23]d. The combined G+C fractions
Page 3 of 13(page number not for citation purposes)
BMC Microbiology 2009, 9:68 http://www.biomedcentral.com/1471-2180/9/68
a higher percentage of sequences and OTUs in the unfrac-tioned were shared.
Shannon entropies of clone libraries of the %G+C profiled sampleThe %G+C fractions 50–55 and 55–60 had comparativelylow Shannon entropies (Additional file 2), indicatinglower diversity, and were abundant with bifidobacteria(Figure 2, Additional file 1). The peripheral %G+C frac-tions and the %G+C fraction 45–50 with sequences affili-ating mainly with Clostridium clusters IV and XIV hadcomparatively higher diversity according to Shannonentropies. The peripheral fraction from the low %G+Cend (25–30% G+C content) contained a substantial pro-portion of Firmicutes that do not belong to the Clostridumclusters IV and XIV. It had the highest Shannon entropy(Additional file 2), indicating rich diversity, and did notreach a plateau in the rarefaction curves (data not shown),which means that more OTUs would have been likely toappear after further sequencing.
DiscussionFor a comprehensive evaluation of the human intestinalmicrobiota, 16S rRNA gene clone libraries were con-structed from a %G+C fractioned pooled faecal DNA sam-ple of 23 healthy subjects followed by a sequence analysisof 3199 clones. Previously, only selected fractions of suchprofiles have been sequenced and analysed. For method-ological comparison, a 16S rRNA gene library of unfrac-tioned DNA from 22 individuals representing the samesubject group was also constructed. The %G+C fractioningprior to cloning and sequencing enhanced the recovery of
sequences affiliating with high G+C Gram-positive bacte-ria, namely the phylum Actinobacteria, proportionally oversevenfold compared with cloning and sequencing of anunfractioned sample.
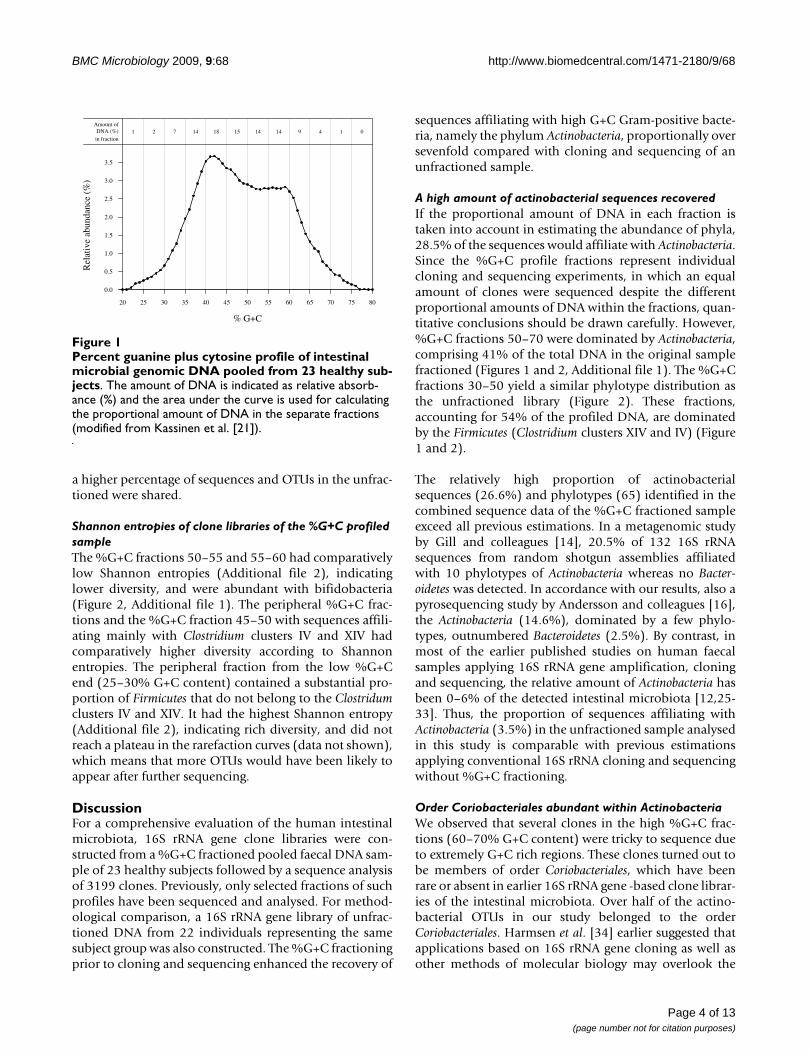
A high amount of actinobacterial sequences recoveredIf the proportional amount of DNA in each fraction istaken into account in estimating the abundance of phyla,28.5% of the sequences would affiliate with Actinobacteria.Since the %G+C profile fractions represent individualcloning and sequencing experiments, in which an equalamount of clones were sequenced despite the differentproportional amounts of DNA within the fractions, quan-titative conclusions should be drawn carefully. However,%G+C fractions 50–70 were dominated by Actinobacteria,comprising 41% of the total DNA in the original samplefractioned (Figures 1 and 2, Additional file 1). The %G+Cfractions 30–50 yield a similar phylotype distribution asthe unfractioned library (Figure 2). These fractions,accounting for 54% of the profiled DNA, are dominatedby the Firmicutes (Clostridium clusters XIV and IV) (Figure1 and 2).
The relatively high proportion of actinobacterialsequences (26.6%) and phylotypes (65) identified in thecombined sequence data of the %G+C fractioned sampleexceed all previous estimations. In a metagenomic studyby Gill and colleagues [14], 20.5% of 132 16S rRNAsequences from random shotgun assemblies affiliatedwith 10 phylotypes of Actinobacteria whereas no Bacter-oidetes was detected. In accordance with our results, also apyrosequencing study by Andersson and colleagues [16],the Actinobacteria (14.6%), dominated by a few phylo-types, outnumbered Bacteroidetes (2.5%). By contrast, inmost of the earlier published studies on human faecalsamples applying 16S rRNA gene amplification, cloningand sequencing, the relative amount of Actinobacteria hasbeen 0–6% of the detected intestinal microbiota [12,25-33]. Thus, the proportion of sequences affiliating withActinobacteria (3.5%) in the unfractioned sample analysedin this study is comparable with previous estimationsapplying conventional 16S rRNA cloning and sequencingwithout %G+C fractioning.
Order Coriobacteriales abundant within ActinobacteriaWe observed that several clones in the high %G+C frac-tions (60–70% G+C content) were tricky to sequence dueto extremely G+C rich regions. These clones turned out tobe members of order Coriobacteriales, which have beenrare or absent in earlier 16S rRNA gene -based clone librar-ies of the intestinal microbiota. Over half of the actino-bacterial OTUs in our study belonged to the orderCoriobacteriales. Harmsen et al. [34] earlier suggested thatapplications based on 16S rRNA gene cloning as well asother methods of molecular biology may overlook the
Percent guanine plus cytosine profile of intestinal microbial genomic DNA pooled from 23 healthy subjectsFigure 1Percent guanine plus cytosine profile of intestinal microbial genomic DNA pooled from 23 healthy sub-jects. The amount of DNA is indicated as relative absorb-ance (%) and the area under the curve is used for calculating the proportional amount of DNA in the separate fractions (modified from Kassinen et al. [21]).
Rel
ativ
e ab
unda
nce
(%)
0.0
0.5
1.0
1.5
2.0
2.5
3.0
3.5
20 25 30 35 40 45 50 55 60 65 70 75 80
% G+C
Amount ofDNA (%)in fraction
1 2 7 14 18 15 14 14 9 4 1 0
Page 4 of 13(page number not for citation purposes)
BMC Microbiology 2009, 9:68 http://www.biomedcentral.com/1471-2180/9/68
Page 5 of 13(page number not for citation purposes)
Cladogram and abundance plot of the phylogenetic affiliation of the 481 OTUs comprising 3658 sequencesFigure 2Cladogram and abundance plot of the phylogenetic affiliation of the 481 OTUs comprising 3658 sequences. The grey scale indicates the OTU abundance in the %G+C fraction libraries and in the unfractioned library. Actinobacteria are abun-dant in the high %G+C fractions (in square brackets). Acidobacteria and Verrucomicrobia phylotypes are denoted with a cross. A phylotype having 79% affiliation with Proteobacteria is indicated with an open circle. Phylotypes having 100% affiliation with Cyanobacteria, and 94% affiliation with TM7 with RDPII Classifier [55] are indicated with a black sphere.
BMC Microbiology 2009, 9:68 http://www.biomedcentral.com/1471-2180/9/68
presence of the family Coriobacteriaceae in the human GItract and they designed a group-specific probe for Atopo-bium (Ato291), covering most of the Coriobacteriaceae, theCoriobacterium group. Using Ato291, the abundance ofdetected intestinal cells in fluorescence in situ hybridiza-tion (FISH) is up to 6.3%. [6,7,35,36]. Recently, Khacha-tryan and colleagues [8] did not detect any Actinobacteriafrom the 16S rRNA gene clone libraries of healthy subjectsbut the abundance with FISH using Ato291 was 7%. Theauthors suggested that constant underestimation of thehigh G+C Gram-positive bacteria might lead to misunder-standing their role in the healthy and diseased gut.
There are some data suggesting that the members of Cori-obacteriaceae may be indicators of a healthy GI microbiota.Subjects with a low risk of colon cancer have beenobserved to have a higher incidence of Collinsella aerofa-ciens than subjects with a high risk of colon cancer [37].Furthermore, when faecal 16S rRNA gene sequences frommetagenomic libraries of Crohn's diseased and healthysubjects were compared, the Atopobium group was moreprevalent and the groups designated "other Actinobacteria"were exclusively detected in healthy subjects' samples[11]. A lower abundance of a C. aerofaciens-like phylotypewithin the Atopobium group has been associated with IBSsubjects' samples [21]. Diminished amount of Atopobiumgroup bacteria is also associated with patients with Medi-terranean fever [8]. On the other hand, increased amountof Actinobacteria have recently been associated with the
faecal microbiota of obese subjects [32]. This indicatesthat more detailed data are required to judge the role ofActinobacteria in health and disease.
Methodological observationsWhen the %G+C gradient is disassembled, the fractionswith the highest G+C content are collected last, makingthem most susceptible to turbulence. This phenomenontogether with possible remnants of DNA from previouslycollected fractions could have caused the bias of adecrease in high G+C Actinobacteria and an increase in lowG+C Firmicutes observed in fractions %G+C 65–75. Thesefractions, however, comprise only 5.5% of the total DNA,making the observed bias less important. Regarding faecalDNA extraction, the method used here was rather rigor-ous, allowing efficient DNA isolation also from moreenduring Gram-positive bacteria. This might lower the rel-ative amount of DNA from more easily lysed Gram-nega-tive bacteria and thus explain the comparatively lowamount of Bacteroides in both of the samples. Moreover,the relative share of Bacteroidetes phyla may be affected bythe delay and temperature of freezing. In a real-time PCRstudy, a decrease of 50% in the Bacteroides group wasobserved in faecal sample aliquots frozen in -70°C within4 h compared to samples that were immediately snap-fro-zen in liquid nitrogen (Salonen et al., personal communi-cation). In our study, the samples were transported within4 h of the defecation and stored at -70°C.
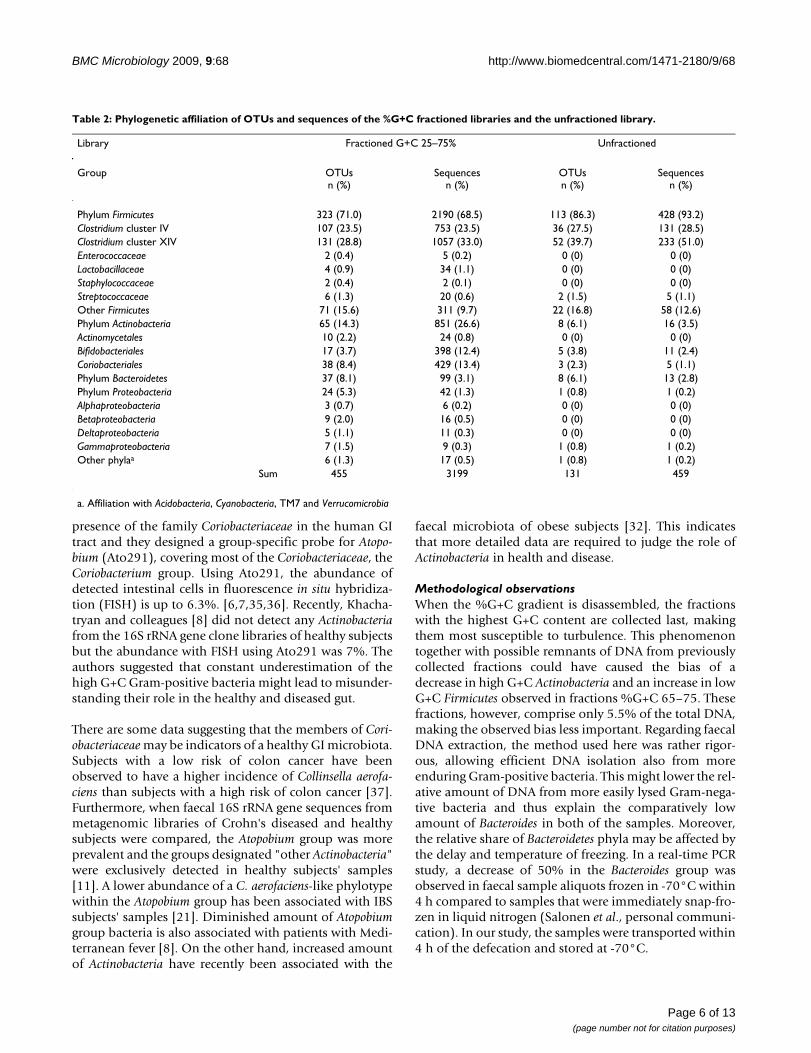
Table 2: Phylogenetic affiliation of OTUs and sequences of the %G+C fractioned libraries and the unfractioned library.
Library Fractioned G+C 25–75% Unfractioned
Group OTUsn (%)
Sequencesn (%)
OTUsn (%)
Sequencesn (%)
Phylum Firmicutes 323 (71.0) 2190 (68.5) 113 (86.3) 428 (93.2)Clostridium cluster IV 107 (23.5) 753 (23.5) 36 (27.5) 131 (28.5)Clostridium cluster XIV 131 (28.8) 1057 (33.0) 52 (39.7) 233 (51.0)Enterococcaceae 2 (0.4) 5 (0.2) 0 (0) 0 (0)Lactobacillaceae 4 (0.9) 34 (1.1) 0 (0) 0 (0)Staphylococcaceae 2 (0.4) 2 (0.1) 0 (0) 0 (0)Streptococcaceae 6 (1.3) 20 (0.6) 2 (1.5) 5 (1.1)Other Firmicutes 71 (15.6) 311 (9.7) 22 (16.8) 58 (12.6)Phylum Actinobacteria 65 (14.3) 851 (26.6) 8 (6.1) 16 (3.5)Actinomycetales 10 (2.2) 24 (0.8) 0 (0) 0 (0)Bifidobacteriales 17 (3.7) 398 (12.4) 5 (3.8) 11 (2.4)Coriobacteriales 38 (8.4) 429 (13.4) 3 (2.3) 5 (1.1)Phylum Bacteroidetes 37 (8.1) 99 (3.1) 8 (6.1) 13 (2.8)Phylum Proteobacteria 24 (5.3) 42 (1.3) 1 (0.8) 1 (0.2)Alphaproteobacteria 3 (0.7) 6 (0.2) 0 (0) 0 (0)Betaproteobacteria 9 (2.0) 16 (0.5) 0 (0) 0 (0)Deltaproteobacteria 5 (1.1) 11 (0.3) 0 (0) 0 (0)Gammaproteobacteria 7 (1.5) 9 (0.3) 1 (0.8) 1 (0.2)Other phylaa 6 (1.3) 17 (0.5) 1 (0.8) 1 (0.2)
Sum 455 3199 131 459
a. Affiliation with Acidobacteria, Cyanobacteria, TM7 and Verrucomicrobia
Page 6 of 13(page number not for citation purposes)
BMC Microbiology 2009, 9:68 http://www.biomedcentral.com/1471-2180/9/68
Page 7 of 13(page number not for citation purposes)
Phylogenetic tree of actinobacterial OTUs in the fraction libraries and in the unfractioned libraryFigure 3Phylogenetic tree of actinobacterial OTUs in the fraction libraries and in the unfractioned library. The amount of sequences in the representative OTUs are denoted after the letter F (fractioned sequence libraries) and U (unfractioned library). Bootstrap values are percentages of 100 resamplings and the scale bar represents 0.05 substitutions per nucleotide position.
BMC Microbiology 2009, 9:68 http://www.biomedcentral.com/1471-2180/9/68
Abundance of Actinobacteria in the faeces of Scandinavian(Finnish and Swedish) subjects has been discovered inde-pendent of the methodology; the techniques used include%G+C profiling and 16S rDNA gene cloning (this study),FISH coupled with flow cytometry [7] and pyrosequenc-ing [16]. These findings may suggest existence of demo-graphic similarities among Scandinavians, which could becaused by environmental or genetic factors and that arenot obscured by methodological bias of DNA extraction,primers and PCR conditions used.
ConclusionThe results further confirm that %G+C fractioning is anefficient method prior to PCR amplification, cloning andsequencing to obtain a more detailed understanding ofthe diversity of complex microbial communities, espe-cially within the high genomic %G+C content region. Thisis proven by the proportionally greater amount of OTUsand sequences affiliating with the high G+C Gram-posi-tive phylum Actinobacteria in the 16S rRNA gene clonelibraries originating from a %G+C-profiled and -frac-tioned faecal microbial genomic DNA sample comparedwith a sample cloned and sequenced without prior %G+Cprofiling. The clone content obtained from the unfrac-tioned library is in accordance with many previous clonelibrary analyses and thus suggests that the potential
underestimation of high G+C gram positive bacteria, havehidden the importance of these bacteria in a healthy gut.The phyla Actinobacteria were the second most abundantphyla detected in the %G+C fractioned sample consistingmainly of sequences affiliating with mainly Coriobacte-riaceae.
MethodsStudy subjectsThe faecal samples were collected from 23 healthy donors(females n = 16, males n = 7), with an average age of 45(range 26–64) years, who served as controls for IBS stud-ies [21,38-40]. Exclusion criteria for study subjects werepregnancy, lactation, organic GI disease, severe systematicdisease, major or complicated abdominal surgery, severeendometriosis, dementia, regular GI symptoms, antimi-crobial therapy during the last two months, lactose intol-erance and celiac disease. All participants gave theirwritten informed consent and were permitted to withdrawfrom the study at any time.
Faecal DNA samplesFaecal samples were immediately stored in anaerobic con-ditions after defecation, aliquoted after homogenizationand stored within 4 h of delivery at -70°C. The bacterialgenomic DNA from 1 g of faecal material was isolatedaccording to the protocol of Apajalahti and colleagues[41]. Briefly, undigested particles were removed from thefaecal material by three rounds of low-speed centrifuga-tion and bacterial cells were collected with high-speedcentrifugation. The samples were then subjected to fivefreeze-thaw cycles, and the bacterial cells were lysed byenzymatic (lysozyme and proteinase K) and mechanical(vortexing with glass beads) means. Following cell lysis,the DNA was extracted and precipitated.
Percent guanine plus cytosine fractioning and purification of fractionsThe faecal microbial DNA of 23 healthy individuals waspooled, and genomic DNA fractions were separated with5% intervals on the basis of %G+C content using caesiumchloride-bisbenzimidazole gradient analysis described inprevious studies [21,41]. The gradient was disassembledinto %G+C fractions with 5 G+C% intervals using per-fluorocarbon (fluorinert) as a piston. In the procedure,the highest %G+C fraction is collected last, exposing it tothe most turbulence. The DNA quantification during thedismantlement was based on A280, as described by Apa-jalahtiand colleagues [41], to avoid background. The DNAfractions were desalted with PD-10 columns according tothe manufacturer's instructions (Amersham Biosciences,Uppsala, Sweden). For the unfractioned DNA sample, fae-cal microbial DNA of the same healthy individuals waspooled (n = 22; there was an insufficient amount of faecalDNA left for one of the individuals).
Table 3: Results from library comparisons with SONS [24].
Library A Unfractioned Uobsa Vobs
b Aotu_sharedc Botu_shared
d
Library B Fr G+C 25–30% 0.41 0.40 0.22 0.34
Library B Fr G+C 30–35% 0.59 0.83 0.40 0.56
Library B Fr G+C 35–40% 0.67 0.82 0.44 0.64
Library B Fr G+C 40–45% 0.72 0.75 0.45 0.51
Library B Fr G+C 45–50% 0.62 0.63 0.33 0.40
Library B Fr G+C 50–55% 0.34 0.64 0.20 0.40
Library B Fr G+C 55–60% 0.18 0.33 0.13 0.34
Library B Fr G+C 60–65% 0.44 0.32 0.17 0.36
Library B Fr G+C 65–70% 0.68 0.53 0.39 0.39
Library B Fr G+C 70–75% 0.69 0.67 0.42 0.47
Library B Fr G+C 25–75%e 0.92 0.60 0.81 0.26
a. Fraction of sequences observed in shared OTUs in library Ab. Fraction of sequences observed in shared OTUs in library Bc. Fraction of shared OTUs in library Ad. Fraction of shared OTUs in library Be. The combined G+C fractions
Page 8 of 13(page number not for citation purposes)
BMC Microbiology 2009, 9:68 http://www.biomedcentral.com/1471-2180/9/68
Amplification of the 16S rRNA genes, cloning and sequencingThe 16S rRNA gene from each of the seven DNA fractionswas amplified, cloned and sequenced, as in the study byKassinen and colleagues [21]. To maximize the recoveryof different phylotypes, two universal primer pairs wereused independently for all samples. The first primer paircorresponded to Escherichia coli 16S rRNA gene positions8–27 and 1492–1512, with sequences 5'-AGAGTTTGATC-CTGGCTCAG-3' [42] and 5'-ACGGCTACCTTGTTAC-GACTT-3' [43], respectively. The second primer paircorresponded to E. coli 16S rRNA gene positions 7–27 and1522–1541, with sequences 5'-GAGAGTTTGATYCT-GGCTCAG-3' and 5'-AAGGAGGTGATCCARCCGCA-3'[44], respectively. The 50-μl PCR reactions contained 1 ×DyNAzyme™ Buffer (Finnzymes, Espoo, Finland), 0.2mM of each dNTP, 50 pmol of primers, 1 U ofDyNAzyme™ II DNA Polymerase (Finnzymes, Espoo, Fin-land), 0.125 U of Pfu DNA polymerase (Fermentas, Viln-ius, Lithuania) and 10 μl of desalted fractioned DNAtemplate (containing less than 2 ng/μl of DNA) or pooledextracted DNA from the faecal samples. The thermocy-cling conditions consisted of 3 min at 95°C, followed bya variable number of cycles of 30 s at 95°C, 30 s at 50°C,2 min at 72°C and a final extension of 10 min at 72°C.The number of PCR cycles used for each fraction was opti-mized to the minimum amount of cycles which resultedin a visually detectable band of the PCR product on ethid-ium bromide stained agarose gel. A protocol of 27, 20, 25and 30 cycles was applied to %G+C fraction 25–30, 30–60, 60–65 and 65–75, respectively. The 16S rRNA genefrom the unfractioned pooled faecal DNA sample wasamplified using 20 PCR cycles. The amplifications wereperformed using 15 reactions, and the products werepooled, concentrated using ethanol precipitation, andeluted with 50 μl of deionized MilliQ water (Millipore,Billerica, MA, USA).
The precipitated PCR products were purified with theQIAquick PCR Purification Kit (Qiagen, Hilden, Ger-many), or using the QIAquick Gel Extraction Kit (Qiagen,Hilden, Germany) after excising from 1.25% SeaPlaqueagar (Cambrex, East Rutherford, NJ, USA), and eluted in35 μl of elution buffer. The concentration of the purifiedamplicons was estimated with serially diluted samples on0.8% agarose gels with ethidium bromide staining. Toenhance the cloning efficiency, adenine overhangs wereadded to the amplicons as follows: The two purifiedinserts were mixed in a 1:1 molecular ratio (the reactionmixture thus contained 10–30 ng/μl DNA) and incubatedin a volume of 20 μl with 1 × DyNAzyme™ Buffer(Finnzymes, Espoo, Finland), 0.2 mM dNTPs and 0.4 U ofDyNAzyme™ II DNA Polymerase (Finnzymes, Espoo, Fin-land) for 40 min at 72°C. The cloning was performedwith the QIAGEN® PCR Cloning plus Kit (Qiagen, Hilden,Germany) according to the manufacturer's instructions.
For the ligation reaction, 2 μl of the reaction mixture usedfor adding adenine overhangs to the amplicons was usedas an insert. The ligation reaction was incubated overnightat 4°C. The plasmids were isolated and purified from theE. coli culture using MultiScreenHTS (Millipore, Billerica,MA, USA), and aliquots were stored in -80°C.
The cloned inserts were amplified from the pDrive plas-mids using M13 forward 5'-GTAAAACGACGGCCAGT-3'and M13 reverse primers 5'-AACAGCTATGACCATG-3',visualized on a 1% agarose gel, stained with ethidium bro-mide and purified using a MultiScreen PCR384 Filter Plate(Millipore, Billerica, MA, USA). Sequencing of the 5'-endof 16S rDNA clones was performed with primer pD' 5'-GTATTACCGCGGCTGCTG-3' corresponding to the E. coli16S rRNA gene position 536-518 [45]. Near full-lengthsequencing was performed on one representative of eachOTU showing less than 95% similarity to any EMBLnucleotide sequence database entry. For this purpose,primers pF' 5'-ACGAGCTGACGACAGCCATG-3' [45] andpE 5'-AAACTCAAAGGAATTGACGG-3' [46], correspond-ing to E. coli 16S rRNA gene positions 1073-1053 and908–928, respectively, were used. Sequencing of the prod-ucts was performed with the BigDye terminator cyclesequencing kit (Applied Biosystems, Foster City, CA,USA). For templates that failed to be sequenced due tohigh G+C content, 1% (v/v) of dimethyl sulfoxide wasadded to the reaction mixture. The sequencing productswere cleaned with Montage SEQ96 plates (Millipore, Bill-erica, MA, USA) and run with an ABI 3700 Capillary DNASequencer (Applied Biosystems, Foster City, CA, USA).
Sequence analysis and alignmentSequences were checked manually utilizing the StadenPackage pregap4 version 1.5 and gap v4.10 assembly pro-grams [47], and primer sequences were removed.Sequences that occurred in more than one clone librarywere considered non-chimeric. Revealing the potentialchimeras was also performed by manually browsing theClustalW 1.83 sequence alignment [48] with Bio Edit ver-sion 7.0.5.3 [49] and for the near full-length sequencesusing Ribosomal Database Project II Chimera Check [50].Sequences from %G+C fractions 25–30, 40–45 and 55–60 with accession numbers AM275396-AM276371 [21]were added prior to further analyses. Sequences of all frac-tions and the unfractioned sample were aligned separatelywith ClustalW 1.83 [48] using the FAST DNA pair-wisealignment algorithm option (Gap penalty 3, Word size 4,Number of top diagonals 1 and Window size 1) and cutfrom E. coli position 430 (totally conserved GTAAA) withBioEdit version 7.0.5.3 [49]. The lengths of the align-ments of the fractioned sample and the unfractioned sam-ple were 478 and 457 base pairs, respectively. The 16SrRNA variable regions V1 and V2 were included in thealignments. The variable regions V1 and V2 have beendemonstrated to be sufficient to reflect the diversity of a
Page 9 of 13(page number not for citation purposes)
BMC Microbiology 2009, 9:68 http://www.biomedcentral.com/1471-2180/9/68
human GI clone library [51]. The alignments were visuallyinspected, but they were not edited manually to avoidsubjectivity and to maintain reproducibility of the align-ments. From the cut alignments, distance matrices werecreated with Phylip 3.66 Dnadist [52] using Jukes-Cantorcorrection.
Determination of OTUs and library coverageThe sequences were assigned into OTUs according to thedistance matrices using DOTUR [53], applying the fur-thest neighbour rule option in which all sequences withinan OTU fulfil the similarity criterion with all the othersequences within the OTU. The 98% cut-off for sequencesimilarity was used to delimit an OTU. The coverage of theclone libraries was calculated with the formula of Good[23] to evaluate the adequacy of amount of sequencing.The Fasta EMBL Environmental and EMBL Prokaryotedatabase searches [54] and Ribosomal Database Project II(RDP II) Classifier Tool [55] were used to affiliate phylo-types.
Phylogenetic analysisFor the phylogenetic analysis, all sequences from the%G+C fractioned sample and the unfractioned samplewere aligned and designated into OTUs with a 98% cut-off as described above. A representative sequence of eachOTU and unaligned reference sequences representing dif-ferent clostridial groups (Additional file 3) were alignedwith ClustalW 1.83 using the SLOW DNA alignment algo-rithm option (Gap penalty 3, Word size 1, Number of topdiagonals 5 and Window size 5) and cut from the E. coliposition 430 (totally conserved GTAAA) with BioEdit ver-sion 7.0.5.3[49]. For a profile alignment, 16S rRNA refer-ence sequences, aligned according to their secondarystructure, were selected from the European ribosomalRNA database [56] (Additional file 4) so that they wouldrepresent the overall diversity of the faecal microbiota,including the most common clostridial 16S rRNA groupsexpected, and sequences closely related to the OTUs com-posed of over 20 sequences. The sequences in this studywere profile-aligned against the European ribosomal RNAdatabase secondary structure-aligned sequences usingClustalW 1.83 profile alignment mode and the SLOWDNA alignment algorithm option (Gap penalty 3, Wordsize 1, Number of top diagonals 5 and Window size 5).The reference sequences were then deleted from the align-ment with BioEdit version 7.0.5.3 [49], and the alignmentwas cut at the E. coli position 430 (totally conservedGTAAA). A phylogenetic tree with a representativesequence from each OTU was generated with a neighbour-joining algorithm from a Jukes-Cantor-corrected distancematrix using Phylip 3.66 dnadist and neighbour [52]. Thetree was visualized with MEGA4 [57].
A phylogenetic tree was constructed for the OTU repre-sentatives of the phylum Actinobacteria. For Bifidobacteri-
ales and Actinomycetales, sequences with nearest FASTAEMBL Prokaryote search (all >98% similarity), and forCoriobacteriales sequences with nearest FASTA EMBLprokaryote and environmental database searches (>85%and >91%, respectively), were selected and alignedtogether with OTU representative sequences. Sequencesfrom the European ribosomal RNA database representingActinobacteria and Clostridium leptum (AF262239) wereused as a reference in the profile alignment (Additionalfile 4). The alignment, distance matrix, and visualizingwas done as described above. A bootstrap analysis of hun-dred replicates was performed using seqboot and con-sense programs of Phylip 3.66 [52].
To describe whether the phylogenies of the combinedsequence data from the fractioned libraries and theunfractioned library were significantly different, the Uni-Frac Significance analysis was applied for each pair ofenvironments using abundance weights [58]. The UniFracLineage-specific analysis was used to break the tree up intothe lineages at a specified distance from the root, and totest whether any particular group differed between thesample libraries [58]. The phylogenetic tree for the analy-ses was constructed from OTU representative sequencesdetermined separately for the combined fractioned librar-ies and for the unfractioned library as described above,with the exception that in the profile alignment a rootsequence (Methanobrevibacter smithii AF054208) wasadded and left to the alignment.
Comparison of individual libraries using SONSThe microbial community composition differencesbetween libraries of individual %G+C profile fractionsand the unfractioned sample were analysed using SONS[24], which calculates the fraction of sequences observedin shared OTUs in each library (Uobs and Vobs) and theobserved fraction of shared OTUs in each library(Aotu_shared and Botu_shared). For the SONS analyses, analignment with all of the sequences from the clone librar-ies of the fractioned sample and the unfractioned samplewas created, and a distance matrix was calculated asdescribed above in the Sequence analysis and alignment sec-tion.
Shannon entropies of clone libraries of the %G+C profiled sampleTo compare the diversity of the clone libraries derivedfrom the fractioned sample, OTUs were also determinedusing a Bayesian clustering method [59], followed by theestimation of Shannon entropies with a standard Baye-sian multinomial-Dirichlet model. In the estimation, 100000 Monte Carlo samples were used for each library undera uniform Dirichlet prior [60]. The Shannon entropyvalue correlates with the amount and evenness of clustersor phylotypes in a community sample, but disregards thedisparity between them [61]. The Bayesian clustering
Page 10 of 13(page number not for citation purposes)
BMC Microbiology 2009, 9:68 http://www.biomedcentral.com/1471-2180/9/68
method groups the sequences into clusters more distinctfrom each other than would, for example, the ClustalWalignment-based Jukes-Cantor-corrected distance matri-ces, demanding more disparity among the sequencespresent in a sample for them to form separate clusters.
Nucleotide sequence accession numbersThe 16S rRNA gene sequences reported in this study havebeen deposited in the EMBL Nucleotide Sequence Data-base under accession numbers AM404446–AM406668and AM888398–AM888856.
Authors' contributionsLK-K and AK conducted the sequence analysis and pre-pared the manuscript, LP supervised the sequencinglibrary construction procedure, JC determined the Shan-non entropies, HM performed %G+C fractioning of thepooled DNA samples, JT acted as bioinformatics specialistand provided scripts needed in data analysis for LK-K andAK, AP designed and supervised the study. All authorshave contributed in the manuscript writing process as wellas approved the final manuscript.
Additional material
AcknowledgementsThis study was supported by the Finnish Funding Agency for Technology and Innovation (Grant no. 40160/05), the Academy of Finland (Grant no. 214 157) and the Finnish Graduate School on Applied Bioscience. This work was performed in the Centre of Excellence on Microbial Food Safety Research, Academy of Finland. We are grateful to Sinikka Ahonen, Anu Suoranta and Matias Rantanen for technical assistance and to Professor Willem M. de Vos and Doctors Erja Malinen and Ilkka Palva for providing constructive criticism during the writing of this manuscript. Doctors Jaana Mättö and Maria Saarela are gratefully acknowledged for recruiting of study subjects and management of sample collection. Kyösti Kurikka, MSc, and Sonja Krogius, BA, are thanked for assisting with the drawing of figures.
References1. Guarner F: Enteric flora in health and disease. Digestion 2006,
73(Suppl 1):5-12.2. Rajilic-Stojanovic M, Smidt H, de Vos WM: Diversity of the human
gastrointestinal tract microbiota revisited. Environ Microbiol2007, 9(9):2125-2136.
3. Zoetendal EG, Rajilic-Stojanovic M, de Vos WM: High-throughputdiversity and functionality analysis of the gastrointestinaltract microbiota. Gut 2008, 57(11):1605-1615.
4. Zoetendal EG, Akkermans AD, De Vos WM: Temperature gradi-ent gel electrophoresis analysis of 16S rRNA from humanfecal samples reveals stable and host-specific communities ofactive bacteria. Appl Environ Microbiol 1998, 64(10):3854-3859.
5. Vanhoutte T, Huys G, de Brandt E, Swings J: Temporal stabilityanalysis of the microbiota in human feces by denaturing gra-dient gel electrophoresis using universal and group-specific16S rRNA gene primers. FEMS Microbiol Ecol 2004,48(2):437-446.
6. Lay C, Rigottier-Gois L, Holmstrøm K, Rajilić M, Vaughan EE, de VosWM, Collins MD, Thiel R, Namsolleck P, Blaut M, Doré J: Colonicmicrobiota signatures across five northern European coun-tries. Appl Environ Microbiol 2005, 71(7):4153-4155.
7. Mueller S, Saunier K, Hanisch C, Norin E, Alm L, Midtvedt T, CresciA, Silvi S, Orpianesi C, Verdenelli MC, Clavel T, Koebnick C, ZunftHJ, Doré J, Blaut M: Differences in fecal microbiota in differentEuropean study populations in relation to age, gender, andcountry: a cross-sectional study. Appl Environ Microbiol 2006,72(2):1027-1033.
8. Khachatryan ZA, Ktsoyan ZA, Manukyan GP, Kelly D, Ghazaryan KA,Aminov RI: Predominant role of host genetics in controllingthe composition of gut microbiota. PLoS ONE 2008, 3(8):e3064.
9. Ley RE, Hamady M, Lozupone C, Turnbaugh PJ, Ramey RR, Bircher JS,Schlegel ML, Tucker TA, Schrenzel MD, Knight R, Gordon JI: Evolu-tion of mammals and their gut microbes. Science 2008,320(5883):1647-1651.
10. Kajander K, Myllyluoma E, Rajilić-Stojanović M, Kyrönpalo S, Rasmus-sen M, Järvenpää S, Zoetendal EG, de Vos WM, Vapaatalo H, KorpelaR: Clinical trial: multispecies probiotic supplementation alle-viates the symptoms of irritable bowel syndrome and stabi-lizes intestinal microbiota. Aliment Pharmacol Ther 2008,27(1):48-57.
11. Manichanh C, Rigottier-Gois L, Bonnaud E, Gloux K, Pelletier E,Frangeul L, Nalin R, Jarrin C, Chardon P, Marteau P, Roca J, Doré J:Reduced diversity of faecal microbiota in Crohn's diseaserevealed by a metagenomic approach. Gut 2006,55(2):205-211.
12. Dethlefsen L, Huse S, Sogin ML, Relman DA: The Pervasive Effectsof an Antibiotic on the Human Gut Microbiota, as Revealedby Deep 16S rRNA Sequencing. PLoS Biol 2008, 6(11):e280.
13. Salonen A, Palva A, de Vos WM: Microbial functionality in thehuman intestinal tract. Front Biosci 2009, 14:3074-3084.
14. Gill SR, Pop M, Deboy RT, Eckburg PB, Turnbaugh PJ, Samuel BS, Gor-don JI, Relman DA, Fraser-Liggett CM, Nelson KE: Metagenomicanalysis of the human distal gut microbiome. Science 2006,312(5778):1355-1359.
15. Kurokawa K, Itoh T, Kuwahara T, Oshima K, Toh H, Toyoda A,Takami H, Morita H, Sharma VK, Srivastava TP, Taylor TD, NoguchiH, Mori H, Ogura Y, Ehrlich DS, Itoh K, Takagi T, Sakaki Y, HayashiT, Hattori M: Comparative metagenomics revealed com-
Additional File 1Affiliation of OTUs derived from the %G+C fractioned sample. Clas-sification of OTUs to phyla utilizing RDB Classifier [55], nearest similar-ity to EMBL prokaryote database sequences [54] and the number of sequences in individual %G+C fractions.Click here for file[http://www.biomedcentral.com/content/supplementary/1471-2180-9-68-S1.pdf]
Additional File 2Comparison of the %G+C clone library diversities using Shannon entropy. The Shannon entropy values correlate with the amount and even-ness of clusters or phylotypes in a community sample, but disregard the dis-parity between them.Click here for file[http://www.biomedcentral.com/content/supplementary/1471-2180-9-68-S2.pdf]
Additional File 3Clostridium cluster reference sequences. Unaligned Clostridium clus-ter reference sequences used in the phylogenetic analysis of sequence data.Click here for file[http://www.biomedcentral.com/content/supplementary/1471-2180-9-68-S3.pdf]
Additional File 4Reference sequences from the European ribosomal RNA database [56]. Reference sequences aligned according to their secondary structure and used in the phylogenetic analysis of sequence data.Click here for file[http://www.biomedcentral.com/content/supplementary/1471-2180-9-68-S4.pdf]
Page 11 of 13(page number not for citation purposes)
BMC Microbiology 2009, 9:68 http://www.biomedcentral.com/1471-2180/9/68
monly enriched gene sets in human gut microbiomes. DNARes 2007, 14(4):169-181.
16. Andersson AF, Lindberg M, Jakobsson H, Bäckhed F, Nyrén P, Eng-strand L: Comparative analysis of human gut microbiota bybarcoded pyrosequencing. PLoS ONE 2008, 3(7):e2836.
17. Holben WE, Jansson JK, Chelm BK, Tiedje JM: DNA Probe Methodfor the Detection of Specific Microorganisms in the Soil Bac-terial Community. Appl Environ Microbiol 1988, 54(3):703-711.
18. Nüsslein K, Tiedje JM: Characterization of the dominant andrare members of a young Hawaiian soil bacterial communitywith small-subunit ribosomal DNA amplified from DNAfractionated on the basis of its guanine and cytosine compo-sition. Appl Environ Microbiol 1998, 64(4):1283-1289.
19. Holben WE, Feris KP, Kettunen A, Apajalahti JH: GC fractionationenhances microbial community diversity assessment anddetection of minority populations of bacteria by denaturinggradient gel electrophoresis. Appl Environ Microbiol 2004,70(4):2263-2270.
20. Holben WE, Harris D: DNA-based monitoring of total bacterialcommunity structure in environmental samples. Mol Ecol1995, 4(5):627-631.
21. Kassinen A, Krogius-Kurikka L, Mäkivuokko H, Rinttilä T, Paulin L,Corander J, Malinen E, Apajalahti J, Palva A: The fecal microbiotaof irritable bowel syndrome patients differs significantlyfrom that of healthy subjects. Gastroenterology 2007,133(1):24-33.
22. Galtier N, Lobry JR: Relationships between genomic G+C con-tent, RNA secondary structures, and optimal growth tem-perature in prokaryotes. J Mol Evol 1997, 44(6):632-636.
23. Good IJ: The population frequencies of species and the esti-mation of population parameters. Biometrika 1953, 40:237-264.
24. Schloss PD, Handelsman J: Introducing SONS, a tool for opera-tional taxonomic unit-based comparisons of microbial com-munity memberships and structures. Appl Environ Microbiol2006, 72(10):6773-6779.
25. Wilson KH, Blitchington RB: Human colonic biota studied byribosomal DNA sequence analysis. Appl Environ Microbiol 1996,62(7):2273-2278.
26. Suau A, Bonnet R, Sutren M, Godon JJ, Gibson GR, Collins MD, DoréJ: Direct analysis of genes encoding 16S rRNA from complexcommunities reveals many novel molecular species withinthe human gut. Appl Environ Microbiol 1999, 65(11):4799-4807.
27. Bonnet R, Suau A, Doré J, Gibson GR, Collins MD: Differences inrDNA libraries of faecal bacteria derived from 10- and 25-cycle PCRs. Int J Syst Evol Microbiol 2002, 52(Pt 3):757-763.
28. Eckburg PB, Bik EM, Bernstein CN, Purdom E, Dethlefsen L, SargentM, Gill SR, Nelson KE, Relman DA: Diversity of the human intes-tinal microbial flora. Science 2005, 308(5728):1635-1638.
29. Li M, Wang B, Zhang M, Rantalainen M, Wang S, Zhou H, Zhang Y,Shen J, Pang X, Zhang M, Wei H, Chen Y, Lu H, Zuo J, Su M, Qiu Y,Jia W, Xiao C, Smith LM, Yang S, Holmes E, Tang H, Zhao G, Nichol-son JK, Li L, Zhao L: Symbiotic gut microbes modulate humanmetabolic phenotypes. Proc Natl Acad Sci USA 2008,105(6):2117-2122.
30. Hayashi H, Sakamoto M, Benno Y: Phylogenetic analysis of thehuman gut microbiota using 16S rDNA clone libraries andstrictly anaerobic culture-based methods. Microbiol Immunol2002, 46(8):535-548.
31. Delgado S, Suárez A, Mayo B: Identification of Dominant Bacte-ria in Feces and Colonic Mucosa from Healthy SpanishAdults by Culturing and by 16S rDNA Sequence Analysis.Dig Dis Sci 2006, 51(4):744-751.
32. Turnbaugh PJ, Hamady M, Yatsunenko T, Cantarel BL, Duncan A, LeyRE, Sogin ML, Jones WJ, Roe BA, Affourtit JP, Egholm M, Henrissat B,Heath AC, Knight R, Gordon JI: A core gut microbiome in obeseand lean twins. Nature 2009, 457(7228):480-484.
33. Ley RE, Turnbaugh PJ, Klein S, Gordon JI: Microbial ecology:human gut microbes associated with obesity. Nature 2006,444(7122):1022-1023.
34. Harmsen HJ, Wildeboer-Veloo AC, Grijpstra J, Knol J, Degener JE,Welling GW: Development of 16S rRNA-based probes for theCoriobacterium group and the Atopobium cluster and theirapplication for enumeration of Coriobacteriaceae in humanfeces from volunteers of different age groups. Appl EnvironMicrobiol 2000, 66(10):4523-4527.
35. Franks AH, Harmsen HJ, Raangs GC, Jansen GJ, Schut F, Welling GW:Variations of bacterial populations in human feces measuredby fluorescent in situ hybridization with group-specific 16SrRNA-targeted oligonucleotide probes. Appl Environ Microbiol1998, 64(9):3336-3345.
36. Chassard C, Scott KP, Marquet P, Martin JC, Del'homme C, DapoignyM, Flint HJ, Bernalier-Donadille A: Assessment of metabolicdiversity within the intestinal microbiota from healthyhumans using combined molecular and cultural approaches.FEMS Microbiol Ecol 2008, 66(3):496-504.
37. Moore WE, Moore LH: Intestinal floras of populations thathave a high risk of colon cancer. Appl Environ Microbiol 1995,61(9):3202-3207.
38. Malinen E, Rinttilä T, Kajander K, Mättö J, Kassinen A, Krogius L,Saarela M, Korpela R, Palva A: Analysis of the fecal microbiota ofirritable bowel syndrome patients and healthy controls withreal-time PCR. Am J Gastroenterol 2005, 100(2):373-382.
39. Mättö J, Maunuksela L, Kajander K, Palva A, Korpela R, Kassinen A,Saarela M: Composition and temporal stability of gastrointes-tinal microbiota in irritable bowel syndrome–a longitudinalstudy in IBS and control subjects. FEMS Immunol Med Microbiol2005, 43(2):213-222.
40. Maukonen J, Satokari R, Mättö J, Söderlund H, Mattila-Sandholm T,Saarela M: Prevalence and temporal stability of selectedclostridial groups in irritable bowel syndrome in relation topredominant faecal bacteria. J Med Microbiol 2006, 55(Pt5):625-633.
41. Apajalahti JH, Särkilahti LK, Mäki BR, Heikkinen JP, Nurminen PH,Holben WE: Effective recovery of bacterial DNA and percent-guanine-plus-cytosine-based analysis of community struc-ture in the gastrointestinal tract of broiler chickens. Appl Envi-ron Microbiol 1998, 64(10):4084-4088.
42. Hicks RE, Amann RI, Stahl DA: Dual staining of natural bacterio-plankton with 4',6-diamidino-2-phenylindole and fluorescentoligonucleotide probes targeting kingdom-level 16S rRNAsequences. Appl Environ Microbiol 1992, 58(7):2158-2163.
43. Kane MD, Poulsen LK, Stahl DA: Monitoring the enrichment andisolation of sulfate-reducing bacteria by using oligonucle-otide hybridization probes designed from environmentallyderived 16S rRNA sequences. Appl Environ Microbiol 1993,59(3):682-686.
44. Wang RF, Kim SJ, Robertson LH, Cerniglia CE: Development of amembrane-array method for the detection of human intes-tinal bacteria in fecal samples. Mol Cell Probes 2002,16(5):341-350.
45. Edwards U, Rogall T, Blöcker H, Emde M, Böttger EC: Isolation anddirect complete nucleotide determination of entire genes.Characterization of a gene coding for 16S ribosomal RNA.Nucleic Acids Res 1989, 17(19):7843-7853.
46. Lane DJ, Pace B, Olsen GJ, Stahl DA, Sogin ML, Pace NR: Rapiddetermination of 16S ribosomal RNA sequences for phyloge-netic analyses. Proc Natl Acad Sci USA 1985, 82(20):6955-6959.
47. Staden R, Beal KF, Bonfield JK: The Staden package. Methods MolBiol 2000, 132:115-130.
48. Thompson JD, Higgins DG, Gibson TJ: CLUSTAL W: improvingthe sensitivity of progressive multiple sequence alignmentthrough sequence weighting, position-specific gap penaltiesand weight matrix choice. Nucleic Acids Res 1994,22(22):4673-4680.
49. Hall T: BioEdit. Biological sequence alignment editor forWindows. 1998 [http://www.mbio.ncsu.edu/BioEdit/bioedit.html].North Carolina State University, NC, USA
50. Cole JR, Chai B, Marsh TL, Farris RJ, Wang Q, Kulam SA, Chandra S,McGarrell DM, Schmidt TM, Garrity GM, Tiedje JM: The RibosomalDatabase Project (RDP-II): previewing a new autoalignerthat allows regular updates and the new prokaryotic taxon-omy. Nucleic Acids Res 2003, 31(1):442-443.
51. Wang X, Heazlewood SP, Krause DO, Florin TH: Molecular char-acterization of the microbial species that colonize humanileal and colonic mucosa by using 16S rDNA sequence anal-ysis. J Appl Microbiol 2003, 95(3):508-520.
52. Felsenstein J: PHYLIP – Phylogeny Inference package (Version3.2). Cladistics 1989:164-166.
53. Schloss PD, Handelsman J: Introducing DOTUR, a computerprogram for defining operational taxonomic units and esti-
Page 12 of 13(page number not for citation purposes)
BMC Microbiology 2009, 9:68 http://www.biomedcentral.com/1471-2180/9/68
Publish with BioMed Central and every scientist can read your work free of charge
"BioMed Central will be the most significant development for disseminating the results of biomedical research in our lifetime."
Sir Paul Nurse, Cancer Research UK
Your research papers will be:
available free of charge to the entire biomedical community
peer reviewed and published immediately upon acceptance
cited in PubMed and archived on PubMed Central
yours — you keep the copyright
Submit your manuscript here:http://www.biomedcentral.com/info/publishing_adv.asp
BioMedcentral
mating species richness. Appl Environ Microbiol 2005,71(3):1501-1506.
54. Pearson WR: Rapid and sensitive sequence comparison withFASTP and FASTA. Methods Enzymol 1990, 183:63-98.
55. Cole JR, Chai B, Farris RJ, Wang Q, Kulam SA, McGarrell DM, GarrityGM, Tiedje JM: The Ribosomal Database Project (RDP-II):sequences and tools for high-throughput rRNA analysis.Nucleic Acids Res 2005:D294-6.
56. Wuyts J, Perriere G, Peer Y Van De: The European ribosomalRNA database. Nucleic Acids Res 2004:D101-3.
57. Kumar S, Tamura K, Nei M: MEGA3: Integrated software forMolecular Evolutionary Genetics Analysis and sequencealignment. Brief Bioinform 2004, 5(2):150-163.
58. Lozupone C, Hamady M, Knight R: UniFrac–an online tool forcomparing microbial community diversity in a phylogeneticcontext. BMC Bioinformatics 2006, 7:371.
59. Corander J, Tang J: Bayesian analysis of population structurebased on linked molecular information. Math Biosci 2007,205(1):19-31.
60. Gelman A, Carlin JB, Stern HS, Rubin DB: Bayesian Data Analysis 2ndedition. Chapman & Hall/CRC; 2004.
61. Krebs C: Ecological Methodology 1st edition. New York: Harper&Col-lins; 1989.
Page 13 of 13(page number not for citation purposes)