Embed Size (px)
Citation preview
LITHUANIAN UNIVERSITY OF HEALTH SCIENCES
MEDICAL ACADEMY
Vestina Strakšytė
VALUE OF MRI
ENTEROCOLONOGRAPHY AND
FAECAL CALPROTECTIN FOR
DIAGNOSIS OF CROHN'S DISEASE
Doctoral Dissertation
Medical and Health Sciences,
Medicine (M 001)
Kaunas, 2021
The dissertation has been prepared at the Department of Radiology of
Lithuanian University of Health Sciences from 2011 to 2020.
The dissertation is defended extramurally.
Scientific Consultant:
Prof. Dr. Gediminas Kiudelis (Lithuanian University of Health Sciences,
Medical and Health Sciences, Medicine – M 001).
The dissertation is defended at the Medical Research Council of the
Lithuanian University of Health Sciences:
Chairperson
Assoc. Prof. Dr. Vaidotas Gurskis (Lithuanian University of Health
Sciences, Medical and Health Sciences, Medicine – M 001).
Members:
Prof. Dr. Rymantė Gleiznienė (Lithuanian University of Health
Sciences, Medical and Health Sciences, Medicine – M 001);
Prof. Dr. Kristina Žvinienė (Lithuanian University of Health Sciences,
Medical and Health Sciences, Medicine – M 001);
Prof. Dr. Nomeda Rima Valevičienė (Vilnius University, Medical and
Health Sciences, Medicine – M 001);
Dr. Povilas Ignatavičius (Zurich University, Medical and Health Scien-
ces, Medicine – M 001).
Dissertation will be defended at the open session of the Medical Research
Council of Lithuanian University of Health Sciences on the 26th
of January,
2021 at 11 a.m. in A-203 of the Centre for the Advanced Pharmaceutical
and Health Technologies of Lithuanian University of Health Sciences.
Address: Sukilėlių 13, LT-50162 Kaunas, Lithuania.
LIETUVOS SVEIKATOS MOKSLŲ UNIVERSITETAS
MEDICINOS AKADEMIJA
Vestina Strakšytė
MRT ENTEROKOLONOGRAFIJOS IR
IŠMATŲ KALPROTEKTINO REIKŠMĖ
DIAGNOZUOJANT KRONO LIGĄ
Daktaro disertacija
Medicinos ir sveikatos mokslai,
medicina (M 001)
Kaunas, 2021
Disertacija rengta 2011–2020 metais Lietuvos sveikatos mokslų universiteto
Medicinos akademijos Radiologijos klinikoje.
Disertacija ginama eksternu.
Mokslinis konsultantas
prof. dr. Gediminas Kiudelis (Lietuvos sveikatos mokslų universitetas,
medicinos ir sveikatos mokslai, medicina – M 001).
Disertacija ginama Lietuvos sveikatos mokslų universiteto medicinos
mokslo krypties taryboje:
Pirmininkas
doc. dr. Vaidotas Gurskis (Lietuvos sveikatos mokslų universitetas,
medicinos ir sveikatos mokslai, medicina – M 001).
Nariai:
prof. dr. Rymantė Gleiznienė (Lietuvos sveikatos mokslų universitetas,
medicinos ir sveikatos mokslai, medicina – M 001);
prof. dr. Kristina Žvinienė (Lietuvos sveikatos mokslų universitetas,
medicinos ir sveikatos mokslai, medicina – M 001);
prof. dr. Nomeda Rima Valevičienė (Vilniaus universitetas, medicinos
ir sveikatos mokslai, medicina – M 001);
dr. Povilas Ignatavičius (Ciuricho universitetas, medicinos ir sveikatos
mokslai, medicina – M 001).
Disertacija bus ginama viešame Lietuvos sveikatos mokslų universiteto medicinos mokslo krypties tarybos posėdyje 2021 m. sausio 26 d. 11 val.
Lietuvos sveikatos mokslų universiteto Naujausių farmacijos ir sveikatos
technologijų centro A-203 auditorijoje. Disertacijos gynimo vietos adresas: Sukilėlių pr. 13, LT-50162 Kaunas, Lietuva.
5
CONTENTS
ABBREVIATIONS ............................................................................................................... 8
INTRODUCTION ................................................................................................................. 9
The aim of the study ................................................................................................................... 10
The objectives of the study ......................................................................................................... 10
The novelty of the study ............................................................................................................. 11
1. LITERATURE REVIEW ............................................................................................ 12
1.1. Epidemiology, Etiology, and Pathogenesis ....................................................................... 12
1.2. Clinical classification of Crohn's disease .......................................................................... 13
1.3. Clinical manifestation of Crohn's disease ......................................................................... 14
1.4. Clinical activity scores ...................................................................................................... 14
1.4.1. Crohn's disease activity index (CDAI) ................................................................. 14
1.4.2. The Harvey Bradshaw index (HBI) ...................................................................... 15
1.4.3. IBDQ – inflammatory bowel disease questionnaire ............................................. 15
1.5. Crohn disease diagnostic gold standard ............................................................................ 15
1.6. Markers of Crohn's disease activity .................................................................................. 16
1.6.1. C reactive protein (CRP) ...................................................................................... 16
1.6.2. Faecal calprotectin ................................................................................................ 17
1.7. Magnetic resonance enterocolonography diagnostic features of Crohn's disease ............. 18
1.7.1. The general principle of magnetic resonance enterocolonography ....................... 18
1.7.2. Enteric contrasts ................................................................................................... 18
1.7.3. Spasmolytics ........................................................................................................ 20
1.7.4. Imaging classification of Crohn’s disease ............................................................ 20
1.7.4.1. Active inflammatory disease subtype ................................................... 20
1.7.4.2. Penetrating subtype ............................................................................... 21
1.7.4.3. Stenosing subtype ................................................................................. 21
1.7.4.4. Reparative-regenerative subtype ........................................................... 22
1.7.5. Magnetic resonance enterocolonography signs of Crohn’s disease activity,
severity, and complications .................................................................................. 22
1.7.5.1. Bowel wall assessment ......................................................................... 22
1.7.5.1.1. Bowel wall thickening .......................................................................... 22
1.7.5.1.2. Enhancement of the bowel wall ............................................................ 23
1.7.5.1.3. Patterns of enhancement ....................................................................... 23
1.7.5.1.4. Bowel wall hyperintensity on T2W images .......................................... 24
1.7.5.1.5. Bowel wall ulceration ........................................................................... 24
1.7.5.2. Extramural findings .............................................................................. 25
1.7.5.2.1. The fibrofatty proliferation ................................................................... 25
1.7.5.2.2. Mesenteric vascularity "comb" sign ...................................................... 25
1.7.5.2.3. Lymph nodes enhancement ................................................................... 25
1.7.6. DWI for CD activity evaluation ........................................................................... 25
1.7.6.1. Technical aspects of DWI ..................................................................... 25
1.7.6.2. DWI assessment .................................................................................... 26
6
1.7.7. Crohn’s disease activity indices ............................................................................ 27
1.7.7.1. Lemann index ........................................................................................ 27
1.7.7.2. MaRIA and mMaRIA ........................................................................... 27
1.7.7.3. Clermont index ...................................................................................... 28
1.8. Crohn disease management ............................................................................................... 29
2. METHODS ................................................................................................................. 31
2.1. Ethics ................................................................................................................................ 31
2.2. Patient selection criteria .................................................................................................... 31
2.2.1. Inclusion criteria ................................................................................................... 31
2.2.2. Exclusion criteria .................................................................................................. 31
2.3. Study design ...................................................................................................................... 31
2.3.1. Questionnaire survey data ..................................................................................... 33
2.3.1.1. Inflammatory bowel disease questionnaire ........................................... 33
2.3.1.2. Crohn’s disease activity index ............................................................... 33
2.3.1.3. Harvey-Bradshaw Index ........................................................................ 33
2.3.2. Blood tests ............................................................................................................ 34
2.3.3. Faecal calprotectin ................................................................................................ 34
2.3.4. Endoscopy with histology ..................................................................................... 34
2.3.5. Magnetic resonance enterocolonography protocol ............................................... 35
2.3.5.1. MR image interpretation ....................................................................... 36
2.3.5.2. Evaluation of MR-EC parameters ......................................................... 36
2.3.5.3. Crohn's disease classification ................................................................ 37
2.3.5.3.1. Active inflammation ............................................................................. 37
2.3.5.3.2. Chronic inflammation ........................................................................... 40
2.3.5.4. Crohn's disease activity grading ............................................................ 42
2.3.5.4.1. Bowel damage assessment .................................................................... 42
2.3.5.4.2. Crohn's disease activity evaluation ....................................................... 42
2.4. Statistical analysis ............................................................................................................. 43
3. RESULTS ................................................................................................................... 44
3.1. Study population characteristics ........................................................................................ 44
3.1.1. Inflammatory bowel disease questionnaire ............................................................. 45
3.2. Overall diagnostic value of MR-EC .................................................................................. 46
3.3. MR-EC parameters ........................................................................................................... 47
3.3.1. Length, location of abnormal segments ................................................................ 47
3.3.2. Bowel wall thickening .......................................................................................... 47
3.3.3. Bowel wall hyperintensity on T2W images .......................................................... 48
3.3.4. Bowel wall enhancement ...................................................................................... 48
3.3.5. Bowel wall pattern of enhancement ...................................................................... 48
3.3.6. Extraluminal changes and complications .............................................................. 49
3.3.7. MR-EC and clinical disease activity ..................................................................... 51
3.4. Correlation between the Crohn's disease activity indices .................................................. 52
3.5. Diffusion-weighted imaging (DWI) and apparent diffusion coefficient (ADC) ................ 54
3.6. Faecal calprotectin ............................................................................................................ 56
3.6.1. Faecal calprotectin and disease behavior .............................................................. 57
3.6.2. Crohn's disease activity indices and faecal calprotectin level ............................... 57
7
4. DISCUSSION ............................................................................................................. 59
4.1. Characteristics of MR-EC for predicting Crohn's disease ....................................... 59
4.2. MR-EC parameters for evaluating disease activity .................................................. 60
4.3. MR-EC indices for evaluating Crohn's disease activity .......................................... 61
4.4. ADC and DWI for predicting CD activity ................................................................. 63
4.5. Faecal calprotectin for monitoring Crohn's disease .................................................. 64
CONCLUSIONS ................................................................................................................. 65
PRACTICAL RECOMMENDATIONS .............................................................................. 66
REFERENCES .................................................................................................................... 67
LIST OF PUBLICATIONS ................................................................................................. 82
LIST OF SCIENTIFIC CONFERENCES ........................................................................... 83
SUMMARY IN LITHUANIAN .......................................................................................... 84
ANNEXES .......................................................................................................................... 98
Annex 1 ...................................................................................................................................... 98
Annex 2 ...................................................................................................................................... 99
Annex 3 .................................................................................................................................... 100
Annex 4 .................................................................................................................................... 109
CURRICULUM VITAE .................................................................................................... 110
8
ABBREVIATIONS
ADC apparent diffusion coefficient
AIS acute inflammatory score
AGA American Gastroenterological Association
anti-TNF antibodies directed against tumor necrosis factor
BW pixel bandwidth
BW bowel wall
BMI Body Mass Index
CD Crohn's disease
CDAI Crohn's Disease Activity Index
CDEIS Crohn's Disease Endoscopic Index of Severity
CRP C reactive protein
DWI diffusion-weighted imaging
eAIS endoscopic biopsy acute inflammatory score
FC faecal calprotectin
FISP fast imaging with steady precession
FOV field of view
fs fat-suppressed
GI gastrointestinal
HASTE Half Fourier acquisition single-shot turbo spin-echo
HBI Harvey-Bradshaw Index
IBD inflammatory bowel disease
IBDQ inflammatory bowel disease questionnaire
IBS Irritable bowel syndrome
IVC intravenous contrast
IV intravenous
LI Lemann index
MaRIA Magnetic Resonance Index of Activity
mMaRIA modified Magnetic Resonance Index of Activity
MR magnetic resonance
MRI magnetic resonance imaging
MR-EC magnetic resonance enterocolonography
PACS picture archiving and communication system
PEG polyethyleneglycol
RCE relative contrast enhancement
ROI region of interest
T1W T1 weighted
T2W T2 weighted
TE echo time
TR repetition time
VIBE Volumetric interpolated breath-hold examination
9
INTRODUCTION
Crohn's disease (CD) is one of the subtypes of idiopathic inflammatory
bowel disease. It is characterized by chronic transmural intestinal inflam-
mation [1, 2] of the gastrointestinal tract anywhere from the mouth to the
anus, with a tendency for the small intestine [3] and an inflammatory
response associated with lymphoid aggregates and granulomas [4].
CD affects more than 2.5 million individuals in the Western world and
has an increasing incidence in the developing world [4].
It is most prevalent in young adults and remains incurable. Patients
usually require lifelong medication and multiple surgeries [5].
CD is usually inflammatory when first recognized but progresses over
time to stricturing or penetrating disease at 3.8–7.5% per year [6].
The symptoms of active CDs, such as abdominal pain and diarrhea,
have a poor correlation to disease severity and behavior (inflammatory,
penetrating, or stricturing) [7]. Additionally, the disease is heterogeneous,
comprising multiple complex phenotypes that vary depending on the age of
onset, disease location, and behavior [8].
Ileocolonoscopy and upper endoscopy are considered the gold standard
to evaluate mucosal inflammation [6]. Endoscopy has the advantage of
getting the tissue sample and investigating the microscopic disease activity
[9]. Nevertheless, they only cover proximal small bowel or terminal ileum
and do not provide information on the possible extra-luminal complications
(fistulas, abscesses), requiring other evaluation modalities [10–13]. More-
over, endoscopy evaluates only the superficial mucosa, while deeper layers
of the bowel wall are not assessed [10].
Thus, cross-sectional imaging is a significant adjunct to endoscopic
evaluation, to allow a complete and sensitive staging of the small bowel and
perineum with the unique advantage to assess mural and extramural disease
[14, 15]. Magnetic resonance imaging (MRI) plays a key role in confirming
the diagnosis, identifying and managing complications, evaluate disease
severity, and determining response to medical therapy [3, 6, 11, 16].
Patients with CD typically need to undergo multiple imaging
examinations because of the nature of the disease. Magnetic resonance
enterocolonography (MR-EC), supply static and dynamic three-dimensional
information of small bowel, enhanced soft-tissue contrast resolution, and
lower incidence of adverse events than computed tomography enterocolono-
graphy [10, 17]. The need for repeated imaging has recently increased more
aggressive medical therapies using biologics or immunosuppressive agents.
10
Also, faecal calprotectin (FC) is a useful biomarker for CD diagnosis of
relapse or mucosal healing [18]. Also, FC is a well-established, useful tool
to identify patients most likely to require conventional colonoscopy for
suspected CD [19].
Grading the activity of CD nowadays is essential [20]. In order to
objectively evaluate the clinical symptoms of a disease, the course, severity,
extent, and to monitor expensive treatment [21]. There are a lot of indices
and scores invented for disease activity and severity evaluation. The most
well-known quality of life assessment – inflammatory bowel disease
questionnaire (IBDQ) [22], Endoscopic Disease Severity Assessment-
Crohn's Disease Endoscopic Index of Severity (CDEIS) [23], and Magnetic
Resonance Index of Activity (MaRIA) [24].
The new quantitative tool for assessing bowel damage in CD is the
Crohn's Disease Digestive Damage Score – the Lemann index (LI) has
recently been developed. [25, 26]. It combines clinical, surgical, endoscopic,
and imaging findings from all digestive tract segments into one composite
score [27].
Current treatments include traditional anti-inflammatory agents, immu-
nomodulators, biological agents with antibodies directed against tumor
necrosis factor (anti-TNF), antibiotics, and surgery [4, 28]. The treatment
goal has changed from symptomatic to complete mucosal healing and
requires periodic imaging examinations to monitor the treatment response
[6, 10, 29–31].
The aim of the study
The aim of the study was to evaluate the role of MR-EC and faecal
calprotectin in the diagnosis and assessment of Crohn's disease.
The objectives of the study
1. To assess the prognostic values of MR-EC in the diagnosis of CD.
2. To compare MR-EC imaging parameters of patients with proven
Crohn's disease with controls (patients without organic gastro-
intestinal lesions).
3. To evaluate the correlations of different Crohn's disease MR-EC
activity indices with CDEIS, clinical activity indices, and IBDQ.
4. To determine the value of apparent diffusion coefficient (ADC) and
DWI for assessment CD inflammatory activity.
5. To evaluate faecal calprotectin as a non-invasive CD activity
marker and it's correlation with various Crohn's disease activity
indices.
11
The novelty of the study
CD remains a clinical challenge due to nonspecific symptoms and a
weak correlation between symptoms and disease activity [32].
In the past two decades, there have been advances in modalities for
imaging the bowel and technologies, providing increased imaging demand
for patients with CD. Improvements in the temporal and spatial resolution of
MRI and the development of enteric agents to distend the bowel have led to
routine visualization of the small and large bowel lumen, wall, and
perienteric tissues using MR-EC [33–36]. Currently, MR-EC is considered
the gold standard to identify and define small bowel CD [14].
The development of modern biologic and immunomodulatory therapies
has increased the need for bowel imaging. The demand to detect, to stage,
and classify inflammatory, penetrating, and stricturing disease, determine
treatment strategies, assess response to therapy, reduce complications, and
reproducibly and accurately track inflammation that is beyond the reach of
the endoscope [37]. In up to 50% of patients with active small bowel
disease, inflammation may skip the terminal ileum or be intramural and not
detected by ileocolonoscopy [38].
The MR-EC methodology was initiated in 2013 at the Department of
Radiology, Lithuanian University of Health Sciences Kauno klinikos. This
clinical study is the first in Lithuania to evaluate CD extension and activity,
so it has considerable scientific and practical value in optimizing the use of
MRI in CD diagnostics.
We performed the first perspective MR-EC study in Lithuania, which
includes CD in a multidisciplinary approach. We evaluated clinical CD
activity indices: CDAI and Harvey Bradshaw, also IBDQ – the quality of life.
Laboratory test whole blood count, CRP, faecal calprotectin. Endoscopy with
biopsy and MR-EC investigation with index calculation was performed.
Also, we adapted the MR-EC protocol in clinical practice. Until now,
routine testing of CD patients in the MR-EC study has not been accepted.
Also, in the present study, we performed a quality of life analysis using
IBDQ.
Up to date, we have not found any study looking for the correlation of
Crohn's Disease Digestive Damage Score – LI and patients' quality of life
measured by IBDQ.
Also, the first clinical study that investigated the performance of the
Lemman index in a clinical setting. Increasing bowel damage evaluated by
LI in this study was associated with decreasing IBDQ. This finding proves
the suggestion that LI could be used for a more global assessment of CD
and even could assess the level of disability.
12
1. LITERATURE REVIEW
1.1. Epidemiology, Etiology, and Pathogenesis
CD is more common in industrialized than in non-industrialized count-
ries [39]. In the 21st century, inflammatory bowel disease (IBD) became a
global disease with accelerating incidence in the newly industrialized count-
ries of Africa, Asia [40–42]. In Europe alone, more than three million
people are affected by IBD [43]. The highest incidence rates are in
Scandinavia, the United Kingdom [39]. However, the classic geographical
distribution of the disease is changing. Low incident regions such as Eastern
Europe
have recently reported rising incidence rates that mean their CD
occurrence is comparable to Western Europe [39]. Increased awareness of
the disease has improved access to healthcare and diagnostic procedures, or
real changes in lifestyle and environmental factors due to the socio-
economic transition from "developing" to "developed" in many Eastern
European countries [44].
Etiology is complex, and the most widely accepted hypothesis purports
CD as an immune-mediated condition in genetically susceptible individuals.
The disease's onset is triggered by environmental factors that disturb the
mucosal barrier, the healthy balance of the gut microbiota, and starts abnor-
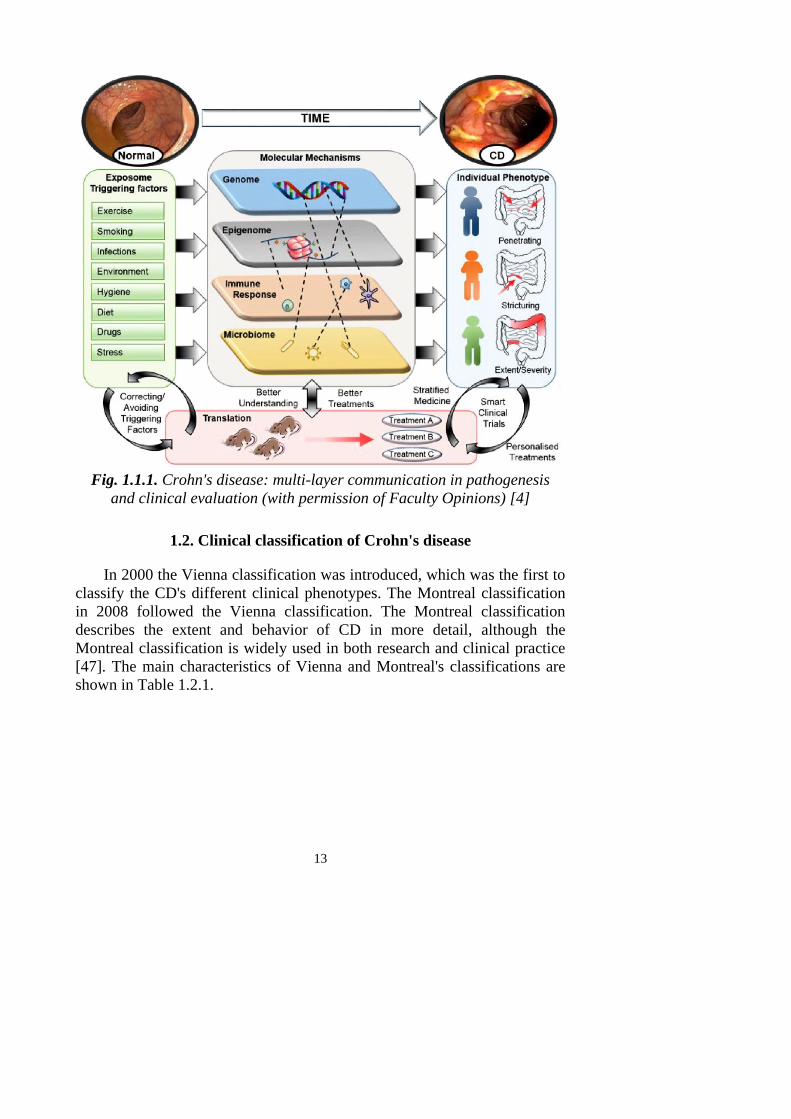
mally stimulating gut immune responses [45]. These factors: genetics, gut
immune response, and the microbiota are influenced by the individual's
environmental exposures or triggers to engage different mechanisms giving
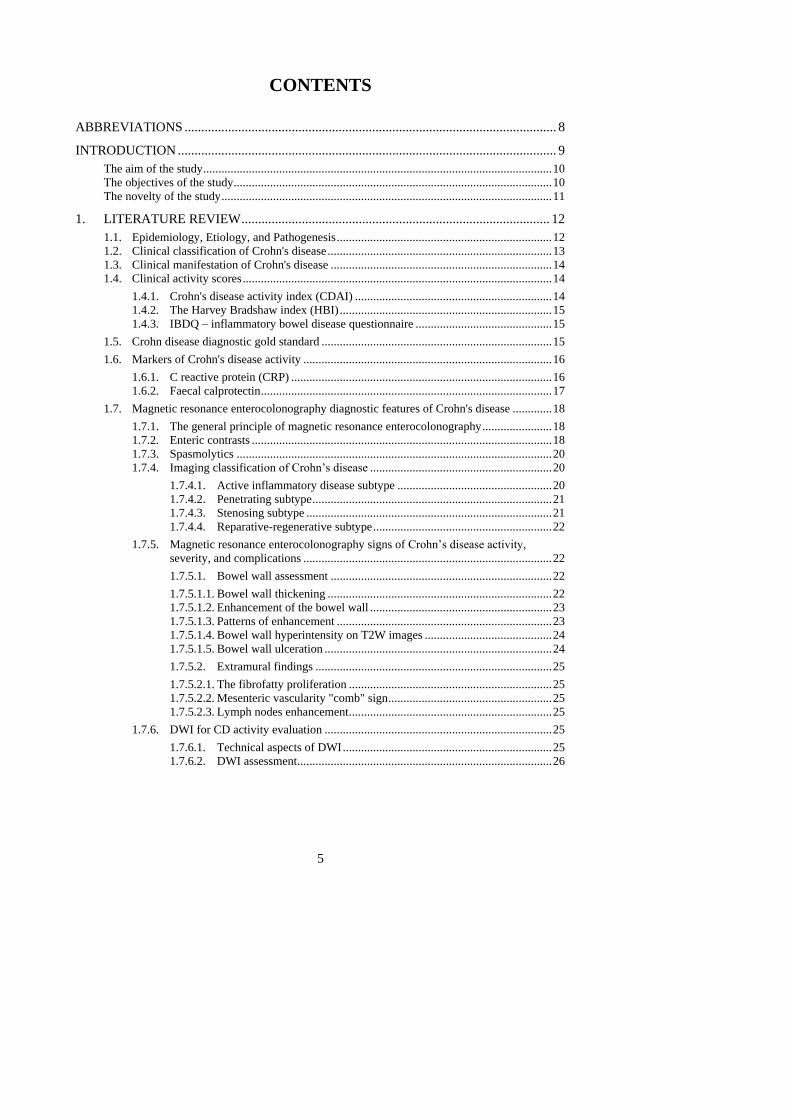
rise to CD (Fig. 1.1.1) [4].
Another theory, other autoimmune and allergic diseases in modern
society, is the "hygiene hypothesis". The hypothesis proposes that these
diseases are caused by abnormal development and response of the immune
system due to the reduced exposure to microorganisms, such as the
microbes in the gut [5].
CD pathogenesis involves a complex interaction over time between ge-
netic, epigenetic, immunological, and microbiological mechanisms affected
by exposure to triggering factors [45, 46]. CD patients have a unique patho-
genic signature comprised of different contributions from each of these
factors. Furthermore, correcting and avoiding triggering factors related to
the exposome are areas of considerable interest [4].
13
Fig. 1.1.1. Crohn's disease: multi-layer communication in pathogenesis
and clinical evaluation (with permission of Faculty Opinions) [4]
1.2. Clinical classification of Crohn's disease
In 2000 the Vienna classification was introduced, which was the first to
classify the CD's different clinical phenotypes. The Montreal classification
in 2008 followed the Vienna classification. The Montreal classification
describes the extent and behavior of CD in more detail, although the
Montreal classification is widely used in both research and clinical practice
[47]. The main characteristics of Vienna and Montreal's classifications are
shown in Table 1.2.1.

14
Table 1.2.1. Vienna and Montreal classification for Crohn's disease
(Permission License Number 4860270033677) [48]
Vienna Montreal
Age at
diagnosis
A1 below 40 years old
A2 above 40 years old
A1 below 16 years old
A2 between 17 and 40 years old
A3 above 40 years old
Location L1 ileal
L2 colonic
L3 ileocolonic
L4 upper
L1 ileal
L2 colonic
L3 ileocolonic
L4 isolated upper disease*
Behavior B1 non-stricturing, non-penetrating
B2 stricturing
B3 penetrating
B1 non-stricturing, non-penetrating
B2 stricturing
B3 penetrating
*L4 is a modifier that can be added to L1–L3 when a concomitant upper gastrointestinal
disease is present.
1.3. Clinical manifestation of Crohn's disease
The most common presenting symptom of CD is chronic diarrhea [49].
More acute presentations may occur, and severe terminal ileal CD may be
mistaken for acute appendicitis, unexplained anemia [45]. Abdominal pain
and weight loss are seen in about 80% and 60% of patients before diagnosis,
respectively [50]. Blood and/or mucus in the stool may be in up to 40–50%
of patients with Crohn's colitis [19]. Patients may present with
extraintestinal manifestations of CD before the gastrointestinal symptoms
become prominent [50]. Extraintestinal manifestations are most common
when CD affects the colon. Perianal fistulas are present in 4–10% of
patients at the time of diagnosis [19].
1.4. Clinical activity scores
1.4.1. Crohn's disease activity index (CDAI)
The CDAI was developed and validated in 1970 and consisted of eight
variables [51]. Variables measured include a number of liquid stools,
abdominal pain, general well-being, extraintestinal complications, use of
antidiarrhoeal drugs, abdominal mass, hematocrit, and body weight [52].
The index ranges from 0 to 600, and the cut off between remission and
active disease has initially taken to be 150, while values above 450 indicate
active and very severe disease [53] – higher scores corresponding to more
severe disease.
15
Although the CDAI index has mostly been used in clinical trials. It has
some limitations: high scores for subjective sign "general well being" and
intensity of "abdominal pain", misleading results in fistulating and stenosing
disease [54]. It is also limited for patients with ileocolic resection and
stoma.
1.4.2. The Harvey Bradshaw index (HBI)
The HBI is a modified and simplified version of the CDAI. HBI uses a
single day's reading for diary entries and excludes three variables: body
weight, hematocrit, and drugs for diarrhea [55]. Scores range from 0 to 20,
with higher scores corresponding to worse disease. The CDAI can be
predicted reasonably well from the HBI [55, 56]. All the clinical indices can
only give an indirect assessment of disease activity. Furthermore, they are
rather complicated and time-consuming to collate. The application of
indices is limited to clinical trials [57].
1.4.3. IBDQ – inflammatory bowel disease questionnaire
The IBDQ examines aspects of the patient's life: bowel and systemic
symptoms, emotional and social functions [22].
Global assessments of patient well-being are subjective and influenced
by disease-specific, inflammatory, psychological, and sociological factors
[58]. A simplified, more reproducible and validated score combining items
from the CDAI and IBDQ could serve in clinical practice and clinical trials
[59].
1.5. Crohn disease diagnostic gold standard
A single reference standard for the diagnosis of CD does not exist. CD's
determination is based on a combination of clinical, biochemical, stool,
endoscopic, cross-sectional imaging, and histological investigations [37].
Ileocolonoscopy with multiple biopsy specimens is well established as
the first-line procedure for diagnosing CD [37, 60]. Ileocolonoscopy with
biopsy can be achieved with practice in at least 85% of colonoscopies and
increases the diagnostic yield [61, 62]. The endoscopic hallmark of CD is
the patchy distribution of inflammation, with skip lesions, the presence of
strictures and fistulas, and perianal involvement [37]. CD ulcers tend to be
longitudinally associated with a "cobblestone" appearance of the ileum or
colon, fistulous orifices, and stricture [37]. When there is a severe, active
disease, the value of full colonoscopy is limited by a higher risk of bowel
perforation [63, 64]. In these circumstances, initial flexible sigmoidoscopy
16
is safer, and ileocolonoscopy should be postponed until the clinical
condition improves [65]. Ileocolonoscopy is superior for diagnosing CD of
the terminal ileum [66–68] compared with radiology techniques, including
MRI and CT, especially for mild lesions [19].
In 2018, ECCO-ESGAR jointly issued a guideline for Diagnostic
Assessment in IBD where initial diagnosis, monitoring of known IBD,
detection of complications are discussed [37].
One of the ECCO-ESGAR statement states, "For suspected IBD,
ileocolonoscopy with biopsies from inflamed and uninflamed segments are
required to establish the diagnosis [EL1]" [37].
A study by Samuel et al. evaluated CD patients with CT enterography
and ileocolonoscopy. From the group of patients with normal ileoscopy,
53.7% of these patients had active small-bowel CD. The ileocolonoscopic
examination can thus miss CD of the terminal ileum, as the disease can skip
the distal ileum or be confined to the intramural portion of the bowel wall
and mesentery [69].
Various endoscopic scoring systems for assessing disease severity and
activity have developed over time, notably the Crohn's disease endoscopic
index of severity (CDEIS).
CDEIS scoring system was developed in 1989 by a French group of
GETID (Groupe d'Etude Therapeutique des Affections Inflammatoires
Digestive) [23] and based upon the presence or absence of four types of the
lesion (superficial ulcers, deep ulcers, ulcerated stenosis, and non-ulcerated
stenosis). The score can range from 0 to 30. Over time CDEIS was
established as the gold standard for endoscopic evaluation of activity [23].
1.6. Markers of Crohn's disease activity
1.6.1. C reactive protein (CRP)
CRP is a useful laboratory surrogate of gut inflammation. However,
low CRP levels were reported in clinically active CD patients with ileal
disease distribution and a low body mass index [3].
CRP – is one of the essential acute phase proteins produced exclusively
in hepatocytes in response to stimuli, including infections, inflammation,
stress, tissue necrosis, trauma, and childbirth [70]. IL-6 and TNF influence
its production, and it has a half-life of 19 hours with a baseline
concentration of 0.8 mg/L [71, 72].
CRP correlates with the disease activity in CD. CRP often increases in
the presence of active disease before rapidly decreasing after the improve-
17
ment in inflammation [73]. Its levels are not directly affected by the admi-
nistration of anti-inflammatory or immunosuppressive drugs [73].
CRP correlates reasonably well with CDAI [7, 74]. A rise in CRP is
commonly seen with moderate to severe clinical activity in CD, and there is
a reasonable correlation with other biomarkers (thrombocytosis, anemia,
and hypoalbuminemia) and endoscopic findings. However, the association
between CRP and radiological and histologic disease activity markers is less
potent [75].
1.6.2. Faecal calprotectin
Calprotectin is a 36 kDa calcium-zinc binding protein, consisting of a
heterodimer of the S100 proteins A8 and A9 [76]. It is expressed abundantly
in the cytoplasm of neutrophils, monocytes, and macrophages [77]. When
the intestine is inflamed, calprotectin is secreted into the faeces from these
types of cells. FC's amount correlates with the degree of neutrophil
infiltration in the gut [76, 78]. FC is a useful and convenient test to
distinguish CD from irritable bowel syndrome (IBS) and assess intestinal
inflammatory activity in patients with CD [79, 80]. FC levels have been
reported to correlate with endoscopic activity of CD [77, 80].
Surprisingly, patients may display elevated FC levels, even when endo-
scopic disease activity is absent [81]. This elevation could be due to disease
activity proximal to the terminal ileum in CD patients or other pathology in
the upper gastrointestinal tract such as peptic ulcers or nonsteroidal entero-
pathy [82].
Alternatively, these elevated calprotectin levels could also be explained
by low-grade inflammation only detectable upon histological evaluation.
Kiesslich et al. and Moum et al. have shown that histological inflammation
can be more extensive and severe than can be appreciated endoscopically
[54, 83]. Earlier studies have shown that elevated calprotectin levels can
predict relapse during follow-up in clinical remission patients with a pooled
sensitivity of 78% and a specificity of 73% [81, 84].
FC is a promising non-invasive marker because it can readily determine
in stool samples [77]. FC is the best-studied faecal biomarker of inflam-
mation. FC is useful as a biomarker to detect response to therapy in Crohn's
colitis and predict recurrence ileocecectomy in CD but is poorly correlated
with endoscopic disease activity in the ileum [3]. Thus, it has remained
unclear whether FC accurately detects inflammation in the large and small
intestines in patients with CD [85].
18
1.7. Magnetic resonance enterocolonography diagnostic
features of Crohn's disease
Many MR-EC parameters are associated with inflammation and
damage, but reported sensitivities and specificities vary widely. Studies
have been performed with different MR-EC protocols and using different
thresholds for a positive. Also, different reference standards have been used,
with different limits. This heterogeneity caused difficulties in choosing the
essential MR-EC parameters in clinical practice [6].
1.7.1. The general principle of magnetic resonance
enterocolonography
There is evidence of optimal patient preparation before MR-EC and
recommendations concerning no solid food and mainly fluid-based diet
[86].
Cronin et al. confirmed that superior bowel distension was achieved in
the prone position [87]. There is no reliable evidence that helps to improve
diagnostic accuracy. Some patients may have difficulty lying prone. Either
supine or prone positioning is considered acceptable [86].
There was no consensus that field strength, either 1.5T or 3T, was
optimal for enteric MRI [88, 89].
There is some evidence that MR-EC can achieve high diagnostic
accuracy without using a spasmolytic [90]. However, other data show
significantly superior distension with the use of these agents [91]. The use
of spasmolytic before MR-EC is, therefore, recommended.
1.7.2. Enteric contrasts
The accuracy of MR-EC is improved by the administration of oral
contrast in comparison to unprepared MR-EC [92, 93]. Many oral contrast
agents are described in the literature, but no substantial evidence from
patient studies supports one particular oral contrast agent over another [94,
95–98]. Therefore, many contrasts are recommended, usually with
hyperosmolar properties and ingested over 46–60 min before the exami-
nation [86].
Three groups of enteric contrast agents may be used for MR-EC to
obtain a homogeneous contrast distribution and achieve uniform bowel
distension (Table 1.7.2.1) [99].
19
Contrast agents:
Negative contrast media – appears low signal intensity on both T1W
and T2W images. Provide better visualization of bowel wall edema and
mucosal enhancement and help to discriminate between intraluminal and
extraluminal fluid (abscess) [100, 101]. The negative contrast agents have a
less pleasant taste compared to others and are more expensive.
Positive contrast media – is high signal intensity on both T1W and
T2W and is helpfully delineating the bowel wall [100]. In general, positive
agents are rarely used in clinical practice.
Biphasic contrast media – is high signal intensity on T2W and low
signal on T1W images [102]. The biphasic contrast agents group is the
largest (including osmotic agents such as mannitol and non-osmotic such as
polyethylene glycol (PEG)). It is the most used type of enteric contrast. The
"dark lumen" on T1W images is essential for evaluating the bowel mucosa
and detecting mural enhancement after intravenous contrast (IVC)
administration. The most commonly used oral contrast agents are mannitol
and PEG.
Critical issues related to the use of oral contrast are the volume of
contrast and administration time. There is high interpersonal variability in
transit times, even higher than the variability between healthy subjects and
patients with CD [103]. The patient takes 1 L in the first 30 min and then
250 ml every 15 min. Immediately before imaging, the patient drinks about
500 ml of water [103].
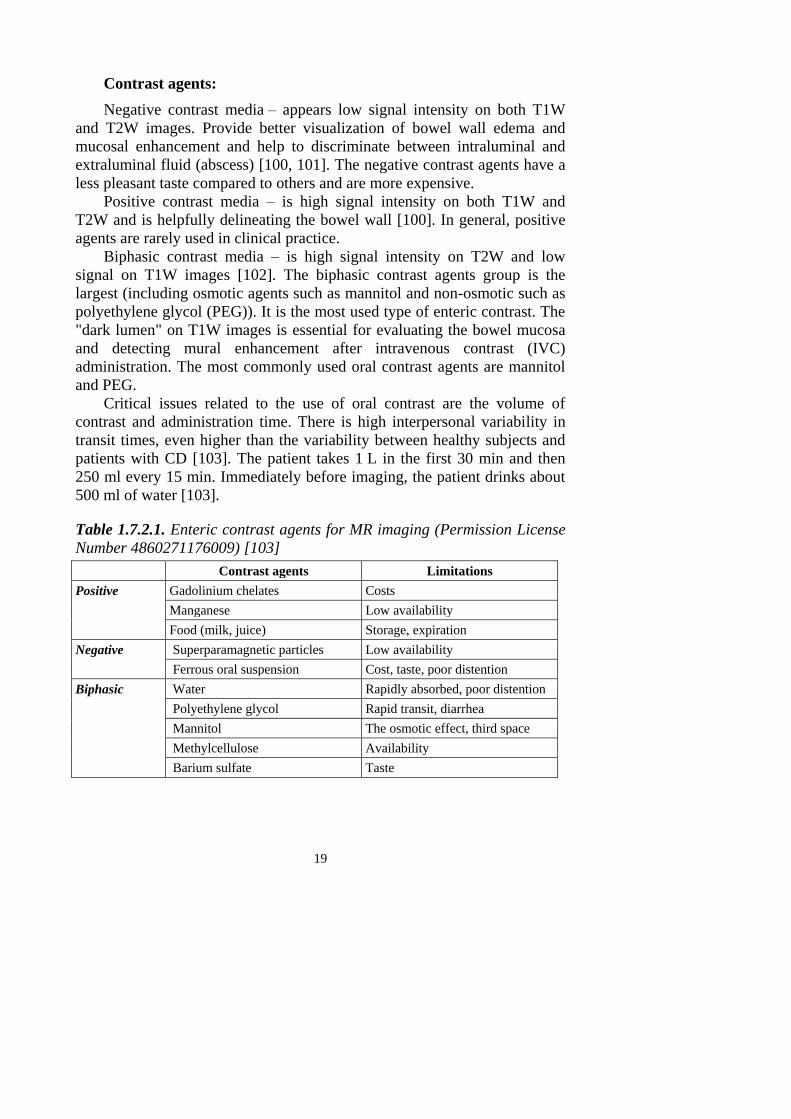
Table 1.7.2.1. Enteric contrast agents for MR imaging (Permission License
Number 4860271176009) [103]
Contrast agents Limitations
Positive Gadolinium chelates Costs
Manganese Low availability
Food (milk, juice) Storage, expiration
Negative Superparamagnetic particles Low availability
Ferrous oral suspension Cost, taste, poor distention
Biphasic Water Rapidly absorbed, poor distention
Polyethylene glycol Rapid transit, diarrhea
Mannitol The osmotic effect, third space
Methylcellulose Availability
Barium sulfate Taste
20
1.7.3. Spasmolytics
The wide variability of spasmolytics is described in the literature [103].
Most authors use N-Butyl Scopolamine or glucagon intravenous (IV) or
intramuscularly immediately before the procedure, as suggested by some
authors [94, 104–107].
Both N-Butyl Scopolamine and glucagon are acceptable agents with
different properties regarding the effect's duration, although they are most
effective when given intravenously [108]. N-Butyl Scopolamine is recom-
mended as the first-line spasmolytic, with glucagon as the second line [109].
The spasmolytics usually are administered before motioning sensitive
sequences and either a single or a split dose [86]. Post-gadolinium T1W
images' use increases diagnostic accuracy [110, 111] and utility of bowel
wall enhancement in validated disease activity scores [24, 86, 112].
1.7.4. Imaging classification of Crohn's disease
CD is classified into several subgroups, and patients may exhibit cha-
racteristics of more than one disease subtype [107, 113]. The subtypes are
the active inflammatory subtype (non-stricturing, non-penetrating),
penetrating, stricturing, and reparative-regenerative subtype. This
classification is useful for determining whether a patient can receive
medical or surgical treatment [103–113].
1.7.4.1. Active inflammatory disease subtype
Early CD manifestations include edema and aphthous ulcers easily
detected by endoscopy, and MRI is less useful [113, 114]. The initial muco-
sal inflammation can progressively develop into deep ulcers, transmural
inflammation, and granuloma formation with further wall thickening,
hyperemia, submucosal edema, and mesenteric fat hypertrophy [103]. Minimal
active inflammatory signs are characterized as aphthous or superficial ulcers
on endoscopic images [113].
Endoscopic and barium examinations are superior in detecting these
superficial mucosal abnormalities [115], which may not identify on MR
imaging even with optimal luminal distension [107, 114]. Mucosal
hyperemia is an area of intense enhancement after contrast agent
administration. The early signal intensity after contrast administration
correlates well with the CDAI [106], as well as a stratified pattern of
contrast enhancement with active inflammation [103].
Additional extramural findings include mesenteric hyperemia with
engorged vessels corresponding to hypervascularity of the inflammated
segment ("comb" sign), usually accompanied by edema and mesenteric fat
21
proliferation around the affected loop. Regional lymphadenopathy was seen
in patients with inflammatory changes [116].
The signs of severe inflammatory activity include deep mucosal ulcera-
tions and a "cobblestone" appearance of the bowel mucosa, very charac-
teristic of CD.
Deep transmural ulcers were readily detected on True FISP, HASTE,
and T1W fat-suppressed (fs) images after IV contrast administration. These
deep transmural ulcers progress to fistula formation [103].
1.7.4.2. Penetrating subtype
This subtype is described by severe inflammation that progresses to
transmural ulceration with fistula formation or intestinal perforation. Before
fistulization, large penetrating ulcers may occur. Differentiation between
deep transmural ulcerations and well-established fistulas is critical as
fissures may respond to more aggressive immunomodulatory treatments
(TNF inhibitors) [103].
Fistula formation has been reported in up to one-third of patients with
CD [117]. MR-EC's sensitivity for detecting fistulizing/penetrating disease
ranges from 83.3–84.4%, with a specificity of 100% [118].
Active fistulas show marked contrast, and chronic fistulas are
considered low signal serpiginous tracts with no enhancement after contrast
injection. Sagittal sequences help delineate fluid-filled tracts that extend
from the small bowel to the anterior abdominal wall [102]. Desmoplastic
reaction incited by transmural inflammation in the mesentery can occur in
band-like areas of fibrosis, often bridging surrounding small bowel loops in
a stellate configuration, also referred to as the "star-sign". These fibrous
bands often show delayed progressive enhancement and are indirect
evidence of enteroenteric fistula [102].
Fistulous may develop between bowel loops or between loops and skin
or other adjacent organs [103].
Extramural complications such as abscesses, inflammatory masses, or
adjacent organ involvement are easily seen at MR-EC [103].
1.7.4.3. Stenosing subtype
Intestinal obstruction is usually together with a greater or lesser degree
of prestenotic dilatation. Differentiation between fibrotic and edematous
stenosis is useful for selecting patients for surgical versus medical treatment
[103].
22
Chronic fibrotic stenoses are typically hypointense on T1W and T2W,
unlike inflammatory stenoses with transmural edema are hyperintense on
T2W fs [103].
Pseudosacculation ("omega" sign) is caused by asymmetric fibrosis
involving the mesenteric margin of the loop resulting in pseudosaccule
formation [103].
Functionally significant stenosis than prestenotic dilatation of bowel
lumen proximal to the stenosis measured >3 cm in diameter [16].
Functionally not significant stenosis than bowel lumen narrowing >10%
compared with normal adjacent bowel in the absence of dilatation [16].
One of the significant disadvantages of MR-EC is the low specificity
and sensitivity in the detection of strictures. Although symptomatic
strictures may be detected, incipient or partial strictures are often missed on
MR-EC because the enterocolonographic technique may not provide
adequate distension of the bowel to highlight partial strictures [102].
1.7.4.4. Reparative-regenerative subtype
Mucosal atrophy and regenerative polyps characterize this phase.
Mucosal atrophy with focal areas of sparing seen as pseudopolyps that
demonstrate no significant enhancement or edema.
Regenerative pseudo-polyps should not be confused with the deep
ulcerations that develop in the advanced inflammatory disease
("cobblestone" sign) [103].
1.7.5. Magnetic resonance enterocolonography signs of
Crohn's disease activity, severity, and complications
The assessment of active CD with MRI may determine the management
of the patient. The findings associated with CD on MRI are divided into
mural and extramural. Mural findings include thickening and enhancement
of the bowel wall, patterns of enhancement, hyperintensity on T2W,
ulcerations. Extramural findings are fibrofatty proliferation, "comb sign",
lymph nodes.
1.7.5.1. Bowel wall assessment
1.7.5.1.1. Bowel wall thickening
The mural thickening one of the signs that better correlates with CD
activity. Wall thickening of more than 3 mm in the good distended small
bowel is considered abnormal [119, 120]. Koh et al. have reported that
mural thickening more than 4 mm is a reliable predictor of the disease
23
activity with a sensitivity and specificity (88% and 75%) [121]. Also, a
significant reduction in mural thickening was in response to the treatment
[122, 123]. Florie et al. stated that wall thickness correlated well with
clinical activity grade (r=0.47, P=0.003) and Van Hees activity index
(r=0.41, P=0.007) [109]. Nonetheless, Punwani et al. reported a precise
correlation between mural thickness on MRI and surgical specimens [103].
Typically, abnormal wall thickening in the acute inflammatory phase of
CD measures >5 mm in thickness. Fat-suppressed balanced steady-state free
precession imaging is best for evaluating wall thickness [102].
1.7.5.1.2. Enhancement of the bowel wall
Mural enhancement in active inflammation is significantly higher than
in normal segments and is highly specific for detecting segmental involve-
ment [121]. Studies comparing segments with active inflammation before
and after treatment showed that the signal intensity decreases significantly
after medical treatment [122, 123].
Florie et al. reported that the bowel wall's enhancement showed a
significant correlation with the clinical grade (r=0.29, P=0.045), CDAI
(r=0.31, P=0.033). The enhancement based on the dynamic series correlated
significantly with the CDAI (r=0.38, P=0.016) [109]. Koh et al. results
analyzing the ratio of the signal intensity of abnormal to normal bowel were
higher in patients with active disease (P<0.05) and had a sensitivity and
specificity (68% and 94%) [121]. Del Vescovo et al. have confirmed that
the layered enhancement has a high sensitivity of 100%, specificity of 87%
in detecting active inflammation [124]. There is evidence suggesting that
bowel wall enhancement is the parameter that correlates with the degree of
inflammation [103].
1.7.5.1.3. Patterns of enhancement
Normal enhancement of adjacent small bowel loops should be used as a
reference when assessing abnormal mural enhancement [102].
Several mural enhancement patterns are described:
– Layered pattern ("target" sign) is due to the edema of the
submucosa and muscularis propria that appears in the early stages
of the CD in bowel loops with increased mucosal and serosal
enhancement due to active inflammation [125]. This sign is useful
to differentiate between loops with active inflammation and loops
with homogeneous enhancement, that is, without the active disease
[102, 103, 105, 107, 121].
24
– Mucosal enhancement may be the only sign of early active inflam-
mation [103].
– Homogeneous mural enhancement is typical for the chronic or
inactive disease [103]. The diffuse transmural enhancement pattern
reflects the transmural nature of the CD [102].
– The absence of mucosal enhancement and weak, homogeneous
enhancement in the rest layers is an indicator of inactive disease.
[103].
Punwani et al. stated statistically significant differences between the
different enhancement patterns and the histologic indexes of acute inflam-
mation [126]. Segments with layered enhancement have a significant
inflammatory component in the histologic analysis, while those with
homogeneous enhancement lack acute inflammatory component [126].
1.7.5.1.4. Bowel wall hyperintensity on T2W images
In segments with wall thickening, edema is best evaluated by
comparing the bowel wall between fat-suppressed and non-fat-suppressed
T2W images. Both mural edema and fat will appear hyperintense on non-
fat-suppressed T2W images. Whereas mural edema alone will persist as a
hyperintense wall signal on fat-suppressed sequences, indicating active
inflammation. Mural fat will lose signal on T2W fs images, suggesting
chronic disease.
Several studies have shown the significant correlation between signal
hyperintensity on T2W images of the affected loops and the presence of
active inflammation [110, 126, 127], as well as significant differences
between healthy individuals and patients with response to treatment [103].
1.7.5.1.5. Bowel wall ulceration
The deep and superficial ulcers are characteristic of active
inflammation. When there is adequate luminal distention, we can observe
aphthous ulcers on MR-EC. The aphthous ulcers are seen as a central focal
area of high T2W signal surrounded by a mound of T2W intermediate
signal [106]. Usually, they are not visualized on MRI [107, 114]. In this
case, conventional endoscopy, capsule endoscopy, and barium imaging are
superior to MRI for aphthous ulcers detection [115].
Deep transmural ulcers are seen as a linear high signal indentation into
the bowel wall. Ulcers are best observed on T2W fs images. Cobblestone
appearance of the mucosa is also associated with deep ulceration areas alter-
nating with thickened mucosal folds [103, 128]. Deep ulcers can develop
into fistula [102].
25
Gourtsoyiannis et al. categorized the bowel wall thickness, lymph node
enhancement, and intestinal ulcers as having the strongest correlation with
active CD [129]. These findings were confirmed by Sinha et al. in a sizeable
validated study of surgically excised bowel segments compared with MR-
EC [102].
1.7.5.2. Extramural findings
1.7.5.2.1. The fibrofatty proliferation
The fibrofatty proliferation may appear in both active and inactive CD.
The fat signal will be hypointense on T2W fs images due to a higher fibrous
content in the inactive disease. In active CD, there is an increase in signal
[130].
1.7.5.2.2. Mesenteric vascularity "comb" sign
Increased vascular engorgement can persist for a long time in patients
with inactive or quiescent disease due to chronic mesenteric fibrosis [103,
116].
The comb sign has a high sensitivity to active disease detection but low
specificity without statistical significance [117]. It has been suggested that
increased vascular spills can persist for a long time in patients with inactive
or transient disease due to chronic mesenteric fibrosis [93, 111].
1.7.5.2.3. Lymph nodes enhancement
Mesenteric lymph nodes moderate or intense contrast enhancement is
highly suggestive of active CD. However, modest lymph node enhancement
can also be seen in 50% of inactive disease [116]. Meanwhile, the regional
lymph nodes' size shows a weak correlation with the degree of inflammatory
activity [103, 131].
1.7.6. DWI for CD activity evaluation
1.7.6.1. Technical aspects of DWI
Contrary to conventional T1W and T2W MRI sequences, DWI
measures changes in water motility caused by the interaction between cell
membranes, macromolecules, and alterations of the tissue that modify the
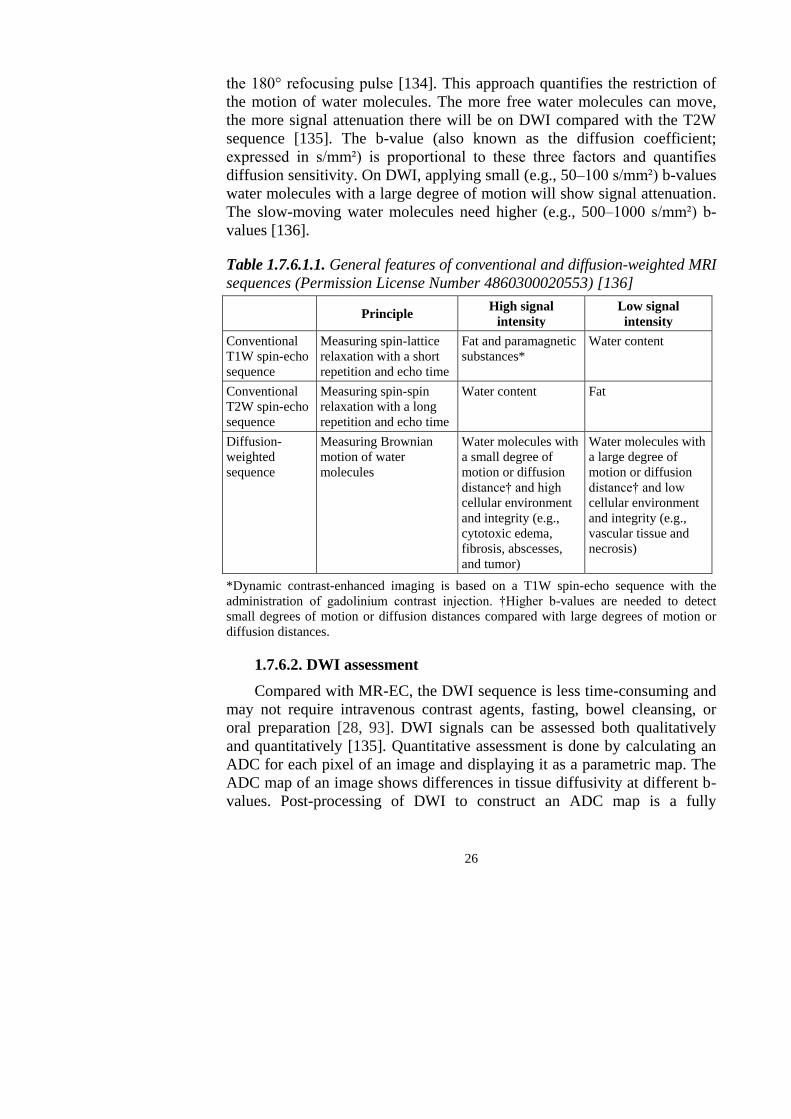
Brownian motion and distribution of fluids (Table 1.7.6.1.1) [132, 133].
Measuring water motion, called apparent diffusion, was first described in
1965 by an experiment that adapted a standard T2W spin-echo sequence by
applying a symmetric pair of diffusion-sensitizing bipolar gradients around
26
the 180° refocusing pulse [134]. This approach quantifies the restriction of
the motion of water molecules. The more free water molecules can move,
the more signal attenuation there will be on DWI compared with the T2W
sequence [135]. The b-value (also known as the diffusion coefficient;
expressed in s/mm²) is proportional to these three factors and quantifies
diffusion sensitivity. On DWI, applying small (e.g., 50–100 s/mm²) b-values
water molecules with a large degree of motion will show signal attenuation.
The slow-moving water molecules need higher (e.g., 500–1000 s/mm²) b-
values [136].
Table 1.7.6.1.1. General features of conventional and diffusion-weighted MRI
sequences (Permission License Number 4860300020553) [136]
Principle High signal
intensity
Low signal
intensity
Conventional
T1W spin-echo
sequence
Measuring spin-lattice
relaxation with a short
repetition and echo time
Fat and paramagnetic
substances*
Water content
Conventional
T2W spin-echo
sequence
Measuring spin-spin
relaxation with a long
repetition and echo time
Water content Fat
Diffusion-
weighted
sequence
Measuring Brownian
motion of water
molecules
Water molecules with
a small degree of
motion or diffusion
distance† and high
cellular environment
and integrity (e.g.,
cytotoxic edema,
fibrosis, abscesses,
and tumor)
Water molecules with
a large degree of
motion or diffusion
distance† and low
cellular environment
and integrity (e.g.,
vascular tissue and
necrosis)
*Dynamic contrast-enhanced imaging is based on a T1W spin-echo sequence with the
administration of gadolinium contrast injection. †Higher b-values are needed to detect
small degrees of motion or diffusion distances compared with large degrees of motion or
diffusion distances.
1.7.6.2. DWI assessment
Compared with MR-EC, the DWI sequence is less time-consuming and
may not require intravenous contrast agents, fasting, bowel cleansing, or
oral preparation [28, 93]. DWI signals can be assessed both qualitatively
and quantitatively [135]. Quantitative assessment is done by calculating an
ADC for each pixel of an image and displaying it as a parametric map. The
ADC map of an image shows differences in tissue diffusivity at different b-
values. Post-processing of DWI to construct an ADC map is a fully
27
automated process done by all commercially available MR scanners.
Calculation of ADCs requires the application of at least two b-values, with
the ADC map's accuracy increasing with the number of b-values [136].
Oto et al. were the first to evaluate DWI and ADC's role in detecting
bowel inflammation and demonstrating increased signal and lower ADC
values in inflamed segments [137]. This observation was confirmed by other
studies [138], and the use of DWI in CD continues to develop [46, 132,
139]. Because of the increased use of DWI in the radiological assessment of
disease activity, Kim et al. recently proposed a modifying MR-EC index,
which replaces ulcers with DWI grade [140]. The similar correlation was
obtained for CDEIS (r=0.737 and r=0.742, P=0.387, respectively) and did
not differ in the ability to diagnose active (r=0.909 and r=0.903, P=0.571) or
severe (r=0.907 and r=0.892, P=0.443) inflammation.
1.7.7. Crohn's disease activity indices
1.7.7.1. Lemann index
The Lemann index (LI) differs from other indices by assessing
structural damage rather than the extent of disease activity and mucosal
inflammation [25, 27]. The LI is a gut damage score. GI tract is divided into
four parts for calculation the score: upper tract (esophagus, stomach,
duodenum), small bowel (each segment is 20 cm), colon (cecum,
ascending/transverse/descending, and sigmoid colon, rectum) and anus. All
the sections are evaluated according to three parameters: surgical
intervention, stricturing lesions, and penetrating lesions, which are being
assessed by either endoscopy, colonoscopy, CT, or MRI and are graded
between 0–3. LI significantly increased with disease durations of years <2
years, ≥2 years, <10 years, and ≥10 years corresponding to LI values of 6.3,
14.3, and 19.0, respectively (P<0.001).
1.7.7.2. MaRIA and mMaRIA
Rimola et al. were the first to develop an MR-EC based index for
quantification of disease activity using CDEIS as a reference standard [141].
They have evaluated six bowel segments (the terminal ileum, ascending,
transverse, descending, sigmoid colon, and rectum). The final score was
based on the features which independently predicted active endoscopic
disease. The features were: bowel wall thickness (mm), ulcers, edema (defi-
ned as hyperintensity of the bowel wall relative to the signal of the m. psoas
on T2W), wall signal intensity (WSI) before and after IV contrast
administration and relative contrast enhancement (RCE) of the bowel wall.
The following formula calculates RCE: RCE = [(WSI postgadolinium −
28
WSI pre-gadolinium)/(WSI pre-gadolinium)] × 100 × [standard deviation
(SD) noise pre-gadolinium/SD noise postgadolinium]. SD noise pre and
postgadolinium is measured outside of the body before and after gadolinium
injection, respectively.
The following formula calculates the segmental MaRIA score: 1.5 ×
wall thickness (mm) + 0.02 × RCE + 5 × edema + 10 × ulceration. The
MaRIA score had a high (r=0.81, P<0.001) correlation with the CDEIS of
the correspondent segment. A global MaRIA score is a sum of six bowel seg-
ments. The significant correlation with CDEIS (r=0.78, P<0.001), HBI
(r=0.56, P<0.001) and CRP (r=0.53, P<0.001) was assessed. Rimola and
colleagues established cutoff points for disease severities [24].
Scardapane et al. obtained the same calculation as MaRIA, excluding
the data related to RCE (0.02 × RCE), and modified the formula: 1.5 × wall
thickness (mm) + 5 × edema + 10 × ulceration [142]. The index was called
mMaRIA.
Recently Ordas et al. developed a simplified version of MaRIA (sMaRIA);
instead of RCE, new item fat stranding was added [143, 144].
1.7.7.3. Clermont index
Buisson et al. developed the first index, which combines DWI and ADC
measurements in the ileum using the MaRIA score as a reference standard
[145]. The Clermont index was proposed by findings showing lower ADC
values in acutely inflamed bowel tissue than in normal tissue [145]. ADC
values and combined conventional MR-EC parameters derived by the
MaRIA index (bowel wall thickness, edema, and ulceration) are used to
calculate the score [146]. The calculation is performed by using the
following formula:
−1.321 × ADC (mm2/s) + 1.646 × wall thickening +
+ 8.306 × ulcers + 5.613 × edema + 5.039 [145].
Validation showed a high correlation of the Clermont index with the
MaRIA score at the ileum and remission prediction after biological therapy
[147–149]. The Clermont index also correlated with ileal CDEIS (r=0.63,
P<0.05) and ileal SES-CD (r=0.58, P<0.05) [150]. A score greater than 18.9
detected ulcerations at endoscopy with sensitivity and specificity, both more
than 70% [150]. Caruso et al. performed a retrospective study and
confirmed the correlation of the Clermont index with the SES-CD for ileal
disease activity (r=0.76, P<0.0001) [151]. The Clermont index is
advantageous because it does not require intravenous contrast injection
[136]. The calculation of the Clermont index depends on the quantitative
29
assessment of DWI. Li X-H et al. [152] confirmed an increased accuracy of
ADC values for the differentiation of inactive-mild CD and moderate-severe
CD compared with conventional MRI parameters [153]. A study by Pendsé
and colleagues [154] supported the use of qualitative grading of DWI signal
to define the burden in CD, and quantitative ADC measurements had a poor
discriminatory ability for segmental disease activity [136].
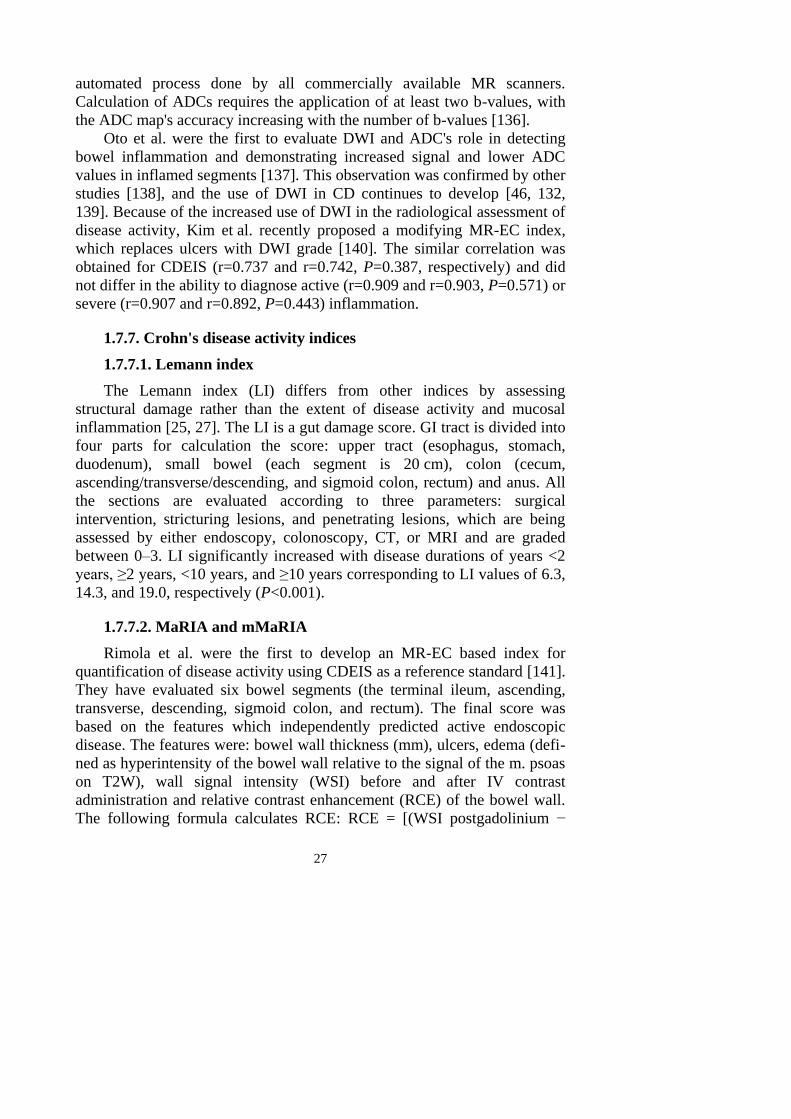
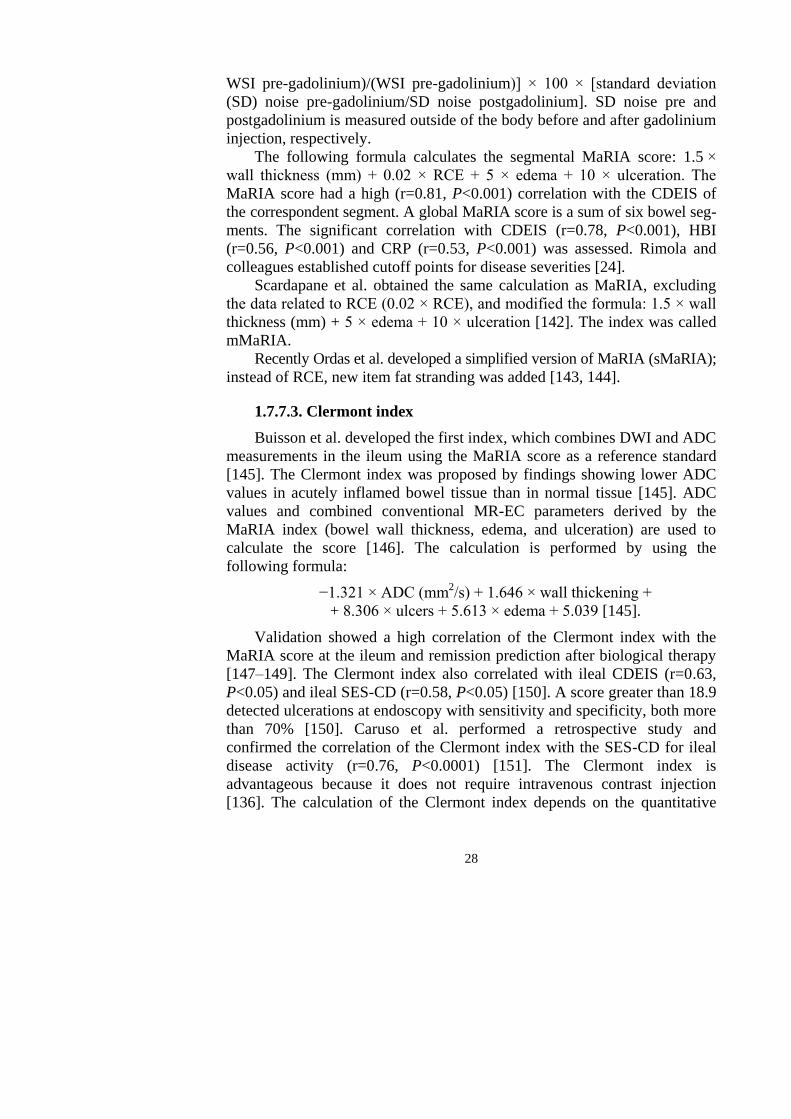
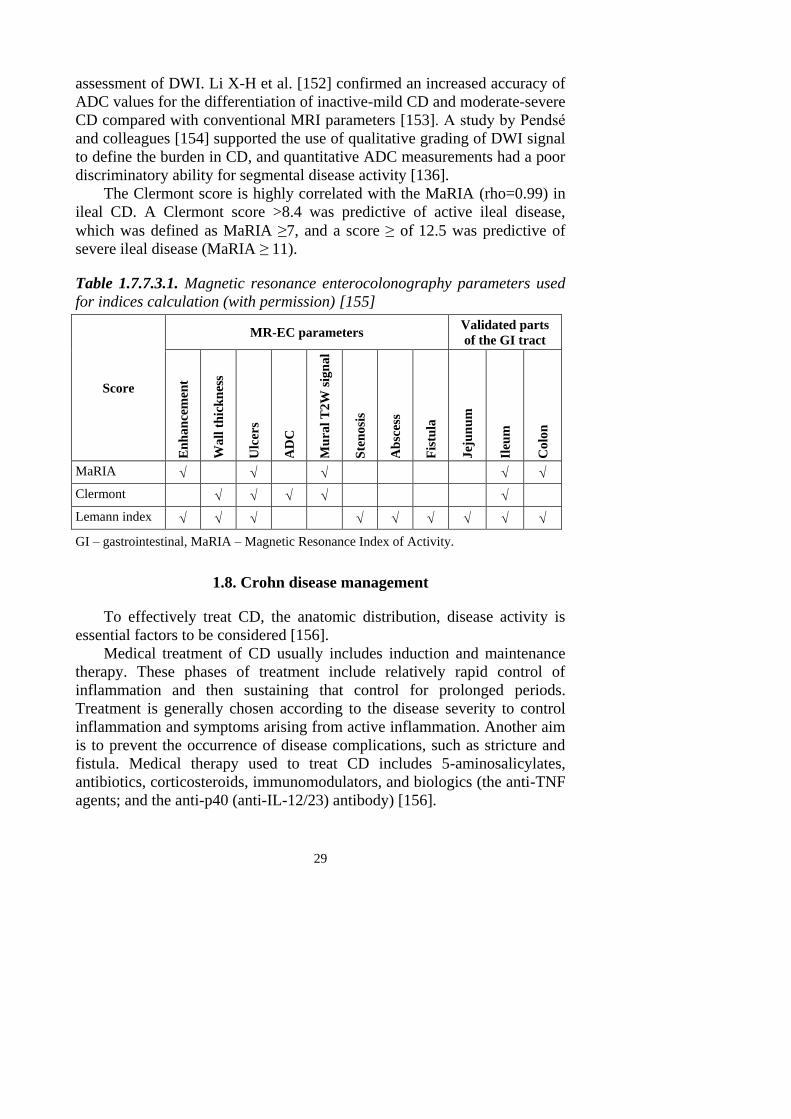
The Clermont score is highly correlated with the MaRIA (rho=0.99) in
ileal CD. A Clermont score >8.4 was predictive of active ileal disease,
which was defined as MaRIA ≥7, and a score ≥ of 12.5 was predictive of
severe ileal disease (MaRIA ≥ 11).
Table 1.7.7.3.1. Magnetic resonance enterocolonography parameters used
for indices calculation (with permission) [155]
Score
MR-EC parameters Validated parts
of the GI tract
En
ha
nce
men
t
Wa
ll t
hic
kn
ess
Ulc
ers
AD
C
Mu
ral
T2W
sig
na
l
Ste
no
sis
Ab
sces
s
Fis
tula
Jej
un
um
Ileu
m
Co
lon
MaRIA
Clermont
Lemann index
GI – gastrointestinal, MaRIA – Magnetic Resonance Index of Activity.
1.8. Crohn disease management
To effectively treat CD, the anatomic distribution, disease activity is
essential factors to be considered [156].
Medical treatment of CD usually includes induction and maintenance
therapy. These phases of treatment include relatively rapid control of
inflammation and then sustaining that control for prolonged periods.
Treatment is generally chosen according to the disease severity to control
inflammation and symptoms arising from active inflammation. Another aim
is to prevent the occurrence of disease complications, such as stricture and
fistula. Medical therapy used to treat CD includes 5-aminosalicylates,
antibiotics, corticosteroids, immunomodulators, and biologics (the anti-TNF
agents; and the anti-p40 (anti-IL-12/23) antibody) [156].
30
Treatment goals for CD that were initially based on symptom control
using corticosteroids have been modified since immunomodulators'
introduction (azathioprine, 6-mercaptopurine, and methotrexate), anti-TNF
therapies (infliximab, adalimumab, and certolizumab pegol). The target of
novel therapies integrin-adhesion molecule interaction-mediated leukocyte
trafficking (vedolizumab) and interleukin-12/23 mediated T-cell activation
(ustekinumab) was introduced into clinical practice [157–158]. The
American Gastroenterological Association (AGA) and European Crohn's
and Colitis Organisation (ECCO) suggests early recognition of disease
severity and inflammatory burden to classify patients at moderate-to-high
risk of disease progression [159]. The known risk factors: diagnosis at age
less than 30 years (expected post-diagnosis life expectancy greater than 30–
40 years); extensive anatomic involvement; perianal and/or severe rectal
disease; deep ulcers in the colon; prior surgical resection; and
stricturing/penetrating disease phenotypes [160- 161]. In the moderate- to
the high-risk patient, the AGA guidelines on medical therapy in CD suggest
the use of a top-down approach with anti-TNF in combination with a
thiopurine is the preferred treatment strategy, in the absence of
contraindications [162].
A subgroup of individuals rapidly progresses to complicated disease
behaviors (stricturing or penetrating disease, or both). These patients are in
the high-risk group. Risk factors for CD progression include young age at
the time of diagnosis, ileal disease location, serological response to specific
microbial antigens, initial extensive bowel involvement, perianal/severe rectal
disease, and presence of a penetrating or stenosis disease phenotype at diag-
nosis [156].
Anti-TNF (infliximab) is approved to induce remission in moderately
severe CD refractory to other therapies, including mesalamine, antibiotics,
corticosteroids, and immunomodulators [162]. These anti-TNFs are superior
to thiopurine monotherapy in inducing remission in moderately severe CD
[163]. Furthermore, a combination of an anti-TNF with a thiopurine is
superior to an anti-TNF alone in inducing remission in moderately severe
CD [163].
31
2. METHODS
2.1. Ethics
We performed a single-center study in the Radiology and Gastroente-
rology Department at the Hospital of Lithuanian University of Health
Sciences Kauno klinikos during 2013–2018.
The Kaunas Regional Ethics Committee approved the study for
Biomedical Research No. BE-2-48 (21st of December, 2012). All patients
have signed an informed consent form before inclusion.
2.2. Patient selection criteria
2.2.1. Inclusion criteria
1. Patients with suspected or established CD.
2. Patients 18 years and older.
3. No pacemakers, metal devices, prostheses, or foreign bodies in the
patient's body.
4. The patients with no evidence of renal insufficiency (serum creati-
nine lower than 130 mg/L).
5. Patient in whom complete MR-EC has been performed.
2.2.2. Exclusion criteria
1. Patients with a high BMI>30.
2. Patients with stomas.
3. Patients with perianal CD only.
4. Patients with ulcerative colitis.
5. Other pathology found on MR-EC: tumors, diverticulitis,
adhesions.
6. Incomplete MR-EC investigation or with severe artifacts.
2.3. Study design
Our study included consecutive patients with suspected or already
diagnosed CD who were referred for MR-EC.
Two hundred twenty-nine patients met the inclusion criteria. Patients
were informed about the purpose of the study, and the research plan was
explained to them. In the absence of exclusion criteria, all patients filled
questionnaires. Blood specimens were obtained before the MR-EC proce-
32
dure. Endoscopy and histology were performed within 14 days before the
MR-EC examination. The stool samples were collected for FC analysis
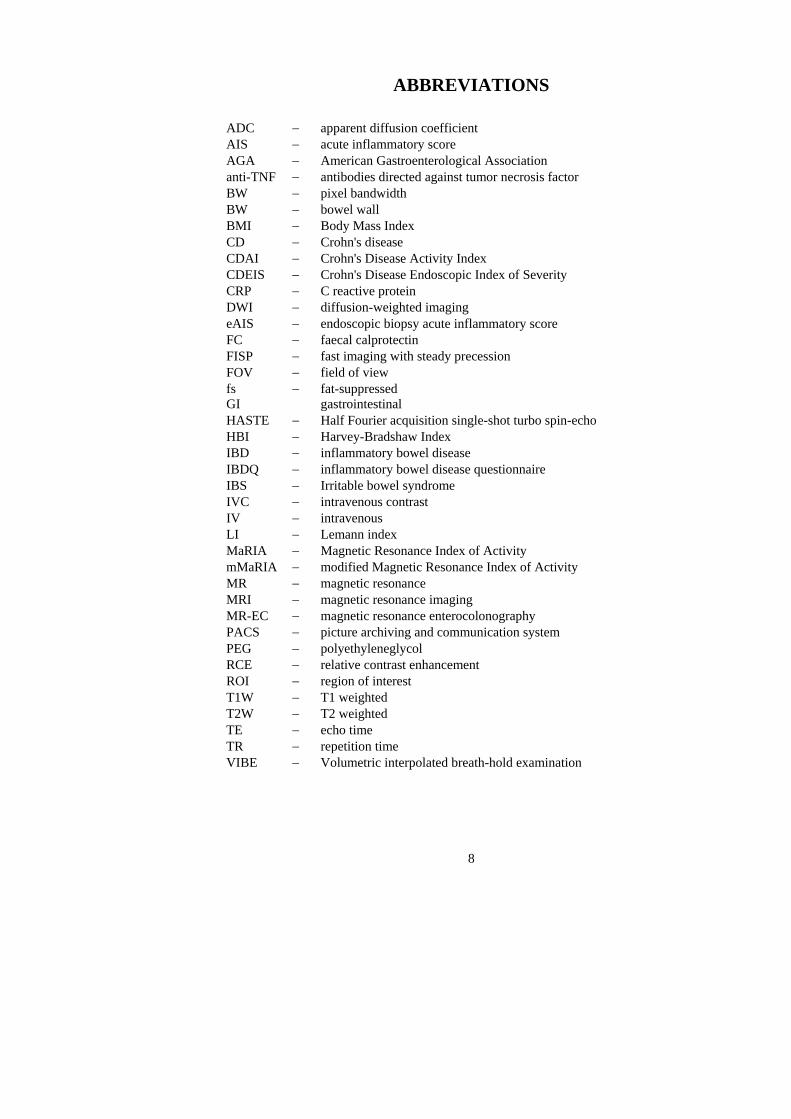
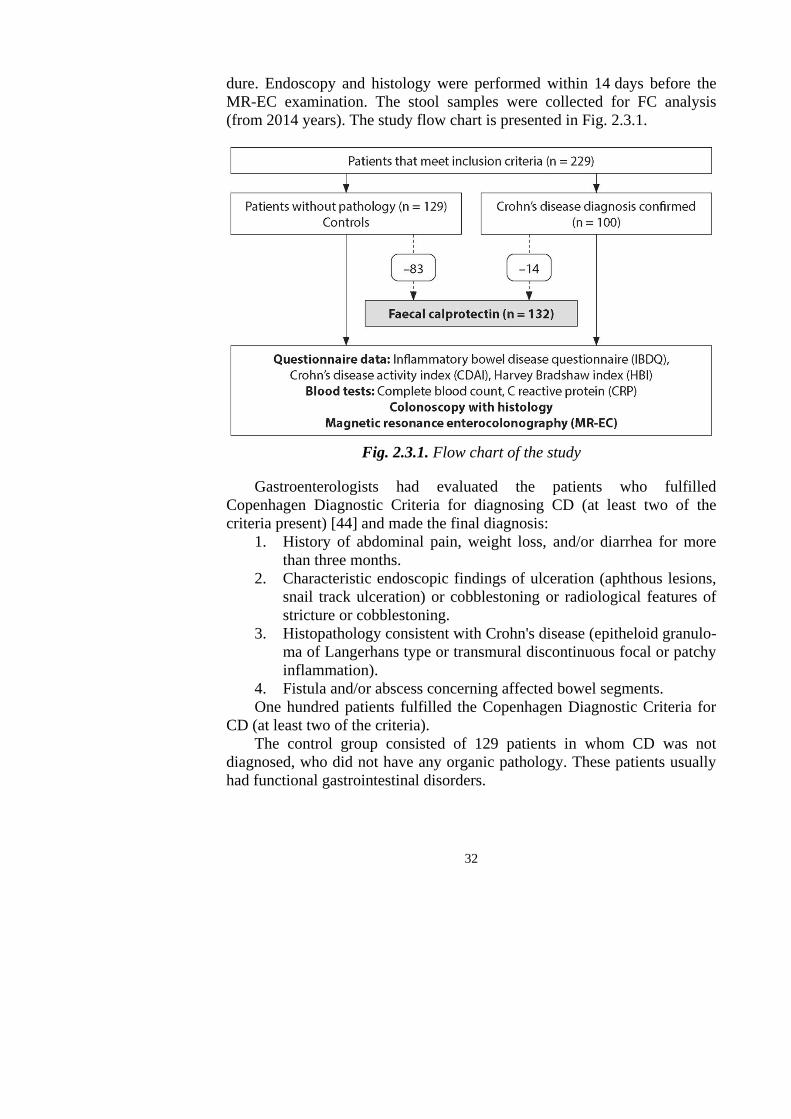
(from 2014 years). The study flow chart is presented in Fig. 2.3.1.
Fig. 2.3.1. Flow chart of the study
Gastroenterologists had evaluated the patients who fulfilled
Copenhagen Diagnostic Criteria for diagnosing CD (at least two of the
criteria present) [44] and made the final diagnosis:
1. History of abdominal pain, weight loss, and/or diarrhea for more
than three months.
2. Characteristic endoscopic findings of ulceration (aphthous lesions,
snail track ulceration) or cobblestoning or radiological features of
stricture or cobblestoning.
3. Histopathology consistent with Crohn's disease (epitheloid granulo-
ma of Langerhans type or transmural discontinuous focal or patchy
inflammation).
4. Fistula and/or abscess concerning affected bowel segments.
One hundred patients fulfilled the Copenhagen Diagnostic Criteria for
CD (at least two of the criteria).
The control group consisted of 129 patients in whom CD was not
diagnosed, who did not have any organic pathology. These patients usually
had functional gastrointestinal disorders.
33
2.3.1. Questionnaire survey data
All patients filled questionnaire forms: inflammatory bowel disease
questionnaire (IBDQ), Crohn's Disease Activity Index (CDAI), Harvey-
Bradshaw Index (HBI).
2.3.1.1. Inflammatory bowel disease questionnaire
IBDQ is a validated, disease-specific quality of life assessment instru-
ment (Annex 3) [164]. This questionnaire includes four main problems that
reflect the quality of life: bowel and systemic symptoms, emotional and
social functions [164]. IBDQ questionnaire consists of 32 questions. In our
study, patients were interviewed, and IBDQ results were calculated
according to the survey's instructions. The response for each item was
graded on a 7-point Likert scale, ranging from 1 (reflects "worst" condition)
to 7 (reflects the "best" condition). The total IBDQ score varies between 32
and 224, and the higher score reflects a better quality of life [165].
2.3.1.2. Crohn's disease activity index
CDAI calculation is based on symptoms: including the number of liquid
stools, abdominal pain, general well-being, extraintestinal complications,
usage of antidiarrhoeal drugs, abdominal mass, hematocrit, and body weight
(Annex 1) [51]. The measured score varies from 0 to 600, and the higher
score corresponds to more severe disease. Values below 150 suggest
quiescent disease (remission), and values above 450 are associated with
very severe disease [51]. Severe disease is thought to be above 300.
However, some researchers have arbitrarily labeled CDAI scores of 150–
219 as mildly active disease and scores of 220–450 as a moderately active
disease [52].
2.3.1.3. Harvey-Bradshaw Index
The HBI is a more simple index than CDAI. The index considers five
clinical parameters only: general well-being, abdominal pain, number of
daily liquid stools, abdominal mass, complications [166]. For each
parameter, a specific score is assigned (Annex 2).
HBI<5 is defined as clinical remission, HBI between 5 and 7 as a mild
disease, HBI between 8 and 16 as the moderate disease, and HBI>16 as a
severe disease [56, 166–167].
34
2.3.2. Blood tests
Routine blood tests were performed. Normal values were established
according to laboratory standards.
2.3.3. Faecal calprotectin
Patients have provided a stool sample within a week after the MR-EC
examination, which was used for FC measurement.
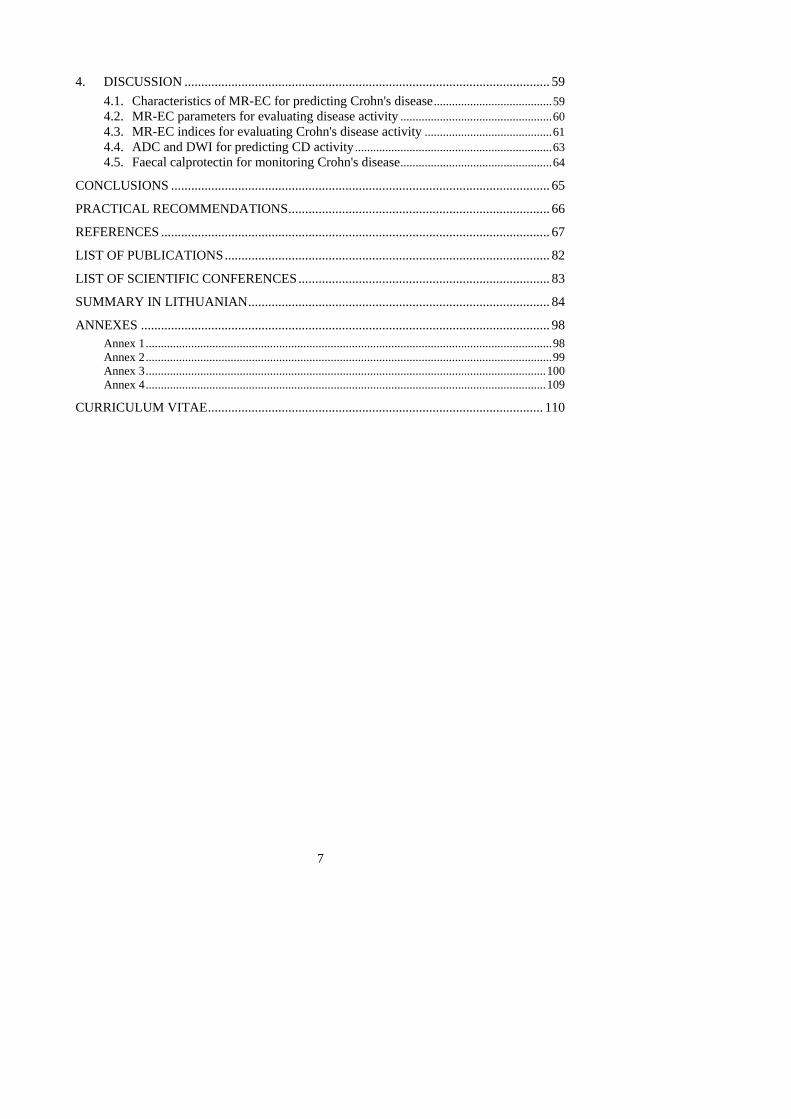
FC was analyzed by a sandwich enzyme-linked immunosorbent assay
(Calprotectin ELISA; Bühlmann Laboratories AG, Basel, Switzerland)
(Fig. 2.3.3.1) using a monoclonal capture antibody specific for calprotectin,
according to the manufacturer's instructions.
The calprotectin's measurement range was between 0 and 300 µg/g, and
samples were diluted to obtain calprotectin levels above the upper limit.
Levels 0<50 µg/g were considered normal, >200 µg/g active process with
inflammation.
Fig. 2.3.3.1. Quantum Blue®
– Calprotectin reader
2.3.4. Endoscopy with histology
An experienced gastroenterologist performed the endoscopy to evaluate
lesions in the colon and terminal ileum blinded to MR-EC results. To assess
the severity and activity of endoscopic inflammation, CDEIS was
calculated. Conventional colonoscopy was performed using standard
equipment (Olympus, Tokyo, Japan). Suspicious inflammatory segments
were recorded, and biopsy samples were collected. Also, the biopsy sample
was collected from healthy-looking bowel segments.
According to the Hospital of Lithuanian University of Health Sciences
Kauno klinikos standard protocol, all tissue sections were stained with
hematoxylin and eosin. The histopathologist applied an endoscopic biopsy
acute inflammatory score (eAIS) based on the typical morphological
features of CD Table 2.3.4.1 [168].
35
Table 2.3.4.1. Histopathology grading for endoscopic acute inflammation
score (eAIS)
Histological variable Grade
Erosion or ulceration 0=No, 1=Yes
Polymorphs in the lamina propria 0=No, 1=Yes
Cryptitis 0=No, 1=Yes
Crypt abscess formation 0=No, 1=Yes
Inflammatory exudates 0=No, 1=Yes
Granulomas 0=No, 1=Yes
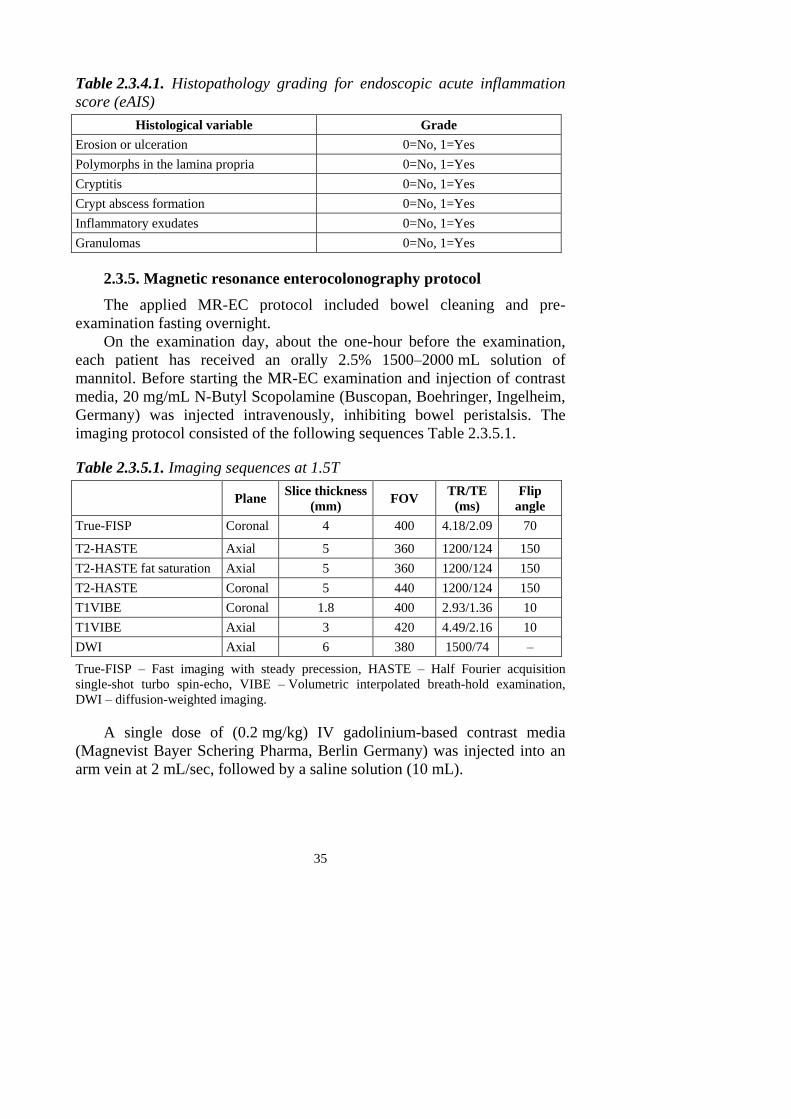
2.3.5. Magnetic resonance enterocolonography protocol
The applied MR-EC protocol included bowel cleaning and pre-
examination fasting overnight.
On the examination day, about the one-hour before the examination,
each patient has received an orally 2.5% 1500–2000 mL solution of
mannitol. Before starting the MR-EC examination and injection of contrast
media, 20 mg/mL N-Butyl Scopolamine (Buscopan, Boehringer, Ingelheim,
Germany) was injected intravenously, inhibiting bowel peristalsis. The
imaging protocol consisted of the following sequences Table 2.3.5.1.
Table 2.3.5.1. Imaging sequences at 1.5T
Plane Slice thickness
(mm) FOV
TR/TE
(ms)
Flip
angle
True-FISP Coronal 4 400 4.18/2.09 70
T2-HASTE Axial 5 360 1200/124 150
T2-HASTE fat saturation Axial 5 360 1200/124 150
T2-HASTE Coronal 5 440 1200/124 150
T1VIBE Coronal 1.8 400 2.93/1.36 10
T1VIBE Axial 3 420 4.49/2.16 10
DWI Axial 6 380 1500/74 –
True-FISP – Fast imaging with steady precession, HASTE – Half Fourier acquisition
single-shot turbo spin-echo, VIBE – Volumetric interpolated breath-hold examination,
DWI – diffusion-weighted imaging.
A single dose of (0.2 mg/kg) IV gadolinium-based contrast media
(Magnevist Bayer Schering Pharma, Berlin Germany) was injected into an
arm vein at 2 mL/sec, followed by a saline solution (10 mL).
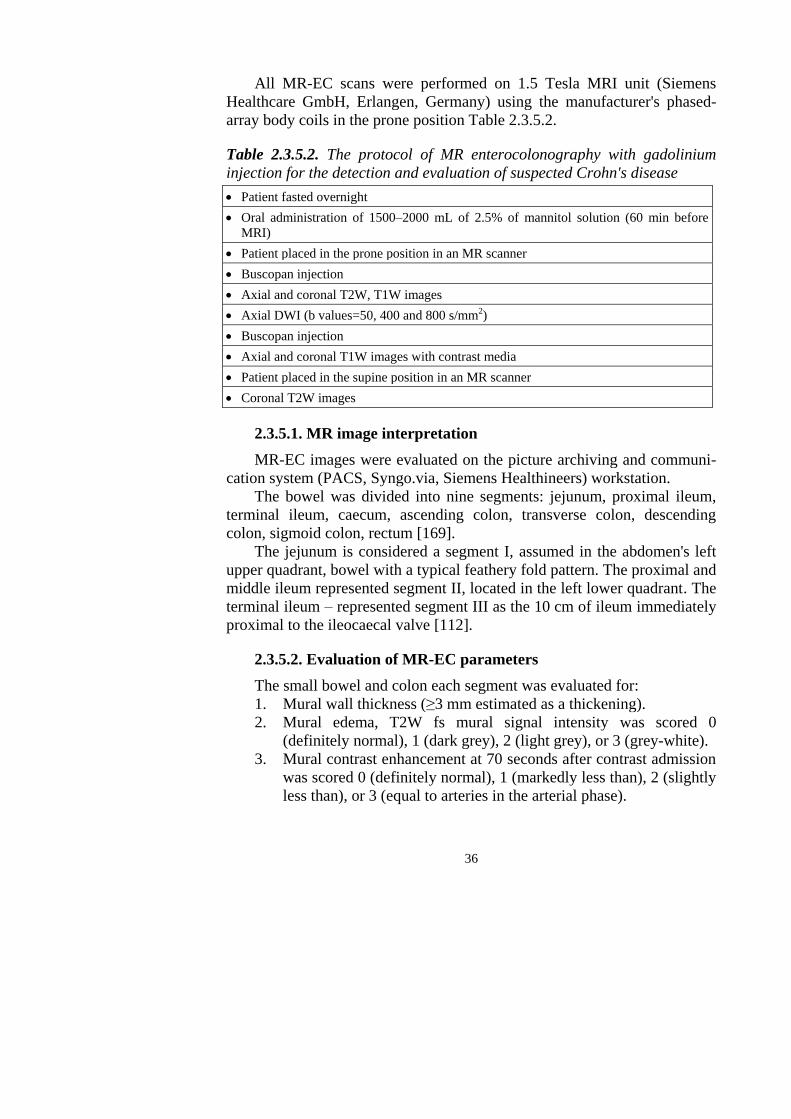
36
All MR-EC scans were performed on 1.5 Tesla MRI unit (Siemens
Healthcare GmbH, Erlangen, Germany) using the manufacturer's phased-
array body coils in the prone position Table 2.3.5.2.
Table 2.3.5.2. The protocol of MR enterocolonography with gadolinium
injection for the detection and evaluation of suspected Crohn's disease
Patient fasted overnight
Oral administration of 1500–2000 mL of 2.5% of mannitol solution (60 min before
MRI)
Patient placed in the prone position in an MR scanner
Buscopan injection
Axial and coronal T2W, T1W images
Axial DWI (b values=50, 400 and 800 s/mm2)
Buscopan injection
Axial and coronal T1W images with contrast media
Patient placed in the supine position in an MR scanner
Coronal T2W images
2.3.5.1. MR image interpretation
MR-EC images were evaluated on the picture archiving and communi-
cation system (PACS, Syngo.via, Siemens Healthineers) workstation.
The bowel was divided into nine segments: jejunum, proximal ileum,
terminal ileum, caecum, ascending colon, transverse colon, descending
colon, sigmoid colon, rectum [169].
The jejunum is considered a segment I, assumed in the abdomen's left
upper quadrant, bowel with a typical feathery fold pattern. The proximal and
middle ileum represented segment II, located in the left lower quadrant. The
terminal ileum – represented segment III as the 10 cm of ileum immediately
proximal to the ileocaecal valve [112].
2.3.5.2. Evaluation of MR-EC parameters
The small bowel and colon each segment was evaluated for:
1. Mural wall thickness (≥3 mm estimated as a thickening).
2. Mural edema, T2W fs mural signal intensity was scored 0
(definitely normal), 1 (dark grey), 2 (light grey), or 3 (grey-white).
3. Mural contrast enhancement at 70 seconds after contrast admission
was scored 0 (definitely normal), 1 (markedly less than), 2 (slightly
less than), or 3 (equal to arteries in the arterial phase).
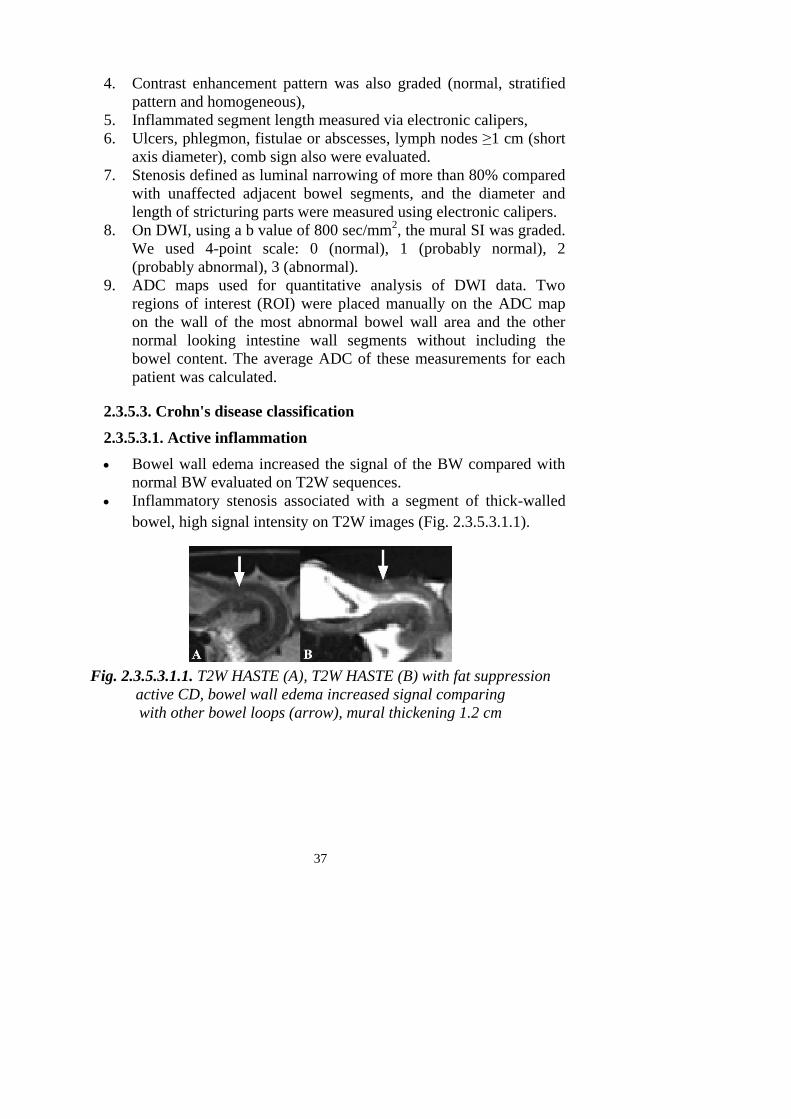
37
4. Contrast enhancement pattern was also graded (normal, stratified
pattern and homogeneous),
5. Inflammated segment length measured via electronic calipers,
6. Ulcers, phlegmon, fistulae or abscesses, lymph nodes ≥1 cm (short
axis diameter), comb sign also were evaluated.
7. Stenosis defined as luminal narrowing of more than 80% compared
with unaffected adjacent bowel segments, and the diameter and
length of stricturing parts were measured using electronic calipers.
8. On DWI, using a b value of 800 sec/mm2, the mural SI was graded.
We used 4-point scale: 0 (normal), 1 (probably normal), 2
(probably abnormal), 3 (abnormal).
9. ADC maps used for quantitative analysis of DWI data. Two
regions of interest (ROI) were placed manually on the ADC map
on the wall of the most abnormal bowel wall area and the other
normal looking intestine wall segments without including the
bowel content. The average ADC of these measurements for each
patient was calculated.
2.3.5.3. Crohn's disease classification
2.3.5.3.1. Active inflammation
Bowel wall edema increased the signal of the BW compared with
normal BW evaluated on T2W sequences.
Inflammatory stenosis associated with a segment of thick-walled
bowel, high signal intensity on T2W images (Fig. 2.3.5.3.1.1).
Fig. 2.3.5.3.1.1. T2W HASTE (A), T2W HASTE (B) with fat suppression
active CD, bowel wall edema increased signal comparing
with other bowel loops (arrow), mural thickening 1.2 cm
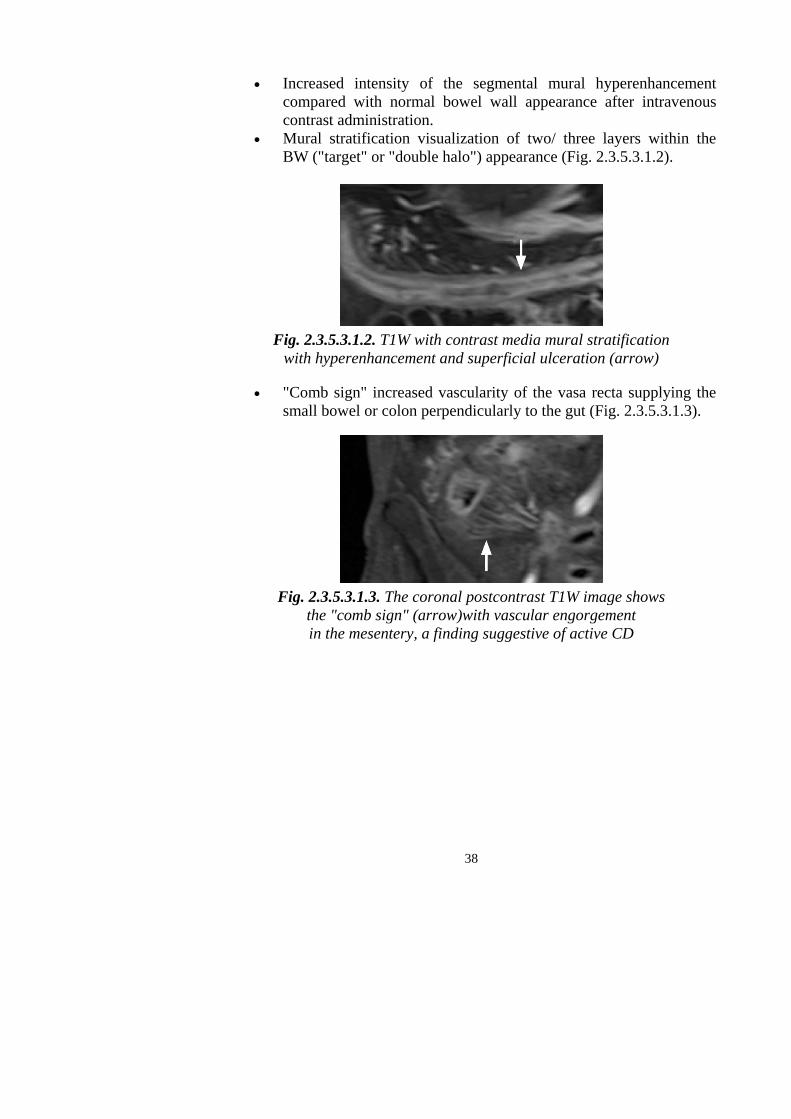
38
Increased intensity of the segmental mural hyperenhancement
compared with normal bowel wall appearance after intravenous
contrast administration.
Mural stratification visualization of two/ three layers within the
BW ("target" or "double halo") appearance (Fig. 2.3.5.3.1.2).
Fig. 2.3.5.3.1.2. T1W with contrast media mural stratification
with hyperenhancement and superficial ulceration (arrow)
"Comb sign" increased vascularity of the vasa recta supplying the
small bowel or colon perpendicularly to the gut (Fig. 2.3.5.3.1.3).
Fig. 2.3.5.3.1.3. The coronal postcontrast T1W image shows
the "comb sign" (arrow)with vascular engorgement
in the mesentery, a finding suggestive of active CD
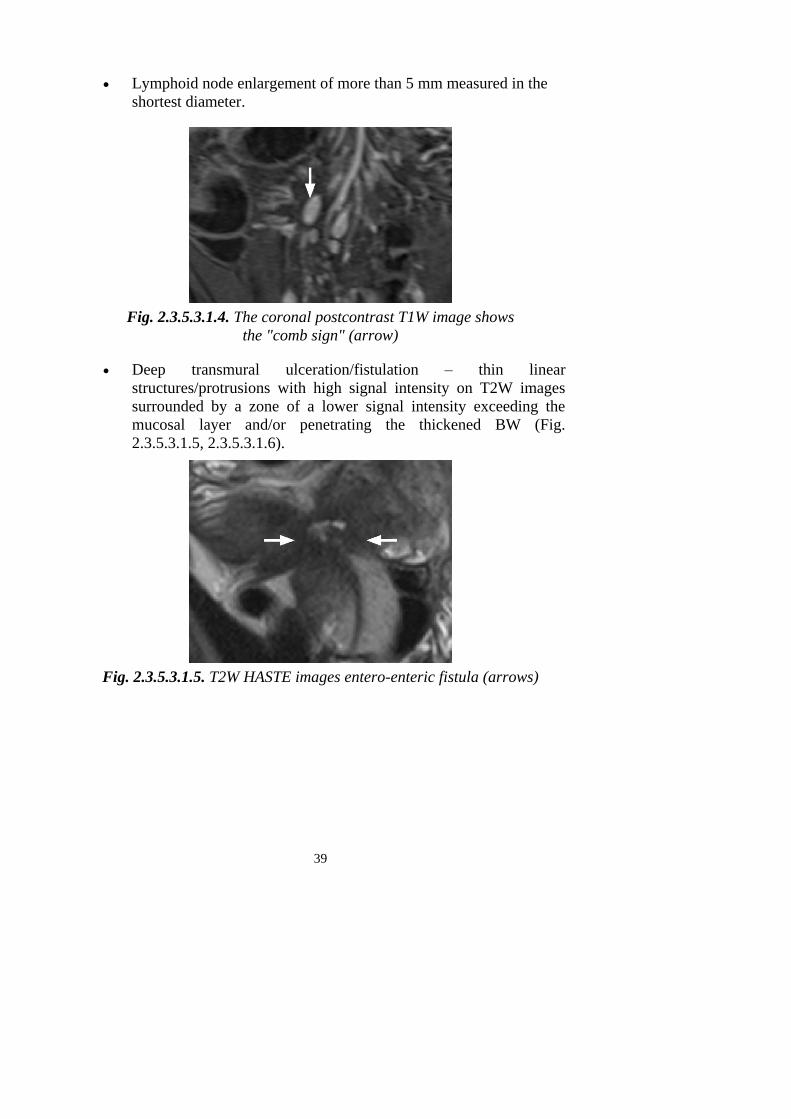
39
Lymphoid node enlargement of more than 5 mm measured in the
shortest diameter.
Fig. 2.3.5.3.1.4. The coronal postcontrast T1W image shows
the "comb sign" (arrow)
Deep transmural ulceration/fistulation – thin linear
structures/protrusions with high signal intensity on T2W images
surrounded by a zone of a lower signal intensity exceeding the
mucosal layer and/or penetrating the thickened BW (Fig.
2.3.5.3.1.5, 2.3.5.3.1.6).
Fig. 2.3.5.3.1.5. T2W HASTE images entero-enteric fistula (arrows)
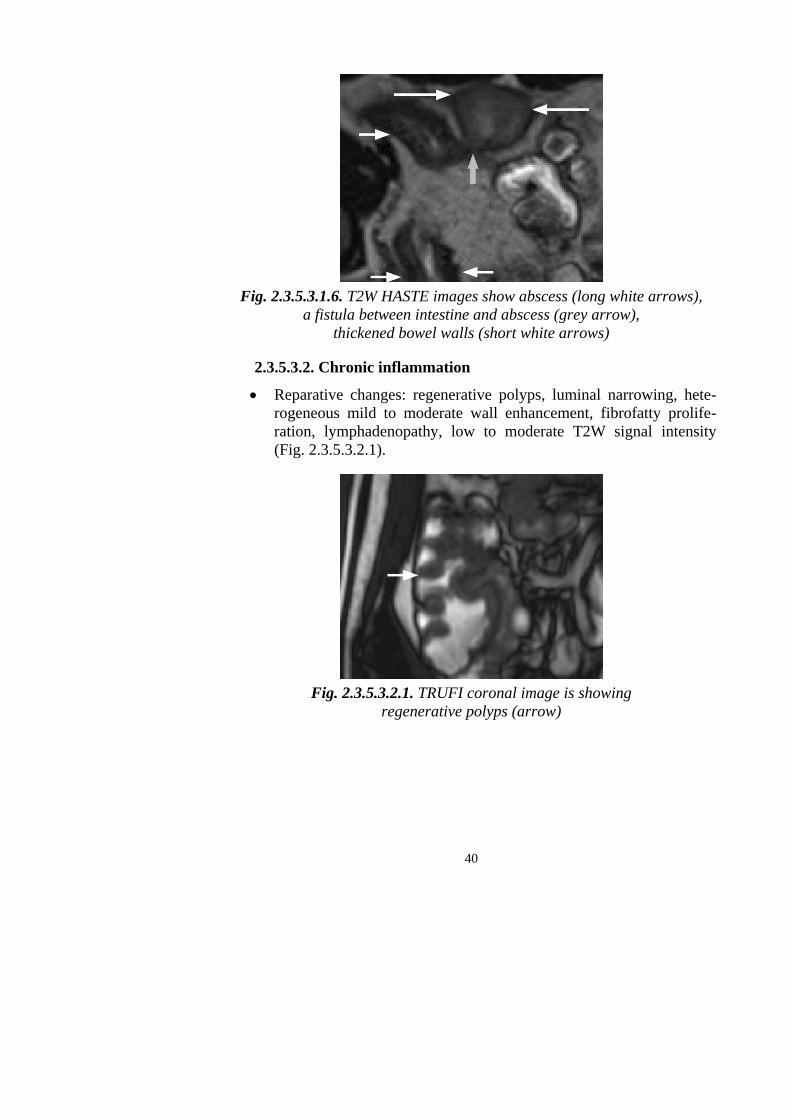
40
Fig. 2.3.5.3.1.6. T2W HASTE images show abscess (long white arrows),
a fistula between intestine and abscess (grey arrow),
thickened bowel walls (short white arrows)
2.3.5.3.2. Chronic inflammation
Reparative changes: regenerative polyps, luminal narrowing, hete-
rogeneous mild to moderate wall enhancement, fibrofatty prolife-
ration, lymphadenopathy, low to moderate T2W signal intensity
(Fig. 2.3.5.3.2.1).
Fig. 2.3.5.3.2.1. TRUFI coronal image is showing
regenerative polyps (arrow)
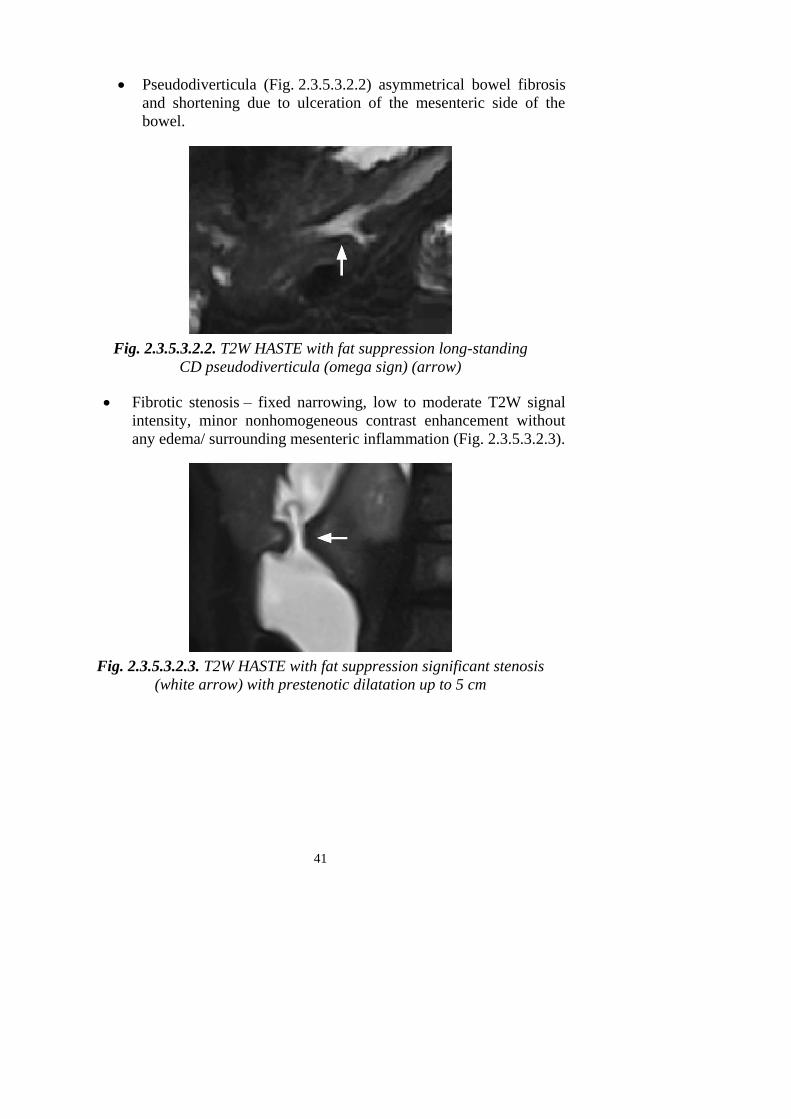
41
Pseudodiverticula (Fig. 2.3.5.3.2.2) asymmetrical bowel fibrosis
and shortening due to ulceration of the mesenteric side of the
bowel.
Fig. 2.3.5.3.2.2. T2W HASTE with fat suppression long-standing
CD pseudodiverticula (omega sign) (arrow)
Fibrotic stenosis – fixed narrowing, low to moderate T2W signal
intensity, minor nonhomogeneous contrast enhancement without
any edema/ surrounding mesenteric inflammation (Fig. 2.3.5.3.2.3).
Fig. 2.3.5.3.2.3. T2W HASTE with fat suppression significant stenosis
(white arrow) with prestenotic dilatation up to 5 cm
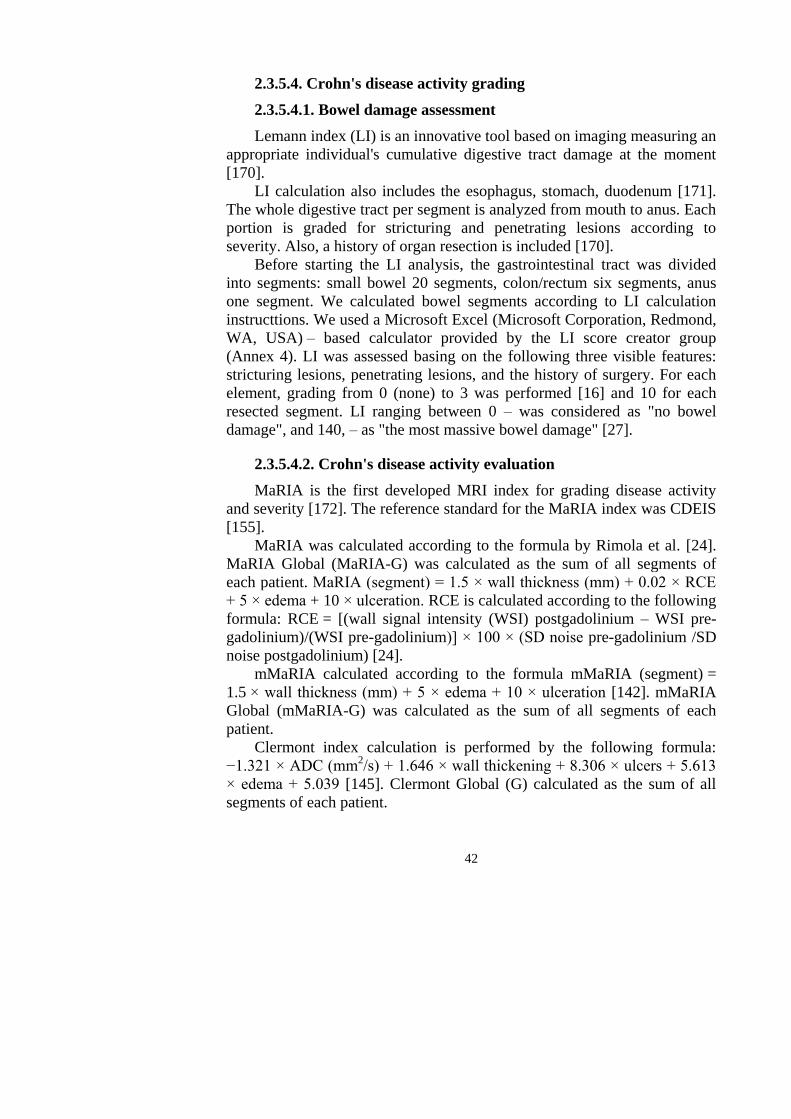
42
2.3.5.4. Crohn's disease activity grading
2.3.5.4.1. Bowel damage assessment
Lemann index (LI) is an innovative tool based on imaging measuring an
appropriate individual's cumulative digestive tract damage at the moment
[170].
LI calculation also includes the esophagus, stomach, duodenum [171].
The whole digestive tract per segment is analyzed from mouth to anus. Each
portion is graded for stricturing and penetrating lesions according to
severity. Also, a history of organ resection is included [170].
Before starting the LI analysis, the gastrointestinal tract was divided
into segments: small bowel 20 segments, colon/rectum six segments, anus
one segment. We calculated bowel segments according to LI calculation
instructtions. We used a Microsoft Excel (Microsoft Corporation, Redmond,
WA, USA) – based calculator provided by the LI score creator group
(Annex 4). LI was assessed basing on the following three visible features:
stricturing lesions, penetrating lesions, and the history of surgery. For each
element, grading from 0 (none) to 3 was performed [16] and 10 for each
resected segment. LI ranging between 0 – was considered as "no bowel
damage", and 140, – as "the most massive bowel damage" [27].
2.3.5.4.2. Crohn's disease activity evaluation
MaRIA is the first developed MRI index for grading disease activity
and severity [172]. The reference standard for the MaRIA index was CDEIS
[155].
MaRIA was calculated according to the formula by Rimola et al. [24].
MaRIA Global (MaRIA-G) was calculated as the sum of all segments of
each patient. MaRIA (segment) = 1.5 × wall thickness (mm) + 0.02 × RCE
+ 5 × edema + 10 × ulceration. RCE is calculated according to the following
formula: RCE = [(wall signal intensity (WSI) postgadolinium – WSI pre-
gadolinium)/(WSI pre-gadolinium)] × 100 × (SD noise pre-gadolinium /SD
noise postgadolinium) [24].
mMaRIA calculated according to the formula mMaRIA (segment) =
1.5 × wall thickness (mm) + 5 × edema + 10 × ulceration [142]. mMaRIA
Global (mMaRIA-G) was calculated as the sum of all segments of each
patient.
Clermont index calculation is performed by the following formula:
−1.321 × ADC (mm2/s) + 1.646 × wall thickening + 8.306 × ulcers + 5.613
× edema + 5.039 [145]. Clermont Global (G) calculated as the sum of all
segments of each patient.
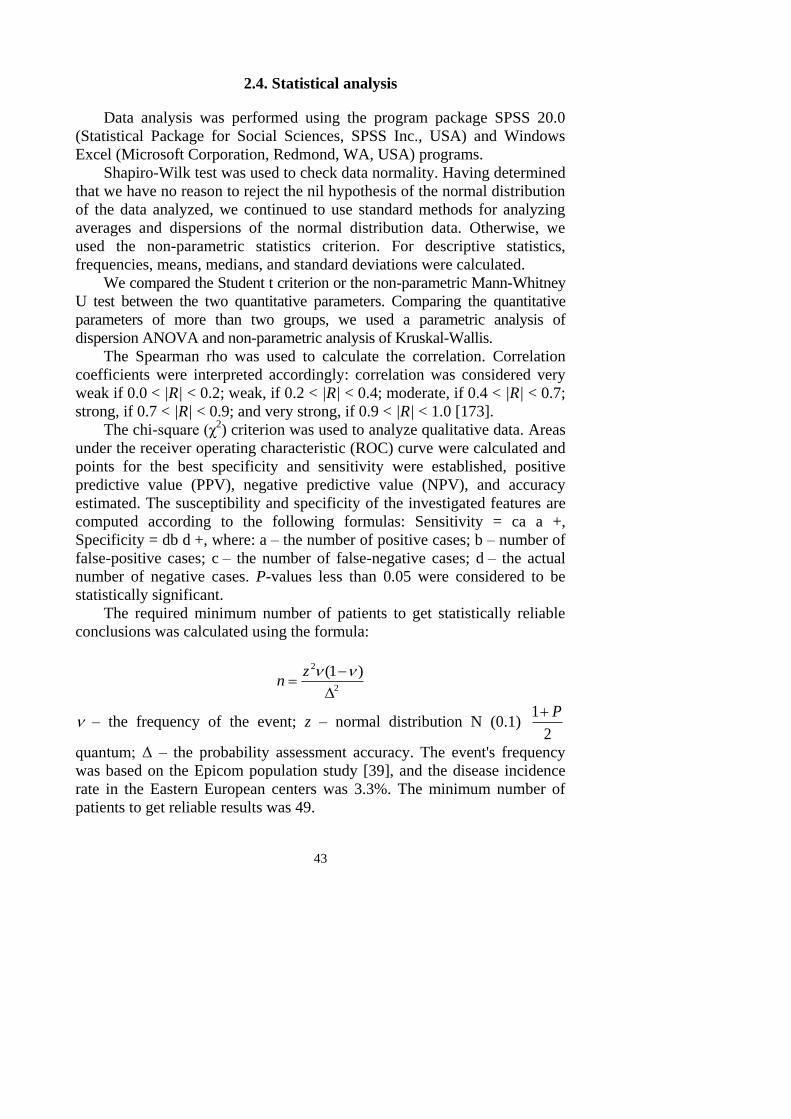
43
2.4. Statistical analysis
Data analysis was performed using the program package SPSS 20.0
(Statistical Package for Social Sciences, SPSS Inc., USA) and Windows
Excel (Microsoft Corporation, Redmond, WA, USA) programs.
Shapiro-Wilk test was used to check data normality. Having determined
that we have no reason to reject the nil hypothesis of the normal distribution
of the data analyzed, we continued to use standard methods for analyzing
averages and dispersions of the normal distribution data. Otherwise, we
used the non-parametric statistics criterion. For descriptive statistics,
frequencies, means, medians, and standard deviations were calculated.
We compared the Student t criterion or the non-parametric Mann-Whitney
U test between the two quantitative parameters. Comparing the quantitative
parameters of more than two groups, we used a parametric analysis of
dispersion ANOVA and non-parametric analysis of Kruskal-Wallis.
The Spearman rho was used to calculate the correlation. Correlation
coefficients were interpreted accordingly: correlation was considered very
weak if 0.0 < |R| < 0.2; weak, if 0.2 < |R| < 0.4; moderate, if 0.4 < |R| < 0.7;
strong, if 0.7 < |R| < 0.9; and very strong, if 0.9 < |R| < 1.0 [173].
The chi-square (χ2) criterion was used to analyze qualitative data. Areas
under the receiver operating characteristic (ROC) curve were calculated and
points for the best specificity and sensitivity were established, positive
predictive value (PPV), negative predictive value (NPV), and accuracy
estimated. The susceptibility and specificity of the investigated features are
computed according to the following formulas: Sensitivity = ca a +,
Specificity = db d +, where: a – the number of positive cases; b – number of
false-positive cases; c – the number of false-negative cases; d – the actual
number of negative cases. P-values less than 0.05 were considered to be
statistically significant.
The required minimum number of patients to get statistically reliable
conclusions was calculated using the formula:
2
2 )1(
zn
– the frequency of the event; z – normal distribution N (0.1) 2
1 P
quantum; Δ – the probability assessment accuracy. The event's frequency
was based on the Epicom population study [39], and the disease incidence
rate in the Eastern European centers was 3.3%. The minimum number of
patients to get reliable results was 49.
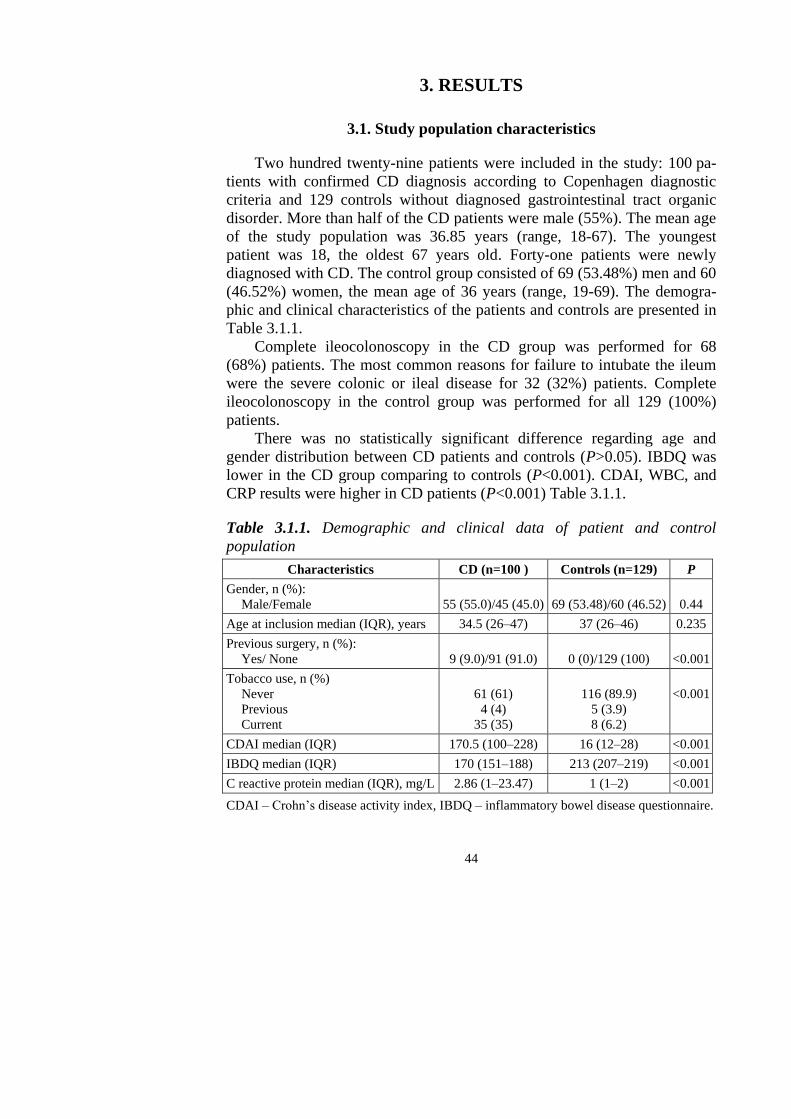
44
3. RESULTS
3.1. Study population characteristics
Two hundred twenty-nine patients were included in the study: 100 pa-
tients with confirmed CD diagnosis according to Copenhagen diagnostic
criteria and 129 controls without diagnosed gastrointestinal tract organic
disorder. More than half of the CD patients were male (55%). The mean age
of the study population was 36.85 years (range, 18-67). The youngest
patient was 18, the oldest 67 years old. Forty-one patients were newly
diagnosed with CD. The control group consisted of 69 (53.48%) men and 60
(46.52%) women, the mean age of 36 years (range, 19-69). The demogra-
phic and clinical characteristics of the patients and controls are presented in
Table 3.1.1.
Complete ileocolonoscopy in the CD group was performed for 68
(68%) patients. The most common reasons for failure to intubate the ileum
were the severe colonic or ileal disease for 32 (32%) patients. Complete
ileocolonoscopy in the control group was performed for all 129 (100%)
patients.
There was no statistically significant difference regarding age and
gender distribution between CD patients and controls (P>0.05). IBDQ was
lower in the CD group comparing to controls (P<0.001). CDAI, WBC, and
CRP results were higher in CD patients (P<0.001) Table 3.1.1.
Table 3.1.1. Demographic and clinical data of patient and control
population
Characteristics CD (n=100 ) Controls (n=129) P
Gender, n (%):
Male/Female
55 (55.0)/45 (45.0)
69 (53.48)/60 (46.52)
0.44
Age at inclusion median (IQR), years 34.5 (26–47) 37 (26–46) 0.235
Previous surgery, n (%):
Yes/ None
9 (9.0)/91 (91.0)
0 (0)/129 (100)
<0.001
Tobacco use, n (%)
Never
Previous
Current
61 (61)
4 (4)
35 (35)
116 (89.9)
5 (3.9)
8 (6.2)
<0.001
CDAI median (IQR) 170.5 (100–228) 16 (12–28) <0.001
IBDQ median (IQR) 170 (151–188) 213 (207–219) <0.001
C reactive protein median (IQR), mg/L 2.86 (1–23.47) 1 (1–2) <0.001
CDAI – Crohn’s disease activity index, IBDQ – inflammatory bowel disease questionnaire.
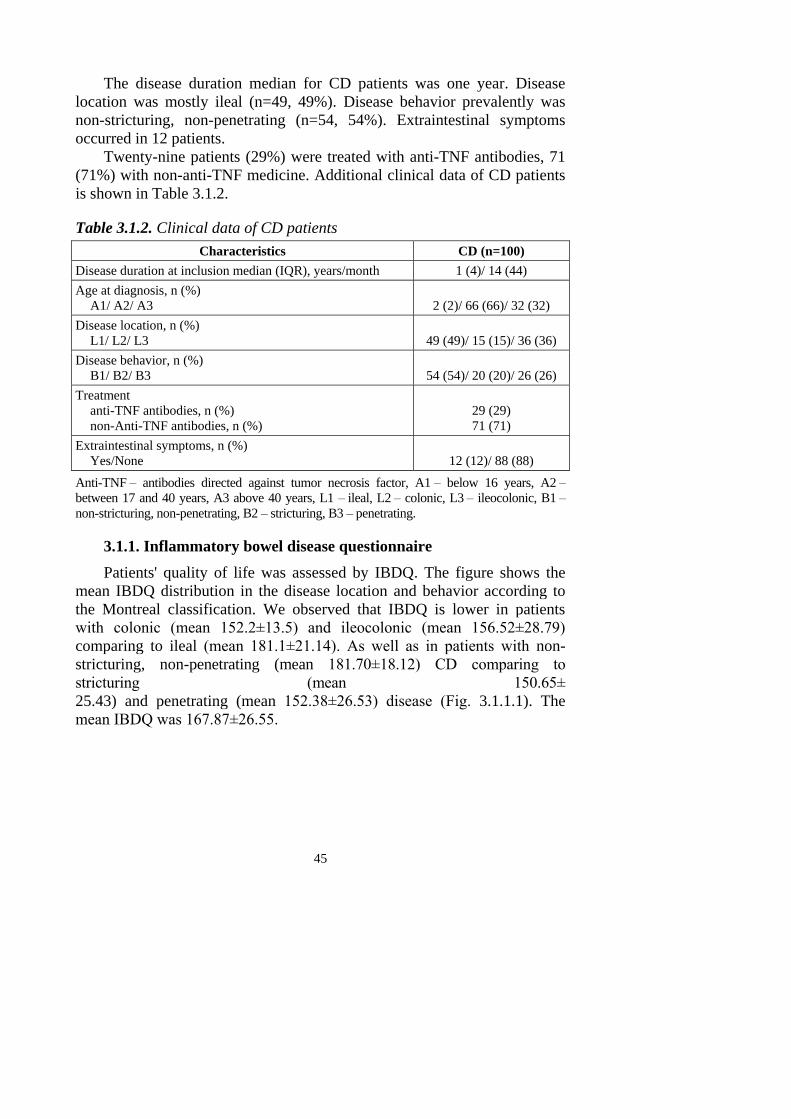
45
The disease duration median for CD patients was one year. Disease
location was mostly ileal (n=49, 49%). Disease behavior prevalently was
non-stricturing, non-penetrating (n=54, 54%). Extraintestinal symptoms
occurred in 12 patients.
Twenty-nine patients (29%) were treated with anti-TNF antibodies, 71
(71%) with non-anti-TNF medicine. Additional clinical data of CD patients
is shown in Table 3.1.2.
Table 3.1.2. Clinical data of CD patients
Characteristics CD (n=100)
Disease duration at inclusion median (IQR), years/month 1 (4)/ 14 (44)
Age at diagnosis, n (%)
A1/ A2/ A3
2 (2)/ 66 (66)/ 32 (32)
Disease location, n (%)
L1/ L2/ L3
49 (49)/ 15 (15)/ 36 (36)
Disease behavior, n (%)
B1/ B2/ B3
54 (54)/ 20 (20)/ 26 (26)
Treatment
anti-TNF antibodies, n (%)
non-Anti-TNF antibodies, n (%)
29 (29)
71 (71)
Extraintestinal symptoms, n (%)
Yes/None
12 (12)/ 88 (88)
Anti-TNF – antibodies directed against tumor necrosis factor, A1 – below 16 years, A2 –
between 17 and 40 years, A3 above 40 years, L1 – ileal, L2 – colonic, L3 – ileocolonic, B1 –
non-stricturing, non-penetrating, B2 – stricturing, B3 – penetrating.
3.1.1. Inflammatory bowel disease questionnaire
Patients' quality of life was assessed by IBDQ. The figure shows the
mean IBDQ distribution in the disease location and behavior according to
the Montreal classification. We observed that IBDQ is lower in patients
with colonic (mean 152.2±13.5) and ileocolonic (mean 156.52±28.79)
comparing to ileal (mean 181.1±21.14). As well as in patients with non-
stricturing, non-penetrating (mean 181.70±18.12) CD comparing to
stricturing (mean 150.65±
25.43) and penetrating (mean 152.38±26.53) disease (Fig. 3.1.1.1). The
mean IBDQ was 167.87±26.55.
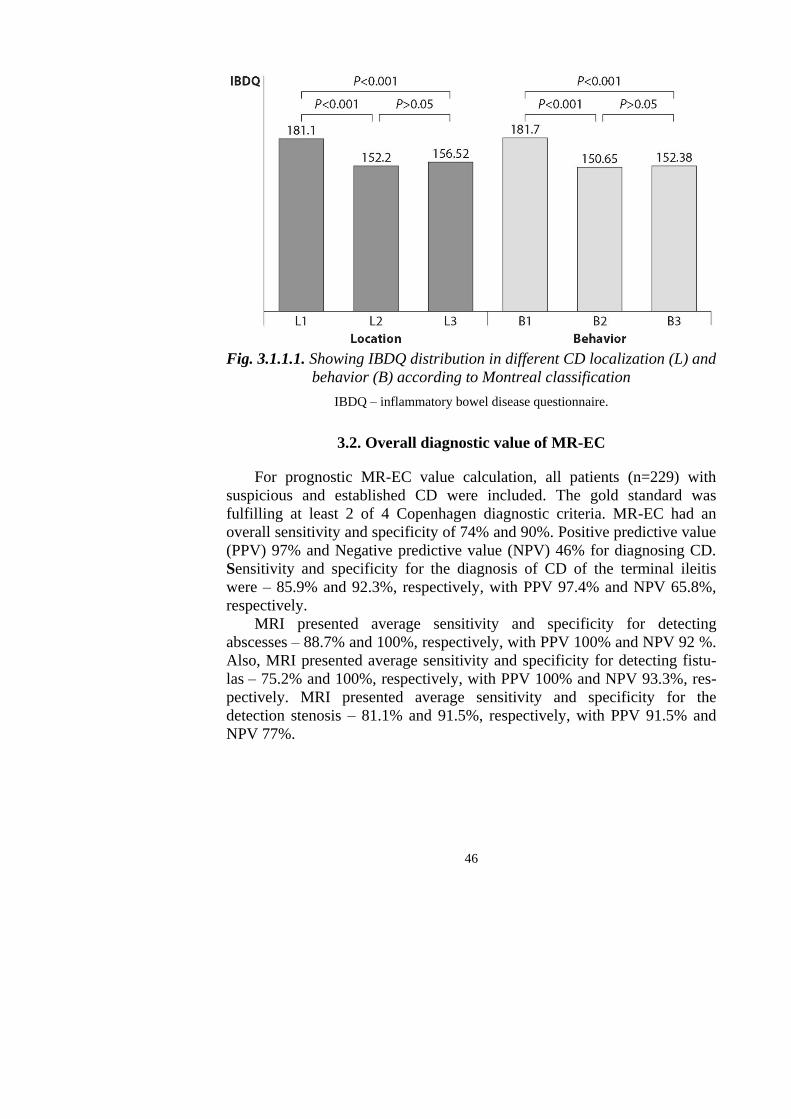
46
Fig. 3.1.1.1. Showing IBDQ distribution in different CD localization (L) and
behavior (B) according to Montreal classification
IBDQ – inflammatory bowel disease questionnaire.
3.2. Overall diagnostic value of MR-EC
For prognostic MR-EC value calculation, all patients (n=229) with
suspicious and established CD were included. The gold standard was
fulfilling at least 2 of 4 Copenhagen diagnostic criteria. MR-EC had an
overall sensitivity and specificity of 74% and 90%. Positive predictive value
(PPV) 97% and Negative predictive value (NPV) 46% for diagnosing CD.
Sensitivity and specificity for the diagnosis of CD of the terminal ileitis
were – 85.9% and 92.3%, respectively, with PPV 97.4% and NPV 65.8%,
respectively.
MRI presented average sensitivity and specificity for detecting
abscesses – 88.7% and 100%, respectively, with PPV 100% and NPV 92 %.
Also, MRI presented average sensitivity and specificity for detecting fistu-
las – 75.2% and 100%, respectively, with PPV 100% and NPV 93.3%, res-
pectively. MRI presented average sensitivity and specificity for the
detection stenosis – 81.1% and 91.5%, respectively, with PPV 91.5% and
NPV 77%.
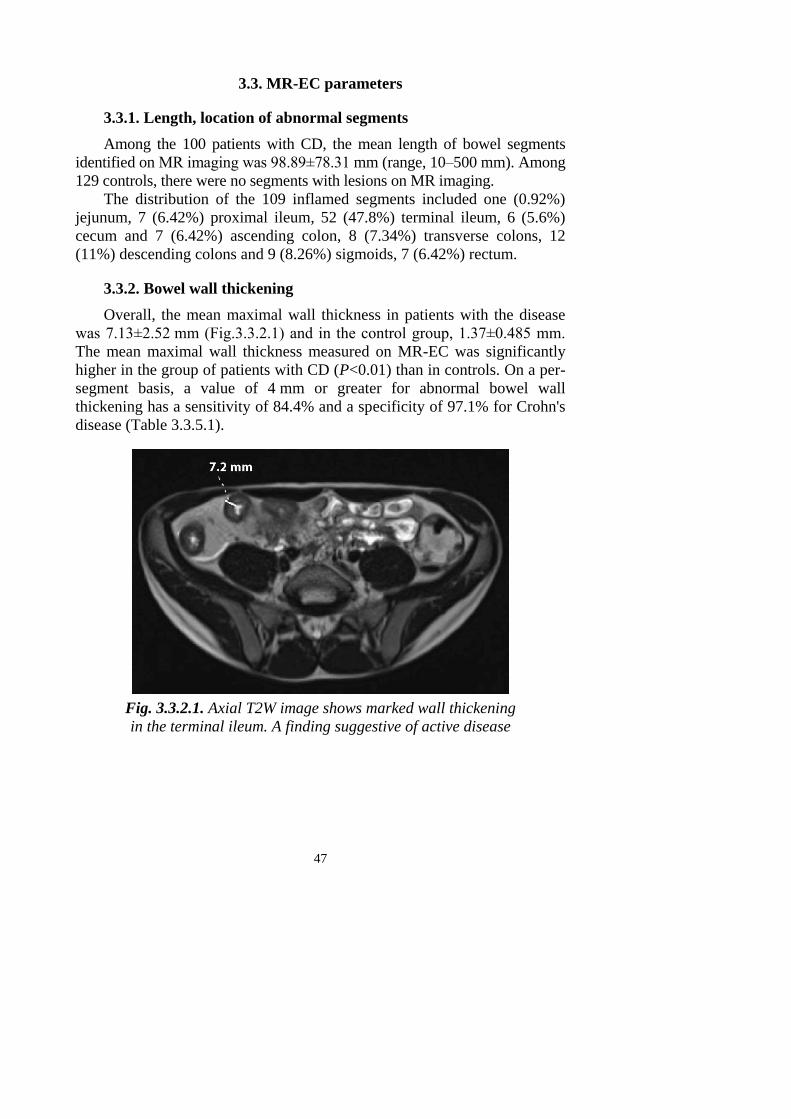
47
3.3. MR-EC parameters
3.3.1. Length, location of abnormal segments
Among the 100 patients with CD, the mean length of bowel segments
identified on MR imaging was 98.89±78.31 mm (range, 10–500 mm). Among
129 controls, there were no segments with lesions on MR imaging.
The distribution of the 109 inflamed segments included one (0.92%)
jejunum, 7 (6.42%) proximal ileum, 52 (47.8%) terminal ileum, 6 (5.6%)
cecum and 7 (6.42%) ascending colon, 8 (7.34%) transverse colons, 12
(11%) descending colons and 9 (8.26%) sigmoids, 7 (6.42%) rectum.
3.3.2. Bowel wall thickening
Overall, the mean maximal wall thickness in patients with the disease
was 7.13±2.52 mm (Fig.3.3.2.1) and in the control group, 1.37±0.485 mm.
The mean maximal wall thickness measured on MR-EC was significantly
higher in the group of patients with CD (P<0.01) than in controls. On a per-
segment basis, a value of 4 mm or greater for abnormal bowel wall
thickening has a sensitivity of 84.4% and a specificity of 97.1% for Crohn's
disease (Table 3.3.5.1).
Fig. 3.3.2.1. Axial T2W image shows marked wall thickening
in the terminal ileum. A finding suggestive of active disease
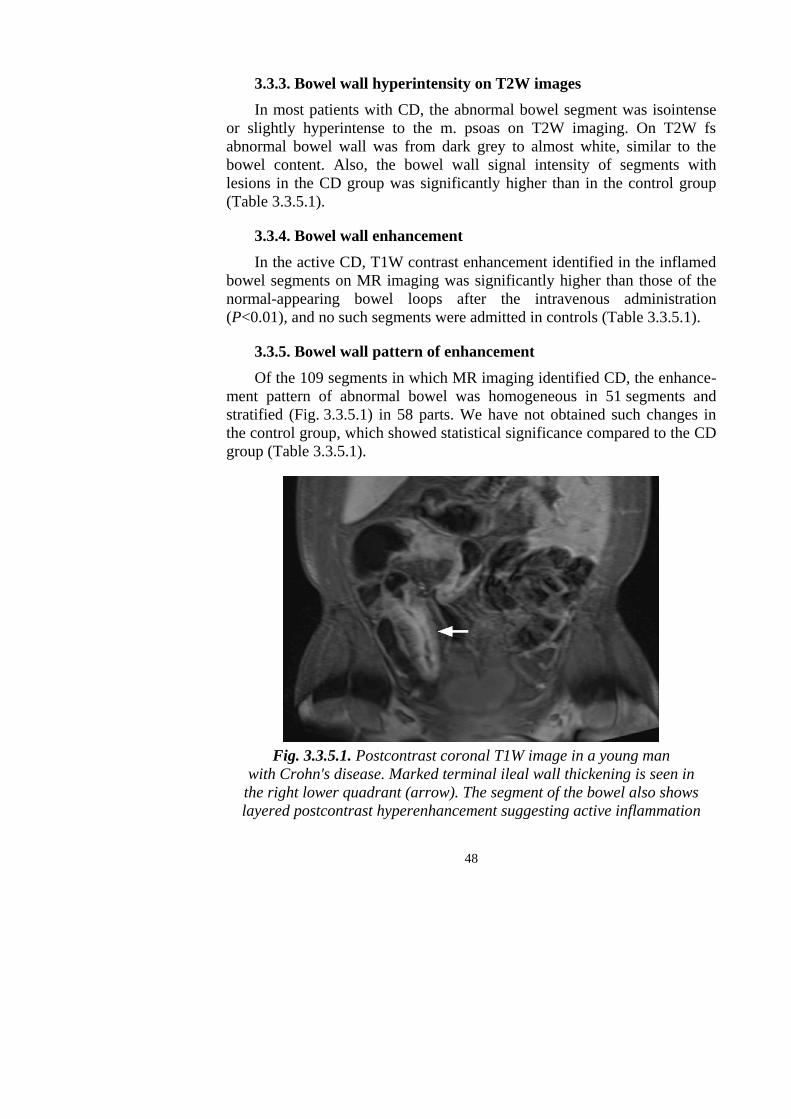
48
3.3.3. Bowel wall hyperintensity on T2W images
In most patients with CD, the abnormal bowel segment was isointense
or slightly hyperintense to the m. psoas on T2W imaging. On T2W fs
abnormal bowel wall was from dark grey to almost white, similar to the
bowel content. Also, the bowel wall signal intensity of segments with
lesions in the CD group was significantly higher than in the control group
(Table 3.3.5.1).
3.3.4. Bowel wall enhancement
In the active CD, T1W contrast enhancement identified in the inflamed
bowel segments on MR imaging was significantly higher than those of the
normal-appearing bowel loops after the intravenous administration
(P<0.01), and no such segments were admitted in controls (Table 3.3.5.1).
3.3.5. Bowel wall pattern of enhancement
Of the 109 segments in which MR imaging identified CD, the enhance-
ment pattern of abnormal bowel was homogeneous in 51 segments and
stratified (Fig. 3.3.5.1) in 58 parts. We have not obtained such changes in
the control group, which showed statistical significance compared to the CD
group (Table 3.3.5.1).
Fig. 3.3.5.1. Postcontrast coronal T1W image in a young man
with Crohn's disease. Marked terminal ileal wall thickening is seen in
the right lower quadrant (arrow). The segment of the bowel also shows
layered postcontrast hyperenhancement suggesting active inflammation
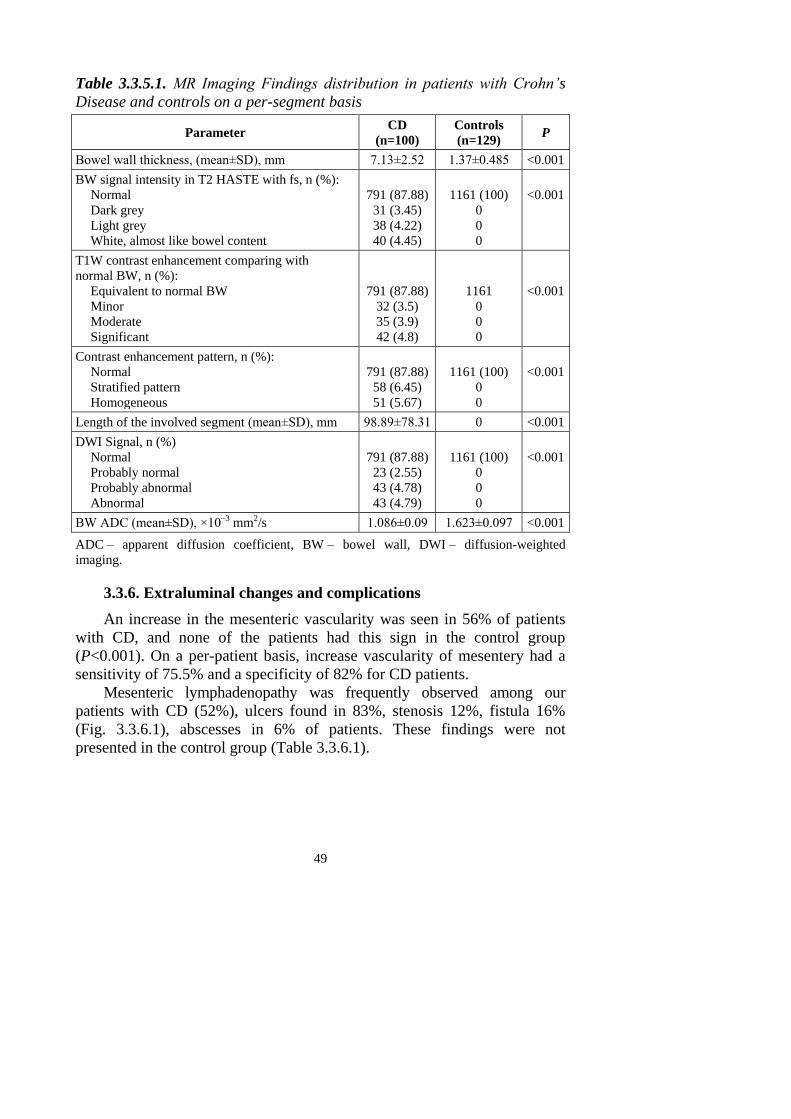
49
Table 3.3.5.1. MR Imaging Findings distribution in patients with Crohn’s
Disease and controls on a per-segment basis
Parameter CD
(n=100)
Controls
(n=129) P
Bowel wall thickness, (mean±SD), mm 7.13±2.52 1.37±0.485 <0.001
BW signal intensity in T2 HASTE with fs, n (%):
Normal
Dark grey
Light grey
White, almost like bowel content
791 (87.88)
31 (3.45)
38 (4.22)
40 (4.45)
1161 (100)
0
0
0
<0.001
T1W contrast enhancement comparing with
normal BW, n (%):
Equivalent to normal BW
Minor
Moderate
Significant
791 (87.88)
32 (3.5)
35 (3.9)
42 (4.8)
1161
0
0
0
<0.001
Contrast enhancement pattern, n (%):
Normal
Stratified pattern
Homogeneous
791 (87.88)
58 (6.45)
51 (5.67)
1161 (100)
0
0
<0.001
Length of the involved segment (mean±SD), mm 98.89±78.31 0 <0.001
DWI Signal, n (%)
Normal
Probably normal
Probably abnormal
Abnormal
791 (87.88)
23 (2.55)
43 (4.78)
43 (4.79)
1161 (100)
0
0
0
<0.001
BW ADC (mean±SD), ×10–3 mm2/s 1.086±0.09 1.623±0.097 <0.001
ADC – apparent diffusion coefficient, BW – bowel wall, DWI – diffusion-weighted
imaging.
3.3.6. Extraluminal changes and complications
An increase in the mesenteric vascularity was seen in 56% of patients
with CD, and none of the patients had this sign in the control group
(P<0.001). On a per-patient basis, increase vascularity of mesentery had a
sensitivity of 75.5% and a specificity of 82% for CD patients.
Mesenteric lymphadenopathy was frequently observed among our
patients with CD (52%), ulcers found in 83%, stenosis 12%, fistula 16%
(Fig. 3.3.6.1), abscesses in 6% of patients. These findings were not
presented in the control group (Table 3.3.6.1).
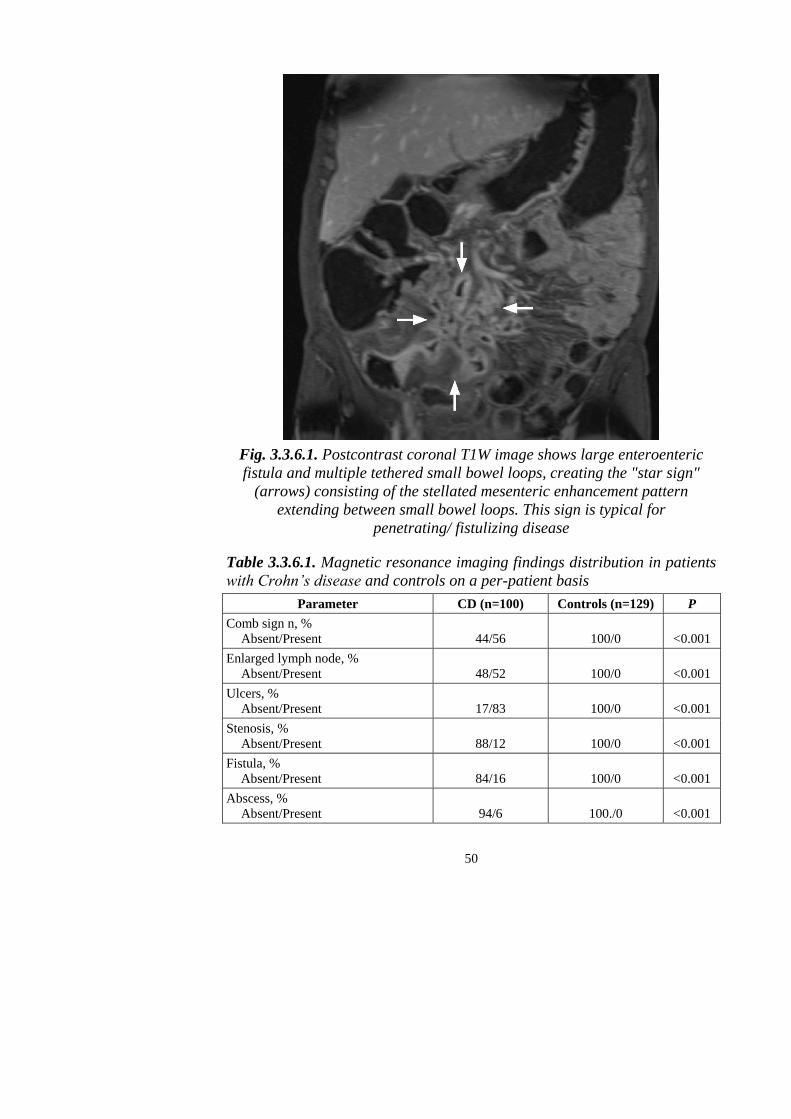
50
Fig. 3.3.6.1. Postcontrast coronal T1W image shows large enteroenteric
fistula and multiple tethered small bowel loops, creating the "star sign"
(arrows) consisting of the stellated mesenteric enhancement pattern
extending between small bowel loops. This sign is typical for
penetrating/ fistulizing disease
Table 3.3.6.1. Magnetic resonance imaging findings distribution in patients
with Crohn’s disease and controls on a per-patient basis
Parameter CD (n=100) Controls (n=129) P
Comb sign n, %
Absent/Present
44/56
100/0
<0.001
Enlarged lymph node, %
Absent/Present
48/52
100/0
<0.001
Ulcers, %
Absent/Present
17/83
100/0
<0.001
Stenosis, %
Absent/Present
88/12
100/0
<0.001
Fistula, %
Absent/Present
84/16
100/0
<0.001
Abscess, %
Absent/Present
94/6
100./0
<0.001
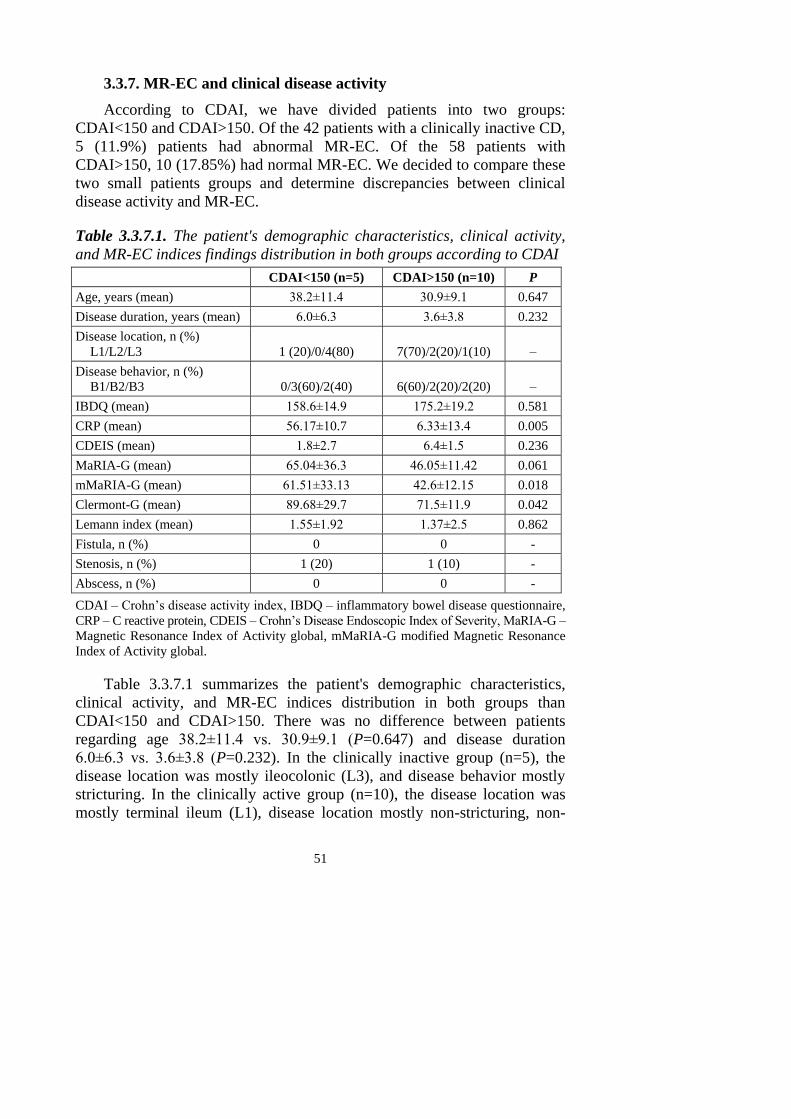
51
3.3.7. MR-EC and clinical disease activity
According to CDAI, we have divided patients into two groups:
CDAI<150 and CDAI>150. Of the 42 patients with a clinically inactive CD,
5 (11.9%) patients had abnormal MR-EC. Of the 58 patients with
CDAI>150, 10 (17.85%) had normal MR-EC. We decided to compare these
two small patients groups and determine discrepancies between clinical
disease activity and MR-EC.
Table 3.3.7.1. The patient's demographic characteristics, clinical activity,
and MR-EC indices findings distribution in both groups according to CDAI
CDAI<150 (n=5) CDAI>150 (n=10) P
Age, years (mean) 38.2±11.4 30.9±9.1 0.647
Disease duration, years (mean) 6.0±6.3 3.6±3.8 0.232
Disease location, n (%)
L1/L2/L3
1 (20)/0/4(80)
7(70)/2(20)/1(10)
–
Disease behavior, n (%)
B1/B2/B3
0/3(60)/2(40)
6(60)/2(20)/2(20)
–
IBDQ (mean) 158.6±14.9 175.2±19.2 0.581
CRP (mean) 56.17±10.7 6.33±13.4 0.005
CDEIS (mean) 1.8±2.7 6.4±1.5 0.236
MaRIA-G (mean) 65.04±36.3 46.05±11.42 0.061
mMaRIA-G (mean) 61.51±33.13 42.6±12.15 0.018
Clermont-G (mean) 89.68±29.7 71.5±11.9 0.042
Lemann index (mean) 1.55±1.92 1.37±2.5 0.862
Fistula, n (%) 0 0 -
Stenosis, n (%) 1 (20) 1 (10) -
Abscess, n (%) 0 0 -
CDAI – Crohn’s disease activity index, IBDQ – inflammatory bowel disease questionnaire,
CRP – C reactive protein, CDEIS – Crohn’s Disease Endoscopic Index of Severity, MaRIA-G –
Magnetic Resonance Index of Activity global, mMaRIA-G modified Magnetic Resonance
Index of Activity global.
Table 3.3.7.1 summarizes the patient's demographic characteristics,
clinical activity, and MR-EC indices distribution in both groups than
CDAI<150 and CDAI>150. There was no difference between patients
regarding age 38.2±11.4 vs. 30.9±9.1 (P=0.647) and disease duration
6.0±6.3 vs. 3.6±3.8 (P=0.232). In the clinically inactive group (n=5), the
disease location was mostly ileocolonic (L3), and disease behavior mostly
stricturing. In the clinically active group (n=10), the disease location was
mostly terminal ileum (L1), disease location mostly non-stricturing, non-
52
penetrating (B1). There was a significant difference between both clinical
activities disease groups between CRP 56.17±10.7 vs. 6.33±13.4 (P<0.005),
as well as between MR-EC indices: MaRIA-G, mMaRIA-G, and Clermont-
G (Table 3.3.7.1). In both groups, one patient had a stenosing disease. No
fistulas or abscesses were estimated in both groups. We noted that MR-EC
could reveal CD features in 11.9% of patients with normal CDAI.
3.4. Correlation between the Crohn's disease activity indices
LI and IBDQ values were eligible for Spearman's rank correlation analysis.
However, LI and IBDQ (r=0.813, P<0.01) showed a strong negative corre-
lation (Fig. 3.4.1). As summarized in Table 3.4.1, IBDQ also demonstrated the
strong negative correlation with other MR-EC indices MaRIA-G, mMaRIA-G
and Clermont-G (r=0.731, r=0.749, r=0.726, P=0.01) respectively.
Fig. 3.4.1. Correlation of Lemann Index and the Inflammatory
Bowel Disease Questionnaire
IBDQ – inflammatory bowel disease questionnaire.
Moreover, there was a moderate correlation between MaRIA-G and
CDEIS, MaRIA-G and LI, respectively (r=0.698 and r=0.658, P=0.01). As well
as MaRIA-G and LI, other MR-EC indices mMaRIA-G and Clermont-G

53
showed a good correlation with CDEIS (r=0.580 and r=0.585, P=0.01).
However, weak correlation between LI and CDEIS (r=0.320, P=0.01) (Table
3.4.1) as well as IBDQ and CDEIS (r=–0.332, P=0.01) were obtained.
Table 3.4.1. Correlation between different indices
IBDQ CDEIS CRP CDAI HBI eAIS-T
MaRIA-G –0.731,
P=0.01
0.698,
P=0.01
0.495,
P=0.01
0.501,
P=0.01
0.582,
P=0.01
0.609,
P=0.01
mMaRIA-G –0.749,
P=0.01
0.580,
P=0.01
0.56,
P=0.01
0.514,
P=0.01
0.591,
P=0.01
0.627,
P=0.01
Clermont-G –0.726,
P=0.01
0.585,
P=0.01
0.522,
P=0.01
0.468,
P=0.01
0.557,
P=0.01
0.601,
P=0.01
Lemann index –0.813,
P=0.01
0.320,
P=0.01
0.386,
P=0.01
0.431,
P=0.01
0.403,
P=0.01
0.472,
P=0.01
CDAI – Crohn’s disease activity index, CDEIS – Crohn’s Disease Endoscopic Index of
Severity, CRP – C reactive protein, eAIS-T – endoscopic biopsy acute inflammatory score,
HBI – Harvey-Bradshaw Index, IBDQ – inflammatory bowel disease questionnaire,
MaRIA-G – Magnetic Resonance Index of Activity global, mMaRIA-G modified Magnetic
Resonance Index of Activity global.
We also evaluated the correlation between MR-EC indices, and the strong
correlation was obtained between MaRIA-G, mMaRIA-G (Fig. 3.4.2), and
Clermont-G, respectively (r=0.975 and r=0.970, r= 0.975, P=0.01).
Fig. 3.4.2. (A) Scatter plot showing the correlation between
MaRIA-G and mMaRIA-G. (B) Scatter plot showing
the correlation between Clermont-G and mMaRIA-G
MaRIA-G – Magnetic Resonance Index of Activity global, mMaRIA-G modified
Magnetic Resonance Index of Activity global.
54
The agreement between the eAIS-T, IBDQ, CDAI, and HBI, CRP, and
CDEIS was calculated. IBDQ, CDEIS, HBI and CRP showed better agree-
ment with eAIS-T respectively (r=0.505, r=0.531, and r=0.421, r=0.414,
P=0.01), than compared to with CDAI much lower (r=0.342, P =0.01).
A significantly stronger correlation was between eAIS-T and MR-EC
indices MaRIA-G, mMaRIA-G, Clermont-G (r=0.609, r=0.627, and
r=0.601, P=0.01), respectively comparing to clinical activity and CDEIS.
However, eAIS-T and LI correlation were lower than other MR-EC indices
(r=0.472, P=0.01).
As CRP is the most widely used inflammatory marker for CD, we cal-
culated bivariate correlations with different activity indices. There was a
moderate correlation between CRP and MaRIA–G (r=0.495, P<0.01). Also,
there was a moderate correlation between CDEIS and CRP (r=0.460,
P<0.01). However, there was a weak, statistically significant correlation
between CRP and LI, as well as with IBDQ (r=0.386 and r=–0.361,
P=0.01).
3.5. Diffusion-weighted imaging (DWI) and apparent
diffusion coefficient (ADC)
Mean bowel wall ADC measurements were as follows: ADC values of
inflammatory bowel wall were significantly lower (1.086±0.09) × 10-3
mm2/s, comparing to normal bowel wall (1.623±0.097) × 10
-3 mm
2/s and m.
psoas (1.46±0.07) × 10-3
mm2/s (P<0.001). ADC distribution is shown in
(Fig. 3.5.1). The ADC mean values in segments with lesions of terminal
ileum (n=51) and colon (n=47) were (1.074±0.09) ×10-3
mm2/sec and
(1.098±0.08) × 10-3
mm2/s, respectively.
The ADC cut-off value of 1.30 × 10⁻³
mm2/s detected by the peak of the
receiver operating characteristic (ROC) curve yielded 73.8% sensitivity and
98% specificity for the discrimination of inflammatory bowel from healthy
(Fig. 3.5.2).
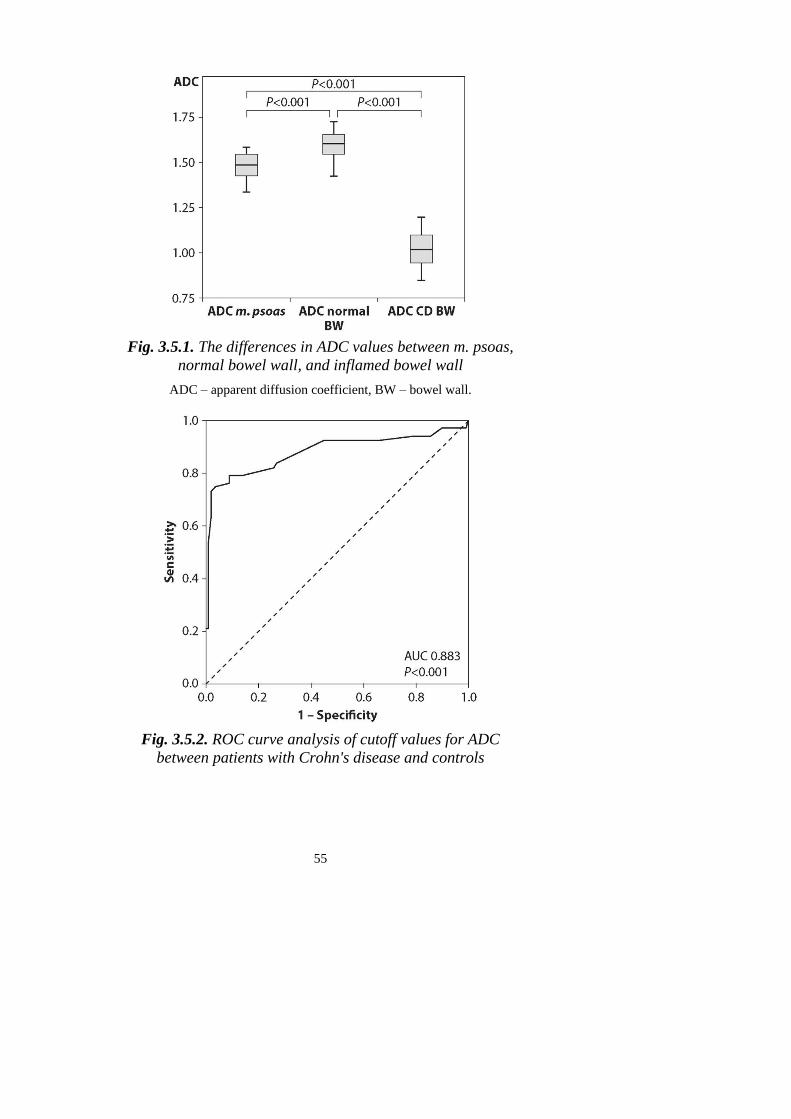
55
Fig. 3.5.1. The differences in ADC values between m. psoas,
normal bowel wall, and inflamed bowel wall
ADC – apparent diffusion coefficient, BW – bowel wall.
Fig. 3.5.2. ROC curve analysis of cutoff values for ADC
between patients with Crohn's disease and controls
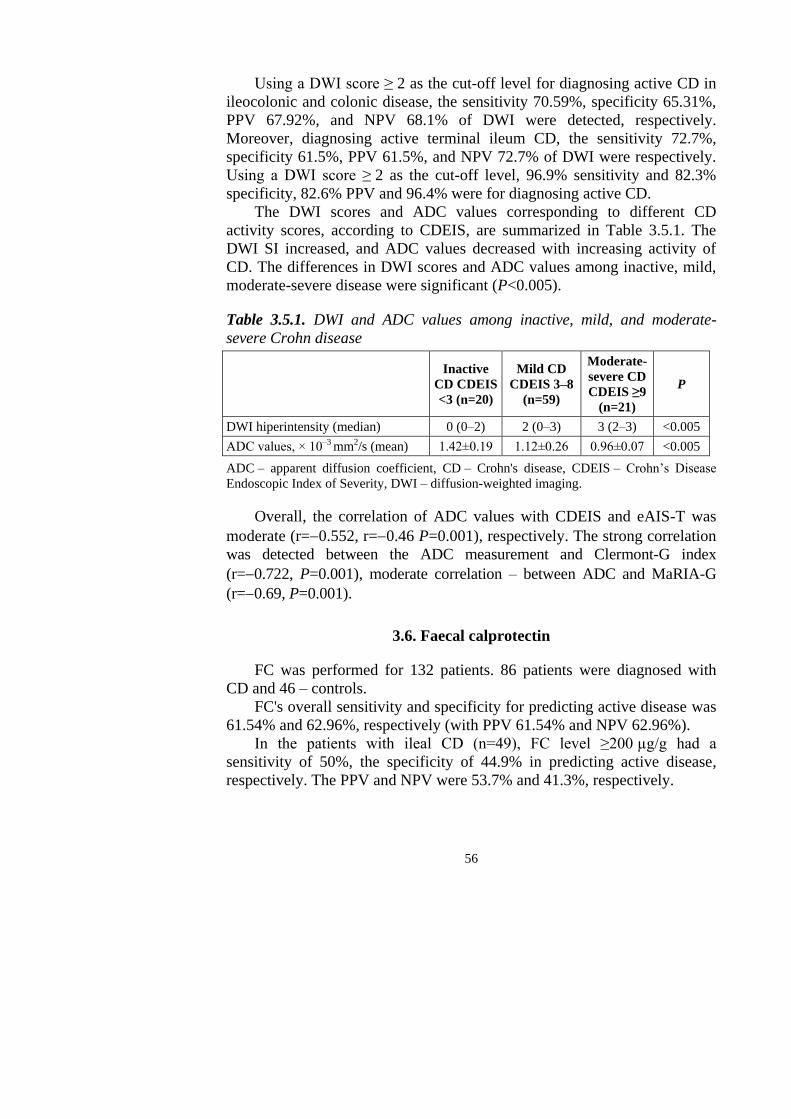
56
Using a DWI score ≥ 2 as the cut-off level for diagnosing active CD in
ileocolonic and colonic disease, the sensitivity 70.59%, specificity 65.31%,
PPV 67.92%, and NPV 68.1% of DWI were detected, respectively.
Moreover, diagnosing active terminal ileum CD, the sensitivity 72.7%,
specificity 61.5%, PPV 61.5%, and NPV 72.7% of DWI were respectively.
Using a DWI score ≥ 2 as the cut-off level, 96.9% sensitivity and 82.3%
specificity, 82.6% PPV and 96.4% were for diagnosing active CD.
The DWI scores and ADC values corresponding to different CD
activity scores, according to CDEIS, are summarized in Table 3.5.1. The
DWI SI increased, and ADC values decreased with increasing activity of
CD. The differences in DWI scores and ADC values among inactive, mild,
moderate-severe disease were significant (P<0.005).
Table 3.5.1. DWI and ADC values among inactive, mild, and moderate-
severe Crohn disease
Inactive
CD CDEIS
<3 (n=20)
Mild CD
CDEIS 3–8
(n=59)
Moderate-
severe CD
CDEIS ≥9
(n=21)
P
DWI hiperintensity (median) 0 (0–2) 2 (0–3) 3 (2–3) <0.005
ADC values, × 10–3 mm2/s (mean) 1.42±0.19 1.12±0.26 0.96±0.07 <0.005
ADC – apparent diffusion coefficient, CD – Crohn's disease, CDEIS – Crohn’s Disease
Endoscopic Index of Severity, DWI – diffusion-weighted imaging.
Overall, the correlation of ADC values with CDEIS and eAIS-T was
moderate (r=0.552, r=0.46 P=0.001), respectively. The strong correlation
was detected between the ADC measurement and Clermont-G index
(r=0.722, P=0.001), moderate correlation – between ADC and MaRIA-G
(r=0.69, P=0.001).
3.6. Faecal calprotectin
FC was performed for 132 patients. 86 patients were diagnosed with
CD and 46 – controls.
FC's overall sensitivity and specificity for predicting active disease was
61.54% and 62.96%, respectively (with PPV 61.54% and NPV 62.96%).
In the patients with ileal CD (n=49), FC level ≥200 µg/g had a
sensitivity of 50%, the specificity of 44.9% in predicting active disease,
respectively. The PPV and NPV were 53.7% and 41.3%, respectively.
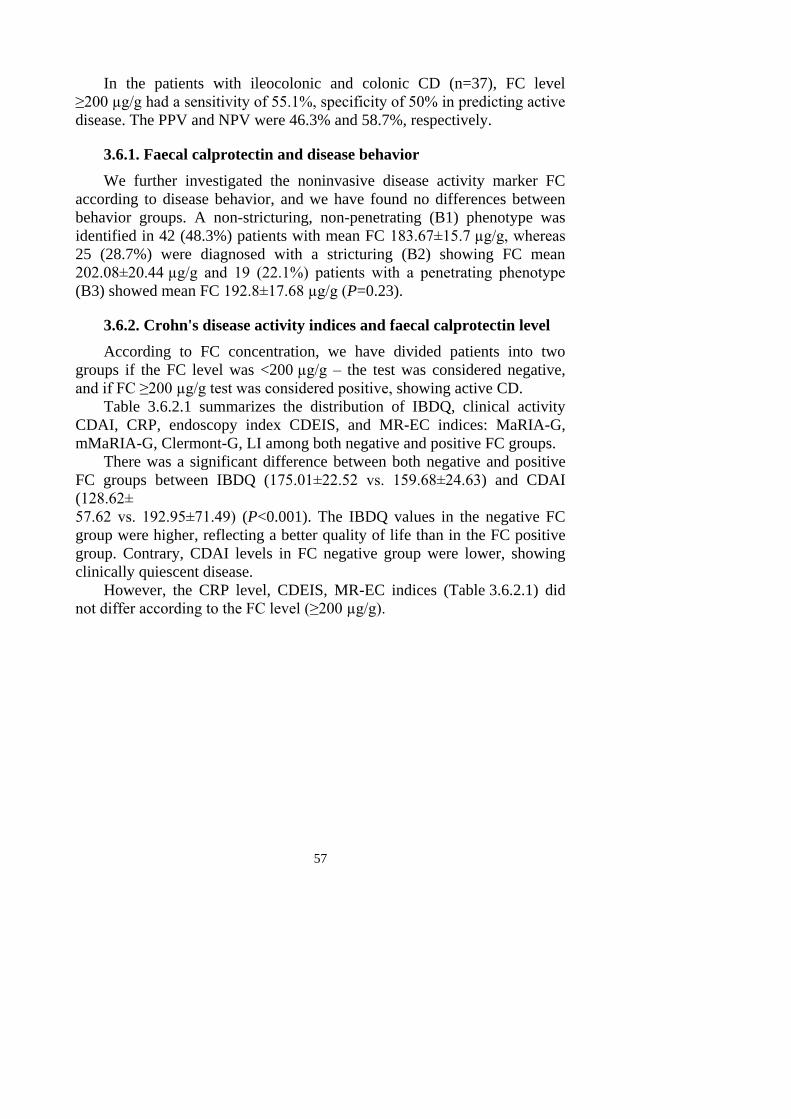
57
In the patients with ileocolonic and colonic CD (n=37), FC level
≥200 µg/g had a sensitivity of 55.1%, specificity of 50% in predicting active
disease. The PPV and NPV were 46.3% and 58.7%, respectively.
3.6.1. Faecal calprotectin and disease behavior
We further investigated the noninvasive disease activity marker FC
according to disease behavior, and we have found no differences between
behavior groups. A non-stricturing, non-penetrating (B1) phenotype was
identified in 42 (48.3%) patients with mean FC 183.67±15.7 µg/g, whereas
25 (28.7%) were diagnosed with a stricturing (B2) showing FC mean
202.08±20.44 µg/g and 19 (22.1%) patients with a penetrating phenotype
(B3) showed mean FC 192.8±17.68 µg/g (P=0.23).
3.6.2. Crohn's disease activity indices and faecal calprotectin level
According to FC concentration, we have divided patients into two
groups if the FC level was <200 µg/g – the test was considered negative,
and if FC ≥200 µg/g test was considered positive, showing active CD.
Table 3.6.2.1 summarizes the distribution of IBDQ, clinical activity
CDAI, CRP, endoscopy index CDEIS, and MR-EC indices: MaRIA-G,
mMaRIA-G, Clermont-G, LI among both negative and positive FC groups.
There was a significant difference between both negative and positive
FC groups between IBDQ (175.01±22.52 vs. 159.68±24.63) and CDAI
(128.62±
57.62 vs. 192.95±71.49) (P<0.001). The IBDQ values in the negative FC
group were higher, reflecting a better quality of life than in the FC positive
group. Contrary, CDAI levels in FC negative group were lower, showing
clinically quiescent disease.
However, the CRP level, CDEIS, MR-EC indices (Table 3.6.2.1) did
not differ according to the FC level (≥200 µg/g).
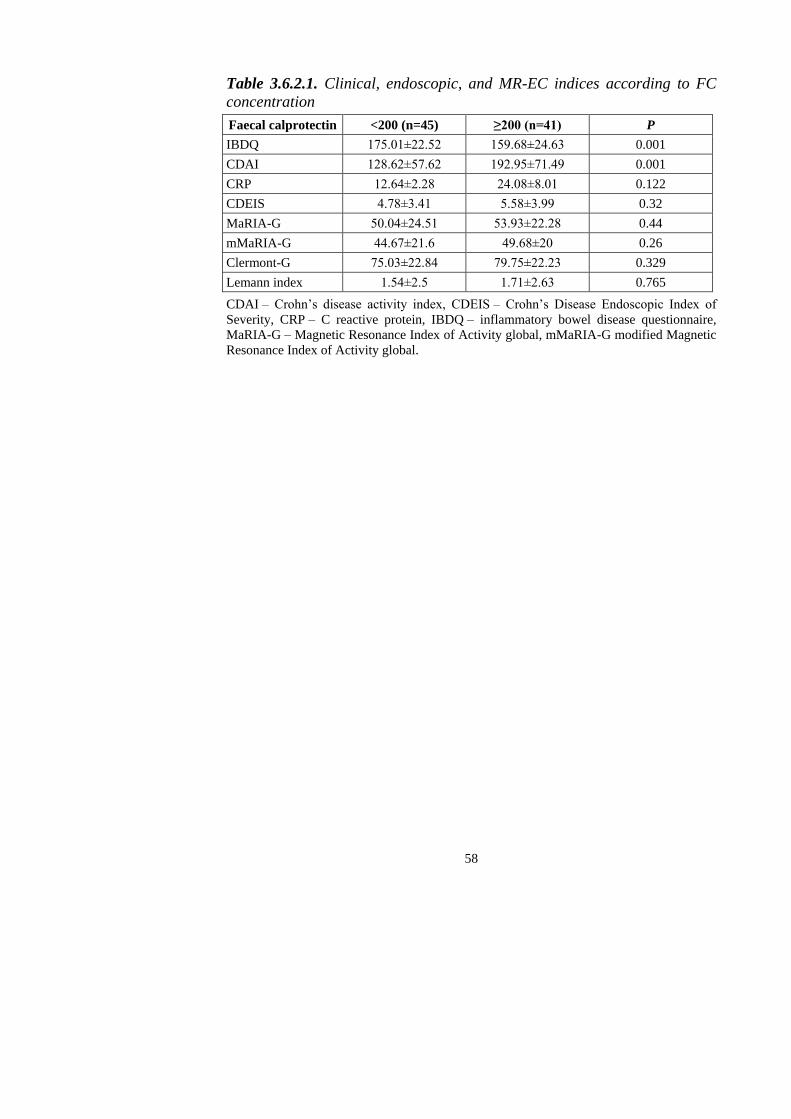
58
Table 3.6.2.1. Clinical, endoscopic, and MR-EC indices according to FC
concentration
Faecal calprotectin <200 (n=45) ≥200 (n=41) P
IBDQ 175.01±22.52 159.68±24.63 0.001
CDAI 128.62±57.62 192.95±71.49 0.001
CRP 12.64±2.28 24.08±8.01 0.122
CDEIS 4.78±3.41 5.58±3.99 0.32
MaRIA-G 50.04±24.51 53.93±22.28 0.44
mMaRIA-G 44.67±21.6 49.68±20 0.26
Clermont-G 75.03±22.84 79.75±22.23 0.329
Lemann index 1.54±2.5 1.71±2.63 0.765
CDAI – Crohn’s disease activity index, CDEIS – Crohn’s Disease Endoscopic Index of
Severity, CRP – C reactive protein, IBDQ – inflammatory bowel disease questionnaire,
MaRIA-G – Magnetic Resonance Index of Activity global, mMaRIA-G modified Magnetic
Resonance Index of Activity global.
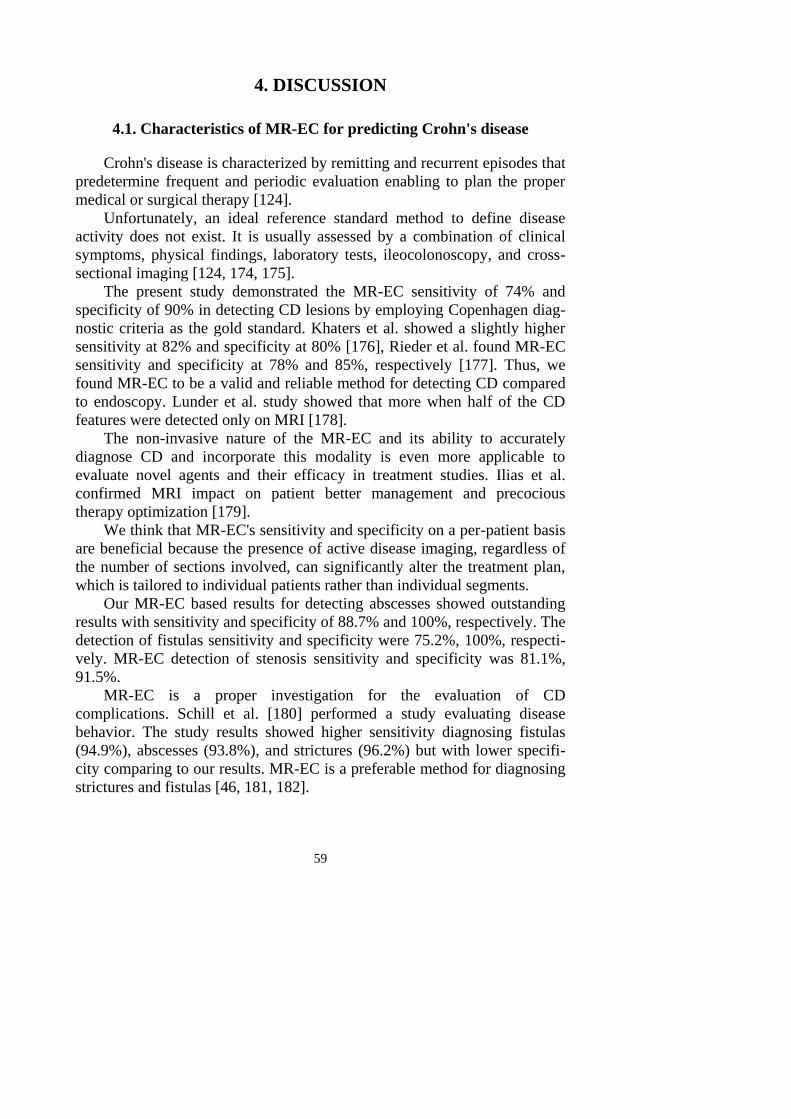
59
4. DISCUSSION
4.1. Characteristics of MR-EC for predicting Crohn's disease
Crohn's disease is characterized by remitting and recurrent episodes that
predetermine frequent and periodic evaluation enabling to plan the proper
medical or surgical therapy [124].
Unfortunately, an ideal reference standard method to define disease
activity does not exist. It is usually assessed by a combination of clinical
symptoms, physical findings, laboratory tests, ileocolonoscopy, and cross-
sectional imaging [124, 174, 175].
The present study demonstrated the MR-EC sensitivity of 74% and
specificity of 90% in detecting CD lesions by employing Copenhagen diag-
nostic criteria as the gold standard. Khaters et al. showed a slightly higher
sensitivity at 82% and specificity at 80% [176], Rieder et al. found MR-EC
sensitivity and specificity at 78% and 85%, respectively [177]. Thus, we
found MR-EC to be a valid and reliable method for detecting CD compared
to endoscopy. Lunder et al. study showed that more when half of the CD
features were detected only on MRI [178].
The non-invasive nature of the MR-EC and its ability to accurately
diagnose CD and incorporate this modality is even more applicable to
evaluate novel agents and their efficacy in treatment studies. Ilias et al.
confirmed MRI impact on patient better management and precocious
therapy optimization [179].
We think that MR-EC's sensitivity and specificity on a per-patient basis
are beneficial because the presence of active disease imaging, regardless of
the number of sections involved, can significantly alter the treatment plan,
which is tailored to individual patients rather than individual segments.
Our MR-EC based results for detecting abscesses showed outstanding
results with sensitivity and specificity of 88.7% and 100%, respectively. The
detection of fistulas sensitivity and specificity were 75.2%, 100%, respecti-
vely. MR-EC detection of stenosis sensitivity and specificity was 81.1%,
91.5%.
MR-EC is a proper investigation for the evaluation of CD
complications. Schill et al. [180] performed a study evaluating disease
behavior. The study results showed higher sensitivity diagnosing fistulas
(94.9%), abscesses (93.8%), and strictures (96.2%) but with lower specifi-
city comparing to our results. MR-EC is a preferable method for diagnosing
strictures and fistulas [46, 181, 182].
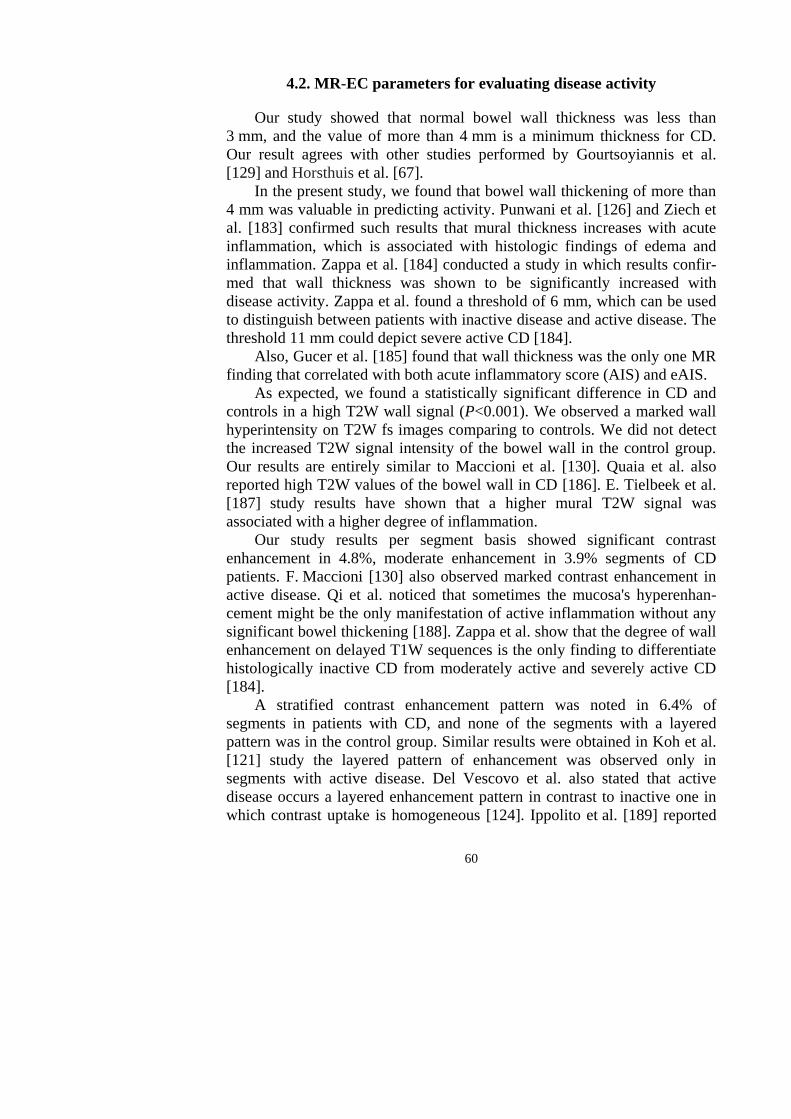
60
4.2. MR-EC parameters for evaluating disease activity
Our study showed that normal bowel wall thickness was less than
3 mm, and the value of more than 4 mm is a minimum thickness for CD.
Our result agrees with other studies performed by Gourtsoyiannis et al.
[129] and Horsthuis et al. [67].
In the present study, we found that bowel wall thickening of more than
4 mm was valuable in predicting activity. Punwani et al. [126] and Ziech et
al. [183] confirmed such results that mural thickness increases with acute
inflammation, which is associated with histologic findings of edema and
inflammation. Zappa et al. [184] conducted a study in which results confir-
med that wall thickness was shown to be significantly increased with
disease activity. Zappa et al. found a threshold of 6 mm, which can be used
to distinguish between patients with inactive disease and active disease. The
threshold 11 mm could depict severe active CD [184].
Also, Gucer et al. [185] found that wall thickness was the only one MR
finding that correlated with both acute inflammatory score (AIS) and eAIS.
As expected, we found a statistically significant difference in CD and
controls in a high T2W wall signal (P<0.001). We observed a marked wall
hyperintensity on T2W fs images comparing to controls. We did not detect
the increased T2W signal intensity of the bowel wall in the control group.
Our results are entirely similar to Maccioni et al. [130]. Quaia et al. also
reported high T2W values of the bowel wall in CD [186]. E. Tielbeek et al.
[187] study results have shown that a higher mural T2W signal was
associated with a higher degree of inflammation.
Our study results per segment basis showed significant contrast
enhancement in 4.8%, moderate enhancement in 3.9% segments of CD
patients. F. Maccioni [130] also observed marked contrast enhancement in
active disease. Qi et al. noticed that sometimes the mucosa's hyperenhan-
cement might be the only manifestation of active inflammation without any
significant bowel thickening [188]. Zappa et al. show that the degree of wall
enhancement on delayed T1W sequences is the only finding to differentiate
histologically inactive CD from moderately active and severely active CD
[184].
A stratified contrast enhancement pattern was noted in 6.4% of
segments in patients with CD, and none of the segments with a layered
pattern was in the control group. Similar results were obtained in Koh et al.
[121] study the layered pattern of enhancement was observed only in
segments with active disease. Del Vescovo et al. also stated that active
disease occurs a layered enhancement pattern in contrast to inactive one in
which contrast uptake is homogeneous [124]. Ippolito et al. [189] reported
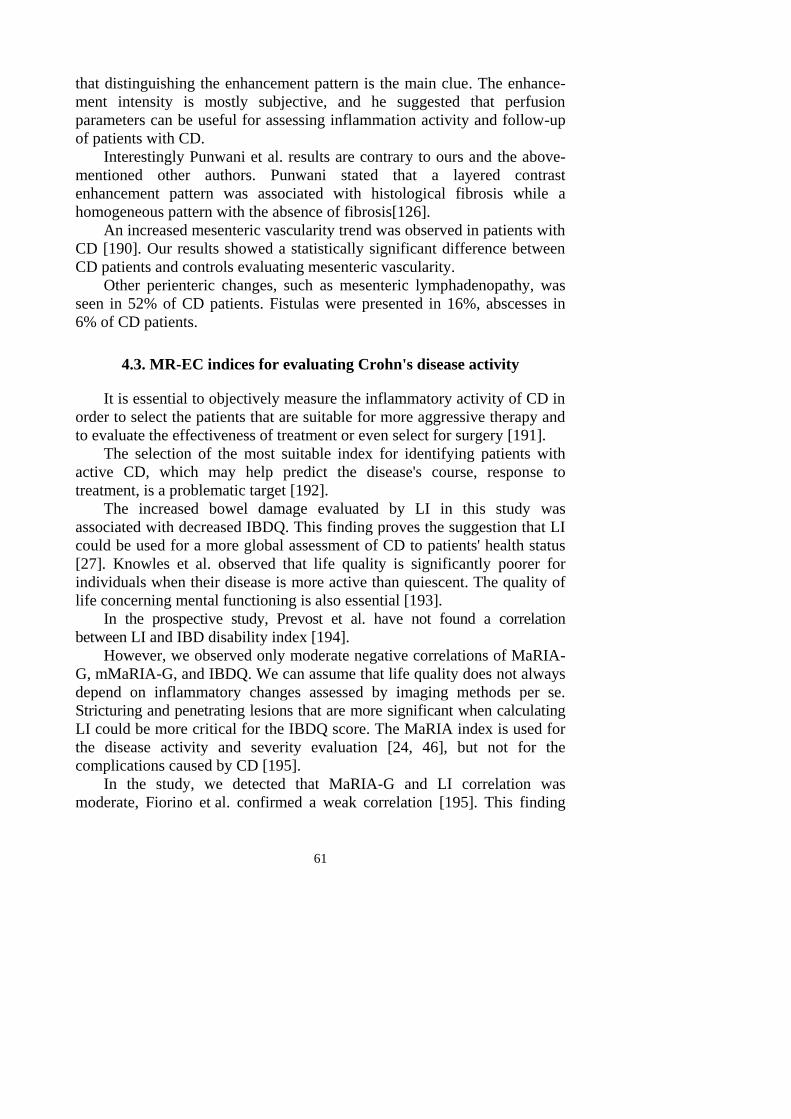
61
that distinguishing the enhancement pattern is the main clue. The enhance-
ment intensity is mostly subjective, and he suggested that perfusion
parameters can be useful for assessing inflammation activity and follow-up
of patients with CD.
Interestingly Punwani et al. results are contrary to ours and the above-
mentioned other authors. Punwani stated that a layered contrast
enhancement pattern was associated with histological fibrosis while a
homogeneous pattern with the absence of fibrosis[126].
An increased mesenteric vascularity trend was observed in patients with
CD [190]. Our results showed a statistically significant difference between
CD patients and controls evaluating mesenteric vascularity.
Other perienteric changes, such as mesenteric lymphadenopathy, was
seen in 52% of CD patients. Fistulas were presented in 16%, abscesses in
6% of CD patients.
4.3. MR-EC indices for evaluating Crohn's disease activity
It is essential to objectively measure the inflammatory activity of CD in
order to select the patients that are suitable for more aggressive therapy and
to evaluate the effectiveness of treatment or even select for surgery [191].
The selection of the most suitable index for identifying patients with
active CD, which may help predict the disease's course, response to
treatment, is a problematic target [192].
The increased bowel damage evaluated by LI in this study was
associated with decreased IBDQ. This finding proves the suggestion that LI
could be used for a more global assessment of CD to patients' health status
[27]. Knowles et al. observed that life quality is significantly poorer for
individuals when their disease is more active than quiescent. The quality of
life concerning mental functioning is also essential [193].
In the prospective study, Prevost et al. have not found a correlation
between LI and IBD disability index [194].
However, we observed only moderate negative correlations of MaRIA-
G, mMaRIA-G, and IBDQ. We can assume that life quality does not always
depend on inflammatory changes assessed by imaging methods per se.
Stricturing and penetrating lesions that are more significant when calculating
LI could be more critical for the IBDQ score. The MaRIA index is used for
the disease activity and severity evaluation [24, 46], but not for the
complications caused by CD [195].
In the study, we detected that MaRIA-G and LI correlation was
moderate, Fiorino et al. confirmed a weak correlation [195]. This finding
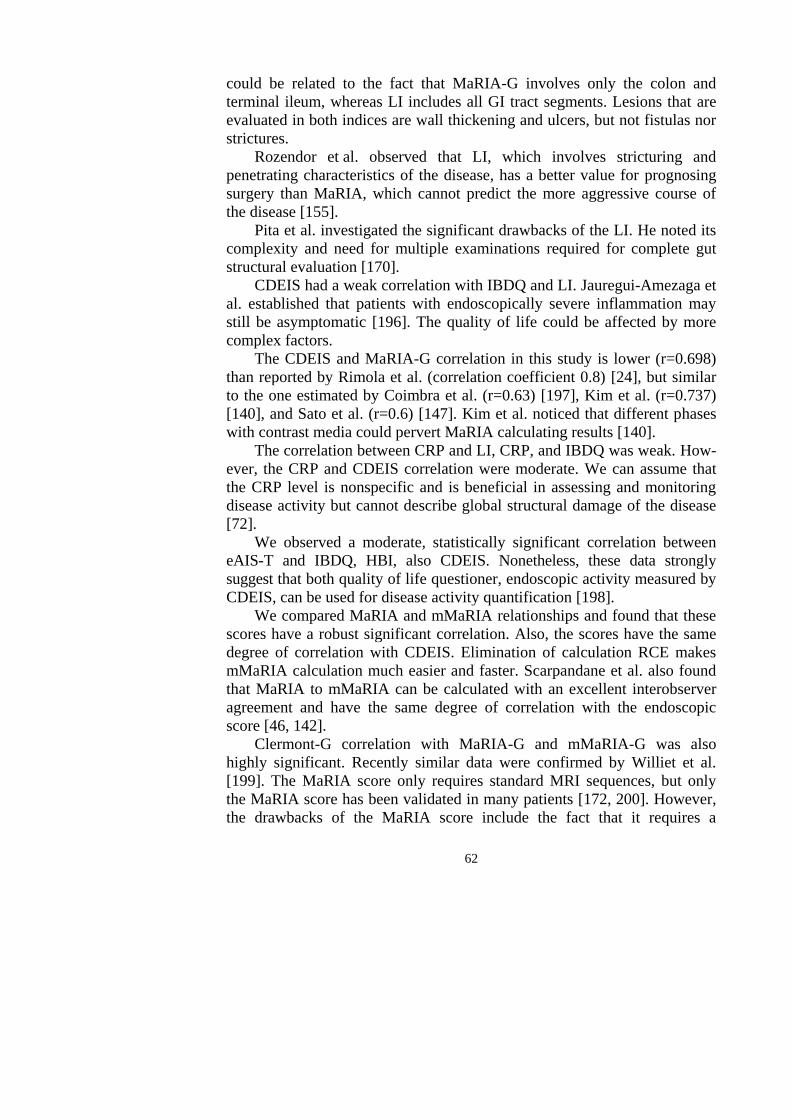
62
could be related to the fact that MaRIA-G involves only the colon and
terminal ileum, whereas LI includes all GI tract segments. Lesions that are
evaluated in both indices are wall thickening and ulcers, but not fistulas nor
strictures.
Rozendor et al. observed that LI, which involves stricturing and
penetrating characteristics of the disease, has a better value for prognosing
surgery than MaRIA, which cannot predict the more aggressive course of
the disease [155].
Pita et al. investigated the significant drawbacks of the LI. He noted its
complexity and need for multiple examinations required for complete gut
structural evaluation [170].
CDEIS had a weak correlation with IBDQ and LI. Jauregui-Amezaga et
al. established that patients with endoscopically severe inflammation may
still be asymptomatic [196]. The quality of life could be affected by more
complex factors.
The CDEIS and MaRIA-G correlation in this study is lower (r=0.698)
than reported by Rimola et al. (correlation coefficient 0.8) [24], but similar
to the one estimated by Coimbra et al. (r=0.63) [197], Kim et al. (r=0.737)
[140], and Sato et al. (r=0.6) [147]. Kim et al. noticed that different phases
with contrast media could pervert MaRIA calculating results [140].
The correlation between CRP and LI, CRP, and IBDQ was weak. How-
ever, the CRP and CDEIS correlation were moderate. We can assume that
the CRP level is nonspecific and is beneficial in assessing and monitoring
disease activity but cannot describe global structural damage of the disease
[72].
We observed a moderate, statistically significant correlation between
eAIS-T and IBDQ, HBI, also CDEIS. Nonetheless, these data strongly
suggest that both quality of life questioner, endoscopic activity measured by
CDEIS, can be used for disease activity quantification [198].
We compared MaRIA and mMaRIA relationships and found that these
scores have a robust significant correlation. Also, the scores have the same
degree of correlation with CDEIS. Elimination of calculation RCE makes
mMaRIA calculation much easier and faster. Scarpandane et al. also found
that MaRIA to mMaRIA can be calculated with an excellent interobserver
agreement and have the same degree of correlation with the endoscopic
score [46, 142].
Clermont-G correlation with MaRIA-G and mMaRIA-G was also
highly significant. Recently similar data were confirmed by Williet et al.
[199]. The MaRIA score only requires standard MRI sequences, but only
the MaRIA score has been validated in many patients [172, 200]. However,
the drawbacks of the MaRIA score include the fact that it requires a
63
complicated formula for calculation and intravenous contrast injection.
Compared to the indices mentioned above, the Clermont index is a mix of
conventional and DWI MRI parameters that might overcome some of these
limitations [136].
4.4. ADC and DWI for predicting CD activity
This study found that DWI findings may help differentiate moderate to
severe CD activity from less severe forms of the disease, which may be
incredibly helpful for disease monitoring.
The ADC measured from the inflamed bowel wall was significantly
lower than the unaffected bowel wall. DWI MR imaging signal intensities
increased, and ADC decreased with increasing activity of CD.
The mean ADC of 1.086±0.09 × 10⁻³
mm2/s in the inflamed bowel wall
in our study was slightly lower compared to the 1.28±0.47 × 10⁻³
mm2/s
reported by Li et al. [201] and 1.2 × 10⁻³
mm2/s by Neubauer et al. [202] but
much lower than in the studies performed by Oto et al. [203] and Pendse et
al. [154].
Differences in the ADC among studies may be related to the different
samples and scan parameters, including the b values. We used three b values
of 50, 400, and 800 s/mm2. For example, Seo et al. used two b values 0 and
900 s/mm2 [204], and Oto et al. also used two b values 0 and 600 s/mm
2
[203].
The ultimate threshold value for ADC, which can distinguish active
from inactive CD, is not yet established. The ability to calculate quantitative
parameters such as ADC may lead to a more objective evaluation of the
disease [137].
Li et al. Studies reported that DWI could distinguish inflamed segments
from normal segments with similar diagnostic accuracies as conventional
MRE [201]. Another study performed by Seo et al. [204] showed no statisti-
cally significant difference in the abilities of DWI and contrast-enhanced
MRI to detect terminal ileitis.
In the present study, we investigated whether MR-EC and DWI signal
can distinguish inactive, mild, and moderate-severe active CD, as defined by
CDEIS and found only significant associations for moderate to severe
disease activity.
Furthermore, we demonstrate excellent agreement between low ADC
and increasing DWI signal increasing in gut inflammation measured by
CDEIS. Also, lots of prior studies established the same results [151, 204,
205]. Lower ADC and higher DWI signals reflected the higher degrees of
64
bowel inflammation, which was in agreement with previous studies
performed by Li et al. [152], Pendse et al. [154], Yu et al. [206].
ADC was only used in the Clermont index calculation. Elimination of
calculation RCE makes it more simple. Rimola et al. had admitted the
introduction of this measure in clinical trials would have the advantage of
avoiding the use of gadolinium contrast [144, 170, 172].
4.5. Faecal calprotectin for monitoring Crohn's disease
In the treatment of CD, re-evaluation is often required to monitor illness
activity, which poses a significant economic burden and the risk of unexpec-
ted complications for patients. The results of this study showed that FC
levels provided clinically relevant data on the CD. Non-invasive procedures
for patients are more accessible to tolerate compared to endoscopy.
Our results have shown sensitivity 61.54% and specificity 62.96% for
predicting active CD than FC ≥200 μg/g. The sensitivity and specificity
were similar in ileocolonic and colonic disease comparing to only small
bowel disease (55.1% and 50% vs. 50% and 44.9%),
The FC cut of value in our study for predicting active CD was ≥200
μg/g. Meanwhile, Lin et al. [207] suggested 50 μg/g as a cut-off screening
value for further endoscopy examination in clinical practice, with a 60%
specificity and sensitivity of 92%. Other experts suggested a higher cut-off
level >100 μg/g for more precise diagnostic results [208]. Sipponen et al.
[209] proposed a cut-off FC level of 200 μg/g to identify endoscopically
inactive CD with sensitivity and specificity (70% and 92%). D'Haens et al.
found that the FC level of more than 250 μg/g predicts active CD [210].
We have found no FC level differences between both small bowel and
colonic disease locations. Our results agree globally with those obtained by
af Bjorkesten et al. [211] and Jensen et al. [212] and others [213- 214],
studies data showed no FC level effect on disease location.
Also, we have found no differences between CD behavior and FC level.
Patients with elevated FC values have a significantly worse quality of
life as compared to patients with lower FC levels.
We have found no statistically significant difference between FC level
(<200 μg/g and ≥200 μg/g) and MR-EC indices, CRP, CDEIS in our study.
Somwaru et al. results are contrary to ours. They have found a positive
correlation between FC and MRE, CDEIS and FC [215]. Somwaru et al.
results could be positive because they evaluated patients with colonic CDs
only.
65
CONCLUSIONS
1. The sensitivity and specificity of MR-EC in detecting CD lesions were
respectively 74% and 90%; sensitivity and specificity for the diagnosis
of terminal ileitis were higher – 85.9% and 92.3%. MR-EC had high
diagnostic accuracy for the diagnosing of CD complications: abscesses
sensitivity 88.7%, and specificity of 100%, fistulas sensitivity 75.2%,
specificity 100%, stenosis sensitivity 81.1%, specificity 91.5%.
2. Signs of disease activity on MR-EC of CD patients were determined:
bowel wall thickening of more than 4 mm, increased bowel wall
enhancement, and stratified enhancement pattern after the intravenous
contrast media, increased mesenteric vascularity.
3. A robust negative correlation between the Lemann index and the quality
of life measured by IBDQ was determined. This correlation was less
pronounced when using the MaRIA-G index. The CRP showed a good
correlation with CDEIS and MARIA-G, but not with the Lemann index
and IBDQ.
4. DWI was able to discriminate between mild, moderate, and severe CD
activity.
5. Overall sensitivity and specificity of FC for predicting active disease
was 61.54% and 62.96%, respectively. Predictive values for the active
ileal disease were lower than for ileocolonic and colonic disease. FC
levels did not differ between different disease behavior groups. Patients
with elevated FC had poorer quality of life and higher CDAI.
66
PRACTICAL RECOMMENDATIONS
1. MR-EC provides an accurate assessment of disease behavior and
activity and enables evaluating the whole intestines. MR-EC is able to
diagnose disease complications such as fistula, abscesses, which allows
optimizing treatment strategy.
2. Lemann index is a beneficial disease activity index providing compre-
hensive information of total bowel damage and complications.
3. The DWI sequence does not replace the conventional MR-EC but adds
additional qualitative and quantitative information regarding disease
activity.
67
REFERENCES
1. Deepak P, Fletcher JG, Fidler JL, Barlow JM, Sheedy SP, Kolbe AB, et al.
Predictors of Durability of Radiological Response in Patients With Small Bowel
Crohn's Disease. Inflamm Bowel Dis. England; 2018;24:1815–25.
2. Torres J, Mehandru S, Colombel J-F, Peyrin-Biroulet L. Crohn's disease. Lancet.
Elsevier; 2017;389:1741–55.
3. Deepak P, Park SH, Ehman EC, Hansel SL, Fidler JL, Bruining DH, et al. Crohn's
disease diagnosis, treatment approach, and management paradigm: what the
radiologist needs to know. Abdom Radiol (NY). Springer US; 2017;42:1068–86.
4. Boyapati R, Satsangi J, Ho G. Pathogenesis of Crohn's disease. F1000 prime reports.
2015.
5. Qin X. Etiology of inflammatory bowel disease : A unified hypothesis. World J
Gastroenterol. 2012;18:1708–22.
6. Church PC, Turner D, Feldman BM, Walters TD, Greer M, Amitai MM, et al.
Alimentary Pharmacology and Therapeutics Systematic review with meta-analysis :
magnetic resonance enterography signs for the detection of inflammation and
intestinal damage in Crohn' s disease. 2015;153–66.
7. Peyrin-Biroulet L, Reinisch W, Colombel J-F, Mantzaris GJ, Kornbluth A, Diamond
R, et al. Clinical disease activity, C-reactive protein normalisation and mucosal
healing in Crohn's disease in the SONIC trial. Gut. 2014;63:88 LP – 95.
8. Silverberg MS, Satsangi J, Ahmad T, et al. Toward an integrated clinical, molecular
and serological classification of inflammatory bowel disease : Report of a Working
Party of the 2005 Montreal World Congress of Gastroenterology. Can J
Gastroenterol. 2005;19 Suppl A:5A-36A.
9. Peyrin-Biroulet L, Sandborn W, Sands BE, Reinisch W, Bemelman W, Bryant R V,
et al. Selecting Therapeutic Targets in Inflammatory Bowel Disease (STRIDE):
Determining Therapeutic Goals for Treat-to-Target. Am J Gastroenterol. United
States; 2015;110:1324–38.
10. Yoon K, Chang K, Lee HJ. MRI for Crohn's Disease : Present and Future. Biomed
Res Int. 2014;2015.
11. Kilcoyne A, Kaplan JL, Gee MS. Inflammatory bowel disease imaging: Current
practice and future directions. World J Gastroenterol. 2016;22:917–32.
12. Varyani F, Samuel S. "Can Magnetic Resonance Enterography (MRE) replace ileo-
colonoscopy for evaluating disease activity in Crohn's disease?". Best Pract Res Clin
Gastroenterol. Netherlands; 2019;38–39:101621.
13. Ojidu H, Palmer H, Lewandowski J, Hampton J, Blakeborough T, Epstein O, et al.
Patient tolerance and acceptance of different colonic imaging modalities: an
observational cohort study. Eur J Gastroenterol Hepatol. England; 2018;30:520–5.
14. Panes J, Bouhnik Y, Reinisch W, Stoker J, Taylor SA, Baumgart DC, et al. Imaging
techniques for assessment of inflammatory bowel disease: Joint ECCO and ESGAR
evidence-based consensus guidelines. J. Crohn's Colitis. European Crohn's and
Colitis Organisation; 2013;7:556–85.
15. Puylaert CAJ, Nolthenius CJT, Tielbeek JAW, Makanyanga JC, Rodriguez-Justo M,
Brosens LAA, et al. Comparison of MRI Activity Scoring Systems and Features for
the Terminal Ileum in Patients With Crohn Disease. AJR Am J Roentgenol. United
States; 2019;212:W25–31.
68
16. Bruining DH, Zimmermann EM, Loftus E V, Sandborn WJ, Sauer CG, Strong SA.
Consensus Recommendations for Evaluation, Interpretation, and Utilization of
Computed Tomography and Magnetic Resonance Enterography in Patients With
Small Bowel Crohn's Disease. Radiology. Radiological Society of North America;
2018;286:776–99.
17. Park SH. DWI at MR enterography for evaluating bowel inflammation in Crohn
disease. Am J Roentgenol. 2016;207:40–8.
18. Ayling RM, Kok K. Chapter Six - Fecal Calprotectin. In: Makowski GSBT-A in
CC, editor. Adv Clin Chem. Elsevier; 2018. p. 161–90.
19. Gomollón F, Dignass A, Annese V, Tilg H, Van Assche G, Lindsay JO, et al. 3rd
European evidence-based consensus on the diagnosis and management of Crohn's
disease 2016: Part 1: Diagnosis and medical management. J Crohn's Colitis. 2017;
11:3–25.
20. Prezzi D, Bhatnagar G, Vega R, Makanyanga J, Halligan S, Taylor SA. Monitoring
Crohn's disease during anti-TNF-alpha therapy: validation of the magnetic
resonance enterography global score (MEGS) against a combined clinical reference
standard. Eur Radiol. Germany; 2016;26:2107–17.
21. Vilela EG, Torres HODG, Martins FP, Ferrari MDLDA, Andrade MM, Cunha AS
Da. Evaluation of inflammatory activity in Crohn's disease and ulcerative colitis.
World J Gastroenterol. 2012;18:872–81.
22. Guyatt G, Mitchell A, Irvine EJAN, Singer J, Williams N, Goodacre R, et al. A new
measure of health status for clinical trials in inflammatory bowel disease. Gastro-
enterology. 1989;804–10.
23. Mary JY, Modigliani R. Development and validation of an endoscopic index of the
severity for Crohn's disease: a prospective multicentre study. Groupe d'Etudes
Therapeutiques des Affections Inflammatoires du Tube Digestif (GETAID). Gut.
1989;30:983–9.
24. Rimola J, Ordas I, Rodriguez S, Garcia-Bosch O, Aceituno M, Llach J, et al.
Magnetic resonance imaging for evaluation of Crohn's disease: validation of
parameters of severity and quantitative index of activity. Inflamm Bowel Dis.
England; 2011;17:1759–68.
25. Pariente B, Cosnes J, Danese S, Sandborn WJ, Lewin M, Fletcher JG, et al.
Development of the Crohn's disease digestive damage score, the Lémann score.
Inflamm Bowel Dis. 2011;17:1415–22.
26. Pariente B, Torres J, Burisch J, Arebi N, Barberio B, Duricova D, et al. OP05
Validation of the Lémann index in Crohn's disease. J. Crohn's Coliti. 2020;14:S005–
6.
27. Pariente B, Mary J-Y, Danese S, Chowers Y, De Cruz P, D'Haens G, et al.
Development of the Lémann Index to Assess Digestive Tract Damage in Patients
With Crohn's Disease. Gastroenterology. Elsevier, Inc; 2015 148:52-63.e3.
28. Sousa HT de, Brito J, Magro F. New cross-sectional imaging in IBD. Curr Opin
Gastroenterol. United States; 2018;34:194–207.
29. Bonnaud G, Bouhnik Y, Hagege H, Hebuterne X, Pariente B, Roblin X, et al.
Monitoring of inflammatory bowel disease in 2019: A French consensus for clinical
practice. Dig liver Dis Off J Ital Soc Gastroenterol Ital Assoc Study Liver. Nether-
lands; 2020;52:704–20.
30. Panes J, Jairath V, Levesque BG. Advances in Use of Endoscopy, Radiology, and
Biomarkers to Monitor Inflammatory Bowel Diseases. Gastroenterology. United
States; 2017;152:362-373.e3.
69
31. Minordi LM, Larosa L, Belmonte G, Scaldaferri F, Poscia A, Gasbarrini A, et al.
Crohn's disease activity before and after medical therapy evaluated by MaRIA score
and others parameters in MR Enterography. Clin Imaging. 2020;62:1–9.
32. Hansel SL, McCurdy JD, Barlow JM, Fidler J, Fletcher JG, Becker B, et al. Clinical
Benefit of Capsule Endoscopy in Crohn's Disease: Impact on Patient Management
and Prevalence of Proximal Small Bowel Involvement. Inflamm Bowel Dis.
England; 2018;24:1582–8.
33. Prassopoulos P, Papanikolaou N, Grammatikakis J, Rousomoustakaki M, Maris T,
Gourtsoyiannis N. MR enteroclysis imaging of Crohn disease. Radiographics. 2001;
21 Spec No: S161–72.
34. Lauenstein TC, Schneemann H, Vogt FM, Herborn CU, Ruhm SG, Debatin JF.
Optimization of oral contrast agents for MR imaging of the small bowel. Radiology.
2003;228:279–83.
35. Mako EK, Mester AR, Tarjan Z, Karlinger K, Toth G. Enteroelysis and spiral CT
examination in diagnosis and evaluation of small bowel Crohn's disease. Eur J
Radiol. Ireland; 2000;35:168–75.
36. Charif I, Abid H, Benajah D, Addou O, Kamaoui I, Tizniti S, et al. Is there a
correlation between endoscopy and imaging findings in Crohn's disease. Open J
Gastroenterol. 2013;03:138–41.
37. Maaser C, Sturm A, Vavricka SR, Kucharzik T, Gionata Fiorino et al. ECCO-
ESGAR Guideline for Diagnostic Assessment in IBD Part 1: Initial diagnosis,
monitoring of known IBD, detections of complications. Journal of Crohn's & colitis.
2018; 144-164.
38. Frolkis AD, Dykeman J, Negrón ME, Debruyn J, Jette N, Fiest KM, et al. Risk of
Surgery for Inflammatory Bowel Diseases Has Decreased Over Time: A Systematic
Review and Meta-analysis of Population-Based Studies. Gastroenterology. Elsevier,
Inc; 2013;145:996–1006.
39. Burisch J, Pedersen N, Čuković-Čavka, Brinar M, Kaimakliotis I, Duricova D, et al.
East-West gradient in the incidence of in flammatory bowel disease in Europe : the
ECCO-EpiCom inception cohort. Gut. 2014;588–97.
40. Kaplan GG. The global burden of IBD: from 2015 to 2025. Nat Rev Gastroenterol
Hepatol. 2015;12(12):720-727.
41. Kaplan GG, Ng SC. Understanding and Preventing the Global Increase of
Inflammatory Bowel Disease. Gastroenterology. Elsevier; 2017;152:313-321.e2.
42. Ng SC, Shi HY, Hamidi N, Underwood FE, Tang W, Benchimol EI, et al.
Worldwide incidence and prevalence of inflammatory bowel disease in the 21st
century: a systematic review of population-based studies. Lancet. Elsevier;
2017;390:2769–78.
43. Burisch J, Jess T, Martinato M, Lakatos PL. The burden of inflammatory bowel
disease in Europe. J Crohn's Colitis. European Crohn's and Colitis Organisation;
2013; 7:322–37.
44. Burisch J. Crohn's disease and ulcerative colitis. Occurrence, course and prognosis
during the first year of disease in a European population-based inception cohort.
Dan Med J. 2014;61:1–32.
45. Vindigni SM, Zisman TL, Suskind DL, Damman CJ. The intestinal microbiome,
barrier function, and immune system in inflammatory bowel disease : a tripartite
pathophysiological circuit with implications for new therapeutic directions. Therap
Adv Gastroentero. 2016;606–25.
70
46. Pous-Serrano S, Frasson M, Pàmies-Guilabert J, Rudenko P, Puchades-Román I,
Beltrán B, et al. Use of magnetic resonance index of activity (MaRIA) in the
preoperative assessment of small bowel Crohn's disease. Cir Esp. Spain; 2019;97:
582–9.
47. Spekhorst LM, Visschedijk MC, Alberts R, Festen EA, Wouden E Van Der,
Spekhorst LM, et al. Performance of the Montreal classification for inflammatory
bowel diseases. World J Gastroenterol. 2014;20:15374–81.
48. Satsangi J, Silverberg MS, Vermeire S, Colombel J-F. The Montreal classification
of inflammatory bowel disease: controversies, consensus, and implications. Gut.
2006;55:749–53.
49. Ha F, Khalil H. Crohn's disease : a clinical update. Therap Adv Gastroenterol. 2015;
352–9.
50. Charpentier C, Salleron J, Savoye G, Fumery M, Merle V, Laberenne J-E, et al.
Natural history of elderly-onset inflammatory bowel disease: a population-based
cohort study. Gut. 2014;63:423 LP – 432.
51. Best WR, Becktel JM, Singleton JW, Kern F Jr. Development of a Crohn's disease
activity index. National Cooperative Crohn's Disease Study. Gastroenterology. The
Williams & Wilkins Co.; 1976;70:439–44.
52. Sostegni R, Daperno M, Scaglione N, Lavagna A, Rocca R, Pera A. Review article:
Crohn's disease: monitoring disease activity. Aliment Pharmacol Ther. 2003;17
Suppl 2:11–7.
53. Sturm A, Maaser C, Calabrese E, Annese V, Fiorino G, Kucharzik T, et al. ECCO
Guideline / Consensus Paper ECCO-ESGAR Guideline for Diagnostic Assessment
in IBD Part 2 : IBD scores and general principles and technical aspects. J Crohns
Colitis. 2018; 273-284.
54. Freeman H-JJ. Use of the Crohn's disease activity index in clinical trials of
biological agents. World J Gastroenterol. 2008/07/14. The WJG Press and
Baishideng; 2008;14: 4127–30.
55. Yoshida EM. The Crohn's Disease Activity Index, its derivatives and the Inflamma-
tory Bowel Disease Questionnaire : A review of instruments to assess Crohn's
disease. Can. J. Gastroenterol. 1999; 65-73.
56. Vermeire S, Schreiber S, Sandborn WJ, Dubois C, Rutgeerts P. Correlation Between
the Crohn's Disease Activity and Harvey – Bradshaw Indices in Assessing Crohn's
Disease Severity. Clin. Gastroenterol. Hepatol. 2010;8:357–63.
57. Best WR. Predicting the Crohn's Disease Activity Index from the Harvey-Bradshaw
Index. Inflamm Bowel Dis. 2006;12:304–10.
58. Sajadinejad MS, Asgari K, Molavi H, Kalantari M, Adibi P. Psychological Issues in
Inflammatory Bowel Disease : An Overview. Gastroenterol Res Pract. 2012; 1-11.
59. Feagan BG, Hanauer SB, Coteur G, Schreiber S. Evaluation of a daily practice
composite score for the assessment of Crohn's disease: The treatment impact of
certolizumab pegol. Aliment Pharmacol Ther. 2011;33:1143–51.
60. Coremans G, Rutgeerts P, Geboes K, Van den Oord J, Ponette E, Vantrappen G. The
value of ileoscopy with biopsy in the diagnosis of intestinal Crohn's disease.
Gastrointest Endosc. Elsevier; 1984;30:167–72.
61. Romagnuolo J, Enns R, Ponich T, Springer J, Armstrong D, Barkun AN. Canadian
credentialing guidelines for colonoscopy. Can J Gastroenterol. 2008;22(1):17-22.
62. Al-Sohaily S, Leong R. The yield of ileoscopy at colonoscopy. J Gastroenterol
Hepatol. 2008;23:4–5.
71
63. Navaneethan U, Kochhar G, Phull H, Gk P, Remzi FH, Kiran RP, et al. Severe
disease on endoscopy and steroid use increase the risk for bowel perforation during
colonoscopy in inflammatory bowel disease patients ☆. J Crohn's Colitis. European
Crohn's and Colitis Organisation; 2012;6:470–5.
64. Lohsiriwat V, Sujarittanakarn S, Akaraviputh T, Lertakyamanee N, Lohsiriwat D,
Kachinthorn U. What are the risk factors of colonoscopic perforation ? BMC
Gastroenterol. 2009;6:1–6.
65. Stange EF, Travis SPL, Vermeire S, Beglinger C, Kupcinskas L, Geboes K, et al.
European evidence based consensus on the diagnosis and management of Crohn' s
disease : definitions and diagnosis. Gut. 2006;1–15.
66. Horsthuis K, Bipat S, Bennink RJ, Stoker J. Inflammatory bowel disease diagnosed
with US, MR, scintigraphy, and CT: meta-analysis of prospective
studies. Radiology. 2008;247(1):64-79.
67. Horsthuis K, Stokkers PCF, Stoker J. Detection of inflammatory bowel disease:
diagnostic performance of cross-sectional imaging modalities. Abdom Imaging.
2008; 33:407–16.
68. Marshall JK, Cawdron R, Zealley I, Riddell RH, Somers S, Irvine EJ. Prospective
Comparison of Small Bowel Meal with Pneumocolon versus Ileo-Colonoscopy for
the Diagnosis of Ileal Crohn's Disease. Am J Gastroenterol. The American College
of Gastroenterology; 2004;99:1321.
69. Samuel S, Bruining DH, Loftus EV Jr, et al. Endoscopic skipping of the distal
terminal ileum in Crohn's disease can lead to negative results from
ileocolonoscopy. Clin Gastroenterol Hepatol. 2012;10(11):1253-1259.
70. Jain S, Gautam V, Naseem S. Acute-phase proteins: As diagnostic tool. J Pharm
Bioallied Sci. Medknow Publications; 2011;3:118–27.
71. Sproston NR, Ashworth JJ. Role of C-Reactive Protein at Sites of inflammation and
infection. Front Immunol. 2018;9:1–11.
72. Iskandar HN, Ciorba MA. Biomarkers in inflammatory bowel disease: current
practices and recent advances. Transl Res. Elsevier; 2012;159:313–25.
73. Cappello M, Morreale GC. The Role of Laboratory Tests in Crohn's Disease. Clin
Med Insights Gastroenterol. Libertas Academica; 2016;9:51–62.
74. Peyrin-Biroulet L, Panés J, Sandborn WJ, Vermeire S, Danese S, Feagan BG, et al.
Defining Disease Severity in Inflammatory Bowel Diseases: Current and Future
Directions. Clin Gastroenterol Hepatol. 2016;14:348-354.e17.
75. A. G. Røseth P. N. Schmidt MKF. Correlation between Faecal Excretion of Indium-
111-Labelled Granulocytes and Calprotectin, a Granulocyte Marker Protein, in
Patients with Inflammatory Bowel Disease. Scand J Gastroenterol. Taylor &
Francis; 1999;34:50–4.
76. Alibrahim B, I Aljasser M, Salh B. Fecal Calprotectin Use in Inflammatory Bowel
Disease and Beyond: A Mini-Review. Can J Gastroenterol Hepatol. 2015;29:157–
63.
77. Zhong J, Rao X. S100 Proteins As an important Regulator of Macrophage
inflammation. Front Immunol. 2018;8:1–11.
78. Fukunaga S, Kuwaki K, Mitsuyama K, Takedatsu H, Yoshioka S, Yamasaki H, et al.
Detection of calprotectin in inflammatory bowel disease: Fecal and serum levels and
immunohistochemical localization. Int J Mol Med. 2018;41:107–18.
79. Carroccio A, Iacono G, Cottone M, Di Prima L, Cartabellotta F, Cavataio F, et al.
Diagnostic Accuracy of Fecal Calprotectin Assay in Distinguishing Organic Causes
72
of Chronic Diarrhea from Irritable Bowel Syndrome: A Prospective Study in Adults
and Children. Clin Chem. 2003;49:861 LP – 867.
80. Velikova T, Shentova R, Spassova Z, Tumangelova-Yuzeir K, Krasimirova E,
Ivanova-Todorova E, et al. Comparative Evaluation of Four Methods for Fecal
Calprotectin Testing : One-Step Card Test, A Point-of-care Lateral Flow Assay, A
Standard and an Automated ELISA. Scimaze Gastroenterol Hepatol (2018) 1:101.
81. Mooiweer E, Severs M, Schipper MEII, Fidder HH, Siersema PD, Laheij RJFF, et
al. Low fecal calprotectin predicts sustained clinical remission in inflammatory
bowel disease patients: A plea for deep remission. J. Crohn's Colitis. 2015;9:50–5.
82. Tibble JA, Sigthorsson G, Foster R, Scott D, Fagerhol MK, Roseth A, et al. High
prevalence of NSAID enteropathy as shown by a simple faecal test. Gut. 1999;45:
362–6.
83. Matsuura R, Watanabe O, Nakamura M, Yamamura T, Matsushita M, Suhara H, et
al. Fecal calprotectin reflects endoscopic activity in patients with small-bowel
Crohn's disease according to double-balloon endoscopy findings. Nagoya J Med Sci.
Nagoya University; 2018;80:257–66.
84. Smith LA, Gaya DR, Smith LA, Gaya DR, Diseases IB. Utility of faecal calprotectin
analysis in adult inflammatory bowel disease. World J Gastroenterol. 2012;18:6782–
9.
85. Iwamoto F, Matsuoka K, Motobayashi M, Takenaka K, Kuno T, Tanaka K, et al.
Prediction of disease activity of Crohn's disease through fecal calprotectin evaluated
by balloon-assisted endoscopy. J Gastroenterol Hepatol. 2018. 1984-1989.
86. Taylor SA, Avni F, Cronin CG, Hoeffel C, Kim SH, Laghi A, et al. The first joint
ESGAR/ ESPR consensus statement on the technical performance of cross-sectional
small bowel and colonic imaging. Eur Radiol. European Radiology; 2016;27: 2570-
2582.
87. Cronin CG, Lohan DG, Mhuircheartaigh JN, McKenna D, Alhajeri N, Roche C, et
al. MRI Small-Bowel Follow-Through: Prone Versus Supine Patient Positioning for
Best Small-Bowel Distention and Lesion Detection. Am J Roentgenol. American
Roentgen Ray Society; 2008;191:502–6.
88. Fiorino G, Bonifacio C, Padrenostro M, Sposta FM, Spinelli A, Malesci A, et al.
Comparison between 1.5 and 3.0 Tesla magnetic resonance enterography for the
assessment of disease activity and complications in ileo-colonic Crohn's disease. Dig
Dis Sci. United States; 2013;58:3246–55.
89. Jiang X, Asbach P, Hamm B, Xu K, Banzer J. MR imaging of distal ileal and
colorectal chronic inflammatory bowel disease--diagnostic accuracy of 1.5 T and 3
T MRI compared to colonoscopy. Int J Colorectal Dis. Germany; 2014;29:1541–50.
90. Grand DJ, Beland MD, Machan JT, Mayo-Smith WW. Detection of Crohn's disease:
Comparison of CT and MR enterography without anti-peristaltic agents performed
on the same day. Eur J Radiol. Ireland: Elsevier Ireland Ltd; 2012;81:1735–41.
91. Cronin CG, Dowd G, Mhuircheartaigh JN, DeLappe E, Allen RH, Roche C, et al.
Hypotonic MR duodenography with water ingestion alone: feasibility and technique.
Eur Radiol. Germany; 2009;19:1731–5.
92. Jesuratnam-Nielsen K, Løgager VB, Rezanavaz-Gheshlagh B, Munkholm P, Thom-
sen HS. Plain magnetic resonance imaging as an alternative in evaluating inflamma-
tion and bowel damage in inflammatory bowel disease – a prospective comparison
with conventional magnetic resonance follow-through. Scand J Gastroenterol.
Taylor & Francis; 2015;50:519–27.
73
93. Allocca M, Danese S, Laurent V, Peyrin-Biroulet L. Use of Cross-Sectional Imaging
for Tight Monitoring of Inflammatory Bowel Diseases. Clin Gastroenterol Hepatol
Off Clin Pract J Am Gastroenterol Assoc. United States; 2020;18:1309-1323.e4.
94. Ippolito D, Invernizzi F, Galimberti S, Panelli MR, Sironi S. MR enterography with
polyethylene glycol as oral contrast medium in the follow-up of patients with Crohn
disease : comparison with CT enterography. Abdom Imaging. United States; 2010;
35:563–70.
95. Laghi A, Paolantonio P, Iafrate F, Borrelli O, Dito L, Tomei E, et al. MR of the
small bowel with a biphasic oral contrast agent (polyethylene glycol): technical
aspects and findings in patients affected by Crohn's disease. Radiol Med.
2003;106:18—27.
96. Maccioni F, Viscido A, Marini M, Caprilli R. MRI evaluation of Crohn's disease of
the small and large bowel with the use of negative superparamagnetic oral contrast
agents. Abdominal Imaging. 2002;393:384–93.
97. Evrimler S, Algin O. MR enterography with oral contrast agent composed of
methylcellulose, low-dose barium sulfate, sorbitol, and lactulose: assessment of
diagnostic performance, reliability, image quality, and patient tolerance. Clin
Imaging. Elsevier; 2016;40:523–30.
98. Ajaj W, Goyen M, Schneemann H, Kuehle Ch, Nuefer M, Ruehm SG, Goehde SC,
Lauenstein TC. Oral contrast agents for small bowel distension in MRI : influence of
the osmolarity for small bowel distention. Eur Radiol. 2005; 1400-1406.
99. Wang Y-R, Yu X-L, Peng Z-Y. Evaluation of different small bowel contrast agents
by multi-detector row CT. Int J Clin Exp Med. e-Century Publishing Corporation;
2015;8:16175–82.
100. Gee MS, Harisinghani MG. MRI in patients with inflammatory bowel disease. J
Magn Reson Imaging. 2011;33:527–34.
101. Khatri G, Coleman J, Leyendecker JR. Magnetic Resonance Enterography for
Inflammatory and Noninflammatory Conditions of the Small Bowel. Radiol Clin
North Am. United States; 2018;56:671–89.
102. Ram R, Sarver D, Pandey T, Guidry CL, Jambhekar KR. Magnetic resonance
enterography: A stepwise interpretation approach and role of imaging in
management of adult Crohn's disease. Indian J Radiol Imaging. India; 2016;26:173.
103. Hidalgo LH, Moreno EA, Arranz JC, Alonso RC, Fernández VMDV. Magnetic
resonance enterography : Review of the technique for the study of Crohn ’ s disease.
Radiología (English Edition). 2011; 421-433.
104. Lee SS, Kim AY, Yang S, Chung J, Kim SY, Park SH, et al. Crohn disease of the
small bowel: comparison of CT enterography, MR enterography, and small-bowel
follow-through as diagnostic techniques. Radiology. 2009;251:751–61.
105. Masselli G, Casciani E, Polettini E, Gualdi G. Comparison of MR enteroclysis with
MR enterography and conventional enteroclysis in patients with Crohn's disease.
Eur Radiol. Germany; 2008;18:438–47.
106. Sinha R, Rajiah P, Murphy P, Hawker P, Sanders S. Utility of high-resolution MR
imaging in demonstrating transmural pathologic changes in Crohn disease.
Radiographics. United States; 2009;29:1847–67.
107. Tolan DJM, Greenhalgh R, Zealley IA, Halligan S, Taylor SA. MR enterographic
manifestations of small bowel Crohn disease. Radiographics. United States;
2010;30: 367–84.
108. Gutzeit A, Binkert CA, Koh D-M, Hergan K, von Weymarn C, Graf N, et al.
Evaluation of the anti-peristaltic effect of glucagon and hyoscine on the small
74
bowel: comparison of intravenous and intramuscular drug administration. Eur
Radiol. Germany; 2012;22:1186–94.
109. Florie J, Wasser MNJM, Arts-Cieslik K, Akkerman EM, Siersema PD, Stoker J.
Dynamic contrast-enhanced MRI of the bowel wall for assessment of disease
activity in Crohn's disease. AJR Am J Roentgenol. United States; 2006;186:1384–
92.
110. Maccioni F, Bruni A, Viscido A, Colaiacomo MC, Cocco A, Montesani C, et al. MR
imaging in patients with Crohn disease: value of T2-versus T1-weighted
gadolinium-enhanced MR sequences with use of an oral superparamagnetic contrast
agent. Radiology. United States; 2006; 238:517–30.
111. Low RN, Sebrechts CP, Politoske DA, Bennett MT, Flores S, Snyder RJ, et al.
Crohn disease with endoscopic correlation: single-shot fast spin-echo and
gadolinium-enhanced fat-suppressed spoiled gradient-echo MR imaging. Radiology.
United States; 2002;222:652–60.
112. Makanyanga JC, Pendse D, Dikaios N, Bloom S, McCartney S, Helbren E, et al.
Evaluation of Crohn's disease activity: initial validation of a magnetic resonance
enterography global score (MEGS) against faecal calprotectin. Eur Radiol.
Germany; 2014;24:277–87.
113. Maglinte DDT, Gourtsoyiannis N, Rex D, Howard TJ, Kelvin FM. Classification of
small bowel Crohn's subtypes based on multimodality imaging. Radiol Clin North
Am. 2003;41:285–303.
114. Rimola J, Rodríguez S, García-Bosch O, Ricart E, Pagès M, Pellisé M, et al. Role of
3.0-T MR Colonography in the Evaluation of Inflammatory Bowel Disease.
RadioGraphics. 2009;29:701–19.
115. Albert JG, Martiny F, Krummenerl A, Stock K, Lesske J, Gobel CM, et al.
Diagnosis of small bowel Crohn's disease: a prospective comparison of capsule
endoscopy with magnetic resonance imaging and fluoroscopic enteroclysis. Gut.
England; 2005;54:1721–7.
116. Gourtsoyiannis N, Papanikolaou N, Grammatikakis J, Papamastorakis G, Prassopou-
los P, Roussomoustakaki M. Assessment of Crohn's disease activity in the small
bowel with MR and conventional enteroclysis: preliminary results. Eur Radiol. Ger-
many; 2004;14:1017–24.
117. O'Malley RB, Al-Hawary MM, Kaza RK, Wasnik AP, Liu PS, Hussain HK. Rectal
imaging: part 2, Perianal fistula evaluation on pelvic MRI--what the radiologist
needs to know. AJR Am J Roentgenol. United States; 2012;199:W43-53.
118. Negaard A, Paulsen V, Sandvik L, Berstad AE, Borthne A, Try K, et al. A
prospective randomized comparison between two MRI studies of the small bowel in
Crohn's disease, the oral contrast method and MR enteroclysis. Eur Radiol.
Germany; 2007; 17:2294–301.
119. Amzallag-Bellenger E, Oudjit A, Ruiz A, Cadiot G, Soyer PA, Hoeffel CC.
Effectiveness of MR enterography for the assessment of small-bowel diseases
beyond Crohn disease. Radiographics. United States; 2012;32:1423–44.
120. Gourtsoyiannis NC, Papanikolaou N, Karantanas A. Magnetic resonance imaging
evaluation of small intestinal Crohn's disease. Best Pract Res Clin Gastroenterol.
Netherlands; 2006;20:137–56.
121. Koh DM, Miao Y, Chinn RJ, Amin Z, Zeegen R, Westaby D, et al. MR imaging
evaluation of the activity of Crohn's disease. AJR Am J Roentgenol. United States;
2001;177:1325–32.
75
122. Madsen SM, Thomsen HS, Schlichting P, Dorph S, Munkholm P. Evaluation of
treatment response in active Crohn's disease by low-field magnetic resonance
imaging. Abdom Imaging. United States; 1999;24:232–9.
123. Sempere GAJ, Martinez Sanjuan V, Medina Chulia E, Benages A, Tome Toyosato
A, Canelles P, et al. MRI Evaluation of Inflammatory Activity in Crohn's Disease.
Am J Roentgenol. American Roentgen Ray Society; 2005;184:1829–35.
124. Del Vescovo R, Sansoni I, Caviglia R, Ribolsi M, Perrone G, Leoncini E, et al.
Dynamic contrast enhanced magnetic resonance imaging of the terminal ileum:
differentiation of activity of Crohn's disease. Abdom Imaging. 2008;33:417–24.
125. Knuesel PR, Kubik RA, Crook DW, Eigenmann F, Froehlich JM. Assessment of
dynamic contrast enhancement of the small bowel in active Crohn's disease using
3D MR enterography. Eur J Radiol. Ireland; 2010;73:607–13.
126. Punwani S, Rodriguez-Justo M, Bainbridge A, Greenhalgh R, De Vita E, Bloom S,
et al. Mural inflammation in Crohn disease: location-matched histologic validation
of MR imaging features. Radiology. United States; 2009;252:712–20.
127. Leyendecker JR, Bloomfeld RS, DiSantis DJ, Waters GS, Mott R, Bechtold RE. MR
enterography in the management of patients with Crohn disease. Radiographics.
2009;29:1827–46.
128. Schmidt S, Chevallier P, Bessoud B, Meuwly J-Y, Felley C, Meuli R, et al.
Diagnostic performance of MRI for detection of intestinal fistulas in patients with
complicated inflammatory bowel conditions. Eur Radiol. Germany; 2007;17:2957–
63.
129. Gourtsoyiannis NC, Grammatikakis J, Papamastorakis G, Koutroumbakis J,
Prassopoulos P, Rousomoustakaki M, et al. Imaging of small intestinal Crohn's
disease: comparison between MR enteroclysis and conventional enteroclysis. Eur
Radiol. Germany; 2006;16:1915–25.
130. Maccioni F, Viscido A, Broglia L, Marrollo M, Masciangelo R, Caprilli R, et al.
Evaluation of Crohn disease activity with magnetic resonance imaging. Abdom
Imaging. United States; 2000;25:219–28.
131. Schunk K, Kern A, Oberholzer K, Kalden P, Mayer I, Orth T, et al. Hydro-MRI in
Crohn's disease: appraisal of disease activity. Invest Radiol. United States; 2000;
35:431–7.
132. Dohan A, Taylor S, Hoeffel C, Barret M, Allez M, Dautry R, et al. Diffusion-
weighted MRI in Crohn's disease: Current status and recommendations. J Magn
Reson Imaging. United States; 2016;44:1381–96.
133. Qayyum A. Diffusion-weighted imaging in the abdomen and pelvis: concepts and
applications. Radiographics. United States; 2009;29:1797–810.
134. Stejskal EO, Tanner JE. Spin Diffusion Measurements: Spin Echoes in the Presence
of a Time Dependent Field Gradient. J Chem Phys. American Institute of Physics;
1965;42:288–92.
135. Koh D-M, Collins DJ. Diffusion-weighted MRI in the body: applications and
challenges in oncology. AJR Am J Roentgenol. United States; 2007;188:1622–35.
136. Pouillon L, Laurent V, Pouillon M, Bossuyt P, Bonifacio C, Danese S, et al.
Diffusion-weighted MRI in inflammatory bowel disease. Lancet Gastroenterol
Hepatol. Elsevier Ltd; 2018;3:433–43.
137. Oto A, Fan X, Mustafi D, Jansen S, Zhu F, Kulkarni K, et al. Evaluation of
diffusion-weighted MR imaging for detection of bowel inflammation in patients
with Crohn's disease. Acad Radiol. 2009/03/17. 2009;16:597–603.
76
138. Ninivaggi V, Missere M, Restaino G, Gangemi E, Di Matteo M, Pierro A, et al. MR-
enterography with diffusion weighted imaging: ADC values in normal and patholo-
gical bowel loops, a possible threshold ADC value to differentiate active from
inactive Crohn's disease. Eur Rev Med Pharmacol Sci. Italy; 2016;20:4540–6.
139. Klang E, Kopylov U, Eliakim R, Rozendorn N, Yablecovitch D, Lahat A, et al.
Diffusion-weighted imaging in quiescent Crohn's disease: correlation with
inflammatory biomarkers and video capsule endoscopy. Clin Radiol. Elsevier;
2017;72:798.e7-798.e13.
140. Kim JS, Jang HY, Park SHSH, Kim K-JJ, Han K, Yang S-KK, et al. MR
Enterography Assessment of Bowel Inflammation Severity in Crohn Disease Using
the MR Index of Activity Score: Modifying Roles of DWI and Effects of Contrast
Phases. Am J Roentgenol. 2017;208:1022–9.
141. Rimola J, Rodriguez S, Garcı O, Orda I, Ayala E, Aceituno M, et al. Magnetic
resonance for assessment of disease activity and severity in ileocolonic Crohn's
disease. Gut. 2009;1113–20.
142. Scardapane A, Ambrosi A, Salinaro E, Mancini ME, Principi M, Di Leo A, et al.
Assessment of Disease Activity in Small Bowel Crohn's Disease: Comparison
between Endoscopy and Magnetic Resonance Enterography Using MRIA and
Modified MRIA Score. Gastroenterol Res Pract. 2015;2015:10–7.
143. Ordás I, Rimola J, Alfaro I, Rodríguez S, Castro-Poceiro J, Ramírez-Morros A, et al.
Development and Validation of a Simplified Magnetic Resonance Index of Activity
for Crohn’s Disease. Gastroenterology. United States; 2019;157:432-439.e1.
144. Capozzi N, Ordás I, Fernandez-Clotet A, Castro-Poceiro J, Rodríguez S, Alfaro I, et
al. Validation of the Simplified Magnetic Resonance Index of Activity [sMARIA]
Without Gadolinium-enhanced Sequences for Crohn's Disease. J. Crohn's Colitis.
2020.
145. Buisson A, Joubert A, Montoriol P-F, Da Ines D, Hordonneau C, Pereira B, et al.
Diffusion-weighted magnetic resonance imaging for detecting and assessing ileal
inflammation in Crohn's disease. Aliment Pharmacol Ther. England; 2013;37:537–
45.
146. Hordonneau C, Buisson a, Scanzi J, Goutorbe F, Pereira B, Borderon C, et al.
Diffusion-weighted magnetic resonance imaging in ileocolonic Crohn's disease:
validation of quantitative index of activity. Am J Gastroenterol. 2014;109:89–98.
147. Sato H, Tamura C, Narimatsu K, Shimizu M, Takajyo T, Yamashita M, et al.
Magnetic resonance enterocolonography in detecting erosion and redness in
intestinal mucosa of patients with Crohn's disease. J Gastroenterol Hepatol. 2015.
30:667–73.
148. Apine I, Pitura R, Franckevica I, Pokrotnieks J, Krumina G. Comparison between
Diffusion-Weighted Sequences with Selective and Non-Selective Fat Suppression in
the Evaluation of Crohn's Disease Activity: Are They Equally Useful? Diagnostics
(Basel, Switzerland). Switzerland; 2020;10.
149. Buisson A, Hordonneau C, Goutorbe F, Allimant C, Goutte M, Reymond M, et al.
Bowel wall healing assessed using magnetic resonance imaging predicts sustained
clinical remission and decreased risk of surgery in Crohn's disease. J Gastroenterol.
Japan; 2019;54:312–20.
150. Buisson A, Hordonneau C, Goutte M, Boyer L, Pereira B, Bommelaer G. Diffusion-
weighted magnetic resonance imaging is effective to detect ileocolonic ulcerations
in Crohn's disease. Aliment Pharmacol Ther. England; 2015;42:452–60.
77
151. Caruso A, D'Inca R, Scarpa M, Manfrin P, Rudatis M, Pozza A, et al. Diffusion-
weighted magnetic resonance for assessing ileal Crohn's disease activity. Inflamm
Bowel Dis. England; 2014;20:1575–83.
152. Li X-H, Sun C-H, Mao R, Huang S-Y, Zhang Z-W, Yang X-F, et al. Diffusion-
weighted MRI Enables to Accurately Grade Inflammatory Activity in Patients of
Ileocolonic Crohn's Disease: Results from an Observational Study. Inflamm Bowel
Dis. England; 2017;23:244–53.
153. Huh J, Kim KJ, Park SH, Park SH, Yang S-K, Ye BD, et al. Diffusion-Weighted
MR Enterography to Monitor Bowel Inflammation after Medical Therapy in Crohn's
Disease: A Prospective Longitudinal Study. Korean J Radiol. Korea (South); 2017;
18:162–72.
154. Pendse DA, Makanyanga JC, Plumb AA, Bhatnagar G, Atkinson D, Rodriguez-
Justo M, et al. Diffusion-weighted imaging for evaluating inflammatory activity in
Crohn's disease: comparison with histopathology, conventional MRI activity scores,
and faecal calprotectin. Abdom Radiol (NY). 2017;42:115–23.
155. Rozendorn N, Amitai MM, Eliakim RA, Kopylov U, Klang E. A review of magnetic
resonance enterography-based indices for quantification of Crohn's disease
inflammation. Therap Adv Gastroenterol. 2018;11:175628481876595.
156. Lichtenstein GR, Loftus E V, Isaacs KL, Regueiro MD, Gerson LB, Sands BE.
ACG Clinical Guideline: Management of Crohn's Disease in Adults. Am J
Gastroenterol. 2018;113:481–517.
157. Deepak P, Bruining DH. Update on the Medical Management of Crohn's Disease.
Curr Gastroenterol Rep. United States; 2015;17:41.
158. Gonczi L, Bessissow T, Lakatos PL. Disease monitoring strategies in inflammatory
bowel diseases: What do we mean by "tight control"? World J Gastroenterol. 2019;
25:6172–89.
159. Torres J, Bonovas S, Doherty G, Kucharzik T, Gisbert JP, Raine T, et al. ECCO
Guidelines on Therapeutics in Crohn's Disease: Medical Treatment. J Crohns
Colitis. England; 2020;14:4–22.
160. Ordas I, Feagan BG, Sandborn WJ. Early use of immunosuppressives or TNF
antagonists for the treatment of Crohn's disease: time for a change. Gut. England;
2011;60:1754–63.
161. Sandborn WJ. Crohn's disease evaluation and treatment: clinical decision tool.
Gastroenterology. United States; 2014;147:702–5.
162. Terdiman JP, Gruss CB, Heidelbaugh JJ, Sultan S, Falck-Ytter YT. American
Gastroenterological Association Institute guideline on the use of thiopurines, metho-
trexate, and anti-TNF-alpha biologic drugs for the induction and maintenance of
remission in inflammatory Crohn's disease. Gastroenterology. United States; 2013;
145:1459–63.
163. Colombel JF, Sandborn WJ, Reinisch W, Mantzaris GJ, Kornbluth A, Rachmilewitz
D, et al. Infliximab, azathioprine, or combination therapy for Crohn's disease. N
Engl J Med. United States; 2010;362:1383–95.
164. Irvine EJ. Development and Subsequent Refinement of the Inflammatory Bowel
Disease Questionnaire: A Quality-of-Life Instrument for Adult Patients with Inflam-
matory Bowel Disease. J Pediatr Gastroenterol Nutr. 1999; S23-S27.
165. Pallis AG, Vlachonikolis IG, Mouzas IA. Assessing health-related quality of life in
patients with inflammatory bowel disease, in Crete, Greece. BMC Gastroenterol.
2002;2:1
78
166. Harvey RF, Bradshaw JM. A simple index of Crohn's-disease activity. Elsevier;
1980;315:514.
167. Sandborn J, Feagan BG, Hanauer SB, Lochs H, Modigliani R, Present DH, et al. A
Review of Activity Indices and Efficacy Endpoints for Clinical Trials of Medical
Therapy in Adults With Crohn's Disease. Gastroenterology. 2002;512–30.
168. Steward MJ, Punwani S, Proctor I, Adjei-Gyamfi Y, Chatterjee F, Bloom S, et al.
Non-perforating small bowel Crohn's disease assessed by MRI enterography:
Derivation and histopathological validation of an MR-based activity index. Eur J
Radiol. Elsevier Ireland Ltd; 2012;81:2080–8.
169. Straksyte V, Kiudelis G, Gineikiene I, Janciauskas D, Basevicius A, Lukosevicius S,
et al. Lemann Index for Assessment of Crohn's Disease: Correlation with the Quality
of Life, Endoscopic Disease Activity, Magnetic Resonance Index of Activity and C-
Reactive Protein. Open Med (Warsaw, Poland). 2019;14:785–91.
170. Pita I, Magro F. Advanced imaging techniques for small bowel Crohn's disease:
what does the future hold? Therap Adv Gastroenterol. SAGE Publications Ltd STM;
2018;11:1756283X18757185.
171. D'Incà R, Caccaro R. Measuring disease activity in Crohn's disease: what is
currently available to the clinician. Clin Exp Gastroenterol. 2014;7:151-161.
172. Rimola J, Alvarez-Cofiño A, Pérez-Jeldres T, Ayuso C, Alfaro I, Rodríguez S, et al.
Comparison of three magnetic resonance enterography indices for grading activity in
Crohn’s disease. J Gastroenterol. 2017;52:585—593.
173. Obuchowski NA, Blackmore CC, Karlik S, Reinhold C. Fundamentals of clinical
research for radiologists. American Journal of Roentgenology. 2005;184:364–372.
174. Cibor D, Szczeklik K, Mach T, Owczarek D. Levels of tissue factor pathway
inhibitor in patients with inflammatory bowel disease. Polish Arch Intern Med.
Poland; 2019;129:253–8.
175. Eder P, Katulska K, Lykowska-Szuber L, Stawczyk-Eder K, Krela-Kaźmierczak I,
Linke K. Simple Enterographic Activity Score for Crohn's Disease: comparison with
endoscopic, biochemical, and clinical findings. Pol Arch Med Wewn. Poland; 2013;
123:378–85.
176. Khater NH, Fahmy HS, Ali HI. Value of MR enterography in assessment of Crohn's
disease: Correlation with capsule endoscopy and colonoscopy. Egypt J Radiol Nucl
Med. Egyptian Society of Radiology and Nuclear Medicine; 2017;48:51–60.
177. Rieder F, Zimmermann EM, Remzi FH, Sandborn WJ. Crohn's disease complicated
by strictures: a systematic review. Gut. BMJ Publishing Group; 2013;62:1072–84.
178. Lunder AK, Jahnsen J, Bakstad LT, Borthne A, Hov JR, Vatn M, et al. Bowel
Damage in Patients With Long-term Crohn's Disease, Assessed by Magnetic
Resonance Enterography and the Lemann Index. Clin Gastroenterol Hepatol.
Elsevier; 2018; 16:75-82.e5.
179. Ilias A, Lovasz BD, Gonczi L, Kurti Z, Vegh Z, Sumegi LD, et al. Optimizing
Patient Management in Crohn's Disease in a Tertiary Referral Center: the Impact of
Fast-Track MRI on Patient Management and Outcomes. J Gastrointestin Liver Dis.
Romania; 2018;27:391–7.
180. Schill G, Iesalnieks I, Haimerl M, Müller-Wille R, Dendl L-M, Wiggermann P, et al.
Assessment of Disease Behavior in Patients with Crohn's Disease by MR
Enterography. Inflamm Bowel Dis. 2013;19:983–90.
181. Rieder F, Bettenworth D, Ma C, Parker CE, Williamson LA, Nelson SA, et al. An
expert consensus to standardise definitions, diagnosis and treatment targets for anti-
79
fibrotic stricture therapies in Crohn's disease. Aliment Pharmacol Ther.
2018;48:347–57.
182. Schulberg JD, Wright EK, Holt BA, Sutherland TR, Hume SJ, Hamilton AL, et al.
Magnetic resonance enterography for predicting the clinical course of Crohn's
disease strictures. J Gastroenterol Hepatol. Australia; 2020;35:980–7.
183. Ziech MLW, Bipat S, Roelofs JJTH, Nio CY, Mearadji B, Van Doorn S, et al.
Retrospective comparison of magnetic resonance imaging features and
histopathology in Crohn's disease patients. Eur J Radiol. Elsevier Ireland Ltd;
2011;80:e299–305.
184. Zappa M, Stefanescu C, Cazals-Hatem D, Bretagnol F, Deschamps L, Attar A, et al.
Which magnetic resonance imaging findings accurately evaluate inflammation in
small bowel Crohn's disease? A retrospective comparison with surgical pathologic
analysis. Inflamm Bowel Dis. 2011;17:984–93.
185. Gucer FI, Senturk S, Ozkanli S, Yilmabasar MG, Koroglu GA, Acar M. Evaluation
of Crohn's disease activity by MR enterography: Derivation and histopathological
comparison of an MR-based activity index. Eur J Radiol. Ireland; 2015;84:1829–34.
186. Quaia E, Sozzi M, Gennari AG, Pontello M, Angileri R, Cova MA. Impact of
gadolinium-based contrast agent in the assessment of Crohn's disease activity: Is
contrast agent injection necessary? J Magn Reson Imaging. 2016;43:688–97.
187. Tielbeek JAW, Ziech MLW, Li Z, Lavini C, Bipat S, Bemelman WA, et al.
Evaluation of conventional, dynamic contrast enhanced and diffusion weighted MRI
for quantitative Crohn's disease assessment with histopathology of surgical
specimens. Eur Radiol. 2014;24:619–29.
188. Qi F, Jun S, Qi QY, Chen PJ, Chuan GX, Jiong Z, et al. Utility of the diffusion-
weighted imaging for activity evaluation in Crohn's disease patients underwent
magnetic resonance enterography. BMC Gastroenterol. 2015;15:12.
189. Ippolito D, Lombardi S, Talei Franzesi C, Drago SG, Querques G, Casiraghi A, et
al. Dynamic Contrast-Enhanced MR with Quantitative Perfusion Analysis of Small
Bowel in Vascular Assessment between Inflammatory and Fibrotic Lesions in
Crohn's Disease: A Feasibility Study. Contrast Media Mol Imaging. England;
2019;2019: 1767620.
190. Sakurai T, Katsuno T, Saito K, Yoshihama S, Nakagawa T, Koseki H, et al.
Mesenteric findings of CT enterography are well correlated with the endoscopic
severity of Crohn's disease. Eur J Radiol. Ireland; 2017;89:242–8.
191. Röttgen R, Grandke T, Grieser C, Lehmkuhl L, Hamm B, Lüdemann L.
Measurement of MRI enhancement kinetics for evaluation of inflammatory activity
in Crohn's disease. Clin Imaging. Elsevier; 2010;34:29–35.
192. D'Amico F, Chateau T, Laurent V, Danese S, Peyrin-Biroulet L. Which MRI Score
and Technique Should Be Used for Assessing Crohn's Disease Activity? J Clin Med.
Switzerland; 2020;9.
193. Knowles SR, Keefer L, Wilding H, Hewitt C, Graff LA, Mikocka-Walus A. Quality
of Life in Inflammatory Bowel Disease: A Systematic Review and Meta-analyses—
Part II. Inflamm Bowel Dis. 2018;24:966–76.
194. dit Prevost C, Azahaf M, Nachury M, Branche J, Gerard R, Wils P, et al. Bowel
damage and disability in Crohn's disease: a prospective study in a tertiary referral
centre of the Lémann Index and Inflammatory Bowel Disease Disability Index.
Aliment Pharmacol Ther. 2020;51:889–98.
195. Fiorino G, Morin M, Bonovas S, Bonifacio C, Spinelli A, Germain A, et al.
Prevalence of Bowel Damage Assessed by Cross-Sectional Imaging in Early Crohn's
80
Disease and its Impact on Disease Outcome. J Crohns Colitis. England; 2017;
11:274–80.
196. Jauregui-Amezaga A, Cabezón R, Ramírez-Morros A, España C, Rimola J, Bru C,
et al. Intraperitoneal Administration of Autologous Tolerogenic Dendritic Cells for
Refractory Crohn’s Disease: A Phase I Study. J Crohns Colitis. 2015;9:1071–8.
197. Coimbra AJF, Rimola J, O'Byrne S, Lu TT, Bengtsson T, De Crespigny A, et al.
Magnetic resonance enterography is feasible and reliable in multicenter clinical
trials in patients with Crohn's disease, and may help select subjects with active
inflammation. Aliment Pharmacol Ther. 2016;43:61–72.
198. Menys A, Puylaert C, Tutein Nolthenius CE, Plumb AA, Makanyanga J, Tielbeek J,
et al. Quantified Terminal Ileal Motility during MR Enterography as a Biomarker of
Crohn Disease Activity: Prospective Multi-Institution Study. Radiology. United
States; 2018;289:428–35.
199. Williet N, Jardin S, Roblin X. The Simplified Magnetic Resonance Index of Activity
(MARIA) for Crohn's Disease Is Strongly Correlated With the MARIA and
Clermont Score: An External Validation. Gastroenterology. United States; 2020. p.
282–3.
200. Buisson A, Pereira B, Goutte M, Reymond M, Allimant C, Obritin-Guilhen H, et al.
Magnetic resonance index of activity (MaRIA) and Clermont score are highly and
equally effective MRI indices in detecting mucosal healing in Crohn's disease. Dig
liver Dis Off J Ital Soc Gastroenterol Ital Assoc Study Liver. Netherlands; 2017;
49:1211–7.
201. Li X-H, Sun C-H, Mao R, Zhang Z-W, Jiang X-S, Pui MH, et al. Assessment of
Activity of Crohn Disease by Diffusion-Weighted Magnetic Resonance Imaging.
Medicine (Baltimore). United States; 2015;94:e1819.
202. Neubauer H, Pabst T, Dick A, Machann W, Evangelista L, Wirth C, et al. Small-
bowel MRI in children and young adults with Crohn disease: retrospective head-to-
head comparison of contrast-enhanced and diffusion-weighted MRI. Pediatr Radiol.
Germany; 2013;43:103–14.
203. Oto A, Kayhan A, Williams JTB, Fan X, Yun L, Arkani S, et al. Active Crohn's
disease in the small bowel: evaluation by diffusion weighted imaging and
quantitative dynamic contrast enhanced MR imaging. J Magn Reson Imaging.
United States; 2011;33:615–24.
204. Seo N, Park SH, Kim K-J, Kang B-K, Lee Y, Yang S-K, et al. MR Enterography for
the Evaluation of Small-Bowel Inflammation in Crohn Disease by Using Diffusion-
weighted Imaging without Intravenous Contrast Material: A Prospective
Noninferiority Study. Radiology. United States; 2016;278:762–72.
205. Choi SH, Kim KW, Park SH, Lee JY, Kim K-J. Diffusion-weighted Magnetic
Resonance Enterography for Evaluating Bowel Inflammation in Crohn's Disease: A
Systematic Review and Meta-analysis. Inflamm Bowel Dis. 2015;22:669–79.
206. Yu H, Shen Y-Q, Tan F-Q, Zhou Z-L, Li Z, Hu D-Y, et al. Quantitative diffusion-
weighted magnetic resonance enterography in ileal Crohn's disease: A systematic
analysis of intra and interobserver reproducibility. World J Gastroenterol.
2019;25:3619–33.
207. Lin J-F, Chen J-M, Zuo J-H, Yu A, Xiao Z-J, Deng F-H, et al. Meta-analysis: fecal
calprotectin for assessment of inflammatory bowel disease activity. Inflamm Bowel
Dis. England; 2014;20:1407–15.
81
208. von Roon AC, Karamountzos L, Purkayastha S, Reese GE, Darzi AW, Teare JP, et
al. Diagnostic precision of fecal calprotectin for inflammatory bowel disease and
colorectal malignancy. Am J Gastroenterol. United States; 2007;102:803–13.
209. Sipponen T, Savilahti E, Kolho K-L, Nuutinen H, Turunen U, Farkkila M. Crohn's
disease activity assessed by fecal calprotectin and lactoferrin: correlation with
Crohn's disease activity index and endoscopic findings. Inflamm Bowel Dis.
England; 2008; 14:40–6.
210. D'Haens G, Ferrante M, Vermeire S, Baert F, Noman M, Moortgat L, et al. Fecal
calprotectin is a surrogate marker for endoscopic lesions in inflammatory bowel
disease. Inflamm Bowel Dis. England; 2012;18:2218–24.
211. af Bjorkesten C-G, Nieminen U, Turunen U, Arkkila P, Sipponen T, Farkkila M.
Surrogate markers and clinical indices, alone or combined, as indicators for endo-
scopic remission in anti-TNF-treated luminal Crohn's disease. Scand J
Gastroenterol. England; 2012;47:528–37.
212. Jensen MD, Kjeldsen J, Nathan T. Fecal calprotectin is equally sensitive in Crohn's
disease affecting the small bowel and colon. Scand J Gastroenterol. England;
2011;46:694–700.
213. Schoepfer AM, Beglinger C, Straumann A, Trummler M, Vavricka SR, Bruegger
LE, et al. Fecal calprotectin correlates more closely with the Simple Endoscopic
Score for Crohn's disease (SES-CD) than CRP, blood leukocytes, and the CDAI.
Am J Gastroenterol. United States; 2010;105:162–9.
214. Goutorbe F, Goutte M, Minet-Quinard R, Boucher A-L, Pereira B, Bommelaer G, et
al. Endoscopic Factors Influencing Fecal Calprotectin Value in Crohn's Disease. J
Crohns Colitis. England; 2015;9:1113–9.
215. Somwaru AS, Khanijow V, Katabathina VS. Magnetic resonance enterography,
colonoscopy, and fecal calprotectin correlate in colonic Crohn's disease. BMC
Gastroenterol. 2019;19:210.
82
LIST OF PUBLICATIONS
Publication related to the results of the dissertation
1. Strakšytė V, Gineikienė I, Kiudelis G, Basevičius A, Puidokaitė E.
Uždegiminių žarnyno ligų diagnostikos naujovės. Medicinos teorija ir
praktika. 2013, t. 20, Nr. 3. p. 238-244.
2. Strakšytė V, Gineikienė I, Kiudelis G, Basevičius A, Puidokaitė E,
Valantienė I, Kupčinskas L. Magnetinio rezonanso enterokolonografijos
reikšmė diagnozuojant uždegimines žarnyno ligas. Sveikatos mokslai.
2014, t. 24, Nr. 3(94). p. 66-71.
3. Strakšytė V, Gineikienė I, Mikšaitė J, Kiudelis G, Basevičius A. MRT
difuzijos reikšmė diagnozuojant Krono ligą. Medicinos teorija ir prakti-
ka. 2015, t. 21, Nr. 4.1. p. 571-575.
4. Demenytė I, Strakšytė V, Gineikienė I, Basevičius A. Magnetinio rezo-
nanso enterokolonografijos pritaikymo galimybės žarnyno ligų diag-
nostikoje: literatūros apžvalga. Medicinos teorija ir praktika. 2015, t.
21, Nr. 4.1. p. 566-570.
5. Straksyte V, Kiudelis G, Gineikiene I, Janciauskas D, Basevicius A,
Lukosevicius S, Kupcinskas L. Lemann Index for Assessment of
Crohn's Disease: Correlation with the Quality of Life, Endoscopic
Disease Activity, Magnetic Resonance Index of Activity and C-
Reactive Protein. Open Med (Wars). 2019 Nov 7;14:785-791.
6. Strakšytė V, Kiudelis G, Gineikienė I, Basevičius A, Lukoševičius S,
Kupčinskas L. Diffusion-weighted magnetic resonance enterocolono-
graphy in assessing Crohn's disease activity. Pol Arch Intern Med. 2020
Other publications
1. Strakšytė V, Gineikienė I, Kiudelis G, Basevičius A, Puidokaitė E,
Valantienė I. Plonųjų žarnų piktybiniai navikai ir jų radiologinės diag-
nostikos galimybės. Sveikatos mokslai. 2013, t. 23, Nr. 4. p. 160-165.
2. Vilčinskas M, Gineikienė I, Švagždys S, Strakšytė V. The Diagnostic
value of free intraperitoneal air amount while diagnosing gastro-
intestinal tract complications after intra-abdominal operations. Radio-
logy update. 2018, vol. 2(3). p. 21-30.
3. Utakienė E, Strakšytė V, Gineikienė V, Švagždys S, Jančiauskas D,
Kiudelis G, Basevičius A, Vilčinskas M. Intestinal pseudo-obstruction:
adult Hirschsprung’s disease and Ogilvie’s syndrome. Clinical case
report. Radiology update. 2018, vol. 2(3). p. 1-12.
83
LIST OF SCIENTIFIC CONFERENCES
The results of the dissertation were presented in the scientific
conferences:
1. 1st Baltic Congress of Gastroenterology, Kaunas, Lithuania, January
31 – February 1, 2014. Poster presentation. “Magnetic resonance
enterocolonography in diagnosing inflammatory bowel disease.”
2. 7th
Baltic Congress of radiology – BCR: 4–6 October 2018, Kaunas,
Lithuania. Oral presentation. "MRI differential diagnosis of inflamma-
tory bowel disease."
3. 7th
Baltic Congress of radiology – BCR: 4–6 October 2018, Kaunas,
Lithuania. Poster presentation. "Magnetic resonance enterocolono-
graphy comparison with Crohn's disease activity index in the evaluation
of Crohn's disease."
4. 7th
Baltic Congress of radiology – BCR: 4–6 October 2018, Kaunas,
Lithuania. Poster presentation. "Comparison of magnetic resonance
enterocolonography indices with clinical activity in Crohn’s disease."
5. 15th
Congress of ECCO "Inflammatory Bowel Diseases." February 12–
15, 2020, Vienna, Austria. Poster presentation. Lemann Index for
Assessment of Crohn's disease association with the quality of life,
endoscopic disease activity and magnetic resonance indices of activity.
6. 15th
Congress of ECCO "Inflammatory Bowel Diseases." February 12–
15, 2020, Vienna, Austria. Poster presentation. Value of Diffusion-
weighted magnetic resonance enterocolonography for assessing Crohn's
disease activity.
7. ESGAR 2020, May 19–22. Virtual Congress. E- Poster. Fecal Calpro-
tectin for Assessment of Crohn’s Disease association with the Quality
of Life, Endoscopic Disease activity, and Magnetic Resonance Indices
of Activity.
8. UEG Week Virtual 2020, October 11–13. Virtual Congress. E-Poster.
Diffusion-weighted Magnetic Resonance Enterocolonography and
CDEIS in assessing Crohn's Disease Activity.

84
SUMMARY IN LITHUANIAN
Sutrumpinimai
anti-TNF antikūnai, nukreiptais prieš naviko nekrozės faktorių
CDEIS Krono ligos sunkumo endoskopijos indeksas
CRB C-reaktyvus baltymas
KT-EK kompiuterinės tomografijos enterokolonografija
IBDQ uždegiminės žarnyno ligos klausimynas
IK išmatų kalprotektinas
KL Krono liga
KLAI Krono ligos aktyvumo indeksas
LI Lemanno indeksas
MaRIA magnetinio rezonanso aktyvumo indeksas
MR-EK magnetinio rezonanso enterokolonografija
MRT magnetinio rezonanso tomografija
ĮVADAS
Krono liga (KL) yra lėtinė uždegiminė liga, kuri gali pažeisti bet kurią
virškinamojo kanalo dalį [1–2], bet dažniausiai uždegimo pokyčiai atsiranda
plonojoje žarnoje [3].
Vakarų Europos šalyse KL serga daugiau kaip 2,5 mln. žmonių. Besi-
vystančiose šalyse sergamumas šia liga nuolat didėja [4].
KL dažniausiai serga jauni žmonės, liga išlieka neišgydoma. Pacien-
tams visą gyvenimą reikalingi medikamentai, ligai progresuojant – operaci-
nis gydymas [5].
Pirmą kartą diagnozavus ligą dažniausiai yra nustatoma uždegiminė
KL, tačiau laikui bėgant ji progresuoja į spindį siaurinančią ar penetracinę
formas 3,8–7,5 proc. dažnumu per metus [6].
Aktyviosios KL simptomai, pavyzdžiui, pilvo skausmas ir viduriavimas
mažai susiję su ligos sunkumu ir pobūdžiu (uždegiminė, penetracinė ar
spindį siaurinanti) [7]. Be to, liga yra įvairialypė, apimanti kelis fenotipus,
kurie priklauso nuo susirgusiojo amžiaus, ligos lokalizacijos ir formos [8].
Ileokolonoskopija ir viršutinio virškinamojo kanalo endoskopija yra
laikomi aukso standartu gleivinės uždegimui įvertinti bei biopsijai paimti
[6]. Šiais metodais įvertinama tik proksimalioji plonosios žarnos dalis ir
galinė klubinė žarna (lot. ileum). Be to, endoskopijos tyrimu įvertinami tik
gleivinės pokyčiai, tuo tarpu gilesni žarnos sienelės sluoksniai ir pakitimai
už jos ribų (fistulės, abscesai) lieka neįvertinami [10]. Visai plonajai žarnai
įvertinti reikalingi kiti tyrimo metodai [10–11].
85
Magnetinio rezonanso tomografija (MRT) papildo endoskopinį tyrimą,
leidžia visiškai įvertinti plonąją žarną ir tarpvietę. Be to, šio tyrimo
privalumas yra tas, kad– įvertinama visa žarnos sienelė ir už jos ribų esantys
pokyčiai [14]. MRT svarbus nustatant ir patvirtinant KL diagnozę, kompli-
kacijas, vertinant ligos sunkumą ir atsaką į gydymą [11].
Pacientams, sergantiems KL, dėl ligos pobūdžio dažniausiai reikia
atlikti kartotinius vaizdo tyrimus. Magnetinio rezonanso enterokolonografija
(MR-EK) suteikia nekintamos ir kintamos trimatės informacijos apie ploną-
ją žarną, minkštųjų audinių kontrastą bei sukelia mažiau nepageidaujamų
požymių, palyginti su kompiuterinės tomografijos enterokolonografija [17].
Kartotinių vaizdo tyrimų poreikis padidėjo pradėjus taikyti intensyvesnį
gydymą, naudojant biologinius ar imunosupresinius vaistus.
Išmatų kalprotektinas (IK) yra naudingas KL diagnozės biologinis
žymuo, suteikiantis informacijos apie ligos atkrytį, gleivinės gijimą, poreikį
koreguoti gydymą [18]. Be to, IK yra naudingas tyrimo metodas, padedantis
atskirti pacientus, kuriems kolonoskopijos reikia dėl įtariamos KL [19].
KL aktyvumo vertinimas yra labai svarbus [20], siekiant objektyviai
įvertinti ligos klinikinius simptomus, eigą, sunkumą, išplitimą ir vertinant
atsaką į brangų gydymą [21]. Sukurta daug rodiklių ir indeksų ligos
aktyvumui ir sunkumui vertinti. Geriausiai žinomas gyvenimo kokybei
vertinti vartojamas uždegiminės žarnyno ligos klausimynas (IBDQ) [22],
endoskopinės ligos sunkumui vertinti – Krono ligos endoskopinis sunkumo
indeksas (CDEIS) [23] ir magnetinio rezonanso aktyvumo indeksas
(MaRIA) [24].
Naujas kiekybinis KL virškinamojo kanalo pažeidimo vertinimas –
Lemanno indeksas (LI) [25]. Jis sujungia visų virškinamojo kanalo segmentų
klinikinius, chirurginius, endoskopinius ir vaizdinius patologinius radinius į
vieną sudėtinį balą [27].
Dabartiniai gydymo būdai apima tradicinius medikamentus nuo uždegi-
mo, imunomoduliatorius, biologinius vaistus turinčius antikūnų, nukreiptais
prieš naviko nekrozės faktorių (anti-TNF) [4], antibiotikus ir operacinį
gydymą. Dėl modernaus gydymo pakito gydymo tikslas – nuo simptomų
kontrolės iki visiško gleivinės išgijimo. Todėl reikia periodiškai atlikti
vaizdo tyrimus, norint įvertinti atsaką į gydymą [6].
86
1. TIKSLAS IR UŽDAVINIAI
1.1. Tikslas
Tyrimo tikslas įvertinti MR-EK ir išmatų kalprotektino įtaką Krono
ligai diagnozuoti ir vertinti.
1.2. Uždaviniai
1. Įvertinti MR-EK prognozines vertes diagnozuojant KL.
2. Palyginti pacientų, sergančių KL, ir kontrolinės grupės MR-EK
požymius.
3. Nustatyti koreliaciją tarp MR-EK Krono ligos aktyvumo indeksų,
CDEIS, klinikinio aktyvumo rodiklių ir IBDQ.
4. Nustatyti tariamojo difuzijos koeficiento (ADC) ir difuzijos (DWI)
vertę, vertinant KL uždegimo aktyvumą.
5. Įvertinti išmatų kalprotektiną kaip neinvazinį KL aktyvumo žymenį
ir IK koreliaciją su įvairiais aktyvumo rodikliais.
1.3. Darbo naujumas
KL diagnostika išlieka – iššūkis dėl nespecifinių simptomų ir silpnos
koreliacijos tarp simptomų ir ligos aktyvumo [32].
Technologijų raida lėmė vaizdo tyrimo metodų pažangą, skatindama
vaizdo tyrimų poreikį pacientams, sergantiems KL. Tobulesnė MRT laikinė
ir erdvinė skiriamoji geba, atsiradusios enterinės kontrastinės medžiagos,
užtikrino kokybišką žarnyno ir perienterinių audinių vizualizavimą, atlie-
kant MR-EK tyrimą [33–36]. MR-EK laikomas plonosios žarnos KL nusta-
tymo aukso standartu [14].
Šiuolaikinė biologinė ir imunomoduliatorių terapija padidino poreikį
žarnyno vaizdo tyrimo metodų, kurie padeda diagnozuoti, nustatyti stadiją,
klasifikuoti ligą į uždegiminę, penetracinę, siaurinančią spindį, pasirinkti
tinkamą gydymo strategiją, vertinti atsaką į gydymą [37]. Iki 50 proc.
pacientų, sergančių aktyviąja plonosios žarnos liga, uždegimas gali aplenkti
galinę klubinės žarnos dalį arba būti intramuralinis ir likti nenustatytas
ileokolonoskopijos tyrimo metu [38].
MR-EK metodika pradėta taikyti 2013 m. Lietuvos sveikatos mokslų
universiteto ligoninėje Kauno klinikų Radiologijos klinikoje. Šis klinikinis
tyrimas yra pirmasis Lietuvoje, siekiant įvertinti KL išplitimą ir aktyvumą,
todėl jis turi didelę mokslinę ir praktinę vertę optimizuojant MRT naudo-
jimą KL diagnostikoje.
Atlikome pirmąjį perspektyvųjį MR-EK tyrimą Lietuvoje, kuris apima
daugiadalykį KL vertinimą. Įvertinome klinikinius KL aktyvumo rodiklius:
87
Krono ligos aktyvumo indeksą (KLAI) ir Harvey Bradshaw indeksą, taip pat
IBDQ – gyvenimo kokybę. Laboratorinius tyrimus: bendrąjį kraujo tyrimą,
CRB, IK. Endoskopijos metu atlikta biopsija ir MR-EK tyrimo – aktyvumo
indeksų apskaičiavimas
Be to, MR-EK protokolą pritaikėme klinikinėje praktikoje. Iki šiol buvo
nepriimtas rutininis KL pacientų tyrimas. Taip pat atlikome gyvenimo koky-
bės analizę, naudodami IBDQ anketas.
Iki šiol mes neradome jokio tyrimo, kuriame būtų ieškoma Krono ligos,
Lemanno indekso ir pacientų gyvenimo kokybės sąsajos.
2. METODIKA
2.1. Tyrimo eiga
Tyrimas atliktas Lietuvos sveikatos mokslų universiteto ligoninės
Kauno klinikų Gastroenterologijos ir Radiologijos klinikose 2013–2018
metais, gavus Kauno regioninio Biomedicinos tyrimų etikos komiteto
leidimą (BE-2-48).
Pacientai, kuriems įtariama ar patvirtinta KL, atitinkantys įtraukimo
kriterijus, neturintys neįtraukimo kriterijų bei pasirašę Informuoto asmens
sutikimo formą, buvo įtraukti į tyrimą. Surinkti demografiniai ir klinikiniai
tiriamųjų duomenys. Pacientams atlikti šie tyrimai: CRB, BKT. Pacientai
užpildė pateiktas anketas, atliekant endoskopiją, paimti mėginiai histologin-
iam ištyrimui, padarytas MR-EK, išmatų kalprotektino tyrimas (nuo 2014
metų). Tyrimo eiga pavaizduota 2.1 pav.
MR-EK tyrimas buvo atliekamas nevalgiusiems pacientams, kurių
žarnynas buvo išvalytas.
Pacientai vieną valandą prieš tyimą pradėdavo gerti 2,5 proc. manitolio
tirpalą 1500–2000 ml. Prieš pradedant tyrimą ir prieš leidžiant kontrastinę
medžiagą, kad būtų nuslopinta žarnų peristaltika pacientams buvo
sušvirkščiama 20 mg/ml N-butyl scopolamine (Buscopan, Boehringer,
Ingelheim, Vokietija). MR-EK protokolas sudarytas iš standartinių T1W ir
T2W, ir difuzijos sekų.
Visi MR-EK tyrimai atlikti 1,5 teslos MRT aparatu (Siemens Medical
Systems, Erlangen, Vokietija) naudojant gamintojo rites, pacientui gulint ant
pilvo.
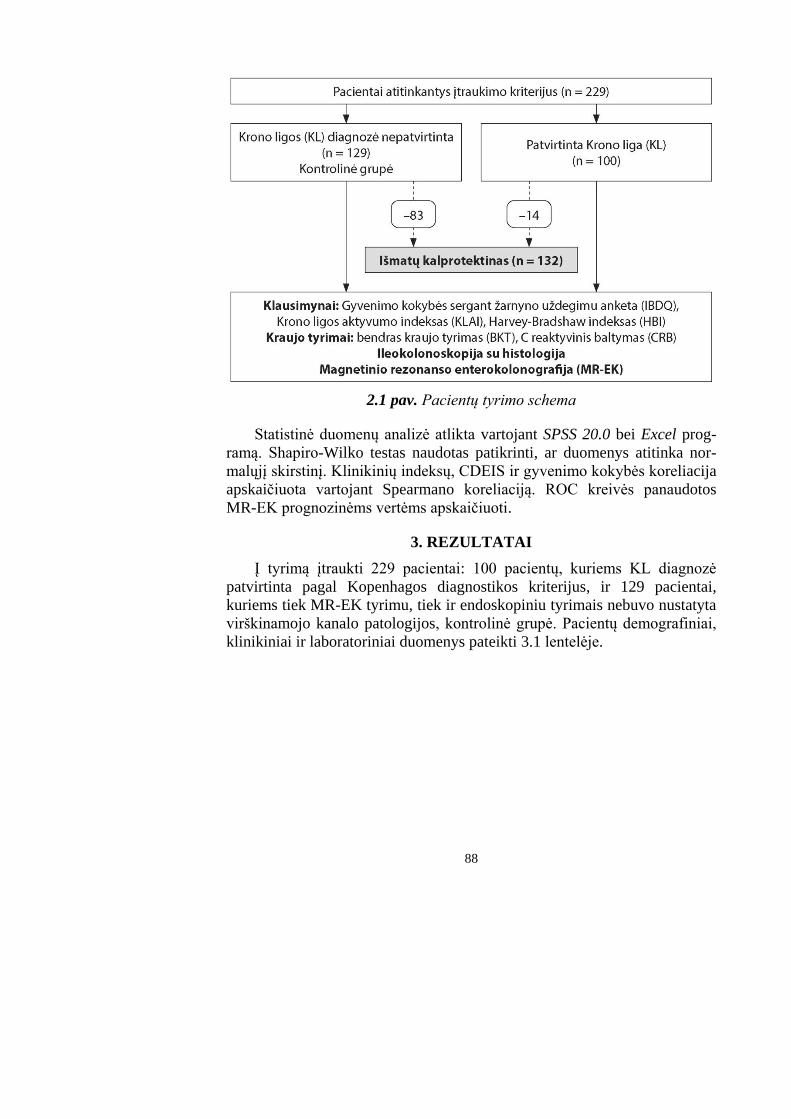
88
2.1 pav. Pacientų tyrimo schema
Statistinė duomenų analizė atlikta vartojant SPSS 20.0 bei Excel prog-
ramą. Shapiro-Wilko testas naudotas patikrinti, ar duomenys atitinka nor-
malųjį skirstinį. Klinikinių indeksų, CDEIS ir gyvenimo kokybės koreliacija
apskaičiuota vartojant Spearmano koreliaciją. ROC kreivės panaudotos
MR-EK prognozinėms vertėms apskaičiuoti.
3. REZULTATAI
Į tyrimą įtraukti 229 pacientai: 100 pacientų, kuriems KL diagnozė
patvirtinta pagal Kopenhagos diagnostikos kriterijus, ir 129 pacientai,
kuriems tiek MR-EK tyrimu, tiek ir endoskopiniu tyrimais nebuvo nustatyta
virškinamojo kanalo patologijos, kontrolinė grupė. Pacientų demografiniai,
klinikiniai ir laboratoriniai duomenys pateikti 3.1 lentelėje.
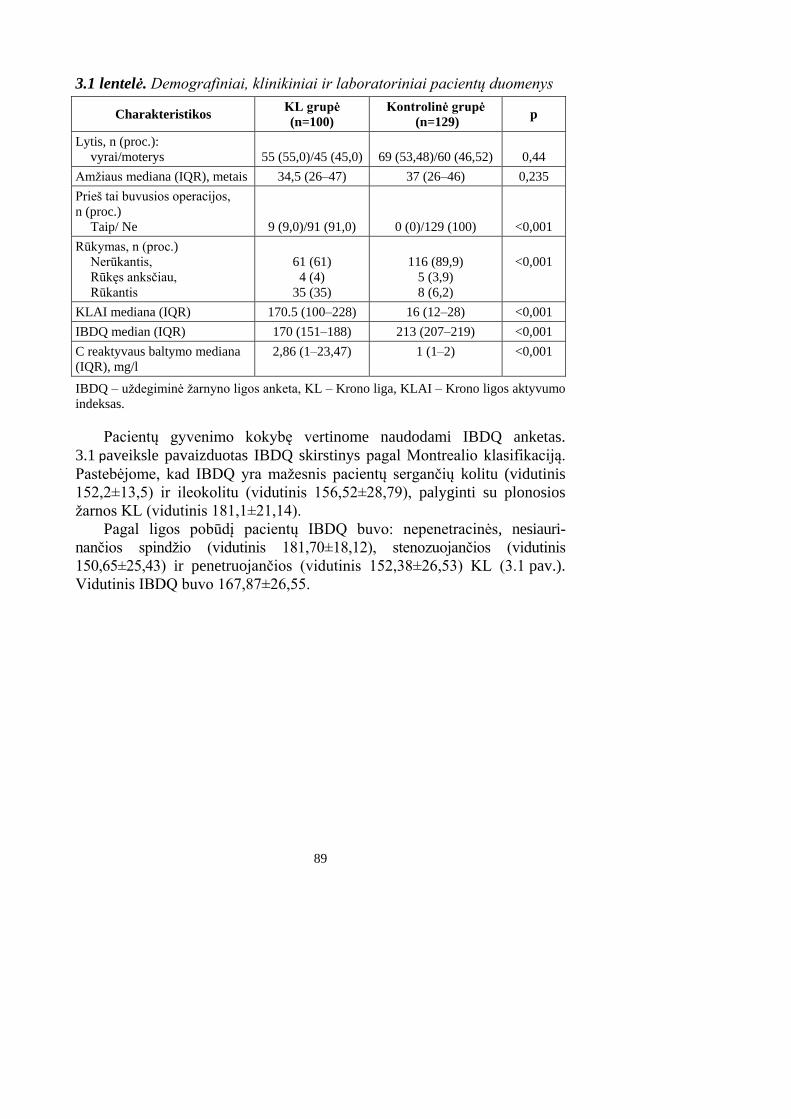
89
3.1 lentelė. Demografiniai, klinikiniai ir laboratoriniai pacientų duomenys
Charakteristikos KL grupė
(n=100)
Kontrolinė grupė
(n=129) p
Lytis, n (proc.):
vyrai/moterys
55 (55,0)/45 (45,0)
69 (53,48)/60 (46,52)
0,44
Amžiaus mediana (IQR), metais 34,5 (26–47) 37 (26–46) 0,235
Prieš tai buvusios operacijos,
n (proc.)
Taip/ Ne
9 (9,0)/91 (91,0)
0 (0)/129 (100)
<0,001
Rūkymas, n (proc.)
Nerūkantis,
Rūkęs anksčiau,
Rūkantis
61 (61)
4 (4)
35 (35)
116 (89,9)
5 (3,9)
8 (6,2)
<0,001
KLAI mediana (IQR) 170.5 (100–228) 16 (12–28) <0,001
IBDQ median (IQR) 170 (151–188) 213 (207–219) <0,001
C reaktyvaus baltymo mediana
(IQR), mg/l
2,86 (1–23,47) 1 (1–2) <0,001
IBDQ – uždegiminė žarnyno ligos anketa, KL – Krono liga, KLAI – Krono ligos aktyvumo
indeksas.
Pacientų gyvenimo kokybę vertinome naudodami IBDQ anketas.
3.1 paveiksle pavaizduotas IBDQ skirstinys pagal Montrealio klasifikaciją.
Pastebėjome, kad IBDQ yra mažesnis pacientų sergančių kolitu (vidutinis
152,2±13,5) ir ileokolitu (vidutinis 156,52±28,79), palyginti su plonosios
žarnos KL (vidutinis 181,1±21,14).
Pagal ligos pobūdį pacientų IBDQ buvo: nepenetracinės, nesiauri-
nančios spindžio (vidutinis 181,70±18,12), stenozuojančios (vidutinis
150,65±25,43) ir penetruojančios (vidutinis 152,38±26,53) KL (3.1 pav.).
Vidutinis IBDQ buvo 167,87±26,55.
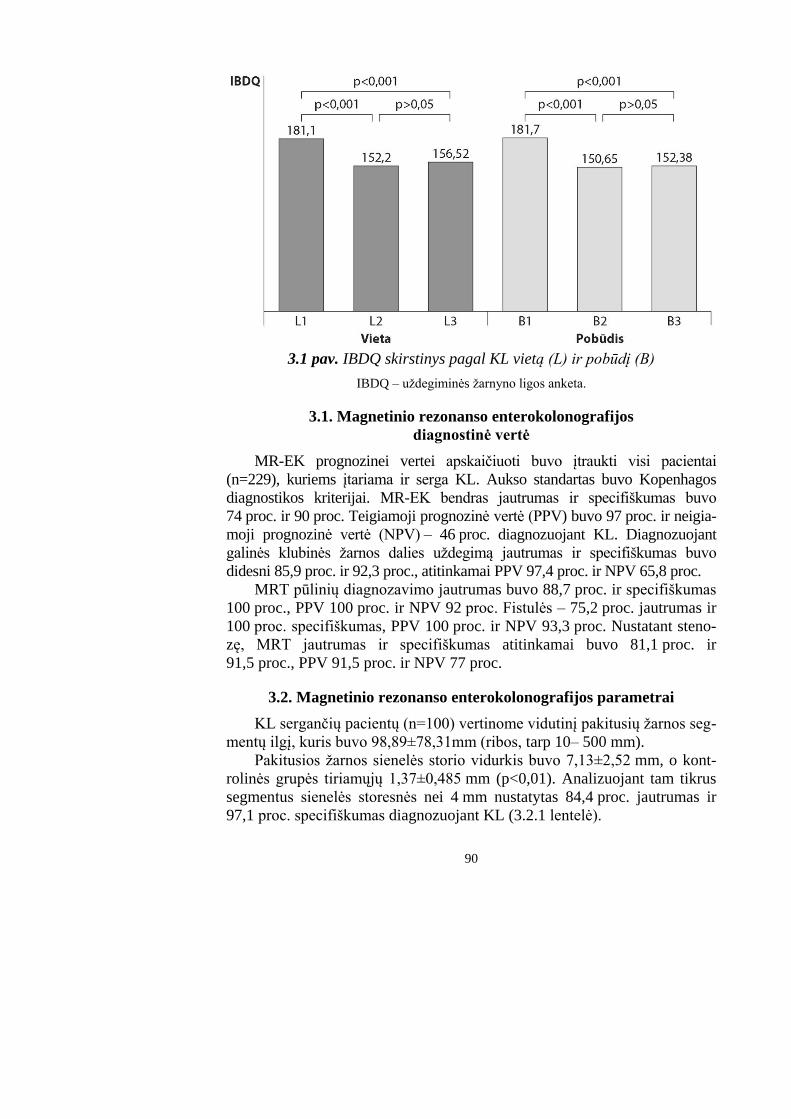
90
3.1 pav. IBDQ skirstinys pagal KL vietą (L) ir pobūdį (B)
IBDQ – uždegiminės žarnyno ligos anketa.
3.1. Magnetinio rezonanso enterokolonografijos
diagnostinė vertė
MR-EK prognozinei vertei apskaičiuoti buvo įtraukti visi pacientai
(n=229), kuriems įtariama ir serga KL. Aukso standartas buvo Kopenhagos
diagnostikos kriterijai. MR-EK bendras jautrumas ir specifiškumas buvo
74 proc. ir 90 proc. Teigiamoji prognozinė vertė (PPV) buvo 97 proc. ir neigia-
moji prognozinė vertė (NPV) – 46 proc. diagnozuojant KL. Diagnozuojant
galinės klubinės žarnos dalies uždegimą jautrumas ir specifiškumas buvo
didesni 85,9 proc. ir 92,3 proc., atitinkamai PPV 97,4 proc. ir NPV 65,8 proc.
MRT pūlinių diagnozavimo jautrumas buvo 88,7 proc. ir specifiškumas
100 proc., PPV 100 proc. ir NPV 92 proc. Fistulės – 75,2 proc. jautrumas ir
100 proc. specifiškumas, PPV 100 proc. ir NPV 93,3 proc. Nustatant steno-
zę, MRT jautrumas ir specifiškumas atitinkamai buvo 81,1 proc. ir
91,5 proc., PPV 91,5 proc. ir NPV 77 proc.
3.2. Magnetinio rezonanso enterokolonografijos parametrai
KL sergančių pacientų (n=100) vertinome vidutinį pakitusių žarnos seg-
mentų ilgį, kuris buvo 98,89±78,31mm (ribos, tarp 10– 500 mm).
Pakitusios žarnos sienelės storio vidurkis buvo 7,13±2,52 mm, o kont-
rolinės grupės tiriamųjų 1,37±0,485 mm (p<0,01). Analizuojant tam tikrus
segmentus sienelės storesnės nei 4 mm nustatytas 84,4 proc. jautrumas ir
97,1 proc. specifiškumas diagnozuojant KL (3.2.1 lentelė).
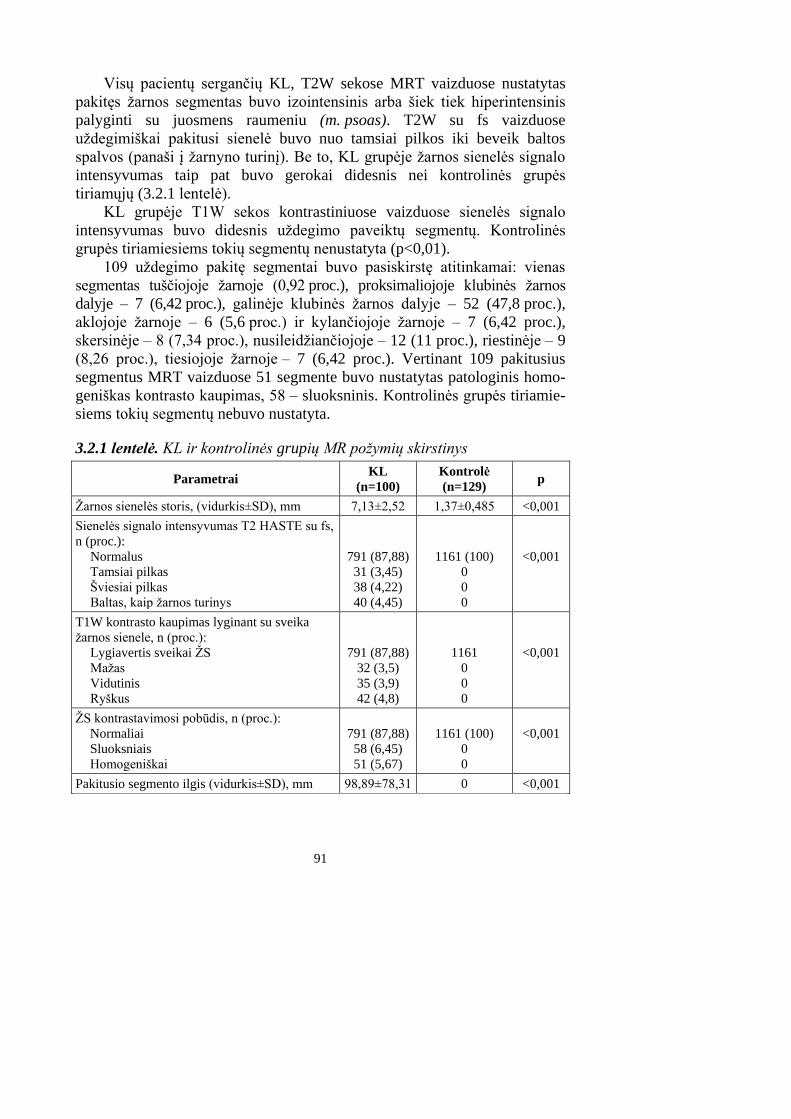
91
Visų pacientų sergančių KL, T2W sekose MRT vaizduose nustatytas
pakitęs žarnos segmentas buvo izointensinis arba šiek tiek hiperintensinis
palyginti su juosmens raumeniu (m. psoas). T2W su fs vaizduose
uždegimiškai pakitusi sienelė buvo nuo tamsiai pilkos iki beveik baltos
spalvos (panaši į žarnyno turinį). Be to, KL grupėje žarnos sienelės signalo
intensyvumas taip pat buvo gerokai didesnis nei kontrolinės grupės
tiriamųjų (3.2.1 lentelė).
KL grupėje T1W sekos kontrastiniuose vaizduose sienelės signalo
intensyvumas buvo didesnis uždegimo paveiktų segmentų. Kontrolinės
grupės tiriamiesiems tokių segmentų nenustatyta (p<0,01).
109 uždegimo pakitę segmentai buvo pasiskirstę atitinkamai: vienas
segmentas tuščiojoje žarnoje (0,92 proc.), proksimaliojoje klubinės žarnos
dalyje – 7 (6,42 proc.), galinėje klubinės žarnos dalyje – 52 (47,8 proc.),
aklojoje žarnoje – 6 (5,6 proc.) ir kylančiojoje žarnoje – 7 (6,42 proc.),
skersinėje – 8 (7,34 proc.), nusileidžiančiojoje – 12 (11 proc.), riestinėje – 9
(8,26 proc.), tiesiojoje žarnoje – 7 (6,42 proc.). Vertinant 109 pakitusius
segmentus MRT vaizduose 51 segmente buvo nustatytas patologinis homo-
geniškas kontrasto kaupimas, 58 – sluoksninis. Kontrolinės grupės tiriamie-
siems tokių segmentų nebuvo nustatyta.
3.2.1 lentelė. KL ir kontrolinės grupių MR požymių skirstinys
Parametrai KL
(n=100)
Kontrolė
(n=129) p
Žarnos sienelės storis, (vidurkis±SD), mm 7,13±2,52 1,37±0,485 <0,001
Sienelės signalo intensyvumas T2 HASTE su fs,
n (proc.):
Normalus
Tamsiai pilkas
Šviesiai pilkas
Baltas, kaip žarnos turinys
791 (87,88)
31 (3,45)
38 (4,22)
40 (4,45)
1161 (100)
0
0
0
<0,001
T1W kontrasto kaupimas lyginant su sveika
žarnos sienele, n (proc.):
Lygiavertis sveikai ŽS
Mažas
Vidutinis
Ryškus
791 (87,88)
32 (3,5)
35 (3,9)
42 (4,8)
1161
0
0
0
<0,001
ŽS kontrastavimosi pobūdis, n (proc.):
Normaliai
Sluoksniais
Homogeniškai
791 (87,88)
58 (6,45)
51 (5,67)
1161 (100)
0
0
<0,001
Pakitusio segmento ilgis (vidurkis±SD), mm 98,89±78,31 0 <0,001
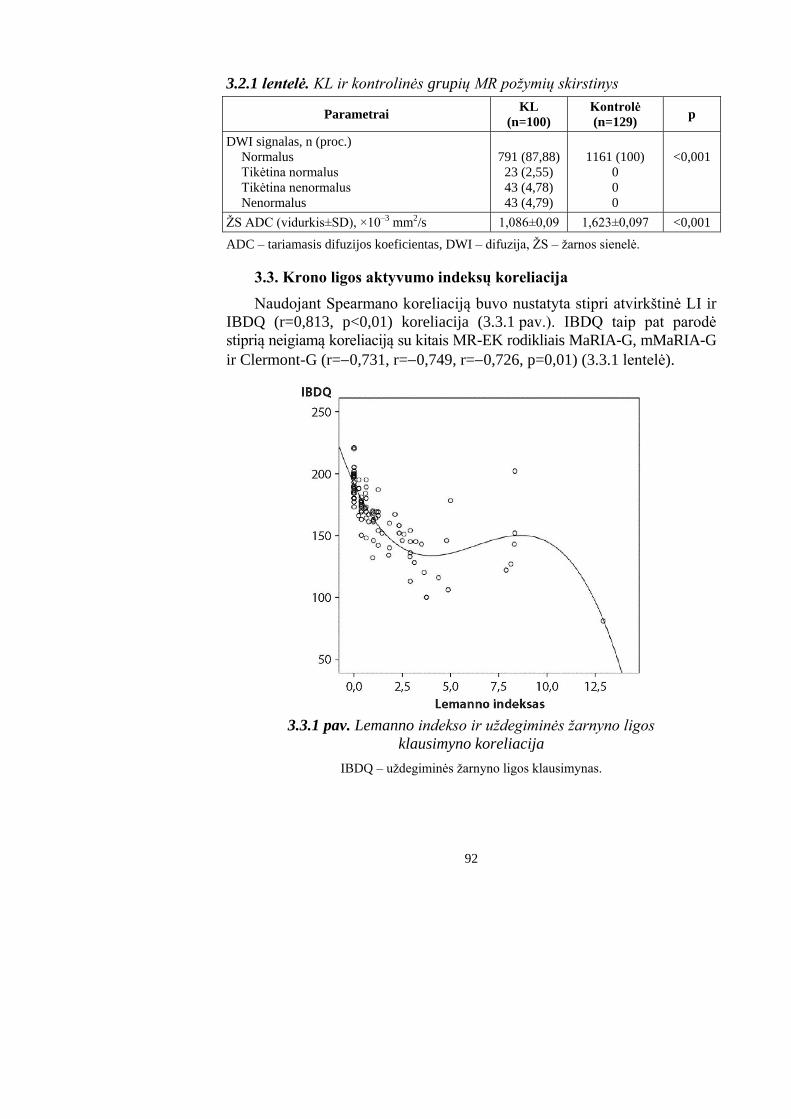
92
3.2.1 lentelė. KL ir kontrolinės grupių MR požymių skirstinys
Parametrai KL
(n=100)
Kontrolė
(n=129) p
DWI signalas, n (proc.)
Normalus
Tikėtina normalus
Tikėtina nenormalus
Nenormalus
791 (87,88)
23 (2,55)
43 (4,78)
43 (4,79)
1161 (100)
0
0
0
<0,001
ŽS ADC (vidurkis±SD), ×10–3 mm2/s 1,086±0,09 1,623±0,097 <0,001
ADC – tariamasis difuzijos koeficientas, DWI – difuzija, ŽS – žarnos sienelė.
3.3. Krono ligos aktyvumo indeksų koreliacija
Naudojant Spearmano koreliaciją buvo nustatyta stipri atvirkštinė LI ir
IBDQ (r=0,813, p<0,01) koreliacija (3.3.1 pav.). IBDQ taip pat parodė
stiprią neigiamą koreliaciją su kitais MR-EK rodikliais MaRIA-G, mMaRIA-G
ir Clermont-G (r=0,731, r=0,749, r=0,726, p=0,01) (3.3.1 lentelė).
3.3.1 pav. Lemanno indekso ir uždegiminės žarnyno ligos
klausimyno koreliacija
IBDQ – uždegiminės žarnyno ligos klausimynas.
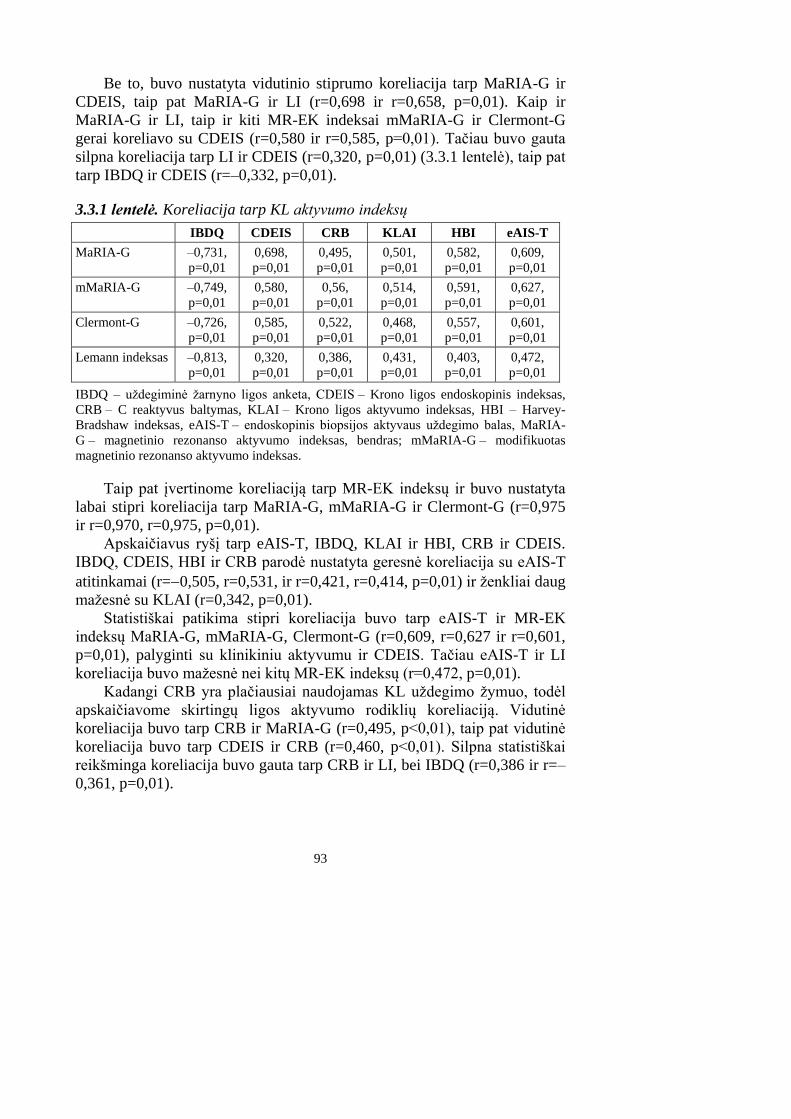
93
Be to, buvo nustatyta vidutinio stiprumo koreliacija tarp MaRIA-G ir
CDEIS, taip pat MaRIA-G ir LI (r=0,698 ir r=0,658, p=0,01). Kaip ir
MaRIA-G ir LI, taip ir kiti MR-EK indeksai mMaRIA-G ir Clermont-G
gerai koreliavo su CDEIS (r=0,580 ir r=0,585, p=0,01). Tačiau buvo gauta
silpna koreliacija tarp LI ir CDEIS (r=0,320, p=0,01) (3.3.1 lentelė), taip pat
tarp IBDQ ir CDEIS (r=–0,332, p=0,01).
3.3.1 lentelė. Koreliacija tarp KL aktyvumo indeksų
IBDQ CDEIS CRB KLAI HBI eAIS-T
MaRIA-G –0,731,
p=0,01
0,698,
p=0,01
0,495,
p=0,01
0,501,
p=0,01
0,582,
p=0,01
0,609,
p=0,01
mMaRIA-G –0,749,
p=0,01
0,580,
p=0,01
0,56,
p=0,01
0,514,
p=0,01
0,591,
p=0,01
0,627,
p=0,01
Clermont-G –0,726,
p=0,01
0,585,
p=0,01
0,522,
p=0,01
0,468,
p=0,01
0,557,
p=0,01
0,601,
p=0,01
Lemann indeksas –0,813,
p=0,01
0,320,
p=0,01
0,386,
p=0,01
0,431,
p=0,01
0,403,
p=0,01
0,472,
p=0,01
IBDQ – uždegiminė žarnyno ligos anketa, CDEIS – Krono ligos endoskopinis indeksas,
CRB – C reaktyvus baltymas, KLAI – Krono ligos aktyvumo indeksas, HBI – Harvey-
Bradshaw indeksas, eAIS-T – endoskopinis biopsijos aktyvaus uždegimo balas, MaRIA-
G – magnetinio rezonanso aktyvumo indeksas, bendras; mMaRIA-G – modifikuotas
magnetinio rezonanso aktyvumo indeksas.
Taip pat įvertinome koreliaciją tarp MR-EK indeksų ir buvo nustatyta
labai stipri koreliacija tarp MaRIA-G, mMaRIA-G ir Clermont-G (r=0,975
ir r=0,970, r=0,975, p=0,01).
Apskaičiavus ryšį tarp eAIS-T, IBDQ, KLAI ir HBI, CRB ir CDEIS.
IBDQ, CDEIS, HBI ir CRB parodė nustatyta geresnė koreliacija su eAIS-T
atitinkamai (r=0,505, r=0,531, ir r=0,421, r=0,414, p=0,01) ir ženkliai daug
mažesnė su KLAI (r=0,342, p=0,01).
Statistiškai patikima stipri koreliacija buvo tarp eAIS-T ir MR-EK
indeksų MaRIA-G, mMaRIA-G, Clermont-G (r=0,609, r=0,627 ir r=0,601,
p=0,01), palyginti su klinikiniu aktyvumu ir CDEIS. Tačiau eAIS-T ir LI
koreliacija buvo mažesnė nei kitų MR-EK indeksų (r=0,472, p=0,01).
Kadangi CRB yra plačiausiai naudojamas KL uždegimo žymuo, todėl
apskaičiavome skirtingų ligos aktyvumo rodiklių koreliaciją. Vidutinė
koreliacija buvo tarp CRB ir MaRIA-G (r=0,495, p<0,01), taip pat vidutinė
koreliacija buvo tarp CDEIS ir CRB (r=0,460, p<0,01). Silpna statistiškai
reikšminga koreliacija buvo gauta tarp CRB ir LI, bei IBDQ (r=0,386 ir r=–
0,361, p=0,01).
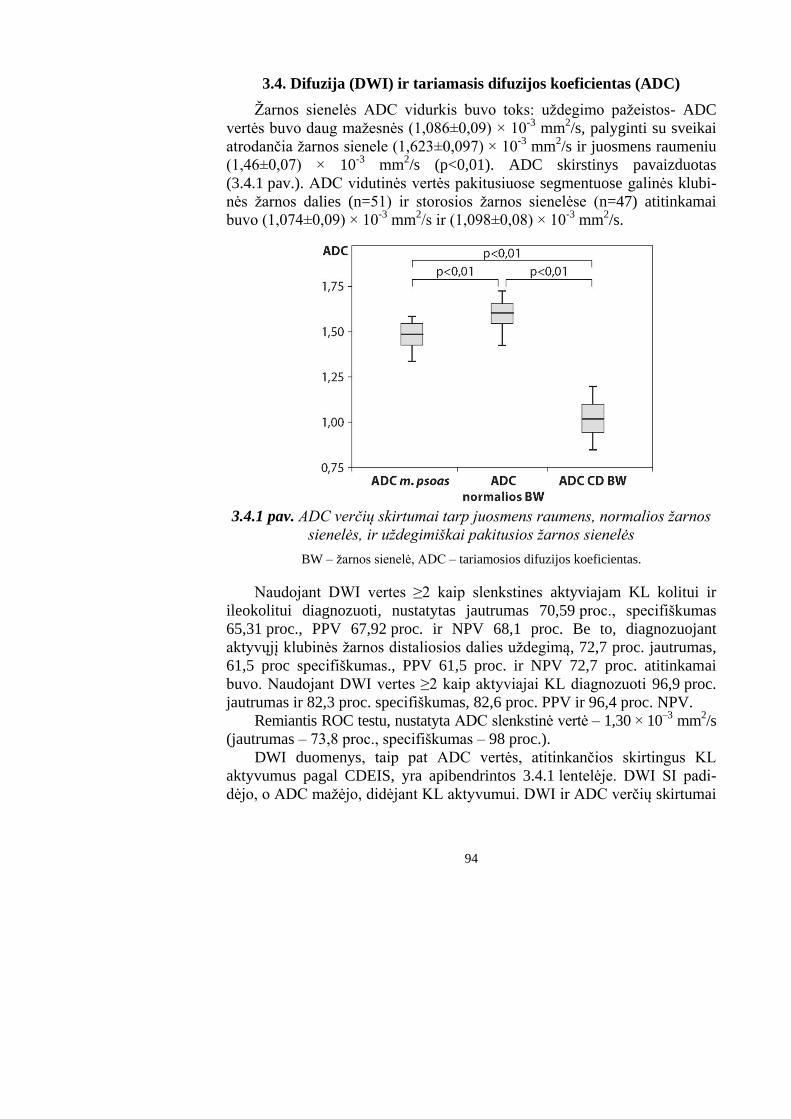
94
3.4. Difuzija (DWI) ir tariamasis difuzijos koeficientas (ADC)
Žarnos sienelės ADC vidurkis buvo toks: uždegimo pažeistos- ADC
vertės buvo daug mažesnės (1,086±0,09) × 10-3
mm2/s, palyginti su sveikai
atrodančia žarnos sienele (1,623±0,097) × 10-3
mm2/s ir juosmens raumeniu
(1,46±0,07) × 10-3
mm2/s (p<0,01). ADC skirstinys pavaizduotas
(3.4.1 pav.). ADC vidutinės vertės pakitusiuose segmentuose galinės klubi-
nės žarnos dalies (n=51) ir storosios žarnos sienelėse (n=47) atitinkamai
buvo (1,074±0,09) × 10-3
mm2/s ir (1,098±0,08) × 10
-3 mm
2/s.
3.4.1 pav. ADC verčių skirtumai tarp juosmens raumens, normalios žarnos
sienelės, ir uždegimiškai pakitusios žarnos sienelės
BW – žarnos sienelė, ADC – tariamosios difuzijos koeficientas.
Naudojant DWI vertes ≥2 kaip slenkstines aktyviajam KL kolitui ir
ileokolitui diagnozuoti, nustatytas jautrumas 70,59 proc., specifiškumas
65,31 proc., PPV 67,92 proc. ir NPV 68,1 proc. Be to, diagnozuojant
aktyvųjį klubinės žarnos distaliosios dalies uždegimą, 72,7 proc. jautrumas,
61,5 proc specifiškumas., PPV 61,5 proc. ir NPV 72,7 proc. atitinkamai
buvo. Naudojant DWI vertes ≥2 kaip aktyviajai KL diagnozuoti 96,9 proc.
jautrumas ir 82,3 proc. specifiškumas, 82,6 proc. PPV ir 96,4 proc. NPV.
Remiantis ROC testu, nustatyta ADC slenkstinė vertė ‒ 1,30 × 10⁻³
mm2/s
(jautrumas – 73,8 proc., specifiškumas – 98 proc.).
DWI duomenys, taip pat ADC vertės, atitinkančios skirtingus KL
aktyvumus pagal CDEIS, yra apibendrintos 3.4.1 lentelėje. DWI SI padi-
dėjo, o ADC mažėjo, didėjant KL aktyvumui. DWI ir ADC verčių skirtumai
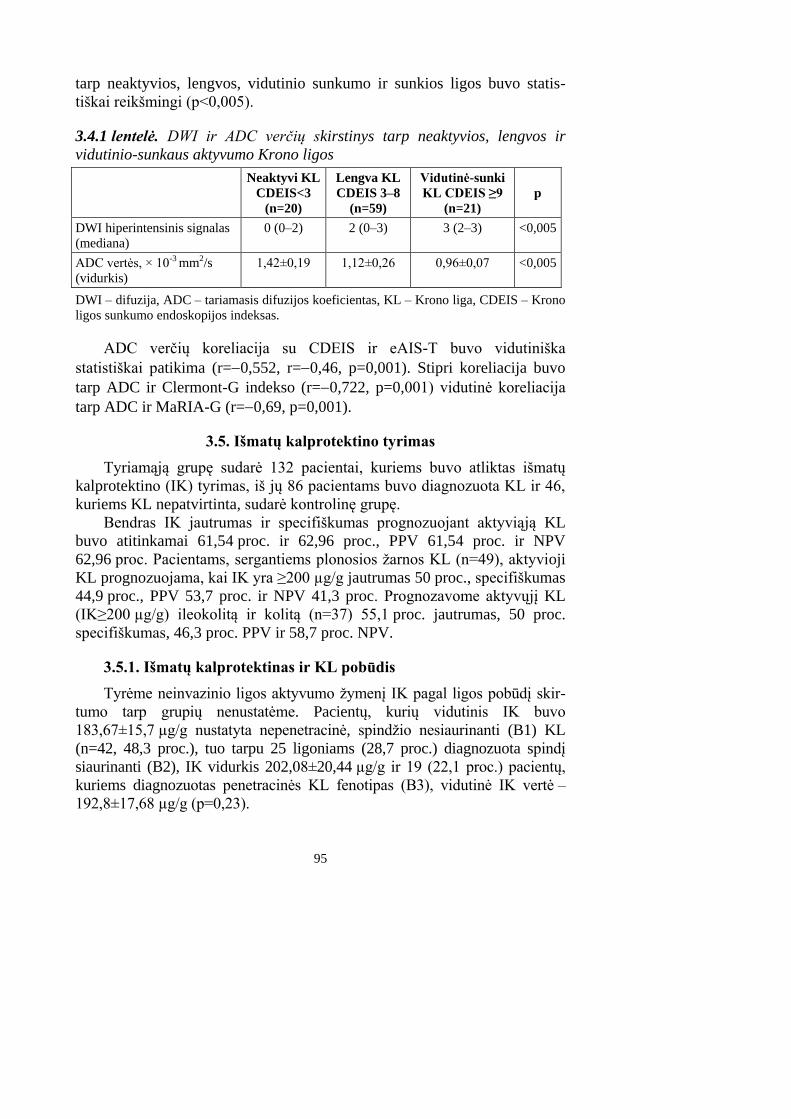
95
tarp neaktyvios, lengvos, vidutinio sunkumo ir sunkios ligos buvo statis-
tiškai reikšmingi (p<0,005).
3.4.1 lentelė. DWI ir ADC verčių skirstinys tarp neaktyvios, lengvos ir
vidutinio-sunkaus aktyvumo Krono ligos
Neaktyvi KL
CDEIS<3
(n=20)
Lengva KL
CDEIS 3–8
(n=59)
Vidutinė-sunki
KL CDEIS ≥9
(n=21)
p
DWI hiperintensinis signalas
(mediana)
0 (0–2) 2 (0–3) 3 (2–3) <0,005
ADC vertės, × 10-3 mm2/s
(vidurkis)
1,42±0,19 1,12±0,26 0,96±0,07 <0,005
DWI – difuzija, ADC – tariamasis difuzijos koeficientas, KL – Krono liga, CDEIS – Krono
ligos sunkumo endoskopijos indeksas.
ADC verčių koreliacija su CDEIS ir eAIS-T buvo vidutiniška
statistiškai patikima (r=0,552, r=0,46, p=0,001). Stipri koreliacija buvo
tarp ADC ir Clermont-G indekso (r=0,722, p=0,001) vidutinė koreliacija
tarp ADC ir MaRIA-G (r=0,69, p=0,001).
3.5. Išmatų kalprotektino tyrimas
Tyriamąją grupę sudarė 132 pacientai, kuriems buvo atliktas išmatų
kalprotektino (IK) tyrimas, iš jų 86 pacientams buvo diagnozuota KL ir 46,
kuriems KL nepatvirtinta, sudarė kontrolinę grupę.
Bendras IK jautrumas ir specifiškumas prognozuojant aktyviąją KL
buvo atitinkamai 61,54 proc. ir 62,96 proc., PPV 61,54 proc. ir NPV
62,96 proc. Pacientams, sergantiems plonosios žarnos KL (n=49), aktyvioji
KL prognozuojama, kai IK yra ≥200 µg/g jautrumas 50 proc., specifiškumas
44,9 proc., PPV 53,7 proc. ir NPV 41,3 proc. Prognozavome aktyvųjį KL
(IK≥200 µg/g) ileokolitą ir kolitą (n=37) 55,1 proc. jautrumas, 50 proc.
specifiškumas, 46,3 proc. PPV ir 58,7 proc. NPV.
3.5.1. Išmatų kalprotektinas ir KL pobūdis
Tyrėme neinvazinio ligos aktyvumo žymenį IK pagal ligos pobūdį skir-
tumo tarp grupių nenustatėme. Pacientų, kurių vidutinis IK buvo
183,67±15,7 µg/g nustatyta nepenetracinė, spindžio nesiaurinanti (B1) KL
(n=42, 48,3 proc.), tuo tarpu 25 ligoniams (28,7 proc.) diagnozuota spindį
siaurinanti (B2), IK vidurkis 202,08±20,44 µg/g ir 19 (22,1 proc.) pacientų,
kuriems diagnozuotas penetracinės KL fenotipas (B3), vidutinė IK vertė –
192,8±17,68 µg/g (p=0,23).
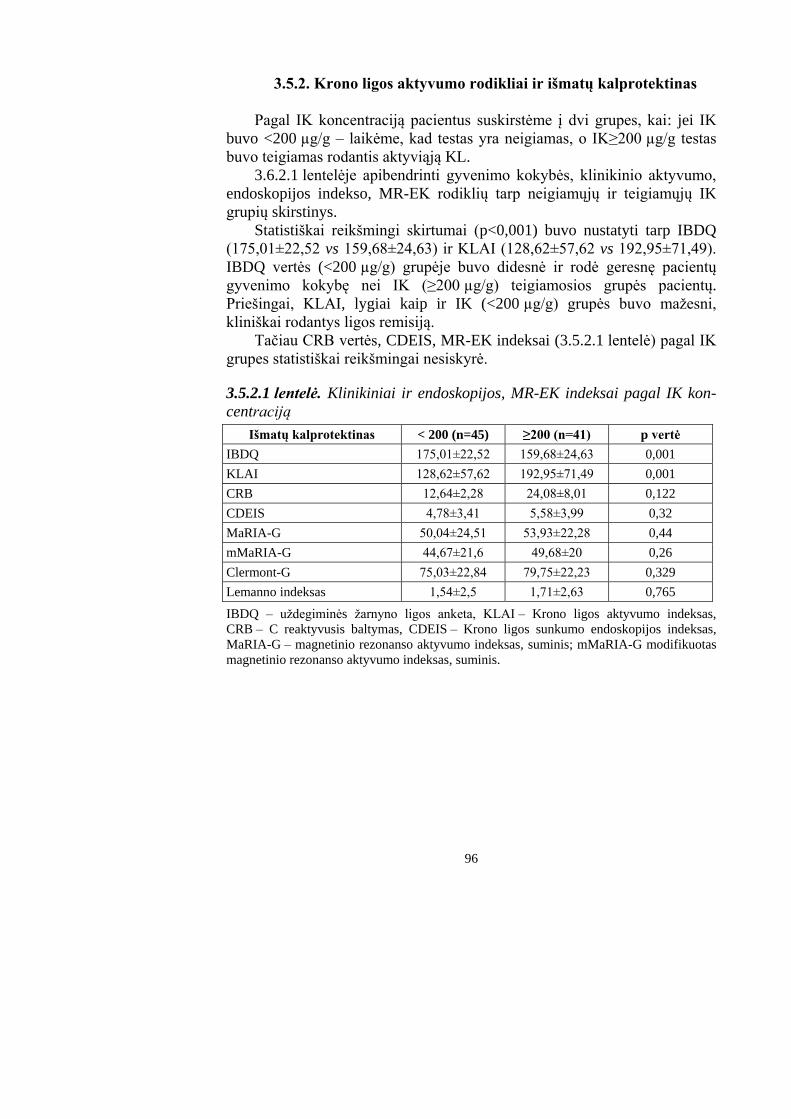
96
3.5.2. Krono ligos aktyvumo rodikliai ir išmatų kalprotektinas
Pagal IK koncentraciją pacientus suskirstėme į dvi grupes, kai: jei IK
buvo <200 µg/g – laikėme, kad testas yra neigiamas, o IK≥200 µg/g testas
buvo teigiamas rodantis aktyviąją KL.
3.6.2.1 lentelėje apibendrinti gyvenimo kokybės, klinikinio aktyvumo,
endoskopijos indekso, MR-EK rodiklių tarp neigiamųjų ir teigiamųjų IK
grupių skirstinys.
Statistiškai reikšmingi skirtumai (p<0,001) buvo nustatyti tarp IBDQ
(175,01±22,52 vs 159,68±24,63) ir KLAI (128,62±57,62 vs 192,95±71,49).
IBDQ vertės (<200 µg/g) grupėje buvo didesnė ir rodė geresnę pacientų
gyvenimo kokybę nei IK (≥200 µg/g) teigiamosios grupės pacientų.
Priešingai, KLAI, lygiai kaip ir IK (<200 µg/g) grupės buvo mažesni,
kliniškai rodantys ligos remisiją.
Tačiau CRB vertės, CDEIS, MR-EK indeksai (3.5.2.1 lentelė) pagal IK
grupes statistiškai reikšmingai nesiskyrė.
3.5.2.1 lentelė. Klinikiniai ir endoskopijos, MR-EK indeksai pagal IK kon-
centraciją
Išmatų kalprotektinas < 200 (n=45) ≥200 (n=41) p vertė
IBDQ 175,01±22,52 159,68±24,63 0,001
KLAI 128,62±57,62 192,95±71,49 0,001
CRB 12,64±2,28 24,08±8,01 0,122
CDEIS 4,78±3,41 5,58±3,99 0,32
MaRIA-G 50,04±24,51 53,93±22,28 0,44
mMaRIA-G 44,67±21,6 49,68±20 0,26
Clermont-G 75,03±22,84 79,75±22,23 0,329
Lemanno indeksas 1,54±2,5 1,71±2,63 0,765
IBDQ – uždegiminės žarnyno ligos anketa, KLAI – Krono ligos aktyvumo indeksas,
CRB – C reaktyvusis baltymas, CDEIS – Krono ligos sunkumo endoskopijos indeksas,
MaRIA-G – magnetinio rezonanso aktyvumo indeksas, suminis; mMaRIA-G modifikuotas
magnetinio rezonanso aktyvumo indeksas, suminis.
97
IŠVADOS
1. MR-EK jautrumas ir specifiškumas nustatant KL buvo atitinkamai
74 proc. ir 90 proc.; jautrumas ir specifiškumas diagnozuojant klubinės
žarnos galinės dalies uždegimą buvo didesnis – 85,9 proc. ir 92,3 proc.
MR-EK tiksliau nustatomos KL komplikacijos: abscesai (jautrumas
88,7 proc. ir specifiškumas 100 proc.), fistulės (jautrumas 75,2 proc. ir
specifiškumas 100 proc.), stenozė (jautrumas 81,1 proc. ir specifišku-
mas 91,5 proc.).
2. Krono liga sergančių pacientų, palyginti su kontroline grupe, MR-EK
buvo nustatyti ligos aktyvumo požymiai: storesnė kaip 4 mm žarnos
sienelė, intensyvus ir sluoksninis intraveninės kontrastinės medžiagos
kaupimasis, ryški mezenterinė kraujotaka.
3. Nustatyta tvirta neigiamoji koreliacija tarp Lemanno indekso ir gyvenimo
kokybės – IBDQ. Ši koreliacija buvo mažesnė vartojant MaRIA-G
indeksą. CRB koreliacija su CDEIS ir MARIA-G buvo gera, priešingai
nei su LI ir IBDQ.
4. DWI gali atskirti lengvą, vidutinį ir sunkų KL aktyvumą.
5. Bendras IK jautrumas ir specifiškumas prognozuojant aktyviąją ligą
buvo atitinkamai 61,54 proc. ir 62,96 proc. Prognozuojamos klubinės
žarnos aktyviosios ligos jautrumas ir specifiškumas buvo mažesni nei
ileokoloninės ir storosios žarnos ligos. IK – skirtingo pobūdžio KL
grupėse nesiskyrė. Pacientų, kurių IK buvo padidėjęs, gyvenimo koky-
bė buvo blogesnė, o KLAI vertė didesnė.
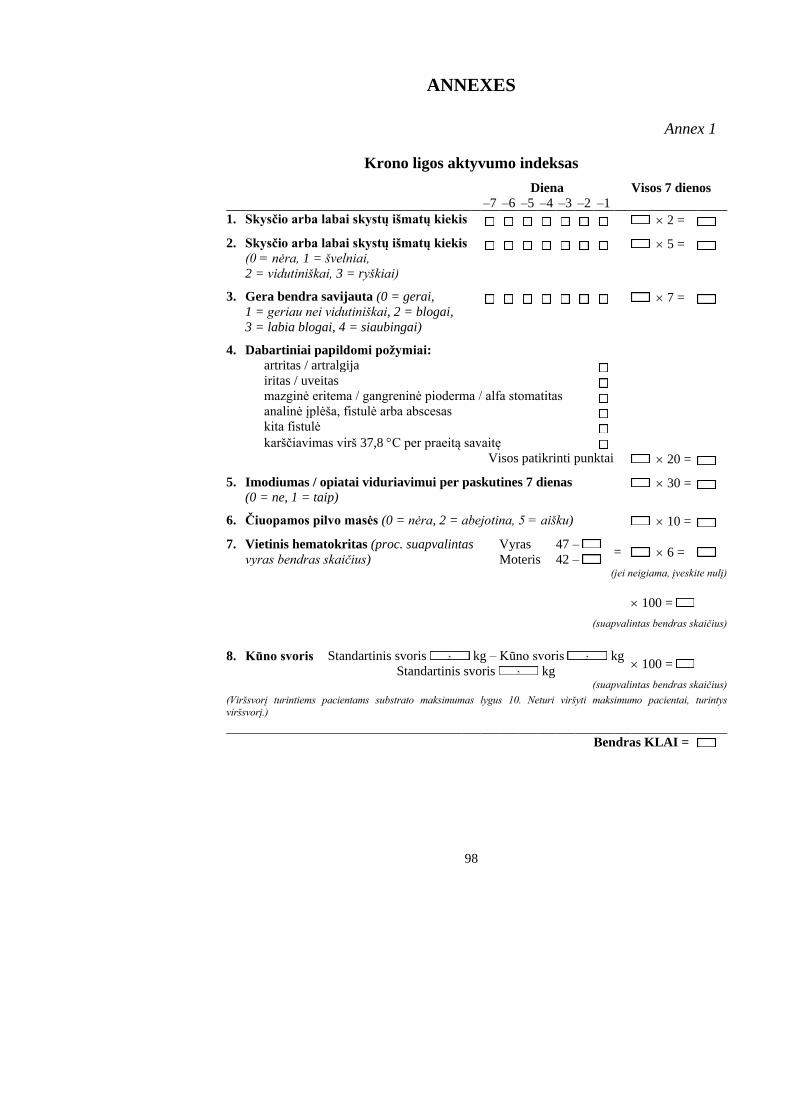
98
ANNEXES
Annex 1
Krono ligos aktyvumo indeksas
Diena Visos 7 dienos
–7 –6 –5 –4 –3 –2 –1
1. Skysčio arba labai skystų išmatų kiekis 2 =
2. Skysčio arba labai skystų išmatų kiekis
(0 = nėra, 1 = švelniai,
2 = vidutiniškai, 3 = ryškiai)
5 =
3. Gera bendra savijauta (0 = gerai,
1 = geriau nei vidutiniškai, 2 = blogai,
3 = labia blogai, 4 = siaubingai)
7 =
4. Dabartiniai papildomi požymiai:
artritas / artralgija
iritas / uveitas
mazginė eritema / gangreninė pioderma / alfa stomatitas
analinė įplėša, fistulė arba abscesas
kita fistulė
karščiavimas virš 37,8 C per praeitą savaitę
Visos patikrinti punktai 20 =
5. Imodiumas / opiatai viduriavimui per paskutines 7 dienas (0 = ne, 1 = taip)
30 =
6. Čiuopamos pilvo masės (0 = nėra, 2 = abejotina, 5 = aišku) 10 =
7. Vietinis hematokritas (proc. suapvalintas
vyras bendras skaičius)
Vyras 47 – = 6 =
Moteris 42 – (jei neigiama, įveskite nulį)
100 =
(suapvalintas bendras skaičius)
8. Kūno svoris Standartinis svoris kg – Kūno svoris kg 100 =
Standartinis svoris kg
(suapvalintas bendras skaičius)
(Viršsvorį turintiems pacientams substrato maksimumas lygus 10. Neturi viršyti maksimumo pacientai, turintys
viršsvorį.)
Bendras KLAI =
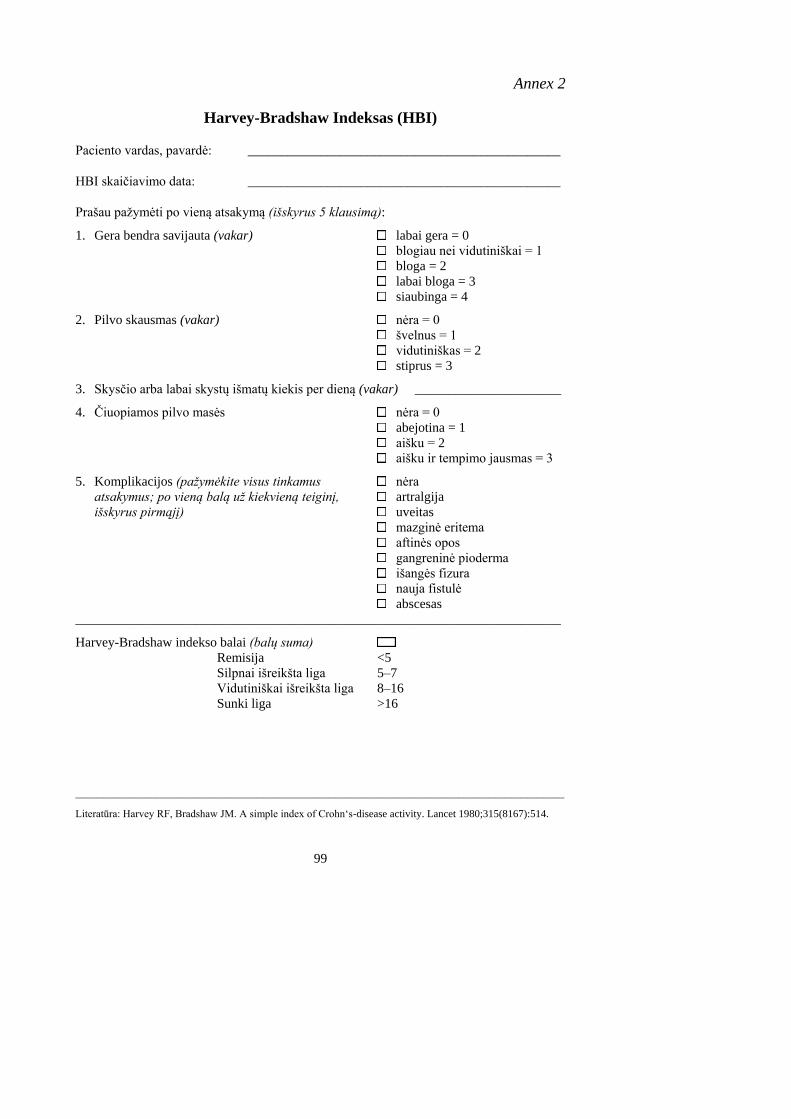
99
Annex 2
Harvey-Bradshaw Indeksas (HBI)
Paciento vardas, pavardė: _______________________________________________
HBI skaičiavimo data: _______________________________________________
Prašau pažymėti po vieną atsakymą (išskyrus 5 klausimą):
1. Gera bendra savijauta (vakar) labai gera = 0
blogiau nei vidutiniškai = 1
bloga = 2
labai bloga = 3
siaubinga = 4
2. Pilvo skausmas (vakar) nėra = 0
švelnus = 1
vidutiniškas = 2
stiprus = 3
3. Skysčio arba labai skystų išmatų kiekis per dieną (vakar) ______________________
4. Čiuopiamos pilvo masės nėra = 0
abejotina = 1
aišku = 2
aišku ir tempimo jausmas = 3
5. Komplikacijos (pažymėkite visus tinkamus nėra
atsakymus; po vieną balą už kiekvieną teiginį, artralgija
išskyrus pirmąjį) uveitas
mazginė eritema
aftinės opos
gangreninė pioderma
išangės fizura
nauja fistulė
abscesas
_________________________________________________________________________
Harvey-Bradshaw indekso balai (balų suma)
Remisija <5
Silpnai išreikšta liga 5–7
Vidutiniškai išreikšta liga 8–16
Sunki liga >16
____________________________________________________________________________________________
Literatūra: Harvey RF, Bradshaw JM. A simple index of Crohn‘s-disease activity. Lancet 1980;315(8167):514.
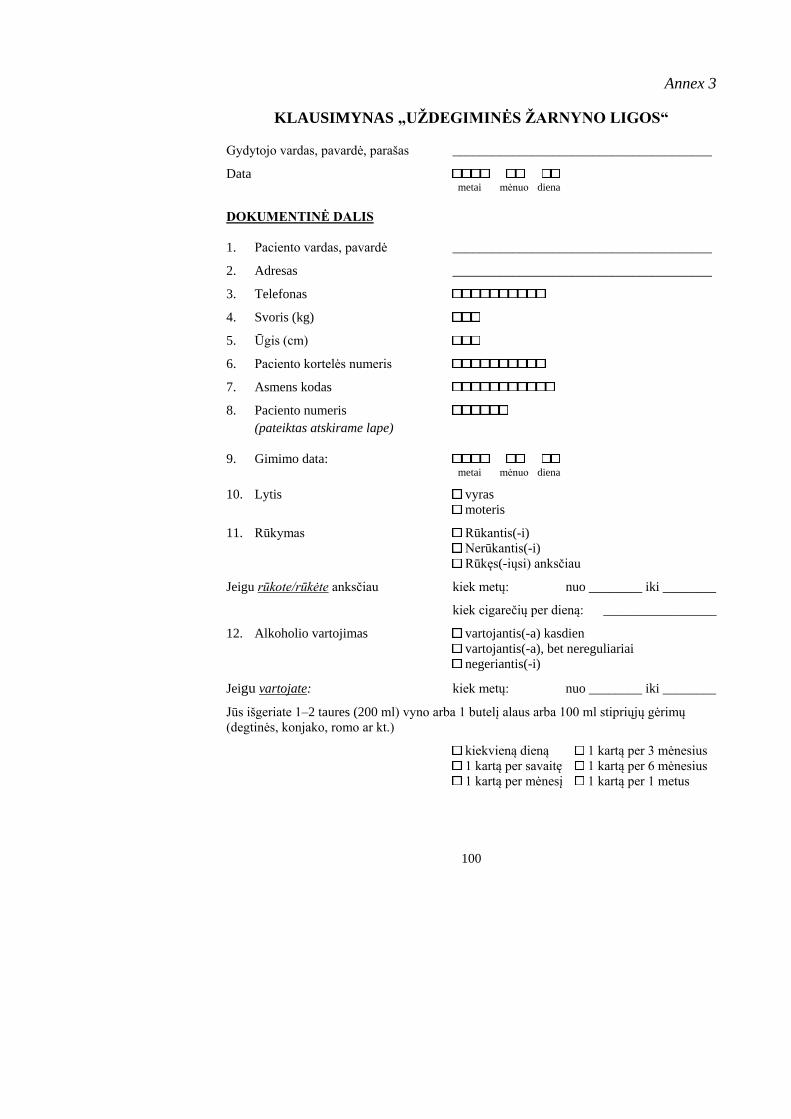
100
Annex 3
KLAUSIMYNAS „UŽDEGIMINĖS ŽARNYNO LIGOS“
Gydytojo vardas, pavardė, parašas _______________________________________
Data metai mėnuo diena
DOKUMENTINĖ DALIS
1. Paciento vardas, pavardė _______________________________________
2. Adresas _______________________________________
3. Telefonas
4. Svoris (kg)
5. Ūgis (cm)
6. Paciento kortelės numeris
7. Asmens kodas
8. Paciento numeris
(pateiktas atskirame lape)
9. Gimimo data: metai mėnuo diena
10. Lytis vyras
moteris
11. Rūkymas Rūkantis(-i)
Nerūkantis(-i) Rūkęs(-iųsi) anksčiau
Jeigu rūkote/rūkėte anksčiau kiek metų: nuo ________ iki ________
kiek cigarečių per dieną: _________________
12. Alkoholio vartojimas vartojantis(-a) kasdien vartojantis(-a), bet nereguliariai
negeriantis(-i)
Jeigu vartojate: kiek metų: nuo ________ iki ________
Jūs išgeriate 1–2 taures (200 ml) vyno arba 1 butelį alaus arba 100 ml stipriųjų gėrimų
(degtinės, konjako, romo ar kt.)
kiekvieną dieną 1 kartą per 3 mėnesius
1 kartą per savaitę 1 kartą per 6 mėnesius
1 kartą per mėnesį 1 kartą per 1 metus
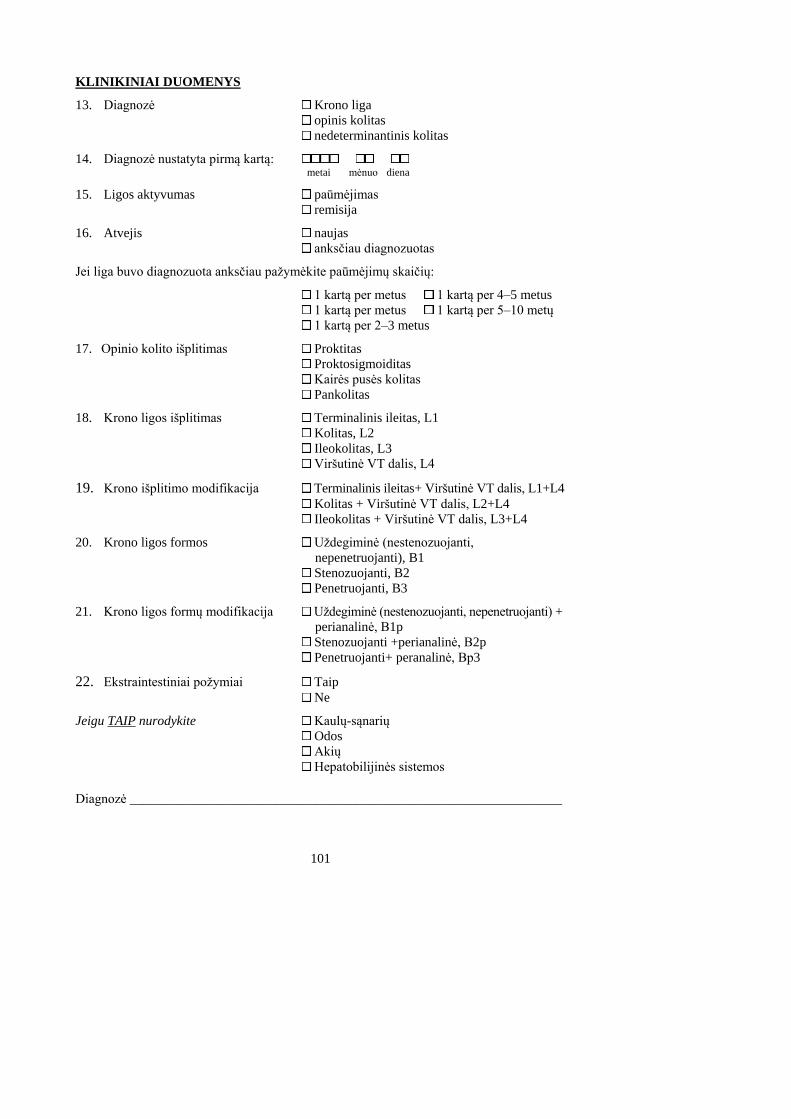
101
KLINIKINIAI DUOMENYS
13. Diagnozė Krono liga
opinis kolitas
nedeterminantinis kolitas
14. Diagnozė nustatyta pirmą kartą: metai mėnuo diena
15. Ligos aktyvumas paūmėjimas
remisija
16. Atvejis naujas
anksčiau diagnozuotas
Jei liga buvo diagnozuota anksčiau pažymėkite paūmėjimų skaičių:
1 kartą per metus 1 kartą per 4–5 metus
1 kartą per metus 1 kartą per 5–10 metų
1 kartą per 2–3 metus
17. Opinio kolito išplitimas Proktitas
Proktosigmoiditas
Kairės pusės kolitas
Pankolitas
18. Krono ligos išplitimas Terminalinis ileitas, L1 Kolitas, L2 Ileokolitas, L3 Viršutinė VT dalis, L4
19. Krono išplitimo modifikacija Terminalinis ileitas+ Viršutinė VT dalis, L1+L4
Kolitas + Viršutinė VT dalis, L2+L4
Ileokolitas + Viršutinė VT dalis, L3+L4
20. Krono ligos formos Uždegiminė (nestenozuojanti, nepenetruojanti), B1
Stenozuojanti, B2
Penetruojanti, B3
21. Krono ligos formų modifikacija Uždegiminė (nestenozuojanti, nepenetruojanti) + perianalinė, B1p
Stenozuojanti +perianalinė, B2p
Penetruojanti+ peranalinė, Bp3
22. Ekstraintestiniai požymiai Taip Ne
Jeigu TAIP nurodykite Kaulų-sąnarių
Odos Akių
Hepatobilijinės sistemos Diagnozė _________________________________________________________________
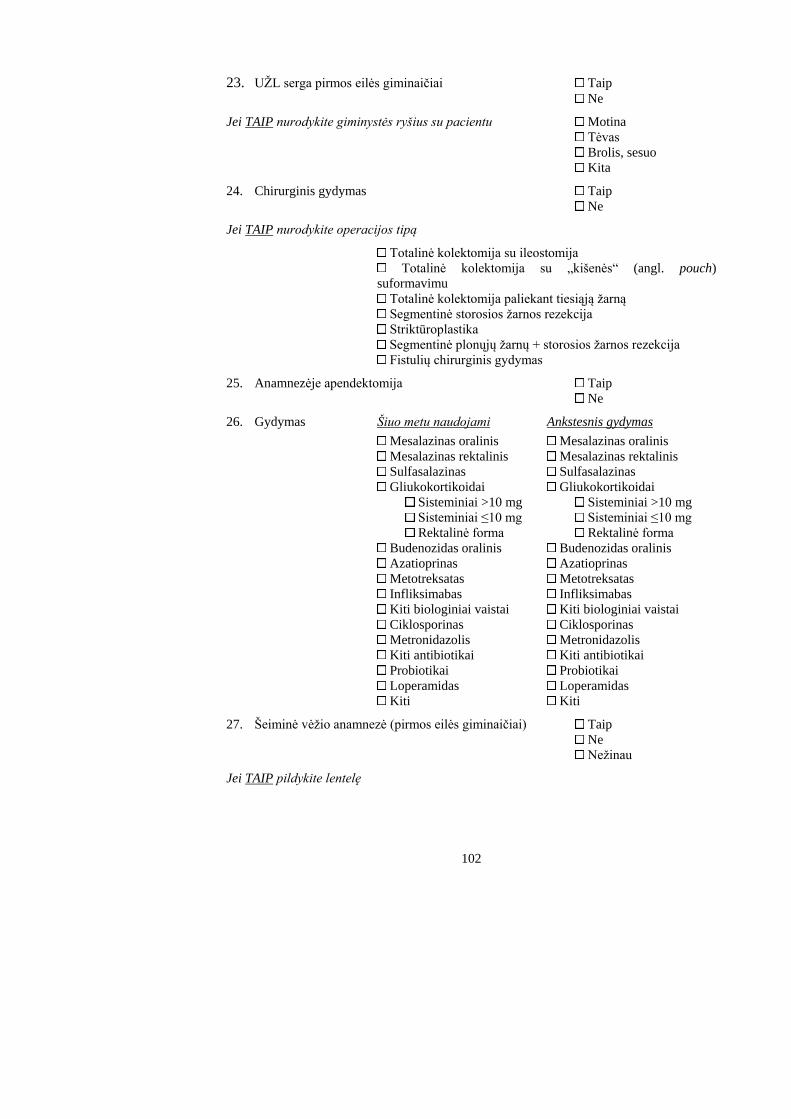
102
23. UŽL serga pirmos eilės giminaičiai Taip Ne
Jei TAIP nurodykite giminystės ryšius su pacientu Motina
Tėvas
Brolis, sesuo
Kita
24. Chirurginis gydymas Taip Ne
Jei TAIP nurodykite operacijos tipą
Totalinė kolektomija su ileostomija
Totalinė kolektomija su „kišenės“ (angl. pouch)
suformavimu
Totalinė kolektomija paliekant tiesiąją žarną Segmentinė storosios žarnos rezekcija
Striktūroplastika
Segmentinė plonųjų žarnų + storosios žarnos rezekcija
Fistulių chirurginis gydymas
25. Anamnezėje apendektomija Taip Ne
26. Gydymas Šiuo metu naudojami Ankstesnis gydymas
Mesalazinas oralinis Mesalazinas oralinis Mesalazinas rektalinis Mesalazinas rektalinis Sulfasalazinas Sulfasalazinas
Gliukokortikoidai Gliukokortikoidai
Sisteminiai >10 mg Sisteminiai >10 mg
Sisteminiai ≤10 mg Sisteminiai ≤10 mg
Rektalinė forma Rektalinė forma
Budenozidas oralinis Budenozidas oralinis Azatioprinas Azatioprinas Metotreksatas Metotreksatas
Infliksimabas Infliksimabas
Kiti biologiniai vaistai Kiti biologiniai vaistai Ciklosporinas Ciklosporinas Metronidazolis Metronidazolis Kiti antibiotikai Kiti antibiotikai
Probiotikai Probiotikai
Loperamidas Loperamidas
Kiti Kiti
27. Šeiminė vėžio anamnezė (pirmos eilės giminaičiai) Taip Ne Nežinau
Jei TAIP pildykite lentelę
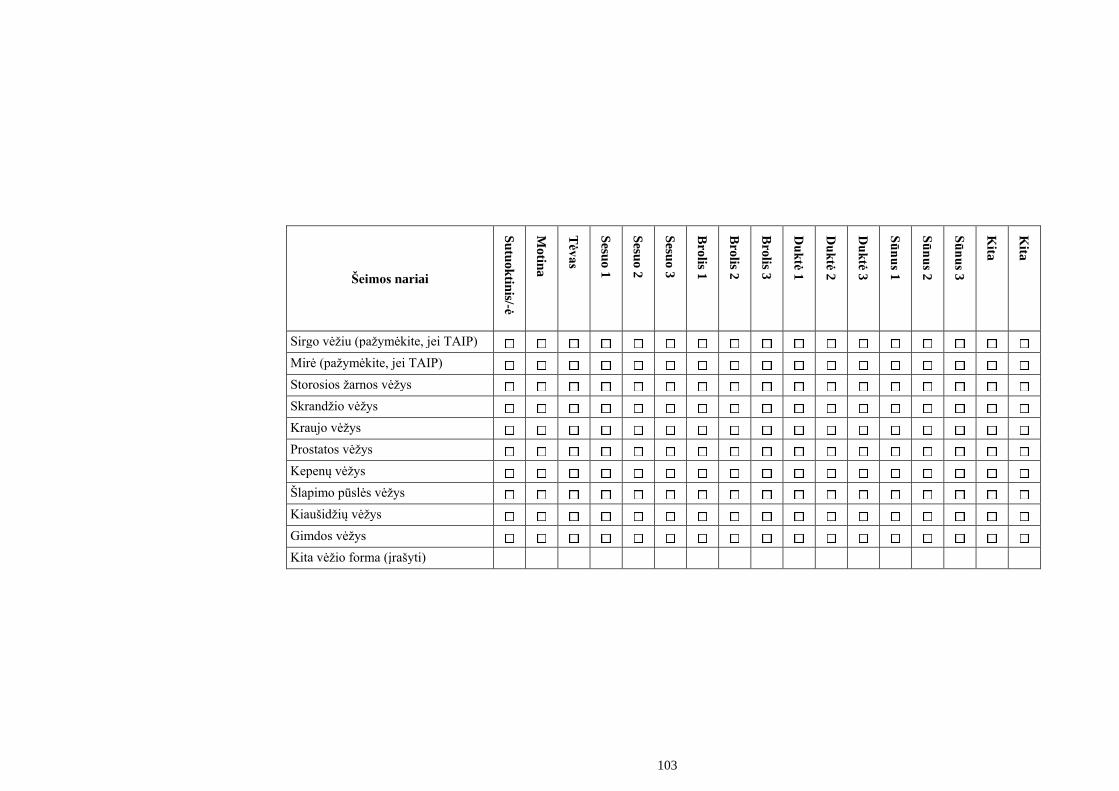
103
Šeimos nariai
Su
tuo
ktin
is/-ė
Mo
tina
Tėv
as
Sesu
o 1
Sesu
o 2
Sesu
o 3
Bro
lis 1
Bro
lis 2
Bro
lis 3
Du
ktė
1
Du
ktė
2
Du
ktė
3
Sū
nu
s 1
Sū
nu
s 2
Sū
nu
s 3
Kita
Kita
Sirgo vėžiu (pažymėkite, jei TAIP)
Mirė (pažymėkite, jei TAIP)
Storosios žarnos vėžys
Skrandžio vėžys
Kraujo vėžys
Prostatos vėžys
Kepenų vėžys
Šlapimo pūslės vėžys
Kiaušidžių vėžys
Gimdos vėžys
Kita vėžio forma (įrašyti)
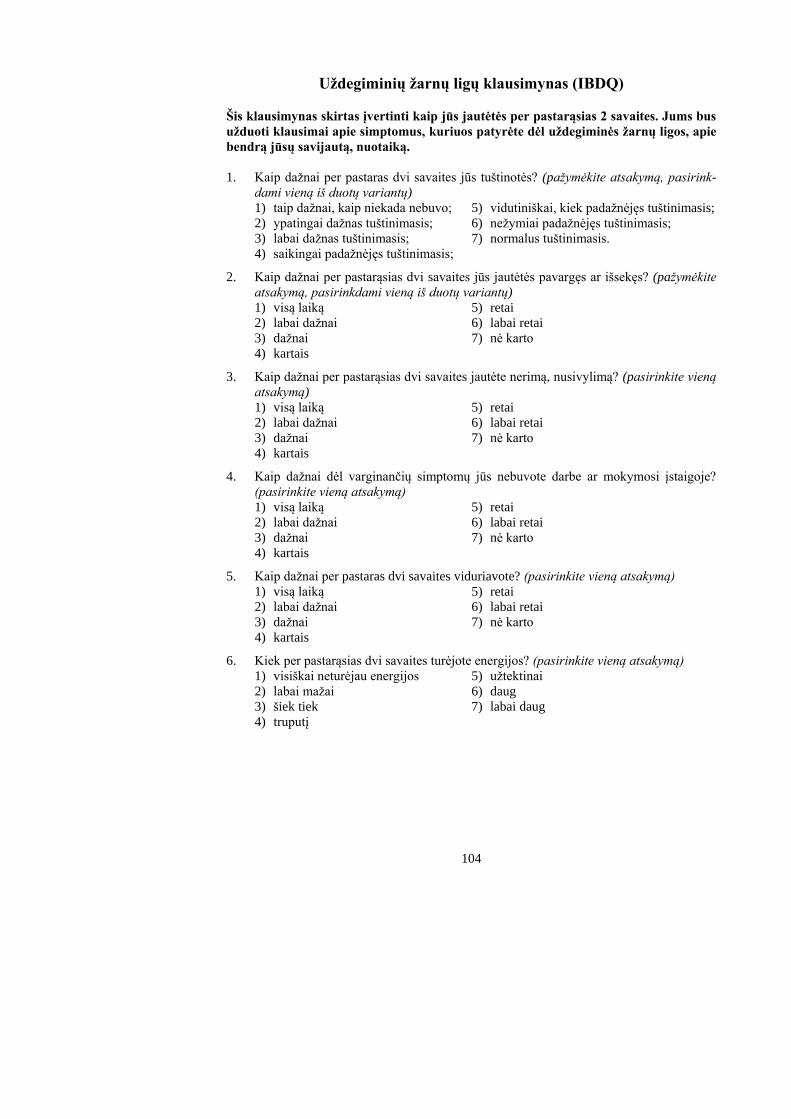
104
Uždegiminių žarnų ligų klausimynas (IBDQ)
Šis klausimynas skirtas įvertinti kaip jūs jautėtės per pastarąsias 2 savaites. Jums bus
užduoti klausimai apie simptomus, kuriuos patyrėte dėl uždegiminės žarnų ligos, apie
bendrą jūsų savijautą, nuotaiką.
1. Kaip dažnai per pastaras dvi savaites jūs tuštinotės? (pažymėkite atsakymą, pasirink-
dami vieną iš duotų variantų)
1) taip dažnai, kaip niekada nebuvo; 5) vidutiniškai, kiek padažnėjęs tuštinimasis;
2) ypatingai dažnas tuštinimasis; 6) nežymiai padažnėjęs tuštinimasis;
3) labai dažnas tuštinimasis; 7) normalus tuštinimasis.
4) saikingai padažnėjęs tuštinimasis;
2. Kaip dažnai per pastarąsias dvi savaites jūs jautėtės pavargęs ar išsekęs? (pažymėkite
atsakymą, pasirinkdami vieną iš duotų variantų)
1) visą laiką 5) retai
2) labai dažnai 6) labai retai
3) dažnai 7) nė karto
4) kartais
3. Kaip dažnai per pastarąsias dvi savaites jautėte nerimą, nusivylimą? (pasirinkite vieną
atsakymą)
1) visą laiką 5) retai
2) labai dažnai 6) labai retai
3) dažnai 7) nė karto
4) kartais
4. Kaip dažnai dėl varginančių simptomų jūs nebuvote darbe ar mokymosi įstaigoje?
(pasirinkite vieną atsakymą)
1) visą laiką 5) retai
2) labai dažnai 6) labai retai
3) dažnai 7) nė karto
4) kartais
5. Kaip dažnai per pastaras dvi savaites viduriavote? (pasirinkite vieną atsakymą)
1) visą laiką 5) retai
2) labai dažnai 6) labai retai
3) dažnai 7) nė karto
4) kartais
6. Kiek per pastarąsias dvi savaites turėjote energijos? (pasirinkite vieną atsakymą)
1) visiškai neturėjau energijos 5) užtektinai
2) labai mažai 6) daug
3) šiek tiek 7) labai daug
4) truputį
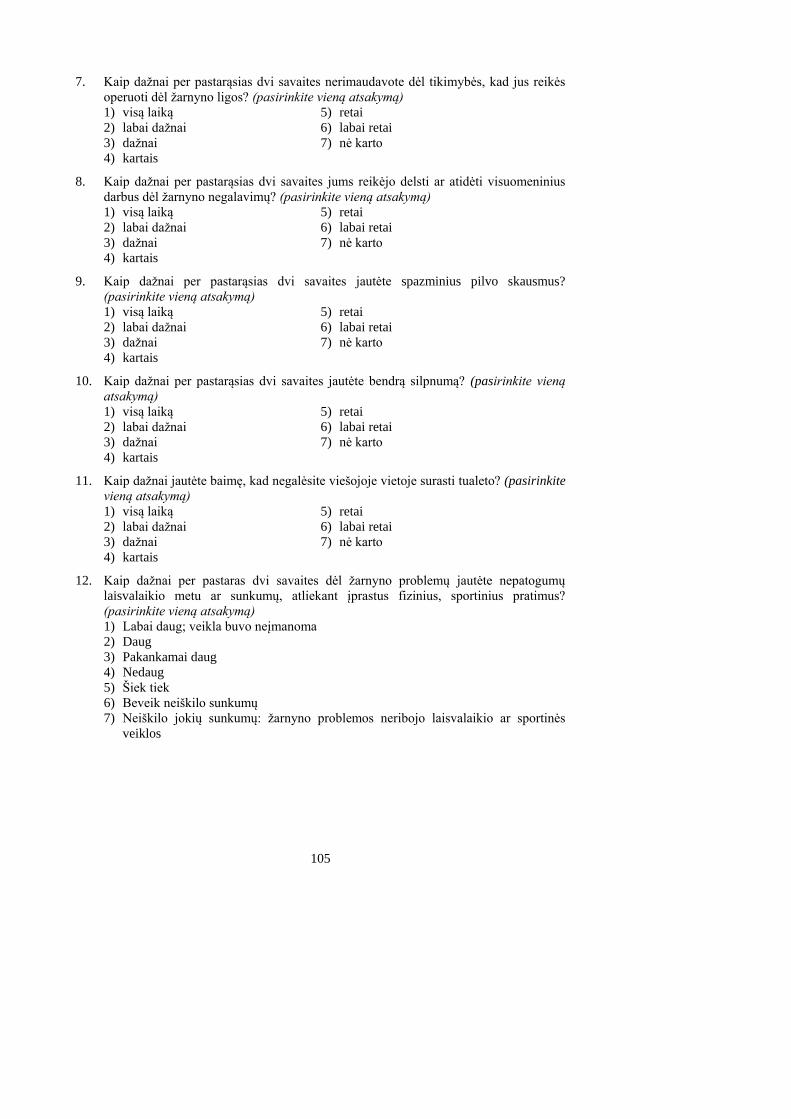
105
7. Kaip dažnai per pastarąsias dvi savaites nerimaudavote dėl tikimybės, kad jus reikės
operuoti dėl žarnyno ligos? (pasirinkite vieną atsakymą)
1) visą laiką 5) retai
2) labai dažnai 6) labai retai
3) dažnai 7) nė karto
4) kartais
8. Kaip dažnai per pastarąsias dvi savaites jums reikėjo delsti ar atidėti visuomeninius
darbus dėl žarnyno negalavimų? (pasirinkite vieną atsakymą)
1) visą laiką 5) retai
2) labai dažnai 6) labai retai
3) dažnai 7) nė karto
4) kartais
9. Kaip dažnai per pastarąsias dvi savaites jautėte spazminius pilvo skausmus?
(pasirinkite vieną atsakymą)
1) visą laiką 5) retai
2) labai dažnai 6) labai retai
3) dažnai 7) nė karto
4) kartais
10. Kaip dažnai per pastarąsias dvi savaites jautėte bendrą silpnumą? (pasirinkite vieną
atsakymą)
1) visą laiką 5) retai
2) labai dažnai 6) labai retai
3) dažnai 7) nė karto
4) kartais
11. Kaip dažnai jautėte baimę, kad negalėsite viešojoje vietoje surasti tualeto? (pasirinkite
vieną atsakymą)
1) visą laiką 5) retai
2) labai dažnai 6) labai retai
3) dažnai 7) nė karto
4) kartais
12. Kaip dažnai per pastaras dvi savaites dėl žarnyno problemų jautėte nepatogumų
laisvalaikio metu ar sunkumų, atliekant įprastus fizinius, sportinius pratimus?
(pasirinkite vieną atsakymą)
1) Labai daug; veikla buvo neįmanoma
2) Daug
3) Pakankamai daug
4) Nedaug
5) Šiek tiek
6) Beveik neiškilo sunkumų
7) Neiškilo jokių sunkumų: žarnyno problemos neribojo laisvalaikio ar sportinės
veiklos
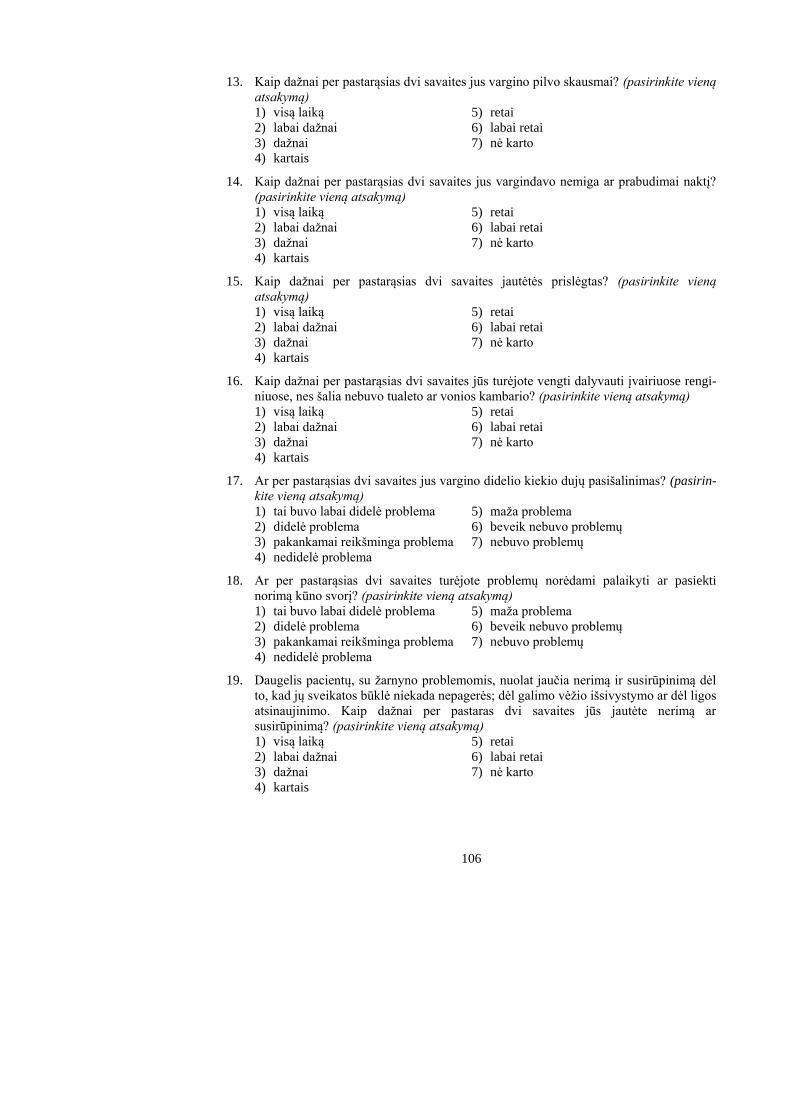
106
13. Kaip dažnai per pastarąsias dvi savaites jus vargino pilvo skausmai? (pasirinkite vieną
atsakymą)
1) visą laiką 5) retai
2) labai dažnai 6) labai retai
3) dažnai 7) nė karto
4) kartais
14. Kaip dažnai per pastarąsias dvi savaites jus vargindavo nemiga ar prabudimai naktį?
(pasirinkite vieną atsakymą)
1) visą laiką 5) retai
2) labai dažnai 6) labai retai
3) dažnai 7) nė karto
4) kartais
15. Kaip dažnai per pastarąsias dvi savaites jautėtės prislėgtas? (pasirinkite vieną
atsakymą)
1) visą laiką 5) retai
2) labai dažnai 6) labai retai
3) dažnai 7) nė karto
4) kartais
16. Kaip dažnai per pastarąsias dvi savaites jūs turėjote vengti dalyvauti įvairiuose rengi-
niuose, nes šalia nebuvo tualeto ar vonios kambario? (pasirinkite vieną atsakymą)
1) visą laiką 5) retai
2) labai dažnai 6) labai retai
3) dažnai 7) nė karto
4) kartais
17. Ar per pastarąsias dvi savaites jus vargino didelio kiekio dujų pasišalinimas? (pasirin-
kite vieną atsakymą)
1) tai buvo labai didelė problema 5) maža problema
2) didelė problema 6) beveik nebuvo problemų
3) pakankamai reikšminga problema 7) nebuvo problemų
4) nedidelė problema
18. Ar per pastarąsias dvi savaites turėjote problemų norėdami palaikyti ar pasiekti
norimą kūno svorį? (pasirinkite vieną atsakymą)
1) tai buvo labai didelė problema 5) maža problema
2) didelė problema 6) beveik nebuvo problemų
3) pakankamai reikšminga problema 7) nebuvo problemų
4) nedidelė problema
19. Daugelis pacientų, su žarnyno problemomis, nuolat jaučia nerimą ir susirūpinimą dėl
to, kad jų sveikatos būklė niekada nepagerės; dėl galimo vėžio išsivystymo ar dėl ligos
atsinaujinimo. Kaip dažnai per pastaras dvi savaites jūs jautėte nerimą ar
susirūpinimą? (pasirinkite vieną atsakymą)
1) visą laiką 5) retai
2) labai dažnai 6) labai retai
3) dažnai 7) nė karto
4) kartais
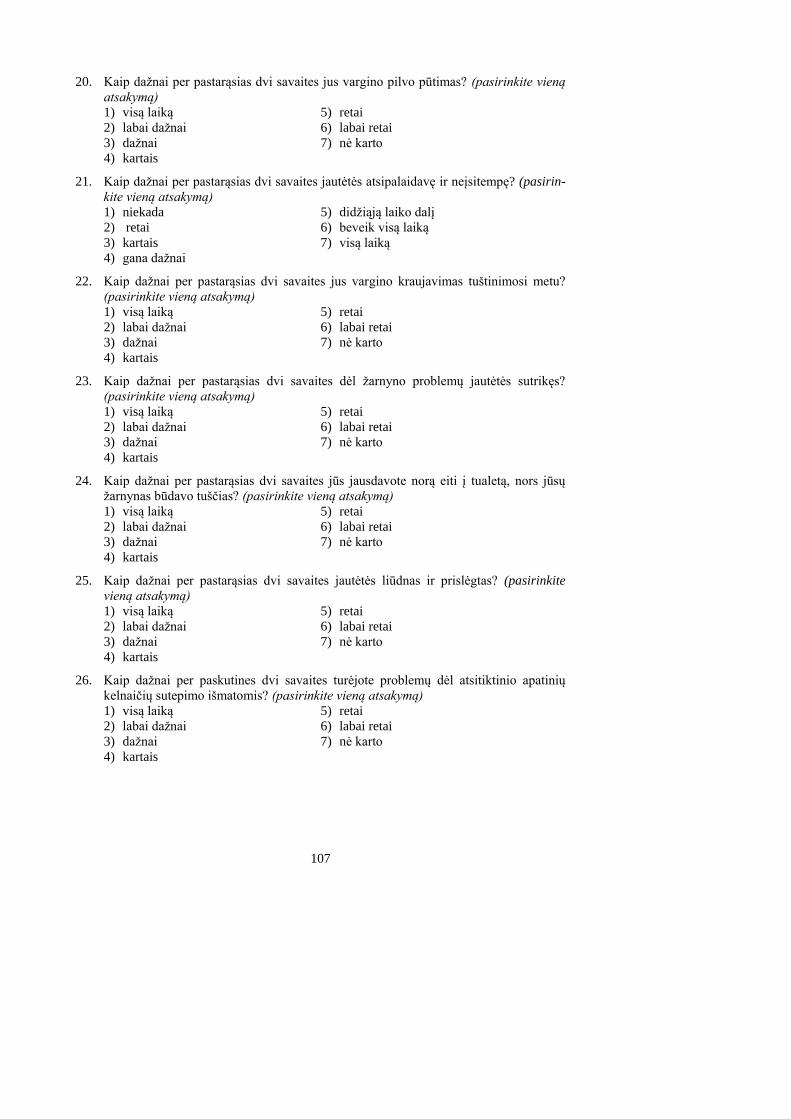
107
20. Kaip dažnai per pastarąsias dvi savaites jus vargino pilvo pūtimas? (pasirinkite vieną
atsakymą)
1) visą laiką 5) retai
2) labai dažnai 6) labai retai
3) dažnai 7) nė karto
4) kartais
21. Kaip dažnai per pastarąsias dvi savaites jautėtės atsipalaidavę ir neįsitempę? (pasirin-
kite vieną atsakymą)
1) niekada 5) didžiąją laiko dalį
2) retai 6) beveik visą laiką
3) kartais 7) visą laiką
4) gana dažnai
22. Kaip dažnai per pastarąsias dvi savaites jus vargino kraujavimas tuštinimosi metu?
(pasirinkite vieną atsakymą)
1) visą laiką 5) retai
2) labai dažnai 6) labai retai
3) dažnai 7) nė karto
4) kartais
23. Kaip dažnai per pastarąsias dvi savaites dėl žarnyno problemų jautėtės sutrikęs?
(pasirinkite vieną atsakymą)
1) visą laiką 5) retai
2) labai dažnai 6) labai retai
3) dažnai 7) nė karto
4) kartais
24. Kaip dažnai per pastarąsias dvi savaites jūs jausdavote norą eiti į tualetą, nors jūsų
žarnynas būdavo tuščias? (pasirinkite vieną atsakymą)
1) visą laiką 5) retai
2) labai dažnai 6) labai retai
3) dažnai 7) nė karto
4) kartais
25. Kaip dažnai per pastarąsias dvi savaites jautėtės liūdnas ir prislėgtas? (pasirinkite
vieną atsakymą)
1) visą laiką 5) retai
2) labai dažnai 6) labai retai
3) dažnai 7) nė karto
4) kartais
26. Kaip dažnai per paskutines dvi savaites turėjote problemų dėl atsitiktinio apatinių
kelnaičių sutepimo išmatomis? (pasirinkite vieną atsakymą)
1) visą laiką 5) retai
2) labai dažnai 6) labai retai
3) dažnai 7) nė karto
4) kartais
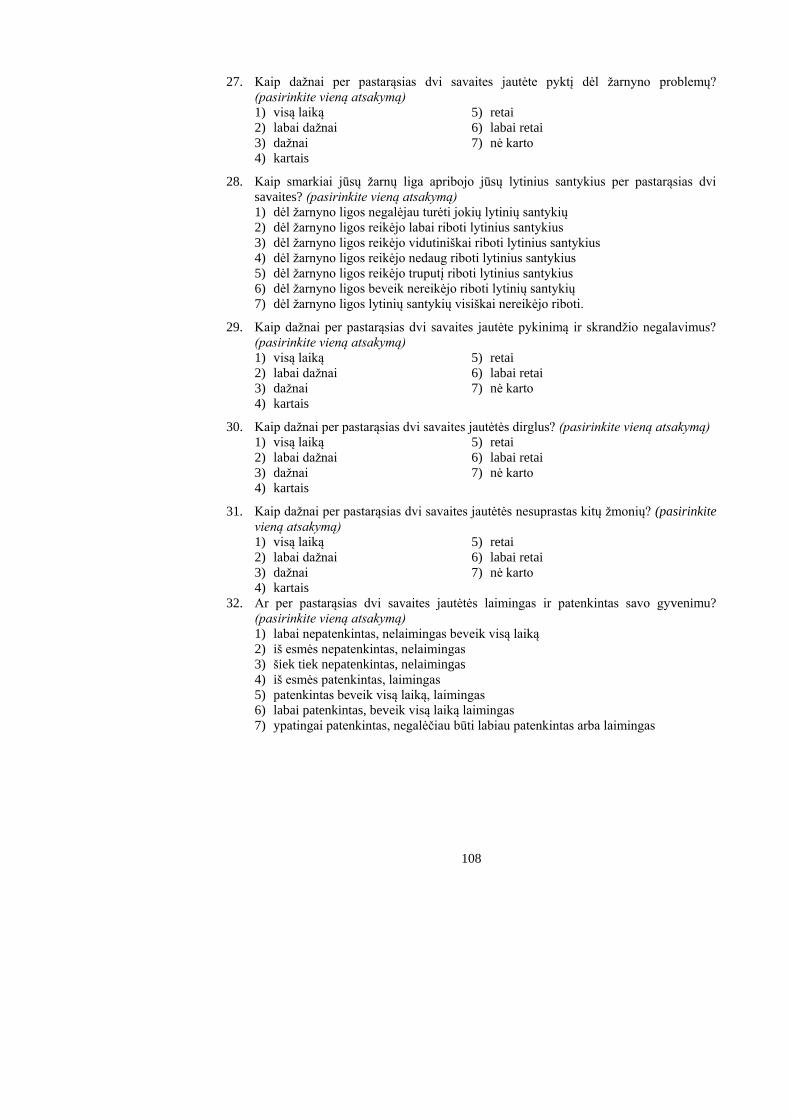
108
27. Kaip dažnai per pastarąsias dvi savaites jautėte pyktį dėl žarnyno problemų?
(pasirinkite vieną atsakymą)
1) visą laiką 5) retai
2) labai dažnai 6) labai retai
3) dažnai 7) nė karto
4) kartais
28. Kaip smarkiai jūsų žarnų liga apribojo jūsų lytinius santykius per pastarąsias dvi
savaites? (pasirinkite vieną atsakymą)
1) dėl žarnyno ligos negalėjau turėti jokių lytinių santykių
2) dėl žarnyno ligos reikėjo labai riboti lytinius santykius
3) dėl žarnyno ligos reikėjo vidutiniškai riboti lytinius santykius
4) dėl žarnyno ligos reikėjo nedaug riboti lytinius santykius
5) dėl žarnyno ligos reikėjo truputį riboti lytinius santykius
6) dėl žarnyno ligos beveik nereikėjo riboti lytinių santykių
7) dėl žarnyno ligos lytinių santykių visiškai nereikėjo riboti.
29. Kaip dažnai per pastarąsias dvi savaites jautėte pykinimą ir skrandžio negalavimus?
(pasirinkite vieną atsakymą)
1) visą laiką 5) retai
2) labai dažnai 6) labai retai
3) dažnai 7) nė karto
4) kartais
30. Kaip dažnai per pastarąsias dvi savaites jautėtės dirglus? (pasirinkite vieną atsakymą)
1) visą laiką 5) retai
2) labai dažnai 6) labai retai
3) dažnai 7) nė karto
4) kartais
31. Kaip dažnai per pastarąsias dvi savaites jautėtės nesuprastas kitų žmonių? (pasirinkite
vieną atsakymą)
1) visą laiką 5) retai
2) labai dažnai 6) labai retai
3) dažnai 7) nė karto
4) kartais
32. Ar per pastarąsias dvi savaites jautėtės laimingas ir patenkintas savo gyvenimu?
(pasirinkite vieną atsakymą)
1) labai nepatenkintas, nelaimingas beveik visą laiką
2) iš esmės nepatenkintas, nelaimingas
3) šiek tiek nepatenkintas, nelaimingas
4) iš esmės patenkintas, laimingas
5) patenkintas beveik visą laiką, laimingas
6) labai patenkintas, beveik visą laiką laimingas
7) ypatingai patenkintas, negalėčiau būti labiau patenkintas arba laimingas
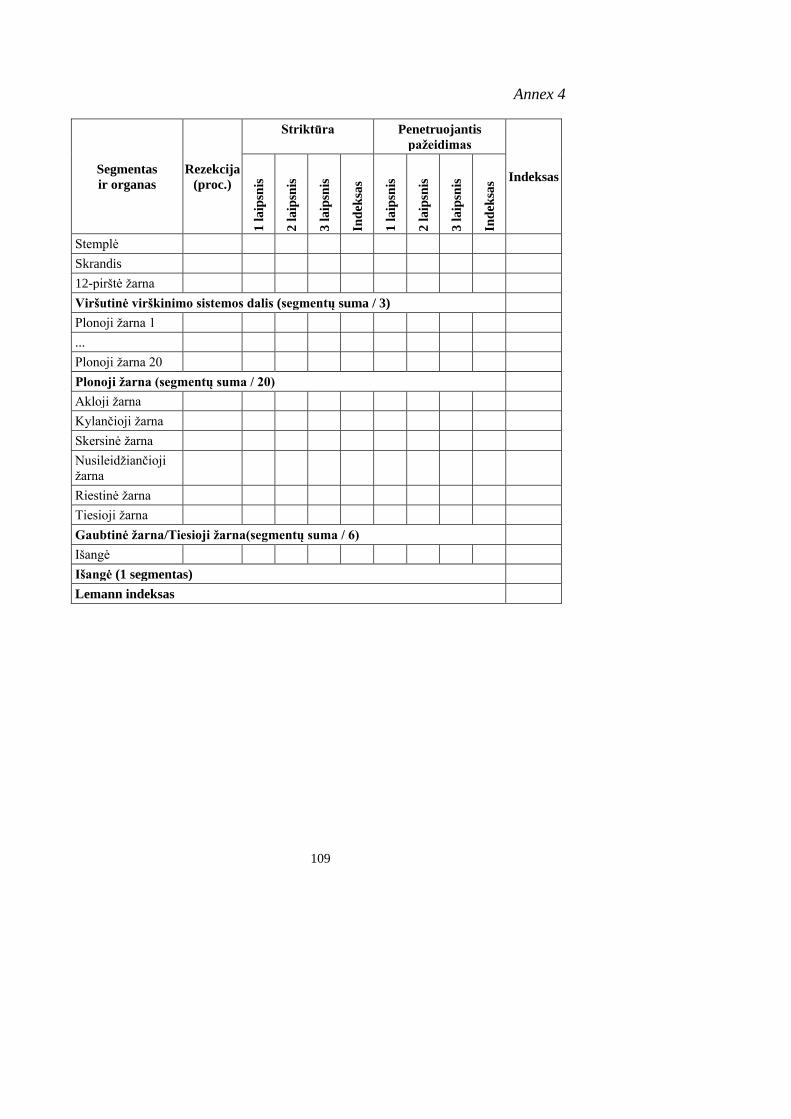
109
Annex 4
Segmentas
ir organas
Rezekcija
(proc.)
Striktūra Penetruojantis
pažeidimas
Indeksas
1 l
aip
snis
2 l
aip
snis
3 l
aip
snis
Ind
eksa
s
1 l
aip
snis
2 l
aip
snis
3 l
aip
snis
Ind
eksa
s
Stemplė
Skrandis
12-pirštė žarna
Viršutinė virškinimo sistemos dalis (segmentų suma / 3)
Plonoji žarna 1
...
Plonoji žarna 20
Plonoji žarna (segmentų suma / 20)
Akloji žarna
Kylančioji žarna
Skersinė žarna
Nusileidžiančioji
žarna
Riestinė žarna
Tiesioji žarna
Gaubtinė žarna/Tiesioji žarna(segmentų suma / 6)
Išangė
Išangė (1 segmentas)
Lemann indeksas
110
CURRICULUM VITAE
Name, Surname: Vestina Strakšytė
Address: Hospital of Lithuanian University of Health
Sciences Kauno klinikos, Department of Radiology.
Eivenių 2, LT-50009 Kaunas, Lithuania
E-mail: [email protected]
Workplace:
from 2011 till present Hospital of Lithuanian University of Health
Sciences Kauno klinikos, Department of Radiology;
radiologist
from 2019 till present Lithuanian University of Health Sciences, Medical
Academy; lecturer
Education:
September 2000 – Kaunas University of Medicine, Lithuania
June 2006 Master Degree in Medicine
September 2006 – University Hospital of Klaipėda, Lithuania
June 2007 Internship
August 2007 – Lithuanian University of Health Sciences, Lithuania
June 2011 Residency in Radiology
September 2011 – Lithuanian University of Health Sciences, Lithuania
June 2018 Ph.D. Student
Membership at professional societies:
Lietuvos radiologų asociacijos narė (LRA),
Kauno krašto radiologų draugijos (KKRD) narė,
ESR – European Society of Radiology,
ESGAR – European Society of Gastrointestinal and Abdominal Radiology,
ESOI – European Society of Oncologic Imaging,
ESER – European Society of Emergency Radiology,
ESTI – European Society of Thoracic Imaging.


