Embed Size (px)
Citation preview

SN
MHa
b
c
a
ARRA
KTN4EH
1
1wescb
le(a(4he
H
0h
Journal of Pharmaceutical and Biomedical Analysis 76 (2013) 13– 20
Contents lists available at SciVerse ScienceDirect
Journal of Pharmaceutical and Biomedical Analysis
jou rn al h om epage: www.elsev ier .com/ locate / jpba
ensitive HPLC–PDA determination of tamoxifen and its metabolites-desmethyltamoxifen, 4-hydroxytamoxifen and endoxifen in human plasma
arina Venzon Antunesa,b,∗, Daniela Dornelles Rosab,c, Tamyris dos Santos Vianaa,uander Andreollac, Tiago Ozelame Fontaniveb, Rafael Lindena
Instituto de Ciências da Saúde, Universidade Feevale, Novo Hamburgo, BrazilPrograma de Pós-graduac ão em Ciências Médicas, Universidade Federal do Rio Grande do Sul, Porto Alegre, BrazilHospital Fêmina de Porto Alegre, Grupo Hospitalar Conceic ão, Porto Alegre, Brazil
r t i c l e i n f o
rticle history:eceived 8 October 2012eceived in revised form 5 December 2012ccepted 5 December 2012
eywords:amoxifen-desmethyltamoxifen
a b s t r a c t
A highly sensitive HPLC–UV method for the simultaneous determination of tamoxifen, N-desmethyltamoxifen, 4-hydroxytamoxifen and endoxifen in human plasma samples was developedand validated. The method employs a two step liquid–liquid extraction and a reversed phase sep-aration on a Hypersil Gold® C18 column (150 mm × 4.6 mm, 5 �m) with isocratic elution. Mobilephase was a mixture of triethylammonium phosphate buffer 5 mM pH 3.3 and acetonitrile (57:43,v/v). Total analytical run time was 16 min. Precision assays showed CV % lower than 10.53% andaccuracy in the range of 93.0–104.2%. The lower limits of quantification (0.75–8.5 ng ml−1) are ade-
-HydroxytamoxifenndoxifenPLC–UV
quate to measure clinically relevant concentrations in plasma samples. The method was successfullyapplied to 110 clinical plasma samples. Median plasma levels and interquartile range were: tamoxifen55.77 ng ml−1 (38.42–83.69 ng ml−1), N-desmethyltamoxifen 124.83 ng ml−1 (86.81–204.80 ng ml−1), 4-hydroxytamoxifen 1.09 ng ml−1 (0.76–1.53 ng ml−1) and endoxifen 6.18 ng ml−1 (4.17–8.22 ng ml−1). Theprocedure has adequate analytical performance and can be employed in therapeutic drug monitoring of
inetic
tamoxifen or pharmacok. Introduction
Tamoxifen (TAM) [trans-1-(4-�-dimethylaminoethoxyphenyl)-,2-diphenyl-1-butene] is a non-steroidal anti-estrogen drugidely used in the treatment of breast carcinoma and, to a lesser
xtent, to the prevention of breast cancer [1]. TAM therapy has aignificant impact on the survival rates of women with breast can-er, reducing mortality by approximately 31% [1] and recurrencesy 50% [2].
TAM is a prodrug since some of its metabolites are more bio-ogically active than the parent compound [3]. Cytochrome P450nzymes CYP 3A4/3A5 metabolize TAM to N-desmethyltamoxifenNDT), which is further transformed, mainly by CYP2D6, to the mostbundant active metabolite, 4-hydroxy-N-desmethyl-tamoxifenendoxifen, EDF). Another important product of TAM metabolism is-hydroxy-tamoxifen (HTF) [4]. HTF and EDF have about 100-fold
igher antiestrogenic effects than TAM. However EDF is consid-red the major active metabolite since its plasma concentrations∗ Corresponding author at: Rodovia RS 239, n. 2755, CEP 93352-000, Novoamburgo-RS, Brazil. Tel.: +55 51 35868800; fax: +55 51 35868800.
E-mail address: [email protected] (M.V. Antunes).
731-7085/$ – see front matter © 2012 Published by Elsevier B.V.ttp://dx.doi.org/10.1016/j.jpba.2012.12.005
s studies.© 2012 Published by Elsevier B.V.
are approximately 6 times higher than of HTF [3,5,6]. The structuresof TAM and its major metabolites are presented in Fig. 1.
Besides the wide use of TAM in breast cancer treatment, thereis substantial inter-patient variability in both the development ofresistance to TAM therapy and the occurrence of adverse reac-tions. One of the possible explanations for this phenomenon is thatactivity and side effects of TAM may be attributed not only to theconcentration of the parent drug but also to the levels of its metabo-lites and their accumulation in plasma [3]. Due to their high affinityto estrogen receptors, HTF and EDF are believed to give a majorcontribution to the effects of TAM. Side effects, however, may becaused either by TAM and its demethylated metabolite NDT, whichare present in plasma in concentrations 50–135 times higher thanHTF and EDF [7].
Plasma concentrations of EDF are highly variable amongpatients, mainly due to the polymorphic distribution of CYP2D6activity, resulting in a range of metabolic activity phenotypes, andto the effect of enzyme activity modulators [8]. Several studies sug-gested that reduced levels of EDF are related to worse prognosis,including higher recurrence rates and mortality [4,9,10]. Thus, peri-
odic monitoring of EDF plasma levels could be considered as a usefulalternative in the assessment of TAM therapy.The widespread use of TAM and the interindividual variability intherapeutic response stimulated efforts to develop routine assays

14 M.V. Antunes et al. / Journal of Pharmaceutical and Biomedical Analysis 76 (2013) 13– 20
tion o
fVowearsu[me
hoTLrdotm[asescsupp
Ha
Fig. 1. Main metabolic pathways of tamoxifen, including forma
or quantitation of the drug and its metabolites in human plasma.arious publications reported analytical methods for the analysisf TAM and its phase I metabolites [3,11–20]. Gas chromatographyith mass spectrometry detection (GC–MS) is highly specific, how-
ver time consuming since TAM and metabolites are non volatilend a derivatization step is necessary [11,20]. Liquid chromatog-aphy coupled to tandem mass spectrometry (LC–MS/MS) is aensitive and highly specific method that has been successfullysing the measurement of TAM and metabolites in biosamples3,8,12,18,21,22]. However, LC–MS/MS requires expensive equip-
ent that is generally not available in many routine laboratories,specially in developing countries.
A cost-effective and more accessible approach is the use ofigh performance liquid chromatography (HPLC) coupled to flu-rescence (FL) or ultra-violet (UV) detection [13,14,16,17,19,23].hese systems are free from matrix ionization effects observed inC–MS/MS, however requiring complete chromatographic sepa-ation of the analytes and matrix components [24]. Fluorescenceetection involves pre- or post-column photochemical conversionf TAM and its metabolites to fluorescent phenanthrene deriva-ives. Besides the high sensibility obtained in this approach, the
ethod is labor intensive and requires special instrumentation16,17,19,23,25]. HPLC–UV is a relatively low cost system, whichllows robust and reproducible measurements [24] at acceptableensitivity once proper sample preparation is employed. How-ver, currently there is no report of a HPLC–UV method for theimultaneous determination of TAM, NDT, HTF and EDF at the con-entration levels usually found in clinical samples. Additionally, thepecificity of the UV detection can be further improved with these of a photodiode array detector (PDA), allowing spectral com-arisons and peak purity evaluation, what is especially useful in the
resence of other drugs [26].In the present work we developed and validated a sensitivePLC–PDA assay for TAM and its main metabolites NDT, HTFnd EDF, with acceptable performance to support clinical studies
f 4-hydrohytamoxifen, N-desmethyltamoxifen and endoxifen.
and therapeutic drug monitoring of these drugs in breast cancerpatients.
2. Experimental
2.1. Chemicals
Tamoxifen, 4-hydroxytamoxifen and verapamil hydrochlo-ride were purchased from Sigma (Saint Louis, USA).N-desmethyltamoxifen hydrochloride and N-desmethyl-4-hydroxytamoxifen were obtained from Toronto ResearchChemicals (North York, Canada). Triethylammonium phos-phate buffer 1 M pH 3.0 was purchased from Fluka (Buchs,Switzerland). Tris(hydroxymethyl)aminomethane was purchasedfrom Nuclear (Diadema, Brazil). Phosphoric acid 85%, reagentgrade, was obtained from Merck (Darmstadt, Germany). Methanol,acetonitrile, n-propanol and hexane (60% n-hexane), all HPLCgrade, were also obtained from Merck. Ultrapure water wasobtained through an Elga Purelab Ultra® apparatus from ElgaLabwater (High Wycombe, UK).
2.2. Preparation of solutions and standards
Individual methanolic stock solutions of TAM, NDT, EDF, andverapamil (IS) were prepared by powder dissolution in order toobtain a concentration of 1 mg ml−1. Stock methanolic solution ofHTF was prepared at the concentration of 0.1 mg ml−1. Workingsolutions were prepared combining aliquots of each stock solutionand proper volumes of methanol to obtain 6 standard solutionscontaining the following concentrations of TAM, NDT, HTF and EDF,
respectively: (1) 50, 85, 7.5 and 20 ng ml−1, (2) 100, 170, 10 and40 ng ml−1, (3) 500, 850, 20 and 80 ng ml−1, (4) 1000, 1700, 50 and100 ng ml−1, (5) 2000, 3400, 100 and 200 ng ml−1; (6) 3000, 5100,200 and 400 ng ml−1.
utical
tpmffp1Nh
2
atGfotflttww
2
toamowafa
2
pwaerti
2
dH5awttdsaroe
M.V. Antunes et al. / Journal of Pharmace
The working internal standard solution was prepared by dilu-ion of stock with methanol to obtain a 1 �g ml−1 solution. Mobilehase buffer was prepared daily diluting 500 �l of triethylam-onium phosphate buffer 1 M to 1000 ml with ultrapure water,
ollowed by filtration with 0.2 �m cellulose acetate membranesrom Sartorius (Göettingen, Germany). Tris buffer pH 10.0 was pre-ared dissolving 2.43 g of tris(hydroxymethyl)-aminomethane in00 ml of ultrapure water and the pH was properly adjusted withaOH 0.1 M. Extraction solvent was prepared by mixing 95 ml ofexane and 5 ml of n-propanol.
.3. Equipment and chromatographic conditions
The HPLC system consisted of an Accela UHPLC® coupled ton Accela® Photodiode Array Detector, both from Thermo Scien-ific (San Jose, USA). The separation was performed on a Hypersilold® C18 column (150 mm × 4.6 mm, particle diameter 5 �m),
rom Thermo Scientific (San Jose, USA). Mobile phase was a mixturef triethylammonium phosphate buffer 5 mM pH 3.3 and acetoni-rile (57:43, v/v), which was sonicated for 15 min before use. Theow rate was set at 1.0 ml min−1 from 0 to 6 min, and increasedo 1.3 ml min−1 at 6.1 min until the end of analysis. The columnemperature was set at 30 ◦C. Total run time was 16 min. Spectraere acquired in the range of 200–380 nm and the quantitationavelength was 280 nm.
.4. Sample preparation
To 10 ml screw cap glass tubes, 2 ml of calibration, quality con-rol or patient’s plasma samples were added, followed by 0.1 mlf IS solution (verapamil 1 �g ml−1), 0.7 ml of Tris buffer pH 10.0nd 5.2 ml of extraction solvent. The tubes were capped and gentlyixed for 10 min and then centrifuged at 2000 g for 10 min. The
rganic layer was transferred to a clean test tube and the analytesere re-extracted to 0.1 ml of an aqueous solution of phosphoric
cid 0.1% (v/v). After homogenization and centrifugation at 2000 × gor 15 min, the aqueous layer was transferred to an autosampler vialnd 50 �l were injected into the HPLC–PDA system.
.5. Selectivity
Blank plasma samples from 6 different human sources were pre-ared as described above to check for peaks that might interfereith the detection of the analytes or the IS. In addition, the use of
photodiode array detector (PDA) permitted to check for the pres-nce of spectral impurities in each chromatographic peak. All drugseported as concurrently used with tamoxifen by patients (listed inhe supplementary material) were also tested for chromatographicnterferences.
.6. Stability
For estimation of stability of processed samples under the con-itions of analysis, two control samples containing TAM, NDT,TF and EDF at 9.0, 15.0, 1.9 and 3.8 ng ml−1 and 240.0, 400.0,0.0 and 100.0 ng ml−1, respectively, (n = 8 each) were extracteds described above. The extracts obtained at each concentrationere pooled. Aliquots of these pooled extracts at each concen-
ration were transferred to autosampler vials and injected underhe conditions of a regular analytical run at time intervals of 1 h,uring 12 h. Stability of analytes was tested by regression analy-is plotting absolute peak areas corresponding to each compound
t each concentration vs. injection time. Using the obtained linearegression, the concentration after 12 h was calculated. A decreaser increase of up to 10% in the measured peak areas was consid-red as acceptable. For evaluation of freeze–thaw stability, qualityand Biomedical Analysis 76 (2013) 13– 20 15
control samples at 3 levels (TAM, NDT, HTF and EDF at 9.0, 15.0,1.9 and 3.8 ng ml−1, 60.0, 100.0, 13.5 and 25.0 ng ml−1 and 240.0,400.0, 50.0 and 100.0 ng ml−1, respectively) were analyzed before(control samples, n = 3) and after 3 freeze–thaw cycles (stabil-ity samples, n = 9). For each freeze–thaw cycle, the samples werefrozen at −20 ◦C for 48 h, thawed, and kept at ambient temperaturefor 3 h before extraction. The concentrations of control and stabilitysamples were calculated from daily calibration curves and the vari-ance evaluated using ANOVA test. P values <0.05 were consideredstatistically significant.
2.7. Linearity
Aliquots of blank plasma (1800 �l) were enriched with 200 �l ofthe corresponding working solutions to obtain 6 calibration sam-ples containing: (1) 5.0, 8.5, 0.75 and 2.0 ng ml−1, (2) 10.0, 17.0,1.0 and 4.0 ng ml−1, (3) 50.0, 85.0, 2.0 and 8.0 ng ml−1, (4) 100.0,170.0, 5.0 and 10.0 ng ml−1, (5) 200.0, 340.0, 10.0 and 20.0 ng ml−1,(6) 300.0, 510.0, 20.0 and 40.0 ng ml−1 of TAM, NDT, HTF and EDF,respectively. Replicates (n = 6) at each concentration were analyzedas described above. Calibration curves were constructed by calcu-lating the ratios of the peak area of the analyte to the peak area of theinternal standard and relating these ratios with nominal concen-trations of the calibration samples. Homoscedasticity of calibrationdata was evaluated with F-test at the confidence level of 95%. Curveswere fitted by least-squares linear regression using several weight-ing factors (1/x, 1/x0.5, 1/x2, 1/y, 1/y0.5, 1/y2). The calibration modelswere evaluated by their correlation coefficients (r) and cumulativepercentage relative error (
∑%RE), according to Almeida et al. [27].
Daily calibration curves using the same concentrations (single mea-surements per concentration) were prepared with each batch ofvalidation and authentic samples.
2.8. Accuracy and precision
Aliquots of blank plasma (1800 �l) were enriched with 200 �lof the corresponding working solutions to obtain quality controlsamples containing TAM, NDT, HTF and EDF at 9.0, 15.0, 1.9 and3.8 ng ml−1, respectively (quality control low, QCL), 60.0, 100.0,13.5, 25.0 ng ml−1 (quality control medium, QCM) and 240.0, 400.0,50.0 and 100 ng ml−1 (quality control high, QCH). The quality con-trol samples were analyzed as described above in triplicate on eachof 5 days. Within-assay precision and between-day precision werecalculated by one-way ANOVA with the grouping variable “day”and were expressed as CV %. Accuracy was defined as the percent-age of the nominal concentration represented by the concentrationestimated with the calibration curve. The acceptance criteria foraccuracy were mean values within ±15% of the theoretical valueand for precision a maximum CV of 15% was accepted [28].
2.9. Lower limit of quantification
The lowest point of the calibration curve was 5.0, 8.5, 0.75 and2.0 ng ml−1 for TAM, NDT, HTF and EDF, respectively. An indepen-dent quality control sample at this concentration was includedin the accuracy and precision experiments (quality control at thelimit of quantitation, QCLOQ) and was tested in triplicate in threedifferent days. The acceptance criteria established for the limit ofquantification was accuracy within 100 ± 20% of the nominal valueand a maximum CV of 20% [28].
2.10. Extraction efficiency
The extraction efficiency was determined by comparing thepeak areas of the analytes obtained at the plasma QC samples ofthe accuracy and precision experiments to those obtained with

1 utical
mmcc
2
mcdtbTApnamotmaat1scSDe(
3
3
datbi(Td1EaaDvpdtofatomao
t
6 M.V. Antunes et al. / Journal of Pharmace
ethanolic solutions at levels corresponding to complete recovery,easured in triplicate at three different days, in the same analyti-
al batch. Extraction efficiency was expressed as percentage of theoncentration of the reference samples.
.11. Method application
After approval by institutional review board and ethics com-ittee of the Grupo Hospitalar Conceic ão (project 09-241), a
ross-sectional study was performed enrolling patients previouslyiagnosed with breast cancer who were taking adjuvant hormonalherapy with TAM. The 110 participants of the study were recruitedetween January and April 2010 from the list of patients receivingAM at pharmacy service of Fêmina Hospital in the city of Portolegre, Brazil. Written informed consent was obtained from allatients. The participants of the study were female patients diag-osed with ER-positive breast cancer at any stage of the disease, indjuvant treatment with a daily dose of 20 mg of TAM for at least 4onths. The study exclusion criteria were the presence of kidney
r liver disease. The date of initiation of therapy and the hour ofhe last TAM dose, were recorded. The adherence to TAM was esti-
ated by counting the number of dispensed tablets used monthly,s reported by the patients. Blood samples were taken 16–24 hfter the last TAM intake, collected by venipuncture to EDTA con-aining tubes. After collection, the tubes were centrifuged within0 min and plasma was separated and kept at −70 ◦C until analy-is, which was performed within two weeks. TAM and metabolitesoncentrations were estimated through daily calibration curves.ince results were not normally distributed as assessed by the’Agostino–Pearson test (P < 0.05, N = 110), concentration data forach analyte was presented as median and interquartile rangeIQR).
. Results and discussion
.1. Chromatography and sample preparation
TAM, NDT, HTF and EDF are structurally very similar, with smallifferences as result of enzymatic demethylation and/or hydroxyl-tion, which results in differences on the polarity to such an extenthat reversed phase octadecylsilyl columns are, in most cases, capa-le of providing sufficient selectivity for their baseline separation
n HPLC [24]. In this study we used a Hypersil Gold® C18 column150 mm × 4.6 mm, 5 �m), which allowed an efficient separation ofAM and the 3 metabolites without the need of mobile phase gra-ient, within a reasonable run time. Total analytical run time was6 min, with retention times of 3.5 min internal standard, 5.2 minDF, 5.6 min HTF, 11.9 min NDT and 13.5 min TAM (Fig. 2B). Ver-pamil was chosen as internal standard by its good absorptiont 280 nm, acceptable chromatographic behavior and availability.espite the fact that none of our patients reported the clinical use oferapamil, care should be taken to obtain a drug use record from theatients to avoid erroneous peak areas of the internal standard. Allrugs reported by the patients as concurrently use with were testedo evaluate the potential interference with analytes’ peaks. Nonef the 39 tested drugs presented retention times similar to thoserom analytes and IS (Table S1, supplementary material). Ritonavir,
more lipophilic drug did not elute within the analytical run time,he possibility of elution as a “ghost peak” in subsequent runs mayccur with other analytes as well, which applies to any analyticalethod. Moreover, all peaks were checked for spectral purity and
lso identified by similarity with reference UV spectra in the rangef 200–380 nm.
Supplementary data associated with this article can be found, inhe online version, at http://dx.doi.org/10.1016/j.jpba.2012.12.005.
and Biomedical Analysis 76 (2013) 13– 20
MacCallum et al. [13] published a 13 min run time HPLC–UVmethod for detection of TAM and metabolites in plasma samples.However the authors did not included EDF in the assay. Consid-ering that EDF is TAM’s major active metabolite and treatmentprognostic seems to be related to its levels [3,5], the applicabil-ity of this method in pharmacokinetic studies and in the evaluationof TAM therapy may be limited. The two published HPLC–FL meth-ods with simultaneous detection of TAM, NDT, HTF and EDF, hadlonger run times, of 25 min [25] and 70 min [17], reducing theirapplicability for routine analysis, along with higher cost associatedto the usage of solvents and the disposal of the chemical residues.Other fluorescence detection based methods had shorter run times,from 11 to 18 min, but EDF was not included in any of the assays[16,19,29] or even only TAM was detected [14,23]. Moreover, theuse of HPLC–FL for TAM and metabolites measurement requiredspecial photochemical reaction cells. Several LC–MS/MS methodsfor simultaneous determination of TAM, NDT, HTF and EDF havebeen described [3,8,21,22]. However, the high purchasing costs ofLC–MS/MS instruments represents a difficulty to the disseminationof these methods in many sites where EDF measurement may beuseful.
Interfering endogenous plasma peaks were not observed inblank plasma samples (Fig. 2A). Additionally, all analytes’ peakswere evaluated with respect to their spectral purity and comparedwith library reference UV spectra, using the PDA software. No spec-tral impurity was observed in identified peaks or in any patient’stested sample.
In the present work, for means of simplicity and cost, we choosea liquid–liquid extraction procedure with a solvent mixture of hex-ane: n-propanol (95:5 v/v) followed by a re-extraction step into anacidic aqueous solution. In order to obtain a high sensitive test,we used a 2 ml plasma sample volume. Additionally, the two stepextraction procedure provided very clean extracts in which the ana-lytes were almost 20-fold concentrated. All compounds presentedadequate limits of detection, with mean extraction recovery of 75.5,86, 95.8 and 80.5% for TAM, NDT, HTF and EDF, respectively. More-over, the fast sample preparation due to the absence of a solventevaporation step represents a considerable advantage of the pro-cedure. Plasma samples have been extracted for the determinationof TAM and metabolites by HPLC–UV mainly using solid-phase [13]and one step liquid–liquid extraction procedures [16,17,19].
3.2. Method validation
There was no indication of instability of the analytes in any ofthe tested conditions. Regression analysis of absolute peak areas ofTAM and metabolites plotted vs. injection time indicated no insta-bility of processed samples during a time interval of 12 h, withconcentration changes based on linear regression on the range of-3.8–4.9%. The time frame of 12 h was determined considering themaximum run time needed for analysis of a large batch of sampleswith the developed method. Freeze–thaw samples also fulfilledthe acceptance criteria, there was no statistically significant dif-ference between means of concentrations of three stability cyclesvs. control samples (P > 0.05) (Table 1).
Calibration samples were prepared at 6 concentrations spreadfrom 5.0 to 300 ng ml−1 for TAM, 8.5 to 510 ng ml−1 for NDT, 0.75to 20 ng ml−1 for HTF and 2.0 to 40 ng ml−1 EDF, covering plasmaconcentrations that are to be expected for patients receiving a dailyTAM dosage of 20 mg [8,15,17,29–34]. Several weighted regressionmodels were evaluated in order to account to the significant het-eroscedasticity of the calibration data. The best weighting factor∑
was chosen according to the %RE, defined as the sum of absolutepercentage relative error, which compares the regressed concen-tration computed from the regression equation obtained for eachweighting factor, with the nominal standard concentration. The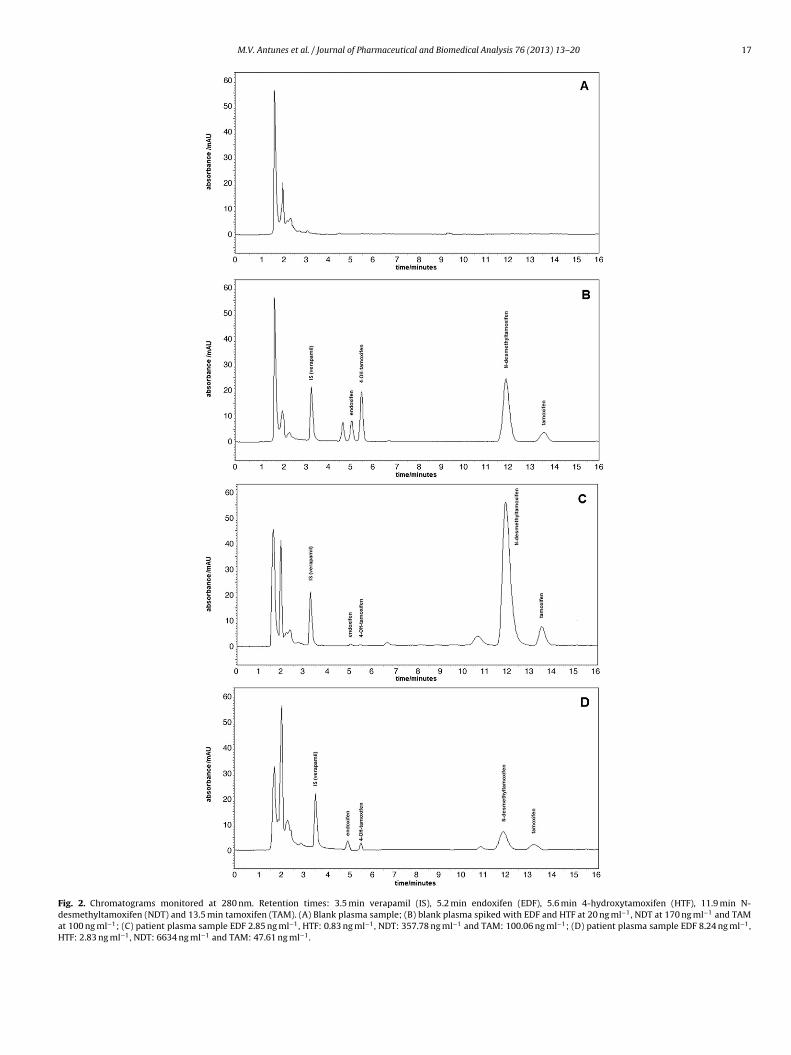
M.V. Antunes et al. / Journal of Pharmaceutical and Biomedical Analysis 76 (2013) 13– 20 17
Fig. 2. Chromatograms monitored at 280 nm. Retention times: 3.5 min verapamil (IS), 5.2 min endoxifen (EDF), 5.6 min 4-hydroxytamoxifen (HTF), 11.9 min N-desmethyltamoxifen (NDT) and 13.5 min tamoxifen (TAM). (A) Blank plasma sample; (B) blank plasma spiked with EDF and HTF at 20 ng ml−1, NDT at 170 ng ml−1 and TAMat 100 ng ml−1; (C) patient plasma sample EDF 2.85 ng ml−1, HTF: 0.83 ng ml−1, NDT: 357.78 ng ml−1 and TAM: 100.06 ng ml−1; (D) patient plasma sample EDF 8.24 ng ml−1,HTF: 2.83 ng ml−1, NDT: 6634 ng ml−1 and TAM: 47.61 ng ml−1.

18 M.V. Antunes et al. / Journal of Pharmaceutical and Biomedical Analysis 76 (2013) 13– 20
Table 1Benchtop and freeze and thaw stability.
Nominal concentration (ng ml−1) Benchtop stability Freeze and thaw stability
Concentration changeafter 12 h (based onregression) (%)
Control concentration after each cycle (n = 3)
First Second Third P value (ANOVA)
TAM9.0 2.1 8.9 9.7 10.0 0.17
60.0 – 60.6 58.3 62.9 0.55240.0 −3.5 247.1 228.7 236.9 0.36
NDT15.0 −3.1 16.3 15.6 15.7 0.82
100.0 – 99.3 95.7 99.5 0.35400.0 −2.9 407.4 407.7 405.3 0.98
HTF1.9 −3.2 1.8 1.8 1.7 0.96
13.5 – 37.3 37.2 39.1 0.4150.0 −2.6 47.6 48.3 48.2 0.96
EDF3.8 −3.8 3.7 3.5 3.6 0.78
25.0 – 24.0 23.1 24.0 0.88
E oxifen
iicr0oe
pciaoWba
ccfcqrbm
dltatmTdstpsitd
100.0 4.9
DF: endoxifen, HTF: 4-hydroxytamoxifen, NDT: N-desmethyltamoxifen, TAM: tam
nverse of the concentration (1/x) was selected as the best weight-ng factor for all analytes, with maximum
∑%RE of 5.9 × 10⁻²,
ontrasting to a maximum∑
%RE of 12.31 when unweightedegression was applied. The coefficients of correlation were above.994 for all weighing factors. The back-calculated concentrationsf all calibration samples fulfilled the criteria established by Shaht al. [28].
QC samples for accuracy and precision experiments were pre-ared at 3 concentrations (QCL, QCM, and CQH) covering thealibration range. The results of the accuracy and precision exper-ments are given in Table 2. All accuracy values fulfilled thecceptance criteria for this parameter, lying within the rangef 93.0–104.2% of the nominal concentrations of the analytes.ith-assay precision (CV %) was in the range of 4.82–10.53% and
etween-assay precision of 3.22–6.75%, also in accordance to thecceptance criteria.
Another QC sample containing TAM and metabolites at con-entrations equal to those of the lowest point of the calibrationurve (QCLOQ) was prepared to determine whether the criteriaor analytical recovery and precision were fulfilled even at thisoncentration, which corresponded to the practical lower limit ofuantitation (LLOQ). The QCLOQ sample presented accuracy in theange of 105.4–110.3%, within-assay precision of 7.11–12.03%, andetween-assay of 8.43–11.54%, also fulfilling the previously deter-ined acceptance criteria.In the last decade many HPLC methods for chromatographic
etermination of TAM and its phase I metabolites have been pub-ished. In the most recent studies, the LC systems were coupledo a mass spectrometer detector, which provides highly sensitivenalysis [3,8,12,18]. Considering the limited access to these sys-ems in many laboratories the availability of a low cost HPLC–UV
ethod with acceptable performance can be a useful alternative.he lower limits of quantification reached in this study with UVetection, particularly for EDF (2.0 ng ml−1), are enough to mea-ure clinically relevant concentration of TAM and its metabolites inhe majority of clinical plasma samples [8,15,17,29–34]. Only HTFresented concentrations below LOQ in 14 (12.7%) of the tested
amples. However, as EDF is the major responsible for the biolog-cal effects of TAM, the assay was capable to quantify accuratelyhis metabolite in all tested samples, as well as NDT and TAM. A UVetection method with a 2.0 ng ml−1 limit of quantification of TAM95.6 108.6 105.0 0.15
.
in plasma has been previously reported [13], however, EDF was notincluded in the assay.
3.3. Method application
The reported method was applied to 110 women who were tak-ing oral TAM adjuvant therapy in a 20 mg/day dosage. All patientswere classified as adherent to TAM, with reported use of 30 tabletsmonthly. Samples were obtained after the fourth month of adjuvanttherapy in order to achieve steady-state plasma concentrations ofTAM and its metabolites. Trough plasma concentrations of TAMand its metabolites of patients presented high variability, as pre-sented in Table 3. Fig. 2C presents a chromatogram obtained from apatient with low EDF (2.85 ng ml−1) and high NDT (357.78 ng ml−1)levels. Fig. 2D presents a chromatogram from a patient with higherEDF (8.24 ng ml−1) and lower NDT (66.34 ng ml−1) levels, which arerelated to differences on the activity of CYP2D6 [6].
Median plasma levels and IQR in the whole cohort were:TAM 55.77 ng ml−1 (38.42–83.69 ng ml−1), NDT 124.83 ng ml−1
(86.81–204.80 ng ml−1), HTF 1.09 ng ml−1 (0.76–1.53 ng ml−1)and EDF 6.18 ng ml−1 (4.17–8.22 ng ml−1). These concentrationswere consistent to those previously reported in the literature[8,15,17,29–34]. Median EDF levels were 5.7-fold higher thanthat of HTF. The magnitude of this difference was similar to the5.8-fold [3] and 6.8-fold [5] previously reported, reinforcing theclinical importance of highly sensitive analytical methods for thisapplication.
Fourteen patients had detectable HTF levels, but with concentra-tions below the lower limit of quantification (0.75 ng ml−1). Besidesthe potent antiestrogenic effect of HTF, once EDF plasma con-centrations are considerably higher, recent studies suggest thatevaluation of TAM therapy should focus mainly on EDF estimationand not only on HTF [3,5].
In our study a wide range of EDF plasma concentrationswas observed, with an 8.7 fold difference between the low-est (2.07 ng ml−1) and the highest (18.05 ng ml−1) measurement.The wide range of values might be attributed to the interindi-
vidual pharmacokinetic variability, including impaired CYP2D6metabolism. Even considering that therapeutic ranges for TAMand its active metabolites have not yet been established, it shouldbe noted that 32 patients (29.2%) had EDF plasma levels below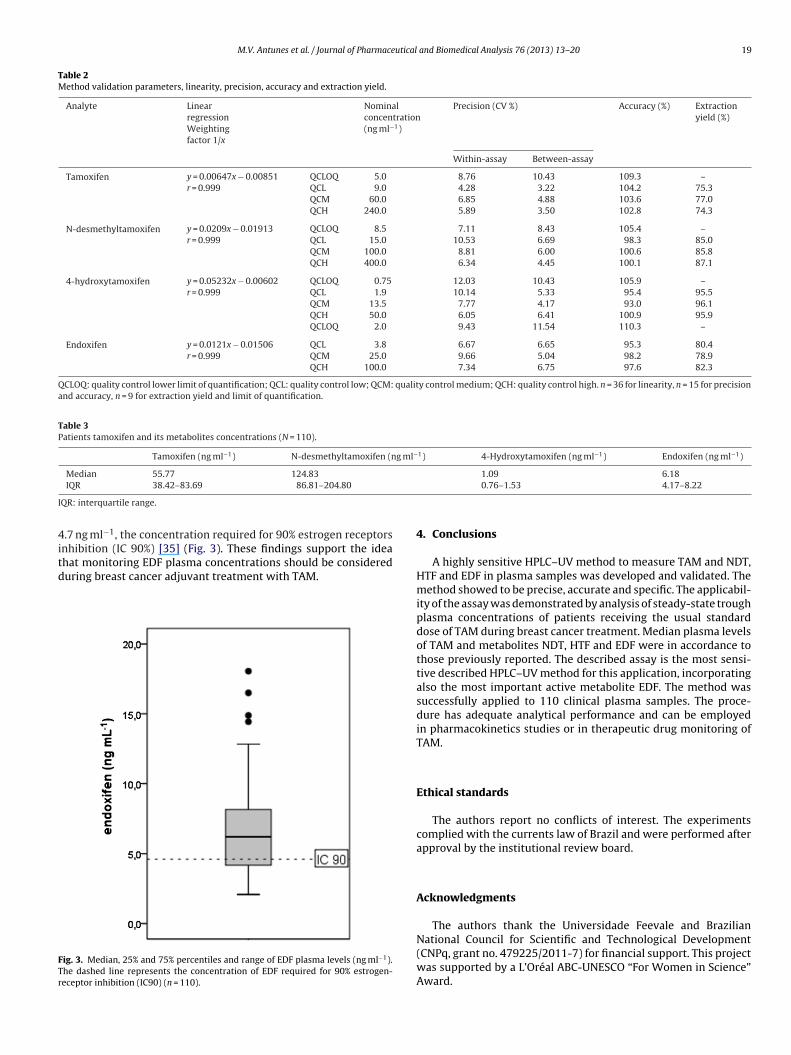
M.V. Antunes et al. / Journal of Pharmaceutical and Biomedical Analysis 76 (2013) 13– 20 19
Table 2Method validation parameters, linearity, precision, accuracy and extraction yield.
Analyte LinearregressionWeightingfactor 1/x
Nominalconcentration(ng ml−1)
Precision (CV %) Accuracy (%) Extractionyield (%)
Within-assay Between-assay
Tamoxifen y = 0.00647x − 0.00851r = 0.999
QCLOQ 5.0 8.76 10.43 109.3 –QCL 9.0 4.28 3.22 104.2 75.3QCM 60.0 6.85 4.88 103.6 77.0QCH 240.0 5.89 3.50 102.8 74.3
N-desmethyltamoxifen y = 0.0209x − 0.01913r = 0.999
QCLOQ 8.5 7.11 8.43 105.4 –QCL 15.0 10.53 6.69 98.3 85.0QCM 100.0 8.81 6.00 100.6 85.8QCH 400.0 6.34 4.45 100.1 87.1
4-hydroxytamoxifen y = 0.05232x − 0.00602r = 0.999
QCLOQ 0.75 12.03 10.43 105.9 –QCL 1.9 10.14 5.33 95.4 95.5QCM 13.5 7.77 4.17 93.0 96.1QCH 50.0 6.05 6.41 100.9 95.9QCLOQ 2.0 9.43 11.54 110.3 –
Endoxifen y = 0.0121x − 0.01506r = 0.999
QCL 3.8 6.67 6.65 95.3 80.4QCM 25.0 9.66 5.04 98.2 78.9QCH 100.0 7.34 6.75 97.6 82.3
QCLOQ: quality control lower limit of quantification; QCL: quality control low; QCM: quality control medium; QCH: quality control high. n = 36 for linearity, n = 15 for precisionand accuracy, n = 9 for extraction yield and limit of quantification.
Table 3Patients tamoxifen and its metabolites concentrations (N = 110).
Tamoxifen (ng ml−1) N-desmethyltamoxifen (ng ml−1) 4-Hydroxytamoxifen (ng ml−1) Endoxifen (ng ml−1)
Median 55.77 124.83 1.09 6.18
I
4itd
FTr
IQR 38.42–83.69 86.81–204.80
QR: interquartile range.
.7 ng ml−1, the concentration required for 90% estrogen receptorsnhibition (IC 90%) [35] (Fig. 3). These findings support the idea
hat monitoring EDF plasma concentrations should be considereduring breast cancer adjuvant treatment with TAM.ig. 3. Median, 25% and 75% percentiles and range of EDF plasma levels (ng ml−1).he dashed line represents the concentration of EDF required for 90% estrogen-eceptor inhibition (IC90) (n = 110).
0.76–1.53 4.17–8.22
4. Conclusions
A highly sensitive HPLC–UV method to measure TAM and NDT,HTF and EDF in plasma samples was developed and validated. Themethod showed to be precise, accurate and specific. The applicabil-ity of the assay was demonstrated by analysis of steady-state troughplasma concentrations of patients receiving the usual standarddose of TAM during breast cancer treatment. Median plasma levelsof TAM and metabolites NDT, HTF and EDF were in accordance tothose previously reported. The described assay is the most sensi-tive described HPLC–UV method for this application, incorporatingalso the most important active metabolite EDF. The method wassuccessfully applied to 110 clinical plasma samples. The proce-dure has adequate analytical performance and can be employedin pharmacokinetics studies or in therapeutic drug monitoring ofTAM.
Ethical standards
The authors report no conflicts of interest. The experimentscomplied with the currents law of Brazil and were performed afterapproval by the institutional review board.
Acknowledgments
The authors thank the Universidade Feevale and Brazilian
National Council for Scientific and Technological Development(CNPq, grant no. 479225/2011-7) for financial support. This projectwas supported by a L’Oréal ABC-UNESCO “For Women in Science”Award.
2 utical
R
[
[
[
[
[
[
[
[
[
[
[
[
[
[
[
[
[
[
[
[
[
[
[
[
[
[
0 M.V. Antunes et al. / Journal of Pharmace
eferences
[1] N.V. Ahsen, C. Binder, J. Brockmoller, M. Oellerich, CYP2D6 and tamoxifen:pharmacogenetic reinvention of an established drug? J. Lab. Med. 33 (2009)1–9.
[2] J.N. Beverage, T. Sissung, A.M. Sion, R. Danesi, W. Figg, CYP2D6 polymorphismsand the impact on tamoxifen therapy, J. Pharm. Sci. 96 (2007) 2224–2231.
[3] S.F. Teunissen, H. Rosing, R.H.T. Koornstra, S.C. Linnb, J.H.M. Schellensc, A.H.Schinkel, J.H. Beijnen, Development and validation of a quantitative assayfor the analysis of tamoxifen with its four main metabolites and flavonoidsdaidzein, genistein and glycitein in human serum using liquid chromatog-raphy coupled with tandem mass spectrometry, J. Chromatgr. B 877 (2009)2519–2529.
[4] W.J. Irvin, C.M. Walko, K.E. Weck, J.G. Ibrahin, W.K. Chiu, E.C. Dees, S.G. Moore,O.A. Olajide, M.L. Grahan, S.T. Canale, R.E. Raab, S.W. Corso, J.M. Peppercorn, S.M.Anderson, K.J. Friedman, E.T. Ogburn, Z. Desta, D.A. Flockhart, H.L. McLeod, J.P.Evans, L.A. Carey, Genotype-guided tamoxifen dosing increases active metabo-lite exposure in women with reduced CYP2D6 metabolism: a multicenter study,J. Clin. Oncol. 29 (2011) 3232–3239.
[5] Y. Jin, Z. Desta, V. Stearns, B. Ward, H. Ho, K.H. Lee, T. Skaar, A.M. Storniolo, L. Li,A. Araba, R. Blanchard, A. Nguyen, L. Ullmer, J. Hayden, Z. Lemler, R.M. Wein-shilboum, J.M. Rae, D.F. Hayes, D.A. Flockhart, CYP2D6 genotype, antidepressantuse, and tamoxifen metabolism during adjuvant breast cancer treatment, J.Natl. Cancer Inst. 97 (2005) 30–39.
[6] M.V. Antunes, R. Linden, T.V. Santos, P. Wallemacq, V. Haufroid, J.F. Classen, H.Andreolla, N. Costa, T.O. Fontanive, D.D. Rosa, Endoxifen levels and its associa-tion with CYP2D6 genotype and phenotype: evaluation of a southern Brazilianpopulation under tamoxifen pharmacotherapy, Ther. Drug Monit. 34 (2012)422–431.
[7] L. Gallicchio, G. Lord, K. Tkaczuk, M. Danton, L.M. Lewis, C.K. Lim, J.A. Flaws,Association of tamoxifen (TAM) and TAM metabolite concentrations with self-reported side effects of TAM in women with breast cancer, Breast Cancer Res.Treat. 85 (2004) 89–97.
[8] J. Gjerde, E.R. Kisanga, M. Hauglid, P.I. Holm, G. Mellgren, E.A. Lien, Identifica-tion and quantification of tamoxifen and four metabolites in serum by liquidchromatography–tandem mass spectrometry, J. Chromatogr. A 1082 (2005)6–14.
[9] S. Borges, Z. Desta, L. Li, T.C. Skaar, B.A. Ward, A. Nguyen, Y. Jin, A.M. Storniolo,M. Nikoloff, L. Wu, G. Hillman, D.F. Hayes, V. Stearns, D.A. Flockhart, Quan-titative effect of CYP2D6 genotype and inhibitors on tamoxifen metabolism:implication for optimization of breast cancer treatment, Clin. Pharmacol. Ther.80 (2006) 61–74.
10] W.G. Newman, K.D. Hadfield, A. Latif, S.A. Roberts, A. Shenton, C. McHague, F.Lalloo, S.G. Howell Evans, Impaired tamoxifen metabolism reduces survival infamilial breast cancer patients, Clin. Cancer Res. 14 (2008) 5913–5918.
11] J. Girault, B. Istin, J.B. Fourtillan, Quantitative measurement of 4-hydroxytamoxifen in human plasma and mammary tumours by combined gas chro-matography/negative chemical ionization mass spectrometry, Biol. MassSpectrom. 22 (1993) 395–402.
12] R.M. Jones, Z.X. Yuan, J.H. Lamb, C.K. Lim, One-line high-performance liquidchromatographic-electrospray ionization mass spectrometric method for thestudy of tamoxifen metabolism, J. Chromatogr. A 722 (1996) 249–255.
13] J. MacCallum, J. Cummings, J.M. Dixon, W.R. Miller, Solid-phase extraction andhigh-performance liquid chromatographic determination of tamoxifen and itsmajor metabolites in plasma, J. Chromatogr. B 678 (1996) 317–323.
14] A. Yazigi, E. Legayada, Direct liquid chromatographic micro-measurement oftamoxifen in plasma of cancer patients, J. Chromatogr. B 691 (1997) 457–462.
15] H.S. Lim, L.H. Ju, L.K. Seok, L.E. Sook, I.J. Jang, J. Ro, Clinical implications ofCYP2D6 genotypes predictive of tamoxifen pharmacokinetics in metastaticbreast cancer, J. Clin. Oncol. 25 (2007) 3837–3845.
16] J.E. Manns, S. Hanks, J.E. Brown, Optimised separation of E- and Z-isomersof tamoxifen and its principal metabolites using reversed-phase high perfor-
mance liquid chromatography, J. Pharm. Biomed. Anal. 16 (1998) 847–852.17] K.H. Lee, B.A. Ward, Z. Desta, D.A. Flockhart, D.R. Jones, Quantification oftamoxifen and three metabolites in plasma by high-performance liquid chro-matography with fluorescence detection: application to a clinical trial, J.Chromatogr. B 791 (2003) 245–253.
and Biomedical Analysis 76 (2013) 13– 20
18] M. Furlanut, L. Franceschi, E. Pasqual, S. Bacchetti, D. Poz, G. Giorda, Tamox-ifen and its main metabolites serum and tissue concentrations in breast cancerwomen, Ther. Drug Monit. 29 (2007) 349–352.
19] Y.B. Zhu, Z. Zhang, J.J. Zou, Z.X. Yu, D.W. Xiao, Optimizing high-performanceliquid chromatography method with fluorescence detection for quantificationof tamoxifen and two metabolites in human plasma: application to a clinicalstudy, J. Pharm. Biom. Anal. 46 (2008) 349–355.
20] B.A. John, R.R. Brodie, G.A. Baldock, A. McBurney, L.F. Chasseaud, P. Jank, A. VonNiecieki, Pharmacokinetics and metabolism of the anti-oestrogen droloxifenein female human subjects, Xenobiotica 32 (2002) 699–713.
21] G.K. Poon, B. Walter, P.E. Lonning, M.N. Horton, R. McCague, Identification oftamoxifen metabolites in human Hep G2 cell line, human liver homogenate,and patients on long-term therapy for breast cancer, Drug Metab. Dispos. 23(1995) 377–382.
22] L.D. Williams, N.C. Twaddle, M.I. Churchwell, D.R. Doerge, Quantification oftamoxifen and metabolites and soy isoflavones in human plasma using liquidchromatography with electrospray ionization tandem mass spectrometry, J.AOAC Int. 89 (2006) 1168–1173.
23] J. Esteve-Romero, E. Ochoa-Aranda, D. Bose, M. Rambla-Alegre, J. Peris-Vicente,A. Martinavarro-Dominquez, Tamoxifen monitoring studies in breast cancerpatients by micellar liquid chromatography, Anal. Bioanal. Chem. 397 (2010)1557–1561.
24] S.F. Teunissen, H. Rosing, A.H. Schinkel, J.H.M. Schellens, J.H. Beijnen, Bioana-lytical methods for determination of tamoxifen and its phase I metabolites: areview, Anal. Chim. Acta 683 (2010) 21–37.
25] E.A. Lien, K. Wester, P.E. Lonning, E. Solheiml, P.M. Ueland, Distribution oftamoxifen and metabolites into brain tissue and brain metastases in breastcancer patients, Br. J. Cancer 63 (1991) 641–645.
26] F. Pragst, M. Herzler, B.T. Erxleben, Systematic toxicological analysis by high-performance liquid chromatography with diode array detection (HPLC–DAD),Clin. Chem. Lab. Med. 42 (2004) 1325–1340.
27] A.M. Almeida, M.M. Castel-Branco, A.C. Falcão, Linear regression for calibrationlines revisited: weighting schemes for bioanalytical methods, J. Chromatogr. B:Analyt. Technol. Biomed. Life Sci. 774 (2002) 215–222.
28] V.P. Shah, K.K. Midha, J.W.A. Findlay, H.M. Hil, J.D. Hulse, J. McGilveray, G.McKay, K.J. Miller, R.N. Patnaik, M.L. Powell, A. Tonelli, C.T. Viswanathan, A.Yacobi, Bioanalytical method validation – a revisit with a decade of progress,Pharm. Res. 17 (2000) 1551–1557.
29] E.R. Kisanga, J. Gjerde, A. Guerrieri-Gonzaga, P. Pigatto, A. Pesci-Feltri, C.Robertson, D. Serrano, G. Pelosi, A. Decensi, E.A. Lien, Tamoxifen and metabo-lite concentrations in serum and breast cancer tissue during three doseregimens in a randomized preoperative trial, Clin. Cancer Res. 10 (2004)2336–2343.
30] B.J.A. Furr, V.C. Jordan, The pharmacology and clinical uses of tamoxifen,Pharmacol. Ther. 25 (1984) 127–205.
31] M. Dowsett, J. Cuzick, A. Howell, I. Jackson, The ATAC Trialists’ Group, Phar-macokinetics of anastrozole and tamoxifen alone, and in combination, duringadjuvant endocrine therapy for early breast cancer in postmenopausal women:a sub-protocol of the ‘arimidexTM and tamoxifen alone or in combination’(ATAC) trial, Br. J. Cancer 85 (2001) 317–324.
32] P.R. Hutson, R.R. Love, T.C. Havighurst, E. Rogers, J.F. Cleary, Effect of exemestaneon tamoxifen pharmacokinetics in postmenopausal women treated for breastcancer, Clin. Cancer Res. 11 (2005) 8722–8727.
33] H.R. Sheth, G. Lord, K. Tkaczuk, M. Danton, L.M. Lewis, P.P. Langenberg, C.K. Lim,J.A. Flaws, Aging may be associated with concentrations of tamoxifen and itsmetabolites in breast cancer patients, J. Womens Health (Larchmt) 12 (2003)799–808.
34] V. Stearns, M.D. Johnson, J.M. Rae, A. Morocho, A. Novielli, P. Bhargava, D.F.Hayes, Z. Desta, D.A. Flockhart, Active tamoxifen metabolite plasma concentra-tions after coadministration of tamoxifen and the selective serotonin reuptakeinhibitor paroxetine, J. Natl. Cancer Inst. 95 (2003) 1758–1764.
35] T.E. Mürdter, W. Schroth, L. Bacchus-Gerybadze, S. Winter, G. Heinkele, W.
Simon, P.A. Fasching, T. Fehm, German Tamoxifen and AI Clinicians Group, M.Eichelbaum, M. Schwab, H. Brauch, Activity levels of tamoxifen metabolites atthe estrogen receptor and the impact of genetic polymorphisms of phase I andII enzymes on their concentration levels in plasma, Clin. Pharmacol. Ther. 89(2011) 708–717.