Embed Size (px)
Citation preview

Copyright reserved Please turn over
MARKS: 150 TIME: 2½ hours
This question paper consists of 16 pages.
LIFE SCIENCES P2 VERSION 2 (OLD CONTENT) FOR PART-TIME CANDIDATES
NOVEMBER 2012
NATIONAL SENIOR CERTIFICATE
GRADE 12

Life Sciences/P2 (Version 2) (Part-time) 2 DBE/November 2012 NSC
Copyright reserved Please turn over
INSTRUCTIONS AND INFORMATION Read the following instructions carefully before answering the questions. 1. 2. 3. 4. 5. 6. 7. 8. 9. 10. 11.
Answer ALL the questions. Write ALL the answers in the ANSWER BOOK. Start the answers to EACH question at the top of a NEW page. Number the answers correctly according to the numbering system used in this question paper. Present your answers according to the instructions at each question. Do ALL drawings in pencil and label them in blue or black ink. Draw diagrams or flow charts only when asked to do so. The diagrams in this question paper are NOT all drawn to scale. Do NOT use graph paper. You must use a non-programmable calculator, a protractor and a compass when necessary. Write neatly and legibly.
Life Sciences/P2 (Version 2) (Part-time) 3 DBE/November 2012 NSC
Copyright reserved Please turn over
SECTION A QUESTION 1
1.1 Various options are given as possible answers to the following questions.
Choose the correct answer and write only the letter (A to D) next to the question number (1.1.1 to 1.1.7) in the ANSWER BOOK, for example 1.1.8 D.
1.1.1
There is little fossil evidence of the earliest forms of life because the organisms …
A
B C D
did not have hard parts which would fossilise easily. evolved so quickly that they left few remains. lived in water and were not preserved. decayed quickly in the oxygen-rich atmosphere.
1.1.2 Deforestation by a forestry company leads to a reduction in
biodiversity. Why should society be concerned about this decrease?
A
B C D
A greater biodiversity increases the chance of climate change. The forest food chains would be longer. Some of the organisms that were lost may have been of future use. There may be an increased use of herbicides in the area.
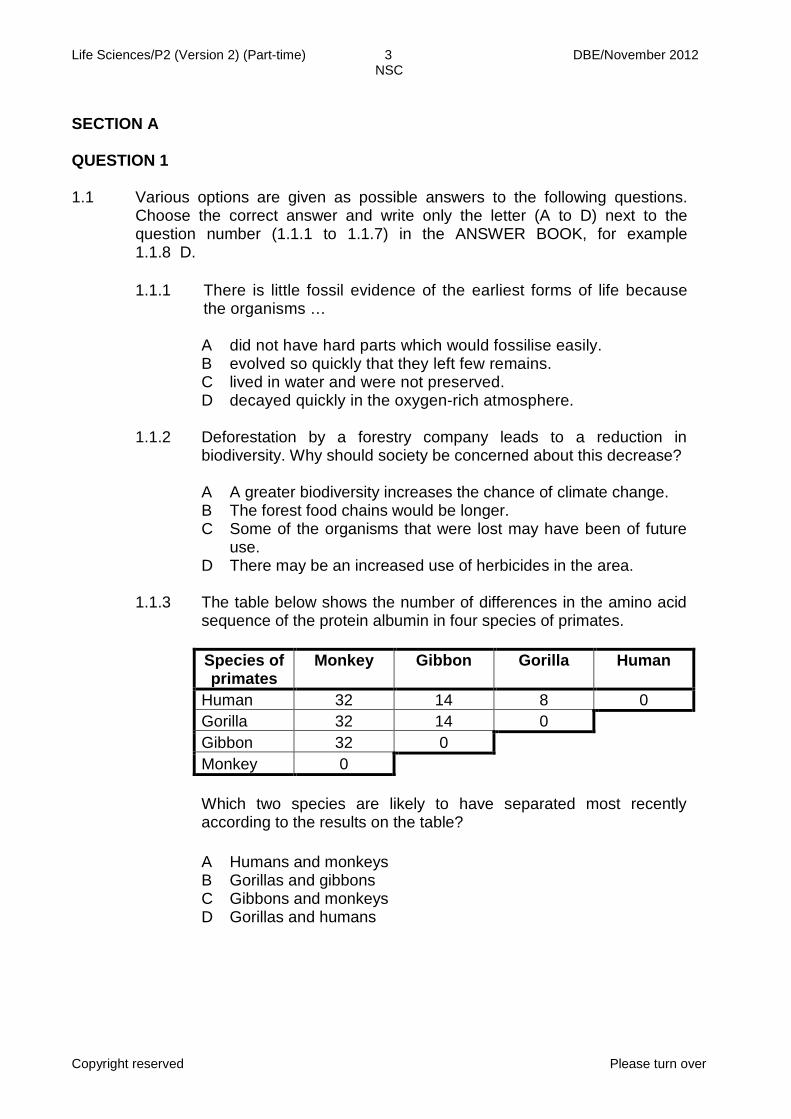
1.1.3 The table below shows the number of differences in the amino acid
sequence of the protein albumin in four species of primates.
Species of primates
Monkey Gibbon Gorilla Human
Human 32 14 8 0 Gorilla 32 14 0 Gibbon 32 0 Monkey 0
Which two species are likely to have separated most recently
according to the results on the table?
A B C D
Humans and monkeys Gorillas and gibbons Gibbons and monkeys Gorillas and humans
Life Sciences/P2 (Version 2) (Part-time) 4 DBE/November 2012 NSC
Copyright reserved Please turn over
1.1.4 Which of the combinations below refer to the sources of variation in
a population? (i) Random fusion of gametes during reproduction (ii) Crossing over during meiosis (iii) Random assortment of chromosomes during meiosis (iv) Natural selection in a population
A B C D
Only (i), (ii) and (iii) Only (i), (ii) and (iv) Only (ii), (iii) and (iv) (i), (ii), (iii) and (iv)
1.1.5 After the publication of a scientist's results, other scientists repeated
his investigation. What is the correct scientific reason for repeating the investigation? Other scientists ...
A
B C D
want to improve accuracy. want to increase reliability of the results. did not believe the original results. did not understand the results.
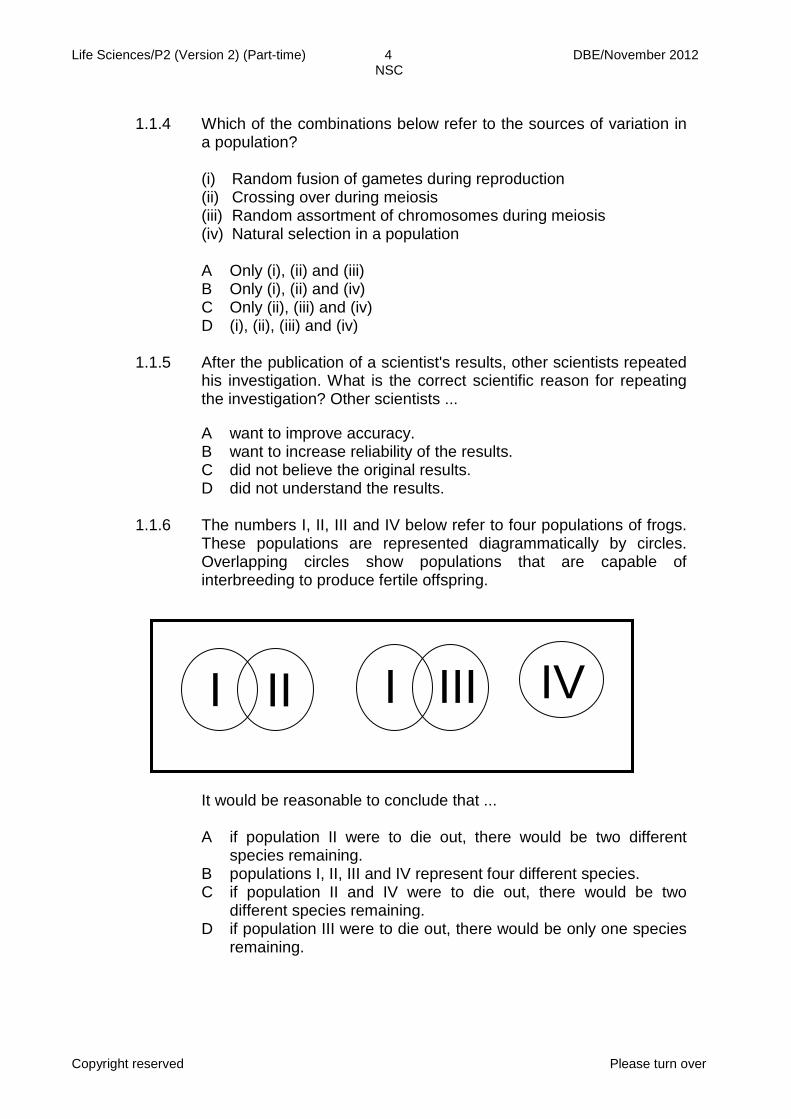
1.1.6 The numbers I, II, III and IV below refer to four populations of frogs.
These populations are represented diagrammatically by circles. Overlapping circles show populations that are capable of interbreeding to produce fertile offspring.
It would be reasonable to conclude that ... A
B C D
if population II were to die out, there would be two different species remaining. populations I, II, III and IV represent four different species. if population II and IV were to die out, there would be two different species remaining. if population III were to die out, there would be only one species remaining.
I
II I III IV

Life Sciences/P2 (Version 2) (Part-time) 5 DBE/November 2012 NSC
Copyright reserved Please turn over
1.1.7 From the cladogram below which statement is CORRECT about the
relationships between A, B, C and D?
A
B C D
B and C are the most closely related. A is more closely related to B than to C. A and B are the most closely related. A and B are the least related. (7 x 2)
(14) 1.2 Give the correct biological term for each of the following descriptions. Write
only the term next to the question number (1.2.1 to 1.2.6) in the ANSWER BOOK.
1.2.1
1.2.2 1.2.3 1.2.4 1.2.5 1.2.6
The use of resources in such a way that they are still available for future generations The present-day distribution of similar organisms Numerous interacting food chains that show the feeding relationships in an ecosystem Species living in a habitat in which they are not naturally found The ability of a substance to be broken down into simpler substances by biological processes Non-living factors in an ecosystem
(6)
A B C D

Life Sciences/P2 (Version 2) (Part-time) 6 DBE/November 2012 NSC
Copyright reserved Please turn over
1.3 Indicate whether each of the statements in COLUMN I applies to A ONLY,
B ONLY, BOTH A AND B or NONE of the items in COLUMN II. Write A only, B only, both A and B or none next to the question number (1.3.1 to 1.3.8) in the ANSWER BOOK.
COLUMN I COLUMN II
1.3.1 Natural resource(s) in South Africa A: Rooibos tea B: Hoodia
1.3.2 The study of ancient humans and their cultural activities
A: Palaeontology B: Anthropology
1.3.3 The disease(s) caused by air pollution
A: Typhoid fever B: Bilharzia
1.3.4 The results of an increase in the amount of carbon dioxide in the atmosphere
A: Global warming B: Acid rain
1.3.5 Produces offspring similar to the parents
A: Inbreeding B: Outbreeding
1.3.6 Substance(s) that can be recycled and reused
A: Glass B: Coal
1.3.7 The causes of overexploitation of some resources
A: Poverty B: Medicinal purposes
1.3.8 Dating of fossils by comparing the age of one fossil to another
A: Absolute dating B: Relative dating
(8 x 2) (16)

Life Sciences/P2 (Version 2) (Part-time) 7 DBE/November 2012 NSC
Copyright reserved Please turn over
1.4
Untreated sewage accidently leaked into a river. Environmental health officers did an investigation to determine the effect of sewage outflow at various distances from the outlet. The percentage of dissolved oxygen in water was measured and the number of organisms were counted at various distances from the sewage outlet. The results were as follows:
DISTANCE
FROM SEWAGE OUTLET (m)
% OF DISSOLVED
OXYGEN
NUMBER OF ORGANISMS PRESENT
Rat-tailed maggots
Sludge worms
Water lice
0 0 20 36 0 50 10 8 20 0 100 25 0 10 46 150 30 0 5 40 200 34 0 0 24
(a) Oxygen-deficient water
(b) The highest amount of dissolved oxygen
(1) (1)
1.4.1 1.4.2
Provide the caption for the data in the table. Which organisms survive better in the following:
(3)
1.4.3 1.4.4 1.4.5
What is the relationship between the distance from the sewage outlet and the percentage of dissolved oxygen present?
Name TWO factors that the environmental health officers could have kept constant during this investigation.
State ONE way in which the researchers could increase the reliability of their results.
(2) (2) (1) (10)

Life Sciences/P2 (Version 2) (Part-time) 8 DBE/November 2012 NSC
Copyright reserved Please turn over
1.5 The diagram below represents a typical food chain in an ocean. Algae Small fish Big fish Great white shark 1.5.1 If the small fish become extinct, what would happen to the
population size of the following:
(a) Algae
(b) Great white sharks
(1) (1)
1.5.2 Explain your answer in QUESTION1.5.1 (b). (2)
(4)
TOTAL SECTION A: 50

Life Sciences/P2 (Version 2) (Part-time) 9 DBE/November 2012 NSC
Copyright reserved Please turn over
SECTION B QUESTION 2 2.1 The table below represents a South African geological time scale as proposed
by Dr John Almond.
TIME
Million years ago
(mya)
ERA PERIOD MOST PREVALENT FOSSILS OF THE TIME
Current
Cenozoic
Mesozoic
Quaternary Hominids 1,75 Neogene Langebaan vertebrates
24 Paleogene
65 Cretaceous 5th mass extinction (meteorite impact in Mexican Gulf)
Zululand ammonites 125 Jurassic Kirkwood dinosaurs 203 Triassic 4th mass extinction
Karoo dinosaurs and mammals 3rd mass extinction
Karoo mammal-like reptiles
251 Permian
295
Palaeozoic
Carboniferous Witteberg fish and plants 355 Devonian 2nd mass extinction
Bokkeveld shelly fauna
410 Silurian
440 Ordovician 1st mass extinction Table mountain trace fossils
500 Cambrian Stromatolites 545 PRECAMBRIAN Barbeton mountain petrified
bacteria [Modified from original by Dr John Almond, Natura Viva cc, 2006]
2.1.1 2.1.2 2.1.3 2.1.4 2.1.5
Which fossils were most prevalent 440 mya? In which period were the fossils of the Kirkwood dinosaurs the most prevalent? Explain the implication on the understanding of human evolution if a hominid fossil which dates about 435 mya could be found. In which period would the hominid fossil mentioned in QUESTION 2.1.3 belong? Describe how the proposed hypothesis of a meteorite impact led to the extinction of dinosaurs.
(1) (1) (3) (1) (5) (11)

Life Sciences/P2 (Version 2) (Part-time) 10 DBE/November 2012 NSC
Copyright reserved Please turn over
2.2 The graph below shows the results of an experiment done to investigate the
average time that fruit flies can survive without food (starvation resistance). The average starvation resistance time is when 80 per cent of the population has died out. The researcher placed 5 000 fruit fly offspring from the same generation in a large container without food. The average starvation resistance time was recorded. The eggs from the container were collected, transferred to a new container and allowed to hatch (2nd generation). The average starvation resistance time was recorded. The procedure was repeated until the 8th generation.
0
5
10
15
20
25
30
35
40
1 2 3 4 5 6 7 8
2.2.1 Identify the dependent variable in the investigation. (1)
2.2.2
State TWO factors that should have been kept constant during the investigation. The results of the first 8 generations in the investigation were as follows:
(2)
2.2.3
In terms of natural selection, explain why the average starvation resistance time of the fruit flies is different in each generation.
(5) (8)
Generations
Ave
rage
sta
rvat
ion
resi
stan
ce ti
me
(ho
urs)
Average starvation resistance time over eight generations

Life Sciences/P2 (Version 2) (Part-time) 11 DBE/November 2012 NSC
Copyright reserved Please turn over
2.3 The diagrams below show the evolution of horses over time as they moved from muddy ground to grassland.
2.3.1 2.3.2 2.3.3 2.3.4 2.3.5
How long did it take to evolve from the average height of 0,6 m to the present average height? What would have been the advantage of tall height as the environment changed to grassland? How many times did the height of the horse increase over the years as shown in the diagrams above? Describe how Lamarck would have explained how the horses lost their toes. Explain why Lamarck's ideas are not accepted in the science community today.
(2) (2) (1) (4) (2) (11) [30]
Toe
Toes
Toes
Toes
Height
1,6 m
1,0 m
0,6 m
0,4 m
Modern horse (Equus)
Merychippus
Mesohippus
Hyracotherium
Evolution of the horse compiled from fossil records
Height
Front leg Timeline
Species of horse
1 mya
30 mya
40 mya
60 mya

Life Sciences/P2 (Version 2) (Part-time) 12 DBE/November 2012 NSC
Copyright reserved Please turn over
QUESTION 3 3.1 Read the passage below and answer the question that follows.
Panama is a narrow strip of land that joins North and South America. This narrow strip of land formed approximately 3 million years ago. Shrimps (sea organisms), genus Alpheus, can be found on either side of Panama. The two groups are phenotypically similar. However, when the males and females from either side of the narrow strip were brought together, they were not able to mate. They are now considered to be two different species.
Describe how this kind of speciation could have taken place to form two different species.
(8)
South America North America
PANAMA
Map showing Panama between North and South America

Life Sciences/P2 (Version 2) (Part-time) 13 DBE/November 2012 NSC
Copyright reserved Please turn over
3.2 The diagrams below represent some of the parts found in two different
organisms (organism A and organism B). Study them and answer the questions that follow.
3.2.2
3.2.3 3.2.4
Which pelvis (1 or 2) represents that of a non-human primate? Identify the structure marked X. Explain how the structure mentioned in QUESTION 3.2.3 has changed to explain evolutionary trends in primates.
(1) (1) (3) (13)
3.2.1
Redraw the table below and use the information in the diagrams above to match the characteristics of the different parts (1 and 2) from the diagram that belong to each organism.
Characteristic Organism A Organism B Jaw Pelvis Foot Skull
(8)
Skull 1
Skull 2
Pelvis 1 Foot 1
Pelvis 2 Foot 2
Jaw 1
Jaw 2 X
Life Sciences/P2 (Version 2) (Part-time) 14 DBE/November 2012 NSC
Copyright reserved Please turn over
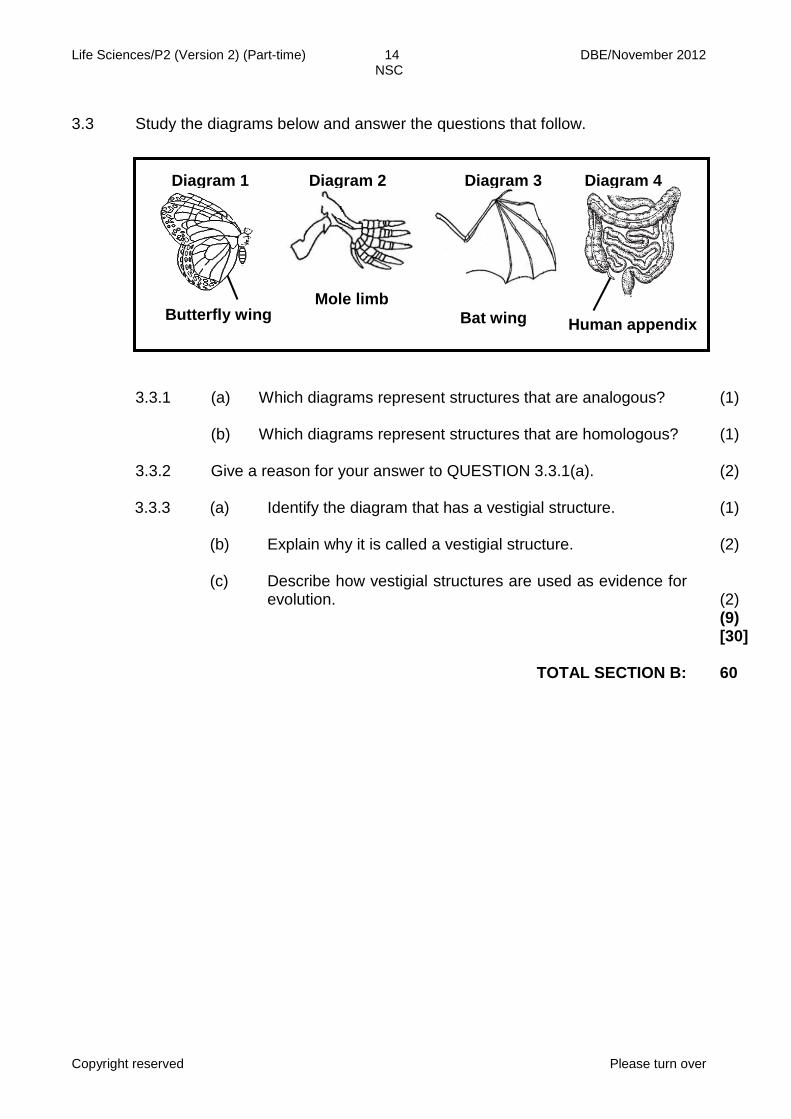
3.3 Study the diagrams below and answer the questions that follow.
3.3.3 (a)
(b) (c)
Identify the diagram that has a vestigial structure. Explain why it is called a vestigial structure. Describe how vestigial structures are used as evidence for evolution.
(1) (2) (2) (9) [30]
TOTAL SECTION B: 60
3.3.1 3.3.2
(a) Which diagrams represent structures that are analogous? (b) Which diagrams represent structures that are homologous? Give a reason for your answer to QUESTION 3.3.1(a).
(1) (1) (2)
Mole limb Human appendix Butterfly wing
Bat wing
Diagram 1 Diagram 2 Diagram 3 Diagram 4
Life Sciences/P2 (Version 2) (Part-time) 15 DBE/November 2012 NSC
Copyright reserved Please turn over
SECTION C QUESTION 4 4.1 Despite a great increase in the demand for food, only 7% more land is now
needed for farming. One of the reasons for this increased productivity of food is a higher yield per hectare, due to the use of fertilisers and pesticides.
4.1.1
4.1.2
Describe how the use of pesticides could destroy food chains. Describe how fertilisers cause eutrophication when they are washed into rivers.
(2) (5) (7)
4.2 State THREE management strategies that a municipality can use to reduce
carbon dioxide pollution.
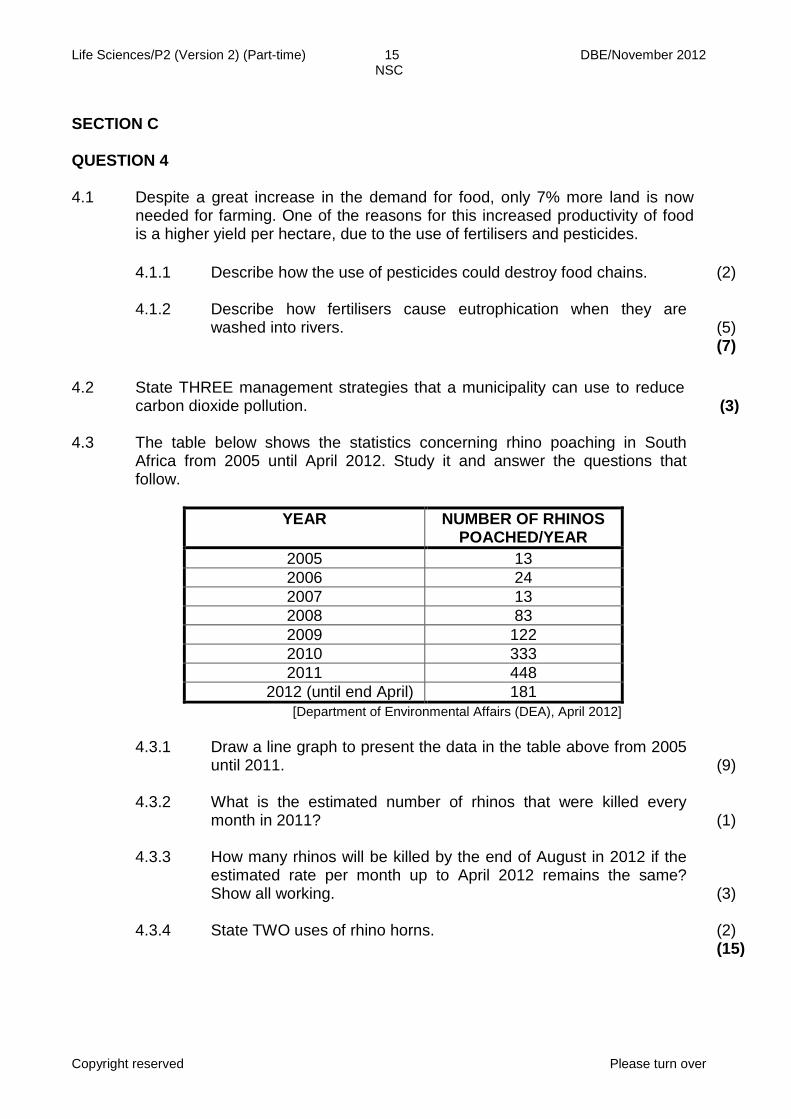
(3) 4.3
The table below shows the statistics concerning rhino poaching in South Africa from 2005 until April 2012. Study it and answer the questions that follow.
YEAR NUMBER OF RHINOS
POACHED/YEAR 2005 13 2006 24 2007 13 2008 83 2009 122 2010 333 2011 448
2012 (until end April) 181 [Department of Environmental Affairs (DEA), April 2012]
4.3.1
4.3.2 4.3.3 4.3.4
Draw a line graph to present the data in the table above from 2005 until 2011. What is the estimated number of rhinos that were killed every month in 2011? How many rhinos will be killed by the end of August in 2012 if the estimated rate per month up to April 2012 remains the same? Show all working. State TWO uses of rhino horns.
(9)
(1) (3) (2) (15)

Life Sciences/P2 (Version 2) (Part-time) 16 DBE/November 2012 NSC
Copyright reserved
TOTAL SECTION C:
GRAND TOTAL: 40
150
4.4 A Western Cape game reserve owner injected the horns of two female rhinos with a chemical containing three substances in a bid to prevent poaching. The three substances used in the experiment were: 1. A dye that penetrates inside the horn and makes the horn look pink 2. A substance that make the horns visible on a scanner (type of X-ray machine that makes wrapped objects visible) 3. A chemical substance called barium, that would make anyone who consumes the product made from rhino horns mildly ill Explain THREE reasons against and THREE reasons for the use of the method used above to prevent rhino horn poaching. Content
Synthesis
(12) (3) (15)