Embed Size (px)
Citation preview

Computers in Human Behavior 46 (2015) 139–148
Contents lists available at ScienceDirect
Computers in Human Behavior
journal homepage: www.elsevier .com/locate /comphumbeh
Satisfaction and continuous use intention of e-learning servicein Brazilian public organizations
http://dx.doi.org/10.1016/j.chb.2015.01.0160747-5632/� 2015 Elsevier Ltd. All rights reserved.
⇑ Corresponding author. Tel.: +55 11948435185/8499545953.E-mail addresses: [email protected], [email protected]
(F.A.M. Pereira), [email protected] (A.S.M. Ramos), [email protected](M.A. Gouvêa), [email protected] (M.F. da Costa).
Fernando Antonio de Melo Pereira a,⇑, Anatália Saraiva Martins Ramos b, Maria Aparecida Gouvêa a,Marconi Freitas da Costa a
a Faculdade de Economia, Administração e Contabilidade da Universidade de São Paulo FEA/USP, Av. Prof. Luciano Gualberto, 908, Bl. C, FEA1, Cidade Universitária, São Paulo,SP 05508-900, Brazilb Universidade Federal do Rio Grande do Norte - UFRN, Av. Sen. Salgado Filho, 3000, Lagoa Nova, Centro de Ciências Sociais Aplicadas, Anexo dos Professores, piso 3, sala 9, Natal, RN59078-970, Brazil
a r t i c l e i n f o
Article history:Available online 28 January 2015
Keywords:E-learningTechnology Readiness IndexExpectancy Disconfirmation TheorySatisfactionContinuance intention
a b s t r a c t
The aim of this paper is to investigate the constructs of Technology Readiness Index (TRI) and the Decom-posed Expectancy Disconfirmation Theory (DEDT) as determinants of satisfaction and continuous useintention in e-learning services applied in public organizations. The research was conducted by onlinesurvey in a sample of 343 employees of two public organizations in Brazil who have had e-learningexperience. The results showed that quality, quality disconfirmation, value and value disconfirmationpositively impact on satisfaction, as well as disconfirmation usability, innovativeness and optimism. Like-wise, satisfaction proved to be decisive for the purpose of continuous use intention. In addition, techno-logical readiness and performance are strongly related. The main contribution of this study is the deliveryof an assessment tool for performance oriented to training courses at distance and applied in publicorganizations.
� 2015 Elsevier Ltd. All rights reserved.
1. Introduction
The expansion of the Internet has contributed in popularizingvarious virtual platforms implemented in electronic services. Onesuch these services, is e-learning. Kaplan and Leiserson (2012)introduce the concept of e-learning used by American Society forTraining and Development’s as a broad set of applications and pro-cesses, such as web based learning, using virtual learning environ-ments (VLE). This definition is shared by others authors whoresearch the topic (Derouin, Fritzsche, & Salas, 2004; Klering &Schroeder, 2011; Nicholson, 2007).
The e-learning finds applications in several areas, including dis-tance education for primary and higher education, corporate train-ing and training for government employees. Several models havebeen shown to be able to measure the satisfaction and continuoususe intention of e-learning services. These aspects are essentials todetermine the success of e-learning (Bolliger & Martindale, 2004;Chiu, Hsu, Sun, Lin, & Sun, 2005; Duque & Weeks, 2010;
Harfoushi & Obiedat, 2011; Lankton & McKnight, 2006; Liao,Chuang, Yu, Lai, & Hong, 2011).
However, few studies focus on the evaluation of online trainingfor employees of public organizations (Erdogmus & Esen, 2011;Gelderman, Ghijsen, & Diemen, 2011; Hess, 2012; Langford &Seaborne, 2008; Lin & Hsieh, 2007; Rhee, Verma, Plaschka, &Kickul, 2007). Under Brazilian studies, the pattern is repeated,and there are few studies using this approach (Klering &Schroeder, 2011; Riss & Grohmann, 2011).
In Brazil, the increasing of distance courses has shown to be sig-nificant since the year 2000. From 2000 to 2009, the number of dis-tance courses rose from 13 to 844. It is estimated that there isinvolvement of more than three million users (Abraead, 2008).One of the causes for this increase was the institutionalization ofthe National Policy on Staff Development, established by Decree5707 to February 23, 2006 (Brasília, 2006), which emphasizes dis-tance learning with the use of VLEs for government employees.
Among the theoretical models that assess the users’ perspectiveon distance learning courses, two of them have the potential to beapplied in public organizations. One is the Technology ReadinessIndex (TRI), developed by Parasuraman (2000) and, the Decom-posed Expectancy Disconfirmation Theory (DEDT), developed byChiu et al. (2005). TRI consists of a tool that checks pre-disposition

140 F.A.M. Pereira et al. / Computers in Human Behavior 46 (2015) 139–148
to use certain technology (Parasuraman, 2000; Ling & Moi, 2007;Erdogmus & Esen, 2011; Lai, 2008; Summak, Baglibel, &Samancioglu, 2010). The DEDT assesses the expectations and per-formance, in context of e-learning, being created specifically forthis technology (Chiu, Wang, Shih, & Fan, 2011; Chiu et al., 2005;Kim, Trimi, Park, & Rhee, 2012; Liao et al., 2011). Such modelsallow the user to assess their own performance in the use of VLE,and encourage public employees to use technological tools of stra-tegic potential, contributing to increased productivity and modern-ization of public organizations (Langford & Seaborne, 2008; Pereira,Ramos, Andrade, & Oliveira, 2011; Pereira, Ramos, & Chagas, 2011;Saha, Nath, & Sangari, 2010).
The objective of the research is to identify factors that influencesatisfaction and continuous use intention of e-learning services.Additionally, a theoretical model through structural equation mod-eling that measures satisfaction and continuous use intention of e-learning services in Brazil will be validated. The theoretical modelthat will support this research uses TRI and DEDT together, beingunprecedented in the literature. The main hypothesis of the studyis that there are significant relationships between performance ine-learning course and satisfaction with it and between satisfactionand continuous use intention of this kind of service.
The presence of e-learning in public organizations is importantto show the need for continued development of employees, dis-semination and management of training activities, rationalizationand effectiveness of spending on training, adequacy of skills ofemployees to goals of institutions and improvement in servicesfor citizens (Brasília, 2006; Saha et al., 2010). Through the use oftheoretical model such as TRI and DEDT it is possible to verify ifthe users take advantage of the potential technological and theactual performance in the courses offered, increasing productivityand reducing public spending.
2. Literature review
This topic addresses the theories that underpin research modeland hypothesis: the TRI and DEDT. Considerations about the pres-ence of e-learning in Brazilian public organizations are also made.
2.1. Technology Readiness Index (TRI)
Developed by Parasuraman (2000), TRI serves as an instrumentto measure consumer technology readiness, therefore, is the provi-sion that the consumer has to use certain technology (Hu, Kuo, &Lin, 2010; Richey & Autry, 2009). This theory was developed inorder to verify the behavior of consumers facing technology-basedservices (Summak et al., 2010). However, the TRI was being appliedin different organizational contexts, such as in public organizationsand technology services in education (Rhee et al., 2007).
The original scale developed by Parasuraman (2000) consists of36 items, divided into four constructs. In the context of e-learning,TRI has been gaining ground, especially by its scope, have con-structs that seek to understand possible resistance to the use oftechnologies by different classes of users (Ismail, Azizan, &Azman, 2011; Rhee et al., 2007). In Table 1 some studies that applythe TRI in the context of e-learning are summarized.
2.2. Decomposed Expectancy Disconfirmation Theory (DEDT)
The DEDT was conceived from the Expectancy DisconfirmationTheory (EDT), (Oliver, 1980). The EDT was originally developedfrom models of cognitive perceptions of consumers before pur-chase and consequences of initial perceptions influencing the reuseor disuse of the product or service. It is a model of consumerbehavior where customer satisfaction is co-determined by the
expectation disconfirmation (Liao et al., 2011; Roca, Chiu, &Martínez, 2006). In the model adapted to e-learning services, titledDEDT (Chiu et al., 2005), disconfirmation can influence the imme-diate satisfaction of the user. The disconfirmation is the degree towhich performance meets or not the individual expectations (Liao,Chen, & Yen, 2007; Oliver & Swan, 1989).
A series of previous studies confirms the predictive ability ofEDT in the context of continuance intention in technology-basedservices (Chou, Min, Chang, & Lin, 2010; Liao et al., 2011; Chou,Lin, Chung, & Tsai, 2012). Noteworthy is the use of EDT in the con-text of user loyalty, in relation to online tourism services (Serenko& Stach, 2009), evaluation of benefits brought by an integratedmanagement model (Estevez, 2005), user satisfaction in onlinebank services (Bhattacherjee, 2001a), consumer satisfaction in e-commerce channel (Devaraj, Fan, & Kohli, 2002), among others.The individual’s satisfaction with the product or service is the con-dition for repurchase. This in turn, is related to the degree of theexpectations that the individual has, at the beginning of theconsumption process. Thus, the expectation is configured as anadditional determinant of satisfaction (Bhattacherjee, 2001a;Paechter, Maier, & Macher, 2010). Table 2 presents studies on thistopic with applications in e-learning.
2.3. E-learning in public organizations
Access to web-based learning has become a key factor in retain-ing quality to public sector employees (Langford & Seaborne,2008). The e-learning when inserted in public organizations con-tributes to be a vehicle to meet organizational objectives, toencourage the use of new technologies and to improve the serviceprovided to citizens (Langford & Seaborne, 2008; Saha et al., 2010).
The TRI has been used as a measure of scale of technologicalreadiness, including studies about e-learning (Lai, 2008; Ling &Moi, 2007; Rhee et al., 2007; Summak et al., 2010). Studies in Bra-zilian public organizations such has contributed to enlarge the TRIapplications in the context of e-learning. Likewise, the model EDThas demonstrated efficacy in evaluating systems on the internetand consequently in VLEs (Chiu et al., 2005, 2011). The EDT modelalso demonstrates utility when applied to public organizationsunder the perception of citizens about government performance(Gregg, 2006; Oliver, 2009).
Several researches and proposals adapted for new models pre-sented an approach that related the constructs or combined testedmodels, as in the study to Erdogmus and Esen (2011), joining Tech-nology Acceptance Model (TAM) and TRI, Roca et al. (2006) and Lin(2011), using EDT and TAM, Liao et al. (2007), using EDT and The-ory of Planned Behavior (TPB), among others. However, EDT andTRI have no applications together in the context of e-learning inpublic organizations.
As causes of the lack of studies using the fusion of TRI and DEDT,the main one is the focus on the adoption and acceptance of e-learning, being more appropriate when applied to education(Akbar, 2013; Alwahaishi & Snášel, 2013; Kocaleva, Stojanovic, &Zdravev, 2014; Marques, Villate, & Carvalho, 2011). Theoreticalmodels such as TAM, UTAUT and IDT focuses on acceptance/rejec-tion of new technologies (Hsu, 2012; Oye, Iahad, & Nor, 2012; Tan,2013). The focus of this study is the satisfaction and continuous useintention, from antecedents linked to the use of VLE. The scarcity ofe-learning services evaluation that is focused on satisfaction andcontinuous use intention is also due to lack of applications in pub-lic organizations. Other difficulties in adapting TRI and DEDTtogether consists of the increased complexity of the model to betested, requiring the use of statistical methods for validating scale,specification research and the use of 2nd order factors (Kline, 2005;Maroco, 2010).

Table 1Synthesis of e-learning studies that approach the TRI.
Author (s) Type Techniques Constructs
Summak et al. (2010) Replication Test t and ANOVA Optimism, innovativeness, discomfort and insecurityErdogmus and Esen (2011) Adaptation Exploratory factor analysis Optimism, innovativeness, discomfort, insecurity, usability and usefulnessRhee et al. (2007) Replication Exploratory factor analysis Optimism, innovativeness, discomfort and insecurityHu et al. (2010) Adaptation Confirmatory factor analysis and
structural equation modelingOptimism, innovativeness, discomfort, insecurity, quality and competence
Lai (2008) Replication Test t and ANOVA Optimism, innovativeness, discomfort and insecurityLing and Moi (2007) Replication Kruskal–Wallis Optimism, innovativeness, discomfort and insecurity
Table 2Synthesis of e-learning studies that approach the DEDT.
Author (s) Type Techniques Constructs
Chiu et al. (2011) Adaptation Confirmatory factor analysis and structural equation modeling Social interaction, quality, value, self-efficacyLin (2011) Adaptation Confirmatory factor analysis and structural equation modeling Usability, usability disconfirmation and attitudeHung and Cho (2008) Adaptation Exploratory factor analysis and multiple linear regression Usability, quality, self-efficacy, compatibility and
perceived performanceChou et al. (2012) Adaptation Structural equation modeling Identidade Percebida e Performance EsperadaLiao et al. (2007) Adaptation Confirmatory factor analysis and structural equation modeling Usability, usability disconfirmation, attitude and
subjective normsChou et al. (2010) Replication Multiple linear regression Quality, usability and valueCheung and Lee (2011) Replication Structural equation modeling Quality, VLE technical attributesLee (2010) Adaptation Exploratory factor analysis, ANOVA and Structural equation modeling Quality, usability, usefulness and subjective normsPaechter et al. (2010) Adaptation Multiple linear regression Behavioral intentions and qualityRoca et al. (2006) Adaptation Confirmatory factor analysis Quality, usability, usefulness and attitudeChiu et al. (2005) New model Confirmatory factor analysis and Structural equation modeling Quality, quality disconfirmation, Usability, usability
disconfirmation, value, value disconfirmation
F.A.M. Pereira et al. / Computers in Human Behavior 46 (2015) 139–148 141
E-learning services in public organizations demonstrate uniquefeatures compared to other organizations, the focus is not in theadoption or acceptance of a particular technology, but on user sat-isfaction as a result of high performance and the employee’s will-ingness to use technology. The DEDT being a model designedspecifically for e-learning, enables higher level of understandingof the performance, by investigating their symptoms. The perfor-mance justifies the use of public expenditures for completion ofthe course. The TRI has great applicability in evaluating new tech-nologies in public, to include in its scope constructs reverse order.Resistance to changes in the public sector tends to be higher due togreater stability of staff in the office, creating barriers in the use ofnew technologies. Another reason is that the courses offered arefree participation, therefore, readiness is the key for the user tohave desire to take the courses.
2.4. Hypotheses and research model
The hypotheses selected for the composition of the componentsof the survey were based on Oliver (1980), Parasuraman (2000),Bhattacherjee (2001b), Chiu et al. (2005), Erdogmus and Esen(2011), among others. The constructs that are part of the modelDEDT are evaluated from two post-usage factors called perceivedperformance and expectancy disconfirmation. According to EDT,disconfirmation is determined by the combination of the expecta-tion and perceived performance (Chiu et al., 2005; Oliver, 1980).The expectations could be positively disconfirmed, when perceivedperformance exceeds expectations. As from the disconfirmatorylevel, the users form a feeling of satisfaction or dissatisfaction. Sev-eral studies have indicated that the disconfirmatory constructshave significant effects attributed to satisfaction (Bhattacherjee,2001b; Terzis, Moridis, & Economides, 2013).
The constructs that make up the TRI, act as drivers of technolog-ical readiness in relation to use of e-learning services. Two of themhave positive relationship with satisfaction: optimism and innova-tiveness, and two others are inversely related to the satisfaction:discomfort and insecurity.
H1: Optimism is positively associated with user’s technologyreadiness.H2: Innovativeness is positively associated with user’s technol-ogy readiness.H3: Discomfort is negatively associated with user’s technologyreadiness.H4: Insecurity is negatively associated with user’s technologyreadiness.
Optimism refers to a positive view of technology, with focus onbenefits of it, which brings a sense of control, flexibility and effi-ciency (Lai, 2008; Parasuraman, 2000; Richey & Autry, 2009). Theinnovativeness dimension gives an idea of an individual whobelieves to be a thought leader and to be in the vanguard of tryingnew products and have new experiences based on technology. Thisvision exacerbates the trend of pioneering the use of technology, asa motivational behavior (Lin, 2007; Hu et al., 2010; Lai, 2008;Summak et al., 2010). Discomfort refers to the perception of lossof technology control and sense of loss of autonomy in the faceof technologies to be used in the organizational environment. Itcan also be characterized as a lack of confidence in using new tech-nologies (Parasuraman, 2000; Lin & Hsieh, 2007; Rhee et al., 2007).The insecurity relates to skepticism and other cultural and psycho-logical barriers that prevent the user to enable the use of certaintechnology. It differs from discomfort because it focuses on specificaspects of technology transactions (Lin, 2007; Lai, 2008; Ling &Moi, 2007).
H5A: Quality is positively associated with perceivedperformance.H5B: Quality disconfirmation is positively associated with per-ceived performance.H6A: Usability is positively associated with perceivedperformance.H6B: Usability disconfirmation is positively associated with per-ceived performance.H7A: Value is positively associated with perceived performance.

142 F.A.M. Pereira et al. / Computers in Human Behavior 46 (2015) 139–148
H7B: Value disconfirmation is positively associated withperceived performance.
Because it is a large, multi-faceted and widely discussed con-cept, the quality in this study is composed of items that measuresonly aspects of user’s performance in e-learning services, asdescribed in DEDT model. This specific approach allows identifymore deepening the user experience in VLE. The quality involvesvariables related to response time, relevance, accuracy and com-pleteness of the information generated by VLE. The quality appliedin studies of e-learning denotes the importance of having a VLEthat meets the quality requirements that the user expects to get(Cheung & Lee, 2011; Paechter et al., 2010). Usability involves fac-tors such as ease of use, familiarity with technology and attitudetoward the use of computer systems. The usability also is used inmodel TAM and SERVQUAL to determine if performance is satisfac-tory through the ease of use (Devaraj et al., 2002). Usability can beseen, for example, as the degree a person believes that using a VLEwill be free of effort (Lin, 2011; Premkumar & Bhattacherjee, 2008).The value is an abstract concept that refers to the mode of conduct,personal preference or position forward the technology offered.Birou (1976) seeks to define value as the ability a person has to sat-isfy a desire, a need, or a human aspiration. Researchers suggestthat high levels of value lead to high user satisfaction (Bojanic,1996; Chou et al., 2010).
H8: Technology readiness and perceived performance influenceeach other (they are interrelated).H9: Technology readiness is positively associated with usersatisfaction.H10: Perceived performance is positively associated with usersatisfaction.H11: Satisfaction is positively associated with continuous useintention.
Users who have high TRI require more technical support(Parasuraman, 2000). The users that have greater understandingand appreciation of technology have a greater chance of obtaininga satisfactory performance. In the same way, individuals with high
Fig. 1. Researc
performances, tend to trust more in technology use (Erdogmus &Esen, 2011; Ismail et al., 2011; Rhee et al., 2007). As there are nostudies that consider performance and predisposition together,the relationship between these two constructs (H8) is formed bya double arrow, indicating a possible correlation. In surveys con-ducted, it was found that the level of willingness of individualsto adopt new technologies contributes to the analysis of factorsthat determine the satisfaction of e-learning service users (Lin &Hsieh, 2007; Marks, Sibley, & Arbaugh, 2005; Ismail et al., 2011).In relation to performance, to develop constructs which could mea-sure it in terms of usability, value or system quality, several studieshave reshaped the perceived performance to define it as a contrib-uting factor to the satisfaction (Chiu et al., 2005; Davis, 1989;Siritongthaworn & Krairit, 2006; Spreng, Mackenzie, & Olshavsky,1996).
Satisfaction is an individual feeling of pleasure resulting fromthe comparison of perceived performance relative to expectations(Chiu et al., 2005). Oliver (1980) theorizes that satisfaction is pos-itively associated with a future intention. Liao et al. (2011) statethat satisfaction with a product or service is the main motivationfor its continued use. There are numerous studies in the literaturethat establish the link between satisfaction and continuous useintention of an e-learning service (Cheung & Lee, 2011; Liaw,2008; Lin & Hsieh, 2007; Riss & Grohmann, 2011). For this study,the effects between constructs of e-learning are presented in Fig. 1.
3. Methodological procedures
This topic presents details about the sampling method, theinstrument of data collection and the statistical techniques appliedin data analysis.
3.1. Sample
The study focuses on employees of two public organizations inthe state of Rio Grande do Norte, located in Northeastern Brazil.They are the Universidade Federal do Rio Grande do Norte (UFRN)and the Ministério Público do Rio Grande do Norte (MPRN). Theservices of e-learning focus of this study are based on a system
h model.

F.A.M. Pereira et al. / Computers in Human Behavior 46 (2015) 139–148 143
of synchronous and asynchronous learning via the web. Factorswere observed for the units of analysis so that they could integratea homogeneous sample. Firstly, organizations operate in the samegeographic boundary. Secondly, there are a significant number ofemployees of both organizations acting in distance courses as orga-nizational training with use of VLEs to support. Furthermore, ineach unit of analysis, respondents in the sample attended at leastone training course distance.
Data collection was conducted in February 2013. Of the 3202employees of UFRN, 273 completed the questionnaire and werevalid for the composition of the study, while in MPRN, of 816 serv-ers, 70 valid responses were computed. An assessment of crossedloads and sample calculation for each proportional stratumallowed the analysis of the samples together (Fragoso, Recuero, &Amaral, 2012; Yin, 2005). Thus, the research sample correspondsto 343 cases.
For the sample composition the criteria of statistical power andsize of explanatory effects of the independent variables on thedependent variables were considered. The statistical power isindispensable for the evaluation of statistical power decisionsand to design trials (Mayr, Erdfelder, Buchner, & Faul, 2007). Thepower of a statistical test helps to avoid probability errors whichlead to falsely accept research hypotheses (Faul, Erdfelder, Lang,& Buchner, 2007; Prajapati, Dunne, & Armstrong, 2010).
Hair, Anderson, Taham, and Black (2009) suggest a statisticalpower of 0.95 as great, and the effect size at 0.15 as average,being the most usual configuration. The software G⁄Power v.3.1.5 was used to calculate the minimum sample size requiredand to generate outcomes after sample collection. The G⁄Powerhas been designed as a general program of power analysis for sta-tistical tests commonly used in science social researches (Faulet al., 2007). Using an average effect of 0.15 a statistical powerof 0.999 was obtained. On sensitivity exam an effect size of0.07 was detected. The sample size also considered suitabilityfor application of multivariate analysis by covariance. The sampleis adequate to have 13 observations per manifest variable. It’srecommended between 10 and 15 observations by Maroco(2010) and Hair et al. (2009).
We also analyzed the influence of common method variance(CMV). It is widely accepted among theorists and researchers thatrelationships among variables measured with the same methodcan be distorted and inflated due to effect of CMV (Lai, Li, &Leung, 2013). It’s used a procedure recommended by Podsakoff,MacKenzie, Lee, and Podsakoff (2003) for identification and evalu-ation the CMV, called single-method-factor approach, being theprocedure with more advantages compared to others and that havebeen frequently used in the literature. The results indicated lowinfluence of CMV (below 0.4), showing that the parameter esti-mates suffer low influence of noise.
The sample is stratified in two groups, with high statisticalpower and meets the recommendations in use of SEM. Further-more, each stratum is proportional to the population size and,the demographic profiles are similar to each other. Thus, thereare evidences that the sample is representative.
3.2. Questionnaire
The questionnaire was applied in the form of online survey andthe answers have been recorded completely. The elimination ofobservations was adopted to avoid the presence of missing valuesand bias data. The survey instrument consists of 45 closed ques-tions with 10 points metric scale, ranging from 1 – less agreement,of 10 – highest agreement assertive, plus five questions dedicatedto the sample profile.
A pretest was conducted with seven managers of both organiza-tions in order to avoid biases, fix bugs and to add or modify
questions (Iraossi, 2006; Pereira, Ramos, & Chagas, 2011). After ini-tial release, a pilot study was applied with 30 employees of bothorganizations. The objective of the pilot study was to obtain addi-tional feedback on the survey instrument and fix important aspectsin the composition of questionnaires, defined by Hair, Babin,Money, and Samouel (2010), such as: clear and simple language,brevity in questions, avoid ambiguities, avoid use of multiple ques-tions and ultimately avoid bias position. It was included a supportpresentation text containing clear instructions on how to answerthe questions as recommended by Hair et al. (2010) and indicationof gifts by lottery. With permission granted, the survey was sent tothe e-mails to the target population.
3.3. Data analysis
This study uses a strategy two-step of structural equation mod-eling (SEM), using the method of maximum likelihood (ML), oper-ationalized in software Analysis of Moment Structures (AMOS v.18). The first step is a confirmatory factor analysis (CFA) and sec-ond step is the analysis of structural equations. The sample withthe use of ML should be between 150 and 400 observations andhas more than 200 observations, meeting the specifications sug-gested by Hair et al. (2009). Thus, it allows the estimates are closerto the value of the population parameter (Joreskog & Sorbom,2003).
The assumptions that are determinant for analysis were veri-fied. First, the multivariate normality of the variables was con-firmed by calculating the skewness (sk) and kurtosis (ku). Thevariables have normal distribution, possessing sk < 3 and ku < 10.Moreover, as the values are close to zero, it can be concluded thatthe normality assumption is reasonable (Teo, 2010b). Also the Var-iance Inflation Factors (VIF) test was performed to verify that theconstructs were not highly correlated. The indices obtained inthe variables ranged between 1.00 and 2.14, thus, confirming theabsence of multicollinearity (Teo, 2010b).
Estimates of calculation for use of SEM in AMOS Graphics wereaccepted, confirming linearity of the model. Similarly, the soft-ware configuration confirmed the assumption of covariance non-zero in the endogenous variables (Maroco, 2010). The constructsof first order and dependent variables were measured with threemanifest variables each one, confirming the existence of multipleindicators (Hair et al., 2009; Joreskog & Sorbom, 2003; Mulaiket al., 1989).
It was used exploratory factor analysis to refine the researchmodel before the start of SEM in two steps. This process accordingto Maroco (2010), called specification search, has a combination ofsimplicity (parsimony) and goodness of fit (Lee, 2010; Maroco,2010; Rhee et al., 2007; Siritongthaworn & Krairit, 2006). In theapplication of exploratory factor analysis, it was used the methodof principal components with orthogonal rotation, as suggestedby Hair et al. (2009). The tests Bartlett Sphericity and Kayser–Meyer–Olkin (KMO) were performed to test the overall signifi-cance of all correlations identified and adequacy of the samplerespectively. The KMO test obtained was 0.930, being consideredsuitable for factor analysis. The significance test of Bartlett Spheric-ity was 0.000, indicating significant correlations between thevariables.
In inspection of the correlation matrix, the assumptions wereassessed as suggested by Kline (2005), indicating variables thatbest fit the data and contribute significantly in the explanatorypower of the model. It was considered the correlations index,anti-image, communality, factor loadings and identification ofcross load. In the evaluation of assumptions, from 39 variables,13 were disallowed in one or more tests and were excluded fromthe research model (Hair et al., 2009).

144 F.A.M. Pereira et al. / Computers in Human Behavior 46 (2015) 139–148
4. Findings
In this topic, the main results that contribute to fulfill the objec-tives of research are highlighted. Firstly, sample profile is pre-sented. After, the SEM is divided in two steps: measurementmodel and structural model.
4.1. Sample profile
The survey sample shows that the workforce required in bothorganizations is predominantly composed of operational positions,but presents a significant portion (over 25%) of strategic levels. Itwas concluded that there is predominance of female respondents,aged between 18 and 25 years old, single, college-educated incom-plete and family income between R$ 670 and R$ 1.920, that corre-sponding approximately to €240 and €720.
To identify possible differences in opinions by internal groups inorganizations comparisons of means were performed of the depen-dent variables of satisfaction and continuous use intention alongdemographic variables. The results of the tests showed no signifi-cant differences in averages by demographic variables.
4.2. Measurement model
Firstly, the Square Distance of Malahanobis (D2) was performedto remove outliers, predicting exclusion of observations with thehigher rates, beyond addition of correlations between errors ofthe variables, which substantially improves the model estimates(Kline, 2005; Maroco, 2010). Also an adjustment from the analysisof the factor loadings was made. The variable EDTV3 – Perform a
Table 3Variables of measurement model.
Cód. Variable
Perceived optimism AVE = 0.574 CR = 0.801 Alpha = 0.808TROT2 New technologies offered in the courses are convenient to useTROT3 I like to study by computerTROT4 Perform distance courses is mentally stimulating
Perceived innovativeness AVE = 0.569 CR = 0.867 Alpha = 0.889TRIN1 In the workplace, I keep more updated than others in relation toTRIN2 In general, I am one of the first at workplace to want to participaTRIN3 Normally, I find new features in the technologies used during theTRIN4 I appreciate the challenge of finding new ways of learning usingTRIN5 I have fewer problems than co-workers to learn using technology
Perceived quality AVE = 0.622 CR = 0.866 Alpha = 0.866EDTQ1 The layout and interface of the VLE are friendlyEDTQ2 I find it easy to navigate by the VLE used in the courseEDTQ3 I feel comfortable using an e-learning service in virtual platformEDTQ4 The VLE offers complete information to users
Perceived value AVE = 0.947 CR = 0.754 Alpha = 0.866EDTV1 Perform a distance course brings me a sense of accomplishmentEDTV2 Perform a distance course brings me a feeling of supplying my neEDTV4 Perform a distance course brings me a sense of feeling smart
Quality disconfirmation AVE = 0.584 CR = 0.806 Alpha = 0.825EDTQ1Dis The layout and interface of the VLE are friendly (was what I expeEDTQ3Dis I feel comfortable using an e-learning service in virtual platformEDTQ4Dis The VLE offers complete information to users (was what I expect
Usability disconfirmation AVE = 0.533 CR = 0.819 Alpha = 0.892EDTU1Dis Learning to work with a VLE is easy for me (was what I expectedEDTU2Dis It’s easy for me become skillful in the use of VLE (was what I expEDTU3Dis The resources and activities offered by course are compatible witEDTU4Dis The tools used in the courses are satisfactory (was what I expecte
Value disconfirmation AVE = 0.519 CR = 0.810 Alpha = 0.825EDTV1Dis Perform a distance course brings me a sense of accomplishmentEDTV2Dis Perform a distance course brings me a feeling of supplying my neEDTV3Dis Perform a distance course brings me a feeling of following a trenEDTV4Dis Perform a distance course brings me a sense of feeling smart (wa
distance course brings me a feeling of following a trend – showedlow factor loading (0.49) and was excluded from the model. Corre-lations and factor loadings of the 26 variables that are contained inthe measurement model are listed in Table 3.
After performing the first adjustment, the goodness of fit of fac-torial model was made according to the goodness of fit indices ormodification indices, as recommended by Maroco (2010), Hairet al. (2009), Kline (2005) and Joreskog and Sorbom (2003). Thus,the indices were calculated for the measurement model set,featuring: X2/df = 1.160; TLI = 0.861; CFI = 0.883; NFI = 0.853;PCFI = 0.747; PNFI = 0.722; RMSEA = 0.099; ECVI = 3.965 e MEC-VI = 4.006. The indices with their respective reference values dem-onstrate adequate goodness of fit.
To validate the measurement model, three types of validitywere examined: factorial validity, convergent validity and discrim-inant validity. Factorial validity was confirmed with factor load-ings, being above 0.5 for variables accepted in measurementmodel, as suggested by Hair et al. (2009). For convergent validity,it was used the average variance extracted (AVE) and compositereliability (CR) as suggested by Maroco (2010) and Kline (2005).The AVE results for each construct exceed 0.5 and CR exceeds theminimum of 0.7, confirming convergent validity. For discriminantvalidity, the square of the correlations was compared with theresults of AVE. For values of AVE not above the square of correla-tions, the validity was confirmed, according to the method ofFornell and Larcker (1981).
4.3. Structural model
This sub-topic is related to the second step of SEM, which pre-sents the structural model as the product of this research. The
Corr. Factor loadings
0.591 0.650.586 0.700.667 0.65
technology 0.679 0.58te in the courses offered 0.554 0.60courses 0.675 0.73
technology 0.678 0.790.679 0.66
0.693 0.610.777 0.690.740 0.840.629 0.66
0.811 0.55eds 0.733 0.65
0.736 0.57
cted) 0.628 0.61(was what I expected) 0.740 0.79ed) 0.749 0.62
) 0.694 0.63ected) 0.739 0.55h the way I learn (was what I expected) 0.721 0.66d) 0.794 0.72
(was what I expected) 0.590 0.71eds (was what I expected) 0.761 0.69
d (was what I expected) 0.777 0.56s what I expected) 0.581 0.55

Table 4Goodness of fit indices of the structural model.
Index Results Diagnosis
Statistic X2/df 1.314 ] 1; 2 [ – Good fitTLI 0.911 >0.90 – Very good fitCFI 0.920 >0.90 – Very good fitNFI 0.885 ] 0.8; 0.9 [ – Acceptable fitPCFI 0.822 >0.8 – Very good fitPNFI 0.790 ] 0.6; 0.8 [ – Good fitRMSEA 0.078 ] 0.05; 0.10 [ – Very good fitECVI 4.567 Smaller is better. . .
MECVI 4.627 Smaller is better. . .
RNFI 0.974 ] 0.8; 1.0 [ – Good fitRPR 0.857 ] 0.8; 1.0 [ – Good fit
F.A.M. Pereira et al. / Computers in Human Behavior 46 (2015) 139–148 145
model of satisfaction and continuous use intention of e-learningservice was evaluated incorporating measurement model set andadding causal relationships. At this stage, the goodness of fit indi-ces were calculated again (Table 4), adding two indexes that mea-sure the quality of the final adjustment of the structural modelaccording to Mulaik et al. (1989) and Maroco (2010). They are:the relative normed-fit index (RNFI), adapted from NFI, which aimsto counter the disproportionate number of parameters betweenthe measurement model and structural model. The second indexis the relative parsimony ratio (RPR), which measures the thriftdegree of the model and assesses the degree of completeness ofthe model with fewer variables as possible.
According to Table 4, the ratios showed adequate adjustments,with a slight improvement compared to the indices of the mea-surement model, being ruled out the possibility of relationshipsthat harm the fit of the model. With the refined model by modifi-cation indices and correlations that lead to considerable improve-ment of the adjustment, the estimates presented in AMOS Graphicswere evaluated with a Z Test (Critical ratio and p value), consider-ing significant relationships between parameters with p < 0.05, andthe significance of the trajectories, considering relevant ones above0.05. Also standardized direct effects in causal relationships wereconsidered, and specifically to the constructs of second order,
Fig. 2. Final model fo
significant with mediation effect set to the path continuous useintention, as suggested by Kline (2005) and Hair et al. (2009).The adjusted final model with standardized regression weightsare shown in Fig. 2.
Fig. 2 shows that only optimism and innovativeness influencetechnology readiness. Only usability has no positive relationshipwith performance. In the structural model, both the performanceas the technology readiness had positive relationship with satisfac-tion. The resulting continuity of use has a strong relationship withsatisfaction and explanatory power of 84%.
5. Discussions and implications
This topic presents the main discussions and implicationsfollowed by limitations and suggestions of future studies.
5.1. Discussions
In study of exploratory factor analysis, the results found byErdogmus and Esen (2011) and Darab and Montazer (2011)showed that the dimensions of optimism and innovativeness influ-ence positively the determinant constructs. However, in this studyinsecurity and discomfort showed no significant effects. It can beinferred that the negative aspects linked to the use of technologyare presenting discredit in the composition of models that assessuser satisfaction, as was pointed by Ismail et al. (2011) and Huet al. (2010), being the discomfort invalidated by the reliabilitytest.
The insecurity items contained in the model TRI of Parasuraman(2000) showed the same behavior in the study of Richey and Autry(2009), also being invalidated. In the studies of Ismail et al. (2011)and Darab and Montazer (2011), the results of the TRI constructs ofreverse scale also showed lower indices compared by innovative-ness and optimism.
In the present study, the factor loadings and no violation ofassumptions for the constructs of quality, usability and value,including disconfirmation level are similar to those found by
und by research.
146 F.A.M. Pereira et al. / Computers in Human Behavior 46 (2015) 139–148
Cheung and Lee (2011) on the use of EDT. Similarly, optimism andinnovativeness have high reliability and are significant in definingdeterminant constructs of satisfaction in e-learning services. Simi-lar results were also found in other studies that approach attri-butes of the TRI (Erdogmus & Esen, 2011; Summak et al., 2010).
In the application of CFA, the results summarized in Table 3show that the constructs that form the performance of the stu-dents were shown to be important for the teaching potential in dis-tance learning, likewise the study developed by Biasutti (2011).The performance in studies of Hung and Cho (2008) and Chen(2011) also proved relevant to determine satisfaction and stillhad indirect effects in determining continuous use intention, cor-roborating the high factor loadings on manifest variables of EDTconstructs. Specifically about quality of system, Roca et al. (2006)point out that managers of e-learning should improve the systemattributes, because users are more inclined to use it when theytrust in technology.
The final model adjusted for a sample of 332 respondents,shown in Fig. 2 provides an appropriate adjustment to the struc-ture of variance and covariance of 26 determinant variables. Theweights of the constructs that form the technology readiness werehigh (Innovativeness – 0.84 and Optimism – 0.99). The standard-ized regression weight from technology readiness to satisfactioncorresponds to b = 0.36. The regression between perceived perfor-mance and satisfaction showed it a little higher (b = 0.52).
All constructs of performance had weights above 0.9,including all constructs in disconfirmation level, emphasizing theimportance of measuring user expectation as pointed out byTerzis et al. (2013). At the confirmation level, usability is theunique to not compose the final model of the study, invalidatedin exploratory factor analysis, being only the disconfirmationusability validated. In the study by Chen (2011), the perceived per-formance also proved to be the most important factor to determinesatisfaction an e-learning service.
An evaluation of non-causal relationship between theconstructs of second order was made and it was found high andpositive relationship (0.89) between performance that employeespresent in distance courses and pre-disposition of the employeesto use technologies commonly used in the course, especially theVLE.
The direct effect from satisfaction to continuous use intentionshowed high rate of coefficient (b = 0.92). The second order con-structs together account for 0.74 of the total variance explainedon satisfaction. About continuous use intention, the variance foundwas 0.84, which is the total variance explained in the final modelset.
These results indicate that there is an individual sense ofsatisfaction by employees with the training courses using distance
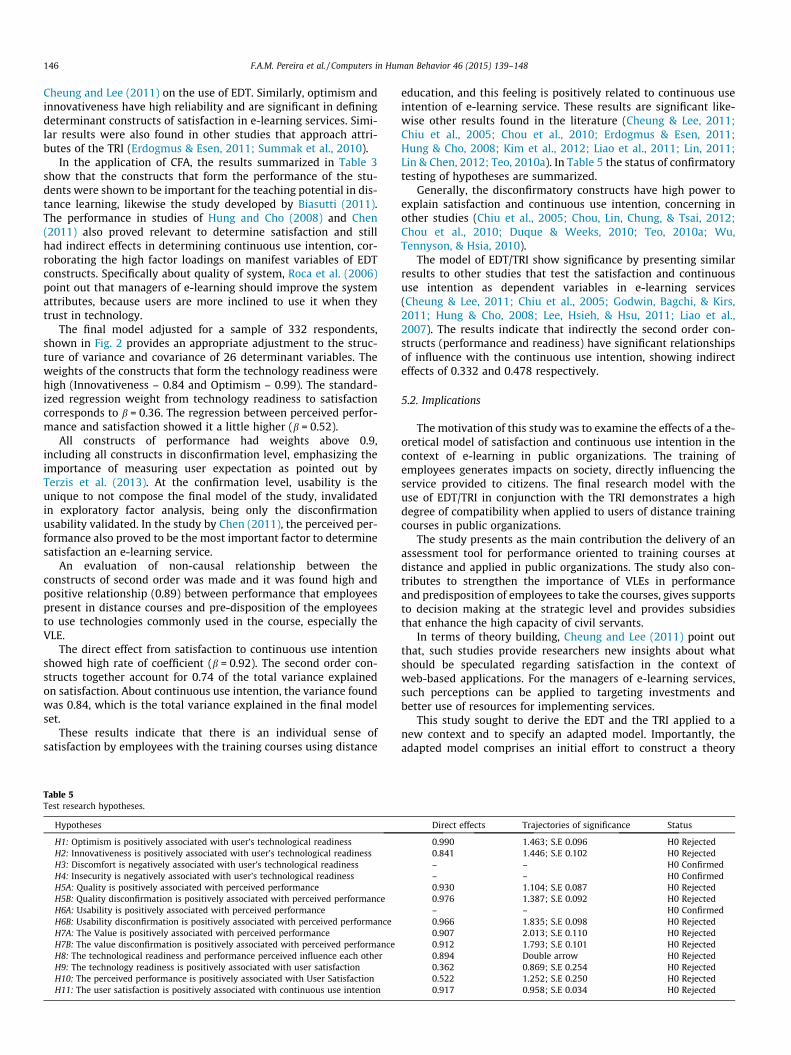
Table 5Test research hypotheses.
Hypotheses
H1: Optimism is positively associated with user’s technological readinessH2: Innovativeness is positively associated with user’s technological readinessH3: Discomfort is negatively associated with user’s technological readinessH4: Insecurity is negatively associated with user’s technological readinessH5A: Quality is positively associated with perceived performanceH5B: Quality disconfirmation is positively associated with perceived performanceH6A: Usability is positively associated with perceived performanceH6B: Usability disconfirmation is positively associated with perceived performanceH7A: The Value is positively associated with perceived performanceH7B: The value disconfirmation is positively associated with perceived performanceH8: The technological readiness and performance perceived influence each otherH9: The technology readiness is positively associated with user satisfactionH10: The perceived performance is positively associated with User SatisfactionH11: The user satisfaction is positively associated with continuous use intention
education, and this feeling is positively related to continuous useintention of e-learning service. These results are significant like-wise other results found in the literature (Cheung & Lee, 2011;Chiu et al., 2005; Chou et al., 2010; Erdogmus & Esen, 2011;Hung & Cho, 2008; Kim et al., 2012; Liao et al., 2011; Lin, 2011;Lin & Chen, 2012; Teo, 2010a). In Table 5 the status of confirmatorytesting of hypotheses are summarized.
Generally, the disconfirmatory constructs have high power toexplain satisfaction and continuous use intention, concerning inother studies (Chiu et al., 2005; Chou, Lin, Chung, & Tsai, 2012;Chou et al., 2010; Duque & Weeks, 2010; Teo, 2010a; Wu,Tennyson, & Hsia, 2010).
The model of EDT/TRI show significance by presenting similarresults to other studies that test the satisfaction and continuoususe intention as dependent variables in e-learning services(Cheung & Lee, 2011; Chiu et al., 2005; Godwin, Bagchi, & Kirs,2011; Hung & Cho, 2008; Lee, Hsieh, & Hsu, 2011; Liao et al.,2007). The results indicate that indirectly the second order con-structs (performance and readiness) have significant relationshipsof influence with the continuous use intention, showing indirecteffects of 0.332 and 0.478 respectively.
5.2. Implications
The motivation of this study was to examine the effects of a the-oretical model of satisfaction and continuous use intention in thecontext of e-learning in public organizations. The training ofemployees generates impacts on society, directly influencing theservice provided to citizens. The final research model with theuse of EDT/TRI in conjunction with the TRI demonstrates a highdegree of compatibility when applied to users of distance trainingcourses in public organizations.
The study presents as the main contribution the delivery of anassessment tool for performance oriented to training courses atdistance and applied in public organizations. The study also con-tributes to strengthen the importance of VLEs in performanceand predisposition of employees to take the courses, gives supportsto decision making at the strategic level and provides subsidiesthat enhance the high capacity of civil servants.
In terms of theory building, Cheung and Lee (2011) point outthat, such studies provide researchers new insights about whatshould be speculated regarding satisfaction in the context ofweb-based applications. For the managers of e-learning services,such perceptions can be applied to targeting investments andbetter use of resources for implementing services.
This study sought to derive the EDT and the TRI applied to anew context and to specify an adapted model. Importantly, theadapted model comprises an initial effort to construct a theory
Direct effects Trajectories of significance Status
0.990 1.463; S.E 0.096 H0 Rejected0.841 1.446; S.E 0.102 H0 Rejected– – H0 Confirmed– – H0 Confirmed0.930 1.104; S.E 0.087 H0 Rejected0.976 1.387; S.E 0.092 H0 Rejected– – H0 Confirmed0.966 1.835; S.E 0.098 H0 Rejected0.907 2.013; S.E 0.110 H0 Rejected0.912 1.793; S.E 0.101 H0 Rejected0.894 Double arrow H0 Rejected0.362 0.869; S.E 0.254 H0 Rejected0.522 1.252; S.E 0.250 H0 Rejected0.917 0.958; S.E 0.034 H0 Rejected

F.A.M. Pereira et al. / Computers in Human Behavior 46 (2015) 139–148 147
focused on e-learning in public service organizations, focusing onuser experience in skills training and practice of the knowledgegenerated. Moreover, a model with the EDT and the TRI togetherpresents an original value because such a configuration was notfound in important studies on the subject.
5.3. Limitations and future studies
The research has some limitations. Firstly, validated and inval-idated constructs should not have the results generalized becausethey need to be retested by the primary research model for futureapplications. It is noteworthy that the model is a simplification ofreality and can present different results when applied to otherunits of analysis. Nonetheless, it is reinforced the premise thatensures reproducibility logic of the theoretical model found (Hairet al., 2010; Maroco, 2010).
By the reason that it is not practical to make a model too muchcomplex, constructs equally significant in determining satisfactionin e-learning were not included, for example, subjective norms,present in the TPB model, validated by Lee (2010) and Raaij andSchepers (2008). Other limitation of this study is the same onepointed out by Lin (2011): external factors and possible effectsderived by conditions facilitating or environmental influenceswere not included in the proposed theoretical model. These limita-tions encourage future studies that use such a construct.
This research suggests the way future works can continue toexplore impacts of satisfaction and intention to continue the usein the context of e-learning or the use of other technologies(Cheung & Lee, 2011; Chiu et al., 2011; Lee, 2010). Conducting lon-gitudinal studies is also recommended, because they generatemore reliable results and allow an assessment of practicalknowledge generated in the courses (Chiu et al., 2005).
The use of model EDT and TRI together reflects a significant linkof influence between the perceived performance and readinesstechnology that can become the focus of further studies. Thus, itis possible to create a theory directed specifically to e-learning ser-vices aimed at training civil servants. Consequently, bridging thegap concerning theoretical models focusing on e-learning servicesin the public sector.
References
Abraead (2008). Anuário Brasileiro de Educação Aberta. ABRAEAD: <http://www.abraead.com.br> Accessed 15.03.14.
Akbar, F. (2013). What affects students’ acceptance and use of technology? DietrichCollege Honors Theses. Carnegie Mellon University.
Alwahaishi, S., & Snášel, V. (2013). Consumers’ acceptance and use of informationand communications technology: A UTAUT and flow based theoretical model.Journal of Technology Management & Innovation, v. 8(2).
Bhattacherjee, A. (2001a). An empirical analysis of the antecedents of eletroniccommerce service continuance. Decisions Support Systems, 32(2), 201–214.
Bhattacherjee, A. U. (2001b). Understanding information systems continuance: Anexpectation-confirmation model. MIS Quarterly, 25(3), 351–370.
Biasutti, M. (2011). The student experience of a collaborative e-learning universitymodule. Computers & Education, 57, 1865–1875.
Birou, A. (1976). Dicionário das ciências sociais (2nd ed.). Lisboa: Dom Quixote.Bojanic, D. C. (1996). Consumer perceptions of price, value and satisfaction in the
hotel industry: An exploratory study. Journal of Hospitality and LeisureMarketing, 4(1), 5–22.
Bolliger, D. U., & Martindale, T. (2004). Key factors for determining studentsatisfaction in online courses. International Journal of E-learning (1).
Brasília (2006). Decree n. 5707 to February 23, 2006. Available in Institui a Política eas Diretrizes para o Desenvolvimento de Pessoal da administração públicafederal: <https://www.planalto.gov.br/ccivil_03/_Ato2004-2006/2006/Decreto/D5707.htm> Accessed 17.11.14.
Chen, J. L. (2011). The effects of education compatibility and technologicalexpectancy on e-learning acceptance. Computers & Education, 57, 1501–1511.
Cheung, C. M., & Lee, M. K. (2011). Antecedents and consequences of user satisfactionwith an e-learning portal. International Journal of Digital Society, v.2(1).
Chiu, C. M., Hsu, M. H., Sun, S. Y., Lin, T. C., & Sun, P. C. (2005). Usability, quality,value and e-learning continuance decisions. Computers & Education, 45,399–416.
Chiu, C. M., Wang, E. T., Shih, F. J., & Fan, Y. W. (2011). Understanding knowledgesharing in virtual communities: An integration of expectancy disconfirmationand justice theories. Online Information Review, 35(1), 134–153.
Chou, H., Lin, I., Chung, L., & Tsai, M. (2012). Engagement in e-learningopportunities: An empirical study on patient education using expectationconfirmation theory. Journal of Medical System, 36, 1697–1706.
Chou, S. W., Min, H. T., Chang, Y. C., & Lin, C. T. (2010). Understanding continuanceintention of knowledge creation using extended expectation-confirmationtheory: An empirical study of Taiwan and China online communities.Behaviour & Information Technology, 29(6), 557–570.
Darab, B., & Montazer, G. (2011). An ecletic model for assessing e-learning readinessin the Iranian universities. Computers & Education, 56, 900–910.
Davis, F. D., 1989. Perceived usefulness, perceived ease of use and user acceptanceof information technology. MIS Quarterly, Set.
Derouin, R. E., Fritzsche, B. A., & Salas, E. (2004). Optimizing e-learning research-based guidelines for learner-controlled training. Human Resource Management,43(2), 147–162.
Devaraj, S., Fan, M., & Kohli, R. (2002). Antecedents of B2C channel satisfaction andpreference: Validating e-commerce metrics. Information Systems Research,13(3), 316–333.
Duque, L. C., & Weeks, J. R. (2010). Towards a model and methodology for assessingstudent learning outcomes and satisfaction. Quality Assurance in Education,18(2), 84–105.
Erdogmus, N., & Esen, M. (2011). An investigation of the effects of technologyreadiness on technology acceptance in e-HRM. Procedia Social and BehavioralSciences, 24, 487–495.
Estevez, J. (2005). Addressing the justification of enterprise systems benefits: Adesires and expectancy disconfirmation model. AMCIS americas conference oninformation systems, (p. 125).
Faul, F., Erdfelder, E., Lang, A., & Buchner, A. (2007). G⁄Power 3: A flexible statisticalpower analysis program for the social, behavioral, and biomedical sciences.Behavior Research Methods, 39(2), 175–191.
Fornell, C., & Larcker, D. F. (1981). Evaluating SEM with unobserved variables andmeasurement error. Journal of Marketing Research, 18, 39–50.
Fragoso, S., Recuero, R., & Amaral, A. (2012). Métodos de pesquisa para internet In C.Cultura (Ed.), (1st ed.), Porto Alegre: Sulina.
Gelderman, C. J., Ghijsen, P. W., & Diemen, R. V. (2011). Choosing self-servicetechnologies or interpersonal services: The impact of situacional factors andtechnology related attitudes. Journal of Retailing and Consumer Services, 18,414–421.
Godwin, J., Bagchi, K., & Kirs, J. (2011). Using SERVQUAL to assess the quality of e-learning experience. Computers in Human Behavior.
Gregg, G. V. (2006). Testing the expectancy disconfirmation model of citizensatisfaction with local government. Journal of Public Administration Research andTheory, 16(4), 599–611.
Hair, J., Anderson, R., Taham, R., & Black, W. (2009). Análise multivariada de dados(6th ed.). Porto Alegre: Bookman.
Hair, J. F., Babin, B., Money, A. H., & Samouel, P. (2010). Fundamentos de métodos depesquisa em administração. São Paulo: Arkmed/Bookman.
Harfoushi, O., & Obiedat, R. (2011). ETraining Acceptance factors in businessorganizations. International Journal of Emerging Technologies in Learning (iJET).
Hess, J. (2012). Distance learning. Available in The Federal Resource Centerfor Special Education: http://www.dssc.org/frc/pubslHess.pdf> Accessed31.07.12.
Hsu, H. (2012). The acceptance of Moodle: An empirical study based on UTAUT.Creative Education, 3, 4446.
Hu, L., Kuo, T., & Lin, B. (2010). Influence of online learning skills in cyberspace.Internet Research, 20(1), 55–71.
Hung, H., & Cho, V. (2008). Continued usage of e-learning communication tools: Astudy from the learners perspective in Hong Kong. International Journal ofTraining and Development.
Iraossi, G. (2006). The power of survey design: A user’s guide for managing surveys,interpreting results and influencing respondents (1st ed.). Washington, DC: TheWorld Bank.
Ismail, I., Azizan, S., & Azman, N. (2011). Accessing innovativeness of distancelearners toward their readiness in embracing technology. African Journal ofBusiness Management, 5(33), 12768–12776.
Joreskog, K. G., & Sorbom, D. (2003). LISREL (Version 8.54). Chicago: ScientificSoftware.
Kaplan, E., & Leiserson, E. (2012). E-learning glossary. Available in Learning circuits:<http://www.learningcircuits.org/glossary.html> Accessed 31.07.12.
Kim, K., Trimi, S., Park, H., & Rhee, S. (Out. de 2012). The impact of CMS quality onthe outcomes of e-learning systems in higher education: An empirical study.Decision Sciences Journal of Innovative Education, v. 4(4).
Klering, L. R., & Schroeder, C. S. (2011). Desenvolvimento de um ambiente virtual deaprendizagem à luz do enfoque sistêmico. Tecnologias de Administração eContabilidade (TAC), 1(2), 42–54.
Kline, R. B. (2005). Principles and practice of structural equation modeling (2nd ed.).New York: Guilford Press.
Kocaleva, Mirjana, Stojanovic, Igor, & Zdravev, Zoran (2014). Research on UTAUTapplication in higher education institutions. In: ITRO 2014, 27 June 2014,Zrenjanin, Serbia.
Lai, M. L. (2008). Technology readiness, internet self-efficacy and computingexperience of professional accounting students. Campus-Wide InformationSystems, v.25(1).

148 F.A.M. Pereira et al. / Computers in Human Behavior 46 (2015) 139–148
Lai, X., Li, F., & Leung, K. (2013). A monte carlo study the effects of common methodvariances on significance testing and parameter bias in hierarchical linearmodeling. Organizational Research Methods, 16, 243–269.
Langford, J., & Seaborne, K. (2008). To click or not to click: E-learning for the publicsector. Canadian Public Administration, 46(1), 50–75.
Lankton, N., & McKnight, D. (2006). Using expectation disconfirmation theory topredict technology trust and usage continuance intentions. Eli Broad College ofBusiness.
Lee, M. C. (2010). Explaining and predicting users continuance intention towarde-learning: An extension of the expectation confirmation model. Computers &Education, 54, 506–516.
Lee, Y. H., Hsieh, Y. C., & Hsu, C. N. (2011). Adding innovation diffusion theory to thetechnology acceptance model: Supporting employees intentions to usee-learning systems. Educational Technology & Society, 14(4), 124–137.
Liao, C., Chen, J. L., & Yen, D. C. (2007). Theory of planning behavior (TPB) andcustomer satisfaction in the continued use of e-service: An integrated model.Computers in Human Behavior, 23, 2804–2822.
Liao, C., Chuang, C. L., Yu, P. L., Lai, T., & Hong, N. L. (2011). Applying the expectancydisconfirmation and regret theories to online consumer behavior.Cyberpsychology, Behavior and Social Networking, 14(4), 241–248.
Liaw, S. S. (2008). Investigating students perceived satisfaction, behavioral intentionand effectiveness of e-learning: A case study of the blackboard system.Computers & Education, 51, 864–873.
Lin, K. M. (2011). E-learning continuance intention: Moderating effects of usere-learning experience. Computers & Education, 56, 515–526.
Lin, T. C., & Chen, C. J. (2012). Validating the satisfaction and continuance intentionof e-learning systems: Combining TAM and IS success models. InternationalJournal of Distance Education Technologies, 10(1), 44–54.
Lin, J. S., & Hsieh, P. L. (2007). The influence of technology readiness on satisfactionand behavioral intentions toward self-service technologies. Computers inHuman Behavior, 23, 1597–1615.
Ling, L. M., & Moi, C. M. (2007). Professional students technology readiness, priorcomputing experience and acceptance of an e-learning system. MalaysianAccounting Review, v.6(1).
Marks, R. B., Sibley, S. D., & Arbaugh, J. B. (2005). A structural equation model ofpredictors for effective online learning. Journal of Management Education, 29(4),531–563.
Maroco, J. (2010). Análise de equações estruturais: Fundamentos teóricos, softwaree aplicações (1st ed.). Perô Pinheiro: Report Number..
Marques, B. P., Villate, J. E., & Carvalho, C.V. (2011). Applying the UTAUT model inengineering higher education: Teacher’s technology adoption. Informationsystems and technologies (CISTI), 6th Iberian conference.
Mayr, S., Erdfelder, E., Buchner, A., & Faul, F. (2007). A short tutorial of GPower.Tutorials in Quantitative Methods for Psychology, 3(2), 51–59.
Mulaik, S. A., James, L. R., Alstine, J. V., Bennett, N., Lind, S., & Stilwell, C. D. (1989).Evaluation of goodness of fit indices for structural equation models.Psychological Bulletin, 105(3), 430–445.
Nicholson, P. (2007). A history of e-learning: Echoes of the pioneers. In: B. F.Manjón, E-learning: From theory to practice (p. 241). Dordrecht: Springer.
Oliver, R. L. (1980). A cognitive model of the antecedents and consequences ofsatisfaction decisions. Journal of Marketing Research, 17(4), 460–469.
Oliver, J. (2009). Evaluating the expectations disconfirmation and expectationsanchoring approaches to citizen satisfaction with local public services. Journal ofPublic Administration Research and Theory, 19(1), 107–123.
Oliver, R. L., & Swan, J. E. (1989). Consumer perceptions of interpersonal equity andsatisfaction in transactions: A field survey approach. Journal of Marketing, 53(2),21–35.
Oye, N. D., Iahad, N., Nor, Zairah A. Rahim (2012). The impact of UTAUT model andICT theoretical framework on university academic staff: Focus onAdamawa State University, Nigeria. International Journal of Computers &Technology, v. 2(2).
Paechter, M., Maier, B., & Macher, D. (2010). Students expectations of andexperiences in e-learning: Their relation to learning achievements and coursesatisfaction. Computers & Education, 54, 222–229.
Parasuraman, A. (2000). Technology Readiness Index (TRI): A multiple-item scale tomeasure readiness to embrace new technologies. Journal of Service Research,2(4), 307–320.
Pereira, F. A. M., Ramos, A. S., Andrade, A. P., & Oliveira, B. M. (2011). Continuedusage of e-learning: Expectations and performance. In: 10th CONTECSI, 11 June2011, São Paulo, Brazil.
Pereira, F. A. M., Ramos, A. S., & Chagas, M. M. (2011). Satisfaction and continuanceuse in virtual learning environment. In: 10th CONTECSI, 11 June 2011, São Paulo,Brazil.
Podsakoff, P. M., MacKenzie, S. B., Lee, J. Y., & Podsakoff, N. P. (2003). Commonmethod biases in behavioral research: A critical review of the literature andrecommended remedies. Journal of Applied Psychology, 88(5), 879–903.
Prajapati, B., Dunne, M., & Armstrong, R. (2010). Sample size estimation andstatistical power analysis. Ot Peer Reviewed.
Premkumar, G., & Bhattacherjee, A. (2008). Explaining information technologyusage: A test of competing models. The International Journal of ManagementScience, 36(1), 64–75.
Raaij, E. M., & Schepers, J. J. (2008). The acceptance and use of a virtual learningenvironment in China. Computers & Education, 50, 838–852.
Rhee, B. V., Verma, R., Plaschka, G. R., & Kickul, J. R. (2007). Technology readiness,learning goals and e-learning: Searching for synergy. Journal of InnovateEducation, 5(1), 127–149.
Richey, R. G., & Autry, C. W. (2009). Assessing interfirm collaboration/technologyinvestment tradeoffs: The effects of technological readiness and organizationallearning. The International Journal of Logistics Management, 20(1), 30–56.
Riss, L. A., Grohmann, M. Z. (2011). Mapeamento da produção científica em e-learning nos anais dos eventos da anpad e seus hot topics no âmbitointernacional: Uma análise de 2000 a 2010. Encontro de Administração daInformação (EnADI). Porto Alegre.
Roca, J. C., Chiu, C. M., & Martínez, F. J. (2006). Understanding e-learningcontinuance intention: An extension of the technology acceptance model.International Journal of Human Computer Studies, 64, 683–696.
Saha, P., Nath, A., & Sangari, E. (2010). Success of government e-service delivery:Does satisfaction matter? Lectures Notes in Computer Science (1), 204–215.
Serenko, A., & Stach, A. (2009). The impact of expectation disconfirmation oncustomer loyalty and recommendation behavior: Investigating online traveland tourism services. Journal of Information Technology, 20(3), 26–41.
Siritongthaworn, S., & Krairit, D. (2006). Satisfaction in e-learning: The context ofsupplementary instruction. Campus-Wide Information Systems, v. 23(2).
Spreng, R. A., Mackenzie, S. B., & Olshavsky, R. W. (1996). A re-examination of thedeterminants of consumer satisfaction. Journal of Marketing, 60, 15–32.
Summak, S., Baglibel, M., & Samancioglu, M. (2010). Technology readiness ofprimary school teachers: A case of study in Turkey. Procedia Social andBehavioral Sciences, 2, 2671–2675.
Tan, P. J. B. (2013). Applying the UTAUT to understand factors affecting the use ofEnglish e-learning websites in Taiwan. SAGE Open, v. 3(4).
Teo, T. (2010a). Development and validation of the e-learning acceptance measure(ELAM). Internet and Higher Education, 46(2), 148–162.
Teo, T. (2010b). Using structural equation modelling (SEM) in educationaltechnology research: Issues and guidelines. British Journal of EducationalTechnology, v. 41(6).
Terzis, V., Moridis, C., & Economides, A. (2013). Continuance acceptance ofcomputer based assessment through the integration of user’s expectationsand perceptions. Computers & Education, 62, 50–61.
Wu, J. H., Tennyson, R. D., & Hsia, T. L. (2010). A study of student satisfaction in ablended e-learning system environment. Computers & Education, 55, 155–164.
Yin, R. K. (2005). Estudo de caso: Planejamento e métodos (3rd ed.). Porto Alegre:Bookman.