Embed Size (px)
Citation preview
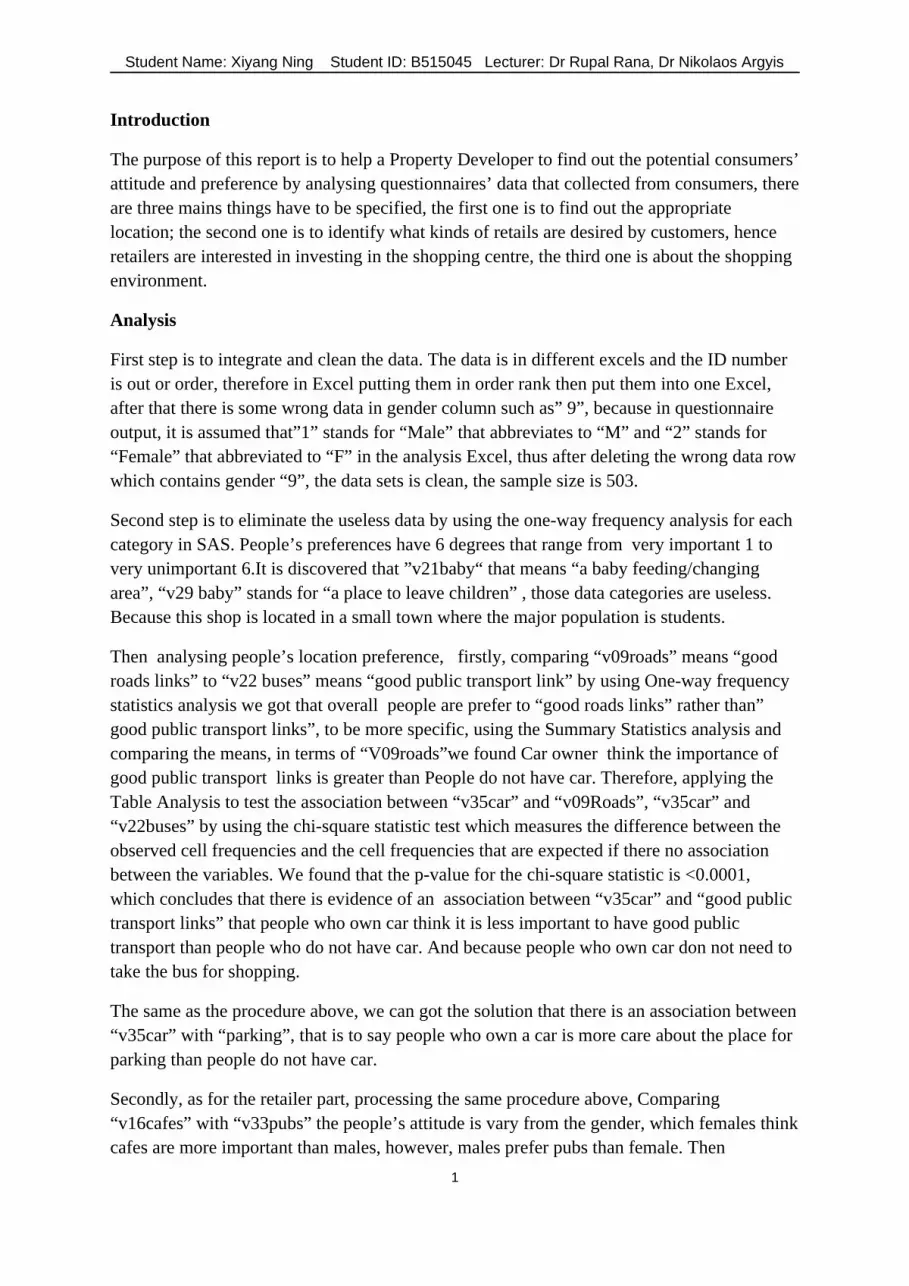
Student Name: Xiyang Ning Student ID: B515045 Lecturer: Dr Rupal Rana, Dr Nikolaos Argyis
Introduction
The purpose of this report is to help a Property Developer to find out the potential consumers’ attitude and preference by analysing questionnaires’ data that collected from consumers, there are three mains things have to be specified, the first one is to find out the appropriate location; the second one is to identify what kinds of retails are desired by customers, hence retailers are interested in investing in the shopping centre, the third one is about the shopping environment.
Analysis
First step is to integrate and clean the data. The data is in different excels and the ID number is out or order, therefore in Excel putting them in order rank then put them into one Excel, after that there is some wrong data in gender column such as” 9”, because in questionnaire output, it is assumed that”1” stands for “Male” that abbreviates to “M” and “2” stands for “Female” that abbreviated to “F” in the analysis Excel, thus after deleting the wrong data row which contains gender “9”, the data sets is clean, the sample size is 503.
Second step is to eliminate the useless data by using the one-way frequency analysis for each category in SAS. People’s preferences have 6 degrees that range from very important 1 to very unimportant 6.It is discovered that ”v21baby“ that means “a baby feeding/changing area”, “v29 baby” stands for “a place to leave children” , those data categories are useless. Because this shop is located in a small town where the major population is students.
Then analysing people’s location preference, firstly, comparing “v09roads” means “good roads links” to “v22 buses” means “good public transport link” by using One-way frequency statistics analysis we got that overall people are prefer to “good roads links” rather than” good public transport links”, to be more specific, using the Summary Statistics analysis and comparing the means, in terms of “V09roads”we found Car owner think the importance of good public transport links is greater than People do not have car. Therefore, applying the Table Analysis to test the association between “v35car” and “v09Roads”, “v35car” and “v22buses” by using the chi-square statistic test which measures the difference between the observed cell frequencies and the cell frequencies that are expected if there no association between the variables. We found that the p-value for the chi-square statistic is <0.0001, which concludes that there is evidence of an association between “v35car” and “good public transport links” that people who own car think it is less important to have good public transport than people who do not have car. And because people who own car don not need to take the bus for shopping.
The same as the procedure above, we can got the solution that there is an association between “v35car” with “parking”, that is to say people who own a car is more care about the place for parking than people do not have car.
Secondly, as for the retailer part, processing the same procedure above, Comparing “v16cafes” with “v33pubs” the people’s attitude is vary from the gender, which females think cafes are more important than males, however, males prefer pubs than female. Then
1
Student Name: Xiyang Ning Student ID: B515045 Lecturer: Dr Rupal Rana, Dr Nikolaos Argyis
comparing “v02quality” and “v03value” ,the results is that nowadays people are more care about goods’ value for money, in other words people are much likely to shopping in a supermarkets/hypermarkets, and there also has association between gender and those, which is women are more care about the value for money than men. The same method, we found the people’s habit here is when shopping, most people are like shopping enjoy themselves, in addition it is associated with gender, which is that females are more prefer enjoy themselves when go shopping than males.
Thirdly, as to the shopping centre environment overall, considering to the staff that people are more like friendly staff rather than helpful and security staff; people take importance of staying dry , clean shopping area, pedestrian zones, shops are easily to be found, toilet which has association with gender.
Recommendation and Conclusion
Conclusion, after the analysis, in general the results are people’s preference for shopping centre is located in a good road links, having nice shopping environment including enough toilets, spacious pedestrian zones, inside dry area, clearly road map in shopping centre, the goods are value for money ,having large supermarket, the shopping centre should recruit friendly staff , developing customer self-shopping. However, on the other hand we must take the customers’ gender into consideration.
The context for the shopping centre is a large university student population, when the main population is female, the additional recommendations are as following:
Good public transport links.
More cafes shops than pubs
Make sure enough toilet
Less staffs to make woman enjoy herself more
Goods value for money
More clear road map for shops
When there are more males in the town, the shopping centre should have more pubs than cafes.
When most customers own a car, the shopping centre should build a convenient parking area.
2
Student Name: Xiyang Ning Student ID: B515045 Lecturer: Dr Rupal Rana, Dr Nikolaos Argyis
Output and Analysis
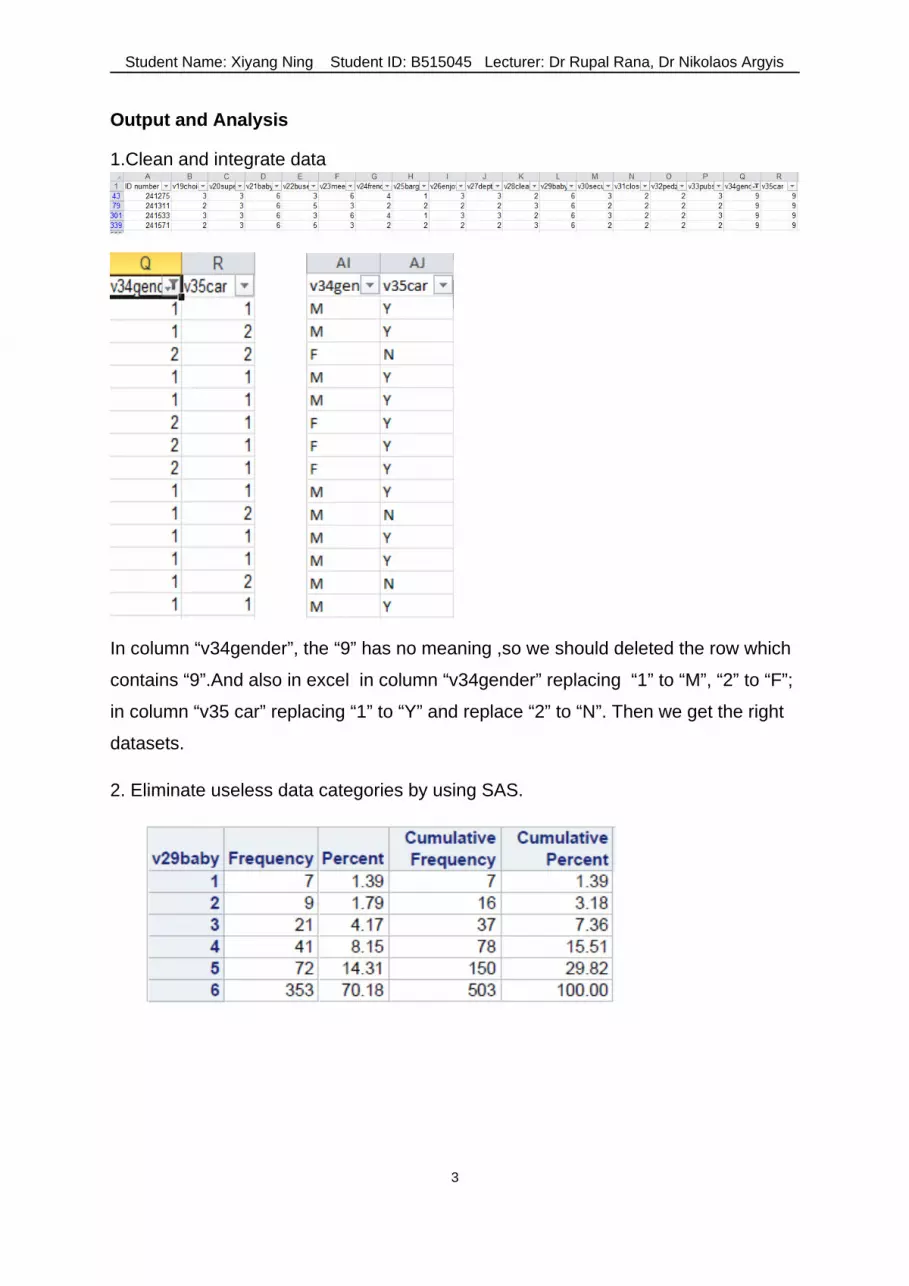
1.Clean and integrate data
In column “v34gender”, the “9” has no meaning ,so we should deleted the row which
contains “9”.And also in excel in column “v34gender” replacing “1” to “M”, “2” to “F”;
in column “v35 car” replacing “1” to “Y” and replace “2” to “N”. Then we get the right
datasets.
2. Eliminate useless data categories by using SAS.
3
Student Name: Xiyang Ning Student ID: B515045 Lecturer: Dr Rupal Rana, Dr Nikolaos Argyis
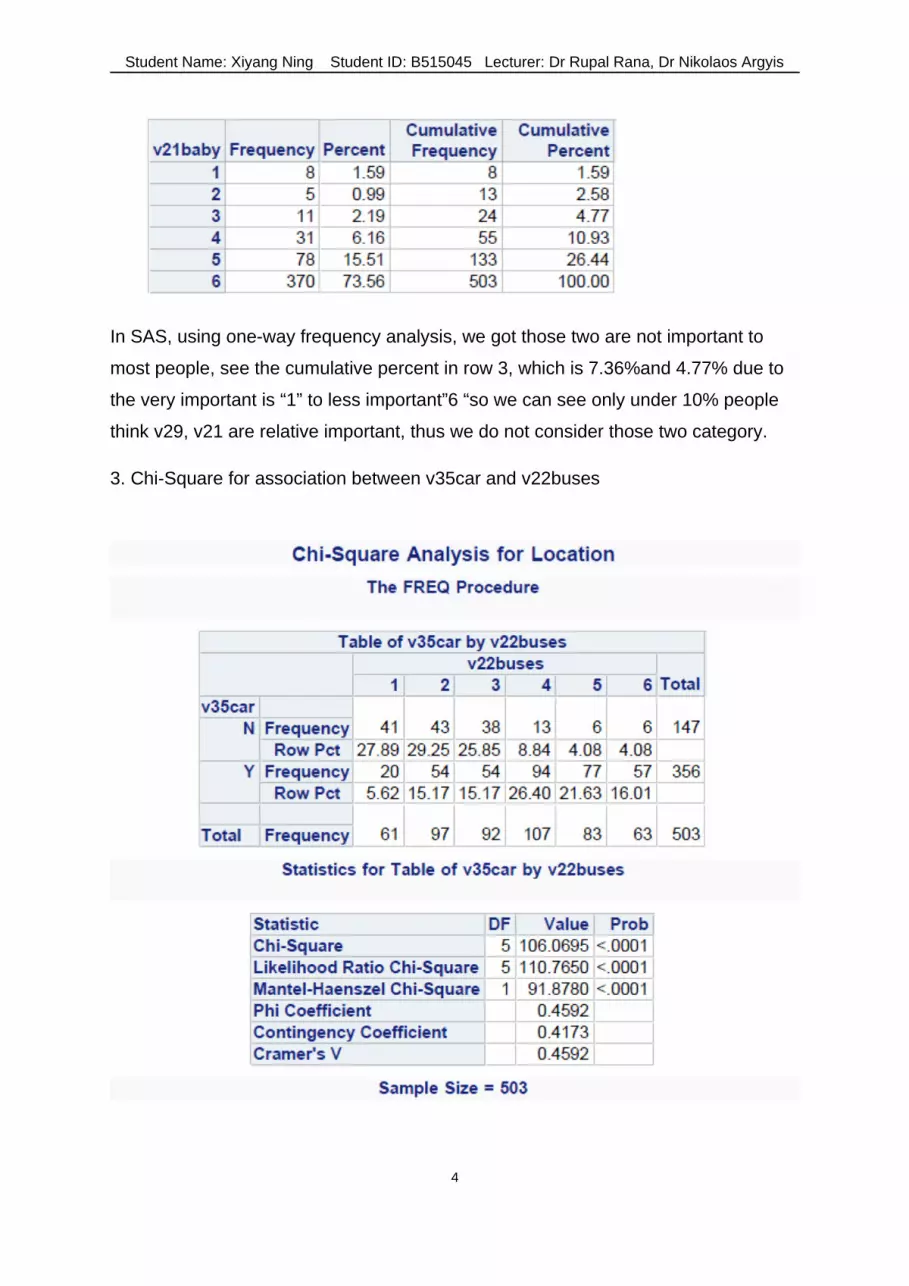
In SAS, using one-way frequency analysis, we got those two are not important to
most people, see the cumulative percent in row 3, which is 7.36%and 4.77% due to
the very important is “1” to less important”6 “so we can see only under 10% people
think v29, v21 are relative important, thus we do not consider those two category.
3. Chi-Square for association between v35car and v22buses
4
Student Name: Xiyang Ning Student ID: B515045 Lecturer: Dr Rupal Rana, Dr Nikolaos Argyis
From this table above ,we got p-value < 0.0001, so there is a evidence of
association between v35car and v22buese, and comparing the people who own car
and do not own car, we got people who do not own car think good public transport
roads is more important people who own car.
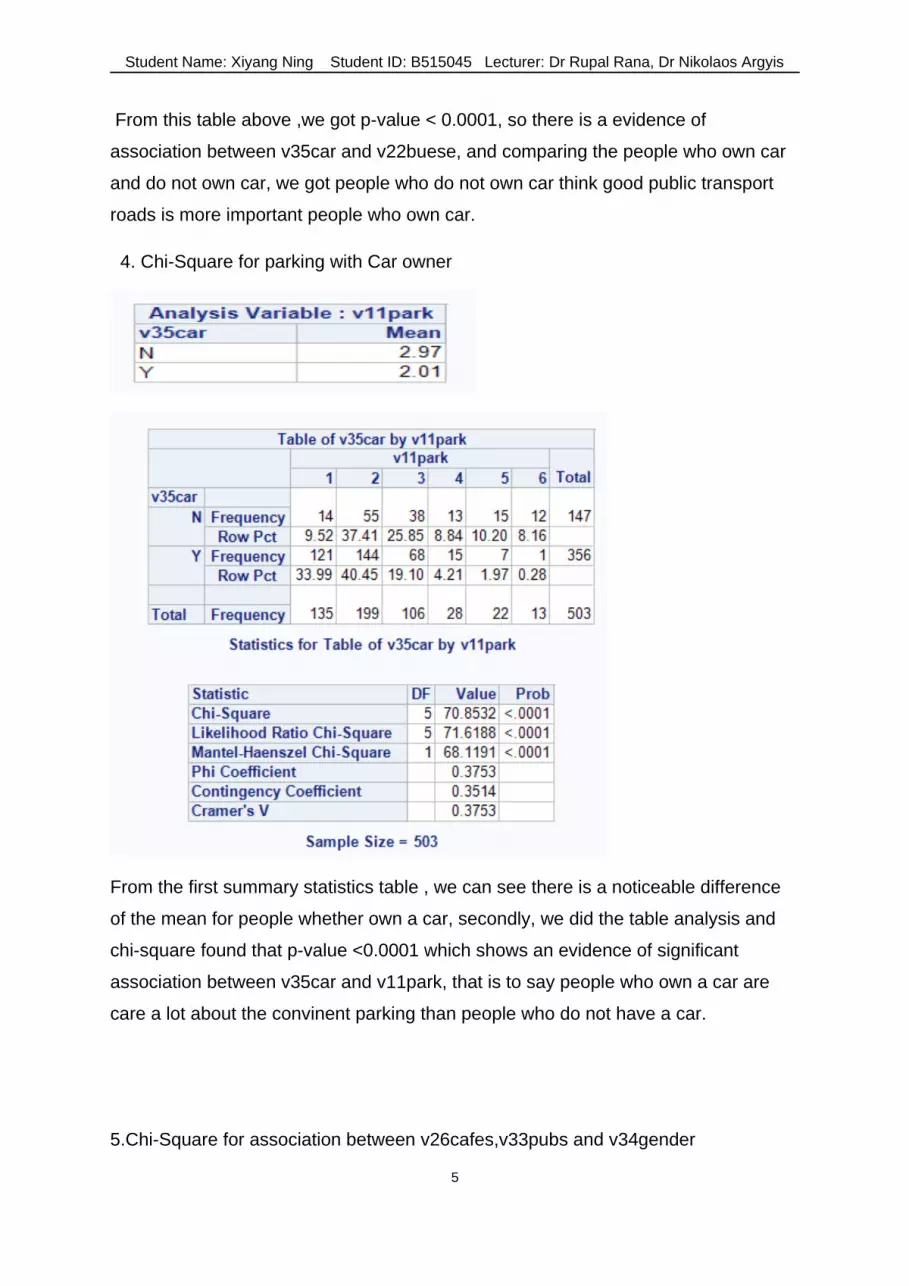
4. Chi-Square for parking with Car owner
From the first summary statistics table , we can see there is a noticeable difference
of the mean for people whether own a car, secondly, we did the table analysis and
chi-square found that p-value <0.0001 which shows an evidence of significant
association between v35car and v11park, that is to say people who own a car are
care a lot about the convinent parking than people who do not have a car.
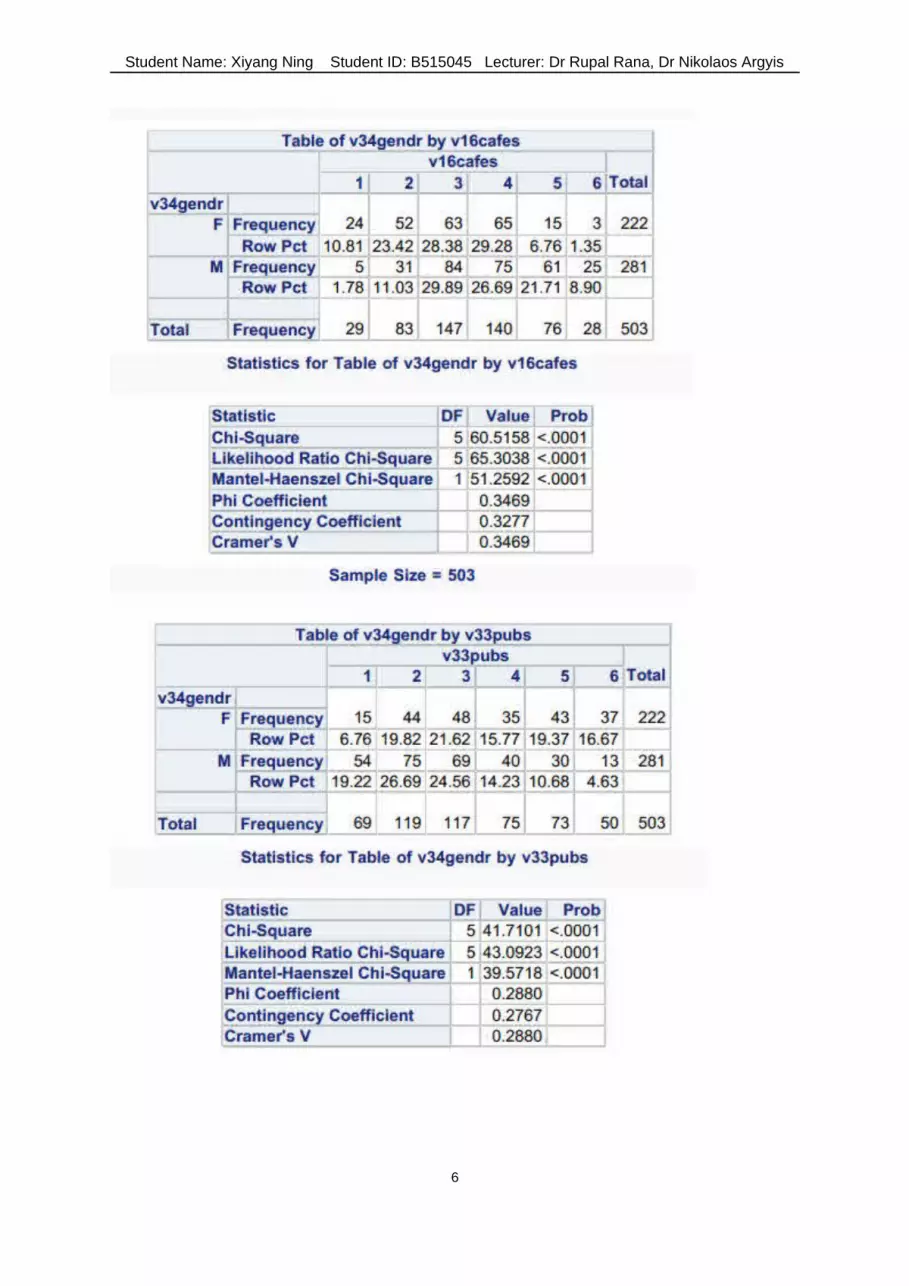
5.Chi-Square for association between v26cafes,v33pubs and v34gender
5
Student Name: Xiyang Ning Student ID: B515045 Lecturer: Dr Rupal Rana, Dr Nikolaos Argyis
6
Student Name: Xiyang Ning Student ID: B515045 Lecturer: Dr Rupal Rana, Dr Nikolaos Argyis
From table above, we foud that in each table p-value <0.0001, so there is an
envidence to show the assocaiiton between v34gender and v26cafe, v34gender and
v33pubs, with thte summary analysis table,because the mean of v16cafes for F is
lesser than M, the mean of v33pubs of M is lesser than F,so the results is that
females are prefer to have cafes palce while males are prefer to have pubs.
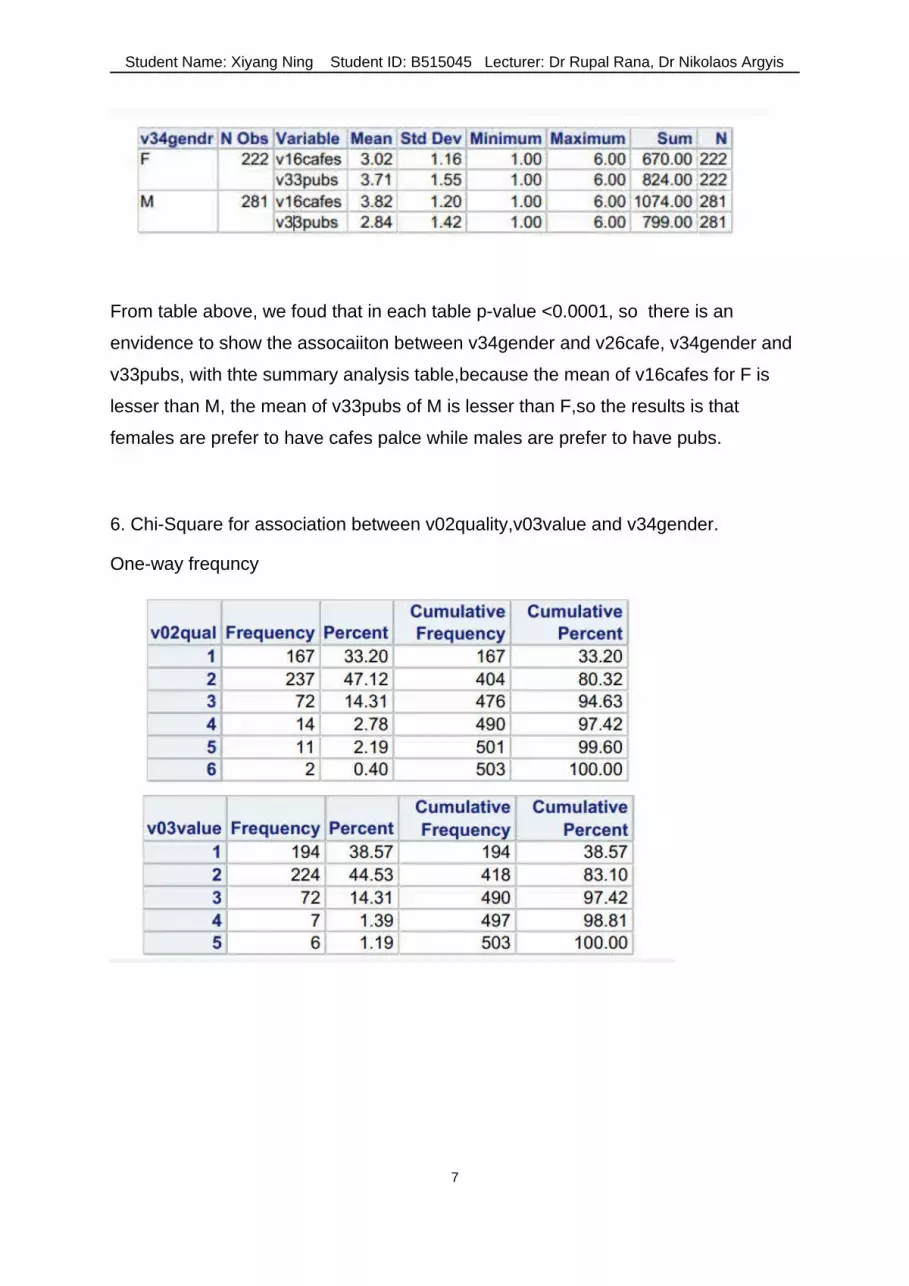
6. Chi-Square for association between v02quality,v03value and v34gender.
One-way frequncy
7
Student Name: Xiyang Ning Student ID: B515045 Lecturer: Dr Rupal Rana, Dr Nikolaos Argyis
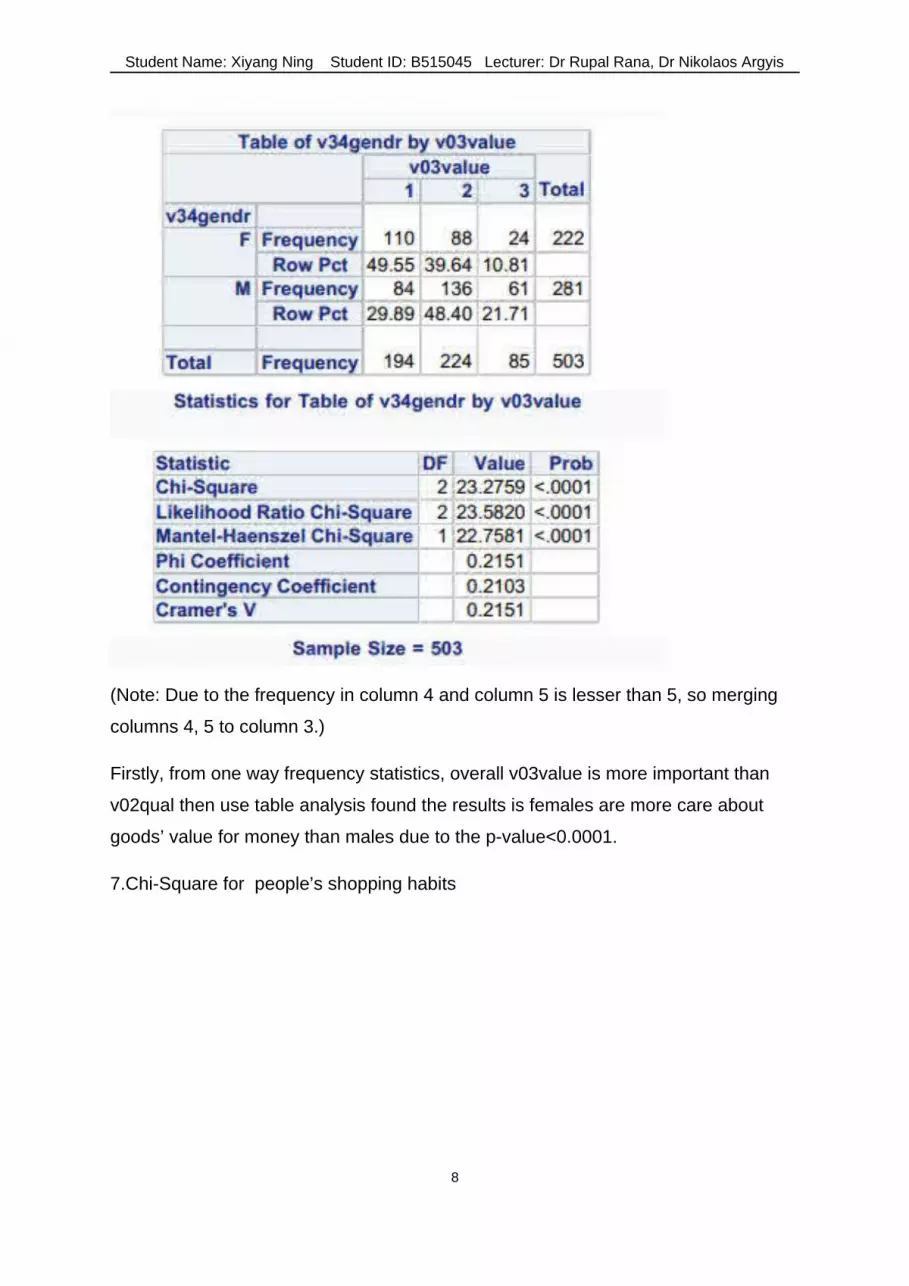
(Note: Due to the frequency in column 4 and column 5 is lesser than 5, so merging
columns 4, 5 to column 3.)
Firstly, from one way frequency statistics, overall v03value is more important than
v02qual then use table analysis found the results is females are more care about
goods’ value for money than males due to the p-value<0.0001.
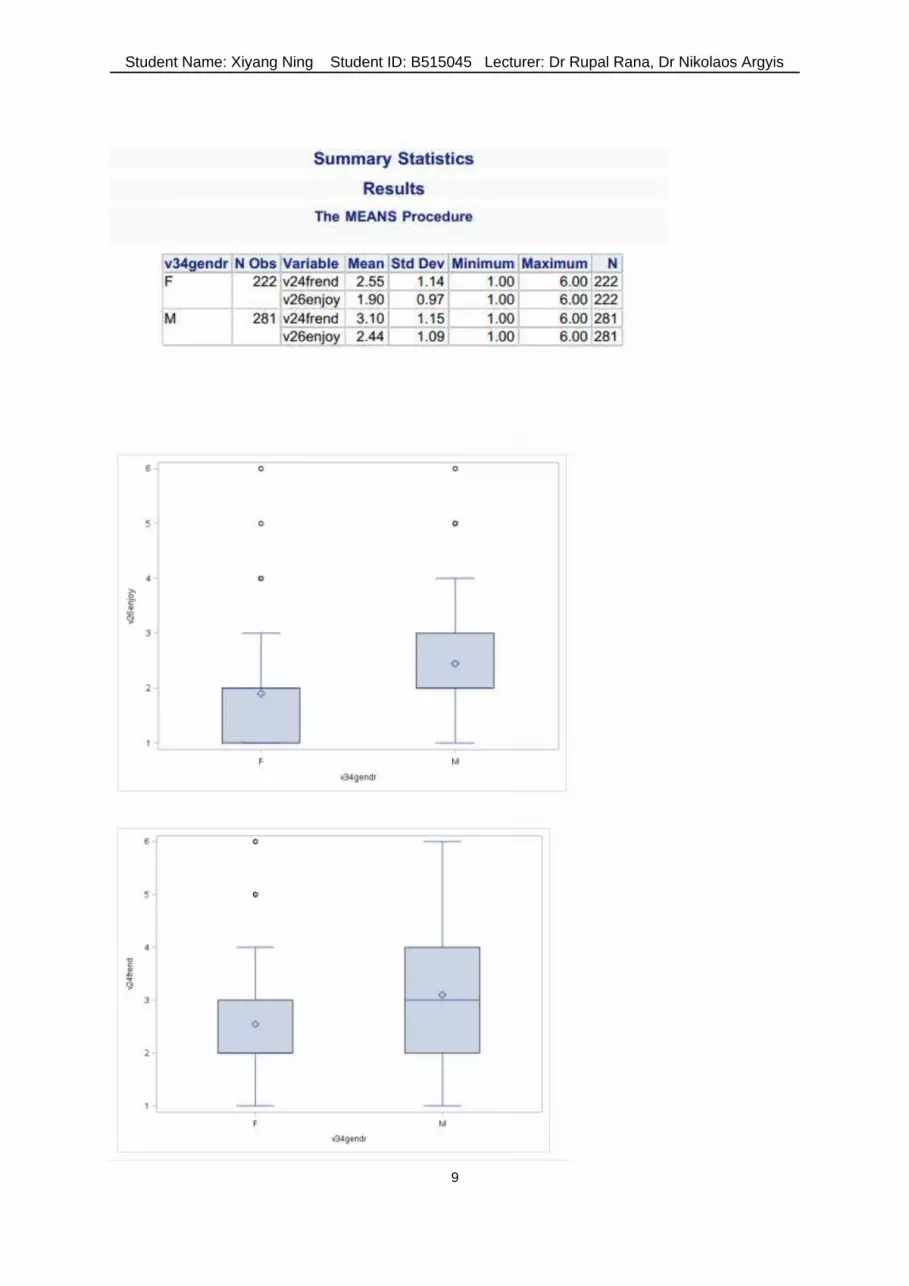
7.Chi-Square for people’s shopping habits
8
Student Name: Xiyang Ning Student ID: B515045 Lecturer: Dr Rupal Rana, Dr Nikolaos Argyis
9
Student Name: Xiyang Ning Student ID: B515045 Lecturer: Dr Rupal Rana, Dr Nikolaos Argyis
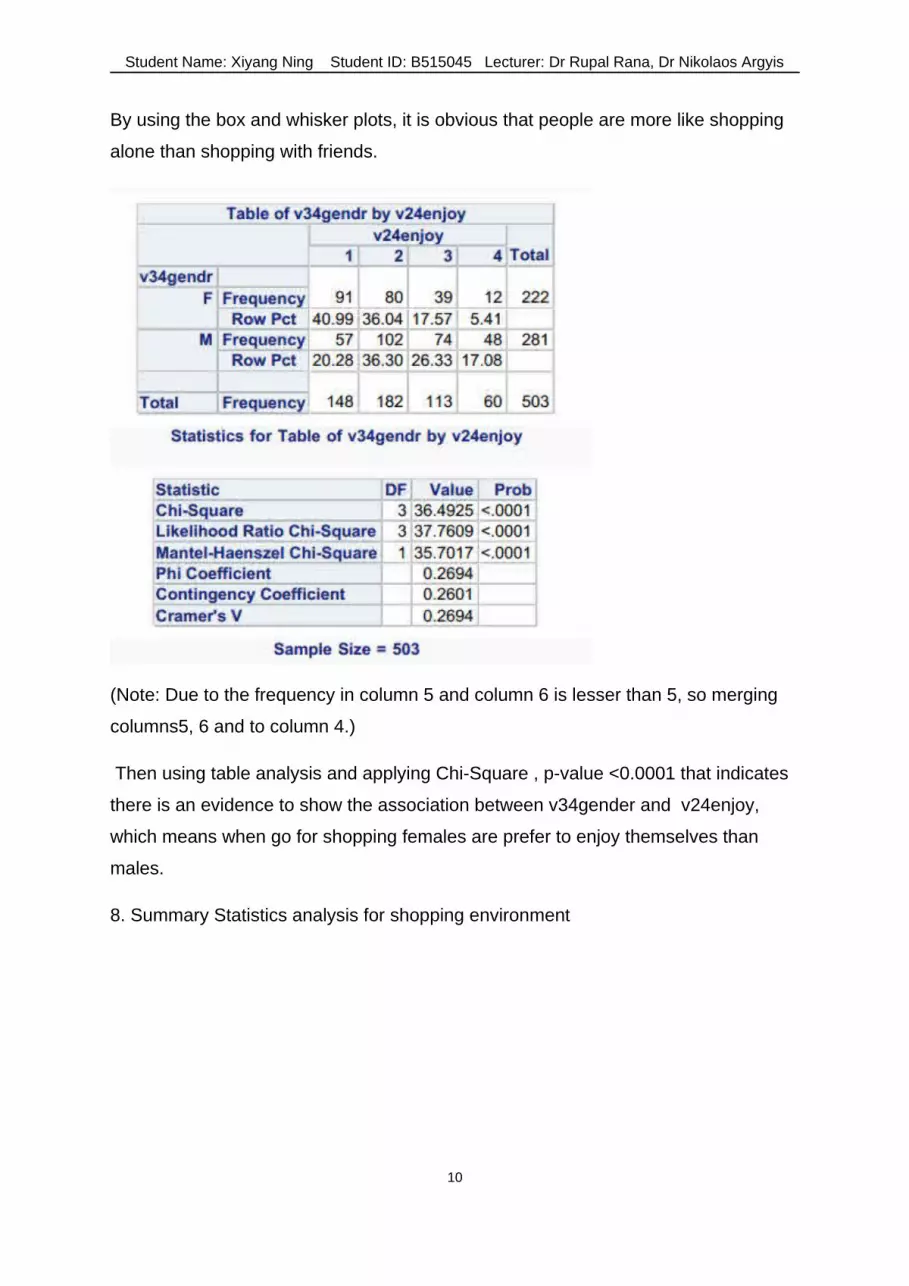
By using the box and whisker plots, it is obvious that people are more like shopping
alone than shopping with friends.
(Note: Due to the frequency in column 5 and column 6 is lesser than 5, so merging
columns5, 6 and to column 4.)
Then using table analysis and applying Chi-Square , p-value <0.0001 that indicates
there is an evidence to show the association between v34gender and v24enjoy,
which means when go for shopping females are prefer to enjoy themselves than
males.
8. Summary Statistics analysis for shopping environment
10
Student Name: Xiyang Ning Student ID: B515045 Lecturer: Dr Rupal Rana, Dr Nikolaos Argyis
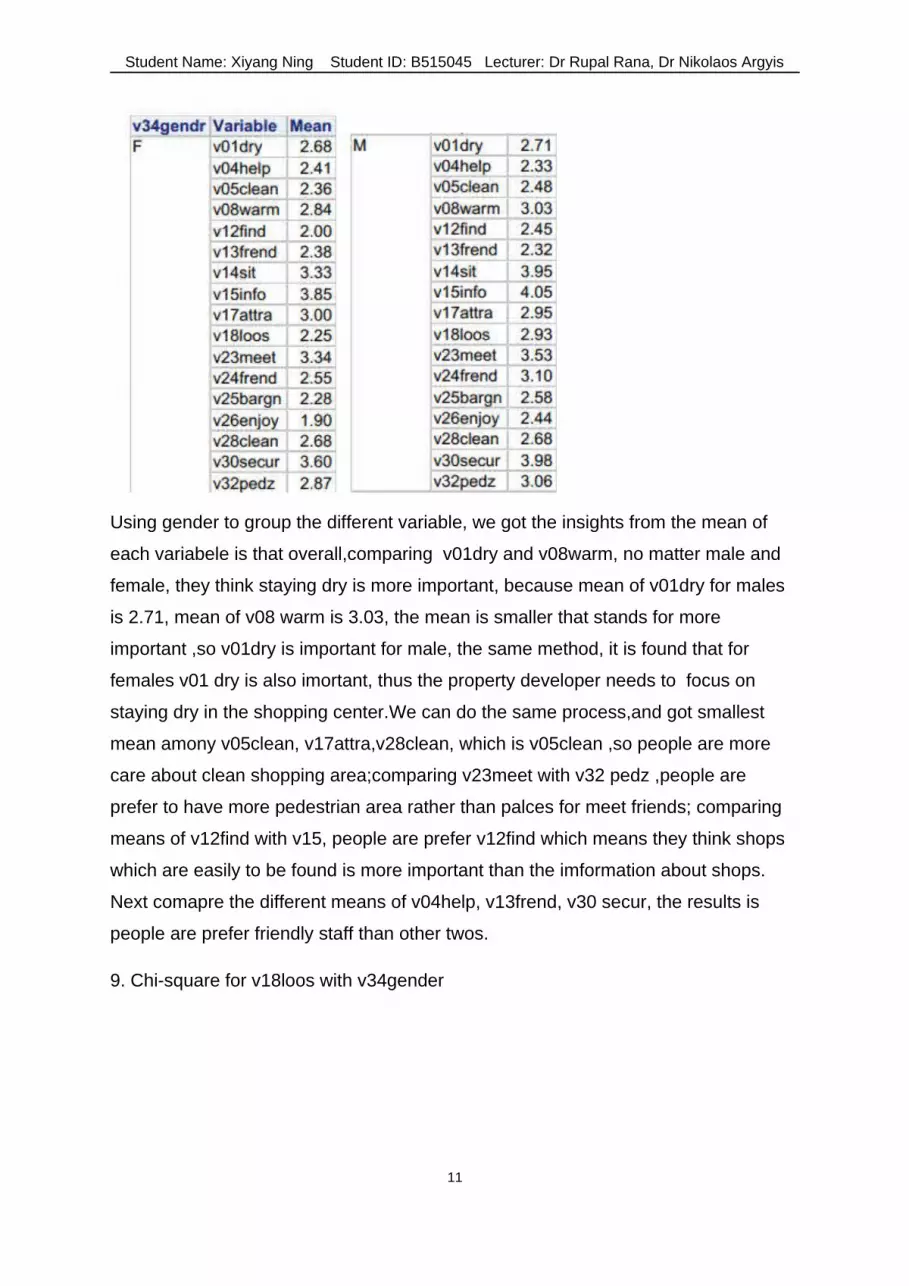
Using gender to group the different variable, we got the insights from the mean of
each variabele is that overall,comparing v01dry and v08warm, no matter male and
female, they think staying dry is more important, because mean of v01dry for males
is 2.71, mean of v08 warm is 3.03, the mean is smaller that stands for more
important ,so v01dry is important for male, the same method, it is found that for
females v01 dry is also imortant, thus the property developer needs to focus on
staying dry in the shopping center.We can do the same process,and got smallest
mean amony v05clean, v17attra,v28clean, which is v05clean ,so people are more
care about clean shopping area;comparing v23meet with v32 pedz ,people are
prefer to have more pedestrian area rather than palces for meet friends; comparing
means of v12find with v15, people are prefer v12find which means they think shops
which are easily to be found is more important than the imformation about shops.
Next comapre the different means of v04help, v13frend, v30 secur, the results is
people are prefer friendly staff than other twos.
9. Chi-square for v18loos with v34gender
11
Student Name: Xiyang Ning Student ID: B515045 Lecturer: Dr Rupal Rana, Dr Nikolaos Argyis
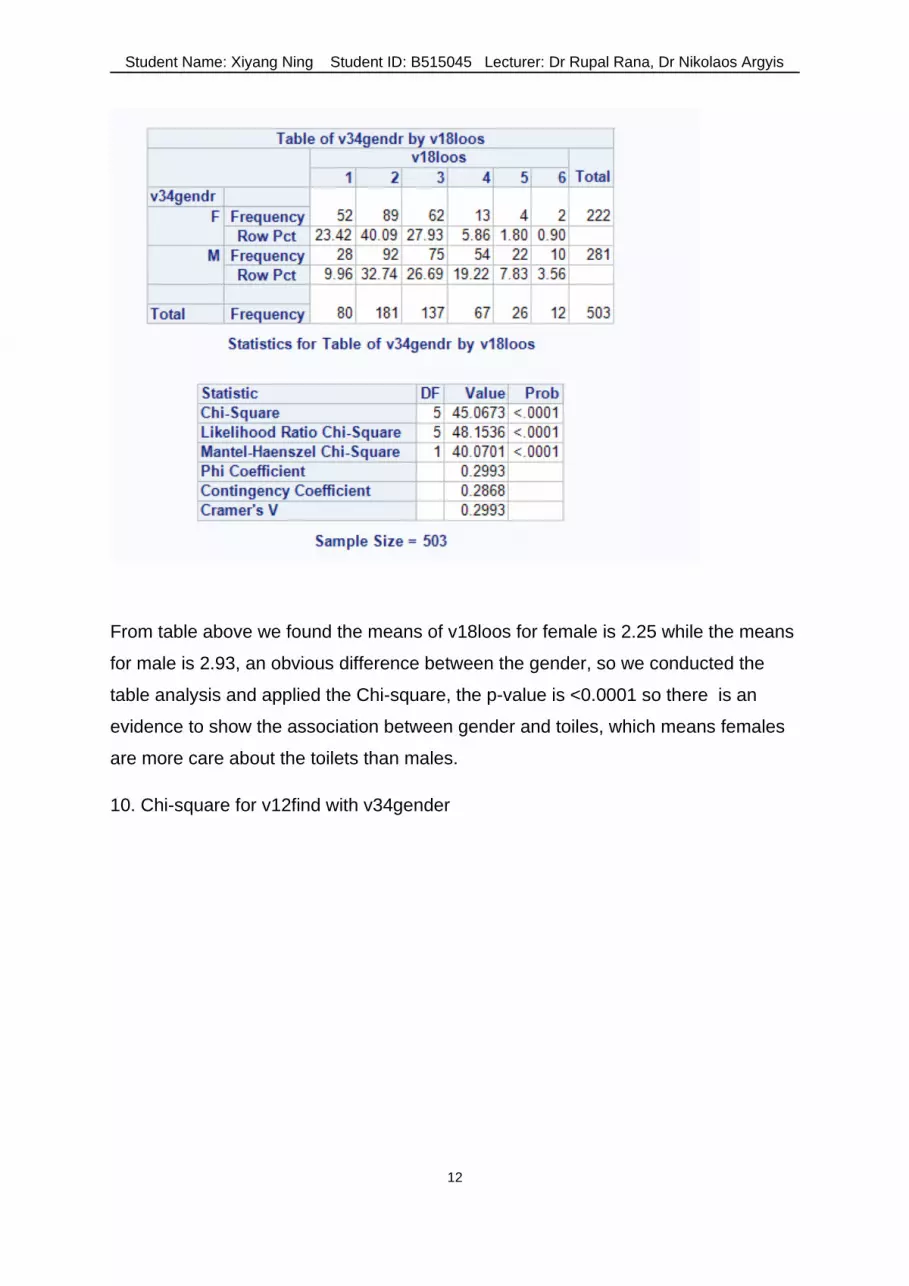
From table above we found the means of v18loos for female is 2.25 while the means
for male is 2.93, an obvious difference between the gender, so we conducted the
table analysis and applied the Chi-square, the p-value is <0.0001 so there is an
evidence to show the association between gender and toiles, which means females
are more care about the toilets than males.
10. Chi-square for v12find with v34gender
12
Student Name: Xiyang Ning Student ID: B515045 Lecturer: Dr Rupal Rana, Dr Nikolaos Argyis
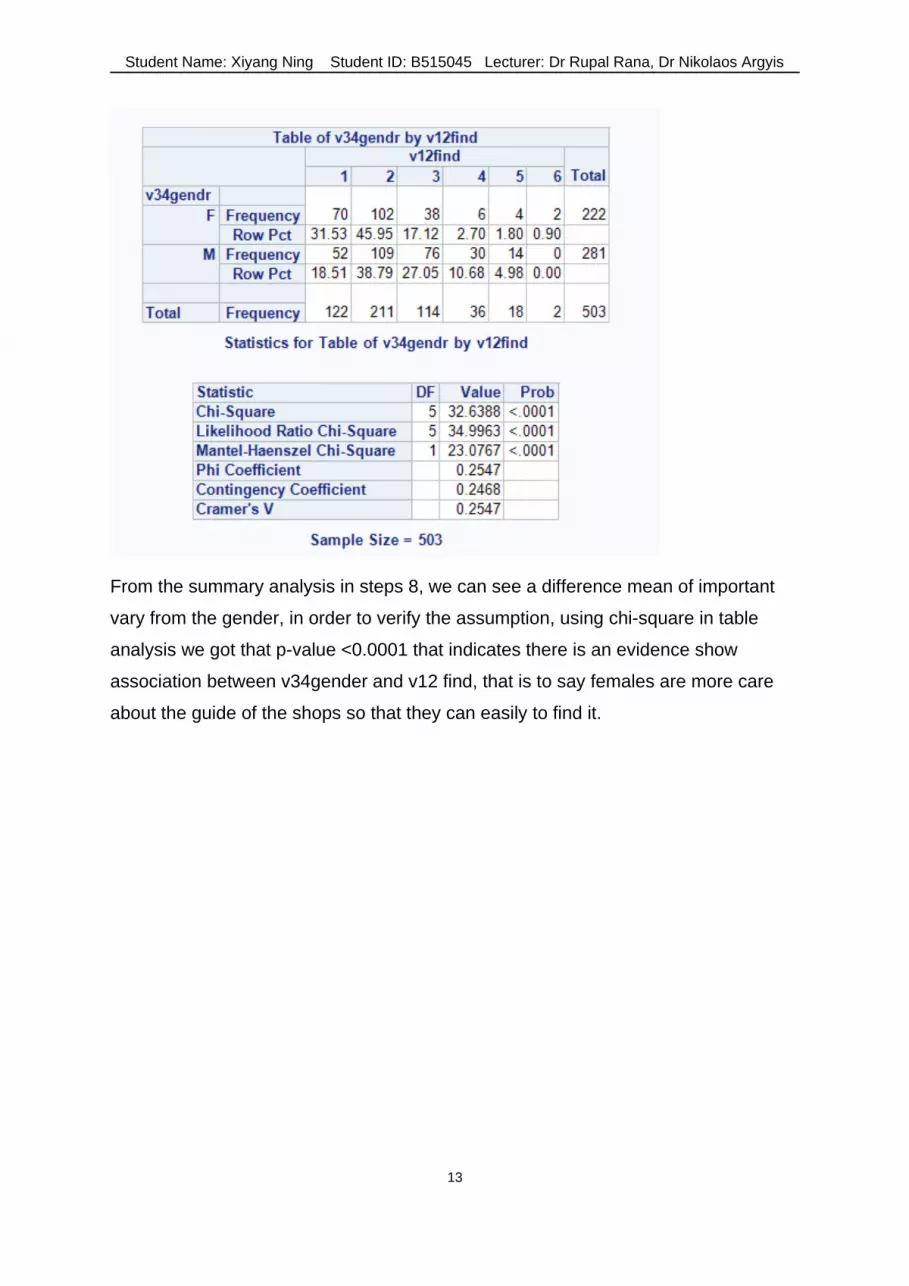
From the summary analysis in steps 8, we can see a difference mean of important
vary from the gender, in order to verify the assumption, using chi-square in table
analysis we got that p-value <0.0001 that indicates there is an evidence show
association between v34gender and v12 find, that is to say females are more care
about the guide of the shops so that they can easily to find it.
13