Embed Size (px)
Citation preview
S
MR
a
ARA
KCST
1
seowacactbmemda
bffua
1d
Chemical Engineering Journal 168 (2011) 1064–1072
Contents lists available at ScienceDirect
Chemical Engineering Journal
journa l homepage: www.e lsev ier .com/ locate /ce j
alty water desalination using carbon nanotubes membrane
aryam Ahmadzadeh Tofighy, Yaser Shirazi, Toraj Mohammadi ∗, Afshin Pakesearch Centre for Membrane Separation Processes, Faculty of Chemical Engineering, Iran University of Science and Technology (IUST), Narmak, Tehran, Iran
r t i c l e i n f o
rticle history:eceived 10 May 2010ccepted 25 January 2011
eywords:arbon nanotubes membranealty water desalination
a b s t r a c t
Carbon nanotube (CNT) film was synthesized directly on macroporous surface of �-alumina supportby chemical vapor deposition (CVD) of cyclohexanol and ferrocene in nitrogen atmosphere at 650 ◦C,and oxidized using HNO3 and H2SO4 and then employed as membrane in desalination process (sodiumchloride removal from water). In order to enhance the performance of the oxidized CNTs membrane,effects of operating parameters on the yield of desalinated water (separation percent and permeate flux)were studied. Four parameters at three levels were selected: feed concentration (10,000, 20,000 and
◦
aguchi method30,000 ppm), temperature (25, 35 and 45 C), pressure (4, 7 and 10 bar) and flow rate (200, 350 and500 l/h). Taguchi method was used to plan a minimum number of experiments and to find the optimalconditions. The results showed that increasing feed concentration, temperature and flow rate as wellas decreasing pressure optimize the performance of the oxidized CNTs membrane (separation percentand permeate flux). Analysis of variance (ANOVA) was applied and it was found that temperature is themost influential factor on the oxidized CNTs membrane performance (its contribution percentage was
%).
calculated to be about 60. Introduction
Desalination is a process that removes dissolved minerals fromeawater, brackish water, or treated water. About 71% of thearth surface is covered by water which is in the form of theceans, seas and the ices in the poles. However, only about 3% ofater is fresh and suitable for drinking. The water of the oceans
nd seas is salty and not directly utilizable. Therefore, some spe-ial processes are needed to desalinate the salty water and asresult overcome the water shortage. Most widely applied and
ommercially desalination processes fall into two categories ofhermal (evaporative) and membrane based methods [1]. Mem-rane based methods are less energy intensive than thermal basedethods and since energy consumption directly affects the cost-
ffectiveness and feasibility of using desalination technologies,embrane based methods such as reverse osmosis (RO), electro-
ialysis (ED) and membrane distillation (MD) have attracted greatttention lately.
Among various membrane based desalination methods, ROelieved to have a great potential for production of drinking water
rom sea water and brackish water. The major energy requiredor desalination by RO is for pressurizing the feed water, typicallyp to 60 bar for sea water. High energy required by RO has beenccused of not being particularly environmentally friendly. Also,∗ Corresponding author. Tel.: +98 21 77240496; fax: +98 21 77240495.E-mail address: [email protected] (T. Mohammadi).
385-8947/$ – see front matter © 2011 Elsevier B.V. All rights reserved.oi:10.1016/j.cej.2011.01.086
© 2011 Elsevier B.V. All rights reserved.
sensitivity of RO membrane to fouling by e.g. suspended solid, andto damage by oxidized compounds is another disadvantage of ROprocess.
Carbon nanotubes (CNTs) have received increasing attentionin the scientific community due to their unique structural andextraordinary chemical and physical properties. One of the mostremarkable properties of CNTs, which makes them attractive fortransport applications, is their unique combination of extremelyhigh aspect ratio with small dimensions. The second impor-tant property of CNTs critical for transport applications is theremarkable atomic scale smoothness and chemical inertness of thegraphitic walls [2]. A number of theoretical reports have consid-ered the behavior of water confined in CNTs [3–12]. Sholl et al.[13] reported simulation results of extremely high gas diffusiv-ity in CNTs and high gas permeability for the vertically alignedCNTs membranes. Hinds et al. [14] and Holt et al. [15] reportedsynthesis of free-standing and silicon-chip supported verticallyaligned CNTs membranes by a complex synthesis method, and con-firmed experimentally high permeability for the CNTs membranes.However, it is difficult to use the free-standing or silicon-chipsupported CNTs membranes in large-scale industrial applications.Macroporous �-alumina in various geometries is arguably themost common support for inorganic membranes used in com-
mercial applications. Lin et al. [16,17] reported synthesis of CNTsmembrane on porous �-alumina support by a multi-step method.Fornasiero et al. [18] reported synthesis of vertically aligned CNTsmembrane. They did fill the gaps between the CNTs by low-pressure silicon nitride deposition, and as a result, the CNTs were
M.A. Tofighy et al. / Chemical Engineering Journal 168 (2011) 1064–1072 1065
of the
ocp
rawttaia
paC(etsoc
Fig. 1. Schematic diagram
nly functionalized at their entrances by plasma treatment toontrol water desalination. Also, they used silicon chips as sup-orts.
In comparison to other membranes, there are only limited workseported on preparation of CNTs membranes for gas or liquid sep-rations. Because, it is impossible to synthesize CNTs membranesith nanotubes inter-grown together without inter-tube gaps, due
o the unique structure of single-walled or multi-walled CNTs andheir growth mechanisms. Hence, filling the inter-tube gaps of CNTrrays is a main step of the CNTs membrane synthesis. Also, remov-ng the excess filling layer from the CNTs membrane is controversialnd difficult.
In this study, CNTs film was synthesized directly on macro-orous surface of �-alumina support and oxidized using HNO3nd H2SO4 and then (without filling the inter-tube gaps ofNTs) employed as an effective membrane in desalination processsodium chloride removal from water). Also, using Taguchi method,
ffects of different operating parameters on the performance ofhe oxidized CNTs membrane in water desalination process weretudied and separation percent and permeate flux through thexidized CNTs membrane with operating parameters were dis-ussed.Fig. 2. A simplified diagram of
experimental CVD set up.
2. Experimental
2.1. Membrane synthesis
A schematic diagram of the experimental set-up is shown inFig. 1 [19–22]. The CVD system consisted of a horizontal stain-less steel tube (70 cm long, 3.2 cm in diameter) was housed in aone stage cylindrical furnace. A flask (steel container) containingreagents was connected to the reactor. The reagents were preparedby dissolving ferrocene (purity ≥98%, B.D.H) in cyclohexanol (purity≥98%, Fluka) with certain mass ratio of 1:20. Cyclohexanol wasselected due to its low boiling point and its carbon ring structure.Also, cyclohexanol is a good solvent for ferrocene and this allowsconstitution of a homogeneous mixture in vapor phase [23,24].Furthermore, the oxygen atom present in cyclohexanol moleculereadily oxidizes the amorphous carbon in situ [25]. Evaporating thereagents was performed using an oil bath. Nitrogen was used as car-
rier gas connected to the reactor nearby the reagent inlet. �-Al2O3disks (20 mm in diameter and 2 mm thick) were used as membranesupport. The �-Al2O3 disks had an average pore diameter of 400 nmand porosity of about 45%. These supports were polished with 800and 1000 mesh sanding papers and cleaned in an ultrasonic acetonethe experimental set up.

1066 M.A. Tofighy et al. / Chemical Engineering Journal 168 (2011) 1064–1072
bt
ntivfltTCddCf
Mrtwo
atPbFoi
2
sASd
2
i
ud(
w
S
w
Fig. 3. Calibration curve of the conductometer.
ath for 30 min. The uncoated pretreated supports were placed inhe middle of the reactor at high temperature zone (650 ◦C).
At first, the reactor was purged with nitrogen in order to elimi-ate oxygen from the reaction chamber. The reactor was preheatedo a preset temperature (at 650 ◦C); subsequently the flask contain-ng the reagents was placed in the oil bath (at 220 ◦C) for immediateaporization process. The obtained vapor was carried by nitrogenow rate of 400 cm3/min towards the high temperature zone ofhe reactor where the un-coated �-alumina support was situated.he reactor pressure was kept constant at about 2 bar during theVD reaction. Pyrolysis of the vapor took place and a CNTs film waseposited on the support surface. The CVD reactor was then cooledown to room temperature and the �-alumina disk coated with theNTs film was removed from the reactor for characterization and
urther processing.The CNTs membrane was immersed in a solution of HNO3 (65%,
erck): H2SO4 (95–97%, Merck) with volume ratio of 1:3 andefluxed at 150 ◦C for about 4 h. The oxidized CNTs membrane washen washed using de-ionized water many times until pH of theashing water showed no change, then dried at 110 ◦C for 24 h. This
xidized CNTs membrane was used for salty water desalination.Scanning electron microscope (SEM, Philips: XL30) was used for
nalysis of the CNTs membrane morphology, and nanostructure ofhe CNTs was observed by transmission electron microscope (TEM,hilips: CM200). Pore size distribution of the oxidized CNTs mem-rane was analyzed by Mercury porosimetry technique (Thermoinnigan (Italy): PASCAL 440). Surface functional groups of thexidized CNTs membrane were determined by Fourier transformnfrared spectroscope (FTIR, SHIMADZU: (IRsolution) 8400S).
.2. Experimental setup
The experimental setup consisted of a feed tank wherealty water was stored, one pump (GRUNDFOS, Model:96532425P10728), three valves, two pressure gauges (BD-ENSO) and one flow meter (G1837). Fig. 2 shows a simplifiediagram of the experimental setup (pilot plant).
.3. Desalination experiments and analysis methods
Sodium chloride (purity ≥99.99%, Iran) was used in all the exper-ments to simulate solutions with sea water qualities.
In all the experiments, a conductometer (CRISON, GLP 32) wassed to measure the salt concentration of permeate. Water con-uctivity directly depends on salt concentration. This dependencycalibration curve of the conductometer) is shown in Fig. 3.
The quality characteristic was separation percent (SP) which
as calculated as follows:P = (C0 − C)C0
× 100 (1)
here, C0 and C are feed and permeate concentrations, respectively.
Fig. 4. (a) Cross sectional SEM image of the CNTs membrane, (b) high magnificationSEM image of CNTs film, (c) TEM image of a typical CNT before acid treatment and(d) TEM image of a typical CNT after acid treatment.
3. Results and discussion
Fig. 4a shows a cross sectional SEM image of the CNTs mem-brane. As can be observed, the macroporous surface of �-alumina
support was coated with a compact film of CNTs with thickness ofabout 15 �m. The top layer is the CNTs film and the bottom layer isthe alumina support. Fig. 4b is an enlarged view of the CNTs film.As can be observed, vertically aligned CNTs with negligible inner-
M.A. Tofighy et al. / Chemical Engineering Journal 168 (2011) 1064–1072 1067
Fig. 5. FTIR spectrum of the oxidized CNTs membrane.
Table 1Surface acidity and pHPZC of the CNTs and the oxidized CNTs membranes.
Surface acidity pHPZC
toaipi
stCwpbCb[imbabCsfiatmmascoboTB
mTCa
Fig. 6. Pore size distributions of the oxidized CNTs membrane (normal line) and thealumina support (bold line).
Table 2Taguchi L9 (34) orthogonal array.
Run Operating parameters
C (ppm) T ( ◦C) P (bar) F (l/h)
1 10,000 25 4 2002 10,000 35 7 3503 10,000 45 10 5004 20,000 25 7 5005 20,000 35 10 2006 20,000 45 4 3507 30,000 25 10 350
(mmol/g)
CNTs membrane 1.8 6.3Oxidized CNTs membrane 4.1 3.4
ube gaps were deposited compactly on the macroporous surfacef support. Nanostructure of a CNT from the CNTs film before andfter acid treatment is shown in Fig. 4c and d, respectively (TEMmages). As can be observed, acid treatment can remove metallicarticles trapped in the CNTs. Also, the CNTs are multi-walled with
nner and outer diameter of about 20 and 50 nm, respectively.As observed before, oxidation of the CNTs can remove encap-
ulated catalyst nanoparticles from the CNTs and as a result openhe CNT inner cavities [17]. As reported in the literature [2,14,15],NT inner cavities have remarkable smooth surfaces and as a resultater molecules can slide through them easily. Therefore, waterermeation through CNT inner cavities and sodium ions retentiony them is the main mechanism of desalination by these oxidizedNTs membranes. Oxidation of the CNTs can also offer a great num-er of acidic functional groups on the external surface of CNTs26–29]. FTIR spectrum of the oxidized CNTs membrane is shownn Fig. 5. As can be observed, acid treatment process introduces
any functional groups onto the surface of oxidized CNTs mem-rane: hydroxyl groups (3500 cm−1), carboxyl groups (1650 cm−1),nd carbonyl groups (1400 cm−1), which can provide a large num-er of chemical adsorption sites onto the surface of the oxidizedNTs membrane. It seems that the chemical interactions betweenodium ions and the acidic functional groups on the external sur-aces of CNTs can facilitate freely water permeation through CNTnner cavities, reduce possibility of the CNTs membrane foulingnd fill the inter-tube gaps of the CNTs array. Therefore, adsorp-ion may have a main effect on performance of the oxidized CNTs
embranes. The surface total acidity of the CNTs and oxidized CNTsembranes were quantified by Boehm method [30]. The results
re presented in Table 1. The surface charge depends on pH of theurrounding electrolyte. There is a pH value, called ‘point of zeroharge’ (PZC), at which the net surface charge is zero. The pHPZCf the CNTs and the oxidized CNTs membranes were quantifiedy mass titration [31]. The results are presented in Table 1. Asbserved, the pHPZC shifts to lower pH values after acid oxidation.hese results confirmed the data obtained from FTIR analysis andoehm’s titration.
Pore size distribution of alumina support and oxidized CNTsembrane was determined using Mercury porosimetry technique.
he obtained results are shown in Fig. 6. As can be observed, beforeNTs deposition, pore size distribution of the support is narrownd its average pore diameter is 400 nm. After CNTs deposition and
8 30,000 35 4 5009 30,000 45 7 200
oxidation process, pore size distribution extends (∼10–500 nm).The larger pores (∼300–500 nm) are attributed to the support,the moderate pores (∼100–300 nm) are attributed to the interfaceof the CNTs layer and the support surface and the smaller pores(∼10–100 nm) are attributed to the CNTs layer composed of innercavities and gaps. Also, the Mercury porosimetry results demon-strated that after CNTs deposition porosity increases from 45% to78%.
In this study, performance evaluation of the CNTs membranesin desalination process was performed using Taguchi method (L9orthogonal array) [32]. Controllable factors (operating parameters)and their levels are presented in Table 2.
As shown, controllable factors and their levels are as follows:feed concentration (10,000, 20,000 and 30,000 ppm); temperature(25, 35 and 45 ◦C); pressure (4, 7 and 10 bar); flow rate (200, 350and 500 l/h). In order to observe the effects of uncontrollable fac-tors, each experiment was repeated twice at the same conditions.The mean response for each run and also an appropriately chosensignal-to-noise ratio (SN) were used to analyze the results. A statis-tical variance analysis (ANOVA) was performed to observe effectiveparameters and their confidence levels and to obtain the maxi-mum permeate flux and separation percent. F-test is a powerfultool to observe which parameters have significant effects to obtainthe maximum permeates flux and separation percent. The resultsof variance analysis for the experiments are given in Table 3 andFigs. 7 and 8. The larger-the-better performance characteristic, Eq.(2), was taken to obtain the maximum permeate flux and separationpercent.
SNL = −10 log
(1n
n∑i=1
1
y2i
)(2)

1068 M.A. Tofighy et al. / Chemical Engineering Journal 168 (2011) 1064–1072
Table 3Mean responses (permeate flux and separation percent) and their SNL values.
Run Response 1 Response 2
Mean flux(kg/m2 h)
SNL Separationpercent (SP)
SNL
1 0.80 −1.94 0.56 −5.042 1.36 2.65 0.73 −2.733 4.38 12.83 0.93 −0.634 1.25 1.94 0.73 −2.705 1.94 5.76 0.82 −1.72
6 6.26 15.937 1.64 4.308 9.08 18.159 6.87 16.74Fig. 7. Effects of controllable fact
Fig. 8. Effects of controllable f
0.98 −0.140.78 −2.160.99 −0.100.99 −0.11
ors on separation percent.
actors on permeate flux.
M.A. Tofighy et al. / Chemical Engineering Journal 168 (2011) 1064–1072 1069
Fa
we(a
pa
itirctt
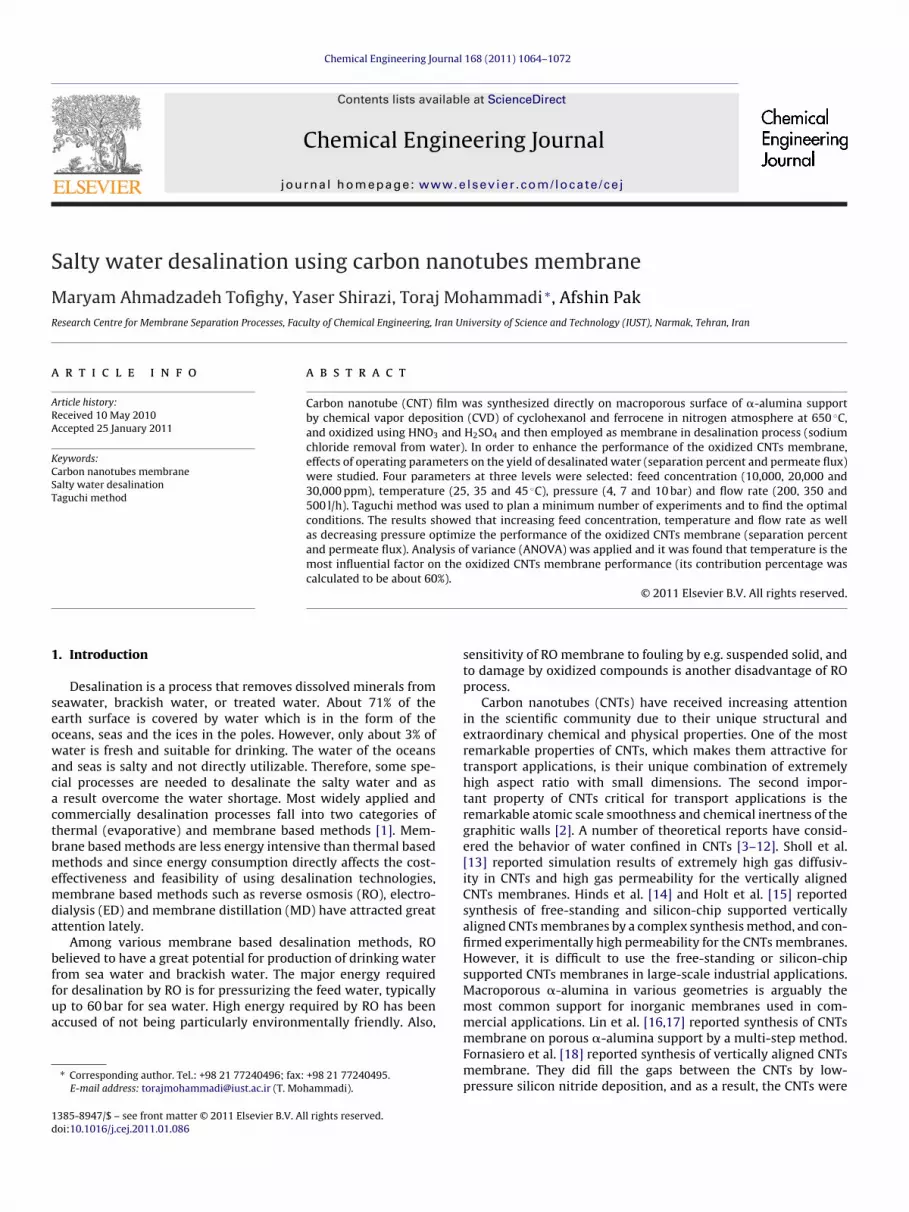
increasing feed concentration, permeate flux and separation per-cent increase. Based on the results, it seems that concentrationpolarization does not have any effect on the performance of theoxidized CNTs membrane. This can be due to the fact that increas-
ig. 9. Effect of temperature on permeate flux at different (a) flow rate, (b) pressurend (c) concentration.
here, n is the number of experiments and yi is the response of eachxperiment at which the system is optimized when the responsespermeate flux and separation percent) are as large as possible. Asresult, levels of the factors maximizing the SNL ratio are optimal.
According to Figs. 7 and 8, increasing feed concentration, tem-erature and flow rate increase the mean responses (permeate fluxnd separation percent).
As can be observed in Figs. 7 and 8, increasing temperaturencreases permeate flux and separation percent. This can be due tohe fact that ion uptake capacity of the CNTs increases with increas-ng temperature, because adsorption to CNTs is an endothermic
eaction [33]. At higher temperature, with increasing the ion uptakeapacity of the CNTs, the number of free accumulated ions aroundhe membrane surface decreases and as a result water permeationhrough the CNT inner cavities becomes easier.Fig. 10. Effect of temperature on separation percent at different (a) flow rate, (b)pressure and (c) concentration.
Usually, concentration polarization is more important at higherfeed concentration. Because at higher feed concentration, a moresignificant concentration boundary layer develops next to themembrane interface and this reduces the driving force of masstransfer. However, as can be observed in Figs. 7 and 8, with
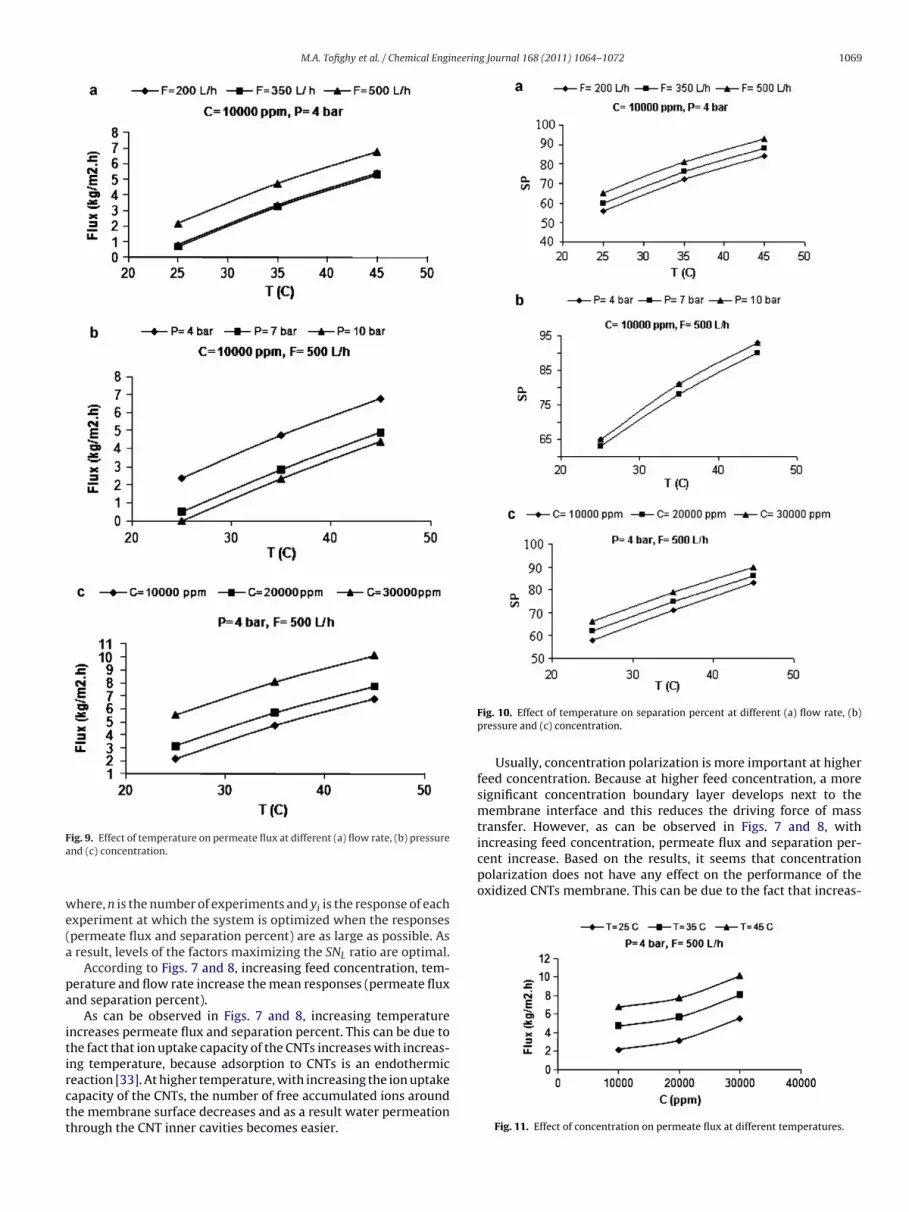
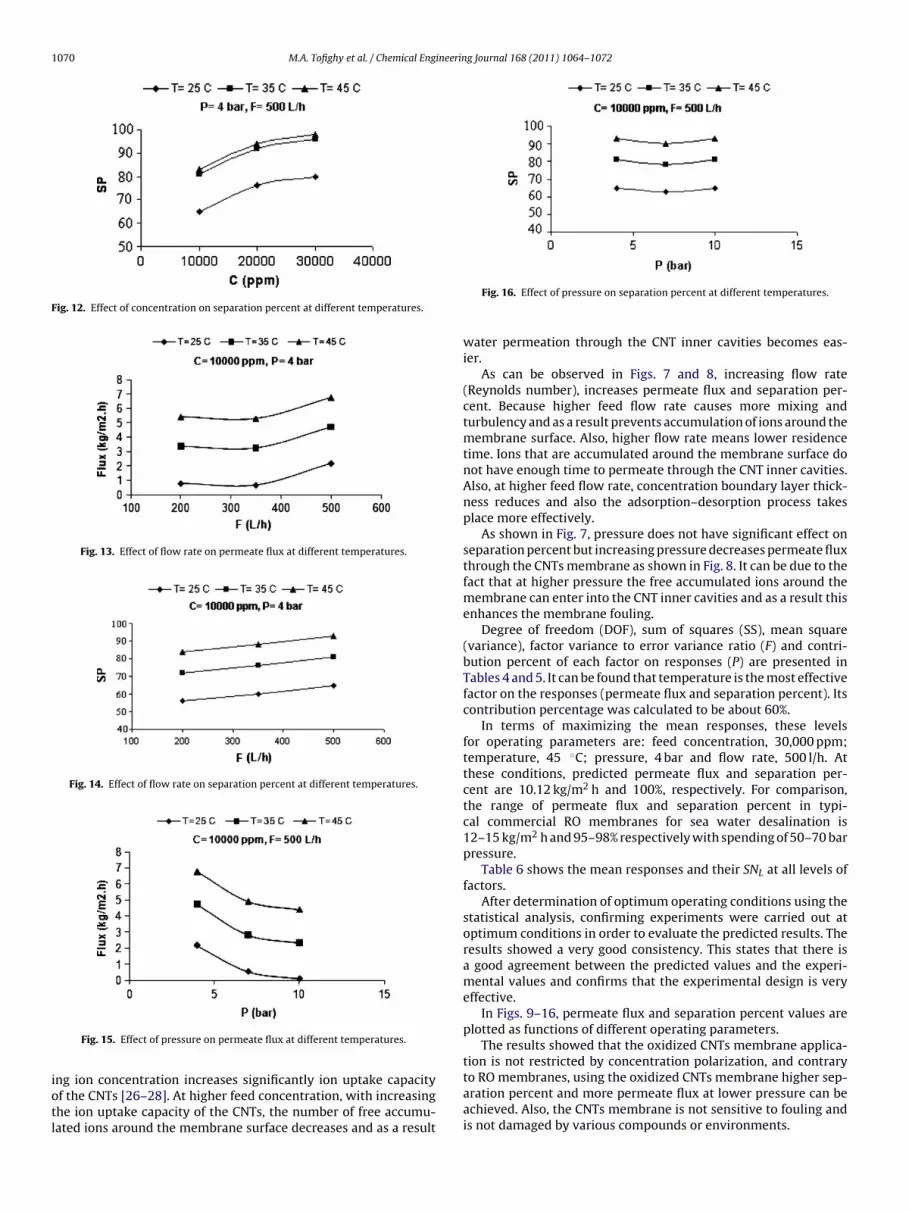
Fig. 11. Effect of concentration on permeate flux at different temperatures.
1070 M.A. Tofighy et al. / Chemical Engineering Journal 168 (2011) 1064–1072
Fig. 12. Effect of concentration on separation percent at different temperatures.
Fig. 13. Effect of flow rate on permeate flux at different temperatures.
Fig. 14. Effect of flow rate on separation percent at different temperatures.
iotl
Fig. 15. Effect of pressure on permeate flux at different temperatures.
ng ion concentration increases significantly ion uptake capacityf the CNTs [26–28]. At higher feed concentration, with increasinghe ion uptake capacity of the CNTs, the number of free accumu-ated ions around the membrane surface decreases and as a result
Fig. 16. Effect of pressure on separation percent at different temperatures.
water permeation through the CNT inner cavities becomes eas-ier.
As can be observed in Figs. 7 and 8, increasing flow rate(Reynolds number), increases permeate flux and separation per-cent. Because higher feed flow rate causes more mixing andturbulency and as a result prevents accumulation of ions around themembrane surface. Also, higher flow rate means lower residencetime. Ions that are accumulated around the membrane surface donot have enough time to permeate through the CNT inner cavities.Also, at higher feed flow rate, concentration boundary layer thick-ness reduces and also the adsorption–desorption process takesplace more effectively.
As shown in Fig. 7, pressure does not have significant effect onseparation percent but increasing pressure decreases permeate fluxthrough the CNTs membrane as shown in Fig. 8. It can be due to thefact that at higher pressure the free accumulated ions around themembrane can enter into the CNT inner cavities and as a result thisenhances the membrane fouling.
Degree of freedom (DOF), sum of squares (SS), mean square(variance), factor variance to error variance ratio (F) and contri-bution percent of each factor on responses (P) are presented inTables 4 and 5. It can be found that temperature is the most effectivefactor on the responses (permeate flux and separation percent). Itscontribution percentage was calculated to be about 60%.
In terms of maximizing the mean responses, these levelsfor operating parameters are: feed concentration, 30,000 ppm;temperature, 45 ◦C; pressure, 4 bar and flow rate, 500 l/h. Atthese conditions, predicted permeate flux and separation per-cent are 10.12 kg/m2 h and 100%, respectively. For comparison,the range of permeate flux and separation percent in typi-cal commercial RO membranes for sea water desalination is12–15 kg/m2 h and 95–98% respectively with spending of 50–70 barpressure.
Table 6 shows the mean responses and their SNL at all levels offactors.
After determination of optimum operating conditions using thestatistical analysis, confirming experiments were carried out atoptimum conditions in order to evaluate the predicted results. Theresults showed a very good consistency. This states that there isa good agreement between the predicted values and the experi-mental values and confirms that the experimental design is veryeffective.
In Figs. 9–16, permeate flux and separation percent values areplotted as functions of different operating parameters.
The results showed that the oxidized CNTs membrane applica-tion is not restricted by concentration polarization, and contrary
to RO membranes, using the oxidized CNTs membrane higher sep-aration percent and more permeate flux at lower pressure can beachieved. Also, the CNTs membrane is not sensitive to fouling andis not damaged by various compounds or environments.
M.A. Tofighy et al. / Chemical Engineering Journal 168 (2011) 1064–1072 1071
Table 4Parameters of the statistical analysis (separation percent).
Factor Degree of freedom Sum of squares Variance F P
Temperature (◦C) 2 13.680 6.840 1315.380 0.619Concentration (ppm) 2 6.200 3.100 596.150 0.280Flow rate (l/h) 2 1.980 0.990 190.380 0.089Pressure (bar) 2 0.190 0.100 19.230 0.009Error 9 0.047 0.005Total 17 22.097
Table 5Parameters of the statistical analysis (permeate flux).
Factor Degree of freedom Sum of squares Variance F P
Temperature (◦C) 2 283.560 141.780 74,621.053 0.635Concentration (ppm) 2 111.250 55.620 29,273.680 0.249Flow rate (l/h) 2 28.760 14.380 7568.420 0.064Pressure (bar) 2 22.780 11.390 5994.740 0.051Error 9 0.017 0.002Total 17 446.367
Table 6Average of mean permeate flux, separation percent and SNL values at all levels of factors obtained from Taguchi method.
Parameter Level Mean flux (kg/m2 h) SNL Separation percent (SP) SNL
Concentration(ppm)
10,000 2.18 4.93 0.74 −2.7820,000 3.15 7.87 0.85 −1.5230,000 5.35 13.06 0.92 −0.77
Temperature( ◦C)
25 1.23 1.43 0.69 −3.2835 3.79 8.85 0.84 −1.5045 5.83 15.57 0.97 −0.29
Pressure (bar)4 5.05 10.71 0.84 −1.727 3.16 7.52 0.82 −1.84
4
cot3dwafaofstfaemTtmcsd
R
[
[
[
[
[
[
[
10 2.65
Flow rate (l/h)200 3.20350 3.08500 4.57
. Conclusion
In this study, a CNTs membrane was synthesized by CVD pro-ess, oxidized and employed for salty water desalination. The effectf feed concentration (10,000, 20,000 and 30,000 ppm), tempera-ure (25, 35 and 45 ◦C), pressure (4, 7 and 10 bar) and flow rate (200,50 and 500 l/h) on performance of the oxidized CNTs membrane inesalination process was scrutinized. Taguchi data analysis methodas utilized to study four parameters in three levels (L9 orthogonal
rray). Maximum separation percent was obtained at the highesteed concentration, temperature and flow rate (30,000 ppm, 45 ◦Cnd 500 l/h, respectively) and pressure was found to have no effectn separation percent. Also, the results showed that increasingeed concentration, temperature, flow rate and decreasing pres-ure improves permeate flux. As a result, higher feed concentration,emperature, flow rate and lower pressure could be recommendedor better performance of the oxidized CNTs membrane. ANOVAnalysis was applied to evaluate the relative importance of theffects of various factors. It was realized that temperature has theost significant effect on permeate flux and separation percent.
he results showed that the oxidized CNTs membrane is very effec-ive for salty water desalination. Also, using this oxidized CNTs
embrane can reduce energy costs of desalination compared toonventional RO membranes due to the operation at lower pres-ures. This oxidized CNTs membrane can be scaled up for large scaleesalination applications.
eferences
[1] M. Sadrzadeh, T. Mohammadi, Sea water desalination using electrodialysis,Desalination 221 (2008) 440–447.
[
[
7.63 0.84 −1.506.85 0.79 −2.297.53 0.83 −1.65
11.38 0.88 −1.12
[2] A. Noy, H.G. Park, F. Fornasiero, J.K. Holt, C.P. Grigoropoulos, O. Bakajin, Nanoflu-idics in carbon nanotubes, Nanotoday 2 (2007) 22–29.
[3] G. Hummer, J.C. Rasaiah, J.P. Noworyta, Water conduction through thehydrophobic channel of a carbon nanotube, Nature 414 (2001)188.
[4] A.I. Kolesnikov, J.-M. Zanotti, C.-K. Loong, P. Thiyagarajan, A.P. Moravsky, R.O.Loutfy, C.J. Burnham, Anomalously soft dynamics of water in a nanotube: Arevelation of nanoscale confinement, Phys. Rev. Lett. 93 (2004) 35503.
[5] N. Naguib, H. Ye, Y. Gogotsi, A.G. Yazicioglu, C.M. Megaridis, M. Yoshimura,Observation of water confined in nanometer channels of closed carbon nan-otubes, Nano Lett. 4 (2004) 2237.
[6] Y. Maniwa, Y. Maniwa, K. Matsuda, H. Kyakuno, S. Ogasawara, T. Hibi, H.Kadowaki, S. Suzuki, Y. Achiba, H. Kataura, Water-filled single-wall carbonnanotubes as molecular nanovalves, Nat. Mater. 6 (2007) 135.
[7] E. Mamontov, C.J. Burnham, S.H. Chen, A.P. Moravsky, C.K. Loong, N.R. de Souza,A.I. Kolesnikov, Dynamics of water confined in single- and double-wall carbonnanotubes, J. Chem. Phys. 124 (2006) 194703.
[8] A. Waghe, J.C. Rasaiah, G. Hummer, Filling and emptying kinetics of carbonnanotubes in water, J. Chem. Phys. 117 (2002) 10789.
[9] A. Kalra, S. Garde, G. Hummer, Osmotic water transport through carbon nan-otube membranes, Proc. Natl. Acad. Sci. U.S.A. 100 (2003) 10175–10180.
10] E.M. Kotsalis, J.H. Walther, P. Koumoutsakos, Multiphase water flow insidecarbon nanotubes, Int. J. Multiphase Flow 39 (2004) 995.
11] I. Hanasaki, A. Nakatani, Flow structure of water in carbon nanotubes: poiseuilletype or plug-like? J. Chem. Phys. 124 (2006) 144708.
12] A. Striolo, The mechanism of water diffusion in narrow carbon nanotubes, NanoLett. 6 (2006) 633.
13] A.I. Skoulidas, D.M. Ackerman, J.K. Johnson, D.S. Sholl, Rapid transport of gasesin carbon nanotubes, Phys. Rev. Lett. 89 (2002) 185901.
14] B.J. Hinds, N. Chopra, R. Rantell, R. Andrew, V. Gavalas, L.G. Bachas, Alignedmultiwalled carbon nanotube membranes, Science 303 (2004) 62.
15] J.K. Halt, H.G. Park, Y.M. Wang, M. Stadermann, A.B. Artyukhin, C.P. Grigoropou-los, A. Noy, Q. Bakajin, Fast mass transfer through sub-2-nanometer carbonnanotubes, Science 312 (2006) 1034.
16] W. Mi, J.Y.S. Lin, Y. Li, B. Zhang, Synthesis of vertically aligned carbon nanotubefilms on macroporous alumina substrates, Mesopor. Micropor. Mater. 81 (2005)
185–189.17] W. Mi, Y.S. Lin, Y. Li, Vertically aligned carbon nanotube membranes on macro-porous alumina supports, J. Membr. Sci. 304 (2007) 1–7.
18] F. Fornasiero, H.G. Park, J.K. Holt, M. Stadermann, C.P. Grigoropoulos, A. Noy, O.Bakajin, Ion exclusion by sub-2-nm carbon nanotube pores, PNAS 105 (2008)17250–17255.

1 ineerin
[
[
[
[
[
[
[
[
[
[
[
[
[
[32] J.T. Lufting, V.S. Jordan, Design of Experiments in Quality Engineering, McGraw-Hill, New York, 1998.
072 M.A. Tofighy et al. / Chemical Eng
19] T. Mohammadi, M.A. Tofighy, A. Pak, Synthesis of carbon nanotube on macro-porous kaolin substrate via a new simple CVD method, Int. J. Chem. React. Eng.7 (2009) A75.
20] M.A. Tofighy, T. Mohammadi, Salty water desalination using carbon nanotubesheets, Desalination 258 (2010) 182–186.
21] M.A. Tofighy, T. Mohammadi, Adsorption of divalent heavy metal ions fromwater using carbon nanotube sheets, J. Hazard. Mater. 185 (2011) 140–147.
22] M.A. Tofighy, T. Mohammadi, Permanent hard water softening using carbonnanotube sheets, Desalination 268 (2011) 208–213.
23] S. Musso, G. Fanchini, A. Tagliaferro, Growth of vertically aligned carbon nan-otubes by CVD by evaporation of carbon precursors, Diamond Relat. Mater. 14(2005) 784–789.
24] S. Musso, M. Zanetti, M. Giorcelli, A. Tagliaferro, L. Costa, Gas chromatography
study of reagent degradation during CVD carbon nanotube growth, J. Nanosci.Nanotechnol. 6 (9) (2009) 3593–3598.25] M. Kumar, Y. Ando, Camphor-a botanical precursor producing garden of carbonnanotubes, Diamond Relat. Mater. 12 (2003) 998–1002.
26] M. Kandah, J. Meunier, Removal of nickel ions from water by multi-walledcarbon nanotubes, J. Hazard. Mater. 146 (2007) 283–288.
[
g Journal 168 (2011) 1064–1072
27] G. Rao, Ch. Lu, F. Su, Sorption of divalent metal ions from aqueous solution bycarbon nanotubes: a review, Sep. Purif. Technol. 58 (2007) 224–231.
28] A. Stafiej, K. Pyrzynska, Adsorption of heavy metal ions with carbon nanotubes,Sep. Purif. Technol. 58 (2008) 49–52.
29] S. Musso, S. Porro, M. Vinante, L. Vanzetti, R. Ploeger, M. Giorcelli, B. Pos-setti, F. Trotta, C. Pederzolli, A. Tagliaferro, Modification of MWNTs obtainedby thermal-CVD, Diamond Relat. Mater. 16 (2007) 1183–1187.
30] H.P. Boehm, Some aspects of the surface chemistry of carbon black and othercarbons, Carbon 32 (5) (1994) 759–769.
31] J.S. Noah, J.A. Schwarz, Effect of HNO3 treatment on the surface acidity of acti-vated carbon, Carbon 28 (1990) 675–682.
33] L. Hua, H.N. Hou, Enrichment and removal of heavy metals contained in PCBboards by multiwalled carbon nanotubes for WEEE directive, in: InternationalConference on Electronic Packaging Technology & High Density Packaging,2008.


