Embed Size (px)
Citation preview
ORIGINAL EMPIRICAL RESEARCH
Sales promotions and channel coordination
Berend Wierenga & Han Soethoudt
Received: 13 August 2008 /Accepted: 8 July 2009# The Author(s) 2009. This article is published with open access at Springerlink.com
Abstract Consumer sales promotions are usually the resultof the decisions of two marketing channel parties, themanufacturer and the retailer. In making these decisions,each party normally follows its own interest: i.e. maximizesits own profit. Unfortunately, this results in a suboptimaloutcome for the channel as a whole. Independent profitmaximization by channel parties leads to a lack of channelcoordination with the implication of leaving money on thetable. This may well contribute to the notoriously lowprofitability of sales promotions. This paper first showsanalytically why the suboptimality occurs, and thenpresents an empirical demonstration, using a unique datasetfrom an Efficient Consumer Response (ECR) project; ECRis a movement in which parties work together to optimizethe distribution channel). In this dataset, actual profit isonly a small fraction of potential profit, implying that thereis a large degree of suboptimality. It is important that (1)channel parties are aware of this suboptimality; and (2) thatthey have tools to deal with it. Solutions to the channelcoordination problem should ensure that the goals of theindividual channel parties are aligned with the goals of thechannel as a whole. The paper proposes one particularagreement for this purpose, called proportional discountsharing. Application to the ECR data shows a win-win
result for both the manufacturer and the retailer. Recogni-tion of the channel coordination problem by the manufac-turer and the retailer is the necessary starting point foragreeing on a way of solving it in a win-win fashion.
Keywords Sales promotions . Price discounts . Channelcoordination . Double marginalization . Efficient consumerresponse .Win-win agreement
Introduction
Sales promotions are instruments to stimulate the sales ofproducts and brands, especially in consumer-packagedgoods. Frequently, over 20% of the sales in a productcategory occur under sales promotions (Teunter 2002). TheTrade Promotion Report, 2005, indicates that promotionaccounted for roughly 75% of marketing expenditures forUS packaged goods manufacturers between 1997 and 2004;the other 25% is advertising. In this way, trade promotionsplay an important role in the marketing of fast-movingconsumer products.
The volume effects of sales promotions are mostly veryevident, sometimes spectacularly so. Gross lift factors of fiveto ten are no exceptions (Blattberg et al. 1995). However,there are continuing doubts about the profitability of salespromotions. In a Supermarket News article in 1996, Orgelmentioned that only 10–20% of grocery promotions areprofitable events. A more recent consultancy report aboutsales promotions carries the telling title, “Pouring Moneyinto a Leaky Bucket” (Jones 2004). Academic researchersalso express concerns, both about the profitability of salespromotions for the manufacturer (Achenbaum and Mitchel1987; Ailawadi 2001; Farris and Ailawadi 1992; Nijs et al.2001) and for the retailer (Urbany et al. 2000; Walzer 1987).
B. Wierenga (*)Rotterdam School of Management, Erasmus University,P.O. Box 1738, 3000 DR Rotterdam, Netherlandse-mail: [email protected]
H. SoethoudtAgrotechnology and Food Innovations BV,P.O. Box 17, 6700 AA Wageningen, Netherlandse-mail: [email protected]
J. of the Acad. Mark. Sci.DOI 10.1007/s11747-009-0161-1
Recent empirical studies confirm this bleak picture. Salespromotions account for approximately two-thirds of allpromotional spending, but only 16% are profitable (Drèzeand Bell 2003). Srinivasan et al.’s (2004) analysis of data for75 brands in 25 categories over 399 weeks indicates that theoverall channel gain from sales promotions is negative.Ailawadi et al. (2006) examine all the promotions in a wholeyear of the leading drug store CVS in the United States andfind that the net profit impact is negative.
Why do channel parties continue to use sales promo-tions, if they are such “leaky buckets”? From a managerialperspective, there can be various motivations for salespromotions, even if they are not directly profitable, e.g. toincrease market share (manufacturer), to boost store traffic(retailer), and strategic considerations (for example tomaintain a good relationship with a favorite channelpartner). Furthermore, there may be a prisoner dilemmasituation: if everyone uses sales promotions, you have tofollow suit, even if it is clear that it would be better torefrain from using them.
Whatever the motivation for sales promotions, theirprofitability should always be an important concern and thispaper investigates how the profitability of sales promotionscan be improved. We focus on one particular cause of thelow profitability of sales promotions—the lack of channelcoordination. A marketing channel is said to be coordinatedif the decisions of the different actors result in themaximum profit for the channel (Jeuland and Shugan1983; Ingene and Parry 2004). In the context of salespromotions, lack of channel coordination occurs when thecombination of the independent decisions of the manufac-turer and the retailer do not fully exploit the potential of thechannel. This results in a channel profitability of salespromotions that is suboptimal. We explain this in moredetail in “Analytical approach to double marginalization insales promotions”.
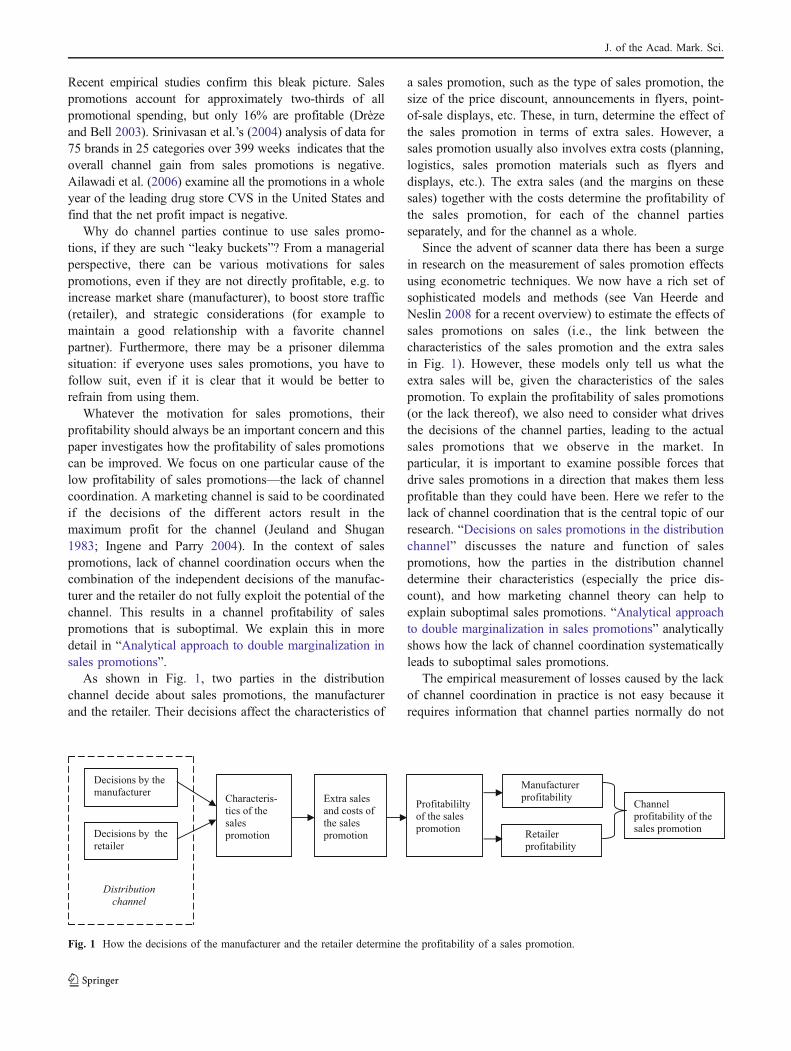
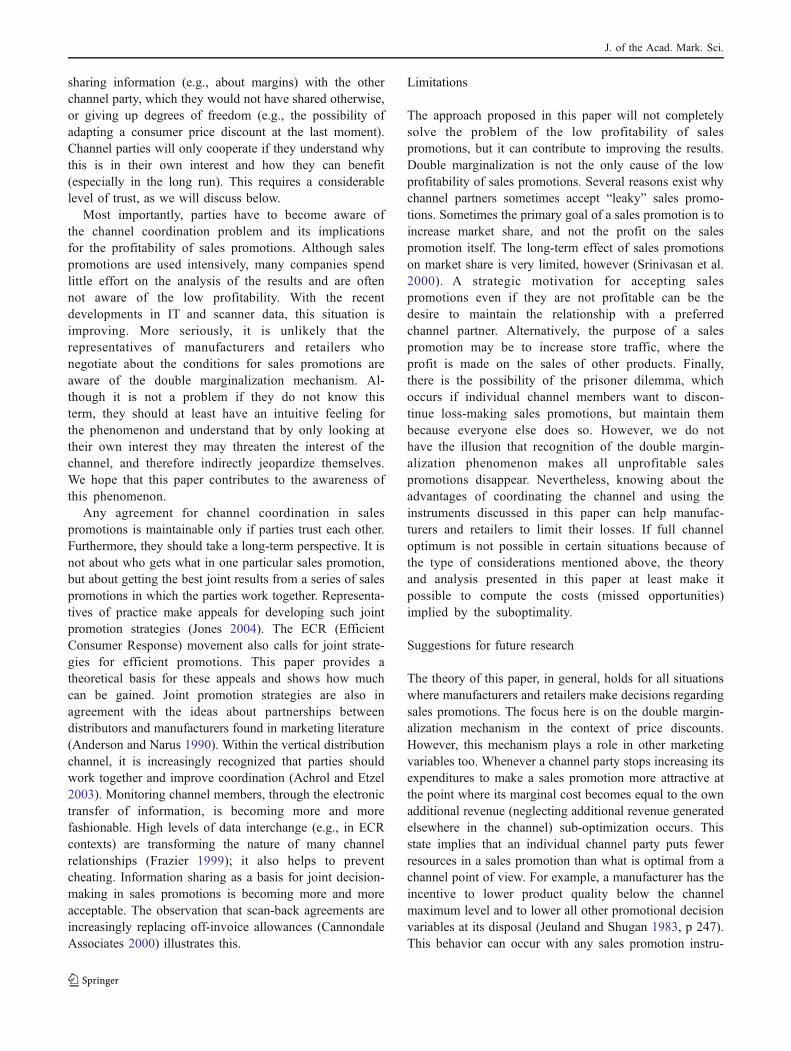
As shown in Fig. 1, two parties in the distributionchannel decide about sales promotions, the manufacturerand the retailer. Their decisions affect the characteristics of
a sales promotion, such as the type of sales promotion, thesize of the price discount, announcements in flyers, point-of-sale displays, etc. These, in turn, determine the effect ofthe sales promotion in terms of extra sales. However, asales promotion usually also involves extra costs (planning,logistics, sales promotion materials such as flyers anddisplays, etc.). The extra sales (and the margins on thesesales) together with the costs determine the profitability ofthe sales promotion, for each of the channel partiesseparately, and for the channel as a whole.
Since the advent of scanner data there has been a surgein research on the measurement of sales promotion effectsusing econometric techniques. We now have a rich set ofsophisticated models and methods (see Van Heerde andNeslin 2008 for a recent overview) to estimate the effects ofsales promotions on sales (i.e., the link between thecharacteristics of the sales promotion and the extra salesin Fig. 1). However, these models only tell us what theextra sales will be, given the characteristics of the salespromotion. To explain the profitability of sales promotions(or the lack thereof), we also need to consider what drivesthe decisions of the channel parties, leading to the actualsales promotions that we observe in the market. Inparticular, it is important to examine possible forces thatdrive sales promotions in a direction that makes them lessprofitable than they could have been. Here we refer to thelack of channel coordination that is the central topic of ourresearch. “Decisions on sales promotions in the distributionchannel” discusses the nature and function of salespromotions, how the parties in the distribution channeldetermine their characteristics (especially the price dis-count), and how marketing channel theory can help toexplain suboptimal sales promotions. “Analytical approachto double marginalization in sales promotions” analyticallyshows how the lack of channel coordination systematicallyleads to suboptimal sales promotions.
The empirical measurement of losses caused by the lackof channel coordination in practice is not easy because itrequires information that channel parties normally do not
Characteris-
tics of the
sales
promotion
Extra sales
and costs of
the sales
promotion
Profitabililty
of the sales
promotion
Decisions by the
manufacturer
Decisions by the
retailer
Manufacturer
profitability
Retailer
profitability
Channel
profitability of the
sales promotion
Distribution
channel
Fig. 1 How the decisions of the manufacturer and the retailer determine the profitability of a sales promotion.
J. of the Acad. Mark. Sci.
share. Especially information about the costs of salespromotions is mostly lacking. The present study uses aunique database from an ECR project, in which parties didexchange detailed information. In “The ECR study”, we usethis database and empirically demonstrate the existence of alack of channel coordination for sales promotions, anddemonstrate how serious its impact can be.
“Removing suboptimality by means of channel coordina-tion” discusses possible solutions for the channel coordina-tion problem and proposes a “proportional discount sharingagreement” (PDS) between the manufacturer and the retailer,in which each party contributes to the consumer pricediscount in proportion to its original margin. “Applicationof PDS to the ECR data” uses data from the ECR project toshow the effect of the proportional discount sharingagreement for the manufacturer and the retailer. Themanagerial implications of PDS and recommendations forfurther research are discussed in the conclusion.
Decisions on sales promotions in the distributionchannel
Sales promotions are “action-oriented marketing eventswhose purpose is to have a direct impact on the behavior ofcustomers” (Blattberg and Neslin 1990, p 3). The mostimportant features of sales promotions are: (i) inducement toenhance sales; (ii) non-routine; and (iii) short duration. Theidea is that a temporary shift in stimuli causes a sudden shiftin behavior (Van Waterschoot and van den Bulte 1992). Thepurpose of these temporary incentives is to “act now”(Rossiter and Bellman 2005, p 347). In the majority of salespromotions in fast-moving consumer goods, these incentivesinclude a price discount for the consumer, mostly accompa-nied by displays on the shop floor, advertisements in leafletsand door-to-door local newspapers, and sometimes radioand/or TV commercials. This implies that a sales promotionusually involves several marketing mix elements: price,communication, product (e.g., special promotional packages)and place. Therefore, sales promotions may pervade all ofthe four Ps (Van Waterschoot and van den Bulte 1992).
As shown in Fig. 1, the characteristics of a salespromotion are the result of decisions made by themanufacturer and the retailer.
The relative influence of these two channel parties on thesales promotion and the contribution of each of the partnersto the costs depend on the relative power of the parties(Kasulis et al. 1999). In the market described in this paper,large manufacturers deal with large supermarket chains.This means that in our case both parties are strong,implying a “strong symmetric situation” in the typologyof Kasulis et al. (1999). These authors state that a strongsymmetric situation leads to agreements such as calendar
marketing schemes, display allowances, and cooperativeadvertising. All these elements are present in the setting ofour study. In the European market studied in this paper, theinfluence of the retailer on sales promotions is relativelystrong. It is the retailer who initiates the process bypresenting an annual promotions plan. The retailer theninvites manufacturers to propose sales promotions, thatshould fit in this plan. These proposals are first quitegeneral (only the products and the weeks are determined),but as the time draws closer, they become more specific andinclude the discounts given by the manufacturer and theretailer (Verstappen et al. 1998). This situation may differfrom North America, where the manufacturer mostly seemsto be the initiator of a sales promotion (comment from oneof the reviewers). The agreements on sharing the costs fordisplays and cooperative promotion are usually structural.However, for each individual sale promotion, each partydecides what it is willing to contribute to the consumerprice discount. The sum of these two elements, themanufacturer discount and the retailer discount, is theconsumer discount. In this paper, we look at how thesediscounts come about—at the mechanism behind them—and examine if and how this mechanism leads to asuboptimal outcome. Since sales promotions occur withinthe environment of the distribution channel, we start ourdiscussion with distribution channel literature.
Distribution channel literature
Over the last 40 years, our understanding of distributionchannels has greatly improved (Coughlan et al. 2006).Channel communication, power of channel members, themonitoring of channel members, channel control, channelconflict, and contracting between channel partners areexamples of topics that have been studied in channelliterature (Frazier 1999). Although sales promotions arerelated to most of these topics in some sense, this subjecthas not received much specific attention in marketingchannel literature. An important sub-stream of this literaturefocuses on channel coordination, using a game-theoryapproach. Authors using this approach include Jeulandand Shugan (1983); McGuire and Staelin (1983); Choi(1991); and Ingene and Parry (2004, 2007). However,publications in this sub-stream do not appear to addresssales promotions to any great degree. The element of price(i.e., price agreements between parties in the distributionchannel) plays an important role in this work, but from ourearlier discussion of sales promotions, it is clear that a salespromotion with a temporary price discount is different froma structural decrease in the consumer price. In the case of asales promotion, consumers know that it is a temporaryopportunity, and marketing communication activities suchas displays, features and advertisements support the sales
J. of the Acad. Mark. Sci.
promotion. Therefore, the sales response elasticity is likelyto be different for a sales promotion, as compared to achange in the regular price. This is also empiricallyconfirmed in, for example, Guadagni and Little (1983)and Inman et al. (1990).
Sales promotions literature
As we already mentioned, sales promotions literature focuseson the measurement of the effects of sales promotions(Blattberg and Neslin 1990; Neslin 2002; Van Heerde andNeslin 2008). When sales promotions literature addresses thedecisions of the actors, the typical approach is from theperspective of one of the actors. For example, researchersstudy how retailers react (or should react) to trade dealsoffered by manufacturers (Murry and Heide 1998; Tyagi1999; Walters 1989). Also recent work on pass-through, seefor example Besanko et al. (2005); Moorthy (2005), andPauwels (2007), examines how retailers make decisions (orshould make decisions), given the decision of the manufac-turer. This is a one-sided approach, lacking the perspective ofchannel optimization. In the context of forward buying, theseauthors show how manufacturers and retailers can makespecific agreements that benefit both parties. Forward buyingmeans that the retailer purchases more from the manufacturerat the sales promotion price than it will sell during the salespromotion. The retailer sells the rest later at the regular price.However, such agreements do not coordinate the channel forsales promotions. This is discussed in more detail in the nextsection.
We conclude that thus far, published sales promotionsliterature has overlooked the problem of lack of channelcoordination (see also Ailawadi et al. 1999).
Link between channels literature and sales promotionsliterature
From the previous discussion, it is clear that the linkbetween channels literature and sales promotions literatureremains incomplete. In the former there is the importantnotion of channel coordination. The most important notionof channel coordination is the following; parties in thedistribution channel make their decisions from the perspec-tive of the benefits for their own organization. However, ifa particular actor somewhere in the marketing channelmakes a decision, this has implications for the sales andprofits of other channel members. For example, if a retailergives a price discount to its consumers, this will result inthe selling of a larger volume. This does not only affect theretailer, but also the manufacturer who will sell more (to theretailer), and make more profit (assuming a positive profit).Therefore, the actions of one particular channel memberaffect the outcome for the channel beyond the outcomes for
the actor itself. If parties act in their own (myopic) interestand do not recognize the extra effects for the channel, sub-optimization of the channel as a whole will occur.
Jeuland and Shugan (1983) show that the lack of channelcoordination is fundamental, and in principle applies to allmarketing variables, price, as well as non-price variables(e.g. advertising and shelf-space decision). In this paper, wetake the general notion of channel coordination and applythis to the specific topic of the sales promotion decisions ofmanufacturers and retailers. A lack of channel coordinationresults in lower channel profits, and therefore contributes tothe low profitability of sales promotions observed inpractice. The problem is solvable through a channelcoordination mechanism (Jeuland and Shugan 1983) guar-anteeing that individual channel members, when pursuingtheir own interest, also act in the interest of the channel as awhole. Channel coordination in its generic form hasreceived considerable attention in economics and market-ing, under the name of the “double marginalizationproblem” (Gerstner and Hess 1995; Jeuland and Shugan1983; Spengler 1950). The term “double marginalization”derives from the fact that each channel member increases itsefforts (i.e., increases its discount) up to the point that itsown marginal revenue is equal to its own marginal costs.As we will see in the next section, if both channel membersdo this (“double marginalization”), the result is a subopti-mal outcome at the channel level.
Relevance of the insights
This paper extends the general channel coordination theoryto sales promotions. We will show that sales promotionagreements that coordinate the channel lead to higherprofits. Although the extension is interesting, this will notcome as a surprise to readers familiar with the theory ofchannel coordination since a coordinated channel alwaysperforms better than an uncoordinated channel. However,the degree of the improvement, as observed in the empiricalstudy, is quite impressive. For readers of sales promotionsliterature, this paper explains how the double margin-alization phenomenon contributes to the low profitability ofsales promotions. For both groups, and for practitioners inthe market place, the possibility of restoring channelcoordination by means of a proportional discount sharingagreement is equally important.
Analytical approach to double marginalization in salespromotions
In this section, we apply the general channel coordinationtheory (Jeuland and Shugan 1983; Ingene and Parry 2004)to sales promotions. We derive expressions for the actual
J. of the Acad. Mark. Sci.
and optimal sales promotions as functions of the discountsgiven during the sales promotions. This section shows thatif both the manufacturer and the retailer maximize theirown profit, the sales promotions are suboptimal at thechannel level. The intuitive reasoning for this is as follows:a channel member spending money to make a salespromotion more attractive for consumers (for example bygiving a larger discount) not only increases its sales, butalso the sales of the channel partner. For example, a largerdiscount given by the retailer also allows the manufacturerto sell more (and make more profit). However, whenmaking the trade-off between costs and increased revenue,a channel member compares the costs of the salespromotion only with an increase in its own profit.Consequently, the channel member has no incentive toenhance the sales promotion beyond the point where theadditional (own) costs become equal to the additional (own)revenue, i.e. where marginal revenue becomes equal tomarginal costs. This neglects the additional revenue that thesales promotion generates elsewhere in the channel. From achannel point of view, an individual channel member stopsenhancing a sales promotion too early in the process.
Consider the following demonstration. Whether or not aprice discount is profitable at the channel level depends onthe extra sales (volume) generated and the margin sacrificedon the regular sales (see also Dekimpe and Hanssens 1999).If and how each of the two parties, the retailer and themanufacturer, benefit from the sales promotion depends onthe sharing of the burden of the consumer price discount,that is, how much each party contributes to this discount.The allocation of other costs in the sales promotion(displays in stores, advertisements in local newspapers
and retailers’ door-to-door leaflets) also affects the profit-ability of the sales promotion for each party.
Table 1 gives the definition of the variables in this paper.Let dm be the contribution to the consumer price
discount by the manufacturer, and dr the contribution ofthe retailer. The consumer price discount, dc, is the sum ofeach party’s contributions to the discount, that is,
dc ¼ dr þ dm:
Now, if the manufacturer sets his discount, dm, in such away that its own profit is at its maximum, it can be shown(Appendix 1, Eq. A1.7) that its optimal discount is:
dm* ¼ s� c� drð Þ=2þ B= 2gð Þ ð1ÞIn the notation * refers to the optimal value if the channelparty maximizes the own profit and ** refers to the optimalvalue if the channel party maximizes the channel profit.Furthermore, s is the (regular) selling price of themanufacturer to the retailer, c is the manufacturing costsper unit, B is the baseline sales, and g is the coefficient of dcin the discount response function. Equation 1 is theexpression for a linear discount response function, but theresults are true for any function where sales increase asdiscount becomes larger. (The results related to the effectsof double marginalization hold for any upward-slopingdiscount response function which is equivalent to adownward-sloping demand function-, see Jeuland andShugan (1983, p 242)).
By considering only its own profit, the manufacturerdoes not take into account that increasing its discount dm,not only affects its own results, but also those of the retailer.After all, a larger dm implies a larger dc, and therefore,
Table 1 Definitions of the variables used in the paper
dm = price discount given by the manufacturer
dr = price discount given by the retailer
dc = total price discount for the consumer (dc=dm+dr)
p = regular consumer price
pd = consumer discount price (pd=p – dc)
q(pd) = volume of the product sold (in units) as a function of the (discounted) consumer price
s = selling price of the manufacturer to the retailer (regular, i.e., in the absence of sales promotions)
c = manufacturing costs per unit (production costs)
B = baseline sales, i.e., the sales volume of the product in the absence of the sales promotion
Fr = fixed costs of the retailer
Fm = fixed costs of the manufacturer
FSr = fixed costs of the sales promotion for the retailer (planning and execution costs)
FSm = fixed costs of the sales promotion for the manufacturer (planning and execution costs)
Πr = profit from the sales promotion for the retailer
Πm = profit from the sales promotion for the manufacturer
Πc = profit from the sales promotion for the channel (Πc = Πr + Πm)
J. of the Acad. Mark. Sci.
higher (volume) sales of the retailer. This means that theretailer’s profit is also larger (as long as the retailer’smargin is positive). The manufacturer would take theadditional profit of the retailer into account if it ownedthe retailer. In that case, it would set its discount (seeAppendix 1, Eq. A1.8) at:
dm** ¼ s� c� drð Þ=2þ B= 2gð Þ þ p� s� drð Þ=2 ð2Þ
A comparison of Eq. (2) with Eq. (1) shows that themanufacturer’s discount is larger if it maximizes overallchannel profit (assuming that the retailer’s margin [p - s -dr] is positive).
Therefore, a manufacturer maximizing its own profit setsthe discount lower than when maximizing the profit of thechannel.
For the retailer, a similar mechanism is at work. If theretailer maximizes its own profit, it sets its discount at(Appendix 1, Eq. A1.10):
dr* ¼ p� s� dmð Þ=2þ B= 2gð Þ ð3ÞHowever, if the retailer takes the profit effect for themanufacturer into account (which it would do if it ownedthe manufacturer) the optimal discount is (Appendix 1,Eq. A1.11):
dr**¼ p� s� dmð Þ=2þ B= 2gð Þþ s� c� dmð Þ=2 ð4ÞThe discount is lower as long as the manufacturer makes apositive margin [s - c - dm].
Therefore, each channel party, the manufacturer and theretailer, sets its discount in a way that the own marginalprofit (δΠm/δdm and δΠr/δdr, respectively) equals zero(double marginalization).
Abstracting from the individual channel parties (manu-facturer and retailer) we can also derive the optimal channeldiscount directly (see Appendix 1, Eq. A1.14):
dc** ¼ p� cð Þ=2þ B= 2gð Þ ð5ÞGoing back to the situation of the manufacturer owning theretailer, the total consumer discount would be: dm**+dr,and using Eq. (1) this is:
dm**þ dr ¼ p� cð Þ=2þ B= 2gð ð6ÞIt is clear from Eq. (5) that this is equal to dc**, i.e. thechannel-optimal discount.
In the same way, if the retailer owned the manufacturer:
dr**þ dm ¼ p� cð Þ=2þ B= 2gð Þ ¼ dc**: ð7ÞIt is apparent that if a channel member sets its discount
to maximize the profit of both parties, it automaticallymaximizes the channel profit. However, channel memberstypically only maximize their own profit, which leads todiscounts that are too low and therefore suboptimal from
the channel point-of-view. The implication of this myopicapproach is that the joint profits are lower than would havebeen possible.
Comments to this modeling approach
We add two comments. First, we use a single-period bilateralmonopoly model and look at the coordination problem withinthe “channel dyad” of one manufacturer and one retailer(Ingene and Parry 2004, 2007). In principle, we have avertical Nash game here. If such a game were “played out”completely, this would lead to equilibrium values for themanufacturer discount and the retailer discount, known asthe Nash equilibrium. We give the expressions for the Nashequilibrium values in Appendix 1 (Eqs. A1.17, A1.18). Wewill check empirically in our database to what extent a Nashequilibrium occurs.
Second, we look at dyadic-coordination between onemanufacturer and one retailer and we abstract from otherretailers and manufacturers. This is reasonable in theempirical setting of the Netherlands, where each salespromotion is unique, with conditions separately negotiatedbetween the manufacturer and the retailer within the dyad.Retailers work with “promotion calendars” and generallythere is no other sales promotion in the same product (sub)category in the same week. Furthermore, the same productof a manufacturer is usually not in a sales promotion atanother retailer in the same week. Nevertheless, even if thepresence of other parties would be a reason for a less thanchannel-optimal sales promotion within a particular dyad, itis still important to know how much is lost by departingfrom the sales promotion that would have been the best forthe particular dyad. In that case, the analysis at the level ofthe dyad remains important.
After this formal analytical approach, we now turn to theECR study to see how this works in practice.
The ECR study
The data used comprise 86 sales promotions in a food productcategory, collected in the context of an ECR project. Asmentioned earlier, Efficient Consumer Response is a move-ment in which manufacturers and retailers work together inorder to optimize the distribution channel (FMI 1993;Coughlan et al. 2006). “Efficient sales promotions” is oneof the four major ECR domains for improving thecooperation between manufacturers and retailers (FMI 1993)
The dataset for each sales promotion contains the actualprice discount, the sales volume generated at this discount,and the contributions of each channel partner to thediscount. Furthermore, in the ECR project there isinformation about manufacturing costs, handling and
J. of the Acad. Mark. Sci.
execution costs of sales promotions, the costs of featuresand display materials, and about the payments made by themanufacturer to the retailer to compensate for salespromotions costs. With this detailed information, we cancompute actual profitability, including the division of profitbetween manufacturer and retailer. Therefore, we candetermine the amount of suboptimality: the extent to whichthe channel parties have acted in a suboptimal way andhave left money on the table.
The data
The 86 sales promotions in the dataset cover a period of23 weeks and are from a retailing chain in the Netherlands.The (overall) product category is fresh dessert productswith six subcategories: yogurt, sweet desserts, drinks,functional foods, curd, and culinary. The actual salespromotions take place within one of these subcategories.The database includes all sales promotions in the retailchain in the six subcategories of the fresh desserts categoryduring the period studied. All promotions are pricediscounts, supported by feature advertisements in door-to-door circulars distributed around the stores. The sales dataare scanner data collected by the retailer.
The running time of these sales promotions is 1 week. Allrelevant information is available: regular consumer price,price discount given to the consumer, regular purchasing pricefor the retailer, and purchasing price for the retailer duringdiscount. In the ECR project for the product category that westudy, the production costs of the manufacturer on averageaccount for 70% of the regular purchasing price of the retailer(“selling price” in Table 1). We use this figure for the salespromotions in our data set. (Often companies do not knowexact production costs figures and then work with similarassumptions). However, we have exact figures for thespecific products for 25 of the 86 sales promotions involvedin our study and we also carry out a separate computation ofthe profit increase from the actual to the channel-optimalconsumer discount for these 25.
We also take into account the processing costs of thesales promotions. For an individual sales promotion theseare “fixed costs”, independent of the sales volumegenerated by the sales promotion. We use the results froman Activity Based Costing project (Verstappen et al. 1998)for the processing costs (at the manufacturer and theretailer). These authors first defined all activities carriedout for a sales promotion at the retailer and the manufac-turer and then measured the resources spent on theseactivities (e.g., time, budget, space) during a particularperiod. Examples of such activities are planning, writing aproposal, logistic activities of storing and transportation,production of leaflets, filling displays, costs of space, etc.The fixed costs per sales promotion is calculated by
dividing the number of sales promotions during the sameperiod. Cost figures for the out-of-pocket cost of advertise-ments and leaflets are directly available. It turns out that theretailer incurs the bulk (96%) of the actual costs of the salespromotions. However, since the manufacturer pays theretailer an amount for each sales promotion, in the end themanufacturer on average pays 72% of the fixed costs.
For the sales promotions in the database, the regularconsumer price of the items ranges from NLG 0.69 cents toNLG 4.99. The average discount is NLG 0.37 cents or 18%of the average regular consumer price of NLG 2.08. In thispaper, we work with the monetary unit (Netherlandsguilders-NLG) that was applicable at the time to whichthe data refer (1 NLG is about 0.45 Euro or 0.60 US$).Data shows that the retailer has paid (on average) 70% ofthe price discount for the promotions in the database. Thislarge share in the consumer discount means that the retailerdoes not simply pass on the manufacturer’s discount to theconsumer but “amplifies” it. The mean “pass-through”equals (Bucklin 1987) 1/(1 – 0.70)* 100=333. In theliterature, the figures for pass-through vary widely. Oneearlier study, Chevalier and Curhan (1976), found pass-through rates ranging from 0 to 211%. Armstrong (1991)reported pass-through rates for four product categories inFMCG ranging from 143% to 285%. In a study of Besankoet al. (2005), the range was from 22% to 558%, whereas therecent study by Pauwels (2007) found pass-through ratesfrom 0% to 183%. Therefore, the pass-through rate in ourstudy is relatively high, but still comparable to those foundin other studies.
Actual profitability of the sales promotions
The analysis computes the profitability of a sales promotionas the extra profit for the specific item due to the salespromotion, that is, the net increase in margin minus thecosts of the sales promotion. The extra sales are actual salesminus baseline sales. “Baseline sales” are the sales thatwould have occurred at the regular price. We computebaseline sales by taking the average weekly sales over aperiod of 10 weeks: 5 weeks before and 5 weeks after theparticular week, leaving out the highest and the lowestvalue, weeks with promotions in the category, and weekswith special days (e.g. the Christmas week). Tables 2 and 3shows the profitability figures calculated in this way.
Table 2 shows that over all 86 sales promotions, theaverage profit per sales promotion is negative for themanufacturer (−59), positive for the retailer (+62), andmarginally positive (+3) for the channel as a whole. Aboutone-third (35%) of all sales promotions are profitable forthe manufacturer whereas this stands at two-thirds (67%)for the retailer. At the channel level, 47 sales promotions(55%) are profitable, implying that the channel profit is
J. of the Acad. Mark. Sci.
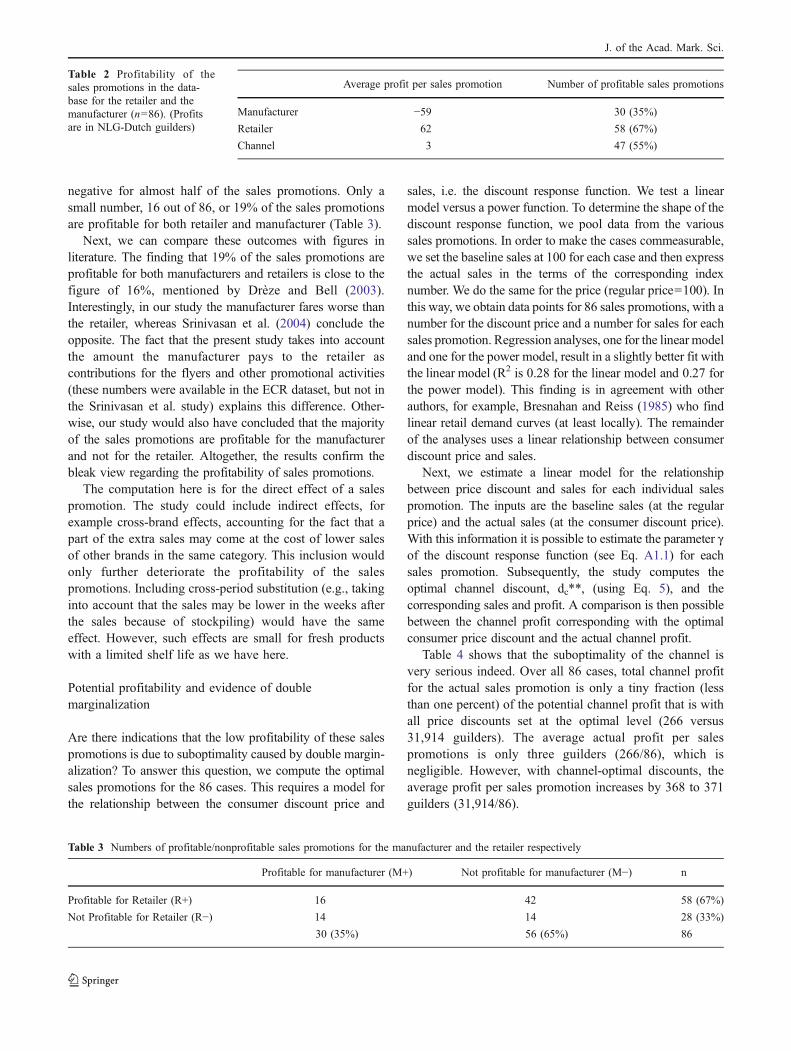
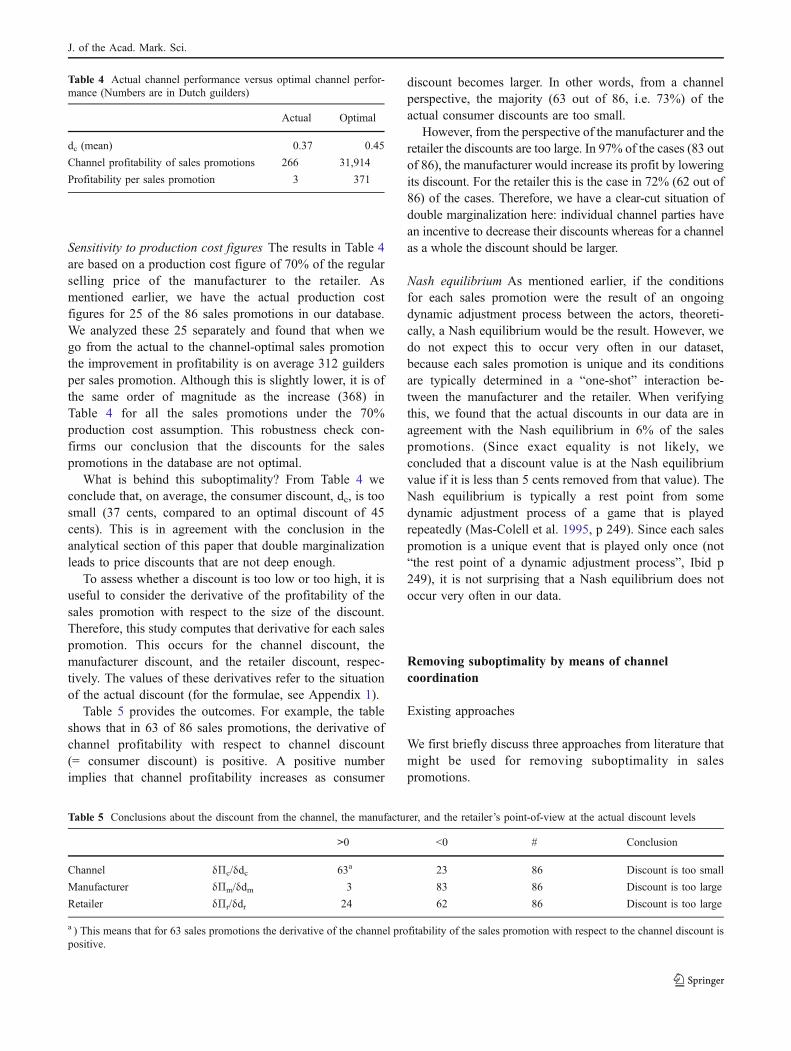
negative for almost half of the sales promotions. Only asmall number, 16 out of 86, or 19% of the sales promotionsare profitable for both retailer and manufacturer (Table 3).
Next, we can compare these outcomes with figures inliterature. The finding that 19% of the sales promotions areprofitable for both manufacturers and retailers is close to thefigure of 16%, mentioned by Drèze and Bell (2003).Interestingly, in our study the manufacturer fares worse thanthe retailer, whereas Srinivasan et al. (2004) conclude theopposite. The fact that the present study takes into accountthe amount the manufacturer pays to the retailer ascontributions for the flyers and other promotional activities(these numbers were available in the ECR dataset, but not inthe Srinivasan et al. study) explains this difference. Other-wise, our study would also have concluded that the majorityof the sales promotions are profitable for the manufacturerand not for the retailer. Altogether, the results confirm thebleak view regarding the profitability of sales promotions.
The computation here is for the direct effect of a salespromotion. The study could include indirect effects, forexample cross-brand effects, accounting for the fact that apart of the extra sales may come at the cost of lower salesof other brands in the same category. This inclusion wouldonly further deteriorate the profitability of the salespromotions. Including cross-period substitution (e.g., takinginto account that the sales may be lower in the weeks afterthe sales because of stockpiling) would have the sameeffect. However, such effects are small for fresh productswith a limited shelf life as we have here.
Potential profitability and evidence of doublemarginalization
Are there indications that the low profitability of these salespromotions is due to suboptimality caused by double margin-alization? To answer this question, we compute the optimalsales promotions for the 86 cases. This requires a model forthe relationship between the consumer discount price and
sales, i.e. the discount response function. We test a linearmodel versus a power function. To determine the shape of thediscount response function, we pool data from the varioussales promotions. In order to make the cases commeasurable,we set the baseline sales at 100 for each case and then expressthe actual sales in the terms of the corresponding indexnumber. We do the same for the price (regular price=100). Inthis way, we obtain data points for 86 sales promotions, with anumber for the discount price and a number for sales for eachsales promotion. Regression analyses, one for the linear modeland one for the power model, result in a slightly better fit withthe linear model (R2 is 0.28 for the linear model and 0.27 forthe power model). This finding is in agreement with otherauthors, for example, Bresnahan and Reiss (1985) who findlinear retail demand curves (at least locally). The remainderof the analyses uses a linear relationship between consumerdiscount price and sales.
Next, we estimate a linear model for the relationshipbetween price discount and sales for each individual salespromotion. The inputs are the baseline sales (at the regularprice) and the actual sales (at the consumer discount price).With this information it is possible to estimate the parameter gof the discount response function (see Eq. A1.1) for eachsales promotion. Subsequently, the study computes theoptimal channel discount, dc**, (using Eq. 5), and thecorresponding sales and profit. A comparison is then possiblebetween the channel profit corresponding with the optimalconsumer price discount and the actual channel profit.
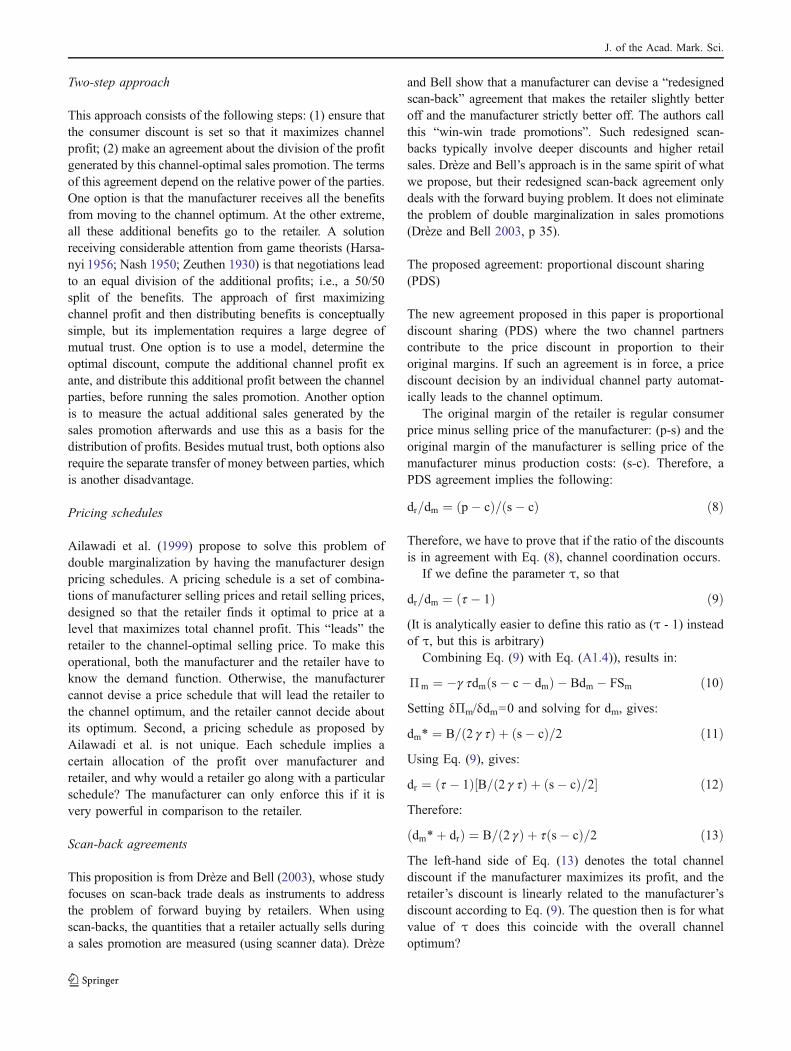
Table 4 shows that the suboptimality of the channel isvery serious indeed. Over all 86 cases, total channel profitfor the actual sales promotion is only a tiny fraction (lessthan one percent) of the potential channel profit that is withall price discounts set at the optimal level (266 versus31,914 guilders). The average actual profit per salespromotions is only three guilders (266/86), which isnegligible. However, with channel-optimal discounts, theaverage profit per sales promotion increases by 368 to 371guilders (31,914/86).
Table 3 Numbers of profitable/nonprofitable sales promotions for the manufacturer and the retailer respectively
Profitable for manufacturer (M+) Not profitable for manufacturer (M−) n
Profitable for Retailer (R+) 16 42 58 (67%)
Not Profitable for Retailer (R−) 14 14 28 (33%)
30 (35%) 56 (65%) 86
Average profit per sales promotion Number of profitable sales promotions
Manufacturer −59 30 (35%)
Retailer 62 58 (67%)
Channel 3 47 (55%)
Table 2 Profitability of thesales promotions in the data-base for the retailer and themanufacturer (n=86). (Profitsare in NLG-Dutch guilders)
J. of the Acad. Mark. Sci.
Sensitivity to production cost figures The results in Table 4are based on a production cost figure of 70% of the regularselling price of the manufacturer to the retailer. Asmentioned earlier, we have the actual production costfigures for 25 of the 86 sales promotions in our database.We analyzed these 25 separately and found that when wego from the actual to the channel-optimal sales promotionthe improvement in profitability is on average 312 guildersper sales promotion. Although this is slightly lower, it is ofthe same order of magnitude as the increase (368) inTable 4 for all the sales promotions under the 70%production cost assumption. This robustness check con-firms our conclusion that the discounts for the salespromotions in the database are not optimal.
What is behind this suboptimality? From Table 4 weconclude that, on average, the consumer discount, dc, is toosmall (37 cents, compared to an optimal discount of 45cents). This is in agreement with the conclusion in theanalytical section of this paper that double marginalizationleads to price discounts that are not deep enough.
To assess whether a discount is too low or too high, it isuseful to consider the derivative of the profitability of thesales promotion with respect to the size of the discount.Therefore, this study computes that derivative for each salespromotion. This occurs for the channel discount, themanufacturer discount, and the retailer discount, respec-tively. The values of these derivatives refer to the situationof the actual discount (for the formulae, see Appendix 1).
Table 5 provides the outcomes. For example, the tableshows that in 63 of 86 sales promotions, the derivative ofchannel profitability with respect to channel discount(= consumer discount) is positive. A positive numberimplies that channel profitability increases as consumer
discount becomes larger. In other words, from a channelperspective, the majority (63 out of 86, i.e. 73%) of theactual consumer discounts are too small.
However, from the perspective of the manufacturer and theretailer the discounts are too large. In 97% of the cases (83 outof 86), the manufacturer would increase its profit by loweringits discount. For the retailer this is the case in 72% (62 out of86) of the cases. Therefore, we have a clear-cut situation ofdouble marginalization here: individual channel parties havean incentive to decrease their discounts whereas for a channelas a whole the discount should be larger.
Nash equilibrium As mentioned earlier, if the conditionsfor each sales promotion were the result of an ongoingdynamic adjustment process between the actors, theoreti-cally, a Nash equilibrium would be the result. However, wedo not expect this to occur very often in our dataset,because each sales promotion is unique and its conditionsare typically determined in a “one-shot” interaction be-tween the manufacturer and the retailer. When verifyingthis, we found that the actual discounts in our data are inagreement with the Nash equilibrium in 6% of the salespromotions. (Since exact equality is not likely, weconcluded that a discount value is at the Nash equilibriumvalue if it is less than 5 cents removed from that value). TheNash equilibrium is typically a rest point from somedynamic adjustment process of a game that is playedrepeatedly (Mas-Colell et al. 1995, p 249). Since each salespromotion is a unique event that is played only once (not“the rest point of a dynamic adjustment process”, Ibid p249), it is not surprising that a Nash equilibrium does notoccur very often in our data.
Removing suboptimality by means of channelcoordination
Existing approaches
We first briefly discuss three approaches from literature thatmight be used for removing suboptimality in salespromotions.
Table 4 Actual channel performance versus optimal channel perfor-mance (Numbers are in Dutch guilders)
Actual Optimal
dc (mean) 0.37 0.45
Channel profitability of sales promotions 266 31,914
Profitability per sales promotion 3 371
Table 5 Conclusions about the discount from the channel, the manufacturer, and the retailer’s point-of-view at the actual discount levels
>0 <0 # Conclusion
Channel δΠc/δdc 63a 23 86 Discount is too small
Manufacturer δΠm/δdm 3 83 86 Discount is too large
Retailer δΠr/δdr 24 62 86 Discount is too large
a ) This means that for 63 sales promotions the derivative of the channel profitability of the sales promotion with respect to the channel discount ispositive.
J. of the Acad. Mark. Sci.
Two-step approach
This approach consists of the following steps: (1) ensure thatthe consumer discount is set so that it maximizes channelprofit; (2) make an agreement about the division of the profitgenerated by this channel-optimal sales promotion. The termsof this agreement depend on the relative power of the parties.One option is that the manufacturer receives all the benefitsfrom moving to the channel optimum. At the other extreme,all these additional benefits go to the retailer. A solutionreceiving considerable attention from game theorists (Harsa-nyi 1956; Nash 1950; Zeuthen 1930) is that negotiations leadto an equal division of the additional profits; i.e., a 50/50split of the benefits. The approach of first maximizingchannel profit and then distributing benefits is conceptuallysimple, but its implementation requires a large degree ofmutual trust. One option is to use a model, determine theoptimal discount, compute the additional channel profit exante, and distribute this additional profit between the channelparties, before running the sales promotion. Another optionis to measure the actual additional sales generated by thesales promotion afterwards and use this as a basis for thedistribution of profits. Besides mutual trust, both options alsorequire the separate transfer of money between parties, whichis another disadvantage.
Pricing schedules
Ailawadi et al. (1999) propose to solve this problem ofdouble marginalization by having the manufacturer designpricing schedules. A pricing schedule is a set of combina-tions of manufacturer selling prices and retail selling prices,designed so that the retailer finds it optimal to price at alevel that maximizes total channel profit. This “leads” theretailer to the channel-optimal selling price. To make thisoperational, both the manufacturer and the retailer have toknow the demand function. Otherwise, the manufacturercannot devise a price schedule that will lead the retailer tothe channel optimum, and the retailer cannot decide aboutits optimum. Second, a pricing schedule as proposed byAilawadi et al. is not unique. Each schedule implies acertain allocation of the profit over manufacturer andretailer, and why would a retailer go along with a particularschedule? The manufacturer can only enforce this if it isvery powerful in comparison to the retailer.
Scan-back agreements
This proposition is from Drèze and Bell (2003), whose studyfocuses on scan-back trade deals as instruments to addressthe problem of forward buying by retailers. When usingscan-backs, the quantities that a retailer actually sells duringa sales promotion are measured (using scanner data). Drèze
and Bell show that a manufacturer can devise a “redesignedscan-back” agreement that makes the retailer slightly betteroff and the manufacturer strictly better off. The authors callthis “win-win trade promotions”. Such redesigned scan-backs typically involve deeper discounts and higher retailsales. Drèze and Bell’s approach is in the same spirit of whatwe propose, but their redesigned scan-back agreement onlydeals with the forward buying problem. It does not eliminatethe problem of double marginalization in sales promotions(Drèze and Bell 2003, p 35).
The proposed agreement: proportional discount sharing(PDS)
The new agreement proposed in this paper is proportionaldiscount sharing (PDS) where the two channel partnerscontribute to the price discount in proportion to theiroriginal margins. If such an agreement is in force, a pricediscount decision by an individual channel party automat-ically leads to the channel optimum.
The original margin of the retailer is regular consumerprice minus selling price of the manufacturer: (p-s) and theoriginal margin of the manufacturer is selling price of themanufacturer minus production costs: (s-c). Therefore, aPDS agreement implies the following:
dr=dm ¼ p� cð Þ= s� cð Þ ð8Þ
Therefore, we have to prove that if the ratio of the discountsis in agreement with Eq. (8), channel coordination occurs.
If we define the parameter τ, so that
dr=dm ¼ t � 1ð Þ ð9Þ(It is analytically easier to define this ratio as (τ - 1) insteadof τ, but this is arbitrary)
Combining Eq. (9) with Eq. (A1.4)), results in:
Πm ¼ �g tdm s� c� dmð Þ � Bdm � FSm ð10ÞSetting δΠm/δdm=0 and solving for dm, gives:
dm* ¼ B= 2 g tð Þ þ s� cð Þ=2 ð11ÞUsing Eq. (9), gives:
dr ¼ t � 1ð Þ B= 2 g tð Þ þ s� cð Þ=2½ � ð12ÞTherefore:
dm*þ drð Þ ¼ B= 2 gð Þ þ t s� cð Þ=2 ð13ÞThe left-hand side of Eq. (13) denotes the total channeldiscount if the manufacturer maximizes its profit, and theretailer’s discount is linearly related to the manufacturer’sdiscount according to Eq. (9). The question then is for whatvalue of τ does this coincide with the overall channeloptimum?
J. of the Acad. Mark. Sci.
If the PDS condition applies dr=dm ¼ p� sð Þ= s� cð Þ½ �,t ¼ p� cð Þ= s� cð Þ. If we substitute this in Eq. (13), we get
dm*þ drð Þ ¼ B= 2gð Þ þ p� cð Þ=2: ð14ÞThe right-hand side of Eq. (14) is identical to the
expression for the optimal consumer discount as given byEq. (7). Therefore, this shows that if PDS applies, thediscount that maximizes the manufacturer’s profit alsomaximizes the profit of the channel. This analysis takesthe perspective of the manufacturer, but taking the retailer’sperspective produces the same result.
This analysis proves the proportional discount sharing(PDS) rule—allocating their contributions to the consumerprice discount in proportion to their original margins—aligns the profit maximization of the manufacturer, theretailer and the channel. Therefore, PDS coordinates thechannel.
Jeuland and Shugan (1983, p 252) propose a generalform for a mechanism for channel coordination, wherebythe manufacturer receives fraction k1 of channel profits plusa fixed amount k2, while the retailer receives fraction (1 -k1) minus the fixed amount k2. They implement theirgeneral principle for channel coordination, formulatedabove, as a quantity-discount-pricing schedule. However,it is straightforward to interpret PDS as an implementationof the general Jeuland and Shugan mechanism to salespromotions, with k1=(s - c)/(p - c) and k2 =0. (In fact, k2 isnot relevant here because it plays no role in the location ofthe optimum). This is another proof that PDS leads tochannel coordination. In the empirical application, we showhow this works for actual sales promotions.
In comparison to the other approaches, the implementationof PDS is very straightforward. It means simply allocating theconsumer price discount between the channel partners inproportion to their margins before the discount. Of course, thisinformation has to be available. If exact information is notavailable, for example about margins, the best possibleestimates should be used. As regards to the size of theconsumer discount, each of the two parties can make thisdecision separately or they decide jointly. Whoever has themost accurate market information is in the best position to dothis. PDS does not require separate money transfer betweenparties, either model-based or scan-back-based. There is alsoan element of fairness in that the party with the largestmargin also contributes most to the consumer discount.
Application of PDS to the ECR data
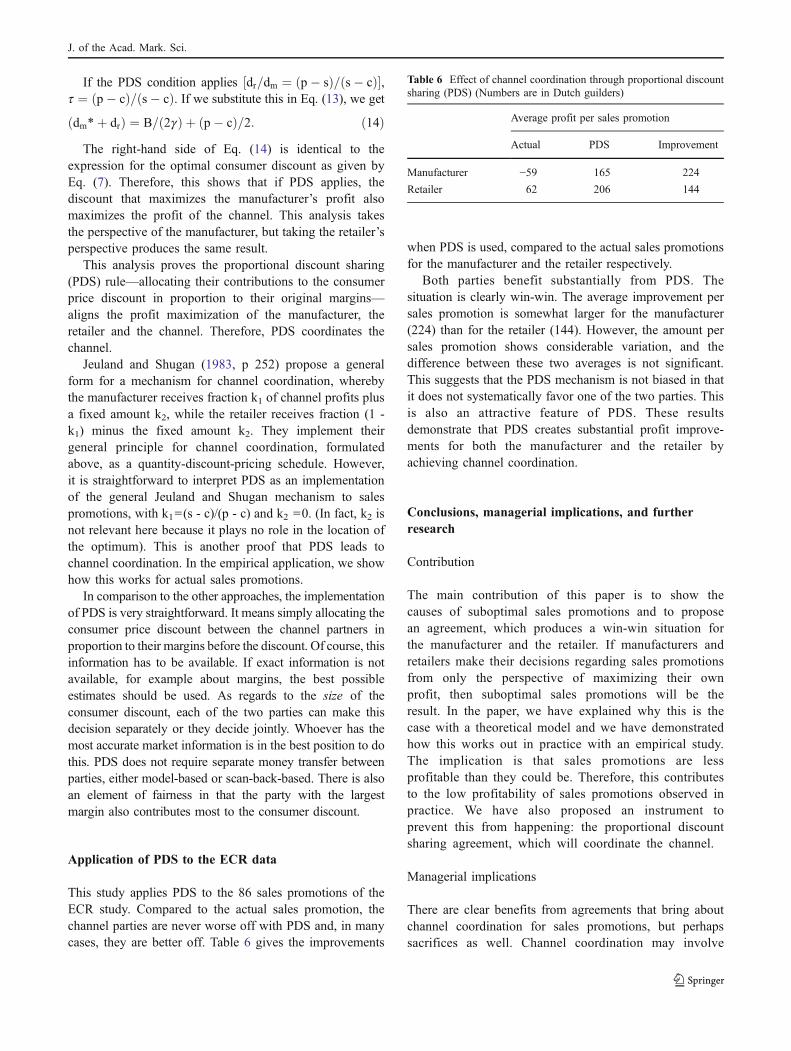
This study applies PDS to the 86 sales promotions of theECR study. Compared to the actual sales promotion, thechannel parties are never worse off with PDS and, in manycases, they are better off. Table 6 gives the improvements
when PDS is used, compared to the actual sales promotionsfor the manufacturer and the retailer respectively.
Both parties benefit substantially from PDS. Thesituation is clearly win-win. The average improvement persales promotion is somewhat larger for the manufacturer(224) than for the retailer (144). However, the amount persales promotion shows considerable variation, and thedifference between these two averages is not significant.This suggests that the PDS mechanism is not biased in thatit does not systematically favor one of the two parties. Thisis also an attractive feature of PDS. These resultsdemonstrate that PDS creates substantial profit improve-ments for both the manufacturer and the retailer byachieving channel coordination.
Conclusions, managerial implications, and furtherresearch
Contribution
The main contribution of this paper is to show thecauses of suboptimal sales promotions and to proposean agreement, which produces a win-win situation forthe manufacturer and the retailer. If manufacturers andretailers make their decisions regarding sales promotionsfrom only the perspective of maximizing their ownprofit, then suboptimal sales promotions will be theresult. In the paper, we have explained why this is thecase with a theoretical model and we have demonstratedhow this works out in practice with an empirical study.The implication is that sales promotions are lessprofitable than they could be. Therefore, this contributesto the low profitability of sales promotions observed inpractice. We have also proposed an instrument toprevent this from happening: the proportional discountsharing agreement, which will coordinate the channel.
Managerial implications
There are clear benefits from agreements that bring aboutchannel coordination for sales promotions, but perhapssacrifices as well. Channel coordination may involve
Table 6 Effect of channel coordination through proportional discountsharing (PDS) (Numbers are in Dutch guilders)
Average profit per sales promotion
Actual PDS Improvement
Manufacturer −59 165 224
Retailer 62 206 144
J. of the Acad. Mark. Sci.
sharing information (e.g., about margins) with the otherchannel party, which they would not have shared otherwise,or giving up degrees of freedom (e.g., the possibility ofadapting a consumer price discount at the last moment).Channel parties will only cooperate if they understand whythis is in their own interest and how they can benefit(especially in the long run). This requires a considerablelevel of trust, as we will discuss below.
Most importantly, parties have to become aware ofthe channel coordination problem and its implicationsfor the profitability of sales promotions. Although salespromotions are used intensively, many companies spendlittle effort on the analysis of the results and are oftennot aware of the low profitability. With the recentdevelopments in IT and scanner data, this situation isimproving. More seriously, it is unlikely that therepresentatives of manufacturers and retailers whonegotiate about the conditions for sales promotions areaware of the double marginalization mechanism. Al-though it is not a problem if they do not know thisterm, they should at least have an intuitive feeling forthe phenomenon and understand that by only looking attheir own interest they may threaten the interest of thechannel, and therefore indirectly jeopardize themselves.We hope that this paper contributes to the awareness ofthis phenomenon.
Any agreement for channel coordination in salespromotions is maintainable only if parties trust each other.Furthermore, they should take a long-term perspective. It isnot about who gets what in one particular sales promotion,but about getting the best joint results from a series of salespromotions in which the parties work together. Representa-tives of practice make appeals for developing such jointpromotion strategies (Jones 2004). The ECR (EfficientConsumer Response) movement also calls for joint strate-gies for efficient promotions. This paper provides atheoretical basis for these appeals and shows how muchcan be gained. Joint promotion strategies are also inagreement with the ideas about partnerships betweendistributors and manufacturers found in marketing literature(Anderson and Narus 1990). Within the vertical distributionchannel, it is increasingly recognized that parties shouldwork together and improve coordination (Achrol and Etzel2003). Monitoring channel members, through the electronictransfer of information, is becoming more and morefashionable. High levels of data interchange (e.g., in ECRcontexts) are transforming the nature of many channelrelationships (Frazier 1999); it also helps to preventcheating. Information sharing as a basis for joint decision-making in sales promotions is becoming more and moreacceptable. The observation that scan-back agreements areincreasingly replacing off-invoice allowances (CannondaleAssociates 2000) illustrates this.
Limitations
The approach proposed in this paper will not completelysolve the problem of the low profitability of salespromotions, but it can contribute to improving the results.Double marginalization is not the only cause of the lowprofitability of sales promotions. Several reasons exist whychannel partners sometimes accept “leaky” sales promo-tions. Sometimes the primary goal of a sales promotion is toincrease market share, and not the profit on the salespromotion itself. The long-term effect of sales promotionson market share is very limited, however (Srinivasan et al.2000). A strategic motivation for accepting salespromotions even if they are not profitable can be thedesire to maintain the relationship with a preferredchannel partner. Alternatively, the purpose of a salespromotion may be to increase store traffic, where theprofit is made on the sales of other products. Finally,there is the possibility of the prisoner dilemma, whichoccurs if individual channel members want to discon-tinue loss-making sales promotions, but maintain thembecause everyone else does so. However, we do nothave the illusion that recognition of the double margin-alization phenomenon makes all unprofitable salespromotions disappear. Nevertheless, knowing about theadvantages of coordinating the channel and using theinstruments discussed in this paper can help manufac-turers and retailers to limit their losses. If full channeloptimum is not possible in certain situations because ofthe type of considerations mentioned above, the theoryand analysis presented in this paper at least make itpossible to compute the costs (missed opportunities)implied by the suboptimality.
Suggestions for future research
The theory of this paper, in general, holds for all situationswhere manufacturers and retailers make decisions regardingsales promotions. The focus here is on the double margin-alization mechanism in the context of price discounts.However, this mechanism plays a role in other marketingvariables too. Whenever a channel party stops increasing itsexpenditures to make a sales promotion more attractive atthe point where its marginal cost becomes equal to the ownadditional revenue (neglecting additional revenue generatedelsewhere in the channel) sub-optimization occurs. Thisstate implies that an individual channel party puts fewerresources in a sales promotion than what is optimal from achannel point of view. For example, a manufacturer has theincentive to lower product quality below the channelmaximum level and to lower all other promotional decisionvariables at its disposal (Jeuland and Shugan 1983, p 247).This behavior can occur with any sales promotion instru-
J. of the Acad. Mark. Sci.
ment besides price discounts, for example with flyers,displays, premiums, etc. Extension of the current work tostudy the effect of lack of channel coordination on othersales promotion instruments is very welcome.
Furthermore, the empirical part of the paper is limited toone dataset. Additional empirical work, with other data,would be useful to further assess the amount of the loss inpractice due to sales promotions lacking channel coordina-tion. As we mentioned, it is not easy to obtain relevant data,and usually the cooperation of both the manufacturer andthe retailer is required. We have examined the problem ofdouble marginalization here for a particular food categoryand in a specific setting of “strong” manufacturers andretailers. It would be interesting to see if the samephenomenon occurs in other product categories and settingsas concerns the relative power of the manufacturer and theretailer.
Other research needed is the development of multi-partydecision support tools, which are useful to facilitate salespromotion agreements like PDS. Existing decision supporttools for sales promotions are single-party tools that lookfrom the perspective of one party, for example, themanufacturers’ sales promotion calendar tool of Silva-Risso et al. (1999). With a multi-party decision supporttool, one can simulate the effects of alternative discountoptions, and show their implications in terms of sales andprofits, both for the retailer and the manufacturer. Multi-party decision support tools can also help manufacturersand retailers to understand the mechanism behind doublemarginalization.
Simple awareness of double marginalization by channelparties can help to alleviate the problem. In salespromotions, channel members are not only each other’sadversaries (aiming for the largest possible part of theprofit), but they also have to cooperate in order to make thejoint profit as large as possible. We hope that this papercreates awareness of the potential benefits of cooperation insales promotions and is helpful in finding and implement-ing solutions.
Message to practice
Our message to practice is the following. Use salespromotions that coordinate the channel if anyhowpossible. We have shown how serious the losses canbe if this is not the case and we propose a method howto achieve channel-coordinating sales promotions. Evenif you are not able to apply channel-coordinating salespromotions, for example because of the relationshipwith your channel partner, it is still important to knowhow much potential profit is foregone at the channellevel. This may help in negotiations with the channelpartner to change the situation.
Appendix 1: Derivation of expressions used in the text
Let q(dc) be the discount response function, i.e. relationshipbetween the consumer price discount and the volume soldduring a sales promotion (pd=p - dc).
We assume:
q dcð Þ ¼ B� gdc ðA1:1Þwhere B=baseline sales (i.e. the sales level if there were noprice discount) and g is parameter (g<0). For a precisedescription of the variables, see Appendix 1.
The baseline profit (i.e., without sales promotion) of themanufacturer is
B s� cð Þ � Fm ðA1:2ÞThe manufacturer’s profit with the price discount is:
B� gdm � gdrð Þ s� c� dmð Þ � Fm � FSm ðA1:3ÞThe manufacturer’s profit due to the sales promotion, Πm,is the difference between expression (A1.3) and expression(A1.2). After rearranging terms, we have:
Πm ¼ �g dm þ drð Þ s� c� dmð Þ � Bdm � FSm ðA1:4Þ
In the same way, the retailer profit due to the salespromotion is:
Πr ¼ �g dm þ drð Þ p� s� drð Þ � Bdr � FSr ðA1:5ÞWhen the manufacturer maximizes only his own (myopic)profit, the expression
dΠm=ddm ¼ 2gdm � g s� c� drð Þ � B ðA1:6Þ
is set equal to zero. This results in:
dm* ¼ s� c� drð Þ=2þ B= 2gð Þ ðA1:7Þ
However, if the manufacturer chooses dm so that thechannel is optimized, he would also take into account theeffect on the retailer’s profit. He would now maximizethe sum of the expressions (A1.4) and (A1.5). The resultis:
dm** ¼ s� c� drð Þ=2þ B= 2gð Þ þ p� s� drð Þ=2 ðA1:8ÞThe situation is symmetric, and we can also take theperspective of the retailer. When the retailer maximizeshis own profit, the expression:
dΠr=ddr ¼ �g p� s� dm � 2drð Þ � B ðA1:9Þ
is set equal to zero, and
dr* ¼ p� s� dmð Þ=2þ B= 2gð Þ ðA1:10Þ
J. of the Acad. Mark. Sci.
If the retailer also took into account the profit effects forthe manufacturer, he would maximize the sum of theexpressions (A1.4) and (A1.5) and arrive at a discount of:
dr** ¼ p� s� dmð Þ=2þ B= 2gð Þ þ s� c� dmð Þ=2 ðA1:11ÞFor the channel level we have:
Πc ¼ �gdc p� c� dcð Þ � dcB� FSr � FSm ðA1:12ÞHence,
dΠc=ddc ¼ �g p� c� 2dcð Þ � B ðA1:13ÞSetting this expression equal to zero gives:
dc** ¼ p� cð Þ=2þ B= 2gð Þ ðA1:14Þ
Nash equilibrium
Given the retailer discount dr, the manufacturer will set hisdiscount according to Eq. A1.7:
dm* ¼ s� c� drð Þ=2þ B= 2gð Þ ðA1:15ÞNext the retailer starting from this dm* sets (following Eq.A2.10) his discount at
dr* ¼ p� s� dm�ð Þ=2þ B= 2gð Þ ðA1:16Þetc. etc.
These iterations eventually result in the equilibriumvalues:
dm 1ð Þ ¼ 1
3* �pþ 3s� 2cþ 2B
g
� �ðA1:17Þ
dr 1ð Þ ¼ 1
3* 2p� 3sþ cþ B
2g
� �ðA1:18Þ
Open Access This article is distributed under the terms of theCreative Commons Attribution Noncommercial License which per-mits any noncommercial use, distribution, and reproduction in anymedium, provided the original author(s) and source are credited.
References
Achenbaum A. A., & Mitchel, K. F. (1987). Pulling away from pushmarketing. Harvard Business Review, (May–June), 38–40.
Achrol, R. S., & Etzel, M. J. (2003). The structure of reseller goalsand performance in marketing channels. Journal of the Academyof Marketing Science, 31(2), 146–163.
Ailawadi, K. L. (2001). The retail power-performance conun-drum: What have we learned? Journal of Retailing, 77(3),299–318.
Ailawadi, K. L., Farris, P., & Shames, E. (1999). Trade promotions:Essential to selling through resellers. Sloan Management Review,Fall, 83–92.
Ailawadi, K. L., Harlam, B. A., César, J., & Trounce, D. (2006).Promotion profitability for a retailer: The role of promotion,brand, category, and store characteristics. Journal of MarketingResearch, 63, 518–535.
Anderson, J. C., & Narus, J. A. (1990). A model of distributor firmand manufacturer firm working partnerships. Journal of Market-ing, 54, 42–58.
Armstrong, M. K. (1991). Retail response to sales promotions: Anincremental analysis of forward buying and retail promotion.Unpublished PhD dissertation, University of Texas at Dallas.
Besanko, D., Dubé, J. P., & Gupta, S. (2005). Own-brand and cross-brand retail pass-through. Marketing Science, 24(1), 123–137.
Blattberg, R. C., & Neslin, S. A. (1990). Sales promotion: Concepts,methods, and strategies. Englewood Cliffs: Prentice Hall.
Blattberg, R. C., Briesch, R., & Fox, E. J. (1995). How promotionswork. Marketing Science, 14(3), 122–132. part 2 of 2.
Bresnahan, T. F., & Reiss, P. C. (1985). Dealer and manufacturermargins. Rand Journal of Economics, 16(2), 253–268.
Bucklin, R. E. (1987). Pass-through of manufacturer trade promotionsby grocery retailers. Working paper, Stanford University, Oct1987.
Cannondale Associates (2000). Trade promotion spending andmerchandising industry study.
Chevalier, M., & Curhan, R. C. (1976). Retail promotions as afunction of trade promotions: A descriptive analysis. SloanManagement Review, 18(3), 19–32.
Choi, S. C. (1991). Price competition in a channel stucture with acommon retailer. Marketing Science, 10(4), 271–296.
Coughlan, A. T., Anderson, E., Stern, L. W., & El-Ansary, A. I.(2006). Marketing channels (7th ed.). Upper Saddle River:Prentice Hall.
Dekimpe, M. G., & Hanssens, D. M. (1999). Sustained spending andpersistent response: A new look at long-term marketing profit-ability. Journal of Marketing Research, 36, 397–412.
Drèze, X., & Bell, D. R. (2003). Creating win-win trade promotions:Theory and empirical analysis of scan-back trade deals. Market-ing Science, 22(1), 16–39.
Farris, P., & Ailawadi, K. L. (1992). Retail power: Monster or mouse?Journal of Retailing, 68(4), 351–369.
FMI. (1993). Efficient consumer response. Washington DC: FoodMarketing Institute.
Frazier, G. L. (1999). Organizing and managing channels ofdistribution. Journal of the Academy of Marketing Science, 27(92), 226–240.
Gerstner, E., & Hess, J. D. (1995). Pull promotion and channelcoordination. Marketing Science, 14(1), 43–60.
Guadagni, P. M., & Little, J. D. C. (1983). A logit model of brandchoice calibrated on scanner data. Marketing Science, 2(no 3),203–238.
Harsanyi, J. C. (1956). Approaches to the bargaining problem beforeand after the theory of games: A critical discussion of Zeuthen’s,Hicks’ and Nash’s theories. Econometrica, 24(2), 144–157.
Ingene, C. A., & Parry, M. E. (2004). Mathematical models ofdistribution channels. International series in quantitative mar-keting. New York: Kluwer Academic.
Ingene, C. A., & Parry, M. E. (2007). Bilateral monopoly, identicaldistributors, and game-theoretic analyses of distribution channels.Journal of the Academy of Marketing Science, 35(4), 586–602.
Inman, J. J., McAlister, L., & Hoyer, W. D. (1990). Promotion signal:Proxy for a price cut. Journal of Consumer Research, 17, 74–81.
Jeuland, A. P., & Shugan, S. M. (1983). Managing channel profits.Marketing Science, 2(3), 239–272.
J. of the Acad. Mark. Sci.
Jones, C. (2004). The trade promotions Benchmark report: Pouringmoney into a leaky bucket (p. 41). Boston: The Aberdeen Group.
Kasulis, J. J., Morgan, F. W., Griffith, D. E., & Kenderdine, J. M.(1999). Managing trade promotions in the context of marketpower. Journal of the Academy of Marketing Science, 27(3),320–332.
Mas-Colell, A., Whinston, M. D., & Green, J. R. (1995). Micro-economic theory. Oxford: Oxford University Press.
McGuire, T. W., & Staelin, R. (1983). An industry equilibriumanalysis of downstream vertical integration. Marketing Science, 2(2), 161–191.
Moorthy, S. (2005). A general theory of pass-through in channels withcategory management and retail competition. Marketing Science,24(12), 110–122.
Murry, J. P., & Heide, J. B. (1998). Managing promotion programparticipation within manufacturer-retailer relationships. Journalof Marketing, 62(1), 58–68.
Nash, J. F. (1950). The bargaining problem. Econometrica, 18(2),155–162.
Neslin, S. A. (2002). Sales promotion. Cambridge: Marketing ScienceInstitute.
Nijs, V., Dekimpe, M., Steenkamp, J. B. E. M., & Hanssens, D.(2001). The category demand effects of price promotions.Marketing Science, 20(1), 1–22.
Orgel, D. (1996). Study urges trade promotion changes. SupermarketNews, 46, 4–5.
Pauwels, K. (2007). How retailer and competitor decisions drivethe long-term effectiveness of manufacturer promotions forfast-moving consumer goods. Journal of Retailing, 83(3),297–308.
Rossiter, J. R., & Bellman, S. (2005). Marketing communications,theory and applications. Frenchs Forest (Aus): Pearson Educa-tion Australia.
Silva-Risso, J. M., Bucklin, R. E., & Morrison, D. G. (1999). Adecision support system for planning manufacturers’ salespromotion calendars. Marketing Science, 18(3), 274–300.
Spengler, J. J. (1950). Vertical integration and anti-trust policy.Journal of Political Economy, 58, 347–552.
Srinivasan, S., Popkowski Leszczyc, P. T. L., & Bass, F. M. (2000).Market share response and competitive interaction: The Impact oftemporary, evolving and structural changes in prices. Interna-tional Journal of Research in Marketing, 12(4), 281–305.
Srinivasan, S., Pauwels, K., Hanssens, D. M., & Dekimpe, M. (2004).Do promotions benefit manufacturers, retailers or both? Man-agement Science, 50(5), 617–629.
Teunter, L. H. (2002). Analysis of sales promotion effects onhousehold purchasing behavior. ERIM PhD Research Series inManagement. Erasmus University Rotterdam, 262 p.
Trade Promotion. (2005). Spending and merchandising study. Wilton:Cannondale Associates.
Tyagi, R. K. (1999). A characterization of retail response to manufacturertrade deals. Journal of Marketing Research, 36, 510–516.
Urbany, J. E., Dickson, P., & Sawyer, A. (2000). Insights into cross-and within-store price search: Retailer estimates vs. consumerself-reports. Journal of Retailing, 76(2), 243–258.
Van Heerde, J., & Neslin, S. A. (2008). Sales promotion models. In B.Wierenga (Ed.), Handbook of marketing decision models(pp. 107–162). New York: Springer Science + Business.
Van Waterschoot, W., & van den Bulte, C. (1992). The 4Pclassification of the marketing mix revisited. Journal of Market-ing, 56(4), 83–93.
Verstappen, C. D. G., van der Vorst, A. G. A. L., & Wierenga, B.(1998). Cost, revenues and profits of sales promotion activities ina grocery channel. Management Report 1998–12, RotterdamSchool of Management, Erasmus University Rotterdam.
Walters, R. G. (1989). An empirical investigation into retailer responseto manufacturer trade promotions. Journal of Retailing, 65(2),253–272.
Walzer, E. (1987). A challenge to the conventional wisdom.Progressive Grocer, (April), 4–5.
Zeuthen, F. (1930). Problems of Monopoly and Economic Welfare.London.
J. of the Acad. Mark. Sci.