Embed Size (px)
Citation preview
Nijmegen School of Management – Master Thesis
The effect of monetary promotions on the purchase intention of hedonic versus utilitarian products when experiencing financial scarcity
Name: Chantal Brouwer Student number: s1048228 Supervisor: Prof. Dr. G. Antonides 2nd examiner: Dr. H.W.M. Joosten 14-06-2021
1
Abstract
Various types of products have been studied in the context of sales promotions. However, to
our knowledge, the possible influence of financial scarcity has never been researched before.
This study attempts to bridge this gap and therefore, the purpose of this research was to
examine the possible moderating effect of financial scarcity on the effect of monetary
promotions of hedonic and utilitarian products.
This was done via an online survey experiment with Qualtrics whereby participants
had to answer questions about a utilitarian or hedonic product they were shown. The 265
respondents participated to the study, where randomly divided into the different groups. The
chosen hedonic and utilitarian products were, respectively, crisps and rice. The product
displayed was either with or without a monetary promotion. By answering the questions, the
attractiveness of product offering and the purchase intention of respondents were measured
while being exposed to the advertisement. First, the direct effect of the product type was
examined on attractiveness of product offering and purchase intention. Second, the interaction
effect of product type and financial scarcity was examined. Lastly, the interaction effect of
product type, promotion and financial scarcity was examined.
The results showed a significant effect of promotions on the attractiveness and
purchase intention of a utilitarian product. This was surprising because this was not proposed
based on literature. Furthermore, a significant relationship between product type and financial
scarcity on purchase intention was found, which was also contrary to the expectations. Lastly,
the results showed that the interaction between product type, promotion and financial scarcity
on attractiveness of product offering was not significant. However, the interaction between
product type, promotion and financial scarcity on purchase intention was significant.
In conclusion, the effectiveness of a monetary promotion is differing per product type.
In addition, financial scarcity has a moderating effect on the attractiveness and purchase
intention of a product offering (with or without a promotion). Consumers who experience
financial scarcity differ from the consumers who do not. Among other things, future research
should try to examine the reasons behind the differentiating effect of financial scarcity more
in-depth.
2
Table of contents
1. Introduction .................................................................................................................... 4 1.1 Problem statement ........................................................................................................ 5 1.2 Research relevance ....................................................................................................... 6
1.3 Research structure ........................................................................................................ 7
2. Theoretical background .................................................................................................. 8 2.1 Attractiveness of product offering and purchase intention ............................................. 8 2.2 Promotions: monetary vs. non-monetary promotions .................................................... 8
2.3 Products: utilitarian vs. hedonic .................................................................................. 12 2.4 Linking promotions to products .................................................................................. 14
2.5 Financial scarcity........................................................................................................ 15 2.6 Linking promotions to financial scarcity ..................................................................... 17
2.7 Linking type of products to financial scarcity ............................................................. 19 2.8 Conceptual model ....................................................................................................... 21
3. Methodology ................................................................................................................ 22 3.1 Research design .......................................................................................................... 22
3.2 Ad stimuli .................................................................................................................. 22 3.3 Pre-test ....................................................................................................................... 23
3.4 Sample ....................................................................................................................... 24 3.5 Survey design and measurement scales ....................................................................... 25
3.5.1 Dependent variables............................................................................................. 25 3.5.2 Covariate ............................................................................................................. 25
3.6 Data analysis procedure .............................................................................................. 26 3.7 Research ethics ........................................................................................................... 26
4. Results ............................................................................................................................. 27 4.1 Description of sample ................................................................................................. 27
4.2 Experience of financial scarcity .................................................................................. 28 4.3 Validity and reliability ................................................................................................ 28
4.4 Assumptions for analyses ........................................................................................... 29 4.5 Hypothesis testing ...................................................................................................... 31
4.5.1 Hypotheses 1a and 1b .......................................................................................... 31 4.5.2 Hypothesis 2 ........................................................................................................ 32 4.5.3 Hypotheses 3a and 3b .......................................................................................... 33 4.5.4 Hypothesis 4a and 4b ........................................................................................... 34
4.6 Additional analyses .................................................................................................... 36
3
5. Discussion and conclusion................................................................................................ 37 5.1 Discussion and conclusion .......................................................................................... 37 5.2 Theoretical and managerial implications ..................................................................... 40
5.3 Limitations and future research ................................................................................... 41
6. References .................................................................................................................... 43
7. Appendix...................................................................................................................... 50 7.1 Appendix A: Examples of advertisements .................................................................. 50
7.2 Appendix B: Pre-test results ....................................................................................... 52 7.3 Appendix C: Survey design and measurement scales .................................................. 53
7.4 Appendix D: Shapiro-Wilk test ................................................................................... 58 7.5 Appendix E: Levene’s test .......................................................................................... 59
7.4 Appendix F: ANCOVA results ................................................................................... 60 7.5 Appendix G: Profile plots ........................................................................................... 63
4
1. Introduction
Sales promotions are often used to promote products and come in different shapes and forms.
Two well-known categories of sales promotions are monetary and nonmonetary, but within
those categories there is a broad range of sales promotion types. An example of a monetary
promotion is a price discount (e.g., 50% off) and an example of a nonmonetary promotion is a
free gift (e.g. a free beach bag when purchasing sun cream). A lot of research has been done
about the effectiveness of sales promotions in general. Schultz and Block (2014) state that in
the United States, coupons, home samples, in-store samples and retail shopper cards have the
most influence on purchase behavior. McNeill (2013) states that in Malaysia and Singapore
price discounts and volume offers are most effective. Mittal and Sethi (2011) state that buy-
one-get-some-free offers are the most preferred in India, followed by bonus packs and price
discounts. Thus, the effectiveness of sales promotions is country-dependent. Furthermore,
there are studies about the difference in effectiveness of sales promotions within varying
cultures (McNeill, 2013), ethnic groups (Kwok & Uncles, 2005) and online vs. offline
channels (Arce-Urriza, Cebollada, & Tarira, 2017).
Prior research shows that the effectiveness of promotions is influenced by the type of
products. A way to distinguish products is to categorize them as utilitarian or hedonic. To
which category a product belongs depends on the benefits a product provides to consumers.
Hedonic products provide practical, instrumental and functional benefits, whereas hedonic
products provide emotional, sensational and experiential benefits (Batra & Ahtola, 1991;
Hirschman & Holbrook, 1982; Lu, Liu, & Fang, 2016). This distinction aligns with the
purchase goals set by Chitturi, Raghunathan and Mahajan (2008) which are more
functionality-related goals with utilitarian products and more pleasure-related goals with
hedonic products. Previous research has also sought to understand the relationship between
the two promotion categories (monetary vs. nonmonetary) and the two product categories
(hedonic vs. utilitarian). Chandon, Wansink and Laurent (2000) state a congruency effect,
whereby monetary promotions are more effective for utilitarian products and non-monetary
promotions are more effective for hedonic products. However, Kwok and Uncles (2005)
argue that the congruency effect is influenced by various factors. For example, Sinha and
Verma (2019) state that the relationship is influenced by the residential area of consumers.
Urban consumers are more affected by sales promotion which are focused on the hedonic
benefits, thus more focused on the pleasure aspects of the product. For rural consumers a sales
promotion is more effective when it is focused on the utilitarian benefits, the more useful
aspects of the product. Such findings raise questions about other factors influencing the effect
5
of promotions on the purchase decisions of hedonic and utilitarian products, one such factor
being financial scarcity, to be considered next.
1.1 Problem statement
Financial scarcity is defined as a mindset in which people perceive that their income is too
low to cover daily expenses (Mullainathan & Shafir, 2013). Financial scarcity is a relatively
new subject in consumer psychology, related to poverty, which is a well-known phenomenon
worldwide. Poverty within a household occurs when a household does not have sufficient
resources to reach a certain minimum consumption level (Statistics Netherlands, n.d.). Poor
households lack monetary resources and therefore experience financial scarcity. Even in
developed countries, such as the Netherlands, financial scarcity often occurs within
households. In 2019, more than 1 million people (6.2%) of the Dutch population were part of
a household which lives below the low-income threshold. 398,000 Of those people were
living under the low-income threshold for at least four subsequent years (Statistics
Netherlands, 2020). Previous research shows financial scarcity has a lot of consequences on a
person’s daily life. For example, it has a negative effect on a person’s social life (Mood &
Jonsson, 2016), mental health (McKane & Richard, 2020), emotional state (Ali et al., 2018)
and psychical health (Zukiewicz-Sobczak et al., 2014). Furthermore, financial scarcity creates
cognitive load which influences how people experience problems and their decision-making
process. People experiencing financial scarcity focus more on problems where the scarcity is
most salient (Shah, Mullainathan, & Shafir, 2012). For example, the focus is on the upcoming
supermarket visit and the rent for that month. When people have a low-income the thought
about money is easily triggered and comes spontaneously. These thoughts are difficult to
suppress once they are in the mind (Shah, Zhao, Mullainathan, & Shafir, 2018). This leads to
the neglection of other problems because cognitive capacity is limited (Shah et al., 2012;
Mani, Mullainathan, Shafir, & Zhao, 2013).
It is clear that financial scarcity has a lot of influence on a person’s daily life, but it
also influences a person as a consumer in their purchase behavior (Gbadamosi, 2009). The
purchases made are based on habit and do not involve any brand loyalty. Research has shown
that people with a low income are more aware of opportunity costs (Spiller, 2011) and
surcharges or hidden taxes (Shah et al., 2012), indicating that this might make them more
resilient against promotions whereby money is wasted. However, they are sensitive to sales
promotion such as buy-one-get-one-free, free samples, coupons and discounts. The focus lies
6
on the value for money people get when purchasing (Gbadamosi, 2009). Therefore, the scope
of this study is limited to monetary promotions.
However, the influence of monetary promotions on the intention to purchase different
product types (hedonic vs. utilitarian) under different experiences of financial scarcity, has
never been empirically tested. The purpose of this research is therefore to examine the
possible moderating effect of financial scarcity on the effect of monetary promotions of
hedonic and utilitarian products. The research question is as follows.
Does financial scarcity influence the effect of monetary promotions on the intention to
purchase hedonic versus utilitarian products?
1.2 Research relevance
The insights generated by this study are two-fold. First, it will contribute to the upcoming
topic of financial scarcity in consumer psychology. Up to now the topic of financial scarcity is
mostly discussed within the area of social and cognitive psychology whereby current
literature mostly focuses on the (negative) consequences of financial scarcity on a person’s
daily life. However, marketing scholars could also use the knowledge to understand the
behavior of consumers who feel financially constrained. Furthermore, this study will add to
the existing literature about the effectiveness of monetary promotions versus the type of
product (hedonic vs. utilitarian). Various types of products have been studied in the context of
sales promotions such as stock-up products versus nonstock-up products, high-risk-
performance products versus low-risk-performance products and hedonic versus utilitarian
products. However, an examination of the existent literature revealed that the possible
influence of financial scarcity, to our knowledge, has never been researched. This study
attempts to bridge this gap by examining the possible effect of financial scarcity on the effect
of monetary promotions of hedonic and utilitarian products on both purchase intention and
product offering attractiveness perceived by the consumer.
Second, it provides insights to marketing or product managers about the perception of
product offerings, with and without monetary promotions, by financially constrained
consumers and allows these mangers to understand the role financial scarcity plays in the
purchase behavior of these consumers. Previous research has shown that monetary
promotions are highly effective by influencing brand switching, stockpiling and brand choice
(Alvarez & Casielles, 2005; Bell, Iyer, & Padmanabhan, 2002; Gilbert & Jackaria, 2002).
Furthermore, Gbadamosi (2008) has shown that monetary promotions are also effective for
7
financially constrained consumers, however this study deepens this knowledge by extending it
to the type of product offered (hedonic versus utilitarian). This study will provide marketing
or product managers with knowledge on how the effectiveness of monetary promotions
differs with respect to product type (hedonic vs. utilitarian), and the consumer’s financial
situation. Nowadays, this type of knowledge is necessary because marketing practitioners
increasingly need to use more knowledge about the consumer’s needs and wants to get them
to consider the offerings. Applying monetary promotion results in more sales, but it is a costly
business for organizations and therefore knowledge about monetary promotions versus the
type of product is useful for deciding on what type of product it is most useful to apply
monetary promotions. This study focuses on convenience goods, however the two types of
product (hedonics vs. utilitarian) also exist in other types of consumer goods such as shopping
goods (Atkins & Kim, 2012). So, this study might be relevant to companies offering various
types of goods. The findings will help managers to plan monetary promotions accordingly to
the effective product type when targeting consumers.
1.3 Research structure
This study will start by providing the theoretical background in Chapter 2. This chapter will
further elaborate on the three main topics of this study: (monetary) promotions, hedonic and
utilitarian products, and financial scarcity. This chapter will result in formulating the
hypotheses and drawing a conceptual model. After this, an elaboration on the methodology
used during this study will be given in Chapter 3, results will be shown in Chapter 4, and
Chapter 5 includes a discussion and provides practical and managerial implications,
limitations and future research recommendations.
8
2. Theoretical background
2.1 Attractiveness of product offering and purchase intention
There are various ways to define and measure the effectiveness of sales promotions, for
example, sales, profits or even market share (Kwok & Uncles, 2005). Effectiveness is also
often measured with purchase likelihood (Homburg, Koschate, & Totzek, 2009; Kivetz &
Zheng, 2017), deal proneness (Martínez & Montaner, 2006; Reid, Thompson, Mavondo, &
Brunsø, 2015) or customer preference (Kwok & Uncles, 2005; Lowe, 2010; Roll & Pfeiffer,
2017). In this study the effectiveness of sales promotions is measured by product offering
attractiveness and purchase intention. Attractiveness measurements are widely used in the
literature, as for example, Büttner, Florack and Göritz (2015) measured promotion
attractiveness and Thang and Tan (2003) measured store attractiveness. According to Khare,
Achtani and Khattar (2014) promotions should enhance a consumer’s feeling of pleasure and
of getting a good deal to be perceived as attractive by a consumer, and store attractiveness is
measured by the consumer preference for a store (Thang & Tan, 2003). Both examples show
the attractiveness of a promotion is subjective. Product offering attractiveness is
psychologically closer to the perception of a product offering than purchase intention, which
follows the evaluation of the product offering (Howard & Sheth, 1969, p. 30). Thus, before a
behavioral intention occurs a certain attitude precedes the intention. In this study, the attitude
towards the product offering, in other words, the product offering attractiveness, precedes the
purchase intention of a consumer.
When consumers are attracted by the product, either in-store or online, the next step is
to examine what the influence of the sales promotions is on purchase intention. Purchase
intention is a person’s conscious plan to make an effort to purchase a product (Spears &
Singh, 2004). Product offering attractiveness and purchase intention are related concepts, and
therefore form the two dependent variables in this study.
2.2 Promotions: monetary vs. non-monetary promotions
In marketing there are two main categories of sales promotions: monetary and nonmonetary
(Büttner et al., 2015; Diamond & Johnson, 1990; Leclerc, 1997), but they are also known as
price and nonprice promotions. The definitions of monetary and nonmonetary promotions
vary in the literature. Many scholars use prospect theory (Kahneman & Tversky, 1979)
whereby monetary promotions are experienced as reducing losses, i.e., a 50% discount will
decrease spending, and nonmonetary promotions are experienced as gains, i.e., buy-one-get-
9
one-free results into more products and thus more gains. However, this only partly fits the
conceptualization of other researchers (Büttner et al., 2015; Sinha & Verma, 2017) whereby
monetary promotions have a direct influence on the cost–benefit relationship of a product in
two ways: by reducing the price of a product or by increasing the content of a product while
charging the same price (e.g., 50% discounts or buy-one-get-one-free). On the other hand,
nonmonetary promotions are promotions which do not have a direct influence on the cost–
benefit relationship (e.g., gifts or coupons). In this study, the definition of Büttner et al.
(2015) and Sinha and Verma (2017) is used because, for example, a buy-one-get-on-free
promotion, in the end, always results in the reduction of money spent, assuming that a
consumer spends the same amount of monetary resources every year for certain products. For
example, if a consumer buys a bottle of shampoo for two euros and gets another bottle for
free, it will reduce the money spent on shampoos in a year.
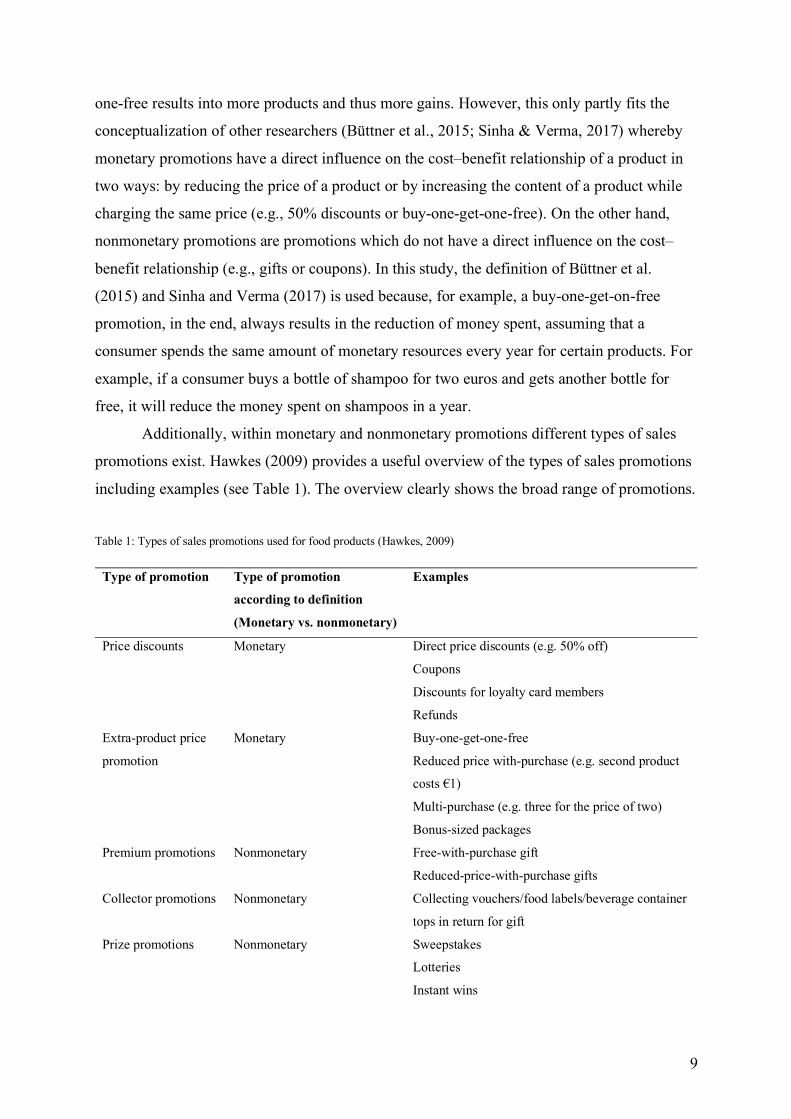
Additionally, within monetary and nonmonetary promotions different types of sales
promotions exist. Hawkes (2009) provides a useful overview of the types of sales promotions
including examples (see Table 1). The overview clearly shows the broad range of promotions.
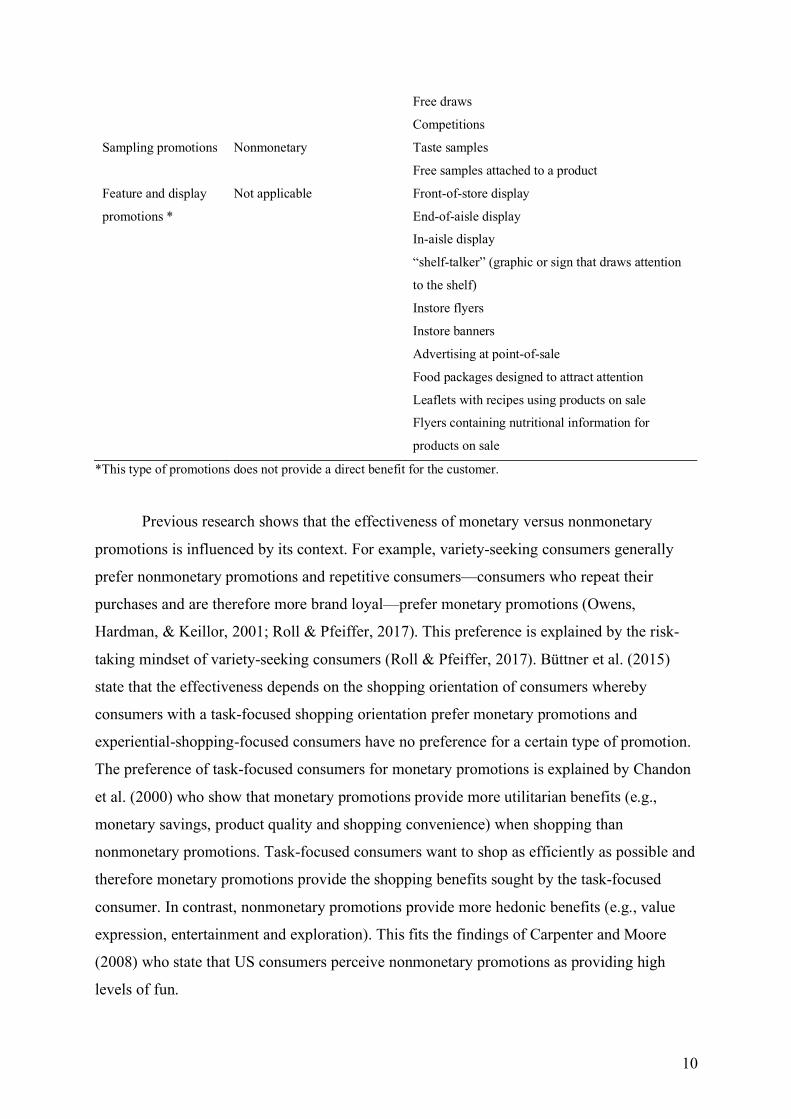
Table 1: Types of sales promotions used for food products (Hawkes, 2009)
Type of promotion Type of promotion
according to definition
(Monetary vs. nonmonetary)
Examples
Price discounts Monetary Direct price discounts (e.g. 50% off)
Coupons
Discounts for loyalty card members
Refunds
Extra-product price
promotion
Monetary Buy-one-get-one-free
Reduced price with-purchase (e.g. second product
costs €1)
Multi-purchase (e.g. three for the price of two)
Bonus-sized packages
Premium promotions Nonmonetary Free-with-purchase gift
Reduced-price-with-purchase gifts
Collector promotions Nonmonetary Collecting vouchers/food labels/beverage container
tops in return for gift
Prize promotions Nonmonetary Sweepstakes
Lotteries
Instant wins
10
Free draws
Competitions
Sampling promotions Nonmonetary Taste samples
Free samples attached to a product
Feature and display
promotions *
Not applicable Front-of-store display
End-of-aisle display
In-aisle display
“shelf-talker” (graphic or sign that draws attention
to the shelf)
Instore flyers
Instore banners
Advertising at point-of-sale
Food packages designed to attract attention
Leaflets with recipes using products on sale
Flyers containing nutritional information for
products on sale
*This type of promotions does not provide a direct benefit for the customer.
Previous research shows that the effectiveness of monetary versus nonmonetary
promotions is influenced by its context. For example, variety-seeking consumers generally
prefer nonmonetary promotions and repetitive consumers—consumers who repeat their
purchases and are therefore more brand loyal—prefer monetary promotions (Owens,
Hardman, & Keillor, 2001; Roll & Pfeiffer, 2017). This preference is explained by the risk-
taking mindset of variety-seeking consumers (Roll & Pfeiffer, 2017). Büttner et al. (2015)
state that the effectiveness depends on the shopping orientation of consumers whereby
consumers with a task-focused shopping orientation prefer monetary promotions and
experiential-shopping-focused consumers have no preference for a certain type of promotion.
The preference of task-focused consumers for monetary promotions is explained by Chandon
et al. (2000) who show that monetary promotions provide more utilitarian benefits (e.g.,
monetary savings, product quality and shopping convenience) when shopping than
nonmonetary promotions. Task-focused consumers want to shop as efficiently as possible and
therefore monetary promotions provide the shopping benefits sought by the task-focused
consumer. In contrast, nonmonetary promotions provide more hedonic benefits (e.g., value
expression, entertainment and exploration). This fits the findings of Carpenter and Moore
(2008) who state that US consumers perceive nonmonetary promotions as providing high
levels of fun.
11
Furthermore, the level of promotional benefits plays a role in the effectiveness of
promotions. A low promotional benefit has little monetary value and, in contrast, a high
promotional benefit has a lot of monetary value. Premiums (nonmonetary) are more effective
when the promotional benefit level is low, price discounts (monetary) are more effective
when the promotional benefit level is high (Palazon & Delgado-Ballester, 2009). Other
examples of factors influencing promotion effectiveness are the life-stage of the consumers,
with families being more affected by promotions than pensioners (Felgate, Fearne, DiFalco,
& Martinez, 2012), or the place of the promotional encounter, with isolated promotions being
more effective for premium brands than traditional shelf promotions in persuading consumers
to purchase. This is because isolated promotions decrease the focus on price and increase the
focus on quality (Sheehan & Van Ittersum, 2021).
Previous research has shown that monetary promotions are noticed faster by
consumers (Campbell & Diamond, 1990) and monetary promotions are more preferred by
consumers than nonmonetary promotions (Banerjee, 2009; Kwok & Uncles, 2005). The
reason consumers prefer monetary promotions to non-monetary promotions is that consumers
seem to be value conscious and want to minimize costs when purchasing (Sharma, Wali, &
Joshi, 2020). Another explanation might be that monetary promotions decrease the
consumer’s motivation to use cognitive thinking (Aydinli, Bertini, & Lambrecht, 2014). The
purchase decisions of monetary promoted products are guided by affective processing which
is easier and faster. In other words, an incentive to purchase can be a disincentive to think.
Therefore, monetary promotions are more appealing for affect-rich products (e.g., a Snickers
bar) than for more healthy products (e.g., crackers). Eventually, monetary promotions lead to
brand switching and trying out new products with discounts, and to brand switching and
stockpiling with buy-one-get-one-free (Bell et al., 2002; Gilbert & Jackaria, 2002). This
behavior aligns with Alvarez and Casielles (2005) who show that price promotions—
monetary promotions—have an influence on buying behavior and brand choice behavior.
Furthermore, monetary promotions are effective for products with low consumer brand
awareness as well as high consumer brand awareness (Alnazer, 2013).
To limit the scope, this study will focus on monetary promotions. The choice for
monetary promotions will be further elaborated on in Section 2.6.
12
2.3 Products: utilitarian vs. hedonic
One way of categorizing products is the distinction between utilitarian and hedonic products.
Utilitarian and hedonic products are categorized by the benefits provided to consumers. For
utilitarian products these are practical, instrumental and functional, whereas hedonic products
provide emotional, sensational and experiential benefits (Batra & Ahtola, 1991; Hirschman &
Holbrook, 1982; Lu et al., 2016). Within a product group, both utilitarian and hedonic
products can exist. For example, within the product group of shoes, there are shoes which are
more utilitarian and can be worn throughout the whole year such as sneakers, whereas high
heels are more hedonic because they are only worn on special occasions. Additionally, even
within a product type such as sneakers, there can be a difference between utilitarian and
hedonic sneakers (e.g. regular sneakers vs. limited edition sneakers). Although the type of
product can be classified into a product category, the type of benefits provided to the
consumer is not unique to the product (Vieira, Santini, & Araujo, 2018). A product such as
sneakers can provide both utilitarian and hedonic benefits by, for example, fulfilling a
functional need of the sneakers being waterproof and providing an emotional benefit of
feeling cool when wearing these sneakers.
Previous research shows that the type of emotional reactions emerging from
purchasing utilitarian products differ from that of hedonic products. Consuming utilitarian
products enhances customer satisfaction by arousing emotions of confidence and security,
whereas consuming hedonic products enhances customer delight by arousing emotions of
cheerfulness and excitement. Additionally, consumers pursue various goals when purchasing
the two types of categories. With utilitarian products, consumers pursue more functionality-
related goals and with hedonic products, they pursue more pleasure-related goals (Chitturi et
al., 2008).
Furthermore, consumers feel more guilt when they purchase hedonic products than
when they purchase utilitarian products; a hedonic choice asks for an internal justification (Lu
et al., 2016; Okada, 2005). Thus, with guilt comes the justification of choice. Nevertheless,
guilt and justification are interrelated concepts. A sense of guilt may be a result of making an
unjustifiable choice, but something might also be unjustifiable if there is guilt associated with
it (Okada, 2005). Because guilt is associated with a hedonic choice, consumers prefer to
purchase hedonic products more for others than for themselves (Lu et al., 2016). However,
Botti and Mcgill (2011) state that a self-made choice is more satisfying than the choice made
by someone else when it concerns a hedonic choice, but not when it is utilitarian. The two
types of reasoning seem to contradict each other. By purchasing hedonic products for others,
13
consumers limit their sense of guilt. However, if others purchase hedonic products for them it
is less satisfying than if consumers purchase hedonic products themselves. An explanation for
this contradiction might be the type of hedonic choices used in the study of Botti and Mcgill
(2011), which were visiting a museum and exercising, which might be considered as
utilitarian by some. Okada (2005) argues that a hedonic choice might be more appealing, but
a utilitarian choice is easier to justify.
Eventually, it is the consumer who makes the choice between the two options and
although the process of decision-making is not the focal topic of this study, it useful to
address the two types of processing because it will help understand the differences between
purchasing utilitarian versus hedonic products. Melnyk, Klein, and Völckner (2012) state that
consumers use different processing strategies when choosing between utilitarian and hedonic
products. With utilitarian products, consumers generally use an attributed-based cognitive
elaboration strategy, and with hedonic products consumers use a holistic-based processing
strategy. The differences in decision making among consumers also has to do with the
cognitive capability of the consumer. If the processing capability of a consumer is low,
immediately evoked affective reactions have a greater impact on choice, and therefore, the
consumer is more likely to choose the option that scores highest on the affective dimension.
In contrast, if the processing capability of a consumer is high, consumers base their decisions
on cognitions, which leads to choosing the option that scores highest on the cognitive
dimension (Shiv & Fedorikhin, 1999). Furthermore, the presentation of the choices also plays
a role in the decision-making process of consumers. Between two comparable options, for
example, two headphones one of which is hedonic and one is utilitarian, consumers tend to
choose the utilitarian option over the hedonic option when the two options are displayed
together. However, when the two options are displayed individually and separated, consumers
tend to choose the hedonic option (Okada, 2005).
In short, hedonic and utilitarian products provide different benefits and cause different
emotional reactions. Relatively much information-based cognitive processing is used with
utilitarian products whereas more emotion-based affective processing is used with hedonic
products. In this study, the most dominant benefit a product provides is considered decisive to
categorize it in the hedonic or utilitarian product category (e.g., for toothpaste, this is cleaning
teeth, and thus utilitarian).
14
2.4 Linking promotions to products
Prior research about the effect of promotions on the purchase decision concerning hedonic
versus utilitarian products is limited and contradictory. Chandon et al. (2000) state that
promotions are more effective when they provide benefits that are corresponding with the
benefits provided by the promoted product. Thus, monetary promotions are more effective for
utilitarian products (vs. hedonic products) and non-monetary promotions are more effective
for hedonic products (vs. utilitarian products). However, this reasoning contradicts Montaner,
De Chernatony and Bui (2011) who state that product type does not influence the
effectiveness of gift promotions (nonmonetary) and Kwok and Uncles (2005) who show that
monetary promotions are applicable for both types of products. Kwok and Uncles (2005)
argue that the congruency effect between the type of promotion and the type of product is
influenced by various factors. For example, nonmonetary promotions might be effective for
utilitarian products because they provide the hedonic benefit which the product itself is
missing. This aligns with Gill (2008) and Klein and Melnyk (2016) who state that utilitarian
products can benefit from hedonic arguments because it enhances information processing
followed by a positive effect on purchase intentions. Those hedonic benefits, such as
exploration, entertainment, value expression and the enjoyment of gambling, can be provided
by nonmonetary promotions (Reid et al., 2015). For hedonic products, the mismatch of
arguments had no effect on promotion effectiveness.
As mentioned in Section 2.3 consumers feel more guilt when they purchase hedonic
products and with guilt comes the justification of choice. Kivetz and Simson (2002) state that
with nonmonetary promotions, as part of a loyalty program, hedonic products are more
preferred as a gift, but this preference decreases when monetary costs are increased. For
example, if a (luxury brand) lipstick or aftershave was offered for free in a loyalty program
with a certain amount of points saved, consumers would prefer it to a utilitarian product (e.g.,
toothpaste). However, if an additional ten euros was asked for the lipstick or aftershave, the
preference for the hedonic type of gift would decrease. Without monetary costs, the
preference for hedonic products elicits an acceptable amount of guilt. This emphasizes the
guilt paired with the purchase of hedonic products.
Kwok and Uncles (2005) argue that a way to decrease the sense of guilt associated
with hedonic choices, is through monetary promotions. This aligns with the study of Kivetz
and Zhen (2017) who state that both types of promotions have a larger effect on hedonic
products than utilitarian products. This effect decreases when the justification for the hedonic
purchase was established beforehand, the purchase quantity increased, or the decision for the
15
hedonic product was made by somebody else. The positive effect of promotions on hedonic
purchases also decreased when the purchase was intended as a gift for others which aligns
with the previously mentioned notion of Lu et al. (2016); consumers prefer to purchase
hedonic products more for others than for themselves. Moreover, within monetary
promotions, direct price discounts, compared to quantity promotions (extra-product-price
promotions), are very effective in justifying and purchasing hedonic products. With a direct
price discount, consumers only have to purchase one product, but with an extra-product-price
promotion, consumers have to purchase multiple products. The sense of guilt consumers
experience seems acceptable when one product is purchased but may increase when multiple
products are purchased. Therefore, justifying one hedonic product seems achievable, but
multiple hedonic products seem unconceivable (Kivetz & Zhen, 2017).
In short, more recent studies show that there is no congruency effect between the type
of promotions and the type of product. With the purchase of hedonic products comes guilt and
to reduce this sense of guilt monetary promotions seems highly effective. This leads to the
first hypothesis:
H1a = Consumers perceive a hedonic product offering with a monetary promotion as
more attractive than a utilitarian product offering with a monetary promotion
H1b = Monetary promotions have a more positive influence on the consumer’s
purchase intention for hedonic products than for utilitarian products
2.5 Financial scarcity
Mullainathan and Shafir (2013) define financial scarcity as a mindset in which people
perceive that their income is too low to cover daily expenses. Financial scarcity implies
having insufficient monetary resources from the person’s own perspective. Financial scarcity
differs from having a low income which is a threshold set by the researcher (Sommet,
Morselli & Spini, 2018). This indicates that financial scarcity is more a subjective assessment
than objective.
Van Dijk, Van der Werf and Van Dillen (submitted for publication) conceptualize
financial scarcity as “the subjective experience in which pressing financial concerns exceed
available resources and bring about responses that may endanger well-being” (p.4). In other
words, every individual experiences financial scarcity differently. This conceptualization
aligns with Cook and Sadeghein (2018) who state that financial scarcity is multidimensional
16
and does not only imply the absence of necessary financial resources. To assess this
subjective state of financial scarcity Van Dijk et al. (submitted for publication) developed the
Psychological Inventory of Financial Scarcity (PIFS). The PIFS captures the two topics of
having insufficient monetary resources and lacking control over a person’s own financial state
by the inclusion of two assessments: “The (potential) harmfulness of the situation and the
perceived ability to adequately deal with the (potential) harmful situation” (Van Dijk et al.,
submitted for publication, p. 4). Additionally, the PIFS assesses cognitive, affective and
behavioral responses towards financial scarcity. The behavioral response focuses on a short-
term orientation and the cognitive and affective responses focus on financial rumination and
financial worry. De Bruijn and Antonides (2020) define financial rumination as “repetitive,
passive, and pessimistic thinking about the possible causes and consequences of one’s
financial concerns” and they define financial worry as “repeated and negative thinking about
the uncertainty of one’s (future) financial situation” (p.1).
Previous studies show that financial scarcity has various consequences for a person’s
daily life. For example, it has a negative effect on a person’s social life. Although people’s
primary needs are fulfilled with, for example, clothing and food, monetary issues may lead to
declining social relationships or political participation. Thus, financial scarcity may result in
social exclusion (Mood & Jonsson, 2016). Furthermore, financial scarcity negatively
influences a person’s mental well-being by creating feelings of unhappiness, shame, anger
and frustration when not being able to keep up with other people in society (Ali et al., 2018;
Sommet et al., 2018). In addition, financial scarcity may lead to more health problems by, for
example, fewer preventive screenings for cancer (Katz & Hofer, 1994) and a higher
prevalence of obesity (Zukiewicz-Sobczak et al., 2014). Moreover, financial scarcity can
negatively affect a person’s financial state even more. (Financial) scarcity creates a tendency
to borrow because people are too focused on their scarcity which results in insufficient
attention given to the consequences of borrowing (Cook & Sadeghein, 2018; Shah et al.,
2012; Mani et al., 2013). Thus, because monetary problems are pressing, financial scarcity
often goes hand in hand with increased chances of borrowing money and also overborrowing.
An explanation of these negative consequences of financial scarcity might be that it
affects people’s cognitive functions. Shah et al. (2012) and Mani et al. (2013) argue that
(financial) scarcity creates cognitive load because people are more focused on problems
where (financial) scarcity is prominent. Because of insufficient monetary resources, each
expense is experienced as pressing. The monetary problems associated with, for example,
buying groceries or paying rent, receive one’s attention and the focus is on solving those
17
problems. This results in the neglect of other problems such as health problems or the
consequences of borrowing money. Thus, financial scarcity influences people’s problem-
solving capabilities. Furthermore, financial scarcity influences people’s decision-making
process (Shah et al., 2012; Shah, Shafir, & Mullainathan, 2015). First, people experiencing
scarcity experience the decision-making process as more tiring because they are deeper
engaged in the process (Shah et al., 2012). Second, when valuing a price or a product, people
are influenced by contextual cues. However, people who experience financial scarcity think
more in trade-offs and are therefore less prone to contextual cues. They do not look to
external factors (e.g., sales location of a product) but instead create their own comparison
standards which are more consistent guides for valuation (Shah et al., 2015).
Shah et al. (2018) have begun to further examine the thoughts and concerns people
facing financial scarcity have, more precisely they focus on the triggers of these monetary
thoughts and concerns. They state that thoughts about money are easily triggered in the mind
of poor people. These thoughts about money are not context dependent; even when money is
not mentioned, they come spontaneously. As an example, Shah et al. (2018) state that visiting
the doctor for serious health problems not only triggers thoughts about the health of a person,
but also about the costs coming with this visit. Once these monetary thoughts are triggered,
they stay persistent in the mind and are hard to suppress. Also, these monetary thoughts and
concerns change the word associations poor people have formed in their mind about concepts.
In other words, financial scarcity forms the connection between things in the mind of poor
people.
In short, financial scarcity is a subjective state which has (negative) consequences on a
person’s daily life and cognitive function by creating cognitive load. This cognitive load
influences the problem-solving and decision-making capabilities of people who experience
financial scarcity.
2.6 Linking promotions to financial scarcity
Reid et al. (2015) state that consumers who feel financially constrained tend to buy products
with in-store monetary and non-monetary promotions. This indicates that promotions play a
large role in the purchase behavior of the poor. However, according to Martínez and
Montaner (2006) people who feel financially constrained are not more prone to promotions
than people who do not experience financial constraints. This makes sense because according
to Martínez and Montaner (2006) deal proneness is defined as “the tendency to use
promotional information as a reference to make purchase decisions” (p.158). As discussed in
18
Section 2.4, people experiencing financial scarcity are less influenced by external factors and
create their own comparison standards when making a purchase decision (Shah et al., 2015).
Additionally, other studies show that promotions do play a role in the purchase decisions of
the poor. In the previous mentioned study of Büttner et al. (2015), the effect of shopping
orientation on the effectiveness of the promotion is moderated by the budget of a consumer.
When the budget is high, experiential-oriented consumers are more likely to choose
nonmonetary promotions (vs. monetary promotions) than task-focused-oriented consumer. In
contrast, when the budget is low, experiential-oriented and task-focused-oriented consumers
both favored monetary promotions more than non-monetary promotions. This is in line with
Sharma et al. (2020) who state that the preference for monetary promotions increases when
the budget is low. Consumers who were more prone towards non-monetary promotions are
becoming increasingly prone to monetary promotions under the condition of a low budget.
Khare et al. (2014) states that consumers with a high income are less attracted by discounts
than consumers with a low and middle income. Thus, when people are financially
constrained, they prefer monetary promotions such as discounts because consumers with a
low and middle income are more concerned with getting the best value for their money. This
complies with Gbadamosi (2008) who argues that low-income (female) consumers are highly
motivated by value for money in their purchases of low-involvement products and therefore
are highly attracted to sales promotions whereby buy-one-get-one-free (monetary) is the
preferred sales promotion, although it is depending on the type of product. The preference
seems more related to long-shelf-life products than short-shelf-life products, or in other
words, stock-up and nonstock-up products.
People experiencing financial scarcity more often and sooner see the monetary aspect
in daily life situations (Shah et al., 2018). This fact might explain why people facing financial
scarcity are more resilient against promotions whereby money is wasted (Shah et al., 2012;
Spiller, 2011), but are sensitive to monetary promotions (Gbadamosi, 2009; Khare et al.,
2014).
In short, previous research has shown that a low budget or low income plays a
moderating role on the effectiveness of the monetary versus nonmonetary promotion whereby
consumers prefer monetary promotions because they want to achieve the greatest value for
their money. Therefore, based on the will of achieving greatest value and based on the finding
that money is often in the mind of people facing financial scarcity, the focus of this study is
on monetary promotions.
19
2.7 Linking type of products to financial scarcity
Financially constrained consumers often rationalize their purchases and their consumption
patterns due to their limited monetary resources (Gbadamosi, 2008; Walker, Dobson,
Middleton, Beardsworth, & Keil, 1995). Each expense is therefore experienced as important,
they cannot afford to make careless decisions when money is involved, and according to Shah
et al. (2018) money is often involved in the thoughts and decisions of the poor. Furthermore,
Okada (2005) argues that financial constraint increases the need for the justification of
choices. This implies a linear relationship between financial scarcity and the need for
justification in making purchase decisions. Because people experiencing financial scarcity
need to justify their choices more, they are more prone towards purchasing utilitarian products
because this limits guilt which comes with purchasing hedonic products. This leads to the
following hypothesis.
H2 = The more consumers’ experience financial scarcity, they more they tend towards
purchasing utilitarian products than hedonic products
Consumers with a task-focused shopping orientation prefer monetary promotions
which provide more utilitarian benefits (Büttner et al., 2015; Chandon et al., 2000). One of
those benefits is to save money which is highly important for financially constrained
consumers since monetary resources are scarce. When purchasing, people experiencing
financial scarcity want to get the best value for their money (Gbadamosi, 2008; Khare et al.,
2014). Monetary resources are therefore highly effective for financially constrained
consumers. However, for which type of product this effect is stronger among financially
constrained consumers is yet unknown. As mentioned before, the budget of financially
constrained consumers is limited, and therefore, Okada (2005) argues that people
experiencing financial scarcity need to justify their choices more, and are more prone to
purchasing utilitarian products. Therefore, the following hypotheses is formulated.
H3a = The more consumers experience financial scarcity, the more they perceive a
utilitarian product offering with a monetary promotion as attractive
H3b = Monetary promotions have a more positive influence on the purchase intention
of utilitarian products the more consumers experience financial scarcity
20
Thus, when purchasing hedonic products, the need for internal justification increases,
and with this the amount of guilt. However, monetary promotions may decrease the sense of
guilt when purchasing hedonic products (Kivetz & Zhen, 2017; Kwok & Uncles, 2005).
Moreover, Shiv and Fedorikhin (1999) and Melnyk et al. (2012) show that consumers use
information-based cognitive processing with utilitarian products versus emotional-based
affective processing with hedonic products. Information-based cognitive processing demands
a high process capability, whereas emotion-based affective processing demands a low process
capability. Additionally, monetary promotions decrease the consumer’s motivation to use
cognitive thinking (Aydinli et al., 2014). The purchase decisions of monetary promoted
products are guided by affective processing which is easier and faster. This is especially true
for people experiencing financial scarcity, which limits a person’s cognitive process
capability by creating cognitive load (Shah et al., 2012). This implies that people facing with
financial scarcity would be more prone towards purchasing monetary promoted hedonic
products. This leads to the following hypotheses.
H4a = The more consumers’ experience financial scarcity, the more they perceive a
hedonic product offering with a monetary promotion as attractive
H4b = Monetary promotions have a more positive influence on the purchase intention
of hedonic products the more consumers experience financial scarcity
21
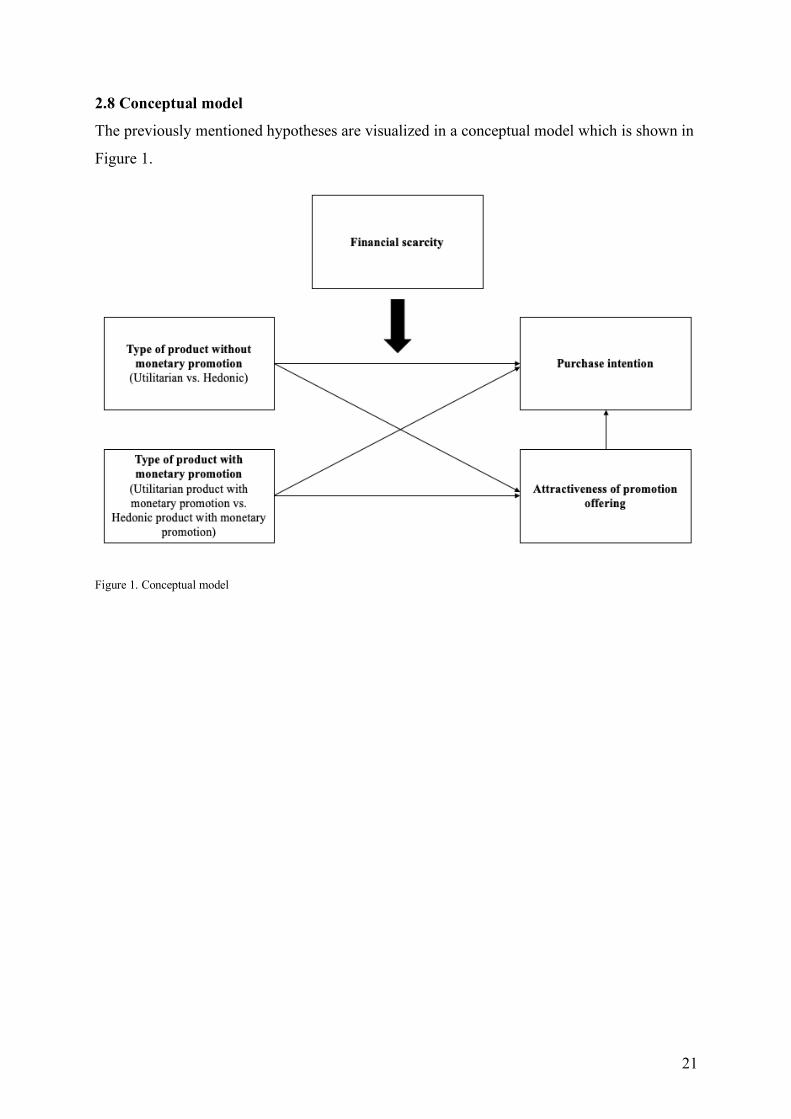
2.8 Conceptual model
The previously mentioned hypotheses are visualized in a conceptual model which is shown in
Figure 1.
Figure 1. Conceptual model
22
3. Methodology
This chapter outlines the research design and methodology based on the hypotheses and
conceptual model in Chapter 2.
3.1 Research design
This study aims to examine the possible influence of financial scarcity on the effect of
monetary promotions of hedonic and utilitarian products on product offering attractiveness
and purchase intention. To be able to answer the research question, a quantitative survey
experiment was used with four conditions. This type of research design made it possible to
test the previously derived hypotheses. The independent variables were manipulated by an ad
stimulus and the effect on the dependent variables was measured by product offering
attractiveness and purchase intention. The covariate of financial scarcity was measured after
exposure to the ad stimulus.
For this study, a 2×2 between-subjects design (monetary promotion vs. no promotion
× utilitarian product versus hedonic product) was used to study product offering attractiveness
and purchase intention of consumers under different experiences of financial scarcity,
included as a covariate. The between-subjects design with this study required four conditions
and the participants were randomly assigned to a certain condition within Qualtrics, the online
experimental setting of this study, so that comparisons could be made between the results of
all groups. A between-subjects was chosen because with this design each person is exposed to
only one condition and thus only needed to participate in the experiment once. This increases
people’s willingness to participate since it decreases participation time. Also, since the
experiment was conducted online, there was an increased change that participants will drop
out during the survey. By using a between-subjects design, participants only had to participate
once, instead of multiple times, which increased the attractiveness to finish the survey
experiment.
3.2 Ad stimuli
The same advertisement was used for all four conditions. However, two groups were a
treatment group and they received the advertisement with a monetary promotion which was
the same promotion for both treatment groups. This promotion was classified as an out-of-
store promotion. This choice was validated by Gbadamosi (2008) who states that low-income
consumers compare promotions from different stores. An assumption was made that the
23
comparisons are done before the actual shopping. Furthermore, the choice for out-store
promotions was easily made since it is difficult to simulate an in-store promotion through an
online experiment.
The advertisements contained an image of a product and were highly similar to real-
life advertisements. The advertisements with a monetary promotion had the same product
image but were displayed with a promotion. The type of monetary promotion chosen was
buy-one-get-one-for-free. This choice was made because Gbadamosi (2008) argues that low-
income consumers are highly attracted by buy-one-get-one-free promotions. Buy-one-get-
one-for free is an extra-product price promotion and requires a certain purchase amount of
two products to make use of the promotion. Although storage space might be limited within a
household, a buy-one-get-one-for-free promotion provided the best chance to be able to
measure the effect of monetary promotions of hedonic and utilitarian products under different
experiences of financial scarcity.
Based on prior research, products with a long shelf-life were chosen, because this
increased the opportunity for stockpiling, for small and large households, and thus the
effectiveness of monetary promotions such as buy-one-get-one-for-free (Bell et al., 2002;
Gbadamosi, 2008; Gilbert & Jackaria, 2002). Elaborating on Gbadamosi (2008), the choice
was made for low-involvement products which led to the choice of food products. Due to the
large role monetary resources play in this study, in real life low-priced products were chosen,
all falling within the same price range. The products were pretested to see if they were
perceived as intended. The products chosen in the advertisement did not include any brand
name. However, since consumers might already be familiar with the packaging, products of
the same brand were chosen. More specifically, the products chosen were from a private label
of a particular supermarket. According to Gbadamosi (2008) private label brands are also
often purchased by consumers with a low income. Examples of the advertisements, with and
without promotion, are shown in Appendix A.
3.3 Pre-test
To validate the choice of products, a pre-test was conducted to see if the products assigned to
the hedonic and utilitarian categories were actually perceived as those categories. This was
tested by the hedonic/utilitarian (HED/UT) scale of Voss, Spangenberg and Grohmann (2003)
which is a multi-item measurement. The HED/UT scale consists of five items which refer to a
hedonic dimension (not fun/fun, dull/exciting, not delightful/delightful, not thrilling/thrilling,
not enjoyable/enjoyable), and five items which refer to utilitarian dimensions
24
(ineffective/effective, unhelpful/helpful, not functional/functional, unnecessary/necessary,
impractical/practical). Beforehand, ten participants were selected to fill out a survey in
Qualtrics consisting those ten items for six different products (three hedonic and three
utilitarian). The mean was calculated for every product and afterwards there was chosen for a
bag of crisps as a hedonic product, and a pack of rice as utilitarian product. An overview of
the pre-test results can be found in Appendix B. Furthermore, before the start of the
experiment, the experiment was tested among a select group of people to detect possible flaws
and to eliminate errors.
3.4 Sample
For this study, a survey experiment was conducted within Qualtrics. After conducting a power
analysis with the software G*Power, with an expected effect of .0625 and a power of .95,
which both met the thresholds for a medium effect and a recommended statistical power
(Hair, Black, Babin, & Anderson, 2019), a sample size of 151 was recommended.
First, participants were recruited through door-to-door flyers with a link to the survey
experiment. This was done in four (small) cities in three different regions within the
Netherlands: Nijmegen (Gelderland), Eindhoven (Noord-Brabant), Wijk bij Duurstede
(Utrecht) and Gemert (Noord-Brabant). A choice was made to explicitly choose
neighborhoods with primarily social rental housing. Second, an announcement was made in
the local newspaper of Gelderland. Third, flyers were distributed via a local volunteer
organization. Last, an announcement was made in various swap and giveaway groups on
Facebook. An incentive, in the form of a €15 gift card of own choice, was provided to
increase the probability that people would participate.
According to Harmonn and Hill (2003), the traditional division of role within
household is fading away, and therefore, both men and women could participate. However,
the participants were required to be 18 years or older, and because the study focuses on
product offering attractiveness and purchase intention of food products, the participants
needed to be the decider and buyer when doing grocery shopping for their own consumption.
A decider is the person who determines which products will be purchased, and a buyer is the
one who actually purchases the product (Hoyer, Macinnis, & Pieters, 2018, p. 351). Since
most of the recruitment of participants was done without personal contact, there was no
guarantee that the sample would only consist of Dutch citizens. However, the survey was only
provided in Dutch, so that the sample would mostly consistent of Dutch citizens to limit
possible effects of cultural influences.
25
3.5 Survey design and measurement scales
The survey consisted out of three sections. First, an introduction was given where was made
clear that the respondents were participating in a study. Second, the respondents had to
answer the control questions to check if they were eligible for the study. Third, the various
dependent variables, followed by the covariate were measured through various items which
are discussed below. Fourth, the respondent’s information was asked (gender, age, residence,
education, household composition and channel survey). The last section includes a closing
word and respondents could enter their email address if they wanted to win the gift card or to
be kept informed about the research results. The following section outlines the measurement
scales used during this study. The survey design and measurement scales are shown in more
detail in Appendix C.
3.5.1 Dependent variables
The effect of monetary promotions of hedonic and utilitarian products was measured through
attractiveness of product offering and purchase intention.
Attractiveness of product offering
Participants rated product offering attractiveness and this was measured by two 7-point scales
(“I like this product offering a lot” and “I’m interested in this product offering”). These scales
are based on prior research (Büttner et al., 2015; Chandon et al., 2000; Shoham, Moldovan, &
Steinhart, 2018).
Purchase intention
Purchase intention was measured by using three 7-point Likert scale whereby participants
indicated how likely they are to make a purchase. Based on Dodds, Monroe and Grewal
(1991) the scales varied from “The likelihood of me purchasing this product is”, “The
probability that I would consider this product is” and “My willingness to buy the product is”.
All varying from 1-very low to 7-very high. Similar measurement scales have been previously
used in research about purchase intention (Bian & Forsythe, 2012; Wu, Lu, Wu, & Fu, 2012)
3.5.2 Covariate
During this study, the effect of monetary promotions on utilitarian and hedonic products was
examined under different experiences of financial scarcity. Therefore, financial scarcity was
26
treated as a covariate. Since financial scarcity is a subjective experience, it needed to be
measured accordingly. Therefore, in this study financial scarcity was measured with the
recently developed Psychological Inventory of Financial Scarcity (PIFS) scale of Van Dijk et
al. (submitted for publication) which consists of twelve statements measured by a 7-item
Likert scale. The PIFS measures a person’s financial situation, assessment of insufficient
resources and lack of control, and the rumination, worry and short-term focus of a person.
3.6 Data analysis procedure
The purpose of this study is to examine the effect of the independent variable on the
dependent variables under different experiences of financial scarcity. The independent
variables were treated as nominal variables, the dependent variables as metric variables and
the covariate was a metric variable. Therefore, the data analysis procedure for this study was
ANCOVA performed in SPSS. ANCOVA provided the opportunity to examine the main
effects and the interaction effect of product type, promotion and financial scarcity. Before
ANCOVA, the data was cleaned with the procedure provided by Hair et al. (2019) whereby
respondents below the age threshold of 18 years and incomplete survey responses were
eliminated. Furthermore, a factor analysis was conducted to ensure that all items used to
measuring product offering attractiveness, purchase intention and financial scarcity loaded on
the corresponding factor. After this, the procedure of ANCOVA started with checking the
assumptions, and afterwards the hypotheses were tested through ANCOVA and some
additional analyses were performed.
3.7 Research ethics
Participating in the experiment was completely voluntary and they were treated fair and with
respect. Before a participant started with the experiment, he or she was informed about his or
her participation in the experiment and the type of experiment involved. Participants were
asked for permission to use their data for research purposes only. Furthermore, they were
informed that the experiment was conducted anonymously and that the data would be treated
with high confidentiality to protect the participant’s privacy. The data collected was treated
anonymously. Lastly, there was a note explaining that participants could stop the experiment
at any given time without any explanation.
27
4. Results
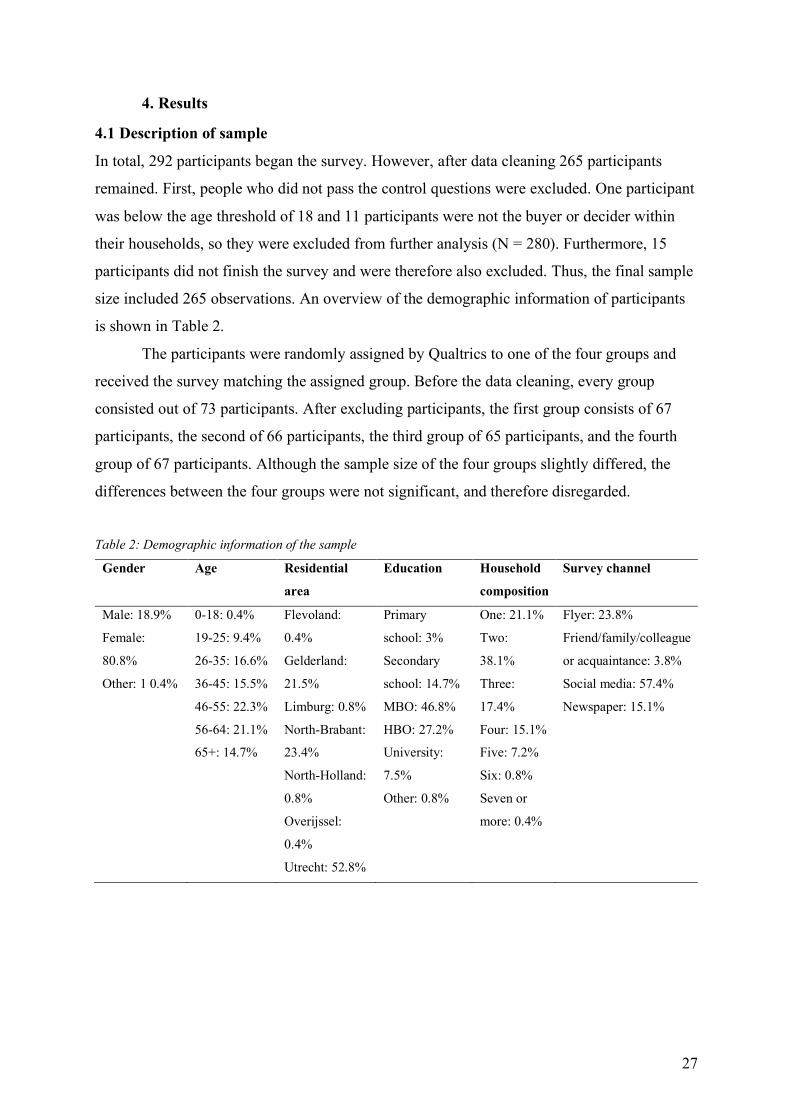
4.1 Description of sample
In total, 292 participants began the survey. However, after data cleaning 265 participants
remained. First, people who did not pass the control questions were excluded. One participant
was below the age threshold of 18 and 11 participants were not the buyer or decider within
their households, so they were excluded from further analysis (N = 280). Furthermore, 15
participants did not finish the survey and were therefore also excluded. Thus, the final sample
size included 265 observations. An overview of the demographic information of participants
is shown in Table 2.
The participants were randomly assigned by Qualtrics to one of the four groups and
received the survey matching the assigned group. Before the data cleaning, every group
consisted out of 73 participants. After excluding participants, the first group consists of 67
participants, the second of 66 participants, the third group of 65 participants, and the fourth
group of 67 participants. Although the sample size of the four groups slightly differed, the
differences between the four groups were not significant, and therefore disregarded.
Table 2: Demographic information of the sample
Gender Age Residential
area
Education Household
composition
Survey channel
Male: 18.9%
Female:
80.8%
Other: 1 0.4%
0-18: 0.4%
19-25: 9.4%
26-35: 16.6%
36-45: 15.5%
46-55: 22.3%
56-64: 21.1%
65+: 14.7%
Flevoland:
0.4%
Gelderland:
21.5%
Limburg: 0.8%
North-Brabant:
23.4%
North-Holland:
0.8%
Overijssel:
0.4%
Utrecht: 52.8%
Primary
school: 3%
Secondary
school: 14.7%
MBO: 46.8%
HBO: 27.2%
University:
7.5%
Other: 0.8%
One: 21.1%
Two:
38.1%
Three:
17.4%
Four: 15.1%
Five: 7.2%
Six: 0.8%
Seven or
more: 0.4%
Flyer: 23.8%
Friend/family/colleague
or acquaintance: 3.8%
Social media: 57.4%
Newspaper: 15.1%
28
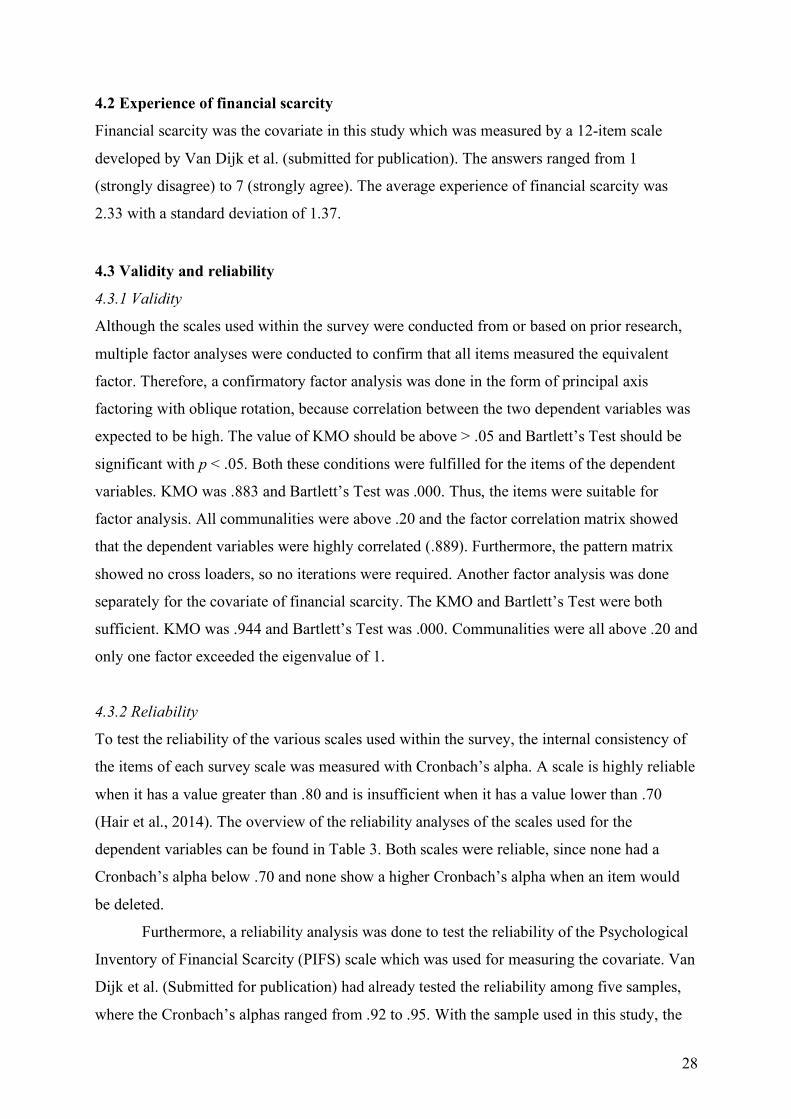
4.2 Experience of financial scarcity
Financial scarcity was the covariate in this study which was measured by a 12-item scale
developed by Van Dijk et al. (submitted for publication). The answers ranged from 1
(strongly disagree) to 7 (strongly agree). The average experience of financial scarcity was
2.33 with a standard deviation of 1.37.
4.3 Validity and reliability
4.3.1 Validity
Although the scales used within the survey were conducted from or based on prior research,
multiple factor analyses were conducted to confirm that all items measured the equivalent
factor. Therefore, a confirmatory factor analysis was done in the form of principal axis
factoring with oblique rotation, because correlation between the two dependent variables was
expected to be high. The value of KMO should be above > .05 and Bartlett’s Test should be
significant with p < .05. Both these conditions were fulfilled for the items of the dependent
variables. KMO was .883 and Bartlett’s Test was .000. Thus, the items were suitable for
factor analysis. All communalities were above .20 and the factor correlation matrix showed
that the dependent variables were highly correlated (.889). Furthermore, the pattern matrix
showed no cross loaders, so no iterations were required. Another factor analysis was done
separately for the covariate of financial scarcity. The KMO and Bartlett’s Test were both
sufficient. KMO was .944 and Bartlett’s Test was .000. Communalities were all above .20 and
only one factor exceeded the eigenvalue of 1.
4.3.2 Reliability
To test the reliability of the various scales used within the survey, the internal consistency of
the items of each survey scale was measured with Cronbach’s alpha. A scale is highly reliable
when it has a value greater than .80 and is insufficient when it has a value lower than .70
(Hair et al., 2014). The overview of the reliability analyses of the scales used for the
dependent variables can be found in Table 3. Both scales were reliable, since none had a
Cronbach’s alpha below .70 and none show a higher Cronbach’s alpha when an item would
be deleted.
Furthermore, a reliability analysis was done to test the reliability of the Psychological
Inventory of Financial Scarcity (PIFS) scale which was used for measuring the covariate. Van
Dijk et al. (Submitted for publication) had already tested the reliability among five samples,
where the Cronbach’s alphas ranged from .92 to .95. With the sample used in this study, the
29
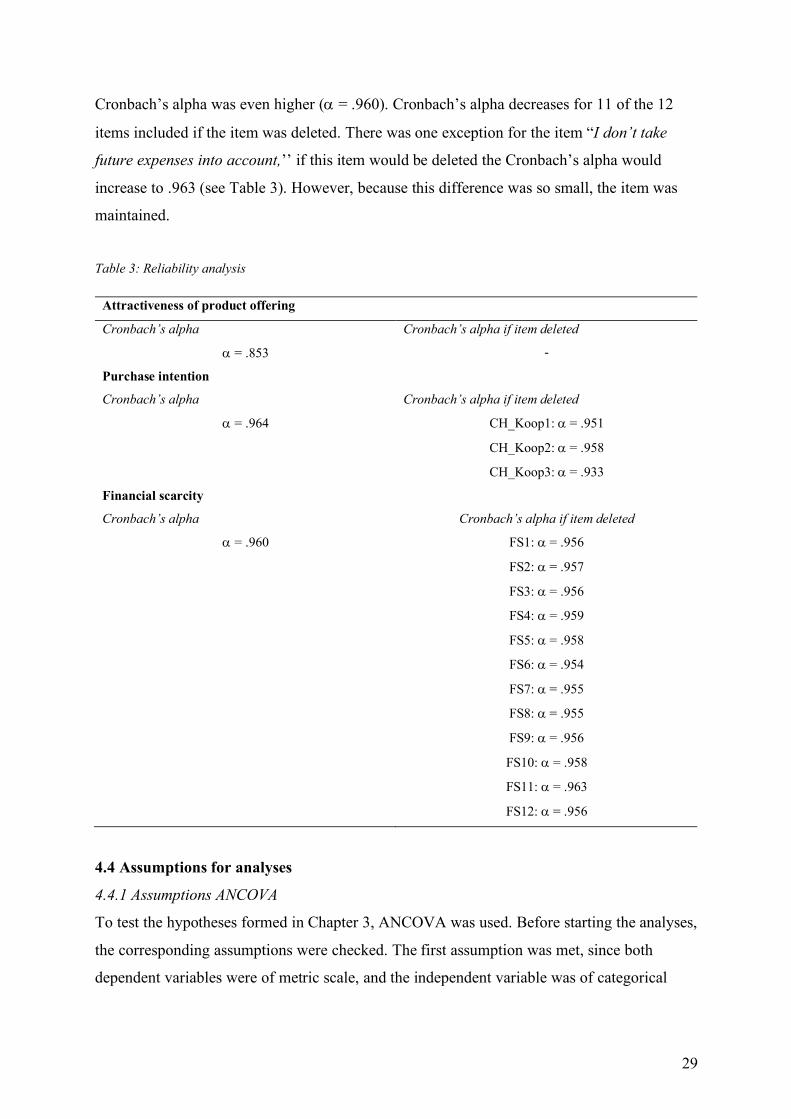
Cronbach’s alpha was even higher (a = .960). Cronbach’s alpha decreases for 11 of the 12
items included if the item was deleted. There was one exception for the item “I don’t take
future expenses into account,’’ if this item would be deleted the Cronbach’s alpha would
increase to .963 (see Table 3). However, because this difference was so small, the item was
maintained.
Table 3: Reliability analysis
Attractiveness of product offering
Cronbach’s alpha Cronbach’s alpha if item deleted
a = .853 -
Purchase intention
Cronbach’s alpha Cronbach’s alpha if item deleted
a = .964 CH_Koop1: a = .951
CH_Koop2: a = .958
CH_Koop3: a = .933
Financial scarcity
Cronbach’s alpha Cronbach’s alpha if item deleted
a = .960 FS1: a = .956
FS2: a = .957
FS3: a = .956
FS4: a = .959
FS5: a = .958
FS6: a = .954
FS7: a = .955
FS8: a = .955
FS9: a = .956
FS10: a = .958
FS11: a = .963
FS12: a = .956
4.4 Assumptions for analyses
4.4.1 Assumptions ANCOVA
To test the hypotheses formed in Chapter 3, ANCOVA was used. Before starting the analyses,
the corresponding assumptions were checked. The first assumption was met, since both
dependent variables were of metric scale, and the independent variable was of categorical
30
level. Furthermore, the experimental units should be independent and randomly distributed
over conditions, which was the case in this study.
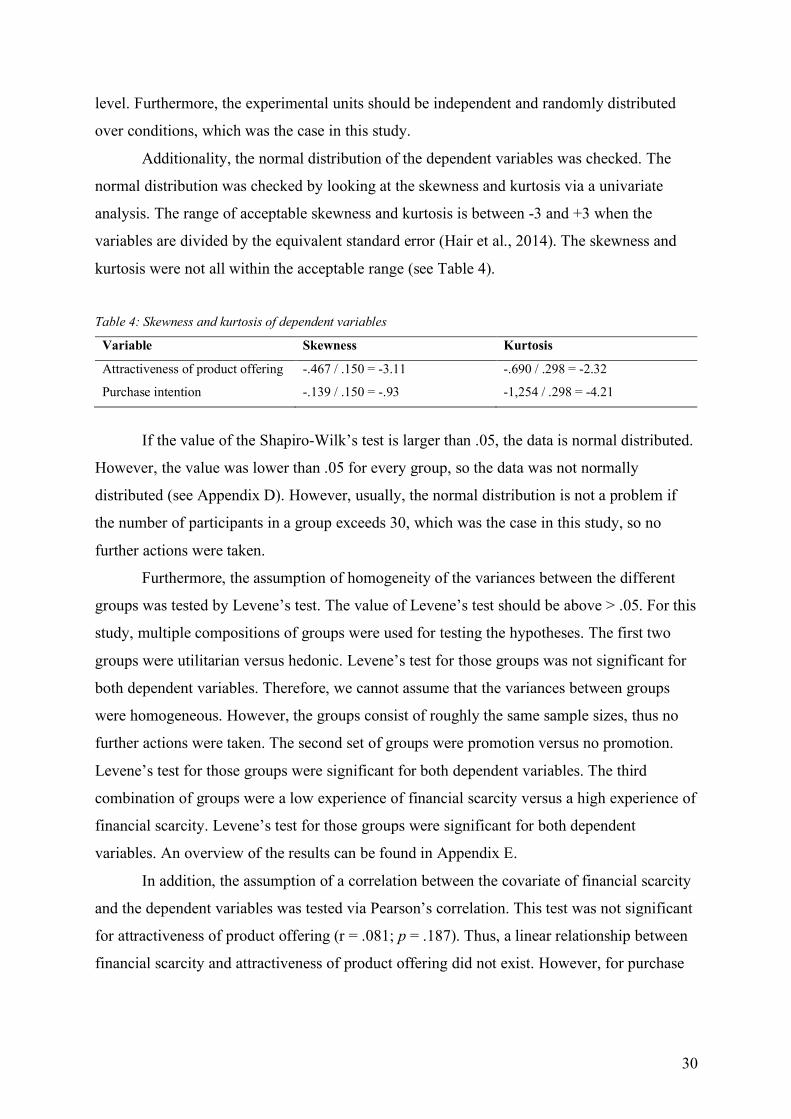
Additionality, the normal distribution of the dependent variables was checked. The
normal distribution was checked by looking at the skewness and kurtosis via a univariate
analysis. The range of acceptable skewness and kurtosis is between -3 and +3 when the
variables are divided by the equivalent standard error (Hair et al., 2014). The skewness and
kurtosis were not all within the acceptable range (see Table 4).
Table 4: Skewness and kurtosis of dependent variables
Variable Skewness Kurtosis
Attractiveness of product offering -.467 / .150 = -3.11 -.690 / .298 = -2.32
Purchase intention -.139 / .150 = -.93 -1,254 / .298 = -4.21
If the value of the Shapiro-Wilk’s test is larger than .05, the data is normal distributed.
However, the value was lower than .05 for every group, so the data was not normally
distributed (see Appendix D). However, usually, the normal distribution is not a problem if
the number of participants in a group exceeds 30, which was the case in this study, so no
further actions were taken.
Furthermore, the assumption of homogeneity of the variances between the different
groups was tested by Levene’s test. The value of Levene’s test should be above > .05. For this
study, multiple compositions of groups were used for testing the hypotheses. The first two
groups were utilitarian versus hedonic. Levene’s test for those groups was not significant for
both dependent variables. Therefore, we cannot assume that the variances between groups
were homogeneous. However, the groups consist of roughly the same sample sizes, thus no
further actions were taken. The second set of groups were promotion versus no promotion.
Levene’s test for those groups were significant for both dependent variables. The third
combination of groups were a low experience of financial scarcity versus a high experience of
financial scarcity. Levene’s test for those groups were significant for both dependent
variables. An overview of the results can be found in Appendix E.
In addition, the assumption of a correlation between the covariate of financial scarcity
and the dependent variables was tested via Pearson’s correlation. This test was not significant
for attractiveness of product offering (r = .081; p = .187). Thus, a linear relationship between
financial scarcity and attractiveness of product offering did not exist. However, for purchase
31
intention, the test was significant (r = .121; p = .05). Thus, linear relationship between
financial scarcity and purchase intention existed.
The last assumption of homogeneity of the regression slopes was tested via General
Linear Model. The assumption of homogeneity was met for attractiveness of product offering
(F (3,257) = 1.980, p = .117). Thus, the effect of financial scarcity was equal in all groups.
However, it was not met for purchase intention (F (3,257) = 3.090; p < .05). This was solved
by creating a dummy variable for financial scarcity, with a cut-off point of 2.5. The group up
to and including 2.5 contained 70.9% participants who hardly experienced financial scarcity
and the group above 2.5 contained 29.1% participants who did experience (some) financial
scarcity. This led to a non-significant interaction effect between the covariate of financial
scarcity and purchase intention (F (17,228) = .852; p = .631), assuming equal regression
slopes. When rerunning the test for attractiveness of product offering with the new dummy
variable the assumption was still met for this dependent variable (F (12,239) = 1.076; p =
.381). The dummy variable of financial scarcity was further used for testing all hypotheses
involving financial scarcity.
4.5 Hypothesis testing
4.5.1 Hypotheses 1a and 1b Hypothesis 1a states that consumers perceive a hedonic product offering with a monetary
promotion as more attractive than a utilitarian product offering with a monetary promotion,
and hypothesis 1b states that monetary promotions have a more positive influence on the
consumer’s purchase intention for hedonic products than for utilitarian products. These
hypotheses were tested separately by ANCOVA (see Appendix F). Dummy variables were
created for product type, with utilitarian as reference category, and for promotion, with no
promotion as the reference category.
The control variables gender, age, education and household composition were
included in the analysis. First, a dummy variable was created for the gender variable with the
category woman as reference category. Second, a dummy variable was created for the age
variable with the age 45 through 65+ as reference category. Third, a dummy variable was
created for education with primary school, secondary school and MBO as reference category.
Lastly, a dummy variable was created for household composition with one and two persons as
reference category.
The results showed a significant main effect of promotion (with a hedonic or
utilitarian product) on attractiveness of product offering (F (1,253) = 4.462; p < .05).
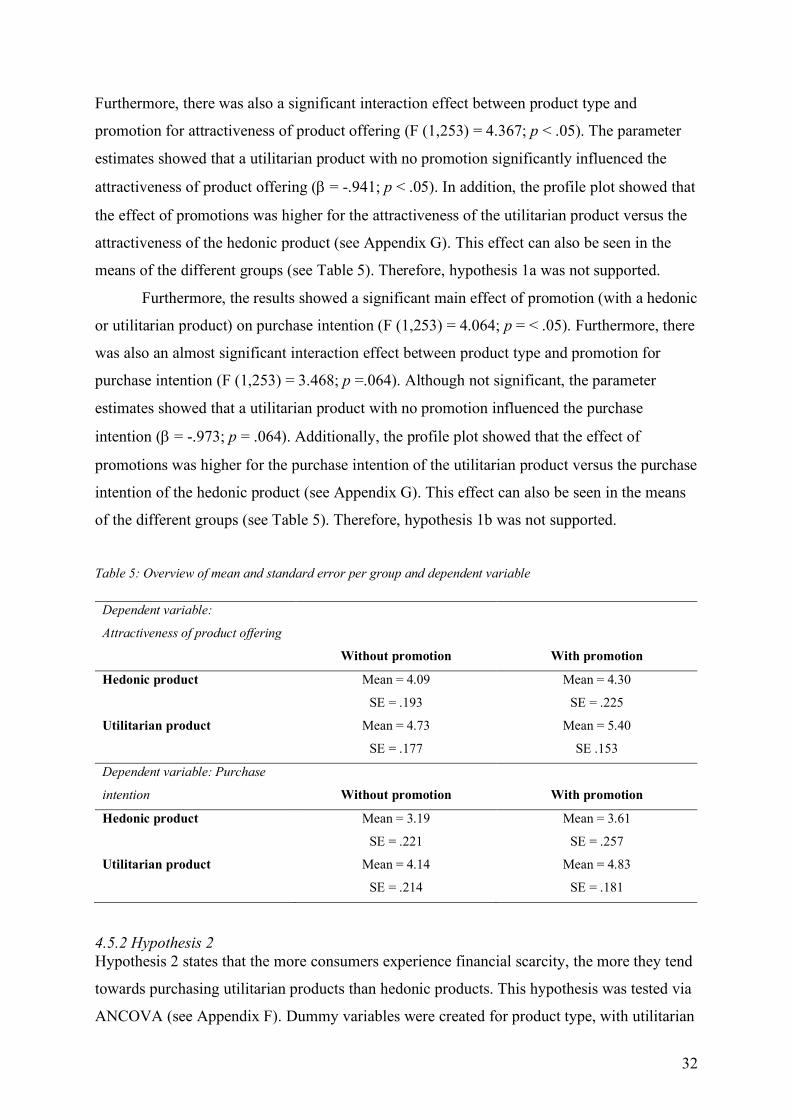
32
Furthermore, there was also a significant interaction effect between product type and
promotion for attractiveness of product offering (F (1,253) = 4.367; p < .05). The parameter
estimates showed that a utilitarian product with no promotion significantly influenced the
attractiveness of product offering (b = -.941; p < .05). In addition, the profile plot showed that
the effect of promotions was higher for the attractiveness of the utilitarian product versus the
attractiveness of the hedonic product (see Appendix G). This effect can also be seen in the
means of the different groups (see Table 5). Therefore, hypothesis 1a was not supported.
Furthermore, the results showed a significant main effect of promotion (with a hedonic
or utilitarian product) on purchase intention (F (1,253) = 4.064; p = < .05). Furthermore, there
was also an almost significant interaction effect between product type and promotion for
purchase intention (F (1,253) = 3.468; p =.064). Although not significant, the parameter
estimates showed that a utilitarian product with no promotion influenced the purchase
intention (b = -.973; p = .064). Additionally, the profile plot showed that the effect of
promotions was higher for the purchase intention of the utilitarian product versus the purchase
intention of the hedonic product (see Appendix G). This effect can also be seen in the means
of the different groups (see Table 5). Therefore, hypothesis 1b was not supported.
Table 5: Overview of mean and standard error per group and dependent variable
Dependent variable:
Attractiveness of product offering
Without promotion
With promotion
Hedonic product
Mean = 4.09
SE = .193
Mean = 4.30
SE = .225
Utilitarian product
Mean = 4.73
SE = .177
Mean = 5.40
SE .153
Dependent variable: Purchase
intention
Without promotion
With promotion
Hedonic product Mean = 3.19
SE = .221
Mean = 3.61
SE = .257
Utilitarian product Mean = 4.14
SE = .214
Mean = 4.83
SE = .181
4.5.2 Hypothesis 2 Hypothesis 2 states that the more consumers experience financial scarcity, the more they tend
towards purchasing utilitarian products than hedonic products. This hypothesis was tested via
ANCOVA (see Appendix F). Dummy variables were created for product type, with utilitarian
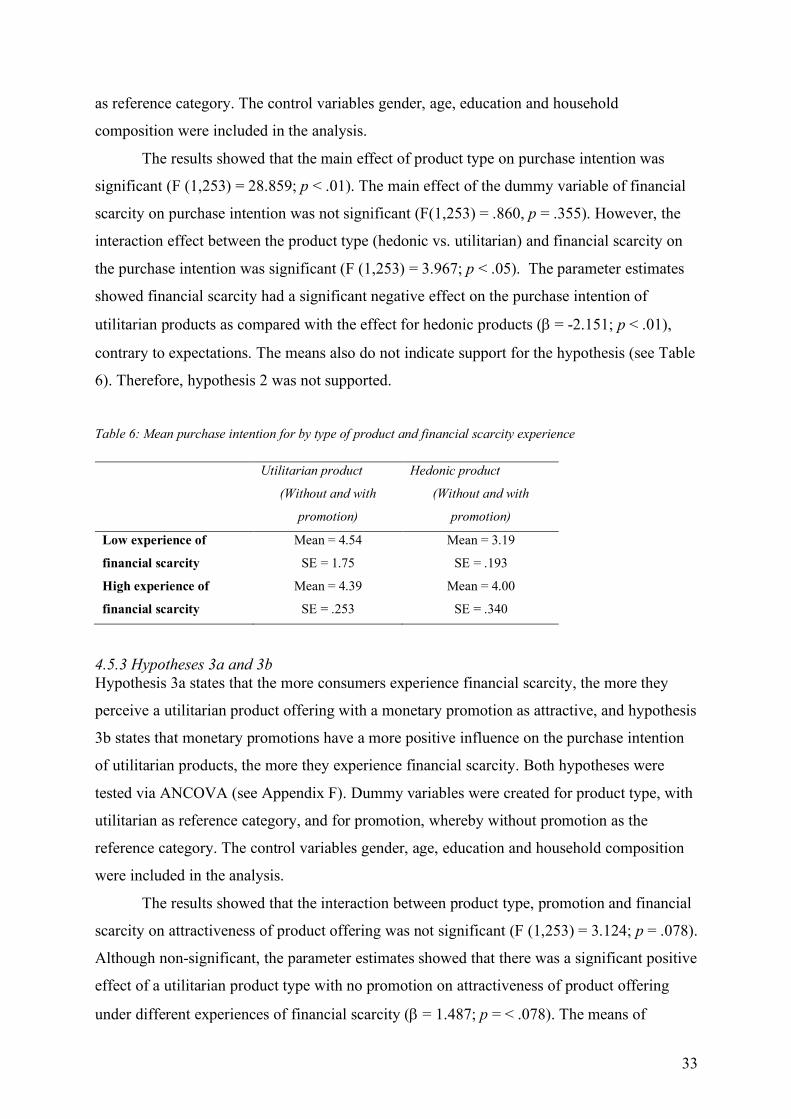
33
as reference category. The control variables gender, age, education and household
composition were included in the analysis.
The results showed that the main effect of product type on purchase intention was
significant (F (1,253) = 28.859; p < .01). The main effect of the dummy variable of financial
scarcity on purchase intention was not significant (F(1,253) = .860, p = .355). However, the
interaction effect between the product type (hedonic vs. utilitarian) and financial scarcity on
the purchase intention was significant (F (1,253) = 3.967; p < .05). The parameter estimates
showed financial scarcity had a significant negative effect on the purchase intention of
utilitarian products as compared with the effect for hedonic products (b = -2.151; p < .01),
contrary to expectations. The means also do not indicate support for the hypothesis (see Table
6). Therefore, hypothesis 2 was not supported.
Table 6: Mean purchase intention for by type of product and financial scarcity experience
Utilitarian product
(Without and with
promotion)
Hedonic product
(Without and with
promotion)
Low experience of
financial scarcity
Mean = 4.54
SE = 1.75
Mean = 3.19
SE = .193
High experience of
financial scarcity
Mean = 4.39
SE = .253
Mean = 4.00
SE = .340
4.5.3 Hypotheses 3a and 3b Hypothesis 3a states that the more consumers experience financial scarcity, the more they
perceive a utilitarian product offering with a monetary promotion as attractive, and hypothesis
3b states that monetary promotions have a more positive influence on the purchase intention
of utilitarian products, the more they experience financial scarcity. Both hypotheses were
tested via ANCOVA (see Appendix F). Dummy variables were created for product type, with
utilitarian as reference category, and for promotion, whereby without promotion as the
reference category. The control variables gender, age, education and household composition
were included in the analysis.
The results showed that the interaction between product type, promotion and financial
scarcity on attractiveness of product offering was not significant (F (1,253) = 3.124; p = .078).
Although non-significant, the parameter estimates showed that there was a significant positive
effect of a utilitarian product type with no promotion on attractiveness of product offering
under different experiences of financial scarcity (b = 1.487; p = < .078). The means of
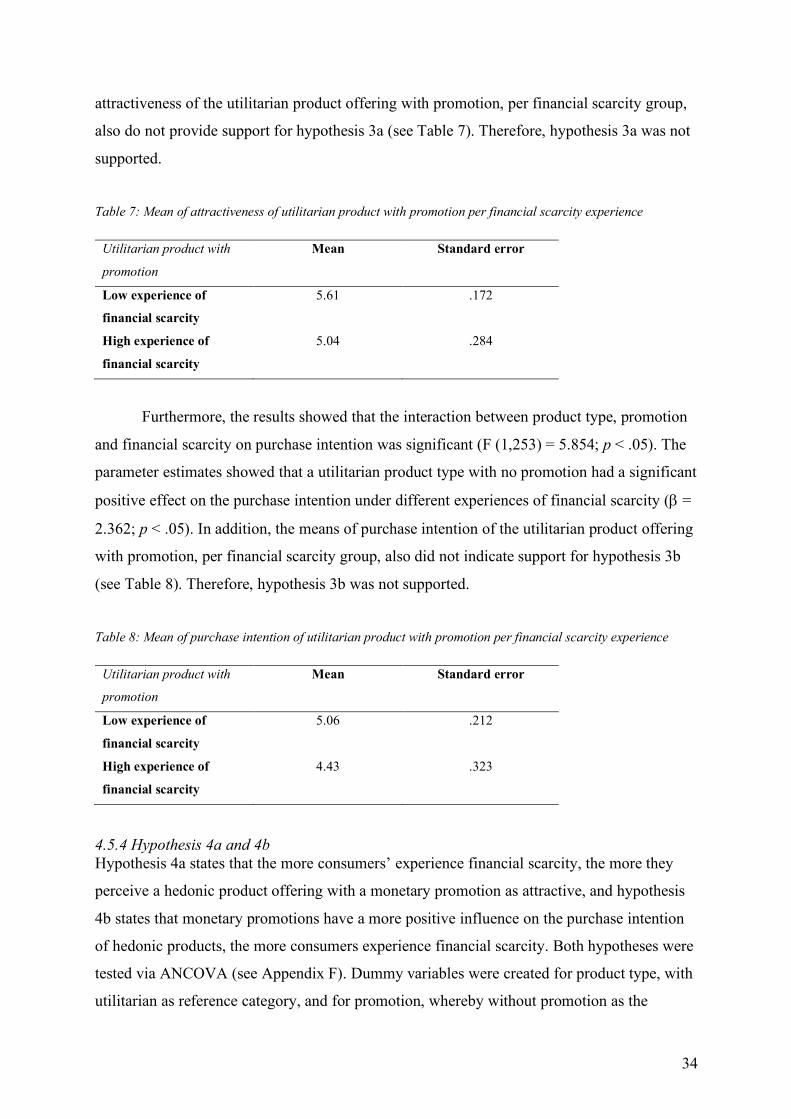
34
attractiveness of the utilitarian product offering with promotion, per financial scarcity group,
also do not provide support for hypothesis 3a (see Table 7). Therefore, hypothesis 3a was not
supported.
Table 7: Mean of attractiveness of utilitarian product with promotion per financial scarcity experience
Utilitarian product with
promotion
Mean Standard error
Low experience of
financial scarcity
5.61 .172
High experience of
financial scarcity
5.04 .284
Furthermore, the results showed that the interaction between product type, promotion
and financial scarcity on purchase intention was significant (F (1,253) = 5.854; p < .05). The
parameter estimates showed that a utilitarian product type with no promotion had a significant
positive effect on the purchase intention under different experiences of financial scarcity (b =
2.362; p < .05). In addition, the means of purchase intention of the utilitarian product offering
with promotion, per financial scarcity group, also did not indicate support for hypothesis 3b
(see Table 8). Therefore, hypothesis 3b was not supported.
Table 8: Mean of purchase intention of utilitarian product with promotion per financial scarcity experience
Utilitarian product with
promotion
Mean Standard error
Low experience of
financial scarcity
5.06 .212
High experience of
financial scarcity
4.43 .323
4.5.4 Hypothesis 4a and 4b Hypothesis 4a states that the more consumers’ experience financial scarcity, the more they
perceive a hedonic product offering with a monetary promotion as attractive, and hypothesis
4b states that monetary promotions have a more positive influence on the purchase intention
of hedonic products, the more consumers experience financial scarcity. Both hypotheses were
tested via ANCOVA (see Appendix F). Dummy variables were created for product type, with
utilitarian as reference category, and for promotion, whereby without promotion as the
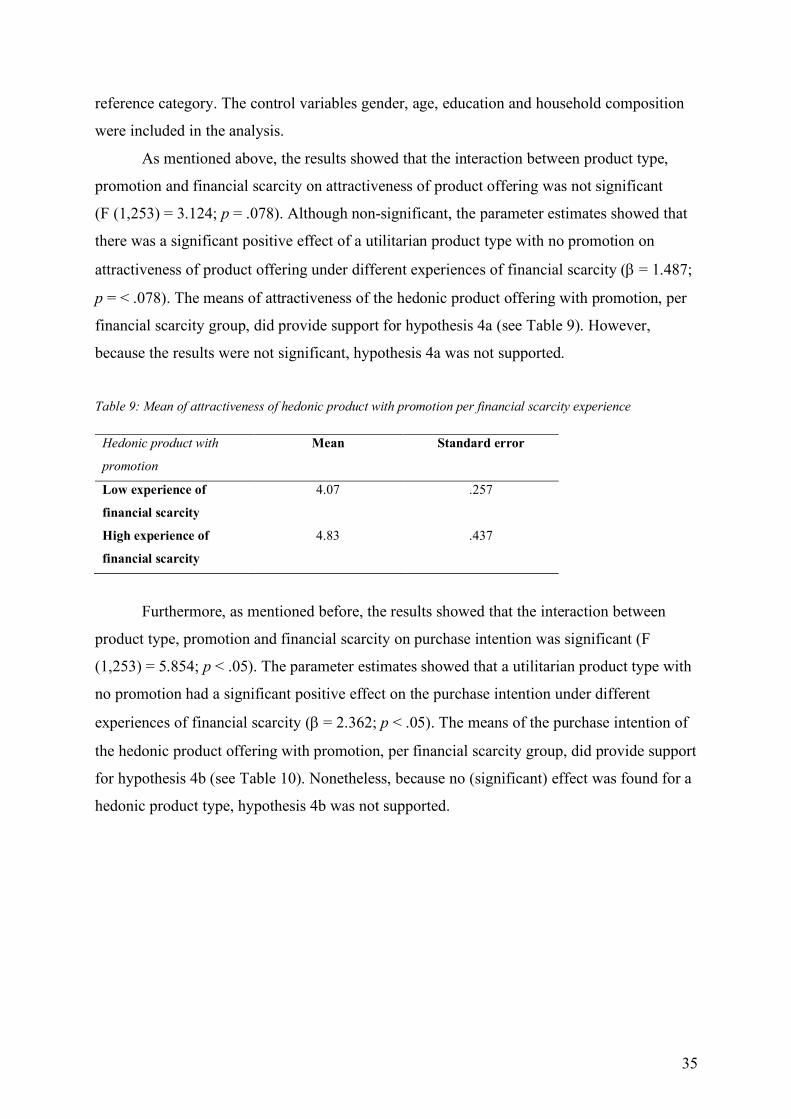
35
reference category. The control variables gender, age, education and household composition
were included in the analysis.
As mentioned above, the results showed that the interaction between product type,
promotion and financial scarcity on attractiveness of product offering was not significant
(F (1,253) = 3.124; p = .078). Although non-significant, the parameter estimates showed that
there was a significant positive effect of a utilitarian product type with no promotion on
attractiveness of product offering under different experiences of financial scarcity (b = 1.487;
p = < .078). The means of attractiveness of the hedonic product offering with promotion, per
financial scarcity group, did provide support for hypothesis 4a (see Table 9). However,
because the results were not significant, hypothesis 4a was not supported.
Table 9: Mean of attractiveness of hedonic product with promotion per financial scarcity experience
Hedonic product with
promotion
Mean Standard error
Low experience of
financial scarcity
4.07 .257
High experience of
financial scarcity
4.83 .437
Furthermore, as mentioned before, the results showed that the interaction between
product type, promotion and financial scarcity on purchase intention was significant (F
(1,253) = 5.854; p < .05). The parameter estimates showed that a utilitarian product type with
no promotion had a significant positive effect on the purchase intention under different
experiences of financial scarcity (b = 2.362; p < .05). The means of the purchase intention of
the hedonic product offering with promotion, per financial scarcity group, did provide support
for hypothesis 4b (see Table 10). Nonetheless, because no (significant) effect was found for a
hedonic product type, hypothesis 4b was not supported.
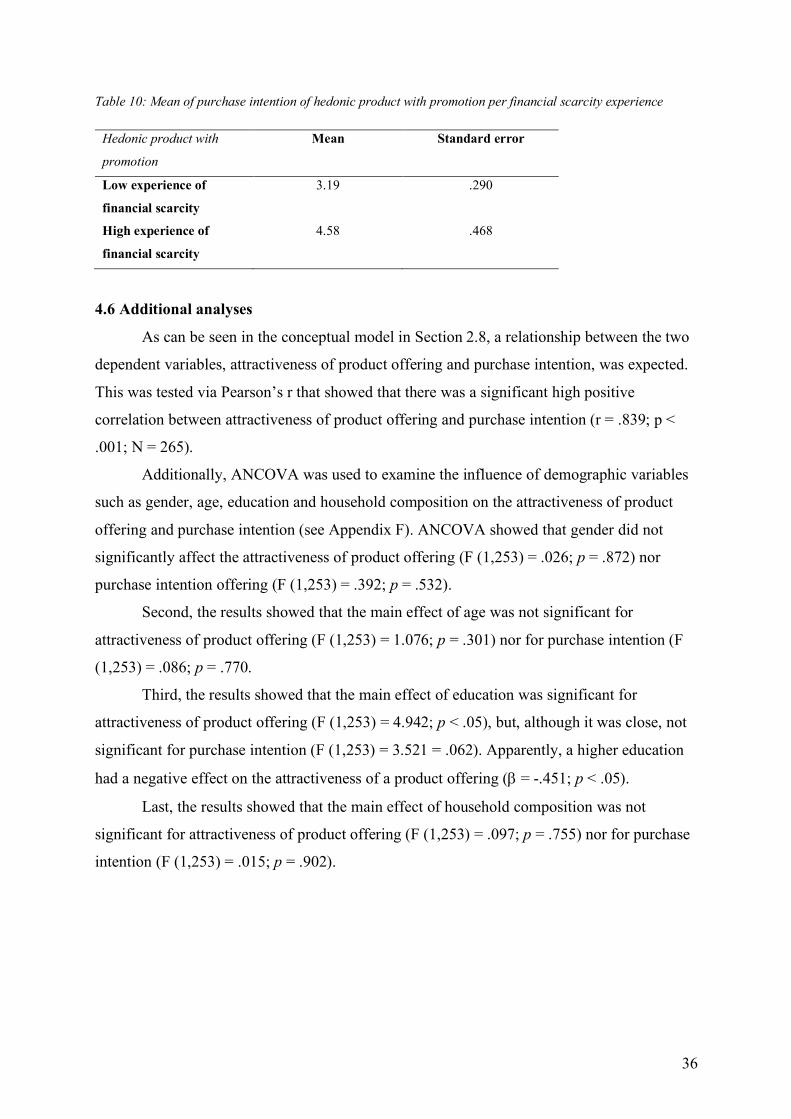
36
Table 10: Mean of purchase intention of hedonic product with promotion per financial scarcity experience
Hedonic product with
promotion
Mean Standard error
Low experience of
financial scarcity
3.19 .290
High experience of
financial scarcity
4.58 .468
4.6 Additional analyses
As can be seen in the conceptual model in Section 2.8, a relationship between the two
dependent variables, attractiveness of product offering and purchase intention, was expected.
This was tested via Pearson’s r that showed that there was a significant high positive
correlation between attractiveness of product offering and purchase intention (r = .839; p <
.001; N = 265).
Additionally, ANCOVA was used to examine the influence of demographic variables
such as gender, age, education and household composition on the attractiveness of product
offering and purchase intention (see Appendix F). ANCOVA showed that gender did not
significantly affect the attractiveness of product offering (F (1,253) = .026; p = .872) nor
purchase intention offering (F (1,253) = .392; p = .532).
Second, the results showed that the main effect of age was not significant for
attractiveness of product offering (F (1,253) = 1.076; p = .301) nor for purchase intention (F
(1,253) = .086; p = .770.
Third, the results showed that the main effect of education was significant for
attractiveness of product offering (F (1,253) = 4.942; p < .05), but, although it was close, not
significant for purchase intention (F (1,253) = 3.521 = .062). Apparently, a higher education
had a negative effect on the attractiveness of a product offering (b = -.451; p < .05).
Last, the results showed that the main effect of household composition was not
significant for attractiveness of product offering (F (1,253) = .097; p = .755) nor for purchase
intention (F (1,253) = .015; p = .902).
37
5. Discussion and conclusion
This section contains a discussion and conclusion based on the empirical results obtained in
Chapter 4. First, the discussion and conclusion will be outlined. Second, the managerial and
theoretical implications will be discussed followed by the limitations of this study and future
research.
5.1 Discussion and conclusion
Prior literature about the influence of monetary promotions on different product types
(hedonic vs. utilitarian) were paradoxical, and in particular, the literature has been silent about
the influence of monetary promotion on the intention to purchase different products under
different experiences of financial scarcity. Financial scarcity is a relatively new concept in the
field of consumer psychology and therefore, the aim of this study was to add knowledge to
this new stream of literature. An online experiment was used with a buy-one-get-one-free
monetary promotion as the manipulation for the advertisement of the products shown. Crisps
and rice were chosen as a hedonic and as a utilitarian product in this experimental study via a
pre-test. Both men and women were shown one of the four conditions where they would see
one of the products, with or without a buy-one-get-one-free promotion.
Chandon et al. (2000) claim that there is a congruency effect between the type of
promotion (non-monetary vs. monetary) and the type of product (hedonic vs. utilitarian).
However, more recent studies have denied the congruency effect, stating that with the
purchase of hedonic products comes guilt and this guilt is reduced by the usage of monetary
promotions, and therefore monetary promotions are more effective for hedonic products (Lu
et al., 2016; Kivetz and Zhen, 2017; Kwok and Uncles, 2005; Okada, 2005). However, the
results of this study are contradicting this effect because the effect of promotions on the
attractiveness of a product offering and purchase intention is (almost) significantly higher for
a utilitarian product (vs. a hedonic product) (H1a/H1b). An explanation for this might be that
with a buy-one-get-one-free promotion, consumers have to purchase two products instead of
one. The guilt paired with purchasing a hedonic product may increase when multiple products
are purchased, and therefore, a buy-one-get-one-free promotion is not effective for hedonic
products. However, this does not fully explain the higher perceived attractiveness of a
utilitarian product. It might also have to do with the goal pursued while consuming. In
general, grocery shopping might be perceived as a functionality-related goal. Utilitarian
products provide matching functional benefits such as obtaining a nutritious meal or a
healthier lifestyle, whereas hedonic products provide emotional benefits, which might be
38
sought more for when pursuing pleasure-related goals (Batra & Ahtola, 1991; Chitturi et al.,
2008; Hirschman & Holbrook, 1982; Lu et al., 2016). Obtaining more utilitarian products for
the same amount of money, during grocery shopping, might lead to the double amount of
customer satisfaction. The deed is good for the wallet and good for the person itself.
Therefore, a utilitarian product with promotion might be more attractive to a consumer.
Furthermore, results of this study showed that there is an interaction effect between the
product type and financial scarcity on purchase intention (H2). However, it was not in the
direction which was proposed. The hypotheses formed based on the existing literature was
rejected, because financial scarcity had a significant negative effect on the purchase intention
of utilitarian products instead of a positive effect. Thus, the willingness to purchase a
utilitarian product actually decreases when experiencing financial scarcity as compared with
the willingness to purchase a hedonic product. This was surprising, because consumers
experiencing financial scarcity often rationalize their purchases and their consumption
patterns due to their limited monetary resources (Gbadamosi, 2008; Walker, Dobson,
Middleton, Beardsworth, & Keil, 1995). Rice is a nutritious meal and can be part of one of the
main meals within a household, other than crisps which is more a snack. One would expect
that people facing financial scarcity would be allocating their budget with careful
considerations, and prefer utilitarian products. An explanation of the consumption pattern of
the financially constrained consumers might be that financial scarcity has multiple negative
influences on a person. Financial scarcity may result in social exclusion and leads to feelings
of unhappiness and frustration (Ali et al., 2018; Mood & Jonsson, 2016; Sommet et al., 2018).
By consuming hedonic products, consumers experience emotions of cheerfulness and
excitement (Chitturi et al., 2008). This might be particular attractive to financially constrained
consumers.
In addition, prior literature states that monetary promotions are highly effective for
financially constrained consumers (Gbadamosi, 2008; Khare et al., 2014). However, what the
effect of monetary promotions is on the different product types under various experiences of
financial scarcity was still unknown. Okada (2005) argues that people experiencing financial
scarcity need to justify their choices more, and are more prone to purchasing utilitarian
products. The results show that monetary promotions do not have a significant effect on the
attractiveness of a utilitarian product offering nor on the purchase intention for utilitarian
products under different experiences of financial scarcity (H3a/H3b). Remarkable is that the
mean attractiveness and purchase intention of a utilitarian product offering with a buy-one-
get-one-free promotion is even higher for people who hardly experience financial scarcity,
39
indicating that a promoted utilitarian product is perceived as more attractive and more often
purchased by people not experiencing financial scarcity. However, since the attractiveness of
a food-related product is subjective, it is also possible that the participants in the high
experience of financial scarcity simply are less fond of rice, and therefore, are less attracted or
willing to purchase rice.
On the other hand, based on Shiv and Fedorikhin (1999) and Melnyk et al. (2012),
consumers use information-based cognitive processing with utilitarian products versus
emotional-based affective processing with hedonic products. The emotional-based effective
processing demand a low process capability relative to information-based. Financial scarcity
limits a person’s cognitive process capability (Shah et al., 2012), and combined with a
monetary promotion, which decrease the consumer’s motivation to use cognitive thinking
(Aydinli et al., 2014), people with financially scarcity seem more prone to purchasing
promoted hedonic products. The results showed that financial scarcity does influence the
attractiveness and purchase intention of the two product offerings (almost) significantly. A
positive effect was found for financial scarcity on the attractiveness and purchase intention of
utilitarian products without promotion. Although no significant effect was found for the effect
of financial scarcity on the attractiveness and purchase intention of a hedonic product with
promotion, the mean attractiveness and purchase intention of a hedonic product offering with
a buy-one-get-one-free promotion is higher for people who experience a high amount of
financial scarcity compared to people who experience a low amount of financial scarcity
(H4a). These results seem plausible, because of the cognitive load financially constrained
consumers experience. This leads them to purchasing more hedonic products because those
products demand a low process capability.
In addition, comparing the means of attractiveness and purchase intention of the two
promoted products indicated that consumers who have high experience of financial scarcity
prefer hedonic products with promotions over utilitarian products with promotions while the
consumers who have a low experience of financial scarcity prefer a utilitarian product with
promotion compared to a hedonic product with promotion. The guilt associated with
consuming hedonic products (Okada, 2005) does not seem to apply to consumers
experiencing financial scarcity. Perhaps because people experiencing financial scarcity are
less influenced by external factors and create their own comparison standards when making a
purchase decision (Shah et al., 2015), the guilt financially constrained consumers feel when
purchasing hedonic products is different from consumers who are not financially constrained.
Another reason might be the presentation of choices in this study. A study by Okada (2005)
40
showed that between two comparable options, one of which is hedonic and one is utilitarian,
consumers tend to choose the utilitarian option over the hedonic option when the two options
are displayed together. However, when the two options are displayed individually and
separated, consumers tend to choose the hedonic option. In this study, the products were
shown separately and no choices had to be made between those products.
To conclude, in general, a monetary promotion has a stronger effect on utilitarian
products than on hedonic products. However, high experiences of financial scarcity positively
influence the attractiveness and purchase intention of utilitarian products without a promotion
compared to utilitarian products with a promotion. In addition, consumers experiencing a high
level of financial scarcity prefer a hedonic product with promotion more than people who do
not experience financial scarcity. In general, the willingness to purchase a utilitarian product
actually decreases when experiencing financial scarcity as compared with the willingness to
purchase a hedonic product. Thus, the attractiveness and purchase intention of products
depends upon the product type rather than the promotion for people experiencing financial
scarcity.
5.2 Theoretical and managerial implications
This study has a few theoretical implications. First, the effect of promotions in combination
with different product types has been a widely researched topic within marketing, in addition
to the study of effect of promotions on hedonic versus utilitarian products. However, results
of prior studies were conflicting. This study contributes to this ongoing debate and shows that
monetary promotions are more effective for utilitarian products.
Second, financial scarcity is a relatively new concept in this literature stream, and has
never been combined before with promotions and product type. This study shows that people
who experience financial scarcity do differ as a consumer compared to people who do not
experience financial scarcity. Although the results were not all significant, this study shows
that financial scarcity is an interesting topic to delve further into. Hopefully this study can act
as a starting point for a future with more research into the effect of financial scarcity on
people as consumers.
Furthermore, this study has a few managerial implications. First, the effect of buy-one-
get-one-free promotions is stronger for the attractiveness and purchase intention of a
utilitarian product versus a hedonic product.
41
Second, this study showed that financial scarcity has a negative effect on the purchase
intention of utilitarian products compared to hedonic products. Indicating that a financially
constrained consumers prefer a hedonic product more, at least in the context of this study.
Third, it was already known that monetary promotions are effective for financially
constrained consumers (Gbadamosi, 2008). However, it was unknown if this differed per
product type and if so, for which product type this effect was stronger. This study implicates
that when people experience financial scarcity, monetary promotions have a more positive
influence on the attractiveness and purchase intention of hedonic products versus utilitarian
products.
Marketing managers should be aware that consumers who experience financial
scarcity differ from the consumers who do not. Applying monetary promotion results in more
sales, but it is a costly business for organizations, and therefore it is wise to know what the
best fit is between a product and a promotion. If the target group are the consumers who are
financially more constrained, then they should focus their monetary promotion on the hedonic
products, and not on the utilitarian product. However, if the target group has more financial
resources, the buy-one-get-one-free promotions are better suited for utilitarian products.
5.3 Limitations and future research
A few limitations were identified in this study which also open up areas for future research.
First, although random sampling has been used, the sample used in this study mostly includes
women. Although, traditional role division is fading, this might be because women are more
often the decider and buyer when purchasing groceries. However, men might differ in their
perception of attractiveness and purchase behavior of different types of products. Therefore,
the sample was not representative for the whole population and this could be improved when
repeating the studies.
Second, the number of people experiencing financial scarcity was lower than the
number of people who did not. Therefore, it was decided to divide the sample into two groups
regarding the experience of financial scarcity; they either did experience financial scarcity or
they did not. This division limited the study to only those two conditions of financial scarcity.
Future studies might incorporate more conditions of financial scarcity, so that relationships
between the various experiences could be examined more in detail.
Third, only one monetary promotion was selected for this study (buy-one-get-one-for-
free). The effect of other monetary promotions, on the hedonic versus utilitarian product type,
under different experiences of financial scarcity might be different. Therefore, the effect of
42
other monetary promotions such as a direct price discount or a coupon could be examined in a
subsequent study.
Fourth, the two products chosen for this study were rice and crisps which are low-
involvement and convenience goods. The study can be repeated with high-involvement
hedonic and utilitarian products, such as shopping goods or specialty goods, to see if there are
differences in the effect of promotions on high-involvement products under different
experiences of financial scarcity versus low-involvement products.
Lastly, this study was a quantitative study and did not examine the differences
between the two product types under different experiences of financial scarcity in-depth.
Reasons behind the differences are not yet known. Perhaps the guilt which Okada (2005)
proposes plays less of a role when consumers experience financial scarcity or the presentation
of the two products has an influence on the choice of a consumer. The reasons may be
examined more in-depth via a future study which is more qualitative in nature.
43
6. References
Ali, S., Sensoy Bahar, O., Gopalan, P., Lukasiewicz, K., Parker, G., McKay, M., & Walker,
R. (2018). “Feeling less than a second class citizen”: Examining the emotional consequences
of poverty in New York City. Journal of Family Issues, 39(10), 2781-2805.
https://doi.org/10.1177/0192513X18760348
Alnazer, M. (2013). The moderating role of promotional benefit level and brand
awareness on the effectiveness of price discount and premium. International Journal of
Business and Management Invention, 6(12), 40-47.
Alvarez, B. A., & Casielles, R. V. (2005). Consumer evaluations of sales promotion:
the effect on brand choice. European Journal of Marketing, 39(1-2), 54–70. DOI
10.1108/03090560510572016
Arce-Urriza, M., Cebollada, J., & Tarira, M. F. (2017). The effect of price promotions
on consumer shopping behavior across online and offline channels: differences between
frequent and non-frequent shoppers. Information Systems and e-Business Management, 15(1),
69-87. 10.1007/s10257-016-0310-2
Atkins, K. G., & Kim, Y. K. (2012). Smart shopping: conceptualization and
measurement. International Journal of Retail & Distribution Management, 40(5), 360-375.
DOI: 10.1108/09590551211222349
Aydinli, A., Bertini, M., & Lambrecht, A. (2014). Price promotion for emotional
impact. Journal of Marketing, 78(4), 80–96. https://doi-
org.ru.idm.oclc.org/10.1509/jm.12.0338
Banerjee, S. (2009). Effect of product category on promotional choice: comparative
study of discounts and freebies. Management Research News, 32(2), 120–131. DOI:
10.1108/01409170910927587
Batra, R., & Ahtola, O. T. (1991). Measuring the hedonic and utilitarian sources of
consumer attitudes. Marketing Letters, 2(2), 159–170.
https://doiorg.ru.idm.oclc.org/10.1007/BF00436035
Bell, D. R., Iyer, G., & Padmanabhan, V. (2002). Price competition under stockpiling
and flexible consumption. Journal of Marketing Research, 39(3), 292–303. https://doi-
org.ru.idm.oclc.org/10.1509/jmkr.39.3.292.19103
Bian, Q., & Forsythe, S. (2012). Purchase intention for luxury brands: A cross cultural
comparison. Journal of Business Research, 65(10), 1443-1451.
https://doi.org/10.1016/j.jbusres.2011.10.010
44
Botti, S., & Mcgill, A. L. (2011). The locus of choice: personal causality and satisfacti
on with hedonic and utilitarian decisions. Journal of Consumer Research, 37(6), 1065–1075.
https://doi-org.ru.idm.oclc.org/10.1086/656570
Büttner, O. B., Florack, A., & Göritz, A. S. (2015). How shopping orientation
influences the effectiveness of monetary and nonmonetary promotions. European Journal of
Marketing, 49(1-2), 170–189. https://doi-org.ru.idm.oclc.org/10.1108/EJM-01-2012-0044
Campbell, L., & Diamond, W. D. (1990). Framing and sales promotions: the
characteristics of a ″good deal″. Journal of Consumer Marketing, 7(4), 25–31. https://doi-
org.ru.idm.oclc.org/10.1108/EUM0000000002586
Carpenter, J. M., & Moore, M. (2008). Us consumers' perceptions of non-price retail
promotions. International Journal of Retail & Distribution Management, 36(2), 111–123.
https://doi-org.ru.idm.oclc.org/10.1108/09590550810853066
Chandon, P., Wansink, B., & Laurent, G. (2000). A benefit congruency framework of
sales promotion effectiveness. Journal of Marketing, 64(4), 65–81. https://doi-
org.ru.idm.oclc.org/10.1509/jmkg.64.4.65.18071
Chitturi, R., Raghunathan, R., & Mahajan, V. (2008). Delight by design: the role of
hedonic versus utilitarian benefits. Journal of Marketing, 72(3), 48–63. https://doi-
org.ru.idm.oclc.org/10.1509/JMKG.72.3.048
Cook, L. A., & Sadeghein, R. (2018). Effects of perceived scarcity on financial
decision making. Journal of Public Policy and Marketing, 37(1), 68–87. https://doi-
org.ru.idm.oclc.org/10.1509/jppm.16.157
De Bruijn, E. J., & Antonides, G. (2020). Determinants of financial worry and
rumination. Journal of Economic Psychology, 76, 102233
https://doi.org/10.1016/j.joep.2019.102233
Diamond, W. D., & Johnson, R. R. (1990). The framing of sales promotions: an
approach to classification. Advances in Consumer Research, 17, 494-500.
Dodds, W. B., Monroe, K. B., & Grewal, D. (1991). Effects of price, brand, and store
information on buyers’ product evaluations. Journal of marketing research, 28(3), 307-319.
https://doi.org/10.1177/002224379102800305
Felgate, M., Fearne, A., DiFalco, S., & Martinez, M. G. (2012). Using supermarket
loyalty card data to analyse the impact of promotions. International Journal of Market
Research, 54(2), 221-240. https://doi.org/10.2501/IJMR-54-2-221-240
45
Gbadamosi, A. (2009). Low-income consumers' reactions to low-involvement
products. Marketing Intelligence & Planning, 27(7), 882–899. DOI:
10.1108/02634500911000207
Gilbert, D. C., & Jackaria, N. (2002). The efficacy of sales promotions in uk
supermarkets: a consumer view. International Journal of Retail & Distribution
Management, 30(6), 315–322. DOI 10.1108/09590550210429522
Gill, T. (2008). Convergent products: what functionalities add more value to the
base? Journal of Marketing, 72(2), 46–62.
https://doiorg.ru.idm.oclc.org/10.1509/jmkg.72.2.46
Hair, J. F., Black, W. C., Babin, B. J. & Anderson, R. E. (2019). Multivariate data
analysis (8th edition). Hampshire, England: Cengage
Harmon, S. K., & Hill, C. J. (2003). Gender and coupon use. Journal of Product &
Brand Management. DOI: 10.1108/10610420310476924
Hawkes, C. (2009). Sales promotions and food consumption. Nutrition Reviews, 67(6),
333–42. https://doi-org.ru.idm.oclc.org/10.1111/j.1753-4887.2009.00206.x
Hirschman, E. C., & Holbrook, M. B. (1982). Hedonic consumption: emerging
concepts, methods and propositions. Journal of Marketing, 46(3), 92–101. DOI:
10.1177/002224298204600314
Homburg, C., Koschate, N., & Totzek, D. (2010). How price increases affect future
purchases: the role of mental budgeting, income, and framing: how price increases affect
future purchases. Psychology & Marketing, 27(1), 36–53. https://doi-
org.ru.idm.oclc.org/10.1002/mar.20318
Howard, J. A., & Sheth, J. N. (1969). The Theory of Buyer Behavior. New York, NY:
Wiley.
Hoyer, W. D., MacInnis, D. J. & Pieters, R. (2018). Consumer Behavior. Boston, MA:
Cengage Learning.
Lu, J., Liu, Z., & Fang, Z. (2016). Hedonic products for you, utilitarian products for
me. Judgment and Decision Making, 4, 332–341.
Kahneman, D., & Tversky, A. (1979). Prospect theory: an analysis of decision under
risk. Econometrica, 47(2), 263–291. https://doi-org.ru.idm.oclc.org/10.2307/1914185
Katz, S. J., & Hofer, T. P. (1994). Socioeconomic disparities in preventive care persist
despite universal coverage: breast and cervical cancer screening in Ontario and the United
States. Jama, 272(7), 530-534. DOI: 10.1001/jama.1994.03520070050037
46
Khare, A., Achtani, D., & Khattar, M. (2014). Influence of price perception and
shopping motives on indian consumers’ attitude towards retailer promotions in malls. Asia
Pacific Journal of Marketing and Logistics, 26(2), 272–295. https://doi-
org.ru.idm.oclc.org/10.1108/APJML-09-2013-0097
Kivetz, R., & Simonson, I. (2002). Earning the right to indulge: effort as a determinant
of customer preferences toward frequency program rewards. Journal of Marketing
Research, 39(2), 155–170. https://doi-org.ru.idm.oclc.org/10.1509/jmkr.39.2.155.19084
Kivetz, R., & Zheng, Y. (2017). The effects of promotions on hedonic versus
utilitarian purchases. Journal of Consumer Psychology, 27(1), 59–68. https://doi-
org.ru.idm.oclc.org/10.1016/j.jcps.2016.05.005
Klein, K., & Melnyk, V. (2016). Speaking to the mind or the heart: effects of matching
hedonic versus utilitarian arguments and products. Marketing Letters, 27(1), 131–142. DOI:
10.1007/s11002-014-9320-3
Kwok, S., & Uncles, M. (2005). Sales promotion effectiveness: the impact of
consumer differences at an ethnic-group level. Journal of Product and Brand
Management, 14(3), 170–186. DOI: 10.1108/10610420510601049
Leclerc, F. (1997). Monetary promotions vs. non-monetary promotions, which is more
effective? Advances in Consumer Research, 24, 220–220.
Lowe, B. (2010). Consumer perceptions of extra free product promotions and
discounts: the moderating role of perceived performance risk. Journal of Product and Brand
management, 19(7), 496-503. https://doi.org/10.1108/10610421011086919
Mani, A., Mullainathan, S., Shafir, E., & Zhao, J. (2013). Poverty impedes cognitive
function. Science, 341(6149), 976–980. DOI: 10.1126/science.1238041
Martínez, E., & Montaner, T. (2006). The effect of consumer's psychographic
variables upon deal-proneness. Journal of Retailing and Consumer Services, 13(3), 157–168.
https://doi-org.ru.idm.oclc.org/10.1016/j.jretconser.2005.08.001
McKane, R. G., & Richard, M. K. (2020). Young Adult Drinking and Depression: The
Long-Term Consequences of Poverty, Maternal Depression, and Childhood Behavioral
Problems. J. Soc. & Soc. Welfare, 47, 85.
McNeill, L. (2013). Sales promotion in Asia: successful strategies for Singapore and
Malaysia. Asia Pacific Journal of Marketing and Logistics, 25(1), 48–69. https://doi-
org.ru.idm.oclc.org/10.1108/13555851311290939
47
Melnyk, V., Klein, K., & Völckner F. (2012). The double-edged sword of foreign
brand names for companies from emerging countries. Journal of Marketing, 76(6), 21–37.
https://doi-org.ru.idm.oclc.org/10.1509/jm.11.0349
Mittal, M., & Sethi, P. (2011). The effectiveness of sales promotion tools among
Indian consumers: An empirical study. Journal of Promotion Management, 17(2), 165-182.
https://doi-org.ru.idm.oclc.org/10.1080/10496491.2011.580693
Montaner, T., De Chernatony, L., & Buil, I. (2011). Consumer response to gift
promotions. Journal of Product & Brand Management. DOI: 10.1108/10610421111121099
Mood, C., & Jonsson, J. O. (2016). The social consequences of poverty: an empirical
test on longitudinal data. Social indicators research, 127(2), 633-652.
https://doi.org/10.1007/s11205-015-0983-9
Mullainathan, S., & Shafir, E. (2013). Scarcity: why having too little means so
much (First). New York, NY: Times Books, Henry Holt and Company.
Okada, E. M. (2005). Justification effects on consumer choice of hedonic and
utilitarian goods. Journal of Marketing Research, 42(1), 43–53. https://doi-
org.ru.idm.oclc.org/10.1509/jmkr.42.1.43.56889
Owens, D. L. P. D., Hardman, M. M. B. A., & Keillor, B. P. D. (2001). The
differential impact of price-related consumer promotions on loyal versus non-loyal users of
the brand. Journal of Promotion Management, 6(1-2), 113–131. https://doi-
org.ru.idm.oclc.org/10.1300/J057v06n01_10
Palazon, M., & Delgado-Ballester, E. (2009). Effectiveness of price discounts and
premium promotions. Psychology & Marketing, 26(12), 1108-1129. DOI: 10.1002/mar.20315
Reid, M., Thompson, P., Mavondo, F., & Brunsø, K. (2015). Economic and utilitarian
benefits of monetary versus non-monetary in-store sales promotions. Journal of Marketing
Management, 31(3-4), 247-268. https://doi-
org.ru.idm.oclc.org/10.1080/0267257X.2014.939216
Roll, O., & Pfeiffer, E. (2017). Are your consumers variety seekers? the moderating
impact on the effectiveness of free gift promotions vs. price discounts. The International
Review of Retail, Distribution and Consumer Research, 27(4), 352–368. https://doi-
org.ru.idm.oclc.org/10.1080/09593969.2017.1299781
Schultz, D. E., & Block, M. P. (2014). Sales promotion influencing consumer brand
preferences/purchases. Journal of Consumer Marketing. DOI: 10.1108/JCM-01-2014-0822
Shah, A. K., Mullainathan, S., & Shafir, E. (2012). Some consequences of having too
little. Science, 338(6107), 682–685. DOI: 10.1126/science.1222426
48
Shah, A. K., Shafir, E., & Mullainathan, S. (2015). Scarcity frames
value. Psychological Science, 26(4), 402–412. https://doi-
org.ru.idm.oclc.org/10.1177/0956797614563958
Shah, A. K., Zhao, J., Mullainathan, S., & Shafir, E. (2018). Money in the mental lives
of the poor. Social Cognition, 36(1), 4-19.
Sharma, A., Wali, O. P., & Joshi, R. M. (2020). A Critical Investigation of Consumer
Response for Monetary and Non-monetary Promotions Across E-services. Paradigm, 24(2),
195-207. https://doi.org/10.1177/0971890720959530
Sheehan, D., & Van Ittersum, K. (2021). Isolating Price Promotions: The Influence of
Promotional Timing on Promotion Redemption. Journal of the Association for Consumer
Research, 6(1), 81-90. DOI: 10.1086/710247
Shiv, B., & Fedorikhin, A. (1999). Heart and mind in conflict: the interplay of affect
and cognition in consumer decision making. Journal of Consumer Research, 26(3), 278–292.
https://doi-org.ru.idm.oclc.org/10.1086/209563
Shoham, M., Moldovan, S., & Steinhart, Y. (2018). Mind the gap: How smaller
numerical differences can increase product attractiveness. Journal of Consumer
Research, 45(4), 761-774. https://doi.org/10.1093/jcr/ucy022
Sinha, S. K., & Verma, P. (2017). Consumer's response towards non-monetary and
monetary sales Promotion: A review and future research directions. Journal of Economic &
Management Perspectives, 11(2), 500-507.
Sinha, S. K., & Verma, P. (2019). The Link Between Sales Promotion’s Benefits and
Consumers Perception: A Comparative Study Between Rural and Urban Consumers. Global
Business Review, 20(2), 498-514. https://doi.org/10.1177/0972150918825398
Sommet, N., Morselli, D., & Spini, D. (2018). Income inequality affects the
psychological health of only the people facing scarcity. Psychological Science, 29(12), 1911–
1921. https://doi-org.ru.idm.oclc.org/10.1177/0956797618798620
Spears, N., & Singh, S. N. (2004). Measuring attitude toward the brand and purchase
intentions. Journal of current issues & research in advertising, 26(2), 53-66.
DOI: 10.1080/10641734.2004.10505164
Spiller, S. A. (2011). Opportunity cost consideration. Journal of Consumer
Research, 38(4), 595–610. https://doi-org.ru.idm.oclc.org/10.1086/660045
Statistics Netherlands. (n.d.). Poverty. Retrieved on January 14, 2020, from
https://www.cbs.nl/en-gb/onze-diensten/methods/definitions/poverty
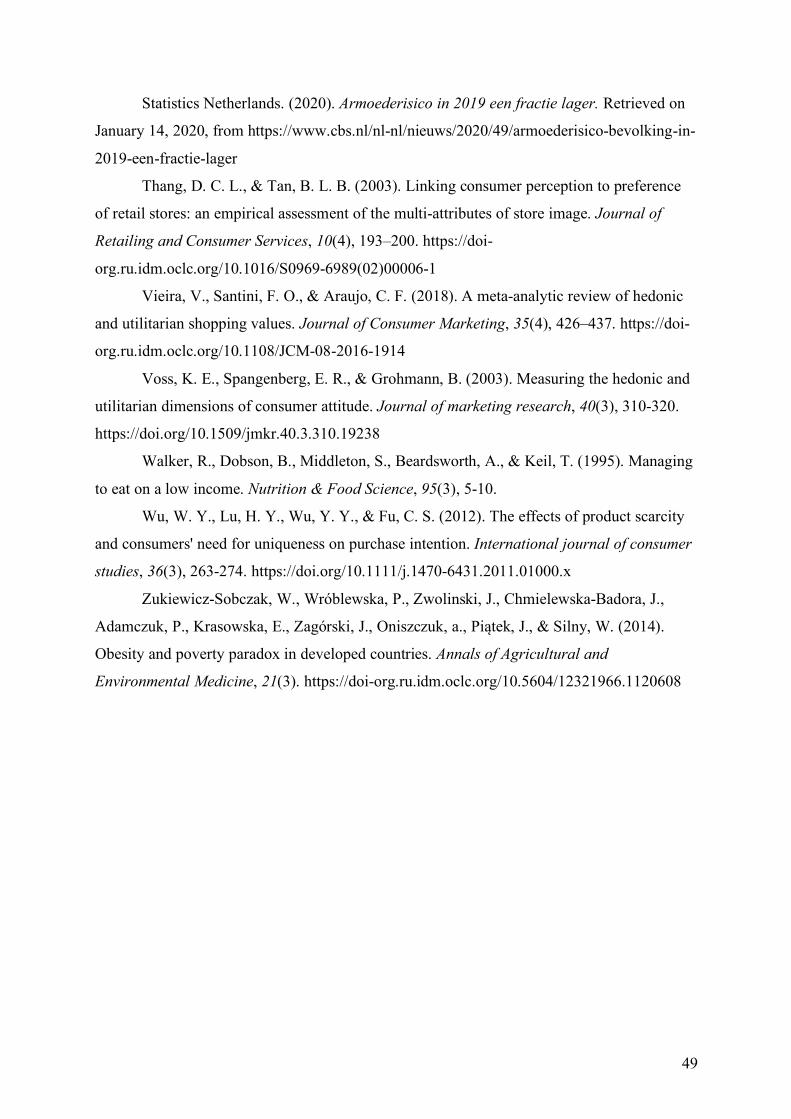
49
Statistics Netherlands. (2020). Armoederisico in 2019 een fractie lager. Retrieved on
January 14, 2020, from https://www.cbs.nl/nl-nl/nieuws/2020/49/armoederisico-bevolking-in-
2019-een-fractie-lager
Thang, D. C. L., & Tan, B. L. B. (2003). Linking consumer perception to preference
of retail stores: an empirical assessment of the multi-attributes of store image. Journal of
Retailing and Consumer Services, 10(4), 193–200. https://doi-
org.ru.idm.oclc.org/10.1016/S0969-6989(02)00006-1
Vieira, V., Santini, F. O., & Araujo, C. F. (2018). A meta-analytic review of hedonic
and utilitarian shopping values. Journal of Consumer Marketing, 35(4), 426–437. https://doi-
org.ru.idm.oclc.org/10.1108/JCM-08-2016-1914
Voss, K. E., Spangenberg, E. R., & Grohmann, B. (2003). Measuring the hedonic and
utilitarian dimensions of consumer attitude. Journal of marketing research, 40(3), 310-320.
https://doi.org/10.1509/jmkr.40.3.310.19238
Walker, R., Dobson, B., Middleton, S., Beardsworth, A., & Keil, T. (1995). Managing
to eat on a low income. Nutrition & Food Science, 95(3), 5-10.
Wu, W. Y., Lu, H. Y., Wu, Y. Y., & Fu, C. S. (2012). The effects of product scarcity
and consumers' need for uniqueness on purchase intention. International journal of consumer
studies, 36(3), 263-274. https://doi.org/10.1111/j.1470-6431.2011.01000.x
Zukiewicz-Sobczak, W., Wróblewska, P., Zwolinski, J., Chmielewska-Badora, J.,
Adamczuk, P., Krasowska, E., Zagórski, J., Oniszczuk, a., Piątek, J., & Silny, W. (2014).
Obesity and poverty paradox in developed countries. Annals of Agricultural and
Environmental Medicine, 21(3). https://doi-org.ru.idm.oclc.org/10.5604/12321966.1120608
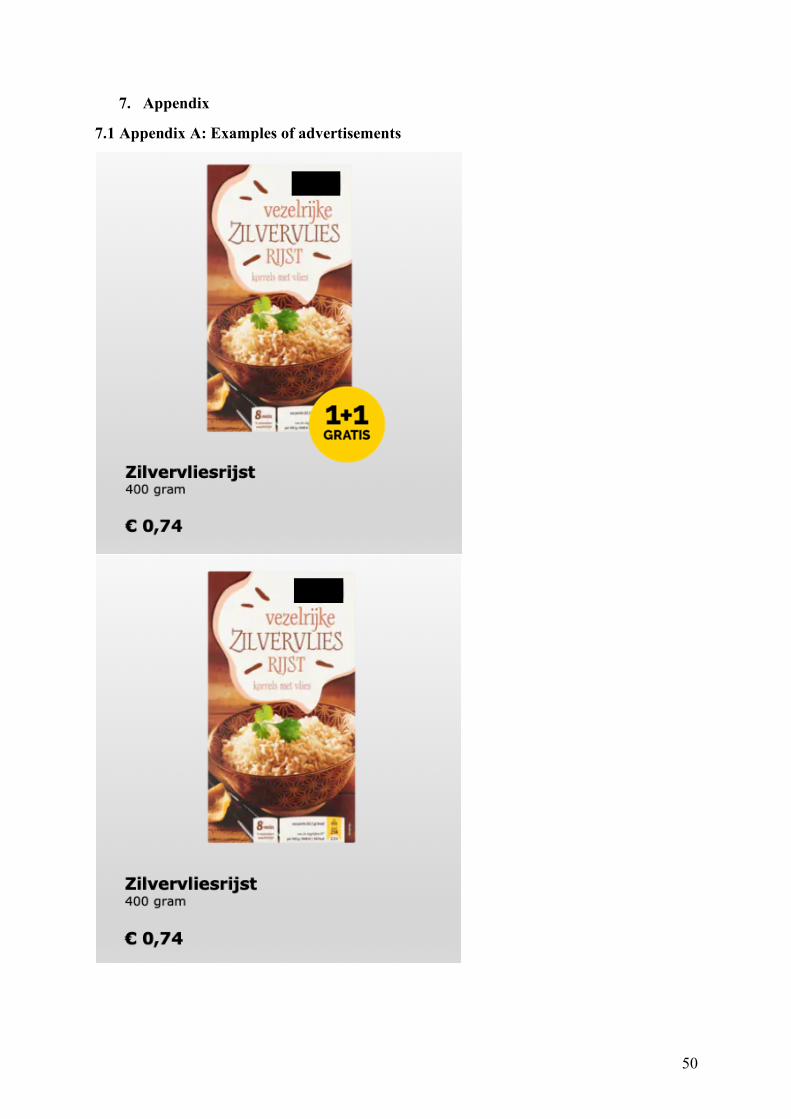
50
7. Appendix
7.1 Appendix A: Examples of advertisements
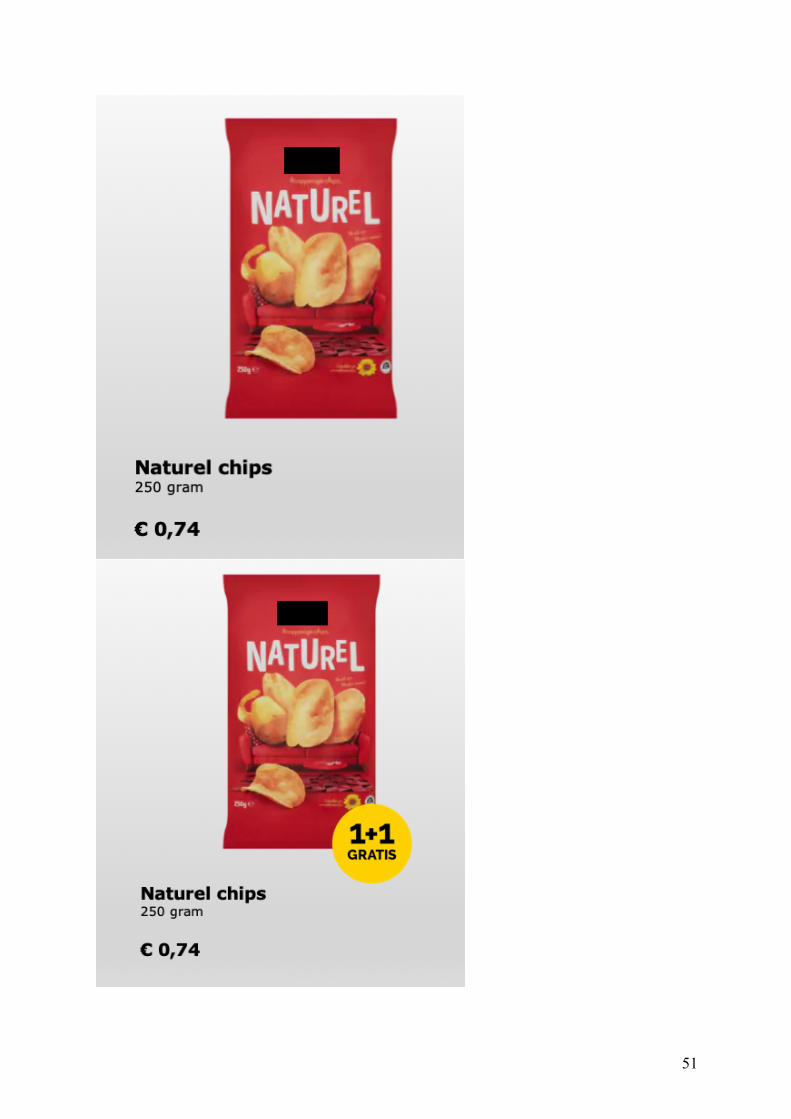
51
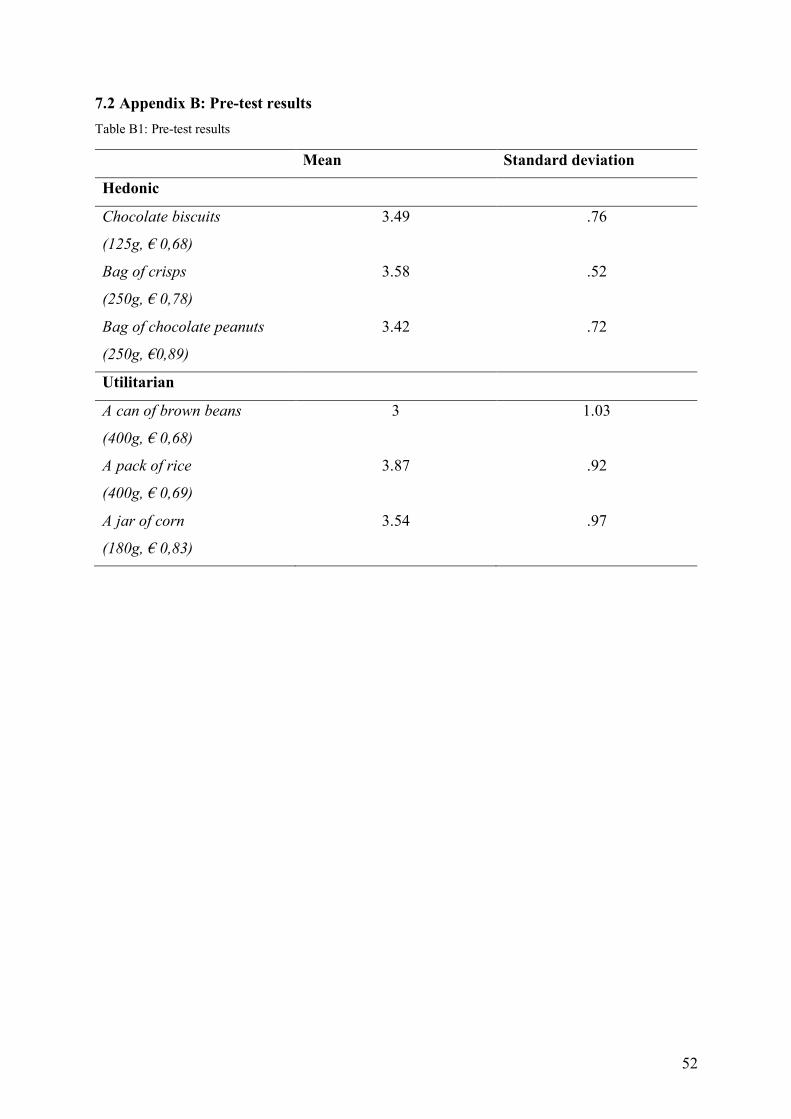
52
7.2 Appendix B: Pre-test results Table B1: Pre-test results
Mean Standard deviation
Hedonic
Chocolate biscuits
(125g, € 0,68)
3.49 .76
Bag of crisps
(250g, € 0,78)
3.58 .52
Bag of chocolate peanuts
(250g, €0,89)
3.42 .72
Utilitarian
A can of brown beans
(400g, € 0,68)
3 1.03
A pack of rice
(400g, € 0,69)
3.87 .92
A jar of corn
(180g, € 0,83)
3.54 .97
53
7.3 Appendix C: Survey design and measurement scales
Section 1: Introduction
Dear participant,
First of all, I would like to thank you for participating in this study. Currently, I am finishing
my master in Marketing at the Radboud University. For my master thesis, I am researching
the effect of promotions on different types of products.
For this study, you have to be 18 years or older and be the decider (in consultation or alone)
and purchaser of groceries within your household. The survey will take approximately 6
minutes of your time. Your data will be handled with high confidentiality and the results will
be processed completely anonymously. Please note that by filling out this survey you
participate in a study. By continuing this survey, you agree that the participation was
voluntary and your data can be used for research purposes only. You are entitled to stop the
survey at any given time without any explanation.
And finally, by completing this survey, you have the chance to win a gift card of your own
choice worth € 15, -. To be eligible for this price, you must complete the survey completely
and fill in your e-mail address on the last page.
If you have any questions or comments about the study, please contact me at
Thank you again for participating in this study.
Kind regards,
Chantal Brouwer
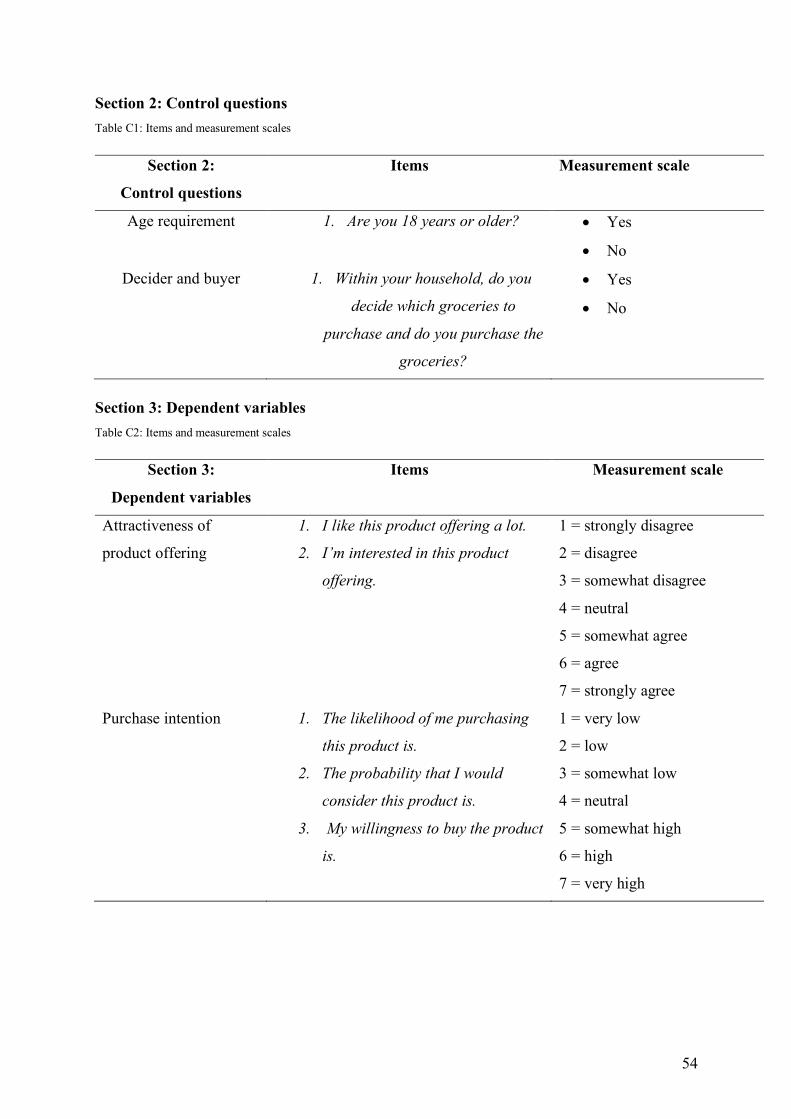
54
Section 2: Control questions Table C1: Items and measurement scales
Section 2:
Control questions
Items Measurement scale
Age requirement 1. Are you 18 years or older? • Yes
• No
Decider and buyer 1. Within your household, do you
decide which groceries to
purchase and do you purchase the
groceries?
• Yes
• No
Section 3: Dependent variables Table C2: Items and measurement scales
Section 3:
Dependent variables
Items Measurement scale
Attractiveness of
product offering
1. I like this product offering a lot.
2. I’m interested in this product
offering.
1 = strongly disagree
2 = disagree
3 = somewhat disagree
4 = neutral
5 = somewhat agree
6 = agree
7 = strongly agree
Purchase intention 1. The likelihood of me purchasing
this product is.
2. The probability that I would
consider this product is.
3. My willingness to buy the product
is.
1 = very low
2 = low
3 = somewhat low
4 = neutral
5 = somewhat high
6 = high
7 = very high
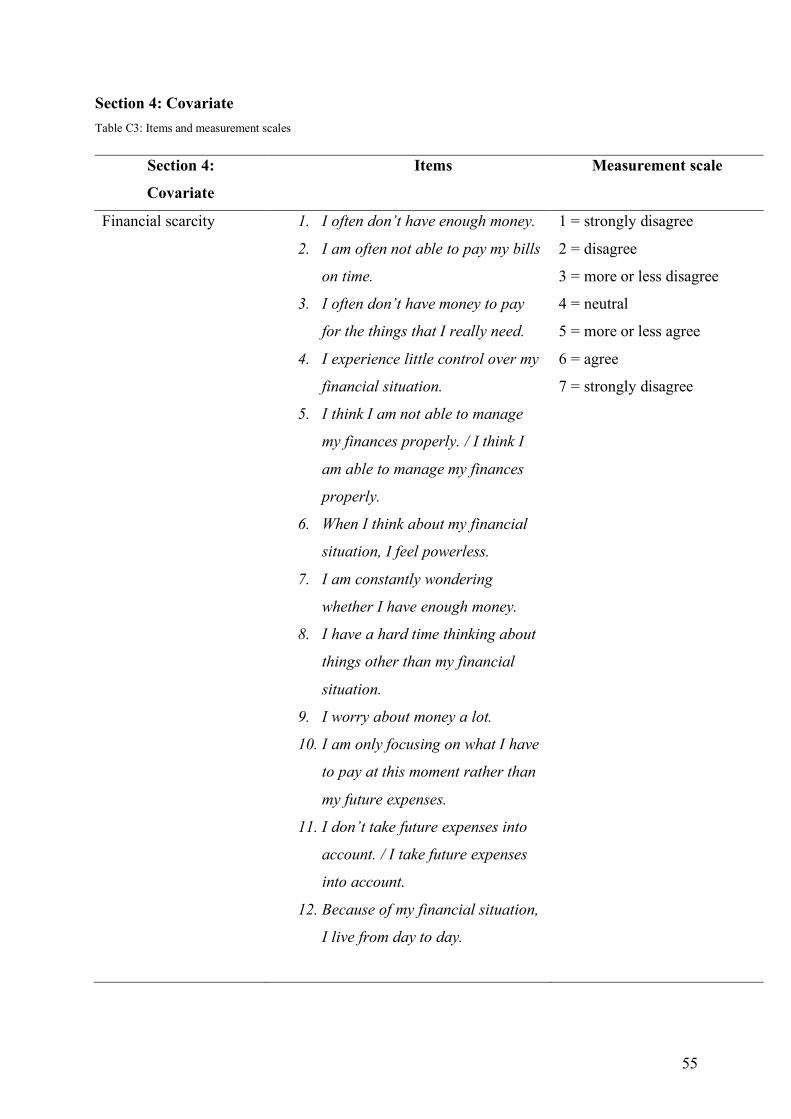
55
Section 4: Covariate Table C3: Items and measurement scales
Section 4:
Covariate
Items Measurement scale
Financial scarcity 1. I often don’t have enough money.
2. I am often not able to pay my bills
on time.
3. I often don’t have money to pay
for the things that I really need.
4. I experience little control over my
financial situation.
5. I think I am not able to manage
my finances properly. / I think I
am able to manage my finances
properly.
6. When I think about my financial
situation, I feel powerless.
7. I am constantly wondering
whether I have enough money.
8. I have a hard time thinking about
things other than my financial
situation.
9. I worry about money a lot.
10. I am only focusing on what I have
to pay at this moment rather than
my future expenses.
11. I don’t take future expenses into
account. / I take future expenses
into account.
12. Because of my financial situation,
I live from day to day.
1 = strongly disagree
2 = disagree
3 = more or less disagree
4 = neutral
5 = more or less agree
6 = agree
7 = strongly disagree
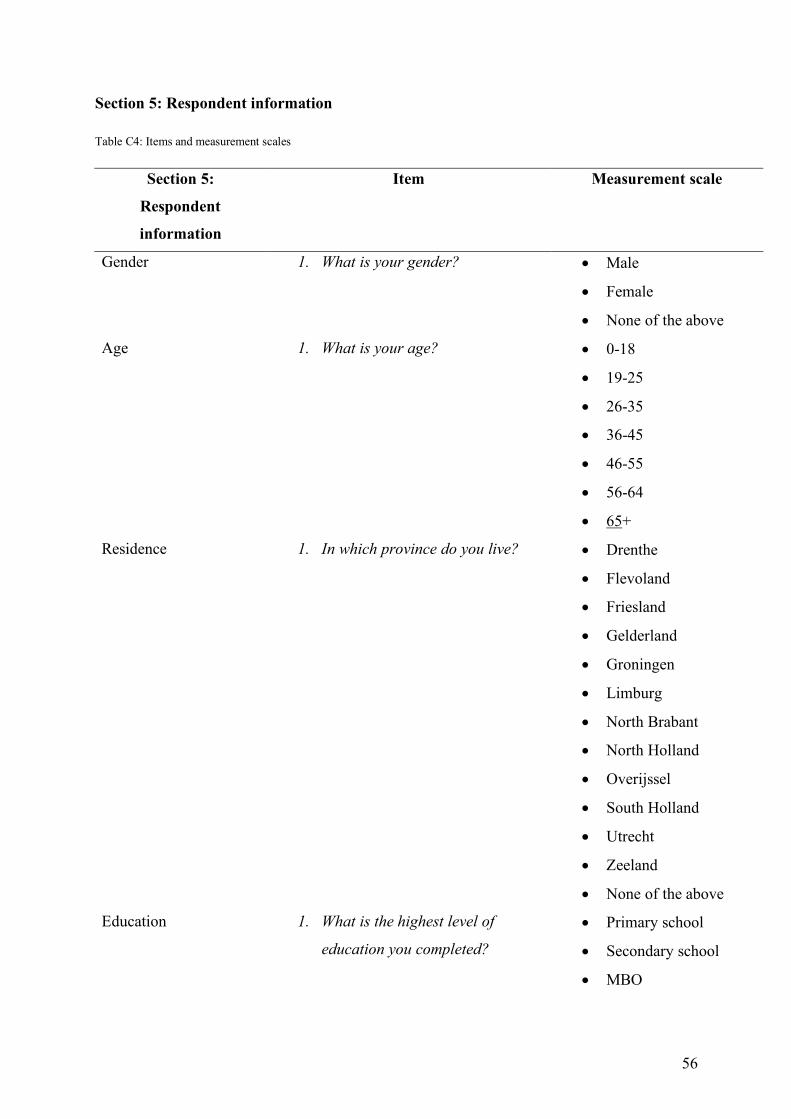
56
Section 5: Respondent information
Table C4: Items and measurement scales
Section 5:
Respondent
information
Item Measurement scale
Gender 1. What is your gender? • Male
• Female
• None of the above
Age 1. What is your age? • 0-18
• 19-25
• 26-35
• 36-45
• 46-55
• 56-64
• 65+
Residence 1. In which province do you live? • Drenthe
• Flevoland
• Friesland
• Gelderland
• Groningen
• Limburg
• North Brabant
• North Holland
• Overijssel
• South Holland
• Utrecht
• Zeeland
• None of the above
Education 1. What is the highest level of
education you completed?
• Primary school
• Secondary school
• MBO
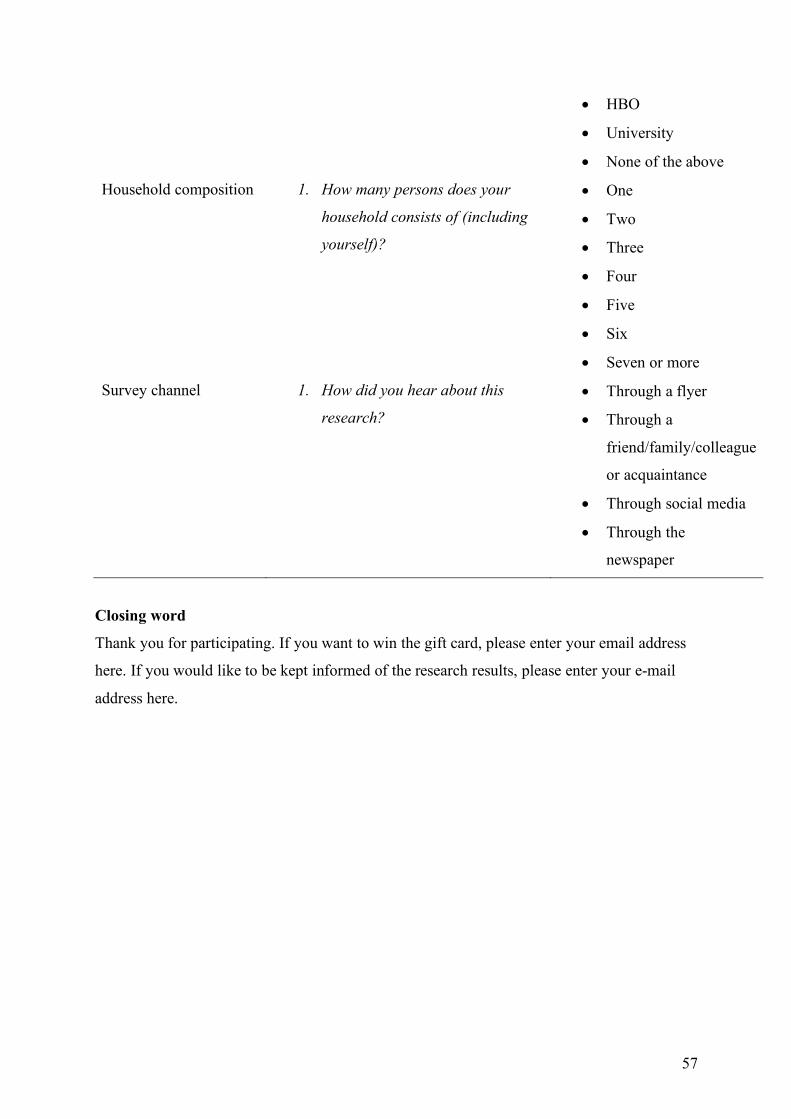
57
• HBO
• University
• None of the above
Household composition 1. How many persons does your
household consists of (including
yourself)?
• One
• Two
• Three
• Four
• Five
• Six
• Seven or more
Survey channel 1. How did you hear about this
research?
• Through a flyer
• Through a
friend/family/colleague
or acquaintance
• Through social media
• Through the
newspaper
Closing word
Thank you for participating. If you want to win the gift card, please enter your email address
here. If you would like to be kept informed of the research results, please enter your e-mail
address here.
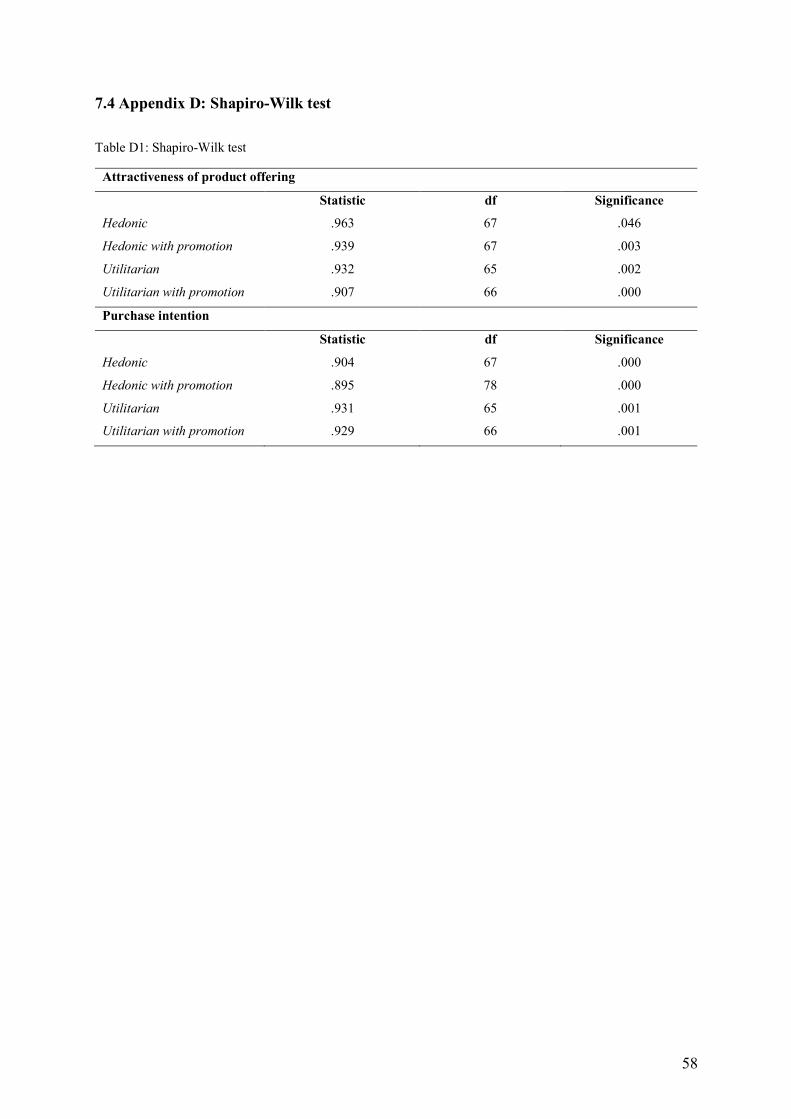
58
7.4 Appendix D: Shapiro-Wilk test
Table D1: Shapiro-Wilk test
Attractiveness of product offering
Statistic df Significance
Hedonic .963 67 .046
Hedonic with promotion .939 67 .003
Utilitarian .932 65 .002
Utilitarian with promotion .907 66 .000
Purchase intention
Statistic df Significance
Hedonic .904 67 .000
Hedonic with promotion .895 78 .000
Utilitarian .931 65 .001
Utilitarian with promotion .929 66 .001
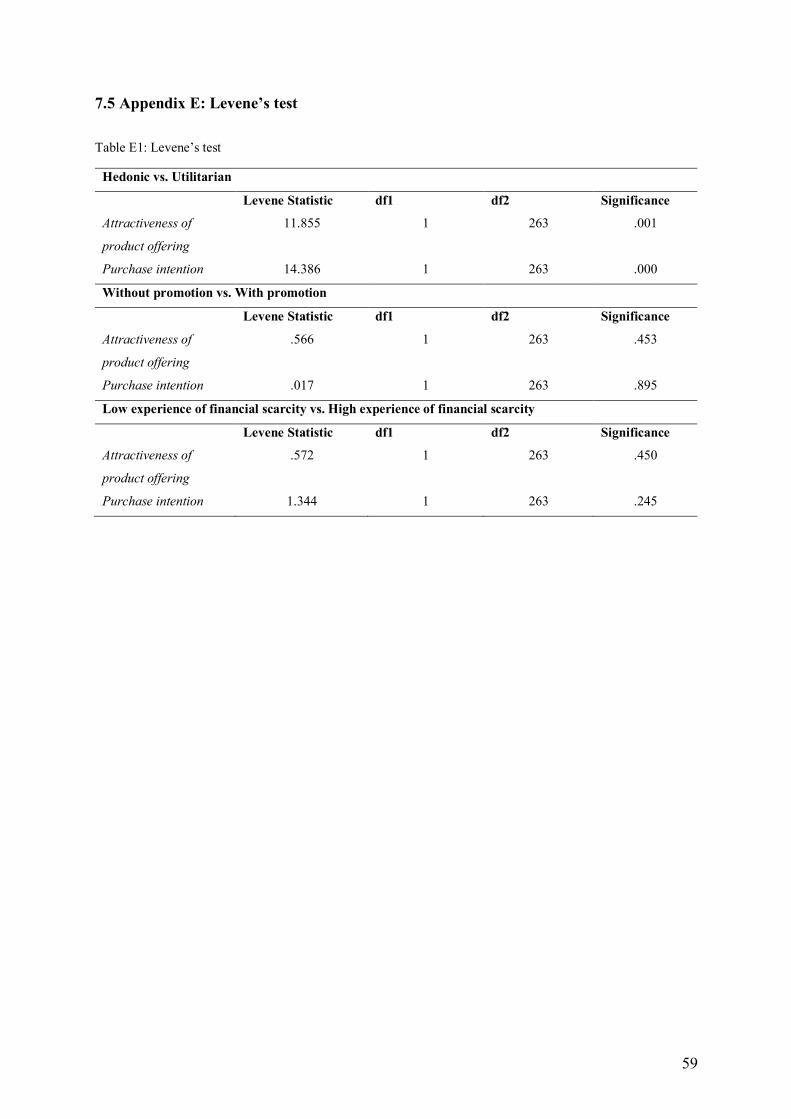
59
7.5 Appendix E: Levene’s test
Table E1: Levene’s test
Hedonic vs. Utilitarian
Levene Statistic df1 df2 Significance
Attractiveness of
product offering
11.855 1 263 .001
Purchase intention 14.386 1 263 .000
Without promotion vs. With promotion
Levene Statistic df1 df2 Significance
Attractiveness of
product offering
.566 1 263 .453
Purchase intention .017 1 263 .895
Low experience of financial scarcity vs. High experience of financial scarcity
Levene Statistic df1 df2 Significance
Attractiveness of
product offering
.572 1 263 .450
Purchase intention 1.344 1 263 .245
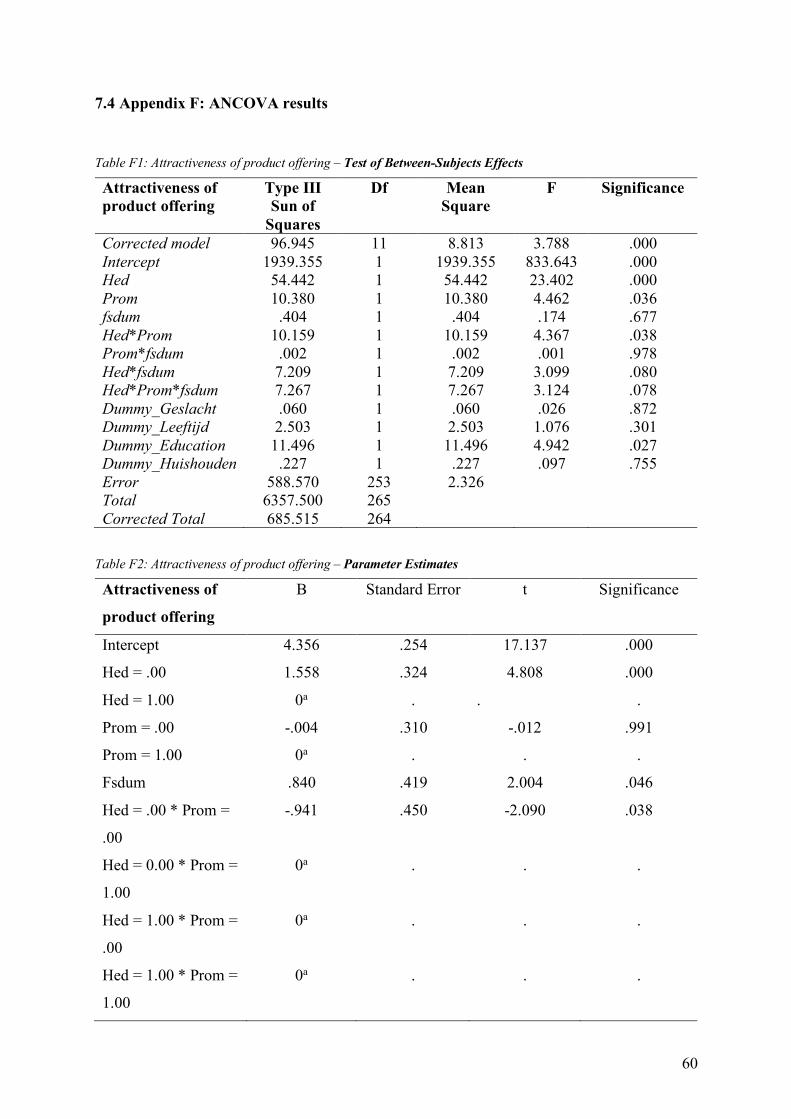
60
7.4 Appendix F: ANCOVA results
Table F1: Attractiveness of product offering – Test of Between-Subjects Effects
Attractiveness of product offering
Type III Sun of
Squares
Df Mean Square
F Significance
Corrected model 96.945 11 8.813 3.788 .000 Intercept 1939.355 1 1939.355 833.643 .000 Hed 54.442 1 54.442 23.402 .000 Prom 10.380 1 10.380 4.462 .036 fsdum .404 1 .404 .174 .677 Hed*Prom 10.159 1 10.159 4.367 .038 Prom*fsdum .002 1 .002 .001 .978 Hed*fsdum 7.209 1 7.209 3.099 .080 Hed*Prom*fsdum 7.267 1 7.267 3.124 .078 Dummy_Geslacht .060 1 .060 .026 .872 Dummy_Leeftijd 2.503 1 2.503 1.076 .301 Dummy_Education 11.496 1 11.496 4.942 .027 Dummy_Huishouden .227 1 .227 .097 .755 Error 588.570 253 2.326 Total 6357.500 265 Corrected Total 685.515 264
Table F2: Attractiveness of product offering – Parameter Estimates
Attractiveness of
product offering
B Standard Error t Significance
Intercept 4.356 .254 17.137 .000
Hed = .00 1.558 .324 4.808 .000
Hed = 1.00 0a . . .
Prom = .00 -.004 .310 -.012 .991
Prom = 1.00 0a . . .
Fsdum .840 .419 2.004 .046
Hed = .00 * Prom =
.00
-.941 .450 -2.090 .038
Hed = 0.00 * Prom =
1.00
0a . . .
Hed = 1.00 * Prom =
.00
0a . . .
Hed = 1.00 * Prom =
1.00
0a . . .
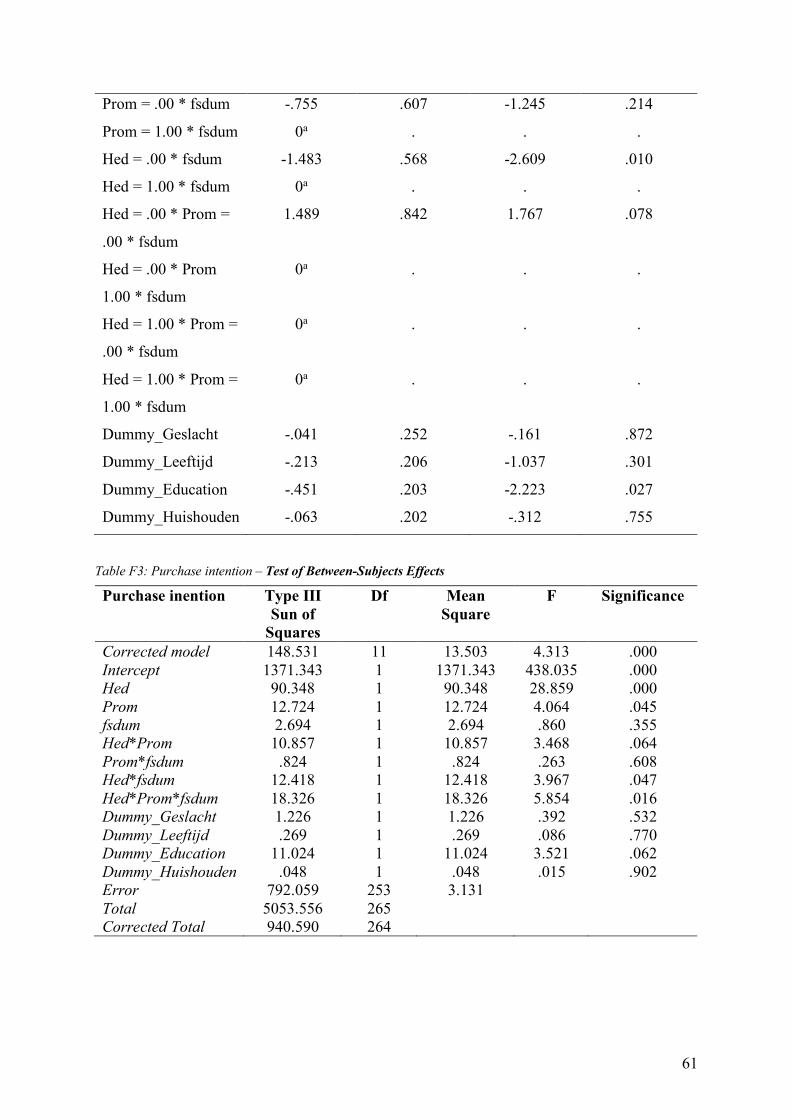
61
Prom = .00 * fsdum -.755 .607 -1.245 .214
Prom = 1.00 * fsdum 0a . . .
Hed = .00 * fsdum -1.483 .568 -2.609 .010
Hed = 1.00 * fsdum 0a . . .
Hed = .00 * Prom =
.00 * fsdum
1.489 .842 1.767 .078
Hed = .00 * Prom
1.00 * fsdum
0a . . .
Hed = 1.00 * Prom =
.00 * fsdum
0a . . .
Hed = 1.00 * Prom =
1.00 * fsdum
0a . . .
Dummy_Geslacht -.041 .252 -.161 .872
Dummy_Leeftijd -.213 .206 -1.037 .301
Dummy_Education -.451 .203 -2.223 .027
Dummy_Huishouden -.063 .202 -.312 .755
Table F3: Purchase intention – Test of Between-Subjects Effects
Purchase inention Type III Sun of
Squares
Df Mean Square
F Significance
Corrected model 148.531 11 13.503 4.313 .000 Intercept 1371.343 1 1371.343 438.035 .000 Hed 90.348 1 90.348 28.859 .000 Prom 12.724 1 12.724 4.064 .045 fsdum 2.694 1 2.694 .860 .355 Hed*Prom 10.857 1 10.857 3.468 .064 Prom*fsdum .824 1 .824 .263 .608 Hed*fsdum 12.418 1 12.418 3.967 .047 Hed*Prom*fsdum 18.326 1 18.326 5.854 .016 Dummy_Geslacht 1.226 1 1.226 .392 .532 Dummy_Leeftijd .269 1 .269 .086 .770 Dummy_Education 11.024 1 11.024 3.521 .062 Dummy_Huishouden .048 1 .048 .015 .902 Error 792.059 253 3.131 Total 5053.556 265 Corrected Total 940.590 264
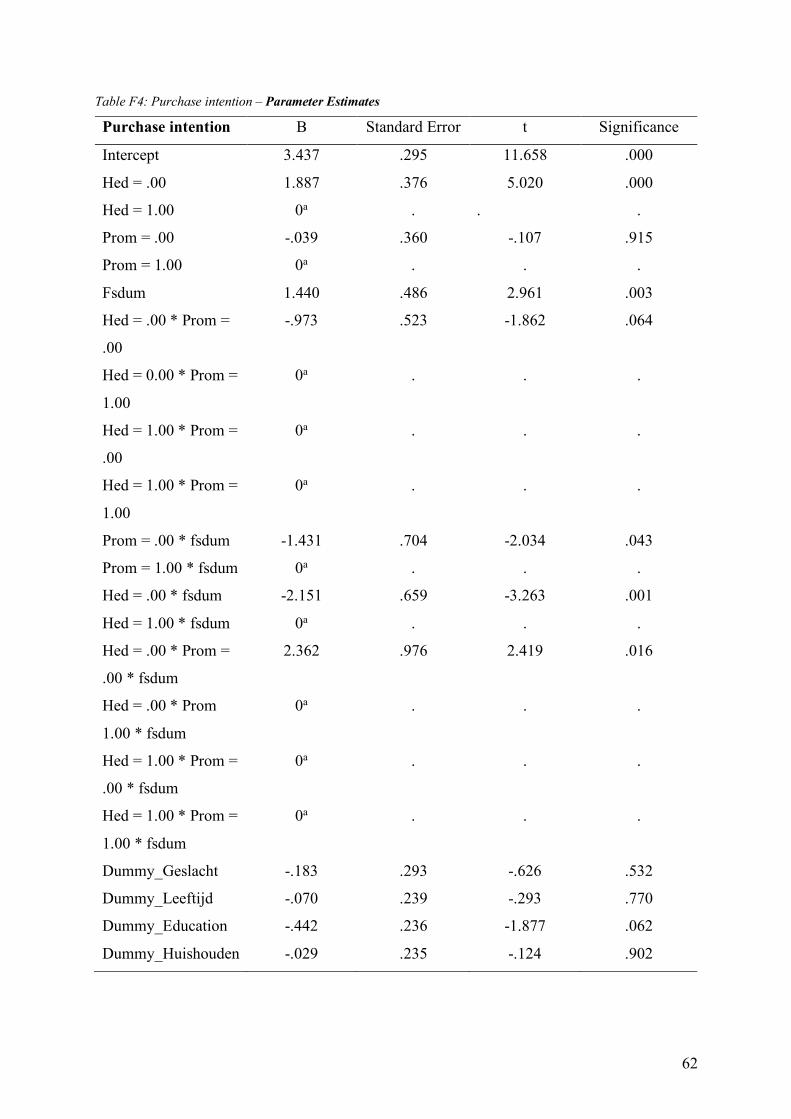
62
Table F4: Purchase intention – Parameter Estimates
Purchase intention B Standard Error t Significance
Intercept 3.437 .295 11.658 .000
Hed = .00 1.887 .376 5.020 .000
Hed = 1.00 0a . . .
Prom = .00 -.039 .360 -.107 .915
Prom = 1.00 0a . . .
Fsdum 1.440 .486 2.961 .003
Hed = .00 * Prom =
.00
-.973 .523 -1.862 .064
Hed = 0.00 * Prom =
1.00
0a . . .
Hed = 1.00 * Prom =
.00
0a . . .
Hed = 1.00 * Prom =
1.00
0a . . .
Prom = .00 * fsdum -1.431 .704 -2.034 .043
Prom = 1.00 * fsdum 0a . . .
Hed = .00 * fsdum -2.151 .659 -3.263 .001
Hed = 1.00 * fsdum 0a . . .
Hed = .00 * Prom =
.00 * fsdum
2.362 .976 2.419 .016
Hed = .00 * Prom
1.00 * fsdum
0a . . .
Hed = 1.00 * Prom =
.00 * fsdum
0a . . .
Hed = 1.00 * Prom =
1.00 * fsdum
0a . . .
Dummy_Geslacht -.183 .293 -.626 .532
Dummy_Leeftijd -.070 .239 -.293 .770
Dummy_Education -.442 .236 -1.877 .062
Dummy_Huishouden -.029 .235 -.124 .902
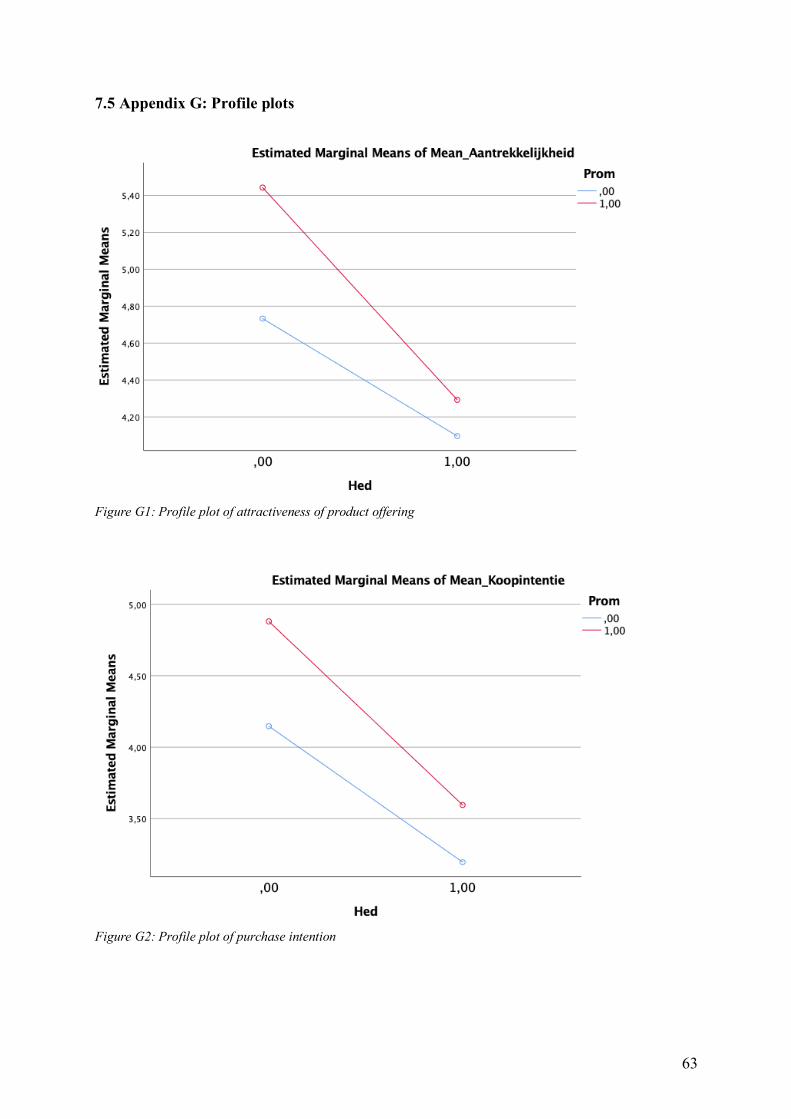
63
7.5 Appendix G: Profile plots
Figure G1: Profile plot of attractiveness of product offering
Figure G2: Profile plot of purchase intention

64