Embed Size (px)
Citation preview
Business Address10 ALMADEN BLVD, 15THFLOORSAN JOSE CA 95113(800) 366-7266
Mailing Address10 ALMADEN BLVD, 15THFLOORSAN JOSE CA 95113
SECURITIES AND EXCHANGE COMMISSION
FORM NPORT-P
Filing Date: 2021-05-27 | Period of Report: 2021-03-31SEC Accession No. 0001145549-21-030896
(HTML Version on secdatabase.com)
FILERSA FUNDS INVESTMENT TRUSTCIK:1075065| IRS No.: 770216379 | State of Incorp.:DE | Fiscal Year End: 0630Type: NPORT-P | Act: 40 | File No.: 811-09195 | Film No.: 21968929
Copyright © 2021 www.secdatabase.com. All Rights Reserved.Please Consider the Environment Before Printing This Document

SA U.S. Fixed Income FundPORTFOLIO OF INVESTMENTS � AS OF MARCH 31, 2021 (Unaudited)
FACEAMOUNT VALUE��
YANKEE CORPORATE BONDS AND NOTES �� 2.6%Consumer, Non-cyclical �� 0.6%
Utah Acquisition Sub, Inc.,3.150%, 6/15/21 $ 3,000,000 $3,009,506
Financial �� 2.0%Royal Bank of Canada GMTN,
(3-mo. USD LIBOR +0.390%), 0.602%, 4/30/21 � 8,000,000 8,002,769
Toronto-Dominion Bank (The)MTN, 2.125%, 4/07/21 3,000,000 3,000,324
11,003,093TOTAL YANKEE CORPORATE BONDS
AND NOTES(Identified Cost $13,996,337) 14,012,599
CORPORATE BONDS AND NOTES �� 39.4%Basic Materials �� 0.7%
Eastman Chemical Co.,3.500%, 12/01/21 2,000,000 2,041,071
Westlake Chemical Corp.,3.600%, 7/15/22 1,500,000 1,534,906
3,575,977Communications �� 1.0%
Alphabet, Inc., 3.625%, 5/19/21 863,000 866,652
Comcast CableCommunications Holdings,Inc., 9.455%, 11/15/22 4,000,000 4,588,525
5,455,177Consumer, Cyclical �� 2.4%
BMW US Capital LLC,3.100%, 4/12/21 ± 500,000 500,283
VF Corp., 2.050%, 4/23/22 3,000,000 3,049,866Walgreen Co., 3.100%, 9/15/22 2,000,000 2,073,557Walmart, Inc., (3-mo. USD
LIBOR + 0.230%), 0.427%,6/23/21 � 7,512,000 7,515,888
13,139,594Consumer, Non-cyclical �� 1.0%
Anthem, Inc., 3.300%, 1/15/23 4,000,000 4,200,627Mylan, Inc., 3.125%, 1/15/23 ± 1,100,000 1,146,581
5,347,208Energy �� 2.8%
Chevron Corp., (3-mo. USDLIBOR + 0.480%), 0.664%,3/03/22 � 1,640,000 1,646,099
Chevron Corp., (3-mo. USDLIBOR + 0.530%), 0.724%,11/15/21 � 7,645,000 7,670,442
ConocoPhillips Co., 2.400%,12/15/22 2,719,000 2,796,452
FACEAMOUNT VALUE��
Bank of Montreal, (3-mo.USD LIBOR + 0.460%),0.685%, 4/13/21 � $1,162,000 $1,162,158
Capital One Financial Corp.,3.200%, 1/30/23 3,000,000 3,142,138
Capital One Financial Corp.,4.750%, 7/15/21 934,000 945,392
Discover Financial Services,3.850%, 11/21/22 1,079,000 1,134,347
Goldman Sachs Group, Inc.(The), 3.200%, 2/23/23 4,000,000 4,186,715
Santander UK GroupHoldings PLC, 2.875%,8/05/21 750,000 756,284
Toronto-Dominion Bank(The) MTN, 3.250%, 6/11/21 502,000 504,836
Wells Fargo & Co. MTN,3.500%, 3/08/22 167,000 172,030
18,189,441Government �� 24.3%
Asian Development Bank,(3-mo. USD LIBOR +0.010%), 0.194%,12/15/21 � 10,000,000 10,002,262
U.S. Treasury Note, 0.125%,2/15/24 51,000,000 50,721,094
U.S. Treasury Note, 0.250%,3/15/24 53,500,000 53,355,801
U.S. Treasury Note, 2.125%,3/31/24 16,000,000 16,842,187
130,921,344Industrial �� 1.2%
CNH Industrial Capital LLC,3.875%, 10/15/21 500,000 508,596
Penske Truck Leasing Co. LP/ PTL Finance Corp.,4.250%, 1/17/23 ± 2,500,000 2,656,624
Ryder System, Inc. MTN,2.500%, 9/01/22 2,600,000 2,668,001
Ryder System, Inc. MTN,2.875%, 6/01/22 515,000 527,946
6,361,167Technology �� 2.5%
Apple, Inc., (3-mo. USDLIBOR + 0.500%),0.691%, 2/09/22 � 3,645,000 3,660,358
Micron Technology, Inc.,2.497%, 4/24/23 2,600,000 2,696,239
Oracle Corp., 2.500%, 10/15/22 3,000,000 3,098,714
Copyright © 2021 www.secdatabase.com. All Rights Reserved.Please Consider the Environment Before Printing This Document

The accompanying notes are an integral part of these portfolio of investments.
EOG Resources, Inc., 2.625%,3/15/23 2,000,000 2,077,139
Kinder Morgan EnergyPartners LP, 3.950%, 9/01/22 449,000 466,824
Williams Cos., Inc. (The),3.350%, 8/15/22 495,000 509,534
15,166,490Financial �� 3.4%
American Express Co.,2.650%, 12/02/22 1,000,000 1,037,493
Aon Corp., 2.200%, 11/15/22 4,500,000 4,622,646Bank of America Corp.
GMTN, 3.300%, 1/11/23 500,000 525,402
VMware, Inc., 2.950%, 8/21/22 3,983,000 4,108,401
13,563,712Utility �� 0.1%
Edison International, 2.950%,3/15/23 681,000 704,031
TOTAL CORPORATE BONDS ANDNOTES(Identified Cost $211,362,606) 212,424,141
U.S. GOVERNMENT & AGENCYOBLIGATIONS �� 27.5%
Agency Securities �� 5.3%Federal Farm Credit Banks,
(1-mo. USD LIBOR +0.045%), 0.151%, 4/16/21 � 28,350,000 28,351,493
Copyright © 2021 www.secdatabase.com. All Rights Reserved.Please Consider the Environment Before Printing This Document

SA U.S. Fixed Income FundPORTFOLIO OF INVESTMENTS � AS OF MARCH 31, 2021 (Unaudited) (Continued)
FACEAMOUNT VALUE��
U.S. GOVERNMENT & AGENCY OBLIGATIONS(Continued)
U.S. Treasury Securities �� 22.2%Treasury Floating Rate Note,
(3-mo. Treasury moneymarket yield + 0.055%),0.070%, 7/31/22 � $30,000,000 $30,016,340
Treasury Floating Rate Note,(3-mo. Treasury moneymarket yield + 0.114%),0.129%, 4/30/22 � 41,250,000 41,298,652
Treasury Floating Rate Note,(3-mo. Treasury moneymarket yield + 0.139%),0.154%, 4/30/21 � 48,250,000 48,253,147
119,568,139TOTAL U.S. GOVERNMENT & AGENCY
OBLIGATIONS(Identified Cost $147,866,987) 147,919,632
SHORT-TERM INVESTMENTS �� 28.5%Agency Securities �� 2.0%
Federal Home Loan BankDiscount Notes, 0.000%,4/27/21 # 11,000,000 11,000,079
Certificates of Deposits �� 0.6%Bank of Montreal, (SOFR +
0.200%), 0.210%,2/11/22 � 3,000,000 3,000,633
Commercial Paper �� 22.2%Apple, Inc., 0.000%,
4/20/21 # 5,000,000 4,999,868Apple, Inc., 0.000%, 4/19/21 # 4,250,000 4,249,809Australia & New Zealand
Banking Group Ltd.,0.000%, 4/26/21 # 5,000,000 4,999,514
Banque Et Caisse Epargne,0.000%, 5/06/21 # 5,000,000 4,999,222
Banque Et Caisse Epargne,0.000%, 6/10/21 # 2,000,000 1,999,606
Caisse Des Depots EtConsignations, 0.000%,6/03/21 # 3,000,000 2,999,392
Caisse Des Depots EtConsignations, 0.000%,5/04/21 # 1,500,000 1,499,814
Chevron Corp., 0.000%, 5/07/21 # 5,000,000 4,999,700
Chevron Corp., 0.000%, 4/08/21 # 1,000,000 999,988
DNB Bank ASA, 0.000%,7/08/21 # 2,750,000 2,749,153
FACEAMOUNT VALUE��
National Securities ClearingCorp., 0.000%, 4/14/21 # 5,000,000 4,999,874
Nederlandse WaterschapsbankNV, 0.000%, 4/07/21 # $2,300,000 $2,299,939
Proctor Gamble And Co.,0.000%, 4/06/21 # 13,000,000 12,999,819
Proctor Gamble And Co.,0.000%, 4/07/21 # 2,000,000 1,999,967
PSP Capital Inc., 0.000%, 4/21/21 # 3,000,000 2,999,667
PSP Capital Inc., 0.000%, 4/21/21 # 8,750,000 8,748,930
Queensland Treasury, 0.000%,6/04/21 # 3,000,000 2,999,447
Skandinaviska Enskilda BankenAB, 0.000%, 5/19/21 # 4,000,000 3,999,253
Svenska Handelsbanken AB,0.000%, 4/08/21 # 6,000,000 5,999,767
Swedbank, 0.000%, 6/11/21 # 1,000,000 999,788Total Capital Canada Ltd.,
0.000%, 5/05/21 # 5,000,000 4,998,961Total Capital Canada Ltd.,
0.000%, 5/06/21 # 6,000,000 5,998,717Westpac Banking Corp.,
0.000%, 4/07/21 # 2,000,000 1,999,947Westpac Banking Corp., (3-mo.
USD LIBOR + 0.010%),0.211%,2/07/22 ±� 3,000,000 2,999,497
119,788,331U.S. Treasury Securities �� 2.9%
Treasury Floating Rate Note,(3-mo. Treasury moneymarket yield + 0.049%),0.064%, 1/31/23 � 7,250,000 7,253,949
U.S. Treasury Bill, 0.000%,4/13/21 # 8,500,000 8,500,000
15,753,949Banks �� 0.3%
Bank of Montreal/Chicago IL,(3-mo. USD LIBOR +0.040%), 0.223%, 3/10/22 � 1,500,000 1,500,000
SHARESInvestment Company �� 0.5%
State Street Institutional U.S.Government Money MarketFund 0.036% 2,508,847 2,508,847
TOTAL SHORT-TERM INVESTMENTS(Identified Cost $153,546,954) 153,551,839
Total Investments �� 98.0%(Identified Cost $526,772,884) 527,908,211
Copyright © 2021 www.secdatabase.com. All Rights Reserved.Please Consider the Environment Before Printing This Document

The accompanying notes are an integral part of these portfolio of investments.
Exxon Mobil Corp., 0.000%,4/21/21 # 4,250,000 4,249,575
FMS Wertmanagement,0.000%, 4/29/21 # 4,000,000 3,999,533
Merck & Co., Inc., 0.000%,4/15/21 # 8,000,000 7,999,813
National Securities ClearingCorp., 0.000%, 5/04/21 # 5,000,000 4,999,771
Cash and Other Assets, LessLiabilities � 2.0% 10,804,220
Net Assets �� 100.0% $538,712,431
� See Note 1� Floating rate or variable rate note. Rate shown is as of
March 31, 2021.
Copyright © 2021 www.secdatabase.com. All Rights Reserved.Please Consider the Environment Before Printing This Document

SA U.S. Fixed Income FundPORTFOLIO OF INVESTMENTS � AS OF MARCH 31, 2021 (Unaudited) (Continued)
The accompanying notes are an integral part of these portfolio of investments.
± 144A Securities. Securities exempt from registrationunder Rule 144A of the Securities Act of 1933. Thesesecurities may be resold in transactions exempt fromregistration to qualified institutional buyers. Thesesecurities have been deemed by the Fund to be liquid andat March 31, 2021 amounted to $7,302,985 or 1.36% ofthe net assets of the Fund.
# Zero coupon bond
Key to abbreviations:
GMTN � Global Medium Term NoteMTN � Medium Term NoteUSD � U.S. DollarLIBOR � London Interbank Offered RateSOFR � Secured Overnight Financing Rate
Copyright © 2021 www.secdatabase.com. All Rights Reserved.Please Consider the Environment Before Printing This Document

Portfolio Sectors as of March 31, 2021(As a percentage of total investments (excluding short-term money market investment)) (Unaudited)
Sector PercentageGovernment 59.3 %Commercial Paper 15.6 %Financial 8.5 %Energy 3.8 %Technology 3.5 %Consumer, Non-cyclical 3.2 %Consumer, Cyclical 2.5 %Industrial 1.2 %Communications 1.0 %Basic Materials 0.7 %Certificates of Deposits 0.6 %Utilities 0.1 %
100.0 %
Copyright © 2021 www.secdatabase.com. All Rights Reserved.Please Consider the Environment Before Printing This Document

SA Global Fixed Income FundPORTFOLIO OF INVESTMENTS � AS OF MARCH 31, 2021 (Unaudited)
FACEAMOUNT VALUE��
BONDS AND NOTES �� 97.4%Australia �� 7.6%
ASB Finance Ltd.,0.500%, 6/10/22 EUR 800,000 $947,817
Australia & NewZealand BankingGroup Ltd.,(3-mo. Swap +0.750%),0.760%,7/16/21 � AUD 1,000,000 760,998
Australia & NewZealand BankingGroup Ltd.,(3-mo. Swap +0.760%),0.770%,1/16/25 � AUD 10,000,000 7,720,791
Australia & NewZealand BankingGroup Ltd.,(3-mo. Swap +0.770%),0.800%,8/29/24 � AUD 500,000 386,184
Australia & NewZealand BankingGroup Ltd.,(3-mo. Swap +0.880%),0.890%,2/08/22 � AUD 500,000 382,284
Australia & NewZealand BankingGroup Ltd.,(3-mo. Swap +1.000%),1.037%,3/07/22 � AUD 1,000,000 765,835
Australia & NewZealand BankingGroup Ltd.,(3-mo. Swap +1.100%),1.110%,2/08/24 � AUD 2,000,000 1,556,006
Australia & NewZealand BankingGroup Ltd.,(3-mo. Swap +1.130%),1.140%,8/16/21 � AUD 500,000 381,228
FACEAMOUNT VALUE��
National AustraliaBank Ltd., (3-mo.Swap + 0.920%),0.949%, 6/19/24 � AUD 2,000,000 $1,550,560
National AustraliaBank Ltd., (3-mo.Swap + 0.930%),0.960%, 9/26/23 � AUD 6,000,000 4,639,290
National AustraliaBank Ltd., 3.000%,5/12/21 AUD 1,643,000 1,251,518
National AustraliaBank Ltd. GMTN,0.350%, 9/07/22 EUR 3,150,000 3,733,915
National AustraliaBank Ltd. GMTN,0.875%, 1/20/22 EUR 2,620,000 3,105,970
Westpac BankingCorp., 0.250%, 1/17/22 EUR 1,575,000 1,858,029
Westpac BankingCorp., (3-mo. Swap+ 0.620%), 0.630%,5/16/22 � AUD 500,000 381,941
Westpac BankingCorp., (3-mo. Swap+ 0.880%), 0.890%,8/16/24 � AUD 2,500,000 1,937,545
Westpac BankingCorp., (3-mo. Swap+ 0.950%), 0.960%,11/16/23 � AUD 1,000,000 774,157
Westpac BankingCorp., (3-mo. Swap+ 1.110%), 1.120%,2/07/22 � AUD 1,000,000 766,061
Westpac BankingCorp., (3-mo. Swap+ 1.140%), 1.150%,4/24/24 � AUD 5,500,000 4,288,999
54,111,358Austria �� 0.7%
OesterreichischeKontrollbank AGGMTN, 0.500%,2/02/26 USD 5,000,000 4,873,006
Belgium �� 2.5%Dexia Credit Local SA,
0.250%, 6/02/22 EUR 5,850,000 6,925,434Dexia Credit Local SA,
0.625%, 1/21/22 EUR 300,000 355,133
Copyright © 2021 www.secdatabase.com. All Rights Reserved.Please Consider the Environment Before Printing This Document

The accompanying notes are an integral part of these portfolio ofinvestments.
AustraliaGovernmentBond, 0.250%,11/21/25 AUD 5,000,000 3,728,161
CommonwealthBank ofAustralia,0.500%,7/11/22 EUR 500,000 593,250
CommonwealthBank ofAustralia, (3-mo.Swap + 0.800%),0.810%,4/25/23 � AUD 3,500,000 2,691,523
CommonwealthBank ofAustralia, (3-mo.Swap + 0.880%),0.890%,7/25/22 � AUD 1,000,000 767,241
CommonwealthBank ofAustralia, (3-mo.Swap + 0.930%),0.940%,8/16/23 � AUD 500,000 386,472
CommonwealthBank ofAustralia,2.750%,8/16/21 AUD 2,500,000 1,916,926
CommonwealthBank ofAustralia,2.900%,7/12/21 AUD 1,790,000 1,369,653
National AustraliaBank Ltd.,(3-mo. Swap +0.770%),0.780%,1/21/25 � AUD 3,100,000 2,393,570
National AustraliaBank Ltd.,(3-mo. Swap +0.800%),0.811%,2/10/23 � AUD 2,000,000 1,537,249
National AustraliaBank Ltd.,(3-mo. Swap +0.900%),0.910%,5/16/23 � AUD 1,000,000 771,163
Dexia Credit Local SA,0.750%, 1/25/23 EUR 1,200,000 1,439,827
Dexia Credit Local SA,0.875%, 9/07/21 GBP 1,500,000 2,074,644
Dexia Credit Local SA,1.125%, 6/15/22 GBP 4,900,000 6,829,787
17,624,825Canada �� 19.9%
Bank of Montreal,(3-mo. EUREURIBOR +0.500%), 0.000%,9/28/21 �# EUR 6,277,000 7,379,779
Bank of Montreal,0.250%, 11/17/21 EUR 300,000 353,467
Bank of Montreal,1.610%, 10/28/21 CAD 10,000,000 8,020,530
Bank of MontrealMTN, (3-mo. Swap +0.920%), 0.939%,10/06/22 � AUD 1,000,000 767,407
Bank of MontrealMTN, (3-mo. Swap +0.990%), 1.027%,9/07/23 � AUD 3,500,000 2,698,827
Bank of Nova Scotia,(3-mo. Swap +0.760%), 0.797%,9/07/21 � AUD 1,000,000 761,592
Copyright © 2021 www.secdatabase.com. All Rights Reserved.Please Consider the Environment Before Printing This Document

National AustraliaBank Ltd.,(3-mo. Swap +0.900%),0.916%,7/05/22 � AUD 1,000,000 767,022
Copyright © 2021 www.secdatabase.com. All Rights Reserved.Please Consider the Environment Before Printing This Document

SA Global Fixed Income FundPORTFOLIO OF INVESTMENTS � AS OF MARCH 31, 2021 (Unaudited) (Continued)
FACEAMOUNT VALUE��
BONDS AND NOTES (Continued)Canada (Continued)
Bank of Nova Scotia(The), 0.375%, 4/06/22 EUR 2,500,000 $2,954,594
Bank of Nova Scotia(The), 1.750%, 12/23/22 GBP 1,000,000 1,409,137
Bank of Nova Scotia(The), 1.900%, 12/02/21 CAD 14,500,000 11,664,614
Canada Housing Trust No1, (CDOR - 0.060%),0.378%, 9/15/23 ±� CAD 16,000,000 12,791,342
Canada Housing Trust No1, (CDOR - 0.040%),0.398%, 3/15/25 ±� CAD 4,000,000 3,202,578
Canadian Imperial Bankof Commerce, 0.750%,3/22/23 EUR 2,300,000 2,751,850
Canadian Imperial Bankof Commerce, 2.040%,3/21/22 CAD 2,500,000 2,024,648
Canadian Imperial Bankof Commerce, 2.300%,7/11/22 CAD 1,000,000 815,167
Canadian Imperial Bankof Commerce, 2.900%,9/14/21 CAD 9,000,000 7,246,694
Export DevelopmentCanada, (3-mo. GBPLIBOR + 0.080%),0.136%, 11/15/21 � GBP 3,000,000 4,135,934
Export DevelopmentCanada, (SONIA +0.310%), 0.359%, 5/29/24 � GBP 1,500,000 2,075,447
Export DevelopmentCanada, (SONIA +0.330%), 0.379%, 1/17/25 � GBP 1,000,000 1,385,250
Export DevelopmentCanada, 2.400%, 6/07/21 AUD 2,000,000 1,525,156
Hydro-Quebec, (CDOR +0.200%), 0.648%, 4/14/23 � CAD 3,000,000 2,399,833
Province of ManitobaCanada, 1.500%, 12/15/22 GBP 825,000 1,159,093
Province of OntarioCanada, (CDOR +0.050%), 0.488%, 8/21/23 � CAD 8,000,000 6,403,819
FACEAMOUNT VALUE��
Toronto-Dominion Bank(The), 3.005%, 5/30/23
CAD15,000,000 $12,532,705
142,282,406Denmark �� 0.2%
Kommunekredit,0.500%, 1/28/26 USD 1,800,000 1,758,582
Finland �� 0.7%Kuntarahoitus Oyj,
0.625%, 3/20/26 USD 1,600,000 1,571,533OP Corporate Bank plc,
0.750%, 3/03/22 EUR 900,000 1,066,837OP Corporate Bank plc,
2.500%, 5/20/22 GBP 1,642,000 2,319,1804,957,550
France �� 7.2%Agence Francaise de
Developpement EPIC,0.625%, 1/22/26 USD 2,800,000 2,743,216
Agence Francaise deDeveloppement EPIC,3.125%, 1/04/24 EUR 10,000,000 12,883,013
Caisse d�Amortissementde la Dette Sociale,3.375%, 4/25/21 EUR 500,000 587,571
Sanofi, 0.500%, 3/21/23 EUR 14,200,000 16,903,978Sanofi, 1.125%, 3/10/22 EUR 500,000 592,590SNCF Reseau, 0.100%,
5/27/21 EUR 2,400,000 2,816,633SNCF Reseau, 5.500%,
12/01/21 GBP 4,628,000 6,601,102Total Capital Canada
Ltd., 1.125%, 3/18/22 EUR 2,000,000 2,380,672Total Capital
International SA,0.250%, 7/12/23 EUR 2,700,000 3,207,224
Total CapitalInternational SA,2.125%, 3/15/23 EUR 2,000,000 2,458,899
UNEDIC ASSEO,0.300%, 11/04/21 EUR 500,000 589,193
51,764,091Germany �� 6.7%
Allianz Finance II BV,3.500%, 2/14/22 EUR 600,000 727,593
Deutsche Bahn FinanceGMBH, 2.750%,6/20/22 GBP 1,780,000 2,530,493
Deutsche Bahn FinanceGMBH, 4.375%,9/23/21 EUR 500,000 599,895
Copyright © 2021 www.secdatabase.com. All Rights Reserved.Please Consider the Environment Before Printing This Document

The accompanying notes are an integral part of these portfolio ofinvestments.
Province of OntarioCanada, (CDOR +0.150%), 0.585%, 6/27/22 � CAD 12,000,000 9,591,979
Province of OntarioCanada, 0.625%, 1/21/26 USD 1,000,000 978,636
Province of QuebecCanada, (CDOR +0.405%), 0.855%, 10/13/24 � CAD 15,000,000 12,171,521
Royal Bank of Canada,1.583%, 9/13/21 CAD 24,000,000 19,213,750
Toronto-Dominion Bank(The), 0.750%, 1/06/26@ USD 1,500,000 1,464,832
Toronto-Dominion Bank(The), (3-mo. Swap +1.000%), 1.016%, 7/10/24 � AUD 2,000,000 1,542,655
Toronto-Dominion Bank(The), 1.128%, 12/09/25 CAD 1,100,000 859,570
Kreditanstalt fuerWiederaufbau,0.625%, 1/22/26 @ USD 3,500,000 3,441,219
Kreditanstalt fuerWiederaufbau,0.750%, 2/19/26 CAD 1,600,000 1,244,491
Kreditanstalt fuerWiederaufbau,1.625%, 4/03/24 NOK 19,000,000 2,263,064
Kreditanstalt fuerWiederaufbau,2.000%, 2/07/22 CAD 15,000,000 12,120,196
Kreditanstalt fuerWiederaufbau,6.250%, 5/19/21 AUD 2,000,000 1,530,234
LandeskreditbankBaden-WuerttembergFoerderbank, (SOFR+ 0.350%), 0.360%,3/15/22 � USD 2,600,000 2,605,733
Copyright © 2021 www.secdatabase.com. All Rights Reserved.Please Consider the Environment Before Printing This Document

SA Global Fixed Income FundPORTFOLIO OF INVESTMENTS � AS OF MARCH 31, 2021 (Unaudited) (Continued)
FACEAMOUNT VALUE��
BONDS AND NOTES (Continued)Germany (Continued)
LandeskreditbankBaden-WuerttembergFoerderbank,1.125%, 5/17/21 GBP 543,000 $749,481
LandwirtschaftlicheRentenbank,0.875%, 3/30/26 USD 8,000,000 7,944,322
LandwirtschaftlicheRentenbank MTN,4.250%, 1/09/25 AUD 3,780,000 3,252,674
State of North Rhine-WestphaliaGermany, (3-mo.GBP LIBOR +0.060%), 0.099%,10/29/21 � GBP 6,000,000 8,270,126
State of Saxony-Anhalt, 3.750%,4/06/21 EUR 250,000 293,175
47,572,696Japan �� 2.6%
Toyota FinanceAustralia Ltd.,0.000%, 4/09/21 # EUR 3,000,000 3,518,262
Toyota FinanceAustralia Ltd.,0.500%, 4/06/23 EUR 4,900,000 5,835,848
Toyota Motor CreditCorp., 0.000%,7/21/21 # EUR 400,000 469,745
Toyota Motor CreditCorp., 0.750%,7/21/22 EUR 2,500,000 2,973,053
Toyota Motor FinanceNetherlands BV,0.250%, 1/10/22 EUR 912,000 1,074,852
Toyota Motor FinanceNetherlands BV,0.625%, 9/26/23 EUR 4,000,000 4,792,862
18,664,622Netherlands �� 3.3%
Bank NederlandseGemeenten NV,1.000%, 3/15/22 GBP 500,000 694,856
FACEAMOUNT VALUE��
Equinor ASA,1.750%, 1/22/26 USD 1,900,000 $1,944,553
Norway GovernmentBond, 1.500%,2/19/26 ± NOK 25,000,000 2,986,794
Norway GovernmentBond, 1.750%,3/13/25 ± NOK 19,000,000 2,293,311
Norway GovernmentBond, 3.000%,3/14/24 ± NOK 30,000,000 3,739,990
11,562,306Singapore �� 1.7%
DBS Bank Ltd. MTN,(3-mo. Swap +0.630%), 0.667%,9/13/22 � AUD 2,500,000 1,910,899
Monetary Authority ofSingapore Bill,0.000%, 4/09/21 # SGD 2,500,000 1,858,292
Monetary Authority ofSingapore Bill,0.000%, 4/30/21 # SGD 6,500,000 4,830,441
United Overseas BankLtd. MTN, (3-mo.Swap + 0.530%),0.540%, 7/25/22 � AUD 4,500,000 3,433,053
12,032,685Supranational �� 13.8%
African DevelopmentBank, 0.875%,3/23/26 USD 11,850,000 11,754,160
Asian DevelopmentBank, (SONIA +0.250%), 0.299%,10/12/23 @� GBP 998,000 1,380,122
Asian DevelopmentBank, (SONIA +0.260%), 0.309%,2/01/22 � GBP 2,500,000 3,452,462
Asian DevelopmentBank, (SONIA +0.290%), 0.338%,3/19/24 @� GBP 4,669,000 6,464,434
Asian DevelopmentBank GMTN,(FEDERAL +0.250%), 0.320%,5/28/24 � USD 6,750,000 6,752,121
Asian DevelopmentBank GMTN,0.500%, 2/04/26 USD 2,500,000 2,443,735
Copyright © 2021 www.secdatabase.com. All Rights Reserved.Please Consider the Environment Before Printing This Document

The accompanying notes are an integral part of these portfolio ofinvestments.
Cooperatieve CentraleRaiffeisen-BoerenleenbankBA, (SOFR +0.300%), 0.335%,1/12/24 � USD 6,000,000 6,006,240
Cooperatieve CentraleRaiffeisen-BoerenleenbankBA, 4.750%, 6/06/22 EUR 5,370,000 6,682,529
Cooperatieve CentraleRaiffeisen-BoerenleenbankBA GMTN,4.000%, 1/11/22 EUR 5,364,000 6,509,041
NederlandseWaterschapsbankNV, (3-mo. USDLIBOR + 0.070%),0.254%, 12/15/21±� USD 2,150,000 2,151,070
Shell InternationalFinance BV,1.000%, 4/06/22 EUR 600,000 713,543
Shell InternationalFinance BV,1.250%, 3/15/22 EUR 625,000 744,643
23,501,922New Zealand �� 0.2%
ANZ New ZealandInt�l Ltd., 0.400%,3/01/22 EUR 355,000 419,363
Bank of NewZealand, 1.000%,3/03/26 ± USD 1,000,000 980,072
1,399,435Norway �� 1.6%
Equinor ASA,0.875%, 2/17/23 EUR 500,000 597,658
EUROFIMA, (3-mo.USD LIBOR +0.100%), 0.277%,3/11/22 � USD 3,500,000 3,499,125
EUROFIMA, (3-mo.USD LIBOR +0.090%), 0.284%,11/15/21 � USD 5,600,000 5,604,928
European Bank forReconstruction &Development,(SONIA + 0.260%),0.309%, 1/18/22 � GBP 1,750,000 2,416,232
European Bank forReconstruction &DevelopmentGMTN, (SOFR +0.260%), 0.270%,3/13/23 � USD 3,000,000 3,008,842
European Bank forReconstruction &DevelopmentGMTN, (SONIA +0.250%), 0.299%,2/27/23 � GBP 772,000 1,066,886
European Bank forReconstruction &DevelopmentGMTN, (SONIA +0.300%), 0.349%,2/28/24 @� GBP 4,329,000 5,998,460
Copyright © 2021 www.secdatabase.com. All Rights Reserved.Please Consider the Environment Before Printing This Document

SA Global Fixed Income FundPORTFOLIO OF INVESTMENTS � AS OF MARCH 31, 2021 (Unaudited) (Continued)
FACEAMOUNT VALUE��
BONDS AND NOTES (Continued)Supranational (Continued)
European Bank forReconstruction &Development GMTN,(SONIA + 0.310%),0.359%, 11/13/24 � GBP 1,700,000 $2,359,033
European InvestmentBank, (SONIA +0.280%), 0.329%, 1/10/22 @� GBP 4,500,000 6,215,328
European InvestmentBank, (SONIA +0.310%), 0.359%, 1/15/25 � GBP 1,550,000 2,152,344
European InvestmentBank, 0.375%, 3/26/26 USD 7,000,000 6,798,662
European InvestmentBank, (SONIA +0.350%), 0.398%, 6/29/23 � GBP 700,000 970,192
European InvestmentBank, (SONIA +1.000%), 1.048%, 9/08/25 � GBP 3,000,000 4,292,955
Inter-AmericanDevelopment Bank,2.750%, 10/30/25 AUD 300,000 246,717
Inter-AmericanDevelopment Bank,4.400%, 1/26/26 CAD 554,000 507,210
Inter-AmericanDevelopment BankMTN, 4.750%, 8/27/24 AUD 6,500,000 5,632,780
Inter-AmericanInvestment Corp.,(3-mo. USD LIBOR +0.090%), 0.314%, 10/12/21 � USD 2,600,000 2,600,905
International Bank forReconstruction &Development, (SONIA+ 0.270%), 0.319%,5/15/24 � GBP 6,023,000 8,337,355
International Bank forReconstruction &Development, 1.750%,11/06/24 NOK 2,000,000 239,104
International Bank forReconstruction &Development GMTN,0.625%, 1/14/26 CAD 2,000,000 1,548,866
FACEAMOUNT VALUE��
Skandinaviska EnskildaBanken AB, 0.850%,9/02/25 ± USD 500,000 $491,082
Skandinaviska EnskildaBanken AB GMTN,0.300%, 2/17/22 EUR 918,000 1,084,012
Svensk Exportkredit AB,(SOFR + 1.000%),1.016%, 5/25/23 � USD 6,000,000 6,112,980
Svenska HandelsbankenAB, 0.250%, 2/28/22 EUR 250,000 295,165
Svenska HandelsbankenAB, 1.125%, 12/14/22 EUR 1,633,000 1,965,493
Svenska HandelsbankenAB, 2.375%, 1/18/22 GBP 400,000 560,639
Svenska HandelsbankenAB, 4.375%, 10/20/21 EUR 1,020,000 1,227,844
24,644,452Switzerland �� 3.5%
Nestle FinanceInternational Ltd.,0.750%, 11/08/21 EUR 1,250,000 1,476,432
Nestle FinanceInternational Ltd.,0.750%, 5/16/23 EUR 3,000,000 3,589,620
Novartis Finance SA,0.125%, 9/20/23 EUR 3,500,000 4,150,687
Novartis Finance SA,0.500%, 8/14/23 EUR 13,460,000 16,064,165
25,280,904United States �� 21.7%
3M Co., 0.950%, 5/15/23 EUR 3,120,000 3,756,3583M Co., 1.875%, 11/15/21 EUR 500,000 594,704Apple, Inc., 0.700%, 2/08/
26 USD 1,175,000 1,152,984Apple, Inc., 3.250%, 2/23/
26 USD 1,192,000 1,302,222Berkshire Hathaway, Inc.,
0.625%, 1/17/23 EUR 1,767,000 2,103,502Berkshire Hathaway, Inc.,
0.750%, 3/16/23 EUR 400,000 476,977Berkshire Hathaway, Inc.,
1.300%, 3/15/24 EUR 560,000 682,600Cisco Systems Inc/
Delaware, 2.950%, 2/28/26 USD 500,000 543,390
Johnson & Johnson,0.250%, 1/20/22 EUR 1,650,000 1,944,773
Merck & Co., Inc., 0.750%,2/24/26 @ USD 3,700,000 3,644,000
Merck & Co., Inc., 1.125%,10/15/21 EUR 1,000,000 1,177,801
Copyright © 2021 www.secdatabase.com. All Rights Reserved.Please Consider the Environment Before Printing This Document

The accompanying notes are an integral part of these portfolio of investments.
International FinanceCorp., (SONIA +0.250%), 0.299%, 1/18/22 � GBP 1,000,000 1,380,659
Nordic Investment Bank,1.500%, 3/13/25 NOK 10,000,000 1,182,981
Nordic Investment Bank,1.875%, 4/10/24 NOK 4,000,000 479,468
98,786,066Sweden �� 3.5%
Kommuninvest I SverigeAB, 0.250%, 6/01/22 SEK 84,380,000 9,701,135
Kommuninvest I SverigeAB, 0.750%, 2/22/23 SEK 10,000,000 1,163,321
Kommuninvest I SverigeAB, 1.000%, 11/13/23 SEK 17,370,000 2,042,781
National SecuritiesClearing Corp., 0.750%,12/07/25 USD 1,000,000 976,044
National SecuritiesClearing Corp., 0.750%,12/07/25 ± USD 3,855,000 3,762,648
Pfizer, Inc., 0.250%, 3/06/22 EUR 5,075,000 5,985,191
Procter & Gamble Co.(The), 1.125%, 11/02/23 EUR 2,000,000 2,433,130
Procter & Gamble Co.(The), 2.000%, 11/05/21 EUR 794,000 944,565
Procter & Gamble Co.(The), 2.000%, 8/16/22 EUR 1,600,000 1,937,861
Roche Holdings, Inc.,0.991%, 3/05/26 ±@ USD 1,300,000 1,288,957
U.S. Treasury Note,0.375%, 1/31/26 USD 45,000,000 43,864,453
Copyright © 2021 www.secdatabase.com. All Rights Reserved.Please Consider the Environment Before Printing This Document
SA Global Fixed Income FundPORTFOLIO OF INVESTMENTS � AS OF MARCH 31, 2021 (Unaudited) (Continued)
FACEAMOUNT VALUE��
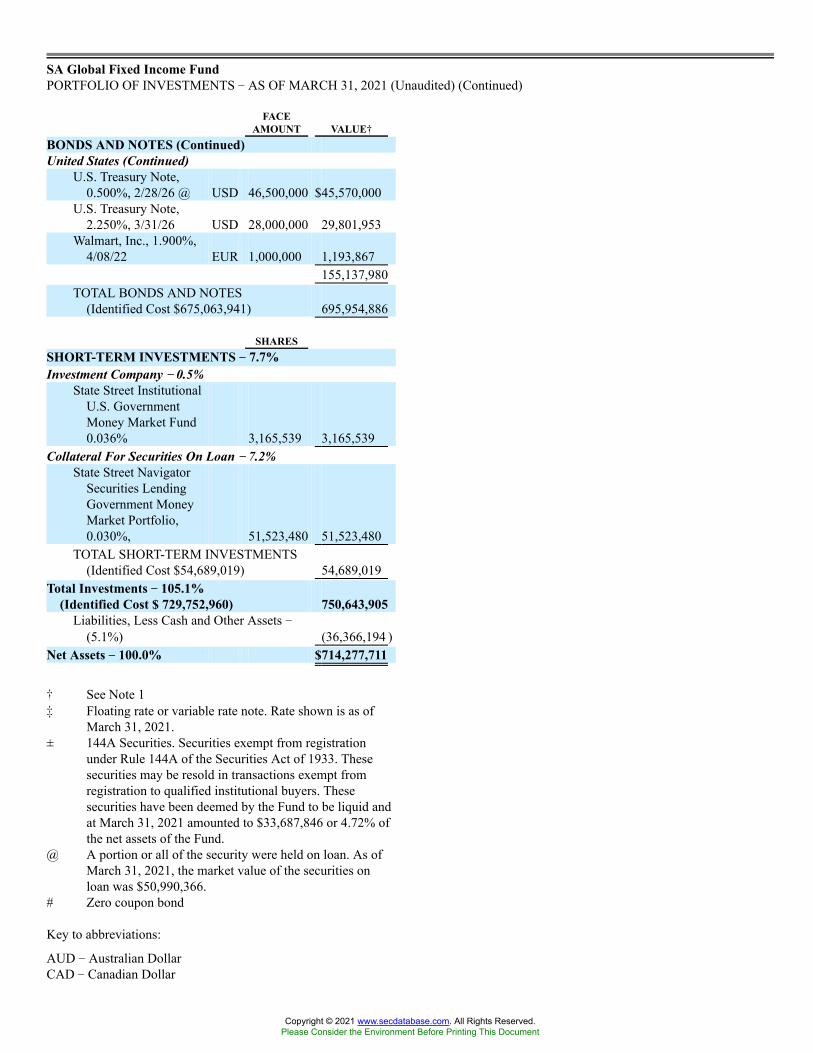
BONDS AND NOTES (Continued)United States (Continued)
U.S. Treasury Note,0.500%, 2/28/26 @ USD 46,500,000 $45,570,000
U.S. Treasury Note,2.250%, 3/31/26 USD 28,000,000 29,801,953
Walmart, Inc., 1.900%,4/08/22 EUR 1,000,000 1,193,867
155,137,980TOTAL BONDS AND NOTES
(Identified Cost $675,063,941) 695,954,886
SHARESSHORT-TERM INVESTMENTS �� 7.7%Investment Company �� 0.5%
State Street InstitutionalU.S. GovernmentMoney Market Fund0.036% 3,165,539 3,165,539
Collateral For Securities On Loan �� 7.2%State Street Navigator
Securities LendingGovernment MoneyMarket Portfolio,0.030%, 51,523,480 51,523,480
TOTAL SHORT-TERM INVESTMENTS(Identified Cost $54,689,019) 54,689,019
Total Investments �� 105.1%(Identified Cost $ 729,752,960) 750,643,905
Liabilities, Less Cash and Other Assets �(5.1%) (36,366,194 )
Net Assets �� 100.0% $714,277,711
� See Note 1� Floating rate or variable rate note. Rate shown is as of
March 31, 2021.± 144A Securities. Securities exempt from registration
under Rule 144A of the Securities Act of 1933. Thesesecurities may be resold in transactions exempt fromregistration to qualified institutional buyers. Thesesecurities have been deemed by the Fund to be liquid andat March 31, 2021 amounted to $33,687,846 or 4.72% ofthe net assets of the Fund.
@ A portion or all of the security were held on loan. As ofMarch 31, 2021, the market value of the securities onloan was $50,990,366.
# Zero coupon bond
Key to abbreviations:
AUD � Australian DollarCAD � Canadian Dollar
Copyright © 2021 www.secdatabase.com. All Rights Reserved.Please Consider the Environment Before Printing This Document

The accompanying notes are an integral part of these portfolio ofinvestments.
EUR � Euro CurrencyGBP � British PoundGMTN � Global Medium Term NoteMTN � Medium Term NoteNOK � Norwegian KroneSEK � Swedish KronaSGD � Singapore DollarUSD � U.S. DollarLIBOR � London Interbank Offered RateSOFR � Secured Overnight Financing RateSONIA � Sterling Overnight Index Average
Copyright © 2021 www.secdatabase.com. All Rights Reserved.Please Consider the Environment Before Printing This Document

SA Global Fixed Income FundPORTFOLIO OF INVESTMENTS � AS OF MARCH 31, 2021 (Unaudited) (Continued)
Forward Foreign Currency Exchange Contracts sold outstanding as of March 31, 2021
SettlementDate
CurrencyPurchased
CurrencySold Counterparty
TotalValue
UnrealizedAppreciation
UnrealizedDepreciation
04/07/21USD 2,737,823 AUD 3,609,880
Australia and New ZealandBanking Group $2,741,905 $� $(4,082 )
04/07/21 USD 64,851,638 AUD 85,144,846 State Street Bank and Trust Co. 64,672,255 179,383 �04/09/21 USD 50,504,745 GBP 36,882,656 Bank of America N.A. 50,846,873 � (342,129 )04/12/21 USD 89,496,409 EUR 73,867,678 State Street Bank and Trust Co. 86,635,390 2,861,019 �04/13/21 USD 29,483,750 SEK 244,946,371 State Street Bank and Trust Co. 28,048,847 1,434,903 �04/14/21 USD 13,358,653 NOK 113,402,218 State Street Bank and Trust Co. 13,258,657 99,996 �04/15/21 USD 72,454,503 EUR 59,989,848 State Street Bank and Trust Co. 70,363,214 2,091,289 �04/21/21 USD 89,258,940 EUR 73,467,589 State Street Bank and Trust Co. 86,182,238 3,076,703 �04/27/21 USD 516,068 CAD 648,587 Bank of America N.A. 516,132 � (64 )04/27/21 USD 124,862,155 CAD 155,652,588 State Street Bank and Trust Co. 123,865,129 997,026 �04/27/21 USD 444,285 CAD 558,572 State Street Bank and Trust Co. 444,500 � (215 )05/18/21 USD 47,212,460 GBP 34,300,208 HSBC Bank USA 47,292,455 � (79,996 )06/09/21 USD 12,615,030 SGD 16,995,710 State Street Bank and Trust Co. 12,630,329 � (15,299 )
$10,740,317 $(441,784 )
Forward Foreign Currency Exchange Contracts purchased outstanding as of March 31, 2021
SettlementDate
CurrencyPurchased
CurrencySold Counterparty
TotalValue
UnrealizedAppreciation
UnrealizedDepreciation
04/09/21 GBP 5,036,382 USD 6,893,901 State Street Bank and Trust Co. $6,943,217 $49,315 $�04/09/21 GBP 1,044,343 USD 1,451,593 State Street Bank and Trust Co. 1,439,744 � (11,850 )04/12/21
EUR 5,166,440 USD 6,059,278Australia and New Zealand
Banking Group 6,059,437 159 �04/12/21 EUR 20,076,234 USD 24,023,889 State Street Bank and Trust Co. 23,546,325 � (477,564 )04/13/21 SEK 7,382,470 USD 845,713 HSBC Bank USA 845,368 � (345 )04/13/21 SEK 15,104,893 USD 1,730,366 Morgan Stanley & Co., Inc. 1,729,664 � (703 )04/13/21 SEK 109,496,678 USD 12,942,309 State Street Bank and Trust Co. 12,538,482 � (403,828 )04/15/21
EUR 11,928,322 USD 13,985,588Australia and New Zealand
Banking Group 13,990,952 5,364 �04/15/21
EUR 2,052,882 USD 2,417,737Australia and New Zealand
Banking Group 2,407,864 � (9,873 )04/15/21 EUR 2,039,744 USD 2,437,434 State Street Bank and Trust Co. 2,392,454 � (44,980 )04/21/21 EUR 24,780,161 USD 29,585,738 State Street Bank and Trust Co. 29,068,734 � (517,005 )05/18/21 GBP 1,523,264 USD 2,100,149 Bank of America N.A. 2,100,247 97 �06/09/21 SGD 7,999,595 USD 5,941,207 State Street Bank and Trust Co. 5,944,883 3,676 �
$58,612 $(1,466,147)Total $10,798,929 $(1,907,931)
The accompanying notes are an integral part of these portfolio of investments.
Copyright © 2021 www.secdatabase.com. All Rights Reserved.Please Consider the Environment Before Printing This Document

Country Weightings as of March 31, 2021(As a percentage of long-term investments) (Unaudited)
Country PercentageUnited States 22.3 %Canada 20.4 %Supranational 14.2 %Australia 7.8 %France 7.4 %Germany 6.8 %Switzerland 3.6 %Sweden 3.6 %Netherlands 3.4 %Others 10.5 %
100.0 %
Copyright © 2021 www.secdatabase.com. All Rights Reserved.Please Consider the Environment Before Printing This Document

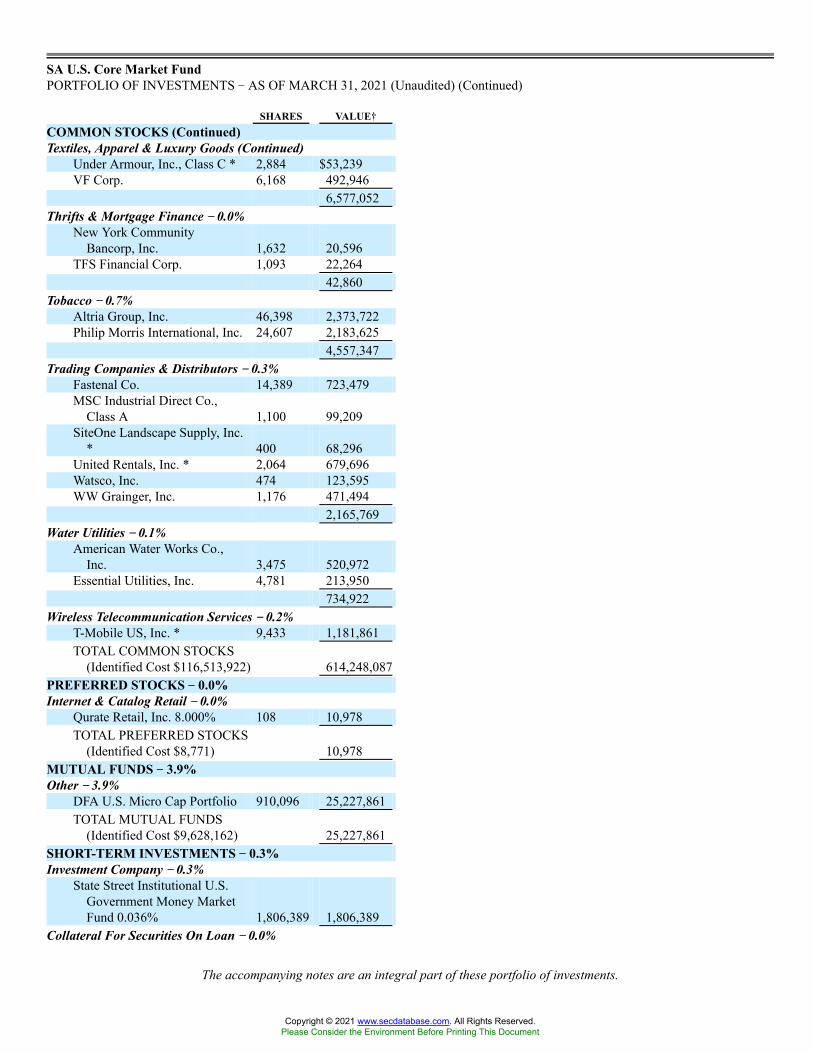
SA U.S. Core Market FundPORTFOLIO OF INVESTMENTS � AS OF MARCH 31, 2021 (Unaudited)
SHARES VALUE��COMMON STOCKS �� 95.7%Aerospace & Defense �� 1.8%
Axon Enterprise, Inc. * 500 $71,210Boeing Co. (The) 9,496 2,418,821BWX Technologies, Inc. 2,913 192,083Curtiss-Wright Corp. 847 100,454General Dynamics Corp. 4,790 869,672HEICO Corp. 909 114,352HEICO Corp., Class A 1,141 129,618Huntington Ingalls Industries, Inc. 1,027 211,408L3Harris Technologies, Inc. 2,477 502,038Lockheed Martin Corp. 6,768 2,500,776Mercury Systems, Inc. * 613 43,309Northrop Grumman Corp. 4,213 1,363,495Raytheon Technologies Corp. 23,214 1,793,746Teledyne Technologies, Inc. * 660 273,009Textron, Inc. 4,852 272,100TransDigm Group, Inc. * 1,007 592,036
11,448,127Air Freight & Logistics �� 0.8%
CH Robinson Worldwide, Inc. 2,800 267,204Expeditors International of
Washington, Inc. 3,525 379,607FedEx Corp. 5,241 1,488,654United Parcel Service, Inc., Class B 15,345 2,608,497XPO Logistics, Inc. * 1,934 238,462
4,982,424Airlines �� 0.2%
Alaska Air Group, Inc. 3,201 221,541American Airlines Group, Inc. 4,400 105,160Delta Air Lines, Inc. 4,487 216,632JetBlue Airways Corp. * 3,600 73,224Southwest Airlines Co. 8,856 540,748United Airlines Holdings, Inc. * 5,620 323,375
1,480,680Auto Components �� 0.2%
Aptiv PLC 4,280 590,212Autoliv, Inc. 1,465 135,952BorgWarner, Inc. 3,685 170,837Dana, Inc. 1,400 34,062Gentex Corp. 5,624 200,608Lear Corp. 1,257 227,831
1,359,502Automobiles �� 1.2%
Ford Motor Co. * 21,768 266,658General Motors Co. 7,100 407,966Tesla, Inc. * 10,190 6,806,207Thor Industries, Inc. 1,179 158,858
7,639,689Beverages �� 1.7%
Boston Beer Co., Inc. (The),Class A * 261 314,839
SHARES VALUE��Alnylam Pharmaceuticals, Inc. * 1,198 $169,146Amgen, Inc. 15,052 3,745,088Arena Pharmaceuticals, Inc. * 1,048 72,721Biogen, Inc. * 4,161 1,164,040BioMarin Pharmaceutical, Inc. * 1,433 108,206Emergent BioSolutions, Inc. * 750 69,682Exact Sciences Corp. *@ 1,421 187,259Exelixis, Inc. * 3,578 80,827Gilead Sciences, Inc. 31,121 2,011,350Incyte Corp. * 656 53,313Ionis Pharmaceuticals, Inc. * 1,498 67,350Moderna, Inc. * 383 50,154Neurocrine Biosciences, Inc. * 608 59,128Regeneron Pharmaceuticals, Inc. * 1,450 686,053Sarepta Therapeutics, Inc. * 770 57,388Seagen, Inc. * 1,165 161,772United Therapeutics Corp. * 835 139,670Vertex Pharmaceuticals, Inc. * 2,363 507,785
13,408,489Building Products �� 0.6%
A.O. Smith Corp. 3,112 210,402AAON, Inc. 600 42,006Allegion plc 3,064 384,900Armstrong World Industries, Inc. 1,390 125,225Carrier Global Corp. 12,472 526,568Fortune Brands Home & Security,
Inc. 2,930 280,752Johnson Controls International plc 1 60Lennox International, Inc. 835 260,178Masco Corp. 5,802 347,540Owens Corning 2,802 258,036Simpson Manufacturing Co., Inc. 1,080 112,028Trane Technologies PLC 5,163 854,786Trex Co., Inc. * 3,457 316,454
3,718,935Capital Markets �� 2.5%
Affiliated Managers Group, Inc. 600 89,418Ameriprise Financial, Inc. 3,129 727,336Ares Management Corp., Class A 406 22,748Artisan Partners Asset Management,
Inc., Class A 764 39,858BlackRock, Inc. 1,229 926,617Blackstone Group, Inc. (The),
Class A 6,683 498,084CBOE Holdings, Inc. 2,123 209,519Charles Schwab Corp. (The) 24,192 1,576,834CME Group, Inc. 2,177 444,609Cohen & Steers, Inc. 300 19,599FactSet Research Systems, Inc. 1,171 361,359Franklin Resources, Inc. 4,676 138,409Goldman Sachs Group, Inc. (The) 1,169 382,263Hamilton Lane, Inc. Class A 723 64,029Houlihan Lokey, Inc. 1,466 97,504
Copyright © 2021 www.secdatabase.com. All Rights Reserved.Please Consider the Environment Before Printing This Document

The accompanying notes are an integral part of these portfolio of investments.
Brown-Forman Corp., Class A 1,202 76,531Brown-Forman Corp., Class B 8,000 551,760Coca-Cola Co. (The) 76,728 4,044,333Constellation Brands, Inc., Class A 2,222 506,616Keurig Dr Pepper, Inc. 3,375 115,999Molson Coors Brewing Co.,
Class B 1,400 71,610Monster Beverage Corp. * 6,606 601,741PepsiCo, Inc. 32,416 4,585,243
10,868,672Biotechnology �� 2.1%
AbbVie, Inc. 35,618 3,854,580ACADIA Pharmaceuticals, Inc. * 971 25,052Alexion Pharmaceuticals, Inc. * 902 137,925
Interactive Brokers Group, Inc.,Class A 1,683 122,926
Intercontinental Exchange, Inc. 7,466 833,803Janus Henderson Group PLC 1 31KKR & Co., Inc. 7,268 355,042LPL Financial Holdings, Inc. 2,331 331,375MarketAxess Holdings, Inc. 900 448,128Moody�s Corp. 4,562 1,362,259Morgan Stanley 27,370 2,125,554Morningstar, Inc. 500 112,520MSCI, Inc. 1,585 664,559Nasdaq, Inc. 1,912 281,943Northern Trust Corp. 3,260 342,658Raymond James Financial, Inc. 2,130 261,053S&P Global, Inc. 5,301 1,870,564
Copyright © 2021 www.secdatabase.com. All Rights Reserved.Please Consider the Environment Before Printing This Document

SA U.S. Core Market FundPORTFOLIO OF INVESTMENTS � AS OF MARCH 31, 2021 (Unaudited) (Continued)
SHARES VALUE��COMMON STOCKS (Continued)Capital Markets (Continued)
SEI Investments Co. 3,132 $190,833State Street Corp. 1,628 136,768Stifel Financial Corp. 2,529 162,008T. Rowe Price Group, Inc. 4,878 837,065
16,037,275Chemicals �� 1.5%
Air Products & Chemicals, Inc. 4,088 1,150,118Albemarle Corp. 956 139,681Ashland Global Holdings, Inc. 970 86,107Balchem Corp. 893 111,991Celanese Corp. 1,968 294,826CF Industries Holdings, Inc. 2,192 99,473Corteva, Inc. 4,128 192,447Dow, Inc. 5,563 355,698DuPont de Nemours, Inc. 1,400 108,192Eastman Chemical Co. 2,800 308,336Ecolab, Inc. 5,708 1,221,912FMC Corp. 1,483 164,035Huntsman Corp. 4,705 135,645International Flavors & Fragrances,
Inc. 2,270 316,915Linde PLC 4,843 1,356,718LyondellBasell Industries NV,
Class A 6,211 646,255NewMarket Corp. 200 76,032PPG Industries, Inc. 4,454 669,258RPM International, Inc. 3,184 292,450Scotts Miracle-Gro Co. (The) 1,264 309,642Sherwin Williams Co. (The) 2,324 1,715,135Valvoline, Inc. 2,246 58,553
9,809,419Commercial Banks �� 2.6%
Ameris Bancorp 700 36,757Associated Banc-Corp. 1,991 42,488Bank of America Corp. 77,670 3,005,052Bank of Hawaii Corp. 300 26,847Bank OZK 600 24,510BankUnited, Inc. 539 23,689BOK Financial Corp. 300 26,796Cathay General Bancorp 500 20,390Citigroup, Inc. 10,651 774,860Columbia Banking System, Inc. 500 21,545Comerica, Inc. 242 17,361Commerce Bancshares, Inc. 2,163 165,707Community Bank System, Inc. 932 71,503Cullen/Frost Bankers, Inc. 532 57,860CVB Financial Corp. 900 19,881East West Bancorp, Inc. 2,039 150,478Fifth Third Bancorp 7,840 293,608First Citizens Bancshares, Inc.,
Class A 112 93,606
SHARES VALUE��Signature Bank 385 $87,049SVB Financial Group * 882 435,408Synovus Financial Corp. 329 15,052TCF Financial Corp. 1 46Truist Financial Corp. 3,769 219,808US Bancorp 20,010 1,106,753Valley National Bancorp 2 28Wells Fargo & Co. 31,501 1,230,744Western Alliance Bancorp 2,242 211,735Zions Bancorp NA 2,092 114,976
16,703,443Commercial Services & Supplies �� 0.6%
Brink�s Co. (The) 300 23,769Cintas Corp. 2,086 711,973Clean Harbors, Inc. * 1,200 100,872Copart, Inc. * 4,707 511,227Iaa, Inc. * 3,052 168,287MSA Safety, Inc. 600 90,012Republic Services, Inc. 4,657 462,673Rollins, Inc. 5,929 204,076Stericycle, Inc. * 1,544 104,235Tetra Tech, Inc. 1,092 148,206UniFirst Corp. 477 106,710Waste Management, Inc. 9,583 1,236,399
3,868,439Communications Equipment �� 0.9%
Arista Networks, Inc. * 798 240,908Ciena Corp. * 2,569 140,576Cisco Systems, Inc. 76,581 3,960,004F5 Networks, Inc. * 1,176 245,337Juniper Networks, Inc. 4,954 125,485Lumentum Holdings, Inc. *@ 1,528 139,583Motorola Solutions, Inc. 2,888 543,088Ubiquiti, Inc. 275 82,032
5,477,013Computers & Peripherals �� 6.7%
Apple, Inc. 335,929 41,033,605Dell Technologies, Inc., Class C * 3,966 349,603Hewlett Packard Enterprise Co. 3,473 54,665HP, Inc. 20,589 653,701NetApp, Inc. 6,772 492,121Seagate Technology PLC 6,304 483,832Western Digital Corp. 3,176 211,998Xerox Holdings Corp. 1 24
43,279,549Construction & Engineering �� 0.1%
AECOM * 1,355 86,869EMCOR Group, Inc. 1,400 157,024MasTec, Inc. * 1,700 159,290Quanta Services, Inc. 2,721 239,394
642,577Construction Materials �� 0.1%
Copyright © 2021 www.secdatabase.com. All Rights Reserved.Please Consider the Environment Before Printing This Document

The accompanying notes are an integral part of these portfolio ofinvestments.
First Financial Bankshares, Inc. 3,094 144,583First Horizon National Corp. 1 17First Republic Bank 1,536 256,128Huntington Bancshares, Inc. 7,349 115,526JPMorgan Chase & Co. 46,059 7,011,562KeyCorp 3,204 64,016PNC Financial Services Group, Inc.
(The) 2,775 486,763Popular, Inc. 2,182 153,438Prosperity Bancshares, Inc. 1,026 76,837Regions Financial Corp. 4,842 100,036
Eagle Materials, Inc. 880 118,281Martin Marietta Materials, Inc. 664 222,985Vulcan Materials Co. 1,851 312,356
653,622Consumer Finance �� 0.5%
American Express Co. 12,759 1,804,633
Copyright © 2021 www.secdatabase.com. All Rights Reserved.Please Consider the Environment Before Printing This Document
SA U.S. Core Market FundPORTFOLIO OF INVESTMENTS � AS OF MARCH 31, 2021 (Unaudited) (Continued)
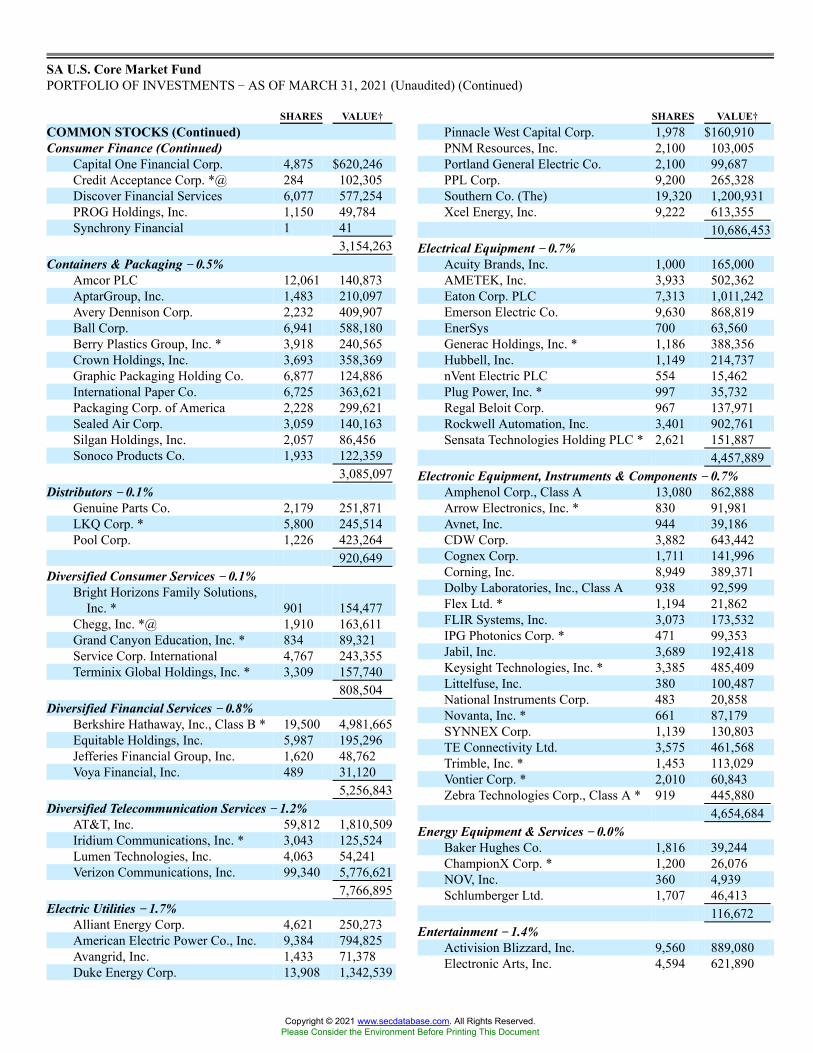
SHARES VALUE��COMMON STOCKS (Continued)Consumer Finance (Continued)
Capital One Financial Corp. 4,875 $620,246Credit Acceptance Corp. *@ 284 102,305Discover Financial Services 6,077 577,254PROG Holdings, Inc. 1,150 49,784Synchrony Financial 1 41
3,154,263Containers & Packaging �� 0.5%
Amcor PLC 12,061 140,873AptarGroup, Inc. 1,483 210,097Avery Dennison Corp. 2,232 409,907Ball Corp. 6,941 588,180Berry Plastics Group, Inc. * 3,918 240,565Crown Holdings, Inc. 3,693 358,369Graphic Packaging Holding Co. 6,877 124,886International Paper Co. 6,725 363,621Packaging Corp. of America 2,228 299,621Sealed Air Corp. 3,059 140,163Silgan Holdings, Inc. 2,057 86,456Sonoco Products Co. 1,933 122,359
3,085,097Distributors �� 0.1%
Genuine Parts Co. 2,179 251,871LKQ Corp. * 5,800 245,514Pool Corp. 1,226 423,264
920,649Diversified Consumer Services �� 0.1%
Bright Horizons Family Solutions,Inc. * 901 154,477
Chegg, Inc. *@ 1,910 163,611Grand Canyon Education, Inc. * 834 89,321Service Corp. International 4,767 243,355Terminix Global Holdings, Inc. * 3,309 157,740
808,504Diversified Financial Services �� 0.8%
Berkshire Hathaway, Inc., Class B * 19,500 4,981,665Equitable Holdings, Inc. 5,987 195,296Jefferies Financial Group, Inc. 1,620 48,762Voya Financial, Inc. 489 31,120
5,256,843Diversified Telecommunication Services �� 1.2%
AT&T, Inc. 59,812 1,810,509Iridium Communications, Inc. * 3,043 125,524Lumen Technologies, Inc. 4,063 54,241Verizon Communications, Inc. 99,340 5,776,621
7,766,895Electric Utilities �� 1.7%
Alliant Energy Corp. 4,621 250,273American Electric Power Co., Inc. 9,384 794,825Avangrid, Inc. 1,433 71,378Duke Energy Corp. 13,908 1,342,539
SHARES VALUE��Pinnacle West Capital Corp. 1,978 $160,910PNM Resources, Inc. 2,100 103,005Portland General Electric Co. 2,100 99,687PPL Corp. 9,200 265,328Southern Co. (The) 19,320 1,200,931Xcel Energy, Inc. 9,222 613,355
10,686,453Electrical Equipment �� 0.7%
Acuity Brands, Inc. 1,000 165,000AMETEK, Inc. 3,933 502,362Eaton Corp. PLC 7,313 1,011,242Emerson Electric Co. 9,630 868,819EnerSys 700 63,560Generac Holdings, Inc. * 1,186 388,356Hubbell, Inc. 1,149 214,737nVent Electric PLC 554 15,462Plug Power, Inc. * 997 35,732Regal Beloit Corp. 967 137,971Rockwell Automation, Inc. 3,401 902,761Sensata Technologies Holding PLC * 2,621 151,887
4,457,889Electronic Equipment, Instruments & Components �� 0.7%
Amphenol Corp., Class A 13,080 862,888Arrow Electronics, Inc. * 830 91,981Avnet, Inc. 944 39,186CDW Corp. 3,882 643,442Cognex Corp. 1,711 141,996Corning, Inc. 8,949 389,371Dolby Laboratories, Inc., Class A 938 92,599Flex Ltd. * 1,194 21,862FLIR Systems, Inc. 3,073 173,532IPG Photonics Corp. * 471 99,353Jabil, Inc. 3,689 192,418Keysight Technologies, Inc. * 3,385 485,409Littelfuse, Inc. 380 100,487National Instruments Corp. 483 20,858Novanta, Inc. * 661 87,179SYNNEX Corp. 1,139 130,803TE Connectivity Ltd. 3,575 461,568Trimble, Inc. * 1,453 113,029Vontier Corp. * 2,010 60,843Zebra Technologies Corp., Class A * 919 445,880
4,654,684Energy Equipment & Services �� 0.0%
Baker Hughes Co. 1,816 39,244ChampionX Corp. * 1,200 26,076NOV, Inc. 360 4,939Schlumberger Ltd. 1,707 46,413
116,672Entertainment �� 1.4%
Activision Blizzard, Inc. 9,560 889,080Electronic Arts, Inc. 4,594 621,890
Copyright © 2021 www.secdatabase.com. All Rights Reserved.Please Consider the Environment Before Printing This Document

The accompanying notes are an integral part of these portfolio of investments.
Edison International 6,635 388,811Entergy Corp. 2,247 223,509Evergy, Inc. 3,652 217,404Eversource Energy 6,457 559,112Exelon Corp. 16,734 731,945FirstEnergy Corp. 5,602 194,334Hawaiian Electric Industries, Inc. 2,245 99,745IDACORP, Inc. 1,054 105,368NextEra Energy, Inc. 38,077 2,879,002NRG Energy, Inc. 6,256 236,039OGE Energy Corp. 4,603 148,953
Liberty Media Corp-Liberty FormulaOne, Class A * 315 12,039
Liberty Media Corp-Liberty FormulaOne, Class C * 495 21,429
Live Nation Entertainment, Inc. * 1,625 137,556Netflix, Inc. * 6,408 3,342,797Take-Two Interactive Software,
Inc. * 1,964 347,039Walt Disney Co. (The) * 20,282 3,742,435Zynga, Inc., Class A * 10,858 110,860
9,225,125
Copyright © 2021 www.secdatabase.com. All Rights Reserved.Please Consider the Environment Before Printing This Document

SA U.S. Core Market FundPORTFOLIO OF INVESTMENTS � AS OF MARCH 31, 2021 (Unaudited) (Continued)
SHARES VALUE��COMMON STOCKS (Continued)Food & Staples Retailing �� 1.4%
BJ�s Wholesale Club Holdings,Inc. * 2,341 $105,017
Casey�s General Stores, Inc. 986 213,163Costco Wholesale Corp. 8,735 3,078,913Kroger Co. (The) 20,121 724,155Sysco Corp. 11,546 909,132Walgreens Boots Alliance, Inc. 7,503 411,915Walmart, Inc. 25,996 3,531,037
8,973,332Food Products �� 0.9%
Archer-Daniels-Midland Co. 1,142 65,094Campbell Soup Co. 4,243 213,296Conagra Brands, Inc. 1 38Darling Ingredients, Inc. * 4,810 353,920Flowers Foods, Inc. 3,652 86,918General Mills, Inc. 12,261 751,845Hain Celestial Group, Inc. (The) * 1,080 47,088Hershey Co. (The) 2,983 471,791Hormel Foods Corp. @ 5,226 249,698Ingredion, Inc. 1,590 142,973J.M. Smucker Co. (The) 1,655 209,407Kellogg Co. 5,495 347,833Kraft Heinz Co. (The) 1,166 46,640Lamb Weston Holdings, Inc. 4,603 356,640Lancaster Colony Corp. 522 91,538McCormick & Co., Inc. 5,490 489,488Mondelez International, Inc., Class A 16,383 958,897Pilgrim�s Pride Corp. * 1,700 40,443Post Holdings, Inc. * 1,501 158,686Tyson Foods, Inc., Class A 5,064 376,255
5,458,488Gas Utilities �� 0.1%
Atmos Energy Corp. 2,360 233,286National Fuel Gas Co. 1,600 79,984ONE Gas, Inc. 953 73,295Southwest Gas Corp. 1,343 92,278Spire, Inc. 963 71,156UGI Corp. 2,799 114,787
664,786Health Care Equipment & Supplies �� 2.5%
Abbott Laboratories 21,703 2,600,887ABIOMED, Inc. * 764 243,510Align Technology, Inc. * 912 493,875Baxter International, Inc. 9,285 783,097Becton Dickinson & Co. 2,950 717,292Boston Scientific Corp. * 14,697 568,039Cooper Companies, Inc. (The) 824 316,490Danaher Corp. 6,260 1,409,001DENTSPLY SIRONA, Inc. 637 40,647DexCom, Inc. * 783 281,402Edwards Lifesciences Corp. * 10,989 919,120
SHARES VALUE��Insulet Corp. * 688 $179,513Integra LifeSciences Holdings
Corp. * 1,168 80,697Intuitive Surgical, Inc. * 919 679,086Masimo Corp. * 787 180,742Medtronic PLC 13,235 1,563,451Neogen Corp. * 222 19,734Penumbra, Inc. * 389 105,256ResMed, Inc. 2,770 537,435STERIS PLC 1,118 212,957Stryker Corp. 5,195 1,265,398Teleflex, Inc. 364 151,227Varian Medical Systems, Inc. * 1,668 294,452West Pharmaceutical Services, Inc. 1,211 341,236Zimmer Biomet Holdings, Inc. 986 157,839
16,224,287Health Care Providers & Services �� 2.7%
Acadia Healthcare Co., Inc. * 400 22,856Amedisys, Inc. * 804 212,891AmerisourceBergen Corp. 2,652 313,122Anthem, Inc. 4,246 1,524,102Cardinal Health, Inc. 5,853 355,570Centene Corp. * 6,123 391,321Chemed Corp. 339 155,879CIGNA Corp. 6,459 1,561,399CVS Health Corp. 5,622 422,943DaVita, Inc. * 2,810 302,834Encompass Health Corp. 2,141 175,348Guardant Health, Inc. * 673 102,733HCA Holdings, Inc. 5,115 963,359Henry Schein, Inc. * 3,048 211,044Humana, Inc. 3,060 1,282,905Laboratory Corp. of America
Holdings * 1,510 385,095LHC Group, Inc. * 573 109,563McKesson Corp. 3,571 696,488Molina Healthcare, Inc. * 1,312 306,693Quest Diagnostics, Inc. 2,132 273,621R1 RCM, Inc. * 1,861 45,929UnitedHealth Group, Inc. 20,064 7,465,212Universal Health Services, Inc.,
Class B 2,001 266,91317,547,820
Health Care Technology �� 0.2%Cerner Corp. 5,716 410,866Change Healthcare, Inc. * 7,084 156,557Omnicell, Inc. * 700 90,909Teladoc Health, Inc. *@ 659 119,773Veeva Systems, Inc., Class A * 1,900 496,356
1,274,461Hotels, Restaurants & Leisure �� 2.1%
Booking Holdings, Inc. * 813 1,894,160Brinker International, Inc. 585 41,570
Copyright © 2021 www.secdatabase.com. All Rights Reserved.Please Consider the Environment Before Printing This Document

The accompanying notes are an integral part of these portfolio of investments.
Envista Holdings Corp. * 2,222 90,658Globus Medical, Inc., Class A * 1,500 92,505Haemonetics Corp. * 1,000 111,010Hill-Rom Holdings, Inc. 1,395 154,120Hologic, Inc. * 4,904 364,759ICU Medical, Inc. * 98 20,133Idexx Laboratories, Inc. * 2,552 1,248,719
Carnival Corp. 2,450 65,023Chipotle Mexican Grill, Inc. * 462 656,419Choice Hotels International, Inc. 1,000 107,290Churchill Downs, Inc. 450 102,339Cracker Barrel Old Country Store,
Inc. 337 58,260Darden Restaurants, Inc. 2,673 379,566Domino�s Pizza, Inc. 810 297,910Expedia Group, Inc. 1,515 260,762Hilton Worldwide Holdings, Inc. 3,953 477,997
Copyright © 2021 www.secdatabase.com. All Rights Reserved.Please Consider the Environment Before Printing This Document

SA U.S. Core Market FundPORTFOLIO OF INVESTMENTS � AS OF MARCH 31, 2021 (Unaudited) (Continued)
SHARES VALUE��COMMON STOCKS (Continued)Hotels, Restaurants & Leisure (Continued)
Hyatt Hotels Corp., Class A 300 $24,810Las Vegas Sands Corp. 6,438 391,173Marriott International, Inc., Class A 5,846 865,851Marriott Vacations Worldwide
Corp. 750 130,635McDonald�s Corp. 13,011 2,916,285MGM Resorts International 7,904 300,273Penn National Gaming, Inc. *@ 462 48,436Planet Fitness, Inc. Class A * 1,743 134,734Royal Caribbean Cruises Ltd. 3,090 264,535Starbucks Corp. 21,520 2,351,490Texas Roadhouse, Inc. 1,257 120,597Vail Resorts, Inc. 780 227,495Wendy�s Co. (The) 5,687 115,219Wingstop, Inc. 489 62,186Wyndham Hotels & Resorts, Inc. 1,765 123,162Wynn Resorts Ltd. 1,361 170,628Yum! Brands, Inc. 5,539 599,209
13,188,014Household Durables �� 0.5%
DR Horton, Inc. 5,753 512,707Garmin Ltd. 2,389 314,990Helen of Troy Ltd. * 496 104,487Leggett & Platt, Inc. 3,378 154,206Lennar Corp., Class A 3,122 316,040Lennar Corp.,B Shares 72 5,928Meritage Homes Corp. * 900 82,728Mohawk Industries, Inc. * 600 115,386Newell Brands, Inc. 1,165 31,199NVR, Inc. * 68 320,343PulteGroup, Inc. 5,849 306,722Tempur Sealy International, Inc. 3,440 125,766Toll Brothers, Inc. 1,650 93,605TopBuild Corp. * 500 104,715Whirlpool Corp. 1,555 342,644
2,931,466Household Products �� 1.5%
Church & Dwight Co., Inc. 5,160 450,726Clorox Co. (The) 3,195 616,252Colgate-Palmolive Co. 14,176 1,117,494Kimberly-Clark Corp. 5,790 805,099Procter & Gamble Co. (The) 48,462 6,563,209
9,552,780Independent Power Producers & Energy Traders �� 0.1%
AES Corp. (The) 11,000 294,910Clearway Energy, Inc., Class C 2,400 67,536Ormat Technologies, Inc. @ 741 58,191Vistra Corp. 3,161 55,886
476,523Industrial Conglomerates �� 1.1%
3M Co. 14,194 2,734,900
SHARES VALUE��Assurant, Inc. 1,143 $162,043Axis Capital Holdings Ltd. 1,300 64,441Brighthouse Financial, Inc. * 1,077 47,657Brown & Brown, Inc. 4,399 201,078Chubb Ltd. 1,225 193,513Cincinnati Financial Corp. 714 73,606CNO Financial Group, Inc. 5,300 128,737Enstar Group Ltd. * 300 74,019Erie Indemnity Co., Class A 545 120,396Everest Re Group Ltd. 50 12,391Fidelity National Financial, Inc. 5,659 230,095First American Financial Corp. 2,790 158,054Globe Life, Inc. 641 61,940Hanover Insurance Group, Inc. (The) 696 90,104Hartford Financial Services Group,
Inc. (The) 1,936 129,305Kemper Corp. 1,200 95,664Kinsale Capital Group, Inc. 257 42,354Lincoln National Corp. 1,001 62,332Loews Corp. 572 29,332Markel Corp. * 100 113,962Marsh & McLennan Cos., Inc. 9,000 1,096,200MBIA, Inc. * 3,900 37,518MetLife, Inc. 318 19,331Old Republic International Corp. 2,863 62,528Primerica, Inc. 1,066 157,576Principal Financial Group, Inc. 3,893 233,424Progressive Corp. (The) 11,708 1,119,402Reinsurance Group of America, Inc. 777 97,941RenaissanceRe Holdings Ltd. 783 125,476RLI Corp. 700 78,099Selective Insurance Group, Inc. 829 60,136Travelers Companies, Inc. (The) 5,274 793,210Unum Group 1,700 47,311W. R. Berkley Corp. 1,770 133,370Willis Towers Watson PLC 1,216 278,318
9,038,568Interactive Media & Services �� 5.0%
Alphabet, Inc., Class A * 4,321 8,912,149Alphabet, Inc., Class C * 4,424 9,151,619Facebook, Inc., Class A * 42,549 12,531,957Iac/InterActiveCorp * 956 206,792Match Group, Inc. * 3,467 476,296Snap, Inc., Class A *@ 3,870 202,362Twitter, Inc. * 2,730 173,710Zillow Group, Inc., Class A * 436 57,282Zillow Group, Inc., Class C *@ 1,159 150,253
31,862,420Internet & Catalog Retail �� 5.2%
Amazon.com, Inc. * 10,252 31,720,508eBay, Inc. 19,478 1,192,833Etsy, Inc. * 2,466 497,318GrubHub, Inc. * 800 48,000
Copyright © 2021 www.secdatabase.com. All Rights Reserved.Please Consider the Environment Before Printing This Document

The accompanying notes are an integral part of these portfolio ofinvestments.
Carlisle Cos., Inc. 1,113 183,177Honeywell International, Inc. 14,340 3,112,784Roper Technologies, Inc. 1,844 743,759
6,774,620Insurance �� 1.4%
Aflac, Inc. 7,771 397,720Alleghany Corp. * 167 104,590Allstate Corp. (The) 2,511 288,514Aon PLC, Class A 6,091 1,401,600Arch Capital Group Ltd. * 993 38,101Arthur J. Gallagher & Co. 3,023 377,180
Qurate Retail, Inc., Series A 3,600 42,336Wayfair, Inc., Class A *@ 542 170,595
33,671,590IT Services �� 6.1%
Accenture PLC, Class A 13,880 3,834,350Akamai Technologies, Inc. * 2,286 232,943Amdocs Ltd. 2,698 189,265Automatic Data Processing, Inc. 10,297 1,940,676Black Knight, Inc. * 2,102 155,527Broadridge Financial Solutions, Inc. 3,283 502,627
Copyright © 2021 www.secdatabase.com. All Rights Reserved.Please Consider the Environment Before Printing This Document

SA U.S. Core Market FundPORTFOLIO OF INVESTMENTS � AS OF MARCH 31, 2021 (Unaudited) (Continued)
SHARES VALUE��COMMON STOCKS (Continued)IT Services (Continued)
Cognizant Technology SolutionsCorp., Class A 11,445 $894,083
Concentrix Corp. * 1,139 170,531DXC Technology Co. 700 21,882EPAM Systems, Inc. * 892 353,848Euronet Worldwide, Inc. * 911 125,991Fidelity National Information
Services, Inc. 6,251 878,953Fiserv, Inc. * 5,669 674,838FleetCor Technologies, Inc. * 1,630 437,867Gartner, Inc. * 1,555 283,865Genpact Ltd. 3,792 162,373Global Payments, Inc. 3,120 628,930Globant SA * 394 81,798GoDaddy, Inc., Class A * 3,070 238,293International Business Machines
Corp. 18,679 2,489,164Jack Henry & Associates, Inc. 1,300 197,236MasterCard, Inc., Class A 25,000 8,901,250Maximus, Inc. 1,704 151,724MongoDB, Inc. *@ 284 75,950Okta, Inc. * 1,243 273,995Paychex, Inc. 8,084 792,394PayPal Holdings, Inc. * 17,499 4,249,457Perspecta, Inc. 2,521 73,235Square, Inc., Class A * 3,898 885,041Twilio, Inc., Class A * 1,065 362,909VeriSign, Inc. * 2,081 413,620Visa, Inc., Class A 39,160 8,291,347Western Union Co. (The) 5,565 137,233WEX, Inc. * 663 138,713
39,241,908Leisure Equipment & Products �� 0.1%
Brunswick Corp. 1,810 172,620Hasbro, Inc. 2,087 200,602Polaris Industries, Inc. 1,034 138,039YETI Holdings, Inc. * 743 53,652
564,913Life Sciences Tools & Services �� 1.1%
Agilent Technologies, Inc. 4,984 633,666Bio-Rad Laboratories, Inc.,
Class A * 290 165,639Bio-Techne Corp. 473 180,653Bruker Corp. 2,044 131,388Charles River Laboratories
International, Inc. * 963 279,106Illumina, Inc. * 2,161 829,954IQVIA Holdings, Inc. * 2,629 507,765Medpace Holdings, Inc. * 500 82,025Mettler-Toledo International, Inc. * 659 761,600PerkinElmer, Inc. 1,576 202,185
SHARES VALUE��Crane Co. 1,115 $104,710Cummins, Inc. 2,875 744,941Deere & Co. 7,564 2,829,995Donaldson Co., Inc. 3,404 197,977Dover Corp. 2,951 404,671Flowserve Corp. 1,775 68,888Fortive Corp. 5,025 354,966Graco, Inc. 3,370 241,359IDEX Corp. 1,322 276,721Illinois Tool Works, Inc. 8,529 1,889,344Ingersoll Rand, Inc. * 3,972 195,462ITT, Inc. 2,281 207,366John Bean Technologies Corp. 992 132,273Lincoln Electric Holdings, Inc. 1,491 183,304Middleby Corp. * 1,300 215,475Nordson Corp. 1,155 229,475Oshkosh Corp. 1,700 201,722Otis Worldwide Corp. 6,236 426,854PACCAR, Inc. 7,238 672,555Parker-Hannifin Corp. 2,800 883,204Pentair PLC 554 34,525RBC Bearings, Inc. * 421 82,840Rexnord Corp. 1,200 56,508Snap-On, Inc. 1,143 263,736Stanley Black & Decker, Inc. 2,408 480,805Timken Co., (The) 1,644 133,443Toro Co. (The) 2,683 276,725Watts Water Technologies, Inc.,
Class A 400 47,524Westinghouse Air Brake
Technologies Corp. 1,144 90,559Woodward, Inc. 1,254 151,270Xylem, Inc. 3,144 330,686
15,729,239Marine �� 0.0%
Kirby Corp. * 749 45,150Media �� 1.4%
Altice USA, Inc., Class A * 5,718 186,007Cable One, Inc. 101 184,664Charter Communications, Inc.,
Class A * 2,672 1,648,677Comcast Corp., Class A 88,426 4,784,731Discovery, Inc., Class A * 3,611 156,934Discovery, Inc., Class C * 4,579 168,919DISH Network Corp., Class A * 3,186 115,333Fox Corp. Class A 1,655 59,762Interpublic Group of Cos., Inc. (The) 6,061 176,981Liberty Broadband Corp., Class A * 315 45,722Liberty Broadband Corp., Class C * 2,045 307,057Liberty Media Corp-Liberty
Siriusxm, Class A * 1,263 55,673Liberty Media Corp-Liberty
Siriusxm, Class C * 1,178 51,962
Copyright © 2021 www.secdatabase.com. All Rights Reserved.Please Consider the Environment Before Printing This Document

The accompanying notes are an integral part of these portfolio of investments.
PRA Health Sciences, Inc. * 1,053 161,456Syneos Health, Inc. * 927 70,313Thermo Fisher Scientific, Inc. 5,819 2,655,675Waters Corp. * 1,204 342,141
7,003,566Machinery �� 2.5%
AGCO Corp. 1,297 186,314Allison Transmission Holdings, Inc. 3,084 125,920Caterpillar, Inc. 12,969 3,007,122
New York Times Co. (The), Class A 1,641 83,067News Corp., Class A 1,498 38,094News Corp., Class B 1,525 35,777Nexstar Media Group, Inc. Class A 900 126,387Omnicom Group, Inc. 4,831 358,219Sirius XM Holdings, Inc. @ 15,954 97,160ViacomCBS, Inc. Class A 1,116 52,642ViacomCBS, Inc. Class B 2,324 104,812
8,838,580
Copyright © 2021 www.secdatabase.com. All Rights Reserved.Please Consider the Environment Before Printing This Document
SA U.S. Core Market FundPORTFOLIO OF INVESTMENTS � AS OF MARCH 31, 2021 (Unaudited) (Continued)
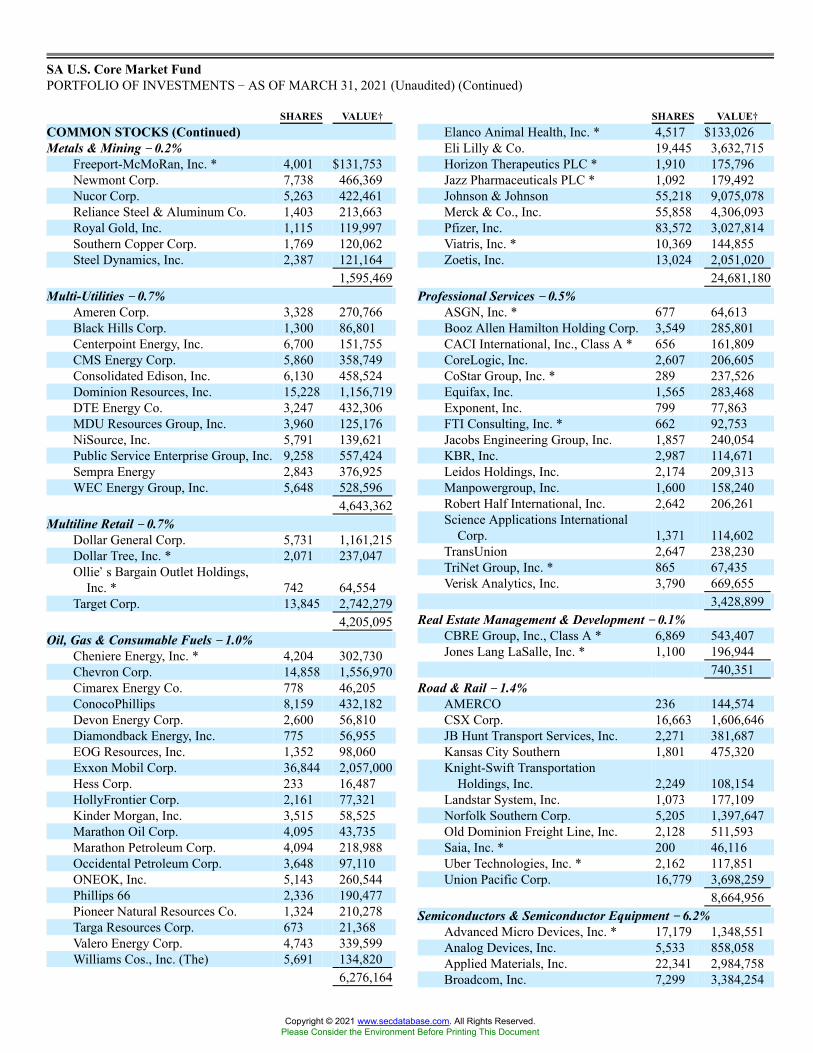
SHARES VALUE��COMMON STOCKS (Continued)Metals & Mining �� 0.2%
Freeport-McMoRan, Inc. * 4,001 $131,753Newmont Corp. 7,738 466,369Nucor Corp. 5,263 422,461Reliance Steel & Aluminum Co. 1,403 213,663Royal Gold, Inc. 1,115 119,997Southern Copper Corp. 1,769 120,062Steel Dynamics, Inc. 2,387 121,164
1,595,469Multi-Utilities �� 0.7%
Ameren Corp. 3,328 270,766Black Hills Corp. 1,300 86,801Centerpoint Energy, Inc. 6,700 151,755CMS Energy Corp. 5,860 358,749Consolidated Edison, Inc. 6,130 458,524Dominion Resources, Inc. 15,228 1,156,719DTE Energy Co. 3,247 432,306MDU Resources Group, Inc. 3,960 125,176NiSource, Inc. 5,791 139,621Public Service Enterprise Group, Inc. 9,258 557,424Sempra Energy 2,843 376,925WEC Energy Group, Inc. 5,648 528,596
4,643,362Multiline Retail �� 0.7%
Dollar General Corp. 5,731 1,161,215Dollar Tree, Inc. * 2,071 237,047Ollie�s Bargain Outlet Holdings,
Inc. * 742 64,554Target Corp. 13,845 2,742,279
4,205,095Oil, Gas & Consumable Fuels �� 1.0%
Cheniere Energy, Inc. * 4,204 302,730Chevron Corp. 14,858 1,556,970Cimarex Energy Co. 778 46,205ConocoPhillips 8,159 432,182Devon Energy Corp. 2,600 56,810Diamondback Energy, Inc. 775 56,955EOG Resources, Inc. 1,352 98,060Exxon Mobil Corp. 36,844 2,057,000Hess Corp. 233 16,487HollyFrontier Corp. 2,161 77,321Kinder Morgan, Inc. 3,515 58,525Marathon Oil Corp. 4,095 43,735Marathon Petroleum Corp. 4,094 218,988Occidental Petroleum Corp. 3,648 97,110ONEOK, Inc. 5,143 260,544Phillips 66 2,336 190,477Pioneer Natural Resources Co. 1,324 210,278Targa Resources Corp. 673 21,368Valero Energy Corp. 4,743 339,599Williams Cos., Inc. (The) 5,691 134,820
6,276,164
SHARES VALUE��Elanco Animal Health, Inc. * 4,517 $133,026Eli Lilly & Co. 19,445 3,632,715Horizon Therapeutics PLC * 1,910 175,796Jazz Pharmaceuticals PLC * 1,092 179,492Johnson & Johnson 55,218 9,075,078Merck & Co., Inc. 55,858 4,306,093Pfizer, Inc. 83,572 3,027,814Viatris, Inc. * 10,369 144,855Zoetis, Inc. 13,024 2,051,020
24,681,180Professional Services �� 0.5%
ASGN, Inc. * 677 64,613Booz Allen Hamilton Holding Corp. 3,549 285,801CACI International, Inc., Class A * 656 161,809CoreLogic, Inc. 2,607 206,605CoStar Group, Inc. * 289 237,526Equifax, Inc. 1,565 283,468Exponent, Inc. 799 77,863FTI Consulting, Inc. * 662 92,753Jacobs Engineering Group, Inc. 1,857 240,054KBR, Inc. 2,987 114,671Leidos Holdings, Inc. 2,174 209,313Manpowergroup, Inc. 1,600 158,240Robert Half International, Inc. 2,642 206,261Science Applications International
Corp. 1,371 114,602TransUnion 2,647 238,230TriNet Group, Inc. * 865 67,435Verisk Analytics, Inc. 3,790 669,655
3,428,899Real Estate Management & Development �� 0.1%
CBRE Group, Inc., Class A * 6,869 543,407Jones Lang LaSalle, Inc. * 1,100 196,944
740,351Road & Rail �� 1.4%
AMERCO 236 144,574CSX Corp. 16,663 1,606,646JB Hunt Transport Services, Inc. 2,271 381,687Kansas City Southern 1,801 475,320Knight-Swift Transportation
Holdings, Inc. 2,249 108,154Landstar System, Inc. 1,073 177,109Norfolk Southern Corp. 5,205 1,397,647Old Dominion Freight Line, Inc. 2,128 511,593Saia, Inc. * 200 46,116Uber Technologies, Inc. * 2,162 117,851Union Pacific Corp. 16,779 3,698,259
8,664,956Semiconductors & Semiconductor Equipment �� 6.2%
Advanced Micro Devices, Inc. * 17,179 1,348,551Analog Devices, Inc. 5,533 858,058Applied Materials, Inc. 22,341 2,984,758Broadcom, Inc. 7,299 3,384,254
Copyright © 2021 www.secdatabase.com. All Rights Reserved.Please Consider the Environment Before Printing This Document

The accompanying notes are an integral part of these portfolio of investments.
Paper & Forest Products �� 0.0%Louisiana-Pacific Corp. 629 34,884
Personal Products �� 0.3%Estee Lauder Companies, Inc. (The),
Class A 5,450 1,585,133Herbalife Nutriation Ltd. * 2,876 127,579
1,712,712Pharmaceuticals �� 3.8%
Bristol-Myers Squibb Co. 27,074 1,709,182Catalent, Inc. * 2,337 246,109
Brooks Automation, Inc. 1,100 89,815Cirrus Logic, Inc. * 1,237 104,885CMC Materials, Inc. 592 104,660Cree, Inc. *@ 1,415 153,004Enphase Energy, Inc. * 1,883 305,347Entegris, Inc. 2,832 316,618First Solar, Inc. * 300 26,190Intel Corp. 89,520 5,729,280KLA-Tencor Corp. 4,336 1,432,614Lam Research Corp. 3,733 2,222,031Lattice Semiconductor Corp. * 1,742 78,425Marvell Technology Group Ltd. 6,428 314,843
Copyright © 2021 www.secdatabase.com. All Rights Reserved.Please Consider the Environment Before Printing This Document

SA U.S. Core Market FundPORTFOLIO OF INVESTMENTS � AS OF MARCH 31, 2021 (Unaudited) (Continued)
SHARES VALUE��COMMON STOCKS (Continued)Semiconductors & Semiconductor Equipment (Continued)
Maxim Integrated Products, Inc. 7,009 $640,412Microchip Technology, Inc. 4,306 668,377Micron Technology, Inc. * 16,331 1,440,558MKS Instruments, Inc. 1,252 232,146Monolithic Power Systems, Inc. 706 249,366NVIDIA Corp. 10,833 5,784,064ON Semiconductor Corp. * 8,229 342,409Power Integrations, Inc. 1,146 93,376Qorvo, Inc. * 1,968 359,554QUALCOMM, Inc. 24,843 3,293,933Semtech Corp. * 600 41,400Silicon Laboratories, Inc. * 600 84,642Skyworks Solutions, Inc. 3,500 642,180SolarEdge Technologies, Inc. * 622 178,788Teradyne, Inc. 3,943 479,784Texas Instruments, Inc. 25,350 4,790,896Universal Display Corp. 786 186,101Xilinx, Inc. 5,194 643,537
39,604,856Software �� 8.5%
ACI Worldwide, Inc. * 2,645 100,642Adobe, Inc. * 9,924 4,717,572Alarm.com Holdings, Inc. * 415 35,848Alteryx, Inc., Class A * 675 55,998Anaplan, Inc. * 700 37,695ANSYS, Inc. * 1,057 358,915Appfolio, Inc., Class A *@ 486 68,725Aspen Technology, Inc. * 2,199 317,382Atlassian Corp. PLC, Class A * 1,245 262,396Autodesk, Inc. * 4,181 1,158,764Avalara, Inc. * 354 47,234Cadence Design Systems, Inc. * 5,300 726,047CDK Global, Inc. 3,162 170,938Cerence, Inc. * 550 49,269Ceridian HCM Holding, Inc. * 995 83,849Citrix Systems, Inc. 2,573 361,146Cloudera, Inc. * 2,900 35,293Cognyte Software Ltd. * 1,038 28,867Coupa Software, Inc. * 709 180,426DocuSign, Inc. * 505 102,237Dropbox, Inc., Class A * 1,689 45,029Envestnet, Inc. * 1,085 78,370Fair Isaac Corp. * 1,050 510,353FireEye, Inc. * 1,537 30,079Five9, Inc. * 200 31,266Fortinet, Inc. * 2,910 536,662Guidewire Software, Inc. * 801 81,406HubSpot, Inc. * 534 242,548Intuit, Inc. 5,723 2,192,252j2 Global, Inc. * 1,013 121,418Manhattan Associates, Inc. * 2,300 269,974
SHARES VALUE��Pegasystems, Inc. 255 $29,157Proofpoint, Inc. * 470 59,121PTC, Inc. * 953 131,180Qualys, Inc. * 503 52,704RealPage, Inc. * 1,381 120,423RingCentral, Inc., Class A * 628 187,069Salesforce.com, Inc. * 7,052 1,494,107ServiceNow, Inc. * 2,217 1,108,744Slack Technologies, Inc., Class A * 1,899 77,156Splunk, Inc. * 1,483 200,917SS&C Technologies Holdings, Inc. 3,246 226,798Synopsys, Inc. * 1,895 469,543Trade Desk, Inc. (The) Class A * 483 314,752Tyler Technologies, Inc. * 424 180,001Verint Systems, Inc. * 1,038 47,219VMware, Inc., Class A * 145 21,815Workday, Inc., Class A * 972 241,474Xperi Holding Corp. 626 13,628Zendesk, Inc. * 1,234 163,653Zoom Video Communications, Inc.,
Class A * 1,325 425,70954,845,928
Specialty Retail �� 2.8%Aaron�s Co. Inc. (The) 575 14,766Advance Auto Parts, Inc. 1,480 271,565American Eagle Outfitters, Inc. @ 1,673 48,919AutoNation, Inc. * 961 89,584AutoZone, Inc. * 433 608,062Bed Bath & Beyond, Inc. 1,619 47,194Best Buy Co., Inc. 6,478 743,739Burlington Stores, Inc. * 695 207,666Carmax, Inc. * 3,709 492,036Carvana Co. *@ 614 161,114Dick�s Sporting Goods, Inc. @ 1,695 129,074Five Below, Inc. * 1,000 190,790Foot Locker, Inc. 1,123 63,169Home Depot, Inc. (The) 20,751 6,334,243Lowe�s Cos., Inc. 19,287 3,668,002Murphy USA, Inc. 1,116 161,329O�Reilly Automotive, Inc. * 2,000 1,014,500Penske Auto Group, Inc. @ 1,318 105,756Ross Stores, Inc. 7,088 849,922TJX Cos., Inc. 21,632 1,430,957Tractor Supply Co. 3,469 614,290Ulta Beauty, Inc. * 984 304,223Williams-Sonoma, Inc. 2,400 430,080
17,980,980Textiles, Apparel & Luxury Goods �� 1.0%
Carter�s, Inc. 934 83,061Columbia Sportswear Co. 858 90,630Crocs, Inc. * 953 76,669Deckers Outdoor Corp. * 473 156,289Hanesbrands, Inc. @ 10,404 204,647
Copyright © 2021 www.secdatabase.com. All Rights Reserved.Please Consider the Environment Before Printing This Document

The accompanying notes are an integral part of these portfolio of investments.
Microsoft Corp. 134,801 31,782,032NortonLifeLock, Inc. 188 3,997Nuance Communications, Inc. * 4,400 192,016Oracle Corp. 49,290 3,458,679Palo Alto Networks, Inc. * 795 256,038Paycom Software, Inc. * 1,160 429,270Paylocity Holding Corp. * 668 120,126
Lululemon Athletica, Inc. * 2,781 852,960NIKE, Inc., Class B 29,730 3,950,820PVH Corp. 760 80,332Ralph Lauren Corp. 1,100 135,476Skechers U.S.A., Inc., Class A * 1,800 75,078Tapestry, Inc. 6,400 263,744Under Armour, Inc., Class A * 2,760 61,161
Copyright © 2021 www.secdatabase.com. All Rights Reserved.Please Consider the Environment Before Printing This Document
SA U.S. Core Market FundPORTFOLIO OF INVESTMENTS � AS OF MARCH 31, 2021 (Unaudited) (Continued)
The accompanying notes are an integral part of these portfolio of investments.
SHARES VALUE��COMMON STOCKS (Continued)Textiles, Apparel & Luxury Goods (Continued)
Under Armour, Inc., Class C * 2,884 $53,239VF Corp. 6,168 492,946
6,577,052Thrifts & Mortgage Finance �� 0.0%
New York CommunityBancorp, Inc. 1,632 20,596
TFS Financial Corp. 1,093 22,26442,860
Tobacco �� 0.7%Altria Group, Inc. 46,398 2,373,722Philip Morris International, Inc. 24,607 2,183,625
4,557,347Trading Companies & Distributors �� 0.3%
Fastenal Co. 14,389 723,479MSC Industrial Direct Co.,
Class A 1,100 99,209SiteOne Landscape Supply, Inc.
* 400 68,296United Rentals, Inc. * 2,064 679,696Watsco, Inc. 474 123,595WW Grainger, Inc. 1,176 471,494
2,165,769Water Utilities �� 0.1%
American Water Works Co.,Inc. 3,475 520,972
Essential Utilities, Inc. 4,781 213,950734,922
Wireless Telecommunication Services �� 0.2%T-Mobile US, Inc. * 9,433 1,181,861TOTAL COMMON STOCKS
(Identified Cost $116,513,922) 614,248,087PREFERRED STOCKS �� 0.0%Internet & Catalog Retail �� 0.0%
Qurate Retail, Inc. 8.000% 108 10,978TOTAL PREFERRED STOCKS
(Identified Cost $8,771) 10,978MUTUAL FUNDS �� 3.9%Other �� 3.9%
DFA U.S. Micro Cap Portfolio 910,096 25,227,861TOTAL MUTUAL FUNDS
(Identified Cost $9,628,162) 25,227,861SHORT-TERM INVESTMENTS �� 0.3%Investment Company �� 0.3%
State Street Institutional U.S.Government Money MarketFund 0.036% 1,806,389 1,806,389
Collateral For Securities On Loan �� 0.0%
Copyright © 2021 www.secdatabase.com. All Rights Reserved.Please Consider the Environment Before Printing This Document

State Street NavigatorSecurities LendingGovernment Money MarketPortfolio, 0.030% 110,450 110,450
TOTAL SHORT-TERM INVESTMENTS(Identified Cost $1,916,839) 1,916,839
Total Investments �� 99.9%(Identified Cost $128,067,694) 641,403,765
Cash and Other Assets, LessLiabilities � 0.1% 692,071
Net Assets �� 100.0% $642,095,836
� See Note 1* Non-income producing security@ A portion or all of the security was held on loan. As of
March 31, 2021, the fair value of the securities on loan was$2,595,901.
Copyright © 2021 www.secdatabase.com. All Rights Reserved.Please Consider the Environment Before Printing This Document

Portfolio Sectors as of March 31, 2021(As a percentage of long-term investments) (Unaudited)
Sector PercentageInformation Technology 29.3 %Consumer Discretionary 14.1 %Health Care 12.5 %Financials 11.9 %Industrials 10.5 %Communication Services 9.2 %Consumer Staples 6.4 %Utilities 2.7 %Materials 2.4 %Energy 1.0 %
100.0 %
Copyright © 2021 www.secdatabase.com. All Rights Reserved.Please Consider the Environment Before Printing This Document
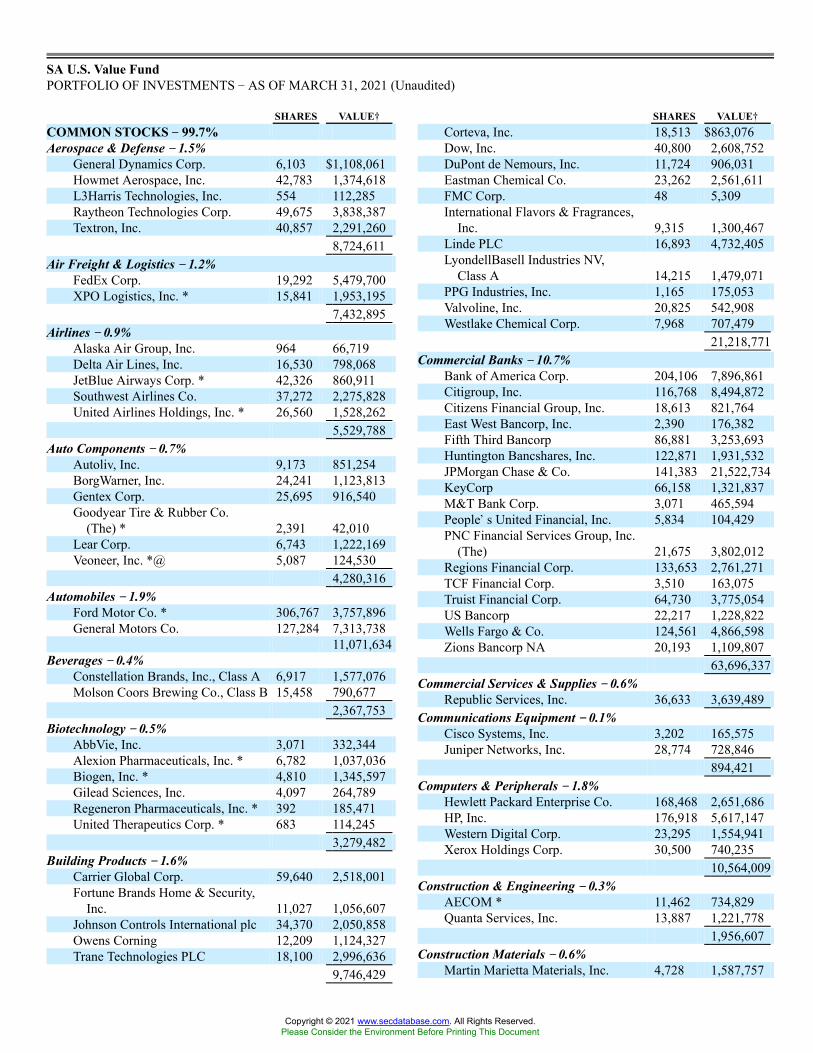
SA U.S. Value FundPORTFOLIO OF INVESTMENTS � AS OF MARCH 31, 2021 (Unaudited)
SHARES VALUE��COMMON STOCKS �� 99.7%Aerospace & Defense �� 1.5%
General Dynamics Corp. 6,103 $1,108,061Howmet Aerospace, Inc. 42,783 1,374,618L3Harris Technologies, Inc. 554 112,285Raytheon Technologies Corp. 49,675 3,838,387Textron, Inc. 40,857 2,291,260
8,724,611Air Freight & Logistics �� 1.2%
FedEx Corp. 19,292 5,479,700XPO Logistics, Inc. * 15,841 1,953,195
7,432,895Airlines �� 0.9%
Alaska Air Group, Inc. 964 66,719Delta Air Lines, Inc. 16,530 798,068JetBlue Airways Corp. * 42,326 860,911Southwest Airlines Co. 37,272 2,275,828United Airlines Holdings, Inc. * 26,560 1,528,262
5,529,788Auto Components �� 0.7%
Autoliv, Inc. 9,173 851,254BorgWarner, Inc. 24,241 1,123,813Gentex Corp. 25,695 916,540Goodyear Tire & Rubber Co.
(The) * 2,391 42,010Lear Corp. 6,743 1,222,169Veoneer, Inc. *@ 5,087 124,530
4,280,316Automobiles �� 1.9%
Ford Motor Co. * 306,767 3,757,896General Motors Co. 127,284 7,313,738
11,071,634Beverages �� 0.4%
Constellation Brands, Inc., Class A 6,917 1,577,076Molson Coors Brewing Co., Class B 15,458 790,677
2,367,753Biotechnology �� 0.5%
AbbVie, Inc. 3,071 332,344Alexion Pharmaceuticals, Inc. * 6,782 1,037,036Biogen, Inc. * 4,810 1,345,597Gilead Sciences, Inc. 4,097 264,789Regeneron Pharmaceuticals, Inc. * 392 185,471United Therapeutics Corp. * 683 114,245
3,279,482Building Products �� 1.6%
Carrier Global Corp. 59,640 2,518,001Fortune Brands Home & Security,
Inc. 11,027 1,056,607Johnson Controls International plc 34,370 2,050,858Owens Corning 12,209 1,124,327Trane Technologies PLC 18,100 2,996,636
9,746,429
SHARES VALUE��Corteva, Inc. 18,513 $863,076Dow, Inc. 40,800 2,608,752DuPont de Nemours, Inc. 11,724 906,031Eastman Chemical Co. 23,262 2,561,611FMC Corp. 48 5,309International Flavors & Fragrances,
Inc. 9,315 1,300,467Linde PLC 16,893 4,732,405LyondellBasell Industries NV,
Class A 14,215 1,479,071PPG Industries, Inc. 1,165 175,053Valvoline, Inc. 20,825 542,908Westlake Chemical Corp. 7,968 707,479
21,218,771Commercial Banks �� 10.7%
Bank of America Corp. 204,106 7,896,861Citigroup, Inc. 116,768 8,494,872Citizens Financial Group, Inc. 18,613 821,764East West Bancorp, Inc. 2,390 176,382Fifth Third Bancorp 86,881 3,253,693Huntington Bancshares, Inc. 122,871 1,931,532JPMorgan Chase & Co. 141,383 21,522,734KeyCorp 66,158 1,321,837M&T Bank Corp. 3,071 465,594People�s United Financial, Inc. 5,834 104,429PNC Financial Services Group, Inc.
(The) 21,675 3,802,012Regions Financial Corp. 133,653 2,761,271TCF Financial Corp. 3,510 163,075Truist Financial Corp. 64,730 3,775,054US Bancorp 22,217 1,228,822Wells Fargo & Co. 124,561 4,866,598Zions Bancorp NA 20,193 1,109,807
63,696,337Commercial Services & Supplies �� 0.6%
Republic Services, Inc. 36,633 3,639,489Communications Equipment �� 0.1%
Cisco Systems, Inc. 3,202 165,575Juniper Networks, Inc. 28,774 728,846
894,421Computers & Peripherals �� 1.8%
Hewlett Packard Enterprise Co. 168,468 2,651,686HP, Inc. 176,918 5,617,147Western Digital Corp. 23,295 1,554,941Xerox Holdings Corp. 30,500 740,235
10,564,009Construction & Engineering �� 0.3%
AECOM * 11,462 734,829Quanta Services, Inc. 13,887 1,221,778
1,956,607Construction Materials �� 0.6%
Martin Marietta Materials, Inc. 4,728 1,587,757
Copyright © 2021 www.secdatabase.com. All Rights Reserved.Please Consider the Environment Before Printing This Document
The accompanying notes are an integral part of these portfolio of investments.
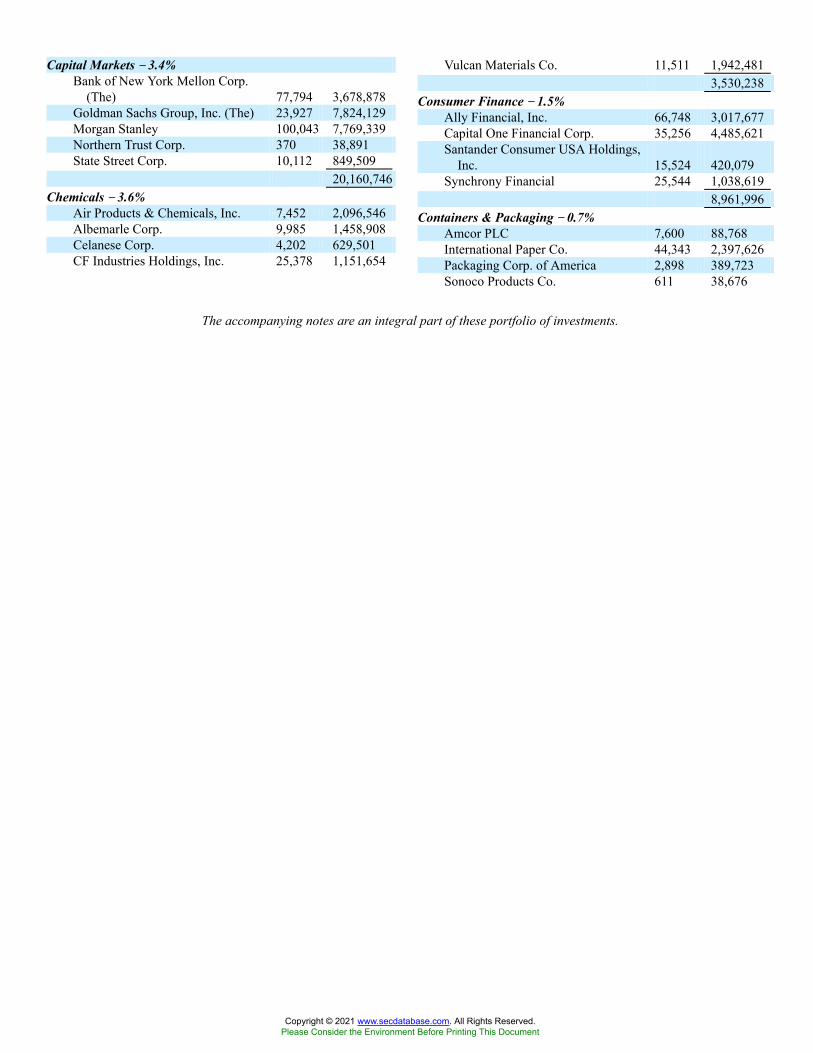
Capital Markets �� 3.4%Bank of New York Mellon Corp.
(The) 77,794 3,678,878Goldman Sachs Group, Inc. (The) 23,927 7,824,129Morgan Stanley 100,043 7,769,339Northern Trust Corp. 370 38,891State Street Corp. 10,112 849,509
20,160,746Chemicals �� 3.6%
Air Products & Chemicals, Inc. 7,452 2,096,546Albemarle Corp. 9,985 1,458,908Celanese Corp. 4,202 629,501CF Industries Holdings, Inc. 25,378 1,151,654
Vulcan Materials Co. 11,511 1,942,4813,530,238
Consumer Finance �� 1.5%Ally Financial, Inc. 66,748 3,017,677Capital One Financial Corp. 35,256 4,485,621Santander Consumer USA Holdings,
Inc. 15,524 420,079Synchrony Financial 25,544 1,038,619
8,961,996Containers & Packaging �� 0.7%
Amcor PLC 7,600 88,768International Paper Co. 44,343 2,397,626Packaging Corp. of America 2,898 389,723Sonoco Products Co. 611 38,676
Copyright © 2021 www.secdatabase.com. All Rights Reserved.Please Consider the Environment Before Printing This Document

SA U.S. Value FundPORTFOLIO OF INVESTMENTS � AS OF MARCH 31, 2021 (Unaudited) (Continued)
SHARES VALUE��COMMON STOCKS (Continued)Containers & Packaging (Continued)
WestRock Co. 24,453 $1,272,7794,187,572
Distributors �� 0.3%Genuine Parts Co. 2,168 250,599LKQ Corp. * 37,512 1,587,883
1,838,482Diversified Consumer Services �� 0.0%
Service Corp. International 2,896 147,841Diversified Financial Services �� 2.0%
Berkshire Hathaway, Inc., Class B * 43,960 11,230,461Jefferies Financial Group, Inc. 6,993 210,489Voya Financial, Inc. 4,101 260,988
11,701,938Diversified Telecommunication Services �� 3.2%
AT&T, Inc. 496,276 15,022,275Lumen Technologies, Inc. 139,832 1,866,757Verizon Communications, Inc. 41,010 2,384,731
19,273,763Electric Utilities �� 0.1%
NRG Energy, Inc. 22,148 835,644Electrical Equipment �� 1.1%
AMETEK, Inc. 5,351 683,483Eaton Corp. PLC 30,411 4,205,233Emerson Electric Co. 8,842 797,726Sensata Technologies Holding
PLC * 14,040 813,6186,500,060
Electronic Equipment, Instruments & Components �� 1.3%Arrow Electronics, Inc. * 7,332 812,532Corning, Inc. 84,494 3,676,334Flex Ltd. * 31,420 575,300Jabil, Inc. 496 25,871SYNNEX Corp. 1,605 184,318TE Connectivity Ltd. 20,879 2,695,688Vontier Corp. * 1,095 33,146
8,003,189Energy Equipment & Services �� 0.4%
Baker Hughes Co. 20,187 436,241Halliburton Co. 15,963 342,566Schlumberger Ltd. 58,070 1,578,923
2,357,730Entertainment �� 1.6%
Activision Blizzard, Inc. 1,844 171,492Electronic Arts, Inc. 383 51,847Liberty Media Corp-Liberty
Formula One, Class A * 1,097 41,927Liberty Media Corp-Liberty
Formula One, Class C * 2,194 94,978Madison Square Garden
Entertainment Corp. * 443 36,238
SHARES VALUE��Walmart, Inc. 49,625 $6,740,564
13,811,045Food Products �� 2.5%
Archer-Daniels-Midland Co. 24,965 1,423,005Bunge Ltd. 12,845 1,018,223Conagra Brands, Inc. 19,827 745,495Ingredion, Inc. 3,073 276,324J.M. Smucker Co. (The) 18,272 2,311,956Kraft Heinz Co. (The) 20,270 810,800Mondelez International, Inc., Class A 68,798 4,026,747Post Holdings, Inc. * 8,176 864,367Seaboard Corp. 22 81,180Tyson Foods, Inc., Class A 41,844 3,109,009
14,667,106Health Care Equipment & Supplies �� 2.7%
Abbott Laboratories 5,886 705,378Becton Dickinson & Co. 3,126 760,087Boston Scientific Corp. * 7,514 290,416Danaher Corp. 23,402 5,267,322Envista Holdings Corp. * 14,141 576,953Medtronic PLC 55,784 6,589,764STERIS PLC 3,637 692,776Zimmer Biomet Holdings, Inc. 6,835 1,094,147
15,976,843Health Care Providers & Services �� 7.1%
Anthem, Inc. 21,524 7,726,040Cardinal Health, Inc. 14,552 884,034Centene Corp. * 32,696 2,089,601CIGNA Corp. 30,656 7,410,781CVS Health Corp. 109,386 8,229,109DaVita, Inc. * 17,462 1,881,880Henry Schein, Inc. * 3,777 261,519Humana, Inc. 9,747 4,086,430Laboratory Corp. of America
Holdings * 16,237 4,140,922McKesson Corp. 8,262 1,611,421Quest Diagnostics, Inc. 19,764 2,536,512UnitedHealth Group, Inc. 1,004 373,558Universal Health Services, Inc.,
Class B 10,322 1,376,85242,608,659
Hotels, Restaurants & Leisure �� 0.9%Aramark 24,025 907,664Carnival Corp. 27,865 739,537Hyatt Hotels Corp., Class A 3,874 320,380MGM Resorts International 42,225 1,604,128Royal Caribbean Cruises Ltd. 19,521 1,671,193
5,242,902Household Durables �� 2.6%
DR Horton, Inc. 63,140 5,627,037Garmin Ltd. 12,982 1,711,677Lennar Corp., Class A 23,116 2,340,032
Copyright © 2021 www.secdatabase.com. All Rights Reserved.Please Consider the Environment Before Printing This Document

The accompanying notes are an integral part of these portfolio of investments.
Walt Disney Co. (The) * 48,893 9,021,7369,418,218
Food & Staples Retailing �� 2.3%Kroger Co. (The) 62,007 2,231,632US Foods Holding Corp. * 20,840 794,421Walgreens Boots Alliance, Inc. 73,669 4,044,428
Lennar Corp.,B Shares 573 47,181Mohawk Industries, Inc. * 369 70,962PulteGroup, Inc. 50,018 2,622,944Toll Brothers, Inc. 4,225 239,684Whirlpool Corp. 12,182 2,684,304
15,343,821Independent Power Producers & Energy Traders �� 0.1%
Vistra Corp. 25,467 450,257
Copyright © 2021 www.secdatabase.com. All Rights Reserved.Please Consider the Environment Before Printing This Document

SA U.S. Value FundPORTFOLIO OF INVESTMENTS � AS OF MARCH 31, 2021 (Unaudited) (Continued)
SHARES VALUE��COMMON STOCKS (Continued)Industrial Conglomerates �� 0.4%
Carlisle Cos., Inc. 6,915 $1,138,071General Electric Co. 63,080 828,240Roper Technologies, Inc. 366 147,623
2,113,934Insurance �� 4.7%
Aflac, Inc. 32,730 1,675,121Alleghany Corp. * 855 535,478Allstate Corp. (The) 16,678 1,916,302American Financial Group, Inc. 6,623 755,684American International Group, Inc. 41,993 1,940,497Arch Capital Group Ltd. * 11,691 448,584Assurant, Inc. 4,786 678,511Athene Holding Ltd., Class A * 1,982 99,893Chubb Ltd. 11,440 1,807,177Cincinnati Financial Corp. 370 38,143CNA Financial Corp. 4,467 199,362Everest Re Group Ltd. 3,050 755,821Fidelity National Financial, Inc. 1,515 61,600Hartford Financial Services Group,
Inc. (The) 49,258 3,289,942Lincoln National Corp. 15,935 992,272Loews Corp. 23,090 1,184,055Markel Corp. * 116 132,196MetLife, Inc. 37,755 2,295,126Old Republic International Corp. 23,484 512,891Principal Financial Group, Inc. 32,419 1,943,843Prudential Financial, Inc. 16,392 1,493,311Reinsurance Group of America, Inc. 5,167 651,300RenaissanceRe Holdings Ltd. 2,534 406,074Travelers Companies, Inc. (The) 23,169 3,484,618Unum Group 19,221 534,920W. R. Berkley Corp. 5,014 377,805
28,210,526IT Services �� 1.3%
Akamai Technologies, Inc. * 1,638 166,912Amdocs Ltd. 15,213 1,067,192Cognizant Technology Solutions
Corp., Class A 13,013 1,016,575Concentrix Corp. * 1,605 240,301DXC Technology Co. 20,249 632,984Fidelity National Information
Services, Inc. 20,662 2,905,284Fiserv, Inc. * 10,198 1,213,970Global Payments, Inc. 3,897 785,557
8,028,775Life Sciences Tools & Services �� 1.4%
Bio-Rad Laboratories, Inc.,Class A * 172 98,241
IQVIA Holdings, Inc. * 4,807 928,424Thermo Fisher Scientific, Inc. 16,006 7,304,819
8,331,484
SHARES VALUE��Snap-On, Inc. 6,351 $1,465,430Stanley Black & Decker, Inc. 14,985 2,992,055Westinghouse Air Brake
Technologies Corp. 5,333 422,16017,860,594
Media �� 5.8%Charter Communications, Inc.,
Class A * 17,590 10,853,382Comcast Corp., Class A 309,165 16,728,918Discovery, Inc., Class A * 21,200 921,352Discovery, Inc., Class C * 35,235 1,299,819DISH Network Corp., Class A * 12,654 458,075Fox Corp. Class A 24,883 898,525Fox Corp. Class B 8,600 300,398Interpublic Group of Cos., Inc. (The) 13,320 388,944Liberty Broadband Corp., Class C * 3,887 583,633Liberty Media Corp-Liberty
Siriusxm, Class A * 4,389 193,467Liberty Media Corp-Liberty
Siriusxm, Class C * 8,778 387,197News Corp., Class A 8,320 211,578News Corp., Class B 1,734 40,680ViacomCBS, Inc. Class A 900 42,453ViacomCBS, Inc. Class B 28,511 1,285,846
34,594,267Metals & Mining �� 2.4%
Arconic Corp. * 10,695 271,546Freeport-McMoRan, Inc. * 116,560 3,838,321Newmont Corp. 46,812 2,821,359Nucor Corp. 47,428 3,807,046Reliance Steel & Aluminum Co. 10,063 1,532,494Royal Gold, Inc. 1,245 133,987Steel Dynamics, Inc. 33,820 1,716,703
14,121,456Multi-Utilities �� 0.0%
MDU Resources Group, Inc. 5,121 161,875Multiline Retail �� 0.4%
Dollar Tree, Inc. * 11,441 1,309,537Kohl�s Corp. 2,215 132,036Target Corp. 5,057 1,001,640
2,443,213Oil, Gas & Consumable Fuels �� 6.5%
Cabot Oil & Gas Corp. 7,836 147,160Chevron Corp. 56,010 5,869,288ConocoPhillips 115,648 6,125,875EOG Resources, Inc. 22,442 1,627,718Exxon Mobil Corp. 157,641 8,801,097Hess Corp. 21,400 1,514,264HollyFrontier Corp. 15,834 566,541Kinder Morgan, Inc. 93,214 1,552,013Marathon Petroleum Corp. 51,843 2,773,082Occidental Petroleum Corp. 63,984 1,703,254
Copyright © 2021 www.secdatabase.com. All Rights Reserved.Please Consider the Environment Before Printing This Document

The accompanying notes are an integral part of these portfolio of investments.
Machinery �� 3.0%AGCO Corp. 8,548 1,227,920Cummins, Inc. 8,463 2,192,848Deere & Co. 2,034 761,001Dover Corp. 8,822 1,209,761Fortive Corp. 2,739 193,483Ingersoll Rand, Inc. * 14,939 735,148Oshkosh Corp. 7,274 863,133Otis Worldwide Corp. 25,885 1,771,828PACCAR, Inc. 16,958 1,575,737Parker-Hannifin Corp. 3,737 1,178,762Pentair PLC 20,400 1,271,328
ONEOK, Inc. 9,150 463,539Phillips 66 25,426 2,073,236Pioneer Natural Resources Co. 11,504 1,827,065Valero Energy Corp. 50,851 3,640,932Williams Cos., Inc. (The) 16,018 379,466
39,064,530Personal Products �� 0.0%
Coty, Inc., Class A 22,181 199,851Pharmaceuticals �� 3.3%
Bristol-Myers Squibb Co. 46,271 2,921,088Jazz Pharmaceuticals PLC * 4,730 777,470
Copyright © 2021 www.secdatabase.com. All Rights Reserved.Please Consider the Environment Before Printing This Document

SA U.S. Value FundPORTFOLIO OF INVESTMENTS � AS OF MARCH 31, 2021 (Unaudited) (Continued)
SHARES VALUE��COMMON STOCKS (Continued)Pharmaceuticals (Continued)
Perrigo Co. PLC 8,476 $343,024Pfizer, Inc. 392,557 14,222,340Viatris, Inc. * 116,508 1,627,617
19,891,539Professional Services �� 0.7%
Jacobs Engineering Group, Inc. 8,552 1,105,517Leidos Holdings, Inc. 16,200 1,559,736Manpowergroup, Inc. 7,075 699,717Nielsen Holdings PLC 25,197 633,705
3,998,675Real Estate Management & Development �� 0.4%
CBRE Group, Inc., Class A * 17,867 1,413,458Jones Lang LaSalle, Inc. * 5,491 983,109
2,396,567Road & Rail �� 1.8%
AMERCO 2,003 1,227,038Kansas City Southern 14,222 3,753,470Norfolk Southern Corp. 21,414 5,750,087
10,730,595Semiconductors & Semiconductor Equipment �� 5.8%
Analog Devices, Inc. 10,368 1,607,869Intel Corp. 274,899 17,593,536Lam Research Corp. 1,242 739,288Marvell Technology Group Ltd. 18,929 927,142Microchip Technology, Inc. 4,042 627,399Micron Technology, Inc. * 94,746 8,357,545ON Semiconductor Corp. * 41,142 1,711,919Qorvo, Inc. * 11,125 2,032,538Skyworks Solutions, Inc. 5,467 1,003,085
34,600,321Software �� 0.1%
NortonLifeLock, Inc. 3,129 66,523SS&C Technologies Holdings, Inc. 7,467 521,719
588,242Specialty Retail �� 0.3%
Advance Auto Parts, Inc. 4,932 904,973Carmax, Inc. * 8,119 1,077,066
1,982,039Textiles, Apparel & Luxury Goods �� 0.3%
PVH Corp. 7,382 780,277Ralph Lauren Corp. 4,113 506,557Tapestry, Inc. 12,722 524,274
1,811,108Thrifts & Mortgage Finance �� 0.0%
New York Community Bancorp,Inc. 8,435 106,450
Trading Companies & Distributors �� 0.3%United Rentals, Inc. * 5,460 1,798,033
Wireless Telecommunication Services �� 0.6%
SHARES VALUE��SHORT-TERM INVESTMENTS �� 0.1%Investment Company �� 0.1%
State Street Institutional U.S.Government Money Market Fund0.036% 467,463 $467,463
TOTAL SHORT-TERM INVESTMENTS(Identified Cost $467,463) 467,463
Total Investments �� 99.8%(Identified Cost $341,511,554) 596,535,868
Cash and Other Assets, LessLiabilities � 0.2% 1,230,959
Net Assets �� 100.0% $597,766,827
� See Note 1* Non-income producing security@ A portion or all of the security was held on loan. As of
March 31, 2021, the fair value of the securities on loan was$121,478.
Copyright © 2021 www.secdatabase.com. All Rights Reserved.Please Consider the Environment Before Printing This Document

The accompanying notes are an integral part of these portfolio ofinvestments.
T-Mobile US, Inc. * 28,843 3,613,739TOTAL COMMON STOCKS
(Identified Cost $341,044,091) 596,068,405
Copyright © 2021 www.secdatabase.com. All Rights Reserved.Please Consider the Environment Before Printing This Document

Portfolio Sectors as of March 31, 2021(As a percentage of long-term investments) (Unaudited)
Sector PercentageFinancials 22.7 %Health Care 15.1 %Industrials 13.4 %Communication Services 11.2 %Information Technology 10.5 %Consumer Discretionary 7.4 %Materials 7.2 %Energy 7.0 %Consumer Staples 5.2 %Utilities 0.3 %
100.0 %
Copyright © 2021 www.secdatabase.com. All Rights Reserved.Please Consider the Environment Before Printing This Document

SA U.S. Small Company FundPORTFOLIO OF INVESTMENTS � AS OF MARCH 31, 2021 (Unaudited)
SHARES VALUE��COMMON STOCKS �� 99.9%Aerospace & Defense �� 1.4%
AAR Corp. 4,633 $192,964Aerojet Rocketdyne Holdings, Inc. 15,617 733,374Aerovironment, Inc. * 3,537 410,504Astronics Corp. * 3,722 67,145Astronics Corp. Class B * 693 12,509Axon Enterprise, Inc. * 5,605 798,264BWX Technologies, Inc. 4,385 289,147CPI Aerostructures, Inc. * 1,342 6,093Cubic Corp. 4,100 305,737Curtiss-Wright Corp. 2,920 346,312Ducommun, Inc. * 2,355 141,300HEXCEL Corp. 6,425 359,800Innovative Solutions & Support, Inc. 3,248 20,527Kaman Corp. 3,434 176,130Kratos Defense & Security
Solutions, Inc. * 13,281 362,306Mercury Systems, Inc. * 4,845 342,299Moog, Inc., Class A 4,674 388,643National Presto Industries, Inc. 972 99,212Park Aerospace Corp. 3,167 41,868SIFCO Industries, Inc. * 1,187 14,885Spirit Aerosystems Holdings, Inc.,
Class A 4,753 231,233Textron, Inc. 11,901 667,408Vectrus, Inc. * 1,947 104,048
6,111,708Air Freight & Logistics �� 0.5%
Air Transport Services Group, Inc. * 9,227 269,982Atlas Air Worldwide Holdings, Inc.
* 4,328 261,584Echo Global Logistics, Inc. * 4,035 126,739Forward Air Corp. 4,406 391,297HUB Group, Inc., Class A * 5,234 352,144Radiant Logistics, Inc. * 9,354 65,010XPO Logistics, Inc. * 5,878 724,758
2,191,514Airlines �� 0.6%
Alaska Air Group, Inc. 8,750 605,587Allegiant Travel Co. 2,728 665,796American Airlines Group, Inc. 12,369 295,619Hawaiian Holdings, Inc. 7,087 189,010JetBlue Airways Corp. * 21,174 430,679Skywest, Inc. 7,623 415,301Spirit Airlines, Inc. * 3,315 122,324
2,724,316Auto Components �� 2.0%
American Axle & ManufacturingHoldings, Inc. * 19,154 185,028
Autoliv, Inc. 6,220 577,216BorgWarner, Inc. 15,123 701,102Cooper Tire & Rubber Co. 9,331 522,349
SHARES VALUE��Stoneridge, Inc. * 5,080 $161,595Strattec Security Corp. 941 44,133Tenneco, Inc. Class A * 5,563 59,635Visteon Corp. * 5,114 623,652
8,679,688Automobiles �� 0.2%
Harley-Davidson, Inc. 10,877 436,168Thor Industries, Inc. 1,091 147,001Winnebago Industries, Inc. 4,978 381,862
965,031Beverages �� 0.4%
Boston Beer Co., Inc. (The), Class A * 34 41,014Celsius Holdings, Inc. * 675 32,434Coca-Cola Consolidated, Inc. 1,225 353,755MGP Ingredients, Inc. 2,096 123,978Molson Coors Brewing Co., Class B 12,855 657,533National Beverage Corp. @ 9,512 465,232
1,673,946Biotechnology �� 1.8%
Acadia Pharmaceuticals, Inc. * 8,765 226,137Acceleron Pharma, Inc. * 223 30,241Adverum Biotechnologies, Inc. * 8,282 81,661Agios Pharmaceuticals, Inc. * 1,978 102,144Alector, Inc. * 567 11,419Alkermes PLC * 4,984 93,101Allakos, Inc. * 1,075 123,389Anika Therapeutics, Inc. * 1,795 73,218Applied Genetic Technologies
Corp. *@ 2,241 11,362Aravive, Inc. * 1,937 12,765Ardelyx, Inc. * 10,642 70,450Arena Pharmaceuticals, Inc. * 305 21,164Arrowhead Pharmaceuticals, Inc. * 3,301 218,889Avid Bioservices, Inc. * 3,045 55,510Bluebird Bio, Inc. * 4,559 137,454Bridgebio Pharma, Inc. *@ 3,514 216,462Calithera Biosciences, Inc. * 3,632 8,789Chimerix, Inc. * 13,027 125,580Concert Pharmaceuticals, Inc. * 4,026 20,090Corvus Pharmaceuticals, Inc. *@ 1,065 3,280CRISPR Therapeutics AG *@ 238 29,000Deciphera Pharmaceuticals, Inc. * 600 26,904Editas Medicine, Inc. *@ 2,278 95,676Emergent BioSolutions, Inc. * 7,807 725,348Enanta Pharmaceuticals, Inc. * 2,747 135,482Exelixis, Inc. * 21,779 491,988Fate Therapeutics, Inc. * 2,492 205,465Five Prime Therapeutics, Inc. * 769 28,968Frequency Therapeutics, Inc. *@ 375 3,563Halozyme Therapeutics, Inc. * 3,864 161,090Heron Therapeutics, Inc. *@ 2,150 34,852Intellia Therapeutics, Inc. * 1,053 84,509Invitae Corp. *@ 5,304 202,666
Copyright © 2021 www.secdatabase.com. All Rights Reserved.Please Consider the Environment Before Printing This Document

The accompanying notes are an integral part of these portfolio ofinvestments.
Cooper-Standard Holdings, Inc. * 2,361 85,752Dana, Inc. 26,955 655,815Dorman Products, Inc. * 4,849 497,701Fox Factory Holding Corp. * 7,279 924,870Gentex Corp. 17,424 621,514Gentherm, Inc. * 5,242 388,485Goodyear Tire & Rubber Co. (The) * 30,115 529,121Horizon Global Corp. * 3,431 35,442LCI Industries 4,449 588,514Lear Corp. 4,555 825,594Modine Manufacturing Co. * 7,149 105,591Motorcar Parts of America, Inc. * 2,267 51,007Patrick Industries, Inc. 3,605 306,425Standard Motor Products, Inc. 4,549 189,147
Ionis Pharmaceuticals, Inc. * 8,368 376,225Ironwood Pharmaceuticals, Inc. * 6,132 68,556Karyopharm Therapeutics, Inc. *@ 895 9,415Kindred Biosciences, Inc. * 3,345 16,625Kodiak Sciences, Inc. * 744 84,362Kura Oncology, Inc. * 1,002 28,327Ligand Pharmaceuticals, Inc. * 1,875 285,844MacroGenics, Inc. * 2,337 74,433Madrigal Pharmaceuticals, Inc. * 101 11,814Merrimack Pharmaceuticals, Inc. * 4,336 27,230Minerva Neurosciences, Inc. *@ 5,077 14,825Mirati Therapeutics, Inc. * 1,284 219,949
Copyright © 2021 www.secdatabase.com. All Rights Reserved.Please Consider the Environment Before Printing This Document

SA U.S. Small Company FundPORTFOLIO OF INVESTMENTS � AS OF MARCH 31, 2021 (Unaudited) (Continued)
SHARES VALUE��COMMON STOCKS (Continued)Biotechnology (Continued)
Myriad Genetics, Inc. * 9,211 $280,475Natera, Inc. * 2,474 251,210Neurocrine Biosciences, Inc. * 7,422 721,789Novavax, Inc. * 411 74,518OPKO Health, Inc. *@ 23,063 98,940PDL BioPharma, Inc. *<> 18,262 45,107REGENXBIO, Inc. * 345 11,768Sage Therapeutics, Inc. * 3,009 225,224Sarepta Therapeutics, Inc. * 905 67,450Spectrum Pharmaceuticals, Inc. * 4,922 16,046Stoke Therapeutics, Inc. *@ 478 18,566Syndax Pharmaceuticals, Inc. * 6,974 155,939TG Therapeutics, Inc. *@ 3,114 150,095Travere Therapeutics, Inc. * 7,246 180,933Turning Point Therapeutics, Inc. * 282 26,674Ultragenyx Pharmaceutical, Inc. * 541 61,598United Therapeutics Corp. * 1,104 184,666Veracyte, Inc. * 488 26,230Verastem, Inc. * 9,653 23,843Vericel Corp. * 575 31,941Vir Biotechnology, Inc. * 470 24,097Xencor, Inc. * 1,697 73,073
7,836,403Building Products �� 2.5%
A.O. Smith Corp. 10,163 687,120AAON, Inc. 8,430 590,184Advanced Drainage Systems, Inc. 10,226 1,057,266American Woodmark Corp. * 2,629 259,167Apogee Enterprises, Inc. 4,884 199,658Armstrong Flooring, Inc. * 5,675 27,751Armstrong World Industries, Inc. 6,484 584,144Builders FirstSource, Inc. * 34,359 1,593,227Cornerstone Building Brands, Inc. * 3,775 52,963CSW Industrials, Inc. 1,329 179,415Fortune Brands Home & Security,
Inc. 8,164 782,274Gibraltar Industries, Inc. * 4,189 383,335Griffon Corp. 9,303 252,762Insteel Industries, Inc. 2,278 70,254Lennox International, Inc. 1,823 568,029Masonite International Corp. * 169 19,476Owens Corning 7,572 697,305PGT Innovations, Inc. * 10,308 260,277Quanex Building Products Corp. 3,883 101,851Simpson Manufacturing Co., Inc. 6,624 687,108Trex Co., Inc. * 11,909 1,090,150UFP Industries, Inc. 10,347 784,716
10,928,432Capital Markets �� 2.3%
Affiliated Managers Group, Inc. 2,857 425,779Ares Management Corp., Class A 1,166 65,331
SHARES VALUE��Diamond Hill Investment Group, Inc. 595 $92,826Donnelley Financial Solutions, Inc. * 7,095 197,454Evercore, Inc., Class A 4,605 606,663Federated Investors, Inc. 15,138 473,819GAMCO Investors, Inc., Class A 1,700 31,535Greenhill & Co., Inc. 3,087 50,874Houlihan Lokey, Inc. 1,002 66,643Invesco Ltd. 27,257 687,422Janus Henderson Group PLC 16,584 516,592Lazard Ltd., Class A 7,639 332,373LPL Financial Holdings, Inc. 6,203 881,818Manning & Napier, Inc. 2,524 16,330Moelis & Co., Class A 3,839 210,684Morningstar, Inc. 3,198 719,678Oppenheimer Holdings, Inc., Class A 1,743 69,807Piper Jaffray Cos. 2,764 303,073PJT Partners, Inc., Class A 597 40,387Pzena Investment Management, Inc. 4,481 47,185Safeguard Scientifics, Inc. * 2,580 17,596SEI Investments Co. 2,881 175,539Silvercrest Asset Management Group,
Inc., Class A 759 10,914Stifel Financial Corp. 18,072 1,157,692Stonex Group, Inc. * 3,859 252,301Virtu Financial, Inc., Class A 5,099 158,324Virtus Investment Partners, Inc. 1,331 313,451Waddell & Reed Financial, Inc.,
Class A 3,742 93,737Westwood Holdings Group, Inc. 1,610 23,281WisdomTree Investments, Inc. 16,477 102,981
9,883,681Chemicals �� 2.9%
Advanced Emissions Solutions, Inc. 2,266 12,463AdvanSix, Inc. * 5,840 156,629Albemarle Corp. 188 27,469American Vanguard Corp. 4,836 98,703Ashland Global Holdings, Inc. 3,607 320,193Avient Corp. 11,830 559,204Axalta Coating Systems Ltd. * 18,164 537,291Balchem Corp. 5,303 665,049Cabot Corp. 6,650 348,726CF Industries Holdings, Inc. 10,240 464,691Chase Corp. 1,731 201,471Chemours Co. (The) 10,027 279,854Core Molding Technologies, Inc. * 1,500 17,590Element Solutions, Inc. 30,212 552,577Ferro Corp. * 16,853 284,142FutureFuel Corp. 8,673 126,019GCP Applied Technologies, Inc. * 2,256 55,362H.B. Fuller Co. 7,908 497,492Hawkins, Inc. 4,796 160,762Huntsman Corp. 13,650 393,530Ingevity Corp. * 948 71,602
Copyright © 2021 www.secdatabase.com. All Rights Reserved.Please Consider the Environment Before Printing This Document

The accompanying notes are an integral part of these portfolio ofinvestments.
Artisan Partners AssetManagement, Inc., Class A 10,977 572,670
BBX Capital, Inc. * 417 2,648BGC Partners, Inc., Class A 54,342 262,472Blucora, Inc. * 10,400 173,056BrightSphere Investment Group
PLC 5,801 118,224Cohen & Steers, Inc. 7,278 475,472Cowen Group, Inc. Class A 3,899 137,050
Innospec, Inc. 3,683 378,207Intrepid Potash, Inc. * 1,589 51,738Koppers Holdings, Inc. * 3,104 107,895Kraton Corp. * 6,776 247,934Kronos Worldwide, Inc. 10,857 166,112Livent Corp. * 1,509 26,136Minerals Technologies, Inc. 5,517 415,540Mosaic Co. (The) 23,505 742,993
Copyright © 2021 www.secdatabase.com. All Rights Reserved.Please Consider the Environment Before Printing This Document

SA U.S. Small Company FundPORTFOLIO OF INVESTMENTS � AS OF MARCH 31, 2021 (Unaudited) (Continued)
SHARES VALUE��COMMON STOCKS (Continued)Chemicals (Continued)
NewMarket Corp. 570 $216,691Olin Corp. 2,299 87,293PQ Group Holdings, Inc. 1,340 22,378Quaker Chemical Corp. 30 7,313Rayonier Advanced Materials,
Inc. * 8,855 80,315RPM International, Inc. 6,495 596,566Scotts Miracle-Gro Co. (The) 3,752 919,127Sensient Technologies Corp. 6,905 538,590Stepan Co. 3,560 452,512Trecora Resources * 5,488 42,642Tredegar Corp. 4,953 74,345Trinseo SA 6,991 445,117Tronox Holdings PLC Class A 12,458 227,981Valvoline, Inc. 5,402 140,830W.R. Grace & Co. 4,369 261,528Westlake Chemical Corp. 4,157 369,100
12,449,702Commercial Banks �� 9.4%
1st Source Corp. 4,820 229,336Allegiance Bancshares, Inc. 1,614 65,432Altabancorp 3,598 151,260American National Bankshares, Inc. 1,508 49,870Ameris Bancorp 9,958 522,895AmeriServ Financial, Inc. 4,400 17,864Arrow Financial Corp. 3,257 108,491Associated Banc-Corp. 20,314 433,501Atlantic Capital Bancshares, Inc. * 2,502 60,298Atlantic Union Bankshares Corp. 9,916 380,378Banc of California, Inc. 6,945 125,566Bancfirst Corp. 5,242 370,557Bancorp, Inc. (The) * 9,002 186,521BancorpSouth Bank 12,702 412,561Bank of Hawaii Corp. 3,915 350,353Bank of Marin Bancorp 1,580 61,873Bank OZK 3,630 148,286BankFinancial Corp. 3,364 34,716BankUnited, Inc. 3,750 164,813Bankwell Financial Group, Inc. 326 8,786Banner Corp. 4,653 248,144Bar Harbor Bankshares 2,489 73,226BCB Bancorp, Inc. 878 12,116Berkshire Hills Bancorp, Inc. 5,886 131,376BOK Financial Corp. 4,613 412,033Boston Private Financial Holdings,
Inc. 11,798 157,149Brookline Bancorp, Inc. 10,982 164,730Bryn Mawr Bank Corp. 2,363 107,540C&F Financial Corp. 962 42,607Cadence BanCorp 6,063 125,686Camden National Corp. 1,756 84,042
SHARES VALUE��Commerce Bancshares, Inc. 8,536 $653,943Community Bank System, Inc. 6,681 512,566Community Trust Bancorp, Inc. 2,206 97,130Connectone Bancorp, Inc. 4,989 126,471Cullen/Frost Bankers, Inc. 4,337 471,692Customers Bancorp, Inc. * 5,348 170,173CVB Financial Corp. 20,692 457,086Dime Community Bancshares, Inc. 6,339 191,057Eagle Bancorp, Inc. 5,450 289,995East West Bancorp, Inc. 11,036 814,457Enterprise Bancorp, Inc. 331 10,764Enterprise Financial Services Corp. 3,286 162,460Equity Bancshares, Inc., Class A * 2,190 60,006Farmers & Merchants Bancorp, Inc./
Archbold OH 1,205 30,294Farmers National Banc Corp. 3,991 66,650FB Financial Corp. 3,274 145,562Financial Institutions, Inc. 1,855 56,188First Bancorp 25,861 291,195First Bancorp, Inc. 2,600 75,894First Bancorp/Southern Pines NC 3,300 143,550First Busey Corp. 6,992 179,345First Business Financial Services, Inc. 551 13,626First Citizens Bancshares, Inc., Class A 551 460,509First Commonwealth Financial Corp. 14,594 209,716First Community Bancshares, Inc. 2,656 79,653First Financial Bancorp 12,704 304,896First Financial Bankshares, Inc. 20,796 971,797First Financial Corp. 1,882 84,709First Financial Northwest, Inc. 2,239 31,906First Foundation, Inc. 4,921 115,447First Hawaiian, Inc. 1,200 32,844First Horizon National Corp. 39,608 669,771First Internet Bancorp 1,284 45,235First Interstate Bancsystem, Inc.,
Class A 6,231 286,875First Merchants Corp. 6,709 311,969First Mid Bancshares, Inc. 500 21,965First Midwest Bancorp, Inc. 13,739 301,021First of Long Island Corp. (The) 4,434 94,223Flushing Financial Corp. 4,840 102,753FNB Corp. 24,564 311,963Fulton Financial Corp. 20,805 354,309German American Bancorp, Inc. 4,050 187,191Glacier Bancorp, Inc. 13,180 752,314Great Southern Bancorp, Inc. 2,813 159,413Great Western Bancorp, Inc. 1,271 38,499Hancock Whiteny Corp. 7,368 309,530Hanmi Financial Corp. 3,586 70,752Harborone Bancorp, Inc. 7,533 101,470Heartland Financial USA, Inc. 5,400 271,404Heritage Commerce Corp. 9,426 115,186Heritage Financial Corp. 4,862 137,303Hilltop Holdings, Inc. 10,971 374,440
Copyright © 2021 www.secdatabase.com. All Rights Reserved.Please Consider the Environment Before Printing This Document

The accompanying notes are an integral part of these portfolio ofinvestments.
Capital City Bank Group, Inc. 1,890 49,178Cathay General Bancorp 10,090 411,470Central Pacific Financial Corp. 3,916 104,479Central Valley Community Bancorp 2,688 49,486Century Bancorp, Inc., Class A 462 43,109CIT Group, Inc. 6,260 322,453Citizens & Northern Corp. 852 20,261Citizens Community Bancorp, Inc. 400 4,964City Holding Co. 2,782 227,512Civista Bancshares, Inc. 270 6,194CNB Financial Corp. 2,764 68,022Columbia Banking System, Inc. 10,292 443,482Comerica, Inc. 7,422 532,454
Home Bancshares, Inc. 14,737 398,636HomeTrust Bancshares, Inc. 2,644 64,381Hope Bancorp, Inc. 17,605 265,131Horizon Bancorp, Inc. 5,096 94,684Howard Bancorp, Inc. * 499 8,204Independent Bank Corp. 4,249 357,723Independent Bank Group, Inc. 2,477 178,938International Bancshares Corp. 8,343 387,282Investors Bancorp, Inc. 2,762 40,574Lakeland Bancorp, Inc. 6,732 117,339Lakeland Financial Corp. 4,384 303,329Live Oak Bancshares, Inc. 500 34,245
Copyright © 2021 www.secdatabase.com. All Rights Reserved.Please Consider the Environment Before Printing This Document

SA U.S. Small Company FundPORTFOLIO OF INVESTMENTS � AS OF MARCH 31, 2021 (Unaudited) (Continued)
SHARES VALUE��COMMON STOCKS (Continued)Commercial Banks (Continued)
Macatawa Bank Corp. 6,741 $67,073Mercantile Bank Corp. 3,005 97,572Midland States Bancorp, Inc. 1,086 30,126MidWestOne Financial Group, Inc. 613 18,985National Bank Holdings Corp.
Class A 3,824 151,736NBT Bancorp, Inc. 6,610 263,739Nicolet Bankshares, Inc. * 1,020 85,129Northeast Bank 1,690 44,599Northrim Bancorp, Inc. 1,380 58,664OceanFirst Financial Corp. 7,799 186,708OFG Bancorp 7,473 169,039Old National Bancorp 21,721 420,084Old Second Bancorp, Inc. 2,244 29,643Pacific Mercantile Bancorp * 2,500 22,250Pacific Premier Bancorp, Inc. 10,374 450,647PacWest Bancorp 6,913 263,731Park National Corp. 2,148 277,736Peapack Gladstone Financial Corp. 3,030 93,566Penns Woods Bancorp, Inc. 1,738 41,868People�s United Financial, Inc. 41,235 738,107Peoples Bancorp, Inc. 3,095 102,661Pinnacle Financial Partners, Inc. 3,114 276,087Popular, Inc. 9,824 690,824Preferred Bank 2,886 183,780Premier Financial Bancorp, Inc. 1,726 32,086Primis Financial Corp. 3,875 56,343Prosperity Bancshares, Inc. 8,898 666,371QCR Holdings, Inc. 1,914 90,379Renasant Corp. 6,735 278,694Republic Bancorp, Inc., Class A 2,887 127,865Republic First Bancorp, Inc. * 3,546 13,368S&T Bancorp, Inc. 5,792 194,032Sandy Spring Bancorp, Inc. 5,644 245,119Seacoast Banking Corp. of Florida * 5,668 205,408Select Bancorp, Inc. * 200 2,214ServisFirst Bancshares, Inc. 6,378 391,163Sierra Bancorp 2,800 75,040Signature Bank 4,291 970,195Silvergate Capital Corp. * 300 42,651Simmons First National Corp.,
Class A 13,092 388,440South State Corp. 9,903 777,485Southern First Bancshares, Inc. * 1,759 82,462Southside Bancshares, Inc. 4,400 169,444Sterling Bancorp 24,347 560,468Stock Yards Bancorp, Inc. 4,336 221,396Summit Financial Group, Inc. 392 10,408Synovus Financial Corp. 10,832 495,564TCF Financial Corp. 22,907 1,064,259Texas Capital Bancshares, Inc. * 3,548 251,624Tompkins Financial Corp. 2,420 200,134
SHARES VALUE��Univest Financial Corp 3,363 $96,148Valley National Bancorp 47,097 647,113Veritex Holdings, Inc. 3,570 116,810Washington Trust Bancorp, Inc. 3,000 154,890Webster Financial Corp. 3,323 183,131WesBanco, Inc. 8,812 317,761West Bancorp, Inc. 3,092 74,486Westamerica Bancorp 4,355 273,407Western Alliance Bancorp 5,446 514,320Wintrust Financial Corp. 5,592 423,874Zions Bancorp NA 11,502 632,150
40,666,410Commercial Services & Supplies �� 2.3%
ABM Industries, Inc. 9,829 501,377ACCO Brands Corp. 19,452 164,175Brady Corp., Class A 7,132 381,205Brink�s Co. (The) 7,356 582,816Casella Waste Systems, Inc.,
Class A * 7,613 483,958Ceco Environmental Corp. * 4,211 33,393Cimpress PLC * 4,254 425,953Clean Harbors, Inc. * 8,441 709,551Covanta Holding Corp. 23,500 325,710Deluxe Corp. 6,449 270,600Ennis, Inc. 4,400 93,940Harsco Corp. * 14,561 249,721Healthcare Services Group, Inc. 7,841 219,783Heritage-Crystal Clean, Inc. * 3,229 87,603Herman Miller, Inc. 9,834 404,669HNI Corp. 7,981 315,728Iaa, Inc. * 8,384 462,294Interface, Inc. 8,689 108,439KAR Auction Services, Inc. 5,924 88,860Kimball International, Inc., Class B 7,180 100,520Knoll, Inc. 10,471 172,876Matthews International Corp.
Class A 5,121 202,536MSA Safety, Inc. 5,857 878,667NL Industries, Inc. 7,891 58,788Pitney Bowes, Inc. 4,177 34,419Quad/Graphics, Inc. 4,591 16,206SP Plus Corp. * 3,390 111,158Steelcase, Inc., Class A 15,351 220,901Stericycle, Inc. * 5,435 366,917Team, Inc. * 5,503 63,450Tetra Tech, Inc. 7,685 1,043,008UniFirst Corp. 2,356 527,061US Ecology, Inc. * 4,572 190,378Viad Corp. 2,833 118,278Vidler Water Resouces, Inc. * 2,830 25,187Virco Manufacturing Corp. * 2,494 7,731VSE Corp. 1,964 77,578
10,125,434
Copyright © 2021 www.secdatabase.com. All Rights Reserved.Please Consider the Environment Before Printing This Document

The accompanying notes are an integral part of these portfolio of investments.
TowneBank 6,582 200,093Trico Bancshares 3,645 172,664TriState Capital Holdings, Inc. * 3,611 83,270Triumph Bancorp, Inc. * 2,765 213,983Trustmark Corp. 8,464 284,898UMB Financial Corp. 5,619 518,802Umpqua Holdings Corp. 9,156 160,688United Bankshares, Inc. 14,718 567,820United Community Banks, Inc. 10,212 348,433
Communications Equipment �� 1.2%ADTRAN, Inc. 7,551 125,951Applied Optoelectronics, Inc. *@ 3,183 26,610Bk Technologies Corp. 2,000 8,360CalAmp Corp. * 5,414 58,742Calix, Inc. * 1,031 35,734Ciena Corp. * 20,878 1,142,444Clearfield, Inc. * 2,783 83,852CommScope Holding Co., Inc. * 3,352 51,487
Copyright © 2021 www.secdatabase.com. All Rights Reserved.Please Consider the Environment Before Printing This Document
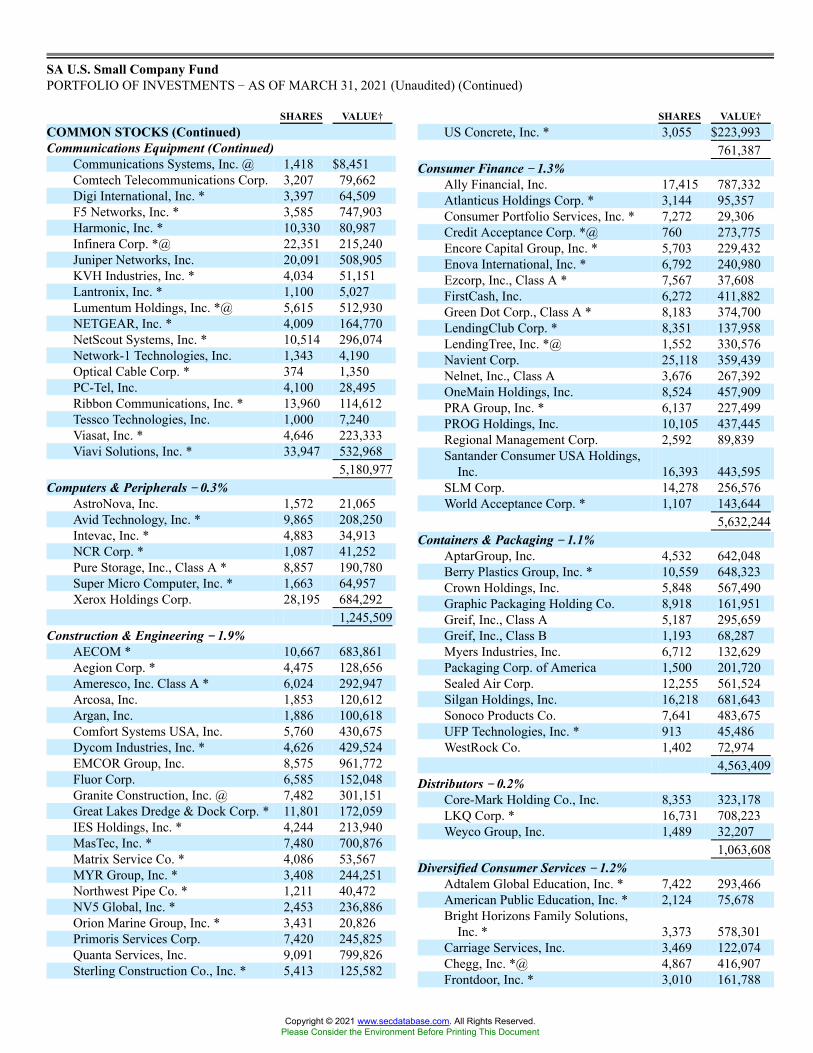
SA U.S. Small Company FundPORTFOLIO OF INVESTMENTS � AS OF MARCH 31, 2021 (Unaudited) (Continued)
SHARES VALUE��COMMON STOCKS (Continued)Communications Equipment (Continued)
Communications Systems, Inc. @ 1,418 $8,451Comtech Telecommunications Corp. 3,207 79,662Digi International, Inc. * 3,397 64,509F5 Networks, Inc. * 3,585 747,903Harmonic, Inc. * 10,330 80,987Infinera Corp. *@ 22,351 215,240Juniper Networks, Inc. 20,091 508,905KVH Industries, Inc. * 4,034 51,151Lantronix, Inc. * 1,100 5,027Lumentum Holdings, Inc. *@ 5,615 512,930NETGEAR, Inc. * 4,009 164,770NetScout Systems, Inc. * 10,514 296,074Network-1 Technologies, Inc. 1,343 4,190Optical Cable Corp. * 374 1,350PC-Tel, Inc. 4,100 28,495Ribbon Communications, Inc. * 13,960 114,612Tessco Technologies, Inc. 1,000 7,240Viasat, Inc. * 4,646 223,333Viavi Solutions, Inc. * 33,947 532,968
5,180,977Computers & Peripherals �� 0.3%
AstroNova, Inc. 1,572 21,065Avid Technology, Inc. * 9,865 208,250Intevac, Inc. * 4,883 34,913NCR Corp. * 1,087 41,252Pure Storage, Inc., Class A * 8,857 190,780Super Micro Computer, Inc. * 1,663 64,957Xerox Holdings Corp. 28,195 684,292
1,245,509Construction & Engineering �� 1.9%
AECOM * 10,667 683,861Aegion Corp. * 4,475 128,656Ameresco, Inc. Class A * 6,024 292,947Arcosa, Inc. 1,853 120,612Argan, Inc. 1,886 100,618Comfort Systems USA, Inc. 5,760 430,675Dycom Industries, Inc. * 4,626 429,524EMCOR Group, Inc. 8,575 961,772Fluor Corp. 6,585 152,048Granite Construction, Inc. @ 7,482 301,151Great Lakes Dredge & Dock Corp. * 11,801 172,059IES Holdings, Inc. * 4,244 213,940MasTec, Inc. * 7,480 700,876Matrix Service Co. * 4,086 53,567MYR Group, Inc. * 3,408 244,251Northwest Pipe Co. * 1,211 40,472NV5 Global, Inc. * 2,453 236,886Orion Marine Group, Inc. * 3,431 20,826Primoris Services Corp. 7,420 245,825Quanta Services, Inc. 9,091 799,826Sterling Construction Co., Inc. * 5,413 125,582
SHARES VALUE��US Concrete, Inc. * 3,055 $223,993
761,387Consumer Finance �� 1.3%
Ally Financial, Inc. 17,415 787,332Atlanticus Holdings Corp. * 3,144 95,357Consumer Portfolio Services, Inc. * 7,272 29,306Credit Acceptance Corp. *@ 760 273,775Encore Capital Group, Inc. * 5,703 229,432Enova International, Inc. * 6,792 240,980Ezcorp, Inc., Class A * 7,567 37,608FirstCash, Inc. 6,272 411,882Green Dot Corp., Class A * 8,183 374,700LendingClub Corp. * 8,351 137,958LendingTree, Inc. *@ 1,552 330,576Navient Corp. 25,118 359,439Nelnet, Inc., Class A 3,676 267,392OneMain Holdings, Inc. 8,524 457,909PRA Group, Inc. * 6,137 227,499PROG Holdings, Inc. 10,105 437,445Regional Management Corp. 2,592 89,839Santander Consumer USA Holdings,
Inc. 16,393 443,595SLM Corp. 14,278 256,576World Acceptance Corp. * 1,107 143,644
5,632,244Containers & Packaging �� 1.1%
AptarGroup, Inc. 4,532 642,048Berry Plastics Group, Inc. * 10,559 648,323Crown Holdings, Inc. 5,848 567,490Graphic Packaging Holding Co. 8,918 161,951Greif, Inc., Class A 5,187 295,659Greif, Inc., Class B 1,193 68,287Myers Industries, Inc. 6,712 132,629Packaging Corp. of America 1,500 201,720Sealed Air Corp. 12,255 561,524Silgan Holdings, Inc. 16,218 681,643Sonoco Products Co. 7,641 483,675UFP Technologies, Inc. * 913 45,486WestRock Co. 1,402 72,974
4,563,409Distributors �� 0.2%
Core-Mark Holding Co., Inc. 8,353 323,178LKQ Corp. * 16,731 708,223Weyco Group, Inc. 1,489 32,207
1,063,608Diversified Consumer Services �� 1.2%
Adtalem Global Education, Inc. * 7,422 293,466American Public Education, Inc. * 2,124 75,678Bright Horizons Family Solutions,
Inc. * 3,373 578,301Carriage Services, Inc. 3,469 122,074Chegg, Inc. *@ 4,867 416,907Frontdoor, Inc. * 3,010 161,788
Copyright © 2021 www.secdatabase.com. All Rights Reserved.Please Consider the Environment Before Printing This Document

The accompanying notes are an integral part of these portfolio of investments.
Tutor Perini Corp. * 7,646 144,892Valmont Industries, Inc. 3,498 831,370WillScot Mobile Mini Holdings
Corp. * 21,315 591,4918,023,727
Construction Materials �� 0.2%Eagle Materials, Inc. 1,439 193,416Forterra, Inc. * 1,512 35,154Summit Materials, Inc., Class A * 5,300 148,506United States Lime & Minerals, Inc. 1,199 160,318
Graham Holdings Co., Class B 523 294,156Grand Canyon Education, Inc. * 6,483 694,329H&R Block, Inc. @ 13,196 287,673Houghton Mifflin Harcourt Co. * 14,959 113,988Laureate Education, Inc. Class A * 2,699 36,679Perdoceo Education Corp. * 12,403 148,340Regis Corp. *@ 5,410 67,950Service Corp. International 12,310 628,426Strategic Education, Inc. 3,002 275,914Stride, Inc. * 7,465 224,771Terminix Global Holdings, Inc. * 10,611 505,826Universal Technical Institute, Inc. * 5,900 34,456
Copyright © 2021 www.secdatabase.com. All Rights Reserved.Please Consider the Environment Before Printing This Document
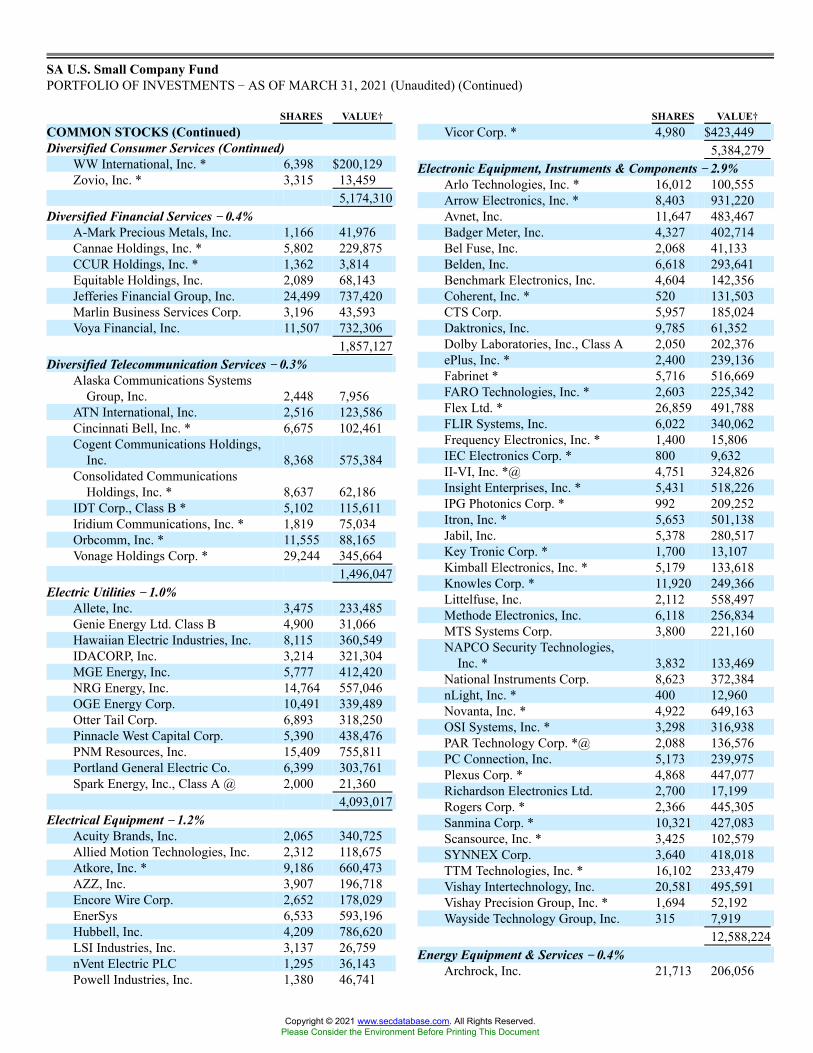
SA U.S. Small Company FundPORTFOLIO OF INVESTMENTS � AS OF MARCH 31, 2021 (Unaudited) (Continued)
SHARES VALUE��COMMON STOCKS (Continued)Diversified Consumer Services (Continued)
WW International, Inc. * 6,398 $200,129Zovio, Inc. * 3,315 13,459
5,174,310Diversified Financial Services �� 0.4%
A-Mark Precious Metals, Inc. 1,166 41,976Cannae Holdings, Inc. * 5,802 229,875CCUR Holdings, Inc. * 1,362 3,814Equitable Holdings, Inc. 2,089 68,143Jefferies Financial Group, Inc. 24,499 737,420Marlin Business Services Corp. 3,196 43,593Voya Financial, Inc. 11,507 732,306
1,857,127Diversified Telecommunication Services �� 0.3%
Alaska Communications SystemsGroup, Inc. 2,448 7,956
ATN International, Inc. 2,516 123,586Cincinnati Bell, Inc. * 6,675 102,461Cogent Communications Holdings,
Inc. 8,368 575,384Consolidated Communications
Holdings, Inc. * 8,637 62,186IDT Corp., Class B * 5,102 115,611Iridium Communications, Inc. * 1,819 75,034Orbcomm, Inc. * 11,555 88,165Vonage Holdings Corp. * 29,244 345,664
1,496,047Electric Utilities �� 1.0%
Allete, Inc. 3,475 233,485Genie Energy Ltd. Class B 4,900 31,066Hawaiian Electric Industries, Inc. 8,115 360,549IDACORP, Inc. 3,214 321,304MGE Energy, Inc. 5,777 412,420NRG Energy, Inc. 14,764 557,046OGE Energy Corp. 10,491 339,489Otter Tail Corp. 6,893 318,250Pinnacle West Capital Corp. 5,390 438,476PNM Resources, Inc. 15,409 755,811Portland General Electric Co. 6,399 303,761Spark Energy, Inc., Class A @ 2,000 21,360
4,093,017Electrical Equipment �� 1.2%
Acuity Brands, Inc. 2,065 340,725Allied Motion Technologies, Inc. 2,312 118,675Atkore, Inc. * 9,186 660,473AZZ, Inc. 3,907 196,718Encore Wire Corp. 2,652 178,029EnerSys 6,533 593,196Hubbell, Inc. 4,209 786,620LSI Industries, Inc. 3,137 26,759nVent Electric PLC 1,295 36,143Powell Industries, Inc. 1,380 46,741
SHARES VALUE��Vicor Corp. * 4,980 $423,449
5,384,279Electronic Equipment, Instruments & Components �� 2.9%
Arlo Technologies, Inc. * 16,012 100,555Arrow Electronics, Inc. * 8,403 931,220Avnet, Inc. 11,647 483,467Badger Meter, Inc. 4,327 402,714Bel Fuse, Inc. 2,068 41,133Belden, Inc. 6,618 293,641Benchmark Electronics, Inc. 4,604 142,356Coherent, Inc. * 520 131,503CTS Corp. 5,957 185,024Daktronics, Inc. 9,785 61,352Dolby Laboratories, Inc., Class A 2,050 202,376ePlus, Inc. * 2,400 239,136Fabrinet * 5,716 516,669FARO Technologies, Inc. * 2,603 225,342Flex Ltd. * 26,859 491,788FLIR Systems, Inc. 6,022 340,062Frequency Electronics, Inc. * 1,400 15,806IEC Electronics Corp. * 800 9,632II-VI, Inc. *@ 4,751 324,826Insight Enterprises, Inc. * 5,431 518,226IPG Photonics Corp. * 992 209,252Itron, Inc. * 5,653 501,138Jabil, Inc. 5,378 280,517Key Tronic Corp. * 1,700 13,107Kimball Electronics, Inc. * 5,179 133,618Knowles Corp. * 11,920 249,366Littelfuse, Inc. 2,112 558,497Methode Electronics, Inc. 6,118 256,834MTS Systems Corp. 3,800 221,160NAPCO Security Technologies,
Inc. * 3,832 133,469National Instruments Corp. 8,623 372,384nLight, Inc. * 400 12,960Novanta, Inc. * 4,922 649,163OSI Systems, Inc. * 3,298 316,938PAR Technology Corp. *@ 2,088 136,576PC Connection, Inc. 5,173 239,975Plexus Corp. * 4,868 447,077Richardson Electronics Ltd. 2,700 17,199Rogers Corp. * 2,366 445,305Sanmina Corp. * 10,321 427,083Scansource, Inc. * 3,425 102,579SYNNEX Corp. 3,640 418,018TTM Technologies, Inc. * 16,102 233,479Vishay Intertechnology, Inc. 20,581 495,591Vishay Precision Group, Inc. * 1,694 52,192Wayside Technology Group, Inc. 315 7,919
12,588,224Energy Equipment & Services �� 0.4%
Archrock, Inc. 21,713 206,056
Copyright © 2021 www.secdatabase.com. All Rights Reserved.Please Consider the Environment Before Printing This Document

The accompanying notes are an integral part of these portfolio of investments.
Preformed Line Products Co. 968 66,550Regal Beloit Corp. 5,003 713,828Sensata Technologies Holding PLC * 11,437 662,774Sunrun, Inc. *@ 6,232 376,911Thermon Group Holdings, Inc. * 4,877 95,053TPI Composites, Inc. * 564 31,827Ultralife Corp. * 3,600 29,808
Bristow Group, Inc. * 1,138 29,451Core Laboratories NV 2,189 63,021Dawson Geophysical Co. * 2,775 6,799DMC Global, Inc. 2,412 130,875Dril-Quip, Inc. * 4,621 153,556Exterran Corp. * 5,983 20,103Geospace Technologies Corp. * 1,646 15,012Gulf Island Fabrication, Inc. * 1,823 7,037
Copyright © 2021 www.secdatabase.com. All Rights Reserved.Please Consider the Environment Before Printing This Document

SA U.S. Small Company FundPORTFOLIO OF INVESTMENTS � AS OF MARCH 31, 2021 (Unaudited) (Continued)
SHARES VALUE��COMMON STOCKS (Continued)Energy Equipment & Services (Continued)
Helix Energy Solutions Group, Inc. * 17,953 $90,663Helmerich & Payne, Inc. 7,229 194,894KLX Energy Services Holdings,
Inc. *@ 766 12,279Nabors Industries Ltd. 853 79,713Natural Gas Services Group, Inc. * 3,685 34,786NOV, Inc. 23,817 326,769Oceaneering International, Inc. * 11,720 133,842Oil States International, Inc. * 7,268 43,826Patterson-UTI Energy, Inc. 599 4,271SEACOR Marine Holdings, Inc. * 3,233 17,232TechnipFMC PLC 5,694 43,958U.S. Silica Holdings, Inc. 8,142 100,065
1,714,208Entertainment �� 0.4%
Ballantyne Strong, Inc. * 3,464 9,041Cinemark Holdings, Inc. @ 1,868 38,126Gaia, Inc. * 1,407 16,729Glu Mobile, Inc. * 12,857 160,455IMAX Corp. * 4,817 96,822Liberty Braves Group, Class A * 338 9,636Liberty Media Corp-Liberty Formula
One, Class A * 1,700 64,974Liberty Media Corp-Liberty Formula
One, Class C * 10,084 436,536Lions Gate Entertainment Corp.,
Class A * 4,059 60,682Lions Gate Entertainment Corp.,
Class B * 5,120 66,048Madison Square Garden
Entertainment Corp. * 631 51,616Marcus Corp. (The) @ 3,728 74,523Reading International, Inc. * 4,951 27,478World Wrestling Entertainment, Inc. 2,212 120,023Zynga, Inc., Class A * 55,936 571,107
1,803,796Food & Staples Retailing �� 0.7%
Andersons, Inc. (The) 5,758 157,654BJ�s Wholesale Club Holdings, Inc.
* 621 27,858Casey�s General Stores, Inc. 2,566 554,744Chefs� Warehouse Inc. (The) * 6,038 183,917Ingles Markets, Inc., Class A 2,846 175,456Natural Grocers by Vitamin Cottage,
Inc. 2,710 47,560Performance Food Group Co. * 6,339 365,190PriceSmart, Inc. 4,645 449,404SpartanNash Co. 7,457 146,381Sprouts Farmers Market, Inc. * 8,100 215,622United Natural Foods, Inc. * 6,250 205,875US Foods Holding Corp. * 9,874 376,397
SHARES VALUE��Ingredion, Inc. 4,253 $382,430J&J Snack Foods Corp. 2,573 404,038John B. Sanfilippo & Son, Inc. 1,857 167,817Lamb Weston Holdings, Inc. 8,392 650,212Lancaster Colony Corp. 4,472 784,210Landec Corp. * 3,872 41,043Lifeway Foods, Inc. * 3,800 20,520Limoneira Co. 2,072 36,260Pilgrim�s Pride Corp. * 5,624 133,795Post Holdings, Inc. * 5,411 572,051Rocky Mountain Chocolate Factory,
Inc. 1,260 6,640Sanderson Farms, Inc. 2,860 445,531Seaboard Corp. 46 169,739Seneca Foods Corp., Class A * 1,383 65,125Tootsie Roll Industries, Inc. @ 5,500 182,222TreeHouse Foods, Inc. * 225 11,754
8,516,494Gas Utilities �� 0.8%
Chesapeake Utilities Corp. 2,784 323,167National Fuel Gas Co. 4,531 226,505New Jersey Resources Corp. 12,600 502,362Northwest Natural Holding Co. 5,013 270,451ONE Gas, Inc. 8,867 681,961RGC Resources, Inc. 600 13,308South Jersey Industries, Inc. 14,522 327,907Southwest Gas Corp. 4,554 312,905Spire, Inc. 6,614 488,709UGI Corp. 10,146 416,087
3,563,362Health Care �� 0.0%
Contra Aduro Biotech § 237 2Contra Pfenex, Inc. § 2,903 163
165Health Care Equipment & Supplies �� 2.7%
Accuray, Inc. * 14,711 72,819Achillion Pharmaceuticals, Inc. § 23,152 32,876Angiodynamics, Inc. * 4,628 108,295Antares Pharma, Inc. * 9,163 37,660AtriCure, Inc. * 2,689 176,183Atrion Corp. 322 206,502Avanos Medical, Inc. * 6,331 276,918Axogen, Inc. * 1,529 30,978Cantel Medical Corp. * 5,856 467,543Cardiovascular Systems, Inc. * 1,234 47,312CONMED Corp. 3,714 485,011CryoLife, Inc. * 5,697 128,638Cutera, Inc. * 1,969 59,168Dentsply Sirona, Inc. 563 35,925Electromed, Inc. * 2,175 22,925Envista Holdings Corp. * 3,555 145,044Fonar Corp. * 1,982 35,854Globus Medical, Inc., Class A * 6,323 389,939
Copyright © 2021 www.secdatabase.com. All Rights Reserved.Please Consider the Environment Before Printing This Document

The accompanying notes are an integral part of these portfolio ofinvestments.
Village Super Market, Inc., Class A 1,435 33,823Weis Markets, Inc. 4,647 262,648
3,202,529Food Products �� 2.0%
B&G Foods, Inc. @ 9,943 308,830Beyond Meat, Inc. *@ 2,085 271,300Bunge Ltd. 6,292 498,767Cal-Maine Foods, Inc. * 6,372 244,812Calavo Growers, Inc. 3,087 239,675Coffee Holding Co., Inc. * 600 2,964Darling Ingredients, Inc. * 31,183 2,294,445Farmer Bros. Co. * 3,098 32,343Flowers Foods, Inc. 12,107 288,147Fresh Del Monte Produce, Inc. 6,809 194,942Hostess Brands, Inc. * 4,664 66,882
Haemonetics Corp. * 7,335 814,258Heska Corp. * 1,136 191,371Hill-Rom Holdings, Inc. 5,319 587,643ICU Medical, Inc. * 1,949 400,403Inogen, Inc. * 2,668 140,123Integer Holdings Corp. * 4,771 439,409Integra LifeSciences Holdings Corp. * 7,218 498,692IntriCon Corp. * 1,000 25,640Invacare Corp. 4,558 36,555iRhythm Technologies, Inc. * 101 14,025Lantheus Holdings, Inc. * 8,245 176,196LeMaitre Vascular, Inc. 3,866 188,583
Copyright © 2021 www.secdatabase.com. All Rights Reserved.Please Consider the Environment Before Printing This Document

SA U.S. Small Company FundPORTFOLIO OF INVESTMENTS � AS OF MARCH 31, 2021 (Unaudited) (Continued)
SHARES VALUE��COMMON STOCKS (Continued)Health Care Equipment & Supplies (Continued)
LENSAR, Inc. * 1,385 $10,055LivaNova PLC * 5,780 426,159Meridian Bioscience, Inc. * 8,392 220,290Merit Medical Systems, Inc. * 6,875 411,675Natus Medical, Inc. * 4,076 104,386Neogen Corp. * 6,380 567,118Nevro Corp. * 446 62,217Novocure Ltd. * 4,570 604,063NuVasive, Inc. * 7,740 507,434OraSure Technologies, Inc. * 9,521 111,110Orthofix Medical, Inc. * 2,339 101,396Penumbra, Inc. * 2,535 685,920Quidel Corp. * 5,750 735,598SeaSpine Holdings Corp. * 2,964 51,574Shockwave Medical, Inc. * 560 72,946Silk Road Medical, Inc. * 189 9,573STAAR Surgical Co. * 1,150 121,222Surgalign Holdings, Inc. * 15,534 33,864SurModics, Inc. * 1,788 100,253Tandem Diabetes Care, Inc. * 1,536 135,552Utah Medical Products, Inc. 630 54,558Varex Imaging Corp. * 2,200 45,078
11,444,529Health Care Providers & Services �� 3.1%
Acadia Healthcare Co., Inc. * 4,406 251,759Addus HomeCare Corp. * 1,863 194,851Amedisys, Inc. * 5,127 1,357,578AMN Healthcare Services, Inc. * 7,715 568,595Brookdale Senior Living, Inc. * 15,683 94,882Castle Biosciences, Inc. * 578 39,570Chemed Corp. 2,186 1,005,167Community Health Systems, Inc. * 6,976 94,316Corvel Corp. * 3,554 364,605Cross Country Healthcare, Inc. * 6,503 81,222DaVita, Inc. * 9,640 1,038,903Encompass Health Corp. 7,365 603,193Ensign Group, Inc. (The) 10,168 954,165Enzo Biochem, Inc. * 9,744 33,519Guardant Health, Inc. * 631 96,322Hanger, Inc. * 1,313 29,963HealthEquity, Inc. * 264 17,952Henry Schein, Inc. * 8,786 608,343Joint Corp. (The) * 845 40,873LHC Group, Inc. * 4,808 919,338Magellan Health, Inc. * 2,949 274,965MEDNAX, Inc. * 2,873 73,175ModivCare, Inc. * 1,567 232,104Molina Healthcare, Inc. * 1,049 245,214National Healthcare Corp. 2,500 194,775National Research Corp. 4,540 212,608Owens & Minor, Inc. 7,490 281,549
SHARES VALUE��Star Equity Holdings, Inc. *@ 210 $655Surgery Partners, Inc. * 3,218 142,429Tenet Healthcare Corp. * 16,691 867,932Tivity Health, Inc. * 1,853 41,359Triple-S Management Corp. * 3,473 90,402U.S. Physical Therapy, Inc. 2,557 266,184Universal Health Services, Inc.,
Class B 3,557 474,46813,545,935
Health Care Technology �� 0.5%Allscripts Healthcare Solutions,
Inc. * 28,891 433,798Computer Programs & Systems, Inc. 1,956 59,854Evolent Health, Inc., Class A * 3,026 61,125Health Catalyst, Inc. * 1,300 60,801HealthStream, Inc. * 5,702 127,383HMS Holdings Corp. * 8,352 308,815Inspire Medical Systems, Inc. * 220 45,538NextGen Healthcare, Inc. * 12,327 223,119Omnicell, Inc. * 5,909 767,402OptimizeRx Corp. *@ 297 14,479Simulations Plus, Inc. @ 1,935 122,369Vocera Communications, Inc. * 881 33,883
2,258,566Hotels, Restaurants & Leisure �� 3.0%
Aramark 12,082 456,458Biglari Holdings, Inc., Class A * 7 4,729Biglari Holdings, Inc., Class B * 74 9,824BJ�s Restaurants, Inc. * 3,923 227,848Bloomin� Brands, Inc. 13,327 360,495Bluegreen Vacations Holding Corp. * 417 7,731Brinker International, Inc. 7,784 553,131Carrols Restaurant Group, Inc. * 8,916 53,362Cheesecake Factory, Inc. (The) 7,512 439,527Choice Hotels International, Inc. 7,584 813,687Churchill Downs, Inc. 4,317 981,772Chuy�s Holdings, Inc. * 2,478 109,825Cracker Barrel Old Country Store,
Inc. 3,034 524,518Dave & Buster�s Entertainment, Inc.
* 6,312 302,345Del Taco Restaurants, Inc. 5,126 49,107Denny�s Corp. * 12,224 221,377Dover Motorsports, Inc. 4,000 8,240El Pollo Loco Holdings, Inc. * 4,284 69,058Everi Holdings, Inc. * 4,400 62,084Extended Stay America, Inc. 8,000 158,000Fiesta Restaurant Group, Inc. * 4,058 51,090Hilton Grand Vacations, Inc. * 559 20,957International Game Technology
PLC @ 969 15,552Jack in the Box, Inc. 4,510 495,108
Copyright © 2021 www.secdatabase.com. All Rights Reserved.Please Consider the Environment Before Printing This Document
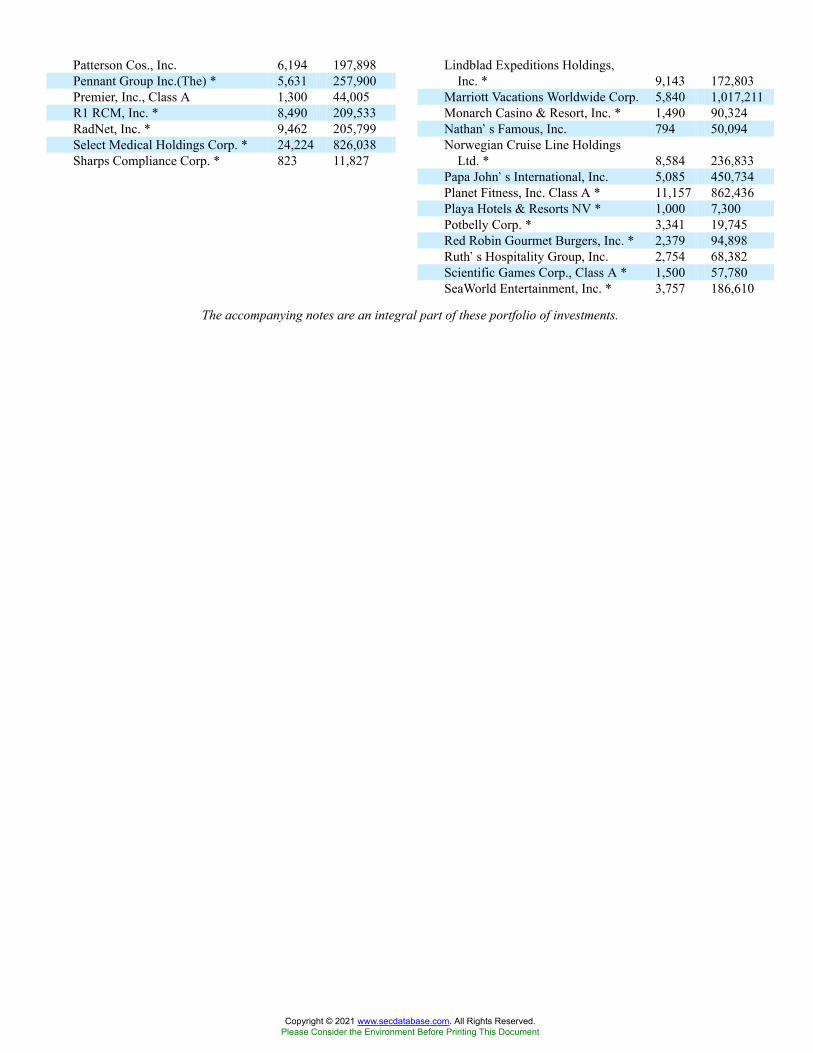
The accompanying notes are an integral part of these portfolio of investments.
Patterson Cos., Inc. 6,194 197,898Pennant Group Inc.(The) * 5,631 257,900Premier, Inc., Class A 1,300 44,005R1 RCM, Inc. * 8,490 209,533RadNet, Inc. * 9,462 205,799Select Medical Holdings Corp. * 24,224 826,038Sharps Compliance Corp. * 823 11,827
Lindblad Expeditions Holdings,Inc. * 9,143 172,803
Marriott Vacations Worldwide Corp. 5,840 1,017,211Monarch Casino & Resort, Inc. * 1,490 90,324Nathan�s Famous, Inc. 794 50,094Norwegian Cruise Line Holdings
Ltd. * 8,584 236,833Papa John�s International, Inc. 5,085 450,734Planet Fitness, Inc. Class A * 11,157 862,436Playa Hotels & Resorts NV * 1,000 7,300Potbelly Corp. * 3,341 19,745Red Robin Gourmet Burgers, Inc. * 2,379 94,898Ruth�s Hospitality Group, Inc. 2,754 68,382Scientific Games Corp., Class A * 1,500 57,780SeaWorld Entertainment, Inc. * 3,757 186,610
Copyright © 2021 www.secdatabase.com. All Rights Reserved.Please Consider the Environment Before Printing This Document

SA U.S. Small Company FundPORTFOLIO OF INVESTMENTS � AS OF MARCH 31, 2021 (Unaudited) (Continued)
SHARES VALUE��COMMON STOCKS (Continued)Hotels, Restaurants & Leisure (Continued)
Shake Shack, Inc., Class A * 2,567 $289,481Six Flags Entertainment Corp. 551 25,605Texas Roadhouse, Inc. 10,688 1,025,407Travel + Leisure Co. 3,425 209,473Vail Resorts, Inc. 2,288 667,318Wendy�s Co. (The) 30,015 608,104Wingstop, Inc. 2,302 292,745Wyndham Hotels & Resorts, Inc. 6,210 433,334
12,862,442Household Durables �� 2.7%
Bassett Furniture Industries, Inc. 2,600 63,102Beazer Homes USA, Inc. * 1,643 34,372Cavco Industries, Inc. * 1,208 272,537Century Communities, Inc. * 4,472 269,751Ethan Allen Interiors, Inc. 3,799 104,890Flexsteel Industries, Inc. 1,493 52,031Green Brick Partners, Inc. * 4,024 91,264Hamilton Beach Brands Holding
Co., Class A 2,000 36,260Helen of Troy Ltd. * 3,719 783,444Hooker Furniture Corp. 2,100 76,566Installed Building Products, Inc. 5,423 601,302iRobot Corp. *@ 4,756 581,088KB Home 14,182 659,888La-Z-Boy, Inc. 6,883 292,390Leggett & Platt, Inc. 9,073 414,182Lifetime Brands, Inc. 3,200 47,008M.D.C. Holdings, Inc. 11,847 703,712M/I Homes, Inc. * 5,641 333,214Meritage Homes Corp. * 6,604 607,040Mohawk Industries, Inc. * 4,358 838,087New Home Co., Inc. (The) * 3,433 17,989Newell Brands, Inc. 30,430 814,915Orleans Homebuilders, Inc. *@§ 4,953 �Skyline Champion Corp. * 2,906 131,526Sonos, Inc. * 902 33,798Taylor Morrison Home Corp. * 13,906 428,444Tempur Sealy International, Inc. 25,976 949,682Toll Brothers, Inc. 11,905 675,371TopBuild Corp. * 4,720 988,510TRI Pointe Homes, Inc. * 17,727 360,922Tupperware Brands Corp. * 773 20,415Universal Electronics, Inc. * 2,258 124,122VOXX International Corp. * 3,284 62,593Whirlpool Corp. 1,079 237,758
11,708,173Household Products �� 0.4%
Central Garden & Pet Co. * 1,647 95,543Central Garden & Pet Co.,
Class A * 6,261 324,883Spectrum Brands Holdings, Inc. 4,389 373,065
SHARES VALUE��Industrial Conglomerates �� 0.2%
Carlisle Cos., Inc. 3,012 $495,715Raven Industries, Inc. 5,661 216,986
712,701Insurance �� 4.1%
Alleghany Corp. * 1,008 631,300Ambac Financial Group, Inc. * 6,709 112,309American Equity Investment Life
Holding Co. 11,817 372,590American Financial Group, Inc. 4,216 481,046American National Group, Inc. 1,527 164,717AMERISAFE, Inc. 3,769 241,216Argo Group International Holdings
Ltd. 4,369 219,848Assurant, Inc. 4,647 658,805Assured Guaranty Ltd. 5,276 223,069Athene Holding Ltd., Class A * 12,800 645,120Axis Capital Holdings Ltd. 5,472 271,247Brighthouse Financial, Inc. * 5,795 256,429Citizens, Inc. *@ 10,192 59,012CNO Financial Group, Inc. 45,733 1,110,855Crawford & Co., Class A 6,728 71,653Crawford & Co., Class B 4,945 47,917Donegal Group, Inc., Class A 4,430 65,830eHealth, Inc. * 3,641 264,810Employers Holdings, Inc. 4,570 196,784Enstar Group Ltd. * 1,353 333,826Erie Indemnity Co., Class A 1,297 286,520Everest Re Group Ltd. 2,685 665,370FBL Financial Group, Inc., Class A 3,610 201,871FedNat Holding Co. 3,068 14,205Fidelity National Financial, Inc. 14,619 594,408First American Financial Corp. 8,507 481,922Genworth Financial, Inc., Class A * 14,918 49,528Global Indemnity Group LLC Class A 2,287 67,787Globe Life, Inc. 5,598 540,935Greenlight Capital Re Ltd. * 4,390 38,193Hallmark Financial Services, Inc. * 4,500 17,460Hanover Insurance Group, Inc. (The) 2,430 314,588HCI Group, Inc. 1,239 95,180Heritage Insurance Holdings, Inc. 3,869 42,868Horace Mann Educators Corp. 5,948 257,013Independence Holding Co. 2,460 98,031Investors Title Co. 393 65,238James River Group Holdings Ltd. 829 37,819Kemper Corp. 10,830 863,368Kingstone Cos, Inc. 2,759 23,562Kinsale Capital Group, Inc. 400 65,920Lincoln National Corp. 8,515 530,229Loews Corp. 1,024 52,511Maiden Holdings Ltd. * 12,853 42,415MBIA, Inc. * 29,495 283,742Mercury General Corp. 6,108 371,427
Copyright © 2021 www.secdatabase.com. All Rights Reserved.Please Consider the Environment Before Printing This Document

The accompanying notes are an integral part of these portfolio ofinvestments.
WD-40 Co. 2,352 720,1351,513,626
Independent Power Producers & Energy Traders �� 0.4%Atlantica Yield plc 1,800 65,934Brookfield Renewable Corp.
Class A 2,097 98,139Clearway Energy, Inc., Class A 5,274 139,814Clearway Energy, Inc., Class C 11,658 328,056Ormat Technologies, Inc. @ 8,379 658,003Sunnova Energy International,
Inc. * 350 14,287Vistra Corp. 26,754 473,011
1,777,244
Old Republic International Corp. 23,032 503,019Primerica, Inc. 5,759 851,295ProAssurance Corp. 7,119 190,504Protective Insurance Corp., Class B 1,818 41,578Reinsurance Group of America, Inc. 3,019 380,545RenaissanceRe Holdings Ltd. 3,281 525,780RLI Corp. 5,917 660,160Safety Insurance Group, Inc. 2,958 249,211Selective Insurance Group, Inc. 7,297 529,324SiriusPoint Ltd. * 655 6,661State Auto Financial Corp. 8,100 159,651Stewart Information Services Corp. 4,518 235,072
Copyright © 2021 www.secdatabase.com. All Rights Reserved.Please Consider the Environment Before Printing This Document
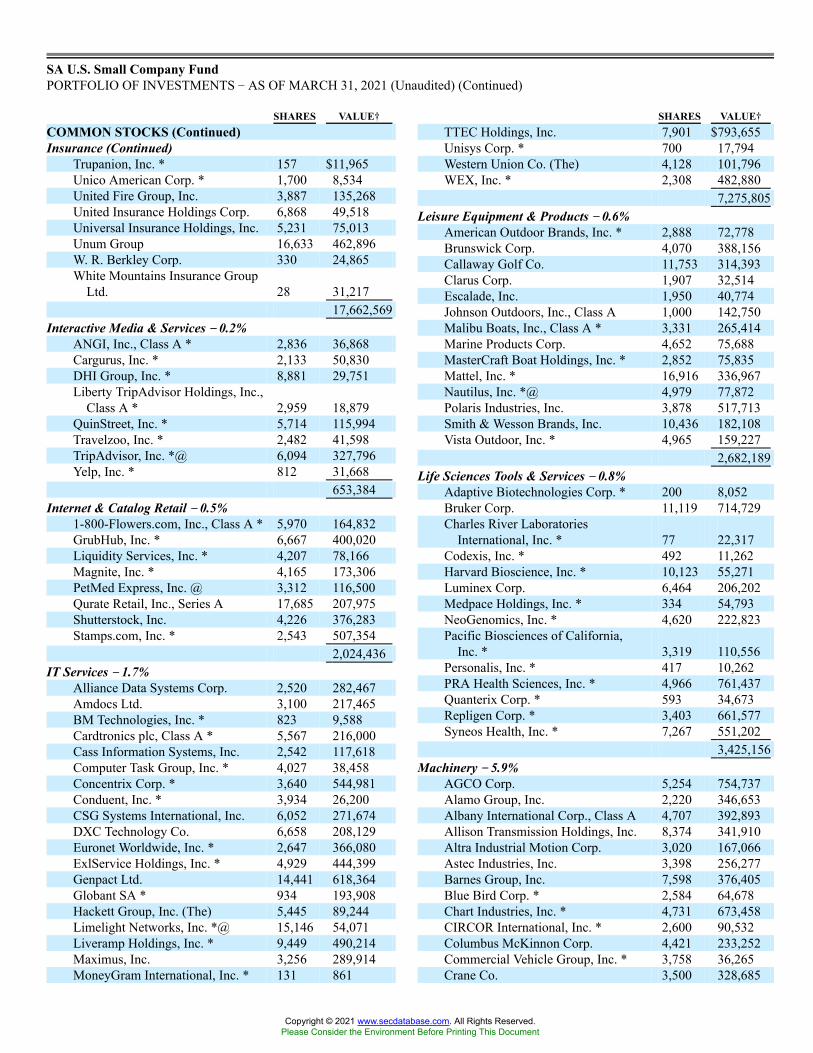
SA U.S. Small Company FundPORTFOLIO OF INVESTMENTS � AS OF MARCH 31, 2021 (Unaudited) (Continued)
SHARES VALUE��COMMON STOCKS (Continued)Insurance (Continued)
Trupanion, Inc. * 157 $11,965Unico American Corp. * 1,700 8,534United Fire Group, Inc. 3,887 135,268United Insurance Holdings Corp. 6,868 49,518Universal Insurance Holdings, Inc. 5,231 75,013Unum Group 16,633 462,896W. R. Berkley Corp. 330 24,865White Mountains Insurance Group
Ltd. 28 31,21717,662,569
Interactive Media & Services �� 0.2%ANGI, Inc., Class A * 2,836 36,868Cargurus, Inc. * 2,133 50,830DHI Group, Inc. * 8,881 29,751Liberty TripAdvisor Holdings, Inc.,
Class A * 2,959 18,879QuinStreet, Inc. * 5,714 115,994Travelzoo, Inc. * 2,482 41,598TripAdvisor, Inc. *@ 6,094 327,796Yelp, Inc. * 812 31,668
653,384Internet & Catalog Retail �� 0.5%
1-800-Flowers.com, Inc., Class A * 5,970 164,832GrubHub, Inc. * 6,667 400,020Liquidity Services, Inc. * 4,207 78,166Magnite, Inc. * 4,165 173,306PetMed Express, Inc. @ 3,312 116,500Qurate Retail, Inc., Series A 17,685 207,975Shutterstock, Inc. 4,226 376,283Stamps.com, Inc. * 2,543 507,354
2,024,436IT Services �� 1.7%
Alliance Data Systems Corp. 2,520 282,467Amdocs Ltd. 3,100 217,465BM Technologies, Inc. * 823 9,588Cardtronics plc, Class A * 5,567 216,000Cass Information Systems, Inc. 2,542 117,618Computer Task Group, Inc. * 4,027 38,458Concentrix Corp. * 3,640 544,981Conduent, Inc. * 3,934 26,200CSG Systems International, Inc. 6,052 271,674DXC Technology Co. 6,658 208,129Euronet Worldwide, Inc. * 2,647 366,080ExlService Holdings, Inc. * 4,929 444,399Genpact Ltd. 14,441 618,364Globant SA * 934 193,908Hackett Group, Inc. (The) 5,445 89,244Limelight Networks, Inc. *@ 15,146 54,071Liveramp Holdings, Inc. * 9,449 490,214Maximus, Inc. 3,256 289,914MoneyGram International, Inc. * 131 861
SHARES VALUE��TTEC Holdings, Inc. 7,901 $793,655Unisys Corp. * 700 17,794Western Union Co. (The) 4,128 101,796WEX, Inc. * 2,308 482,880
7,275,805Leisure Equipment & Products �� 0.6%
American Outdoor Brands, Inc. * 2,888 72,778Brunswick Corp. 4,070 388,156Callaway Golf Co. 11,753 314,393Clarus Corp. 1,907 32,514Escalade, Inc. 1,950 40,774Johnson Outdoors, Inc., Class A 1,000 142,750Malibu Boats, Inc., Class A * 3,331 265,414Marine Products Corp. 4,652 75,688MasterCraft Boat Holdings, Inc. * 2,852 75,835Mattel, Inc. * 16,916 336,967Nautilus, Inc. *@ 4,979 77,872Polaris Industries, Inc. 3,878 517,713Smith & Wesson Brands, Inc. 10,436 182,108Vista Outdoor, Inc. * 4,965 159,227
2,682,189Life Sciences Tools & Services �� 0.8%
Adaptive Biotechnologies Corp. * 200 8,052Bruker Corp. 11,119 714,729Charles River Laboratories
International, Inc. * 77 22,317Codexis, Inc. * 492 11,262Harvard Bioscience, Inc. * 10,123 55,271Luminex Corp. 6,464 206,202Medpace Holdings, Inc. * 334 54,793NeoGenomics, Inc. * 4,620 222,823Pacific Biosciences of California,
Inc. * 3,319 110,556Personalis, Inc. * 417 10,262PRA Health Sciences, Inc. * 4,966 761,437Quanterix Corp. * 593 34,673Repligen Corp. * 3,403 661,577Syneos Health, Inc. * 7,267 551,202
3,425,156Machinery �� 5.9%
AGCO Corp. 5,254 754,737Alamo Group, Inc. 2,220 346,653Albany International Corp., Class A 4,707 392,893Allison Transmission Holdings, Inc. 8,374 341,910Altra Industrial Motion Corp. 3,020 167,066Astec Industries, Inc. 3,398 256,277Barnes Group, Inc. 7,598 376,405Blue Bird Corp. * 2,584 64,678Chart Industries, Inc. * 4,731 673,458CIRCOR International, Inc. * 2,600 90,532Columbus McKinnon Corp. 4,421 233,252Commercial Vehicle Group, Inc. * 3,758 36,265Crane Co. 3,500 328,685
Copyright © 2021 www.secdatabase.com. All Rights Reserved.Please Consider the Environment Before Printing This Document

The accompanying notes are an integral part of these portfolio of investments.
NIC, Inc. 9,876 335,093Perficient, Inc. * 5,214 306,166Perspecta, Inc. 4,329 125,757PFSweb, Inc. * 3,727 25,157Sabre Corp. @ 19,391 287,181ServiceSource International, Inc. * 10,651 15,657SYKES Enterprises, Inc. * 6,920 305,034
Donaldson Co., Inc. 9,298 540,772Douglas Dynamics, Inc. 4,736 218,566Eastern Co. (The) 1,272 34,090Enerpac Tool Group Corp. 8,724 227,871EnPro Industries, Inc. 2,882 245,748ESCO Technologies, Inc. 3,251 354,001Federal Signal Corp. 11,132 426,356
Copyright © 2021 www.secdatabase.com. All Rights Reserved.Please Consider the Environment Before Printing This Document

SA U.S. Small Company FundPORTFOLIO OF INVESTMENTS � AS OF MARCH 31, 2021 (Unaudited) (Continued)
SHARES VALUE��COMMON STOCKS (Continued)Machinery (Continued)
Flowserve Corp. 9,994 $387,867Franklin Electric Co., Inc. 7,620 601,523Gorman-Rupp Co. (The) 5,655 187,237Graco, Inc. 12,071 864,525Graham Corp. 1,759 25,048Greenbrier Cos., Inc. (The) 5,392 254,610Helios Technologies, Inc. 5,762 419,877Hurco Cos., Inc. 1,000 35,300Hyster-Yale Materials Handling,
Inc. 2,000 174,240ITT, Inc. 5,814 528,551John Bean Technologies Corp. 5,533 737,770Kadant, Inc. 1,880 347,819Kennametal, Inc. 10,652 425,761LB Foster Co., Class A * 2,165 38,754Lincoln Electric Holdings, Inc. 3,730 458,566Lindsay Corp. 1,706 284,254Lydall, Inc. * 3,767 127,099Manitex International, Inc. * 1,300 10,257Manitowoc Co., Inc. (The) * 3,607 74,376Meritor, Inc. * 10,708 315,029Middleby Corp. * 4,593 761,290Miller Industries, Inc. 2,054 94,874Mueller Industries, Inc. 9,160 378,766Mueller Water Products, Inc.,
Class A 26,133 362,987Navistar International Corp. * 6,372 280,559NN, Inc. * 6,764 47,822Nordson Corp. 3,371 669,750Omega Flex, Inc. 1,525 240,767Oshkosh Corp. 4,679 555,210Park-Ohio Holdings Corp. 2,956 93,085Pentair PLC 12,478 777,629Perma-Pipe International Holdings,
Inc. * 1,900 11,552Proto Labs, Inc. * 4,228 514,759RBC Bearings, Inc. * 4,135 813,644Rexnord Corp. 19,247 906,341Shyft Group, Inc. (The) 7,102 264,194Snap-On, Inc. 1,600 369,184SPX Corp. * 6,763 394,080SPX FLOW, Inc. 4,940 312,850Standex International Corp. 2,256 215,606Tennant Co. 3,621 289,282Terex Corp. 10,958 504,835Timken Co. (The) 11,431 927,854Titan International, Inc. 13,779 127,869Toro Co. (The) 8,408 867,201Trimas Corp. * 6,519 197,656Trinity Industries, Inc. 5,561 158,433Wabash National Corp. 10,633 199,900
SHARES VALUE��Media �� 1.2%
AMC Networks, Inc., Class A * 4,654 247,407Cable One, Inc. 431 $788,023Entravision Communications Corp.,
Class A 12,528 50,613EW Scripps Co. (The) 8,014 154,430Gannett Co., Inc. * 1 5Gray Television, Inc. 13,871 255,226Hemisphere Media Group, Inc. * 2,950 34,367Interpublic Group of Cos., Inc. (The) 18,387 536,900John Wiley & Sons, Inc., Class A 1,866 101,137Meredith Corp. 7,502 223,410MSG Networks, Inc., Class A * 8,693 130,743New York Times Co. (The), Class A 23,764 1,202,934News Corp., Class B 11,666 273,684Nexstar Media Group, Inc. Class A 4,746 666,481Saga Communications, Inc., Class A 1,116 24,385Scholastic Corp. 3,986 120,018TechTarget, Inc. * 4,551 316,067Tribune Publishing Co. 4,438 79,840
5,205,670Metals & Mining �� 1.8%
Alcoa Corp. * 21,882 710,946Allegheny Technologies, Inc. * 20,184 425,075Ampco-Pittsburgh Corp. * 1,498 10,112Carpenter Technology Corp. 6,711 276,158Century Aluminum Co. * 10,675 188,520Coeur Mining, Inc. * 19,749 178,333Commercial Metals Co. 18,462 569,368Compass Minerals International, Inc. 5,112 320,625Ferroglobe Representation &
Warranty Insurance Trust § 24,025 �Fortitude Gold Corp. * 4,671 21,580Friedman Industries, Inc. 700 5,663Gold Resource Corp. 16,351 43,167Haynes International, Inc. 1,520 45,098Hecla Mining Co. 34,978 199,025Kaiser Aluminum Corp. 4,533 500,896Materion Corp. 2,627 174,012McEwen Mining, Inc. *@ 11,315 11,768Olympic Steel, Inc. 1,900 55,955Reliance Steel & Aluminum Co. 8,056 1,226,848Royal Gold, Inc. 4,971 534,979Ryerson Holding Corp. * 6,828 116,349Schnitzer Steel Industries, Inc.,
Class A 3,716 155,292Steel Dynamics, Inc. 16,505 837,794SunCoke Energy, Inc. 14,843 104,049TimkenSteel Corp. * 6,473 76,058United States Steel Corp. 13,108 343,036Universal Stainless & Alloy Products,
Inc. * 1,092 11,106Worthington Industries, Inc. 7,129 478,285
Copyright © 2021 www.secdatabase.com. All Rights Reserved.Please Consider the Environment Before Printing This Document

The accompanying notes are an integral part of these portfolio of investments.
Watts Water Technologies, Inc.,Class A 4,723 561,140
Welbilt, Inc. * 28,893 469,511Woodward, Inc. 4,897 590,725
25,368,033Marine �� 0.2%
Costamare, Inc. 5,728 55,103Eagle Bulk Shipping, Inc. *@ 436 15,748Eneti, Inc. 420 8,833Kirby Corp. * 4,949 298,326Matson, Inc. 6,524 435,151SEACOR Holdings, Inc. * 2,643 107,702
920,863
7,620,097Multi-Utilities �� 0.6%
Avista Corp. 10,618 507,010Black Hills Corp. 8,028 536,030Centerpoint Energy, Inc. 22,600 511,890MDU Resources Group, Inc. 12,786 404,165NiSource, Inc. 7,242 174,605NorthWestern Corp. 4,700 306,440Unitil Corp. 3,202 146,299
2,586,439Multiline Retail �� 0.5%
Big Lots, Inc. 5,471 373,669Dillard�s, Inc., Class A 1,249 120,616Kohl�s Corp. 12,490 744,529Macy�s, Inc. 22,038 356,795Ollie�s Bargain Outlet Holdings,
Inc. * 4,252 369,9241,965,533
Copyright © 2021 www.secdatabase.com. All Rights Reserved.Please Consider the Environment Before Printing This Document

SA U.S. Small Company FundPORTFOLIO OF INVESTMENTS � AS OF MARCH 31, 2021 (Unaudited) (Continued)
SHARES VALUE��COMMON STOCKS (Continued)Oil, Gas & Consumable Fuels �� 1.8%
Adams Resources & Energy, Inc. 900 $25,209Apa Corp. 11,482 205,528Arch Resources, Inc. 1,730 71,968Ardmore Shipping Corp. 1,612 7,319Bonanza Creek Energy, Inc. * 1,752 62,599Cabot Oil & Gas Corp. 23,549 442,250Cimarex Energy Co. 7,087 420,897Clean Energy Fuels Corp. * 22,203 305,069CNX Resources Corp. * 19,013 279,491CONSOL Energy, Inc. * 2,376 23,095Continental Resources, Inc. 5,643 145,984CVR Energy, Inc. 3,184 61,069Delek US Holdings, Inc. 11,411 248,532Devon Energy Corp. 18,199 397,648DHT Holdings, Inc. 19,547 115,914Diamondback Energy, Inc. 641 47,107Dorian LPG Ltd. * 3,332 43,749Earthstone Energy, Inc. Class A * 3,602 25,754EnLink Midstream LLC 26,027 111,656EQT Corp. 18,191 337,989Equitrans Midstream Corp. 4,100 33,456Evolution Petroleum Corp. 8,084 27,324GasLog Ltd. 10,419 60,118Goodrich Petroleum Corp. * 401 3,794Green Plains, Inc. *@ 5,774 156,302HollyFrontier Corp. 10,890 389,644International Seaways, Inc. 4,383 84,943Magnolia Oil & Gas Corp. * 1,028 11,801Marathon Oil Corp. 22,346 238,655Matador Resources Co. 16,331 382,962Murphy Oil Corp. 20,866 342,411NACCO Industries, Inc. 1,000 24,950New Fortress Energy, Inc. @ 1,844 84,658Overseas Shipholding Group, Inc.,
Class A * 11,837 24,384Par Pacific Holdings, Inc. * 4,135 58,386PBF Energy, Inc., Class A 13,660 193,289PDC Energy, Inc. * 14,120 485,728Penn Virginia Corp. * 1,880 25,192Range Resources Corp. * 9,528 98,424Renewable Energy Group, Inc. * 5,954 393,202Rex American Resources Corp. * 788 66,326Scorpio Tankers, Inc. 4,277 78,953SFL Corp. Ltd. 14,559 116,763SilverBow Resources, Inc. * 1,024 7,967Southwestern Energy Co. * 69,513 323,235Talos Energy, Inc. * 4,465 53,759Targa Resources Corp. 10,817 343,440W&T Offshore, Inc. * 26,515 95,189World Fuel Services Corp. 6,251 220,035
7,804,117
SHARES VALUE��Louisiana-Pacific Corp. 15,124 $838,777Mercer International, Inc. 9,426 135,640Neenah Paper, Inc. 2,400 123,312Resolute Forest Products, Inc. * 8,572 93,864Schweitzer-Mauduit International, Inc. 5,096 249,551Verso Corp. Class A 5,404 78,844
2,079,501Personal Products �� 0.6%
Coty, Inc., Class A 49,522 446,193Edgewell Personal Care Co. 5,042 199,663Herbalife Nutriation Ltd. * 10,721 475,584Inter Parfums, Inc. 4,405 312,447Medifast, Inc. 1,801 381,488Natural Alternatives International,
Inc. * 1,000 15,360Natural Health Trends Corp. 1,100 7,425Natures Sunshine Products, Inc. 1,700 33,932Nu Skin Enterprises, Inc., Class A 7,742 409,474United-Guardian, Inc. 600 9,090USANA Health Sciences, Inc. * 3,475 339,160
2,629,816Pharmaceuticals �� 0.7%
Amphastar Pharmaceuticals, Inc. * 6,170 113,034ANI Pharmaceuticals, Inc. * 1,928 69,678Corcept Therapeutics, Inc. * 6,100 145,119Cumberland Pharmaceuticals, Inc. * 5,912 17,913Endo International PLC * 13,442 99,605Innoviva, Inc. * 9,199 109,928Intra-Cellular Therapies, Inc. * 3,760 127,577Jazz Pharmaceuticals PLC * 4,540 746,240Lannett Co., Inc. *@ 4,608 24,330NGM Biopharmaceuticals, Inc. * 691 20,087Otonomy, Inc. * 6,289 16,037Pacira Pharmaceuticals, Inc. * 528 37,008Perrigo Co. PLC 14,081 569,858Phibro Animal Health Corp. 3,593 87,669Prestige Consumer Healthcare Inc * 8,116 357,753Supernus Pharmaceuticals, Inc. * 9,800 256,564Taro Pharmaceutical Industries Ltd. * 250 18,438Zogenix, Inc. *@ 2,380 46,458Zynerba Pharmaceuticals, Inc. * 1,626 7,561
2,870,857Professional Services �� 2.4%
Acacia Research Corp. * 7,978 53,054ASGN, Inc. * 9,204 878,430Barrett Business Services, Inc. 1,622 111,691Booz Allen Hamilton Holding Corp. 1,166 93,898CACI International, Inc., Class A * 3,460 853,444CBIZ, Inc. * 6,994 228,424CoreLogic, Inc. 4,731 374,932CRA International, Inc. 1,646 122,857Exponent, Inc. 7,806 760,695Forrester Research, Inc. * 2,660 112,997
Copyright © 2021 www.secdatabase.com. All Rights Reserved.Please Consider the Environment Before Printing This Document

The accompanying notes are an integral part of these portfolio of investments.
Paper & Forest Products �� 0.5%Clearwater Paper Corp. * 2,687 101,085Domtar Corp. 8,300 306,685Glatfelter Corp. 8,848 151,743
Franklin Covey Co. * 2,254 63,766FTI Consulting, Inc. * 5,344 748,748GP Strategies Corp. * 4,107 71,667Heidrick & Struggles International,
Inc. 2,913 104,052Huron Consulting Group, Inc. * 2,993 150,787ICF International, Inc. 2,528 220,947Insperity, Inc. 5,651 473,215
Copyright © 2021 www.secdatabase.com. All Rights Reserved.Please Consider the Environment Before Printing This Document
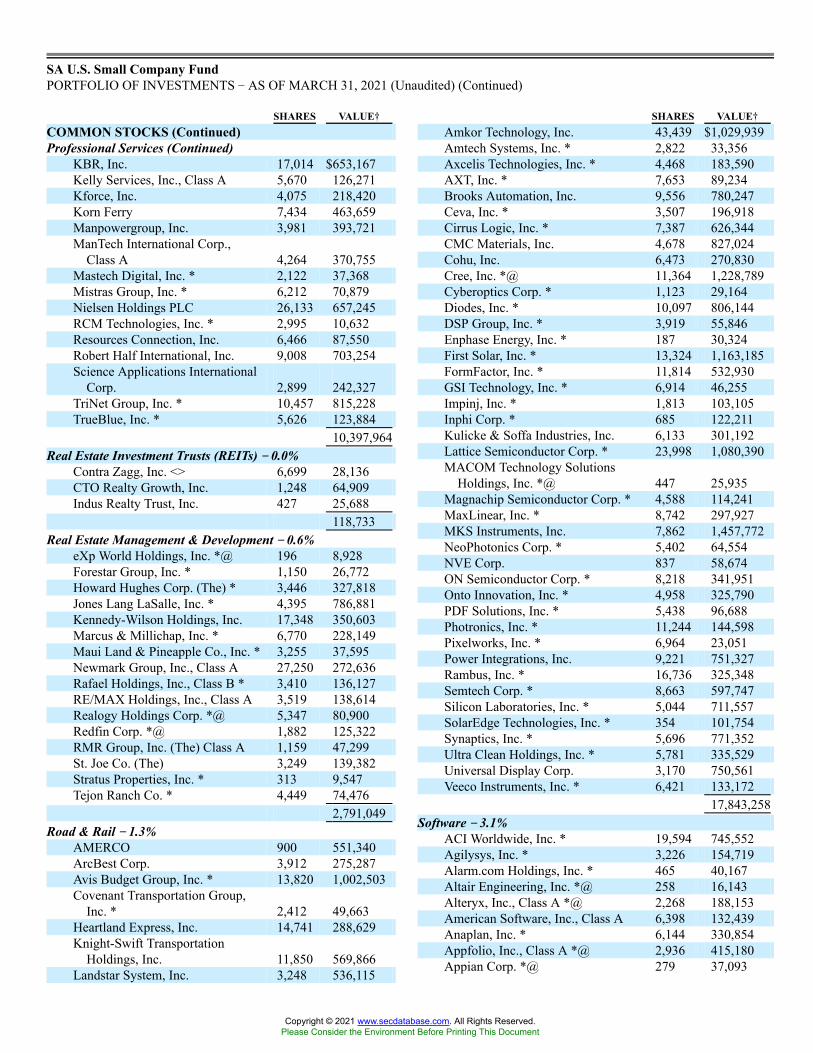
SA U.S. Small Company FundPORTFOLIO OF INVESTMENTS � AS OF MARCH 31, 2021 (Unaudited) (Continued)
SHARES VALUE��COMMON STOCKS (Continued)Professional Services (Continued)
KBR, Inc. 17,014 $653,167Kelly Services, Inc., Class A 5,670 126,271Kforce, Inc. 4,075 218,420Korn Ferry 7,434 463,659Manpowergroup, Inc. 3,981 393,721ManTech International Corp.,
Class A 4,264 370,755Mastech Digital, Inc. * 2,122 37,368Mistras Group, Inc. * 6,212 70,879Nielsen Holdings PLC 26,133 657,245RCM Technologies, Inc. * 2,995 10,632Resources Connection, Inc. 6,466 87,550Robert Half International, Inc. 9,008 703,254Science Applications International
Corp. 2,899 242,327TriNet Group, Inc. * 10,457 815,228TrueBlue, Inc. * 5,626 123,884
10,397,964Real Estate Investment Trusts (REITs) �� 0.0%
Contra Zagg, Inc. <> 6,699 28,136CTO Realty Growth, Inc. 1,248 64,909Indus Realty Trust, Inc. 427 25,688
118,733Real Estate Management & Development �� 0.6%
eXp World Holdings, Inc. *@ 196 8,928Forestar Group, Inc. * 1,150 26,772Howard Hughes Corp. (The) * 3,446 327,818Jones Lang LaSalle, Inc. * 4,395 786,881Kennedy-Wilson Holdings, Inc. 17,348 350,603Marcus & Millichap, Inc. * 6,770 228,149Maui Land & Pineapple Co., Inc. * 3,255 37,595Newmark Group, Inc., Class A 27,250 272,636Rafael Holdings, Inc., Class B * 3,410 136,127RE/MAX Holdings, Inc., Class A 3,519 138,614Realogy Holdings Corp. *@ 5,347 80,900Redfin Corp. *@ 1,882 125,322RMR Group, Inc. (The) Class A 1,159 47,299St. Joe Co. (The) 3,249 139,382Stratus Properties, Inc. * 313 9,547Tejon Ranch Co. * 4,449 74,476
2,791,049Road & Rail �� 1.3%
AMERCO 900 551,340ArcBest Corp. 3,912 275,287Avis Budget Group, Inc. * 13,820 1,002,503Covenant Transportation Group,
Inc. * 2,412 49,663Heartland Express, Inc. 14,741 288,629Knight-Swift Transportation
Holdings, Inc. 11,850 569,866Landstar System, Inc. 3,248 536,115
SHARES VALUE��Amkor Technology, Inc. 43,439 $1,029,939Amtech Systems, Inc. * 2,822 33,356Axcelis Technologies, Inc. * 4,468 183,590AXT, Inc. * 7,653 89,234Brooks Automation, Inc. 9,556 780,247Ceva, Inc. * 3,507 196,918Cirrus Logic, Inc. * 7,387 626,344CMC Materials, Inc. 4,678 827,024Cohu, Inc. 6,473 270,830Cree, Inc. *@ 11,364 1,228,789Cyberoptics Corp. * 1,123 29,164Diodes, Inc. * 10,097 806,144DSP Group, Inc. * 3,919 55,846Enphase Energy, Inc. * 187 30,324First Solar, Inc. * 13,324 1,163,185FormFactor, Inc. * 11,814 532,930GSI Technology, Inc. * 6,914 46,255Impinj, Inc. * 1,813 103,105Inphi Corp. * 685 122,211Kulicke & Soffa Industries, Inc. 6,133 301,192Lattice Semiconductor Corp. * 23,998 1,080,390MACOM Technology Solutions
Holdings, Inc. *@ 447 25,935Magnachip Semiconductor Corp. * 4,588 114,241MaxLinear, Inc. * 8,742 297,927MKS Instruments, Inc. 7,862 1,457,772NeoPhotonics Corp. * 5,402 64,554NVE Corp. 837 58,674ON Semiconductor Corp. * 8,218 341,951Onto Innovation, Inc. * 4,958 325,790PDF Solutions, Inc. * 5,438 96,688Photronics, Inc. * 11,244 144,598Pixelworks, Inc. * 6,964 23,051Power Integrations, Inc. 9,221 751,327Rambus, Inc. * 16,736 325,348Semtech Corp. * 8,663 597,747Silicon Laboratories, Inc. * 5,044 711,557SolarEdge Technologies, Inc. * 354 101,754Synaptics, Inc. * 5,696 771,352Ultra Clean Holdings, Inc. * 5,781 335,529Universal Display Corp. 3,170 750,561Veeco Instruments, Inc. * 6,421 133,172
17,843,258Software �� 3.1%
ACI Worldwide, Inc. * 19,594 745,552Agilysys, Inc. * 3,226 154,719Alarm.com Holdings, Inc. * 465 40,167Altair Engineering, Inc. *@ 258 16,143Alteryx, Inc., Class A *@ 2,268 188,153American Software, Inc., Class A 6,398 132,439Anaplan, Inc. * 6,144 330,854Appfolio, Inc., Class A *@ 2,936 415,180Appian Corp. *@ 279 37,093
Copyright © 2021 www.secdatabase.com. All Rights Reserved.Please Consider the Environment Before Printing This Document

The accompanying notes are an integral part of these portfolio ofinvestments.
Marten Transport Ltd. 15,585 264,477P.A.M. Transportation Services,
Inc. * 1,523 93,969Saia, Inc. * 5,108 1,177,803Schneider National, Inc., Class B 1,500 37,455Universal Truckload Services, Inc. 3,300 86,823USA Truck, Inc. * 2,154 41,163Werner Enterprises, Inc. 10,451 492,974Yellow Corp. * 7,448 65,468
5,533,535Semiconductors & Semiconductor Equipment �� 4.1%
ACM Research, Inc. * 239 19,309Advanced Energy Industries, Inc. 4,984 544,103Alpha & Omega Semiconductor
Ltd. * 3,966 129,688Ambarella, Inc. * 1,829 183,613
Aspen Technology, Inc. * 5,207 751,526Asure Software, Inc. * 4,622 35,312Avalara, Inc. * 288 38,428Aware, Inc. * 4,900 17,885Blackbaud, Inc. 7,542 536,085Blackline, Inc. * 249 26,992Bottomline Technologies de, Inc. * 3,996 180,819Bsquare Corp. * 2,300 7,866CDK Global, Inc. 8,754 473,241Cognyte Software Ltd. * 9,249 257,215Commvault Systems, Inc. * 646 41,667
Copyright © 2021 www.secdatabase.com. All Rights Reserved.Please Consider the Environment Before Printing This Document

SA U.S. Small Company FundPORTFOLIO OF INVESTMENTS � AS OF MARCH 31, 2021 (Unaudited) (Continued)
SHARES VALUE��COMMON STOCKS (Continued)Software (Continued)
Dropbox, Inc., Class A * 11,120 $296,459Ebix, Inc. 2,155 69,025eGain Corp. * 6,644 63,052Elastic NV * 1,900 211,280Envestnet, Inc. * 1,760 127,125Everbridge, Inc. * 716 86,765Five9, Inc. * 3,204 500,881Guidewire Software, Inc. * 3,439 349,506InterDigital, Inc. 4,393 278,736j2 Global, Inc. * 3,394 406,805Manhattan Associates, Inc. * 4,150 487,127MicroStrategy, Inc., Class A *@ 1,021 693,055Model N, Inc. * 401 14,127New Relic, Inc. * 3,973 244,260Nuance Communications, Inc. * 5,332 232,688OneSpan, Inc. * 7,112 174,244Paylocity Holding Corp. * 3,663 658,717Pegasystems, Inc. 7,381 843,943Progress Software Corp. 6,751 297,449Proofpoint, Inc. * 4,384 551,463QAD, Inc., Class A 1,972 131,296QAD, Inc., Class B 960 41,520Qualys, Inc. * 4,710 493,514RealPage, Inc. * 6,552 571,334Sailpoint Technologies Holdings,
Inc. * 770 38,993Smartsheet, Inc. * 400 25,568Teradata Corp. * 6,634 255,674Verint Systems, Inc. * 9,249 420,737Xperi Holding Corp. 21,265 462,939
13,455,618Specialty Retail �� 4.0%
Aaron�s Co. Inc. (The) 5,052 129,735Abercrombie & Fitch Co., Class A 11,239 385,610Advance Auto Parts, Inc. 4,458 817,998America�s Car-Mart, Inc. * 822 125,248American Eagle Outfitters, Inc. @ 27,688 809,597Asbury Automotive Group, Inc. * 2,883 566,510AutoNation, Inc. * 1,802 167,982Barnes & Noble Education, Inc. * 5,686 46,284Bed Bath & Beyond, Inc. 3,408 99,343Boot Barn Holdings, Inc. * 5,243 326,691Buckle, Inc. (The) 9,615 377,677Build-A-Bear Workshop, Inc. * 5,546 38,267Caleres, Inc. 6,546 142,703Cato Corp. (The) Class A 3,965 47,580Children�s Place, Inc. (The) * 2,369 165,119Citi Trends, Inc. 1,997 167,309Conn�s, Inc. * 5,865 114,074Designer Brands, Inc., Class A 9,029 157,105Dick�s Sporting Goods, Inc. @ 9,418 717,181
SHARES VALUE��Hibbett Sports, Inc. * 3,220 $221,826L Brands, Inc. 1,927 119,204Lithia Motors, Inc. Class A 4,458 1,739,021MarineMax, Inc. * 3,415 168,564Monro, Inc. 5,014 329,921Murphy USA, Inc. 5,094 736,389ODP Corp/The 4,538 196,450Penske Auto Group, Inc. @ 1,742 139,778Rent-A-Center, Inc. 8,723 502,968RH * 611 364,523Sally Beauty Holdings, Inc. * 4,925 99,140Shoe Carnival, Inc. 2,038 126,111Signet Jewelers Ltd. * 9,096 527,386Sleep Number Corp. * 5,467 784,460Sonic Automotive, Inc., Class A @ 4,889 242,348Sportsman�s Warehouse Holdings,
Inc. * 7,232 124,680Tilly�s, Inc., Class A * 3,349 37,911TravelCenters of America, Inc. * 1,344 36,463Urban Outfitters, Inc. * 4,462 165,942Williams-Sonoma, Inc. 4,597 823,782Winmark Corp. 737 137,399Zumiez, Inc. * 4,879 209,309
17,135,862Textiles, Apparel & Luxury Goods �� 1.9%
Capri Holdings Ltd. * 8,732 445,332Carter�s, Inc. 1,548 137,664Columbia Sportswear Co. 5,106 539,347Crocs, Inc. * 12,283 988,167Culp, Inc. 3,004 46,232Deckers Outdoor Corp. * 4,269 1,410,563Delta Apparel, Inc. * 1,153 31,281Fossil Group, Inc. * 2,477 30,715G-III Apparel Group Ltd. * 9,938 299,531Hanesbrands, Inc. @ 25,238 496,432Lakeland Industries, Inc. * 1,669 46,498Movado Group, Inc. 2,220 63,159Oxford Industries, Inc. 2,428 212,256PVH Corp. 5,039 532,622Ralph Lauren Corp. 2,582 317,999Rocky Brands, Inc. 1,000 54,060Skechers U.S.A., Inc., Class A * 7,216 300,979Steven Madden Ltd. 12,602 469,551Superior Group of Cos., Inc. 2,200 55,924Tapestry, Inc. 19,202 791,314Under Armour, Inc., Class A * 11,819 261,909Under Armour, Inc., Class C * 11,353 209,576Unifi, Inc. * 3,026 83,397Vera Bradley, Inc. * 6,960 70,296Wolverine World Wide, Inc. 12,535 480,341
8,375,145Thrifts & Mortgage Finance �� 1.4%
Axos Financial, Inc. * 8,663 407,248
Copyright © 2021 www.secdatabase.com. All Rights Reserved.Please Consider the Environment Before Printing This Document

The accompanying notes are an integral part of these portfolio ofinvestments.
Five Below, Inc. * 8,068 1,539,294Floor & Decor Holdings, Inc.,
Class A * 4,095 390,991Foot Locker, Inc. 6,115 343,969Gap, Inc. (The) * 25,256 752,124Genesco, Inc. * 2,502 118,845Group 1 Automotive, Inc. 2,384 376,171Guess?, Inc. 11,454 269,169Haverty Furniture Cos., Inc. 2,950 109,711
Capitol Federal Financial, Inc. 17,891 236,966ESSA Bancorp, Inc. 1,900 30,400Essent Group Ltd. 5,259 249,750Federal Agricultural Mortgage Corp.,
Class C 1,400 141,008Flagstar Bancorp, Inc. 8,069 363,912FS Bancorp, Inc. 481 32,323Hingham Institution for Savings 348 98,748
Copyright © 2021 www.secdatabase.com. All Rights Reserved.Please Consider the Environment Before Printing This Document

SA U.S. Small Company FundPORTFOLIO OF INVESTMENTS � AS OF MARCH 31, 2021 (Unaudited) (Continued)
SHARES VALUE��COMMON STOCKS (Continued)Thrifts & Mortgage Finance (Continued)
Home Bancorp, Inc. 994 $35,834HomeStreet, Inc. 3,265 143,888Kearny Financial Corp. 12,990 156,919Meridian Bancorp, Inc. 7,205 132,716Meta Financial Group, Inc. 6,645 301,085MGIC Investment Corp. 12,435 172,225Mr Cooper Group, Inc. * 5,663 196,846New York Community Bancorp, Inc. 31,398 396,243NMI Holdings, Inc., Class A * 8,926 211,011Northfield Bancorp, Inc. 8,395 133,648Northwest Bancshares, Inc. 18,353 265,201Ocwen Financial Corp. * 984 27,975PennyMac Financial Services, Inc. 574 38,383Premier Financial Corp. 5,204 173,085Provident Financial Holdings, Inc. 1,124 18,996Provident Financial Services, Inc. 11,488 255,953Radian Group, Inc. 8,095 188,209Riverview Bancorp, Inc. 5,418 37,547Southern Missouri Bancorp, Inc. 686 27,042Territorial Bancorp, Inc. 1,557 41,198Timberland Bancorp, Inc. 2,163 60,153Trustco Bank Corp. NY 14,183 104,529Walker & Dunlop, Inc. 5,777 593,529Washington Federal, Inc. 11,612 357,650Waterstone Financial, Inc. 2,966 60,566Western New England Bancorp, Inc. 6,806 57,374WSFS Financial Corp. 7,269 361,923
6,110,083Tobacco �� 0.2%
Turning Point Brands, Inc. 1,280 66,778Universal Corp. 3,185 187,883Vector Group Ltd. 30,775 429,311
683,972Trading Companies & Distributors �� 1.7%
Air Lease Corp. 5,997 293,853Applied Industrial Technologies, Inc. 5,521 503,350Beacon Roofing Supply, Inc. * 10,977 574,317Boise Cascade Co. 5,991 358,442CAI International, Inc. 3,151 143,434DXP Enterprises, Inc. * 2,967 89,514GATX Corp. 5,845 542,065GMS, Inc. * 2,900 121,075H&E Equipment Services, Inc. 5,490 208,620Herc Holdings, Inc. * 5,162 523,065Huttig Building Products, Inc. * 1,858 6,800Lawson Products, Inc. * 1,071 55,542Mcgrath Rentcorp 4,419 356,392MRC Global, Inc. * 11,495 103,800MSC Industrial Direct Co., Class A 936 84,418NOW, Inc. * 13,653 137,759Rush Enterprises, Inc., Class A 8,270 412,094
SHARES VALUE��Water Utilities �� 0.4%
American States Water Co. 5,638 $426,346Artesian Resources Corp.,
Class A 1,783 70,215California Water Service Group 7,648 430,888Consolidated Water Co., Ltd. 1,751 23,551Middlesex Water Co. 3,166 250,177Pure Cycle Corp. * 1,000 13,420SJW Corp. 4,079 256,936York Water Co. 2,247 110,036
1,581,569Wireless Telecommunication Services �� 0.3%
Boingo Wireless, Inc. * 9,496 133,609Shenandoah
Telecommunications Co. 8,785 428,796Spok Holdings, Inc. 3,861 40,502Telephone & Data Systems, Inc. 16,337 375,097United States Cellular Corp. * 2,957 107,871
1,085,875TOTAL COMMON STOCKS
(Identified Cost $229,498,646) 431,067,493PREFERRED STOCKS �� 0.1%Internet & Catalog Retail �� 0.0%
Qurate Retail, Inc. 8.000% 374 38,017Media �� 0.0%
Liberty Broadband Corp.7.000% 1,225 32,769
Trading Companies & Distributors �� 0.1%WESCO International,
Inc.10.625%, 5-year CMT +10.325% 4,390 135,124
TOTAL PREFERRED STOCKS(Identified Cost $168,077) 205,910
RIGHTS AND WARRANTS �� 0.0%Capital Markets �� 0.0%
Newsstar Financial, Inc.CVR §*¶ 13,144 501
Media �� 0.0%Media General, Inc. CVR §*¶ 3,965 139
Pharmaceuticals �� 0.0%Elanco Animal Health, Inc.
CVR §*¶ 16,344 �FRD Acquisition Co. CVR §*¶ 656 �
�
TOTAL RIGHTS AND WARRANTS(Identified Cost $411) 640
SHORT-TERM INVESTMENTS �� 0.6%Collateral For Securities On Loan �� 0.6%
State Street Navigator SecuritiesLending Government MoneyMarket Portfolio, 0.030% 2,652,636 2,652,636
Copyright © 2021 www.secdatabase.com. All Rights Reserved.Please Consider the Environment Before Printing This Document

The accompanying notes are an integral part of these portfolio of investments.
SiteOne Landscape Supply, Inc. * 185 31,587Systemax, Inc. 7,368 302,972Textainer Group Holdings Ltd. * 6,922 198,315Titan Machinery, Inc. * 4,710 120,105Triton International Ltd. 11,628 639,424Univar, Inc. * 1,143 24,620Veritiv Corp. * 1,000 42,540Watsco, Inc. 1,976 515,242WESCO International, Inc. * 9,569 828,006Willis Lease Finance Corp. * 900 39,114
7,256,465
TOTAL SHORT-TERM INVESTMENTS(Identified Cost $2,652,636) 2,652,636
Total Investments �� 100.6%(Identified Cost $232,319,770) 433,926,679Liabilities, Less Cash and Other
Assets � (0.6%) (2,398,807 )Net Assets �� 100.0% $431,527,872
� See Note 1* Non-income producing security@ A portion or all of the security was held on loan. As of
March 31, 2021, the fair value of the securities on loan was$12,005,431.
Copyright © 2021 www.secdatabase.com. All Rights Reserved.Please Consider the Environment Before Printing This Document

SA U.S. Small Company FundPORTFOLIO OF INVESTMENTS � AS OF MARCH 31, 2021 (Unaudited) (Continued)
The accompanying notes are an integral part of these portfolio of investments.
<> Fair valued security. Security is valued using significantobservable inputs other than quoted prices as determinedpursuant to procedures approved by the Fund�s Board ofTrustees. See Note 1
§ Fair valued security. Security is valued using significantunobservable inputs as determined pursuant to proceduresapproved by the Fund�s Board of Trustees. See Note 1
¶ Contingent value rights based on future performance.
Key to abbreviations:CVR � Contingent Value RightsCMT � Constant Maturity Treasury
Copyright © 2021 www.secdatabase.com. All Rights Reserved.Please Consider the Environment Before Printing This Document
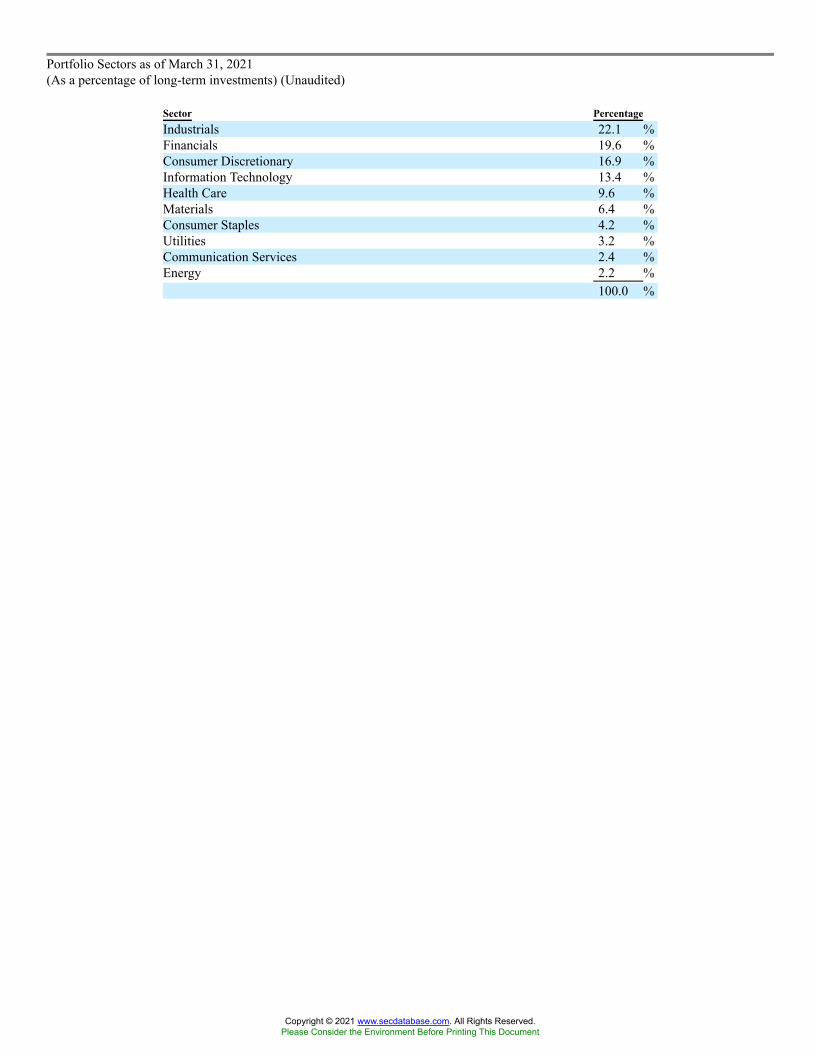
Portfolio Sectors as of March 31, 2021(As a percentage of long-term investments) (Unaudited)
Sector PercentageIndustrials 22.1 %Financials 19.6 %Consumer Discretionary 16.9 %Information Technology 13.4 %Health Care 9.6 %Materials 6.4 %Consumer Staples 4.2 %Utilities 3.2 %Communication Services 2.4 %Energy 2.2 %
100.0 %
Copyright © 2021 www.secdatabase.com. All Rights Reserved.Please Consider the Environment Before Printing This Document

SA International Value FundPORTFOLIO OF INVESTMENTS � AS OF MARCH 31, 2021 (Unaudited)
SHARES VALUE��COMMON STOCKS �� 97.1%Australia �� 5.9%
AMP Ltd. 276,963 $266,115Australia & New Zealand
Banking Group Ltd. 344,269 7,368,775BlueScope Steel Ltd. 171,676 2,523,172Boral Ltd. * 186,148 776,224Challenger Ltd. 21,253 103,313Crown Resorts Ltd. *@ 25,077 223,996Downer EDI Ltd. 33,146 129,153Harvey Norman Holdings
Ltd. @ 136,089 592,290Incitec Pivot Ltd. * 234,863 519,116Lendlease Group 43,821 430,032National Australia Bank Ltd. 341,816 6,750,285Newcrest Mining Ltd. 26,074 483,626Oil Search Ltd. 204,804 637,791Origin Energy Ltd. 168,307 599,558QBE Insurance Group Ltd. 29,598 216,269Qube Holdings Ltd. 59,413 134,930Santos Ltd. 319,417 1,722,554South32 Ltd. 674,463 1,439,530Suncorp Group Ltd. 186,999 1,406,147TABCORP Holdings Ltd. 198,572 705,863Westpac Banking Corp. 474,678 8,800,822Woodside Petroleum Ltd. 123,874 2,258,124Worley Ltd. 30,039 239,341
38,327,026Austria �� 0.0%
Erste Group Bank AG * 5,081 172,319Belgium �� 1.0%
Ageas SA/NV 28,366 1,715,134KBC Groep NV * 25,395 1,846,404Solvay SA @ 14,904 1,856,155UCB SA 11,003 1,046,709
6,464,402Canada �� 8.5%
Alamos Gold, Inc., Class A 19,905 155,458Bank of Montreal @ 79,335 7,070,335Bank of Montreal 19,125 1,704,768Bank of Nova Scotia (The) 88,567 5,539,866Bank of Nova Scotia (The) 33,498 2,095,658Barrick Gold Corp. 23,095 457,281Canadian Imperial Bank of
Commerce 15,004 1,468,441Canadian Imperial Bank of
Commerce @ 44,533 4,360,456Canadian Natural Resources
Ltd. @ 237,398 7,328,476Cenovus Energy, Inc. 3,357 25,245Fairfax Financial Holdings
Ltd. 3,673 1,603,266First Quantum Minerals Ltd. 67,465 1,285,738
SHARES VALUE��Denmark �� 2.3%
AP Moeller - Maersk A/S,Class A 158 $343,984
AP Moeller - Maersk A/S,Class B @ 212 492,464
Carlsberg A/S, Class B 15,445 2,373,026Danske Bank A/S 41,578 778,041Demant A/S *@ 8,441 357,561DSV PANALPINA A/S 17,724 3,477,321Genmab A/S * 4,088 1,344,998GN Store Nord A/S 1,709 134,548H Lundbeck A/S 7,078 241,801Novozymes A/S, B Shares @ 15,777 1,010,554Pandora A/S 771 82,603Rockwool International A/S, B
Shares @ 1,147 483,518Tryg A/S @ 15,313 361,144Vestas Wind Systems A/S 15,134 3,106,368
14,587,931Finland �� 1.0%
Fortum Oyj 43,616 1,164,140Nokia Oyj, ADR * 291,727 1,155,239Nordea Bank Abp 243,629 2,403,054Stora Enso Oyj, R Shares 55,739 1,039,632UPM-Kymmene Oyj 12,508 449,285
6,211,350France �� 10.3%
Amundi SA *± 3,901 311,995Arkema SA 15,142 1,835,188Atos SE * 12,284 958,250AXA SA 161,385 4,331,128BNP Paribas SA * 92,085 5,602,422Bollore SA 138,791 670,247Bouygues SA 55,128 2,210,336Capgemini SE 7,262 1,235,693Carrefour SA 128,110 2,320,373Cie de Saint-Gobain * 101,314 5,978,566Cie Generale des
Etablissements MichelinSCA 34,478 5,161,190
CNP Assurances * 26,215 498,333Credit Agricole SA * 58,593 848,250Eiffage SA * 5,767 577,286Electricite de France SA * 85,557 1,147,806Engie SA * 153,978 2,185,800EssilorLuxottica SA 5,018 817,078Faurecia SE * 3,439 182,731Faurecia SE * 5,048 268,936Iliad SA 537 102,081Natixis SA * 75,173 359,850Orange SA 322,578 3,973,907Publicis Groupe SA 26,839 1,637,912Renault SA * 21,069 912,452
Copyright © 2021 www.secdatabase.com. All Rights Reserved.Please Consider the Environment Before Printing This Document

The accompanying notes are an integral part of these portfolio ofinvestments.
Great-West Lifeco, Inc. 12,930 344,059Imperial Oil Ltd. @ 33,555 811,360Kinross Gold Corp. 173,331 1,154,437Lundin Mining Corp. 146,222 1,504,456Magna International, Inc. 73,006 6,427,448Manulife Financial Corp. @ 161,124 3,464,166Nutrien Ltd. 65,686 3,539,819Nutrien Ltd. 1,100 59,258Onex Corp. 1,608 100,009Pembina Pipeline Corp. @ 14,784 426,371SNC-Lavalin Group, Inc. @ 7,445 159,362Suncor Energy, Inc. ¥ 109,045 2,279,472Suncor Energy, Inc. 4,073 85,126Teck Resources Ltd., Class B 52,545 1,007,813The Toronto-Dominion Bank 1,666 108,654Toronto-Dominion Bank/
The @ 3,785 246,82054,813,618
Sanofi 10,237 1,011,415Societe Generale SA * 88,773 2,323,083Total SE 387,084 18,055,202Valeo SA 10,794 366,706Vivendi SE 14,883 488,692
66,372,908Germany �� 7.2%
Allianz SE 26,240 6,678,986BASF SE 26,480 2,199,801Bayer AG 20,429 1,292,725Bayerische Motoren Werke
AG 53,296 5,529,394Commerzbank AG * 53,244 326,432Continental AG * 7,866 1,039,596
Copyright © 2021 www.secdatabase.com. All Rights Reserved.Please Consider the Environment Before Printing This Document

SA International Value FundPORTFOLIO OF INVESTMENTS � AS OF MARCH 31, 2021 (Unaudited) (Continued)
SHARES VALUE��COMMON STOCKS (Continued)Germany (Continued)
Covestro AG ± 5,523 $371,381Daimler AG 142,114 12,667,605Deutsche Bank AG * 143,698 1,724,376Deutsche Bank AG * 46,122 551,041Evonik Industries AG 18,004 636,777Fresenius SE & Co. KGaA 36,273 1,615,569Hapag-Lloyd AG ± 480 74,527HeidelbergCement AG 25,898 2,352,506Muenchener
Rueckversicherungs AG 12,421 3,825,060RWE AG 43,651 1,710,754Talanx AG * 12,026 509,961Telefonica Deutschland
Holding AG 207,880 609,452Uniper SE 18,954 686,381Volkswagen AG 6,122 2,219,830
46,622,154Hong Kong �� 2.2%
Bank of East Asia Ltd.(The) 36,400 77,537
BOC Aviation Ltd. ± 47,800 462,991BOC Hong Kong Holdings
Ltd. 99,000 345,744Cathay Pacific Airways
Ltd. *@ 286,363 267,058CK Asset Holdings Ltd. 313,000 1,900,361CK Hutchison Holdings
Ltd. 336,624 2,682,479CK Infrastructure Holdings
Ltd. 5,000 29,714Hang Lung Properties Ltd. 239,000 621,011Henderson Land
Development Co., Ltd. 133,684 600,143HKT Trust & HKT Ltd. 41,000 58,435MTR Corp. Ltd. 126,669 717,738New World Development
Co. Ltd. 231,859 1,198,947Sino Land Co., Ltd. @ 417,674 581,319SJM Holdings Ltd. 61,000 79,721Sun Hung Kai Properties
Ltd. 182,177 2,760,506Swire Pacific Ltd., Series A 29,500 221,228Swire Pacific Ltd., Series B 127,500 150,558Tsim Sha Tsui Properties 14,907 46,021WH Group Ltd. ± 1,079,000 874,403Xinyi Glass Holdings Ltd. 106,000 346,330
14,022,244Ireland �� 0.6%
CRH plc ADR 47,484 2,230,798Flutter Entertainment plc * 4,863 1,045,331Flutter Entertainment plc * 3,025 646,599
SHARES VALUE��Japan �� 22.1%
AEON Financial Service Co.Ltd. 5,400 $72,423
AGC, Inc. 48,500 2,028,042Air Water, Inc. 4,900 85,852Aisin Seiki Co., Ltd. 22,500 853,466Alfresa Holdings Corp. 7,700 148,332Alps Alpine Co. Ltd. 27,500 362,610Amada Co., Ltd. 37,100 413,469Aozora Bank Ltd. @ 14,700 336,417Asahi Kasei Corp. 53,400 614,661Bank of Kyoto Ltd. (The) @ 8,000 492,030Bridgestone Corp. 35,400 1,430,707Brother Industries Ltd. 14,700 325,133Canon Marketing Japan, Inc. @ 12,000 266,173Canon, Inc. 42,600 962,804Chiba Bank Ltd. (The) 79,000 517,273Coca-Cola Bottlers Japan
Holdings, Inc. @ 13,975 243,466Concordia Financial Group
Ltd. @ 111,200 450,926Credit Saison Co., Ltd. 23,900 286,649Dai Nippon Printing Co., Ltd. 30,000 628,313Dai-ichi Life Holdings, Inc.
(The) 69,900 1,200,721Daicel Corp. 52,000 400,126Daio Paper Corp. 12,400 212,667Daiwa House Industry Co.,
Ltd. @ 11,100 324,905Daiwa Securities Group, Inc. 214,000 1,105,707Denka Co., Ltd. 16,200 646,683Dentsu Group, Inc. 24,200 775,886DIC Corp. 16,000 414,288Dowa Holdings Co., Ltd. 9,600 399,259Ebara Corp. 16,800 685,049ENEOS Holdings, Inc. 240,100 1,087,687FUJIFILM Holdings Corp. 10,700 634,994Fukuoka Financial Group, Inc. @ 18,000 341,224Fukuyama Transporting Co., Ltd. 4,300 177,087Fuyo General Lease Co., Ltd. 800 55,055Hachijuni Bank Ltd. (The) 48,000 174,703Hankyu Hanshin Holdings, Inc. 31,900 1,021,319Haseko Corp. 22,300 311,968Hino Motors Ltd. 25,900 222,685Hitachi Capital Corp. <> 9,900 299,776Hitachi Ltd. 83,700 3,782,658Honda Motor Co., Ltd. 185,900 5,572,383Idemitsu Kosan Co., Ltd. @ 27,500 708,828IHI Corp. @ 7,700 156,121Iida Group Holdings Co., Ltd. @ 36,900 891,799Inpex Corp. 144,500 986,606Isuzu Motors Ltd. 67,000 719,467ITOCHU Corp. @ 52,100 1,687,809Itoham Yonekyu Holdings, Inc. 22,300 146,821
Copyright © 2021 www.secdatabase.com. All Rights Reserved.Please Consider the Environment Before Printing This Document

The accompanying notes are an integral part of these portfolio ofinvestments.
3,922,728Israel �� 0.3%
Bank Leumi Le-Israel 81,999 539,612Isracard Ltd. 1 2Israel Discount Bank Ltd.,
Series A 172,804 717,973Teva Pharmaceutical
Industries Ltd., ADR * 47,500 548,1501,805,737
Italy �� 1.3%Eni SpA 158,215 1,947,044Intesa Sanpaolo SpA * 1,042,149 2,823,727Mediobanca Banca di
Credito FinanziarioSpA * 39,607 439,204
Telecom Italia SpA 2,860,918 1,547,325UniCredit SpA * 163,283 1,725,827
8,483,127
Iyo Bank Ltd. (The) 19,600 117,538J. Front Retailing Co., Ltd. 51,400 487,888Japan Post Holdings Co., Ltd. * 71,600 638,047JFE Holdings, Inc. * 34,100 419,763JGC Holdings Corp. 16,300 199,619JTEKT Corp. 43,200 440,876K�s Holdings Corp. 32,000 439,576Kajima Corp. 54,000 766,168Kamigumi Co., Ltd. 15,700 297,339Kaneka Corp. 16,000 657,485Kawasaki Heavy Industries
Ltd. * 32,800 812,261Komatsu Ltd. 66,800 2,062,671
Copyright © 2021 www.secdatabase.com. All Rights Reserved.Please Consider the Environment Before Printing This Document
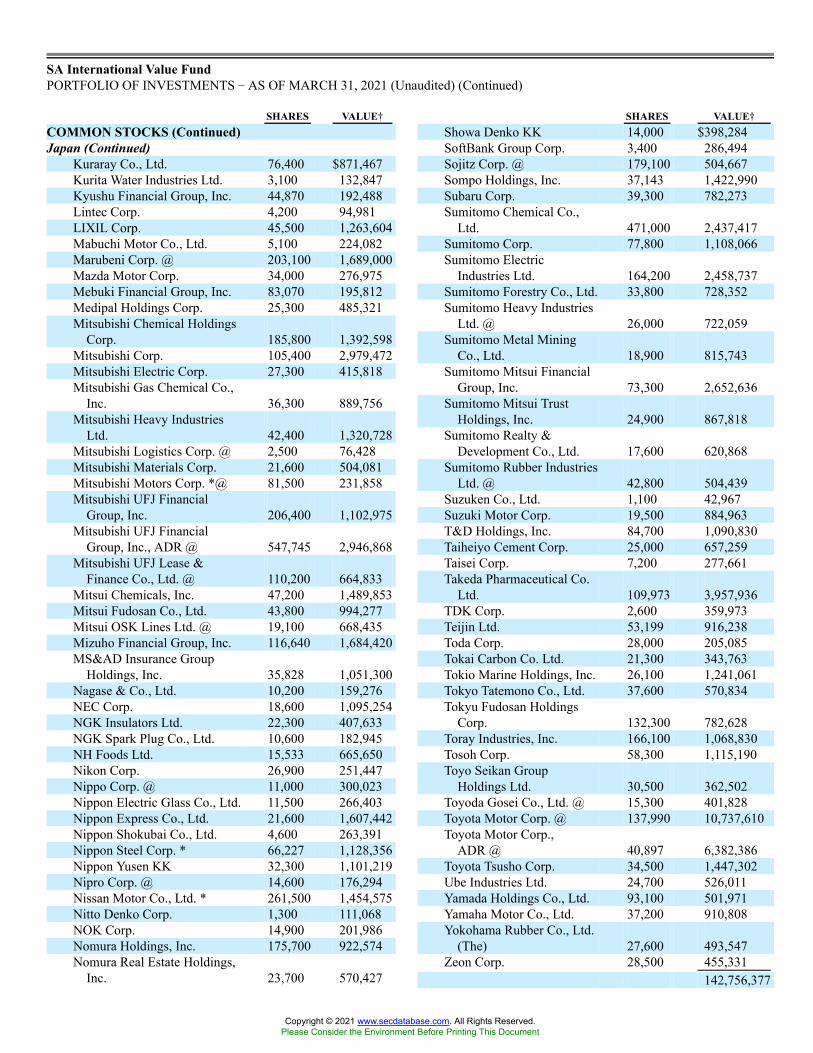
SA International Value FundPORTFOLIO OF INVESTMENTS � AS OF MARCH 31, 2021 (Unaudited) (Continued)
SHARES VALUE��COMMON STOCKS (Continued)Japan (Continued)
Kuraray Co., Ltd. 76,400 $871,467Kurita Water Industries Ltd. 3,100 132,847Kyushu Financial Group, Inc. 44,870 192,488Lintec Corp. 4,200 94,981LIXIL Corp. 45,500 1,263,604Mabuchi Motor Co., Ltd. 5,100 224,082Marubeni Corp. @ 203,100 1,689,000Mazda Motor Corp. 34,000 276,975Mebuki Financial Group, Inc. 83,070 195,812Medipal Holdings Corp. 25,300 485,321Mitsubishi Chemical Holdings
Corp. 185,800 1,392,598Mitsubishi Corp. 105,400 2,979,472Mitsubishi Electric Corp. 27,300 415,818Mitsubishi Gas Chemical Co.,
Inc. 36,300 889,756Mitsubishi Heavy Industries
Ltd. 42,400 1,320,728Mitsubishi Logistics Corp. @ 2,500 76,428Mitsubishi Materials Corp. 21,600 504,081Mitsubishi Motors Corp. *@ 81,500 231,858Mitsubishi UFJ Financial
Group, Inc. 206,400 1,102,975Mitsubishi UFJ Financial
Group, Inc., ADR @ 547,745 2,946,868Mitsubishi UFJ Lease &
Finance Co., Ltd. @ 110,200 664,833Mitsui Chemicals, Inc. 47,200 1,489,853Mitsui Fudosan Co., Ltd. 43,800 994,277Mitsui OSK Lines Ltd. @ 19,100 668,435Mizuho Financial Group, Inc. 116,640 1,684,420MS&AD Insurance Group
Holdings, Inc. 35,828 1,051,300Nagase & Co., Ltd. 10,200 159,276NEC Corp. 18,600 1,095,254NGK Insulators Ltd. 22,300 407,633NGK Spark Plug Co., Ltd. 10,600 182,945NH Foods Ltd. 15,533 665,650Nikon Corp. 26,900 251,447Nippo Corp. @ 11,000 300,023Nippon Electric Glass Co., Ltd. 11,500 266,403Nippon Express Co., Ltd. 21,600 1,607,442Nippon Shokubai Co., Ltd. 4,600 263,391Nippon Steel Corp. * 66,227 1,128,356Nippon Yusen KK 32,300 1,101,219Nipro Corp. @ 14,600 176,294Nissan Motor Co., Ltd. * 261,500 1,454,575Nitto Denko Corp. 1,300 111,068NOK Corp. 14,900 201,986Nomura Holdings, Inc. 175,700 922,574Nomura Real Estate Holdings,
Inc. 23,700 570,427
SHARES VALUE��Showa Denko KK 14,000 $398,284SoftBank Group Corp. 3,400 286,494Sojitz Corp. @ 179,100 504,667Sompo Holdings, Inc. 37,143 1,422,990Subaru Corp. 39,300 782,273Sumitomo Chemical Co.,
Ltd. 471,000 2,437,417Sumitomo Corp. 77,800 1,108,066Sumitomo Electric
Industries Ltd. 164,200 2,458,737Sumitomo Forestry Co., Ltd. 33,800 728,352Sumitomo Heavy Industries
Ltd. @ 26,000 722,059Sumitomo Metal Mining
Co., Ltd. 18,900 815,743Sumitomo Mitsui Financial
Group, Inc. 73,300 2,652,636Sumitomo Mitsui Trust
Holdings, Inc. 24,900 867,818Sumitomo Realty &
Development Co., Ltd. 17,600 620,868Sumitomo Rubber Industries
Ltd. @ 42,800 504,439Suzuken Co., Ltd. 1,100 42,967Suzuki Motor Corp. 19,500 884,963T&D Holdings, Inc. 84,700 1,090,830Taiheiyo Cement Corp. 25,000 657,259Taisei Corp. 7,200 277,661Takeda Pharmaceutical Co.
Ltd. 109,973 3,957,936TDK Corp. 2,600 359,973Teijin Ltd. 53,199 916,238Toda Corp. 28,000 205,085Tokai Carbon Co. Ltd. 21,300 343,763Tokio Marine Holdings, Inc. 26,100 1,241,061Tokyo Tatemono Co., Ltd. 37,600 570,834Tokyu Fudosan Holdings
Corp. 132,300 782,628Toray Industries, Inc. 166,100 1,068,830Tosoh Corp. 58,300 1,115,190Toyo Seikan Group
Holdings Ltd. 30,500 362,502Toyoda Gosei Co., Ltd. @ 15,300 401,828Toyota Motor Corp. @ 137,990 10,737,610Toyota Motor Corp.,
ADR @ 40,897 6,382,386Toyota Tsusho Corp. 34,500 1,447,302Ube Industries Ltd. 24,700 526,011Yamada Holdings Co., Ltd. 93,100 501,971Yamaha Motor Co., Ltd. 37,200 910,808Yokohama Rubber Co., Ltd.
(The) 27,600 493,547Zeon Corp. 28,500 455,331
142,756,377
Copyright © 2021 www.secdatabase.com. All Rights Reserved.Please Consider the Environment Before Printing This Document

The accompanying notes are an integral part of these portfolio of investments.
NSK Ltd. 59,600 610,937Obayashi Corp. 113,200 1,037,688Oji Holdings Corp. 226,000 1,461,422Otsuka Holdings Co., Ltd. 1,800 76,194Panasonic Corp. 97,500 1,253,477Rengo Co., Ltd. 35,400 307,242Resona Holdings, Inc. @ 246,400 1,034,335Rohm Co., Ltd. 9,500 927,478Sawai Pharmaceutical Co.,
Ltd. <> 3,200 153,317Seiko Epson Corp. @ 8,700 141,431Seino Holdings Co., Ltd. 20,400 284,098Sekisui Chemical Co., Ltd. 16,000 307,067Sekisui House Ltd. 81,800 1,753,833Seven & i Holdings Co., Ltd. 58,200 2,345,871Shimizu Corp. @ 68,400 553,501Shinsei Bank Ltd. 18,500 298,907Shizuoka Bank Ltd. (The) @ 58,000 455,724
Netherlands �� 5.8%ABN AMRO Group NV *± 42,957 521,892Aegon NV 114,981 546,095Akzo Nobel NV 2,244 250,733ArcelorMittal SA *@ 53,718 1,566,954ArcelorMittal SA *= 1,708 49,333Coca-Cola European
Partners PLC 9,243 479,096Heineken NV @ 18,388 1,889,403ING Groep NV 283,487 3,468,068Koninklijke Ahold Delhaize
NV 237,160 6,605,291Koninklijke DSM NV 38,541 6,521,932Koninklijke KPN NV 54,934 186,435Koninklijke Philips NV *@ 13,217 753,766Koninklijke Philips NV * 32,464 1,853,083NN Group NV 31,342 1,532,306Randstad NV @ 16,773 1,179,788Stellantis NV 296,437 5,242,286Stellantis NV 202,005 3,573,268Stellantis NV 52,894 940,984
37,160,713New Zealand �� 0.2%
Auckland InternationalAirport Ltd. * 143,857 787,683
EBOS Group Ltd. @ 14,665 302,140Fletcher Building Ltd. 41,268 204,057Ryman Healthcare Ltd. 16,629 177,689
1,471,569
Copyright © 2021 www.secdatabase.com. All Rights Reserved.Please Consider the Environment Before Printing This Document

SA International Value FundPORTFOLIO OF INVESTMENTS � AS OF MARCH 31, 2021 (Unaudited) (Continued)
SHARES VALUE��COMMON STOCKS (Continued)Norway �� 0.9%
DNB ASA 96,212 $2,047,267Equinor ASA 43,535 851,547Norsk Hydro ASA 156,773 1,003,711SpareBank 1 SR-Bank ASA 25,719 315,731Storebrand ASA * 56,200 565,998Subsea 7 SA * 28,831 289,552Yara International ASA 14,514 754,790
5,828,596Portugal �� 0.1%
Banco Espirito Santo SA § 414,564 �EDP Renovaveis SA 32,371 691,658
691,658Singapore �� 0.9%
CapitaLand Ltd. 430,800 1,204,139City Developments Ltd. 103,600 614,576Frasers Property Ltd. @ 23,300 20,785Hongkong Land Holdings
Ltd. 101,200 496,892Jardine Cycle & Carriage Ltd. 3,000 50,201Keppel Corp. Ltd. 367,700 1,454,181Olam International Ltd. 82,000 104,847Oversea-Chinese Banking
Corp. Ltd. 43,569 380,565Singapore Airlines Ltd. * 301,449 1,243,712UOL Group Ltd. 47,218 277,299
5,847,197Spain �� 1.9%
Banco Bilbao VizcayaArgentaria SA 530,653 2,754,286
Banco Bilbao VizcayaArgentaria SA, ADR @ 134,068 699,835
Banco Santander SA *@ 2,050,205 6,965,186Banco Santander SA, ADR
*@ 210,864 723,263CaixaBank SA 63,253 195,753Naturgy Energy Group SA 14,411 353,205Repsol SA 48,223 597,180
12,288,708Sweden �� 2.9%
Annehem Fastigheter AB * 640 1,971BillerudKorsnas AB 26,684 496,041Boliden AB 68,429 2,538,630Dometic Group AB *± 22,074 320,111Getinge AB, B Shares 21,260 590,322Holmen AB 11,612 509,769Husqvarna AB, Class B 21,106 304,019ICA Gruppen AB 15,599 762,674Millicom International
Cellular SA * 8,745 336,444Peab AB * 3,201 38,705
SHARES VALUE��Tele2 AB, B Shares 8,541 $115,204Telia Co. AB 343,398 1,487,470Trelleborg AB * 28,547 725,651Volvo AB, Series A * 21,144 539,891Volvo AB, Series B *@ 104,968 2,655,014
18,604,093Switzerland �� 8.4%
ABB Ltd. 79,542 2,403,554Adecco Group SA 21,532 1,449,819Alcon, Inc. *µ 31,115 2,178,692Alcon, Inc. * 3,914 274,685Baloise Holding AG 6,063 1,031,509Banque Cantonale Vaudoise 1,730 168,763Chocoladefabriken Lindt &
Spruengli AG 1 91,520Cie Financiere Richemont
SA 36,877 3,540,410Clariant AG @* 5,547 111,861Credit Suisse Group AG 129,912 1,361,042Credit Suisse Group AG,
ADR 6,288 66,653Helvetia Holding AG 2,160 253,674Julius Baer Group Ltd. * 38,000 2,430,006LafargeHolcim Ltd. * 56,614 3,326,817Lonza Group AG * 1,822 1,018,616Novartis AG 122,351 10,455,790Swatch Group AG (The) µ 6,226 346,822Swatch Group AG (The) µ 1,834 527,604Swiss Life Holding AG 4,192 2,060,629Swiss Prime Site AG 1,574 145,135Swiss Re AG @ 27,273 2,682,429Swisscom AG @ 4,128 2,214,353UBS Group AG 364,408 5,642,608Vifor Pharma AG 3,119 424,546Zurich Insurance Group AG 23,631 10,085,960
54,293,497United Kingdom �� 13.3%
Anglo American PLC 123,369 4,834,422Antofagasta PLC 11,948 278,368Aviva PLC 745,467 4,195,072Barclays PLC, ADR @ 330,258 3,378,539Barratt Developments PLC * 70,307 723,837BP PLC 350,960 1,425,614BP PLC, ADR 347,274 8,456,122British American Tobacco
PLC 179,302 6,856,928British American Tobacco
PLC, ADR @ 2,004 77,635BT Group PLC * 1,007,366 2,149,791Carnival PLC 7,715 168,632DS Smith PLC * 96,352 541,551Entain PLC * 7,933 166,015Glencore PLC * 1,433,844 5,618,759
Copyright © 2021 www.secdatabase.com. All Rights Reserved.Please Consider the Environment Before Printing This Document
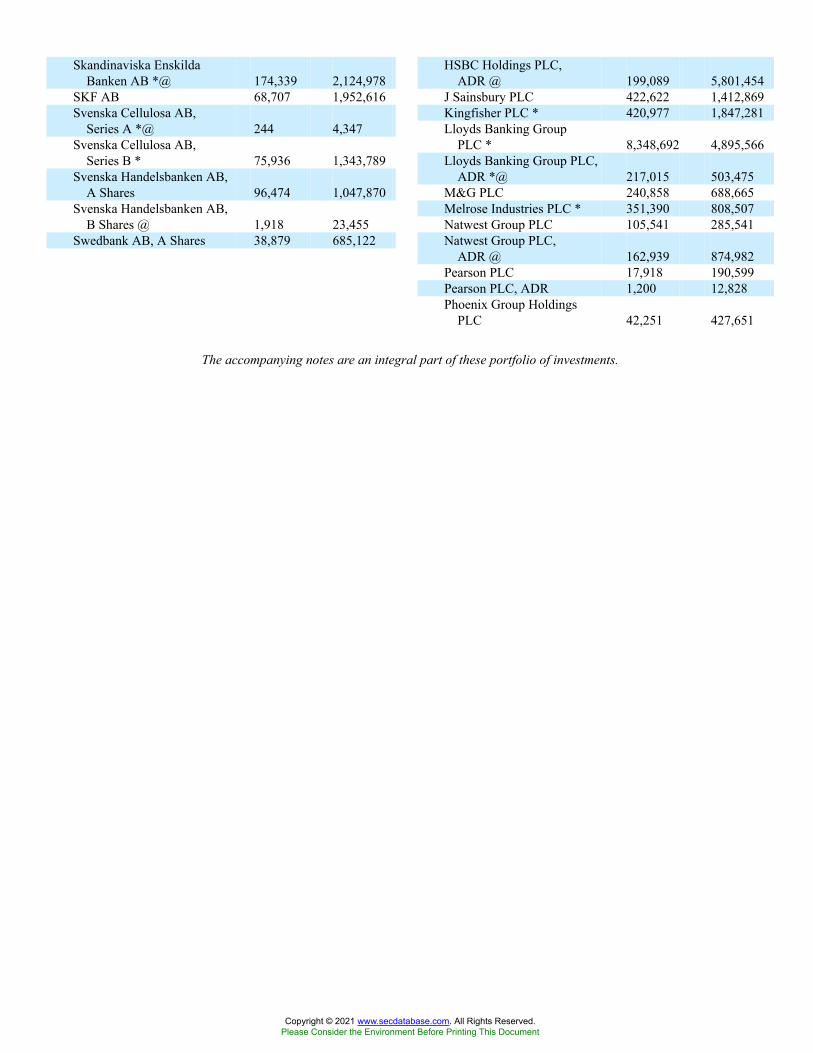
The accompanying notes are an integral part of these portfolio of investments.
Skandinaviska EnskildaBanken AB *@ 174,339 2,124,978
SKF AB 68,707 1,952,616Svenska Cellulosa AB,
Series A *@ 244 4,347Svenska Cellulosa AB,
Series B * 75,936 1,343,789Svenska Handelsbanken AB,
A Shares 96,474 1,047,870Svenska Handelsbanken AB,
B Shares @ 1,918 23,455Swedbank AB, A Shares 38,879 685,122
HSBC Holdings PLC,ADR @ 199,089 5,801,454
J Sainsbury PLC 422,622 1,412,869Kingfisher PLC * 420,977 1,847,281Lloyds Banking Group
PLC * 8,348,692 4,895,566Lloyds Banking Group PLC,
ADR *@ 217,015 503,475M&G PLC 240,858 688,665Melrose Industries PLC * 351,390 808,507Natwest Group PLC 105,541 285,541Natwest Group PLC,
ADR @ 162,939 874,982Pearson PLC 17,918 190,599Pearson PLC, ADR 1,200 12,828Phoenix Group Holdings
PLC 42,251 427,651
Copyright © 2021 www.secdatabase.com. All Rights Reserved.Please Consider the Environment Before Printing This Document

SA International Value FundPORTFOLIO OF INVESTMENTS � AS OF MARCH 31, 2021 (Unaudited) (Continued)
SHARES VALUE��COMMON STOCKS (Continued)United Kingdom (Continued)
Royal Dutch Shell PLC,ADR, Class B 460,830 $16,972,369
Standard Chartered PLC 186,070 1,281,297Standard Life Aberdeen
PLC 140,358 560,949Tesco PLC 22,721 71,683Vodafone Group PLC 3,881,420 7,056,797Whitbread PLC * 5,727 270,491WM Morrison
Supermarkets PLC 445,248 1,119,912WPP PLC 92,413 1,172,849WPP PLC, ADR @ 8,470 541,233
85,668,283TOTAL COMMON STOCKS
(Identified Cost $522,014,646) 626,416,235PREFERRED STOCKS �� 1.9%Germany �� 1.8%
Bayerische Motoren WerkeAG, 1.680% 9,731 774,273
Porsche Automobil HoldingSE, 3.960% 17,284 1,832,718
Volkswagen AG, 1.890% 31,732 8,878,81111,485,802
Italy �� 0.1%Telecom Italia SpA,
4.080% 711,381 409,110TOTAL PREFERRED STOCKS
(Identified Cost $9,502,759) 11,894,912RIGHTS AND WARRANTS �� 0.0%Switzerland �� 0.0%
Cie Financiere RichemontSA * 124,562 47,445
TOTAL RIGHTS AND WARRANTS(Identified Cost $0) 47,445
SHORT-TERM INVESTMENTS �� 6.7%Investment Company �� 0.1%
State Street InstitutionalU.S. Government MoneyMarket Fund 0.036% 600,075 600,075
Collateral For Securities On Loan �� 6.6%State Street Navigator
Securities LendingGovernment MoneyMarket Portfolio, 0.030% 42,617,256 42,617,256
TOTAL SHORT-TERM INVESTMENTS(Identified Cost $43,217,331) 43,217,331
Total Investments �� 105.7%(Identified Cost $574,734,736) 681,575,923
Liabilities, Less Cash andOther Assets � (5.7%) (36,550,172 )
§ Fair valued security. Security is valued using significantunobservable inputs as determined pursuant to proceduresapproved by the Fund�s Board of Trustees. See Note 1
µ Traded on the Switzerland, Swiss Exchange.
Key to abbreviations:ADR � American Depository Receipt
Copyright © 2021 www.secdatabase.com. All Rights Reserved.Please Consider the Environment Before Printing This Document

The accompanying notes are an integral part of these portfolio ofinvestments.
Net Assets �� 100.0% $645,025,751
� See Note 1* Non-income producing security@ A portion or all of the security was held on loan. As of
March 31, 2021, the fair value of the securities on loanwas $77,123,355.
¥ Traded on the Canada, Toronto StockExchange.
± 144A Securities. Securities exempt from registrationunder Rule 144A of the Securities Act of 1933. Thesesecurities may be resold in transactions exempt fromregistration to qualified institutional buyers. Thesesecurities have been deemed by the Fund to be liquid andat March 31, 2021 amounted to $2,937,301 or 0.46% ofthe net assets of the Fund.
<> Fair valued security. Security is valued using significantobservable inputs other than quoted prices as determinedpursuant to procedures approved by the Fund�s Board ofTrustees. See Note 1
= Traded on the France, Euronext Paris Exchange.
Copyright © 2021 www.secdatabase.com. All Rights Reserved.Please Consider the Environment Before Printing This Document

Ten largest industry holdings as of March 31, 2021(As a percentage of net assets) (Unaudited)
Industry PercentageCommercial Banks 18.5 %Automobiles 10.9 %Oil, Gas & Consumable Fuels 10.4 %Insurance 8.5 %Chemicals 5.4 %Metals & Mining 4.5 %Auto Components 3.2 %Pharmaceuticals 3.0 %Real Estate Management & Development 2.3 %Capital Markets 2.3 %
Country Weightings as of March 31, 2021(As a percentage of long-term investments) (Unaudited)
Country PercentageJapan 22.4 %United Kingdom 13.4 %France 10.4 %Germany 9.1 %Canada 8.6 %Switzerland 8.5 %Australia 6.0 %Netherlands 5.8 %Sweden 2.9 %Other 12.9 %
100.0 %
Copyright © 2021 www.secdatabase.com. All Rights Reserved.Please Consider the Environment Before Printing This Document

SA International Small Company FundPORTFOLIO OF INVESTMENTS � AS OF MARCH 31, 2021 (Unaudited)
The accompanying notes are an integral part of these portfolio of investments.
SHARES VALUE��MUTUAL FUNDS �� 100.1%Other �� 100.1%
DFA International SmallCompany Portfolio £ 15,095,079 $323,940,406
TOTAL MUTUAL FUNDS(Identified Cost $166,236,425) 323,940,406
Total Investments �� 100.1%(Identified Cost $166,236,425) 323,940,406
Liabilities, Less Cash andOther Assets � (0.1%) (301,192 )
Net Assets �� 100.0% $323,639,214
� See Note 1£ Please refer to the Portfolio of Investments of the DFA
International Small Company Portfolio includedelsewhere in this report.
Copyright © 2021 www.secdatabase.com. All Rights Reserved.Please Consider the Environment Before Printing This Document

SA Emerging Markets Value FundPORTFOLIO OF INVESTMENTS � AS OF MARCH 31, 2021 (Unaudited)
SHARES VALUE��COMMON STOCKS �� 98.5%Belgium �� 0.0%
Titan Cement InternationalSA * 1,153 $21,634
Brazil �� 3.5%Banco ABC Brasil SA * 287 738Banco Bradesco SA 35,883 149,878Banco Bradesco SA, ADR 112,711 529,742Banco do Brasil SA 54,444 294,533Banco Santander Brasil SA 15,497 109,028Cia Brasileira de Distribuicao 3,300 19,453Cogna Educacao * 134,331 94,985Cyrela Brazil Realty SA
Empreendimentos eParticipacoes 8,100 35,473
Enauta Participacoes SA 13,118 36,823Gerdau SA, ADR 73,328 391,572Hypera SA 7,312 41,609International Meal Co.,
Alimentacao SA * 16,347 11,181Iochpe Maxion SA 12,197 26,068JBS SA 53,851 289,698JHSF Participacoes SA 20,831 25,758MRV Engenharia e
Participacoes SA 7,300 23,604Petroleo Brasileiro SA 294,300 1,251,729Sendas Distribuidora SA * 3,300 43,291Tupy SA * 9,747 36,106Usinas Siderurgicas de Minas
Gerais SA 9,100 28,923Vale SA 233,906 4,071,273
7,511,465British Virgin Islands �� 0.0%
AsiaInfo Technologies Ltd. ± 8,000 12,307C&D Property Management
Group Co. Ltd. * 18,000 7,17819,485
Cayman Islands �� 0.3%Alibaba Group Holding Ltd. * 11,300 319,780Ausnutria Dairy Corp. Ltd. 14,000 18,333DaFa Properties Group Ltd. 16,000 12,987Ginko International Co. Ltd. 5,000 31,543Hope Education Group Co.
Ltd. ± 120,000 40,133IMAX China Holding, Inc. ± 6,300 14,003Lee�s Pharmaceutical
Holdings Ltd. 34,500 26,449Mobvista, Inc. *± 10,000 7,512Sun King Technology Group
Ltd. 88,000 28,412ZTO Express Cayman, Inc. * 1,700 47,453
546,605Chile �� 0.6%
SHARES VALUE��SONDA SA 26,216 $16,812
1,236,085China �� 35.9%
360 Security Technology, Inc.,Class A 20,500 43,533
361 Degrees International Ltd. 71,000 20,2753SBio, Inc. *± 81,000 71,580AAC Technologies Holdings,
Inc. @ 60,500 304,675Accelink Technologies Co. Ltd. 9,200 31,186Agile Group Holdings Ltd. 131,091 214,829Agricultural Bank of China
Ltd., H Shares 1,793,000 717,283Air China Ltd., Class H 154,000 133,317Aluminum Corp. of China Ltd.,
H Shares * 290,000 119,371Angang Steel Co., Ltd., H
Shares @ 142,999 71,370Anhui Conch Cement Co.,
Ltd., H Sharess 117,500 764,027Anhui Guangxin Agrochemical
Co. Ltd. * 2,200 10,451Anhui Truchum Advanced
Materials & Technology Co.Ltd. 13,800 14,968
Anhui Zhongding Sealing PartsCo. Ltd. 13,300 20,168
Anton Oilfield ServicesGroup * 226,000 14,245
Asia Cement China HoldingsCorp. 40,000 41,008
Atlas Corp. @ 6,910 94,321Avary Holding Shenzhen Co.
Ltd., Class A 1,600 8,714AviChina Industry &
Technology Co., Ltd. HShares 254,000 170,224
BAIC Motor Corp., Ltd., HShares ± 145,000 46,443
Baidu, Inc. ADR * 12,143 2,641,710Bank of Beijing Co. Ltd.,
Class A 98,400 72,055Bank of Changsha Co. Ltd.,
Class A 25,500 40,652Bank of Chengdu Co. Ltd.,
Class A 26,000 44,662Bank of China Ltd., H Shares 4,829,902 1,838,992Bank of Chongqing Co., Ltd.,
H Shares 46,500 31,881Bank of Communications Co.,
Ltd., H Shares 565,400 360,007Bank of Hangzhou Co. Ltd.,
Class A 21,100 54,368
Copyright © 2021 www.secdatabase.com. All Rights Reserved.Please Consider the Environment Before Printing This Document

The accompanying notes are an integral part of these portfolio of investments.
CAP SA 1,549 25,087Cencosud SA 120,649 257,916Empresas CMPC SA 54,329 174,427Empresas COPEC SA 20,815 257,083Enel Chile SA, ADR 8,973 35,174Enersis Americas SA, ADR 13,036 110,545ENTEL Chile SA 13,467 84,585Grupo Security SA 60,409 14,682Inversiones Aguas
Metropolitanas SA 40,036 31,398Itau CorpBanca Chile SA 8,900,248 34,097PAZ Corp. SA 9,073 9,005Ripley Corp. SA 71,991 25,991Salfacorp SA 43,600 37,824Sigdo Koppers SA 27,803 36,469SMU SA 147,411 24,145Sociedad Matriz SAAM SA 550,961 46,651Socovesa SA 38,881 14,194
Bank of Nanjing Co. Ltd. 61,300 94,639Bank of Ningbo Co. Ltd.,
Class A 16,800 99,647Bank of Shanghai Co. Ltd.,
Class A 68,500 91,856Baoshan Iron & Steel Co. Ltd.,
Class A 124,500 153,465BBMG Corp., H Shares @ 184,000 38,343Beijing Capital Co. Ltd.,
Class A 48,000 23,945Beijing Capital Development
Co. Ltd. 12,200 10,795Beijing Capital International
Airport Co., Ltd., H Shares 190,000 147,863Beijing Capital Land Ltd., H
Shares 150,000 18,909Beijing Dabeinong Technology
Group Co. Ltd., Class A 32,000 41,104Beijing Energy International
Holding Co. Ltd. *@ 310,000 9,969Beijing Enlight Media Co.
Ltd., Class A 11,300 20,652Beijing Enterprises Holdings
Ltd. 46,000 162,424Beijing Enterprises Water
Group Ltd. 448,000 170,000Beijing GeoEnviron
Engineering & Technology,Inc. 7,200 20,024
Beijing Kunlun Tech Co. Ltd.,Class A 5,800 20,979
Beijing North Star Co., Ltd.,Class H 100,000 18,652
Beijing Orient Landscape &Environment Co. Ltd. * 20,000 13,333
Beijing Orient NationalCommunication Science &Technology Co. Ltd. 8,200 11,759
Beijing OriginwaterTechnology Co. Ltd. 18,000 22,050
Beijing Sinnet Technology Co.Ltd., Class A 12,200 31,956
Beijing SL Pharmaceutical Co.Ltd. 8,900 12,844
Beijing Thunisoft Corp. Ltd. 4,400 12,733Beijing Yanjing Brewery Co.
Ltd., Class A 9,600 10,750
Copyright © 2021 www.secdatabase.com. All Rights Reserved.Please Consider the Environment Before Printing This Document
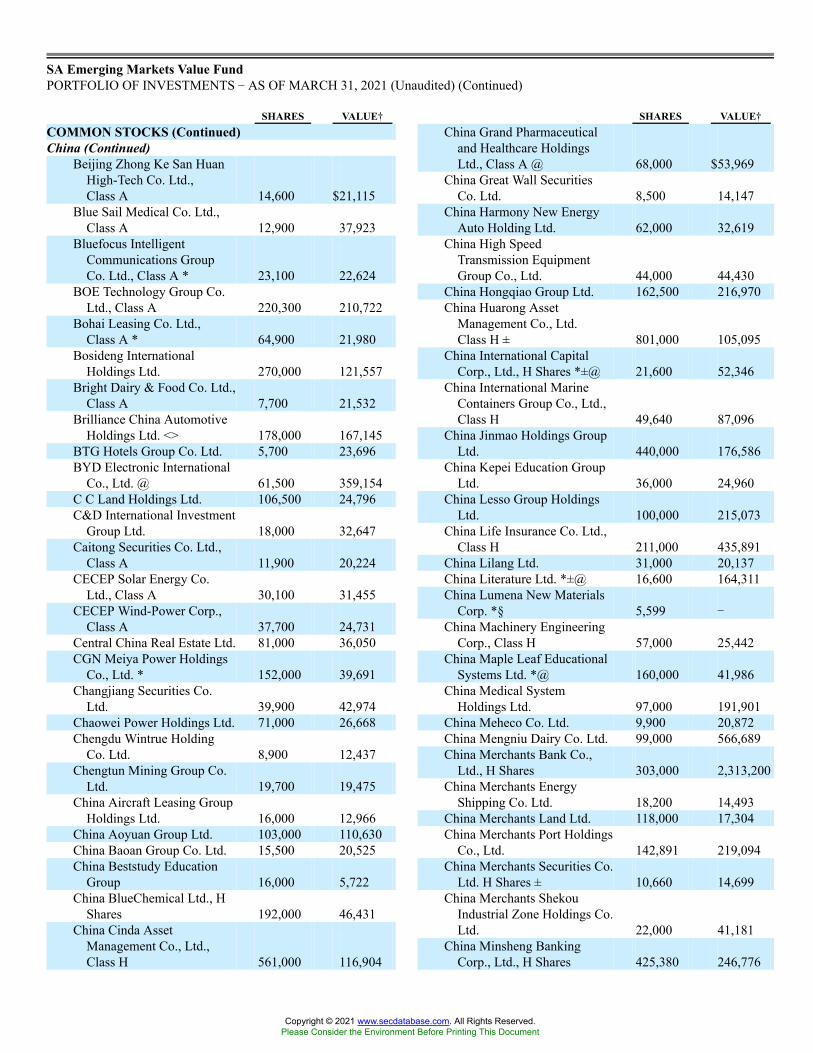
SA Emerging Markets Value FundPORTFOLIO OF INVESTMENTS � AS OF MARCH 31, 2021 (Unaudited) (Continued)
SHARES VALUE��COMMON STOCKS (Continued)China (Continued)
Beijing Zhong Ke San HuanHigh-Tech Co. Ltd.,Class A 14,600 $21,115
Blue Sail Medical Co. Ltd.,Class A 12,900 37,923
Bluefocus IntelligentCommunications GroupCo. Ltd., Class A * 23,100 22,624
BOE Technology Group Co.Ltd., Class A 220,300 210,722
Bohai Leasing Co. Ltd.,Class A * 64,900 21,980
Bosideng InternationalHoldings Ltd. 270,000 121,557
Bright Dairy & Food Co. Ltd.,Class A 7,700 21,532
Brilliance China AutomotiveHoldings Ltd. <> 178,000 167,145
BTG Hotels Group Co. Ltd. 5,700 23,696BYD Electronic International
Co., Ltd. @ 61,500 359,154C C Land Holdings Ltd. 106,500 24,796C&D International Investment
Group Ltd. 18,000 32,647Caitong Securities Co. Ltd.,
Class A 11,900 20,224CECEP Solar Energy Co.
Ltd., Class A 30,100 31,455CECEP Wind-Power Corp.,
Class A 37,700 24,731Central China Real Estate Ltd. 81,000 36,050CGN Meiya Power Holdings
Co., Ltd. * 152,000 39,691Changjiang Securities Co.
Ltd. 39,900 42,974Chaowei Power Holdings Ltd. 71,000 26,668Chengdu Wintrue Holding
Co. Ltd. 8,900 12,437Chengtun Mining Group Co.
Ltd. 19,700 19,475China Aircraft Leasing Group
Holdings Ltd. 16,000 12,966China Aoyuan Group Ltd. 103,000 110,630China Baoan Group Co. Ltd. 15,500 20,525China Beststudy Education
Group 16,000 5,722China BlueChemical Ltd., H
Shares 192,000 46,431China Cinda Asset
Management Co., Ltd.,Class H 561,000 116,904
SHARES VALUE��China Grand Pharmaceutical
and Healthcare HoldingsLtd., Class A @ 68,000 $53,969
China Great Wall SecuritiesCo. Ltd. 8,500 14,147
China Harmony New EnergyAuto Holding Ltd. 62,000 32,619
China High SpeedTransmission EquipmentGroup Co., Ltd. 44,000 44,430
China Hongqiao Group Ltd. 162,500 216,970China Huarong Asset
Management Co., Ltd.Class H ± 801,000 105,095
China International CapitalCorp., Ltd., H Shares *±@ 21,600 52,346
China International MarineContainers Group Co., Ltd.,Class H 49,640 87,096
China Jinmao Holdings GroupLtd. 440,000 176,586
China Kepei Education GroupLtd. 36,000 24,960
China Lesso Group HoldingsLtd. 100,000 215,073
China Life Insurance Co. Ltd.,Class H 211,000 435,891
China Lilang Ltd. 31,000 20,137China Literature Ltd. *±@ 16,600 164,311China Lumena New Materials
Corp. *§ 5,599 �China Machinery Engineering
Corp., Class H 57,000 25,442China Maple Leaf Educational
Systems Ltd. *@ 160,000 41,986China Medical System
Holdings Ltd. 97,000 191,901China Meheco Co. Ltd. 9,900 20,872China Mengniu Dairy Co. Ltd. 99,000 566,689China Merchants Bank Co.,
Ltd., H Shares 303,000 2,313,200China Merchants Energy
Shipping Co. Ltd. 18,200 14,493China Merchants Land Ltd. 118,000 17,304China Merchants Port Holdings
Co., Ltd. 142,891 219,094China Merchants Securities Co.
Ltd. H Shares ± 10,660 14,699China Merchants Shekou
Industrial Zone Holdings Co.Ltd. 22,000 41,181
China Minsheng BankingCorp., Ltd., H Shares 425,380 246,776
Copyright © 2021 www.secdatabase.com. All Rights Reserved.Please Consider the Environment Before Printing This Document

The accompanying notes are an integral part of these portfolio ofinvestments.
China Citic Bank Corp., Ltd.,H Shares 613,000 311,464
China Coal Energy Co., Ltd.,H Shares 158,000 72,760
China CommunicationServices Corp., Ltd., HShares 231,600 103,971
China Conch VentureHoldings Ltd. 80,500 378,471
China Construction BankCorp., H Shares 6,141,810 5,166,828
China COSCO Holdings Co.,Ltd., H Shares * 189,500 243,758
China Development BankFinancial Leasing Co., Ltd.,H Shares ± 128,000 18,441
China Dongxiang Group Co.,Ltd 218,000 25,238
China Eastern Airlines Corp.Ltd. 403 9,430
China Eastern Airlines Corp.,Ltd., H Shares 142,000 66,853
China Education GroupHoldings Ltd. 30,000 53,331
China Energy EngineeringCorp., Ltd., H Shares 152,000 15,642
China Everbright Bank Co.,Ltd., H Shares 241,000 105,091
China Everbright GreentechLtd. ± 32,000 13,007
China Everbright Ltd. 88,000 115,008China Evergrande Group @ 200,000 380,751China Film Co. Ltd. 10,100 21,833China Foods Ltd. 86,000 36,395China Fortune Land
Development Co. Ltd.,Class A 19,211 18,405
China Galaxy Securities Co.,Ltd., H Shares 194,500 120,091
China Gas Holdings Ltd. 211,800 867,731China Gezhouba Group Co.
Ltd. 20,000 23,127
China Modern Dairy HoldingsLtd. *@ 209,000 50,004
China Molybdenum Co., Ltd.,H Shares 135,000 81,791
China National AccordMedicines Corp. Ltd.,Class A 5,200 33,397
China National BuildingMaterial Co., Ltd., H Shares 440,850 636,258
China National MedicinesCorp. Ltd., Class A 2,900 14,976
China New Higher EducationGroup Ltd. ± 74,000 41,216
China Oil & Gas Group Ltd.*@ 200,000 10,934
China Oilfield Services Ltd., HShares 180,000 185,230
China Oriental Group Co., Ltd. 122,000 37,036China Overseas Grand Oceans
Group Ltd. 131,500 85,929China Overseas Land &
Investment Ltd. 414,000 1,075,726China Pacific Insurance Group
Co. Ltd. H Shares 203,200 801,132China Petroleum & Chemical
Corp., H Shares 1,784,400 950,260China Pharmaceutical Group
Ltd. 618,000 747,250China Railway Group Ltd., H
Shares 326,000 172,349China Railway Signal &
Communication Corp. Ltd.H Shares ± 77,000 31,596
China Reinsurance GroupCorp., H Shares 323,000 34,485
Copyright © 2021 www.secdatabase.com. All Rights Reserved.Please Consider the Environment Before Printing This Document

SA Emerging Markets Value FundPORTFOLIO OF INVESTMENTS � AS OF MARCH 31, 2021 (Unaudited) (Continued)
SHARES VALUE��COMMON STOCKS (Continued)China (Continued)
China Resources CementHoldings Ltd. 238,000 $267,264
China Resources DoubleCrane Pharmaceutical Co.Ltd. 6,300 11,264
China Resources Gas GroupLtd. 64,000 354,819
China Resources Land Ltd. 372,000 1,801,598China Resources Medical
Holdings Co., Ltd. 71,500 56,287China Resources
Pharmaceutical GroupLtd. ± 134,500 83,910
China Resources SanjiuMedical & PharmaceuticalCo. Ltd., Class A 7,900 29,479
China Sanjiang FineChemicals Co., Ltd. 44,000 20,602
China SCE Group HoldingsLtd. 170,000 78,723
China Shanshui CementGroup Ltd. * 53,000 13,976
China Shenhua Energy Co.,Ltd., H Shares 358,000 737,727
China ShinewayPharmaceutical Group Ltd. 36,000 23,895
China South City HoldingsLtd. 308,000 34,072
China South Publishing &Media Group Co. Ltd.,Class A 11,600 18,564
China Southern Airlines Co.,Ltd., H Shares *@ 170,000 125,957
China Taiping InsuranceHoldings Co., Ltd. 137,800 280,772
China Tianrui Group CementCo., Ltd. * 11,000 8,419
China Tower Corp.Ltd.�Class H ± 3,174,000 469,521
China Traditional ChineseMedicine Holdings Co.,Ltd. 260,000 162,205
China TransInfo TechnologyCo. Ltd., Class A 6,900 16,600
China Travel InternationalInvestment Hong KongLtd. * 180,000 30,563
China Vanke Co., Ltd.,Class H 149,400 585,178
China Yongda AutomobilesServices Holdings Ltd. 84,000 153,433
SHARES VALUE��CSG Holding Co. Ltd., Class A 19,500 $18,712CT Environmental Group
Ltd. *@§ 98,000 �CTS International Logistics
Corp. Ltd. 11,000 21,580Dali Foods Group Co. Ltd. ± 93,000 52,876Daqin Railway Co. Ltd.,
Class A 85,800 91,756DBG Technology Co. Ltd. 7,000 12,644Dexin China Holdings Co.,
Ltd. 76,000 29,230DHC Software Co. Ltd.,
Class A 28,100 31,894Digital China Holdings Ltd. 62,000 43,385Digital China Information
Service Co. Ltd. 10,000 22,426Dong-E-E-Jiao Co. Ltd.,
Class A 3,300 19,020Dongfang Electric Corp. Ltd. H
Shares @ 29,800 27,484Dongfeng Motor Group Co.,
Ltd., H Shares 184,000 170,885Dongxing Securities Co. Ltd.,
Class A 12,000 20,046Dongyue Group Ltd. 112,000 86,153Dynagreen Environmental
Protection Group Co. Ltd.,Class H 52,000 25,752
Everbright Securities Co., Ltd.,Class H ±@ 16,000 14,160
Fangda Carbon New MaterialCo. Ltd. * 15,700 19,544
Fangda Special SteelTechnology Co. Ltd. * 19,000 25,913
Fantasia Holdings Group Co.,Ltd. 142,500 18,697
Far East Horizon Ltd. 200,000 240,285FAW Jiefang Group Co. Ltd.,
Class A * 24,100 40,148Fiberhome Telecommunication
Technologies Co. Ltd.,Class A 5,800 16,281
Financial Street Holdings Co.Ltd. 23,300 24,278
FinVolution Group @ 11,439 80,187Fosun International Ltd. 200,500 280,604Founder Securities Co. Ltd. * 23,800 31,588Fu Shou Yuan International
Group Ltd. 65,000 66,638Fufeng Group Ltd. 153,000 55,106Fujian Funeng Co. Ltd. 14,100 20,779Fujian Star-net Communication
Co. Ltd., Class A 6,100 18,519
Copyright © 2021 www.secdatabase.com. All Rights Reserved.Please Consider the Environment Before Printing This Document

The accompanying notes are an integral part of these portfolio of investments.
China ZhengTong AutoServices Holdings Ltd. *@ 74,500 6,708
China Zhongwang HoldingsLtd. *@ 154,000 37,836
Chinasoft International Ltd. * 216,000 232,279Chinese Universe Publishing
and Media Group Co. Ltd. 9,200 14,835Chongqing Changan
Automobile Co. Ltd.,Class A * 12,500 27,059
Chongqing Department StoreCo. Ltd. 2,400 11,061
Chongqing Rural CommercialBank Co., Ltd., H Shares 226,000 97,387
CIFI Holdings Group Co.,Ltd. 285,364 276,771
CIMC Enric Holdings Ltd. 74,000 52,829CITIC Ltd. 417,000 394,788CITIC Securities Co., Ltd.,
Class H 64,000 147,361Citychamp Watch &
Jewellery Group Ltd. * 62,000 13,398CNHTC Jinan Truck Co. Ltd. 2,000 11,655CNNC Hua Yuan Titanium
Dioxide Co. Ltd. 14,800 20,772COFCO Biotechnology Co.
Ltd., Class A 15,100 20,686Cogobuy Group *± 40,000 11,989Concord New Energy Group
Ltd. 420,000 30,254Consun Pharmaceutical
Group Ltd. 23,000 11,893COSCO SHIPPING
Development Co., Ltd., HShares 324,200 52,962
COSCO SHIPPING EnergyTransportation Co., Ltd., HShares 136,000 59,654
COSCO SHIPPING PortsLtd. 152,431 110,979
Country Garden HoldingsCo., Ltd. 882,036 1,132,314
CP Pokphand Co., Ltd. 364,000 46,822CPMC Holdings Ltd. 53,000 29,997
Fujian Sunner DevelopmentCo. Ltd., Class A 9,000 35,355
Fuyao Glass Industry GroupCo. Ltd.�Class H ± 13,200 78,530
Gansu Shangfeng Cement Co.Ltd., Class A 5,200 17,333
GCL-Poly Energy HoldingsLtd.* 1,351,000 344,089
Geely Automobile HoldingsLtd. 493,000 1,254,363
GEM Co. Ltd., Class A 33,500 43,747Gemdale Corp., Class A 30,000 54,966Gemdale Properties &
Investment Corp., Ltd. 442,000 67,089Genertec Universal Medical
Group Co., Ltd. ± 75,500 61,961GF Securities Co., Ltd.,
Class H 75,800 116,224Giant Network Group Co. Ltd. 9,400 20,822Glory Sun Financial Group
Ltd.* 356,000 11,677Golden Eagle Retail Group
Ltd. 15,000 13,487GOME Retail Holdings Ltd.
*@ 438,000 81,131Gotion High-tech Co. Ltd.,
Class A * 3,500 19,238Grandjoy Holdings Group Co.
Ltd. 30,000 17,666Great Wall Motor Co., Ltd., H
Shares 221,000 612,618Greattown Holdings Ltd. 34,100 19,716Greatview Aseptic Packaging
Co. Ltd. 88,000 43,807Greenland Hong Kong
Holdings Ltd. 112,000 40,483Greentown China Holdings
Ltd. @ 78,500 101,380GRG Banking Equipment Co.
Ltd., Class A 10,900 18,957Guangdong HEC Technology
Holding Co. Ltd., Class A * 28,100 21,263Guangdong Huatie Tongda
High-speed RailwayEquipment Corp. * 22,300 18,643
Guangdong Tapai Group Co.Ltd. 9,300 17,508
Copyright © 2021 www.secdatabase.com. All Rights Reserved.Please Consider the Environment Before Printing This Document

SA Emerging Markets Value FundPORTFOLIO OF INVESTMENTS � AS OF MARCH 31, 2021 (Unaudited) (Continued)
SHARES VALUE��COMMON STOCKS (Continued)China (Continued)
Guanghui Energy Co. Ltd.,Class A * 26,800 $12,674
Guangxi Liugong Machinery Co.Ltd. 14,900 22,458
Guangxi Wuzhou ZhonghengGroup Co. Ltd. 24,500 10,391
Guangzhou Automobile GroupCo., Ltd., H Shares 188,000 157,914
Guangzhou Baiyun InternationalAirport Co. Ltd., Class A 11,000 22,386
Guangzhou BaiyunshanPharmaceutical Holdings Co.,Ltd.�Class H 16,000 38,816
Guangzhou HaigeCommunications Group, Inc.Co. 22,300 34,428
Guangzhou R&F Properties Co.,Ltd., H Shares 212,400 280,318
Guangzhou Yuexiu FinancialHoldings Group Co. Ltd. 9,900 21,189
Guizhou Panjiang Refined CoalCo. Ltd. 9,269 9,630
Guorui Properties Ltd. 63,000 3,160Guosen Securities Co. Ltd.,
Class A 22,400 40,870Guotai Junan Securities Co., Ltd.,
H Shares ± 29,000 41,854Haier Smart Home Co. Ltd.,
Class A 20,500 97,512Haier Smart Home Co. Ltd., H
Shares * 60,800 243,228Hainan Meilan International
Airport Co. Ltd., H Shares * 4,000 17,417Haitian International Holdings Ltd. 44,000 175,454Haitong Securities Co., Ltd.,
Class H 169,600 156,857Hang Zhou Great Star Industrial
Co. Ltd., Class A * 4,400 23,561Hangzhou Binjiang Real Estate
Group Co. Ltd. 45,200 30,823Harbin Electric Co., Ltd., H Shares
* 54,000 14,656HC Group, Inc. * 70,500 9,522Health & Happiness H&H
International Holdings Ltd. 15,000 56,920Hebei Construction Group Corp.
Ltd.�Class H 41,000 13,712Heilongjiang Agriculture Co. Ltd.,
Class A 8,000 19,100Hengan International Group Co.
Ltd. 55,500 364,807Hengdeli Holdings Ltd. * 184,000 7,219
SHARES VALUE��Huaxia Bank Co. Ltd., Class A 43,300 $42,540Huaxin Cement Co. Ltd. 7,000 25,352Huayu Automotive Systems
Co. Ltd., Class A 17,500 73,604Hubei Biocause
Pharmaceutical Co. Ltd. 17,600 11,089Hubei Jumpcan Pharmaceutical
Co. Ltd., Class A 4,400 13,405Hubei Xingfa Chemicals
Group Co. Ltd. 9,400 19,646Hunan Gold Corp. Ltd. 15,800 19,235Hunan Valin Steel Co. Ltd.,
Class A 47,300 50,511Huolinhe Opencut Coal
Industry Corp. Ltd. of InnerMongolia, Class A 12,000 18,343
Hytera Communications Corp.Ltd., Class A * 23,400 19,455
Industrial & Commercial Bankof China Ltd., H Shares 4,684,000 3,362,025
Industrial Bank Co. Ltd.,,Class A 122,900 451,665
Industrial Securities Co. Ltd. 40,700 52,466Infore Environment
Technology Group Co. Ltd. 12,400 15,814Inner Mongolia BaoTou Steel
Union Co. Ltd., Class A * 169,960 40,448Inner Mongolia Junzheng
Energy & Chemical IndustryGroup Co. Ltd., Class A 55,300 44,544
Jiangsu Changshu RuralCommercial Bank Co. Ltd.,Class A 20,200 23,420
Jiangsu Guotai InternationalGroup Co. Ltd. 10,400 10,551
Jiangsu Jiangyin RuralCommercial Bank Co. Ltd.,Class A 34,700 22,551
Jiangsu Nhwa PharmaceuticalCo. Ltd. 6,700 15,158
Jiangsu Provincial AgriculturalReclamation andDevelopment Corp. 11,200 18,453
Jiangsu Yuyue MedicalEquipment & Supply Co.Ltd., Class A 5,600 22,417
Jiangsu Zhangjiagang RuralCommercial Bank Co. Ltd. 23,200 19,714
Jiangsu Zhongnan ConstructionGroup Co. Ltd., Class A 13,900 14,801
Jiangsu Zhongtian TechnologyCo. Ltd. 18,600 32,490
Jiangxi Copper Co., Ltd., HShares 82,000 156,741
Copyright © 2021 www.secdatabase.com. All Rights Reserved.Please Consider the Environment Before Printing This Document
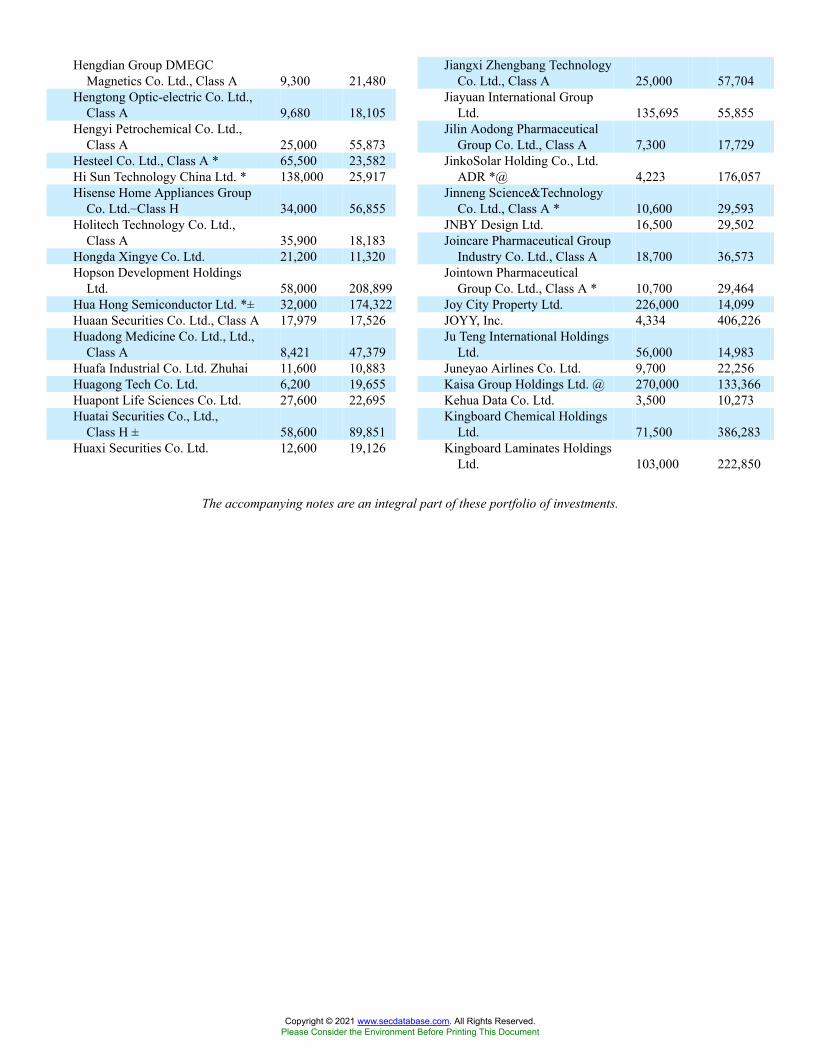
The accompanying notes are an integral part of these portfolio of investments.
Hengdian Group DMEGCMagnetics Co. Ltd., Class A 9,300 21,480
Hengtong Optic-electric Co. Ltd.,Class A 9,680 18,105
Hengyi Petrochemical Co. Ltd.,Class A 25,000 55,873
Hesteel Co. Ltd., Class A * 65,500 23,582Hi Sun Technology China Ltd. * 138,000 25,917Hisense Home Appliances Group
Co. Ltd.�Class H 34,000 56,855Holitech Technology Co. Ltd.,
Class A 35,900 18,183Hongda Xingye Co. Ltd. 21,200 11,320Hopson Development Holdings
Ltd. 58,000 208,899Hua Hong Semiconductor Ltd. *± 32,000 174,322Huaan Securities Co. Ltd., Class A 17,979 17,526Huadong Medicine Co. Ltd., Ltd.,
Class A 8,421 47,379Huafa Industrial Co. Ltd. Zhuhai 11,600 10,883Huagong Tech Co. Ltd. 6,200 19,655Huapont Life Sciences Co. Ltd. 27,600 22,695Huatai Securities Co., Ltd.,
Class H ± 58,600 89,851Huaxi Securities Co. Ltd. 12,600 19,126
Jiangxi Zhengbang TechnologyCo. Ltd., Class A 25,000 57,704
Jiayuan International GroupLtd. 135,695 55,855
Jilin Aodong PharmaceuticalGroup Co. Ltd., Class A 7,300 17,729
JinkoSolar Holding Co., Ltd.ADR *@ 4,223 176,057
Jinneng Science&TechnologyCo. Ltd., Class A * 10,600 29,593
JNBY Design Ltd. 16,500 29,502Joincare Pharmaceutical Group
Industry Co. Ltd., Class A 18,700 36,573Jointown Pharmaceutical
Group Co. Ltd., Class A * 10,700 29,464Joy City Property Ltd. 226,000 14,099JOYY, Inc. 4,334 406,226Ju Teng International Holdings
Ltd. 56,000 14,983Juneyao Airlines Co. Ltd. 9,700 22,256Kaisa Group Holdings Ltd. @ 270,000 133,366Kehua Data Co. Ltd. 3,500 10,273Kingboard Chemical Holdings
Ltd. 71,500 386,283Kingboard Laminates Holdings
Ltd. 103,000 222,850
Copyright © 2021 www.secdatabase.com. All Rights Reserved.Please Consider the Environment Before Printing This Document

SA Emerging Markets Value FundPORTFOLIO OF INVESTMENTS � AS OF MARCH 31, 2021 (Unaudited) (Continued)
SHARES VALUE��COMMON STOCKS (Continued)China (Continued)
Kingsoft Corp. Ltd. 41,000 $272,134Kunlun Energy Co., Ltd. 378,000 397,250KWG Living Group Holdings
Ltd. * 65,000 66,053KWG Property Holding Ltd. 130,000 222,405Lao Feng Xiang Co. Ltd. 2,700 22,856Lee & Man Paper Manufacturing
Ltd. 122,000 112,206Legend Holdings Corp.,
H Shares ± 38,400 60,854Lenovo Group Ltd. 632,000 899,129Leo Group Co. Ltd., Class A 48,000 21,529LexinFintech Holdings Ltd.
ADR *@ 6,213 62,503Leyard Optoelectronic Co. Ltd. 20,300 22,359Liaoning Cheng Da Co. Ltd.,
Class A 5,800 18,042Livzon Pharmaceutical Group,
Inc., H Shares 14,100 60,125Logan Group Co., Ltd. 96,000 161,768Longfor Properties Co., Ltd. ± 139,000 920,814Longshine Technology Group Co.
Ltd. 4,500 10,730Lonking Holdings Ltd. 158,000 67,069Luenmei Quantum Co. Ltd.,
Class A 13,300 21,284Luoniushan Co. Ltd., Class A 16,000 20,284Luxi Chemical Group Co. Ltd.,
Class A 8,600 20,375Luye Pharma Group Ltd. ± 161,500 103,247LVGEM China Real Estate
Investment Co. Ltd. 12,000 3,257Maanshan Iron & Steel Co., Ltd.,
H Shares 38,000 12,953Maoyan Entertainment *± 6,200 10,304Metallurgical Corp., of China
Ltd., H Shares 225,000 58,463Mingfa Group International Co.,
Ltd. * 91,000 8,311Minth Group Ltd. 60,000 250,061MLS Co. Ltd. 9,200 18,667MMG Ltd. * 192,000 107,187Momo, Inc. ADR 12,916 190,382Nanjing Iron & Steel Co. Ltd. 36,600 21,608Nanjing Xinjiekou Department
Store Co. Ltd. * 6,900 9,705NARI Technology Co. Ltd.,
Class A 24,339 115,624NavInfo Co. Ltd. 10,200 22,672NetDragon Websoft Holdings Ltd. 25,500 64,946New China Life Insurance Co.
Ltd. H Shares 47,700 184,686
SHARES VALUE��PICC Property & Casualty Co., Ltd.,
H Shares 494,000 $428,289Ping An Bank Co. Ltd., Class A 114,400 384,126Ping An Insurance Group Co. of
China Ltd. 37,500 446,434Pingdingshan Tianan Coal Mining
Co. Ltd. 15,900 13,050Poly Property Group Co., Ltd. 186,000 54,790Postal Savings Bank of China Co.,
Ltd., Class H ± 595,000 444,675Pou Sheng International Holdings
Ltd. * 252,000 56,403Powerlong Real Estate Holdings Ltd. 143,000 142,373Q Technology Group Co. Ltd. 31,000 63,084Qingdao Hanhe Cable Co. Ltd.,
Class A 35,800 20,917Qingling Motors Co., Ltd.,Class H 84,000 16,316Qudian, Inc. *@ 3,805 8,675Red Star Macalline Group Corp.,
Ltd., H Shares ± 35,700 21,124Redco Properties Group Ltd. ±@ 80,000 27,476Redsun Properties Group Ltd. 49,000 18,342Renhe Pharmacy Co. Ltd. 19,700 20,226RISE Education Cayman Ltd.
ADR *@ 3,702 14,993RiseSun Real Estate Development
Co. Ltd. 35,400 34,833Ronshine China Holdings Ltd. *@ 43,500 30,048SAIC Motor Corp. Ltd., Class A 29,700 89,123Sailun Group Co. Ltd., Class A 13,900 19,148Sanan Optoelectronics Co. Ltd.,
Class A 18,700 66,413Sansteel Minguang Co. Ltd. Fujian 13,700 15,529Sany Heavy Equipment International
Holdings Co. Ltd. 83,000 98,544Sealand Securities Co. Ltd., Class A 24,800 16,912Seazen Group Ltd. 180,000 221,119Seazen Holdings Co. Ltd., Class A 13,800 102,737Shaanxi Coal Industry Co. Ltd.,
Class A 50,037 84,426Shan Xi Hua Yang Group New
Energy Co. Ltd. 20,800 16,056Shandong Buchang Pharmaceuticals
Co. Ltd. 9,200 32,042Shandong Chenming Paper Holdings
Ltd., H Shares @ 35,250 32,602Shandong Gold Mining Co. Ltd., H
Shares ± 22,250 41,729Shandong Himile Mechanical
Science & Technology Co. Ltd. 2,700 12,130Shandong Hualu Hengsheng
Chemical Co. Ltd. 1,900 10,884Shandong Humon Smelting Co. Ltd. 10,800 19,326
Copyright © 2021 www.secdatabase.com. All Rights Reserved.Please Consider the Environment Before Printing This Document

The accompanying notes are an integral part of these portfolio ofinvestments.
New Hope Liuhe Co. Ltd.,Class A 28,415 86,697
Newland Digital Technology Co.Ltd. 4,500 9,714
Nexteer Automotive Group Ltd. 69,000 84,585Nine Dragons Paper Holdings
Ltd. 173,000 253,243Ningbo Huaxiang Electronic Co.
Ltd., Class A 8,950 27,062Ningbo Joyson Electronic Corp.,
Class A 5,200 14,287Ningbo Zhoushan Port Co. Ltd. 33,200 21,120Northeast Securities Co. Ltd. 8,500 11,178OFILM Group Co. Ltd., Class A 20,800 27,511ORG Technology Co. Ltd. 26,800 21,996Orient Securities Co., Ltd.,
Class H ± 52,400 33,836Oriental Pearl Group Co. Ltd.,
Class A 10,700 15,687Ourpalm Co. Ltd., Class A * 27,500 21,228Pangang Group Vanadium
Titanium & Resources Co.Ltd. * 61,900 20,775
PAX Global Technology Ltd. 75,000 80,556PCI-Suntek Technology Co. Ltd. 15,600 15,207People�s Insurance Co., Group of
China Ltd. (The), H Shares 305,000 98,867Perfect World Co. Ltd., Class A 12,900 38,926PetroChina Co., Ltd., H Shares 2,160,000 780,746
Shandong Jincheng PharmaceuticalGroup Co. Ltd. 3,100 10,787
Shandong Linglong Tyre Co. Ltd.,Class A 7,700 54,975
Shandong Longda Meat FoodstuffCo. Ltd. 8,100 12,320
Shandong Nanshan Aluminum Co.Ltd., Class A 37,900 19,947
Shandong Sun Paper Industry JSCLtd., Class A 16,800 40,289
Shandong Weigao Group MedicalPolymer Co. Ltd., H Shares 188,000 370,965
Shandong Yisheng Livestock &Poultry Breeding Co. Ltd. 7,471 11,728
Shanghai AJ Group Co. Ltd. 16,900 18,382Shanghai Electric Group Co., Ltd., H
Shares * 166,000 59,788Shanghai Environment Group Co.
Ltd. 11,600 20,705Shanghai Fosun Pharmaceutical
Group Co. Ltd., H Shares @ 29,500 125,793Shanghai Industrial Holdings Ltd. 45,000 67,146Shanghai Industrial Urban
Development Group Ltd. 274,000 26,786
Copyright © 2021 www.secdatabase.com. All Rights Reserved.Please Consider the Environment Before Printing This Document

SA Emerging Markets Value FundPORTFOLIO OF INVESTMENTS � AS OF MARCH 31, 2021 (Unaudited) (Continued)
SHARES VALUE��COMMON STOCKS (Continued)China (Continued)
Shanghai International Airport Co.Ltd., Class A 2,300 $20,316
Shanghai International Port GroupCo. Ltd., Class A 48,600 35,440
Shanghai Jahwa United Co. Ltd.,Class A 2,600 19,047
Shanghai Jin Jiang InternationalHotels Group Co., Ltd., HShares 148,000 28,747
Shanghai Jinjiang InternationalHotels Co. Ltd., Class A 1,300 11,007
Shanghai Lingang Holdings Corp.Ltd., Class A 7,300 20,424
Shanghai Lujiazui Finance &Trade Zone Development Co.Ltd., Class A 13,500 22,387
Shanghai Mechanical andElectrical Industry Co. Ltd. 7,100 20,905
Shanghai Pharmaceuticals HoldingCo., Ltd., Class H 63,600 124,842
Shanghai Pudong DevelopmentBank Co. Ltd., Class A 118,900 199,346
Shanghai RAAS Blood ProductsCo. Ltd., Class A 37,200 42,222
Shanghai Shimao Co. Ltd. 23,100 15,294Shanghai Sinyang Semiconductor
Materials Co. Ltd., Class A 3,000 18,645Shanghai Tunnel Engineering Co.
Ltd. 25,600 21,324Shanghai Yuyuan Tourist Mart
Group Co. Ltd., Class A 18,000 29,437Shanghai Zhangjiang High-Tech
Park Development Co. Ltd.,Class A 7,800 19,848
Shanxi Coking Coal Energy GroupCo. Ltd., Class A 50,000 38,215
Shanxi Lu�an EnvironmentalEnergy Development Co. Ltd.,Class A 22,000 20,574
Shanxi Meijin Energy Co. Ltd. * 20,300 22,205Shanxi Securities Co. Ltd. 24,700 26,490Shanxi Taigang Stainless Steel Co.
Ltd. 34,300 23,913Shanying International Holding
Co. Ltd. * 37,500 20,938Shenwan Hongyuan Group Co.
Ltd., H Shares ± 43,200 12,114Shenzhen Agricultural Products
Group Co. Ltd. 15,600 13,970Shenzhen Airport Co. Ltd. 16,200 21,946Shenzhen Aisidi Co. Ltd. 14,200 18,132
SHARES VALUE��Shenzhen Zhongjin Lingnan
Nonfemet Co. Ltd., Class A 31,900 $22,094Shijiazhuang Changshan
BeiMing Technology Co. Ltd.,Class A * 24,200 18,496
Shijiazhuang YilingPharmaceutical Co. Ltd.,Class A 8,000 30,059
Shimao Property Holdings Ltd. 131,000 412,003Shoucheng Holdings Ltd. @ 134,400 32,329Shougang Fushan Resources
Group Ltd. 219,790 54,565Shui On Land Ltd. 280,000 42,860Siasun Robot & Automation Co.
Ltd. * 12,500 21,606Sichuan Hebang Biotechnology
Co. Ltd. * 84,300 19,676Sichuan Kelun Pharmaceutical
Co. Ltd., Class A 12,500 42,124Sichuan Languang Development
Co. Ltd. 32,900 21,080Sieyuan Electric Co. Ltd.,
Class A 4,300 19,489Sihuan Pharmaceutical Holdings
Group Ltd. @ 328,000 86,070Sino Biopharmaceutical Ltd. 647,000 647,491Sino-Ocean Land Holdings Ltd. 293,712 65,361Sinofert Holdings Ltd. * 244,000 31,386Sinolink Securities Co. Ltd. 11,700 24,114Sinoma International
Engineering Co. 14,600 20,959Sinoma Science & Technology
Co. Ltd., Class A 11,000 39,117Sinopec Engineering Group Co.,
Ltd., H Shares 111,000 61,253Sinopec Kantons Holdings Ltd. 90,000 34,383Sinopec Shanghai Petrochemical
Co., Ltd., Class H 248,000 58,697Sinopec Yizheng Chemical Fibre
Co., Ltd., H Shares *@ 256,000 22,392Sinopharm Group Co. Ltd. H
Shares 140,400 339,889Sinotrans Ltd., H Shares 145,000 53,717Sinotruk Hong Kong Ltd. 67,000 200,808Skyfame Realty Holdings Ltd. 22,000 2,688Skyworth Digital Holdings Ltd. * 156,114 53,215SOHO China Ltd. * 153,500 46,993SooChow Securities Co. Ltd.,
Class A 15,600 22,966Spring Airlines Co. Ltd., Class A 2,300 20,898SSY Group Ltd. 124,000 72,255Sunac China Holdings Ltd. 234,000 1,003,833Sunac Services Holdings Ltd. *± 7,528 23,724Suning Universal Co. Ltd. 32,100 19,490
Copyright © 2021 www.secdatabase.com. All Rights Reserved.Please Consider the Environment Before Printing This Document

The accompanying notes are an integral part of these portfolio of investments.
Shenzhen HepalinkPharmaceutical Group Co. Ltd. 4,900 12,790
Shenzhen International HoldingsLtd. 99,337 166,369
Shenzhen Investment Ltd. 323,060 112,201Shenzhen Jinjia Group Co. Ltd.,
Class A 15,600 23,108Shenzhen Kinwong Electronic Co.
Ltd., Class A 2,300 9,228Shenzhen MTC Co. Ltd.,
Class A * 42,300 34,330Shenzhen Neptunus
Bioengineering Co. Ltd. * 28,200 13,465Shenzhen Overseas Chinese Town
Co. Ltd., Class A 61,400 95,449Shenzhen Tagen Group Co. Ltd.,
Class A 25,000 24,409Shenzhen World Union Group,
Inc. 33,300 21,895Shenzhen Yinghe Technology Co.
Ltd. 7,000 17,310
Suning.com Co. Ltd., Class A 37,200 39,044Sunward Intelligent Equipment
Co. Ltd. 10,800 15,356Suzhou Dongshan Precision
Manufacturing Co. Ltd.,Class A 10,800 30,184
Suzhou Gold MantisConstruction Decoration Co.Ltd., Class A 15,000 21,648
Tangshan Jidong Cement Co.Ltd., Class A <> 10,000 23,875
TangShan Port Group Co. Ltd. 55,900 23,452Tangshan Sanyou Chemical
Industries Co. Ltd. 11,600 19,165TBEA Co. Ltd., Class A 13,000 22,192TCL Electronics Holdings Ltd. 54,667 42,262Tech-Bank Food Co. Ltd.,
Class A * 16,600 43,836Tencent Music Entertainment
Group, ADR * 11,297 231,476Texhong Textile Group Ltd. 18,000 26,071
Copyright © 2021 www.secdatabase.com. All Rights Reserved.Please Consider the Environment Before Printing This Document

SA Emerging Markets Value FundPORTFOLIO OF INVESTMENTS � AS OF MARCH 31, 2021 (Unaudited) (Continued)
SHARES VALUE��COMMON STOCKS (Continued)China (Continued)
Tian Di Science & TechnologyCo. Ltd. 40,500 $20,760
Tiangong International Co., Ltd. 76,000 37,638Tianjin Chase Sun
Pharmaceutical Co. Ltd.,Class A 30,700 19,249
Tianjin Port DevelopmentHoldings Ltd. 180,000 14,587
Tianjin ZhonghuanSemiconductor Co. Ltd.,Class A 11,000 47,474
Tianneng Power InternationalLtd. @ 74,000 139,736
Tianshui Huatian TechnologyCo. Ltd., Class A 10,300 18,353
Tingyi Cayman Islands HoldingCorp. 154,000 282,878
Titan Wind Energy Suzhou Co.Ltd. 8,800 12,445
Tomson Group Ltd. 24,000 6,020Tong Ren Tang Technologies
Co. Ltd.�Class H 41,000 28,005Tongcheng-Elong Holdings
Ltd. * 49,200 111,006Tongda Group Holdings Ltd. 340,000 23,617Tonghua Dongbao
Pharmaceutical Co. Ltd.,Class A 11,000 20,825
Tongkun Group Co. Ltd.,Class A 11,100 34,968
Tongling Nonferrous MetalsGroup Co. Ltd., Class A 49,000 19,959
Tongyu Heavy Industry Co.Ltd. 40,800 19,980
Topsec Technologies Group,Inc., Class A * 7,000 21,272
Transfar Zhilian Co. Ltd.,Class A 27,553 30,474
TravelSky Technology Ltd., HShares 53,000 123,942
Trip.com Group Ltd. ADR * 32,162 1,274,580Truly International Holdings
Ltd. * 120,000 19,140Tsingtao Brewery Co. Ltd. 24,000 212,706Tus Environmental Science And
Technology Development Co.Ltd. * 23,000 23,439
Uni-President China HoldingsLtd. 60,000 73,012
Unisplendour Corp. Ltd.,Class A 13,440 40,679
United Energy Group Ltd. * 310,000 59,814
SHARES VALUE��Xiamen International Port Co.,
Ltd., Class H 94,000 $13,542Xiamen ITG Group Corp. Ltd. 17,300 17,472Xiamen Tungsten Co. Ltd. 7,300 20,424Xiamen Xiangyu Co. Ltd. 22,200 21,777Xilinmen Furniture Co. Ltd. 5,200 20,951Xinfengming Group Co. Ltd. 4,000 10,130Xingda International Holdings
Ltd. 88,123 23,351Xinhu Zhongbao Co. Ltd. 44,900 20,960Xinhua Winshare Publishing and
Media Co., Ltd.�Class H 36,000 24,821Xinjiang Goldwind Science &
Technology Co., Ltd., HShares @ 47,800 89,770
Xinjiang Tianshan Cement Co.Ltd. 4,500 11,760
Xinjiang Zhongtai Chemical Co.Ltd. 14,500 20,484
Xinxing Ductile Iron Pipes Co.Ltd., Class A 18,100 11,100
Xinyangfeng AgriculturalTechnology Co. Ltd., Class A 6,900 18,726
Xinyu Iron & Steel Co. Ltd. 27,300 23,906Xinyuan Real Estate Co. Ltd.,
ADR 4,102 11,527Xtep International Holdings Ltd. 97,578 57,110Xuji Electric Co. Ltd., Class A 9,300 21,849YaGuang Technology Group Co.
Ltd. 8,000 10,874Yango Group Co. Ltd., Class A 22,400 20,777Yantai Changyu Pioneer Wine
Co. Ltd. 3,700 18,288Yantai Jereh Oilfield Services
Group Co. Ltd., Class A 7,300 38,922Yanzhou Coal Mining Co., Ltd.,
H Shares 186,000 220,116YiChang HEC ChangJiang
Pharmaceutical Co. Ltd., HShares ±@ 25,600 27,200
Yifan Pharmaceutical Co. Ltd.,Class A 7,200 22,352
Yintai Gold Co. Ltd., Class A 15,700 21,341Yiren Digital Ltd., ADR * 6,796 34,456Yixintang Pharmaceutical Group
Co. Ltd., Class A 2,800 19,803Yonghui Superstores Co. Ltd.,
Class A 58,500 60,686Youngor Group Co. Ltd., Class A 11,500 14,246Youzu Interactive Co. Ltd. 8,100 14,618Yuexiu Property Co., Ltd. 675,033 152,823Yum China Holdings, Inc. 17,404 1,030,491Yunda Holding Co. Ltd., Class A 23,700 50,762
Copyright © 2021 www.secdatabase.com. All Rights Reserved.Please Consider the Environment Before Printing This Document

The accompanying notes are an integral part of these portfolio ofinvestments.
Universal Scientific IndustrialShanghai Co. Ltd., Class A 10,000 29,519
Untrade Hua Han Health § 504,000 �Vinda International Holdings
Ltd. @ 22,000 74,285Vipshop Holdings Ltd. ADR * 8,029 239,746Wangfujing Group Co. Ltd.,
Class A 4,200 19,235Wangsu Science & Technology
Co. Ltd., Class A 20,900 20,501Want Want China Holdings Ltd. 349,000 261,724Wanxiang Qianchao Co. Ltd. 42,900 30,629Wasion Holdings Ltd. 48,000 14,818Weibo Corp., ADR *@ 4,404 222,226Weichai Power Co., Ltd., H
Shares 151,000 372,931Weifu High-Technology Group
Co. Ltd. 5,600 20,230Wellhope Foods Co. Ltd. 7,700 14,120Wens Foodstuffs Group Co.
Ltd., Class A 47,100 121,576West China Cement Ltd. 198,000 33,874Wharf Holdings Ltd. (The) 66,000 174,888Wingtech Technology Co. Ltd.,
Class A 5,300 79,237Wisdom Education International
Holdings Co., Ltd. 18,000 8,011Wolong Electric Group Co. Ltd. 11,600 19,271Wuchan Zhongda Group Co.
Ltd., Class A 29,100 21,575Wuhan Department Store Group
Co. Ltd. 12,600 24,354Wuhu Token Science Co. Ltd.,
Class A 16,000 18,136Wuxi Taiji Industry Co. Ltd.,
Class A 14,900 18,798XCMG Construction Machinery
Co. Ltd., Class A 47,400 54,884Xiamen C & D, Inc., Class A 17,600 22,607
Yunnan Aluminium Co. Ltd.,Class A * 18,200 26,849
Yunnan Copper Co. Ltd.,Class A * 8,100 16,682
Yunnan Tin Co. Ltd., Class A * 14,600 27,440Yuzhou Properties Co., Ltd. 180,216 53,781Zhaojin Mining Industry Co.,
Ltd.�Class H 120,000 109,132Zhefu Holding Group Co. Ltd.,
Class A 16,400 14,236Zhejiang Century Huatong
Group Co. Ltd., Class A * 39,280 42,726Zhejiang Chint Electrics Co.
Ltd., Class A 13,100 72,545Zhejiang Crystal-Optech Co.
Ltd., Class A 12,400 20,506Zhejiang Dahua Technology Co.
Ltd., Class A 19,700 74,142Zhejiang Hailiang Co. Ltd.,
Class A 19,700 26,537Zhejiang Hisoar Pharmaceutical
Co. Ltd., Class A 12,700 17,263Zhejiang Jiahua Energy
Chemical Industry Co. Ltd. 9,000 13,922Zhejiang Juhua Co. Ltd. 7,900 11,112Zhejiang Longsheng Group Co.
Ltd., Class A 19,300 42,634Zhejiang Medicine Co. Ltd.,
Class A 10,400 22,244Zhejiang Narada Power Source
Co. Ltd., Class A * 9,800 16,416Zhejiang NHU Co. Ltd. Class A 8,500 49,574
Copyright © 2021 www.secdatabase.com. All Rights Reserved.Please Consider the Environment Before Printing This Document

SA Emerging Markets Value FundPORTFOLIO OF INVESTMENTS � AS OF MARCH 31, 2021 (Unaudited) (Continued)
SHARES VALUE��COMMON STOCKS (Continued)China (Continued)
Zhejiang Orient FinancialHoldings Group Co. Ltd. 13,400 $11,386
Zhejiang SatellitePetrochemical Co. Ltd.,Class A 4,320 24,826
Zhejiang Semir Garment Co.Ltd. 21,700 33,535
Zhejiang Wanfeng AutoWheel Co. Ltd. 24,800 20,544
Zhejiang Wanliyang Co. Ltd. 11,400 13,078Zhejiang Xinan Chemical
Industrial Group Co. Ltd. 10,700 20,551Zhejiang Yasha Decoration
Co. Ltd. 16,000 21,187Zhengzhou Coal Mining
Machinery Group Co. Ltd.,H Shares 10,200 14,354
Zhengzhou Yutong Bus Co.Ltd. 13,300 29,116
Zhenro Properties GroupLtd. @ 93,000 65,915
Zhongji Innolight Co. Ltd.,Class A 3,700 19,891
Zhongjin Gold Corp. Ltd.,Class A 32,000 40,714
Zhongsheng Group HoldingsLtd. 18,000 126,883
Zhongtian Financial GroupCo. Ltd. * 38,300 17,295
Zhou Hei Ya InternationalHoldings Co. Ltd. ±@ 57,000 59,683
Zhuzhou CRRC TimesElectric Co., Ltd., Class H 43,800 163,389
Zhuzhou Kibing Group Co.Ltd., Class A 10,500 20,712
Zibo Qixiang TengdaChemical Co. Ltd. 15,800 21,549
Zijin Mining Group Co.Ltd.�Class H 516,000 634,538
Zoomlion Heavy IndustryScience & Technology Co.,Ltd., H Shares 85,800 122,507
ZTE Corp., H Shares @ 55,800 141,687ZTO Express Cayman, Inc.,
ADR 15,793 460,36676,871,846
Colombia �� 0.1%Cementos Argos SA 31,937 44,918CEMEX Latam Holdings
SA * 13,000 14,201Grupo Argos SA 29,921 96,258
SHARES VALUE��Adani Enterprises Ltd. 12,586 $177,479Adani Ports & Special Economic
Zone Ltd. 15,271 146,708Adani Transmissions Ltd. * 664 8,261Aditya Birla Capital Ltd. * 44,000 71,855Ambuja Cements Ltd. 41,841 176,804Apollo Tyres Ltd. 31,532 96,584Arvind Fashions Ltd. * 4,522 8,606Arvind Fashions Ltd. <> 678 1,288Arvind Ltd. * 13,452 12,171Ashok Leyland Ltd. 10,707 16,607Aurobindo Pharma Ltd. 25,561 306,604Axis Bank Ltd. * 92,879 886,948Axis Bank Ltd. GDR * 1,352 64,626Bajaj Holdings & Investment Ltd. 3,496 157,792Balrampur Chini Mills Ltd. 14,783 44,068Bank of Baroda * 66,538 67,481Bharat Electronics Ltd. 74,073 126,437Bharat Heavy Electricals Ltd. * 96,730 64,364Bharti Airtel Ltd. 39,180 276,834Birla Corp., Ltd. 3,237 42,500Birlasoft Ltd. 13,059 45,189Brigade Enterprises Ltd. 1,061 3,962Canara Bank * 19,961 41,471Ceat Ltd. 3,536 75,591Chambal Fertilizers and Chemicals
Ltd. 14,403 45,250Cholamandalam Financial Holdings
Ltd. 2,985 24,496Cipla Ltd. 32,099 357,347City Union Bank Ltd. 8,853 18,883Cochin Shipyard Ltd. ± 3,997 20,364Container Corp. Of India Ltd. 7,508 61,383Cyient Ltd. 7,451 65,528Dalmia Bharat Ltd. 939 20,356DCB Bank Ltd. * 19,962 28,040DCM Shriram Ltd. 4,319 29,634Dilip Buildcon Ltd. ± 2,860 22,610Dishman Carbogen Amcis Ltd. * 5,292 7,889DLF Ltd. 37,826 148,197eClerx Services Ltd. 1,042 15,862Edelweiss Financial Services Ltd. * 37,825 32,748EID Parry India Ltd. * 7,288 31,599Escorts Ltd. 6,126 107,968Exide Industries Ltd. 21,360 53,726Federal Bank Ltd. * 161,831 167,777Finolex Cables Ltd. 3,726 19,391Finolex Industries Ltd. 1,266 11,031Firstsource Solutions Ltd. 20,730 32,408Fortis Healthcare Ltd. * 23,296 63,407GAIL India Ltd. 175,583 325,644Gateway Distriparks Ltd. 6,284 15,299General Insurance Corp. of India *± 7,543 20,510Glenmark Pharmaceuticals Ltd. 12,966 82,374
Copyright © 2021 www.secdatabase.com. All Rights Reserved.Please Consider the Environment Before Printing This Document

The accompanying notes are an integral part of these portfolio ofinvestments.
Grupo de InversionesSuramericana SA 22,033 130,572
285,949Czech Republic �� 0.1%
CEZ, AS 6,787 167,721Greece �� 0.2%
Alpha Bank AE * 81,255 87,417Bank of Greece 859 16,098Ellaktor SA * 3,635 6,202Eurobank Ergasias Services
and Holdings SA * 125,060 106,327Hellenic Petroleum SA 3,804 26,364Mytilineos Holdings SA 5,774 95,135National Bank of Greece
SA * 43,869 127,584Piraeus Financial Holdings
SA * 30,732 15,742480,869
Hong Kong �� 0.0%Untrade Huiyuan Juice § 84,500 �
Hungary �� 0.2%MOL Hungarian Oil & Gas
PLC * 48,906 354,105India �� 11.0%
ACC Ltd. 4,759 123,792
Godfrey Phillips India Ltd. 794 9,948Granules India Ltd. 17,305 71,834Grasim Industries Ltd. 22,682 451,352Great Eastern Shipping Co., Ltd.
(The) 4,320 18,376Gujarat Alkalies & Chemicals Ltd. 2,551 12,107Gujarat Narmada Valley Fertilizers &
Chemicals Ltd. 4,596 19,182Gujarat Pipavav Port Ltd. 19,498 26,001
Copyright © 2021 www.secdatabase.com. All Rights Reserved.Please Consider the Environment Before Printing This Document

SA Emerging Markets Value FundPORTFOLIO OF INVESTMENTS � AS OF MARCH 31, 2021 (Unaudited) (Continued)
SHARES VALUE��COMMON STOCKS (Continued)India (Continued)
Gujarat State Petronet Ltd. 17,561 $66,003HFCL Ltd. * 69,784 24,100Hindalco Industries Ltd. 170,691 761,311ICICI Bank Ltd. * 15,316 122,075ICICI Bank Ltd., ADR *@ 93,780 1,503,293IDFC Bank Ltd. * 81,058 61,808IDFC Ltd. * 78,818 51,637IFCI Ltd. * 68,818 11,248IIFL Holdings Ltd. 11,597 44,864IIFL Securities Ltd. 25,376 16,260IIFL Wealth Management Ltd. 3,625 60,984India Cements Ltd. (The) 18,543 42,367Indiabulls Housing Finance Ltd. 31,451 84,269Indian Bank * 2,394 3,790Inox Fluorochemicals Ltd. * 4,451 34,919Jindal Saw Ltd. 14,261 14,434Jindal Steel & Power Ltd. * 46,366 218,406JK Cement Ltd. * 1,001 39,293JM Financial Ltd. 26,872 31,185JSW Energy Ltd. 46,779 56,079JSW Steel Ltd. 94,084 604,546Jubilant Ingrevia Ltd. Common
Stock * 9,690 34,989Jubilant Pharmova Ltd. 9,690 89,990Kalpataru Power Transmission
Ltd. 5,415 27,773Karnataka Bank Ltd. (The) * 14,840 12,422Kaveri Seed Co., Ltd. 2,043 14,349KEC International Ltd. 2,756 15,455KPR Mill Ltd. 1,232 17,744KRBL Ltd. 2,340 5,742L&T Finance Holdings Ltd. 78,972 103,530Larsen & Toubro Ltd. 9,327 180,892Larsen & Toubro Ltd. GDR 16,815 323,521Laurus Labs Ltd. ± 14,785 72,657LIC Housing Finance Ltd. 20,180 118,201Lupin Ltd. 22,898 319,447Maharashtra Scooters Ltd. 198 9,663Mahindra & Mahindra
Financial Services Ltd. * 63,808 173,410Mahindra & Mahindra Ltd. 65,830 714,000Mahindra CIE Automotive
Ltd. * 6,907 15,257Mphasis Ltd. 7,024 172,930MRF Ltd. 116 130,335Natco Pharma Ltd. 2,129 23,994National Aluminium Co., Ltd. 40,705 30,092NCC Ltd. 30,074 32,495Oberoi Realty Ltd. * 6,703 53,174Persistent Systems Ltd. 4,699 123,912Petronet LNG Ltd. 18,380 56,449Piramal Enterprises Ltd. 5,591 133,516
SHARES VALUE��Shipping Corp. of India Ltd. 14,166 $21,381Shriram City Union Finance
Ltd. 2,635 49,014Shriram Transport Finance
Co., Ltd. 9,860 191,580Sobha Ltd. 6,105 36,385State Bank of India * 62,809 313,127State Bank of India, GDR * 2,800 138,880Steel Authority of India Ltd. 89,762 96,989Strides Pharma Science Ltd. 5,470 63,406Sun Pharmaceutical
Industries Ltd. 38,050 311,030Sun TV Network Ltd. 3,649 23,457Sunteck Realty Ltd. 5,951 22,758Tata Chemicals Ltd. 10,372 106,566Tata Global Beverages Ltd. 32,805 285,588Tata Motors Ltd. * 2,406 50,021Tata Motors Ltd. * 178,887 737,556Tata Steel Ltd. 31,314 350,514Tube Investments of India
Ltd. 2,032 33,101TV18 Broadcast Ltd. * 55,772 21,893Uflex Ltd. 3,166 16,498Union Bank of India * 36,541 16,968UPL Ltd. 17,262 151,091Vedanta Ltd. 158,002 494,447Vedanta Ltd., ADR @ 11,569 145,422Welspun Corp., Ltd. 11,246 21,265Welspun India Ltd. 31,519 34,789Wipro Ltd. 133,839 758,217Wockhardt Ltd. * 4,111 23,278Yes Bank Ltd. * 193,770 41,079Zee Entertainment
Enterprises Ltd. 51,165 141,674Zensar Technologies Ltd. 5,610 21,024
23,576,632Indonesia �� 1.5%
Adaro Energy Tbk PT 1,844,400 149,203AKR Corporindo Tbk PT 184,700 40,945Astra Agro Lestari Tbk PT 61,744 42,615Astra International Tbk PT 1,609,400 584,481Astra Otoparts Tbk PT 19,600 1,565Bank Danamon Indonesia
Tbk PT 136,773 25,707Bank Mandiri Persero Tbk
PT 710,600 300,874Bank Maybank Indonesia
Tbk PT 568,800 14,176Bank Negara Indonesia
Persero Tbk PT 499,366 196,824Bank Pan Indonesia Tbk
PT * 626,700 46,598
Copyright © 2021 www.secdatabase.com. All Rights Reserved.Please Consider the Environment Before Printing This Document

The accompanying notes are an integral part of these portfolio of investments.
PNB Housing Finance Ltd. *± 4,224 21,607PNC Infratech Ltd. * 4,201 14,801Power Finance Corp. Ltd. 75,664 117,666Prestige Estates Projects Ltd. 14,610 60,747Punjab National Bank * 115,447 57,792Quess Corp., Ltd. *± 2,433 22,828Rain Industries Ltd. 7,350 14,315Rajesh Exports Ltd. 7,411 48,624Rashtriya Chemicals &
Fertilizers Ltd. 7,262 7,688Raymond Ltd. * 3,276 16,186RBL Bank Ltd. ± 23,980 68,007REC Ltd. 93,608 167,976Redington India Ltd. 28,950 75,291Reliance Industries Ltd. 212,262 5,822,753
Bank Pembangunan DaerahJawa Barat Dan BantenTbk PT 173,300 17,360
Bank Pembangunan DaerahJawa Timur Tbk PT 69,000 3,729
Bank Tabungan NegaraPersero Tbk PT 405,590 48,029
Barito Pacific Tbk PT * 220,900 14,600BISI International Tbk PT 94,000 7,313Bukit Asam Tbk PT 339,600 61,257Bumi Serpong Damai Tbk
PT * 435,700 33,596Ciputra Development Tbk
PT 924,577 69,701Delta Dunia Makmur Tbk PT
* 589,400 15,420Eagle High Plantations Tbk
PT * 1,380,100 10,547Erajaya Swasembada Tbk
PT * 1,042,500 36,245Gudang Garam Tbk PT * 4,500 11,207Hanson International Tbk
PT *§ 5,335,700 �Indah Kiat Pulp & Paper
Corp., Tbk PT 294,700 212,022Indo Tambangraya Megah
Tbk PT 52,800 41,531Indofood Sukses Makmur
Tbk PT 407,500 185,163Japfa Comfeed Indonesia
Tbk PT 567,600 75,029Lippo Karawaci Tbk PT * 3,192,872 42,425Medco Energi Internasional
Tbk PT * 1,248,052 48,977Media Nusantara Citra Tbk
PT * 629,000 41,356
Copyright © 2021 www.secdatabase.com. All Rights Reserved.Please Consider the Environment Before Printing This Document

SA Emerging Markets Value FundPORTFOLIO OF INVESTMENTS � AS OF MARCH 31, 2021 (Unaudited) (Continued)
SHARES VALUE��COMMON STOCKS (Continued)Indonesia (Continued)
Pabrik Kertas Tjiwi KimiaTbk PT 28,300 $20,312
Panin Financial Tbk PT * 1,598,900 22,456PP Persero Tbk PT 442,900 41,774Ramayana Lestari Sentosa
Tbk PT 70,400 3,780Semen Indonesia Persero Tbk
PT 203,700 146,201Sri Rejeki Isman Tbk PT 996,900 13,864Surya Semesta Internusa Tbk
PT 393,100 13,045Tiga Pilar Sejahtera Food Tbk
PT * 168,600 3,180Tunas Baru Lampung Tbk PT 317,700 19,576United Tractors Tbk PT 167,100 254,533Vale Indonesia Tbk PT * 184,400 55,606Waskita Beton Precast Tbk PT 1,138,000 16,610Waskita Karya Persero Tbk
PT 606,100 48,196Wijaya Karya Persero Tbk PT 459,200 48,528XL Axiata Tbk PT 426,800 61,412
3,147,568Korea �� 15.2%
AK Holdings, Inc. 449 10,593AMOREPACIFIC Group 612 35,095Aprogen KIC, Inc. * 11,871 21,817Aprogen pharmaceuticals,
Inc. * 18,660 19,291Asia Paper Manufacturing Co.
Ltd. 567 24,474BGF Co., Ltd. 4,970 30,784Binggrae Co. Ltd. 417 22,071BNK Financial Group, Inc. 28,834 172,991Capro Corp. * 3,814 13,362Chongkundang Holdings
Corp. 196 17,924CJ CheilJedang Corp. 1,017 369,328CJ Corp. 2,104 174,752CJ Hellovision Co., Ltd. 4,225 18,367CJ Korea Express Co., Ltd. * 395 63,870Dae Han Flour Mills Co., Ltd. 157 20,462Daesang Corp. 2,426 53,911Daewoo Engineering &
Construction Co., Ltd. * 22,242 129,905Daewoo Shipbuilding &
Marine Engineering Co.,Ltd. * 5,100 127,528
Daishin Securities Co., Ltd. 3,671 52,709Daou Technology, Inc. 3,137 74,978DB Insurance Co., Ltd. 6,249 261,169DGB Financial Group, Inc. 21,295 158,807
SHARES VALUE��GS Retail Co. Ltd. 1,230 $41,462Halla Holdings Corp. 1,090 39,295Hana Financial Group, Inc. 32,602 1,232,927Handsome Co., Ltd. 1,970 70,671Hanil Holdings Co Ltd. 955 10,759Hanjin Transportation Co., Ltd. 1,142 43,389Hankook Tire & Technology
Co., Ltd. 8,825 382,475Hansol Paper Co., Ltd. 2,232 28,301Hansol Technics Co., Ltd. * 1,664 15,512Hanwha Aerospace Co., Ltd. 4,682 169,202Hanwha Chem Corp. * 9,139 404,563Hanwha Corp. 3,953 111,246Hanwha General Insurance Co.,
Ltd. * 8,055 34,732Hanwha Investment & Securities
Co., Ltd. * 18,065 67,839Hanwha Life Insurance Co., Ltd. 20,246 57,424Harim Holdings Co., Ltd. 3,907 31,967HDC Hyundai Development
Co.-Engineering &Construction 2,554 66,234
Heungkuk Fire & MarineInsurance Co., Ltd. * 7,083 25,691
Hy-Lok Corp. 918 13,465Hyosung Corp. 1,039 81,614Hyosung Heavy Industries
Corp. * 306 21,198Hyundai Construction
Equipment Co., Ltd. * 1,558 74,063Hyundai Department Store Co.,
Ltd. 1,286 103,062Hyundai Electric & Energy
System Co., Ltd. * 1,980 36,652Hyundai Engineering &
Construction Co., Ltd. 5,848 227,616Hyundai Futurenet Co., Ltd. 3,997 16,917Hyundai Greenfood Co., Ltd. 5,396 50,301Hyundai Heavy Industries
Holdings Co., Ltd. 635 163,554Hyundai Home Shopping
Network Corp. 716 51,181Hyundai Livart Furniture Co.
Ltd. 1,625 25,989Hyundai Marine & Fire
Insurance Co., Ltd. 9,136 197,775Hyundai Mipo Dockyard Co.,
Ltd. * 2,135 126,204Hyundai Mobis Co., Ltd. 4,144 1,069,183Hyundai Motor Co. 8,868 1,708,172Hyundai Motor Securities Co.,
Ltd. 1,658 19,118Hyundai Steel Co. 6,102 259,069Hyundai Wia Corp. 1,719 117,106
Copyright © 2021 www.secdatabase.com. All Rights Reserved.Please Consider the Environment Before Printing This Document
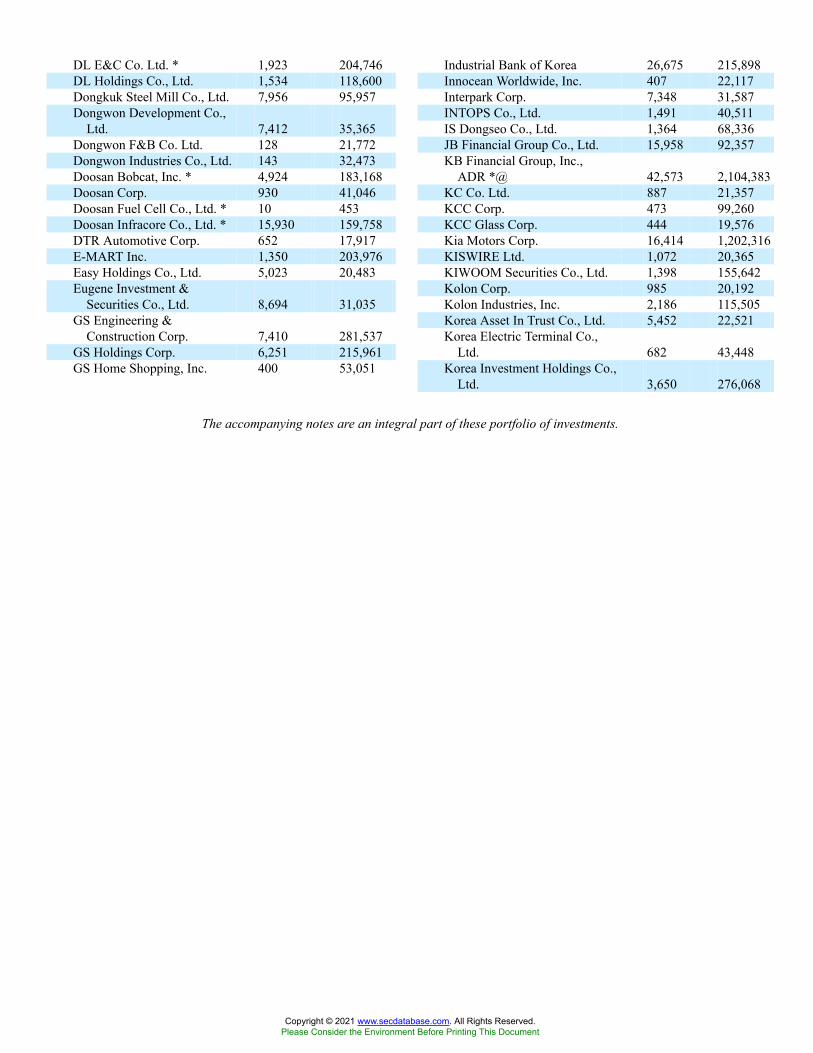
The accompanying notes are an integral part of these portfolio of investments.
DL E&C Co. Ltd. * 1,923 204,746DL Holdings Co., Ltd. 1,534 118,600Dongkuk Steel Mill Co., Ltd. 7,956 95,957Dongwon Development Co.,
Ltd. 7,412 35,365Dongwon F&B Co. Ltd. 128 21,772Dongwon Industries Co., Ltd. 143 32,473Doosan Bobcat, Inc. * 4,924 183,168Doosan Corp. 930 41,046Doosan Fuel Cell Co., Ltd. * 10 453Doosan Infracore Co., Ltd. * 15,930 159,758DTR Automotive Corp. 652 17,917E-MART Inc. 1,350 203,976Easy Holdings Co., Ltd. 5,023 20,483Eugene Investment &
Securities Co., Ltd. 8,694 31,035GS Engineering &
Construction Corp. 7,410 281,537GS Holdings Corp. 6,251 215,961GS Home Shopping, Inc. 400 53,051
Industrial Bank of Korea 26,675 215,898Innocean Worldwide, Inc. 407 22,117Interpark Corp. 7,348 31,587INTOPS Co., Ltd. 1,491 40,511IS Dongseo Co., Ltd. 1,364 68,336JB Financial Group Co., Ltd. 15,958 92,357KB Financial Group, Inc.,
ADR *@ 42,573 2,104,383KC Co. Ltd. 887 21,357KCC Corp. 473 99,260KCC Glass Corp. 444 19,576Kia Motors Corp. 16,414 1,202,316KISWIRE Ltd. 1,072 20,365KIWOOM Securities Co., Ltd. 1,398 155,642Kolon Corp. 985 20,192Kolon Industries, Inc. 2,186 115,505Korea Asset In Trust Co., Ltd. 5,452 22,521Korea Electric Terminal Co.,
Ltd. 682 43,448Korea Investment Holdings Co.,
Ltd. 3,650 276,068
Copyright © 2021 www.secdatabase.com. All Rights Reserved.Please Consider the Environment Before Printing This Document

SA Emerging Markets Value FundPORTFOLIO OF INVESTMENTS � AS OF MARCH 31, 2021 (Unaudited) (Continued)
SHARES VALUE��COMMON STOCKS (Continued)Korea (Continued)
Korea Line Corp. * 18,834 $56,997Korea Petrochemical Ind Co.,
Ltd. 384 110,441Korea Real Estate
Investment & Trust Co., Ltd. 23,805 50,691Korea Shipbuilding & Offshore
Engineering Co., Ltd. * 2,645 312,001Korea Zinc Co., Ltd. 678 244,721Korean Air Lines Co., Ltd. * 11,113 267,085Korean Reinsurance Co. 8,995 67,239KT Skylife Co., Ltd. 3,507 26,773KT&G Corp. 4,337 311,934Kumho Tire Co., Inc. * 7,034 23,680Kwang Dong Pharmaceutical
Co., Ltd. 5,019 38,006Kyobo Securities Co., Ltd. 2,156 15,031LF Corp. 3,054 44,120LG Corp. 5,866 468,554LG Display Co., Ltd. * 12,166 244,556LG Display Co., Ltd., ADR *@ 33,235 332,018LG Electronics, Inc. 10,656 1,412,326LG Hausys Ltd. 907 68,120LG International Corp. 3,459 97,497LG Uplus Corp. 15,900 172,101Lotte Chemical Corp. 1,056 280,854Lotte Chilsung Beverage Co.,
Ltd. 470 56,687Lotte Confectionery Co., Ltd. 72 8,461Lotte Corp. 1,582 47,526LOTTE Fine Chemicals Co.,
Ltd. 2,473 128,266Lotte Food Co., Ltd. 34 11,371LOTTE Himart Co., Ltd. 1,461 54,090Lotte Shopping Co., Ltd. 885 98,529LS Corp. 1,543 93,391Lumens Co., Ltd. * 5,701 7,732Maeil Dairies Co. Ltd. 341 21,784Meritz Financial Group, Inc. 4,689 71,262Meritz Fire & Marine Insurance
Co., Ltd. 6,331 108,244Meritz Securities Co., Ltd. 31,284 127,430Mirae Asset Daewoo Co., Ltd. 33,581 292,563Muhak Co., Ltd. 2,076 12,620Namyang Dairy Products Co.,
Ltd. 41 10,977Neowiz * 1,039 21,482Nexen Corp. 2,630 10,934Nexen Tire Corp. 5,151 34,590NH Investment & Securities
Co., Ltd. 10,116 104,132NHN Corp. * 1,188 76,103NICE Holdings Co. Ltd. 708 10,697
SHARES VALUE��Samsung Electronics Co., Ltd. 22,336 $1,606,495Samsung Electronics Co., Ltd.,
GDR 384 700,416Samsung Fire & Marine
Insurance Co., Ltd. 3,466 581,878Samsung Heavy Industries Co.,
Ltd. * 32,079 220,238Samsung Life Insurance Co.,
Ltd. 4,656 321,302Samsung Securities Co., Ltd. 4,339 151,247Samyang Corp. 427 21,694Samyang Holdings Corp. 409 33,862Sangsangin Co., Ltd. * 4,957 28,995SeAH Steel Corp. 210 17,609SeAH Steel Holdings Corp. 235 11,441Sebang Co., Ltd. 1,306 15,232Sebang Global Battery Co., Ltd. 944 64,977Seohan Co., Ltd. 5,607 7,902Seoul Semiconductor Co. Ltd. 1,842 30,110Shinhan Financial Group Co.,
Ltd. 24,135 798,636Shinhan Financial Group Co.,
Ltd., ADR * 19,576 656,579Shinsegae Inc. 727 180,505Shinyoung Securities Co., Ltd. 511 25,781SK Discovery Co Ltd. 1,247 66,992SK Gas Co., Ltd. 364 34,253SK Holdings Co., Ltd. 3,700 921,935SK Innovation Co., Ltd. * 1,070 207,051SK Networks Co., Ltd. 21,566 107,282SK Securities Co., Ltd. 36,346 28,325SL Corp. 1,820 35,861SM Entertainment Co. Ltd. * 925 24,193Solus Advanced Materials Co.,
Ltd. 1,715 71,449Songwon Industrial Co. Ltd. 1,925 34,613Soulbrain Holdings Co. Ltd. * 523 19,594Spigen Korea Co. Ltd. 361 19,330Suheung Co. Ltd. 475 21,447Sung Kwang Bend Co., Ltd. 2,941 21,283Sungwoo Hitech Co., Ltd. 7,756 41,873Sunjin Co., Ltd. 941 14,052Taekwang Industrial Co., Ltd. 48 39,019Taeyoung Engineering &
Construction Co., Ltd. 2,546 26,995Theragen Etex Co. Ltd. * 2,386 18,721Tongyang, Inc. 18,180 22,248Toptec Co. Ltd. 1,934 21,104TY Holdings Co. Ltd/Korea * 2,455 57,050Unid Co., Ltd. 672 40,139Wonik Holdings Co., Ltd. * 5,077 29,652Woori Financial Group, Inc. 53,621 478,526Young Poong Corp. 46 23,655Youngone Corp. 2,640 93,307
Copyright © 2021 www.secdatabase.com. All Rights Reserved.Please Consider the Environment Before Printing This Document

The accompanying notes are an integral part of these portfolio of investments.
Nong Shim Co., Ltd. 255 63,877Nong Shim Holdings Co., Ltd. 185 12,407NS Shopping Co., Ltd. 1,784 18,443OCI Co., Ltd. * 1,256 134,839Orion Holdings Corp. 2,572 32,384Pan Ocean Co., Ltd. 26,033 141,925Partron Co. Ltd. 2,142 20,251Poongsan Corp. 1,950 57,720POSCO 984 278,224Posco International Corp. 5,870 104,511POSCO, ADR 19,502 1,408,044Pulmuone Co. Ltd. 1,307 19,690S&T Dynamics Co., Ltd. 2,008 13,307S&T Motiv Co., Ltd. 1,086 59,590Sajo Industries Co., Ltd. 327 14,403Samjin Pharmaceutical Co. Ltd. 808 17,349Samsung C&T Corp. 4,716 518,791Samsung Card Co., Ltd. 2,904 88,397
Youngone Holdings Co., Ltd. 787 30,110Yuanta Securities Korea Co.,
Ltd. 11,552 36,08232,477,661
Malaysia �� 1.7%Aeon Co. M Bhd 64,400 20,035Alliance Financial Group
Berhad * 118,600 75,796AMMB Holdings Berhad 220,887 156,083Batu Kawan Berhad 18,200 78,129Boustead Plantations Bhd 55,720 7,861Bumi Armada Bhd * 264,700 26,811Cahya Mata Sarawak Bhd 68,100 35,803CIMB Group Holdings Bhd 511,305 535,165DRB-Hicom Berhad 119,100 55,148Ekovest Bhd 165,800 19,393Gamuda Bhd * 145,185 125,350Genting Bhd 187,100 226,966Genting Malaysia Bhd 237,300 175,693
Copyright © 2021 www.secdatabase.com. All Rights Reserved.Please Consider the Environment Before Printing This Document

SA Emerging Markets Value FundPORTFOLIO OF INVESTMENTS � AS OF MARCH 31, 2021 (Unaudited) (Continued)
SHARES VALUE��COMMON STOCKS (Continued)Malaysia (Continued)
HAP Seng Consolidated Bhd 24,400 $49,135Hengyuan Refining Co. Bhd 9,900 12,415Hong Leong Financial Group
Berhad 29,521 124,022IJM Corp. Berhad 250,560 102,121IOI Properties Group Bhd 50,050 17,261Lotte Chemical Titan Holding
Bhd ± 36,200 22,262Mah Sing Group Bhd 205,885 41,957Malayan Banking Bhd 266,726 530,686Malaysia Airports Holdings
Bhd 31,300 47,178Malaysia Building Society Bhd 197,932 31,505Malaysian Resources Corp. Bhd 133,300 14,788Matrix Concepts Holdings Bhd 42,800 19,921Mega First Corp. Bhd 6,400 11,236MISC Bhd 94,320 155,134MKH Bhd 36,950 12,832MMC Corp. Bhd 61,400 15,252Multi-Purpose Holdings Bhd 86,961 46,139Oriental Holdings Berhad 25,760 32,243OSK Holdings Berhad 74,455 17,777Pos Malaysia Berhad * 53,800 11,483PPB Group Berhad 37,500 167,310RHB Capital Berhad 177,571 229,967Sarawak Oil Palms Bhd 20,500 19,677Sime Darby Bhd 293,600 169,936Sime Darby Property Bhd 308,000 48,282SP Setia Bhd Group * 143,480 36,333Sunway Bhd 96,197 39,439Ta Ann Holdings Bhd 60 41United Malacca Bhd 14,600 18,239UOA Development Bhd 12,900 5,600WCT Holdings Bhd * 114,790 15,918YTL Corp. Berhad * 464,943 75,687
3,680,009Mexico �� 2.1%
ALEATICA SAB de CV 17,691 19,474Alfa SAB de CV, Class A 260,453 151,000Alpek SA de CV * 27,384 25,616Arca Continental SAB de CV 25,220 124,005Banco del Bajio SA *± 52,670 70,838Cemex SAB de CV * 724,467 509,337Coca-Cola Femsa SAB de CV 24,353 111,998Consorcio ARA SAB de CV * 72,788 15,918Controladora Nemak SAB de
CV * 260,453 32,621Corp. Actinver SAB de CV * 15,700 7,681El Puerto de Liverpool SAB de
CV, Series C 8,547 30,091
SHARES VALUE��Industrias Bachoco SAB de
CV, ADR @ 1,239 $49,225Industrias Bachoco SAB de
CV, Series B 5,634 18,746Industrias CH SAB de CV,
Series B 23,916 136,678Industrias Penoles SAB de
CV * 8,090 104,409La Comer SAB de CV 37,216 73,815Minera Frisco SAB de CV,
Class A2 * 52,254 10,737Nemak SAB de CV ± 78,001 21,142Orbia Advance Corp. SAB de
CV 82,897 221,037Organizacion Soriana SAB de
CV, Class B * 69,961 68,457Promotora y Operadora de
Infraestructura SAB de CV 1,600 8,141Promotora y Operadora de
Infraestructura SAB de CV 5,185 39,573Unifin Financiera SAB de
CV * 9,884 13,4004,580,983
Philippines �� 0.7%Alliance Global Group, Inc. 253,300 55,526Ayala Corp. 8,840 134,774Bank of the Philippine Islands 67,429 113,221BDO Unibank, Inc. 40,857 85,860Belle Corp. 176,000 5,330Cebu Air, Inc. * 23,560 21,867CEMEX Holdings Philippines,
Inc. *± 324,537 7,622China Banking Corp. 74,676 35,463Cosco Capital, Inc. 257,000 27,269DMCI Holdings, Inc. 385,900 44,126East West Banking Corp. * 27,450 5,486Emperador, Inc. 81,900 17,211Filinvest Land, Inc. 1,435,000 32,521First Philippine Holdings Corp. 33,750 48,535GT Capital Holdings, Inc. 3,472 37,340JG Summit Holdings, Inc. 161,003 198,196LT Group, Inc. 170,000 47,283Megaworld Corp. 1,004,700 74,104Metropolitan Bank & Trust 120,747 110,454Nickel Asia Corp. 146,900 15,133Puregold Price Club, Inc. 33,600 27,205Rizal Commercial Banking
Corp. 47,790 16,561Robinsons Land Corp. 313,155 115,358Robinsons Retail Holdings,
Inc. 43,490 51,296San Miguel Corp. 46,060 112,926Security Bank Corp. 23,180 57,786
Copyright © 2021 www.secdatabase.com. All Rights Reserved.Please Consider the Environment Before Printing This Document

The accompanying notes are an integral part of these portfolio of investments.
Fomento Economico MexicanoSAB de CV 3,768 28,390
Gentera SAB de CV * 67,054 29,854Grupo Carso SAB de CV, Series
A * 24,499 66,583Grupo Cementos de Chihuahua
SAB de CV 9,847 67,953Grupo Comercial Chedraui SA
de CV 29,127 46,043Grupo Elektra SAB de CV 1,119 75,214Grupo Financiero Banorte SAB
de CV * 142,853 805,490Grupo Financiero Inbursa SAB
de CV * 133,245 120,667Grupo Hotelero Santa Fe SAB
de CV * 22,600 5,584Grupo Mexico SAB de CV,
Series B 201,484 1,062,056Grupo Sanborns SAB de CV * 49,041 42,588Grupo Televisa SAB * 206,264 366,622
Top Frontier InvestmentHoldings, Inc. * 4,630 13,345
Union Bank of the Philippines 24,340 34,902Vista Land & Lifescapes, Inc. 491,200 37,849
1,584,549Poland �� 0.7%
Alior Bank SA * 7,579 44,110Amica SA 306 11,460Bank Handlowy w Warszawie
SA * 965 9,572Bank Millennium SA * 35,359 33,857Ciech SA * 1,973 18,497Echo Investment SA * 1,732 1,920Enea SA * 22,161 35,609Grupa Azoty SA * 5,354 40,847Grupa Lotos SA 3,925 43,124Jastrzebska Spolka Weglowa
SA * 2,892 21,647Kernel Holding SA 6,315 85,491KGHM Polska Miedz SA * 8,611 414,437
Copyright © 2021 www.secdatabase.com. All Rights Reserved.Please Consider the Environment Before Printing This Document

SA Emerging Markets Value FundPORTFOLIO OF INVESTMENTS � AS OF MARCH 31, 2021 (Unaudited) (Continued)
SHARES VALUE��COMMON STOCKS (Continued)Poland (Continued)
LC Corp. SA 26,490 $15,953mBank SA * 910 49,370PGE SA * 46,452 79,906Polski Koncern Naftowy Orlen
SA 28,302 454,476Tauron Polska Energia SA * 59,319 38,906
1,399,182Russia �� 1.3%
Gazprom PAO, ADR 169,698 1,012,079Lukoil PJSC, ADR 18,875 1,526,232RusHydro PJSC, ADR 61,905 63,391VTB Bank PJSC 92,145 100,438
2,702,140South Africa �� 3.9%
Absa Group Ltd. 40,917 349,541Advtech Ltd. * 40,887 36,566Aeci Ltd. 11,902 83,443African Rainbow Minerals Ltd. 9,314 175,496Alexander Forbes Group
Holdings Ltd. 100,385 27,885AngloGold Ashanti Ltd., ADR 16,757 368,151Aspen Pharmacare Holdings
Ltd. * 21,622 211,474Astral Foods Ltd. 5,245 52,034Barloworld Ltd. * 20,449 125,063Bidvest Group Ltd. (The) @ 7,758 89,559DataTec Ltd. * 27,420 48,301Discovery Ltd. 25,478 228,853Exxaro Resources Ltd. 16,359 192,695FirstRand Ltd. @ 67,549 236,238Gold Fields Ltd., ADR 59,766 567,179Grindrod Ltd. *@ 33,342 10,843Grindrod Shipping Holdings
Ltd. * 905 6,404Harmony Gold Mining Co.,
Ltd., ADR *@ 25,436 110,901Impala Platinum Holdings Ltd. 51,232 950,117Imperial Holdings Ltd. 19,398 62,189Investec Ltd. 21,334 62,542KAP Industrial Holdings Ltd. * 75,439 21,109Lewis Group Ltd. 3,337 6,943Liberty Holdings Ltd. 2,624 10,482Life Healthcare Group Holdings
Ltd. * 128,351 160,873Long4Life Ltd. * 66,407 16,017Metair Investments Ltd. * 23,331 35,676Momentum Metropolitan
Holdings 100,980 119,110Motus Holdings Ltd. @ 16,843 98,239Mpact Ltd. 15,365 20,820MTN Group Ltd. 167,369 984,824
SHARES VALUE��Super Group Ltd. * 41,508 $83,522Telkom SA SOC Ltd. 36,286 104,138Tiger Brands Ltd. 2,333 33,312Wilson Bayly Holmes-Ovcon
Ltd. * 6,827 45,2918,421,728
Taiwan �� 16.7%Acer, Inc. 187,884 207,092Alpha Networks, Inc. 24,973 32,690Ambassador Hotel (The) * 20,000 20,643AmTRAN Technology Co.,
Ltd. * 99,360 63,552Apex International Co., Ltd. 15,000 34,960Ardentec Corp. 39,092 61,653ASE Technology Holding Co.
Ltd. 88,000 331,546Asia Cement Corp. 253,269 424,290Asia Pacific Telecom Co.,
Ltd. * 125,842 42,119Asia Polymer Corp. 30,983 26,712Asia Vital Components Co.,
Ltd. 36,000 86,048Asustek Computer, Inc. 56,000 731,083AU Optronics Corp. * 628,000 463,302Avermedia Technologies 14,000 23,527Basso Industry Corp. 9,000 14,825Capital Securities Corp. 216,437 118,334Career Technology MFG. Co.,
Ltd. 20,400 26,025Catcher Technology Co., Ltd. 78,000 578,173Cathay Financial Holding Co.,
Ltd. 735,166 1,235,454Cathay Real Estate
Development Co., Ltd. 70,000 48,453Chang Hwa Commercial Bank
Ltd. 441,561 271,594Cheng Loong Corp. 82,000 100,298Cheng Uei Precision Industry
Co., Ltd. 44,543 75,011Chia Hsin Cement Corp. 22,000 16,076Chilisin Electronics Corp. 19,380 73,355Chin-Poon Industrial Co., Ltd. 36,000 41,447China Airlines Ltd. * 315,111 168,417China Bills Finance Corp. 89,000 48,659China Chemical &
Pharmaceutical Co., Ltd. 19,000 15,382China Development Financial
Holding Corp. 956,468 351,975China General Plastics Corp. 27,300 35,688China Life Insurance Co., Ltd. 56,600 51,079China Manmade Fibers Corp. * 110,595 38,295China Metal Products 31,000 35,201China Motor Corp. * 22,478 52,230
Copyright © 2021 www.secdatabase.com. All Rights Reserved.Please Consider the Environment Before Printing This Document
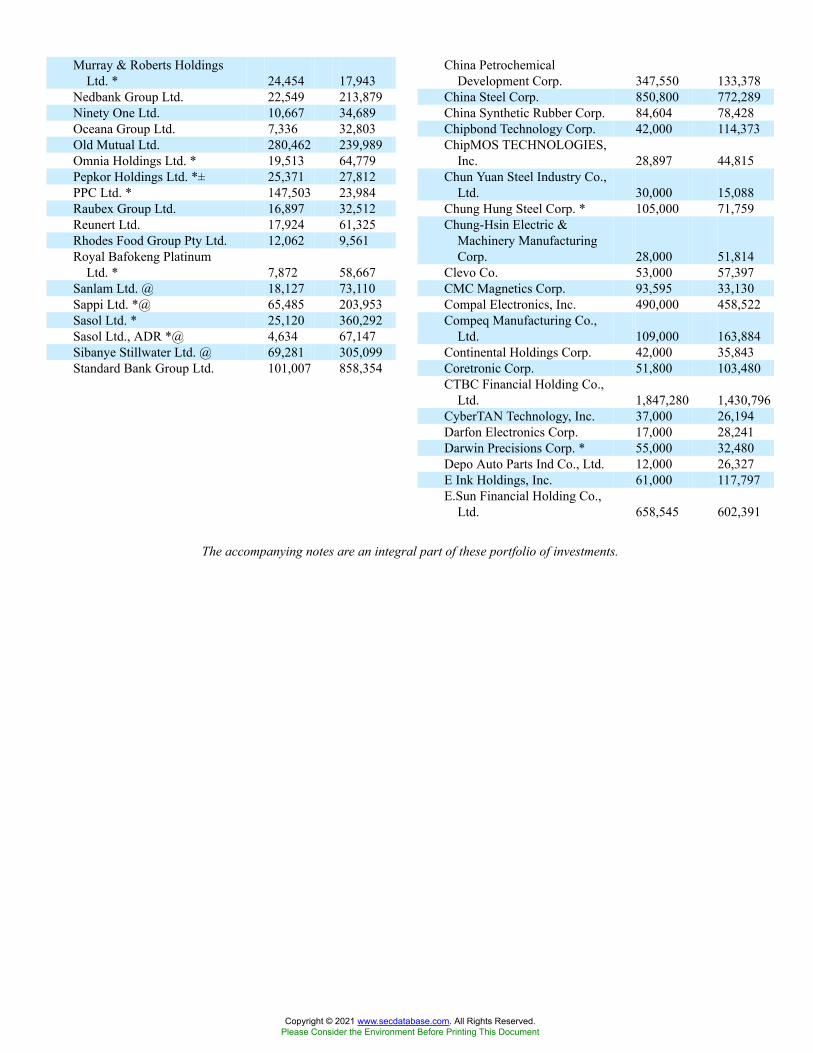
The accompanying notes are an integral part of these portfolio of investments.
Murray & Roberts HoldingsLtd. * 24,454 17,943
Nedbank Group Ltd. 22,549 213,879Ninety One Ltd. 10,667 34,689Oceana Group Ltd. 7,336 32,803Old Mutual Ltd. 280,462 239,989Omnia Holdings Ltd. * 19,513 64,779Pepkor Holdings Ltd. *± 25,371 27,812PPC Ltd. * 147,503 23,984Raubex Group Ltd. 16,897 32,512Reunert Ltd. 17,924 61,325Rhodes Food Group Pty Ltd. 12,062 9,561Royal Bafokeng Platinum
Ltd. * 7,872 58,667Sanlam Ltd. @ 18,127 73,110Sappi Ltd. *@ 65,485 203,953Sasol Ltd. * 25,120 360,292Sasol Ltd., ADR *@ 4,634 67,147Sibanye Stillwater Ltd. @ 69,281 305,099Standard Bank Group Ltd. 101,007 858,354
China PetrochemicalDevelopment Corp. 347,550 133,378
China Steel Corp. 850,800 772,289China Synthetic Rubber Corp. 84,604 78,428Chipbond Technology Corp. 42,000 114,373ChipMOS TECHNOLOGIES,
Inc. 28,897 44,815Chun Yuan Steel Industry Co.,
Ltd. 30,000 15,088Chung Hung Steel Corp. * 105,000 71,759Chung-Hsin Electric &
Machinery ManufacturingCorp. 28,000 51,814
Clevo Co. 53,000 57,397CMC Magnetics Corp. 93,595 33,130Compal Electronics, Inc. 490,000 458,522Compeq Manufacturing Co.,
Ltd. 109,000 163,884Continental Holdings Corp. 42,000 35,843Coretronic Corp. 51,800 103,480CTBC Financial Holding Co.,
Ltd. 1,847,280 1,430,796CyberTAN Technology, Inc. 37,000 26,194Darfon Electronics Corp. 17,000 28,241Darwin Precisions Corp. * 55,000 32,480Depo Auto Parts Ind Co., Ltd. 12,000 26,327E Ink Holdings, Inc. 61,000 117,797E.Sun Financial Holding Co.,
Ltd. 658,545 602,391
Copyright © 2021 www.secdatabase.com. All Rights Reserved.Please Consider the Environment Before Printing This Document

SA Emerging Markets Value FundPORTFOLIO OF INVESTMENTS � AS OF MARCH 31, 2021 (Unaudited) (Continued)
SHARES VALUE��COMMON STOCKS (Continued)Taiwan (Continued)
Elite Advanced Laser Corp. 8,000 $18,505Elitegroup Computer Systems
Co., Ltd. * 35,877 39,042ENNOSTAR, Inc. * 17,414 50,107Entie Commercial Bank Co.,
Ltd. 68,000 36,940Eva Airways Corp. 265,478 146,077Everest Textile Co., Ltd. * 45,444 13,028Evergreen International
Storage & Transport Corp. 54,000 35,012Evergreen Marine Corp.,
Taiwan Ltd. * 244,459 389,825Everlight Chemical Industrial
Corp. 56,000 32,972Everlight Electronics Co., Ltd. 51,000 82,578Far Eastern Department Stores
Ltd. 121,220 101,962Far Eastern International Bank 298,962 112,112Far Eastern New Century Corp. 342,338 362,339Farglory Land Development
Co., Ltd. 26,721 53,380Federal Corp. * 33,000 24,692First Financial Holding Co.,
Ltd. 849,034 660,588First Steamship Co., Ltd. 39,240 14,853Formosa Advanced
Technologies Co., Ltd. 20,000 28,318Formosa Chemicals & Fibre
Corp. 161,000 494,291Formosa Plastics Corp. 8,000 28,318Formosa Taffeta Co., Ltd. 50,000 53,973Formosan Rubber Group, Inc. 20,080 17,383Formosan Union Chemical 48,179 28,367Foxconn Technology Co., Ltd. 64,127 163,166Fubon Financial Holding Co.,
Ltd. 613,211 1,220,705Fulltech Fiber Glass Corp. * 31,310 17,009Gemtek Technology Corp. 47,000 52,958General Interface Solution
Holding Ltd. 30,000 131,952Getac Technology Corp. 9,000 18,484Giantplus Technology Co., Ltd. 37,000 17,052Gigastorage Corp. * 294 209Gloria Material Technology
Corp. 50,392 30,112Gold Circuit Electronics Ltd. * 45,000 88,634Goldsun Building Materials
Co., Ltd. 82,973 78,660Grand Pacific Petrochemical * 102,000 98,307Great Wall Enterprise Co., Ltd. 56,155 107,457Hannstar Board Corp. 38,929 67,331HannStar Display Corp. * 109,770 59,246
SHARES VALUE��Lien Hwa Industrial Corp. 13,345 $22,146Lingsen Precision Industries Ltd. * 41,000 23,063Lite-On Technology Corp. 234,874 516,948Long Chen Paper Co., Ltd. 89,648 78,548Macronix International Co., Ltd. 119,171 185,232MediaTek, Inc. 11,000 373,567Mega Financial Holding Co., Ltd. 690,850 772,373Mercuries & Associates Holdings
Ltd. 42,344 31,313Mercuries Life Insurance Co.,
Ltd. * 142,740 44,373MIN AIK Technology Co., Ltd. * 25,600 14,849Mitac Holdings Corp. 27,637 27,944Namchow Holdings Co. Ltd. 7,000 11,665Nan Ya Plastics Corp. 45,000 125,854Nanya Technology Corp. 133,000 428,371O-Bank Co., Ltd. 91,943 22,556OptoTech Corp. * 49,063 45,911Orient Semiconductor Electronics
Ltd. 42,485 24,568Oriental Union Chemical Corp. 16,000 10,907Pan Jit International, Inc. 21,600 40,500Pan-International Industrial Corp. 34,380 53,800Pegatron Corp. 235,249 610,940POU Chen Corp. 169,133 195,612Powertech Technology, Inc. 23,000 85,042President Securities Corp. 111,304 91,671Prince Housing & Development
Corp. 77,970 30,059Qisda Corp. 187,400 224,948Radium Life Tech Co., Ltd. 101,477 40,722Rich Development Co., Ltd. 19,978 7,212Ritek Corp. * 47,211 17,373Ruentex Development Co., Ltd. 69,423 120,437Ruentex Industries Ltd. 41,400 115,641Sampo Corp. 10,600 11,386San Fang Chemical Industry Co.,
Ltd. 13,000 9,818Sanyang Motor Co., Ltd. 41,573 45,167Sesoda Corp. 24,948 21,509Shanghai Commercial & Savings
Bank Ltd. (The) 13,000 19,113Shihlin Electric & Engineering
Corp. 26,000 44,832Shin Kong Financial Holding Co.,
Ltd. 806,983 258,784Shin Zu Shing Co., Ltd. 16,660 76,781Shinkong Insurance Co., Ltd. 30,000 42,057Shinkong Synthetic Fibers Corp. 140,151 85,958Sigurd Microelectronics Corp. 54,694 100,252Sincere Navigation Corp. 27,810 21,345Sinon Corp. 56,000 45,337SinoPac Financial Holdings Co.,
Ltd. 955,094 430,132
Copyright © 2021 www.secdatabase.com. All Rights Reserved.Please Consider the Environment Before Printing This Document
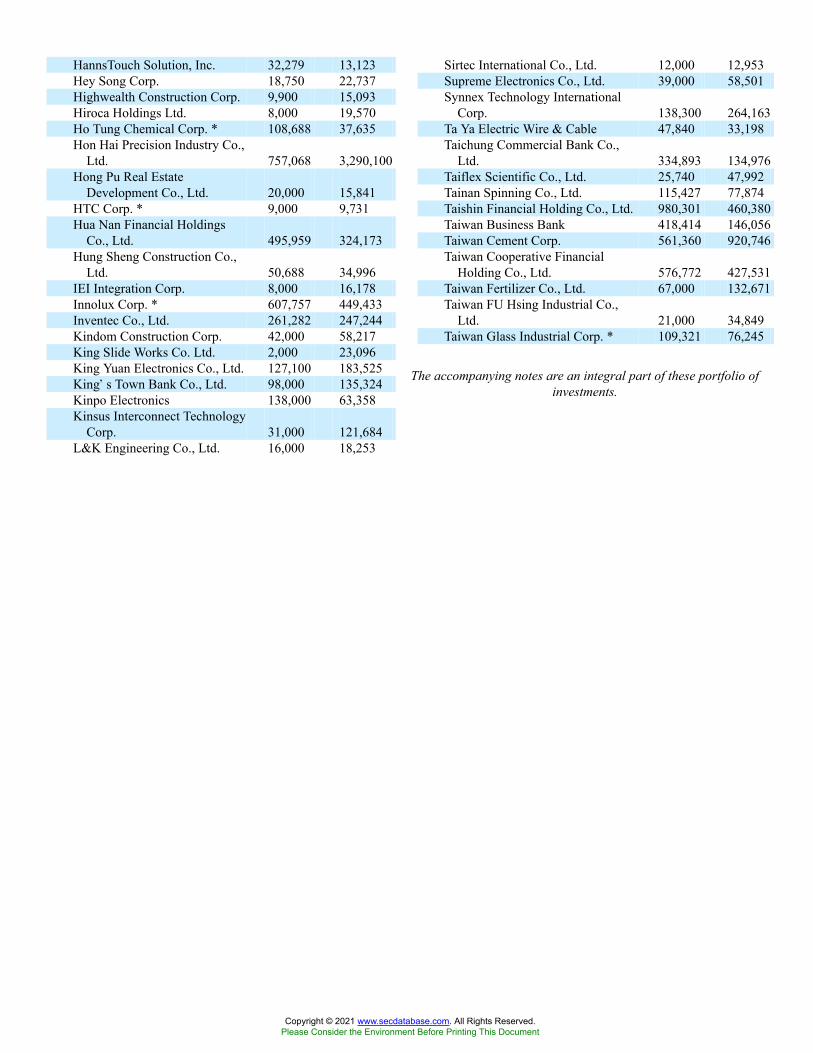
The accompanying notes are an integral part of these portfolio ofinvestments.
HannsTouch Solution, Inc. 32,279 13,123Hey Song Corp. 18,750 22,737Highwealth Construction Corp. 9,900 15,093Hiroca Holdings Ltd. 8,000 19,570Ho Tung Chemical Corp. * 108,688 37,635Hon Hai Precision Industry Co.,
Ltd. 757,068 3,290,100Hong Pu Real Estate
Development Co., Ltd. 20,000 15,841HTC Corp. * 9,000 9,731Hua Nan Financial Holdings
Co., Ltd. 495,959 324,173Hung Sheng Construction Co.,
Ltd. 50,688 34,996IEI Integration Corp. 8,000 16,178Innolux Corp. * 607,757 449,433Inventec Co., Ltd. 261,282 247,244Kindom Construction Corp. 42,000 58,217King Slide Works Co. Ltd. 2,000 23,096King Yuan Electronics Co., Ltd. 127,100 183,525King�s Town Bank Co., Ltd. 98,000 135,324Kinpo Electronics 138,000 63,358Kinsus Interconnect Technology
Corp. 31,000 121,684L&K Engineering Co., Ltd. 16,000 18,253
Sirtec International Co., Ltd. 12,000 12,953Supreme Electronics Co., Ltd. 39,000 58,501Synnex Technology International
Corp. 138,300 264,163Ta Ya Electric Wire & Cable 47,840 33,198Taichung Commercial Bank Co.,
Ltd. 334,893 134,976Taiflex Scientific Co., Ltd. 25,740 47,992Tainan Spinning Co., Ltd. 115,427 77,874Taishin Financial Holding Co., Ltd. 980,301 460,380Taiwan Business Bank 418,414 146,056Taiwan Cement Corp. 561,360 920,746Taiwan Cooperative Financial
Holding Co., Ltd. 576,772 427,531Taiwan Fertilizer Co., Ltd. 67,000 132,671Taiwan FU Hsing Industrial Co.,
Ltd. 21,000 34,849Taiwan Glass Industrial Corp. * 109,321 76,245
Copyright © 2021 www.secdatabase.com. All Rights Reserved.Please Consider the Environment Before Printing This Document
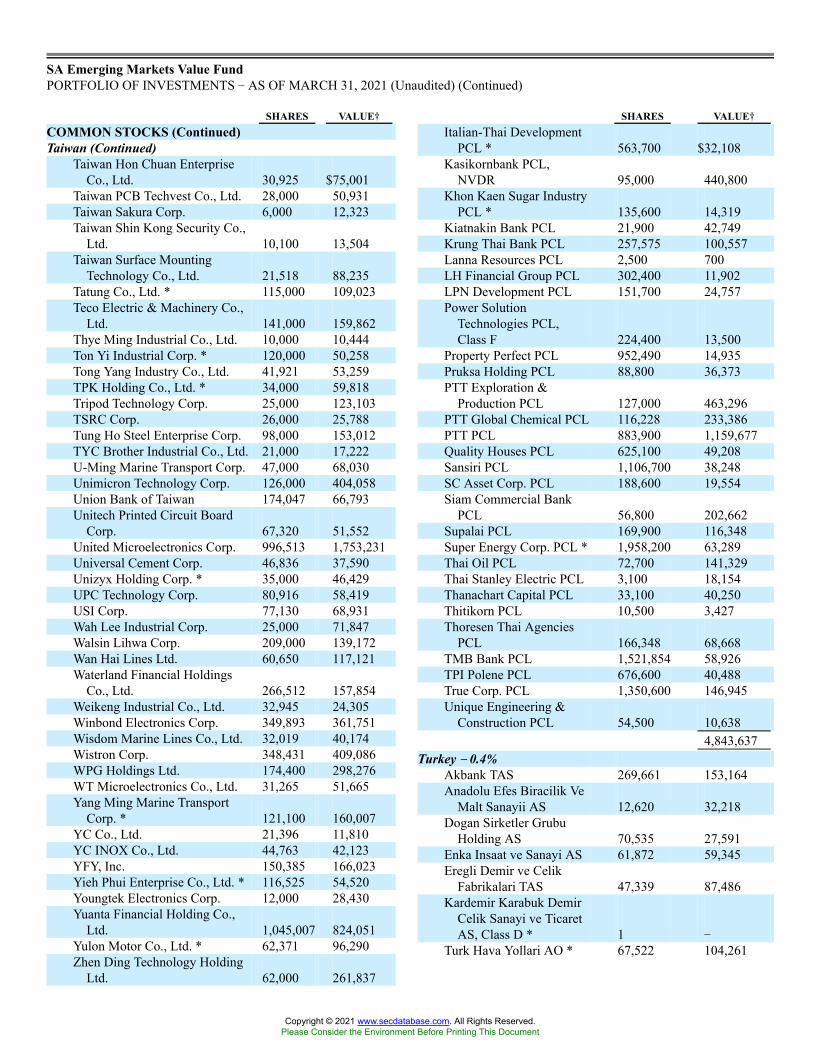
SA Emerging Markets Value FundPORTFOLIO OF INVESTMENTS � AS OF MARCH 31, 2021 (Unaudited) (Continued)
SHARES VALUE��COMMON STOCKS (Continued)Taiwan (Continued)
Taiwan Hon Chuan EnterpriseCo., Ltd. 30,925 $75,001
Taiwan PCB Techvest Co., Ltd. 28,000 50,931Taiwan Sakura Corp. 6,000 12,323Taiwan Shin Kong Security Co.,
Ltd. 10,100 13,504Taiwan Surface Mounting
Technology Co., Ltd. 21,518 88,235Tatung Co., Ltd. * 115,000 109,023Teco Electric & Machinery Co.,
Ltd. 141,000 159,862Thye Ming Industrial Co., Ltd. 10,000 10,444Ton Yi Industrial Corp. * 120,000 50,258Tong Yang Industry Co., Ltd. 41,921 53,259TPK Holding Co., Ltd. * 34,000 59,818Tripod Technology Corp. 25,000 123,103TSRC Corp. 26,000 25,788Tung Ho Steel Enterprise Corp. 98,000 153,012TYC Brother Industrial Co., Ltd. 21,000 17,222U-Ming Marine Transport Corp. 47,000 68,030Unimicron Technology Corp. 126,000 404,058Union Bank of Taiwan 174,047 66,793Unitech Printed Circuit Board
Corp. 67,320 51,552United Microelectronics Corp. 996,513 1,753,231Universal Cement Corp. 46,836 37,590Unizyx Holding Corp. * 35,000 46,429UPC Technology Corp. 80,916 58,419USI Corp. 77,130 68,931Wah Lee Industrial Corp. 25,000 71,847Walsin Lihwa Corp. 209,000 139,172Wan Hai Lines Ltd. 60,650 117,121Waterland Financial Holdings
Co., Ltd. 266,512 157,854Weikeng Industrial Co., Ltd. 32,945 24,305Winbond Electronics Corp. 349,893 361,751Wisdom Marine Lines Co., Ltd. 32,019 40,174Wistron Corp. 348,431 409,086WPG Holdings Ltd. 174,400 298,276WT Microelectronics Co., Ltd. 31,265 51,665Yang Ming Marine Transport
Corp. * 121,100 160,007YC Co., Ltd. 21,396 11,810YC INOX Co., Ltd. 44,763 42,123YFY, Inc. 150,385 166,023Yieh Phui Enterprise Co., Ltd. * 116,525 54,520Youngtek Electronics Corp. 12,000 28,430Yuanta Financial Holding Co.,
Ltd. 1,045,007 824,051Yulon Motor Co., Ltd. * 62,371 96,290Zhen Ding Technology Holding
Ltd. 62,000 261,837
SHARES VALUE��Italian-Thai Development
PCL * 563,700 $32,108Kasikornbank PCL,
NVDR 95,000 440,800Khon Kaen Sugar Industry
PCL * 135,600 14,319Kiatnakin Bank PCL 21,900 42,749Krung Thai Bank PCL 257,575 100,557Lanna Resources PCL 2,500 700LH Financial Group PCL 302,400 11,902LPN Development PCL 151,700 24,757Power Solution
Technologies PCL,Class F 224,400 13,500
Property Perfect PCL 952,490 14,935Pruksa Holding PCL 88,800 36,373PTT Exploration &
Production PCL 127,000 463,296PTT Global Chemical PCL 116,228 233,386PTT PCL 883,900 1,159,677Quality Houses PCL 625,100 49,208Sansiri PCL 1,106,700 38,248SC Asset Corp. PCL 188,600 19,554Siam Commercial Bank
PCL 56,800 202,662Supalai PCL 169,900 116,348Super Energy Corp. PCL * 1,958,200 63,289Thai Oil PCL 72,700 141,329Thai Stanley Electric PCL 3,100 18,154Thanachart Capital PCL 33,100 40,250Thitikorn PCL 10,500 3,427Thoresen Thai Agencies
PCL 166,348 68,668TMB Bank PCL 1,521,854 58,926TPI Polene PCL 676,600 40,488True Corp. PCL 1,350,600 146,945Unique Engineering &
Construction PCL 54,500 10,6384,843,637
Turkey �� 0.4%Akbank TAS 269,661 153,164Anadolu Efes Biracilik Ve
Malt Sanayii AS 12,620 32,218Dogan Sirketler Grubu
Holding AS 70,535 27,591Enka Insaat ve Sanayi AS 61,872 59,345Eregli Demir ve Celik
Fabrikalari TAS 47,339 87,486Kardemir Karabuk Demir
Celik Sanayi ve TicaretAS, Class D * 1 �
Turk Hava Yollari AO * 67,522 104,261
Copyright © 2021 www.secdatabase.com. All Rights Reserved.Please Consider the Environment Before Printing This Document

The accompanying notes are an integral part of these portfolio of investments.
Zinwell Corp. * 24,000 15,56135,742,339
Thailand �� 2.3%Ananda Development PCL 180,700 13,646AP Thailand PCL 242,500 63,244Asia Aviation PCL * 299,900 27,063Asia Plus Group Holdings PCL 122,900 10,383Bangchak Corp. PCL 112,900 93,030Bangkok Bank PCL 16,600 66,931Bangkok Bank PCL, NVDR 13,300 53,626Bangkok Insurance PCL 2,100 18,144Bangkok Land PCL 1,039,700 39,259Bangkok Life Assurance PCL * 57,200 47,590Banpu PCL 487,750 196,661Cal-Comp Electronics Thailand
PCL 264,550 20,487Charoen Pokphand Foods PCL 322,300 304,251Indorama Ventures PCL 145,200 206,765IRPC PCL 633,100 75,364
Turk Sise ve CamFabrikalari AS 51,778 45,650
Turkiye Garanti BankasiAS * 241,936 196,016
Turkiye Halk BankasiAS * 35,220 18,426
Turkiye Is Bankasi * 92,912 54,236Turkiye Sinai Kalkinma
Bankasi AS * 190,047 31,071Turkiye Vakiflar Bankasi
TAO * 80,351 33,669Yapi ve Kredi Bankasi
AS * 194,984 51,950895,083
United States �� 0.1%Textainer Group Holdings
Ltd. * 4,015 115,030TOTAL COMMON STOCKS
(Identified Cost $175,423,471) 210,662,305PREFERRED STOCKS �� 0.9%Brazil �� 0.9%
Banco ABC Brasil SA,4.910% 10,815 27,861
Banco Bradesco SA,2.640% 24,310 115,619
Banco do Estado do RioGrande do Sul SA, PFB, 5.280% 24,408 52,210
Cia Ferro Ligas da Bahia -Ferbasa, 2.620% 4,895 29,629
Marcopolo SA, 0.740% 2,983 1,484Petroleo Brasileiro SA,
3.090% 382,139 1,636,192Usinas Siderurgicas de Minas
Gerais SA, PF A, 0.230% 6,900 20,9621,883,957
Copyright © 2021 www.secdatabase.com. All Rights Reserved.Please Consider the Environment Before Printing This Document

SA Emerging Markets Value FundPORTFOLIO OF INVESTMENTS � AS OF MARCH 31, 2021 (Unaudited) (Continued)
SHARES VALUE��PREFERRED STOCKS (Continued)Colombia �� 0.0%
Grupo Argos SA, 3.870% 12,517 $32,474Grupo de Inversiones
Suramericana SA, 3.380% 8,046 41,61874,092
Philippines �� 0.0%Cebu Air, Inc., 6.000% 12,909 10,824TOTAL PREFERRED STOCKS
(Identified Cost $1,984,057) 1,968,873SHORT-TERM INVESTMENTS �� 2.1%Investment Company �� 0.2%
State Street Institutional U.S.Government MoneyMarket Fund 0.036% 333,933 333,933
Collateral For Securities On Loan �� 1.9%State Street Navigator
Securities LendingGovernment MoneyMarket Portfolio, 0.030% 4,174,377 4,174,377
TOTAL SHORT-TERM INVESTMENTS(Identified Cost $4,508,310) 4,508,310
Total Investments �� 101.5%(Identified Cost $181,915,838) 217,139,488
Liabilities, Less Cash and OtherAssets � (1.5%) (3,115,990 )
Net Assets �� 100.0% $214,023,498
� See Note 1* Non-income producing security± 144A Securities. Securities exempt from registration
under Rule 144A of the Securities Act of 1933. Thesesecurities may be resold in transactions exempt fromregistration to qualified institutional buyers. Thesesecurities have been deemed by the Fund to be liquid andat March 31, 2021 amounted to $3,896,705 or 1.82% ofthe net assets of the Fund.
@ A portion or all of the security was held on loan. As ofMarch 31, 2021, the fair value of the securities on loanwas $7,780,114.
<> Fair valued security. Security is valued using significantobservable inputs other than quoted prices as determinedpursuant to procedures approved by the Fund�s Board ofTrustees. See Note 1
§ Fair valued security. Security is valued using significantunobservable inputs as determined pursuant to proceduresapproved by the Fund�s Board of Trustees. See Note 1
Key to abbreviations:
ADR � American Depository ReceiptGDR � Global Depository ReceiptNVDR � Non-Voting Depository Receipt
Copyright © 2021 www.secdatabase.com. All Rights Reserved.Please Consider the Environment Before Printing This Document

The accompanying notes are an integral part of these portfolio of investments.
Copyright © 2021 www.secdatabase.com. All Rights Reserved.Please Consider the Environment Before Printing This Document

Ten largest industry holdings as of March 31, 2021(As a percentage of net assets) (Unaudited)
Industry PercentageCommercial Banks 19.1 %Oil, Gas & Consumable Fuels 9.0 %Metals & Mining 8.3 %Real Estate Management & Development 6.4 %Electronic Equipment, Instruments & Components 4.6 %Insurance 3.9 %Automobiles 3.7 %Computers & Peripherals 3.6 %Chemicals 2.7 %Semiconductors & Semiconductor Equipment 2.6 %
Country Weightings as of March 31, 2021(As a percentage of long-term investments) (Unaudited)
Country PercentageChina 36.2 %Taiwan 16.8 %Korea 15.3 %India 11.1 %Brazil 4.4 %South Africa 4.0 %Thailand 2.3 %Mexico 2.1 %Malaysia 1.7 %Other 6.1 %
100.0 %
Copyright © 2021 www.secdatabase.com. All Rights Reserved.Please Consider the Environment Before Printing This Document
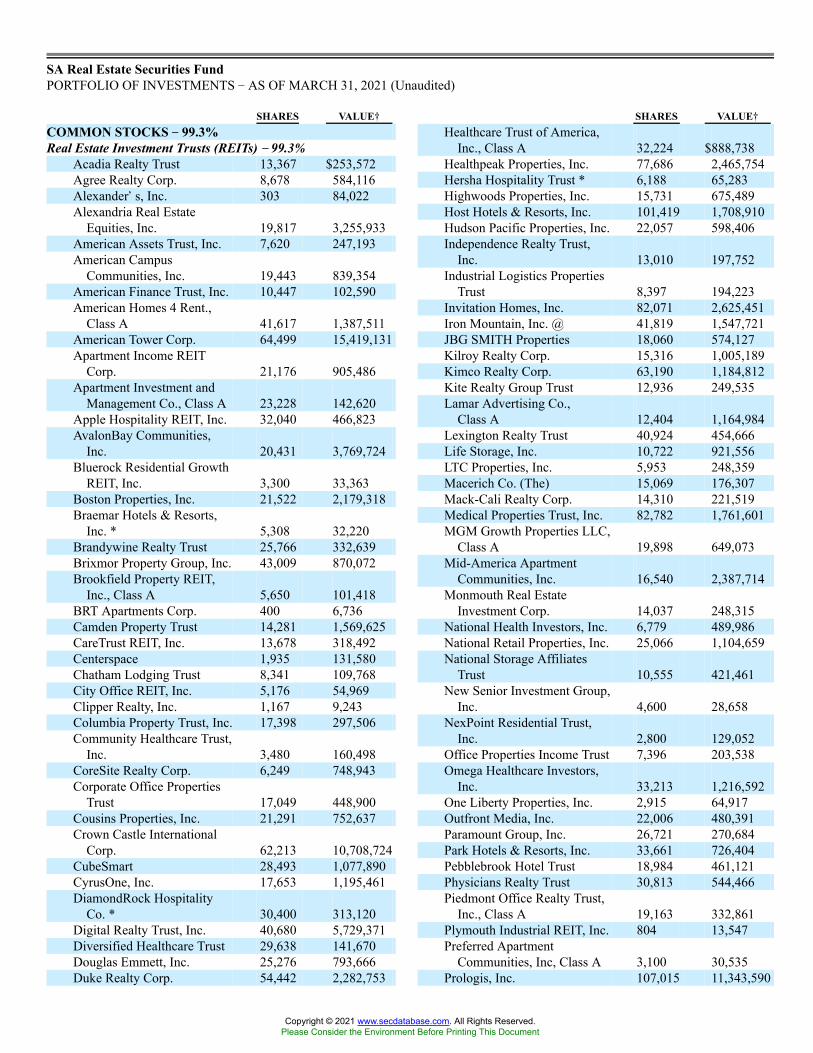
SA Real Estate Securities FundPORTFOLIO OF INVESTMENTS � AS OF MARCH 31, 2021 (Unaudited)
SHARES VALUE��COMMON STOCKS �� 99.3%Real Estate Investment Trusts (REITs) �� 99.3%
Acadia Realty Trust 13,367 $253,572Agree Realty Corp. 8,678 584,116Alexander�s, Inc. 303 84,022Alexandria Real Estate
Equities, Inc. 19,817 3,255,933American Assets Trust, Inc. 7,620 247,193American Campus
Communities, Inc. 19,443 839,354American Finance Trust, Inc. 10,447 102,590American Homes 4 Rent.,
Class A 41,617 1,387,511American Tower Corp. 64,499 15,419,131Apartment Income REIT
Corp. 21,176 905,486Apartment Investment and
Management Co., Class A 23,228 142,620Apple Hospitality REIT, Inc. 32,040 466,823AvalonBay Communities,
Inc. 20,431 3,769,724Bluerock Residential Growth
REIT, Inc. 3,300 33,363Boston Properties, Inc. 21,522 2,179,318Braemar Hotels & Resorts,
Inc. * 5,308 32,220Brandywine Realty Trust 25,766 332,639Brixmor Property Group, Inc. 43,009 870,072Brookfield Property REIT,
Inc., Class A 5,650 101,418BRT Apartments Corp. 400 6,736Camden Property Trust 14,281 1,569,625CareTrust REIT, Inc. 13,678 318,492Centerspace 1,935 131,580Chatham Lodging Trust 8,341 109,768City Office REIT, Inc. 5,176 54,969Clipper Realty, Inc. 1,167 9,243Columbia Property Trust, Inc. 17,398 297,506Community Healthcare Trust,
Inc. 3,480 160,498CoreSite Realty Corp. 6,249 748,943Corporate Office Properties
Trust 17,049 448,900Cousins Properties, Inc. 21,291 752,637Crown Castle International
Corp. 62,213 10,708,724CubeSmart 28,493 1,077,890CyrusOne, Inc. 17,653 1,195,461DiamondRock Hospitality
Co. * 30,400 313,120Digital Realty Trust, Inc. 40,680 5,729,371Diversified Healthcare Trust 29,638 141,670Douglas Emmett, Inc. 25,276 793,666Duke Realty Corp. 54,442 2,282,753
SHARES VALUE��Healthcare Trust of America,
Inc., Class A 32,224 $888,738Healthpeak Properties, Inc. 77,686 2,465,754Hersha Hospitality Trust * 6,188 65,283Highwoods Properties, Inc. 15,731 675,489Host Hotels & Resorts, Inc. 101,419 1,708,910Hudson Pacific Properties, Inc. 22,057 598,406Independence Realty Trust,
Inc. 13,010 197,752Industrial Logistics Properties
Trust 8,397 194,223Invitation Homes, Inc. 82,071 2,625,451Iron Mountain, Inc. @ 41,819 1,547,721JBG SMITH Properties 18,060 574,127Kilroy Realty Corp. 15,316 1,005,189Kimco Realty Corp. 63,190 1,184,812Kite Realty Group Trust 12,936 249,535Lamar Advertising Co.,
Class A 12,404 1,164,984Lexington Realty Trust 40,924 454,666Life Storage, Inc. 10,722 921,556LTC Properties, Inc. 5,953 248,359Macerich Co. (The) 15,069 176,307Mack-Cali Realty Corp. 14,310 221,519Medical Properties Trust, Inc. 82,782 1,761,601MGM Growth Properties LLC,
Class A 19,898 649,073Mid-America Apartment
Communities, Inc. 16,540 2,387,714Monmouth Real Estate
Investment Corp. 14,037 248,315National Health Investors, Inc. 6,779 489,986National Retail Properties, Inc. 25,066 1,104,659National Storage Affiliates
Trust 10,555 421,461New Senior Investment Group,
Inc. 4,600 28,658NexPoint Residential Trust,
Inc. 2,800 129,052Office Properties Income Trust 7,396 203,538Omega Healthcare Investors,
Inc. 33,213 1,216,592One Liberty Properties, Inc. 2,915 64,917Outfront Media, Inc. 22,006 480,391Paramount Group, Inc. 26,721 270,684Park Hotels & Resorts, Inc. 33,661 726,404Pebblebrook Hotel Trust 18,984 461,121Physicians Realty Trust 30,813 544,466Piedmont Office Realty Trust,
Inc., Class A 19,163 332,861Plymouth Industrial REIT, Inc. 804 13,547Preferred Apartment
Communities, Inc, Class A 3,100 30,535Prologis, Inc. 107,015 11,343,590
Copyright © 2021 www.secdatabase.com. All Rights Reserved.Please Consider the Environment Before Printing This Document

The accompanyinging notes are an integral part of these portfolio ofinvestments.
Easterly GovernmentProperties, Inc. 12,305 255,083
EastGroup Properties, Inc. 5,854 838,761Empire State Realty Trust,
Inc., Class A 21,950 244,304EPR Properties 11,329 527,818Equinix, Inc. 12,300 8,358,957Equity Commonwealth 11,006 305,967Equity LifeStyle Properties,
Inc. 25,178 1,602,328Equity Residential 53,976 3,866,301Esc War Ind § 9,141 2,446Essential Properties Realty
Trust, Inc. 14,323 326,994Essex Property Trust, Inc. 9,549 2,595,800Extra Space Storage, Inc. 19,212 2,546,551Federal Realty Investment
Trust 10,531 1,068,370First Industrial Realty Trust,
Inc. 18,210 833,836Four Corners Property Trust,
Inc. 10,646 291,700Franklin Street Properties
Corp. 17,095 93,168Gaming and Leisure
Properties, Inc. 31,595 1,340,576Getty Realty Corp. 5,638 159,668Gladstone Commercial Corp. 5,309 103,844Global Medical REIT, Inc. 5,127 67,215Global Net Lease, Inc. 12,591 227,393Global Self Storage, Inc. 2,195 10,448Healthcare Realty Trust, Inc. 20,674 626,836
PS Business Parks, Inc. 3,086 477,034Public Storage 22,712 5,604,413QTS Realty Trust, Inc.,
Class A @ 9,479 588,077Realty Income Corp. 54,086 3,434,461Regency Centers Corp. 24,483 1,388,431Retail Opportunity
Investments Corp. 18,201 288,850Retail Properties of America,
Inc., Class A 32,721 342,916Retail Value, Inc. 2,965 55,475Rexford Industrial Realty, Inc. 18,869 950,998RLJ Lodging Trust 25,067 388,037RPT Realty 12,520 142,853Ryman Hospitality Properties 7,916 613,569Sabra Healthcare REIT, Inc. 31,344 544,132Saul Centers, Inc. 2,195 88,041SBA Communications Corp. 15,879 4,407,216Seritage Growth Properties,
Class A * 3,790 69,547Service Properties Trust 20,700 245,502Simon Property Group, Inc. 47,861 5,445,146SITE Centers Corp. 20,663 280,190SL Green Realty Corp. @ 9,819 687,232Sotherly Hotels, Inc. 3,111 10,826Spirit Realty Capital, Inc. 16,707 710,048STAG Industrial, Inc. @ 21,962 738,143STORE Capital Corp. 36,497 1,222,649
Copyright © 2021 www.secdatabase.com. All Rights Reserved.Please Consider the Environment Before Printing This Document

SA Real Estate Securities FundPORTFOLIO OF INVESTMENTS � AS OF MARCH 31, 2021 (Unaudited) (Continued)
The accompanyinging notes are an integral part of these portfolio of investments.
SHARES VALUE��COMMON STOCKS (Continued)Real Estate Investment Trusts (REITs) (Continued)
Summit Hotel Properties, Inc. 16,205 $164,643Sun Communities, Inc. 15,957 2,394,188Sunstone Hotel Investors, Inc. 32,748 408,040Tanger Factory Outlet Centers,
Inc. 11,102 167,973Terreno Realty Corp. 10,373 599,248UDR, Inc. 43,143 1,892,252UMH Properties, Inc. 5,369 102,924Uniti Group, Inc. 29,183 321,888Universal Health Realty
Income Trust 1,815 123,021Urban Edge Properties 17,737 293,015Urstadt Biddle Properties, Inc. 1,000 13,700Urstadt Biddle Properties, Inc.,
Class A 4,732 78,788Ventas, Inc. 54,145 2,888,094VEREIT, Inc. 32,374 1,250,284Vornado Realty Trust 23,137 1,050,188Washington Real Estate
Investment Trust 12,497 276,184Weingarten Realty Investors 18,472 497,082Welltower, Inc. 60,350 4,322,870Whitestone REIT 6,078 58,957WP Carey, Inc. 25,357 1,794,261Xenia Hotels & Resorts, Inc. 17,324 337,818
171,990,171TOTAL COMMON STOCKS
(Identified Cost $96,713,713) 171,990,171SHORT-TERM INVESTMENTS �� 0.4%Investment Company �� 0.4%
State Street Institutional U.S.Government Money MarketFund 0.036% 764,548 764,548
TOTAL SHORT-TERM INVESTMENTS(Identified Cost $764,548) 764,548
Total Investments �� 99.7%(Identified Cost $97,478,261) 172,754,719
Cash and Other Assets, Less Liabilities �0.3% 469,989
Net Assets �� 100.0% $173,224,708
� See Note 1* Non-income producing security§ Fair valued security. Security is valued using significant
unobservable inputs as determined pursuant to proceduresapproved by the Fund�s Board of Trustees. See Note 1
@ A portion or all of the security was held on loan. As ofMarch 31, 2021, the fair value of the securities on loan was$3,500,167.
Copyright © 2021 www.secdatabase.com. All Rights Reserved.Please Consider the Environment Before Printing This Document

Key to abbreviations:
REIT � Real Estate Investment Trust
Copyright © 2021 www.secdatabase.com. All Rights Reserved.Please Consider the Environment Before Printing This Document

Portfolio Sectors as of March 31, 2021(As a percentage of long-term investments) (Unaudited)
Sector PercentageSpecialized REITs 27.6 %Residential REITs 14.9 %Diversified REITs 13.7 %Retail REITs 11.1 %Industrial REITs 10.5 %Health Care REITs 9.8 %Office REITs 8.4 %Hotels & Resorts REITs 4.0 %
100.0 %
Copyright © 2021 www.secdatabase.com. All Rights Reserved.Please Consider the Environment Before Printing This Document

SA Worldwide Moderate Growth FundPORTFOLIO OF INVESTMENTS � AS OF MARCH 31, 2021 (Unaudited)
The accompanyinging notes are an integral part of these portfolio of investments.
SHARES VALUE��MUTUAL FUNDS �� 100.0%Other �� 100.0%
SA Emerging Markets ValueFund � 286,541 $2,982,890
SA Global Fixed Income Fund � 426,066 4,005,019SA International Value Fund � 437,493 5,131,799SA Real Estate Securities Fund � 131,445 1,628,601SA U.S. Core Market Fund � 117,457 3,273,522SA U.S. Fixed Income Fund � 263,148 2,670,955SA U.S. Small Company Fund � 91,934 2,988,767SA U.S. Value Fund � 221,439 4,346,850
27,028,403TOTAL MUTUAL FUNDS
(Identified Cost $22,577,731) 27,028,403Total Investments �� 100.0%
(Identified Cost $22,577,731) 27,028,403Cash and Other Assets, Less Liabilities �
0.0% 3,390Net Assets �� 100.0% $27,031,793
� See Note 1� SA Worldwide Moderate Growth Fund invests substantially
all of its assets in the Select Class shares of the affiliatedUnderlying SA Funds
Copyright © 2021 www.secdatabase.com. All Rights Reserved.Please Consider the Environment Before Printing This Document

SA FUNDSNOTES TO PORTFOLIOS OF INVESTMENTS � March 31, 2021 (Unaudited)
Security Valuation �� Domestic equity securities listed on an exchange or stock market for which market quotations are readilyavailable are valued according to the official closing price, if any, or at their last reported sale price on the exchange or stock marketwhere the security is primarily traded, or in the absence of such reported prices, at the mean between the most recent quoted bid andasked prices. Domestic equity securities traded on the over-the-counter markets are valued at the mean between the most recent quotedbid and asked prices in the absence of an official closing price or last reported sale price.
Foreign equity securities traded on a foreign exchange or over-the-counter markets are generally valued at the most recent quoted bidprice in the absence of an official closing price or last reported sale price. Foreign securities quoted in foreign currencies are translatedinto U.S. dollars using prevailing exchange rates.
Fixed income investments are generally valued based on prices received from independent pricing services. In determining the value ofa fixed income investment, pricing services may use certain information with respect to transactions in such investments, quotationsfrom dealers, pricing matrixes, market transactions in comparable investments, various relationships observed in the market betweeninvestments and calculated yield measures.
Shares of registered open-end investment companies are valued at the investment company�s net asset value. Forward currencycontracts are valued based on prices received from independent pricing services. Securities for which market quotations are not readilyavailable, or for which available quotations appear not to accurately reflect the current value of an investment, are valued at fair value asdetermined in good faith by a pricing committee (the �Pricing Committee�) (or its designee) appointed by the Board of Trustees of theTrust (the �Board� or the �Trustees�) pursuant to procedures approved by the Board.
Certain Funds hold securities traded in foreign markets. Foreign securities are valued at the latest market price in the foreign market.However, if events occurring after the close of the foreign market (but before the close of regular trading on the New York StockExchange) are believed to materially affect the value of those securities, such securities may be valued at fair value as determined ingood faith by the Pricing Committee (or its designee). Any determinations of fair value made by the Pricing Committee (or its designee)are presented to the Board for ratification.
Valuation of securities by the DFA Portfolio and the Series in which it invests is discussed in the �Selected Financial Statements of DFAInvestment Dimensions Group Inc. � Notes to Financial Statements,� and �Selected Financial Statements of the DFA Investment TrustCompany � Notes to Financial Statements,� which are included elsewhere in this report.
Fair Value Measurement � The Board has adopted procedures to fair value securities and other assets of each Fund when marketprices are not readily available or do not accurately reflect their current market value. The Board has designated the responsibility forapplying these fair valuation methods to the Pricing Committee (or its designee). For example, a Fund may fair value an asset when it isdelisted or trading is halted or suspended; when it has not been traded for an extended period of time; when its primary pricing source isunavailable or other data calls the primary source�s reliability into question; or when its primary trading market is closed during regularU.S. market hours. Each Fund makes fair valuation determinations in accordance with the Trust�s Procedures for Valuing Securities andAssets, as amended. The Pricing Committee (or its designee) may consider various factors, including unobservable market inputs whenarriving at fair value. The Pricing Committee (or its designee) may use, but is not limited to, techniques such as review of related orcomparable assets or liabilities, related market activities, recent transactions, market multiples, book value, and other relevantinformation when determining fair value. The Pricing Committee regularly reviews these inputs and assumptions when reviewing fairvaluations of investments held by
Copyright © 2021 www.secdatabase.com. All Rights Reserved.Please Consider the Environment Before Printing This Document

SA FUNDSNOTES TO PORTFOLIOS OF INVESTMENTS � March 31, 2021 (Unaudited) (Continued)
the Funds. Fair value pricing involves subjective judgement and it is possible that the fair value determined for an asset is materiallydifferent than the value that could be realized upon the sale of that asset. The inputs or methodologies used for valuing securities are notnecessarily an indication of the risk associated with investing in those securities.
The Funds value their investments based on a three-level hierarchy of inputs that establishes classification of fair value measurementsfor disclosure purposes. If inputs used to measure a financial instrument fall within different levels of the hierarchy, the categorization isbased on the lowest level input that is significant to the valuation. The three-level hierarchy of inputs is summarized in the three broadlevels below.
Level 1 � unadjusted quoted prices in active markets for identical investments.
Level 2 � significant observable inputs other than quoted prices within Level 1 (including quoted prices for similar investments, interestrates, yield curves, foreign exchange rates, put or call provisions, credit risk and default rates for similar securities).
Level 3 � significant unobservable inputs to the extent that observable inputs are not available (including the Pricing Committee�s ownassumptions used to determine the fair value of investments).
The tables below provide a summary of the inputs as of March 31, 2021, in valuing each Fund�s investments:
Investments in Securities
Description
Unadjusted QuotedPrices in Active
Markets forIdentical
Investments(Level 1)
Significant OtherObservable
Inputs(Level 2)
SignificantUnobservable
Inputs(Level 3)
Total Balanceas of
March 31, 2021AssetsSA U.S. Fixed Income Fund
Yankee Corporate Bonds and Notes $ � $14,012,599 $ � $14,012,599Corporate Bonds and Notes � 212,424,141 � 212,424,141U.S. Government & Agency Obligations � 147,919,632 � 147,919,632Short-Term Investments 2,508,847 151,042,992 � 153,551,839Total Investments $ 2,508,847 $525,399,364 $ � $527,908,211
SA Global Fixed Income FundAssets
Bonds and Notes $ � $695,954,886 $ � $695,954,886Short-Term Investments 54,689,019 � � 54,689,019Other Financial Instruments
Forward Foreign CurrencyContracts � 10,798,929 � 10,798,929
Total Investments $ 54,689,019 $706,753,815 $ � $761,442,834Liabilities
Other Financial InstrumentsForward Foreign Currency
Contracts $ � $(1,907,931 ) $ � $(1,907,931 )
Copyright © 2021 www.secdatabase.com. All Rights Reserved.Please Consider the Environment Before Printing This Document

SA FUNDSNOTES TO PORTFOLIOS OF INVESTMENTS � March 31, 2021 (Unaudited) (Continued)
Investments in Securities
Description
Unadjusted QuotedPrices in Active
Markets forIdentical
Investments(Level 1)
Significant OtherObservable
Inputs(Level 2)
SignificantUnobservable
Inputs(Level 3)
Total Balanceas of
March 31, 2021SA U.S. Core Market FundAssets
Common Stocks $614,248,087 $ � $ � $614,248,087Preferred Stocks 10,978 � � 10,978Mutual Funds 25,227,861 � � 25,227,861Short-Term Investments 1,916,839 � � 1,916,839Total Investments $641,403,765 $ � $ $641,403,765
SA U.S. Value FundAssets
Common Stocks $596,068,405 $ � $ � $596,068,405Short-Term Investments 467,463 � � 467,463Total Investments $596,535,868 $ � $ � $596,535,868
SA U.S. Small Company FundAssets
Common Stocks $430,961,209 $ 73,243 $ 33,041 � $431,067,493Preferred Stocks 205,910 � � 205,910Rights and Warrants � � 640 � 640Short-Term Investments 2,652,636 � � 2,652,636Total Investments $433,819,755 $ 73,243 $ 33,681 $433,926,679
SA International Value FundAssets
Common Stocks $625,963,142 $ 453,093 $ 0 � $626,416,235Preferred Stocks 11,894,912 � � 11,894,912Rights and Warrants 47,445 � � 47,445Short-Term Investments 43,217,331 � � 43,217,331Total Investments $681,122,830 $ 453,093 $ 0 $681,575,923
SA International Small Company FundAssets
Mutual Funds $323,940,406 $ � $ � $323,940,406Total Investments $323,940,406 $ � $ � $323,940,406
SA Emerging Markets Value FundAssets
Common Stocks $210,469,997 $ 192,308 � $ 0 � $210,662,305Preferred Stocks 1,968,873 � � 1,968,873Short-Term Investments 4,508,310 � � 4,508,310Total Investments $216,947,180 $ 192,308 $ 0 $217,139,488
Copyright © 2021 www.secdatabase.com. All Rights Reserved.Please Consider the Environment Before Printing This Document

SA FUNDSNOTES TO PORTFOLIOS OF INVESTMENTS � March 31, 2021 (Unaudited) (Continued)
Investments in Securities
Description
Unadjusted QuotedPrices in Active
Markets forIdentical
Investments(Level 1)
Significant OtherObservable
Inputs(Level 2)
SignificantUnobservable
Inputs(Level 3)
Total Balanceas of
March 31, 2021SA Real Estate Securities FundAssets
Common Stocks $171,987,725 $ � $ 2,446 $171,990,171Short-Term Investments 764,548 � � 764,548Total Investments $172,752,273 $ � $ 2,446 $172,754,719
SA Worldwide Moderate Growth FundAssets
Mutual Funds $27,028,403 $ � $ � $27,028,403Total Investments $27,028,403 $ � $ � $27,028,403
� Contains securities with a market value of zero.
Transfers between investment valuation levels may occur as the markets fluctuate and/or the availability of data used in an investment�svaluation changes.
Securities Lending � The Funds may lend any of their securities held by State Street Bank and Trust Company (�State Street�) ascustodian to certain qualified broker-dealers, banks and other institutions, except those securities which Buckingham Strategic Partners,LLC (the �Adviser�) specifically identifies as not being available. Any gain or loss in the fair price of the securities loaned that mightoccur and any interest or dividends declared during the term of the loan would accrue to the account of the Funds. Risks of delay inrecovery of the securities or even loss of rights in the collateral may occur should the borrower of the securities fail financially. Risksmay also arise to the extent that the value of the collateral decreases below the value of the securities loaned.
Upon entering into a securities lending transaction, a Fund maintains cash or other securities as collateral in an amount equal to orexceeding 100% of the current fair value of the loaned securities with respect to securities of the U.S. government or its agencies orinstrumentalities, a loan of sovereign debt issued by non-U.S. governments, or a loan of non-U.S. corporate debt, 102% of the currentfair value of the loaned securities with respect to other U.S. securities and 105% of the current fair value of the loaned securities withrespect to foreign equity securities. The fair value of the loaned security is determined at the close of each business day of the Fund andany additional required collateral is delivered to the Fund, or excess collateral is returned by the Fund, on the next business day. Anycash received as collateral is generally invested by State Street, acting in its capacity as securities lending agent (the �Agent�), in theState Street Navigator Securities Lending Government Money Market Portfolio, which is a money market fund registered under the1940 Act. A portion of the income received on the collateral is rebated to the borrower of the securities, and the remainder is splitbetween the Agent and each respective Fund.
Copyright © 2021 www.secdatabase.com. All Rights Reserved.Please Consider the Environment Before Printing This Document

SA FUNDSNOTES TO PORTFOLIOS OF INVESTMENTS � March 31, 2021 (Unaudited) (Continued)
As of March 31, 2021, the following Funds had securities on loan, which were collateralized by short-term investments. The value ofsecurities on loan and the value of the related collateral were as follows:
Value ofSecurities
Value of CashCollateral
Value ofNon-CashCollateral*
TotalCollateral(IncludingCalculated
Mark)SA Global Fixed Income Fund $50,990,366 $51,523,480 $632,101 $52,155,581SA U.S Core Market Fund $2,595,901 $110,450 $2,556,673 $2,667,123SA U.S. Value Fund $121,478 $� $124,431 $124,431SA U.S. Small Company Fund $12,005,431 $2,652,636 $9,593,476 $12,246,112SA International Value Fund $77,123,355 $42,617,256 $38,001,995 $80,619,251SA Emerging Markets Value Fund $7,780,114 $4,174,377 $3,986,285 $8,160,662SA Real Estate Securities Fund $3,500,167 $� $3,603,386 $3,603,386
* The Funds cannot repledge or resell this collateral. The non-cash collateral is comprised of U.S. government securities.
The following table provides increased transparency about the types of collateral pledged for securities lending transactions that areaccounted for as secured borrowing. Non-cash collateral is not reflected in the table because the Funds cannot repledge or resell thiscollateral.
Remaining Contractual Maturity of the AgreementsAs of March 31, 2021
Securities Lending Transaction (1)
Overnightand
Continuous <30 daysBetween
30 & 90 days >90 days TotalSA Global Fixed Income Fund
Government Money Market $51,523,480 $ � $ � $ � $51,523,480Total Borrowings $51,523,480 $ �� $ �� $ �� $51,523,480Gross amount of recognized liabilities for securities lending
transactions $51,523,480SA U.S. Core Market Fund
Government Money Market $110,450 $ � $ � $ � $110,450Total Borrowings $110,450 $ �� $ �� $ �� $110,450Gross amount of recognized liabilities for securities lending
transactions $110,450SA U.S. Small Company Fund
Government Money Market $2,652,636 $ � $ � $ � $2,652,636Total Borrowings $2,652,636 $ �� $ �� $ �� $2,652,636Gross amount of recognized liabilities for securities lending
transactions $2,652,636SA International Value Fund
Government Money Market $42,617,256 $ � $ � $ � $42,617,256Total Borrowings $42,617,256 $ �� $ �� $ �� $42,617,256Gross amount of recognized liabilities for securities lending
transactions $42,617,256
Copyright © 2021 www.secdatabase.com. All Rights Reserved.Please Consider the Environment Before Printing This Document

SA FUNDSNOTES TO PORTFOLIOS OF INVESTMENTS � March 31, 2021 (Unaudited) (Continued)
Remaining Contractual Maturity of the AgreementsAs of March 31, 2021
Securities Lending Transaction (1)Overnight and
Continuous <30 daysBetween
30 & 90 days >90 days TotalSA Emerging Markets Value Fund
Government Money Market $4,174,377 $ � $ � $ � $4,174,377Total Borrowings $4,174,377 $ �� $ �� $ �� $4,174,377Gross amount of recognized liabilities for securities lending transactions $4,174,377
(1) Amounts represent the payable for cash collateral received on securities on loan. This will generally be in the �Overnight andContinuous� column as the securities are typically callable on demand. The payable will be allocated into categories of securitiesbased on the market value of the securities on loan.
Foreign Currency Translation and Foreign Investments �� The books and records of the Funds are maintained in U.S. dollars. Thevalue of securities, currencies and other assets and liabilities denominated in currencies other than U.S. dollars are translated into U.S.dollars based upon foreign currency exchange rates prevailing at the end of the period. Purchases and sales of investment securities aretranslated at contractual currency exchange rates established at the time of the trade. Income and expenses are translated at prevailingexchange rates on the respective dates of such transactions.
The results of operations resulting from changes in foreign exchange rates on investments are not reported separately from fluctuationsarising from changes in market prices of securities held. All such fluctuations are included with net realized and unrealized gain or losson investments. Reported net realized foreign exchange gains or losses arise from sales of foreign currencies, currency gains or lossesrealized between the trade and settlement dates on securities transactions, and the difference between the amounts of dividends, interest,and foreign withholding taxes recorded on the Funds� books and the U.S. dollar equivalent of the amounts actually received or paid.Net unrealized foreign exchange gains and losses arise from changes in the fair values of assets and liabilities, other than investments insecurities at period-end, resulting from changes in exchange rates.
Investing in foreign securities may involve certain sovereign and other risks, in addition to the credit and market risks normallyassociated with domestic securities. Investments in foreign securities are subject to fluctuations in currency exchange rates, which maynegatively affect the value of a Fund�s portfolio. Additional risks may include exposure to less developed or less efficient tradingmarkets; social, political or economic instability; nationalization of assets, currency controls or redenomination; changes in tax policy;high transaction costs; settlement, custodial or other operation risks; and less stringent accounting, auditing, financial reporting, andlegal standards and practices. As a result, foreign securities can fluctuate more widely in price, and may also be less liquid, thancomparable U.S. securities.
Forward Foreign Currency Exchange Contracts �� Each Fund that may invest in foreign securities may enter into forward foreigncurrency exchange contracts. A forward foreign currency exchange contract is an agreement between two parties to buy or sell currencyat a set price on a future date. By entering into a forward contract for the purchase or sale for a fixed amount of dollars of the amount offoreign currency involved in an underlying security transaction, a Fund may be able to protect itself against a possible loss resultingfrom an adverse change in the relationship between the U.S. dollar and the applicable foreign currency during the period between thedate the security is purchased or sold and the date on which payment is made or received.
Copyright © 2021 www.secdatabase.com. All Rights Reserved.Please Consider the Environment Before Printing This Document

SA FUNDSNOTES TO PORTFOLIOS OF INVESTMENTS � March 31, 2021 (Unaudited) (Continued)
The market value of a contract will fluctuate with changes in currency exchange rates. The contract is marked-to-market daily using the4:00 PM Eastern Time pricing for the forward currency exchange rate, and the change in market value is recorded as unrealizedappreciation (depreciation) on foreign currency and forward currency transactions in a fund�s statement of assets and liabilities. Whenthe contract is closed, a realized gain or loss is recognized, which is equal to the difference between the value of the contract at the timeit was opened and the value at the time it was closed, and recorded as realized gain (loss) on foreign currency and forward currencytransactions in a fund�s statement of operations.
Forward foreign currency exchange contracts may involve risks from the potential inability of counterparties to meet the terms of theircontracts and from unanticipated movements in the value of a foreign currency relative to the U.S. dollar
Federal Income Tax � At March 31, 2021, the aggregate cost of investment securities, aggregate gross unrealized appreciation(depreciation) and net unrealized appreciation (depreciation) for all securities as computed on a federal income tax basis for each Fundwere as follows:
CostUnrealized
AppreciationUnrealized
Depreciation
Net UnrealizedAppreciation
(Depreciation)SA U.S. Fixed Income Fund $526,772,884 $1,159,869 $(24,542 ) $1,135,327SA Global Fixed Income Fund 729,752,960 22,448,543 (1,557,598 ) 20,890,945SA U.S. Core Market Fund 128,067,694 513,489,977 (153,906 ) 513,336,071SA U.S. Value Fund 341,511,554 271,004,701 (15,980,387) 255,024,314SA U.S. Small Company Fund 232,319,770 216,402,788 (14,795,879) 201,606,909SA International Value Fund 574,734,736 147,653,206 (40,812,019) 106,841,187SA International Small Company Fund 166,236,425 157,703,981 � 157,703,981SA Emerging Markets Value Fund 181,915,838 54,737,267 (19,513,617) 35,223,650SA Real Estate Securities Fund 97,478,261 79,540,433 (4,263,975 ) 75,276,458SA Worldwide Moderate Growth 22,577,731 4,501,645 (50,973 ) 4,450,672
Copyright © 2021 www.secdatabase.com. All Rights Reserved.Please Consider the Environment Before Printing This Document

DFA INVESTMENT DIMENSIONS GROUP INC.INTERNATIONAL SMALL COMPANY PORTFOLIO
SCHEDULE OF INVESTMENTS
March 31, 2021
(Unaudited)
Value��AFFILIATED INVESTMENT COMPANIES � (99.3%)Investment in The Continental Small Company Series of
The DFA Investment Trust Company $5,108,748,111Investment in The Japanese Small Company Series of
The DFA Investment Trust Company 2,649,907,196Investment in The United Kingdom Small Company Series of
The DFA Investment Trust Company 1,940,026,126Investment in The Asia Pacific Small Company Series of
The DFA Investment Trust Company 1,423,080,172Investment in The Canadian Small Company Series of
The DFA Investment Trust Company 1,306,422,004TOTAL INVESTMENTS IN AFFILIATED INVESTMENT COMPANIES $12,428,183,609
SharesTEMPORARY CASH INVESTMENTS � (0.7%)State Street Institutional U.S. Government Money Market Fund, Premier Class, 0.036%
(Cost $93,557,635) 93,557,635 93,557,635TOTAL INVESTMENTS � (100.0%)
(Cost $9,623,891,835)^^ $12,521,741,244
As of March 31, 2021, International Small Company Portfolio had entered into the following outstanding futures contracts:
DescriptionNumber ofContracts
ExpirationDate
NotionalValue
MarketValue
UnrealizedAppreciation
(Depreciation)Long Position Contracts:S&P 500® Emini Index
35006/18/21 $68,806,136 $69,429,500 $ 623,364
Total Futures Contracts $68,806,136 $69,429,500 $ 623,364
Summary of the Portfolio�s investments as of March 31, 2019, based on their valuation inputs, is as follows (See Security ValuationNote):
Investments in Securities (Market Value)Level 1 Level 2 Level 3 Total
Affiliated Investment Companies $12,428,183,609 � � $12,428,183,609Temporary Cash Investments 93,557,635 � � 93,557,635Futures Contracts** 623,364 � � 623,364TOTAL $12,522,364,608 � � $12,522,364,608
** Valued at the unrealized appreciation/(depreciation) on the investment.
Copyright © 2021 www.secdatabase.com. All Rights Reserved.Please Consider the Environment Before Printing This Document

ORGANIZATION
DFA Investment Dimensions Group Inc. (the �Fund�) is an open-end management investment company registered under the InvestmentCompany Act of 1940, whose shares are generally offered to institutional investors, retirement plans and clients of registered investmentadvisors. At March 31, 2021, the Fund consisted of one hundred and six operational portfolios, of which one, International SmallCompany Portfolio (the �Portfolio�) is included in this document. The Fund�s investment advisor is Dimensional Fund Advisors LP(the �Advisor�). The Portfolio is a �Fund-of-Funds�, which generally allocates its assets among the five series (the �UnderlyingFunds�) of The DFA Investment Trust Company, which is also advised by the Advisor. The Schedules of Investments for theUnderlying Funds have been included in this document.
SECURITY VALUATION
The International Small Company Portfolio invests in the five Underlying Funds indicated on its Schedule of Investments.
The Portfolio uses a fair value hierarchy, which prioritizes the inputs to valuation techniques used to measure fair value into three broadlevels described below:
� Level 1 - inputs are quoted prices in active markets for identical securities (including equity securities, open-end investmentcompanies and futures contracts)
� Level 2 - other significant observable inputs (including quoted prices for similar securities, interest rates, prepaymentspeeds, credit risk, etc.)
� Level 3 - significant unobservable inputs (including the Portfolio�s own assumptions in determining the fair value ofinvestments)
Shares held by the International Small Company Portfolio in other investment companies (such as the Underlying Funds) are valued attheir respective daily net asset values as reported by their administrator. The Portfolio�s investments in the Underlying Funds reflect itsproportionate interest in the net assets of such corresponding Underlying Fund. These valuations are classified as Level 1 in thehierarchy.
Futures contracts held by the Portfolio are valued using the settlement price established each day on the exchange on which they aretraded. These valuations are generally categorized as Level 1 in the hierarchy.
A summary of the inputs used to value the Portfolio�s investments by each major security type, industry and/or country is disclosedpreviously in this note. A valuation hierarchy table has been included at the end of the Schedule of Investments for the Portfolio. Themethodology or inputs used for valuing securities are not necessarily an indication of the risk associated with investing in thosesecurities.
DERIVATIVE FINANCIAL INSTRUMENTS
Summarized below are the specific types of derivative instruments used by the Portfolio.
1. FUTURES CONTRACTS: The Portfolio may purchase or sell futures contracts and options on futures contracts for equity securitiesand indices to adjust market exposure based on actual or expected cash inflows to or outflows from the Portfolio. The Portfolio,however, does not intend to sell futures contracts to establish short positions in individual securities. Upon entering into a futurescontract, the Portfolio deposits cash or pledges U.S. Government securities to a broker in an amount equal to the minimum �initialmargin� requirements of the exchange on which the contract is traded. Subsequent payments are received from or paid to the brokereach day, based on the daily fluctuation in the market value of the contract. These receipts or payments are known as �variation margin�and are recorded daily by the Portfolio as unrealized gains or losses until the contracts are closed. When the contracts are closed, thePortfolio records a realized gain or loss, which is presented in the Statement of Operations as a net realized gain or loss on futures, equalto the difference between the value of the contract at the time it was opened and the value at the time it was closed.
Risks may arise upon entrance into futures contracts from potential imperfect price correlations between the futures contracts and theunderlying securities, from the possibility of an illiquid secondary market for these instruments and from the possibility that thePortfolio could lose more than the initial margin requirements. The Portfolio entering into stock index futures is subject to equity pricerisk from those futures contracts. Counterparty credit risk related to exchange-traded futures is minimal because the exchange�sclearinghouse, as counterparty to all exchange-traded futures, guarantees the futures against default.
Copyright © 2021 www.secdatabase.com. All Rights Reserved.Please Consider the Environment Before Printing This Document

FEDERAL TAX COST
At March 31, 2021, the total cost of securities for federal income tax purposes was $9,785,925.
RECENTLY ISSUED ACCOUNTING STANDARDS
In March 2017, the Financial Accounting Standards Board (FASB) issued Accounting Standards Update (ASU) 2017-08 which changesthe amortization period for a callable debt security from the maturity date to the earliest call date. The ASU is effective for annualperiods beginning after December 15, 2018, and interim periods within those annual periods. The Fund�s adoption of ASU 2017-08disclosure requirements are reflected within these financial statements prepared as of October 31, 2020 and management has concludedthat the change in accounting principle does not materially impact the financial statement amounts.
In August 2018, the FASB issued ASU No. 2018-13, �Fair Value Measurements� (�ASU 2018-13�). This update makes certainremovals from, changes to and additions to existing disclosure requirements for fair value measurement. ASU 2018-13 does not changefair value measurements already required or permitted by existing standards. ASU 2018-13 is effective for financial statements issuedfor fiscal years beginning after December 15, 2019, and interim periods within those fiscal years. The Portfolio�s early adoption of allof the ASU 2018-13 disclosure requirements are reflected within these financial statements prepared as of October 31, 2020.
On July 27, 2017, the head of the United Kingdom�s Financial Conduct Authority announced the intention to phase out the use ofLondon Interbank Offered Rate (�LIBOR�) by the end of 2021. In the interim, there remains uncertainty regarding the impact thetransition to replacement rates may have on the value of LIBOR-based investments. In March 2020, the FASB issued ASU 2020-04which provides optional guidance to ease the potential accounting burden associated with transitioning away from the LIBOR and otherreference rates that are expected to be discontinued. The ASU is effective immediately upon release of the update on March 12, 2020through December 31, 2022. At this time, management is evaluating implications of these changes on the financial statements.
CORONAVIRUS (COVID-19) PANDEMIC
The continued worldwide spread of novel coronavirus (COVID-19) and its impact on international business operations, supply chains,travel, commodity prices, consumer confidence and business forecasts, and the associated impact on domestic and international equitymarkets and fixed income yields, has caused uncertainty for the global economy and financial markets. If market expectations regardingthe impact of COVID-19 worsen, or if expected returns change because investors demand higher returns to invest in these uncertaintimes, there may be a detrimental impact on returns in the near term.
SUBSEQUENT EVENT EVALUATIONS
On November 12, 2020, President Trump issued an Executive Order titled �Addressing the Threat from Securities Investments thatFinance Communist Chinese Military Companies� (the �Order�). The Order prohibits U.S. entities from participating in certain types oftransactions involving securities of Chinese companies known to be associated with the Chinese military. Management is currentlyevaluating the Order�s effect on the Portfolio.
Copyright © 2021 www.secdatabase.com. All Rights Reserved.Please Consider the Environment Before Printing This Document

THE JAPANESE SMALL COMPANY SERIES
SUMMARY SCHEDULE OF PORTFOLIO HOLDINGS
March 31, 2021
(Unaudited)
Shares Value»COMMON STOCKS � (93.3%)COMMUNICATION SERVICES � (2.7%)# Aeria, Inc. 15,800 $89,827# Akatsuki, Inc. 30,200 1,225,390* AlphaPolis Co., Ltd. 10,700 317,989
Amuse, Inc. 11,000 253,406# AOI TYO Holdings, Inc. 139,131 890,076
ARTERIA Networks Corp. 14,500 215,522Asahi Broadcasting Group Holdings Corp. 54,000 355,005
# Asahi Net, Inc. 102,300 748,620Ateam, Inc. 77,600 1,206,038
* Atrae, Inc. 66,000 1,024,722# Avex, Inc. 239,800 2,967,274#* Broadmedia Corp. 55,200 44,467
Broccoli Co., Ltd. 2,900 39,546Carta Holdings, Inc. 8,700 120,830
# Ceres, Inc. 24,900 1,056,956# Daiichikosho Co., Ltd. 65,400 2,540,797
DeNA Co., Ltd. 115,900 2,267,084Digital Holdings, Inc. 4,900 88,969Dip Corp. 177,300 4,664,528
* Drecom Co., Ltd. 22,600 161,987* eBook Initiative Japan Co., Ltd. 14,200 346,233# Extreme Co., Ltd. 17,300 227,014# Faith, Inc. 56,010 406,720
FAN Communications, Inc. 300,200 1,119,806# Fibergate, Inc. 19,700 331,176
Freebit Co., Ltd. 55,300 501,549#* GA Technologies Co., Ltd. 2,400 48,065# Gakken Holdings Co., Ltd. 121,800 1,607,042
Gree, Inc. 730,600 3,699,159Gumi, Inc. 32,700 269,355GungHo Online Entertainment, Inc. 122,800 2,432,870Imagica Group, Inc. 105,100 513,257Imagineer Co., Ltd. 1,600 18,144Intage Holdings, Inc. 224,700 2,645,459Internet Initiative Japan, Inc. 252,800 5,947,858
#* IPS, Inc. 10,900 281,468ITmedia, Inc. 30,000 507,257
* Itokuro, Inc. 52,400 579,183# J-Stream, Inc. 9,500 411,619
Kadokawa Corp. 88,516 3,445,257* KLab, Inc. 141,900 1,036,943
LIFULL Co., Ltd. 327,500 1,220,491Macromill, Inc. 239,900 2,082,906MarkLines Co., Ltd. 67,000 1,517,348Marvelous, Inc. 197,300 1,537,428Members Co., Ltd. 45,500 1,030,097Mixi, Inc. 229,900 5,764,173
#* Mobile Factory, Inc. 10,500 144,204
Copyright © 2021 www.secdatabase.com. All Rights Reserved.Please Consider the Environment Before Printing This Document

# MTI, Ltd. 131,000 959,241* Mynet, Inc. 3,500 27,180
Okinawa Cellular Telephone Co. 80,100 3,679,797# Orchestra Holdings, Inc. 3,000 84,571#* PR Times, Inc. 11,900 382,197
Proto Corp. 155,200 1,646,543
Copyright © 2021 www.secdatabase.com. All Rights Reserved.Please Consider the Environment Before Printing This Document
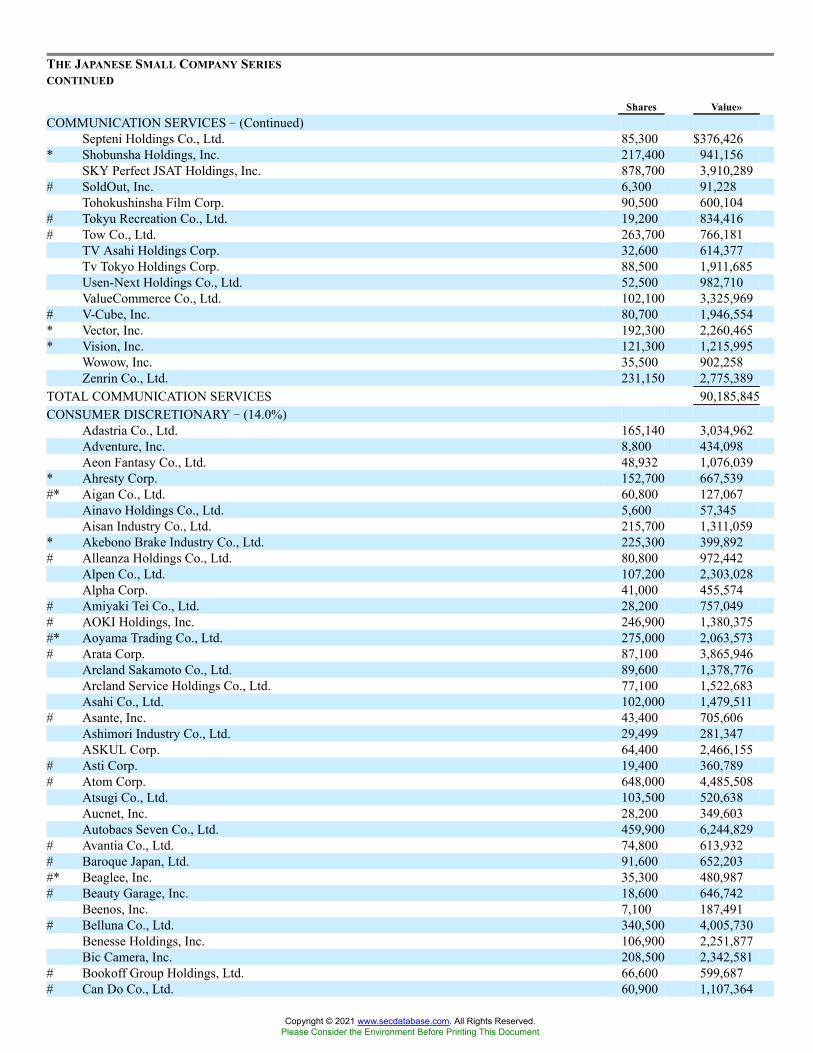
THE JAPANESE SMALL COMPANY SERIESCONTINUED
Shares Value»COMMUNICATION SERVICES � (Continued)
Septeni Holdings Co., Ltd. 85,300 $376,426* Shobunsha Holdings, Inc. 217,400 941,156
SKY Perfect JSAT Holdings, Inc. 878,700 3,910,289# SoldOut, Inc. 6,300 91,228
Tohokushinsha Film Corp. 90,500 600,104# Tokyu Recreation Co., Ltd. 19,200 834,416# Tow Co., Ltd. 263,700 766,181
TV Asahi Holdings Corp. 32,600 614,377Tv Tokyo Holdings Corp. 88,500 1,911,685Usen-Next Holdings Co., Ltd. 52,500 982,710ValueCommerce Co., Ltd. 102,100 3,325,969
# V-Cube, Inc. 80,700 1,946,554* Vector, Inc. 192,300 2,260,465* Vision, Inc. 121,300 1,215,995
Wowow, Inc. 35,500 902,258Zenrin Co., Ltd. 231,150 2,775,389
TOTAL COMMUNICATION SERVICES 90,185,845CONSUMER DISCRETIONARY � (14.0%)
Adastria Co., Ltd. 165,140 3,034,962Adventure, Inc. 8,800 434,098Aeon Fantasy Co., Ltd. 48,932 1,076,039
* Ahresty Corp. 152,700 667,539#* Aigan Co., Ltd. 60,800 127,067
Ainavo Holdings Co., Ltd. 5,600 57,345Aisan Industry Co., Ltd. 215,700 1,311,059
* Akebono Brake Industry Co., Ltd. 225,300 399,892# Alleanza Holdings Co., Ltd. 80,800 972,442
Alpen Co., Ltd. 107,200 2,303,028Alpha Corp. 41,000 455,574
# Amiyaki Tei Co., Ltd. 28,200 757,049# AOKI Holdings, Inc. 246,900 1,380,375#* Aoyama Trading Co., Ltd. 275,000 2,063,573# Arata Corp. 87,100 3,865,946
Arcland Sakamoto Co., Ltd. 89,600 1,378,776Arcland Service Holdings Co., Ltd. 77,100 1,522,683Asahi Co., Ltd. 102,000 1,479,511
# Asante, Inc. 43,400 705,606Ashimori Industry Co., Ltd. 29,499 281,347ASKUL Corp. 64,400 2,466,155
# Asti Corp. 19,400 360,789# Atom Corp. 648,000 4,485,508
Atsugi Co., Ltd. 103,500 520,638Aucnet, Inc. 28,200 349,603Autobacs Seven Co., Ltd. 459,900 6,244,829
# Avantia Co., Ltd. 74,800 613,932# Baroque Japan, Ltd. 91,600 652,203#* Beaglee, Inc. 35,300 480,987# Beauty Garage, Inc. 18,600 646,742
Beenos, Inc. 7,100 187,491# Belluna Co., Ltd. 340,500 4,005,730
Benesse Holdings, Inc. 106,900 2,251,877Bic Camera, Inc. 208,500 2,342,581
# Bookoff Group Holdings, Ltd. 66,600 599,687# Can Do Co., Ltd. 60,900 1,107,364
Copyright © 2021 www.secdatabase.com. All Rights Reserved.Please Consider the Environment Before Printing This Document

Central Automotive Products, Ltd. 81,900 2,058,273# Central Sports Co., Ltd. 45,100 1,021,226# Chieru Co., Ltd. 1,900 27,390
Chiyoda Co., Ltd. 113,500 1,018,279
Copyright © 2021 www.secdatabase.com. All Rights Reserved.Please Consider the Environment Before Printing This Document
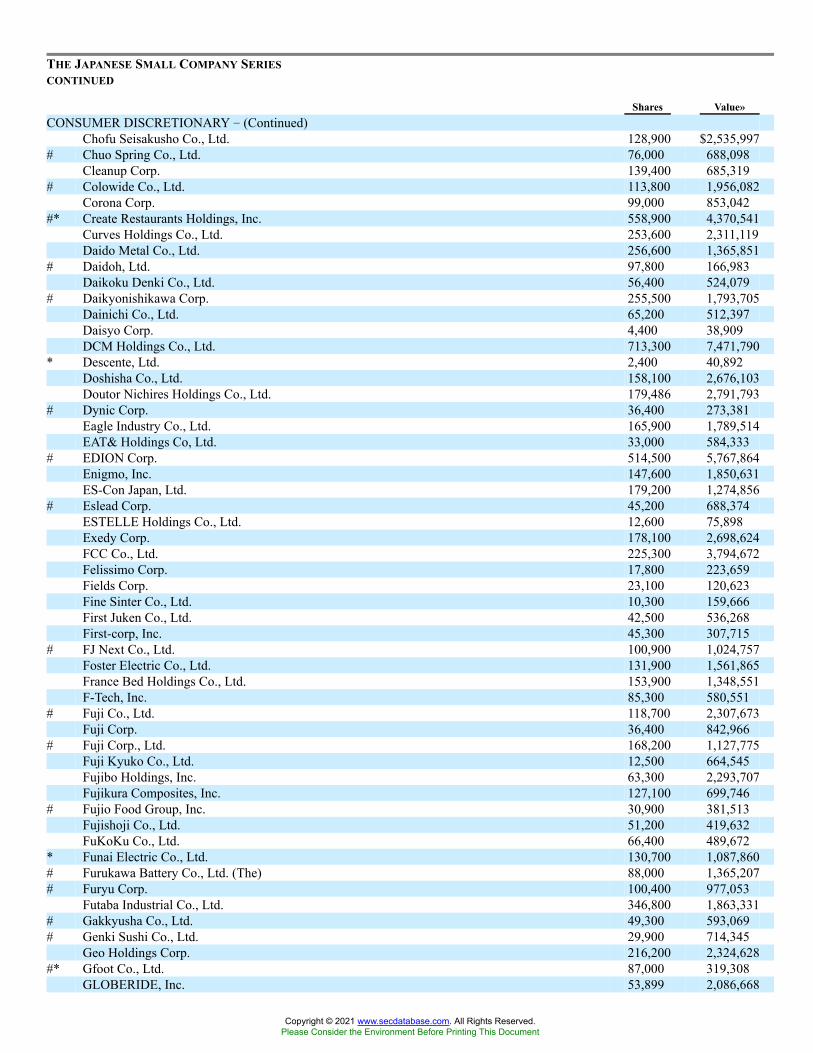
THE JAPANESE SMALL COMPANY SERIESCONTINUED
Shares Value»CONSUMER DISCRETIONARY � (Continued)
Chofu Seisakusho Co., Ltd. 128,900 $2,535,997# Chuo Spring Co., Ltd. 76,000 688,098
Cleanup Corp. 139,400 685,319# Colowide Co., Ltd. 113,800 1,956,082
Corona Corp. 99,000 853,042#* Create Restaurants Holdings, Inc. 558,900 4,370,541
Curves Holdings Co., Ltd. 253,600 2,311,119Daido Metal Co., Ltd. 256,600 1,365,851
# Daidoh, Ltd. 97,800 166,983Daikoku Denki Co., Ltd. 56,400 524,079
# Daikyonishikawa Corp. 255,500 1,793,705Dainichi Co., Ltd. 65,200 512,397Daisyo Corp. 4,400 38,909DCM Holdings Co., Ltd. 713,300 7,471,790
* Descente, Ltd. 2,400 40,892Doshisha Co., Ltd. 158,100 2,676,103Doutor Nichires Holdings Co., Ltd. 179,486 2,791,793
# Dynic Corp. 36,400 273,381Eagle Industry Co., Ltd. 165,900 1,789,514EAT& Holdings Co, Ltd. 33,000 584,333
# EDION Corp. 514,500 5,767,864Enigmo, Inc. 147,600 1,850,631ES-Con Japan, Ltd. 179,200 1,274,856
# Eslead Corp. 45,200 688,374ESTELLE Holdings Co., Ltd. 12,600 75,898Exedy Corp. 178,100 2,698,624FCC Co., Ltd. 225,300 3,794,672Felissimo Corp. 17,800 223,659Fields Corp. 23,100 120,623Fine Sinter Co., Ltd. 10,300 159,666First Juken Co., Ltd. 42,500 536,268First-corp, Inc. 45,300 307,715
# FJ Next Co., Ltd. 100,900 1,024,757Foster Electric Co., Ltd. 131,900 1,561,865France Bed Holdings Co., Ltd. 153,900 1,348,551F-Tech, Inc. 85,300 580,551
# Fuji Co., Ltd. 118,700 2,307,673Fuji Corp. 36,400 842,966
# Fuji Corp., Ltd. 168,200 1,127,775Fuji Kyuko Co., Ltd. 12,500 664,545Fujibo Holdings, Inc. 63,300 2,293,707Fujikura Composites, Inc. 127,100 699,746
# Fujio Food Group, Inc. 30,900 381,513Fujishoji Co., Ltd. 51,200 419,632FuKoKu Co., Ltd. 66,400 489,672
* Funai Electric Co., Ltd. 130,700 1,087,860# Furukawa Battery Co., Ltd. (The) 88,000 1,365,207# Furyu Corp. 100,400 977,053
Futaba Industrial Co., Ltd. 346,800 1,863,331# Gakkyusha Co., Ltd. 49,300 593,069# Genki Sushi Co., Ltd. 29,900 714,345
Geo Holdings Corp. 216,200 2,324,628#* Gfoot Co., Ltd. 87,000 319,308
GLOBERIDE, Inc. 53,899 2,086,668
Copyright © 2021 www.secdatabase.com. All Rights Reserved.Please Consider the Environment Before Printing This Document

#* Gokurakuyu Holdings Co., Ltd. 47,400 147,802Golf Digest Online, Inc. 61,600 721,769
# GSI Creos Corp. 63,184 729,763G-Tekt Corp. 147,400 2,009,150
# Gunze, Ltd. 103,400 3,885,326
Copyright © 2021 www.secdatabase.com. All Rights Reserved.Please Consider the Environment Before Printing This Document

THE JAPANESE SMALL COMPANY SERIESCONTINUED
Shares Value»CONSUMER DISCRETIONARY � (Continued)
H2O Retailing Corp. 402,400 $3,342,206Hagihara Industries, Inc. 79,000 1,042,262
* Hakuyosha Co., Ltd. 12,900 277,664# Hamee Corp. 36,100 535,165# Handsman Co., Ltd. 39,600 615,093
Happinet Corp. 100,700 1,399,011# Harada Industry Co., Ltd. 23,300 190,839
Hard Off Corp. Co., Ltd. 58,800 442,957# Haruyama Holdings, Inc. 54,800 337,989
Heian Ceremony Service Co., Ltd. 8,300 66,165Heiwa Corp. 77,200 1,261,040Hiday Hidaka Corp. 14,797 240,546HI-LEX Corp. 115,600 1,832,268
# Himaraya Co., Ltd. 32,100 287,879Hinokiya Group Co., Ltd. 700 15,929
#* Hiramatsu, Inc. 104,300 148,177* HIS Co., Ltd. 105,900 2,128,234
H-One Co., Ltd. 136,000 986,859Honeys Holdings Co., Ltd. 114,040 1,117,590Hoosiers Holdings 266,100 1,774,882
#* Hotland Co., Ltd. 41,100 478,869House Do Co., Ltd. 28,700 301,520
* I K K, Inc. 4,200 26,778IBJ, Inc. 86,800 748,869Ichibanya Co., Ltd. 96,058 4,189,112Ichikoh Industries, Ltd. 162,000 1,116,187IDOM, Inc. 399,100 2,610,228IJTT Co., Ltd. 143,880 799,325
# Imasen Electric Industrial 30,100 213,082Izuhakone Railway Co., Ltd. 300 0J Front Retailing Co., Ltd. 17,600 167,890
# Janome Sewing Machine Co., Ltd. 104,900 792,868# Japan Best Rescue System Co., Ltd. 114,400 876,067
Japan Wool Textile Co., Ltd. (The) 350,400 3,266,233# JFLA Holdings, Inc. 106,300 350,787# JINS Holdings, Inc. 82,900 5,911,521# Joban Kosan Co., Ltd. 42,799 559,763# Joshin Denki Co., Ltd. 109,800 3,141,673
Joyful Honda Co., Ltd. 15,000 194,791JP-Holdings, Inc. 339,700 876,258JVCKenwood Corp. 747,400 1,488,045
# Kasai Kogyo Co., Ltd. 159,200 654,646Kawai Musical Instruments Manufacturing Co., Ltd. 34,000 1,077,525
# Keiyo Co., Ltd. 245,000 1,625,070KeyHolder, Inc. 2,100 19,257
# KFC Holdings Japan, Ltd. 69,400 1,865,065King Co., Ltd. 54,100 285,601
# Kintetsu Department Store Co., Ltd. 53,900 1,585,783Ki-Star Real Estate Co., Ltd. 50,600 1,849,846Kohnan Shoji Co., Ltd. 152,700 4,400,157Kojima Co., Ltd. 189,400 1,211,623
# Komatsu Matere Co., Ltd. 209,500 1,843,673KOMEDA Holdings Co., Ltd. 306,800 5,595,843Komehyo Holdings Co., Ltd. 39,800 386,691
Copyright © 2021 www.secdatabase.com. All Rights Reserved.Please Consider the Environment Before Printing This Document

Komeri Co., Ltd. 210,400 5,867,737# Konaka Co., Ltd. 163,506 491,789
Koshidaka Holdings Co., Ltd. 188,000 1,014,215* Kourakuen Holdings Corp. 9,200 142,439# KU Holdings Co., Ltd. 115,500 1,016,051
Copyright © 2021 www.secdatabase.com. All Rights Reserved.Please Consider the Environment Before Printing This Document

THE JAPANESE SMALL COMPANY SERIESCONTINUED
Shares Value»CONSUMER DISCRETIONARY � (Continued)
Kura Sushi, Inc. 19,300 $1,300,214Kurabo Industries, Ltd. 121,000 2,098,530Kushikatsu Tanaka Holdings Co. 8,000 134,187
* KYB Corp. 133,400 3,653,257LEC, Inc. 156,800 1,791,435
* Litalico, Inc. 42,200 1,568,327#* Locondo, Inc. 20,800 420,336
Look Holdings, Inc. 24,200 265,893Mamiya-Op Co., Ltd. 25,100 174,418Mars Group Holdings Corp. 83,200 1,242,798Maruzen CHI Holdings Co., Ltd. 106,300 373,923Matsuoka Corp. 2,500 43,545
# Matsuyafoods Holdings Co., Ltd. 56,700 1,794,200Media Do Co., Ltd. 32,700 1,945,662
# Meiko Network Japan Co., Ltd. 134,900 728,364Meiwa Estate Co., Ltd. 78,000 498,914Mikuni Corp. 154,900 445,779
* Mitsuba Corp. 209,590 1,287,920# Mizuno Corp. 119,700 2,356,998
Monogatari Corp. (The) 62,600 4,076,756Morito Co., Ltd. 105,900 618,379
# MrMax Holdings, Ltd. 158,200 1,029,488Murakami Corp. 30,200 875,886Musashi Seimitsu Industry Co., Ltd. 306,100 5,248,421
# Nafco Co., Ltd. 50,300 973,636Nagase Brothers, Inc. 200 9,852Nagawa Co., Ltd. 44,300 3,570,904
# Nakayamafuku Co., Ltd. 74,400 331,497New Art Holdings Co., Ltd. 8,934 89,275Nextage Co., Ltd. 193,700 3,312,130NHK Spring Co., Ltd. 619,000 4,658,396
# Nichirin Co., Ltd. 61,160 988,510Nihon House Holdings Co., Ltd. 283,600 870,499Nihon Plast Co., Ltd. 107,800 604,421Nihon Tokushu Toryo Co., Ltd. 79,400 773,981Nikki Co., Ltd. 2,100 34,626
# Nippon Felt Co., Ltd. 84,000 344,094# Nippon Piston Ring Co., Ltd. 46,000 484,665
Nippon Seiki Co., Ltd. 326,900 3,801,086Nishikawa Rubber Co., Ltd. 32,400 441,477Nishimatsuya Chain Co., Ltd. 254,500 3,850,042
# Nissan Shatai Co., Ltd. 500,500 3,608,959# Nissan Tokyo Sales Holdings Co., Ltd. 166,400 390,168
Nittan Valve Co., Ltd. 93,500 187,736Nojima Corp. 199,700 5,085,827NOK Corp. 38,500 524,394
# Ohashi Technica, Inc. 66,800 949,383# Ohsho Food Service Corp. 84,200 4,432,605* Oisix ra daichi, Inc. 74,800 1,975,948
Onward Holdings Co., Ltd. 625,700 1,766,338# Ozu Corp. 19,000 346,082
Pacific Industrial Co., Ltd. 286,700 3,306,511* PAL GROUP Holdings Co., Ltd. 135,300 1,876,297
PAPYLESS Co., Ltd. 33,000 641,506
Copyright © 2021 www.secdatabase.com. All Rights Reserved.Please Consider the Environment Before Printing This Document

# Paris Miki Holdings, Inc. 131,400 344,775# PC Depot Corp. 183,381 821,945
People Co., Ltd. 14,600 134,977Piolax, Inc. 198,100 2,915,168Plenus Co., Ltd. 54,000 923,421
Copyright © 2021 www.secdatabase.com. All Rights Reserved.Please Consider the Environment Before Printing This Document

THE JAPANESE SMALL COMPANY SERIESCONTINUED
Shares Value»CONSUMER DISCRETIONARY � (Continued)
Press Kogyo Co., Ltd. 629,500 $1,899,924# Pressance Corp. 92,900 1,421,344* QB Net Holdings Co., Ltd. 18,200 272,030# Raccoon Holdings, Inc. 90,200 2,219,234
Regal Corp. 1,500 27,825# Renaissance, Inc. 74,700 793,250
Resorttrust, Inc. 440,600 7,381,733Rhythm Co., Ltd. 46,900 384,739
# Riberesute Corp. 46,100 358,906# Ride On Express Holdings Co., Ltd. 46,900 716,152#* Right On Co., Ltd. 100,725 634,616# Riken Corp. 59,500 1,347,008
Riso Kyoiku Co., Ltd. 626,300 1,918,830Round One Corp. 144,000 1,622,168
* Royal Holdings Co., Ltd. 7,000 126,793# Sac�s Bar Holdings, Inc. 125,350 686,064
Saizeriya Co., Ltd. 191,100 3,931,290# Sakai Ovex Co., Ltd. 31,499 855,442
San Holdings, Inc. 61,300 612,596* Sanden Holdings Corp. 16,100 58,410
Sanei Architecture Planning Co., Ltd. 55,200 881,898Sangetsu Corp. 306,650 4,657,821Sankyo Co., Ltd. 85,600 2,270,097
# Sankyo Seiko Co., Ltd. 248,900 1,238,907# Sanoh Industrial Co., Ltd. 157,800 1,850,001
Sanyei Corp. 4,300 83,190# Sanyo Electric Railway Co., Ltd. 112,598 1,922,487* Sanyo Shokai, Ltd. 65,899 472,253# Scroll Corp. 182,600 1,798,885# Seiko Holdings Corp. 165,881 2,820,237# Seiren Co., Ltd. 305,700 5,389,624* Senshukai Co., Ltd. 174,600 590,039* Shidax Corp. 137,200 372,685# Shikibo, Ltd. 65,500 589,106# Shimojima Co., Ltd. 46,100 537,339
Shoei Co., Ltd. 153,500 6,341,521* Silver Life Co., Ltd. 2,000 38,507# Snow Peak, Inc. 65,500 2,039,809# SNT Corp. 197,100 517,177# Soft99 Corp. 83,400 974,382
Sotoh Co., Ltd. 47,400 353,162# Space Value Holdings Co., Ltd. 199,500 1,436,036
SPK Corp. 45,400 530,504#* SRS Holdings Co., Ltd. 47,600 369,751# St Marc Holdings Co., Ltd. 100,800 1,569,136
Step Co., Ltd. 61,500 872,721Studio Alice Co., Ltd. 52,700 998,379Suminoe Textile Co., Ltd. 32,800 673,117Sumitomo Riko Co., Ltd. 254,600 1,644,953
# Suncall Corp. 129,600 567,451# Syuppin Co., Ltd. 124,400 1,153,372
T RAD Co., Ltd. 37,900 700,632Tachikawa Corp. 69,800 871,605
# Tachi-S Co., Ltd. 198,640 2,158,263
Copyright © 2021 www.secdatabase.com. All Rights Reserved.Please Consider the Environment Before Printing This Document

# Taiho Kogyo Co., Ltd. 113,300 1,097,405Takashimaya Co., Ltd. 701,000 7,505,249Take And Give Needs Co., Ltd. 65,910 571,780Takihyo Co., Ltd. 30,600 519,200Tama Home Co., Ltd. 91,000 1,809,770
Copyright © 2021 www.secdatabase.com. All Rights Reserved.Please Consider the Environment Before Printing This Document

THE JAPANESE SMALL COMPANY SERIESCONTINUED
Shares Value»CONSUMER DISCRETIONARY � (Continued)
Tamron Co., Ltd. 106,900 $2,086,281# Tbk Co., Ltd. 155,300 633,431# Tear Corp. 60,900 271,479
Temairazu, Inc. 5,400 258,706Tenpos Holdings Co., Ltd. 17,700 384,071T-Gaia Corp. 132,300 2,296,020
# Tigers Polymer Corp. 79,800 344,903Toa Corp. 161,700 1,409,886Toabo Corp. 45,799 200,173Tokai Rika Co., Ltd. 322,000 5,476,245Token Corp. 47,650 4,654,877
* Tokyo Base Co., Ltd. 106,600 679,198Tokyo Individualized Educational Institute, Inc. 78,300 437,875Tokyo Radiator Manufacturing Co., Ltd. 24,300 129,835Tokyotokeiba Co., Ltd. 76,000 3,844,839Tomy Co., Ltd. 565,593 5,150,651Topre Corp. 227,500 3,219,336
# Toridoll Holdings Corp. 288,200 4,331,058#* Torikizoku Holdings Co., Ltd. 27,900 415,697
Tosho Co., Ltd. 96,100 1,626,988Toyo Tire Corp. 157,600 2,799,461TPR Co., Ltd. 157,300 2,289,356Treasure Factory Co., Ltd. 10,300 102,047TS Tech Co., Ltd. 275,386 4,114,650
* TSI Holdings Co., Ltd. 333,495 968,890#* Tsukada Global Holdings, Inc. 86,100 262,869# Tsukamoto Corp. Co., Ltd. 18,100 247,206
Tsutsumi Jewelry Co., Ltd. 41,500 815,817Unipres Corp. 242,900 2,341,297United Arrows, Ltd. 137,000 2,614,065
* Unitika, Ltd. 265,600 989,490* Universal Entertainment Corp. 56,800 1,387,433* Village Vanguard Co., Ltd. 35,500 312,437
VT Holdings Co., Ltd. 536,700 2,167,460Wacoal Holdings Corp. 271,900 6,044,357
# Waseda Academy Co., Ltd. 30,400 250,502Watts Co., Ltd. 52,100 430,313Weds Co., Ltd. 14,500 69,638World Co., Ltd. 25,300 338,369Xebio Holdings Co., Ltd. 158,600 1,343,824
#* Yachiyo Industry Co., Ltd. 40,800 235,873# Yagi & Co., Ltd. 18,600 242,761# Yamato International, Inc. 100,500 315,217# Yasunaga Corp. 53,200 636,109
Yellow Hat, Ltd. 225,100 3,857,411Yondoshi Holdings, Inc. 106,520 1,854,713Yorozu Corp. 135,600 1,638,944Yossix Co., Ltd. 1,600 30,945Yutaka Giken Co., Ltd. 8,700 155,842
TOTAL CONSUMER DISCRETIONARY 470,408,248CONSUMER STAPLES � (7.1%)# Aeon Hokkaido Corp. 196,000 2,149,356
AFC-HD AMS Life Science Co., Ltd. 48,300 529,500Ain Holdings, Inc. 31,400 2,030,395
Copyright © 2021 www.secdatabase.com. All Rights Reserved.Please Consider the Environment Before Printing This Document

# Albis Co., Ltd. 38,700 861,894Arcs Co., Ltd. 274,400 5,938,476
# Artnature, Inc. 116,400 742,462Axial Retailing, Inc. 105,200 4,585,284
Copyright © 2021 www.secdatabase.com. All Rights Reserved.Please Consider the Environment Before Printing This Document

THE JAPANESE SMALL COMPANY SERIESCONTINUED
Shares Value»CONSUMER STAPLES � (Continued)
Belc Co., Ltd. 67,800 $3,782,800# Bourbon Corp. 50,700 1,008,745# Bull-Dog Sauce Co., Ltd. 3,000 73,247
Cawachi, Ltd. 55,400 1,443,338#* C�BON COSMETICS Co., Ltd. 10,800 199,745
Chubu Shiryo Co., Ltd. 153,500 1,993,309Chuo Gyorui Co., Ltd. 9,800 260,335
# cocokara fine, Inc. 127,060 9,785,909Como Co., Ltd. 2,600 61,049
# Cota Co., Ltd. 100,366 1,428,216Create SD Holdings Co., Ltd. 68,700 2,237,647Daikokutenbussan Co., Ltd. 35,500 2,336,221Delica Foods Holdings Co., Ltd. 66,400 402,170
# DyDo Group Holdings, Inc. 58,800 2,830,752Earth Corp. 43,800 2,638,900Ebara Foods Industry, Inc. 27,900 682,509Eco�s Co., Ltd. 43,100 761,287
# Ensuiko Sugar Refining Co., Ltd. 86,200 202,381# Feed One Co., Ltd. 155,448 1,286,296* First Baking Co., Ltd. 12,000 105,675# Fujicco Co., Ltd. 125,300 2,209,234
Fujiya Co., Ltd. 67,800 1,391,393G-7 Holdings, Inc. 69,600 1,663,155Genky DrugStores Co., Ltd. 49,800 1,721,362
# HABA Laboratories, Inc. 15,000 618,221Hagoromo Foods Corp. 17,900 511,961
# Halows Co., Ltd. 51,800 1,361,881Hayashikane Sangyo Co., Ltd. 29,400 174,526Heiwado Co., Ltd. 194,900 3,960,125Hokkaido Coca-Cola Bottling Co., Ltd. 18,699 686,337
# Hokuto Corp. 135,500 2,555,264Ichimasa Kamaboko Co., Ltd. 37,500 438,057Imuraya Group Co., Ltd. 60,500 1,389,600
# Inageya Co., Ltd. 8,200 122,858Itochu-Shokuhin Co., Ltd. 35,100 1,741,108Itoham Yonekyu Holdings, Inc. 366,500 2,418,064Iwatsuka Confectionery Co., Ltd. 7,700 300,422JM Holdings Co., Ltd. 71,100 1,464,922J-Oil Mills, Inc. 128,200 2,309,624
# Kadoya Sesame Mills, Inc. 15,600 593,306Kakiyasu Honten Co., Ltd. 52,800 1,260,749
# Kameda Seika Co., Ltd. 83,900 3,655,955Kaneko Seeds Co., Ltd. 41,300 606,470
# Kansai Super Market, Ltd. 89,900 913,233Kato Sangyo Co., Ltd. 159,400 5,145,921
# Kenko Mayonnaise Co., Ltd. 79,700 1,361,295# Key Coffee, Inc. 4,900 94,166
Kitanotatsujin Corp. 258,100 1,489,535KOIKE YA, Inc. 300 13,645
# Kotobuki Spirits Co., Ltd. 30,200 1,964,506# Kyokuyo Co., Ltd. 63,799 1,761,610# Lacto Japan Co., Ltd. 32,000 818,574
Life Corp. 44,500 1,359,237Mandom Corp. 19,100 361,163
Copyright © 2021 www.secdatabase.com. All Rights Reserved.Please Consider the Environment Before Printing This Document

Marudai Food Co., Ltd. 136,300 2,114,964# Maruha Nichiro Corp. 197,607 4,685,323
Maxvalu Tokai Co., Ltd. 45,200 1,060,147# Medical System Network Co., Ltd. 161,200 1,038,926# Megmilk Snow Brand Co., Ltd. 277,400 5,629,734
Copyright © 2021 www.secdatabase.com. All Rights Reserved.Please Consider the Environment Before Printing This Document

THE JAPANESE SMALL COMPANY SERIESCONTINUED
Shares Value»CONSUMER STAPLES � (Continued)# Meito Sangyo Co., Ltd. 57,500 $785,118
Milbon Co., Ltd. 154,752 8,506,047Ministop Co., Ltd. 90,500 1,192,643Mitsubishi Shokuhin Co., Ltd. 106,600 2,985,219Mitsui Sugar Co., Ltd. 104,670 1,856,082Miyoshi Oil & Fat Co., Ltd. 42,900 501,728Morinaga & Co., Ltd. 53,700 1,921,472Morinaga Milk Industry Co., Ltd. 82,500 4,332,378Morozoff, Ltd. 18,900 993,153Nagatanien Holdings Co., Ltd. 76,300 1,609,678Nakamuraya Co., Ltd. 28,400 997,207Natori Co., Ltd. 64,300 1,140,608Nichimo Co., Ltd. 17,000 326,448Nihon Chouzai Co., Ltd. 68,420 1,104,473
# Niitaka Co., Ltd. 2,860 68,439# Nippn Corp. 376,800 5,644,170
Nippon Beet Sugar Manufacturing Co., Ltd. 67,100 995,002Nippon Suisan Kaisha, Ltd. 1,794,300 8,625,860Nishimoto Co., Ltd. 13,300 393,428Nisshin Oillio Group, Ltd. (The) 171,400 5,054,880Nissin Sugar Co., Ltd. 104,400 1,731,246Nitto Fuji Flour Milling Co., Ltd. 8,100 558,434Noevir Holdings Co., Ltd. 54,300 2,466,841Oenon Holdings, Inc. 317,700 1,175,330
# OIE Sangyo Co., Ltd. 22,000 280,002Okuwa Co., Ltd. 153,500 1,681,072
# Olympic Group Corp. 52,200 402,675OUG Holdings, Inc. 19,800 533,186Pickles Corp. 24,200 760,742Prima Meat Packers, Ltd. 172,000 5,431,318Qol Holdings Co., Ltd. 162,300 2,286,769
# Retail Partners Co., Ltd. 107,600 1,353,743# Riken Vitamin Co., Ltd. 150,100 1,852,672
Rock Field Co., Ltd. 94,800 1,446,043Rokko Butter Co., Ltd. 82,400 1,259,987
# S Foods, Inc. 116,762 4,000,288# S&B Foods, Inc. 42,798 1,879,688# Sagami Rubber Industries Co., Ltd. 57,700 586,724
Sakata Seed Corp. 10,300 381,310# San-A Co., Ltd. 114,500 4,771,234
Sapporo Holdings, Ltd. 314,800 6,531,979Sato Foods Co., Ltd. 800 35,713Satudora Holdings Co., Ltd. 1,300 26,256Shinobu Foods Products Co., Ltd. 1,600 8,630Shoei Foods Corp. 68,000 2,794,479
# Showa Sangyo Co., Ltd. 115,200 3,231,882# Soiken Holdings, Inc. 24,200 123,322
ST Corp. 18,900 333,996Starzen Co., Ltd. 90,600 1,989,399
* Toho Co., Ltd. 49,900 851,580# Torigoe Co., Ltd. (The) 94,500 714,893# Toyo Sugar Refining Co., Ltd. 14,500 159,067# Transaction Co., Ltd. 89,700 1,062,167
United Super Markets Holdings, Inc. 365,600 3,854,555
Copyright © 2021 www.secdatabase.com. All Rights Reserved.Please Consider the Environment Before Printing This Document

Valor Holdings Co., Ltd. 237,700 5,351,533Warabeya Nichiyo Holdings Co., Ltd. 84,860 1,295,907
# Watahan & Co., Ltd. 97,400 1,146,794Yaizu Suisankagaku Industry Co., Ltd. 62,100 563,573YAKUODO Holdings Co., Ltd. 70,500 1,780,802
Copyright © 2021 www.secdatabase.com. All Rights Reserved.Please Consider the Environment Before Printing This Document

THE JAPANESE SMALL COMPANY SERIESCONTINUED
Shares Value»CONSUMER STAPLES � (Continued)
Yamami Co. 1,200 $23,063YA-MAN, Ltd. 149,500 2,127,971Yamatane Corp. 61,600 846,848
# Yamaya Corp. 25,000 554,812# Yamazawa Co., Ltd. 11,800 185,740
Yokohama Reito Co., Ltd. 325,000 2,684,498# Yomeishu Seizo Co., Ltd. 48,700 838,688* Yoshimura Food Holdings KK 5,300 47,536# Yuasa Funashoku Co., Ltd. 14,300 387,448
Yutaka Foods Corp. 3,900 66,577TOTAL CONSUMER STAPLES 236,817,516ENERGY � (1.0%)
BP Castrol K.K. 44,100 536,137# Cosmo Energy Holdings Co., Ltd. 344,800 8,234,075
Fuji Kosan Co., Ltd. 4,400 48,588* Fuji Oil Co., Ltd. 292,200 608,603
Itochu Enex Co., Ltd. 351,400 3,472,932Japan Oil Transportation Co., Ltd. 15,500 381,220Japan Petroleum Exploration Co., Ltd. 230,100 4,278,124
# Mitsuuroko Group Holdings Co., Ltd. 205,200 2,520,301Modec, Inc. 128,800 2,641,644Nippon Coke & Engineering Co., Ltd. 978,100 1,010,578Sala Corp. 324,100 1,798,239
# San-Ai Oil Co., Ltd. 397,800 4,731,054# Sinanen Holdings Co., Ltd. 47,500 1,307,786# Toa Oil Co., Ltd. 46,200 1,185,312
Toyo Kanetsu K.K. 48,700 1,195,948TOTAL ENERGY 33,950,541FINANCIALS � (8.5%)
77 Bank, Ltd. (The) 366,652 5,169,418# Advance Create Co., Ltd. 63,400 617,942
Aichi Bank, Ltd. (The) 49,700 1,356,428* Aiful Corp. 1,614,500 4,680,527# Aizawa Securities Co., Ltd. 216,100 1,961,605
Akatsuki Corp. 118,100 416,057Akita Bank, Ltd. (The) 93,540 1,239,071Anicom Holdings, Inc. 17,700 161,306Aomori Bank, Ltd. (The) 125,800 2,871,846
# Aozora Bank, Ltd. 58,800 1,348,212* Aruhi Corp. 14,700 240,033# Asax Co., Ltd. 9,300 60,126# Awa Bank, Ltd. (The) 244,200 5,504,508
Bank of Iwate, Ltd. (The) 92,600 2,000,423# Bank of Kochi, Ltd. (The) 54,300 416,804# Bank of Nagoya, Ltd. (The) 76,330 2,174,320
Bank of Okinawa, Ltd. (The) 146,260 4,035,191Bank of Saga, Ltd. (The) 84,120 1,122,585Bank of the Ryukyus, Ltd. 237,880 1,678,055
# Bank of Toyama, Ltd. (The) 14,500 418,086Casa, Inc. 3,200 28,944Chiba Kogyo Bank, Ltd. (The) 285,900 768,080Chugoku Bank, Ltd. (The) 559,500 4,730,979Chukyo Bank, Ltd. (The) 70,400 1,118,615
Copyright © 2021 www.secdatabase.com. All Rights Reserved.Please Consider the Environment Before Printing This Document

Credit Saison Co., Ltd. 218,300 2,631,235# Daishi Hokuetsu Financial Group, Inc. 273,200 6,448,354
Daito Bank, Ltd. (The) 62,600 397,111
Copyright © 2021 www.secdatabase.com. All Rights Reserved.Please Consider the Environment Before Printing This Document

THE JAPANESE SMALL COMPANY SERIESCONTINUED
Shares Value»FINANCIALS � (Continued)* Dream Incubator, Inc. 900 $9,481# eGuarantee, Inc. 178,100 3,361,164
Ehime Bank, Ltd. (The) 216,700 2,007,894# Entrust, Inc. 28,900 178,955
FIDEA Holdings Co., Ltd. 1,258,300 1,558,677Financial Products Group Co., Ltd. 220,000 1,441,292
# First Bank of Toyama, Ltd. (The) 294,300 836,040First Brothers Co., Ltd. 31,900 296,493
# Fukui Bank, Ltd. (The) 149,100 2,643,149Fukushima Bank, Ltd. (The) 17,200 40,947Fuyo General Lease Co., Ltd. 115,400 7,954,762GCA Corp. 125,600 964,006
# GMO Financial Holdings, Inc. 252,300 2,079,675# Gunma Bank, Ltd. (The) 1,786,640 6,408,648
Hachijuni Bank, Ltd. (The) 765,000 2,785,678# Hirogin Holdings, Inc. 1,301,600 7,962,410# Hirose Tusyo, Inc. 20,800 408,934
Hokkoku Bank, Ltd. (The) 153,300 3,912,727Hokuhoku Financial Group, Inc. 834,800 7,757,460
# Hyakugo Bank, Ltd. (The) 1,446,009 4,363,078Hyakujushi Bank, Ltd. (The) 155,600 2,378,308Ichiyoshi Securities Co., Ltd. 219,700 1,222,429
# IwaiCosmo Holdings, Inc. 121,900 1,949,744Iyo Bank, Ltd. (The) 916,018 5,497,349
#* J Trust Co., Ltd. 335,100 707,383Jaccs Co., Ltd. 138,700 2,848,980
# Jafco Group Co., Ltd. 204,100 12,189,959* Japan Asia Investment Co., Ltd. 93,300 227,206
Japan Investment Adviser Co., Ltd. 70,300 1,070,017Japan Securities Finance Co., Ltd. 611,800 4,413,062
# Jimoto Holdings, Inc. 102,850 738,568Juroku Bank, Ltd. (The) 194,300 3,881,690Keiyo Bank, Ltd. (The) 724,800 3,003,194Kita-Nippon Bank, Ltd. (The) 50,206 908,440Kiyo Bank, Ltd. (The) 434,090 6,503,025Kyokuto Securities Co., Ltd. 146,800 1,156,049Kyushu Financial Group, Inc. 1,291,727 5,545,878
# Kyushu Leasing Service Co., Ltd. 34,000 213,562* M&A Capital Partners Co., Ltd. 82,500 4,117,067# Marusan Securities Co., Ltd. 363,500 2,116,149# Matsui Securities Co., Ltd. 149,000 1,214,726# Mercuria Investment Co., Ltd. 70,500 510,555# Michinoku Bank, Ltd. (The) 277,998 2,730,860# Minkabu The Infonoid, Inc. 21,700 866,317# Mito Securities Co., Ltd. 359,500 1,048,694
Miyazaki Bank, Ltd. (The) 108,900 2,300,531# Mizuho Leasing Co., Ltd. 189,600 5,700,295# Monex Group, Inc. 1,007,400 8,562,988# Money Partners Group Co., Ltd. 149,100 349,653
Mortgage Service Japan, Ltd. 5,600 59,582Musashino Bank, Ltd. (The) 206,800 3,417,388Nagano Bank, Ltd. (The) 51,899 650,947Nanto Bank, Ltd. (The) 193,100 3,441,256NEC Capital Solutions, Ltd. 55,100 1,010,054
Copyright © 2021 www.secdatabase.com. All Rights Reserved.Please Consider the Environment Before Printing This Document

NFC Holdings, Inc. 4,200 85,312Nishi-Nippon Financial Holdings, Inc. 848,600 6,096,013
# North Pacific Bank, Ltd. 1,842,500 5,329,627#* OAK Capital Corp. 319,800 288,959
Ogaki Kyoritsu Bank, Ltd. (The) 239,400 4,821,132
Copyright © 2021 www.secdatabase.com. All Rights Reserved.Please Consider the Environment Before Printing This Document

THE JAPANESE SMALL COMPANY SERIESCONTINUED
Shares Value»FINANCIALS � (Continued)
Oita Bank, Ltd. (The) 89,099 $1,735,987# Okasan Securities Group, Inc. 1,076,200 4,394,772
Orient Corp. 296,400 413,147Premium Group Co., Ltd. 11,400 248,834Resona Holdings, Inc. 419,421 1,761,780Ricoh Leasing Co., Ltd. 93,200 2,926,145San ju San Financial Group, Inc. 126,510 1,592,386San-In Godo Bank, Ltd. (The) 980,700 4,974,242
# Sawada Holdings Co., Ltd. 152,200 1,040,666# Senshu Ikeda Holdings, Inc. 1,375,518 2,212,728
Shiga Bank, Ltd. (The) 304,000 6,585,907Shikoku Bank, Ltd. (The) 265,100 1,872,960Shimizu Bank, Ltd. (The) 54,600 836,340
# Sparx Group Co., Ltd. 604,900 1,635,076Strike Co., Ltd. 47,700 1,907,985Suruga Bank, Ltd. 241,800 933,591
# Taiko Bank, Ltd. (The) 41,800 568,247Tochigi Bank, Ltd. (The) 610,200 1,047,185
# Toho Bank, Ltd. (The) 1,298,700 2,886,756Tohoku Bank, Ltd. (The) 64,700 668,536Tokai Tokyo Financial Holdings, Inc. 1,290,200 4,732,043
# Tokyo Kiraboshi Financial Group, Inc. 170,738 2,162,645# Tomato Bank, Ltd. 54,500 561,972
TOMONY Holdings, Inc. 954,550 2,797,738Tottori Bank, Ltd. (The) 57,700 595,343Towa Bank, Ltd. (The) 184,000 1,144,783
# Toyo Securities Co., Ltd. 378,800 664,986#* Traders Holdings Co., Ltd. 13,720 47,593# Tsukuba Bank, Ltd. 402,600 669,031
Yamagata Bank, Ltd. (The) 181,000 1,860,895Yamaguchi Financial Group, Inc. 1,109,872 7,377,296Yamanashi Chuo Bank, Ltd. (The) 180,400 1,499,663
TOTAL FINANCIALS 284,097,537HEALTH CARE � (4.2%)# Advantage Risk Management Co., Ltd. 38,800 261,230
ASKA Pharmaceutical Co., Ltd. 161,700 2,137,989# Biofermin Pharmaceutical Co., Ltd. 28,700 740,443
BML, Inc. 152,200 5,269,812# Carenet, Inc. 25,600 1,121,828
CE Holdings Co., Ltd. 3,400 17,307Charm Care Corp. KK 57,500 695,303CMIC Holdings Co., Ltd. 60,600 844,296Create Medic Co., Ltd. 38,700 350,688Daiken Medical Co., Ltd. 111,400 613,967Daito Pharmaceutical Co., Ltd. 77,380 2,517,528
# Dvx, Inc. 44,300 426,368Eiken Chemical Co., Ltd. 198,100 3,876,575Elan Corp. 172,200 2,189,818EM Systems Co., Ltd. 241,300 1,851,444EPS Holdings, Inc. 196,700 2,011,624FALCO HOLDINGS Co., Ltd. 53,300 844,424FINDEX, Inc. 94,500 930,619Fuji Pharma Co., Ltd. 99,100 1,142,488Fukuda Denshi Co., Ltd. 57,200 4,348,645
Copyright © 2021 www.secdatabase.com. All Rights Reserved.Please Consider the Environment Before Printing This Document

Fuso Pharmaceutical Industries, Ltd. 45,600 1,049,603# H.U. Group Holdings, Inc. 336,700 11,315,980
Hogy Medical Co., Ltd. 84,200 2,568,896# I�rom Group Co., Ltd. 31,800 703,937
Copyright © 2021 www.secdatabase.com. All Rights Reserved.Please Consider the Environment Before Printing This Document

THE JAPANESE SMALL COMPANY SERIESCONTINUED
Shares Value»HEALTH CARE � (Continued)
Iwaki & Co., Ltd. 156,700 $915,939#* Japan Animal Referral Medical Center Co., Ltd. 9,600 180,690* Japan Hospice Holdings, Inc. 1,100 26,955
Japan Lifeline Co., Ltd. 387,300 4,915,260# Japan Medical Dynamic Marketing, Inc. 99,300 2,037,970
Jeol, Ltd. 211,800 8,436,422# JMS Co., Ltd. 96,557 854,822
Kaken Pharmaceutical Co., Ltd. 53,800 2,108,033Kanamic Network Co., Ltd. 106,000 712,124Kissei Pharmaceutical Co., Ltd. 171,000 3,790,952
# KYORIN Holdings, Inc. 256,000 4,462,893# Linical Co., Ltd. 75,200 534,812
Medical Data Vision Co., Ltd. 152,500 2,959,617Medikit Co., Ltd. 2,000 58,954
# Medius Holdings Co., Ltd. 67,100 569,191* MedPeer, Inc. 700 41,499# Menicon Co., Ltd. 44,400 2,625,316# Mizuho Medy Co., Ltd. 22,400 744,497
Mochida Pharmaceutical Co., Ltd. 12,698 492,828Nakanishi, Inc. 166,000 3,460,423
# Nichi-iko Pharmaceutical Co., Ltd. 325,550 2,932,198Nippon Chemiphar Co., Ltd. 13,400 318,549
# Nipro Corp. 561,700 6,798,512Nissui Pharmaceutical Co., Ltd. 78,000 701,795Paramount Bed Holdings Co., Ltd. 268,800 5,729,010
# Rion Co., Ltd. 52,100 1,415,674Sawai Pharmaceutical Co., Ltd. 78,700 3,770,634
# Seed Co., Ltd. 72,900 521,459Seikagaku Corp. 248,900 2,329,466
# Shin Nippon Biomedical Laboratories, Ltd. 41,600 263,363Shofu, Inc. 69,200 1,241,791
# Software Service, Inc. 19,700 1,931,761Solasto Corp. 318,000 4,110,670
# St-Care Holding Corp. 87,200 1,022,970# Taiko Pharmaceutical Co., Ltd. 55,900 631,061
Techno Medica Co., Ltd. 13,800 206,194Toho Holdings Co., Ltd. 292,000 5,367,062Tokai Corp. 139,800 3,051,015Torii Pharmaceutical Co., Ltd. 96,100 2,609,172
# Towa Pharmaceutical Co., Ltd. 175,400 3,876,013# UNIMAT Retirement Community Co., Ltd. 9,329 117,638# Value HR Co., Ltd. 46,400 686,150
Vital KSK Holdings, Inc. 272,800 1,946,015#* Wakamoto Pharmaceutical Co., Ltd. 112,300 435,102# WIN-Partners Co., Ltd. 113,300 1,078,933
ZERIA Pharmaceutical Co., Ltd. 4,100 77,989TOTAL HEALTH CARE 140,930,205INDUSTRIALS � (28.8%)# A&A Material Corp. 26,000 260,824# Abist Co., Ltd. 19,600 551,597
Advan Co., Ltd. 149,900 1,380,473Advanex, Inc. 17,999 264,662Aeon Delight Co., Ltd. 90,100 2,629,665Aichi Corp. 239,900 1,932,583
Copyright © 2021 www.secdatabase.com. All Rights Reserved.Please Consider the Environment Before Printing This Document

Aida Engineering, Ltd. 315,900 2,839,699Ajis Co., Ltd. 28,900 1,001,776Alconix Corp. 151,600 2,271,175Alinco, Inc. 80,500 716,029
Copyright © 2021 www.secdatabase.com. All Rights Reserved.Please Consider the Environment Before Printing This Document

THE JAPANESE SMALL COMPANY SERIESCONTINUED
Shares Value»INDUSTRIALS � (Continued)# Alps Logistics Co., Ltd. 111,600 $958,443
Altech Co., Ltd. 10,900 34,527Altech Corp. 114,470 2,273,051Anest Iwata Corp. 216,200 2,022,723Asahi Diamond Industrial Co., Ltd. 342,600 1,647,419
# Asahi Kogyosha Co., Ltd. 25,700 708,707# Asanuma Corp. 44,000 1,780,646# Asukanet Co., Ltd. 56,500 573,519
Bando Chemical Industries, Ltd. 215,300 1,455,543Bell System24 Holdings, Inc. 218,600 3,745,270
# BeNEXT Group, Inc. 305,997 4,890,573# Br Holdings Corp. 188,100 1,004,623# Bunka Shutter Co., Ltd. 366,000 3,489,055
Canare Electric Co., Ltd. 20,300 331,053Career Design Center Co., Ltd. 23,900 230,415Central Glass Co., Ltd. 229,300 4,887,946Central Security Patrols Co., Ltd. 53,000 1,634,904
# Chilled & Frozen Logistics Holdings Co., Ltd., Class H 108,700 1,779,354Chiyoda Integre Co., Ltd. 71,700 1,232,171Chodai Co., Ltd. 6,800 110,046Chori Co., Ltd. 73,000 1,113,455Chudenko Corp. 202,600 4,320,984
# Chugai Ro Co., Ltd. 36,600 701,900# Chuo Warehouse Co., Ltd. 21,000 214,763
CKD Corp. 56,600 1,185,352CMC Corp. 14,600 295,503Comany, Inc. 4,700 45,774Cosel Co., Ltd. 164,300 1,626,758Creek & River Co., Ltd. 57,400 744,985CTI Engineering Co., Ltd. 72,000 1,641,709CTS Co., Ltd. 166,400 1,288,666Dai-Dan Co., Ltd. 99,100 2,657,784Daido Kogyo Co., Ltd. 46,500 406,494Daihatsu Diesel Manufacturing Co., Ltd. 122,100 553,355Daihen Corp. 133,400 5,883,642Daiho Corp. 99,500 3,480,599Dai-Ichi Cutter Kogyo K.K. 44,000 588,574Daiichi Jitsugyo Co., Ltd. 54,700 2,068,855Daiichi Kensetsu Corp. 31,000 543,038Daiki Axis Co., Ltd. 41,900 364,530Daiohs Corp. 22,100 199,055
# Daiseki Co., Ltd. 243,963 8,860,419Daiseki Eco. Solution Co., Ltd. 11,759 96,041Daisue Construction Co., Ltd. 48,200 415,586Daiwa Industries, Ltd. 216,200 2,161,388Denyo Co., Ltd. 108,700 2,051,317
# DMG Mori Co., Ltd. 673,200 11,063,135DMW Corp. 4,800 160,973Duskin Co., Ltd. 285,100 7,182,926Ebara Jitsugyo Co., Ltd. 36,200 1,674,384Eidai Co., Ltd. 184,700 497,839EJ Holdings, Inc. 4,200 40,238Endo Lighting Corp. 33,400 205,588en-japan, Inc. 58,600 1,817,464
Copyright © 2021 www.secdatabase.com. All Rights Reserved.Please Consider the Environment Before Printing This Document

Enshu, Ltd. 26,199 231,626EPCO Co., Ltd. 20,200 180,799ERI Holdings Co., Ltd. 1,500 8,203
* Escrow Agent Japan, Inc. 136,700 374,082F&M Co., Ltd. 41,700 579,654
Copyright © 2021 www.secdatabase.com. All Rights Reserved.Please Consider the Environment Before Printing This Document

THE JAPANESE SMALL COMPANY SERIESCONTINUED
Shares Value»INDUSTRIALS � (Continued)* FDK Corp. 47,198 $600,144# Freund Corp. 75,600 537,228
Fudo Tetra Corp. 109,680 1,907,535Fuji Corp. 248,600 6,381,971
# Fuji Die Co., Ltd. 55,300 345,176Fuji Furukawa Engineering & Construction Co., Ltd. 1,200 26,997
* Fujikura, Ltd. 1,545,600 7,609,149Fujimak Corp. 12,600 85,388Fujisash Co., Ltd. 573,900 414,373Fujitec Co., Ltd. 264,100 5,640,495Fukuda Corp. 59,200 2,828,295Fukushima Galilei Co., Ltd. 84,100 3,324,543Fukuvi Chemical Industry Co., Ltd. 10,600 50,552Fukuyama Transporting Co., Ltd. 21,357 881,800FULLCAST Holdings Co., Ltd. 133,200 2,415,387Funai Soken Holdings, Inc. 249,470 4,849,479Furukawa Co., Ltd. 204,200 2,467,931
# Furukawa Electric Co., Ltd. 401,200 10,792,379Furusato Industries, Ltd. 65,000 802,397
# Futaba Corp. 233,600 2,056,274Gecoss Corp. 95,900 835,179Giken, Ltd. 82,700 3,730,016Glory, Ltd. 278,555 6,002,232Grace Technology, Inc. 108,600 2,844,885
# gremz, Inc. 14,800 255,434# GS Yuasa Corp. 318,683 8,675,727
Hamakyorex Co., Ltd. 109,500 3,217,911Hanwa Co., Ltd. 232,200 7,144,936
# Hashimoto Sogyo Holdings Co., Ltd. 4,070 100,456# Hazama Ando Corp. 1,302,400 10,000,232
Helios Techno Holding Co., Ltd. 109,800 429,512Hibiya Engineering, Ltd. 122,300 2,147,433Hirakawa Hewtech Corp. 70,800 874,815
# Hirano Tecseed Co., Ltd. 64,200 1,687,886Hirata Corp. 5,900 367,297Hisaka Works, Ltd. 127,300 977,305
# Hitachi Zosen Corp. 1,071,679 8,681,161Hito Communications Holdings, Inc. 43,900 835,935Hokuetsu Industries Co., Ltd. 140,700 1,378,172Hokuriku Electrical Construction Co., Ltd. 74,200 824,264
# Hosokawa Micron Corp. 45,600 2,769,530# Howa Machinery, Ltd. 62,700 491,940# Ichikawa Co., Ltd. 1,000 12,722# Ichiken Co., Ltd. 33,600 622,312
Ichinen Holdings Co., Ltd. 137,500 1,678,732Idec Corp. 204,800 3,294,652
# Ihara Science Corp. 52,200 802,063Iino Kaiun Kaisha, Ltd. 573,100 2,747,809Inaba Denki Sangyo Co., Ltd. 347,600 8,400,737Inaba Seisakusho Co., Ltd. 62,800 851,610Inabata & Co., Ltd. 296,500 4,447,749Insource Co., Ltd. 112,750 2,361,405
# Inui Global Logistics Co., Ltd. 81,480 782,564* Iseki & Co., Ltd. 124,500 1,858,342
Copyright © 2021 www.secdatabase.com. All Rights Reserved.Please Consider the Environment Before Printing This Document

# Ishii Iron Works Co., Ltd. 11,000 298,137Isolite Insulating Products Co., Ltd. 48,000 282,137Itoki Corp. 228,600 864,552
# Iwaki Co., Ltd. 41,000 335,092# Iwasaki Electric Co., Ltd. 39,400 556,281
Copyright © 2021 www.secdatabase.com. All Rights Reserved.Please Consider the Environment Before Printing This Document

THE JAPANESE SMALL COMPANY SERIESCONTINUED
Shares Value»INDUSTRIALS � (Continued)
JAC Recruitment Co., Ltd. 100,900 $1,595,931# Jalux, Inc. 38,600 571,070
Jamco Corp. 69,800 639,108# Japan Asia Group, Ltd. 176,800 1,564,544
Japan Elevator Service Holdings Co., Ltd. 286,800 6,180,423Japan Foundation Engineering Co., Ltd. 128,800 590,251
# Japan Pulp & Paper Co., Ltd. 77,600 2,562,375Japan Steel Works, Ltd. (The) 389,300 9,274,157Japan Transcity Corp. 251,200 1,275,506JDC Corp. 15,000 83,405
# JK Holdings Co., Ltd. 94,440 749,871Juki Corp. 185,300 1,490,918Kamei Corp. 154,500 1,737,297Kanaden Corp. 118,500 1,300,959Kanagawa Chuo Kotsu Co., Ltd. 42,800 1,459,207Kaname Kogyo Co., Ltd. 1,300 10,868Kanamoto Co., Ltd. 205,200 5,352,762Kandenko Co., Ltd. 400,000 3,504,934Kanematsu Corp. 521,625 7,014,534
# Katakura Industries Co., Ltd. 152,600 2,006,898Kato Works Co., Ltd. 63,300 659,850Kawada Technologies, Inc. 34,100 1,453,338Kawagishi Bridge Works Co., Ltd. 8,700 243,553Kawanishi Warehouse Co., Ltd. 1,700 18,962Kawasaki Kinkai Kisen Kaisha, Ltd. 7,899 194,465
#* Kawasaki Kisen Kaisha, Ltd. 257,700 5,926,725# Kawata Manufacturing Co., Ltd. 25,100 205,232
Keihin Co., Ltd. 15,700 198,577KFC, Ltd. 8,700 165,123
# Kimura Chemical Plants Co., Ltd. 107,500 738,339Kimura Unity Co., Ltd. 23,500 256,836King Jim Co., Ltd. 43,500 373,939
#* Kinki Sharyo Co., Ltd. (The) 16,599 199,682Kintetsu World Express, Inc. 244,200 6,347,463Kitagawa Corp. 53,300 763,168Kitano Construction Corp. 25,672 588,526Kito Corp. 135,400 2,239,478Kitz Corp. 475,900 2,762,378
#* Kobe Electric Railway Co., Ltd. 37,299 1,236,688# Kobelco Eco-Solutions Co., Ltd. 21,399 488,053
Koike Sanso Kogyo Co., Ltd. 12,600 263,237Kokusai Co., Ltd. 51,600 340,266Kokuyo Co., Ltd. 314,825 4,884,781
# KOMAIHALTEC, Inc. 20,300 403,594Komatsu Wall Industry Co., Ltd. 49,300 898,755
# Komori Corp. 317,900 2,156,645# Kondotec, Inc. 123,800 1,195,459
Konoike Transport Co., Ltd. 179,700 1,966,998* Kosaido Co., Ltd. 212,900 1,977,303
Kozo Keikaku Engineering, Inc. 20,700 535,153KRS Corp. 37,800 570,823Kumagai Gumi Co., Ltd. 239,400 6,494,935Kyodo Printing Co., Ltd. 48,900 1,319,105
# Kyokuto Boeki Kaisha, Ltd. 39,700 537,238
Copyright © 2021 www.secdatabase.com. All Rights Reserved.Please Consider the Environment Before Printing This Document

Kyokuto Kaihatsu Kogyo Co., Ltd. 208,800 3,123,929Kyoritsu Printing Co., Ltd. 179,200 227,049Kyudenko Corp. 31,600 1,208,373Like Co., Ltd. 63,200 1,153,125Link And Motivation, Inc. 210,200 1,145,870
Copyright © 2021 www.secdatabase.com. All Rights Reserved.Please Consider the Environment Before Printing This Document

THE JAPANESE SMALL COMPANY SERIESCONTINUED
Shares Value»INDUSTRIALS � (Continued)
Lonseal Corp. 13,900 $188,689Maeda Corp. 914,100 7,894,292Maeda Kosen Co., Ltd. 121,000 3,647,779Maeda Road Construction Co., Ltd. 127,100 2,464,110Maezawa Industries, Inc. 25,300 145,160
# Maezawa Kasei Industries Co., Ltd. 85,100 783,905Maezawa Kyuso Industries Co., Ltd. 128,400 1,328,517Makino Milling Machine Co., Ltd. 151,200 5,937,617
* Management Solutions Co., Ltd. 1,000 19,317Marufuji Sheet Piling Co., Ltd. 11,800 226,806Maruka Corp. 36,400 663,507Marumae Co., Ltd. 28,300 344,498
# Maruyama Manufacturing Co., Inc. 18,800 299,420Maruzen Co., Ltd. 65,800 1,175,065Maruzen Showa Unyu Co., Ltd. 80,000 2,349,973
# Matching Service Japan Co., Ltd. 52,000 533,886Matsuda Sangyo Co., Ltd. 95,282 1,758,481
# Matsui Construction Co., Ltd. 125,500 850,557Max Co., Ltd. 167,600 2,482,123Meidensha Corp. 227,210 4,958,912Meiji Electric Industries Co., Ltd. 52,500 707,984
# Meiji Shipping Co., Ltd. 102,500 457,042Meisei Industrial Co., Ltd. 268,800 1,883,525Meitec Corp. 169,000 9,348,416
# Meiwa Corp. 145,600 647,038Mesco, Inc. 29,800 276,234METAWATER Co., Ltd. 153,600 3,074,270
# Mie Kotsu Group Holdings, Inc. 359,200 1,656,403Mirai Industry Co., Ltd. 2,900 47,764Mirait Holdings Corp. 524,835 8,661,418Mitani Corp. 73,800 4,590,973
# Mitani Sangyo Co., Ltd. 145,000 562,890# Mitsubishi Kakoki Kaisha, Ltd. 39,700 1,015,224# Mitsubishi Logisnext Co., Ltd. 179,200 2,100,727
Mitsubishi Pencil Co., Ltd. 89,700 1,298,357Mitsuboshi Belting, Ltd. 163,400 2,633,539
* Mitsui E&S Holdings Co., Ltd. 448,900 2,270,508Mitsui Matsushima Holdings Co., Ltd. 65,700 592,366Mitsui-Soko Holdings Co., Ltd. 137,800 2,705,897Mitsumura Printing Co., Ltd. 6,300 103,810Miyaji Engineering Group, Inc. 39,417 844,964
# Mori-Gumi Co., Ltd. 69,500 207,477# Morita Holdings Corp. 211,100 3,407,253
Musashi Co., Ltd. 5,000 90,970# NAC Co., Ltd. 61,300 529,037
Nachi-Fujikoshi Corp. 87,400 3,811,229Nadex Co., Ltd. 40,600 273,239Nagase & Co., Ltd. 418,400 6,552,948Naigai Trans Line, Ltd. 40,500 522,991Nakabayashi Co., Ltd. 113,400 631,083Nakakita Seisakusho Co., Ltd. 3,700 91,765Nakamoto Packs Co., Ltd. 33,300 502,496Nakanishi Manufacturing Co., Ltd. 5,700 55,793
# Nakano Corp. 107,000 383,628
Copyright © 2021 www.secdatabase.com. All Rights Reserved.Please Consider the Environment Before Printing This Document

Namura Shipbuilding Co., Ltd. 286,828 577,093Narasaki Sangyo Co., Ltd. 25,400 472,244
* Nice Corp. 32,400 551,642Nichias Corp. 392,400 9,949,469
# Nichiban Co., Ltd. 65,900 1,140,145
Copyright © 2021 www.secdatabase.com. All Rights Reserved.Please Consider the Environment Before Printing This Document

THE JAPANESE SMALL COMPANY SERIESCONTINUED
Shares Value»INDUSTRIALS � (Continued)
Nichiden Corp. 98,900 $1,957,546Nichiha Corp. 166,380 4,851,052
# Nichireki Co., Ltd. 167,400 2,392,095Nihon Dengi Co., Ltd. 30,200 1,092,664Nihon Flush Co., Ltd. 120,900 1,483,957
# Nikkato Corp. 53,000 364,209Nikkiso Co., Ltd. 316,800 3,230,702Nikko Co., Ltd. 164,000 1,084,370Nikkon Holdings Co., Ltd. 385,300 7,752,179Nippi, Inc. 11,900 406,943Nippon Air Conditioning Services Co., Ltd. 183,100 1,237,620Nippon Aqua Co., Ltd. 27,600 153,465Nippon Carbon Co., Ltd. 60,400 2,538,089Nippon Concept Corp. 37,000 595,688
# Nippon Densetsu Kogyo Co., Ltd. 244,200 4,279,930# Nippon Dry-Chemical Co., Ltd. 5,100 78,516# Nippon Filcon Co., Ltd. 15,700 74,249
Nippon Hume Corp. 139,300 963,976# Nippon Kanzai Co., Ltd. 12,900 254,346
Nippon Koei Co., Ltd. 78,800 2,238,899Nippon Parking Development Co., Ltd., Class C 1,271,000 1,758,485
# Nippon Rietec Co., Ltd. 12,600 231,651Nippon Road Co., Ltd. (The) 46,100 3,427,226Nippon Seisen Co., Ltd. 21,300 683,251
* Nippon Sharyo, Ltd. 45,399 1,022,500* Nippon Sheet Glass Co., Ltd. 8,300 42,628
Nippon Steel Trading Corp. 99,460 3,655,432# Nippon Thompson Co., Ltd. 382,500 2,294,232
Nippon Tungsten Co., Ltd. 6,699 109,708# Nishimatsu Construction Co., Ltd. 345,000 8,756,759# Nishi-Nippon Railroad Co., Ltd. 132,600 3,547,323
Nishio Rent All Co., Ltd. 123,800 3,355,946Nissei ASB Machine Co., Ltd. 52,500 2,498,409Nissei Corp. 38,900 371,626Nissei Plastic Industrial Co., Ltd. 127,000 1,172,749Nisshinbo Holdings, Inc. 908,180 6,772,133Nissin Corp. 95,000 1,250,755Nissin Electric Co., Ltd. 333,100 3,755,337Nisso Corp. 3,800 29,618Nitta Corp. 136,400 3,251,160
# Nitto Boseki Co., Ltd. 14,500 528,506Nitto Kogyo Corp. 178,200 3,271,721Nitto Kohki Co., Ltd. 66,900 1,162,858Nitto Seiko Co., Ltd. 180,900 961,630
# Nittoc Construction Co., Ltd. 132,600 994,569NJS Co., Ltd. 36,800 688,569Noda Corp. 145,500 1,000,834
# Nomura Co., Ltd. 505,600 4,192,576Noritake Co., Ltd. 59,600 1,914,888Noritsu Koki Co., Ltd. 123,900 2,979,820Noritz Corp. 196,500 3,135,456
# NS Tool Co., Ltd. 107,000 1,613,023NS United Kaiun Kaisha, Ltd. 58,700 1,002,618
* NTN Corp. 2,736,400 8,465,438
Copyright © 2021 www.secdatabase.com. All Rights Reserved.Please Consider the Environment Before Printing This Document
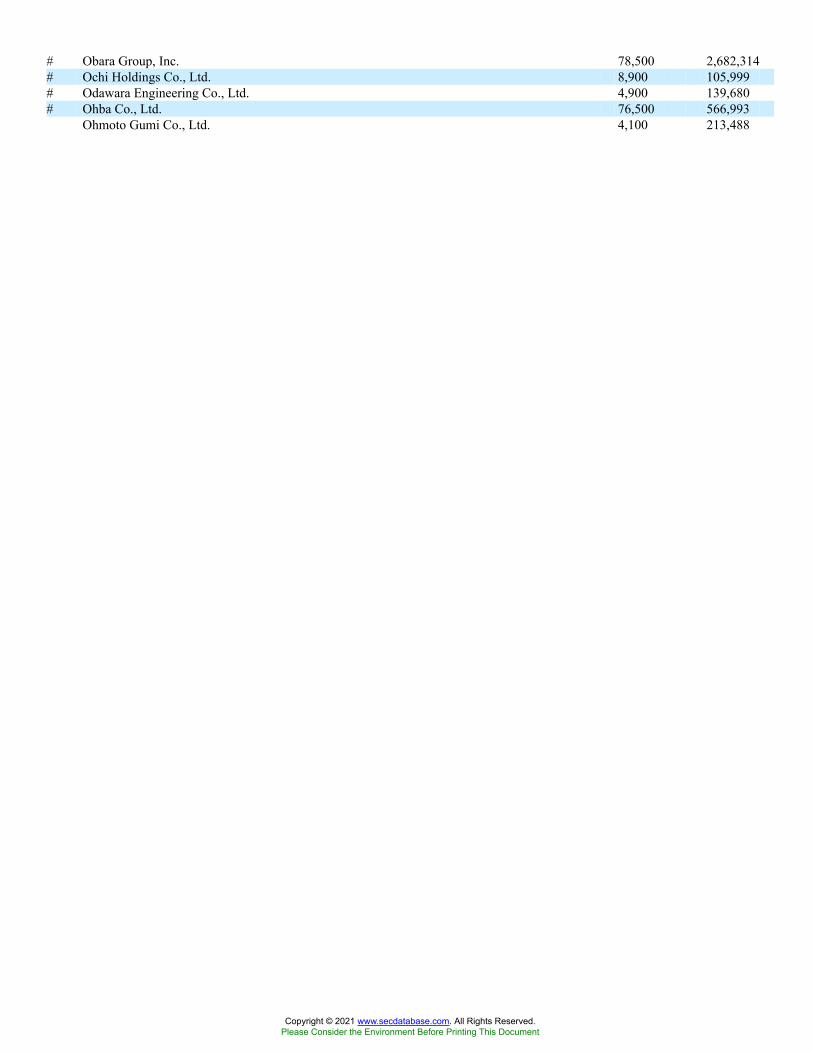
# Obara Group, Inc. 78,500 2,682,314# Ochi Holdings Co., Ltd. 8,900 105,999# Odawara Engineering Co., Ltd. 4,900 139,680# Ohba Co., Ltd. 76,500 566,993
Ohmoto Gumi Co., Ltd. 4,100 213,488
Copyright © 2021 www.secdatabase.com. All Rights Reserved.Please Consider the Environment Before Printing This Document

THE JAPANESE SMALL COMPANY SERIESCONTINUED
Shares Value»INDUSTRIALS � (Continued)# Oiles Corp. 145,770 $2,236,071
Okabe Co., Ltd. 258,200 1,822,104# Okada Aiyon Corp. 42,800 506,105# Okamoto Machine Tool Works, Ltd. 21,699 619,564# Okamura Corp. 381,500 4,484,147
OKUMA Corp. 137,100 7,871,221Okumura Corp. 182,380 4,849,444Onoken Co., Ltd. 111,900 1,397,494Organo Corp. 41,500 2,491,443
# Oriental Consultants Holdings Co., Ltd. 6,100 136,197# Origin Co., Ltd. 27,600 361,455# OSG Corp. 396,200 7,071,122
OSJB Holdings Corp. 826,500 2,209,474Outsourcing, Inc. 732,300 11,883,230Oyo Corp. 129,300 1,511,121
# Paraca, Inc. 35,900 544,972Parker Corp. 34,000 155,583
# Pasco Corp. 11,200 150,809Pasona Group, Inc. 133,000 2,250,010Pegasus Sewing Machine Manufacturing Co., Ltd. 139,900 580,878Penta-Ocean Construction Co., Ltd. 1,176,000 9,242,167
* Phil Co., Inc. 5,700 116,030Pilot Corp. 79,900 2,554,096Prestige International, Inc. 662,200 4,931,234
# Pronexus, Inc. 108,700 1,193,943* Prored Partners Co., Ltd. 7,900 221,710# PS Mitsubishi Construction Co., Ltd. 213,300 1,296,535# Punch Industry Co., Ltd. 105,700 581,946
Quick Co., Ltd. 71,300 796,792Raito Kogyo Co., Ltd. 301,300 5,129,443Raiznext Corp. 304,500 3,289,206
# Rasa Corp. 63,200 537,904Relia, Inc. 248,100 3,216,635Rheon Automatic Machinery Co., Ltd. 120,500 1,280,848
# Rix Corp. 17,300 242,894#* Rozetta Corp. 22,800 503,455* Ryobi, Ltd. 153,140 2,305,821
S LINE Co., Ltd. 23,800 195,465Sakai Heavy Industries, Ltd. 24,000 487,911Sakai Moving Service Co., Ltd. 74,500 3,341,451
#* Sanix, Inc. 146,200 424,254Sanki Engineering Co., Ltd. 285,300 3,739,179Sanko Gosei, Ltd. 121,900 500,402Sanko Metal Industrial Co., Ltd. 16,200 445,120Sankyo Tateyama, Inc. 142,900 1,064,804
# Sanoyas Holdings Corp. 151,100 220,295# Sansei Technologies, Inc. 78,400 559,228
Sansha Electric Manufacturing Co., Ltd. 64,300 475,506Sanyo Denki Co., Ltd. 44,100 2,353,315Sanyo Engineering & Construction, Inc. 60,200 387,350Sanyo Industries, Ltd. 9,900 165,538
# Sanyo Trading Co., Ltd. 140,000 1,459,332# Sata Construction Co., Ltd. 89,399 362,520
Sato Holdings Corp. 184,700 4,822,930
Copyright © 2021 www.secdatabase.com. All Rights Reserved.Please Consider the Environment Before Printing This Document

# Sato Shoji Corp. 86,800 852,871# Sawafuji Electric Co., Ltd. 1,900 40,938
SBS Holdings, Inc. 122,400 3,069,351# SEC Carbon, Ltd. 10,900 732,312# Secom Joshinetsu Co., Ltd. 30,800 1,017,377
Copyright © 2021 www.secdatabase.com. All Rights Reserved.Please Consider the Environment Before Printing This Document

THE JAPANESE SMALL COMPANY SERIESCONTINUED
Shares Value»INDUSTRIALS � (Continued)# Seibu Electric & Machinery Co., Ltd. 10,300 $116,262
Seika Corp. 61,700 864,293Seikitokyu Kogyo Co., Ltd. 191,330 1,611,713Seiwa Electric Manufacturing Co., Ltd. 1,700 9,433Sekisui Jushi Corp. 215,100 4,082,509
# Senko Group Holdings Co., Ltd. 715,500 6,783,256Senshu Electric Co., Ltd. 51,200 1,667,836Shibaura Machine Co., Ltd. 135,500 3,427,653Shibusawa Warehouse Co., Ltd. (The) 61,600 1,261,378Shibuya Corp. 96,600 3,098,455Shima Seiki Manufacturing, Ltd. 172,300 4,001,103
# Shin Nippon Air Technologies Co., Ltd. 94,480 2,057,120# Shin-Keisei Electric Railway Co., Ltd. 39,399 791,394# Shinki Bus Co., Ltd. 1,900 55,138
Shinmaywa Industries, Ltd. 413,700 3,823,415Shinnihon Corp. 180,600 1,442,344Shinsho Corp. 31,800 647,670Shinwa Co., Ltd. 62,300 1,226,912
#* Shoko Co., Ltd. 25,700 185,250# SIGMAXYZ, Inc. 87,500 1,476,006
Sinfonia Technology Co., Ltd. 142,400 1,697,437# Sinko Industries, Ltd. 127,700 2,515,180
Sintokogio, Ltd. 284,600 1,989,726Soda Nikka Co., Ltd. 109,200 566,727Sodick Co., Ltd. 211,200 1,972,124Space Co., Ltd. 95,062 846,796S-Pool, Inc. 301,000 3,103,436Star Micronics Co., Ltd. 240,200 3,589,177Subaru Enterprise Co., Ltd. 6,300 463,080
# Sugimoto & Co., Ltd. 63,900 1,369,348# Sumiseki Holdings, Inc. 363,100 404,043
Sumitomo Densetsu Co., Ltd. 111,200 2,421,234Sumitomo Mitsui Construction Co., Ltd. 1,006,140 4,534,681
* Sumitomo Precision Products Co., Ltd. 18,184 389,880Sumitomo Warehouse Co., Ltd. (The) 399,600 5,317,719Suzumo Machinery Co., Ltd. 2,200 34,554SWCC Showa Holdings Co., Ltd. 98,700 1,457,844
# Tacmina Corp. 14,700 177,671# Tadano, Ltd. 640,100 6,869,994
Taihei Dengyo Kaisha, Ltd. 97,000 2,318,632# Taiheiyo Kouhatsu, Inc. 43,500 302,165
Taikisha, Ltd. 169,500 4,652,533Taisei Oncho Co., Ltd. 14,200 258,949
# Takadakiko Co., Ltd. 7,500 190,927Takamatsu Construction Group Co., Ltd. 106,800 2,080,634Takamatsu Machinery Co., Ltd. 41,800 283,079
# Takamiya Co., Ltd. 128,600 713,074# Takano Co., Ltd. 52,400 289,525
Takaoka Toko Co., Ltd. 59,620 852,128Takara & Co., Ltd. 25,555 426,741Takara Standard Co., Ltd. 225,000 3,393,967Takasago Thermal Engineering Co., Ltd. 290,500 4,530,737Takashima & Co., Ltd. 25,200 404,876Takeei Corp. 130,100 1,520,768
Copyright © 2021 www.secdatabase.com. All Rights Reserved.Please Consider the Environment Before Printing This Document

Takeuchi Manufacturing Co., Ltd. 230,900 6,458,969Takigami Steel Construction Co., Ltd. (The) 5,300 274,535Takisawa Machine Tool Co., Ltd. 41,700 430,254Takuma Co., Ltd. 102,600 2,228,396Tanabe Consulting Co., Ltd. 1,200 15,558
Copyright © 2021 www.secdatabase.com. All Rights Reserved.Please Consider the Environment Before Printing This Document

THE JAPANESE SMALL COMPANY SERIESCONTINUED
Shares Value»INDUSTRIALS � (Continued)# Tanabe Engineering Corp. 39,500 $314,401
Tanseisha Co., Ltd. 243,549 1,947,820# Tatsuta Electric Wire and Cable Co., Ltd. 287,400 1,636,457
TECHNO ASSOCIE Co., Ltd. 50,100 477,607# Techno Ryowa, Ltd. 68,690 541,810# Techno Smart Corp. 49,500 619,255
Teikoku Electric Manufacturing Co., Ltd. 111,000 1,328,029Teikoku Sen-I Co., Ltd. 108,500 2,201,746Tekken Corp. 84,200 1,503,153Tenox Corp. 22,500 180,473Teraoka Seisakusho Co., Ltd. 76,000 271,463Terasaki Electric Co., Ltd. 24,400 275,754
# Toa Corp. 103,400 2,284,654TOA ROAD Corp. 27,300 1,045,285Toba, Inc. 9,800 228,182Tobishima Corp. 126,570 1,376,734Tocalo Co., Ltd. 389,800 5,117,932
# Toda Corp. 256,100 1,878,974Toenec Corp. 53,500 1,894,534Togami Electric Manufacturing Co., Ltd. 17,800 296,755TOKAI Holdings Corp. 634,900 5,493,772Tokai Lease Co., Ltd. 18,800 236,128Tokyo Energy & Systems, Inc. 154,000 1,275,717
# Tokyo Keiki, Inc. 69,022 590,098# Tokyo Sangyo Co., Ltd. 130,800 764,650
Tokyu Construction Co., Ltd. 551,700 3,003,412Toli Corp. 277,100 626,276
# Tomoe Corp. 155,100 562,833Tomoe Engineering Co., Ltd. 51,100 1,003,438Tonami Holdings Co., Ltd. 37,200 1,813,679Toppan Forms Co., Ltd. 326,500 3,302,492
# Torishima Pump Manufacturing Co., Ltd. 130,700 1,026,743TORQ Inc 7,900 18,834
# Totech Corp. 49,200 1,291,315Totetsu Kogyo Co., Ltd. 159,600 3,819,560Totoku Electric Co., Ltd. 17,700 415,955
# Toyo Construction Co., Ltd. 524,200 2,720,420Toyo Denki Seizo K.K. 35,450 419,681
* Toyo Engineering Corp. 205,878 1,456,462# Toyo Logistics Co., Ltd. 85,100 266,406
Toyo Machinery & Metal Co., Ltd. 97,300 440,007Toyo Tanso Co., Ltd. 75,600 1,468,954
# Toyo Wharf & Warehouse Co., Ltd. 36,000 513,169Trancom Co., Ltd. 49,100 3,922,311
# Trinity Industrial Corp. 36,000 276,362# Trusco Nakayama Corp. 171,500 4,549,606
Tsubaki Nakashima Co., Ltd. 277,100 4,258,487Tsubakimoto Chain Co. 172,140 4,749,999
# Tsubakimoto Kogyo Co., Ltd. 28,800 989,645* Tsudakoma Corp. 17,698 148,694
Tsugami Corp. 268,700 4,051,787# Tsukishima Kikai Co., Ltd. 187,700 2,179,860
Tsurumi Manufacturing Co., Ltd. 128,400 2,108,729Uchida Yoko Co., Ltd. 51,600 2,303,764
Copyright © 2021 www.secdatabase.com. All Rights Reserved.Please Consider the Environment Before Printing This Document

# Ueki Corp. 60,800 853,098Union Tool Co. 45,500 1,451,084UPR Corp. 700 20,438
# Ushio, Inc. 660,300 8,729,494* UT Group Co., Ltd. 169,800 5,603,822
Copyright © 2021 www.secdatabase.com. All Rights Reserved.Please Consider the Environment Before Printing This Document

THE JAPANESE SMALL COMPANY SERIESCONTINUED
Shares Value»INDUSTRIALS � (Continued)
Utoc Corp. 102,200 $458,624Waida Manufacturing Co., Ltd. 5,100 51,387Wakachiku Construction Co., Ltd. 79,300 982,848Wakita & Co., Ltd. 253,000 2,286,709WDB Holdings Co., Ltd. 63,200 1,482,962Weathernews, Inc. 34,300 1,634,595
# Welbe, Inc. 5,300 72,758Will Group, Inc. 99,600 1,031,864World Holdings Co., Ltd. 39,600 1,027,799Yahagi Construction Co., Ltd. 181,400 1,378,063YAMABIKO Corp. 228,128 2,536,312
# YAMADA Consulting Group Co., Ltd. 72,700 787,819# Yamashina Corp. 224,200 160,414# Yamato Corp. 110,500 673,438# Yamaura Corp. 9,900 82,659
Yamazen Corp. 390,200 3,680,726Yasuda Logistics Corp. 102,000 896,025Yokogawa Bridge Holdings Corp. 204,100 3,783,308
# Yondenko Corp. 26,560 736,873# Yuasa Trading Co., Ltd. 118,200 3,340,622
Yuken Kogyo Co., Ltd. 20,500 318,047Yurtec Corp. 264,600 1,948,384Zaoh Co., Ltd. 23,400 299,915
# Zenitaka Corp. (The) 19,200 893,469Zuiko Corp. 90,400 861,177
TOTAL INDUSTRIALS 965,823,240INFORMATION TECHNOLOGY � (12.8%)# A&D Co., Ltd. 124,300 1,403,495* Access Co., Ltd. 87,800 662,690# Ad-sol Nissin Corp. 43,000 1,109,565
Adtec Plasma Technology Co., Ltd. 2,200 28,318* Advanced Media, Inc. 7,300 54,458# AGS Corp. 13,000 99,015
Ai Holdings Corp. 248,100 4,930,744Aichi Tokei Denki Co., Ltd. 17,900 703,259Aiphone Co., Ltd. 63,500 1,061,420
# Alpha Systems, Inc. 45,620 1,484,973Amano Corp. 127,500 3,101,420AOI Electronics Co., Ltd. 27,700 577,701Argo Graphics, Inc. 105,800 3,042,606
# Arisawa Manufacturing Co., Ltd. 207,800 1,881,423Artiza Networks, Inc. 6,200 109,313ArtSpark Holdings, Inc. 33,700 630,397Asahi Intelligence Service Co., Ltd. 1,300 14,508Ascentech KK 1,700 25,359Atled Corp. 1,400 28,893Avant Corp. 100,300 1,504,676
# Axell Corp. 27,900 249,553# Azia Co., Ltd. 14,300 225,472* BrainPad, Inc. 7,200 357,833# Broadband Tower, Inc. 105,600 266,204
Broadleaf Co., Ltd. 606,400 2,983,250# Business Brain Showa-Ota, Inc. 29,000 506,994
Business Engineering Corp. 800 25,141
Copyright © 2021 www.secdatabase.com. All Rights Reserved.Please Consider the Environment Before Printing This Document

CAC Holdings Corp. 75,200 979,439Canon Electronics, Inc. 126,200 1,967,877CDS Co., Ltd. 15,300 207,859
#* Change, Inc. 2,400 77,685
Copyright © 2021 www.secdatabase.com. All Rights Reserved.Please Consider the Environment Before Printing This Document

THE JAPANESE SMALL COMPANY SERIESCONTINUED
Shares Value»INFORMATION TECHNOLOGY � (Continued)# Chino Corp. 46,300 $608,788# Citizen Watch Co., Ltd. 1,795,100 6,150,998
CMK Corp. 310,300 1,349,094Computer Engineering & Consulting, Ltd. 164,800 2,146,439Computer Institute of Japan, Ltd. 94,700 775,574Comture Corp. 138,200 3,348,449CONEXIO Corp. 95,500 1,198,408
# Core Corp. 45,800 626,707# Cresco, Ltd. 83,000 1,212,238* CRI Middleware Co., Ltd. 2,300 37,074# Cube System, Inc. 60,600 646,192
Cyber Com Co., Ltd. 10,600 151,475Cyberlinks Co., Ltd. 1,500 22,455Cybernet Systems Co., Ltd. 57,700 458,725
# Cybozu, Inc. 115,500 2,337,256# Daiko Denshi Tsushin, Ltd. 37,200 189,026
Daishinku Corp. 42,399 951,860Daitron Co., Ltd. 58,200 949,613Daiwabo Holdings Co., Ltd. 587,500 8,946,132Dawn Corp. 3,200 94,337
# Densan System Co., Ltd. 39,200 1,149,885Dexerials Corp. 357,200 6,124,022Digital Arts, Inc. 71,800 6,315,716Digital Garage, Inc. 110,100 4,496,616
# Digital Hearts Holdings Co., Ltd. 87,100 1,281,410Digital Information Technologies Corp. 40,000 831,631DKK Co., Ltd. 61,700 1,517,677
# DKK-Toa Corp. 28,300 209,758# Double Standard, Inc. 14,000 524,020
DTS Corp. 262,800 6,010,443# Ebase Co., Ltd. 63,000 540,148
Edulab, Inc. 6,200 462,210E-Guardian, Inc. 51,100 1,337,503
# Eizo Corp. 106,700 4,035,013Elecom Co., Ltd. 132,800 2,952,033Elematec Corp. 116,842 1,076,153Enomoto Co., Ltd. 30,200 569,215
# Enplas Corp. 57,200 2,143,884ESPEC Corp. 119,800 2,005,453Fenwal Controls of Japan, Ltd. 20,500 289,883
# Ferrotec Holdings Corp. 239,200 4,806,702#* FFRI Security, Inc. 22,500 448,552# Fixstars Corp. 97,100 909,783# Focus Systems Corp. 30,900 276,301# Forval Corp. 51,100 404,353
FTGroup Co., Ltd. 51,000 654,269Fuji Soft, Inc. 100,200 5,201,719Fukui Computer Holdings, Inc. 53,500 1,920,673Furuno Electric Co., Ltd. 157,500 1,559,441
# Furuya Metal Co., Ltd. 7,600 484,109Future Corp. 143,400 2,597,109Future Innovation Group, Inc. 11,900 29,523
# Gig Works, Inc. 9,600 91,687# GL Sciences, Inc. 45,000 1,016,450
Copyright © 2021 www.secdatabase.com. All Rights Reserved.Please Consider the Environment Before Printing This Document

# Glosel Co., Ltd. 113,200 454,366# GMO GlobalSign Holdings K.K. 19,300 1,189,608# GMO Pepabo, Inc. 7,300 526,496
Hagiwara Electric Holdings Co., Ltd. 49,500 1,175,977Hakuto Co., Ltd. 87,300 1,011,282
Copyright © 2021 www.secdatabase.com. All Rights Reserved.Please Consider the Environment Before Printing This Document

THE JAPANESE SMALL COMPANY SERIESCONTINUED
Shares Value»INFORMATION TECHNOLOGY � (Continued)
Hibino Corp. 26,900 $395,785Himacs, Ltd. 960 10,786Hioki EE Corp. 67,100 2,607,688Hochiki Corp. 88,900 1,101,834
# Hokuriku Electric Industry Co., Ltd. 46,800 405,461# Holon Co., Ltd. 2,100 92,284# Honda Tsushin Kogyo Co., Ltd. 107,100 507,108
Hosiden Corp. 343,500 3,595,022# Icom, Inc. 61,500 1,536,020# ID Holdings Corp. 52,100 601,398
Ikegami Tsushinki Co., Ltd. 32,799 263,958# Ines Corp. 126,600 1,523,432# I-Net Corp. 74,290 1,024,307
Infocom Corp. 108,100 2,760,406Infomart Corp. 235,600 2,036,696Information Services International-Dentsu, Ltd. 148,000 5,255,220
# Innotech Corp. 101,900 1,224,783Intelligent Wave, Inc. 36,600 231,853Inter Action Corp. 27,600 584,667I-O Data Device, Inc. 50,700 482,810I-PEX, Inc. 38,100 698,568
# Iriso Electronics Co., Ltd. 132,500 5,931,346# ISB Corp. 23,100 262,806
Itfor, Inc. 164,700 1,239,485* Iwatsu Electric Co., Ltd. 54,900 447,252
Japan Aviation Electronics Industry, Ltd. 301,700 4,911,492Japan Cash Machine Co., Ltd. 141,800 784,401
* Japan Display, Inc. 1,005,500 436,377# Japan Electronic Materials Corp. 51,800 894,823
Japan Material Co., Ltd. 417,100 4,950,465# Jastec Co., Ltd. 68,200 744,196# JBCC Holdings, Inc. 88,800 1,191,723
JFE Systems, Inc. 6,200 104,254#* JIG-SAW, Inc. 17,300 2,266,945
Kaga Electronics Co., Ltd. 108,800 2,445,711Kanematsu Electronics, Ltd. 79,200 2,673,527KEL Corp. 27,900 232,672Koa Corp. 172,100 2,443,690Konica Minolta, Inc. 47,900 260,879KSK Co., Ltd. 3,000 63,688Kyoden Co., Ltd. 116,100 332,186Kyosan Electric Manufacturing Co., Ltd. 268,600 1,002,440Kyowa Electronic Instruments Co., Ltd. 129,800 510,650LAC Co., Ltd. 100,100 972,157Lecip Holdings Corp. 10,900 58,404Macnica Fuji Electronics Holdings, Inc. 328,350 6,579,107
# Marubun Corp. 112,200 538,669Maruwa Co., Ltd. 56,500 5,811,711
* Maxell Holdings, Ltd. 306,100 3,879,468MCJ Co., Ltd. 420,800 3,669,592
# Megachips Corp. 105,500 3,376,550Meiko Electronics Co., Ltd. 135,300 3,292,287Melco Holdings, Inc. 18,600 650,065Micronics Japan Co., Ltd. 18,200 278,075
Copyright © 2021 www.secdatabase.com. All Rights Reserved.Please Consider the Environment Before Printing This Document

* Mimaki Engineering Co., Ltd. 113,200 643,661Mimasu Semiconductor Industry Co., Ltd. 107,881 2,666,060Miraial Co., Ltd. 39,500 454,482
# Miroku Jyoho Service Co., Ltd. 112,800 2,106,584Mitachi Co., Ltd. 7,900 48,846
Copyright © 2021 www.secdatabase.com. All Rights Reserved.Please Consider the Environment Before Printing This Document

THE JAPANESE SMALL COMPANY SERIESCONTINUED
Shares Value»INFORMATION TECHNOLOGY � (Continued)# Mitsubishi Research Institute, Inc. 53,500 $1,995,004
Mitsui High-Tec, Inc. 130,600 5,482,066m-up Holdings, Inc. 13,200 351,603Mutoh Holdings Co., Ltd. 9,300 137,469Nagano Keiki Co., Ltd. 85,300 757,749Nakayo, Inc. 73,100 1,015,774
# NF Holdings Corp. 25,900 477,980# Nichicon Corp. 317,300 3,229,136
Nihon Denkei Co., Ltd. 31,800 392,964* Nippon Chemi-Con Corp. 83,600 1,473,345# Nippon Computer Dynamics Co., Ltd. 36,200 220,719
Nippon Electric Glass Co., Ltd. 431,236 10,023,913# Nippon Information Development Co., Ltd. 12,600 159,089# Nippon Kodoshi Corp. 51,600 1,458,724
Nippon Signal Co., Ltd. 317,300 2,818,340Nippon Systemware Co., Ltd. 46,200 872,690Nissha Co., Ltd. 232,800 2,892,298Nohmi Bosai, Ltd. 146,200 2,847,686
# NPC, Inc. 30,900 219,133NSD Co., Ltd. 508,160 8,478,289
# Ohara, Inc. 35,900 548,771#* Okaya Electric Industries Co., Ltd. 77,800 279,245# Oki Electric Industry Co., Ltd. 548,300 5,712,188
ONO Sokki Co., Ltd. 32,200 162,104Optex Group Co., Ltd. 191,620 2,861,262
* Optim Corp. 32,000 864,187Optorun Co., Ltd. 46,600 1,161,218Oro Co., Ltd. 18,400 635,809Osaki Electric Co., Ltd. 281,800 1,554,354
# Oval Corp. 35,600 92,797# Paltek Corp. 38,500 182,574# PCA Corp. 4,700 181,007# PCI Holdings, Inc. 30,800 404,649# Poletowin Pitcrew Holdings, Inc. 189,900 2,368,699# Pro-Ship, Inc. 41,700 504,432
Restar Holdings Corp. 130,000 2,398,984* Ricksoft Co., Ltd. 2,000 66,460
Riken Keiki Co., Ltd. 94,800 2,363,034# Riso Kagaku Corp. 131,200 1,747,392
Roland DG Corp. 82,600 1,354,437Rorze Corp. 54,400 3,864,491RS Technologies Co., Ltd. 21,100 1,223,766
# Ryoden Corp. 96,700 1,442,275Ryosan Co., Ltd. 144,100 2,947,172
# Ryoyo Electro Corp. 7,300 176,401Saison Information Systems Co., Ltd. 24,800 480,358Sakura Internet, Inc. 122,900 871,056
# Sanken Electric Co., Ltd. 152,400 7,173,273Sanshin Electronics Co., Ltd. 121,500 2,204,650Santec Corp. 3,000 48,900
# Satori Electric Co., Ltd. 79,180 573,988* Saxa Holdings, Inc. 30,600 443,568# SB Technology Corp. 61,300 1,784,325# Scala, Inc. 83,700 565,490
Copyright © 2021 www.secdatabase.com. All Rights Reserved.Please Consider the Environment Before Printing This Document

Segue Group Co., Ltd. 1,900 22,260# Seikoh Giken Co., Ltd. 22,300 484,829# SEMITEC Corp. 5,500 241,810# SERAKU Co., Ltd. 8,300 146,591
Shibaura Electronics Co., Ltd. 52,600 1,744,735
Copyright © 2021 www.secdatabase.com. All Rights Reserved.Please Consider the Environment Before Printing This Document

THE JAPANESE SMALL COMPANY SERIESCONTINUED
Shares Value»INFORMATION TECHNOLOGY � (Continued)# Shibaura Mechatronics Corp. 24,100 $1,213,563
Shindengen Electric Manufacturing Co., Ltd. 45,600 1,343,339Shinko Shoji Co., Ltd. 266,500 1,929,005
# Shizuki Electric Co., Inc. 121,600 665,800Showa Shinku Co., Ltd. 24,400 389,797Sigma Koki Co., Ltd. 27,000 348,793Siix Corp. 203,600 3,009,521SK-Electronics Co., Ltd. 47,300 545,386
#* Smaregi, Inc. 2,000 103,229# SMK Corp. 32,699 839,109# Softcreate Holdings Corp. 50,000 1,136,220
Soliton Systems K.K. 36,600 551,798Solxyz Co., Ltd. 1,800 15,091SRA Holdings 72,100 1,769,991Sumida Corp. 176,449 1,728,994Sun-Wa Technos Corp. 79,800 780,616Suzuden Corp. 1,200 14,067Suzuki Co., Ltd. 67,100 662,528System D, Inc. 1,100 15,447
# System Information Co., Ltd. 54,800 523,007System Research Co., Ltd. 27,200 512,336System Support, Inc. 3,200 45,657Systems Engineering Consultants Co., Ltd. 2,100 53,089Systena Corp. 312,400 6,267,470
# Tachibana Eletech Co., Ltd. 110,760 1,617,841# Takachiho Koheki Co., Ltd. 38,500 391,194# TAKEBISHI Corp. 52,200 710,286# Tamagawa Holdings Co., Ltd. 7,500 122,381
Tamura Corp. 467,400 2,165,867Tazmo Co., Ltd. 16,300 285,406
# TDC Soft, Inc. 95,200 878,608* TeamSpirit, Inc. 1,300 24,327
TechMatrix Corp. 233,600 4,174,894# Techno Horizon Co., Ltd. 56,700 607,138
Tecnos Japan, Inc. 8,800 55,156Teikoku Tsushin Kogyo Co., Ltd. 51,500 512,124Terilogy Co., Ltd. 22,900 127,036TKC Corp. 181,200 5,772,202Tobila Systems, Inc. 1,600 20,935Toho System Science Co., Ltd. 2,700 23,555Tokyo Electron Device, Ltd. 43,800 1,546,729Tokyo Seimitsu Co., Ltd. 257,200 11,766,642
# Tomen Devices Corp. 15,300 556,646Topcon Corp. 691,700 8,415,284Torex Semiconductor, Ltd. 52,900 812,104Toshiba TEC Corp. 49,300 1,809,740Toukei Computer Co., Ltd. 6,210 255,597Towa Corp. 134,700 2,615,310Toyo Corp. 149,600 1,450,234Transcosmos, Inc. 30,500 825,055Tri Chemical Laboratories, Inc. 125,600 4,018,448
# Tsuzuki Denki Co., Ltd. 42,800 642,349# Ubicom Holdings, Inc. 12,500 349,083
ULS Group, Inc. 1,000 28,738
Copyright © 2021 www.secdatabase.com. All Rights Reserved.Please Consider the Environment Before Printing This Document
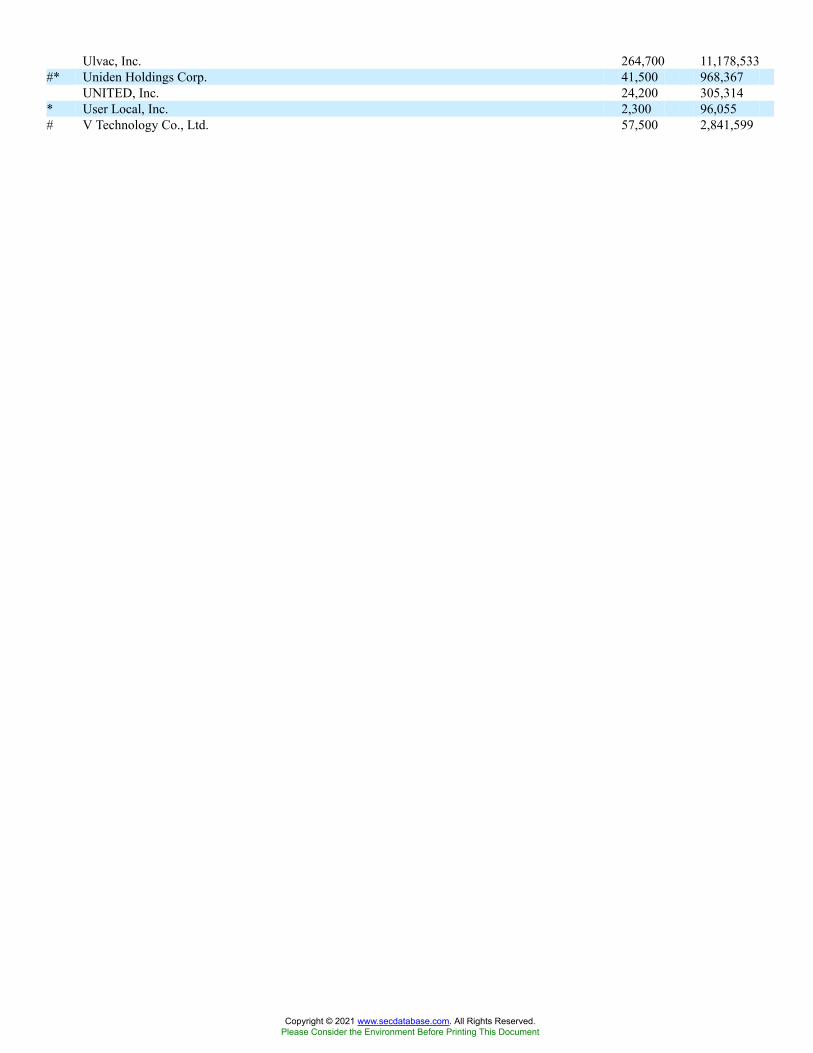
Ulvac, Inc. 264,700 11,178,533#* Uniden Holdings Corp. 41,500 968,367
UNITED, Inc. 24,200 305,314* User Local, Inc. 2,300 96,055# V Technology Co., Ltd. 57,500 2,841,599
Copyright © 2021 www.secdatabase.com. All Rights Reserved.Please Consider the Environment Before Printing This Document

THE JAPANESE SMALL COMPANY SERIESCONTINUED
Shares Value»INFORMATION TECHNOLOGY � (Continued)
VINX Corp. 13,200 $132,096# Wacom Co., Ltd. 927,100 6,247,974
Wellnet Corp. 10,100 51,069# YAC Holdings Co., Ltd. 62,600 553,900# Yamaichi Electronics Co., Ltd. 144,700 1,966,381# Yashima Denki Co., Ltd. 119,500 1,077,151
YE DIGITAL Corp. 7,100 44,531Yokowo Co., Ltd. 95,500 2,348,500Zuken, Inc. 1,900 48,620
TOTAL INFORMATION TECHNOLOGY 429,322,629MATERIALS � (11.1%)
Achilles Corp. 92,400 1,241,137ADEKA Corp. 604,300 11,878,267Agro-Kanesho Co., Ltd. 1,300 19,164Aichi Steel Corp. 66,400 2,231,090Arakawa Chemical Industries, Ltd. 110,100 1,314,116Araya Industrial Co., Ltd. 19,600 310,294
# Asahi Holdings, Inc. 455,700 8,753,534Asahi Printing Co., Ltd. 25,700 217,070Asahi Yukizai Corp. 86,600 1,175,577Asahipen Corp. 2,100 38,051Asia Pile Holdings Corp. 210,800 1,018,929C Uyemura & Co., Ltd. 35,900 2,559,426Carlit Holdings Co., Ltd. 122,800 814,314Chuetsu Pulp & Paper Co., Ltd. 49,900 571,999Chugoku Marine Paints, Ltd. 355,300 3,202,334CI Takiron Corp. 291,200 1,789,313
# CK-San-Etsu Co., Ltd. 21,200 798,747Dai Nippon Toryo Co., Ltd. 131,600 1,081,540Daido Steel Co., Ltd. 155,000 7,191,299
# Daiichi Kigenso Kagaku-Kogyo Co., Ltd. 127,500 1,508,200Daiken Corp. 78,100 1,557,120Daiki Aluminium Industry Co., Ltd. 180,300 1,752,396Dainichiseika Color & Chemicals Manufacturing Co., Ltd. 84,300 1,884,542Daito Chemix Corp. 2,900 28,838DKS Co., Ltd. 47,800 1,590,795Dowa Holdings Co., Ltd. 116,905 4,877,878Dynapac Co., Ltd. 8,500 111,021Fuji Seal International, Inc. 191,300 4,284,820Fujikura Kasei Co., Ltd. 167,500 806,951Fujimori Kogyo Co., Ltd. 107,900 4,400,146Fuso Chemical Co., Ltd. 122,500 4,509,807Geostr Corp. 57,100 221,300Godo Steel, Ltd. 60,000 1,181,047Gun-Ei Chemical Industry Co., Ltd. 29,900 683,266Hakudo Co., Ltd. 43,900 707,552
# Harima Chemicals Group, Inc. 96,100 820,598Hodogaya Chemical Co., Ltd. 39,100 1,710,235
# Hokkan Holdings, Ltd. 56,100 741,639Hokko Chemical Industry Co., Ltd. 120,700 1,280,202
# Hokuetsu Corp. 772,899 3,625,297Honshu Chemical Industry Co., Ltd. 25,800 425,381Ise Chemicals Corp. 13,000 396,623
# Ishihara Chemical Co., Ltd. 35,500 724,916
Copyright © 2021 www.secdatabase.com. All Rights Reserved.Please Consider the Environment Before Printing This Document

Ishihara Sangyo Kaisha, Ltd. 207,750 1,713,641* Ishizuka Glass Co., Ltd. 12,900 233,171# JCU Corp. 139,300 5,263,225# JSP Corp. 81,100 1,364,411
Copyright © 2021 www.secdatabase.com. All Rights Reserved.Please Consider the Environment Before Printing This Document

THE JAPANESE SMALL COMPANY SERIESCONTINUED
Shares Value»MATERIALS � (Continued)
Kaneka Corp. 87,200 $3,588,588Kanto Denka Kogyo Co., Ltd. 279,100 2,261,707Katakura & Co-op Agri Corp. 21,500 246,673KeePer Technical Laboratory Co., Ltd. 99,000 2,216,822KH Neochem Co., Ltd. 216,800 5,489,682
# Kimoto Co., Ltd. 222,300 432,621Koatsu Gas Kogyo Co., Ltd. 202,193 1,345,315
* Kobe Steel, Ltd. 1,747,900 11,848,585Kohsoku Corp. 70,200 945,833Konishi Co., Ltd. 216,600 3,517,028Konoshima Chemical Co., Ltd. 31,600 455,391Krosaki Harima Corp. 30,400 1,347,415Kumiai Chemical Industry Co., Ltd. 205,287 1,866,243
# Kunimine Industries Co., Ltd. 40,400 467,567Kureha Corp. 104,150 7,205,011Kurimoto, Ltd. 59,300 939,052Kuriyama Holdings Corp. 78,000 497,848Kyoei Steel, Ltd. 135,500 2,033,623
# Kyowa Leather Cloth Co., Ltd. 81,300 553,929Lintec Corp. 265,600 6,015,744Maruichi Steel Tube, Ltd. 86,600 1,979,585MEC Co., Ltd. 100,400 2,193,142
# Mitani Sekisan Co., Ltd. 67,400 2,440,365Mitsubishi Paper Mills, Ltd. 277,700 950,830
* Mitsubishi Steel Manufacturing Co., Ltd. 53,500 424,077Mitsui Mining & Smelting Co., Ltd. 379,600 13,209,602
# Molitec Steel Co., Ltd. 83,100 327,328# MORESCO Corp. 39,800 406,910
Mory Industries, Inc. 34,700 831,164Nakayama Steel Works, Ltd. 169,700 669,861Neturen Co., Ltd. 222,100 1,225,213
# New Japan Chemical Co., Ltd. 117,500 311,445Nicca Chemical Co., Ltd. 45,700 379,896
# Nichia Steel Works, Ltd. 138,600 412,881# Nihon Kagaku Sangyo Co., Ltd. 83,100 945,650
Nihon Nohyaku Co., Ltd. 243,500 1,198,207Nihon Parkerizing Co., Ltd. 517,500 5,598,989
# Nihon Yamamura Glass Co., Ltd. 67,600 626,113# Nippon Carbide Industries Co., Inc. 46,200 561,060
Nippon Chemical Industrial Co., Ltd. 42,600 1,148,524# Nippon Concrete Industries Co., Ltd. 293,100 1,092,350
Nippon Denko Co., Ltd. 767,314 2,396,546# Nippon Fine Chemical Co., Ltd. 79,200 1,074,125
Nippon Kayaku Co., Ltd. 310,700 3,004,741Nippon Light Metal Holdings Co., Ltd. 360,090 7,230,978
# Nippon Paper Industries Co., Ltd. 450,400 5,402,582# Nippon Pillar Packing Co., Ltd. 134,200 2,264,305
Nippon Soda Co., Ltd. 155,000 4,898,138Nippon Yakin Kogyo Co., Ltd. 89,749 1,670,628Nitta Gelatin, Inc. 85,500 518,598Nittetsu Mining Co., Ltd. 35,200 2,171,196Nozawa Corp. 47,500 310,760Oat Agrio Co., Ltd. 18,000 244,919Okamoto Industries, Inc. 69,900 2,658,044
Copyright © 2021 www.secdatabase.com. All Rights Reserved.Please Consider the Environment Before Printing This Document

Okura Industrial Co., Ltd. 55,200 1,029,788Osaka Organic Chemical Industry, Ltd. 95,200 3,205,720Osaka Soda Co., Ltd. 94,699 2,257,566Osaka Steel Co., Ltd. 89,300 1,149,882
# OSAKA Titanium Technologies Co., Ltd. 127,500 1,108,489
Copyright © 2021 www.secdatabase.com. All Rights Reserved.Please Consider the Environment Before Printing This Document
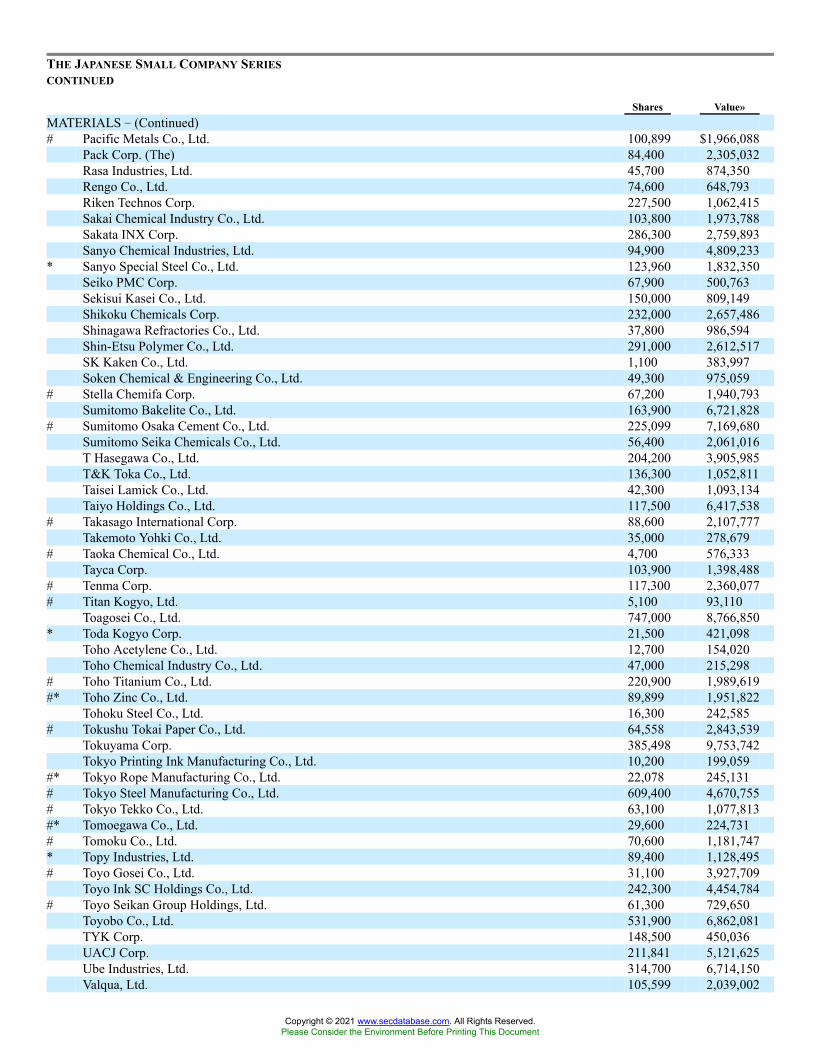
THE JAPANESE SMALL COMPANY SERIESCONTINUED
Shares Value»MATERIALS � (Continued)# Pacific Metals Co., Ltd. 100,899 $1,966,088
Pack Corp. (The) 84,400 2,305,032Rasa Industries, Ltd. 45,700 874,350Rengo Co., Ltd. 74,600 648,793Riken Technos Corp. 227,500 1,062,415Sakai Chemical Industry Co., Ltd. 103,800 1,973,788Sakata INX Corp. 286,300 2,759,893Sanyo Chemical Industries, Ltd. 94,900 4,809,233
* Sanyo Special Steel Co., Ltd. 123,960 1,832,350Seiko PMC Corp. 67,900 500,763Sekisui Kasei Co., Ltd. 150,000 809,149Shikoku Chemicals Corp. 232,000 2,657,486Shinagawa Refractories Co., Ltd. 37,800 986,594Shin-Etsu Polymer Co., Ltd. 291,000 2,612,517SK Kaken Co., Ltd. 1,100 383,997Soken Chemical & Engineering Co., Ltd. 49,300 975,059
# Stella Chemifa Corp. 67,200 1,940,793Sumitomo Bakelite Co., Ltd. 163,900 6,721,828
# Sumitomo Osaka Cement Co., Ltd. 225,099 7,169,680Sumitomo Seika Chemicals Co., Ltd. 56,400 2,061,016T Hasegawa Co., Ltd. 204,200 3,905,985T&K Toka Co., Ltd. 136,300 1,052,811Taisei Lamick Co., Ltd. 42,300 1,093,134Taiyo Holdings Co., Ltd. 117,500 6,417,538
# Takasago International Corp. 88,600 2,107,777Takemoto Yohki Co., Ltd. 35,000 278,679
# Taoka Chemical Co., Ltd. 4,700 576,333Tayca Corp. 103,900 1,398,488
# Tenma Corp. 117,300 2,360,077# Titan Kogyo, Ltd. 5,100 93,110
Toagosei Co., Ltd. 747,000 8,766,850* Toda Kogyo Corp. 21,500 421,098
Toho Acetylene Co., Ltd. 12,700 154,020Toho Chemical Industry Co., Ltd. 47,000 215,298
# Toho Titanium Co., Ltd. 220,900 1,989,619#* Toho Zinc Co., Ltd. 89,899 1,951,822
Tohoku Steel Co., Ltd. 16,300 242,585# Tokushu Tokai Paper Co., Ltd. 64,558 2,843,539
Tokuyama Corp. 385,498 9,753,742Tokyo Printing Ink Manufacturing Co., Ltd. 10,200 199,059
#* Tokyo Rope Manufacturing Co., Ltd. 22,078 245,131# Tokyo Steel Manufacturing Co., Ltd. 609,400 4,670,755# Tokyo Tekko Co., Ltd. 63,100 1,077,813#* Tomoegawa Co., Ltd. 29,600 224,731# Tomoku Co., Ltd. 70,600 1,181,747* Topy Industries, Ltd. 89,400 1,128,495# Toyo Gosei Co., Ltd. 31,100 3,927,709
Toyo Ink SC Holdings Co., Ltd. 242,300 4,454,784# Toyo Seikan Group Holdings, Ltd. 61,300 729,650
Toyobo Co., Ltd. 531,900 6,862,081TYK Corp. 148,500 450,036UACJ Corp. 211,841 5,121,625Ube Industries, Ltd. 314,700 6,714,150Valqua, Ltd. 105,599 2,039,002
Copyright © 2021 www.secdatabase.com. All Rights Reserved.Please Consider the Environment Before Printing This Document
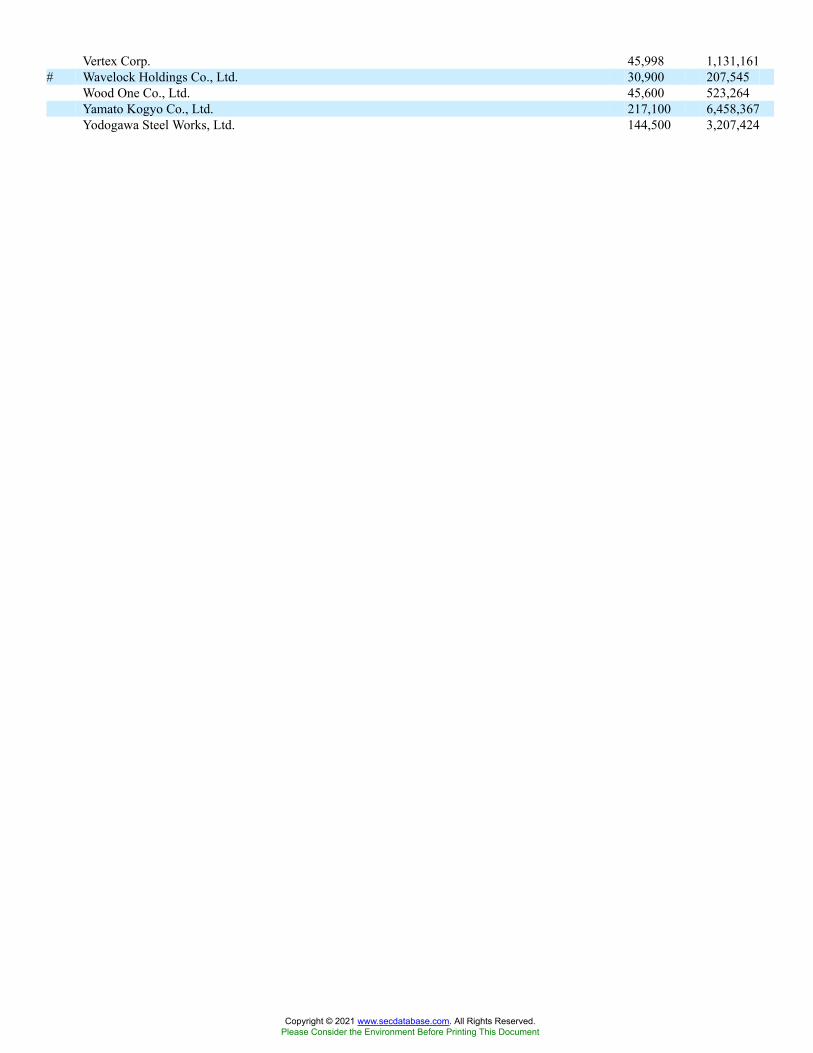
Vertex Corp. 45,998 1,131,161# Wavelock Holdings Co., Ltd. 30,900 207,545
Wood One Co., Ltd. 45,600 523,264Yamato Kogyo Co., Ltd. 217,100 6,458,367Yodogawa Steel Works, Ltd. 144,500 3,207,424
Copyright © 2021 www.secdatabase.com. All Rights Reserved.Please Consider the Environment Before Printing This Document

THE JAPANESE SMALL COMPANY SERIESCONTINUED
Shares Value»MATERIALS � (Continued)
Yotai Refractories Co., Ltd. 118,000 $1,096,991Yushiro Chemical Industry Co., Ltd. 67,000 697,531
TOTAL MATERIALS 370,438,473REAL ESTATE � (1.6%)
AD Works Group Co., Ltd. 194,879 290,847Airport Facilities Co., Ltd. 138,870 737,345Anabuki Kosan, Inc. 12,900 232,188
# Aoyama Zaisan Networks Co., Ltd. 43,700 633,267Apaman Co., Ltd. 71,700 386,040Ardepro Co., Ltd. 70,700 38,451Arealink Co., Ltd. 29,600 310,586
# B-Lot Co., Ltd. 40,000 254,066Cosmos Initia Co., Ltd. 94,400 381,213CRE, Inc. 3,400 41,193Daibiru Corp. 314,900 4,073,846Dear Life Co., Ltd. 132,800 545,979Goldcrest Co., Ltd. 103,270 1,585,720
# Good Com Asset Co., Ltd. 22,800 292,320Grandy House Corp. 95,600 418,159Heiwa Real Estate Co., Ltd. 229,400 7,176,965Ichigo, Inc. 1,187,800 3,524,730
* Japan Asset Marketing Co., Ltd. 1,296,000 1,370,390Japan Corporate Housing Service, Inc. 11,700 107,869
# Japan Property Management Center Co., Ltd. 83,400 976,865JSB Co., Ltd. 7,400 220,760Katitas Co., Ltd. 73,100 2,042,850Keihanshin Building Co., Ltd. 216,700 2,918,194
* Miyakoshi Holdings, Inc. 3,000 25,046Mugen Estate Co., Ltd. 64,200 300,422Nippon Commercial Development Co., Ltd. 82,300 1,279,222
# Nisshin Group Holdings Co., Ltd. 210,700 931,078Prospect Co., Ltd. 2,912,000 947,044
# Raysum Co., Ltd. 97,800 798,519SAMTY Co., Ltd. 145,350 2,670,134Sankyo Frontier Co., Ltd. 23,100 815,732Sansei Landic Co., Ltd. 29,100 226,886Shinoken Group Co., Ltd. 112,600 1,292,252Star Mica Holdings Co., Ltd. 84,400 927,411Starts Corp., Inc. 225,500 5,931,704Sun Frontier Fudousan Co., Ltd. 204,700 1,794,318Takara Leben Co., Ltd. 547,800 1,851,057TOC Co., Ltd. 325,750 2,325,645Tokyo Rakutenchi Co., Ltd. 19,000 828,743
# Tokyo Theatres Co., Inc. 47,099 541,241Tosei Corp. 202,900 2,055,441Urbanet Corp. Co., Ltd. 81,400 233,458Yoshicon Co., Ltd. 3,100 29,521
TOTAL REAL ESTATE 54,364,717UTILITIES � (1.5%)# EF-ON, Inc. 88,520 882,407# eRex Co., Ltd. 142,500 2,386,019
Hiroshima Gas Co., Ltd. 322,200 1,211,613Hokkaido Electric Power Co., Inc. 1,093,200 4,999,208
Copyright © 2021 www.secdatabase.com. All Rights Reserved.Please Consider the Environment Before Printing This Document

# Hokkaido Gas Co., Ltd. 98,500 1,427,798# Hokuriku Electric Power Co. 911,200 6,245,066# Hokuriku Gas Co., Ltd. 10,100 288,345
Copyright © 2021 www.secdatabase.com. All Rights Reserved.Please Consider the Environment Before Printing This Document

THE JAPANESE SMALL COMPANY SERIESCONTINUED
Shares Value»UTILITIES � (Continued)
K&O Energy Group, Inc. 100,400 $1,332,929Nippon Gas Co., Ltd. 611,100 10,644,532
# Okinawa Electric Power Co., Inc. (The) 303,716 4,261,094# Saibu Gas Co., Ltd. 223,700 6,414,221
Shikoku Electric Power Co., Inc. 460,200 3,582,704Shizuoka Gas Co., Ltd. 339,500 3,056,639
# Toell Co., Ltd. 57,500 485,754West Holdings Corp. 133,003 4,162,967
TOTAL UTILITIES 51,381,296TOTAL COMMON STOCKS
Cost ($2,542,369,091) 3,127,720,247
Value��SECURITIES LENDING COLLATERAL � (6.7%)@§ The DFA Short Term Investment Fund 19,307,486 223,387,612TOTAL INVESTMENTS � (100.0%)
(Cost $2,765,742,576)^^ $3,351,107,859
Summary of the Series� investments as of March 31, 2021, based on their valuation inputs, is as follows (see Security Valuation Note):
Investments in Securities (Market Value)Level 1 Level 2 Level 3 Total
Common StocksCommunication Services � $90,185,845 � $90,185,845Consumer Discretionary � 470,408,248 � 470,408,248Consumer Staples � 236,817,516 � 236,817,516Energy � 33,950,541 � 33,950,541Financials � 284,097,537 � 284,097,537Health Care � 140,930,205 � 140,930,205Industrials � 965,823,240 � 965,823,240Information Technology � 429,322,629 � 429,322,629Materials � 370,438,473 � 370,438,473Real Estate � 54,364,717 � 54,364,717Utilities � 51,381,296 � 51,381,296
Securities Lending Collateral � 223,387,612 � 223,387,612TOTAL � $3,351,107,859 � $3,351,107,859
Copyright © 2021 www.secdatabase.com. All Rights Reserved.Please Consider the Environment Before Printing This Document

THE ASIA PACIFIC SMALL COMPANY SERIES
SUMMARY SCHEDULE OF PORTFOLIO HOLDINGS
March 31, 2021
(Unaudited)
Shares Value»COMMON STOCKS � (98.7%)AUSTRALIA � (58.6%)* 3P Learning, Ltd. 93,233 $91,296# 5G Networks, Ltd. 35,296 31,503* A2B Australia, Ltd. 267,268 244,661
Accent Group, Ltd. 2,095,327 3,596,395# Adairs, Ltd. 643,521 1,867,377
Adbri, Ltd. 2,564,728 6,792,300#* Advance NanoTek, Ltd. 4,230 13,185* Ainsworth Game Technology, Ltd. 399,992 246,164#* Alkane Resources, Ltd. 2,214,509 1,164,974* Alliance Aviation Services, Ltd. 149,763 447,671
ALS, Ltd. 1,933,329 14,294,949Altium, Ltd. 165,829 3,351,574
#* Altura Mining, Ltd. 1,171,741 23,362Alumina, Ltd. 5,128,836 6,814,777
#* AMA Group, Ltd. 2,283,100 967,028* Amaysim Australia, Ltd. 1,851,450 295,430
AMP, Ltd. 1,092,335 1,053,167Ansell, Ltd. 534,625 15,982,562APN Property Group, Ltd. 59,773 24,306Appen, Ltd. 144,558 1,749,119
* Arafura Resources, Ltd. 1,591,642 199,994ARB Corp., Ltd. 533,754 14,032,185
#* Ardent Leisure Group, Ltd. 2,770,378 1,959,349Asaleo Care, Ltd. 1,167,762 1,241,801AUB Group, Ltd. 478,705 7,008,994
# Aurelia Metals, Ltd. 5,287,455 1,491,358Austal, Ltd. 2,278,005 3,889,983
* Australian Agricultural Co., Ltd. 3,439,805 3,137,100# Australian Ethical Investment, Ltd. 22,322 120,501
Australian Finance Group, Ltd. 1,604,223 3,218,226Australian Pharmaceutical Industries, Ltd. 2,800,625 2,724,568
#* Australian Strategic Materials, Ltd. 442,903 1,596,769Australian Strategic Materials, Ltd. 50,401 181,074Australian Vintage, Ltd. 4,317,004 2,376,330Auswide Bank, Ltd. 112,639 570,232
# Ava Risk Group, Ltd. 27,751 9,520# AVJennings, Ltd. 7,058,528 2,898,354#* AVZ Minerals, Ltd. 1,847,793 275,199* Axsesstoday, Ltd. 1,687 5
Baby Bunting Group, Ltd. 429,435 1,818,959Bank of Queensland, Ltd. 3,982,680 26,239,954
* Bannerman Resources, Ltd. 189,736 17,361Bapcor, Ltd. 2,252,217 12,874,558Base Resources, Ltd. 393,323 89,666Beach Energy, Ltd. 7,499,201 9,805,889Bega Cheese, Ltd. 2,143,926 10,350,531Bell Financial Group, Ltd. 122,493 166,941Bendigo & Adelaide Bank, Ltd. 2,114,458 16,194,679
Copyright © 2021 www.secdatabase.com. All Rights Reserved.Please Consider the Environment Before Printing This Document

* Berkeley Energia, Ltd. 27,600 12,264# Bingo Industries, Ltd. 1,091,685 2,516,379# Blackmores, Ltd. 97,147 5,899,797# Bravura Solutions, Ltd. 1,664,952 3,241,363
Breville Group, Ltd. 821,653 16,914,132Brickworks, Ltd. 512,139 8,133,744BWX, Ltd. 587,374 2,065,341
Copyright © 2021 www.secdatabase.com. All Rights Reserved.Please Consider the Environment Before Printing This Document

THE ASIA PACIFIC SMALL COMPANY SERIESCONTINUED
Shares Value»AUSTRALIA � (Continued)* Byron Energy, Ltd. 89,192 $8,494
Capitol Health, Ltd. 3,495,372 917,664# Cardno, Ltd. 1,127,842 524,348#* Carnarvon Petroleum, Ltd. 3,381,086 669,528
Carsales.com, Ltd. 1,191,399 16,201,977# Cash Converters International, Ltd. 2,766,362 483,295#* Catapult Group International, Ltd. 401,552 579,195
CDS Technologies, Ltd. 13,276 0Cedar Woods Properties, Ltd. 422,690 2,169,725
* Central Petroleum, Ltd. 299,384 31,876Centrebet Litigation 81,336 0Centrebet Litigation Claim 81,336 0
# Challenger, Ltd. 2,246,123 10,944,179* Champion Iron, Ltd. 428,652 1,794,730#* City Chic Collective, Ltd. 187,917 570,020
Class, Ltd. 386,717 491,328* Clean Seas Seafood, Ltd. 87,730 44,740* Clean TeQ Holdings, Ltd. 8,692 19,212
Cleanaway Waste Management, Ltd. 7,046,328 11,830,248Clinuvel Pharmaceuticals, Ltd. 108,279 2,232,133
# Clover Corp., Ltd. 365,203 511,868Codan, Ltd. 670,501 7,885,262
#* Collection House, Ltd. 2,084,920 356,310Collins Foods, Ltd. 745,683 5,922,708
#* Cooper Energy, Ltd. 11,837,413 2,435,044#* Corporate Travel Management, Ltd. 650,080 9,733,223
Costa Group Holdings, Ltd. 2,640,354 9,530,593# Credit Corp. Group, Ltd. 495,925 12,397,026
CSR, Ltd. 3,273,096 14,408,813#* Dacian Gold, Ltd. 687,075 172,548
Data#3, Ltd. 962,073 3,811,577* Decmil Group, Ltd. 424,759 195,093
Deterra Royalties, Ltd. 1,655,501 4,948,928# Dicker Data, Ltd. 231,853 1,796,103* Domain Holdings Australia, Ltd. 1,576,647 5,054,252
Downer EDI, Ltd. 2,782,821 10,890,623# Eagers Automotive, Ltd. 775,292 8,283,269#* Eclipx Group, Ltd. 2,008,091 2,986,261# Elanor Investor Group 87,848 100,236
Elders, Ltd. 1,232,076 11,658,782#* Electro Optic Systems Holdings, Ltd. 497,236 1,975,956#* Emeco Holdings, Ltd. 1,441,745 1,044,486#* EML Payments, Ltd. 16,229 60,981
Enero Group, Ltd. 10,609 26,391EQT Holdings, Ltd. 99,023 1,808,315
* Estia Health, Ltd. 1,663,088 2,723,285Euroz, Ltd. 116,329 137,400
# EVENT Hospitality and Entertainment, Ltd. 546,035 4,774,671* FAR, Ltd. 12,771,552 39,773
Finbar Group, Ltd. 203,868 129,475Fleetwood, Ltd. 347,465 682,593
#* Flight Centre Travel Group, Ltd. 581,094 7,986,894* Fluence Corp., Ltd. 116,395 18,546#* Freedom Foods Group, Ltd. 362,595 129,402
Copyright © 2021 www.secdatabase.com. All Rights Reserved.Please Consider the Environment Before Printing This Document

# G8 Education, Ltd. 5,316,355 4,196,397#* Galaxy Resources, Ltd. 3,083,972 5,964,609#* Genex Power, Ltd. 298,371 48,857
Genex Power, Ltd. 164,104 0Genex Power, Ltd. 252,576 41,247
Copyright © 2021 www.secdatabase.com. All Rights Reserved.Please Consider the Environment Before Printing This Document

THE ASIA PACIFIC SMALL COMPANY SERIESCONTINUED
Shares Value»AUSTRALIA � (Continued)
Genworth Mortgage Insurance Australia, Ltd. 1,475,090 $2,875,099* Geopacific Resources, Ltd. 14,236 3,142
Geopacific Resources, Ltd. 19,080 4,203Gold Road Resources, Ltd. 3,183,092 2,668,229GR Engineering Services, Ltd. 55,230 51,333GrainCorp, Ltd., Class A 1,547,172 6,189,014Grange Resources, Ltd. 524,857 191,673
* Greenland Minerals, Ltd. 1,692,337 225,323GTN, Ltd. 15,394 5,132GUD Holdings, Ltd. 860,592 7,668,802GWA Group, Ltd. 1,782,472 3,879,657Hansen Technologies, Ltd. 1,293,047 5,345,721Healius, Ltd. 4,144,191 12,891,936
# Helloworld Travel, Ltd. 51,370 84,270* Highfield Resources, Ltd. 160,730 87,639* Horizon Oil, Ltd. 714,889 45,156* Hot Chili, Ltd. 971,208 29,673
HT&E, Ltd. 1,686,962 2,231,633# HUB24, Ltd. 281,179 4,452,688#* Humm Group, Ltd. 2,755,893 2,021,480* IDM International, Ltd. 958 0
IDP Education, Ltd. 13,647 248,319IGO, Ltd. 3,925,542 18,824,535Iluka Resources, Ltd. 1,655,501 9,118,523
* Image Resources NL 332,933 48,219Imdex, Ltd. 2,381,029 2,946,293
#* ImpediMed, Ltd. 417,437 39,700* Incitec Pivot, Ltd. 4,974,729 11,007,106
Infomedia, Ltd. 2,776,535 3,171,172# Inghams Group, Ltd. 2,191,759 5,566,210* Intega Group, Ltd. 1,127,842 340,853
Integral Diagnostics, Ltd. 311,931 1,126,696# Integrated Research, Ltd. 611,969 1,082,067# InvoCare, Ltd. 1,056,358 9,018,874* ioneer, Ltd. 361,132 93,609
IOOF Holdings, Ltd. 3,815,495 10,223,313IPH, Ltd. 1,243,670 6,279,130IRESS, Ltd. 1,225,060 8,581,572IVE Group, Ltd. 513,788 553,970Japara Healthcare, Ltd. 1,594,623 898,149JB Hi-Fi, Ltd. 91,817 3,623,784Johns Lyng Group, Ltd. 414,722 1,216,045Jumbo Interactive, Ltd. 208,843 2,018,513Jupiter Mines, Ltd. 4,784,049 1,144,740
#* Karoon Energy, Ltd. 3,390,788 2,792,055#* Kingsgate Consolidated, Ltd. 1,132,755 735,957
Kogan.com, Ltd. 292,389 2,678,353Lednium Technology Pty, Ltd. 195,019 0Lifestyle Communities, Ltd. 132,875 1,391,958Link Administration Holdings, Ltd. 1,812,772 7,098,696
#* Livetiles, Ltd. 344,818 56,604# Lovisa Holdings, Ltd. 152,650 1,669,862* Lynas Rare Earths, Ltd. 5,868,035 27,639,412
MACA, Ltd. 1,622,774 1,265,357
Copyright © 2021 www.secdatabase.com. All Rights Reserved.Please Consider the Environment Before Printing This Document

Macmahon Holdings, Ltd. 5,344,671 813,874* Macquarie Telecom Group, Ltd. 1,458 52,619* Mayne Pharma Group, Ltd. 9,518,774 2,538,253
McMillan Shakespeare, Ltd. 490,350 4,075,994# McPherson�s, Ltd. 653,702 713,954
Copyright © 2021 www.secdatabase.com. All Rights Reserved.Please Consider the Environment Before Printing This Document

THE ASIA PACIFIC SMALL COMPANY SERIESCONTINUED
Shares Value»AUSTRALIA � (Continued)
Medusa Mining, Ltd. 475,938 $282,176#* Mesoblast, Ltd. 1,561,474 2,585,823#* Metals X, Ltd. 3,565,919 569,531
Metcash, Ltd. 7,963,936 22,348,119# Michael Hill International, Ltd. 1,490,263 717,967* Millennium Minerals, Ltd. 1,065,474 0
Mineral Resources, Ltd. 853,620 24,779,397* MMA Offshore, Ltd. 1,249,410 309,265# MNF Group, Ltd. 196,094 773,018# Moelis Australia, Ltd. 76,325 293,869
Monadelphous Group, Ltd. 566,488 4,505,800Monash IVF Group, Ltd. 1,738,681 1,045,308
# Money3 Corp., Ltd. 926,438 2,052,180* Morning Star Gold NL 332,749 0# Mortgage Choice, Ltd. 792,577 1,157,592
Motorcycle Holdings, Ltd. 19,615 36,830Mount Gibson Iron, Ltd. 3,756,776 2,176,331
#* Myanmar Metals, Ltd. 494,858 26,311#* Myer Holdings, Ltd. 3,707,181 905,344
MyState, Ltd. 549,554 1,825,417* Nanosonics, Ltd. 158,101 687,416
Navigator Global Investments, Ltd. 864,297 972,578* nearmap, Ltd. 1,938,623 2,992,956#* Neometals, Ltd. 626,513 176,686
Netwealth Group, Ltd. 406,590 4,182,853# New Energy Solar, Ltd. 201,504 119,476# New Hope Corp., Ltd. 2,234,532 2,417,771* NEXTDC, Ltd. 1,024,875 8,162,762
nib holdings, Ltd. 3,098,293 12,349,231Nick Scali, Ltd. 400,543 3,039,670Nickel Mines, Ltd. 602,916 563,234Nine Entertainment Co. Holdings, Ltd. 9,297,395 19,647,943Northern Star Resources, Ltd. 451,498 3,270,526NRW Holdings, Ltd. 2,939,598 4,420,374
* Nufarm, Ltd. 1,868,539 7,560,394Objective Corp., Ltd. 6,233 60,452OFX Group, Ltd. 1,813,799 1,518,306
* Oklo Resources, Ltd. 202,639 22,308# OM Holdings, Ltd. 342,290 174,335
Omni Bridgeway, Ltd. 2,382,146 6,381,302#* oOh!media, Ltd. 3,082,993 4,102,807* Ora Banda Mining, Ltd. 674,394 125,788* Orocobre, Ltd. 166,529 605,439
Orora, Ltd. 6,339,374 14,680,354Over the Wire Holdings, Ltd. 16,080 52,352OZ Minerals, Ltd. 2,162,237 37,714,628Pacific Current Group, Ltd. 259,417 1,069,079
# Pacific Smiles Group, Ltd. 272,678 518,975Pact Group Holdings, Ltd. 1,422,949 3,811,917
#* Paladin Energy, Ltd. 1,591,886 449,816* Panoramic Resources, Ltd. 10,316,364 1,064,422#* Pantoro, Ltd. 1,023,926 147,679#* Peak Resources, Ltd. 224,220 14,860
Peet, Ltd. 928,220 810,525
Copyright © 2021 www.secdatabase.com. All Rights Reserved.Please Consider the Environment Before Printing This Document

Pendal Group, Ltd. 1,950,282 9,652,076People Infrastructure, Ltd. 40,407 114,849Perenti Global, Ltd. 4,835,224 3,749,447
# Perpetual, Ltd. 405,248 10,202,303#* Perseus Mining, Ltd. 9,066,296 7,411,668
Copyright © 2021 www.secdatabase.com. All Rights Reserved.Please Consider the Environment Before Printing This Document

THE ASIA PACIFIC SMALL COMPANY SERIESCONTINUED
Shares Value»AUSTRALIA � (Continued)
Platinum Asset Management, Ltd. 2,013,396 $7,669,803* Poseidon Nickel, Ltd. 643,832 27,976
PPK Group, Ltd. 17,813 72,421#* Praemium, Ltd. 1,152,591 557,757
Premier Investments, Ltd. 622,552 12,351,659# Pro Medicus, Ltd. 300,101 9,460,220
Probiotec, Ltd. 7,178 11,739Propel Funeral Partners, Ltd. 58,013 135,923PSC Insurance Group, Ltd. 91,885 229,369PWR Holdings, Ltd. 208,570 909,213QANTM Intellectual Property, Ltd. 15,371 11,988Qube Holdings, Ltd. 669,320 1,527,980
* Quickstep Holdings, Ltd. 134,452 6,346Ramelius Resources, Ltd. 4,758,357 5,357,340
* ReadyTech Holdings, Ltd. 8,492 11,954# Reckon, Ltd. 391,834 234,213#* Red 5, Ltd. 6,878,068 812,045* Redbubble, Ltd. 126,785 485,345
Redcape Hotel Group 111,772 84,079# Regis Healthcare, Ltd. 863,552 1,355,002# Regis Resources, Ltd. 3,283,753 7,266,284#* Reject Shop, Ltd. (The) 109,654 525,684
Reliance Worldwide Corp., Ltd. 4,342,033 14,869,653# Resimac Group, Ltd. 12,006 19,749#* Resolute Mining, Ltd. 8,007,059 2,688,078* Retail Food Group, Ltd. 3,048,355 169,557# Rhipe, Ltd. 298,914 355,145
Ridley Corp., Ltd. 1,862,695 1,702,775* RPMGlobal Holdings, Ltd. 220,542 230,968* Salmat, Ltd. 667,137 0
Sandfire Resources, Ltd. 1,249,475 5,094,519SeaLink Travel Group, Ltd. 369,244 2,573,221Select Harvests, Ltd. 880,705 4,189,622
# Senex Energy, Ltd. 1,196,550 2,643,713# Servcorp, Ltd. 342,954 861,168# Service Stream, Ltd. 2,572,185 2,089,325#* Seven West Media, Ltd. 2,765,037 991,778
SG Fleet Group, Ltd. 393,656 771,424Shaver Shop Group, Ltd. 399,193 341,985
* Sigma Healthcare, Ltd. 6,192,917 3,200,067* Silver Lake Resources, Ltd. 6,142,732 7,008,217* Silver Mines, Ltd. 345,904 55,449
Sims, Ltd. 1,162,937 13,191,541SmartGroup Corp., Ltd. 674,100 3,254,795
* SomnoMed, Ltd. 25,160 38,278Southern Cross Electrical Engineering, Ltd. 75,077 28,748
* Southern Cross Media Group, Ltd. 1,320,693 2,088,559Spark Infrastructure Group 11,933,662 19,721,643
#* SpeedCast International Ltd. 1,497,915 0* Spirit Technology Solutions, Ltd. 64,859 18,285# SRG Global, Ltd. 330,321 114,328
St Barbara, Ltd. 5,328,067 7,985,542* Star Entertainment Grp, Ltd. (The) 3,693,648 10,690,310
Steadfast Group, Ltd. 5,683,479 16,512,402
Copyright © 2021 www.secdatabase.com. All Rights Reserved.Please Consider the Environment Before Printing This Document

#* Strike Energy, Ltd. 2,573,361 616,245Sunland Group, Ltd. 1,211,896 2,164,036Super Retail Group, Ltd. 1,139,326 10,235,953
#* Superloop, Ltd. 762,929 534,671#* Syrah Resources, Ltd. 2,676,718 2,141,970
Copyright © 2021 www.secdatabase.com. All Rights Reserved.Please Consider the Environment Before Printing This Document

THE ASIA PACIFIC SMALL COMPANY SERIESCONTINUED
Shares Value»AUSTRALIA � (Continued)# Tassal Group, Ltd. 1,531,815 $3,891,591
Technology One, Ltd. 1,748,272 12,463,619#* Temple & Webster Group, Ltd. 138,534 962,068* Tiger Resources, Ltd. 9,447,997 1,435
Tribune Resources, Ltd. 14,725 59,660United Malt Grp, Ltd. 1,771,214 5,486,469Virgin Australia Holdings, Ltd. 7,648,897 0Virtus Health, Ltd. 553,707 2,553,597Vita Group, Ltd. 503,915 333,934Viva Energy Group, Ltd. 3,832,748 4,912,630
#* Vmoto, Ltd. 267,457 90,863* Vocus Group, Ltd. 4,091,642 17,003,398#* Wagners Holding Co., Ltd. 122,838 178,291#* Webjet, Ltd. 2,056,935 8,771,395
Western Areas, Ltd. 2,254,139 3,525,087#* Westgold Resources, Ltd. 2,414,524 3,670,299* Whitehaven Coal, Ltd. 4,887,743 6,586,910* WPP AUNZ, Ltd. 1,788,160 885,971TOTAL AUSTRALIA 1,119,436,643CHINA � (0.2%)#* FIH Mobile, Ltd. 26,034,000 3,689,892
TK Group Holdings, Ltd. 1,482,000 570,576TOTAL CHINA 4,260,468HONG KONG � (22.1%)* Aceso Life Science Group, Ltd. 18,044,400 529,100
Aeon Credit Service Asia Co., Ltd. 986,000 693,504Allied Group, Ltd. 13,040,000 5,378,951APAC Resources, Ltd. 3,766,513 574,232
#* Apollo Future Mobility Group, Ltd. 8,436,000 542,925#* Applied Development Holdings, Ltd. 13,430,000 229,786* Arts Optical International Hldgs, Ltd. 614,000 59,467
Asia Financial Holdings, Ltd. 2,404,908 1,236,928* Asia Standard Hotel Group, Ltd. 4,961,654 146,303* Asia Standard International Group, Ltd. 13,222,917 1,858,743
Asiasec Properties, Ltd. 1,737,000 263,654ASM Pacific Technology, Ltd. 911,000 11,658,702Associated International Hotels, Ltd. 952,000 1,779,509Automated Systems Holdings, Ltd. 340,400 77,381Bel Global Resources Holdings, Ltd. 2,576,000 0Best Mart 360 Holdings, Ltd. 882,000 216,077BOC Aviation, Ltd. 292,000 2,841,741BOCOM International Holdings Co., Ltd. 943,000 193,192BOE Varitronix, Ltd. 3,807,293 1,668,860Bright Smart Securities & Commodities Group, Ltd. 1,644,000 451,143Brightoil Petroleum Holdings, Ltd. 9,034,000 326,889Build King Holdings, Ltd. 440,000 61,902
* Burwill Holdings, Ltd. 37,300,960 63,815# Cafe de Coral Holdings, Ltd. 3,090,000 6,716,180* Cathay Pacific Airways, Ltd. 189,000 176,847
Century City International Holdings, Ltd. 7,111,460 384,461# CGN Mining Co., Ltd. 5,570,000 374,762
Chen Hsong Holdings 1,296,000 404,137Cheuk Nang Holdings, Ltd. 771,714 283,534
Copyright © 2021 www.secdatabase.com. All Rights Reserved.Please Consider the Environment Before Printing This Document

Chevalier International Holdings, Ltd. 820,989 1,040,076* China Baoli Technologies Holdings, Ltd. 1,147,500 2,613* China Best Group Holding, Ltd. 849,999 40,053
Copyright © 2021 www.secdatabase.com. All Rights Reserved.Please Consider the Environment Before Printing This Document

THE ASIA PACIFIC SMALL COMPANY SERIESCONTINUED
Shares Value»HONG KONG � (Continued)* China Display Optoelectronics Technology Holdings, Ltd. 6,384,000 $407,185* China Energy Development Holdings, Ltd. 59,474,000 771,905
China Motor Bus Co., Ltd. 71,600 922,581* China Solar Energy Holdings, Ltd. 1,669,500 7,248#* China Star Entertainment, Ltd. 11,170,000 2,046,516* China Strategic Holdings, Ltd. 80,821,250 1,444,139* China Tonghai International Financial, Ltd. 1,300,000 41,513
Chinese Estates Holdings, Ltd. 3,108,500 1,621,029Chinney Investments, Ltd. 1,180,000 249,262Chong Hing Bank, Ltd. 244,000 309,597Chow Sang Sang Holdings International, Ltd. 2,417,000 3,741,373Chuang�s China Investments, Ltd. 8,811,407 501,162Chuang�s Consortium International, Ltd. 7,519,043 1,027,860CITIC Telecom International Holdings, Ltd. 13,794,125 4,886,434
# CK Life Sciences Intl Holdings, Inc. 18,634,000 1,973,319# CMBC Capital Holdings, Ltd. 17,640,000 240,007
CNQC International Holdings, Ltd. 4,052,500 406,673CNT Group, Ltd. 7,979,264 387,208
# Convenience Retail Asia, Ltd. 1,026,000 96,449#* Convoy Global Holdings, Ltd. 38,622,000 155,499
Crystal International Group, Ltd. 38,000 19,588# CSI Properties, Ltd. 47,866,383 1,540,743
Dah Sing Banking Group, Ltd. 3,977,516 4,501,715Dah Sing Financial Holdings, Ltd. 1,509,744 4,981,469Dickson Concepts International, Ltd. 1,620,500 863,386
#* Digital Domain Holdings, Ltd. 2,310,000 26,462* Dingyi Group Investment, Ltd. 300,000 3,394
Dynamic Holdings, Ltd. 96,000 165,384Eagle Nice International Holdings, Ltd. 2,194,000 1,334,885EcoGreen International Group, Ltd. 1,994,640 417,282
* Emperor Capital Group, Ltd. 31,611,000 590,997Emperor Entertainment Hotel, Ltd. 4,840,000 661,447Emperor International Holdings, Ltd. 10,584,753 1,511,524
* Emperor Watch & Jewellery, Ltd. 34,460,000 625,990* Energy International Investments Holdings, Ltd. 1,960,000 19,049* ENM Holdings, Ltd. 16,260,000 1,217,324* Esprit Holdings, Ltd. 11,506,550 1,143,127* Eternity Investment, Ltd. 820,000 27,488
Ezcom Holdings, Ltd. 72,576 0# Fairwood Holdings, Ltd. 826,100 1,811,557
Far East Consortium International, Ltd. 12,296,827 4,655,812First Pacific Co., Ltd. 15,728,000 5,200,012
* First Shanghai Investments, Ltd. 5,568,000 252,130Fosun Tourism Group 25,200 35,492Fountain SET Holdings, Ltd. 6,594,000 899,695Four Seas Mercantile Holdings, Ltd. 610,000 203,691
* Freeman Fintech Corp, Ltd. 13,680,000 29,739FSE Services Group, Ltd. 91,000 55,551GDH Guangnan Holdings., Ltd. 2,083,600 177,146
* Genting Hong Kong, Ltd. 2,702,000 212,314Get Nice Financial Group, Ltd. 2,438,600 308,411Giordano International, Ltd. 8,494,000 1,701,568Glorious Sun Enterprises, Ltd. 3,932,000 420,769
* Gold Peak Industries Holdings, Ltd. 3,029,642 265,423
Copyright © 2021 www.secdatabase.com. All Rights Reserved.Please Consider the Environment Before Printing This Document

Golden Resources Development International, Ltd. 4,082,500 330,774* Good Resources Holdings, Ltd. 6,860,000 56,298* Goodbaby International Holdings, Ltd. 6,163,000 1,137,740
Great Eagle Holdings, Ltd. 1,068,349 3,711,873#* Greater Bay Area Investments Group Holdings, Ltd. 18,640,000 23,977
Copyright © 2021 www.secdatabase.com. All Rights Reserved.Please Consider the Environment Before Printing This Document

THE ASIA PACIFIC SMALL COMPANY SERIESCONTINUED
Shares Value»HONG KONG � (Continued)* Greentech Technology International, Ltd. 8,860,000 $118,333* G-Resources Group, Ltd. 191,781,600 1,189,800
Guoco Group, Ltd. 2,000 24,583Guotai Junan International Holdings, Ltd. 31,755,797 5,864,347Haitong International Securities Group, Ltd. 21,115,400 6,751,816Hang Lung Group, Ltd. 2,564,000 6,499,484Hanison Construction Holdings, Ltd. 2,713,649 433,748
* Hans Energy Co., Ltd. 352,000 15,448# Harbour Centre Development, Ltd. 935,500 944,509
HKBN, Ltd. 3,773,500 5,496,383HKR International, Ltd. 7,149,369 2,969,633Hon Kwok Land Investment Co., Ltd. 388,800 147,965Hong Kong Ferry Holdings Co., Ltd. 1,007,300 779,981Hongkong & Shanghai Hotels, Ltd. (The) 3,648,489 3,633,992Hongkong Chinese, Ltd. 5,038,000 441,216Honma Golf, Ltd. 1,060,000 767,388Hsin Chong Group Holdings, Ltd. 10,243,403 86,437Hung Hing Printing Group, Ltd. 3,040,000 532,399Hutchison Telecommunications Hong Kong Holdings, Ltd. 13,164,000 2,510,273
* Hypebeast, Ltd. 2,320,000 263,623Hysan Development Co., Ltd. 2,192,000 8,577,642
#* I-CABLE Communications, Ltd. 4,080,000 34,222IGG, Inc. 9,421,000 12,179,534
* Imagi International Holdings, Ltd. 2,220,984 388,094International Housewares Retail Co., Ltd. 2,042,000 694,165IPE Group, Ltd. 3,345,000 305,106
* IRC, Ltd. 37,862,266 940,189* IT, Ltd. 5,060,532 1,874,126# ITC Properties Group, Ltd. 6,505,292 964,267
Jacobson Pharma Corp., Ltd. 3,616,000 447,067* JBM Healthcare, Ltd. 452,000 77,910
Johnson Electric Holdings, Ltd. 2,863,992 7,724,420K Wah International Holdings, Ltd. 1,588,000 824,996
* Kader Holdings Co., Ltd. 378,000 19,285Kam Hing International Holdings, Ltd. 1,270,000 63,611Karrie International Holdings, Ltd. 2,440,000 471,669Keck Seng Investments Hong Kong, Ltd. 912,600 362,421Kerry Logistics Network, Ltd. 4,063,500 12,183,204Kerry Properties, Ltd. 1,944,000 6,286,969Kingmaker Footwear Holdings, Ltd. 1,878,955 217,953Kowloon Development Co., Ltd. 3,133,000 3,448,631
* Kwoon Chung Bus Holdings, Ltd. 44,000 13,225* Lai Sun Development Co., Ltd. 1,976,896 1,632,101* Lai Sun Garment International, Ltd. 665,530 503,389
Lam Soon Hong Kong, Ltd. 325,310 662,142* Landing International Development, Ltd. 6,932,800 277,423
Landsea Green Properties Co., Ltd. 3,016,000 192,095Langham Hospitality Investments and Langham Hospitality Investments, Ltd. 3,960,750 607,761
* Lifestyle International Holdings, Ltd. 3,713,000 3,243,774Lippo China Resources, Ltd. 17,982,000 342,875Lippo, Ltd. 1,161,700 330,403Liu Chong Hing Investment, Ltd. 1,531,200 1,453,138L�Occitane International SA 2,278,500 6,378,782Luk Fook Holdings International, Ltd. 3,704,000 10,216,403
Copyright © 2021 www.secdatabase.com. All Rights Reserved.Please Consider the Environment Before Printing This Document

Lung Kee Bermuda Holdings 1,521,875 606,823Magnificent Hotel Investment, Ltd. 13,170,000 189,787Man Wah Holdings, Ltd. 7,668,400 15,949,323
* Mason Group Holdings, Ltd. 111,713,399 581,595
Copyright © 2021 www.secdatabase.com. All Rights Reserved.Please Consider the Environment Before Printing This Document

THE ASIA PACIFIC SMALL COMPANY SERIESCONTINUED
Shares Value»HONG KONG � (Continued)
Matrix Holdings, Ltd. 1,067,414 $274,839MECOM Power and Construction, Ltd. 1,716,000 1,025,717Melbourne Enterprises, Ltd. 39,500 799,660Melco International Development, Ltd. 2,383,000 4,864,433MGM China Holdings, Ltd. 150,800 268,139
#* MH Development, Ltd. 3,238,000 90,591* Midland Holdings, Ltd. 3,239,987 400,240
Ming Fai International Holdings, Ltd. 1,728,000 155,610Miramar Hotel & Investment 1,144,000 2,144,833Modern Dental Group, Ltd. 2,865,000 740,665NagaCorp., Ltd. 674,000 799,066
# Nameson Holdings, Ltd. 7,744,000 459,777Nanyang Holdings, Ltd. 133,500 696,507National Electronics Hldgs 2,668,600 362,153
* National United Resources Holdings, Ltd. 18,280,000 62,547* Neo-Neon Holdings, Ltd. 2,315,500 143,514#* NewOcean Energy Holdings, Ltd. 7,246,000 576,411# Nissin Foods Co., Ltd. 904,000 689,714
NWS Holdings, Ltd. 5,148,000 5,457,529Oriental Watch Holdings 2,669,120 902,200
#* Oshidori International Holdings, Ltd. 20,024,400 1,657,185Pacific Andes International Holdings, Ltd. 19,435,067 68,499Pacific Basin Shipping, Ltd. 33,421,000 9,051,210
* Pacific Century Premium Developments, Ltd. 354,240 34,771Pacific Textiles Holdings, Ltd. 8,088,000 5,184,732Pak Fah Yeow International, Ltd. 5,000 1,176Paliburg Holdings, Ltd. 3,180,830 844,267
* Paradise Entertainment, Ltd. 3,672,000 482,010* PC Partner Group, Ltd. 1,932,000 973,018# PCCW, Ltd. 10,624,545 6,000,015# Peace Mark Holdings, Ltd. 2,479,870 0* Pegasus International Holdings, Ltd. 100,000 10,612# Pentamaster International, Ltd. 736,000 168,914
Perfect Shape Medical, Ltd. 3,452,000 1,976,320Pico Far East Holdings, Ltd. 5,214,000 829,760
* Planetree International Development, Ltd. 76,000 8,086Playmates Holdings, Ltd. 7,082,000 794,073Plover Bay Technologies, Ltd. 2,032,000 361,505Pokfulam Development Co., Ltd. 130,000 199,033Polytec Asset Holdings, Ltd. 21,978,136 4,105,132
* PT International Development Co., Ltd. 8,345,150 402,866Public Financial Holdings, Ltd. 2,880,000 809,033
* PYI Corp., Ltd. 4,005,194 197,146PYXIS Group, Ltd. 1,936,000 0Regal Hotels International Holdings, Ltd. 2,953,800 1,170,754Regina Miracle International Holdings, Ltd. 1,983,000 590,863
* Renco Holdings Group, Ltd. 103,000 2,694#* Sa Sa International Holdings, Ltd. 5,060,961 1,163,973
Safety Godown Co., Ltd. 1,200,000 527,236* Samsonite International SA 5,346,000 10,396,602
SAS Dragon Holdings, Ltd. 2,182,000 801,103SEA Holdings, Ltd. 1,711,523 1,708,055
#* Shangri-La Asia, Ltd. 2,748,000 2,748,995# Shenwan Hongyuan HK, Ltd. 3,701,250 490,951
Copyright © 2021 www.secdatabase.com. All Rights Reserved.Please Consider the Environment Before Printing This Document

Shun Ho Property Investments, Ltd. 1,254,757 209,608Shun Tak Holdings, Ltd. 11,755,419 3,608,288
* Sincere Watch Hong Kong, Ltd. 4,450,000 39,623Sing Pao Media Enterprises 250,511 0
* Sing Tao News Corp., Ltd. 1,974,000 229,388
Copyright © 2021 www.secdatabase.com. All Rights Reserved.Please Consider the Environment Before Printing This Document

THE ASIA PACIFIC SMALL COMPANY SERIESCONTINUED
Shares Value»HONG KONG � (Continued)# Singamas Container Holdings, Ltd. 9,506,000 $734,316
SITC International Holdings Co., Ltd. 6,142,000 20,903,104SmarTone Telecommunications Holdings, Ltd. 2,175,481 1,271,051
* Solomon Systech International, Ltd. 10,960,000 636,385Soundwill Holdings, Ltd. 600,500 651,110
* South China Holdings Co., Ltd. 17,774,502 266,349Stella International Holdings, Ltd. 2,620,000 3,313,876
* Success Universe Group, Ltd. 1,392,000 25,251#* Summit Ascent Holdings, Ltd. 7,556,000 838,986
Sun Hung Kai & Co., Ltd. 5,271,429 2,686,812SUNeVision Holdings, Ltd. 2,464,000 2,552,927TAI Cheung Holdings, Ltd. 2,345,000 1,498,966Tai Sang Land Development, Ltd. 798,910 438,623
# Tan Chong International, Ltd. 1,176,000 310,003# Tao Heung Holdings, Ltd. 1,396,000 171,411
Television Broadcasts, Ltd. 2,131,700 2,222,907* Termbray Industries International Holdings, Ltd. 1,314,900 52,179
Texwinca Holdings, Ltd. 4,950,000 1,136,683* Theme International Holdings, Ltd. 5,990,000 349,706
Tian Teck Land, Ltd. 1,024,000 693,238* TOM Group, Ltd. 532,000 29,184#* Town Health International Medical Group, Ltd. 4,980,115 243,429
Tradelink Electronic Commerce, Ltd. 6,206,000 919,773Transport International Holdings, Ltd. 1,590,602 3,173,629Union Medical Healthcare, Ltd. 1,377,097 1,203,744United Laboratories International Holdings, Ltd. (The) 6,644,000 4,921,034
* Universal Technologies Holdings, Ltd. 1,730,000 56,980Untrade CW Group Holdings 1,361,500 7,583Untrade Gold Fin Holdings 9,580,000 0Untrade Master Glory GP 972,981 6,108
* Up Energy Development Group, Ltd. 3,929,000 12,231Value Partners Group, Ltd. 5,237,000 3,577,330Vanke Overseas Investment Holding Co., Ltd. 16,000 5,541Vedan International Holdings, Ltd. 3,576,000 368,452Vitasoy International Holdings, Ltd. 2,549,000 9,811,494
# VPower Group International Holdings, Ltd. 1,815,000 421,166VSTECS Holdings, Ltd. 6,665,600 6,079,548VTech Holdings, Ltd. 1,438,200 12,956,282Wai Kee Holdings, Ltd. 7,038,738 3,831,141Wang On Group, Ltd. 41,740,000 354,920
* Wealthking Investments, Ltd. 8,104,000 908,911Wing On Co. International, Ltd. 759,000 1,677,935Wing Tai Properties, Ltd. 2,187,331 1,210,614
* YGM Trading, Ltd. 274,000 79,918YT Realty Group, Ltd. 3,088,124 676,938YTO Express Holdings, Ltd. 424,000 303,076Yue Yuen Industrial Holdings, Ltd. 2,152,500 5,383,001
#* Yunfeng Financial Group, Ltd. 612,000 232,395# Zensun Enterprises, Ltd. 2,770,000 169,357* Zhaobangji Properties Holdings, Ltd. 856,000 82,620TOTAL HONG KONG 421,611,388NEW ZEALAND � (6.6%)#* AFT Pharmaceuticals, Ltd. 3,642 12,604* Air New Zealand, Ltd. 275,554 329,561
Copyright © 2021 www.secdatabase.com. All Rights Reserved.Please Consider the Environment Before Printing This Document

# Arvida Group, Ltd. 824,120 950,040Briscoe Group, Ltd. 23,531 91,512Chorus, Ltd. 3,018,063 14,929,824Colonial Motor Co., Ltd. (The) 144,588 899,097
Copyright © 2021 www.secdatabase.com. All Rights Reserved.Please Consider the Environment Before Printing This Document
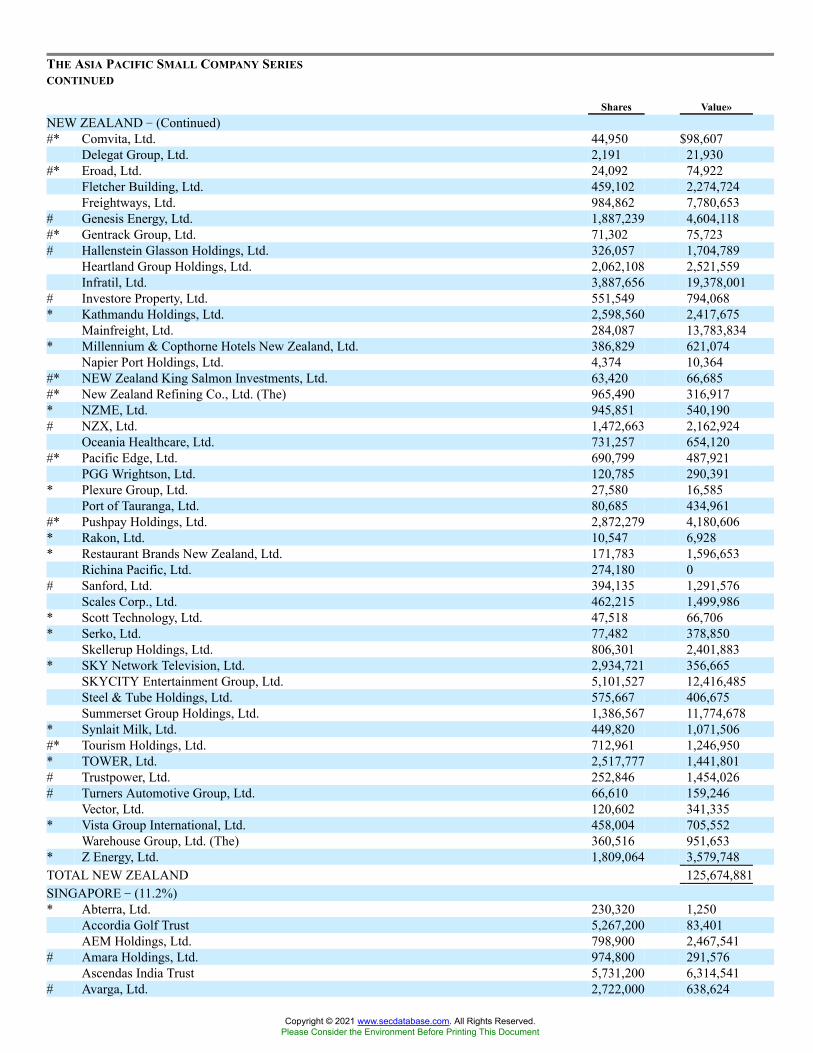
THE ASIA PACIFIC SMALL COMPANY SERIESCONTINUED
Shares Value»NEW ZEALAND � (Continued)#* Comvita, Ltd. 44,950 $98,607
Delegat Group, Ltd. 2,191 21,930#* Eroad, Ltd. 24,092 74,922
Fletcher Building, Ltd. 459,102 2,274,724Freightways, Ltd. 984,862 7,780,653
# Genesis Energy, Ltd. 1,887,239 4,604,118#* Gentrack Group, Ltd. 71,302 75,723# Hallenstein Glasson Holdings, Ltd. 326,057 1,704,789
Heartland Group Holdings, Ltd. 2,062,108 2,521,559Infratil, Ltd. 3,887,656 19,378,001
# Investore Property, Ltd. 551,549 794,068* Kathmandu Holdings, Ltd. 2,598,560 2,417,675
Mainfreight, Ltd. 284,087 13,783,834* Millennium & Copthorne Hotels New Zealand, Ltd. 386,829 621,074
Napier Port Holdings, Ltd. 4,374 10,364#* NEW Zealand King Salmon Investments, Ltd. 63,420 66,685#* New Zealand Refining Co., Ltd. (The) 965,490 316,917* NZME, Ltd. 945,851 540,190# NZX, Ltd. 1,472,663 2,162,924
Oceania Healthcare, Ltd. 731,257 654,120#* Pacific Edge, Ltd. 690,799 487,921
PGG Wrightson, Ltd. 120,785 290,391* Plexure Group, Ltd. 27,580 16,585
Port of Tauranga, Ltd. 80,685 434,961#* Pushpay Holdings, Ltd. 2,872,279 4,180,606* Rakon, Ltd. 10,547 6,928* Restaurant Brands New Zealand, Ltd. 171,783 1,596,653
Richina Pacific, Ltd. 274,180 0# Sanford, Ltd. 394,135 1,291,576
Scales Corp., Ltd. 462,215 1,499,986* Scott Technology, Ltd. 47,518 66,706* Serko, Ltd. 77,482 378,850
Skellerup Holdings, Ltd. 806,301 2,401,883* SKY Network Television, Ltd. 2,934,721 356,665
SKYCITY Entertainment Group, Ltd. 5,101,527 12,416,485Steel & Tube Holdings, Ltd. 575,667 406,675Summerset Group Holdings, Ltd. 1,386,567 11,774,678
* Synlait Milk, Ltd. 449,820 1,071,506#* Tourism Holdings, Ltd. 712,961 1,246,950* TOWER, Ltd. 2,517,777 1,441,801# Trustpower, Ltd. 252,846 1,454,026# Turners Automotive Group, Ltd. 66,610 159,246
Vector, Ltd. 120,602 341,335* Vista Group International, Ltd. 458,004 705,552
Warehouse Group, Ltd. (The) 360,516 951,653* Z Energy, Ltd. 1,809,064 3,579,748TOTAL NEW ZEALAND 125,674,881SINGAPORE � (11.2%)* Abterra, Ltd. 230,320 1,250
Accordia Golf Trust 5,267,200 83,401AEM Holdings, Ltd. 798,900 2,467,541
# Amara Holdings, Ltd. 974,800 291,576Ascendas India Trust 5,731,200 6,314,541
# Avarga, Ltd. 2,722,000 638,624
Copyright © 2021 www.secdatabase.com. All Rights Reserved.Please Consider the Environment Before Printing This Document

#* Banyan Tree Holdings, Ltd. 783,400 195,325# Best World International, Ltd. 2,911,550 547,160* Bonvests Holdings, Ltd. 950,000 677,868
Boustead Singapore, Ltd. 2,320,982 1,745,076
Copyright © 2021 www.secdatabase.com. All Rights Reserved.Please Consider the Environment Before Printing This Document

THE ASIA PACIFIC SMALL COMPANY SERIESCONTINUED
Shares Value»SINGAPORE � (Continued)
Bukit Sembawang Estates, Ltd. 1,236,103 $4,434,665Bund Center Investment, Ltd. 659,825 260,203
# Centurion Corp., Ltd. 1,405,100 360,629China Aviation Oil Singapore Corp., Ltd. 2,708,399 2,278,726China Sunsine Chemical Holdings, Ltd. 3,917,000 1,530,938Chip Eng Seng Corp., Ltd. 3,894,900 1,419,658Chuan Hup Holdings, Ltd. 3,937,600 643,604Civmec, Ltd. 162,700 67,835ComfortDelGro Corp., Ltd. 10,328,200 13,163,226
#* COSCO Shipping International Singapore Co., Ltd. 7,065,000 1,474,743#* Creative Technology, Ltd. 321,100 607,798
CSE Global, Ltd. 2,713,000 1,049,829# Del Monte Pacific, Ltd. 2,230,164 439,158
Delfi, Ltd. 979,700 584,578DMX Technologies Group, Ltd. 2,096,000 0
#* Ezion Holdings, Ltd. 9,845,878 59,286#* Ezra Holdings, Ltd. 8,161,986 12,499# Far East Orchard, Ltd. 1,249,303 1,040,021# First Resources, Ltd. 5,615,400 5,810,703# First Sponsor Group, Ltd. 484,728 504,027# Food Empire Holdings, Ltd. 1,473,700 1,030,579#* Fragrance Group, Ltd. 6,077,000 522,097
Fraser and Neave, Ltd. 241,400 260,490Frasers Property, Ltd. 93,500 83,499Frencken Group, Ltd. 2,124,300 2,425,309
# Fu Yu Corp., Ltd. 3,824,600 852,858* Gallant Venture, Ltd. 5,262,600 540,301* Geo Energy Resources, Ltd. 3,837,000 485,415# GK Goh Holdings, Ltd. 1,484,065 1,070,935
Golden Agri-Resources, Ltd. 38,086,600 5,966,108* Golden Energy & Resources, Ltd. 603,700 65,660* GP Industries, Ltd. 1,376,409 577,168# GuocoLand, Ltd. 1,932,314 2,416,145#* Halcyon Agri Corp., Ltd. 1,635,533 340,368# Hanwell Holdings, Ltd. 1,765,919 537,664# Haw Par Corp., Ltd. 385,000 3,767,180# Hiap Hoe, Ltd. 498,000 248,050
Ho Bee Land, Ltd. 1,656,200 3,129,895Hong Fok Corp., Ltd. 3,566,294 2,349,247Hong Fok Land, Ltd. 1,210,000 0Hong Leong Asia, Ltd. 2,025,000 1,156,445Hong Leong Finance, Ltd. 1,002,000 1,841,241Hotel Grand Central, Ltd. 1,660,083 1,333,742Hour Glass, Ltd. (The) 1,879,432 1,321,269HRnetgroup, Ltd. 130,100 64,893Hutchison Port Holdings Trust 25,256,400 5,698,450Hwa Hong Corp., Ltd. 2,123,500 465,350
#* Hyflux, Ltd. 3,707,700 458,088iFAST Corp., Ltd. 956,000 4,379,886
* Indofood Agri Resources, Ltd. 3,097,300 713,804# ISDN Holdings, Ltd. 374,200 168,719
Japfa, Ltd. 3,244,210 2,209,613# Jurong Technologies Industrial Corp., Ltd. 2,227,680 0# k1 Ventures, Ltd. 1,005,220 0
Copyright © 2021 www.secdatabase.com. All Rights Reserved.Please Consider the Environment Before Printing This Document
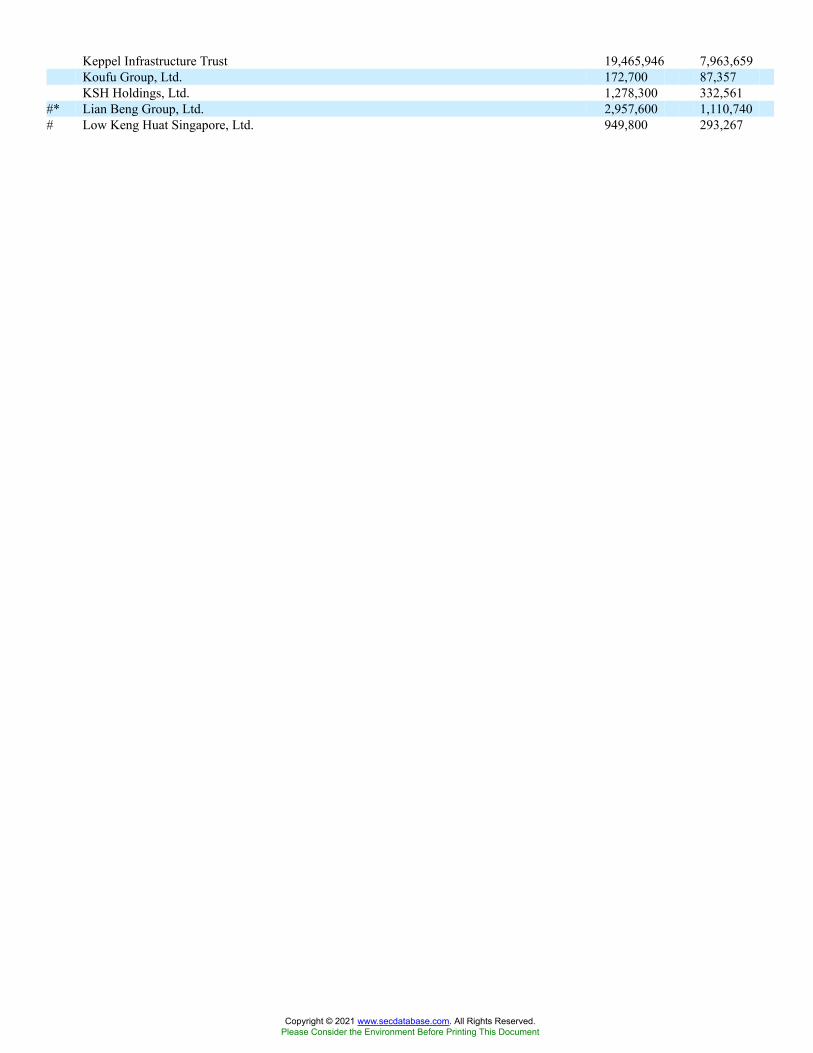
Keppel Infrastructure Trust 19,465,946 7,963,659Koufu Group, Ltd. 172,700 87,357KSH Holdings, Ltd. 1,278,300 332,561
#* Lian Beng Group, Ltd. 2,957,600 1,110,740# Low Keng Huat Singapore, Ltd. 949,800 293,267
Copyright © 2021 www.secdatabase.com. All Rights Reserved.Please Consider the Environment Before Printing This Document

THE ASIA PACIFIC SMALL COMPANY SERIESCONTINUED
Shares Value»SINGAPORE � (Continued)#* Mandarin Oriental International, Ltd. 1,497,700 $2,669,291
Metro Holdings, Ltd. 3,069,792 1,735,320Mewah International, Inc. 89,000 26,102
# Micro-Mechanics Holdings, Ltd. 84,500 200,638#* Midas Holdings, Ltd. 8,576,553 229,524#* mm2 Asia, Ltd. 3,521,000 155,048
NetLink NBN Trust 4,453,100 3,130,620# NSL, Ltd. 409,900 271,157#* Oceanus Group, Ltd. 8,888,300 256,004
OUE, Ltd. 2,207,800 2,053,264# Oxley Holdings, Ltd. 8,016,663 1,494,566
Pan-United Corp., Ltd. 2,435,750 554,041# Q&M Dental Group Singapore, Ltd. 2,102,100 1,001,448# QAF, Ltd. 1,665,280 1,213,202#* Raffles Education Corp., Ltd. 3,856,223 415,309
Raffles Medical Group, Ltd. 7,832,632 6,528,125Riverstone Holdings, Ltd. 2,862,600 2,622,731
# Roxy-Pacific Holdings, Ltd. 505,740 131,613#* SATS, Ltd. 1,492,200 4,833,086# SBS Transit, Ltd. 855,500 1,999,062
Sembcorp Industries, Ltd. 7,106,600 9,741,082#* Sembcorp Marine, Ltd. 44,540,812 5,647,664# Sheng Siong Group, Ltd. 5,499,100 6,299,540
SHS Holdings, Ltd. 2,175,300 261,686# SIA Engineering Co., Ltd. 2,031,100 3,284,049# SIIC Environment Holdings, Ltd. 5,890,920 898,628
Sinarmas Land, Ltd. 7,118,701 1,220,864Sing Holdings, Ltd. 1,579,500 487,954Sing Investments & Finance, Ltd. 350,675 364,966Singapore Post, Ltd. 12,106,600 6,311,695
# Singapore Press Holdings, Ltd. 7,633,400 8,699,835Singapore Reinsurance Corp., Ltd. 1,514,530 394,297Singapore Shipping Corp., Ltd. 1,640,700 324,089
# Stamford Land Corp., Ltd. 3,297,700 969,544StarHub, Ltd. 5,997,300 5,715,571Straco Corp., Ltd. 130,000 56,078Straits Trading Co., Ltd. 54,500 114,843Sunningdale Tech, Ltd. 1,295,460 1,588,990
#* Swiber Holdings, Ltd. 2,895,250 43,907# Tuan Sing Holdings, Ltd. 5,503,116 1,476,404# UMS Holdings, Ltd. 2,839,175 2,816,760# United Industrial Corp., Ltd. 141,069 274,876
United Overseas Insurance, Ltd. 181,850 980,439UOB-Kay Hian Holdings, Ltd. 2,318,060 2,831,150
# Valuetronics Holdings, Ltd. 3,079,850 1,387,924Vicom, Ltd. 568,400 921,962
# Wee Hur Holdings, Ltd. 2,769,000 430,512Wing Tai Holdings, Ltd. 4,165,367 5,947,891
# Yangzijiang Shipbuilding Holdings, Ltd. 8,286,100 7,905,865# Yeo Hiap Seng, Ltd. 223,731 148,415TOTAL SINGAPORE 214,040,171TOTAL COMMON STOCKS 1,885,023,551RIGHTS/WARRANTS � (0.0%)AUSTRALIA � (0.0%)
Copyright © 2021 www.secdatabase.com. All Rights Reserved.Please Consider the Environment Before Printing This Document
* Australian Strategic Materials, Ltd. Warrant 04/16/21 31,635 0
Copyright © 2021 www.secdatabase.com. All Rights Reserved.Please Consider the Environment Before Printing This Document

THE ASIA PACIFIC SMALL COMPANY SERIESCONTINUED
Shares Value»HONG KONG � (0.0%)* Esprit Holdings, Ltd. Warrant 04/14/21 5,753,275 $25,902SINGAPORE � (0.0%)#* Ezion Holdings, Ltd. Warrants 04/16/23 5,659,201 0* First Sponsor Group, Ltd. Warrants 03/21/29 121,181 29,728* mm2 Asia, Ltd. Warrant 04/08/21 3,521,000 15,705TOTAL SINGAPORE 45,433TOTAL RIGHTS/WARRANTS 71,335TOTAL INVESTMENT SECURITIES
(Cost $1,618,368,575) 1,885,094,886
Value��SECURITIES LENDING COLLATERAL � (1.3%)@§ The DFA Short Term Investment Fund 2,088,032 24,158,534TOTAL INVESTMENTS � (100.0%)
(Cost $1,642,522,820)^^ $1,909,253,420
Summary of the Series� investments as of March 31, 2021, based on their valuation inputs, is as follows (see Security Valuation Note):
Investments in Securities (Market Value)Level 1 Level 2 Level 3 Total
Common StocksAustralia $597,843 $1,118,838,800 � $1,119,436,643China � 4,260,468 � 4,260,468Hong Kong 345,316 421,266,072 � 421,611,388New Zealand � 125,674,881 � 125,674,881Singapore � 214,040,171 � 214,040,171
Rights/WarrantsHong Kong � 25,902 � 25,902Singapore � 45,433 � 45,433
Securities Lending Collateral � 24,158,534 � 24,158,534TOTAL $943,159 $1,908,310,261 � $1,909,253,420
Copyright © 2021 www.secdatabase.com. All Rights Reserved.Please Consider the Environment Before Printing This Document

THE UNITED KINGDOM SMALL COMPANY SERIES
SUMMARY SCHEDULE OF PORTFOLIO HOLDINGS
March 31, 2021
(Unaudited)
Shares Value»COMMON STOCKS � (98.4%)COMMUNICATION SERVICES � (2.6%)* 4imprint Group P.L.C. 151,995 $5,131,404* Ascential P.L.C. 566,257 2,628,836
Bloomsbury Publishing P.L.C. 262,372 1,032,815#* Centaur Media P.L.C. 254,249 138,418#* Cineworld Group P.L.C. 3,566,962 4,741,687
Daily Mail & General Trust P.L.C., Class A 1,013,252 12,654,746Euromoney Institutional Investor P.L.C. 678,928 8,924,271
* Frontier Developments P.L.C. 25,825 969,452Future P.L.C. 133,861 3,534,159Gamma Communications P.L.C. 72,623 1,641,592
#* Hyve Group P.L.C. 1,300,796 2,149,102* Kin & Carta P.L.C. 615,086 1,504,541* Next Fifteen Communications Group P.L.C. 21,318 199,167* Reach P.L.C. 2,111,014 6,282,095* STV Group P.L.C. 4,918 23,596TOTAL COMMUNICATION SERVICES 51,555,881CONSUMER DISCRETIONARY � (19.8%)
888 Holdings P.L.C. 1,923,050 10,463,631* AO World P.L.C. 149,170 606,385
Bellway P.L.C. 502,596 23,573,111* Card Factory P.L.C. 837,076 826,009* Coats Group P.L.C. 2,324,447 1,823,519* Countryside Properties P.L.C. 2,813,575 19,672,144* Crest Nicholson Holdings P.L.C. 1,771,568 9,945,437# Debenhams P.L.C. 6,862,458 0#* DFS Furniture P.L.C. 1,199,370 4,506,430#* Dignity P.L.C. 201,819 1,830,865* Dixons Carphone P.L.C. 4,761,380 9,382,618
Domino�s Pizza Group P.L.C. 3,370,017 16,121,714Dunelm Group P.L.C. 629,959 11,283,463
* Frasers Group P.L.C. 1,412,209 8,966,799* Fuller Smith & Turner P.L.C., Class A 145,156 1,721,128
Games Workshop Group P.L.C. 194,756 26,757,268Gamesys Group P.L.C. 420,215 11,189,691
* Greggs P.L.C. 617,131 19,101,996* Gym Group P.L.C. (The) 819,655 2,659,589* Halfords Group P.L.C. 1,274,323 6,673,969* Headlam Group P.L.C. 483,420 3,015,808
Henry Boot P.L.C. 520,199 1,900,229* Hollywood Bowl Group P.L.C. 244,388 775,415* Hostelworld Group P.L.C. 154,128 165,666* Inchcape P.L.C. 2,472,981 25,657,194* J D Wetherspoon P.L.C. 502,787 9,410,502* Joules Group P.L.C. 3,586 10,487* Lookers P.L.C. 1,317,719 962,612* Marks & Spencer Group P.L.C. 6,447,927 13,402,506* Marston�s P.L.C. 4,154,820 5,632,979
Copyright © 2021 www.secdatabase.com. All Rights Reserved.Please Consider the Environment Before Printing This Document

* Mitchells & Butlers P.L.C. 2,031,189 9,023,778MJ Gleeson P.L.C. 228,782 2,650,559Moneysupermarket.com Group P.L.C. 3,293,217 12,107,592
* Motorpoint group P.L.C. 48,046 172,406#* N Brown Group P.L.C. 992,550 897,756
Copyright © 2021 www.secdatabase.com. All Rights Reserved.Please Consider the Environment Before Printing This Document

THE UNITED KINGDOM SMALL COMPANY SERIESCONTINUED
Shares Value»CONSUMER DISCRETIONARY � (Continued)* On the Beach Group P.L.C. 754,984 $4,232,318* Pendragon P.L.C. 3,844,114 884,952
Pets at Home Group P.L.C. 3,218,903 18,354,480* Photo-Me International P.L.C. 1,345,982 1,054,938* Playtech P.L.C. 2,005,632 12,220,361#* PPHE Hotel Group, Ltd. 12,871 266,796* Rank Group P.L.C. 956,436 2,476,899
Redrow P.L.C. 1,433,942 12,414,863#* Restaurant Group P.L.C. (The) 569,302 961,480* Sportech P.L.C. 408,363 151,152* SSP Group P.L.C. 2,708,721 13,897,948* Studio Retail Group P.L.C. 211,086 770,335#* Superdry P.L.C. 286,415 1,002,933#* Ted Baker P.L.C. 100,022 155,250* TEN Entertainment Group P.L.C. 5,930 18,798# Thomas Cook Group P.L.C. 6,366,734 0
TI Fluid Systems P.L.C. 114,543 425,835* Topps Tiles P.L.C. 773,408 737,113
TUI AG 185,770 938,559* Vertu Motors P.L.C. 812,199 453,710
Vistry Group P.L.C. 952,828 14,308,372* Vitec Group P.L.C. (The) 208,551 3,291,278
Vivo Energy P.L.C. 276,363 369,819* Watches of Switzerland Group P.L.C. 45,254 411,912* WH Smith P.L.C. 637,672 15,799,058* William Hill P.L.C. 4,503,782 16,887,373* Young & Co�s Brewery P.L.C., Class A 839 16,820TOTAL CONSUMER DISCRETIONARY 395,394,607CONSUMER STAPLES � (6.2%)* A.G. Barr P.L.C. 725,645 4,895,895
Anglo-Eastern Plantations P.L.C. 118,624 995,650* Bakkavor Group P.L.C. 102,612 166,458
Britvic P.L.C. 1,585,438 18,253,552* C&C Group P.L.C. 544,330 2,103,877
Carr�s Group P.L.C. 349,511 645,250Cranswick P.L.C. 379,875 19,019,456Devro P.L.C. 1,090,025 2,899,680Fevertree Drinks P.L.C. 610,255 17,980,676
#* Greencore Group P.L.C. 3,440,003 7,433,917Hilton Food Group P.L.C. 275,615 4,060,639McBride P.L.C. 853,865 983,900
* Naked Wines P.L.C. 221,368 2,290,063Nichols P.L.C. 2,884 51,581
* Premier Foods P.L.C. 4,304,508 5,644,745PZ Cussons P.L.C. 1,705,648 6,266,195Stock Spirits Group P.L.C. 1,171,278 4,510,074Tate & Lyle P.L.C. 2,442,033 25,762,884
TOTAL CONSUMER STAPLES 123,964,492ENERGY � (2.0%)# Afren P.L.C. 5,446,344 0
Cairn Energy P.L.C. 3,196,867 7,503,467Diversified Gas & Oil P.L.C. 770,970 1,179,859
* EnQuest P.L.C. 9,216,228 2,250,865
Copyright © 2021 www.secdatabase.com. All Rights Reserved.Please Consider the Environment Before Printing This Document

# Genel Energy P.L.C. 785,321 1,883,715* Gulf Keystone Petroleum, Ltd. 1,319,637 3,249,112
Hunting P.L.C. 907,515 3,207,218
Copyright © 2021 www.secdatabase.com. All Rights Reserved.Please Consider the Environment Before Printing This Document
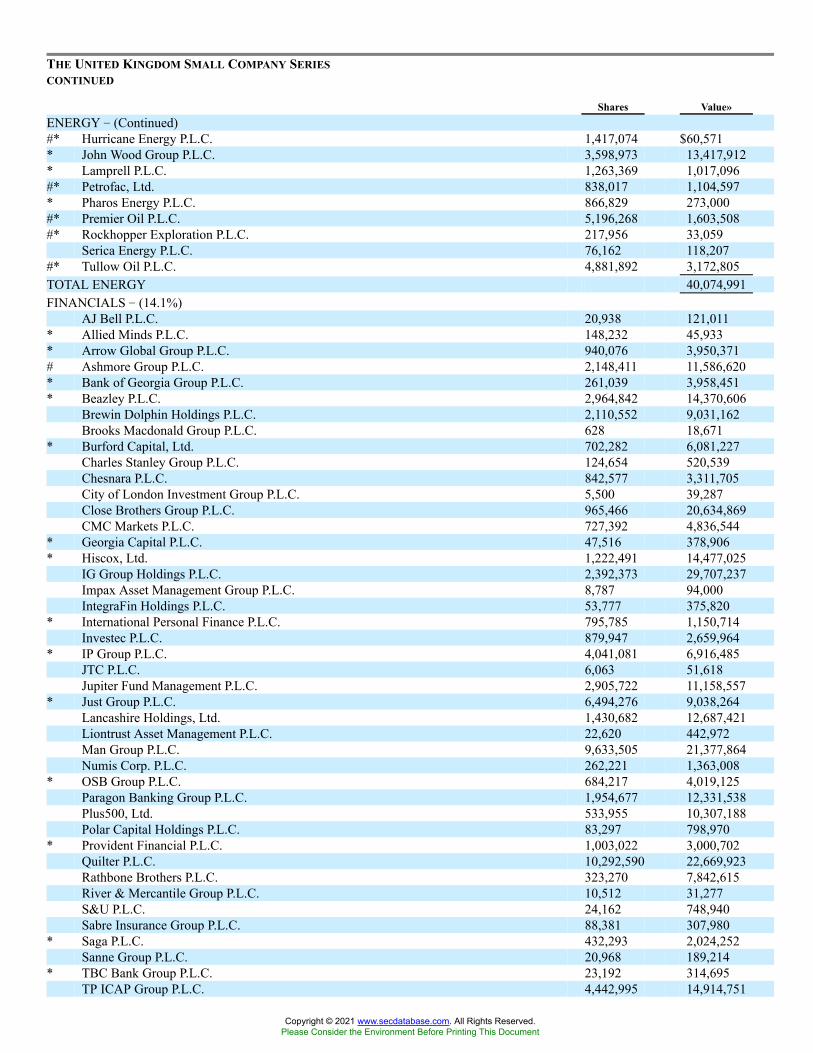
THE UNITED KINGDOM SMALL COMPANY SERIESCONTINUED
Shares Value»ENERGY � (Continued)#* Hurricane Energy P.L.C. 1,417,074 $60,571* John Wood Group P.L.C. 3,598,973 13,417,912* Lamprell P.L.C. 1,263,369 1,017,096#* Petrofac, Ltd. 838,017 1,104,597* Pharos Energy P.L.C. 866,829 273,000#* Premier Oil P.L.C. 5,196,268 1,603,508#* Rockhopper Exploration P.L.C. 217,956 33,059
Serica Energy P.L.C. 76,162 118,207#* Tullow Oil P.L.C. 4,881,892 3,172,805TOTAL ENERGY 40,074,991FINANCIALS � (14.1%)
AJ Bell P.L.C. 20,938 121,011* Allied Minds P.L.C. 148,232 45,933* Arrow Global Group P.L.C. 940,076 3,950,371# Ashmore Group P.L.C. 2,148,411 11,586,620* Bank of Georgia Group P.L.C. 261,039 3,958,451* Beazley P.L.C. 2,964,842 14,370,606
Brewin Dolphin Holdings P.L.C. 2,110,552 9,031,162Brooks Macdonald Group P.L.C. 628 18,671
* Burford Capital, Ltd. 702,282 6,081,227Charles Stanley Group P.L.C. 124,654 520,539Chesnara P.L.C. 842,577 3,311,705City of London Investment Group P.L.C. 5,500 39,287Close Brothers Group P.L.C. 965,466 20,634,869CMC Markets P.L.C. 727,392 4,836,544
* Georgia Capital P.L.C. 47,516 378,906* Hiscox, Ltd. 1,222,491 14,477,025
IG Group Holdings P.L.C. 2,392,373 29,707,237Impax Asset Management Group P.L.C. 8,787 94,000IntegraFin Holdings P.L.C. 53,777 375,820
* International Personal Finance P.L.C. 795,785 1,150,714Investec P.L.C. 879,947 2,659,964
* IP Group P.L.C. 4,041,081 6,916,485JTC P.L.C. 6,063 51,618Jupiter Fund Management P.L.C. 2,905,722 11,158,557
* Just Group P.L.C. 6,494,276 9,038,264Lancashire Holdings, Ltd. 1,430,682 12,687,421Liontrust Asset Management P.L.C. 22,620 442,972Man Group P.L.C. 9,633,505 21,377,864Numis Corp. P.L.C. 262,221 1,363,008
* OSB Group P.L.C. 684,217 4,019,125Paragon Banking Group P.L.C. 1,954,677 12,331,538Plus500, Ltd. 533,955 10,307,188Polar Capital Holdings P.L.C. 83,297 798,970
* Provident Financial P.L.C. 1,003,022 3,000,702Quilter P.L.C. 10,292,590 22,669,923Rathbone Brothers P.L.C. 323,270 7,842,615River & Mercantile Group P.L.C. 10,512 31,277S&U P.L.C. 24,162 748,940Sabre Insurance Group P.L.C. 88,381 307,980
* Saga P.L.C. 432,293 2,024,252Sanne Group P.L.C. 20,968 189,214
* TBC Bank Group P.L.C. 23,192 314,695TP ICAP Group P.L.C. 4,442,995 14,914,751
Copyright © 2021 www.secdatabase.com. All Rights Reserved.Please Consider the Environment Before Printing This Document
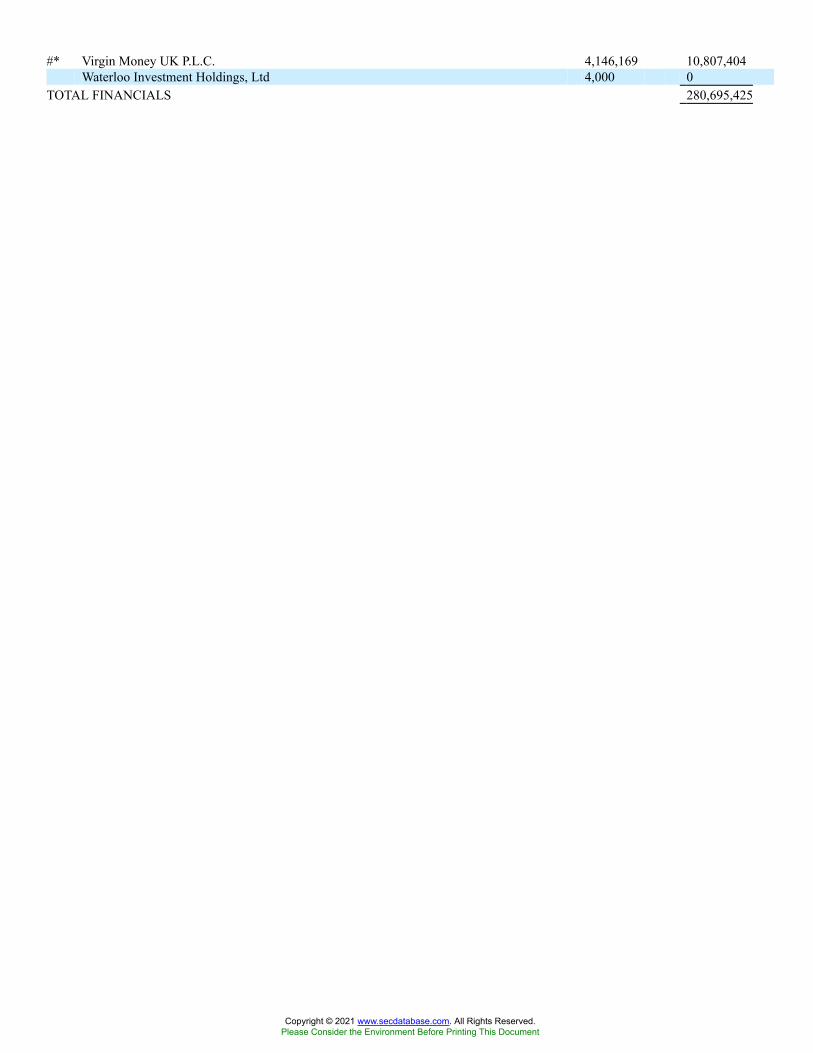
#* Virgin Money UK P.L.C. 4,146,169 10,807,404Waterloo Investment Holdings, Ltd 4,000 0
TOTAL FINANCIALS 280,695,425
Copyright © 2021 www.secdatabase.com. All Rights Reserved.Please Consider the Environment Before Printing This Document

THE UNITED KINGDOM SMALL COMPANY SERIESCONTINUED
Shares Value»HEALTH CARE � (3.1%)
Advanced Medical Solutions Group P.L.C 141,508 $455,731Alliance Pharma P.L.C. 1,594,283 2,065,539CareTech Holdings P.L.C. 260,873 1,934,375
#* Circassia Group P.L.C. 202,629 82,165Clinigen Group P.L.C. 229,356 2,452,122ConvaTec Group P.L.C. 1,076,276 2,909,256
* CVS Group P.L.C. 366,703 9,480,985EKF Diagnostics Holdings P.L.C. 43,005 46,261EMIS Group P.L.C. 273,584 4,149,785Genus P.L.C. 8,494 568,794
* Indivior P.L.C. 2,150,059 3,764,105Integrated Diagnostics Holdings P.L.C. 1,261,482 1,330,612
* Mediclinic International P.L.C. 2,438,263 9,612,566* PureTech Health P.L.C. 81,299 447,769* Spire Healthcare Group P.L.C. 1,733,464 3,995,615
UDG Healthcare P.L.C. 1,115,754 12,082,034* Vectura Group P.L.C. 4,085,018 6,509,265TOTAL HEALTH CARE 61,886,979INDUSTRIALS � (31.4%)
Aggreko P.L.C. 1,306,953 15,790,585Air Partner P.L.C. 253,425 235,527Avon Rubber P.L.C. 188,841 8,220,449
#* Babcock International Group P.L.C. 2,966,254 9,347,634* Balfour Beatty P.L.C. 4,538,052 18,466,542
Begbies Traynor Group P.L.C. 44,955 73,161* Biffa P.L.C. 1,196,429 4,384,159
Bodycote P.L.C. 1,256,928 14,320,330* Braemar Shipping Services P.L.C. 91,109 251,158
Chemring Group P.L.C. 1,806,230 6,622,849Clarkson P.L.C. 191,385 7,260,622Clipper Logistics P.L.C. 198,686 1,621,273
* Costain Group P.L.C. 237,261 188,827* De La Rue P.L.C. 449,522 1,280,331* Dialight P.L.C. 89,929 323,378
Diploma P.L.C. 650,354 22,866,108DiscoverIE Group P.L.C. 498,854 4,608,714Electrocomponents P.L.C. 1,667,511 22,835,432
#* Esken, Ltd. 1,517,493 714,747* Firstgroup P.L.C. 7,153,685 9,073,957* G4S P.L.C. 9,287,044 31,369,965
Galliford Try Holdings P.L.C. 463,722 811,593* Go-Ahead Group P.L.C. (The) 276,719 5,191,333
Goodwin P.L.C. 383 15,574Grafton Group P.L.C. 1,582,491 22,336,400
* Hays P.L.C. 8,263,185 17,025,357* Howden Joinery Group P.L.C. 580,448 5,865,204
IMI P.L.C. 1,740,984 32,004,364Industrial and Commercial Holding Group, Ltd. 5,000 0
# Interserve P.L.C. 629,566 0James Fisher & Sons P.L.C. 316,172 4,627,551James Halstead P.L.C. 8,111 55,692
* JET2 P.L.C. 403,306 7,045,731John Laing Group P.L.C. 2,506,978 10,825,937
* John Menzies P.L.C. 380,804 1,732,352
Copyright © 2021 www.secdatabase.com. All Rights Reserved.Please Consider the Environment Before Printing This Document

* Johnson Service Group P.L.C. 198,324 405,851Keller Group P.L.C. 465,858 5,160,969
* Kier Group P.L.C. 773,329 960,830Luceco P.L.C. 249,615 936,366
Copyright © 2021 www.secdatabase.com. All Rights Reserved.Please Consider the Environment Before Printing This Document

THE UNITED KINGDOM SMALL COMPANY SERIESCONTINUED
Shares Value»INDUSTRIALS � (Continued)* Mears Group P.L.C. 670,193 $1,792,064* Meggitt P.L.C. 2,977,030 19,575,938* Mitie Group P.L.C. 6,831,237 5,929,979
Morgan Advanced Materials P.L.C. 1,867,655 8,013,696Morgan Sindall Group P.L.C. 240,008 5,841,514
* National Express Group P.L.C. 2,738,577 11,622,225* Norcros P.L.C. 131,163 484,717* Pagegroup P.L.C. 2,063,842 13,388,777
PayPoint P.L.C. 409,596 3,333,121* Polypipe Group P.L.C. 1,352,535 10,351,011
Porvair P.L.C. 18,060 135,966QinetiQ Group P.L.C. 3,744,786 16,316,717Redde Northgate P.L.C. 1,996,988 8,483,977Renew Holdings P.L.C. 27,213 211,581
* Renewi P.L.C. 5,097,968 3,355,404Ricardo P.L.C. 291,046 1,725,921Robert Walters P.L.C. 392,744 3,302,043Rotork P.L.C. 5,397,898 26,531,054
* Royal Mail P.L.C. 5,014,011 34,896,231* RPS Group P.L.C. 940,773 1,218,423
RWS Holdings P.L.C. 641,629 5,386,626* Senior P.L.C. 2,283,856 3,485,556* Serco Group P.L.C. 1,035,024 1,960,897
Severfield P.L.C. 1,090,941 1,178,744* SIG P.L.C. 4,775,670 2,516,988* Signature Aviation P.L.C. 5,396,257 30,055,300
Smart Metering Systems P.L.C. 424,453 4,860,688* Speedy Hire P.L.C. 3,123,066 2,864,566* Stagecoach Group P.L.C. 2,510,475 3,478,261* SThree P.L.C. 766,760 4,075,048
T Clarke P.L.C. 64,142 97,482* Travis Perkins P.L.C. 1,545,039 32,850,466* Trifast P.L.C. 524,611 1,085,452* Tyman P.L.C. 935,887 4,806,850
Ultra Electronics Holdings P.L.C. 576,077 16,115,039Vesuvius P.L.C. 1,467,384 10,909,819Volex P.L.C. 341,719 1,586,756Volution Group P.L.C. 383,473 2,087,776Vp P.L.C. 156,511 1,755,514
* Weir Group P.L.C (The) 487,503 11,948,820Wilmington P.L.C. 334,384 899,195Wincanton P.L.C. 636,980 3,412,856XP Power, Ltd. 101,307 6,561,201
TOTAL INDUSTRIALS 625,347,111INFORMATION TECHNOLOGY � (6.9%)* Capita P.L.C. 7,411,267 4,452,008
Computacenter P.L.C. 537,371 17,555,010dotdigital group P.L.C. 54,013 124,338
* Equiniti Group P.L.C. 2,329,628 4,150,641FDM Group Holdings P.L.C. 381,786 5,291,568
* First Derivatives P.L.C. 15,666 573,342IDOX P.L.C. 79,223 68,804iomart Group P.L.C. 182,629 788,630
#* IQE P.L.C. 761,262 616,124
Copyright © 2021 www.secdatabase.com. All Rights Reserved.Please Consider the Environment Before Printing This Document

Kainos Group P.L.C. 391,260 8,044,216Learning Technologies Group P.L.C. 77,035 159,344Micro Focus International P.L.C. 625,598 4,779,121
# NCC Group P.L.C. 1,665,557 5,921,221
Copyright © 2021 www.secdatabase.com. All Rights Reserved.Please Consider the Environment Before Printing This Document

THE UNITED KINGDOM SMALL COMPANY SERIESCONTINUED
Shares Value»INFORMATION TECHNOLOGY � (Continued)
Oxford Instruments P.L.C. 343,175 $9,008,031Renishaw P.L.C. 106,065 9,364,591RM P.L.C. 351,353 1,082,355Softcat P.L.C. 755,673 18,883,931Spectris P.L.C. 649,656 29,799,830Spirent Communications P.L.C. 3,988,309 13,110,746Strix Group P.L.C. 206,915 768,113
* Telit Communications P.L.C. 143,592 412,706Trellus Health, Ltd. 1,632 0
* TT Electronics P.L.C. 1,053,269 3,339,048#* Xaar P.L.C. 223,245 440,787TOTAL INFORMATION TECHNOLOGY 138,734,505MATERIALS � (6.9%)* Accsys Technologies P.L.C. 9,505 21,620
Anglo Pacific Group P.L.C. 1,065,073 1,919,615Castings P.L.C. 165,113 855,096Centamin P.L.C. 7,348,995 10,533,461Central Asia Metals P.L.C. 507,903 1,750,984
* Elementis P.L.C. 2,934,605 5,075,932* Essentra P.L.C. 1,625,038 6,494,941
Ferrexpo P.L.C. 1,920,094 9,914,581#* Forterra P.L.C. 1,374,279 5,432,545* Gem Diamonds, Ltd. 384,962 354,608
Hill & Smith Holdings P.L.C. 536,254 10,880,026Hochschild Mining P.L.C. 1,698,439 4,583,229
* Ibstock P.L.C. 2,582,634 7,838,084KAZ Minerals P.L.C. 1,557,504 18,611,640
* Marshalls P.L.C. 1,419,950 13,397,029Pan African Resources P.L.C. 515,630 112,945
* Petropavlovsk P.L.C. 838,033 275,484Rhi Magnesita NV 106,971 6,219,556
* Scapa Group P.L.C. 89,332 264,085* SolGold P.L.C. 386,507 117,755
Synthomer P.L.C. 2,272,816 14,535,787Victrex P.L.C. 561,893 17,115,074Zotefoams P.L.C. 98,053 583,476
TOTAL MATERIALS 136,887,553REAL ESTATE � (3.9%)
CLS Holdings P.L.C. 684,455 2,161,026* Foxtons Group P.L.C. 1,164,669 1,021,246
Grainger P.L.C. 4,422,116 16,261,613Helical P.L.C. 783,105 4,462,917
* IWG P.L.C. 4,022,124 18,883,723* LSL Property Services P.L.C. 429,575 1,805,523* Purplebricks Group P.L.C. 65,365 83,760* Raven Property Group, Ltd. 871,934 354,505* Savills P.L.C. 960,490 15,125,186
St. Modwen Properties P.L.C. 2,692,487 15,027,905* U & I Group P.L.C. 729,169 936,835# Watkin Jones P.L.C. 521,040 1,531,640TOTAL REAL ESTATE 77,655,879UTILITIES � (1.5%)* Centrica P.L.C. 12,213,519 9,117,919
Copyright © 2021 www.secdatabase.com. All Rights Reserved.Please Consider the Environment Before Printing This Document

ContourGlobal P.L.C. 68,127 191,938Drax Group P.L.C. 2,382,905 13,809,301
Copyright © 2021 www.secdatabase.com. All Rights Reserved.Please Consider the Environment Before Printing This Document

THE UNITED KINGDOM SMALL COMPANY SERIESCONTINUED
Shares Value»UTILITIES � (Continued)
Telecom Plus P.L.C. 413,592 $7,240,894TOTAL UTILITIES 30,360,052TOTAL COMMON STOCKS
Cost ($1,553,195,921) 1,962,557,475
Value��SECURITIES LENDING COLLATERAL � (1.6%)@§ The DFA Short Term Investment Fund 2,681,989 31,030,615TOTAL INVESTMENTS � (100.0%)
(Cost $1,584,221,568)^^ $1,993,588,090
Summary of the Series� investments as of March 31, 2021, based on their valuation inputs, is as follows (see Security Valuation Note):
Investments in Securities (Market Value)Level 1 Level 2 Level 3 Total
Common StocksCommunication Services � $51,555,881 � $51,555,881Consumer Discretionary � 395,394,607 � 395,394,607Consumer Staples � 123,964,492 � 123,964,492Energy � 40,074,991 � 40,074,991Financials � 280,695,425 � 280,695,425Health Care � 61,886,979 � 61,886,979Industrials � 625,347,111 � 625,347,111Information Technology � 138,734,505 � 138,734,505Materials � 136,887,553 � 136,887,553Real Estate � 77,655,879 � 77,655,879Utilities � 30,360,052 � 30,360,052
Securities Lending Collateral � 31,030,615 � 31,030,615TOTAL � $1,993,588,090 � $1,993,588,090
Copyright © 2021 www.secdatabase.com. All Rights Reserved.Please Consider the Environment Before Printing This Document
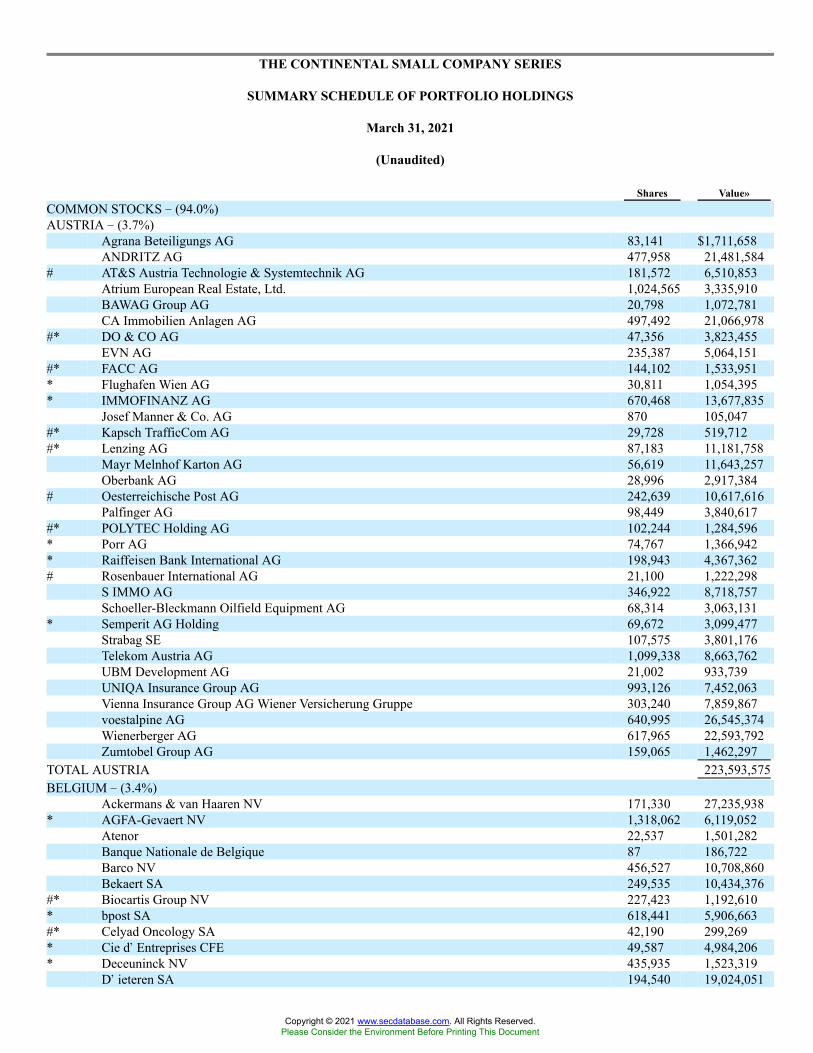
THE CONTINENTAL SMALL COMPANY SERIES
SUMMARY SCHEDULE OF PORTFOLIO HOLDINGS
March 31, 2021
(Unaudited)
Shares Value»COMMON STOCKS � (94.0%)AUSTRIA � (3.7%)
Agrana Beteiligungs AG 83,141 $1,711,658ANDRITZ AG 477,958 21,481,584
# AT&S Austria Technologie & Systemtechnik AG 181,572 6,510,853Atrium European Real Estate, Ltd. 1,024,565 3,335,910BAWAG Group AG 20,798 1,072,781CA Immobilien Anlagen AG 497,492 21,066,978
#* DO & CO AG 47,356 3,823,455EVN AG 235,387 5,064,151
#* FACC AG 144,102 1,533,951* Flughafen Wien AG 30,811 1,054,395* IMMOFINANZ AG 670,468 13,677,835
Josef Manner & Co. AG 870 105,047#* Kapsch TrafficCom AG 29,728 519,712#* Lenzing AG 87,183 11,181,758
Mayr Melnhof Karton AG 56,619 11,643,257Oberbank AG 28,996 2,917,384
# Oesterreichische Post AG 242,639 10,617,616Palfinger AG 98,449 3,840,617
#* POLYTEC Holding AG 102,244 1,284,596* Porr AG 74,767 1,366,942* Raiffeisen Bank International AG 198,943 4,367,362# Rosenbauer International AG 21,100 1,222,298
S IMMO AG 346,922 8,718,757Schoeller-Bleckmann Oilfield Equipment AG 68,314 3,063,131
* Semperit AG Holding 69,672 3,099,477Strabag SE 107,575 3,801,176Telekom Austria AG 1,099,338 8,663,762UBM Development AG 21,002 933,739UNIQA Insurance Group AG 993,126 7,452,063Vienna Insurance Group AG Wiener Versicherung Gruppe 303,240 7,859,867voestalpine AG 640,995 26,545,374Wienerberger AG 617,965 22,593,792Zumtobel Group AG 159,065 1,462,297
TOTAL AUSTRIA 223,593,575BELGIUM � (3.4%)
Ackermans & van Haaren NV 171,330 27,235,938* AGFA-Gevaert NV 1,318,062 6,119,052
Atenor 22,537 1,501,282Banque Nationale de Belgique 87 186,722Barco NV 456,527 10,708,860Bekaert SA 249,535 10,434,376
#* Biocartis Group NV 227,423 1,192,610* bpost SA 618,441 5,906,663#* Celyad Oncology SA 42,190 299,269* Cie d�Entreprises CFE 49,587 4,984,206* Deceuninck NV 435,935 1,523,319
D�ieteren SA 194,540 19,024,051
Copyright © 2021 www.secdatabase.com. All Rights Reserved.Please Consider the Environment Before Printing This Document

Econocom Group SA 727,792 2,851,484# Elia Group SA 132,252 14,564,646
Etablissements Franz Colruyt NV 1,697 101,171Euronav NV 1,353,879 12,392,619
* EVS Broadcast Equipment SA 69,287 1,462,541#* Exmar NV 145,690 609,020
Fagron 291,162 6,460,826
Copyright © 2021 www.secdatabase.com. All Rights Reserved.Please Consider the Environment Before Printing This Document

THE CONTINENTAL SMALL COMPANY SERIESCONTINUED
Shares Value»BELGIUM � (Continued)
Gimv NV 110,540 $6,609,742# Immobel SA 22,042 1,669,962# Ion Beam Applications 125,553 2,415,786* Jensen-Group NV 20,961 647,840#* Kinepolis Group NV 92,310 4,780,439
Lotus Bakeries NV 1,758 9,296,395#* MDxHealth 69,016 93,308
Melexis NV 111,148 11,757,045#* Ontex Group NV 360,468 3,796,340
Orange Belgium SA 184,054 4,941,864#* Oxurion NV 128,049 373,069# Picanol 26,368 2,330,139
Proximus SADP 193,630 4,212,984Recticel SA 272,024 3,961,061Resilux 5,788 1,113,367
* Roularta Media Group NV 19,318 325,070# Shurgard Self Storage SA 10,845 493,937* Sipef NV 36,491 1,967,561
Telenet Group Holding NV 181,801 7,369,284TER Beke SA 3,565 475,783
* Tessenderlo Group SA 208,770 9,163,931Van de Velde NV 38,938 1,143,440VGP NV 4,100 655,742Viohalco SA 498,361 2,896,964
TOTAL BELGIUM 210,049,708DENMARK � (5.2%)* ALK-Abello A.S. 43,541 16,533,826
Alm Brand A.S. 554,009 6,500,306#* Bang & Olufsen A.S. 614,019 2,926,866* BankNordik P/F 10,800 265,656* Bavarian Nordic A.S. 276,592 12,468,359* Brodrene Hartmann A.S. 16,148 1,328,775# cBrain A/S 625 20,796
Chemometec A/S 3,914 370,178* Columbus A.S. 381,353 924,732
D/S Norden A.S. 193,229 4,474,416* Dfds A.S. 288,567 14,755,434* Djurslands Bank A.S. 6,458 315,607* Drilling Co. of 1972 A.S. (The) 67,501 2,676,129# FLSmidth & Co. A.S. 250,483 9,596,134# Fluegger Group A.S. 4,198 490,531
GronlandsBANKEN A.S. 1,125 108,156H Lundbeck A.S. 21,136 721,718
* H+H International A.S., Class B 111,938 2,881,337* Harboes Bryggeri A.S., Class B 9,576 107,189* ISS A.S. 521,164 9,713,000* Jeudan A.S. 38,740 1,522,673* Jyske Bank A.S. 431,986 20,614,102
Lan & Spar Bank 4,981 400,378* Matas A.S. 239,471 3,136,227# Netcompany Group A.S. 12,638 1,203,724* Nilfisk Holding A.S. 153,943 4,694,645* NKT A.S. 269,569 11,710,565# NNIT A.S. 69,757 1,169,829
Copyright © 2021 www.secdatabase.com. All Rights Reserved.Please Consider the Environment Before Printing This Document

Pandora A.S. 192,255 20,561,552* Parken Sport & Entertainment A.S. 18,593 219,742
Per Aarsleff Holding A.S. 131,712 5,720,046Ringkjoebing Landbobank A.S. 192,088 18,764,387
Copyright © 2021 www.secdatabase.com. All Rights Reserved.Please Consider the Environment Before Printing This Document

THE CONTINENTAL SMALL COMPANY SERIESCONTINUED
Shares Value»DENMARK � (Continued)* Roblon A.S., Class B 973 $28,991
Rockwool International A.S., Class A 730 273,158Rockwool International A.S., Class B 11,400 4,798,217Royal Unibrew A.S. 327,792 34,265,285
# RTX A.S. 54,444 1,657,625Scandinavian Tobacco Group A.S., Class A 388,052 7,448,657Schouw & Co., A.S. 89,926 9,406,006
# SimCorp A.S. 260,025 32,195,339Solar A.S., Class B 38,054 2,872,433
* Spar Nord Bank A.S. 596,853 6,370,491Sydbank A.S. 471,338 12,698,635
#* Tivoli A.S. 9,878 1,164,595# Topdanmark A.S. 437,897 19,972,371# TORM P.L.C. 189,104 1,722,175
United International Enterprises, Ltd. 10,336 2,715,214* Vestjysk Bank A.S. 1,931,528 1,041,666* Zealand Pharma A.S. 183,481 5,804,389TOTAL DENMARK 321,332,262FINLAND � (6.0%)
Aktia Bank Oyj 324,379 3,744,621# Alandsbanken Abp, Class B 20,869 653,429
Alma Media Oyj 129,772 1,370,233# Altia Oyj 12,029 150,040
Apetit Oyj 19,668 307,792Aspo Oyj 103,690 1,079,190Atria Oyj 89,419 1,240,072
* BasWare Oyj 51,269 2,203,459#* Bittium Oyj 204,447 1,584,327# Cargotec Oyj, Class B 284,301 15,384,700# Caverion Oyj 646,986 3,924,055# Citycon Oyj 477,252 3,970,647
Digia Oyj 75,945 670,067# Enento Group Oyj 1,665 68,546#* Finnair Oyj 4,731,016 3,934,431
Fiskars Oyj Abp 211,905 3,944,237F-Secure Oyj 647,558 3,067,477
* Glaston Oyj ABP 9,217 9,182Harvia Oyj 664 23,995
* HKScan Oyj, Class A 234,984 631,278Huhtamaki Oyj 652,963 29,546,881Ilkka-Yhtyma Oyj 58,887 356,895Kamux Corp. 2,121 32,536Kemira Oyj 734,431 11,282,150Kojamo Oyj 205,926 4,034,033Konecranes Oyj 464,401 20,697,296
# Lassila & Tikanoja Oyj 209,178 3,427,526#* Lehto Group Oyj 159,853 330,935
Marimekko Oyj 247 14,015Metsa Board Oyj 1,300,465 14,160,155Metso Outotec Oyj 2,828,773 31,539,751Neles Oyj 667,333 8,472,255Nokian Renkaat Oyj 561,685 20,345,493Olvi Oyj, Class A 95,688 5,463,209Oriola Oyj, Class A 6,054 15,617
Copyright © 2021 www.secdatabase.com. All Rights Reserved.Please Consider the Environment Before Printing This Document
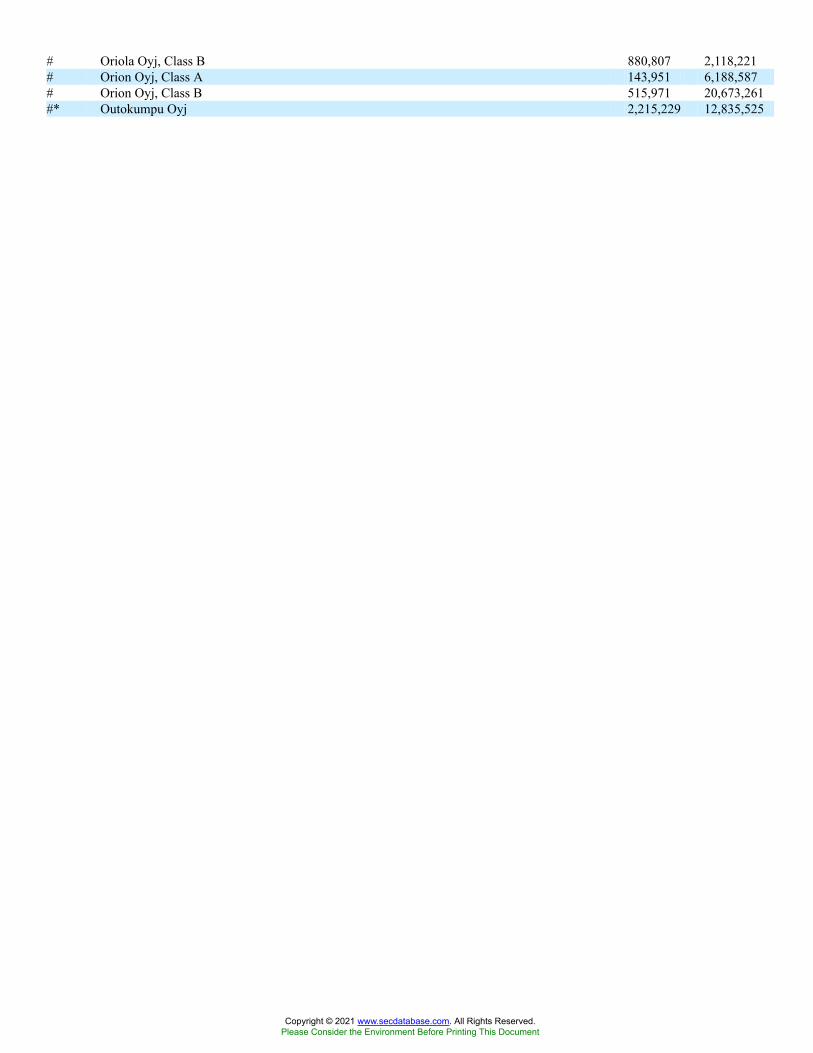
# Oriola Oyj, Class B 880,807 2,118,221# Orion Oyj, Class A 143,951 6,188,587# Orion Oyj, Class B 515,971 20,673,261#* Outokumpu Oyj 2,215,229 12,835,525
Copyright © 2021 www.secdatabase.com. All Rights Reserved.Please Consider the Environment Before Printing This Document

THE CONTINENTAL SMALL COMPANY SERIESCONTINUED
Shares Value»FINLAND � (Continued)* Pihlajalinna Oyj 77,064 $1,048,389# Ponsse Oyj 71,199 3,153,658* QT Group Oyj 56,327 5,902,512
Raisio Oyj, Class V 947,762 4,350,984* Rapala VMC Oyj 113,078 944,461
Raute Oyj, Class A 2,644 70,648# Revenio Group Oyj 129,671 7,699,100
Sanoma Oyj 730,928 12,277,577Teleste Oyj 52,966 319,216Terveystalo Oyj 24,688 342,660TietoEVRY Oyj 439,754 13,626,648
* Tikkurila Oyj 240,104 9,532,268Tokmanni Group Corp. 313,447 7,345,933Uponor Oyj 387,896 8,609,569Vaisala Oyj, Class A 120,241 4,492,893
# Valmet Oyj 889,683 32,393,982#* Viking Line Abp 7,869 137,380# Wartsila Oyj Abp 731,015 7,663,107# YIT Oyj 1,240,508 6,594,873TOTAL FINLAND 366,001,977FRANCE � (9.8%)
ABC arbitrage 84,953 722,433#* Akka Technologies 78,596 2,050,389
AKWEL 61,489 2,153,938Albioma SA 191,797 9,399,771ALD SA 21,119 308,893Altamir 136,094 3,765,641
* Alten SA 164,730 19,326,802#* Amplitude Surgical SAS 19,526 51,478
Assystem SA 60,928 1,835,704* Ateme SA 490 8,791
Aubay 41,374 2,090,533* Axway Software SA 38,973 1,229,241# Bastide le Confort Medical 18,680 1,071,663* Beneteau SA 236,902 3,319,999* Bigben Interactive 94,289 2,180,839
Boiron SA 37,981 1,593,515Bonduelle SCA 93,424 2,340,867
# Bourbon Corp. 28,851 0Burelle SA 1,134 1,201,552
#* Casino Guichard Perrachon SA 271,603 9,048,228#* Catering International Services 14,124 198,742* Cegedim SA 32,518 915,214* CGG SA 4,294,730 5,150,520# Chargeurs SA 125,784 3,408,241* Cie des Alpes 68,915 1,770,020
Cie Plastic Omnium SA 397,771 14,557,259* Coface SA 666,148 7,360,173* Derichebourg SA 674,728 5,521,758
Electricite de Strasbourg SA 21,112 2,896,807# Elior Group SA 577,567 4,280,045* Elis SA 1,122,246 18,317,199* Eramet SA 50,163 3,556,242* Erytech Pharma SA 3,609 25,564
Copyright © 2021 www.secdatabase.com. All Rights Reserved.Please Consider the Environment Before Printing This Document

* Esso SA Francaise 6,184 84,913* Etablissements Maurel et Prom SA 294,902 693,543
Euronext NV 223,445 22,489,674# Eutelsat Communications SA 1,232,764 14,996,821
Copyright © 2021 www.secdatabase.com. All Rights Reserved.Please Consider the Environment Before Printing This Document

THE CONTINENTAL SMALL COMPANY SERIESCONTINUED
Shares Value»FRANCE � (Continued)* Exel Industries, Class A 10,459 $821,743* Faurecia SE 308,936 16,438,902
Fleury Michon SA 5,329 127,529* Fnac Darty SA 121,981 7,480,085* Gaumont SA 10,956 1,417,262
Gaztransport Et Technigaz SA 130,815 10,422,406# GEA 2,433 299,701#* GL Events 58,364 965,283* Groupe Crit 22,187 1,820,564
Groupe Gorge SA 4,320 82,245* Groupe SFPI 21,754 43,178
Guerbet 38,504 1,495,593Haulotte Group SA 73,020 517,581
* HEXAOM 15,908 817,067* ID Logistics Group 14,640 3,915,181# Imerys SA 208,694 10,149,730#* Innate Pharma SA 15,558 67,997
IPSOS 248,613 9,379,637# Jacquet Metals SA 87,314 2,029,391* JCDecaux SA 165,865 4,181,406
Kaufman & Broad SA 122,744 5,301,087* Korian SA 466,206 16,179,751#* Lagardere SCA 603,838 15,855,430
Laurent-Perrier 13,890 1,293,428Lectra 166,120 5,492,601Linedata Services 14,505 595,653
* LISI 114,546 3,337,806LNA Sante SA 33,206 1,783,740
* Maisons du Monde SA 280,214 6,197,622Manitou BF SA 66,010 2,213,517Manutan International 15,102 1,256,264
* Mersen SA 115,668 4,025,750#* METabolic EXplorer SA 142,767 889,198* Metropole Television SA 242,637 5,181,755#* Neoen SA 27,987 1,403,001* Nexans SA 198,725 17,583,834
Nexity SA 297,674 14,669,744#* Nicox 145,865 728,092* NRJ Group 85,587 653,657#* Oeneo SA 128,172 1,669,075* OL Groupe SA 10,735 29,565#* Onxeo SA 88,887 75,075#* Onxeo SA 48,958 41,712* Orpea SA 17,320 2,005,627
Pharmagest Interactive 436 48,720* Pierre Et Vacances SA 781 10,663* Plastivaloire 14,341 135,821
Quadient SA 207,325 4,977,053#* Rallye SA 36,059 307,564#* Recylex SA 102,008 41,450* Rexel SA 2,073,563 41,044,383# Robertet SA 2,749 2,983,659* Rothschild & Co. 116,118 4,194,638
Rubis SCA 510,543 24,161,526
Copyright © 2021 www.secdatabase.com. All Rights Reserved.Please Consider the Environment Before Printing This Document

Samse SA 7,930 1,617,814* Savencia SA 33,976 2,899,925* SCOR SE 263,872 8,988,268
Seche Environnement SA 18,630 1,115,649SES SA 1,000,143 7,934,177
Copyright © 2021 www.secdatabase.com. All Rights Reserved.Please Consider the Environment Before Printing This Document

THE CONTINENTAL SMALL COMPANY SERIESCONTINUED
Shares Value»FRANCE � (Continued)
Societe BIC SA 174,241 $10,199,173* Societe des Bains de Mer et du Cercle des Etrangers a Monaco 56,151 4,177,407* Societe Marseillaise du Tunnel Prado-Carenage SA 5,211 107,989
Societe pour l�Informatique Industrielle 41,811 1,245,036* SOITEC 131,953 26,935,223#* Solocal Group 681,417 2,294,234
Somfy SA 90,725 15,166,119* Sopra Steria Group 108,873 18,192,485* SPIE SA 839,574 20,085,084#* SRP Groupe SA 56,827 198,239
Stef SA 25,714 2,702,665Sword Group 33,570 1,506,635
* Synergie SE 67,143 2,553,299* Tarkett SA 202,726 3,233,682* Television Francaise 1 427,799 3,890,350# TFF Group 9,347 329,655
Thermador Groupe 37,127 3,370,330# Tikehau Capital SCA 14,886 441,739
Total Gabon 3,883 644,021Trigano SA 53,337 9,969,192
* Union Financiere de France BQE SA 18,515 430,245#* Vallourec SA 49,247 1,671,649* Valneva SE 69,195 859,097
Verallia SASU 28,437 1,024,434Vetoquinol SA 16,496 1,905,538Vicat SA 126,485 6,138,191VIEL & Cie SA 156,945 1,085,684Vilmorin & Cie SA 35,656 2,531,463
* Virbac SA 21,378 5,500,753* Vranken-Pommery Monopole SA 16,787 352,242* Wavestone 1,222 49,287* X-Fab Silicon Foundries SE 5,875 50,575* Xilam Animation S.A. 197 10,965* XPO Logistics Europe SADIR 33 11,596TOTAL FRANCE 600,184,063GERMANY � (15.3%)
1&1 Drillisch AG 195,276 5,486,8677C Solarparken AG 31,077 148,604
* Aareal Bank AG 462,545 13,130,476Adesso SE 597 76,042
* ADLER Group SA 84,233 2,306,844* ADVA Optical Networking SE 355,643 4,221,990* AIXTRON SE 484,849 11,020,437
All for One Group SE 4,222 308,934# Allgeier SE 46,117 1,325,104* Amadeus Fire AG 2,066 302,555
Atoss Software AG 5,654 1,072,452Aurubis AG 290,148 24,046,491Basler AG 30,321 3,491,468
#* Bauer AG 71,621 988,322BayWa AG 105,190 4,639,974BayWa AG 124 5,741Bechtle AG 32,696 6,133,624Befesa SA 8,592 575,719
Copyright © 2021 www.secdatabase.com. All Rights Reserved.Please Consider the Environment Before Printing This Document

Bertrandt AG 36,691 1,999,380bet-at-home.com AG 20,877 1,122,023
* Bijou Brigitte AG 22,688 641,423Bilfinger SE 193,165 7,069,153
Copyright © 2021 www.secdatabase.com. All Rights Reserved.Please Consider the Environment Before Printing This Document

THE CONTINENTAL SMALL COMPANY SERIESCONTINUED
Shares Value»GERMANY � (Continued)* Borussia Dortmund GmbH & Co. KGaA 530,026 $3,374,122
CANCOM SE 203,056 11,709,944* CECONOMY AG 1,044,271 6,047,968* CENIT AG 54,144 851,386
Cewe Stiftung & Co. KGAA 43,389 6,127,807* Commerzbank AG 2,926,710 17,960,089
CompuGroup Medical SE & Co. KgaA 185,429 15,672,081#* Corestate Capital Holding SA 77,099 1,280,489
CropEnergies AG 177,529 2,489,738* CTS Eventim AG & Co. KGaA 349,410 20,291,073
Data Modul AG Produktion Und Vertrieb Von Elektronischen Systemen 11,455 647,805Dermapharm Holding SE 26,807 1,917,293Deutsche Beteiligungs AG 92,778 4,185,457
* Deutsche EuroShop AG 320,657 6,682,746* Deutsche Lufthansa AG 65,367 866,982* Deutsche Pfandbriefbank AG 1,030,684 12,005,783* Deutz AG 1,015,496 7,593,683* Dialog Semiconductor P.L.C. 544,240 41,032,970
DIC Asset AG 384,623 6,662,674DMG Mori AG 12,442 614,604Dr Hoenle AG 35,520 1,981,888Draegerwerk AG & Co. KGaA 20,476 1,552,867
# Duerr AG 407,164 16,952,702Eckert & Ziegler Strahlen- und Medizintechnik AG 103,812 8,287,984
* EDAG Engineering Group AG 51,353 541,296Elmos Semiconductor SE 34,207 1,438,348
* ElringKlinger AG 186,329 2,735,816# Encavis AG 159,054 3,014,719
Energiekontor AG 2,624 179,184#* Evotec SE 78,410 2,825,105
Fabasoft AG 509 24,112* Ferratum Oyj 39,731 293,868* Fielmann AG 118,208 9,431,338
First Sensor AG 23,426 1,115,532* Flatex AG 18,537 1,717,951
FORTEC Elektronik AG 372 7,850* Francotyp-Postalia Holding AG, Class A 55,619 202,303* Fraport AG Frankfurt Airport Services Worldwide 76,050 4,620,524
Freenet AG 930,432 22,288,840Fuchs Petrolub SE 108,436 4,364,841GEA Group AG 847,030 34,741,565Gerresheimer AG 242,136 24,048,308Gesco AG 55,404 1,546,839GFT Technologies SE 123,639 2,293,437Grand City Properties SA 803,479 20,125,336
* H&R GmbH & Co. KGaA 71,674 512,871Hamburger Hafen und Logistik AG 188,498 4,176,154Hawesko Holding AG 52 2,823
#* Heidelberger Druckmaschinen AG 1,340,269 1,806,818* Hella GmbH & Co KGaA 241,744 13,574,756* Highlight Communications AG 98,406 456,453
Hochtief AG 8,694 778,354* HolidayCheck Group AG 325,440 849,383
Hornbach Baumarkt AG 51,444 2,163,640
Copyright © 2021 www.secdatabase.com. All Rights Reserved.Please Consider the Environment Before Printing This Document

Hornbach Holding AG & Co. KGaA 39,996 3,906,066Hugo Boss AG 382,229 15,019,334
* Hypoport SE 3,088 1,637,779Indus Holding AG 134,558 5,587,308
* Instone Real Estate Group AG 7,571 208,145
Copyright © 2021 www.secdatabase.com. All Rights Reserved.Please Consider the Environment Before Printing This Document

THE CONTINENTAL SMALL COMPANY SERIESCONTINUED
Shares Value»GERMANY � (Continued)
IVU Traffic Technologies AG 50,948 $1,105,024Jenoptik AG 383,317 11,520,621
* JOST Werke AG 5,660 357,873K+S AG 1,185,372 11,794,294
* Kloeckner & Co. SE 463,926 5,842,669#* Koenig & Bauer AG 93,035 2,774,131
Krones AG 113,425 9,214,052KSB SE & Co. KGaA 3,326 1,178,209KWS Saat SE & Co., KGaA 80,774 6,995,376Lanxess AG 597,294 44,083,134Leifheit AG 60,321 3,196,629
#* Leoni AG 185,404 2,325,947# LPKF Laser & Electronics AG 88,339 2,470,932#* Manz AG 28,275 1,757,288* Mediclin AG 88,966 450,543#* Medigene AG 116,971 535,146
METRO AG 553,216 5,842,337MLP SE 377,507 3,111,968
* Nagarro SE 46,117 5,063,756Nemetschek SE 44,616 2,848,017New Work SE 20,199 5,242,334
# Nexus AG 88,367 5,679,955* Nordex SE 508,398 16,312,695
Norma Group SE 231,101 10,970,284#* OHB SE 37,995 1,573,468
Patrizia AG 349,841 8,856,572Pfeiffer Vacuum Technology AG 48,322 8,784,884PNE AG 493,007 4,275,002
* Progress-Werk Oberkirch AG 8,558 264,981* ProSiebenSat.1 Media SE 1,254,182 25,613,007
PSI Software AG 50,850 1,599,382* PVA TePla AG 3,771 115,668
q.beyond AG 768,941 1,706,150* R Stahl AG 14,952 438,583
Rheinmetall AG 313,337 31,779,676* RTL Group SA 27,994 1,641,647#* S&T AG 335,113 8,336,757* SAF-Holland SE 320,332 4,668,419* Salzgitter AG 262,490 8,196,959#* Schaltbau Holding AG 33,065 1,299,771
Schloss Wachenheim AG 8,017 151,340# Secunet Security Networks AG 6,313 2,003,391#* SGL Carbon SE 298,485 2,115,237#* Siltronic AG 146,283 23,587,585* Sixt SE 95,154 12,582,235* SMA Solar Technology AG 69,928 4,113,597#* SNP Schneider-Neureither & Partner SE 2,373 161,793
Softing AG 14,914 91,049Software AG 359,622 15,149,837Stabilus SA 173,972 12,264,313STRATEC SE 24,591 3,321,697Stroeer SE & Co. KGaA 198,823 16,199,627Suedzucker AG 522,404 8,854,936
* SUESS MicroTec SE 134,313 4,193,984
Copyright © 2021 www.secdatabase.com. All Rights Reserved.Please Consider the Environment Before Printing This Document

* Surteco Group SE 46,502 1,394,293* Syzygy AG 2,030 13,947
TAG Immobilien AG 954,559 27,246,880* Takkt AG 209,522 3,171,699#* Technotrans SE 46,673 1,399,839
Copyright © 2021 www.secdatabase.com. All Rights Reserved.Please Consider the Environment Before Printing This Document

THE CONTINENTAL SMALL COMPANY SERIESCONTINUED
Shares Value»GERMANY � (Continued)#* Tele Columbus AG 327,138 $1,239,140# Telefonica Deutschland Holding AG 1,092,787 3,205,665* Thyssenkrupp AG 499,402 6,670,017
Traffic Systems SE 36,351 1,487,334* va-Q-tec AG 869 32,203# VERBIO Vereinigte BioEnergie AG 157,195 6,769,486* Vossloh AG 66,029 3,286,900
Wacker Chemie AG 86,247 12,270,386* Wacker Neuson SE 218,897 5,240,937* Washtec AG 77,520 4,455,832
Wuestenrot & Wuerttembergische AG 113,328 2,362,910Zeal Network SE 53,361 2,744,793
* zooplus AG 4,165 1,189,745TOTAL GERMANY 933,937,521GREECE � (0.0%)
Alfa Alfa Energy SA 3,810 0Babis Vovos International Construction SA 21,073 0
* Neorion Holdings SA 14,991 0TOTAL GREECE 0IRELAND � (0.8%)#* AIB Group P.L.C. 538,900 1,413,788* Bank of Ireland Group P.L.C. 4,480,331 22,125,075* Cairn Homes P.L.C 1,682,438 2,106,555#* Datalex P.L.C. 107,125 61,843* FBD Holdings P.L.C. 125,459 1,016,417* FBD Holdings P.L.C. 17,353 141,873
Glanbia P.L.C. 346,148 5,137,311Glanbia P.L.C. 700,613 10,358,449
* Irish Continental Group P.L.C. 586,653 3,036,778* Irish Continental Group P.L.C. 234,200 1,174,689* Permanent TSB Group Holdings P.L.C. 229,967 291,397TOTAL IRELAND 46,864,175ISRAEL � (3.2%)
Adgar Investment and Development, Ltd. 39,391 70,112# Afcon Holdings, Ltd. 3,064 135,656#* AFI Properties, Ltd. 109,219 3,816,594# Africa Israel Residences, Ltd. 2,237 106,415* Airport City, Ltd. 287,717 4,044,768
Albaad Massuot Yitzhak, Ltd. 2,031 44,767* Allot, Ltd. 188,324 2,947,025#* Alrov Properties and Lodgings, Ltd. 49,397 2,312,238# Arad, Ltd. 18,409 264,572# Ashtrom Group, Ltd. 222,875 4,186,106
Atreyu Capital Markets, Ltd. 2,819 41,761AudioCodes, Ltd. 49,870 1,349,517
#* Avgol Industries 1953, Ltd. 468,925 396,515#* Azorim-Investment Development & Construction Co., Ltd. 511,227 1,861,164#* Bet Shemesh Engines Holdings 1997, Ltd. 21,702 459,850* Big Shopping Centers, Ltd. 33,343 3,597,803
Blue Square Real Estate, Ltd. 36,428 2,525,985* Brack Capital Properties NV 18,347 1,562,068#* Brainsway, Ltd. 54,222 244,371#* Camtek, Ltd. 113,800 3,278,610
Copyright © 2021 www.secdatabase.com. All Rights Reserved.Please Consider the Environment Before Printing This Document

Carasso Motors, Ltd. 127,286 612,395* Cellcom Israel, Ltd. 495,333 1,854,885
Copyright © 2021 www.secdatabase.com. All Rights Reserved.Please Consider the Environment Before Printing This Document

THE CONTINENTAL SMALL COMPANY SERIESCONTINUED
Shares Value»ISRAEL � (Continued)#* Ceragon Networks, Ltd. 266,244 $1,003,740* Clal Insurance Enterprises Holdings, Ltd. 308,932 5,088,733#* Compugen, Ltd. 120,052 977,426
Danel Adir Yeoshua, Ltd. 21,947 3,601,063Delek Automotive Systems, Ltd. 226,353 2,767,442
#* Delek Group, Ltd. 7,609 383,393Delta-Galil Industries, Ltd. 70,358 1,738,500Dor Alon Energy in Israel 1988, Ltd. 15,057 352,496Duniec Brothers, Ltd. 304 10,672
# Electra Consumer Products 1970, Ltd. 53,953 2,331,416# Electra Real Estate, Ltd. 24,849 201,439
Electra, Ltd. 12,063 6,292,661* Ellomay Capital, Ltd. 291 9,290#* Enlight Renewable Energy, Ltd. 2,350,621 4,406,138#* Equital, Ltd. 117,510 2,854,941* FMS Enterprises Migun, Ltd. 19,186 534,444# Formula Systems 1985, Ltd. 62,881 5,562,023# Fox Wizel, Ltd. 57,376 6,554,067# Gev-Yam Land Corp., Ltd. 667,282 5,321,496
Gilat Satellite Networks, Ltd. 225,761 2,360,709# Hadera Paper, Ltd. 21,885 1,407,153#* Hamlet Israel-Canada, Ltd. 32,585 622,830
Harel Insurance Investments & Financial Services, Ltd. 867,528 8,772,800# Hilan, Ltd. 100,860 4,783,355# IDI Insurance Co., Ltd. 44,734 1,696,313
IES Holdings, Ltd. 322 22,042# Inrom Construction Industries, Ltd. 359,755 1,776,968
Isracard, Ltd. 3,448 11,856# Israel Canada T.R, Ltd. 131,507 374,487# Israel Land Development�Urban Renewal, Ltd. 41,747 464,549
Isras Investment Co., Ltd. 5,655 1,089,719* Issta Lines, Ltd. 12,135 213,957#* Kamada, Ltd. 212,977 1,302,558
Kenon Holdings, Ltd. 124,381 3,785,238# Kerur Holdings, Ltd. 31,762 937,034
Klil Industries, Ltd. 5,696 580,124# Magic Software Enterprises, Ltd. 133,913 2,080,495# Malam�Team, Ltd. 3,720 105,025
Matrix IT, Ltd. 221,443 5,311,180Maytronics, Ltd. 285,819 5,198,754
# Mediterranean Towers, Ltd. 407,515 1,132,493# Mega Or Holdings, Ltd. 81,523 2,407,645#* Mehadrin, Ltd. 3,072 132,382# Meitav Dash Investments, Ltd. 125,156 642,425
Menora Mivtachim Holdings, Ltd. 183,680 3,810,765* Migdal Insurance & Financial Holdings, Ltd. 2,542,729 2,945,621* Minrav Holdings, Ltd. 263 55,632# Mivne Real Estate KD, Ltd. 698,650 1,719,790* Mivtach Shamir Holdings, Ltd. 24,697 757,895
Mizrahi Tefahot Bank, Ltd. 1 27#* Naphtha Israel Petroleum Corp., Ltd. 244,337 1,126,577
Nawi Brothers, Ltd. 116,369 764,726Neto ME Holdings, Ltd. 9,545 465,609
#* Nova Measuring Instruments, Ltd. 162,077 14,224,977
Copyright © 2021 www.secdatabase.com. All Rights Reserved.Please Consider the Environment Before Printing This Document

NR Spuntech Industries, Ltd. 76,176 201,551* Oil Refineries, Ltd. 9,609,294 2,230,649# One Software Technologies, Ltd. 2,082 271,266#* OPC Energy, Ltd. 57,888 591,026#* Partner Communications Co., Ltd. 806,477 3,907,086
Copyright © 2021 www.secdatabase.com. All Rights Reserved.Please Consider the Environment Before Printing This Document

THE CONTINENTAL SMALL COMPANY SERIESCONTINUED
Shares Value»ISRAEL � (Continued)# Paz Oil Co., Ltd. 60,870 $5,587,826* Perion Network, Ltd. 31,361 541,054* Phoenix Holdings, Ltd. (The) 595,683 5,228,132# Plasson Industries, Ltd. 20,585 978,973* Pluristem Therapeutics, Inc. 3,536 15,913
Rami Levy Chain Stores Hashikma Marketing 2006, Ltd. 51,193 3,328,582Scope Metals Group, Ltd. 47,147 1,175,511
* Shikun & Binui, Ltd. 422,330 2,447,618Shufersal, Ltd. 399,279 3,284,990
* Summit Real Estate Holdings, Ltd. 215,385 3,171,783* Suny Cellular Communication, Ltd. 473,129 153,060
Tadiran Holdings, Ltd. 15,407 1,619,892YH Dimri Construction & Development, Ltd. 10,844 593,425
TOTAL ISRAEL 194,116,604ITALY � (8.2%)
A2A SpA 9,873,712 17,971,151ACEA SpA 377,888 8,259,096
#* Aeffe SpA 156,636 202,090#* Amplifon SpA 106,318 3,956,160
Anima Holding SpA 2,104,654 10,833,479#* Aquafil SpA 77,554 474,728* Arnoldo Mondadori Editore SpA 904,095 1,652,269
Ascopiave SpA 474,229 2,170,821#* Autogrill SpA 871,040 7,208,518* Autostrade Meridionali SpA 3,917 120,835* Avio SpA 104,775 1,507,718
Azimut Holding SpA 742,592 16,916,335* B&C Speakers SpA 16,806 226,610#* Banca Carige SpA 148,412 48,732* Banca Farmafactoring SpA 754,049 5,540,878* Banca Generali SpA 362,225 12,746,386* Banca IFIS SpA 151,590 2,000,030* Banca Mediolanum SpA 142,358 1,342,900#* Banca Monte dei Paschi di Siena SpA 213,039 285,504* Banca Popolare di Sondrio SCPA 2,843,111 9,511,390* Banca Profilo SpA 1,711,765 486,741#* Banca Sistema SpA 379,814 966,182#* Banco BPM SpA 10,026,255 28,599,717* Banco di Desio e della Brianza SpA 238,796 769,468
BasicNet SpA 10,343 50,802Be Shaping The Future SpA 533,191 963,788
* Biesse SpA 58,060 1,664,416* BPER Banca 6,140,387 13,496,829* Brunello Cucinelli SpA 234,739 10,095,340
Buzzi Unicem SpA 566,127 14,705,139* Cairo Communication SpA 229,086 423,344
Carel Industries SpA 6,786 138,178#* Carraro SpA 102,068 289,545
Cementir Holding NV 333,699 3,424,836* Cerved Group SpA 1,348,374 14,912,925* CIR SpA-Compagnie Industriali 5,326,857 2,964,728* Credito Emiliano SpA 539,334 3,148,025* Credito Valtellinese SpA 391,012 5,588,683* d�Amico International Shipping SA 1,821,713 238,394
Copyright © 2021 www.secdatabase.com. All Rights Reserved.Please Consider the Environment Before Printing This Document

Danieli & C Officine Meccaniche SpA 43,085 659,868Danieli & C Officine Meccaniche SpA 102,606 2,579,974De� Longhi SpA 387,895 15,666,957DeA Capital SpA 679,797 1,151,521
Copyright © 2021 www.secdatabase.com. All Rights Reserved.Please Consider the Environment Before Printing This Document

THE CONTINENTAL SMALL COMPANY SERIESCONTINUED
Shares Value»ITALY � (Continued)* Elica SpA 166,709 $660,540* Emak SpA 388,913 601,061
ERG SpA 343,497 10,212,025* Esprinet SpA 221,349 2,790,728#* Eurotech SpA 216,751 1,310,684# Fiera Milano SpA 107,924 438,401#* Fila SpA 142,640 1,689,083#* Fincantieri SpA 3,504,948 2,873,527# Finmatica SpA 5,960 0* FNM SpA 1,412,345 1,040,114* Freni Brembo SpA 816,977 10,169,421#* Gefran SpA 35,925 304,863#* Geox SpA 494,420 475,686
Gruppo MutuiOnline SpA 164,315 8,657,877#* Guala Closures SpA 56,729 562,770
Hera SpA 4,939,246 18,939,453* Illimity Bank SpA 43,783 491,144* IMMSI SpA 965,549 521,796#* Intek Group SpA 1,885,608 751,830
Interpump Group SpA 130,995 6,602,092Iren SpA 4,259,847 11,781,346Italgas SpA 3,402,703 22,097,472Italmobiliare SpA 76,176 2,562,986
* IVS Group SA 58,424 388,786* Juventus Football Club SpA 2,997,765 2,759,472
La Doria SpA 86,202 1,818,459Leonardo SpA 996,204 8,058,956LU-VE SpA 5,064 88,502
#* Maire Tecnimont SpA 977,846 2,872,522#* Mariella Burani Fashion Group S.p.A. 22,744 0* Mediaset SpA 3,709,525 10,664,604* Mediobanca Banca di Credito Finanziario SpA 164,882 1,827,098#* Mondo TV SpA 38,811 61,609
Openjobmetis SpA agenzia per il lavoro 63,025 635,516#* OVS SpA 1,107,354 1,743,453
Piaggio & C SpA 1,243,896 4,716,891* Pirelli & C SpA 2,304,139 13,507,922#* Prima Industrie SpA 32,067 843,516
Prysmian SpA 521,713 16,940,076RAI Way SpA 581,655 3,282,020Reno de Medici SpA 1,173,753 1,570,201Reply SpA 147,531 18,670,779
* Rizzoli Corriere Della Sera Mediagroup SpA 956,821 801,247Sabaf SpA 49,948 1,365,169
#* Safilo Group SpA 233,748 249,439# Saipem SpA 3,688,367 10,048,467#* Saras SpA 3,470,844 2,351,645
Servizi Italia SpA 62,874 169,005* Sesa SpA 50,391 6,154,633#* Societa Cattolica di Assicurazioni SC 779,964 4,575,589* Sogefi SpA 332,859 517,602
SOL SpA 162,544 3,193,765Tamburi Investment Partners SpA 801,679 7,121,759
* Technogym SpA 631,612 7,334,570
Copyright © 2021 www.secdatabase.com. All Rights Reserved.Please Consider the Environment Before Printing This Document

# Tenaris SA 297,746 3,366,900* Tinexta S.p.A. 122,766 3,253,087#* Tiscali SpA 2,577,711 83,054* Tod�s SpA 60,475 1,975,491* TXT e-solutions SpA 43,931 382,262
Copyright © 2021 www.secdatabase.com. All Rights Reserved.Please Consider the Environment Before Printing This Document

THE CONTINENTAL SMALL COMPANY SERIESCONTINUED
Shares Value»ITALY � (Continued)* Unieuro SpA 66,937 $1,698,026* Unipol Gruppo SpA 3,109,522 17,320,381# UnipolSai Assicurazioni SpA 242,919 729,690# Webuild SpA 1,282,257 2,682,176
Zignago Vetro SpA 181,037 3,436,855TOTAL ITALY 500,757,123NETHERLANDS � (6.9%)
Aalberts NV 691,302 34,961,599* Accell Group NV 144,227 6,650,644#* AFC Ajax NV 13,955 258,931
AMG Advanced Metallurgical Group NV 184,488 7,388,778Amsterdam Commodities NV 119,479 2,990,937APERAM SA 341,294 15,344,048
* Arcadis NV 526,518 21,435,438ASR Nederland NV 873,857 39,057,045
* Avantium N.V. 1,640 11,437* Basic-Fit NV 181,929 6,992,430
BE Semiconductor Industries NV 476,805 39,828,820#* Beter Bed Holding NV 10,924 66,962* Boskalis Westminster 600,774 19,301,175* Brunel International NV 155,477 2,004,768
Corbion NV 416,939 23,132,980Flow Traders 223,910 9,365,880ForFarmers NV 214,677 1,480,436
#* Fugro NV 478,984 5,011,961* GrandVision NV 173,216 5,343,072* Heijmans NV 146,628 2,437,668* Hunter Douglas NV 25,613 2,018,379
IMCD NV 357,089 49,503,612* Intertrust NV 466,539 7,723,204* Kendrion NV 96,440 2,473,785* Koninklijke BAM Groep NV 1,732,479 4,381,393#* Lucas Bols NV 23,064 297,350
Nedap N.V. 33,400 2,411,447* OCI NV 327,478 7,062,724
Ordina NV 625,125 2,426,881* PostNL NV 3,372,376 16,347,639# SBM Offshore NV 1,193,312 21,828,000* SIF Holding NV 34,182 647,947* Signify NV 780,137 40,124,918* Sligro Food Group NV 166,461 4,444,926# SNS NV 705,718 0
TKH Group NV 267,721 12,817,266* TomTom NV 483,754 4,464,684* Van Lanschot Kempen NV 78,301 2,189,736TOTAL NETHERLANDS 424,228,900NORWAY � (2.4%)
ABG Sundal Collier Holding ASA 2,446,501 2,542,500AF Gruppen ASA 68,590 1,411,226
* Akastor ASA 797,680 567,089#* Aker Solutions ASA 1,573,806 2,710,600# American Shipping Co. ASA 236,690 849,699#* ArcticZymes Technologies ASA 6,045 51,529
Copyright © 2021 www.secdatabase.com. All Rights Reserved.Please Consider the Environment Before Printing This Document

# Arendals Fossekompani A.S. 2,250 71,174* Asetek A/S 2,229 21,898
Atea ASA 529,509 8,998,247
Copyright © 2021 www.secdatabase.com. All Rights Reserved.Please Consider the Environment Before Printing This Document

THE CONTINENTAL SMALL COMPANY SERIESCONTINUED
Shares Value»NORWAY � (Continued)#* Atlantic Sapphire ASA 29,091 $410,054
Austevoll Seafood ASA 437,677 5,313,192# Avance Gas Holding, Ltd. 393,737 2,192,167#* Axactor SE 900,429 962,820* B2Holding ASA 1,390,160 1,427,022
Bonheur ASA 146,347 3,868,800#* Borr Drilling Ltd. 65,386 64,856
Borregaard ASA 725,237 15,796,412Bouvet ASA 623 45,956
* BW Energy, Ltd. 205,065 642,561BW LPG, Ltd. 662,186 4,546,742BW Offshore, Ltd. 759,145 3,139,060
* Crayon Group Holding ASA 3,751 58,954#* DNO ASA 3,329,878 3,646,788
Elkem ASA 24,828 108,172Europris ASA 1,186,781 7,111,051Fjordkraft Holding ASA 2,390 19,501FLEX LNG, Ltd. 193,381 1,679,192
# Frontline, Ltd. 521,533 3,824,139Golden Ocean Group, Ltd. 197,708 1,373,226
#* Grieg Seafood ASA 346,230 3,427,487#* Hexagon Composites ASA 640,597 3,561,162
Hoegh LNG Holdings, Ltd. 173,599 475,320* IDEX Biometrics ASA 560,544 170,582
Itera ASA 10,713 18,395Kitron ASA 10,967 28,273
* Kongsberg Automotive ASA 1,743,947 580,935Medistim ASA 255 7,593
#* Nordic Nanovector ASA 328,770 925,171#* Nordic Semiconductor ASA 707,590 12,683,611
Norway Royal Salmon ASA 92,975 2,213,663* Norwegian Finans Holding ASA 672,342 7,569,324
Norwegian Property ASA 50,689 84,684* NRC Group ASA 6,559 13,207# Ocean Yield ASA 377,896 1,301,876* Odfjell Drilling, Ltd. 586,600 1,401,898* Odfjell SE, Class A 137,586 452,767* Olav Thon Eiendomsselskap ASA 118,760 2,273,337#* Otello Corp. ASA 571,363 2,046,778* Panoro Energy ASA 51,126 123,957
Pareto Bank ASA 2,965 16,388#* PGS ASA 1,907,777 1,369,209* PhotoCure ASA 22,827 363,587#* Protector Forsikring ASA 438,078 4,589,222* REC Silicon ASA 1,473,908 3,311,736
Sbanken ASA 486,979 4,693,150Selvaag Bolig ASA 309,083 2,279,237
* Solon Eiendom ASA 56,855 246,167SpareBank 1 SR-Bank ASA 8,727 107,261Stolt-Nielsen, Ltd. 195,297 2,887,792
#* Subsea 7 SA 135,523 1,361,529TGS NOPEC Geophysical Co. ASA 35,570 565,375Treasure ASA 314,079 640,025Veidekke ASA 712,897 9,896,418
Copyright © 2021 www.secdatabase.com. All Rights Reserved.Please Consider the Environment Before Printing This Document

* Wallenius Wilhelmsen ASA 401,589 1,304,275Wilh Wilhelmsen Holding ASA, Class A 68,304 1,463,204
* XXL ASA 631,470 1,380,713TOTAL NORWAY 149,289,935
Copyright © 2021 www.secdatabase.com. All Rights Reserved.Please Consider the Environment Before Printing This Document

THE CONTINENTAL SMALL COMPANY SERIESCONTINUED
Shares Value»PORTUGAL � (0.7%)
Altri SGPS SA 537,332 $4,104,772#* Banco Comercial Portugues SA, Class R 46,385,547 6,308,669
Banco Espirito Santo SA 4,777,921 0Corticeira Amorim SGPS SA 12,093 143,332
* CTT-Correios de Portugal SA 665,115 2,626,662Galp Energia SGPS SA 51,035 591,610
* Ibersol SGPS SA 35,043 223,836#* Mota-Engil SGPS SA 641,747 1,059,097# Navigator Co. SA (The) 1,820,852 5,949,632
NOS SGPS SA 1,704,809 6,204,211#* Novabase SGPS SA 72,649 321,119
REN�Redes Energeticas Nacionais SGPS SA 3,006,659 8,390,997Semapa-Sociedade de Investimento e Gestao 166,209 2,295,119Sonae SGPS SA 6,383,870 5,819,144
TOTAL PORTUGAL 44,038,200SPAIN � (5.5%)
Acciona SA 130,597 21,944,689Acerinox SA 1,140,518 14,939,442
#* Adveo Group International SA 84,445 9,002Alantra Partners SA 70,405 1,155,775Almirall SA 424,745 6,440,941
#* Amper SA 5,396,257 1,328,199* Applus Services SA 911,014 9,460,211#* Atresmedia Corp. de Medios de Comunicacion SA 512,148 2,112,810* Azkoyen SA 67,253 464,546
Banco de Sabadell SA 25,441,031 13,641,945Bankinter SA 3,802,314 26,460,397CaixaBank SA 4,339,354 13,472,759
#* Caja de Ahorros del Mediterraneo 116,412 0Cia de Distribucion Integral Logista Holdings SA 357,479 7,093,026CIE Automotive SA 424,373 11,132,602Construcciones y Auxiliar de Ferrocarriles SA 129,621 5,940,288
* Distribuidora Internacional de Alimentacion SA 207,031 29,167Ebro Foods SA 531,944 10,982,165
#* eDreams ODIGEO SA 424,956 2,345,197Elecnor SA 200,108 2,474,906Enagas SA 625,236 13,611,921
* Ence Energia y Celulosa SA 988,129 4,933,926Ercros SA 643,000 1,933,692Euskaltel SA 548,865 7,144,095Faes Farma SA 2,022,017 8,664,787Fluidra SA 324,873 9,300,874Fomento de Construcciones y Contratas SA 348,032 4,110,241
* Gestamp Automocion SA 387,621 1,968,298Global Dominion Access SA 695,411 3,509,204Grupo Catalana Occidente SA 271,298 10,810,974
# Grupo Empresarial San Jose SA 151,317 1,112,629#* Grupo Ezentis SA 1,629,459 817,471
Iberpapel Gestion SA 47,911 1,071,133#* Indra Sistemas SA 856,710 7,545,624
Laboratorios Farmaceuticos Rovi SA 72,954 3,931,659* Liberbank SA 12,317,710 4,414,212
Mapfre SA 633,456 1,319,824* Mediaset Espana Comunicacion SA 1,072,499 6,394,327
Copyright © 2021 www.secdatabase.com. All Rights Reserved.Please Consider the Environment Before Printing This Document

* Melia Hotels International SA 706,277 5,276,731* Metrovacesa S.A. 18,415 160,184
Miquel y Costas & Miquel SA 142,055 2,568,347Neinor Homes SA 29,907 368,669
Copyright © 2021 www.secdatabase.com. All Rights Reserved.Please Consider the Environment Before Printing This Document

THE CONTINENTAL SMALL COMPANY SERIESCONTINUED
Shares Value»SPAIN � (Continued)#* Obrascon Huarte Lain SA 905,725 $673,505# Pharma Mar SA 79,333 9,224,595
Prim SA 39,523 481,980* Promotora de Informaciones SA, Class A 1,752,528 2,004,733
Prosegur Cash SA 73,463 67,076# Prosegur Cia de Seguridad SA 1,584,655 5,046,057#* Quabit Inmobiliaria SA 576,617 265,827* Realia Business SA 1,667,905 1,357,425* Renta 4 Banco SA 442 4,146# Sacyr SA 2,889,691 7,412,050#* Solaria Energia y Medio Ambiente SA 395,783 8,394,157* Solarpack Corp. Tecnologica SA 707 17,367* Talgo SA 587,102 2,950,110#* Tecnicas Reunidas SA 188,993 2,768,086* Tubacex SA 692,872 1,463,909* Unicaja Banco SA 2,633,759 2,650,635
Vidrala SA 123,414 13,573,585Viscofan SA 280,336 19,376,679
* Vocento SA 352,577 448,854Zardoya Otis SA 1,131,276 7,238,354
TOTAL SPAIN 337,816,019SWEDEN � (8.7%)
AcadeMedia AB 415,939 3,891,396* Adapteo Oyj 280,480 3,601,522
AddLife AB, Class B 242,271 4,352,301* AddNode Group AB 84,843 2,545,796
AddTech AB, Class B 1,058,674 15,757,464* AF Poyry AB 595,413 17,626,389
Alimak Group AB 253,043 4,059,281* Ambea AB 92,436 767,078* Annehem Fastigheter AB, Class B 126,142 388,343* Arise AB 55,606 316,569
Arjo AB, Class B 1,029,592 7,665,182Atrium Ljungberg AB, Class B 244,368 4,375,437
* Attendo AB 686,389 3,898,557Avanza Bank Holding AB 409,511 12,715,967
* Balco Group AB 979 9,537Beijer Alma AB 282,919 5,167,946
* Beijer Electronics Group AB 93,898 503,489Bergman & Beving AB 193,579 2,688,331Besqab AB 21,962 359,068Betsson AB 928,684 8,615,130
* Better Collective A/S 13,659 334,202* BHG Group AB 144,894 2,412,569* Bilia AB, Class A 653,084 9,667,279
BillerudKorsnas AB 100,759 1,874,125BioGaia AB, Class B 122,544 5,750,136
* Biotage AB 390,521 6,883,819* Bjorn Borg AB 13,009 33,784* Bonava AB, Class B 466,945 5,414,201* Boozt AB 90,604 1,885,333
Bravida Holding AB 978,791 13,486,807* Bufab AB 215,726 5,309,342* Bulten AB 117,488 1,405,445
Copyright © 2021 www.secdatabase.com. All Rights Reserved.Please Consider the Environment Before Printing This Document

Bure Equity AB 450,981 15,494,791* Byggmax Group AB 356,302 3,107,846* Calliditas Therapeutics AB, Class B 23,655 330,088* Catella AB 11,889 37,011
Copyright © 2021 www.secdatabase.com. All Rights Reserved.Please Consider the Environment Before Printing This Document
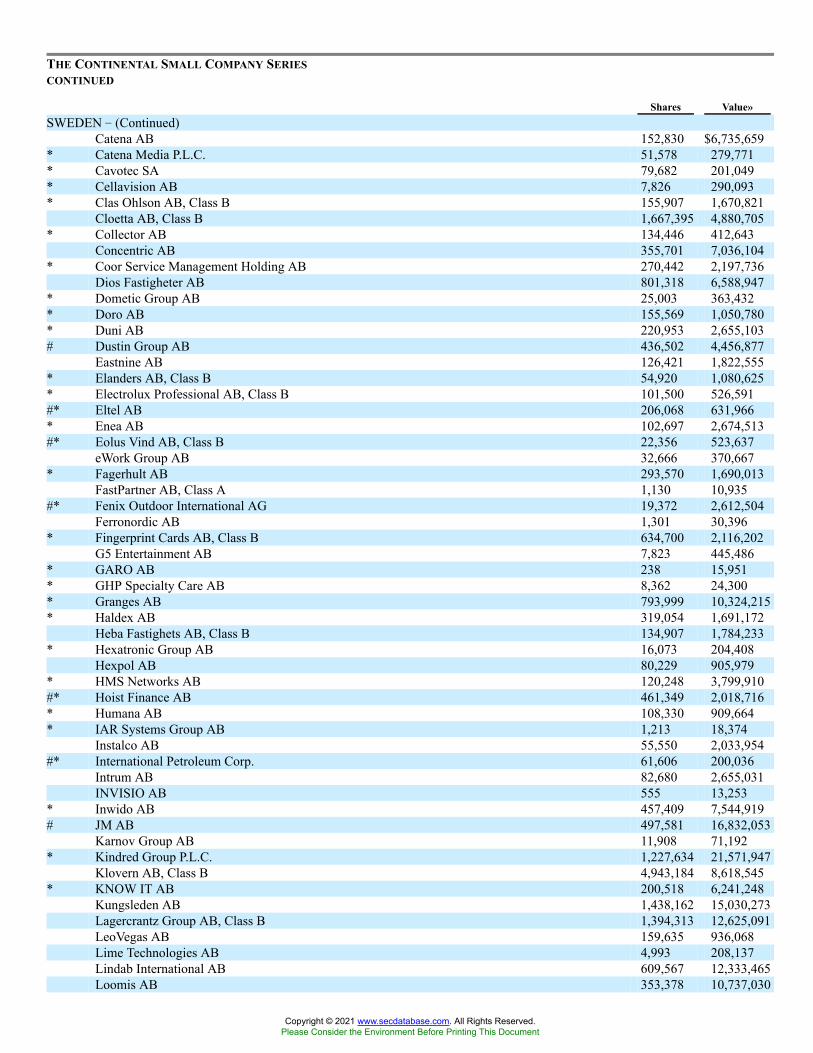
THE CONTINENTAL SMALL COMPANY SERIESCONTINUED
Shares Value»SWEDEN � (Continued)
Catena AB 152,830 $6,735,659* Catena Media P.L.C. 51,578 279,771* Cavotec SA 79,682 201,049* Cellavision AB 7,826 290,093* Clas Ohlson AB, Class B 155,907 1,670,821
Cloetta AB, Class B 1,667,395 4,880,705* Collector AB 134,446 412,643
Concentric AB 355,701 7,036,104* Coor Service Management Holding AB 270,442 2,197,736
Dios Fastigheter AB 801,318 6,588,947* Dometic Group AB 25,003 363,432* Doro AB 155,569 1,050,780* Duni AB 220,953 2,655,103# Dustin Group AB 436,502 4,456,877
Eastnine AB 126,421 1,822,555* Elanders AB, Class B 54,920 1,080,625* Electrolux Professional AB, Class B 101,500 526,591#* Eltel AB 206,068 631,966* Enea AB 102,697 2,674,513#* Eolus Vind AB, Class B 22,356 523,637
eWork Group AB 32,666 370,667* Fagerhult AB 293,570 1,690,013
FastPartner AB, Class A 1,130 10,935#* Fenix Outdoor International AG 19,372 2,612,504
Ferronordic AB 1,301 30,396* Fingerprint Cards AB, Class B 634,700 2,116,202
G5 Entertainment AB 7,823 445,486* GARO AB 238 15,951* GHP Specialty Care AB 8,362 24,300* Granges AB 793,999 10,324,215* Haldex AB 319,054 1,691,172
Heba Fastighets AB, Class B 134,907 1,784,233* Hexatronic Group AB 16,073 204,408
Hexpol AB 80,229 905,979* HMS Networks AB 120,248 3,799,910#* Hoist Finance AB 461,349 2,018,716* Humana AB 108,330 909,664* IAR Systems Group AB 1,213 18,374
Instalco AB 55,550 2,033,954#* International Petroleum Corp. 61,606 200,036
Intrum AB 82,680 2,655,031INVISIO AB 555 13,253
* Inwido AB 457,409 7,544,919# JM AB 497,581 16,832,053
Karnov Group AB 11,908 71,192* Kindred Group P.L.C. 1,227,634 21,571,947
Klovern AB, Class B 4,943,184 8,618,545* KNOW IT AB 200,518 6,241,248
Kungsleden AB 1,438,162 15,030,273Lagercrantz Group AB, Class B 1,394,313 12,625,091LeoVegas AB 159,635 936,068Lime Technologies AB 4,993 208,137Lindab International AB 609,567 12,333,465Loomis AB 353,378 10,737,030
Copyright © 2021 www.secdatabase.com. All Rights Reserved.Please Consider the Environment Before Printing This Document

* Medcap AB 3,296 78,545* Medicover AB, Class B 38,704 829,493* Mekonomen AB 277,209 4,101,099
Midsona AB, Class B 2,661 25,217MIPS AB 17,916 1,283,206
Copyright © 2021 www.secdatabase.com. All Rights Reserved.Please Consider the Environment Before Printing This Document

THE CONTINENTAL SMALL COMPANY SERIESCONTINUED
Shares Value»SWEDEN � (Continued)* Modern Times Group MTG AB, Class B 412,810 $5,985,462* Momentum Group AB, Class B 144,169 2,559,044* Munters Group AB 1,207 10,016
Mycronic AB 437,340 10,273,070NCC AB, Class B 236,798 3,997,090
* Nederman Holding AB 30,189 504,971#* Nelly Group AB 70,318 272,061* Net Insight AB, Class B 1,178,944 351,227* New Wave Group AB, Class B 426,925 3,417,787* Nobia AB 852,732 6,504,342* Nobina AB 732,991 6,147,885* Nolato AB, Class B 159,009 14,159,864* Nordic Entertainment Group AB, Class B 70,640 3,141,229* Nordic Waterproofing Holding AB 66,975 1,288,889
NP3 Fastigheter AB 152,387 2,426,373* Nyfosa AB 1,249,698 12,848,723* OEM International AB, Class B 47,898 1,863,384* Pandox AB 345,074 5,844,718* Peab AB, Class B 744,929 9,009,932
Platzer Fastigheter Holding AB, Class B 250,352 2,973,795# Pricer AB, Class B 892,974 3,527,851
Proact IT Group AB 61,875 2,073,914* Qliro AB 70,318 377,543# Ratos AB, Class B 1,526,547 8,299,591* RaySearch Laboratories AB 157,470 1,614,746* Resurs Holding AB 670,656 3,668,548* Rottneros AB 672,020 791,160#* SAS AB 8,865,842 2,043,337* Scandi Standard AB 397,762 2,885,635#* Scandic Hotels Group AB 183,625 756,440
Sectra AB, Class B 115,969 7,282,630* Semcon AB 118,592 1,356,375* Sensys Gatso Group AB 2,498,845 385,892#* SkiStar AB 321,068 4,394,373* Systemair AB 90,209 2,429,566
Tethys Oil AB 54,710 406,300Troax Group AB 214,262 5,959,152
* VBG Group AB, Class B 26,732 517,607Vitec Software Group AB, Class B 13,721 589,661Wihlborgs Fastigheter AB 796,443 15,111,707
TOTAL SWEDEN 529,805,985SWITZERLAND � (14.2%)
Allreal Holding AG 115,683 23,304,516ALSO Holding AG 44,564 12,810,540
* ams AG 1,057,314 21,051,882* APG SGA SA 8,640 1,995,526* Arbonia AG 343,677 6,107,286* Aryzta AG 6,038,912 6,672,533* Ascom Holding AG 156,857 2,411,990* Autoneum Holding AG 21,144 3,970,513
Bachem Holding AG, Class B 4,373 1,872,427Baloise Holding AG 1,875 318,847Banque Cantonale de Geneve 9,528 1,622,775
* Banque Cantonale du Jura SA 4,071 232,548
Copyright © 2021 www.secdatabase.com. All Rights Reserved.Please Consider the Environment Before Printing This Document

Banque Cantonale Vaudoise 62,952 6,142,433Belimo Holding AG 3,028 24,481,202Bell Food Group AG 14,524 4,347,425Bellevue Group AG 57,974 2,386,305
Copyright © 2021 www.secdatabase.com. All Rights Reserved.Please Consider the Environment Before Printing This Document

THE CONTINENTAL SMALL COMPANY SERIESCONTINUED
Shares Value»SWITZERLAND � (Continued)
Berner Kantonalbank AG 28,933 $6,521,806BKW AG 153,128 16,670,729Bobst Group SA 65,642 4,345,659Bossard Holding AG, Class A 43,180 9,473,798Bucher Industries AG 54,197 27,617,062Burckhardt Compression Holding AG 541 180,108Burkhalter Holding AG 28,978 2,239,721
* Calida Holding AG 32,749 1,268,336#* Carlo Gavazzi Holding AG 2,982 606,541
Cembra Money Bank AG 187,433 20,655,417# Cicor Technologies, Ltd. 14,897 815,816
Cie Financiere Tradition SA 10,661 1,347,825# Clariant AG 301,120 6,075,692
Coltene Holding AG 25,850 3,304,044Comet Holding AG 850 195,018Conzzeta AG 9,616 11,902,765
* COSMO Pharmaceuticals NV 235 20,665Daetwyler Holding AG 12,039 3,585,081DKSH Holding AG 225,777 17,336,014dormakaba Holding AG 24,057 16,432,672
#* Dottikon Es Holding AG 1,430 277,302#* Dufry AG 399,735 27,274,045
EFG International AG 675,982 5,184,618Emmi AG 15,057 15,209,187Energiedienst Holding AG 83,637 3,396,480
#* Evolva Holding SA 3,349,123 721,187* Feintool International Holding AG 16,000 1,210,297* Flughafen Zurich AG 126,351 20,788,334
Forbo Holding AG 8,604 15,618,073Galenica AG 39,604 2,469,333
* GAM Holding AG 1,195,762 3,155,753Georg Fischer AG 31,470 42,057,561Gurit Holding AG 3,022 7,665,553Helvetia Holding AG 224,235 26,322,447
* Hiag Immobilien Holding AG 20,030 2,307,553#* HOCHDORF Holding AG 6,697 427,216
Huber & Suhner AG 94,378 7,313,059Hypothekarbank Lenzburg AG 6 27,438Implenia AG 120,182 3,313,938
* Ina Invest Holding AG 25,352 508,062Inficon Holding AG 14,229 14,958,893Interroll Holding AG 4,787 16,936,459Intershop Holding AG 10,283 6,789,367Investis Holding SA 3,673 357,093
* Jungfraubahn Holding AG 17,432 2,715,118Kardex Holding AG 47,102 9,627,823
* Komax Holding AG 20,789 5,030,126# Kudelski SA 217,692 1,007,937
Landis & Gyr Group AG 34,693 2,333,961#* Lastminute.com NV 23,689 938,812
LEM Holding SA 3,808 7,355,531Liechtensteinische Landesbank AG 63,994 3,647,361Luzerner Kantonalbank AG 20,110 9,199,938
#* Meier Tobler Group AG 45,826 782,610
Copyright © 2021 www.secdatabase.com. All Rights Reserved.Please Consider the Environment Before Printing This Document

Metall Zug AG 1,082 2,318,159#* Meyer Burger Technology AG 2,931,882 1,344,354* Mikron Holding AG 8,692 56,135
Mobilezone Holding AG 279,877 3,653,280Mobimo Holding AG 55,872 17,057,360
Copyright © 2021 www.secdatabase.com. All Rights Reserved.Please Consider the Environment Before Printing This Document

THE CONTINENTAL SMALL COMPANY SERIESCONTINUED
Shares Value»SWITZERLAND � (Continued)
OC Oerlikon Corp. AG 1,609,083 $18,622,863* Orascom Development Holding AG 93,520 1,041,767# Orell Fuessli AG 5,028 595,926
Orior AG 37,151 3,282,842* Peach Property Group AG 556 29,231
Phoenix Mecano AG 4,472 2,170,011Plazza AG, Class A 7,122 2,419,834PSP Swiss Property AG 326,804 39,813,879Rieter Holding AG 20,000 2,692,805Romande Energie Holding SA 2,625 3,405,189
# Schaffner Holding AG 3,363 846,416Schweiter Technologies AG 7,099 11,723,018
# Schweizerische Nationalbank 23 130,885* Sensirion Holding AG 229 15,343
SFS Group AG 124,609 15,506,564Siegfried Holding AG 30,001 24,720,948SIG Combibloc Group AG 302,634 6,992,376Softwareone Holding AG 56,780 1,461,431St Galler Kantonalbank AG 17,241 7,776,775Sulzer AG 136,230 15,344,884Swiss Prime Site AG 55,059 5,082,934
#* Swiss Steel Holding AG 3,310,891 920,124Swissquote Group Holding SA 77,115 9,947,687Thurgauer Kantonalbank 3,152 353,700
#* Tornos Holding AG 26,632 205,137TX Group AG 17,190 1,375,881u-blox Holding AG 42,416 2,748,243Valiant Holding AG 106,532 11,089,432
* Valora Holding AG 27,553 5,837,153VAT Group AG 195,701 54,780,636Vaudoise Assurances Holding SA 6,710 3,419,523
* Vetropack Holding AG 64,600 4,056,456* Von Roll Holding AG 378,198 335,074
Vontobel Holding AG 223,125 17,029,835VP Bank AG 24,056 2,909,580VZ Holding AG 90,005 7,450,023
* V-ZUG Holding AG 10,820 1,275,010Walliser Kantonalbank 18,991 2,122,091Warteck Invest AG 27 65,994Ypsomed Holding AG 7,722 1,294,092Zehnder Group AG 82,191 6,552,811Zug Estates Holding AG, Class B 1,178 2,448,988Zuger Kantonalbank AG 700 5,032,929
TOTAL SWITZERLAND 866,607,590UNITED STATES � (0.0%)#* Arko Corp. 135,431 1,346,595TOTAL COMMON STOCKS 5,749,970,232PREFERRED STOCKS � (0.9%)GERMANY � (0.9%)
Biotest AG 99,466 3,520,282Draegerwerk AG & Co. KGaA 60,431 4,863,713Fuchs Petrolub SE 284,114 13,614,534Jungheinrich AG 366,703 17,649,303
Copyright © 2021 www.secdatabase.com. All Rights Reserved.Please Consider the Environment Before Printing This Document

Sixt SE 116,451 9,103,483STO SE & Co. KGaA 13,696 2,538,931
Copyright © 2021 www.secdatabase.com. All Rights Reserved.Please Consider the Environment Before Printing This Document

THE CONTINENTAL SMALL COMPANY SERIESCONTINUED
Shares Value»GERMANY � (Continued)
Villeroy & Boch AG 49,772 $930,951TOTAL GERMANY 52,221,197RIGHTS/WARRANTS � (0.0%)NORWAY � (0.0%)* Nordic Nanovector A.S. 15,774 2,232TOTAL INVESTMENT SECURITIES
(Cost $4,188,000,355) 5,802,193,661
Value��SECURITIES LENDING COLLATERAL � (5.1%)@ § The DFA Short Term Investment Fund 27,020,554 312,627,808TOTAL INVESTMENTS � (100.0%)
(Cost $4,500,599,776) $6,114,821,469
Summary of the Series� investments as of March 31, 2021, based on their valuation inputs, is as follows (see Security Valuation Note):
Investments in Securities (Market Value)Level 1 Level 2 Level 3 Total
Common StocksAustria � $223,593,575 � $223,593,575Belgium � 210,049,708 � 210,049,708Denmark � 321,332,262 � 321,332,262Finland � 366,001,977 � 366,001,977France � 600,184,063 � 600,184,063Germany $24,826,725 909,110,796 � 933,937,521Ireland � 46,864,175 � 46,864,175Israel 1,003,740 193,112,864 � 194,116,604Italy � 500,757,123 � 500,757,123Netherlands � 424,228,900 � 424,228,900Norway � 149,289,935 � 149,289,935Portugal � 44,038,200 � 44,038,200Spain � 337,816,019 � 337,816,019Sweden � 529,805,985 � 529,805,985Switzerland � 866,607,590 � 866,607,590United States � 1,346,595 � 1,346,595
Preferred StocksGermany � 52,221,197 � 52,221,197
Rights/WarrantsNorway � 2,232 � 2,232
Securities Lending Collateral � 312,627,808 � 312,627,808TOTAL $25,830,465 $6,088,991,004 � $6,114,821,469
Copyright © 2021 www.secdatabase.com. All Rights Reserved.Please Consider the Environment Before Printing This Document
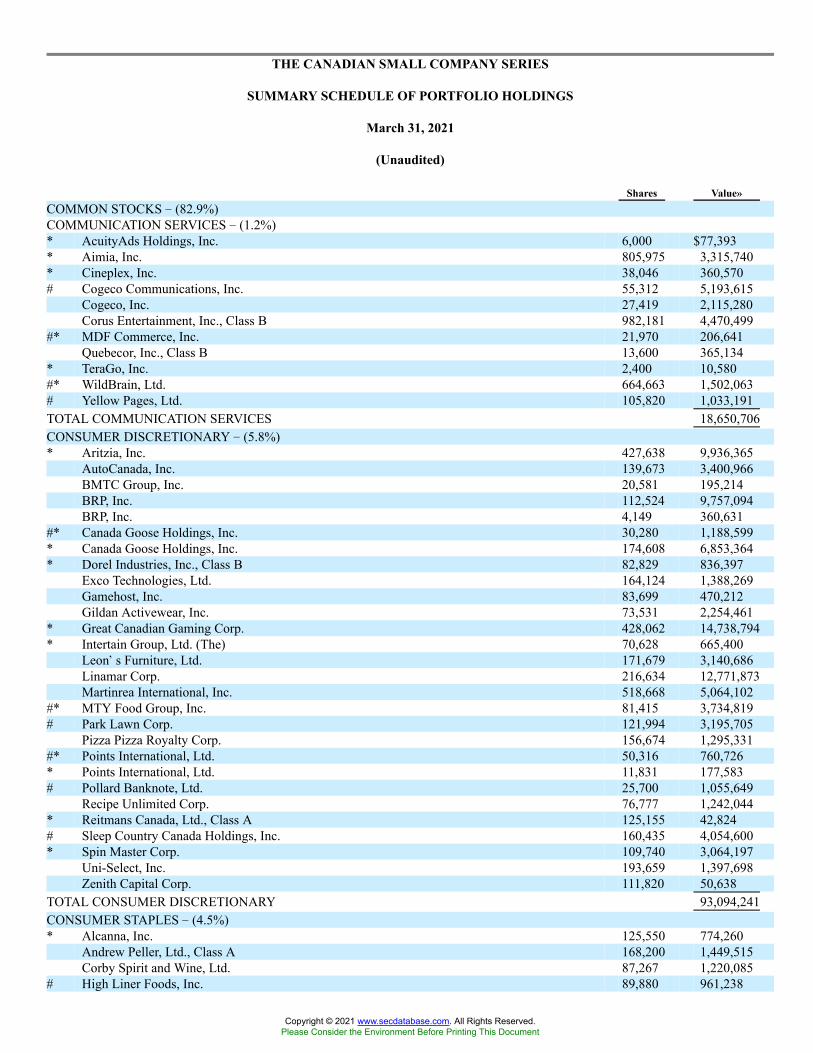
THE CANADIAN SMALL COMPANY SERIES
SUMMARY SCHEDULE OF PORTFOLIO HOLDINGS
March 31, 2021
(Unaudited)
Shares Value»COMMON STOCKS � (82.9%)COMMUNICATION SERVICES � (1.2%)* AcuityAds Holdings, Inc. 6,000 $77,393* Aimia, Inc. 805,975 3,315,740* Cineplex, Inc. 38,046 360,570# Cogeco Communications, Inc. 55,312 5,193,615
Cogeco, Inc. 27,419 2,115,280Corus Entertainment, Inc., Class B 982,181 4,470,499
#* MDF Commerce, Inc. 21,970 206,641Quebecor, Inc., Class B 13,600 365,134
* TeraGo, Inc. 2,400 10,580#* WildBrain, Ltd. 664,663 1,502,063# Yellow Pages, Ltd. 105,820 1,033,191TOTAL COMMUNICATION SERVICES 18,650,706CONSUMER DISCRETIONARY � (5.8%)* Aritzia, Inc. 427,638 9,936,365
AutoCanada, Inc. 139,673 3,400,966BMTC Group, Inc. 20,581 195,214BRP, Inc. 112,524 9,757,094BRP, Inc. 4,149 360,631
#* Canada Goose Holdings, Inc. 30,280 1,188,599* Canada Goose Holdings, Inc. 174,608 6,853,364* Dorel Industries, Inc., Class B 82,829 836,397
Exco Technologies, Ltd. 164,124 1,388,269Gamehost, Inc. 83,699 470,212Gildan Activewear, Inc. 73,531 2,254,461
* Great Canadian Gaming Corp. 428,062 14,738,794* Intertain Group, Ltd. (The) 70,628 665,400
Leon�s Furniture, Ltd. 171,679 3,140,686Linamar Corp. 216,634 12,771,873Martinrea International, Inc. 518,668 5,064,102
#* MTY Food Group, Inc. 81,415 3,734,819# Park Lawn Corp. 121,994 3,195,705
Pizza Pizza Royalty Corp. 156,674 1,295,331#* Points International, Ltd. 50,316 760,726* Points International, Ltd. 11,831 177,583# Pollard Banknote, Ltd. 25,700 1,055,649
Recipe Unlimited Corp. 76,777 1,242,044* Reitmans Canada, Ltd., Class A 125,155 42,824# Sleep Country Canada Holdings, Inc. 160,435 4,054,600* Spin Master Corp. 109,740 3,064,197
Uni-Select, Inc. 193,659 1,397,698Zenith Capital Corp. 111,820 50,638
TOTAL CONSUMER DISCRETIONARY 93,094,241CONSUMER STAPLES � (4.5%)* Alcanna, Inc. 125,550 774,260
Andrew Peller, Ltd., Class A 168,200 1,449,515Corby Spirit and Wine, Ltd. 87,267 1,220,085
# High Liner Foods, Inc. 89,880 961,238
Copyright © 2021 www.secdatabase.com. All Rights Reserved.Please Consider the Environment Before Printing This Document
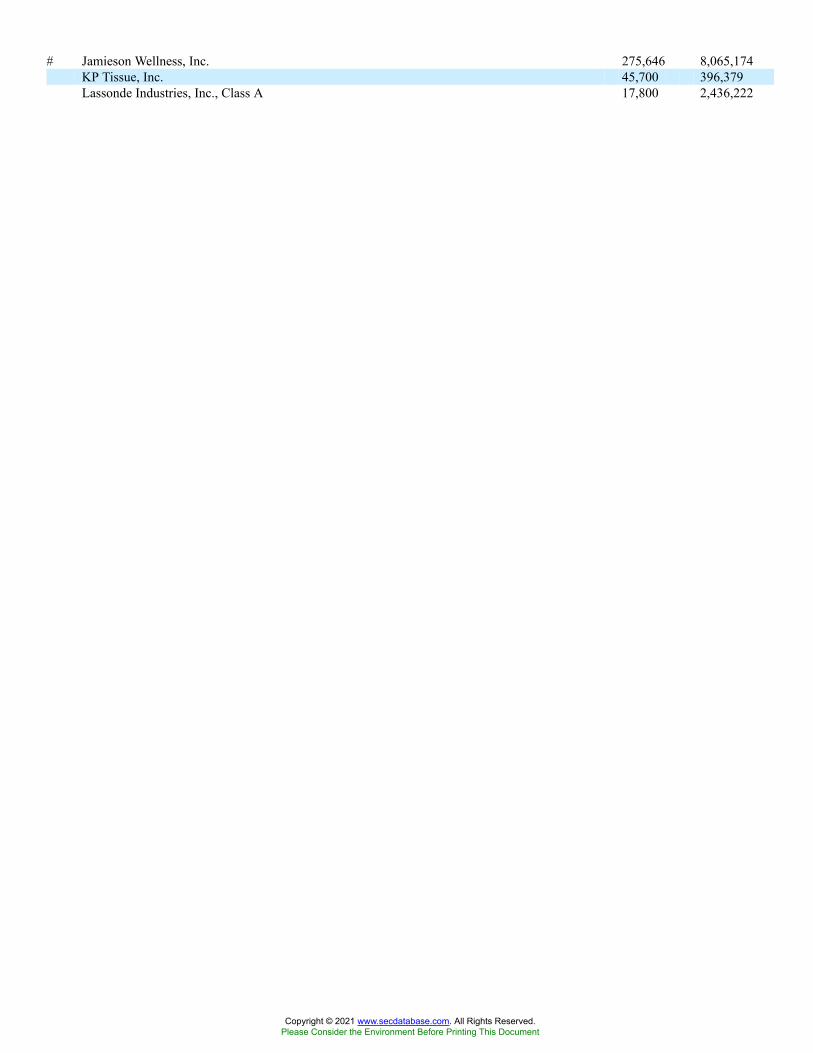
# Jamieson Wellness, Inc. 275,646 8,065,174KP Tissue, Inc. 45,700 396,379Lassonde Industries, Inc., Class A 17,800 2,436,222
Copyright © 2021 www.secdatabase.com. All Rights Reserved.Please Consider the Environment Before Printing This Document

THE CANADIAN SMALL COMPANY SERIESCONTINUED
Shares Value»CONSUMER STAPLES � (Continued)
Maple Leaf Foods, Inc. 355,793 $8,111,299* Mav Beauty Brands, Inc. 7,000 30,914# North West Co., Inc. (The) 319,480 9,281,622# Premium Brands Holdings Corp. 182,482 17,387,121
Primo Water Corp. 96,682 1,572,049Primo Water Corp. 813,424 13,249,614
# Rogers Sugar, Inc. 712,254 3,105,874* SunOpta, Inc. 291,540 4,310,347#* Village Farms International, Inc. 21,817 288,359* Village Farms International, Inc. 20,293 268,476TOTAL CONSUMER STAPLES 72,908,548ENERGY � (15.6%)#* Advantage Oil & Gas, Ltd. 918,066 1,731,373#* Africa Oil Corp. 1,333,299 1,241,314# ARC Resources, Ltd. 2,215,726 13,611,367#* Athabasca Oil Corp. 2,177,410 918,300* Baytex Energy Corp. 1 1# Birchcliff Energy, Ltd. 1,289,021 2,677,126
Cameco Corp. 209,026 3,466,302Cameco Corp. 1,119,182 18,589,613
# Canacol Energy, Ltd. 930,761 2,666,302# Cardinal Energy, Ltd. 245,096 510,982# CES Energy Solutions Corp. 1,207,291 1,546,700
Computer Modelling Group, Ltd. 464,145 2,123,684# Crescent Point Energy Corp. 2,370,438 9,883,898#* Crew Energy, Inc. 384,876 361,386#* Denison Mines Corp. 2,613,375 2,848,988# Enerflex, Ltd. 448,285 2,892,967#* Energy Fuels, Inc. 347,960 1,982,487# Enerplus Corp. 1,046,075 5,252,434# Ensign Energy Services, Inc. 617,495 550,326#* Fission Uranium Corp. 1,962,000 811,841# Freehold Royalties, Ltd. 447,473 2,581,507# Frontera Energy Corp. 244,929 1,249,300* Gasfrac Energy Services, Inc. 91,560 0# Gibson Energy, Inc. 940,791 16,671,772#* Gran Tierra Energy, Inc. 1,826,935 1,279,305# Inter Pipeline, Ltd. 885,858 12,667,198#* Kelt Exploration, Ltd. 773,541 1,637,319# Keyera Corp. 700,274 14,554,911* Lightstream Resources, Ltd. 687,816 0#* MEG Energy Corp. 2,470,617 12,818,034# North American Construction Group, Ltd. 118,644 1,278,300
North American Construction Group, Ltd. 9,342 100,427#* NuVista Energy, Ltd. 1,093,750 2,062,694* Obsidian Energy, Ltd. 1 1
Ovintiv, Inc. 218,932 5,221,128#* Paramount Resources, Ltd., Class A 332,422 2,690,168* Parex Resources, Inc. 786,291 14,021,470
Parkland Corp. 453,150 13,615,775Pason Systems, Inc. 379,526 2,681,778
# Peyto Exploration & Development Corp. 789,824 3,349,854PHX Energy Services Corp. 74,028 162,582Pinnacle Renewable Energy, Inc. 43,606 391,056
Copyright © 2021 www.secdatabase.com. All Rights Reserved.Please Consider the Environment Before Printing This Document

# PrairieSky Royalty, Ltd. 1,029,307 11,098,202* Precision Drilling Corp. 67,041 1,448,363* Pulse Seismic, Inc. 38,716 48,984#* Questerre Energy Corp., Class A 797,460 117,395
Copyright © 2021 www.secdatabase.com. All Rights Reserved.Please Consider the Environment Before Printing This Document
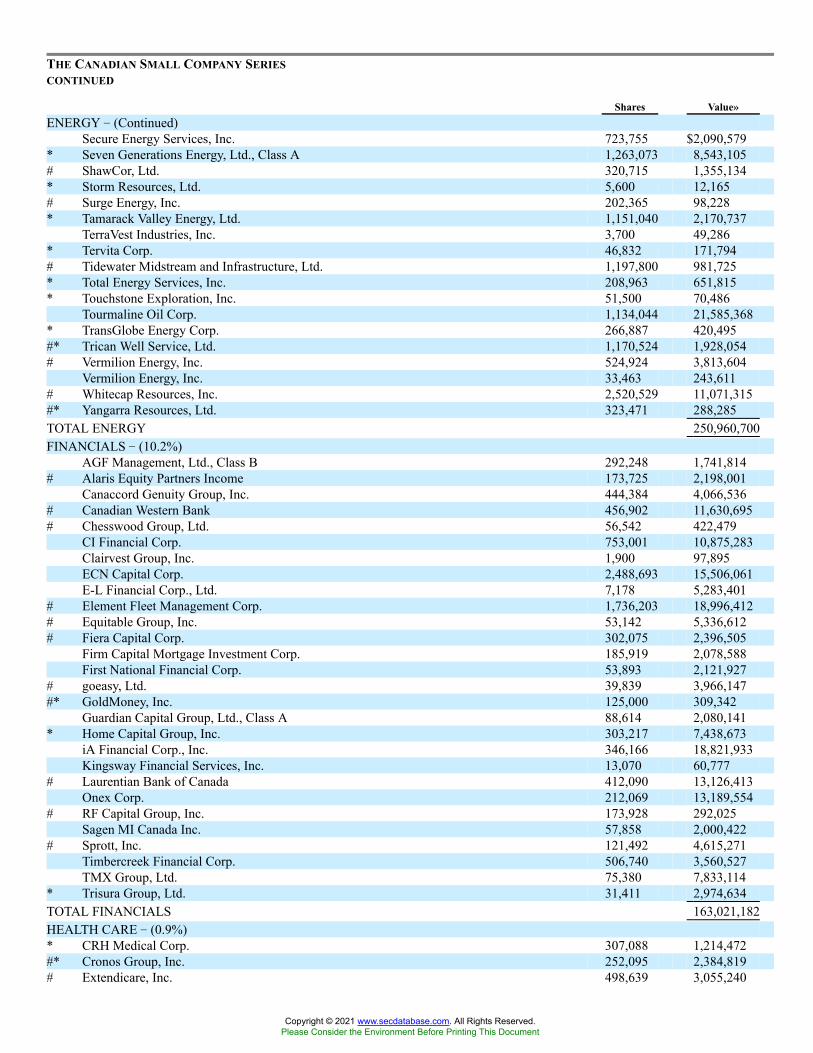
THE CANADIAN SMALL COMPANY SERIESCONTINUED
Shares Value»ENERGY � (Continued)
Secure Energy Services, Inc. 723,755 $2,090,579* Seven Generations Energy, Ltd., Class A 1,263,073 8,543,105# ShawCor, Ltd. 320,715 1,355,134* Storm Resources, Ltd. 5,600 12,165# Surge Energy, Inc. 202,365 98,228* Tamarack Valley Energy, Ltd. 1,151,040 2,170,737
TerraVest Industries, Inc. 3,700 49,286* Tervita Corp. 46,832 171,794# Tidewater Midstream and Infrastructure, Ltd. 1,197,800 981,725* Total Energy Services, Inc. 208,963 651,815* Touchstone Exploration, Inc. 51,500 70,486
Tourmaline Oil Corp. 1,134,044 21,585,368* TransGlobe Energy Corp. 266,887 420,495#* Trican Well Service, Ltd. 1,170,524 1,928,054# Vermilion Energy, Inc. 524,924 3,813,604
Vermilion Energy, Inc. 33,463 243,611# Whitecap Resources, Inc. 2,520,529 11,071,315#* Yangarra Resources, Ltd. 323,471 288,285TOTAL ENERGY 250,960,700FINANCIALS � (10.2%)
AGF Management, Ltd., Class B 292,248 1,741,814# Alaris Equity Partners Income 173,725 2,198,001
Canaccord Genuity Group, Inc. 444,384 4,066,536# Canadian Western Bank 456,902 11,630,695# Chesswood Group, Ltd. 56,542 422,479
CI Financial Corp. 753,001 10,875,283Clairvest Group, Inc. 1,900 97,895ECN Capital Corp. 2,488,693 15,506,061E-L Financial Corp., Ltd. 7,178 5,283,401
# Element Fleet Management Corp. 1,736,203 18,996,412# Equitable Group, Inc. 53,142 5,336,612# Fiera Capital Corp. 302,075 2,396,505
Firm Capital Mortgage Investment Corp. 185,919 2,078,588First National Financial Corp. 53,893 2,121,927
# goeasy, Ltd. 39,839 3,966,147#* GoldMoney, Inc. 125,000 309,342
Guardian Capital Group, Ltd., Class A 88,614 2,080,141* Home Capital Group, Inc. 303,217 7,438,673
iA Financial Corp., Inc. 346,166 18,821,933Kingsway Financial Services, Inc. 13,070 60,777
# Laurentian Bank of Canada 412,090 13,126,413Onex Corp. 212,069 13,189,554
# RF Capital Group, Inc. 173,928 292,025Sagen MI Canada Inc. 57,858 2,000,422
# Sprott, Inc. 121,492 4,615,271Timbercreek Financial Corp. 506,740 3,560,527TMX Group, Ltd. 75,380 7,833,114
* Trisura Group, Ltd. 31,411 2,974,634TOTAL FINANCIALS 163,021,182HEALTH CARE � (0.9%)* CRH Medical Corp. 307,088 1,214,472#* Cronos Group, Inc. 252,095 2,384,819# Extendicare, Inc. 498,639 3,055,240
Copyright © 2021 www.secdatabase.com. All Rights Reserved.Please Consider the Environment Before Printing This Document

HLS Therapeutics, Inc. 5,300 82,239* Knight Therapeutics, Inc. 808,695 3,494,242# Medical Facilities Corp. 157,139 910,298
Copyright © 2021 www.secdatabase.com. All Rights Reserved.Please Consider the Environment Before Printing This Document
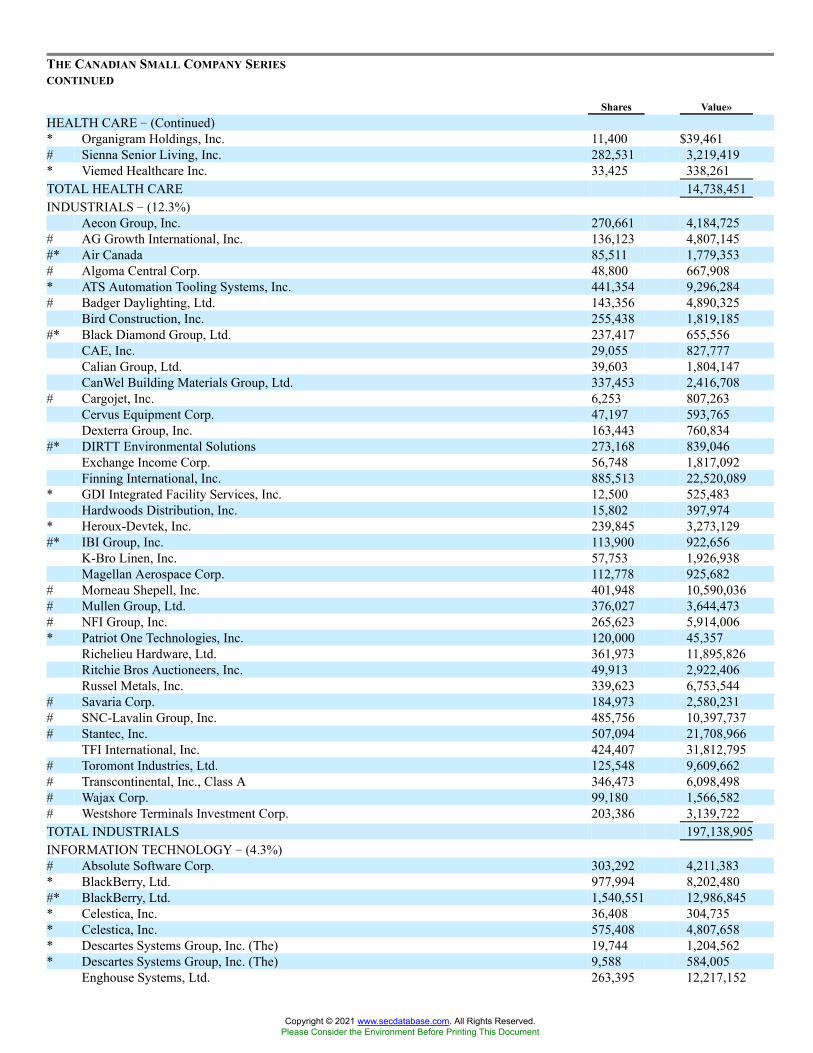
THE CANADIAN SMALL COMPANY SERIESCONTINUED
Shares Value»HEALTH CARE � (Continued)* Organigram Holdings, Inc. 11,400 $39,461# Sienna Senior Living, Inc. 282,531 3,219,419* Viemed Healthcare Inc. 33,425 338,261TOTAL HEALTH CARE 14,738,451INDUSTRIALS � (12.3%)
Aecon Group, Inc. 270,661 4,184,725# AG Growth International, Inc. 136,123 4,807,145#* Air Canada 85,511 1,779,353# Algoma Central Corp. 48,800 667,908* ATS Automation Tooling Systems, Inc. 441,354 9,296,284# Badger Daylighting, Ltd. 143,356 4,890,325
Bird Construction, Inc. 255,438 1,819,185#* Black Diamond Group, Ltd. 237,417 655,556
CAE, Inc. 29,055 827,777Calian Group, Ltd. 39,603 1,804,147CanWel Building Materials Group, Ltd. 337,453 2,416,708
# Cargojet, Inc. 6,253 807,263Cervus Equipment Corp. 47,197 593,765Dexterra Group, Inc. 163,443 760,834
#* DIRTT Environmental Solutions 273,168 839,046Exchange Income Corp. 56,748 1,817,092Finning International, Inc. 885,513 22,520,089
* GDI Integrated Facility Services, Inc. 12,500 525,483Hardwoods Distribution, Inc. 15,802 397,974
* Heroux-Devtek, Inc. 239,845 3,273,129#* IBI Group, Inc. 113,900 922,656
K-Bro Linen, Inc. 57,753 1,926,938Magellan Aerospace Corp. 112,778 925,682
# Morneau Shepell, Inc. 401,948 10,590,036# Mullen Group, Ltd. 376,027 3,644,473# NFI Group, Inc. 265,623 5,914,006* Patriot One Technologies, Inc. 120,000 45,357
Richelieu Hardware, Ltd. 361,973 11,895,826Ritchie Bros Auctioneers, Inc. 49,913 2,922,406Russel Metals, Inc. 339,623 6,753,544
# Savaria Corp. 184,973 2,580,231# SNC-Lavalin Group, Inc. 485,756 10,397,737# Stantec, Inc. 507,094 21,708,966
TFI International, Inc. 424,407 31,812,795# Toromont Industries, Ltd. 125,548 9,609,662# Transcontinental, Inc., Class A 346,473 6,098,498# Wajax Corp. 99,180 1,566,582# Westshore Terminals Investment Corp. 203,386 3,139,722TOTAL INDUSTRIALS 197,138,905INFORMATION TECHNOLOGY � (4.3%)# Absolute Software Corp. 303,292 4,211,383* BlackBerry, Ltd. 977,994 8,202,480#* BlackBerry, Ltd. 1,540,551 12,986,845* Celestica, Inc. 36,408 304,735* Celestica, Inc. 575,408 4,807,658* Descartes Systems Group, Inc. (The) 19,744 1,204,562* Descartes Systems Group, Inc. (The) 9,588 584,005
Enghouse Systems, Ltd. 263,395 12,217,152
Copyright © 2021 www.secdatabase.com. All Rights Reserved.Please Consider the Environment Before Printing This Document

# Evertz Technologies, Ltd. 146,939 1,700,082* EXFO, Inc. 60,487 258,948* Kinaxis, Inc. 141,544 16,518,535
Copyright © 2021 www.secdatabase.com. All Rights Reserved.Please Consider the Environment Before Printing This Document

THE CANADIAN SMALL COMPANY SERIESCONTINUED
Shares Value»INFORMATION TECHNOLOGY � (Continued)* Photon Control, Inc. 447,494 $897,338
Quarterhill, Inc. 575,556 1,177,034#* Sierra Wireless, Inc. 241,452 3,552,517
Vecima Networks, Inc. 6,059 71,091TOTAL INFORMATION TECHNOLOGY 68,694,365MATERIALS � (18.6%)#* 5N Plus, Inc. 414,065 1,515,635
Acadian Timber Corp. 65,067 1,009,634AirBoss of America Corp. 76,006 2,434,345Alamos Gold, Inc., Class A 2,007,719 15,688,546
# Altius Minerals Corp. 169,012 2,018,676#* Americas Gold & Silver Corp. 86,596 196,387* Amerigo Resources, Ltd. 18,200 13,179* Argonaut Gold, Inc. 1,555,539 2,846,933
B2Gold Corp. 130,208 561,196* Canfor Corp. 245,098 5,076,710
Canfor Pulp Products, Inc. 138,951 984,057* Capstone Mining Corp. 2,456,528 8,092,644# Cascades, Inc. 430,569 5,389,393
Centerra Gold, Inc. 1,270,606 11,243,050#* China Gold International Resources Corp., Ltd. 1,488,085 4,002,329#* Copper Mountain Mining Corp. 690,855 1,709,683
Dundee Precious Metals, Inc. 810,500 4,946,714#* Eldorado Gold Corp. 664,263 7,178,077* Eldorado Gold Corp. 111,244 1,200,323# Endeavour Mining Corp. 966,160 19,473,893#* Endeavour Silver Corp. 360,197 1,782,785* ERO Copper Corp. 105,067 1,808,386#* First Majestic Silver Corp. 606,133 9,453,499#* First Mining Gold Corp. 749,400 214,676#* Fortuna Silver Mines, Inc. 574,492 3,725,718* Fortuna Silver Mines, Inc. 437,641 2,831,537#* Galiano Gold, Inc. 696,057 792,044* GoGold Resources, Inc. 40,000 74,799* Gold Standard Ventures Corp. 10,700 6,386#* Golden Star Resources, Ltd. 374,657 1,106,053* Great Panther Mining, Ltd. 17,600 13,865* Hanfeng Evergreen, Inc. 45,837 0
Hudbay Minerals, Inc. 45,055 309,528# Hudbay Minerals, Inc. 1,003,501 6,867,278* IAMGOLD Corp. 2,197,656 6,540,331* IAMGOLD Corp. 599,837 1,787,514#* Imperial Metals Corp. 346,592 1,238,321* Interfor Corp. 299,241 6,738,697
Intertape Polymer Group, Inc. 203,244 4,528,393#* Ivanhoe Mines, Ltd., Class A 2,911,597 14,990,079# Labrador Iron Ore Royalty Corp. 289,259 8,523,324* Largo Resources, Ltd. 57,371 794,348#* Lucara Diamond Corp. 1,564,773 896,504#* Lundin Gold, Inc. 86,276 675,544
Lundin Mining Corp. 459,834 4,731,164#* MAG Silver Corp. 9,800 147,542#* Major Drilling Group International, Inc. 441,505 2,371,416* Mandalay Resources Corp. 464 719
Copyright © 2021 www.secdatabase.com. All Rights Reserved.Please Consider the Environment Before Printing This Document

#* Marathon Gold Corp. 147,500 261,737# Methanex Corp. 140,382 5,179,847
Methanex Corp. 55,254 2,033,347#* New Gold, Inc. 3,469,405 5,355,809
Copyright © 2021 www.secdatabase.com. All Rights Reserved.Please Consider the Environment Before Printing This Document

THE CANADIAN SMALL COMPANY SERIESCONTINUED
Shares Value»MATERIALS � (Continued)#* Northern Dynasty Minerals, Ltd. 76,877 $49,551#* OceanaGold Corp. 3,272,419 4,869,439* Orbite Technologies, Inc. 73,500 0# Osisko Gold Royalties, Ltd. 548,849 6,044,458#* Osisko Mining, Inc. 219,488 513,483
Pan American Silver Corp. 42,818 1,285,825* PolyMet Mining Corp. 64,208 203,349#* Premier Gold Mines, Ltd. 998,349 2,208,491#* Pretium Resources, Inc. 293,903 3,047,774* Pretium Resources, Inc. 455,178 4,723,101* Roxgold, Inc. 1,208,860 1,490,995* Sabina Gold & Silver Corp. 1,421,714 2,047,666* Sandstorm Gold, Ltd. 792,058 5,376,187* Seabridge Gold, Inc. 61,595 995,460# SSR Mining, Inc. 1,130,996 16,172,511
Stelco Holdings, Inc. 37,984 851,444# Stella-Jones, Inc. 207,304 8,409,611* Taseko Mines, Ltd. 1,204,804 2,061,215#* Torex Gold Resources, Inc. 381,514 4,817,878#* Trevali Mining Corp. 2,559,289 397,120* Turquoise Hill Resources, Ltd. 6,045 97,264#* Turquoise Hill Resources, Ltd. 224,833 3,621,093* Wesdome Gold Mines, Ltd. 637,024 4,227,564
West Fraser Timber Co., Ltd. 160,144 11,521,115West Fraser Timber Co., Ltd. 0 13
# Western Forest Products, Inc. 1,866,235 2,687,901# Winpak, Ltd. 124,683 4,471,602
Yamana Gold, Inc. 3,304,447 14,356,872TOTAL MATERIALS 297,911,576REAL ESTATE � (3.0%)# Altus Group, Ltd. 261,893 12,595,538
Bridgemarq Real Estate Services 53,069 692,975Colliers International Group, Inc. 165,544 16,265,913Colliers International Group, Inc. 4,163 408,973DREAM Unlimited Corp., Class A 246,187 4,429,289Information Services Corp. 17,674 345,829
# Invesque, Inc. 191,266 545,108* Mainstreet Equity Corp. 31,349 2,006,117
Melcor Developments, Ltd. 55,340 524,028Morguard Corp. 21,982 2,046,546
* Real Matters, Inc. 341,820 3,889,573Tricon Residential, Inc. 467,907 4,788,163
TOTAL REAL ESTATE 48,538,052UTILITIES � (6.5%)
AltaGas, Ltd. 678,375 11,303,551Atco, Ltd., Class I 131,759 4,374,143
# Boralex, Inc., Class A 549,954 17,294,646# Capital Power Corp. 771,649 22,350,620# Innergex Renewable Energy, Inc. 604,787 10,573,063* Just Energy Group, Inc. 4,926 4,729* Maxim Power Corp. 66,734 126,384# Polaris Infrastructure, Inc. 115,463 1,966,188# Superior Plus Corp. 781,510 8,843,059
Copyright © 2021 www.secdatabase.com. All Rights Reserved.Please Consider the Environment Before Printing This Document

# TransAlta Corp. 1,784,708 16,899,837TransAlta Corp. 16,789 158,824
Copyright © 2021 www.secdatabase.com. All Rights Reserved.Please Consider the Environment Before Printing This Document

THE CANADIAN SMALL COMPANY SERIESCONTINUED
Shares Value»UTILITIES � (Continued)# TransAlta Renewables, Inc. 614,934 $10,065,403TOTAL UTILITIES 103,960,447TOTAL COMMON STOCKS 1,329,617,173RIGHTS/WARRANTS � (0.1%)ENERGY � (0.0%)* Cenovus Energy, Inc. Warrants 01/01/26 41,142 163,691MATERIALS � (0.1%)* Pan American Silver Corp. Rights 02/22/29 1,876,416 1,632,482TOTAL RIGHTS/WARRANTS 1,796,173TOTAL INVESTMENT SECURITIES
(Cost $1,002,603,631) 1,331,413,346
Value��SECURITIES LENDING COLLATERAL � (17.0%)@§ The DFA Short Term Investment Fund 23,493,974 271,825,278TOTAL INVESTMENTS � (100.0%)
(Cost $1,274,413,566)^^ $1,603,238,624
Summary of the Series� investments as of March 31, 2021, based on their valuation inputs, is as follows (see Security Valuation Note):
Investments in Securities (Market Value)Level 1 Level 2 Level 3 Total
Common StocksCommunication Services $18,650,706 � � $18,650,706Consumer Discretionary 92,378,203 $716,038 � 93,094,241Consumer Staples 72,908,548 � � 72,908,548Energy 250,960,700 � � 250,960,700Financials 163,021,182 � � 163,021,182Health Care 14,738,451 � � 14,738,451Industrials 197,138,905 � � 197,138,905Information Technology 68,694,365 � � 68,694,365Materials 297,911,576 � � 297,911,576Real Estate 48,538,052 � � 48,538,052Utilities 103,955,718 4,729 � 103,960,447
Rights/WarrantsEnergy � 163,691 � 163,691Materials � 1,632,482 � 1,632,482
Securities Lending Collateral � 271,825,278 � 271,825,278TOTAL $1,328,896,406 $274,342,218 � $1,603,238,624
Copyright © 2021 www.secdatabase.com. All Rights Reserved.Please Consider the Environment Before Printing This Document

ORGANIZATION
The DFA Investment Trust Company (the �Trust�) is an open-end management investment company registered under the InvestmentCompany Act of 1940, whose shares are generally offered to institutional investors, retirement plans and clients of registered investmentadvisors. At March 31, 2021, the Trust consisted of eleven operational investment portfolios, of which five The Japanese SmallCompany Series, The Asia Pacific Small Company Series, The United Kingdom Small Company Series, The Continental SmallCompany Series and The Canadian Small Company Series (collectively, the �Series�), are included in this document.
SECURITY VALUATION
The Series use a fair value hierarchy which prioritizes the inputs to valuation techniques used to measure fair value into three broadlevels described below:
� Level 1 - inputs are quoted prices in active markets for identical securities (including equity securities, open-end investmentcompanies and futures contracts)
� Level 2 - other significant observable inputs (including quoted prices for similar securities, interest rates, prepayment speeds,credit risk, etc.)
� Level 3 - significant unobservable inputs (including the Series� own assumptions in determining the fair value of investments)
Securities held by the Series, including over-the-counter securities, are valued at the last quoted sale price of the day. Internationalequity securities are subject to a fair value factor, as described later in this note. Securities held by the Series that are listed on Nasdaqare valued at the Nasdaq Official Closing Price (�NOCP�). If there is no last reported sale price or NOCP for the day, the Series valuethe securities within the range of the most recent quoted bid and ask prices. Price information on listed securities is taken from theexchange where the security is primarily traded. Generally, securities issued by open-end management investment companies are valuedusing their respective net asset values or public offering prices, as appropriate, for purchase orders placed at the close of the New YorkStock Exchange (NYSE). These securities are generally categorized as Level 1 in the hierarchy.
Securities for which no market quotations are readily available (including restricted securities), or for which market quotations havebecome unreliable, are valued in good faith at fair value in accordance with procedures adopted by the Board of Trustees of the Trust.Fair value pricing may also be used if events that have a significant effect on the value of an investment (as determined in the discretionof Dimensional Fund Advisors LP) occur before the net asset value of the Series is calculated. When fair value pricing is used, theprices of securities used by the Series may differ from the quoted or published prices for the same securities on their primary markets orexchanges. These securities are generally categorized as Level 2 in the hierarchy.
The Series will also apply a fair value price in the circumstances described below. Generally, trading in foreign securities markets iscompleted each day at various times prior to the close of the NYSE. For example, trading in the Japanese securities markets iscompleted each day at the close of the Tokyo Stock Exchange (normally, 2:00 a.m. ET), which is fourteen hours before the close of theNYSE (normally, 4:00 p.m. ET) and the time that the net asset values of the Series are computed. Due to the time differences betweenthe closings of the relevant foreign securities exchanges and the time the Series price their shares at the close of the NYSE, the Serieswill fair value their foreign investments when it is determined that the market quotations for the foreign investments are eitherunreliable or not readily available. The fair value prices will attempt to reflect the impact of the U.S. financial markets� perceptions andtrading activities on the Series� foreign investments since the last closing prices of the foreign investments were calculated on theirprimary foreign securities markets or exchanges. For these purposes, the Board of Trustees of the Series has determined that movementsin relevant indices or other appropriate market indicators, after the close of the Tokyo Stock Exchange or the London Stock Exchange,demonstrate that market quotations may be unreliable. Fair valuation of portfolio securities may occur on a daily basis. The fair valuepricing by the Series uses data furnished by an independent pricing service (and that data draws upon, among other information, themarket values of foreign investments). When a Series uses fair value pricing, the values assigned to the Series� foreign investments maynot be the quoted or published prices of the investments on their primary markets or exchanges. These securities are generallycategorized as Level 2 in the hierarchy.
Futures contracts held by the Series are valued using the settlement price established each day on the exchange on which they aretraded. These valuations are generally categorized as Level 1 in the hierarchy.
Copyright © 2021 www.secdatabase.com. All Rights Reserved.Please Consider the Environment Before Printing This Document

Over-the-counter derivative contracts, which include forward currency contracts, do not require material subjectivity as pricing inputsare observed from quoted markets and are categorized as Level 2 in the hierarchy.
A summary of the inputs used to value the Series� investments by each major security type, industry and/or country is disclosedpreviously in this note. A valuation hierarchy table has been included at the end of the Schedule of Investments. The methodology orinputs used for valuing securities are not necessarily an indication of the risk associated with investing in those securities.
FINANCIAL INSTRUMENTS
In accordance with the Series� investment objectives and policies, the Series may invest in certain financial instruments that haveoff-balance sheet risk in excess of the amounts recognized in the financial statements and concentrations of credit and market risk.These instruments and their significant corresponding risks are described below:
1. FOREIGN MARKET RISKS: Investments in foreign markets may involve certain considerations and risks not typically associatedwith investments in the United States of America, including the possibility of future political and economic developments and the levelof foreign governmental supervision and regulation of foreign securities markets. These markets are generally smaller, less liquid andmore volatile than the major securities markets in the United States of America. Consequently, acquisition and disposition ofinternational securities held by the Series may be inhibited.
Derivative Financial Instruments
Summarized below are the specific types of derivative instruments used by the Series.
2. FUTURES CONTRACTS: The Series may purchase or sell futures contracts and options on futures contracts for equity securitiesand indices to adjust market exposure based on actual or expected cash inflows to or outflows from the Series. The Series, however, donot intend to sell futures contracts to establish short positions in individual securities. Upon entering into a futures contract, a Seriesdeposits cash or pledges U.S. Government securities to a broker in an amount equal to the minimum initial margin requirements of theexchange on which the contract is traded. Subsequent payments are received from or paid to the broker each day, based on the dailyfluctuation in the market value of the contract. These receipts or payments are known as variation margin and are recorded daily by theSeries as unrealized gains or losses until the contracts are closed. When the contracts are closed, the Series record a realized gain or loss,which is presented in the Statements of Operations as a net realized gain or loss on futures, equal to the difference between the value ofthe contract at the time it was opened and the value at the time it was closed.
Risks may arise upon entrance into futures contracts from potential imperfect price correlations between the futures contracts and theunderlying securities or indices, from the possibility of an illiquid secondary market for these instruments and from the possibility thatthe Series could lose more than the initial margin requirements. Entering into stock index futures subjects the Series to equity price riskfrom those futures contracts. Counterparty credit risk related to exchange-traded futures is minimal because the exchange�sclearinghouse, as counterparty to all exchange-traded futures, guarantees the futures against default.
FEDERAL TAX COST
At March 31, 2021, the total cost of securities for federal income tax purposes was:
FederalTax Cost
UnrealizedAppreciation
Unrealized(Depreciation)
NetUnrealized
Appreciation(Depreciation)
The Japanese Small Company Series $2,832,803 � � �The Asia Pacific Small Company Series 1,674,747 � � �The United Kingdom Small Company Series 1,603,615 � � �The Continental Small Company Series 4,532,864 � � �The Canadian Small Company Series 1,300,419 � � �
Copyright © 2021 www.secdatabase.com. All Rights Reserved.Please Consider the Environment Before Printing This Document

RECENTLY ISSUED ACCOUNTING STANDARDS
In March 2017, the Financial Accounting Standards Board (FASB) issued Accounting Standards Update (ASU) 2017-08 which changesthe amortization period for a callable debt security from the maturity date to the earliest call date. The ASU is effective for annualperiods beginning after December 15, 2018, and interim periods within those annual periods. The Trust�s adoption of ASU 2017-08disclosure requirements are reflected within these financial statements prepared as of October 31, 2020 and management has concludedthat the change in accounting principle does not materially impact the financial statement amounts.
In August 2018, the FASB issued ASU No. 2018-13, �Fair Value Measurements� (�ASU 2018-13�). This update makes certainremovals from, changes to and additions to existing disclosure requirements for fair value measurement. ASU 2018-13 does not changefair value measurements already required or permitted by existing standards. ASU 2018-13 is effective for financial statements issuedfor fiscal years beginning after December 15, 2019, and interim periods within those fiscal years. The Series� early adoption of all ofthe ASU 2018-13 disclosure requirements are reflected within these financial statements prepared as of October 31, 2020.
On July 27, 2017, the head of the United Kingdom�s Financial Conduct Authority announced the intention to phase out the use ofLondon Interbank Offered Rate (�LIBOR�) by the end of 2021. In the interim, there remains uncertainty regarding the impact thetransition to replacement rates may have on the value of LIBOR-based investments. In March 2020, the FASB issued ASU 2020-04which provides optional guidance to ease the potential accounting burden associated with transitioning away from the LIBOR and otherreference rates that are expected to be discontinued. The ASU is effective immediately upon release of the update on March 12, 2020through December 31, 2022. At this time, management is evaluating implications of these changes on the financial statements.
CORONAVIRUS (COVID-19) PANDEMIC
The continued worldwide spread of novel coronavirus (COVID-19) and its impact on international business operations, supply chains,travel, commodity prices, consumer confidence and business forecasts, and the associated impact on domestic and international equitymarkets and fixed income yields, has caused uncertainty for the global economy and financial markets. If market expectations regardingthe impact of COVID-19 worsen, or if expected returns change because investors demand higher returns to invest in these uncertaintimes, there may be a detrimental impact on returns in the near term.
SUBSEQUENT EVENT EVALUATIONS
On November 12, 2020, President Trump issued an Executive Order titled �Addressing the Threat from Securities Investments thatFinance Communist Chinese Military Companies� (the �Order�). The Order prohibits U.S. entities from participating in certain types oftransactions involving securities of Chinese companies known to be associated with the Chinese military. Management is currentlyevaluating the Order�s effect on the Series.
Copyright © 2021 www.secdatabase.com. All Rights Reserved.Please Consider the Environment Before Printing This Document


