Embed Size (px)
Citation preview

S
IND
STATE302 W
DIANAP
F
IVY TEC
BOARWest W
RooPOLIS,
FEDERAL SIN
CH COMMUN
INDIANA
July 1, 201
RD OF AWashingt
om E41 INDIA
NGLE AUDIT
OF
NITY COLLEG
APOLIS, INDI
13 to June 30
ACCOUton Stre8
ANA 462
REPORT
GE OF INDIA
ANA
0, 2014
UNTS eet
204-276
ANA
69

-1-
TABLE OF CONTENTS
Description Page Schedule of College Officials ............................................................................................................. 2 Independent Auditor's Report on Internal Control Over Financial Reporting and on Compliance and Other Matters Based on an Audit of Financial Statements Performed in Accordance With Government Auditing Standards ............................................... 3-4 Independent Auditor's Report on Compliance for Each Major Federal Program; on Internal Control Over Compliance; and on Schedule of Expenditures of Federal Awards Required by OMB Circular A-133 .................................................................. 5-7 Schedule of Expenditures of Federal Awards and Accompanying Notes Schedule of Expenditures of Federal Awards ............................................................................ 8-9 Notes to Schedule of Expenditures of Federal Awards ............................................................... 10-11 Schedule of Findings and Questioned Costs ..................................................................................... 12
-2-
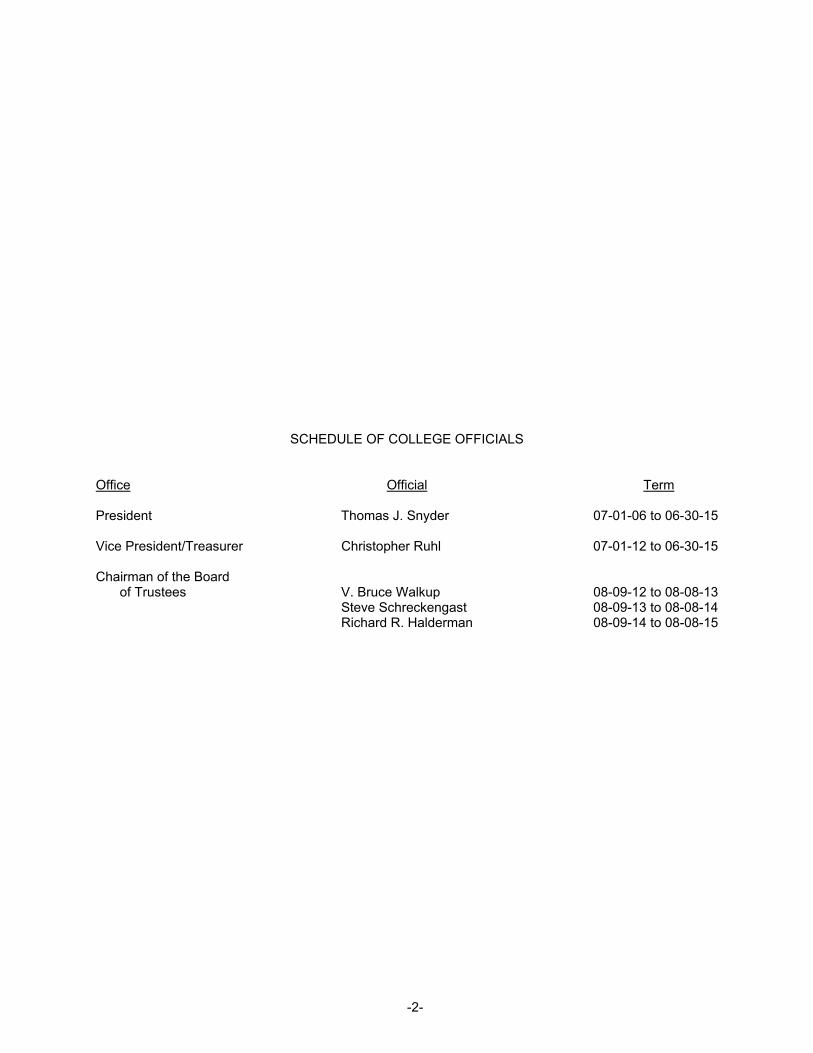
SCHEDULE OF COLLEGE OFFICIALS Office Official Term President Thomas J. Snyder 07-01-06 to 06-30-15 Vice President/Treasurer Christopher Ruhl 07-01-12 to 06-30-15 Chairman of the Board
of Trustees V. Bruce Walkup 08-09-12 to 08-08-13 Steve Schreckengast 08-09-13 to 08-08-14
Richard R. Halderman 08-09-14 to 08-08-15
SA
INDEPEN
ON CO
TO: THE
WeAmerica anthe Comptraggregate ponent unitfinancial stareport therecial statemefinancial stStandards. Internal Co
In pcontrol ovecircumstanexpressingan opinion
A dagement orcorrect, misinternal constatementsdeficiency, important e
Ousection andsignificant dnal control tbeen identi
STATE AN EQUAL OP
NDENT AUDITOMPLIANCE A
PERFORME
OFFICIALS O
e have auditend the standarroller Generaldiscretely pret of the State atements, wheon dated Octents of Ivy Tetatements of
ontrol Over F
planning and er financial repces for the pu an opinion oon the effecti
deficiency in ir employees, sstatements ontrol, such thas will not be p
or combinatioenough to me
ur consideratiod was not desideficiencies. that we considified.
OF INDPPORTUNITY
TOR'S REPOAND OTHER ED IN ACCOR
OF IVY TECH
ed, in accordards applicablel of the Unitedesented compof Indiana, asich collectiveltober 23, 2014
ech FoundatioIvy Tech Fo
Financial Rep
performing oporting (internurpose of expron the effectivveness of the
internal controin the norma
on a timely basat there is a reaprevented, or on of deficienrit attention b
on of internal cgned to identiGiven these
der to be mate
DIANAY EMPLOYE
ORT ON INTEMATTERS B
RDANCE WIT
H COMMUNIT
ance with aud to financial aud States, the fponent unit of s of and for thly comprise th4. Our report
on, as describeoundation we
porting
ur audit of thenal control) toressing our opveness of thee College's int
ol exists whel course of pe
sis. A materiaasonable possdetected andcies, in intern
by those charg
control was fofy all deficienclimitations, drial weakness
-3-
R
RNAL CONTBASED ON ATH GOVERN
TY COLLEGE
diting standardudits containefinancial stateIvy Tech Com
he year endedhe College's bincludes a refed in our repore not audite
e financial stadetermine th
pinions on theCollege's inteternal control
n the designerforming theial weakness issibility that a m
d corrected, onal control thaged with gove
or the limited pcies in interna
during our audses. Howeve
TROL OVER FN AUDIT OF
NMENT AUDI
E OF INDIANA
ds generally aed in Governmements of themmunity Colld June 30, 20
basic financialference to othort on the Colled in accorda
atements, we he audit proce
financial stateernal control. .
or operation r assigned fu
s a deficiency,material misstn a timely ba
at is less seveernance.
purpose descal control that mdit we did noter, material we
STATE302 WE
INDIANA
TeF
W
FINANCIAL RFINANCIAL TING STAND
A, INDIANAP
accepted in tment Auditing Se business-typege of Indian014, and the statements, a
her auditors whlege's financiaance with Go
considered thedures that arements, but n Accordingly
of a control dnctions, to pre, or combinatiotatement of thasis. A signifiere than a mat
cribed in the firmight be matet identify any deaknesses ma
E BOARD OF AEST WASHING
ROOM E4APOLIS, INDIA
elephone: (317)Fax: (317) 232-4eb Site: www.in
REPORTING STATEMENT
DARDS
POLIS, INDIAN
he United StaStandards issupe activities ana (College), arelated notesand have issuho audited theal statementsovernment Au
he College's inre appropriateot for the purp, we do not ex
does not allowevent, or deteon of deficience College's fincant deficienterial weakne
rst paragrapherial weak-nesdeficiencies in
ay exist that ha
ACCOUNTS TON STREET 18
ANA 46204-2769
232-2513 4711 n.gov/sboa
AND TS
NA
ates of ued by
and the a com- to the
ued our e finan-s. The uditing
nternal e in the pose of xpress
w man-ect and cies, in nancial cy is a ss, yet
of this sses or n inter-ave not
9
-4-
INDEPENDENT AUDITOR'S REPORT ON INTERNAL CONTROL OVER FINANCIAL REPORTING AND ON COMPLIANCE AND OTHER MATTERS BASED ON AN AUDIT OF FINANCIAL
STATEMENTS PERFORMED IN ACCORDANCE WITH GOVERNMENT AUDITING STANDARDS (Continued)
Compliance and Other Matters
As part of obtaining reasonable assurance about whether the College's financial statements are free of material misstatement, we performed tests of its compliance with certain provisions of laws, regulations, contracts, and grant agreements, noncompliance with which could have a direct and material effect on the determination of financial statement amounts. However, providing an opinion on compliance with those pro- visions was not an objective of our audit and, accordingly, we do not express such an opinion. The results of our tests disclosed no instances of noncompliance or other matters that are required to be reported under Government Auditing Standards. Purpose of This Report
The purpose of this report is solely to describe the scope of our testing of internal control and compli-ance and the results of that testing, and not to provide an opinion on the effectiveness of the College's internal control or on compliance. This report is an integral part of an audit performed in accordance with Government Auditing Standards in considering the College's internal control and compliance. Accordingly, this communi-cation is not suitable for any other purpose.
Paul D. Joyce, CPA State Examiner October 23, 2014
A
TO: THE Report on Wcompliancdirect andCollege's panying S Managem Mgrants ap Auditor's Oprogramsaudit of cAmerica; tthe Compand Non-Pthe audit requiremeoccurred. requireme Wfederal pr Opinion o Inments refethe year e
STATAN EQUAL OP
INDEPENFEDER
AND
OFFICIALS
n Complianc
We have auditce requiremend material effemajor federa
Schedule of F
ment's Respo
Management isplicable to its
s Responsibi
Our responsibbased on our
compliance inthe standardstroller GeneraProfit Organizto obtain rea
ents referred An audit incl
ents and perfo
We believe tharogram. Howe
on Each Majo
n our opinion,erred to aboveended June 3
TE OF IPPORTUNITY
NDENT AUDIRAL PROGRAD ON SCHED
RE
OF IVY TECH
ce for Each M
ted Ivy Tech nts describedect on each ol programs arindings and Q
onsibility
s responsible federal progr
ility
ility is to exprr audit of the tn accordances applicable toal of the Unitezations. Thosasonable assto above thaudes examiniorming such o
at our audit proever, our aud
or Federal P
the College e that could h0, 2014.
NDIANY EMPLOYER
TOR'S REPOAM; ON INTE
DULE OF EXPEQUIRED BY
H COMMUNI
Major Federa
Community Cd in the OMB of its major fere identified inQuestioned C
for compliancrams.
ress an opiniotypes of compe with auditino financial audd States; and se standards asurance abouat could have ing, on a test other procedu
ovides a reasdit does not pr
Program
complied in aave a direct a
-5-
A
R
ORT ON COMERNAL CONTPENDITURES
OMB CIRCU
TY COLLEGE
al Program
College of IndCircular A-13ederal progran the Summa
Costs.
ce with the req
on on complipliance requireg standards
dits contained OMB Circulaand OMB Circ
ut whether noa direct and
basis, evidenures as we co
sonable basis rovide a legal
all material reand material e
MPLIANCE FOTROL OVER S OF FEDERAULAR A-133
E OF INDIAN
diana (Colleg33 Complianceams for the yeary of Auditor'
quirements of
ance for eachements referrgenerally acin Governmer A-133, Audit
rcular A-133 roncomplianced material effece about the C
onsidered nec
for our opiniol determinatio
espects with thffect on each
STAT302 WE
INDIANA
TeF
We
OR EACH MACOMPLIANCAL AWARDS
NA, INDIANAP
e) compliance Supplemenear ended Ju's Results sec
laws, regulati
h of the Collered to above. ccepted in theent Auditing Stts of States, L
require that wee with the typect on a majoCollege's comcessary in the
on on compliaon of the Colle
he types of cof its major fe
TE BOARD OF AEST WASHINGT
ROOM E41APOLIS, INDIA
elephone: (317) 2Fax: (317) 232-4eb Site: www.in
AJOR CE; S
POLIS, INDIA
ce with the typnt that could hune 30, 2014.ction of the ac
ions, contract
ege's major fe We conductee United Stattandards, issu
Local Governme plan and pepes of compor federal prompliance with e circumstanc
ance for each ege's complia
ompliance reederal program
ACCOUNTS TON STREET18
ANA 46204-2769
232-2513 4711 .gov/sboa
ANA
pes of have a . The ccom-
ts, and
ederal ed our tes of
ued by ments, erform liance ogram those
ces.
major ance.
quire-ms for
9
-6-
INDEPENDENT AUDITOR'S REPORT ON COMPLIANCE FOR EACH MAJOR FEDERAL PROGRAM; ON INTERNAL CONTROL OVER COMPLIANCE;
AND ON SCHEDULE OF EXPENDITURES OF FEDERAL AWARDS REQUIRED BY OMB CIRCULAR A-133
(Continued) Report on Internal Control Over Compliance Management of the College is responsible for establishing and maintaining effective internal control over compliance with types of compliance requirements referred to above. In planning and performing our audit of compliance, we considered the College's internal control over compliance with the types of require-ments that could have a direct and material effect on each major federal program to determine the auditing procedures that are appropriate in the circumstances for the purpose of expressing an opinion on compliance for each major federal program and to test and report on internal control over compliance in accordance with OMB Circular A-133, but not for the purpose of expressing an opinion on the effectiveness of internal control over compliance. Accordingly, we do not express an opinion on the effectiveness of the College's internal control over compliance. A deficiency in internal control over compliance exists when the design or operation of a control over compliance does not allow management or employees, in the normal course of performing their assigned functions, to prevent, or detect and correct, noncompliance with a type of compliance requirement of a federal program on a timely basis. A material weakness in internal control over compliance is a deficiency, or com-bination of deficiencies, in internal control over compliance, such that there is a reasonable possibility that material noncompliance with a type of compliance requirement of a federal program will not be prevented, or detected and corrected, in a timely basis. A significant deficiency in internal control over compliance is a defi-ciency, or a combination of deficiencies, in internal control over compliance with a type of compliance require-ment of a federal program that is less severe than a material weakness in internal control over compliance, yet important enough to merit attention by those charged with governance. Our consideration of the internal control over compliance was for the limited purpose described in the first paragraph of this section and was not designed to identify all deficiencies in internal control over compli-ance that might be material weaknesses or significant deficiencies. We did not identify any deficiencies in internal control over compliance that we consider to be material weaknesses. However, material weaknesses may exist that have not been identified. The purpose of this report on internal control over compliance is solely to describe the scope of testing of internal control over compliance and the results of that testing based on the requirements of OMB Circular A-133. Accordingly, this report is not suitable for any other purpose. Report on Schedule of Expenditures of Federal Awards Required by OMB Circular A-133
We have audited the financial statements of the business-type activities and the discretely presented component unit of the College, a component unit of the State of Indiana, as of and for the year ended June 30, 2014, and the related notes to the financial statements, which collectively comprise the College's basic financial statements. We issued our report thereon October 23, 2014, which contained unmodified opinions on those financial statements. Our audit was conducted for the purpose of forming opinions on the financial statements that collectively comprise the basic financial statements. The accompanying schedule of expendi-tures of federal awards is presented for purposes of additional analysis as required by OMB Circular A-133 and is not a required part of the basic financial statements. Such information is the responsibility of manage-ment and was derived from and relates directly to the underlying accounting and other records used to prepare the financial statements. The information has been subjected to the auditing procedures applied in
-7-
INDEPENDENT AUDITOR'S REPORT ON COMPLIANCE FOR EACH MAJOR FEDERAL PROGRAM; ON INTERNAL CONTROL OVER COMPLIANCE;
AND ON SCHEDULE OF EXPENDITURES OF FEDERAL AWARDS REQUIRED BY OMB CIRCULAR A-133
(Continued) the audit of the financial statements and certain additional procedures, including comparing and reconciling such information directly to the underlying accounting and other records used to prepare the basic financial statements or to the basic financial statements themselves, and other additional procedures in accordance with auditing standards generally accepted in the United States of America. In our opinion, the Schedule of Expenditure of Federal Awards is fairly stated in all material respects in relation to the basic financial statements as a whole.
Paul D. Joyce, CPA State Examiner March 18, 2015
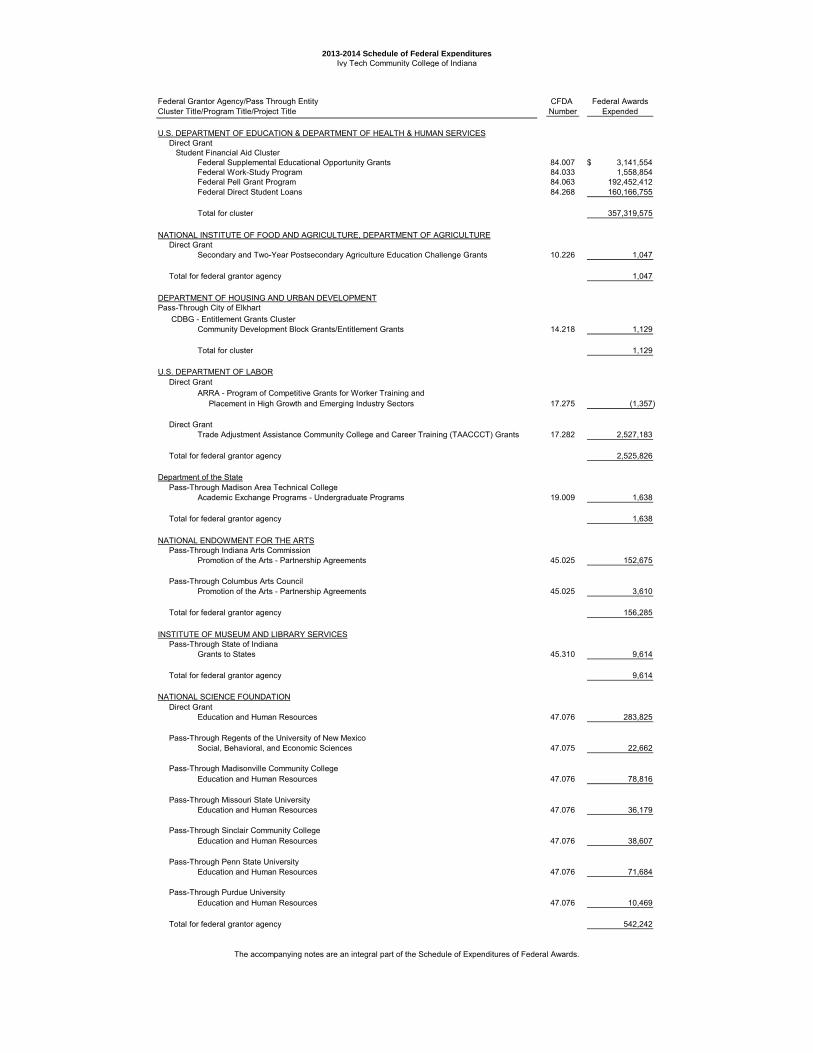
2013-2014 Schedule of Federal ExpendituresIvy Tech Community College of Indiana
Federal Grantor Agency/Pass Through Entity CFDA Federal AwardsCluster Title/Program Title/Project Title Number Expended
U.S. DEPARTMENT OF EDUCATION & DEPARTMENT OF HEALTH & HUMAN SERVICES Direct Grant Student Financial Aid Cluster Federal Supplemental Educational Opportunity Grants 84.007 3,141,554$
Federal Work-Study Program 84.033 1,558,854 Federal Pell Grant Program 84.063 192,452,412 Federal Direct Student Loans 84.268 160,166,755
Total for cluster 357,319,575
NATIONAL INSTITUTE OF FOOD AND AGRICULTURE, DEPARTMENT OF AGRICULTURE Direct Grant
Secondary and Two-Year Postsecondary Agriculture Education Challenge Grants 10.226 1,047
Total for federal grantor agency 1,047
DEPARTMENT OF HOUSING AND URBAN DEVELOPMENTPass-Through City of Elkhart
CDBG - Entitlement Grants ClusterCommunity Development Block Grants/Entitlement Grants 14.218 1,129
Total for cluster 1,129
U.S. DEPARTMENT OF LABOR Direct Grant
ARRA - Program of Competitive Grants for Worker Training and Placement in High Growth and Emerging Industry Sectors 17.275 (1,357)
Direct GrantTrade Adjustment Assistance Community College and Career Training (TAACCCT) Grants 17.282 2,527,183
Total for federal grantor agency 2,525,826
Department of the State Pass-Through Madison Area Technical College Academic Exchange Programs - Undergraduate Programs 19.009 1,638
Total for federal grantor agency 1,638
NATIONAL ENDOWMENT FOR THE ARTS Pass-Through Indiana Arts Commission
Promotion of the Arts - Partnership Agreements 45.025 152,675
Pass-Through Columbus Arts CouncilPromotion of the Arts - Partnership Agreements 45.025 3,610
Total for federal grantor agency 156,285
INSTITUTE OF MUSEUM AND LIBRARY SERVICES Pass-Through State of Indiana
Grants to States 45.310 9,614
Total for federal grantor agency 9,614
NATIONAL SCIENCE FOUNDATION Direct Grant
Education and Human Resources 47.076 283,825
Pass-Through Regents of the University of New MexicoSocial, Behavioral, and Economic Sciences 47.075 22,662
Pass-Through Madisonville Community CollegeEducation and Human Resources 47.076 78,816
Pass-Through Missouri State UniversityEducation and Human Resources 47.076 36,179
Pass-Through Sinclair Community CollegeEducation and Human Resources 47.076 38,607
Pass-Through Penn State UniversityEducation and Human Resources 47.076 71,684
Pass-Through Purdue UniversityEducation and Human Resources 47.076 10,469
Total for federal grantor agency 542,242
The accompanying notes are an integral part of the Schedule of Expenditures of Federal Awards.
2013-2014 Schedule of Federal ExpendituresIvy Tech Community College of Indiana
(Continued)
Federal Grantor Agency/Pass Through Entity CFDA Federal AwardsCluster Title/Program Title/Project Title Number Expended
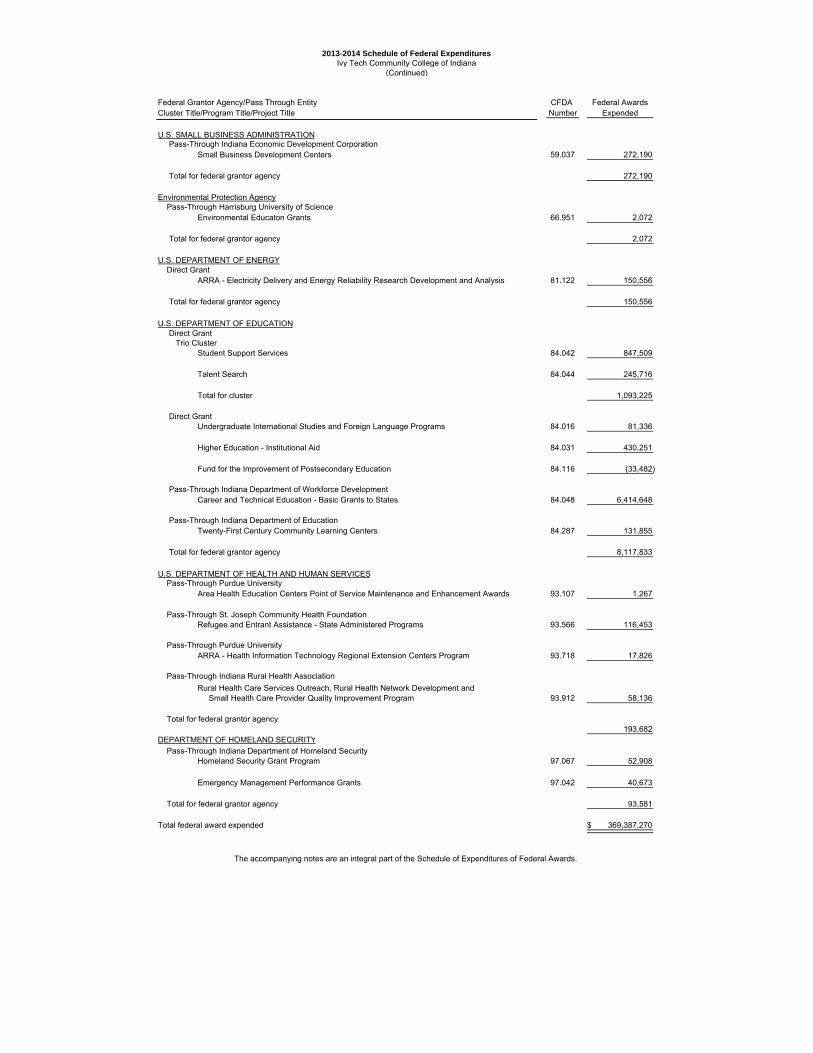
U.S. SMALL BUSINESS ADMINISTRATION Pass-Through Indiana Economic Development Corporation
Small Business Development Centers 59.037 272,190
Total for federal grantor agency 272,190
Environmental Protection Agency Pass-Through Harrisburg University of Science
Environmental Educaton Grants 66.951 2,072
Total for federal grantor agency 2,072
U.S. DEPARTMENT OF ENERGY Direct Grant
ARRA - Electricity Delivery and Energy Reliability Research Development and Analysis 81.122 150,556
Total for federal grantor agency 150,556
U.S. DEPARTMENT OF EDUCATION Direct Grant Trio Cluster
Student Support Services 84.042 847,509
Talent Search 84.044 245,716
Total for cluster 1,093,225
Direct GrantUndergraduate International Studies and Foreign Language Programs 84.016 81,336
Higher Education - Institutional Aid 84.031 430,251
Fund for the Improvement of Postsecondary Education 84.116 (33,482)
Pass-Through Indiana Department of Workforce DevelopmentCareer and Technical Education - Basic Grants to States 84.048 6,414,648
Pass-Through Indiana Department of EducationTwenty-First Century Community Learning Centers 84.287 131,855
Total for federal grantor agency 8,117,833
U.S. DEPARTMENT OF HEALTH AND HUMAN SERVICES Pass-Through Purdue University
Area Health Education Centers Point of Service Maintenance and Enhancement Awards 93.107 1,267
Pass-Through St. Joseph Community Health FoundationRefugee and Entrant Assistance - State Administered Programs 93.566 116,453
Pass-Through Purdue UniversityARRA - Health Information Technology Regional Extension Centers Program 93.718 17,826
Pass-Through Indiana Rural Health Association
Rural Health Care Services Outreach, Rural Health Network Development and Small Health Care Provider Quality Improvement Program 93.912 58,136
Total for federal grantor agency193,682
DEPARTMENT OF HOMELAND SECURITY
Pass-Through Indiana Department of Homeland SecurityHomeland Security Grant Program 97.067 52,908
Emergency Management Performance Grants 97.042 40,673
Total for federal grantor agency 93,581
Total federal award expended 369,387,270$
The accompanying notes are an integral part of the Schedule of Expenditures of Federal Awards.
-10-
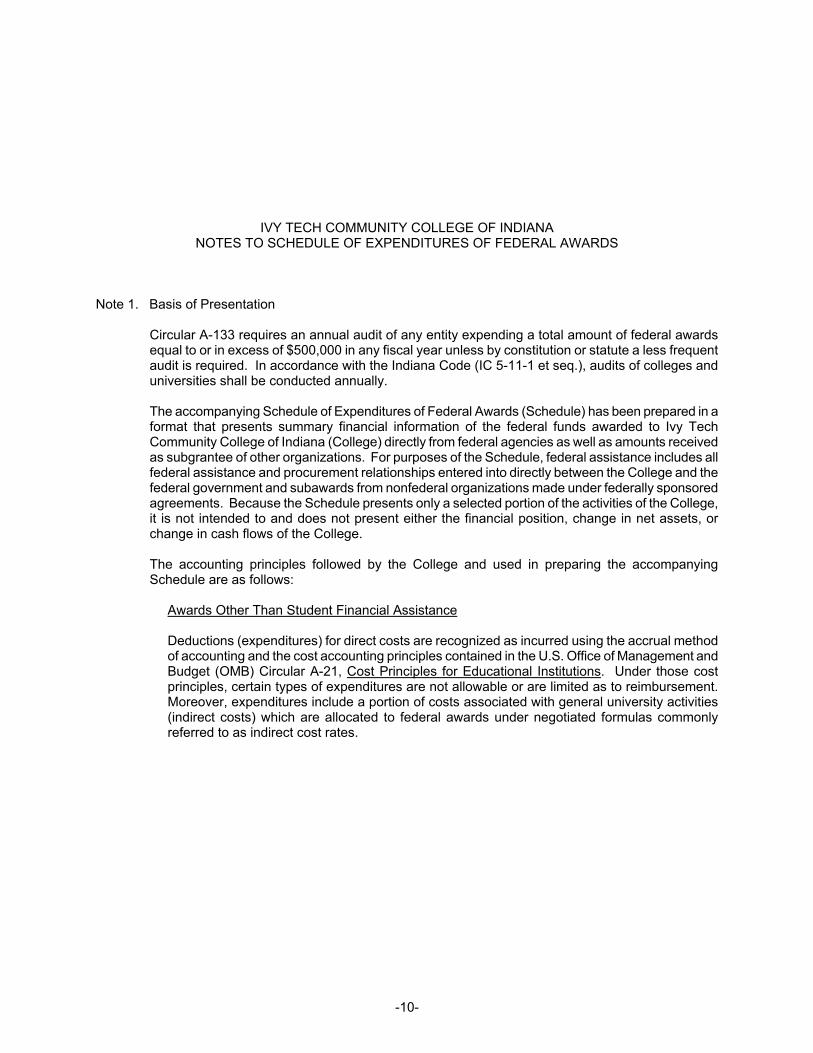
IVY TECH COMMUNITY COLLEGE OF INDIANA NOTES TO SCHEDULE OF EXPENDITURES OF FEDERAL AWARDS
Note 1. Basis of Presentation
Circular A-133 requires an annual audit of any entity expending a total amount of federal awards equal to or in excess of $500,000 in any fiscal year unless by constitution or statute a less frequent audit is required. In accordance with the Indiana Code (IC 5-11-1 et seq.), audits of colleges and universities shall be conducted annually.
The accompanying Schedule of Expenditures of Federal Awards (Schedule) has been prepared in a format that presents summary financial information of the federal funds awarded to Ivy Tech Community College of Indiana (College) directly from federal agencies as well as amounts received as subgrantee of other organizations. For purposes of the Schedule, federal assistance includes all federal assistance and procurement relationships entered into directly between the College and the federal government and subawards from nonfederal organizations made under federally sponsored agreements. Because the Schedule presents only a selected portion of the activities of the College, it is not intended to and does not present either the financial position, change in net assets, or change in cash flows of the College.
The accounting principles followed by the College and used in preparing the accompanying Schedule are as follows:
Awards Other Than Student Financial Assistance
Deductions (expenditures) for direct costs are recognized as incurred using the accrual method of accounting and the cost accounting principles contained in the U.S. Office of Management and Budget (OMB) Circular A-21, Cost Principles for Educational Institutions. Under those cost principles, certain types of expenditures are not allowable or are limited as to reimbursement. Moreover, expenditures include a portion of costs associated with general university activities (indirect costs) which are allocated to federal awards under negotiated formulas commonly referred to as indirect cost rates.
-11-
IVY TECH COMMUNITY COLLEGE OF INDIANA NOTES TO SCHEDULE OF EXPENDITURES OF FEDERAL AWARDS
(Continued)
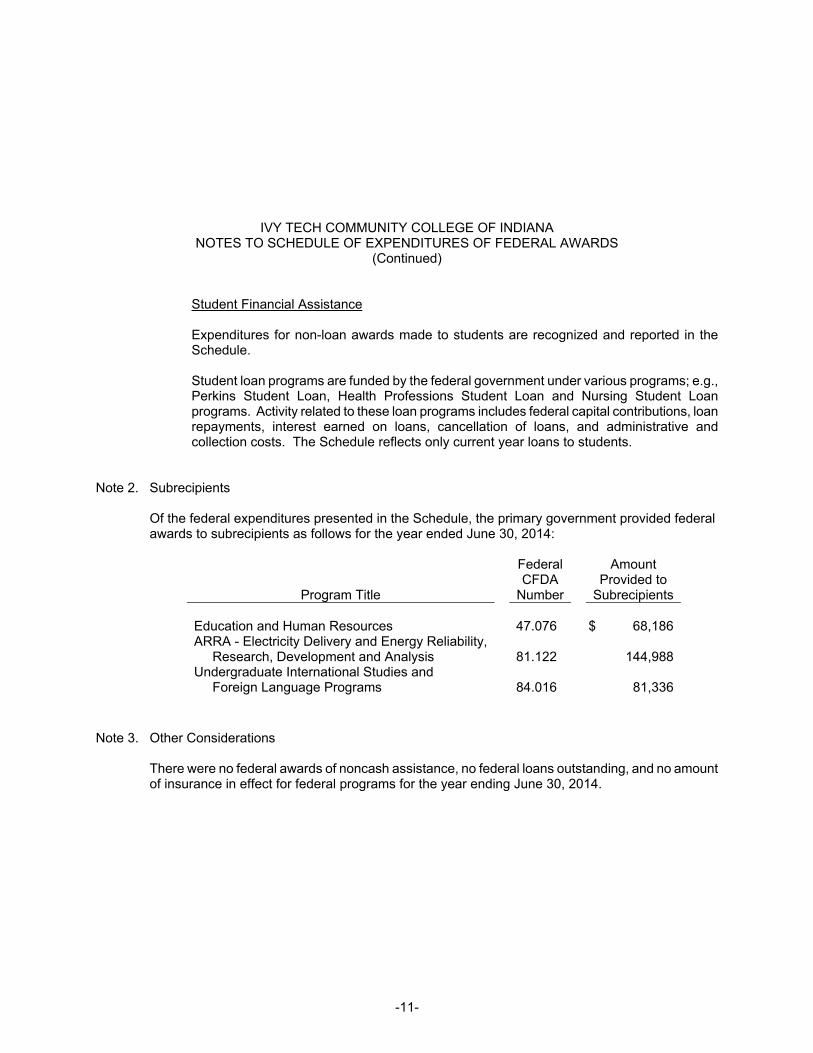
Student Financial Assistance Expenditures for non-loan awards made to students are recognized and reported in the Schedule. Student loan programs are funded by the federal government under various programs; e.g., Perkins Student Loan, Health Professions Student Loan and Nursing Student Loan programs. Activity related to these loan programs includes federal capital contributions, loan repayments, interest earned on loans, cancellation of loans, and administrative and collection costs. The Schedule reflects only current year loans to students.
Note 2. Subrecipients
Of the federal expenditures presented in the Schedule, the primary government provided federal awards to subrecipients as follows for the year ended June 30, 2014:
Federal Amount CFDA Provided to
Program Title Number Subrecipients
Education and Human Resources 47.076 $ 68,186ARRA - Electricity Delivery and Energy Reliability, Research, Development and Analysis 81.122 144,988Undergraduate International Studies and Foreign Language Programs 84.016 81,336
Note 3. Other Considerations
There were no federal awards of noncash assistance, no federal loans outstanding, and no amount of insurance in effect for federal programs for the year ending June 30, 2014.
-12-
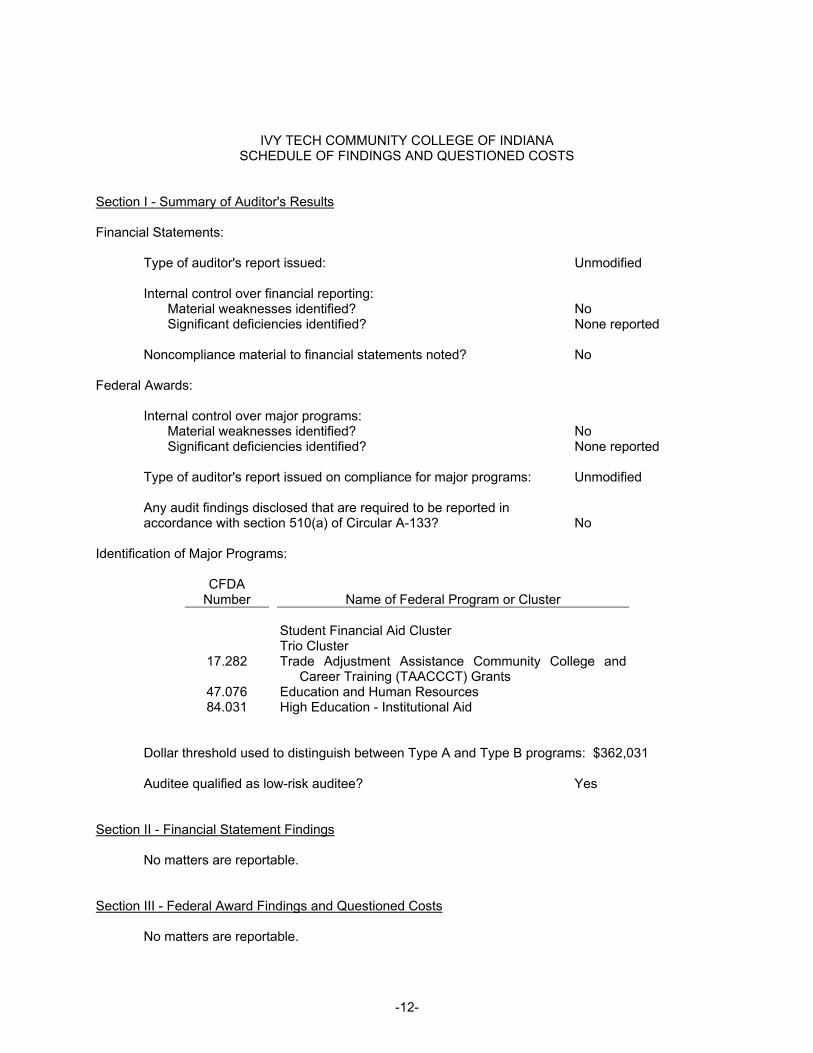
IVY TECH COMMUNITY COLLEGE OF INDIANA SCHEDULE OF FINDINGS AND QUESTIONED COSTS
Section I - Summary of Auditor's Results
Financial Statements:
Type of auditor's report issued: Unmodified
Internal control over financial reporting: Material weaknesses identified? No Significant deficiencies identified? None reported
Noncompliance material to financial statements noted? No
Federal Awards:
Internal control over major programs: Material weaknesses identified? No Significant deficiencies identified? None reported
Type of auditor's report issued on compliance for major programs: Unmodified Any audit findings disclosed that are required to be reported in accordance with section 510(a) of Circular A-133? No
Identification of Major Programs:
CFDA Number
Name of Federal Program or Cluster
Student Financial Aid Cluster
17.282
47.076 84.031
Trio Cluster Trade Adjustment Assistance Community College and
Career Training (TAACCCT) Grants Education and Human Resources High Education - Institutional Aid
Dollar threshold used to distinguish between Type A and Type B programs: $362,031 Auditee qualified as low-risk auditee? Yes
Section II - Financial Statement Findings No matters are reportable. Section III - Federal Award Findings and Questioned Costs No matters are reportable.
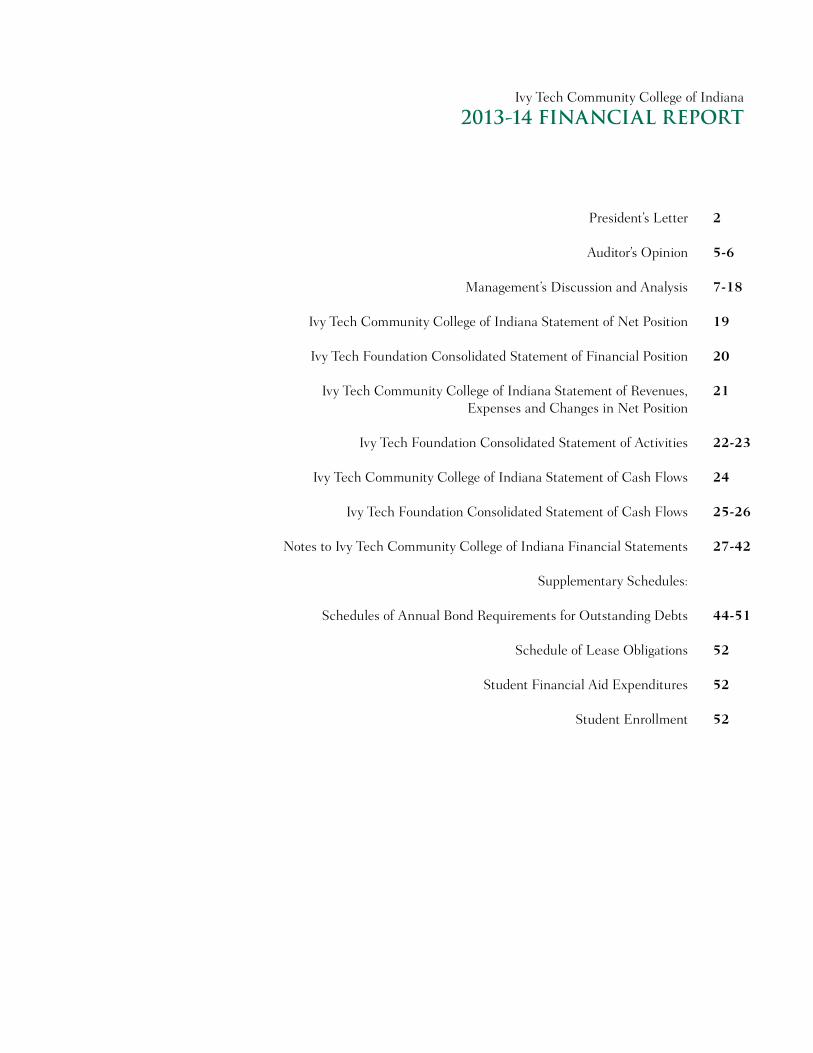
President’s Letter
Auditor’s Opinion
Management’s Discussion and Analysis
Ivy Tech Community College of Indiana Statement of Net Position
Ivy Tech Foundation Consolidated Statement of Financial Position
Ivy Tech Community College of Indiana Statement of Revenues,Expenses and Changes in Net Position
Ivy Tech Foundation Consolidated Statement of Activities
Ivy Tech Community College of Indiana Statement of Cash Flows
Ivy Tech Foundation Consolidated Statement of Cash Flows
Notes to Ivy Tech Community College of Indiana Financial Statements
Supplementary Schedules:
Schedules of Annual Bond Requirements for Outstanding Debts
Schedule of Lease Obligations
Student Financial Aid Expenditures
Student Enrollment
2
5-6
7-18
19
20
21
22-23
24
25-26
27-42
44-51
52
52
52
Ivy Tech Community College of Indiana
2013-14 FINANCIAL REPORT

2
Dear Friends of Ivy Tech,
On behalf of the Trustees of Ivy Tech Community College of Indiana, I am pleased to present the College’s 2013-14 Financial Report.
As evidenced by this document, the College maintained a strong financial position in 2013-14. In alignment with Ivy Tech’s strategic plan, Focus on Student Success 2025, College leadership, faculty, and staff have worked diligently to provide quality programs and the services necessary for student success while controlling expenditures, increasing efficiencies and maximizing available resources.
Nearly 200,000 students annually choose Ivy Tech as their institution of higher education. The College offers an opportunity for individuals from a variety backgrounds to pursue higher education, including those beginning their postsecondary studies for the first time or those working to obtain the education and skills necessary to change careers. Ivy Tech’s affordability, transferable credits, supportive learning environment, and adaptability have enabled the College to meet the changing needs of the global economy.
The College continues to hold the funding it receives as a public trust and is grateful for the support received from state appropriations, donor contributions, grants, contracts, and student fees. The College is committed to maximizing this support, and believes there is no better return on investment in Indiana. With your input and support, we will ensure students complete their educational goals and continue Changing Lives and Making Indiana Great.
Sincerely,
Thomas J. Snyder
3
State Board of Trustees 2013-14
Mr. Michael DoraRushville, Indiana
Dr. Michael Evans Indianapolis, Indiana
Mr. Larry GaratoniMishawaka, Indiana
Ms. Paula HughesFort Wayne, Indiana
Mr. Bob Jones Evansville, Indiana
Ms. Lillian Sue Livers Madison, Indiana
Mr. Lee Marchant Bloomington, Indiana
Mr. Stewart McMillanValparaiso, Indiana
Mr. Anthony MoravecColumbus, Indiana
Mr. Norman Pfau, Jr. Jeffersonville, Indiana
Board listing as of June 30, 2014.
PresidentThomas J. Snyder
ChairmanMr. Steve Schreckengast
Lafayette, Indiana
Vice ChairmanMr. Richard Halderman
Zionsville, Indiana
SecretaryMs. Kaye Whitehead,
Muncie, Indiana

4
October 23, 2014
To the President and State Board of Trustees of Ivy Tech Community College of Indiana
On behalf of all those individuals responsible for the financial stewardship of College resources, I am pleased to present the Ivy Tech Community College of Indiana Annual Financial Report for the year ended June 30, 2014.
The report has been prepared in conformance with authoritative reporting standards and guidelines for colleges and universities. This report utilizes Governmental Accounting Standards Board Statement No. 35, Basic Financial Statement and Management’s Discussion and Analysis for Public Colleges and Universities. An analysis is included which compares 2013-14 figures with the prior year.
The report contains data, which is consolidated for all College locations as well as statements and schedules listed in the table of contents.
The Indiana State Board of Accounts has audited the financial statements. Their audit opinion on the financial statements is a part of this report.
The final schedule provides information on student enrollment. The data is for five years and provides users of this report statistics relative to students enrolled in education provided by this College.
Respectfully submitted,
Christopher A. RuhlSenior Vice President, Chief Financial Officer and General Counsel
5
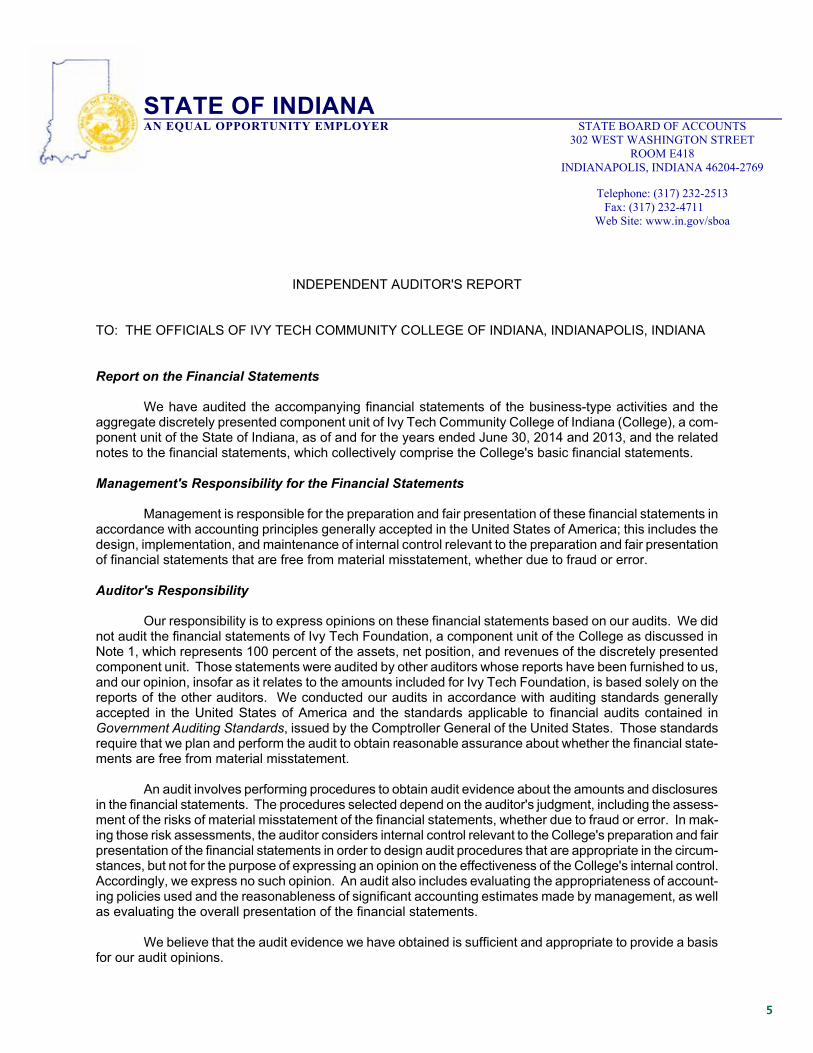
STATE OF INDIANAAN EQUAL OPPORTUNITY EMPLOYER STATE BOARD OF ACCOUNTS
302 WEST WASHINGTON STREET ROOM E418 INDIANAPOLIS, INDIANA 46204-2769
Telephone: (317) 232-2513 Fax: (317) 232-4711
Web Site: www.in.gov/sboa
INDEPENDENT AUDITOR'S REPORT
TO: THE OFFICIALS OF IVY TECH COMMUNITY COLLEGE OF INDIANA, INDIANAPOLIS, INDIANA
Report on the Financial Statements
We have audited the accompanying financial statements of the business-type activities and the aggregate discretely presented component unit of Ivy Tech Community College of Indiana (College), a com-ponent unit of the State of Indiana, as of and for the years ended June 30, 2014 and 2013, and the related notes to the financial statements, which collectively comprise the College's basic financial statements.
Management's Responsibility for the Financial Statements
Management is responsible for the preparation and fair presentation of these financial statements in accordance with accounting principles generally accepted in the United States of America; this includes the design, implementation, and maintenance of internal control relevant to the preparation and fair presentation of financial statements that are free from material misstatement, whether due to fraud or error.
Auditor's Responsibility
Our responsibility is to express opinions on these financial statements based on our audits. We did not audit the financial statements of Ivy Tech Foundation, a component unit of the College as discussed in Note 1, which represents 100 percent of the assets, net position, and revenues of the discretely presented component unit. Those statements were audited by other auditors whose reports have been furnished to us, and our opinion, insofar as it relates to the amounts included for Ivy Tech Foundation, is based solely on the reports of the other auditors. We conducted our audits in accordance with auditing standards generally accepted in the United States of America and the standards applicable to financial audits contained in Government Auditing Standards, issued by the Comptroller General of the United States. Those standards require that we plan and perform the audit to obtain reasonable assurance about whether the financial state-ments are free from material misstatement.
An audit involves performing procedures to obtain audit evidence about the amounts and disclosures in the financial statements. The procedures selected depend on the auditor's judgment, including the assess-ment of the risks of material misstatement of the financial statements, whether due to fraud or error. In mak-ing those risk assessments, the auditor considers internal control relevant to the College's preparation and fair presentation of the financial statements in order to design audit procedures that are appropriate in the circum-stances, but not for the purpose of expressing an opinion on the effectiveness of the College's internal control. Accordingly, we express no such opinion. An audit also includes evaluating the appropriateness of account-ing policies used and the reasonableness of significant accounting estimates made by management, as well as evaluating the overall presentation of the financial statements.
We believe that the audit evidence we have obtained is sufficient and appropriate to provide a basis for our audit opinions.
6
INDEPENDENT AUDITOR'S REPORT (Continued)
Opinions
In our opinion, based on our audits and the reports of the other auditors, the financial statements referred to above present fairly, in all material respects, the respective financial position of the business-type activities and the aggregate discretely presented component unit of the College as of June 30, 2014 and 2013, and the respective changes in financial position, where applicable, and its cash flows thereof for the years then ended in accordance with accounting principles generally accepted in the United States of America.
Other Matters
Required Supplementary Information
Accounting principles generally accepted in the United States of America require that the Management's Discussion and Analysis (MD&A) be presented to supplement the basic financial statements. Such information, although not a part of the basic financial statements, is required by the Governmental Accounting Standards Board who considers it to be an essential part of the financial reporting for placing the basic financial statements in an appropriate operational, economic, or historical context. We have applied certain limited procedures to the required supplementary information in accordance with auditing standards generally accepted in the United States of America, which consisted of inquiries of management about the methods of preparing the information and comparing the information for consistency with management's responses to our inquiries, the basic financial statements, and other knowledge we obtained during our audit of the basic financial statements. We do not express an opinion or provide an assurance on the information because of the limited procedures do not provide us with sufficient evidence to express an opinion or provide any assurance.
Other Information
Our audits were conducted for the purpose of forming opinions on the financial statements that collec-tively comprise the College's basic financial statements. The Introductory Section, Schedules of Annual Bond Requirements for Outstanding Debts, Schedule of Operating Leases, Student Financial Aid Expenditures, and Student Enrollment Trend Information are presented for purposes of additional analysis and are not a required part of the basic financial statements.
The Introductory Section, Schedules of Annual Bond Requirements for Outstanding Debts, Schedule of Operating Leases, Student Financial Aid Expenditures, and Student Enrollment Trend Information have not been subjected to the auditing procedures applied in the audit of the basic financial statements and, accordingly, we do not express an opinion or provide any assurance on this information.
Other Reporting Required by Government Auditing Standards
In accordance with Government Auditing Standards, we have also issued our report dated October 23, 2014 on our consideration of the College's internal control over financial reporting and on our tests of its compliance with certain provisions of laws, regulations, contracts, grant agreements, and other matters. The purpose of that report is to describe the scope of our testing of internal control over financial reporting and compliance and the results of that testing, and not to provide an opinion on internal control over financial reporting or on compliance. That report is an integral part of an audit performed in accordance with Government Auditing Standards in considering the College's internal control over financial reporting and compliance.
Paul D. Joyce, CPA State Examiner
October 23, 2014

7
Management’s Discussionand Analysis
This section of Ivy Tech Community College of Indiana’s (Ivy Tech) annual financial report presents a discussion and analysis of the financial performance of the College for the fiscal year ending June 30, 2014, along with comparative data for the year ending June 30, 2013. The management’s discussion and analysis provides summary level financial information; therefore, it should be read in conjunction with the accompanying financial statements and note disclosures. The management’s discussion and analysis is designed to focus on current activities, significant changes, and currently known facts. The financial statements, notes, and this discussion are the responsibility of management.
Using this Annual Report
This annual report consists of a series of financial statements, prepared in accordance with the Governmental Accounting Standards Board (GASB) Statement No. 35, Basic Financial Statements-and Management’s Discussion and Analysis-for Public Colleges and Universities, an Amendment of GASB Statement No. 34 Basic Financial Statements and Management’s Discussion and Analysis – for State and Local Governments. The financial statements focus on the financial condition of the College, the results of operations, and cash flows of the College as a whole.
One of the most important questions asked about the College’s finances is whether the College is better or worse as a result of this year’s activity. The keys to understanding that question are the Statement of Net Position, Statement of Revenues, Expenses, and Changes in Net Position, and the Statement of Cash Flows. These statements present financial information in a form similar to that used by corporations. The College’s net position is one indicator of the College’s financial strength. Over time, increases or decreases in net position is one indicator of the improvement or erosion of the College’s financial health when considered with non-financial facts such as enrollment levels and the condition of facilities.
The Statement of Net Position includes all assets and liabilities. It is prepared under the accrual basis of accounting, whereby revenues and assets are recognized when the service is provided and expenses and liabilities are recognized when others provide the service to the College, regardless of when cash is exchanged.
The Statement of Revenues, Expenses, and Changes in Net Position presents the revenues earned and expenses incurred during the year. Activities are reported as either operating or nonoperating. The authoritative financial reporting model classifies State appropriations and gifts as nonoperating revenues; therefore, such a classification results in an operating deficit being shown in this statement. The utilization of long-lived assets, referred to as capital assets, is reflected in the financial statements as depreciation, which amortizes the cost of an asset over its expected useful life.
Another important factor to consider when evaluating financial viability is the College’s ability to meet financial obligations as they mature. The Statement of Cash Flows presents the information related to cash inflows and outflows summarized by operating, capital, and noncapital financing and investing activities.
INDEPENDENT AUDITOR'S REPORT (Continued)
Opinions
In our opinion, based on our audits and the reports of the other auditors, the financial statements referred to above present fairly, in all material respects, the respective financial position of the business-type activities and the aggregate discretely presented component unit of the College as of June 30, 2014 and 2013, and the respective changes in financial position, where applicable, and its cash flows thereof for the years then ended in accordance with accounting principles generally accepted in the United States of America.
Other Matters
Required Supplementary Information
Accounting principles generally accepted in the United States of America require that the Management's Discussion and Analysis (MD&A) be presented to supplement the basic financial statements. Such information, although not a part of the basic financial statements, is required by the Governmental Accounting Standards Board who considers it to be an essential part of the financial reporting for placing the basic financial statements in an appropriate operational, economic, or historical context. We have applied certain limited procedures to the required supplementary information in accordance with auditing standards generally accepted in the United States of America, which consisted of inquiries of management about the methods of preparing the information and comparing the information for consistency with management's responses to our inquiries, the basic financial statements, and other knowledge we obtained during our audit of the basic financial statements. We do not express an opinion or provide an assurance on the information because of the limited procedures do not provide us with sufficient evidence to express an opinion or provide any assurance.
Other Information
Our audits were conducted for the purpose of forming opinions on the financial statements that collec-tively comprise the College's basic financial statements. The Introductory Section, Schedules of Annual Bond Requirements for Outstanding Debts, Schedule of Operating Leases, Student Financial Aid Expenditures, and Student Enrollment Trend Information are presented for purposes of additional analysis and are not a required part of the basic financial statements.
The Introductory Section, Schedules of Annual Bond Requirements for Outstanding Debts, Schedule of Operating Leases, Student Financial Aid Expenditures, and Student Enrollment Trend Information have not been subjected to the auditing procedures applied in the audit of the basic financial statements and, accordingly, we do not express an opinion or provide any assurance on this information.
Other Reporting Required by Government Auditing Standards
In accordance with Government Auditing Standards, we have also issued our report dated October 23, 2014 on our consideration of the College's internal control over financial reporting and on our tests of its compliance with certain provisions of laws, regulations, contracts, grant agreements, and other matters. The purpose of that report is to describe the scope of our testing of internal control over financial reporting and compliance and the results of that testing, and not to provide an opinion on internal control over financial reporting or on compliance. That report is an integral part of an audit performed in accordance with Government Auditing Standards in considering the College's internal control over financial reporting and compliance.
Paul D. Joyce, CPA State Examiner
October 23, 2014
8
Financial Highlights
In return for providing the resources necessary for the operations of the College, Ivy Tech’s students and the taxpayers of Indiana demand careful stewardship of state appropriations, student fees, grants and contracts, donor contributions, and other funds. This Annual Financial Report for the 2013-14 fiscal year reflects that commitment.
Overall, the College’s financial position continues to be strong. During fiscal year 2013-14 the College’s Net position increased by a total of $39.9 million (7.8%) compared to the previous year. During the last five years, the College’s Net position has grown from $362.0 million to $549.4 million, an increase of 52%. Unrestricted Net position also grew in 2013-14, by $18.0 million (6.6%). Unrestricted Net position has grown from $171.1 million to $291.2 million, a 70.2% increase in five years. This performance has allowed the College to continue to fully fund internally designated funds to offset liabilities for accrued vacation, sick leave, and other post-employment benefits (OPEB) while also establishing reserves for operations, repair and rehabilitation and technology related infrastructure.
Overall, long-term debt increased from $271.9 million to $328.5 million due to the issuance of debt to fund new facilities in Anderson and Bloomington and renovations on the College’s Indianapolis campus (Series R). The College’s liability for compensated absences declined in 2013-14 due to payouts from the College’s early retirement incentive package described in greater detail below.
Operating revenue declined in 2013-14 as FTE enrollment modestly declined compared to 2012-13. Gross Tuition and Fee revenue declined by 2.1% compared to 2012-13. Non-operating revenues declined 2.3% as reductions in federal financial aid grants due to changes made to the Federal aid programs and lower enrollment offset growth in state operating appropriations. State appropriations for all public institutions of higher education were reduced by (2%) compared to the as-passed state budget under a directive from the Governor’s Office to meet reductions in State of Indiana operating revenues. For the College this 2% equaled a $4.2 million reduction; however, despite this reduction, state operating appropriations were 7.8% higher than the previous year. Over the previous five years, gross tuition and fee revenue has grown by 11.6% and non-operating revenues have grown by 12.4%.
Operating expenses totaled $603.7 million, a decline of 3.8% compared to 2012-13. This decline was primarily attributable to a decline in scholarship expense. Salaries and wages grew compared to prior year largely due to one-time payouts of approximately $12 million as the College implemented an early retirement incentive package that was accepted by 241
employees. (For further information see note IX Termination Benefits Liability).
Previously implemented measures such as the outsourcing of College bookstores, move to self-insurance for employee healthcare, improved energy efficiency, consolidation of information technology into a single statewide function and various purchasing related initiatives continue to produce sizeable cost savings. Additionally in 2013-14, the College made changes to its retirement benefits package. Effective July 1, 2014, the College’s retirement contribution will decline from 15% to 12% for newly hired employees. Additionally, all newly hired employees will participate in the College’s 403(b) Plan and no longer be members of the Public Employees Retirement Fund (PERF). The changes are expected to produce significant expense reduction over a multi-year period. Also in 2013-14 the College embarked upon a plan to reorganize its administrative regions. The College previously operated with fourteen regions each with a separate chancellor and administrative cabinet. When fully complete the College will reduce the number of regions with a separate chancellor and cabinet to nine. Consolidating those leadership positions are expected to generate modest expense reductions for the College.
Following modification of its Investment Policy Statement in August 2013, the College implemented a process to modernize the investment of College funds. Seven professional fixed income money managers were hired and assets transitioned from bank savings accounts and certificates of deposits to fixed income investments – treasuries/government agencies, corporate bonds, asset-backed securities, mortgage backed securities and municipal bonds. This modernization is expected to generate additional investment income over time. See Note V. Investments for additional details.
9
Assets
Current AssetsCash and cash equivalents are comprised of cash (in banks and on hand) and investments with maturity dates of 0-90 days at date of purchase as of June 30, 2014. This category decreased by $156.6 million or 74.7% with a corresponding increase in short-term investments of 539.8%, which include those investments with maturity dates of 91-365 days as of June 30, 2014. Long-term investments increased by $126.6 million or 181.1%. This is due to the College’s hiring of external investment managers to manage the College’s investment portfolio in the fall of 2013. The College had shortened maturities as of June 30, 2013 in anticipation of the change to external investment managers.
Cash with Fiscal Agent is primarily attributable to the debt principal and interest payment made in fiscal year 2013-14 and not due until July 1, 2014. This category decreased by $15.9 million or 36.0%. This was primarily due to the permanent refinancing in FY 2013-2014 of the $19.9 million short term note.
Accounts receivable are related, but not limited to, student and contract tuition and fees, grants, and financial aid. Accounting standards typically require the establishment of an allowance for doubtful accounts in the Statement of Net Position to reflect receivables that are likely to be uncollectible. The College policy is that all accounts receivable greater than one-year old are to be written off unless payments are being made currently. The net accounts receivable decreased from the previous year by 12.7%, due to several factors; increased collections on accounts receivables from continued participation in the State of Indiana’s tax refund offset program, a reduction in Federal grants and loans, and reductions in enrollment.
The current portion of the deposits with trustee is $47.8 million, a significant increase from the previous year, due to new construction projects related to the Series R bonds. It is anticipated that current deposits with trustee will be spent in fiscal year 2014-15. The deposits with trustee are mainly attributable to the residual funds for the Series R construction projects at the Anderson, Bloomington and Indianapolis campuses.
Prepaid expenses are payments made in the current or a previous fiscal year, which we have not realized the full value of through fiscal year 2013-14. This category decreased $226 thousand mainly due to a contract for services being completed.
Overall, current assets decreased by $73.6 million, due to large decreases in the cash and cash equivalents, cash with fiscal agent, accounts receivable and prepaid expenses with smaller increases in short-term investments and deposits with trustee. Noncurrent AssetsLong-term investments increased by $126.6 million or 181.1% from the previous year. This increase is due to the change from internally managing the College’s investment portfolio to the utilization of external investment firms.
Noncurrent accounts receivable represents future income related to the lease of the rights to operate the College’s bookstores. The $2.0 million prior year balance was reclassified to current as payment is expected to be received in fiscal year 2014-15. Capital assets increased by $10.1 million or 1.8%, which includes land, buildings, infrastructure, equipment, and construction work in progress. The change was mainly due to the increase of
Condensed statement of net Position
June 30
Current assets
Noncurrent assets
Total assets
Deferred Outflows of Resources
Loss on Refunding
Current liabilities
Noncurrent liabilities
Total liabilities
Net position
Net investment in capital assets
Restricted
Unrestricted
total net position
2014
$228,965,987
768,071,532
997,037,519
669,729
94,236,977
354,070,540
448,307,517
247,421,276
10,741,718
291,236,737
$549,399,731
2013
$302,542,807
626,419,090
928,961,897
-
122,345,536
297,160,192
419,505,728
230,827,744
5,424,841
273,203,584
$509,456,169
Percent Change
-24.3%
22.6%
7.3%
100%
-23.0%
19.2%
6.9%
7.2%
98.0%
6.6%
7.8%
10
construction work in progress from large construction projects at the Anderson, Bloomington, Indianapolis and Hamilton County campuses.
Noncurrent assets increased by $141.7 million or a 22.6% increase from the previous year. The net increase is attributable to a large increase in long-term investments and an increase in capital assets.
Liabilities
Current LiabilitiesCurrent liabilities will be paid in one year or less from the date of the Statement of Net Position.
Accounts payable and accrued liabilities increased by $14.0 million or 60.4%. The increase was due to four new large construction projects, the early retirement incentive program, and other general increases in accounts payable.
Compensated absences, which is the amounts due to employees for earned but unpaid vacation and accrued sick leave payout, decreased by $955 thousand or 9.2%.
Deposits held in custody for others are monies held by the College for payroll withholdings ($4.8 million), and student clubs ($1.3 million).
Unearned revenue represents monies received in the current year for services, tuition and fees, future revenue related to the lease of the College bookstores, or goods to be provided by the College in a future period and not applicable with GASB Statement No. 63, Financial Reporting of Deferred Outflows of Resources, Deferred Inflows of Resources, and Net Position. Unearned revenue decreased by $4.0 million or 19.8% mainly related to the implementation of a new grants billing module in fiscal year 2012-13. Unearned revenue was overstated by approximately $2.7 million in fiscal year 2012-13. Other factors included a reduction of $622 thousand related to a decrease in summer term enrollment and $533 thousand related to the recognition of revenue from the bookstore lease.
The Current portion of debt obligation is the portion of the College’s long-term debt which is payable within the next fiscal year. This category decreased by $36.6 million or 59.1%. This is mainly due to the partial refunding of the Series H and L bond issues, using a short term note in the amount of $19.9 million, which was repaid with a permanent refinancing in the fall of 2013. Overall, current liabilities decreased by $28.1 million.
Noncurrent LiabilitiesNoncurrent liabilities will be paid one year or later from the date of the Statement of Net Position. The College’s noncurrent liabilities include compensated absences, long-term debt and other obligations, and other post-employment benefits. Noncurrent liabilities increased by $56.9 million or
increaseLeases, notes, & Bonds Payable 6/30/2014 6/30/2013 (decrease) Percent Change
Revenue Bonds Payable:
Series H Student Fee Bonds $11,200,000 $27,485,000 $ (16,285,000) -59.3%
Series I Student Fee Bonds 8,830,000 10,795,000 (1,965,000) -18.2%
Series J Student Fee Bonds 9,245,000 9,245,000 - 0.0%
Series K Student Fee Bonds 35,675,000 38,155,000 (2,480,000) -6.5%
Series L Student Fee Bonds 38,105,000 47,805,000 (9,700,000) -20.3%
Series M Student Fee Bonds 3,735,000 7,340,000 (3,605,000) -49.1%
Series N Student Fee Bonds 70,290,000 70,290,000 - 0.0%
Series O Student Fee Bonds 9,200,000 9,200,000 - 0.0%
Series P Student Fee Bonds 30,590,000 31,510,000 (920,000) -2.9%
Series Q Student Fee Bonds 11,490,000 14,480,000 (2,990,000) -20.6%
Series R Student Fee Bonds 71,355,000 - 71,355,000 100.0%
Total Bonds Payable 299,715,000 266,305,000 33,410,000 12.5%
Premium on Bonds -H,I,J,K,L,M,P & R 13,220,258 7,310,915 5,909,343 80.8%
Lease Obligations 38,096,647 37,547,321 549,326 1.5%
Notes Payable 2,784,491 22,731,332 (19,946,841) -87.8%
total Leases, notes, and Bonds Payable $ 353,816,396 $ 333,894,568 $ 19,921,828 6.0%
outstanding deBt at Year end
11
Net Position
Net position represents the difference between the College’s assets and liabilities.
The classification “net investment in capital assets” (which includes building and equipment less depreciation, land owned by the College, and construction work in progress) increased by 7.2% compared to the prior year. This increase was mainly due to the capitalization of repairs and rehabilitations and other building projects.
The restricted “capital projects” classification increased by 99.2% from the prior year. This increase was primarily due to the construction in progress for four projects at the Anderson, Bloomington, Indianapolis, and the Hamilton County campuses.
Unrestricted Net position increased by 6.6%. This is mainly due to the College reducing operating expenses and increasing unrestricted reserves.
Overall, Net Position increased in fiscal year 2013-14 by $39.9 million or 7.8%. The Net position is comprised of 53.0% Unrestricted Net Position, 45.0% Net Investment in Capital Assets, and 2.0% Capital Projects and Endowments.
Internally Designated Reserves of Unrestricted Funds
The College ended the fiscal year with an unrestricted net position balance of $291.2 million, an increase of $18.0 million, or 6.6% as compared to the prior fiscal year. The following provides additional information concerning the allocation of the Unrestricted Net position.
2014 anaLYsis of net Position
Net Investment in Capital Assets Capital Projects & Endowments
45.0%
2.0%
$247,421,276 $291,236,737
$10,741,718
Unrestricted Net Position
53.0%
description
Self-Insurance
Bookstore Commissions
Economic Development Revolving Loan
Student Accounts Receivable
Insurance Stabilization
Parking Lot Repair and Replacement
Compensated Absences Reserve
Other Post-Employment Benefits
Enterprise Software Enhancements
Unclaimed Property
Student Loan Fund
Institutional R&R Reserve
Operating Budget
total
fY 2014 amount
$8,384,296
37,131,724
5,610,333
14,348,776
907,716
3,992,620
14,877,126
21,794,135
3,302,889
2,605,096
68,808
19,743,614
158,469,604
$291,236,737
fY 2013 amount
$10,597,948
33,561,223
5,459,500
13,860,990
903,176
3,889,706
17,427,365
19,357,803
3,302,889
2,469,241
70,546
21,096,569
141,206,628
$273,203,584
19.2%, primarily due to Series R Student Fee Bonds issued in the fall of 2013.
In accordance with the appropriate accounting guidance, the entire amount of Post-Employment Benefits is considered a long-term liability.

12
The College administers health insurance for all benefits eligible employees. Under the self-insurance plan, claims are paid directly by the College in the month incurred. A reserve in the amount of $8,384,296 represents the excess of employer contribution over claims expense.
Effective June 30, 2008, all College bookstores have been leased to Follett Higher Education Group, Inc. The College maintains a reserve from the commissions to be used for various one-time budget needs. Expenditures from this reserve are approved by the Sr. Vice President, Chief Financial Officer and General Counsel.
The Economic Development Revolving Loan Fund is primarily used within the College to acquire equipment necessary to rapidly implement training programs relative to economic development as well as other College initiatives. This fund is a revolving fund and is paid back over time by the College site originally granted the loan.
The College does not recognize certain student accounts receivable balances for budget purposes. After they have been collected, they are recognized for budgetary purposes and therefore available for expenditure. These funds are held in the Student Accounts Receivable reserve.
The insurance stabilization reserve was established in the fiscal year ending June 30, 1994. The interest earned on this reserve has been used to reduce the amount of health insurance increases that must be passed on to the employees of the College.
The parking lot repair and replacement reserve is funded with a College designated portion of student fee collections. Currently seventy-five cents ($.75) per student credit hour is designated to assist the funding of repairing, maintaining, and providing new parking lots throughout the College. The amount listed is the available cash balance for this reserve as of June 30, 2014.
The compensated absences reserve was established to offset the College’s compensated absences liability. The total amount of unrestricted monies set aside is $784,108 more than the total liability of $14,093,018. This benefit is discussed in more detail in the Notes to the Financial Statements, page 41. The amount listed is the available cash balance for this reserve as of June 30, 2014.
The Other Post-Employment Benefits (OPEB) cash reserve was established in fiscal year 2005-06 to offset the College’s other post-employment benefit liability. This reserve was established in advance of the reporting requirements of GASB Statement No. 45, Accounting and Financial Reporting by Employers for Postemployment Benefits Other Than Pensions.
An actuarial estimate was obtained by the College as of June 30, 2014. As a result of this estimate, the College reported an OPEB liability in the amount of $20.9 million as of June 30, 2014. This cash reserve is $867,537 more than the corresponding liability. The amount listed is the available cash balance for this reserve as of June 30, 2014.
The enterprise software enhancement reserve has been established to assist the College in maintaining and enhancing the enterprise-wide software programs.
State law allows the College to maintain unclaimed property. The unclaimed properties are checks that have not been cashed and are greater than two years old. The payees may claim these checks upon the filing of a claim and proof of identity.
The College maintains a loan fund for the purpose of making short-term loans to students. The funds are derived from a number of different sources.
The College has unrestricted reserves for potential R&R projects within the College.
The operating budget is the remaining amount of the Unrestricted Net position available for expenditure.
13
Condensed statement of revenues, exPenses and Changes in net Position
increase 6/30/2014 6/30/2013 (decrease) Percent Change
Construction Work In Progress $26,460,996 $ 12,831,385 $ 13,629,611 106.2%
Land, Improvements, and Infrastructure 43,757,456 41,203,314 2,554,142 6.2%
Buildings 471,916,445 478,909,644 (6,993,199) -1.5%
Furniture, fixtures, and equipment 21,707,020 20,697,767 1,009,253 4.9%
Library materials 720,030 864,442 (144,412) -16.7%
totals $564,561,947 $554,506,552 $10,055,395 1.8%
Year ended June 30 2014 2013 Percent Change
Operating revenue
Tuition and fees, net $137,417,388 $146,425,861 -6.2%
Grants and contracts 28,913,220 28,873,090 0.1%
Auxiliary services, net 8,718,709 9,742,534 -10.5%
Other 6,830,035 6,444,576 6.0%
Total operating revenue 181,879,352 191,486,061 -5.0%
Operating expense (603,696,093) (627,839,295) -3.8%
Operating income (loss) (421,816,741) (436,353,234) -3.3%
Nonoperating revenue (expense)
State/Federal appropriations 235,492,735 218,527,291 7.8%
Governmental Grants and Contracts 231,903,361 260,011,060 -10.8%
Other nonoperating revenue (expense) (8,734,245) (9,222,053) -5.3%
Net nonoperating revenue 458,661,851 469,316,298 -2.3%
Income before other revenue, expenses,
gains, or losses 36,845,110 32,963,064 11.8%
Capital appropriations/Gifts 3,098,452 1,835,245 68.8%
Total increase in Net position 39,943,562 34,798,309 14.8%
Net position
Net position - beginning of year 509,456,169 474,657,860 7.3%
net position - end of year $549,399,731 $509,456,169 7.8%
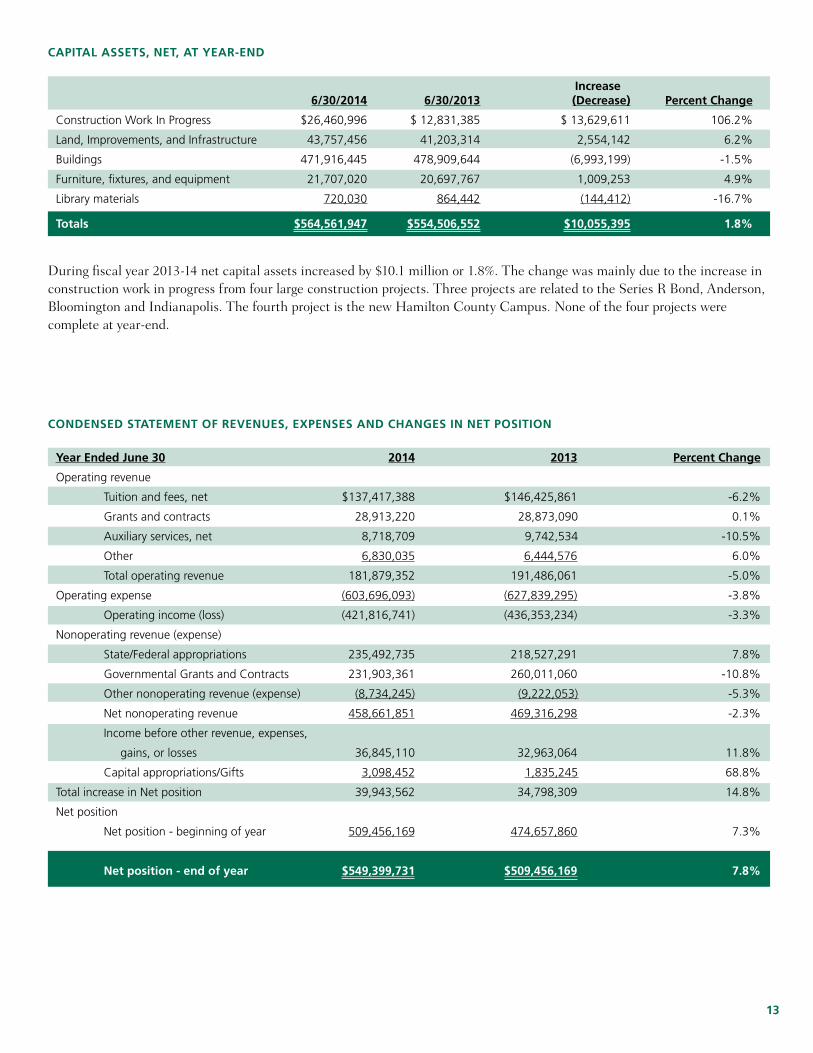
CaPitaL assets, net, at Year-end
During fiscal year 2013-14 net capital assets increased by $10.1 million or 1.8%. The change was mainly due to the increase in construction work in progress from four large construction projects. Three projects are related to the Series R Bond, Anderson, Bloomington and Indianapolis. The fourth project is the new Hamilton County Campus. None of the four projects were complete at year-end.
14
Revenues
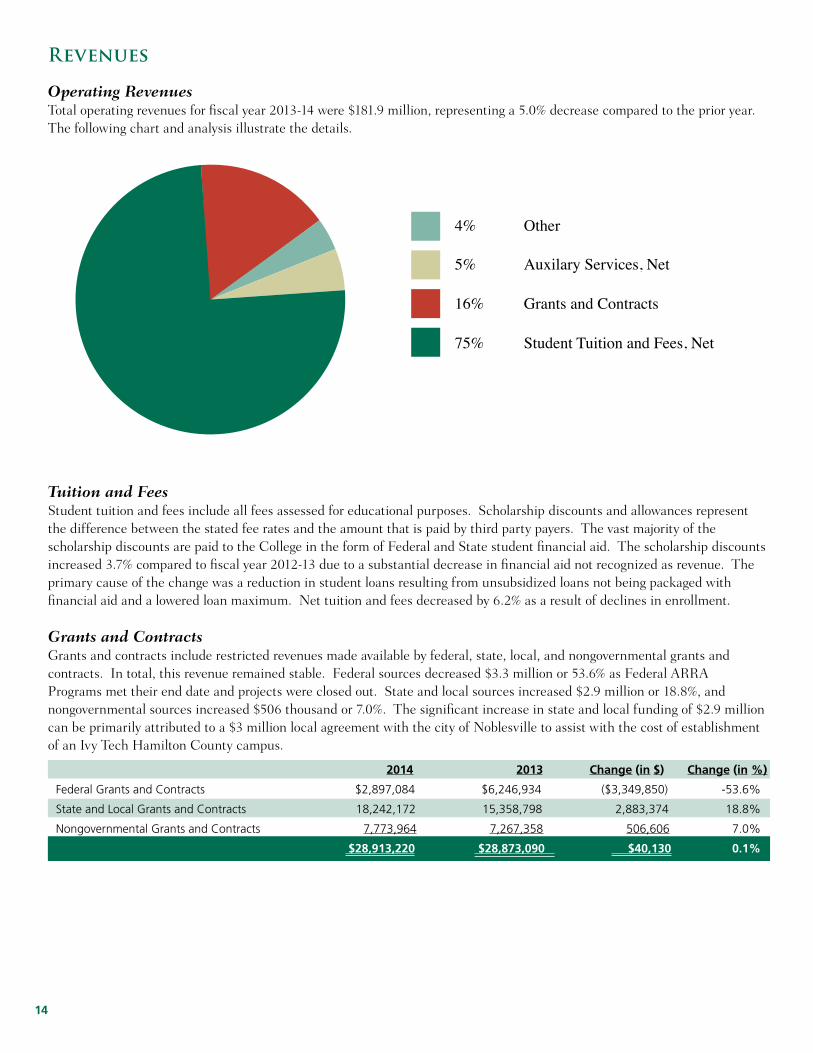
Operating RevenuesTotal operating revenues for fiscal year 2013-14 were $181.9 million, representing a 5.0% decrease compared to the prior year. The following chart and analysis illustrate the details.
Tuition and FeesStudent tuition and fees include all fees assessed for educational purposes. Scholarship discounts and allowances represent the difference between the stated fee rates and the amount that is paid by third party payers. The vast majority of the scholarship discounts are paid to the College in the form of Federal and State student financial aid. The scholarship discounts increased 3.7% compared to fiscal year 2012-13 due to a substantial decrease in financial aid not recognized as revenue. The primary cause of the change was a reduction in student loans resulting from unsubsidized loans not being packaged with financial aid and a lowered loan maximum. Net tuition and fees decreased by 6.2% as a result of declines in enrollment.
Grants and ContractsGrants and contracts include restricted revenues made available by federal, state, local, and nongovernmental grants and contracts. In total, this revenue remained stable. Federal sources decreased $3.3 million or 53.6% as Federal ARRA Programs met their end date and projects were closed out. State and local sources increased $2.9 million or 18.8%, and nongovernmental sources increased $506 thousand or 7.0%. The significant increase in state and local funding of $2.9 million can be primarily attributed to a $3 million local agreement with the city of Noblesville to assist with the cost of establishment of an Ivy Tech Hamilton County campus.
5% Auxilary Services, Net
4% Other
16% Grants and Contracts
75% Student Tuition and Fees, Net
2014 2013 Change (in $) Change (in %)
Federal Grants and Contracts $2,897,084 $6,246,934 ($3,349,850) -53.6%
State and Local Grants and Contracts 18,242,172 15,358,798 2,883,374 18.8%
Nongovernmental Grants and Contracts 7,773,964 7,267,358 506,606 7.0%
$28,913,220 $28,873,090 $40,130 0.1%
15
Auxiliary Enterprises
Auxiliary enterprises are intended to be self-supporting and supplement the operations of the College. The total auxiliary enterprise revenue was $8.7 million. The primary revenue source is the commission on book sales. This category decreased by 10.5% in 2013-14 due to a decrease in enrollment, a reduction in Federal financial aid and a decrease in the amount the College allowed students to charge to their anticipated financial aid.
Nonoperating Revenue and Expense
This category consists of State and Federal appropriations, investment income, interest on capital asset-related debt, governmental grants and contracts and student government support. The category remained relatively stable with the exception of Governmental grants and contracts. Federal grants and contracts totaled $198.0 million, a reduction of $27.2 million from the previous year. This was mainly due to a change in eligibility limits for Federal financial aid. The decrease in Federal grants and contracts was partially offset by a $17.0 million increase in State appropriations.
Other Revenues, Expenses, Gains, or Losses
Capital Gifts, Grants and Appropriations increased by $1.3 million. This increase is attributed to the recognition of a Boeing 737 aircraft donated to the Northwest region’s Aviation Technology program. The aircraft was valued at $1.4 million.
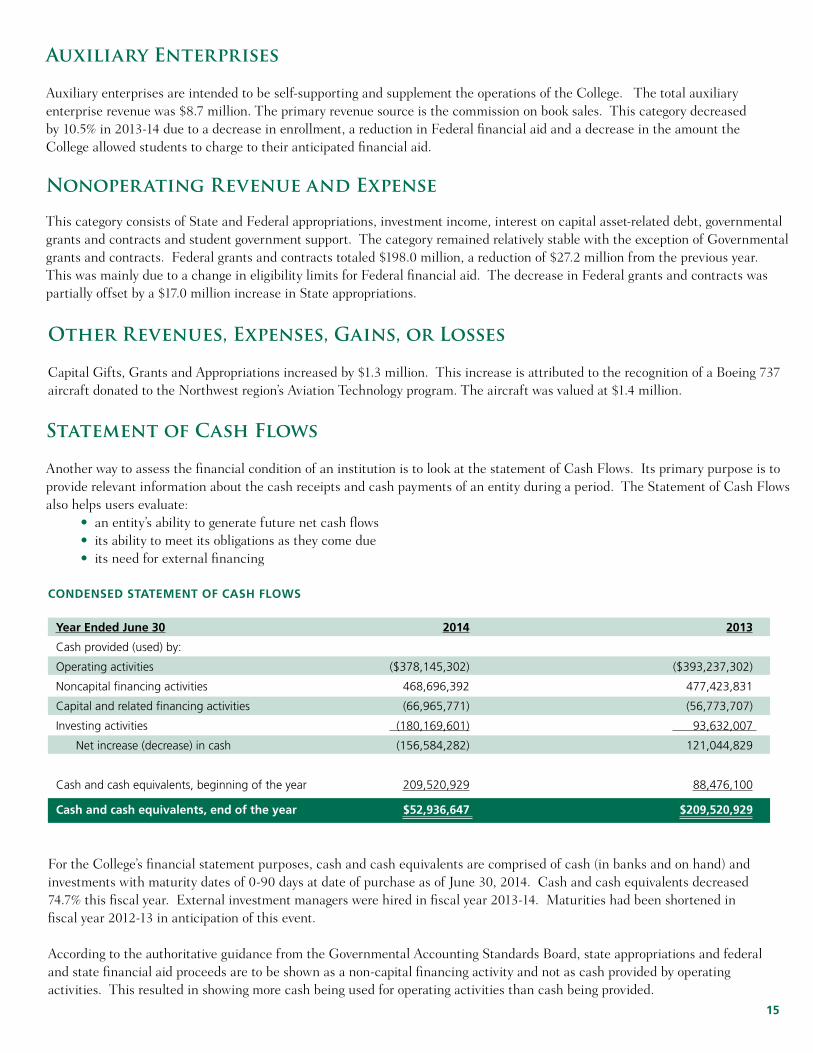
Statement of Cash Flows
Another way to assess the financial condition of an institution is to look at the statement of Cash Flows. Its primary purpose is to provide relevant information about the cash receipts and cash payments of an entity during a period. The Statement of Cash Flows also helps users evaluate:
• an entity’s ability to generate future net cash flows• its ability to meet its obligations as they come due• its need for external financing
For the College’s financial statement purposes, cash and cash equivalents are comprised of cash (in banks and on hand) and investments with maturity dates of 0-90 days at date of purchase as of June 30, 2014. Cash and cash equivalents decreased 74.7% this fiscal year. External investment managers were hired in fiscal year 2013-14. Maturities had been shortened in fiscal year 2012-13 in anticipation of this event.
According to the authoritative guidance from the Governmental Accounting Standards Board, state appropriations and federal and state financial aid proceeds are to be shown as a non-capital financing activity and not as cash provided by operating activities. This resulted in showing more cash being used for operating activities than cash being provided.
Year ended June 30 2014 2013
Cash provided (used) by:
Operating activities ($378,145,302) ($393,237,302)
Noncapital financing activities 468,696,392 477,423,831
Capital and related financing activities (66,965,771) (56,773,707)
Investing activities (180,169,601) 93,632,007
Net increase (decrease) in cash (156,584,282) 121,044,829
Cash and cash equivalents, beginning of the year 209,520,929 88,476,100
Cash and cash equivalents, end of the year $52,936,647 $209,520,929
Condensed statement of Cash fLows

16
Factors Impacting Future Periods
Modest economic recovery continued for the State of Indiana in 2013-14. In Indiana, the current jobless rate hovers around 5.9% compared to 7.6% in the same month of the prior year (July).
State of Indiana general fund revenues were flat compared to the prior year. The state’s largest source of revenue – sales and use taxes – grew 1.9% vs. FY 2013. Individual income tax revenue declined by 1.6%. Solid management of operating expenses allowed the State to end 2013-14 with a combined balance of $2 billion and a $107 million operating surplus. The most recent economic and revenue forecast (December 2013) projects modest revenue growth of 3% in FY 2015. Combined balances are expected to remain between $2 billion and $2.2 billion for the 2014-15 biennium. The next economic and revenue forecast will occur in December, 2014 and be used for the next two year state biennial budget.
In July, the state announced that the 2% budget reduction for all public colleges and universities directed in FY 2014 will continue for FY 2015. The result is a reduction in state operating appropriations to the College of approximately $4.2 million in FY 2015.
For FY 2015, the College has targeted a significant portion of increased tuition revenues and state operating funds toward retention and completion efforts—hiring more full time faculty with a focus on math, English, health sciences, industrial technology and information technology, adding academic advisors and upgrading and updating laboratory and industrial technology equipment. State appropriations per full
time equivalent (FTE) student still lag behind other Indiana public colleges and universities. The College’s strong results under Indiana’s performance funding formula have modestly reduced this gap. Preliminary data on the College’s results under the performance funding formula set for the next budget biennium indicates excellent performance, particularly in degree completion and persistence points.
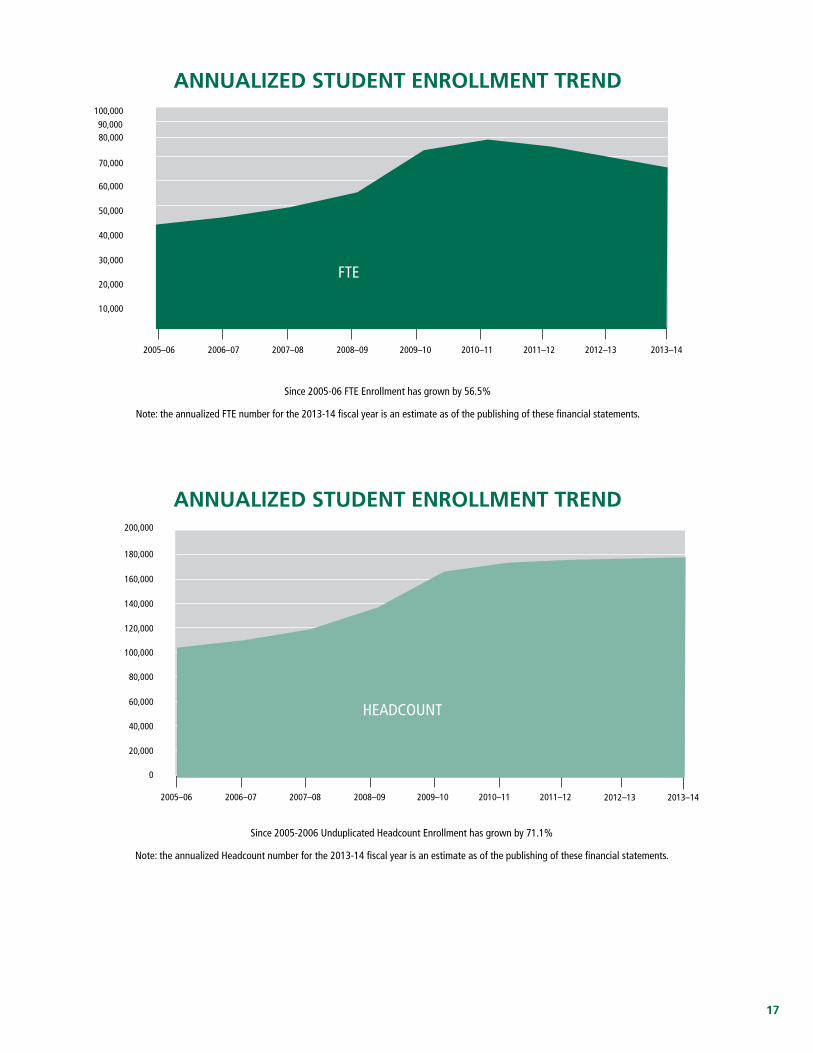
Enrollment at Ivy Tech declined modestly in 2013-14. Preliminary figures for 2013-14 show annualized unduplicated headcount of 179,191 compared to 180,398 for 2012-13. 2013-14 preliminary FTE is 67,265 compared to 71,055 in 2012-13.
Over the previous five years, headcount and FTE enrollment have increased by 7.6% and decreased 7.4%, respectively.
GASB 68, Accounting and Financial Reporting for Pensions will be in effect for 2014-15 and it requires the recognition of the College’s portion of any PERF unfunded liability.
Ivy Tech Community College is well positioned to continue to serve the educational and training needs of Hoosiers. The College is in sound financial shape. Key financial ratios are strong as evidenced by the Higher Learning Commission’s financial ratios. Standard and Poor’s and Fitch Ratings maintain a bond rating of “AA-“ and “AA” respectively on the College. S&P raised its outlook to positive from stable during FY 2013-14.
17
annuaLized student enroLLment trend
annuaLized student enroLLment trend
Since 2005-06 FTE Enrollment has grown by 56.5%
Since 2005-2006 Unduplicated Headcount Enrollment has grown by 71.1%
Note: the annualized FTE number for the 2013-14 fiscal year is an estimate as of the publishing of these financial statements.
Note: the annualized Headcount number for the 2013-14 fiscal year is an estimate as of the publishing of these financial statements.
2005–06 2006–07 2007–08 2008–09 2009–10 2010–11 2011–12
10,000
20,000
30,000
40,000
50,000
60,000
70,000
80,000
2012–13 2013–14
FTE
100,000
2005–06 2006–07 2007–08 2008–09 2009–10 2010–11 2011–12
20,000
0
40,000
60,000
80,000
100,000
120,000
140,000
160,000
180,000
2012–13
200,000
HEADCOUNT
2013–14
90,000
18
2005–06 2006–07 2007–08 2008–09 2009–10 2010–11 2011–12
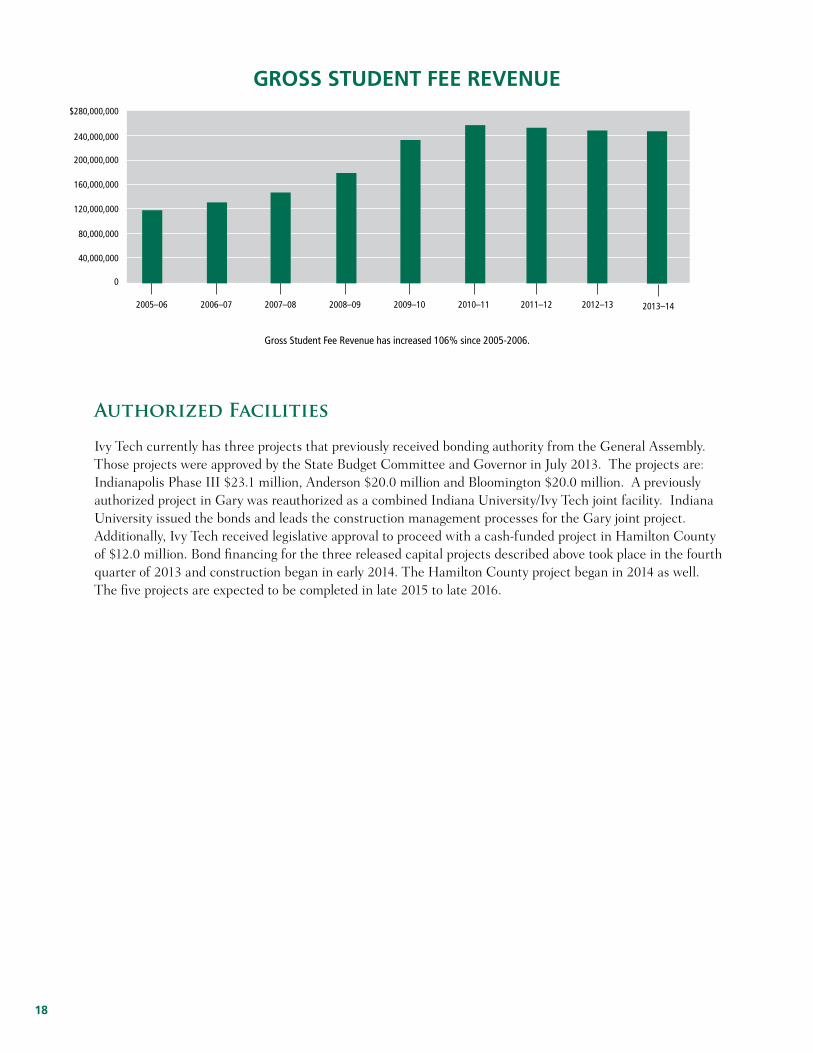
gross student fee revenue
0
40,000,000
80,000,000
120,000,000
160,000,000
200,000,000
240,000,000
$280,000,000
Gross Student Fee Revenue has increased 106% since 2005-2006.
Authorized Facilities
Ivy Tech currently has three projects that previously received bonding authority from the General Assembly. Those projects were approved by the State Budget Committee and Governor in July 2013. The projects are: Indianapolis Phase III $23.1 million, Anderson $20.0 million and Bloomington $20.0 million. A previously authorized project in Gary was reauthorized as a combined Indiana University/Ivy Tech joint facility. Indiana University issued the bonds and leads the construction management processes for the Gary joint project. Additionally, Ivy Tech received legislative approval to proceed with a cash-funded project in Hamilton County of $12.0 million. Bond financing for the three released capital projects described above took place in the fourth quarter of 2013 and construction began in early 2014. The Hamilton County project began in 2014 as well. The five projects are expected to be completed in late 2015 to late 2016.
2012–13 2013–14
19
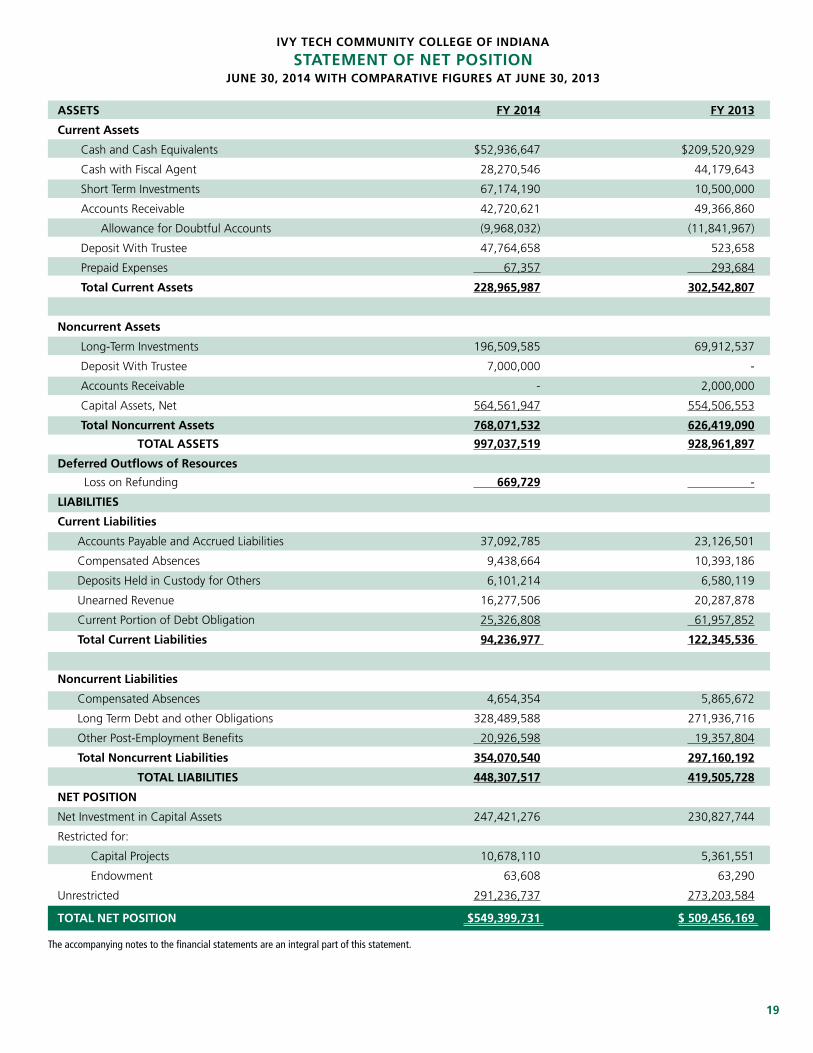
assets fY 2014 fY 2013
Current assets
Cash and Cash Equivalents $52,936,647 $209,520,929
Cash with Fiscal Agent 28,270,546 44,179,643
Short Term Investments 67,174,190 10,500,000
Accounts Receivable 42,720,621 49,366,860
Allowance for Doubtful Accounts (9,968,032) (11,841,967)
Deposit With Trustee 47,764,658 523,658
Prepaid Expenses 67,357 293,684
total Current assets 228,965,987 302,542,807
noncurrent assets
Long-Term Investments 196,509,585 69,912,537
Deposit With Trustee 7,000,000 -
Accounts Receivable - 2,000,000
Capital Assets, Net 564,561,947 554,506,553
total noncurrent assets 768,071,532 626,419,090
totaL assets 997,037,519 928,961,897
deferred outflows of resources
Loss on Refunding 669,729 -
LiaBiLities
Current Liabilities
Accounts Payable and Accrued Liabilities 37,092,785 23,126,501
Compensated Absences 9,438,664 10,393,186
Deposits Held in Custody for Others 6,101,214 6,580,119
Unearned Revenue 16,277,506 20,287,878
Current Portion of Debt Obligation 25,326,808 61,957,852
total Current Liabilities 94,236,977 122,345,536
noncurrent Liabilities
Compensated Absences 4,654,354 5,865,672
Long Term Debt and other Obligations 328,489,588 271,936,716
Other Post-Employment Benefits 20,926,598 19,357,804
total noncurrent Liabilities 354,070,540 297,160,192
totaL LiaBiLities 448,307,517 419,505,728
net Position
Net Investment in Capital Assets 247,421,276 230,827,744
Restricted for:
Capital Projects 10,678,110 5,361,551
Endowment 63,608 63,290
Unrestricted 291,236,737 273,203,584
totaL net Position $549,399,731 $ 509,456,169
ivY teCh CommunitY CoLLege of indiana
statement of net PositionJune 30, 2014 with ComParative figures at June 30, 2013
The accompanying notes to the financial statements are an integral part of this statement.
20
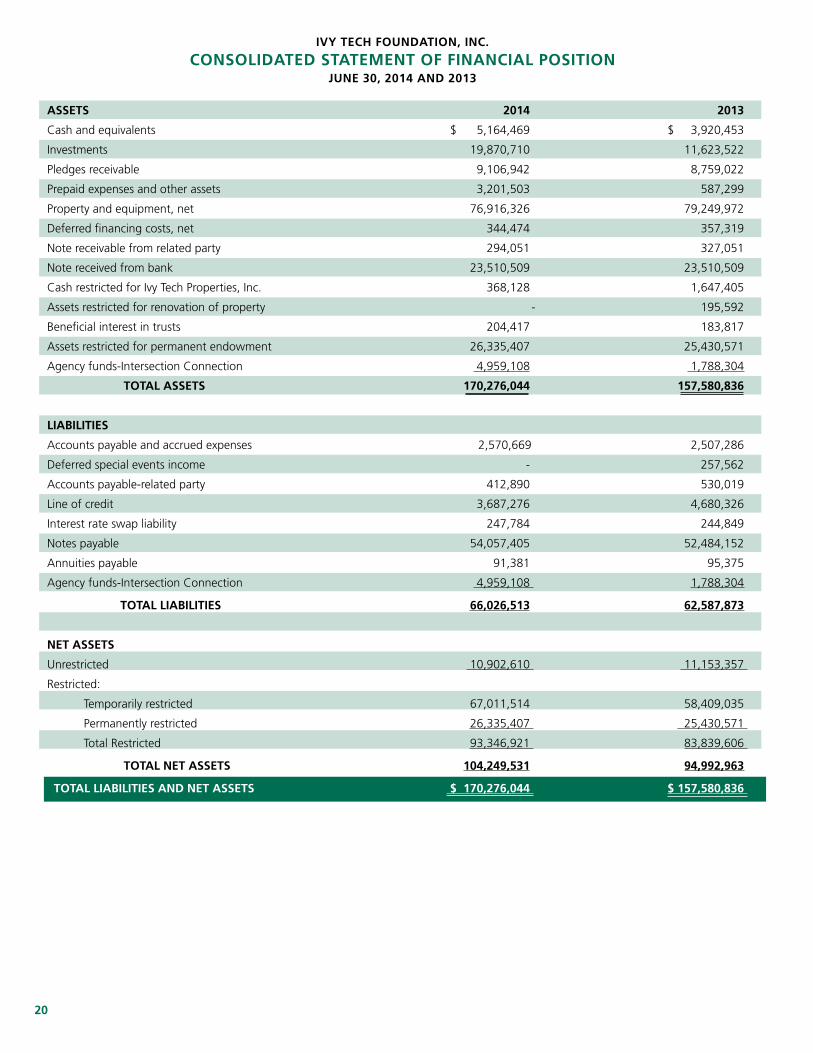
assets 2014 2013
Cash and equivalents $ 5,164,469 $ 3,920,453
Investments 19,870,710 11,623,522
Pledges receivable 9,106,942 8,759,022
Prepaid expenses and other assets 3,201,503 587,299
Property and equipment, net 76,916,326 79,249,972
Deferred financing costs, net 344,474 357,319
Note receivable from related party 294,051 327,051
Note received from bank 23,510,509 23,510,509
Cash restricted for Ivy Tech Properties, Inc. 368,128 1,647,405
Assets restricted for renovation of property - 195,592
Beneficial interest in trusts 204,417 183,817
Assets restricted for permanent endowment 26,335,407 25,430,571
Agency funds-Intersection Connection 4,959,108 1,788,304
totaL assets 170,276,044 157,580,836
LiaBiLities
Accounts payable and accrued expenses 2,570,669 2,507,286
Deferred special events income - 257,562
Accounts payable-related party 412,890 530,019
Line of credit 3,687,276 4,680,326
Interest rate swap liability 247,784 244,849
Notes payable 54,057,405 52,484,152
Annuities payable 91,381 95,375
Agency funds-Intersection Connection 4,959,108 1,788,304
totaL LiaBiLities 66,026,513 62,587,873
net assets
Unrestricted 10,902,610 11,153,357
Restricted:
Temporarily restricted 67,011,514 58,409,035
Permanently restricted 26,335,407 25,430,571
Total Restricted 93,346,921 83,839,606
totaL net assets totaL net assets 104,249,531 94,992,963
totaL LiaBiLities and net assets $ 170,276,044 $ 157,580,836
ivY teCh foundation, inC.
ConsoLidated statement of finanCiaL PositionJune 30, 2014 and 2013
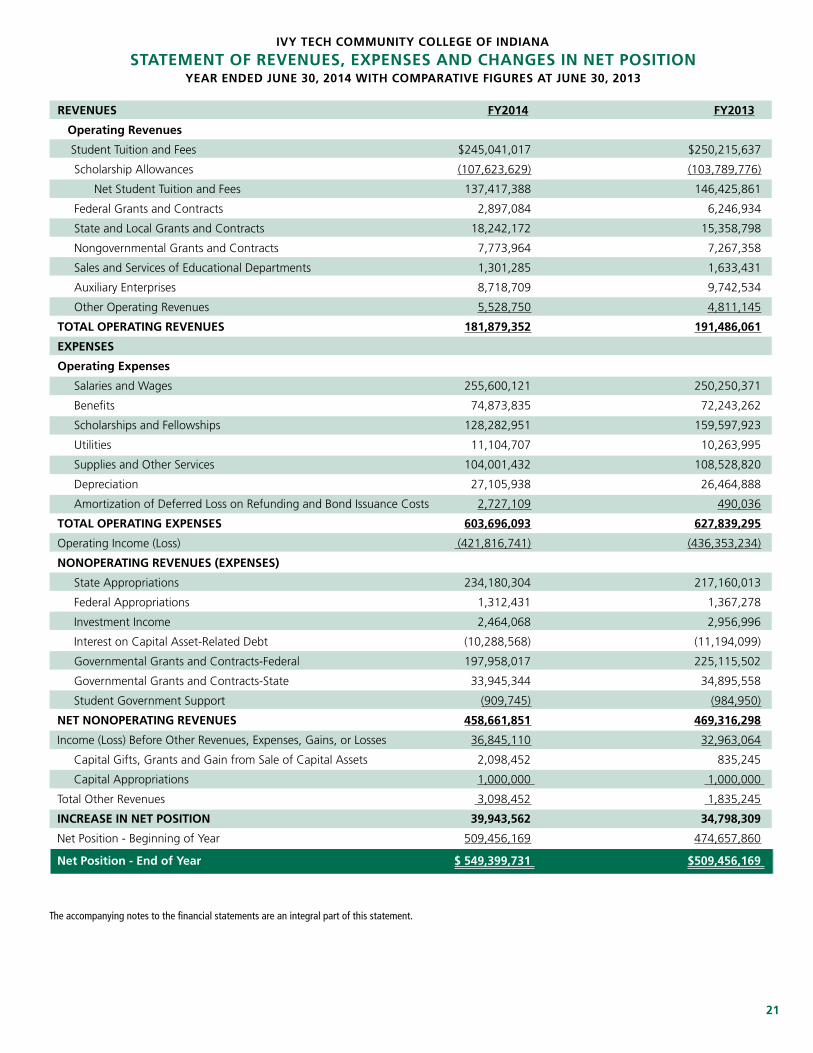
21
The accompanying notes to the financial statements are an integral part of this statement.
revenues fY2013
operating revenues
Student Tuition and Fees $245,041,017 $250,215,637
Scholarship Allowances (107,623,629) (103,789,776)
Net Student Tuition and Fees 137,417,388 146,425,861
Federal Grants and Contracts 2,897,084 6,246,934
State and Local Grants and Contracts 18,242,172 15,358,798
Nongovernmental Grants and Contracts 7,773,964 7,267,358
Sales and Services of Educational Departments 1,301,285 1,633,431
Auxiliary Enterprises 8,718,709 9,742,534
Other Operating Revenues 5,528,750 4,811,145
totaL oPerating revenues 181,879,352 191,486,061
exPenses
operating expenses
Salaries and Wages 255,600,121 250,250,371
Benefits 74,873,835 72,243,262
Scholarships and Fellowships 128,282,951 159,597,923
Utilities 11,104,707 10,263,995
Supplies and Other Services 104,001,432 108,528,820
Depreciation 27,105,938 26,464,888
Amortization of Deferred Loss on Refunding and Bond Issuance Costs 2,727,109 490,036
totaL oPerating exPenses 603,696,093 627,839,295
Operating Income (Loss) (421,816,741) (436,353,234)
nonoPerating revenues (exPenses)
State Appropriations 234,180,304 217,160,013
Federal Appropriations 1,312,431 1,367,278
Investment Income 2,464,068 2,956,996
Interest on Capital Asset-Related Debt (10,288,568) (11,194,099)
Governmental Grants and Contracts-Federal 197,958,017 225,115,502
Governmental Grants and Contracts-State 33,945,344 34,895,558
Student Government Support (909,745) (984,950)
net nonoPerating revenues 458,661,851 469,316,298
Income (Loss) Before Other Revenues, Expenses, Gains, or Losses 36,845,110 32,963,064
Capital Gifts, Grants and Gain from Sale of Capital Assets 2,098,452 835,245
Capital Appropriations 1,000,000 1,000,000
Total Other Revenues 3,098,452 1,835,245
inCrease in net Position 39,943,562 34,798,309
Net Position - Beginning of Year 509,456,169 474,657,860
net Position - end of Year $ 549,399,731 $509,456,169
ivY teCh CommunitY CoLLege of indiana
statement of revenues, exPenses and Changes in net PositionYear ended June 30, 2014 with ComParative figures at June 30, 2013
fY2014
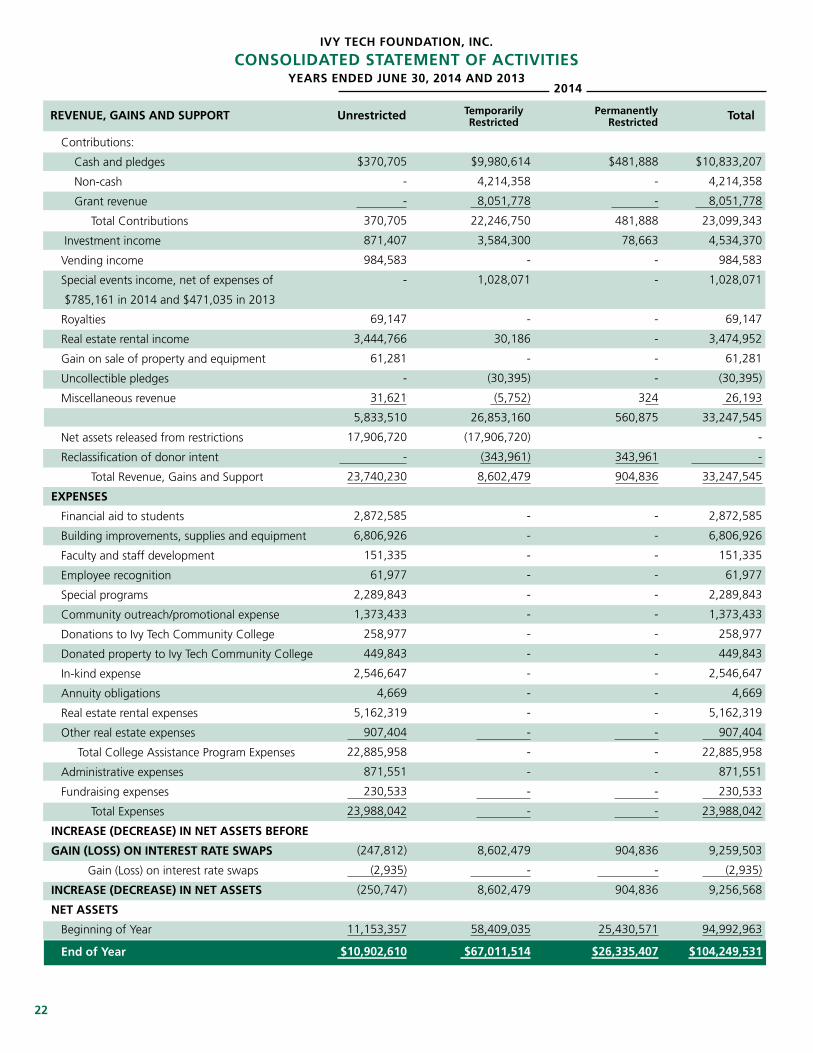
22
Contributions:
Cash and pledges
Non-cash
Grant revenue
Total Contributions
Investment income
Vending income
Special events income, net of expenses of
$785,161 in 2014 and $471,035 in 2013
Royalties
Real estate rental income
Gain on sale of property and equipment
Uncollectible pledges
Miscellaneous revenue
Net assets released from restrictions
Reclassification of donor intent
Total Revenue, Gains and Support
exPenses
Financial aid to students
Building improvements, supplies and equipment
Faculty and staff development
Employee recognition
Special programs
Community outreach/promotional expense
Donations to Ivy Tech Community College
Donated property to Ivy Tech Community College
In-kind expense
Annuity obligations
Real estate rental expenses
Other real estate expenses
Total College Assistance Program Expenses
Administrative expenses
Fundraising expenses
Total Expenses
inCrease (deCrease) in net assets Before
gain (Loss) on interest rate swaPs
Gain (Loss) on interest rate swaps
inCrease (deCrease) in net assets
net assets
Beginning of Year
end of Year
ivY teCh foundation, inC.
ConsoLidated statement of aCtivitiesYears ended June 30, 2014 and 2013
revenue, gains and suPPort unrestricted totaltemporarilyrestricted
Permanentlyrestricted
$370,705
-
-
370,705
871,407
984,583
-
69,147
3,444,766
61,281
-
31,621
5,833,510
17,906,720
-
23,740,230
2,872,585
6,806,926
151,335
61,977
2,289,843
1,373,433
258,977
449,843
2,546,647
4,669
5,162,319
907,404
22,885,958
871,551
230,533
23,988,042
(247,812)
(2,935)
(250,747)
11,153,357
$10,902,610
$9,980,614
4,214,358
8,051,778
22,246,750
3,584,300
-
1,028,071
-
30,186
-
(30,395)
(5,752)
26,853,160
(17,906,720)
(343,961)
8,602,479
-
-
-
-
-
-
-
-
-
-
-
-
-
-
-
-
8,602,479
-
8,602,479
58,409,035
$67,011,514
$481,888
-
-
481,888
78,663
-
-
-
-
-
-
324
560,875
343,961
904,836
-
-
-
-
-
-
-
-
-
-
-
-
-
-
-
-
904,836
-
904,836
25,430,571
$26,335,407
$10,833,207
4,214,358
8,051,778
23,099,343
4,534,370
984,583
1,028,071
69,147
3,474,952
61,281
(30,395)
26,193
33,247,545
-
-
33,247,545
2,872,585
6,806,926
151,335
61,977
2,289,843
1,373,433
258,977
449,843
2,546,647
4,669
5,162,319
907,404
22,885,958
871,551
230,533
23,988,042
9,259,503
(2,935)
9,256,568
94,992,963
$104,249,531
2014
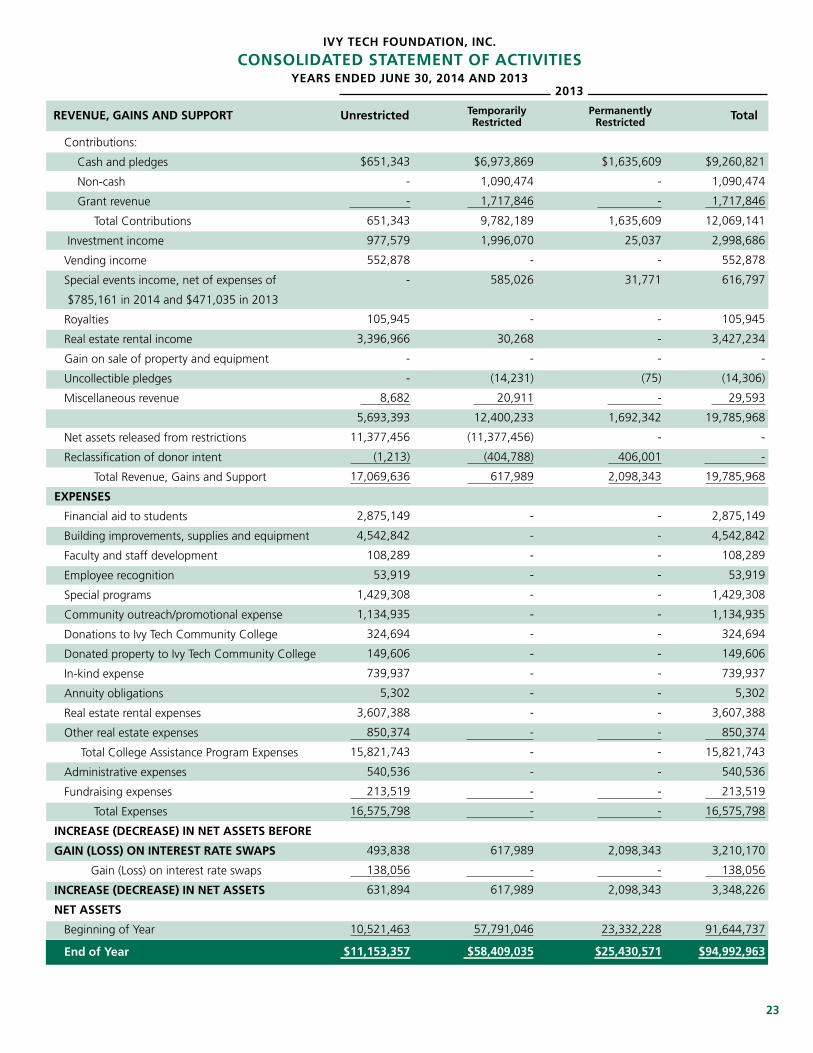
23
Contributions:
Cash and pledges
Non-cash
Grant revenue
Total Contributions
Investment income
Vending income
Special events income, net of expenses of
$785,161 in 2014 and $471,035 in 2013
Royalties
Real estate rental income
Gain on sale of property and equipment
Uncollectible pledges
Miscellaneous revenue
Net assets released from restrictions
Reclassification of donor intent
Total Revenue, Gains and Support
exPenses
Financial aid to students
Building improvements, supplies and equipment
Faculty and staff development
Employee recognition
Special programs
Community outreach/promotional expense
Donations to Ivy Tech Community College
Donated property to Ivy Tech Community College
In-kind expense
Annuity obligations
Real estate rental expenses
Other real estate expenses
Total College Assistance Program Expenses
Administrative expenses
Fundraising expenses
Total Expenses
inCrease (deCrease) in net assets Before
gain (Loss) on interest rate swaPs
Gain (Loss) on interest rate swaps
inCrease (deCrease) in net assets
net assets
Beginning of Year
end of Year
ivY teCh foundation, inC.
ConsoLidated statement of aCtivitiesYears ended June 30, 2014 and 2013
revenue, gains and suPPort unrestricted totaltemporarilyrestricted
Permanentlyrestricted
$651,343
-
-
651,343
977,579
552,878
-
105,945
3,396,966
-
-
8,682
5,693,393
11,377,456
(1,213)
17,069,636
2,875,149
4,542,842
108,289
53,919
1,429,308
1,134,935
324,694
149,606
739,937
5,302
3,607,388
850,374
15,821,743
540,536
213,519
16,575,798
493,838
138,056
631,894
10,521,463
$11,153,357
$6,973,869
1,090,474
1,717,846
9,782,189
1,996,070
-
585,026
-
30,268
-
(14,231)
20,911
12,400,233
(11,377,456)
(404,788)
617,989
-
-
-
-
-
-
-
-
-
-
-
-
-
-
-
-
617,989
-
617,989
57,791,046
$58,409,035
$1,635,609
-
-
1,635,609
25,037
-
31,771
-
-
-
(75)
-
1,692,342
-
406,001
2,098,343
-
-
-
-
-
-
-
-
-
-
-
-
-
-
-
-
2,098,343
-
2,098,343
23,332,228
$25,430,571
$9,260,821
1,090,474
1,717,846
12,069,141
2,998,686
552,878
616,797
105,945
3,427,234
-
(14,306)
29,593
19,785,968
-
-
19,785,968
2,875,149
4,542,842
108,289
53,919
1,429,308
1,134,935
324,694
149,606
739,937
5,302
3,607,388
850,374
15,821,743
540,536
213,519
16,575,798
3,210,170
138,056
3,348,226
91,644,737
$94,992,963
2013
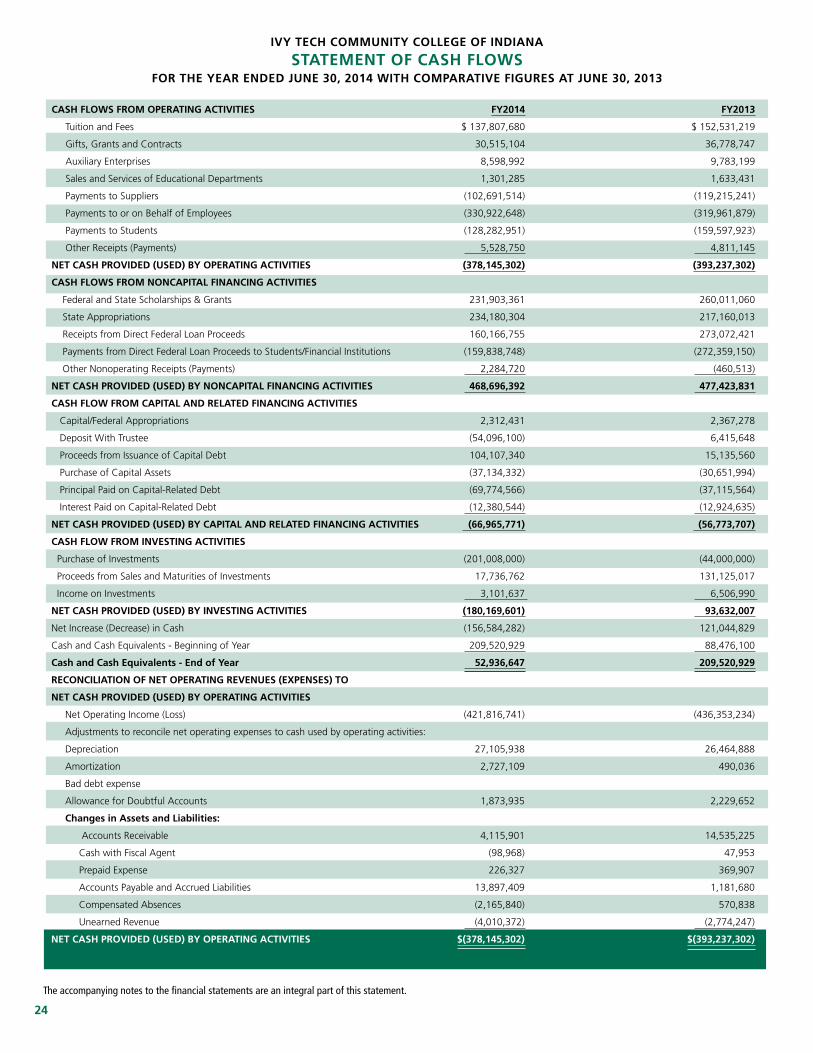
24
Cash fLows from oPerating aCtivities fY2014 fY2013
Tuition and Fees $ 137,807,680 $ 152,531,219
Gifts, Grants and Contracts 30,515,104 36,778,747
Auxiliary Enterprises 8,598,992 9,783,199
Sales and Services of Educational Departments 1,301,285 1,633,431
Payments to Suppliers (102,691,514) (119,215,241)
Payments to or on Behalf of Employees (330,922,648) (319,961,879)
Payments to Students (128,282,951) (159,597,923)
Other Receipts (Payments) 5,528,750 4,811,145
net Cash Provided (used) BY oPerating aCtivities (378,145,302) (393,237,302)
Cash fLows from nonCaPitaL finanCing aCtivities
Federal and State Scholarships & Grants 231,903,361 260,011,060
State Appropriations 234,180,304 217,160,013
Receipts from Direct Federal Loan Proceeds 160,166,755 273,072,421
Payments from Direct Federal Loan Proceeds to Students/Financial Institutions (159,838,748) (272,359,150)
Other Nonoperating Receipts (Payments) 2,284,720 (460,513)
net Cash Provided (used) BY nonCaPitaL finanCing aCtivities 468,696,392 477,423,831
Cash fLow from CaPitaL and reLated finanCing aCtivities
Capital/Federal Appropriations 2,312,431 2,367,278
Deposit With Trustee (54,096,100) 6,415,648
Proceeds from Issuance of Capital Debt 104,107,340 15,135,560
Purchase of Capital Assets (37,134,332) (30,651,994)
Principal Paid on Capital-Related Debt (69,774,566) (37,115,564)
Interest Paid on Capital-Related Debt (12,380,544) (12,924,635)
net Cash Provided (used) BY CaPitaL and reLated finanCing aCtivities (66,965,771) (56,773,707)
Cash fLow from investing aCtivities
Purchase of Investments (201,008,000) (44,000,000)
Proceeds from Sales and Maturities of Investments 17,736,762 131,125,017
Income on Investments 3,101,637 6,506,990
net Cash Provided (used) BY investing aCtivities (180,169,601) 93,632,007
Net Increase (Decrease) in Cash (156,584,282) 121,044,829
Cash and Cash Equivalents - Beginning of Year 209,520,929 88,476,100
Cash and Cash equivalents - end of Year 52,936,647 209,520,929
reConCiLiation of net oPerating revenues (exPenses) to
net Cash Provided (used) BY oPerating aCtivities
Net Operating Income (Loss) (421,816,741) (436,353,234)
Adjustments to reconcile net operating expenses to cash used by operating activities:
Depreciation 27,105,938 26,464,888
Amortization 2,727,109 490,036
Bad debt expense
Allowance for Doubtful Accounts 1,873,935 2,229,652
Changes in assets and Liabilities:
Accounts Receivable 4,115,901 14,535,225
Cash with Fiscal Agent (98,968) 47,953
Prepaid Expense 226,327 369,907
Accounts Payable and Accrued Liabilities 13,897,409 1,181,680
Compensated Absences (2,165,840) 570,838
Unearned Revenue (4,010,372) (2,774,247)
net Cash Provided (used) BY oPerating aCtivities $(378,145,302) $(393,237,302)
ivY teCh CommunitY CoLLege of indiana
statement of Cash fLowsfor the Year ended June 30, 2014 with ComParative figures at June 30, 2013
The accompanying notes to the financial statements are an integral part of this statement.
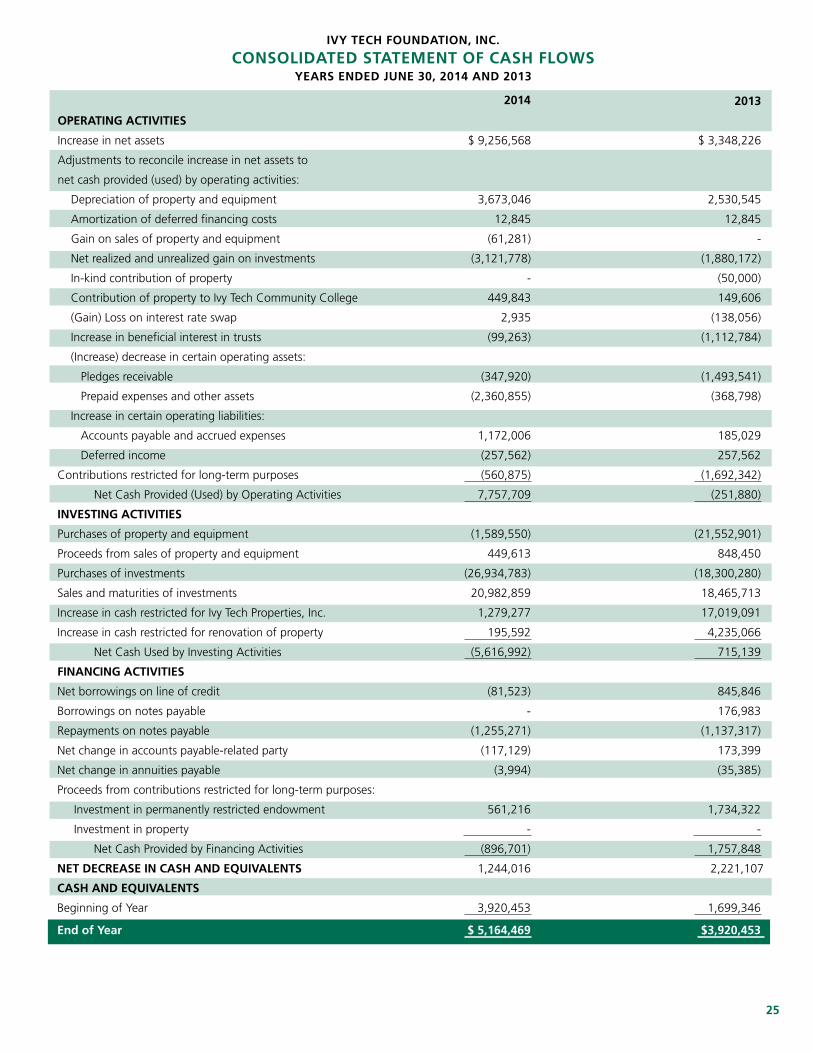
25
ivY teCh foundation, inC.
ConsoLidated statement of Cash fLowsYears ended June 30, 2014 and 2013
2013
oPerating aCtivities
Increase in net assets $ 9,256,568 $ 3,348,226
Adjustments to reconcile increase in net assets to
net cash provided (used) by operating activities:
Depreciation of property and equipment 3,673,046 2,530,545
Amortization of deferred financing costs 12,845 12,845
Gain on sales of property and equipment (61,281) -
Net realized and unrealized gain on investments (3,121,778) (1,880,172)
In-kind contribution of property - (50,000)
Contribution of property to Ivy Tech Community College 449,843 149,606
(Gain) Loss on interest rate swap 2,935 (138,056)
Increase in beneficial interest in trusts (99,263) (1,112,784)
(Increase) decrease in certain operating assets:
Pledges receivable (347,920) (1,493,541)
Prepaid expenses and other assets (2,360,855) (368,798)
Increase in certain operating liabilities:
Accounts payable and accrued expenses 1,172,006 185,029
Deferred income (257,562) 257,562
Contributions restricted for long-term purposes (560,875) (1,692,342)
Net Cash Provided (Used) by Operating Activities 7,757,709 (251,880)
investing aCtivities
Purchases of property and equipment (1,589,550) (21,552,901)
Proceeds from sales of property and equipment 449,613 848,450
Purchases of investments (26,934,783) (18,300,280)
Sales and maturities of investments 20,982,859 18,465,713
Increase in cash restricted for Ivy Tech Properties, Inc. 1,279,277 17,019,091
Increase in cash restricted for renovation of property 195,592 4,235,066
Net Cash Used by Investing Activities (5,616,992) 715,139
finanCing aCtivities
Net borrowings on line of credit (81,523) 845,846
Borrowings on notes payable - 176,983
Repayments on notes payable (1,255,271) (1,137,317)
Net change in accounts payable-related party (117,129) 173,399
Net change in annuities payable (3,994) (35,385)
Proceeds from contributions restricted for long-term purposes:
Investment in permanently restricted endowment 561,216 1,734,322
Investment in property - -
Net Cash Provided by Financing Activities (896,701) 1,757,848
net deCrease in Cash and eQuivaLents 1,244,016 2,221,107
Cash and eQuivaLents
Beginning of Year 3,920,453 1,699,346
end of Year $ 5,164,469 $3,920,453
2014
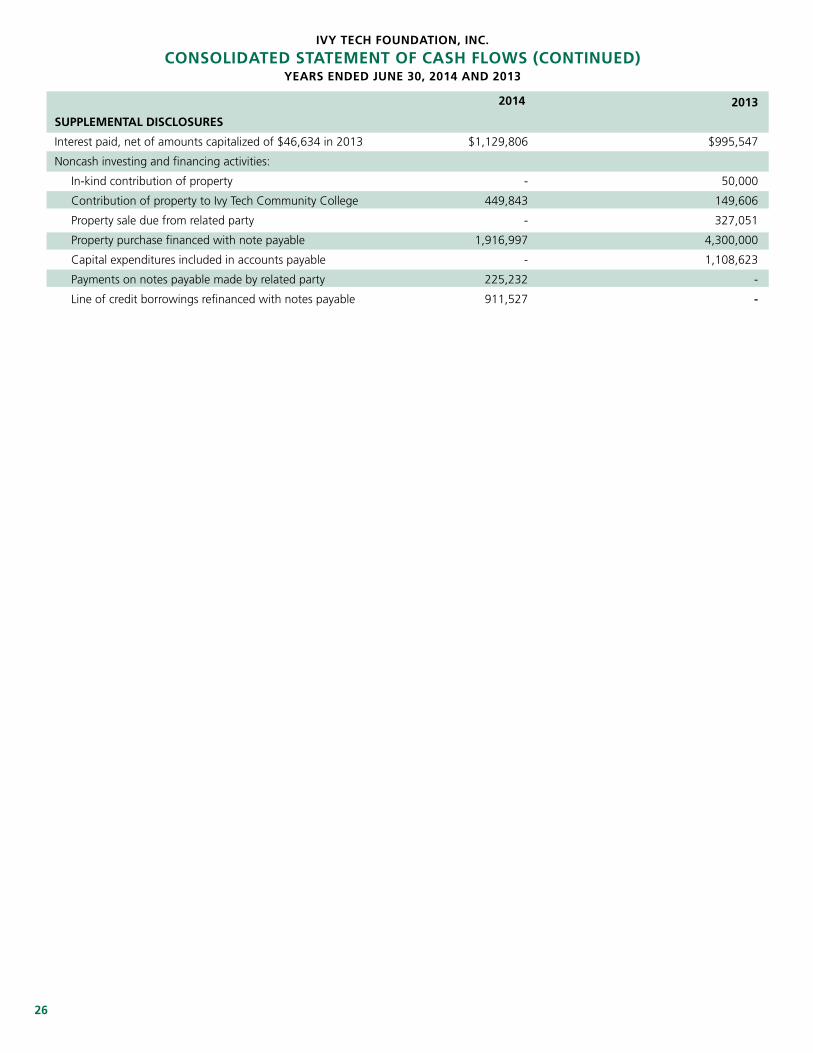
26
ivY teCh foundation, inC.
ConsoLidated statement of Cash fLows (Continued)Years ended June 30, 2014 and 2013
2013
suPPLementaL disCLosures
Interest paid, net of amounts capitalized of $46,634 in 2013 $1,129,806 $995,547
Noncash investing and financing activities:
In-kind contribution of property - 50,000
Contribution of property to Ivy Tech Community College 449,843 149,606
Property sale due from related party - 327,051
Property purchase financed with note payable 1,916,997 4,300,000
Capital expenditures included in accounts payable - 1,108,623
Payments on notes payable made by related party 225,232 -
Line of credit borrowings refinanced with notes payable 911,527 -
2014
27
IVY TECH COMMUNITY COLLEGE OF INDIANANOTES TO FINANCIAL STATEMENTS
June 30, 2014
I. Summary of Significant Accounting Policies
A. General InformationIvy Tech Community College of Indiana (Ivy Tech) prepares Indiana residents to learn, live, and work in a diverse and globally competitive environment by delivering professional, technical, transfer, and lifelong education. Through its affordable, open-access education and training programs, the College enhances the development of Indiana’s citizens and communities and strengthens its economy. The Indiana General Assembly (by IC 20-12-61-2) established Ivy Tech in 1963. In 2005 the General Assembly adopted Senate Bill 296 which broadened the institution’s mission to include serving as the state’s community college system. Ivy Tech’s official name changed to “Ivy Tech Community College of Indiana.” Ivy Tech is governed by a board of trustees, composed of fourteen (14) members, appointed by the governor. Each member of the state board must have knowledge or experience in one (1) or more of the following areas; manufacturing; commerce; labor; agriculture; state and regional economic development needs; or Indiana’s educational delivery system. At least one (1) trustee must reside in each College region. Appointments are made for three (3) year terms, on a staggered basis. Ivy Tech has fourteen (14) main regional sites located across the State of Indiana. The President’s office and other statewide administrative offices are located in Indianapolis, Indiana.
Ivy Tech Foundation (the Foundation) was incorporated on June 9, 1969, under The Indiana Foundations and Holding Companies Act of 1921 as a corporation organized exclusively for charitable, educational and scientific purposes. The Foundation, whose principal activity is to promote educational, scientific and charitable purposes in connection with or at the request of Ivy Tech Community College (the College), commenced its financial activities with the receipt of various unrestricted contributions in October 1970 and provided $22.9 million to assist the College during fiscal year 2013-14. The Foundation currently operates under the Indiana Nonprofit Corporations Law of 1971 as amended, which is codified as IC 23-17. As required by the Governmental Accounting Standards Board (GASB) Statement No. 39, Determining Whether Certain Organizations Are Component Units and GASB Statement No. 61, The Financial Reporting Entity: Omnibus an amendment of GASB Statements No. 14 and No. 34, the audited financial statements of the Foundation are discretely presented with the College’s financial statements. The Foundation’s fiscal year reporting period is from July 1 through June 30. Further information regarding the Foundation may be obtained at Ivy Tech Foundation; 50 West Fall Creek Parkway Drive North, Indianapolis, IN 46208-5752 or http://ivytech.edu/giving.
With the implementation of GASB Statement No. 35, Basic Financial Statements and Management’s Discussion and Analysis for Public Colleges and Universities, Ivy Tech is considered a special purpose government. The College has elected to report as a business type activity using proprietary fund accounting and financial reporting model. The College is considered to be a component unit of the State of Indiana.
As such there is a close relationship between the College and the State of Indiana. The College receives appropriations, program approvals and grants from the State.
The financial statements have been prepared to incorporate all fund groups utilized internally by Ivy Tech. These statements have been prepared in accordance with accounting principles generally accepted in the United States of America as prescribed by GASB Statements No. 34 and 35. These Statements require the College to report revenues net of discounts and allowances. The following components of the College’s financial statements are also required by GASB Statements No. 34 and 35:
• Management’s Discussion and Analysis• Basic financial statements including a Statement of Net Position, Statement of Revenues, Expenses and Changes in Net Position, and Statement of Cash Flows for the College as a whole• Notes to the financial statements

28
There were new GASB statements that were effective for the fiscal year 2013-2014. The new standards were reviewed and any required changes were incorporated. Specifically GASB Statement No. 65 Items Previously Reported as Assets and Liabilities establishes accounting and financial reporting standards that reclassify, as deferred outflows of resources or deferred inflows of resources, certain items that were previously reported as assets and liabilities. The College did reclassify a previously recorded asset for a loss on refunding to a deferred outflow of resources. Additionally, as the standard required, the College expensed debt issuance costs previously recorded as an asset.
B. Measurement Focus, Basis of Accounting, and Financial Statement Presentation The College’s financial statements are reported using the economic resources measurement focus and the accrual basis of accounting. Revenues are recorded when earned and expenses are recorded when a liability is incurred, regardless of the timing of related cash flows. Grants and similar items are recognized as revenue as soon as all eligibility requirements imposed by the provider have been met. Eliminations have been made to prevent the double counting of internal activities.
The preparation of financial statements in conformity with accounting principles generally accepted in the United States of America requires management to make estimates and assumptions that affect the reported amounts of assets and liabilities at the date of the financial statements and the reported amounts of revenue and expenses during the reporting period. Actual results could differ from those estimates.
The College utilizes the accounting standard of the establishment of an allowance for doubtful accounts in the Statement of Net Position to reflect receivables that are likely to be uncollectible.
Operating revenues of the College consist of tuition and fees, non-financial aid grants and contracts, sales and services of educational activities and bookstore commission revenues. Transactions related to financial aid grants, capital and related financing activities, non-capital financing activities, investing activities, and State appropriations are components of non-operating income. C. Cash and Cash EquivalentsCash and cash equivalents are comprised of cash (in banks and on hand) and investments with maturity dates of 0-90 days at date of purchase as of June 30, 2014.
D. Prepaid ExpensesPrepaid expenses are payments made in the current or a previous fiscal year, which the College has not realized the full value of through fiscal year 2013-14.
E. Cash with Fiscal AgentThe balance is primarily attributable to the debt principal and interest payment made in fiscal year 2013-14 and not due until July 1, 2014.
29
F. Capital Assets Accounting Policy Disclosure
The College’s capitalization threshold is defined as any non-expendable item, or group of items making up one unit, with a useful life of more than one year, and a unit acquisition cost of $3,000 or more. Library books costing $35 or more are generally capitalized as a group, with the detail maintained and updated periodically as new acquisitions are made or other items are removed.
College capital equipment and facilities are depreciated on a Straight Line basis dividing the cost of the asset by the appropriate useful life. Building improvements are depreciated over the remaining life of the facilities to which they pertain. Leasehold improvements are depreciated over the remaining life of the asset for capital leases and over the remaining life of the lease for operating leases.
Land Improvements 10 years
Buildings 40 years
Building Improvement Remaining life of the building
Furniture, Fixtures, and Equipment 3-8 years
Library Books and Materials 5 years
Ivy Tech has a minimal amount of infrastructure assets that are components of buildings or land improvements and are depreciated accordingly.
If both restricted and unrestricted resources are to be expended for the same purpose or project the determination of the portion of the expenses paid from the restricted sources are made on a case-by-case basis.
II. Accrual of Loss Contingency
The College has been named a party in unasserted claims, assessments, and litigation. College management has reviewed these actions to determine if one (1) it is probable that as of the date of the financial statements, an asset has been impaired or a liability incurred, based on subsequent available information prior to the issuance of the financial statements, and two (2) the amount of the loss can be reasonably estimated.
No accrual of loss contingency has been established, as in the opinion of management, the above conditions do not exist in a material amount.
The College has three (3) active matters in litigation; two (2) in county Circuit Court and one (1) in United States District Court; and four (4) matters with the Equal Employment Opportunity Commission; and one (1) matter with the United States Department of Education. In the opinion of management, an unfavorable outcome in these matters will not have a material adverse effect on the balance sheet of the institution. Management is currently unable to assess the probability of an unfavorable outcome.
III. Lease Obligations The College has entered into certain operating leases for facilities, office furniture and equipment, vehicles, computing equipment, etc. Many of these leases require payments in excess of one year from the date of initiation. The schedule on page 52 provides the minimum future annual payments for those leases, which were in effect on June 30, 2014.
The College has multiple lease obligations with Ivy Tech Foundation, Inc. which were determined to meet the requirements necessary to be recognized as capital leases, which are reflected in the College’s Statement of Net Position.
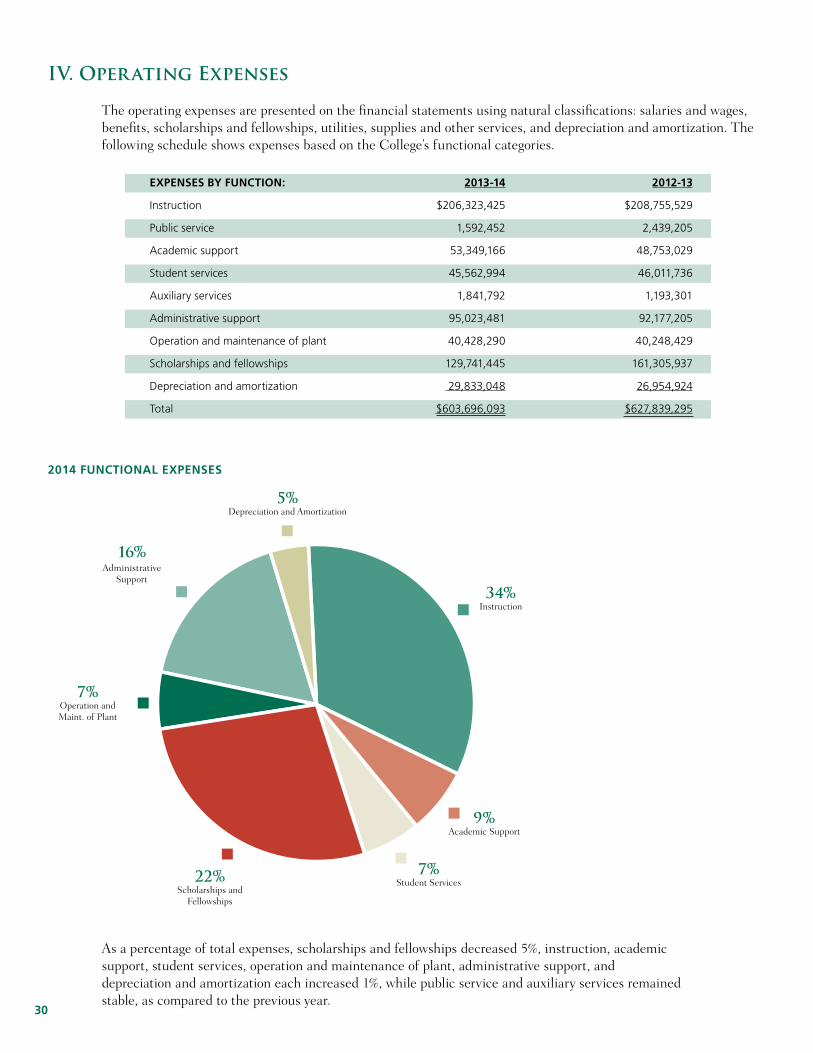
30
IV. Operating Expenses
The operating expenses are presented on the financial statements using natural classifications: salaries and wages, benefits, scholarships and fellowships, utilities, supplies and other services, and depreciation and amortization. The following schedule shows expenses based on the College’s functional categories.
exPenses BY funCtion:
Instruction
Public service
Academic support
Student services
Auxiliary services
Administrative support
Operation and maintenance of plant
Scholarships and fellowships
Depreciation and amortization
Total
2013-14
$206,323,425
1,592,452
53,349,166
45,562,994
1,841,792
95,023,481
40,428,290
129,741,445
29,833,048
$603,696,093
2012-13
$208,755,529
2,439,205
48,753,029
46,011,736
1,193,301
92,177,205
40,248,429
161,305,937
26,954,924
$627,839,295
34% Instruction
9%Academic Support
7% Student Services
16%Administrative
Support
7%Operation and Maint. of Plant
22%Scholarships and
Fellowships
2014 funCtionaL exPenses
5%Depreciation and Amortization
As a percentage of total expenses, scholarships and fellowships decreased 5%, instruction, academic support, student services, operation and maintenance of plant, administrative support, and depreciation and amortization each increased 1%, while public service and auxiliary services remained stable, as compared to the previous year.
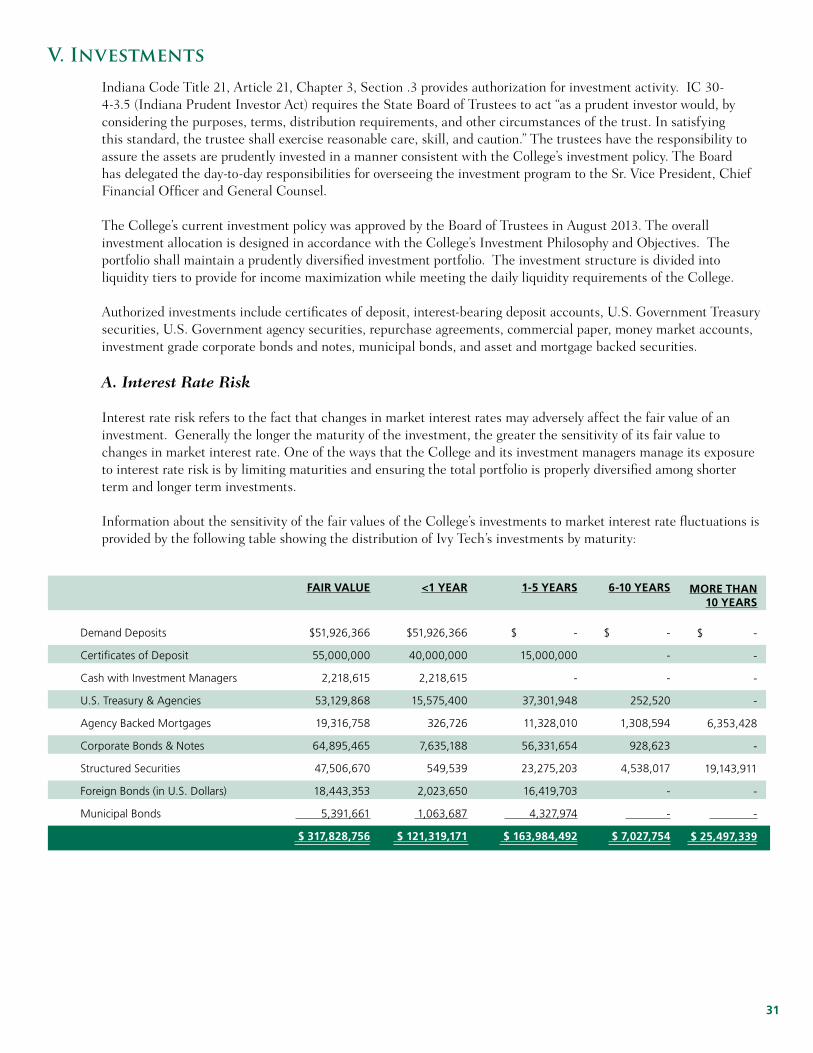
31
V. Investments
Indiana Code Title 21, Article 21, Chapter 3, Section .3 provides authorization for investment activity. IC 30-4-3.5 (Indiana Prudent Investor Act) requires the State Board of Trustees to act “as a prudent investor would, by considering the purposes, terms, distribution requirements, and other circumstances of the trust. In satisfying this standard, the trustee shall exercise reasonable care, skill, and caution.” The trustees have the responsibility to assure the assets are prudently invested in a manner consistent with the College’s investment policy. The Board has delegated the day-to-day responsibilities for overseeing the investment program to the Sr. Vice President, Chief Financial Officer and General Counsel.
The College’s current investment policy was approved by the Board of Trustees in August 2013. The overall investment allocation is designed in accordance with the College’s Investment Philosophy and Objectives. The portfolio shall maintain a prudently diversified investment portfolio. The investment structure is divided into liquidity tiers to provide for income maximization while meeting the daily liquidity requirements of the College.
Authorized investments include certificates of deposit, interest-bearing deposit accounts, U.S. Government Treasury securities, U.S. Government agency securities, repurchase agreements, commercial paper, money market accounts, investment grade corporate bonds and notes, municipal bonds, and asset and mortgage backed securities.
A. Interest Rate Risk
Interest rate risk refers to the fact that changes in market interest rates may adversely affect the fair value of an investment. Generally the longer the maturity of the investment, the greater the sensitivity of its fair value to changes in market interest rate. One of the ways that the College and its investment managers manage its exposure to interest rate risk is by limiting maturities and ensuring the total portfolio is properly diversified among shorter term and longer term investments.
Information about the sensitivity of the fair values of the College’s investments to market interest rate fluctuations is provided by the following table showing the distribution of Ivy Tech’s investments by maturity:
Demand Deposits
Certificates of Deposit
Cash with Investment Managers
U.S. Treasury & Agencies
Agency Backed Mortgages
Corporate Bonds & Notes
Structured Securities
Foreign Bonds (in U.S. Dollars)
Municipal Bonds
fair vaLue
$51,926,366
55,000,000
2,218,615
53,129,868
19,316,758
64,895,465
47,506,670
18,443,353
5,391,661
$ 317,828,756
<1 Year
$51,926,366
40,000,000
2,218,615
15,575,400
326,726
7,635,188
549,539
2,023,650
1,063,687
$ 121,319,171
1-5 Years
$ -
15,000,000
-
37,301,948
11,328,010
56,331,654
23,275,203
16,419,703
4,327,974
$ 163,984,492
6-10 Years
$ -
-
-
252,520
1,308,594
928,623
4,538,017
-
-
$ 7,027,754
more than 10 Years
$ -
-
-
-
6,353,428
-
19,143,911
-
-
$ 25,497,339
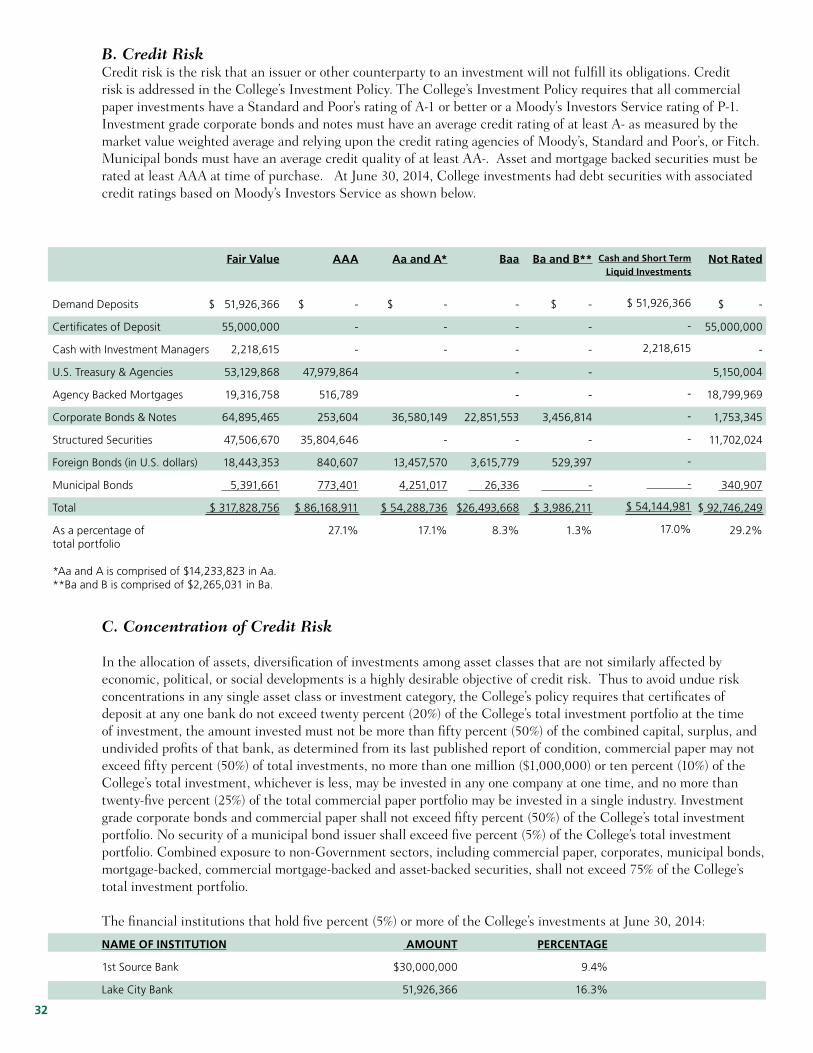
32
B. Credit RiskCredit risk is the risk that an issuer or other counterparty to an investment will not fulfill its obligations. Credit risk is addressed in the College’s Investment Policy. The College’s Investment Policy requires that all commercial paper investments have a Standard and Poor’s rating of A-1 or better or a Moody’s Investors Service rating of P-1. Investment grade corporate bonds and notes must have an average credit rating of at least A- as measured by the market value weighted average and relying upon the credit rating agencies of Moody’s, Standard and Poor’s, or Fitch. Municipal bonds must have an average credit quality of at least AA-. Asset and mortgage backed securities must be rated at least AAA at time of purchase. At June 30, 2014, College investments had debt securities with associated credit ratings based on Moody’s Investors Service as shown below.
C. Concentration of Credit Risk
In the allocation of assets, diversification of investments among asset classes that are not similarly affected by economic, political, or social developments is a highly desirable objective of credit risk. Thus to avoid undue risk concentrations in any single asset class or investment category, the College’s policy requires that certificates of deposit at any one bank do not exceed twenty percent (20%) of the College’s total investment portfolio at the time of investment, the amount invested must not be more than fifty percent (50%) of the combined capital, surplus, and undivided profits of that bank, as determined from its last published report of condition, commercial paper may not exceed fifty percent (50%) of total investments, no more than one million ($1,000,000) or ten percent (10%) of the College’s total investment, whichever is less, may be invested in any one company at one time, and no more than twenty-five percent (25%) of the total commercial paper portfolio may be invested in a single industry. Investment grade corporate bonds and commercial paper shall not exceed fifty percent (50%) of the College’s total investment portfolio. No security of a municipal bond issuer shall exceed five percent (5%) of the College’s total investment portfolio. Combined exposure to non-Government sectors, including commercial paper, corporates, municipal bonds, mortgage-backed, commercial mortgage-backed and asset-backed securities, shall not exceed 75% of the College’s total investment portfolio.
The financial institutions that hold five percent (5%) or more of the College’s investments at June 30, 2014:
name of institution amount PerCentage
1st Source Bank $30,000,000 9.4%
Lake City Bank 51,926,366 16.3%
Demand Deposits
Certificates of Deposit
Cash with Investment Managers
U.S. Treasury & Agencies
Agency Backed Mortgages
Corporate Bonds & Notes
Structured Securities
Foreign Bonds (in U.S. dollars)
Municipal Bonds
Total
As a percentage of total portfolio
*Aa and A is comprised of $14,233,823 in Aa.**Ba and B is comprised of $2,265,031 in Ba.
fair value
$ 51,926,366
55,000,000
2,218,615
53,129,868
19,316,758
64,895,465
47,506,670
18,443,353
5,391,661
$ 317,828,756
aaa
$ -
-
-
47,979,864
516,789
253,604
35,804,646
840,607
773,401
$ 86,168,911
27.1%
aa and a*
$ -
-
-
36,580,149
-
13,457,570
4,251,017
$ 54,288,736
17.1%
Ba and B**
$ -
-
-
-
-
3,456,814
-
529,397
-
$ 3,986,211
1.3%
Baa
-
-
-
-
-
22,851,553
-
3,615,779
26,336
$26,493,668
8.3%
Cash and short term Liquid investments
$ 51,926,366
-
2,218,615
-
-
-
-
-
$ 54,144,981
17.0%
not rated
$ -
55,000,000
-
5,150,004
18,799,969
1,753,345
11,702,024
340,907
$ 92,746,249
29.2%
33
D. Custodial Credit RiskThe custodial credit risk for investments is the risk that, in the event of the failure of the counterparty to a transaction, a government will not be able to recover the value of investment or collateral securities that are in the possession of an outside party. The College manages custodial credit risk through the types of investments that are allowed by the Investment Policy. As of June 30, 2014, Ivy Tech deposits with financial institutions held in uncollateralized accounts are insured up to $250,000 by the FDIC and in excess of $250,000 by the Indiana Public Deposits Insurance Fund. Certificates of Deposits, totaling $55,000,000 are also covered under the Indiana Public Deposits Insurance Fund, as they were invested in financial institutions on the approved list of depositories for the Public Deposits Insurance Fund.
E. Foreign Currency RiskAs of June 30, 2014, all of the College’s accounts are in U.S. dollars and not exposed to foreign currency risk.
F. Endowment and Foundation InvestmentsThe College’s policy regarding the Endowment investments are the same as the College’s investment policy, unless restricted by the Endowment Trustee.
Types of investments held by the College’s Foundation, a component unit, are authorized by the Foundation’s Board of Trustees. They include a broader selection of investments including domestic equities, international equities, corporate bonds, mutual funds, certain types of alternative investments (hedge funds, REITS, commodities), certificates of deposit, money market accounts, interest bearing demand deposits insured by FDIC, commercial paper, donated real and personal property, and U.S. Government notes, bills, bonds, and agencies.
VI. Post-Employment Benefits
All employees who retire between the age of fifty-five (55) and up to but not including sixty-five (65) with ten (10) years of benefits-eligible service with the College, or at the age of sixty-five (65) or later with five (5) years of benefits-eligible service with the College may continue participation in College group medical and/or dental benefits. For pre-Medicare coverage, the retiree pays one hundred percent (100%) of the premium cost of an active employee. The College subsidizes the difference between the retiree premium cost and active premium cost. The expenditure is accrued and recognized under the terms of GASB Statement No. 45. The College does not subsidize the cost of retiree coverage for Medicare eligible retirees.
In addition, all employees who retire between the age of fifty-five (55) and sixty-five (65), and whose combined age and years of continuous benefit-eligible service equal at least seventy-five (75), and were hired on or before December 31, 2008 and were benefits-eligible and continuously employed in a benefits-eligible position on or prior to December 31, 2008, may elect to remain in the College group medical and/or dental programs. Employees who meet the above requirements and remain in the programs pay only twenty percent (20%) of the full premium expense. The College pays the remaining eighty percent (80%) of the premium.
Annual OPEB Cost and Net OPEB Obligation
The College’s annual other postemployment benefit (OPEB) cost (expense) is calculated based on the annual required contribution of the employer (ARC), an amount actuarially determined in accordance with the parameters of the GASB Statement No. 45, Accounting and Financial Reporting by Employers for Postemployment Benefits Other than Pensions. The ARC represents a level of funding that, if paid on an ongoing basis, is projected to cover normal cost each year and amortize any unfunded actuarial liabilities (or funding excess) over a period not to exceed thirty (30) years. The following table shows the components of the College’s annual OPEB cost for the fiscal year, the amount actually contributed to the plan, and changes in the College’s net OPEB obligation to the plan:
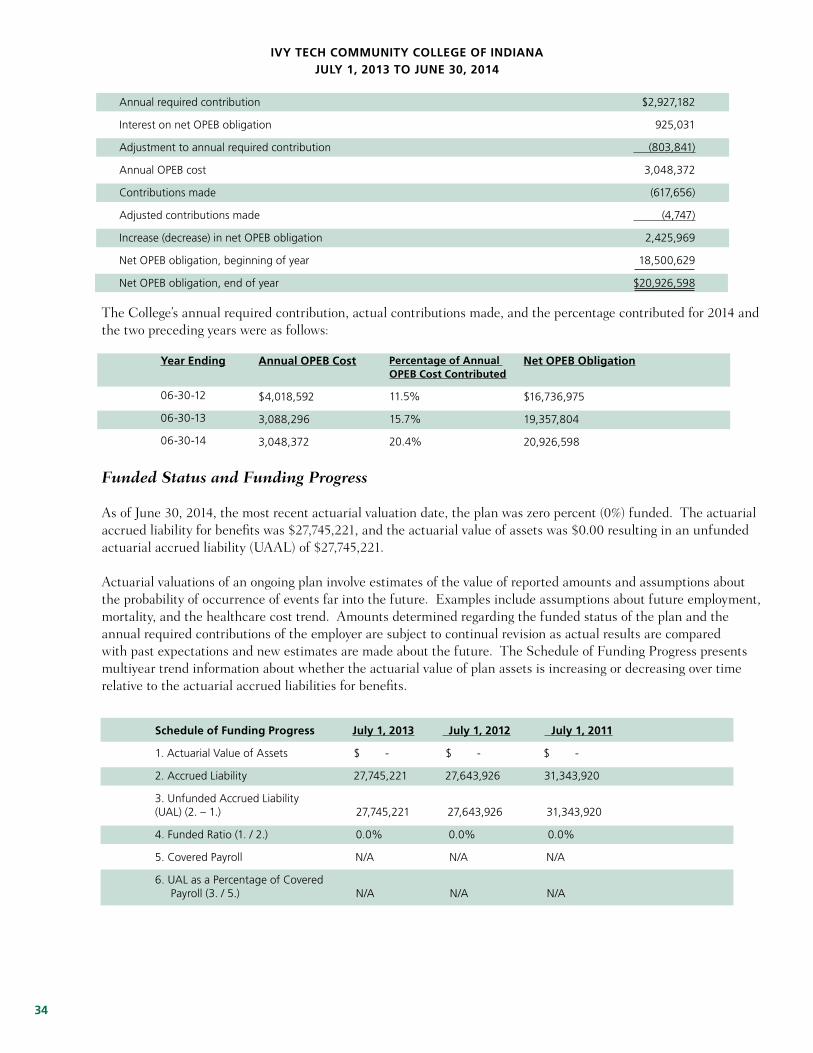
34
The College’s annual required contribution, actual contributions made, and the percentage contributed for 2014 and the two preceding years were as follows:
Funded Status and Funding Progress
As of June 30, 2014, the most recent actuarial valuation date, the plan was zero percent (0%) funded. The actuarial accrued liability for benefits was $27,745,221, and the actuarial value of assets was $0.00 resulting in an unfunded actuarial accrued liability (UAAL) of $27,745,221.
Actuarial valuations of an ongoing plan involve estimates of the value of reported amounts and assumptions about the probability of occurrence of events far into the future. Examples include assumptions about future employment, mortality, and the healthcare cost trend. Amounts determined regarding the funded status of the plan and the annual required contributions of the employer are subject to continual revision as actual results are compared with past expectations and new estimates are made about the future. The Schedule of Funding Progress presents multiyear trend information about whether the actuarial value of plan assets is increasing or decreasing over time relative to the actuarial accrued liabilities for benefits.
Annual required contribution $2,927,182
Interest on net OPEB obligation 925,031
Adjustment to annual required contribution (803,841)
Annual OPEB cost 3,048,372
Contributions made (617,656)
Adjusted contributions made (4,747)
Increase (decrease) in net OPEB obligation 2,425,969
Net OPEB obligation, beginning of year 18,500,629
Net OPEB obligation, end of year $20,926,598
ivY teCh CommunitY CoLLege of indianaJuLY 1, 2013 to June 30, 2014
Year ending
06-30-12
06-30-13
06-30-14
annual oPeB Cost
$4,018,592
3,088,296
3,048,372
Percentage of annual oPeB Cost Contributed
11.5%
15.7%
20.4%
net oPeB obligation
$16,736,975
19,357,804
20,926,598
schedule of funding Progress July 1, 2013 July 1, 2012 July 1, 2011
1. Actuarial Value of Assets $ - $ - $ -
2. Accrued Liability 27,745,221 27,643,926 31,343,920
3. Unfunded Accrued Liability (UAL) (2. – 1.) 27,745,221 27,643,926 31,343,920
4. Funded Ratio (1. / 2.) 0.0% 0.0% 0.0%
5. Covered Payroll N/A N/A N/A
6. UAL as a Percentage of Covered Payroll (3. / 5.) N/A N/A N/A
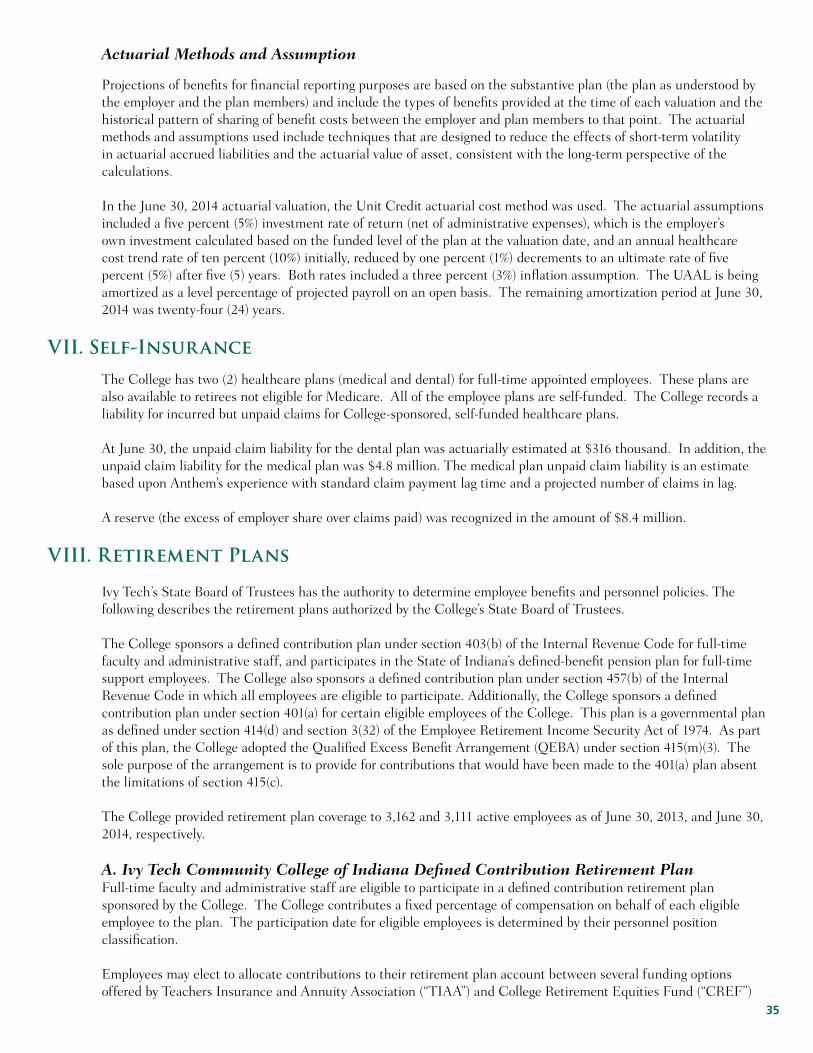
35
Actuarial Methods and Assumption
Projections of benefits for financial reporting purposes are based on the substantive plan (the plan as understood by the employer and the plan members) and include the types of benefits provided at the time of each valuation and the historical pattern of sharing of benefit costs between the employer and plan members to that point. The actuarial methods and assumptions used include techniques that are designed to reduce the effects of short-term volatility in actuarial accrued liabilities and the actuarial value of asset, consistent with the long-term perspective of the calculations.
In the June 30, 2014 actuarial valuation, the Unit Credit actuarial cost method was used. The actuarial assumptions included a five percent (5%) investment rate of return (net of administrative expenses), which is the employer’s own investment calculated based on the funded level of the plan at the valuation date, and an annual healthcare cost trend rate of ten percent (10%) initially, reduced by one percent (1%) decrements to an ultimate rate of five percent (5%) after five (5) years. Both rates included a three percent (3%) inflation assumption. The UAAL is being amortized as a level percentage of projected payroll on an open basis. The remaining amortization period at June 30, 2014 was twenty-four (24) years.
VII. Self-Insurance
The College has two (2) healthcare plans (medical and dental) for full-time appointed employees. These plans are also available to retirees not eligible for Medicare. All of the employee plans are self-funded. The College records a liability for incurred but unpaid claims for College-sponsored, self-funded healthcare plans. At June 30, the unpaid claim liability for the dental plan was actuarially estimated at $316 thousand. In addition, the unpaid claim liability for the medical plan was $4.8 million. The medical plan unpaid claim liability is an estimate based upon Anthem’s experience with standard claim payment lag time and a projected number of claims in lag.
A reserve (the excess of employer share over claims paid) was recognized in the amount of $8.4 million.
VIII. Retirement Plans
Ivy Tech’s State Board of Trustees has the authority to determine employee benefits and personnel policies. The following describes the retirement plans authorized by the College’s State Board of Trustees.
The College sponsors a defined contribution plan under section 403(b) of the Internal Revenue Code for full-time faculty and administrative staff, and participates in the State of Indiana’s defined-benefit pension plan for full-time support employees. The College also sponsors a defined contribution plan under section 457(b) of the Internal Revenue Code in which all employees are eligible to participate. Additionally, the College sponsors a defined contribution plan under section 401(a) for certain eligible employees of the College. This plan is a governmental plan as defined under section 414(d) and section 3(32) of the Employee Retirement Income Security Act of 1974. As part of this plan, the College adopted the Qualified Excess Benefit Arrangement (QEBA) under section 415(m)(3). The sole purpose of the arrangement is to provide for contributions that would have been made to the 401(a) plan absent the limitations of section 415(c).
The College provided retirement plan coverage to 3,162 and 3,111 active employees as of June 30, 2013, and June 30, 2014, respectively.
A. Ivy Tech Community College of Indiana Defined Contribution Retirement Plan Full-time faculty and administrative staff are eligible to participate in a defined contribution retirement plan sponsored by the College. The College contributes a fixed percentage of compensation on behalf of each eligible employee to the plan. The participation date for eligible employees is determined by their personnel position classification.
Employees may elect to allocate contributions to their retirement plan account between several funding options offered by Teachers Insurance and Annuity Association (“TIAA”) and College Retirement Equities Fund (“CREF”)
schedule of funding Progress July 1, 2013 July 1, 2012 July 1, 2011
1. Actuarial Value of Assets $ - $ - $ -
2. Accrued Liability 27,745,221 27,643,926 31,343,920
3. Unfunded Accrued Liability (UAL) (2. – 1.) 27,745,221 27,643,926 31,343,920
4. Funded Ratio (1. / 2.) 0.0% 0.0% 0.0%
5. Covered Payroll N/A N/A N/A
6. UAL as a Percentage of Covered Payroll (3. / 5.) N/A N/A N/A
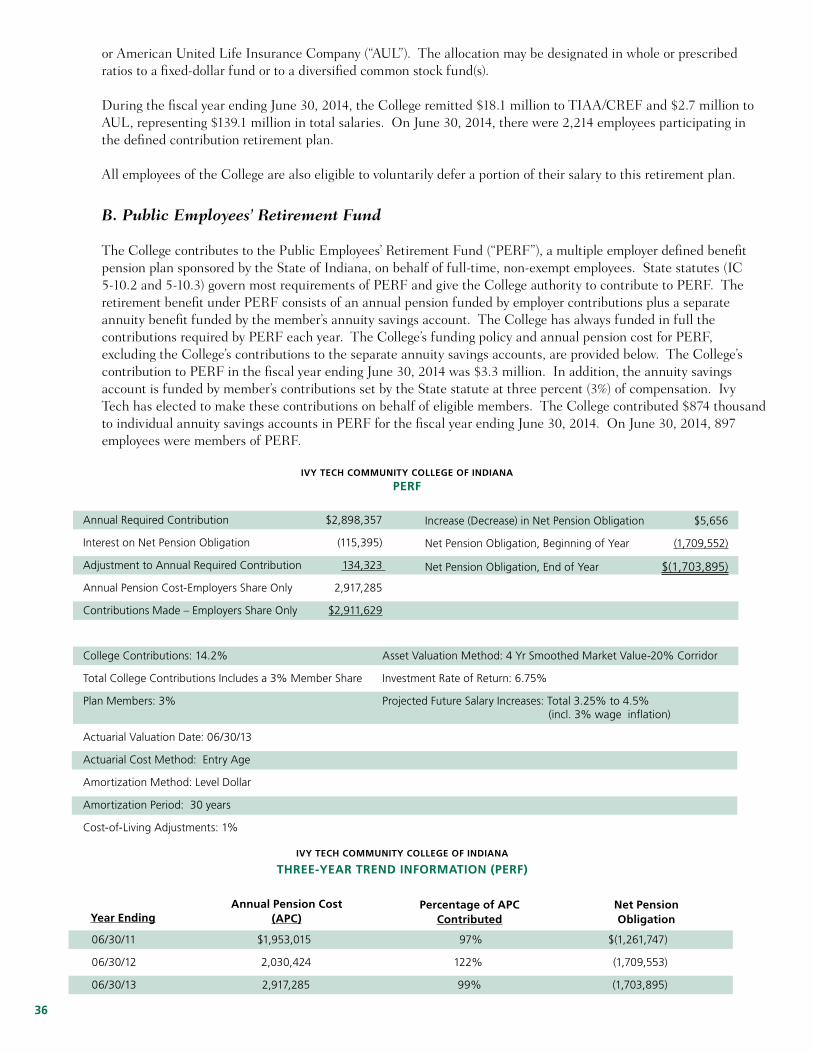
36
or American United Life Insurance Company (“AUL”). The allocation may be designated in whole or prescribed ratios to a fixed-dollar fund or to a diversified common stock fund(s).
During the fiscal year ending June 30, 2014, the College remitted $18.1 million to TIAA/CREF and $2.7 million to AUL, representing $139.1 million in total salaries. On June 30, 2014, there were 2,214 employees participating in the defined contribution retirement plan.
All employees of the College are also eligible to voluntarily defer a portion of their salary to this retirement plan.
B. Public Employees’ Retirement Fund
The College contributes to the Public Employees’ Retirement Fund (“PERF”), a multiple employer defined benefit pension plan sponsored by the State of Indiana, on behalf of full-time, non-exempt employees. State statutes (IC 5-10.2 and 5-10.3) govern most requirements of PERF and give the College authority to contribute to PERF. The retirement benefit under PERF consists of an annual pension funded by employer contributions plus a separate annuity benefit funded by the member’s annuity savings account. The College has always funded in full the contributions required by PERF each year. The College’s funding policy and annual pension cost for PERF, excluding the College’s contributions to the separate annuity savings accounts, are provided below. The College’s contribution to PERF in the fiscal year ending June 30, 2014 was $3.3 million. In addition, the annuity savings account is funded by member’s contributions set by the State statute at three percent (3%) of compensation. Ivy Tech has elected to make these contributions on behalf of eligible members. The College contributed $874 thousand to individual annuity savings accounts in PERF for the fiscal year ending June 30, 2014. On June 30, 2014, 897 employees were members of PERF.
Annual Required Contribution $2,898,357
Interest on Net Pension Obligation (115,395)
Adjustment to Annual Required Contribution 134,323
Annual Pension Cost-Employers Share Only 2,917,285
Contributions Made – Employers Share Only $2,911,629
College Contributions: 14.2% Asset Valuation Method: 4 Yr Smoothed Market Value-20% Corridor
Total College Contributions Includes a 3% Member Share Investment Rate of Return: 6.75%
Plan Members: 3% Projected Future Salary Increases: Total 3.25% to 4.5% (incl. 3% wage inflation)
Actuarial Valuation Date: 06/30/13
Actuarial Cost Method: Entry Age
Amortization Method: Level Dollar
Amortization Period: 30 years
Cost-of-Living Adjustments: 1%
Increase (Decrease) in Net Pension Obligation $5,656
Net Pension Obligation, Beginning of Year (1,709,552)
Net Pension Obligation, End of Year $(1,703,895)
ivY teCh CommunitY CoLLege of indiana
Perf
ivY teCh CommunitY CoLLege of indiana
three-Year trend information (Perf)
06/30/11 $1,953,015 97% $(1,261,747)
06/30/12 2,030,424 122% (1,709,553)
06/30/13 2,917,285 99% (1,703,895)
Year endingPercentage of aPC
Contributednet Pension obligation
annual Pension Cost(aPC)
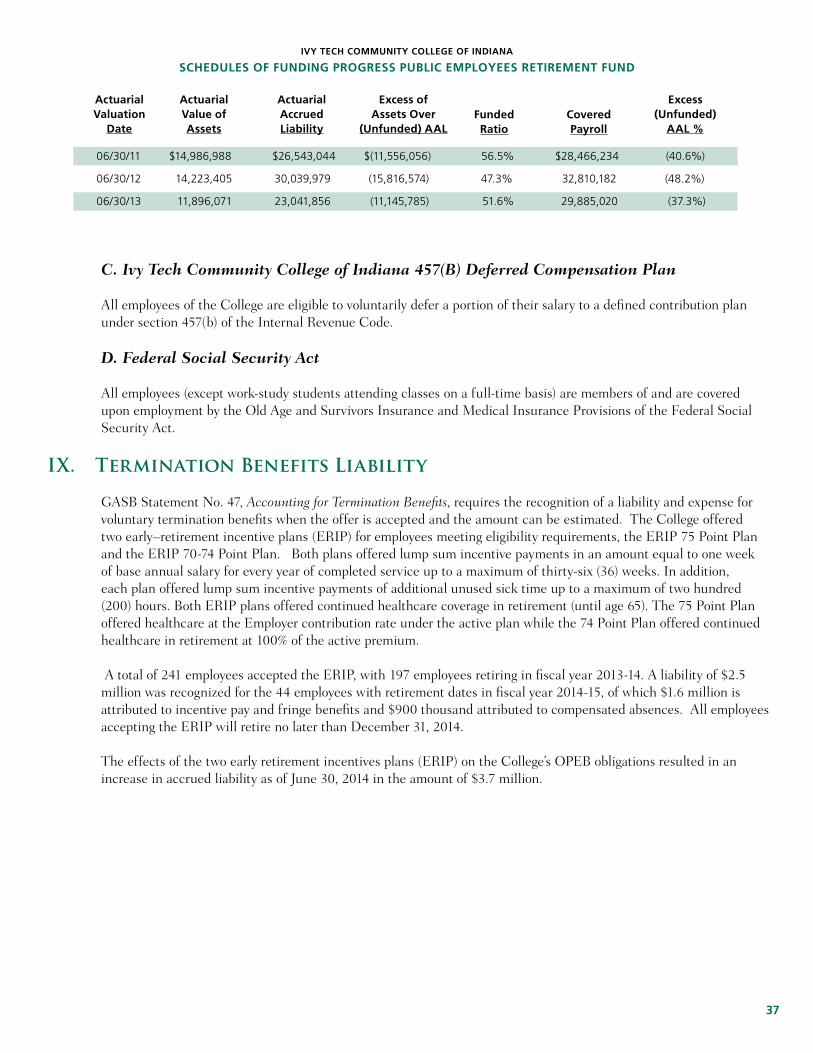
37
ivY teCh CommunitY CoLLege of indiana
sCheduLes of funding Progress PuBLiC emPLoYees retirement fund
06/30/11 $14,986,988 $26,543,044 $(11,556,056) 56.5% $28,466,234 (40.6%)
06/30/12 14,223,405 30,039,979 (15,816,574) 47.3% 32,810,182 (48.2%)
06/30/13 11,896,071 23,041,856 (11,145,785) 51.6% 29,885,020 (37.3%)
actuarialvaluation
date
actuarialvalue ofassets
actuarialaccruedLiability
excess of assets over
(unfunded) aaLfundedratio
CoveredPayroll
excess(unfunded)
aaL %
C. Ivy Tech Community College of Indiana 457(B) Deferred Compensation Plan
All employees of the College are eligible to voluntarily defer a portion of their salary to a defined contribution plan under section 457(b) of the Internal Revenue Code.
D. Federal Social Security Act
All employees (except work-study students attending classes on a full-time basis) are members of and are covered upon employment by the Old Age and Survivors Insurance and Medical Insurance Provisions of the Federal Social Security Act.
IX. Termination Benefits Liability
GASB Statement No. 47, Accounting for Termination Benefits, requires the recognition of a liability and expense for voluntary termination benefits when the offer is accepted and the amount can be estimated. The College offered two early–retirement incentive plans (ERIP) for employees meeting eligibility requirements, the ERIP 75 Point Plan and the ERIP 70-74 Point Plan. Both plans offered lump sum incentive payments in an amount equal to one week of base annual salary for every year of completed service up to a maximum of thirty-six (36) weeks. In addition, each plan offered lump sum incentive payments of additional unused sick time up to a maximum of two hundred (200) hours. Both ERIP plans offered continued healthcare coverage in retirement (until age 65). The 75 Point Plan offered healthcare at the Employer contribution rate under the active plan while the 74 Point Plan offered continued healthcare in retirement at 100% of the active premium.
A total of 241 employees accepted the ERIP, with 197 employees retiring in fiscal year 2013-14. A liability of $2.5 million was recognized for the 44 employees with retirement dates in fiscal year 2014-15, of which $1.6 million is attributed to incentive pay and fringe benefits and $900 thousand attributed to compensated absences. All employees accepting the ERIP will retire no later than December 31, 2014.
The effects of the two early retirement incentives plans (ERIP) on the College’s OPEB obligations resulted in an increase in accrued liability as of June 30, 2014 in the amount of $3.7 million.
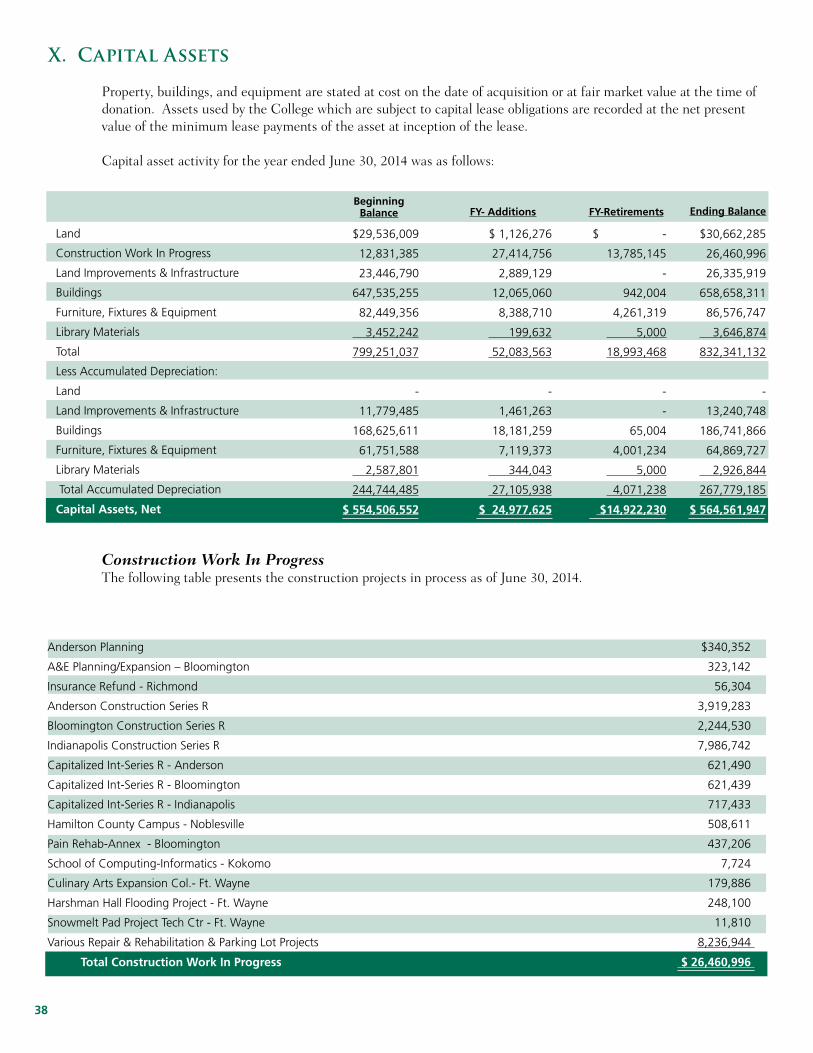
38
X. Capital Assets Property, buildings, and equipment are stated at cost on the date of acquisition or at fair market value at the time of donation. Assets used by the College which are subject to capital lease obligations are recorded at the net present value of the minimum lease payments of the asset at inception of the lease.
Capital asset activity for the year ended June 30, 2014 was as follows:
Construction Work In ProgressThe following table presents the construction projects in process as of June 30, 2014.
fY- additionsBeginning
Balance fY-retirements ending Balance
Land
Construction Work In Progress
Land Improvements & Infrastructure
Buildings
Furniture, Fixtures & Equipment
Library Materials
Total
Less Accumulated Depreciation:
Land
Land Improvements & Infrastructure
Buildings
Furniture, Fixtures & Equipment
Library Materials
Total Accumulated Depreciation
Capital assets, net
$29,536,009
12,831,385
23,446,790
647,535,255
82,449,356
3,452,242
799,251,037
-
11,779,485
168,625,611
61,751,588
2,587,801
244,744,485
$ 554,506,552
$ 1,126,276
27,414,756
2,889,129
12,065,060
8,388,710
199,632
52,083,563
-
1,461,263
18,181,259
7,119,373
344,043
27,105,938
$ 24,977,625
$ -
13,785,145
-
942,004
4,261,319
5,000
18,993,468
-
-
65,004
4,001,234
5,000
4,071,238
$14,922,230
$30,662,285
26,460,996
26,335,919
658,658,311
86,576,747
3,646,874
832,341,132
-
13,240,748
186,741,866
64,869,727
2,926,844
267,779,185
$ 564,561,947
Anderson Planning $340,352
A&E Planning/Expansion – Bloomington 323,142
Insurance Refund - Richmond 56,304
Anderson Construction Series R 3,919,283
Bloomington Construction Series R 2,244,530
Indianapolis Construction Series R 7,986,742
Capitalized Int-Series R - Anderson 621,490
Capitalized Int-Series R - Bloomington 621,439
Capitalized Int-Series R - Indianapolis 717,433
Hamilton County Campus - Noblesville 508,611
Pain Rehab-Annex - Bloomington 437,206
School of Computing-Informatics - Kokomo 7,724
Culinary Arts Expansion Col.- Ft. Wayne 179,886
Harshman Hall Flooding Project - Ft. Wayne 248,100
Snowmelt Pad Project Tech Ctr - Ft. Wayne 11,810
Various Repair & Rehabilitation & Parking Lot Projects 8,236,944
total Construction work in Progress $ 26,460,996
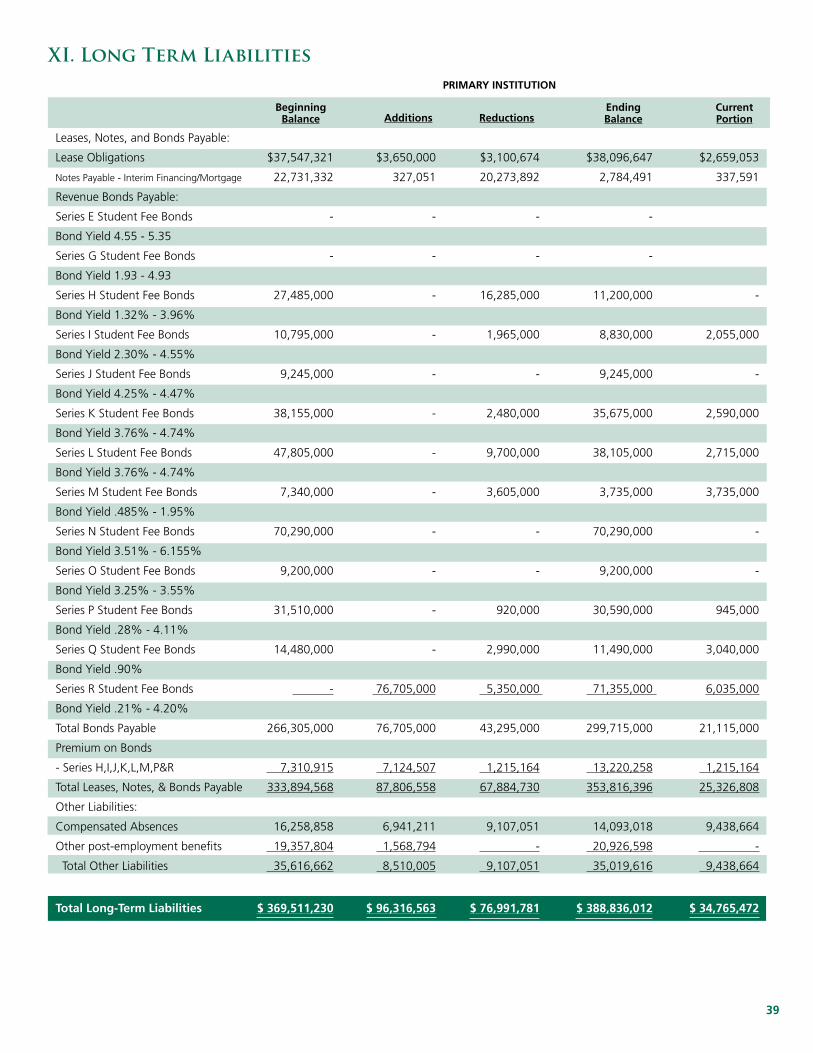
39
XI. Long Term Liabilities
Leases, Notes, and Bonds Payable:
Lease Obligations $37,547,321 $3,650,000 $3,100,674 $38,096,647 $2,659,053
Notes Payable - Interim Financing/Mortgage 22,731,332 327,051 20,273,892 2,784,491 337,591
Revenue Bonds Payable:
Series E Student Fee Bonds - - - -
Bond Yield 4.55 - 5.35
Series G Student Fee Bonds - - - -
Bond Yield 1.93 - 4.93
Series H Student Fee Bonds 27,485,000 - 16,285,000 11,200,000 -
Bond Yield 1.32% - 3.96%
Series I Student Fee Bonds 10,795,000 - 1,965,000 8,830,000 2,055,000
Bond Yield 2.30% - 4.55%
Series J Student Fee Bonds 9,245,000 - - 9,245,000 -
Bond Yield 4.25% - 4.47%
Series K Student Fee Bonds 38,155,000 - 2,480,000 35,675,000 2,590,000
Bond Yield 3.76% - 4.74%
Series L Student Fee Bonds 47,805,000 - 9,700,000 38,105,000 2,715,000
Bond Yield 3.76% - 4.74%
Series M Student Fee Bonds 7,340,000 - 3,605,000 3,735,000 3,735,000
Bond Yield .485% - 1.95%
Series N Student Fee Bonds 70,290,000 - - 70,290,000 -
Bond Yield 3.51% - 6.155%
Series O Student Fee Bonds 9,200,000 - - 9,200,000 -
Bond Yield 3.25% - 3.55%
Series P Student Fee Bonds 31,510,000 - 920,000 30,590,000 945,000
Bond Yield .28% - 4.11%
Series Q Student Fee Bonds 14,480,000 - 2,990,000 11,490,000 3,040,000
Bond Yield .90%
Series R Student Fee Bonds - 76,705,000 5,350,000 71,355,000 6,035,000
Bond Yield .21% - 4.20%
Total Bonds Payable 266,305,000 76,705,000 43,295,000 299,715,000 21,115,000
Premium on Bonds
- Series H,I,J,K,L,M,P&R 7,310,915 7,124,507 1,215,164 13,220,258 1,215,164
Total Leases, Notes, & Bonds Payable 333,894,568 87,806,558 67,884,730 353,816,396 25,326,808
Other Liabilities:
Compensated Absences 16,258,858 6,941,211 9,107,051 14,093,018 9,438,664
Other post-employment benefits 19,357,804 1,568,794 - 20,926,598 -
Total Other Liabilities 35,616,662 8,510,005 9,107,051 35,019,616 9,438,664
total Long-term Liabilities $ 369,511,230 $ 96,316,563 $ 76,991,781 $ 388,836,012 $ 34,765,472
additionsBeginning
Balance
PrimarY institution
endingBalance
CurrentPortionreductions
Anderson Planning $340,352
A&E Planning/Expansion – Bloomington 323,142
Insurance Refund - Richmond 56,304
Anderson Construction Series R 3,919,283
Bloomington Construction Series R 2,244,530
Indianapolis Construction Series R 7,986,742
Capitalized Int-Series R - Anderson 621,490
Capitalized Int-Series R - Bloomington 621,439
Capitalized Int-Series R - Indianapolis 717,433
Hamilton County Campus - Noblesville 508,611
Pain Rehab-Annex - Bloomington 437,206
School of Computing-Informatics - Kokomo 7,724
Culinary Arts Expansion Col.- Ft. Wayne 179,886
Harshman Hall Flooding Project - Ft. Wayne 248,100
Snowmelt Pad Project Tech Ctr - Ft. Wayne 11,810
Various Repair & Rehabilitation & Parking Lot Projects 8,236,944
total Construction work in Progress $ 26,460,996
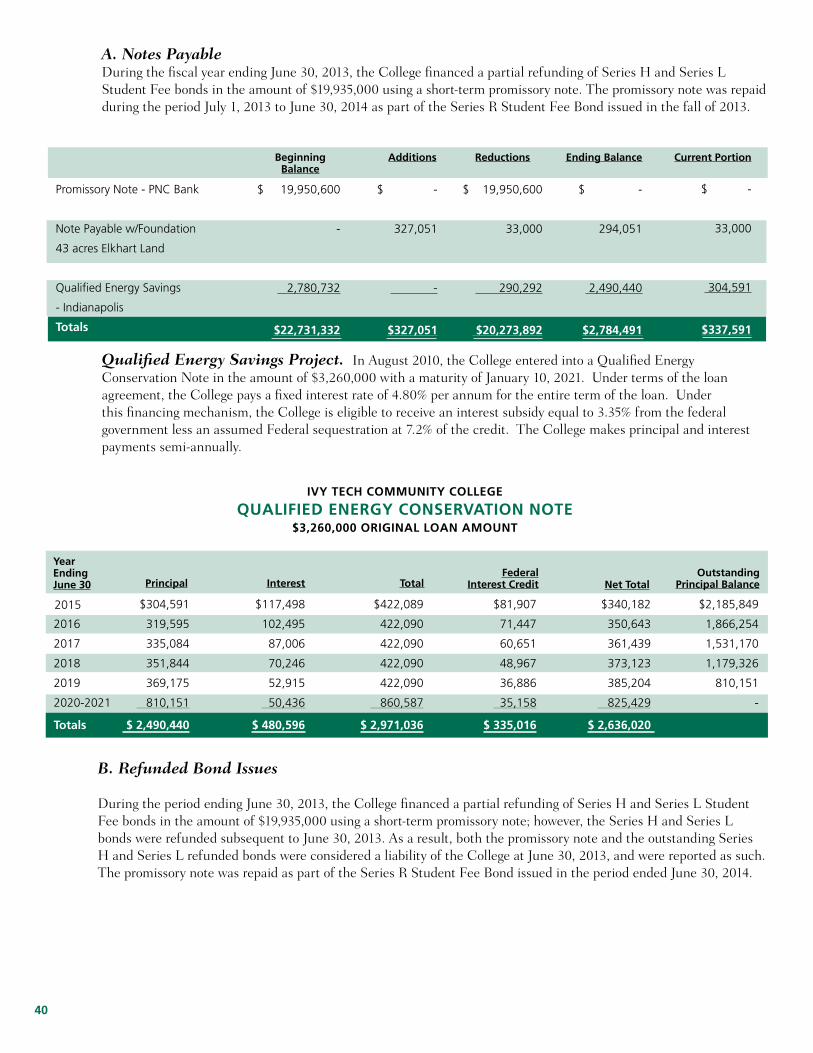
40
A. Notes PayableDuring the fiscal year ending June 30, 2013, the College financed a partial refunding of Series H and Series L Student Fee bonds in the amount of $19,935,000 using a short-term promissory note. The promissory note was repaid during the period July 1, 2013 to June 30, 2014 as part of the Series R Student Fee Bond issued in the fall of 2013.
additionsBeginningBalance
reductions ending Balance Current Portion
$ 19,950,600
-
2,780,732
$22,731,332
$ -
327,051
-
$327,051
$ 19,950,600
33,000
290,292
$20,273,892
$ -
294,051
2,490,440
$2,784,491
$ -
33,000
304,591
$337,591
Qualified Energy Savings Project. In August 2010, the College entered into a Qualified Energy Conservation Note in the amount of $3,260,000 with a maturity of January 10, 2021. Under terms of the loan agreement, the College pays a fixed interest rate of 4.80% per annum for the entire term of the loan. Under this financing mechanism, the College is eligible to receive an interest subsidy equal to 3.35% from the federal government less an assumed Federal sequestration at 7.2% of the credit. The College makes principal and interest payments semi-annually.
$304,591 $117,498 $422,089 $81,907 $340,182 $2,185,849
2016 319,595 102,495 422,090 71,447 350,643 1,866,254
2017 335,084 87,006 422,090 60,651 361,439 1,531,170
2018 351,844 70,246 422,090 48,967 373,123 1,179,326
2019 369,175 52,915 422,090 36,886 385,204 810,151
2020-2021 810,151 50,436 860,587 35,158 825,429 -
totals $ 2,490,440 $ 480,596 $ 2,971,036 $ 335,016 $ 2,636,020
Principal
Year endingJune 30 interest total net total
federal interest Credit
outstandingPrincipal Balance
ivY teCh CommunitY CoLLege
QuaLified energY Conservation note $3,260,000 originaL Loan amount
B. Refunded Bond Issues
During the period ending June 30, 2013, the College financed a partial refunding of Series H and Series L Student Fee bonds in the amount of $19,935,000 using a short-term promissory note; however, the Series H and Series L bonds were refunded subsequent to June 30, 2013. As a result, both the promissory note and the outstanding Series H and Series L refunded bonds were considered a liability of the College at June 30, 2013, and were reported as such. The promissory note was repaid as part of the Series R Student Fee Bond issued in the period ended June 30, 2014.
2015
Promissory Note - PNC Bank
Note Payable w/Foundation
43 acres Elkhart Land
Qualified Energy Savings
- Indianapolis
totals
41
C. Bond Issuance Costs
The College previously reported Bond Debt Issuance Costs as an asset. The implementation of GASB Statement No. 65, Items Previously Reported as Assets and Liabilities, determined that bond debt issuance costs no longer meet the definition of an asset. Therefore, for the period ended June 30, 2014, the College expensed the prior balance of the bond issuance costs totaling $2.5 million. Additionally, in accordance with GASB Statement No. 65, the College expensed the bond issuance costs related to the Series R Student Fee Bonds issued in the period ended June 30, 2014.
D. Premium on Bonds
The June 30, 2013 Premium on Bonds of $7.3 million includes the remaining balance from the sale of Series H, I, J, K, L, M and P Student Fee Bonds. The ending balance at June 30, 2014 of $13.2 million includes the remaining balance from the sale of Series H, I, J, K, L, M, P and R Student Fee Bonds. It is amortized over the remaining life of the related bonds.
E. Loss on Refunding
The College previously reported Loss on Refunding as an asset. The implementation of GASB Statement No. 65 determined that bond debt issuance costs no longer meet the definition of an asset. Therefore, for the period ending June 30, 2014, the College reclassified the remaining balance of the loss on refunding totaling $669,729 as a deferred outflow of resources. The loss on refunding was considered to be immaterial in relation to the financial statements and therefore the College did not restate the prior year data.
F. Pollution Remediation
To comply with GASB Statement No. 49, Accounting and Reporting for Pollution Remediation Obligations, the College must report a liability for an obligating event. An obligating event occurs when the College commences or legally obligates itself to commence pollution remediation. During the period July 1, 2013 to June 30, 2014, the College obligated itself to remediate pollution in the North Meridian Center on the Indianapolis campus. As of June 30, 2014, the project had not been completed, leaving an estimated outstanding obligation of $756,410, which is included in accounts payable and accrued liabilities.
G. Compensated Absences
Accrued time for vacation and sick vests to a maximum and is equal to the amount accrued during the preceding eighteen (18) months. Unused vacation time is paid out upon termination regardless of age or years of service. The sick maximum is equal to 1,056 hours. Unused sick is paid out upon retirement only if the employee’s age is a least fifty-five years and their age plus years of service equal seventy-five or more. Employees eligible for this benefit are paid at a rate of one-half the accumulated time up to an accumulated maximum of one hundred (100) days. The accrued vacation benefit is $10.6 million and the eligible sick leave benefit is $3.5 million. The College has internally designated a portion of its unrestricted funds to more than offset the entire liability for compensated absences as identified on page 12 of the Management Discussion & Analysis section.
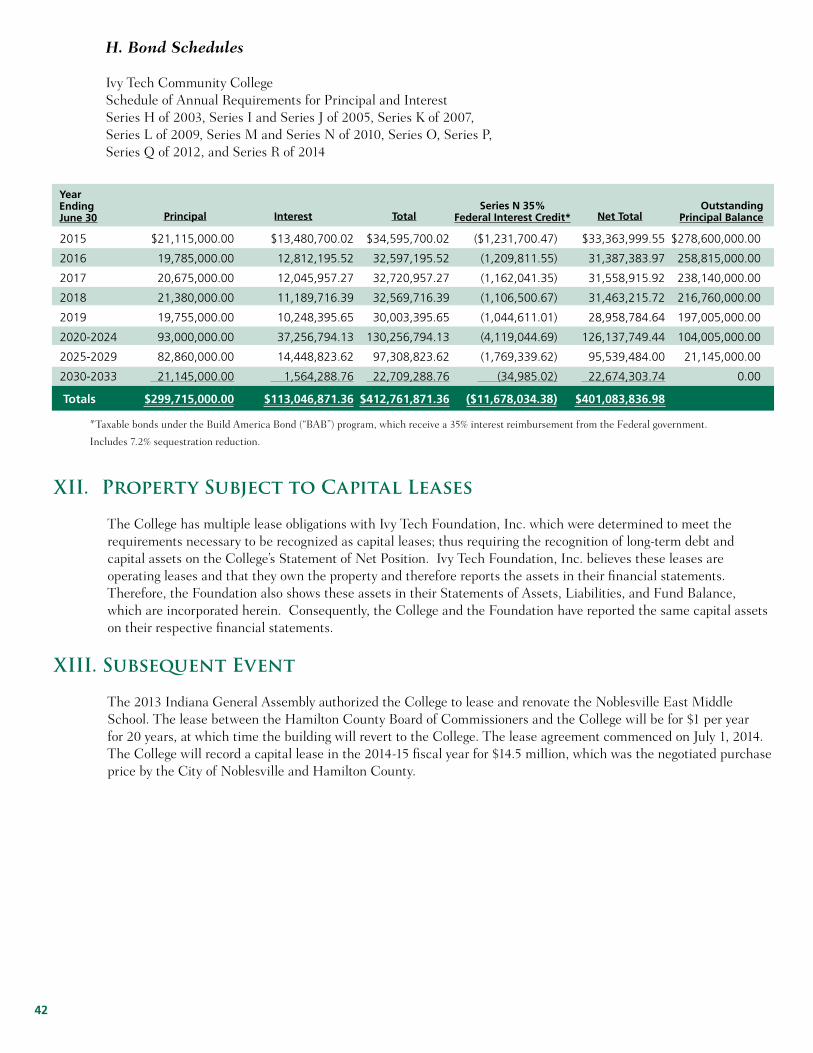
42
Principal
Year endingJune 30 interest total net total
series n 35%federal interest Credit*
outstandingPrincipal Balance
XII. Property Subject to Capital Leases
The College has multiple lease obligations with Ivy Tech Foundation, Inc. which were determined to meet the requirements necessary to be recognized as capital leases; thus requiring the recognition of long-term debt and capital assets on the College’s Statement of Net Position. Ivy Tech Foundation, Inc. believes these leases are operating leases and that they own the property and therefore reports the assets in their financial statements. Therefore, the Foundation also shows these assets in their Statements of Assets, Liabilities, and Fund Balance, which are incorporated herein. Consequently, the College and the Foundation have reported the same capital assets on their respective financial statements.
XIII. Subsequent Event
The 2013 Indiana General Assembly authorized the College to lease and renovate the Noblesville East Middle School. The lease between the Hamilton County Board of Commissioners and the College will be for $1 per year for 20 years, at which time the building will revert to the College. The lease agreement commenced on July 1, 2014. The College will record a capital lease in the 2014-15 fiscal year for $14.5 million, which was the negotiated purchase price by the City of Noblesville and Hamilton County.
2015
2016
2017
2018
2019
2020-2024
2025-2029
2030-2033
totals
$21,115,000.00
19,785,000.00
20,675,000.00
21,380,000.00
19,755,000.00
93,000,000.00
82,860,000.00
21,145,000.00
$299,715,000.00
$13,480,700.02
12,812,195.52
12,045,957.27
11,189,716.39
10,248,395.65
37,256,794.13
14,448,823.62
1,564,288.76
$113,046,871.36
$34,595,700.02
32,597,195.52
32,720,957.27
32,569,716.39
30,003,395.65
130,256,794.13
97,308,823.62
22,709,288.76
$412,761,871.36
($1,231,700.47)
(1,209,811.55)
(1,162,041.35)
(1,106,500.67)
(1,044,611.01)
(4,119,044.69)
(1,769,339.62)
(34,985.02)
($11,678,034.38)
$33,363,999.55
31,387,383.97
31,558,915.92
31,463,215.72
28,958,784.64
126,137,749.44
95,539,484.00
22,674,303.74
$401,083,836.98
$278,600,000.00
258,815,000.00
238,140,000.00
216,760,000.00
197,005,000.00
104,005,000.00
21,145,000.00
0.00
*Taxable bonds under the Build America Bond (“BAB”) program, which receive a 35% interest reimbursement from the Federal government.
Includes 7.2% sequestration reduction.
H. Bond Schedules
Ivy Tech Community CollegeSchedule of Annual Requirements for Principal and InterestSeries H of 2003, Series I and Series J of 2005, Series K of 2007, Series L of 2009, Series M and Series N of 2010, Series O, Series P,Series Q of 2012, and Series R of 2014

43
the foLLowing information is Presented as additionaL data and is not suBJeCt to the audit oPinion exPressed BY the indiana state Board of aCCounts. these rePorts were PrePared
BY the management of ivY teCh CommunitY CoLLege of indiana.
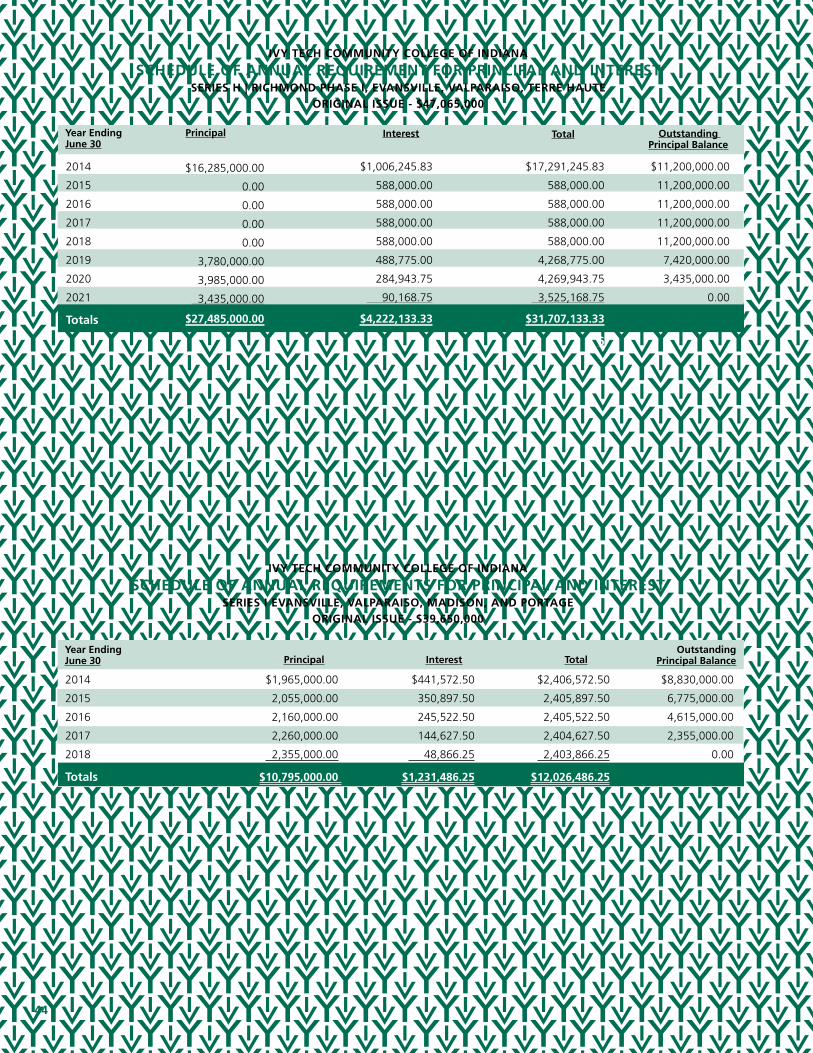
44
interestPrincipal total outstanding Principal Balance
Year endingJune 30
ivY teCh CommunitY CoLLege of indiana
sCheduLe of annuaL reQuirement for PrinCiPaL and interestseries h | riChmond Phase i, evansviLLe, vaLParaiso, terre haute
originaL issue - $47,065,000
2014
2015
2016
2017
2018
2019
2020
2021
totals
$16,285,000.00
0.00
0.00
0.00
0.00
3,780,000.00
3,985,000.00
3,435,000.00
$27,485,000.00
$1,006,245.83
588,000.00
588,000.00
588,000.00
588,000.00
488,775.00
284,943.75
90,168.75
$4,222,133.33
$17,291,245.83
588,000.00
588,000.00
588,000.00
588,000.00
4,268,775.00
4,269,943.75
3,525,168.75
$31,707,133.33
6
$11,200,000.00
11,200,000.00
11,200,000.00
11,200,000.00
11,200,000.00
7,420,000.00
3,435,000.00
0.00
PrincipalYear endingJune 30 interest total
outstandingPrincipal Balance
ivY teCh CommunitY CoLLege of indiana
sCheduLe of annuaL reQuirements for PrinCiPaL and interestseries i evansviLLe, vaLParaiso, madison, and Portage
originaL issue - $39,650,000
2014 $1,965,000.00 $441,572.50 $2,406,572.50 $8,830,000.00
2015 2,055,000.00 350,897.50 2,405,897.50 6,775,000.00
2016 2,160,000.00 245,522.50 2,405,522.50 4,615,000.00
2017 2,260,000.00 144,627.50 2,404,627.50 2,355,000.00
2018 2,355,000.00 48,866.25 2,403,866.25 0.00
totals $10,795,000.00 $1,231,486.25 $12,026,486.25
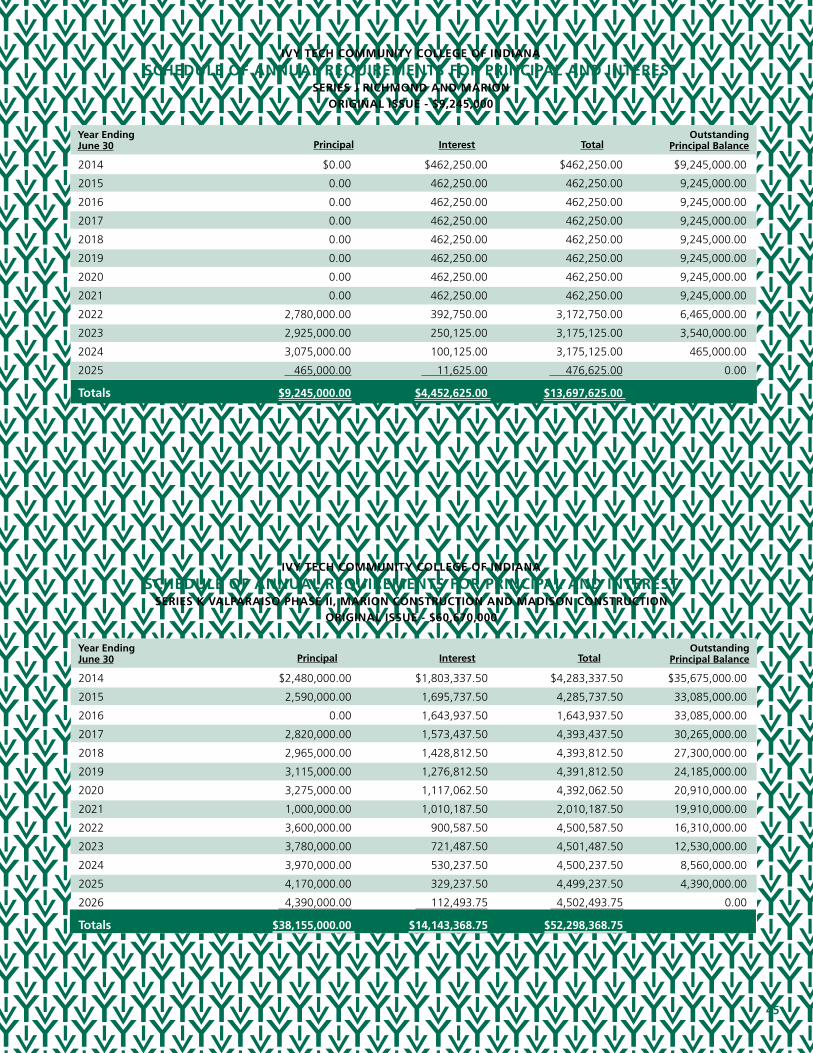
45
2014 $2,480,000.00 $1,803,337.50 $4,283,337.50 $35,675,000.00
2015 2,590,000.00 1,695,737.50 4,285,737.50 33,085,000.00
2016 0.00 1,643,937.50 1,643,937.50 33,085,000.00
2017 2,820,000.00 1,573,437.50 4,393,437.50 30,265,000.00
2018 2,965,000.00 1,428,812.50 4,393,812.50 27,300,000.00
2019 3,115,000.00 1,276,812.50 4,391,812.50 24,185,000.00
2020 3,275,000.00 1,117,062.50 4,392,062.50 20,910,000.00
2021 1,000,000.00 1,010,187.50 2,010,187.50 19,910,000.00
2022 3,600,000.00 900,587.50 4,500,587.50 16,310,000.00
2023 3,780,000.00 721,487.50 4,501,487.50 12,530,000.00
2024 3,970,000.00 530,237.50 4,500,237.50 8,560,000.00
2025 4,170,000.00 329,237.50 4,499,237.50 4,390,000.00
2026 4,390,000.00 112,493.75 4,502,493.75 0.00
totals $38,155,000.00 $14,143,368.75 $52,298,368.75
PrincipalYear endingJune 30 interest total
outstandingPrincipal Balance
ivY teCh CommunitY CoLLege of indiana
sCheduLe of annuaL reQuirements for PrinCiPaL and interestseries K vaLParaiso Phase ii, marion ConstruCtion and madison ConstruCtion
originaL issue - $60,670,000
PrincipalYear endingJune 30 interest total
outstandingPrincipal Balance
ivY teCh CommunitY CoLLege of indiana
sCheduLe of annuaL reQuirements for PrinCiPaL and interestseries J riChmond and marion
originaL issue - $9,245,000
2014 $0.00 $462,250.00 $462,250.00 $9,245,000.00
2015 0.00 462,250.00 462,250.00 9,245,000.00
2016 0.00 462,250.00 462,250.00 9,245,000.00
2017 0.00 462,250.00 462,250.00 9,245,000.00
2018 0.00 462,250.00 462,250.00 9,245,000.00
2019 0.00 462,250.00 462,250.00 9,245,000.00
2020 0.00 462,250.00 462,250.00 9,245,000.00
2021 0.00 462,250.00 462,250.00 9,245,000.00
2022 2,780,000.00 392,750.00 3,172,750.00 6,465,000.00
2023 2,925,000.00 250,125.00 3,175,125.00 3,540,000.00
2024 3,075,000.00 100,125.00 3,175,125.00 465,000.00
2025 465,000.00 11,625.00 476,625.00 0.00
totals $9,245,000.00 $4,452,625.00 $13,697,625.00

46
2014 $3,605,000.00 $188,625.00 $3,793,625.00 $3,735,000.00
2015 3,735,000.00 63,525.00 3,798,525.00 0.00
totals $7,340,000.00 $252,150.00 $7,592,150.00
PrincipalYear endingJune 30 interest total
outstandingPrincipal Balance
ivY teCh CommunitY CoLLege of indiana
sCheduLe of annuaL reQuirements for PrinCiPaL and interestseries m (tax-exemPt) eLKhart, seLLersBurg, warsaw and indianaPoLis ProJeCts
originaL issue - $18,800,000
2014 $9,700,000.00 $1,991,480.01 $11,691,480.01 $38,105,000.00
2015 2,715,000.00 1,746,231.26 4,461,231.26 35,390,000.00
2016 2,815,000.00 1,642,418.76 4,457,418.76 32,575,000.00
2017 2,935,000.00 1,527,418.76 4,462,418.76 29,640,000.00
2018 3,070,000.00 1,391,968.76 4,461,968.76 26,570,000.00
2019 3,225,000.00 1,234,593.76 4,459,593.76 23,345,000.00
2020 0.00 1,153,968.76 1,153,968.76 23,345,000.00
2021 3,530,000.00 1,065,718.76 4,595,718.76 19,815,000.00
2022 3,210,000.00 897,218.76 4,107,218.76 16,605,000.00
2023 2,915,000.00 744,093.76 3,659,093.76 13,690,000.00
2024 3,065,000.00 594,593.76 3,659,593.76 10,625,000.00
2025 0.00 517,968.76 517,968.76 10,625,000.00
2026 3,370,000.00 435,825.01 3,805,825.01 7,255,000.00
2027 3,540,000.00 267,393.76 3,807,393.76 3,715,000.00
2028 3,715,000.00 90,553.13 3,805,553.13 0.00
totals $47,805,000.00 $15,301,445.77 $63,106,445.77
PrincipalYear endingJune 30 interest total
outstandingPrincipal Balance
ivY teCh CommunitY CoLLege of indiana
sCheduLe of annuaL reQuirements for PrinCiPaL and interestseries L fort waYne, LogansPort and greenCastLe ProJeCts;
fairBanKs refinanCing and series e refundingoriginaL issue - $65,095,000

47
ivY teCh CommunitY CoLLege of indiana
sCheduLe of annuaL reQuirements for PrinCiPaL and interestseries n (taxaBLe BuiLd ameriCa - direCt PaY oPtion) eLKhart, seLLersBurg, warsaw and indianaPoLis ProJeCts
originaL issue - $70,290,000
2014 $3,792,181.26 $3,792,181.26 ($1,231,700.47) $2,560,480.79 $70,290,000.00
2015 3,792,181.26 3,792,181.26 (1,231,700.47) 2,560,480.79 70,290,000.00
2016 3,840,000.00 3,724,789.26 7,564,789.26 (1,209,811.55) 6,354,977.71 66,450,000.00
2017 3,935,000.00 3,577,713.51 7,512,713.51 (1,162,041.35) 6,350,672.16 62,515,000.00
2018 4,045,000.00 3,406,713.88 7,451,713.88 (1,106,500.67) 6,345,213.21 58,470,000.00
2019 4,165,000.00 3,216,166.89 7,381,166.89 (1,044,611.01) 6,336,555.88 54,305,000.00
2020 4,300,000.00 3,009,113.27 7,309,113.27 (977,359.99) 6,331,753.28 50,005,000.00
2021 4,440,000.00 2,789,624.76 7,229,624.76 (906,070.12) 6,323,554.64 45,565,000.00
2022 4,600,000.00 2,555,713.76 7,155,713.76 (830,095.83) 6,325,617.93 40,965,000.00
2023 4,760,000.00 2,299,831.77 7,059,831.77 (746,985.36) 6,312,846.41 36,205,000.00
2024 4,940,000.00 2,027,504.27 6,967,504.27 (658,533.39) 6,308,970.88 31,265,000.00
2025 5,135,000.00 1,739,513.64 6,874,513.64 (564,994.03) 6,309,519.61 26,130,000.00
2026 5,320,000.00 1,435,534.52 6,755,534.52 (466,261.61) 6,289,272.91 20,810,000.00
2027 5,545,000.00 1,110,208.14 6,655,208.14 (360,595.60) 6,294,612.54 15,265,000.00
2028 5,765,000.00 762,142.89 6,527,142.89 (247,544.01) 6,279,598.88 9,500,000.00
2029 6,000,000.00 400,075.02 6,400,075.02 (129,944.37) 6,270,130.65 3,500,000.00
2030 3,500,000.00 107,712.51 3,607,712.51 (34,985.02) 3,572,727.49 0.00
totals $70,290,000.00 $39,746,720.61 $110,036,720.61 ($12,909,734.85) $97,126,985.76
PrincipalYear endingJune 30 interest total net total
outstandingPrincipal Balance
35% federalinterest Credit*
* Taxable bonds issued under the Build America Bond ("BAB") program, which receive a 35% interest reimbursement from the Federal government. Includes 7.2% sequestration reduction.

48
2014 $314,727.50 $314,727.50 $9,200,000.00
2015 314,727.50 314,727.50 9,200,000.00
2016 314,727.50 314,727.50 9,200,000.00
2017 314,727.50 314,727.50 9,200,000.00
2018 314,727.50 314,727.50 9,200,000.00
2019 314,727.50 314,727.50 9,200,000.00
2020 314,727.50 314,727.50 9,200,000.00
2021 314,727.50 314,727.50 9,200,000.00
2022 314,727.50 314,727.50 9,200,000.00
2023 314,727.50 314,727.50 9,200,000.00
2024 314,727.50 314,727.50 9,200,000.00
2025 $2,250,000.00 278,165.00 2,528,165.00 6,950,000.00
2026 3,415,000.00 183,547.50 3,598,547.50 3,535,000.00
2027 3,535,000.00 62,746.25 3,597,746.25 0.00
totals $9,200,000.00 $3,986,461.25 $13,186,461.25
Principal interest totaloutstanding
Principal Balance
ivY teCh CommunitY CoLLege of indianasCheduLe of annuaL reQuirements for PrinCiPaL and interest
series o (tax-exemPt) series i refunding originaL issue - $9,200,000
Year endingJune 30
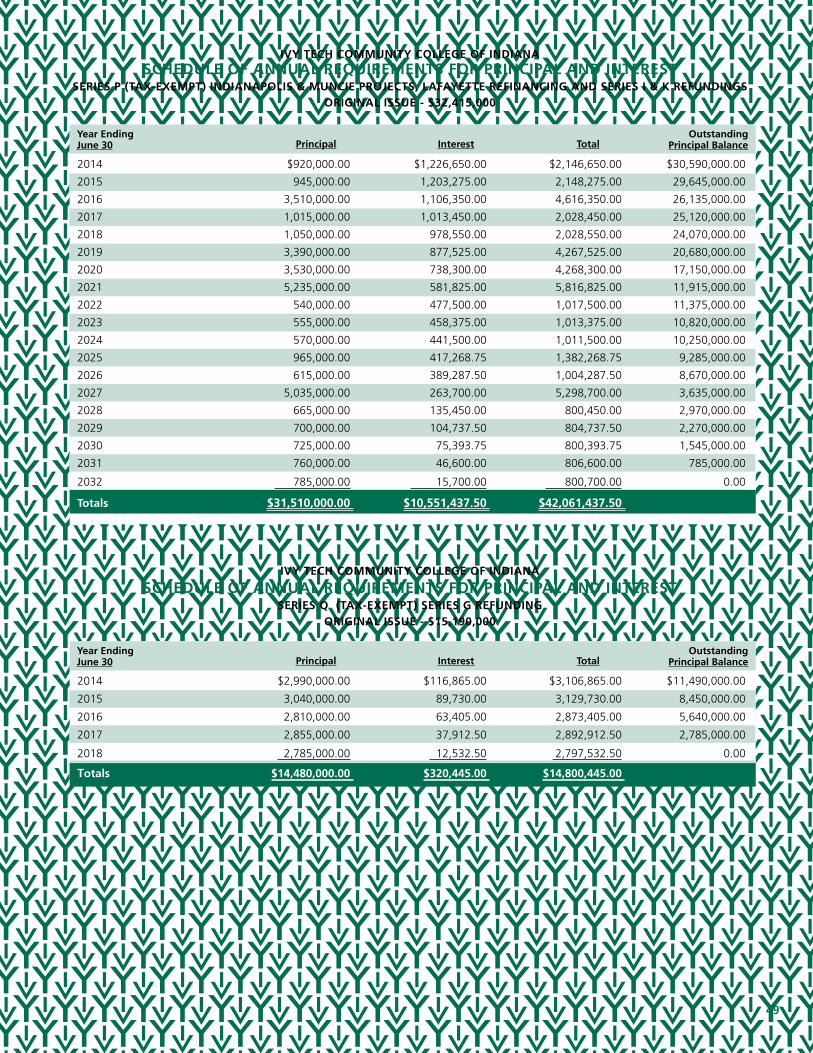
49
2014 $2,990,000.00 $116,865.00 $3,106,865.00 $11,490,000.00
2015 3,040,000.00 89,730.00 3,129,730.00 8,450,000.00
2016 2,810,000.00 63,405.00 2,873,405.00 5,640,000.00
2017 2,855,000.00 37,912.50 2,892,912.50 2,785,000.00
2018 2,785,000.00 12,532.50 2,797,532.50 0.00
totals $14,480,000.00 $320,445.00 $14,800,445.00
PrincipalYear endingJune 30 interest total
outstandingPrincipal Balance
ivY teCh CommunitY CoLLege of indiana
sCheduLe of annuaL reQuirements for PrinCiPaL and interestseries Q (tax-exemPt) series g refunding
originaL issue - $15,190,000
2014 $920,000.00 $1,226,650.00 $2,146,650.00 $30,590,000.00
2015 945,000.00 1,203,275.00 2,148,275.00 29,645,000.00
2016 3,510,000.00 1,106,350.00 4,616,350.00 26,135,000.00
2017 1,015,000.00 1,013,450.00 2,028,450.00 25,120,000.00
2018 1,050,000.00 978,550.00 2,028,550.00 24,070,000.00
2019 3,390,000.00 877,525.00 4,267,525.00 20,680,000.00
2020 3,530,000.00 738,300.00 4,268,300.00 17,150,000.00
2021 5,235,000.00 581,825.00 5,816,825.00 11,915,000.00
2022 540,000.00 477,500.00 1,017,500.00 11,375,000.00
2023 555,000.00 458,375.00 1,013,375.00 10,820,000.00
2024 570,000.00 441,500.00 1,011,500.00 10,250,000.00
2025 965,000.00 417,268.75 1,382,268.75 9,285,000.00
2026 615,000.00 389,287.50 1,004,287.50 8,670,000.00
2027 5,035,000.00 263,700.00 5,298,700.00 3,635,000.00
2028 665,000.00 135,450.00 800,450.00 2,970,000.00
2029 700,000.00 104,737.50 804,737.50 2,270,000.00
2030 725,000.00 75,393.75 800,393.75 1,545,000.00
2031 760,000.00 46,600.00 806,600.00 785,000.00
2032 785,000.00 15,700.00 800,700.00 0.00
totals $31,510,000.00 $10,551,437.50 $42,061,437.50
PrincipalYear endingJune 30 interest total
outstandingPrincipal Balance
ivY teCh CommunitY CoLLege of indianasCheduLe of annuaL reQuirements for PrinCiPaL and interest
series P (tax-exemPt) indianaPoLis & munCie ProJeCts, LafaYette refinanCing and series i & K refundingsoriginaL issue - $32,415,000
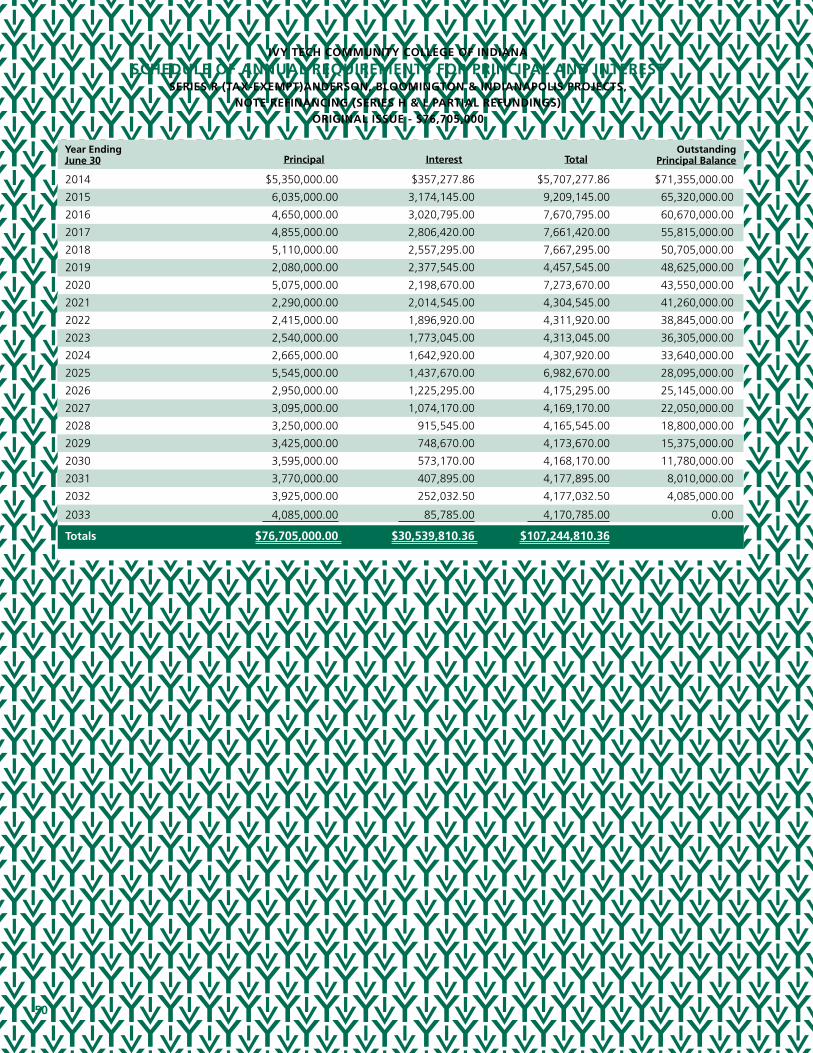
50
2014 $5,350,000.00 $357,277.86 $5,707,277.86 $71,355,000.00
2015 6,035,000.00 3,174,145.00 9,209,145.00 65,320,000.00
2016 4,650,000.00 3,020,795.00 7,670,795.00 60,670,000.00
2017 4,855,000.00 2,806,420.00 7,661,420.00 55,815,000.00
2018 5,110,000.00 2,557,295.00 7,667,295.00 50,705,000.00
2019 2,080,000.00 2,377,545.00 4,457,545.00 48,625,000.00
2020 5,075,000.00 2,198,670.00 7,273,670.00 43,550,000.00
2021 2,290,000.00 2,014,545.00 4,304,545.00 41,260,000.00
2022 2,415,000.00 1,896,920.00 4,311,920.00 38,845,000.00
2023 2,540,000.00 1,773,045.00 4,313,045.00 36,305,000.00
2024 2,665,000.00 1,642,920.00 4,307,920.00 33,640,000.00
2025 5,545,000.00 1,437,670.00 6,982,670.00 28,095,000.00
2026 2,950,000.00 1,225,295.00 4,175,295.00 25,145,000.00
2027 3,095,000.00 1,074,170.00 4,169,170.00 22,050,000.00
2028 3,250,000.00 915,545.00 4,165,545.00 18,800,000.00
2029 3,425,000.00 748,670.00 4,173,670.00 15,375,000.00
2030 3,595,000.00 573,170.00 4,168,170.00 11,780,000.00
2031 3,770,000.00 407,895.00 4,177,895.00 8,010,000.00
2032 3,925,000.00 252,032.50 4,177,032.50 4,085,000.00
2033 4,085,000.00 85,785.00 4,170,785.00 0.00
totals $76,705,000.00 $30,539,810.36 $107,244,810.36
PrincipalYear endingJune 30 interest total
outstandingPrincipal Balance
ivY teCh CommunitY CoLLege of indiana
sCheduLe of annuaL reQuirements for PrinCiPaL and interestseries r (tax-exemPt)anderson, BLoomington & indianaPoLis ProJeCts,
note refinanCing (series h & L PartiaL refundings) originaL issue - $76,705,000

51
2014 $43,295,000.00 $11,701,212.46 $54,996,212.46 ($1,231,700.47) $53,764,511.99 $299,715,000.00
2015 21,115,000.00 13,480,700.02 34,595,700.02 (1,231,700.47) 33,363,999.55 278,600,000.00
2016 19,785,000.00 12,812,195.52 32,597,195.52 (1,209,811.55) 31,387,383.97 258,815,000.00
2017 20,675,000.00 12,045,957.27 32,720,957.27 (1,162,041.35) 31,558,915.92 238,140,000.00
2018 21,380,000.00 11,189,716.39 32,569,716.39 (1,106,500.67) 31,463,215.72 216,760,000.00
2019 19,755,000.00 10,248,395.65 30,003,395.65 (1,044,611.01) 28,958,784.64 197,005,000.00
2020 20,165,000.00 9,279,035.78 29,444,035.78 (977,359.99) 28,466,675.79 176,840,000.00
2021 19,930,000.00 8,329,047.27 28,259,047.27 (906,070.12) 27,352,977.15 156,910,000.00
2022 17,145,000.00 7,435,417.52 24,580,417.52 (830,095.83) 23,750,321.69 139,765,000.00
2023 17,475,000.00 6,561,685.53 24,036,685.53 (746,985.36) 23,289,700.17 122,290,000.00
2024 18,285,000.00 5,651,608.03 23,936,608.03 (658,533.39) 23,278,074.64 104,005,000.00
2025 18,530,000.00 4,731,448.65 23,261,448.65 (564,994.03) 22,696,454.62 85,475,000.00
2026 20,060,000.00 3,781,983.28 23,841,983.28 (466,261.61) 23,375,721.67 65,415,000.00
2027 20,750,000.00 2,778,218.15 23,528,218.15 (360,595.60) 23,167,622.55 44,665,000.00
2028 13,395,000.00 1,903,691.02 15,298,691.02 (247,544.01) 15,051,147.01 31,270,000.00
2029 10,125,000.00 1,253,482.52 11,378,482.52 (129,944.37) 11,248,538.15 21,145,000.00
2030 7,820,000.00 756,276.26 8,576,276.26 (34,985.02) 8,541,291.24 13,325,000.00
2031 4,530,000.00 454,495.00 4,984,495.00 0.00 4,984,495.00 8,795,000.00
2032 4,710,000.00 267,732.50 4,977,732.50 0.00 4,977,732.50 4,085,000.00
2033 4,085,000.00 85,785.00 4,170,785.00 0.00 4,170,785.00 0.00
totals $343,010,000.00 $124,748,083.82 $467,758,083.82 ($12,909,734.85) $454,848,348.97
PrincipalYear endingJune 30 interest total net total
outstandingPrincipal Balance
35% federalinterest Credit*
ivY teCh CommunitY CoLLege of indiana
sCheduLe of annuaL reQuirement for PrinCiPaL and interestseries h of 2003, series i and series J of 2005, series K of 2007,
series L of 2009, series m and series n of 2010, series o, series P, and series Q of 2012, series r of 2014
Series H Bonds Principal Debt of $30,280,000.00
Series I Bonds Principal Debt of $12,680,000.00
Series J Bonds Principal Debt of $9,245,000.00
Series K Bonds Principal Debt of $40,525,000.00
Series L Bonds Principal Debt of $51,670,000.00
Series M Bonds Principal Debt of $10,830,000.00
Series N Bonds Principal Debt of $70,290,000.00
Series O Bonds Principal Debt of $9,200,000.00
Series P Bonds Principal Debt of $32,415,000.00
Series Q Bonds Principal Debt of $15,190,000.00
Series R Bonds Principal Debt of $76,705,000.00
* Taxable bonds issued under the Build America Bond (“BAB”) program, which receive a 35% interest
reimbursement from the Federal government. Includes 7.2% sequestration reduction.
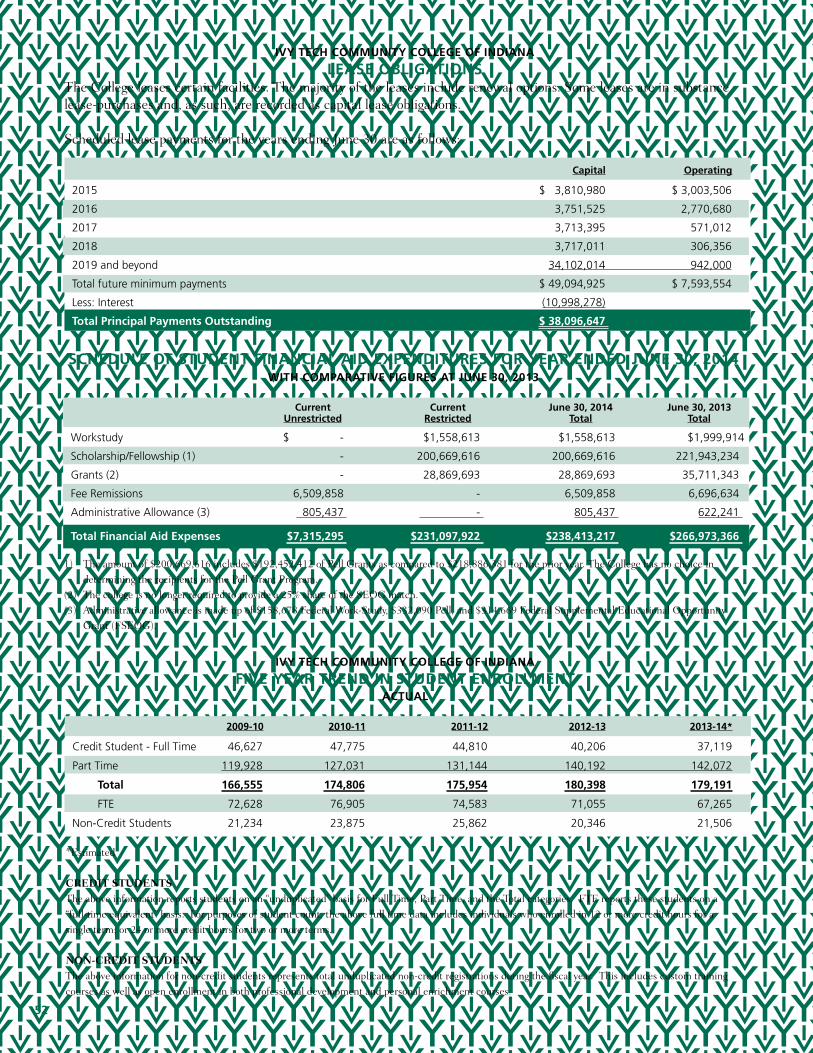
52
2009-10 2010-11 2011-12
Capital
2012-13
operating
2013-14*
ivY teCh CommunitY CoLLege of indiana
Lease oBLigationsThe College leases certain facilities. The majority of the leases include renewal options. Some leases are in substance lease-purchases and, as such, are recorded as capital lease obligations.
Scheduled lease payments for the years ending June 30 are as follows:
ivY teCh CommunitY CoLLege of indiana
five Year trend in student enroLLmentaCtuaL
Workstudy $ - $1,558,613 $1,558,613 $1,999,914
Scholarship/Fellowship (1) - 200,669,616 200,669,616 221,943,234
Grants (2) - 28,869,693 28,869,693 35,711,343
Fee Remissions 6,509,858 - 6,509,858 6,696,634
Administrative Allowance (3) 805,437 - 805,437 622,241
total financial aid expenses $7,315,295 $231,097,922 $238,413,217 $266,973,366
June 30, 2013total
Currentunrestricted
Currentrestricted
June 30, 2014total
sCheduLe of student finanCiaL aid exPenditures for Year ended June 30, 2014with ComParative figures at June 30, 2013
1) The amount of $200,669,616 includes $192,452,412 of Pell Grants as compared to $218,886,381 for the prior year. The College has no choice in
determining the recipients for the Pell Grant Program.
(2) The college is no longer required to provide a 25% share of the SEOG match.
(3) Administrative allowance is made up of $158,678 Federal Work-Study, $332,090 Pell, and $314,669 Federal Supplemental Educational Opportunity
Grant (FSEOG).
*Estimated
Credit StudentSThe above information reports students on an “unduplicated” basis for Full Time, Part Time, and the Total categories. FTE reports these students on a
“full-time equivalent” basis. For purposes of student count, the above full time data includes individuals who enrolled in 12 or more credit hours for a
single term; or 24 or more credit hours for two or more terms.
non-Credit StudentSThe above information for non-credit students represents total unduplicated non-credit registrations during the fiscal year. This includes custom training
courses as well as open enrollment in both professional development and personal enrichment courses.
Credit Student - Full Time 46,627 47,775 44,810 40,206 37,119
Part Time 119,928 127,031 131,144 140,192 142,072
total 166,555 174,806 175,954 180,398 179,191
FTE 72,628 76,905 74,583 71,055 67,265
Non-Credit Students 21,234 23,875 25,862 20,346 21,506
2015 $ 3,810,980 $ 3,003,506
2016 3,751,525 2,770,680
2017 3,713,395 571,012
2018 3,717,011 306,356
2019 and beyond 34,102,014 942,000
Total future minimum payments $ 49,094,925 $ 7,593,554
Less: Interest (10,998,278)
total Principal Payments outstanding $ 38,096,647


![International Vie wpo in ts[Lyngby] - IVy Articles](https://img.dokumen.tips/doc/110x75/633e740fa1ef0c03530feb83/international-vie-wpo-in-tslyngby-ivy-articles.jpg)


