Embed Size (px)
Citation preview
Analysts who prepared this report are registered as research analysts in Korea but not in any other jurisdiction, including the U.S.
Korea Tech Strategy
November 13, 2012The Age of Transition
The outlook for IT from a “disruptive innovation” perspective
Mobile revolution: From revolution to evolution
The mobile revolution has been a history of „disruptive innovation.‰ And at the heart of
this remarkable shake-up lie Apple, Samsung Electronics (SEC), Google, and Amazon.
Notably, the global IT industry is currently facing several major shifts and issues,
including: 1) AppleÊs „innovatorÊs dilemma‰; 2) a reshuffling of global supply chains; 3)
the return of Microsoft; and 4) the zero growth of the PC industry. How Korean IT
players approach these issues will create significant implications for the memory,
display, components, and electronic materialsÊ markets in 2013 onwards.
“Apple without SEC” vs. “SEC without Apple”
Apple is now one of the most valuable corporations in the world. However, SEC sells
more smartphones than Apple does. Unsurprisingly, global investors are paying keen
attention to the competition between Apple and SEC, their innovations, and their
potential breakup. Our analysis suggests Apple is increasingly leaning toward
„sustaining innovation‰ while SEC pursues a strategy of differentiation. At the same
time, in reshuffling the global supply chain, we expect Apple could have difficulty
procuring parts supply without SECÊs contributions, while the Korean giant is likely to
see very limited impacts from the absence of demand from Apple.
SEC: Disruptive innovation and strategic decisions
In the late 1990s, Nokia focused on disruptive innovation on its way to achieving
massive global expansion. In the 1980s, Intel made a key strategic decision to move
from the memory sector into the CPU sector, a shift that led the company to become
the global CPU leader.
This year, SEC has followed in the footsteps of both Nokia and Intel. SECÊs mass
customization of smartphones reminds us of NokiaÊs expansion strategy, which enabled
Nokia to obtain a global handset market share of more than 40%. And, just as Intel did
in the 1980s, SECÊs semiconductor division is shifting its focus from the memory unit to
the System LSI unit. In 2013, we believe SEC is likely to face a key strategic decision in
its pursuit of fresh disruptive innovation.
Daewoo Securities Co., Ltd.
James Song +822-768-3722
Wonjae Park +822-768-3372
Jonathan Hwang +822-768-4140
Will Cho +822-768-4306
Young Ryu +822-768-4138
Brian Oh +822-768-4135
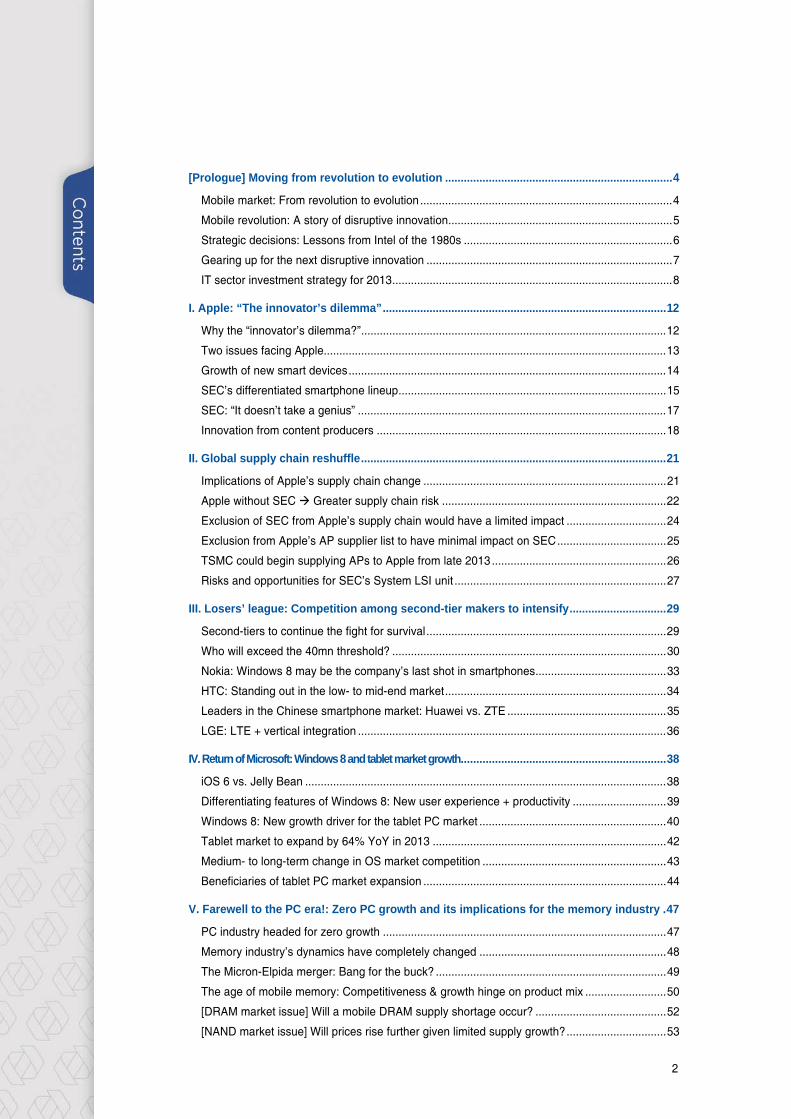
Disruptive and sustaining innovation in the mobile industry
Strategic decision(e.g., entering into a new market)
Sustaining innovation:Evolution
Sustaining innovation:Evolution
Innovation
2000 201020051995
iPad
iPhone
Nokia 9000
StarTAC
?
2015
Time
Disruptive innovation: Revolution
Strategic decision(e.g., entering into a new market)
Sustaining innovation:Evolution
Sustaining innovation:Evolution
Innovation
2000 201020051995
iPad
iPhone
Nokia 9000
StarTAC
?
2015
Time
Disruptive innovation: Revolution
Source: KDB Daewoo Securities Research
2
[Prologue] Moving from revolution to evolution .........................................................................4
Mobile market: From revolution to evolution.................................................................................4
Mobile revolution: A story of disruptive innovation........................................................................5
Strategic decisions: Lessons from Intel of the 1980s ...................................................................6
Gearing up for the next disruptive innovation ...............................................................................7
IT sector investment strategy for 2013..........................................................................................8
I. Apple: “The innovator’s dilemma”...........................................................................................12
Why the “innovator’s dilemma?”..................................................................................................12
Two issues facing Apple..............................................................................................................13
Growth of new smart devices......................................................................................................14
SEC’s differentiated smartphone lineup......................................................................................15
SEC: “It doesn’t take a genius” ...................................................................................................17
Innovation from content producers .............................................................................................18
II. Global supply chain reshuffle..................................................................................................21
Implications of Apple’s supply chain change ..............................................................................21
Apple without SEC Greater supply chain risk ........................................................................22
Exclusion of SEC from Apple’s supply chain would have a limited impact ................................24
Exclusion from Apple’s AP supplier list to have minimal impact on SEC...................................25
TSMC could begin supplying APs to Apple from late 2013 ........................................................26
Risks and opportunities for SEC’s System LSI unit ....................................................................27
III. Losers’ league: Competition among second-tier makers to intensify...............................29
Second-tiers to continue the fight for survival.............................................................................29
Who will exceed the 40mn threshold? ........................................................................................30
Nokia: Windows 8 may be the company’s last shot in smartphones..........................................33
HTC: Standing out in the low- to mid-end market.......................................................................34
Leaders in the Chinese smartphone market: Huawei vs. ZTE ...................................................35
LGE: LTE + vertical integration ...................................................................................................36
IV. Return of Microsoft: Windows 8 and tablet market growth..................................................................38
iOS 6 vs. Jelly Bean ....................................................................................................................38
Differentiating features of Windows 8: New user experience + productivity ..............................39
Windows 8: New growth driver for the tablet PC market ............................................................40
Tablet market to expand by 64% YoY in 2013 ...........................................................................42
Medium- to long-term change in OS market competition ...........................................................43
Beneficiaries of tablet PC market expansion ..............................................................................44
V. Farewell to the PC era!: Zero PC growth and its implications for the memory industry .47
PC industry headed for zero growth ...........................................................................................47
Memory industry’s dynamics have completely changed ............................................................48
The Micron-Elpida merger: Bang for the buck? ..........................................................................49
The age of mobile memory: Competitiveness & growth hinge on product mix ..........................50
[DRAM market issue] Will a mobile DRAM supply shortage occur? ..........................................52
[NAND market issue] Will prices rise further given limited supply growth?................................53
3 KDB Daewoo Securities Research
VI. Best tech migration play: Semiconductor materials ...........................................................57
Delays to EUV development to slow tech migration ...................................................................57
Materials offer solution to limitations of lithography ....................................................................58
Core material 1: Spin-on hardmask (SOH) .................................................................................59
Core material 2: Spin-on dielectrics (SOD).................................................................................60
Core material 3: High-k/metal gate (HKMG)...............................................................................61
Core material 4: Double patterning technology (DPT)................................................................62
VII. The ongoing innovation of displays: AMOLED vs. Retina display ...................................64
Proliferation of high-resolution displays: Form factor counts!.....................................................64
Apple: Retina displays to be adopted across Apple’s product lineup.........................................65
Apple: Form factor differentiation via in-cell touch displays........................................................66
SEC: Improved resolution of OLED displays ..............................................................................67
SEC: Differentiating itself with flexible OLED technology...........................................................68
[Supply and demand] Limited supply in 2013 to drive gradual recovery....................................69
VIII. IT sector investment strategy for 2013................................................................................71
[Macroeconomic view] The IT sector in context..........................................................................71
[Global view] Apple vs. SEC .......................................................................................................72
[2013 investment strategy] Weak in 1H, but strong in 2H ..........................................................73
SEC’s supply chain vs. Apple’s supply chain [Top 11 IT stocks] ...............................................74
Semiconductor.............................................................................................................................77
Display .........................................................................................................................................78
Telecom equipment/electronic components ...............................................................................79
IX. Top picks ................................................................................................................................. 80
Samsung Electronics (005930 KS/Buy)......................................................................................80
SK Hynix (000660 KS/Buy) .........................................................................................................83
LG Electronics (066570 KS/Buy) ................................................................................................86
Samsung Electro-Mechanics (009150 KS/Buy)..........................................................................89
Samsung SDI (006400 KS/Buy)..................................................................................................92
SFA Engineering (056190 KQ/Buy) ............................................................................................95
Soulbrain (036830 KQ/Buy) ........................................................................................................98
Duksan Hi-Metal (077360 KQ/Buy)...........................................................................................101
Partron (091700 KQ/Buy)..........................................................................................................104
Nepes (033640 KQ/Buy) ...........................................................................................................106
Simmtech (036710 KQ/Buy) .....................................................................................................109
November 13, 2012 The Age of Transition
4 KDB Daewoo Securities Research
[Prologue] Moving from revolution to evolution
Mobile market: From revolution to evolution
The mobile revolution triggered by AppleÊs iPhone and iPad has become so deeply
entrenched in our everyday lives that it is now hard to find a single person who does not
own a smartphone. As of 2012, there are more than 2bn smartphone users worldwide,
according to the market research firm Gartner.
Since 2010, we have closely followed the changes and innovations that have unfolded in the
IT industry in the context of the mobile revolution, as highlighted in our reports „Tablet PC –
Another megatrend‰ (February 4, 2010), „2011 Outlook: Mobile revolution to prompt
valuation re-rating‰ (December 2, 2010), and „Mobile revolution to bring about a paradigm
shift‰ (December 30, 2011).
The mobile game players we underscored in our 2010 tablet report have already seen their
share prices soar 400~500% in less than two years. However, AppleÊs new iPhone 5 has
been met with criticism for lacking the breakthrough innovation that many had expected.
Without Steve Jobs, will the mobile revolution no longer be what it used to be?
On the contrary, we believe the mobile revolution has entered an evolutionary phase. The
global popularity of PsyÊs „Gangnam Style‰ has been in large part powered by the
widespread use of smartphones and social network services (SNS) (on top of the songÊs
catchy hook). This phenomenon shows how, nowadays, new changes, innovations, content,
and trends resonate on a global scale.
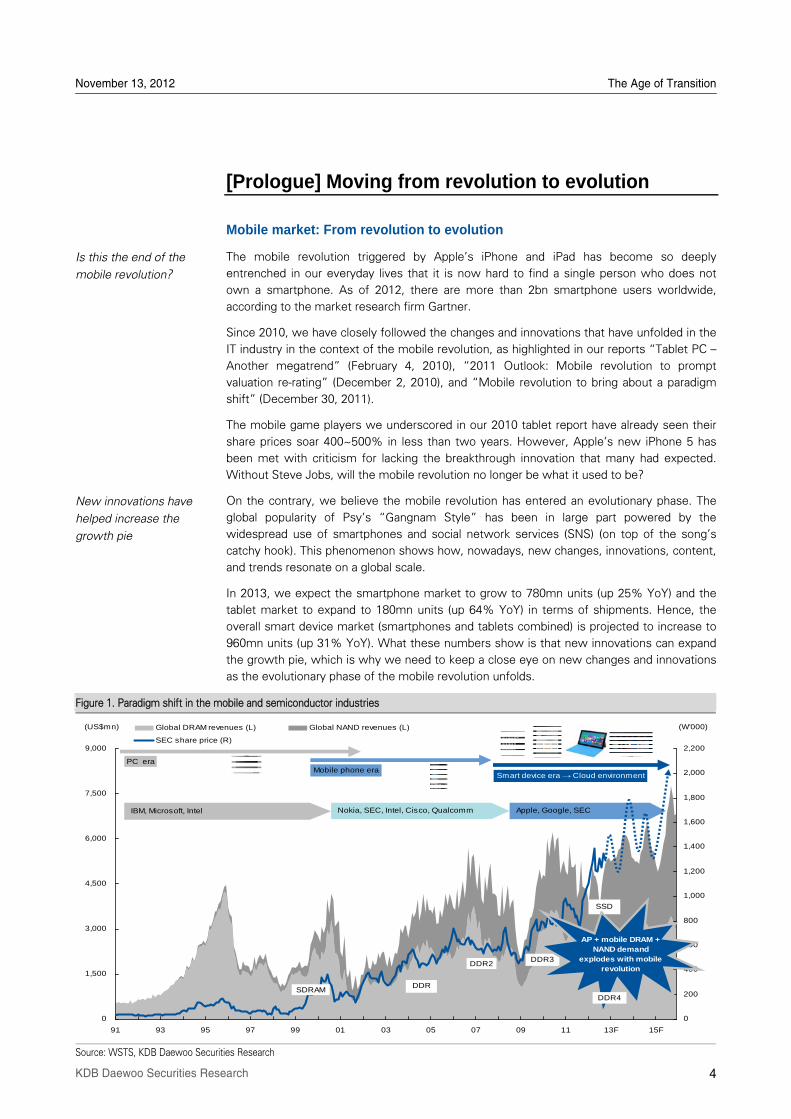
In 2013, we expect the smartphone market to grow to 780mn units (up 25% YoY) and the
tablet market to expand to 180mn units (up 64% YoY) in terms of shipments. Hence, the
overall smart device market (smartphones and tablets combined) is projected to increase to
960mn units (up 31% YoY). What these numbers show is that new innovations can expand
the growth pie, which is why we need to keep a close eye on new changes and innovations
as the evolutionary phase of the mobile revolution unfolds.
Figure 1. Paradigm shift in the mobile and semiconductor industries
Source: WSTS, KDB Daewoo Securities Research
Is this the end of the
mobile revolution?
New innovations have
helped increase the
growth pie
0
1,500
3,000
4,500
6,000
7,500
9,000
91 93 95 97 99 01 03 05 07 09 11 13F 15F
0
200
400
600
800
1,000
1,200
1,400
1,600
1,800
2,000
2,200
Global DRAM revenues (L) Global NAND revenues (L)
SEC share price (R)
(US$mn) (W'000)
SDRAMDDR
DDR2DDR3
PC eraMobile phone era
Smart device era → Cloud environment
Apple, Google, SEC IBM, Microsoft, Intel Nokia, SEC, Intel, Cisco, Qualcomm
SSD
AP + mobile DRAM +NAND demand
explodes with mobilerevolution
DDR4
November 13, 2012 The Age of Transition
5 KDB Daewoo Securities Research
Mobile revolution: A story of disruptive innovation
The Apple-led mobile revolution could be summed up as a story of disruptive innovation – a
process that is still ongoing. This story is not just a linear narrative about growth; it is also a
story about the struggle to survive amid radical changes. Indeed, a disruptive innovator of
the current generation can easily become the one facing disruption in the next. A prime
example of this is the downfall of Nokia brought about by AppleÊs disruptive innovation.
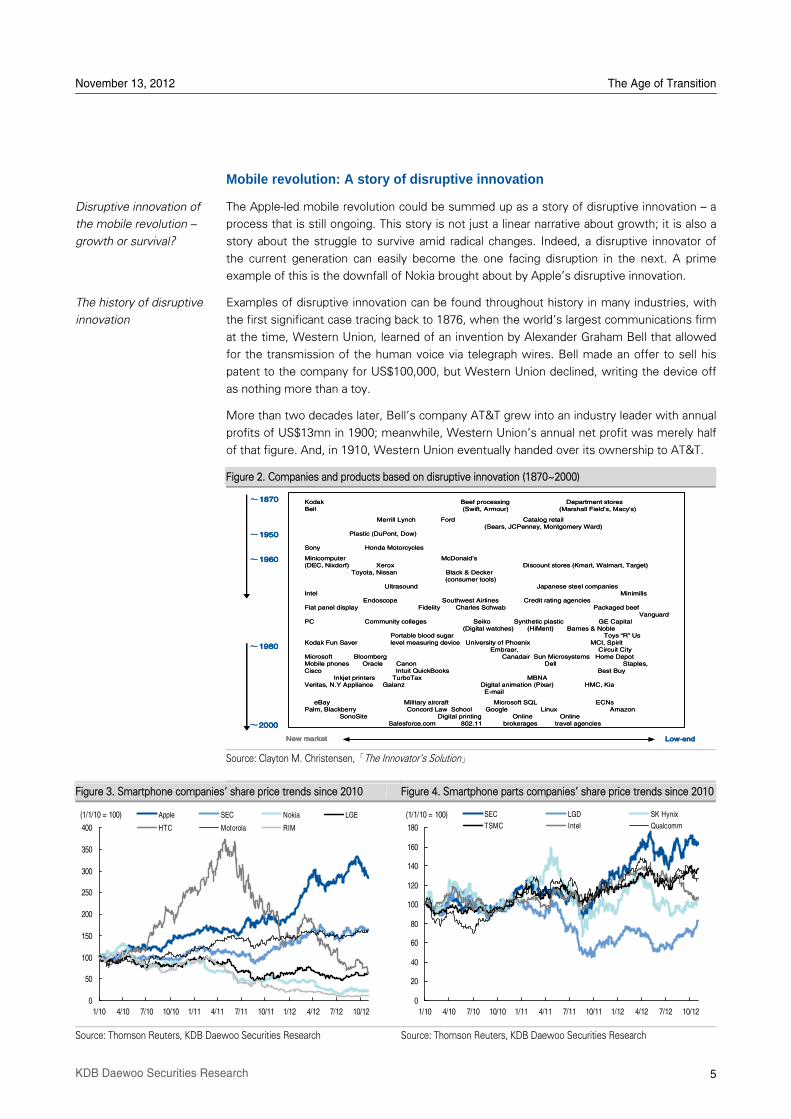
Examples of disruptive innovation can be found throughout history in many industries, with
the first significant case tracing back to 1876, when the worldÊs largest communications firm
at the time, Western Union, learned of an invention by Alexander Graham Bell that allowed
for the transmission of the human voice via telegraph wires. Bell made an offer to sell his
patent to the company for US$100,000, but Western Union declined, writing the device off
as nothing more than a toy.
More than two decades later, BellÊs company AT&T grew into an industry leader with annual
profits of US$13mn in 1900; meanwhile, Western UnionÊs annual net profit was merely half
of that figure. And, in 1910, Western Union eventually handed over its ownership to AT&T.
Figure 2. Companies and products based on disruptive innovation (1870~2000)
Source: Clayton M. Christensen,「The InnovatorÊs Solution」
Figure 3. Smartphone companiesÊ share price trends since 2010 Figure 4. Smartphone parts companiesÊ share price trends since 2010
Source: Thomson Reuters, KDB Daewoo Securities Research Source: Thomson Reuters, KDB Daewoo Securities Research
Disruptive innovation of
the mobile revolution –
growth or survival?
The history of disruptive
innovation
0
50
100
150
200
250
300
350
400
1/10 4/10 7/10 10/10 1/11 4/11 7/11 10/11 1/12 4/12 7/12 10/12
Apple SEC Nokia LGE
HTC Motorola RIM
(1/1/10 = 100)
0
20
40
60
80
100
120
140
160
180
1/10 4/10 7/10 10/10 1/11 4/11 7/11 10/11 1/12 4/12 7/12 10/12
SEC LGD SK Hynix
TSMC Intel Qualcomm
(1/1/10 = 100)
Kodak Beef processing Department storesBell (Swift, Armour) (Marshall FieldÊs, Macy's)
Merrill Lynch Ford Catalog retail(Sears, JCPenney, Montgomery Ward)
Plastic (DuPont, Dow)
Sony Honda Motorcycles
Minicomputer McDonaldÊs (DEC, Nixdorf) Xerox Discount stores (Kmart, Walmart, Target)
Toyota, Nissan Black & Decker(consumer tools)
Ultrasound Japanese steel companiesIntel Minimills
Endoscope Southwest Airlines Credit rating agencies Flat panel display Fidelity Charles Schwab Packaged beef
VanguardPC Community colleges Seiko Synthetic plastic GE Capital
(Digital watches) (HiMent) Barnes & NoblePortable blood sugar Toys „R‰ Us
Kodak Fun Saver level measuring device University of Phoenix MCI, SpiritEmbraer, Circuit City
Microsoft Bloomberg Canadair Sun Microsystems Home DepotMobile phones Oracle Canon Dell Staples,Cisco Intuit QuickBooks Best Buy
Inkjet printers TurboTax MBNAVeritas, N.Y Appliance Galanz Digital animation (Pixar) HMC, Kia
eBay Military aircraft Microsoft SQL ECNsPalm, Blackberry Concord Law School Google Linux Amazon
SonoSite Digital printing Online OnlineSalesforce.com 802.11 brokerages travel agencies
New market Low-end
∼1870
∼1950
∼1960
∼1980
∼2000
November 13, 2012 The Age of Transition
6 KDB Daewoo Securities Research
Strategic decisions: Lessons from Intel of the 1980s
For disruptive innovation to be successful, it must be supported by strategic decision-making.
Here, we look at the key takeaways that SEC can learn from: 1) the disruptive innovation
that triggered the collapse of Nokia, which had ruled the global handset market from the late
1990s to the early 21st century; and 2) the strategic decision of Intel to move away from
memory products and into CPUs in the 1980s. We think the situation facing present-day SEC
share similarities to what Nokia went through in 1999 and Intel in 1980.
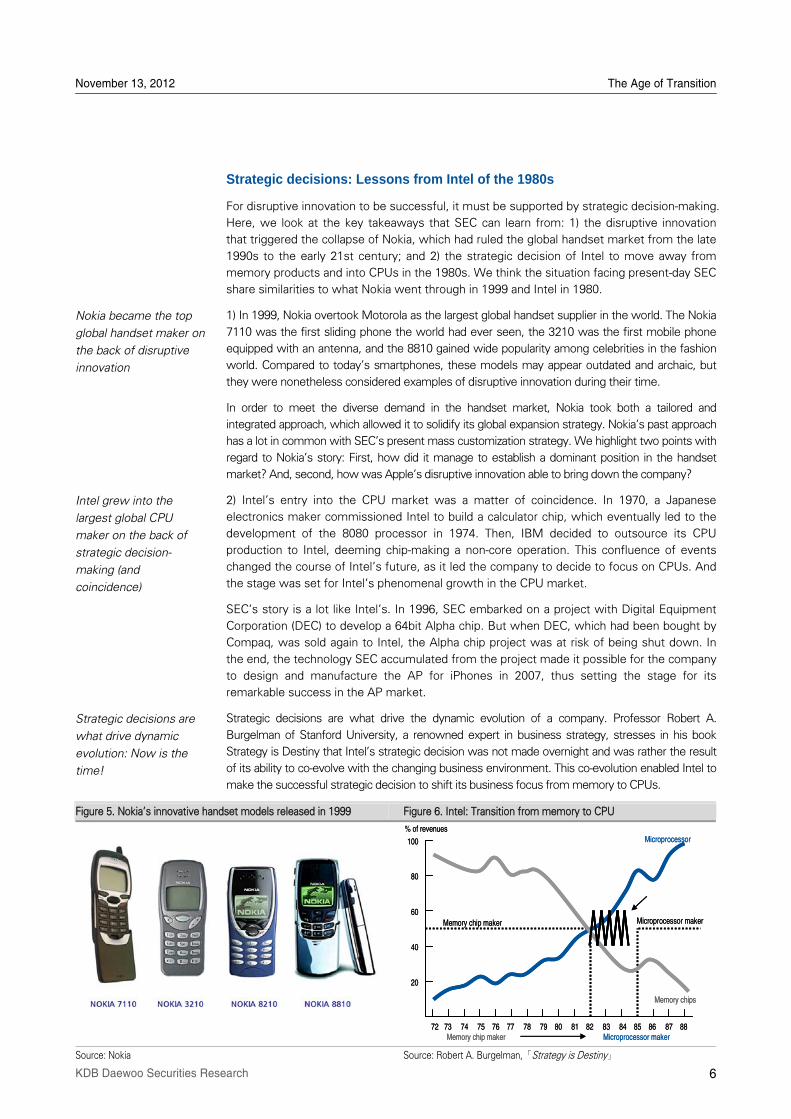
1) In 1999, Nokia overtook Motorola as the largest global handset supplier in the world. The Nokia
7110 was the first sliding phone the world had ever seen, the 3210 was the first mobile phone
equipped with an antenna, and the 8810 gained wide popularity among celebrities in the fashion
world. Compared to todayÊs smartphones, these models may appear outdated and archaic, but
they were nonetheless considered examples of disruptive innovation during their time.
In order to meet the diverse demand in the handset market, Nokia took both a tailored and
integrated approach, which allowed it to solidify its global expansion strategy. NokiaÊs past approach
has a lot in common with SECÊs present mass customization strategy. We highlight two points with
regard to NokiaÊs story: First, how did it manage to establish a dominant position in the handset
market? And, second, how was AppleÊs disruptive innovation able to bring down the company?
2) IntelÊs entry into the CPU market was a matter of coincidence. In 1970, a Japanese
electronics maker commissioned Intel to build a calculator chip, which eventually led to the
development of the 8080 processor in 1974. Then, IBM decided to outsource its CPU
production to Intel, deeming chip-making a non-core operation. This confluence of events
changed the course of IntelÊs future, as it led the company to decide to focus on CPUs. And
the stage was set for IntelÊs phenomenal growth in the CPU market.
SECÊs story is a lot like IntelÊs. In 1996, SEC embarked on a project with Digital Equipment
Corporation (DEC) to develop a 64bit Alpha chip. But when DEC, which had been bought by
Compaq, was sold again to Intel, the Alpha chip project was at risk of being shut down. In
the end, the technology SEC accumulated from the project made it possible for the company
to design and manufacture the AP for iPhones in 2007, thus setting the stage for its
remarkable success in the AP market.
Strategic decisions are what drive the dynamic evolution of a company. Professor Robert A.
Burgelman of Stanford University, a renowned expert in business strategy, stresses in his book
Strategy is Destiny that IntelÊs strategic decision was not made overnight and was rather the result
of its ability to co-evolve with the changing business environment. This co-evolution enabled Intel to
make the successful strategic decision to shift its business focus from memory to CPUs.
Figure 5. NokiaÊs innovative handset models released in 1999 Figure 6. Intel: Transition from memory to CPU
Source: Nokia Source: Robert A. Burgelman,「Strategy is Destiny」
Nokia became the top
global handset maker on
the back of disruptive
innovation
Intel grew into the
largest global CPU
maker on the back of
strategic decision-
making (and
coincidence)
Strategic decisions are
what drive dynamic
evolution: Now is the
time!
72 73 74 75 76 77 78 79 80 81 82 83 84 85 86 87 88
100
80
60
40
20
% of revenues
Microprocessor makerMemory chip maker
Microprocessor
Memory chips
Memory chip maker Microprocessor maker72 73 74 75 76 77 78 79 80 81 82 83 84 85 86 87 88
100
80
60
40
20
% of revenues
Microprocessor makerMemory chip maker
Microprocessor
Memory chips
Memory chip maker Microprocessor maker
November 13, 2012 The Age of Transition
7 KDB Daewoo Securities Research
Gearing up for the next disruptive innovation
Then what will the next disruptive innovation look like? The mobile revolution triggered by
AppleÊs disruptive innovation continues to evolve into more advanced technologies. We
believe the immense potential of the disruptive innovation we witnessed in the mobile
market will once again prove itself in the smart TV market. The growth of smart TVs should
help create a stronger cloud environment, heralding the arrival of the age of big data. At this
very moment, all of the data and traces we leave on our smartphones are piling up at Apple
and Google data centers located throughout the world. We believe all of this marks a
tentative step towards the next big disruptive innovation.
Unless Apple and SEC fully prepare themselves for the forthcoming disruptive innovation,
there is no way to tell whether they will avoid the same kind of fate that befell Nokia and
Sony. In particular, leading firms in the software space, such as Google, Amazon, and
Microsoft, may be partners today but foes tomorrow. Therefore, for a hardware-oriented
company like SEC, it is important to get ready for the upcoming disruptive innovation, by: 1)
forming strategic alliances with software providers, 2) strengthening internal capabilities, and
3) pursuing mergers and acquisitions in its core areas.
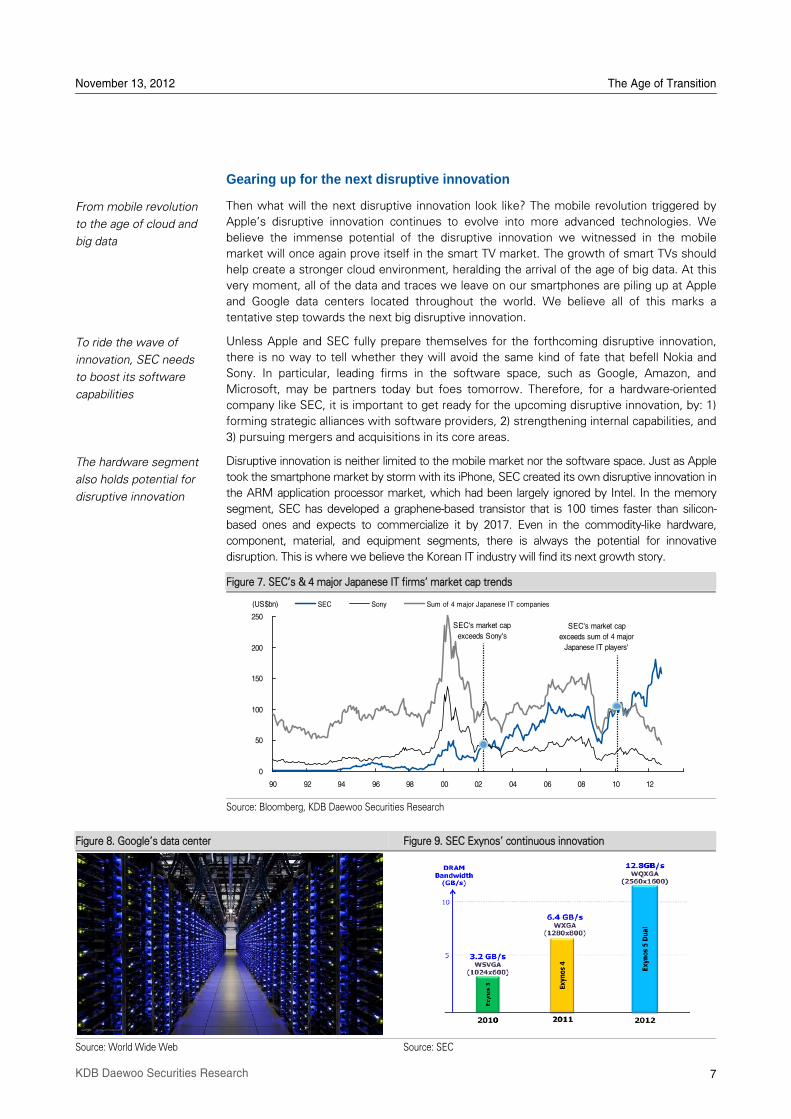
Disruptive innovation is neither limited to the mobile market nor the software space. Just as Apple
took the smartphone market by storm with its iPhone, SEC created its own disruptive innovation in
the ARM application processor market, which had been largely ignored by Intel. In the memory
segment, SEC has developed a graphene-based transistor that is 100 times faster than silicon-
based ones and expects to commercialize it by 2017. Even in the commodity-like hardware,
component, material, and equipment segments, there is always the potential for innovative
disruption. This is where we believe the Korean IT industry will find its next growth story.
Figure 7. SECÊs & 4 major Japanese IT firmsÊ market cap trends
Source: Bloomberg, KDB Daewoo Securities Research
Figure 8. GoogleÊs data center Figure 9. SEC ExynosÊ continuous innovation
Source: World Wide Web Source: SEC
From mobile revolution
to the age of cloud and
big data
To ride the wave of
innovation, SEC needs
to boost its software
capabilities
The hardware segment
also holds potential for
disruptive innovation
0
50
100
150
200
250
90 92 94 96 98 00 02 04 06 08 10 12
SEC Sony Sum of 4 major Japanese IT companies
SEC's market cap
exceeds Sony's
SEC's market cap
exceeds sum of 4 major
Japanese IT players'
(US$bn)
November 13, 2012 The Age of Transition
8 KDB Daewoo Securities Research
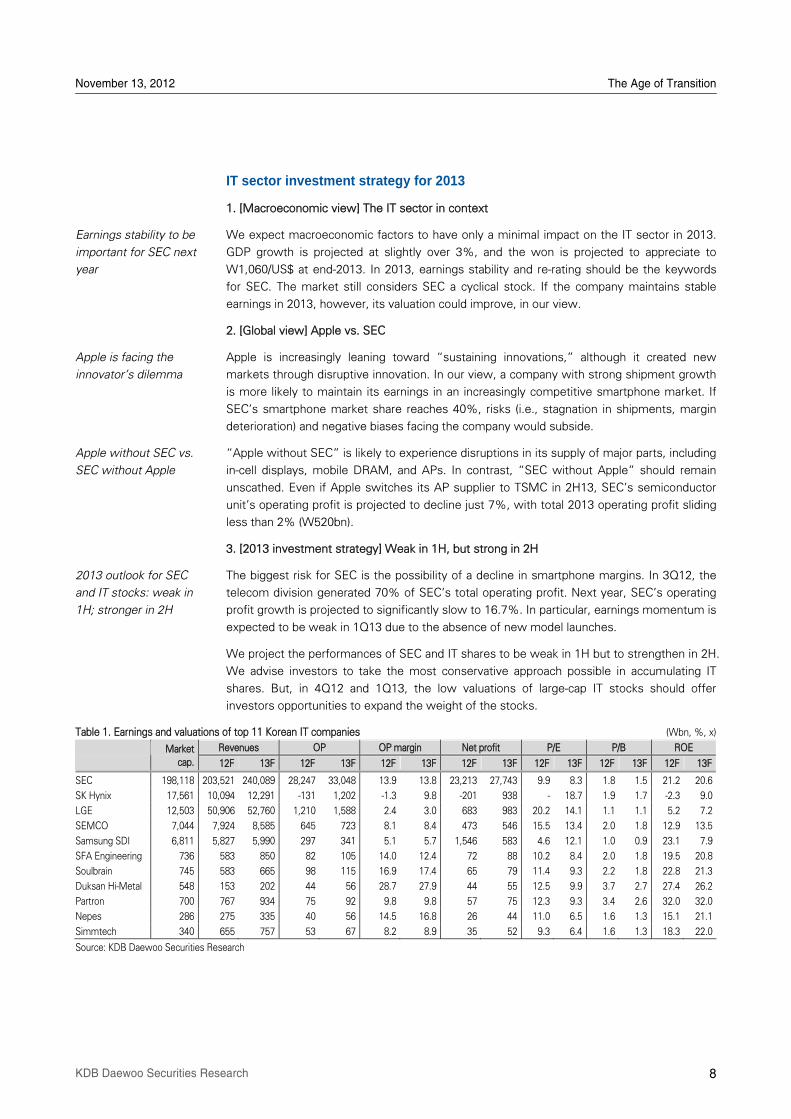
IT sector investment strategy for 2013
1. [Macroeconomic view] The IT sector in context
We expect macroeconomic factors to have only a minimal impact on the IT sector in 2013.
GDP growth is projected at slightly over 3%, and the won is projected to appreciate to
W1,060/US$ at end-2013. In 2013, earnings stability and re-rating should be the keywords
for SEC. The market still considers SEC a cyclical stock. If the company maintains stable
earnings in 2013, however, its valuation could improve, in our view.
2. [Global view] Apple vs. SEC
Apple is increasingly leaning toward „sustaining innovations,‰ although it created new
markets through disruptive innovation. In our view, a company with strong shipment growth
is more likely to maintain its earnings in an increasingly competitive smartphone market. If
SECÊs smartphone market share reaches 40%, risks (i.e., stagnation in shipments, margin
deterioration) and negative biases facing the company would subside.
„Apple without SEC‰ is likely to experience disruptions in its supply of major parts, including
in-cell displays, mobile DRAM, and APs. In contrast, „SEC without Apple‰ should remain
unscathed. Even if Apple switches its AP supplier to TSMC in 2H13, SECÊs semiconductor
unitÊs operating profit is projected to decline just 7%, with total 2013 operating profit sliding
less than 2% (W520bn).
3. [2013 investment strategy] Weak in 1H, but strong in 2H
The biggest risk for SEC is the possibility of a decline in smartphone margins. In 3Q12, the
telecom division generated 70% of SECÊs total operating profit. Next year, SECÊs operating
profit growth is projected to significantly slow to 16.7%. In particular, earnings momentum is
expected to be weak in 1Q13 due to the absence of new model launches.
We project the performances of SEC and IT shares to be weak in 1H but to strengthen in 2H.
We advise investors to take the most conservative approach possible in accumulating IT
shares. But, in 4Q12 and 1Q13, the low valuations of large-cap IT stocks should offer
investors opportunities to expand the weight of the stocks.
Table 1. Earnings and valuations of top 11 Korean IT companies (Wbn, %, x)
Revenues OP OP margin Net profit P/E P/B ROE
Market
cap. 12F 13F 12F 13F 12F 13F 12F 13F 12F 13F 12F 13F 12F 13F
SEC 198,118 203,521 240,089 28,247 33,048 13.9 13.8 23,213 27,743 9.9 8.3 1.8 1.5 21.2 20.6
SK Hynix 17,561 10,094 12,291 -131 1,202 -1.3 9.8 -201 938 - 18.7 1.9 1.7 -2.3 9.0
LGE 12,503 50,906 52,760 1,210 1,588 2.4 3.0 683 983 20.2 14.1 1.1 1.1 5.2 7.2
SEMCO 7,044 7,924 8,585 645 723 8.1 8.4 473 546 15.5 13.4 2.0 1.8 12.9 13.5
Samsung SDI 6,811 5,827 5,990 297 341 5.1 5.7 1,546 583 4.6 12.1 1.0 0.9 23.1 7.9
SFA Engineering 736 583 850 82 105 14.0 12.4 72 88 10.2 8.4 2.0 1.8 19.5 20.8
Soulbrain 745 583 665 98 115 16.9 17.4 65 79 11.4 9.3 2.2 1.8 22.8 21.3
Duksan Hi-Metal 548 153 202 44 56 28.7 27.9 44 55 12.5 9.9 3.7 2.7 27.4 26.2
Partron 700 767 934 75 92 9.8 9.8 57 75 12.3 9.3 3.4 2.6 32.0 32.0
Nepes 286 275 335 40 56 14.5 16.8 26 44 11.0 6.5 1.6 1.3 15.1 21.1
Simmtech 340 655 757 53 67 8.2 8.9 35 52 9.3 6.4 1.6 1.3 18.3 22.0
Source: KDB Daewoo Securities Research
Earnings stability to be
important for SEC next
year
Apple is facing the
innovatorÊs dilemma
Apple without SEC vs.
SEC without Apple
2013 outlook for SEC
and IT stocks: weak in
1H; stronger in 2H
November 13, 2012 The Age of Transition
9 KDB Daewoo Securities Research
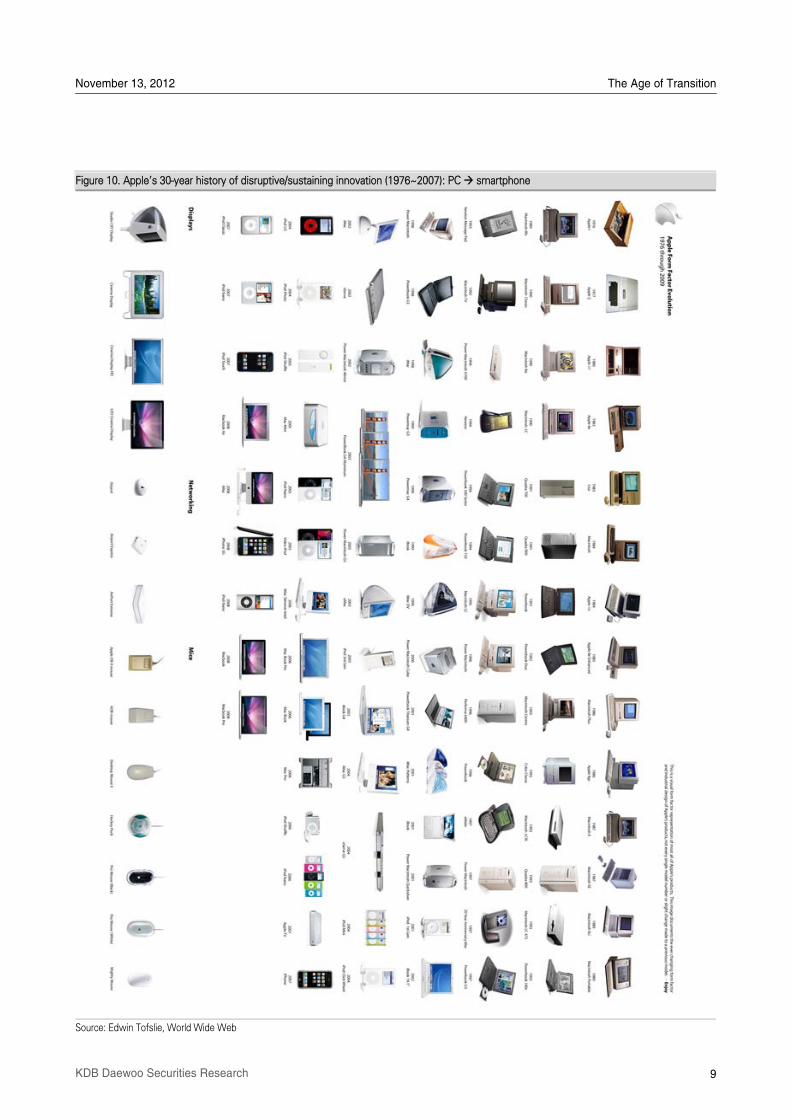
Figure 10. AppleÊs 30-year history of disruptive/sustaining innovation (1976~2007): PC smartphone
Source: Edwin Tofslie, World Wide Web
November 13, 2012 The Age of Transition
10 KDB Daewoo Securities Research
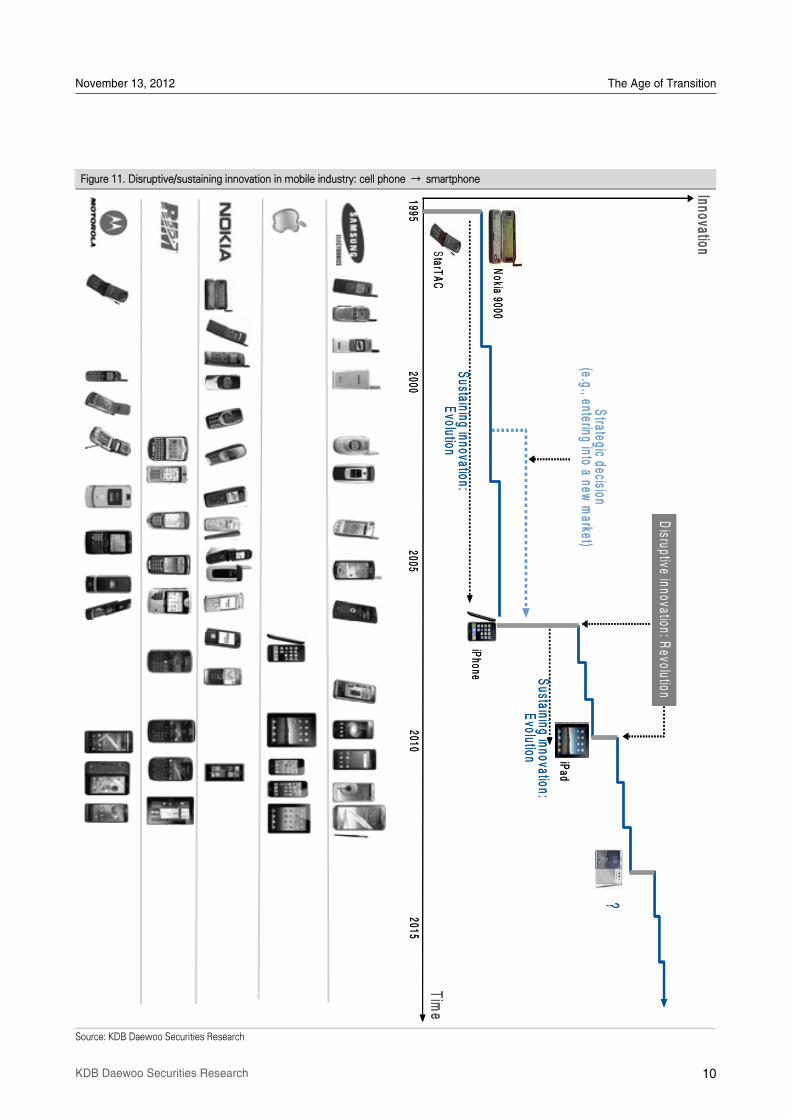
Figure 11. Disruptive/sustaining innovation in mobile industry: cell phone → smartphone
Source: KDB Daewoo Securities Research
Strategic decision
(e.g., entering into a new m
arket)
Sustaining innovation:
Evolution
Sustaining innovation:
Evolution
Innovation
20002010
20051995
iPad
iPhone
Nokia 9000
StarT
AC
?
2015
Time
Disruptive innovation: R
evolution
Strategic decision
(e.g., entering into a new m
arket)
Sustaining innovation:
Evolution
Sustaining innovation:
Evolution
Innovation
20002010
20051995
iPad
iPhone
Nokia 9000
StarT
AC
?
2015
Time
Disruptive innovation: R
evolution
11 KDB Daewoo Securities Research
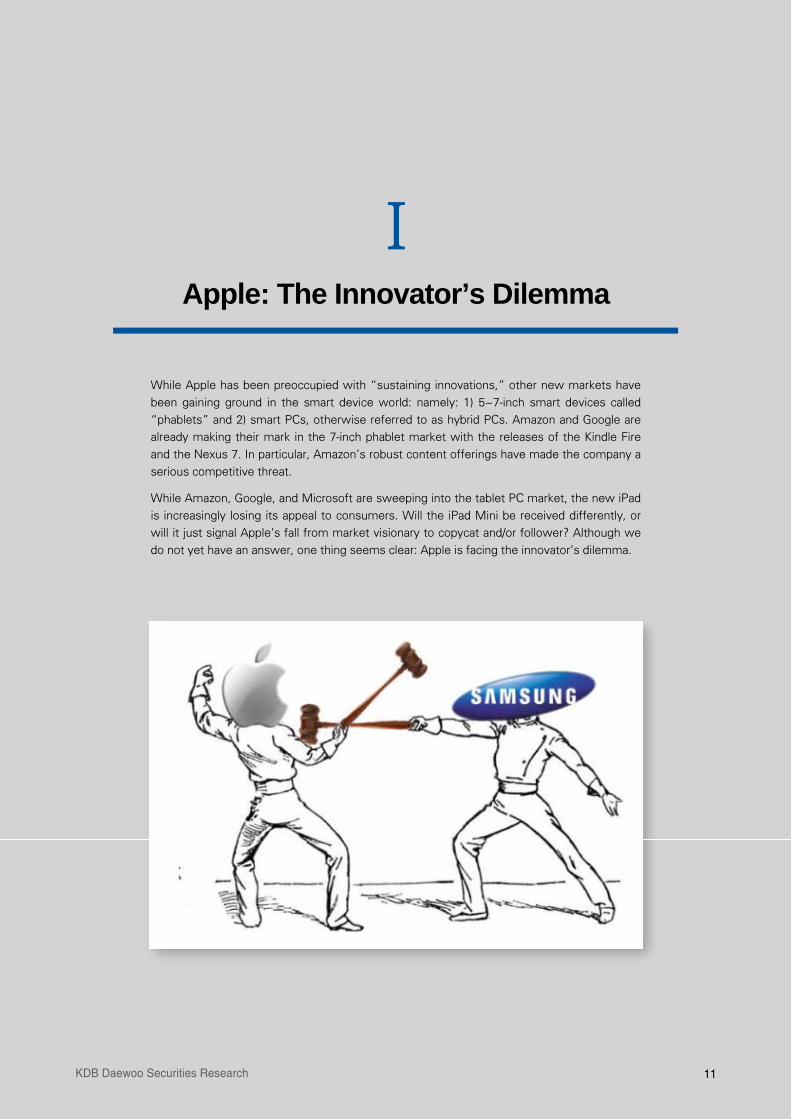
I Apple: The Innovator’s Dilemma
While Apple has been preoccupied with „sustaining innovations,‰ other new markets have
been gaining ground in the smart device world: namely: 1) 5~7-inch smart devices called
„phablets‰ and 2) smart PCs, otherwise referred to as hybrid PCs. Amazon and Google are
already making their mark in the 7-inch phablet market with the releases of the Kindle Fire
and the Nexus 7. In particular, AmazonÊs robust content offerings have made the company a
serious competitive threat.
While Amazon, Google, and Microsoft are sweeping into the tablet PC market, the new iPad
is increasingly losing its appeal to consumers. Will the iPad Mini be received differently, or
will it just signal AppleÊs fall from market visionary to copycat and/or follower? Although we
do not yet have an answer, one thing seems clear: Apple is facing the innovatorÊs dilemma.
November 13, 2012 The Age of Transition
12 KDB Daewoo Securities Research
I. Apple: “The innovator’s dilemma”
Why the “innovator’s dilemma?”
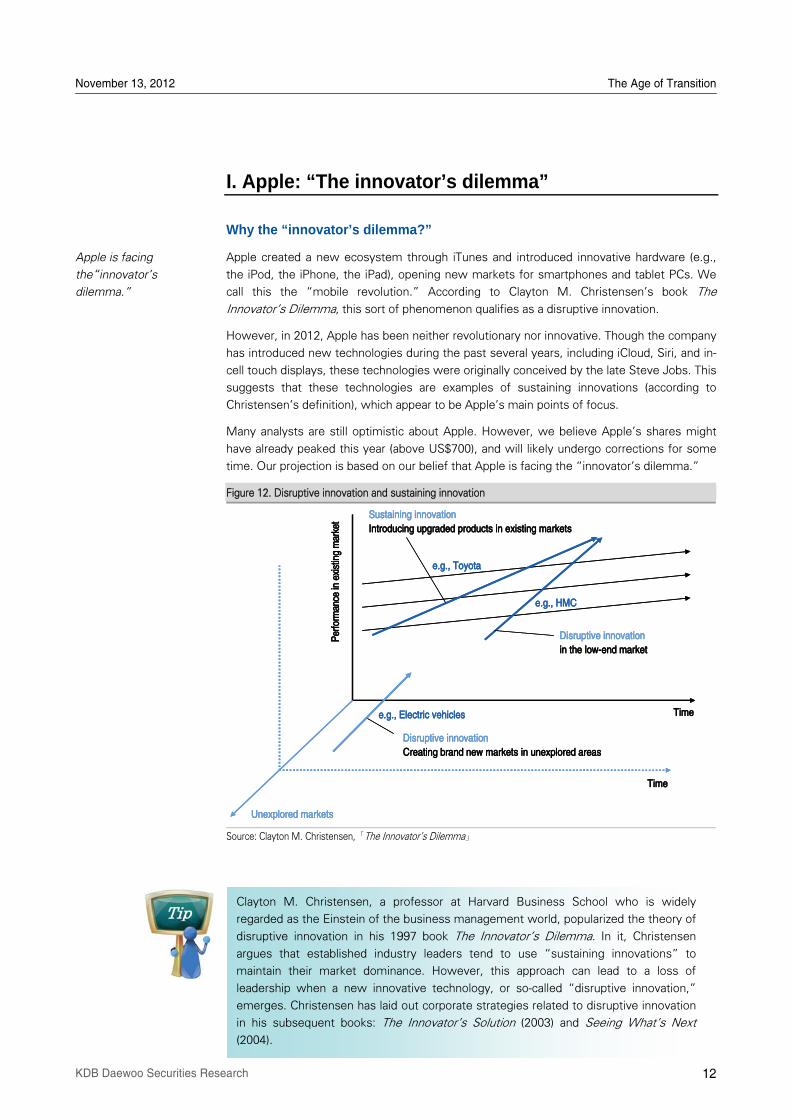
Apple created a new ecosystem through iTunes and introduced innovative hardware (e.g.,
the iPod, the iPhone, the iPad), opening new markets for smartphones and tablet PCs. We
call this the „mobile revolution.‰ According to Clayton M. ChristensenÊs book The
InnovatorÊs Dilemma, this sort of phenomenon qualifies as a disruptive innovation.
However, in 2012, Apple has been neither revolutionary nor innovative. Though the company
has introduced new technologies during the past several years, including iCloud, Siri, and in-
cell touch displays, these technologies were originally conceived by the late Steve Jobs. This
suggests that these technologies are examples of sustaining innovations (according to
ChristensenÊs definition), which appear to be AppleÊs main points of focus.
Many analysts are still optimistic about Apple. However, we believe AppleÊs shares might
have already peaked this year (above US$700), and will likely undergo corrections for some
time. Our projection is based on our belief that Apple is facing the „innovatorÊs dilemma.‰
Figure 12. Disruptive innovation and sustaining innovation
Source: Clayton M. Christensen,「The InnovatorÊs Dilemma」
Apple is facing
the„innovatorÊs
dilemma.‰
Clayton M. Christensen, a professor at Harvard Business School who is widely
regarded as the Einstein of the business management world, popularized the theory of
disruptive innovation in his 1997 book The InnovatorÊs Dilemma. In it, Christensen
argues that established industry leaders tend to use „sustaining innovations‰ to
maintain their market dominance. However, this approach can lead to a loss of
leadership when a new innovative technology, or so-called „disruptive innovation,‰
emerges. Christensen has laid out corporate strategies related to disruptive innovation
in his subsequent books: The InnovatorÊs Solution (2003) and Seeing WhatÊs Next
(2004).
Disruptive innovation
Creating brand new markets in unexplored areas
e.g., Electric vehicles
Unexplored markets
Per
form
ance
in e
xist
ing
mar
ket
e.g., Toyota
e.g., HMC
Disruptive innovation
in the low-end market
Time
Time
Sustaining innovation
Introducing upgraded products in existing markets
Disruptive innovation
Creating brand new markets in unexplored areas
e.g., Electric vehicles
Unexplored markets
Per
form
ance
in e
xist
ing
mar
ket
e.g., Toyota
e.g., HMC
Disruptive innovation
in the low-end market
Time
Time
Sustaining innovation
Introducing upgraded products in existing markets
November 13, 2012 The Age of Transition
13 KDB Daewoo Securities Research
Two issues facing Apple
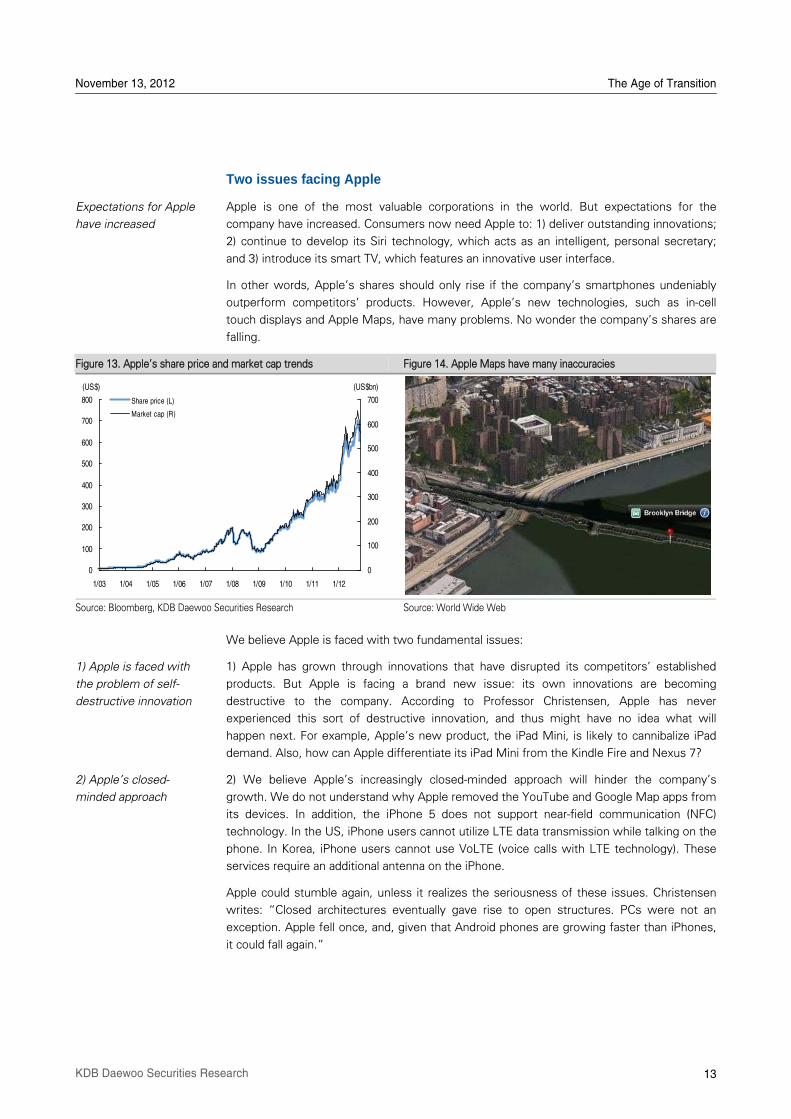
Apple is one of the most valuable corporations in the world. But expectations for the
company have increased. Consumers now need Apple to: 1) deliver outstanding innovations;
2) continue to develop its Siri technology, which acts as an intelligent, personal secretary;
and 3) introduce its smart TV, which features an innovative user interface.
In other words, AppleÊs shares should only rise if the companyÊs smartphones undeniably
outperform competitorsÊ products. However, AppleÊs new technologies, such as in-cell
touch displays and Apple Maps, have many problems. No wonder the companyÊs shares are
falling.
Figure 13. AppleÊs share price and market cap trends Figure 14. Apple Maps have many inaccuracies
Source: Bloomberg, KDB Daewoo Securities Research Source: World Wide Web
We believe Apple is faced with two fundamental issues:
1) Apple has grown through innovations that have disrupted its competitorsÊ established
products. But Apple is facing a brand new issue: its own innovations are becoming
destructive to the company. According to Professor Christensen, Apple has never
experienced this sort of destructive innovation, and thus might have no idea what will
happen next. For example, AppleÊs new product, the iPad Mini, is likely to cannibalize iPad
demand. Also, how can Apple differentiate its iPad Mini from the Kindle Fire and Nexus 7?
2) We believe AppleÊs increasingly closed-minded approach will hinder the companyÊs
growth. We do not understand why Apple removed the YouTube and Google Map apps from
its devices. In addition, the iPhone 5 does not support near-field communication (NFC)
technology. In the US, iPhone users cannot utilize LTE data transmission while talking on the
phone. In Korea, iPhone users cannot use VoLTE (voice calls with LTE technology). These
services require an additional antenna on the iPhone.
Apple could stumble again, unless it realizes the seriousness of these issues. Christensen
writes: „Closed architectures eventually gave rise to open structures. PCs were not an
exception. Apple fell once, and, given that Android phones are growing faster than iPhones,
it could fall again.‰
Expectations for Apple
have increased
1) Apple is faced with
the problem of self-
destructive innovation
2) AppleÊs closed-
minded approach
0
100
200
300
400
500
600
700
800
1/03 1/04 1/05 1/06 1/07 1/08 1/09 1/10 1/11 1/12
0
100
200
300
400
500
600
700Share price (L)
Market cap (R)
(US$) (US$bn)
November 13, 2012 The Age of Transition
14 KDB Daewoo Securities Research
Growth of new smart devices
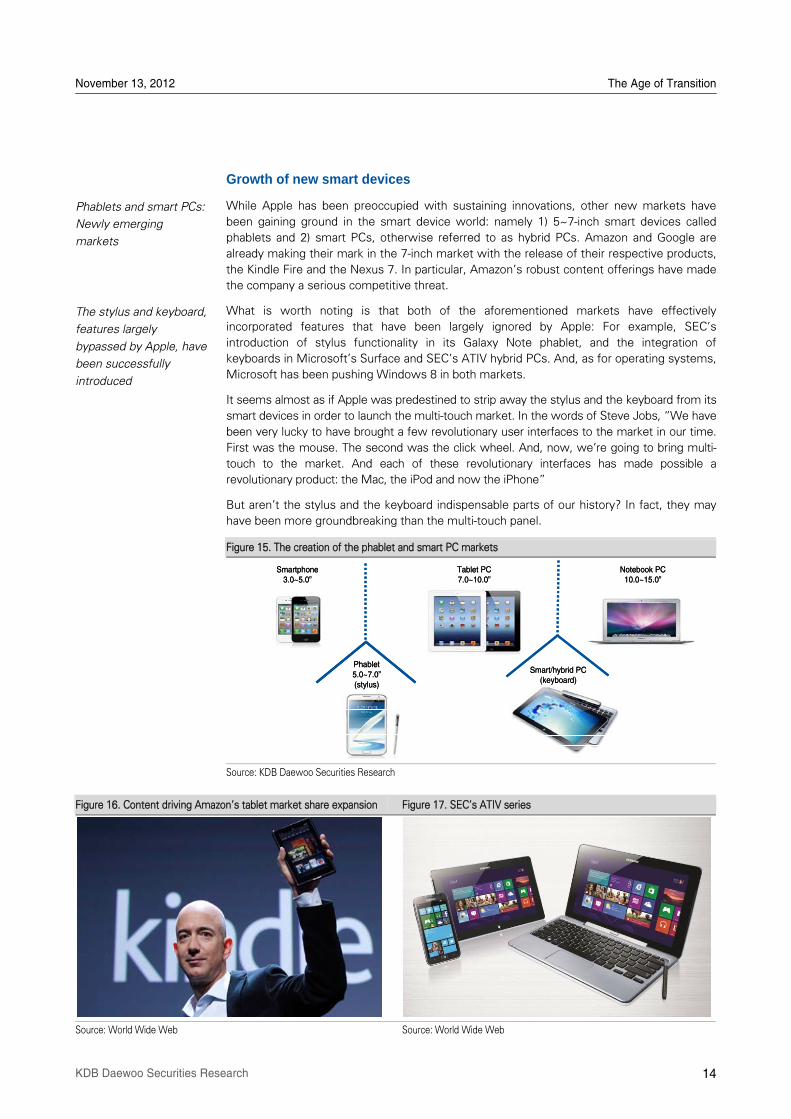
While Apple has been preoccupied with sustaining innovations, other new markets have
been gaining ground in the smart device world: namely 1) 5~7-inch smart devices called
phablets and 2) smart PCs, otherwise referred to as hybrid PCs. Amazon and Google are
already making their mark in the 7-inch market with the release of their respective products,
the Kindle Fire and the Nexus 7. In particular, AmazonÊs robust content offerings have made
the company a serious competitive threat.
What is worth noting is that both of the aforementioned markets have effectively
incorporated features that have been largely ignored by Apple: For example, SECÊs
introduction of stylus functionality in its Galaxy Note phablet, and the integration of
keyboards in MicrosoftÊs Surface and SECÊs ATIV hybrid PCs. And, as for operating systems,
Microsoft has been pushing Windows 8 in both markets.
It seems almost as if Apple was predestined to strip away the stylus and the keyboard from its
smart devices in order to launch the multi-touch market. In the words of Steve Jobs, „We have
been very lucky to have brought a few revolutionary user interfaces to the market in our time.
First was the mouse. The second was the click wheel. And, now, we're going to bring multi-
touch to the market. And each of these revolutionary interfaces has made possible a
revolutionary product: the Mac, the iPod and now the iPhone‰
But arenÊt the stylus and the keyboard indispensable parts of our history? In fact, they may
have been more groundbreaking than the multi-touch panel.
Figure 15. The creation of the phablet and smart PC markets
Source: KDB Daewoo Securities Research
Figure 16. Content driving AmazonÊs tablet market share expansion Figure 17. SECÊs ATIV series
Source: World Wide Web Source: World Wide Web
Phablets and smart PCs:
Newly emerging
markets
The stylus and keyboard,
features largely
bypassed by Apple, have
been successfully
introduced
Smartphone3.0~5.0‰
Tablet PC7.0~10.0‰
Notebook PC10.0~15.0‰
Smart/hybrid PC(keyboard)
Phablet5.0~7.0‰(stylus)
Smartphone3.0~5.0‰
Tablet PC7.0~10.0‰
Notebook PC10.0~15.0‰
Smart/hybrid PC(keyboard)
Phablet5.0~7.0‰(stylus)
November 13, 2012 The Age of Transition
15 KDB Daewoo Securities Research
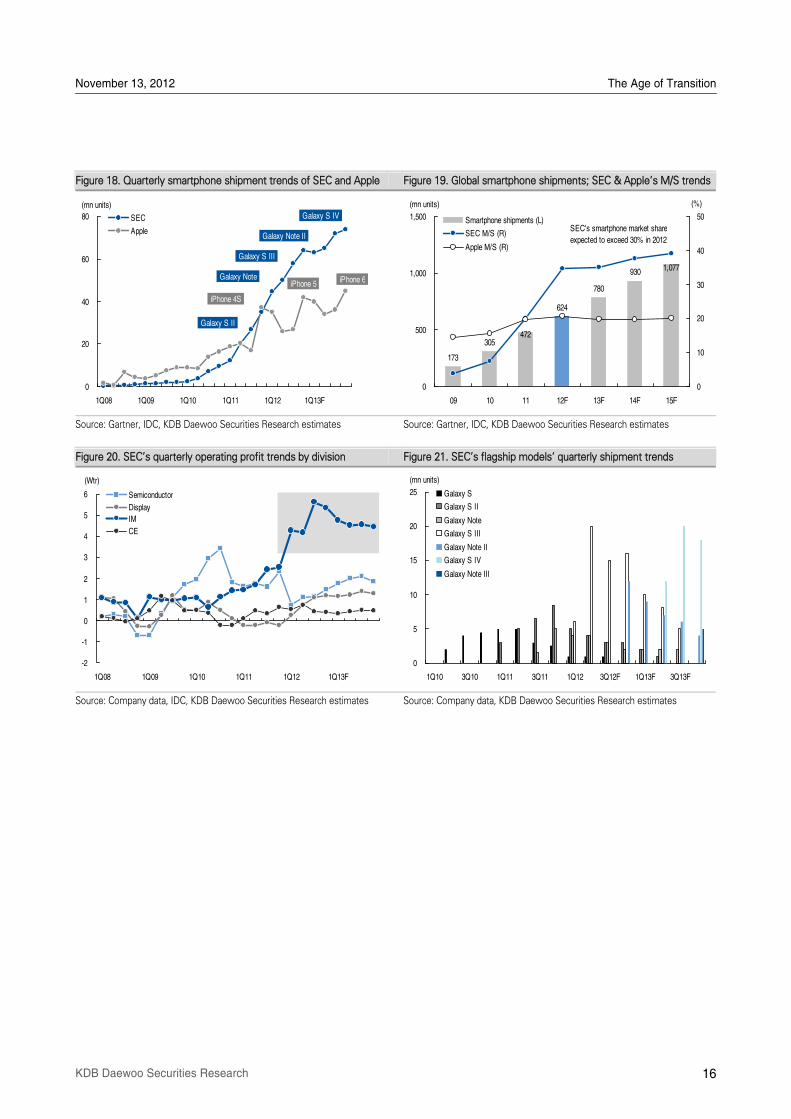
SEC’s differentiated smartphone lineup
The strategic differences between SEC and Apple have become pronounced in 2012. Given
that smartphone demand is projected to increase by 33% YoY this year, SECÊs differentiated
strategy of diversification will likely stand out.
Early this year, we believed that competition between SEC and Apple would be
characterized simply by a battle between the Galaxy S III and the iPhone 5. However, SEC
has moved more quickly than expected following its launch of the Galaxy Note, establishing
a high-end smartphone lineup of the Galaxy Note, Galaxy S III, and Galaxy Note II. If SEC
releases the Galaxy S IV early next year, the company will establish a track record of rolling
out new models every one or two quarters.
In comparison, AppleÊs strategy of launching a new model only once a year seems to be
causing the company to lag behind smartphone demand growth. The launch of the iPhone 5
should be too late despite consumersÊ desire to see a new iPhone model as soon as
possible. This strategic difference has led to SECÊs recent overwhelming edge in
smartphone shipments.
Some Investors believe that the launch of the iPhone 5 will dent Galaxy S III sales. However,
we believe that the sales volume of the Galaxy S III will not plunge on the rollout of the new
iPhone model, as the innovations that the Galaxy S III features are different from those of
the iPhone 5. Consumers who think that a four-inch screen is the greatest downside to the
iPhone are unlikely to buy the iPhone 5.
Diversification: SECÊs
strategic differentiation
AppleÊs new product
launch strategy is not
keeping up with
smartphone demand
growth
The innovations that the
Galaxy S III features are
different from those of
the iPhone 5
November 13, 2012 The Age of Transition
16 KDB Daewoo Securities Research
Figure 18. Quarterly smartphone shipment trends of SEC and Apple Figure 19. Global smartphone shipments; SEC & AppleÊs M/S trends
Source: Gartner, IDC, KDB Daewoo Securities Research estimates Source: Gartner, IDC, KDB Daewoo Securities Research estimates
Figure 20. SECÊs quarterly operating profit trends by division Figure 21. SECÊs flagship modelsÊ quarterly shipment trends
Source: Company data, IDC, KDB Daewoo Securities Research estimates Source: Company data, KDB Daewoo Securities Research estimates
0
5
10
15
20
25
1Q10 3Q10 1Q11 3Q11 1Q12 3Q12F 1Q13F 3Q13F
Galaxy S
Galaxy S II
Galaxy Note
Galaxy S III
Galaxy Note II
Galaxy S IV
Galaxy Note III
(mn units)
0
20
40
60
80
1Q08 1Q09 1Q10 1Q11 1Q12 1Q13F
SEC
Apple
(mn units)
iPhone 4S
Galaxy Note
Galaxy S II
Galaxy S III
iPhone 5
Galaxy Note II
Galaxy S IV
iPhone 6
173
305
780
930
472
624
1,077
0
500
1,000
1,500
09 10 11 12F 13F 14F 15F
0
10
20
30
40
50Smartphone shipments (L)
SEC M/S (R)
Apple M/S (R)
(mn units) (%)
SEC's smartphone market share
expected to exceed 30% in 2012
-2
-1
0
1
2
3
4
5
6
1Q08 1Q09 1Q10 1Q11 1Q12 1Q13F
(Wtr)
Semiconductor
Display
IM
CE
November 13, 2012 The Age of Transition
17 KDB Daewoo Securities Research
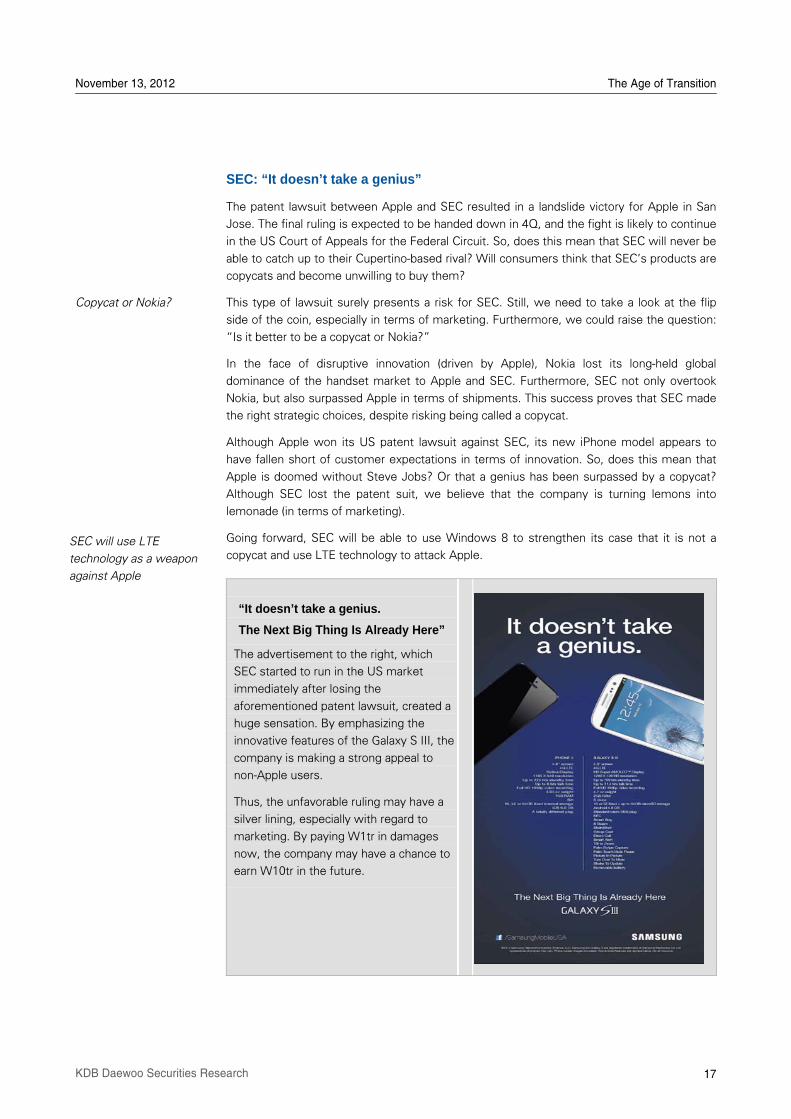
SEC: “It doesn’t take a genius”
The patent lawsuit between Apple and SEC resulted in a landslide victory for Apple in San
Jose. The final ruling is expected to be handed down in 4Q, and the fight is likely to continue
in the US Court of Appeals for the Federal Circuit. So, does this mean that SEC will never be
able to catch up to their Cupertino-based rival? Will consumers think that SECÊs products are
copycats and become unwilling to buy them?
This type of lawsuit surely presents a risk for SEC. Still, we need to take a look at the flip
side of the coin, especially in terms of marketing. Furthermore, we could raise the question:
„Is it better to be a copycat or Nokia?‰
In the face of disruptive innovation (driven by Apple), Nokia lost its long-held global
dominance of the handset market to Apple and SEC. Furthermore, SEC not only overtook
Nokia, but also surpassed Apple in terms of shipments. This success proves that SEC made
the right strategic choices, despite risking being called a copycat.
Although Apple won its US patent lawsuit against SEC, its new iPhone model appears to
have fallen short of customer expectations in terms of innovation. So, does this mean that
Apple is doomed without Steve Jobs? Or that a genius has been surpassed by a copycat?
Although SEC lost the patent suit, we believe that the company is turning lemons into
lemonade (in terms of marketing).
Going forward, SEC will be able to use Windows 8 to strengthen its case that it is not a
copycat and use LTE technology to attack Apple.
“It doesn’t take a genius.
The Next Big Thing Is Already Here”
The advertisement to the right, which
SEC started to run in the US market
immediately after losing the
aforementioned patent lawsuit, created a
huge sensation. By emphasizing the
innovative features of the Galaxy S III, the
company is making a strong appeal to
non-Apple users.
Thus, the unfavorable ruling may have a
silver lining, especially with regard to
marketing. By paying W1tr in damages
now, the company may have a chance to
earn W10tr in the future.
Copycat or Nokia?
SEC will use LTE
technology as a weapon
against Apple
November 13, 2012 The Age of Transition
18 KDB Daewoo Securities Research
Innovation from content producers
„Demand is an unusual form of energy that turns many wheels from big to small, from
economies to markets to organizations to our paychecks, here and around the world.
Everything depends on it. Without it, growth slows, economies falter, progress stops.‰
--Adrian J. Slyworzky, Demand
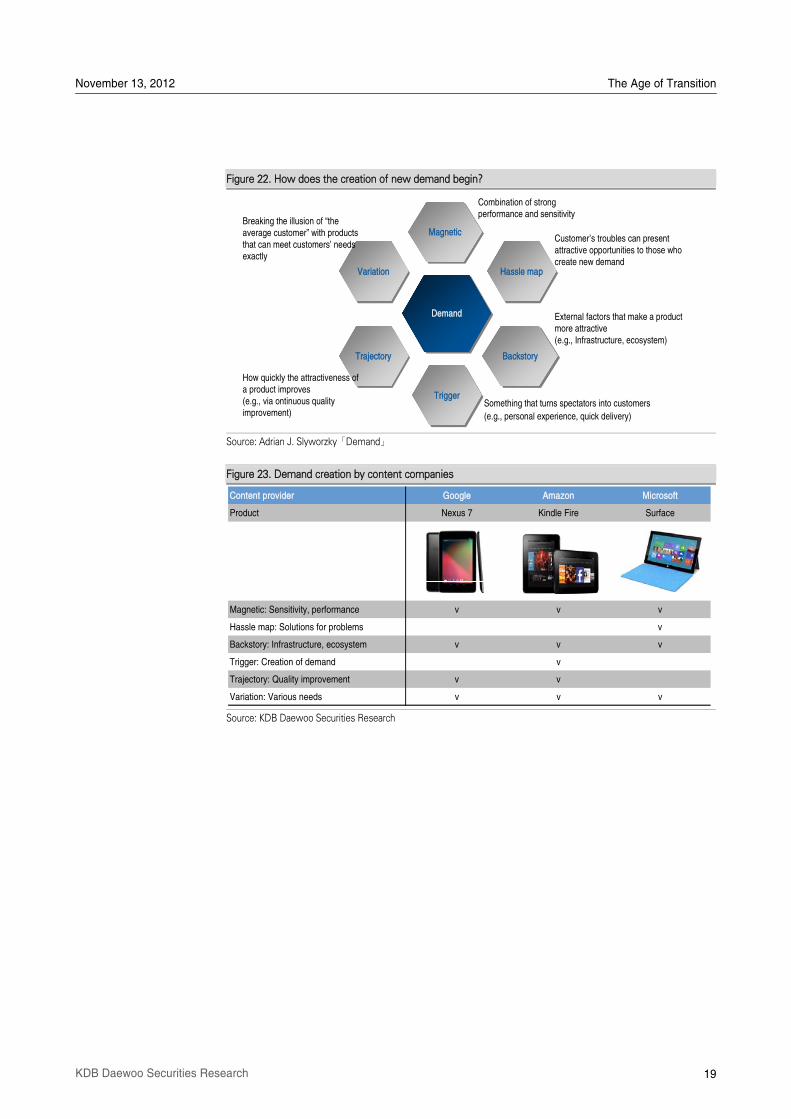
In his book Demand, Adrian J. Slyworzky examined six factors that lead to the creation of
demand: 1) magnetic offers, 2) a hassle map (and its resolution), 3) a back story, 4) a trigger,
5) a trajectory, and 6) variation.
Take Apple, for example. The tablet PC market was spawned by AppleÊs disruptive
innovation, the iPad. Although several tablet PC models had preceded the iPad, it was not
until the release of AppleÊs version that the market, and an accompanying ecosystem,
actually emerged. Based on its ecosystem, Apple could build a differentiated user interface
and hardware. And, importantly, all of the six aforementioned factors necessary for demand
creation were present during the iPadÊs rise.
However, while Apple was resting on its laurels, content providers stepped in and started to
drive innovation.
Jeff Bezos claims that AmazonÊs new Kindle Fire, priced at US$119, is a service, not a
product. AmazonÊs Kindle and GoogleÊs Nexus 7 have: 1) magnetic offers and backstories
(rich content), 2) triggers (reasonable prices), and 3) variation (7-inch screens). MicrosoftÊs
Surface resolved a hassle map problem (e.g., inconveniences arising from the lack of a
keyboard) and also has a trigger (Windows 8) and a backstory (Microsoft Office).
As mentioned earlier, Clayton Christensen warned of the risk of the innovatorÊs dilemma,
saying that a disruptor of one decade could become a disruptee in the following one. Steve
Jobs also emphasized the need to constantly innovate to tackle this issue.
Indeed, while Amazon, Google, and Microsoft are sweeping into the tablet PC market, the
new iPad is increasingly losing its appeal to consumers. Will the iPad Mini become a
variation, or just signal AppleÊs fall from market visionary to copycat and/or follower?
Although we do not yet have an answer, one thing seems clear: Apple is facing the
innovatorÊs dilemma.
Where does demand
come from?
Creating a legend
through disruptive
innovation
Content makers have
emerged as new
innovation drivers
November 13, 2012 The Age of Transition
19 KDB Daewoo Securities Research
Figure 22. How does the creation of new demand begin?
Source: Adrian J. Slyworzky「Demand」
Figure 23. Demand creation by content companies
Source: KDB Daewoo Securities Research
Content provider Google Amazon Microsoft
Product Nexus 7 Kindle Fire Surface
Magnetic: Sensitivity, performance v v v
Hassle map: Solutions for problems v
Backstory: Infrastructure, ecosystem v v v
Trigger: Creation of demand v
Trajectory: Quality improvement v v
Variation: Various needs v v v
DemandDemand
MagneticMagnetic
Hassle mapHassle map
BackstoryBackstory
VariationVariation
TrajectoryTrajectory
TriggerTrigger
Combination of strong performance and sensitivity
CustomerÊs troubles can present attractive opportunities to those who create new demand
External factors that make a product more attractive(e.g., Infrastructure, ecosystem)
Something that turns spectators into customers
(e.g., personal experience, quick delivery)
How quickly the attractiveness of a product improves(e.g., via ontinuous quality improvement)
Breaking the illusion of „the average customer‰ with products that can meet customersÊ needs exactly
20 KDB Daewoo Securities Research
II Global Supply Chain Reshuffle
Although Apple and SEC had been widely anticipated to remain business partners despite
their court battles, the latest change in AppleÊs supply chain (for the iPhone 5) suggests
otherwise. Given their interdependence up to this point, it will be interesting to see how
Apple and SEC operate without the help of one another going forward.
How will this change affect SEC next year? SECÊs semiconductor operating profit is forecast
to expand to W7.8tr in 2013, from W4.5tr in 2012. However, if SEC does not supply APs to
Apple (from 2H13) and fails to find new customers, the 2013 revenues and operating profit
of the System LSI segment should decline 15% YoY and 20% YoY, respectively. Even so, a
20% contraction (W520bn) corresponds to only 7% of the semiconductor divisionÊs 2013
operating profit estimate, and just 1.6% of the companyÊs total operating profit projection of
W33tr.
November 13, 2012 The Age of Transition
21 KDB Daewoo Securities Research
II. Global supply chain reshuffle
Implications of Apple’s supply chain change
Unlike AppleÊs previous smartphone models, the iPhone 5 does not feature SECÊs memory
chips. Given that SEC is the worldÊs largest memory maker, AppleÊs decision not to use
SECÊs chips has given rise to much speculation about the souring relationship between the
two companies. This change in AppleÊs supply chain has caught the attention of global parts
makers as well as investors.
The huge success of AppleÊs iPod, iPhone, and iPad has considerably increased the
companyÊs influence on the global memory market. Indeed, Apple consumes about 30% of
global NAND production, and ToshibaÊs and ElpidaÊs shares of the memory market have
fluctuated widely depending on AppleÊs order volume.
However, AppleÊs large order volume does not appear to have improved the earnings of
memory makers, such as Toshiba, SK Hynix and Elpida, due to low supply prices. Apple
even caused a supply glut in the NAND market after cancelling a large number of orders.
Some memory makers that expanded capacity to supply to Apple suffered severe inventory
buildup.
It is not clear whether it was Apple or SEC that caused the exclusion of SECÊs memory chips
from the iPhone 5. SECÊs basic guideline is that it supplies parts only if a reasonable margin
is guaranteed. Thus, we believe that SEC refused to supply its products to Apple.
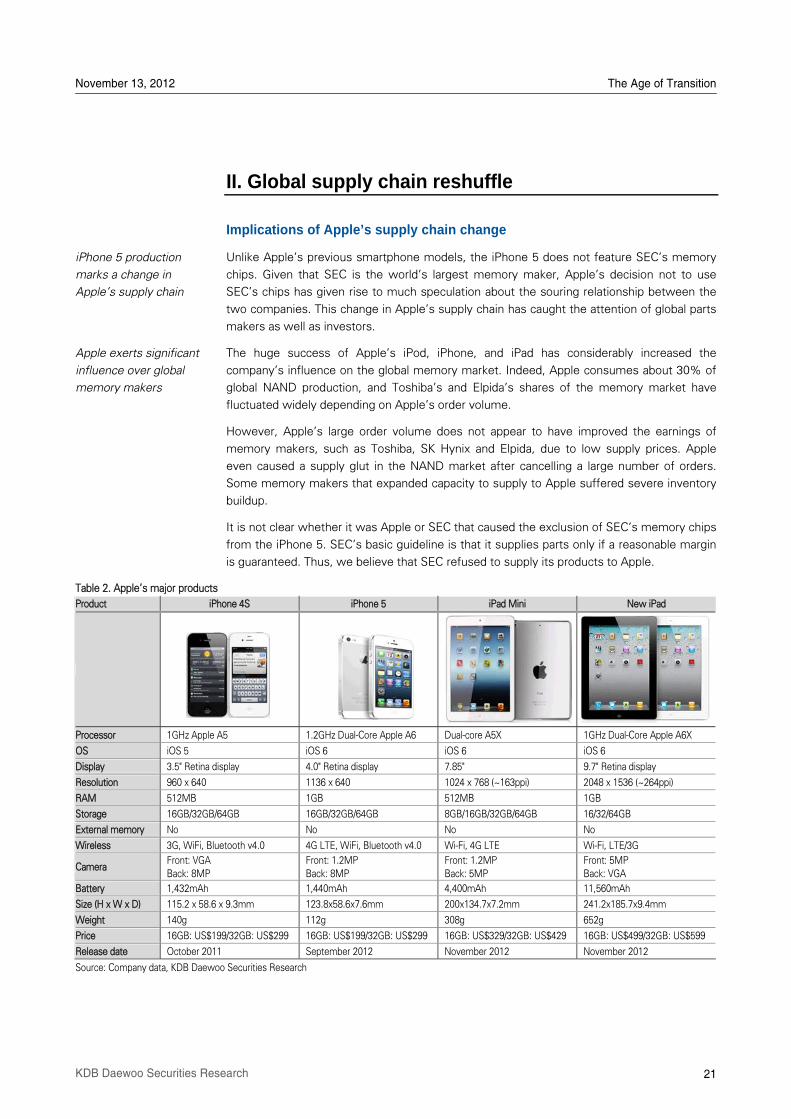
Table 2. AppleÊs major products
Product iPhone 4S iPhone 5 iPad Mini New iPad
Processor 1GHz Apple A5 1.2GHz Dual-Core Apple A6 Dual-core A5X 1GHz Dual-Core Apple A6X
OS iOS 5 iOS 6 iOS 6 iOS 6
Display 3.5" Retina display 4.0" Retina display 7.85" 9.7" Retina display
Resolution 960 x 640 1136 x 640 1024 x 768 (~163ppi) 2048 x 1536 (~264ppi)
RAM 512MB 1GB 512MB 1GB
Storage 16GB/32GB/64GB 16GB/32GB/64GB 8GB/16GB/32GB/64GB 16/32/64GB
External memory No No No No
Wireless 3G, WiFi, Bluetooth v4.0 4G LTE, WiFi, Bluetooth v4.0 Wi-Fi, 4G LTE Wi-Fi, LTE/3G
Camera Front: VGA
Back: 8MP
Front: 1.2MP
Back: 8MP
Front: 1.2MP
Back: 5MP
Front: 5MP
Back: VGA
Battery 1,432mAh 1,440mAh 4,400mAh 11,560mAh
Size (H x W x D) 115.2 x 58.6 x 9.3mm 123.8x58.6x7.6mm 200x134.7x7.2mm 241.2x185.7x9.4mm
Weight 140g 112g 308g 652g
Price 16GB: US$199/32GB: US$299 16GB: US$199/32GB: US$299 16GB: US$329/32GB: US$429 16GB: US$499/32GB: US$599
Release date October 2011 September 2012 November 2012 November 2012
Source: Company data, KDB Daewoo Securities Research
iPhone 5 production
marks a change in
AppleÊs supply chain
Apple exerts significant
influence over global
memory makers
November 13, 2012 The Age of Transition
22 KDB Daewoo Securities Research
Apple without SEC Greater supply chain risk
Although Apple and SEC had been widely anticipated to remain business partners despite
their court battles, the latest change in AppleÊs supply chain (for the iPhone 5) suggests
otherwise. Given their interdependence up to this point, it will be interesting to see how
Apple and SEC operate without the help of one another going forward.
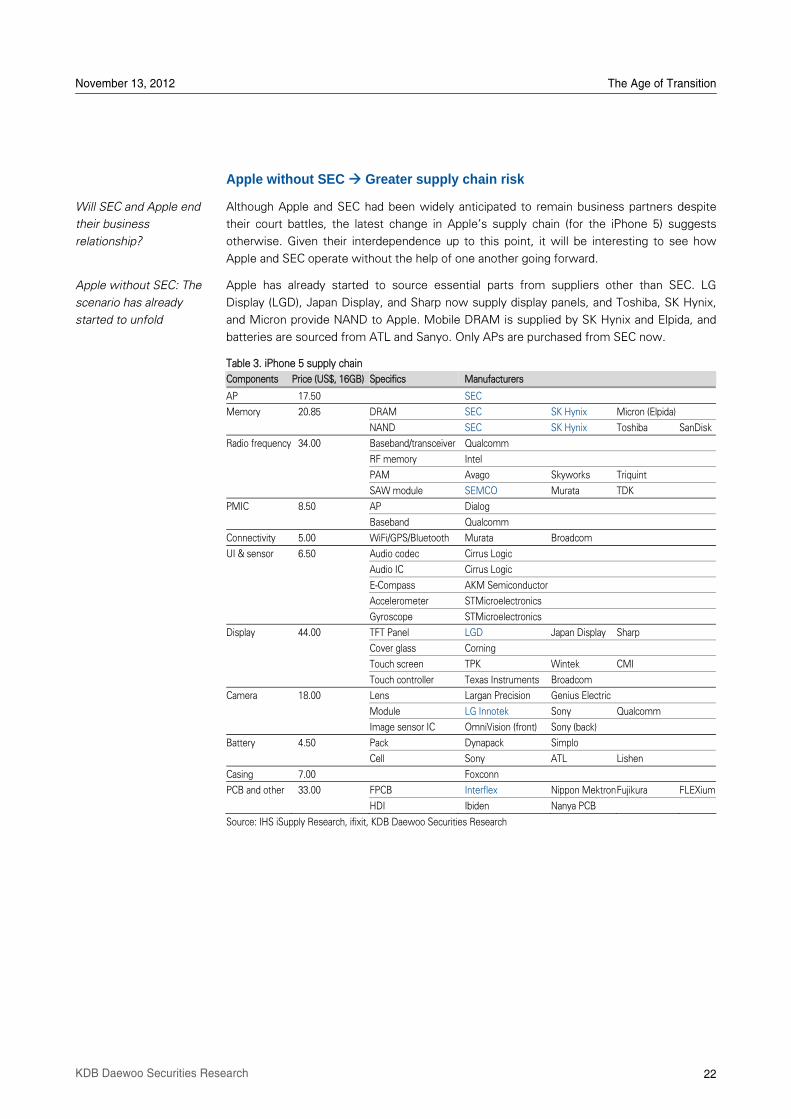
Apple has already started to source essential parts from suppliers other than SEC. LG
Display (LGD), Japan Display, and Sharp now supply display panels, and Toshiba, SK Hynix,
and Micron provide NAND to Apple. Mobile DRAM is supplied by SK Hynix and Elpida, and
batteries are sourced from ATL and Sanyo. Only APs are purchased from SEC now.
Table 3. iPhone 5 supply chain
Components Price (US$, 16GB) Specifics Manufacturers
AP 17.50 SEC
Memory 20.85 DRAM SEC SK Hynix Micron (Elpida)
NAND SEC SK Hynix Toshiba SanDisk
Radio frequency 34.00 Baseband/transceiver Qualcomm
RF memory Intel
PAM Avago Skyworks Triquint
SAW module SEMCO Murata TDK
PMIC 8.50 AP Dialog
Baseband Qualcomm
Connectivity 5.00 WiFi/GPS/Bluetooth Murata Broadcom
UI & sensor 6.50 Audio codec Cirrus Logic
Audio IC Cirrus Logic
E-Compass AKM Semiconductor
Accelerometer STMicroelectronics
Gyroscope STMicroelectronics
Display 44.00 TFT Panel LGD Japan Display Sharp
Cover glass Corning
Touch screen TPK Wintek CMI
Touch controller Texas Instruments Broadcom
Camera 18.00 Lens Largan Precision Genius Electric
Module LG Innotek Sony Qualcomm
Image sensor IC OmniVision (front) Sony (back)
Battery 4.50 Pack Dynapack Simplo
Cell Sony ATL Lishen
Casing 7.00 Foxconn
PCB and other 33.00 FPCB Interflex Nippon Mektron Fujikura FLEXium
HDI Ibiden Nanya PCB
Source: IHS iSupply Research, ifixit, KDB Daewoo Securities Research
Will SEC and Apple end
their business
relationship?
Apple without SEC: The
scenario has already
started to unfold
November 13, 2012 The Age of Transition
23 KDB Daewoo Securities Research
On the surface, the „Apple without SEC‰ scenario seems perfectly viable, given AppleÊs
strong market power. However, problems have already begun to emerge on three fronts.
In-cell display: The in-cell display significantly improved iPhone 5Ês form factor, but some
users are experiencing screen-related problems. Moreover, insufficient supply is limiting
production. LGD and Japan Display, which each satisfy 50% of AppleÊs in-cell display
needs, can each produce up to 7mn displays per month. This means that 4Q iPhone 5
shipments are likely to fall short of 45mn units.
Mobile DRAM: Apple consumes around 30% of global mobile DRAM production, and SEC
produces 60% of global mobile DRAM. Without SEC, Apple has to fully rely on SK Hynix and
Elpida, which produce the remaining 40% of the global supply. This means a greater risk for
Apple in case of any disruption in mobile DRAM production, especially at Elpida.
AP: SEC is currently AppleÊs exclusive AP supplier. Apple is estimated to need 70mn APs
per quarter, or 50,000 wafers/month based on SECÊs dual-core AP production capacity. SEC
started to produce 28nm chips in 2H, and its customer base (Qualcomm) and product
portfolio (baseband) have begun to diversify. Next year, if SEC cuts its AP production for
Apple to the 30~40,000 wafer/month level, Apple may face a huge problem in making its
products.
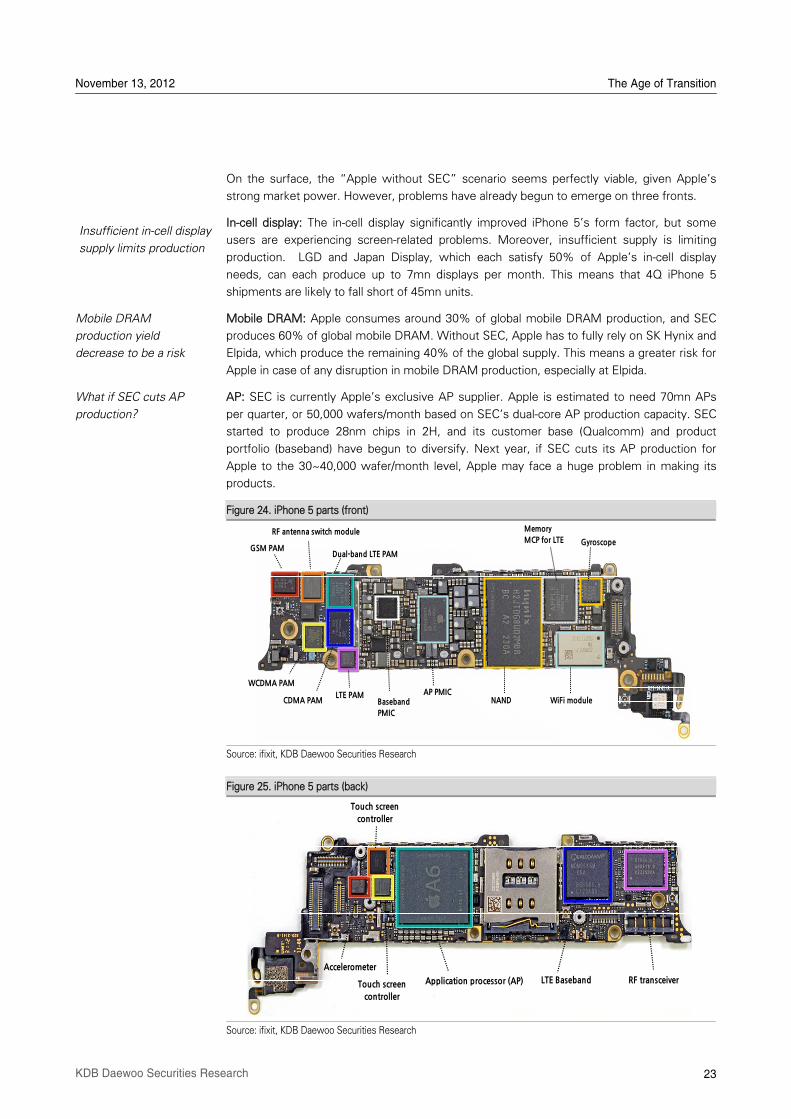
Figure 24. iPhone 5 parts (front)
Source: ifixit, KDB Daewoo Securities Research
Figure 25. iPhone 5 parts (back)
Source: ifixit, KDB Daewoo Securities Research
Insufficient in-cell display
supply limits production
Mobile DRAM
production yield
decrease to be a risk
What if SEC cuts AP
production?
GSM PAM
RF antenna switch module
Dual-band LTE PAM
WCDMA PAM
LTE PAMCDMA PAM Baseband
PMIC
AP PMICNAND WiFi module
Gyroscope
Memory
MCP for LTE
Application processor (AP) LTE Baseband RF transceiver
Touch screen
controller
Accelerometer
Touch screen
controller
November 13, 2012 The Age of Transition
24 KDB Daewoo Securities Research
Exclusion of SEC from Apple’s supply chain would have a limited impact
The likelihood of Apple diversifying its parts suppliers has been seen as the biggest risk
factor for SEC due to AppleÊs firm dominance in the smart device market. If Apple excludes
SEC completely from its supply chain, how much of an impact would it have on SEC?
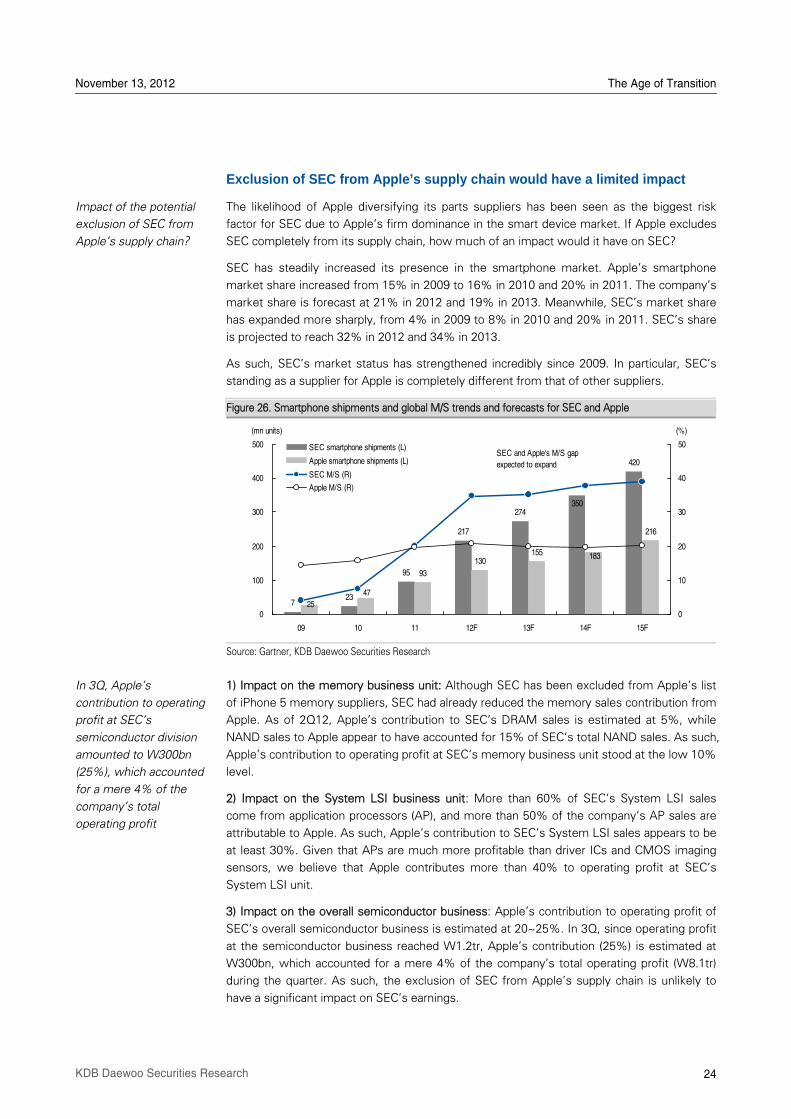
SEC has steadily increased its presence in the smartphone market. AppleÊs smartphone
market share increased from 15% in 2009 to 16% in 2010 and 20% in 2011. The companyÊs
market share is forecast at 21% in 2012 and 19% in 2013. Meanwhile, SECÊs market share
has expanded more sharply, from 4% in 2009 to 8% in 2010 and 20% in 2011. SECÊs share
is projected to reach 32% in 2012 and 34% in 2013.
As such, SECÊs market status has strengthened incredibly since 2009. In particular, SECÊs
standing as a supplier for Apple is completely different from that of other suppliers.
Figure 26. Smartphone shipments and global M/S trends and forecasts for SEC and Apple
Source: Gartner, KDB Daewoo Securities Research
1) Impact on the memory business unit: Although SEC has been excluded from AppleÊs list
of iPhone 5 memory suppliers, SEC had already reduced the memory sales contribution from
Apple. As of 2Q12, AppleÊs contribution to SECÊs DRAM sales is estimated at 5%, while
NAND sales to Apple appear to have accounted for 15% of SECÊs total NAND sales. As such,
AppleÊs contribution to operating profit at SECÊs memory business unit stood at the low 10%
level.
2) Impact on the System LSI business unit: More than 60% of SECÊs System LSI sales
come from application processors (AP), and more than 50% of the companyÊs AP sales are
attributable to Apple. As such, AppleÊs contribution to SECÊs System LSI sales appears to be
at least 30%. Given that APs are much more profitable than driver ICs and CMOS imaging
sensors, we believe that Apple contributes more than 40% to operating profit at SECÊs
System LSI unit.
3) Impact on the overall semiconductor business: AppleÊs contribution to operating profit of
SECÊs overall semiconductor business is estimated at 20~25%. In 3Q, since operating profit
at the semiconductor business reached W1.2tr, AppleÊs contribution (25%) is estimated at
W300bn, which accounted for a mere 4% of the companyÊs total operating profit (W8.1tr)
during the quarter. As such, the exclusion of SEC from AppleÊs supply chain is unlikely to
have a significant impact on SECÊs earnings.
Impact of the potential
exclusion of SEC from
AppleÊs supply chain?
In 3Q, AppleÊs
contribution to operating
profit at SECÊs
semiconductor division
amounted to W300bn
(25%), which accounted
for a mere 4% of the
companyÊs total
operating profit
723
95
217
274
420
93
130155
216
350
183
47
250
100
200
300
400
500
09 10 11 12F 13F 14F 15F
0
10
20
30
40
50SEC smartphone shipments (L)
Apple smartphone shipments (L)
SEC M/S (R)
Apple M/S (R)
(mn units) (%)
SEC and Apple's M/S gap
expected to expand
November 13, 2012 The Age of Transition
25 KDB Daewoo Securities Research
Exclusion from Apple’s AP supplier list to have minimal impact on SEC
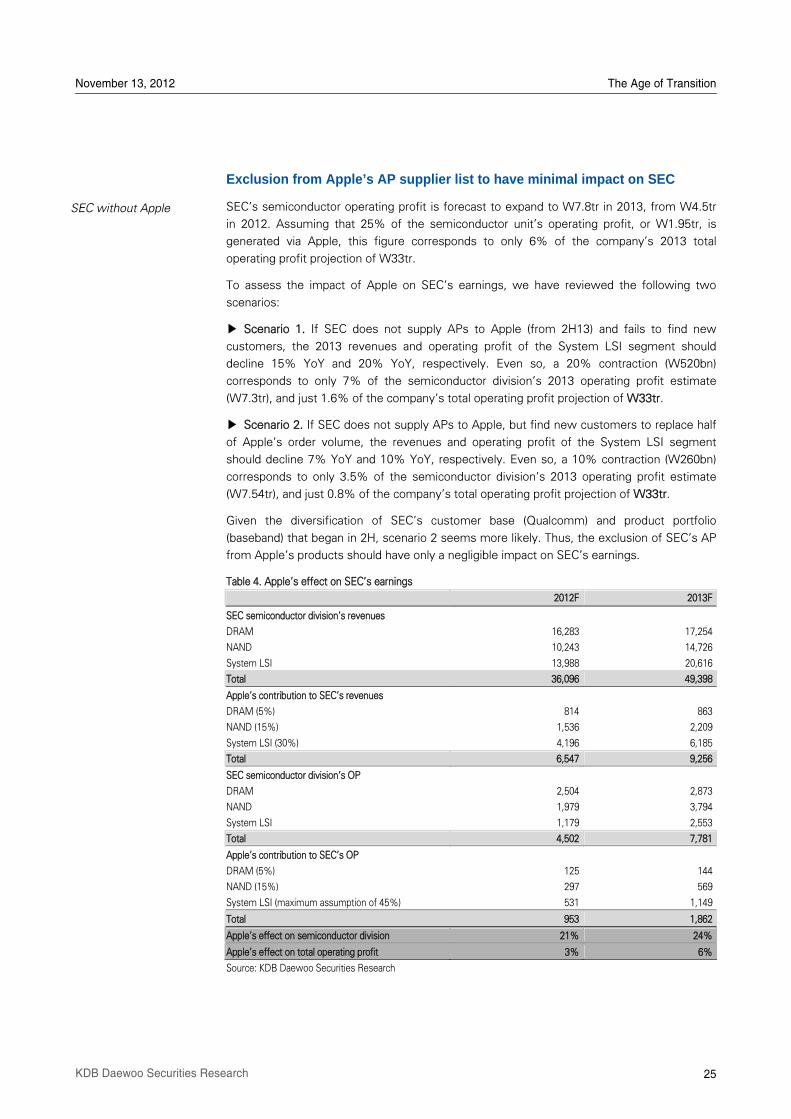
SECÊs semiconductor operating profit is forecast to expand to W7.8tr in 2013, from W4.5tr
in 2012. Assuming that 25% of the semiconductor unitÊs operating profit, or W1.95tr, is
generated via Apple, this figure corresponds to only 6% of the companyÊs 2013 total
operating profit projection of W33tr.
To assess the impact of Apple on SECÊs earnings, we have reviewed the following two
scenarios:
▶ Scenario 1. If SEC does not supply APs to Apple (from 2H13) and fails to find new
customers, the 2013 revenues and operating profit of the System LSI segment should
decline 15% YoY and 20% YoY, respectively. Even so, a 20% contraction (W520bn)
corresponds to only 7% of the semiconductor divisionÊs 2013 operating profit estimate
(W7.3tr), and just 1.6% of the companyÊs total operating profit projection of W33tr.
▶ Scenario 2. If SEC does not supply APs to Apple, but find new customers to replace half
of AppleÊs order volume, the revenues and operating profit of the System LSI segment
should decline 7% YoY and 10% YoY, respectively. Even so, a 10% contraction (W260bn)
corresponds to only 3.5% of the semiconductor divisionÊs 2013 operating profit estimate
(W7.54tr), and just 0.8% of the companyÊs total operating profit projection of W33tr.
Given the diversification of SECÊs customer base (Qualcomm) and product portfolio
(baseband) that began in 2H, scenario 2 seems more likely. Thus, the exclusion of SECÊs AP
from AppleÊs products should have only a negligible impact on SECÊs earnings.
Table 4. AppleÊs effect on SECÊs earnings
2012F 2013F
SEC semiconductor divisionÊs revenues
DRAM 16,283 17,254
NAND 10,243 14,726
System LSI 13,988 20,616
Total 36,096 49,398
AppleÊs contribution to SECÊs revenues
DRAM (5%) 814 863
NAND (15%) 1,536 2,209
System LSI (30%) 4,196 6,185
Total 6,547 9,256
SEC semiconductor divisionÊs OP
DRAM 2,504 2,873
NAND 1,979 3,794
System LSI 1,179 2,553
Total 4,502 7,781
AppleÊs contribution to SECÊs OP
DRAM (5%) 125 144
NAND (15%) 297 569
System LSI (maximum assumption of 45%) 531 1,149
Total 953 1,862
AppleÊs effect on semiconductor division 21% 24%
AppleÊs effect on total operating profit 3% 6%
Source: KDB Daewoo Securities Research
SEC without Apple
November 13, 2012 The Age of Transition
26 KDB Daewoo Securities Research
TSMC could begin supplying APs to Apple from late 2013
Why has Apple kept SEC as an AP supplier while removing it from its list of memory
suppliers? Probably because it has no other viable options. For now, it is next to impossible
for Apple to make its tablets and smartphones without SECÊs AP supply. The most viable
alternative would be the Taiwanese firm TSMC, but we believe the company does not yet
have the production yield and capacity to meet AppleÊs needs.
Then, at what point will TSMC have the yield and capacity to begin supplying Apple?
The A6 chip that powers the new iPhone 5 is a dual-core processor manufactured on a 32nm
high-k metal gate (HKMG) process. Even though TSMC was one step ahead of SEC in
offering a 28nm HKMG process (SEC followed after 3Q12), the fact that Apple still relies on
SECÊs 32nm process instead indicates that TSMCÊs 28nm process lags behind in terms of
both capacity and efficiency.
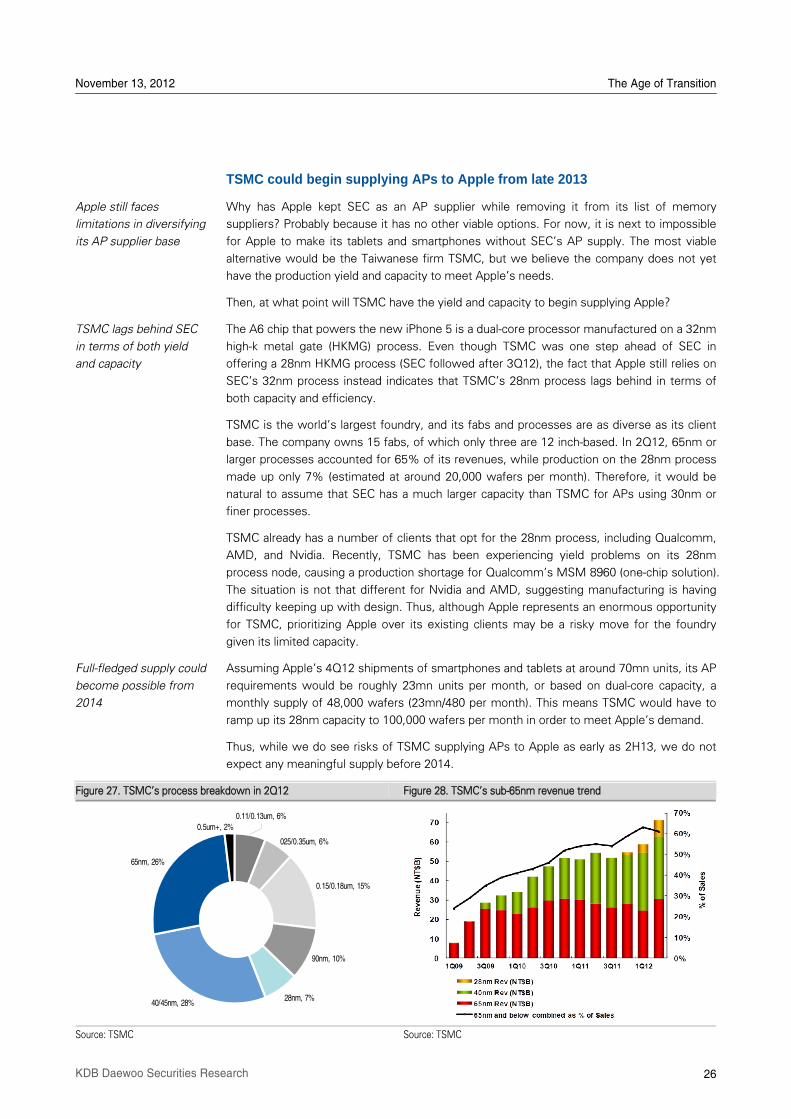
TSMC is the worldÊs largest foundry, and its fabs and processes are as diverse as its client
base. The company owns 15 fabs, of which only three are 12 inch-based. In 2Q12, 65nm or
larger processes accounted for 65% of its revenues, while production on the 28nm process
made up only 7% (estimated at around 20,000 wafers per month). Therefore, it would be
natural to assume that SEC has a much larger capacity than TSMC for APs using 30nm or
finer processes.
TSMC already has a number of clients that opt for the 28nm process, including Qualcomm,
AMD, and Nvidia. Recently, TSMC has been experiencing yield problems on its 28nm
process node, causing a production shortage for QualcommÊs MSM 8960 (one-chip solution).
The situation is not that different for Nvidia and AMD, suggesting manufacturing is having
difficulty keeping up with design. Thus, although Apple represents an enormous opportunity
for TSMC, prioritizing Apple over its existing clients may be a risky move for the foundry
given its limited capacity.
Assuming AppleÊs 4Q12 shipments of smartphones and tablets at around 70mn units, its AP
requirements would be roughly 23mn units per month, or based on dual-core capacity, a
monthly supply of 48,000 wafers (23mn/480 per month). This means TSMC would have to
ramp up its 28nm capacity to 100,000 wafers per month in order to meet AppleÊs demand.
Thus, while we do see risks of TSMC supplying APs to Apple as early as 2H13, we do not
expect any meaningful supply before 2014.
Figure 27. TSMCÊs process breakdown in 2Q12 Figure 28. TSMCÊs sub-65nm revenue trend
Source: TSMC Source: TSMC
Apple still faces
limitations in diversifying
its AP supplier base
TSMC lags behind SEC
in terms of both yield
and capacity
Full-fledged supply could
become possible from
2014
0.15/0.18um, 15%
90nm, 10%
28nm, 7%40/45nm, 28%
65nm, 26%
025/0.35um, 6%
0.5um+, 2%
0.11/0.13um, 6%
November 13, 2012 The Age of Transition
27 KDB Daewoo Securities Research
Risks and opportunities for SEC’s System LSI unit
If Apple replaces Samsung with other vendors, including TSMC, for AP production in the
medium- to long-term, SEC will be required to formulate new growth strategies, such as 1)
business portfolio diversification, including the expansion of foundry production, 2) the
diversification of value-added products from APs to include baseband processors (BP), and 3)
a steady increase in sales contributions from customers other than Apple (including
Qualcomm).
SEC appears to have been requested to produce MSM 8960, a one-chip solution (AP + BP)
product, for Qualcomm (after migration to a 28nm process). As such, the proportion of
foundry production out of SECÊs total production is expected to climb from 15% to more
than 30% in the medium- to long-term. For MDM 9615 (QualcommÊs BP that supports both
3G and LTE technologies), TSMCÊs production is unlikely to meet QualcommÊs demand.
SEC has already adopted its in-house produced BPs in the 3G Galaxy S III model. As such,
SEC will diversify its value-added product portfolio from APs to include BPs. Furthermore,
SEC is projected to bolster its product competiveness by developing an integrated chip that
incorporates AP, BP, and connectivity (Wifi, Bluetooth, GPS, etc.) In addition, given its
superior mobile DRAM and NAND technologies, SEC is likely to emerge as a total mobile
platform provider for smart devices.
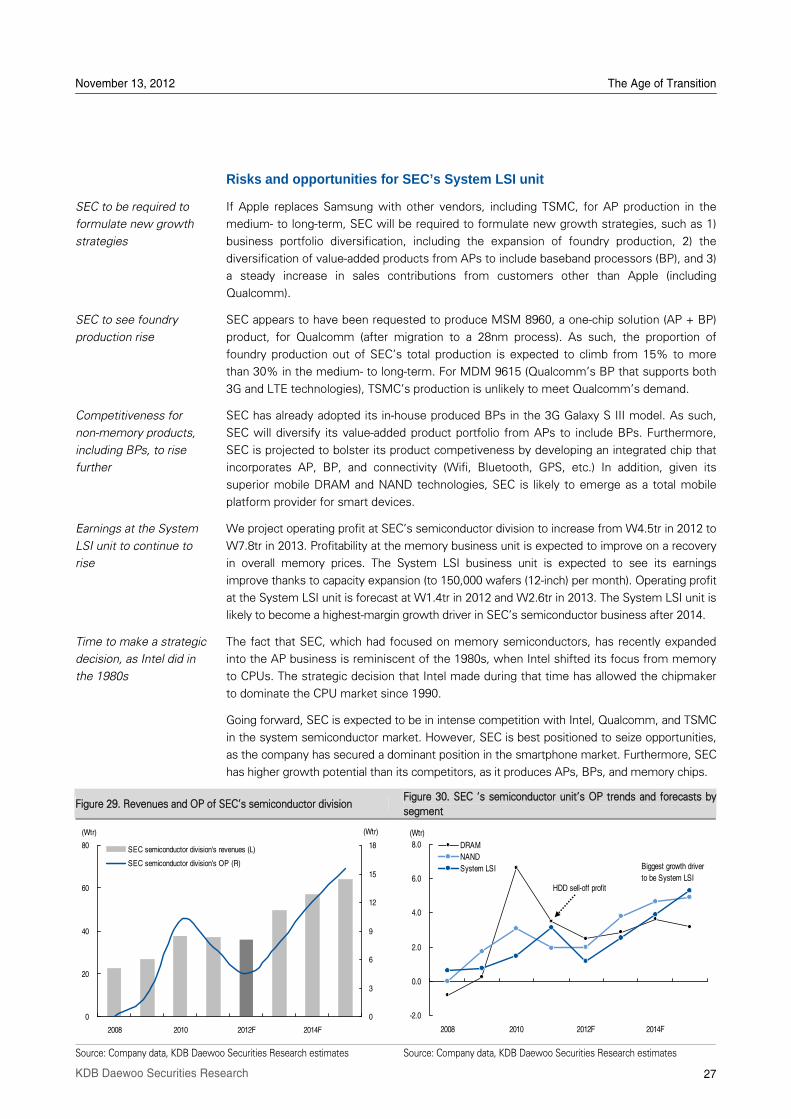
We project operating profit at SECÊs semiconductor division to increase from W4.5tr in 2012 to
W7.8tr in 2013. Profitability at the memory business unit is expected to improve on a recovery
in overall memory prices. The System LSI business unit is expected to see its earnings
improve thanks to capacity expansion (to 150,000 wafers (12-inch) per month). Operating profit
at the System LSI unit is forecast at W1.4tr in 2012 and W2.6tr in 2013. The System LSI unit is
likely to become a highest-margin growth driver in SECÊs semiconductor business after 2014.
The fact that SEC, which had focused on memory semiconductors, has recently expanded
into the AP business is reminiscent of the 1980s, when Intel shifted its focus from memory
to CPUs. The strategic decision that Intel made during that time has allowed the chipmaker
to dominate the CPU market since 1990.
Going forward, SEC is expected to be in intense competition with Intel, Qualcomm, and TSMC
in the system semiconductor market. However, SEC is best positioned to seize opportunities,
as the company has secured a dominant position in the smartphone market. Furthermore, SEC
has higher growth potential than its competitors, as it produces APs, BPs, and memory chips.
Figure 29. Revenues and OP of SECÊs semiconductor division Figure 30. SEC Âs semiconductor unitÊs OP trends and forecasts by
segment
Source: Company data, KDB Daewoo Securities Research estimates Source: Company data, KDB Daewoo Securities Research estimates
SEC to be required to
formulate new growth
strategies
SEC to see foundry
production rise
Competitiveness for
non-memory products,
including BPs, to rise
further
Earnings at the System
LSI unit to continue to
rise
Time to make a strategic
decision, as Intel did in
the 1980s
-2.0
0.0
2.0
4.0
6.0
8.0
2008 2010 2012F 2014F
(Wtr)
DRAM
NAND
System LSI Biggest growth driver
to be System LSIHDD sell-off profit
0
20
40
60
80
2008 2010 2012F 2014F
(Wtr)
0
3
6
9
12
15
18SEC semiconductor division's revenues (L)
SEC semiconductor division's OP (R)
(Wtr)
28 KDB Daewoo Securities Research
III Losers’ League
With the global smartphone market being dominated by only two makers, we do not expect
a third player (that is able to churn out over 50mn smartphones per year) to join the
competition anytime soon. Second-tier smartphone makers have yet to differentiate
themselves in terms of: 1) hardware, 2) software/content, and 3) marketing strategies.
In 2013, we expect second-tier smartphone makers to compete within their own league.
Among the eight second-tier makers, we believe that four (Nokia, HTC, LG Electronics (LGE)
and Huawei) will take loftier positions (40mn shipments per year). The rest are anticipated to
ship around 20~30mn smartphones per year.
November 13, 2012 The Age of Transition
29 KDB Daewoo Securities Research
III. Losers’ league: Competition among second-tier makers to intensify
Second-tiers to continue the fight for survival
In 2012, top-tier smartphone makers further widened the gap with their second-tier
competitors. Their combined market share is forecast to increase to 54% in 2012, up from
23% in 2010 and 40% in 2011, while second-tier makers, including Nokia, are expected to
ship only 25~45mn smartphones. So, does this mean that there will remain only two
dominant players, while the rest struggle to stay afloat?
Among the eight second-tier makers, Motorola was acquired by Google. NokiaÊs quarterly
smartphone shipments have continued to decline, to around 10mn. RIM performed even
worse, reporting quarterly smartphone shipments of less than 8mn units. Will second-tier
makers ever be able to turn around?
This year, our forecast for second-tiersÊ smartphone shipments is: 42mn smartphones by
Nokia, 36mn by HTC, 32mn by RIM, 29mn by Huawei, 26mn by LGE, 25mn by ZTE, 24mn
by Sony, and 22mn by Motorola. Among these eight second-tier smartphone makers, Nokia
(down 51% YoY) and RIM (down 40% YoY) are likely to suffer the biggest declines in
shipments.
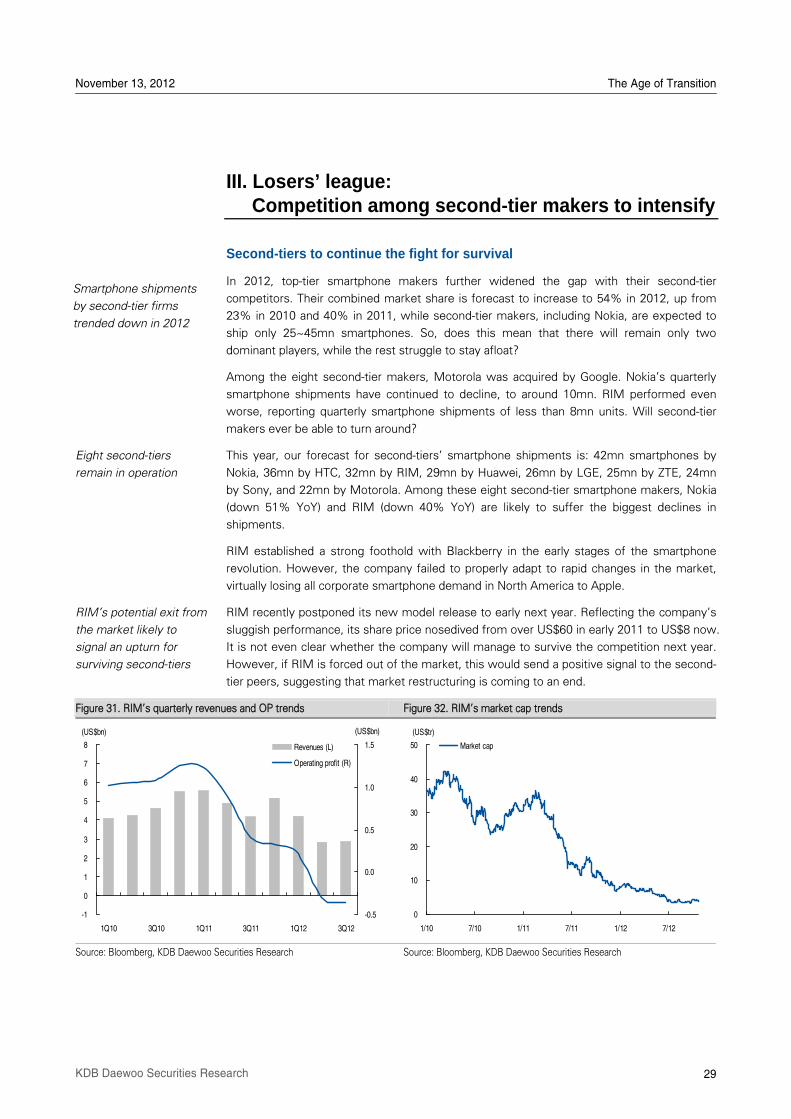
RIM established a strong foothold with Blackberry in the early stages of the smartphone
revolution. However, the company failed to properly adapt to rapid changes in the market,
virtually losing all corporate smartphone demand in North America to Apple.
RIM recently postponed its new model release to early next year. Reflecting the companyÊs
sluggish performance, its share price nosedived from over US$60 in early 2011 to US$8 now.
It is not even clear whether the company will manage to survive the competition next year.
However, if RIM is forced out of the market, this would send a positive signal to the second-
tier peers, suggesting that market restructuring is coming to an end.
Figure 31. RIMÊs quarterly revenues and OP trends Figure 32. RIMÊs market cap trends
Source: Bloomberg, KDB Daewoo Securities Research Source: Bloomberg, KDB Daewoo Securities Research
Smartphone shipments
by second-tier firms
trended down in 2012
Eight second-tiers
remain in operation
RIMÊs potential exit from
the market likely to
signal an upturn for
surviving second-tiers
-1
0
1
2
3
4
5
6
7
8
1Q10 3Q10 1Q11 3Q11 1Q12 3Q12
(US$bn)
-0.5
0.0
0.5
1.0
1.5Revenues (L)
Operating profit (R)
(US$bn)
0
10
20
30
40
50
1/10 7/10 1/11 7/11 1/12 7/12
(US$tr)
Market cap
November 13, 2012 The Age of Transition
30 KDB Daewoo Securities Research
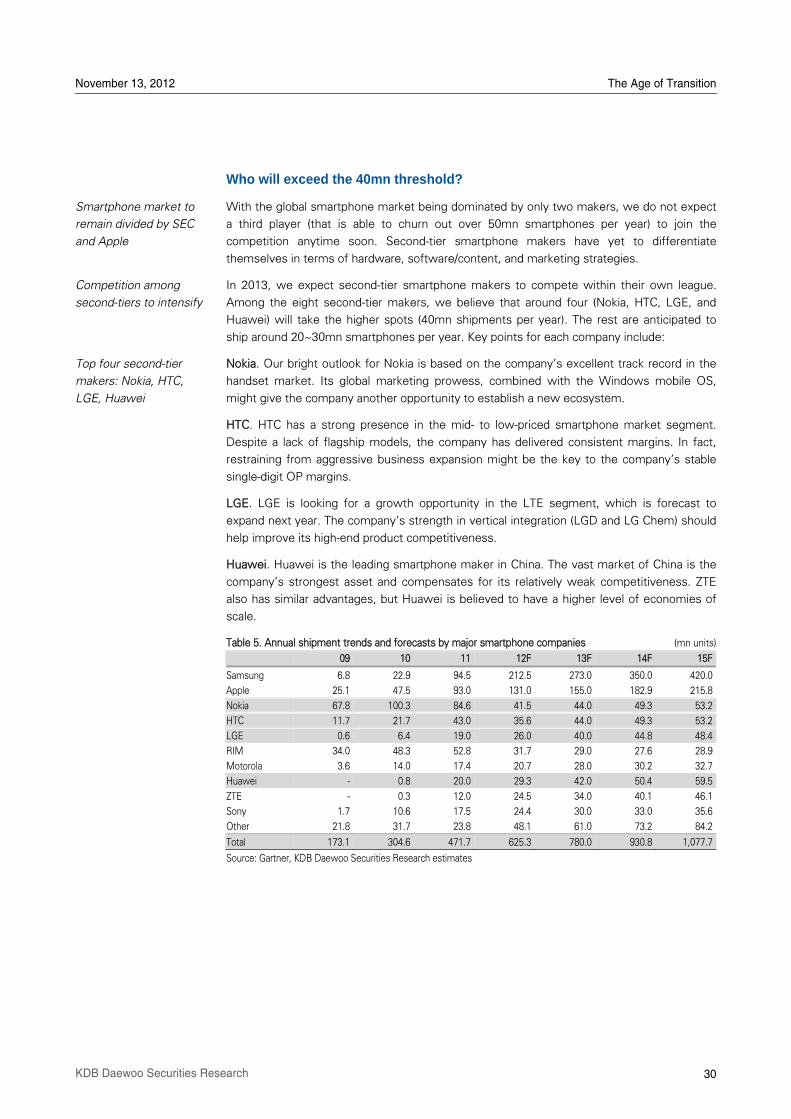
Who will exceed the 40mn threshold?
With the global smartphone market being dominated by only two makers, we do not expect
a third player (that is able to churn out over 50mn smartphones per year) to join the
competition anytime soon. Second-tier smartphone makers have yet to differentiate
themselves in terms of hardware, software/content, and marketing strategies.
In 2013, we expect second-tier smartphone makers to compete within their own league.
Among the eight second-tier makers, we believe that around four (Nokia, HTC, LGE, and
Huawei) will take the higher spots (40mn shipments per year). The rest are anticipated to
ship around 20~30mn smartphones per year. Key points for each company include:
Nokia. Our bright outlook for Nokia is based on the companyÊs excellent track record in the
handset market. Its global marketing prowess, combined with the Windows mobile OS,
might give the company another opportunity to establish a new ecosystem.
HTC. HTC has a strong presence in the mid- to low-priced smartphone market segment.
Despite a lack of flagship models, the company has delivered consistent margins. In fact,
restraining from aggressive business expansion might be the key to the companyÊs stable
single-digit OP margins.
LGE. LGE is looking for a growth opportunity in the LTE segment, which is forecast to
expand next year. The companyÊs strength in vertical integration (LGD and LG Chem) should
help improve its high-end product competitiveness.
Huawei. Huawei is the leading smartphone maker in China. The vast market of China is the
companyÊs strongest asset and compensates for its relatively weak competitiveness. ZTE
also has similar advantages, but Huawei is believed to have a higher level of economies of
scale.
Table 5. Annual shipment trends and forecasts by major smartphone companies (mn units)
09 10 11 12F 13F 14F 15F
Samsung 6.8 22.9 94.5 212.5 273.0 350.0 420.0
Apple 25.1 47.5 93.0 131.0 155.0 182.9 215.8
Nokia 67.8 100.3 84.6 41.5 44.0 49.3 53.2
HTC 11.7 21.7 43.0 35.6 44.0 49.3 53.2
LGE 0.6 6.4 19.0 26.0 40.0 44.8 48.4
RIM 34.0 48.3 52.8 31.7 29.0 27.6 28.9
Motorola 3.6 14.0 17.4 20.7 28.0 30.2 32.7
Huawei - 0.8 20.0 29.3 42.0 50.4 59.5
ZTE - 0.3 12.0 24.5 34.0 40.1 46.1
Sony 1.7 10.6 17.5 24.4 30.0 33.0 35.6
Other 21.8 31.7 23.8 48.1 61.0 73.2 84.2
Total 173.1 304.6 471.7 625.3 780.0 930.8 1,077.7
Source: Gartner, KDB Daewoo Securities Research estimates
Smartphone market to
remain divided by SEC
and Apple
Competition among
second-tiers to intensify
Top four second-tier
makers: Nokia, HTC,
LGE, Huawei
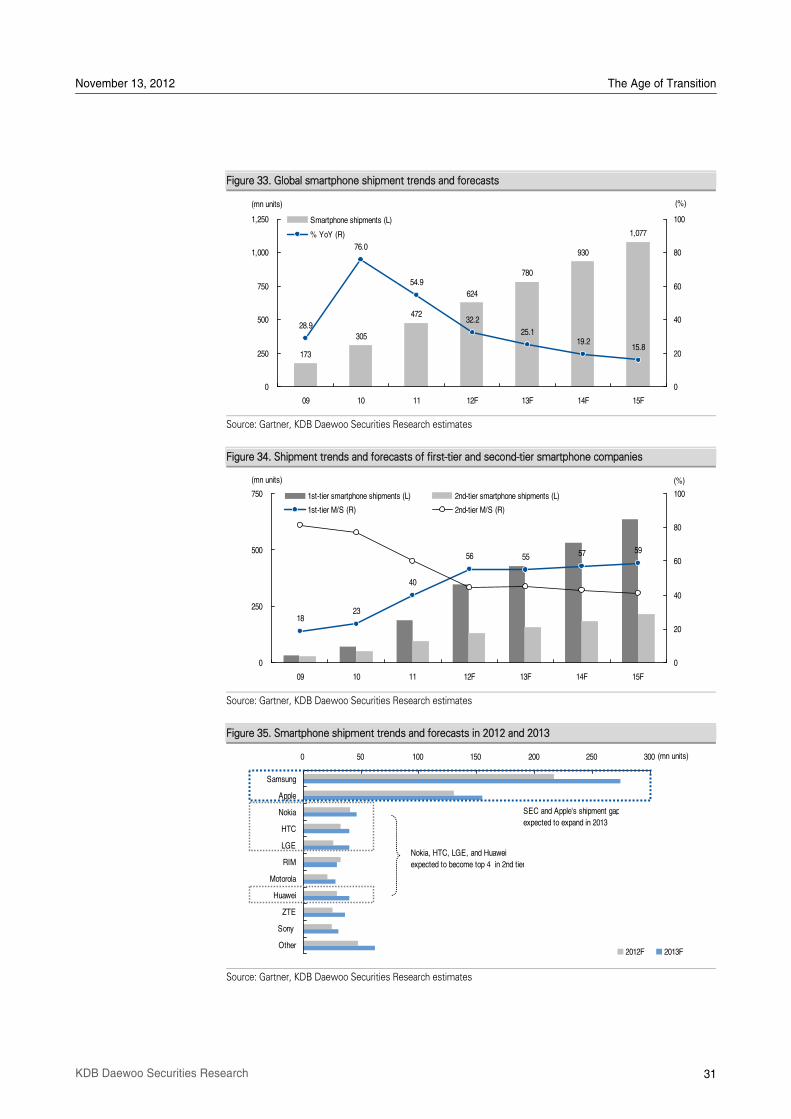
November 13, 2012 The Age of Transition
31 KDB Daewoo Securities Research
Figure 33. Global smartphone shipment trends and forecasts
Source: Gartner, KDB Daewoo Securities Research estimates
Figure 34. Shipment trends and forecasts of first-tier and second-tier smartphone companies
Source: Gartner, KDB Daewoo Securities Research estimates
Figure 35. Smartphone shipment trends and forecasts in 2012 and 2013
Source: Gartner, KDB Daewoo Securities Research estimates
173
305
472
624
780
930
1,077
28.9
76.0
54.9
15.8
32.2
25.119.2
0
250
500
750
1,000
1,250
09 10 11 12F 13F 14F 15F
0
20
40
60
80
100Smartphone shipments (L)
% YoY (R)
(mn units) (%)
1823
40
56 55 57 59
0
250
500
750
09 10 11 12F 13F 14F 15F
0
20
40
60
80
1001st-tier smartphone shipments (L) 2nd-tier smartphone shipments (L)
1st-tier M/S (R) 2nd-tier M/S (R)
(mn units) (%)
0 50 100 150 200 250 300
Samsung
Apple
Nokia
HTC
LGE
RIM
Motorola
Huawei
ZTE
Sony
Other2012F 2013F
(mn units)
SEC and Apple's shipment gap
expected to expand in 2013
Nokia, HTC, LGE, and Huawei
expected to become top 4 in 2nd tier
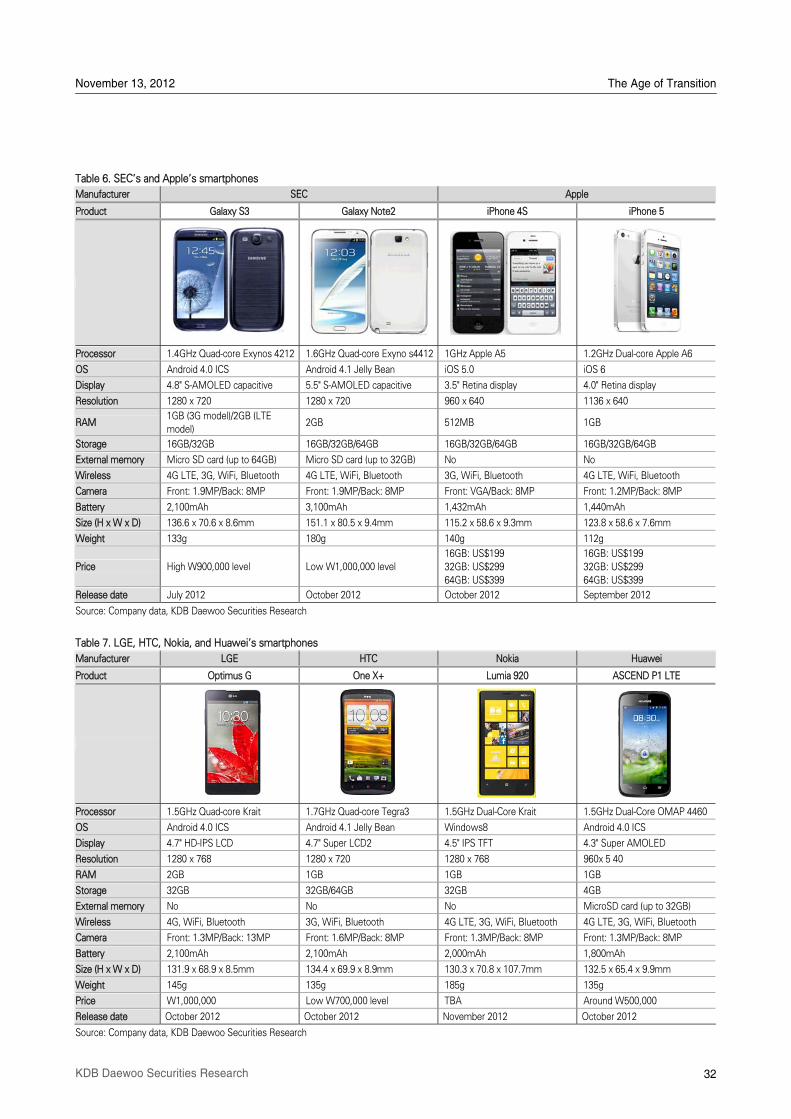
November 13, 2012 The Age of Transition
32 KDB Daewoo Securities Research
Table 6. SECÊs and AppleÊs smartphones
Manufacturer SEC Apple
Product Galaxy S3 Galaxy Note2 iPhone 4S iPhone 5
Processor 1.4GHz Quad-core Exynos 4212 1.6GHz Quad-core Exyno s4412 1GHz Apple A5 1.2GHz Dual-core Apple A6
OS Android 4.0 ICS Android 4.1 Jelly Bean iOS 5.0 iOS 6
Display 4.8" S-AMOLED capacitive 5.5" S-AMOLED capacitive 3.5" Retina display 4.0" Retina display
Resolution 1280 x 720 1280 x 720 960 x 640 1136 x 640
RAM 1GB (3G model)/2GB (LTE
model) 2GB 512MB 1GB
Storage 16GB/32GB 16GB/32GB/64GB 16GB/32GB/64GB 16GB/32GB/64GB
External memory Micro SD card (up to 64GB) Micro SD card (up to 32GB) No No
Wireless 4G LTE, 3G, WiFi, Bluetooth 4G LTE, WiFi, Bluetooth 3G, WiFi, Bluetooth 4G LTE, WiFi, Bluetooth
Camera Front: 1.9MP/Back: 8MP Front: 1.9MP/Back: 8MP Front: VGA/Back: 8MP Front: 1.2MP/Back: 8MP
Battery 2,100mAh 3,100mAh 1,432mAh 1,440mAh
Size (H x W x D) 136.6 x 70.6 x 8.6mm 151.1 x 80.5 x 9.4mm 115.2 x 58.6 x 9.3mm 123.8 x 58.6 x 7.6mm
Weight 133g 180g 140g 112g
Price High W900,000 level Low W1,000,000 level 16GB: US$199
32GB: US$299
64GB: US$399
16GB: US$199
32GB: US$299
64GB: US$399
Release date July 2012 October 2012 October 2012 September 2012
Source: Company data, KDB Daewoo Securities Research
Table 7. LGE, HTC, Nokia, and HuaweiÊs smartphones
Manufacturer LGE HTC Nokia Huawei
Product Optimus G One X+ Lumia 920 ASCEND P1 LTE
Processor 1.5GHz Quad-core Krait 1.7GHz Quad-core Tegra3 1.5GHz Dual-Core Krait 1.5GHz Dual-Core OMAP 4460
OS Android 4.0 ICS Android 4.1 Jelly Bean Windows8 Android 4.0 ICS
Display 4.7" HD-IPS LCD 4.7" Super LCD2 4.5" IPS TFT 4.3" Super AMOLED
Resolution 1280 x 768 1280 x 720 1280 x 768 960x 5 40
RAM 2GB 1GB 1GB 1GB
Storage 32GB 32GB/64GB 32GB 4GB
External memory No No No MicroSD card (up to 32GB)
Wireless 4G, WiFi, Bluetooth 3G, WiFi, Bluetooth 4G LTE, 3G, WiFi, Bluetooth 4G LTE, 3G, WiFi, Bluetooth
Camera Front: 1.3MP/Back: 13MP Front: 1.6MP/Back: 8MP Front: 1.3MP/Back: 8MP Front: 1.3MP/Back: 8MP
Battery 2,100mAh 2,100mAh 2,000mAh 1,800mAh
Size (H x W x D) 131.9 x 68.9 x 8.5mm 134.4 x 69.9 x 8.9mm 130.3 x 70.8 x 107.7mm 132.5 x 65.4 x 9.9mm
Weight 145g 135g 185g 135g
Price W1,000,000 Low W700,000 level TBA Around W500,000
Release date October 2012 October 2012 November 2012 October 2012
Source: Company data, KDB Daewoo Securities Research
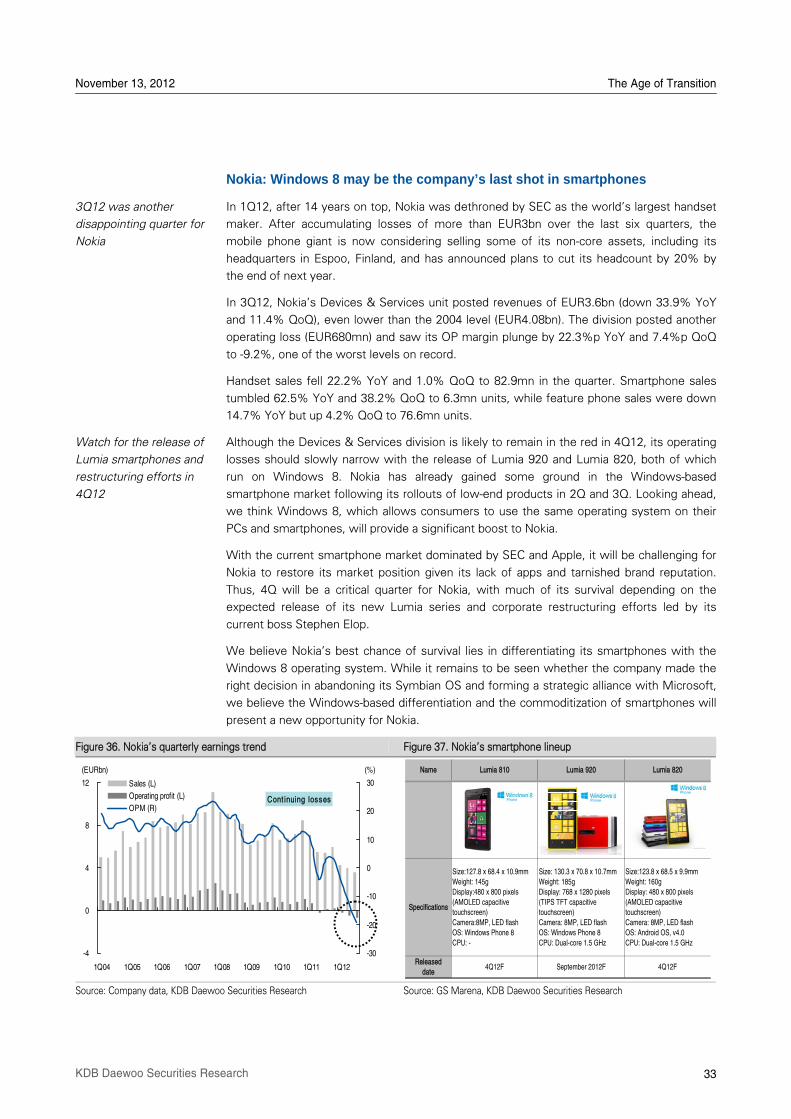
November 13, 2012 The Age of Transition
33 KDB Daewoo Securities Research
Nokia: Windows 8 may be the company’s last shot in smartphones
In 1Q12, after 14 years on top, Nokia was dethroned by SEC as the worldÊs largest handset
maker. After accumulating losses of more than EUR3bn over the last six quarters, the
mobile phone giant is now considering selling some of its non-core assets, including its
headquarters in Espoo, Finland, and has announced plans to cut its headcount by 20% by
the end of next year.
In 3Q12, NokiaÊs Devices & Services unit posted revenues of EUR3.6bn (down 33.9% YoY
and 11.4% QoQ), even lower than the 2004 level (EUR4.08bn). The division posted another
operating loss (EUR680mn) and saw its OP margin plunge by 22.3%p YoY and 7.4%p QoQ
to -9.2%, one of the worst levels on record.
Handset sales fell 22.2% YoY and 1.0% QoQ to 82.9mn in the quarter. Smartphone sales
tumbled 62.5% YoY and 38.2% QoQ to 6.3mn units, while feature phone sales were down
14.7% YoY but up 4.2% QoQ to 76.6mn units.
Although the Devices & Services division is likely to remain in the red in 4Q12, its operating
losses should slowly narrow with the release of Lumia 920 and Lumia 820, both of which
run on Windows 8. Nokia has already gained some ground in the Windows-based
smartphone market following its rollouts of low-end products in 2Q and 3Q. Looking ahead,
we think Windows 8, which allows consumers to use the same operating system on their
PCs and smartphones, will provide a significant boost to Nokia.
With the current smartphone market dominated by SEC and Apple, it will be challenging for
Nokia to restore its market position given its lack of apps and tarnished brand reputation.
Thus, 4Q will be a critical quarter for Nokia, with much of its survival depending on the
expected release of its new Lumia series and corporate restructuring efforts led by its
current boss Stephen Elop.
We believe NokiaÊs best chance of survival lies in differentiating its smartphones with the
Windows 8 operating system. While it remains to be seen whether the company made the
right decision in abandoning its Symbian OS and forming a strategic alliance with Microsoft,
we believe the Windows-based differentiation and the commoditization of smartphones will
present a new opportunity for Nokia.
Figure 36. NokiaÊs quarterly earnings trend Figure 37. NokiaÊs smartphone lineup
Source: Company data, KDB Daewoo Securities Research Source: GS Marena, KDB Daewoo Securities Research
3Q12 was another
disappointing quarter for
Nokia
Watch for the release of
Lumia smartphones and
restructuring efforts in
4Q12
-4
0
4
8
12
1Q04 1Q05 1Q06 1Q07 1Q08 1Q09 1Q10 1Q11 1Q12
-30
-20
-10
0
10
20
30Sales (L)
Operating profit (L)
OPM (R)
(EURbn) (%)
Cont inuing losses
Specifications
Size:127.8 x 68.4 x 10.9mm
Weight: 145g
Display:480 x 800 pixels
(AMOLED capacitive
touchscreen)
Camera:8MP, LED flash
OS: Windows Phone 8
CPU: -
Size: 130.3 x 70.8 x 10.7mm
Weight: 185g
Display: 768 x 1280 pixels
(TIPS TFT capacitive
touchscreen)
Camera: 8MP, LED flash
OS: Windows Phone 8
CPU: Dual-core 1.5 GHz
Size:123.8 x 68.5 x 9.9mm
Weight: 160g
Display: 480 x 800 pixels
(AMOLED capacitive
touchscreen)
Camera: 8MP, LED flash
OS: Android OS, v4.0
CPU: Dual-core 1.5 GHz
Released
date4Q12F September 2012F 4Q12F
Lumia 920 Lumia 820Name Lumia 810
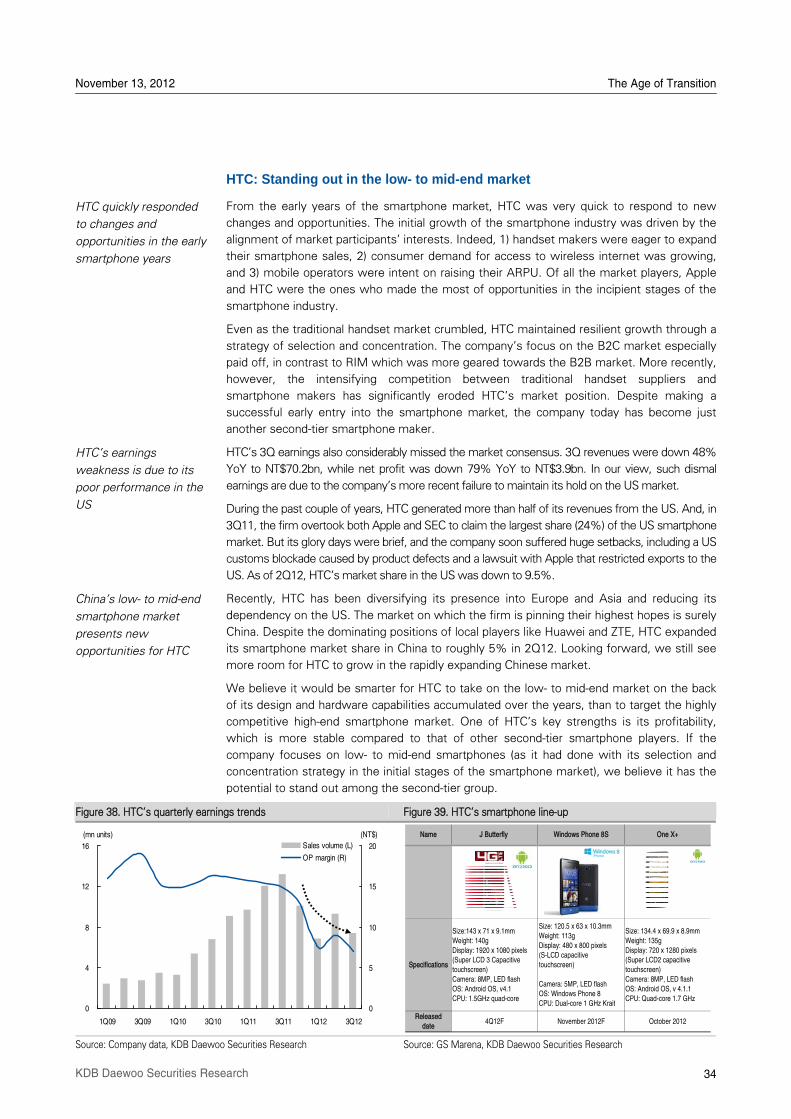
November 13, 2012 The Age of Transition
34 KDB Daewoo Securities Research
HTC: Standing out in the low- to mid-end market
From the early years of the smartphone market, HTC was very quick to respond to new
changes and opportunities. The initial growth of the smartphone industry was driven by the
alignment of market participantsÊ interests. Indeed, 1) handset makers were eager to expand
their smartphone sales, 2) consumer demand for access to wireless internet was growing,
and 3) mobile operators were intent on raising their ARPU. Of all the market players, Apple
and HTC were the ones who made the most of opportunities in the incipient stages of the
smartphone industry.
Even as the traditional handset market crumbled, HTC maintained resilient growth through a
strategy of selection and concentration. The companyÊs focus on the B2C market especially
paid off, in contrast to RIM which was more geared towards the B2B market. More recently,
however, the intensifying competition between traditional handset suppliers and
smartphone makers has significantly eroded HTCÊs market position. Despite making a
successful early entry into the smartphone market, the company today has become just
another second-tier smartphone maker.
HTCÊs 3Q earnings also considerably missed the market consensus. 3Q revenues were down 48%
YoY to NT$70.2bn, while net profit was down 79% YoY to NT$3.9bn. In our view, such dismal
earnings are due to the companyÊs more recent failure to maintain its hold on the US market.
During the past couple of years, HTC generated more than half of its revenues from the US. And, in
3Q11, the firm overtook both Apple and SEC to claim the largest share (24%) of the US smartphone
market. But its glory days were brief, and the company soon suffered huge setbacks, including a US
customs blockade caused by product defects and a lawsuit with Apple that restricted exports to the
US. As of 2Q12, HTCÊs market share in the US was down to 9.5%.
Recently, HTC has been diversifying its presence into Europe and Asia and reducing its
dependency on the US. The market on which the firm is pinning their highest hopes is surely
China. Despite the dominating positions of local players like Huawei and ZTE, HTC expanded
its smartphone market share in China to roughly 5% in 2Q12. Looking forward, we still see
more room for HTC to grow in the rapidly expanding Chinese market.
We believe it would be smarter for HTC to take on the low- to mid-end market on the back
of its design and hardware capabilities accumulated over the years, than to target the highly
competitive high-end smartphone market. One of HTCÊs key strengths is its profitability,
which is more stable compared to that of other second-tier smartphone players. If the
company focuses on low- to mid-end smartphones (as it had done with its selection and
concentration strategy in the initial stages of the smartphone market), we believe it has the
potential to stand out among the second-tier group.
Figure 38. HTCÊs quarterly earnings trends Figure 39. HTCÊs smartphone line-up
Source: Company data, KDB Daewoo Securities Research Source: GS Marena, KDB Daewoo Securities Research
HTC quickly responded
to changes and
opportunities in the early
smartphone years
HTCÊs earnings
weakness is due to its
poor performance in the
US
ChinaÊs low- to mid-end
smartphone market
presents new
opportunities for HTC
0
4
8
12
16
1Q09 3Q09 1Q10 3Q10 1Q11 3Q11 1Q12 3Q12
0
5
10
15
20Sales volume (L)
OP margin (R)
(mn units) (NT$) Name J Butterfly Windows Phone 8S One X+
November 2012F October 2012
Specifications
Size:143 x 71 x 9.1mm
Weight: 140g
Display: 1920 x 1080 pixels(Super LCD 3 Capacitive
touchscreen)
Camera: 8MP, LED flash
OS: Android OS, v4.1
CPU: 1.5GHz quad-core
Size: 120.5 x 63 x 10.3mm
Weight: 113g
Display: 480 x 800 pixels
(S-LCD capacitive
touchscreen)
Camera: 5MP, LED flashOS: Windows Phone 8
CPU: Dual-core 1 GHz Krait
Size: 134.4 x 69.9 x 8.9mm
Weight: 135g
Display: 720 x 1280 pixels(Super LCD2 capacitive
touchscreen)
Camera: 8MP, LED flash
OS: Android OS, v 4.1.1
CPU: Quad-core 1.7 GHz
Released
date4Q12F
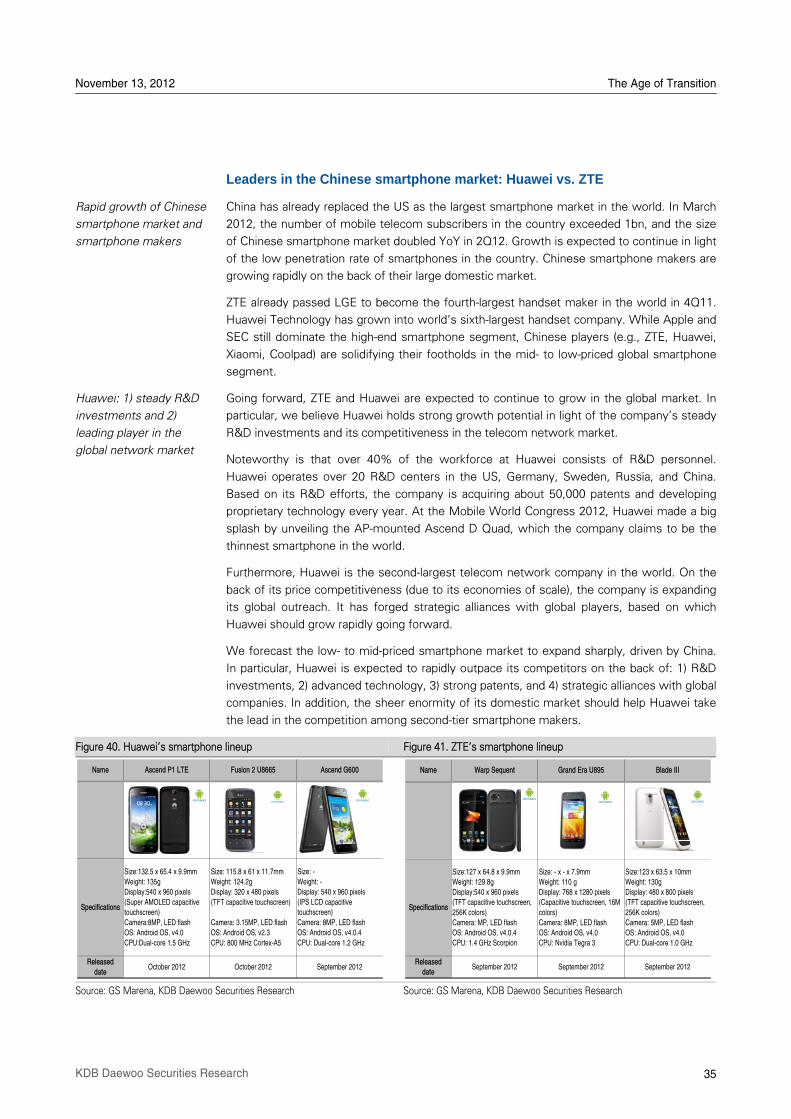
November 13, 2012 The Age of Transition
35 KDB Daewoo Securities Research
Leaders in the Chinese smartphone market: Huawei vs. ZTE
China has already replaced the US as the largest smartphone market in the world. In March
2012, the number of mobile telecom subscribers in the country exceeded 1bn, and the size
of Chinese smartphone market doubled YoY in 2Q12. Growth is expected to continue in light
of the low penetration rate of smartphones in the country. Chinese smartphone makers are
growing rapidly on the back of their large domestic market.
ZTE already passed LGE to become the fourth-largest handset maker in the world in 4Q11.
Huawei Technology has grown into worldÊs sixth-largest handset company. While Apple and
SEC still dominate the high-end smartphone segment, Chinese players (e.g., ZTE, Huawei,
Xiaomi, Coolpad) are solidifying their footholds in the mid- to low-priced global smartphone
segment.
Going forward, ZTE and Huawei are expected to continue to grow in the global market. In
particular, we believe Huawei holds strong growth potential in light of the companyÊs steady
R&D investments and its competitiveness in the telecom network market.
Noteworthy is that over 40% of the workforce at Huawei consists of R&D personnel.
Huawei operates over 20 R&D centers in the US, Germany, Sweden, Russia, and China.
Based on its R&D efforts, the company is acquiring about 50,000 patents and developing
proprietary technology every year. At the Mobile World Congress 2012, Huawei made a big
splash by unveiling the AP-mounted Ascend D Quad, which the company claims to be the
thinnest smartphone in the world.
Furthermore, Huawei is the second-largest telecom network company in the world. On the
back of its price competitiveness (due to its economies of scale), the company is expanding
its global outreach. It has forged strategic alliances with global players, based on which
Huawei should grow rapidly going forward.
We forecast the low- to mid-priced smartphone market to expand sharply, driven by China.
In particular, Huawei is expected to rapidly outpace its competitors on the back of: 1) R&D
investments, 2) advanced technology, 3) strong patents, and 4) strategic alliances with global
companies. In addition, the sheer enormity of its domestic market should help Huawei take
the lead in the competition among second-tier smartphone makers.
Figure 40. HuaweiÊs smartphone lineup Figure 41. ZTEÊs smartphone lineup
Source: GS Marena, KDB Daewoo Securities Research Source: GS Marena, KDB Daewoo Securities Research
Rapid growth of Chinese
smartphone market and
smartphone makers
Huawei: 1) steady R&D
investments and 2)
leading player in the
global network market
Name Ascend P1 LTE Fusion 2 U8665 Ascend G600
Released
dateOctober 2012 October 2012 September 2012
Specifications
Size:132.5 x 65.4 x 9.9mm
Weight: 135g
Display:540 x 960 pixels
(Super AMOLED capacitive
touchscreen)
Camera:8MP, LED flash
OS: Android OS, v4.0
CPU:Dual-core 1.5 GHz
Size: 115.8 x 61 x 11.7mm
Weight: 124.2g
Display: 320 x 480 pixels
(TFT capacitive touchscreen)
Camera: 3.15MP, LED flash
OS: Android OS, v2.3
CPU: 800 MHz Cortex-A5
Size: -
Weight: -
Display: 540 x 960 pixels
(IPS LCD capacitive
touchscreen)
Camera: 8MP, LED flash
OS: Android OS, v4.0.4
CPU: Dual-core 1.2 GHz
Size:123 x 63.5 x 10mm
Weight: 130g
Display: 480 x 800 pixels
(TFT capacitive touchscreen,
256K colors)
Camera: 5MP, LED flash
OS: Android OS, v4.0
CPU: Dual-core 1.0 GHz
Released
dateSeptember 2012 September 2012 September 2012
Specifications
Size:127 x 64.8 x 9.9mm
Weight: 129.8g
Display:540 x 960 pixels
(TFT capacitive touchscreen,
256K colors)
Camera: MP, LED flash
OS: Android OS, v4.0.4
CPU: 1.4 GHz Scorpion
Size: - x - x 7.9mm
Weight: 110 g
Display: 768 x 1280 pixels
(Capacitive touchscreen, 16M
colors)
Camera: 8MP, LED flash
OS: Android OS, v4.0
CPU: Nvidia Tegra 3
Blade IIIName Warp Sequent Grand Era U895
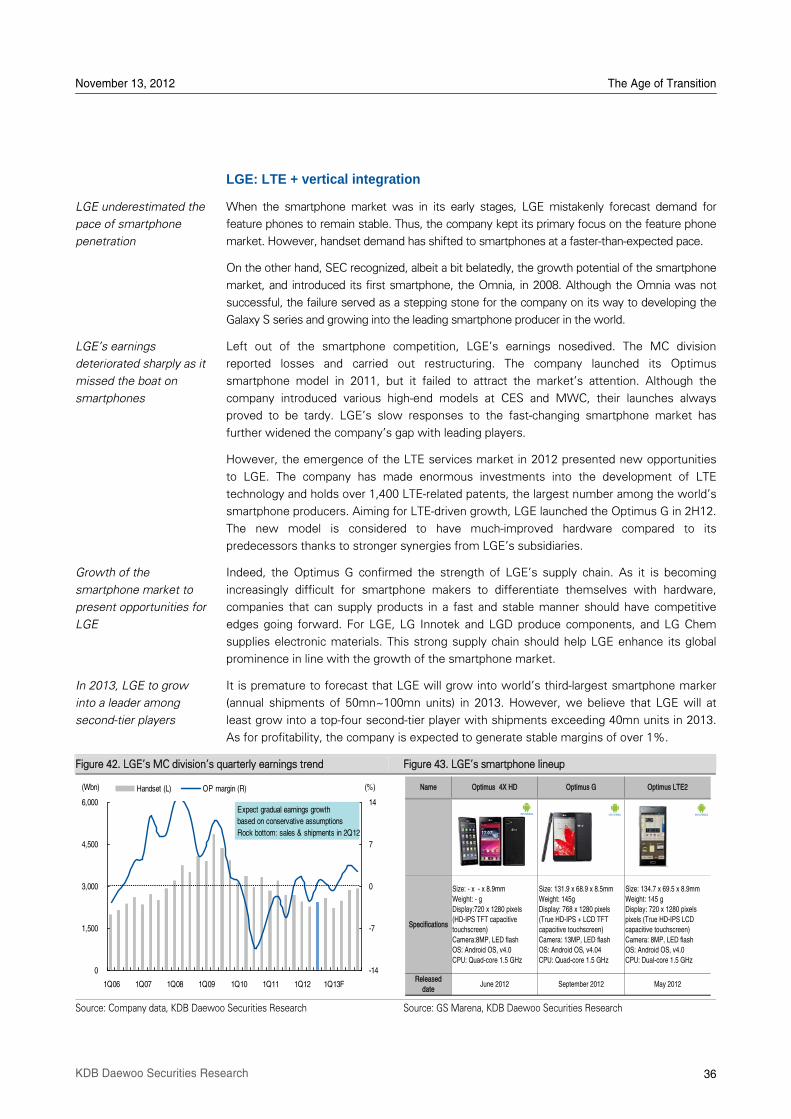
November 13, 2012 The Age of Transition
36 KDB Daewoo Securities Research
LGE: LTE + vertical integration
When the smartphone market was in its early stages, LGE mistakenly forecast demand for
feature phones to remain stable. Thus, the company kept its primary focus on the feature phone
market. However, handset demand has shifted to smartphones at a faster-than-expected pace.
On the other hand, SEC recognized, albeit a bit belatedly, the growth potential of the smartphone
market, and introduced its first smartphone, the Omnia, in 2008. Although the Omnia was not
successful, the failure served as a stepping stone for the company on its way to developing the
Galaxy S series and growing into the leading smartphone producer in the world.
Left out of the smartphone competition, LGEÊs earnings nosedived. The MC division
reported losses and carried out restructuring. The company launched its Optimus
smartphone model in 2011, but it failed to attract the marketÊs attention. Although the
company introduced various high-end models at CES and MWC, their launches always
proved to be tardy. LGEÊs slow responses to the fast-changing smartphone market has
further widened the companyÊs gap with leading players.
However, the emergence of the LTE services market in 2012 presented new opportunities
to LGE. The company has made enormous investments into the development of LTE
technology and holds over 1,400 LTE-related patents, the largest number among the worldÊs
smartphone producers. Aiming for LTE-driven growth, LGE launched the Optimus G in 2H12.
The new model is considered to have much-improved hardware compared to its
predecessors thanks to stronger synergies from LGEÊs subsidiaries.
Indeed, the Optimus G confirmed the strength of LGEÊs supply chain. As it is becoming
increasingly difficult for smartphone makers to differentiate themselves with hardware,
companies that can supply products in a fast and stable manner should have competitive
edges going forward. For LGE, LG Innotek and LGD produce components, and LG Chem
supplies electronic materials. This strong supply chain should help LGE enhance its global
prominence in line with the growth of the smartphone market.
It is premature to forecast that LGE will grow into worldÊs third-largest smartphone marker
(annual shipments of 50mn~100mn units) in 2013. However, we believe that LGE will at
least grow into a top-four second-tier player with shipments exceeding 40mn units in 2013.
As for profitability, the company is expected to generate stable margins of over 1%.
Figure 42. LGEÊs MC divisionÊs quarterly earnings trend Figure 43. LGEÊs smartphone lineup
Source: Company data, KDB Daewoo Securities Research Source: GS Marena, KDB Daewoo Securities Research
LGE underestimated the
pace of smartphone
penetration
LGEÊs earnings
deteriorated sharply as it
missed the boat on
smartphones
Growth of the
smartphone market to
present opportunities for
LGE
In 2013, LGE to grow
into a leader among
second-tier players
May 2012September 2012Released
dateJune 2012
Specifications
Size: - x - x 8.9mm
Weight: - g
Display:720 x 1280 pixels
(HD-IPS TFT capacitive
touchscreen)
Camera:8MP, LED flash
OS: Android OS, v4.0
CPU: Quad-core 1.5 GHz
Optimus LTE2
Size: 134.7 x 69.5 x 8.9mm
Weight: 145 g
Display: 720 x 1280 pixels
pixels (True HD-IPS LCD
capacitive touchscreen)
Camera: 8MP, LED flash
OS: Android OS, v4.0
CPU: Dual-core 1.5 GHz
Name Optimus 4X HD
Size: 131.9 x 68.9 x 8.5mm
Weight: 145g
Display: 768 x 1280 pixels
(True HD-IPS + LCD TFT
capacitive touchscreen)
Camera: 13MP, LED flash
OS: Android OS, v4.04
CPU: Quad-core 1.5 GHz
Optimus G
0
1,500
3,000
4,500
6,000
1Q06 1Q07 1Q08 1Q09 1Q10 1Q11 1Q12 1Q13F
-14
-7
0
7
14
Handset (L) OP margin (R)(Wbn) (%)
Expect gradual earnings growth
based on conservative assumptions
Rock bottom: sales & shipments in 2Q12
37 KDB Daewoo Securities Research
IV The Return of Microsoft
Will Windows 8 boost demand for traditional PCs? We do not believe so. The era of
operating system and CPU upgrades boosting PC demand appears to be over. Now, demand
is being driven by innovation. Therefore, the effect of the Windows 8 launch should be
examined through the lens of mobile revolution-driven innovation.
The tablet market is steadily evolving. Newly growing segments are the 5- and 7-inch
phablet markets and the hybrid PC (i.e., a tablet with a keyboard) market. In particular, the
markets for 7-inch phablets and hybrid PCs running Windows RT (a version of Windows 8)
are expected to expand rapidly.
Tablet shipments are projected to surge by 64% YoY to 180mn units in 2013, boosted by
the market expansion of 7-inch tablets, including the iPad Mini, and Windows 8-based
tablets (including the Surface).
.
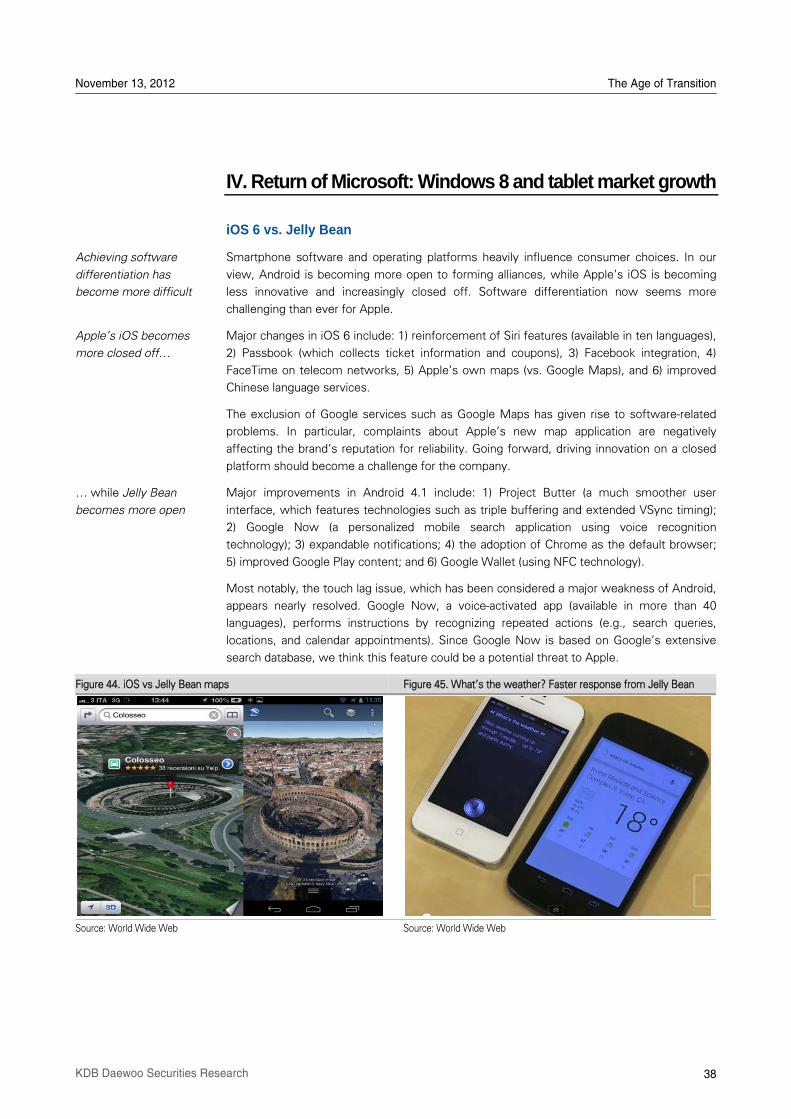
November 13, 2012 The Age of Transition
38 KDB Daewoo Securities Research
IV. Return of Microsoft: Windows 8 and tablet market growth
iOS 6 vs. Jelly Bean
Smartphone software and operating platforms heavily influence consumer choices. In our
view, Android is becoming more open to forming alliances, while AppleÊs iOS is becoming
less innovative and increasingly closed off. Software differentiation now seems more
challenging than ever for Apple.
Major changes in iOS 6 include: 1) reinforcement of Siri features (available in ten languages),
2) Passbook (which collects ticket information and coupons), 3) Facebook integration, 4)
FaceTime on telecom networks, 5) AppleÊs own maps (vs. Google Maps), and 6) improved
Chinese language services.
The exclusion of Google services such as Google Maps has given rise to software-related
problems. In particular, complaints about AppleÊs new map application are negatively
affecting the brandÊs reputation for reliability. Going forward, driving innovation on a closed
platform should become a challenge for the company.
Major improvements in Android 4.1 include: 1) Project Butter (a much smoother user
interface, which features technologies such as triple buffering and extended VSync timing);
2) Google Now (a personalized mobile search application using voice recognition
technology); 3) expandable notifications; 4) the adoption of Chrome as the default browser;
5) improved Google Play content; and 6) Google Wallet (using NFC technology).
Most notably, the touch lag issue, which has been considered a major weakness of Android,
appears nearly resolved. Google Now, a voice-activated app (available in more than 40
languages), performs instructions by recognizing repeated actions (e.g., search queries,
locations, and calendar appointments). Since Google Now is based on GoogleÊs extensive
search database, we think this feature could be a potential threat to Apple.
Figure 44. iOS vs Jelly Bean maps Figure 45. WhatÊs the weather? Faster response from Jelly Bean
Source: World Wide Web Source: World Wide Web
Achieving software
differentiation has
become more difficult
AppleÊs iOS becomes
more closed off⁄
⁄ while Jelly Bean
becomes more open
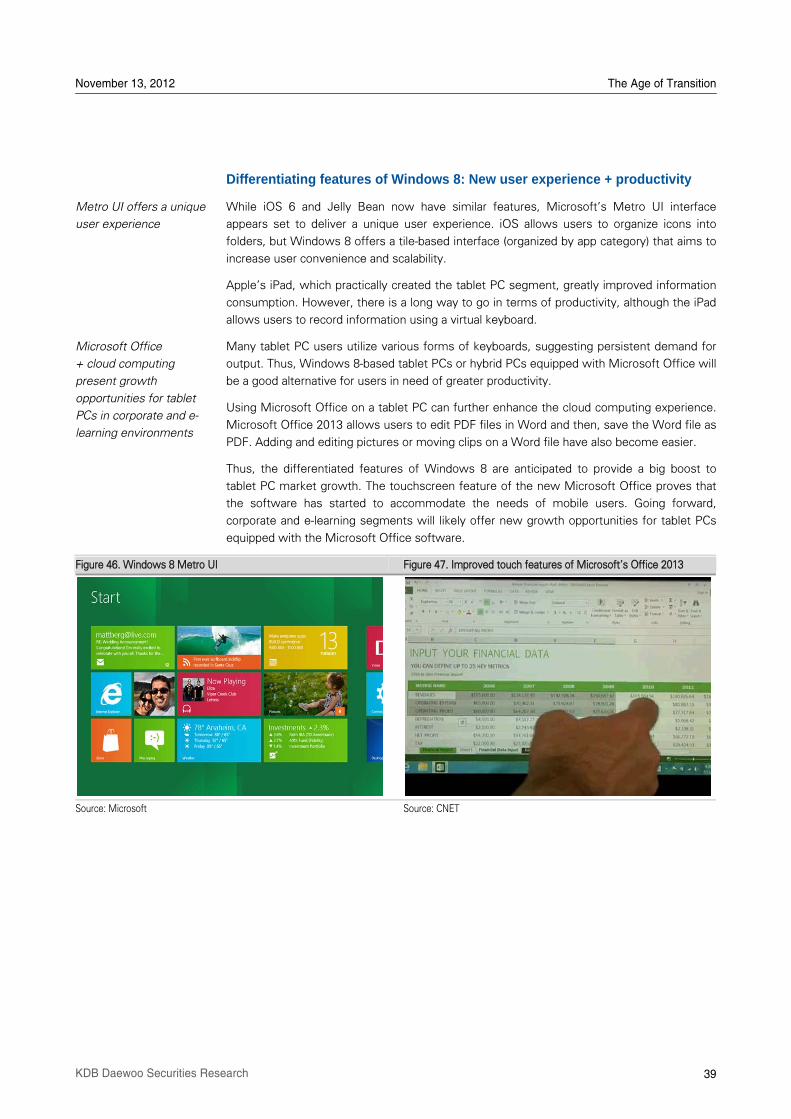
November 13, 2012 The Age of Transition
39 KDB Daewoo Securities Research
Differentiating features of Windows 8: New user experience + productivity
While iOS 6 and Jelly Bean now have similar features, MicrosoftÊs Metro UI interface
appears set to deliver a unique user experience. iOS allows users to organize icons into
folders, but Windows 8 offers a tile-based interface (organized by app category) that aims to
increase user convenience and scalability.
AppleÊs iPad, which practically created the tablet PC segment, greatly improved information
consumption. However, there is a long way to go in terms of productivity, although the iPad
allows users to record information using a virtual keyboard.
Many tablet PC users utilize various forms of keyboards, suggesting persistent demand for
output. Thus, Windows 8-based tablet PCs or hybrid PCs equipped with Microsoft Office will
be a good alternative for users in need of greater productivity.
Using Microsoft Office on a tablet PC can further enhance the cloud computing experience.
Microsoft Office 2013 allows users to edit PDF files in Word and then, save the Word file as
PDF. Adding and editing pictures or moving clips on a Word file have also become easier.
Thus, the differentiated features of Windows 8 are anticipated to provide a big boost to
tablet PC market growth. The touchscreen feature of the new Microsoft Office proves that
the software has started to accommodate the needs of mobile users. Going forward,
corporate and e-learning segments will likely offer new growth opportunities for tablet PCs
equipped with the Microsoft Office software.
Figure 46. Windows 8 Metro UI Figure 47. Improved touch features of MicrosoftÊs Office 2013
Source: Microsoft Source: CNET
Metro UI offers a unique
user experience
Microsoft Office
+ cloud computing
present growth
opportunities for tablet
PCs in corporate and e-
learning environments
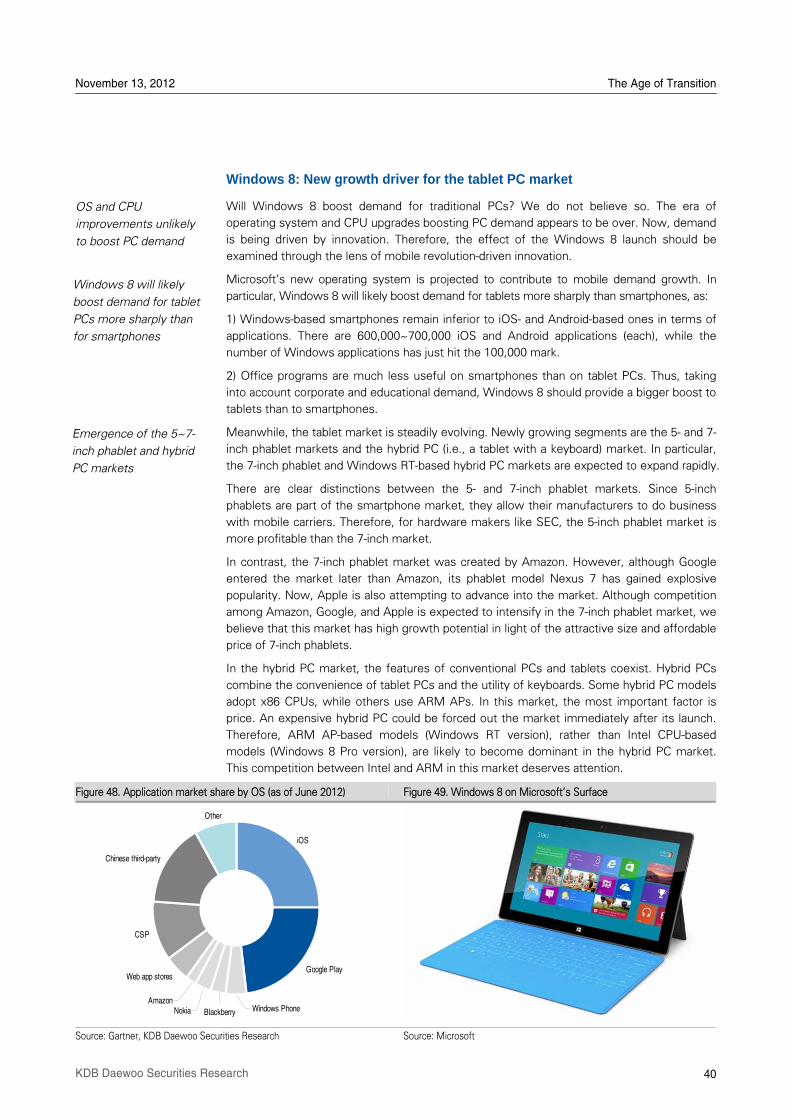
November 13, 2012 The Age of Transition
40 KDB Daewoo Securities Research
Windows 8: New growth driver for the tablet PC market
Will Windows 8 boost demand for traditional PCs? We do not believe so. The era of
operating system and CPU upgrades boosting PC demand appears to be over. Now, demand
is being driven by innovation. Therefore, the effect of the Windows 8 launch should be
examined through the lens of mobile revolution-driven innovation.
MicrosoftÊs new operating system is projected to contribute to mobile demand growth. In
particular, Windows 8 will likely boost demand for tablets more sharply than smartphones, as:
1) Windows-based smartphones remain inferior to iOS- and Android-based ones in terms of
applications. There are 600,000~700,000 iOS and Android applications (each), while the
number of Windows applications has just hit the 100,000 mark.
2) Office programs are much less useful on smartphones than on tablet PCs. Thus, taking
into account corporate and educational demand, Windows 8 should provide a bigger boost to
tablets than to smartphones.
Meanwhile, the tablet market is steadily evolving. Newly growing segments are the 5- and 7-
inch phablet markets and the hybrid PC (i.e., a tablet with a keyboard) market. In particular,
the 7-inch phablet and Windows RT-based hybrid PC markets are expected to expand rapidly.
There are clear distinctions between the 5- and 7-inch phablet markets. Since 5-inch
phablets are part of the smartphone market, they allow their manufacturers to do business
with mobile carriers. Therefore, for hardware makers like SEC, the 5-inch phablet market is
more profitable than the 7-inch market.
In contrast, the 7-inch phablet market was created by Amazon. However, although Google
entered the market later than Amazon, its phablet model Nexus 7 has gained explosive
popularity. Now, Apple is also attempting to advance into the market. Although competition
among Amazon, Google, and Apple is expected to intensify in the 7-inch phablet market, we
believe that this market has high growth potential in light of the attractive size and affordable
price of 7-inch phablets.
In the hybrid PC market, the features of conventional PCs and tablets coexist. Hybrid PCs
combine the convenience of tablet PCs and the utility of keyboards. Some hybrid PC models
adopt x86 CPUs, while others use ARM APs. In this market, the most important factor is
price. An expensive hybrid PC could be forced out the market immediately after its launch.
Therefore, ARM AP-based models (Windows RT version), rather than Intel CPU-based
models (Windows 8 Pro version), are likely to become dominant in the hybrid PC market.
This competition between Intel and ARM in this market deserves attention.
Figure 48. Application market share by OS (as of June 2012) Figure 49. Windows 8 on MicrosoftÊs Surface
Source: Gartner, KDB Daewoo Securities Research Source: Microsoft
OS and CPU
improvements unlikely
to boost PC demand
Windows 8 will likely
boost demand for tablet
PCs more sharply than
for smartphones
Emergence of the 5~7-
inch phablet and hybrid
PC markets
iOS
Google Play
Windows PhoneBlackberryNokiaAmazon
Web app stores
CSP
Chinese third-party
Other
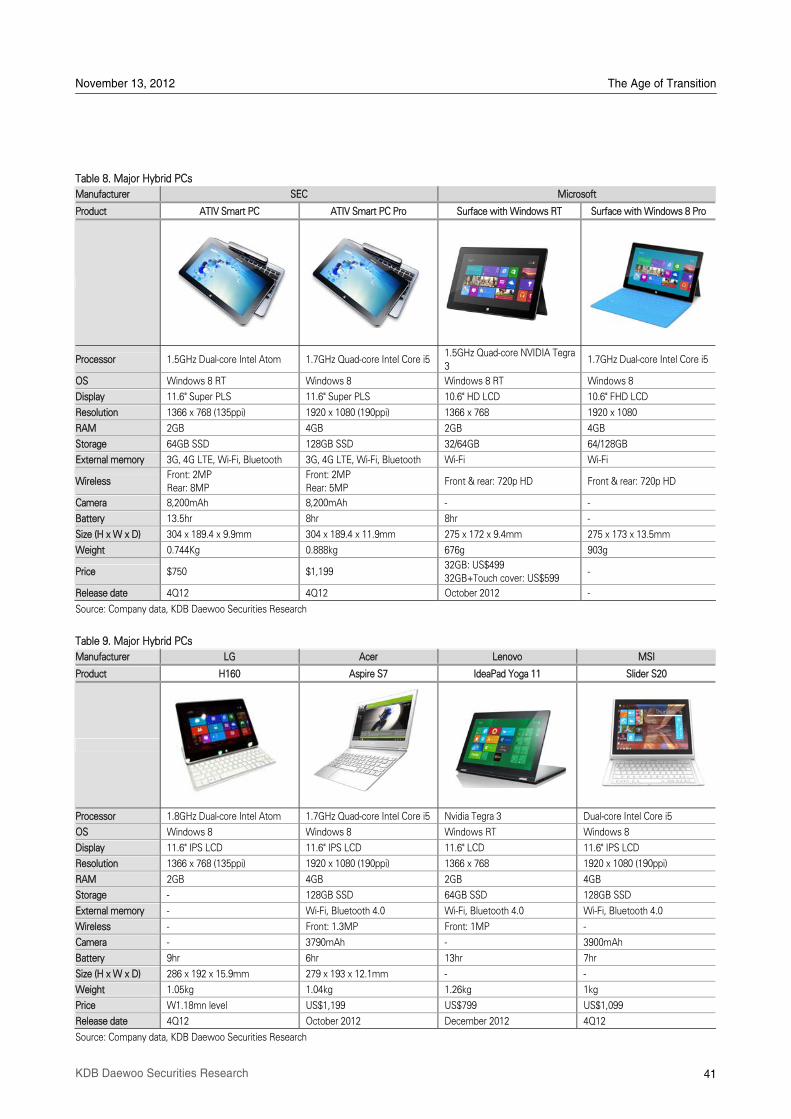
November 13, 2012 The Age of Transition
41 KDB Daewoo Securities Research
Table 8. Major Hybrid PCs
Manufacturer SEC Microsoft
Product ATIV Smart PC ATIV Smart PC Pro Surface with Windows RT Surface with Windows 8 Pro
Processor 1.5GHz Dual-core Intel Atom 1.7GHz Quad-core Intel Core i51.5GHz Quad-core NVIDIA Tegra
3 1.7GHz Dual-core Intel Core i5
OS Windows 8 RT Windows 8 Windows 8 RT Windows 8
Display 11.6" Super PLS 11.6" Super PLS 10.6" HD LCD 10.6" FHD LCD
Resolution 1366 x 768 (135ppi) 1920 x 1080 (190ppi) 1366 x 768 1920 x 1080
RAM 2GB 4GB 2GB 4GB
Storage 64GB SSD 128GB SSD 32/64GB 64/128GB
External memory 3G, 4G LTE, Wi-Fi, Bluetooth 3G, 4G LTE, Wi-Fi, Bluetooth Wi-Fi Wi-Fi
Wireless Front: 2MP
Rear: 8MP
Front: 2MP
Rear: 5MP Front & rear: 720p HD Front & rear: 720p HD
Camera 8,200mAh 8,200mAh - -
Battery 13.5hr 8hr 8hr -
Size (H x W x D) 304 x 189.4 x 9.9mm 304 x 189.4 x 11.9mm 275 x 172 x 9.4mm 275 x 173 x 13.5mm
Weight 0.744Kg 0.888kg 676g 903g
Price $750 $1,199 32GB: US$499 32GB+Touch cover: US$599
-
Release date 4Q12 4Q12 October 2012 -
Source: Company data, KDB Daewoo Securities Research
Table 9. Major Hybrid PCs
Manufacturer LG Acer Lenovo MSI
Product H160 Aspire S7 IdeaPad Yoga 11 Slider S20
Processor 1.8GHz Dual-core Intel Atom 1.7GHz Quad-core Intel Core i5 Nvidia Tegra 3 Dual-core Intel Core i5
OS Windows 8 Windows 8 Windows RT Windows 8
Display 11.6" IPS LCD 11.6" IPS LCD 11.6" LCD 11.6" IPS LCD
Resolution 1366 x 768 (135ppi) 1920 x 1080 (190ppi) 1366 x 768 1920 x 1080 (190ppi)
RAM 2GB 4GB 2GB 4GB
Storage - 128GB SSD 64GB SSD 128GB SSD
External memory - Wi-Fi, Bluetooth 4.0 Wi-Fi, Bluetooth 4.0 Wi-Fi, Bluetooth 4.0
Wireless - Front: 1.3MP Front: 1MP -
Camera - 3790mAh - 3900mAh
Battery 9hr 6hr 13hr 7hr
Size (H x W x D) 286 x 192 x 15.9mm 279 x 193 x 12.1mm - -
Weight 1.05kg 1.04kg 1.26kg 1kg
Price W1.18mn level US$1,199 US$799 US$1,099
Release date 4Q12 October 2012 December 2012 4Q12
Source: Company data, KDB Daewoo Securities Research
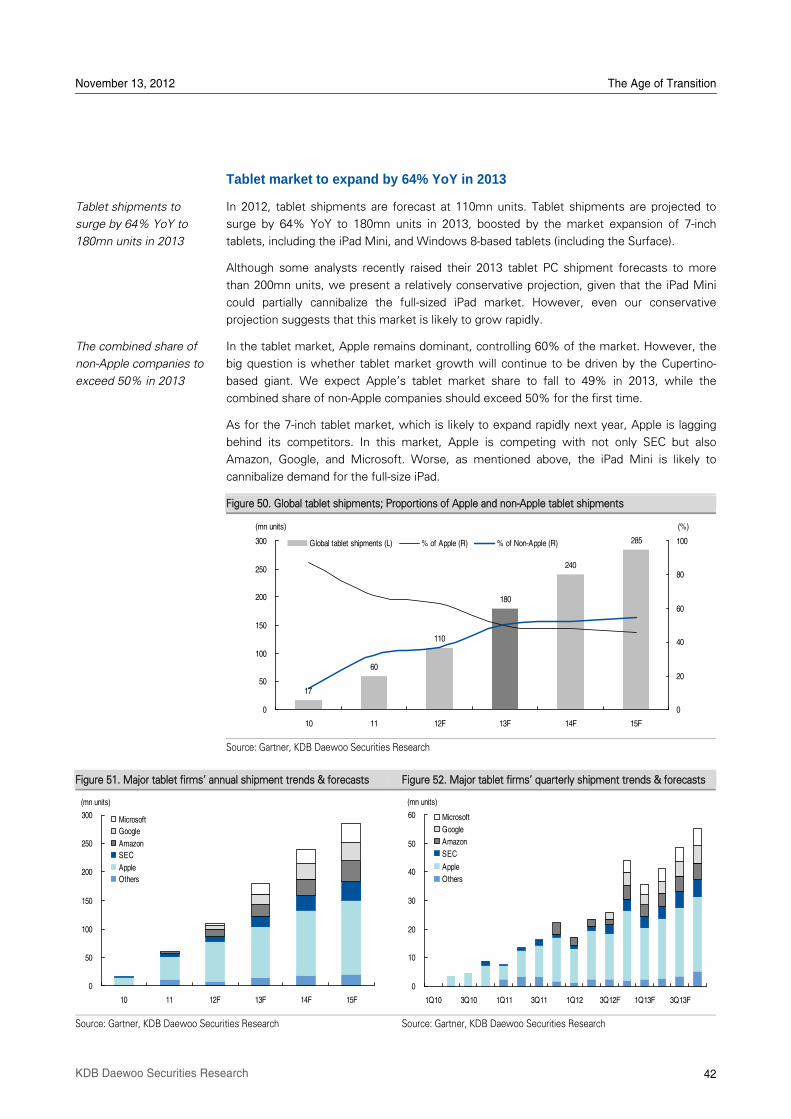
November 13, 2012 The Age of Transition
42 KDB Daewoo Securities Research
Tablet market to expand by 64% YoY in 2013
In 2012, tablet shipments are forecast at 110mn units. Tablet shipments are projected to
surge by 64% YoY to 180mn units in 2013, boosted by the market expansion of 7-inch
tablets, including the iPad Mini, and Windows 8-based tablets (including the Surface).
Although some analysts recently raised their 2013 tablet PC shipment forecasts to more
than 200mn units, we present a relatively conservative projection, given that the iPad Mini
could partially cannibalize the full-sized iPad market. However, even our conservative
projection suggests that this market is likely to grow rapidly.
In the tablet market, Apple remains dominant, controlling 60% of the market. However, the
big question is whether tablet market growth will continue to be driven by the Cupertino-
based giant. We expect AppleÊs tablet market share to fall to 49% in 2013, while the
combined share of non-Apple companies should exceed 50% for the first time.
As for the 7-inch tablet market, which is likely to expand rapidly next year, Apple is lagging
behind its competitors. In this market, Apple is competing with not only SEC but also
Amazon, Google, and Microsoft. Worse, as mentioned above, the iPad Mini is likely to
cannibalize demand for the full-size iPad.
Figure 50. Global tablet shipments; Proportions of Apple and non-Apple tablet shipments
Source: Gartner, KDB Daewoo Securities Research
Figure 51. Major tablet firmsÊ annual shipment trends & forecasts Figure 52. Major tablet firmsÊ quarterly shipment trends & forecasts
Source: Gartner, KDB Daewoo Securities Research Source: Gartner, KDB Daewoo Securities Research
Tablet shipments to
surge by 64% YoY to
180mn units in 2013
The combined share of
non-Apple companies to
exceed 50% in 2013
17
60
110
180
240
285
0
50
100
150
200
250
300
10 11 12F 13F 14F 15F
0
20
40
60
80
100Global tablet shipments (L) % of Apple (R) % of Non-Apple (R)
(mn units) (%)
0
10
20
30
40
50
60
1Q10 3Q10 1Q11 3Q11 1Q12 3Q12F 1Q13F 3Q13F
Microsoft
Amazon
SEC
Apple
Others
(mn units)
0
50
100
150
200
250
300
10 11 12F 13F 14F 15F
Microsoft
Amazon
SEC
Apple
Others
(mn units)
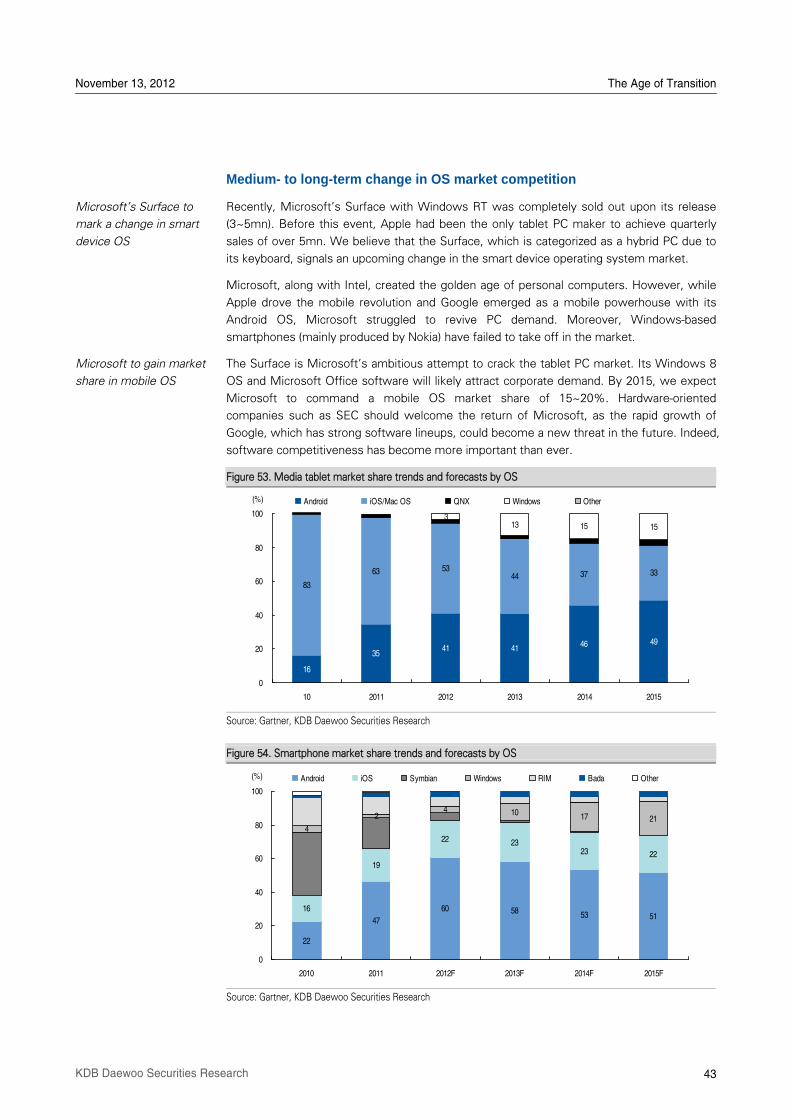
November 13, 2012 The Age of Transition
43 KDB Daewoo Securities Research
Medium- to long-term change in OS market competition
Recently, MicrosoftÊs Surface with Windows RT was completely sold out upon its release
(3~5mn). Before this event, Apple had been the only tablet PC maker to achieve quarterly
sales of over 5mn. We believe that the Surface, which is categorized as a hybrid PC due to
its keyboard, signals an upcoming change in the smart device operating system market.
Microsoft, along with Intel, created the golden age of personal computers. However, while
Apple drove the mobile revolution and Google emerged as a mobile powerhouse with its
Android OS, Microsoft struggled to revive PC demand. Moreover, Windows-based
smartphones (mainly produced by Nokia) have failed to take off in the market.
The Surface is Microsoft's ambitious attempt to crack the tablet PC market. Its Windows 8
OS and Microsoft Office software will likely attract corporate demand. By 2015, we expect
Microsoft to command a mobile OS market share of 15~20%. Hardware-oriented
companies such as SEC should welcome the return of Microsoft, as the rapid growth of
Google, which has strong software lineups, could become a new threat in the future. Indeed,
software competitiveness has become more important than ever.
Figure 53. Media tablet market share trends and forecasts by OS
Source: Gartner, KDB Daewoo Securities Research
Figure 54. Smartphone market share trends and forecasts by OS
Source: Gartner, KDB Daewoo Securities Research
MicrosoftÊs Surface to
mark a change in smart
device OS
Microsoft to gain market
share in mobile OS
16
3541 41 46 49
83
63 5344 37 33
- 313 15 15
0
20
40
60
80
100
10 2011 2012 2013 2014 2015
Android iOS/Mac OS QNX Windows Other(%)
22
47
60 58 53 5116
19
22 2323 22
4
24 10 17 21
0
20
40
60
80
100
2010 2011 2012F 2013F 2014F 2015F
Android iOS Symbian Windows RIM Bada Other(%)
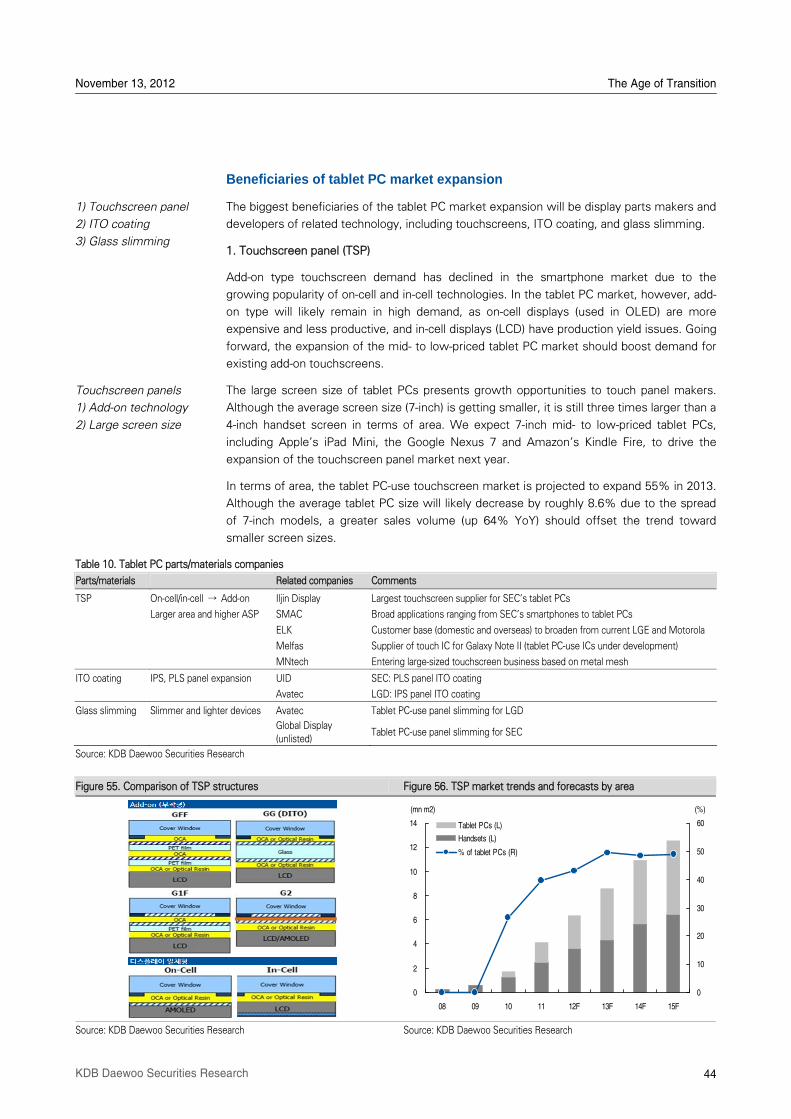
November 13, 2012 The Age of Transition
44 KDB Daewoo Securities Research
Beneficiaries of tablet PC market expansion
The biggest beneficiaries of the tablet PC market expansion will be display parts makers and
developers of related technology, including touchscreens, ITO coating, and glass slimming.
1. Touchscreen panel (TSP)
Add-on type touchscreen demand has declined in the smartphone market due to the
growing popularity of on-cell and in-cell technologies. In the tablet PC market, however, add-
on type will likely remain in high demand, as on-cell displays (used in OLED) are more
expensive and less productive, and in-cell displays (LCD) have production yield issues. Going
forward, the expansion of the mid- to low-priced tablet PC market should boost demand for
existing add-on touchscreens.
The large screen size of tablet PCs presents growth opportunities to touch panel makers.
Although the average screen size (7-inch) is getting smaller, it is still three times larger than a
4-inch handset screen in terms of area. We expect 7-inch mid- to low-priced tablet PCs,
including AppleÊs iPad Mini, the Google Nexus 7 and AmazonÊs Kindle Fire, to drive the
expansion of the touchscreen panel market next year.
In terms of area, the tablet PC-use touchscreen market is projected to expand 55% in 2013.
Although the average tablet PC size will likely decrease by roughly 8.6% due to the spread
of 7-inch models, a greater sales volume (up 64% YoY) should offset the trend toward
smaller screen sizes.
Table 10. Tablet PC parts/materials companies
Parts/materials Related companies Comments
TSP On-cell/in-cell → Add-on Iljin Display Largest touchscreen supplier for SECÊs tablet PCs
Larger area and higher ASP SMAC Broad applications ranging from SECÊs smartphones to tablet PCs
ELK Customer base (domestic and overseas) to broaden from current LGE and Motorola
Melfas Supplier of touch IC for Galaxy Note II (tablet PC-use ICs under development)
MNtech Entering large-sized touchscreen business based on metal mesh
ITO coating IPS, PLS panel expansion UID SEC: PLS panel ITO coating
Avatec LGD: IPS panel ITO coating
Glass slimming Slimmer and lighter devices Avatec Tablet PC-use panel slimming for LGD
Global Display
(unlisted) Tablet PC-use panel slimming for SEC
Source: KDB Daewoo Securities Research
Figure 55. Comparison of TSP structures Figure 56. TSP market trends and forecasts by area
Source: KDB Daewoo Securities Research Source: KDB Daewoo Securities Research
1) Touchscreen panel
2) ITO coating
3) Glass slimming
Touchscreen panels
1) Add-on technology
2) Large screen size
0
2
4
6
8
10
12
14
08 09 10 11 12F 13F 14F 15F
0
10
20
30
40
50
60Tablet PCs (L)
Handsets (L)
% of tablet PCs (R)
(mn m2) (%)
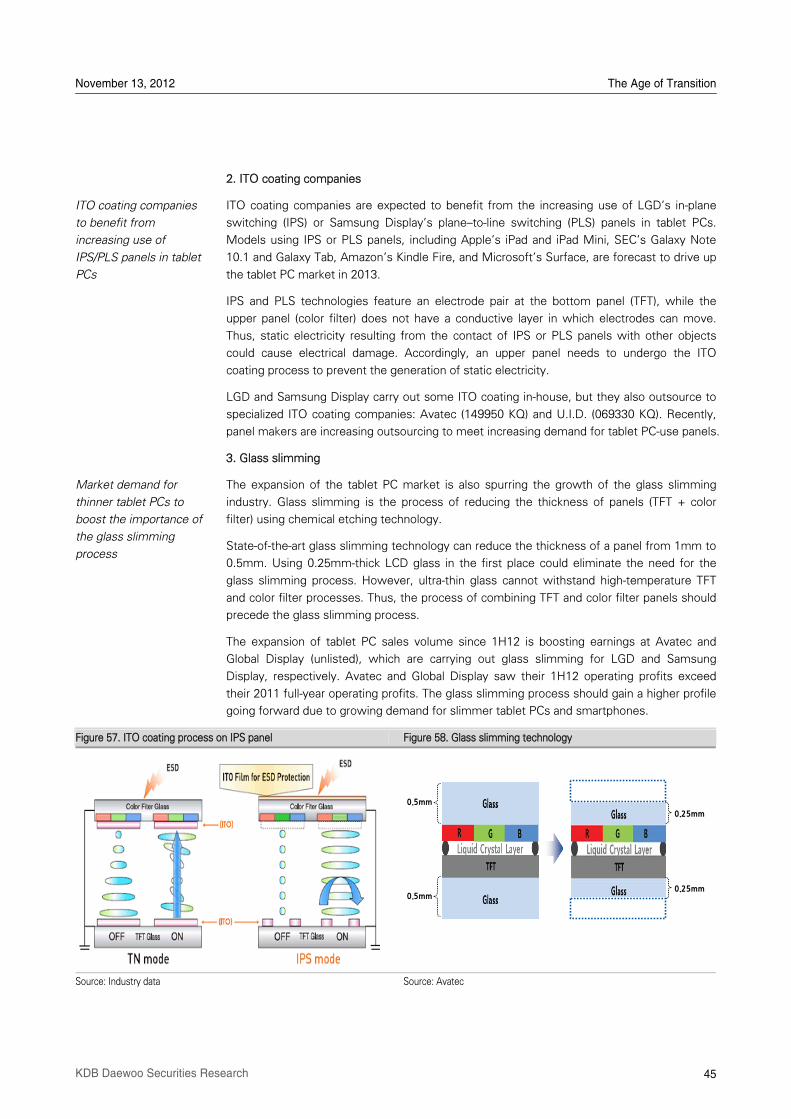
November 13, 2012 The Age of Transition
45 KDB Daewoo Securities Research
2. ITO coating companies
ITO coating companies are expected to benefit from the increasing use of LGDÊs in-plane
switching (IPS) or Samsung DisplayÊs plane–to-line switching (PLS) panels in tablet PCs.
Models using IPS or PLS panels, including AppleÊs iPad and iPad Mini, SECÊs Galaxy Note
10.1 and Galaxy Tab, AmazonÊs Kindle Fire, and MicrosoftÊs Surface, are forecast to drive up
the tablet PC market in 2013.
IPS and PLS technologies feature an electrode pair at the bottom panel (TFT), while the
upper panel (color filter) does not have a conductive layer in which electrodes can move.
Thus, static electricity resulting from the contact of IPS or PLS panels with other objects
could cause electrical damage. Accordingly, an upper panel needs to undergo the ITO
coating process to prevent the generation of static electricity.
LGD and Samsung Display carry out some ITO coating in-house, but they also outsource to
specialized ITO coating companies: Avatec (149950 KQ) and U.I.D. (069330 KQ). Recently,
panel makers are increasing outsourcing to meet increasing demand for tablet PC-use panels.
3. Glass slimming
The expansion of the tablet PC market is also spurring the growth of the glass slimming
industry. Glass slimming is the process of reducing the thickness of panels (TFT + color
filter) using chemical etching technology.
State-of-the-art glass slimming technology can reduce the thickness of a panel from 1mm to
0.5mm. Using 0.25mm-thick LCD glass in the first place could eliminate the need for the
glass slimming process. However, ultra-thin glass cannot withstand high-temperature TFT
and color filter processes. Thus, the process of combining TFT and color filter panels should
precede the glass slimming process.
The expansion of tablet PC sales volume since 1H12 is boosting earnings at Avatec and
Global Display (unlisted), which are carrying out glass slimming for LGD and Samsung
Display, respectively. Avatec and Global Display saw their 1H12 operating profits exceed
their 2011 full-year operating profits. The glass slimming process should gain a higher profile
going forward due to growing demand for slimmer tablet PCs and smartphones.
Figure 57. ITO coating process on IPS panel Figure 58. Glass slimming technology
Source: Industry data Source: Avatec
ITO coating companies
to benefit from
increasing use of
IPS/PLS panels in tablet
PCs
Market demand for
thinner tablet PCs to
boost the importance of
the glass slimming
process
0.5mm
0.25mm
0.25mm0.5mm
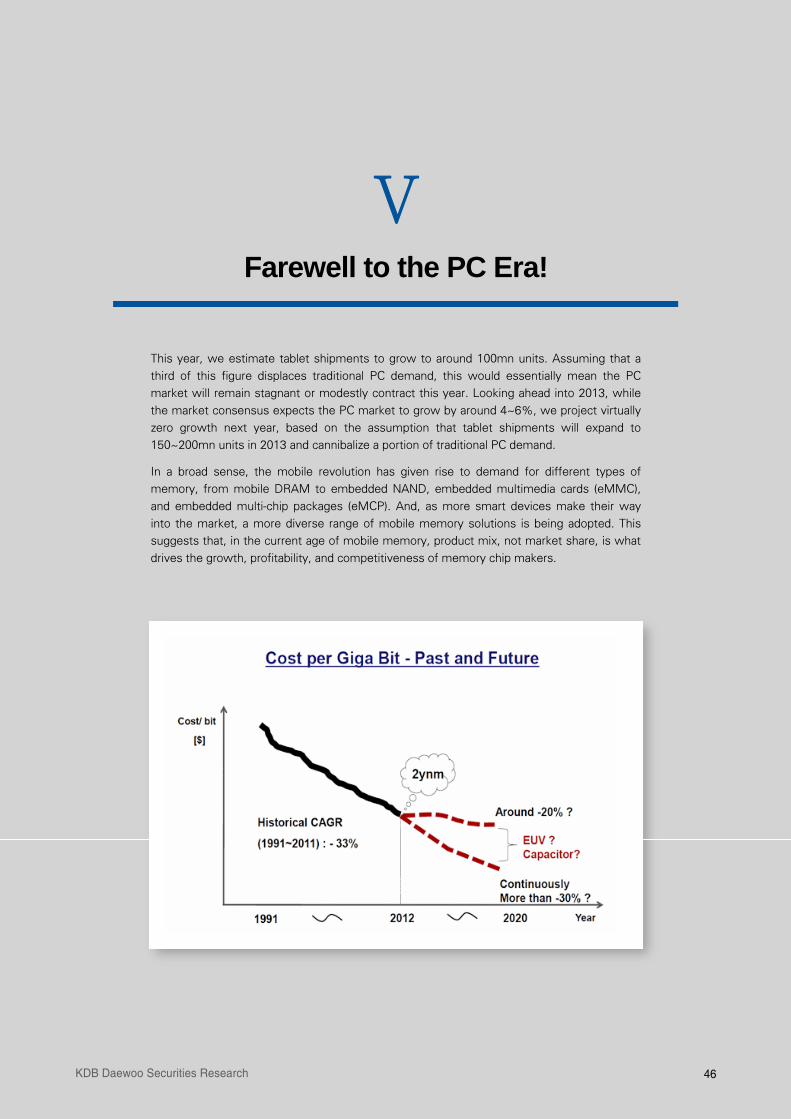
46 KDB Daewoo Securities Research
V Farewell to the PC Era!
This year, we estimate tablet shipments to grow to around 100mn units. Assuming that a
third of this figure displaces traditional PC demand, this would essentially mean the PC
market will remain stagnant or modestly contract this year. Looking ahead into 2013, while
the market consensus expects the PC market to grow by around 4~6%, we project virtually
zero growth next year, based on the assumption that tablet shipments will expand to
150~200mn units in 2013 and cannibalize a portion of traditional PC demand.
In a broad sense, the mobile revolution has given rise to demand for different types of
memory, from mobile DRAM to embedded NAND, embedded multimedia cards (eMMC),
and embedded multi-chip packages (eMCP). And, as more smart devices make their way
into the market, a more diverse range of mobile memory solutions is being adopted. This
suggests that, in the current age of mobile memory, product mix, not market share, is what
drives the growth, profitability, and competitiveness of memory chip makers.
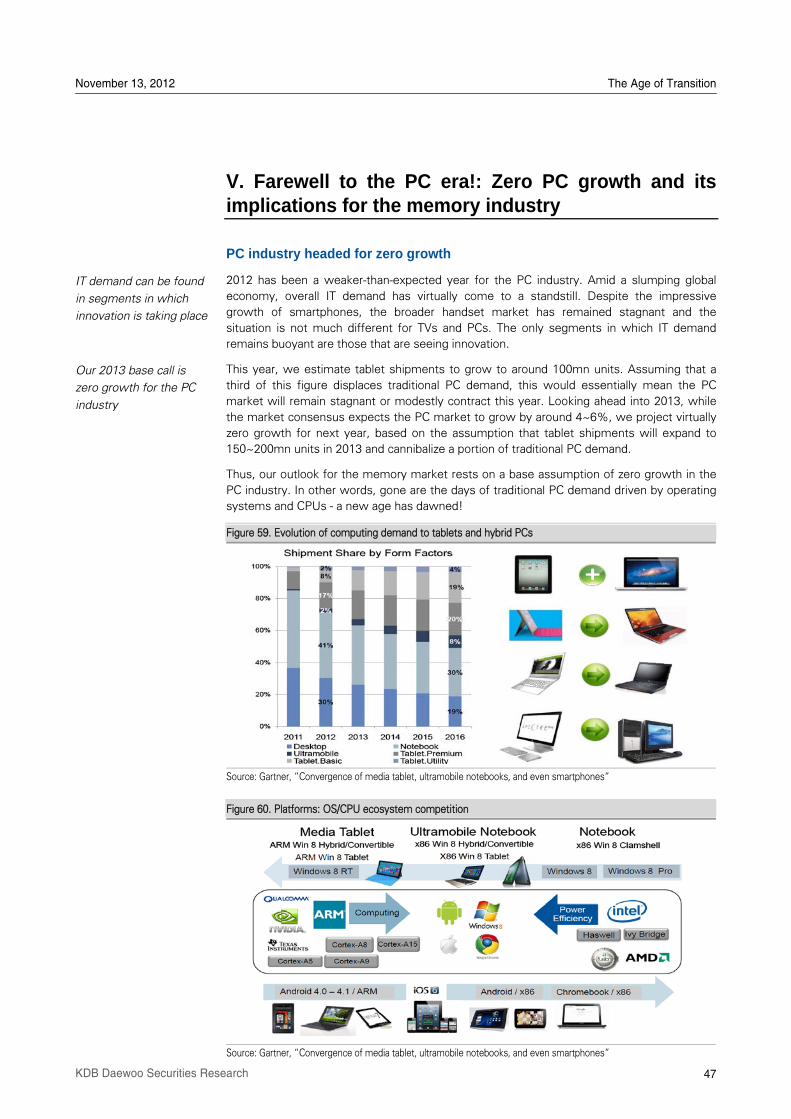
November 13, 2012 The Age of Transition
47 KDB Daewoo Securities Research
V. Farewell to the PC era!: Zero PC growth and its implications for the memory industry
PC industry headed for zero growth
2012 has been a weaker-than-expected year for the PC industry. Amid a slumping global
economy, overall IT demand has virtually come to a standstill. Despite the impressive
growth of smartphones, the broader handset market has remained stagnant and the
situation is not much different for TVs and PCs. The only segments in which IT demand
remains buoyant are those that are seeing innovation.
This year, we estimate tablet shipments to grow to around 100mn units. Assuming that a
third of this figure displaces traditional PC demand, this would essentially mean the PC
market will remain stagnant or modestly contract this year. Looking ahead into 2013, while
the market consensus expects the PC market to grow by around 4~6%, we project virtually
zero growth for next year, based on the assumption that tablet shipments will expand to
150~200mn units in 2013 and cannibalize a portion of traditional PC demand.
Thus, our outlook for the memory market rests on a base assumption of zero growth in the
PC industry. In other words, gone are the days of traditional PC demand driven by operating
systems and CPUs - a new age has dawned!
Figure 59. Evolution of computing demand to tablets and hybrid PCs
Source: Gartner, „Convergence of media tablet, ultramobile notebooks, and even smartphones‰
Figure 60. Platforms: OS/CPU ecosystem competition
Source: Gartner, „Convergence of media tablet, ultramobile notebooks, and even smartphones‰
IT demand can be found
in segments in which
innovation is taking place
Our 2013 base call is
zero growth for the PC
industry
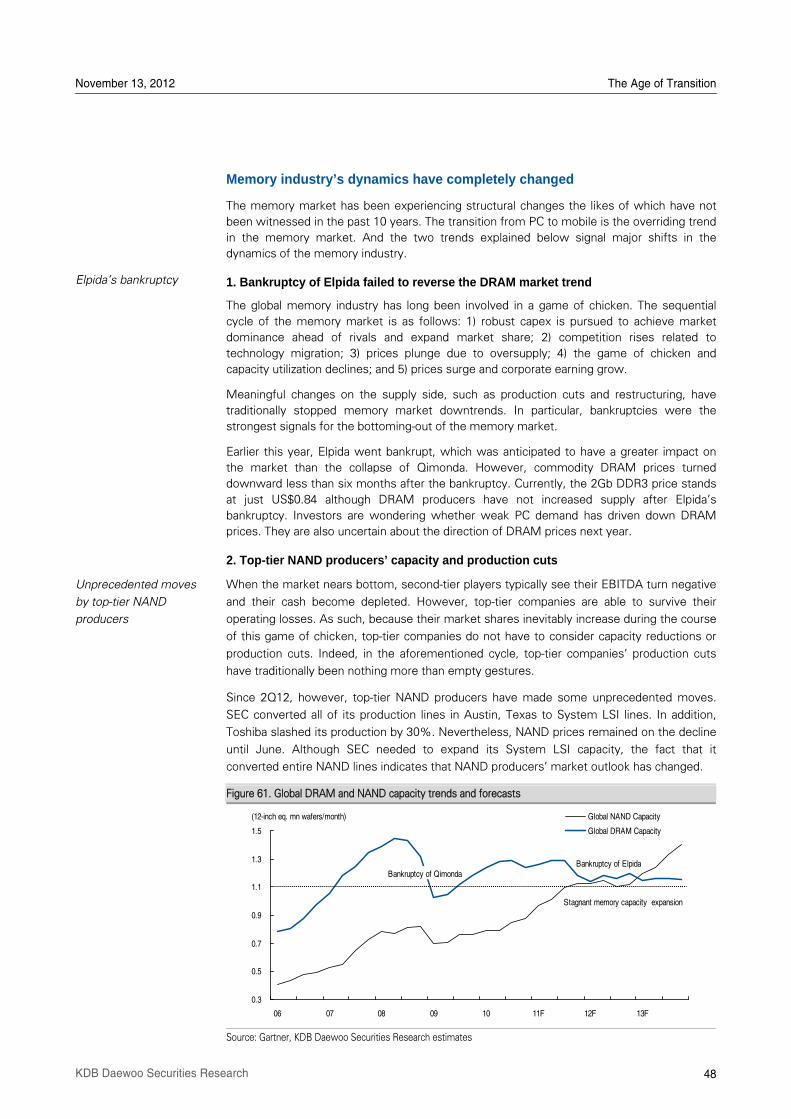
November 13, 2012 The Age of Transition
48 KDB Daewoo Securities Research
Memory industry’s dynamics have completely changed
The memory market has been experiencing structural changes the likes of which have not
been witnessed in the past 10 years. The transition from PC to mobile is the overriding trend
in the memory market. And the two trends explained below signal major shifts in the
dynamics of the memory industry.
1. Bankruptcy of Elpida failed to reverse the DRAM market trend
The global memory industry has long been involved in a game of chicken. The sequential
cycle of the memory market is as follows: 1) robust capex is pursued to achieve market
dominance ahead of rivals and expand market share; 2) competition rises related to
technology migration; 3) prices plunge due to oversupply; 4) the game of chicken and
capacity utilization declines; and 5) prices surge and corporate earning grow.
Meaningful changes on the supply side, such as production cuts and restructuring, have
traditionally stopped memory market downtrends. In particular, bankruptcies were the
strongest signals for the bottoming-out of the memory market.
Earlier this year, Elpida went bankrupt, which was anticipated to have a greater impact on
the market than the collapse of Qimonda. However, commodity DRAM prices turned
downward less than six months after the bankruptcy. Currently, the 2Gb DDR3 price stands
at just US$0.84 although DRAM producers have not increased supply after ElpidaÊs
bankruptcy. Investors are wondering whether weak PC demand has driven down DRAM
prices. They are also uncertain about the direction of DRAM prices next year.
2. Top-tier NAND producers’ capacity and production cuts
When the market nears bottom, second-tier players typically see their EBITDA turn negative
and their cash become depleted. However, top-tier companies are able to survive their
operating losses. As such, because their market shares inevitably increase during the course
of this game of chicken, top-tier companies do not have to consider capacity reductions or
production cuts. Indeed, in the aforementioned cycle, top-tier companiesÊ production cuts
have traditionally been nothing more than empty gestures.
Since 2Q12, however, top-tier NAND producers have made some unprecedented moves.
SEC converted all of its production lines in Austin, Texas to System LSI lines. In addition,
Toshiba slashed its production by 30%. Nevertheless, NAND prices remained on the decline
until June. Although SEC needed to expand its System LSI capacity, the fact that it
converted entire NAND lines indicates that NAND producersÊ market outlook has changed.
Figure 61. Global DRAM and NAND capacity trends and forecasts
Source: Gartner, KDB Daewoo Securities Research estimates
ElpidaÊs bankruptcy
Unprecedented moves
by top-tier NAND
producers
0.3
0.5
0.7
0.9
1.1
1.3
1.5
06 07 08 09 10 11F 12F 13F
Global NAND Capacity
Global DRAM Capacity
(12-inch eq. mn wafers/month)
Bankruptcy of QimondaBankruptcy of Elpida
Stagnant memory capacity expansion
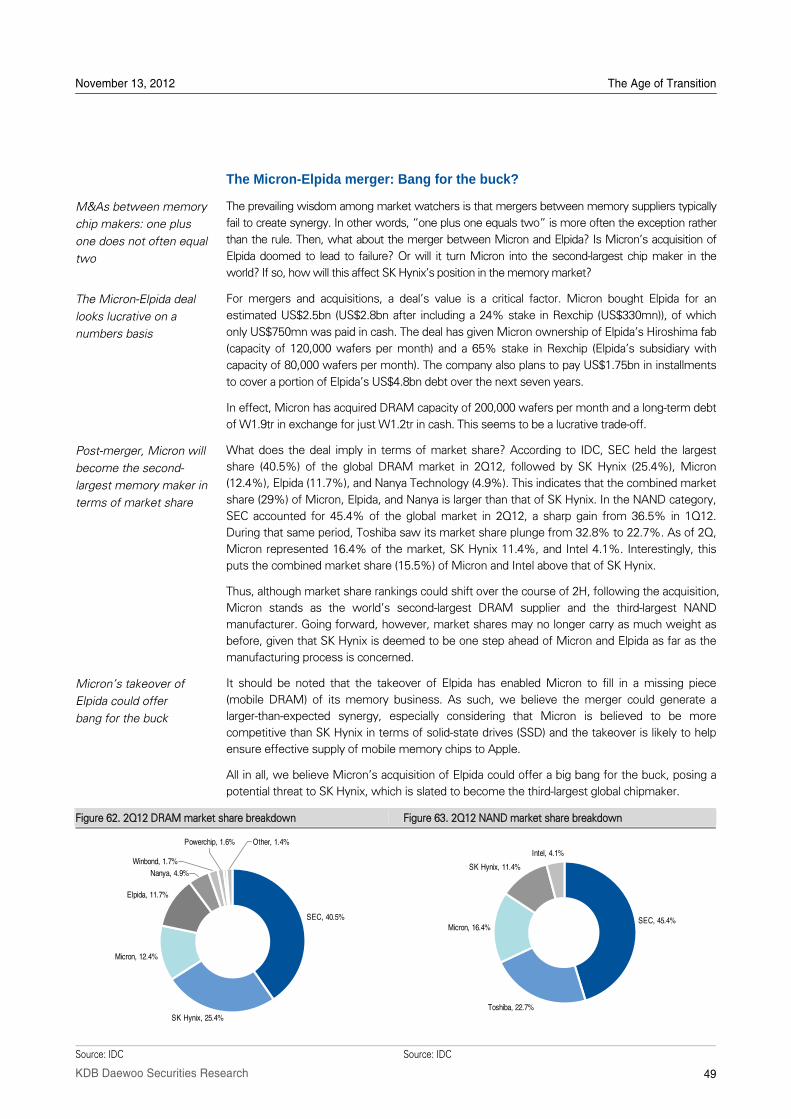
November 13, 2012 The Age of Transition
49 KDB Daewoo Securities Research
The Micron-Elpida merger: Bang for the buck?
The prevailing wisdom among market watchers is that mergers between memory suppliers typically
fail to create synergy. In other words, „one plus one equals two‰ is more often the exception rather
than the rule. Then, what about the merger between Micron and Elpida? Is MicronÊs acquisition of
Elpida doomed to lead to failure? Or will it turn Micron into the second-largest chip maker in the
world? If so, how will this affect SK HynixÊs position in the memory market?
For mergers and acquisitions, a dealÊs value is a critical factor. Micron bought Elpida for an
estimated US$2.5bn (US$2.8bn after including a 24% stake in Rexchip (US$330mn)), of which
only US$750mn was paid in cash. The deal has given Micron ownership of ElpidaÊs Hiroshima fab
(capacity of 120,000 wafers per month) and a 65% stake in Rexchip (ElpidaÊs subsidiary with
capacity of 80,000 wafers per month). The company also plans to pay US$1.75bn in installments
to cover a portion of ElpidaÊs US$4.8bn debt over the next seven years.
In effect, Micron has acquired DRAM capacity of 200,000 wafers per month and a long-term debt
of W1.9tr in exchange for just W1.2tr in cash. This seems to be a lucrative trade-off.
What does the deal imply in terms of market share? According to IDC, SEC held the largest
share (40.5%) of the global DRAM market in 2Q12, followed by SK Hynix (25.4%), Micron
(12.4%), Elpida (11.7%), and Nanya Technology (4.9%). This indicates that the combined market
share (29%) of Micron, Elpida, and Nanya is larger than that of SK Hynix. In the NAND category,
SEC accounted for 45.4% of the global market in 2Q12, a sharp gain from 36.5% in 1Q12.
During that same period, Toshiba saw its market share plunge from 32.8% to 22.7%. As of 2Q,
Micron represented 16.4% of the market, SK Hynix 11.4%, and Intel 4.1%. Interestingly, this
puts the combined market share (15.5%) of Micron and Intel above that of SK Hynix.
Thus, although market share rankings could shift over the course of 2H, following the acquisition,
Micron stands as the worldÊs second-largest DRAM supplier and the third-largest NAND
manufacturer. Going forward, however, market shares may no longer carry as much weight as
before, given that SK Hynix is deemed to be one step ahead of Micron and Elpida as far as the
manufacturing process is concerned.
It should be noted that the takeover of Elpida has enabled Micron to fill in a missing piece
(mobile DRAM) of its memory business. As such, we believe the merger could generate a
larger-than-expected synergy, especially considering that Micron is believed to be more
competitive than SK Hynix in terms of solid-state drives (SSD) and the takeover is likely to help
ensure effective supply of mobile memory chips to Apple.
All in all, we believe MicronÊs acquisition of Elpida could offer a big bang for the buck, posing a
potential threat to SK Hynix, which is slated to become the third-largest global chipmaker.
Figure 62. 2Q12 DRAM market share breakdown Figure 63. 2Q12 NAND market share breakdown
Source: IDC Source: IDC
M&As between memory
chip makers: one plus
one does not often equal
two
The Micron-Elpida deal
looks lucrative on a
numbers basis
Post-merger, Micron will
become the second-
largest memory maker in
terms of market share
MicronÊs takeover of
Elpida could offer
bang for the buck
SEC, 40.5%
SK Hynix, 25.4%
Micron, 12.4%
Elpida, 11.7%
Nanya, 4.9%
Winbond, 1.7%
Powerchip, 1.6% Other, 1.4%
SEC, 45.4%
Toshiba, 22.7%
Micron, 16.4%
SK Hynix, 11.4%
Intel, 4.1%
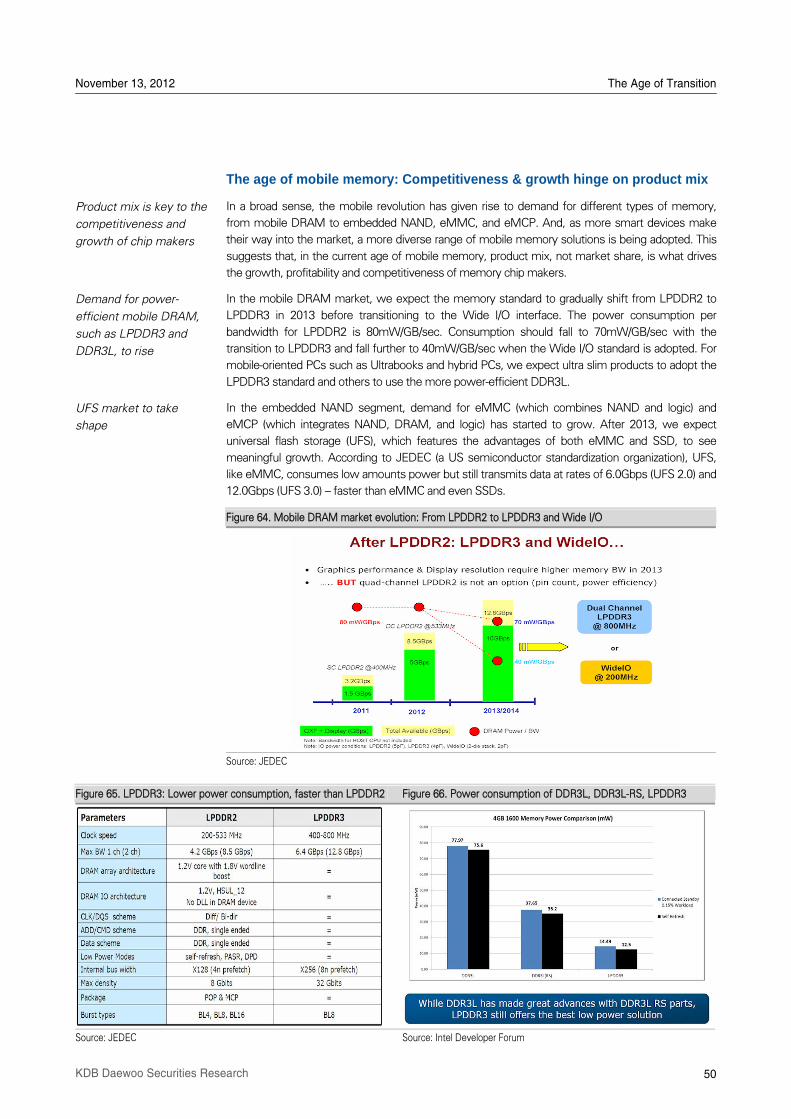
November 13, 2012 The Age of Transition
50 KDB Daewoo Securities Research
The age of mobile memory: Competitiveness & growth hinge on product mix
In a broad sense, the mobile revolution has given rise to demand for different types of memory,
from mobile DRAM to embedded NAND, eMMC, and eMCP. And, as more smart devices make
their way into the market, a more diverse range of mobile memory solutions is being adopted. This
suggests that, in the current age of mobile memory, product mix, not market share, is what drives
the growth, profitability and competitiveness of memory chip makers.
In the mobile DRAM market, we expect the memory standard to gradually shift from LPDDR2 to
LPDDR3 in 2013 before transitioning to the Wide I/O interface. The power consumption per
bandwidth for LPDDR2 is 80mW/GB/sec. Consumption should fall to 70mW/GB/sec with the
transition to LPDDR3 and fall further to 40mW/GB/sec when the Wide I/O standard is adopted. For
mobile-oriented PCs such as Ultrabooks and hybrid PCs, we expect ultra slim products to adopt the
LPDDR3 standard and others to use the more power-efficient DDR3L.
In the embedded NAND segment, demand for eMMC (which combines NAND and logic) and
eMCP (which integrates NAND, DRAM, and logic) has started to grow. After 2013, we expect
universal flash storage (UFS), which features the advantages of both eMMC and SSD, to see
meaningful growth. According to JEDEC (a US semiconductor standardization organization), UFS,
like eMMC, consumes low amounts power but still transmits data at rates of 6.0Gbps (UFS 2.0) and
12.0Gbps (UFS 3.0) -- faster than eMMC and even SSDs.
Figure 64. Mobile DRAM market evolution: From LPDDR2 to LPDDR3 and Wide I/O
Source: JEDEC
Figure 65. LPDDR3: Lower power consumption, faster than LPDDR2 Figure 66. Power consumption of DDR3L, DDR3L-RS, LPDDR3
Source: JEDEC Source: Intel Developer Forum
Product mix is key to the
competitiveness and
growth of chip makers
Demand for power-
efficient mobile DRAM,
such as LPDDR3 and
DDR3L, to rise
UFS market to take
shape
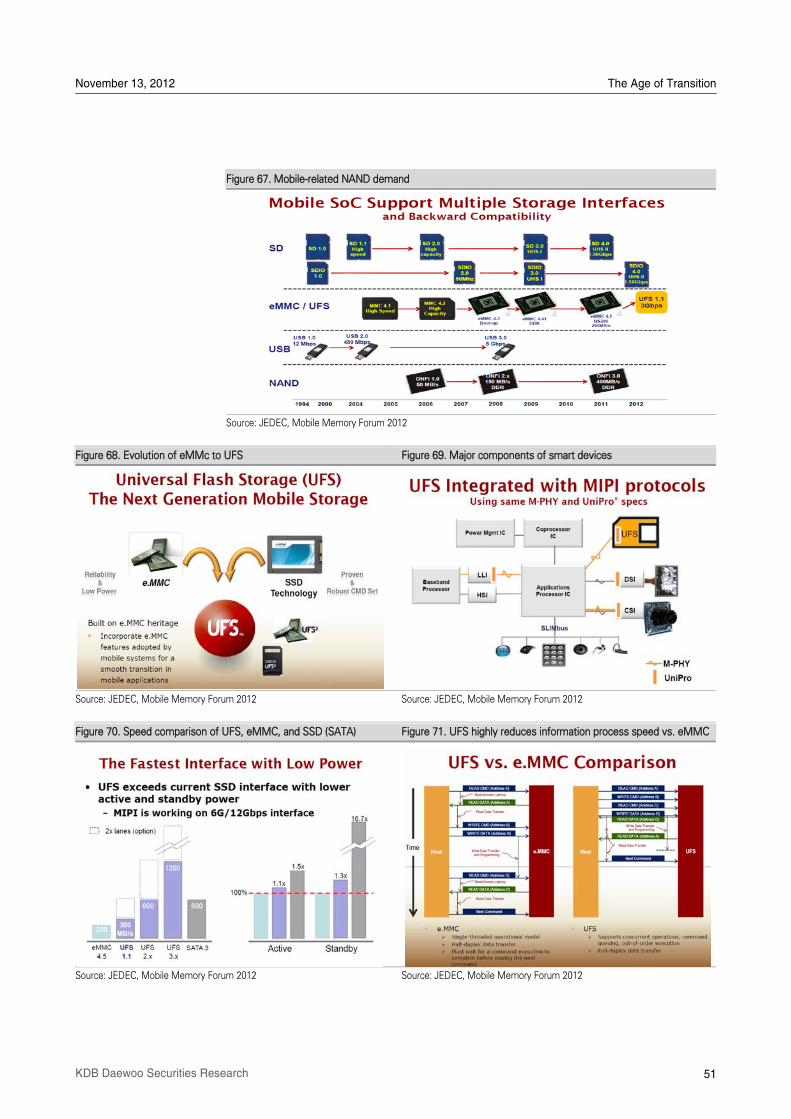
November 13, 2012 The Age of Transition
51 KDB Daewoo Securities Research
Figure 67. Mobile-related NAND demand
Source: JEDEC, Mobile Memory Forum 2012
Figure 68. Evolution of eMMc to UFS Figure 69. Major components of smart devices
Source: JEDEC, Mobile Memory Forum 2012 Source: JEDEC, Mobile Memory Forum 2012
Figure 70. Speed comparison of UFS, eMMC, and SSD (SATA) Figure 71. UFS highly reduces information process speed vs. eMMC
Source: JEDEC, Mobile Memory Forum 2012 Source: JEDEC, Mobile Memory Forum 2012
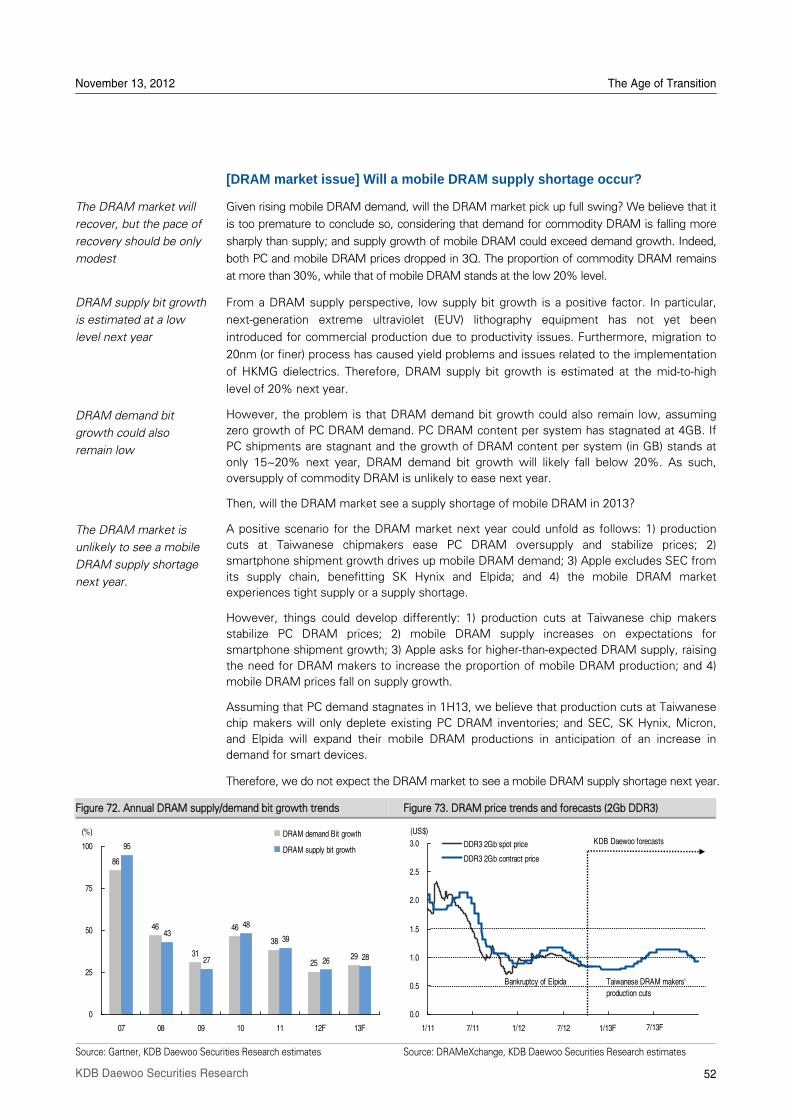
November 13, 2012 The Age of Transition
52 KDB Daewoo Securities Research
[DRAM market issue] Will a mobile DRAM supply shortage occur?
Given rising mobile DRAM demand, will the DRAM market pick up full swing? We believe that it
is too premature to conclude so, considering that demand for commodity DRAM is falling more
sharply than supply; and supply growth of mobile DRAM could exceed demand growth. Indeed,
both PC and mobile DRAM prices dropped in 3Q. The proportion of commodity DRAM remains
at more than 30%, while that of mobile DRAM stands at the low 20% level.
From a DRAM supply perspective, low supply bit growth is a positive factor. In particular,
next-generation extreme ultraviolet (EUV) lithography equipment has not yet been
introduced for commercial production due to productivity issues. Furthermore, migration to
20nm (or finer) process has caused yield problems and issues related to the implementation
of HKMG dielectrics. Therefore, DRAM supply bit growth is estimated at the mid-to-high
level of 20% next year.
However, the problem is that DRAM demand bit growth could also remain low, assuming
zero growth of PC DRAM demand. PC DRAM content per system has stagnated at 4GB. If
PC shipments are stagnant and the growth of DRAM content per system (in GB) stands at
only 15~20% next year, DRAM demand bit growth will likely fall below 20%. As such,
oversupply of commodity DRAM is unlikely to ease next year.
Then, will the DRAM market see a supply shortage of mobile DRAM in 2013?
A positive scenario for the DRAM market next year could unfold as follows: 1) production
cuts at Taiwanese chipmakers ease PC DRAM oversupply and stabilize prices; 2)
smartphone shipment growth drives up mobile DRAM demand; 3) Apple excludes SEC from
its supply chain, benefitting SK Hynix and Elpida; and 4) the mobile DRAM market
experiences tight supply or a supply shortage.
However, things could develop differently: 1) production cuts at Taiwanese chip makers
stabilize PC DRAM prices; 2) mobile DRAM supply increases on expectations for
smartphone shipment growth; 3) Apple asks for higher-than-expected DRAM supply, raising
the need for DRAM makers to increase the proportion of mobile DRAM production; and 4)
mobile DRAM prices fall on supply growth.
Assuming that PC demand stagnates in 1H13, we believe that production cuts at Taiwanese
chip makers will only deplete existing PC DRAM inventories; and SEC, SK Hynix, Micron,
and Elpida will expand their mobile DRAM productions in anticipation of an increase in
demand for smart devices.
Therefore, we do not expect the DRAM market to see a mobile DRAM supply shortage next year.
Figure 72. Annual DRAM supply/demand bit growth trends Figure 73. DRAM price trends and forecasts (2Gb DDR3)
Source: Gartner, KDB Daewoo Securities Research estimates Source: DRAMeXchange, KDB Daewoo Securities Research estimates
The DRAM market will
recover, but the pace of
recovery should be only
modest
DRAM supply bit growth
is estimated at a low
level next year
DRAM demand bit
growth could also
remain low
The DRAM market is
unlikely to see a mobile
DRAM supply shortage
next year.
86
46
31
46
38
2529
95
43
27
48
39
26 28
0
25
50
75
100
07 08 09 10 11 12F 13F
(%) DRAM demand Bit growth
DRAM supply bit growth
0.0
0.5
1.0
1.5
2.0
2.5
3.0
1/11 7/11 1/12 7/12 1/13 7/13
DDR3 2Gb spot price
DDR3 2Gb contract price
(US$)KDB Daewoo forecasts
Bankruptcy of Elpida Taiwanese DRAM makers'
production cuts
1/13F 7/13F
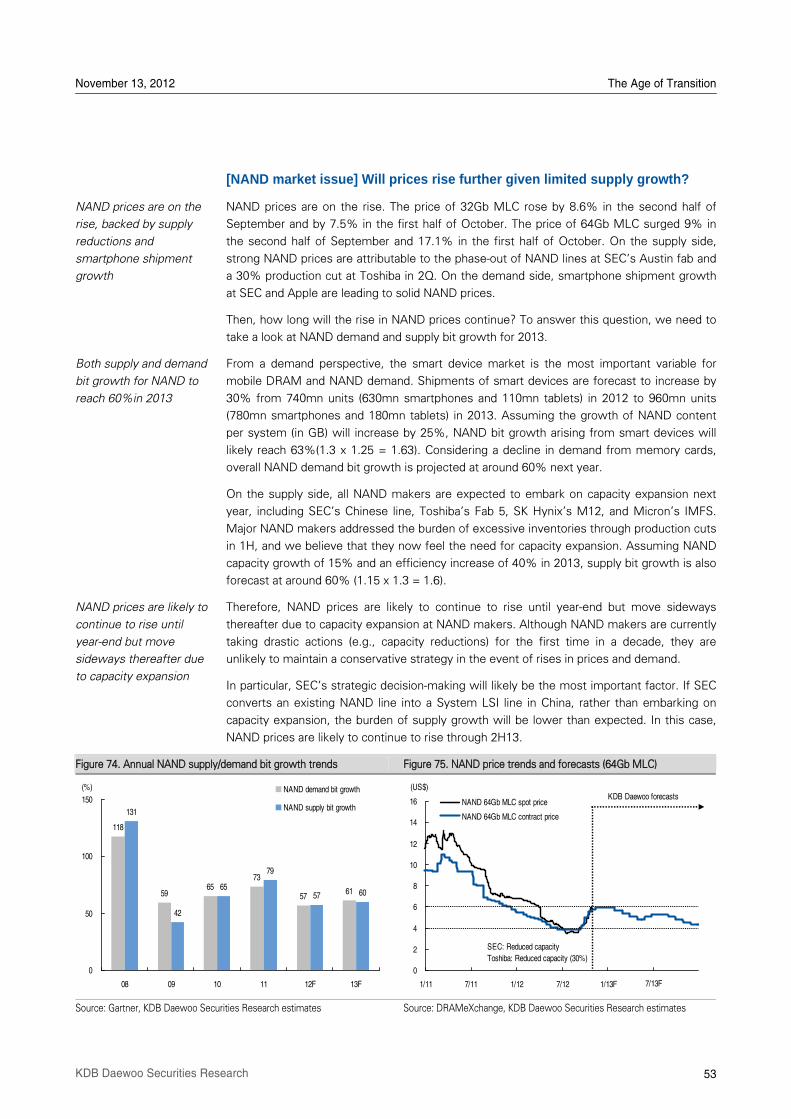
November 13, 2012 The Age of Transition
53 KDB Daewoo Securities Research
[NAND market issue] Will prices rise further given limited supply growth?
NAND prices are on the rise. The price of 32Gb MLC rose by 8.6% in the second half of
September and by 7.5% in the first half of October. The price of 64Gb MLC surged 9% in
the second half of September and 17.1% in the first half of October. On the supply side,
strong NAND prices are attributable to the phase-out of NAND lines at SECÊs Austin fab and
a 30% production cut at Toshiba in 2Q. On the demand side, smartphone shipment growth
at SEC and Apple are leading to solid NAND prices.
Then, how long will the rise in NAND prices continue? To answer this question, we need to
take a look at NAND demand and supply bit growth for 2013.
From a demand perspective, the smart device market is the most important variable for
mobile DRAM and NAND demand. Shipments of smart devices are forecast to increase by
30% from 740mn units (630mn smartphones and 110mn tablets) in 2012 to 960mn units
(780mn smartphones and 180mn tablets) in 2013. Assuming the growth of NAND content
per system (in GB) will increase by 25%, NAND bit growth arising from smart devices will
likely reach 63%(1.3 x 1.25 = 1.63). Considering a decline in demand from memory cards,
overall NAND demand bit growth is projected at around 60% next year.
On the supply side, all NAND makers are expected to embark on capacity expansion next
year, including SECÊs Chinese line, ToshibaÊs Fab 5, SK HynixÊs M12, and MicronÊs IMFS.
Major NAND makers addressed the burden of excessive inventories through production cuts
in 1H, and we believe that they now feel the need for capacity expansion. Assuming NAND
capacity growth of 15% and an efficiency increase of 40% in 2013, supply bit growth is also
forecast at around 60% (1.15 x 1.3 = 1.6).
Therefore, NAND prices are likely to continue to rise until year-end but move sideways
thereafter due to capacity expansion at NAND makers. Although NAND makers are currently
taking drastic actions (e.g., capacity reductions) for the first time in a decade, they are
unlikely to maintain a conservative strategy in the event of rises in prices and demand.
In particular, SECÊs strategic decision-making will likely be the most important factor. If SEC
converts an existing NAND line into a System LSI line in China, rather than embarking on
capacity expansion, the burden of supply growth will be lower than expected. In this case,
NAND prices are likely to continue to rise through 2H13.
Figure 74. Annual NAND supply/demand bit growth trends Figure 75. NAND price trends and forecasts (64Gb MLC)
Source: Gartner, KDB Daewoo Securities Research estimates Source: DRAMeXchange, KDB Daewoo Securities Research estimates
NAND prices are on the
rise, backed by supply
reductions and
smartphone shipment
growth
Both supply and demand
bit growth for NAND to
reach 60%in 2013
NAND prices are likely to
continue to rise until
year-end but move
sideways thereafter due
to capacity expansion
118
5965
73
5761
131
42
65
79
57 60
0
50
100
150
08 09 10 11 12F 13F
NAND demand bit growth
NAND supply bit growth
(%)
0
2
4
6
8
10
12
14
16
1/11 7/11 1/12 7/12 1/13 7/13
NAND 64Gb MLC spot price
NAND 64Gb MLC contract price
(US$)KDB Daewoo forecasts
1/13F 7/13F
SEC: Reduced capacity
Toshiba: Reduced capacity (30%)
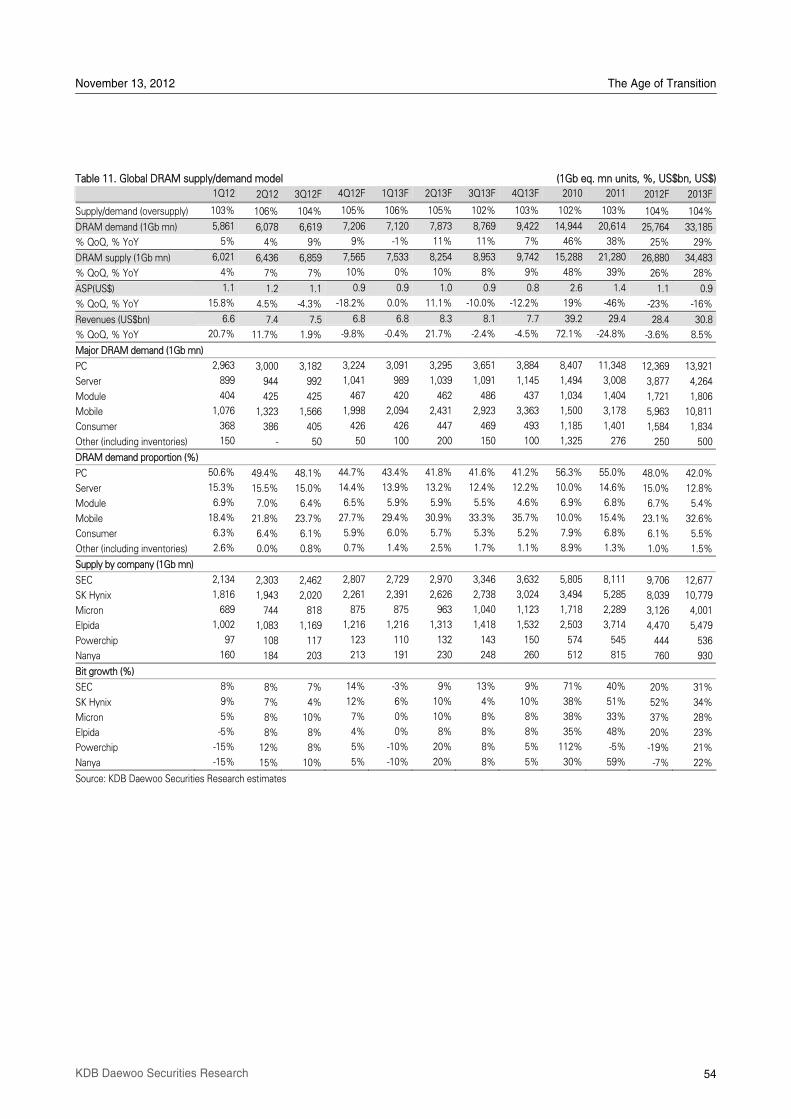
November 13, 2012 The Age of Transition
54 KDB Daewoo Securities Research
Table 11. Global DRAM supply/demand model (1Gb eq. mn units, %, US$bn, US$)
1Q12 2Q12 3Q12F 4Q12F 1Q13F 2Q13F 3Q13F 4Q13F 2010 2011 2012F 2013F
Supply/demand (oversupply) 103% 106% 104% 105% 106% 105% 102% 103% 102% 103% 104% 104%
DRAM demand (1Gb mn) 5,861 6,078 6,619 7,206 7,120 7,873 8,769 9,422 14,944 20,614 25,764 33,185
% QoQ, % YoY 5% 4% 9% 9% -1% 11% 11% 7% 46% 38% 25% 29%
DRAM supply (1Gb mn) 6,021 6,436 6,859 7,565 7,533 8,254 8,953 9,742 15,288 21,280 26,880 34,483
% QoQ, % YoY 4% 7% 7% 10% 0% 10% 8% 9% 48% 39% 26% 28%
ASP(US$) 1.1 1.2 1.1 0.9 0.9 1.0 0.9 0.8 2.6 1.4 1.1 0.9
% QoQ, % YoY 15.8% 4.5% -4.3% -18.2% 0.0% 11.1% -10.0% -12.2% 19% -46% -23% -16%
Revenues (US$bn) 6.6 7.4 7.5 6.8 6.8 8.3 8.1 7.7 39.2 29.4 28.4 30.8
% QoQ, % YoY 20.7% 11.7% 1.9% -9.8% -0.4% 21.7% -2.4% -4.5% 72.1% -24.8% -3.6% 8.5%
Major DRAM demand (1Gb mn)
PC 2,963 3,000 3,182 3,224 3,091 3,295 3,651 3,884 8,407 11,348 12,369 13,921
Server 899 944 992 1,041 989 1,039 1,091 1,145 1,494 3,008 3,877 4,264
Module 404 425 425 467 420 462 486 437 1,034 1,404 1,721 1,806
Mobile 1,076 1,323 1,566 1,998 2,094 2,431 2,923 3,363 1,500 3,178 5,963 10,811
Consumer 368 386 405 426 426 447 469 493 1,185 1,401 1,584 1,834
Other (including inventories) 150 - 50 50 100 200 150 100 1,325 276 250 500
DRAM demand proportion (%)
PC 50.6% 49.4% 48.1% 44.7% 43.4% 41.8% 41.6% 41.2% 56.3% 55.0% 48.0% 42.0%
Server 15.3% 15.5% 15.0% 14.4% 13.9% 13.2% 12.4% 12.2% 10.0% 14.6% 15.0% 12.8%
Module 6.9% 7.0% 6.4% 6.5% 5.9% 5.9% 5.5% 4.6% 6.9% 6.8% 6.7% 5.4%
Mobile 18.4% 21.8% 23.7% 27.7% 29.4% 30.9% 33.3% 35.7% 10.0% 15.4% 23.1% 32.6%
Consumer 6.3% 6.4% 6.1% 5.9% 6.0% 5.7% 5.3% 5.2% 7.9% 6.8% 6.1% 5.5%
Other (including inventories) 2.6% 0.0% 0.8% 0.7% 1.4% 2.5% 1.7% 1.1% 8.9% 1.3% 1.0% 1.5%
Supply by company (1Gb mn)
SEC 2,134 2,303 2,462 2,807 2,729 2,970 3,346 3,632 5,805 8,111 9,706 12,677
SK Hynix 1,816 1,943 2,020 2,261 2,391 2,626 2,738 3,024 3,494 5,285 8,039 10,779
Micron 689 744 818 875 875 963 1,040 1,123 1,718 2,289 3,126 4,001
Elpida 1,002 1,083 1,169 1,216 1,216 1,313 1,418 1,532 2,503 3,714 4,470 5,479
Powerchip 97 108 117 123 110 132 143 150 574 545 444 536
Nanya 160 184 203 213 191 230 248 260 512 815 760 930
Bit growth (%)
SEC 8% 8% 7% 14% -3% 9% 13% 9% 71% 40% 20% 31%
SK Hynix 9% 7% 4% 12% 6% 10% 4% 10% 38% 51% 52% 34%
Micron 5% 8% 10% 7% 0% 10% 8% 8% 38% 33% 37% 28%
Elpida -5% 8% 8% 4% 0% 8% 8% 8% 35% 48% 20% 23%
Powerchip -15% 12% 8% 5% -10% 20% 8% 5% 112% -5% -19% 21%
Nanya -15% 15% 10% 5% -10% 20% 8% 5% 30% 59% -7% 22%
Source: KDB Daewoo Securities Research estimates
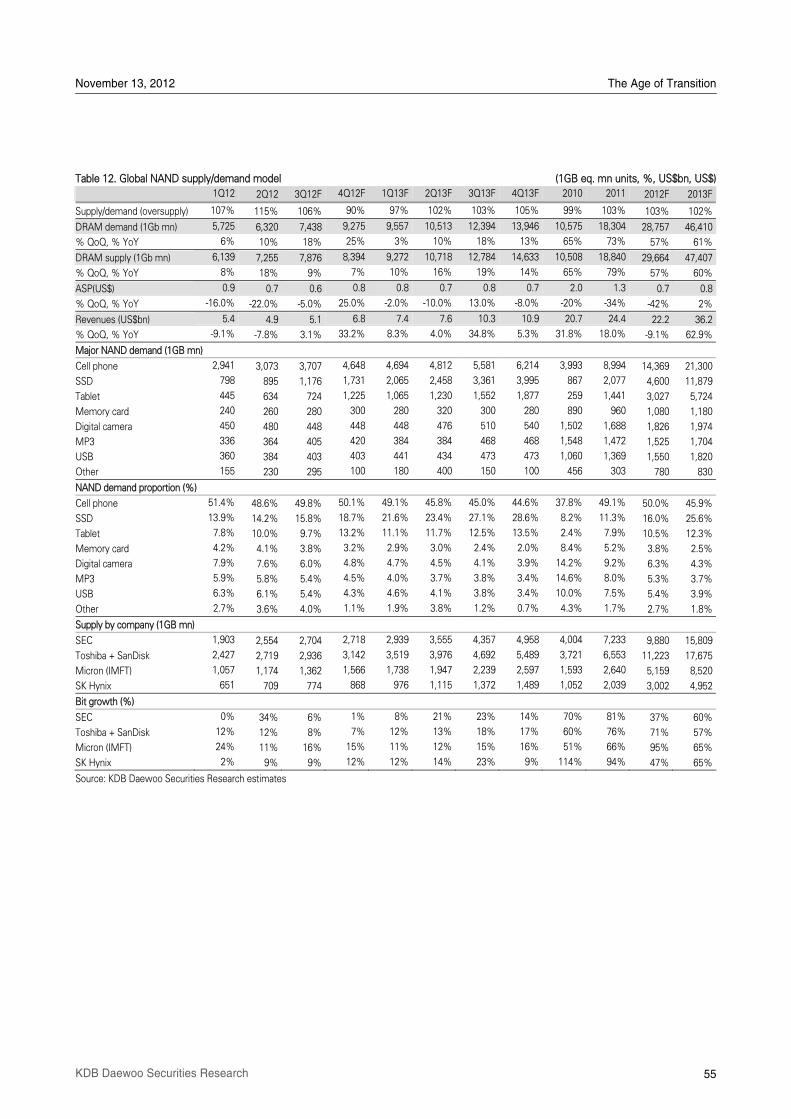
November 13, 2012 The Age of Transition
55 KDB Daewoo Securities Research
Table 12. Global NAND supply/demand model (1GB eq. mn units, %, US$bn, US$)
1Q12 2Q12 3Q12F 4Q12F 1Q13F 2Q13F 3Q13F 4Q13F 2010 2011 2012F 2013F
Supply/demand (oversupply) 107% 115% 106% 90% 97% 102% 103% 105% 99% 103% 103% 102%
DRAM demand (1Gb mn) 5,725 6,320 7,438 9,275 9,557 10,513 12,394 13,946 10,575 18,304 28,757 46,410
% QoQ, % YoY 6% 10% 18% 25% 3% 10% 18% 13% 65% 73% 57% 61%
DRAM supply (1Gb mn) 6,139 7,255 7,876 8,394 9,272 10,718 12,784 14,633 10,508 18,840 29,664 47,407
% QoQ, % YoY 8% 18% 9% 7% 10% 16% 19% 14% 65% 79% 57% 60%
ASP(US$) 0.9 0.7 0.6 0.8 0.8 0.7 0.8 0.7 2.0 1.3 0.7 0.8
% QoQ, % YoY -16.0% -22.0% -5.0% 25.0% -2.0% -10.0% 13.0% -8.0% -20% -34% -42% 2%
Revenues (US$bn) 5.4 4.9 5.1 6.8 7.4 7.6 10.3 10.9 20.7 24.4 22.2 36.2
% QoQ, % YoY -9.1% -7.8% 3.1% 33.2% 8.3% 4.0% 34.8% 5.3% 31.8% 18.0% -9.1% 62.9%
Major NAND demand (1GB mn)
Cell phone 2,941 3,073 3,707 4,648 4,694 4,812 5,581 6,214 3,993 8,994 14,369 21,300
SSD 798 895 1,176 1,731 2,065 2,458 3,361 3,995 867 2,077 4,600 11,879
Tablet 445 634 724 1,225 1,065 1,230 1,552 1,877 259 1,441 3,027 5,724
Memory card 240 260 280 300 280 320 300 280 890 960 1,080 1,180
Digital camera 450 480 448 448 448 476 510 540 1,502 1,688 1,826 1,974
MP3 336 364 405 420 384 384 468 468 1,548 1,472 1,525 1,704
USB 360 384 403 403 441 434 473 473 1,060 1,369 1,550 1,820
Other 155 230 295 100 180 400 150 100 456 303 780 830
NAND demand proportion (%)
Cell phone 51.4% 48.6% 49.8% 50.1% 49.1% 45.8% 45.0% 44.6% 37.8% 49.1% 50.0% 45.9%
SSD 13.9% 14.2% 15.8% 18.7% 21.6% 23.4% 27.1% 28.6% 8.2% 11.3% 16.0% 25.6%
Tablet 7.8% 10.0% 9.7% 13.2% 11.1% 11.7% 12.5% 13.5% 2.4% 7.9% 10.5% 12.3%
Memory card 4.2% 4.1% 3.8% 3.2% 2.9% 3.0% 2.4% 2.0% 8.4% 5.2% 3.8% 2.5%
Digital camera 7.9% 7.6% 6.0% 4.8% 4.7% 4.5% 4.1% 3.9% 14.2% 9.2% 6.3% 4.3%
MP3 5.9% 5.8% 5.4% 4.5% 4.0% 3.7% 3.8% 3.4% 14.6% 8.0% 5.3% 3.7%
USB 6.3% 6.1% 5.4% 4.3% 4.6% 4.1% 3.8% 3.4% 10.0% 7.5% 5.4% 3.9%
Other 2.7% 3.6% 4.0% 1.1% 1.9% 3.8% 1.2% 0.7% 4.3% 1.7% 2.7% 1.8%
Supply by company (1GB mn)
SEC 1,903 2,554 2,704 2,718 2,939 3,555 4,357 4,958 4,004 7,233 9,880 15,809
Toshiba + SanDisk 2,427 2,719 2,936 3,142 3,519 3,976 4,692 5,489 3,721 6,553 11,223 17,675
Micron (IMFT) 1,057 1,174 1,362 1,566 1,738 1,947 2,239 2,597 1,593 2,640 5,159 8,520
SK Hynix 651 709 774 868 976 1,115 1,372 1,489 1,052 2,039 3,002 4,952
Bit growth (%)
SEC 0% 34% 6% 1% 8% 21% 23% 14% 70% 81% 37% 60%
Toshiba + SanDisk 12% 12% 8% 7% 12% 13% 18% 17% 60% 76% 71% 57%
Micron (IMFT) 24% 11% 16% 15% 11% 12% 15% 16% 51% 66% 95% 65%
SK Hynix 2% 9% 9% 12% 12% 14% 23% 9% 114% 94% 47% 65%
Source: KDB Daewoo Securities Research estimates
56 KDB Daewoo Securities Research
VI Best Tech Migration Play:
Semiconductor Materials
EUV machines, the development of which is being led by the Dutch company ASML in
partnership with major chip makers including Intel and SEC, are not yet sufficiently efficient
for mass production. The delay in the development of EUV machines has underscored the
importance of materials related to microfabrication; as a result, additional processes like
double patterning technology (DPT) are emerging, and related materials are becoming
increasingly sophisticated.
Among the key materials used in sub-30nm processes, we highlight 1) spin-on hardmasks
(SOH), 2) spin-on dielectrics (SOD), 3) CVD precursors, 4) high-K materials, 5) DPT materials,
and 6) disilane (Si2H6). Major material manufacturers include Cheil Industries, Soulbrain,
DNF, Hansol Chemical, Wonik Materials, OCI Materials, and UP Chemical (unlisted).
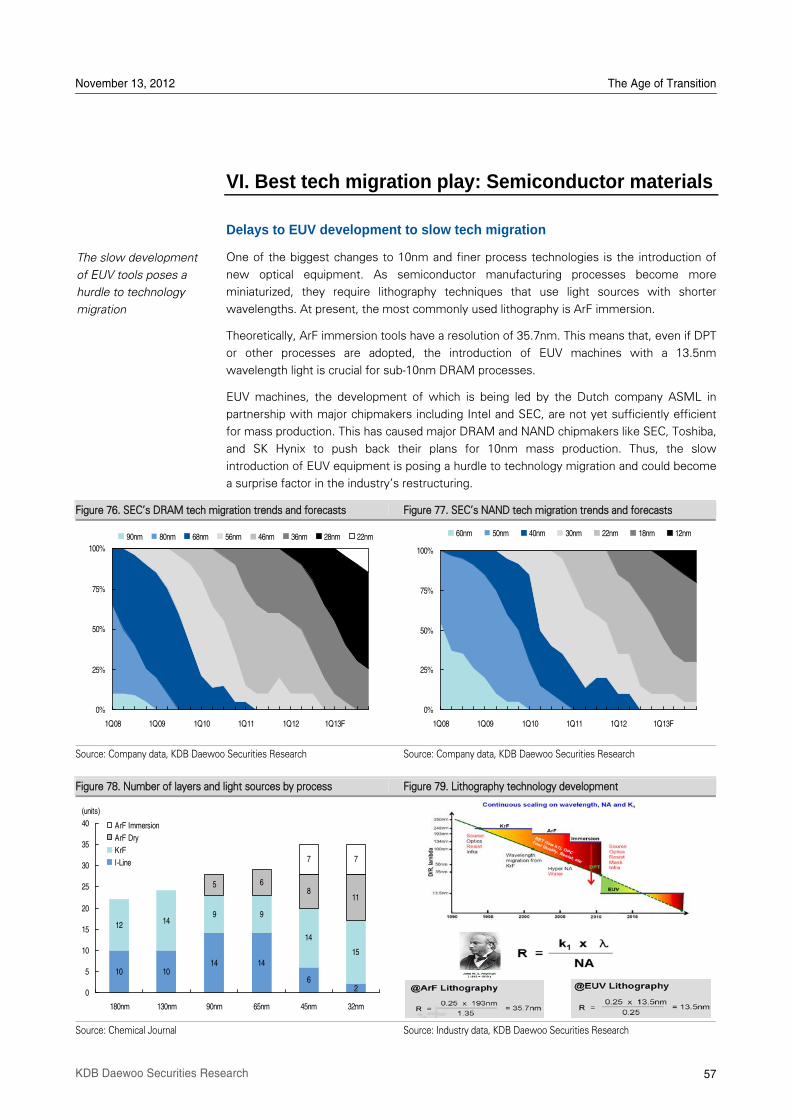
November 13, 2012 The Age of Transition
57 KDB Daewoo Securities Research
VI. Best tech migration play: Semiconductor materials
Delays to EUV development to slow tech migration
One of the biggest changes to 10nm and finer process technologies is the introduction of
new optical equipment. As semiconductor manufacturing processes become more
miniaturized, they require lithography techniques that use light sources with shorter
wavelengths. At present, the most commonly used lithography is ArF immersion.
Theoretically, ArF immersion tools have a resolution of 35.7nm. This means that, even if DPT
or other processes are adopted, the introduction of EUV machines with a 13.5nm
wavelength light is crucial for sub-10nm DRAM processes.
EUV machines, the development of which is being led by the Dutch company ASML in
partnership with major chipmakers including Intel and SEC, are not yet sufficiently efficient
for mass production. This has caused major DRAM and NAND chipmakers like SEC, Toshiba,
and SK Hynix to push back their plans for 10nm mass production. Thus, the slow
introduction of EUV equipment is posing a hurdle to technology migration and could become
a surprise factor in the industryÊs restructuring.
Figure 76. SECÊs DRAM tech migration trends and forecasts Figure 77. SECÊs NAND tech migration trends and forecasts
Source: Company data, KDB Daewoo Securities Research Source: Company data, KDB Daewoo Securities Research
Figure 78. Number of layers and light sources by process Figure 79. Lithography technology development
Source: Chemical Journal Source: Industry data, KDB Daewoo Securities Research
The slow development
of EUV tools poses a
hurdle to technology
migration
0%
25%
50%
75%
100%
1Q08 1Q09 1Q10 1Q11 1Q12 1Q13F
90nm 80nm 68nm 56nm 46nm 36nm 28nm 22nm
0%
25%
50%
75%
100%
1Q08 1Q09 1Q10 1Q11 1Q12 1Q13F
60nm 50nm 40nm 30nm 22nm 18nm 12nm
10 1014 14
62
12 149 9
14
15
5 68
11
7 7
0
5
10
15
20
25
30
35
40
180nm 130nm 90nm 65nm 45nm 32nm
ArF Immersion
ArF Dry
KrF
I-Line
(units)
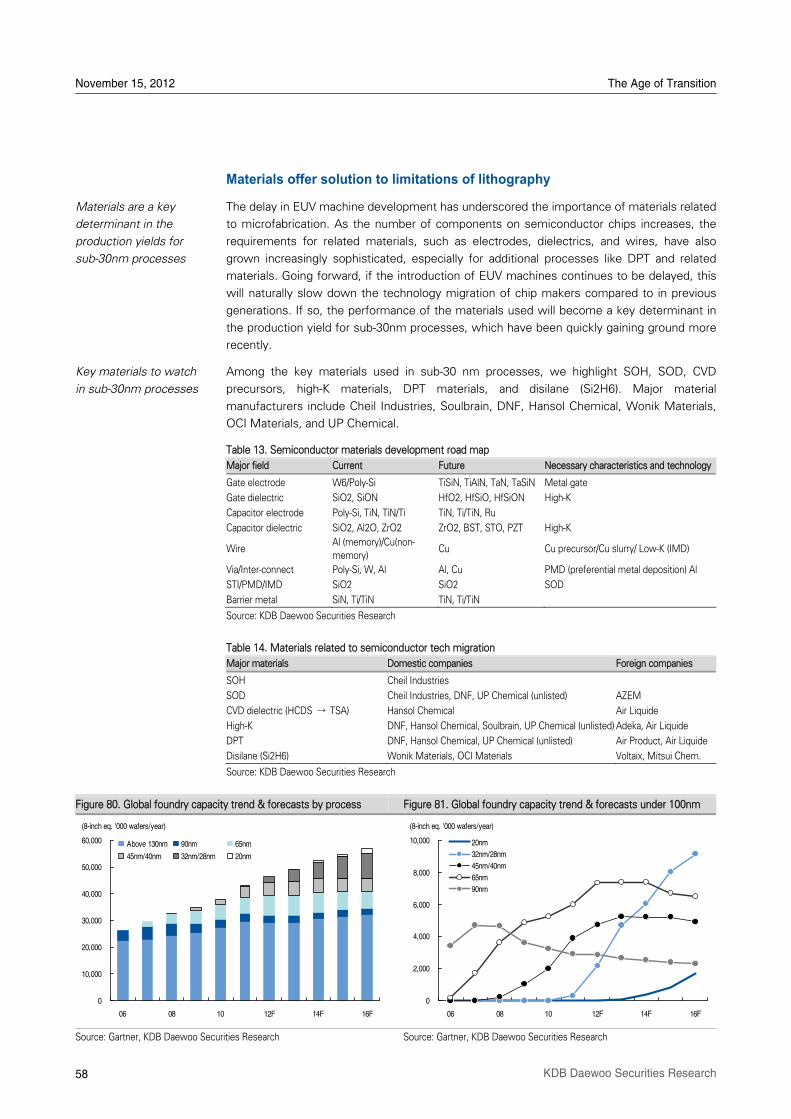
November 15, 2012 The Age of Transition
58 KDB Daewoo Securities Research
Materials offer solution to limitations of lithography
The delay in EUV machine development has underscored the importance of materials related
to microfabrication. As the number of components on semiconductor chips increases, the
requirements for related materials, such as electrodes, dielectrics, and wires, have also
grown increasingly sophisticated, especially for additional processes like DPT and related
materials. Going forward, if the introduction of EUV machines continues to be delayed, this
will naturally slow down the technology migration of chip makers compared to in previous
generations. If so, the performance of the materials used will become a key determinant in
the production yield for sub-30nm processes, which have been quickly gaining ground more
recently.
Among the key materials used in sub-30 nm processes, we highlight SOH, SOD, CVD
precursors, high-K materials, DPT materials, and disilane (Si2H6). Major material
manufacturers include Cheil Industries, Soulbrain, DNF, Hansol Chemical, Wonik Materials,
OCI Materials, and UP Chemical.
Table 13. Semiconductor materials development road map
Major field Current Future Necessary characteristics and technology
Gate electrode W6/Poly-Si TiSiN, TiAlN, TaN, TaSiN Metal gate
Gate dielectric SiO2, SiON HfO2, HfSiO, HfSiON High-K
Capacitor electrode Poly-Si, TiN, TiN/Ti TiN, Ti/TiN, Ru
Capacitor dielectric SiO2, Al2O, ZrO2 ZrO2, BST, STO, PZT High-K
Wire Al (memory)/Cu(non-
memory) Cu Cu precursor/Cu slurry/ Low-K (IMD)
Via/Inter-connect Poly-Si, W, Al Al, Cu PMD (preferential metal deposition) Al
STI/PMD/IMD SiO2 SiO2 SOD
Barrier metal SiN, Ti/TiN TiN, Ti/TiN
Source: KDB Daewoo Securities Research
Table 14. Materials related to semiconductor tech migration
Major materials Domestic companies Foreign companies
SOH Cheil Industries
SOD Cheil Industries, DNF, UP Chemical (unlisted) AZEM
CVD dielectric (HCDS → TSA) Hansol Chemical Air Liquide
High-K DNF, Hansol Chemical, Soulbrain, UP Chemical (unlisted) Adeka, Air Liquide
DPT DNF, Hansol Chemical, UP Chemical (unlisted) Air Product, Air Liquide
Disilane (Si2H6) Wonik Materials, OCI Materials Voltaix, Mitsui Chem.
Source: KDB Daewoo Securities Research
Figure 80. Global foundry capacity trend & forecasts by process Figure 81. Global foundry capacity trend & forecasts under 100nm
Source: Gartner, KDB Daewoo Securities Research Source: Gartner, KDB Daewoo Securities Research
Materials are a key
determinant in the
production yields for
sub-30nm processes
Key materials to watch
in sub-30nm processes
0
10,000
20,000
30,000
40,000
50,000
60,000
06 08 10 12F 14F 16F
Above 130nm 90nm 65nm
45nm/40nm 32nm/28nm 20nm
(8-inch eq. '000 wafers/year)
0
2,000
4,000
6,000
8,000
10,000
06 08 10 12F 14F 16F
20nm
32nm/28nm
45nm/40nm
65nm
90nm
(8-inch eq. '000 wafers/year)
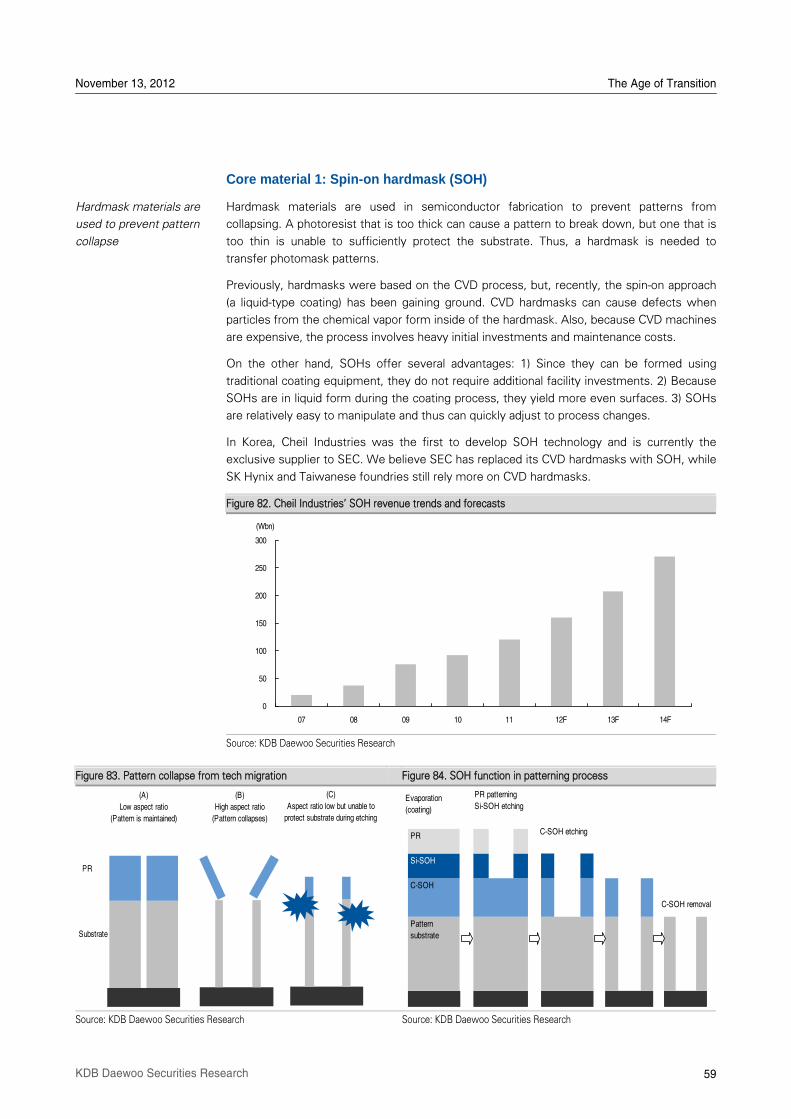
November 13, 2012 The Age of Transition
59 KDB Daewoo Securities Research
Core material 1: Spin-on hardmask (SOH)
Hardmask materials are used in semiconductor fabrication to prevent patterns from
collapsing. A photoresist that is too thick can cause a pattern to break down, but one that is
too thin is unable to sufficiently protect the substrate. Thus, a hardmask is needed to
transfer photomask patterns.
Previously, hardmasks were based on the CVD process, but, recently, the spin-on approach
(a liquid-type coating) has been gaining ground. CVD hardmasks can cause defects when
particles from the chemical vapor form inside of the hardmask. Also, because CVD machines
are expensive, the process involves heavy initial investments and maintenance costs.
On the other hand, SOHs offer several advantages: 1) Since they can be formed using
traditional coating equipment, they do not require additional facility investments. 2) Because
SOHs are in liquid form during the coating process, they yield more even surfaces. 3) SOHs
are relatively easy to manipulate and thus can quickly adjust to process changes.
In Korea, Cheil Industries was the first to develop SOH technology and is currently the
exclusive supplier to SEC. We believe SEC has replaced its CVD hardmasks with SOH, while
SK Hynix and Taiwanese foundries still rely more on CVD hardmasks.
Figure 82. Cheil IndustriesÊ SOH revenue trends and forecasts
Source: KDB Daewoo Securities Research
Figure 83. Pattern collapse from tech migration Figure 84. SOH function in patterning process
Source: KDB Daewoo Securities Research Source: KDB Daewoo Securities Research
Hardmask materials are
used to prevent pattern
collapse
0
50
100
150
200
250
300
07 08 09 10 11 12F 13F 14F
(Wbn)
(A)
Low aspect ratio
(Pattern is maintained)
(B)
High aspect ratio
(Pattern collapses)
(C)
Aspect ratio low but unable to
protect substrate during etching
PR
SubstratePattern
substrate
C-SOH
Si-SOH
PR
Evaporation
(coating)
PR patterning
Si-SOH etching
C-SOH etching
C-SOH removal
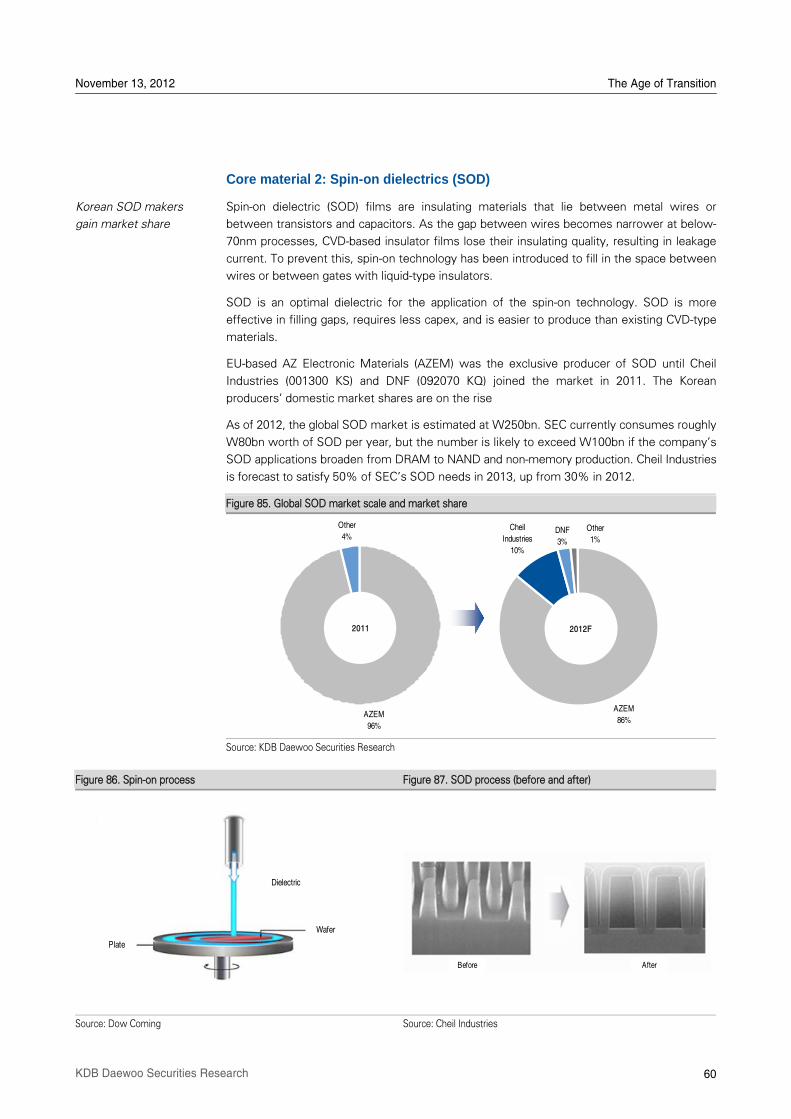
November 13, 2012 The Age of Transition
60 KDB Daewoo Securities Research
Core material 2: Spin-on dielectrics (SOD)
Spin-on dielectric (SOD) films are insulating materials that lie between metal wires or
between transistors and capacitors. As the gap between wires becomes narrower at below-
70nm processes, CVD-based insulator films lose their insulating quality, resulting in leakage
current. To prevent this, spin-on technology has been introduced to fill in the space between
wires or between gates with liquid-type insulators.
SOD is an optimal dielectric for the application of the spin-on technology. SOD is more
effective in filling gaps, requires less capex, and is easier to produce than existing CVD-type
materials.
EU-based AZ Electronic Materials (AZEM) was the exclusive producer of SOD until Cheil
Industries (001300 KS) and DNF (092070 KQ) joined the market in 2011. The Korean
producersÊ domestic market shares are on the rise
As of 2012, the global SOD market is estimated at W250bn. SEC currently consumes roughly
W80bn worth of SOD per year, but the number is likely to exceed W100bn if the companyÊs
SOD applications broaden from DRAM to NAND and non-memory production. Cheil Industries
is forecast to satisfy 50% of SECÊs SOD needs in 2013, up from 30% in 2012.
Figure 85. Global SOD market scale and market share
Source: KDB Daewoo Securities Research
Figure 86. Spin-on process Figure 87. SOD process (before and after)
Source: Dow Coming Source: Cheil Industries
Korean SOD makers
gain market share
AZEM
96%
Other
4%
2011
AZEM
86%
Cheil
Industries
10%
DNF
3%
Other
1%
2012F
Wafer
Plate
Dielectric
Before After
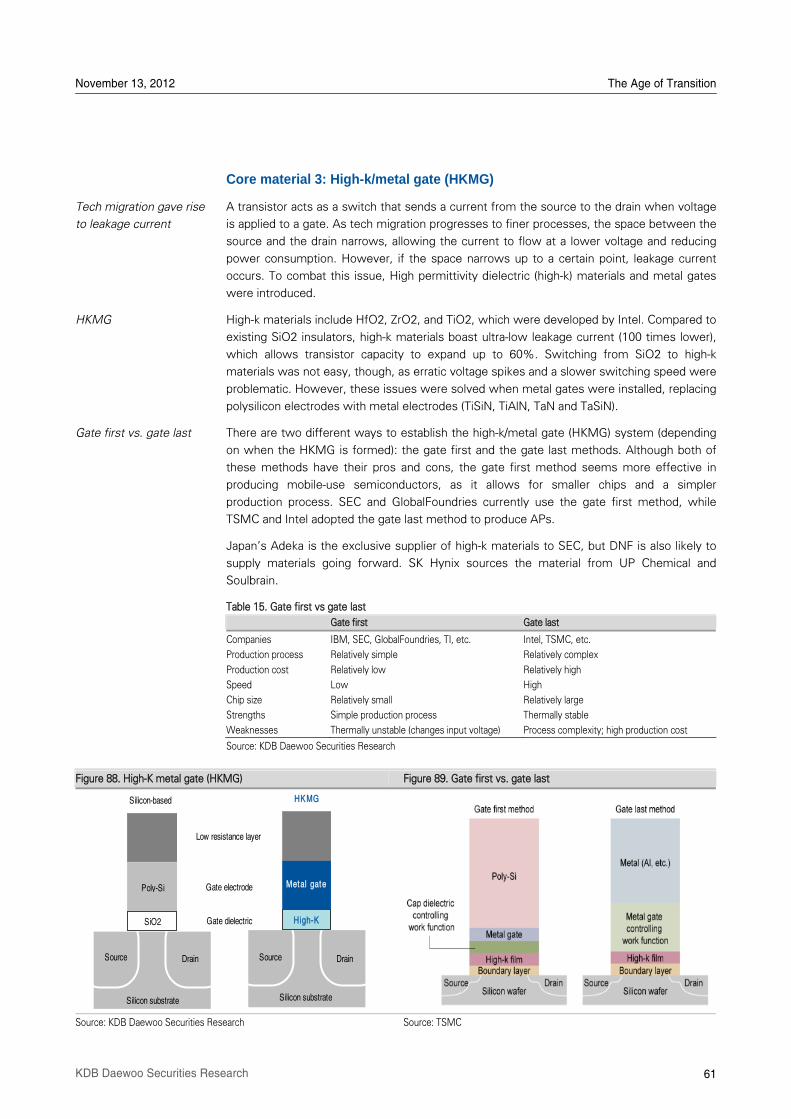
November 13, 2012 The Age of Transition
61 KDB Daewoo Securities Research
Core material 3: High-k/metal gate (HKMG)
A transistor acts as a switch that sends a current from the source to the drain when voltage
is applied to a gate. As tech migration progresses to finer processes, the space between the
source and the drain narrows, allowing the current to flow at a lower voltage and reducing
power consumption. However, if the space narrows up to a certain point, leakage current
occurs. To combat this issue, High permittivity dielectric (high-k) materials and metal gates
were introduced.
High-k materials include HfO2, ZrO2, and TiO2, which were developed by Intel. Compared to
existing SiO2 insulators, high-k materials boast ultra-low leakage current (100 times lower),
which allows transistor capacity to expand up to 60%. Switching from SiO2 to high-k
materials was not easy, though, as erratic voltage spikes and a slower switching speed were
problematic. However, these issues were solved when metal gates were installed, replacing
polysilicon electrodes with metal electrodes (TiSiN, TiAlN, TaN and TaSiN).
There are two different ways to establish the high-k/metal gate (HKMG) system (depending
on when the HKMG is formed): the gate first and the gate last methods. Although both of
these methods have their pros and cons, the gate first method seems more effective in
producing mobile-use semiconductors, as it allows for smaller chips and a simpler
production process. SEC and GlobalFoundries currently use the gate first method, while
TSMC and Intel adopted the gate last method to produce APs.
JapanÊs Adeka is the exclusive supplier of high-k materials to SEC, but DNF is also likely to
supply materials going forward. SK Hynix sources the material from UP Chemical and
Soulbrain.
Table 15. Gate first vs gate last
Gate first Gate last
Companies IBM, SEC, GlobalFoundries, TI, etc. Intel, TSMC, etc.
Production process Relatively simple Relatively complex
Production cost Relatively low Relatively high
Speed Low High
Chip size Relatively small Relatively large
Strengths Simple production process Thermally stable
Weaknesses Thermally unstable (changes input voltage) Process complexity; high production cost
Source: KDB Daewoo Securities Research
Figure 88. High-K metal gate (HKMG) Figure 89. Gate first vs. gate last
Source: KDB Daewoo Securities Research Source: TSMC
Tech migration gave rise
to leakage current
HKMG
Gate first vs. gate last
Silicon-based HK MG
Low resistance layer
Metal gate
High-K
Silicon substrateSilicon substrate
Source Drain Source Drain
Poly-Si
SiO2
Gate electrode
Gate dielectric
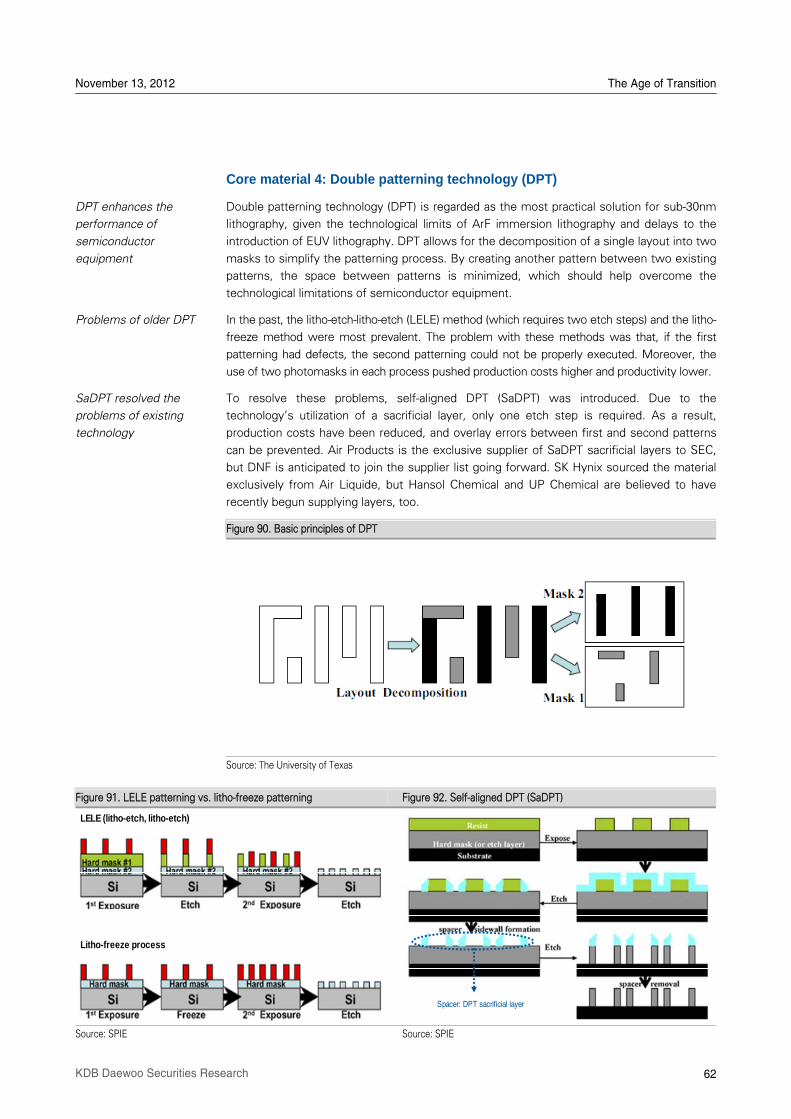
November 13, 2012 The Age of Transition
62 KDB Daewoo Securities Research
Core material 4: Double patterning technology (DPT)
Double patterning technology (DPT) is regarded as the most practical solution for sub-30nm
lithography, given the technological limits of ArF immersion lithography and delays to the
introduction of EUV lithography. DPT allows for the decomposition of a single layout into two
masks to simplify the patterning process. By creating another pattern between two existing
patterns, the space between patterns is minimized, which should help overcome the
technological limitations of semiconductor equipment.
In the past, the litho-etch-litho-etch (LELE) method (which requires two etch steps) and the litho-
freeze method were most prevalent. The problem with these methods was that, if the first
patterning had defects, the second patterning could not be properly executed. Moreover, the
use of two photomasks in each process pushed production costs higher and productivity lower.
To resolve these problems, self-aligned DPT (SaDPT) was introduced. Due to the
technologyÊs utilization of a sacrificial layer, only one etch step is required. As a result,
production costs have been reduced, and overlay errors between first and second patterns
can be prevented. Air Products is the exclusive supplier of SaDPT sacrificial layers to SEC,
but DNF is anticipated to join the supplier list going forward. SK Hynix sourced the material
exclusively from Air Liquide, but Hansol Chemical and UP Chemical are believed to have
recently begun supplying layers, too.
Figure 90. Basic principles of DPT
Source: The University of Texas
Figure 91. LELE patterning vs. litho-freeze patterning Figure 92. Self-aligned DPT (SaDPT)
Source: SPIE Source: SPIE
DPT enhances the
performance of
semiconductor
equipment
Problems of older DPT
SaDPT resolved the
problems of existing
technology
LELE (litho-etch, litho-etch)
Litho-freeze process
Spacer: DPT sacrificial layer
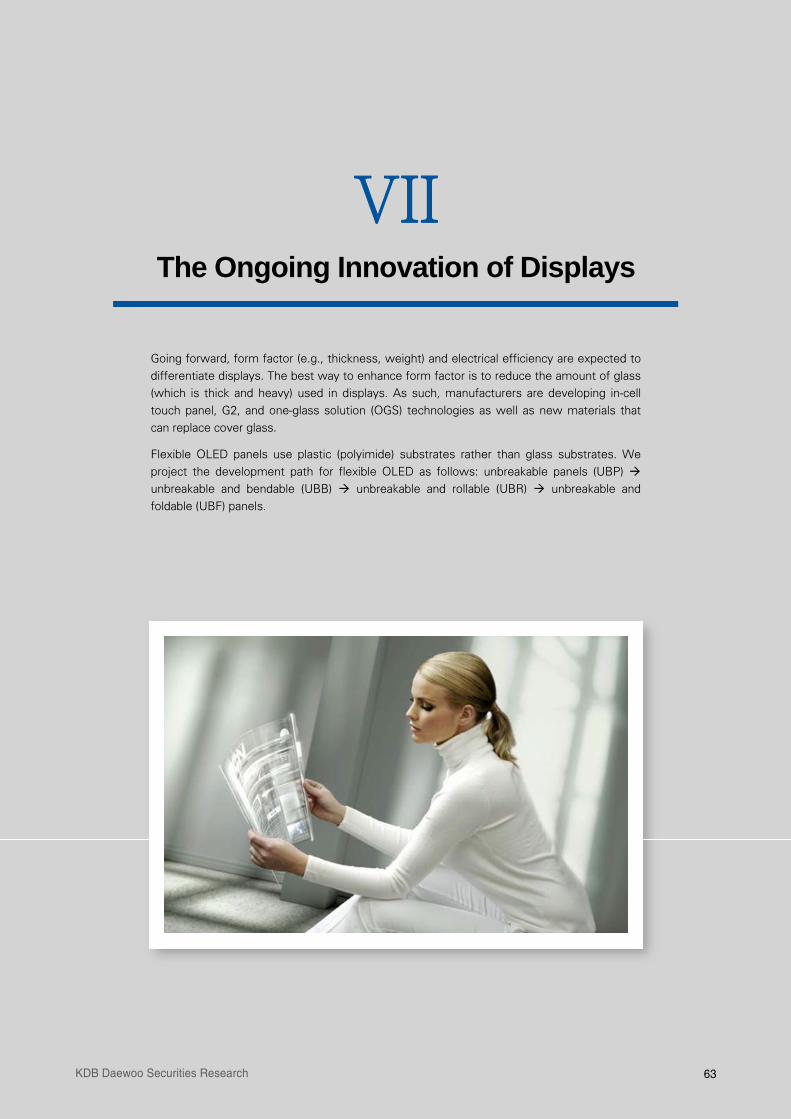
63 KDB Daewoo Securities Research
VII The Ongoing Innovation of Displays
Going forward, form factor (e.g., thickness, weight) and electrical efficiency are expected to
differentiate displays. The best way to enhance form factor is to reduce the amount of glass
(which is thick and heavy) used in displays. As such, manufacturers are developing in-cell
touch panel, G2, and one-glass solution (OGS) technologies as well as new materials that
can replace cover glass.
Flexible OLED panels use plastic (polyimide) substrates rather than glass substrates. We
project the development path for flexible OLED as follows: unbreakable panels (UBP)
unbreakable and bendable (UBB) unbreakable and rollable (UBR) unbreakable and
foldable (UBF) panels.
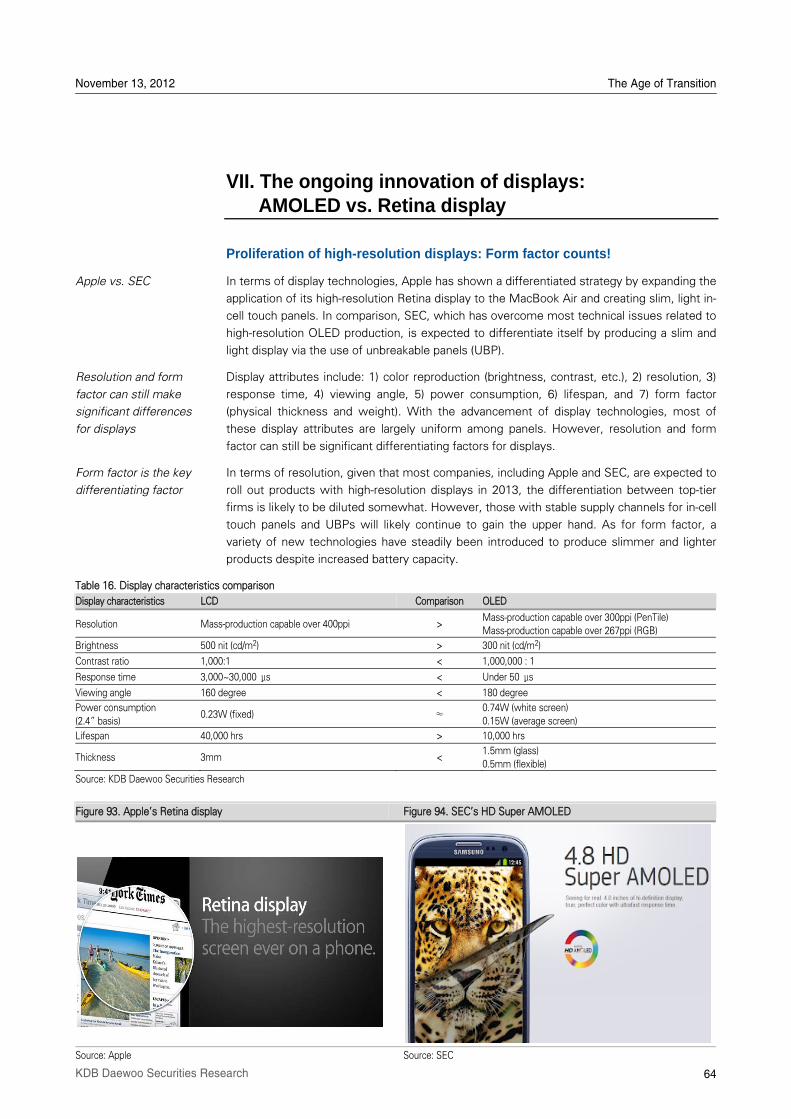
November 13, 2012 The Age of Transition
64 KDB Daewoo Securities Research
VII. The ongoing innovation of displays: AMOLED vs. Retina display
Proliferation of high-resolution displays: Form factor counts!
In terms of display technologies, Apple has shown a differentiated strategy by expanding the
application of its high-resolution Retina display to the MacBook Air and creating slim, light in-
cell touch panels. In comparison, SEC, which has overcome most technical issues related to
high-resolution OLED production, is expected to differentiate itself by producing a slim and
light display via the use of unbreakable panels (UBP).
Display attributes include: 1) color reproduction (brightness, contrast, etc.), 2) resolution, 3)
response time, 4) viewing angle, 5) power consumption, 6) lifespan, and 7) form factor
(physical thickness and weight). With the advancement of display technologies, most of
these display attributes are largely uniform among panels. However, resolution and form
factor can still be significant differentiating factors for displays.
In terms of resolution, given that most companies, including Apple and SEC, are expected to
roll out products with high-resolution displays in 2013, the differentiation between top-tier
firms is likely to be diluted somewhat. However, those with stable supply channels for in-cell
touch panels and UBPs will likely continue to gain the upper hand. As for form factor, a
variety of new technologies have steadily been introduced to produce slimmer and lighter
products despite increased battery capacity.
Table 16. Display characteristics comparison
Display characteristics LCD Comparison OLED
Resolution Mass-production capable over 400ppi > Mass-production capable over 300ppi (PenTile) Mass-production capable over 267ppi (RGB)
Brightness 500 nit (cd/m2) > 300 nit (cd/m2)
Contrast ratio 1,000:1 < 1,000,000 : 1
Response time 3,000~30,000 μs < Under 50 μs
Viewing angle 160 degree < 180 degree
Power consumption
(2.4‰ basis) 0.23W (fixed) ≈
0.74W (white screen)
0.15W (average screen)
Lifespan 40,000 hrs > 10,000 hrs
Thickness 3mm < 1.5mm (glass)
0.5mm (flexible)
Source: KDB Daewoo Securities Research
Figure 93. AppleÊs Retina display Figure 94. SECÊs HD Super AMOLED
Source: Apple Source: SEC
Apple vs. SEC
Resolution and form
factor can still make
significant differences
for displays
Form factor is the key
differentiating factor
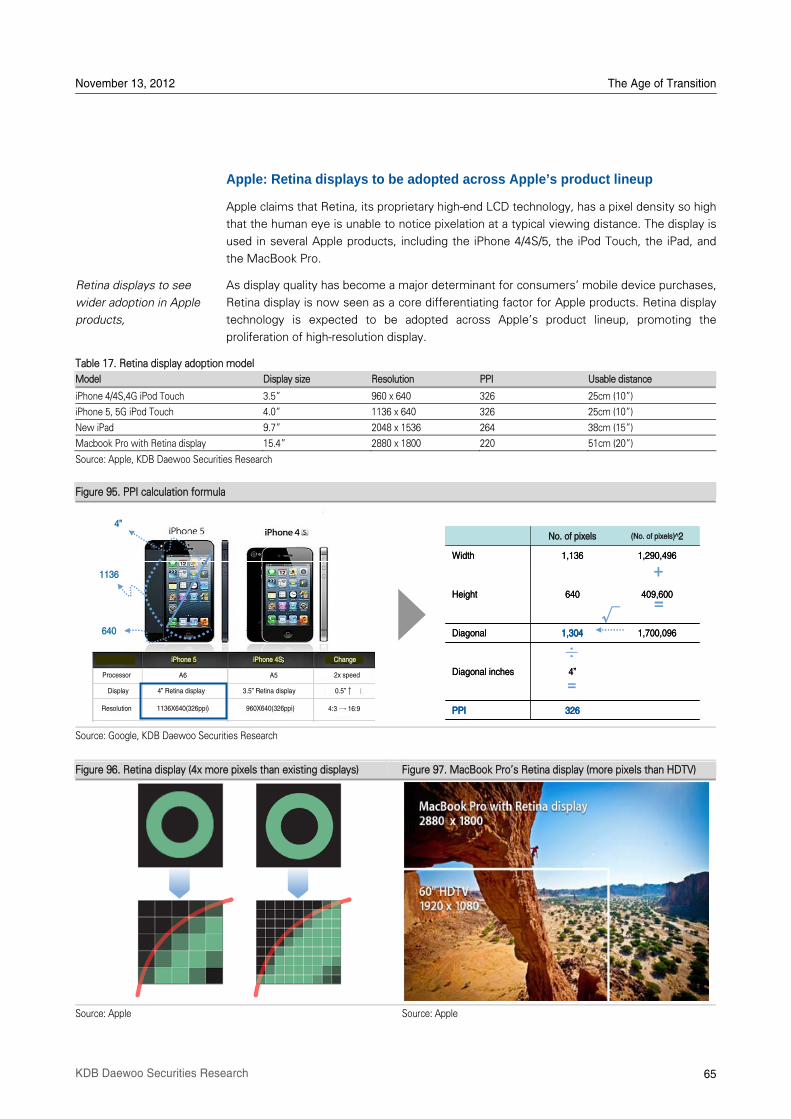
November 13, 2012 The Age of Transition
65 KDB Daewoo Securities Research
Apple: Retina displays to be adopted across Apple’s product lineup
Apple claims that Retina, its proprietary high-end LCD technology, has a pixel density so high
that the human eye is unable to notice pixelation at a typical viewing distance. The display is
used in several Apple products, including the iPhone 4/4S/5, the iPod Touch, the iPad, and
the MacBook Pro.
As display quality has become a major determinant for consumersÊ mobile device purchases,
Retina display is now seen as a core differentiating factor for Apple products. Retina display
technology is expected to be adopted across AppleÊs product lineup, promoting the
proliferation of high-resolution display.
Table 17. Retina display adoption model
Model Display size Resolution PPI Usable distance
iPhone 4/4S,4G iPod Touch 3.5‰ 960 x 640 326 25cm (10‰)
iPhone 5, 5G iPod Touch 4.0‰ 1136 x 640 326 25cm (10‰)
New iPad 9.7‰ 2048 x 1536 264 38cm (15‰)
Macbook Pro with Retina display 15.4‰ 2880 x 1800 220 51cm (20‰)
Source: Apple, KDB Daewoo Securities Research
Figure 95. PPI calculation formula
Source: Google, KDB Daewoo Securities Research
Figure 96. Retina display (4x more pixels than existing displays) Figure 97. MacBook ProÊs Retina display (more pixels than HDTV)
Source: Apple Source: Apple
Retina displays to see
wider adoption in Apple
products,
No. of pixels (No. of pixels)^2
Width 1,136 1,290,496
Height 640 409,600
Diagonal 1,304 1,700,096
Diagonal inches 4‰
PPI 326
No. of pixels (No. of pixels)^2
Width 1,136 1,290,496
Height 640 409,600
Diagonal 1,304 1,700,096
Diagonal inches 4‰
PPI 326
÷
=
√
=
+
4‰
640
1136
Processor
Display
Resolution
iPhone 5 iPhone 4S Change
4‰ Retina display 3.5‰ Retina display 0.5‰ ↑
4:3 → 16:9
2x speedA6
1136X640(326ppi) 960X640(326ppi)
A5
4‰
640
1136
Processor
Display
Resolution
iPhone 5 iPhone 4S Change
4‰ Retina display 3.5‰ Retina display 0.5‰ ↑
4:3 → 16:9
2x speedA6
1136X640(326ppi) 960X640(326ppi)
A5
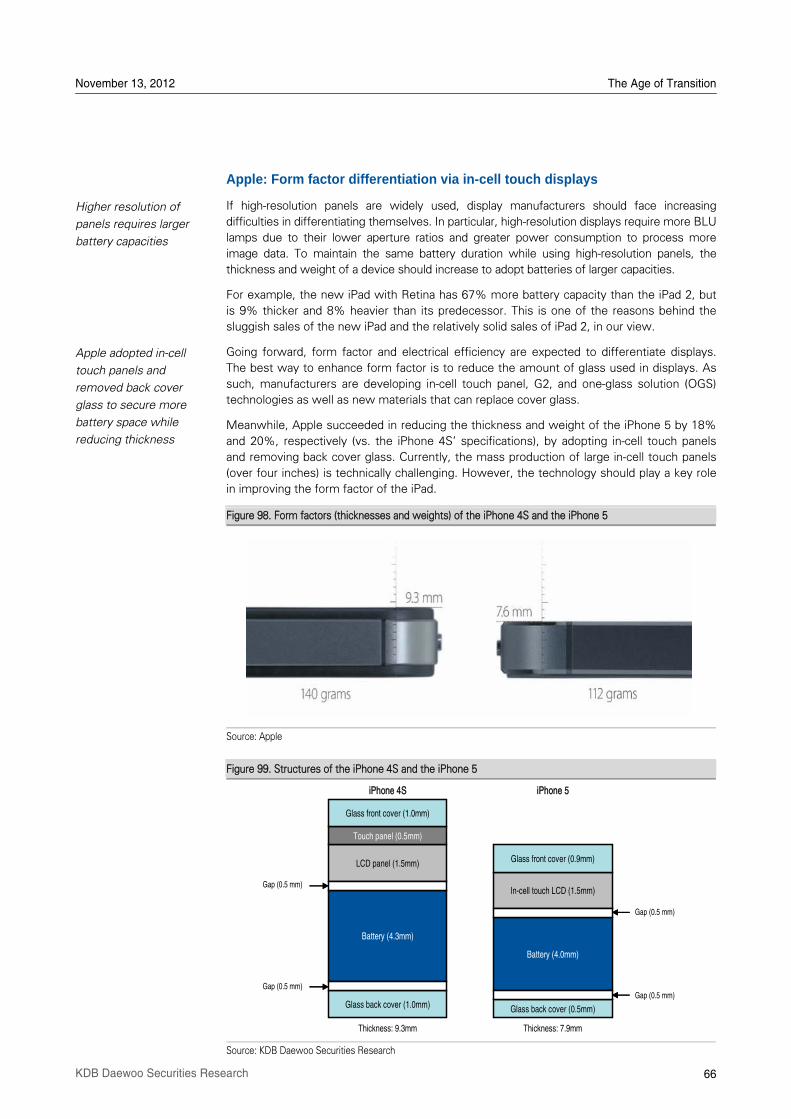
November 13, 2012 The Age of Transition
66 KDB Daewoo Securities Research
Apple: Form factor differentiation via in-cell touch displays
If high-resolution panels are widely used, display manufacturers should face increasing
difficulties in differentiating themselves. In particular, high-resolution displays require more BLU
lamps due to their lower aperture ratios and greater power consumption to process more
image data. To maintain the same battery duration while using high-resolution panels, the
thickness and weight of a device should increase to adopt batteries of larger capacities.
For example, the new iPad with Retina has 67% more battery capacity than the iPad 2, but
is 9% thicker and 8% heavier than its predecessor. This is one of the reasons behind the
sluggish sales of the new iPad and the relatively solid sales of iPad 2, in our view.
Going forward, form factor and electrical efficiency are expected to differentiate displays.
The best way to enhance form factor is to reduce the amount of glass used in displays. As
such, manufacturers are developing in-cell touch panel, G2, and one-glass solution (OGS)
technologies as well as new materials that can replace cover glass.
Meanwhile, Apple succeeded in reducing the thickness and weight of the iPhone 5 by 18%
and 20%, respectively (vs. the iPhone 4SÊ specifications), by adopting in-cell touch panels
and removing back cover glass. Currently, the mass production of large in-cell touch panels
(over four inches) is technically challenging. However, the technology should play a key role
in improving the form factor of the iPad.
Figure 98. Form factors (thicknesses and weights) of the iPhone 4S and the iPhone 5
Source: Apple
Figure 99. Structures of the iPhone 4S and the iPhone 5
Source: KDB Daewoo Securities Research
Higher resolution of
panels requires larger
battery capacities
Apple adopted in-cell
touch panels and
removed back cover
glass to secure more
battery space while
reducing thickness
Gap (0.5 mm)
Gap (0.5 mm)
Gap (0.5 mm)
Gap (0.5 mm)
Battery (4.3mm)
Glass back cover (1.0mm)
LCD panel (1.5mm)
Touch panel (0.5mm)
Glass front cover (1.0mm)
Battery (4.0mm)
Glass back cover (0.5mm)
In-cell touch LCD (1.5mm)
Glass front cover (0.9mm)
iPhone 4S
Thickness: 9.3mm
iPhone 5
Thickness: 7.9mm
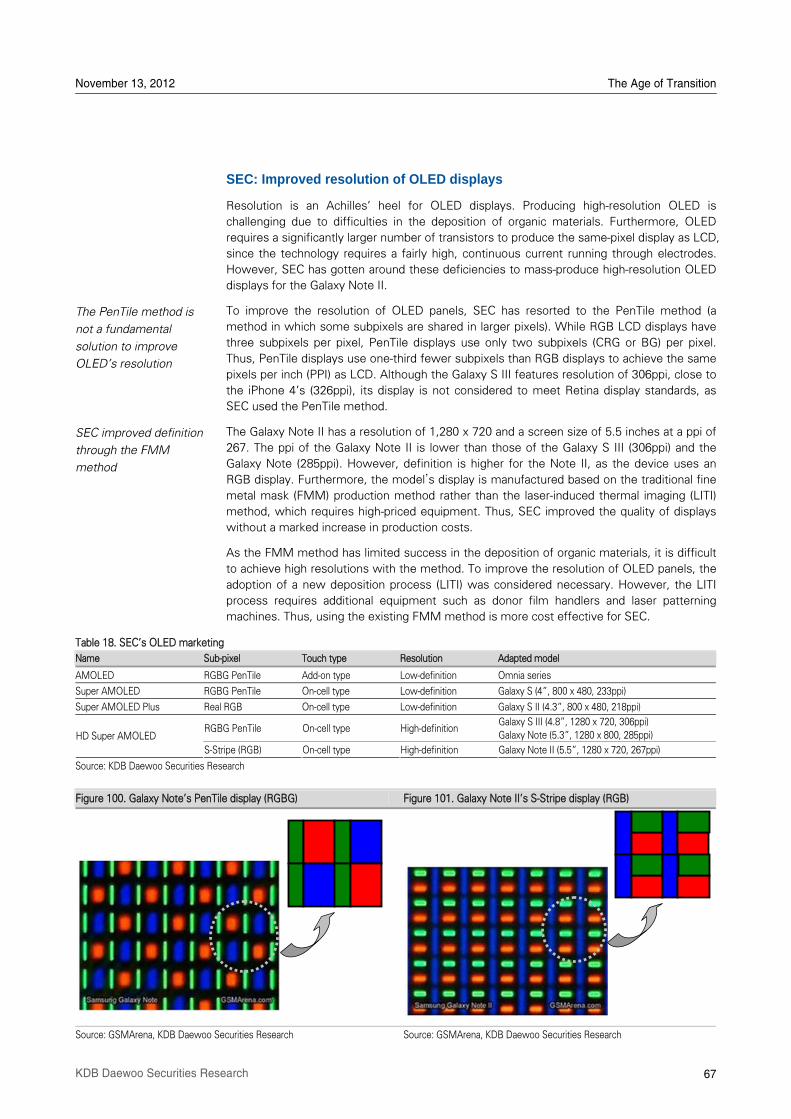
November 13, 2012 The Age of Transition
67 KDB Daewoo Securities Research
SEC: Improved resolution of OLED displays
Resolution is an AchillesÊ heel for OLED displays. Producing high-resolution OLED is
challenging due to difficulties in the deposition of organic materials. Furthermore, OLED
requires a significantly larger number of transistors to produce the same-pixel display as LCD,
since the technology requires a fairly high, continuous current running through electrodes.
However, SEC has gotten around these deficiencies to mass-produce high-resolution OLED
displays for the Galaxy Note II.
To improve the resolution of OLED panels, SEC has resorted to the PenTile method (a
method in which some subpixels are shared in larger pixels). While RGB LCD displays have
three subpixels per pixel, PenTile displays use only two subpixels (CRG or BG) per pixel.
Thus, PenTile displays use one-third fewer subpixels than RGB displays to achieve the same
pixels per inch (PPI) as LCD. Although the Galaxy S III features resolution of 306ppi, close to
the iPhone 4Ês (326ppi), its display is not considered to meet Retina display standards, as
SEC used the PenTile method.
The Galaxy Note II has a resolution of 1,280 x 720 and a screen size of 5.5 inches at a ppi of
267. The ppi of the Galaxy Note II is lower than those of the Galaxy S III (306ppi) and the
Galaxy Note (285ppi). However, definition is higher for the Note II, as the device uses an
RGB display. Furthermore, the model’s display is manufactured based on the traditional fine
metal mask (FMM) production method rather than the laser-induced thermal imaging (LITI)
method, which requires high-priced equipment. Thus, SEC improved the quality of displays
without a marked increase in production costs.
As the FMM method has limited success in the deposition of organic materials, it is difficult
to achieve high resolutions with the method. To improve the resolution of OLED panels, the
adoption of a new deposition process (LITI) was considered necessary. However, the LITI
process requires additional equipment such as donor film handlers and laser patterning
machines. Thus, using the existing FMM method is more cost effective for SEC.
Table 18. SECÊs OLED marketing
Name Sub-pixel Touch type Resolution Adapted model
AMOLED RGBG PenTile Add-on type Low-definition Omnia series
Super AMOLED RGBG PenTile On-cell type Low-definition Galaxy S (4‰, 800 x 480, 233ppi)
Super AMOLED Plus Real RGB On-cell type Low-definition Galaxy S II (4.3‰, 800 x 480, 218ppi)
RGBG PenTile On-cell type High-definition Galaxy S III (4.8‰, 1280 x 720, 306ppi)
Galaxy Note (5.3‰, 1280 x 800, 285ppi) HD Super AMOLED
S-Stripe (RGB) On-cell type High-definition Galaxy Note II (5.5‰, 1280 x 720, 267ppi)
Source: KDB Daewoo Securities Research
Figure 100. Galaxy NoteÊs PenTile display (RGBG) Figure 101. Galaxy Note IIÊs S-Stripe display (RGB)
Source: GSMArena, KDB Daewoo Securities Research Source: GSMArena, KDB Daewoo Securities Research
The PenTile method is
not a fundamental
solution to improve
OLEDÊs resolution
SEC improved definition
through the FMM
method
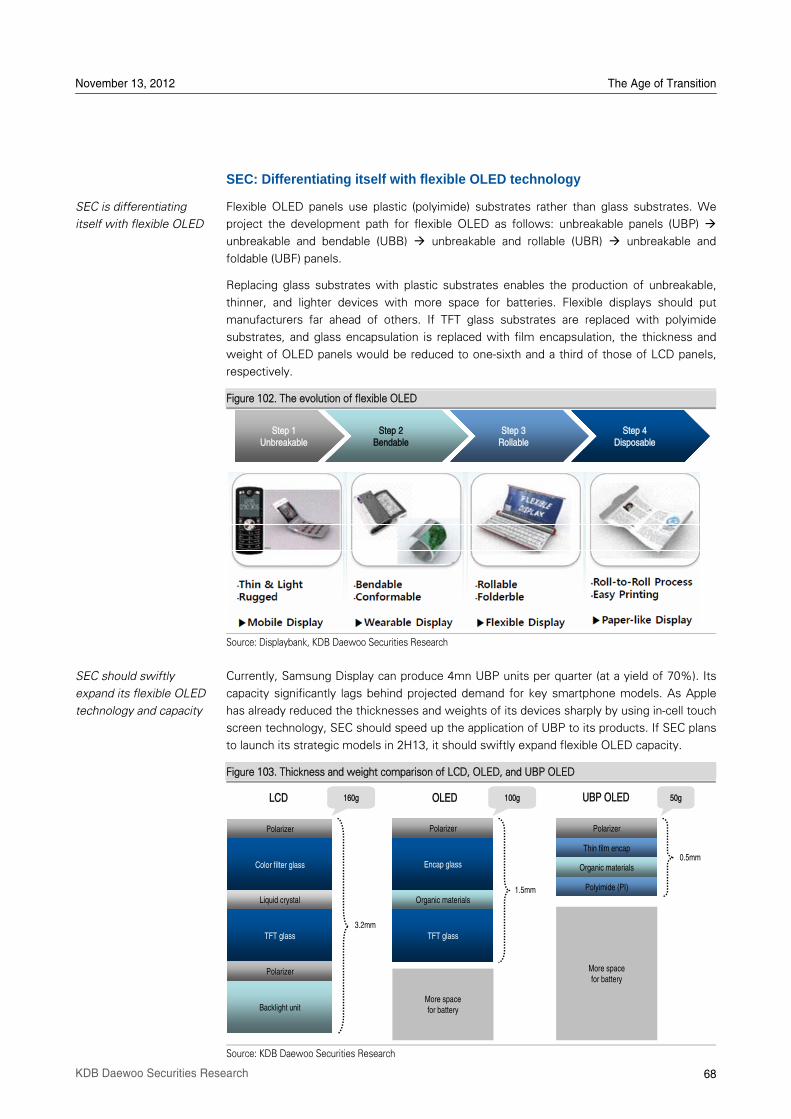
November 13, 2012 The Age of Transition
68 KDB Daewoo Securities Research
SEC: Differentiating itself with flexible OLED technology
Flexible OLED panels use plastic (polyimide) substrates rather than glass substrates. We
project the development path for flexible OLED as follows: unbreakable panels (UBP)
unbreakable and bendable (UBB) unbreakable and rollable (UBR) unbreakable and
foldable (UBF) panels.
Replacing glass substrates with plastic substrates enables the production of unbreakable,
thinner, and lighter devices with more space for batteries. Flexible displays should put
manufacturers far ahead of others. If TFT glass substrates are replaced with polyimide
substrates, and glass encapsulation is replaced with film encapsulation, the thickness and
weight of OLED panels would be reduced to one-sixth and a third of those of LCD panels,
respectively.
Figure 102. The evolution of flexible OLED
Source: Displaybank, KDB Daewoo Securities Research
Currently, Samsung Display can produce 4mn UBP units per quarter (at a yield of 70%). Its
capacity significantly lags behind projected demand for key smartphone models. As Apple
has already reduced the thicknesses and weights of its devices sharply by using in-cell touch
screen technology, SEC should speed up the application of UBP to its products. If SEC plans
to launch its strategic models in 2H13, it should swiftly expand flexible OLED capacity.
Figure 103. Thickness and weight comparison of LCD, OLED, and UBP OLED
Source: KDB Daewoo Securities Research
SEC is differentiating
itself with flexible OLED
SEC should swiftly
expand its flexible OLED
technology and capacity
1단계Unbreakable
2단계Bendable
3단계Rollable
4단계Disposable
1단계Unbreakable
2단계Bendable
3단계Rollable
4단계Disposable
Step 1Unbreakable
Step 2Bendable
Step 3Rollable
Step 4Disposable
LCD
3.2mm
Color filter glass
Polarizer
Liquid crystal
TFT glass
Polarizer
Backlight unit
Encap glass
Polarizer
Organic materials
TFT glass
Polarizer
Thin film encap
Organic materials
Polyimide (PI)1.5mm
0.5mm
OLED UBP OLED160g 100g 50g
More space for battery
More spacefor battery
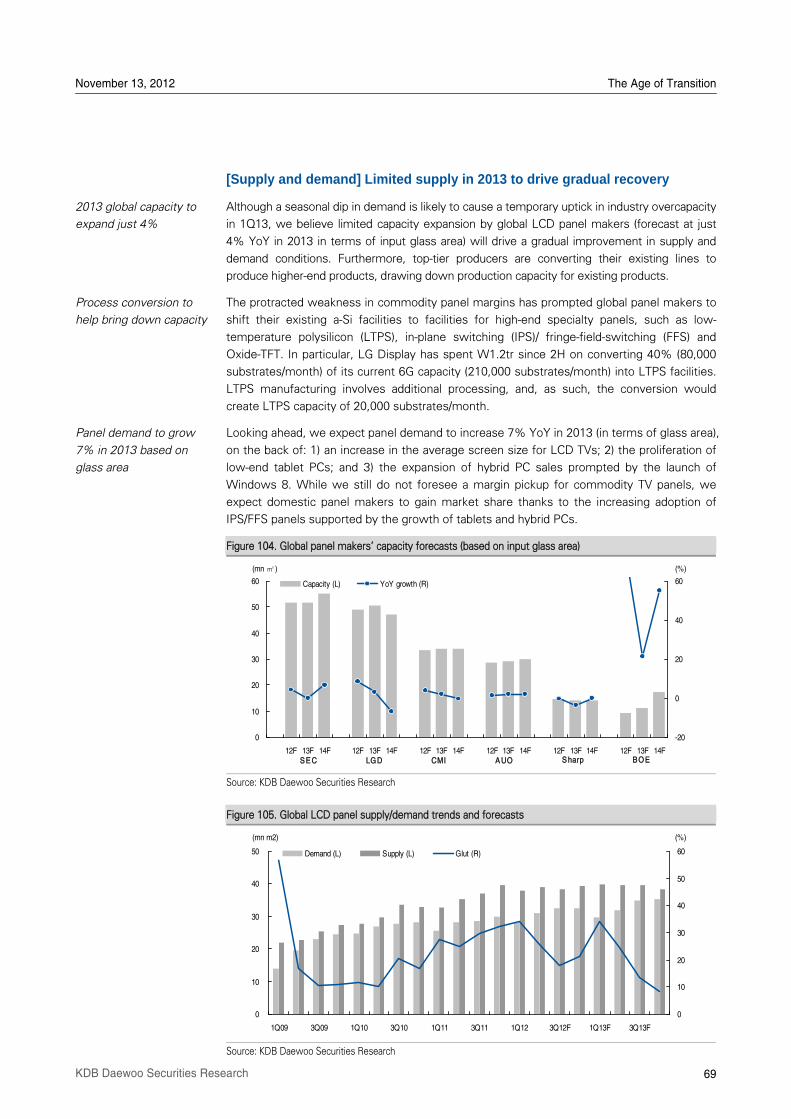
November 13, 2012 The Age of Transition
69 KDB Daewoo Securities Research
[Supply and demand] Limited supply in 2013 to drive gradual recovery
Although a seasonal dip in demand is likely to cause a temporary uptick in industry overcapacity
in 1Q13, we believe limited capacity expansion by global LCD panel makers (forecast at just
4% YoY in 2013 in terms of input glass area) will drive a gradual improvement in supply and
demand conditions. Furthermore, top-tier producers are converting their existing lines to
produce higher-end products, drawing down production capacity for existing products.
The protracted weakness in commodity panel margins has prompted global panel makers to
shift their existing a-Si facilities to facilities for high-end specialty panels, such as low-
temperature polysilicon (LTPS), in-plane switching (IPS)/ fringe-field-switching (FFS) and
Oxide-TFT. In particular, LG Display has spent W1.2tr since 2H on converting 40% (80,000
substrates/month) of its current 6G capacity (210,000 substrates/month) into LTPS facilities.
LTPS manufacturing involves additional processing, and, as such, the conversion would
create LTPS capacity of 20,000 substrates/month.
Looking ahead, we expect panel demand to increase 7% YoY in 2013 (in terms of glass area),
on the back of: 1) an increase in the average screen size for LCD TVs; 2) the proliferation of
low-end tablet PCs; and 3) the expansion of hybrid PC sales prompted by the launch of
Windows 8. While we still do not foresee a margin pickup for commodity TV panels, we
expect domestic panel makers to gain market share thanks to the increasing adoption of
IPS/FFS panels supported by the growth of tablets and hybrid PCs.
Figure 104. Global panel makersÊ capacity forecasts (based on input glass area)
Source: KDB Daewoo Securities Research
Figure 105. Global LCD panel supply/demand trends and forecasts
Source: KDB Daewoo Securities Research
2013 global capacity to
expand just 4%
Process conversion to
help bring down capacity
Panel demand to grow
7% in 2013 based on
glass area
0
10
20
30
40
50
60
12F 13F 14F 12F 13F 14F 12F 13F 14F 12F 13F 14F 12F 13F 14F 12F 13F 14F
-20
0
20
40
60Capacity (L) YoY growth (R)
(mn ㎡) (%)
S E C LG D CMI A UO S harp B O E
0
10
20
30
40
50
1Q09 3Q09 1Q10 3Q10 1Q11 3Q11 1Q12 3Q12F 1Q13F 3Q13F
0
10
20
30
40
50
60Demand (L) Supply (L) Glut (R)
(mn m2) (%)
70 KDB Daewoo Securities Research
VIII IT Sector Investment Strategy for 2013
We project the performances of SEC and IT shares to be weak in 1H but to strengthen in
2H. We advise investors to take the most conservative approach possible in accumulating IT
shares. As the global economic outlook remains uncertain, there is no reason for investors to
hastily purchase IT shares. In early 2013, SEC is not expected to serve as more than a risk
hedging instrument. Still, in 1H13, the low valuations of large-cap IT stocks should offer
investors opportunities to expand the weight of the stocks.
We recommend 11 stocks in 2013: Among large-cap plays, we recommend SEC (005930
KS), SK Hynix (000660 KS), LGE (066570 KS), Samsung Electro-Mechanics (009150 KS), and
Samsung SDI (006400 KS). Among small- to mid-cap plays, we recommend SFA Engineering
(056190 KQ), Duksan Hi-Metal (077360 KQ), Soulbrain (036830 KQ), Partron (091700 KQ),
Nepes (033640 KQ), and Simmtech (036710 KQ).
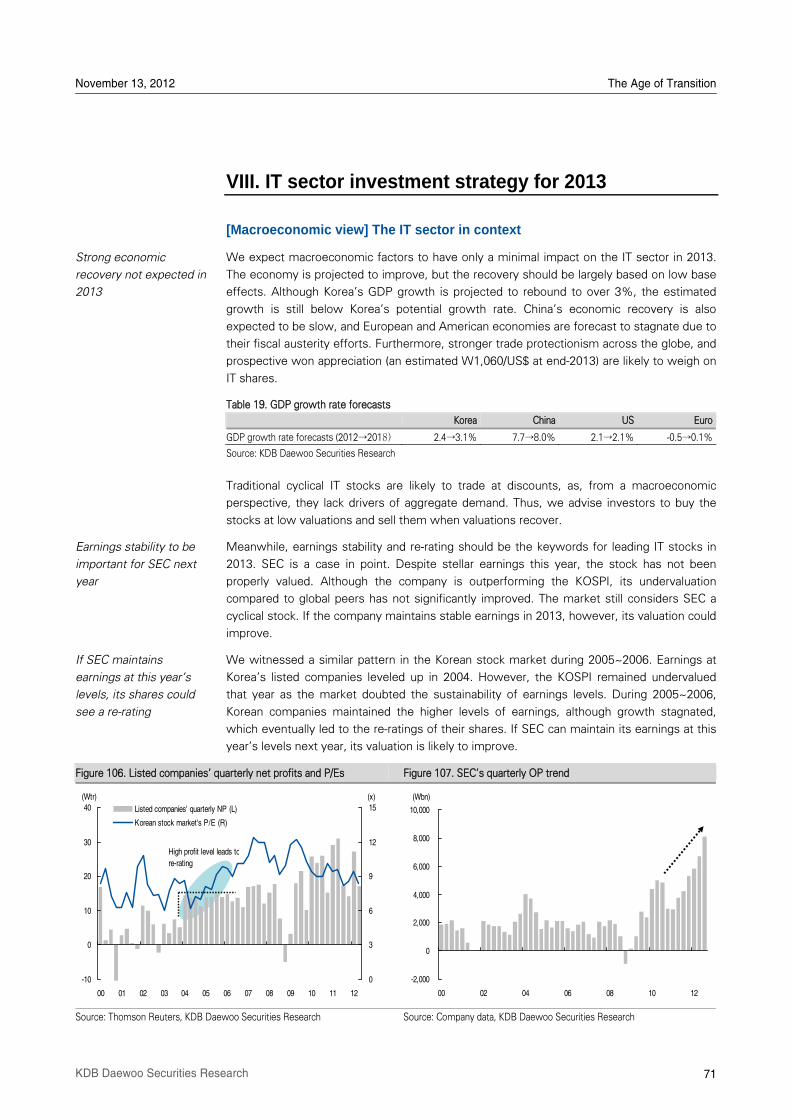
November 13, 2012 The Age of Transition
71 KDB Daewoo Securities Research
VIII. IT sector investment strategy for 2013
[Macroeconomic view] The IT sector in context
We expect macroeconomic factors to have only a minimal impact on the IT sector in 2013.
The economy is projected to improve, but the recovery should be largely based on low base
effects. Although KoreaÊs GDP growth is projected to rebound to over 3%, the estimated
growth is still below KoreaÊs potential growth rate. ChinaÊs economic recovery is also
expected to be slow, and European and American economies are forecast to stagnate due to
their fiscal austerity efforts. Furthermore, stronger trade protectionism across the globe, and
prospective won appreciation (an estimated W1,060/US$ at end-2013) are likely to weigh on
IT shares.
Table 19. GDP growth rate forecasts
Korea China US Euro
GDP growth rate forecasts (2012→2018) 2.4→3.1% 7.7→8.0% 2.1→2.1% -0.5→0.1%
Source: KDB Daewoo Securities Research
Traditional cyclical IT stocks are likely to trade at discounts, as, from a macroeconomic
perspective, they lack drivers of aggregate demand. Thus, we advise investors to buy the
stocks at low valuations and sell them when valuations recover.
Meanwhile, earnings stability and re-rating should be the keywords for leading IT stocks in
2013. SEC is a case in point. Despite stellar earnings this year, the stock has not been
properly valued. Although the company is outperforming the KOSPI, its undervaluation
compared to global peers has not significantly improved. The market still considers SEC a
cyclical stock. If the company maintains stable earnings in 2013, however, its valuation could
improve.
We witnessed a similar pattern in the Korean stock market during 2005~2006. Earnings at
KoreaÊs listed companies leveled up in 2004. However, the KOSPI remained undervalued
that year as the market doubted the sustainability of earnings levels. During 2005~2006,
Korean companies maintained the higher levels of earnings, although growth stagnated,
which eventually led to the re-ratings of their shares. If SEC can maintain its earnings at this
yearÊs levels next year, its valuation is likely to improve.
Figure 106. Listed companiesÊ quarterly net profits and P/Es Figure 107. SECÊs quarterly OP trend
Source: Thomson Reuters, KDB Daewoo Securities Research Source: Company data, KDB Daewoo Securities Research
Strong economic
recovery not expected in
2013
Earnings stability to be
important for SEC next
year
If SEC maintains
earnings at this yearÊs
levels, its shares could
see a re-rating
-10
0
10
20
30
40
00 01 02 03 04 05 06 07 08 09 10 11 12
(Wtr)
0
3
6
9
12
15(x)
Listed companies' quarterly NP (L)
Korean stock market's P/E (R)
High profit level leads to
re-rating
-2,000
0
2,000
4,000
6,000
8,000
10,000
00 02 04 06 08 10 12
(Wbn)
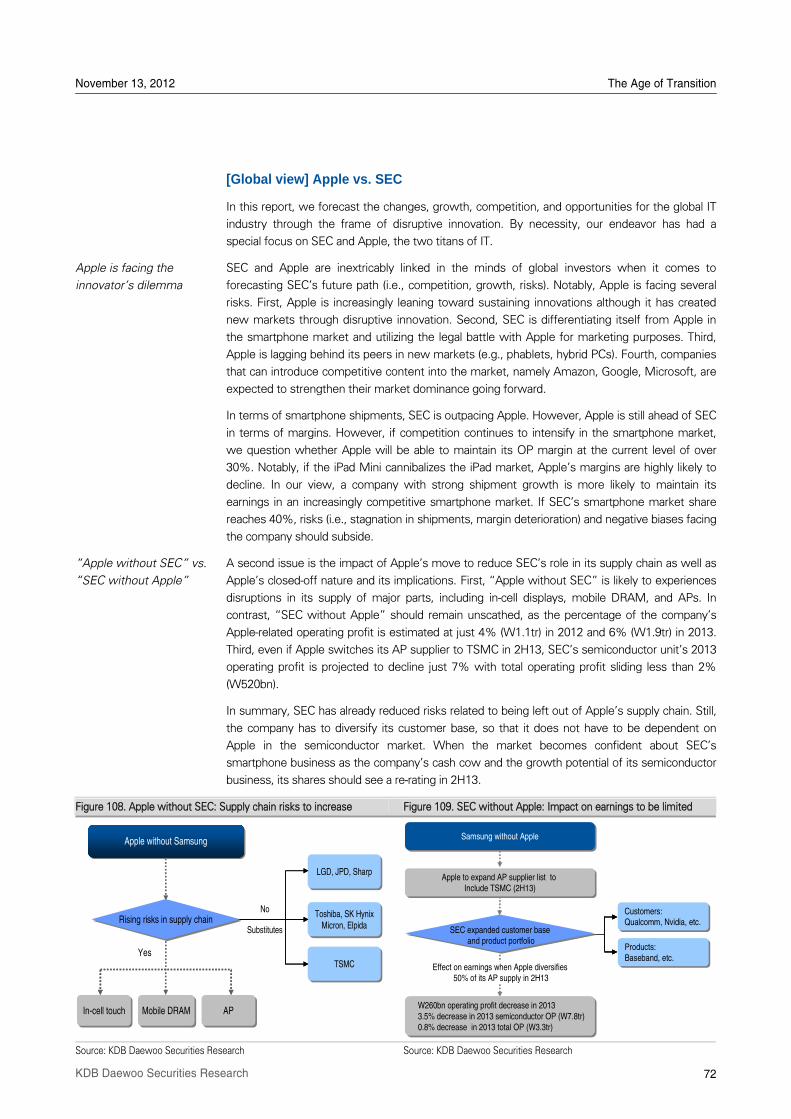
November 13, 2012 The Age of Transition
72 KDB Daewoo Securities Research
[Global view] Apple vs. SEC
In this report, we forecast the changes, growth, competition, and opportunities for the global IT
industry through the frame of disruptive innovation. By necessity, our endeavor has had a
special focus on SEC and Apple, the two titans of IT.
SEC and Apple are inextricably linked in the minds of global investors when it comes to
forecasting SECÊs future path (i.e., competition, growth, risks). Notably, Apple is facing several
risks. First, Apple is increasingly leaning toward sustaining innovations although it has created
new markets through disruptive innovation. Second, SEC is differentiating itself from Apple in
the smartphone market and utilizing the legal battle with Apple for marketing purposes. Third,
Apple is lagging behind its peers in new markets (e.g., phablets, hybrid PCs). Fourth, companies
that can introduce competitive content into the market, namely Amazon, Google, Microsoft, are
expected to strengthen their market dominance going forward.
In terms of smartphone shipments, SEC is outpacing Apple. However, Apple is still ahead of SEC
in terms of margins. However, if competition continues to intensify in the smartphone market,
we question whether Apple will be able to maintain its OP margin at the current level of over
30%. Notably, if the iPad Mini cannibalizes the iPad market, AppleÊs margins are highly likely to
decline. In our view, a company with strong shipment growth is more likely to maintain its
earnings in an increasingly competitive smartphone market. If SECÊs smartphone market share
reaches 40%, risks (i.e., stagnation in shipments, margin deterioration) and negative biases facing
the company should subside.
A second issue is the impact of Apple's move to reduce SECÊs role in its supply chain as well as
AppleÊs closed-off nature and its implications. First, „Apple without SEC‰ is likely to experiences
disruptions in its supply of major parts, including in-cell displays, mobile DRAM, and APs. In
contrast, „SEC without Apple‰ should remain unscathed, as the percentage of the companyÊs
Apple-related operating profit is estimated at just 4% (W1.1tr) in 2012 and 6% (W1.9tr) in 2013.
Third, even if Apple switches its AP supplier to TSMC in 2H13, SECÊs semiconductor unitÊs 2013
operating profit is projected to decline just 7% with total operating profit sliding less than 2%
(W520bn).
In summary, SEC has already reduced risks related to being left out of AppleÊs supply chain. Still,
the company has to diversify its customer base, so that it does not have to be dependent on
Apple in the semiconductor market. When the market becomes confident about SECÊs
smartphone business as the companyÊs cash cow and the growth potential of its semiconductor
business, its shares should see a re-rating in 2H13.
Figure 108. Apple without SEC: Supply chain risks to increase Figure 109. SEC without Apple: Impact on earnings to be limited
Source: KDB Daewoo Securities Research Source: KDB Daewoo Securities Research
Apple is facing the
innovatorÊs dilemma
„Apple without SEC‰ vs.
„SEC without Apple‰
No
Yes
In-cell touchIn-cell touch Mobile DRAMMobile DRAM APAP
Substitutes
LGD, JPD, SharpLGD, JPD, Sharp
Toshiba, SK HynixMicron, Elpida
Toshiba, SK HynixMicron, Elpida
TSMCTSMC
Apple without SamsungApple without Samsung
Rising risks in supply chain
W260bn operating profit decrease in 20133.5% decrease in 2013 semiconductor OP (W7.8tr)0.8% decrease in 2013 total OP (W3.3tr)
W260bn operating profit decrease in 20133.5% decrease in 2013 semiconductor OP (W7.8tr)0.8% decrease in 2013 total OP (W3.3tr)
Effect on earnings when Apple diversifies50% of its AP supply in 2H13
Customers: Qualcomm, Nvidia, etc.
Customers: Qualcomm, Nvidia, etc.
Products:Baseband, etc.
Products:Baseband, etc.
Samsung without AppleSamsung without Apple
Apple to expand AP supplier list to Include TSMC (2H13)
Apple to expand AP supplier list to Include TSMC (2H13)
SEC expanded customer baseand product portfolio
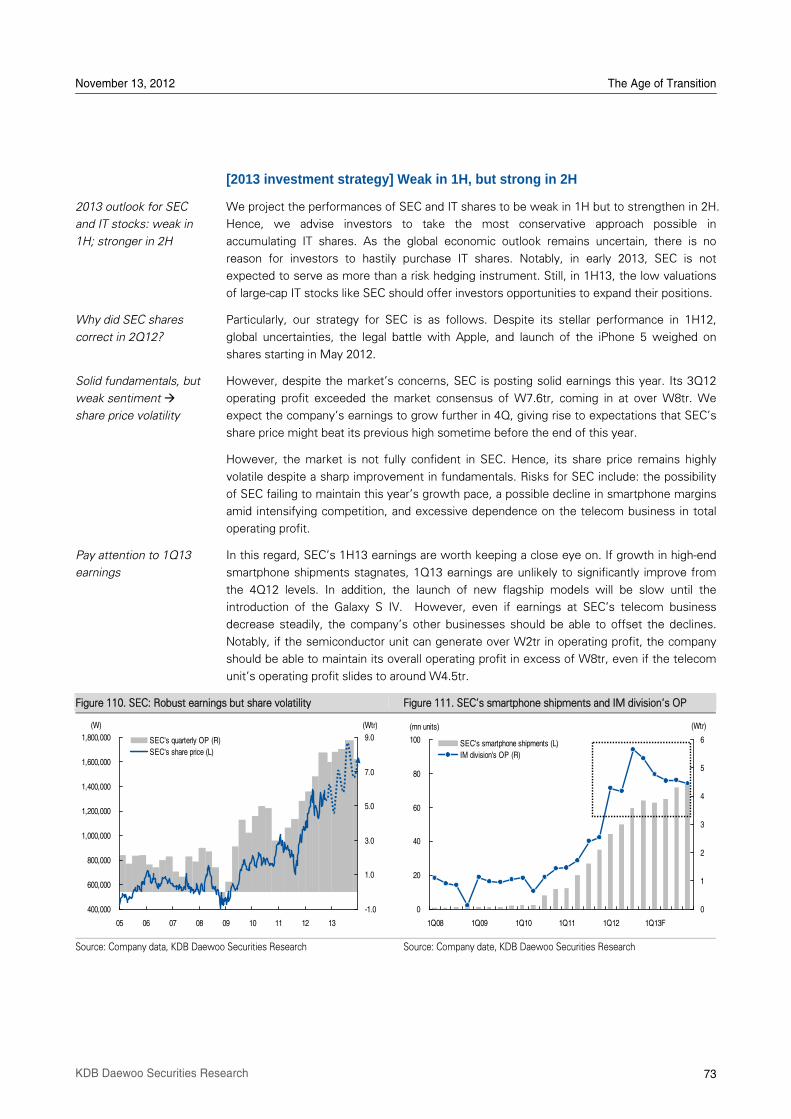
November 13, 2012 The Age of Transition
73 KDB Daewoo Securities Research
[2013 investment strategy] Weak in 1H, but strong in 2H
We project the performances of SEC and IT shares to be weak in 1H but to strengthen in 2H.
Hence, we advise investors to take the most conservative approach possible in
accumulating IT shares. As the global economic outlook remains uncertain, there is no
reason for investors to hastily purchase IT shares. Notably, in early 2013, SEC is not
expected to serve as more than a risk hedging instrument. Still, in 1H13, the low valuations
of large-cap IT stocks like SEC should offer investors opportunities to expand their positions.
Particularly, our strategy for SEC is as follows. Despite its stellar performance in 1H12,
global uncertainties, the legal battle with Apple, and launch of the iPhone 5 weighed on
shares starting in May 2012.
However, despite the marketÊs concerns, SEC is posting solid earnings this year. Its 3Q12
operating profit exceeded the market consensus of W7.6tr, coming in at over W8tr. We
expect the companyÊs earnings to grow further in 4Q, giving rise to expectations that SECÊs
share price might beat its previous high sometime before the end of this year.
However, the market is not fully confident in SEC. Hence, its share price remains highly
volatile despite a sharp improvement in fundamentals. Risks for SEC include: the possibility
of SEC failing to maintain this yearÊs growth pace, a possible decline in smartphone margins
amid intensifying competition, and excessive dependence on the telecom business in total
operating profit.
In this regard, SECÊs 1H13 earnings are worth keeping a close eye on. If growth in high-end
smartphone shipments stagnates, 1Q13 earnings are unlikely to significantly improve from
the 4Q12 levels. In addition, the launch of new flagship models will be slow until the
introduction of the Galaxy S IV. However, even if earnings at SECÊs telecom business
decrease steadily, the companyÊs other businesses should be able to offset the declines.
Notably, if the semiconductor unit can generate over W2tr in operating profit, the company
should be able to maintain its overall operating profit in excess of W8tr, even if the telecom
unitÊs operating profit slides to around W4.5tr.
Figure 110. SEC: Robust earnings but share volatility Figure 111. SECÊs smartphone shipments and IM divisionÊs OP
Source: Company data, KDB Daewoo Securities Research Source: Company date, KDB Daewoo Securities Research
2013 outlook for SEC
and IT stocks: weak in
1H; stronger in 2H
Why did SEC shares
correct in 2Q12?
Solid fundamentals, but
weak sentiment
share price volatility
Pay attention to 1Q13
earnings
400,000
600,000
800,000
1,000,000
1,200,000
1,400,000
1,600,000
1,800,000
05 06 07 08 09 10 11 12 13
-1.0
1.0
3.0
5.0
7.0
9.0SEC's quarterly OP (R)
SEC's share price (L)
(W) (Wtr)
0
20
40
60
80
100
1Q08 1Q09 1Q10 1Q11 1Q12 1Q13F
(mn units)
0
1
2
3
4
5
6SEC's smartphone shipments (L)
IM division's OP (R)
(Wtr)
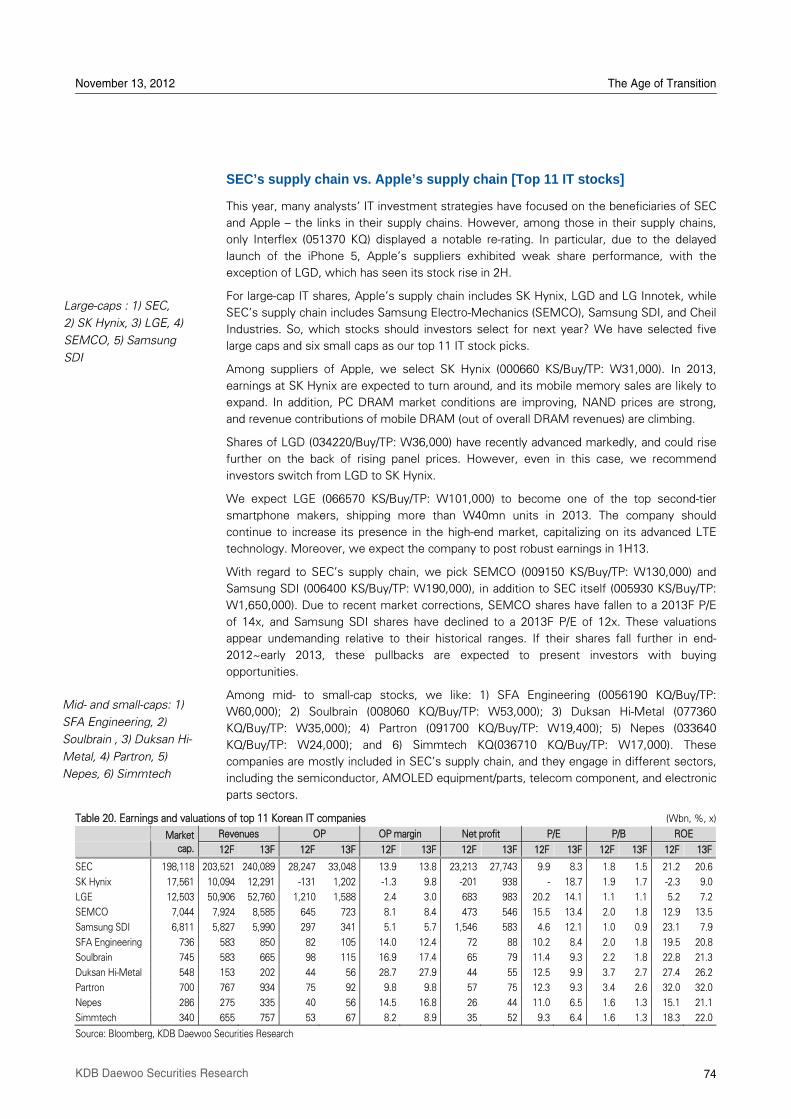
November 13, 2012 The Age of Transition
74 KDB Daewoo Securities Research
SEC’s supply chain vs. Apple’s supply chain [Top 11 IT stocks]
This year, many analystsÊ IT investment strategies have focused on the beneficiaries of SEC
and Apple – the links in their supply chains. However, among those in their supply chains,
only Interflex (051370 KQ) displayed a notable re-rating. In particular, due to the delayed
launch of the iPhone 5, AppleÊs suppliers exhibited weak share performance, with the
exception of LGD, which has seen its stock rise in 2H.
For large-cap IT shares, AppleÊs supply chain includes SK Hynix, LGD and LG Innotek, while
SECÊs supply chain includes Samsung Electro-Mechanics (SEMCO), Samsung SDI, and Cheil
Industries. So, which stocks should investors select for next year? We have selected five
large caps and six small caps as our top 11 IT stock picks.
Among suppliers of Apple, we select SK Hynix (000660 KS/Buy/TP: W31,000). In 2013,
earnings at SK Hynix are expected to turn around, and its mobile memory sales are likely to
expand. In addition, PC DRAM market conditions are improving, NAND prices are strong,
and revenue contributions of mobile DRAM (out of overall DRAM revenues) are climbing.
Shares of LGD (034220/Buy/TP: W36,000) have recently advanced markedly, and could rise
further on the back of rising panel prices. However, even in this case, we recommend
investors switch from LGD to SK Hynix.
We expect LGE (066570 KS/Buy/TP: W101,000) to become one of the top second-tier
smartphone makers, shipping more than W40mn units in 2013. The company should
continue to increase its presence in the high-end market, capitalizing on its advanced LTE
technology. Moreover, we expect the company to post robust earnings in 1H13.
With regard to SECÊs supply chain, we pick SEMCO (009150 KS/Buy/TP: W130,000) and
Samsung SDI (006400 KS/Buy/TP: W190,000), in addition to SEC itself (005930 KS/Buy/TP:
W1,650,000). Due to recent market corrections, SEMCO shares have fallen to a 2013F P/E
of 14x, and Samsung SDI shares have declined to a 2013F P/E of 12x. These valuations
appear undemanding relative to their historical ranges. If their shares fall further in end-
2012~early 2013, these pullbacks are expected to present investors with buying
opportunities.
Among mid- to small-cap stocks, we like: 1) SFA Engineering (0056190 KQ/Buy/TP:
W60,000); 2) Soulbrain (008060 KQ/Buy/TP: W53,000); 3) Duksan Hi-Metal (077360
KQ/Buy/TP: W35,000); 4) Partron (091700 KQ/Buy/TP: W19,400); 5) Nepes (033640
KQ/Buy/TP: W24,000); and 6) Simmtech KQ(036710 KQ/Buy/TP: W17,000). These
companies are mostly included in SECÊs supply chain, and they engage in different sectors,
including the semiconductor, AMOLED equipment/parts, telecom component, and electronic
parts sectors.
Table 20. Earnings and valuations of top 11 Korean IT companies (Wbn, %, x)
Revenues OP OP margin Net profit P/E P/B ROE
Market
cap. 12F 13F 12F 13F 12F 13F 12F 13F 12F 13F 12F 13F 12F 13F
SEC 198,118 203,521 240,089 28,247 33,048 13.9 13.8 23,213 27,743 9.9 8.3 1.8 1.5 21.2 20.6
SK Hynix 17,561 10,094 12,291 -131 1,202 -1.3 9.8 -201 938 - 18.7 1.9 1.7 -2.3 9.0
LGE 12,503 50,906 52,760 1,210 1,588 2.4 3.0 683 983 20.2 14.1 1.1 1.1 5.2 7.2
SEMCO 7,044 7,924 8,585 645 723 8.1 8.4 473 546 15.5 13.4 2.0 1.8 12.9 13.5
Samsung SDI 6,811 5,827 5,990 297 341 5.1 5.7 1,546 583 4.6 12.1 1.0 0.9 23.1 7.9
SFA Engineering 736 583 850 82 105 14.0 12.4 72 88 10.2 8.4 2.0 1.8 19.5 20.8
Soulbrain 745 583 665 98 115 16.9 17.4 65 79 11.4 9.3 2.2 1.8 22.8 21.3
Duksan Hi-Metal 548 153 202 44 56 28.7 27.9 44 55 12.5 9.9 3.7 2.7 27.4 26.2
Partron 700 767 934 75 92 9.8 9.8 57 75 12.3 9.3 3.4 2.6 32.0 32.0
Nepes 286 275 335 40 56 14.5 16.8 26 44 11.0 6.5 1.6 1.3 15.1 21.1
Simmtech 340 655 757 53 67 8.2 8.9 35 52 9.3 6.4 1.6 1.3 18.3 22.0
Source: Bloomberg, KDB Daewoo Securities Research
Large-caps : 1) SEC,
2) SK Hynix, 3) LGE, 4)
SEMCO, 5) Samsung
SDI
Mid- and small-caps: 1)
SFA Engineering, 2)
Soulbrain , 3) Duksan Hi-
Metal, 4) Partron, 5)
Nepes, 6) Simmtech
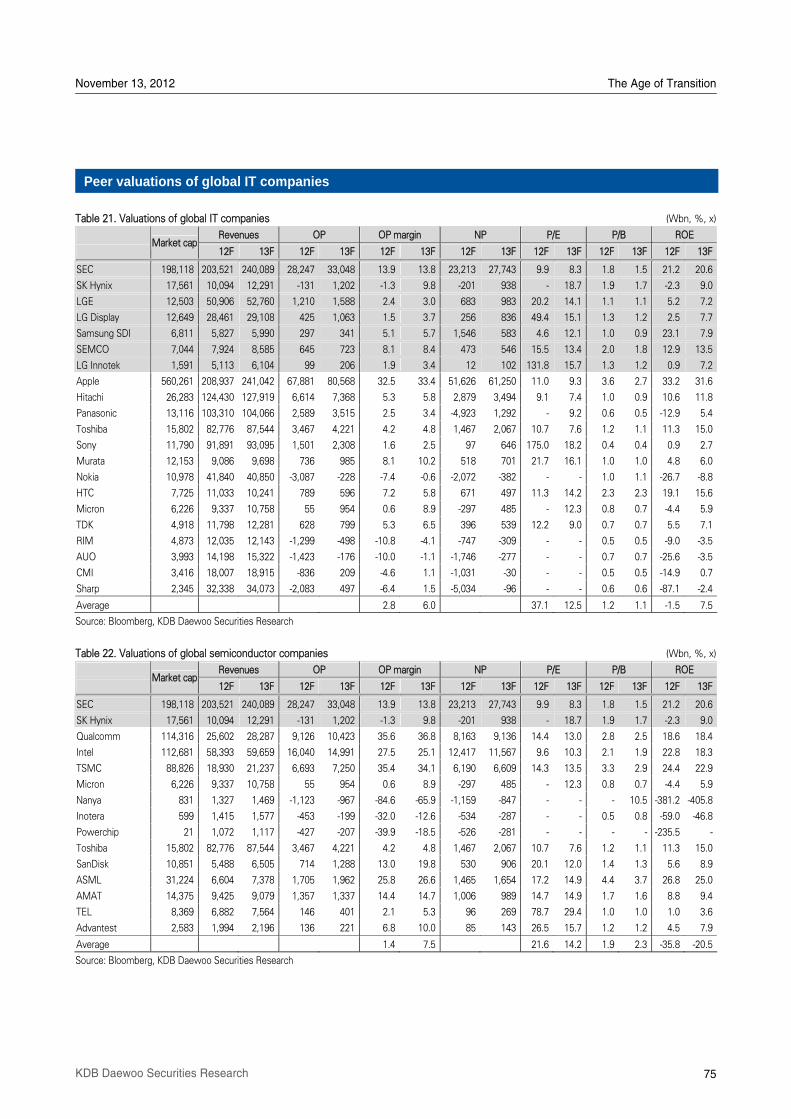
November 13, 2012 The Age of Transition
75 KDB Daewoo Securities Research
Peer valuations of global IT companies
Table 21. Valuations of global IT companies (Wbn, %, x)
Revenues OP OP margin NP P/E P/B ROE
Market cap
12F 13F 12F 13F 12F 13F 12F 13F 12F 13F 12F 13F 12F 13F
SEC 198,118 203,521 240,089 28,247 33,048 13.9 13.8 23,213 27,743 9.9 8.3 1.8 1.5 21.2 20.6
SK Hynix 17,561 10,094 12,291 -131 1,202 -1.3 9.8 -201 938 - 18.7 1.9 1.7 -2.3 9.0
LGE 12,503 50,906 52,760 1,210 1,588 2.4 3.0 683 983 20.2 14.1 1.1 1.1 5.2 7.2
LG Display 12,649 28,461 29,108 425 1,063 1.5 3.7 256 836 49.4 15.1 1.3 1.2 2.5 7.7
Samsung SDI 6,811 5,827 5,990 297 341 5.1 5.7 1,546 583 4.6 12.1 1.0 0.9 23.1 7.9
SEMCO 7,044 7,924 8,585 645 723 8.1 8.4 473 546 15.5 13.4 2.0 1.8 12.9 13.5
LG Innotek 1,591 5,113 6,104 99 206 1.9 3.4 12 102 131.8 15.7 1.3 1.2 0.9 7.2
Apple 560,261 208,937 241,042 67,881 80,568 32.5 33.4 51,626 61,250 11.0 9.3 3.6 2.7 33.2 31.6
Hitachi 26,283 124,430 127,919 6,614 7,368 5.3 5.8 2,879 3,494 9.1 7.4 1.0 0.9 10.6 11.8
Panasonic 13,116 103,310 104,066 2,589 3,515 2.5 3.4 -4,923 1,292 - 9.2 0.6 0.5 -12.9 5.4
Toshiba 15,802 82,776 87,544 3,467 4,221 4.2 4.8 1,467 2,067 10.7 7.6 1.2 1.1 11.3 15.0
Sony 11,790 91,891 93,095 1,501 2,308 1.6 2.5 97 646 175.0 18.2 0.4 0.4 0.9 2.7
Murata 12,153 9,086 9,698 736 985 8.1 10.2 518 701 21.7 16.1 1.0 1.0 4.8 6.0
Nokia 10,978 41,840 40,850 -3,087 -228 -7.4 -0.6 -2,072 -382 - - 1.0 1.1 -26.7 -8.8
HTC 7,725 11,033 10,241 789 596 7.2 5.8 671 497 11.3 14.2 2.3 2.3 19.1 15.6
Micron 6,226 9,337 10,758 55 954 0.6 8.9 -297 485 - 12.3 0.8 0.7 -4.4 5.9
TDK 4,918 11,798 12,281 628 799 5.3 6.5 396 539 12.2 9.0 0.7 0.7 5.5 7.1
RIM 4,873 12,035 12,143 -1,299 -498 -10.8 -4.1 -747 -309 - - 0.5 0.5 -9.0 -3.5
AUO 3,993 14,198 15,322 -1,423 -176 -10.0 -1.1 -1,746 -277 - - 0.7 0.7 -25.6 -3.5
CMI 3,416 18,007 18,915 -836 209 -4.6 1.1 -1,031 -30 - - 0.5 0.5 -14.9 0.7
Sharp 2,345 32,338 34,073 -2,083 497 -6.4 1.5 -5,034 -96 - - 0.6 0.6 -87.1 -2.4
Average 2.8 6.0 37.1 12.5 1.2 1.1 -1.5 7.5
Source: Bloomberg, KDB Daewoo Securities Research
Table 22. Valuations of global semiconductor companies (Wbn, %, x)
Revenues OP OP margin NP P/E P/B ROE
Market cap
12F 13F 12F 13F 12F 13F 12F 13F 12F 13F 12F 13F 12F 13F
SEC 198,118 203,521 240,089 28,247 33,048 13.9 13.8 23,213 27,743 9.9 8.3 1.8 1.5 21.2 20.6
SK Hynix 17,561 10,094 12,291 -131 1,202 -1.3 9.8 -201 938 - 18.7 1.9 1.7 -2.3 9.0
Qualcomm 114,316 25,602 28,287 9,126 10,423 35.6 36.8 8,163 9,136 14.4 13.0 2.8 2.5 18.6 18.4
Intel 112,681 58,393 59,659 16,040 14,991 27.5 25.1 12,417 11,567 9.6 10.3 2.1 1.9 22.8 18.3
TSMC 88,826 18,930 21,237 6,693 7,250 35.4 34.1 6,190 6,609 14.3 13.5 3.3 2.9 24.4 22.9
Micron 6,226 9,337 10,758 55 954 0.6 8.9 -297 485 - 12.3 0.8 0.7 -4.4 5.9
Nanya 831 1,327 1,469 -1,123 -967 -84.6 -65.9 -1,159 -847 - - - 10.5 -381.2 -405.8
Inotera 599 1,415 1,577 -453 -199 -32.0 -12.6 -534 -287 - - 0.5 0.8 -59.0 -46.8
Powerchip 21 1,072 1,117 -427 -207 -39.9 -18.5 -526 -281 - - - - -235.5 -
Toshiba 15,802 82,776 87,544 3,467 4,221 4.2 4.8 1,467 2,067 10.7 7.6 1.2 1.1 11.3 15.0
SanDisk 10,851 5,488 6,505 714 1,288 13.0 19.8 530 906 20.1 12.0 1.4 1.3 5.6 8.9
ASML 31,224 6,604 7,378 1,705 1,962 25.8 26.6 1,465 1,654 17.2 14.9 4.4 3.7 26.8 25.0
AMAT 14,375 9,425 9,079 1,357 1,337 14.4 14.7 1,006 989 14.7 14.9 1.7 1.6 8.8 9.4
TEL 8,369 6,882 7,564 146 401 2.1 5.3 96 269 78.7 29.4 1.0 1.0 1.0 3.6
Advantest 2,583 1,994 2,196 136 221 6.8 10.0 85 143 26.5 15.7 1.2 1.2 4.5 7.9
Average 1.4 7.5 21.6 14.2 1.9 2.3 -35.8 -20.5
Source: Bloomberg, KDB Daewoo Securities Research
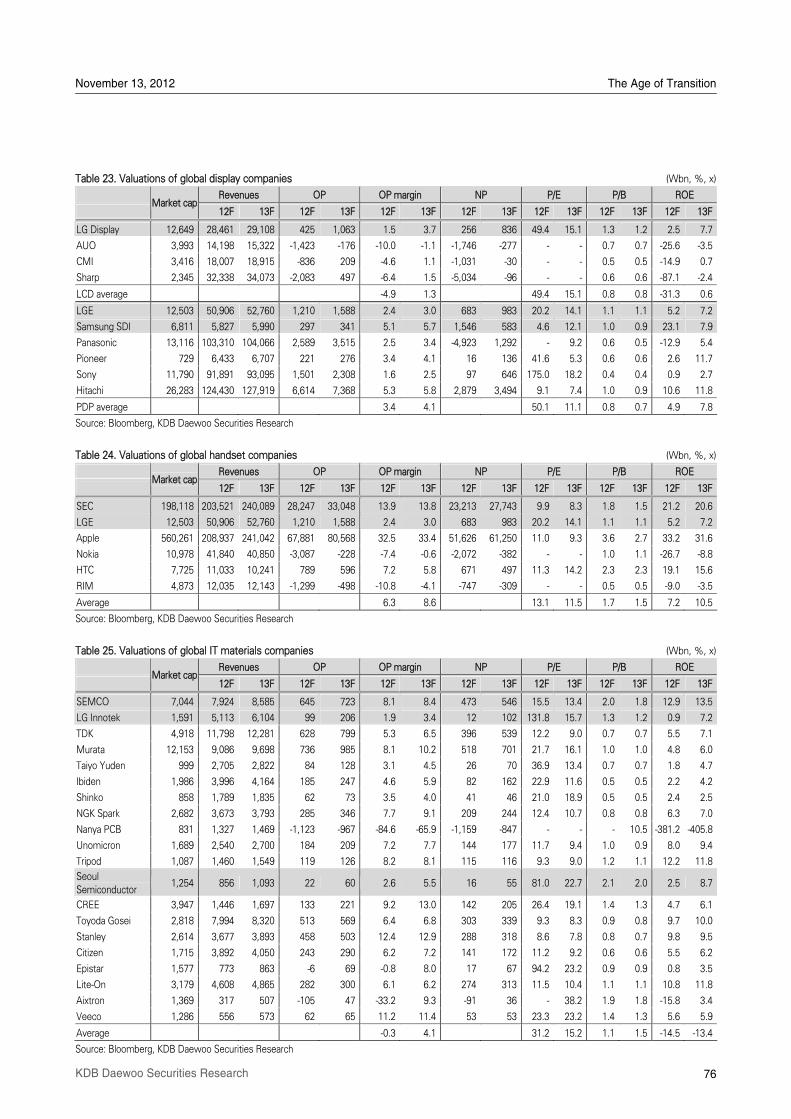
November 13, 2012 The Age of Transition
76 KDB Daewoo Securities Research
Table 23. Valuations of global display companies (Wbn, %, x)
Revenues OP OP margin NP P/E P/B ROE
Market cap
12F 13F 12F 13F 12F 13F 12F 13F 12F 13F 12F 13F 12F 13F
LG Display 12,649 28,461 29,108 425 1,063 1.5 3.7 256 836 49.4 15.1 1.3 1.2 2.5 7.7
AUO 3,993 14,198 15,322 -1,423 -176 -10.0 -1.1 -1,746 -277 - - 0.7 0.7 -25.6 -3.5
CMI 3,416 18,007 18,915 -836 209 -4.6 1.1 -1,031 -30 - - 0.5 0.5 -14.9 0.7
Sharp 2,345 32,338 34,073 -2,083 497 -6.4 1.5 -5,034 -96 - - 0.6 0.6 -87.1 -2.4
LCD average -4.9 1.3 49.4 15.1 0.8 0.8 -31.3 0.6
LGE 12,503 50,906 52,760 1,210 1,588 2.4 3.0 683 983 20.2 14.1 1.1 1.1 5.2 7.2
Samsung SDI 6,811 5,827 5,990 297 341 5.1 5.7 1,546 583 4.6 12.1 1.0 0.9 23.1 7.9
Panasonic 13,116 103,310 104,066 2,589 3,515 2.5 3.4 -4,923 1,292 - 9.2 0.6 0.5 -12.9 5.4
Pioneer 729 6,433 6,707 221 276 3.4 4.1 16 136 41.6 5.3 0.6 0.6 2.6 11.7
Sony 11,790 91,891 93,095 1,501 2,308 1.6 2.5 97 646 175.0 18.2 0.4 0.4 0.9 2.7
Hitachi 26,283 124,430 127,919 6,614 7,368 5.3 5.8 2,879 3,494 9.1 7.4 1.0 0.9 10.6 11.8
PDP average 3.4 4.1 50.1 11.1 0.8 0.7 4.9 7.8
Source: Bloomberg, KDB Daewoo Securities Research
Table 24. Valuations of global handset companies (Wbn, %, x)
Revenues OP OP margin NP P/E P/B ROE
Market cap
12F 13F 12F 13F 12F 13F 12F 13F 12F 13F 12F 13F 12F 13F
SEC 198,118 203,521 240,089 28,247 33,048 13.9 13.8 23,213 27,743 9.9 8.3 1.8 1.5 21.2 20.6
LGE 12,503 50,906 52,760 1,210 1,588 2.4 3.0 683 983 20.2 14.1 1.1 1.1 5.2 7.2
Apple 560,261 208,937 241,042 67,881 80,568 32.5 33.4 51,626 61,250 11.0 9.3 3.6 2.7 33.2 31.6
Nokia 10,978 41,840 40,850 -3,087 -228 -7.4 -0.6 -2,072 -382 - - 1.0 1.1 -26.7 -8.8
HTC 7,725 11,033 10,241 789 596 7.2 5.8 671 497 11.3 14.2 2.3 2.3 19.1 15.6
RIM 4,873 12,035 12,143 -1,299 -498 -10.8 -4.1 -747 -309 - - 0.5 0.5 -9.0 -3.5
Average 6.3 8.6 13.1 11.5 1.7 1.5 7.2 10.5
Source: Bloomberg, KDB Daewoo Securities Research
Table 25. Valuations of global IT materials companies (Wbn, %, x)
Revenues OP OP margin NP P/E P/B ROE
Market cap
12F 13F 12F 13F 12F 13F 12F 13F 12F 13F 12F 13F 12F 13F
SEMCO 7,044 7,924 8,585 645 723 8.1 8.4 473 546 15.5 13.4 2.0 1.8 12.9 13.5
LG Innotek 1,591 5,113 6,104 99 206 1.9 3.4 12 102 131.8 15.7 1.3 1.2 0.9 7.2
TDK 4,918 11,798 12,281 628 799 5.3 6.5 396 539 12.2 9.0 0.7 0.7 5.5 7.1
Murata 12,153 9,086 9,698 736 985 8.1 10.2 518 701 21.7 16.1 1.0 1.0 4.8 6.0
Taiyo Yuden 999 2,705 2,822 84 128 3.1 4.5 26 70 36.9 13.4 0.7 0.7 1.8 4.7
Ibiden 1,986 3,996 4,164 185 247 4.6 5.9 82 162 22.9 11.6 0.5 0.5 2.2 4.2
Shinko 858 1,789 1,835 62 73 3.5 4.0 41 46 21.0 18.9 0.5 0.5 2.4 2.5
NGK Spark 2,682 3,673 3,793 285 346 7.7 9.1 209 244 12.4 10.7 0.8 0.8 6.3 7.0
Nanya PCB 831 1,327 1,469 -1,123 -967 -84.6 -65.9 -1,159 -847 - - - 10.5 -381.2 -405.8
Unomicron 1,689 2,540 2,700 184 209 7.2 7.7 144 177 11.7 9.4 1.0 0.9 8.0 9.4
Tripod 1,087 1,460 1,549 119 126 8.2 8.1 115 116 9.3 9.0 1.2 1.1 12.2 11.8
Seoul
Semiconductor 1,254 856 1,093 22 60 2.6 5.5 16 55 81.0 22.7 2.1 2.0 2.5 8.7
CREE 3,947 1,446 1,697 133 221 9.2 13.0 142 205 26.4 19.1 1.4 1.3 4.7 6.1
Toyoda Gosei 2,818 7,994 8,320 513 569 6.4 6.8 303 339 9.3 8.3 0.9 0.8 9.7 10.0
Stanley 2,614 3,677 3,893 458 503 12.4 12.9 288 318 8.6 7.8 0.8 0.7 9.8 9.5
Citizen 1,715 3,892 4,050 243 290 6.2 7.2 141 172 11.2 9.2 0.6 0.6 5.5 6.2
Epistar 1,577 773 863 -6 69 -0.8 8.0 17 67 94.2 23.2 0.9 0.9 0.8 3.5
Lite-On 3,179 4,608 4,865 282 300 6.1 6.2 274 313 11.5 10.4 1.1 1.1 10.8 11.8
Aixtron 1,369 317 507 -105 47 -33.2 9.3 -91 36 - 38.2 1.9 1.8 -15.8 3.4
Veeco 1,286 556 573 62 65 11.2 11.4 53 53 23.3 23.2 1.4 1.3 5.6 5.9
Average -0.3 4.1 31.2 15.2 1.1 1.5 -14.5 -13.4
Source: Bloomberg, KDB Daewoo Securities Research
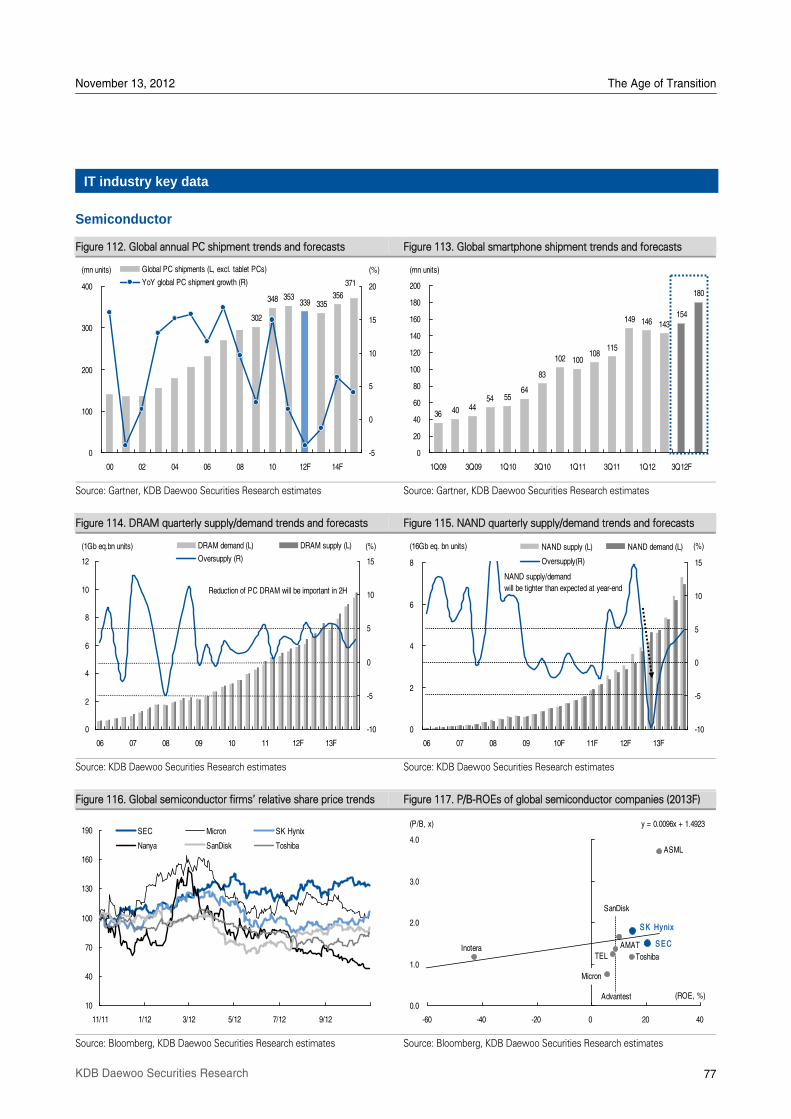
November 13, 2012 The Age of Transition
77 KDB Daewoo Securities Research
IT industry key data
Semiconductor
Figure 112. Global annual PC shipment trends and forecasts Figure 113. Global smartphone shipment trends and forecasts
Source: Gartner, KDB Daewoo Securities Research estimates Source: Gartner, KDB Daewoo Securities Research estimates
Figure 114. DRAM quarterly supply/demand trends and forecasts Figure 115. NAND quarterly supply/demand trends and forecasts
Source: KDB Daewoo Securities Research estimates Source: KDB Daewoo Securities Research estimates
Figure 116. Global semiconductor firmsÊ relative share price trends Figure 117. P/B-ROEs of global semiconductor companies (2013F)
Source: Bloomberg, KDB Daewoo Securities Research estimates Source: Bloomberg, KDB Daewoo Securities Research estimates
302
348 353339 335
356
371
0
100
200
300
400
00 02 04 06 08 10 12F 14F
-5
0
5
10
15
20
Global PC shipments (L, excl. tablet PCs)
YoY global PC shipment growth (R)
(mn units) (%)
36 40 4454 55
64
83
102 100108
115
149 146 143154
180
0
20
40
60
80
100
120
140
160
180
200
1Q09 3Q09 1Q10 3Q10 1Q11 3Q11 1Q12 3Q12F
(mn units)
0
2
4
6
8
10
12
06 07 08 09 10 11 12F 13F
-10
-5
0
5
10
15
DRAM demand (L) DRAM supply (L)
Oversupply (R)
(%)(1Gb eq.bn units)
Reduction of PC DRAM will be important in 2H
0
2
4
6
8
06 07 08 09 10F 11F 12F 13F
-10
-5
0
5
10
15
NAND supply (L) NAND demand (L)
Oversupply(R)
(%)(16Gb eq. bn units)
NAND supply/demand
will be tighter than expected at year-end
10
40
70
100
130
160
190
11/11 1/12 3/12 5/12 7/12 9/12
SEC Micron SK Hynix
Nanya SanDisk Toshiba
S E C
S K Hynix
Micron
InoteraToshiba
SanDisk
ASML
AMAT
TEL
Advantest
y = 0.0096x + 1.4923
0.0
1.0
2.0
3.0
4.0
-60 -40 -20 0 20 40
(P/B, x)
(ROE, %)
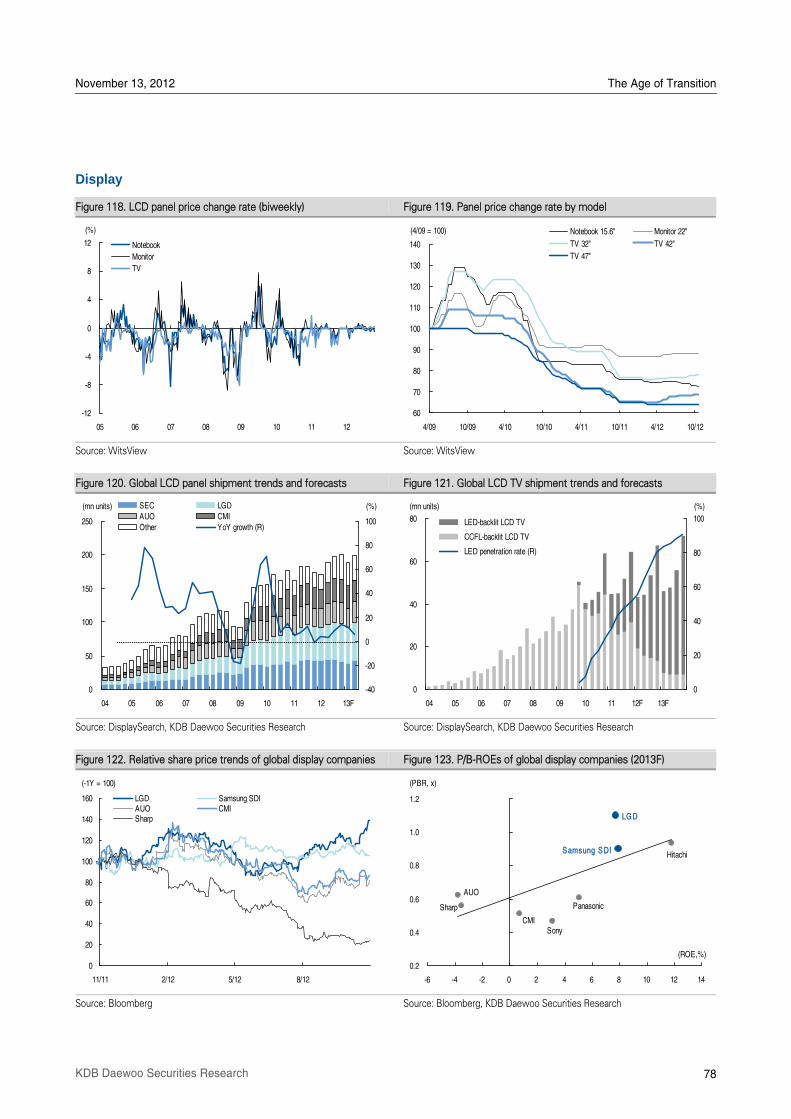
November 13, 2012 The Age of Transition
78 KDB Daewoo Securities Research
Display
Figure 118. LCD panel price change rate (biweekly) Figure 119. Panel price change rate by model
Source: WitsView Source: WitsView
Figure 120. Global LCD panel shipment trends and forecasts Figure 121. Global LCD TV shipment trends and forecasts
Source: DisplaySearch, KDB Daewoo Securities Research Source: DisplaySearch, KDB Daewoo Securities Research
Figure 122. Relative share price trends of global display companies Figure 123. P/B-ROEs of global display companies (2013F)
Source: Bloomberg Source: Bloomberg, KDB Daewoo Securities Research
-12
-8
-4
0
4
8
12
05 06 07 08 09 10 11 12
Notebook
Monitor
TV
(%)
60
70
80
90
100
110
120
130
140
4/09 10/09 4/10 10/10 4/11 10/11 4/12 10/12
Notebook 15.6" Monitor 22"
TV 32" TV 42"
TV 47"
(4/09 = 100)
0
50
100
150
200
250
04 05 06 07 08 09 10 11 12 13F
-40
-20
0
20
40
60
80
100
SEC LGD
AUO CMI
Other YoY growth (R)
(mn units) (%)
0
20
40
60
80
04 05 06 07 08 09 10 11 12F 13F
0
20
40
60
80
100 LED-backlit LCD TV
CCFL-backlit LCD TV
LED penetration rate (R)
(mn units) (%)
0
20
40
60
80
100
120
140
160
11/11 2/12 5/12 8/12
(-1Y = 100)
LGD Samsung SDIAUO CMISharp
S amsung S DI
Sharp
Sony
Panasonic
Hitachi
AUO
CMI
0.2
0.4
0.6
0.8
1.0
1.2
-6 -4 -2 0 2 4 6 8 10 12 14
(PBR, x)
(ROE,%)
LGD
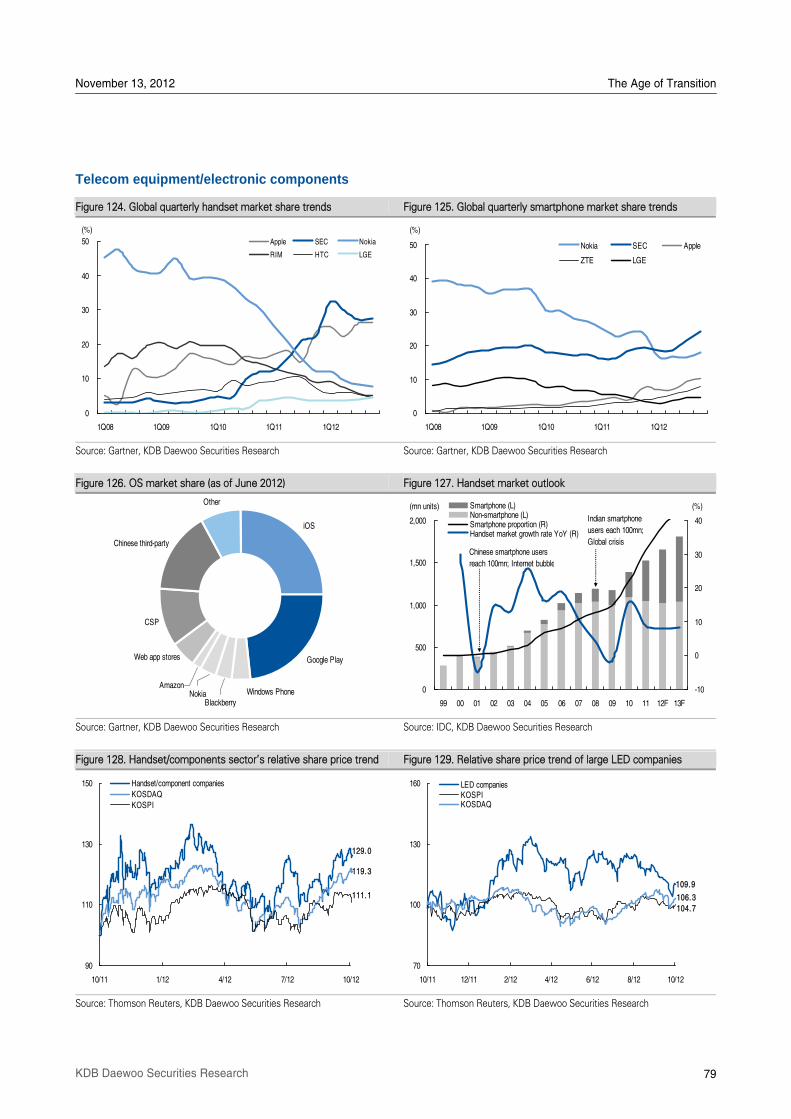
November 13, 2012 The Age of Transition
79 KDB Daewoo Securities Research
Telecom equipment/electronic components
Figure 124. Global quarterly handset market share trends Figure 125. Global quarterly smartphone market share trends
Source: Gartner, KDB Daewoo Securities Research Source: Gartner, KDB Daewoo Securities Research
Figure 126. OS market share (as of June 2012) Figure 127. Handset market outlook
Source: Gartner, KDB Daewoo Securities Research Source: IDC, KDB Daewoo Securities Research
Figure 128. Handset/components sectorÊs relative share price trend Figure 129. Relative share price trend of large LED companies
Source: Thomson Reuters, KDB Daewoo Securities Research Source: Thomson Reuters, KDB Daewoo Securities Research
0
10
20
30
40
50
1Q08 1Q09 1Q10 1Q11 1Q12
Apple SEC Nokia
RIM HTC LGE
(%)
0
10
20
30
40
50
1Q08 1Q09 1Q10 1Q11 1Q12
Nokia SEC Apple
ZTE LGE
(%)
iOS
Google Play
Windows PhoneBlackberry
NokiaAmazon
Web app stores
CSP
Chinese third-party
Other
0
500
1,000
1,500
2,000
99 00 01 02 03 04 05 06 07 08 09 10 11 12F 13F
-10
0
10
20
30
40
Smartphone (L)Non-smartphone (L)Smartphone proportion (R)Handset market growth rate YoY (R)
(%)(mn units)
Indian smartphone
users each 100mn;
Global crisisChinese smartphone users
reach 100mn; Internet bubble
90
110
130
150
10/11 1/12 4/12 7/12 10/12
Handset/component companies
KOSDAQKOSPI
129.0
119.3
111.1
70
100
130
160
10/11 12/11 2/12 4/12 6/12 8/12 10/12
LED companiesKOSPIKOSDAQ
106.3
109.9
104.7
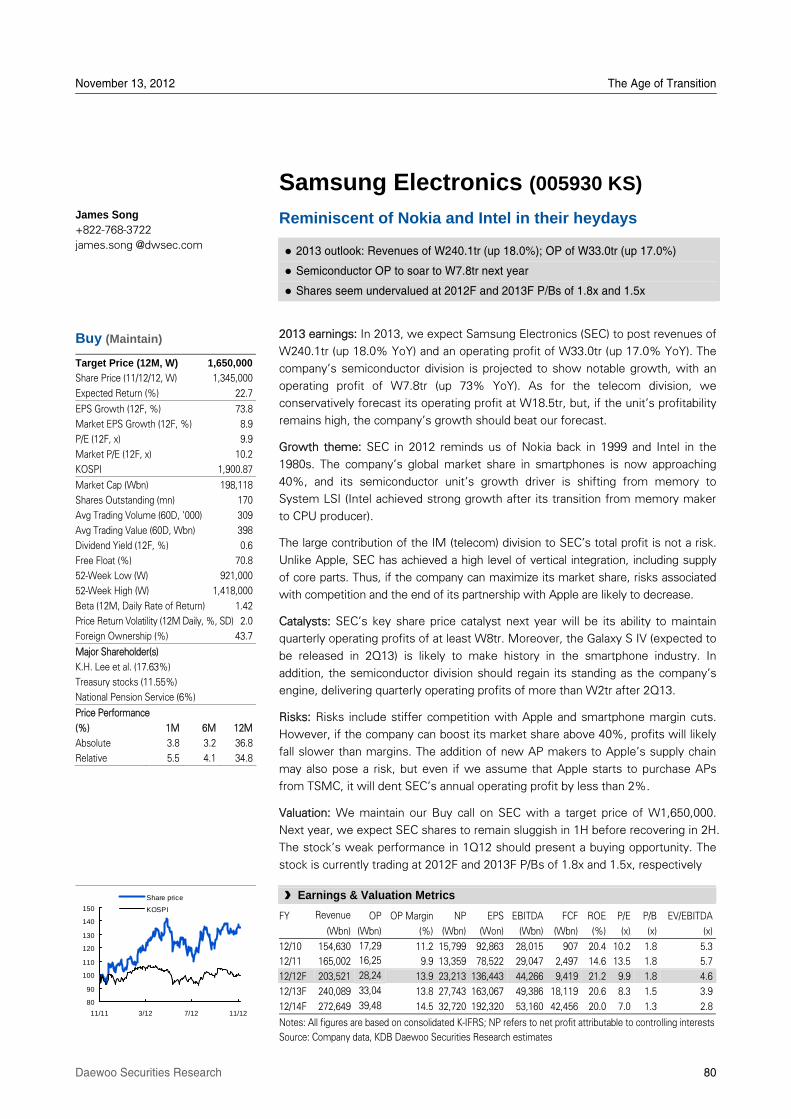
November 13, 2012 The Age of Transition
Daewoo Securities Research 80
Samsung Electronics (005930 KS)
Reminiscent of Nokia and Intel in their heydays
2013 outlook: Revenues of W240.1tr (up 18.0%); OP of W33.0tr (up 17.0%)
Semiconductor OP to soar to W7.8tr next year
Shares seem undervalued at 2012F and 2013F P/Bs of 1.8x and 1.5x
2013 earnings: In 2013, we expect Samsung Electronics (SEC) to post revenues of
W240.1tr (up 18.0% YoY) and an operating profit of W33.0tr (up 17.0% YoY). The
companyÊs semiconductor division is projected to show notable growth, with an
operating profit of W7.8tr (up 73% YoY). As for the telecom division, we
conservatively forecast its operating profit at W18.5tr, but, if the unitÊs profitability
remains high, the companyÊs growth should beat our forecast.
Growth theme: SEC in 2012 reminds us of Nokia back in 1999 and Intel in the
1980s. The companyÊs global market share in smartphones is now approaching
40%, and its semiconductor unitÊs growth driver is shifting from memory to
System LSI (Intel achieved strong growth after its transition from memory maker
to CPU producer).
The large contribution of the IM (telecom) division to SECÊs total profit is not a risk.
Unlike Apple, SEC has achieved a high level of vertical integration, including supply
of core parts. Thus, if the company can maximize its market share, risks associated
with competition and the end of its partnership with Apple are likely to decrease.
Catalysts: SECÊs key share price catalyst next year will be its ability to maintain
quarterly operating profits of at least W8tr. Moreover, the Galaxy S IV (expected to
be released in 2Q13) is likely to make history in the smartphone industry. In
addition, the semiconductor division should regain its standing as the companyÊs
engine, delivering quarterly operating profits of more than W2tr after 2Q13.
Risks: Risks include stiffer competition with Apple and smartphone margin cuts.
However, if the company can boost its market share above 40%, profits will likely
fall slower than margins. The addition of new AP makers to AppleÊs supply chain
may also pose a risk, but even if we assume that Apple starts to purchase APs
from TSMC, it will dent SECÊs annual operating profit by less than 2%.
Valuation: We maintain our Buy call on SEC with a target price of W1,650,000.
Next year, we expect SEC shares to remain sluggish in 1H before recovering in 2H.
The stockÊs weak performance in 1Q12 should present a buying opportunity. The
stock is currently trading at 2012F and 2013F P/Bs of 1.8x and 1.5x, respectively
James Song +822-768-3722
james.song @dwsec.com
Buy (Maintain)
Target Price (12M, W) 1,650,000
Share Price (11/12/12, W) 1,345,000
Expected Return (%) 22.7
EPS Growth (12F, %) 73.8
Market EPS Growth (12F, %) 8.9
P/E (12F, x) 9.9
Market P/E (12F, x) 10.2
KOSPI 1,900.87
Market Cap (Wbn) 198,118
Shares Outstanding (mn) 170
Avg Trading Volume (60D, '000) 309
Avg Trading Value (60D, Wbn) 398
Dividend Yield (12F, %) 0.6
Free Float (%) 70.8
52-Week Low (W) 921,000
52-Week High (W) 1,418,000
Beta (12M, Daily Rate of Return) 1.42
Price Return Volatility (12M Daily, %, SD) 2.0
Foreign Ownership (%) 43.7
Major Shareholder(s)
K.H. Lee et al. (17.63%)
Treasury stocks (11.55%)
National Pension Service (6%)
Price Performance
(%) 1M 6M 12M
Absolute 3.8 3.2 36.8
Relative 5.5 4.1 34.8
80
90
100
110
120
130
140
150
11/11 3/12 7/12 11/12
Share price
KOSPI
§ Earnings & Valuation Metrics
FY Revenue OP OP Margin NP EPS EBITDA FCF ROE P/E P/B EV/EBITDA
(Wbn) (Wbn) (%) (Wbn) (Won) (Wbn) (Wbn) (%) (x) (x) (x)
12/10 154,630 17,29 11.2 15,799 92,863 28,015 907 20.4 10.2 1.8 5.3
12/11 165,002 16,25 9.9 13,359 78,522 29,047 2,497 14.6 13.5 1.8 5.7
12/12F 203,521 28,24 13.9 23,213 136,443 44,266 9,419 21.2 9.9 1.8 4.6
12/13F 240,089 33,04 13.8 27,743 163,067 49,386 18,119 20.6 8.3 1.5 3.9
12/14F 272,649 39,48 14.5 32,720 192,320 53,160 42,456 20.0 7.0 1.3 2.8
Notes: All figures are based on consolidated K-IFRS; NP refers to net profit attributable to controlling interests
Source: Company data, KDB Daewoo Securities Research estimates
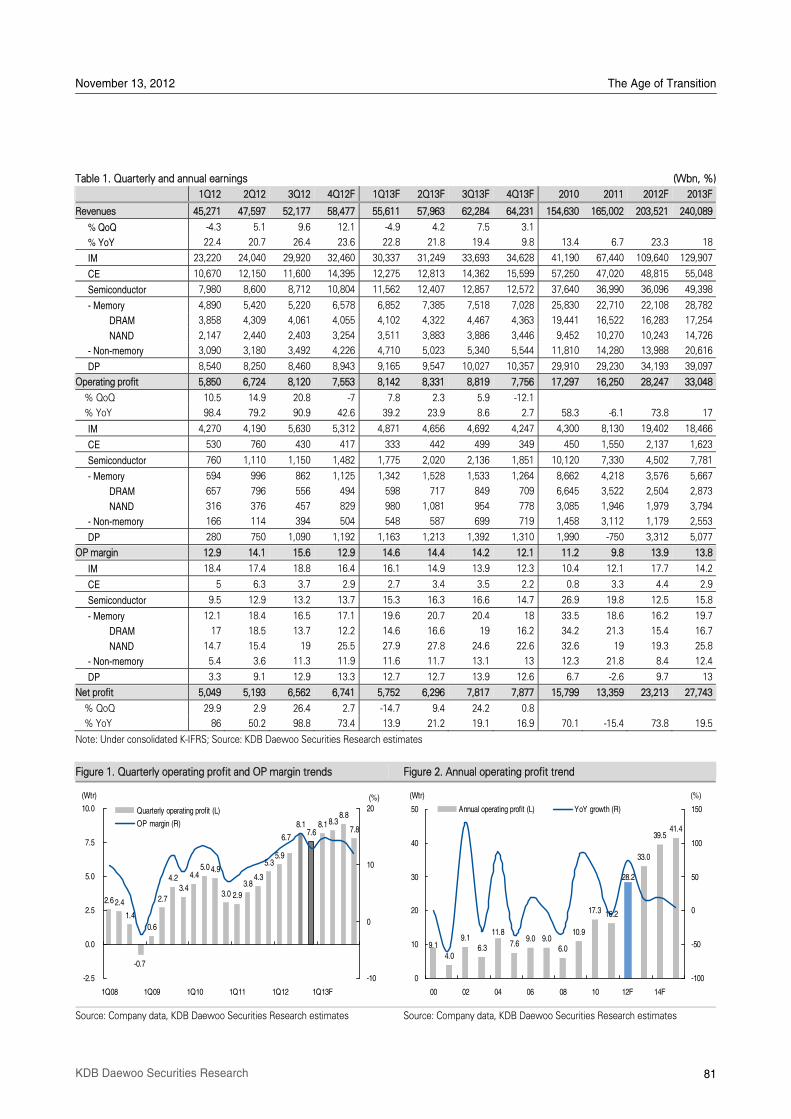
November 13, 2012 The Age of Transition
81 KDB Daewoo Securities Research
Table 1. Quarterly and annual earnings (Wbn, %)
1Q12 2Q12 3Q12 4Q12F 1Q13F 2Q13F 3Q13F 4Q13F 2010 2011 2012F 2013F
Revenues 45,271 47,597 52,177 58,477 55,611 57,963 62,284 64,231 154,630 165,002 203,521 240,089
% QoQ -4.3 5.1 9.6 12.1 -4.9 4.2 7.5 3.1
% YoY 22.4 20.7 26.4 23.6 22.8 21.8 19.4 9.8 13.4 6.7 23.3 18
IM 23,220 24,040 29,920 32,460 30,337 31,249 33,693 34,628 41,190 67,440 109,640 129,907
CE 10,670 12,150 11,600 14,395 12,275 12,813 14,362 15,599 57,250 47,020 48,815 55,048
Semiconductor 7,980 8,600 8,712 10,804 11,562 12,407 12,857 12,572 37,640 36,990 36,096 49,398
- Memory 4,890 5,420 5,220 6,578 6,852 7,385 7,518 7,028 25,830 22,710 22,108 28,782
DRAM 3,858 4,309 4,061 4,055 4,102 4,322 4,467 4,363 19,441 16,522 16,283 17,254
NAND 2,147 2,440 2,403 3,254 3,511 3,883 3,886 3,446 9,452 10,270 10,243 14,726
- Non-memory 3,090 3,180 3,492 4,226 4,710 5,023 5,340 5,544 11,810 14,280 13,988 20,616
DP 8,540 8,250 8,460 8,943 9,165 9,547 10,027 10,357 29,910 29,230 34,193 39,097
Operating profit 5,850 6,724 8,120 7,553 8,142 8,331 8,819 7,756 17,297 16,250 28,247 33,048
% QoQ 10.5 14.9 20.8 -7 7.8 2.3 5.9 -12.1
% YoY 98.4 79.2 90.9 42.6 39.2 23.9 8.6 2.7 58.3 -6.1 73.8 17
IM 4,270 4,190 5,630 5,312 4,871 4,656 4,692 4,247 4,300 8,130 19,402 18,466
CE 530 760 430 417 333 442 499 349 450 1,550 2,137 1,623
Semiconductor 760 1,110 1,150 1,482 1,775 2,020 2,136 1,851 10,120 7,330 4,502 7,781
- Memory 594 996 862 1,125 1,342 1,528 1,533 1,264 8,662 4,218 3,576 5,667
DRAM 657 796 556 494 598 717 849 709 6,645 3,522 2,504 2,873
NAND 316 376 457 829 980 1,081 954 778 3,085 1,946 1,979 3,794
- Non-memory 166 114 394 504 548 587 699 719 1,458 3,112 1,179 2,553
DP 280 750 1,090 1,192 1,163 1,213 1,392 1,310 1,990 -750 3,312 5,077
OP margin 12.9 14.1 15.6 12.9 14.6 14.4 14.2 12.1 11.2 9.8 13.9 13.8
IM 18.4 17.4 18.8 16.4 16.1 14.9 13.9 12.3 10.4 12.1 17.7 14.2
CE 5 6.3 3.7 2.9 2.7 3.4 3.5 2.2 0.8 3.3 4.4 2.9
Semiconductor 9.5 12.9 13.2 13.7 15.3 16.3 16.6 14.7 26.9 19.8 12.5 15.8
- Memory 12.1 18.4 16.5 17.1 19.6 20.7 20.4 18 33.5 18.6 16.2 19.7
DRAM 17 18.5 13.7 12.2 14.6 16.6 19 16.2 34.2 21.3 15.4 16.7
NAND 14.7 15.4 19 25.5 27.9 27.8 24.6 22.6 32.6 19 19.3 25.8
- Non-memory 5.4 3.6 11.3 11.9 11.6 11.7 13.1 13 12.3 21.8 8.4 12.4
DP 3.3 9.1 12.9 13.3 12.7 12.7 13.9 12.6 6.7 -2.6 9.7 13
Net profit 5,049 5,193 6,562 6,741 5,752 6,296 7,817 7,877 15,799 13,359 23,213 27,743
% QoQ 29.9 2.9 26.4 2.7 -14.7 9.4 24.2 0.8
% YoY 86 50.2 98.8 73.4 13.9 21.2 19.1 16.9 70.1 -15.4 73.8 19.5
Note: Under consolidated K-IFRS; Source: KDB Daewoo Securities Research estimates
Figure 1. Quarterly operating profit and OP margin trends Figure 2. Annual operating profit trend
Source: Company data, KDB Daewoo Securities Research estimates Source: Company data, KDB Daewoo Securities Research estimates
4.0
9.16.3 7.6
9.0 9.06.0
10.9
17.3 16.2
33.0
39.541.4
28.2
9.1
11.8
0
10
20
30
40
50
00 02 04 06 08 10 12F 14F
(Wtr)
-100
-50
0
50
100
150Annual operating profit (L) YoY growth (R)
(%)
2.6 2.4
1.4
-0.7
0.6
2.7
4.23.4
4.45.0 4.9
3.0 2.93.8
4.3
5.35.9
8.17.6
8.1 8.38.8
7.86.7
-2.5
0.0
2.5
5.0
7.5
10.0
1Q08 1Q09 1Q10 1Q11 1Q12 1Q13F
(Wtr)
-10
0
10
20Quarterly operating profit (L)
OP margin (R)
(%)
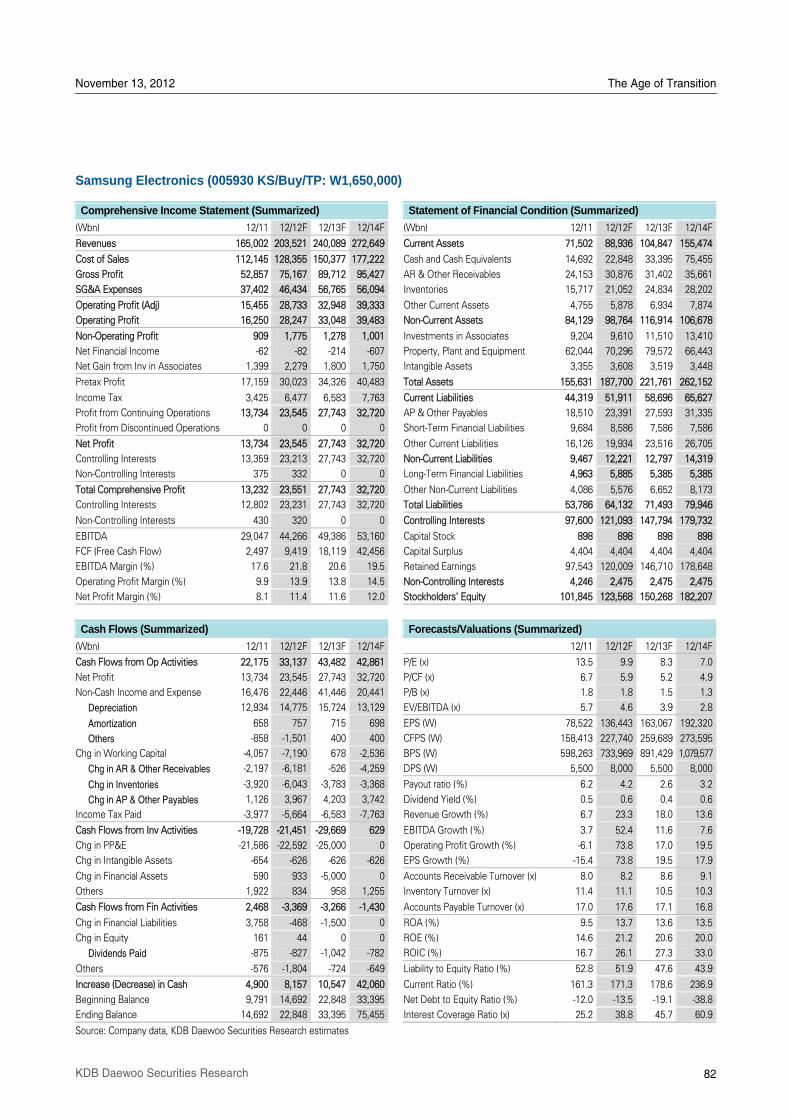
November 13, 2012 The Age of Transition
82 KDB Daewoo Securities Research
Samsung Electronics (005930 KS/Buy/TP: W1,650,000)
Comprehensive Income Statement (Summarized) Statement of Financial Condition (Summarized)
(Wbn) 12/11 12/12F 12/13F 12/14F (Wbn) 12/11 12/12F 12/13F 12/14F
Revenues 165,002 203,521 240,089 272,649 Current Assets 71,502 88,936 104,847 155,474
Cost of Sales 112,145 128,355 150,377 177,222 Cash and Cash Equivalents 14,692 22,848 33,395 75,455
Gross Profit 52,857 75,167 89,712 95,427 AR & Other Receivables 24,153 30,876 31,402 35,661
SG&A Expenses 37,402 46,434 56,765 56,094 Inventories 15,717 21,052 24,834 28,202
Operating Profit (Adj) 15,455 28,733 32,948 39,333 Other Current Assets 4,755 5,878 6,934 7,874
Operating Profit 16,250 28,247 33,048 39,483 Non-Current Assets 84,129 98,764 116,914 106,678
Non-Operating Profit 909 1,775 1,278 1,001 Investments in Associates 9,204 9,610 11,510 13,410
Net Financial Income -62 -82 -214 -607 Property, Plant and Equipment 62,044 70,296 79,572 66,443
Net Gain from Inv in Associates 1,399 2,279 1,800 1,750 Intangible Assets 3,355 3,608 3,519 3,448
Pretax Profit 17,159 30,023 34,326 40,483 Total Assets 155,631 187,700 221,761 262,152
Income Tax 3,425 6,477 6,583 7,763 Current Liabilities 44,319 51,911 58,696 65,627
Profit from Continuing Operations 13,734 23,545 27,743 32,720 AP & Other Payables 18,510 23,391 27,593 31,335
Profit from Discontinued Operations 0 0 0 0 Short-Term Financial Liabilities 9,684 8,586 7,586 7,586
Net Profit 13,734 23,545 27,743 32,720 Other Current Liabilities 16,126 19,934 23,516 26,705
Controlling Interests 13,359 23,213 27,743 32,720 Non-Current Liabilities 9,467 12,221 12,797 14,319
Non-Controlling Interests 375 332 0 0 Long-Term Financial Liabilities 4,963 5,885 5,385 5,385
Total Comprehensive Profit 13,232 23,551 27,743 32,720 Other Non-Current Liabilities 4,086 5,576 6,652 8,173
Controlling Interests 12,802 23,231 27,743 32,720 Total Liabilities 53,786 64,132 71,493 79,946
Non-Controlling Interests 430 320 0 0 Controlling Interests 97,600 121,093 147,794 179,732
EBITDA 29,047 44,266 49,386 53,160 Capital Stock 898 898 898 898
FCF (Free Cash Flow) 2,497 9,419 18,119 42,456 Capital Surplus 4,404 4,404 4,404 4,404
EBITDA Margin (%) 17.6 21.8 20.6 19.5 Retained Earnings 97,543 120,009 146,710 178,648
Operating Profit Margin (%) 9.9 13.9 13.8 14.5 Non-Controlling Interests 4,246 2,475 2,475 2,475
Net Profit Margin (%) 8.1 11.4 11.6 12.0 Stockholders' Equity 101,845 123,568 150,268 182,207
Cash Flows (Summarized) Forecasts/Valuations (Summarized)
(Wbn) 12/11 12/12F 12/13F 12/14F 12/11 12/12F 12/13F 12/14F
Cash Flows from Op Activities 22,175 33,137 43,482 42,861 P/E (x) 13.5 9.9 8.3 7.0
Net Profit 13,734 23,545 27,743 32,720 P/CF (x) 6.7 5.9 5.2 4.9
Non-Cash Income and Expense 16,476 22,446 41,446 20,441 P/B (x) 1.8 1.8 1.5 1.3
Depreciation 12,934 14,775 15,724 13,129 EV/EBITDA (x) 5.7 4.6 3.9 2.8
Amortization 658 757 715 698 EPS (W) 78,522 136,443 163,067 192,320
Others -858 -1,501 400 400 CFPS (W) 158,413 227,740 259,689 273,595
Chg in Working Capital -4,057 -7,190 678 -2,536 BPS (W) 598,263 733,969 891,429 1,079,577
Chg in AR & Other Receivables -2,197 -6,181 -526 -4,259 DPS (W) 5,500 8,000 5,500 8,000
Chg in Inventories -3,920 -6,043 -3,783 -3,368 Payout ratio (%) 6.2 4.2 2.6 3.2
Chg in AP & Other Payables 1,126 3,967 4,203 3,742 Dividend Yield (%) 0.5 0.6 0.4 0.6
Income Tax Paid -3,977 -5,664 -6,583 -7,763 Revenue Growth (%) 6.7 23.3 18.0 13.6
Cash Flows from Inv Activities -19,728 -21,451 -29,669 629 EBITDA Growth (%) 3.7 52.4 11.6 7.6
Chg in PP&E -21,586 -22,592 -25,000 0 Operating Profit Growth (%) -6.1 73.8 17.0 19.5
Chg in Intangible Assets -654 -626 -626 -626 EPS Growth (%) -15.4 73.8 19.5 17.9
Chg in Financial Assets 590 933 -5,000 0 Accounts Receivable Turnover (x) 8.0 8.2 8.6 9.1
Others 1,922 834 958 1,255 Inventory Turnover (x) 11.4 11.1 10.5 10.3
Cash Flows from Fin Activities 2,468 -3,369 -3,266 -1,430 Accounts Payable Turnover (x) 17.0 17.6 17.1 16.8
Chg in Financial Liabilities 3,758 -468 -1,500 0 ROA (%) 9.5 13.7 13.6 13.5
Chg in Equity 161 44 0 0 ROE (%) 14.6 21.2 20.6 20.0
Dividends Paid -875 -827 -1,042 -782 ROIC (%) 16.7 26.1 27.3 33.0
Others -576 -1,804 -724 -649 Liability to Equity Ratio (%) 52.8 51.9 47.6 43.9
Increase (Decrease) in Cash 4,900 8,157 10,547 42,060 Current Ratio (%) 161.3 171.3 178.6 236.9
Beginning Balance 9,791 14,692 22,848 33,395 Net Debt to Equity Ratio (%) -12.0 -13.5 -19.1 -38.8
Ending Balance 14,692 22,848 33,395 75,455 Interest Coverage Ratio (x) 25.2 38.8 45.7 60.9
Source: Company data, KDB Daewoo Securities Research estimates
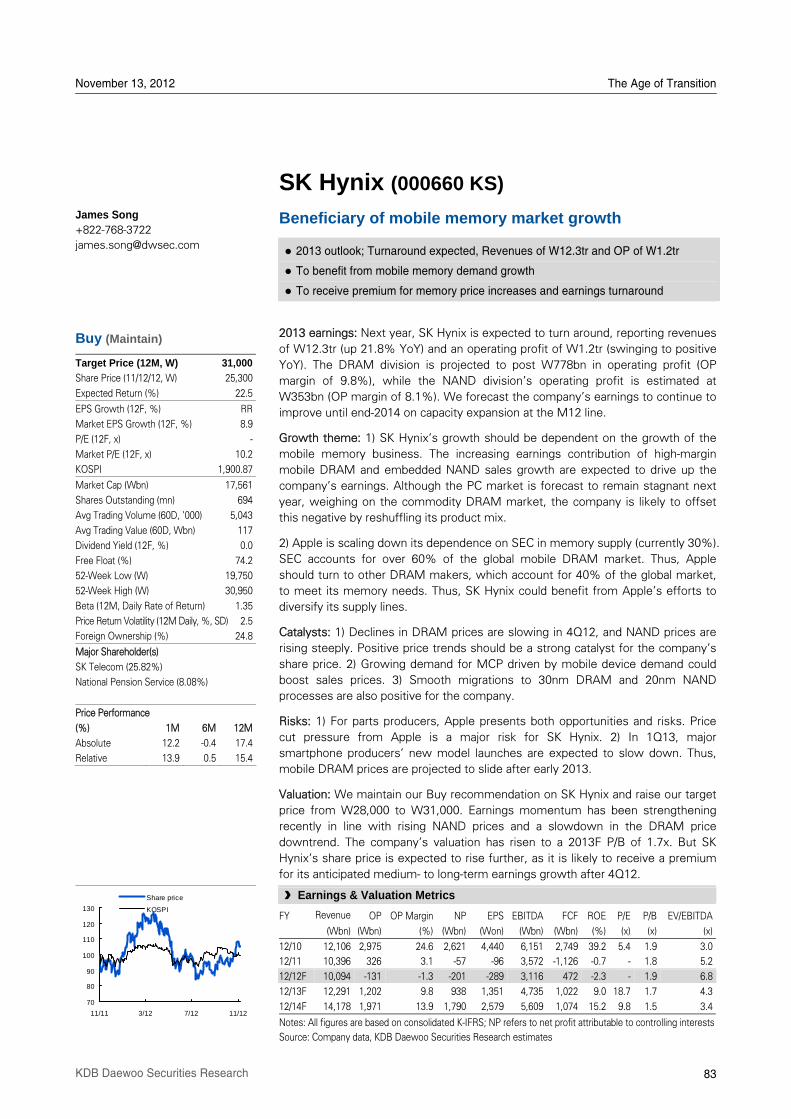
November 13, 2012 The Age of Transition
83 KDB Daewoo Securities Research
SK Hynix (000660 KS)
Beneficiary of mobile memory market growth
2013 outlook; Turnaround expected, Revenues of W12.3tr and OP of W1.2tr
To benefit from mobile memory demand growth
To receive premium for memory price increases and earnings turnaround
2013 earnings: Next year, SK Hynix is expected to turn around, reporting revenues
of W12.3tr (up 21.8% YoY) and an operating profit of W1.2tr (swinging to positive
YoY). The DRAM division is projected to post W778bn in operating profit (OP
margin of 9.8%), while the NAND divisionÊs operating profit is estimated at
W353bn (OP margin of 8.1%). We forecast the companyÊs earnings to continue to
improve until end-2014 on capacity expansion at the M12 line.
Growth theme: 1) SK HynixÊs growth should be dependent on the growth of the
mobile memory business. The increasing earnings contribution of high-margin
mobile DRAM and embedded NAND sales growth are expected to drive up the
companyÊs earnings. Although the PC market is forecast to remain stagnant next
year, weighing on the commodity DRAM market, the company is likely to offset
this negative by reshuffling its product mix.
2) Apple is scaling down its dependence on SEC in memory supply (currently 30%).
SEC accounts for over 60% of the global mobile DRAM market. Thus, Apple
should turn to other DRAM makers, which account for 40% of the global market,
to meet its memory needs. Thus, SK Hynix could benefit from AppleÊs efforts to
diversify its supply lines.
Catalysts: 1) Declines in DRAM prices are slowing in 4Q12, and NAND prices are
rising steeply. Positive price trends should be a strong catalyst for the companyÊs
share price. 2) Growing demand for MCP driven by mobile device demand could
boost sales prices. 3) Smooth migrations to 30nm DRAM and 20nm NAND
processes are also positive for the company.
Risks: 1) For parts producers, Apple presents both opportunities and risks. Price
cut pressure from Apple is a major risk for SK Hynix. 2) In 1Q13, major
smartphone producersÊ new model launches are expected to slow down. Thus,
mobile DRAM prices are projected to slide after early 2013.
Valuation: We maintain our Buy recommendation on SK Hynix and raise our target
price from W28,000 to W31,000. Earnings momentum has been strengthening
recently in line with rising NAND prices and a slowdown in the DRAM price
downtrend. The companyÊs valuation has risen to a 2013F P/B of 1.7x. But SK
HynixÊs share price is expected to rise further, as it is likely to receive a premium
for its anticipated medium- to long-term earnings growth after 4Q12.
James Song +822-768-3722
Buy (Maintain)
Target Price (12M, W) 31,000
Share Price (11/12/12, W) 25,300
Expected Return (%) 22.5
EPS Growth (12F, %) RR
Market EPS Growth (12F, %) 8.9
P/E (12F, x) -
Market P/E (12F, x) 10.2
KOSPI 1,900.87
Market Cap (Wbn) 17,561
Shares Outstanding (mn) 694
Avg Trading Volume (60D, '000) 5,043
Avg Trading Value (60D, Wbn) 117
Dividend Yield (12F, %) 0.0
Free Float (%) 74.2
52-Week Low (W) 19,750
52-Week High (W) 30,950
Beta (12M, Daily Rate of Return) 1.35
Price Return Volatility (12M Daily, %, SD) 2.5
Foreign Ownership (%) 24.8
Major Shareholder(s)
SK Telecom (25.82%)
National Pension Service (8.08%)
Price Performance
(%) 1M 6M 12M
Absolute 12.2 -0.4 17.4
Relative 13.9 0.5 15.4
70
80
90
100
110
120
130
11/11 3/12 7/12 11/12
Share price
KOSPI
§ Earnings & Valuation Metrics
FY Revenue OP OP Margin NP EPS EBITDA FCF ROE P/E P/B EV/EBITDA
(Wbn) (Wbn) (%) (Wbn) (Won) (Wbn) (Wbn) (%) (x) (x) (x)
12/10 12,106 2,975 24.6 2,621 4,440 6,151 2,749 39.2 5.4 1.9 3.0
12/11 10,396 326 3.1 -57 -96 3,572 -1,126 -0.7 - 1.8 5.2
12/12F 10,094 -131 -1.3 -201 -289 3,116 472 -2.3 - 1.9 6.8
12/13F 12,291 1,202 9.8 938 1,351 4,735 1,022 9.0 18.7 1.7 4.3
12/14F 14,178 1,971 13.9 1,790 2,579 5,609 1,074 15.2 9.8 1.5 3.4
Notes: All figures are based on consolidated K-IFRS; NP refers to net profit attributable to controlling interests
Source: Company data, KDB Daewoo Securities Research estimates
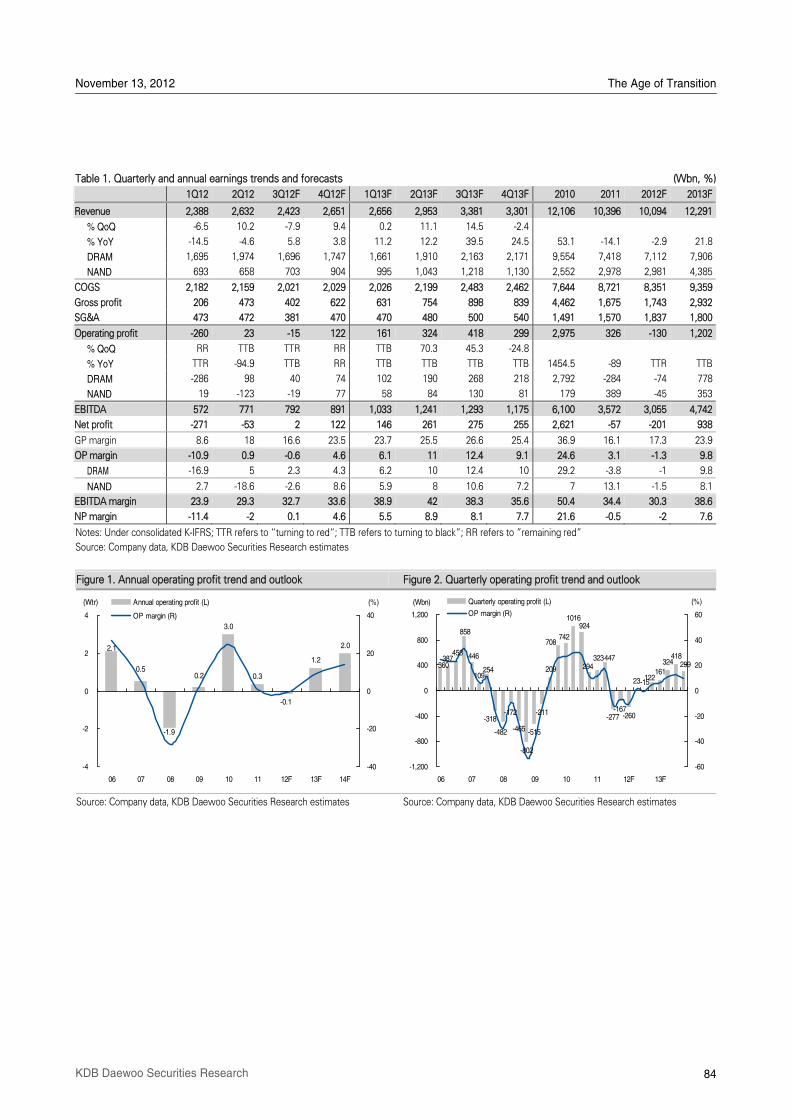
November 13, 2012 The Age of Transition
84 KDB Daewoo Securities Research
Table 1. Quarterly and annual earnings trends and forecasts (Wbn, %)
1Q12 2Q12 3Q12F 4Q12F 1Q13F 2Q13F 3Q13F 4Q13F 2010 2011 2012F 2013F
Revenue 2,388 2,632 2,423 2,651 2,656 2,953 3,381 3,301 12,106 10,396 10,094 12,291
% QoQ -6.5 10.2 -7.9 9.4 0.2 11.1 14.5 -2.4
% YoY -14.5 -4.6 5.8 3.8 11.2 12.2 39.5 24.5 53.1 -14.1 -2.9 21.8
DRAM 1,695 1,974 1,696 1,747 1,661 1,910 2,163 2,171 9,554 7,418 7,112 7,906
NAND 693 658 703 904 995 1,043 1,218 1,130 2,552 2,978 2,981 4,385
COGS 2,182 2,159 2,021 2,029 2,026 2,199 2,483 2,462 7,644 8,721 8,351 9,359
Gross profit 206 473 402 622 631 754 898 839 4,462 1,675 1,743 2,932
SG&A 473 472 381 470 470 480 500 540 1,491 1,570 1,837 1,800
Operating profit -260 23 -15 122 161 324 418 299 2,975 326 -130 1,202
% QoQ RR TTB TTR RR TTB 70.3 45.3 -24.8
% YoY TTR -94.9 TTB RR TTB TTB TTB TTB 1454.5 -89 TTR TTB
DRAM -286 98 40 74 102 190 268 218 2,792 -284 -74 778
NAND 19 -123 -19 77 58 84 130 81 179 389 -45 353
EBITDA 572 771 792 891 1,033 1,241 1,293 1,175 6,100 3,572 3,055 4,742
Net profit -271 -53 2 122 146 261 275 255 2,621 -57 -201 938
GP margin 8.6 18 16.6 23.5 23.7 25.5 26.6 25.4 36.9 16.1 17.3 23.9
OP margin -10.9 0.9 -0.6 4.6 6.1 11 12.4 9.1 24.6 3.1 -1.3 9.8
DRAM -16.9 5 2.3 4.3 6.2 10 12.4 10 29.2 -3.8 -1 9.8
NAND 2.7 -18.6 -2.6 8.6 5.9 8 10.6 7.2 7 13.1 -1.5 8.1
EBITDA margin 23.9 29.3 32.7 33.6 38.9 42 38.3 35.6 50.4 34.4 30.3 38.6
NP margin -11.4 -2 0.1 4.6 5.5 8.9 8.1 7.7 21.6 -0.5 -2 7.6
Notes: Under consolidated K-IFRS; TTR refers to „turning to red„; TTB refers to turning to black‰; RR refers to ‰remaining red‰
Source: Company data, KDB Daewoo Securities Research estimates
Figure 1. Annual operating profit trend and outlook Figure 2. Quarterly operating profit trend and outlook
Source: Company data, KDB Daewoo Securities Research estimates Source: Company data, KDB Daewoo Securities Research estimates
3.0
0.3
-0.1
1.2
2.02.1
0.5
-1.9
0.2
-4
-2
0
2
4
06 07 08 09 10 11 12F 13F 14F
(Wtr)
-40
-20
0
20
40
Annual operating profit (L)
OP margin (R)
(%)
-465
-802
-515
-211
209
1016
-277 -260
23-15161
324418
858
446
254109
387453
360 299
122
924
708742
294323447
-172
-482
-318-167
-1,200
-800
-400
0
400
800
1,200
06 07 08 09 10 11 12F 13F
(Wbn)
-60
-40
-20
0
20
40
60
Quarterly operating profit (L)
OP margin (R)
(%)

November 13, 2012 The Age of Transition
85 KDB Daewoo Securities Research
SK Hynix (000660 KS/Buy/TP: W31,000)
Comprehensive Income Statement (Summarized) Statement of Financial Condition (Summarized)
(Wbn) 12/11 12/12F 12/13F 12/14F (Wbn) 12/11 12/12F 12/13F 12/14F
Revenues 10,396 10,094 12,291 14,178 Current Assets 4,937 5,647 5,917 7,044
Cost of Sales 8,721 8,391 9,169 10,257 Cash and Cash Equivalents 1,244 1,698 1,596 2,260
Gross Profit 1,675 1,703 3,122 3,921 AR & Other Receivables 1,754 1,378 1,475 1,701
SG&A Expenses 1,569 1,797 1,990 2,000 Inventories 1,184 1,166 1,420 1,638
Operating Profit (Adj) 105 -94 1,132 1,921 Other Current Assets 124 127 149 167
Operating Profit 326 -131 1,202 1,971 Non-Current Assets 12,301 13,136 13,375 14,168
Non-Operating Profit -280 -28 -125 114 Investments in Associates 104 96 97 98
Net Financial Income 254 214 126 87 Property, Plant and Equipment 10,899 11,571 11,680 12,183
Net Gain from Inv in Associates 3 1 1 1 Intangible Assets 708 787 786 786
Pretax Profit 45 -159 1,077 2,085 Total Assets 17,238 18,783 19,292 21,213
Income Tax 101 43 139 295 Current Liabilities 4,817 4,688 5,137 5,553
Profit from Continuing Operations -56 -201 938 1,790 AP & Other Payables 1,195 1,378 1,758 2,028
Profit from Discontinued Operations 0 0 0 0 Short-Term Financial Liabilities 2,869 2,528 2,428 2,428
Net Profit -56 -201 938 1,790 Other Current Liabilities 753 782 952 1,098
Controlling Interests -57 -201 938 1,790 Non-Current Liabilities 4,546 4,112 3,234 2,949
Non-Controlling Interests 1 0 0 0 Long-Term Financial Liabilities 3,954 3,515 2,615 2,315
Total Comprehensive Profit 13 -221 938 1,790 Other Non-Current Liabilities 133 84 106 120
Controlling Interests 13 -223 935 1,787 Total Liabilities 9,363 8,800 8,372 8,502
Non-Controlling Interests 0 2 3 3 Controlling Interests 7,876 9,981 10,916 12,703
EBITDA 3,572 3,116 4,735 5,609 Capital Stock 2,979 3,488 3,488 3,488
FCF (Free Cash Flow) -1,126 472 1,022 1,074 Capital Surplus 1,229 3,049 3,049 3,049
EBITDA Margin (%) 34.4 30.9 38.5 39.6 Retained Earnings 3,555 3,354 4,292 6,082
Operating Profit Margin (%) 3.1 -1.3 9.8 13.9 Non-Controlling Interests -1 2 5 8
Net Profit Margin (%) -0.5 -2.0 7.6 12.6 Stockholders' Equity 7,875 9,983 10,921 12,711
Cash Flows (Summarized) Forecasts/Valuations (Summarized)
(Wbn) 12/11 12/12F 12/13F 12/14F 12/11 12/12F 12/13F 12/14F
Cash Flows from Op Activities 3,055 3,305 4,666 5,192 P/E (x) - - 18.7 9.8
Net Profit 45 -192 938 1,790 P/CF (x) 3.8 5.8 3.9 3.2
Non-Cash Income and Expense 3,847 3,466 3,727 3,770 P/B (x) 1.8 1.9 1.7 1.5
Depreciation 3,401 3,189 3,391 3,497 EV/EBITDA (x) 5.2 6.8 4.3 3.4
Amortization 66 58 142 142 EPS (W) -96 -289 1,351 2,579
Others -89 -42 50 50 CFPS (W) 5,759 4,388 6,441 7,821
Chg in Working Capital -813 76 140 -72 BPS (W) 12,105 13,246 14,594 17,169
Chg in AR & Other Receivables 138 346 -97 -226 DPS (W) 0 0 0 0
Chg in Inventories 100 27 -254 -218 Payout ratio (%) 0.0 0.0 0.0 0.0
Chg in AP & Other Payables -230 -338 380 270 Dividend Yield (%) 0.0 0.0 0.0 0.0
Income Tax Paid -24 -45 -139 -295 Revenue Growth (%) -14.1 -2.9 21.8 15.4
Cash Flows from Inv Activities -3,312 -3,860 -3,499 -4,004 EBITDA Growth (%) -41.9 -12.8 51.9 18.5
Chg in PP&E -3,554 -3,094 -3,500 -4,000 Operating Profit Growth (%) -89.1 TTR TTB 64.0
Chg in Intangible Assets -162 -141 -141 -141 EPS Growth (%) TTR RR TTB 90.8
Chg in Financial Assets 322 -694 0 0 Accounts Receivable Turnover (x) 5.9 6.5 8.6 8.9
Others 82 69 143 138 Inventory Turnover (x) 8.4 8.6 9.5 9.3
Cash Flows from Fin Activities 244 1,011 -1,269 -525 Accounts Payable Turnover (x) 13.4 14.2 14.3 13.4
Chg in Financial Liabilities 608 -992 -1,000 -300 ROA (%) -0.3 -1.1 4.9 8.8
Chg in Equity 0 2,328 0 0 ROE (%) -0.7 -2.3 9.0 15.2
Dividends Paid -89 0 0 0 ROIC (%) -1.1 -1.1 7.6 12.5
Others -276 -326 -269 -225 Liability to Equity Ratio (%) 118.9 88.2 76.7 66.9
Increase (Decrease) in Cash -9 454 -102 664 Current Ratio (%) 102.5 120.5 115.2 126.9
Beginning Balance 1,253 1,244 1,698 1,596 Net Debt to Equity Ratio (%) 62.8 30.7 19.9 9.5
Ending Balance 1,244 1,698 1,596 2,260 Interest Coverage Ratio (x) 1.0 -0.4 4.5 8.8
Source: Company data, KDB Daewoo Securities Research estimates
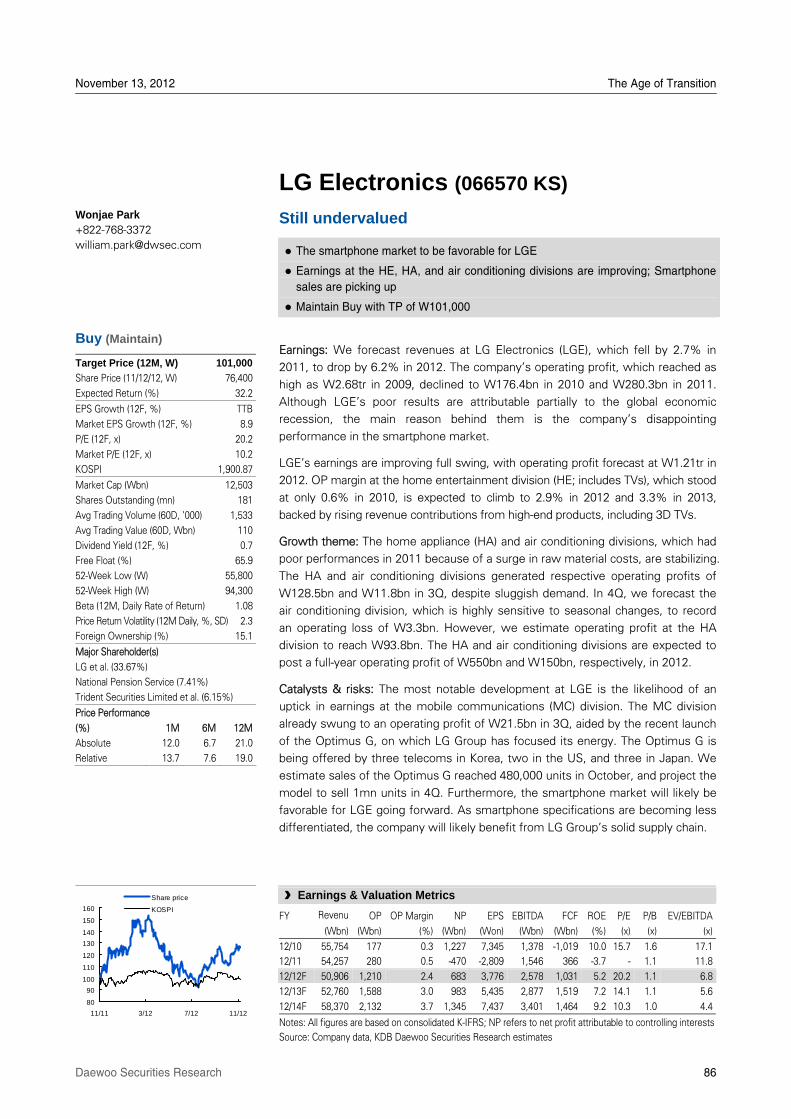
November 13, 2012 The Age of Transition
Daewoo Securities Research 86
LG Electronics (066570 KS)
Still undervalued
The smartphone market to be favorable for LGE
Earnings at the HE, HA, and air conditioning divisions are improving; Smartphone sales are picking up
Maintain Buy with TP of W101,000
Earnings: We forecast revenues at LG Electronics (LGE), which fell by 2.7% in
2011, to drop by 6.2% in 2012. The companyÊs operating profit, which reached as
high as W2.68tr in 2009, declined to W176.4bn in 2010 and W280.3bn in 2011.
Although LGEÊs poor results are attributable partially to the global economic
recession, the main reason behind them is the companyÊs disappointing
performance in the smartphone market.
LGEÊs earnings are improving full swing, with operating profit forecast at W1.21tr in
2012. OP margin at the home entertainment division (HE; includes TVs), which stood
at only 0.6% in 2010, is expected to climb to 2.9% in 2012 and 3.3% in 2013,
backed by rising revenue contributions from high-end products, including 3D TVs.
Growth theme: The home appliance (HA) and air conditioning divisions, which had
poor performances in 2011 because of a surge in raw material costs, are stabilizing.
The HA and air conditioning divisions generated respective operating profits of
W128.5bn and W11.8bn in 3Q, despite sluggish demand. In 4Q, we forecast the
air conditioning division, which is highly sensitive to seasonal changes, to record
an operating loss of W3.3bn. However, we estimate operating profit at the HA
division to reach W93.8bn. The HA and air conditioning divisions are expected to
post a full-year operating profit of W550bn and W150bn, respectively, in 2012.
Catalysts & risks: The most notable development at LGE is the likelihood of an
uptick in earnings at the mobile communications (MC) division. The MC division
already swung to an operating profit of W21.5bn in 3Q, aided by the recent launch
of the Optimus G, on which LG Group has focused its energy. The Optimus G is
being offered by three telecoms in Korea, two in the US, and three in Japan. We
estimate sales of the Optimus G reached 480,000 units in October, and project the
model to sell 1mn units in 4Q. Furthermore, the smartphone market will likely be
favorable for LGE going forward. As smartphone specifications are becoming less
differentiated, the company will likely benefit from LG GroupÊs solid supply chain.
Wonjae Park +822-768-3372
Buy (Maintain)
Target Price (12M, W) 101,000
Share Price (11/12/12, W) 76,400
Expected Return (%) 32.2
EPS Growth (12F, %) TTB
Market EPS Growth (12F, %) 8.9
P/E (12F, x) 20.2
Market P/E (12F, x) 10.2
KOSPI 1,900.87
Market Cap (Wbn) 12,503
Shares Outstanding (mn) 181
Avg Trading Volume (60D, '000) 1,533
Avg Trading Value (60D, Wbn) 110
Dividend Yield (12F, %) 0.7
Free Float (%) 65.9
52-Week Low (W) 55,800
52-Week High (W) 94,300
Beta (12M, Daily Rate of Return) 1.08
Price Return Volatility (12M Daily, %, SD) 2.3
Foreign Ownership (%) 15.1
Major Shareholder(s)
LG et al. (33.67%)
National Pension Service (7.41%)
Trident Securities Limited et al. (6.15%)
Price Performance
(%) 1M 6M 12M
Absolute 12.0 6.7 21.0
Relative 13.7 7.6 19.0
80
90
100
110
120
130
140
150
160
11/11 3/12 7/12 11/12
Share price
KOSPI
§ Earnings & Valuation Metrics
FY Revenu OP OP Margin NP EPS EBITDA FCF ROE P/E P/B EV/EBITDA
(Wbn) (Wbn) (%) (Wbn) (Won) (Wbn) (Wbn) (%) (x) (x) (x)
12/10 55,754 177 0.3 1,227 7,345 1,378 -1,019 10.0 15.7 1.6 17.1
12/11 54,257 280 0.5 -470 -2,809 1,546 366 -3.7 - 1.1 11.8
12/12F 50,906 1,210 2.4 683 3,776 2,578 1,031 5.2 20.2 1.1 6.8
12/13F 52,760 1,588 3.0 983 5,435 2,877 1,519 7.2 14.1 1.1 5.6
12/14F 58,370 2,132 3.7 1,345 7,437 3,401 1,464 9.2 10.3 1.0 4.4
Notes: All figures are based on consolidated K-IFRS; NP refers to net profit attributable to controlling interests
Source: Company data, KDB Daewoo Securities Research estimates
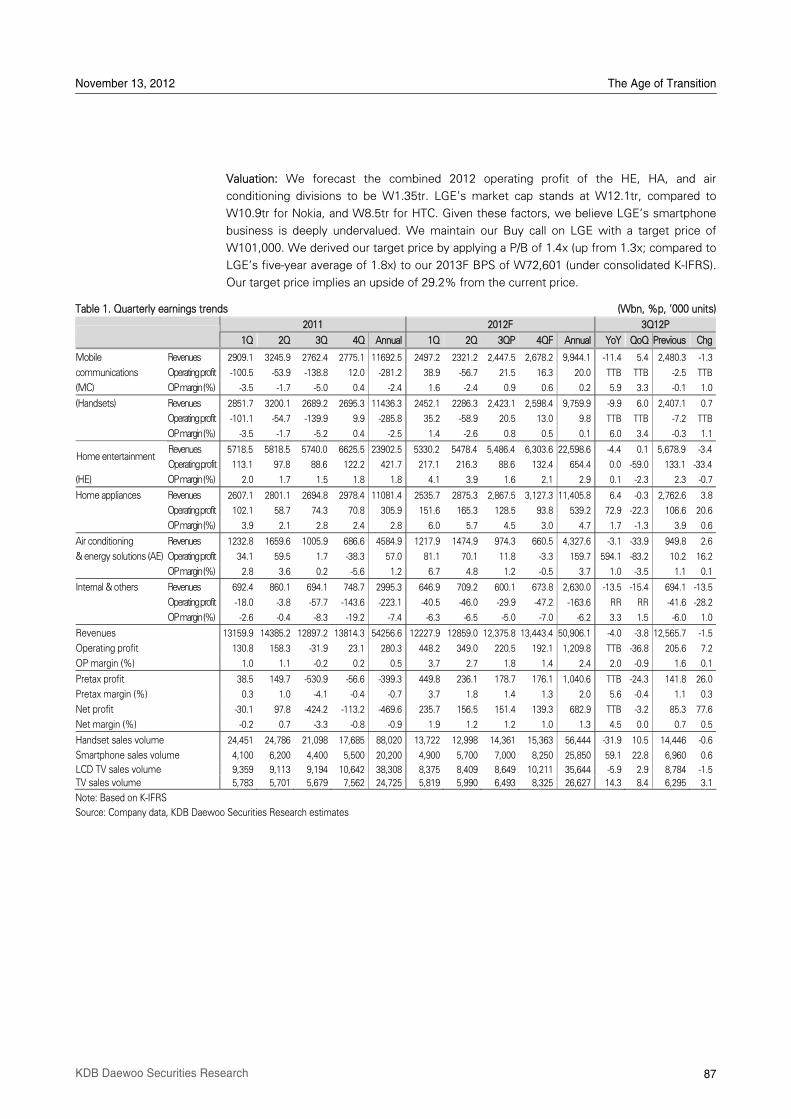
November 13, 2012 The Age of Transition
87 KDB Daewoo Securities Research
Valuation: We forecast the combined 2012 operating profit of the HE, HA, and air
conditioning divisions to be W1.35tr. LGEÊs market cap stands at W12.1tr, compared to
W10.9tr for Nokia, and W8.5tr for HTC. Given these factors, we believe LGEÊs smartphone
business is deeply undervalued. We maintain our Buy call on LGE with a target price of
W101,000. We derived our target price by applying a P/B of 1.4x (up from 1.3x; compared to
LGEÊs five-year average of 1.8x) to our 2013F BPS of W72,601 (under consolidated K-IFRS).
Our target price implies an upside of 29.2% from the current price.
Table 1. Quarterly earnings trends (Wbn, %p, Ê000 units)
2011 2012F 3Q12P
1Q 2Q 3Q 4Q Annual 1Q 2Q 3QP 4QF Annual YoY QoQ Previous Chg
Mobile Revenues 2909.1 3245.9 2762.4 2775.1 11692.5 2497.2 2321.2 2,447.5 2,678.2 9,944.1 -11.4 5.4 2,480.3 -1.3
communications Operating profit -100.5 -53.9 -138.8 12.0 -281.2 38.9 -56.7 21.5 16.3 20.0 TTB TTB -2.5 TTB
(MC) OP margin (%) -3.5 -1.7 -5.0 0.4 -2.4 1.6 -2.4 0.9 0.6 0.2 5.9 3.3 -0.1 1.0
(Handsets) Revenues 2851.7 3200.1 2689.2 2695.3 11436.3 2452.1 2286.3 2,423.1 2,598.4 9,759.9 -9.9 6.0 2,407.1 0.7
Operating profit -101.1 -54.7 -139.9 9.9 -285.8 35.2 -58.9 20.5 13.0 9.8 TTB TTB -7.2 TTB
OP margin (%) -3.5 -1.7 -5.2 0.4 -2.5 1.4 -2.6 0.8 0.5 0.1 6.0 3.4 -0.3 1.1
Revenues 5718.5 5818.5 5740.0 6625.5 23902.5 5330.2 5478.4 5,486.4 6,303.6 22,598.6 -4.4 0.1 5,678.9 -3.4 Home entertainment
Operating profit 113.1 97.8 88.6 122.2 421.7 217.1 216.3 88.6 132.4 654.4 0.0 -59.0 133.1 -33.4
(HE) OP margin (%) 2.0 1.7 1.5 1.8 1.8 4.1 3.9 1.6 2.1 2.9 0.1 -2.3 2.3 -0.7
Home appliances Revenues 2607.1 2801.1 2694.8 2978.4 11081.4 2535.7 2875.3 2,867.5 3,127.3 11,405.8 6.4 -0.3 2,762.6 3.8
Operating profit 102.1 58.7 74.3 70.8 305.9 151.6 165.3 128.5 93.8 539.2 72.9 -22.3 106.6 20.6
OP margin (%) 3.9 2.1 2.8 2.4 2.8 6.0 5.7 4.5 3.0 4.7 1.7 -1.3 3.9 0.6
Air conditioning Revenues 1232.8 1659.6 1005.9 686.6 4584.9 1217.9 1474.9 974.3 660.5 4,327.6 -3.1 -33.9 949.8 2.6
& energy solutions (AE) Operating profit 34.1 59.5 1.7 -38.3 57.0 81.1 70.1 11.8 -3.3 159.7 594.1 -83.2 10.2 16.2
OP margin (%) 2.8 3.6 0.2 -5.6 1.2 6.7 4.8 1.2 -0.5 3.7 1.0 -3.5 1.1 0.1
Internal & others Revenues 692.4 860.1 694.1 748.7 2995.3 646.9 709.2 600.1 673.8 2,630.0 -13.5 -15.4 694.1 -13.5
Operating profit -18.0 -3.8 -57.7 -143.6 -223.1 -40.5 -46.0 -29.9 -47.2 -163.6 RR RR -41.6 -28.2
OP margin (%) -2.6 -0.4 -8.3 -19.2 -7.4 -6.3 -6.5 -5.0 -7.0 -6.2 3.3 1.5 -6.0 1.0
Revenues 13159.9 14385.2 12897.2 13814.3 54256.6 12227.9 12859.0 12,375.8 13,443.4 50,906.1 -4.0 -3.8 12,565.7 -1.5
Operating profit 130.8 158.3 -31.9 23.1 280.3 448.2 349.0 220.5 192.1 1,209.8 TTB -36.8 205.6 7.2
OP margin (%) 1.0 1.1 -0.2 0.2 0.5 3.7 2.7 1.8 1.4 2.4 2.0 -0.9 1.6 0.1
Pretax profit 38.5 149.7 -530.9 -56.6 -399.3 449.8 236.1 178.7 176.1 1,040.6 TTB -24.3 141.8 26.0
Pretax margin (%) 0.3 1.0 -4.1 -0.4 -0.7 3.7 1.8 1.4 1.3 2.0 5.6 -0.4 1.1 0.3
Net profit -30.1 97.8 -424.2 -113.2 -469.6 235.7 156.5 151.4 139.3 682.9 TTB -3.2 85.3 77.6
Net margin (%) -0.2 0.7 -3.3 -0.8 -0.9 1.9 1.2 1.2 1.0 1.3 4.5 0.0 0.7 0.5
Handset sales volume 24,451 24,786 21,098 17,685 88,020 13,722 12,998 14,361 15,363 56,444 -31.9 10.5 14,446 -0.6
Smartphone sales volume 4,100 6,200 4,400 5,500 20,200 4,900 5,700 7,000 8,250 25,850 59.1 22.8 6,960 0.6
LCD TV sales volume 9,359 9,113 9,194 10,642 38,308 8,375 8,409 8,649 10,211 35,644 -5.9 2.9 8,784 -1.5
TV sales volume 5,783 5,701 5,679 7,562 24,725 5,819 5,990 6,493 8,325 26,627 14.3 8.4 6,295 3.1
Note: Based on K-IFRS
Source: Company data, KDB Daewoo Securities Research estimates
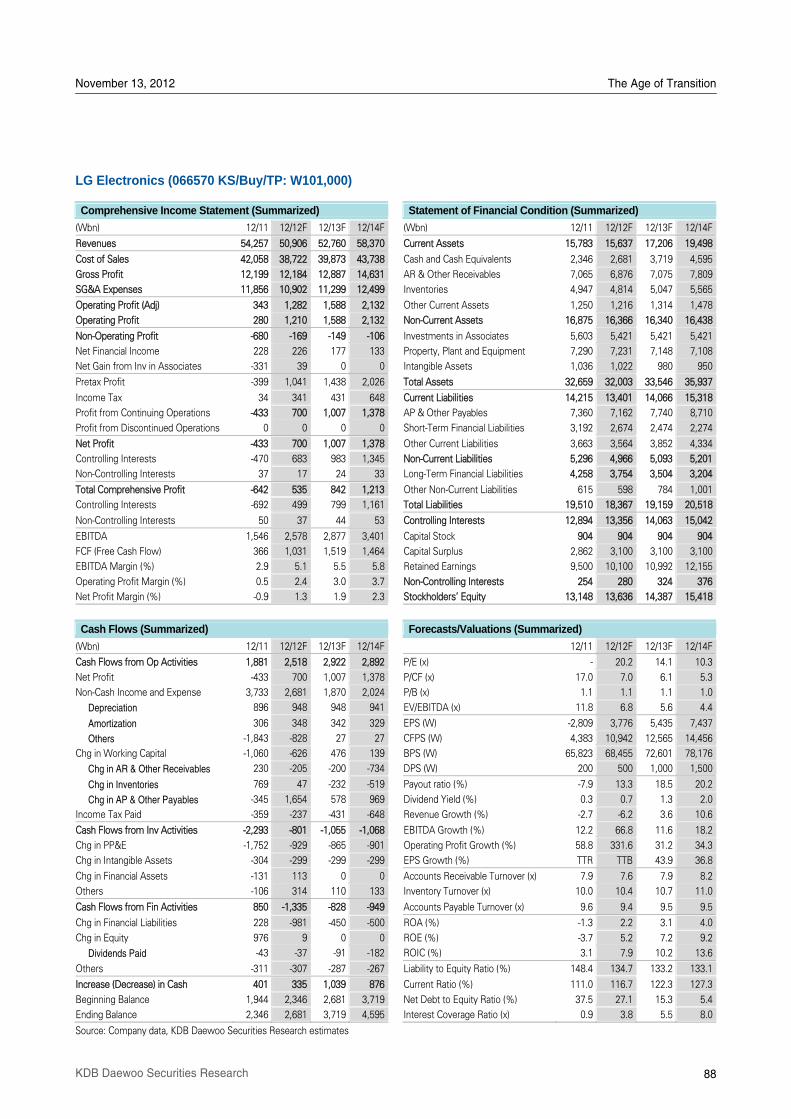
November 13, 2012 The Age of Transition
88 KDB Daewoo Securities Research
LG Electronics (066570 KS/Buy/TP: W101,000)
Comprehensive Income Statement (Summarized) Statement of Financial Condition (Summarized)
(Wbn) 12/11 12/12F 12/13F 12/14F (Wbn) 12/11 12/12F 12/13F 12/14F
Revenues 54,257 50,906 52,760 58,370 Current Assets 15,783 15,637 17,206 19,498
Cost of Sales 42,058 38,722 39,873 43,738 Cash and Cash Equivalents 2,346 2,681 3,719 4,595
Gross Profit 12,199 12,184 12,887 14,631 AR & Other Receivables 7,065 6,876 7,075 7,809
SG&A Expenses 11,856 10,902 11,299 12,499 Inventories 4,947 4,814 5,047 5,565
Operating Profit (Adj) 343 1,282 1,588 2,132 Other Current Assets 1,250 1,216 1,314 1,478
Operating Profit 280 1,210 1,588 2,132 Non-Current Assets 16,875 16,366 16,340 16,438
Non-Operating Profit -680 -169 -149 -106 Investments in Associates 5,603 5,421 5,421 5,421
Net Financial Income 228 226 177 133 Property, Plant and Equipment 7,290 7,231 7,148 7,108
Net Gain from Inv in Associates -331 39 0 0 Intangible Assets 1,036 1,022 980 950
Pretax Profit -399 1,041 1,438 2,026 Total Assets 32,659 32,003 33,546 35,937
Income Tax 34 341 431 648 Current Liabilities 14,215 13,401 14,066 15,318
Profit from Continuing Operations -433 700 1,007 1,378 AP & Other Payables 7,360 7,162 7,740 8,710
Profit from Discontinued Operations 0 0 0 0 Short-Term Financial Liabilities 3,192 2,674 2,474 2,274
Net Profit -433 700 1,007 1,378 Other Current Liabilities 3,663 3,564 3,852 4,334
Controlling Interests -470 683 983 1,345 Non-Current Liabilities 5,296 4,966 5,093 5,201
Non-Controlling Interests 37 17 24 33 Long-Term Financial Liabilities 4,258 3,754 3,504 3,204
Total Comprehensive Profit -642 535 842 1,213 Other Non-Current Liabilities 615 598 784 1,001
Controlling Interests -692 499 799 1,161 Total Liabilities 19,510 18,367 19,159 20,518
Non-Controlling Interests 50 37 44 53 Controlling Interests 12,894 13,356 14,063 15,042
EBITDA 1,546 2,578 2,877 3,401 Capital Stock 904 904 904 904
FCF (Free Cash Flow) 366 1,031 1,519 1,464 Capital Surplus 2,862 3,100 3,100 3,100
EBITDA Margin (%) 2.9 5.1 5.5 5.8 Retained Earnings 9,500 10,100 10,992 12,155
Operating Profit Margin (%) 0.5 2.4 3.0 3.7 Non-Controlling Interests 254 280 324 376
Net Profit Margin (%) -0.9 1.3 1.9 2.3 Stockholders' Equity 13,148 13,636 14,387 15,418
Cash Flows (Summarized) Forecasts/Valuations (Summarized)
(Wbn) 12/11 12/12F 12/13F 12/14F 12/11 12/12F 12/13F 12/14F
Cash Flows from Op Activities 1,881 2,518 2,922 2,892 P/E (x) - 20.2 14.1 10.3
Net Profit -433 700 1,007 1,378 P/CF (x) 17.0 7.0 6.1 5.3
Non-Cash Income and Expense 3,733 2,681 1,870 2,024 P/B (x) 1.1 1.1 1.1 1.0
Depreciation 896 948 948 941 EV/EBITDA (x) 11.8 6.8 5.6 4.4
Amortization 306 348 342 329 EPS (W) -2,809 3,776 5,435 7,437
Others -1,843 -828 27 27 CFPS (W) 4,383 10,942 12,565 14,456
Chg in Working Capital -1,060 -626 476 139 BPS (W) 65,823 68,455 72,601 78,176
Chg in AR & Other Receivables 230 -205 -200 -734 DPS (W) 200 500 1,000 1,500
Chg in Inventories 769 47 -232 -519 Payout ratio (%) -7.9 13.3 18.5 20.2
Chg in AP & Other Payables -345 1,654 578 969 Dividend Yield (%) 0.3 0.7 1.3 2.0
Income Tax Paid -359 -237 -431 -648 Revenue Growth (%) -2.7 -6.2 3.6 10.6
Cash Flows from Inv Activities -2,293 -801 -1,055 -1,068 EBITDA Growth (%) 12.2 66.8 11.6 18.2
Chg in PP&E -1,752 -929 -865 -901 Operating Profit Growth (%) 58.8 331.6 31.2 34.3
Chg in Intangible Assets -304 -299 -299 -299 EPS Growth (%) TTR TTB 43.9 36.8
Chg in Financial Assets -131 113 0 0 Accounts Receivable Turnover (x) 7.9 7.6 7.9 8.2
Others -106 314 110 133 Inventory Turnover (x) 10.0 10.4 10.7 11.0
Cash Flows from Fin Activities 850 -1,335 -828 -949 Accounts Payable Turnover (x) 9.6 9.4 9.5 9.5
Chg in Financial Liabilities 228 -981 -450 -500 ROA (%) -1.3 2.2 3.1 4.0
Chg in Equity 976 9 0 0 ROE (%) -3.7 5.2 7.2 9.2
Dividends Paid -43 -37 -91 -182 ROIC (%) 3.1 7.9 10.2 13.6
Others -311 -307 -287 -267 Liability to Equity Ratio (%) 148.4 134.7 133.2 133.1
Increase (Decrease) in Cash 401 335 1,039 876 Current Ratio (%) 111.0 116.7 122.3 127.3
Beginning Balance 1,944 2,346 2,681 3,719 Net Debt to Equity Ratio (%) 37.5 27.1 15.3 5.4
Ending Balance 2,346 2,681 3,719 4,595 Interest Coverage Ratio (x) 0.9 3.8 5.5 8.0
Source: Company data, KDB Daewoo Securities Research estimates
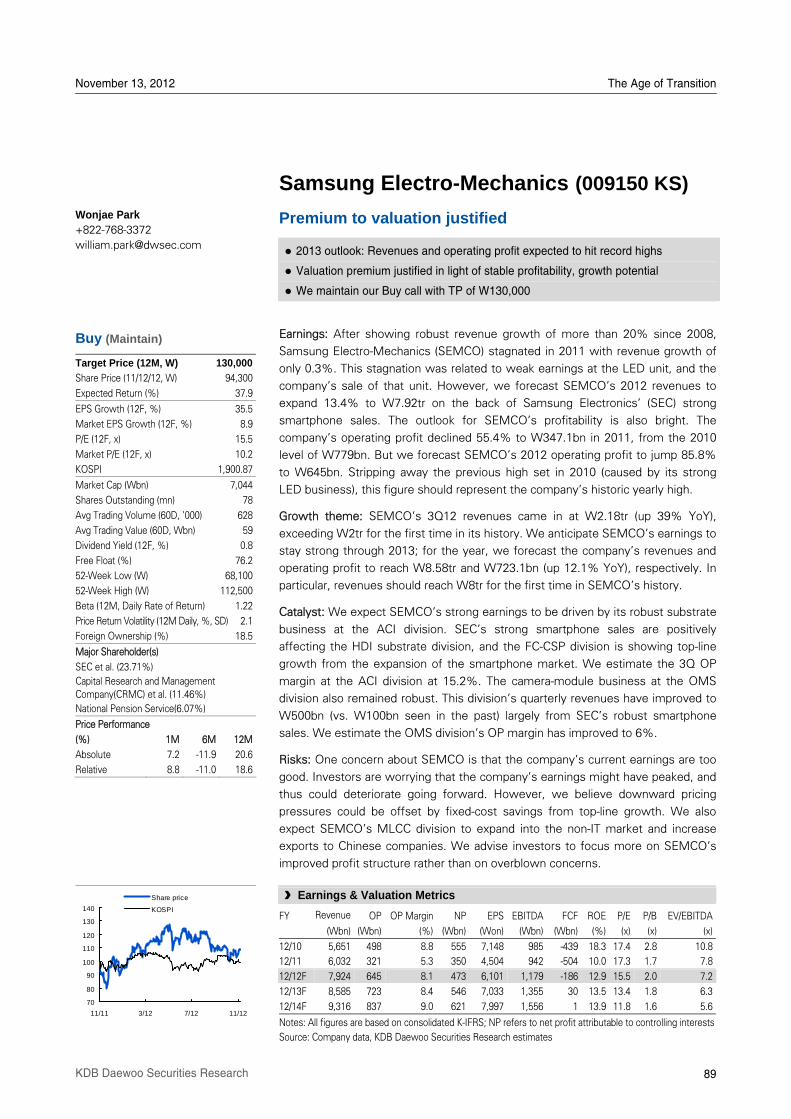
November 13, 2012 The Age of Transition
89 KDB Daewoo Securities Research
Samsung Electro-Mechanics (009150 KS)
Premium to valuation justified
2013 outlook: Revenues and operating profit expected to hit record highs
Valuation premium justified in light of stable profitability, growth potential
We maintain our Buy call with TP of W130,000
Earnings: After showing robust revenue growth of more than 20% since 2008,
Samsung Electro-Mechanics (SEMCO) stagnated in 2011 with revenue growth of
only 0.3%. This stagnation was related to weak earnings at the LED unit, and the
companyÊs sale of that unit. However, we forecast SEMCOÊs 2012 revenues to
expand 13.4% to W7.92tr on the back of Samsung ElectronicsÊ (SEC) strong
smartphone sales. The outlook for SEMCOÊs profitability is also bright. The
companyÊs operating profit declined 55.4% to W347.1bn in 2011, from the 2010
level of W779bn. But we forecast SEMCOÊs 2012 operating profit to jump 85.8%
to W645bn. Stripping away the previous high set in 2010 (caused by its strong
LED business), this figure should represent the companyÊs historic yearly high.
Growth theme: SEMCOÊs 3Q12 revenues came in at W2.18tr (up 39% YoY),
exceeding W2tr for the first time in its history. We anticipate SEMCOÊs earnings to
stay strong through 2013; for the year, we forecast the companyÊs revenues and
operating profit to reach W8.58tr and W723.1bn (up 12.1% YoY), respectively. In
particular, revenues should reach W8tr for the first time in SEMCOÊs history.
Catalyst: We expect SEMCOÊs strong earnings to be driven by its robust substrate
business at the ACI division. SECÊs strong smartphone sales are positively
affecting the HDI substrate division, and the FC-CSP division is showing top-line
growth from the expansion of the smartphone market. We estimate the 3Q OP
margin at the ACI division at 15.2%. The camera-module business at the OMS
division also remained robust. This divisionÊs quarterly revenues have improved to
W500bn (vs. W100bn seen in the past) largely from SECÊs robust smartphone
sales. We estimate the OMS divisionÊs OP margin has improved to 6%.
Risks: One concern about SEMCO is that the companyÊs current earnings are too
good. Investors are worrying that the companyÊs earnings might have peaked, and
thus could deteriorate going forward. However, we believe downward pricing
pressures could be offset by fixed-cost savings from top-line growth. We also
expect SEMCOÊs MLCC division to expand into the non-IT market and increase
exports to Chinese companies. We advise investors to focus more on SEMCOÊs
improved profit structure rather than on overblown concerns.
Wonjae Park +822-768-3372
Buy (Maintain)
Target Price (12M, W) 130,000
Share Price (11/12/12, W) 94,300
Expected Return (%) 37.9
EPS Growth (12F, %) 35.5
Market EPS Growth (12F, %) 8.9
P/E (12F, x) 15.5
Market P/E (12F, x) 10.2
KOSPI 1,900.87
Market Cap (Wbn) 7,044
Shares Outstanding (mn) 78
Avg Trading Volume (60D, '000) 628
Avg Trading Value (60D, Wbn) 59
Dividend Yield (12F, %) 0.8
Free Float (%) 76.2
52-Week Low (W) 68,100
52-Week High (W) 112,500
Beta (12M, Daily Rate of Return) 1.22
Price Return Volatility (12M Daily, %, SD) 2.1
Foreign Ownership (%) 18.5
Major Shareholder(s)
SEC et al. (23.71%)
Capital Research and Management Company(CRMC) et al. (11.46%)
National Pension Service(6.07%)
Price Performance
(%) 1M 6M 12M
Absolute 7.2 -11.9 20.6
Relative 8.8 -11.0 18.6
70
80
90
100
110
120
130
140
11/11 3/12 7/12 11/12
Share price
KOSPI
§ Earnings & Valuation Metrics
FY Revenue OP OP Margin NP EPS EBITDA FCF ROE P/E P/B EV/EBITDA
(Wbn) (Wbn) (%) (Wbn) (Won) (Wbn) (Wbn) (%) (x) (x) (x)
12/10 5,651 498 8.8 555 7,148 985 -439 18.3 17.4 2.8 10.8
12/11 6,032 321 5.3 350 4,504 942 -504 10.0 17.3 1.7 7.8
12/12F 7,924 645 8.1 473 6,101 1,179 -186 12.9 15.5 2.0 7.2
12/13F 8,585 723 8.4 546 7,033 1,355 30 13.5 13.4 1.8 6.3
12/14F 9,316 837 9.0 621 7,997 1,556 1 13.9 11.8 1.6 5.6
Notes: All figures are based on consolidated K-IFRS; NP refers to net profit attributable to controlling interests
Source: Company data, KDB Daewoo Securities Research estimates
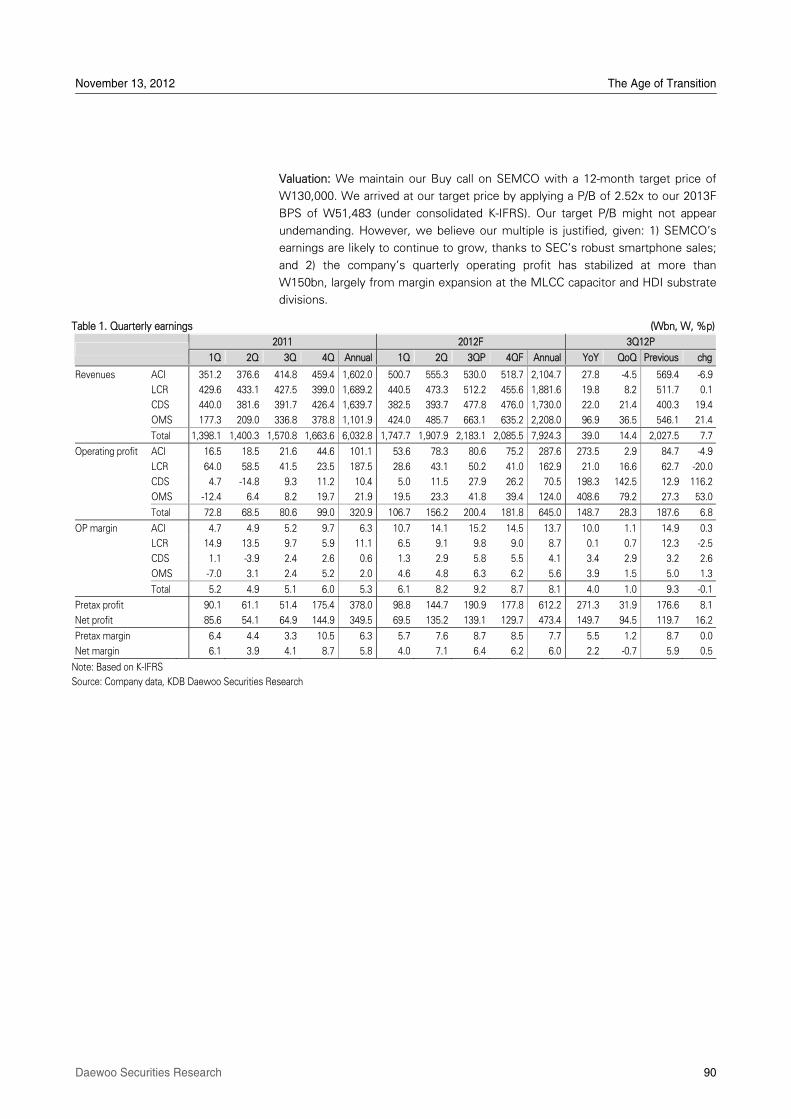
November 13, 2012 The Age of Transition
Daewoo Securities Research 90
Valuation: We maintain our Buy call on SEMCO with a 12-month target price of
W130,000. We arrived at our target price by applying a P/B of 2.52x to our 2013F
BPS of W51,483 (under consolidated K-IFRS). Our target P/B might not appear
undemanding. However, we believe our multiple is justified, given: 1) SEMCOÊs
earnings are likely to continue to grow, thanks to SECÊs robust smartphone sales;
and 2) the companyÊs quarterly operating profit has stabilized at more than
W150bn, largely from margin expansion at the MLCC capacitor and HDI substrate
divisions.
Table 1. Quarterly earnings (Wbn, W, %p)
2011 2012F 3Q12P
1Q 2Q 3Q 4Q Annual 1Q 2Q 3QP 4QF Annual YoY QoQ Previous chg
Revenues ACI 351.2 376.6 414.8 459.4 1,602.0 500.7 555.3 530.0 518.7 2,104.7 27.8 -4.5 569.4 -6.9
LCR 429.6 433.1 427.5 399.0 1,689.2 440.5 473.3 512.2 455.6 1,881.6 19.8 8.2 511.7 0.1
CDS 440.0 381.6 391.7 426.4 1,639.7 382.5 393.7 477.8 476.0 1,730.0 22.0 21.4 400.3 19.4
OMS 177.3 209.0 336.8 378.8 1,101.9 424.0 485.7 663.1 635.2 2,208.0 96.9 36.5 546.1 21.4
Total 1,398.1 1,400.3 1,570.8 1,663.6 6,032.8 1,747.7 1,907.9 2,183.1 2,085.5 7,924.3 39.0 14.4 2,027.5 7.7
Operating profit ACI 16.5 18.5 21.6 44.6 101.1 53.6 78.3 80.6 75.2 287.6 273.5 2.9 84.7 -4.9
LCR 64.0 58.5 41.5 23.5 187.5 28.6 43.1 50.2 41.0 162.9 21.0 16.6 62.7 -20.0
CDS 4.7 -14.8 9.3 11.2 10.4 5.0 11.5 27.9 26.2 70.5 198.3 142.5 12.9 116.2
OMS -12.4 6.4 8.2 19.7 21.9 19.5 23.3 41.8 39.4 124.0 408.6 79.2 27.3 53.0
Total 72.8 68.5 80.6 99.0 320.9 106.7 156.2 200.4 181.8 645.0 148.7 28.3 187.6 6.8
OP margin ACI 4.7 4.9 5.2 9.7 6.3 10.7 14.1 15.2 14.5 13.7 10.0 1.1 14.9 0.3
LCR 14.9 13.5 9.7 5.9 11.1 6.5 9.1 9.8 9.0 8.7 0.1 0.7 12.3 -2.5
CDS 1.1 -3.9 2.4 2.6 0.6 1.3 2.9 5.8 5.5 4.1 3.4 2.9 3.2 2.6
OMS -7.0 3.1 2.4 5.2 2.0 4.6 4.8 6.3 6.2 5.6 3.9 1.5 5.0 1.3
Total 5.2 4.9 5.1 6.0 5.3 6.1 8.2 9.2 8.7 8.1 4.0 1.0 9.3 -0.1
Pretax profit 90.1 61.1 51.4 175.4 378.0 98.8 144.7 190.9 177.8 612.2 271.3 31.9 176.6 8.1
Net profit 85.6 54.1 64.9 144.9 349.5 69.5 135.2 139.1 129.7 473.4 149.7 94.5 119.7 16.2
Pretax margin 6.4 4.4 3.3 10.5 6.3 5.7 7.6 8.7 8.5 7.7 5.5 1.2 8.7 0.0
Net margin 6.1 3.9 4.1 8.7 5.8 4.0 7.1 6.4 6.2 6.0 2.2 -0.7 5.9 0.5
Note: Based on K-IFRS
Source: Company data, KDB Daewoo Securities Research
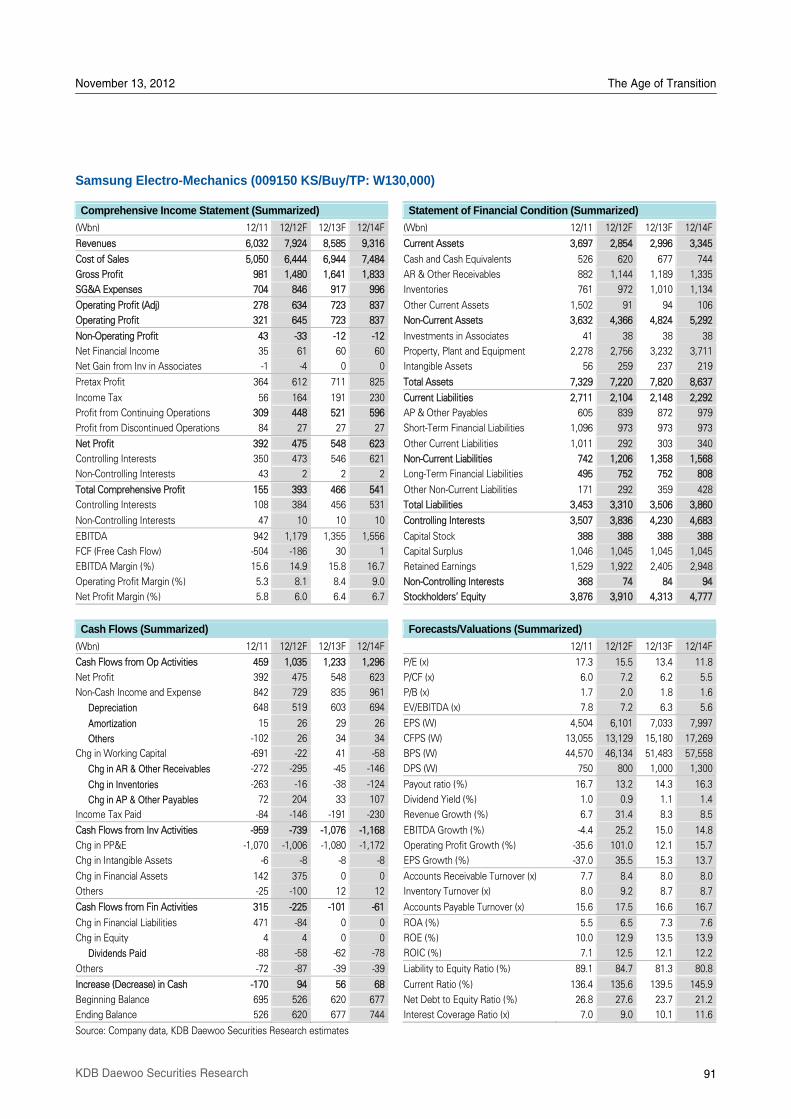
November 13, 2012 The Age of Transition
91 KDB Daewoo Securities Research
Samsung Electro-Mechanics (009150 KS/Buy/TP: W130,000)
Comprehensive Income Statement (Summarized) Statement of Financial Condition (Summarized)
(Wbn) 12/11 12/12F 12/13F 12/14F (Wbn) 12/11 12/12F 12/13F 12/14F
Revenues 6,032 7,924 8,585 9,316 Current Assets 3,697 2,854 2,996 3,345
Cost of Sales 5,050 6,444 6,944 7,484 Cash and Cash Equivalents 526 620 677 744
Gross Profit 981 1,480 1,641 1,833 AR & Other Receivables 882 1,144 1,189 1,335
SG&A Expenses 704 846 917 996 Inventories 761 972 1,010 1,134
Operating Profit (Adj) 278 634 723 837 Other Current Assets 1,502 91 94 106
Operating Profit 321 645 723 837 Non-Current Assets 3,632 4,366 4,824 5,292
Non-Operating Profit 43 -33 -12 -12 Investments in Associates 41 38 38 38
Net Financial Income 35 61 60 60 Property, Plant and Equipment 2,278 2,756 3,232 3,711
Net Gain from Inv in Associates -1 -4 0 0 Intangible Assets 56 259 237 219
Pretax Profit 364 612 711 825 Total Assets 7,329 7,220 7,820 8,637
Income Tax 56 164 191 230 Current Liabilities 2,711 2,104 2,148 2,292
Profit from Continuing Operations 309 448 521 596 AP & Other Payables 605 839 872 979
Profit from Discontinued Operations 84 27 27 27 Short-Term Financial Liabilities 1,096 973 973 973
Net Profit 392 475 548 623 Other Current Liabilities 1,011 292 303 340
Controlling Interests 350 473 546 621 Non-Current Liabilities 742 1,206 1,358 1,568
Non-Controlling Interests 43 2 2 2 Long-Term Financial Liabilities 495 752 752 808
Total Comprehensive Profit 155 393 466 541 Other Non-Current Liabilities 171 292 359 428
Controlling Interests 108 384 456 531 Total Liabilities 3,453 3,310 3,506 3,860
Non-Controlling Interests 47 10 10 10 Controlling Interests 3,507 3,836 4,230 4,683
EBITDA 942 1,179 1,355 1,556 Capital Stock 388 388 388 388
FCF (Free Cash Flow) -504 -186 30 1 Capital Surplus 1,046 1,045 1,045 1,045
EBITDA Margin (%) 15.6 14.9 15.8 16.7 Retained Earnings 1,529 1,922 2,405 2,948
Operating Profit Margin (%) 5.3 8.1 8.4 9.0 Non-Controlling Interests 368 74 84 94
Net Profit Margin (%) 5.8 6.0 6.4 6.7 Stockholders' Equity 3,876 3,910 4,313 4,777
Cash Flows (Summarized) Forecasts/Valuations (Summarized)
(Wbn) 12/11 12/12F 12/13F 12/14F 12/11 12/12F 12/13F 12/14F
Cash Flows from Op Activities 459 1,035 1,233 1,296 P/E (x) 17.3 15.5 13.4 11.8
Net Profit 392 475 548 623 P/CF (x) 6.0 7.2 6.2 5.5
Non-Cash Income and Expense 842 729 835 961 P/B (x) 1.7 2.0 1.8 1.6
Depreciation 648 519 603 694 EV/EBITDA (x) 7.8 7.2 6.3 5.6
Amortization 15 26 29 26 EPS (W) 4,504 6,101 7,033 7,997
Others -102 26 34 34 CFPS (W) 13,055 13,129 15,180 17,269
Chg in Working Capital -691 -22 41 -58 BPS (W) 44,570 46,134 51,483 57,558
Chg in AR & Other Receivables -272 -295 -45 -146 DPS (W) 750 800 1,000 1,300
Chg in Inventories -263 -16 -38 -124 Payout ratio (%) 16.7 13.2 14.3 16.3
Chg in AP & Other Payables 72 204 33 107 Dividend Yield (%) 1.0 0.9 1.1 1.4
Income Tax Paid -84 -146 -191 -230 Revenue Growth (%) 6.7 31.4 8.3 8.5
Cash Flows from Inv Activities -959 -739 -1,076 -1,168 EBITDA Growth (%) -4.4 25.2 15.0 14.8
Chg in PP&E -1,070 -1,006 -1,080 -1,172 Operating Profit Growth (%) -35.6 101.0 12.1 15.7
Chg in Intangible Assets -6 -8 -8 -8 EPS Growth (%) -37.0 35.5 15.3 13.7
Chg in Financial Assets 142 375 0 0 Accounts Receivable Turnover (x) 7.7 8.4 8.0 8.0
Others -25 -100 12 12 Inventory Turnover (x) 8.0 9.2 8.7 8.7
Cash Flows from Fin Activities 315 -225 -101 -61 Accounts Payable Turnover (x) 15.6 17.5 16.6 16.7
Chg in Financial Liabilities 471 -84 0 0 ROA (%) 5.5 6.5 7.3 7.6
Chg in Equity 4 4 0 0 ROE (%) 10.0 12.9 13.5 13.9
Dividends Paid -88 -58 -62 -78 ROIC (%) 7.1 12.5 12.1 12.2
Others -72 -87 -39 -39 Liability to Equity Ratio (%) 89.1 84.7 81.3 80.8
Increase (Decrease) in Cash -170 94 56 68 Current Ratio (%) 136.4 135.6 139.5 145.9
Beginning Balance 695 526 620 677 Net Debt to Equity Ratio (%) 26.8 27.6 23.7 21.2
Ending Balance 526 620 677 744 Interest Coverage Ratio (x) 7.0 9.0 10.1 11.6
Source: Company data, KDB Daewoo Securities Research estimates
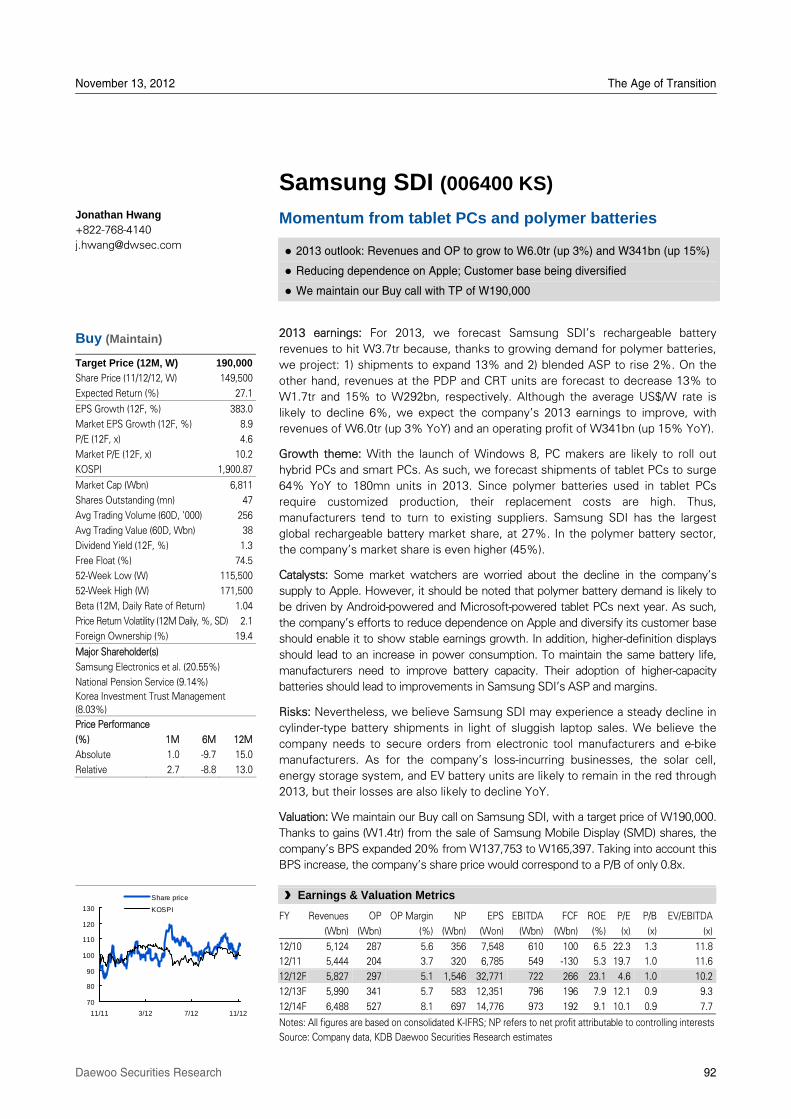
November 13, 2012 The Age of Transition
Daewoo Securities Research 92
Samsung SDI (006400 KS)
Momentum from tablet PCs and polymer batteries
2013 outlook: Revenues and OP to grow to W6.0tr (up 3%) and W341bn (up 15%)
Reducing dependence on Apple; Customer base being diversified
We maintain our Buy call with TP of W190,000
2013 earnings: For 2013, we forecast Samsung SDIÊs rechargeable battery
revenues to hit W3.7tr because, thanks to growing demand for polymer batteries,
we project: 1) shipments to expand 13% and 2) blended ASP to rise 2%. On the
other hand, revenues at the PDP and CRT units are forecast to decrease 13% to
W1.7tr and 15% to W292bn, respectively. Although the average US$/W rate is
likely to decline 6%, we expect the companyÊs 2013 earnings to improve, with
revenues of W6.0tr (up 3% YoY) and an operating profit of W341bn (up 15% YoY).
Growth theme: With the launch of Windows 8, PC makers are likely to roll out
hybrid PCs and smart PCs. As such, we forecast shipments of tablet PCs to surge
64% YoY to 180mn units in 2013. Since polymer batteries used in tablet PCs
require customized production, their replacement costs are high. Thus,
manufacturers tend to turn to existing suppliers. Samsung SDI has the largest
global rechargeable battery market share, at 27%. In the polymer battery sector,
the companyÊs market share is even higher (45%).
Catalysts: Some market watchers are worried about the decline in the companyÊs
supply to Apple. However, it should be noted that polymer battery demand is likely to
be driven by Android-powered and Microsoft-powered tablet PCs next year. As such,
the companyÊs efforts to reduce dependence on Apple and diversify its customer base
should enable it to show stable earnings growth. In addition, higher-definition displays
should lead to an increase in power consumption. To maintain the same battery life,
manufacturers need to improve battery capacity. Their adoption of higher-capacity
batteries should lead to improvements in Samsung SDIÊs ASP and margins.
Risks: Nevertheless, we believe Samsung SDI may experience a steady decline in
cylinder-type battery shipments in light of sluggish laptop sales. We believe the
company needs to secure orders from electronic tool manufacturers and e-bike
manufacturers. As for the companyÊs loss-incurring businesses, the solar cell,
energy storage system, and EV battery units are likely to remain in the red through
2013, but their losses are also likely to decline YoY.
Valuation: We maintain our Buy call on Samsung SDI, with a target price of W190,000.
Thanks to gains (W1.4tr) from the sale of Samsung Mobile Display (SMD) shares, the
companyÊs BPS expanded 20% from W137,753 to W165,397. Taking into account this
BPS increase, the companyÊs share price would correspond to a P/B of only 0.8x.
Jonathan Hwang +822-768-4140
Buy (Maintain)
Target Price (12M, W) 190,000
Share Price (11/12/12, W) 149,500
Expected Return (%) 27.1
EPS Growth (12F, %) 383.0
Market EPS Growth (12F, %) 8.9
P/E (12F, x) 4.6
Market P/E (12F, x) 10.2
KOSPI 1,900.87
Market Cap (Wbn) 6,811
Shares Outstanding (mn) 47
Avg Trading Volume (60D, '000) 256
Avg Trading Value (60D, Wbn) 38
Dividend Yield (12F, %) 1.3
Free Float (%) 74.5
52-Week Low (W) 115,500
52-Week High (W) 171,500
Beta (12M, Daily Rate of Return) 1.04
Price Return Volatility (12M Daily, %, SD) 2.1
Foreign Ownership (%) 19.4
Major Shareholder(s)
Samsung Electronics et al. (20.55%)
National Pension Service (9.14%)
Korea Investment Trust Management
(8.03%)
Price Performance
(%) 1M 6M 12M
Absolute 1.0 -9.7 15.0
Relative 2.7 -8.8 13.0
70
80
90
100
110
120
130
11/11 3/12 7/12 11/12
Share price
KOSPI
§ Earnings & Valuation Metrics
FY Revenues OP OP Margin NP EPS EBITDA FCF ROE P/E P/B EV/EBITDA
(Wbn) (Wbn) (%) (Wbn) (Won) (Wbn) (Wbn) (%) (x) (x) (x)
12/10 5,124 287 5.6 356 7,548 610 100 6.5 22.3 1.3 11.8
12/11 5,444 204 3.7 320 6,785 549 -130 5.3 19.7 1.0 11.6
12/12F 5,827 297 5.1 1,546 32,771 722 266 23.1 4.6 1.0 10.2
12/13F 5,990 341 5.7 583 12,351 796 196 7.9 12.1 0.9 9.3
12/14F 6,488 527 8.1 697 14,776 973 192 9.1 10.1 0.9 7.7
Notes: All figures are based on consolidated K-IFRS; NP refers to net profit attributable to controlling interests
Source: Company data, KDB Daewoo Securities Research estimates
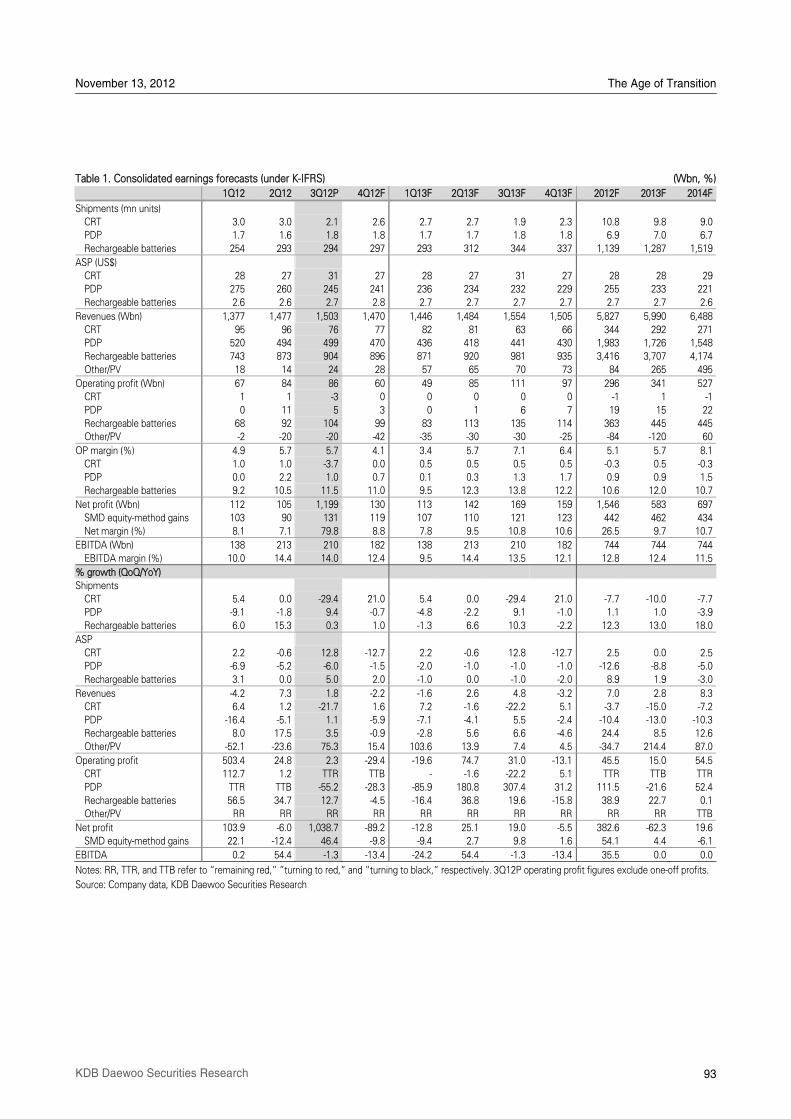
November 13, 2012 The Age of Transition
93 KDB Daewoo Securities Research
Table 1. Consolidated earnings forecasts (under K-IFRS) (Wbn, %)
1Q12 2Q12 3Q12P 4Q12F 1Q13F 2Q13F 3Q13F 4Q13F 2012F 2013F 2014F
Shipments (mn units)
CRT 3.0 3.0 2.1 2.6 2.7 2.7 1.9 2.3 10.8 9.8 9.0 PDP 1.7 1.6 1.8 1.8 1.7 1.7 1.8 1.8 6.9 7.0 6.7
Rechargeable batteries 254 293 294 297 293 312 344 337 1,139 1,287 1,519
ASP (US$)
CRT 28 27 31 27 28 27 31 27 28 28 29 PDP 275 260 245 241 236 234 232 229 255 233 221
Rechargeable batteries 2.6 2.6 2.7 2.8 2.7 2.7 2.7 2.7 2.7 2.7 2.6
Revenues (Wbn) 1,377 1,477 1,503 1,470 1,446 1,484 1,554 1,505 5,827 5,990 6,488
CRT 95 96 76 77 82 81 63 66 344 292 271 PDP 520 494 499 470 436 418 441 430 1,983 1,726 1,548
Rechargeable batteries 743 873 904 896 871 920 981 935 3,416 3,707 4,174
Other/PV 18 14 24 28 57 65 70 73 84 265 495
Operating profit (Wbn) 67 84 86 60 49 85 111 97 296 341 527
CRT 1 1 -3 0 0 0 0 0 -1 1 -1
PDP 0 11 5 3 0 1 6 7 19 15 22
Rechargeable batteries 68 92 104 99 83 113 135 114 363 445 445Other/PV -2 -20 -20 -42 -35 -30 -30 -25 -84 -120 60
OP margin (%) 4.9 5.7 5.7 4.1 3.4 5.7 7.1 6.4 5.1 5.7 8.1
CRT 1.0 1.0 -3.7 0.0 0.5 0.5 0.5 0.5 -0.3 0.5 -0.3
PDP 0.0 2.2 1.0 0.7 0.1 0.3 1.3 1.7 0.9 0.9 1.5 Rechargeable batteries 9.2 10.5 11.5 11.0 9.5 12.3 13.8 12.2 10.6 12.0 10.7
Net profit (Wbn) 112 105 1,199 130 113 142 169 159 1,546 583 697
SMD equity-method gains 103 90 131 119 107 110 121 123 442 462 434
Net margin (%) 8.1 7.1 79.8 8.8 7.8 9.5 10.8 10.6 26.5 9.7 10.7
EBITDA (Wbn) 138 213 210 182 138 213 210 182 744 744 744
EBITDA margin (%) 10.0 14.4 14.0 12.4 9.5 14.4 13.5 12.1 12.8 12.4 11.5
% growth (QoQ/YoY)
Shipments
CRT 5.4 0.0 -29.4 21.0 5.4 0.0 -29.4 21.0 -7.7 -10.0 -7.7 PDP -9.1 -1.8 9.4 -0.7 -4.8 -2.2 9.1 -1.0 1.1 1.0 -3.9
Rechargeable batteries 6.0 15.3 0.3 1.0 -1.3 6.6 10.3 -2.2 12.3 13.0 18.0
ASP
CRT 2.2 -0.6 12.8 -12.7 2.2 -0.6 12.8 -12.7 2.5 0.0 2.5 PDP -6.9 -5.2 -6.0 -1.5 -2.0 -1.0 -1.0 -1.0 -12.6 -8.8 -5.0
Rechargeable batteries 3.1 0.0 5.0 2.0 -1.0 0.0 -1.0 -2.0 8.9 1.9 -3.0
Revenues -4.2 7.3 1.8 -2.2 -1.6 2.6 4.8 -3.2 7.0 2.8 8.3
CRT 6.4 1.2 -21.7 1.6 7.2 -1.6 -22.2 5.1 -3.7 -15.0 -7.2 PDP -16.4 -5.1 1.1 -5.9 -7.1 -4.1 5.5 -2.4 -10.4 -13.0 -10.3
Rechargeable batteries 8.0 17.5 3.5 -0.9 -2.8 5.6 6.6 -4.6 24.4 8.5 12.6
Other/PV -52.1 -23.6 75.3 15.4 103.6 13.9 7.4 4.5 -34.7 214.4 87.0
Operating profit 503.4 24.8 2.3 -29.4 -19.6 74.7 31.0 -13.1 45.5 15.0 54.5
CRT 112.7 1.2 TTR TTB - -1.6 -22.2 5.1 TTR TTB TTR
PDP TTR TTB -55.2 -28.3 -85.9 180.8 307.4 31.2 111.5 -21.6 52.4
Rechargeable batteries 56.5 34.7 12.7 -4.5 -16.4 36.8 19.6 -15.8 38.9 22.7 0.1Other/PV RR RR RR RR RR RR RR RR RR RR TTB
Net profit 103.9 -6.0 1,038.7 -89.2 -12.8 25.1 19.0 -5.5 382.6 -62.3 19.6
SMD equity-method gains 22.1 -12.4 46.4 -9.8 -9.4 2.7 9.8 1.6 54.1 4.4 -6.1
EBITDA 0.2 54.4 -1.3 -13.4 -24.2 54.4 -1.3 -13.4 35.5 0.0 0.0
Notes: RR, TTR, and TTB refer to „remaining red,‰ ‰turning to red,‰ and ‰turning to black,‰ respectively. 3Q12P operating profit figures exclude one-off profits.
Source: Company data, KDB Daewoo Securities Research
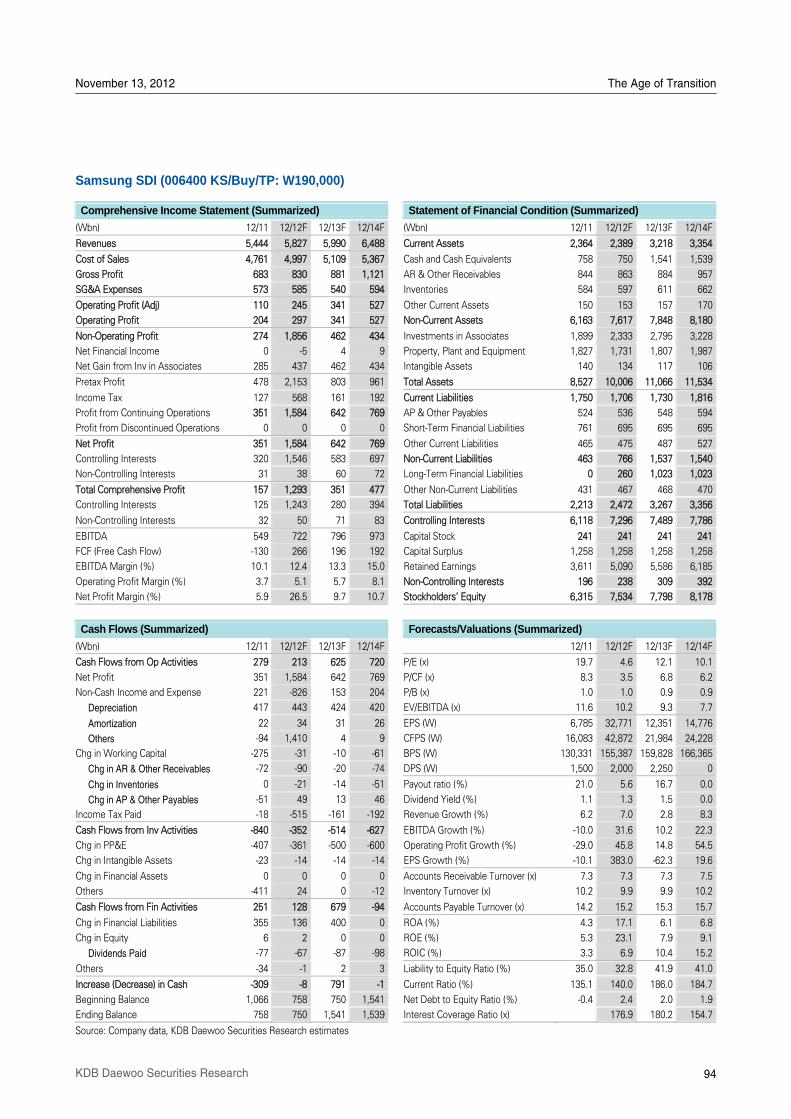
November 13, 2012 The Age of Transition
94 KDB Daewoo Securities Research
Samsung SDI (006400 KS/Buy/TP: W190,000)
Comprehensive Income Statement (Summarized) Statement of Financial Condition (Summarized)
(Wbn) 12/11 12/12F 12/13F 12/14F (Wbn) 12/11 12/12F 12/13F 12/14F
Revenues 5,444 5,827 5,990 6,488 Current Assets 2,364 2,389 3,218 3,354
Cost of Sales 4,761 4,997 5,109 5,367 Cash and Cash Equivalents 758 750 1,541 1,539
Gross Profit 683 830 881 1,121 AR & Other Receivables 844 863 884 957
SG&A Expenses 573 585 540 594 Inventories 584 597 611 662
Operating Profit (Adj) 110 245 341 527 Other Current Assets 150 153 157 170
Operating Profit 204 297 341 527 Non-Current Assets 6,163 7,617 7,848 8,180
Non-Operating Profit 274 1,856 462 434 Investments in Associates 1,899 2,333 2,795 3,228
Net Financial Income 0 -5 4 9 Property, Plant and Equipment 1,827 1,731 1,807 1,987
Net Gain from Inv in Associates 285 437 462 434 Intangible Assets 140 134 117 106
Pretax Profit 478 2,153 803 961 Total Assets 8,527 10,006 11,066 11,534
Income Tax 127 568 161 192 Current Liabilities 1,750 1,706 1,730 1,816
Profit from Continuing Operations 351 1,584 642 769 AP & Other Payables 524 536 548 594
Profit from Discontinued Operations 0 0 0 0 Short-Term Financial Liabilities 761 695 695 695
Net Profit 351 1,584 642 769 Other Current Liabilities 465 475 487 527
Controlling Interests 320 1,546 583 697 Non-Current Liabilities 463 766 1,537 1,540
Non-Controlling Interests 31 38 60 72 Long-Term Financial Liabilities 0 260 1,023 1,023
Total Comprehensive Profit 157 1,293 351 477 Other Non-Current Liabilities 431 467 468 470
Controlling Interests 125 1,243 280 394 Total Liabilities 2,213 2,472 3,267 3,356
Non-Controlling Interests 32 50 71 83 Controlling Interests 6,118 7,296 7,489 7,786
EBITDA 549 722 796 973 Capital Stock 241 241 241 241
FCF (Free Cash Flow) -130 266 196 192 Capital Surplus 1,258 1,258 1,258 1,258
EBITDA Margin (%) 10.1 12.4 13.3 15.0 Retained Earnings 3,611 5,090 5,586 6,185
Operating Profit Margin (%) 3.7 5.1 5.7 8.1 Non-Controlling Interests 196 238 309 392
Net Profit Margin (%) 5.9 26.5 9.7 10.7 Stockholders' Equity 6,315 7,534 7,798 8,178
Cash Flows (Summarized) Forecasts/Valuations (Summarized)
(Wbn) 12/11 12/12F 12/13F 12/14F 12/11 12/12F 12/13F 12/14F
Cash Flows from Op Activities 279 213 625 720 P/E (x) 19.7 4.6 12.1 10.1
Net Profit 351 1,584 642 769 P/CF (x) 8.3 3.5 6.8 6.2
Non-Cash Income and Expense 221 -826 153 204 P/B (x) 1.0 1.0 0.9 0.9
Depreciation 417 443 424 420 EV/EBITDA (x) 11.6 10.2 9.3 7.7
Amortization 22 34 31 26 EPS (W) 6,785 32,771 12,351 14,776
Others -94 1,410 4 9 CFPS (W) 16,083 42,872 21,984 24,228
Chg in Working Capital -275 -31 -10 -61 BPS (W) 130,331 155,387 159,828 166,365
Chg in AR & Other Receivables -72 -90 -20 -74 DPS (W) 1,500 2,000 2,250 0
Chg in Inventories 0 -21 -14 -51 Payout ratio (%) 21.0 5.6 16.7 0.0
Chg in AP & Other Payables -51 49 13 46 Dividend Yield (%) 1.1 1.3 1.5 0.0
Income Tax Paid -18 -515 -161 -192 Revenue Growth (%) 6.2 7.0 2.8 8.3
Cash Flows from Inv Activities -840 -352 -514 -627 EBITDA Growth (%) -10.0 31.6 10.2 22.3
Chg in PP&E -407 -361 -500 -600 Operating Profit Growth (%) -29.0 45.8 14.8 54.5
Chg in Intangible Assets -23 -14 -14 -14 EPS Growth (%) -10.1 383.0 -62.3 19.6
Chg in Financial Assets 0 0 0 0 Accounts Receivable Turnover (x) 7.3 7.3 7.3 7.5
Others -411 24 0 -12 Inventory Turnover (x) 10.2 9.9 9.9 10.2
Cash Flows from Fin Activities 251 128 679 -94 Accounts Payable Turnover (x) 14.2 15.2 15.3 15.7
Chg in Financial Liabilities 355 136 400 0 ROA (%) 4.3 17.1 6.1 6.8
Chg in Equity 6 2 0 0 ROE (%) 5.3 23.1 7.9 9.1
Dividends Paid -77 -67 -87 -98 ROIC (%) 3.3 6.9 10.4 15.2
Others -34 -1 2 3 Liability to Equity Ratio (%) 35.0 32.8 41.9 41.0
Increase (Decrease) in Cash -309 -8 791 -1 Current Ratio (%) 135.1 140.0 186.0 184.7
Beginning Balance 1,066 758 750 1,541 Net Debt to Equity Ratio (%) -0.4 2.4 2.0 1.9
Ending Balance 758 750 1,541 1,539 Interest Coverage Ratio (x) 176.9 180.2 154.7
Source: Company data, KDB Daewoo Securities Research estimates
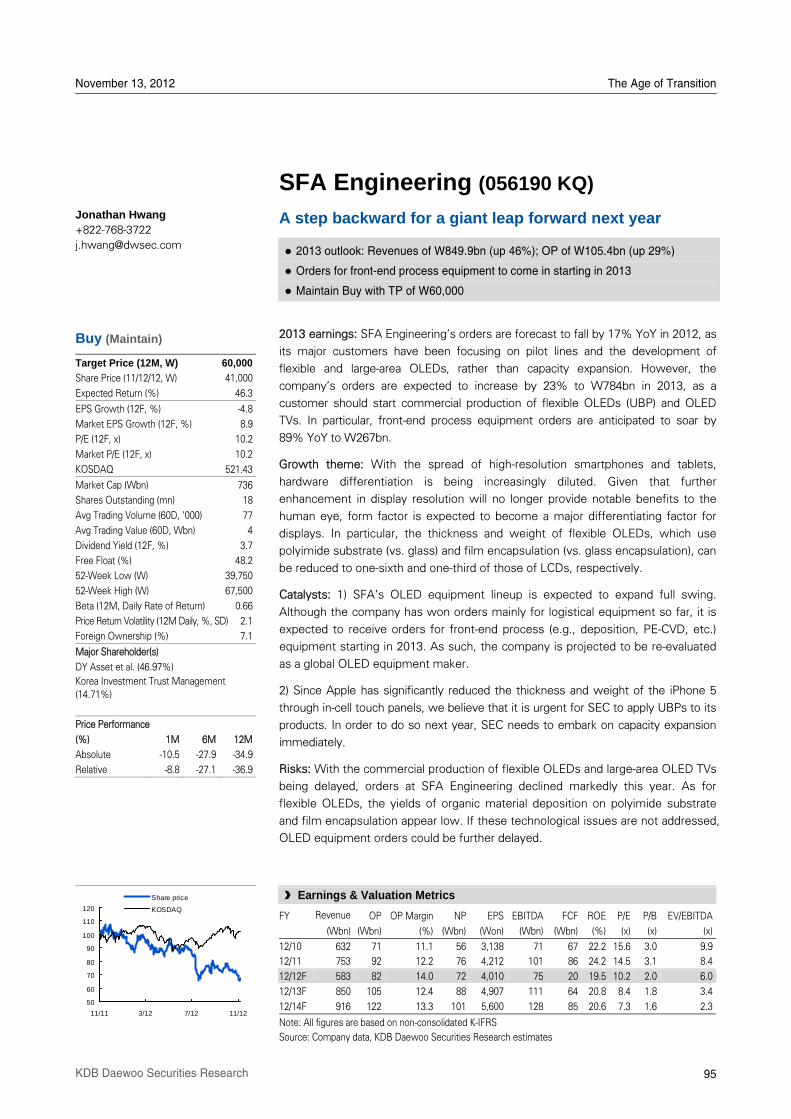
November 13, 2012 The Age of Transition
95 KDB Daewoo Securities Research
SFA Engineering (056190 KQ)
A step backward for a giant leap forward next year
2013 outlook: Revenues of W849.9bn (up 46%); OP of W105.4bn (up 29%)
Orders for front-end process equipment to come in starting in 2013
Maintain Buy with TP of W60,000
2013 earnings: SFA EngineeringÊs orders are forecast to fall by 17% YoY in 2012, as
its major customers have been focusing on pilot lines and the development of
flexible and large-area OLEDs, rather than capacity expansion. However, the
companyÊs orders are expected to increase by 23% to W784bn in 2013, as a
customer should start commercial production of flexible OLEDs (UBP) and OLED
TVs. In particular, front-end process equipment orders are anticipated to soar by
89% YoY to W267bn.
Growth theme: With the spread of high-resolution smartphones and tablets,
hardware differentiation is being increasingly diluted. Given that further
enhancement in display resolution will no longer provide notable benefits to the
human eye, form factor is expected to become a major differentiating factor for
displays. In particular, the thickness and weight of flexible OLEDs, which use
polyimide substrate (vs. glass) and film encapsulation (vs. glass encapsulation), can
be reduced to one-sixth and one-third of those of LCDs, respectively.
Catalysts: 1) SFAÊs OLED equipment lineup is expected to expand full swing.
Although the company has won orders mainly for logistical equipment so far, it is
expected to receive orders for front-end process (e.g., deposition, PE-CVD, etc.)
equipment starting in 2013. As such, the company is projected to be re-evaluated
as a global OLED equipment maker.
2) Since Apple has significantly reduced the thickness and weight of the iPhone 5
through in-cell touch panels, we believe that it is urgent for SEC to apply UBPs to its
products. In order to do so next year, SEC needs to embark on capacity expansion
immediately.
Risks: With the commercial production of flexible OLEDs and large-area OLED TVs
being delayed, orders at SFA Engineering declined markedly this year. As for
flexible OLEDs, the yields of organic material deposition on polyimide substrate
and film encapsulation appear low. If these technological issues are not addressed,
OLED equipment orders could be further delayed.
Jonathan Hwang +822-768-3722
Buy (Maintain)
Target Price (12M, W) 60,000
Share Price (11/12/12, W) 41,000
Expected Return (%) 46.3
EPS Growth (12F, %) -4.8
Market EPS Growth (12F, %) 8.9
P/E (12F, x) 10.2
Market P/E (12F, x) 10.2
KOSDAQ 521.43
Market Cap (Wbn) 736
Shares Outstanding (mn) 18
Avg Trading Volume (60D, '000) 77
Avg Trading Value (60D, Wbn) 4
Dividend Yield (12F, %) 3.7
Free Float (%) 48.2
52-Week Low (W) 39,750
52-Week High (W) 67,500
Beta (12M, Daily Rate of Return) 0.66
Price Return Volatility (12M Daily, %, SD) 2.1
Foreign Ownership (%) 7.1
Major Shareholder(s)
DY Asset et al. (46.97%)
Korea Investment Trust Management (14.71%)
Price Performance
(%) 1M 6M 12M
Absolute -10.5 -27.9 -34.9
Relative -8.8 -27.1 -36.9
50
60
70
80
90
100
110
120
11/11 3/12 7/12 11/12
Share price
KOSDAQ
§ Earnings & Valuation Metrics
FY Revenue OP OP Margin NP EPS EBITDA FCF ROE P/E P/B EV/EBITDA
(Wbn) (Wbn) (%) (Wbn) (Won) (Wbn) (Wbn) (%) (x) (x) (x)
12/10 632 71 11.1 56 3,138 71 67 22.2 15.6 3.0 9.9
12/11 753 92 12.2 76 4,212 101 86 24.2 14.5 3.1 8.4
12/12F 583 82 14.0 72 4,010 75 20 19.5 10.2 2.0 6.0
12/13F 850 105 12.4 88 4,907 111 64 20.8 8.4 1.8 3.4
12/14F 916 122 13.3 101 5,600 128 85 20.6 7.3 1.6 2.3
Note: All figures are based on non-consolidated K-IFRS
Source: Company data, KDB Daewoo Securities Research estimates
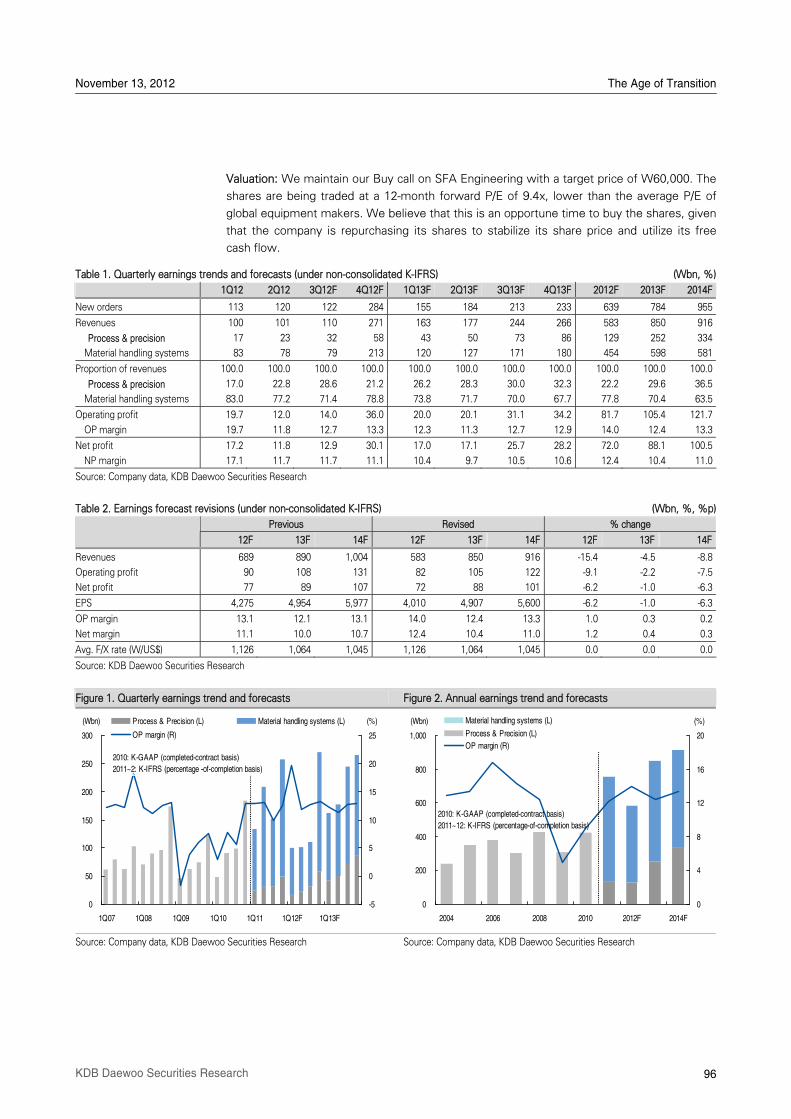
November 13, 2012 The Age of Transition
96 KDB Daewoo Securities Research
Valuation: We maintain our Buy call on SFA Engineering with a target price of W60,000. The
shares are being traded at a 12-month forward P/E of 9.4x, lower than the average P/E of
global equipment makers. We believe that this is an opportune time to buy the shares, given
that the company is repurchasing its shares to stabilize its share price and utilize its free
cash flow.
Table 1. Quarterly earnings trends and forecasts (under non-consolidated K-IFRS) (Wbn, %)
1Q12 2Q12 3Q12F 4Q12F 1Q13F 2Q13F 3Q13F 4Q13F 2012F 2013F 2014F
New orders 113 120 122 284 155 184 213 233 639 784 955
Revenues 100 101 110 271 163 177 244 266 583 850 916
Process & precision 17 23 32 58 43 50 73 86 129 252 334
Material handling systems 83 78 79 213 120 127 171 180 454 598 581
Proportion of revenues 100.0 100.0 100.0 100.0 100.0 100.0 100.0 100.0 100.0 100.0 100.0
Process & precision 17.0 22.8 28.6 21.2 26.2 28.3 30.0 32.3 22.2 29.6 36.5
Material handling systems 83.0 77.2 71.4 78.8 73.8 71.7 70.0 67.7 77.8 70.4 63.5
Operating profit 19.7 12.0 14.0 36.0 20.0 20.1 31.1 34.2 81.7 105.4 121.7
OP margin 19.7 11.8 12.7 13.3 12.3 11.3 12.7 12.9 14.0 12.4 13.3
Net profit 17.2 11.8 12.9 30.1 17.0 17.1 25.7 28.2 72.0 88.1 100.5
NP margin 17.1 11.7 11.7 11.1 10.4 9.7 10.5 10.6 12.4 10.4 11.0
Source: Company data, KDB Daewoo Securities Research
Table 2. Earnings forecast revisions (under non-consolidated K-IFRS) (Wbn, %, %p)
Previous Revised % change
12F 13F 14F 12F 13F 14F 12F 13F 14F
Revenues 689 890 1,004 583 850 916 -15.4 -4.5 -8.8
Operating profit 90 108 131 82 105 122 -9.1 -2.2 -7.5
Net profit 77 89 107 72 88 101 -6.2 -1.0 -6.3
EPS 4,275 4,954 5,977 4,010 4,907 5,600 -6.2 -1.0 -6.3
OP margin 13.1 12.1 13.1 14.0 12.4 13.3 1.0 0.3 0.2
Net margin 11.1 10.0 10.7 12.4 10.4 11.0 1.2 0.4 0.3
Avg. F/X rate (W/US$) 1,126 1,064 1,045 1,126 1,064 1,045 0.0 0.0 0.0
Source: KDB Daewoo Securities Research
Figure 1. Quarterly earnings trend and forecasts Figure 2. Annual earnings trend and forecasts
Source: Company data, KDB Daewoo Securities Research Source: Company data, KDB Daewoo Securities Research
0
50
100
150
200
250
300
1Q07 1Q08 1Q09 1Q10 1Q11 1Q12F 1Q13F
-5
0
5
10
15
20
25
Process & Precision (L) Material handling systems (L)
OP margin (R)
(Wbn) (%)
2010: K-GAAP (completed-contract basis)2011~2: K-IFRS (percentage -of-completion basis)
0
200
400
600
800
1,000
2004 2006 2008 2010 2012F 2014F
0
4
8
12
16
20
Material handling systems (L)
Process & Precision (L)OP margin (R)
(Wbn) (%)
2010: K-GAAP (completed-contract basis)2011~12: K-IFRS (percentage-of-completion basis)
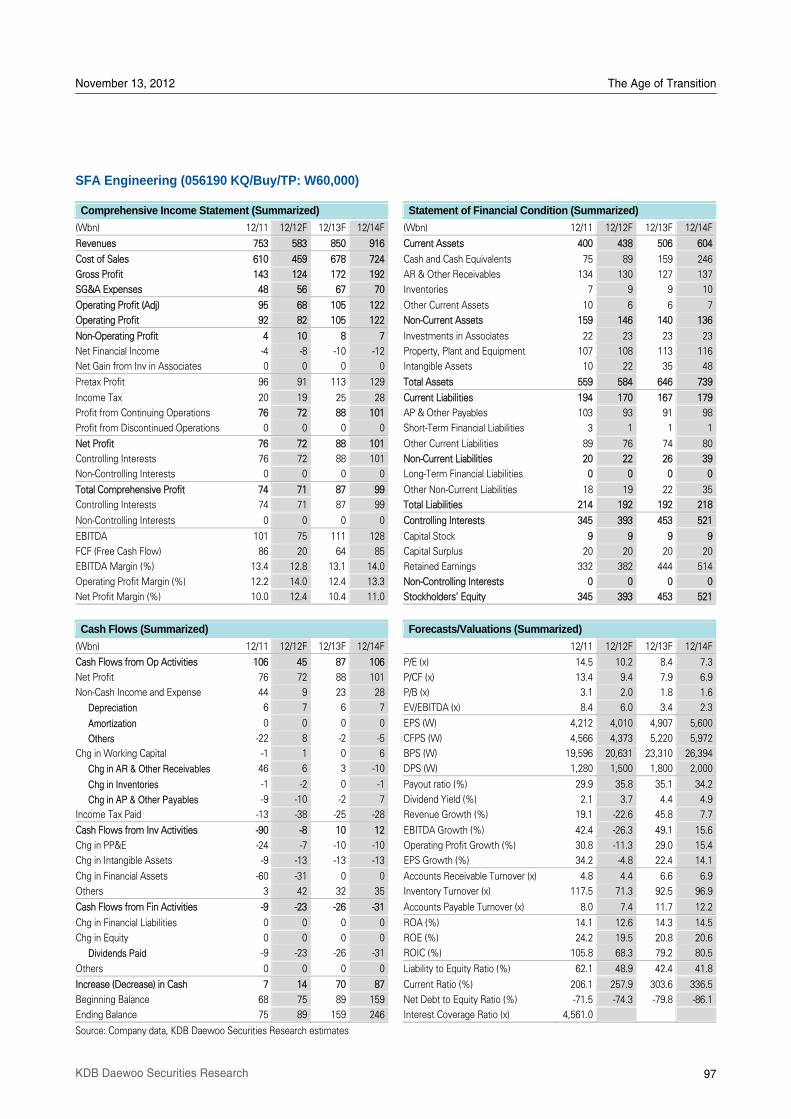
November 13, 2012 The Age of Transition
97 KDB Daewoo Securities Research
SFA Engineering (056190 KQ/Buy/TP: W60,000)
Comprehensive Income Statement (Summarized) Statement of Financial Condition (Summarized)
(Wbn) 12/11 12/12F 12/13F 12/14F (Wbn) 12/11 12/12F 12/13F 12/14F
Revenues 753 583 850 916 Current Assets 400 438 506 604
Cost of Sales 610 459 678 724 Cash and Cash Equivalents 75 89 159 246
Gross Profit 143 124 172 192 AR & Other Receivables 134 130 127 137
SG&A Expenses 48 56 67 70 Inventories 7 9 9 10
Operating Profit (Adj) 95 68 105 122 Other Current Assets 10 6 6 7
Operating Profit 92 82 105 122 Non-Current Assets 159 146 140 136
Non-Operating Profit 4 10 8 7 Investments in Associates 22 23 23 23
Net Financial Income -4 -8 -10 -12 Property, Plant and Equipment 107 108 113 116
Net Gain from Inv in Associates 0 0 0 0 Intangible Assets 10 22 35 48
Pretax Profit 96 91 113 129 Total Assets 559 584 646 739
Income Tax 20 19 25 28 Current Liabilities 194 170 167 179
Profit from Continuing Operations 76 72 88 101 AP & Other Payables 103 93 91 98
Profit from Discontinued Operations 0 0 0 0 Short-Term Financial Liabilities 3 1 1 1
Net Profit 76 72 88 101 Other Current Liabilities 89 76 74 80
Controlling Interests 76 72 88 101 Non-Current Liabilities 20 22 26 39
Non-Controlling Interests 0 0 0 0 Long-Term Financial Liabilities 0 0 0 0
Total Comprehensive Profit 74 71 87 99 Other Non-Current Liabilities 18 19 22 35
Controlling Interests 74 71 87 99 Total Liabilities 214 192 192 218
Non-Controlling Interests 0 0 0 0 Controlling Interests 345 393 453 521
EBITDA 101 75 111 128 Capital Stock 9 9 9 9
FCF (Free Cash Flow) 86 20 64 85 Capital Surplus 20 20 20 20
EBITDA Margin (%) 13.4 12.8 13.1 14.0 Retained Earnings 332 382 444 514
Operating Profit Margin (%) 12.2 14.0 12.4 13.3 Non-Controlling Interests 0 0 0 0
Net Profit Margin (%) 10.0 12.4 10.4 11.0 Stockholders' Equity 345 393 453 521
Cash Flows (Summarized) Forecasts/Valuations (Summarized)
(Wbn) 12/11 12/12F 12/13F 12/14F 12/11 12/12F 12/13F 12/14F
Cash Flows from Op Activities 106 45 87 106 P/E (x) 14.5 10.2 8.4 7.3
Net Profit 76 72 88 101 P/CF (x) 13.4 9.4 7.9 6.9
Non-Cash Income and Expense 44 9 23 28 P/B (x) 3.1 2.0 1.8 1.6
Depreciation 6 7 6 7 EV/EBITDA (x) 8.4 6.0 3.4 2.3
Amortization 0 0 0 0 EPS (W) 4,212 4,010 4,907 5,600
Others -22 8 -2 -5 CFPS (W) 4,566 4,373 5,220 5,972
Chg in Working Capital -1 1 0 6 BPS (W) 19,596 20,631 23,310 26,394
Chg in AR & Other Receivables 46 6 3 -10 DPS (W) 1,280 1,500 1,800 2,000
Chg in Inventories -1 -2 0 -1 Payout ratio (%) 29.9 35.8 35.1 34.2
Chg in AP & Other Payables -9 -10 -2 7 Dividend Yield (%) 2.1 3.7 4.4 4.9
Income Tax Paid -13 -38 -25 -28 Revenue Growth (%) 19.1 -22.6 45.8 7.7
Cash Flows from Inv Activities -90 -8 10 12 EBITDA Growth (%) 42.4 -26.3 49.1 15.6
Chg in PP&E -24 -7 -10 -10 Operating Profit Growth (%) 30.8 -11.3 29.0 15.4
Chg in Intangible Assets -9 -13 -13 -13 EPS Growth (%) 34.2 -4.8 22.4 14.1
Chg in Financial Assets -60 -31 0 0 Accounts Receivable Turnover (x) 4.8 4.4 6.6 6.9
Others 3 42 32 35 Inventory Turnover (x) 117.5 71.3 92.5 96.9
Cash Flows from Fin Activities -9 -23 -26 -31 Accounts Payable Turnover (x) 8.0 7.4 11.7 12.2
Chg in Financial Liabilities 0 0 0 0 ROA (%) 14.1 12.6 14.3 14.5
Chg in Equity 0 0 0 0 ROE (%) 24.2 19.5 20.8 20.6
Dividends Paid -9 -23 -26 -31 ROIC (%) 105.8 68.3 79.2 80.5
Others 0 0 0 0 Liability to Equity Ratio (%) 62.1 48.9 42.4 41.8
Increase (Decrease) in Cash 7 14 70 87 Current Ratio (%) 206.1 257.9 303.6 336.5
Beginning Balance 68 75 89 159 Net Debt to Equity Ratio (%) -71.5 -74.3 -79.8 -86.1
Ending Balance 75 89 159 246 Interest Coverage Ratio (x) 4,561.0
Source: Company data, KDB Daewoo Securities Research estimates
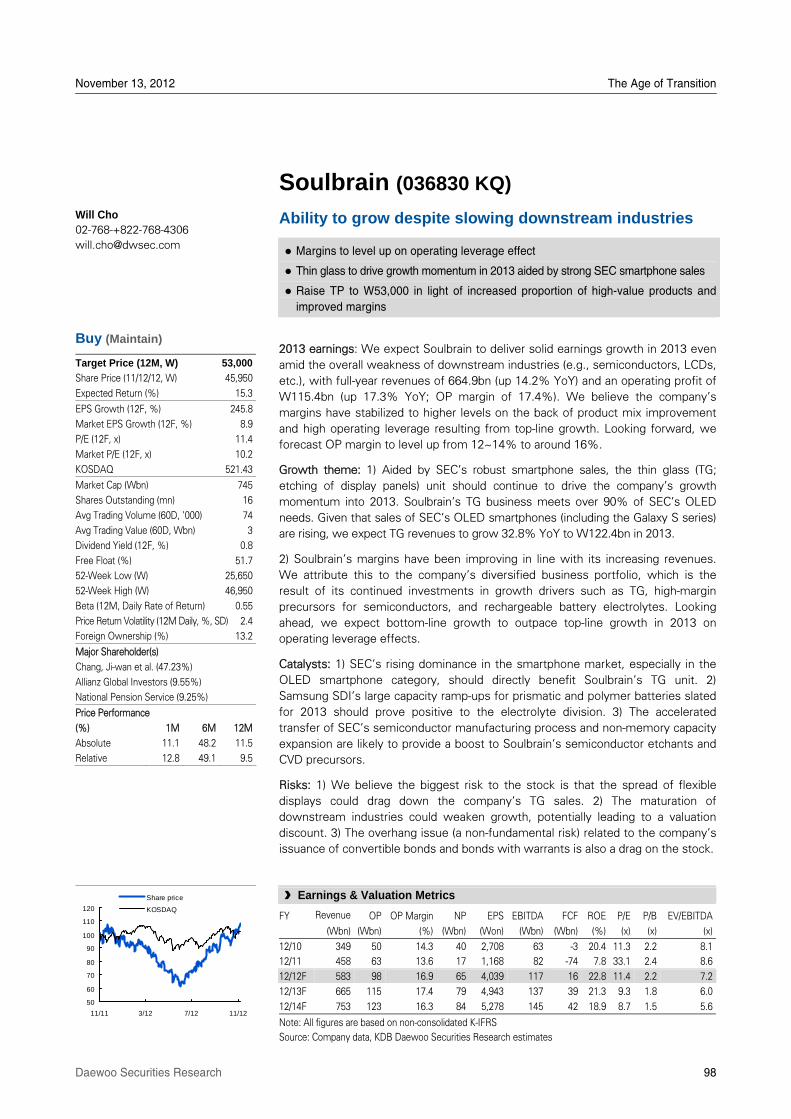
November 13, 2012 The Age of Transition
Daewoo Securities Research 98
Soulbrain (036830 KQ)
Ability to grow despite slowing downstream industries
Margins to level up on operating leverage effect
Thin glass to drive growth momentum in 2013 aided by strong SEC smartphone sales
Raise TP to W53,000 in light of increased proportion of high-value products and improved margins
2013 earnings: We expect Soulbrain to deliver solid earnings growth in 2013 even
amid the overall weakness of downstream industries (e.g., semiconductors, LCDs,
etc.), with full-year revenues of 664.9bn (up 14.2% YoY) and an operating profit of
W115.4bn (up 17.3% YoY; OP margin of 17.4%). We believe the companyÊs
margins have stabilized to higher levels on the back of product mix improvement
and high operating leverage resulting from top-line growth. Looking forward, we
forecast OP margin to level up from 12~14% to around 16%.
Growth theme: 1) Aided by SECÊs robust smartphone sales, the thin glass (TG;
etching of display panels) unit should continue to drive the companyÊs growth
momentum into 2013. SoulbrainÊs TG business meets over 90% of SECÊs OLED
needs. Given that sales of SECÊs OLED smartphones (including the Galaxy S series)
are rising, we expect TG revenues to grow 32.8% YoY to W122.4bn in 2013.
2) SoulbrainÊs margins have been improving in line with its increasing revenues.
We attribute this to the companyÊs diversified business portfolio, which is the
result of its continued investments in growth drivers such as TG, high-margin
precursors for semiconductors, and rechargeable battery electrolytes. Looking
ahead, we expect bottom-line growth to outpace top-line growth in 2013 on
operating leverage effects.
Catalysts: 1) SECÊs rising dominance in the smartphone market, especially in the
OLED smartphone category, should directly benefit SoulbrainÊs TG unit. 2)
Samsung SDIÊs large capacity ramp-ups for prismatic and polymer batteries slated
for 2013 should prove positive to the electrolyte division. 3) The accelerated
transfer of SECÊs semiconductor manufacturing process and non-memory capacity
expansion are likely to provide a boost to SoulbrainÊs semiconductor etchants and
CVD precursors.
Risks: 1) We believe the biggest risk to the stock is that the spread of flexible
displays could drag down the companyÊs TG sales. 2) The maturation of
downstream industries could weaken growth, potentially leading to a valuation
discount. 3) The overhang issue (a non-fundamental risk) related to the companyÊs
issuance of convertible bonds and bonds with warrants is also a drag on the stock.
Will Cho 02-768-+822-768-4306
Buy (Maintain)
Target Price (12M, W) 53,000
Share Price (11/12/12, W) 45,950
Expected Return (%) 15.3
EPS Growth (12F, %) 245.8
Market EPS Growth (12F, %) 8.9
P/E (12F, x) 11.4
Market P/E (12F, x) 10.2
KOSDAQ 521.43
Market Cap (Wbn) 745
Shares Outstanding (mn) 16
Avg Trading Volume (60D, '000) 74
Avg Trading Value (60D, Wbn) 3
Dividend Yield (12F, %) 0.8
Free Float (%) 51.7
52-Week Low (W) 25,650
52-Week High (W) 46,950
Beta (12M, Daily Rate of Return) 0.55
Price Return Volatility (12M Daily, %, SD) 2.4
Foreign Ownership (%) 13.2
Major Shareholder(s)
Chang, Ji-wan et al. (47.23%)
Allianz Global Investors (9.55%)
National Pension Service (9.25%)
Price Performance
(%) 1M 6M 12M
Absolute 11.1 48.2 11.5
Relative 12.8 49.1 9.5
50
60
70
80
90
100
110
120
11/11 3/12 7/12 11/12
Share price
KOSDAQ
§ Earnings & Valuation Metrics
FY Revenue OP OP Margin NP EPS EBITDA FCF ROE P/E P/B EV/EBITDA
(Wbn) (Wbn) (%) (Wbn) (Won) (Wbn) (Wbn) (%) (x) (x) (x)
12/10 349 50 14.3 40 2,708 63 -3 20.4 11.3 2.2 8.1
12/11 458 63 13.6 17 1,168 82 -74 7.8 33.1 2.4 8.6
12/12F 583 98 16.9 65 4,039 117 16 22.8 11.4 2.2 7.2
12/13F 665 115 17.4 79 4,943 137 39 21.3 9.3 1.8 6.0
12/14F 753 123 16.3 84 5,278 145 42 18.9 8.7 1.5 5.6
Note: All figures are based on non-consolidated K-IFRS
Source: Company data, KDB Daewoo Securities Research estimates
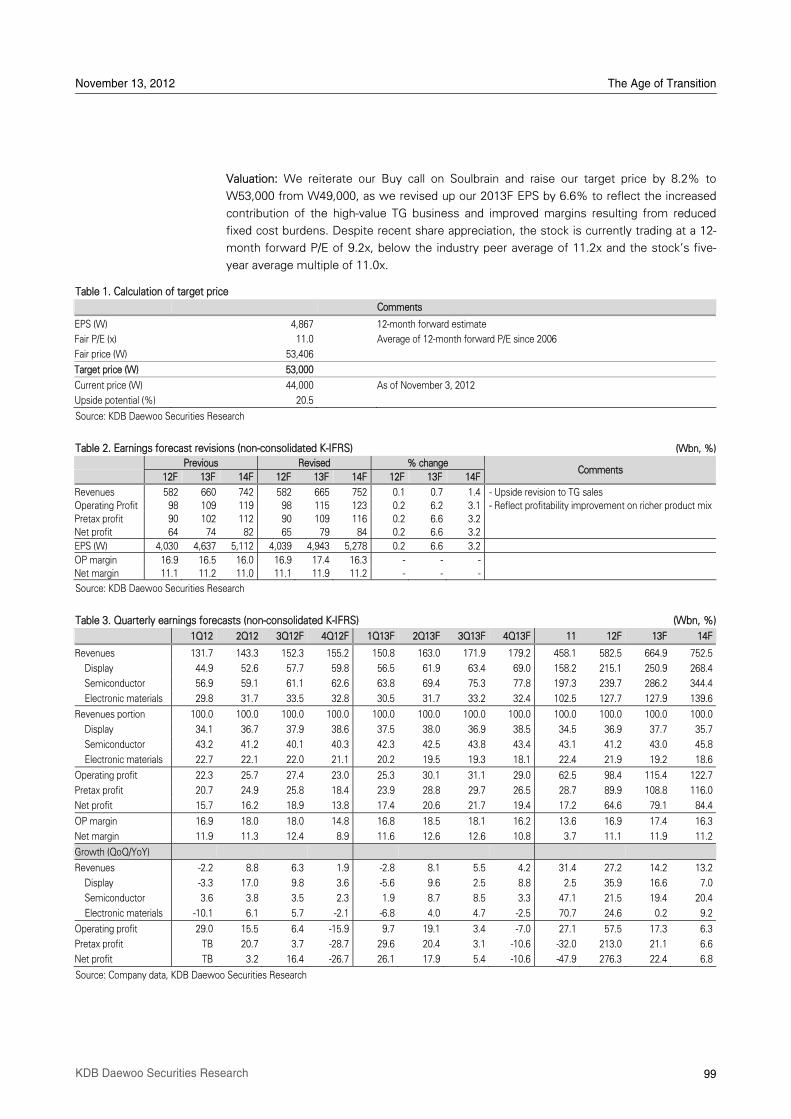
November 13, 2012 The Age of Transition
99 KDB Daewoo Securities Research
Valuation: We reiterate our Buy call on Soulbrain and raise our target price by 8.2% to
W53,000 from W49,000, as we revised up our 2013F EPS by 6.6% to reflect the increased
contribution of the high-value TG business and improved margins resulting from reduced
fixed cost burdens. Despite recent share appreciation, the stock is currently trading at a 12-
month forward P/E of 9.2x, below the industry peer average of 11.2x and the stockÊs five-
year average multiple of 11.0x.
Table 1. Calculation of target price
Comments
EPS (W) 4,867 12-month forward estimate
Fair P/E (x) 11.0 Average of 12-month forward P/E since 2006
Fair price (W) 53,406
Target price (W) 53,000
Current price (W) 44,000 As of November 3, 2012
Upside potential (%) 20.5
Source: KDB Daewoo Securities Research
Table 2. Earnings forecast revisions (non-consolidated K-IFRS) (Wbn, %)
Previous Revised % change
12F 13F 14F 12F 13F 14F 12F 13F 14FComments
Revenues 582 660 742 582 665 752 0.1 0.7 1.4 - Upside revision to TG sales
Operating Profit 98 109 119 98 115 123 0.2 6.2 3.1 - Reflect profitability improvement on richer product mix
Pretax profit 90 102 112 90 109 116 0.2 6.6 3.2 Net profit 64 74 82 65 79 84 0.2 6.6 3.2
EPS (W) 4,030 4,637 5,112 4,039 4,943 5,278 0.2 6.6 3.2
OP margin 16.9 16.5 16.0 16.9 17.4 16.3 - - -
Net margin 11.1 11.2 11.0 11.1 11.9 11.2 - - -
Source: KDB Daewoo Securities Research
Table 3. Quarterly earnings forecasts (non-consolidated K-IFRS) (Wbn, %)
1Q12 2Q12 3Q12F 4Q12F 1Q13F 2Q13F 3Q13F 4Q13F 11 12F 13F 14F
Revenues 131.7 143.3 152.3 155.2 150.8 163.0 171.9 179.2 458.1 582.5 664.9 752.5
Display 44.9 52.6 57.7 59.8 56.5 61.9 63.4 69.0 158.2 215.1 250.9 268.4
Semiconductor 56.9 59.1 61.1 62.6 63.8 69.4 75.3 77.8 197.3 239.7 286.2 344.4
Electronic materials 29.8 31.7 33.5 32.8 30.5 31.7 33.2 32.4 102.5 127.7 127.9 139.6
Revenues portion 100.0 100.0 100.0 100.0 100.0 100.0 100.0 100.0 100.0 100.0 100.0 100.0
Display 34.1 36.7 37.9 38.6 37.5 38.0 36.9 38.5 34.5 36.9 37.7 35.7
Semiconductor 43.2 41.2 40.1 40.3 42.3 42.5 43.8 43.4 43.1 41.2 43.0 45.8
Electronic materials 22.7 22.1 22.0 21.1 20.2 19.5 19.3 18.1 22.4 21.9 19.2 18.6
Operating profit 22.3 25.7 27.4 23.0 25.3 30.1 31.1 29.0 62.5 98.4 115.4 122.7
Pretax profit 20.7 24.9 25.8 18.4 23.9 28.8 29.7 26.5 28.7 89.9 108.8 116.0
Net profit 15.7 16.2 18.9 13.8 17.4 20.6 21.7 19.4 17.2 64.6 79.1 84.4
OP margin 16.9 18.0 18.0 14.8 16.8 18.5 18.1 16.2 13.6 16.9 17.4 16.3
Net margin 11.9 11.3 12.4 8.9 11.6 12.6 12.6 10.8 3.7 11.1 11.9 11.2
Growth (QoQ/YoY)
Revenues -2.2 8.8 6.3 1.9 -2.8 8.1 5.5 4.2 31.4 27.2 14.2 13.2
Display -3.3 17.0 9.8 3.6 -5.6 9.6 2.5 8.8 2.5 35.9 16.6 7.0
Semiconductor 3.6 3.8 3.5 2.3 1.9 8.7 8.5 3.3 47.1 21.5 19.4 20.4
Electronic materials -10.1 6.1 5.7 -2.1 -6.8 4.0 4.7 -2.5 70.7 24.6 0.2 9.2
Operating profit 29.0 15.5 6.4 -15.9 9.7 19.1 3.4 -7.0 27.1 57.5 17.3 6.3
Pretax profit TB 20.7 3.7 -28.7 29.6 20.4 3.1 -10.6 -32.0 213.0 21.1 6.6
Net profit TB 3.2 16.4 -26.7 26.1 17.9 5.4 -10.6 -47.9 276.3 22.4 6.8
Source: Company data, KDB Daewoo Securities Research
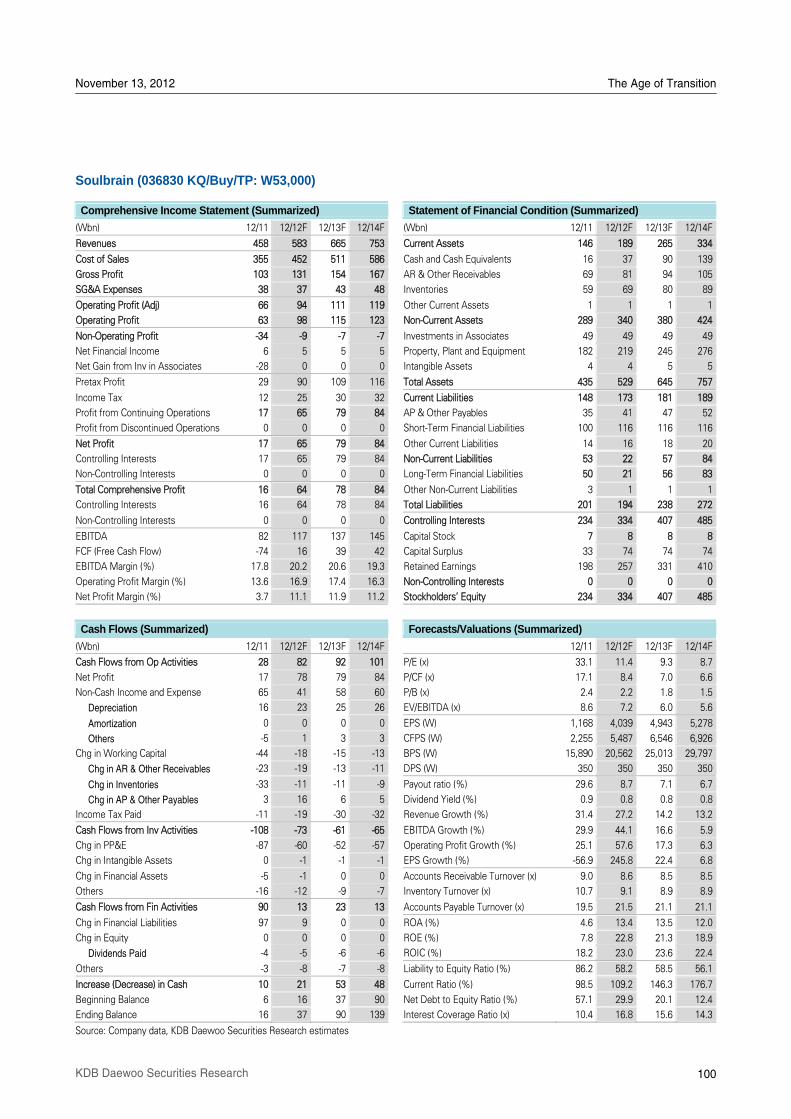
November 13, 2012 The Age of Transition
100 KDB Daewoo Securities Research
Soulbrain (036830 KQ/Buy/TP: W53,000)
Comprehensive Income Statement (Summarized) Statement of Financial Condition (Summarized)
(Wbn) 12/11 12/12F 12/13F 12/14F (Wbn) 12/11 12/12F 12/13F 12/14F
Revenues 458 583 665 753 Current Assets 146 189 265 334
Cost of Sales 355 452 511 586 Cash and Cash Equivalents 16 37 90 139
Gross Profit 103 131 154 167 AR & Other Receivables 69 81 94 105
SG&A Expenses 38 37 43 48 Inventories 59 69 80 89
Operating Profit (Adj) 66 94 111 119 Other Current Assets 1 1 1 1
Operating Profit 63 98 115 123 Non-Current Assets 289 340 380 424
Non-Operating Profit -34 -9 -7 -7 Investments in Associates 49 49 49 49
Net Financial Income 6 5 5 5 Property, Plant and Equipment 182 219 245 276
Net Gain from Inv in Associates -28 0 0 0 Intangible Assets 4 4 5 5
Pretax Profit 29 90 109 116 Total Assets 435 529 645 757
Income Tax 12 25 30 32 Current Liabilities 148 173 181 189
Profit from Continuing Operations 17 65 79 84 AP & Other Payables 35 41 47 52
Profit from Discontinued Operations 0 0 0 0 Short-Term Financial Liabilities 100 116 116 116
Net Profit 17 65 79 84 Other Current Liabilities 14 16 18 20
Controlling Interests 17 65 79 84 Non-Current Liabilities 53 22 57 84
Non-Controlling Interests 0 0 0 0 Long-Term Financial Liabilities 50 21 56 83
Total Comprehensive Profit 16 64 78 84 Other Non-Current Liabilities 3 1 1 1
Controlling Interests 16 64 78 84 Total Liabilities 201 194 238 272
Non-Controlling Interests 0 0 0 0 Controlling Interests 234 334 407 485
EBITDA 82 117 137 145 Capital Stock 7 8 8 8
FCF (Free Cash Flow) -74 16 39 42 Capital Surplus 33 74 74 74
EBITDA Margin (%) 17.8 20.2 20.6 19.3 Retained Earnings 198 257 331 410
Operating Profit Margin (%) 13.6 16.9 17.4 16.3 Non-Controlling Interests 0 0 0 0
Net Profit Margin (%) 3.7 11.1 11.9 11.2 Stockholders' Equity 234 334 407 485
Cash Flows (Summarized) Forecasts/Valuations (Summarized)
(Wbn) 12/11 12/12F 12/13F 12/14F 12/11 12/12F 12/13F 12/14F
Cash Flows from Op Activities 28 82 92 101 P/E (x) 33.1 11.4 9.3 8.7
Net Profit 17 78 79 84 P/CF (x) 17.1 8.4 7.0 6.6
Non-Cash Income and Expense 65 41 58 60 P/B (x) 2.4 2.2 1.8 1.5
Depreciation 16 23 25 26 EV/EBITDA (x) 8.6 7.2 6.0 5.6
Amortization 0 0 0 0 EPS (W) 1,168 4,039 4,943 5,278
Others -5 1 3 3 CFPS (W) 2,255 5,487 6,546 6,926
Chg in Working Capital -44 -18 -15 -13 BPS (W) 15,890 20,562 25,013 29,797
Chg in AR & Other Receivables -23 -19 -13 -11 DPS (W) 350 350 350 350
Chg in Inventories -33 -11 -11 -9 Payout ratio (%) 29.6 8.7 7.1 6.7
Chg in AP & Other Payables 3 16 6 5 Dividend Yield (%) 0.9 0.8 0.8 0.8
Income Tax Paid -11 -19 -30 -32 Revenue Growth (%) 31.4 27.2 14.2 13.2
Cash Flows from Inv Activities -108 -73 -61 -65 EBITDA Growth (%) 29.9 44.1 16.6 5.9
Chg in PP&E -87 -60 -52 -57 Operating Profit Growth (%) 25.1 57.6 17.3 6.3
Chg in Intangible Assets 0 -1 -1 -1 EPS Growth (%) -56.9 245.8 22.4 6.8
Chg in Financial Assets -5 -1 0 0 Accounts Receivable Turnover (x) 9.0 8.6 8.5 8.5
Others -16 -12 -9 -7 Inventory Turnover (x) 10.7 9.1 8.9 8.9
Cash Flows from Fin Activities 90 13 23 13 Accounts Payable Turnover (x) 19.5 21.5 21.1 21.1
Chg in Financial Liabilities 97 9 0 0 ROA (%) 4.6 13.4 13.5 12.0
Chg in Equity 0 0 0 0 ROE (%) 7.8 22.8 21.3 18.9
Dividends Paid -4 -5 -6 -6 ROIC (%) 18.2 23.0 23.6 22.4
Others -3 -8 -7 -8 Liability to Equity Ratio (%) 86.2 58.2 58.5 56.1
Increase (Decrease) in Cash 10 21 53 48 Current Ratio (%) 98.5 109.2 146.3 176.7
Beginning Balance 6 16 37 90 Net Debt to Equity Ratio (%) 57.1 29.9 20.1 12.4
Ending Balance 16 37 90 139 Interest Coverage Ratio (x) 10.4 16.8 15.6 14.3
Source: Company data, KDB Daewoo Securities Research estimates
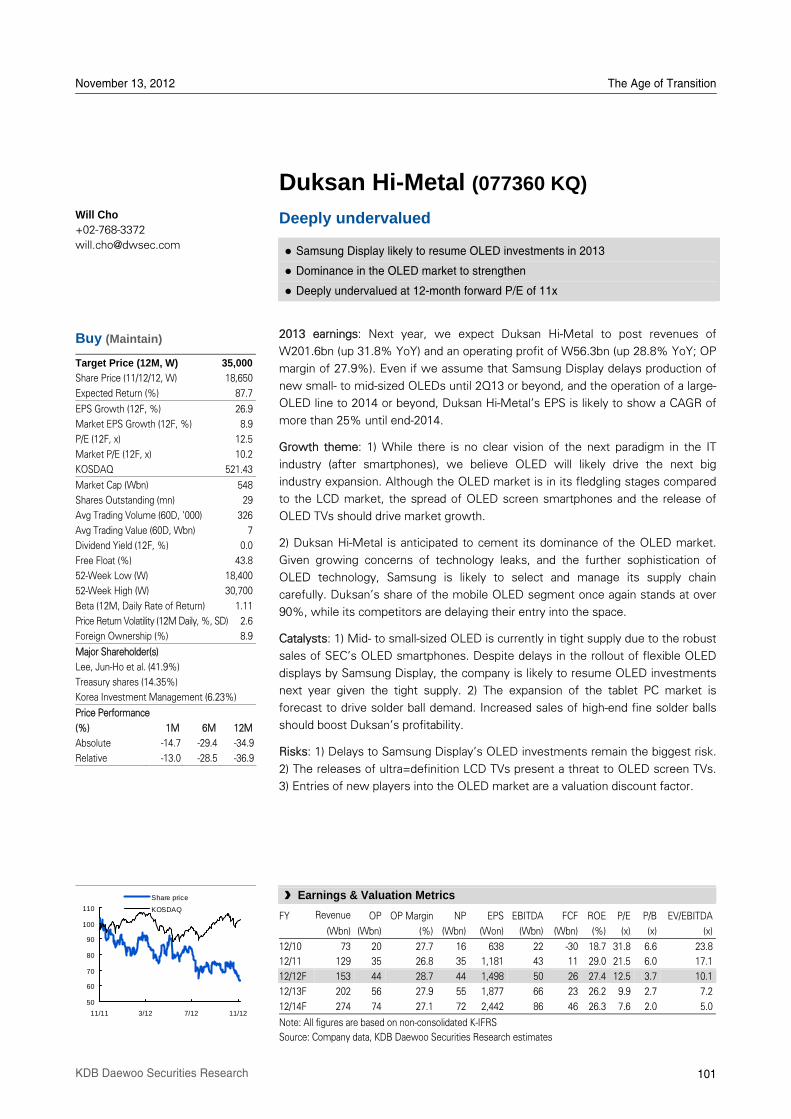
November 13, 2012 The Age of Transition
101 KDB Daewoo Securities Research
Duksan Hi-Metal (077360 KQ)
Deeply undervalued
Samsung Display likely to resume OLED investments in 2013
Dominance in the OLED market to strengthen
Deeply undervalued at 12-month forward P/E of 11x
2013 earnings: Next year, we expect Duksan Hi-Metal to post revenues of
W201.6bn (up 31.8% YoY) and an operating profit of W56.3bn (up 28.8% YoY; OP
margin of 27.9%). Even if we assume that Samsung Display delays production of
new small- to mid-sized OLEDs until 2Q13 or beyond, and the operation of a large-
OLED line to 2014 or beyond, Duksan Hi-MetalÊs EPS is likely to show a CAGR of
more than 25% until end-2014.
Growth theme: 1) While there is no clear vision of the next paradigm in the IT
industry (after smartphones), we believe OLED will likely drive the next big
industry expansion. Although the OLED market is in its fledgling stages compared
to the LCD market, the spread of OLED screen smartphones and the release of
OLED TVs should drive market growth.
2) Duksan Hi-Metal is anticipated to cement its dominance of the OLED market.
Given growing concerns of technology leaks, and the further sophistication of
OLED technology, Samsung is likely to select and manage its supply chain
carefully. DuksanÊs share of the mobile OLED segment once again stands at over
90%, while its competitors are delaying their entry into the space.
Catalysts: 1) Mid- to small-sized OLED is currently in tight supply due to the robust
sales of SECÊs OLED smartphones. Despite delays in the rollout of flexible OLED
displays by Samsung Display, the company is likely to resume OLED investments
next year given the tight supply. 2) The expansion of the tablet PC market is
forecast to drive solder ball demand. Increased sales of high-end fine solder balls
should boost DuksanÊs profitability.
Risks: 1) Delays to Samsung DisplayÊs OLED investments remain the biggest risk.
2) The releases of ultra=definition LCD TVs present a threat to OLED screen TVs.
3) Entries of new players into the OLED market are a valuation discount factor.
Will Cho +02-768-3372
Buy (Maintain)
Target Price (12M, W) 35,000
Share Price (11/12/12, W) 18,650
Expected Return (%) 87.7
EPS Growth (12F, %) 26.9
Market EPS Growth (12F, %) 8.9
P/E (12F, x) 12.5
Market P/E (12F, x) 10.2
KOSDAQ 521.43
Market Cap (Wbn) 548
Shares Outstanding (mn) 29
Avg Trading Volume (60D, '000) 326
Avg Trading Value (60D, Wbn) 7
Dividend Yield (12F, %) 0.0
Free Float (%) 43.8
52-Week Low (W) 18,400
52-Week High (W) 30,700
Beta (12M, Daily Rate of Return) 1.11
Price Return Volatility (12M Daily, %, SD) 2.6
Foreign Ownership (%) 8.9
Major Shareholder(s)
Lee, Jun-Ho et al. (41.9%)
Treasury shares (14.35%)
Korea Investment Management (6.23%)
Price Performance
(%) 1M 6M 12M
Absolute -14.7 -29.4 -34.9
Relative -13.0 -28.5 -36.9
50
60
70
80
90
100
110
11/11 3/12 7/12 11/12
Share price
KOSDAQ
§ Earnings & Valuation Metrics
FY Revenue OP OP Margin NP EPS EBITDA FCF ROE P/E P/B EV/EBITDA
(Wbn) (Wbn) (%) (Wbn) (Won) (Wbn) (Wbn) (%) (x) (x) (x)
12/10 73 20 27.7 16 638 22 -30 18.7 31.8 6.6 23.8
12/11 129 35 26.8 35 1,181 43 11 29.0 21.5 6.0 17.1
12/12F 153 44 28.7 44 1,498 50 26 27.4 12.5 3.7 10.1
12/13F 202 56 27.9 55 1,877 66 23 26.2 9.9 2.7 7.2
12/14F 274 74 27.1 72 2,442 86 46 26.3 7.6 2.0 5.0
Note: All figures are based on non-consolidated K-IFRS
Source: Company data, KDB Daewoo Securities Research estimates
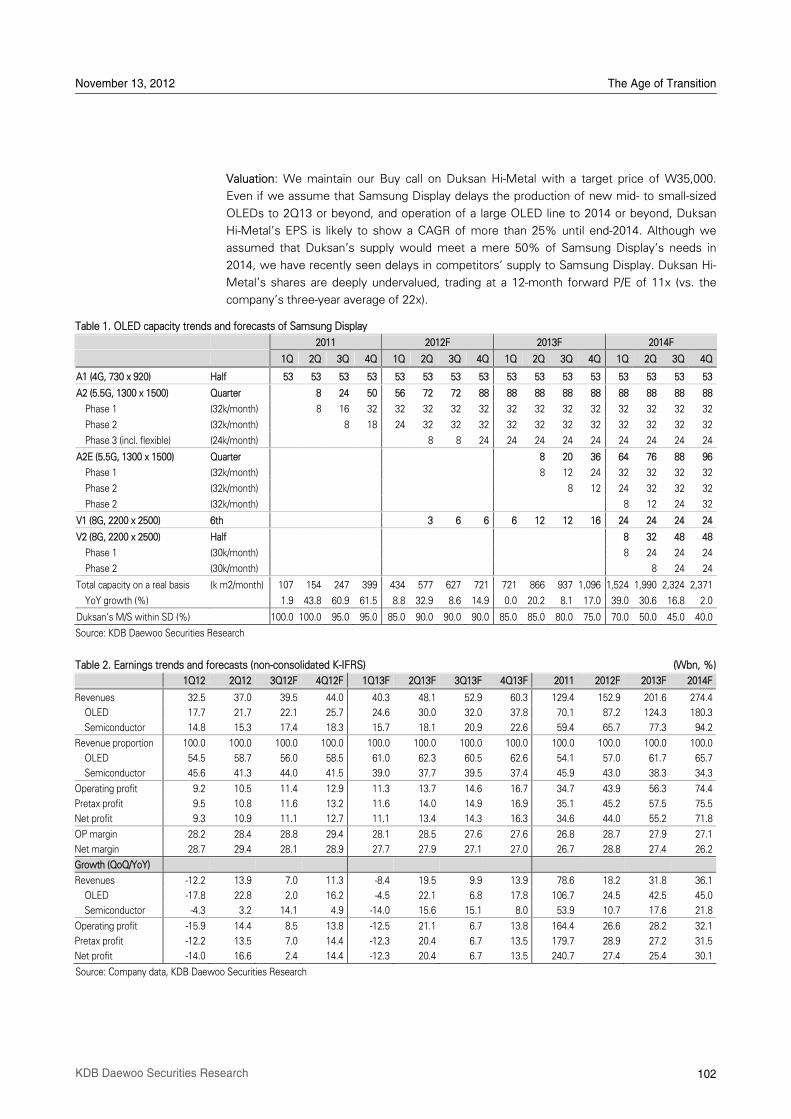
November 13, 2012 The Age of Transition
102 KDB Daewoo Securities Research
Valuation: We maintain our Buy call on Duksan Hi-Metal with a target price of W35,000.
Even if we assume that Samsung Display delays the production of new mid- to small-sized
OLEDs to 2Q13 or beyond, and operation of a large OLED line to 2014 or beyond, Duksan
Hi-MetalÊs EPS is likely to show a CAGR of more than 25% until end-2014. Although we
assumed that DuksanÊs supply would meet a mere 50% of Samsung DisplayÊs needs in
2014, we have recently seen delays in competitorsÊ supply to Samsung Display. Duksan Hi-
MetalÊs shares are deeply undervalued, trading at a 12-month forward P/E of 11x (vs. the
companyÊs three-year average of 22x).
Table 1. OLED capacity trends and forecasts of Samsung Display
2011 2012F 2013F 2014F
1Q 2Q 3Q 4Q 1Q 2Q 3Q 4Q 1Q 2Q 3Q 4Q 1Q 2Q 3Q 4Q
A1 (4G, 730 x 920) Half 53 53 53 53 53 53 53 53 53 53 53 53 53 53 53 53
A2 (5.5G, 1300 x 1500) Quarter 8 24 50 56 72 72 88 88 88 88 88 88 88 88 88
Phase 1 (32k/month) 8 16 32 32 32 32 32 32 32 32 32 32 32 32 32
Phase 2 (32k/month) 8 18 24 32 32 32 32 32 32 32 32 32 32 32
Phase 3 (incl. flexible) (24k/month) 8 8 24 24 24 24 24 24 24 24 24
A2E (5.5G, 1300 x 1500) Quarter 8 20 36 64 76 88 96
Phase 1 (32k/month) 8 12 24 32 32 32 32
Phase 2 (32k/month) 8 12 24 32 32 32
Phase 2 (32k/month) 8 12 24 32
V1 (8G, 2200 x 2500) 6th 3 6 6 6 12 12 16 24 24 24 24
V2 (8G, 2200 x 2500) Half 8 32 48 48
Phase 1 (30k/month) 8 24 24 24
Phase 2 (30k/month) 8 24 24
Total capacity on a real basis (k m2/month) 107 154 247 399 434 577 627 721 721 866 937 1,096 1,524 1,990 2,324 2,371
YoY growth (%) 1.9 43.8 60.9 61.5 8.8 32.9 8.6 14.9 0.0 20.2 8.1 17.0 39.0 30.6 16.8 2.0
Duksan's M/S within SD (%) 100.0 100.0 95.0 95.0 85.0 90.0 90.0 90.0 85.0 85.0 80.0 75.0 70.0 50.0 45.0 40.0
Source: KDB Daewoo Securities Research
Table 2. Earnings trends and forecasts (non-consolidated K-IFRS) (Wbn, %)
1Q12 2Q12 3Q12F 4Q12F 1Q13F 2Q13F 3Q13F 4Q13F 2011 2012F 2013F 2014F
Revenues 32.5 37.0 39.5 44.0 40.3 48.1 52.9 60.3 129.4 152.9 201.6 274.4
OLED 17.7 21.7 22.1 25.7 24.6 30.0 32.0 37.8 70.1 87.2 124.3 180.3
Semiconductor 14.8 15.3 17.4 18.3 15.7 18.1 20.9 22.6 59.4 65.7 77.3 94.2
Revenue proportion 100.0 100.0 100.0 100.0 100.0 100.0 100.0 100.0 100.0 100.0 100.0 100.0
OLED 54.5 58.7 56.0 58.5 61.0 62.3 60.5 62.6 54.1 57.0 61.7 65.7
Semiconductor 45.6 41.3 44.0 41.5 39.0 37.7 39.5 37.4 45.9 43.0 38.3 34.3
Operating profit 9.2 10.5 11.4 12.9 11.3 13.7 14.6 16.7 34.7 43.9 56.3 74.4
Pretax profit 9.5 10.8 11.6 13.2 11.6 14.0 14.9 16.9 35.1 45.2 57.5 75.5
Net profit 9.3 10.9 11.1 12.7 11.1 13.4 14.3 16.3 34.6 44.0 55.2 71.8
OP margin 28.2 28.4 28.8 29.4 28.1 28.5 27.6 27.6 26.8 28.7 27.9 27.1
Net margin 28.7 29.4 28.1 28.9 27.7 27.9 27.1 27.0 26.7 28.8 27.4 26.2
Growth (QoQ/YoY)
Revenues -12.2 13.9 7.0 11.3 -8.4 19.5 9.9 13.9 78.6 18.2 31.8 36.1
OLED -17.8 22.8 2.0 16.2 -4.5 22.1 6.8 17.8 106.7 24.5 42.5 45.0
Semiconductor -4.3 3.2 14.1 4.9 -14.0 15.6 15.1 8.0 53.9 10.7 17.6 21.8
Operating profit -15.9 14.4 8.5 13.8 -12.5 21.1 6.7 13.8 164.4 26.6 28.2 32.1
Pretax profit -12.2 13.5 7.0 14.4 -12.3 20.4 6.7 13.5 179.7 28.9 27.2 31.5
Net profit -14.0 16.6 2.4 14.4 -12.3 20.4 6.7 13.5 240.7 27.4 25.4 30.1
Source: Company data, KDB Daewoo Securities Research
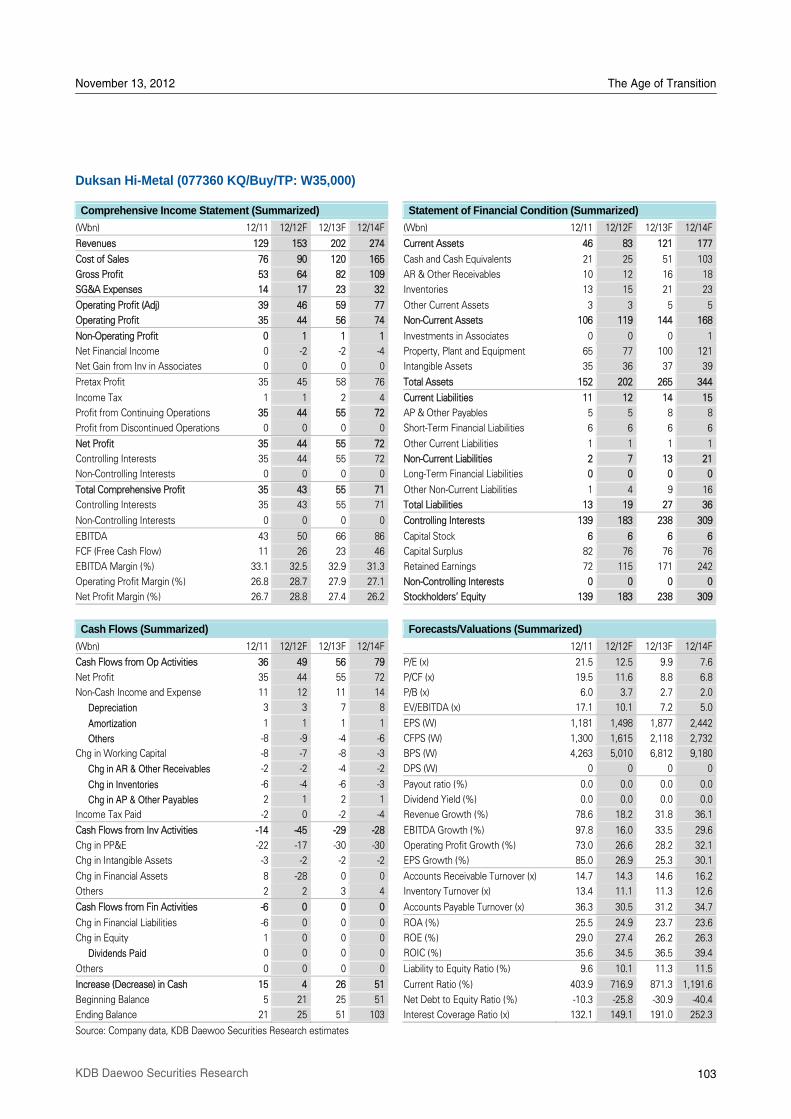
November 13, 2012 The Age of Transition
103 KDB Daewoo Securities Research
Duksan Hi-Metal (077360 KQ/Buy/TP: W35,000)
Comprehensive Income Statement (Summarized) Statement of Financial Condition (Summarized)
(Wbn) 12/11 12/12F 12/13F 12/14F (Wbn) 12/11 12/12F 12/13F 12/14F
Revenues 129 153 202 274 Current Assets 46 83 121 177
Cost of Sales 76 90 120 165 Cash and Cash Equivalents 21 25 51 103
Gross Profit 53 64 82 109 AR & Other Receivables 10 12 16 18
SG&A Expenses 14 17 23 32 Inventories 13 15 21 23
Operating Profit (Adj) 39 46 59 77 Other Current Assets 3 3 5 5
Operating Profit 35 44 56 74 Non-Current Assets 106 119 144 168
Non-Operating Profit 0 1 1 1 Investments in Associates 0 0 0 1
Net Financial Income 0 -2 -2 -4 Property, Plant and Equipment 65 77 100 121
Net Gain from Inv in Associates 0 0 0 0 Intangible Assets 35 36 37 39
Pretax Profit 35 45 58 76 Total Assets 152 202 265 344
Income Tax 1 1 2 4 Current Liabilities 11 12 14 15
Profit from Continuing Operations 35 44 55 72 AP & Other Payables 5 5 8 8
Profit from Discontinued Operations 0 0 0 0 Short-Term Financial Liabilities 6 6 6 6
Net Profit 35 44 55 72 Other Current Liabilities 1 1 1 1
Controlling Interests 35 44 55 72 Non-Current Liabilities 2 7 13 21
Non-Controlling Interests 0 0 0 0 Long-Term Financial Liabilities 0 0 0 0
Total Comprehensive Profit 35 43 55 71 Other Non-Current Liabilities 1 4 9 16
Controlling Interests 35 43 55 71 Total Liabilities 13 19 27 36
Non-Controlling Interests 0 0 0 0 Controlling Interests 139 183 238 309
EBITDA 43 50 66 86 Capital Stock 6 6 6 6
FCF (Free Cash Flow) 11 26 23 46 Capital Surplus 82 76 76 76
EBITDA Margin (%) 33.1 32.5 32.9 31.3 Retained Earnings 72 115 171 242
Operating Profit Margin (%) 26.8 28.7 27.9 27.1 Non-Controlling Interests 0 0 0 0
Net Profit Margin (%) 26.7 28.8 27.4 26.2 Stockholders' Equity 139 183 238 309
Cash Flows (Summarized) Forecasts/Valuations (Summarized)
(Wbn) 12/11 12/12F 12/13F 12/14F 12/11 12/12F 12/13F 12/14F
Cash Flows from Op Activities 36 49 56 79 P/E (x) 21.5 12.5 9.9 7.6
Net Profit 35 44 55 72 P/CF (x) 19.5 11.6 8.8 6.8
Non-Cash Income and Expense 11 12 11 14 P/B (x) 6.0 3.7 2.7 2.0
Depreciation 3 3 7 8 EV/EBITDA (x) 17.1 10.1 7.2 5.0
Amortization 1 1 1 1 EPS (W) 1,181 1,498 1,877 2,442
Others -8 -9 -4 -6 CFPS (W) 1,300 1,615 2,118 2,732
Chg in Working Capital -8 -7 -8 -3 BPS (W) 4,263 5,010 6,812 9,180
Chg in AR & Other Receivables -2 -2 -4 -2 DPS (W) 0 0 0 0
Chg in Inventories -6 -4 -6 -3 Payout ratio (%) 0.0 0.0 0.0 0.0
Chg in AP & Other Payables 2 1 2 1 Dividend Yield (%) 0.0 0.0 0.0 0.0
Income Tax Paid -2 0 -2 -4 Revenue Growth (%) 78.6 18.2 31.8 36.1
Cash Flows from Inv Activities -14 -45 -29 -28 EBITDA Growth (%) 97.8 16.0 33.5 29.6
Chg in PP&E -22 -17 -30 -30 Operating Profit Growth (%) 73.0 26.6 28.2 32.1
Chg in Intangible Assets -3 -2 -2 -2 EPS Growth (%) 85.0 26.9 25.3 30.1
Chg in Financial Assets 8 -28 0 0 Accounts Receivable Turnover (x) 14.7 14.3 14.6 16.2
Others 2 2 3 4 Inventory Turnover (x) 13.4 11.1 11.3 12.6
Cash Flows from Fin Activities -6 0 0 0 Accounts Payable Turnover (x) 36.3 30.5 31.2 34.7
Chg in Financial Liabilities -6 0 0 0 ROA (%) 25.5 24.9 23.7 23.6
Chg in Equity 1 0 0 0 ROE (%) 29.0 27.4 26.2 26.3
Dividends Paid 0 0 0 0 ROIC (%) 35.6 34.5 36.5 39.4
Others 0 0 0 0 Liability to Equity Ratio (%) 9.6 10.1 11.3 11.5
Increase (Decrease) in Cash 15 4 26 51 Current Ratio (%) 403.9 716.9 871.3 1,191.6
Beginning Balance 5 21 25 51 Net Debt to Equity Ratio (%) -10.3 -25.8 -30.9 -40.4
Ending Balance 21 25 51 103 Interest Coverage Ratio (x) 132.1 149.1 191.0 252.3
Source: Company data, KDB Daewoo Securities Research estimates
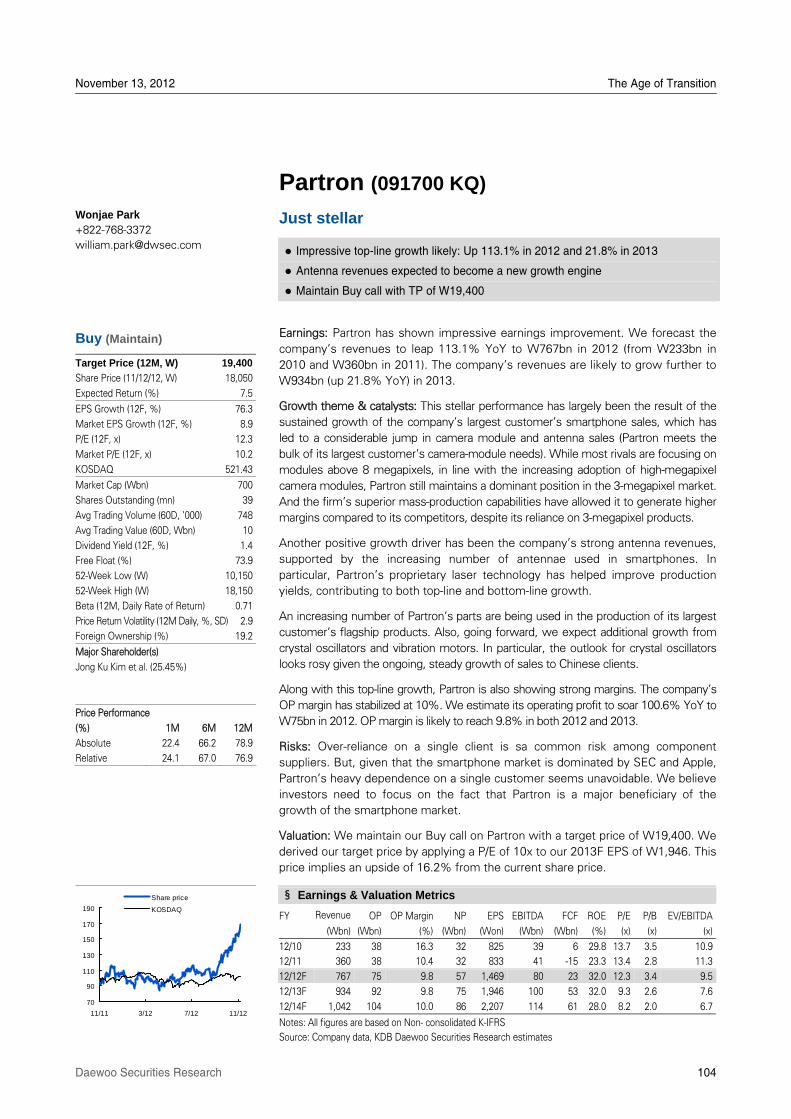
November 13, 2012 The Age of Transition
Daewoo Securities Research 104
Partron (091700 KQ)
Just stellar
Impressive top-line growth likely: Up 113.1% in 2012 and 21.8% in 2013
Antenna revenues expected to become a new growth engine
Maintain Buy call with TP of W19,400
Earnings: Partron has shown impressive earnings improvement. We forecast the
companyÊs revenues to leap 113.1% YoY to W767bn in 2012 (from W233bn in
2010 and W360bn in 2011). The companyÊs revenues are likely to grow further to
W934bn (up 21.8% YoY) in 2013.
Growth theme & catalysts: This stellar performance has largely been the result of the
sustained growth of the companyÊs largest customerÊs smartphone sales, which has
led to a considerable jump in camera module and antenna sales (Partron meets the
bulk of its largest customerÊs camera-module needs). While most rivals are focusing on
modules above 8 megapixels, in line with the increasing adoption of high-megapixel
camera modules, Partron still maintains a dominant position in the 3-megapixel market.
And the firmÊs superior mass-production capabilities have allowed it to generate higher
margins compared to its competitors, despite its reliance on 3-megapixel products.
Another positive growth driver has been the companyÊs strong antenna revenues,
supported by the increasing number of antennae used in smartphones. In
particular, PartronÊs proprietary laser technology has helped improve production
yields, contributing to both top-line and bottom-line growth.
An increasing number of PartronÊs parts are being used in the production of its largest
customerÊs flagship products. Also, going forward, we expect additional growth from
crystal oscillators and vibration motors. In particular, the outlook for crystal oscillators
looks rosy given the ongoing, steady growth of sales to Chinese clients.
Along with this top-line growth, Partron is also showing strong margins. The companyÊs
OP margin has stabilized at 10%. We estimate its operating profit to soar 100.6% YoY to
W75bn in 2012. OP margin is likely to reach 9.8% in both 2012 and 2013.
Risks: Over-reliance on a single client is sa common risk among component
suppliers. But, given that the smartphone market is dominated by SEC and Apple,
PartronÊs heavy dependence on a single customer seems unavoidable. We believe
investors need to focus on the fact that Partron is a major beneficiary of the
growth of the smartphone market.
Valuation: We maintain our Buy call on Partron with a target price of W19,400. We
derived our target price by applying a P/E of 10x to our 2013F EPS of W1,946. This
price implies an upside of 16.2% from the current share price.
Wonjae Park +822-768-3372
Buy (Maintain)
Target Price (12M, W) 19,400
Share Price (11/12/12, W) 18,050
Expected Return (%) 7.5
EPS Growth (12F, %) 76.3
Market EPS Growth (12F, %) 8.9
P/E (12F, x) 12.3
Market P/E (12F, x) 10.2
KOSDAQ 521.43
Market Cap (Wbn) 700
Shares Outstanding (mn) 39
Avg Trading Volume (60D, '000) 748
Avg Trading Value (60D, Wbn) 10
Dividend Yield (12F, %) 1.4
Free Float (%) 73.9
52-Week Low (W) 10,150
52-Week High (W) 18,150
Beta (12M, Daily Rate of Return) 0.71
Price Return Volatility (12M Daily, %, SD) 2.9
Foreign Ownership (%) 19.2
Major Shareholder(s)
Jong Ku Kim et al. (25.45%)
Price Performance
(%) 1M 6M 12M
Absolute 22.4 66.2 78.9
Relative 24.1 67.0 76.9
70
90
110
130
150
170
190
11/11 3/12 7/12 11/12
Share price
KOSDAQ
§ Earnings & Valuation Metrics
FY Revenue OP OP Margin NP EPS EBITDA FCF ROE P/E P/B EV/EBITDA
(Wbn) (Wbn) (%) (Wbn) (Won) (Wbn) (Wbn) (%) (x) (x) (x)
12/10 233 38 16.3 32 825 39 6 29.8 13.7 3.5 10.9
12/11 360 38 10.4 32 833 41 -15 23.3 13.4 2.8 11.3
12/12F 767 75 9.8 57 1,469 80 23 32.0 12.3 3.4 9.5
12/13F 934 92 9.8 75 1,946 100 53 32.0 9.3 2.6 7.6
12/14F 1,042 104 10.0 86 2,207 114 61 28.0 8.2 2.0 6.7
Notes: All figures are based on Non- consolidated K-IFRS
Source: Company data, KDB Daewoo Securities Research estimates
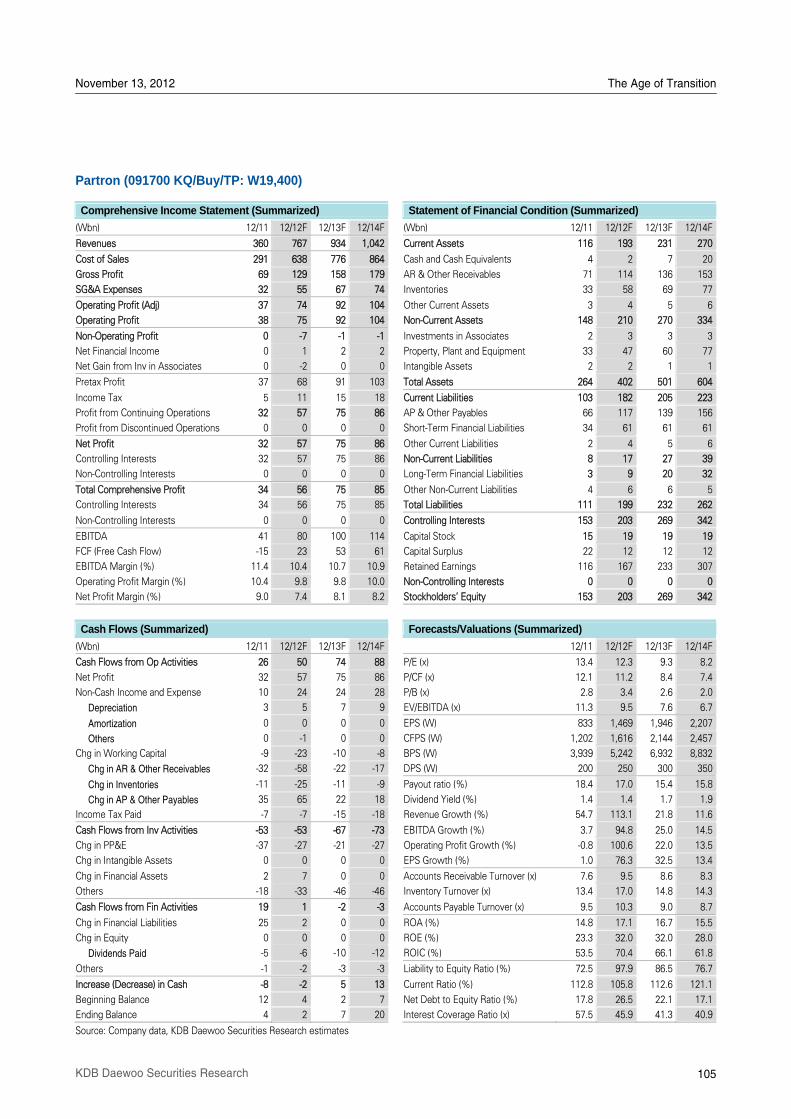
November 13, 2012 The Age of Transition
105 KDB Daewoo Securities Research
Partron (091700 KQ/Buy/TP: W19,400)
Comprehensive Income Statement (Summarized) Statement of Financial Condition (Summarized)
(Wbn) 12/11 12/12F 12/13F 12/14F (Wbn) 12/11 12/12F 12/13F 12/14F
Revenues 360 767 934 1,042 Current Assets 116 193 231 270
Cost of Sales 291 638 776 864 Cash and Cash Equivalents 4 2 7 20
Gross Profit 69 129 158 179 AR & Other Receivables 71 114 136 153
SG&A Expenses 32 55 67 74 Inventories 33 58 69 77
Operating Profit (Adj) 37 74 92 104 Other Current Assets 3 4 5 6
Operating Profit 38 75 92 104 Non-Current Assets 148 210 270 334
Non-Operating Profit 0 -7 -1 -1 Investments in Associates 2 3 3 3
Net Financial Income 0 1 2 2 Property, Plant and Equipment 33 47 60 77
Net Gain from Inv in Associates 0 -2 0 0 Intangible Assets 2 2 1 1
Pretax Profit 37 68 91 103 Total Assets 264 402 501 604
Income Tax 5 11 15 18 Current Liabilities 103 182 205 223
Profit from Continuing Operations 32 57 75 86 AP & Other Payables 66 117 139 156
Profit from Discontinued Operations 0 0 0 0 Short-Term Financial Liabilities 34 61 61 61
Net Profit 32 57 75 86 Other Current Liabilities 2 4 5 6
Controlling Interests 32 57 75 86 Non-Current Liabilities 8 17 27 39
Non-Controlling Interests 0 0 0 0 Long-Term Financial Liabilities 3 9 20 32
Total Comprehensive Profit 34 56 75 85 Other Non-Current Liabilities 4 6 6 5
Controlling Interests 34 56 75 85 Total Liabilities 111 199 232 262
Non-Controlling Interests 0 0 0 0 Controlling Interests 153 203 269 342
EBITDA 41 80 100 114 Capital Stock 15 19 19 19
FCF (Free Cash Flow) -15 23 53 61 Capital Surplus 22 12 12 12
EBITDA Margin (%) 11.4 10.4 10.7 10.9 Retained Earnings 116 167 233 307
Operating Profit Margin (%) 10.4 9.8 9.8 10.0 Non-Controlling Interests 0 0 0 0
Net Profit Margin (%) 9.0 7.4 8.1 8.2 Stockholders' Equity 153 203 269 342
Cash Flows (Summarized) Forecasts/Valuations (Summarized)
(Wbn) 12/11 12/12F 12/13F 12/14F 12/11 12/12F 12/13F 12/14F
Cash Flows from Op Activities 26 50 74 88 P/E (x) 13.4 12.3 9.3 8.2
Net Profit 32 57 75 86 P/CF (x) 12.1 11.2 8.4 7.4
Non-Cash Income and Expense 10 24 24 28 P/B (x) 2.8 3.4 2.6 2.0
Depreciation 3 5 7 9 EV/EBITDA (x) 11.3 9.5 7.6 6.7
Amortization 0 0 0 0 EPS (W) 833 1,469 1,946 2,207
Others 0 -1 0 0 CFPS (W) 1,202 1,616 2,144 2,457
Chg in Working Capital -9 -23 -10 -8 BPS (W) 3,939 5,242 6,932 8,832
Chg in AR & Other Receivables -32 -58 -22 -17 DPS (W) 200 250 300 350
Chg in Inventories -11 -25 -11 -9 Payout ratio (%) 18.4 17.0 15.4 15.8
Chg in AP & Other Payables 35 65 22 18 Dividend Yield (%) 1.4 1.4 1.7 1.9
Income Tax Paid -7 -7 -15 -18 Revenue Growth (%) 54.7 113.1 21.8 11.6
Cash Flows from Inv Activities -53 -53 -67 -73 EBITDA Growth (%) 3.7 94.8 25.0 14.5
Chg in PP&E -37 -27 -21 -27 Operating Profit Growth (%) -0.8 100.6 22.0 13.5
Chg in Intangible Assets 0 0 0 0 EPS Growth (%) 1.0 76.3 32.5 13.4
Chg in Financial Assets 2 7 0 0 Accounts Receivable Turnover (x) 7.6 9.5 8.6 8.3
Others -18 -33 -46 -46 Inventory Turnover (x) 13.4 17.0 14.8 14.3
Cash Flows from Fin Activities 19 1 -2 -3 Accounts Payable Turnover (x) 9.5 10.3 9.0 8.7
Chg in Financial Liabilities 25 2 0 0 ROA (%) 14.8 17.1 16.7 15.5
Chg in Equity 0 0 0 0 ROE (%) 23.3 32.0 32.0 28.0
Dividends Paid -5 -6 -10 -12 ROIC (%) 53.5 70.4 66.1 61.8
Others -1 -2 -3 -3 Liability to Equity Ratio (%) 72.5 97.9 86.5 76.7
Increase (Decrease) in Cash -8 -2 5 13 Current Ratio (%) 112.8 105.8 112.6 121.1
Beginning Balance 12 4 2 7 Net Debt to Equity Ratio (%) 17.8 26.5 22.1 17.1
Ending Balance 4 2 7 20 Interest Coverage Ratio (x) 57.5 45.9 41.3 40.9
Source: Company data, KDB Daewoo Securities Research estimates
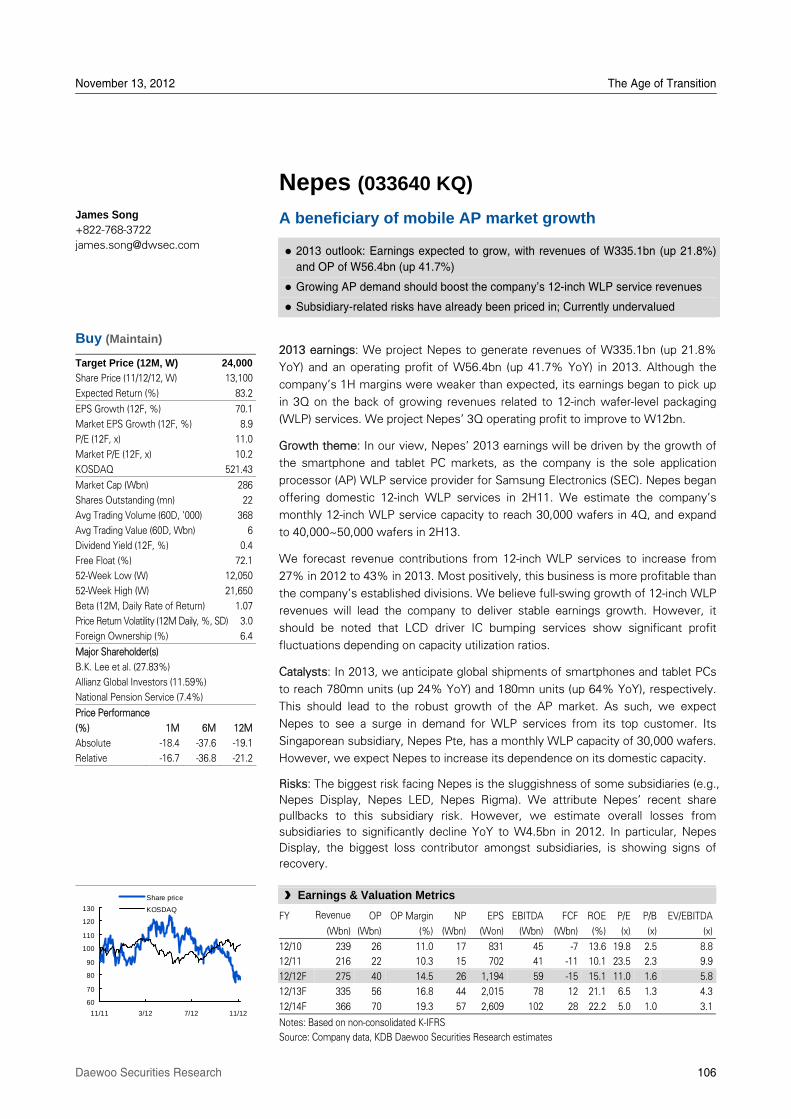
November 13, 2012 The Age of Transition
Daewoo Securities Research 106
Nepes (033640 KQ)
A beneficiary of mobile AP market growth
2013 outlook: Earnings expected to grow, with revenues of W335.1bn (up 21.8%) and OP of W56.4bn (up 41.7%)
Growing AP demand should boost the company’s 12-inch WLP service revenues
Subsidiary-related risks have already been priced in; Currently undervalued
2013 earnings: We project Nepes to generate revenues of W335.1bn (up 21.8%
YoY) and an operating profit of W56.4bn (up 41.7% YoY) in 2013. Although the
companyÊs 1H margins were weaker than expected, its earnings began to pick up
in 3Q on the back of growing revenues related to 12-inch wafer-level packaging
(WLP) services. We project NepesÊ 3Q operating profit to improve to W12bn.
Growth theme: In our view, NepesÊ 2013 earnings will be driven by the growth of
the smartphone and tablet PC markets, as the company is the sole application
processor (AP) WLP service provider for Samsung Electronics (SEC). Nepes began
offering domestic 12-inch WLP services in 2H11. We estimate the companyÊs
monthly 12-inch WLP service capacity to reach 30,000 wafers in 4Q, and expand
to 40,000~50,000 wafers in 2H13.
We forecast revenue contributions from 12-inch WLP services to increase from
27% in 2012 to 43% in 2013. Most positively, this business is more profitable than
the companyÊs established divisions. We believe full-swing growth of 12-inch WLP
revenues will lead the company to deliver stable earnings growth. However, it
should be noted that LCD driver IC bumping services show significant profit
fluctuations depending on capacity utilization ratios.
Catalysts: In 2013, we anticipate global shipments of smartphones and tablet PCs
to reach 780mn units (up 24% YoY) and 180mn units (up 64% YoY), respectively.
This should lead to the robust growth of the AP market. As such, we expect
Nepes to see a surge in demand for WLP services from its top customer. Its
Singaporean subsidiary, Nepes Pte, has a monthly WLP capacity of 30,000 wafers.
However, we expect Nepes to increase its dependence on its domestic capacity.
Risks: The biggest risk facing Nepes is the sluggishness of some subsidiaries (e.g.,
Nepes Display, Nepes LED, Nepes Rigma). We attribute NepesÊ recent share
pullbacks to this subsidiary risk. However, we estimate overall losses from
subsidiaries to significantly decline YoY to W4.5bn in 2012. In particular, Nepes
Display, the biggest loss contributor amongst subsidiaries, is showing signs of
recovery.
James Song +822-768-3722
Buy (Maintain)
Target Price (12M, W) 24,000
Share Price (11/12/12, W) 13,100
Expected Return (%) 83.2
EPS Growth (12F, %) 70.1
Market EPS Growth (12F, %) 8.9
P/E (12F, x) 11.0
Market P/E (12F, x) 10.2
KOSDAQ 521.43
Market Cap (Wbn) 286
Shares Outstanding (mn) 22
Avg Trading Volume (60D, '000) 368
Avg Trading Value (60D, Wbn) 6
Dividend Yield (12F, %) 0.4
Free Float (%) 72.1
52-Week Low (W) 12,050
52-Week High (W) 21,650
Beta (12M, Daily Rate of Return) 1.07
Price Return Volatility (12M Daily, %, SD) 3.0
Foreign Ownership (%) 6.4
Major Shareholder(s)
B.K. Lee et al. (27.83%)
Allianz Global Investors (11.59%)
National Pension Service (7.4%)
Price Performance
(%) 1M 6M 12M
Absolute -18.4 -37.6 -19.1
Relative -16.7 -36.8 -21.2
60
70
80
90
100
110
120
130
11/11 3/12 7/12 11/12
Share price
KOSDAQ
§ Earnings & Valuation Metrics
FY Revenue OP OP Margin NP EPS EBITDA FCF ROE P/E P/B EV/EBITDA
(Wbn) (Wbn) (%) (Wbn) (Won) (Wbn) (Wbn) (%) (x) (x) (x)
12/10 239 26 11.0 17 831 45 -7 13.6 19.8 2.5 8.8
12/11 216 22 10.3 15 702 41 -11 10.1 23.5 2.3 9.9
12/12F 275 40 14.5 26 1,194 59 -15 15.1 11.0 1.6 5.8
12/13F 335 56 16.8 44 2,015 78 12 21.1 6.5 1.3 4.3
12/14F 366 70 19.3 57 2,609 102 28 22.2 5.0 1.0 3.1
Notes: Based on non-consolidated K-IFRS
Source: Company data, KDB Daewoo Securities Research estimates
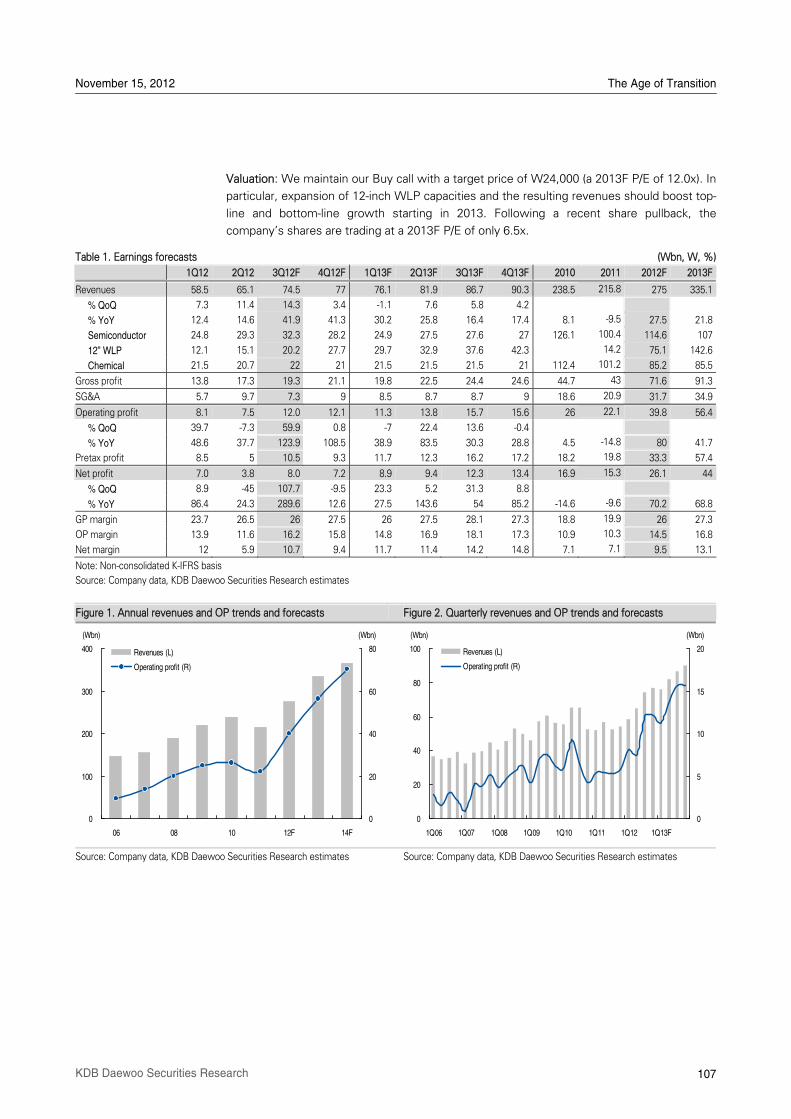
November 15, 2012 The Age of Transition
107 KDB Daewoo Securities Research
Valuation: We maintain our Buy call with a target price of W24,000 (a 2013F P/E of 12.0x). In
particular, expansion of 12-inch WLP capacities and the resulting revenues should boost top-
line and bottom-line growth starting in 2013. Following a recent share pullback, the
companyÊs shares are trading at a 2013F P/E of only 6.5x.
Table 1. Earnings forecasts (Wbn, W, %)
1Q12 2Q12 3Q12F 4Q12F 1Q13F 2Q13F 3Q13F 4Q13F 2010 2011 2012F 2013F
Revenues 58.5 65.1 74.5 77 76.1 81.9 86.7 90.3 238.5 215.8 275 335.1
% QoQ 7.3 11.4 14.3 3.4 -1.1 7.6 5.8 4.2
% YoY 12.4 14.6 41.9 41.3 30.2 25.8 16.4 17.4 8.1 -9.5 27.5 21.8
Semiconductor 24.8 29.3 32.3 28.2 24.9 27.5 27.6 27 126.1 100.4 114.6 107
12‰ WLP 12.1 15.1 20.2 27.7 29.7 32.9 37.6 42.3 14.2 75.1 142.6
Chemical 21.5 20.7 22 21 21.5 21.5 21.5 21 112.4 101.2 85.2 85.5
Gross profit 13.8 17.3 19.3 21.1 19.8 22.5 24.4 24.6 44.7 43 71.6 91.3
SG&A 5.7 9.7 7.3 9 8.5 8.7 8.7 9 18.6 20.9 31.7 34.9
Operating profit 8.1 7.5 12.0 12.1 11.3 13.8 15.7 15.6 26 22.1 39.8 56.4
% QoQ 39.7 -7.3 59.9 0.8 -7 22.4 13.6 -0.4
% YoY 48.6 37.7 123.9 108.5 38.9 83.5 30.3 28.8 4.5 -14.8 80 41.7
Pretax profit 8.5 5 10.5 9.3 11.7 12.3 16.2 17.2 18.2 19.8 33.3 57.4
Net profit 7.0 3.8 8.0 7.2 8.9 9.4 12.3 13.4 16.9 15.3 26.1 44
% QoQ 8.9 -45 107.7 -9.5 23.3 5.2 31.3 8.8
% YoY 86.4 24.3 289.6 12.6 27.5 143.6 54 85.2 -14.6 -9.6 70.2 68.8
GP margin 23.7 26.5 26 27.5 26 27.5 28.1 27.3 18.8 19.9 26 27.3
OP margin 13.9 11.6 16.2 15.8 14.8 16.9 18.1 17.3 10.9 10.3 14.5 16.8
Net margin 12 5.9 10.7 9.4 11.7 11.4 14.2 14.8 7.1 7.1 9.5 13.1
Note: Non-consolidated K-IFRS basis
Source: Company data, KDB Daewoo Securities Research estimates
Figure 1. Annual revenues and OP trends and forecasts Figure 2. Quarterly revenues and OP trends and forecasts
Source: Company data, KDB Daewoo Securities Research estimates Source: Company data, KDB Daewoo Securities Research estimates
0
100
200
300
400
06 08 10 12F 14F
0
20
40
60
80Revenues (L)
Operating profit (R)
(Wbn) (Wbn)
0
20
40
60
80
100
1Q06 1Q07 1Q08 1Q09 1Q10 1Q11 1Q12 1Q13F
0
5
10
15
20Revenues (L)
Operating profit (R)
(Wbn) (Wbn)
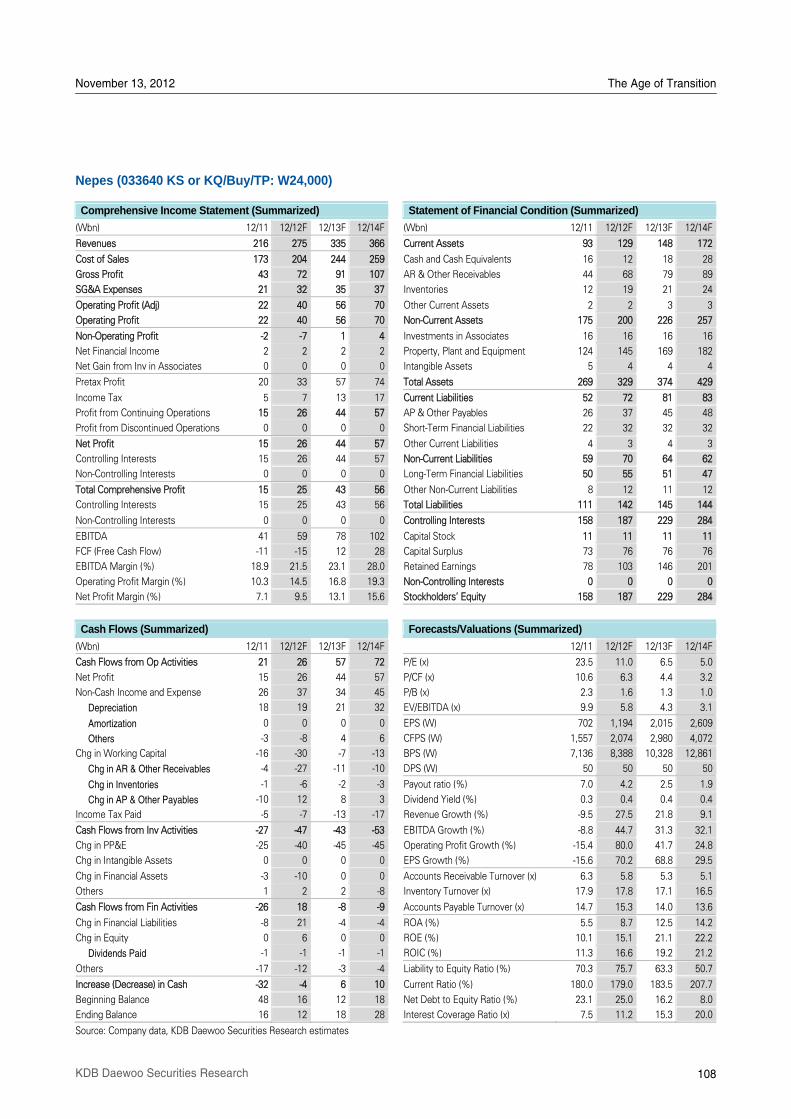
November 13, 2012 The Age of Transition
108 KDB Daewoo Securities Research
Nepes (033640 KS or KQ/Buy/TP: W24,000)
Comprehensive Income Statement (Summarized) Statement of Financial Condition (Summarized)
(Wbn) 12/11 12/12F 12/13F 12/14F (Wbn) 12/11 12/12F 12/13F 12/14F
Revenues 216 275 335 366 Current Assets 93 129 148 172
Cost of Sales 173 204 244 259 Cash and Cash Equivalents 16 12 18 28
Gross Profit 43 72 91 107 AR & Other Receivables 44 68 79 89
SG&A Expenses 21 32 35 37 Inventories 12 19 21 24
Operating Profit (Adj) 22 40 56 70 Other Current Assets 2 2 3 3
Operating Profit 22 40 56 70 Non-Current Assets 175 200 226 257
Non-Operating Profit -2 -7 1 4 Investments in Associates 16 16 16 16
Net Financial Income 2 2 2 2 Property, Plant and Equipment 124 145 169 182
Net Gain from Inv in Associates 0 0 0 0 Intangible Assets 5 4 4 4
Pretax Profit 20 33 57 74 Total Assets 269 329 374 429
Income Tax 5 7 13 17 Current Liabilities 52 72 81 83
Profit from Continuing Operations 15 26 44 57 AP & Other Payables 26 37 45 48
Profit from Discontinued Operations 0 0 0 0 Short-Term Financial Liabilities 22 32 32 32
Net Profit 15 26 44 57 Other Current Liabilities 4 3 4 3
Controlling Interests 15 26 44 57 Non-Current Liabilities 59 70 64 62
Non-Controlling Interests 0 0 0 0 Long-Term Financial Liabilities 50 55 51 47
Total Comprehensive Profit 15 25 43 56 Other Non-Current Liabilities 8 12 11 12
Controlling Interests 15 25 43 56 Total Liabilities 111 142 145 144
Non-Controlling Interests 0 0 0 0 Controlling Interests 158 187 229 284
EBITDA 41 59 78 102 Capital Stock 11 11 11 11
FCF (Free Cash Flow) -11 -15 12 28 Capital Surplus 73 76 76 76
EBITDA Margin (%) 18.9 21.5 23.1 28.0 Retained Earnings 78 103 146 201
Operating Profit Margin (%) 10.3 14.5 16.8 19.3 Non-Controlling Interests 0 0 0 0
Net Profit Margin (%) 7.1 9.5 13.1 15.6 Stockholders' Equity 158 187 229 284
Cash Flows (Summarized) Forecasts/Valuations (Summarized)
(Wbn) 12/11 12/12F 12/13F 12/14F 12/11 12/12F 12/13F 12/14F
Cash Flows from Op Activities 21 26 57 72 P/E (x) 23.5 11.0 6.5 5.0
Net Profit 15 26 44 57 P/CF (x) 10.6 6.3 4.4 3.2
Non-Cash Income and Expense 26 37 34 45 P/B (x) 2.3 1.6 1.3 1.0
Depreciation 18 19 21 32 EV/EBITDA (x) 9.9 5.8 4.3 3.1
Amortization 0 0 0 0 EPS (W) 702 1,194 2,015 2,609
Others -3 -8 4 6 CFPS (W) 1,557 2,074 2,980 4,072
Chg in Working Capital -16 -30 -7 -13 BPS (W) 7,136 8,388 10,328 12,861
Chg in AR & Other Receivables -4 -27 -11 -10 DPS (W) 50 50 50 50
Chg in Inventories -1 -6 -2 -3 Payout ratio (%) 7.0 4.2 2.5 1.9
Chg in AP & Other Payables -10 12 8 3 Dividend Yield (%) 0.3 0.4 0.4 0.4
Income Tax Paid -5 -7 -13 -17 Revenue Growth (%) -9.5 27.5 21.8 9.1
Cash Flows from Inv Activities -27 -47 -43 -53 EBITDA Growth (%) -8.8 44.7 31.3 32.1
Chg in PP&E -25 -40 -45 -45 Operating Profit Growth (%) -15.4 80.0 41.7 24.8
Chg in Intangible Assets 0 0 0 0 EPS Growth (%) -15.6 70.2 68.8 29.5
Chg in Financial Assets -3 -10 0 0 Accounts Receivable Turnover (x) 6.3 5.8 5.3 5.1
Others 1 2 2 -8 Inventory Turnover (x) 17.9 17.8 17.1 16.5
Cash Flows from Fin Activities -26 18 -8 -9 Accounts Payable Turnover (x) 14.7 15.3 14.0 13.6
Chg in Financial Liabilities -8 21 -4 -4 ROA (%) 5.5 8.7 12.5 14.2
Chg in Equity 0 6 0 0 ROE (%) 10.1 15.1 21.1 22.2
Dividends Paid -1 -1 -1 -1 ROIC (%) 11.3 16.6 19.2 21.2
Others -17 -12 -3 -4 Liability to Equity Ratio (%) 70.3 75.7 63.3 50.7
Increase (Decrease) in Cash -32 -4 6 10 Current Ratio (%) 180.0 179.0 183.5 207.7
Beginning Balance 48 16 12 18 Net Debt to Equity Ratio (%) 23.1 25.0 16.2 8.0
Ending Balance 16 12 18 28 Interest Coverage Ratio (x) 7.5 11.2 15.3 20.0
Source: Company data, KDB Daewoo Securities Research estimates
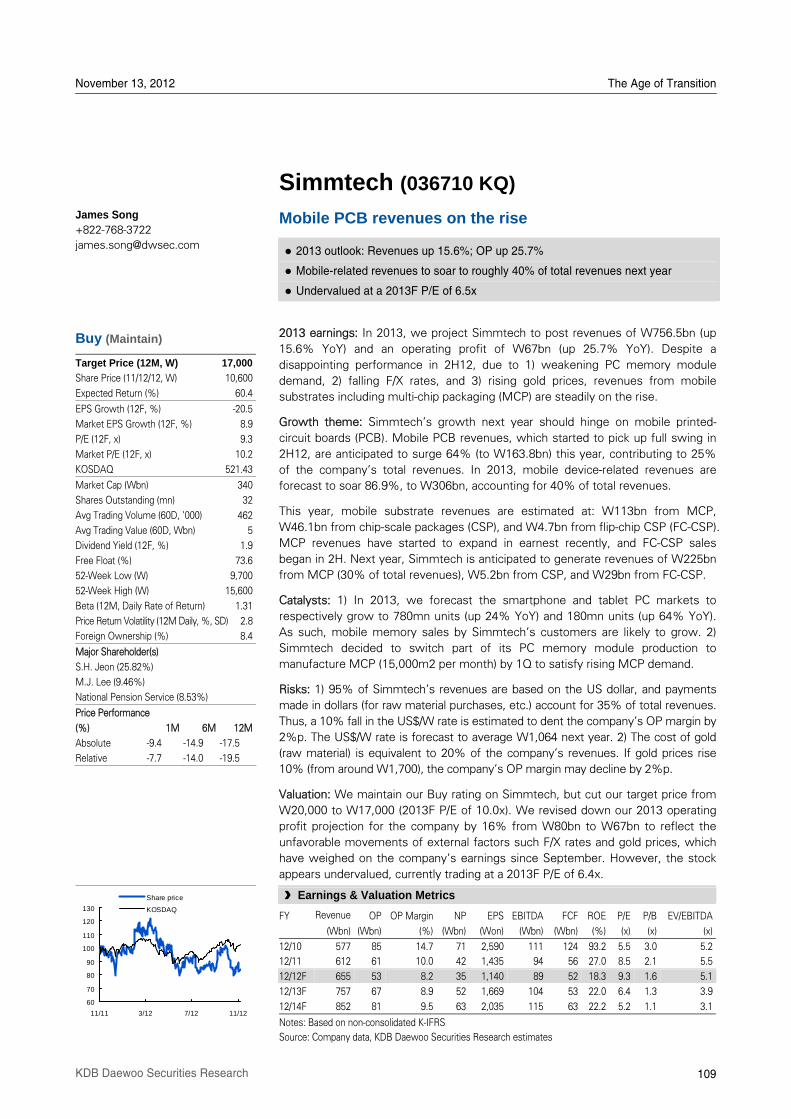
November 13, 2012 The Age of Transition
109 KDB Daewoo Securities Research
Simmtech (036710 KQ)
Mobile PCB revenues on the rise
2013 outlook: Revenues up 15.6%; OP up 25.7%
Mobile-related revenues to soar to roughly 40% of total revenues next year
Undervalued at a 2013F P/E of 6.5x
2013 earnings: In 2013, we project Simmtech to post revenues of W756.5bn (up
15.6% YoY) and an operating profit of W67bn (up 25.7% YoY). Despite a
disappointing performance in 2H12, due to 1) weakening PC memory module
demand, 2) falling F/X rates, and 3) rising gold prices, revenues from mobile
substrates including multi-chip packaging (MCP) are steadily on the rise.
Growth theme: SimmtechÊs growth next year should hinge on mobile printed-
circuit boards (PCB). Mobile PCB revenues, which started to pick up full swing in
2H12, are anticipated to surge 64% (to W163.8bn) this year, contributing to 25%
of the companyÊs total revenues. In 2013, mobile device-related revenues are
forecast to soar 86.9%, to W306bn, accounting for 40% of total revenues.
This year, mobile substrate revenues are estimated at: W113bn from MCP,
W46.1bn from chip-scale packages (CSP), and W4.7bn from flip-chip CSP (FC-CSP).
MCP revenues have started to expand in earnest recently, and FC-CSP sales
began in 2H. Next year, Simmtech is anticipated to generate revenues of W225bn
from MCP (30% of total revenues), W5.2bn from CSP, and W29bn from FC-CSP.
Catalysts: 1) In 2013, we forecast the smartphone and tablet PC markets to
respectively grow to 780mn units (up 24% YoY) and 180mn units (up 64% YoY).
As such, mobile memory sales by SimmtechÊs customers are likely to grow. 2)
Simmtech decided to switch part of its PC memory module production to
manufacture MCP (15,000m2 per month) by 1Q to satisfy rising MCP demand.
Risks: 1) 95% of SimmtechÊs revenues are based on the US dollar, and payments
made in dollars (for raw material purchases, etc.) account for 35% of total revenues.
Thus, a 10% fall in the US$/W rate is estimated to dent the companyÊs OP margin by
2%p. The US$/W rate is forecast to average W1,064 next year. 2) The cost of gold
(raw material) is equivalent to 20% of the companyÊs revenues. If gold prices rise
10% (from around W1,700), the companyÊs OP margin may decline by 2%p.
Valuation: We maintain our Buy rating on Simmtech, but cut our target price from
W20,000 to W17,000 (2013F P/E of 10.0x). We revised down our 2013 operating
profit projection for the company by 16% from W80bn to W67bn to reflect the
unfavorable movements of external factors such F/X rates and gold prices, which
have weighed on the companyÊs earnings since September. However, the stock
appears undervalued, currently trading at a 2013F P/E of 6.4x.
James Song +822-768-3722
Buy (Maintain)
Target Price (12M, W) 17,000
Share Price (11/12/12, W) 10,600
Expected Return (%) 60.4
EPS Growth (12F, %) -20.5
Market EPS Growth (12F, %) 8.9
P/E (12F, x) 9.3
Market P/E (12F, x) 10.2
KOSDAQ 521.43
Market Cap (Wbn) 340
Shares Outstanding (mn) 32
Avg Trading Volume (60D, '000) 462
Avg Trading Value (60D, Wbn) 5
Dividend Yield (12F, %) 1.9
Free Float (%) 73.6
52-Week Low (W) 9,700
52-Week High (W) 15,600
Beta (12M, Daily Rate of Return) 1.31
Price Return Volatility (12M Daily, %, SD) 2.8
Foreign Ownership (%) 8.4
Major Shareholder(s)
S.H. Jeon (25.82%)
M.J. Lee (9.46%)
National Pension Service (8.53%)
Price Performance
(%) 1M 6M 12M
Absolute -9.4 -14.9 -17.5
Relative -7.7 -14.0 -19.5
60
70
80
90
100
110
120
130
11/11 3/12 7/12 11/12
Share price
KOSDAQ
§ Earnings & Valuation Metrics
FY Revenue OP OP Margin NP EPS EBITDA FCF ROE P/E P/B EV/EBITDA
(Wbn) (Wbn) (%) (Wbn) (Won) (Wbn) (Wbn) (%) (x) (x) (x)
12/10 577 85 14.7 71 2,590 111 124 93.2 5.5 3.0 5.2
12/11 612 61 10.0 42 1,435 94 56 27.0 8.5 2.1 5.5
12/12F 655 53 8.2 35 1,140 89 52 18.3 9.3 1.6 5.1
12/13F 757 67 8.9 52 1,669 104 53 22.0 6.4 1.3 3.9
12/14F 852 81 9.5 63 2,035 115 63 22.2 5.2 1.1 3.1
Notes: Based on non-consolidated K-IFRS
Source: Company data, KDB Daewoo Securities Research estimates
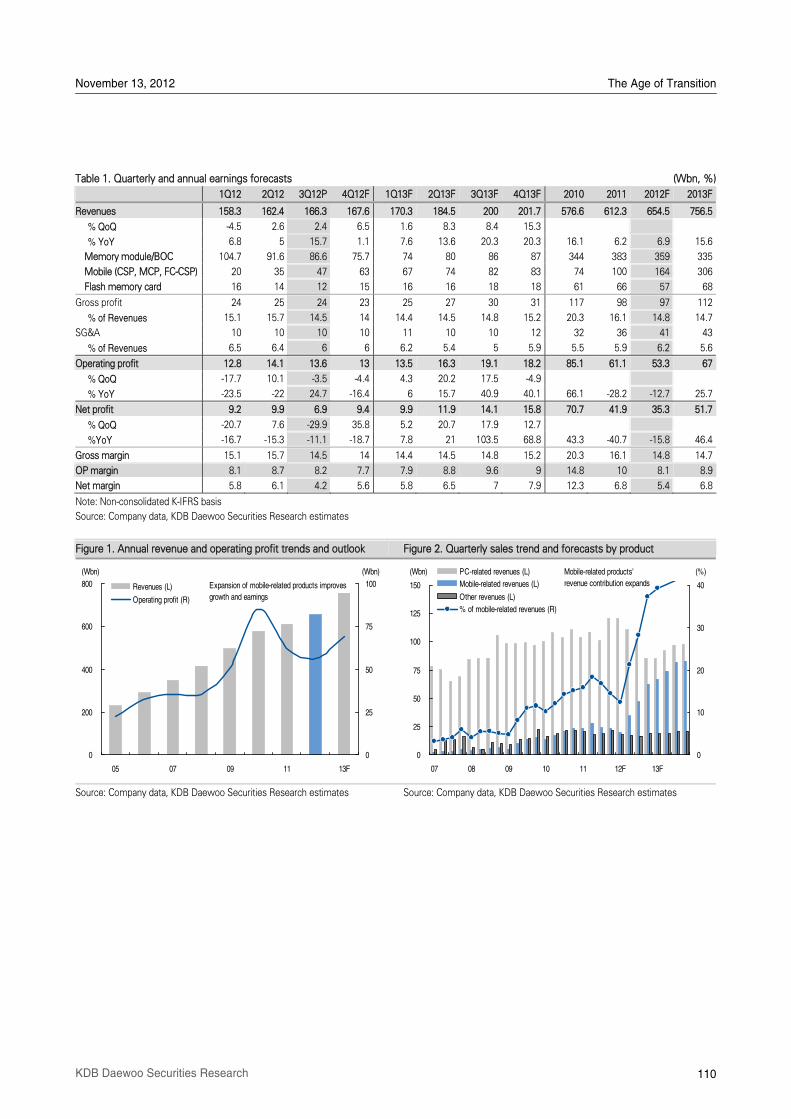
November 13, 2012 The Age of Transition
110 KDB Daewoo Securities Research
Table 1. Quarterly and annual earnings forecasts (Wbn, %)
1Q12 2Q12 3Q12P 4Q12F 1Q13F 2Q13F 3Q13F 4Q13F 2010 2011 2012F 2013F
Revenues 158.3 162.4 166.3 167.6 170.3 184.5 200 201.7 576.6 612.3 654.5 756.5
% QoQ -4.5 2.6 2.4 6.5 1.6 8.3 8.4 15.3
% YoY 6.8 5 15.7 1.1 7.6 13.6 20.3 20.3 16.1 6.2 6.9 15.6
Memory module/BOC 104.7 91.6 86.6 75.7 74 80 86 87 344 383 359 335
Mobile (CSP, MCP, FC-CSP) 20 35 47 63 67 74 82 83 74 100 164 306
Flash memory card 16 14 12 15 16 16 18 18 61 66 57 68
Gross profit 24 25 24 23 25 27 30 31 117 98 97 112
% of Revenues 15.1 15.7 14.5 14 14.4 14.5 14.8 15.2 20.3 16.1 14.8 14.7
SG&A 10 10 10 10 11 10 10 12 32 36 41 43
% of Revenues 6.5 6.4 6 6 6.2 5.4 5 5.9 5.5 5.9 6.2 5.6
Operating profit 12.8 14.1 13.6 13 13.5 16.3 19.1 18.2 85.1 61.1 53.3 67
% QoQ -17.7 10.1 -3.5 -4.4 4.3 20.2 17.5 -4.9
% YoY -23.5 -22 24.7 -16.4 6 15.7 40.9 40.1 66.1 -28.2 -12.7 25.7
Net profit 9.2 9.9 6.9 9.4 9.9 11.9 14.1 15.8 70.7 41.9 35.3 51.7
% QoQ -20.7 7.6 -29.9 35.8 5.2 20.7 17.9 12.7
%YoY -16.7 -15.3 -11.1 -18.7 7.8 21 103.5 68.8 43.3 -40.7 -15.8 46.4
Gross margin 15.1 15.7 14.5 14 14.4 14.5 14.8 15.2 20.3 16.1 14.8 14.7
OP margin 8.1 8.7 8.2 7.7 7.9 8.8 9.6 9 14.8 10 8.1 8.9
Net margin 5.8 6.1 4.2 5.6 5.8 6.5 7 7.9 12.3 6.8 5.4 6.8
Note: Non-consolidated K-IFRS basis
Source: Company data, KDB Daewoo Securities Research estimates
Figure 1. Annual revenue and operating profit trends and outlook Figure 2. Quarterly sales trend and forecasts by product
Source: Company data, KDB Daewoo Securities Research estimates Source: Company data, KDB Daewoo Securities Research estimates
0
25
50
75
100
125
150
07 08 09 10 11 12F 13F
0
10
20
30
40
PC-related revenues (L)Mobile-related revenues (L)
Other revenues (L)% of mobile-related revenues (R)
(Wbn) (%)Mobile-related products'revenue contribution expands
0
200
400
600
800
05 07 09 11 13F
0
25
50
75
100Revenues (L)
Operating profit (R)
(Wbn) (Wbn)
Expansion of mobile-related products improvesgrowth and earnings

November 13, 2012 The Age of Transition
111 KDB Daewoo Securities Research
Simmtech (036710 KQ/Buy/TP: W17,000)
Comprehensive Income Statement (Summarized) Statement of Financial Condition (Summarized)
(Wbn) 12/11 12/12F 12/13F 12/14F (Wbn) 12/11 12/12F 12/13F 12/14F
Revenues 612 655 757 852 Current Assets 153 163 205 259
Cost of Sales 514 558 645 726 Cash and Cash Equivalents 16 28 31 64
Gross Profit 98 97 112 126 AR & Other Receivables 70 74 91 103
SG&A Expenses 36 41 43 45 Inventories 66 60 72 81
Operating Profit (Adj) 62 56 69 81 Other Current Assets 1 1 1 1
Operating Profit 61 53 67 81 Non-Current Assets 294 297 288 284
Non-Operating Profit -10 -9 -1 1 Investments in Associates 14 14 14 14
Net Financial Income 9 6 4 2 Property, Plant and Equipment 231 235 226 223
Net Gain from Inv in Associates 0 0 0 0 Intangible Assets 5 4 3 2
Pretax Profit 52 45 66 80 Total Assets 447 460 492 543
Income Tax 10 10 14 17 Current Liabilities 226 171 169 173
Profit from Continuing Operations 42 35 52 63 AP & Other Payables 93 94 111 125
Profit from Discontinued Operations 0 0 0 0 Short-Term Financial Liabilities 126 70 50 40
Net Profit 42 35 52 63 Other Current Liabilities 7 7 8 9
Controlling Interests 42 35 52 63 Non-Current Liabilities 48 77 67 59
Non-Controlling Interests 0 0 0 0 Long-Term Financial Liabilities 35 51 40 30
Total Comprehensive Profit 40 33 50 61 Other Non-Current Liabilities 3 12 14 15
Controlling Interests 40 33 50 61 Total Liabilities 274 247 236 232
Non-Controlling Interests 0 0 0 0 Controlling Interests 173 213 256 311
EBITDA 94 89 104 115 Capital Stock 15 16 16 16
FCF (Free Cash Flow) 56 52 53 63 Capital Surplus 82 92 92 92
EBITDA Margin (%) 15.4 13.6 13.8 13.5 Retained Earnings 78 108 153 210
Operating Profit Margin (%) 10.0 8.2 8.9 9.5 Non-Controlling Interests 0 0 0 0
Net Profit Margin (%) 6.9 5.4 6.8 7.4 Stockholders' Equity 173 213 256 311
Cash Flows (Summarized) Forecasts/Valuations (Summarized)
(Wbn) 12/11 12/12F 12/13F 12/14F 12/11 12/12F 12/13F 12/14F
Cash Flows from Op Activities 71 86 79 93 P/E (x) 8.5 9.3 6.4 5.2
Net Profit 42 35 52 63 P/CF (x) 4.9 4.8 3.8 3.4
Non-Cash Income and Expense 63 58 53 52 P/B (x) 2.1 1.6 1.3 1.1
Depreciation 32 31 34 34 EV/EBITDA (x) 5.5 5.1 3.9 3.1
Amortization 0 2 1 1 EPS (W) 1,435 1,140 1,669 2,035
Others -8 -5 0 1 CFPS (W) 2,527 2,200 2,806 3,142
Chg in Working Capital -33 -1 -11 -6 BPS (W) 5,865 6,565 7,950 9,678
Chg in AR & Other Receivables -2 -5 -17 -12 DPS (W) 200 200 200 200
Chg in Inventories -17 6 -12 -9 Payout ratio (%) 13.7 18.1 12.4 10.1
Chg in AP & Other Payables -7 -5 17 14 Dividend Yield (%) 1.6 1.9 1.9 1.9
Income Tax Paid 0 -6 -14 -17 Revenue Growth (%) 6.2 6.9 15.6 12.6
Cash Flows from Inv Activities -15 -36 -35 -30 EBITDA Growth (%) -14.6 -5.8 17.2 10.7
Chg in PP&E -20 -31 -25 -30 Operating Profit Growth (%) -28.0 -12.7 25.7 21.0
Chg in Intangible Assets 1 0 0 0 EPS Growth (%) -44.6 -20.5 46.4 22.0
Chg in Financial Assets 5 -4 -10 0 Accounts Receivable Turnover (x) 9.8 11.3 11.1 10.6
Others -1 -1 0 0 Inventory Turnover (x) 10.7 10.4 11.4 11.2
Cash Flows from Fin Activities -54 -38 -42 -30 Accounts Payable Turnover (x) 15.5 16.7 17.5 17.2
Chg in Financial Liabilities -40 -77 -50 -20 ROA (%) 9.5 7.8 10.9 12.2
Chg in Equity 0 12 0 0 ROE (%) 27.0 18.3 22.0 22.2
Dividends Paid -5 -6 -6 -6 ROIC (%) 18.9 16.1 19.8 23.3
Others -9 -3 -4 -3 Liability to Equity Ratio (%) 158.3 116.2 92.1 74.7
Increase (Decrease) in Cash 2 12 2 34 Current Ratio (%) 67.5 95.6 121.4 149.3
Beginning Balance 14 16 28 31 Net Debt to Equity Ratio (%) 83.8 43.6 19.2 -1.4
Ending Balance 16 28 31 64 Interest Coverage Ratio (x) 6.7 8.3 15.9 25.8
Source: Company data, KDB Daewoo Securities Research estimates
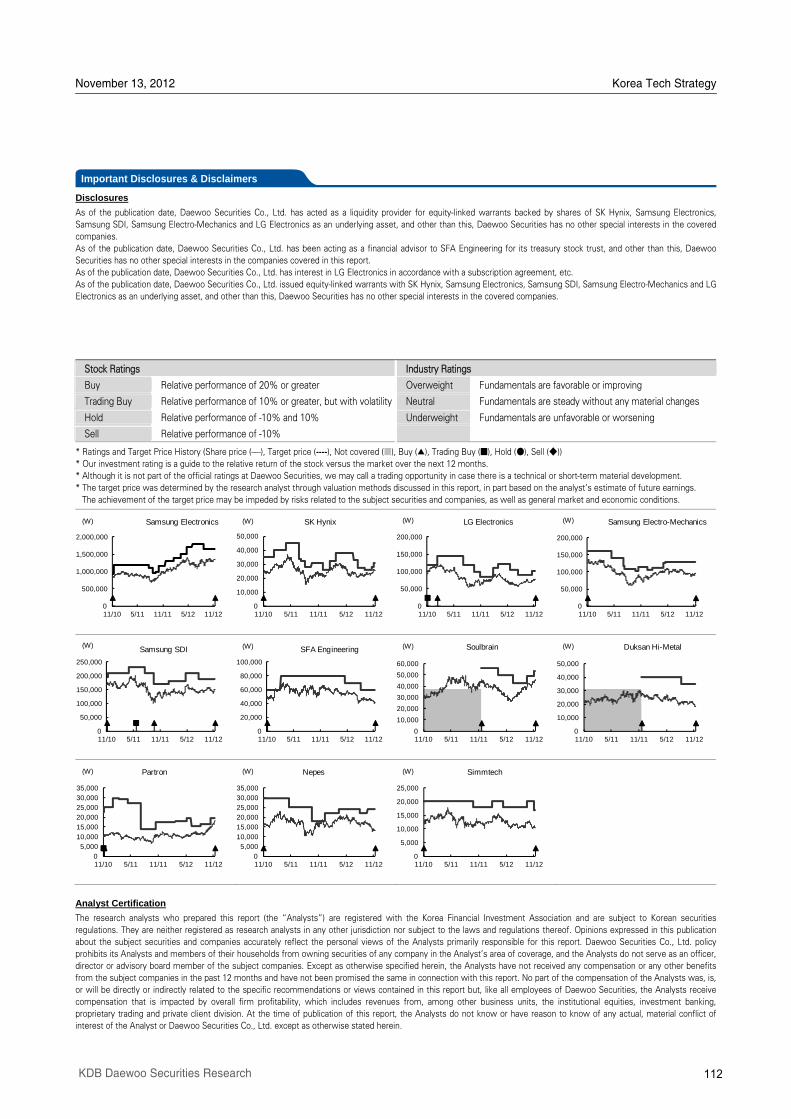
November 13, 2012 Korea Tech Strategy
112KDB Daewoo Securities Research
Disclosures
As of the publication date, Daewoo Securities Co., Ltd. has acted as a liquidity provider for equity-linked warrants backed by shares of SK Hynix, Samsung Electronics,
Samsung SDI, Samsung Electro-Mechanics and LG Electronics as an underlying asset, and other than this, Daewoo Securities has no other special interests in the covered
companies.
As of the publication date, Daewoo Securities Co., Ltd. has been acting as a financial advisor to SFA Engineering for its treasury stock trust, and other than this, Daewoo
Securities has no other special interests in the companies covered in this report.
As of the publication date, Daewoo Securities Co., Ltd. has interest in LG Electronics in accordance with a subscription agreement, etc.
As of the publication date, Daewoo Securities Co., Ltd. issued equity-linked warrants with SK Hynix, Samsung Electronics, Samsung SDI, Samsung Electro-Mechanics and LG
Electronics as an underlying asset, and other than this, Daewoo Securities has no other special interests in the covered companies.
Stock Ratings Industry Ratings
Buy Relative performance of 20% or greater Overweight Fundamentals are favorable or improving
Trading Buy Relative performance of 10% or greater, but with volatility Neutral Fundamentals are steady without any material changes
Hold Relative performance of -10% and 10% Underweight Fundamentals are unfavorable or worsening
Sell Relative performance of -10%
* Ratings and Target Price History (Share price (----), Target price (----), Not covered (■), Buy (▲), Trading Buy (■), Hold (●), Sell (◆))
* Our investment rating is a guide to the relative return of the stock versus the market over the next 12 months.
* Although it is not part of the official ratings at Daewoo Securities, we may call a trading opportunity in case there is a technical or short-term material development.
* The target price was determined by the research analyst through valuation methods discussed in this report, in part based on the analystÊs estimate of future earnings.
The achievement of the target price may be impeded by risks related to the subject securities and companies, as well as general market and economic conditions.
Analyst Certification
The research analysts who prepared this report (the „Analysts‰) are registered with the Korea Financial Investment Association and are subject to Korean securities
regulations. They are neither registered as research analysts in any other jurisdiction nor subject to the laws and regulations thereof. Opinions expressed in this publication
about the subject securities and companies accurately reflect the personal views of the Analysts primarily responsible for this report. Daewoo Securities Co., Ltd. policy
prohibits its Analysts and members of their households from owning securities of any company in the AnalystÊs area of coverage, and the Analysts do not serve as an officer,
director or advisory board member of the subject companies. Except as otherwise specified herein, the Analysts have not received any compensation or any other benefits
from the subject companies in the past 12 months and have not been promised the same in connection with this report. No part of the compensation of the Analysts was, is,
or will be directly or indirectly related to the specific recommendations or views contained in this report but, like all employees of Daewoo Securities, the Analysts receive
compensation that is impacted by overall firm profitability, which includes revenues from, among other business units, the institutional equities, investment banking,
proprietary trading and private client division. At the time of publication of this report, the Analysts do not know or have reason to know of any actual, material conflict of
interest of the Analyst or Daewoo Securities Co., Ltd. except as otherwise stated herein.
Important Disclosures & Disclaimers
0
500,000
1,000,000
1,500,000
2,000,000
11/10 5/11 11/11 5/12 11/12
(W) Samsung Electronics
0
10,000
20,000
30,000
40,000
50,000
11/10 5/11 11/11 5/12 11/12
(W) SK Hynix
0
50,000
100,000
150,000
200,000
11/10 5/11 11/11 5/12 11/12
(W) LG Electronics
0
50,000
100,000
150,000
200,000
11/10 5/11 11/11 5/12 11/12
(W) Samsung Electro-Mechanics
0
50,000
100,000
150,000
200,000
250,000
11/10 5/11 11/11 5/12 11/12
(W)Samsung SDI
0
20,000
40,000
60,000
80,000
100,000
11/10 5/11 11/11 5/12 11/12
(W) SFA Engineering
0
10,000
20,000
30,000
40,000
50,000
60,000
11/10 5/11 11/11 5/12 11/12
(W) Soulbrain
0
10,000
20,000
30,000
40,000
50,000
11/10 5/11 11/11 5/12 11/12
(W) Duksan Hi-Metal
0
5,000
10,000
15,000
20,000
25,000
30,000
35,000
11/10 5/11 11/11 5/12 11/12
(W) Partron
0
5,000
10,000
15,000
20,000
25,000
30,000
35,000
11/10 5/11 11/11 5/12 11/12
(W) Nepes
0
5,000
10,000
15,000
20,000
25,000
11/10 5/11 11/11 5/12 11/12
(W) Simmtech
November 13, 2012 Korea Tech Strategy
113KDB Daewoo Securities Research
Disclaimers
This report is published by Daewoo Securities Co., Ltd. („Daewoo‰), a broker-dealer registered in the Republic of Korea and a member of the Korea Exchange. Information
and opinions contained herein have been compiled from sources believed to be reliable and in good faith, but such information has not been independently verified and
Daewoo makes no guarantee, representation or warranty, express or implied, as to the fairness, accuracy, completeness or correctness of the information and opinions
contained herein or of any translation into English from the Korean language. If this report is an English translation of a report prepared in the Korean language, the original
Korean language report may have been made available to investors in advance of this report. Daewoo, its affiliates and their directors, officers, employees and agents do not
accept any liability for any loss arising from the use hereof. This report is for general information purposes only and it is not and should not be construed as an offer or a
solicitation of an offer to effect transactions in any securities or other financial instruments. The intended recipients of this report are sophisticated institutional investors who
have substantial knowledge of the local business environment, its common practices, laws and accounting principles and no person whose receipt or use of this report would
violate any laws and regulations or subject Daewoo and its affiliates to registration or licensing requirements in any jurisdiction should receive or make any use hereof.
Information and opinions contained herein are subject to change without notice and no part of this document may be copied or reproduced in any manner or form or
redistributed or published, in whole or in part, without the prior written consent of Daewoo. Daewoo, its affiliates and their directors, officers, employees and agents may
have long or short positions in any of the subject securities at any time and may make a purchase or sale, or offer to make a purchase or sale, of any such securities or other
financial instruments from time to time in the open market or otherwise, in each case either as principals or agents. Daewoo and its affiliates may have had, or may be
expecting to enter into, business relationships with the subject companies to provide investment banking, market-making or other financial services as are permitted under
applicable laws and regulations. The price and value of the investments referred to in this report and the income from them may go down as well as up, and investors may
realize losses on any investments. Past performance is not a guide to future performance. Future returns are not guaranteed, and a loss of original capital may occur.
Distribution
United Kingdom: This report is being distributed by Daewoo Securities (Europe) Ltd. in the United Kingdom only to (i) investment professionals falling within Article 19(5) of
the Financial Services and Markets Act 2000 (Financial Promotion) Order 2005 (the „Order‰), and (ii) high net worth companies and other persons to whom it may lawfully be
communicated, falling within Article 49(2)(A) to (E) of the Order (all such persons together being referred to as „Relevant Persons‰). This report is directed only at Relevant
Persons. Any person who is not a Relevant Person should not act or rely on this report or any of its contents.
United States: This report is distributed in the U.S. by Daewoo Securities (America) Inc., a member of FINRA/SIPC, and is only intended for major institutional investors as
defined in Rule 15a-6(b)(4) under the U.S. Securities Exchange Act of 1934. All U.S. persons that receive this document by their acceptance thereof represent and warrant
that they are a major institutional investor and have not received this report under any express or implied understanding that they will direct commission income to Daewoo
or its affiliates. Any U.S. recipient of this document wishing to effect a transaction in any securities discussed herein should contact and place orders with Daewoo Securities
(America) Inc., which accepts responsibility for the contents of this report in the U.S. The securities described in this report may not have been registered under the U.S.
Securities Act of 1933, as amended, and, in such case, may not be offered or sold in the U.S. or to U.S. persons absent registration or an applicable exemption from the
registration requirements.
Hong Kong: This document has been approved for distribution in Hong Kong by Daewoo Securities (Hong Kong) Ltd., which is regulated by the Hong Kong Securities and
Futures Commission. The contents of this report have not been reviewed by any regulatory authority in Hong Kong. This report is for distribution only to professional
investors within the meaning of Part I of Schedule 1 to the Securities and Futures Ordinance of Hong Kong (Cap. 571, Laws of Hong Kong) and any rules made thereunder
and may not be redistributed in whole or in part in Hong Kong to any person.
All Other Jurisdictions: Customers in all other countries who wish to effect a transaction in any securities referenced in this report should contact Daewoo or its affiliates only
if distribution to or use by such customer of this report would not violate applicable laws and regulations and not subject Daewoo and its affiliates to any registration or
licensing requirement within such jurisdiction.
Daewoo Securities Co. Ltd. (Seoul) Daewoo Securities (Hong Kong) Ltd. Daewoo Securities (America) Inc. Head Office 34-3 Yeouido-dong, Yeongdeungpo-gu
Seoul 150-716
Korea
Two International Finance Centre Suites 2005-2012
8 Finance Street, Central
Hong Kong
600 Lexington Avenue Suite 301
New York, NY 10022
United States
Tel: 82-2-768-3026 Tel: 85-2-2514-1304 Tel: 1-212-407-1022
Daewoo Securities (Europe) Ltd. Tokyo Representative Office Beijing Representative Office Tower 42, Level 41 25 Old Broad Street
London EC2N 1HQ
United Kingdom
7th Floor, Yusen Building 2-3-2 Marunouchi, Chiyoda-ku
Tokyo 100-0005
Japan
Suite 2602, Twin Towers (East) B-12 Jianguomenwai Avenue
Chaoyang District, Beijing 100022
China
Tel: 44-20-7982-8016 Tel: 81-3- 3211-5511 Tel: 86-10-6567-9699
Shanghai Representative Office Ho Chi Minh Representative Office
Unit 13, 28th Floor, Hang Seng Bank Tower 1000 Lujiazui Ring Road
Pudong New Area, Shanghai 200120
China
Centec Tower 72-74 Nguyen Thi Minh Khai Street
Ward 6, District 3, Ho Chi Minh City
Vietnam
Tel: 86-21-5013-6392 Tel: 84-8-3910-6000
KDB Daewoo Securities International Network