Embed Size (px)
Citation preview

SANLAM UNIVERSAL FUNDS PLC
1
SANLAM UNIVERSAL FUNDS PLC Unaudited condensed interim financial statements for the six months ended 30 June 2019

SANLAM UNIVERSAL FUNDS PLC
1
UNAUDITED CONDENSED INTERIM FINANCIAL STATEMENTS for the six months ended 30 June 2019 Contents Page(s) Company information 3 - 9 Directors’ report 10 - 16 Economic & market review 17 - 19 Investment Manager’s reports 20 - 100 Statement of comprehensive income
of the Company 101 of the Funds 102 - 118
Statement of financial position of the Company 119 of the Funds 120 - 137
Statement of changes in net assets attributable to holders of redeemable participating shares
of the Company 138 of the Funds 139 - 155
Statement of cash flows of the Company 156 of the Funds 157 - 173
Portfolio of investments 173 - 411
Bridge Global Property Income Fund 174 - 175 Sanlam African Frontier Markets Fund 176 - 178 Denker Global Equity Fund 179 - 181 Sanlam Global Bond Fund 182 - 204 Denker Global Financial Fund 205 - 208 Sanlam Global Property Fund 209 - 214 Sanlam World Equity Fund 215 - 217 Satrix World Equity Tracker Fund 218 - 249 SIIP India Opportunities Fund 250 - 251 Denker Global Dividend Fund 252 - 254 Sanlam Strategic Bond Fund 255 - 261 Sanlam Accel Income Fund 262 - 263 Satrix North America Equity Tracker Fund 264 - 277 Satrix UK Equity Tracker Fund 278 - 281 Satrix Europe (ex UK) Equity Tracker Fund 282 - 291 Satrix Emerging Market Equity Tracker Fund 292 - 314 Sanlam Managed Risk Fund 315 - 317
SANLAM UNIVERSAL FUNDS PLC
2
UNAUDITED CONDENSED INTERIM FINANCIAL STATEMENTS (CONTINUED) for the six months ended 30 June 2019 Contents (continued) Page(s) Portfolio of investments (continued)
Sanlam Global High Quality Fund 318 - 320 Sanlam US Dividend Fund 321 - 324 High Street Global Balanced Fund 325 - 327 Sanlam Global Value Fund 328 - 331 Sanlam Stable Global Fund 332 - 333 Sanlam Active UK Fund 334 - 336 Sanlam Multi Strategy Fund 337 - 341 Anchor Global Stable Fund 342 - 345 Anchor Global Equity Fund 346 - 347 Bridge Global Managed Growth Fund 348 - 350 Sanlam Global Emerging Markets Fund 351 - 353 ABSA Africa Equity Fund 354 - 356 Sanlam Centre American Select Equity Fund 357 - 359 Sanlam Global Convertible Securities Fund 360 - 363 Sanlam Japan Equity Fund 364 Sanlam Centre Active US Treasury Fund 365 - 366 Autus Global Equity Fund 367 - 369 Wisian Capital South African Equity Fund 370 - 372 Cameron Hume Global Fixed Income ESG Fund 373 - 390 Sanlam Centre Global Listed Infrastructure Fund 391 - 396 Sanlam Real Assets Fund 397 - 400 Satrix Global Factor Enhanced Equity Fund 401 - 417 Perpetua Global Equity UCITS Fund 418 - 420
Notes to and forming part of the unaudited condensed interim financial statements 412 - 545 Securities Financing Transactions Regulation Disclosures 546 - 575 Purchases and Sales for the period ended 30 June 2019 576 - 616
SANLAM UNIVERSAL FUNDS PLC
3
COMPANY INFORMATION
Directors of Sanlam Ùniversal Paul Dobbyn – Irish1 Funds Plc (the “Company”) Thomas Murray – Irish1
Haydn Franckeiss – South African Richard Aslett – British
All Directors are non-executive
Registered number 267451
Funds of the Company Bridge Global Property Income Fund P-Solve Inflation Plus Fund3 Sanlam African Frontier Markets Fund Denker Global Equity Fund Sanlam Global Bond Fund Denker Global Financial Fund Sanlam Global Property Fund Sanlam World Equity Fund Satrix World Equity Tracker Fund SIIP India Opportunities Fund Denker Global Dividend Fund Sanlam Strategic Bond Fund
Sanlam Accel Income Fund Satrix North America Equity Tracker Fund
Satrix UK Equity Tracker Fund Satrix Europe (ex UK) Equity Tracker Fund Satrix Emerging Market Equity Tracker Fund
Sanlam Managed Risk Fund Sanlam Global High Quality Fund Sanlam US Dividend Fund2
High Street Global Balanced Fund Sanlam Global Value Fund2
Sanlam Stable Global Fund2
Sanlam Active UK Fund2
Sanlam Multi-Strategy Fund2
Anchor Global Stable Fund
Anchor Global Equity Fund Bridge Global Managed Growth Fund4 Sanlam Global Emerging Markets Fund2
Absa Africa Equity Fund
Sanlam Centre American Select Equity Fund Sanlam Global Convertible Securities Fund Sanlam Japan Equity Fund Sanlam Centre Active US Treasury Fund Autus Global Equity Fund Wisian Capital South African Equity Fund
Cameron Hume Global Fixed Income ESG Fund Sanlam Centre Global Listed Infrastructure Fund Sanlam Real Assets Fund
Satrix Global Factor Enhanced Equity Fund
Perpetua Global Equity UCITS Fund
1Paul Dobbyn is considered an independent Director by the Central Bank of Ireland and the Irish Stock Exchange. Thomas Murray is
considered an independent Director by the Irish Stock Exchange only.
2These sub-funds have been renamed since the publication of the last annual report. The previous names of these Funds were Sanlam
FOUR US Dividend Fund, Sanlam FOUR Global Equity Fund, Sanlam FOUR Stable Global Equity Fund, Sanlam FOUR Active UK Equity Fund, Sanlam FOUR Multi-Strategy Fund and Denker Global Emerging Markets Fund, respectively.
3These sub-funds of the Company closed during the period.
4At an EGM on 25 March 2019, shareholders of Bridge Global Equity Income Growth Fund approved the merger of the fund into Bridge Global Managed Growth Fund. The merger took effect from 23.59pm on Friday 12 April 2019.

SANLAM UNIVERSAL FUNDS PLC
4
COMPANY INFORMATION (CONTINUED)
Registered office of the Company Beech House Beech Hill Road Dublin 4 Ireland
Manager, Securities Lending Agent Sanlam Asset Management (Ireland) Limited & Secretary Beech House Beech Hill Road Dublin 4 Ireland Administrator Brown Brothers Harriman Fund Administration Services 30 Herbert Street Dublin 2 Ireland Registrar & Transfer Agent Brown Brothers Harriman Fund Administration Services (Ireland) Limited 30 Herbert Street Dublin 2 Ireland
Investment Managers Sanlam Investment Management (Pty) Limited1 55 Willie Van Schoor Avenue Bellville 7530 South Africa Sanlam Investments UK Limited2 Monument Place 24 Monument Street London, EC3R 8AJ United Kingdom Investment Manager – Sanlam Centre Centre Asset Management LLC American Select Equity Fund, Sanlam 48 Wall Street Centre Active US Treasury Fund, Suite 1100 Sanlam Centre Global Listed Infrastructure New York, N.Y. 10005 Fund United States of America
Investment Manager – Sanlam Global Sanlam Private Investments (UK) Limited High Quality Fund 16 South Park Sevenoaks Kent TN13 1AN United Kingdom Investment Manager – Sanlam AllianceBernstein Limited Global Property Fund 50 Berkeley Street London W1J 8HA United Kingdom 1Satrix World Equity Tracker Fund, SIIP India Opportunities Fund, Sanlam African Frontier Markets Fund, Satrix North America Equity Tracker Fund, Satrix UK Equity Tracker Fund, Satrix Europe (ex UK) Equity Tracker Fund, Satrix Emerging Market Equity Tracker Fund, Sanlam Managed Risk Fund and Sanlam Global Emerging Markets Fund are managed by Sanlam Investment Management
(Pty) Limited.
2Sanlam Strategic Bond Fund, Sanlam Accel Income Fund, Sanlam US Dividend Fund, Sanlam Global Value Fund, Sanlam Stable Global Fund, Sanlam Active UK Fund and Sanlam Multi-Strategy Fund are managed by Sanlam Investments UK Limited.

SANLAM UNIVERSAL FUNDS PLC
5
COMPANY INFORMATION (CONTINUED) Investment Manager – Bridge Bridge Fund Managers (Proprietary) Limited Global Property Income Fund, 5 Arundel Close Bridge Global Managed Growth Fund Kingsmead Office Park PO Box 3211 Durban, KwaZulu Natal, 4001 South Africa Investment Manager – Sanlam Cameron Hume Limited Global Bond Fund Exchange Place 1 1 Temple Street Edinburgh, EH13 0JB United Kingdom Investment Manager – Denker Global Denker Capital (Pty) Ltd Equity Fund, Denker Global Financial 6th Floor Fund, Denker Global Dividend Fund The Edge 3 Howick Close Tyger Falls Belville 7530 South Africa Investment Manager – Sanlam GLG Partners LP Strategic Bond Fund Riverbank House 2 Swan Lane London EC4R 3AD United Kingdom Investment Managers – Sanlam Sanlam Investments UK Limited World Equity Fund Monument Place 24 Monument Street London, EC3R 8AJ United Kingdom Sanlam Investment Management (Pty) Limited
55 Willie Van Schoor Avenue Bellville 7530 South Africa Centre Asset Management LLC 48 Wall Street Suite 1100 New York N.Y. 10005 United States of America AllianceBernstein Limited 50 Berkeley Street London W1J 8HA United Kingdom Asset Management One Ltd ` Bracken House One Friday Street London, EC4M 9JA United Kingdom

SANLAM UNIVERSAL FUNDS PLC
6
COMPANY INFORMATION (CONTINUED) Investment Manager – High Street Global High Street Asset Management (Pty) Limited Balanced Fund The Offices of Hyde Park Block B, 1 Strouthos Road Hyde Park, Sandton Gauteng 2196 South Africa
Investment Manager – Anchor Global Anchor Capital (Pty) Limited Stable Fund, Anchor Global 25 Culross Road Equity Fund Bryanston Sandton 2191 South Africa Investment Manager – Absa Africa Absa Asset Management (Pty) Limited Equity Fund Barclays Sandton South Campus 15 Alice Lane 2nd Floor South Africa
Investment Manager – Sanlam Global Zazove Associates, LLC Convertible Securities Fund 1001 Tahoe Boulevard Incline Village NV89451 Unites States of America
Investment Manager – Sanlam Japan Asset Management One Ltd Equity Fund Mizuho House 30 Old Bailey London EC4M 7AU United Kingdom
Investment Manager – Autus Global Autus Fund Managers (Pty) Limited Equity Fund Pointbreak Building The Vineyards Office Estate 99 Jip De Jager Avenue Bellville 7530 South Africa Investment Manager – Wisian Capital First Avenue Investment Management (Pty) Limited South African Equity Fund 21 Fricker Road Ground floor Illovo, 2196 South Africa Investment Manager – Satrix Global Wells Capital Management, Inc Factor Enhanced Equity Fund 525 Market Street 10th Floor San Francisco CA 94105 United States of America Investment Manager – Perpetua Perpetua Investment Managers (Pty) Limited Global Equity UCITS Fund 5th Floor The Citadel 15 Cavendish Street Claremont, 7708 South Africa

SANLAM UNIVERSAL FUNDS PLC
7
COMPANY INFORMATION (CONTINUED) Investment Allocation Manager Sanlam Investments UK Limited1 Monument Place 24 Monument Street London, EC3R 8AJ United Kingdom
Investment Transition Managers Morgan Stanley & Co. International Limited 25 Cabot Square Canary Wharf London E14 4QA United Kingdom
State Street Bank Europe Limited 20 Churchill Place Canary Wharf London E14 5HJ United Kingdom
Investment Advisors Sanlam Investments UK Limited Monument Place 24 Monument Street London, EC3R 8AJ United Kingdom
High Street Global Ltd OMC Chambers Roadtown Tortola British Virgin Islands
Depositary Brown Brothers Harriman Trustee Services (Ireland) Limited 30 Herbert Street Dublin 2 Ireland Listing Broker Maples and Calder 75 St. Stephens Green Dublin 2 Ireland
Auditor Ernst & Young2 Harcourt Centre Harcourt Street Dublin 2 Ireland Legal Adviser Maples and Calder 75 St. Stephens Green Dublin 2 Ireland
1Sanlam Investments UK Limited is the investment allocation manager to Sanlam Global Bond Fund, Sanlam Global Property Fund, Sanlam World Equity Fund, Satrix World Equity Tracker Fund, SIIP India Opportunities Fund, Satrix North America Equity Tracker
Fund, Satrix UK Equity Tracker Fund, Satrix Europe (ex UK) Equity Tracker Fund, Satrix Emerging Markets Equity Tracker Fund Sanlam Equity Allocation Fund, Sanlam Japan Equity Fund and Sanlam Real Assets Fund.
2The auditor has not expressed an opinion nor have they reviewed the unaudited condensed interim financial statements for the six months ended 30 June 2019.

SANLAM UNIVERSAL FUNDS PLC
8
COMPANY INFORMATION (CONTINUED) Distributors Sanlam Investments UK Limited Monument Place 24 Monument Street London, EC3R 8AJ United Kingdom Sanlam Investment Management (Pty) Limited1 55 Willie Van Schoor Avenue Bellville 7530 South Africa Bridge Fund Managers (Proprietary) Limited 5 Arundel Close Kingsmead Office Park PO Box 3211 Durban, KwaZulu Natal, 4001 South Africa Anchor Capital (Pty) Limited 25 Culross Road Bryanston Sandton 2191 South Africa High Street Asset Management (Pty) Limited The Offices of Hyde Park Block B, 1 Strouthos Road Hyde Park, Sandton Gauteng 2196 South Africa Sanlam Global Investment Solutions Ltd Canon’s Court 22 Victoria Street Hamilton HM12 Bermuda Absa Asset Management (Pty) Limited Barclays Sandton South Campus 15 Alice Lane 2nd Floor South Africa Autus Fund Managers (Pty) Limited Pointbreak Building The Vineyards Office Estate 99 Jip De Jager Avenue Bellville 7530 South Africa
SANLAM UNIVERSAL FUNDS PLC
9
COMPANY INFORMATION (CONTINUED) Distributors (continued) First Avenue Investment Management (Pty) Limited 21 Fricker Road Ground floor Illovo, 2196 South Africa Perpetua Investment Managers (Pty) Limited 5th Floor The Citadel 15 Cavendish Street Claremont, 7708 South Africa

SANLAM UNIVERSAL FUNDS PLC
10
DIRECTORS’ REPORT
The Directors of Sanlam Universal Funds plc (the “Company”) present herewith their unaudited condensed interim financial statements for the period ended 30 June 2019.
RESULTS AND BUSINESS ACTIVITIES Detailed investment reviews are included in the Reports of the Investment Managers on pages 20 to 100 The results of operations are set out in the Statement of Comprehensive Income on pages 101 to 118. The Directors also draw your attention to the significant events during the period disclosed in Note 16 on page 543. PRINCIPAL RISKS AND UNCERTAINTIES The Company is exposed to the risks associated with the financial instruments and markets in which they invest. There has been no significant change to the principal risks and uncertainties to which the Company is exposed since the most recent annual financial statements of the Company. A further comprehensive summary of the risk factors that investors should consider is included in the prospectus of the Company and the offering supplement of each Fund. DIVIDENDS The present intention of the Directors is to distribute sufficient surplus net income of specific share classes, currently:
Fund Name Classes
Distribution
Frequency
Denker Global Equity Fund A (GBP) / C (GBP) Annual
Denker Global Financial Fund A (GBP) / C (GBP) Annual
Satrix World Equity Tracker Fund I (GBP) Annual
Denker Global Dividend Fund A (USD) / A (GBP / B (USD) / C (USD) / I (USD) Semi-Annual
Sanlam Strategic Bond Fund A Income (GBP) / I Income (GBP)/ I Income (EUR)
/ I Income (USD) / P Income (GBP)
Monthly
Sanlam Accel Income Fund Class A Net Income Monthly
Satrix North America Equity Tracker Fund I (GBP) Annual
Satrix UK Equity Tracker Fund I (GBP) Annual
Satrix Europe (ex UK) Equity Tracker Fund I (GBP) Annual
Satrix Emerging Markets Equity Tracker Fund I (GBP) Annual
Sanlam Managed Risk Fund A (GBP) / I (GBP) / N (GBP) / D(GBP)
/ L(GBP) / N2 (GBP)
Annual
Sanlam Global High Quality Fund C Income (GBP) / D Income (USD) / E Income
(USD) / F Income (GBP) / G Income (USD)
Semi-Annual
Sanlam US Dividend Fund Distribution A (GBP) / Distribution A (USD) /
Distribution A (EUR) / Distribution H (GBP)
Quarterly
Sanlam Global Value Fund Distribution A (GBP) Quarterly
Sanlam Stable Global Fund Distribution A (GBP) Quarterly
Sanlam Active UK Fund C (GBP) Annual
I (GBP) Semi-Annual
Sanlam Multi-Strategy Fund Income Distribution A (GBP) / Income Distribution
B (GBP) / Income Distribution Founder (GBP) Monthly
Sanlam Global Emerging Markets Fund C2 (GBP) Annual
Absa Africa Equity Fund A (USD) / A (EUR) / A (GBP) Monthly
Sanlam Centre Active US Treasury Fund A (USD) / B (USD) / C(USD) / E(USD) Monthly
Sanlam Centre Global Listed Infrastructure
Fund
C (USD) / C (GBP) / E (USD) Quarterly
Sanlam Real Assets Fund A Distribution (GBP) / B Distribution (GBP) / D
Distribution (GBP) / SI Accumulation (USD) /
SR Accumulation (USD)
Monthly

SANLAM UNIVERSAL FUNDS PLC
11
DIRECTORS’ REPORT (CONTINUED)
DIVIDENDS (CONTINUED) For those Funds which distribute annually, dividends (if any) will be declared and paid following the completion of the annual audits for the year ended 31 December in each calendar year. Sanlam Accel Income Fund, Sanlam Strategic Bond Fund, Sanlam Multi-Strategy Fund, Sanlam Centre Active US Treasury Fund and Sanlam Real Assets Fund will distribute on a monthly basis and for those Funds that distribute on a semi-annual or quarterly basis, the dates for the distributions will be as stated in the Fund supplement. All dividends will be subject to the discretion of the Directors.
Unless otherwise stated in the Fund Supplement, payment will be made in cash unless the payment is for an amount less than USD100, EUR100 or GBP100 (depending on the functional currency of each Fund) in which case such payment will be automatically reinvested in the purchase of shares of the relevant class, for the account of the relevant shareholder. The Directors reserve the right to change the dividend policy of the Fund to reflect changes that may occur from time to time in the requirements for qualifying as a reporting Fund for the purposes of United Kingdom taxation.
With reference to the Statement of Comprehensive Income on pages 101 to 118, Shareholders should note that surplus net income for the year ended 31 December 2018 was distributed during the course of 2019 as follows: P-Solve Inflation Plus Fund distributed GBP 314,599 (2018: GBP 329,681), Denker Global Equity Fund distributed USD 2,144 (2018: USD 1,190), Denker Global Financial Fund distributed USD 52,852 (2018: USD 76,845), Sanlam World Equity Tracker Fund distributed USD 26,566 (2018: USD 15,497), Denker Global Dividend Fund distributed USD 278,299 (2018: USD 233,959), Sanlam Strategic Bond Fund distributed GBP 4,801,954 (2018: GBP 2,949,524), Sanlam Accel Income Fund distributed GBP 278,300 (2018: GBP 415,350), Satrix North America Equity Tracker Fund distributed USD 7,277 (2018: USD 5,895), Satrix UK Equity Tracker Fund distributed GBP 32,879 (2018: GBP 29,462), Satrix Europe (ex UK) Equity Tracker Fund distributed EUR 10,754 (2018: EUR 14,988), Satrix Emerging Market Equity Tracker Fund distributed USD 175,548 (2018: USD 213,645), Sanlam Global High Quality Fund distributed GBP 138,018 (2018: GBP 133,021); Sanlam US Dividend Fund distributed USD 377,099 (2018: USD 346,211); Sanlam Stable Global Fund distributed USD 126 (2018: USD 172); Sanlam Active UK Fund distributed GBP 8,860 (2018: GBP 5,917); Sanlam Multi-Strategy Fund distributed GBP 481,902 (2018: GBP 140,305), Sanlam Global Emerging Markets Fund distributed USD 3,079 (2018: USD Nil), Absa Africa Equity Fund distributed USD 403,002 (2018: USD Nil), Sanlam Centre Active US Treasury Fund distributed USD 114,237 (2018: USD 266,296), Sanlam Centre Listed Infrastructure Fund distributed USD 24,273 (2018: USD Nil) and Sanlam Real Assets Fund distributed GBP 13,936 (2018: GBP Nil). During the period ended 30 June 2018, Sanlam Active UK Fund made distributions out of capital, distributing an amount of GBP 2,200 out of capital at the end of April 2018. No Funds of the Company made distributions out of capital during the period ended 30 June 2019. DIRECTORS The Directors of the Company during the period were as follows:
• Paul Dobbyn (Irish)
• Thomas Murray (Irish)
• Haydn Franckeiss (South African)
• Richard Aslett (British)
Paul Dobbyn is a Director of Sanlam Global Funds Plc and Sanlam Qualifying Investors Funds Plc.
Thomas Murray is a Director of Sanlam Global Funds Plc and Sanlam Qualifying Investors Funds Plc. Thomas Murray is also a Director of Sanlam Asset Management (Ireland) Ltd. (“SAMI”).
Haydn Franckeiss is a Director of Sanlam Global Funds Plc and Sanlam Qualifying Investors Funds Plc. Richard Aslett is the Chief Executive Officer of SAMI. Richard Aslett is also a Director of Sanlam Global Funds Plc, Sanlam Qualifying Investors Funds Plc and SAMI.

SANLAM UNIVERSAL FUNDS PLC
12
DIRECTORS’ REPORT (CONTINUED) DIRECTORS’ AND SECRETARY’S INTEREST IN SHARES AND CONTRACTS At 30 June 2019 and 31 December 2018, Haydn Franckeiss had an interest of 183,154 shares in Denker Global Dividend Fund. The other Directors who held office on 30 June 2019 had no interest in the shares of the Company or Funds at that date or at any time during the financial period. None of the Directors has a service contract with the Company. The Manager holds non-participating shares of the Company as explained in the notes to the Financial Statements. RELATED PARTIES Disclosures in respect of related parties are contained in note 8 to the financial statements. CONNECTED PERSONS Part 2, Chapter 10 of the Central Bank (Supervision and Enforcement) Act 2013 (Section 48(1)) (Undertakings for Collective Investment in Transferable Securities) Regulations 2015 (the “CBI UCITS Regulations”) on transactions involving connected persons states that any transactions between a UCITS and a Connected Person must be carried out as if negotiated at arm’s length. Transactions must be in the best interests of the shareholders.
A ‘Connected Person’ is defined as the Management Company or Depositary to a UCITS; and the delegates or sub-delegates of such a Management Company or Depositary (excluding non-group company sub-custodians appointed by a Depositary); and any associated or group company of such a Management Company, Depositary, delegate or sub-delegate. The Directors are satisfied that there are arrangements (evidenced by written procedures) in place, to ensure that the obligations set out above are applied to all transactions with Connected Persons entered into during the period and that all such transactions have complied with these obligations. SUBSEQUENT EVENTS Other than as disclosed in note 18, up to the date of the approval of these financial statements there were no events subsequent to the period end, which, in the opinion of the Directors of the Company, may have had an impact on the unaudited condensed interim financial statements for the period ended 30 June 2019. ACCOUNTING RECORDS The measures taken by the Directors to ensure compliance with the Company’s obligation to keep proper accounting records are the use of appropriate systems and procedures which are carefully implemented by the Administrator. The accounting records of the Company are kept at 30 Herbert Street, Dublin 2, Ireland. STATEMENT OF DIRECTORS’ RESPONSIBILITIES Irish company law requires the Directors to prepare financial statements for each financial period which give a true and fair view of the state of affairs of the Company and of the results of the Company for that period.
In preparing those financial statements, the Directors are required to:
▪ Select suitable accounting policies and then apply them consistently; ▪ Make judgements and estimates that are reasonable and prudent; ▪ Follow applicable accounting standards or disclose or explain material departures from them in the
financial statements; ▪ Ensure that financial statements comply with the Memorandum and Articles of Association; ▪ Provide a fair review of the development and performance of the Company; ▪ Give a description of principal risks and uncertainties that they may face; and ▪ Prepare the financial statements on the going concern basis, unless it is inappropriate to presume that the
Company will continue in business.

SANLAM UNIVERSAL FUNDS PLC
13
DIRECTORS’ REPORT (CONTINUED) STATEMENT OF DIRECTORS’ RESPONSIBILITIES (CONTINUED) The Directors are responsible for keeping proper books of account which disclose with reasonable accuracy, at any time, the financial position of the Company and to enable them to ensure that the financial statements are prepared in accordance with International Financial Reporting Standards (“IFRS”) as adopted by the EU and comply with the Irish Companies Act 2014 and the European Communities (Undertakings for Collective Investment in Transferable Securities) Regulations, 2011 (as amended) (the “UCITS Regulations”). They are also responsible for safeguarding the assets of the Company and in fulfilment of this responsibility, they have entrusted the assets of the Company to the Depositary for safekeeping, in accordance with the Memorandum and Articles of Association of the Company. The Directors are responsible for taking reasonable steps for the prevention and detection of fraud and other irregularities. CORPORATE GOVERNANCE CODE The European Communities (Directive 2006/46/EC) Regulations (S.I. 450 of 2009 and S.I.83 of 2010) (the “Regulations”) require the inclusion of a corporate governance statement in the Director’s Report.
Although there is no specific statutory corporate governance code applicable to Irish collective investment schemes whose shares are admitted to trading on the Global Exchange Market of Euronext Dublin (“GEM”), the Irish Funds (“IF”) has published a corporate governance code (“IF Code”) that may be adopted on a voluntary basis by Irish authorised collective investments schemes. This code became effective from 1 January 2012, with a twelve month transitional period. It should be noted that the IF Code reflects existing corporate governance practises imposed on Irish authorised collective investment schemes, as noted above. On 19 December 2012, the Board of Directors voluntarily adopted the IF Code as the Company’s corporate governance code.
The Board of Directors has assessed the measures included in the IF Code as being consistent with its corporate governance practises and procedures for the financial period. The code is available at www.sanlam.ie.
In addition to the IF Code, the Company is subject to corporate governance practices imposed by:
i) The Irish Companies Act 2014, which is available for inspection at the registered office of the Company. It may also be obtained at http://www.irishstatutebook.ie/eli/2014/act/38/enacted/en/html.
ii) The Articles of Association of the Company which are available for inspection at the registered office of the Company at Beech House, Beech Hill Road, Dublin 4, Ireland and the Companies Registration Office in Ireland.
iii) The CBI UCITS Regulations and related Guidance Notes of the Central Bank of Ireland which can be obtained from the Central Bank of Ireland website at http://www.centralbank.ie/regulation/industry-sectors/funds/Pages/default.aspx and are available for inspection at the registered Office of the Company.
iv) Euronext Dublin through the Global Exchange Market Rules for Investment Funds which can be
obtained from Euronext Dublin’s website at https://www.ise.ie/Products-Services/Sponsorsand-
Advisors/GEM-Rules-for-Investment-Funds.pdf. v) SAMI's Programme of Activity, Business Plan and Code of Conduct, which are available for inspection
at the registered office of SAMI at Beech House, Beech Hill Road, Dublin 4, Ireland. vi) SAMI is also subject to the Corporate Governance Code of the Sanlam Group.
The Board of Directors is responsible for establishing and maintaining internal control and risk management systems of the Company in relation to the financial reporting process. Such systems are designed to manage rather than eliminate the risk of error or fraud in achieving the Company’s financial reporting objectives and can only provide reasonable and not absolute assurance against material misstatement and loss. The Board of Directors has delegated this duty to SAMI. SAMI is authorised and regulated by the Central Bank of Ireland and must comply with the rules imposed by the Central Bank of Ireland. SAMI also monitors and evaluates the external auditor’s performance, qualifications and independence. Brown Brothers Harriman Fund Administration Services is appointed as administrator to maintain the books and records of the Company.

SANLAM UNIVERSAL FUNDS PLC
14
DIRECTORS’ REPORT (CONTINUED) CORPORATE GOVERNANCE CODE (CONTINUED) The Company has procedures in place to ensure all relevant books of accounts are properly maintained and are readily available, including production of annual and half-yearly financial statements. The annual financial statements of the Company are required to be approved by the Board of Directors of the Company and the annual and half yearly financial statements are required to be filed with the Central Bank of Ireland and Euronext Dublin.
The statutory financial statements are required to be audited by the independent auditors who report annually to the Board on their findings.
The Board evaluates and discusses significant accounting and reporting issues as the need arises.
Shareholders’ meetings The convening and conduct of shareholders’ meetings are governed by the Articles of Association of the Company and the Companies Acts. Although the Directors may convene an extraordinary general meeting of the Company at any time, the Directors of the Company are required to convene a general meeting within eighteen months of incorporation and fifteen months of the previous annual general meeting thereafter. Shareholders representing not less than one-tenth of the paid up share capital of the Company may also request to convene a shareholders meeting. Not less than twenty one days notice of every annual general meeting and any meeting for the passing of a special resolution must be given to shareholders and fourteen days’ notice must be given in the case of any other general meeting unless the auditors of the Company and all the shareholders entitled to attend and vote agree to shorter notice. Two members present either in person or by proxy constitutes a quorum at a general meeting provided that the quorum for a general meeting convened to consider any alteration to the class rights of shares is two shareholders holding or representing by proxy at least one third of the issued shares of the relevant Funds or class. Every holder of participating shares or non-participating shares present in person or by proxy who votes on a show of hands is entitled to one vote. On a poll, every holder of participating shares present in person or by proxy is entitled to one vote in respect of each share held by him and every holder of non-participating shares is entitled to one vote in respect of all non-participating shares held by him. The chairman of a general meeting of the Company, or at least two members present in person or by proxy, or any holder or holders of participating shares present in person or by proxy representing at least one-tenth of the shares in issue having the right to vote at such meeting, may demand a poll. Shareholders may decide to sanction an ordinary resolution or special resolution at a shareholder’s meeting. An ordinary resolution of the Company (or of the shareholders of a particular Funds or class) requires a simple majority vote cast by the shareholders voting in person or by proxy at the meeting at which the resolution is proposed. A special resolution of the Company (or of the shareholders of a particular Fund or class) requires a majority vote of not less than 75% of the shareholders present in person or by proxy and voting in general meeting in order to pass a special resolution including a resolution to amend the Articles of Association. Composition and Operation of the Board Unless otherwise determined by an ordinary resolution of the Company in a general meeting, the number of Directors may not be less than two. Currently the Board of Directors of the Company is composed of four Non-Executive Directors, being those listed on page 3 of these financial statements with Paul Dobbyn, Thomas Murray and Richard Aslett being Irish residents. None of the Company’s Directors hold directorships with the Depositary. The business of the Company is managed by the Directors, who exercise all such powers of the Company as are not required by the Companies Acts or the Articles of Association to be exercised by the Company in a general meeting.

SANLAM UNIVERSAL FUNDS PLC
15
DIRECTORS’ REPORT (CONTINUED) Composition and Operation of the Board (continued) A Director may, and the company secretary of the Company on the requisition of a Director will, at any time summon a meeting of Directors. Questions arising at any meeting of Directors are determined by a majority of votes. In the case of quality of votes, the chairman has a second or casting vote. The quorum necessary for the transaction of business at a meeting of the Directors is two. All key management functions of the Company have been delegated to SAMI. SAMI will manage these in terms of their Programme of Activity and Business Plan. SAMI is approved by the Central Bank of Ireland, and is authorised as a UCITS Management Company and an Alternative Investment Fund Manager. Board Diversity As noted above, the Company has adopted the IF Code which includes requirements regarding board composition. The Company is also subject to a number of legal and regulatory requirements regarding the make-up of its Board of Directors (the "Board") including the European Communities (Undertakings for Collective Investment in Transferable Securities (Regulations 2011) as amended), the Central Bank (Supervision and Enforcement) Act 2013 (Section 48(1)) (Undertakings for Collective Investment in Transferable Securities (Regulations, 2015 (as amended)) and the Companies Act, 2014 (as amended). As a consequence, the Company is obliged to have at least two Directors resident in Ireland, to have at least one independent Director and to have a majority of Non-Executive Directors (as defined for the purposes of the IF Code). In addition, the Company is obliged to ensure that each of its Directors meet all legal and regulatory requirements including being of sufficiently good repute and sufficiently experienced in relation to the type of business carried out by the Company, that all Directors meet the Central Bank's fitness and probity requirements and that the Board of the Company has a good balance of skill and expertise so as to enable it to properly and effectively conduct the business of the Company. These requirements aim to ensure a diverse and balanced range of skills as between the Directors on the Board. In addition, the Board is obliged to have regard to the educational and professional background of any prospective directors. At this time the Board does not have a specific policy as regards gender representation on the Board but, as noted, is subject to other legal, regulatory and corporate governance requirements applicable to the Company's appointment of prospective directors. The Board has regard to the various requirements set out above when considering any prospective new appointments to the Board. IMPLICATIONS OF BREXIT The UK triggered Article 50 of the Lisbon Treaty on 29 March 2017 which meant the UK was due to leave the EU at 11:00pm on 29 March 2019. On 21 March 2019, the UK and the EU agreed to extend Article 50 until either 22 May, subject to MPs approving the Withdrawal Agreement, or failing that until 12 April 2019. On 29 March 2019 MPs rejected the Withdrawal Agreement for the third time. On 5 April 2019, Theresa May wrote to the President of the European Council Donald Tusk requesting an extension until 30 June 2019. At the Special European Council (Art. 50) Summit held on 10 April 2019, the EU27 agreed two options:
• To delay Brexit until 31 October 2019 (at the latest) on the condition that the UK participated in European Parliament elections in May 2019 and that such further extension does not undermine the smooth running of the EU and its institutions;
• If the UK failed to hold European Parliament elections, the UK would leave the EU on 1 June. The European Union (Withdrawal) Act 2019, which is an Act of the Parliament of the UK, has fixed the exit day upon which the UK is to leave the EU as 31 October 2019. If the UK and EU ratify the Withdrawal Agreement before 31 October 2019, then the UK would leave the EU on the first day of the following month. However, given the political situation in the UK, there remains uncertainty as to how and when the UK will leave and an increasing risk of a no deal Brexit on 31 October 2019.

SANLAM UNIVERSAL FUNDS PLC
16
DIRECTORS’ REPORT (CONTINUED) IMPLICATIONS OF BREXIT (CONTINUED) Ireland will remain a member of the EU. The Company shall also remain an EU regulated UCITS that can avail of passporting rights under the UCITS Regulations to market and sell shares in the Funds in the EU, subject to complying with the terms of the UCITS Regulations. The Company has appointed UK domiciled and regulated Investment Managers to certain of the Funds of the Company. UCITS funds are permitted to have non-EU investment managers. On 1 February 2019 ESMA confirmed the agreement of no-deal Brexit MoUs with the FCA. One memorandum of understanding (“MoU”) is a multilateral MoU between national EU/EEA regulators and the FCA covering exchange of information and the delegation of portfolio management to UK authorised managers. This multilateral MoU will allow arrangements for fund manager delegation of portfolio/investment management to the UK to continue in the event of a no-deal Brexit. Accordingly, the UK domiciled and regulated Investment Managers that have been appointed to Funds of the Company should be in a position to continue to act as investment managers in the event of no deal. Whilst this most significant Brexit risk has been minimised as a result of the multilateral MoU, Brexit may still negatively impact certain of the Funds of the Company as a result of:
• changes in law and tax treatment resulting from Brexit, including as regards any UK investments held by the particular Fund in question; and/or
• the continued market uncertainty regarding the exit process, which could negatively impact the value of investments held by a Fund.
No assurance can be given that such matters will not adversely affect certain Funds of the Company and the relevant Investment Managers’ ability to achieve the Funds' respective investment objectives. That said, the memorandum and articles of association and prospectus of the Company contain provisions for certain liquidity management tools to help manage market volatility (e.g. ability to control large redemption requests, temporary suspension, redemption in specie) should the need arise. VALUATION OF INVESTMENTS As at 30 June 2019, the following delisted securities were held by the Company:
- Accident Exchange Group Plc (Denker Global Equity Fund; Denker Global Financial Fund) - Banco Espirito Santo SA (Satrix Europe (ex-UK) Equity Tracker Fund) - Rolls-Royce Holding Pfd (Sanlam World Equity Fund, Satrix World Equity Tracker Fund, Satrix UK
Equity Tracker Fund and Sanlam Active UK Fund) The fair value of those securities listed above and used in preparing these financial statements may differ significantly from the values that would have been used had those securities had readily available market prices at 30 June 2019. All other investments in 2019 have readily available market prices.
Approved by the Board of Directors on 29 August 2019
SANLAM UNIVERSAL FUNDS PLC
17
ECONOMIC & MARKET REVIEW
for the six months ended 30 June 2019
While the last quarter of 2018 proved to be very challenging for markets, the first quarter of 2019 seen a remarkable recovery in market levels, primarily in the equity market. This was largely driven by the US Federal Reserve’s rapid change in stance from December to early January. This change in direction for US interest rates, which signalled pausing for now, and perhaps for the rest of 2019, encouraged markets that central banks were prepared to keep policy flexible, if not accommodative, for the foreseeable future. Central bankers have been able to do this in light of the lack of inflationary pressures, which have been broadly absent since the Global Financial Crisis. Additionally, the People’s Bank of China, has already started to loosen monetary conditions, and there are early signs that this is beginning to have a stimulative impact on Chinese economic conditions, which global investors have taken positively. While the US-China trade talks continue, the first quarter also saw increasing confidence that these will be resolved relatively swiftly and satisfactorily, although this is potentially the market being optimistic, as they remain unresolved. Elsewhere, economic conditions in the euro-zone were also difficult, with even Germany struggling in particular segments, especially car manufacturing. As a result, the European Central Bank has also signalled a willingness to loosen policy further, in an effort to stimulate the region’s economy. In the UK, Brexit continued to dominate, and while the UK was originally scheduled to have left the European Union by now, the stalemate within the British Parliament has led to delay much to the frustration of those in the British electorate who wish to leave and voted as such back in June 2016. In summary, the first quarter has seen a turning point in central banks likely path for interest rates, and this has comforted market participants who have even started to anticipate that the US economy may have already seen interest rates peak for the quarter. While equity markets experienced one of their weakest quarters in Q4, 2018, since the Global Financial Crisis, Q1, 2019 seen equity markets produce their best quarter since Q3, 2010, and it was the best first quarter since Q1, 1998. For the quarter, equity markets as measured by the MSCI World Index rose by 12.48%.1 The majority of this return was delivered in January, when markets rose by 7.78%, but February and March also saw equity markets make progress with returns of 3.01% and 1.31% respectively. While one can point to the declining rate of return, a 1% monthly return remains a healthy rate. Across the regions, markets all made strong progress, with North American equities leading the way and rising by 13.82%. This was followed by the Pacific excluding Japan region, which gained 12.24%, while Europe and more so Japan, were the laggards returning 10.84% and 6.66% respectively – although all are notable moves. Emerging Markets also made substantial progress rising 9.91%. Although under-performing Developed Markets, this was really a function of February and March, as in January Emerging Markets delivered a return just shy of 9%, and thus out-performed Developed Markets for that month. At a sector level, all eleven Global Industry Classification System (GICS) sectors delivered positive returns, and all but two delivered double-digit returns. The two main laggards were the Health Care and Financials sectors, which returned 8.14% and 8.41% respectively. Utilities managed to creep into double-digit returns with a gain of 10.02%. In contrast, the major winner for the first quarter, having been one of the main losers of the fourth quarter 2018, was Information Technology which rose 19.57%. Real Estate was perhaps the surprising second-best performer during the first quarter, rising 16.15% – this sector benefitted from the change to the path of global interest rates, as a more interest rate sensitive sector. Energy was also one of the major rebound plays from the fourth quarter 2018 and rose 14.44%. Industrials were the fourth best sector for the first quarter. They rose 14.39% and were the only other sector to out-perform the wider market during the quarter.
1 All performance numbers are in US dollars unless stated otherwise.
SANLAM UNIVERSAL FUNDS PLC
18
ECONOMIC & MARKET REVIEW (CONTINUED)
for the six months ended 30 June 2019
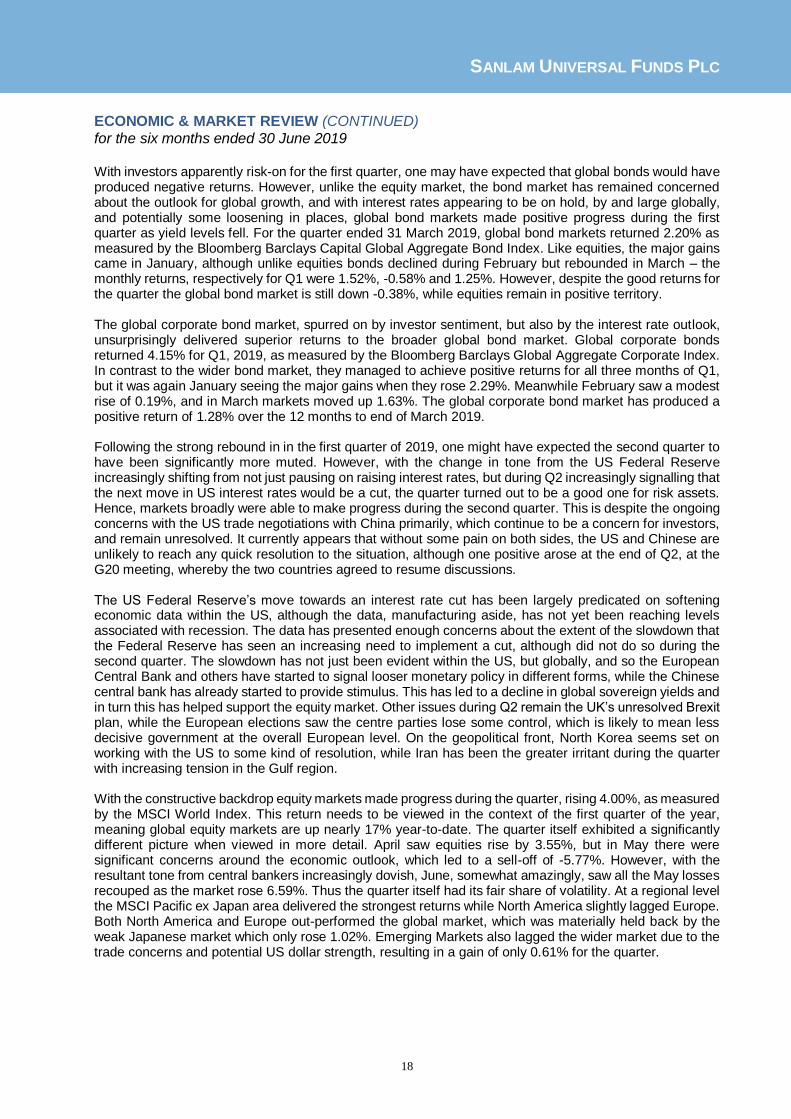
With investors apparently risk-on for the first quarter, one may have expected that global bonds would have produced negative returns. However, unlike the equity market, the bond market has remained concerned about the outlook for global growth, and with interest rates appearing to be on hold, by and large globally, and potentially some loosening in places, global bond markets made positive progress during the first quarter as yield levels fell. For the quarter ended 31 March 2019, global bond markets returned 2.20% as measured by the Bloomberg Barclays Capital Global Aggregate Bond Index. Like equities, the major gains came in January, although unlike equities bonds declined during February but rebounded in March – the monthly returns, respectively for Q1 were 1.52%, -0.58% and 1.25%. However, despite the good returns for the quarter the global bond market is still down -0.38%, while equities remain in positive territory. The global corporate bond market, spurred on by investor sentiment, but also by the interest rate outlook, unsurprisingly delivered superior returns to the broader global bond market. Global corporate bonds returned 4.15% for Q1, 2019, as measured by the Bloomberg Barclays Global Aggregate Corporate Index. In contrast to the wider bond market, they managed to achieve positive returns for all three months of Q1, but it was again January seeing the major gains when they rose 2.29%. Meanwhile February saw a modest rise of 0.19%, and in March markets moved up 1.63%. The global corporate bond market has produced a positive return of 1.28% over the 12 months to end of March 2019. Following the strong rebound in in the first quarter of 2019, one might have expected the second quarter to have been significantly more muted. However, with the change in tone from the US Federal Reserve increasingly shifting from not just pausing on raising interest rates, but during Q2 increasingly signalling that the next move in US interest rates would be a cut, the quarter turned out to be a good one for risk assets. Hence, markets broadly were able to make progress during the second quarter. This is despite the ongoing concerns with the US trade negotiations with China primarily, which continue to be a concern for investors, and remain unresolved. It currently appears that without some pain on both sides, the US and Chinese are unlikely to reach any quick resolution to the situation, although one positive arose at the end of Q2, at the G20 meeting, whereby the two countries agreed to resume discussions. The US Federal Reserve’s move towards an interest rate cut has been largely predicated on softening economic data within the US, although the data, manufacturing aside, has not yet been reaching levels associated with recession. The data has presented enough concerns about the extent of the slowdown that the Federal Reserve has seen an increasing need to implement a cut, although did not do so during the second quarter. The slowdown has not just been evident within the US, but globally, and so the European Central Bank and others have started to signal looser monetary policy in different forms, while the Chinese central bank has already started to provide stimulus. This has led to a decline in global sovereign yields and in turn this has helped support the equity market. Other issues during Q2 remain the UK’s unresolved Brexit plan, while the European elections saw the centre parties lose some control, which is likely to mean less decisive government at the overall European level. On the geopolitical front, North Korea seems set on working with the US to some kind of resolution, while Iran has been the greater irritant during the quarter with increasing tension in the Gulf region. With the constructive backdrop equity markets made progress during the quarter, rising 4.00%, as measured by the MSCI World Index. This return needs to be viewed in the context of the first quarter of the year, meaning global equity markets are up nearly 17% year-to-date. The quarter itself exhibited a significantly different picture when viewed in more detail. April saw equities rise by 3.55%, but in May there were significant concerns around the economic outlook, which led to a sell-off of -5.77%. However, with the resultant tone from central bankers increasingly dovish, June, somewhat amazingly, saw all the May losses recouped as the market rose 6.59%. Thus the quarter itself had its fair share of volatility. At a regional level the MSCI Pacific ex Japan area delivered the strongest returns while North America slightly lagged Europe. Both North America and Europe out-performed the global market, which was materially held back by the weak Japanese market which only rose 1.02%. Emerging Markets also lagged the wider market due to the trade concerns and potential US dollar strength, resulting in a gain of only 0.61% for the quarter.

SANLAM UNIVERSAL FUNDS PLC
19
ECONOMIC & MARKET REVIEW (CONTINUED)
for the six months ended 30 June 2019
On a sector basis, ten of the eleven global sectors produced positive returns. The exception was the Energy sector which declined -1.56% and was clearly the weakest sector for the quarter. Health Care was the next weakest sector but still managed a respectable increase of 1.50% while the other defensive sectors, such as Real Estate, Utilities and Consumer Staples, all under-performed the wider market. Communication Services was also the weakest sector that did manage to out-perform the wider market with a gain of 4.44%. The best performing sector for the quarter was the Financials sector, which rose 6.16%, though this was closely followed by Information Technology that gained 5.87%. The Consumer Discretionary sector also managed to rise more than 5% while Materials and Industrials delivered near identical returns of circa 4.75%. These return patterns clearly indicate the risk-on nature of the quarter with the more cyclical sectors out-performing their more defensive counterparts. Global bond markets had a strong quarter and their strongest since the first quarter of 2016. This was driven by the fall in global yield levels but with spread levels also tightening the rally in bonds was not solely linked to the decline in global yields. Using the US 10-year Treasury bond as a guide, April saw the yield level remain fairly stable at around 2.5% but in May this declined persistently to almost 2.1% by the end of the month. In June the rate of decline eased significantly, only temporarily breaking below 2% during June. While the start and end point for many global government bonds differed significantly to the US Treasury, the direction and magnitude of changes were broadly equivalent. As a result, the Bloomberg Barclays Global Aggregate Bond Index delivered 3.29% for the quarter. April saw a return of -0.30%, while in May global bond markets moved up 1.35% and this accelerated in June as markets moved up 2.22%. In the global corporate bond space, with the combination of lower yield and a risk on environment, it was unsurprising that the Bloomberg Barclays Global Aggregate Corporate Index out-performed the wider market for the quarter with a return of 3.93%. The pattern of returns was somewhat different with positive returns in each month of the quarter. April saw the corporate market gain 0.46%, while in May it failed to keep up with the wider bond market in a risk off environment with a return of 0.68%. Then in June it benefitted from both tailwinds i.e. declining yields and risk on, to gain 2.75% – its best month since March 2016.
SANLAM UNIVERSAL FUNDS PLC
20
BRIDGE GLOBAL PROPERTY INCOME FUND
Investment Objective The Bridge Global Property Income Fund (the “Fund”) aims to provide investors with a high level of current income, as well as long-term income and capital growth, by investing primarily in a global range of transferable securities of real estate companies and real estate related companies, or in companies which own significant real estate assets at the time of investment or in Real Estate Investment Trusts (“REITS”) including publicly traded closed-ended real estate funds listed or traded on a regulated stock exchange or market.
Fund Performance
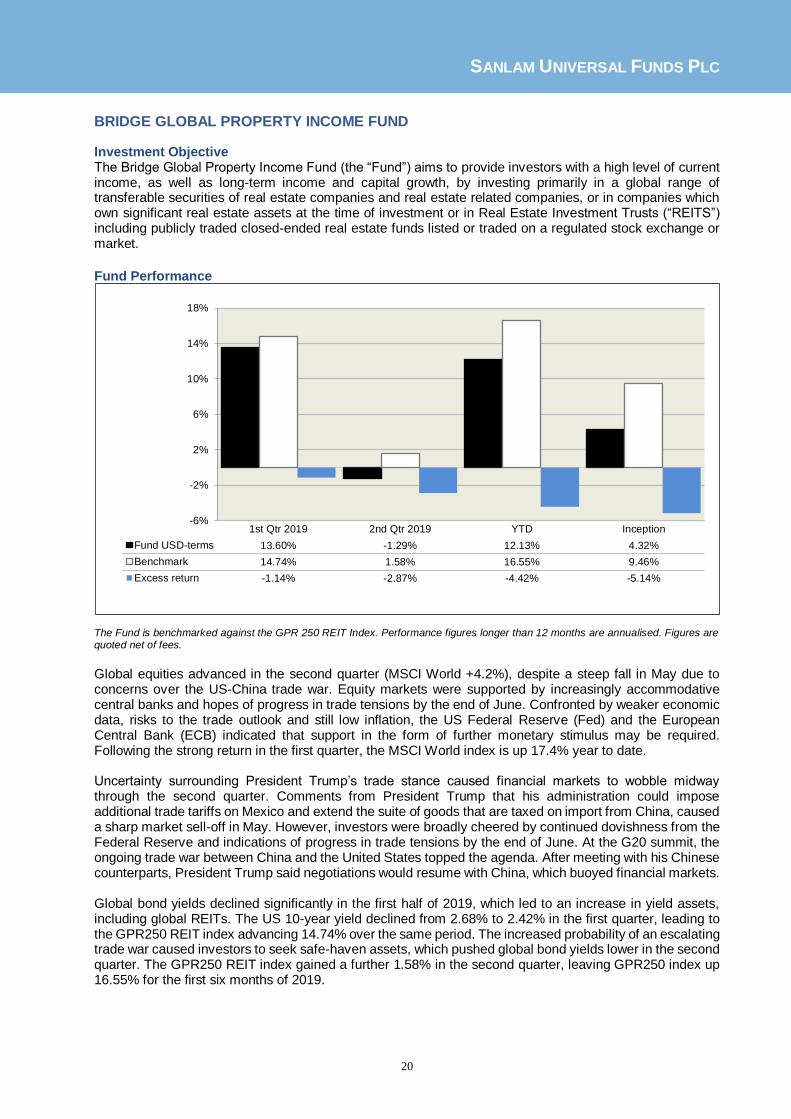
The Fund is benchmarked against the GPR 250 REIT Index. Performance figures longer than 12 months are annualised. Figures are quoted net of fees.
Global equities advanced in the second quarter (MSCI World +4.2%), despite a steep fall in May due to concerns over the US-China trade war. Equity markets were supported by increasingly accommodative central banks and hopes of progress in trade tensions by the end of June. Confronted by weaker economic data, risks to the trade outlook and still low inflation, the US Federal Reserve (Fed) and the European Central Bank (ECB) indicated that support in the form of further monetary stimulus may be required. Following the strong return in the first quarter, the MSCI World index is up 17.4% year to date. Uncertainty surrounding President Trump’s trade stance caused financial markets to wobble midway through the second quarter. Comments from President Trump that his administration could impose additional trade tariffs on Mexico and extend the suite of goods that are taxed on import from China, caused a sharp market sell-off in May. However, investors were broadly cheered by continued dovishness from the Federal Reserve and indications of progress in trade tensions by the end of June. At the G20 summit, the ongoing trade war between China and the United States topped the agenda. After meeting with his Chinese counterparts, President Trump said negotiations would resume with China, which buoyed financial markets. Global bond yields declined significantly in the first half of 2019, which led to an increase in yield assets, including global REITs. The US 10-year yield declined from 2.68% to 2.42% in the first quarter, leading to the GPR250 REIT index advancing 14.74% over the same period. The increased probability of an escalating trade war caused investors to seek safe-haven assets, which pushed global bond yields lower in the second quarter. The GPR250 REIT index gained a further 1.58% in the second quarter, leaving GPR250 index up 16.55% for the first six months of 2019.
-6%
-2%
2%
6%
10%
14%
18%
1st Qtr 2019 2nd Qtr 2019 YTD Inception
Fund USD-terms 13.60% -1.29% 12.13% 4.32%
Benchmark 14.74% 1.58% 16.55% 9.46%
Excess return -1.14% -2.87% -4.42% -5.14%

SANLAM UNIVERSAL FUNDS PLC
21
BRIDGE GLOBAL PROPERTY INCOME FUND (CONTINUED)
Fund Performance (continued) Market sentiment to UK REITs has soured in 2019. Retail landlords continue to face increased pressure as more and more UK retailers use the CVA process to negotiate lower base rents. Some of the notable retailers include Debenhams, Marks & Spencer, New Look and House of Frasers. UK commercial property valuers have responded by slashing retail property values, which has weakened many of the retail landlord’s balance sheets. Increased uncertainty around the Brexit outcome also continues to weigh on business confidence, increasing the pressure on office landlords to fill vacant space. Most mall operators globally continue to increase their capex programmes to counteract the threat of online shopping. The Fund has advanced 12.13% year to date, underperforming its benchmark by 4.42% year to date. The underperformance came about as a result of the Fund’s overweight position to South African REITs, and exposure to retail landlords Macerich, Hammerson and Simon Property. The longer-term underperformance to its benchmark can be attributed to the Fund’s service fee and the payment of dividend withholdings tax, neither of which are adjusted for when comparing the Fund’s performance to the benchmark. Fund Outlook Market participants are expecting central banks, led by the US Federal Reserve (the Fed), to start cutting interest rates as global growth slows. The uncertainty created by a prolonged trade war featuring the world’s two largest economic powers; the US and China, is undermining consumer and business confidence. Recent economic data releases point to a further slowdown in the second half of the year if central banks don’t provide further stimulus. According to Bloomberg, the market is currently pricing in slightly more than a 0.25% cut in official interest rates when the Fed meets in July. In Europe, Christine Lagarde, currently head of the International Monetary Fund, has been nominated by the European Council to succeed Mario Draghi as President of the European Central Bank (ECB). Lagarde, whose background is in politics and not economics, has been a vocal advocate of increased central bank stimulus to promote growth and is expected to put that into action when she assumes her new role at the beginning of November. Both the Fed and the ECB will now be headed by politicians at a time when politics, rather than economics, is driving global financial markets. The UK has moved no closer to Brexit. Despite a further extension of the Article 50 deadline to 31 October, there remains considerable uncertainty as to the path the country may eventually take around Brexit. Against this backdrop of increased economic and political uncertainty, global bond yields continue to decline. The yield on US 10-year Treasuries is just above 2% while the yields on 10-year bonds in Germany and Japan are negative again. Inflation expectations continue to fall, supporting the case for lower bond yields, while most central banks have turned dovish since the start of the year and are expected to continue with extremely accommodative monetary policies. Global listed property markets rallied on the back of lower global bond yields. The GPR 250 REIT index has advanced nearly 17% year to date as investors continued to upweight their exposure to income-producing or interest rate sensitive sectors of the equity market, like REITs. Global REITs have had their best start to a year amid a broad-based rally fuelled by lower government bond yields, tighter corporate credit spreads and an improving earnings outlook relative to other sectors of the market (for REITs, the earnings outlook has not changed much, while other sectors have seen earnings downgrades as global economic growth has slowed). Listed property companies, on average, are still trading at deep discounts to the underlying value of their property portfolios and on forward dividend yields well above the yields on longer-dated, investment-grade corporate bonds. Most companies are expected to produce inflation-beating dividend growth over the medium-term, while increased levels of corporate activity, particularly in those sectors and markets offering the deepest discounts to net asset value, is expected to drive share price appreciation in the short-term.

SANLAM UNIVERSAL FUNDS PLC
22
BRIDGE GLOBAL PROPERTY INCOME FUND (CONTINUED)
Fund Outlook (continued) The Fund continues to favour investments in high quality Real Estate Investment Trusts (REITs) that are expected to withstand the impact of technological disruptions. The Fund is well diversified both geographically and by property-type. The Fund continues to offer investors a high level of initial income in US dollars, as well as inflation-beating income and capital growth in US dollars over the medium and long term. The current one-year forward yield on the portfolio is 4.83% (before fees and WHT) and the portfolio’s income is expected to grow by 3.71% per annum over the next three years. The portfolio income is rolled up into the Fund and is not distributed to investors.
Investment Manager Bridge Fund Managers (Pty) Limited
SANLAM UNIVERSAL FUNDS PLC
23
SANLAM AFRICAN FRONTIER MARKETS FUND
Investment Objective
The investment objective of the Sanlam African Frontier Markets Fund (the “Fund”) is to achieve long-term
capital growth by investing in listed African equities (ex-South Africa) that offer above average growth
potential.
Fund Performance
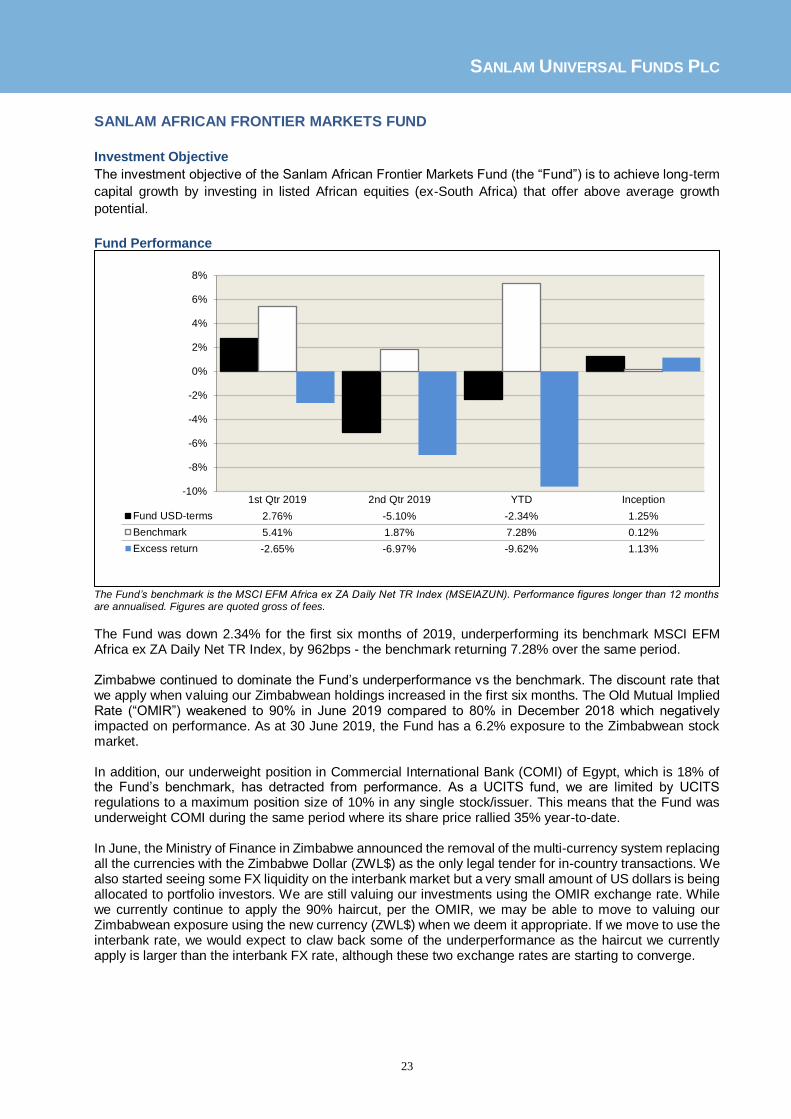
The Fund’s benchmark is the MSCI EFM Africa ex ZA Daily Net TR Index (MSEIAZUN). Performance figures longer than 12 months are annualised. Figures are quoted gross of fees.
The Fund was down 2.34% for the first six months of 2019, underperforming its benchmark MSCI EFM Africa ex ZA Daily Net TR Index, by 962bps - the benchmark returning 7.28% over the same period. Zimbabwe continued to dominate the Fund’s underperformance vs the benchmark. The discount rate that we apply when valuing our Zimbabwean holdings increased in the first six months. The Old Mutual Implied Rate (“OMIR”) weakened to 90% in June 2019 compared to 80% in December 2018 which negatively impacted on performance. As at 30 June 2019, the Fund has a 6.2% exposure to the Zimbabwean stock market. In addition, our underweight position in Commercial International Bank (COMI) of Egypt, which is 18% of the Fund’s benchmark, has detracted from performance. As a UCITS fund, we are limited by UCITS regulations to a maximum position size of 10% in any single stock/issuer. This means that the Fund was underweight COMI during the same period where its share price rallied 35% year-to-date. In June, the Ministry of Finance in Zimbabwe announced the removal of the multi-currency system replacing all the currencies with the Zimbabwe Dollar (ZWL$) as the only legal tender for in-country transactions. We also started seeing some FX liquidity on the interbank market but a very small amount of US dollars is being allocated to portfolio investors. We are still valuing our investments using the OMIR exchange rate. While we currently continue to apply the 90% haircut, per the OMIR, we may be able to move to valuing our Zimbabwean exposure using the new currency (ZWL$) when we deem it appropriate. If we move to use the interbank rate, we would expect to claw back some of the underperformance as the haircut we currently apply is larger than the interbank FX rate, although these two exchange rates are starting to converge.
-10%
-8%
-6%
-4%
-2%
0%
2%
4%
6%
8%
1st Qtr 2019 2nd Qtr 2019 YTD Inception
Fund USD-terms 2.76% -5.10% -2.34% 1.25%
Benchmark 5.41% 1.87% 7.28% 0.12%
Excess return -2.65% -6.97% -9.62% 1.13%

SANLAM UNIVERSAL FUNDS PLC
24
SANLAM AFRICAN FRONTIER MARKETS FUND (CONTINUED) Fund Outlook With regards to our investments in Zimbabwe it is worth pointing out that all three businesses that we are invested in operate in extremely attractive industries/sectors in which they totally dominate with market shares >90% and their operating performance has actually been very decent through all the turmoil in the country. These companies, in our view, are incredibly well run and are entrenching their dominant positions against a backdrop of very difficult economic circumstances. It is in these situations that we often find the best opportunities. The Zimbabwean trade has been a painful one for the last twelve months but our focus is on the future and the potential we see. We don’t know when and how things may resolve in Zimbabwe, but we know we hold high quality businesses, acquired at very reasonable prices. This is an uncomfortable period but we remain comfortable that we can still deliver against our longer term goals. Investment Manager
Sanlam Investment Management (Pty) Limited
SANLAM UNIVERSAL FUNDS PLC
25
DENKER GLOBAL EQUITY FUND
Investment Objective The investment objective of the Denker Global Equity Fund (the “Fund”) is to provide above average long-term capital growth by investing primarily in global equities which the Investment Manager has identified as being undervalued and as offering above average growth potential.
Fund Performance
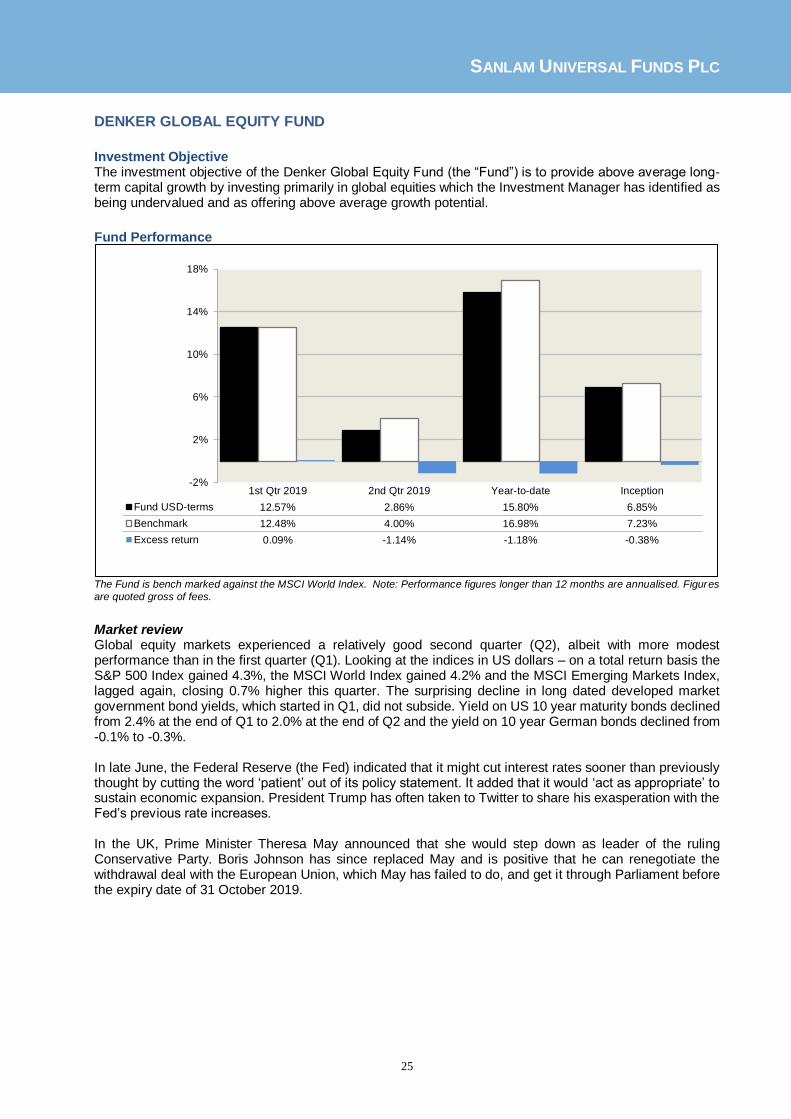
The Fund is bench marked against the MSCI World Index. Note: Performance figures longer than 12 months are annualised. Figures
are quoted gross of fees.
Market review Global equity markets experienced a relatively good second quarter (Q2), albeit with more modest performance than in the first quarter (Q1). Looking at the indices in US dollars – on a total return basis the S&P 500 Index gained 4.3%, the MSCI World Index gained 4.2% and the MSCI Emerging Markets Index, lagged again, closing 0.7% higher this quarter. The surprising decline in long dated developed market government bond yields, which started in Q1, did not subside. Yield on US 10 year maturity bonds declined from 2.4% at the end of Q1 to 2.0% at the end of Q2 and the yield on 10 year German bonds declined from -0.1% to -0.3%. In late June, the Federal Reserve (the Fed) indicated that it might cut interest rates sooner than previously thought by cutting the word ‘patient’ out of its policy statement. It added that it would ‘act as appropriate’ to sustain economic expansion. President Trump has often taken to Twitter to share his exasperation with the Fed’s previous rate increases. In the UK, Prime Minister Theresa May announced that she would step down as leader of the ruling Conservative Party. Boris Johnson has since replaced May and is positive that he can renegotiate the withdrawal deal with the European Union, which May has failed to do, and get it through Parliament before the expiry date of 31 October 2019.
-2%
2%
6%
10%
14%
18%
1st Qtr 2019 2nd Qtr 2019 Year-to-date Inception
Fund USD-terms 12.57% 2.86% 15.80% 6.85%
Benchmark 12.48% 4.00% 16.98% 7.23%
Excess return 0.09% -1.14% -1.18% -0.38%

SANLAM UNIVERSAL FUNDS PLC
26
DENKER GLOBAL EQUITY FUND (CONTINUED)
Fund Performance (continued)
Portfolio review Q1 2019 The Fund benefited from its overweight stance in Information Technology (+20%), with Micro Focus rising 51% after better than expected results in the aftermath of integration problems with its acquisition of HP Enterprise’s software business. Cisco Systems rose 25% after strong fiscal 2nd quarter results. Performance was further boosted by a partial reversal of the deeply negative sentiment plaguing tobacco stocks of late, in the wake of US Federal Drug Administration pronouncements against menthol cigarettes and flavoured vaping products (Philip Morris International +34%; Altria Group +17%). TUI AG detracted from performance (-29%) after issuing separate profit warnings in February and on the last trading day of the quarter. TUI blamed lower than expected bookings in its tour operator business in the first instance and the costs associated with the forced grounding of its 15 Boeing 737 Max aircraft in the second. Raiffeisen Bank also negatively affected portfolio performance, falling 11% on unsubstantiated rumours of a money laundering scandal. From a global geographic perspective, the Fund’s lack of exposure to Japan, which rallied only 7% vs. the 12.5% rally in the MSCI World Index, benefited performance, as did the Fund’s sole holding in China (Alibaba, +33%). The Fund’s UK stock picks (+14%) were also beneficial to performance as asset prices here were beginning to reflect parliament’s resolution to prevent a hard Brexit, even if the details of such an outcome remain opaque. The Fund’s holdings in the US detracted from performance overall (Medtronic +1%; HP Inc. -4.5%; Berkshire Hathaway –1.6%), despite rallies in the previously mentioned tobacco names, Cisco and mortgage insurer Essent Group (+27%). Q2 2019 Solid outperformance for the Fund in the energy, healthcare and information technology sectors could not offset the market’s negative view of the tobacco industry’s headwinds, which sent stocks in the latter tumbling. The Fund’s exposure to these highly cash generative businesses was the overriding cause of underperformance against the MSCI World Index benchmark in the quarter. The company-specific detractors were Imperial Brands which fell 30%, Altria which was down 17% and Philip Morris off by 10%. These tobacco company sell-offs appear to have been precipitated by sharper than expected volume declines in traditional cigarette sales volumes, possibly exacerbated by somewhat disappointing growth numbers for the so-called ‘next generation products’. Alarmingly, the former declines were reported by the market researcher Nielsen to be of the order of 8%-10%, which was worse than market expectations. However, Nielsen subsequently admitted that their sampling methodology was likely outdated and not accurate. Another poor performer was Alibaba Group, which fell 7% despite excellent fiscal Q4 results. Market participants worried about the ongoing United States/China trade dispute, as well as a strategic decision by the company to delay ad feed monetisation in fiscal 2020, in order to capture market share in China’s lower-tier cities. Other laggards were Lions Gate Entertainment (-22%) and United Kingdom-based mortgage lender OneSavings Bank (-8%). The major contributors to performance were United States homebuilder NVR, which rose 22% in the wake of better than expected first quarter numbers, equipment rentals business Ashtead Group (+19%), which reported solid full year results in mid-June and reiterated 15-20% earnings growth guidance for the 2020 fiscal year, and Microsoft, up 14% after their third quarter results printed substantially above expectations. This was on the back of continued strength in their cloud businesses as well as surprisingly good growth in their traditional on-premise revenues.
SANLAM UNIVERSAL FUNDS PLC
27
DENKER GLOBAL EQUITY FUND (CONTINUED)
Fund Outlook The Fund endeavours to control risk in a rational manner by dampening hard-to-predict factor exposures and focusing its risk budget on proven bottom-up stock picking. Based on current consensus expectations the Fund offers a more attractive valuation than the overall market (fwd P/E: 12.5x vs. 15.6x and Div Yld: 3.0% vs. 2.4%), while producing a better return (ROE: 24% vs. 19%) and better profitability (operating margin: 25% vs. 20%). The Fund has an Active Share of 90%.
Investment Manager Denker Capital (Pty) Limited

SANLAM UNIVERSAL FUNDS PLC
28
SANLAM GLOBAL BOND FUND
Investment Objective The Sanlam Global Bond Fund (the “Fund”) aims to provide income with the possibility of long-term growth from capital appreciation.
Fund Performance
The Fund’s benchmark is the Barclays Capital Global Aggregate Bond Index. Performance figures longer than 12 months are
annualised. Figures are quoted gross of Investment Manager and Manager fees.
Bond markets on the whole had a strong first half of the year, with the Bloomberg Barclays Global Aggregate Index gaining 5.57% in absolute terms over the period. The Fund kept pace with this benchmark, ending 2 basis points ahead over H1. The two quarters were stark contrasts in terms of relative performance of the Fund, underperforming the benchmark by -0.48% in Q1, but outperforming by +0.52% in Q2. Absolute returns during the first and second quarters were 1.72% and 3.81% respectively, with the strongest absolute month for the Fund YTD coming in June. Since inception, the Fund and the benchmark have annualised 3.19% and 3.65% respectively. Fund Outlook There is little doubt that the global economy is experiencing a period of economic softening, and the most severe since 2016. The primary issue going forward is how cyclical this slowdown is or whether it is more of a structural slowdown. If it is the former then the global economy should avert recessionary levels, but if it is the latter then investors should all be significantly more concerned, as this could result in a recession in the USA and elsewhere. Global central bankers have shifted materially in their thinking from hawkish to dovish in the last twelve months, and their willingness to provide liquidity through easier monetary policy looks set to help markets in the second half of 2019. The questions that are really being asked now are what the extent of this easing will be by each central bank, and perhaps more importantly what the efficacy of monetary policy will be, from what are already low levels of interest rates by historical standards. Whether or not the US Federal Reserve cuts interest rates is not the crucial issue in the long term - how far the US Federal Reserve will have to cut to reignite the relevant parts of the US economy and prevent a more significant slowdown materialising is more prevalent here. The European Central Bank also faces its own challenges, especially as, unlike the US, it has been unable to raise base interest rates at all. Consequently, there are already significant expectations of additional quantitative easing in the euro-zone and potentially in other jurisdictions like Japan.
-2%
0%
2%
4%
6%
1st Qtr 2019 2nd Qtr 2019 Year-to-date Inception
Fund USD-terms 1.72% 3.81% 5.59% 3.19%
Benchmark 2.20% 3.29% 5.57% 3.65%
Excess return -0.48% 0.52% 0.02% -0.46%

SANLAM UNIVERSAL FUNDS PLC
29
SANLAM GLOBAL BOND FUND (CONTINUED)
Fund Outlook (continued) With the economic backdrop perhaps the most uncertain it has been in recent years, the buoyancy of risk markets is somewhat concerning. The decline in global bond yields is worrying from an economic perspective, and the long-term sustainability of those yield levels can be questioned. However, fundamentally in the short-term the change in stance by central banks does help explain these movements, though concern remains. While bond yields will probably remain at current levels, if not fall further, during the remainder of 2019, the long-term outlook for yields should be higher if economic recovery is to materialise in the future. While the fundamental risks outlined above are likely to be the driver of the economic outlook, and then in turn the market outlook, one must remember that there are also other threats including the escalating international tension around Iran, which could have serious geopolitical consequences and potential economic spill-over impacts. In Europe, the uncertainty around Brexit remains and while the current deadline is earmarked for the end of October, there is no certainty that further extensions will not also be required. Lastly, 2020 sees a US presidential election - with the US political machine gathering pace, President Trump may find himself encouraged to reach an agreement with China, though only time will tell.
Investment Manager
Cameron Hume Limited

SANLAM UNIVERSAL FUNDS PLC
30
DENKER GLOBAL FINANCIAL FUND
Investment Objective The investment objective of the Denker Global Financial Fund (the “Fund”) is to achieve steady growth in the US Dollar value of investments primarily through global investment in securities of companies of which the principle operations specifically focus on, and derive benefit from or pertain to, the provision of banking, insurance and other financial services.
Fund Performance
The Fund’s benchmark is the MSCI World Financials Index. Performance figures longer than 12 months are annualised. Figures are
quoted gross of fees.
Market review Global equity markets experienced a relatively good second quarter (Q2), albeit with more modest performance than in the first quarter (Q1). Looking at the indices in US dollars – on a total return basis the S&P 500 Index gained 4.3%, the MSCI World Index gained 4.2% and the MSCI Emerging Markets Index, lagged again, closing 0.7% higher this quarter. The surprising decline in long dated developed market government bond yields, which started in Q1, did not subside. Yield on US 10 year maturity bonds declined from 2.4% at the end of Q1 to 2.0% at the end of Q2 and the yield on 10 year German bonds declined from -0.1% to -0.3%. In late June, the Federal Reserve (the Fed) indicated that it might cut interest rates sooner than previously thought by cutting the word ‘patient’ out of its policy statement. It added that it would ‘act as appropriate’ to sustain economic expansion. President Trump has often taken to Twitter to share his exasperation with the Fed’s previous rate increases. In the UK, Prime Minister Theresa May announced that she would step down as leader of the ruling Conservative Party. Boris Johnson has since replaced May and is positive that he can renegotiate the withdrawal deal with the European Union, which May has failed to do, and get it through Parliament before the expiry date of 31 October 2019.
-2%
2%
6%
10%
14%
18%
1st Qtr 2019 2nd Qtr 2019 Year-to-date Inception
Fund USD-terms 10.64% 4.78% 15.94% 9.71%
Benchmark 8.41% 6.16% 15.08% 2.95%
Excess return 2.24% -1.37% 0.86% 6.75%

SANLAM UNIVERSAL FUNDS PLC
31
DENKER GLOBAL FINANCIAL FUND (CONTINUED)
Fund Performance (continued)
Portfolio review
Q1 2019 The companies we were invested in reported good financial results, in particular Tinkoff Credit Services (TCS), Essent, Adira and TBC (4 of our largest holdings) but also others like OneSavings Bank, Credicorp, Renaissance Re, Signature Bank, JP Morgan, etc. confirming our view that the companies the fund is invested in have adapted to the new lower growth, low interest rate environment and taking market share from slower moving, still challenged competitors. The investments that contributed most to the strong performance were Essent (US), Yes Bank (India), Adira (Indonesia), Citigroup (US) and Sberbank (Russia) whilst the investments that detracted were the more defensive holdings like Berkshire Hathaway, ICE and our investment in Norwegian savings banks with the largest detractor being Raiffeisen Bank (Asutria/CEE) which is being accused of money laundering charges (which are old and have been dealt with by the regulators). Besides increasing the investment in Citigroup we gradually divested from Bradesco in Brazil (as the market became over confident about new president Bolsonaro’s ability to push through reforms) and increased the funds’ investment in India. Q2 2019 The Fund performed well this quarter, and year to date, largely thanks to the US which was the largest contributor to the positive return. India, Europe and the UK were the largest detractors. Although we invest “bottom-up” (i.e. we have a stock picking philosophy), in a low growth, low interest rate environment the macroenvironment plays a significant role and we continuously assess the environments in which the companies we are invested in operate. At the moment the largest geographical investments of the Fund are the US (37%) and then around 10% each in India, the UK and Europe. The US banks and insurers have done very well for us and are reporting good results, but Europe has lagged so much and has become so undervalued that we decided to switch a bit of the US into the best positioned opportunities in Europe (ING, Kruk and NLB). ING is one of the best banks in Europe and a leader in digitalisation strategies, Kruk is a leading debt collector (based in Poland) and has been buying up books to collect at significant discounts whilst NLB is domiciled in Slovenia (and has operations in Slovenia and surrounding higher growth countries) and due to being a fairly new and unknown listing is trading on a 10% dividend yield. India is experiencing a liquidity scare after a few real estate developers defaulted in 2018 and 2019. Hence we decided to reduce exposure to banks potentially affected and invest in HDFC. Over many years and through many crises we’ve learnt that in times of uncertainty there is a flight to quality banks and insurers and hence it is better to sit on safe ground whilst the crisis plays out. We did consider selling out of India totally but it is one of the few countries in the world that can still grow at 5%+ and the financial sector is the oil that is vital to facilitate such growth and benefits from it. Fund Outlook The combination of quality and very attractive valuation makes us want to add to our UK holdings (especially OneSavings Bank and Legal and General), but we don’t want to increase our position until we see how Brexit plays out.

SANLAM UNIVERSAL FUNDS PLC
32
DENKER GLOBAL FINANCIAL FUND (CONTINUED)
Fund Outlook (continued) The financial sector is currently ignored by investors and unloved, and based on the increased regulatory complexity and negative press about low interest rates we understand that emotion. However, the market misses the fact that the sector has largely dealt with the regulatory burdens and focused on cutting costs and unprofitable units (Deutsche Bank is one of the last that is finally being forced to do this). What the market really misses is that in times of change there are winners and losers and we’re finding that the managements (and countries) that were on the front foot are taking market share and have improved their return on capital. Two examples are our top holdings, JP Morgan and Essent (both in the US), but the best example is TCS which has grown its market share from almost zero to 12% over the past 10 years by being one of the most technologically advanced financial services players in the world (I recommend you Google TCS and see for yourself). Finally, we are encouraged by the fact that Warren Buffett (with a 50 year track record of substantially outperforming the markets) has increased Berkshire Hathaway’s investment in the financial sector to about 70%. Like Warren, we take longer term views and focus on shareholder value growth, but we have the advantage that we have a much larger pond to fish in being able to invest in smaller challengers (like TCS and Essent) and also in faster growing emerging markets such as India and Indonesia. You have to go back a long time to find when last the sector was this undervalued. It’s important to remember that, when investing for the long term, it’s usually best to be patient and let the compounding shareholder value growth work for you. Even in this tough environment, the average annual growth in shareholder value of our portfolio is around 12% per annum - and investors are getting this at a discounted valuation. Investment Manager
Denker Capital (Pty) Limited
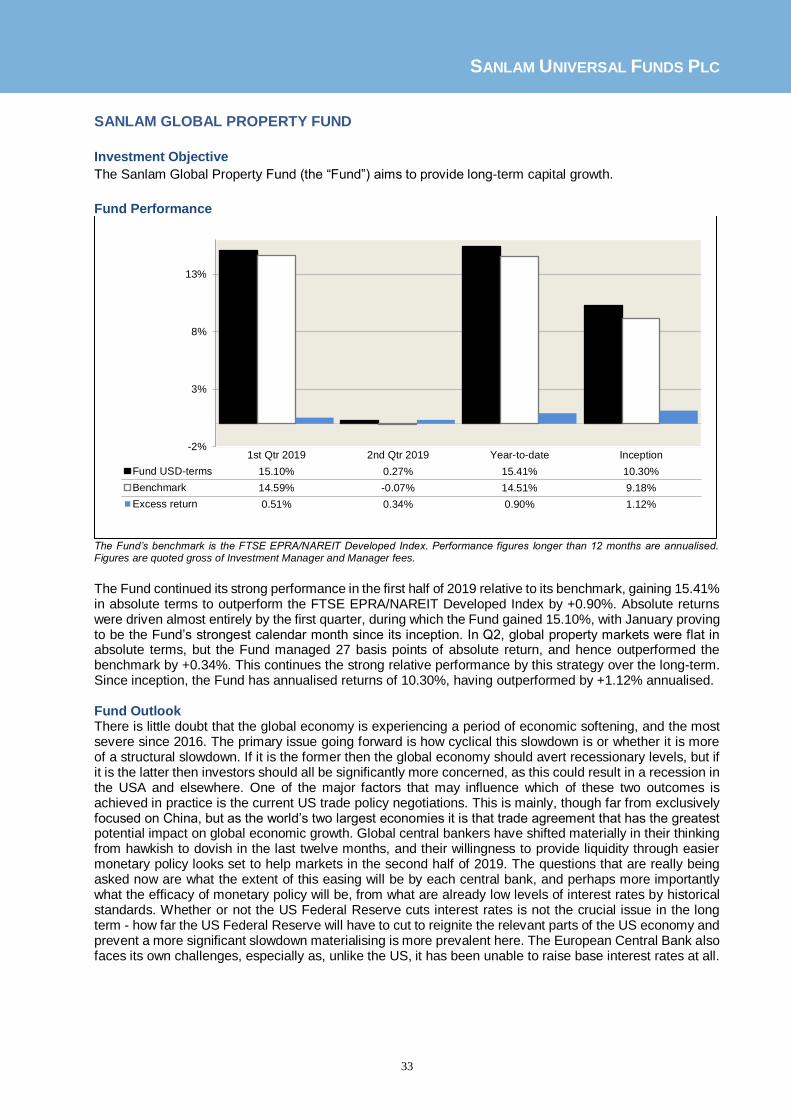
SANLAM UNIVERSAL FUNDS PLC
33
SANLAM GLOBAL PROPERTY FUND
Investment Objective
The Sanlam Global Property Fund (the “Fund”) aims to provide long-term capital growth.
Fund Performance
The Fund’s benchmark is the FTSE EPRA/NAREIT Developed Index. Performance figures longer than 12 months are annualised. Figures are quoted gross of Investment Manager and Manager fees.
The Fund continued its strong performance in the first half of 2019 relative to its benchmark, gaining 15.41% in absolute terms to outperform the FTSE EPRA/NAREIT Developed Index by +0.90%. Absolute returns were driven almost entirely by the first quarter, during which the Fund gained 15.10%, with January proving to be the Fund’s strongest calendar month since its inception. In Q2, global property markets were flat in absolute terms, but the Fund managed 27 basis points of absolute return, and hence outperformed the benchmark by +0.34%. This continues the strong relative performance by this strategy over the long-term. Since inception, the Fund has annualised returns of 10.30%, having outperformed by +1.12% annualised. Fund Outlook There is little doubt that the global economy is experiencing a period of economic softening, and the most severe since 2016. The primary issue going forward is how cyclical this slowdown is or whether it is more of a structural slowdown. If it is the former then the global economy should avert recessionary levels, but if it is the latter then investors should all be significantly more concerned, as this could result in a recession in the USA and elsewhere. One of the major factors that may influence which of these two outcomes is achieved in practice is the current US trade policy negotiations. This is mainly, though far from exclusively focused on China, but as the world’s two largest economies it is that trade agreement that has the greatest potential impact on global economic growth. Global central bankers have shifted materially in their thinking from hawkish to dovish in the last twelve months, and their willingness to provide liquidity through easier monetary policy looks set to help markets in the second half of 2019. The questions that are really being asked now are what the extent of this easing will be by each central bank, and perhaps more importantly what the efficacy of monetary policy will be, from what are already low levels of interest rates by historical standards. Whether or not the US Federal Reserve cuts interest rates is not the crucial issue in the long term - how far the US Federal Reserve will have to cut to reignite the relevant parts of the US economy and prevent a more significant slowdown materialising is more prevalent here. The European Central Bank also faces its own challenges, especially as, unlike the US, it has been unable to raise base interest rates at all.
-2%
3%
8%
13%
1st Qtr 2019 2nd Qtr 2019 Year-to-date Inception
Fund USD-terms 15.10% 0.27% 15.41% 10.30%
Benchmark 14.59% -0.07% 14.51% 9.18%
Excess return 0.51% 0.34% 0.90% 1.12%

SANLAM UNIVERSAL FUNDS PLC
34
SANLAM GLOBAL PROPERTY FUND (CONTINUED) Fund Outlook (continued) Consequently, there are already significant expectations of additional quantitative easing in the euro-zone and potentially in other jurisdictions like Japan. While the fundamental risks outlined above are likely to be the driver of the economic outlook, and then in turn the market outlook, one must remember that there are also other threats including the escalating international tension around Iran, which could have serious geopolitical consequences and potential economic spill-over impacts. In Europe, the uncertainty around Brexit remains and while the current deadline is earmarked for the end of October, there is no certainty that further extensions will not also be required. Lastly, 2020 sees a US presidential election - with the US political machine gathering pace, President Trump may find himself encouraged to reach an agreement with China, though only time will tell.
Investment Manager
AllianceBernstein Limited

SANLAM UNIVERSAL FUNDS PLC
35
SANLAM WORLD EQUITY FUND
Investment Objective The Sanlam World Equity Fund (the “Fund”) aims to provide above average long-term capital growth by investing primarily in global equities.
Fund Performance
The Fund‘s benchmark is the MSCI World Index. Performance figures longer than 12 months are annualised. Figures are quoted gross of Investment Manager and Manager fees. Despite strong absolute performance, the Fund struggled to keep pace with global equity markets over the first half of 2019. The Fund lagged the MSCI World index by -1.86% over the period, having gained 15.12% in absolute terms. The Fund underperformed the benchmark in both quarters, lagging over Q1 and Q2 by -0.82% and -0.90% respectively. The Fund’s strongest absolute quarter came in Q1, where the Fund gained 11.66% driven off a strong rebound in January. The second quarter for the Fund was dominated by a transition away from the incumbent managers, terminating them in place of the Sanlam Global High-Quality team who have taken over responsibility for the Fund. Assets were transferred from the legacy accounts into one single account for the team to take hold of, with the transition having been completed by the end of Q2. Fund Outlook There is little doubt that the global economy is experiencing a period of economic softening, and the most severe since 2016. The primary issue going forward is how cyclical this slowdown is or whether it is more of a structural slowdown. If it is the former then the global economy should avert recessionary levels, but if it is the latter then investors should all be significantly more concerned, as this could result in a recession in the USA and elsewhere. One of the major factors that may influence which of these two outcomes is achieved in practice is the current US trade policy negotiations. This is mainly, though far from exclusively focused on China, but as the world’s two largest economies it is that trade agreement that has the greatest potential impact on global economic growth. Global central bankers have shifted materially in their thinking from hawkish to dovish in the last twelve months, and their willingness to provide liquidity through easier monetary policy looks set to help markets in the second half of 2019. The questions that are really being asked now are what the extent of this easing will be by each central bank, and perhaps more importantly what the efficacy of monetary policy will be, from what are already low levels of interest rates by historical standards. Equities themselves do not look cheap globally, and clearly look to be on the expensive side in the USA, but they have been supported till now by earnings coming through.
-2%
2%
6%
10%
14%
18%
1st Qtr 2019 2nd Qtr 2019 Year-to-date Inception
Fund USD-terms 11.66% 3.10% 15.12% 6.17%
Benchmark 12.48% 4.00% 16.98% 7.32%
Excess return -0.82% -0.90% -1.86% -1.15%

SANLAM UNIVERSAL FUNDS PLC
36
SANLAM WORLD EQUITY FUND (CONTINUED) Fund Outlook (continued) The current challenge for equities is whether, in the face of a cyclical economic slowdown, or something more severe, earnings growth will be materially impacted. In the scenario of a cyclical slowdown, earnings growth may well hold up, acknowledging the potential here for some softening of growth levels. However, if the slowdown becomes protracted and potentially recessionary then earnings should expect to take a material hit. This fall in earnings would exacerbate the stretch in valuations in the short-term, leading to a potential fall in equity market levels as a result. While this sounds bearish, it is not an unrealistic scenario if a bleaker economic picture emerges than simply a cyclical slowdown. While the fundamental risks outlined above are likely to be the driver of the economic outlook, and then in turn the market outlook, one must remember that there are also other threats including the escalating international tension around Iran, which could have serious geopolitical consequences and potential economic spill-over impacts. In Europe, the uncertainty around Brexit remains and while the current deadline is earmarked for the end of October, there is no certainty that further extensions will not also be required. Lastly, 2020 sees a US presidential election - with the US political machine gathering pace, President Trump may find himself encouraged to reach an agreement with China, though only time will tell.
Investment Managers
AllianceBernstein Limited
Centre Asset Management LLC
Asset Management One Limited
Sanlam Investments UK Limited Sanlam Investment Management (Pty) Limited

SANLAM UNIVERSAL FUNDS PLC
37
SATRIX WORLD EQUITY TRACKER FUND
Investment Objective
The investment objective of the Satrix World Equity Tracker Fund (the “Fund”) is to provide capital growth
equivalent to that gained from investment in world equity markets.
Fund Performance
The Fund‘s benchmark is the MSCI World Index. Performance figures longer than 12 months are annualised. Figures are quoted gross of Investment Manager and Manager fees.
The Fund performed fairly well in tracking the MSCI World Index in the first six months of 2019. The Fund gained 16.92% whilst the benchmark returned 16.98% and hence the Fund deviated from its benchmark by -0.06%. Both quarters were positive for the Fund in absolute terms, gaining 12.38% and 4.04% over Q1 and Q2 respectively. First and second-quarter deviations were therefore -0.10% and +0.04% respectively. Since inception the Fund and the benchmark have produced annualised returns of 6.99% and 7.32% respectively. Fund Outlook There is little doubt that the global economy is experiencing a period of economic softening, and the most severe since 2016. The primary issue going forward is how cyclical this slowdown is or whether it is more of a structural slowdown. If it is the former then the global economy should avert recessionary levels, but if it is the latter then investors should all be significantly more concerned, as this could result in a recession in the USA and elsewhere. One of the major factors that may influence which of these two outcomes is achieved in practice is the current US trade policy negotiations. This is mainly, though far from exclusively focused on China, but as the world’s two largest economies it is that trade agreement that has the greatest potential impact on global economic growth. Global central bankers have shifted materially in their thinking from hawkish to dovish in the last twelve months, and their willingness to provide liquidity through easier monetary policy looks set to help markets in the second half of 2019. The questions that are really being asked now are what the extent of this easing will be by each central bank, and perhaps more importantly what the efficacy of monetary policy will be, from what are already low levels of interest rates by historical standards. Equities themselves do not look cheap globally, and clearly look to be on the expensive side in the USA, but they have been supported till now by earnings coming through. The current challenge for equities is whether, in the face of a cyclical economic slowdown, or something more severe, earnings growth will be materially impacted.
-2%
0%
2%
4%
6%
8%
10%
12%
14%
16%
18%
1st Qtr 2019 2nd Qtr 2019 Year-to-date Inception
Fund USD-terms 12.38% 4.04% 16.92% 6.99%
Benchmark 12.48% 4.00% 16.98% 7.32%
Excess return -0.10% 0.04% -0.06% -0.33%
SANLAM UNIVERSAL FUNDS PLC
38
SATRIX WORLD EQUITY TRACKER FUND (CONTINUED) Fund Outlook (continued) In the scenario of a cyclical slowdown, earnings growth may well hold up, acknowledging the potential here for some softening of growth levels. However, if the slowdown becomes protracted and potentially recessionary then earnings should expect to take a material hit. This fall in earnings would exacerbate the stretch in valuations in the short-term, leading to a potential fall in equity market levels as a result. While this sounds bearish, it is not an unrealistic scenario if a bleaker economic picture emerges than simply a cyclical slowdown. While the fundamental risks outlined above are likely to be the driver of the economic outlook, and then in turn the market outlook, one must remember that there are also other threats including the escalating international tension around Iran, which could have serious geopolitical consequences and potential economic spill-over impacts. In Europe, the uncertainty around Brexit remains and while the current deadline is earmarked for the end of October, there is no certainty that further extensions will not also be required. Lastly, 2020 sees a US presidential election - with the US political machine gathering pace, President Trump may find himself encouraged to reach an agreement with China, though only time will tell. Investment Manager
Sanlam Investment Management (Pty) Limited

SANLAM UNIVERSAL FUNDS PLC
39
SIIP INDIA OPPORTUNITIES FUND
Investment Objective The investment objective of the SIIP India Opportunities Fund (the “Fund”) is to provide long-term capital growth.
Fund Performance
The Fund’s benchmark is the Bombay Stock Exchange 500 Index. Performance figures longer than 12 months are annualised. Figures are quoted gross of Investment Manager and Manager fees.
Indian equity markets saw a strong recovery from the lows of 2018 in the first half of this year, with the Bombay Stock Exchange 500 index gaining 6.37% over the period. The Fund has performed materially better than this benchmark, outperforming by +3.55% over the period, driven off outperformances of +1.43% and 1.96% in the first and second quarters respectively. The first quarter saw absolute returns rebound strongly, with the Fund gaining 7.51% over the period following an 11.42% return in March alone. Returns were slightly more subdued in Q2, with the Fund returning 2.24%. Since inception, the Fund and the benchmark have annualised 3.27% and 3.23% respectively. Fund Outlook There is little doubt that the global economy is experiencing a period of economic softening, and the most severe since 2016. The primary issue going forward is how cyclical this slowdown is or whether it is more of a structural slowdown. If it is the former then the global economy should avert recessionary levels, but if it is the latter then investors should all be significantly more concerned, as this could result in a recession in the USA and elsewhere. One of the major factors that may influence which of these two outcomes is achieved in practice is the current US trade policy negotiations. This is mainly, though far from exclusively focused on China, but as the world’s two largest economies it is that trade agreement that has the greatest potential impact on global economic growth. The Indian economy has not been exempt from this slowdown, with services and exports faring particularly badly in the second quarter of the year. Following the decisive election victory, the Modi-led BJP are now firmly established as the dominant party which should allow the Prime Minister to push through reform without the concerns over achieving a voting majority. Global central bankers have shifted materially in their thinking from hawkish to dovish in the last twelve months, and their willingness to provide liquidity through easier monetary policy looks set to help markets in the second half of 2019.
-2%
0%
2%
4%
6%
8%
10%
12%
1st Qtr 2019 2nd Qtr 2019 Year-to-date Inception
Fund USD-terms 7.51% 2.24% 9.92% 3.27%
Benchmark 6.08% 0.27% 6.37% 3.23%
Excess return 1.43% 1.96% 3.55% 0.03%

SANLAM UNIVERSAL FUNDS PLC
40
SIIP INDIA OPPORTUNITIES FUND (CONTINUED) Fund Outlook (continued) At the time of writing the Modi government, and specifically finance minister Nirmala Sitharaman, have announced a tighter than expected fiscal budget, with a new fiscal deficit target of 3.3% of GDP – we expect this is to combat the high fiscal spending in the build-up to the election. With the economy slowing and the government looking for avenues to spur growth, we expect the Reserve Bank of India to continue loosening monetary policy off the back of a healthier government balance sheet. Elsewhere in the Budget, there was renewed focus on the development of the railway network and boosting infrastructure investment which should have positive multiplier effects on both industry and employment. While the fundamental risks outlined above are likely to be the driver of the economic outlook, and then in turn the market outlook, one must remember that there are also other threats including the escalating international tension around Iran, which could have serious geopolitical consequences and potential economic spill-over impacts. In Europe, the uncertainty around Brexit remains and while the current deadline is earmarked for the end of October, there is no certainty that further extensions will not also be required. Lastly, 2020 sees a US presidential election - with the US political machine gathering pace, President Trump may find himself encouraged to reach an agreement with China, though only time will tell. Investment Manager
Sanlam Investment Management (Pty) Limited

SANLAM UNIVERSAL FUNDS PLC
41
DENKER GLOBAL DIVIDEND FUND
Investment Objective The investment objective of the Denker Global Dividend Fund (the “Fund”) is to provide a regular income stream for investors with the potential for capital growth. It aims to provide a regular income which will be in line with the annual average dividend yield of the MSCI World High Dividend Yield NTR Index as well as provide capital growth exceeding inflation.
Fund Performance
The Fund’s benchmark is a composite index, being the yield of the MSCI World High Dividend Yield NTR Index and the US CPI. Performance figures longer than 12 months are annualised. Figures are quoted gross of fees.
Market review Global equity markets experienced a relatively good second quarter (Q2), albeit with more modest performance than in the first quarter (Q1). Looking at the indices in US dollars – on a total return basis the S&P 500 Index gained 4.3%, the MSCI World Index gained 4.2% and the MSCI Emerging Markets Index, lagged again, closing 0.7% higher this quarter. The surprising decline in long dated developed market government bond yields, which started in Q1, did not subside. Yield on US 10 year maturity bonds declined from 2.4% at the end of Q1 to 2.0% at the end of Q2 and the yield on 10 year German bonds declined from -0.1% to -0.3%. In late June, the Federal Reserve (the Fed) indicated that it might cut interest rates sooner than previously thought by cutting the word ‘patient’ out of its policy statement. It added that it would ‘act as appropriate’ to sustain economic expansion. President Trump has often taken to Twitter to share his exasperation with the Fed’s previous rate increases. In the UK, Prime Minister Theresa May announced that she would step down as leader of the ruling Conservative Party. Boris Johnson has since replaced May and is positive that he can renegotiate the withdrawal deal with the European Union, which May has failed to do, and get it through Parliament before the expiry date of 31 October 2019.
-2%
0%
2%
4%
6%
8%
10%
12%
14%
1st Qtr 2019 2nd Qtr 2019 Year-to-date Inception
Fund USD-terms 11.43% 2.31% 13.75% 7.40%
Benchmark 1.00% 1.46% 2.46% 4.70%
Excess return 10.43% 0.86% 11.29% 2.70%

SANLAM UNIVERSAL FUNDS PLC
42
DENKER GLOBAL DIVIDEND FUND (CONTINUED) Fund Performance (continued)
Portfolio review Q1 2019 The Fund participated in the recovery of the market during the quarter, closely tracking its performance. The largest contributions to this performance came from the Fund’s exposure to the consumer staples, information technology and financial sectors where large moves were seen in the share prices of Philip Morris International (+34%), British American Tobacco (+33%), Micro Focus International (+51%), Cisco Systems (+26%) and Legal & General Group (+22%). A number of these shares had underperformed significantly during the past year. Other notable positive movements were seen in the prices of UK homebuilder Taylor Wimpey (+32%) and US aircraft manufacturer Boeing Company (+19%). While a number of shares lagged the substantial bounce in the market, the only notable detractor from performance was European leisure company TUI AG (-28%). Distribution The Fund declared a distribution of 22.25 US cents per unit (Class A) for the six month period to the end of March 2019. This reflects a 26% increase compared to the corresponding period of the previous year. Combined with the 29.02 US cents per unit distribution paid for the period to September 2018, it denotes a dividend yield of 4.3% (net of withholding taxes paid by the Fund) on capital invested 12 months ago. This is higher than the 4.0% gross yield of the benchmark MSCI World High Dividend Yield Index at 31 March 2019. Q2 2019 While the market recorded a pleasing gain during the quarter, it was by no means a smooth ride. Uncertainty about the direction of interest rates in the US combined with President Trump’s open criticism of the Fed’s actions meant that investors were subjected to a rollercoaster ride which saw monthly returns of +3.6%, -5.8% and +6.6% respectively from the MSCI World Index. The Fund, likewise, experienced somewhat of a topsy-turvy quarter - underperforming the overall market during the up months and outperforming during the down month. Given the Fund’s customary relatively defensive positioning, due to its focus on yield, this is not surprising. The largest positive contributions to the Fund’s performance came from its holdings in Lockheed Martin (+22%), American International Group (+24%), Unilever (+10%), JP Morgan Chase (+11%) and ageas SA (+12%), while the biggest detractors from its performance came from Imperial Brands (-30%), Royal Ahold Delhaize (-13%), British American Tobacco (-14%), Philip Morris International (-10%) and Altria (-16%). Fund Outlook On current consensus expectations the fund offers a significantly better yield than the overall market (dividend yield of 4.5% versus 2.5%), while trading on a lower valuation (forward P/E of 11.2x versus 14.9x) and producing a considerably better return (ROE of 22.8% versus 20.1%). When compared to the MSCI World Index the fund displays an active share of 91%. Given the prospect of a global economic slowdown, we believe that this positions the Fund well for the future and, based on our current projections, we expect it to deliver a yield greater than the target yield during the coming 12 months. Investment Manager Denker Capital (Pty) Limited

SANLAM UNIVERSAL FUNDS PLC
43
SANLAM STRATEGIC BOND FUND
Investment Objective The investment objective of the Sanlam Strategic Bond Fund (the “Fund”) is to provide a total return for investors, through generating an income that may be received monthly, and the potential for capital growth. The Fund will mainly invest in investment grade government and corporate bonds, in the UK and overseas.
Fund Performance
The Fund is bench marked against the IA £ Strategic Bond sector. Note: Performance figures longer than 12 months are annualised. Figures are quoted net of fees.
With the rally in corporate bond markets since December, the Fund has done particularly well, returning 7.11% over the 6 months to 30 June 2019. The major pillars of the Fund’s investment strategy have contributed positively to performance. The Fund outperformed in a rising market with two of the largest contributing credits being Tesco and GE. Tesco bonds have been a long held conviction position in the Fund strategy that has now regained its investment grade rating. GE is a position that was established in late 2018 and built further early in the year. GE bonds continued to recover following a more coherent and transparent approach from management, an important sale of the biopharma business and better than expected results. In addition with the strong rally in government bonds in 2019, the Fund has been a significant beneficiary from tactical positioning in core government bonds such as US treasuries, and non-core government bonds such as Italy. Fund Outlook The Fund continues to have a significant allocation to government bonds, where both the seasonal and supply pictures become very favourable in August. We view peripheral European government bonds as attractive, as the yields on offer are significantly higher than those in core markets and the ECB’s announced package of potential monetary stimulus measures is expected to drive spread compression amongst the Euro area governments. We view the degree of dovishness communicated by the Bank of England’s reaction to the new UK Prime Minister’s Brexit stance as less predictable, and therefore the most likely to surprise markets, making UK gilts an attractive proposition. The FOMC however has much more room to cut interest rates than other major central banks. This dynamic can potentially support the US economy and could drive investment into both US treasuries and corporate bonds as the cost to hedge the US Dollar into other currencies also diminishes.
-2%
0%
2%
4%
6%
8%
1st Qtr 2019 2nd Qtr 2019 YTD Inception
Fund - P Acc GBP 3.17% 3.94% 7.11% 7.15%
Benchmark 3.65% 2.44% 6.09% 4.54%
Excess return -0.48% 1.50% 1.02% 2.61%

SANLAM UNIVERSAL FUNDS PLC
44
SANLAM STRATEGIC BOND FUND (CONTINUED) Fund Outlook (continued) In its corporate bond portfolio, the Fund maintains a cautious yet constructive stance, acknowledging the broad economic weakness, but also recognising that coordinated global central bank actions can have a big impact on economies and markets. We continue to favour corporates that offer yield enhancement, high quality balance sheets and idiosyncratic catalysts for realising excess return. Investment Manager
GLG Partners LP
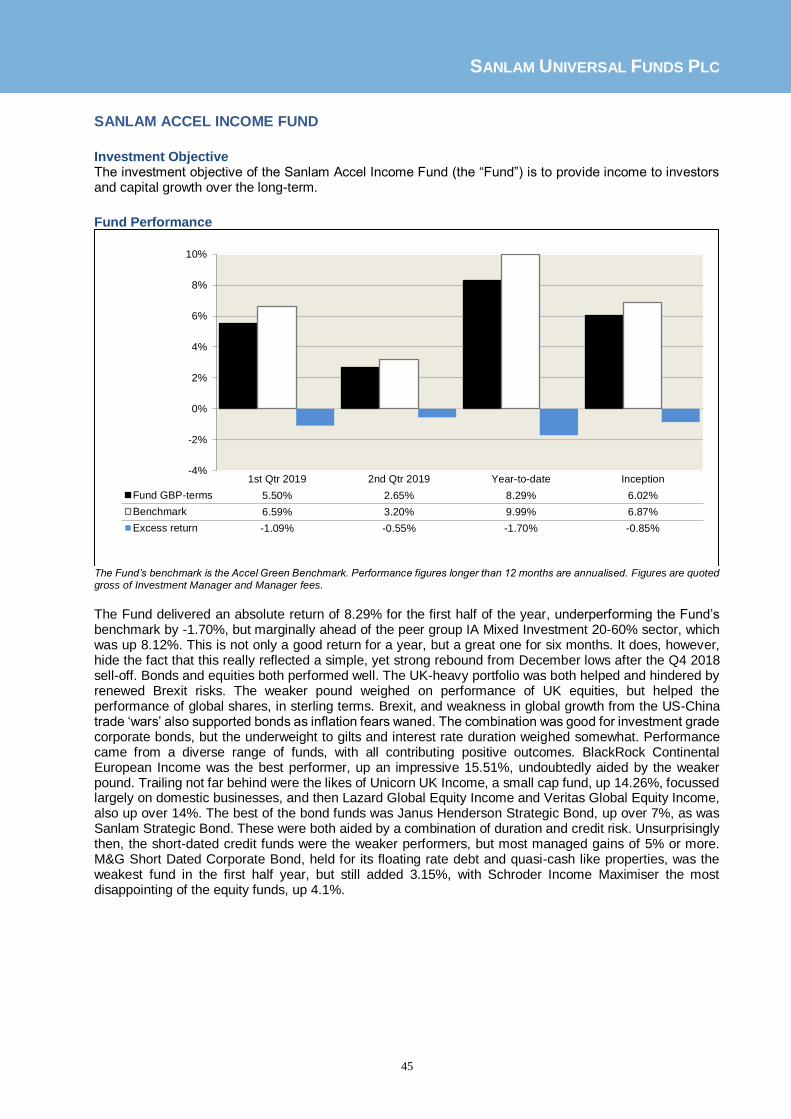
SANLAM UNIVERSAL FUNDS PLC
45
SANLAM ACCEL INCOME FUND
Investment Objective The investment objective of the Sanlam Accel Income Fund (the “Fund”) is to provide income to investors and capital growth over the long-term.
Fund Performance
The Fund’s benchmark is the Accel Green Benchmark. Performance figures longer than 12 months are annualised. Figures are quoted gross of Investment Manager and Manager fees. The Fund delivered an absolute return of 8.29% for the first half of the year, underperforming the Fund’s benchmark by -1.70%, but marginally ahead of the peer group IA Mixed Investment 20-60% sector, which was up 8.12%. This is not only a good return for a year, but a great one for six months. It does, however, hide the fact that this really reflected a simple, yet strong rebound from December lows after the Q4 2018 sell-off. Bonds and equities both performed well. The UK-heavy portfolio was both helped and hindered by renewed Brexit risks. The weaker pound weighed on performance of UK equities, but helped the performance of global shares, in sterling terms. Brexit, and weakness in global growth from the US-China trade ‘wars’ also supported bonds as inflation fears waned. The combination was good for investment grade corporate bonds, but the underweight to gilts and interest rate duration weighed somewhat. Performance came from a diverse range of funds, with all contributing positive outcomes. BlackRock Continental European Income was the best performer, up an impressive 15.51%, undoubtedly aided by the weaker pound. Trailing not far behind were the likes of Unicorn UK Income, a small cap fund, up 14.26%, focussed largely on domestic businesses, and then Lazard Global Equity Income and Veritas Global Equity Income, also up over 14%. The best of the bond funds was Janus Henderson Strategic Bond, up over 7%, as was Sanlam Strategic Bond. These were both aided by a combination of duration and credit risk. Unsurprisingly then, the short-dated credit funds were the weaker performers, but most managed gains of 5% or more. M&G Short Dated Corporate Bond, held for its floating rate debt and quasi-cash like properties, was the weakest fund in the first half year, but still added 3.15%, with Schroder Income Maximiser the most disappointing of the equity funds, up 4.1%.
-4%
-2%
0%
2%
4%
6%
8%
10%
1st Qtr 2019 2nd Qtr 2019 Year-to-date Inception
Fund GBP-terms 5.50% 2.65% 8.29% 6.02%
Benchmark 6.59% 3.20% 9.99% 6.87%
Excess return -1.09% -0.55% -1.70% -0.85%

SANLAM UNIVERSAL FUNDS PLC
46
SANLAM ACCEL INCOME FUND (CONTINUED) Fund Outlook There is little doubt that the global economy is experiencing a period of economic softening, and the most severe since 2016. The primary issue going forward is how cyclical this slowdown is or whether it is more of a structural slowdown. If it is the former then the global economy should avert recessionary levels, but if it is the latter then investors should all be significantly more concerned, as this could result in a recession in the USA and elsewhere. One of the major factors that may influence which of these two outcomes is achieved in practice is the current US trade policy negotiations. This is mainly, though far from exclusively focused on China, but as the world’s two largest economies it is that trade agreement that has the greatest potential impact on global economic growth. Global central bankers have shifted materially in their thinking from hawkish to dovish in the last twelve months, and their willingness to provide liquidity through easier monetary policy looks set to help markets in the second half of 2019. The questions that are really being asked now are what the extent of this easing will be by each central bank, and perhaps more importantly what the efficacy of monetary policy will be, from what are already low levels of interest rates by historical standards. Equities themselves do not look cheap globally, and clearly look to be on the expensive side in the USA, but they have been supported till now by earnings coming through. The current challenge for equities is whether, in the face of a cyclical economic slowdown, or something more severe, earnings growth will be materially impacted. In the scenario of a cyclical slowdown, earnings growth may well hold up, acknowledging the potential here for some softening of growth levels. However, if the slowdown becomes protracted and potentially recessionary then earnings should expect to take a material hit. This fall in earnings would exacerbate the stretch in valuations in the short-term, leading to a potential fall in equity market levels as a result. While this sounds bearish, it is not an unrealistic scenario if a bleaker economic picture emerges than simply a cyclical slowdown. While the fundamental risks outlined above are likely to be the driver of the economic outlook, and then in turn the market outlook, one must remember that there are also other threats including the escalating international tension around Iran, which could have serious geopolitical consequences and potential economic spill-over impacts. In Europe, the uncertainty around Brexit remains and while the current deadline is earmarked for the end of October, there is no certainty that further extensions will not also be required. Lastly, 2020 sees a US presidential election - with the US political machine gathering pace, President Trump may find himself encouraged to reach an agreement with China, though only time will tell. Investment Manager
Sanlam Investments UK Limited

SANLAM UNIVERSAL FUNDS PLC
47
SATRIX NORTH AMERICA EQUITY TRACKER FUND
Investment Objective The investment objective of the Satrix North America Equity Tracker Fund (the “Fund”) is to provide capital growth equivalent to that gained from investment in the North American equity markets by tracking the performance of the MSCI North America Index.
Fund Performance
The Fund’s benchmark is the MSCI North America Index. Performance figures longer than 12 months are annualised. Figures are quoted gross of Investment Manager and Manager fees.
The fund fell slightly behind the MSCI North America Index for the first half of 2019, deviating by -0.23% having gained 18.34% in absolute terms. The majority of this absolute return came in the first quarter, during which the Fund gained 13.77%, deviating from the benchmark by -0.05%. In the second quarter, the Fund gained 4.01%, deviating by -0.15%. Since inception, the Fund and the benchmark have annualised 10.60% and 10.88%, and hence the Fund has deviated by -0.29%. Fund Outlook There is little doubt that the global economy is experiencing a period of economic softening, and the most severe since 2016. The primary issue going forward is how cyclical this slowdown is or whether it is more of a structural slowdown. If it is the former then the global economy should avert recessionary levels, but if it is the latter then investors should all be significantly more concerned, as this could result in a recession in the USA and elsewhere. One of the major factors that may influence which of these two outcomes is achieved in practice is the current US trade policy negotiations. This is mainly, though far from exclusively focused on China, but as the world’s two largest economies it is that trade agreement that has the greatest potential impact on global economic growth. Global central bankers have shifted materially in their thinking from hawkish to dovish in the last twelve months, and their willingness to provide liquidity through easier monetary policy looks set to help markets in the second half of 2019. Whether or not the US Federal Reserve cuts interest rates is not the crucial issue in the long term - how far the US Federal Reserve will have to cut to reignite the relevant parts of the US economy and prevent a more significant slowdown materialising is more prevalent here. Equities themselves do not look cheap globally, and clearly look to be on the expensive side in the USA, but they have been supported till now by earnings coming through.
-2%
0%
2%
4%
6%
8%
10%
12%
14%
16%
18%
20%
1st Qtr 2019 2nd Qtr 2019 Year-to-date Inception
Fund USD-terms 13.77% 4.01% 18.34% 10.60%
Benchmark 13.82% 4.17% 18.57% 10.88%
Excess return -0.05% -0.15% -0.23% -0.29%

SANLAM UNIVERSAL FUNDS PLC
48
SATRIX NORTH AMERICA EQUITY TRACKER FUND (CONTINUED) Fund Outlook (continued) The current challenge for equities is whether, in the face of a cyclical economic slowdown, or something more severe, earnings growth will not be impacted too materially. If it is the former scenario then this looks to be possible, although some softening in earnings growth levels would likely be evident. However, if it is the latter then this does not look reasonable, and earnings should expect to take a material hit. That fall in earnings should also then lead to valuations looking even more stretched in the short-term and a fall in equity market levels should then follow. While this sounds bearish, it is not an unrealistic scenario if a bleaker economic picture emerges than just a cyclical slowdown. While the fundamental risks outlined above are likely to be the driver of the economic outlook, and then in turn the market outlook, one must remember that there are also other threats including the escalating international tension around Iran, which could have serious geopolitical consequences and potential economic spill-over impacts. In Europe, the uncertainty around Brexit remains and while the current deadline is earmarked for the end of October, there is no certainty that further extensions will not also be required. Lastly, 2020 sees a US presidential election - with the US political machine gathering pace, President Trump may find himself encouraged to reach an agreement with China, though only time will tell. Investment Manager Sanlam Investment Management (Pty) Limited
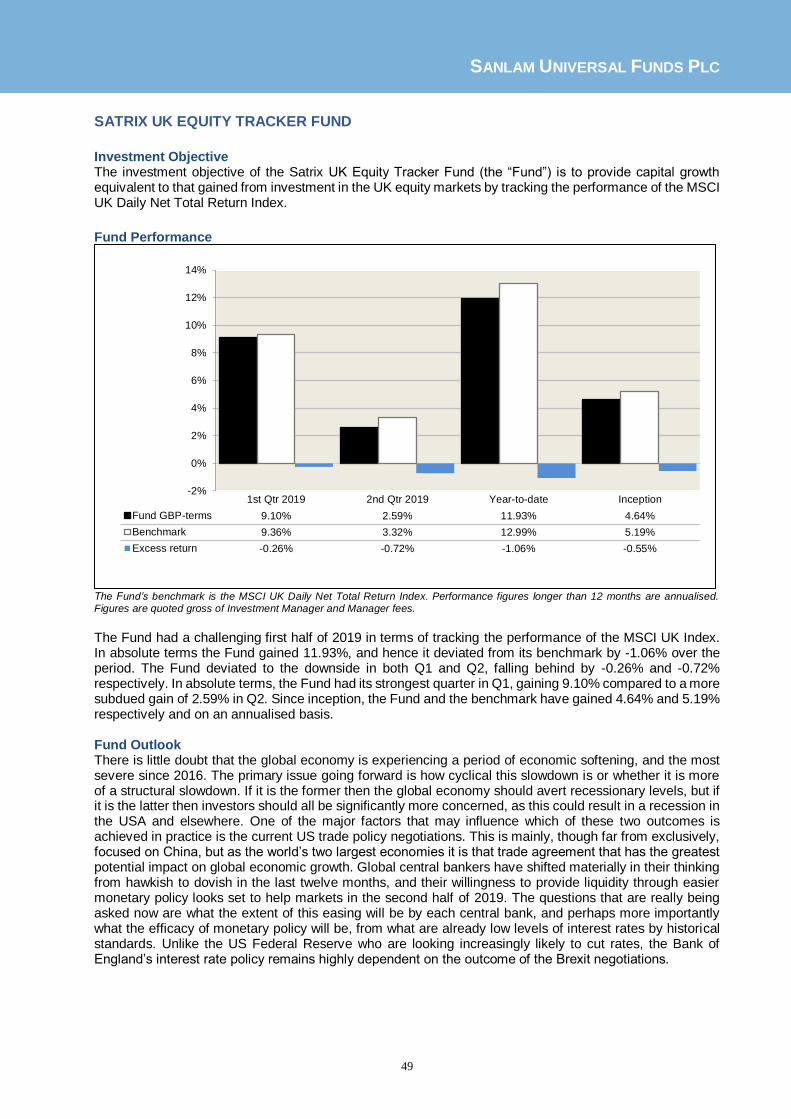
SANLAM UNIVERSAL FUNDS PLC
49
SATRIX UK EQUITY TRACKER FUND
Investment Objective The investment objective of the Satrix UK Equity Tracker Fund (the “Fund”) is to provide capital growth equivalent to that gained from investment in the UK equity markets by tracking the performance of the MSCI UK Daily Net Total Return Index.
Fund Performance
The Fund’s benchmark is the MSCI UK Daily Net Total Return Index. Performance figures longer than 12 months are annualised. Figures are quoted gross of Investment Manager and Manager fees.
The Fund had a challenging first half of 2019 in terms of tracking the performance of the MSCI UK Index. In absolute terms the Fund gained 11.93%, and hence it deviated from its benchmark by -1.06% over the period. The Fund deviated to the downside in both Q1 and Q2, falling behind by -0.26% and -0.72% respectively. In absolute terms, the Fund had its strongest quarter in Q1, gaining 9.10% compared to a more subdued gain of 2.59% in Q2. Since inception, the Fund and the benchmark have gained 4.64% and 5.19% respectively and on an annualised basis. Fund Outlook There is little doubt that the global economy is experiencing a period of economic softening, and the most severe since 2016. The primary issue going forward is how cyclical this slowdown is or whether it is more of a structural slowdown. If it is the former then the global economy should avert recessionary levels, but if it is the latter then investors should all be significantly more concerned, as this could result in a recession in the USA and elsewhere. One of the major factors that may influence which of these two outcomes is achieved in practice is the current US trade policy negotiations. This is mainly, though far from exclusively, focused on China, but as the world’s two largest economies it is that trade agreement that has the greatest potential impact on global economic growth. Global central bankers have shifted materially in their thinking from hawkish to dovish in the last twelve months, and their willingness to provide liquidity through easier monetary policy looks set to help markets in the second half of 2019. The questions that are really being asked now are what the extent of this easing will be by each central bank, and perhaps more importantly what the efficacy of monetary policy will be, from what are already low levels of interest rates by historical standards. Unlike the US Federal Reserve who are looking increasingly likely to cut rates, the Bank of England’s interest rate policy remains highly dependent on the outcome of the Brexit negotiations.
-2%
0%
2%
4%
6%
8%
10%
12%
14%
1st Qtr 2019 2nd Qtr 2019 Year-to-date Inception
Fund GBP-terms 9.10% 2.59% 11.93% 4.64%
Benchmark 9.36% 3.32% 12.99% 5.19%
Excess return -0.26% -0.72% -1.06% -0.55%
SANLAM UNIVERSAL FUNDS PLC
50
SATRIX UK EQUITY TRACKER FUND (CONTINUED) Fund Outlook (continued) In turn, these negotiations depend on the new Boris Johnson government –the risk of a No-Deal Brexit having increased, but we also believe that the risk of a general election has also increased given some of the legal and political challenges faced by the new government. Acknowledging these challenges, we do not expect a material shift in rate policy from the Bank of England until the Brexit negotiations are resolved. In equities, valuations and dividend yields remain supportive on a relative basis, while a disorderly Brexit and subsequent Sterling weakness could reinforce these effects, particularly for the larger FTSE 100 names who earn revenue abroad. It is important to acknowledge, however, that the UK is also party to the gradual economic slowdown, hence making it difficult to attribute the cheap equity valuations to either Brexit uncertainty, or in fact to a more severe deterioration of economic activity. While the fundamental risks outlined above are likely to be the driver of the economic outlook, and then in turn the market outlook, one must remember that there are also other threats including the escalating international tension around Iran, which could have serious geopolitical consequences and potential economic spill-over impacts. In addition, 2020 sees a US presidential election - with the US political machine gathering pace, President Trump may find himself encouraged to reach an agreement with China, though only time will tell. Investment Manager Sanlam Investment Management (Pty) Limited

SANLAM UNIVERSAL FUNDS PLC
51
SATRIX EUROPE (EX-UK) EQUITY TRACKER FUND
Investment Objective The investment objective of the Satrix Europe (ex-UK) Equity Tracker Fund (the “Fund”) is to provide capital growth equivalent to that gained from investment in the European equity markets, excluding the UK, by tracking the performance of the MSCI Europe (ex UK) Index.
Fund Performance
The Fund’s benchmark is the MSCI Europe (ex UK) Index. Performance figures longer than 12 months are annualised. Figures are quoted gross of Investment Manager and Manager fees. The Fund surprised to the upside in the first half of 2019, gaining 17.60% in absolute terms and hence deviating by +0.28% from the MSCI Europe ex UK Index over the period. In Q1, the Fund posted strong absolute gains of 12.42%, ending relatively flat against the benchmark. As such, the majority of the YTD deviation came in the second quarter whereby the Fund gained 4.61%, deviating by +0.27%. Since inception, the Fund and the benchmark have annualised 7.24% and 7.10% respectively. Fund Outlook There is little doubt that the global economy is experiencing a period of economic softening, and the most severe since 2016. The primary issue going forward is how cyclical this slowdown is or whether it is more of a structural slowdown. If it is the former then the global economy should avert recessionary levels, but if it is the latter then investors should all be significantly more concerned, as this could result in a recession in the USA and elsewhere. One of the major factors that may influence which of these two outcomes is achieved in practice is the current US trade policy negotiations. This is mainly, though far from exclusively focused on China, but as the world’s two largest economies it is that trade agreement that has the greatest potential impact on global economic growth. Global central bankers have shifted materially in their thinking from hawkish to dovish in the last twelve months, and their willingness to provide liquidity through easier monetary policy looks set to help markets in the second half of 2019. The questions that are really being asked now are what the extent of this easing will be by each central bank, and perhaps more importantly what the efficacy of monetary policy will be, from what are already low levels of interest rates by historical standards. The European Central Bank faces its own challenges, especially as, unlike the US, it has been unable to raise base interest rates at all.
-2%
0%
2%
4%
6%
8%
10%
12%
14%
16%
18%
1st Qtr 2019 2nd Qtr 2019 Year-to-date Inception
Fund EUR-terms 12.42% 4.61% 17.60% 7.24%
Benchmark 12.45% 4.34% 17.33% 7.10%
Excess return -0.02% 0.27% 0.28% 0.14%

SANLAM UNIVERSAL FUNDS PLC
52
SATRIX EUROPE (EX-UK) EQUITY TRACKER FUND (CONTINUED) Fund Outlook (continued) Consequently, there are already significant expectations of additional quantitative easing in the Euro-zone and potentially in other jurisdictions like Japan. As a result of this the use of fiscal policy to compliment monetary policy is increasingly being discussed, with many expecting that fiscal stimulus may also be required, if the current slowdown is anything more than a cyclical slowdown. Equities themselves do not look cheap globally, and clearly look to be on the expensive side in the USA, but they have been supported till now by earnings coming through. The current challenge for equities is whether, in the face of a cyclical economic slowdown, or something more severe, earnings growth will not be impacted too materially. If it is the former scenario then this looks to be possible, although some softening in earnings growth levels would likely be evident. However, if it is the latter then this does not look reasonable, and earnings should expect to take a material hit. That fall in earnings should also then lead to valuations looking even more stretched in the short-term and a fall in equity market levels should then follow. While this sounds bearish, it is not an unrealistic scenario if a bleaker economic picture emerges than just a cyclical slowdown. While the fundamental risks outlined above are likely to be the driver of the economic outlook, and then in turn the market outlook, one must remember that there are also other threats including the escalating international tension around Iran, which could have serious geopolitical consequences and potential economic spill-over impacts. In Europe, the uncertainty around Brexit remains and while the current deadline is earmarked for the end of October, there is no certainty that further extensions will not also be required. Lastly, 2020 sees a US presidential election - with the US political machine gathering pace, President Trump may find himself encouraged to reach an agreement with China, though only time will tell. Investment Manager
Sanlam Investment Management (Pty) Limited

SANLAM UNIVERSAL FUNDS PLC
53
SATRIX EMERGING MARKETS EQUITY TRACKER FUND
Investment Objective The investment objective of the Satrix Emerging Markets Equity Tracker Fund (the “Fund”) is to provide capital growth equivalent to that gained from investment in the emerging equity markets by tracking the performance of the MSCI Emerging Markets Index.
Fund Performance
The Fund’s benchmark is the MSCI Emerging Markets Index. Performance figures longer than 12 months are annualised. Figures are quoted gross of Investment Manager and Manager fees.
The Fund’s performance deviated from that of the MSCI Emerging Markets Index by -0.19% over the course of the first half of 2019, gaining 10.41% in absolute terms. In Q1 the Fund’s performance deviated from that of the benchmarks by -0.28% and the Fund gained 9.65% in absolute terms. The Fund then ended largely flat in absolute terms over the second quarter, and the performance deviated from that of the benchmark by +0.08%. Since inception, the Fund has deviated from its benchmark by -0.36% on an annualised basis. Fund Outlook There is little doubt that the global economy is experiencing a period of economic softening, and the most severe since 2016. The primary issue going forward is how cyclical this slowdown is or whether it is more of a structural slowdown. If it is the former then the global economy should avert recessionary levels, but if it is the latter then investors should all be significantly more concerned, as this could result in a recession in the USA and elsewhere. One of the major factors that may influence which of these two outcomes is achieved in practice is the current US trade policy negotiations. This is mainly, though far from exclusively focused on China, but as the world’s two largest economies it is that trade agreement that has the greatest potential impact on global economic growth. Global central bankers have shifted materially in their thinking from hawkish to dovish in the last twelve months, and their willingness to provide liquidity through easier monetary policy looks set to help markets in the second half of 2019. The questions that are really being asked now are what the extent of this easing will be by each central bank, and perhaps more importantly what the efficacy of monetary policy will be, from what are already low levels of interest rates by historical standards.
-2%
0%
2%
4%
6%
8%
10%
12%
1st Qtr 2019 2nd Qtr 2019 Year-to-date Inception
Fund USD-terms 9.65% 0.69% 10.41% 2.55%
Benchmark 9.93% 0.61% 10.59% 2.91%
Excess return -0.28% 0.08% -0.19% -0.36%

SANLAM UNIVERSAL FUNDS PLC
54
SATRIX EMERGING MARKETS EQUITY TRACKER FUND (CONTINUED) Fund Outlook (continued) Whether or not the US Federal Reserve cuts interest rates is not the crucial issue in the long term - how far the US Federal Reserve will have to cut to reignite the relevant parts of the US economy and prevent a more significant slowdown materialising is more prevalent here. This potential easing from the Federal Reserve should in turn ease the pressure on emerging market currencies, thereby removing some of the US Dollar headwind faced by emerging market equities. While the fundamental risks outlined above are likely to be the driver of the economic outlook, and then in turn the market outlook, one must remember that there are also other threats including the escalating international tension around Iran, which could have serious geopolitical consequences and potential economic spill-over impacts. In Europe, the uncertainty around Brexit remains and while the current deadline is earmarked for the end of October, there is no certainty that further extensions will not also be required. Lastly, 2020 sees a US presidential election - with the US political machine gathering pace, President Trump may find himself encouraged to reach an agreement with China, though only time will tell. Investment Manager Sanlam Investment Management (Pty) Limited

SANLAM UNIVERSAL FUNDS PLC
55
SANLAM MANAGED RISK FUND
Investment Objective The investment objective of the Sanlam Managed Risk Fund (the “Fund”) is to provide long-term capital growth through exposure to world equity markets. The Fund is a feeder fund which will invest 85% or more of its Net Asset Value permanently in Satrix World Equity Tracker Fund (the “Master Fund”). The Fund also utilises a risk management strategy designed to reduce volatility and minimise losses in declining markets. Investors should note that although this strategy intends to minimise market risk it does mean that in rising markets the Fund will not rise to the same degree as the Master Fund as the Fund will always carry some degree of effective short exposure. The Fund is suitable to investors who are looking to achieve long-term capital growth with lower volatility and better risk adjusted returns. Income will not be a consideration.
Fund Performance
Fund’s benchmark is the Morningstar EAA USD Flexible Allocation Category. Performance figures longer than 12 months are annualised. Figures are quoted net of fees.
For 6 month period ending June 2019, the Fund underperformed its benchmark by 1.97%, with the bulk of the underperformance coming from Q1 of 2019. The reason for this was due to the Fund’s under exposure to equity markets in Q1 2019 which was intended to avoid the risk of falling markets which haunted all global markets in Q4 2018. Following the Fund’s relative underperformance in Q1 2019, the Fund managed to avoid most of the volatility in Q2 before increasing equity exposure in June and significantly participating in the equity market rebound during that month. As a result the Fund outperformed its benchmark by 2.03% in Q2 of 2019 and remains in line with its benchmark and sector over a 12 month period and materially ahead in all periods exceeding 1 year (outperforming the benchmark by 2.54% since inception).
-6%
-4%
-2%
0%
2%
4%
6%
8%
10%
1st Qtr 2019 2nd Qtr 2019 Year to date Inception
Fund USD-terms 2.75% 4.03% 6.89% 5.39%
Benchmark 6.73% 2.00% 8.87% 2.85%
Excess return -3.98% 2.03% -1.97% 2.54%

SANLAM UNIVERSAL FUNDS PLC
56
SANLAM MANAGED RISK FUND (CONTINUED) Fund Performance (continued) Starting off the year, the Fund had an effective market exposure to global equities through its investment in the Satrix World Equity Tracker Fund of 57% which soon after was lowered in anticipation of equity market falls through an increase in short future exposure to hedge the market risk as determined by the AI engine utilised by the Investment Manager. During Q2 effective equity market exposure increased to above 80% before the Investment Manager returned the Fund to capital preservation mode in anticipation of market falls at the end of June with an effective equity exposure of 15%. As per the investment objective, the volatility of the Fund remains material lower (25%) than an investment in the underlying Master Fund since inception and the maximum drawdown was also lower by 13%. Fund Outlook It is not possible to make a prediction as per what the Fund’s outlook may be as the Fund’s behaviour is driven by market data which is a function of market conditions which no market participant has any clarity of. In addition, the Fund’s equity exposure is a function of the Fund’s risk management decisions and since June 2017 the Investment Manager utilises signals from an AI investment engine to determine the Fund’s effective exposure to the Master Fund. It is anticipated that over the long-term the Fund will “smoothen” the investment journey for shareholders and provide better risk-adjusted returns over a market cycle. Investment Managers Sanlam Investment Management (Pty) Ltd

SANLAM UNIVERSAL FUNDS PLC
57
SANLAM GLOBAL HIGH QUALITY FUND
Investment Objective The investment objective of the Sanlam Global High Quality Fund (the “Fund”) is to produce compounded total returns in excess of the MSCI World index over the medium to long-term, through a concentrated portfolio of high quality stocks, using our proprietary quantitative screening process combined with rigorous fundamental research.
Fund Performance
The Fund’s benchmark is the MSCI World Total Return Index (NDDUWI). Performance figures longer than 12 months are annualised. Figures are quoted gross of fees.
After a turbulent end to 2018, this year managed to get off to a positive start, with equity markets recovering most of the losses they had endured previously. This recovery was largely due to the US Federal Reserve (Fed) taking a U-turn on monetary policy in the wake of the market’s reaction to increasing interest rates. During the first quarter, the Fund underperformed the benchmark by -1.08%. During the quarter we sold our positions in Moody’s, Waters and Yum China after significant rallies from the December lows which left these names over valued. We initiated a position in Bayer. Our assessment being that at current share prices shareholders were able to invest in Bayer at a very attractive valuation based on a normalised free cash flow multiple. We believe Bayer has a strong but cyclical crop science business as well as a competitive healthcare segment which creates good economic moats. These two core divisions enable the group to exhibit steady cash flows over time. The animal healthcare division is being sold which should bring relief to some of the group’s relatively high gearing. Litigation concerns against Bayer's glyphosate business has caused a capitulation in the share price with recent court cases going against the company. This bore fruit during the second quarter as Bayer was one of our best contributors along with Allergan and Facebook. Allergan had been sold off heavily and was then the subject of a takeover bid from Abbvie. The takeover price was equivalent to US$188 on the day and the share price rose over 25% on the announcement. Bayer also benefited from interest from activist investor Elliot who has taken a sizable position in the stock. We still see compelling upside to the share as long term investors who are prepared to look past current litigation concerns. The Fund was up 6.45% for quarter 2 versus 6.48% for the benchmark. For the 6 month period to 30 June, the Fund underperformed the benchmark by -1.11%
-2%
0%
2%
4%
6%
8%
10%
12%
14%
16%
18%
1st Qtr 2019 2nd Qtr 2019 Year-to-date Inception
Fund GBP-terms 9.50% 6.45% 15.95% 15.95%
Benchmark 10.58% 6.48% 17.06% 12.82%
Excess return -1.08% -0.03% -1.11% 3.13%
SANLAM UNIVERSAL FUNDS PLC
58
SANLAM GLOBAL HIGH QUALITY FUND (CONTINUED) Fund Outlook While it is important to be nimble when short-term opportunities present themselves, it is equally important to be focused on the longer-term outlook, and evidence suggests we will soon see a moderation in global economic growth. With regards to equities, the recovery we have experienced in the year to date has unwound much of the opportunity we saw at the end of last year, and this has reduced future return prospects. Earnings growth is critical for equities to deliver acceptable returns. If it stagnates, then this asset class will struggle. Corporate profit margins remain high, due to low historical wage growth, lower tax rates and the demand boost in the US from fiscal stimulus measures. The risk remains that current earnings represent a cyclical peak, which investors should not extrapolate in perpetuity. Although we currently do not view the markets as severely cheap, we have made changes to the portfolio to rotate to shares with better intrinsic value. There are also some definite pockets of great long term valuation opportunities now as despite headline indices being high, there are some sub-sectors that are extremely unloved. With the MSCI at over 16x earnings, it will be difficult for further rerating upwards. Investment Manager Sanlam Private Investments (UK) Limited
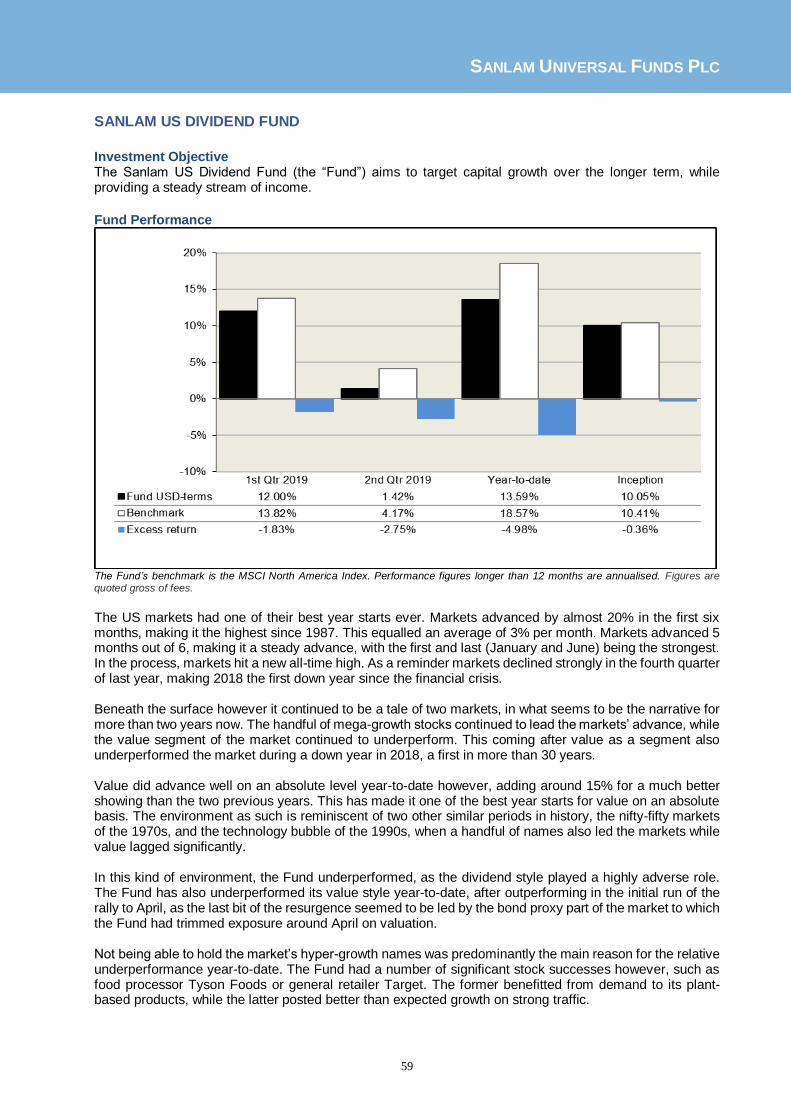
SANLAM UNIVERSAL FUNDS PLC
59
SANLAM US DIVIDEND FUND
Investment Objective The Sanlam US Dividend Fund (the “Fund”) aims to target capital growth over the longer term, while providing a steady stream of income.
Fund Performance
The Fund’s benchmark is the MSCI North America Index. Performance figures longer than 12 months are annualised. Figures are quoted gross of fees.
The US markets had one of their best year starts ever. Markets advanced by almost 20% in the first six months, making it the highest since 1987. This equalled an average of 3% per month. Markets advanced 5 months out of 6, making it a steady advance, with the first and last (January and June) being the strongest. In the process, markets hit a new all-time high. As a reminder markets declined strongly in the fourth quarter of last year, making 2018 the first down year since the financial crisis. Beneath the surface however it continued to be a tale of two markets, in what seems to be the narrative for more than two years now. The handful of mega-growth stocks continued to lead the markets’ advance, while the value segment of the market continued to underperform. This coming after value as a segment also underperformed the market during a down year in 2018, a first in more than 30 years. Value did advance well on an absolute level year-to-date however, adding around 15% for a much better showing than the two previous years. This has made it one of the best year starts for value on an absolute basis. The environment as such is reminiscent of two other similar periods in history, the nifty-fifty markets of the 1970s, and the technology bubble of the 1990s, when a handful of names also led the markets while value lagged significantly. In this kind of environment, the Fund underperformed, as the dividend style played a highly adverse role. The Fund has also underperformed its value style year-to-date, after outperforming in the initial run of the rally to April, as the last bit of the resurgence seemed to be led by the bond proxy part of the market to which the Fund had trimmed exposure around April on valuation. Not being able to hold the market’s hyper-growth names was predominantly the main reason for the relative underperformance year-to-date. The Fund had a number of significant stock successes however, such as food processor Tyson Foods or general retailer Target. The former benefitted from demand to its plant-based products, while the latter posted better than expected growth on strong traffic.

SANLAM UNIVERSAL FUNDS PLC
60
SANLAM US DIVIDEND FUND (CONTINUED) Fund Outlook With the markets advancing by more than 18% in the first half of 2019, the trailing multiple has become stretched again, boasting a price to earnings ratio north of 19.5. The portfolio on the other hand remained heavily entrenched in value territory, with strong dividends. Its multiple moved up less than the markets, boasting a ratio of only 10.4. This has made the discount to the markets widen again, to record levels of more than 45%, which we view positively. On a price to sales basis the discount is even more attractive and has widened back again to close to the 70% levels, after a period at the 60% levels following the Fund’s good performance in the first quarter of this year. In the meantime, the main story of the markets from our perspective remained the significant trailing of the markets of the value style of investment. While the style has advanced around 15% making for a very respectable absolute showing and one of the best year starts ever for the style, it still paled in comparison to an advance of 21% by growth indices. This is on the footsteps of significant underperformance in 2017 and 2018, putting the differential back to record levels of divergence. Over three years value now lags growth by 31%, over five years by 44%, while over a 10-year market cycle value lags by 106%. Over longer time periods however, value has outperformed growth. This should create an attractive entry point for the strategy. We believe the Fund offers one of the best risk-reward exposures to the US equities space. The large discount offered versus the markets, coupled with the extreme underperformance of the style makes the fund a highly attractive proposition in US equities currently. We continue to focus all our efforts on identifying, analysing and investing in undervalued North American equities, and providing the best risk-reward profile for US equity investors. Investment Manager
Sanlam Investments UK Limited

SANLAM UNIVERSAL FUNDS PLC
61
HIGH STREET GLOBAL BALANCED FUND
Investment Objective
The High Street Global Balanced Fund (the “Fund”) aims to provide a high level of income and the potential
for capital growth.
Fund Performance
The Fund is bench marked against 50% USD 3-month LIBOR and 50% EUR 3-month EURIBOR. Performance figures longer than 12 months are annualised. Figures are quoted net of fees.
The first quarter of 2019 saw strong gains of 6.05% for the Fund, as world equity markets maintained their bullish start to the year. Constructive dialogue in the US-China trade talks helped to ease trade tensions, which alleviated investor fears of a wider crackdown in global trade. Furthermore, in stark contrast to their December forecast (in which they saw two rate hikes for the year), the US Federal Reserve left short term interest rates unchanged and struck a more dovish tone as they indicated no further rate hikes this year. The market took this as a net positive since it had largely been pricing in a lower economic growth outlook, and so there was relief that the Fed was likely to adopt a patient stance and postpone further hikes until they became justified by the economic data. We continued in our belief that the US economy was one of the shining lights in the global economy, and invested accordingly in alignment with our mandate. With jobs data remaining buoyant, unemployment near record lows and wage inflation coming through at healthy levels, we felt it was too early to align ourselves for an impending recession. While rising debt levels and increasing budget deficits were concerns, low financing costs coupled with structural deflation trends seemed to have translated into adequate solvency levels for the time being. We decided to increase our equity exposure through derivatives which, while having to pay a small premium, allowed us to participate in upside movements with limited downside.
-2%
0%
2%
4%
6%
8%
10%
1st Qtr 2019 2nd Qtr 2019 YTD Inception
Fund USD-terms 6.05% 1.80% 7.85% 5.07%
Benchmark 0.91% 0.89% 1.80% 2.96%
Excess return 5.14% 0.91% 6.05% 2.11%

SANLAM UNIVERSAL FUNDS PLC
62
HIGH STREET GLOBAL BALANCED FUND (CONTINUED) Fund Performance (continued) The European Central Bank (ECB) followed the Fed’s tone with a promise to keep rates at historic lows for at least the rest of the year and slashed their 2019 Eurozone growth forecast from 1.7% to 1.1%. Contrary to our stance on the US economy, years of monetary stimulus have failed to materially kick-start the Eurozone economy and inflation remains well below target at 1%. We took the view that the Eurozone faced structural problems that would increasingly manifest with populist movements across the continent. With a solitary monetary policy being dictated by the ECB to the entire Eurozone, economic stresses are bound to surface due to the differences in fiscal policy adopted by each member state. While we didn’t foresee any imminent cracks in the incumbent system, we consider it one of the greatest risks hanging over financial markets. Consequently, our exposure to European equities remained low, with us largely seeing value in the German property sector given the low interest rate environment and relatively strong economy driving top-line rental growth. The second quarter saw less attractive growth, with the Fund returning 1.80%. The main reason for this stunted performance was the sharp sell-off in equity markets on the back of escalations in the US-China trade talks. Donald Trump confirmed in May that the US would be moving ahead with additional tariff increases on $200bn of Chinese imports, while China announced a retaliatory move to tariff $60bn of US imports. Tensions were further escalated when US officials indicated that Chinese technology giant Huawei would be blacklisted on short notice. These events added to the stress in the market, which is acutely aware of the economic weapons available to China should trade tensions continue to escalate – namely their large holding of US government bonds and their stranglehold on the supply of rare-earth metals, which are crucial in the production of technological devices. Losses were largely recovered in June, however, as world markets regained their bullish sentiment. Anxiety surrounding global trade seemed to ease, as the US and China indicated an agreeable advancement in their talks. More importantly, the US Federal Reserve indicated that it would cut short-term interest rates three times in 2019, with a further two potential cuts in 2020. While these expectations point to a deterioration in the growth outlook, they more notably have the short-term effect of pushing up share prices as future earnings are now discounted at a significantly lower rate. We took the belief that both of these catalysts were now captured in current market levels, and if these expectations were not met in the coming months, we could see the market losing some of its momentum. We planned to watch the inflation and jobs numbers coming out of the US very carefully over the coming months, as any good news on these fronts could likely be bad news for financial markets. Fund Outlook As has been our stance since the beginning of the year, we believe a cautious approach is still justified and hence we maintain our downside protection on the entirety of our equity exposure. This insurance did not come at great expense to the Fund as low prevailing volatility allowed us to purchase it at attractive levels. Due to the underlying mechanics of the instruments used in this strategy, resulting returns in a declining market will only increase as the instruments approach maturity towards the end of September. The fluidity of the US-China trade war, the sensitivity of global markets to the US Federal Reserve’s short-term rate decisions, and the impact of structural deflation in economies worldwide are just some of the risks that we will continue to monitor going forwards. Alongside our derivative protection, we have also continued to increase the defensive/yielding component of the Fund, investing in a number of corporate preference shares and infrastructure plays. We therefore feel that we are well placed in what is a very fluid global economy susceptible to a high degree of event risk. Investment Manager
High Street Asset Management (Pty) Limited
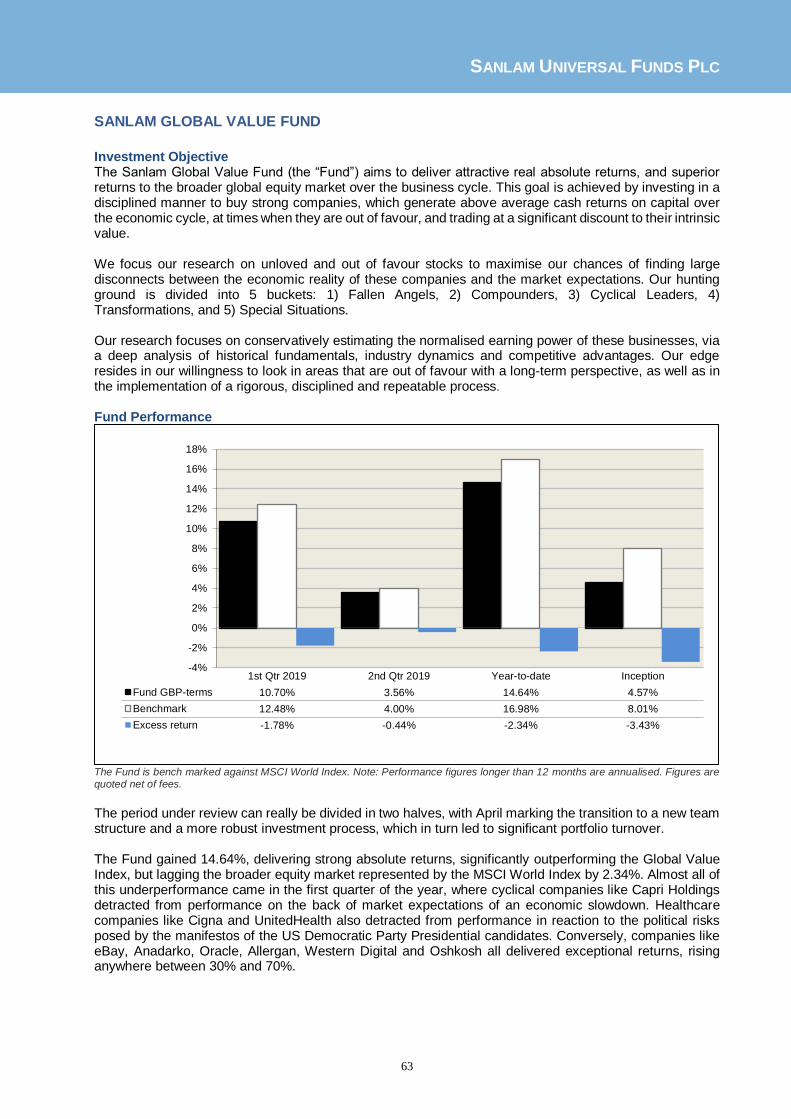
SANLAM UNIVERSAL FUNDS PLC
63
SANLAM GLOBAL VALUE FUND
Investment Objective The Sanlam Global Value Fund (the “Fund”) aims to deliver attractive real absolute returns, and superior returns to the broader global equity market over the business cycle. This goal is achieved by investing in a disciplined manner to buy strong companies, which generate above average cash returns on capital over the economic cycle, at times when they are out of favour, and trading at a significant discount to their intrinsic value. We focus our research on unloved and out of favour stocks to maximise our chances of finding large disconnects between the economic reality of these companies and the market expectations. Our hunting ground is divided into 5 buckets: 1) Fallen Angels, 2) Compounders, 3) Cyclical Leaders, 4) Transformations, and 5) Special Situations. Our research focuses on conservatively estimating the normalised earning power of these businesses, via a deep analysis of historical fundamentals, industry dynamics and competitive advantages. Our edge resides in our willingness to look in areas that are out of favour with a long-term perspective, as well as in the implementation of a rigorous, disciplined and repeatable process. Fund Performance
The Fund is bench marked against MSCI World Index. Note: Performance figures longer than 12 months are annualised. Figures are quoted net of fees.
The period under review can really be divided in two halves, with April marking the transition to a new team structure and a more robust investment process, which in turn led to significant portfolio turnover. The Fund gained 14.64%, delivering strong absolute returns, significantly outperforming the Global Value Index, but lagging the broader equity market represented by the MSCI World Index by 2.34%. Almost all of this underperformance came in the first quarter of the year, where cyclical companies like Capri Holdings detracted from performance on the back of market expectations of an economic slowdown. Healthcare companies like Cigna and UnitedHealth also detracted from performance in reaction to the political risks posed by the manifestos of the US Democratic Party Presidential candidates. Conversely, companies like eBay, Anadarko, Oracle, Allergan, Western Digital and Oshkosh all delivered exceptional returns, rising anywhere between 30% and 70%.
-4%
-2%
0%
2%
4%
6%
8%
10%
12%
14%
16%
18%
1st Qtr 2019 2nd Qtr 2019 Year-to-date Inception
Fund GBP-terms 10.70% 3.56% 14.64% 4.57%
Benchmark 12.48% 4.00% 16.98% 8.01%
Excess return -1.78% -0.44% -2.34% -3.43%

SANLAM UNIVERSAL FUNDS PLC
64
SANLAM GLOBAL VALUE FUND (CONTINUED) Fund Performance (continued) We have written before how our companies, by the virtue of being cheap with valuable assets, have attracted corporate actions in the past. We have had 3 takeovers and 2 spinoffs in the past 6 months alone with Anadarko and Allergan contributing significantly to performance. Exploration and production company, Anadarko was the target of 2 takeover approaches in April and rose over 60%, contributing to a big portion of the Fund’s performance over the period. As the stock approached the bid price, we sold the position and recycled the capital into holdings with higher upside. Allergan was approached by AbbVie in June and caused the stock to jump 40%.The stock is now trading close to our target price and a 10% discount to the bid price – we expect to exit this position in due course. eBay has also been a notable contributor, rising 42% in the first half of the year and continuing to deliver strong organic growth and free cash flow generation. The involvement of activist investor Elliott Management in January 2019 catalysed several value creation initiatives at the company, which were in part reflected in the market movements. New notable investments are EXOR, Berkshire Hathaway, Delphi Technologies, American Express, Lloyds, Spirit AeroSystems, Heineken, Adecco, Heineken; while we exited our positions in Cigna, Societe Generale, BNP Paribas, Malaysia Airports, Airbus, ENI, Japan Tobacco, MS&AD and Gilead Sciences. As patient, long term investors we do not typically expect immediate gratification, but we are very pleased that the changes we implemented in Q2 have already benefited performance – EXOR, Delphi, American Express, Corteva, Adecco and Heineken were some of the top contributors. Fund Outlook With the broader equity market trading at or above its long-term average valuation, it is difficult to claim equities as a group are cheap. In fact, we would argue that after a decade of low inflation aided by US tax cuts, a healthy consumer environment and cheap credit, the market multiples have in all likelihood an inflated denominator. Corporate profit margins, particularly in the US, have never been higher and the cost of debt has rarely been this low. While we are always weary of leverage, thinking about the next 3 to 5 years we would be particularly careful in getting into investments that make liberal use of debt combined with high operating leverage. The unwinding of this relationship could be disastrous. As always, we do not claim to have a particular edge in predicting the macro environment, but the slowing interest rate schedule in the US and renewed monetary commitment in Europe, as well as heightened geopolitical tensions, makes us wary to invest in anything that at its core relies on a specific interest rate environment. As a result, we will continue focusing on bottom up, fundamental analysis, selecting companies that we think are obviously undervalued and whose future is largely under their own control. We will look for businesses where a variety of macro outcomes are priced in the stock, that way we make money for our investors even if things don’t go as we hope. Paraphrasing Philip Fisher “Hope is not a strategy. It is like running through a dynamite factory with a lit match, you may live, but you are still an idiot…” Protection of capital is and remains our primary concern.

SANLAM UNIVERSAL FUNDS PLC
65
SANLAM GLOBAL VALUE FUND (CONTINUED) Fund Outlook (continued) While markets overall do not appear particularly cheap, the spread of valuation between in-favour and out-of-favour stocks remains significant. Just think of how anything with “subscription” in the business model description trades at a minimum of 25x earnings, and how everything else perceived as old tech, capital intensive or discretionary trades in the teens or lower with much higher volatility. As value investors we will continue looking at both camps and find large disconnects between market perception and reality while always remaining faithful to our conservative projections. The richest hunting grounds we can find at the moment are in Industrials, particularly in the Aviation, Auto and Auto supply industries, but we also find opportunities in pockets of Consumer Staples, Healthcare and
Consumer Discretionary stocks. Investment Manager Sanlam Investments UK Limited

SANLAM UNIVERSAL FUNDS PLC
66
SANLAM ACTIVE UK FUND
Investment Objective The Sanlam Active UK Fund (the “Fund”) aims to target capital growth over the longer-term.
Fund Performance
The Fund is bench marked against MSCI UK. Performance figures longer than 12 months are annualised. Figures are quoted gross of fees.
The first half of 2019 has been an eventful time for financial markets. Equity markets recovered strongly in the New Year from the depressed levels prevailing at the end of 2018, largely in response to the changed outlook for US interest rates as the Fed acknowledged that global growth was slowing. This dramatically reduces the risk of a policy error induced recession and is therefore positive for equities as well as bonds. The US has been the major beneficiary but all global equity markets have benefitted. The main threat clouding global growth prospects is the continuing trade war between the US and China. The uncertainty that this engenders has caused companies to curtail investment and thus manufacturing has borne the brunt of the economic slowdown. The UK market has, of course, also been impacted by political developments along the tortuous path towards Brexit. The first quarter saw some optimism that an agreement might be achievable, thus supporting the shares of companies exposed to the domestic UK economy such as housebuilders and banks. More recently, however, with the appointment of Boris Johnson as Conservative Party leader and Prime Minister, the risk of a hard “no-deal” Brexit has risen significantly. Accordingly the second quarter was more volatile and Sterling weakness reflects growing anxiety and risks to the domestic economy. Overall, while H1 was good for both bond and equity returns, risks to growth and political uncertainty have driven share performance as much as individual company results. The Fund has performed broadly in line with the UK market over this period. The star performers have been our technology holdings First Derivatives, Micro Focus and Sage. A strong iron ore price has helped Rio Tinto, while Taylor Wimpey has recovered strongly from the low levels late last year when we purchased our initial position.
-2%
0%
2%
4%
6%
8%
10%
12%
14%
1st Qtr 2019 2nd Qtr 2019 Year-to-date Inception
Fund GBP-terms 10.41% 2.60% 13.28% 5.82%
Benchmark 9.36% 3.32% 12.99% 5.06%
Excess return 1.05% -0.72% 0.29% 0.76%

SANLAM UNIVERSAL FUNDS PLC
67
SANLAM ACTIVE UK FUND (CONTINUED) Fund Performance (continued) In contrast, a diverse range of stocks have held back the Fund, including International Consolidated Airways (overcapacity concerns), Imperial Brands (weak North American cigarette sales) and Tui (impacted by the grounding of the Boeing 737 Max and softer holiday bookings). Three new holdings were acquired in the period, namely Rolls Royce, Intercontinental Hotels Group and AstraZeneca. We also increased our investment in Taylor Wimpey, Unilever, First Derivatives and Lloyds Banking. In contrast, we sold out of holdings in smaller companies Sophos, Kenmare Resources, Hipgnosis Songs, and from ITV, where weaker advertising trends and competition from new entrants present structural growth challenges. Fund Outlook
The UK market overall is currently lowly rated by international standards and offers a generous yield of well over 4% compared with negligible yields on cash and just 0.6% on Gilts. We consider this highly attractive for long term investors. While short term Brexit uncertainty might lead to near term volatility the eventual resolution will provide the basis for a return to growth. The global backdrop is also broadly constructive. With a more supportive policy backdrop likely for the foreseeable future investors should continue to look through most of the numerous risk factors that currently generate anxiety and volatility. Whilst slower growth is not necessarily a threat to equities it does suggest that investors should focus on high quality businesses that offer more predictable and structural growth prospects. In this regard, our new holdings (Rolls Royce, Intercontinental Hotels and AstraZeneca) are all international businesses with clear growth opportunities and long term demand drivers. Such holdings are complemented by market leading domestic companies that have strong balance sheets, such as Taylor Wimpey and Lloyds Banking. Whilst these businesses are by no means immune to the economic cycle, we believe they can sustain good levels of profitability and cash generation under most scenarios. Moreover, with Brexit uncertainty weighing heavily on investor sentiment, their shares currently offer exceptional value to long term investors.
Investment Manager
Sanlam Investments UK Limited

SANLAM UNIVERSAL FUNDS PLC
68
SANLAM MULTI-STRATEGY FUND
Investment Objective The Sanlam Multi-Strategy Fund (the “Fund”) aims to seek to outperform the Consumer Price Index by 4% per annum over five-year periods with a target of generating a positive absolute return on a rolling three year basis.
Fund Performance
The Fund is bench marked against the Consumer Price Index plus 4%. Performance figures longer than 12 months are annualised. Performance figures longer than 12 months are annualised. Figures are quoted gross of fees.
The first half of 2019 was dominated by the well-worn themes of Brexit, the UK leadership contest, trade tariffs and the path of US interest rates which all contributed to volatility. The focus shifted from normalizing rates to a more dovish stance by the Fed on the back of global growth concerns in the market. This change in focus sent both the bond and the equity markets higher. Top contributors were renewables, investment grade debt, high yield, infrastructure and global equity momentum. Over the period our hedges contributed negatively. The 90-day volatility decreased from 3.4% to 2.8% and the fund gained 2.37% over the period under review. The table on the next page illustrates the changes to the asset allocation during H1 2019.
-2%
0%
2%
4%
6%
8%
1st Qtr 2019 2nd Qtr 2019 Year-to-date Inception
Fund GBP-terms 3.71% 2.43% 6.23% 3.99%
Benchmark -0.19% 1.03% 0.84% 1.58%
Excess return 3.90% 1.40% 5.39% 2.42%

SANLAM UNIVERSAL FUNDS PLC
69
SANLAM MULTI-STRATEGY FUND (CONTINUED)
Fund Performance (continued)
Source: Sanlam Investments UK Limited
Fund Outlook The first half of the year produced positive returns in most asset classes, but not without a significant dose of volatility. The mixed messages from equity and bond markets are unlikely to make the second half any easier. In the UK, the election of Boris Johnston as prime minister has set the tone for the withdrawal process from Europe later this year and sterling should continue to be volatile. The omission of key words from the FOMC press release and the news that the ECB is priming the QE pumps once again in the face of slowing global growth concerns has the market pricing in a more accommodative environment over the short term. Whether these steps are enough to prop up this aging rally or cause a rush for the exits remains to be seen.
Positioning We continue to position the portfolio with the profile of a diversified convertible. We favour option-based equity exposure (rather than pure directional investments) alongside income producing real assets and short duration bonds. A quarter of the portfolio is currently invested in these real assets which have a strong link to inflation and yields more than 4%. Our risk to interest rates is relatively low with a weighted duration of 2.2 years in the fixed income portfolio.
Investment Manager
Sanlam Investments UK Limited

SANLAM UNIVERSAL FUNDS PLC
70
ANCHOR GLOBAL STABLE FUND
Investment Objective
The Anchor Global Stable Fund (the “Fund”) aims to provide capital growth over the long-term.
Fund Performance
The Fund is bench marked against average CPI of G7 countries + 1.5% p.a. Figures are quoted net of fees. Opening NAV is taken as
USD1, based on the theoretical close on 27/2/2015.
The first half of 2019 was characterized by a strong rebound in risk assets after inverted yield curves, downgraded earnings estimates, and trade wars sparked recession fears in the last quarter of 2018. As trade wars looked to re-escalate in the 2nd quarter global central bankers stepped in to commit to monetary stimulus in order to offset any impact slowing global trade may have on the current economic expansion. In this environment, the Fund’s bond components did well and the currency hedges against Euro and British pound assets also contributed meaningfully in the strong US dollar environment. Despite being less than a quarter of the Fund assets, the equity portfolio contributed more than half the Fund’s returns for the 1st half of the year. As US 10-year bond yields dropped from 2.7% to 2% over the period, it lifted duration assets which were also a meaningful contributor to the Fund’s performance. Fund Outlook
With both bonds and equities having rallied hard in the first half of the year, we’ve been gradually taking profits in some of the equity positions and shifting into lower duration bond positions. The Fund’s equity exposure is currently around 21% - towards the low end of its typical 20 – 30% exposure range. The fixed income portfolio now has a duration of around 2.7, considerably lower than its typical duration. In the corporate bond allocation, we’ve pivoted towards the more liquid financial issues in the investment grade space, trying not to overreach for yield at this point in the cycle. Investment Manager
Anchor Capital (Pty) Limited
-4%
-2%
0%
2%
4%
6%
8%
1st Qtr 2019 2nd Qtr 2019 YTD Inception (Ann)
Fund USD-terms 5.03% 1.91% 7.04% 0.15%
Benchmark 0.68% 0.67% 1.36% 2.71%
Excess return 4.35% 1.24% 5.68% -2.56%

SANLAM UNIVERSAL FUNDS PLC
71
ANCHOR GLOBAL EQUITY FUND
Investment Objective
The Anchor Global Equity Fund (the “Fund”) aims to provide capital growth over the long-term.
Fund Performance
The Fund is bench marked against MSCI World All Country Total Return Net USD Index. Figures are quoted net of fees. Opening
NAV is taken as USD1, based on the theoretical close on 13/3/2015. Excess return is calculated on a geometric basis.
The Fund enjoyed a strong first half of 2019. The top five contributors to alpha were Facebook, Constellation Software, MasterCard, Nintendo and Ulta Beauty. The five largest detractors were Charles Schwab, Ryanair, Alphabet, Activision Blizzard and Zozo. The blistering ascent of the first quarter gave way to a more volatile second quarter, as markets fretted over decelerating global growth and renewed trade tensions between the US and China. We used this period of weakness to opportunistically add to our position in Alibaba, which is predominantly domestically oriented and stands to gain market share in a tougher economic environment. Fund Outlook Trade war rhetoric has ratcheted up several notches, causing rising market angst. Growth expectations and interest rates have both fallen. While bearish at first glance, a re-basing of expectations (and valuations) and the stimulative effect of lower rates should provide a foundation for a rebound in both economic activity as well as the stock market. Timing, as ever, is unknowable. Rather than attempting to time these cyclical turns, we believe our efforts are best spent on bottom-up stock picking. In this context, we are long term bullish on our holdings’ underlying business quality, valuations and future prospects. Investment Manager
Anchor Capital (Pty) Limited
-6%
-2%
2%
6%
10%
14%
18%
22%
26%
30%
34%
38%
1st Qtr 2019 2nd Qtr 2019 YTD Inception (Ann)
Fund USD-terms 16.36% 4.22% 21.26% 30.48%
Benchmark 12.18% 3.61% 16.23% 36.52%
Excess return 3.73% 0.58% 4.33% -4.42%

SANLAM UNIVERSAL FUNDS PLC
72
BRIDGE GLOBAL MANAGED GROWTH FUND
Investment Objective The Bridge Global Managed Growth Fund (the “Fund”) aims to seek income and moderate capital growth over the long-term. Income (which will be reinvested in the portfolio) will be a key component of the portfolio return.
Fund Performance
The Fund is benchmarked against US Consumer Price Index plus 3%. Performance figures longer than 12 months are annualised. Figures are quoted net of fees.
Global equities advanced in the second quarter (MSCI World +4.2%), despite a steep fall in May due to concerns over the US-China trade war. Equity markets were supported by increasingly accommodative central banks and hopes of progress in trade tensions by the end of June. Confronted by weaker economic data, risks to the trade outlook and still low inflation, the US Federal Reserve (Fed) and the European Central Bank (ECB) indicated that support in the form of further monetary stimulus may be required. Following the strong return in the first quarter, the MSCI World index is up 17.4% year to date. US equities advanced in Q2 and the S&P 500 set a record high. Uncertainty surrounding President Trump’s trade stance caused financial markets to wobble midway through the quarter. Comments from President Trump that his administration could impose additional trade tariffs on Mexico and extend the suite of goods that are taxed on import from China, caused a sharp market sell-off in May. However, investors were broadly cheered by continued dovishness from the Federal Reserve and indications of progress in trade tensions by the end of June. At the G20 summit, the ongoing trade war between China and the United States topped the agenda. After meeting with his Chinese counterparts, President Trump said negotiations would resume with China, which buoyed financial markets. Global bond yields declined significantly in the first half of 2019, which led to an increase in yield assets, including global REITs. The US 10-year yield declined from 2.68% to 2.42% in the first quarter, leading to the GPR250 REIT index advancing 14.74% over the same period. The increased probability of an escalating trade war caused investors to seek safe-haven assets, which pushed global bond yields lower in the second quarter. The GPR250 REIT index gained a further 1.58% in the second quarter, leaving GPR250 index up 16.55% for the first six months of 2019. The Fund has advanced 11.26% year to date on positive returns from its equity, listed property and fixed income asset allocations. As the Fund’s benchmark is inflation and not market-linked, the Fund outperformed its benchmark by 8.85% over this period.
-2%
0%
2%
4%
6%
8%
10%
12%
1st Qtr 2019 2nd Qtr 2019 YTD Inception
Fund USD-terms 9.74% 1.38% 11.26% 3.77%
Benchmark 0.84% 1.56% 2.41% 5.16%
Excess return 8.90% -0.18% 8.85% -1.39%

SANLAM UNIVERSAL FUNDS PLC
73
BRIDGE GLOBAL MANAGED GROWTH FUND (CONTINUED) Fund Outlook Market participants are expecting central banks, led by the US Federal Reserve (the Fed), to start cutting interest rates as global growth slows. The uncertainty created by a prolonged trade war featuring the world’s two largest economic powers; the US and China, is undermining consumer and business confidence. Recent economic data releases point to a further slowdown in the second half of the year if central banks don’t provide further stimulus. According to Bloomberg, the market is currently pricing in slightly more than a 0.25% cut in official interest rates when the Fed meets in July. In Europe, Christine Lagarde, currently head of the International Monetary Fund, has been nominated by the European Council to succeed Mario Draghi as President of the European Central Bank (ECB). Lagarde, whose background is in politics and not economics, has been a vocal advocate of increased central bank stimulus to promote growth and is expected to put that into action when she assumes her new role at the beginning of November. Both the Fed and the ECB will now be headed by politicians at a time when politics, rather than economics, is driving global financial markets. The UK has moved no closer to Brexit. Despite a further extension of the Article 50 deadline to 31 October, there remains considerable uncertainty as to the path the country may take around Brexit. Against this backdrop of increased economic and political uncertainty, global bond yields continue to decline. The yield on US 10-year Treasuries is just above 2% while the yields on 10-year bonds in Germany and Japan are negative again. Inflation expectations continue to fall, supporting the case for lower bond yields, while most central banks have turned dovish since the start of the year and are expected to continue with extremely accommodative monetary policies. Global equity markets were buoyed by the prospect of more accommodative monetary policy and continued their steady climb higher in June. Since the start of the year, the MSCI World index has gained 17.4% in US dollars, mainly on the back of a recovery in the value of tech stocks, which had led the large declines in the fourth quarter of last year. Equity investors appear to be ignoring the threat to earnings posed by a slowdown in global economic activity and focussing instead on the prospect of lower interest rates for longer. Global listed property markets rallied on the back of lower global bond yields. The GPR 250 REIT index has advanced nearly 17% year to date as investors continued to upweight their exposure to income-producing or interest rate sensitive sectors of the equity market, like REITs. Global REITs have had their best start to a year amid a broad-based rally fuelled by lower government bond yields, tighter corporate credit spreads and an improving earnings outlook relative to other sectors of the market (for REITs, the earnings outlook has not changed much, while other sectors have seen earnings downgrades as global economic growth has slowed). The Fund allocates 65% of the portfolio to high quality businesses that are expected to deliver inflation-beating earnings growth over the medium and long term and reward shareholders with above-average dividend yields. The Fund also allocates 25% of the portfolio to listed property companies that offer the highest possible combination of income yield and income growth, while at the same time providing an acceptable level of property and geographic diversification. The balance of the portfolio comprises short and medium-dated government and corporate debt. As a result, the Fund is expected to exhibit lower price volatility in the short-term, without compromising the potential to deliver on the Fund’s long-term objective of providing returns in excess of US CPI+3%. The combination of dividend-yielding equities and listed property companies provides the portfolio with a moderate level of initial income, as well as inflation-beating income and capital growth over the medium and long term. The current one-year forward yield on the portfolio is 3.9% (before fees and WHT) and the portfolio’s gross income is expected to grow by 4.9% per annum over the next three years. The portfolio income is rolled up into the Fund and is not distributed to investors.
Investment Manager
Bridge Fund Managers (Pty) Limited

SANLAM UNIVERSAL FUNDS PLC
74
SANLAM GLOBAL EMERGING MARKETS FUND
Investment Objective The Investment objective of Sanlam Global Emerging Markets Fund (the “Fund”) is to provide a regular income stream for investors with the potential for capital growth. It aims to provide a regular income which will be in line with the annual average dividend yield of the MSCI World High Dividend Yield NTR Index (Bloomberg Code: MHDYWOUN) as well as provide capital growth exceeding inflation.
Fund Performance
The Fund’s benchmark is the MSCI Emerging Markets Index. Performance figures longer than 12 months are annualised. Figures are quoted gross of fees.
Market review Global equity markets experienced a relatively good second quarter (Q2), albeit with more modest performance than in the first quarter (Q1). Looking at the indices in US dollars – on a total return basis the S&P 500 Index gained 4.3%, the MSCI World Index gained 4.2% and the MSCI Emerging Markets Index, lagged again, closing 0.7% higher this quarter. The surprising decline in long dated developed market government bond yields, which started in Q1, did not subside. Yield on US 10 year maturity bonds declined from 2.4% at the end of Q1 to 2.0% at the end of Q2 and the yield on 10 year German bonds declined from -0.1% to -0.3%. In late June, the Federal Reserve (the Fed) indicated that it might cut interest rates sooner than previously thought by cutting the word ‘patient’ out of its policy statement. It added that it would ‘act as appropriate’ to sustain economic expansion. President Trump has often taken to Twitter to share his exasperation with the Fed’s previous rate increases. In the UK, Prime Minister Theresa May announced that she would step down as leader of the ruling Conservative Party. Boris Johnson has since replaced May and is positive that he can renegotiate the withdrawal deal with the European Union, which May has failed to do, and get it through Parliament before the expiry date of 31 October 2019.
-2%
0%
2%
4%
6%
8%
10%
12%
14%
1st Qtr 2019 2nd Qtr 2019 Year-to-date Inception
Fund USD-terms 12.64% -0.39% 12.21% 5.78%
Benchmark 9.93% 0.61% 10.59% 3.72%
Excess return 2.71% -0.99% 1.61% 2.06%
SANLAM UNIVERSAL FUNDS PLC
75
SANLAM GLOBAL EMERGING MARKETS FUND (CONTINUED)
Fund Performance (continued)
Portfolio review
Q1 2019 During the quarter we increased our positions in Swatch, the world’s largest watchmaker, and NetEase, the Chinese gaming company. We also initiated a new position in Regional, the fifth biggest Mexican bank which specialises in the SME segment. We trimmed our positions in Bank Rakyat, a leading bank in Indonesia, and in Cia Hering, a Brazilian retailer, as their prices approached our estimate of intrinsic value. We also reduced our exposure to Matahari Department Stores, an Indonesian retailer. Detractors during the quarter were Matahari Department Stores, BIM Birlesik Magazalaar and Arcos Dorados. Contributors were VipShop, Yes Bank and AIA Group. Q2 2019 In mid-June, a number of high quality businesses were added to the portfolio. In addition, the number of shares in the portfolio increased from 32 to 45 providing further diversification and reducing concentration risk To highlight a few changes, we sold out of Jeronimo Martins (Portugese listed retailer) and Swatch group (developed market watch maker) as the valuations and fundamentals of these businesses were not compelling. Additions to the top 10 included NMC Health (best in class hospital group operating in the UAE) and Noah Financials (Wealth Services Business in China). These businesses are trading at deeply discounted valuations and have added to the quality (higher ROE and ROIC) of the overall portfolio. Detractors during the quarter were Yes Bank and Baidu.
- To date, five directors have left Yes Bank after its founder left the company. The bank is undergoing severe challenges (rising NPL's, low loan growth & capital constraints) and could ill afford any further disruption. The business would potentially have to raise capital from the market at a deeply discounted rights issue in the future and with lack of leadership coupled with an unclear strategy. We decided to sell all the shares in the portfolio and have replaced it with a high quality, deeply discounted bank in Mexico.
- Baidu is investing significantly in exciting new ventures like Artificial Intelligence, cloud computing and autonomous driving. The main issue is their flagship search business is under strain. Ad revenues are declining and traffic on their sites is not growing at previous high rates. In addition, profit margins have come under pressure due to higher volumes in lower margin areas. Earnings will therefore be down significantly over the next few years and hence the share price underperformance. The business has also been through some management changes in these tough times and would need to proof their value going forward. The company looks cheap on long-term normalised earnings, but we have taken the decision to sell out of our position and monitor progress on a number of key variables before we decide to invest in this company again.
Contributors to performance were X and Netease. - In an extremely tough market, X5 has continued to produce very good results. The management
team have done a phenomenal job in turning around the food retail group and have been rewarded by investors with strong share price performance. We still like the business model but have taken profits post the strong run. The proceeds have been invested in Magnit, a similar high quality competitor in the food retail market in Russia.
- Significant downgrades to earnings in 2018 led to a sharp pullback in Netease's share price post government regulation on gaming. Regulation in 2019 has eased and a number of new games have been approved for both Netease and Tencent. Earnings seem to be stabilising and long term fundamentals for the industry are still intact. On a normalised earnings base, Netease is attractively valued and hence forms a core part of our top ten holdings.
SANLAM UNIVERSAL FUNDS PLC
76
SANLAM GLOBAL EMERGING MARKETS FUND (CONTINUED)
Fund Outlook Since the inception of the MSCI Emerging Markets Index, emerging markets have yielded attractive investment returns relative to their developed market counterparts. As with all things that tend to be cyclical, the investment performance of emerging markets has not been generated in a straight line. There have been periods of significant - and widely publicised – emerging market underperformance. However these periods tend to be followed by periods of exceptional returns and when we look at current emerging markets valuations versus developed market valuations the opportunities in emerging markets are evident.
Investment Manager
Sanlam Investment Management (Pty) Ltd
Note: During at the end of June 2019, the investment manager of the Fund changed from Denker Capital (Pty) Ltd to Sanlam Investment Management (Pty) Ltd. At the same time, the name of the Fund was changed to Sanlam Global Emerging Markets Fund.
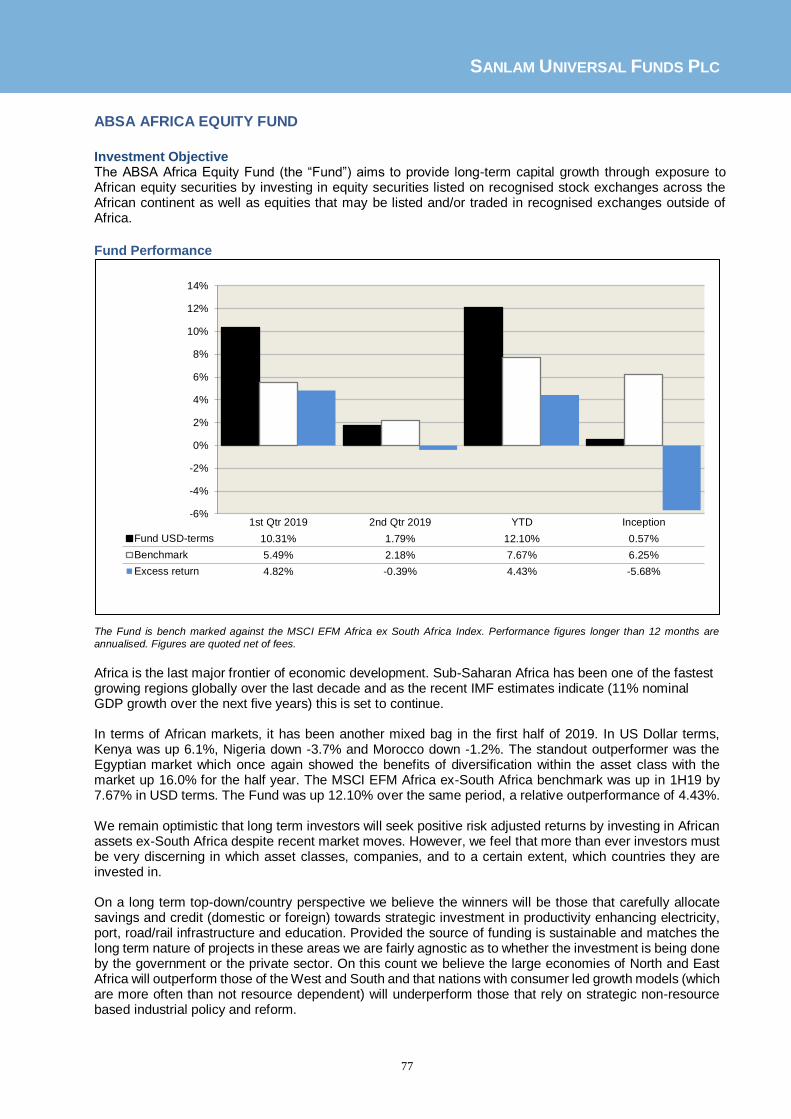
SANLAM UNIVERSAL FUNDS PLC
77
ABSA AFRICA EQUITY FUND
Investment Objective The ABSA Africa Equity Fund (the “Fund”) aims to provide long-term capital growth through exposure to African equity securities by investing in equity securities listed on recognised stock exchanges across the African continent as well as equities that may be listed and/or traded in recognised exchanges outside of Africa.
Fund Performance
The Fund is bench marked against the MSCI EFM Africa ex South Africa Index. Performance figures longer than 12 months are
annualised. Figures are quoted net of fees.
Africa is the last major frontier of economic development. Sub-Saharan Africa has been one of the fastest growing regions globally over the last decade and as the recent IMF estimates indicate (11% nominal GDP growth over the next five years) this is set to continue. In terms of African markets, it has been another mixed bag in the first half of 2019. In US Dollar terms, Kenya was up 6.1%, Nigeria down -3.7% and Morocco down -1.2%. The standout outperformer was the Egyptian market which once again showed the benefits of diversification within the asset class with the market up 16.0% for the half year. The MSCI EFM Africa ex-South Africa benchmark was up in 1H19 by 7.67% in USD terms. The Fund was up 12.10% over the same period, a relative outperformance of 4.43%. We remain optimistic that long term investors will seek positive risk adjusted returns by investing in African assets ex-South Africa despite recent market moves. However, we feel that more than ever investors must be very discerning in which asset classes, companies, and to a certain extent, which countries they are invested in. On a long term top-down/country perspective we believe the winners will be those that carefully allocate savings and credit (domestic or foreign) towards strategic investment in productivity enhancing electricity, port, road/rail infrastructure and education. Provided the source of funding is sustainable and matches the long term nature of projects in these areas we are fairly agnostic as to whether the investment is being done by the government or the private sector. On this count we believe the large economies of North and East Africa will outperform those of the West and South and that nations with consumer led growth models (which are more often than not resource dependent) will underperform those that rely on strategic non-resource based industrial policy and reform.
-6%
-4%
-2%
0%
2%
4%
6%
8%
10%
12%
14%
1st Qtr 2019 2nd Qtr 2019 YTD Inception
Fund USD-terms 10.31% 1.79% 12.10% 0.57%
Benchmark 5.49% 2.18% 7.67% 6.25%
Excess return 4.82% -0.39% 4.43% -5.68%
SANLAM UNIVERSAL FUNDS PLC
78
ABSA AFRICA EQUITY FUND (CONTINUED) Fund Performance (continued) In the short term there are three conditions for a rally in any equity market (accelerating economic growth, low valuations and improved investment flows). Egypt stands out on all three counts with the most upgraded growth estimates, historically low equity valuation, fair currency valuation and the possibility of improved domestic (if not foreign) flows into equities as inflation and interest rates decline. Egypt remains our largest country exposure. Nigerian equities trade at an even greater discount to their historical norms than their Egyptian counterparts and the currency is fairly valued. However, growth estimates have been downgraded and local asset allocators are unlikely to take the lead in buying equities. Kenyan equity valuations are as historically cheap as Nigeria particularly in the Banking sector but compared to other ex-SA currencies, the local unit is expensive by most measures. While growth estimates have been upgraded on the back of an improved harvest, the irrational interest rate cap policy that is stifling credit expansion will continue to will act as an anchor to growth. Fund Outlook We expect the broad Egyptian market to take the lead in performance in the second half of the year. This will be partly driven by lower interest rates in that market, spurred by lower inflation prints and an improving domestic and external balances. Our overweight positioning in Egypt should generate alpha from a geographical “asset allocation” point of view in the short term. This is despite the fact that long term we aim to generate alpha mostly from security selection. We expect Kenya and Nigerian markets to be stock picking markets with no major market-wide catalysts while Morocco will remain a defensive place to hide. Investment Manager
Absa Asset Management (Pty) Limited

SANLAM UNIVERSAL FUNDS PLC
79
SANLAM CENTRE AMERICAN SELECT EQUITY FUND
Investment Objective
The Sanlam Centre American Select Equity Fund (the “Fund”) aims to achieve long-term capital growth.
Fund Performance
The Fund is bench marked against MSCI North America Index. Performance figures longer than 12 months are annualised. Figures
are quoted net of fees.
For the 6 month period ended 30 June 2019, the Fund returned 11.56%, underperforming the MSCI North America Index by 7.01%.
The largest detractors to relative performance over the period included the Fund’s investments within the Industrials sector due to our underweight allocation and stock selection (Knight-Swift Transportation, 3M, Raytheon, Union Pacific Corp.); the Materials sector due to our overweight allocation and stock selection (Mosaic, CF Industries Holdings); the Energy sector due to overweight allocation and stock selection (Cimarex Energy, Cabot Oil & Gas); as well as the Financials sector due to stock selection (Berkshire Hathaway, Wells Fargo). Investments that added to the Fund’s relative performance included investments within the Health Care sector due stock selection (Celgene, Alexion Pharmaceuticals, Incyte Corp., Regeneron Pharmaceuticals).Fund performance was also negatively impacted from a total return perspective by the amortization costs of certain hedges that were viewed, and continue to be viewed by us, as capital protective in nature. That said, these hedges, namely put options on the S&P 500 Total Return Index, have in the past insulated the Fund from the same magnitude of maximum drawdown experienced by the overall stock market over prior volatile episodes, namely in February and December 2018.
The process used to manage the Fund focuses on each individual portfolio company's growth outlook and capacity to create shareholder value, utilizing our bottom‐up fundamental stock selection process and to meet its objective as a risk‐managed growth fund, the Fund may complement its equity securities with hedges and other capital preservation strategies when deemed tactically appropriate.
The very strong rebound in U.S. stock market indexes during the first half of 2019, in particularly the first quarter after the mini-correction at the end of 2018, has laid the foundation for expectations that 2019 overall will be solid, as each time the S&P 500 Index has scored a gain of 10% or more in the first quarter of a year since 1935, the market managed to climb up 6% more on average for the rest of the year, with positive performance during 11 of those 12 times, 1987 being the only exception.
-8%
-4%
0%
4%
8%
12%
16%
20%
1st Qtr 2019 2nd Qtr 2019 YTDAnnualized Since
Inception (11/21/2016)
Fund USD-terms 11.13% 0.39% 11.56% 11.90%
Benchmark 13.82% 4.17% 18.57% 13.07%
Excess return -2.69% -3.78% -7.01% -1.17%
SANLAM UNIVERSAL FUNDS PLC
80
SANLAM CENTRE AMERICAN SELECT EQUITY FUND (CONTINUED) Fund Outlook (continued) This said, it must be remembered that indexes are still just near their peak levels of last September and, furthermore, we reiterate our belief that the current market dynamics are unique despite our erstwhile attempts to find a historical analog for guidance. The two contributing attributes leading to this uniqueness are the levels of overall stock market valuation and the most important economic phenomenon that may be persistent for the next two decades, namely demographic decline in the developed economies, including China, and its impact on growth and inflation. The catalyst behind the strong start to the year lays at the feet of Federal Reserve Chairman Jerome Powell who surprised markets by doing a complete U-turn on monetary policy. After the financial markets impact of the current rate hiking cycle began to have significance, i.e., a stock market correction, Chairman Powell abruptly communicated a full reversal in short-term interest rate targets for 2019 and, not only removed expectations of further planned tightening through 2019, but instilled confidence that the Federal Reserve would actually move to accommodation with up to two interest rate cuts imbedding themselves into market expectations. Concurrently, the Federal Reserve unveiled a plan to stop scaling back the vast portfolio of bonds it built up to spur an economic recovery from the 2007-2009 financial crisis, leaving the Federal Reserve still holding at least $3.5 trillion in bonds, more than four times the roughly $800 billion it had heading into the crisis more than a decade ago. Furthermore, the European Central Bank (ECB), although it decided to end its bond purchases in December 2018, announced that it intends to continue reinvesting, in full, the principal payments from maturing securities purchased for an extended period to maintain favorable liquidity conditions and an ample degree of monetary accommodation. Never before in modern times have the world’s leading central banks abandoned a monetary tightening cycle before even moving real interest rates above zero and, in the case of the Japanese and Swiss Central Banks, expanded their mandates to engage in massive purchases of equities. While we admit that the three underpinnings of the U.S. stock market’s excess valuation, arising from elevated profit margins, can sustain themselves for longer and, thus, keeping indexes stable until a resumption of global growth allows earnings to grow into the existing prices to justify stability, we see fragility and indexes vulnerable to significant dislocations just lacking a catalyst. Ironically, this is at a time when market prices for forward volatility are back to near all-time lows and, thus, allowing us to efficiently purchase protective options to help insulate the Fund’s underlying holdings against a material decline occurring over a short period of time in stock prices. Whether labelled a traditional growth or value stock, we consider valuation or the price one pays at purchase as the most critical element of successful investment. Currently, the consensus driver to enable the stock market in aggregate to move higher is continued reliance upon already stratospheric valuation multiples re‐rating higher still, on further accommodative monetary policies or a significant increase in risk appetite by investors, as well as momentum of highly elevated net profit margins reliant upon factors that are likely to reverse course. To repeat ourselves for emphasis, we see fragility and major stock market indexes vulnerable to significant dislocations in 2019, just lacking a catalyst. Given this, the Fund currently continues to concentrate the number of positions in its portfolio in an attempt to maximize individual stock risk rather than market risk and use derivative instruments intended to hedge the risks of existing equity positions, namely put options on the S&P 500 Index, as a potential hedge against its underlying stock holdings in the event of a material correction. We continue to emphasize a barbell of secular growth stocks with contrarian, opportunistic cyclical growth companies in the midst of business restructurings. We believe that our pragmatic, large-capitalization, valuation-sensitive growth and concentrated, high‐conviction approach to stock selection, with a cognizance of risk management that includes tactically implementing capital protective investments, seems positioned to perform well relative to less risk aware strategies.
Investment Manager
Centre Asset Management, LLC

SANLAM UNIVERSAL FUNDS PLC
81
SANLAM GLOBAL CONVERTIBLE SECURITIES FUND
Investment Objective The investment objective of the Sanlam Global Convertible Securities Fund (the “Fund”) is to provide global equity-like returns with significantly less risk. The objective is achieved by seeking to capture the majority of stock market advances while simultaneously providing downside protection during market declines. Statistical focus on convertible structure is used to create a balanced, diversified portfolio that optimizes the asymmetrical risk/reward characteristics of convertibles. The investment approach is not reliant on forecasting or market timing. The Fund strives for a consistent risk/reward profile at all times.
Fund Performance
The Fund is bench marked against the JP Morgan 3M USD LIBOR +3% p.a. Index. Performance figures longer than 12 months are annualised. Figures are quoted net of fees.
Financial markets rallied in the first half of 2019, becoming increasingly impacted by global macro issues as the year progressed. Markets grappled with fluctuating views regarding global economic growth, US-China trade, and the outlook for interest rates. These competing factors caused an uptick in volatility/weakness in May, but ultimately resulted in strong performance by both stocks and bonds supported by dovish statements by the Fed and ECB. The rally in equities generally broadened in 2019 to encompass a greater number of companies, sectors, and regions. Technology and US large cap equities were the top performers. Europe and Asia Ex-Japan also performed strongly, while returns in Japan were more modest. Credit spreads tightened and interest rates fell substantially, driving robust fixed income returns. Despite an uptick in May, equity market volatility declined substantially from the elevated levels at year end. Convertibles securities moved higher buoyed by advances in underlying stocks, tightening corporate spreads, and falling rates. The US was the top performing convertible market, followed by Asia Ex-Japan and Europe. Japanese convertibles lagged due to the more defensive nature of the market but still posted positive returns. The convertible universe continued to expand with $40Bln of new paper coming to market. Issuance exceeded redemptions by $9.6Bln. Deals were well diversified across sectors on a global basis.
-2%
0%
2%
4%
6%
8%
10%
12%
1st Qtr 2019 2nd Qtr 2019 YTD Inception
Fund USD-terms 7.49% 3.62% 11.11% 6.14%
Benchmark 1.47% 1.50% 2.97% 6.20%
Excess return 6.02% 2.12% 8.14% -0.06%

SANLAM UNIVERSAL FUNDS PLC
82
SANLAM GLOBAL CONVERTIBLE SECURITIES FUND (CONTINUED) Fund Performance (continued) The Fund performed strongly in the first half of 2019 returning 11.11%. The Fund was structurally well positioned to take advantage of market conditions, with a highly convex profile that captured the majority of equity market advances and provided strong downside protection during the selloff in May. All regions contributed positively, with the Americas as the top performer followed by Europe, while portfolio holdings in Asia and Japan outperformed their respective markets. Technology was the top contributing sector, followed by Energy. Market movements provided abundant opportunities to improve the risk/return structure of the Fund. Technology convertibles that became too equity sensitive in April and June were exited. A swap was completed out of a Retail convertible that had lost most of its equity sensitivity into a more balanced security from the same issuer. Other notable sales included securities, particularly in Asia Ex-Japan, that became too bond-like after providing strong downside protection when markets were hit by trade concerns. Proceeds were primarily reinvested in positions with attractive profiles in similar regions and sectors that had become more balanced during the period. Fund Outlook 1H 2019 served to highlight the benefits of the convertible asset class and the Fund’s bottom-up focus on optimizing convertible structure. With an investment premium of 21.7% and a conversion premium 27.8% the Fund is well positioned to provide strong upside participation should equity markets continue to advance while offering meaningful downside protection should markets reverse. An uptick in equity market volatility would likely help cushion convertible performance by enhancing the value of the embedded option.
Investment Manager
Zazove Associates, LLC
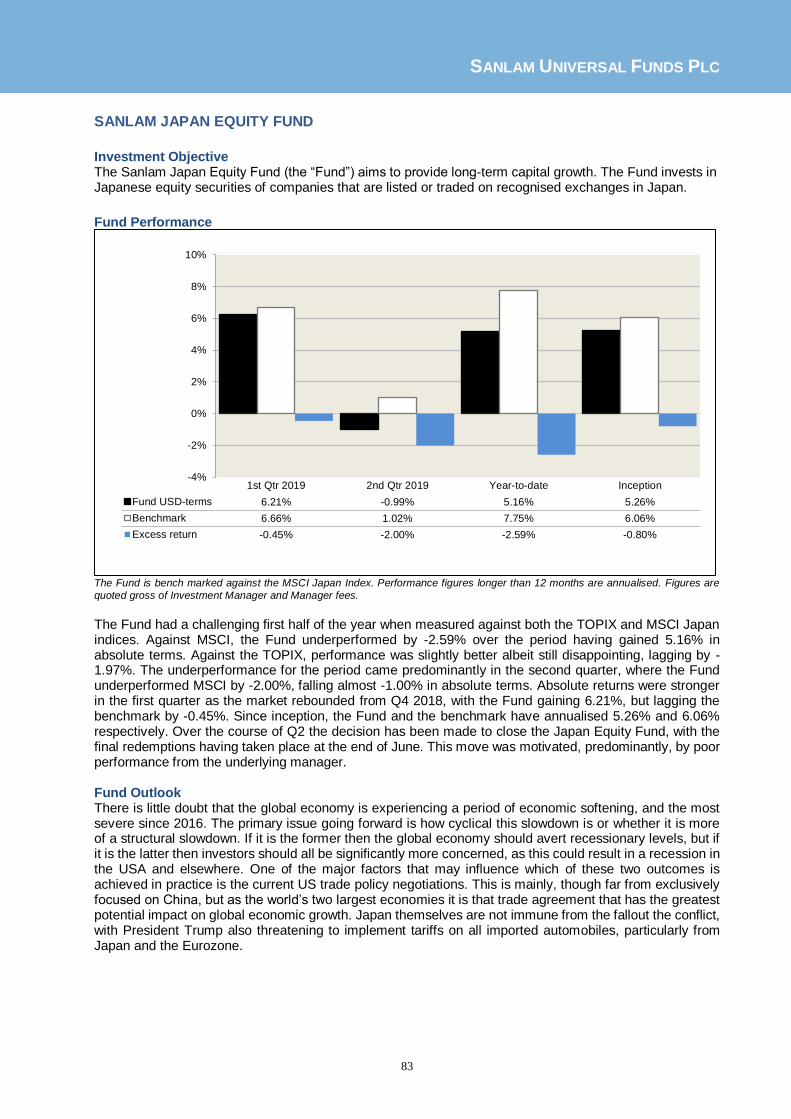
SANLAM UNIVERSAL FUNDS PLC
83
SANLAM JAPAN EQUITY FUND
Investment Objective The Sanlam Japan Equity Fund (the “Fund”) aims to provide long-term capital growth. The Fund invests in Japanese equity securities of companies that are listed or traded on recognised exchanges in Japan.
Fund Performance
The Fund is bench marked against the MSCI Japan Index. Performance figures longer than 12 months are annualised. Figures are
quoted gross of Investment Manager and Manager fees.
The Fund had a challenging first half of the year when measured against both the TOPIX and MSCI Japan indices. Against MSCI, the Fund underperformed by -2.59% over the period having gained 5.16% in absolute terms. Against the TOPIX, performance was slightly better albeit still disappointing, lagging by -1.97%. The underperformance for the period came predominantly in the second quarter, where the Fund underperformed MSCI by -2.00%, falling almost -1.00% in absolute terms. Absolute returns were stronger in the first quarter as the market rebounded from Q4 2018, with the Fund gaining 6.21%, but lagging the benchmark by -0.45%. Since inception, the Fund and the benchmark have annualised 5.26% and 6.06% respectively. Over the course of Q2 the decision has been made to close the Japan Equity Fund, with the final redemptions having taken place at the end of June. This move was motivated, predominantly, by poor performance from the underlying manager. Fund Outlook There is little doubt that the global economy is experiencing a period of economic softening, and the most severe since 2016. The primary issue going forward is how cyclical this slowdown is or whether it is more of a structural slowdown. If it is the former then the global economy should avert recessionary levels, but if it is the latter then investors should all be significantly more concerned, as this could result in a recession in the USA and elsewhere. One of the major factors that may influence which of these two outcomes is achieved in practice is the current US trade policy negotiations. This is mainly, though far from exclusively focused on China, but as the world’s two largest economies it is that trade agreement that has the greatest potential impact on global economic growth. Japan themselves are not immune from the fallout the conflict, with President Trump also threatening to implement tariffs on all imported automobiles, particularly from Japan and the Eurozone.
-4%
-2%
0%
2%
4%
6%
8%
10%
1st Qtr 2019 2nd Qtr 2019 Year-to-date Inception
Fund USD-terms 6.21% -0.99% 5.16% 5.26%
Benchmark 6.66% 1.02% 7.75% 6.06%
Excess return -0.45% -2.00% -2.59% -0.80%

SANLAM UNIVERSAL FUNDS PLC
84
SANLAM JAPAN EQUITY FUND (CONTINUED) Fund Outlook (continued) This threat adds to the trade war uncertainty, making it difficult to vendors to plan supply chains in the midst of the conflict. Global central bankers have shifted materially in their thinking from hawkish to dovish in the last twelve months, and their willingness to provide liquidity through easier monetary policy looks set to help markets in the second half of 2019. The questions that are really being asked now are what the extent of this easing will be by each central bank, and perhaps more importantly what the efficacy of monetary policy will be, from what are already low levels of interest rates by historical standards. Unlike the US Federal Reserve, Japan are not afforded the luxury of cutting interest rates given their already accommodative stance driven by struggles in achieving the inflation target in recent years. It is, therefore, anticipated that there is more likely to be some form of quantitative easing implemented to combat the apparent economic slowdown. In addition, the planned increase in national sales tax for later this year may need to be counteracted by an increase in government spending, so as to help maintain consumer spending. While the fundamental risks outlined above are likely to be the driver of the economic outlook, and then in turn the market outlook, one must remember that there are also other threats including the escalating international tension around Iran, which could have serious geopolitical consequences and potential economic spill-over impacts. In Europe, the uncertainty around Brexit remains and while the current deadline is earmarked for the end of October, there is no certainty that further extensions will not also be required. Lastly, 2020 sees a US presidential election - with the US political machine gathering pace, President Trump may find himself encouraged to reach an agreement with China, though only time will tell.
Investment Manager
Asset Management One Ltd

SANLAM UNIVERSAL FUNDS PLC
85
SANLAM CENTRE ACTIVE U.S. TREASURY FUND
Investment Objective The Sanlam Centre Active US Treasury Fund (the “Fund”) aims to maximize investors' total return through capital appreciation and current income.
Fund Performance
The Fund is bench marked against Bloomberg Barclays U.S. Treasury Total Return Unhedged USD. Note: Performance figures longer than 12 months are annualised. Figures are quoted net of fees.
For the 6 month period ended 30 June 2019, the Fund returned 0.78%, underperforming its benchmark by 4.40%. Performance attribution in the Fund portfolio reflects interest income combined with our active duration management decisions that impact capital gain or loss capture. Duration decisions are implemented using futures contracts on U.S. Treasury securities. These contracts are very liquid and allow us to maintain consistent cash flow from the core portfolio of U.S. Treasury notes and bonds. As there are no corporate or mortgage related securities in the portfolio, there are no “spread” components to performance. Active duration decisions are based on the near-term outlook for interest rates which is based, in turn, on a monthly review of economic conditions and current bond market valuation. Factors utilized in the assessment of the outlook make up our investment discipline, the Interest Rate Scorecard. At the start of 2019 the Scorecard targeted portfolio duration at the discipline’s zero lower bound in February and March, following a market neutral reading in January (a duration equal to that of the U.S. Treasury market). The generally cautious stance and change in duration to zero reflected the strong U.S. labour market which saw the unemployment rate decline to 3.8% and weekly claims for unemployment insurance decline to a level not seen since December 1969 when the labour force was significantly smaller. While investors’ inflation rate expectations remained well anchored, reported inflation in the preceding twelve months was roughly at the FOMC’s 2% target. Additionally, wage growth and the inflation measures calculated by the various Federal Reserve Banks, e.g. “sticky-price”, trimmed mean and the “underlying inflation gauge”, were also consistent with the 2% goal. Finally, the term premia on longer dated Treasuries were well below those demanded on average in the past by investors for taking on maturity risk. The low premia available likely reflected the current policy and political uncertainty both in the U.S. and elsewhere that generates a demand for the global safe haven investment.
-6%
-4%
-2%
0%
2%
4%
6%
1st Qtr 2019 2nd Qtr 2019 YTDAnnualized Since
Inception (1/11/2017)
Fund USD-terms 0.33% 0.45% 0.78% 2.13%
Benchmark 2.11% 3.01% 5.18% 3.18%
Excess return -1.78% -2.56% -4.40% -1.05%
SANLAM UNIVERSAL FUNDS PLC
86
SANLAM CENTRE ACTIVE U.S. TREASURY FUND (CONTINUED) Fund Performance (continued) During the second quarter of 2019 the Scorecard target portfolio duration remained at the discipline’s zero lower bound. The cautious stance reflected the ongoing strength of the labour market activity, both level and momentum, in the U.S. In the period, the unemployment rate declined to a 50-year low and weekly claims for unemployment insurance declined to levels not consistently seen for 50 years when the labour force was significantly smaller. Labour market strength provides the wherewithal to fuel consumer spending, the primary driver of GDP growth. While investors’ inflation rate expectations remained well anchored, the inflation data in June represented an acceleration in inflation as core CPI increased at a 3.6% annualized rate, the largest increase in 1 ½ years. Additionally, the wage growth tracker maintained by the Federal Reserve indicated wage growth at 3.9%. After adjustment for productivity, wage growth at this pace would indicate inflation at a pace faster than the FOMC’s 2% target. The short run Phillips curve may be alive and well after all. The “sticky-price” inflation measure maintained by the Atlanta Federal Reserve bank had inflation at a 3.7% annual rate. Benchmark performance in the period reflected investor fears of a trade shock induced downturn in economic growth that would require significant easing by the FOMC. And, while there may be some slowing relative to the well above trend growth in the first half of 2019, the actual data on growth and inflation do not support significant easing. Monetary policy rules maintained at both the Cleveland and Atlanta Federal Reserve Banks indicate that the current target for the federal fund’s rate may be too low. The term premia on longer dated Treasuries reached the lowest levels since 1961, the start of the data published by the New York Fed. Reversion to the mean from these levels would carry the 10-year rate 100 basis points higher and the Fund remains positioned to capitalize on this kind of scenario. Fund Outlook Over the long run, interest rate behaviour primarily reflects real economic growth, investors’ inflation expectations or concerns, monetary policy, and bond market valuations. The Fund portfolio manager’s view (or “we”) is that over the next few years, barring a recessionary shock, steady real growth in the U.S. economy, inflation overshooting the Fed’s 2% goal before moving back to the target rate and continued monetary policy normalization should push interest rates higher, perhaps significantly higher. As of now, the U.S. economy continues in what has become the longest expansion in recorded, by the NBER, U.S. business cycle history. As we have noted previously, research suggests that expansions do not “die of old age”; we are not “due” for a recession. Recessions are caused/exacerbated by policy mistakes that result in excessive debt relative to income or by some type of shock, perhaps from foreign sources. Regardless of the eventual outcomes for growth and inflation rates, there is nothing in this debate to suggest that the business cycle has been tamed out of existence or that it will not be exacerbated by monetary policy, either conventional or unconventional, as has been true in the past. In fact, some suggest that business cycles may occur more frequently and potentially be of greater downside magnitude if a lower real Federal funds rate, consistent with slower trend growth, limits the Fed’s ability to stimulate growth through conventional monetary policy.
Investment Manager Centre Asset Management, LLC

SANLAM UNIVERSAL FUNDS PLC
87
AUTUS GLOBAL EQUITY FUND
Investment Objective
The Autus Global Equity Fund (the “Fund”) aims to provide capital growth over the long-term.
Fund Performance
The Fund is benchmarked against the MSCI All Country World Index USD Net Return. Note: Performance figures longer than 12 months are annualised. Figures are quoted net of fees.
The Autus Investment Team customarily begins the year with a strategic investment workshop to consider the economic and investment factors likely to influence the markets in coming year. This year the mood was less sanguine because members identified several risks to keep an eye on in the coming months. Internationally, global growth began to slow. More interest rate cuts in the United States (US) are looking more likely this year as consumer spending weakens. Talks of a US recession are beginning to emerge. Interest rates in China were lowered to support flagging growth there. The lack of consensus in the UK on an acceptable Brexit and the concomitant uncertainty is harming new investment and the prospect of growth in the UK. These factors combined with the ongoing trade negotiations between China and the US have fuelled investor jitters. The US-China trade war reached a new apex when the US hit Chinese phone maker Huawei with a sales ban on many of its products. We expect more of this jostling to occur in the markets until these major issues are resolved. US corporate earnings growth appeared to be sustained in the first half of 2019, albeit at a lower rate than in 2018 due to the base effects of President Trump’s sweeping 2017 tax cuts. Theresa May resigned as prime minister of the United Kingdom as her attempts to make a deal with the European Union failed repeatedly. Geopolitical tensions rose as Iran threatened to violate parts of the nuclear deal following the withdrawal from the deal by the US. Major central banks signalled dovishness throughout the second quarter as US 10-year yields dropped to below 2%. A deliberate switch to lower-beta stocks as well as a slightly higher level of cash holdings was achieved during the quarter. Boeing was sold out of the portfolio as uncertainty surrounds the company following two fatal airplane crashes in less than five months. Health Insurance Innovations was also sold out as a result of a possible class action lawsuit against the company. General Motors, Netflix, and Encana was sold due to lower expected growth in the future, while Coca Cola was the only new share to be added during the quarter. Broadcom and Comcast were sold during the quarter on expectations of lower returns for the telecommunications industry. Similarly, wariness of certain parts of the healthcare industry has led to sell our positions in Celgene and Allergan. Enbridge, Cigna, and ConocoPhillips were bought as promising opportunities for the portfolio in the long term. Raytheon was added to the Fund again after a months-long hiatus as its valuation became attractive during the quarter.
-2%
0%
2%
4%
6%
8%
10%
12%
14%
16%
18%
20%
1st Qtr 2019 2nd Qtr 2019 YTD Inception (Ann)
Fund USD-terms 13.12% 5.66% 18.78% 11.67%
Benchmark 12.18% 3.61% 15.79% 9.72%
Excess return 0.94% 2.05% 2.99% 1.95%

SANLAM UNIVERSAL FUNDS PLC
88
AUTUS GLOBAL EQUITY FUND (CONTINUED) Fund Outlook The portfolio is expected to continue along its current line of positioning as valuations tighten and corporate profit growth trends lower. We expect earnings growth to continue at a slow but steady pace for the companies in the portfolio and will make use of the portfolio’s cash reserves to seize opportunities that may arise. Investment Manager Autus Fund Managers (Pty) Limited

SANLAM UNIVERSAL FUNDS PLC
89
WISIAN CAPITAL SOUTH AFRICAN EQUITY FUND
Investment Objective
The Wisian Capital South African Equity Fund (“the Fund”) aims to achieve long-term capital growth.
Fund Performance
The Fund is bench marked against MSCI Emerging Markets BM. Note: Performance figures longer than 12 months are annualised. Figures are quoted net of fees.
The Fund underperformed its benchmark year to date due to: 1) strengthening of the South African Rand which negatively impacted portfolio dollar hedges and 2) a strong rebound within Asian markets driven by a more dovish Fed together with the resumption of trade talks between China and the US. South African domestic stocks did not benefit from the resurgence in emerging markets due to policy uncertainty post the national elections and the emergence of credit downgrade risks related to the sovereign. While the macroeconomic movements have worked against our strategy, we are confident in the sustained high returns on capital and dividend growth offered by the companies we invest in. Furthermore, these now trade at superior valuation multiples well below their historical average. We are encouraged by the strong free cash flow yields offered by domestic South African stocks which are amongst the highest across all emerging markets. These will, no doubt, revert to the mean due to the concentrated industry structures and lack of competition in the markets in which they operate. We therefore have sustained our positioning in the belief that these fundamentals will be reflected in market prices
Fund Outlook
The factors driving our underperformance (currency and easing of the trade war) have reverted significantly in the third quarter of 2019. We anticipate more certainty in the coming months around policy in South Africa as the new President and his team work to address failing state-owned enterprises and widespread corruption. While the market already has priced in that the country will be downgraded by Moody’s to sub-investment grade, we believe that uncertainty is what is driving the reluctance by foreigners to invest in the South African market. Given attractive valuations, strong free cash flows and the quality of South African industrials and financials, we believe that policy certainty will ultimately enable price discovery and a reversion to the mean of valuations. Pessimism toward South African markets remains at elevated levels creating a unique opportunity to exploit undemanding valuations in a world where most major global markets are at peak valuations.
Investment Manager
First Avenue Investment Management (Pty) Ltd
-16%
-12%
-8%
-4%
0%
4%
8%
1st Qtr 2019 2nd Qtr 2019 YTD Inception
Fund USD-terms -3.43% 2.37% -1.06% -14.94%
Benchmark 9.56% -0.31% 9.25% -11.74%
Excess return -12.99% 2.68% -10.31% -3.20%
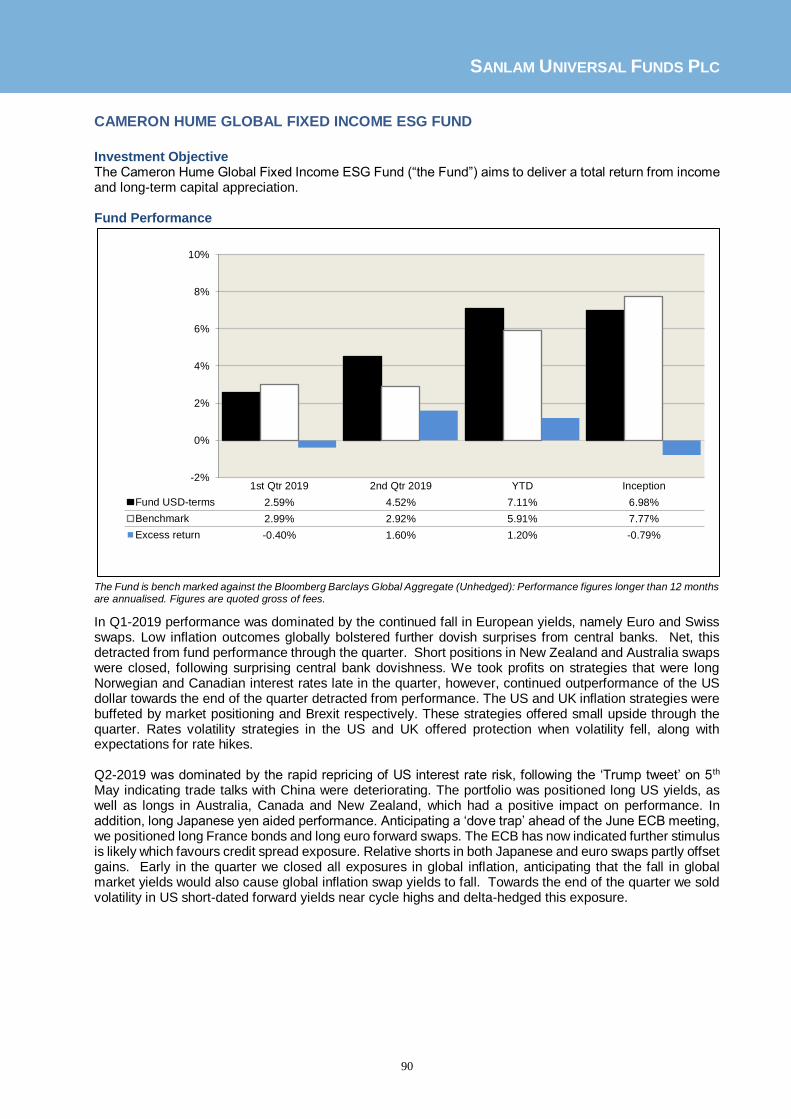
SANLAM UNIVERSAL FUNDS PLC
90
CAMERON HUME GLOBAL FIXED INCOME ESG FUND
Investment Objective
The Cameron Hume Global Fixed Income ESG Fund (“the Fund”) aims to deliver a total return from income and long-term capital appreciation. Fund Performance
The Fund is bench marked against the Bloomberg Barclays Global Aggregate (Unhedged): Performance figures longer than 12 months are annualised. Figures are quoted gross of fees.
In Q1-2019 performance was dominated by the continued fall in European yields, namely Euro and Swiss swaps. Low inflation outcomes globally bolstered further dovish surprises from central banks. Net, this detracted from fund performance through the quarter. Short positions in New Zealand and Australia swaps were closed, following surprising central bank dovishness. We took profits on strategies that were long Norwegian and Canadian interest rates late in the quarter, however, continued outperformance of the US dollar towards the end of the quarter detracted from performance. The US and UK inflation strategies were buffeted by market positioning and Brexit respectively. These strategies offered small upside through the quarter. Rates volatility strategies in the US and UK offered protection when volatility fell, along with expectations for rate hikes. Q2-2019 was dominated by the rapid repricing of US interest rate risk, following the ‘Trump tweet’ on 5th May indicating trade talks with China were deteriorating. The portfolio was positioned long US yields, as well as longs in Australia, Canada and New Zealand, which had a positive impact on performance. In addition, long Japanese yen aided performance. Anticipating a ‘dove trap’ ahead of the June ECB meeting, we positioned long France bonds and long euro forward swaps. The ECB has now indicated further stimulus is likely which favours credit spread exposure. Relative shorts in both Japanese and euro swaps partly offset gains. Early in the quarter we closed all exposures in global inflation, anticipating that the fall in global market yields would also cause global inflation swap yields to fall. Towards the end of the quarter we sold volatility in US short-dated forward yields near cycle highs and delta-hedged this exposure.
-2%
0%
2%
4%
6%
8%
10%
1st Qtr 2019 2nd Qtr 2019 YTD Inception
Fund USD-terms 2.59% 4.52% 7.11% 6.98%
Benchmark 2.99% 2.92% 5.91% 7.77%
Excess return -0.40% 1.60% 1.20% -0.79%

SANLAM UNIVERSAL FUNDS PLC
91
CAMERON HUME GLOBAL FIXED INCOME ESG FUND (CONTINUED) Fund Outlook In the near term we expect policy stimulus from the ECB and FOMC will keep yields low, given the disinflationary backdrop. Credit spreads should remain supported from extended forward guidance and monetary policy accommodation. The US dollar should remain supported by relatively robust domestic data. Emerging market yields can fall further on Fed policy accommodation and benign global inflation. Investment Manager Cameron Hume Limited
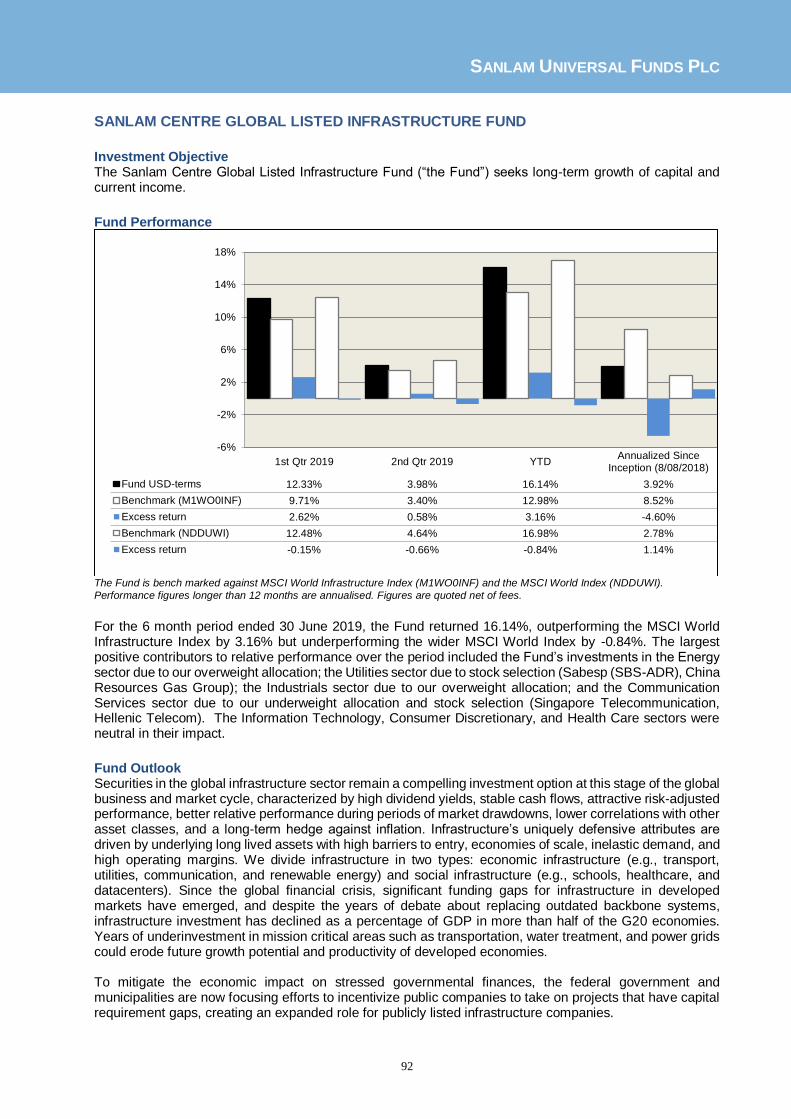
SANLAM UNIVERSAL FUNDS PLC
92
SANLAM CENTRE GLOBAL LISTED INFRASTRUCTURE FUND
Investment Objective
The Sanlam Centre Global Listed Infrastructure Fund (“the Fund”) seeks long-term growth of capital and current income.
Fund Performance
The Fund is bench marked against MSCI World Infrastructure Index (M1WO0INF) and the MSCI World Index (NDDUWI).
Performance figures longer than 12 months are annualised. Figures are quoted net of fees.
For the 6 month period ended 30 June 2019, the Fund returned 16.14%, outperforming the MSCI World Infrastructure Index by 3.16% but underperforming the wider MSCI World Index by -0.84%. The largest positive contributors to relative performance over the period included the Fund’s investments in the Energy sector due to our overweight allocation; the Utilities sector due to stock selection (Sabesp (SBS-ADR), China Resources Gas Group); the Industrials sector due to our overweight allocation; and the Communication Services sector due to our underweight allocation and stock selection (Singapore Telecommunication, Hellenic Telecom). The Information Technology, Consumer Discretionary, and Health Care sectors were neutral in their impact.
Fund Outlook Securities in the global infrastructure sector remain a compelling investment option at this stage of the global business and market cycle, characterized by high dividend yields, stable cash flows, attractive risk-adjusted performance, better relative performance during periods of market drawdowns, lower correlations with other asset classes, and a long-term hedge against inflation. Infrastructure’s uniquely defensive attributes are driven by underlying long lived assets with high barriers to entry, economies of scale, inelastic demand, and high operating margins. We divide infrastructure in two types: economic infrastructure (e.g., transport, utilities, communication, and renewable energy) and social infrastructure (e.g., schools, healthcare, and datacenters). Since the global financial crisis, significant funding gaps for infrastructure in developed markets have emerged, and despite the years of debate about replacing outdated backbone systems, infrastructure investment has declined as a percentage of GDP in more than half of the G20 economies. Years of underinvestment in mission critical areas such as transportation, water treatment, and power grids could erode future growth potential and productivity of developed economies. To mitigate the economic impact on stressed governmental finances, the federal government and municipalities are now focusing efforts to incentivize public companies to take on projects that have capital requirement gaps, creating an expanded role for publicly listed infrastructure companies.
-6%
-2%
2%
6%
10%
14%
18%
1st Qtr 2019 2nd Qtr 2019 YTDAnnualized Since
Inception (8/08/2018)
Fund USD-terms 12.33% 3.98% 16.14% 3.92%
Benchmark (M1WO0INF) 9.71% 3.40% 12.98% 8.52%
Excess return 2.62% 0.58% 3.16% -4.60%
Benchmark (NDDUWI) 12.48% 4.64% 16.98% 2.78%
Excess return -0.15% -0.66% -0.84% 1.14%

SANLAM UNIVERSAL FUNDS PLC
93
SANLAM CENTRE GLOBAL LISTED INFRASTRUCTURE FUND (CONTINUED) Fund Outlook (continued) We continue to believe that infrastructure forecasts of efficiency gains are underestimating the proliferation of technology use cases which are expected to reduce costs associated with maintaining infrastructure assets. Emerging areas to support global infrastructure projects that we believe aren’t priced into earnings estimates include predictive maintenance, IIoT (“Industrial Internet of Things”), and cybersecurity. The oil and gas industry has been one of the first sectors to deploy IIoT and predictive maintenance software leading to significant reduction in downtime and elimination of breakdowns. The oil and gas industry still faces serious challenges, including the costs of maintaining its aging infrastructure. On average, 42% of offshore equipment is more than 15 years old and has 13% downtime – the majority of which is unplanned. It is estimated that refiners in the U.S. alone lose around $6.6 billion a year due to unplanned downtimes. Data optimization and predictive maintenance can push rig performance beyond 95%, increase production by 2% to 5%, improve efficiency and thus, reduce costs by 10% – and perhaps most importantly, it can help prevent disasters like oil spills or wildfires. Chevron expects to outfit oil machinery with sensors for predictive maintenance by the end of 2019 in a wide-scale pilot program and aims to have sensors connected to much of the high-value equipment that could significantly disrupt oil and gas operations and create lost profit opportunities by 2024. IIoT’s impact may span many other major industries besides energy, including transportation, manufacturing, and healthcare. To conclude, we believe the Fund will perform well with exposure to undervalued U.S. and international stocks with strong balance sheets and free cash flows, solid dividend yields, and, in certain cases, cyclically depressed profits that are inflecting higher. Furthermore, the Fund is well positioned by targeting energy, telecom, industrials, and other undervalued areas of global infrastructure sector. With non-U.S. value stocks sitting at decade-low relative performance and valuation levels, there is a broad opportunity set that matches our targeted criteria to complement the Fund’s U.S. investments. Lastly, the Fund’s unique exposure to next-generation global infrastructure adjacencies, including public cloud deployments, data center monitoring, cybersecurity, and IIoT is a key differentiator against legacy managed infrastructure portfolios, which overlook these powerful trends within the industry.
Investment Manager
Centre Asset Management, LLC

SANLAM UNIVERSAL FUNDS PLC
94
SANLAM REAL ASSETS FUND
Investment Objective
The investment focus of the Sanlam Real Assets Fund (the “Fund”) is on listed securities that derive their value from underlying real assets. These exhibit distinct attractive characteristics that differentiate themselves from other asset classes. Our overriding mandate is real asset exposure and there are no restrictions on access vehicles. The Fund aims for regular income and capital growth through investments in real asset securities, with a target return of CPI+4% over a full investment cycle.
Fund Performance
Performance figures are based on fund inception as at 21st August 2018. Figures are quoted gross of fees.
The first half of the year proved to be a very strong period for the Fund, generating solid performance amidst an environment where fixed income and equity markets were increasingly signalling opposing viewpoints. During the sell-off in May the Fund again highlighted its defensive characteristics when markets got spooked by the re-emergence of US imposed trade tariffs and its possible effects on global growth. Despite this, the 6-month period saw positive contributions from infrastructure, renewables, property and other alternatives. Over the first half of the year, the holdings in the Fund raised over £2bn in fresh capital to expand portfolios and to capitalise on attractive opportunities. Over £1bn of this was raised in the renewables sector, which continued to garner attention in the media, in politics and the investment community. The vast majority of capital fundraising activity conducted by the portfolio constituents were oversubscribed, re-affirming the strong appetite for this asset class in the current environment.
The first half of the year produced positive returns in most asset classes, but not without a significant dose of volatility. The mixed messages from equity and bond markets are unlikely to make the second half any easier. In the UK, the new UK prime minister and government will set the tone for the withdrawal process from Europe later this year and sterling should continue to be volatile. The omission of key words from the FOMC press release and the news that the ECB is priming the QE pumps once again in the face of slowing global growth concerns has the market pricing in a more accommodative environment over the short term. Whether these steps are enough to prop up this aging rally or cause a rush for the exits remains to be seen.
-2%
0%
2%
4%
6%
8%
10%
12%
1st Qtr 2019 2nd Qtr 2019 Year-to-date Inception
Fund GBP-terms 7.20% 4.28% 11.79% 9.75%
Benchmark 0.39% 0.39% 0.79% 1.56%
Excess return 6.80% 3.89% 11.00% 8.19%

SANLAM UNIVERSAL FUNDS PLC
95
SANLAM REAL ASSETS FUND (CONTINUED)
Fund Outlook
Taking this environment into consideration, the Fund continues to hold and pursue investments that fit our theme of “pillars of a functioning economy” with long-term, stable and predictable cash generative assets with defensive characteristics. The Fund has a yield of 4.0% with a good degree of inflation linkage and a portfolio beta of 0.28.
Investment Manager
Sanlam Investments UK Limited

SANLAM UNIVERSAL FUNDS PLC
96
SATRIX GLOBAL FACTOR ENHANCED EQUITY FUND
Investment Objective
The Satrix Global Factor Enhanced Equity Fund (“the Fund”) aims to target capital growth over the long term in excess of the MSCI World Index (un-hedged) in U.S. dollars with net dividends reinvested (the “Benchmark”), over rolling thirty six-month periods. The Investment Manager shall manage a diversified Portfolio consisting primarily of equity securities by varying the proportions of securities held by the Portfolio on the basis of exposure to factors, with the aim to deliver returns in excess of the Benchmark. The factors the Investment Manager will consider are Value, Momentum, Small Size, Quality, and Low Volatility. Fund Performance
The Fund is bench marked against the MSCI World Index. Note: Performance figures longer than 12 months are annualised. Figures are quoted net of fees.
For the full 6 month period from 1 January to 30 June 2019, the MSCI World returned 16.98%, one of the strongest starts to the year since the late 1990s. The sharply rising market presented a headwind for factor-based strategies, as the market seemed to be driven more by headlines and emotion than long-term fundamentals. In general our factor categories struggled, with Momentum, Value, and Small Size delivering negative payoffs. Quality had the sole positive payoff during the first half of the year, however its contribution to excess return was drowned out by the drag from our exposure to less expensive stocks, which significantly underperformed their more expensive peers in 1H 2019. Fund Outlook
While the recent underperformance of factors is certainly uncomfortable, it is a reminder that all factor premiums are cyclical and portfolios should remain balanced across diversified factor premia. The long-term evidence and strong economic rationale for the factors we are targeting is compelling, and despite recent headwinds we continue to have confidence that the four categories we focus on will show positive excess returns over the long run. Our approach to multi-factor investing creates “pure” factors that are neutral to the impact of the other components in the model, which our research shows is the most efficient way to harvest long-term factor premia. This style of investing ensures that there is no overlap between factor characteristics and that our portfolio is not taking a concentrated bet on one particular anomaly or group of stocks.
-4%
0%
4%
8%
12%
16%
1st Qtr 2019 2nd Qtr 2019 YTD Inception
Fund USD-terms 11.95% 2.68% 14.95% 2.33%
Benchmark 12.48% 4.00% 16.98% 5.72%
Excess return -0.53% -1.32% -2.03% -3.39%

SANLAM UNIVERSAL FUNDS PLC
97
SATRIX GLOBAL FACTOR ENHANCED EQUITY FUND (CONTINUED) Fund Outlook (continued) Among the factors in our portfolio, expect that value and small size, both of which experienced underperformance over the past year, to revert towards their long-term averages of positive performance. While value continues to be a drag on performance, we still feel the factor category should provide positive returns over the long run. Oftentimes, the best time to have exposure to a factor or a strategy is when it has been beaten up and fallen out of favour with the investing public. As value is unpopular now and should remain relevant as a behavioural anomaly going forward, we continue to use it as a key component in the Satrix portfolio.
Investment Manager Wells Capital Management, Inc.

SANLAM UNIVERSAL FUNDS PLC
98
PERPETUA GLOBAL EQUITY UCITS FUND
Investment Objective
The Perpetua Global Equity UCITS Fund (“the Fund”) aims to target capital growth over the long term.
Fund Performance
The Fund is bench marked against MSCI All Country World Index. Note: Performance figures longer than 12 months are annualised. Figures are quoted net of fees.
For the five months ended 30 June 20192, the Fund returned 3.63%, compared to the MSCI ACWI, which returned 7.72%. The majority of the underperformance since inception came during the month of May as the Fund’s more cyclical stocks fell sharply on recession fears; the US-China trade war; geopolitics and other macroeconomic concerns. The top ten contributors to performance since inception were Apple, American Express, Universal Display, Franklin Resources, X5 Retail, AIA Group, AB InBev, Facebook, DIA and Dollar Tree, collectively adding 6.97% to the Fund’s return. The top ten detractors since inception were Michaels Co, Capri Holdings, Bed, Bath & Beyond, Pandora, Textainer, Limited Brands, Affiliated Managers Group, Ingredion, Bayer and Hastings, collectively detracting 3.77% from the Fund’s performance. Most of the Fund’s poorly performing shares tend to be more economically sensitive and have been impacted by negative investor sentiment and macroeconomic fears in the short-term. However, we consider these holdings to be deeply undervalued and expect their long-term business value to be realised over time.
Fund Outlook
The dominant driver of markets today is the growing disparity in valuation between companies that investors perceive to have long-term growth potential and high earnings certainty, irrespective of economic conditions, and those that tend to have exhibit earnings cyclicality. This has manifested itself in the significant outperformance, especially since 2017, of the MSCI World Growth Index (“Growth”) and MSCI World Quality Index (“Quality”) compared to the MSCI World Value Index (“Value”). The valuation spread between Growth and Quality relative to Value has only been greater than it is today, during the tech bubble. A good example to illustrate this is PayPal which trades on 39x earnings; Nestle SA on 26x earnings; and BMW AG on 8x earnings.
1 The Perpetua Global Equity UCITS Fund launched on 01 February 2019
-6%
-4%
-2%
0%
2%
4%
6%
8%
1st Qtr 2019 2nd Qtr 2019 YTD Inception
Fund USD-terms 4.49% -0.86% 3.63% 3.63%
Benchmark 4.11% 3.61% 7.72% 7.72%
Excess return 0.38% -4.47% -4.09% -4.09%

SANLAM UNIVERSAL FUNDS PLC
99
PERPETUA GLOBAL EQUITY UCITS FUND (CONTINUED) Fund Outlook (continued) Anecdotally, we see further evidence of this in the valuations of many new tech and biotech IPOs, reminiscent of the tech bubble. Most of these new IPOs are loss-making, yet trade on 15x-25x sales. A recent example is the IPO of Beyond Meat, a company that produces meat substitutes commonly known as “veggie-burgers”. From its IPO price of $25, the share has increased 10-fold to $250 giving it a market value of $14.1 billion, despite only having $87 million in sales and incurring losses in the region of $29 million. To put this into perspective, Beyond Meat has a higher market value today than Molson Coors ($12.2 billion), a global brewer with iconic brands that generates $10.7 billion is sales, $1.1 billion in net earnings and $1.4 billion in free cash flow annually. Another notable example is the IPO of Chewy Inc, an online retailer of pet products, that has returned 50% since going public at $22 on 14 June 2019. The company has a market value today of $13 billion; yet it has never posted a profit since founding in 2011; has reported net losses of $713m over the past three years alone; and is expected to lose another $300m over the next three years before posting a small profit in 2023. The similarities to Pets.com, a failed tech bubble IPO with the same business model, should not be surprising. At nearly 4x Price/Sales multiple, Chewy would need to grow sales by 25% per annum for 10 years and generate an online retail margin near the top-end of 2.5%, and then still would only be on 15.8x P/E today. Only a select few online retailers that have been able to achieve this, most notably Amazon. According to Professor Jay Ritter of the University of Florida, the percentage of loss-making IPOs today stands at 84%, higher than the peak of the tech bubble. A recent Economist article, entitled “The wave of unicorn IPOs reveals Silicon Valley’s groupthink”, highlights the growing anecdotal evidence of a crowded trade in growth shares. The article highlights 12 recent unicorn IPOs - Uber, Workday, Meituan Dianping, Tencent Music, Spotify, Pinduoduo, iQIYI, Lyft, Snap, Pinterest, Sea and Dropbox – that have been in business for at least 10 years which the market has richly-rewarded with high valuations. These 12 unicorns had a combined market value of over $350 billion, despite burning through a cumulative $47 billion over the past four years. They lost a combined $14 billion in 2018 alone from total sales of $44 billion. The success of companies such Facebook, Alphabet, Amazon, Tencent and Alibaba has created the impression that all new tech companies will follow in their footsteps. It’s a natural human tendency to extrapolate the recent past into the future, not unlike the gambler that only remembers his/her wins. While a few of these high-flying growth shares may live up to the expectations, history tells us that not all of them will. The examples highlighted above say more about the current psychology of the market than it does about the fundamentals of the companies: investors are disregarding current profitability and prizing future growth potential and earnings certainty. Our investment approach is rooted in two beliefs. Firstly, the price you pay for a company is a crucial determinant of the return you can expect to earn from the investment. Secondly, the best opportunities are often found in areas of the market that are out-of-favour or unpopular; where capital is fleeing or scarce. In line with this investment approach, we have taken advantage of market fears in cyclical sectors such as Global Autos (BMW and Continental); Asset Managers (Franklin Resources); Consumer Retail (Pandora, L Brands, Capri); Banks (Wells Fargo); Semiconductors (Samsung); Energy (Transocean, EnscoRowan); as well as special situations (Bayer) where the worst-case scenario is more than discounted at today’s low prices. We have balanced this cyclical positioning against exposure to high-quality businesses when the market has offered up attractive prices – below average valuations for above-average businesses - in sectors such as Tobacco & Beverages (PMI, BATS, AB InBev); Financials (American Express, Berkshire Hathaway); Technology (Apple, Facebook); Food and Staples Retail (Tesco, X5 Retail) and Health Care (Mediclinic, Gilead Sciences).

SANLAM UNIVERSAL FUNDS PLC
100
PERPETUA GLOBAL EQUITY UCITS FUND (CONTINUED) Fund Outlook (continued) The Fund has been notably out of step with the beat of the broad market indices as the large cap growth and defensive shares have re-rated while the cheap cyclicals have de-rated. In the short-term this has driven the Fund’s relative underperformance, but we believe will be rewarded over the longer-term investment horizon. Historically, value shares have tended to outperform when valuation dispersions become as wide as they are today. We can’t point to a specific catalyst or time frame for this dispersion to narrow but we do know from nearly 100 years of history that the value investing style has endured the Great Depression, the Tech Bubble and the Global Financial Crisis, and in the process outperformed the market and growth shares3. The Fund holds a number of shares trading on low P/E multiples and low earnings. If we are correct in our assessment of the long-term earnings potential for these companies, we believe the market will come to recognize their long-term business value and reappraise them accordingly.
Investment Manager Perpetua Investment Managers (Pty) Limited
3 Based on daily returns of the U.S. Fama/French HML (High Minus Low) Factor. Data from 01 July 1926 to 30 June 2019.
Source: http://mba.tuck.dartmouth.edu/pages/faculty/ken.french/Data_Library/f-f_factors.html

SANLAM UNIVERSAL FUNDS PLC
101
STATEMENT OF COMPREHENSIVE INCOME OF THE COMPANY for the six months ended 30 June 2019
Six months ended
30 June 2019 Six months ended
30 June 2018 USD USD
Investment income
Net gains/(losses) on financial assets and liabilities at fair value through profit or loss – held for trading 543,557,235 (112,230,002) Income from securities lending 355,840 181,444 Income from financial assets at fair value through profit or loss 97,732,919 91,262,902 Bank interest 1,168,887 595,554 Other income 520,925 486,228
Net investment income/(deficit) 638,335,806 (19,703,874)
Operating expenses Management and investment management fees (10,934,463) (10,376,243) Other operating expenses (1,741,634) (1,707,186) Custody fees (817,925) (782,141) Administration fees (976,528) (1,051,519) Performance fee - (373,476) Directors’ fees (32,858) (32,253)
Total operating expenses (14,503,408) (14,322,818)
Operating profit/(loss) 623,832,398 (34,026,692)
Finance costs Distribution to shareholders (9,322,133) (6,878,447) Interest expense (6,918) (94,619)
Profit/(loss) before tax 614,503,347 (40,999,758)
Withholding tax (10,475,249) (10,941,304)
Change in net assets attributable to holders of redeemable participating shares 604,028,098 (51,941,062)
The accompanying notes form an integral part of these unaudited condensed interim financial statements.

SANLAM UNIVERSAL FUNDS PLC
102
STATEMENTS OF COMPREHENSIVE INCOME OF THE FUNDS for the six months ended 30 June 2019
Bridge Global Property Income
Fund P-Solve Inflation
Plus Fund
Sanlam African Frontier Markets
Fund Denker Global Equity
Fund Sanlam Global
Bond Fund USD GBP USD USD USD Investment income Net gains/(losses) on financial assets and liabilities at fair value through profit or loss – held for trading 3,026,969 3,646,983 12,352,371 12,064,641 23,825,853 Income from securities lending - 1,032 155 4,308 25,835 Income from financial assets at fair value through profit or loss 613,471 105,754 2,884,679 2,369,418 7,420,591 Bank interest 2,560 1,363 5,964 23,719 94,078 Other income - 9,822 - - 39,996 Rebates received - - - - -
Net investment income/(deficit) 3,643,000 3,764,954 15,243,169 14,462,086 31,406,353 Operating expenses Management and investment management fees (194,488) (20,027) (133,870) (277,910) (178,071) Performance fee - - - - - Administration fees (10,013) (11,564) (18,619) (26,485) (85,685) Directors’ fees (230) 1,212 (507) (762) (3,063) Custody fees (2,601) (7,198) (93,906) (7,940) (41,880) Other operating expenses (21,206) (14,692) (53,376) (23,620) (138,089)
Total operating expenses (228,538) (52,269) (300,278) (336,717) (446,788)
Operating profit/(loss) 3,414,462 3,712,685 14,942,891 14,125,369 30,959,565 Finance costs
Distribution to shareholders - (314,599) - (2,144) -
Interest expense - - - - -
Profit/(loss) before tax 3,414,462 3,398,086 14,942,891 14,123,225 30,959,565
Withholding tax (49,772) - (268,429) (314,246) (13,560) Change in net assets attributable to
holders of redeemable participating shares 3,364,690 3,398,086 14,674,462 13,808,979 30,946,005

SANLAM UNIVERSAL FUNDS PLC
103
STATEMENTS OF COMPREHENSIVE INCOME OF THE FUNDS (CONTINUED) for the six months ended 30 June 2019
Denker Global Financial Fund
Sanlam Global Property Fund
Sanlam World Equity Fund
Satrix World Equity Tracker Fund
SIIP India Opportunities Fund
USD USD USD USD USD Investment income Net gains/(losses) on financial assets and liabilities at fair value through profit or loss – held for trading 15,897,673 14,546,605 7,698,542 156,566,311 1,724,950 Income from securities lending 25,600 18 7,369 144,850 - Income from financial assets fair value through profit or loss
3,265,217 2,529,112 770,564 17,120,006 54,399
Bank interest 13,424 19,545 10,404 68,642 674 Other income 2 31 2,854 158,448 - Rebates received - - - - -
Net investment income/(deficit) 19,201,916 17,095,311 8,489,733 174,058,257 1,780,023 Operating expenses Management and investment management fees (599,498) (267,155) (173,130) (1,341,351) (67,569) Performance fee - - - - - Administration fees (30,921) (24,662) (12,961) (186,297) (5,649) Directors’ fees (822) (829) (2,310) (5,052) (159) Custody fees (30,643) (31,074) (94,591) (40,099) (99,179) Other operating expenses (30,082) (19,517) (34,676) (99,733) (11,805)
Total operating expenses (691,966) (343,237) (317,668) (1,672,532) (184,361)
Operating profit/(loss) 18,509,950 16,752,074 8,172,065 172,385,725 1,595,662 Finance costs Distribution to shareholders (52,852) - - (26,566) -
Interest expense - - - - -
Profit/(loss) before tax 18,457,098 16,752,074 8,172,065 172,359,159 1,595,662
Withholding tax (502,623) (446,370) (132,039) (2,761,171) - Change in net assets attributable to
holders of redeemable participating shares 17,954,475 16,305,704 8,040,026 169,597,988 1,595,662

SANLAM UNIVERSAL FUNDS PLC
104
STATEMENTS OF COMPREHENSIVE INCOME OF THE FUNDS (CONTINUED)
for the six months ended 30 June 2019
Denker Global Dividend Fund
Sanlam Strategic Bond Fund
Sanlam Accel Income Fund
Satrix North America Equity Tracker Fund
Satrix UK Equity Tracker Fund
USD GBP GBP USD GBP Investment income Net gains/(losses) on financial assets and liabilities at fair value through profit or loss – held for trading 14,160,891 18,040,672 1,715,350 12,720,662 2,606,084 Income from securities lending 7,256 - - 16,941 970 Income from financial assets at fair value through profit or loss 3,600,616
8,565,561 540,085 845,625 721,108
Bank interest 37,747 5,696 1,513 4,711 1,064 Other income 84 14,203 90,083 1,188 1,683 Rebates received - - - - -
Net investment income/(deficit) 17,806,594 26,626,132 2,347,031 13,589,127 3,330,859 Operating expenses Management and investment management fees (448,799) (819,961) (132,979) (3,155) (3,769) Performance fee - - - - - Administration fees (24,983) (29,753) (8,454) (23,894) (7,140) Directors’ fees (795) (1,128) (232) (399) (335) Custody fees (6,940) (12,084) (2,992) 4,472 (3,734) Other operating expenses (19,804) (76,057) (9,689) (36,302) (9,360)
Total operating expenses (501,321) (938,983) (154,346) (59,278) (24,338) Operating profit/(loss) 17,305,273 25,687,149 2,192,685 13,529,849 3,306,521 Finance costs Distribution to shareholders (278,229) (4,801,954) (278,300) (7,277) (32,879) Interest expense - - - - -
Profit/(loss) before tax 17,027,044 20,885,195 1,914,385 13,522,572 3,273,642
Withholding tax (420,552) (17,261) - (215,810) (10,349) Change in net assets attributable to
holders of redeemable participating shares 16,606,492 20,867,934 1,914,385 13,306,762 3,263,293

SANLAM UNIVERSAL FUNDS PLC
105
STATEMENTS OF COMPREHENSIVE INCOME OF THE FUNDS (CONTINUED) for the six months ended 30 June 2019
1This sub-fund was renamed during the period ended 30 June 2019. The previous name of the Fund was Sanlam FOUR US Dividend Fund.
Satrix Europe (ex UK) Equity Tracker Fund
Satrix Emerging Market Equity Tracker Fund
Sanlam Managed Risk Fund
Sanlam Global High Quality Fund
Sanlam US Dividend Fund1
EUR USD USD GBP USD Investment income Net gains/(losses) on financial assets and liabilities at fair value through profit or loss – held for trading 22,311,498 3,854,411 5,696,583 46,801,900 38,437,630 Income from securities lending 21,445 946 - 7,529 50,514 Income from financial assets at fair value through profit or loss 4,404,376 677,191 -
4,043,575
5,044,700
Bank interest - 1,883 16,635 247,734 208,897 Other income 25,825 37,386 (1) - - Rebates received - - - - -
Net investment income/(deficit) 26,763,144 4,571,817 5,713,217 51,100,738 43,741,741 Operating expenses
Management and investment management fees (95,757) (88,204) (473,217) (1,366,497) (841,364) Performance fee - - - - -
Administration fees (29,294) (15,909) - (29,753) (70,034) Directors’ fees (1,741) (358) - (1,379) (1,695) Custody fees (32,500) (23,155) (10,739) (7,379) (21,219) Other operating expenses (21,177) (17,943) (389,022) (35,084) (42,709)
Total operating expenses (180,469) (145,569) (872,978) (1,440,092) (977,021) Operating profit/(loss) 26,582,675 4,426,248 4,840,239 49,660,646 42,764,720 Finance costs Distribution to shareholders (10,754) (175,548) - (138,018) (377,099) Interest expense (6,124) - - - -
Profit/(loss) before tax 26,565,797 4,250,700 4,840,239 49,522,628 42,387,621
Withholding tax (591,868) (83,200) 394 (629,558) (1,455,649) Change in net assets attributable to
holders of redeemable participating shares 25,973,929 4,167,500 4,840,633 48,893,070 40,931,972

SANLAM UNIVERSAL FUNDS PLC
106
STATEMENTS OF COMPREHENSIVE INCOME OF THE FUNDS (CONTINUED) for the six months ended 30 June 2019
1These sub-funds were renamed during the period ended 30 June 2019. The previous names of these Funds were Sanlam FOUR Global Equity Fund, Sanlam FOUR Stable Global Equity Fund, Sanlam FOUR Active UK Equity Fund and Sanlam FOUR Multi-Strategy Fund, respectively.
High Street Global Balanced Fund
Sanlam Global Value Fund1
Sanlam Stable Global Fund1
Sanlam Active UK Fund1
Sanlam Multi-Strategy Fund1
USD USD USD GBP GBP Investment income Net gains/(losses) on financial assets and liabilities at fair value through profit or loss – held for trading 1,721,007 16,724,100 9,370,864 2,406,281 7,498,006 Income from securities lending 65 4,855 3,129 11,285 364 Income from financial assets at fair value through profit or loss 295,121 2,344,616 1,342,820 849,260 4,047,867 Bank interest 27,429 29,381 19,034 495 19,644 Other income 94 72 67 15 54,976 Rebates received - - - - -
Net investment income/(deficit) 2,043,716 19,103,024 10,735,914 3,267,336 11,620,857
Operating expenses
Management and investment management fees (142,060) (121,327) (366,920) (7,280) (331,113) Performance fee - - - - -
Administration fees (9,838) (16,906) (10,739) (26,864) (31,777)
Directors’ fees (125) (1,222) (875) (276) (899)
Custody fees (2,096) (18,138) (7,825) (5,032) (9,453)
Other operating expenses (16,266) (24,381) (21,945) (11,729) (43,421)
Total operating expenses (170,385) (181,974) (408,304) (51,181) (416,663) Operating profit/(loss) 1,873,331 18,921,050 10,327,610 3,216,155 11,204,194 Finance costs
Distribution to shareholders - - (126) (8,860) (481,902) Interest expense - - - - -
Profit/(loss) before tax 1,873,331 18,921,050 10,327,484 3,207,295 10,722,292
Withholding tax (44,011) (334,605) (169,581) (11,438) (36,669) Change in net assets attributable to
holders of redeemable participating shares 1,829,320 18,586,445 10,157,903 3,195,857 10,685,623

SANLAM UNIVERSAL FUNDS PLC
107
STATEMENTS OF COMPREHENSIVE INCOME OF THE FUNDS (CONTINUED)
for the six months ended 30 June 2019
1At an EGM on 25 March 2019, shareholders of Bridge Global Equity Income Growth Fund approved the merger of the fund into Bridge Global Managed Growth Fund. The merger took effect from 23.59pm on
Friday 12 April 2019. 2 This sub-fund was renamed during the period ended 30 June 2019. The previous name of the Fund was Denker Global Emerging Markets Fund.
Anchor Global Stable Fund
Bridge Global Equity Income Growth Fund1
Anchor Global Equity Fund
Bridge Global Managed Growth
Fund1
Sanlam Global Emerging Markets
Fund2 USD USD USD USD USD Investment income Net gains/(losses) on financial assets and liabilities at fair value through profit or loss – held for trading 1,016,204 372,877 7,223,125 1,616,426 11,021,509 Income from securities lending 27 - 77 - 4,618 Income from financial assets at fair value through profit or loss
172,474 49,287 113,444 287,102 2,207,009
Bank interest 18,831 887 4,780 7,155 22,236 Other income 58 - - 52 25 Rebates received - - - - -
Net investment income/(deficit) 1,207,594 423,051 7,341,426 1,910,735 13,255,397
Operating expenses Management and investment management fees (88,075) (10,872) (211,351) (63,501) (391,199) Performance fee - - - - Administration fees (5,917) (1,357) (10,369) (4,546) (30,450) Directors’ fees (81) (16) (1,761) (73) (588) Custody fees (2,031) (645) (3,711) (1,482) (15,052) Other operating expenses (14,756) (6,901) (14,816) (13,675) (55,365)
Total operating expenses (110,860) (19,791) (242,008) (83,277) (492,654) Operating profit/(loss) 1,096,734 403,260 7,099,418 1,827,458 12,762,743 Finance costs
Distribution to shareholders - - - - (3,079)
Interest expense - - - - -
Profit/(loss) before tax 1,096,734 403,260 7,099,418 1,827,458 12,759,664
Withholding tax (6,089) (11,607) (29,370) (49,122) (469,846)
Change in net assets attributable to
holders of redeemable participating shares 1,090,645 391,653 7,070,048 1,778,336 12,289,818

SANLAM UNIVERSAL FUNDS PLC
108
STATEMENTS OF COMPREHENSIVE INCOME OF THE FUNDS (CONTINUED) for the six months ended 30 June 2019
ABSA Africa Equity Fund
Sanlam Centre American Select
Equity Fund
Sanlam Global Convertible
Securities Fund
Sanlam Japan Equity Fund
Sanlam Centre Active US Treasury
Fund USD USD USD USD USD Investment income Net gains/(losses) on financial assets and liabilities at fair value through profit or loss – held for trading 1,999,989 13,979,166 4,326,087 2,118,825 (63,748) Income from securities lending - 6,369 - 856 - Income from financial assets at fair value through profit or loss
961,507 1,480,666 362,427 508,266 123,822
Bank interest 8,799 21,149 4,755 361 2,868 Other income - - 44 - 2 Rebates received - - - - -
Net investment income/(deficit) 2,970,295 15,487,350 4,693,313 2,628,308 62,944 Operating expenses Management and investment management fees (27,612) - (126,943) - (369) Performance fee - - - - - Administration fees (7,003) (26,345) (8,134) (14,049) (3,788) Directors’ fees (237) (1,017) (194) 160 (81) Custody fees (44,989) (6,235) (1,814) (19,602) (863) Other operating expenses (29,142) (16,661) (13,300) (24,024) (8,845)
Total operating expenses (108,983) (50,258) (150,385) (57,515) (13,946) Operating profit/(loss) 2,861,312 15,437,092 4,542,928 2,570,793 48,998 Finance costs
Distribution to shareholders (403,002) - - - (114,237) Interest expense - - - - -
Profit/(loss) before tax 2,458,310 15,437,092 4,542,928 2,570,793 (65,239)
Withholding tax (142,737) (403,387) (5,414) (76,240) -
Change in net assets attributable to
holders of redeemable participating shares 2,315,573 15,033,705 4,537,514 2,494,553 (65,239)

SANLAM UNIVERSAL FUNDS PLC
109
STATEMENTS OF COMPREHENSIVE INCOME OF THE FUNDS (CONTINUED) for the six months ended 30 June 2019
Autus Global Equity Fund
Wisian Capital South African
Equity Fund
Cameron Hume Global Fixed Income
ESG Fund
Sanlam Centre Global Listed
Infrastructure Fund
Sanlam Real Assets Fund
USD USD USD USD GBP Investment income Net gains/(losses) on financial assets and liabilities at fair value through profit or loss – held for trading 2,698,887 (153,469) 5,785,211 675,835
10,175,134
Income from securities lending - - - - - Income from financial assets at fair value through profit or loss 109,560 147,666 1,315,093 108,185
2,262,858
Bank interest 15,285 26,504 42,439 1,118 18,252 Other income 94 - 9,225 4 - Rebates received - - - - -
Net investment income/(deficit) 2,823,826 20,701 7,151,968 785,142 12,456,244 Operating expenses
Management and investment management fees (82,995) (44,999) (75,184) (44) (294,732)
Performance fee - - - - -
Administration fees (3,495) (3,118) (20,876) (4,781) (5,575)
Directors’ fees (103) (25) (655) (74) (1,093)
Custody fees (1,895) (6,074) (45,822) (7,758) (21,235)
Other operating expenses (14,524) (17,771) (75,110) (32,882) (59,322)
Total operating expenses (103,012) (71,987) (217,647) (45,539) (381,957) Operating profit/(loss) 2,720,814 (51,286) 6,934,321 739,603 12,074,287 Finance costs Distribution to shareholders - - - (24,273) (10,454) Interest expense - - - - -
Profit/(loss) before tax 2,720,814 (51,286) 6,934,321 715,330 12,063,833
Withholding tax (26,575) (12,288) (2,075) (20,788) (125,564) Change in net assets attributable to
holders of redeemable participating shares 2,694,239 (63,574) 6,932,246 694,542 11,938,269

SANLAM UNIVERSAL FUNDS PLC
110
STATEMENTS OF COMPREHENSIVE INCOME OF THE FUNDS (CONTINUED) for the six months ended 30 June 2019
Satrix Global Factor Enhanced
Equity Fund
Perpetua Global Equity UCITS
Fund USD USD Investment income Net gains/(losses) on financial assets and liabilities at fair value through profit or loss – held for trading 7,227,454 446,832 Income from securities lending 437 - Income from financial assets at fair value through profit or loss 1,010,993 289,400 Bank interest 13,930 10,597 Other income 21,177 - Rebates received - -
Net investment income/(deficit) 8,273,991 746,829 Operating expenses Management and investment management fees (68,827) (67,324) Performance fee - - Administration fees (26,958) (3,542) Directors’ fees (1,499) (103) Custody fees (1,931) (4,387) Other operating expenses (33,485) (10,592)
Total operating expenses (132,700) (85,948) Operating profit/(loss) 8,141,291 660,881 Finance costs Distribution to shareholders - - Interest expense - -
Profit/(loss) before tax 8,141,291 660,881
Withholding tax (215,809) (49,645) Change in net assets attributable to
holders of redeemable participating shares 7,925,482 611,236

SANLAM UNIVERSAL FUNDS PLC
111
STATEMENTS OF COMPREHENSIVE INCOME OF THE FUNDS for for the six months ended 30 June 2018
Bridge Global Property Income
Fund P-Solve Inflation
Plus Fund
Sanlam African Frontier Markets
Fund Denker Global Equity
Fund Sanlam Global
Bond Fund USD GBP USD USD USD Investment income Net gains/(losses) on financial assets and liabilities at fair value through profit or loss – held for trading (997,034) (684,803) (8,140,361) (5,235,916) (17,267,817) Income from securities lending - 2,426 617 6,800 - Income from financial assets at fair value through profit or loss 860,402 143,027 2,642,893 2,481,376 7,162,622 Bank interest 280 3,021 14,867 5,952 51,015 Other income - - 41,822 - 245,802 Rebates received - 9,939 - - -
Net investment income/(deficit) (136,352) (526,390) (5,440,162) (2,741,788) (9,808,378) Operating expenses Management and investment management fees (227,296) (24,924) (313,961) (346,161) (196,826) Performance fee - - - - - Administration fees (14,292) (11,670) (20,996) (44,090) (18,293) Directors’ fees (230) (352) (508) (763) (3,063) Custody fees (2,602) (3,907) (93,906) (7,940) (41,879) Other operating expenses (15,940) (13,288) (19,073) (29,460) (58,813)
Total operating expenses (260,360) (54,141) (448,444) (428,414) (318,874)
Operating profit/(loss) (396,712) (580,531) (5,888,606) (3,170,202) (10,127,252) Finance costs
Distribution to shareholders - (329,861) - (1,090) -
Interest expense - - - - -
Profit/(loss) before tax (396,712) (910,392) (5,888,606) (3,171,292) (10,127,252)
Withholding tax (154,033) (11,438) (229,835) (449,692) (12,783) Change in net assets attributable to
holders of redeemable participating shares (550,745) (921,830) (6,118,441) (3,620,984) (10,140,035)

SANLAM UNIVERSAL FUNDS PLC
112
STATEMENTS OF COMPREHENSIVE INCOME OF THE FUNDS (CONTINUED) for the six months ended 30 June 2018
Sanlam Global Financial Fund
Sanlam Global Property Fund
Sanlam World Equity Fund
Satrix World Equity Tracker Fund
SIIP India Opportunities Fund
USD USD USD USD USD Investment income Net gains/(losses) on financial assets and liabilities at fair value through profit or loss – held for trading (11,663,965) (322,376) (2,042,601) (9,910,872) (1,924,342) Income from securities lending 4,905 860 22,517 37,655 - Income from financial assets fair value through profit or loss
3,138,382 2,795,840 4,035,794 13,820,341 119,640
Bank interest 14,967 6,506 28,961 22,316 2,116 Other income 26 21 - 76 - Rebates received - - - 76,978 -
Net investment income/(deficit) (8,505,685) 2,480,851 2,044,671 4,046,494 (1,802,586) Operating expenses Management and investment management fees (634,876) (240,558) (1,149,855) (1,200,308) (84,630) Performance fee - - - - - Administration fees (55,612) (25,928) (49,588) (73,968) (5,851) Directors’ fees (824) (829) (2,310) (5,052) (160) Custody fees (30,643) (31,075) (94,590) (40,098) (99,177) Other operating expenses (27,260) (20,457) (87,482) (81,948) (95,067)
Total operating expenses (749,215) (318,847) (1,383,825) (1,401,374) (284,885)
Operating profit/(loss) (9,254,900) 2,162,004 660,846 2,645,120 (2,087,471) Finance costs Distribution to shareholders (76,845) - - (15,497) -
Interest expense - - - - -
Profit/(loss) before tax (9,331,745) 2,162,004 660,846 2,629,623 (2,087,471)
Withholding tax (259,009) (453,208) (717,413) (2,505,339) - Change in net assets attributable to
holders of redeemable participating shares (9,590,754) 1,708,796 (56,567) 124,284 (2,087,471)
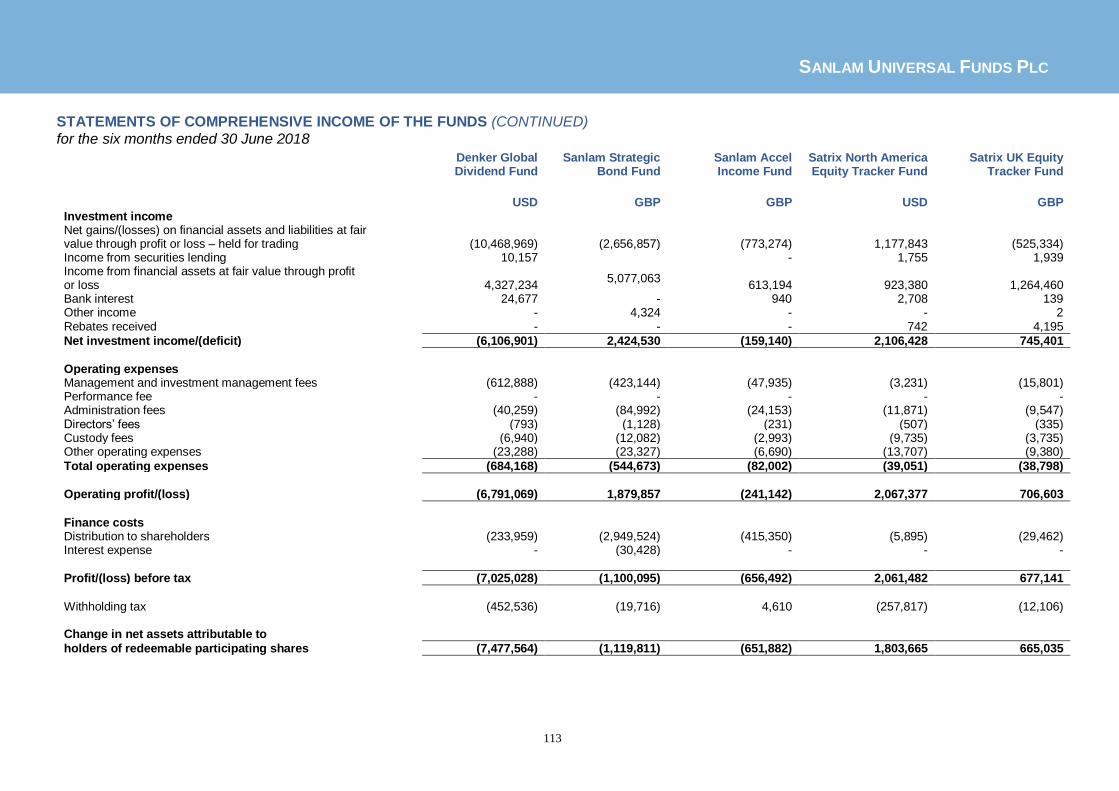
SANLAM UNIVERSAL FUNDS PLC
113
STATEMENTS OF COMPREHENSIVE INCOME OF THE FUNDS (CONTINUED)
for the six months ended 30 June 2018
Denker Global Dividend Fund
Sanlam Strategic Bond Fund
Sanlam Accel Income Fund
Satrix North America Equity Tracker Fund
Satrix UK Equity Tracker Fund
USD GBP GBP USD GBP Investment income Net gains/(losses) on financial assets and liabilities at fair value through profit or loss – held for trading (10,468,969) (2,656,857) (773,274) 1,177,843 (525,334) Income from securities lending 10,157 - 1,755 1,939 Income from financial assets at fair value through profit or loss 4,327,234
5,077,063 613,194 923,380 1,264,460
Bank interest 24,677 - 940 2,708 139 Other income - 4,324 - - 2 Rebates received - - - 742 4,195
Net investment income/(deficit) (6,106,901) 2,424,530 (159,140) 2,106,428 745,401 Operating expenses Management and investment management fees (612,888) (423,144) (47,935) (3,231) (15,801) Performance fee - - - - - Administration fees (40,259) (84,992) (24,153) (11,871) (9,547) Directors’ fees (793) (1,128) (231) (507) (335) Custody fees (6,940) (12,082) (2,993) (9,735) (3,735) Other operating expenses (23,288) (23,327) (6,690) (13,707) (9,380)
Total operating expenses (684,168) (544,673) (82,002) (39,051) (38,798) Operating profit/(loss) (6,791,069) 1,879,857 (241,142) 2,067,377 706,603 Finance costs Distribution to shareholders (233,959) (2,949,524) (415,350) (5,895) (29,462) Interest expense - (30,428) - - -
Profit/(loss) before tax (7,025,028) (1,100,095) (656,492) 2,061,482 677,141
Withholding tax (452,536) (19,716) 4,610 (257,817) (12,106) Change in net assets attributable to
holders of redeemable participating shares (7,477,564) (1,119,811) (651,882) 1,803,665 665,035

SANLAM UNIVERSAL FUNDS PLC
114
STATEMENTS OF COMPREHENSIVE INCOME OF THE FUNDS (CONTINUED for the six months ended 30 June 2018
1This sub-fund was renamed during the period ended 30 June 2019. The previous name of the Funds was Sanlam FOUR US Dividend Fund.
Satrix Europe (ex UK) Equity Tracker Fund
Satrix Emerging Market Equity Tracker Fund
Sanlam Managed Risk Fund
Sanlam Global High Quality Fund
Sanlam US Dividend Fund1
EUR USD USD GBP USD Investment income Net gains/(losses) on financial assets and liabilities at fair value through profit or loss – held for trading (8,722,814) (4,043,056) 1,097,835 3,710,386 (1,060,810) Income from securities lending 47,886 2,637 - 7,279 - Income from financial assets at fair value through profit or loss 6,871,367 728,315
- 2,242,185 4,645,999
Bank interest - 2,118 16,732 76,900 131,469 Other income 66 - 16,404 66 - Rebates received 16,868 37,059 - - -
Net investment income/(deficit) (1,786,627) (3,272,927) 1,130,971 6,036,816 3,716,658 Operating expenses
Management and investment management fees (132,331) (122,543) (247,920) (996,490) (536,643) Performance fee - - - - -
Administration fees (17,410) (37,978) - (99,327) (58,552) Directors’ fees (1,742) (358) - (1,380) (1,713) Custody fees (32,501) (23,156) (10,738) (7,380) (18,806) Other operating expenses (27,286) (32,795) (260,431) (28,709) (33,355)
Total operating expenses (211,270) (216,830) (519,089) (1,133,286) (649,069) Operating profit/(loss) (1,997,897) (3,489,757) 611,882 4,903,530 3,067,589 Finance costs Distribution to shareholders (14,988) (213,645) - (133,021) (346,211) Interest expense (4,152) - - - -
Profit/(loss) before tax (2,017,037) (3,703,402) 611,882 4,770,509 2,721,378
Withholding tax (1,060,929) (89,520) - (394,422) (1,275,163) Change in net assets attributable to
holders of redeemable participating shares (3,077,966) (3,792,922) 611,882 4,376,087 1,446,215

SANLAM UNIVERSAL FUNDS PLC
115
STATEMENTS OF COMPREHENSIVE INCOME OF THE FUNDS (CONTINUED) for the six months ended 30 June 2018
1These sub-funds were renamed during the period ended 30 June 2019. The previous names of these Funds were Sanlam FOUR Global Equity Fund, Sanlam FOUR Stable Global Equity Fund, Sanlam FOUR
Active UK Equity Fund and Sanlam FOUR Multi-Strategy Fund, respectively.
High Street Global Balanced Fund
Sanlam Global Value Fund1
Sanlam Stable Global Fund1
Sanlam Active UK Fund1
Sanlam Multi-Strategy Fund1
USD USD USD GBP GBP Investment income Net gains/(losses) on financial assets and liabilities at fair value through profit or loss – held for trading (187,726) (193,379) (562,581) (1,079,467) (2,400,502) Income from securities lending 47 - - - - Income from financial assets at fair value through profit or loss 270,719 3,291,024 2,662,093 1,000,598 4,375,219 Bank interest 3,820 33,016 24,883 1,143 6,842 Other income 3 8,241 6,882 25 - Rebates received - - - - -
Net investment income/(deficit) 86,863 3,138,902 2,131,277 (77,701) 1,981,559
Operating expenses
Management and investment management fees (113,766) (160,781) (241,428) (75,926) (200,677) Performance fee - - - - -
Administration fees (10,638) (34,542) (28,575) (16,871) (33,758)
Directors’ fees (125) (1,393) (1,190) (376) (911)
Custody fees (2,095) (18,594) (8,346) (5,576) (7,866)
Other operating expenses (14,577) (217,615) (26,893) 1,191 (22,455)
Total operating expenses (141,201) (432,925) (306,432) (97,558) (265,667) Operating profit/(loss) (54,338) 2,705,977 1,824,845 (175,259) 1,715,892 Finance costs
Distribution to shareholders - - (172) (5,917) (140,305) Interest expense - - - - -
Profit/(loss) before tax (54,338) 2,705,977 1,824,673 (181,176) 1,575,587
Withholding tax (35,741) (447,712) (437,765) (19,709) (21,214) Change in net assets attributable to
holders of redeemable participating shares (90,079) 2,258,265 1,386,908 (200,885) 1,554,373

SANLAM UNIVERSAL FUNDS PLC
116
STATEMENTS OF COMPREHENSIVE INCOME OF THE FUNDS (CONTINUED)
for the six months ended 30 June 2018
1At an EGM on 25 March 2019, shareholders of Bridge Global Equity Income Growth Fund approved the merger of the fund into Bridge Global Managed Growth Fund. The merger took effect from 23.59pm on
Friday 12 April 2019. 2 This sub-fund was renamed during the period ended 30 June 2019. The previous name of the Fund was Denker Global Emerging Markets Fund.
Anchor Global Stable Fund
Bridge Global Equity Income Growth Fund1
Anchor Global Equity Fund
Bridge Global Managed Growth
Fund1
Sanlam Global Emerging Markets
Fund2
USD USD USD USD USD Investment income Net gains/(losses) on financial assets and liabilities at fair value through profit or loss – held for trading (98,069) (280,189) 2,073,611 (497,388) (26,294,246) Income from securities lending 25 - 2,546 - 2,625 Income from financial assets at fair value through profit or loss
146,287 97,785 129,983 212,181 1,866,485
Bank interest 8,949 357 - 402 22,734 Other income 13 1 - 2 21 Rebates received - - - - -
Net investment income/(deficit) 57,205 (182,046) 2,206,140 (284,803) (24,402,381) Operating expenses Management and investment management fees (90,110) (19,736) (200,870) (44,376) (548,837) Performance fee - - (41,044) - (180,490) Administration fees (8,220) (2,440) (17,478) (3,896) (30,080) Directors’ fees (83) (29) (205) (60) (588) Custody fees (2,030) (1,157) (2,483) (1,482) (15,051) Other operating expenses (14,027) (12,330) (17,346) (12,948) (279,757)
Total operating expenses (114,470) (35,692) (279,426) (62,762) (1,054,803) Operating profit/(loss) (57,265) (217,738) 1,926,714 (347,565) (25,457,184) Finance costs
Distribution to shareholders - - - - - Interest expense - - (47,236) - -
Profit/(loss) before tax (57,265) (217,738) 1,879,478 (347,565) (25,457,184)
Withholding tax (7,576) (17,910) 38,298 (41,145) (250,231)
Change in net assets attributable to
holders of redeemable participating shares (64,841) (235,648) 1,917,776 (388,710) (25,707,415)

SANLAM UNIVERSAL FUNDS PLC
117
STATEMENTS OF COMPREHENSIVE INCOME OF THE FUNDS (CONTINUED) for the six months ended 30 June 2018
ABSA Africa Equity Fund
Sanlam Centre American Select
Equity Fund
Sanlam Global Convertible
Securities Fund
Sanlam Japan Equity Fund
Sanlam Centre Active US Treasury
Fund USD USD USD USD USD Investment income Net gains/(losses) on financial assets and liabilities at fair value through profit or loss – held for trading 1,418,591 9,339,337 178,343 (4,010,247) (169,067) Income from securities lending - - - - - Income from financial assets at fair value through profit or loss 863,417 1,129,240 371,000 793,102 274,465 Bank interest 6,382 12,442 5,759 1,180 6,549 Other income 11,247 - - 18 - Rebates received - - - - -
Net investment income/(deficit) 2,299,637 10,481,019 555,102 (3,215,947) 111,947 Operating expenses Management and investment management fees (141,873) (73) (156,847) - (4,496) Performance fee - - - - - Administration fees (7,374) (17,149) (7,902) (1,637) (5,206) Directors’ fees (237) (1,018) (194) (496) (81) Custody fees (44,990) (6,235) (1,813) (14,606) (864) Other operating expenses (30,588) (23,214) (13,505) (13,846) (9,956)
Total operating expenses (225,062) (47,689) (180,261) (30,585) (20,603) Operating profit/(loss) 2,074,575 10,433,330 374,841 (3,246,532) 91,344 Finance costs
Distribution to shareholders - - - - (266,296) Interest expense - - - - -
Profit/(loss) before tax 2,074,575 10,433,330 374,841 (3,246,532) (174,952)
Withholding tax (159,291) (336,642) (10,533) (118,965) -
Change in net assets attributable to
holders of redeemable participating shares 1,915,284 10,096,688 364,308 (3,365,497) (174,952)

SANLAM UNIVERSAL FUNDS PLC
118
STATEMENTS OF COMPREHENSIVE INCOME OF THE FUNDS (CONTINUED) for the six months ended 30 June 2018
Autus Global Equity Fund
Wisian Capital South African
Equity Fund
Sanlam Equity Allocation Fund
Sanlam FOUR Enhanced Income
Fund USD USD USD GBP Investment income Net gains/(losses) on financial assets and liabilities at fair value through profit or loss – held for trading 579,942 (374,115) (5,988,809) 57,506 Income from securities lending - - 14,392 - Income from financial assets at fair value through profit or loss 115,243 48,893 2,641,153 94,304 Bank interest 6,714 14,627 - 529 Other income - - 277 - Rebates received - - - (3,917)
Net investment income/(deficit) 701,899 (310,595) (3,332,987) 148,422 Operating expenses Management and investment management fees (95,967) (25,687) - - Performance fee (113,711) (38,231) - - Administration fees (3,843) (525) (1,399) (5,044) Directors’ fees (102) - (714) (31) Custody fees (1,895) - (44,969) (3,707) Other operating expenses (18,477) (297) (14,417) (10,330)
Total operating expenses (233,995) (64,740) (61,499) (19,112) Operating profit/(loss) 467,904 (375,335) (3,394,486) 129,310 Finance costs Distribution to shareholders - - - (143,439) Interest expense - - (533) -
Profit/(loss) before tax 467,904 (375,335) (3,395,019) (14,129)
Withholding tax (26,281) (4,968) (293,507) (441) Change in net assets attributable to
holders of redeemable participating shares 441,623 (380,303) (3,688,526) (14,570)

SANLAM UNIVERSAL FUNDS PLC
119
STATEMENT OF FINANCIAL POSITION OF THE COMPANY as at 30 June 2019
30 June 2019 31 December 2018
USD USD
Assets
Cash and cash equivalents 214,891,569 182,875,413
Margin accounts 21,581,847 11,005,380
Accrued income 22,684,056 19,849,126
Amounts receivable on sale of securities 146,383,831 22,105,985
Amounts receivable on issue of shares 38,146,884 22,355,246
Other debtors 1,642,482 908,116
Financial assets at fair value through profit or loss
- Transferable securities 5,510,574,602 4,662,605,862
- Collective investment schemes 97,364,879 72,087,443
- Derivative financial assets 13,361,688 29,172,176
Total assets 6,066,631,838 5,022,964,747
Liabilities
Bank overdraft (7,435,017) (6,486,330)
Financial liabilities at fair value through profit or loss
- Derivative financial liabilities (14,986,920) (27,381,606)
Accrued expenses (6,059,256) (6,270,217)
Administration fees accrued (1,220,066) (628,609)
Amounts payable on purchases of securities (138,417,400) (33,170,109)
Amounts payable on repurchases of shares (32,656,710) (13,456,801)
Liabilities (excluding net assets attributable to
holders of redeemable participating shares) (200,775,369) (87,393,672)
Net assets attributable to holder of redeemable
participating shares 5,865,856,469 4,935,571,075
The unaudited condensed interim financial statements were approved by the Board of Directors on 29 August 2019. The accompanying notes form an integral part of these unaudited condensed interim financial statements.

SANLAM UNIVERSAL FUNDS PLC
120
STATEMENTS OF FINANCIAL POSITION OF THE FUNDS as at 30 June 2019
Bridge Global Property Income
Fund
P-Solve Inflation Plus Fund
Sanlam African Frontier Markets
Fund
Denker Global Equity Fund
Sanlam Global Bond Fund
USD GBP USD USD USD Assets Cash and cash equivalents 458,593 - 4,941,273 4,104,976 21,703,156 Margin accounts - - - - 3,520,000 Accrued income 99,986 - 280,247 327,555 4,426,647 Amounts receivable on sale of securities 790,806 - - - 12,453,490 Amounts receivable on issue of shares - - 22,965 - 614,530 Other debtors 427 - 1,301 1,720 9,209 Financial assets at fair value through profit or loss
- Transferable securities 21,685,738 - 118,749,129 96,056,390 567,575,445 - Collective investment schemes - - - - - - FDI assets - - 526,606 - 7,347,626
Total assets 23,035,450 - 124,521,521 100,490,641 617,650,103
Liabilities Bank overdraft - - - - - Margin accounts - - - - (1,474,270) Financial liabilities at fair value through profit or loss
- FDI liabilities - - - - (7,961,577) Accrued expenses (155,719) - (72,569) (142,748) (222,368) Administration fees accrued (3,536) - (1,360) (18,172) (60,093) Amounts payable on purchases of securities - - - - (12,655,579) Amounts payable on repurchases of shares (412,088) - (104) (85,580) (48,747)
Liabilities (excluding net assets attributable to
holders of redeemable participating shares) (571,343) - (74,033) (246,500) (22,422,634)
Net assets attributable to holder of redeemable
participating shares 22,464,107 - 124,447,488 100,244,141 595,227,469

SANLAM UNIVERSAL FUNDS PLC
121
STATEMENTS OF FINANCIAL POSITION OF THE FUNDS (CONTINUED) as at 30 June 2019
Denker Global Financial Fund
Sanlam Global Property Fund
Sanlam World Equity Fund
Satrix World Equity Tracker Fund
SIIP India Opportunities Fund
USD USD USD USD USD Assets Cash and cash equivalents 2,715,751 1,214,623 4,110,062 8,997,185 92,532 Margin accounts - - - - - Accrued income 843,788 574,375 81,754 1,527,994 29,120 Amounts receivable on sale of securities 2,968,344 252,595 - - - Amounts receivable on issue of shares 634 - 1,345,100 2,545,017 - Other debtors 9,723 12,853 46,278 113,675 25,014
Financial assets at fair value through profit or loss
- Transferable securities 125,245,972 144,675,750 84,995,944 1,364,719,631 18,396,309
- Collective investment schemes - - - - -
- FDI assets - 71,227 510 45,058 -
Total assets 131,784,212 146,801,423 90,579,648 1,377,948,560 18,542,975
Liabilities Bank overdraft - - - - - Margin accounts - - - - - Financial liabilities at fair value through profit or loss
- FDI liabilities - (52,105) - - - Accrued expenses (291,612) (168,372) (332,610) (517,022) (289,532) Administration fees accrued (12,838) (18,218) (18,189) (139,118) (1,611) Amounts payable on purchases of securities (2,211,267) (376,258) - (2,147,882) - Amounts payable on repurchases of shares (164,514) (7,369) (48,308) (823,242) -
Liabilities (excluding net assets attributable to
holders of redeemable participating shares) (2,680,231) (622,322) (399,107) (3,627,264) (291,143)
Net assets attributable to holder of redeemable
participating shares 129,103,981 146,179,101 90,180,541 1,374,321,296 18,251,832

SANLAM UNIVERSAL FUNDS PLC
122
STATEMENTS OF FINANCIAL POSITION OF THE FUNDS (CONTINUED) as at 30 June 2019
Denker Global Dividend Fund
Sanlam Strategic Bond Fund
Sanlam Accel Income Fund
Satrix North America Equity Tracker Fund
Satrix UK Equity Tracker Fund
USD GBP GBP USD GBP Assets Cash and cash equivalents 2,420,568 - 786,671 42,961 104,402 Margin accounts - 704,441 - - -
Accrued income 237,042 5,238,614 91,067 3,916 66,377
Amounts receivable on sale of securities - 66,272,650 - - -
Amounts receivable on issue of shares - 20,694,310 123,869 - -
Other debtors 740 173,393 124,122 2,010 12,817
Financial assets at fair value through profit or loss
- Transferable securities 80,418,369 389,995,849 - 5,362,769 7,823,644
- Collective investment schemes - - 26,599,913 - -
- FDI assets - 246,384 - - -
Total assets 83,076,719 483,325,641 27,725,642 5,411,656 8,007,240
Liabilities Bank overdraft - (4,621,329) - - - Margin accounts - - - - - Financial liabilities at fair value through profit or loss
- FDI liabilities - (734,665) - - - Accrued expenses (154,292) (278,013) (185,646) (57,013) (24,668) Administration fees accrued (13,780) - (61) (16,227) - Amounts payable on purchases of securities - (75,294,990) - - - Amounts payable on repurchases of shares (92,799) (9,290,480) (175,143) (1,031) (168)
Liabilities (excluding net assets attributable to
holders of redeemable participating shares) (260,871) (90,219,477) (360,850) (74,271) (24,836)
Net assets attributable to holder of redeemable
participating shares 82,815,848 393,106,164 27,364,792 5,337,385 7,982,404

SANLAM UNIVERSAL FUNDS PLC
123
STATEMENTS OF FINANCIAL POSITION OF THE FUNDS (CONTINUED) as at 30 June 2019
Satrix Europe (ex-UK) Equity Tracker Fund
Satrix Emerging Markets Equity
Tracker Fund
Sanlam Managed Risk Fund
Sanlam Global High Quality Fund
Sanlam US Dividend Fund1
EUR USD USD GBP USD Assets
Cash and cash equivalents 1,005,867 298,315 - 44,255,322 24,357,876
Margin accounts - - 7,339,376 - -
Accrued income 32,383 191,956 - 277,923 546,968
Amounts receivable on sale of securities 280,338 - 28,225 97 9,203,212
Amounts receivable on issue of shares 321,819 111,440 804,790 3,645,267 275,868
Other debtors 19,401 45,594 392,659 54,955 161,526
Financial assets at fair value through profit or loss
- Transferable securities 85,835,388 49,750,241 - 323,199,911 387,826,543
- Collective investment schemes - - 82,943,259 23,193,265 -
- FDI assets 15,249 1,844 262,461 292 159,992
Total assets 87,510,445 50,399,390 91,770,770 394,627,032 422,531,985
Liabilities
Bank overdraft - - (78,949) - -
Margin accounts - - - - -
Financial liabilities at fair value through profit or loss
- FDI liabilities - - (711,054) (39,176) (4,426)
Accrued expenses (79,416) (88,418) (196,838) (594,636) (26,138)
Administration fees accrued (19,924) - - - (430,349)
Amounts payable on purchases of securities (803,583) - (122,541) - (5,908,869)
Amounts payable on repurchases of shares (790) (11,365) (110,240) (483,038) (229,928)
Liabilities (excluding net assets attributable to
holders of redeemable participating shares) (903,713) (99,783) (1,219,622) (1,116,850) (6,599,710)
Net assets attributable to holder of redeemable
participating shares 86,606,732 50,299,607 90,551,148 393,510,182 415,932,275
1This sub-fund was renamed during the period ended 30 June 2019. The previous name of the Funds was Sanlam FOUR US Dividend Fund.

SANLAM UNIVERSAL FUNDS PLC
124
STATEMENTS OF FINANCIAL POSITION OF THE FUNDS (CONTINUED) as at 30 June 2019
High Street Global
Balanced Fund Sanlam Global
Value Fund1
Sanlam Stable Global Fund1
Sanlam Active UK Fund1
Sanlam Multi-Strategy Fund1
USD USD USD GBP GBP Assets
Cash and cash equivalents 5,548,301 861,457 2,365,603 233,039 17,396,709
Margin accounts 1,017,085 - - - 3,952,339
Accrued income 17,197 333,533 345,481 128,182 2,637,590
Amounts receivable on sale of securities (780) 3,728,450 16,556,777 294,205 (471)
Amounts receivable on issue of shares 32,648 - 2,530 - 198,568
Other debtors 6,731 32,712 10,663 808 17,304
Financial assets at fair value through profit or loss
- Transferable securities 21,045,691 122,662,521 73,309,126 44,505,007 179,580,196
- Collective investment schemes - - - - 30,054,576
- FDI assets 311,685 2,230 - - 1,174,820
Total assets 27,978,558 127,620,903 92,590,180 45,161,241 235,011,631
Liabilities
Bank overdraft - - - - -
Margin accounts - - - - - Financial liabilities at fair value through profit or loss
- FDI liabilities (34,233) - - - (264,361)
Accrued expenses (108,900) (26,201) (118,558) (4,045) (89,555)
Administration fees accrued (3,843) (130,078) (66,705) (41,257) (61,669)
Amounts payable on purchases of securities - (1,834,602) - (69,168) (139,780)
Amounts payable on repurchases of shares (21,104) (1,592) (16,729,761) - (121,628)
Liabilities (excluding net assets attributable to
holders of redeemable participating shares) (168,080) (1,992,473) (16,915,024) (114,470) (676,993)
Net assets attributable to holder of redeemable
participating shares 27,810,478 125,628,430 75,675,156 45,046,771 234,334,638
1These sub-funds were renamed during the period ended 30 June 2019. The previous names of these Funds were Sanlam FOUR Global Equity Fund, Sanlam FOUR Stable Global Equity Fund, Sanlam FOUR Active UK Equity Fund and Sanlam FOUR Multi-Strategy Fund, respectively.
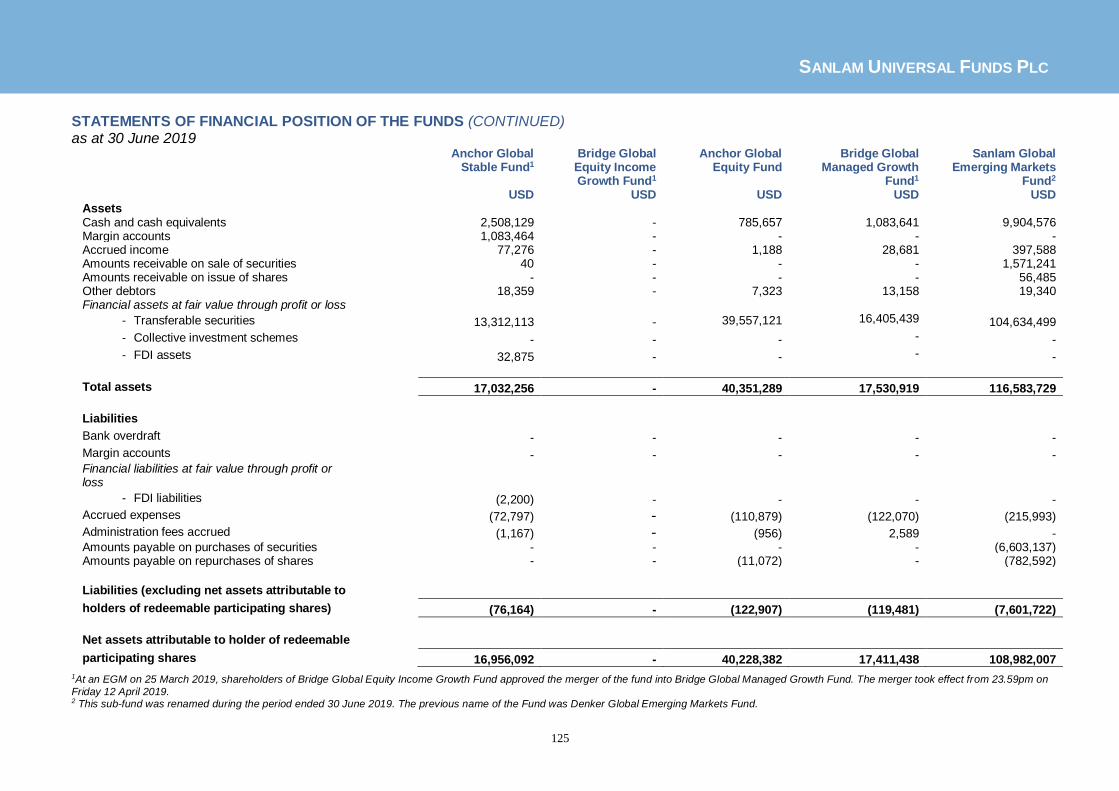
SANLAM UNIVERSAL FUNDS PLC
125
STATEMENTS OF FINANCIAL POSITION OF THE FUNDS (CONTINUED) as at 30 June 2019
Anchor Global Stable Fund1
Bridge Global Equity Income Growth Fund1
Anchor Global Equity Fund
Bridge Global Managed Growth
Fund1
Sanlam Global Emerging Markets
Fund2
USD USD USD USD USD Assets Cash and cash equivalents 2,508,129 - 785,657 1,083,641 9,904,576 Margin accounts 1,083,464 - - - - Accrued income 77,276 - 1,188 28,681 397,588 Amounts receivable on sale of securities 40 - - - 1,571,241 Amounts receivable on issue of shares - - - - 56,485 Other debtors 18,359 - 7,323 13,158 19,340 Financial assets at fair value through profit or loss
- Transferable securities 13,312,113 - 39,557,121 16,405,439 104,634,499
- Collective investment schemes - - - - -
- FDI assets 32,875 - - - -
Total assets 17,032,256 - 40,351,289 17,530,919 116,583,729
Liabilities
Bank overdraft - - - - -
Margin accounts - - - - - Financial liabilities at fair value through profit or loss
- FDI liabilities (2,200) - - - -
Accrued expenses (72,797) - (110,879) (122,070) (215,993)
Administration fees accrued (1,167) - (956) 2,589 - Amounts payable on purchases of securities - - - - (6,603,137) Amounts payable on repurchases of shares - - (11,072) - (782,592)
Liabilities (excluding net assets attributable to
holders of redeemable participating shares) (76,164) - (122,907) (119,481) (7,601,722)
Net assets attributable to holder of redeemable
participating shares 16,956,092 - 40,228,382 17,411,438 108,982,007
1At an EGM on 25 March 2019, shareholders of Bridge Global Equity Income Growth Fund approved the merger of the fund into Bridge Global Managed Growth Fund. The merger took effect from 23.59pm on
Friday 12 April 2019. 2 This sub-fund was renamed during the period ended 30 June 2019. The previous name of the Fund was Denker Global Emerging Markets Fund.

SANLAM UNIVERSAL FUNDS PLC
126
STATEMENTS OF FINANCIAL POSITION OF THE FUNDS (CONTINUED) as at 30 June 2019
ABSA Africa Equity Fund
Sanlam Centre American Select
Equity Fund
Sanlam Global Convertible
Securities Fund
Sanlam Japan Equity Fund
Sanlam Centre Active US Treasury
Fund USD USD USD USD USD
Assets
Cash and cash equivalents 1,626,509 1,272,110 1,064,543 3,137,476 195,372
Margin accounts - 667,506 - - 310,092
Accrued income 145 185,953 174,482 (503) 78,673
Amounts receivable on sale of securities 1,452,331 6,235,025 535,513 253,667 -
Amounts receivable on issue of shares - - - - -
Other debtors 13,076 21,387 14,502 (389) 11,706
Financial assets at fair value through profit or loss
- Transferable securities 29,052,589 295,405,059 43,476,494 - 4,911,796
- Collective investment schemes - - - - -
- FDI assets - 814,351 - - -
Total assets 32,144,650 304,601,391 45,265,534 3,390,251 5,507,639
Liabilities
Bank overdraft - - - - -
Margin accounts - - - - - Financial liabilities at fair value through profit or loss
- FDI liabilities - - (92,163) - (32,864)
Accrued expenses (89,361) (32,092) (79,448) (37,404) (28,136)
Administration fees accrued (5,950) (34,411) (7,999) (10,226) 1,855 Amounts payable on purchases of securities (485,491) - (649,907) - -
Amounts payable on repurchases of shares - - - - (1)
Liabilities (excluding net assets attributable to
holders of redeemable participating shares) (580,802) (66,503) (829,517) (47,630) (59,146)
Net assets attributable to holder of redeemable
participating shares 31,563,848 304,534,888 44,436,017 3,342,621 5,448,493
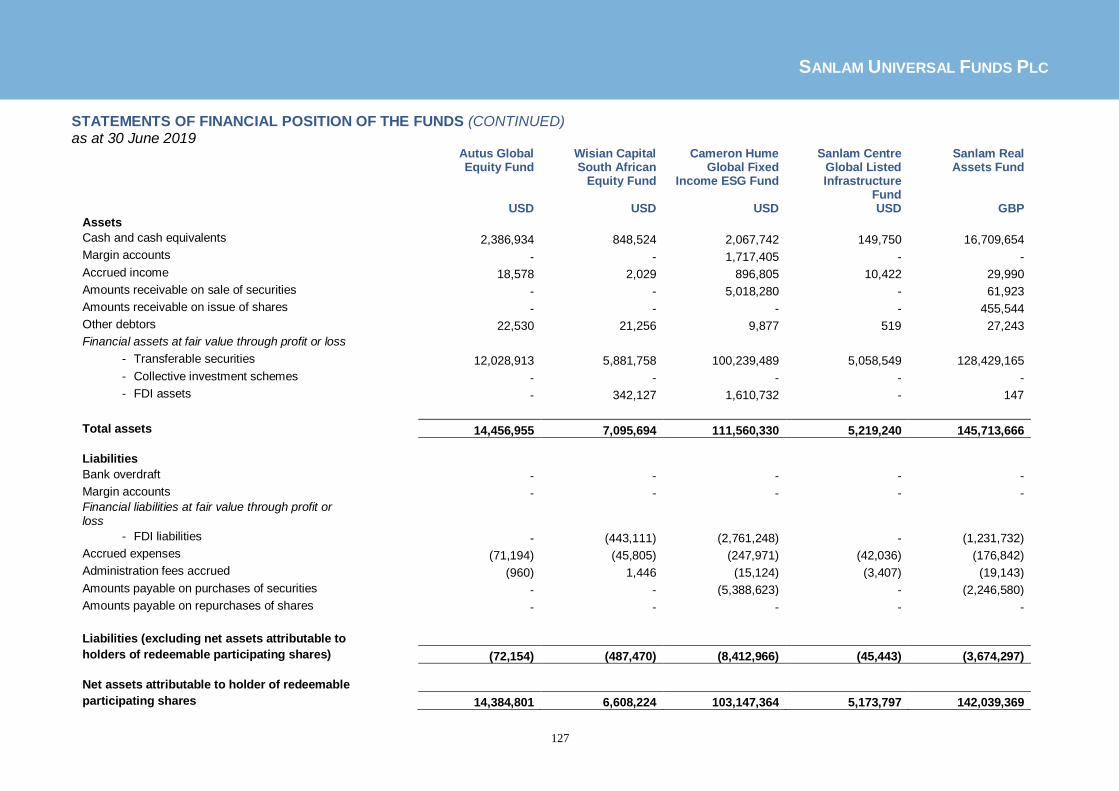
SANLAM UNIVERSAL FUNDS PLC
127
STATEMENTS OF FINANCIAL POSITION OF THE FUNDS (CONTINUED) as at 30 June 2019
Autus Global Equity Fund
Wisian Capital South African
Equity Fund
Cameron Hume Global Fixed
Income ESG Fund
Sanlam Centre Global Listed Infrastructure
Fund
Sanlam Real Assets Fund
USD USD USD USD GBP Assets
Cash and cash equivalents 2,386,934 848,524 2,067,742 149,750 16,709,654
Margin accounts - - 1,717,405 - -
Accrued income 18,578 2,029 896,805 10,422 29,990
Amounts receivable on sale of securities - - 5,018,280 - 61,923
Amounts receivable on issue of shares - - - - 455,544
Other debtors 22,530 21,256 9,877 519 27,243
Financial assets at fair value through profit or loss
- Transferable securities 12,028,913 5,881,758 100,239,489 5,058,549 128,429,165
- Collective investment schemes - - - - -
- FDI assets - 342,127 1,610,732 - 147
Total assets 14,456,955 7,095,694 111,560,330 5,219,240 145,713,666
Liabilities
Bank overdraft - - - - -
Margin accounts - - - - - Financial liabilities at fair value through profit or loss
- FDI liabilities - (443,111) (2,761,248) - (1,231,732)
Accrued expenses (71,194) (45,805) (247,971) (42,036) (176,842)
Administration fees accrued (960) 1,446 (15,124) (3,407) (19,143)
Amounts payable on purchases of securities - - (5,388,623) - (2,246,580)
Amounts payable on repurchases of shares - - - - -
Liabilities (excluding net assets attributable to
holders of redeemable participating shares) (72,154) (487,470) (8,412,966) (45,443) (3,674,297)
Net assets attributable to holder of redeemable
participating shares 14,384,801 6,608,224 103,147,364 5,173,797 142,039,369
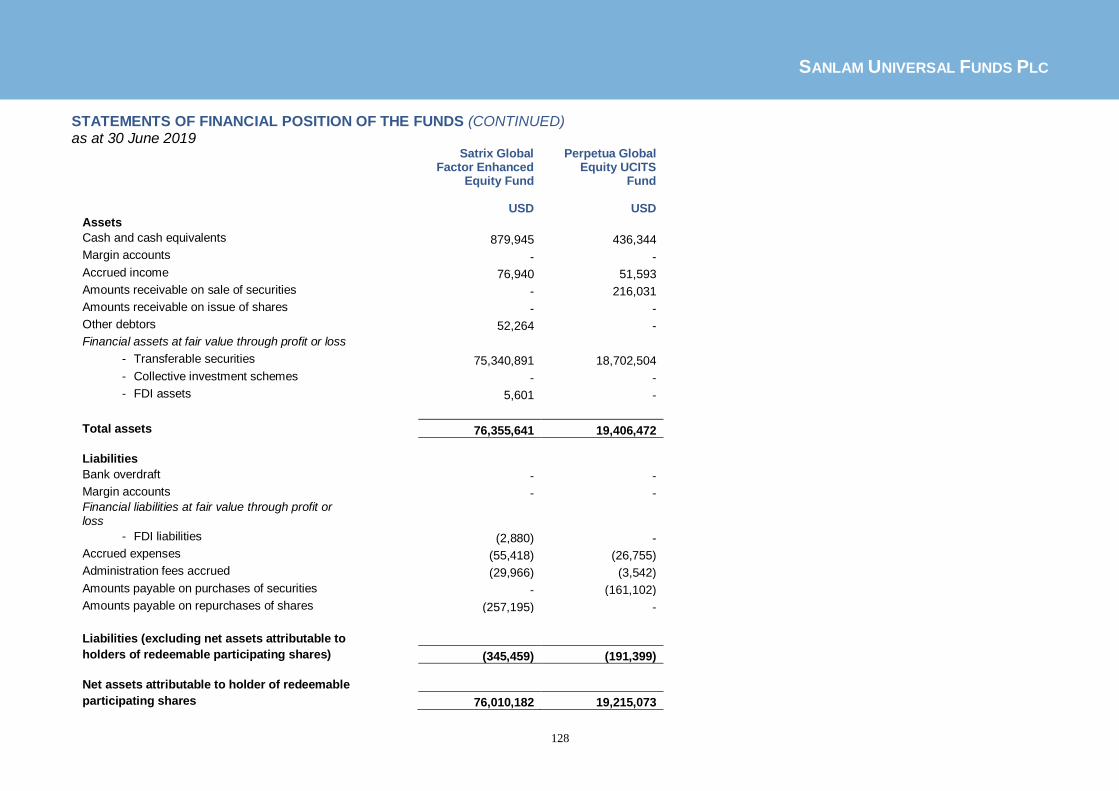
SANLAM UNIVERSAL FUNDS PLC
128
STATEMENTS OF FINANCIAL POSITION OF THE FUNDS (CONTINUED) as at 30 June 2019
Satrix Global Factor Enhanced
Equity Fund
Perpetua Global Equity UCITS
Fund
USD USD Assets
Cash and cash equivalents 879,945 436,344
Margin accounts - -
Accrued income 76,940 51,593
Amounts receivable on sale of securities - 216,031
Amounts receivable on issue of shares - -
Other debtors 52,264 -
Financial assets at fair value through profit or loss
- Transferable securities 75,340,891 18,702,504
- Collective investment schemes - -
- FDI assets 5,601 -
Total assets 76,355,641 19,406,472
Liabilities
Bank overdraft - -
Margin accounts - - Financial liabilities at fair value through profit or loss
- FDI liabilities (2,880) -
Accrued expenses (55,418) (26,755)
Administration fees accrued (29,966) (3,542)
Amounts payable on purchases of securities - (161,102)
Amounts payable on repurchases of shares (257,195) -
Liabilities (excluding net assets attributable to
holders of redeemable participating shares) (345,459) (191,399)
Net assets attributable to holder of redeemable
participating shares 76,010,182 19,215,073

SANLAM UNIVERSAL FUNDS PLC
129
STATEMENTS OF FINANCIAL POSITION OF THE FUNDS as at 31 December 2018
Bridge Global Property Income
Fund
P-Solve Inflation Plus Fund
Sanlam African Frontier Markets
Fund
Denker Global Equity Fund
Sanlam Global Bond Fund
USD GBP USD USD USD Assets Cash and cash equivalents 564,991 655,614 4,968,290 657,367 7,468,323 Margin accounts - - - - 3,903,986 Accrued income 136,265 64,979 107,176 172,152 4,804,774 Amounts receivable on sale of securities - - - - 573,757 Amounts receivable on issue of shares - - - - - Other debtors 427 241 - - - Financial assets at fair value through profit or loss
- Transferable securities 26,935,649 22,607,953 108,070,324 89,046,084 521,818,277 - Collective investment schemes - 25,478,194 - - - - FDI assets - - - - 11,800,046
Total assets 27,637,332 48,806,981 113,145,790 89,875,603 550,369,163
Liabilities Bank overdraft - - - - (1,530,000) Margin accounts - - - - - Financial liabilities at fair value through profit or loss
- FDI liabilities - - - - (13,081,671) Accrued expenses (104,340) (29,170) (140,939) (141,196) (548,463) Administration fees accrued (5,781) (8,094) (5,127) (17,812) (37,085) Amounts payable on purchases of securities - (9,007) - - - Amounts payable on repurchases of shares - - (500,000) (48) - Liabilities (excluding net assets attributable to
holders of redeemable participating shares) (110,121) (46,271) (646,066) (159,056) (15,197,219) Net assets attributable to holder of redeemable
participating shares 27,527,211 48,760,710 112,499,724 89,716,547 535,171,944

SANLAM UNIVERSAL FUNDS PLC
130
STATEMENTS OF FINANCIAL POSITION OF THE FUNDS (CONTINUED as at 31 December 2018
Denker Global Dividend Fund
Sanlam Global Property Fund
Sanlam World Equity Fund
Satrix World Equity Tracker Fund
SIIP India Opportunities Fund
USD USD USD USD USD Assets Cash and cash equivalents 2,080,230 723,927 786,725 9,026,333 691,343 Margin accounts - - - - - Accrued income 49,891 373,263 57,461 1,012,644 8,376 Amounts receivable on sale of securities - - 61,411 792,675 - Amounts receivable on issue of shares - - - 2,293,178 - Other debtors - - - 36,378 -
Financial assets at fair value through profit or loss
- Transferable securities 116,478,904 107,980,382 40,796,294 903,864,485 18,583,682
- Collective investment schemes - - 1,883,181 - -
- FDI assets - 57,408 506 20,413 -
Total assets 118,609,025 109,134,980 43,585,578 917,046,106 19,283,401
Liabilities Bank overdraft - - - - - Financial liabilities at fair value through profit or loss
- FDI liabilities - (90,165) - (13) - Accrued expenses (272,585) (127,111) (293,107) (419,207) (193,025) Administration fees accrued (21,204) (16,198) (26,241) (65,364) (3,580) Amounts payable on purchases of securities (347,939) (41,824) (813) - (654,903) Amounts payable on repurchases of shares (1,623) (1,035) - (247,529) -
Liabilities (excluding net assets attributable to
holders of redeemable participating shares) (643,351) (276,333) (320,161) (732,113) (851,508)
Net assets attributable to holder of redeemable
participating shares 117,965,674 108,858,647 43,265,417 916,313,993 18,431,893

SANLAM UNIVERSAL FUNDS PLC
131
STATEMENTS OF FINANCIAL POSITION OF THE FUNDS (CONTINUED)as at 31 December 2018
Denker Global Dividend Fund
Sanlam Strategic Bond Fund
Sanlam Accel Income Fund
Satrix North America Equity Tracker Fund
Satrix UK Equity Tracker Fund
USD GBP GBP USD GBP Assets Cash and cash equivalents 4,702,161 2,645,189 1,075,918 276,343 3,749,542 Margin accounts - 285,653 - - -
Accrued income 440,509 4,553,627 103,890 88,276 153,736
Amounts receivable on sale of securities - 1,567,800 - 114,416 -
Amounts receivable on issue of shares - 13,323,021 691 184,101 1,354
Other debtors - 10,688 - 1,178 30,493
Financial assets at fair value through profit or loss
- Transferable securities 132,238,387 342,362,920 - 91,208,456 37,005,475
- Collective investment schemes - - 28,172,114 - -
- FDI assets 9 4,555,001 - - -
Total assets 137,381,066 369,303,899 29,352,613 91,872,770 40,940,600
Liabilities Bank overdraft - - - - - Margin accounts - - - - - Financial liabilities at fair value through profit or loss
- FDI liabilities - (4,479,204) - - (2,452) Accrued expenses (233,713) (216,901) (58,584) (46,656) (31,158) Administration fees accrued (23,541) - (5,391) (7,705) (3,767) Amounts payable on purchases of securities - (14,670,383) - - - Amounts payable on repurchases of shares (2,812) (581,283) (85,617) (1,683) (2,811,238)
Liabilities (excluding net assets attributable to
holders of redeemable participating shares) (260,066) (19,947,771) (149,592) (56,044) (2,848,615)
Net assets attributable to holder of redeemable
participating shares 137,121,000 349,356,128 29,203,021 91,816,726 38,091,985

SANLAM UNIVERSAL FUNDS PLC
132
STATEMENTS OF FINANCIAL POSITION OF THE FUNDS (CONTINUED) as at 31 December 2018
Satrix Europe (ex-UK) Equity Tracker Fund
Satrix Emerging Markets Equity
Tracker Fund
Sanlam Managed Risk Fund
Sanlam Global High Quality Fund
Sanlam US Dividend Fund1
EUR USD USD GBP USD Assets
Cash and cash equivalents 4,444,719 76,582 9,794,256 39,839,580 22,048,108
Margin accounts - - - - -
Accrued income 80,657 66,028 - 383,615 742,815
Amounts receivable on sale of securities 495,542 - 2,177,907 - -
Amounts receivable on issue of shares 38,680 195,432 473,338 297,268 1,535,072
Other debtors 8,783 18,404 447,397 1,447 67,840
Financial assets at fair value through profit or loss
- Transferable securities 184,774,584 41,401,366 - 259,341,113 281,399,797
- Collective investment schemes - - 69,696,549 4,754,245 -
- FDI assets 20,330 162 665,031 2,369 79,898
Total assets 189,863,295 41,757,974 83,254,478 304,619,637 305,873,530
Liabilities
Bank overdraft - - (238,605) - -
Margin accounts - - - - -
Financial liabilities at fair value through profit or loss
- FDI liabilities (1,529) (2) (21,993) (65,304) (4,418)
Accrued expenses (98,994) (66,235) (172,627) (520,579) (386,571)
Administration fees accrued (17,844) (3,690) - - (45,173)
Amounts payable on purchases of securities - - (161,098) - -
Amounts payable on repurchases of shares (4,405,454) (45,628) (587,669) (166,014) (957,448)
Liabilities (excluding net assets attributable to
holders of redeemable participating shares) (4,523,821) (115,555) (1,181,992) (751,897) (1,393,610)
Net assets attributable to holder of redeemable
participating shares 185,339,474 41,642,419 82,072,486 303,867,740 304,479,920
1This sub-fund was renamed during the period ended 30 June 2019. The previous name of the Funds was Sanlam FOUR US Dividend Fund.

SANLAM UNIVERSAL FUNDS PLC
133
STATEMENTS OF FINANCIAL POSITION OF THE FUNDS (CONTINUED) as at 31 December 2018
High Street Global
Balanced Fund Sanlam Global
Value Fund1
Sanlam Stable Global Fund1
Sanlam Active UK Fund1
Sanlam Multi-Strategy Fund1
USD USD USD GBP GBP Assets
Cash and cash equivalents 3,405,435 804,821 1,632,894 132,084 12,008,082
Margin accounts 930,500 - - - 1,566,857
Accrued income 44,894 312,376 170,619 49,429 1,978,186
Amounts receivable on sale of securities 25,953 2,352,672 2,363,939 - 45,739
Amounts receivable on issue of shares - 899 - - 189,939
Other debtors 8,102 21,380 - - 947
Financial assets at fair value through profit or loss
- Transferable securities 17,233,461 142,596,634 70,651,005 24,654,155 151,969,467
- Collective investment schemes - - - - -
- FDI assets 316,806 2,214 - - 2,125,840
Total assets 21,965,151 146,090,996 74,818,457 24,835,668 169,885,057
Liabilities
Bank overdraft - - - - -
Margin accounts - - - - - Financial liabilities at fair value through profit or loss
- FDI liabilities (137,770) - - - (830,373)
Accrued expenses (78,364) (28,447) (165,601) (40,956) (136,782)
Administration fees accrued (2,906) (132,575) (14,128) (4,537) (21,489)
Amounts payable on purchases of securities - - - - (5,671,027)
Amounts payable on repurchases of shares (30,453) (15) (20) (3) (72,771) Liabilities (excluding net assets attributable to
holders of redeemable participating shares) (249,493) (161,037) (179,749) (45,496) (6,732,442)
Net assets attributable to holder of redeemable
participating shares 21,715,658 145,929,959 74,638,708 24,790,172 163,152,615
1These sub-funds were renamed during the period ended 30 June 2019. The previous names of these Funds were Sanlam FOUR Global Equity Fund, Sanlam FOUR Stable Global Equity Fund, Sanlam FOUR Active UK Equity Fund and Sanlam FOUR Multi-Strategy Fund, respectively.

SANLAM UNIVERSAL FUNDS PLC
134
STATEMENTS OF FINANCIAL POSITION OF THE FUNDS (CONTINUED) as at 31 December 2018
Anchor Global Stable Fund1
Bridge Global Equity Income Growth Fund1
Anchor Global Equity Fund
Bridge Global Managed Growth
Fund1
Sanlam Global Emerging Markets
Fund2
USD USD USD USD USD Assets Cash and cash equivalents 1,278,533 197,014 544,584 410,873 953,083 Margin accounts 893,442 - - - - Accrued income 82,528 9,324 1,424 27,519 93,366 Amounts receivable on sale of securities - - - - 416,557 Amounts receivable on issue of shares - - - 1,000 11,569 Other debtors 25,707 6,447 9,807 8,101 10,867 Financial assets at fair value through profit or loss
- Transferable securities 12,571,545 3,746,738 32,464,196 9,960,063 104,940,142
- Collective investment schemes - - - - -
- FDI assets 1,550 - - - -
Total assets 14,853,305 3,959,523 33,020,011 10,407,556 106,425,584
Liabilities
Bank overdraft - - - - -
Margin accounts - - - - - Financial liabilities at fair value through profit or loss
- FDI liabilities (56,025) - - - - Accrued expenses (75,271) (45,323) (104,094) (56,015) (169,650) Administration fees accrued (2,477) (516) (5,406) (1,865) (12,021) Amounts payable on purchases of securities - - - - - Amounts payable on repurchases of shares - - - - (2,388)
Liabilities (excluding net assets attributable to
holders of redeemable participating shares) (133,773) (45,839) (109,500) (57,880) (184,059)
Net assets attributable to holder of redeemable
participating shares 14,719,532 3,913,684 32,910,511 10,349,676 106,241,525
1At an EGM on 25 March 2019, shareholders of Bridge Global Equity Income Growth Fund approved the merger of the fund into Bridge Global Managed Growth Fund. The merger took effect from 23.59pm on Friday 12 April 2019. 2 This sub-fund was renamed during the period ended 30 June 2019. The previous name of the Fund was Denker Global Emerging Markets Fund.

SANLAM UNIVERSAL FUNDS PLC
135
STATEMENTS OF FINANCIAL POSITION OF THE FUNDS (CONTINUED) as at 31 December 2018
ABSA Africa Equity Fund
Sanlam Centre American Select
Equity Fund
Sanlam Global Convertible
Securities Fund
Sanlam Japan Equity Fund
Salam Centre Active US Treasury Fund
USD USD USD USD USD Assets
Cash and cash equivalents 2,601,717 - 512,397 1,158,036 170,929
Margin accounts - - - - 288,030
Accrued income 143,945 141,849 156,691 99,315 -
Amounts receivable on sale of securities - 10,132,575 - 98,699 84,645
Amounts receivable on issue of shares - - - - -
Other debtors 15,592 17,243 1,709 560 11,671
Financial assets at fair value through profit or loss
- Transferable securities 32,401,795 133,617,363 39,423,890 46,976,211 4,969,332
- Collective investment schemes - - - - -
- FDI assets - 3,032,100 4,453 - -
Total assets 35,163,049 146,941,130 40,099,140 48,332,821 5,524,607
Liabilities
Bank overdraft - (4,127,725) - - -
Margin accounts - - - - - Financial liabilities at fair value through profit or loss
- FDI liabilities - - (69,231) - -
Accrued expenses (90,309) (38,136) (77,414) (51,737) (25,490)
Administration fees accrued (7,997) (23,070) (10,127) (3,707) (981) Amounts payable on purchases of securities (350,150) (5,200,517) (162,165) (229,316) -
Amounts payable on repurchases of shares - - - - (2) Liabilities (excluding net assets attributable to
holders of redeemable participating shares) (448,456) (9,389,448) (318,937) (284,760) (26,473)
Net assets attributable to holder of redeemable
participating shares 34,714,593 137,551,682 39,780,203 48,048,061 5,498,134

SANLAM UNIVERSAL FUNDS PLC
136
STATEMENTS OF FINANCIAL POSITION OF THE FUNDS (CONTINUED) as at 31 December 2018
Autus Global Equity Fund
Wisian Capital South African
Equity Fund
Cameron Hume Global Fixed
Income ESG Fund
Sanlam Equity Allocation Fund
Sanlam FOUR Enhanced Income
Fund USD USD USD USD GBP
Assets
Cash and cash equivalents 2,904,722 1,183,462 3,168,662 1,325,865 967
Margin accounts - - 2,630,065 - -
Accrued income 3,797 - 890,031 26,626 -
Amounts receivable on sale of securities - - 124,181 - -
Amounts receivable on issue of shares - - - - -
Other debtors 15,157 21,231 - 2,121 47,543
Financial assets at fair value through profit or loss
- Transferable securities 11,598,919 5,531,556 94,924,028 452 -
- Collective investment schemes - - - - -
- FDI assets - 3,808 4,477,602 - -
Total assets 14,522,595 6,740,057 106,214,569 1,355,064 48,510
Liabilities
Bank overdraft - - (590,000) - -
Margin accounts - - - - - Financial liabilities at fair value through profit or loss
- FDI liabilities - - (5,974,750) - -
Accrued expenses (103,878) (67,055) (229,718) (81,894) (20,649)
Administration fees accrued (3,723) (1,204) (4,984) - (140)
Amounts payable on purchases of securities - - - - -
Amounts payable on repurchases of shares - - - (1,273,170) (27,721)
Liabilities (excluding net assets attributable to
holders of redeemable participating shares) (107,601) (68,259) (6,799,452) (1,355,064) (48,510) Net assets attributable to holder of redeemable
participating shares 14,414,994 6,671,798 99,415,117 - -

SANLAM UNIVERSAL FUNDS PLC
137
STATEMENTS OF FINANCIAL POSITION OF THE FUNDS (CONTINUED) as at 31 December 2018
Sanlam Centre Global Listed
Infrastructure Fund Sanlam Real Assets Fund
Satrix Global Factor Enhanced
Equity Fund USD GBP USD
Assets
Cash and cash equivalents 93,007 10,518,357 1,634,998
Margin accounts - - -
Accrued income 8,791 135,006 30,943
Amounts receivable on sale of securities - - 165,116
Amounts receivable on issue of shares - 19,731 -
Other debtors 4,493 23,484 -
Financial assets at fair value through profit or loss
- Transferable securities 4,375,569 69,024,457 48,464,488
- Collective investment schemes - - -
- FDI assets - 137,094 635
Total assets 4,481,860 79,858,129 50,296,180
Liabilities
Bank overdraft - - -
Margin accounts - - - Financial liabilities at fair value through profit or loss
- FDI liabilities - (859,963) -
Accrued expenses (24,828) (99,247) (28,285)
Administration fees accrued (2,052) (27,811) (9,253)
Amounts payable on purchases of securities - - (103,094)
Amounts payable on repurchases of shares - - -
Liabilities (excluding net assets attributable to
holders of redeemable participating shares) (26,880) (987,021) (140,632)
Net assets attributable to holder of redeemable
participating shares 4,454,980 78,871,108 50,155,548
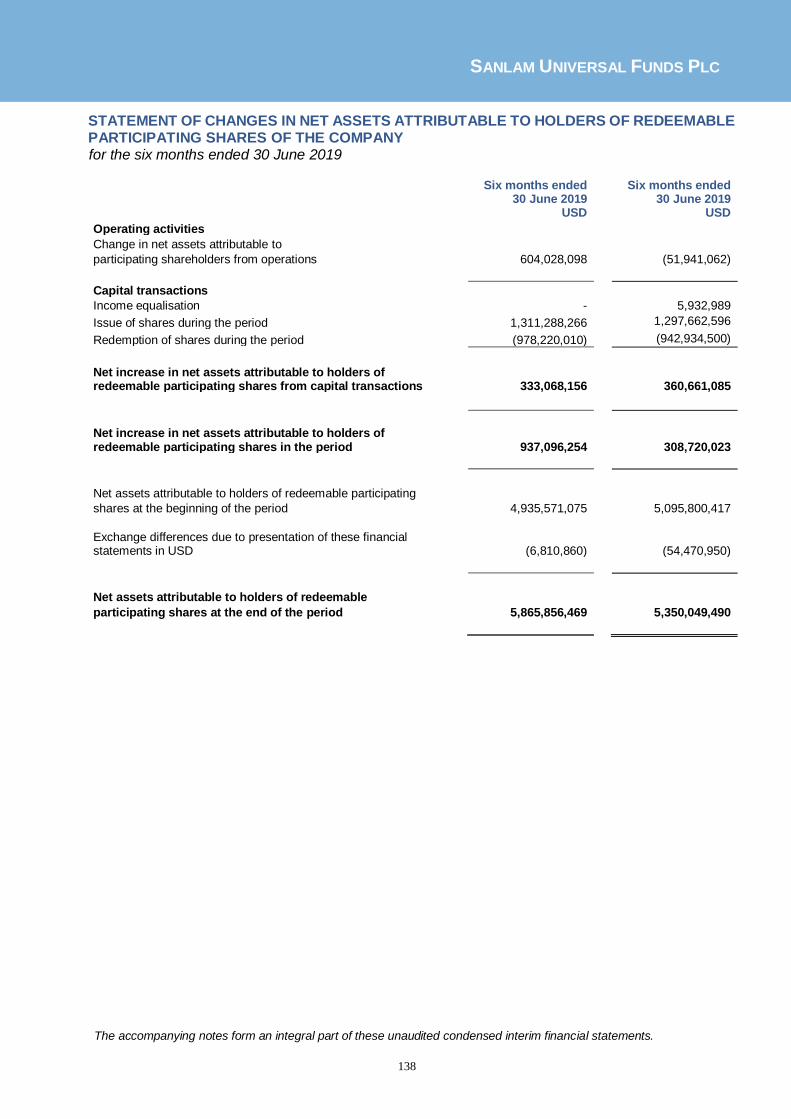
SANLAM UNIVERSAL FUNDS PLC
138
STATEMENT OF CHANGES IN NET ASSETS ATTRIBUTABLE TO HOLDERS OF REDEEMABLE PARTICIPATING SHARES OF THE COMPANY for the six months ended 30 June 2019
Six months ended
30 June 2019 Six months ended
30 June 2019 USD USD
Operating activities
Change in net assets attributable to
participating shareholders from operations 604,028,098 (51,941,062)
Capital transactions
Income equalisation - 5,932,989
Issue of shares during the period 1,311,288,266 1,297,662,596
Redemption of shares during the period (978,220,010) (942,934,500)
Net increase in net assets attributable to holders of redeemable participating shares from capital transactions
333,068,156 360,661,085
Net increase in net assets attributable to holders of redeemable participating shares in the period
937,096,254 308,720,023
Net assets attributable to holders of redeemable participating
shares at the beginning of the period 4,935,571,075 5,095,800,417
Exchange differences due to presentation of these financial statements in USD
(6,810,860) (54,470,950)
Net assets attributable to holders of redeemable
participating shares at the end of the period 5,865,856,469 5,350,049,490
The accompanying notes form an integral part of these unaudited condensed interim financial statements.

SANLAM UNIVERSAL FUNDS PLC
139
STATEMENTS OF CHANGES IN NET ASSETS ATTRIBUTABLE TO PARTICIPATING SHAREHOLDERS OF THE FUNDS for the six months ended 30 June 2019
Bridge Global Property Income
Fund
P-Solve Inflation Plus Fund
Sanlam African Frontier Markets Fund
Denker Global Equity Fund
Sanlam Global Bond Fund
USD GBP USD USD USD Operating activities Change in net assets attributable to participating shareholders from operations 3,364,690 3,398,086 14,674,462 13,808,979 30,946,005
Capital transactions
Issue of shares during the period 19,214 456,244 79,685 288,443 36,432,110 Redemption of shares during the period (8,447,008) (52,615,040) (2,806,383) (3,569,828) (7,322,590)
Net increase/(decrease) in net assets attributable to holders of redeemable participating shares from capital transactions
(8,427,794) (52,158,796) (2,726,698) (3,281,385) 29,109,520
Net increase/(decrease) in net assets attributable to holders of redeemable participating shares in the period
(5,063,104) (48,760,710) 11,947,764 10,527,594 60,055,525
Net assets attributable to holders of redeemable participating shares at the beginning of the period
27,527,211 48,760,710 112,499,724 89,716,547 535,171,944
Net assets attributable to holders of redeemable
participating shares at the end of the period 22,464,107 - 124,447,488 100,244,141 595,227,469
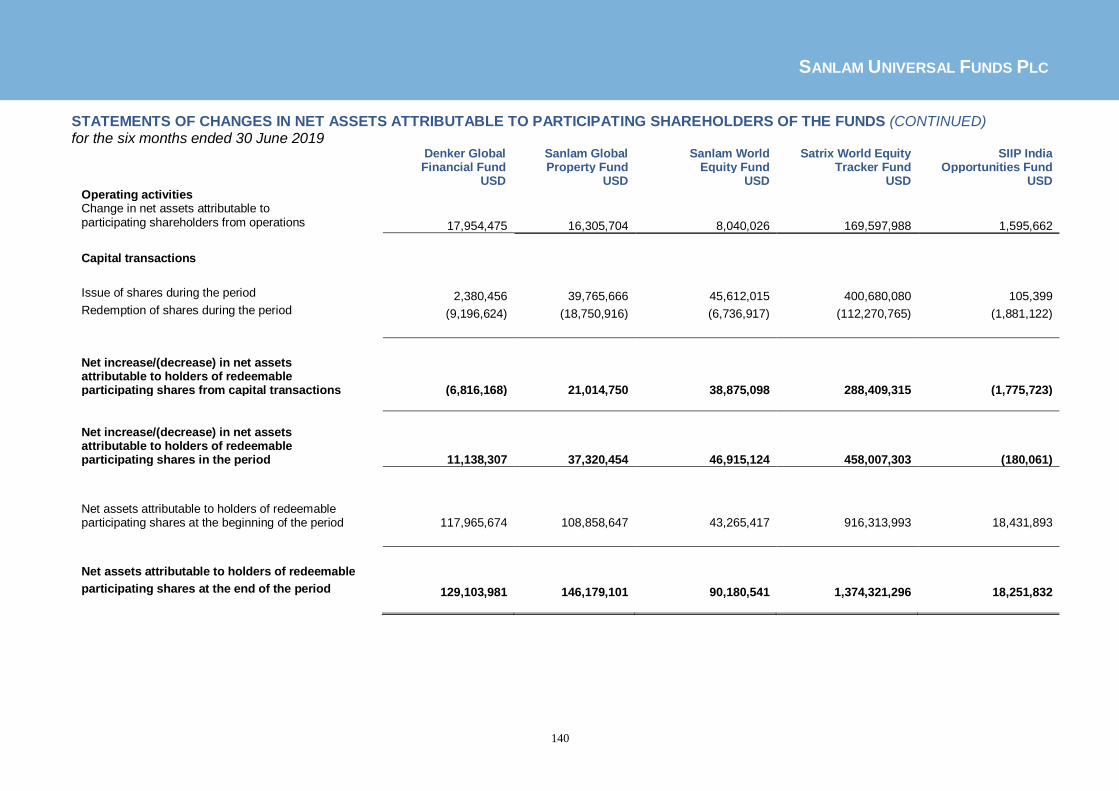
SANLAM UNIVERSAL FUNDS PLC
140
STATEMENTS OF CHANGES IN NET ASSETS ATTRIBUTABLE TO PARTICIPATING SHAREHOLDERS OF THE FUNDS (CONTINUED) for the six months ended 30 June 2019
Denker Global Financial Fund
Sanlam Global Property Fund
Sanlam World Equity Fund
Satrix World Equity Tracker Fund
SIIP India Opportunities Fund
USD USD USD USD USD Operating activities Change in net assets attributable to participating shareholders from operations 17,954,475 16,305,704 8,040,026 169,597,988 1,595,662
Capital transactions
Issue of shares during the period 2,380,456 39,765,666 45,612,015 400,680,080 105,399 Redemption of shares during the period (9,196,624) (18,750,916) (6,736,917) (112,270,765) (1,881,122)
Net increase/(decrease) in net assets attributable to holders of redeemable participating shares from capital transactions (6,816,168) 21,014,750 38,875,098 288,409,315 (1,775,723)
Net increase/(decrease) in net assets attributable to holders of redeemable participating shares in the period 11,138,307 37,320,454 46,915,124 458,007,303 (180,061)
Net assets attributable to holders of redeemable participating shares at the beginning of the period 117,965,674 108,858,647 43,265,417 916,313,993 18,431,893
Net assets attributable to holders of redeemable participating shares at the end of the period 129,103,981 146,179,101 90,180,541 1,374,321,296 18,251,832

SANLAM UNIVERSAL FUNDS PLC
141
STATEMENTS OF CHANGES IN NET ASSETS ATTRIBUTABLE TO PARTICIPATING SHAREHOLDERS OF THE FUNDS (CONTINUED) for the six months ended 30 June 2019
Denker Global Dividend Fund
Sanlam Strategic Bond Fund
Sanlam Accel Income Fund
Satrix North America Equity Tracker Fund
Satrix UK Equity Tracker Fund
USD GBP GBP USD GBP Operating activities Change in net assets attributable to participating shareholders from operations 16,606,492 20,867,934 1,914,385 13,306,762 3,263,293
Capital transactions
Issue of shares during the period 304,310 80,803,664 1,250,861 175,456 23,065 Redemption of shares during the period (71,215,954) (57,921,561) (5,003,475) (99,961,559) (33,395,939)
Net increase/(decrease) in net assets attributable to holders of redeemable participating shares from capital transactions (70,911,644) 22,882,103 (3,752,614) (99,786,103) (33,372,874)
Net increase/(decrease) in net assets attributable to holders of redeemable participating shares in the period (54,305,152) 43,750,037 (1,838,229) (86,479,341) (30,109,581)
Net assets attributable to holders of redeemable participating shares at the beginning of the period 137,121,000 349,356,127 29,203,021 91,816,726 38,091,985
Net assets attributable to holders of redeemable participating shares at the end of the period 82,815,848 393,106,164 27,364,792 5,337,385 7,982,404
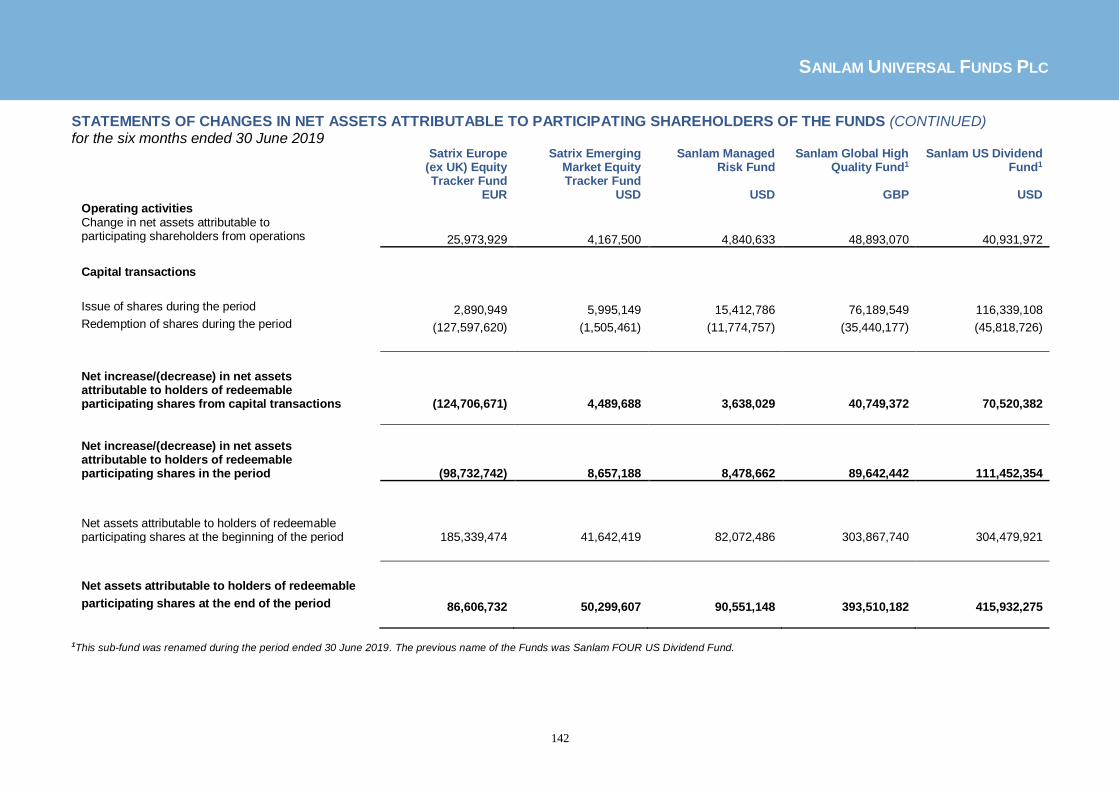
SANLAM UNIVERSAL FUNDS PLC
142
STATEMENTS OF CHANGES IN NET ASSETS ATTRIBUTABLE TO PARTICIPATING SHAREHOLDERS OF THE FUNDS (CONTINUED) for the six months ended 30 June 2019
Satrix Europe (ex UK) Equity Tracker Fund
Satrix Emerging Market Equity Tracker Fund
Sanlam Managed Risk Fund
Sanlam Global High Quality Fund1
Sanlam US Dividend Fund1
EUR USD USD GBP USD Operating activities Change in net assets attributable to participating shareholders from operations 25,973,929 4,167,500 4,840,633 48,893,070 40,931,972
Capital transactions
Issue of shares during the period 2,890,949 5,995,149 15,412,786 76,189,549 116,339,108 Redemption of shares during the period (127,597,620) (1,505,461) (11,774,757) (35,440,177) (45,818,726)
Net increase/(decrease) in net assets attributable to holders of redeemable participating shares from capital transactions (124,706,671) 4,489,688 3,638,029 40,749,372 70,520,382
Net increase/(decrease) in net assets attributable to holders of redeemable participating shares in the period (98,732,742) 8,657,188 8,478,662 89,642,442 111,452,354
Net assets attributable to holders of redeemable participating shares at the beginning of the period 185,339,474 41,642,419 82,072,486 303,867,740 304,479,921
Net assets attributable to holders of redeemable participating shares at the end of the period 86,606,732 50,299,607 90,551,148 393,510,182 415,932,275
1This sub-fund was renamed during the period ended 30 June 2019. The previous name of the Funds was Sanlam FOUR US Dividend Fund.
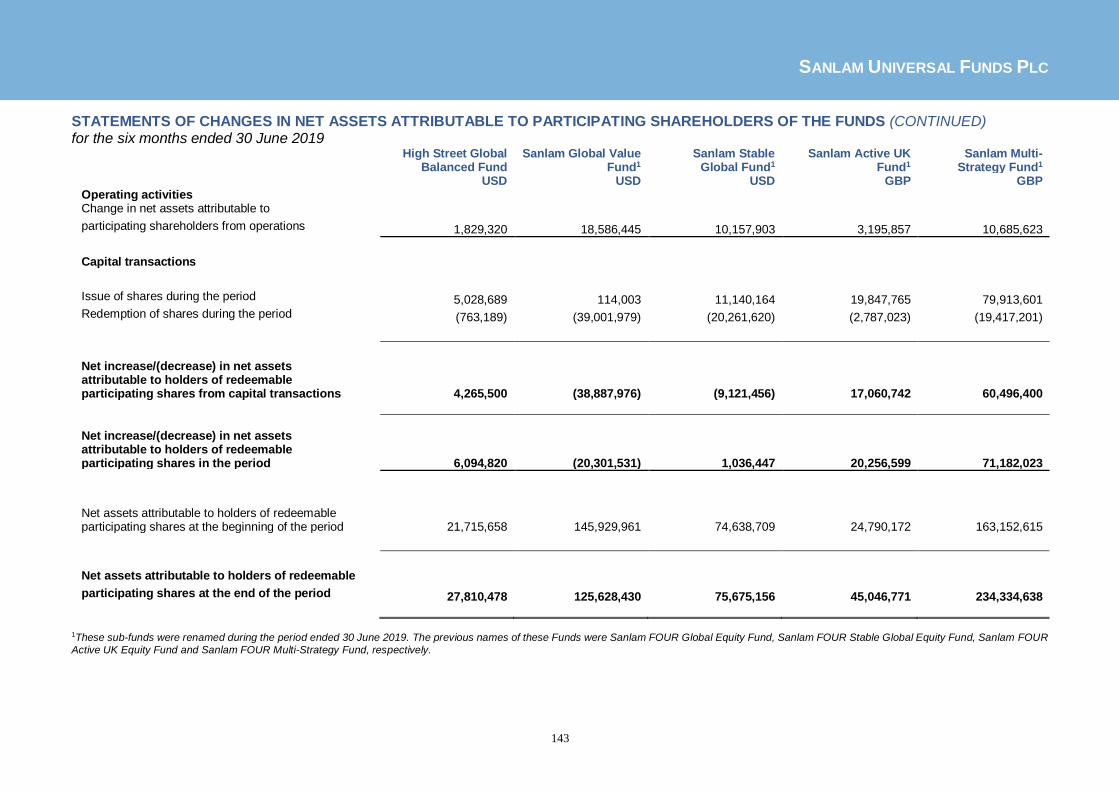
SANLAM UNIVERSAL FUNDS PLC
143
STATEMENTS OF CHANGES IN NET ASSETS ATTRIBUTABLE TO PARTICIPATING SHAREHOLDERS OF THE FUNDS (CONTINUED) for the six months ended 30 June 2019
High Street Global Balanced Fund
Sanlam Global Value Fund1
Sanlam Stable Global Fund1
Sanlam Active UK Fund1
Sanlam Multi- Strategy Fund1
USD USD USD GBP GBP Operating activities Change in net assets attributable to participating shareholders from operations 1,829,320 18,586,445 10,157,903 3,195,857 10,685,623
Capital transactions
Issue of shares during the period 5,028,689 114,003 11,140,164 19,847,765 79,913,601 Redemption of shares during the period (763,189) (39,001,979) (20,261,620) (2,787,023) (19,417,201)
Net increase/(decrease) in net assets attributable to holders of redeemable participating shares from capital transactions 4,265,500 (38,887,976) (9,121,456) 17,060,742 60,496,400
Net increase/(decrease) in net assets attributable to holders of redeemable participating shares in the period 6,094,820 (20,301,531) 1,036,447 20,256,599 71,182,023
Net assets attributable to holders of redeemable participating shares at the beginning of the period 21,715,658 145,929,961 74,638,709 24,790,172 163,152,615
Net assets attributable to holders of redeemable participating shares at the end of the period 27,810,478 125,628,430 75,675,156 45,046,771 234,334,638
1These sub-funds were renamed during the period ended 30 June 2019. The previous names of these Funds were Sanlam FOUR Global Equity Fund, Sanlam FOUR Stable Global Equity Fund, Sanlam FOUR
Active UK Equity Fund and Sanlam FOUR Multi-Strategy Fund, respectively.

SANLAM UNIVERSAL FUNDS PLC
144
STATEMENTS OF CHANGES IN NET ASSETS ATTRIBUTABLE TO PARTICIPATING SHAREHOLDERS OF THE FUNDS (CONTINUED) for the six months ended 30 June 2019
Anchor Global Stable Fund1
Bridge Global Equity Income Growth Fund1
Anchor Global Equity Fund
Bridge Global Managed Growth
Fund1
Sanlam Global Emerging Markets
Fund2
USD USD USD USD USD Operating activities Change in net assets attributable to participating shareholders from operations 1,090,645 391,653 7,070,048 1,778,336 12,289,818
Capital transactions
Issue of shares during the period 2,181,574 - 2,248,271 5,283,426 1,907,889 Redemption of shares during the period (1,035,659) (4,305,337) (2,000,448) - (11,457,225)
Net increase/(decrease) in net assets attributable to holders of redeemable participating shares from capital transactions 1,145,915 (4,305,337) 247,823 5,283,426 (9,549,336)
Net increase/(decrease) in net assets attributable to holders of redeemable participating shares in the period 2,236,560 (3,913,684) 7,317,871 7,061,762 2,740,482
Net assets attributable to holders of redeemable participating shares at the beginning of the period 14,719,532 3,913,684 32,910,511 10,349,676 106,241,525
Net assets attributable to holders of redeemable participating shares at the end of the period 16,956,092 - 40,228,382 17,411,438 108,982,007
1At an EGM on 25 March 2019, shareholders of Bridge Global Equity Income Growth Fund approved the merger of the fund into Bridge Global Managed Growth Fund. The merger took effect from 23.59pm on
Friday 12 April 2019. 2 This sub-fund was renamed during the period ended 30 June 2019. The previous name of the Fund was Denker Global Emerging Markets Fund.

SANLAM UNIVERSAL FUNDS PLC
145
STATEMENTS OF CHANGES IN NET ASSETS ATTRIBUTABLE TO PARTICIPATING SHAREHOLDERS OF THE FUNDS (CONTINUED) for the six months ended 30 June 2019
ABSA Africa Equity Fund
Sanlam Centre American Select
Equity Fund
Sanlam Global Convertible
Securities Fund
Sanlam Japan Equity Fund
Sanlam Centre Active US Treasury Fund
USD USD USD USD USD Operating activities Change in net assets attributable to participating shareholders from operations 2,315,573 15,033,705 4,537,514 2,494,553 (65,239)
Capital transactions
Issue of shares during the period 3,433,682 169,489,501 118,300 - 114,798 Redemption of shares during the period (8,900,000) (17,540,000) - (47,199,993) (99,200)
Net increase/(decrease) in net assets attributable to holders of redeemable participating shares from capital transactions (5,466,318) 151,949,501 118,300 (47,199,993) 15,598
Net increase/(decrease) in net assets attributable to holders of redeemable participating shares in the period (3,150,745) 166,983,206 4,655,814 (44,705,440) (49,641)
Net assets attributable to holders of redeemable participating shares at the beginning of the period 34,714,593 137,551,682 39,780,203 48,048,061 5,498,134
Net assets attributable to holders of redeemable participating shares at the end of the period 31,563,848 304,534,888 44,436,017 3,342,621 5,448,493

SANLAM UNIVERSAL FUNDS PLC
146
STATEMENTS OF CHANGES IN NET ASSETS ATTRIBUTABLE TO PARTICIPATING SHAREHOLDERS OF THE FUNDS (CONTINUED) for the six months ended 30 June 2019
Autus Global Equity Fund
Wisian Capital South African
Equity Fund
Cameron Hume Global Fixed Income
ESG Fund
Sanlam Centre Global Listed
Infrastracture Fund
Sanlam Real Assets Fund
USD USD USD USD GBP Operating activities Change in net assets attributable to participating shareholders from operations 2,694,239 (63,574) 6,932,246 694,542 11,938,269
Capital transactions
Issue of shares during the period 45,148 - 10,000,000 24,275 52,696,487 Redemption of shares during the period (2,769,580) - (13,199,999) - (1,466,495)
Net increase/(decrease) in net assets attributable to holders of redeemable participating shares from capital transactions
(2,724,432) - (3,199,999) 24,275
51,229,992
Net increase/(decrease) in net assets attributable to holders of redeemable participating shares in the period (30,193) (63,574) 3,732,247 718,817
63,168,261
Net assets attributable to holders of redeemable participating shares at the beginning of the period 14,414,994 6,671,798 99,415,117 4,454,980
78,871,108
Net assets attributable to holders of redeemable participating shares at the end of the period 14,384,801 6,608,224 103,147,364 5,173,797 142,039,369

SANLAM UNIVERSAL FUNDS PLC
147
STATEMENTS OF CHANGES IN NET ASSETS ATTRIBUTABLE TO PARTICIPATING SHAREHOLDERS OF THE FUNDS (CONTINUED) for the six months ended 30 June 2019
Satrix Global Factor Enhanced Equity
Fund
Perpetua Global Equity UCITS Fund
USD USD Operating activities Change in net assets attributable to participating shareholders from operations 7,925,482 611,236
Capital transactions
Issue of shares during the period 21,088,240 18,841,370 Redemption of shares during the period (3,159,088) (237,533)
Net increase/(decrease) in net assets attributable to holders of redeemable participating shares from capital transactions 17,929,152 18,603,837
Net increase/(decrease) in net assets attributable to holders of redeemable participating shares in the period 25,854,634 19,215,073
Net assets attributable to holders of redeemable participating shares at the beginning of the period 50,155,548 -
Net assets attributable to holders of redeemable participating shares at the end of the period 76,010,182 19,215,073

SANLAM UNIVERSAL FUNDS PLC
148
STATEMENTS OF CHANGES IN NET ASSETS ATTRIBUTABLE TO PARTICIPATING SHAREHOLDERS OF THE FUNDS for the six months ended 30 June 2018
Bridge Global Property Income
Fund
P-Solve Inflation Plus Fund
Sanlam African Frontier Markets Fund
Denker Global Equity Fund
Sanlam Global Bond Fund
USD GBP USD USD USD Operating activities Change in net assets attributable to participating shareholders from operations (550,745) (921,830) (6,118,441) (3,620,984) (10,140,035)
Capital transactions Income equalisation (463,768) (28,038) 2,802,456 (1,118,640) 15,759,262 Issue of shares during the period 15,944 616,150 52,022,944 238,941 160,049,765 Redemption of shares during the period (3,146,515) (4,552,757) (37,414,551) (9,095,365) (35,441,804)
Net increase/(decrease) in net assets attributable to holders of redeemable participating shares from capital transactions
(3,594,339) (3,964,645) 17,410,849 (9,975,064) 140,367,223
Net increase/(decrease) in net assets attributable to holders of redeemable participating shares in the period
(4,145,084) (4,886,475) 11,292,408 (13,596,048) 130,227,188
Net assets attributable to holders of redeemable participating shares at the beginning of the period
36,847,088 55,545,049 87,414,059 121,186,824 488,622,322
Net assets attributable to holders of redeemable
participating shares at the end of the period 32,702,004 50,658,574 98,706,467 107,590,776 618,849,510

SANLAM UNIVERSAL FUNDS PLC
149
STATEMENTS OF CHANGES IN NET ASSETS ATTRIBUTABLE TO PARTICIPATING SHAREHOLDERS OF THE FUNDS (CONTINUED) for the six months ended 30 June 2018
Sanlam Global Financial Fund
Sanlam Global Property Fund
Sanlam World Equity Fund
Satrix World Equity Tracker Fund
SIIP India Opportunities Fund
USD USD USD USD USD Operating activities Change in net assets attributable to participating shareholders from operations (9,590,754) 1,708,796 (56,567) 124,284 (2,087,471)
Capital transactions Income equalisation 250,193 (70,491) (17,365,406) 4,557,945 90,001 Issue of shares during the period 29,882,973 2,148,814 5,763,186 308,828,768 360,843 Redemption of shares during the period (11,206,241) (2,617,217) (246,155,172) (111,316,041) (3,636,114)
Net increase/(decrease) in net assets attributable to holders of redeemable participating shares from capital transactions 18,926,925 (538,894) (257,757,392) 202,070,672 (3,185,270)
Net increase/(decrease) in net assets attributable to holders of redeemable participating shares in the period 9,336,171 1,169,902 (257,813,959) 202,194,956 (5,272,741)
Net assets attributable to holders of redeemable participating shares at the beginning of the period 131,245,297 131,118,575 365,989,532 800,625,577 25,205,732
Net assets attributable to holders of redeemable participating shares at the end of the period 140,581,468 132,288,477 108,175,573 1,002,820,533 19,932,991
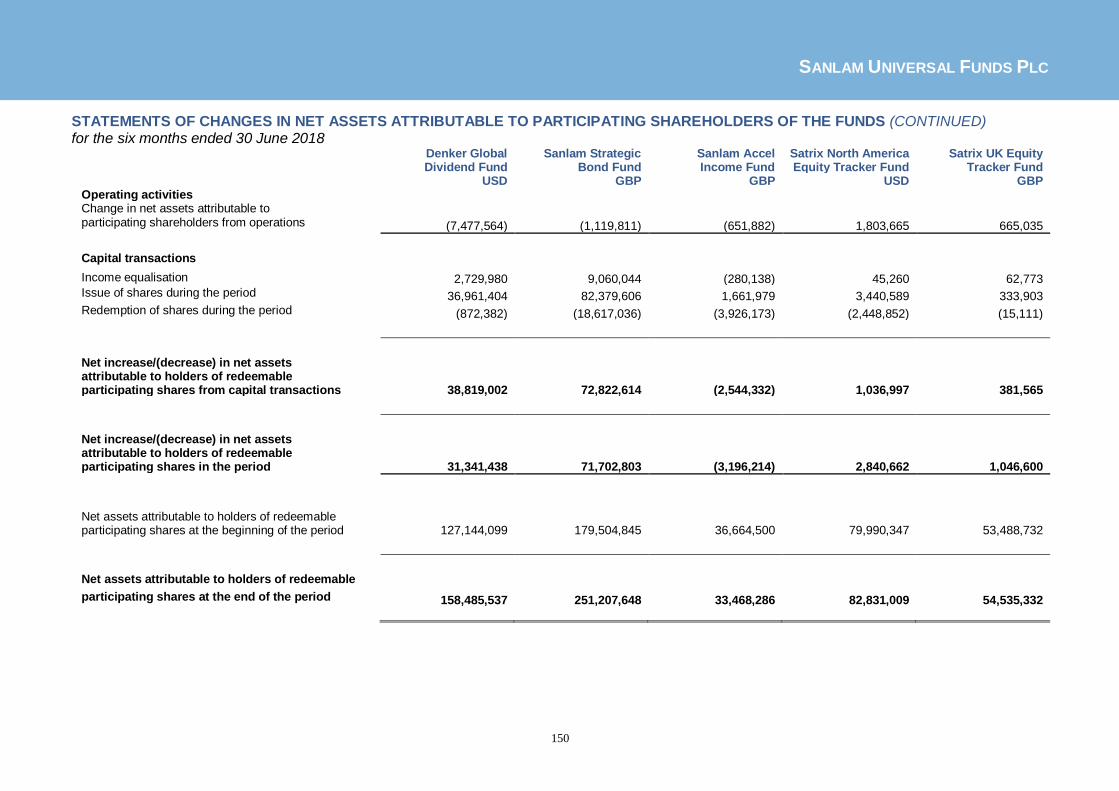
SANLAM UNIVERSAL FUNDS PLC
150
STATEMENTS OF CHANGES IN NET ASSETS ATTRIBUTABLE TO PARTICIPATING SHAREHOLDERS OF THE FUNDS (CONTINUED) for the six months ended 30 June 2018
Denker Global Dividend Fund
Sanlam Strategic Bond Fund
Sanlam Accel Income Fund
Satrix North America Equity Tracker Fund
Satrix UK Equity Tracker Fund
USD GBP GBP USD GBP Operating activities Change in net assets attributable to participating shareholders from operations (7,477,564) (1,119,811) (651,882) 1,803,665 665,035
Capital transactions
Income equalisation 2,729,980 9,060,044 (280,138) 45,260 62,773 Issue of shares during the period 36,961,404 82,379,606 1,661,979 3,440,589 333,903 Redemption of shares during the period (872,382) (18,617,036) (3,926,173) (2,448,852) (15,111)
Net increase/(decrease) in net assets attributable to holders of redeemable participating shares from capital transactions 38,819,002 72,822,614 (2,544,332) 1,036,997 381,565
Net increase/(decrease) in net assets attributable to holders of redeemable participating shares in the period 31,341,438 71,702,803 (3,196,214) 2,840,662 1,046,600
Net assets attributable to holders of redeemable participating shares at the beginning of the period 127,144,099 179,504,845 36,664,500 79,990,347 53,488,732
Net assets attributable to holders of redeemable participating shares at the end of the period 158,485,537 251,207,648 33,468,286 82,831,009 54,535,332

SANLAM UNIVERSAL FUNDS PLC
151
STATEMENTS OF CHANGES IN NET ASSETS ATTRIBUTABLE TO PARTICIPATING SHAREHOLDERS OF THE FUNDS (CONTINUED) for the six months ended 30 June 2018
Satrix Europe (ex UK) Equity Tracker Fund
Satrix Emerging Market Equity Tracker Fund
Sanlam Managed Risk Fund
Sanlam Global High Quality
Fund
Sanlam US Dividend Fund1
EUR USD USD GBP USD Operating activities Change in net assets attributable to participating shareholders from operations (3,077,966) (3,792,922) 611,882 4,376,087 1,446,215
Capital transactions Income equalisation (1,407,414) (309,390) (262,606) 1,763,890 1,758,065 Issue of shares during the period 4,147,905 8,044,932 19,020,651 123,017,778 101,689,982 Redemption of shares during the period (16,964,972) (13,976,430) (11,682,362) (48,848,402) (40,071,421)
Net increase/(decrease) in net assets attributable to holders of redeemable participating shares from capital transactions (14,224,481) (6,240,888) 7,075,683 75,933,266 63,376,626
Net increase/(decrease) in net assets attributable to holders of redeemable participating shares in the period (17,302,447) (10,033,810) 7,687,565 80,309,353 64,822,841
Net assets attributable to holders of redeemable participating shares at the beginning of the period 273,336,186 57,424,129 54,116,201 214,403,915 269,842,716
Net assets attributable to holders of redeemable participating shares at the end of the period 256,033,739 47,390,319 61,803,766 294,713,268 334,665,557
1This sub-fund was renamed during the period ended 30 June 2019. The previous name of the Funds was Sanlam FOUR US Dividend Fund.

SANLAM UNIVERSAL FUNDS PLC
152
STATEMENTS OF CHANGES IN NET ASSETS ATTRIBUTABLE TO PARTICIPATING SHAREHOLDERS OF THE FUNDS (CONTINUED) for the six months ended 30 June 2018
High Street Global Balanced Fund
Sanlam Global Value Fund1
Sanlam Stable Global Fund1
Sanlam Active UK Fund1
Sanlam Multi-Strategy Fund1
USD USD USD GBP GBP Operating activities Change in net assets attributable to participating shareholders from operations (90,079) 2,258,265 1,386,908 (200,885) 1,554,373
Capital transactions Income equalisation 33,210 (1,914,454) (5,647,101) (2,917,608) 238,492 Issue of shares during the period 1,360,227 5,157,382 70,467,312 60,242 17,794,065 Redemption of shares during the period (736,649) (25,723,858) (111,176,578) (16,261,385) (9,444,372)
Net increase/(decrease) in net assets attributable to holders of redeemable participating shares from capital transactions 656,788 (22,480,930) (46,356,367) (19,118,751) 8,588,185
Net increase/(decrease) in net assets attributable to holders of redeemable participating shares in the period 566,709 (20,222,665) (44,969,459) (19,319,636) 10,142,558
Net assets attributable to holders of redeemable participating shares at the beginning of the period 19,823,184 215,668,408 183,676,438 60,300,183 143,267,019 Exchange differences due to presentation of these financial statements in USD - (5,154,715) (3,183,083) - -
Net assets attributable to holders of redeemable participating shares at the end of the period 20,389,893 190,291,028 135,523,896 40,980,547 153,409,577
1These sub-funds were renamed during the period ended 30 June 2019. The previous names of these Funds were Sanlam FOUR Global Equity Fund, Sanlam FOUR Stable Global Equity Fund, Sanlam
FOUR Active UK Equity Fund and Sanlam FOUR Multi-Strategy Fund, respectively.

SANLAM UNIVERSAL FUNDS PLC
153
STATEMENTS OF CHANGES IN NET ASSETS ATTRIBUTABLE TO PARTICIPATING SHAREHOLDERS OF THE FUNDS (CONTINUED) for the six months ended 30 June 2018
Anchor Global Stable Fund1
Bridge Global Equity Income Growth Fund1
Anchor Global Equity Fund
Bridge Global Managed Growth
Fund1
Sanlam Global Emerging Markets
Fund2
USD USD USD USD USD Operating activities Change in net assets attributable to participating shareholders from operations (64,841) (235,648) 1,917,776 (388,710) (25,707,415)
Capital transactions Income equalisation (10,858) (8,470) (13,372) 23,715 (102,764) Issue of shares during the period 5,193,438 4,853 2,148,134 632,283 113,889,309 Redemption of shares during the period (1,382,459) (325,305) (528,642) (43) (55,216,981)
Net increase/(decrease) in net assets attributable to holders of redeemable participating shares from capital transactions 3,800,121 -328,922 1,606,120 655,955 58,569,564
Net increase/(decrease) in net assets attributable to holders of redeemable participating shares in the period 3,735,280 (564,570) 3,523,896 267,245 32,862,149
Net assets attributable to holders of redeemable participating shares at the beginning of the period 13,056,691 4,588,888 32,252,686 9,603,486 93,360,906
Net assets attributable to holders of redeemable participating shares at the end of the period 16,791,971 4,024,318 35,776,582 9,870,731 126,223,055
1At an EGM on 25 March 2019, shareholders of Bridge Global Equity Income Growth Fund approved the merger of the fund into Bridge Global Managed Growth Fund. The merger took effect from 23.59pm on
Friday 12 April 2019. 2 This sub-fund was renamed during the period ended 30 June 2019. The previous name of the Fund was Denker Global Emerging Markets Fund.

SANLAM UNIVERSAL FUNDS PLC
154
STATEMENTS OF CHANGES IN NET ASSETS ATTRIBUTABLE TO PARTICIPATING SHAREHOLDERS OF THE FUNDS (CONTINUED) for the six months ended 30 June 2018
ABSA Africa Equity Fund
Sanlam Centre American Select
Equity Fund
Sanlam Global Convertible
Securities Fund
Sanlam Japan Equity Fund
Sanlam Centre Active US Treasury Fund
USD USD USD USD USD Operating activities Change in net assets attributable to participating shareholders from operations 1,915,284 10,096,688 364,308 (3,365,497) (174,952)
Capital transactions Income equalisation 33,530 236,857 9,695 37,375 (1,692) Issue of shares during the period 2,775,660 27,461,923 14,111,890 11,761,949 342,370 Redemption of shares during the period (4,413,661) (3,948,779) (2,215,409) (9,399,324) (2,561,630)
Net increase/(decrease) in net assets attributable to holders of redeemable participating shares from capital transactions (1,604,471) 23,750,001 11,906,176 2,400,000 (2,220,952)
Net increase/(decrease) in net assets attributable to holders of redeemable participating shares in the period 310,813 33,846,689 12,270,484 (965,497) (2,395,904)
Net assets attributable to holders of redeemable participating shares at the beginning of the period 38,381,521 160,853,474 30,756,214 78,512,990 12,833,717
Net assets attributable to holders of redeemable participating shares at the end of the period 38,692,334 194,700,163 43,026,698 77,547,493 10,437,813

SANLAM UNIVERSAL FUNDS PLC
155
STATEMENTS OF CHANGES IN NET ASSETS ATTRIBUTABLE TO PARTICIPATING SHAREHOLDERS OF THE FUNDS (CONTINUED) for the six months ended 30 June 2018
Autus Global Equity Fund
Wisian Capital South African Equity Fund
Sanlam Equity Allocation Fund
Sanlam Four Enhanced Income
Fund USD USD USD GBP Operating activities Change in net assets attributable to participating shareholders from operations 441,623 (380,303) (3,688,526) (14,570)
Capital transactions Income equalisation 159 2,639 (4,305,948) - Issue of shares during the period 50,536 12,060,784 - 126,155 Redemption of shares during the period (92) (4,298,902) (30,370,551) -
Net increase/(decrease) in net assets attributable to holders of redeemable participating shares from capital transactions 50,603 7,764,521 (34,676,499) 126,155
Net increase/(decrease) in net assets attributable to holders of redeemable participating shares in the period 492,226 7,384,218 (38,365,025) 111,585
Net assets attributable to holders of redeemable participating shares at the beginning of the period 16,188,979 - 114,172,923 4,963,745
Net assets attributable to holders of redeemable participating shares at the end of the period 16,681,205 7,384,218 75,807,898 5,075,330

SANLAM UNIVERSAL FUNDS PLC
156
STATEMENT OF CASH FLOWS OF THE COMPANY for the six months ended 30 June 2019
Six months ended 30 June
2019
Six months ended 30 June
2019 USD USD
Cash flows from operating activities
Purchases of financial assets and settlement of financial liabilities (3,730,395,605) (2,985,664,534)
Proceeds from sale of investments (including realised gains) 3,374,074,379 2,553,304,251
Dividends received 57,857,531 59,174,995
Income from financial assets through profit or loss 21,538,767 15,512,445
Interest received 1,159,112 495,055
Income from securities lending received 330,005 122,867
Other income received 520,925 556,199
Operating expenses paid (14,812,864) (14,538,367)
Net cash outflow from operating activities (289,727,750) (371,037,089)
Cash flows from financing activities
Distributions paid to holders of redeemable participating shares (9,322,133) (6,441,063)
Proceeds from redeemable participating shares issued 1,295,256,971 1,273,894,680
Payments on redemption of redeemable participating shares (958,843,886) (864,906,982)
Income equalization - 5,847,808
Net cash provided by financing activities 327,090,952 408,394,443
Net increase in cash and cash equivalents 37,363,202 37,357,354
Cash and cash equivalents at the start of the period 187,394,463 163,231,683
Exchange gains on cash and cash equivalents 4,280,734 (3,344,703)
Cash and cash equivalents at the end of the period 229,038,399 197,244,334
The accompanying notes form an integral part of these unaudited condensed interim financial statements.

SANLAM UNIVERSAL FUNDS PLC
157
STATEMENTS OF CASH FLOWS OF THE FUNDS for the six months ended 30 June 2019
Bridge Global Property Income
Fund1
P-Solve Inflation Plus Fund
Sanlam African Frontier Markets
Fund
Denker Global Equity Fund
Sanlam Global Bond Fund
USD GBP USD USD USD
Cash flows from operating activities
Purchases of financial assets and settlement of financial liabilities (582,451) (3,643,117) (4,164,457) (11,039,389) (110,154,110)
Proceeds from sale of investments (including realised gains) 8,069,022 55,372,232 5,313,579 16,095,977 89,391,491
Dividends received 600,078 71,637 2,443,179 1,900,355
Income from financial assets through profit of loss - 99,096 - - 7,811,030
Interest received 2,560 1,363 5,964 23,132 94,041
Income from securities lending received - 1,032 155 4,308 -
Other income - 9,822 - - 39,996
Rebates received - - - - -
Operating expenses paid (179,404) (89,292) (373,716) (336,525) (759,085)
Net cash inflow/(outflow) from operating activities 7,909,805 51,822,773 3,224,704 6,647,858 (13,576,637)
Cash flows from financing activities
Distributions paid to holders of redeemable participating shares - (314,599) - (2,144) -
Proceeds from redeemable participating shares issued 19,214 456,244 56,720 288,443 35,817,580
Payment on redemption of redeemable participating shares (8,034,920) (52,615,040) (3,306,279) (3,484,296) (7,273,843)
Income equalization - - - - -
Net cash provided/(used in) by financing activities (8,015,706) (52,473,395) (3,249,559) (3,197,997) 28,543,737
Net increase/(decrease) in cash and cash equivalents (105,901) (650,622) (24,855) 3,449,861 14,967,100
Cash and cash equivalents at the start of the period 564,991 655,614 4,968,290 657,367 9,842,309
Exchange gains/(losses) on cash and cash equivalents (497) (4,992) (2,162) (2,252) (1,060,523)
Cash and cash equivalents at the end of the period 458,593 - 4,941,273 4,104,976 23,748,886

SANLAM UNIVERSAL FUNDS PLC
158
STATEMENTS OF CASH FLOWS OF THE FUNDS (CONTINUED) for the six months ended 30 June 2019
Denker Global Financial Fund
Sanlam Global Property Fund
Sanlam World Equity Fund
Satrix World Equity Tracker Fund
SIIP India Opportunities Fund
USD USD USD USD USD
Cash flows from operating activities
Purchases of financial assets and settlement of financial liabilities (18,249,372) (65,327,503) (136,754,411) (376,744,793) (2,754,239)
Proceeds from sale of investments (including realised gains) 24,270,688 43,223,185 102,193,809 75,373,866 4,010,234
Dividends received 1,968,697 1,881,630 614,232 13,843,485 33,655
Income from financial assets through profit of loss - - - - -
Interest received 13,424 19,545 10,404 68,642 674
Income from securities lending received 25,600 18 7,369 144,850 -
Other income 2 31 2,854 158,448 -
Rebates received - - - - -
Operating expenses paid (691,028) (312,809) (332,495) (1,578,260) (114,837)
Net cash inflow/(outflow) from operating activities 7,338,011 (20,515,903) (34,258,238) (288,733,762) 1,175,487
Cash flows from financing activities
Distributions paid to holders of redeemable participating shares (52,852) - - (26,566) -
Proceeds from redeemable participating shares issued 2,379,822 39,765,666 44,266,915 400,428,241 105,399
Payment on redemption of redeemable participating shares (9,033,733) (18,744,582) (6,688,609) (111,695,052) (1,881,122)
Income equalisation - - - - -
Net cash provided by/(used in) financing activities (6,706,763) 21,021,084 37,578,306 288,706,623 (1,775,723)
Net increase/(decrease) in cash and cash equivalents 631,248 505,181 3,320,068 (27,139) (600,236)
Cash and cash equivalents at the start of the period 2,080,230 723,927 786,725 9,026,335 691,343
Exchange gains/(losses) on cash and cash equivalents 4,273 (14,485) 3,269 (2,011) 1,425
Cash and cash equivalents at the end of the period 2,715,751 1,214,623 4,110,062 8,997,185 92,532

SANLAM UNIVERSAL FUNDS PLC
159
STATEMENTS OF CASH FLOWS OF THE FUNDS (CONTINUED) for the six months ended 30 June 2019
Denker Global Dividend Fund
Sanlam Strategic Bond Fund
Sanlam Accel Income Fund
Satrix North America Equity
Tracker Fund
Satrix UK Equity Tracker Fund
USD GBP GBP USD GBP
Cash flows from operating activities
Purchases of financial assets and settlement of financial liabilities (1,538,773) (1,202,840,468) - (56,519) (1,331,777)
Proceeds from sale of investments (including realised gains) 67,524,749 1,168,562,540 3,287,559 98,743,030 32,958,812
Dividends received 3,383,531 1,017,244 552,908 714,175 798,118
Income from financial assets through profit of loss - 6,846,069 - - -
Interest received 37,747 5,696 1,513 4,711 1,064
Income from securities lending received 7,256 - - 16,941 970
Other income 84 14,203 90,083 1,188 1,683
Rebates received - - - - -
Operating expenses paid (594,055) (1,040,576) (156,736) (41,231) (16,919)
Net cash inflow/(outflow) from operating activities 68,820,539 (27,435,292) 3,775,327 99,382,295 32,411,951
Cash flows from financing activities
Distributions paid to holders of redeemable participating shares (278,229) (4,801,954) (278,300) (7,277) (32,879)
Proceeds from redeemable participating shares issued 304,310 73,432,375 1,127,683 359,557 24,419
Payment on redemption of redeemable participating shares (71,123,155) (49,212,364) (4,913,949) (99,962,211) (36,207,009)
Income equalization - - - - -
Net cash provided by/(used in) financing activities (71,097,074) 19,418,057 (4,064,566) (99,609,931) (36,215,469)
Net increase/(decrease) in cash and cash equivalents (2,276,535) (8,017,235) (289,239) (227,636) (3,803,518)
Cash and cash equivalents at the start of the period 4,702,169 2,930,842 1,075,918 276,343 3,749,542
Exchange gains/(losses) on cash and cash equivalents (5,066) 1,169,505 (8) (5,746) 158,378
Cash and cash equivalents at the end of the period 2,420,568 (3,916,888) 786,671 42,961 104,402
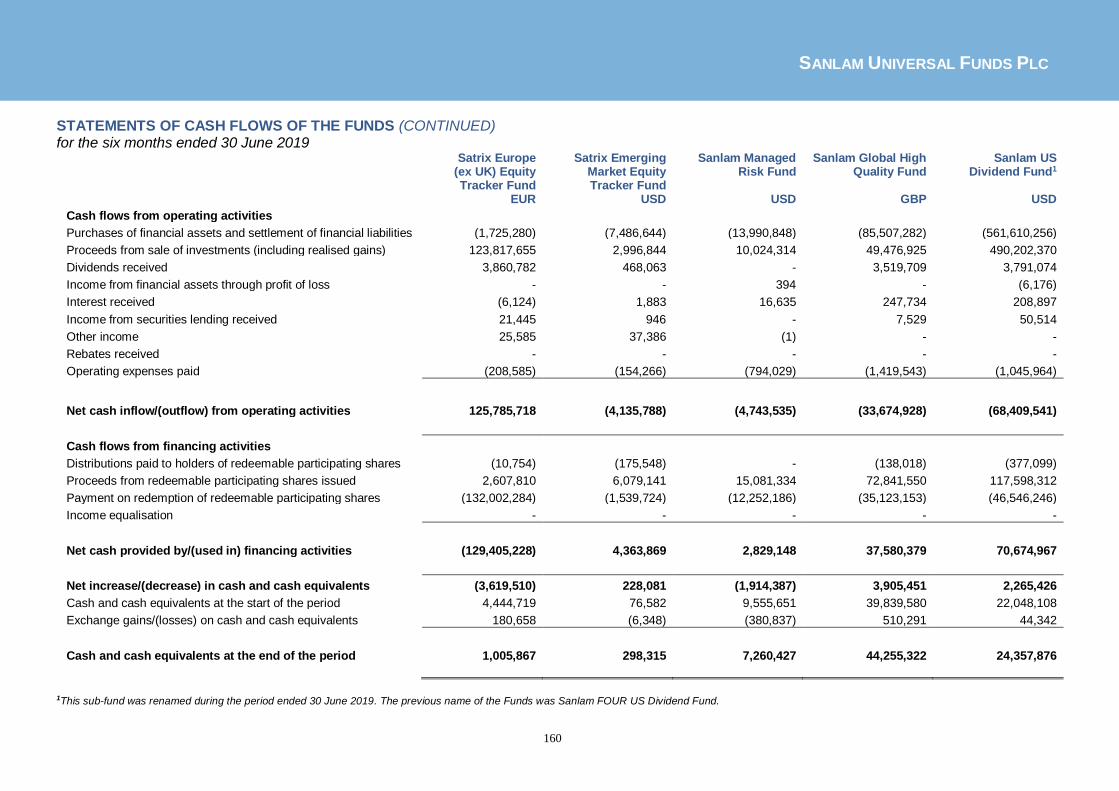
SANLAM UNIVERSAL FUNDS PLC
160
STATEMENTS OF CASH FLOWS OF THE FUNDS (CONTINUED) for the six months ended 30 June 2019
Satrix Europe (ex UK) Equity Tracker Fund
Satrix Emerging Market Equity Tracker Fund
Sanlam Managed Risk Fund
Sanlam Global High Quality Fund
Sanlam US Dividend Fund1
EUR USD USD GBP USD
Cash flows from operating activities
Purchases of financial assets and settlement of financial liabilities (1,725,280) (7,486,644) (13,990,848) (85,507,282) (561,610,256)
Proceeds from sale of investments (including realised gains) 123,817,655 2,996,844 10,024,314 49,476,925 490,202,370
Dividends received 3,860,782 468,063 - 3,519,709 3,791,074
Income from financial assets through profit of loss - - 394 - (6,176)
Interest received (6,124) 1,883 16,635 247,734 208,897
Income from securities lending received 21,445 946 - 7,529 50,514
Other income 25,585 37,386 (1) - -
Rebates received - - - - -
Operating expenses paid (208,585) (154,266) (794,029) (1,419,543) (1,045,964)
Net cash inflow/(outflow) from operating activities 125,785,718 (4,135,788) (4,743,535) (33,674,928) (68,409,541)
Cash flows from financing activities
Distributions paid to holders of redeemable participating shares (10,754) (175,548) - (138,018) (377,099)
Proceeds from redeemable participating shares issued 2,607,810 6,079,141 15,081,334 72,841,550 117,598,312
Payment on redemption of redeemable participating shares (132,002,284) (1,539,724) (12,252,186) (35,123,153) (46,546,246)
Income equalisation - - - - -
Net cash provided by/(used in) financing activities (129,405,228) 4,363,869 2,829,148 37,580,379 70,674,967
Net increase/(decrease) in cash and cash equivalents (3,619,510) 228,081 (1,914,387) 3,905,451 2,265,426
Cash and cash equivalents at the start of the period 4,444,719 76,582 9,555,651 39,839,580 22,048,108
Exchange gains/(losses) on cash and cash equivalents 180,658 (6,348) (380,837) 510,291 44,342
Cash and cash equivalents at the end of the period 1,005,867 298,315 7,260,427 44,255,322 24,357,876
1This sub-fund was renamed during the period ended 30 June 2019. The previous name of the Funds was Sanlam FOUR US Dividend Fund.

SANLAM UNIVERSAL FUNDS PLC
161
STATEMENTS OF CASH FLOWS OF THE FUNDS (CONTINUED) for the six months ended 30 June 2019
High Street Global Balanced Fund
Sanlam Global Value Fund1
Sanlam Stable Global Fund1
Sanlam Active UK Fund1
Sanlam Multi- Strategy Fund1
USD USD USD GBP GBP
Cash flows from operating activities
Purchases of financial assets and settlement of financial liabilities (7,605,029) (57,216,153) (28,077,534) (21,987,957) (87,388,051)
Proceeds from sale of investments (including realised gains) 5,441,428 94,377,457 20,670,841 (4,306,889) 31,836,664
Dividends received 197,433 1,988,854 998,377 759,069 1,088,307
Income from financial assets through profit of loss 81,374 - - - 2,263,487
Interest received 27,429 29,381 19,034 495 19,644
Income from securities lending received 65 4,855 3,129 11,285 364
Other income 94 72 67 15 54,976
Rebates received - - - - -
Operating expenses paid (137,541) (198,049) (413,433) (52,180) (439,124)
Net cash inflow/(outflow) from operating activities (1,994,747) 38,986,417 (6,799,519) (16,962,384) (52,563,733)
Cash flows from financing activities
Distributions paid to holders of redeemable participating shares - - (126) (8,860) (481,902)
Proceeds from redeemable participating shares issued 4,996,041 114,901 11,137,634 19,847,765 79,904,972
Payment on redemption of redeemable participating shares (772,538) (39,000,402) (3,531,879) (2,787,026) (19,368,344)
Income equalisation - - - - -
Net cash provided by/(used in) financing activities 4,223,503 (38,885,501) 7,605,629 17,051,879 60,054,726
Net increase/(decrease) in cash and cash equivalents 2,228,756 100,916 806,110 89,495 7,490,993
Cash and cash equivalents at the start of the period 4,335,935 804,821 1,632,894 132,085 13,574,939
Exchange gains/(losses) on cash and cash equivalents 695 (44,280) (73,401) 11,459 283,116
Cash and cash equivalents at the end of the period 6,565,386 861,457 2,365,603 (233,039) 21,349,048
1These sub-funds were renamed during the period ended 30 June 2019. The previous names of these Funds were Sanlam FOUR Global Equity Fund, Sanlam FOUR Stable Global Equity Fund, Sanlam FOUR Active UK Equity Fund and Sanlam FOUR Multi-Strategy Fund, respectively.

SANLAM UNIVERSAL FUNDS PLC
162
STATEMENTS OF CASH FLOWS OF THE FUNDS (CONTINUED) for the six months ended 30 June 2019
Anchor Global Stable Fund1
Bridge Global Equity Income Growth Fund1
Anchor Global Equity Fund
Bridge Global Managed Growth
Fund1
Sanlam Global Emerging Markets
Fund2
USD USD USD USD USD Cash flows from operating activities
Purchases of financial assets and settlement of financial liabilities (3,399,621) (1) (5,808,117) (5,633,892) (67,708,958)
Proceeds from sale of investments (including realised gains) 3,590,226 4,119,657 5,937,680 (805,199) 84,448,188
Dividends received 55,967 47,004 84,310 236,818 1,435,166
Income from financial assets through profit of loss 115,670 - - - -
Interest received 18,831 887 4,780 7,155 20,011
Income from securities lending received 27 - 77 - 4,618
Other income 58 - - 52 25
Rebates received - - - - -
Operating expenses paid (107,296) (59,183) (237,189) (26,733) (466,805)
Net cash inflow/(outflow) from operating activities 273,862 4,108,364 (18,459) (4,611,401) 17,732,245
Cash flows from financing activities
Distributions paid to holders of redeemable participating shares - - - - (3,079)
Proceeds from redeemable participating shares issued 2,181,574 - 2,248,271 5,284,426 1,862,972
Payment on redemption of redeemable participating shares (1,035,659) (4,305,337) (1,989,376) - (10,677,021)
Income equalisation - - - - -
Net cash provided by/(used in) financing activities 1,145,915 (4,305,337) 258,895 5,284,426 (8,817,128)
Net increase/(decrease) in cash and cash equivalents 1,419,777 (196,973) 240,436 673,025 8,915,117
Cash and cash equivalents at the start of the period 2,171,975 197,014 544,583 410,873 953,083
Exchange gains/(losses) on cash and cash equivalents (159) (41) 638 (257) 36,376
Cash and cash equivalents at the end of the period 3,591,593 - 785,657 1,083,641 9,904,576
1At an EGM on 25 March 2019, shareholders of Bridge Global Equity Income Growth Fund approved the merger of the fund into Bridge Global Managed Growth Fund. The merger took effect from 23.59pm on
Friday 12 April 2019. 2 This sub-fund was renamed during the period ended 30 June 2019. The previous name of the Fund was Denker Global Emerging Markets Fund.

SANLAM UNIVERSAL FUNDS PLC
163
STATEMENTS OF CASH FLOWS OF THE FUNDS (CONTINUED) for the six months ended 30 June 2019
ABSA Africa Equity Fund
Sanlam Centre American Select
Equity Fund
Sanlam Global Convertible
Securities Fund
Sanlam Japan Equity Fund
Sanlam Centre Active US Treasury
Fund USD USD USD USD USD Cash flows from operating activities
Purchases of financial assets and settlement of financial liabilities (15,502,159) (227,328,967) (12,940,700) (9,483,272) (67,785)
Proceeds from sale of investments (including realised gains) 19,443,562 80,435,201 13,192,129 58,173,818 180,790
Dividends received 962,570 1,033,175 75,247 518,997 -
Income from financial assets through profit of loss - - 263,975 12,847 45,149
Interest received 8,799 21,149 4,755 361 2,868
Income from securities lending received - 6,369 - 856 -
Other income - - 44 - 2
Rebates received - - - - -
Operating expenses paid (109,462) (49,105) (163,272) (64,380) (14,171)
Net cash inflow/(outflow) from operating activities 4,803,310 (145,882,178) 432,178 49,159,227 146,853
Cash flows from financing activities
Distributions paid to holders of redeemable participating shares (403,002) - - - (114,237)
Proceeds from redeemable participating shares issued 3,433,682 169,489,501 118,300 - 114,798
Payment on redemption of redeemable participating shares (8,900,000) (17,540,000) - (47,199,993) (99,201)
Income equalisation - - - - -
Net cash provided by/(used in) financing activities (5,869,320) 151,949,501 118,300 (47,199,993) (98,640)
Net increase/(decrease) in cash and cash equivalents (1,066,010) 6,067,323 550,478 1,959,234 48,213
Cash and cash equivalents at the start of the period 2,601,717 (4,127,725) 512,397 1,158,036 458,959
Exchange gains/(losses) on cash and cash equivalents 90,802 18 1,668 20,206 (1,708)
Cash and cash equivalents at the end of the period 1,626,509 1,939,616 1,064,543 3,137,476 505,464

SANLAM UNIVERSAL FUNDS PLC
164
STATEMENTS OF CASH FLOWS OF THE FUNDS (CONTINUED) for the six months ended 30 June 2019
Autus Global Equity Fund
Wisian Capital South African
Equity Fund
Cameron Hume Global Fixed
Income ESG Fund
Sanlam Centre Global Listed Infrastructure
Fund
Sanlam Real Assets Fund
USD USD USD USD GBP
Cash flows from operating activities
Purchases of financial assets and settlement of financial liabilities (759,295) (493,989) (43,529,202) (476,519) (47,318,456)
Proceeds from sale of investments (including realised gains) 3,029,792 35,734 (44,547,510) 469,288 (1,782,909)
Dividends received 68,204 133,349 - 85,730 2,242,310
Income from financial assets through profit of loss - - 1,306,251 - -
Interest received 15,285 26,504 42,431 1,118 18,252
Income from securities lending received - - - - -
Other income 94 - 9,225 4 -
Rebates received - - - - -
Operating expenses paid (145,832) (95,912) (199,131) (22,911) (316,789)
Net cash inflow/(outflow) from operating activities 2,208,248 (394,314) 2,177,084 56,761 (47,157,592)
Cash flows from financing activities
Distributions paid to holders of redeemable participating shares - - - (24,273) (10,454)
Proceeds from redeemable participating shares issued 45,148 - 10,000,000 24,275 52,260,674
Payment on redemption of redeemable participating shares (2,769,580) - (13,200,000) - (1,466,495)
Income equalisation - - - - -
Net cash provided by/(used in) financing activities (2,724,432) - (3,200,000) 2 50,783,725
Net increase/(decrease) in cash and cash equivalents (516,184) (394,314) (1,022,916) 56,763 3,626,133
Cash and cash equivalents at the start of the period 2,904,722 1,183,462 5,208,727 93,007 10,518,357
Exchange gains/(losses) on cash and cash equivalents (1,604) 59,376 (400,664) (20) 2,565,164
Cash and cash equivalents at the end of the period 2,386,934 848,524 3,785,147 149,750 16,709,654

SANLAM UNIVERSAL FUNDS PLC
165
STATEMENTS OF CASH FLOWS OF THE FUNDS (CONTINUED) for the six months ended 30 June 2019
Satrix Global Factor Enhanced Equity Fund
Perpetua Global Equity UCITS Fund
USD USD Cash flows from operating activities
Purchases of financial assets and settlement of financial liabilities (45,594,331) (20,298,026)
Proceeds from sale of investments (including realised gains) 26,002,296 1,987,536
Dividends received 749,187 188,162
Income from financial assets through profit of loss - -
Interest received 13,930 10,597
Income from securities lending received 437 -
Other income 21,177 -
Rebates received - -
Operating expenses paid (137,118) (55,651)
Net cash inflow/(outflow) from operating activities (18,944,422) (18,167,382)
Cash flows from financing activities
Distributions paid to holders of redeemable participating shares - -
Proceeds from redeemable participating shares issued 21,088,240 18,841,370
Payment on redemption of redeemable participating shares (2,901,893) (237,533)
Income equalisation - -
Net cash provided by/(used in) financing activities 18,186,347 18,603,837
Net increase/(decrease) in cash and cash equivalents (758,075) 436,455
Cash and cash equivalents at the start of the period 1,634,998 -
Exchange gains/(losses) on cash and cash equivalents 3,022 (111)
Cash and cash equivalents at the end of the period 879,945 436,344

SANLAM UNIVERSAL FUNDS PLC
166
STATEMENTS OF CASH FLOWS OF THE FUNDS for the six months ended 30 June 2018
Bridge Global Property Income
Fund1
P-Solve Inflation Plus Fund
Sanlam African Frontier Markets
Fund
Denker Global Equity Fund
Sanlam Global Bond Fund
USD GBP USD USD USD
Cash flows from operating activities
Purchases of financial assets and settlement of financial liabilities (3,093,503) (12,997,336) (7,399,660) (4,293,457) (225,130,906)
Proceeds from sale of investments (including realised gains) 6,167,512 16,779,236 5,182,822 12,710,102 78,971,061
Dividends received 690,021 50,104 2,344,603 1,968,572 -
Income from financial assets through profit of loss - 73,565 - - -
Interest received 280 3,021 14,867 5,952 6,877,324
Income from securities lending received - 2,426 617 6,800 51,015
Other income - - 41,822 - 245,802
Rebates received - 9,939 - - -
Operating expenses paid (271,970) (54,154) (564,496) (429,002) (389,729)
Net cash inflow/(outflow) from operating activities 3,492,340 3,866,801 (379,425) 9,968,967 (139,375,433)
Cash flows from financing activities
Distributions paid to holders of redeemable participating shares - (329,861) - (1,090) -
Proceeds from redeemable participating shares issued 15,944 637,958 52,022,944 238,941 160,049,765
Payment on redemption of redeemable participating shares (3,160,501) (4,552,757) (36,664,551) (8,892,750) (35,440,516)
Income equalization (463,768) (28,038) 2,802,456 (1,118,640) 15,759,262
Net cash provided/(used in) by financing activities (3,608,325) (4,272,698) 18,160,849 (9,773,539) 140,368,511
Net increase/(decrease) in cash and cash equivalents (115,985) (405,897) 17,781,424 195,428 993,078
Cash and cash equivalents at the start of the period 26,236 1,135,641 4,957,532 1,620,960 8,723,047
Exchange gains/(losses) on cash and cash equivalents (7,460) (928) (87,681) (27,926) (3,264,936)
Cash and cash equivalents at the end of the period (97,209) 728,816 22,651,275 1,788,462 6,451,189

SANLAM UNIVERSAL FUNDS PLC
167
STATEMENTS OF CASH FLOWS OF THE FUNDS (CONTINUED) for the six months ended 30 June 2018
Sanlam Global Financial Fund
Sanlam Global Property Fund
Sanlam World Equity Fund
Satrix World Equity Tracker Fund
SIIP India Opportunities Fund
USD USD USD USD USD
Cash flows from operating activities
Purchases of financial assets and settlement of financial liabilities (58,467,223) (49,158,398) (89,357,275) (302,520,740) (11,027,600)
Proceeds from sale of investments (including realised gains) 37,154,412 48,553,889 304,993,324 95,051,801 14,440,181
Dividends received 2,750,185 2,243,140 3,443,436 10,809,802 75,062
Income from financial assets through profit of loss - - - - -
Interest received 14,967 6,506 28,961 22,316 2,116
Income from securities lending received 4,905 860 22,517 37,655 -
Other income 26 21 - 76 -
Rebates received - - - 103,219 62,970
Operating expenses paid (738,211) (320,772) (1,526,933) (1,448,544) (329,626)
Net cash inflow/(outflow) from operating activities (19,280,939) 1,325,246 217,604,030 (197,944,415) 3,223,103
Cash flows from financing activities
Distributions paid to holders of redeemable participating shares (76,845) - - (15,497) -
Proceeds from redeemable participating shares issued 29,933,741 2,148,814 5,763,186 307,808,105 393,086
Payment on redemption of redeemable participating shares (10,483,456) (4,382,698) (208,359,369) (111,316,041) (3,413,562)
Income equalisation 250,193 (70,491) (17,365,406) 4,557,945 90,001
Net cash provided by/(used in) financing activities 19,623,633 (2,304,375) (219,961,589) 201,034,512 (2,930,475)
Net increase/(decrease) in cash and cash equivalents 342,694 (979,129) (2,357,559) 3,090,097 292,628
Cash and cash equivalents at the start of the period 1,742,521 2,309,141 6,076,037 5,593,231 130,147
Exchange gains/(losses) on cash and cash equivalents (115,639) (119,803) 30,064 (183,539) (32,029)
Cash and cash equivalents at the end of the period 1,969,576 1,210,209 3,748,542 8,499,789 390,746

SANLAM UNIVERSAL FUNDS PLC
168
STATEMENTS OF CASH FLOWS OF THE FUNDS (CONTINUED) for the six months ended 30 June 2018
Denker Global Dividend Fund
Sanlam Strategic Bond Fund
Sanlam Accel Income Fund
Satrix North America Equity
Tracker Fund
Satrix UK Equity Tracker Fund
USD GBP GBP USD GBP
Cash flows from operating activities
Purchases of financial assets and settlement of financial liabilities (41,460,105) (936,207,043) (400,000) (8,210,215) (3,953,473)
Proceeds from sale of investments (including realised gains) 2,186,308 855,216,812 2,550,000 6,648,713 2,935,719
Dividends received 3,661,225 298,985 635,206 673,715 1,099,587
Income from financial assets through profit of loss - 3,439,124 - - -
Interest received 24,677 (30,428) 940 2,708 139
Income from securities lending received 10,157 - 1,755 1,939
Other income - 4,324 - - 2
Rebates received - - - - 4,119
Operating expenses paid (671,264) (487,486) (84,019) (39,259) (40,025)
Net cash inflow/(outflow) from operating activities (36,249,002) (77,765,712) 2,702,127 (922,583) 48,007
Cash flows from financing activities
Distributions paid to holders of redeemable participating shares (233,959) (2,949,524) (415,350) (5,895) (29,462)
Proceeds from redeemable participating shares issued 36,961,404 81,009,090 1,661,979 3,248,182 333,903
Payment on redemption of redeemable participating shares (872,381) (18,617,035) (3,778,745) (2,448,852) (15,112)
Income equalization 2,729,980 9,060,044 (280,138) 45,260 62,773
Net cash provided by/(used in) financing activities 38,585,044 68,502,575 (2,812,254) 838,695 352,102
Net increase/(decrease) in cash and cash equivalents 2,336,042 (9,263,137) (110,127) (83,888) 400,109
Cash and cash equivalents at the start of the period 2,863,278 3,017,091 1,077,173 162,715 57,637
Exchange gains/(losses) on cash and cash equivalents (29,321) 791,737 865 332 (2,229)
Cash and cash equivalents at the end of the period 5,169,999 (5,454,309) 967,911 79,159 455,517

SANLAM UNIVERSAL FUNDS PLC
169
STATEMENTS OF CASH FLOWS OF THE FUNDS (CONTINUED) for the six months ended 30 June 2018
Satrix Europe (ex UK) Equity Tracker Fund
Satrix Emerging Market Equity Tracker Fund
Sanlam Managed Risk Fund
Sanlam Global High Quality
Fund
Sanlam US Dividend Fund1
EUR USD USD GBP USD
Cash flows from operating activities
Purchases of financial assets and settlement of financial liabilities (10,355,216) (8,893,973) (13,818,125) (90,574,566) (282,887,110)
Proceeds from sale of investments (including realised gains) 15,286,931 14,822,918 10,479,490 24,551,145 221,547,145
Dividends received 5,799,557 500,256 - 1,858,366 3,195,934
Income from financial assets through profit of loss 47,886 - - -
Interest received (4,152) 2,118 16,732 76,900 131,469
Income from securities lending received - 2,637 - 7,279
Other income 66 - 16,404 66
Rebates received (1) 35,405 - -
Operating expenses paid (237,451) (264,556) (611,714) (1,068,805) (640,179)
Net cash inflow/(outflow) from operating activities 10,537,620 6,204,805 (3,917,213) (65,149,615) (58,652,741)
Cash flows from financing activities
Distributions paid to holders of redeemable participating shares (14,988) (213,645) - (133,021) (346,211)
Proceeds from redeemable participating shares issued 4,264,785 8,110,952 19,082,360 123,017,778 96,811,325
Payment on redemption of redeemable participating shares (8,712,466) (13,918,507) (11,682,362) (46,214,883) (42,065,703)
Income equalisation (1,407,414) (309,390) (262,606) 1,763,890 1,758,065
Net cash provided by/(used in) financing activities (5,870,083) (6,330,590) 7,137,392 78,433,764 56,157,476
Net increase/(decrease) in cash and cash equivalents 4,667,537 (125,785) 3,220,179 13,284,149 (2,495,265)
Cash and cash equivalents at the start of the period 517,466 418,172 4,440,260 40,245,266 21,932,873
Exchange gains/(losses) on cash and cash equivalents (4,192) (19,127) (989,539) 14,867 872,334
Cash and cash equivalents at the end of the period 5,180,811 273,260 6,670,900 53,544,282 20,309,942
1This sub-fund was renamed during the period ended 30 June 2019. The previous name of the Funds was Sanlam FOUR US Dividend Fund.

SANLAM UNIVERSAL FUNDS PLC
170
STATEMENTS OF CASH FLOWS OF THE FUNDS (CONTINUED) for the six months ended 30 June 2018
High Street Global Balanced Fund
Sanlam Global Value Fund1
Sanlam Stable Global Fund1
Sanlam Active UK Fund1
Sanlam Multi-Strategy Fund1
USD USD USD GBP GBP
Cash flows from operating activities
Purchases of financial assets and settlement of financial liabilities (5,081,289) (24,862,428) (53,876,022) (10,206,649) (36,689,120)
Proceeds from sale of investments (including realised gains) 5,022,281 42,730,002 90,188,673 28,290,037 23,057,870
Dividends received 193,131 2,472,489 1,753,130 968,293 1,857,818
Income from financial assets through profit of loss - - - 2,472,222
Interest received 69,626 31,580 23,801 1,143 6,842
Income from securities lending received 47 - - - -
Other income 3 7,883 6,582 25 -
Rebates received - - - -
Operating expenses paid (134,739) (444,903) (292,910) (71,445) (240,037)
Net cash inflow/(outflow) from operating activities 69,060 19,934,623 37,803,254 18,981,404 (9,534,405)
Cash flows from financing activities
Distributions paid to holders of redeemable participating shares - - - (5,917) (140,305)
Proceeds from redeemable participating shares issued 1,360,227 5,247,005 67,657,630 159,534 17,679,533
Payment on redemption of redeemable participating shares (736,650) (24,603,515) (100,762,787) (16,261,385) (10,306,848)
Income equalisation 33,210 (1,831,174) (5,401,450) (2,917,608) 238,492
Net cash provided by/(used in) financing activities 656,787 (21,187,684) (38,506,607) (19,025,376) 7,470,872
Net increase/(decrease) in cash and cash equivalents 725,847 (1,253,061) (703,353) (43,972) (2,063,533)
Cash and cash equivalents at the start of the period 980,258 6,190,380 3,632,489 667,893 9,293,568
Exchange gains/(losses) on cash and cash equivalents 115,571 (64,550) 40,683 1,926 799,954
Cash and cash equivalents at the end of the period 1,821,676 4,872,770 2,969,779 625,847 8,029,989
1These sub-funds were renamed during the period ended 30 June 2019. The previous names of these Funds were Sanlam FOUR Global Equity Fund, Sanlam FOUR Stable Global Equity Fund, Sanlam FOUR
Active UK Equity Fund and Sanlam FOUR Multi-Strategy Fund, respectively.
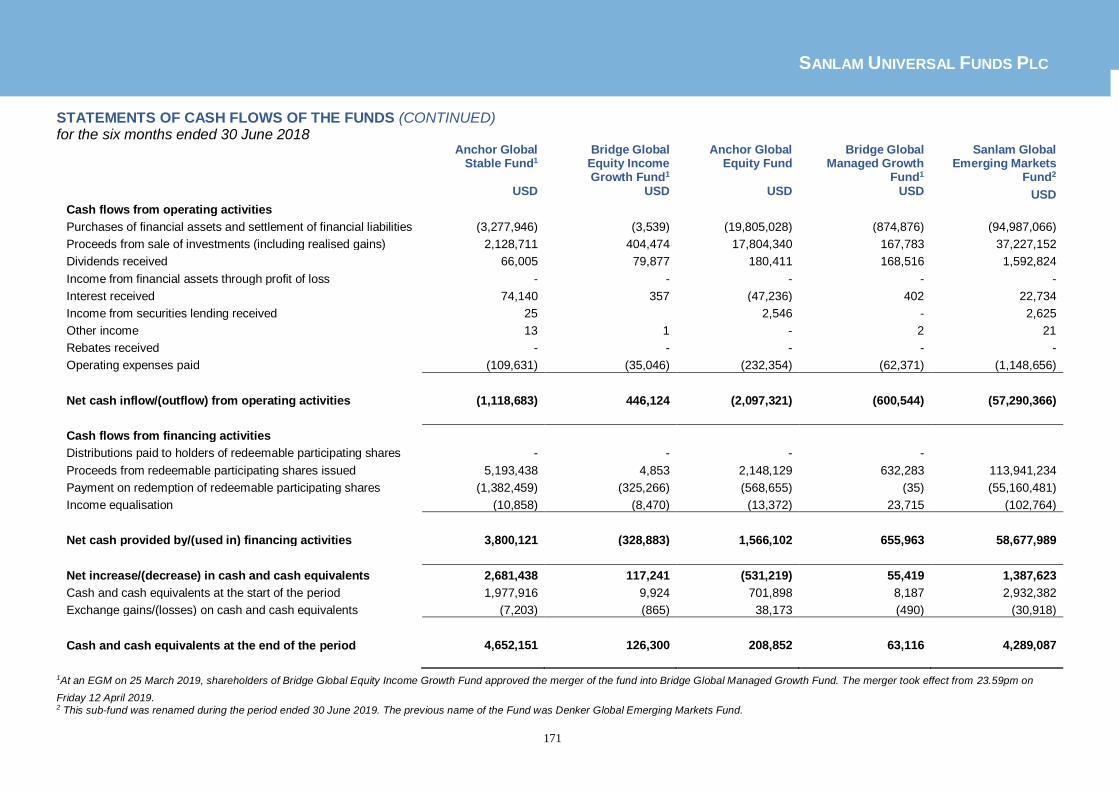
SANLAM UNIVERSAL FUNDS PLC
171
STATEMENTS OF CASH FLOWS OF THE FUNDS (CONTINUED) for the six months ended 30 June 2018
Anchor Global Stable Fund1
Bridge Global Equity Income Growth Fund1
Anchor Global Equity Fund
Bridge Global Managed Growth
Fund1
Sanlam Global Emerging Markets
Fund2
USD USD USD USD USD Cash flows from operating activities
Purchases of financial assets and settlement of financial liabilities (3,277,946) (3,539) (19,805,028) (874,876) (94,987,066)
Proceeds from sale of investments (including realised gains) 2,128,711 404,474 17,804,340 167,783 37,227,152
Dividends received 66,005 79,877 180,411 168,516 1,592,824
Income from financial assets through profit of loss - - - - -
Interest received 74,140 357 (47,236) 402 22,734
Income from securities lending received 25 2,546 - 2,625
Other income 13 1 - 2 21
Rebates received - - - - -
Operating expenses paid (109,631) (35,046) (232,354) (62,371) (1,148,656)
Net cash inflow/(outflow) from operating activities (1,118,683) 446,124 (2,097,321) (600,544) (57,290,366)
Cash flows from financing activities
Distributions paid to holders of redeemable participating shares - - - -
Proceeds from redeemable participating shares issued 5,193,438 4,853 2,148,129 632,283 113,941,234
Payment on redemption of redeemable participating shares (1,382,459) (325,266) (568,655) (35) (55,160,481)
Income equalisation (10,858) (8,470) (13,372) 23,715 (102,764)
Net cash provided by/(used in) financing activities 3,800,121 (328,883) 1,566,102 655,963 58,677,989
Net increase/(decrease) in cash and cash equivalents 2,681,438 117,241 (531,219) 55,419 1,387,623
Cash and cash equivalents at the start of the period 1,977,916 9,924 701,898 8,187 2,932,382
Exchange gains/(losses) on cash and cash equivalents (7,203) (865) 38,173 (490) (30,918)
Cash and cash equivalents at the end of the period 4,652,151 126,300 208,852 63,116 4,289,087
1At an EGM on 25 March 2019, shareholders of Bridge Global Equity Income Growth Fund approved the merger of the fund into Bridge Global Managed Growth Fund. The merger took effect from 23.59pm on
Friday 12 April 2019. 2 This sub-fund was renamed during the period ended 30 June 2019. The previous name of the Fund was Denker Global Emerging Markets Fund.

SANLAM UNIVERSAL FUNDS PLC
172
STATEMENTS OF CASH FLOWS OF THE FUNDS (CONTINUED) for the six months ended 30 June 2018
ABSA Africa Equity Fund
Sanlam Centre American Select
Equity Fund
Sanlam Global Convertible
Securities Equity Fund
Sanlam Japan Equity Fund
Sanlam Centre Active US Treasury
Fund
USD USD USD USD USD Cash flows from operating activities
Purchases of financial assets and settlement of financial liabilities (11,251,150) (104,091,321) (30,176,372) (37,694,414) (758,298)
Proceeds from sale of investments (including realised gains) 15,187,069 80,473,339 15,543,989 27,161,288 2,251,000
Dividends received 683,397 777,816 68,235 681,913 -
Income from financial assets through profit of loss - - - - -
Interest received 6,382 12,442 261,634 1,180 308,652
Income from securities lending received - - - 18 -
Other income 11,247 - - - -
Rebates received - - - - -
Operating expenses paid (278,722) (44,744) (175,863) (23,747) (24,746)
Net cash inflow/(outflow) from operating activities 4,358,223 (22,872,468) (14,478,377) (9,873,762) 1,776,608
Cash flows from financing activities
Distributions paid to holders of redeemable participating shares (266,296)
Proceeds from redeemable participating shares issued 2,775,660 27,461,923 14,111,890 11,761,949 342,370
Payment on redemption of redeemable participating shares (4,413,660) 51,221 (2,215,409) (1,399,324) (2,564,719)
Income equalisation 33,530 236,857 9,695 37,375 (1,692)
Net cash provided by/(used in) financing activities (1,604,470) 27,750,001 11,906,176 10,400,000 (2,490,337)
Net increase/(decrease) in cash and cash equivalents 2,753,753 4,877,533 (2,572,201) 526,238 (713,729)
Cash and cash equivalents at the start of the period 143,148 1,492,368 2,502,286 296,599 1,630,904
Exchange gains/(losses) on cash and cash equivalents (209,622) (3,568) 207,291 (38,043) (389)
Cash and cash equivalents at the end of the period 2,687,279 6,366,333 137,376 784,794 916,786

SANLAM UNIVERSAL FUNDS PLC
173
STATEMENTS OF CASH FLOWS OF THE FUNDS (CONTINUED) for the six months ended 30 June 2018
Autus Global Equity Fund
Wisian Capital South African
Equity Fund
Sanlam Equity Allocation
Fund
Sanlam FOUR Enhanced
Income Fund USD USD USD GBP
Cash flows from operating activities
Purchases of financial assets and settlement of financial liabilities (9,868,858) (7,644,856) (40,529,093) (1,761,345)
Proceeds from sale of investments (including realised gains) 10,304,125 233,842 72,707,949 1,615,349
Dividends received 87,021 37,850 2,243,605 46,339
Income from financial assets through profit of loss - - - -
Interest received 6,714 14,627 (533) 16,249
Income from securities lending received - - 14,392 -
Other income - - 277 -
Rebates received - - - 43
Operating expenses paid (116,648) (16,763) (62,995) (20,986)
Net cash inflow/(outflow) from operating activities 412,354 (7,375,300) 34,373,602 (104,351)
Cash flows from financing activities
Distributions paid to holders of redeemable participating shares - - - (167,998)
Proceeds from redeemable participating shares issued 50,536 12,060,784 - 166,071
Payment on redemption of redeemable participating shares (92) (4,298,902) (30,783,931) (20,531)
Income equalisation 159 2,639 (4,305,948) -
Net cash provided by/(used in) financing activities 50,603 7,764,521 (35,089,879) (22,458)
Net increase/(decrease) in cash and cash equivalents 462,957 389,221 (716,277) (126,809)
Cash and cash equivalents at the start of the period 1,782,090 - 1,028,775 844,627
Exchange gains/(losses) on cash and cash equivalents (15,802) 884,531 (179,173) 119,630
Cash and cash equivalents at the end of the period 2,229,245 1,273,752 133,325 837,448

SANLAM UNIVERSAL FUNDS PLC
174
PORTFOLIO OF INVESTMENTS OF BRIDGE GLOBAL PROPERTY INCOME FUND
as at 30 June 2019
Nominal Security Classification Fair Value
USD
% of
Net Assets
Financial assets at fair value through profit or loss
Equities - 96.54%
Australia - 5.94%
155,000 Gpt Group 668,943 2.98%
230,000 Growthpoint Properties A 664,979 2.96%
Total Australia 1,333,922 5.94%
Canada - 3.01%
34,000 Riocan Real Estate Invstments 676,227 3.01%
Total Canada 676,227 3.01%
France – 5.78%
21,000 Klepierre 705,008 3.14%
3,950 Unibail-Rodamco-Westfield 592,646 2.64%
Total France 1,297,654 5.78%
Mauritius - 2.56%
450,000 Grit Real Estate Income 574,417 2.56%
Total Mauritius 574,417 2.56%
United Kingdom - 7.95%
72,000 British Land Co Plc 493,360 2.20%
11,500 Derwent London Plc 456,059 2.03%
101,950 Hammerson Plc 359,542 1.60%
45,000 Land Securities Group Plc 477,186 2.12%
Total United Kingdom 1,786,147 7.95%
United States - 71.30%
25,400 Acadia Realty Trust 695,198 3.09%
3,400 Avalonbay Communities Inc 690,812 3.08%
5,400 Boston Properties Inc 696,600 3.10%
33,500 Columbia Property Trust Inc 694,790 3.09%
20,900 Cubesmart 698,896 3.11%
5,800 Digital Realty Trust Inc 683,182 3.04%
22,400 Duke Realty Corp 708,064 3.15%
9,100 Equity Residential 690,872 3.08%
5,400 Federal Realty Invs Trust 695,304 3.09%
22,000 Healthcare Realty Trust Inc 689,040 3.07%
21,400 Hudson Pacific Properties In 711,978 3.17%
26,000 Invitation Homes Inc 694,980 3.09%
37,800 Kimco Realty Corp 698,544 3.11%
14,100 Liberty Property Trust 705,564 3.14%
20,800 Macerich Co/The 696,592 3.10%
6,000 Mid-America Apartment Comm 706,560 3.15%
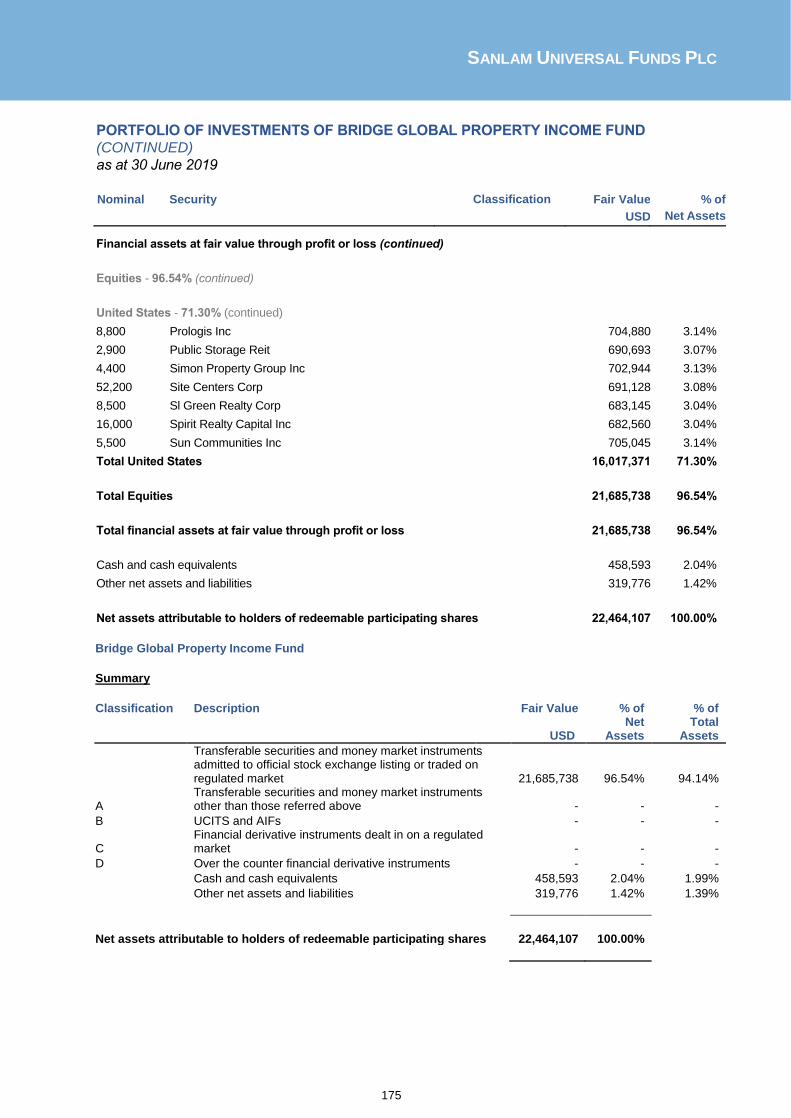
SANLAM UNIVERSAL FUNDS PLC
175
PORTFOLIO OF INVESTMENTS OF BRIDGE GLOBAL PROPERTY INCOME FUND
(CONTINUED)
as at 30 June 2019
Nominal Security Classification Fair Value
USD
% of
Net Assets
Financial assets at fair value through profit or loss (continued)
Equities - 96.54% (continued)
United States - 71.30% (continued)
8,800 Prologis Inc 704,880 3.14%
2,900 Public Storage Reit 690,693 3.07%
4,400 Simon Property Group Inc 702,944 3.13%
52,200 Site Centers Corp 691,128 3.08%
8,500 Sl Green Realty Corp 683,145 3.04%
16,000 Spirit Realty Capital Inc 682,560 3.04%
5,500 Sun Communities Inc 705,045 3.14%
Total United States 16,017,371 71.30%
Total Equities 21,685,738 96.54%
Total financial assets at fair value through profit or loss 21,685,738 96.54%
Cash and cash equivalents 458,593 2.04%
Other net assets and liabilities 319,776 1.42%
Net assets attributable to holders of redeemable participating shares 22,464,107 100.00%
Bridge Global Property Income Fund
Summary
Classification Description Fair Value % of % of
USD Net
Assets Total
Assets
Transferable securities and money market instruments admitted to official stock exchange listing or traded on regulated market 21,685,738 96.54% 94.14%
A Transferable securities and money market instruments other than those referred above - - -
B UCITS and AIFs - - -
C Financial derivative instruments dealt in on a regulated market - - -
D Over the counter financial derivative instruments - - -
Cash and cash equivalents 458,593 2.04% 1.99%
Other net assets and liabilities 319,776 1.42% 1.39%
Net assets attributable to holders of redeemable participating shares 22,464,107 100.00%

SANLAM UNIVERSAL FUNDS PLC
176
PORTFOLIO OF INVESTMENTS OF SANLAM AFRICAN FRONTIERS MARKETS FUND
as at 30 June 2019
Nominal Security Classification Fair Value
USD
% of
Net Assets
Financial assets at fair value through profit or loss
Equities - 93.28%
Egypt - 7.69%
485,000 Credit Agricole Egypt 1,365,379 1.10%
5,335,000 Eastern Company Tobacco 4,933,956 3.96%
1,150,000 Elswedy Electric Co 984,337 0.79%
924,000 Qatar National Bank Alah 2,283,019 1.83%
Total Egypt 9,566,691 7.69%
Jersey Channel Islands - 1.17%
1,000,000 Centamin Plc 1,455,969 1.17%
Total Jersey Channel Islands 1,455,969 1.17%
Kenya – 8.87%
1 Co-Operative Bank Of Ken - 0.00%
1,085,000 East African Breweries L 2,120,634 1.70%
5,120,000 Equity Group Holdings Pl 1,951,311 1.57%
5,400,000 Kcb Group Ltd 2,021,037 1.62%
17,999,904 Safaricom Plc 4,949,093 3.98%
Total Kenya 11,042,075 8.87%
Mauritius - 2.47%
378,000 Mcb Group Ltd 3,077,239 2.47%
Total Mauritius 3,077,239 2.47%
Morocco - 11.02%
77,200 Attijariwafa Bank Von 3,759,655 3.02%
35,000 Banque Centrale Populair 987,224 0.79%
7,200 Lafargeholcim Maroc Sa 1,241,542 1.00%
273,650 Maroc Telecom 3,975,164 3.19%
13,600 Societe Des Boissons Du 3,752,214 3.02%
Total Morocco 13,715,799 11.02%
Nigeria - 14.51%
37,000,000 Guaranty Trust Bank 3,381,389 2.72%
955,000 Nestle Nigeria Plc 3,687,361 2.96%
13,000,000 Nigerian Breweries Plc 2,275,000 1.83%
1,765,000 Seplat Petroleum Develop 2,616,958 2.10%
13,000,000 Stanbic Ibtc Holdings Pl 1,453,472 1.17%
11,000,000 Unilever Nigeria Plc 1,008,333 0.81%
66,000,000 Zenith Bank Plc 3,630,000 2.92%
Total Nigeria 18,052,513 14.51%
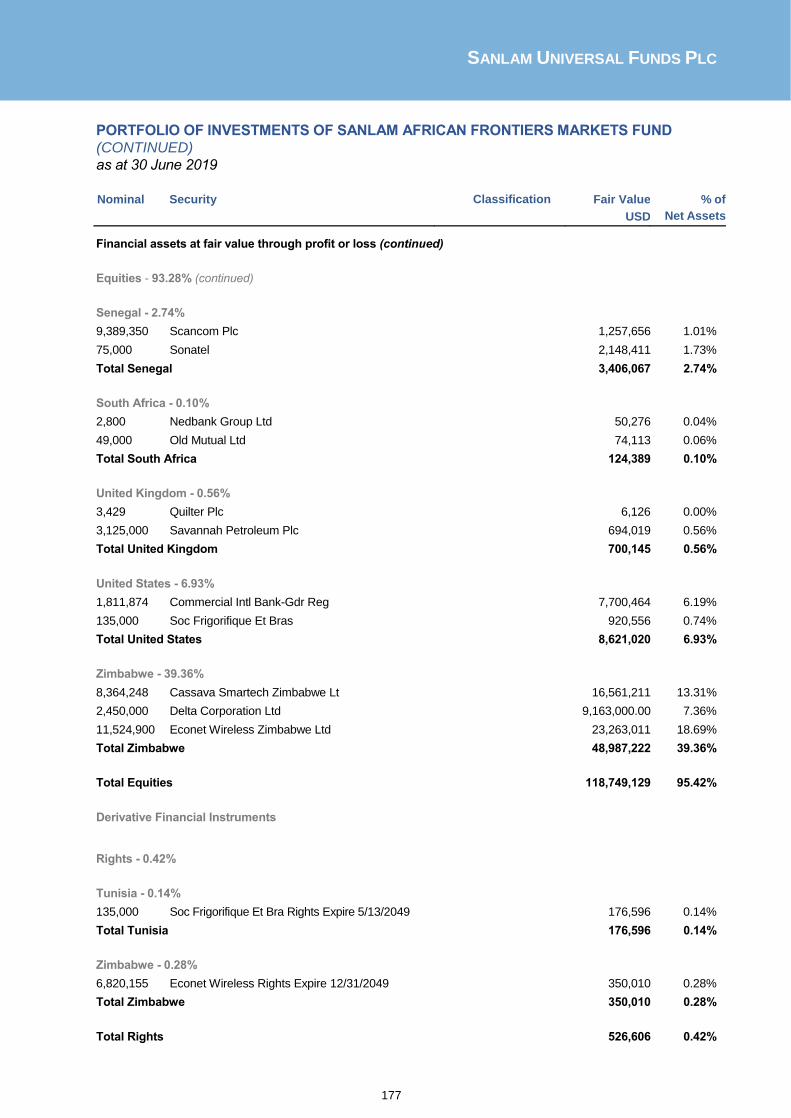
SANLAM UNIVERSAL FUNDS PLC
177
PORTFOLIO OF INVESTMENTS OF SANLAM AFRICAN FRONTIERS MARKETS FUND
(CONTINUED)
as at 30 June 2019
Nominal Security Classification Fair Value
USD
% of
Net Assets
Financial assets at fair value through profit or loss (continued)
Equities - 93.28% (continued)
Senegal - 2.74%
9,389,350 Scancom Plc 1,257,656 1.01%
75,000 Sonatel 2,148,411 1.73%
Total Senegal 3,406,067 2.74%
South Africa - 0.10%
2,800 Nedbank Group Ltd 50,276 0.04%
49,000 Old Mutual Ltd 74,113 0.06%
Total South Africa 124,389 0.10%
United Kingdom - 0.56%
3,429 Quilter Plc 6,126 0.00%
3,125,000 Savannah Petroleum Plc 694,019 0.56%
Total United Kingdom 700,145 0.56%
United States - 6.93%
1,811,874 Commercial Intl Bank-Gdr Reg 7,700,464 6.19%
135,000 Soc Frigorifique Et Bras 920,556 0.74%
Total United States 8,621,020 6.93%
Zimbabwe - 39.36%
8,364,248 Cassava Smartech Zimbabwe Lt 16,561,211 13.31%
2,450,000 Delta Corporation Ltd 9,163,000.00 7.36%
11,524,900 Econet Wireless Zimbabwe Ltd 23,263,011 18.69%
Total Zimbabwe 48,987,222 39.36%
Total Equities 118,749,129 95.42%
Derivative Financial Instruments
Rights - 0.42%
Tunisia - 0.14%
135,000 Soc Frigorifique Et Bra Rights Expire 5/13/2049 176,596 0.14%
Total Tunisia 176,596 0.14%
Zimbabwe - 0.28%
6,820,155 Econet Wireless Rights Expire 12/31/2049 350,010 0.28%
Total Zimbabwe 350,010 0.28%
Total Rights 526,606 0.42%

SANLAM UNIVERSAL FUNDS PLC
178
PORTFOLIO OF INVESTMENTS OF SANLAM AFRICAN FRONTIERS MARKETS FUND
(CONTINUED)
as at 30 June 2019
Nominal Security Classification Fair Value
USD
% of
Net Assets
Financial assets at fair value through profit or loss (continued)
Total financial assets at fair value through profit or loss 119,275,735 95.84%
Cash and cash equivalents 4,941,273 3.97%
Other net assets and liabilities 230,480 0.19%
Net assets attributable to holders of redeemable participating shares 124,447,488 100.00%
Sanlam African Frontier Markets Fund Summary
Classification Description Fair Value % of % of
USD Net
Assets Total
Assets
Transferable securities and money market instruments admitted to official stock exchange listing or traded on regulated market
118,749,129 95.42% 95.36%
A Transferable securities and money market instruments other than those referred above - - -
B UCITS and AIFs - - -
C Financial derivative instruments dealt in on a regulated market
- - -
D Over the counter financial derivative instruments 526,606 0.42% 0.42%
Cash and cash equivalents 4,941,273 3.97% 3.97%
Other net assets and liabilities 230,480 0.19% 0.19%
Net assets attributable to holders of redeemable participating shares 124,447,488 100.00%
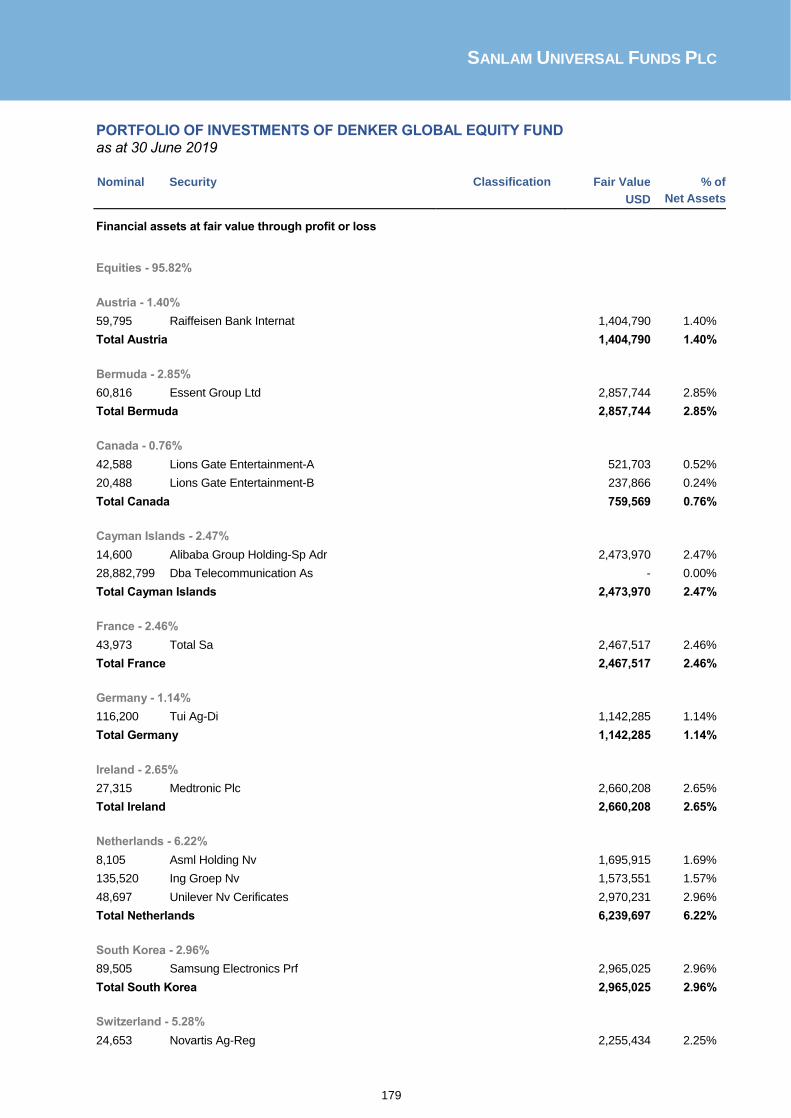
SANLAM UNIVERSAL FUNDS PLC
179
PORTFOLIO OF INVESTMENTS OF DENKER GLOBAL EQUITY FUND
as at 30 June 2019
Nominal Security Classification Fair Value
USD
% of
Net Assets
Financial assets at fair value through profit or loss
Equities - 95.82%
Austria - 1.40%
59,795 Raiffeisen Bank Internat 1,404,790 1.40%
Total Austria 1,404,790 1.40%
Bermuda - 2.85%
60,816 Essent Group Ltd 2,857,744 2.85%
Total Bermuda 2,857,744 2.85%
Canada - 0.76%
42,588 Lions Gate Entertainment-A 521,703 0.52%
20,488 Lions Gate Entertainment-B 237,866 0.24%
Total Canada 759,569 0.76%
Cayman Islands - 2.47%
14,600 Alibaba Group Holding-Sp Adr 2,473,970 2.47%
28,882,799 Dba Telecommunication As - 0.00%
Total Cayman Islands 2,473,970 2.47%
France - 2.46%
43,973 Total Sa 2,467,517 2.46%
Total France 2,467,517 2.46%
Germany - 1.14%
116,200 Tui Ag-Di 1,142,285 1.14%
Total Germany 1,142,285 1.14%
Ireland - 2.65%
27,315 Medtronic Plc 2,660,208 2.65%
Total Ireland 2,660,208 2.65%
Netherlands - 6.22%
8,105 Asml Holding Nv 1,695,915 1.69%
135,520 Ing Groep Nv 1,573,551 1.57%
48,697 Unilever Nv Cerificates 2,970,231 2.96%
Total Netherlands 6,239,697 6.22%
South Korea - 2.96%
89,505 Samsung Electronics Prf 2,965,025 2.96%
Total South Korea 2,965,025 2.96%
Switzerland - 5.28%
24,653 Novartis Ag-Reg 2,255,434 2.25%

SANLAM UNIVERSAL FUNDS PLC
180
PORTFOLIO OF INVESTMENTS OF DENKER GLOBAL EQUITY FUND (CONTINUED)
as at 30 June 2019
Nominal Security Classification Fair Value
USD
% of
Net Assets
Financial assets at fair value through profit or loss (continued)
Equities - 95.82% (continued)
Switzerland - 5.28% (continued)
10,780 Roche Holding Ag-Genussc 3,036,643 3.03%
Total Switzerland 5,292,077 5.28%
United Kingdom - 22.20%
4,700,000 Accident Exchange Group - 0.00%
92,874 Ashtead Group Plc 2,664,245 2.66%
105,190 Glaxosmithkline Plc (Lse) 2,110,678 2.10%
255,670 Howden Joinery Group Plc 1,649,733 1.65%
45,606 Imperial Brands Plc 1,071,934 1.07%
390,535 Legal & General Group Pl 1,339,506 1.34%
90,872 Micro Focus International 2,387,074 2.38%
51,631 Nielsen Holdings Plc 1,166,860 1.16%
279,748 Onesavings Bank Plc 1,290,984 1.29%
136,102 Prudential Plc 2,972,404 2.96%
95,762 Royal Dutch Shell Plc-A 3,130,933 3.12%
727,564 Taylor Wimpey Plc 1,460,719 1.46%
49,981 Tbc Bank Group Plc 1,010,140 1.01%
Total United Kingdom 22,255,210 22.20%
United States - 45.43%
40,412 Altria Group Inc 1,913,508 1.91%
15,789 Becton Dickinson And Co 3,978,986 3.97%
9,193 Berkshire Hathaway Inc-Cl B 1,959,672 1.95%
6,596 Boeing Co 2,401,010 2.40%
90,198 Cisco Systems Inc 4,936,536 4.92%
39,591 Citigroup Inc 2,772,558 2.77%
77,603 Hp Inc 1,613,366 1.61%
7,052 Illinois Tool Works 1,063,512 1.06%
28,032 Jpmorgan Chase & Co 3,133,978 3.13%
12,884 Kla-Tencor Corp 1,522,889 1.52%
39,054 Microsoft Corp 5,231,674 5.22%
682 Nvr Inc 2,298,510 2.29%
65,604 Oracle Corp 3,737,460 3.73%
19,520 Pepsico Inc 2,559,658 2.55%
22,089 Philip Morris International 1,734,649 1.73%
13,755 Signature Bank 1,662,154 1.66%

SANLAM UNIVERSAL FUNDS PLC
181
PORTFOLIO OF INVESTMENTS OF DENKER GLOBAL EQUITY FUND (CONTINUED)
as at 30 June 2019
Nominal Security Classification Fair Value
USD
% of
Net Assets
Financial assets at fair value through profit or loss (continued)
Equities - 95.82% (continued)
United States - 45.43% (continued)
52,830 Verizon Communications - Vz.N 3,018,178 3.01%
Total United States 45,538,298 45.43%
Total Equities 96,056,390 95.82%
Total financial assets at fair value through profit or loss 96,056,390 95.82%
Cash and cash equivalents 4,104,976 4.09%
Other net assets and liabilities 82,775 0.08%
Net assets attributable to holders of redeemable participating shares 100,244,141 100.00%
Denker Global Equity Fund Summary Classification Description Fair Value % of % of
USD Net
Assets Total
Assets
Transferable securities and money market instruments admitted to official stock exchange listing or traded on regulated market 96,056,390 95.82% 95.59%
A Transferable securities and money market instruments other than those referred above - - -
B UCITS and AIFs - - -
C Financial derivative instruments dealt in on a regulated market - - -
D Over the counter financial derivative instruments - - -
Cash and cash equivalents 4,104,976 4.09% 4.08%
Other net assets and liabilities 82,775 0.08% 0.08%
Net assets attributable to holders of redeemable participating shares 100,244,141 100.00%

SANLAM UNIVERSAL FUNDS PLC
182
PORTFOLIO OF INVESTMENTS OF SANLAM GLOBAL BOND FUND
as at 30 June 2019
Nominal Security Coupon Maturity Classification Fair Value % of
USD Net Assets
Financial assets at fair value through profit or loss
Corporate Debt - 33.69%
Australia – 2.82% 400,000 Apt Pipelines 2.000% 03/22/2027 487,646 0.08% 2,300,000 Aust & Nz Bank 2.625% 11/09/2022 2,320,677 0.39% 1,000,000 Aust & Nz Banki 2.250% 11/09/2020 999,990 0.17% 400,000 Commonwea 0.875% 02/19/2029 477,932 0.08% 900,000 Commonwealth V/R 1.936% 10/03/2029 1,047,356 0.18% 1,242,000 Macquarie Group 6.250% 01/14/2021 1,308,484 0.22% 800,000 Stockland 1.625% 04/27/2026 940,325 0.16% 850,000 Transurban 1.750% 03/29/2028 1,037,162 0.17% 600,000 Westpac B 7.250% 02/11/2020 435,688 0.07% 1,552,000 Westpac Banking 3.350% 03/08/2027 1,620,604 0.27% 1,774,000 Westpac Banking C V/R 4.322% 11/23/2031 1,834,077 0.31% 1,947,000 Woodside Financ 3.650% 03/05/2025 1,999,783 0.34% 1,774,000 Woodside Finance 3.700% 09/15/2026 1,796,796 0.30% 700,000 Commonwealth Bank 3.750% 18/10/2019 494,476 0.08% Total Australia 16,800,996 2.82%
Austria – 0.02% 73,000 Energie Obe 4.500% 03/04/2025 103,143 0.02% Total Austria 103,143 0.02%
Belgium – 0.21% 350,000 Anheuser-B 3.250% 01/24/2033 496910 0.08% 600,000 Anheuser-B 2.750% 03/17/2036 795000 0.13% Total Belgium 1,291910 0.21%
Canada – 1.35% 94,000 Toronto-D 3.226% 07/24/2024 75,966 0.01% 800,000 Toronto-Do 0.250% 01/12/2023 928,664 0.16% 500,000 Toronto-Dominion 3.500% 07/19/2023 524,263 0.09% 1,500,000 National B 0.250% 07/24/2023 1,744,422 0.29% 1,298,000 Rogers Communica 4.500% 03/15/2043 1,402,714 0.24% 1,431,000 Royal Bank 4.930% 07/16/2025 1,266,059 0.21% 850,000 Bank Of Montreal V/R 4.338% 10/05/2028 893,601 0.15% 93,000 General E 5.730% 10/22/2037 77,490 0.01% 654,000 Rogers Com 6.560% 03/22/2041 696,100 0.12% 470,000 Telus Corp 4.850% 04/05/2044 406,842 0.07% Total Canada 8,016,121 1.35%
China – 0.66% 2,000,000 Ind & Comm Bk 1.875% 08/11/2019 1,998,710 0.34% 350,000 Bank Of Ch 0.750% 07/12/2021 403,231 0.07% 1,500,000 Bank Of China 2.375% 02/14/2020 1,498,650 0.25% Total China 3,900,591 0.66%
European Union – 2.30% 791,000 Inter-American Devel Bk 4.375% 24/01/2044 1,025,180 0.17%
300,000 European Investment Bank 0.875% 13/09/2024 364,673 0.06%
272,000 Euro Stability Mechanism 1.625% 17/11/2036 367,163 0.06%
1,000,000 Inter-American Devel Bk 1.250% 15/12/2023 1,289,194 0.22%
471,000 European Investment Bank 1.000% 14/03/2031 588,848 0.10%
465,000 Eurofima 2.875% 04/02/2030 629,283 0.11%
506,000 Inter-American Devel Bk 3.200% 07/08/2042 548,175 0.09%

SANLAM UNIVERSAL FUNDS PLC
183
PORTFOLIO OF INVESTMENTS OF SANLAM GLOBAL BOND FUND (CONTINUED)
as at 30 June 2019
Nominal Security Coupon Maturity Classification Fair Value % of
USD Net Assets
Financial assets at fair value through profit or loss (continued)
Corporate Debt - 33.69% (continued)
European Union – 2.30% (continued) 540,040 European Investment Bank 5.625% 15/02/2028 912,189 0.15%
200,000 Inter-American Devel Bk 3.875% 28/10/2041 239,528 0.04%
888,000 European Investment Bank 4.625% 12/10/2054 2,015,461 0.34%
322,000 European Investment Bank 4.000% 15/10/2037 589,707 0.10%
754,000 European Investment Bank 4.875% 15/02/2036 994,281 0.17%
1,080,000 Asian Development Bank 1.400% 06/02/2037 1,387,147 0.23%
975,000 Inter-American Devel Bk 4.000% 22/05/2023 751,987 0.13%
1,006,000 European Investment Bank 6.500% 07/08/2019 709,677 0.12%
850,000 African Development Bank 0.250% 21/11/2024 998,476 0.17%
208,000 Asian Development Bank 5.820% 16/06/2028 265,744 0.04%
Total European Union 13,676,713 2.30%
Finland – 0.10% 500,000 Elisa Oyj 1.125% 02/26/2026 583,692 0.10% Total Finland 583,692 0.10%
France – 1.82% 100,000 Credit Agri 5.500% 12/17/2021 140,724 0.02% 800,000 Bpce Sa 4.500% 04/26/2028 616,959 0.10% 600,000 Societe Genera 5.625% 11/24/2045 686,719 0.12% 886,000 IXIS CORP 5.875% 02/24/2020 1,162,089 0.20% 180,000 Engie Sa 2.875% 10/10/2022 183,909 0.03% 501,000 Engie Sa 6.375% 01/18/2021 629,778 0.11% 950,000 Pernod Ricard Sa 5.500% 01/15/2042 1,115,797 0.19% 750,000 BPCE SA 4.000% 09/12/2023 785,321 0.13% 200,000 Credit Ag 0.875% 05/06/2034 238,575 0.04% 1,200,000 Wendel Sa 1.375% 04/26/2026 1,394,868 0.23% 242,000 GDF SUEZ 6.375% 01/18/2021 304,204 0.05% 200,000 Electrici 6.125% 06/02/2034 365,239 0.06% 400,000 Dexia Cred 1.250% 11/26/2024 490,085 0.08% 750,000 Dexia Credit 1.000% 10/18/2027 915,523 0.15% 374,000 CIE FINAN 4.000% 10/24/2025 538,113 0.09% 991,000 Caisse D'Amort Dette Soc 4.375% 25/10/2021 1,259,463 0.21% Total France 10,827,366 1.82%
Germany – 0.59% 940,000 Landwirtsch 2.700% 09/05/2022 687,555 0.12% 800,000 Allianz Se 5.500% 03/26/2168 807,846 0.14% 337,000 Nrw.Bank 3.875% 01/27/2020 393,418 0.07% 478,000 Kfw Zcp 0.000% 06/29/2037 303,164 0.05% 83,000 Commerzba 4.375% 07/02/2019 94,535 0.02% 685,000 KFW 2.000% 05/02/2025 689,511 0.12% 446,000 EWE AG 4.875% 10/14/2019 515,401 0.09% Total Germany 3,491,430 0.59%
Guernsey – 0.17% 1,000,000 Credit Suisse Group Fund 3.800% 15/09/2022 1,037,175 0.17% Total Guernsey 1,037,175 0.17%

SANLAM UNIVERSAL FUNDS PLC
184
PORTFOLIO OF INVESTMENTS OF SANLAM GLOBAL BOND FUND (CONTINUED)
as at 30 June 2019
Nominal Security Coupon Maturity Classification Fair Value % of
USD Net Assets
Financial assets at fair value through profit or loss (continued) Corporate Debt - 33.69% (continued)
Hong Kong – 0.13% 665,000 AIA Group Ltd 4.875% 03/11/2044 799,732 0.13% Total Hong Kong 799,732 0.13%
India – 0.14% 800,000 Indian Oil Corp 4.750% 01/16/2024 842,800 0.14% Total India 842,800 0.14%
Ireland – 0.04% 200,000 SMBC Aviation 4.125% 07/15/2023 209,551 0.04% Total Ireland 209,551 0.04% Jersey Channel Islands – 0.19% 420,000 Heathrow F 0.450% 10/15/2026 440,033 0.07% 400,000 Heathrow 4.625% 10/31/2046 682,157 0.11% Total Jersey Channel Islands 1,122,190 0.19%
Luxembourg – 0.24% 16,000 EFSF 3.5% 3.500% 02/04/2022 20,184 0.00% 400,000 Swiss RE FIN V/R 0.000% 04/30/2050 495,034 0.08% 137,000 CCB EUROP 0.625% 02/17/2020 156,460 0.03% 200,000 Prologis 2.375% 11/14/2030 257,439 0.04% 400,000 CNH INDUST 1.750% 03/25/2027 469,069 0.08% Total Luxembourg 1,398,187 0.24%
Netherlands – 2.00% 939,000 Shell Internat 4.375% 05/11/2045 1,083,000 0.18% 1,500,000 Shell Internat 6.375% 12/15/2038 2,115,608 0.36% 400,000 NE Property 3.750% 02/26/2021 475,337 0.08% 1,886,000 Nederland 2.625% 07/13/2022 2,333,624 0.39% 700,000 Abn Amro Bank 1.000% 04/13/2031 860,610 0.14% 166,000 Innogy Fi 1.875% 01/30/2020 191,315 0.03% 850,000 Unilever 1.125% 04/29/2028 1,038,478 0.17% 528,000 Rwe Ag 5.75% 02/14/2033 942,345 0.16% 1,000,000 Nibc Bank Nv 2.000% 04/09/2024 1,174,262 0.20% 300,000 Bharti Ai 3.375% 05/20/2021 359,052 0.06% 611,000 Enbw Intl 6.125% 07/07/2039 1,268,254 0.21% 34,000 Rabobank / 4.125% 07/14/2025 48,143 0.01% Total Netherlands 11,890,028 2.00%
New Zealand – 1.12% 1,150,000 Asb Bank Limited 3.750% 06/14/2023 1,197,242 0.20% 1,100,000 Westpac Sec 0.300% 06/25/2024 1,254,753 0.21% 515,000 Bnz Intl 0.125% 06/17/2021 591,810 0.10% 3,620,000 ANZ New Zealand 2.750% 01/22/2021 3,639,385 0.61% Total New Zealand 6,683,190 1.12%
Norway – 0.07% 400,000 SR-Boligkreditt 2.500% 04/12/2022 404,108 0.07% Total Norway 404,108 0.07%

SANLAM UNIVERSAL FUNDS PLC
185
PORTFOLIO OF INVESTMENTS OF SANLAM GLOBAL BOND FUND (CONTINUED)
as at 30 June 2019
Nominal Security Coupon Maturity Classificatio
n
Fair Value % of
USD Net Assets
Financial assets at fair value through profit or loss (continued) Corporate Debt - 33.69% (continued)
Portugal – 0.04%
200,000 Banco Santander 1.250% 26/09/2027 245,020 0.04% Total Portugal 245,020 0.04%
Singapore – 0.13%%
400,000 Temasek Financial 5.125% 26/07/2040 777,826 0.13% Total Singapore 777,826 0.13% Spain – 1.26% 400,000 Caixabank Sa 1.625% 14/07/2032 511,403 0.09%
700,000 Banco Bilbao Vizcaya Arg 3.875% 30/01/2023 918,129 0.15%
1,000,000 Santan Consumer Finance 1.000% 26/05/2021 1,163,182 0.20%
400,000 Bankia Sa 4.000% 03/02/2025 557,488 0.09%
600,000 Santan Consumer Finance 0.875% 24/01/2022 699,187 0.12%
1,200,000 Banco Santander Sa 1.375% 09/02/2022 1,414,191 0.24%
100,000 Banco Santander 2.000% 27/11/2034 137,344 0.02%
1,800,000 Caixabank 0.750% 18/04/2023 2,090,970 0.35%
Total Spain 7,491,894 1.26%
Sweden – 0.77% 2,800,000 Swedbank Ab 2.800% 14/03/2022 2,807,462 0.47%
1,200,000 Swedish Export Credit 1.750% 18/05/2020 1,196,478 0.20%
500,000 Swedish Covered Bond 0.500% 29/01/2025 590,960 0.10%
Total Sweden 4,594,900 0.77%
Switzerland – 0.37% 320,000 Pfandbrief Schweiz Hypo 1.625% 15/03/2022 348,972 0.06%
580,000 Pfandbrief Schweiz Hypo 0.875% 25/06/2037 659,894 0.11%
1,000,000 Credit Suisse 5.750% 18/09/2025 1,213,260 0.20%
Total Switzerland 2,222,126 0.37%

SANLAM UNIVERSAL FUNDS PLC
186
PORTFOLIO OF INVESTMENTS OF SANLAM GLOBAL BOND FUND (CONTINUED)
as at 30 June 2019
Nominal Security Coupon Maturity Classification Fair Value % of
USD Net Assets
Financial assets at fair value through profit or loss (continued)
Corporate Debt - 33.69% (continued)
United Kingdom – 6.77% 1,600,000 Itv Plc 2.125% 21/09/2022 1,899,373 0.32%
300,000 Easyjet Plc 0.875% 11/06/2025 341,613 0.06%
1,418,000 Astrazeneca Plc 4.375% 16/11/2045 1,581,545 0.27%
700,000,000 Natwest Markets Plc 0.737% 04/07/2022 6,496,863 1.09%
500,000,000 Natwest Markets Plc 0.000% 04/07/2024 4,640,988 0.78%
320,000 Natl Westminster Bank 5.125% 13/01/2024 478,332 0.08%
287,000 Centrica Plc / 4.375% 13/03/2029 425,501 0.07%
300,000 Natl Grid Elect Trans 4.000% 08/06/2027 449,062 0.08%
2,100,000 British Telecommunicatio 1.125% 10/03/2023 2,481,340 0.42%
1,900,000 Standard Chartered Plc 4.050% 12/04/2026 1,970,367 0.33%
1,700,000 Standard Chartered Plc 3.950% 11/01/2023 1,737,485 0.29%
250,000 Next Group Pl 3.625% 18/05/2028 332,106 0.06%
509,000 Network Rail Infra Fin 4.750% 22/01/2024 758,316 0.13%
250,000 Glaxosmithkline Capital 5.250% 10/04/2042 465,826 0.08%
850,000 Vodafone Group Plc 4.200% 03/10/2078 1,026,214 0.17%
300,000 Vodafone Group Plc 6.250% 03/10/2078 311,021 0.05%
1,750,000 Standard Chartered Plc 1.625% 13/06/2021 2,057,191 0.35%
700,000 Lloyds Bank Plc 4.250% 28/08/2025 538,830 0.09%
150,000 London Stock Exchange Pl 9.125% 18/10/2019 195,365 0.03%
998,000 Royal Mail Pl 2.375% 29/07/2024 1,200,259 0.20%
1,400,000 Bp Capital Markets Plc 2.518% 16/01/2020 1,401,092 0.24%
830,000 Santander Uk Plc 0.100% 12/05/2024 956,641 0.16%
950,000 Wpp Finance 2010 Regd 3.750% 19/09/2024 983,511 0.17%
710,000 Lloyds Bank Plc 1.000% 19/11/2021 829,619 0.14%
55,000 Lloyds Ts 6.500% 24/03/2020 65,541 0.01%
210,000 Hsbc Hold 6% 6.000% 29/03/2040 352,707 0.06%
600,000 Standard Chartered Plc 3.125% 19/11/2024 758,451 0.13%
900,000 Standard Chartered Plc / 1.625% 03/10/2027 1,079,707 0.18%
1,100,000 Standard Chartered Plc 4.300% 19/02/2027 1,134,084 0.19%
250,000 University Of Oxford 2.544% 08/12/2117 338,693 0.06%
713,000 Vodafone Group Plc 7.875% 15/02/2030 967,338 0.16%
600,000 Nationwide Bldg Society 0.625% 25/03/2027 711,021 0.12%
930,000 Investec Plc 4.500% 05/05/2022 1,264,369 0.21%
Total United Kingdom 40,230,371 6.77% United States – 6.60% 1,477,000 Harley-Davidson Inc 3.500% 28/07/2025 1,488,144 0.25%
400,000 Campbell Soup Co 4.800% 15/03/2048 407,514 0.07%
774,000 Dominion Energy Inc R 4.900% 01/08/2041 876,172 0.15%
400,000 Goldman Sachs Group 6.250% 01/02/2041 536,160 0.09%
798,000 Ibm Corp 5.600% 30/11/2039 1,008,197 0.17%
1,500,000 Eqt Corp 4.875% 15/11/2021 1,569,960 0.26%
100,000 Goldman Sachs Group Inc 2.000% 01/11/2028 123,575 0.02%
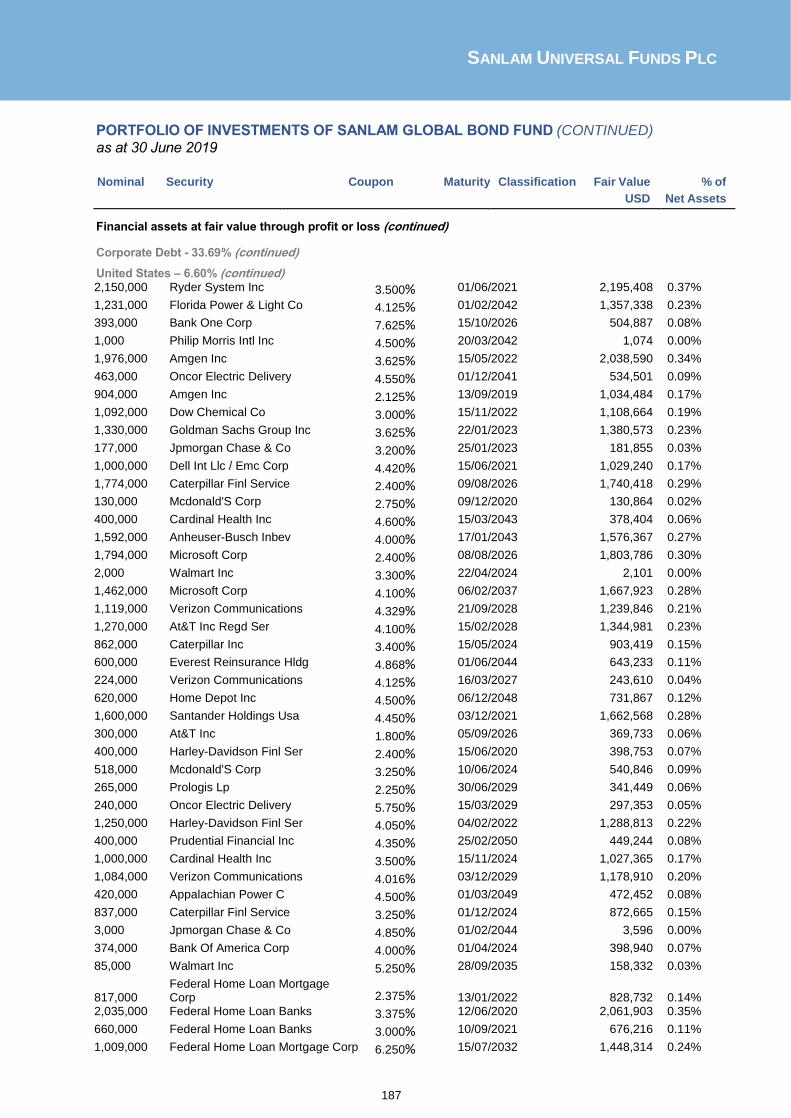
SANLAM UNIVERSAL FUNDS PLC
187
PORTFOLIO OF INVESTMENTS OF SANLAM GLOBAL BOND FUND (CONTINUED)
as at 30 June 2019
Nominal Security Coupon Maturity Classification Fair Value % of
USD Net Assets
Financial assets at fair value through profit or loss (continued)
Corporate Debt - 33.69% (continued)
United States – 6.60% (continued) 2,150,000 Ryder System Inc 3.500% 01/06/2021 2,195,408 0.37%
1,231,000 Florida Power & Light Co 4.125% 01/02/2042 1,357,338 0.23%
393,000 Bank One Corp 7.625% 15/10/2026 504,887 0.08%
1,000 Philip Morris Intl Inc 4.500% 20/03/2042 1,074 0.00%
1,976,000 Amgen Inc 3.625% 15/05/2022 2,038,590 0.34%
463,000 Oncor Electric Delivery 4.550% 01/12/2041 534,501 0.09%
904,000 Amgen Inc 2.125% 13/09/2019 1,034,484 0.17%
1,092,000 Dow Chemical Co 3.000% 15/11/2022 1,108,664 0.19%
1,330,000 Goldman Sachs Group Inc 3.625% 22/01/2023 1,380,573 0.23%
177,000 Jpmorgan Chase & Co 3.200% 25/01/2023 181,855 0.03%
1,000,000 Dell Int Llc / Emc Corp 4.420% 15/06/2021 1,029,240 0.17%
1,774,000 Caterpillar Finl Service 2.400% 09/08/2026 1,740,418 0.29%
130,000 Mcdonald'S Corp 2.750% 09/12/2020 130,864 0.02%
400,000 Cardinal Health Inc 4.600% 15/03/2043 378,404 0.06%
1,592,000 Anheuser-Busch Inbev 4.000% 17/01/2043 1,576,367 0.27%
1,794,000 Microsoft Corp 2.400% 08/08/2026 1,803,786 0.30%
2,000 Walmart Inc 3.300% 22/04/2024 2,101 0.00%
1,462,000 Microsoft Corp 4.100% 06/02/2037 1,667,923 0.28%
1,119,000 Verizon Communications 4.329% 21/09/2028 1,239,846 0.21%
1,270,000 At&T Inc Regd Ser 4.100% 15/02/2028 1,344,981 0.23%
862,000 Caterpillar Inc 3.400% 15/05/2024 903,419 0.15%
600,000 Everest Reinsurance Hldg 4.868% 01/06/2044 643,233 0.11%
224,000 Verizon Communications 4.125% 16/03/2027 243,610 0.04%
620,000 Home Depot Inc 4.500% 06/12/2048 731,867 0.12%
1,600,000 Santander Holdings Usa 4.450% 03/12/2021 1,662,568 0.28%
300,000 At&T Inc 1.800% 05/09/2026 369,733 0.06%
400,000 Harley-Davidson Finl Ser 2.400% 15/06/2020 398,753 0.07%
518,000 Mcdonald'S Corp 3.250% 10/06/2024 540,846 0.09%
265,000 Prologis Lp 2.250% 30/06/2029 341,449 0.06%
240,000 Oncor Electric Delivery 5.750% 15/03/2029 297,353 0.05%
1,250,000 Harley-Davidson Finl Ser 4.050% 04/02/2022 1,288,813 0.22%
400,000 Prudential Financial Inc 4.350% 25/02/2050 449,244 0.08%
1,000,000 Cardinal Health Inc 3.500% 15/11/2024 1,027,365 0.17%
1,084,000 Verizon Communications 4.016% 03/12/2029 1,178,910 0.20%
420,000 Appalachian Power C 4.500% 01/03/2049 472,452 0.08%
837,000 Caterpillar Finl Service 3.250% 01/12/2024 872,665 0.15%
3,000 Jpmorgan Chase & Co 4.850% 01/02/2044 3,596 0.00%
374,000 Bank Of America Corp 4.000% 01/04/2024 398,940 0.07%
85,000 Walmart Inc 5.250% 28/09/2035 158,332 0.03%
817,000 Federal Home Loan Mortgage Corp 2.375% 13/01/2022 828,732 0.14%
2,035,000 Federal Home Loan Banks 3.375% 12/06/2020 2,061,903 0.35%
660,000 Federal Home Loan Banks 3.000% 10/09/2021 676,216 0.11%
1,009,000 Federal Home Loan Mortgage Corp 6.250% 15/07/2032 1,448,314 0.24%

SANLAM UNIVERSAL FUNDS PLC
188
PORTFOLIO OF INVESTMENTS OF SANLAM GLOBAL BOND FUND (CONTINUED)
as at 30 June 2019
Nominal Security Coupon Maturity Classification Fair Value % of
USD Net Assets
Financial assets at fair value through profit or loss (continued)
Corporate Debt - 33.69% (continued)
United States – 6.60% (continued) 1,497,000 Jp Morgan Chase Commercial
Mortgage Securities Trust 4.166% 15/12/2046 1,606,264 0.27%
703,715 Jp Morgan Chase Commercial Mortgage Securitie Ser
4.717% 15/02/2046 725,461 0.12%
1,134,000 Citigroup Commercial Mortgage Trust
3.818% 10/11/2048 1,218,973 0.21%
970,164 Citigroup Commercial Mortgage Trust
3.024% 10/09/2045 991,480 0.17%
2,330,000 Gs Mortgage Securities Trust 3.964% 10/11/2047 2,461,694 0.41%
611,818 Gs Mortgage Securities Trust 3.516% 10/06/2047 623,258 0.10%
904,985 Wfrbs Commercial Mortgage Trust
3.603% 15/03/2046 930,168 0.16%
145,000 Morgan Stanley Bank Of America Merrill Lynch Trust
2.988% 15/02/2048 148,755 0.03%
920,000 Morgan Stanley Bank Of America Merrill Lynch Trust
3.176% 15/08/2045 942,235 0.16%
1,500,000 Jp Morgan Chase Commercial Mortgage Securities Ser
3.353% 15/12/2047 1,535,620 0.26%
1,000,000 Jp Morgan Chase Commercial Mortgage Securitie Ser
5.058% 15/06/2043 1,018,003 0.17%
1,920,000 Comm 2014-Ubs5 Mortgage Trust Ser
4.193% 10/09/2047 2,042,218 0.34%
220,000 Csmc Trust 2016-Nxsr Ser 3.795% 15/12/2049 235,397 0.04%
660,000 Wells Fargo Commercial Mortgage Trust
3.400% 15/06/2048 683,000 0.11%
412,810 Jp Morgan Chase Commercial Mortgage Securities Trust
3.143% 15/12/2047 423,796 0.07%
2,000,000 Gsms 2010 C1 4.592% 10/08/2043 2,025,674 0.34%
1,176,651 Fannie Mae Pool Umbs 4.500% 01/05/2040 1,264,281 0.21%
606,193 Ginnie Mae Ii Pool 4.000% 20/02/2041 642,287 0.11%
2,981,924 Freddie Mac Gold Pool 3.000% 01/04/2033 3,044,666 0.51%
1,705,965 Fannie Mae Pool Umbs 3.000% 01/09/2046 1,741,966 0.29%
4,407,029 Ginnie Mae Ii Pool 4.000% 20/05/2048 4,579,347 0.77%
249,250 Fannie Mae Pool Umbs 5.500% 01/12/2038 276,619 0.05%
7,750 Fannie Mae Pool Umbs 5.500% 01/03/2023 8,265 0.00%
1,070,537 Ginnie Mae I Pool 4.000% 15/08/2041 1,137,367 0.19%
1,837,262 Freddie Mac Gold Pool 4.000% 01/10/2044 1,936,626 0.33%
289,491 Fannie Mae Pool Umbs 3.000% 01/11/2034 294,911 0.05%
138,668 Fannie Mae Pool Umbs 3.000% 01/09/2034 141,263 0.02%
471,845 Ginnie Mae I Pool 4.000% 15/04/2044 499,524 0.08%
1,417,877 Fannie Mae Pool Umbs 4.500% 01/02/2045 1,523,077 0.26%
564,682 Fannie Mae Pool Umbs 3.500% 01/05/2042 586,353 0.10%
1,826,044 Freddie Mac Gold Pool 3.000% 01/09/2027 1,870,480 0.31%
3,964,554 Freddie Mac Gold Pool 2.500% 01/01/2029 4,003,437 0.67%
1,105,386 Fannie Mae Pool Umbs 3.000% 01/10/2046 1,121,127 0.19%
2,066,387 Fannie Mae Pool Umbs 3.000% 01/11/2042 2,102,633 0.35%
168,298 Ginnie Mae I Pool 2.500% 15/09/2042 169,106 0.03%
565,690 Freddie Mac Gold Pool 3.000% 01/04/2028 579,457 0.10%
978,934 Fannie Mae Pool Umbs 3.000% 01/07/2043 996,081 0.17%

SANLAM UNIVERSAL FUNDS PLC
189
PORTFOLIO OF INVESTMENTS OF SANLAM GLOBAL BOND FUND (CONTINUED)
as at 30 June 2019
Nominal Security Coupon Maturity Classification Fair Value % of
USD Net Assets
Financial assets at fair value through profit or loss (continued)
Corporate Debt - 33.69% (continued)
United States – 6.60% (continued) 118,518 Fannie Mae Pool Umbs 3.500% 01/06/2039 121,360 0.02%
786,821 Ginnie Mae I Pool 4.000% 15/10/2044 829,681 0.14%
2,243,623 Fannie Mae Pool Umbs 3.000% 01/12/2047 2,292,941 0.39%
474,581 Ginnie Mae Ii Pool 4.500% 20/08/2043 508,538 0.09%
181,354 Freddie Mac Gold Pool 3.000% 01/09/2027 185,765 0.03%
769,120 Freddie Mac Gold Pool 3.500% 01/04/2046 793,639 0.13%
2,753,394 Fannie Mae Pool Umbs 3.500% 01/01/2048 2,863,544 0.48%
52,455 Ginnie Mae I Pool 4.000% 15/03/2044 55,606 0.01%
687,177 Fannie Mae Pool Umbs 3.500% 01/03/2040 708,584 0.12%
1,270,062 Fannie Mae Pool Umbs 3.500% 01/04/2046 1,318,881 0.22%
150,172 Ginnie Mae Ii Pool 2.500% 20/01/2045 151,931 0.03%
2,995,978 Freddie Mac Gold Pool 3.000% 01/01/2047 3,052,628 0.51%
220,471 Freddie Mac Gold Pool 3.500% 01/12/2044 228,101 0.04%
653,669 Ginnie Mae Ii Pool 4.500% 20/03/2046 690,636 0.12%
1,428,987 Fannie Mae Pool Umbs 3.000% 01/06/2042 1,454,017 0.24%
3,615,362 Ginnie Mae I Pool 3.500% 15/12/2041 3,754,788 0.63%
94,990 Freddie Mac Gold Pool 3.500% 01/10/2041 98,261 0.02%
677,268 Fannie Mae Pool Umbs 4.000% 01/08/2048 700,151 0.12%
3,656,644 Fannie Mae Pool Umbs 4.000% 01/02/2048 3,805,952 0.64%
517,733 Ginnie Mae Ii Pool 4.500% 20/08/2043 548,789 0.09%
2,737,481 Ginnie Mae Ii Pool 4.000% 20/09/2048 2,839,007 0.48%
1,474,898 Freddie Mac Gold Pool 3.000% 01/07/2045 1,508,049 0.25%
1,044,408 Fannie Mae Pool Umbs 5.500% 01/11/2035 1,165,673 0.20%
52,395 Ginnie Mae Ii Pool 4.000% 20/11/2044 55,272 0.01%
189,818 Fannie Mae Pool Umbs 4.500% 01/08/2040 203,956 0.03%
3,948,056 Ginnie Mae Ii Pool 4.500% 20/03/2048 4,139,555 0.70%
Total United States 106,853,517 17.97% Total Corporate Debt 263,106,570 33.69%
Government Debt – 61.67%
Australia – 1.66% 189,000 Australian Government 5.750% 15/07/2022 151,610 0.03%
1,054,000 Australian Government 4.750% 21/04/2027 933,195 0.16%
171,000 Australian Government 3.250% 21/04/2029 141,205 0.02%
849,000 Australian Government 2.750% 21/04/2024 644,167 0.11%
2,954,000 Australian Government 3.000% 21/03/2047 2,551,297 0.43%
550,000 Australian Government 2.750% 21/11/2028 434,630 0.07%
4,450,000 Australian Government 0.981% 21/02/2050 3,694,367 0.62%
178,000 Australian Government 5.750% 15/05/2021 135,927 0.02%
101,000 Australian Government 4.500% 15/04/2020 72,793 0.01%
310,000 Australian Government 3.750% 21/04/2037 288,279 0.05%
1,074,000 Queensland Treasury Corp 3.250% 21/07/2026 837,458 0.14%
Total Australia 9,884,928 1.66%

SANLAM UNIVERSAL FUNDS PLC
190
PORTFOLIO OF INVESTMENTS OF SANLAM GLOBAL BOND FUND (CONTINUED) as at 30 June 2019
Nominal Security Coupon Maturity Classification Fair Value % of
USD Net Assets
Financial assets at fair value through profit or loss (continued)
Government Debt – 61.67% (continued)
Austria – 0.54% 97,000 Republic Of Austria 3.650% 20/04/2022 123,929 0.02%
516,000 Republic Of Austria 3.150% 20/06/2044 939,932 0.16%
1,216,133 Republic Of Austria 6.250% 15/07/2027 2,118,192 0.36%
Total Austria 3,182,053 0.54%
Belgium – 0.90% 690,000 Belgium Kingdom 1.250% 22/04/2033 881,279 0.15%
987,000 Belgium Kingdom 4.500% 28/03/2026 1,489,457 0.25%
314,788 Belgium Kingdom 3.000% 28/09/2019 361,608 0.06%
695,428 Belgium Kingdom 5.500% 28/03/2028 1,179,710 0.20%
183,331 Belgium Kingdom 4.000% 28/03/2022 235,788 0.04%
200,000 Region Wallonne 0.250% 03/05/2026 232,057 0.04%
484,328 Belgium Kingdom 3.750% 22/06/2045 924,770 0.16%
Total Belgium 5,304,669 0.90%
Canada – 3.11% 841,000 Canadian Government 3.500% 01/12/2045 890,331 0.15%
197,000 Canadian Government 2.750% 01/06/2022 156,391 0.03%
1,363,000 British Columbia Prov Of 4.700% 18/06/2037 1,397,379 0.24%
3,160,000 Canadian Government 0.750% 01/03/2021 2,387,719 0.40%
1,475,000 Ontario (Province Of) 2.100% 08/09/2019 1,129,262 0.19%
1,570,000 Province Of Quebec 2.500% 20/04/2026 1,602,876 0.27%
1,330,000 British Columbia Prov Of 2.700% 18/12/2022 1,051,288 0.18%
398,000 Province Of Alberta 3.300% 01/12/2046 349,308 0.06%
1,557,000 Ontario (Province Of) 4.700% 02/06/2037 1,577,148 0.27%
532,000 Canadian Government 1.000% 01/06/2027 393,576 0.07%
1,130,000 Cdp Financial Inc 4.600% 15/07/2020 888,547 0.15%
1,900,000 Ontario (Province Of) 1.875% 21/05/2024 2,385,523 0.40%
405,000 British Columbia Prov Of 9.000% 23/08/2024 417,949 0.07%
200,000 Manitoba (Province Of) 0.750% 15/12/2021 252,552 0.04%
500,000 Canadian Government 2.000% 01/06/2028 399,935 0.07%
1,300,000 Prov Of New Brunswick 3.100% 14/08/2028 1,064,135 0.18%
723,000 Canadian Government 2.500% 01/06/2024 582,345 0.10%
556,000 Canadian Government 1.500% 01/03/2020 424,828 0.07%
310,000 Canadian Government 5.750% 01/06/2029 329,742 0.06%
608,000 Ontario (Province Of) 6.200% 02/06/2031 656,477 0.11%
Total Canada 18,337,311 3.11%

SANLAM UNIVERSAL FUNDS PLC
191
PORTFOLIO OF INVESTMENTS OF SANLAM GLOBAL BOND FUND (CONTINUED)
as at 30 June 2019
Nominal Security Coupon Maturity Classification Fair Value % of
USD Net Assets
Financial assets at fair value through profit or loss (continued)
Government Debt – 61.67% (continued)
China – 0.34% 1,750,000 Export-Import Bank China 0.250% 14/03/2020 1,998,201 0.34%
Total China 1,998,201 0.34%
Cyprus – 0.02% 80,000 Republic Of Cyprus 0.625% 03/12/2024 93,492 0.02%
Total Cyprus 93,492 0.02%
Czech Republic – 0.05% 6,300,000 Czech Republic 2.500% 25/08/2028 307,591 0.05%
Total Czech Republic 307,591 0.05%
Denmark – 0.23% 1,116,000 Kingdom Of Denmark 4.500% 15/11/2039 325,408 0.05%
6,453,763 Kingdom Of Denmark 1.500% 15/11/2023 1,080,365 0.18%
Total Denmark 1,405,773 0.23%
European Union – 0.32% 800,000 International Bank For
Reconstruction & Development 2.500% 03/08/2023 631,527 0.11%
1,165,000 International Bank For Reconstruction & Development
0.000% 26/11/2021 1,219,594 0.21%
Total European Union 1,851,121 0.32%
Finland – 0.08% 400,000 Finnvera Plc 0.500% 13/04/2026 476,624 0.08%
Total Finland 476,624 0.08%
France – 4.36% 2,888,000 France (Govt Of) 2.250% 25/05/2024 3,742,305 0.63%
967,131 France (Govt Of) 3.250% 25/10/2021 1,203,334 0.20%
900,000 Sncf Reseau 4.250% 07/10/2026 1,345,766 0.23%
3,090,000 France (Govt Of) 0.750% 25/11/2028 3,788,122 0.64%
2,599,705 France (Govt Of) 3.500% 25/04/2026 3,752,800 0.63%
844,000 France (Govt Of) 1.500% 25/05/2031 1,113,648 0.19%
200,000 Sncf Reseau 5.000% 10/10/2033 365,177 0.06%
1,401,848 France (Govt Of) 4.000% 25/10/2038 2,619,126 0.44%
805,918 France (Govt Of) / 2.500% 25/05/2030 1,160,693 0.20%
600,000 Sncf Reseau 0.875% 22/01/2029 720,317 0.12%
500,000 Sncf Reseau 2.250% 20/12/2047 711,639 0.12%
631,806 France (Govt Of) 3.750% 25/10/2019 729,325 0.12%
487,235 France (Govt Of) 4.000% 25/04/2060 1,100,174 0.19%
400,000 Societe Du Grand Paris 1.125% 25/05/2034 488,901 0.08%
1,985,324 France Oat 8.5% 8.500% 25/04/2023 3,060,472 0.51%
Total France 25,901,799 4.36%
Germany – 1.92% 900,000 Land Nordrhein-Westfalen 0.950% 13/03/2028 1,110,583 0.19%
250,000 Land Nordrhein-Westfalen 2.375% 13/05/2033 358,867 0.06%
7,458 Bundesrepub. Deutschland 2.000% 04/01/2022 9,091 0.00%
1,000,000 Land Nordrhein-Westfalen 1.250% 16/09/2019 997,730 0.17%
994,123 Bundesrepub. Deutschland 5.625% 04/01/2028 1,730,895 0.29%
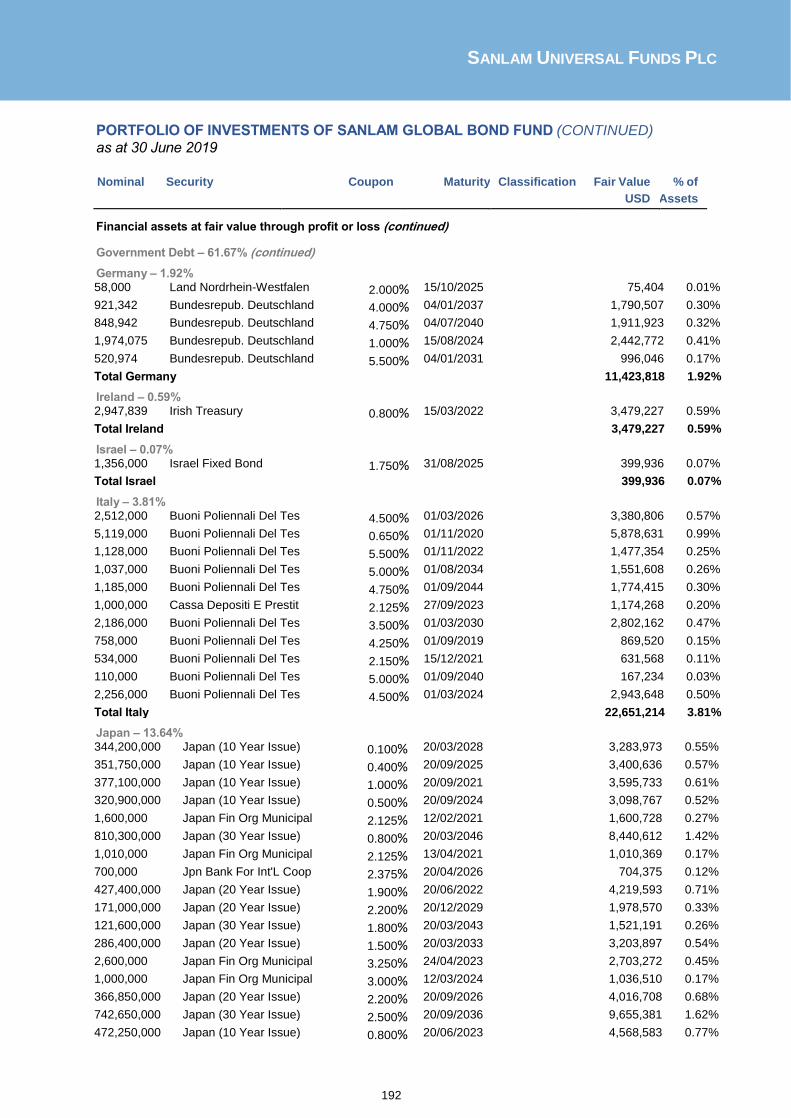
SANLAM UNIVERSAL FUNDS PLC
192
PORTFOLIO OF INVESTMENTS OF SANLAM GLOBAL BOND FUND (CONTINUED)
as at 30 June 2019
Nominal Security Coupon Maturity Classification Fair Value % of
USD Net Assets
Financial assets at fair value through profit or loss (continued)
Government Debt – 61.67% (continued)
Germany – 1.92% 58,000 Land Nordrhein-Westfalen 2.000% 15/10/2025 75,404 0.01%
921,342 Bundesrepub. Deutschland 4.000% 04/01/2037 1,790,507 0.30%
848,942 Bundesrepub. Deutschland 4.750% 04/07/2040 1,911,923 0.32%
1,974,075 Bundesrepub. Deutschland 1.000% 15/08/2024 2,442,772 0.41%
520,974 Bundesrepub. Deutschland 5.500% 04/01/2031 996,046 0.17%
Total Germany 11,423,818 1.92%
Ireland – 0.59% 2,947,839 Irish Treasury 0.800% 15/03/2022 3,479,227 0.59%
Total Ireland 3,479,227 0.59%
Israel – 0.07% 1,356,000 Israel Fixed Bond 1.750% 31/08/2025 399,936 0.07%
Total Israel 399,936 0.07%
Italy – 3.81% 2,512,000 Buoni Poliennali Del Tes 4.500% 01/03/2026 3,380,806 0.57%
5,119,000 Buoni Poliennali Del Tes 0.650% 01/11/2020 5,878,631 0.99%
1,128,000 Buoni Poliennali Del Tes 5.500% 01/11/2022 1,477,354 0.25%
1,037,000 Buoni Poliennali Del Tes 5.000% 01/08/2034 1,551,608 0.26%
1,185,000 Buoni Poliennali Del Tes 4.750% 01/09/2044 1,774,415 0.30%
1,000,000 Cassa Depositi E Prestit 2.125% 27/09/2023 1,174,268 0.20%
2,186,000 Buoni Poliennali Del Tes 3.500% 01/03/2030 2,802,162 0.47%
758,000 Buoni Poliennali Del Tes 4.250% 01/09/2019 869,520 0.15%
534,000 Buoni Poliennali Del Tes 2.150% 15/12/2021 631,568 0.11%
110,000 Buoni Poliennali Del Tes 5.000% 01/09/2040 167,234 0.03%
2,256,000 Buoni Poliennali Del Tes 4.500% 01/03/2024 2,943,648 0.50%
Total Italy 22,651,214 3.81%
Japan – 13.64% 344,200,000 Japan (10 Year Issue) 0.100% 20/03/2028 3,283,973 0.55%
351,750,000 Japan (10 Year Issue) 0.400% 20/09/2025 3,400,636 0.57%
377,100,000 Japan (10 Year Issue) 1.000% 20/09/2021 3,595,733 0.61%
320,900,000 Japan (10 Year Issue) 0.500% 20/09/2024 3,098,767 0.52%
1,600,000 Japan Fin Org Municipal 2.125% 12/02/2021 1,600,728 0.27%
810,300,000 Japan (30 Year Issue) 0.800% 20/03/2046 8,440,612 1.42%
1,010,000 Japan Fin Org Municipal 2.125% 13/04/2021 1,010,369 0.17%
700,000 Jpn Bank For Int'L Coop 2.375% 20/04/2026 704,375 0.12%
427,400,000 Japan (20 Year Issue) 1.900% 20/06/2022 4,219,593 0.71%
171,000,000 Japan (20 Year Issue) 2.200% 20/12/2029 1,978,570 0.33%
121,600,000 Japan (30 Year Issue) 1.800% 20/03/2043 1,521,191 0.26%
286,400,000 Japan (20 Year Issue) 1.500% 20/03/2033 3,203,897 0.54%
2,600,000 Japan Fin Org Municipal 3.250% 24/04/2023 2,703,272 0.45%
1,000,000 Japan Fin Org Municipal 3.000% 12/03/2024 1,036,510 0.17%
366,850,000 Japan (20 Year Issue) 2.200% 20/09/2026 4,016,708 0.68%
742,650,000 Japan (30 Year Issue) 2.500% 20/09/2036 9,655,381 1.62%
472,250,000 Japan (10 Year Issue) 0.800% 20/06/2023 4,568,583 0.77%

SANLAM UNIVERSAL FUNDS PLC
193
PORTFOLIO OF INVESTMENTS OF SANLAM GLOBAL BOND FUND (CONTINUED)
as at 30 June 2019
Nominal Security Coupon Maturity Classification Fair Value % of
USD Net Assets
Financial assets at fair value through profit or loss (continued)
Government Debt – 61.67% (continued)
Japan – 13.64% 222,100,000 Japan (10 Year Issue) 0.100% 20/03/2027 2,118,886 0.36% 412,250,000 Japan (40 Year Issue) 1.700% 20/03/2054 5,464,321 0.92%
307,500,000 Japan (10 Year Issue) 1.400% 20/09/2019 2,863,868 0.48%
136,650,000 Japan (10 Year Issue) 0.800% 20/09/2020 1,283,951 0.22%
520,500,000 Japan (20 Year Issue) 2.400% 20/06/2028 5,970,411 1.00%
463,100,000 Japan (20 Year Issue) 1.900% 20/03/2031 5,302,160 0.89%
Total Japan 81,042,495 13.64%
Malaysia – 0.12% 448,000 Malaysia Government 3.418% 15/08/2022 108,560 0.02%
347,000 Malaysia Government 4.127% 15/04/2032 85,537 0.01%
435,000 Malaysia Government 5.734% 30/07/2019 105,491 0.02%
1,566,000 Malaysia Government 4.709% 15/09/2026 404,488 0.07%
Total Malaysia 704,076 0.12%
Mexico – 0.36% 20,777,900 Mex Bonos Desarr Fix Rt 6.500% 10/06/2021 1,061,940 0.18%
11,400,000 Mex Bonos Desarr Fix Rt 5.750% 05/03/2026 540,546 0.09%
508,000 United Mexican States 4.750% 08/03/2044 531,185 0.09%
Total Mexico 2,133,671 0.36%
Netherlands – 0.31% 217,481 Netherlands Government 2.250% 15/07/2022 270,312 0.05%
267,938 Netherlands Government 5.500% 15/01/2028 459,297 0.08%
1,295 Netherlands Government 4.000% 15/07/2019 1,477 0.00%
533,131 Netherlands Government 3.750% 15/01/2042 1,080,612 0.18%
Total Netherlands 1,811,698 0.31%
New Zealand – 0.61% 2,249,000 New Zealand Government 5.500% 15/04/2023 1,752,039 0.29%
2,063,000 New Zealand 2.500% 20/09/2040 1,896,384 0.32%
Total New Zealand 3,648,423 0.61%
Norway – 0.14% 6,607,000 Norwegian Government 3.000% 14/03/2024 836,289 0.14%
Total Norway 836,289 0.14%
Philippines– 0.12% 676,000 Republic Of Philippines 3.000% 01/02/2028 695,614 0.12%
Total Philippines 695,614 0.12%
Poland – 0.33% 1,049,000 Republic Of Poland 4.000% 22/01/2024 1,130,638 0.19%
2,790,000 Poland Government Bond 5.750% 23/09/2022 841,040 0.14%
Total Poland 1,971,678 0.33%
Portugal– 0.13% 434,000 Obrigacoes Do Tesouro 4.100% 15/02/2045 785,425 0.13%
Total Portugal 785,425 0.13%
Singapore– 0.11% 886,000 Singapore Government 2.375% 01/06/2025 674,511 0.11%
Total Singapore 674,511 0.11%

SANLAM UNIVERSAL FUNDS PLC
194
PORTFOLIO OF INVESTMENTS OF SANLAM GLOBAL BOND FUND (CONTINUED)
as at 30 June 2019
Nominal Security Coupon Maturity Classification Fair Value % of
USD Net Assets
Financial assets at fair value through profit or loss (continued)
Government Debt - 61.67% (continued)
South Korea – 0.73% 314,910,000 Korea Treasury Bond 3.000% 10/12/2042 345,420 0.06%
1,000,000 Republic of Korea Regd 2.750% 19/01/2027 1,017,040 0.17%
1,000,000 Export-Import Bank Korea 0.375% 26/03/2024 1,159,036 0.20%
1,000,000 Korea Development Bank 2.500% 11/03/2020 1,001,920 0.17%
588,070,000 Korea Treasury Bond 3.000% 10/09/2024 545,850 0.09%
224,420,000 Korea Treasury Bond 5.500% 10/12/2029 267,039 0.04%
Total South Korea 4,336,305 0.73%
Spain – 2.70% 1,475,000 Bonos Y Oblig Del Estado 5.500% 30/04/2021 1,862,485 0.31%
896,000 Bonos Y Oblig Del Estado 5.850% 31/01/2022 1,185,960 0.20%
945,426 Bonos Y Oblig Del Estado 6.000% 31/01/2029 1,652,261 0.28%
853,000 Bonos Y Oblig Del Estado 3.450% 30/07/2066 1,520,002 0.26%
741,000 Bonos Y Oblig Del Estado 4.200% 31/01/2037 1,296,615 0.22%
1,000,000 Bonos Y Oblig Del Estado 2.350% 30/07/2033 1,383,477 0.23%
498,000 Bonos Y Oblig Del Estado 4.800% 31/01/2024 698,369 0.12%
693,000 Bonos Y Oblig Del Estado 4.300% 31/10/2019 801,594 0.13%
2,019,000 Bonos Y Oblig Del Estado 4.650% 30/07/2025 2,955,244 0.50%
2,191,000 Bonos Y Oblig Del Estado 4.850% 31/10/2020 2,671,615 0.45%
Total Spain 16,027,622 2.70%
Sweden– 0.09% 3,755,000 Swedish Government 2.250% 01/06/2032 509,763 0.09%
Total Sweden 509,763 0.09%
Thailand – 0.35% 17,722,000 Thailand Government Bond 2.875% 17/06/2046 571,537 0.10%
20,000,000 Thailand Government Bond 4.875% 22/06/2029 810,917 0.14%
19,430,000 Thailand Government Bond 3.625% 16/06/2023 677,435 0.11%
Total Thailand 2,059,889 0.35%
United Kingdom – 2.69% 1,019,448 Uk Tsy 1 1/2% 2021 1.500% 22/01/2021 1,315,324 0.22%
132,000 Uk Tsy 1 5/8% 2071 1.625% 22/10/2071 185,031 0.03%
582,007 Uk Tsy 1.75% 2022 1.750% 07/09/2022 768,360 0.13%
1,368,750 Uk Tsy 4 1/4% 2027 4.250% 07/12/2027 2,244,273 0.38%
1,096,730 Uk Tsy 4 1/2% 2042 4.500% 07/12/2042 2,249,079 0.38%
398,000 Uk Tsy 2 3/4% 2024 2.750% 07/09/2024 561,342 0.09%
1,320,000 Uk Tsy 4 3/4% 2030 4.750% 07/12/2030 2,374,511 0.40%
1,151,368 Uk Tsy 4 1/4% 2049 4.250% 07/12/2049 2,469,819 0.42%
432,000 Uk Tsy 4% 2022 / 4.000% 07/03/2022 600,235 0.10%
410,220 Uk Tsy 4% 2060 4.000% 22/01/2060 944,252 0.16%
221,000 Uk Tsy 2 1/4% 2023 2.250% 07/09/2023 300,452 0.05%
1,018,188 Uk Tsy 5% 2025 / 5.000% 07/03/2025 1,610,817 0.27%
169,000 Uk Tsy 4 3/4% 2038 4.750% 07/12/2038 340,913 0.06%
Total United Kingdom 15,964,408 2.69%

SANLAM UNIVERSAL FUNDS PLC
195
PORTFOLIO OF INVESTMENTS OF SANLAM GLOBAL BOND FUND (CONTINUED)
as at 30 June 2019
Nominal Security Coupon Maturity Classification Fair Value % of
USD Net Assets
Financial assets at fair value through profit or loss (continued)
Government Debt - 61.67% (continued)
United States – 10.87% 6,230,000 United States Treasury Note 2.750% 15/02/2024 6,503,779 1.09%
4,500 United States Treasury Note 1.375% 31/08/2020 4,473 0.00%
7,200,300 United States Treasury Bond 3.750% 15/08/2041 8,838,931 1.49%
3,727,300 United States Treasury Note 2.250% 15/11/2025 3,815,095 0.64%
10,365,600 United States Treasury Note 2.000% 15/02/2022 10,437,268 1.76%
4,410,000 United States Treasury Note 1.750% 31/01/2023 4,412,239 0.74%
6,584,300 United States Treasury Bond 2.500% 15/02/2046 6,547,778 1.10%
2,166,000 United States Treasury Note 1.125% 28/02/2021 2,141,294 0.36%
574,000 United States Treasury Note 2.000% 31/05/2021 576,354 0.10%
1,052,000 United States Treasury Note 2.375% 15/05/2027 1,087,012 0.18%
170,000 New York Ny 5.206% 01/10/2031 202,788 0.03%
1,914,200 United States Treasury Note 2.250% 15/11/2024 1,957,942 0.33%
28,400 United States Treasury Note 3.625% 15/02/2020 28,671 0.00%
3,616,200 United States Treasury Note 2.125% 31/12/2021 3,650,384 0.61%
2,100,000 United States Treasury Bond 4.500% 15/02/2036 2,769,375 0.47%
3,073,000 United States Treasury Note 2.500% 31/01/2025 3,185,717 0.54%
750,000 United States Treasury Note 2.750% 15/02/2028 796,992 0.13%
2,889,000 United States Treasury Bond 5.250% 15/02/2029 3,709,657 0.62%
952,000 United States Treasury Bond 5.375% 15/02/2031 1,277,911 0.22%
1,983,800 United States Treasury Bond 6.750% 15/08/2026 2,625,590 0.44%
Total United States 64,569,250 10.87%
Total Government Debt 304,468,875 61.67% Derivative Financial Instruments Futures Contracts – 0.00%
3 US 2YR NOTE (CBT) SEP19 94 0.00%
33 US 5YR NOTE (CBT) SEP19 16,594 0.00%
14 US 10YR ULTRA FUT SEP19 43,531 0.00%
Total Futures Contracts 60,219 0.00%
1BNP Paribas acts as the Fund’s clearing broker with respect to the open futures contracts at 30 June 2019.
Buy Currency Buy Amount Sell currency Sell Amount Maturity Fair Value % of
USD Net
Assets Forward Contracts – 0.71%
GBP 69,139,482 USD (87,086,708) 19/07/2019 984,352 0.17%1
JPY 1,160,000,000 USD (10,538,604) 13/09/2019 287,392 0.05%2
CHF 8,295,099 EUR (7,276,007) 13/09/2019 230,631 0.04%2
CAD 8,678,835 USD (6,441,315) 13/09/2019 209,383 0.04%2
JPY 851,000,000 USD (7,746,152) 13/09/2019 196,023 0.03%2
CAD 8,650,621 USD (6,448,685) 13/09/2019 180,392 0.03%2

SANLAM UNIVERSAL FUNDS PLC
196
PORTFOLIO OF INVESTMENTS OF SANLAM GLOBAL BOND FUND (CONTINUED) as at 30 June 2019
Buy Currency Buy Amount Sell currency Sell Amount Maturity Fair Value % of
USD Net
Assets Financial assets at fair value through profit or loss (continued)
Derivative Financial Instruments (continued)
Forward Contracts – 0.71% (continued)
CAD 7,396,191 USD (5,500,000) 13/09/2019 167,792 0.03%2
PLN 20,150,000 USD (5,254,511) 13/09/2019 158,003 0.03%2
USD 8,835,526 GBP (6,800,000) 13/09/2019 152,254 0.03%2
CAD 9,491,925 USD (7,150,000) 13/09/2019 123,779 0.02%2
PLN 27,184,945 USD (7,188,702) 13/09/2019 113,477 0.02%2
PLN 27,122,327 USD (7,181,298) 13/09/2019 104,061 0.02%2
CHF 2,904,553 EUR (2,546,603) 13/09/2019 82,030 0.01%3
CHF 2,902,747 EUR (2,546,603) 13/09/2019 80,166 0.01%2
CHF 2,752,905 EUR (2,420,000) 13/09/2019 70,466 0.01%2
CHF 2,730,753 EUR (2,401,082) 13/09/2019 69,263 0.01%3
USD 1,751,990 GBP (1,320,000) 13/09/2019 66,414 0.01%4
NZD 4,139,658 AUD (3,875,540) 13/09/2019 58,534 0.01%4
NZD 4,110,556 AUD (3,849,012) 13/09/2019 57,618 0.01%2
JPY 248,000,000 USD (2,257,398) 13/09/2019 57,125 0.01%2
NZD 4,074,180 AUD (3,815,329) 13/09/2019 56,842 0.01%2
NZD 4,074,180 AUD (3,816,769) 13/09/2019 55,829 0.01%2
NZD 4,001,427 AUD (3,747,496) 13/09/2019 55,617 0.01%2
USD 5,597,387 AUD (7,900,000) 13/09/2019 40,960 0.01%2
EUR 4,120,000 USD (4,682,586) 13/09/2019 37,016 0.01%2
USD 992,423 GBP (750,000) 13/09/2019 34,709 0.01%2
CAD 1,450,000 USD (1,082,230) 13/09/2019 28,923 0.01%2
CAD 1,840,000 USD (1,385,787) 13/09/2019 24,227 0.01%2
USD 1,651,925 NZD (2,422,000) 13/09/2019 22,863 0.01%2
USD 1,132,478 NZD (1,650,000) 13/09/2019 22,671 0.01%2
EUR 1,350,000 USD (1,528,241) 13/09/2019 18,231 0.01%2
EUR 1,250,000 USD (1,415,038) 13/09/2019 16,881 0.01%4
JPY 106,000,000 USD (972,799) 13/09/2019 16,473 0.00%4
JPY 121,656,640 USD (1,120,000) 13/09/2019 15,392 0.00%2
JPY 106,449,560 USD (980,000) 13/09/2019 13,468 0.00%4
USD 600,556 NZD (875,000) 13/09/2019 12,022 0.00%4
USD 439,743 GBP (335,000) 13/09/2019 11,965 0.00%2
EUR 5,198,566 USD (5,944,535) 13/09/2019 10,602 0.00%3
CHF 316,000 USD (315,763) 13/09/2019 10,540 0.00%
JPY 602,562,800 EUR (4,900,000) 13/09/2019 10,453 0.00%
CHF 400,000 USD (404,491) 13/09/2019 8,550 0.00%
RUB 26,000,000 USD (399,766) 13/09/2019 8,051 0.00%
RUB 26,000,000 USD (399,766) 13/09/2019 8,051 0.00%
SEK 3,120,000 USD (330,183) 13/09/2019 7,895 0.00%

SANLAM UNIVERSAL FUNDS PLC
197
PORTFOLIO OF INVESTMENTS OF SANLAM GLOBAL BOND FUND (CONTINUED) as at 30 June 2019
Buy Currency Buy Amount Sell currency Sell Amount Maturity Fair Value % of
USD Net Assets
Financial assets at fair value through profit or loss (continued)
Derivative Financial Instruments (continued)
Forward Contracts – 0.71% (continued)
EUR 450,000 USD (508,220) 13/09/2019 7,270 0.00%
CNY 6,000,000 USD (866,426) 16/09/2019 7,196 0.00%
CNY 6,000,000 USD (866,426) 16/09/2019 7,196 0.00%
USD 192,227 GBP (145,000) 13/09/2019 7,069 0.00%
USD 192,227 GBP (145,000) 13/09/2019 7,069 0.00%
USD 7,470,000 JPY (799,700,850) 13/09/2019 6,587 0.00%
CHF 300,000 USD (303,368) 13/09/2019 6,413 0.00%
IDR 10,700,000,000 USD (744,607) 13/09/2019 6,369 0.00%
IDR 10,700,000,000 USD (744,607) 13/09/2019 6,369 0.00%
JPY 40,600,000 USD (372,600) 13/09/2019 6,309 0.00%
AUD 900,000 USD (627,108) 13/09/2019 5,902 0.00%
AUD 15,600,000 USD (10,966,488) 13/09/2019 5,697 0.00%
THB 6,000,000 USD (190,322) 13/09/2019 5,673 0.00%
EUR 340,000 USD (383,989) 13/09/2019 5,493 0.00%
USD 190,525 GBP (145,000) 13/09/2019 5,367 0.00%
USD 190,525 GBP (145,000) 13/09/2019 5,367 0.00%
EUR 250,000 USD (281,651) 13/09/2019 4,732 0.00%
USD 3,716,086 EUR (3,240,000) 13/09/2019 4,554 0.00%
CAD 268,000 USD (200,936) 13/09/2019 4,436 0.00%
EUR 230,000 USD (259,119) 13/09/2019 4,354 0.00%
CAD 191,000 USD (142,231) 13/09/2019 4,135 0.00%
EUR 2,599,283 USD (2,973,541) 13/09/2019 4,027 0.00%
KRW 135,000,000 USD (113,560) 16/09/2019 3,639 0.00%
KRW 135,000,000 USD (113,560) 16/09/2019 3,639 0.00%
EUR 300,000 USD (340,169) 13/09/2019 3,492 0.00%
PLN 700,000 USD (184,764) 13/09/2019 3,263 0.00%
JPY 21,239,829 USD (195,000) 13/09/2019 3,226 0.00%
CAD 147,717 USD (110,000) 13/09/2019 3,198 0.00%
CAD 147,717 USD (110,000) 13/09/2019 3,198 0.00%
USD 2,750,000 NOK (23,370,056) 13/09/2019 3,166 0.00%
JPY 64,000,000 USD (594,359) 13/09/2019 2,937 0.00%
NOK 3,680,000 USD (429,693) 13/09/2019 2,841 0.00%
USD 2,580,783 NOK (21,933,449) 13/09/2019 2,803 0.00%
USD 3,900,000 JPY (417,587,040) 13/09/2019 2,762 0.00%
KRW 135,000,000 USD (114,441) 16/09/2019 2,758 0.00%
JPY 54,000,000 USD (501,491) 13/09/2019 2,478 0.00%
IDR 822,000,000 USD (55,391) 13/09/2019 2,301 0.00%
IDR 822,000,000 USD (55,391) 13/09/2019 2,301 0.00%

SANLAM UNIVERSAL FUNDS PLC
198
PORTFOLIO OF INVESTMENTS OF SANLAM GLOBAL BOND FUND (CONTINUED) as at 30 June 2019
Buy Currency Buy Amount Sell currency Sell Amount Maturity Fair Value % of
USD Net
Assets Financial assets at fair value through profit or loss (continued)
Derivative Financial Instruments (continued)
Forward Contracts – 0.71% (continued)
CAD 133,000 USD (99,718) 13/09/2019 2,201 0.00%
KRW 100,000,000 USD (84,771) 16/09/2019 2,043 0.00%
SEK 550,000 USD (57,563) 13/09/2019 2,034 0.00%
SEK 550,000 USD (57,563) 13/09/2019 2,034 0.00%
USD 754,596 AUD (1,070,000) 13/09/2019 2,017 0.00%
SEK 781,000 USD (82,651) 13/09/2019 1,976 0.00%
CHF 57,000 USD (56,957) 13/09/2019 1,901 0.00%
RUB 3,670,000 USD (55,758) 13/09/2019 1,807 0.00%
RUB 3,670,000 USD (55,758) 13/09/2019 1,807 0.00%
AUD 125,000 USD (86,164) 13/09/2019 1,755 0.00%
USD 558,395 EUR (486,000) 13/09/2019 1,665 0.00%
MXN 1,580,000 USD (79,576) 13/09/2019 1,652 0.00%
IDR 1,150,000,000 USD (79,228) 13/09/2019 1,484 0.00%
CHF 300,000 USD (308,302) 13/09/2019 1,479 0.00%
ILS 900,000 USD (252,044) 13/09/2019 1,452 0.00%
USD 80,661 NZD (118,000) 13/09/2019 1,293 0.00%
GBP 140,000 USD (177,575) 13/09/2019 1,199 0.00%
PLN 209,127 USD (55,000) 13/09/2019 1,174 0.00%
GBP 1,747,207 USD (2,224,538) 19/07/2019 1,084 0.00%
CZK 1,850,000 USD (81,833) 13/09/2019 1,068 0.00%
CZK 1,850,000 USD (81,833) 13/09/2019 1,068 0.00%
IDR 775,000,000 USD (53,393) 13/09/2019 1,000 0.00%
CNY 600,000 USD (86,368) 16/09/2019 994 0.00%
CNY 600,000 USD (86,368) 16/09/2019 994 0.00%
USD 155,166 MXN (3,000,000) 13/09/2019 937 0.00%
AUD 685,000 USD (480,861) 13/09/2019 930 0.00%
AUD 120,000 USD (83,515) 13/09/2019 886 0.00%
MYR 900,000 USD (216,685) 13/09/2019 834 0.00%
EUR 100,000 USD (113,913) 13/09/2019 641 0.00%
EUR 100,000 USD (113,913) 13/09/2019 641 0.00%
SGD 80,000 USD (58,570) 13/09/2019 627 0.00%
SGD 80,000 USD (58,570) 13/09/2019 627 0.00%
AUD 80,000 USD (55,677) 13/09/2019 591 0.00%
PLN 102,662 USD (27,000) 13/09/2019 576 0.00%
USD 212,540 GBP (166,000) 13/09/2019 566 0.00%
USD 412,910 EUR (360,000) 13/09/2019 518 0.00%
USD 43,906 NOK (370,000) 13/09/2019 418 0.00%
CNY 6,100,000 USD (887,789) 16/09/2019 393 0.00%
CNY 6,000,000 USD (873,235) 16/09/2019 386 0.00%

SANLAM UNIVERSAL FUNDS PLC
199
PORTFOLIO OF INVESTMENTS OF SANLAM GLOBAL BOND FUND (CONTINUED) as at 30 June 2019
Buy Currency Buy Amount Sell currency Sell Amount Maturity Fair Value % of
USD Net
Assets Financial assets at fair value through profit or loss (continued)
Derivative Financial Instruments (continued)
Forward Contracts – 0.71% (continued)
USD 298,204 EUR (260,000) 13/09/2019 365 0.00%
CAD 235,000 USD (179,733) 13/09/2019 351 0.00%
EUR 2,350,000 USD (2,691,690) 13/09/2019 316 0.00%
JPY 12,500,000 USD (116,364) 13/09/2019 296 0.00%
PLN 900,000 USD (241,514) 13/09/2019 236 0.00%
USD 26,057 NOK (220,000) 13/09/2019 199 0.00%
AUD 125,000 USD (87,743) 13/09/2019 175 0.00%
GBP 220,000 USD (280,784) 13/09/2019 145 0.00%
USD 53,855 DKK (350,000) 13/09/2019 112 0.00%
USD 53,855 DKK (350,000) 13/09/2019 112 0.00%
USD 445,000 SEK (4,105,738) 13/09/2019 110 0.00%
GBP 90,000 USD (114,866) 13/09/2019 60 0.00%
THB 1,800,000 USD (58,793) 13/09/2019 6 0.00%
THB 1,800,000 USD (58,793) 13/09/2019 6 0.00% Total Forward Contracts 4,222,213 0.71%
1The following entities act as counterparty to the open forward currency contracts at 30 June 2019: Brown Brothers Harriman, JP
Morgan, Goldman Sachs, Societe Generale, and StateStreet.
Nominal Security Classification Fair Value
USD
% of
Net Assets
Interest Rate Swaps – 0.51%
100,000,000 IR Swap USD 13/04/2021 1,143,735 0.19%
1,342,000,000 IR Swap SEK 28/05/2021 268,318 0.05%
200,000,000 IR Swap MXN 02/05/2028 218,237 0.04%
15,800,000 IR Swap GBP 16/05/2029 204,759 0.03%
14,250,000 IR Swap EUR 13/06/2039 204,231 0.03%
135,340,000 IR Swap JPY 13/11/2031 170,076 0.03%
150,000,000 IR Swap MXN 26/05/2028 153,812 0.03%
110,000,000 IR Swap USD 13/09/2021 146,171 0.02%
3,050,000 IR Swap USD 22/02/2025 128,174 0.02%
13,390,000 IR Swap EUR 11/06/2039 121,476 0.02%
438,400,000 IR Swap SEK 21/06/2024 102,253 0.02%
436,900,000 IR Swap SEK 14/06/2024 80,138 0.01%
3,000,000 IR Swap USD 22/02/2022 62,022 0.01%
5,000,000 IR Swap USD 26/02/2021 61,792 0.01% Total Interest Rate Swaps 3,065,194 0.51% 1The following entities act as counterparty to the open swap contracts at 30 June 2019: JP Morgan, Morgan Stanley, Goldman Sachs, and BNP Paribas.
Total financial assets at fair value through profit or loss 574,923,071 312.67%
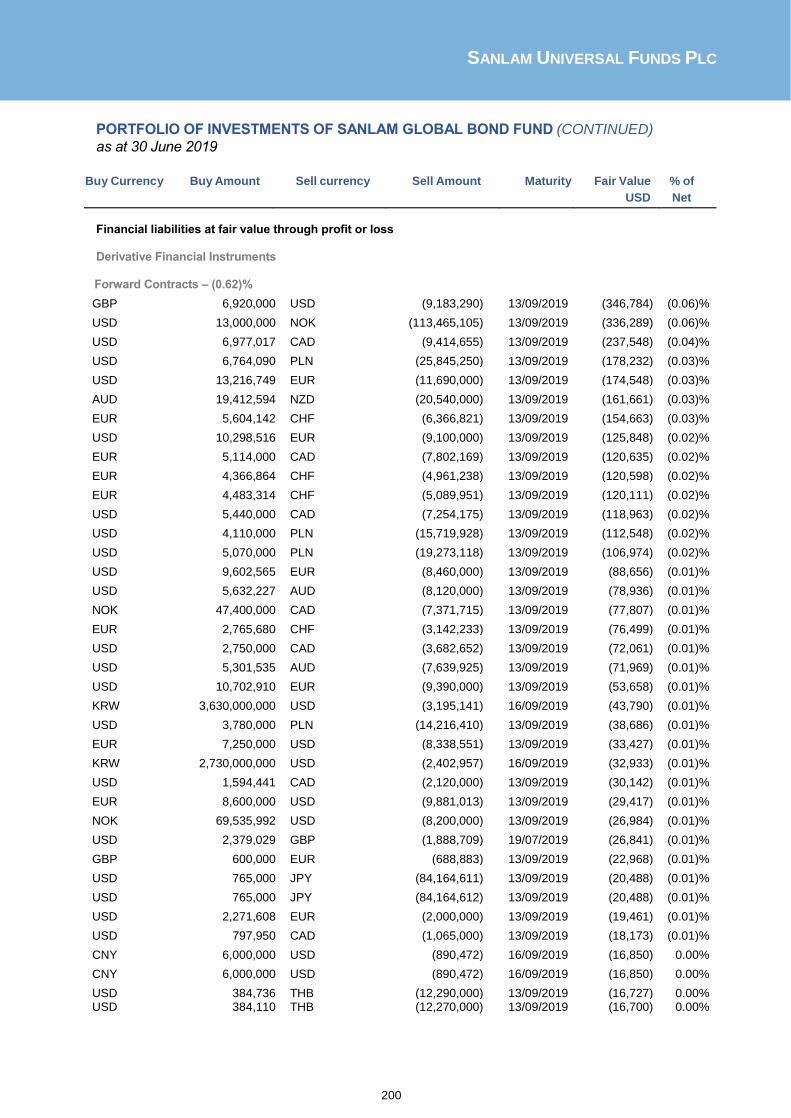
SANLAM UNIVERSAL FUNDS PLC
200
PORTFOLIO OF INVESTMENTS OF SANLAM GLOBAL BOND FUND (CONTINUED)
as at 30 June 2019
Buy Currency Buy Amount Sell currency Sell Amount Maturity Fair Value % of
USD Net
Assets Financial liabilities at fair value through profit or loss Derivative Financial Instruments Forward Contracts – (0.62)%
GBP 6,920,000 USD (9,183,290) 13/09/2019 (346,784) (0.06)%
USD 13,000,000 NOK (113,465,105) 13/09/2019 (336,289) (0.06)%
USD 6,977,017 CAD (9,414,655) 13/09/2019 (237,548) (0.04)%
USD 6,764,090 PLN (25,845,250) 13/09/2019 (178,232) (0.03)%
USD 13,216,749 EUR (11,690,000) 13/09/2019 (174,548) (0.03)%
AUD 19,412,594 NZD (20,540,000) 13/09/2019 (161,661) (0.03)%
EUR 5,604,142 CHF (6,366,821) 13/09/2019 (154,663) (0.03)%
USD 10,298,516 EUR (9,100,000) 13/09/2019 (125,848) (0.02)%
EUR 5,114,000 CAD (7,802,169) 13/09/2019 (120,635) (0.02)%
EUR 4,366,864 CHF (4,961,238) 13/09/2019 (120,598) (0.02)%
EUR 4,483,314 CHF (5,089,951) 13/09/2019 (120,111) (0.02)%
USD 5,440,000 CAD (7,254,175) 13/09/2019 (118,963) (0.02)%
USD 4,110,000 PLN (15,719,928) 13/09/2019 (112,548) (0.02)%
USD 5,070,000 PLN (19,273,118) 13/09/2019 (106,974) (0.02)%
USD 9,602,565 EUR (8,460,000) 13/09/2019 (88,656) (0.01)%
USD 5,632,227 AUD (8,120,000) 13/09/2019 (78,936) (0.01)%
NOK 47,400,000 CAD (7,371,715) 13/09/2019 (77,807) (0.01)%
EUR 2,765,680 CHF (3,142,233) 13/09/2019 (76,499) (0.01)%
USD 2,750,000 CAD (3,682,652) 13/09/2019 (72,061) (0.01)%
USD 5,301,535 AUD (7,639,925) 13/09/2019 (71,969) (0.01)%
USD 10,702,910 EUR (9,390,000) 13/09/2019 (53,658) (0.01)%
KRW 3,630,000,000 USD (3,195,141) 16/09/2019 (43,790) (0.01)%
USD 3,780,000 PLN (14,216,410) 13/09/2019 (38,686) (0.01)%
EUR 7,250,000 USD (8,338,551) 13/09/2019 (33,427) (0.01)%
KRW 2,730,000,000 USD (2,402,957) 16/09/2019 (32,933) (0.01)%
USD 1,594,441 CAD (2,120,000) 13/09/2019 (30,142) (0.01)%
EUR 8,600,000 USD (9,881,013) 13/09/2019 (29,417) (0.01)%
NOK 69,535,992 USD (8,200,000) 13/09/2019 (26,984) (0.01)%
USD 2,379,029 GBP (1,888,709) 19/07/2019 (26,841) (0.01)%
GBP 600,000 EUR (688,883) 13/09/2019 (22,968) (0.01)%
USD 765,000 JPY (84,164,611) 13/09/2019 (20,488) (0.01)%
USD 765,000 JPY (84,164,612) 13/09/2019 (20,488) (0.01)%
USD 2,271,608 EUR (2,000,000) 13/09/2019 (19,461) (0.01)%
USD 797,950 CAD (1,065,000) 13/09/2019 (18,173) (0.01)%
CNY 6,000,000 USD (890,472) 16/09/2019 (16,850) 0.00%
CNY 6,000,000 USD (890,472) 16/09/2019 (16,850) 0.00%
USD 384,736 THB (12,290,000) 13/09/2019 (16,727) 0.00% USD 384,110 THB (12,270,000) 13/09/2019 (16,700) 0.00%
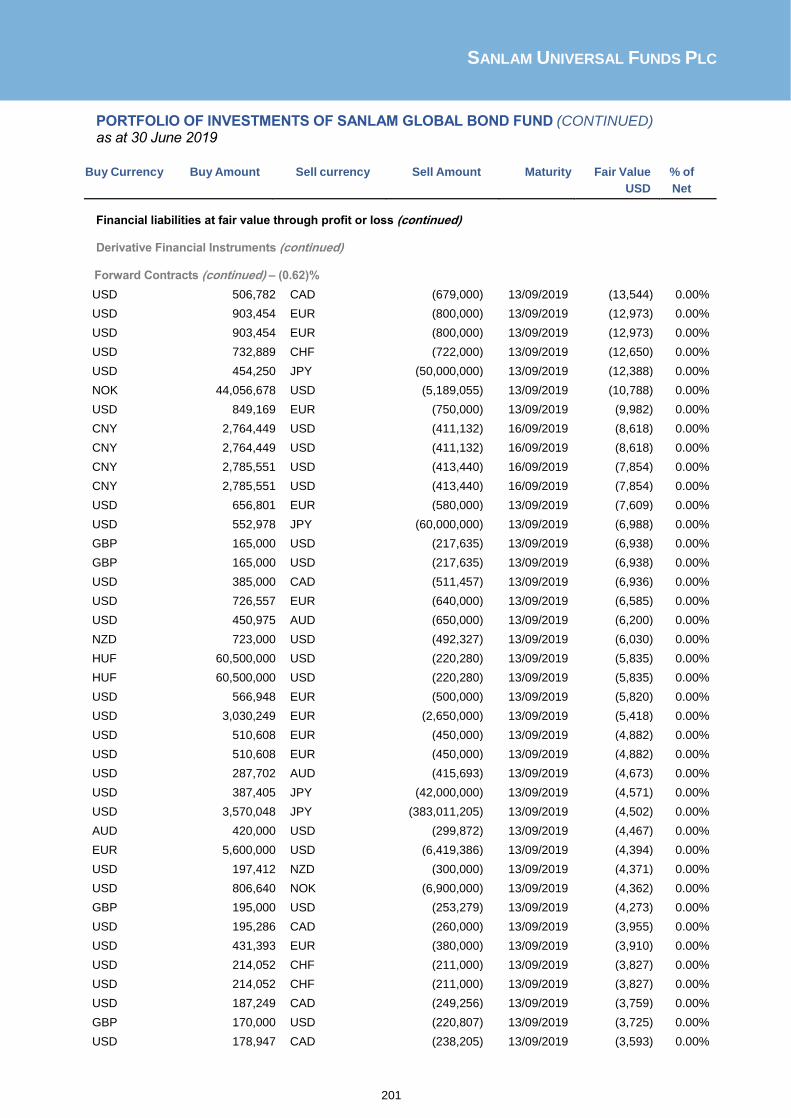
SANLAM UNIVERSAL FUNDS PLC
201
PORTFOLIO OF INVESTMENTS OF SANLAM GLOBAL BOND FUND (CONTINUED) as at 30 June 2019
Buy Currency Buy Amount Sell currency Sell Amount Maturity Fair Value % of
USD Net
Assets Financial liabilities at fair value through profit or loss (continued) Derivative Financial Instruments (continued) Forward Contracts (continued) – (0.62)%
USD 506,782 CAD (679,000) 13/09/2019 (13,544) 0.00%
USD 903,454 EUR (800,000) 13/09/2019 (12,973) 0.00%
USD 903,454 EUR (800,000) 13/09/2019 (12,973) 0.00%
USD 732,889 CHF (722,000) 13/09/2019 (12,650) 0.00%
USD 454,250 JPY (50,000,000) 13/09/2019 (12,388) 0.00%
NOK 44,056,678 USD (5,189,055) 13/09/2019 (10,788) 0.00%
USD 849,169 EUR (750,000) 13/09/2019 (9,982) 0.00%
CNY 2,764,449 USD (411,132) 16/09/2019 (8,618) 0.00%
CNY 2,764,449 USD (411,132) 16/09/2019 (8,618) 0.00%
CNY 2,785,551 USD (413,440) 16/09/2019 (7,854) 0.00%
CNY 2,785,551 USD (413,440) 16/09/2019 (7,854) 0.00%
USD 656,801 EUR (580,000) 13/09/2019 (7,609) 0.00%
USD 552,978 JPY (60,000,000) 13/09/2019 (6,988) 0.00%
GBP 165,000 USD (217,635) 13/09/2019 (6,938) 0.00%
GBP 165,000 USD (217,635) 13/09/2019 (6,938) 0.00%
USD 385,000 CAD (511,457) 13/09/2019 (6,936) 0.00%
USD 726,557 EUR (640,000) 13/09/2019 (6,585) 0.00%
USD 450,975 AUD (650,000) 13/09/2019 (6,200) 0.00%
NZD 723,000 USD (492,327) 13/09/2019 (6,030) 0.00%
HUF 60,500,000 USD (220,280) 13/09/2019 (5,835) 0.00%
HUF 60,500,000 USD (220,280) 13/09/2019 (5,835) 0.00%
USD 566,948 EUR (500,000) 13/09/2019 (5,820) 0.00%
USD 3,030,249 EUR (2,650,000) 13/09/2019 (5,418) 0.00%
USD 510,608 EUR (450,000) 13/09/2019 (4,882) 0.00%
USD 510,608 EUR (450,000) 13/09/2019 (4,882) 0.00%
USD 287,702 AUD (415,693) 13/09/2019 (4,673) 0.00%
USD 387,405 JPY (42,000,000) 13/09/2019 (4,571) 0.00%
USD 3,570,048 JPY (383,011,205) 13/09/2019 (4,502) 0.00%
AUD 420,000 USD (299,872) 13/09/2019 (4,467) 0.00%
EUR 5,600,000 USD (6,419,386) 13/09/2019 (4,394) 0.00%
USD 197,412 NZD (300,000) 13/09/2019 (4,371) 0.00%
USD 806,640 NOK (6,900,000) 13/09/2019 (4,362) 0.00%
GBP 195,000 USD (253,279) 13/09/2019 (4,273) 0.00%
USD 195,286 CAD (260,000) 13/09/2019 (3,955) 0.00%
USD 431,393 EUR (380,000) 13/09/2019 (3,910) 0.00%
USD 214,052 CHF (211,000) 13/09/2019 (3,827) 0.00%
USD 214,052 CHF (211,000) 13/09/2019 (3,827) 0.00%
USD 187,249 CAD (249,256) 13/09/2019 (3,759) 0.00%
GBP 170,000 USD (220,807) 13/09/2019 (3,725) 0.00%
USD 178,947 CAD (238,205) 13/09/2019 (3,593) 0.00%

SANLAM UNIVERSAL FUNDS PLC
202
PORTFOLIO OF INVESTMENTS OF SANLAM GLOBAL BOND FUND (CONTINUED)
as at 30 June 2019
Buy Currency Buy Amount Sell currency Sell Amount Maturity Fair Value % of
USD Net
Assets Financial liabilities at fair value through profit or loss (continued) Derivative Financial Instruments (continued) Forward Contracts (continued) – (0.62)%
USD 340,487 EUR (300,000) 13/09/2019 (3,174) 0.00%
USD 340,487 EUR (300,000) 13/09/2019 (3,174) 0.00%
USD 1,168,283 JPY (125,500,000) 13/09/2019 (2,978) 0.00%
GBP 1,250,000 USD (1,599,116) 13/09/2019 (2,927) 0.00%
USD 340,889 EUR (300,000) 13/09/2019 (2,772) 0.00%
USD 340,889 EUR (300,000) 13/09/2019 (2,772) 0.00%
USD 341,002 EUR (300,000) 13/09/2019 (2,659) 0.00%
USD 173,035 CHF (170,000) 13/09/2019 (2,507) 0.00%
USD 81,204 THB (2,560,000) 13/09/2019 (2,421) 0.00%
USD 202,926 JPY (22,000,000) 13/09/2019 (2,394) 0.00%
USD 437,286 AUD (625,000) 13/09/2019 (2,305) 0.00%
USD 508,540 GBP (400,000) 13/09/2019 (2,240) 0.00%
USD 317,076 GBP (250,000) 13/09/2019 (2,162) 0.00%
NOK 3,550,000 USD (419,008) 13/09/2019 (1,753) 0.00%
USD 296,165 EUR (260,000) 13/09/2019 (1,674) 0.00%
USD 84,843 AUD (123,000) 13/09/2019 (1,668) 0.00%
USD 290,000 JPY (31,246,775) 13/09/2019 (1,619) 0.00%
USD 290,000 JPY (31,246,775) 13/09/2019 (1,619) 0.00%
USD 279,812 AUD (400,000) 13/09/2019 (1,526) 0.00%
USD 80,869 NOK (700,000) 13/09/2019 (1,406) 0.00%
SEK 8,620,000 USD (935,442) 13/09/2019 (1,395) 0.00%
USD 92,028 JPY (10,000,000) 13/09/2019 (1,300) 0.00%
USD 45,481 JPY (5,000,000) 13/09/2019 (1,183) 0.00%
USD 53,994 CAD (72,000) 13/09/2019 (1,180) 0.00%
USD 572,068 AUD (815,000) 13/09/2019 (1,158) 0.00%
KRW 93,000,000 USD (81,848) 16/09/2019 (1,111) 0.00%
USD 113,476 EUR (100,000) 13/09/2019 (1,078) 0.00%
USD 113,476 EUR (100,000) 13/09/2019 (1,078) 0.00%
USD 82,947 JPY (9,000,000) 13/09/2019 (1,048) 0.00%
USD 84,917 EUR (75,000) 13/09/2019 (998) 0.00%
GBP 244,000 USD (312,461) 13/09/2019 (884) 0.00%
SEK 5,130,000 USD (556,707) 13/09/2019 (830) 0.00%
USD 134,440 NOK (1,150,000) 13/09/2019 (727) 0.00%
USD 293,055 GBP (230,000) 13/09/2019 (644) 0.00%
USD 199,858 EUR (175,000) 13/09/2019 (611) 0.00%
GBP 155,000 USD (198,489) 13/09/2019 (562) 0.00%
USD 26,191 MXN (520,000) 13/09/2019 (542) 0.00%
USD 66,700 ILS (238,000) 13/09/2019 (336) 0.00%
USD 140,157 GBP (110,000) 13/09/2019 (308) 0.00%
USD 227,970 MXN (4,440,000) 13/09/2019 (290) 0.00%
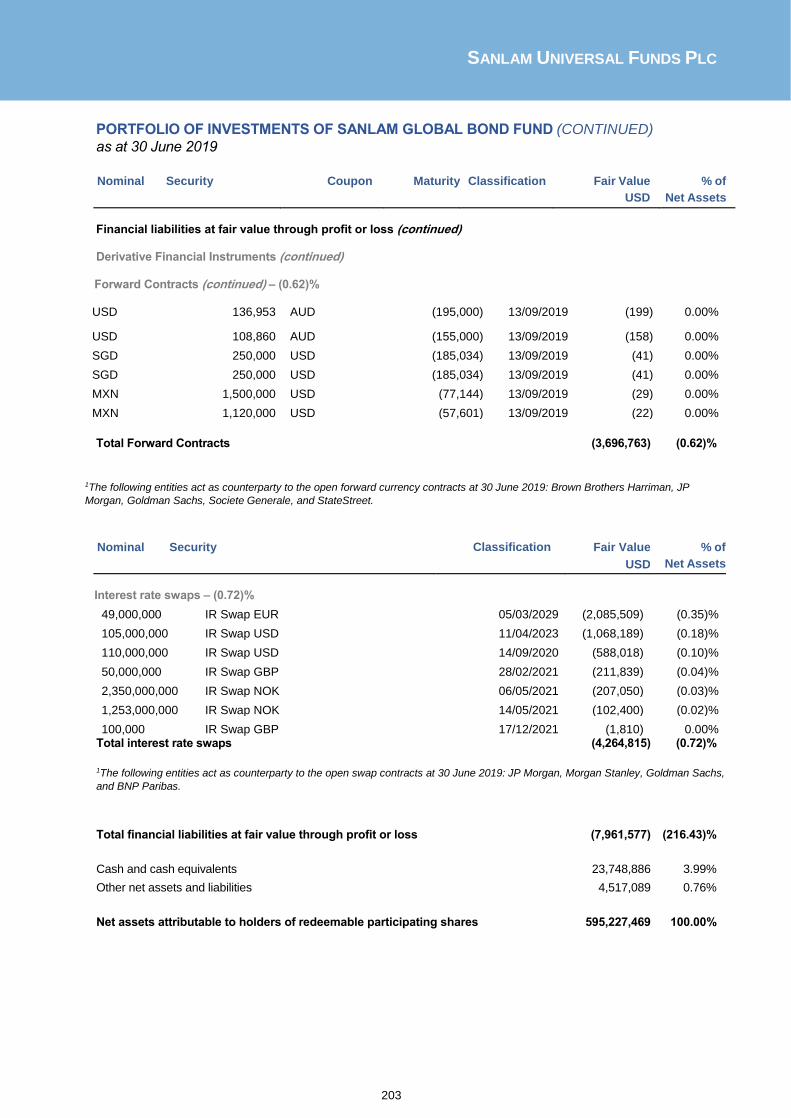
SANLAM UNIVERSAL FUNDS PLC
203
PORTFOLIO OF INVESTMENTS OF SANLAM GLOBAL BOND FUND (CONTINUED)
as at 30 June 2019
Nominal Security Coupon Maturity Classification Fair Value % of
USD Net Assets
Financial liabilities at fair value through profit or loss (continued) Derivative Financial Instruments (continued) Forward Contracts (continued) – (0.62)% USD 136,953 AUD (195,000) 13/09/2019 (199) 0.00%
USD 108,860 AUD (155,000) 13/09/2019 (158) 0.00%
SGD 250,000 USD (185,034) 13/09/2019 (41) 0.00%
SGD 250,000 USD (185,034) 13/09/2019 (41) 0.00%
MXN 1,500,000 USD (77,144) 13/09/2019 (29) 0.00%
MXN 1,120,000 USD (57,601) 13/09/2019 (22) 0.00%
Total Forward Contracts (3,696,763) (0.62)%
1The following entities act as counterparty to the open forward currency contracts at 30 June 2019: Brown Brothers Harriman, JP
Morgan, Goldman Sachs, Societe Generale, and StateStreet.
Nominal Security Classification Fair Value
USD
% of
Net Assets
Interest rate swaps – (0.72)%
49,000,000 IR Swap EUR 05/03/2029 (2,085,509) (0.35)%
105,000,000 IR Swap USD 11/04/2023 (1,068,189) (0.18)%
110,000,000 IR Swap USD 14/09/2020 (588,018) (0.10)%
50,000,000 IR Swap GBP 28/02/2021 (211,839) (0.04)%
2,350,000,000 IR Swap NOK 06/05/2021 (207,050) (0.03)%
1,253,000,000 IR Swap NOK 14/05/2021 (102,400) (0.02)%
100,000 IR Swap GBP 17/12/2021 (1,810) 0.00% Total interest rate swaps (4,264,815) (0.72)%
1The following entities act as counterparty to the open swap contracts at 30 June 2019: JP Morgan, Morgan Stanley, Goldman Sachs,
and BNP Paribas.
Total financial liabilities at fair value through profit or loss (7,961,577) (216.43)%
Cash and cash equivalents 23,748,886 3.99%
Other net assets and liabilities 4,517,089 0.76%
Net assets attributable to holders of redeemable participating shares 595,227,469 100.00%

SANLAM UNIVERSAL FUNDS PLC
204
PORTFOLIO OF INVESTMENTS OF SANLAM GLOBAL BOND FUND (CONTINUED)
as at 30 June 2019
Sanlam Global Bond Fund Summary
Classification Description Fair Value % of % of
USD Net
Assets Total
Assets
Transferable securities and money market instruments admitted to official stock exchange listing or traded on regulated market - - -
A Transferable securities and money market instruments other than those referred above 567,575,445 95.35% 91.89%
B UCITS and AIFs - - -
C Financial derivative instruments dealt in on a regulated market
60,219 0.01% 0.01%
D Over the counter financial derivative instruments (674,171) (0.11%) (0.11%)
Cash and cash equivalents 23,748,886 3.99% 3.85%
Other net assets and liabilities 4,517,089 0.76% 0.73%
Net assets attributable to holders of redeemable participating shares 595,227,469 100.00%

SANLAM UNIVERSAL FUNDS PLC
205
PORTFOLIO OF INVESTMENTS OF DENKER GLOBAL FINANCIAL FUND as at 30 June 2019
Nominal Security Classification Fair Value
USD
% of
Net Assets
Financial assets at fair value through profit or loss
Equities - 97.01%
Austria - 2.06%
113,345 Raiffeisen Bank Internat 2,662,864 2.06%
Total Austria 2,662,864 2.06%
Bermuda - 8.31%
4,721 Credicorp Ltd 1,080,684 0.84%
148,509 Essent Group Ltd 6,978,438 5.40%
13,315 Renaissancere Holdings Ltd 2,370,203 1.84%
47,880 Vostok New Ventures Ltd-Sdr 294,148 0.23%
Total Bermuda 10,723,473 8.31%
Cayman Islands - 0.00%
4,000,000 Dba Telecommunication As - 0.00%
Total Cayman Islands - 0.00%
Cyprus - 5.53%
364,428 Tcs Group Holding -Reg S 7,142,789 5.53%
Total Cyprus 7,142,789 5.53%
France - 0.85%
14,674 Axa Sa 386,018 0.30%
27,993 Societe Generale Sa 708,339 0.55%
Total France 1,094,357 0.85%
India - 11.81%
6,578,463 Bank Rakyat Indonesia Pe 2,030,232 1.57%
48,279 Hdfc Bank Limited 1,709,200 1.32%
56,378 Housing Development Finance 1,790,391 1.39%
228,275 Indiabulls Housing Finan 2,009,673 1.56%
96,990 Lic Housing Finance Ltd 780,177 0.60%
19,715,400 Panin Sekuritas Tbk Pt 2,016,546 1.56%
82,555 Shriram City Union-Forei 1,937,416 1.50%
190,328 Shriram Transport-Foreig 2,979,101 2.31%
Total India 15,252,736 11.81%
Indonesia - 3.35%
6,202,200 Adira Dinamika Multi Fin 4,324,309 3.35%
Total Indonesia 4,324,309 3.35%
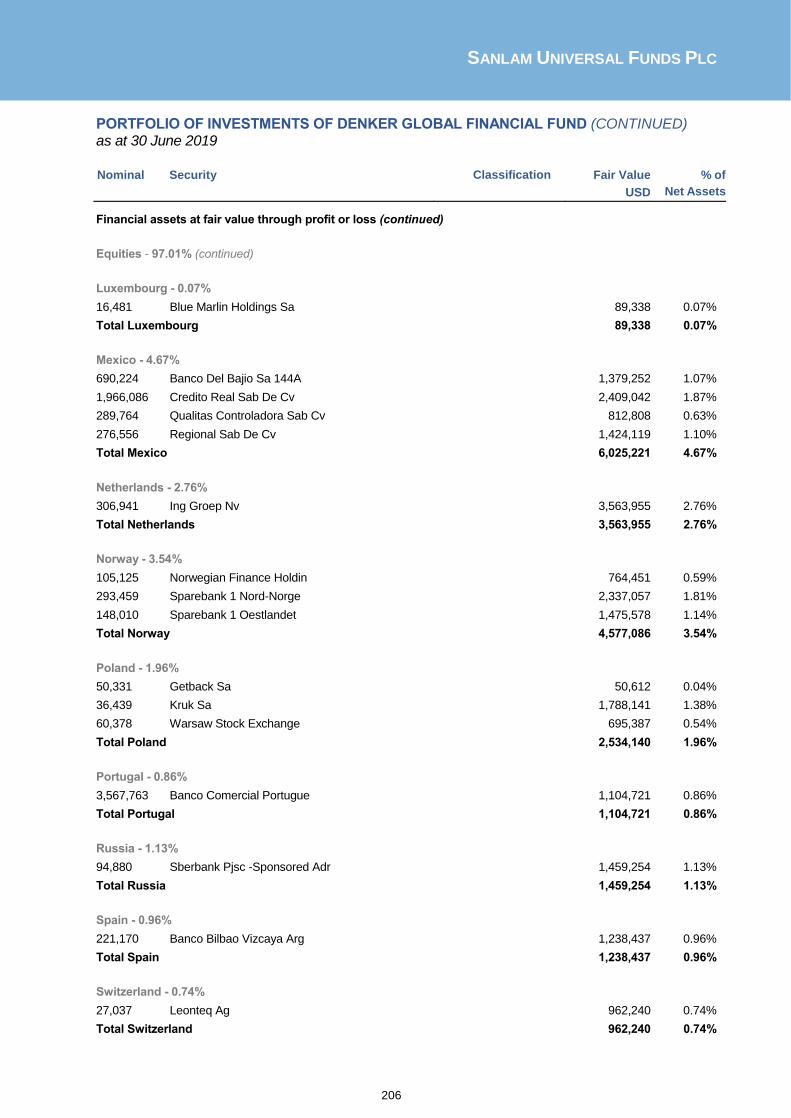
SANLAM UNIVERSAL FUNDS PLC
206
PORTFOLIO OF INVESTMENTS OF DENKER GLOBAL FINANCIAL FUND (CONTINUED) as at 30 June 2019
Nominal Security Classification Fair Value
USD
% of
Net Assets
Financial assets at fair value through profit or loss (continued)
Equities - 97.01% (continued)
Luxembourg - 0.07%
16,481 Blue Marlin Holdings Sa 89,338 0.07%
Total Luxembourg 89,338 0.07%
Mexico - 4.67%
690,224 Banco Del Bajio Sa 144A 1,379,252 1.07%
1,966,086 Credito Real Sab De Cv 2,409,042 1.87%
289,764 Qualitas Controladora Sab Cv 812,808 0.63%
276,556 Regional Sab De Cv 1,424,119 1.10%
Total Mexico 6,025,221 4.67%
Netherlands - 2.76%
306,941 Ing Groep Nv 3,563,955 2.76%
Total Netherlands 3,563,955 2.76%
Norway - 3.54%
105,125 Norwegian Finance Holdin 764,451 0.59%
293,459 Sparebank 1 Nord-Norge 2,337,057 1.81%
148,010 Sparebank 1 Oestlandet 1,475,578 1.14%
Total Norway 4,577,086 3.54%
Poland - 1.96%
50,331 Getback Sa 50,612 0.04%
36,439 Kruk Sa 1,788,141 1.38%
60,378 Warsaw Stock Exchange 695,387 0.54%
Total Poland 2,534,140 1.96%
Portugal - 0.86%
3,567,763 Banco Comercial Portugue 1,104,721 0.86%
Total Portugal 1,104,721 0.86%
Russia - 1.13%
94,880 Sberbank Pjsc -Sponsored Adr 1,459,254 1.13%
Total Russia 1,459,254 1.13%
Spain - 0.96%
221,170 Banco Bilbao Vizcaya Arg 1,238,437 0.96%
Total Spain 1,238,437 0.96%
Switzerland - 0.74%
27,037 Leonteq Ag 962,240 0.74%
Total Switzerland 962,240 0.74%

SANLAM UNIVERSAL FUNDS PLC
207
PORTFOLIO OF INVESTMENTS OF DENKER GLOBAL FINANCIAL FUND (CONTINUED) as at 30 June 2019
Nominal Security Classification Fair Value
USD
% of
Net Assets
Financial assets at fair value through profit or loss (continued)
Equities - 97.01% (continued)
Thailand - 0.52%
108,700 Kasikornbank Pcl-Nvdr 666,360 0.52%
Total Thailand 666,360 0.52%
United Kingdom - 16.49%
2,215,749 Accident Exchange Group - 0.00%
793,810 Arrow Global Group Plc 2,293,340 1.78%
141,865 Asa International Group 633,736 0.49%
50,745 Bank Of Georgia Group Pl 967,456 0.75%
79,115 Georgia Capital Plc 1,097,517 0.85%
517,549 Legal & General Group Pl 1,775,155 1.37%
891,497 Onesavings Bank Plc 4,114,089 3.19%
241,530 Prudential Plc 5,274,902 4.08%
254,086 Tbc Bank Group Plc 5,135,199 3.98%
Total United Kingdom 21,291,394 16.49%
United States - 31.40%
91,890 American International Group 4,895,899 3.79%
10,407 Berkshire Hathaway Inc-Cl B 2,218,460 1.72%
23,982 Capital One Financial Corp 2,176,127 1.69%
89,191 Citigroup Inc 6,246,046 4.84%
74,717 Encore Capital Group Inc 2,530,665 1.96%
27,421 Intercontinental Exchange In 2,356,561 1.82%
62,595 Jpmorgan Chase & Co 6,998,121 5.42%
82,774 Keycorp 1,469,239 1.14%
12,770 Marsh & Mclennan Cos 1,273,808 0.99%
218,723 Mgic Investment Stk 2,874,020 2.23%
190,967 Nova Ljubljanska B-Gdr R 2,522,689 1.95%
12,305 Signature Bank 1,486,936 1.15%
38,338 Us Bancorp 2,008,911 1.56%
31,188 Wells Fargo & Co 1,475,816 1.14%
Total United States 40,533,298 31.40%
Total Equities 125,245,972 97.01%
Total financial assets at fair value through profit or loss 125,245,972 97.01%
Cash and cash equivalents 2,715,751 2.10%
Other net assets and liabilities 1,142,258 0.89%
Net assets attributable to holders of redeemable participating shares 129,103,981 100.00%

SANLAM UNIVERSAL FUNDS PLC
208
PORTFOLIO OF INVESTMENTS OF DENKER GLOBAL FINANCIAL FUND (CONTINUED) as at 30 June 2019 Denker Global Financial Fund Summary Classification Description Fair Value % of % of
USD Net
Assets Total
Assets
Transferable securities and money market instruments admitted to official stock exchange listing or traded on regulated market 125,245,972 97.01% 95.04%
A Transferable securities and money market instruments other than those referred above - - -
B UCITS and AIFs - - -
C Financial derivative instruments dealt in on a regulated market - - -
D Over the counter financial derivative instruments - - -
Cash and cash equivalents 2,715,751 2.10% 2.06%
Other net assets and liabilities 1,142,258 0.89% 0.87%
Net assets attributable to holders of redeemable participating shares 129,103,981 100.00%
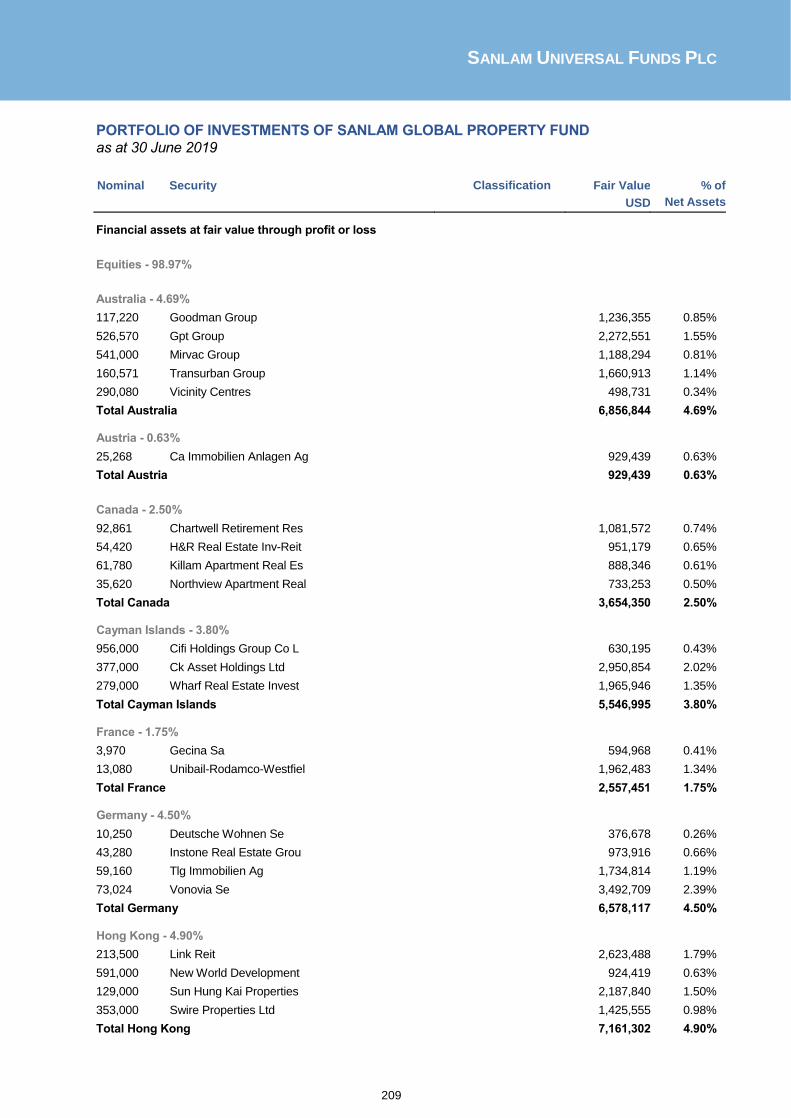
SANLAM UNIVERSAL FUNDS PLC
209
PORTFOLIO OF INVESTMENTS OF SANLAM GLOBAL PROPERTY FUND
as at 30 June 2019
Nominal Security Classification Fair Value
USD
% of
Net Assets
Financial assets at fair value through profit or loss
Equities - 98.97%
Australia - 4.69%
117,220 Goodman Group 1,236,355 0.85%
526,570 Gpt Group 2,272,551 1.55%
541,000 Mirvac Group 1,188,294 0.81%
160,571 Transurban Group 1,660,913 1.14%
290,080 Vicinity Centres 498,731 0.34%
Total Australia 6,856,844 4.69% Austria - 0.63%
25,268 Ca Immobilien Anlagen Ag 929,439 0.63%
Total Austria 929,439 0.63%
Canada - 2.50%
92,861 Chartwell Retirement Res 1,081,572 0.74%
54,420 H&R Real Estate Inv-Reit 951,179 0.65%
61,780 Killam Apartment Real Es 888,346 0.61%
35,620 Northview Apartment Real 733,253 0.50%
Total Canada 3,654,350 2.50% Cayman Islands - 3.80%
956,000 Cifi Holdings Group Co L 630,195 0.43%
377,000 Ck Asset Holdings Ltd 2,950,854 2.02%
279,000 Wharf Real Estate Invest 1,965,946 1.35%
Total Cayman Islands 5,546,995 3.80% France - 1.75%
3,970 Gecina Sa 594,968 0.41%
13,080 Unibail-Rodamco-Westfiel 1,962,483 1.34%
Total France 2,557,451 1.75% Germany - 4.50%
10,250 Deutsche Wohnen Se 376,678 0.26%
43,280 Instone Real Estate Grou 973,916 0.66%
59,160 Tlg Immobilien Ag 1,734,814 1.19%
73,024 Vonovia Se 3,492,709 2.39%
Total Germany 6,578,117 4.50% Hong Kong - 4.90%
213,500 Link Reit 2,623,488 1.79%
591,000 New World Development 924,419 0.63%
129,000 Sun Hung Kai Properties 2,187,840 1.50%
353,000 Swire Properties Ltd 1,425,555 0.98%
Total Hong Kong 7,161,302 4.90%

SANLAM UNIVERSAL FUNDS PLC
210
PORTFOLIO OF INVESTMENTS OF SANLAM GLOBAL PROPERTY FUND (CONTINUED)
as at 30 June 2019
Nominal Security Classification Fair Value
USD
% of
Net Assets
Financial assets at fair value through profit or loss (continued)
Equities - 98.97% (continued)
India - 0.40%
36,040 Lic Housing Finance-Regs Gdr Reg S 580,244 0.40%
Total India 580,244 0.40%
Israel - 0.64%
14,010 Azrieli Group 938,832 0.64%
Total Israel 938,832 0.64%
Japan - 10.96%
110 Daiwa Office Investment 789,215 0.54%
463 Hulic Reit Inc 804,040 0.55%
2,138 Japan Hotel Reit Investment Corporation 1,722,465 1.18%
128 Japan Real Estate Invest 779,358 0.53%
188 Japan Retail Fund Invest 380,397 0.26%
66 Kenedix Office Investmen 472,304 0.32%
54,800 Mitsubishi Estate Co Ltd 1,019,807 0.70%
166,600 Mitsui Fudosan Co Ltd 4,039,748 2.77%
170 Nippon Accommodations Fu 953,035 0.65%
179 Nippon Building Fund Inc 1,226,118 0.84%
461 Nippon Prologis Reit Inc 1,064,998 0.73%
16,900 Open House Co Ltd 691,749 0.47%
435 Orix Jreit Inc 793,772 0.54%
15,900 Sumitomo Realty & Develo 567,878 0.39%
19,600 Taisei Corp 712,215 0.49%
Total Japan 16,017,099 10.96%
Luxembourg - 0.78%
27,610 Ado Properties Sa 144A 1,143,870 0.78%
Total Luxembourg 1,143,870 0.78%
Mexico - 0.49%
261,920 Fibra Uno Administracion 346,561 0.24%
66,040 Grupo Cementos Chihuahua 363,721 0.25%
Total Mexico 710,282 0.49%
Norway - 0.66%
62,375 Entra Asa 958,372 0.66%
Total Norway 958,372 0.66%
Portugal - 0.56%
2,637,920 Banco Comercial Portugue 816,805 0.56%
Total Portugal 816,805 0.56%

SANLAM UNIVERSAL FUNDS PLC
211
PORTFOLIO OF INVESTMENTS OF SANLAM GLOBAL PROPERTY FUND (CONTINUED)
as at 30 June 2019
Nominal Security Classification Fair Value
USD
% of
Net Assets
Financial assets at fair value through profit or loss (continued)
Equities - 98.97% (continued)
Singapore - 2.34%
846,100 Capitaland Commercial Tr 1,357,062 0.93%
183,200 City Developments Ltd 1,282,312 0.87%
141,200 Uol Group Ltd 787,952 0.54%
Total Singapore 3,427,326 2.34%
Spain - 1.14%
63,690 Inmobiliaria Colonial So 710,433 0.48%
69,175 Merlin Properties Socimi 961,073 0.66%
Total Spain 1,671,506 1.14%
Sweden - 1.80%
39,930 Castellum Ab 764,111 0.52%
70,980 Fabege Ab 1,069,114 0.73%
84,990 Hemfosa Fastigheter Ab 803,806 0.55%
Total Sweden 2,637,031 1.80%
United Kingdom - 4.40%
1,186,340 Assura Plc 963,287 0.66%
89,330 Great Portland Estates P 777,642 0.53%
209,480 Hammerson Plc 738,763 0.51%
65,530 Safestore Holdings Plc 511,659 0.35%
157,210 Segro Plc 1,460,993 1.00%
493,280 Tritax Big Box Reit Plc 968,691 0.66%
81,807 Unite Group Plc 1,014,608 0.69%
Total United Kingdom 6,435,643 4.40%
United States - 52.03%
18,460 Agree Realty Corp 1,182,363 0.81%
19,350 Alexandria Real Estate Equit 2,730,091 1.87%
28,110 American Campus Communities 1,297,558 0.89%
83,960 American Homes 4 Rent- A 2,041,068 1.40%
50,010 Americold Realty Trust 1,621,324 1.11%
37,725 Apartment Invt & Mgmt Co -A 1,890,777 1.29%
88,210 Armada Hoffler Properties In 1,459,876 1.00%
19,740 Boston Properties Inc 2,546,460 1.74%
125,500 Brixmor Property Group Inc 2,243,940 1.54%
20,870 Camden Property Trust 2,178,619 1.49%
41,650 City Office Reit Inc 499,384 0.34%
50,085 Cousins Properties Inc 1,811,574 1.24%
65,260 Cubesmart 2,182,294 1.49%
27,030 Digital Realty Trust Inc 3,183,864 2.18%

SANLAM UNIVERSAL FUNDS PLC
212
PORTFOLIO OF INVESTMENTS OF SANLAM GLOBAL PROPERTY FUND (CONTINUED)
as at 30 June 2019
Nominal Security Classification Fair Value
USD
% of
Net Assets
Financial assets at fair value through profit or loss (continued)
Equities - 98.97% (continued)
United States - 52.03% (continued)
14,456 Easterly Government Properti 261,798 0.18%
78,430 Empire State Realty Trust-A 1,161,548 0.80%
14,910 Epr Properties 1,112,137 0.76%
61,860 Essential Properties Realty 1,239,674 0.85%
10,450 Essex Property Trust Inc 3,050,668 2.09%
88,610 Hcp Inc 2,833,748 1.94%
157,020 Independence Realty Trust In 1,816,721 1.24%
19,390 Kilroy Realty Corp 1,431,176 0.98%
14,010 Lennar Corp-A 678,925 0.46%
114,090 Medical Properties Trust Inc 1,989,730 1.36%
48,130 Mgm Growth Properties Llc-A 1,475,185 1.01%
19,690 Mid-America Apartment Comm 2,318,694 1.59%
36,410 National Retail Properties 1,930,094 1.32%
63,980 National Storage Affiliates 1,851,581 1.27%
58,580 Omega Healthcare Investors 2,152,815 1.47%
76,330 Park Hotels & Resorts Inc 2,103,655 1.44%
41,270 Physicians Realty Trust 719,749 0.49%
10,170 Planet Fitness Inc - Cl A 736,715 0.50%
73,680 Prologis Inc 5,901,768 4.04%
35,980 Regency Centers Corp 2,401,305 1.64%
154,450 Retail Properties Of Ame - A 1,816,332 1.24%
26,690 Rexford Industrial Realty In 1,077,475 0.74%
101,730 Rlj Lodging Trust 1,804,690 1.23%
15,390 Simon Property Group Inc 2,458,706 1.68%
75,240 Site Centers Corp 996,178 0.68%
46,090 Stag Industrial Inc 1,393,762 0.95%
19,270 Sun Communities Inc 2,470,221 1.69%
Total United States 76,054,242 52.03%
Total Equities 144,675,750 98.97%
Buy Currency Buy Amount Sell currency Sell Amount Maturity Fair Value % of
USD Net Assets
Derivative Financial Instruments Forward Contracts – 0.05%
USD 293,874 JPY (31,483,000) 13/09/2019 51 0.00%1
SGD 567,000 USD (419,486) 13/09/2019 78 0.00%1
NOK 2,705,000 USD (317,790) 13/09/2019 147 0.00%1
AUD 619,000 USD (435,213) 13/09/2019 158 0.00%1
USD 475,098 JPY (50,883,000) 13/09/2019 219 0.00%1
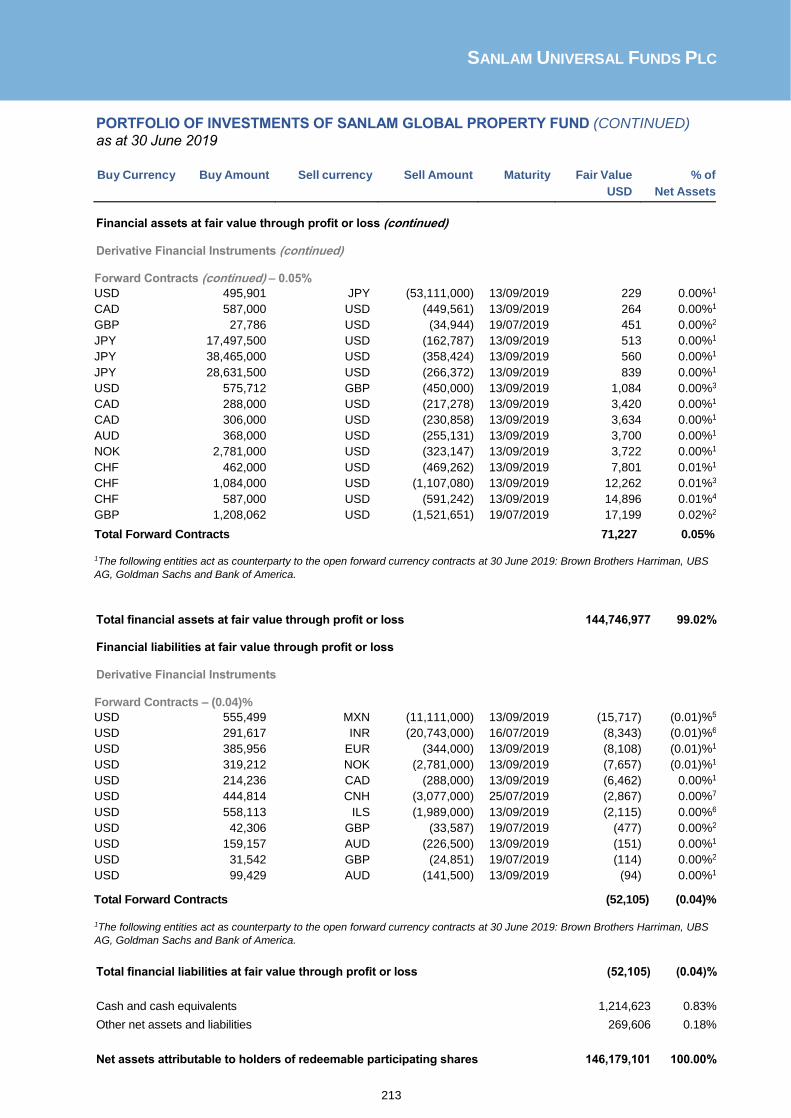
SANLAM UNIVERSAL FUNDS PLC
213
PORTFOLIO OF INVESTMENTS OF SANLAM GLOBAL PROPERTY FUND (CONTINUED)
as at 30 June 2019
Buy Currency Buy Amount Sell currency Sell Amount Maturity Fair Value % of
USD Net Assets
Financial assets at fair value through profit or loss (continued) Derivative Financial Instruments (continued) Forward Contracts (continued) – 0.05%
USD 495,901 JPY (53,111,000) 13/09/2019 229 0.00%1
CAD 587,000 USD (449,561) 13/09/2019 264 0.00%1
GBP 27,786 USD (34,944) 19/07/2019 451 0.00%2
JPY 17,497,500 USD (162,787) 13/09/2019 513 0.00%1
JPY 38,465,000 USD (358,424) 13/09/2019 560 0.00%1
JPY 28,631,500 USD (266,372) 13/09/2019 839 0.00%1
USD 575,712 GBP (450,000) 13/09/2019 1,084 0.00%3
CAD 288,000 USD (217,278) 13/09/2019 3,420 0.00%1
CAD 306,000 USD (230,858) 13/09/2019 3,634 0.00%1
AUD 368,000 USD (255,131) 13/09/2019 3,700 0.00%1
NOK 2,781,000 USD (323,147) 13/09/2019 3,722 0.00%1
CHF 462,000 USD (469,262) 13/09/2019 7,801 0.01%1
CHF 1,084,000 USD (1,107,080) 13/09/2019 12,262 0.01%3
CHF 587,000 USD (591,242) 13/09/2019 14,896 0.01%4
GBP 1,208,062 USD (1,521,651) 19/07/2019 17,199 0.02%2
Total Forward Contracts 71,227 0.05% 1The following entities act as counterparty to the open forward currency contracts at 30 June 2019: Brown Brothers Harriman, UBS
AG, Goldman Sachs and Bank of America.
Total financial assets at fair value through profit or loss 144,746,977 99.02% Financial liabilities at fair value through profit or loss Derivative Financial Instruments Forward Contracts – (0.04)%
USD 555,499 MXN (11,111,000) 13/09/2019 (15,717) (0.01)%5
USD 291,617 INR (20,743,000) 16/07/2019 (8,343) (0.01)%6
USD 385,956 EUR (344,000) 13/09/2019 (8,108) (0.01)%1
USD 319,212 NOK (2,781,000) 13/09/2019 (7,657) (0.01)%1
USD 214,236 CAD (288,000) 13/09/2019 (6,462) 0.00%1
USD 444,814 CNH (3,077,000) 25/07/2019 (2,867) 0.00%7
USD 558,113 ILS (1,989,000) 13/09/2019 (2,115) 0.00%6
USD 42,306 GBP (33,587) 19/07/2019 (477) 0.00%2
USD 159,157 AUD (226,500) 13/09/2019 (151) 0.00%1
USD 31,542 GBP (24,851) 19/07/2019 (114) 0.00%2
USD 99,429 AUD (141,500) 13/09/2019 (94) 0.00%1
Total Forward Contracts (52,105) (0.04)%
1The following entities act as counterparty to the open forward currency contracts at 30 June 2019: Brown Brothers Harriman, UBS
AG, Goldman Sachs and Bank of America.
Total financial liabilities at fair value through profit or loss (52,105) (0.04)%
Cash and cash equivalents 1,214,623 0.83%
Other net assets and liabilities 269,606 0.18%
Net assets attributable to holders of redeemable participating shares 146,179,101 100.00%

SANLAM UNIVERSAL FUNDS PLC
214
PORTFOLIO OF INVESTMENTS OF SANLAM GLOBAL PROPERTY FUND (CONTINUED)
as at 30 June 2019
Sanlam Global Property Fund Summary
Classification Description Fair Value % of % of
USD Net
Assets Total
Assets
Transferable securities and money market instruments admitted to official stock exchange listing or traded on regulated market
144,675,750 98.97% 98.55%
A Transferable securities and money market instruments other than those referred above - - -
B UCITS and AIFs - - -
C Financial derivative instruments dealt in on a regulated market - - -
D Over the counter financial derivative instruments 19,122 0.01% 0.01%
Cash and cash equivalents 1,214,623 0.83% 0.83%
Other net assets and liabilities 269,606 0.18% 0.18%
Net assets attributable to holders of redeemable participating shares 146,179,101 100.00%

SANLAM UNIVERSAL FUNDS PLC
215
PORTFOLIO OF INVESTMENTS OF SANLAM WORLD EQUITY FUND
as at 30 June 2019
Nominal Security Classification Fair Value
USD
% of
Net Assets
Financial assets at fair value through profit or loss
Equities - 94.25%
Cayman Island - 4.01%
80,092 Tencent Holdings Ltd 3,614,776 4.01%
Total Cayman Island 3,614,776 4.01%
France - 2.74%
29,094 Danone 2,468,352 2.74%
Total France 2,468,352 2.74%
Germany - 8.73%
61,205 Bayer Ag-Reg 4,247,534 4.71%
46,075 Fresenius Medical Care Ag & Co 3,622,543 4.02%
Total Germany 7,870,077 8.73%
Ireland - 8.90%
21,875 Allergan Plc 3,662,531 4.06%
44,838 Medtronic Plc 4,366,773 4.84%
Total Ireland 8,029,304 8.90%
South Korea - 3.77%
3,346 Samsung Electr-Gdr Reg S 3,402,882 3.77%
Total South Korea 3,402,882 3.77%
Switzerland - 3.33%
10,651 Roche Holding Ag-Genussc 3,000,305 3.33%
Total Switzerland 3,000,305 3.33%
United Kingdom - 19.35%
73,675 British American Tobacco 2,577,632 2.86%
46,665 Diageo Plc 2,009,776 2.23%
84,038 Imperial Brands Plc 1,975,248 2.19%
39,716 Intercontinental Hotels Grou 2,614,268 2.90%
44,407 Reckitt Benckiser Group 3,511,953 3.89%
367,922 Rolls-Royce Holdings-Ent 468 0.00%
242,526 Sage Group Plc 2,476,710 2.74%
36,752 Unilever Plc 2,289,367 2.54%
Total United Kingdom 17,455,422 19.35%
United States - 43.42%
3,958 Alphabet Inc-Cl C 4,278,242 4.74%
25,001 Altria Group Inc 1,183,797 1.31%
19,242 American Express Co 2,375,232 2.63%
2,172 Booking Holdings Inc 4,071,870 4.52%
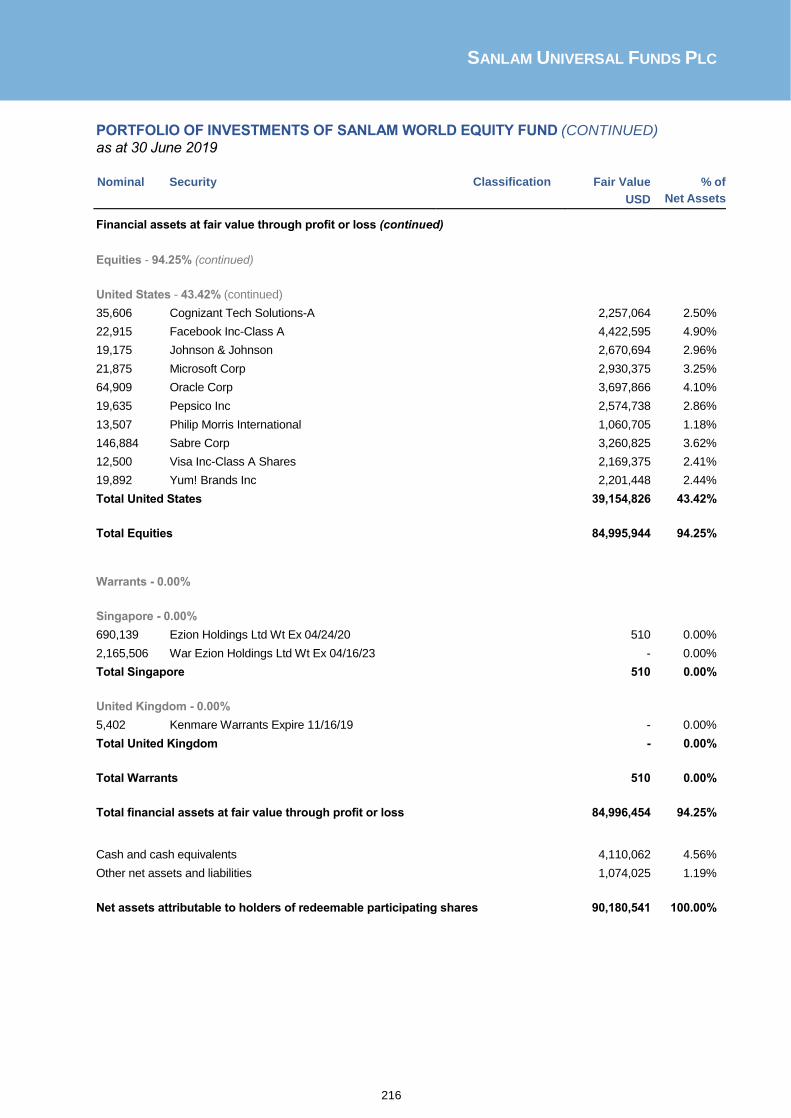
SANLAM UNIVERSAL FUNDS PLC
216
PORTFOLIO OF INVESTMENTS OF SANLAM WORLD EQUITY FUND (CONTINUED)
as at 30 June 2019
Nominal Security Classification Fair Value
USD
% of
Net Assets
Financial assets at fair value through profit or loss (continued)
Equities - 94.25% (continued)
United States - 43.42% (continued)
35,606 Cognizant Tech Solutions-A 2,257,064 2.50%
22,915 Facebook Inc-Class A 4,422,595 4.90%
19,175 Johnson & Johnson 2,670,694 2.96%
21,875 Microsoft Corp 2,930,375 3.25%
64,909 Oracle Corp 3,697,866 4.10%
19,635 Pepsico Inc 2,574,738 2.86%
13,507 Philip Morris International 1,060,705 1.18%
146,884 Sabre Corp 3,260,825 3.62%
12,500 Visa Inc-Class A Shares 2,169,375 2.41%
19,892 Yum! Brands Inc 2,201,448 2.44%
Total United States 39,154,826 43.42%
Total Equities 84,995,944 94.25%
Warrants - 0.00%
Singapore - 0.00%
690,139 Ezion Holdings Ltd Wt Ex 04/24/20 510 0.00%
2,165,506 War Ezion Holdings Ltd Wt Ex 04/16/23 - 0.00%
Total Singapore 510 0.00%
United Kingdom - 0.00%
5,402 Kenmare Warrants Expire 11/16/19 - 0.00%
Total United Kingdom - 0.00%
Total Warrants 510 0.00%
Total financial assets at fair value through profit or loss 84,996,454 94.25%
Cash and cash equivalents 4,110,062 4.56%
Other net assets and liabilities 1,074,025 1.19%
Net assets attributable to holders of redeemable participating shares 90,180,541 100.00%

SANLAM UNIVERSAL FUNDS PLC
217
PORTFOLIO OF INVESTMENTS OF SANLAM WORLD EQUITY FUND (CONTINUED)
as at 30 June 2019 Sanlam World Equity Fund Summary Classification Description Fair Value % of % of
USD Net
Assets Total
Assets
Transferable securities and money market instruments admitted to official stock exchange listing or traded on regulated market 84,995,944 94.25% 93.84%
A Transferable securities and money market instruments other than those referred above - - -
B UCITS and AIFs - - -
C Financial derivative instruments dealt in on a regulated market - - -
D Over the counter financial derivative instruments 510 0.00% 0.00%
Cash and cash equivalents 4,110,062 4.56% 4.54%
Other net assets and liabilities 1,074,025 1.19% 1.19%
Net assets attributable to holders of redeemable participating shares 90,180,541 100.00%

SANLAM UNIVERSAL FUNDS PLC
218
PORTFOLIO OF INVESTMENTS OF SATRIX WORLD EQUITY TRACKER FUND
as at 30 June 2019
Nominal Security Classification Fair Value
USD
% of
Net Assets
Financial assets at fair value through profit or loss
Equities - 95.68%
Australia - 2.41%
72,309 Amcor Limited 821,527 0.06%
273,904 Amp Ltd 407,490 0.03%
111,096 Aust And Nz Banking Group 2,199,297 0.16%
93,411 Bhp Group Ltd 2,698,086 0.20%
85,096 Brambles Ltd 769,144 0.06%
29,316 Caltex Australia Ltd 509,169 0.04%
79,393 Coles Group Ltd 743,782 0.05%
53,991 Commonwealth Bank Of Australia 3,136,384 0.23%
32,269 Crown Resorts Ltd 281,927 0.02%
18,256 Csl Ltd 2,754,397 0.20%
57,748 Dexus 526,010 0.04%
119,744 Insurance Australia Grou 694,091 0.05%
34,733 Lend Lease Group 316,861 0.02%
21,003 Macquarie Group Ltd 1,848,105 0.13%
433,044 Mirvac Group 951,171 0.07%
78,156 National Australia Bank 1,465,484 0.11%
22,520 Newcrest Mining Ltd 504,919 0.04%
18,717 Orica Ltd 266,240 0.02%
121,131 Origin Energy Ltd 621,377 0.05%
46,934 Qbe Insurance Group Ltd 389,632 0.03%
18,778 Rio Tinto Ltd 1,367,293 0.10%
69,799 Santos Ltd 346,789 0.03%
216,974 Scentre Group 584,684 0.04%
318,681 South32 Ltd 711,157 0.05%
49,358 Suncorp Group Ltd 466,560 0.03%
92,461 Sydney Airport 521,671 0.04%
88,818 Tabcorp Holdings Ltd 277,360 0.02%
267,386 Telstra Corp Ltd 722,407 0.05%
108,859 Transurban Group 1,126,015 0.08%
39,822 Wesfarmers Ltd 1,010,494 0.07%
105,934 Westpac Banking Corporation 2,108,259 0.15%
23,676 Woodside Petroleum Ltd 604,108 0.04%
56,477 Woolworths Group Ltd 1,316,996 0.10%
Total Australia 33,068,886 2.41%
Austria - 0.39%
16,487 Elisa Oyj 805,652 0.06%
16,818 Erste Group Bank Ag 625,132 0.05%
20,337 Fortum Oyj 450,110 0.03%
5,998 Kone Oyj-B 354,504 0.03%
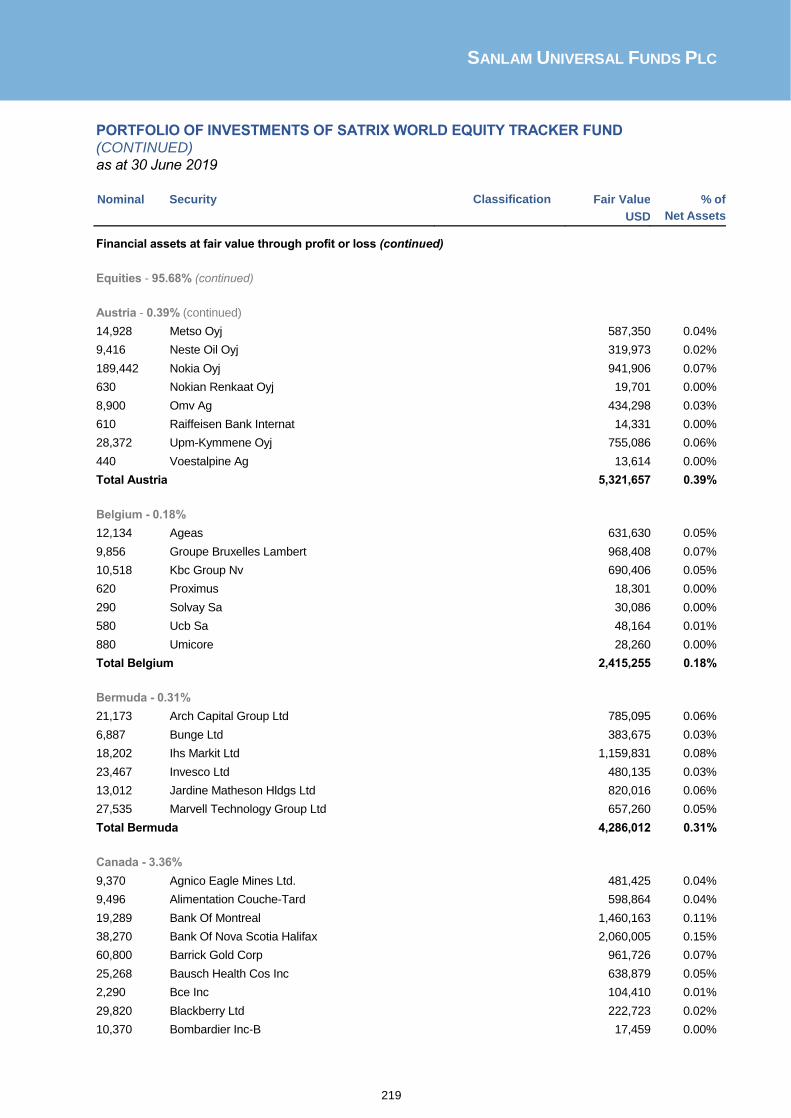
SANLAM UNIVERSAL FUNDS PLC
219
PORTFOLIO OF INVESTMENTS OF SATRIX WORLD EQUITY TRACKER FUND
(CONTINUED)
as at 30 June 2019
Nominal Security Classification Fair Value
USD
% of
Net Assets
Financial assets at fair value through profit or loss (continued)
Equities - 95.68% (continued)
Austria - 0.39% (continued)
14,928 Metso Oyj 587,350 0.04%
9,416 Neste Oil Oyj 319,973 0.02%
189,442 Nokia Oyj 941,906 0.07%
630 Nokian Renkaat Oyj 19,701 0.00%
8,900 Omv Ag 434,298 0.03%
610 Raiffeisen Bank Internat 14,331 0.00%
28,372 Upm-Kymmene Oyj 755,086 0.06%
440 Voestalpine Ag 13,614 0.00%
Total Austria 5,321,657 0.39%
Belgium - 0.18%
12,134 Ageas 631,630 0.05%
9,856 Groupe Bruxelles Lambert 968,408 0.07%
10,518 Kbc Group Nv 690,406 0.05%
620 Proximus 18,301 0.00%
290 Solvay Sa 30,086 0.00%
580 Ucb Sa 48,164 0.01%
880 Umicore 28,260 0.00%
Total Belgium 2,415,255 0.18%
Bermuda - 0.31%
21,173 Arch Capital Group Ltd 785,095 0.06%
6,887 Bunge Ltd 383,675 0.03%
18,202 Ihs Markit Ltd 1,159,831 0.08%
23,467 Invesco Ltd 480,135 0.03%
13,012 Jardine Matheson Hldgs Ltd 820,016 0.06%
27,535 Marvell Technology Group Ltd 657,260 0.05%
Total Bermuda 4,286,012 0.31%
Canada - 3.36%
9,370 Agnico Eagle Mines Ltd. 481,425 0.04%
9,496 Alimentation Couche-Tard 598,864 0.04%
19,289 Bank Of Montreal 1,460,163 0.11%
38,270 Bank Of Nova Scotia Halifax 2,060,005 0.15%
60,800 Barrick Gold Corp 961,726 0.07%
25,268 Bausch Health Cos Inc 638,879 0.05%
2,290 Bce Inc 104,410 0.01%
29,820 Blackberry Ltd 222,723 0.02%
10,370 Bombardier Inc-B 17,459 0.00%

SANLAM UNIVERSAL FUNDS PLC
220
PORTFOLIO OF INVESTMENTS OF SATRIX WORLD EQUITY TRACKER FUND
(CONTINUED)
as at 30 June 2019
Nominal Security Classification Fair Value
USD
% of
Net Assets
Financial assets at fair value through profit or loss (continued)
Equities - 95.68% (continued)
Canada - 3.36% (continued)
22,921 Brookfield Asset Manage-Cl A 1,098,910 0.08%
28,568 Cameco Corp 306,941 0.02%
15,949 Can Imperial Bk Of Comme 1,256,880 0.09%
23,154 Canadian Natl Railway Co 2,147,515 0.16%
38,365 Canadian Natural Resourc 1,036,670 0.08%
5,139 Canadian Pacific Railway 1,212,949 0.09%
1,140 Canopy Growth Corp 46,123 0.00%
31,367 Cenovus Energy Inc 277,244 0.02%
1,820 Cgi Inc 140,224 0.01%
1,627 Constellation Software I 1,536,732 0.11%
69,467 Enbridge Inc 2,514,474 0.18%
68,962 Encana Corp 354,639 0.03%
2,060 First Quantum Minerals Ltd 19,611 0.00%
28,739 Fortis Inc 1,137,244 0.08%
6,340 Franco-Nevada Corp 539,270 0.04%
66,018 Husky Energy Inc 626,963 0.05%
6,847 Imperial Oil Ltd 189,992 0.01%
11,150 Intact Financial Corp 1,032,618 0.08%
83,601 Kinross Gold Corp 323,720 0.02%
15,655 Loblaw Companies Ltd 803,266 0.06%
16,996 Magna International Inc 847,491 0.06%
84,474 Manulife Financial Corp 1,538,535 0.11%
470 Methanex Corp 21,382 0.00%
17,146 Metro Inc 644,771 0.05%
26,966 National Bank Of Canada 1,283,761 0.09%
24,209 Nutrien Ltd 1,297,754 0.09%
2,370 Pembina Pipeline Corp 88,416 0.01%
2,460 Power Corp Of Canada 53,106 0.00%
21,848 Prairiesky Royalty Ltd 307,636 0.02%
19,837 Rogers Communications In 1,064,147 0.08%
36,498 Royal Bank Of Canada 2,906,713 0.21%
40,717 Shaw Communications Inc- 832,568 0.06%
2,907 Shopify Inc - Class A 875,559 0.06%
24,098 Sun Life Financial Inc 1,000,065 0.07%
68,762 Suncor Energy Inc 2,149,552 0.16%
25,066 Tc Energy Corp 1,245,292 0.09%
20,533 Teck Resources Ltd Cls B 474,848 0.03%
9,926 Telus Corp 367,720 0.03%
15,223 Thomson Reuters Corp 984,151 0.07%
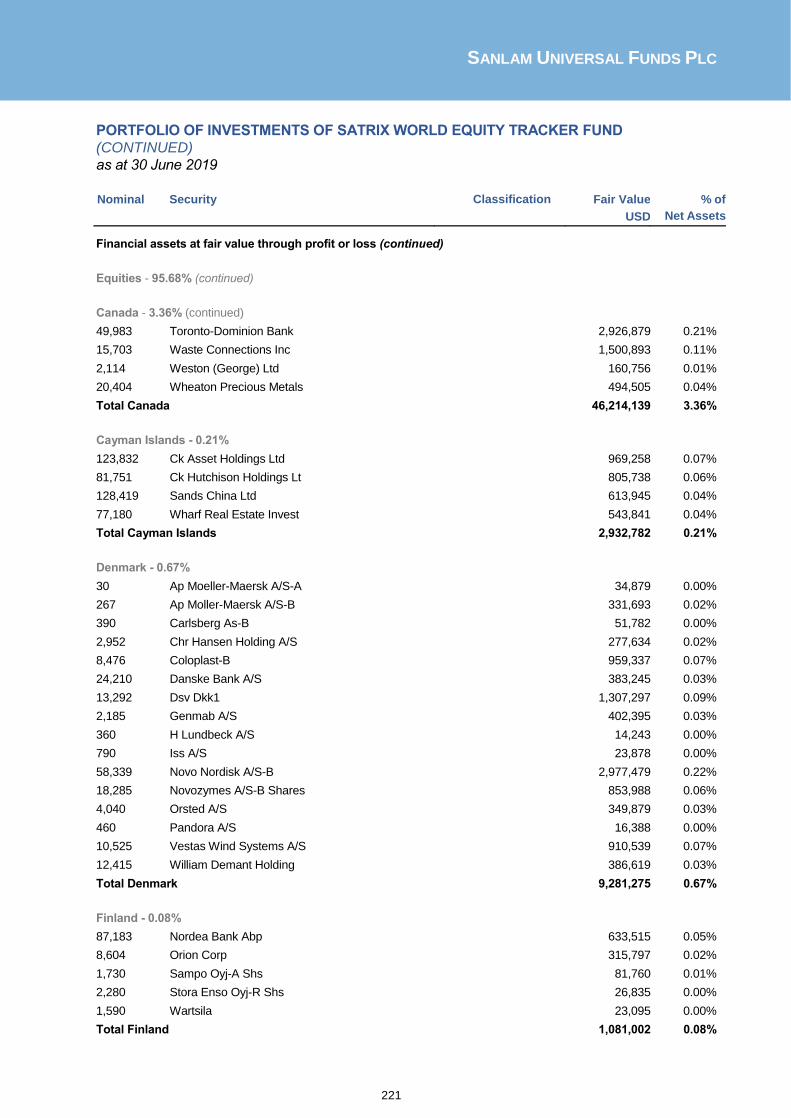
SANLAM UNIVERSAL FUNDS PLC
221
PORTFOLIO OF INVESTMENTS OF SATRIX WORLD EQUITY TRACKER FUND
(CONTINUED)
as at 30 June 2019
Nominal Security Classification Fair Value
USD
% of
Net Assets
Financial assets at fair value through profit or loss (continued)
Equities - 95.68% (continued)
Canada - 3.36% (continued)
49,983 Toronto-Dominion Bank 2,926,879 0.21%
15,703 Waste Connections Inc 1,500,893 0.11%
2,114 Weston (George) Ltd 160,756 0.01%
20,404 Wheaton Precious Metals 494,505 0.04%
Total Canada 46,214,139 3.36%
Cayman Islands - 0.21%
123,832 Ck Asset Holdings Ltd 969,258 0.07%
81,751 Ck Hutchison Holdings Lt 805,738 0.06%
128,419 Sands China Ltd 613,945 0.04%
77,180 Wharf Real Estate Invest 543,841 0.04%
Total Cayman Islands 2,932,782 0.21%
Denmark - 0.67%
30 Ap Moeller-Maersk A/S-A 34,879 0.00%
267 Ap Moller-Maersk A/S-B 331,693 0.02%
390 Carlsberg As-B 51,782 0.00%
2,952 Chr Hansen Holding A/S 277,634 0.02%
8,476 Coloplast-B 959,337 0.07%
24,210 Danske Bank A/S 383,245 0.03%
13,292 Dsv Dkk1 1,307,297 0.09%
2,185 Genmab A/S 402,395 0.03%
360 H Lundbeck A/S 14,243 0.00%
790 Iss A/S 23,878 0.00%
58,339 Novo Nordisk A/S-B 2,977,479 0.22%
18,285 Novozymes A/S-B Shares 853,988 0.06%
4,040 Orsted A/S 349,879 0.03%
460 Pandora A/S 16,388 0.00%
10,525 Vestas Wind Systems A/S 910,539 0.07%
12,415 William Demant Holding 386,619 0.03%
Total Denmark 9,281,275 0.67%
Finland - 0.08%
87,183 Nordea Bank Abp 633,515 0.05%
8,604 Orion Corp 315,797 0.02%
1,730 Sampo Oyj-A Shs 81,760 0.01%
2,280 Stora Enso Oyj-R Shs 26,835 0.00%
1,590 Wartsila 23,095 0.00%
Total Finland 1,081,002 0.08%
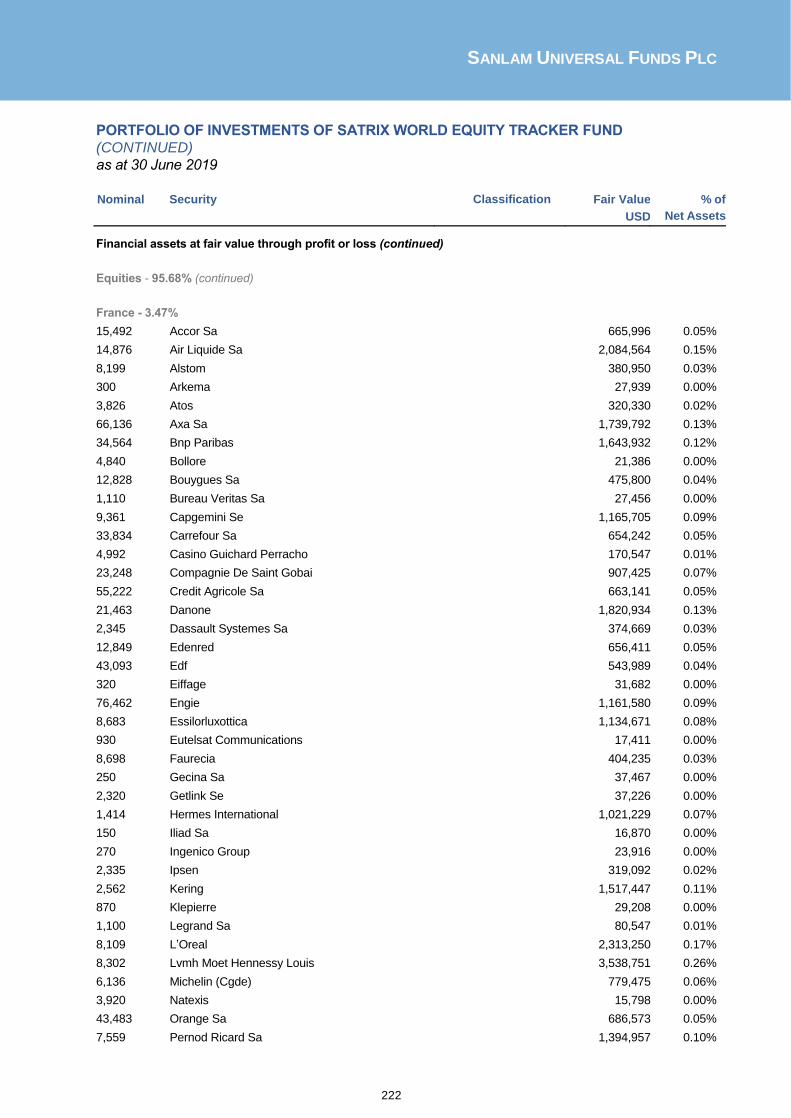
SANLAM UNIVERSAL FUNDS PLC
222
PORTFOLIO OF INVESTMENTS OF SATRIX WORLD EQUITY TRACKER FUND
(CONTINUED)
as at 30 June 2019
Nominal Security Classification Fair Value
USD
% of
Net Assets
Financial assets at fair value through profit or loss (continued)
Equities - 95.68% (continued)
France - 3.47%
15,492 Accor Sa 665,996 0.05%
14,876 Air Liquide Sa 2,084,564 0.15%
8,199 Alstom 380,950 0.03%
300 Arkema 27,939 0.00%
3,826 Atos 320,330 0.02%
66,136 Axa Sa 1,739,792 0.13%
34,564 Bnp Paribas 1,643,932 0.12%
4,840 Bollore 21,386 0.00%
12,828 Bouygues Sa 475,800 0.04%
1,110 Bureau Veritas Sa 27,456 0.00%
9,361 Capgemini Se 1,165,705 0.09%
33,834 Carrefour Sa 654,242 0.05%
4,992 Casino Guichard Perracho 170,547 0.01%
23,248 Compagnie De Saint Gobai 907,425 0.07%
55,222 Credit Agricole Sa 663,141 0.05%
21,463 Danone 1,820,934 0.13%
2,345 Dassault Systemes Sa 374,669 0.03%
12,849 Edenred 656,411 0.05%
43,093 Edf 543,989 0.04%
320 Eiffage 31,682 0.00%
76,462 Engie 1,161,580 0.09%
8,683 Essilorluxottica 1,134,671 0.08%
930 Eutelsat Communications 17,411 0.00%
8,698 Faurecia 404,235 0.03%
250 Gecina Sa 37,467 0.00%
2,320 Getlink Se 37,226 0.00%
1,414 Hermes International 1,021,229 0.07%
150 Iliad Sa 16,870 0.00%
270 Ingenico Group 23,916 0.00%
2,335 Ipsen 319,092 0.02%
2,562 Kering 1,517,447 0.11%
870 Klepierre 29,208 0.00%
1,100 Legrand Sa 80,547 0.01%
8,109 L’Oreal 2,313,250 0.17%
8,302 Lvmh Moet Hennessy Louis 3,538,751 0.26%
6,136 Michelin (Cgde) 779,475 0.06%
3,920 Natexis 15,798 0.00%
43,483 Orange Sa 686,573 0.05%
7,559 Pernod Ricard Sa 1,394,957 0.10%

SANLAM UNIVERSAL FUNDS PLC
223
PORTFOLIO OF INVESTMENTS OF SATRIX WORLD EQUITY TRACKER FUND
(CONTINUED)
as at 30 June 2019
Nominal Security Classification Fair Value
USD
% of
Net Assets
Financial assets at fair value through profit or loss (continued)
Equities - 95.68% (continued)
France - 3.47% (continued)
2,330 Peugeot Sa 57,499 0.00%
850 Publicis Groupe 44,943 0.00%
6,479 Renault Stk 407,945 0.03%
12,608 Safran Sa 1,850,027 0.14%
36,789 Sanofi 3,180,273 0.23%
20,844 Schneider Elec Sa 1,893,275 0.14%
13,678 Scor Se 600,630 0.04%
160 Societe Bic Sa 12,217 0.00%
20,492 Societe Generale Sa 518,532 0.04%
6,970 Sodexo Sa 815,968 0.06%
15,667 Suez 226,410 0.02%
270 Teleperformance 54,177 0.00%
470 Thales Sa 58,153 0.00%
72,631 Total Sa 4,075,643 0.30%
3,698 Ubisoft Entertainment 289,905 0.02%
5,369 Unibail-Rodamco-Westfiel 805,548 0.06%
1,040 Valeo Sa 33,872 0.00%
29,420 Veolia Environnement 717,645 0.05%
17,753 Vinci Sa 1,820,754 0.13%
43,344 Vivendi Sa 1,195,009 0.09%
130 Wendel 17,751 0.00%
1,370 Worldline Sa 144A 99,850 0.01%
Total France 47,682,619 3.47%
Germany - 2.74%
5,671 Adidas Ag 1,753,384 0.13%
13,646 Allianz Se Registered 3,294,494 0.24%
33,202 Basf Se 2,416,843 0.18%
29,466 Bayer Ag-Reg 2,044,895 0.15%
14,693 Bayerische Motoren Werke 1,086,483 0.08
390 Beiersdorf Ag 46,878 0.00%
750 Brenntag Ag 36,991 0.00%
53,360 Commerzbank Ag(Gy) 383,983 0.03%
450 Continental Ag 65,708 0.01%
800 Covestro Ag 40,733 0.00%
27,425 Daimler Ag-Registered Sh 1,528,005 0.11%
88,346 Deutsche Bank Ag-Registe 682,125 0.05%
8,030 Deutsche Boerse Ag 1,137,584 0.08%
990 Deutsche Lufthansa-Reg 16,990 0.00%

SANLAM UNIVERSAL FUNDS PLC
224
PORTFOLIO OF INVESTMENTS OF SATRIX WORLD EQUITY TRACKER FUND
(CONTINUED)
as at 30 June 2019
Nominal Security Classification Fair Value
USD
% of
Net Assets
Financial assets at fair value through profit or loss (continued)
Equities - 95.68% (continued)
Germany - 2.74% (continued)
36,058 Deutsche Post Ag-Reg 1,186,716 0.09%
97,397 Deutsche Telekom Ag-Reg 1,687,250 0.12%
28,707 Deutsche Wohnen Se 1,054,956 0.08%
91,973 E.On Se 1,000,361 0.07%
700 Evonik Industries Ag 20,415 0.00%
4,383 Fresenius Medical Care Ag & Co 344,603 0.03%
16,375 Fresenius Se & Co Kgaa 889,129 0.07%
650 Gea Group Ag 18,505 0.00%
340 Hannover Rueckversicheru Se 55,059 0.00%
570 Heidelbergcement Ag 46,191 0.00%
10,302 Henkel Ag & Co Kgaa 951,013 0.07
280 Hugo Boss Ag -Ord 18,654 0.00%
4,260 Infineon Technologies Ag 75,438 0.01%
310 Kion Group Ag 19,572 0.00%
410 Lanxess Ag 24,401 0.00%
7,908 Merck Kgaa 828,158 0.06%
22,322 Metro Ag 408,631 0.03%
1,424 Mtu Aero Engines Ag 339,736 0.03%
6,090 Muenchener Rueckver Ag-R 1,530,619 0.11%
7,575 Porsche Automobil Hldg-P 492,913 0.04%
5,210 Puma Se 347,979 0.03%
19,755 Rwe Ag 487,510 0.04%
30,500 Sap Se 4,194,405 0.31%
1,539 Sartorius Ag-Vorzug 315,996 0.02%
23,505 Siemens Ag-Reg 2,799,880 0.20%
690 Siemens Healthineers Ag 29,160 0.00%
3,398 Symrise Ag 327,526 0.02%
27,314 Thyssenkrupp Ag 398,924 0.03%
1,040 Tui Ag-Di 10,224 0.00%
940 Uniper Se 28,507 0.00%
490 United Internet Ag-Reg S 16,160 0.00%
180 Volkswagen Ag 30,983 0.00%
7,200 Volkswagenwerk Ag Prf 1,215,309 0.09%
17,730 Vonovia Se 848,019 0.06%
5,927 Wirecard Ag 999,288 0.07%
570 Zalando Se 25,328 0.00%
Total Germany 37,602,614 2.74%

SANLAM UNIVERSAL FUNDS PLC
225
PORTFOLIO OF INVESTMENTS OF SATRIX WORLD EQUITY TRACKER FUND
(CONTINUED)
as at 30 June 2019
Nominal Security Classification Fair Value
USD
% of
Net Assets
Financial assets at fair value through profit or loss (continued)
Equities - 95.68% (continued)
Hong Kong - 0.93%
409,446 Aia Group Ltd 4,415,466 0.32%
21,065 Bank Of East Asia Ltd 58,915 0.00%
189,336 Boc Hong Kong Holdings L 745,227 0.05%
47,953 Clp Holdings Ltd 529,094 0.04%
125,848 Galaxy Entertainment Gro 848,115 0.06%
34,865 Hang Seng Bank Ltd 867,999 0.06%
423,253 Hong Kong & China Gas 938,335 0.07%
38,906 Hong Kong Exchanges & Cl 1,373,475 0.10%
95,067 Link Reit 1,168,183 0.09%
39,300 Power Assets Holdings Limited 282,708 0.02%
55,904 Sun Hung Kai Properties 948,132 0.07%
41,873 Swire Pacific Ltd - Cl A 514,535 0.04%
28,617 Wharf Holdings Ltd 75,824 0.01%
Total Hong Kong 12,766,008 0.93%
India - 0.16%
25,404 Anheuser-Busch Inbev Sa/ 2,251,917 0.16%
Total India 2,251,917 0.16%
Ireland - 1.52%
19,027 Accenture Plc-Cl A 3,515,619 0.26%
4,180 Aib Group Plc 17,118 0.00%
10,215 Allergan Plc 1,710,297 0.13%
4,310 Bank Of Ireland Group Pl 22,558 0.00%
42,837 Crh Plc 1,398,586 0.11
250 Dcc Plc 22,336 0.00%
13,367 Eaton Corp Plc 1,113,204 0.08%
8,153 Ingersoll-Rand Plc 1,032,740 0.08%
31,399 Johnson Controls Internation 1,297,093 0.09%
8,729 Kerry Group Plc-A 1,043,762 0.07
16,646 Linde Plc 3,342,517 0.24%
39,736 Medtronic Plc 3,869,889 0.28%
350 Paddy Power Betfair Plc 26,362 0.00%
9,939 Pentair Plc 369,731 0.03%
11,957 Perrigo Company Plc 569,392 0.04%
10,502 Seagate Technology 494,854 0.04%
860 Smurfit Kappa Group Plc 26,061 0.00%
5,232 Willis Towers Watson Plc 1,002,137 0.07%
Total Ireland 20,874,256 1.52%

SANLAM UNIVERSAL FUNDS PLC
226
PORTFOLIO OF INVESTMENTS OF SATRIX WORLD EQUITY TRACKER FUND
(CONTINUED)
as at 30 June 2019
Nominal Security Classification Fair Value
USD
% of
Net Assets
Financial assets at fair value through profit or loss (continued)
Equities - 95.68% (continued)
Isle of Man - 0.02%
7,782 Coca-Cola Hbc Ag-Di 294,352 0.02%
1,280 Gvc Holdings Plc 10,618 0.00%
Total Isle of Man 304,970 0.02%
Israel - 0.11%
163,395 Bank Leumi Le-Israel 1,180,147 0.09%
34,246 Teva Pharmaceutical-Sp Adr 316,091 0.02%
Total Israel 1,496,238 0.11%
Italy - 0.55%
41,362 Assicurazioni Generali 780,026 0.06%
20,370 Atlantia Spa 531,451 0.04%
236,305 Enel Spa 1,652,299 0.12%
81,627 Eni Spa 1,357,727 0.10%
425,702 Intesa Sanpaolo 912,374 0.07%
33,234 Leonardo Spa 421,804 0.03%
55,787 Mediobanca Spa 575,965 0.04%
720 Moncler Spa 30,830 0.00%
1,210 Prysmian Spa 25,010 0.00%
9,970 Snam Spa 49,628 0.01%
554,886 Telecom Italia Spa 303,440 0.02%
58,774 Telecom Italia-Rsp 30,528 0.00%
7,220 Terna Spa 46,044 0.00%
65,591 Unicredit Spa 808,648 0.06%
Total Italy 7,525,774 0.55%
Japan - 7.67%
42,695 Aeon Co Ltd 733,511 0.05%
13,130 Agc Inc 453,956 0.03%
9,207 Aisin Seiki Co Ltd 317,041 0.02%
45,368 Ajinomoto Co Inc 786,592 0.06%
18,994 Asahi Group Holdings Ltd 854,148 0.06%
61,806 Asahi Kasei Corp 658,847 0.05%
72,308 Astellas Pharma Inc 1,030,191 0.08%
20,920 Bridgestone Corp 823,674 0.06%
26,770 Canon Inc 781,682 0.06%
5,128 Central Japan Railway Co 1,027,123 0.07%
34,213 Chiba Bank Ltd 167,032 0.01%
36,513 Chubu Electric Power Co 512,246 0.04%
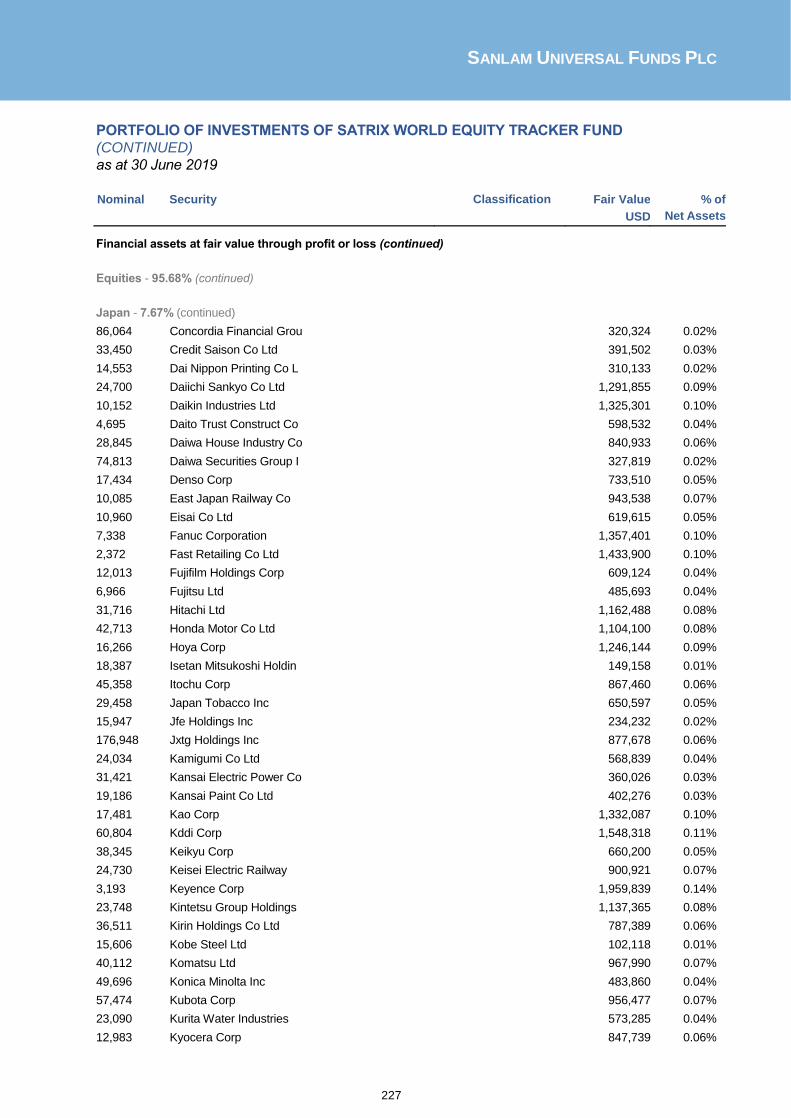
SANLAM UNIVERSAL FUNDS PLC
227
PORTFOLIO OF INVESTMENTS OF SATRIX WORLD EQUITY TRACKER FUND
(CONTINUED)
as at 30 June 2019
Nominal Security Classification Fair Value
USD
% of
Net Assets
Financial assets at fair value through profit or loss (continued)
Equities - 95.68% (continued)
Japan - 7.67% (continued)
86,064 Concordia Financial Grou 320,324 0.02%
33,450 Credit Saison Co Ltd 391,502 0.03%
14,553 Dai Nippon Printing Co L 310,133 0.02%
24,700 Daiichi Sankyo Co Ltd 1,291,855 0.09%
10,152 Daikin Industries Ltd 1,325,301 0.10%
4,695 Daito Trust Construct Co 598,532 0.04%
28,845 Daiwa House Industry Co 840,933 0.06%
74,813 Daiwa Securities Group I 327,819 0.02%
17,434 Denso Corp 733,510 0.05%
10,085 East Japan Railway Co 943,538 0.07%
10,960 Eisai Co Ltd 619,615 0.05%
7,338 Fanuc Corporation 1,357,401 0.10%
2,372 Fast Retailing Co Ltd 1,433,900 0.10%
12,013 Fujifilm Holdings Corp 609,124 0.04%
6,966 Fujitsu Ltd 485,693 0.04%
31,716 Hitachi Ltd 1,162,488 0.08%
42,713 Honda Motor Co Ltd 1,104,100 0.08%
16,266 Hoya Corp 1,246,144 0.09%
18,387 Isetan Mitsukoshi Holdin 149,158 0.01%
45,358 Itochu Corp 867,460 0.06%
29,458 Japan Tobacco Inc 650,597 0.05%
15,947 Jfe Holdings Inc 234,232 0.02%
176,948 Jxtg Holdings Inc 877,678 0.06%
24,034 Kamigumi Co Ltd 568,839 0.04%
31,421 Kansai Electric Power Co 360,026 0.03%
19,186 Kansai Paint Co Ltd 402,276 0.03%
17,481 Kao Corp 1,332,087 0.10%
60,804 Kddi Corp 1,548,318 0.11%
38,345 Keikyu Corp 660,200 0.05%
24,730 Keisei Electric Railway 900,921 0.07%
3,193 Keyence Corp 1,959,839 0.14%
23,748 Kintetsu Group Holdings 1,137,365 0.08%
36,511 Kirin Holdings Co Ltd 787,389 0.06%
15,606 Kobe Steel Ltd 102,118 0.01%
40,112 Komatsu Ltd 967,990 0.07%
49,696 Konica Minolta Inc 483,860 0.04%
57,474 Kubota Corp 956,477 0.07%
23,090 Kurita Water Industries 573,285 0.04%
12,983 Kyocera Corp 847,739 0.06%

SANLAM UNIVERSAL FUNDS PLC
228
PORTFOLIO OF INVESTMENTS OF SATRIX WORLD EQUITY TRACKER FUND
(CONTINUED)
as at 30 June 2019
Nominal Security Classification Fair Value
USD
% of
Net Assets
Financial assets at fair value through profit or loss (continued)
Equities - 95.68% (continued)
Japan - 7.67% (continued)
42,702 M3 Inc 780,399 0.06%
51,813 Marubeni Corp 342,887 0.02%
29,800 Mazda Motor Corp 311,027 0.02%
204,232 Mebuki Financial Group I 532,664 0.04%
45,280 Mitsubishi Chemical Hold 316,296 0.02%
29,022 Mitsubishi Corp 765,013 0.06%
70,659 Mitsubishi Electric Corp 930,621 0.07%
32,156 Mitsubishi Estate Co Ltd 598,411 0.04%
41,304 Mitsubishi Gas Chemical 550,516 0.04%
8,691 Mitsubishi Heavy Industr 378,406 0.03%
91,755 Mitsubishi Motors Corp 439,443 0.03%
20,287 Mitsubishi Tanabe Pharma 225,955 0.02%
294,233 Mitsubishi Ufj Financial 1,398,249 0.10%
57,136 Mitsui & Co Ltd 930,170 0.07%
34,846 Mitsui Fudosan Co Ltd 844,952 0.06%
4,886 Mitsui Osk Lines Ltd 116,957 0.01%
574,221 Mizuho Financial Group I 831,965 0.06%
14,570 Ms&Ad Insurance Group Holdings 462,497 0.03%
23,059 Murata Manufacturing Co 1,035,879 0.08%
11,970 Nec Corp 471,067 0.03%
22,607 Ngk Spark Plug Co Ltd 424,275 0.03%
10,121 Nidec Corp 1,383,253 0.10%
17,606 Nikon Corp 249,040 0.02%
5,641 Nintendo Co Ltd 2,067,599 0.15%
122 Nippon Building Fund Inc 835,679 0.06%
25,311 Nippon Steel And Sumitomo Metal Corporation 434,379 0.03%
21,468 Nippon Telegraph & Telep 999,675 0.07%
42,622 Nissan Motor Co Ltd 305,245 0.02%
3,974 Nitori Holdings Co Ltd 526,719 0.04%
13,235 Nitto Denko Corp 653,151 0.05%
191,467 Nomura Holdings Inc 674,240 0.05%
32,951 Ntt Docomo Inc 768,418 0.06%
74,257 Obayashi Corp 731,267 0.05%
30,272 Ono Pharmaceutical Co Lt 542,839 0.04%
49,795 Orix Corp 743,181 0.05%
12,719 Otsuka Holdings Co Ltd 415,073 0.03%
62,380 Panasonic Corp 519,698 0.04%
17,447 Pigeon Corp 701,993 0.05%
53,041 Recruit Holdings Co Ltd 1,769,346 0.13%

SANLAM UNIVERSAL FUNDS PLC
229
PORTFOLIO OF INVESTMENTS OF SATRIX WORLD EQUITY TRACKER FUND
(CONTINUED)
as at 30 June 2019
Nominal Security Classification Fair Value
USD
% of
Net Assets
Financial assets at fair value through profit or loss (continued)
Equities - 95.68% (continued)
Japan - 7.67% (continued)
143,842 Resona Holdings Inc 598,919 0.04%
50,157 Ricoh Co Ltd 500,918 0.04%
10,646 Secom Co Ltd 916,382 0.07%
22,592 Sega Sammy Holdings Inc 274,484 0.02%
40,191 Seven & I Holdings Co Lt 1,360,839 0.10%
3,389 Shimano Inc 504,229 0.04%
11,648 Shin-Etsu Chemical Co Lt 1,084,905 0.08%
15,443 Shionogi & Co Ltd 889,972 0.06%
15,201 Shiseido Co Ltd 1,145,789 0.08%
20,873 Shizuoka Bank Ltd 153,826 0.01%
2,892 Smc Corp 1,078,259 0.08%
54,081 Softbank Corp 702,491 0.05%
62,040 Softbank Group Corp 2,974,166 0.22%
21,913 Sompo Holdings Inc 846,297 0.06%
39,999 Sony Corp 2,096,848 0.15%
32,306 Subaru Corp 785,311 0.06%
107,541 Sumitomo Chemical Co Ltd 499,076 0.04%
30,187 Sumitomo Corp 457,400 0.03%
57,728 Sumitomo Electric Indust 757,901 0.06%
15,458 Sumitomo Heavy Industrie 531,575 0.04%
34,979 Sumitomo Mitsui Financia 1,235,661 0.09%
17,314 Sumitomo Mitsui Trust Holdings Inc 627,701 0.05%
14,016 Sumitomo Realty & Develo 500,590 0.04%
10,374 Suzuki Motor Corp 487,599 0.04%
43,986 T&D Holdings Inc 477,461 0.03%
55,115 Takeda Pharmaceutical Co 1,955,677 0.14%
37,754 Terumo Corp 1,124,841 0.08%
20,126 Toho Co Ltd 855,551 0.06%
25,767 Tohoku Electric Power Co 260,444 0.02%
19,152 Tokio Marine Holdings Inc 959,733 0.07%
92,758 Tokyo Electric Power Co 483,850 0.04%
6,884 Tokyo Electron Ltd 966,086 0.07%
16,084 Tokyo Gas Co Ltd 378,811 0.03%
57,968 Tokyu Corp 1,028,187 0.07%
73,162 Tokyu Fudosan Holdings C 404,041 0.03%
80,692 Toray Industries Inc 613,541 0.04%
27,554 Toshiba Corp 858,026 0.06%
72,469 Toyota Motor Corp 4,498,540 0.33%
13,823 Toyota Tsusho Corp 418,898 0.03%

SANLAM UNIVERSAL FUNDS PLC
230
PORTFOLIO OF INVESTMENTS OF SATRIX WORLD EQUITY TRACKER FUND
(CONTINUED)
as at 30 June 2019
Nominal Security Classification Fair Value
USD
% of
Net Assets
Financial assets at fair value through profit or loss (continued)
Equities - 95.68% (continued)
Japan - 7.67% (continued)
9,232 Trend Micro Inc 411,730 0.03%
5,945 West Japan Railway Co 480,941 0.04%
171,226 Yahoo Japan Corp 502,204 0.04%
73,234 Yamada Denki Co Ltd 324,231 0.02%
21,347 Yamaha Motor Co Ltd 379,427 0.03%
19,136 Yamato Holdings Co Ltd 389,150 0.03%
Total Japan 105,406,761 7.67%
Jersey Channel Islands - 0.35%
12,194 Aptiv Plc 985,641 0.07%
40,680 Experian Plc 1,234,279 0.09%
13,381 Ferguson Plc 953,680 0.07%
317,947 Glencore Plc 1,106,114 0.08%
45,171 Wpp Plc 569,257 0.04%
Total Jersey Channel Islands 4,848,971 0.35%
Liberia - 0.06%
6,905 Royal Caribbean Cruises Ltd 836,955 0.06%
Total Liberia 836,955 0.06%
Luxembourg - 0.03%
21,252 Arcelormittal 380,839 0.03%
60 Eurofins Scientific 26,580 0.00%
370 Millicom Intl Cellular-S 20,836 0.00%
1,360 Ses Fdr 21,296 0.00%
2,130 Tenaris Sa 27,919 0.00%
Total Luxembourg 477,470 0.03%
Netherlands - 1.72%
1,520 Abn Amro Group Nv-Cva 32,568 0.00%
88,022 Aegon Nv 438,848 0.03%
530 Aercap Holdings Nv 27,565 0.00%
18,146 Airbus Se 2,576,470 0.19%
10,929 Akzo Nobel N.V. 1,028,533 0.08%
13,470 Asml Holding Nv 2,818,505 0.21%
35,102 Cnh Industrial Nv 360,487 0.03%
9,230 Exor Nv 647,485 0.05%
5,299 Ferrari Nv 861,727 0.06%
34,580 Fiat Chrysler Automobiles Nv 483,031 0.04%
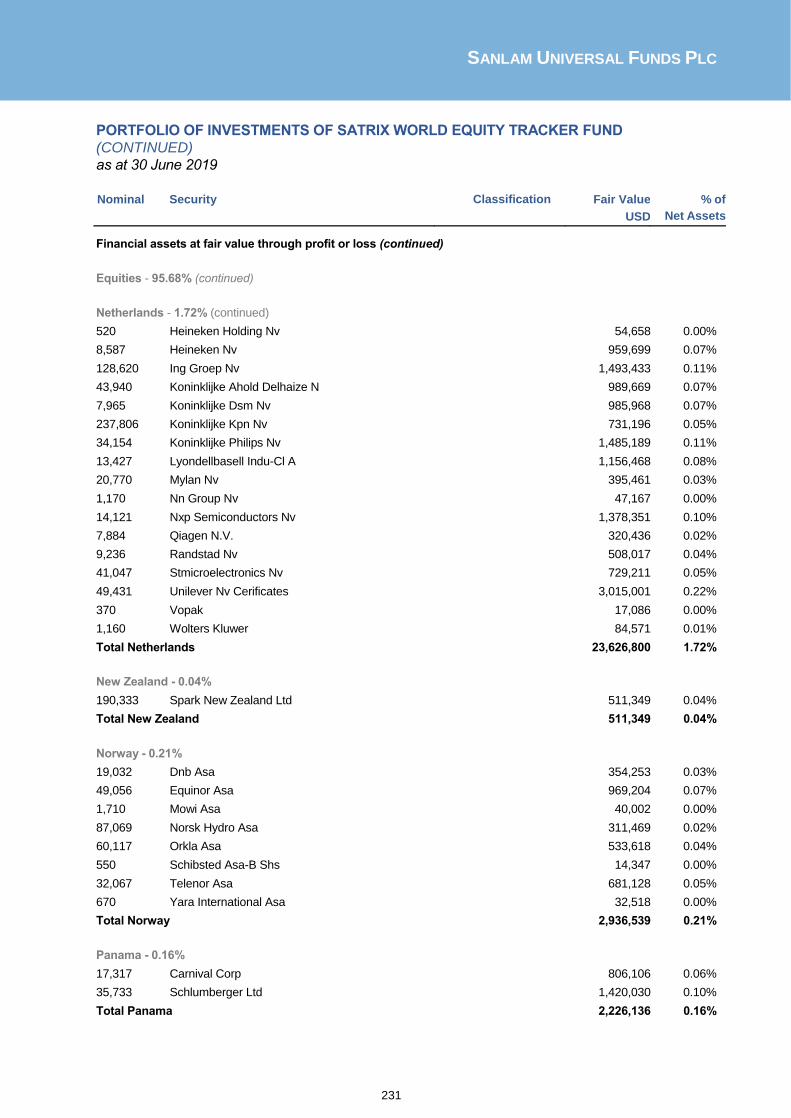
SANLAM UNIVERSAL FUNDS PLC
231
PORTFOLIO OF INVESTMENTS OF SATRIX WORLD EQUITY TRACKER FUND
(CONTINUED)
as at 30 June 2019
Nominal Security Classification Fair Value
USD
% of
Net Assets
Financial assets at fair value through profit or loss (continued)
Equities - 95.68% (continued)
Netherlands - 1.72% (continued)
520 Heineken Holding Nv 54,658 0.00%
8,587 Heineken Nv 959,699 0.07%
128,620 Ing Groep Nv 1,493,433 0.11%
43,940 Koninklijke Ahold Delhaize N 989,669 0.07%
7,965 Koninklijke Dsm Nv 985,968 0.07%
237,806 Koninklijke Kpn Nv 731,196 0.05%
34,154 Koninklijke Philips Nv 1,485,189 0.11%
13,427 Lyondellbasell Indu-Cl A 1,156,468 0.08%
20,770 Mylan Nv 395,461 0.03%
1,170 Nn Group Nv 47,167 0.00%
14,121 Nxp Semiconductors Nv 1,378,351 0.10%
7,884 Qiagen N.V. 320,436 0.02%
9,236 Randstad Nv 508,017 0.04%
41,047 Stmicroelectronics Nv 729,211 0.05%
49,431 Unilever Nv Cerificates 3,015,001 0.22%
370 Vopak 17,086 0.00%
1,160 Wolters Kluwer 84,571 0.01%
Total Netherlands 23,626,800 1.72%
New Zealand - 0.04%
190,333 Spark New Zealand Ltd 511,349 0.04%
Total New Zealand 511,349 0.04%
Norway - 0.21%
19,032 Dnb Asa 354,253 0.03%
49,056 Equinor Asa 969,204 0.07%
1,710 Mowi Asa 40,002 0.00%
87,069 Norsk Hydro Asa 311,469 0.02%
60,117 Orkla Asa 533,618 0.04%
550 Schibsted Asa-B Shs 14,347 0.00%
32,067 Telenor Asa 681,128 0.05%
670 Yara International Asa 32,518 0.00%
Total Norway 2,936,539 0.21%
Panama - 0.16%
17,317 Carnival Corp 806,106 0.06%
35,733 Schlumberger Ltd 1,420,030 0.10%
Total Panama 2,226,136 0.16%

SANLAM UNIVERSAL FUNDS PLC
232
PORTFOLIO OF INVESTMENTS OF SATRIX WORLD EQUITY TRACKER FUND
(CONTINUED)
as at 30 June 2019
Nominal Security Classification Fair Value
USD
% of
Net Assets
Financial assets at fair value through profit or loss (continued)
Equities - 95.68% (continued)
Portugal - 0.07%
2,670 Banco Espirito Santo-Reg - 0.00%
132,533 Edp-Energias De Portugal 504,403 0.04%
26,445 Galp Energia Sgps Sa B 407,313 0.03%
1,000 Jeronimo Martins 16,131 0.00%
Total Portugal 927,847 0.07%
Singapore - 0.47%
170,909 Capitaland Ltd 445,921 0.03%
75,728 Dbs Group Holdings Ltd 1,453,046 0.11%
36,091 Flex Ltd 345,391 0.03%
376,048 Genting Singapore Ltd 255,711 0.02%
106,179 Keppel Corp Ltd 522,674 0.04%
110,954 Oversea-Chinese Banking 934,902 0.07%
86,158 Singapore Press Holdings 155,383 0.01%
315,165 Singapore Telecommunicat 815,313 0.06%
59,573 United Overseas Bk Ltd Ord 1,150,554 0.08%
123,436 Wilmar International Ltd 337,569 0.02%
Total Singapore 6,416,464 0.47%
Spain - 0.93%
11,071 Acs Actividades Cons Y S 442,655 0.03%
270 Aena Sme Sa 53,593 0.01%
18,655 Amadeus It Group Sa 1,479,879 0.11%
205,456 Banco Bilbao Vizcaya Arg 1,150,447 0.09%
24,520 Banco De Sabadell Sa 25,438 0.00%
529,720 Banco Santander Sa 2,461,542 0.18%
109,590 Bankia Sa 259,337 0.02%
3,200 Bankinter Sa 22,076 0.00%
14,650 Caixabank Sa 42,009 0.00%
770 Enagas Sa 20,580 0.00%
1,490 Endesa Sa 38,365 0.00%
1,920 Ferrovial Sa 49,218 0.00%
11,432 Grifols Sa 338,488 0.03%
237,462 Iberdrola Sa 2,370,517 0.17%
36,609 Industria De Diseno Text 1,102,709 0.08%
1,350 Naturgy Energy Group Sa 37,251 0.00%
38,135 Red Electrica Corporacio 795,386 0.06%
49,791 Repsol Sa 781,637 0.06%
1,120 Siemens Gamesa Renewable 18,647 0.00%

SANLAM UNIVERSAL FUNDS PLC
233
PORTFOLIO OF INVESTMENTS OF SATRIX WORLD EQUITY TRACKER FUND
(CONTINUED)
as at 30 June 2019
Nominal Security Classification Fair Value
USD
% of
Net Assets
Financial assets at fair value through profit or loss (continued)
Equities - 95.68% (continued)
Spain - 0.93% (continued)
154,516 Telefonica Sa 1,270,627 0.09%
Total Spain 12,760,401 0.93%
Sweden - 0.76%
1,210 Alfa Laval Ab 26,422 0.00%
17,311 Assa Abloy Ab-B 391,625 0.03%
29,440 Atlas Copco Ab-B Shs 845,295 0.06%
1,040 Electrolux Ab-Ser B 26,599 0.00%
29,480 Epiroc Ab-B 292,252 0.02%
130,798 Ericsson Lm-B Shs 1,241,976 0.09%
11,305 Essity Aktiebolag-B 347,745 0.02%
40,923 Hennes & Mauritz Ab-B Sh 729,347 0.05%
1,020 Hexagon Ab-B Shs 56,682 0.00%
1,840 Investor Ab-B Shs 88,468 0.01%
1,110 Kinnevik Ab - B 28,892 0.00%
930 Lundin Petroleum Ab 28,858 0.00%
79,023 Sandvik Ab 1,453,011 0.11%
20,140 Securitas Ab-B Shs 353,604 0.03%
56,997 Skandinaviska Enskilda B 527,816 0.04%
19,584 Skanska Ab-B Shs 353,973 0.03%
31,535 Skf Ab-B Shares 580,350 0.04%
63,402 Svenska Handelsbanken-A 627,856 0.05%
26,922 Swedbank Ab - A Shares 404,634 0.03%
16,739 Swedish Match Ab 707,216 0.05%
2,270 Tele2 Ab-B Shs 33,151 0.00%
110,166 Telia Co Ab 489,669 0.04%
50,577 Volvo Ab-B Shs 803,229 0.06%
Total Sweden 10,438,670 0.76%
Switzerland - 3.34%
69,306 Abb Ltd-Reg 1,392,517 0.10%
650 Adecco Group Ag-Reg 39,107 0.00%
12,940 Alcon Inc 800,024 0.06%
220 Baloise Holding Ag 38,991 0.00%
10 Barry Callebaut Ag-Reg 20,082 0.00%
12 Chocoladefabriken Lindt- 977,231 0.07%
12,122 Chubb Ltd 1,785,449 0.13%
19,798 Cie Financiere Richemont 1,682,119 0.12%
108,389 Credit Suisse Group Ag-R 1,301,224 0.10%

SANLAM UNIVERSAL FUNDS PLC
234
PORTFOLIO OF INVESTMENTS OF SATRIX WORLD EQUITY TRACKER FUND
(CONTINUED)
as at 30 June 2019
Nominal Security Classification Fair Value
USD
% of
Net Assets
Financial assets at fair value through profit or loss (continued)
Equities - 95.68% (continued)
Switzerland - 3.34% (continued)
170 Dufry Ag 14,416 0.00%
3,122 Geberit Ag-Reg 1,460,135 0.11%
516 Givaudan-Reg 1,458,560 0.11%
12,379 Julius Baer Group Ltd 551,786 0.04%
250 Kuehne + Nagel Intl Ag-R 37,154 0.00%
22,973 Lafargeholcim Ltd-Reg 1,123,203 0.08%
3,120 Lonza Group Ag-Reg 1,054,080 0.08%
92,897 Nestle Sa-Reg 9,628,893 0.70%
64,693 Novartis Ag-Reg 5,918,580 0.43%
80 Partners Group Holding Ag 62,933 0.00%
21,920 Roche Holding Ag-Genussc 6,174,695 0.45%
4,013 Schindler Holding-Part C 894,385 0.07%
428 Sgs Sa-Reg 1,091,729 0.08%
2,291 Sika Ag-Reg 391,467 0.03%
3,538 Sonova Holding Ag 804,850 0.06%
50 Straumann Holding Ag-Reg 44,174 0.00%
1,663 Swatch Group Ag-Br 476,727 0.04%
400 Swatch Group Ag-Reg 21,682 0.00%
160 Swiss Life Holding Ag-Re 79,393 0.01%
400 Swiss Prime Site-Reg 34,974 0.00%
9,231 Swiss Re Ltd 939,574 0.07%
916 Swisscom Ag-Reg 460,443 0.03%
12,729 Te Connectivity Ltd 1,219,184 0.09%
1,784 Temenos Ag - Reg 319,565 0.02%
127,255 Ubs Group Ag-Reg 1,514,008 0.11%
210 Vifor Pharma Ag 30,380 0.00%
5,757 Zurich Insurance Group Ag 2,006,979 0.15%
Total Switzerland 45,850,693 3.34%
United Kingdom - 5.42%
63,499 3I Group Plc 899,877 0.07%
490 Admiral Group Plc 13,770 0.00%
41,915 Anglo American Plc 1,197,333 0.09%
910 Antofagasta Plc 10,766 0.00%
8,580 Aon Plc 1,655,768 0.12%
11,955 Ashtead Group Plc 342,949 0.03%
9,258 Associated British Foods 290,207 0.02%
42,441 Astrazeneca Plc 3,477,464 0.25%
37,426 Auto Trader Group Plc 260,928 0.02%

SANLAM UNIVERSAL FUNDS PLC
235
PORTFOLIO OF INVESTMENTS OF SATRIX WORLD EQUITY TRACKER FUND
(CONTINUED)
as at 30 June 2019
Nominal Security Classification Fair Value
USD
% of
Net Assets
Financial assets at fair value through profit or loss (continued)
Equities - 95.68% (continued)
United Kingdom - 5.42% (continued)
204,814 Aviva Plc 1,085,677 0.08%
114,032 Bae Systems Plc 718,967 0.05%
635,367 Barclays Plc 1,211,330 0.09%
2,510 Barratt Developments Plc 18,292 0.00%
300 Berkeley Group Holdings 14,245 0.00%
63,665 Bhp Group Plc 1,632,683 0.12%
630,881 Bp Plc 4,404,831 0.32%
75,507 British American Tobacco 2,641,727 0.19%
50,725 British Land Co Plc 347,579 0.03%
337,375 Bt Group Plc 843,554 0.06%
10,905 Bunzl Plc 288,263 0.02%
12,969 Burberry Group Plc 307,335 0.02%
420 Carnival Plc 18,596 0.00%
287,478 Centrica Plc 321,164 0.02%
5,725 Coca-Cola European Partners 323,462 0.02%
59,826 Compass Group Plc 1,436,772 0.11%
4,446 Croda International Plc 289,711 0.02%
72,640 Diageo Plc 3,128,472 0.23%
3,290 Direct Line Insurance Gr 13,893 0.00%
410 Easyjet Plc 4,974 0.00%
580 Fresnillo Plc 6,424 0.00%
3,590 G4S Plc 9,504 0.00%
166,485 Glaxosmithkline Plc (Lse) 3,340,586 0.24%
9,928 Hargreaves Lansdown Plc 242,473 0.02%
592,861 Hsbc Holdings Plc 4,956,535 0.36%
30,924 Imperial Brands Plc 726,845 0.05%
29,883 Informa Plc 317,568 0.02%
13,388 Intercontinental Hotels Grou 881,252 0.06%
4,337 Intertek Group Plc 303,694 0.02%
1,580 Investec Plc 10,276 0.00%
8,790 Itv Plc 12,082 0.00%
6,982 Johnson Matthey Plc 295,815 0.02%
125,579 Kingfisher Plc 343,463 0.03%
35,906 Land Securities Group Pl 380,752 0.03%
286,938 Legal & General Group Pl 984,176 0.07%
10,391 Liberty Global Plc- C 275,673 0.02%
16,893 Liberty Global Plc-A 455,942 0.03%
2,472,051 Lloyds Banking Group Plc 1,780,423 0.13%
15,497 London Stock Exchange Gr 1,082,005 0.08%

SANLAM UNIVERSAL FUNDS PLC
236
PORTFOLIO OF INVESTMENTS OF SATRIX WORLD EQUITY TRACKER FUND
(CONTINUED)
as at 30 June 2019
Nominal Security Classification Fair Value
USD
% of
Net Assets
Financial assets at fair value through profit or loss (continued)
Equities - 95.68% (continued)
United Kingdom - 5.42% (continued)
80,044 Marks & Spencer Group Pl 214,644 0.02%
1,850 Meggitt Plc 12,338 0.00%
184,781 Melrose Industries Plc 425,306 0.03%
1,940 Merlin Entertainment 11,088 0.00%
760 Micro Focus International 19,964 0.00%
13,431 Mondi Plc 305,976 0.02%
86,843 National Grid Plc 923,769 0.07%
5,099 Next Plc 358,610 0.03%
12,806 Nielsen Holdings Plc 289,416 0.02%
230 Nmc Health Plc 7,034 0.00%
46,069 Pearson Plc 480,431 0.04%
790 Persimmon Plc 20,078 0.00%
76,827 Prudential Plc 1,677,866 0.12%
21,915 Reckitt Benckiser Group 1,733,160 0.13%
71,232 Relx Plc 1,731,095 0.13%
39,633 Rio Tinto Plc 2,461,769 0.18%
79,910 Rolls-Royce Holdings Plc 854,699 0.06%
3,597,317 Rolls-Royce Holdings-Ent 4,578 0.00%
169,020 Royal Bank Of Scotland G 472,816 0.04%
135,334 Royal Dutch Shell Plc-A 4,425,713 0.32%
114,413 Royal Dutch Shell Plc-B 3,758,282 0.27%
40,503 Rsa Insurance Group Plc 297,330 0.02%
30,619 Sage Group Plc 312,686 0.02%
4,150 Sainsbury (J) Plc 10,349 0.00%
290 Schroders Plc 11,257 0.00%
2,730 Segro Plc 25,371 0.00%
570 Severn Trent Plc Ord 14,857 0.00%
39,706 Smith & Nephew Plc 861,602 0.06%
32,469 Smiths Group Plc 646,710 0.05%
33,666 Sse Plc 480,740 0.04%
1,310 St James’S Place Plc 18,306 0.00%
88,475 Standard Chartered Plc 804,204 0.06%
6,280 Standard Life Aberdeen P 23,546 0.00%
538,899 Taylor Wimpey Plc 1,081,939 0.08%
21,970 Technipfmc Plc 569,902 0.04%
308,491 Tesco Plc 890,062 0.07%
34,415 Unilever Plc 2,143,789 0.16%
56,848 United Utilities 566,359 0.04%
811,735 Vodafone Group Plc 1,335,999 0.10%

SANLAM UNIVERSAL FUNDS PLC
237
PORTFOLIO OF INVESTMENTS OF SATRIX WORLD EQUITY TRACKER FUND
(CONTINUED)
as at 30 June 2019
Nominal Security Classification Fair Value
USD
% of
Net Assets
Financial assets at fair value through profit or loss (continued)
Equities - 95.68% (continued)
United Kingdom - 5.42% (continued)
590 Weir Group Plc 11,613 0.00%
4,979 Whitbread Plc 293,329 0.02%
108,754 Wm Morrison Supermarkets 278,760 0.02%
1,560 Wood Group (John) Plc 8,974 0.00%
Total United Kingdom 74,482,393 5.42%
United States - 57.30%
17,487 3M Co 3,031,197 0.22%
53,423 Abbott Laboratories 4,492,874 0.33%
47,370 Abbvie Inc 3,444,746 0.25%
1,837 Abiomed Inc 478,520 0.03%
23,767 Activision Blizzard Inc 1,121,802 0.08%
15,470 Adobe Inc 4,558,235 0.33%
27,938 Advanced Micro Devices 848,477 0.06%
28,640 Aes Corp 480,006 0.03%
380 Affiliated Managers Group 35,013 0.00%
24,722 Aflac Inc 1,355,013 0.10%
14,982 Agilent Technologies Inc 1,118,706 0.08%
28,398 Agnc Investment Corp 477,654 0.03%
8,391 Air Products & Chemicals Inc 1,899,471 0.14%
1,230 Akamai Technologies Inc 98,572 0.01%
8,131 Alexion Pharmaceuticals Inc 1,064,998 0.08%
3,271 Align Technology Inc 895,273 0.07%
240 Alliance Data Systems Corp 33,631 0.00%
23,380 Alliant Energy Corp 1,147,490 0.08%
12,469 Allstate Corp 1,267,973 0.09%
6,058 Alnylam Pharmaceuticals Inc 439,568 0.03%
8,913 Alphabet Inc-Cl A 9,650,996 0.70%
10,198 Alphabet Inc-Cl C 11,023,120 0.80%
59,866 Altria Group Inc 2,834,655 0.21%
13,103 Amazon.Com Inc 24,812,234 1.81%
15,352 Ameren Corporation 1,153,089 0.08%
13,465 American Airlines Group Inc 439,094 0.03%
14,983 American Electric Power 1,318,654 0.10%
26,163 American Express Co 3,229,561 0.24%
28,350 American International Group 1,510,488 0.11%
15,913 American Tower Corp 3,253,413 0.24%
6,306 Ameriprise Financial Inc 915,379 0.07%
8,551 Amerisourcebergen Corp 729,058 0.05%

SANLAM UNIVERSAL FUNDS PLC
238
PORTFOLIO OF INVESTMENTS OF SATRIX WORLD EQUITY TRACKER FUND
(CONTINUED)
as at 30 June 2019
Nominal Security Classification Fair Value
USD
% of
Net Assets
Financial assets at fair value through profit or loss (continued)
Equities - 95.68% (continued)
United States - 57.30% (continued)
8,952 Ametek Inc 813,200 0.06%
19,534 Amgen Inc 3,599,726 0.26%
13,690 Amphenol Corp-Cl A 1,313,419 0.10%
18,321 Anadarko Petroleum Corp 1,292,730 0.09%
12,955 Analog Devices Inc 1,462,231 0.11%
43,930 Annaly Capital Management Inc 401,081 0.03%
8,018 Anthem Inc 2,262,760 0.16%
17,578 Apache Corp 509,235 0.04%
149,300 Apple Inc 29,549,456 2.15%
37,261 Applied Materials Inc 1,673,392 0.12%
21,180 Archer-Daniels-Midland Co 864,144 0.06%
22,184 Arconic Inc 572,791 0.04%
2,373 Arista Networks Inc 616,078 0.04%
215,871 At&T Inc 7,233,837 0.53%
9,296 Autodesk Inc 1,514,318 0.11%
13,206 Automatic Data Processing 2,183,348 0.16%
1,387 Autozone Inc 1,524,965 0.11%
6,881 Avalonbay Communities Inc 1,398,082 0.10%
5,754 Avery Dennison Corp 665,623 0.05%
14,515 Baker Hughes A Ge Co 357,504 0.03%
19,637 Ball Corp 1,374,394 0.10%
282,498 Bank Of America Corp 8,192,442 0.60%
32,092 Bank Of New York Mellon Corp 1,416,862 0.10%
18,550 Baxter International Inc 1,519,245 0.11%
27,753 Bb&T Corp 1,363,505 0.10%
7,938 Becton Dickinson And Co 2,000,455 0.15%
38,280 Berkshire Hathaway Inc-Cl B 8,160,148 0.59%
9,102 Best Buy Co Inc 634,682 0.05%
6,946 Biogen Inc 1,624,461 0.12%
7,459 Biomarin Pharmaceutical Inc 638,863 0.05%
4,224 Blackrock Inc 1,982,323 0.14%
16,886 Boeing Co 6,146,673 0.45%
1,484 Booking Holdings Inc 2,782,070 0.20%
1,550 Borgwarner Inc 65,069 0.00%
8,969 Boston Properties Inc 1,157,001 0.08%
51,298 Boston Scientific Corp 2,204,788 0.16%
7,467 Brighthouse Financial Inc 273,964 0.02%
56,426 Bristol Myers Stk 2,558,919 0.19%
14,318 Broadcom Inc 4,121,579 0.30%
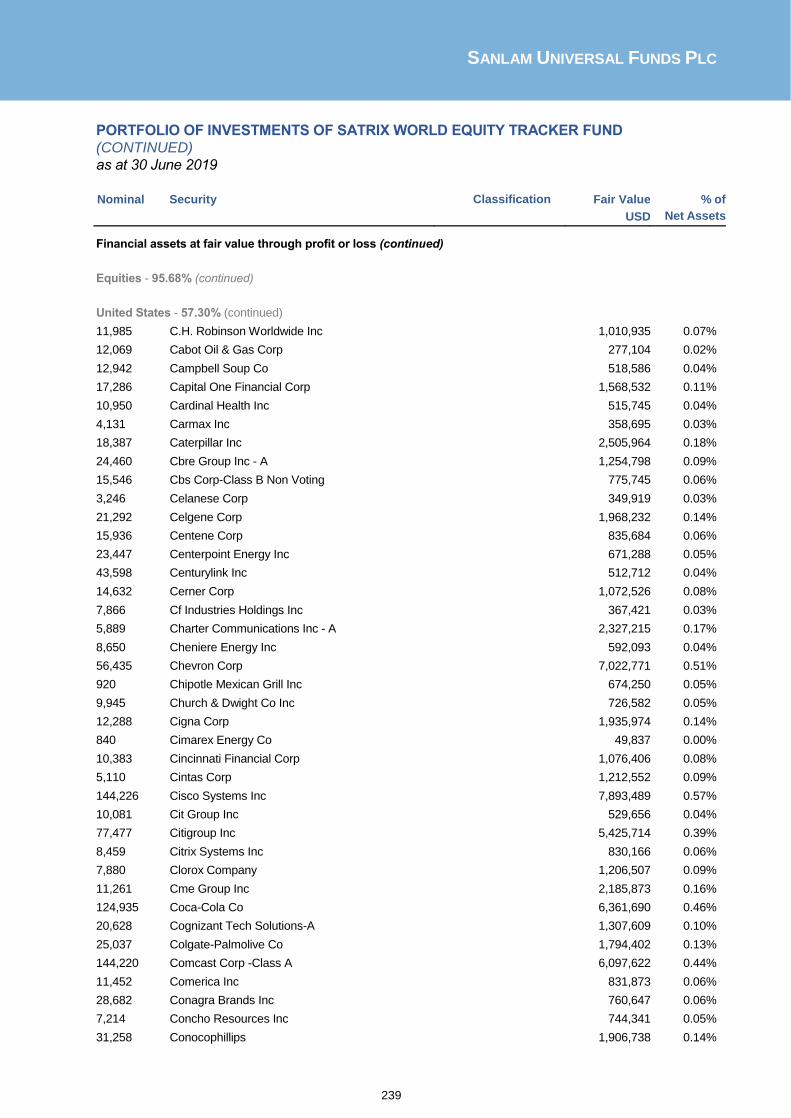
SANLAM UNIVERSAL FUNDS PLC
239
PORTFOLIO OF INVESTMENTS OF SATRIX WORLD EQUITY TRACKER FUND
(CONTINUED)
as at 30 June 2019
Nominal Security Classification Fair Value
USD
% of
Net Assets
Financial assets at fair value through profit or loss (continued)
Equities - 95.68% (continued)
United States - 57.30% (continued)
11,985 C.H. Robinson Worldwide Inc 1,010,935 0.07%
12,069 Cabot Oil & Gas Corp 277,104 0.02%
12,942 Campbell Soup Co 518,586 0.04%
17,286 Capital One Financial Corp 1,568,532 0.11%
10,950 Cardinal Health Inc 515,745 0.04%
4,131 Carmax Inc 358,695 0.03%
18,387 Caterpillar Inc 2,505,964 0.18%
24,460 Cbre Group Inc - A 1,254,798 0.09%
15,546 Cbs Corp-Class B Non Voting 775,745 0.06%
3,246 Celanese Corp 349,919 0.03%
21,292 Celgene Corp 1,968,232 0.14%
15,936 Centene Corp 835,684 0.06%
23,447 Centerpoint Energy Inc 671,288 0.05%
43,598 Centurylink Inc 512,712 0.04%
14,632 Cerner Corp 1,072,526 0.08%
7,866 Cf Industries Holdings Inc 367,421 0.03%
5,889 Charter Communications Inc - A 2,327,215 0.17%
8,650 Cheniere Energy Inc 592,093 0.04%
56,435 Chevron Corp 7,022,771 0.51%
920 Chipotle Mexican Grill Inc 674,250 0.05%
9,945 Church & Dwight Co Inc 726,582 0.05%
12,288 Cigna Corp 1,935,974 0.14%
840 Cimarex Energy Co 49,837 0.00%
10,383 Cincinnati Financial Corp 1,076,406 0.08%
5,110 Cintas Corp 1,212,552 0.09%
144,226 Cisco Systems Inc 7,893,489 0.57%
10,081 Cit Group Inc 529,656 0.04%
77,477 Citigroup Inc 5,425,714 0.39%
8,459 Citrix Systems Inc 830,166 0.06%
7,880 Clorox Company 1,206,507 0.09%
11,261 Cme Group Inc 2,185,873 0.16%
124,935 Coca-Cola Co 6,361,690 0.46%
20,628 Cognizant Tech Solutions-A 1,307,609 0.10%
25,037 Colgate-Palmolive Co 1,794,402 0.13%
144,220 Comcast Corp -Class A 6,097,622 0.44%
11,452 Comerica Inc 831,873 0.06%
28,682 Conagra Brands Inc 760,647 0.06%
7,214 Concho Resources Inc 744,341 0.05%
31,258 Conocophillips 1,906,738 0.14%

SANLAM UNIVERSAL FUNDS PLC
240
PORTFOLIO OF INVESTMENTS OF SATRIX WORLD EQUITY TRACKER FUND
(CONTINUED)
as at 30 June 2019
Nominal Security Classification Fair Value
USD
% of
Net Assets
Financial assets at fair value through profit or loss (continued)
Equities - 95.68% (continued)
United States - 57.30% (continued)
11,317 Consolidated Edison Inc 992,275 0.07%
6,048 Constellation Brands Inc-A 1,191,093 0.09%
33,083 Corning Inc 1,099,348 0.08%
22,326 Corteva Inc 660,180 0.05%
14,638 Costco Wholesale Corp 3,868,238 0.28%
14,252 Crown Castle Intl Corp 1,857,748 0.14%
900 Crown Holdings Inc 54,990 0.00%
24,325 Csx Corp 1,882,025 0.14%
6,635 Cummins Inc 1,136,841 0.08%
38,709 Cvs Health Corporation 2,109,253 0.15%
19,496 Danaher Corp 2,786,368 0.20%
4,581 Darden Restaurants Inc 557,645 0.04%
740 Davita Healthcare Partner Inc 41,632 0.00%
11,247 Deere And Co 1,863,740 0.14%
11,371 Dell Technologies -C 577,647 0.04%
10,763 Dentsply Sirona Inc 628,129 0.05%
22,606 Devon Energy Corp 644,723 0.05%
4,505 Diamondback Energy Inc 490,910 0.04%
8,713 Digital Realty Trust Inc 1,026,304 0.07%
14,136 Discover Financial Services 1,096,812 0.08%
890 Discovery Communications Inc 27,323 0.00%
12,314 Discovery Inc-C 350,333 0.03%
960 Dish Network Corp-A 36,874 0.00%
7,163 Dollar General Corp 968,151 0.07%
14,420 Dollar Tree Inc 1,548,564 0.11%
20,588 Dominion Energy Inc 1,591,864 0.12%
9,583 Dover Corp 960,217 0.07%
22,323 Dow Inc 1,100,747 0.08%
28,934 Dr Horton Inc 1,247,923 0.09%
7,934 Dte Energy Company 1,014,600 0.07%
18,806 Duke Energy Corp 1,659,441 0.12%
22,326 Dupont De Nemours Inc 1,676,013 0.12%
10,922 Dxc Technology Co 602,348 0.04%
620 Eastman Chemical Co 48,255 0.00%
30,267 Ebay Inc 1,195,546 0.09%
10,450 Ecolab Inc 2,063,248 0.15%
12,030 Edison International 810,942 0.06%
7,734 Edwards Lifesciences Corp 1,428,779 0.10%
13,057 Electronic Arts Inc 1,322,152 0.10%

SANLAM UNIVERSAL FUNDS PLC
241
PORTFOLIO OF INVESTMENTS OF SATRIX WORLD EQUITY TRACKER FUND
(CONTINUED)
as at 30 June 2019
Nominal Security Classification Fair Value
USD
% of
Net Assets
Financial assets at fair value through profit or loss (continued)
Equities - 95.68% (continued)
United States - 57.30% (continued)
28,986 Eli Lilly & Co 3,211,359 0.23%
21,306 Emerson Electric Co 1,421,536 0.10%
6,999 Entergy Corp 720,407 0.05%
19,561 Eog Resources Inc 1,822,303 0.13%
5,406 Equifax Inc 731,107 0.05%
2,907 Equinix Inc 1,465,971 0.11%
18,363 Equity Residential 1,394,119 0.10%
8,332 Estee Lauder Companies-Cl A 1,525,673 0.11%
14,891 Evergy Inc 895,694 0.07%
17,469 Eversource Energy 1,323,451 0.10%
24,455 Exelon Corp 1,172,373 0.09%
11,039 Expeditors Intl Wash Inc 837,419 0.06%
127,124 Exxon Mobil Corporation 9,741,512 0.71%
520 F5 Networks Inc 75,728 0.01%
75,687 Facebook Inc-Class A 14,607,591 1.06%
25,972 Fastenal Co 846,427 0.06%
8,860 Fedex Corp 1,454,723 0.11%
18,039 Fidelity National Financial 726,972 0.05%
15,251 Fidelity National Info Serv 1,870,993 0.14%
43,007 Fifth Third Bancorp 1,199,895 0.09%
12,003 Firstenergy Corp 513,848 0.04%
24,389 Fiserv Inc 2,223,301 0.16%
3,152 Fleetcor Technologies Inc 885,239 0.06%
7,478 Fluor Corp 251,934 0.02%
740 Fmc Corp 61,383 0.00%
136,933 Ford Motor Co 1,400,825 0.10%
12,205 Fortive Corp 994,952 0.07%
14,479 Fox Corp - Class A 530,511 0.04%
10,140 Fox Corp - Class B 370,414 0.03%
11,560 Franklin Resources Inc 402,288 0.03%
31,116 Freeport-Mcmoran Inc 361,257 0.03%
15,458 Gap Inc 277,780 0.02%
8,579 General Dynamics Corp 1,559,834 0.11%
285,233 General Electric Co 2,994,946 0.22%
20,327 General Mills Inc 1,067,574 0.08%
40,479 General Motors Co 1,559,656 0.11%
3,594 Genuine Parts Co 372,267 0.03%
42,796 Gilead Sciences Inc 2,891,298 0.21%
8,367 Global Payments Inc 1,339,808 0.10%

SANLAM UNIVERSAL FUNDS PLC
242
PORTFOLIO OF INVESTMENTS OF SATRIX WORLD EQUITY TRACKER FUND
(CONTINUED)
as at 30 June 2019
Nominal Security Classification Fair Value
USD
% of
Net Assets
Financial assets at fair value through profit or loss (continued)
Equities - 95.68% (continued)
United States - 57.30% (continued)
11,210 Goldman Sachs Group Inc 2,293,566 0.17%
12,079 H&R Block Inc 353,915 0.03%
31,023 Halliburton Co 705,463 0.05%
10,715 Harley-Davidson Inc 383,918 0.03%
17,481 Hartford Financial Svcs Grp 974,041 0.07%
11,459 Hca Holdings Inc 1,548,913 0.11%
35,614 Hcp Inc 1,138,936 0.08%
420 Helmerich & Payne 21,260 0.00%
6,271 Henry Schein Inc 438,343 0.03%
5,050 Hershey Co 676,851 0.05%
12,273 Hess Corp 780,195 0.06%
56,983 Hewlett Packard Enterpris 851,896 0.06%
7,500 Hollyfrontier Corp 347,100 0.03%
34,090 Home Depot Inc 7,089,697 0.52%
21,913 Honeywell International Inc 3,825,791 0.28%
34,079 Host Hotels & Resorts Inc 620,919 0.05%
69,109 Hp Inc 1,436,776 0.10%
4,928 Humana Inc 1,307,398 0.10%
3,474 Iac/Interactivecorp 755,699 0.05%
5,025 Idexx Laboratories Inc 1,383,533 0.10%
7,972 Illinois Tool Works 1,202,257 0.09%
4,836 Illumina Inc 1,780,373 0.13%
7,319 Incyte Corp 621,822 0.05%
140,673 Intel Corp 6,734,017 0.49%
18,489 Intercontinental Exchange In 1,588,945 0.12%
13,975 International Paper Co 605,397 0.04%
2,300 Interpublic Group Of Cos Inc 51,957 0.00%
26,770 Intl Business Machines Corp 3,691,583 0.27%
3,917 Intl Flavors & Fragrances 568,318 0.04%
8,092 Intuit Inc 2,114,682 0.15%
3,899 Intuitive Surgical Inc 2,045,220 0.15%
7,549 Iqvia Holdings Inc 1,214,634 0.09%
7,790 Jacobs Engineering Group Inc 657,398 0.05%
19,838 Jefferies Financial Group In 381,485 0.03%
4,520 Jm Smucker Co 520,659 0.04%
82,134 Johnson & Johnson 11,439,624 0.83%
96,864 Jpmorgan Chase & Co 10,829,395 0.79%
23,063 Juniper Networks Inc 614,168 0.04%
4,839 Kansas City Southern 589,487 0.04%

SANLAM UNIVERSAL FUNDS PLC
243
PORTFOLIO OF INVESTMENTS OF SATRIX WORLD EQUITY TRACKER FUND
(CONTINUED)
as at 30 June 2019
Nominal Security Classification Fair Value
USD
% of
Net Assets
Financial assets at fair value through profit or loss (continued)
Equities - 95.68% (continued)
United States - 57.30% (continued)
11,380 Kellogg Co 609,627 0.04%
39,885 Keycorp 707,959 0.05%
12,745 Kimberly-Clark Corp 1,698,654 0.12%
34,535 Kimco Realty Corp 638,207 0.05%
74,089 Kinder Morgan Inc 1,546,978 0.11%
5,553 Kla-Tencor Corp 656,365 0.05%
7,168 Kohls Corp 340,838 0.02%
16,470 Kraft Heinz Co 511,229 0.04%
26,455 Kroger Co 574,338 0.04%
19,873 L Brands Inc 518,685 0.04%
3,257 L3 Technologies Inc 798,519 0.06%
3,353 Laboratory Crp Of Amer Hldgs 579,734 0.04%
5,695 Lam Research Corp 1,069,749 0.08%
14,876 Las Vegas Sands Corp 879,023 0.06%
1,670 Lennar Corp-A 80,928 0.01%
330 Liberty Media Cor-Siriusxm A 12,477 0.00%
1,990 Liberty Media Cor-Siriusxm C 75,580 0.01%
10,958 Lincoln National Corp 706,243 0.05%
1,550 Lkq Corp 41,246 0.00%
8,042 Lockheed Martin Corp 2,923,589 0.21%
22,428 Loews Corp 1,226,139 0.09%
24,690 Lowe’S Cos Inc 2,491,468 0.18%
3,070 Lululemon Athletica Inc 553,245 0.04%
8,207 M&TBankCorp 1,395,764 0.10%
710 Macerich Co 23,778 0.00%
9,095 Macy’S Inc 195,179 0.01%
6,756 Manpower Group 652,630 0.05%
44,980 Marathon Oil Corp 639,166 0.05%
24,248 Marathon Petroleum Corp 1,354,978 0.10%
1,211 Markel Corp 1,319,506 0.10%
12,476 Marriott International -Cl A 1,750,258 0.13%
15,375 Marsh & Mclennan Cos 1,533,656 0.11%
23,474 Masco Corp 921,120 0.07%
28,004 Mastercard Inc - A 7,407,898 0.54%
2,090 Maxim Integrated Products 125,024 0.01%
23,572 Mcdonald’S Corp 4,894,962 0.36%
7,539 Mckesson Corp 1,013,166 0.07%
2,059 Mercadolibre Inc 1,259,634 0.09%
78,168 Merck & Co. Inc. 6,554,387 0.48%

SANLAM UNIVERSAL FUNDS PLC
244
PORTFOLIO OF INVESTMENTS OF SATRIX WORLD EQUITY TRACKER FUND
(CONTINUED)
as at 30 June 2019
Nominal Security Classification Fair Value
USD
% of
Net Assets
Financial assets at fair value through profit or loss (continued)
Equities - 95.68% (continued)
United States - 57.30% (continued)
23,699 Metlife Inc 1,177,129 0.09%
3,650 Mgm Resorts International Stk 104,281 0.01%
9,786 Microchip Technology Inc 848,446 0.06%
36,305 Micron Technology Inc 1,401,010 0.10%
228,002 Microsoft Corp 30,543,148 2.22%
4,202 Mohawk Industries Inc 619,669 0.05%
5,645 Molson Coors Brewing Co -B 316,120 0.02%
46,371 Mondelez International Inc-A 2,499,397 0.18%
17,292 Monster Beverage Corp 1,103,748 0.08%
6,250 Moody’S Corp 1,220,687 0.09%
36,195 Morgan Stanley 1,585,703 0.12%
22,842 Mosaic Co 571,735 0.04%
8,137 Motorola Solutions Inc 1,356,682 0.10%
16,944 National Oilwell Varco Inc 376,665 0.03%
8,917 Nektar Therapeutics 317,267 0.02%
10,790 Netapp Inc 665,743 0.05%
14,242 Netflix Inc 5,231,371 0.38%
12,757 Newell Brands Inc 196,713 0.01%
29,053 Newmont Mining Corp 1,117,224 0.08%
34,605 News Corp - Class A 466,821 0.03%
12,438 Nextera Energy Inc 2,548,049 0.19%
39,351 Nike Inc -Cl B 3,303,516 0.24%
21,888 Noble Energy Inc 490,291 0.04%
580 Nordstrom Inc 18,479 0.00%
10,450 Norfolk Southern Corp 2,082,998 0.15%
9,532 Northern Trust Corp 857,880 0.06%
6,268 Northrop Grumman Corp 2,025,253 0.15%
13,121 Nucor Corp 722,967 0.05%
18,830 Nvidia Corp 3,092,451 0.23%
23,080 Occidental Petroleum Corp 1,160,462 0.08%
9,581 Omnicom Group 785,163 0.06%
17,734 Oneok Inc 1,220,277 0.09%
90,324 Oracle Corp 5,145,758 0.37%
3,963 O’Reilly Automotive Inc 1,463,615 0.11%
10,354 Paccar Inc 741,968 0.05%
3,646 Palo Alto Networks Inc 742,909 0.05%
4,510 Parker Hannifin Corp 766,745 0.06%
12,200 Parsley Energy Inc-Class A 231,922 0.02%
14,531 Paychex Inc 1,195,756 0.09%
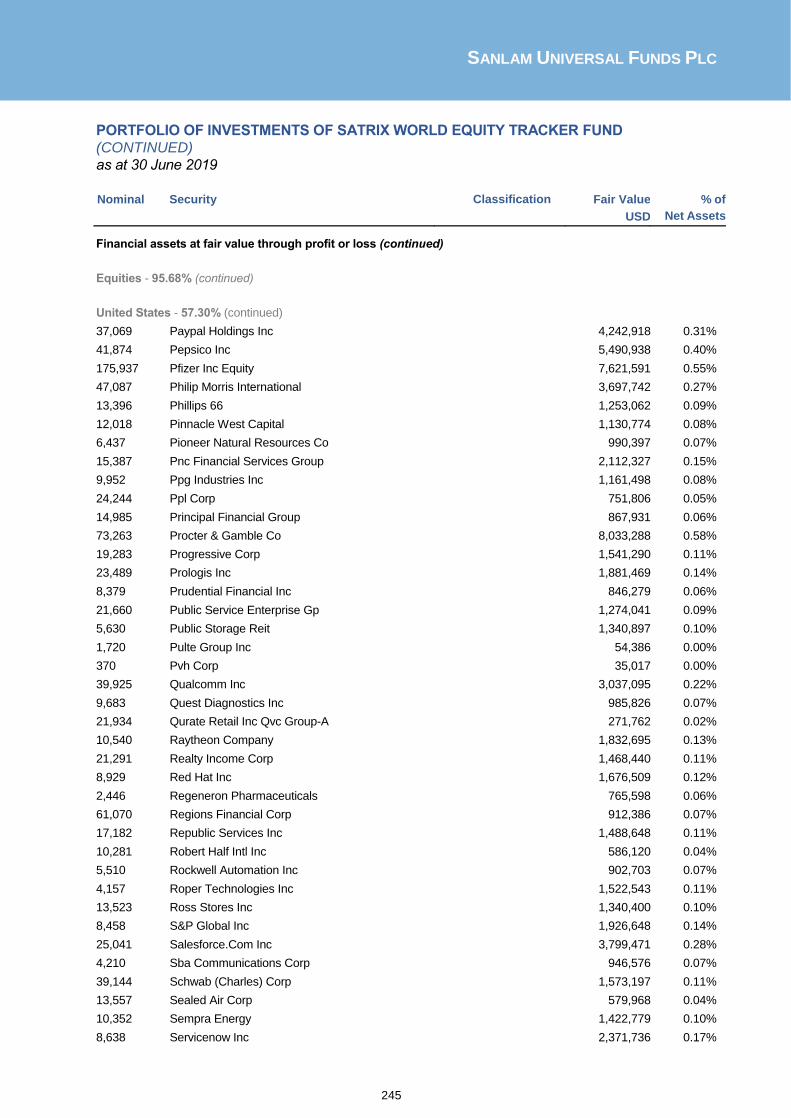
SANLAM UNIVERSAL FUNDS PLC
245
PORTFOLIO OF INVESTMENTS OF SATRIX WORLD EQUITY TRACKER FUND
(CONTINUED)
as at 30 June 2019
Nominal Security Classification Fair Value
USD
% of
Net Assets
Financial assets at fair value through profit or loss (continued)
Equities - 95.68% (continued)
United States - 57.30% (continued)
37,069 Paypal Holdings Inc 4,242,918 0.31%
41,874 Pepsico Inc 5,490,938 0.40%
175,937 Pfizer Inc Equity 7,621,591 0.55%
47,087 Philip Morris International 3,697,742 0.27%
13,396 Phillips 66 1,253,062 0.09%
12,018 Pinnacle West Capital 1,130,774 0.08%
6,437 Pioneer Natural Resources Co 990,397 0.07%
15,387 Pnc Financial Services Group 2,112,327 0.15%
9,952 Ppg Industries Inc 1,161,498 0.08%
24,244 Ppl Corp 751,806 0.05%
14,985 Principal Financial Group 867,931 0.06%
73,263 Procter & Gamble Co 8,033,288 0.58%
19,283 Progressive Corp 1,541,290 0.11%
23,489 Prologis Inc 1,881,469 0.14%
8,379 Prudential Financial Inc 846,279 0.06%
21,660 Public Service Enterprise Gp 1,274,041 0.09%
5,630 Public Storage Reit 1,340,897 0.10%
1,720 Pulte Group Inc 54,386 0.00%
370 Pvh Corp 35,017 0.00%
39,925 Qualcomm Inc 3,037,095 0.22%
9,683 Quest Diagnostics Inc 985,826 0.07%
21,934 Qurate Retail Inc Qvc Group-A 271,762 0.02%
10,540 Raytheon Company 1,832,695 0.13%
21,291 Realty Income Corp 1,468,440 0.11%
8,929 Red Hat Inc 1,676,509 0.12%
2,446 Regeneron Pharmaceuticals 765,598 0.06%
61,070 Regions Financial Corp 912,386 0.07%
17,182 Republic Services Inc 1,488,648 0.11%
10,281 Robert Half Intl Inc 586,120 0.04%
5,510 Rockwell Automation Inc 902,703 0.07%
4,157 Roper Technologies Inc 1,522,543 0.11%
13,523 Ross Stores Inc 1,340,400 0.10%
8,458 S&P Global Inc 1,926,648 0.14%
25,041 Salesforce.Com Inc 3,799,471 0.28%
4,210 Sba Communications Corp 946,576 0.07%
39,144 Schwab (Charles) Corp 1,573,197 0.11%
13,557 Sealed Air Corp 579,968 0.04%
10,352 Sempra Energy 1,422,779 0.10%
8,638 Servicenow Inc 2,371,736 0.17%
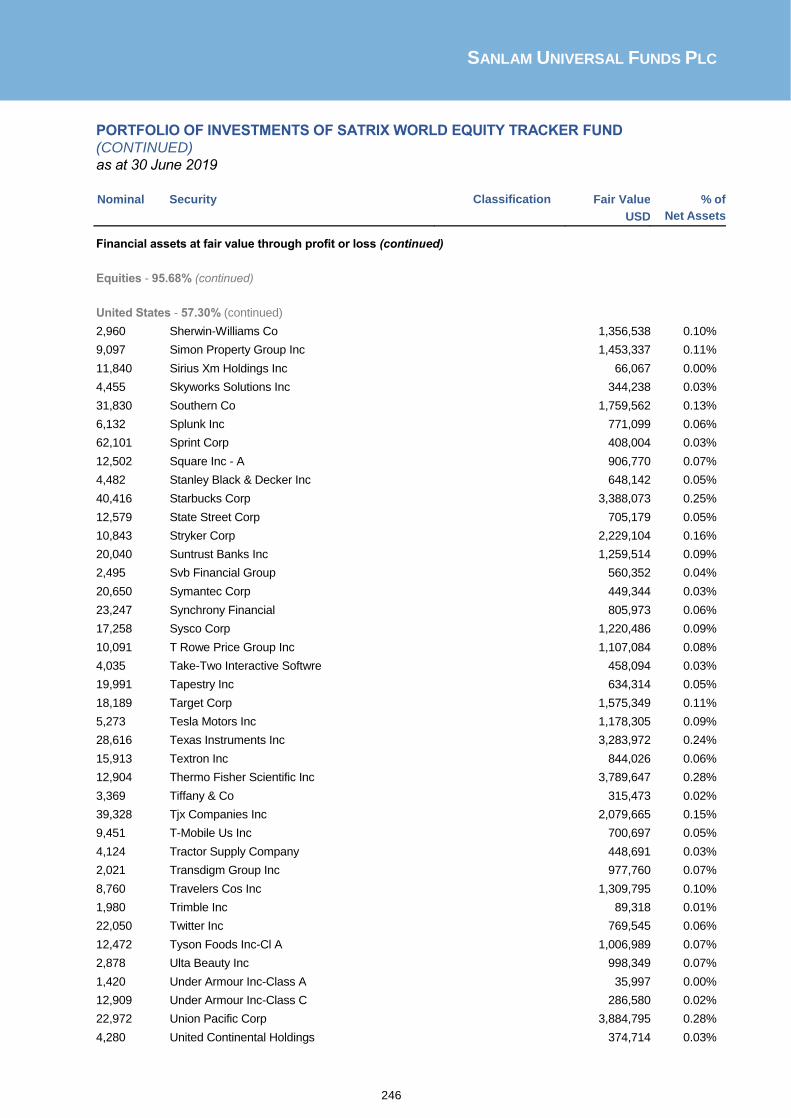
SANLAM UNIVERSAL FUNDS PLC
246
PORTFOLIO OF INVESTMENTS OF SATRIX WORLD EQUITY TRACKER FUND
(CONTINUED)
as at 30 June 2019
Nominal Security Classification Fair Value
USD
% of
Net Assets
Financial assets at fair value through profit or loss (continued)
Equities - 95.68% (continued)
United States - 57.30% (continued)
2,960 Sherwin-Williams Co 1,356,538 0.10%
9,097 Simon Property Group Inc 1,453,337 0.11%
11,840 Sirius Xm Holdings Inc 66,067 0.00%
4,455 Skyworks Solutions Inc 344,238 0.03%
31,830 Southern Co 1,759,562 0.13%
6,132 Splunk Inc 771,099 0.06%
62,101 Sprint Corp 408,004 0.03%
12,502 Square Inc - A 906,770 0.07%
4,482 Stanley Black & Decker Inc 648,142 0.05%
40,416 Starbucks Corp 3,388,073 0.25%
12,579 State Street Corp 705,179 0.05%
10,843 Stryker Corp 2,229,104 0.16%
20,040 Suntrust Banks Inc 1,259,514 0.09%
2,495 Svb Financial Group 560,352 0.04%
20,650 Symantec Corp 449,344 0.03%
23,247 Synchrony Financial 805,973 0.06%
17,258 Sysco Corp 1,220,486 0.09%
10,091 T Rowe Price Group Inc 1,107,084 0.08%
4,035 Take-Two Interactive Softwre 458,094 0.03%
19,991 Tapestry Inc 634,314 0.05%
18,189 Target Corp 1,575,349 0.11%
5,273 Tesla Motors Inc 1,178,305 0.09%
28,616 Texas Instruments Inc 3,283,972 0.24%
15,913 Textron Inc 844,026 0.06%
12,904 Thermo Fisher Scientific Inc 3,789,647 0.28%
3,369 Tiffany & Co 315,473 0.02%
39,328 Tjx Companies Inc 2,079,665 0.15%
9,451 T-Mobile Us Inc 700,697 0.05%
4,124 Tractor Supply Company 448,691 0.03%
2,021 Transdigm Group Inc 977,760 0.07%
8,760 Travelers Cos Inc 1,309,795 0.10%
1,980 Trimble Inc 89,318 0.01%
22,050 Twitter Inc 769,545 0.06%
12,472 Tyson Foods Inc-Cl A 1,006,989 0.07%
2,878 Ulta Beauty Inc 998,349 0.07%
1,420 Under Armour Inc-Class A 35,997 0.00%
12,909 Under Armour Inc-Class C 286,580 0.02%
22,972 Union Pacific Corp 3,884,795 0.28%
4,280 United Continental Holdings 374,714 0.03%

SANLAM UNIVERSAL FUNDS PLC
247
PORTFOLIO OF INVESTMENTS OF SATRIX WORLD EQUITY TRACKER FUND
(CONTINUED)
as at 30 June 2019
Nominal Security Classification Fair Value
USD
% of
Net Assets
Financial assets at fair value through profit or loss (continued)
Equities - 95.68% (continued)
United States - 57.30% (continued)
18,620 United Parcel Service-Cl B 1,922,887 0.14%
24,047 United Technologies Corp 3,130,919 0.23%
29,717 Unitedhealth Group Inc 7,251,245 0.53%
16,514 Unum Group 554,045 0.04%
43,490 Us Bancorp 2,278,876 0.17%
14,876 Valero Energy Corp 1,273,534 0.09%
7,809 Varian Medical Systems Inc 1,063,039 0.08%
5,610 Veeva Systems Inc-Class A 909,437 0.07%
13,125 Ventas Inc 897,094 0.07%
6,194 Verisign Inc 1,295,537 0.09%
6,363 Verisk Analytics Inc 931,925 0.07%
133,089 Verizon Communications - Vz.N 7,603,375 0.55%
8,277 Vertex Pharmaceuticals Inc 1,517,836 0.11%
14,214 Vf Corp 1,241,593 0.09%
21,547 Viacom Inc-Class B 643,609 0.05%
55,322 Visa Inc-Class A Shares 9,601,133 0.70%
3,296 Vmware Inc-Class A 551,124 0.04%
14,451 Vornado Realty Trust 926,309 0.07%
10,654 Vulcan Materials Co 1,462,901 0.11%
6,195 Wabtec Corp 444,553 0.03%
24,259 Walgreens Boots Alliance Inc 1,326,240 0.10%
44,010 Walmart Inc 4,862,665 0.35%
61,914 Walt Disney Co 8,645,671 0.63%
16,032 Waste Management Inc 1,849,612 0.13%
3,138 Waters Corp 675,423 0.05%
136,980 Wells Fargo & Co 6,481,894 0.47%
13,674 Welltower Inc 1,114,841 0.08%
10,543 Western Digital Corp 501,320 0.04%
20,493 Western Union Co 407,606 0.03%
9,137 Westrock Co 333,226 0.02%
40,249 Weyerhaeuser Co 1,060,159 0.08%
4,041 Whirlpool Corp 575,277 0.04%
45,145 Williams Cos Inc 1,265,866 0.09%
5,754 Workday Inc-Class A 1,182,907 0.09%
13,536 Worldpay Inc - Cl A 1,658,837 0.12%
21,667 Wr Berkley Corp 1,428,505 0.10%
1,690 Ww Grainger Inc 453,309 0.03%
2,835 Wynn Resorts Ltd 351,512 0.03%
33,396 Xcel Energy Inc 1,986,728 0.14%

SANLAM UNIVERSAL FUNDS PLC
248
PORTFOLIO OF INVESTMENTS OF SATRIX WORLD EQUITY TRACKER FUND
(CONTINUED)
as at 30 June 2019
Nominal Security Classification Fair Value
USD
% of
Net Assets
Financial assets at fair value through profit or loss (continued)
Equities - 95.68% (continued)
United States - 57.30% (continued)
10,070 Xerox Corp 356,579 0.03%
8,339 Xilinx Inc 983,335 0.07%
9,649 Xylem Inc 807,042 0.06%
13,379 Yum! Brands Inc 1,480,654 0.11%
830 Zillow Group Inc - C 38,504 0.00%
6,694 Zimmer Biomet Holdings Inc 788,152 0.06%
16,328 Zoetis Inc 1,853,065 0.13%
Total United States 787,538,972 57.30%
Virgin Islands - 0.04%
340 Andritz Ag 12,816 0.00%
14,229 Capri Holdings Ltd 493,462 0.04%
Total Virgin Islands 506,278 0.04%
Total Equities 1,314,898,103 95.68%
Exchange Traded Funds - 3.62%
861,666 Ishares Core Msci World 49,821,528 3.62%
Total Exchange Traded Funds 49,821,528 3.62% Derivative Financial Instruments
Rights - 0.00%
Spain - 0.00%
11,071 Acs Actividades De Construccio Rights Expire 07/08/2019 17,399 0.00%
49,791 Repsol Sa Rights Expire 07/04/2019 27,659 0.00%
Total Spain 45,058 0.00%
Total Rights 45,058 0.00%
Total financial assets at fair value through profit or loss 1,364,764,689 99.30%
Cash and cash equivalents 8,997,185 0.65%
Other net assets and liabilities 559,422 0.04%
Net assets attributable to holders of redeemable participating shares 1,374,321,296 100.00%

SANLAM UNIVERSAL FUNDS PLC
249
PORTFOLIO OF INVESTMENTS OF SATRIX WORLD EQUITY TRACKER FUND
(CONTINUED)
as at 30 June 2019
Satrix World Equity Tracker Fund Summary
Classification Description Fair Value % of % of
USD Net
Assets Total
Assets
Transferable securities and money market instruments admitted to official stock exchange listing or traded on regulated market
1,364,719,631 99.30% 99.04%
A Transferable securities and money market instruments other than those referred above - - -
B UCITS and AIFs - - -
C Financial derivative instruments dealt in on a regulated market - - -
D Over the counter financial derivative instruments 45,058 0.00% 0.00%
Cash and cash equivalents 8,997,185 0.65% 0.65%
Other net assets and liabilities 559,422 0.04% 0.04%
Net assets attributable to holders of redeemable participating shares 1,374,321,296 100.00%

SANLAM UNIVERSAL FUNDS PLC
250
PORTFOLIO OF INVESTMENTS OF SIIP INDIA OPPORTUNITIES FUND
as at 30 June 2019
Nominal Security Classification Fair Value
USD
% of
Net Assets
Financial assets at fair value through profit or loss
Equities - 100.79%
India - 100.79%
12,410 Aarti Industries Limited 319,664 1.75%
19,616 Asian Paints Ltd 385,954 2.11%
12,355 Astral Poly Technik Ltd 237,318 1.30%
5,894 Avenue Supermarts Ltd 119,361 0.65%
76,592 Axis Bank Ltd-Foreign 897,156 4.91%
6,865 Bajaj Finance Ltd 366,097 2.01%
2,735 Bajaj Finserv Ltd 337,763 1.85%
11,965 Bandhan Bank Ltd 93,385 0.51%
20,274 Bata India Ltd 424,835 2.33%
18,671 Britannia Industries Ltd 742,134 4.07%
39,518 Cadila Healthcare Ltd 138,372 0.76%
19,905 Cholamandalam Investment And 82,371 0.45%
28,277 Dcb Bank Ltd 97,128 0.53%
5,552 Divi’S Laboratories Ltd 128,445 0.70%
2,003 Dr. Reddy’S Laboratories 74,007 0.41%
7,289 Gmm Pfaudler Ltd 141,609 0.78%
7,235 Gujarat Fluorochemicals 96,082 0.53%
32,605 Havells India Ltd-Foreig 371,336 2.03%
51,521 Hdfc Bank Limited 1,823,975 9.99%
25,669 Hindustan Unilever Ltd 664,748 3.64%
33,201 Housing Development Finance 1,054,361 5.78%
153,736 Icici Bank Ltd 973,496 5.33%
27,276 Indraprastha Gas Ltd 124,333 0.68%
10,293 Indusind Bank Ltd 210,326 1.15%
75,540 Infosys Ltd 801,062 4.39%
124,803 Itc Ltd 495,126 2.71%
4,041 Jubilant Foodworks Ltd-F 72,179 0.40%
28,500 Kei Industries Ltd 198,223 1.09%
38,792 Kotak Mahindra Bank Ltd 830,099 4.55%
6,116 L&T Technology Services 154,669 0.85%
7,025 Larsen & Toubro Infotech 186,185 1.02%
31,212 Larsen & Toubro Ltd 702,307 3.85%
2,119 Maruti Suzuki India Ltd 200,600 1.10%
64,285 Petronet Lng Ltd 228,261 1.25%
28,377 Rbl Bank Ltd 262,547 1.44%
75,808 Reliance Industries Ltd 1,376,191 7.54%
800 Shree Cement Ltd 252,894 1.39%
144,826 State Bank Of India 757,936 4.15%
25,695 Tata Consultancy Svcs Lt 829,060 4.54%
18,819 Tech Mahindra Ltd 192,641 1.06%

SANLAM UNIVERSAL FUNDS PLC
251
PORTFOLIO OF INVESTMENTS OF SIIP INDIA OPPORTUNITIES FUND (CONTINUED)
as at 30 June 2019
Nominal Security Classification Fair Value
USD
% of
Net Assets
Financial assets at fair value through profit or loss (continued)
Equities - 100.79% (continued)
India - 100.79% (continued)
15,500 Titan Co Ltd-For 299,704 1.64%
1,335 Ttk Prestige Ltd 130,584 0.72%
42,996 Ujjivan Financial Servic 184,716 1.01%
2,168 Ultratech Cement Ltd 143,089 0.78%
20,141 V.I.P. Industries Ltd 129,989 0.71%
2,076 Vinati Organics Ltd 63,991 0.35%
Total India 18,396,309 100.79%
Total Equities 18,396,309 100.79%
Total financial assets at fair value through profit or loss 18,396,309 100.79%
Cash and cash equivalents 92,532 0.51%
Other net assets and liabilities (237,009) (1.30)%
Net assets attributable to holders of redeemable participating shares 18,251,832 100.00%
SIIP India Opportunity Funds Summary
Classification Description Fair Value % of % of
USD Net
Assets Total
Assets
Transferable securities and money market instruments admitted to official stock exchange listing or traded on regulated market 18,396,309 100.79% 99.21%
A Transferable securities and money market instruments other than those referred above - - -
B UCITS and AIFs - - -
C Financial derivative instruments dealt in on a regulated market - - -
D Over the counter financial derivative instruments - - -
Cash and cash equivalents 92,532 0.51% 0.50%
Other net assets and liabilities (237,009) (1.30)% (1.28)%
Net assets attributable to holders of redeemable participating shares 18,251,832 100.00%

SANLAM UNIVERSAL FUNDS PLC
252
PORTFOLIO OF INVESTMENTS OF DENKER GLOBAL DIVIDEND FUND
as at 30 June 2019
Nominal Security Classification Fair Value
USD
% of
Net Assets
Financial assets at fair value through profit or loss
Equities - 97.11%
Belgium - 2.17%
34,490 Ageas 1,795,361 2.17%
Total Belgium 1,795,361 2.17%
France - 9.23%
67,866 Axa Sa 1,785,302 2.15%
20,686 Sanofi 1,788,228 2.16%
40,896 Scor Se 1,795,831 2.17%
40,536 Total Sa 2,274,652 2.75%
Total France 7,644,013 9.23%
Germany - 2.13%
179,700 Tui Ag-Di 1,766,511 2.13%
Total Germany 1,766,511 2.13%
Netherlands - 4.59%
143,100 Ing Groep Nv 1,661,564 2.01%
95,085 Koninklijke Ahold Delhaize N 2,141,617 2.58%
Total Netherlands 3,803,181 4.59%
Norway - 2.73%
283,400 Sparebank 1 Nord-Norge 2,256,949 2.73%
Total Norway 2,256,949 2.73%
Panama - 1.94%
34,500 Carnival Corp 1,605,975 1.94%
Total Panama 1,605,975 1.94%
South Korea - 2.06%
51,550 Samsung Electronics Prf 1,707,693 2.06%
Total South Korea 1,707,693 2.06%
Switzerland - 6.66%
29,119 Novartis Ag-Reg 2,664,015 3.22%
10,117 Roche Holding Ag-Genussc 2,849,881 3.44%
Total Switzerland 5,513,896 6.66%
United Kingdom - 26.97%
372,674 Bp Plc 2,602,022 3.14%
51,667 British American Tobacco 1,807,649 2.18%
96,314 Glaxosmithkline Plc (Lse) 1,932,578 2.33%
254,006 Ig Group Holdings Plc 1,888,563 2.28%

SANLAM UNIVERSAL FUNDS PLC
253
PORTFOLIO OF INVESTMENTS OF DENKER GLOBAL DIVIDEND FUND (CONTINUED)
as at 30 June 2019
Nominal Security Classification Fair Value
USD
% of
Net Assets
Financial assets at fair value through profit or loss (continued)
Equities - 97.11% (continued)
United Kingdom - 26.97% (continued)
35,052 Imperial Brands Plc 823,870 1.00%
842,874 Legal & General Group Pl 2,890,996 3.49%
81,960 Micro Focus International 2,152,968 2.60%
95,986 Royal Dutch Shell Plc-B 3,152,985 3.81%
797,163 Taylor Wimpey Plc 1,600,452 1.93%
55,888 Unilever Plc 3,481,392 4.21%
Total United Kingdom 22,333,475 26.97%
United States - 38.63%
17,096 Altria Group Inc 809,496 0.98%
40,700 American International Group 2,168,496 2.62%
6,030 Boeing Co 2,194,980 2.65%
91,061 Cisco Systems Inc 4,983,769 6.02%
125,265 Hp Inc 2,604,259 3.14%
24,150 Jpmorgan Chase & Co 2,699,970 3.26%
8,700 Lockheed Martin Corp 3,162,798 3.82%
9,737 Mcdonald’S Corp 2,021,985 2.44%
21,408 Pepsico Inc 2,807,231 3.39%
31,690 Philip Morris International 2,488,616 3.00%
33,053 Procter & Gamble Co 3,624,261 4.38%
42,455 Verizon Communications - Vz.N 2,425,454 2.93%
Total United States 31,991,315 38.63%
Total Equities 80,418,369 97.11%
Total financial assets at fair value through profit or loss 80,418,369 97.11%
Cash and cash equivalents 2,420,568 2.92%
Other net assets and liabilities (23,089) (0.03)%
Net assets attributable to holders of redeemable participating shares 82,815,848 100.00%

SANLAM UNIVERSAL FUNDS PLC
254
PORTFOLIO OF INVESTMENTS OF DENKER GLOBAL DIVIDEND FUND (CONTINUED)
as at 30 June 2019 Denker Global Dividend Fund Summary
Classification Description Fair Value % of % of
USD Net
Assets Total
Assets
Transferable securities and money market instruments admitted to official stock exchange listing or traded on regulated market 80,418,369 97.11% 96.80%
A Transferable securities and money market instruments other than those referred above - - -
B UCITS and AIFs - - -
C Financial derivative instruments dealt in on a regulated market - - -
D Over the counter financial derivative instruments - - -
Cash and cash equivalents 2,420,568 2.92% 2.91%
Other net assets and liabilities (23,089) (0.03)% (0.03)%
Net assets attributable to holders of redeemable participating shares 82,815,848 100.00%

SANLAM UNIVERSAL FUNDS PLC
255
PORTFOLIO OF INVESTMENTS OF SANLAM STRATEGIC BOND FUND as at 30 June 2019
Nominal Security Classification Fair Value
GBP
% of
Net Assets
Financial assets at fair value through profit or loss
Equities - 7.19%
United Kingdom - 7.18%
1,825,000 Aviva Plc Preferred 2,591,682 0.66%
1,475,000 Ecclesiastical Ins 2,271,500 0.58%
3,360,000 Gen Accid 7.875% 4,379,283 1.11%
2,645,000 General Accident Plc 3,811,974 0.97%
452,250 Lloyds Bank Group Plc 667,069 0.17%
385,000 Natl Westmister Bk Plc 582,698 0.15%
2,085,000 Rsa Insrn Grp Pfd 7.375% 2,585,400 0.66%
5,469,000 Santander Uk Plc 8,703,913 2.21%
665,000 Santander Uk Plc 901,407 0.23%
900,000 Standard Chartered 1,067,850 0.27%
500,000 Standard Chartered Plc 668,750 0.17%
Total United Kingdom 28,231,526 7.18%
United States - 0.01%
468 Slm Corp Preferred Series B 22,065 0.01%
Total United States 22,065 0.01%
Total Equities 28,253,591 7.19%
Nominal Security Coupon Maturity Classification Fair Value % of
GBP Net Assets
Corporate Debt - 64.25%
Austria - 0.70% 3,000,000 Bawag Group Ag 2.380% 26/03/2029 2,740,835 0.70% Total Austria 2,740,835 0.70%
Canada - 0.58%
2,211,000 Entertainment One Ltd 4.630% 15/07/2026 2,277,772 0.58%
Total Canada 2,277,772 0.58%
France – 1.80% 600,000 Electricite De V/R 6.000% 29/07/2167 6,013,392 1.53% 1,000,000 Electricite De V/R 5.880% 22/07/2167 1,061,500 0.27% Total France 7,074,892 1.80%
Germany - 0.65% 2,792,000 Novem Group Gmbh 5.250% 15/05/2024 2,570,360 0.65%
Total Germany 2,570,360 0.65%
Ireland – 1.01% 2,962,000 Ge Capital Euro Funding 6.030% 01/03/2038 3,961,071 1.01%
Total Ireland 3,961,071 1.01%

SANLAM UNIVERSAL FUNDS PLC
256
PORTFOLIO OF INVESTMENTS OF SANLAM STRATEGIC BOND FUND (CONTINUED) as at 30 June 2019
Nominal Security Coupon Maturity Classification Fair Value % of
GBP Net Assets
Financial assets at fair value through profit or loss (continued)
Corporate Debt - 64.25% (continued)
Isle Of Man - 0.37% 1,526,000 Playtech Plc Regd Reg S 4.250% 07/03/2026 1,451,335 0.37% Total Isle of Man 1,451,335 0.37%
Italy – 4.49% 5,350,000 Assicurazioni V/R 6.270% 16/06/2168 5,630,206 1.43% 700,000 Assicurazioni V/R 6.420% 08/02/2168 736,001 0.19% 1,491,000 Banca Ifis Spa Regd 4.500% 17/10/2027 1,135,227 0.29% 868,000 Almaviva The Italian Inn Regd 7.250% 15/10/2022 690,324 0.18% 2,000,000 Cooperati 6.880% 01/08/2022 91,052 0.02% 1,800,000 Soc Cattolica Assicurazi Regd 4.250% 14/12/2047 1,584,180 0.40% 4,363,000 Unicredit Spa Regd V/R Reg S 4.880% 20/02/2029 4,132,824 1.05% 4,064,000 Unicredit Spa Regd V/R Reg S 0.000% 03/07/2025 3,639,542 0.93% Total Italy 17,639,356 4.49%
Jersey Channel Islands – 1.34% 3,189,000 Aa Bond C 6.269% 6.270% 31/07/2025 3,314,083 0.84% 1,511,000 Hsbc Bnk Cao F V/R 5.840% 05/11/2167 1,953,898 0.50% Total Jersey Channel Islands 5,267,981 1.34%
Luxembourg – 1.85% 2,480,000 Ses Sa Regd V/R Reg S 5.630% 29/01/2168 2,453,745 0.62% 3,052,000 Medtronic Global Hldings 1.500% 02/07/2039 2,711,404 0.69% 2,441,000 Medtronic Global Hldings 1.750% 02/07/2049 2,122,627 0.54% Total Luxembourg 7,287,776 1.85%
Mexico – 2.09% 600,000 Alfa S.A. 6.880% 25/03/2044 527,156 0.13% 5,283,000 Petroleos Mexicanos Regd Reg 4.750% 26/02/2029 4,535,259 1.15% 3,138,000 Petroleos Mexicanos Regd Reg 4.880% 21/02/2028 2,751,085 0.70% 600,000 Petroleos Mexic 6.750% 21/09/2047 417,513 0.11% Total Mexico 8,231,013 2.09%
Netherlands – 4.66% 3,000,000 Cooperatieve R V/R 6.910% 10/12/2167 4,344,879 1.11% 780,000 Koninklijke Kpn N V/R 03/28/73 7.000% 28/03/2073 658,389 0.17% 6,418,000 Petrobras Global Finance Regd 6.630% 16/01/2034 7,162,860 1.82% 2,500,000 Telefonica Europe Bv Regd V/R 3.000% 04/12/2167 2,296,629 0.58% 1,800,000 Telefonica Eur V/R 5.880% 31/03/2168 1,876,524 0.48% 2,000,000 Volkswagen Int V/R 4.630% 24/03/2168 1,968,993 0.50% Total Netherlands 18,308,274 4.66%
Portugal - 0.30% 1,200,000 Caixa Geral De Depositos 5.750% 28/06/2028 1,178,448 0.30% Total Portugal 1,178,448 0.30%
Spain – 2.48% 6,200,000 Banco De Sabadell Sa V/R 5.380% 12/12/2028 6,121,931 1.56% 1,600,000 Intl Consolidated Airlin Regd 1.500% 04/07/2027 1,418,128 0.36% 2,463,000 Telefonica Emisiones Sau 1.960% 01/07/2039 2,218,639 0.56% Total Spain 9,758,698 2.48%

SANLAM UNIVERSAL FUNDS PLC
257
PORTFOLIO OF INVESTMENTS OF SANLAM STRATEGIC BOND FUND (CONTINUED) as at 30 June 2019
Nominal Security Coupon Maturity Classification Fair Value % of
GBP Net Assets
Financial assets at fair value through profit or loss (continued)
Corporate Debt - 64.25% (continued)
United Kingdom – 31.24% 200,000 Aldermore Gr V/R 10/28/26 8.500% 28/10/2026 224,120 0.06% 3,000,000 Aviva Plc Pfd 8.75% 8.750% 31/12/2049 4,230,000 1.08% 900,000 Aviva Plc V/R 6.130% 29/09/2167 974,985 0.25% 235,000 Aviva Plc V/R 6.880% 21/05/2168 240,139 0.06% 150,000 Bank Of Sc 13.625% 13.630% 10/12/2167 324,750 0.08% 200,000 Bank Of Scotla 12% 12.000% 01/03/2168 235,500 0.06% 50,000 Bank Of Scotland 8.750% 01/09/2167 58,000 0.01% 1,155,000 Barclays Bank P 9% 9.000% 11/10/2167 1,413,732 0.36% 700,000 Barclays Bank V/R 6.000% 15/12/2167 706,300 0.18% 350,000 Barclays Bank V/R 6.370% 15/12/2167 360,745 0.09% 8,189,000 Brit Insuran V/R 12/09/30 6.630% 09/12/2030 8,438,355 2.15% 2,102 Canary Wharf Fin 2 6.460% 22/04/2030 2,644 0.00% 7,239,000 Centrica Plc V/R 04/10/75 5.250% 10/04/2075 7,414,799 1.89% 1,567,000 Co-Operative Group Ltd Regd 5.130% 17/05/2024 1,649,267 0.42% 5,160,940 Co-Operative 11% 11.000% 18/12/2025 6,347,496 1.61% 1,558,000 Co-Operative Bnk Finance Regd 9.500% 25/04/2029 1,554,105 0.40% 150,000 Cybg Plc V/R 02/09/26 5.000% 09/02/2026 150,425 0.04% 3,277,000 Gkn Holdings Ltd Regd Reg S 4.630% 12/05/2032 3,255,857 0.83% 1,500,000 Investec Ban V/R 07/24/28/Gbp/ 4.250% 24/07/2028 1,516,888 0.39%
2,005,000 Just Group 3.5% 02/07/25/Gbp/ 3.500% 07/02/2025 1,930,997 0.49%
3,550,000 Lloyds Bank 11.75% /Perp//Gbp/ 11.750% 28/04/2168 7,408,886 1.88%
5,871,000 Lloyds Banking 13.0% /Perp/Gbp 13.000% 21/07/2167 10,164,462 2.59%
1,870,000 Marb Bondco Plc 7% 03/15/24 7.000% 15/03/2024 1,534,998 0.39%
610,000 Motabilit 2.375% 07/03/39/Gbp/ 2.375% 03/07/2039 597,123 0.15%
433,000 Nationwide Bld V/R /Perp//Gbp/ 6.250% 22/04/2168 484,329 0.12%
5,143,800 Nationwide Bldg /Perp//Gbp/ 10.250% 31/12/2049 7,786,427 1.98%
38,000 Natl Westmin 11.5% /Perp//Gbp/ 11.500% 17/12/2167 64,220 0.02%
998,000 Natl Westmin 11.5% /Perp//Gbp/ 11.500% 17/12/2167 1,663,217 0.42%
1,847,000 Omnicom Fin 0.8% 07/08/27/Eur/ 0.800% 08/07/2027 1,649,896 0.42%
2,018,000 Paragon B 6.125% 01/30/22/Gbp/ 6.125% 30/01/2022 2,109,450 0.54%
1,670,000 Paragon Bank V/R 09/09/26/Gbp/ 7.250% 09/09/2026 1,787,775 0.45%
1,173,000 Paragon Banki 6% 08/28/24/Gbp/ 6.000% 28/08/2024 1,239,590 0.32%
130,000 Paragon Banki 6% 12/05/20/Gbp/ 6.000% 05/12/2020 134,386 0.03%
260,000 Pension Ins 6.5% 6.500% 03/07/2024 290,540 0.07%
1,619,000 Pension Insur 8% 8.000% 23/11/2026 1,956,984 0.50%
1,648,000 Phoenix G 6.625% 6.625% 18/12/2025 1,822,309 0.46%
174,000 Principality B V/R 7.000% 01/12/2167 175,923 0.04%
179,000 Prudential P V/R 6.250% 20/10/2068 204,906 0.05%
622,000 Rl Financ 6.125% 6.125% 13/11/2028 714,232 0.18%
3,292,000 Rl Finance B V/R 6.125% 30/11/2043 3,712,823 0.94%
900,000 Santander 5.875% 5.875% 14/08/2031 1,077,585 0.27%
3,100,000 Sse Plc V/R 4.750% 16/09/2077 2,454,959 0.62%
3,900,000 Tesco Plc 5.125% / 5.125% 10/04/2047 5,017,996 1.28%
1,870,000 Tesco Plc 6.15% 6.150% 15/11/2037 1,714,631 0.44%
2,331,000 Tesco Plc 6.15% 6.150% 15/11/2037 2,137,329 0.54%
2,527,188 Tesco Pro 5.744% 5.744% 13/04/2040 3,313,223 0.84%

SANLAM UNIVERSAL FUNDS PLC
258
PORTFOLIO OF INVESTMENTS OF SANLAM STRATEGIC BOND FUND (CONTINUED) as at 30 June 2019
Nominal Security Coupon Maturity Classification Fair Value % of
GBP Net Assets
Financial assets at fair value through profit or loss (continued)
Corporate Debt - 64.25% (continued)
United Kingdom – 31.24% (continued) 2,288,640 Tesco Pro 5.8% 5.801% 13/10/2040 3,030,129 0.77%
1,865,000 Tp Icap Pl 5.25% 5.250% 29/05/2026 1,908,949 0.49%
1,567,000 Virgin Med 5.25% 5.250% 15/05/2029 1,624,783 0.41%
4,081,000 Virgin Money H V/R 7.875% 31/10/2167 4,103,931 1.04%
3,100,000 Virgin Money H V/R 8.750% 10/05/2168 3,337,823 0.85%
3,800,000 Vodafone Gro V/R 4.875% 03/10/2078 3,890,459 0.99%
1,814,000 Yorkshire 13.5% 13.500% 01/04/2025 2,651,288 0.67%
Total United Kingdom 122,794,665 31.24%
United States – 10.55% 9,770,000 Berkshire 2.375% 2.375% 19/06/2039 9,987,041 2.54%
2,770,000 Cheniere Energy 4.25% 4.250% 15/03/2045 1,713,785 0.44%
4,000,000 Dell Int Llc / 6.02% 6.020% 15/06/2026 3,462,791 0.88%
2,820,000 Dow Chemical C 4.375% 4.375% 15/11/2042 2,250,821 0.57%
2,769,000 Fiserv Inc 3% 3.000% 01/07/2031 2,815,079 0.72%
2,042,000 Gamestop Corp 6.75% 6.750% 15/03/2021 1,590,082 0.40%
3,355,000 General E 4.125% 4.125% 19/09/2035 3,692,213 0.94%
4,000,000 General Ele 1.5% 1.500% 17/05/2029 3,544,094 0.90%
2,962,000 General Electri 6.75% 6.750% 15/03/2032 2,875,371 0.73%
1,977,000 Kraft Heinz Fo 6.875% 6.875% 26/01/2039 1,873,301 0.48%
1,869,000 Kraft Heinz Food 6.5% 6.500% 09/02/2040 1,714,174 0.44%
3,353,000 L Brands Inc 6.694% 6.694% 15/01/2027 2,576,588 0.66%
2,968,000 Macys Retail H 5.125% 5.125% 15/01/2042 2,066,754 0.53%
1,871,000 Murphy Oil Cor 5.625% 5.875% 01/12/2042 1,327,160 0.34%
Total United States 41,489,252 10.55%
Virgin Islands - 0.14% 600,000 GTL Trade Finan 7.25% 7.250% 16/04/2044 560,798 0.14%
Total Virgin Islands 560,798 0.14% Total Corporate Debt 252,592,526 64.25%
Government Debt – 27.77%
France – 1.90% 6,808,900 France 1.250% 25/05/2036 6,866,782 1.75%
542,570 France 1.750% 25/05/2066 598,729 0.15%
784 France 2.000% 25/05/2048 906 0.00%
Total France 7,466,417 1.90%
Germany - 0.01% 30,000 Bundesrepublic 4.750% 04/07/2034 46,772 0.01%
Total Germany 46,772 0.01%

SANLAM UNIVERSAL FUNDS PLC
259
PORTFOLIO OF INVESTMENTS OF SANLAM STRATEGIC BOND FUND (CONTINUED)
as at 30 June 2019
Nominal Security Coupon Maturity Classification Fair Value % of
GBP Net Assets
Financial assets at fair value through profit or loss (continued) Government Debt – 27.77% (continued)
Italy – 5.23% 9,762,000 Buoni Poli 3.85% 3.850% 01/09/2049 10,148,475 2.58%
9,739,000 Buoni Polienn 5% 5.000% 01/03/2025 10,409,210 2.65%
Total Italy 20,557,685 5.23%
Portugal – 3.34% 9,236,250 Obrigacoes 4.1% 4.100% 15/02/2045 13,131,636 3.34%
Total Portugal 13,131,636 3.34%
Spain – 2.30% 9,162,000 Bonos Y Ob 1.45% 1.450% 30/04/2029 9,053,324 2.30%
Total Spain 9,053,324 2.30% United Kingdom – 3.29%
8,600,150 Uk Tsy 1 1.625% 1.625% 22/10/2028 9,215,061 2.34%
3,657,175 Uk Tsy 1% 202 1% 1.000% 22/04/2024 3,722,949 0.95%
Total United Kingdom 12,938,010 3.29%
United States – 11.69% 74,600 US T Bill Zcp 0.000% 18/07/2019 58,742 0.01%
200 US Treas Nts 1.625% 0.000% 30/06/2019 158 0.00%
18,000,200 US Treas Nts 2% 2.000% 15/02/2023 14,317,575 3.64%
16,670,100 US Treas Nts 2% 2.000% 15/11/2026 13,225,468 3.36%
9,607,700 US Treas Nts 3.625% 3.625% 15/02/2020 7,642,819 1.94%
12,902,800 Wi Treasury Se 2.625% 2.625% 15/02/2029 10,711,127 2.72%
Total United States 45,955,889 11.69%
Total Government Debt 109,149,732 27.77%
Derivative Financial Instruments
Buy Currency Buy Amount Sell currency Sell Amount Maturity Fair Value % of
GBP Net Assets
Forward Contracts – 0.06%
AUD 69,200,000 GBP (38,025,551) 04/07/2019 189,926 0.05%1
JPY 5,212,617,128 GBP (38,144,497) 18/07/2019 28,284 0.01%2
EUR 2,372,731 GBP (2,116,664) 19/07/2019 13,039 0.00%2
EUR 1,039,805 GBP (927,588) 19/07/2019 5,714 0.00%2
GBP 3,988,851 USD (5,058,258) 18/07/2019 5,475 0.00%2
GBP 1,016,000 USD (1,288,389) 18/07/2019 1,395 0.00%2
EUR 55,321 GBP (49,198) 19/07/2019 457 0.00%2
USD 400,000 GBP (314,763) 05/07/2019 447 0.00%1
EUR 64,089 GBP (57,174) 19/07/2019 350 0.00%2
EUR 89,643 GBP (80,191) 19/07/2019 270 0.00%2
USD 53,592 GBP (41,964) 19/07/2019 237 0.00%2

SANLAM UNIVERSAL FUNDS PLC
260
PORTFOLIO OF INVESTMENTS OF SANLAM STRATEGIC BOND FUND (CONTINUED)
as at 30 June 2019
Buy Currency Buy Amount Sell currency Sell Amount Maturity Fair Value % of
GBP Net Assets
Financial assets at fair value through profit or loss (continued) Derivative Financial Instruments (continued) Forward Contracts – 0.06% (continued)
GBP 963,000 EUR (1,072,665) 18/07/2019 236 0.00%2
GBP 23,864 USD (30,059) 19/07/2019 194 0.00%2
USD 491,893 GBP (387,161) 19/07/2019 185 0.00%2
EUR 65,913 GBP (59,007) 19/07/2019 155 0.00%2
USD 2,440 GBP (1,913) 19/07/2019 9 0.00%2
EUR 4,955 GBP (4,442) 19/07/2019 6 0.00%2
USD 14,022 GBP (11,038) 19/07/2019 4 0.00%2
EUR 363 GBP (324) 19/07/2019 1 0.00%2
GBP 1 USD (1) 19/07/2019 - 0.00%2
GBP 25 USD (32) 19/07/2019 - 0.00%2
GBP 64 USD (81) 19/07/2019 - 0.00%2
Total Forward Contracts 246,384 0.06%
1The following entities act as counterparty to the open forward currency contracts at 30 June 2019: Brown Brothers Harriman, and JP
Morgan.
Total financial assets at fair value through profit or loss 389,995,849 99.21%
Financial liabilities at fair value through profit or loss
Derivative Financial Instruments Forward Contracts – (0.19)%
GBP 38,046,907 AUD (69,248,642) 18/07/2019 (186,282) (0.05)%1
GBP 68,489,252 EUR (76,478,587) 18/07/2019 (153,615) (0.04)%2
USD 22,345,778 GBP (17,740,658) 19/07/2019 (144,283) (0.04)%2
GBP 88,567,375 USD (112,625,816) 18/07/2019 (125,405) (0.03)%2
GBP 38,506,662 JPY (5,265,404,880) 04/07/2019 (36,867) (0.01)%1
GBP 5,857,242 EUR (6,558,364) 18/07/2019 (29,176) (0.01)%2
USD 3,285,801 GBP (2,608,648) 19/07/2019 (21,216) (0.01)%2
GBP 12,793,526 EUR (14,263,223) 18/07/2019 (8,338) 0.00%1
USD 1,122,549 GBP (891,209) 19/07/2019 (7,248) 0.00%2
GBP 971,000 EUR (1,089,077) 18/07/2019 (6,494) 0.00%2
GBP 935,000 EUR (1,048,035) 18/07/2019 (5,657) 0.00%2
USD 600,154 GBP (476,462) 19/07/2019 (3,865) 0.00%2
USD 6,798,462 GBP (5,356,177) 18/07/2019 (2,392) 0.00%2
USD 254,280 GBP (201,608) 19/07/2019 (1,373) 0.00%2
EUR 20,736,000 GBP (18,612,779) 19/07/2019 (680) 0.00%2
USD 75,098 GBP (59,720) 19/07/2019 (583) 0.00%2
USD 89,671 GBP (71,190) 19/07/2019 (578) 0.00%2
USD 40,763 GBP (32,319) 19/07/2019 (220) 0.00%2
GBP 23,103 EUR (25,897) 19/07/2019 (141) 0.00%2
GBP 14,666 EUR (16,450) 19/07/2019 (99) 0.00%2
GBP 6,860 EUR (7,700) 19/07/2019 (52) 0.00%2
GBP 7,714 USD (9,853) 18/07/2019 (46) 0.00%2
GBP 31,496 USD (40,051) 19/07/2019 (42) 0.00%2
GBP 4,446 USD (5,658) 19/07/2019 (9) 0.00%2
USD 77,481 GBP (61,016) 19/07/2019 (3) 0.00%2
EUR 32,000 GBP (28,723) 19/07/2019 (1) 0.00%2
Total Forward Contracts (734,665) (0.19)% 1The following entities act as counterparty to the open forward currency contracts at 30 June 2019: Brown Brothers Harriman, and JP Morgan.

SANLAM UNIVERSAL FUNDS PLC
261
PORTFOLIO OF INVESTMENTS OF SANLAM STRATEGIC BOND FUND (CONTINUED) as at 30 June 2019
Fair Value % of
GBP Net Assets
Total financial liabilities at fair value through profit or loss (734,665) (0.19)%
Bank overdraft (3,916,888) (1.00)%
Other net assets and liabilities 7,515,484 1.91%
Net assets attributable to holders of redeemable participating shares 393,106,164 100.00%
Sanlam Strategic Bond Fund Summary Classification Description Fair Value % of % of
GBP Net
Assets Total
Assets
Transferable securities and money market instruments admitted to official stock exchange listing or traded on regulated market 28,253,591 7.19% 5.85%
A Transferable securities and money market instruments other than those referred above
361,742,258 92.02% 74.84%
B UCITS and AIFs - - -
C Financial derivative instruments dealt in on a regulated market - - -
D Over the counter financial derivative instruments (488,281) (0.12)% (0.10)%
Cash and cash equivalents (3,916,888) (1.00)% (0.81)%
Other net assets and liabilities 7,515,484 1.91% 1.55%
Net assets attributable to holders of redeemable participating shares 393,106,164 100.00%

SANLAM UNIVERSAL FUNDS PLC
262
PORTFOLIO OF INVESTMENTS OF SANLAM ACCEL INCOME FUND
as at 30 June 2019
Nominal Security Classification Fair Value
GBP
% of
Net Assets
Financial assets at fair value through profit or loss
Collective Investment Schemes - 97.20%
799,892 Fidelity Inst Uk Corp Bd 1,073,455 3.92%
608,556 Jan Hnd Strat Bd Fd-I In 840,416 3.07%
430,482 Unicorn Uk Income-Inst B 1,130,747 4.13%
211,346 Trojan Income Fund-O Inc 397,056 1.45%
1,075,899 Schroder Strategic Credi 1,037,059 3.79%
1,159,436 Mi -Chelverton Uk Equity 1,345,684 4.92%
1,433,553 Invesco Corp Bond Fd-Uk 1,718,257 6.28%
1,296,793 Jpm Sterling Corp Bond-C 1,674,160 6.12%
234,565 Artemis Income-I-Inc 566,943 2.07%
1,190,044 Artemis Strategic Bd-M-I 673,803 2.46%
467,154 Blackrock Cont Eur Inc-D 724,089 2.65%
3,272,114 Schroder Inc Maximiser-Z 1,607,917 5.88%
9,572 Mi Twentyfour Investment 1,054,515 3.85%
1,092,545 Artemis Global Income Fd 1,046,876 3.83%
975,159 Lazard Gl Eq Inc Fd-C In 1,057,852 3.87%
125,733 M&G Short Dated Corp Bd- 1,295,709 4.73%
1,953,508 Fidelity-Enhanced Income 1,714,985 6.27%
1,906 Vanguard Uk Govt Bond Id 262,117 0.96%
5,009 Veritas Gl Eq Inc-D Gbp 1,056,554 3.86%
1,496,258 Sanlam Strategic Bond Fd 1,669,674 6.10%
18,973 Muzin-Emrg Mk Sh Dur-Agb 1,703,577 6.22%
79,341 Guinness Asia Eq Inc-Z G 1,272,207 4.65%
103,273 Sanlam Four Us Dvd Fd-Ad 1,676,261 6.12%
Total Collective Investment Schemes 26,599,913 97.20%
Total financial assets at fair value through profit or loss 26,599,913 97.20%
Cash and cash equivalents 786,671 2.88%
Other net assets and liabilities (21,792) (0.08)%
Net assets attributable to holders of redeemable participating shares 27,364,792 100.00%
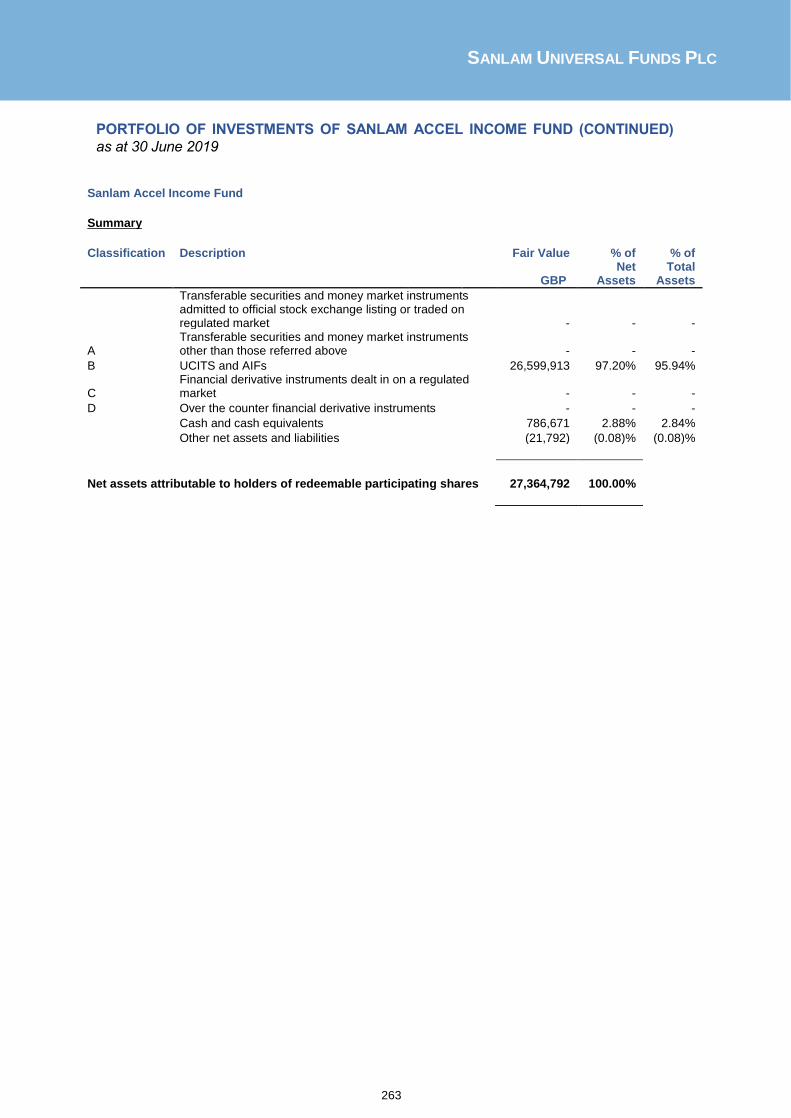
SANLAM UNIVERSAL FUNDS PLC
263
PORTFOLIO OF INVESTMENTS OF SANLAM ACCEL INCOME FUND (CONTINUED)
as at 30 June 2019
Sanlam Accel Income Fund Summary Classification Description Fair Value % of % of
GBP Net
Assets Total
Assets
Transferable securities and money market instruments admitted to official stock exchange listing or traded on regulated market - - -
A Transferable securities and money market instruments other than those referred above - - -
B UCITS and AIFs 26,599,913 97.20% 95.94%
C Financial derivative instruments dealt in on a regulated market - - -
D Over the counter financial derivative instruments - - -
Cash and cash equivalents 786,671 2.88% 2.84%
Other net assets and liabilities (21,792) (0.08)% (0.08)%
Net assets attributable to holders of redeemable participating shares 27,364,792 100.00%

SANLAM UNIVERSAL FUNDS PLC
264
PORTFOLIO OF INVESTMENTS OF SATRIX NORTH AMERICA EQUITY TRACKER FUND
as at 30 June 2019
Nominal Security Classification Fair Value
USD
% of
Net Assets
Financial assets at fair value through profit or loss
Equities - 100.48%
Bermuda - 0.25%
165 Arch Capital Group Ltd 6,118 0.11%
161 Invesco Ltd 3,294 0.06%
170 Marvell Technology Group Ltd 4,058 0.08%
Total Bermuda 13,470 0.25%
Canada - 5.15%
60 Agnico Eagle Mines Ltd. 3,083 0.06%
104 Alimentation Couche-Tard 6,559 0.12%
131 Bank Of Montreal 9,917 0.19%
252 Bank Of Nova Scotia Halifax 13,565 0.25%
431 Barrick Gold Corp 6,817 0.13%
81 Bausch Health Cos Inc 2,048 0.04%
102 Bce Inc 4,650 0.09%
155 Blackberry Ltd 1,158 0.02%
674 Bombardier Inc-B 1,135 0.02%
212 Brookfield Asset Manage-Cl A 10,164 0.19%
107 Can Imperial Bk Of Comme 8,432 0.16%
141 Canadian Natl Railway Co 13,078 0.24%
295 Canadian Natural Resourc 7,971 0.15%
30 Canadian Pacific Railway 7,081 0.13%
72 Canopy Growth Corp 2,913 0.05%
169 Cenovus Energy Inc 1,494 0.03%
97 Cgi Inc 7,473 0.14%
431 Enbridge Inc 15,601 0.29%
228 Encana Corp 1,172 0.02%
138 First Quantum Minerals Ltd (Cad) 1,314 0.02%
149 Fortis Inc 5,896 0.11%
61 Franco-Nevada Corp 5,188 0.10%
71 Husky Energy Inc 674 0.01%
44 Intact Financial Corp 4,075 0.08%
87 Loblaw Companies Ltd 4,464 0.08%
128 Magna International Inc 6,383 0.12%
410 Manulife Financial Corp 7,467 0.14%
32 Methanex Corp 1,456 0.03%
127 National Bank Of Canada 6,046 0.11%
143 Nutrien Ltd 7,666 0.14%
159 Pembina Pipeline Corp 5,932 0.11%
161 Power Corp Of Canada 3,476 0.06%
71 Prairiesky Royalty Ltd 1,000 0.02%
106 Rogers Communications In 5,686 0.11%

SANLAM UNIVERSAL FUNDS PLC
265
PORTFOLIO OF INVESTMENTS OF SATRIX NORTH AMERICA EQUITY TRACKER FUND
(CONTINUED)
as at 30 June 2019
Nominal Security Classification Fair Value
USD
% of
Net Assets
Financial assets at fair value through profit or loss (continued)
Equities - 100.48% (continued)
Canada - 5.15% (continued)
259 Royal Bank Of Canada 20,627 0.39%
150 Shaw Communications Inc- 3,067 0.06%
23 Shopify Inc - Class A 6,927 0.13%
153 Sun Life Financial Inc 6,349 0.12%
340 Suncor Energy Inc 10,629 0.20%
215 Tc Energy Corp 10,681 0.20%
55 Thomson Reuters Corp 3,556 0.07%
353 Toronto-Dominion Bank 20,671 0.39%
20 Weston (George) Ltd 1,521 0.03%
Total Canada 275,062 5.15%
Ireland - 2.37%
133 Accenture Plc-Cl A 24,574 0.46%
68 Allergan Plc 11,385 0.21%
95 Eaton Corp Plc 7,912 0.15%
65 Ingersoll-Rand Plc 8,234 0.15%
215 Johnson Controls Internation 8,882 0.17%
110 Linde Plc 22,088 0.41%
257 Medtronic Plc 25,029 0.47%
98 Pentair Plc 3,646 0.07%
73 Perrigo Company Plc 3,476 0.07%
75 Seagate Technology 3,534 0.07%
39 Willis Towers Watson Plc 7,470 0.14%
Total Ireland 126,230 2.37%
Jersey Channel Islands - 0.12%
78 Aptiv Plc 6,305 0.12%
Total Jersey Channel Islands 6,305 0.12%
Liberia - 0.09%
38 Royal Caribbean Cruises Ltd 4,606 0.09%
Total Liberia 4,606 0.09%
Netherlands - 0.15%
56 Lyondellbasell Indu-Cl A 4,823 0.09%
152 Mylan Nv 2,894 0.06%
Total Netherlands 7,717 0.15%
Panama - 0.26%
95 Carnival Corp 4,422 0.08%

SANLAM UNIVERSAL FUNDS PLC
266
PORTFOLIO OF INVESTMENTS OF SATRIX NORTH AMERICA EQUITY TRACKER FUND
(CONTINUED)
as at 30 June 2019
Nominal Security Classification Fair Value
USD
% of
Net Assets
Financial assets at fair value through profit or loss (continued)
Equities - 100.48% (continued)
Panama - 0.26% (continued)
242 Schlumberger Ltd 9,617 0.18%
Total Panama 14,039 0.26%
Switzerland - 0.40%
90 Chubb Ltd 13,256 0.25%
83 Te Connectivity Ltd 7,950 0.15%
Total Switzerland 21,206 0.40%
United Kingdom - 0.36%
55 Aon Plc 10,614 0.20%
117 Liberty Global Plc- C 3,104 0.06%
84 Nielsen Holdings Plc 1,898 0.03%
141 Technipfmc Plc 3,658 0.07%
Total United Kingdom 19,274 0.36%
United States - 91.33%
112 3M Co 19,414 0.36%
353 Abbott Laboratories 29,687 0.56%
289 Abbvie Inc 21,016 0.39%
11 Abiomed Inc 2,865 0.05%
177 Activision Blizzard Inc 8,354 0.16%
102 Adobe Inc 30,054 0.56%
180 Advanced Micro Devices 5,467 0.10%
229 Aes Corp 3,838 0.07%
128 Aflac Inc 7,016 0.13%
78 Agilent Technologies Inc 5,824 0.11%
182 Agnc Investment Corp 3,061 0.06%
49 Air Products & Chemicals Inc 11,092 0.21%
60 Akamai Technologies Inc 4,808 0.09%
48 Alexion Pharmaceuticals Inc 6,287 0.12%
20 Align Technology Inc 5,474 0.10%
21 Alliance Data Systems Corp 2,943 0.05%
71 Allstate Corp 7,220 0.14%
32 Alnylam Pharmaceuticals Inc 2,322 0.04%
55 Alphabet Inc-Cl A 59,554 1.12%
65 Alphabet Inc-Cl C 70,259 1.32%
380 Altria Group Inc 17,993 0.34%
83 Amazon.Com Inc 157,171 2.94%
43 Ameren Corporation 3,230 0.06%

SANLAM UNIVERSAL FUNDS PLC
267
PORTFOLIO OF INVESTMENTS OF SATRIX NORTH AMERICA EQUITY TRACKER FUND
(CONTINUED)
as at 30 June 2019
Nominal Security Classification Fair Value
USD
% of
Net Assets
Financial assets at fair value through profit or loss (continued)
Equities - 100.48% (continued)
United States - 91.33% (continued)
115 American Electric Power 10,121 0.19%
147 American Express Co 18,146 0.34%
179 American International Group 9,537 0.18%
95 American Tower Corp 19,423 0.36%
37 Ameriprise Financial Inc 5,371 0.10%
37 Amerisourcebergen Corp 3,155 0.06%
87 Ametek Inc 7,903 0.15%
119 Amgen Inc 21,929 0.41%
83 Amphenol Corp-Cl A 7,963 0.15%
109 Anadarko Petroleum Corp 7,691 0.14%
90 Analog Devices Inc 10,158 0.19%
335 Annaly Capital Management Inc 3,059 0.06%
56 Anthem Inc 15,804 0.30%
121 Apache Corp 3,505 0.07%
925 Apple Inc 183,076 3.43%
195 Applied Materials Inc 8,757 0.16%
132 Archer-Daniels-Midland Co 5,386 0.10%
9 Arista Networks Inc 2,337 0.04%
1,441 At&T Inc 48,288 0.90%
55 Autodesk Inc 8,959 0.17%
97 Automatic Data Processing 16,037 0.30%
6 Autozone Inc 6,597 0.12%
55 Avalonbay Communities Inc 11,175 0.21%
124 Baker Hughes A Ge Co 3,054 0.06%
96 Ball Corp 6,719 0.13%
1,778 Bank Of America Corp 51,562 0.97%
203 Bank Of New York Mellon Corp 8,962 0.17%
120 Baxter International Inc 9,828 0.18%
180 Bb&T Corp 8,843 0.17%
57 Becton Dickinson And Co 14,365 0.27%
251 Berkshire Hathaway Inc-Cl B 53,506 1.00%
51 Best Buy Co Inc 3,556 0.07%
41 Biogen Inc 9,589 0.18%
54 Biomarin Pharmaceutical Inc 4,625 0.09%
27 Blackrock Inc 12,671 0.24%
107 Boeing Co 38,949 0.73%
9 Booking Holdings Inc 16,872 0.32%
99 Borgwarner Inc 4,156 0.08%
56 Boston Properties Inc 7,224 0.14%

SANLAM UNIVERSAL FUNDS PLC
268
PORTFOLIO OF INVESTMENTS OF SATRIX NORTH AMERICA EQUITY TRACKER FUND
(CONTINUED)
as at 30 June 2019
Nominal Security Classification Fair Value
USD
% of
Net Assets
Financial assets at fair value through profit or loss (continued)
Equities - 100.48% (continued)
United States - 91.33% (continued)
314 Boston Scientific Corp 13,496 0.25%
324 Bristol Myers Stk 14,693 0.28%
79 Broadcom Inc 22,741 0.43%
44 C.H. Robinson Worldwide Inc 3,711 0.07%
116 Cabot Oil & Gas Corp 2,663 0.05%
116 Capital One Financial Corp 10,526 0.20%
69 Cardinal Health Inc 3,250 0.06%
49 Carmax Inc 4,255 0.08%
109 Caterpillar Inc 14,856 0.28%
101 Cbre Group Inc - A 5,181 0.10%
85 Cbs Corp-Class B Non Voting 4,242 0.08%
38 Celanese Corp 4,096 0.08%
141 Celgene Corp 13,034 0.24%
100 Centene Corp 5,244 0.10%
189 Centerpoint Energy Inc 5,411 0.10%
235 Centurylink Inc 2,764 0.05%
72 Cerner Corp 5,278 0.10%
33 Charter Communications Inc - A 13,041 0.24%
79 Cheniere Energy Inc 5,408 0.10%
345 Chevron Corp 42,932 0.80%
7 Chipotle Mexican Grill Inc 5,130 0.10%
79 Church & Dwight Co Inc 5,772 0.11%
77 Cigna Corp 12,131 0.23%
33 Cimarex Energy Co 1,958 0.04%
854 Cisco Systems Inc 46,739 0.88%
74 Cit Group Inc 3,888 0.07%
450 Citigroup Inc 31,513 0.59%
50 Citrix Systems Inc 4,907 0.09%
40 Clorox Company 6,124 0.11%
79 Cme Group Inc 15,335 0.29%
750 Coca-Cola Co 38,190 0.72%
144 Cognizant Tech Solutions-A 9,128 0.17%
162 Colgate-Palmolive Co 11,611 0.22%
889 Comcast Corp -Class A 37,587 0.70%
128 Conagra Brands Inc 3,395 0.06%
53 Concho Resources Inc 5,469 0.10%
215 Conocophillips 13,115 0.25%
103 Consolidated Edison Inc 9,031 0.17%
34 Constellation Brands Inc-A 6,696 0.13%
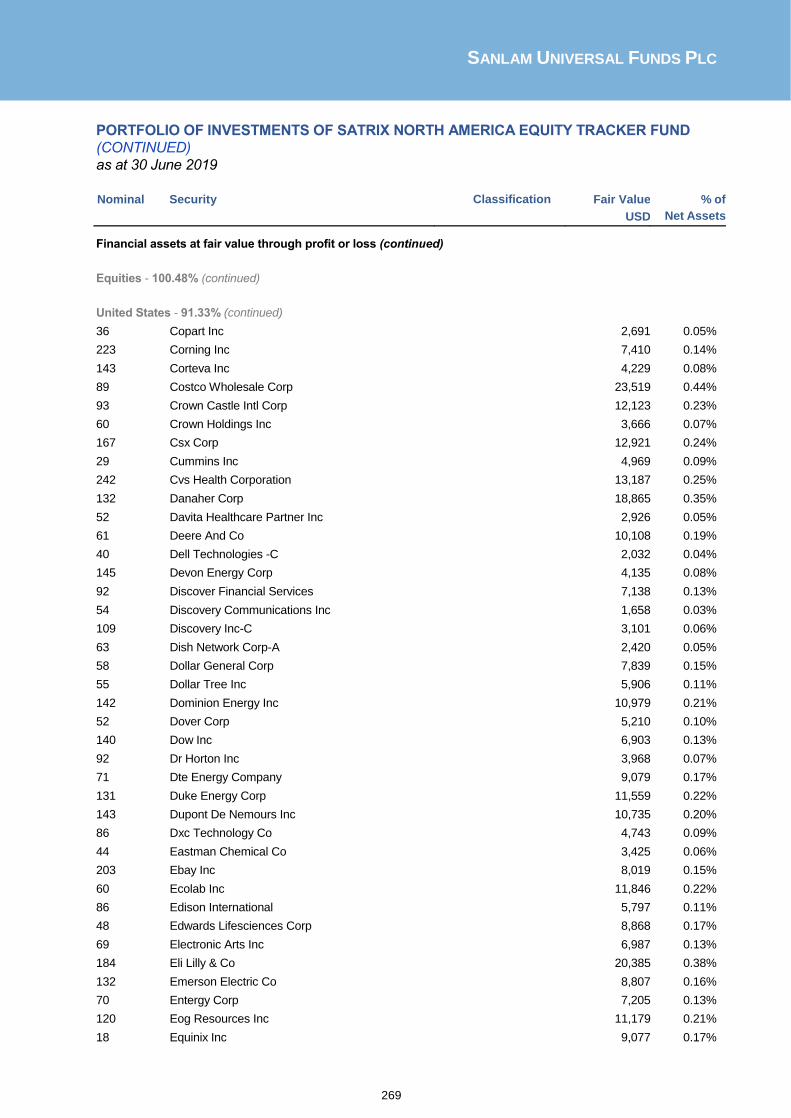
SANLAM UNIVERSAL FUNDS PLC
269
PORTFOLIO OF INVESTMENTS OF SATRIX NORTH AMERICA EQUITY TRACKER FUND
(CONTINUED)
as at 30 June 2019
Nominal Security Classification Fair Value
USD
% of
Net Assets
Financial assets at fair value through profit or loss (continued)
Equities - 100.48% (continued)
United States - 91.33% (continued)
36 Copart Inc 2,691 0.05%
223 Corning Inc 7,410 0.14%
143 Corteva Inc 4,229 0.08%
89 Costco Wholesale Corp 23,519 0.44%
93 Crown Castle Intl Corp 12,123 0.23%
60 Crown Holdings Inc 3,666 0.07%
167 Csx Corp 12,921 0.24%
29 Cummins Inc 4,969 0.09%
242 Cvs Health Corporation 13,187 0.25%
132 Danaher Corp 18,865 0.35%
52 Davita Healthcare Partner Inc 2,926 0.05%
61 Deere And Co 10,108 0.19%
40 Dell Technologies -C 2,032 0.04%
145 Devon Energy Corp 4,135 0.08%
92 Discover Financial Services 7,138 0.13%
54 Discovery Communications Inc 1,658 0.03%
109 Discovery Inc-C 3,101 0.06%
63 Dish Network Corp-A 2,420 0.05%
58 Dollar General Corp 7,839 0.15%
55 Dollar Tree Inc 5,906 0.11%
142 Dominion Energy Inc 10,979 0.21%
52 Dover Corp 5,210 0.10%
140 Dow Inc 6,903 0.13%
92 Dr Horton Inc 3,968 0.07%
71 Dte Energy Company 9,079 0.17%
131 Duke Energy Corp 11,559 0.22%
143 Dupont De Nemours Inc 10,735 0.20%
86 Dxc Technology Co 4,743 0.09%
44 Eastman Chemical Co 3,425 0.06%
203 Ebay Inc 8,019 0.15%
60 Ecolab Inc 11,846 0.22%
86 Edison International 5,797 0.11%
48 Edwards Lifesciences Corp 8,868 0.17%
69 Electronic Arts Inc 6,987 0.13%
184 Eli Lilly & Co 20,385 0.38%
132 Emerson Electric Co 8,807 0.16%
70 Entergy Corp 7,205 0.13%
120 Eog Resources Inc 11,179 0.21%
18 Equinix Inc 9,077 0.17%
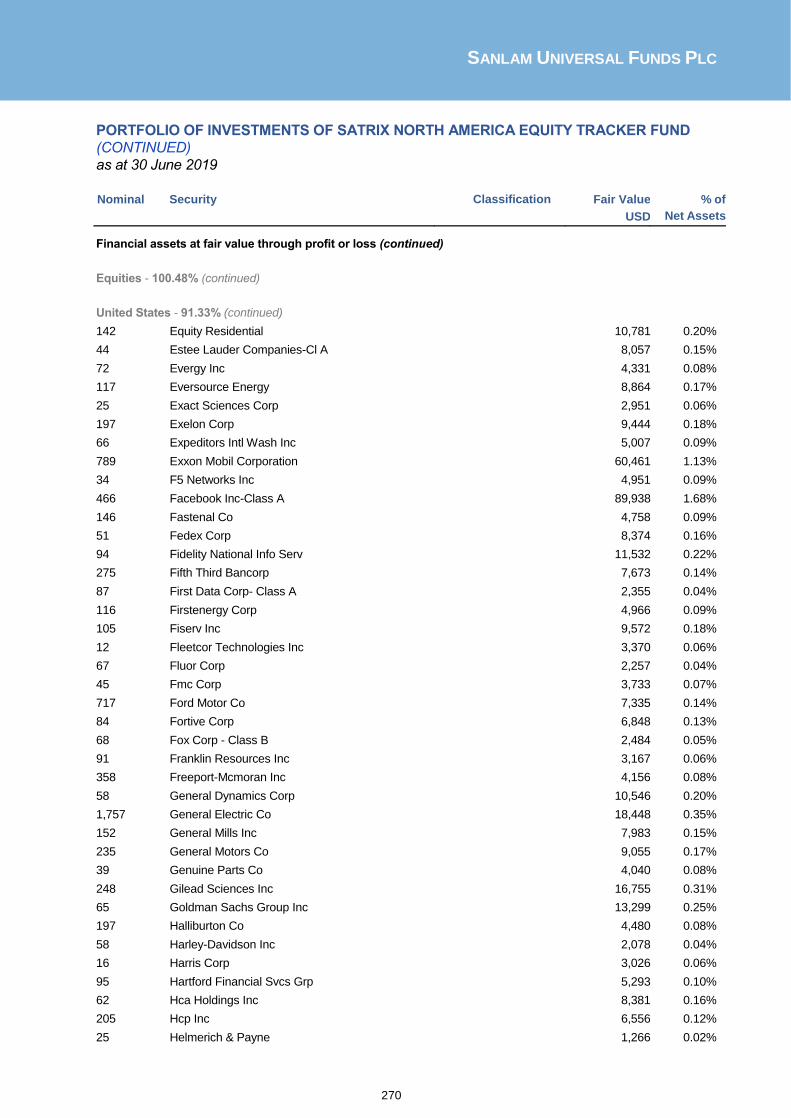
SANLAM UNIVERSAL FUNDS PLC
270
PORTFOLIO OF INVESTMENTS OF SATRIX NORTH AMERICA EQUITY TRACKER FUND
(CONTINUED)
as at 30 June 2019
Nominal Security Classification Fair Value
USD
% of
Net Assets
Financial assets at fair value through profit or loss (continued)
Equities - 100.48% (continued)
United States - 91.33% (continued)
142 Equity Residential 10,781 0.20%
44 Estee Lauder Companies-Cl A 8,057 0.15%
72 Evergy Inc 4,331 0.08%
117 Eversource Energy 8,864 0.17%
25 Exact Sciences Corp 2,951 0.06%
197 Exelon Corp 9,444 0.18%
66 Expeditors Intl Wash Inc 5,007 0.09%
789 Exxon Mobil Corporation 60,461 1.13%
34 F5 Networks Inc 4,951 0.09%
466 Facebook Inc-Class A 89,938 1.68%
146 Fastenal Co 4,758 0.09%
51 Fedex Corp 8,374 0.16%
94 Fidelity National Info Serv 11,532 0.22%
275 Fifth Third Bancorp 7,673 0.14%
87 First Data Corp- Class A 2,355 0.04%
116 Firstenergy Corp 4,966 0.09%
105 Fiserv Inc 9,572 0.18%
12 Fleetcor Technologies Inc 3,370 0.06%
67 Fluor Corp 2,257 0.04%
45 Fmc Corp 3,733 0.07%
717 Ford Motor Co 7,335 0.14%
84 Fortive Corp 6,848 0.13%
68 Fox Corp - Class B 2,484 0.05%
91 Franklin Resources Inc 3,167 0.06%
358 Freeport-Mcmoran Inc 4,156 0.08%
58 General Dynamics Corp 10,546 0.20%
1,757 General Electric Co 18,448 0.35%
152 General Mills Inc 7,983 0.15%
235 General Motors Co 9,055 0.17%
39 Genuine Parts Co 4,040 0.08%
248 Gilead Sciences Inc 16,755 0.31%
65 Goldman Sachs Group Inc 13,299 0.25%
197 Halliburton Co 4,480 0.08%
58 Harley-Davidson Inc 2,078 0.04%
16 Harris Corp 3,026 0.06%
95 Hartford Financial Svcs Grp 5,293 0.10%
62 Hca Holdings Inc 8,381 0.16%
205 Hcp Inc 6,556 0.12%
25 Helmerich & Payne 1,266 0.02%

SANLAM UNIVERSAL FUNDS PLC
271
PORTFOLIO OF INVESTMENTS OF SATRIX NORTH AMERICA EQUITY TRACKER FUND
(CONTINUED)
as at 30 June 2019
Nominal Security Classification Fair Value
USD
% of
Net Assets
Financial assets at fair value through profit or loss (continued)
Equities - 100.48% (continued)
United States - 91.33% (continued)
62 Henry Schein Inc 4,334 0.08%
51 Hershey Co 6,836 0.13%
65 Hess Corp 4,132 0.08%
376 Hewlett Packard Enterpris 5,621 0.11%
215 Home Depot Inc 44,714 0.84%
141 Honeywell International Inc 24,617 0.46%
212 Host Hotels & Resorts Inc 3,863 0.07%
328 Hp Inc 6,819 0.13%
36 Humana Inc 9,551 0.18%
21 Iac/Interactivecorp 4,568 0.09%
26 Idexx Laboratories Inc 7,159 0.13%
72 Illinois Tool Works 10,858 0.20%
33 Illumina Inc 12,149 0.23%
43 Incyte Corp 3,653 0.07%
884 Intel Corp 42,317 0.79%
135 Intercontinental Exchange In 11,602 0.22%
89 International Paper Co 3,855 0.07%
172 Intl Business Machines Corp 23,719 0.44%
59 Intuit Inc 15,418 0.29%
26 Intuitive Surgical Inc 13,638 0.26%
43 Iqvia Holdings Inc 6,919 0.13%
49 Jacobs Engineering Group Inc 4,135 0.08%
29 Jm Smucker Co 3,341 0.06%
505 Johnson & Johnson 70,336 1.32%
612 Jpmorgan Chase & Co 68,422 1.28%
119 Juniper Networks Inc 3,169 0.06%
38 Kansas City Southern 4,629 0.09%
70 Kellogg Co 3,750 0.07%
332 Keycorp 5,893 0.11%
73 Kimberly-Clark Corp 9,729 0.18%
203 Kimco Realty Corp 3,751 0.07%
414 Kinder Morgan Inc 8,644 0.16%
40 Kla-Tencor Corp 4,728 0.09%
46 Kohls Corp 2,187 0.04%
13 Kontoor Brands Inc 364 0.01%
141 Kraft Heinz Co 4,377 0.08%
180 Kroger Co 3,908 0.07%
51 L Brands Inc 1,331 0.02%
28 Laboratory Crp Of Amer Hldgs 4,841 0.09%

SANLAM UNIVERSAL FUNDS PLC
272
PORTFOLIO OF INVESTMENTS OF SATRIX NORTH AMERICA EQUITY TRACKER FUND
(CONTINUED)
as at 30 June 2019
Nominal Security Classification Fair Value
USD
% of
Net Assets
Financial assets at fair value through profit or loss (continued)
Equities - 100.48% (continued)
United States - 91.33% (continued)
33 Lam Research Corp 6,199 0.12%
99 Las Vegas Sands Corp 5,850 0.11%
78 Lennar Corp-A 3,780 0.07%
26 Liberty Media Cor-Siriusxm A 983 0.02%
84 Liberty Media Cor-Siriusxm C 3,190 0.06%
78 Lincoln National Corp 5,027 0.09%
97 Lkq Corp 2,581 0.05%
56 Lockheed Martin Corp 20,358 0.38%
94 Loews Corp 5,139 0.10%
162 Lowe’S Cos Inc 16,347 0.31%
26 Lululemon Athletica Inc 4,685 0.09%
48 M&TBankCorp 8,163 0.15%
63 Macy’S Inc 1,352 0.03%
30 Manpower Group 2,898 0.05%
183 Marathon Oil Corp 2,600 0.05%
125 Marathon Petroleum Corp 6,985 0.13%
7 Marketaxess Holdings Inc 2,250 0.04%
75 Marriott International -Cl A 10,522 0.20%
119 Marsh & Mclennan Cos 11,870 0.22%
130 Masco Corp 5,101 0.10%
176 Mastercard Inc - A 46,557 0.87%
100 Maxim Integrated Products 5,982 0.11%
155 Mcdonald’S Corp 32,187 0.60%
49 Mckesson Corp 6,585 0.12%
10 Mercadolibre Inc 6,118 0.11%
481 Merck & Co. Inc. 40,332 0.76%
131 Metlife Inc 6,507 0.12%
151 Mgm Resorts International Stk 4,314 0.08%
231 Micron Technology Inc 8,914 0.17%
1,435 Microsoft Corp 192,233 3.60%
30 Mohawk Industries Inc 4,424 0.08%
62 Molson Coors Brewing Co -B 3,472 0.06%
300 Mondelez International Inc-A 16,170 0.30%
100 Monster Beverage Corp 6,383 0.12%
47 Moody’S Corp 9,180 0.17%
248 Morgan Stanley 10,865 0.20%
131 Mosaic Co 3,279 0.06%
51 Motorola Solutions Inc 8,503 0.16%
56 Nektar Therapeutics 1,992 0.04%

SANLAM UNIVERSAL FUNDS PLC
273
PORTFOLIO OF INVESTMENTS OF SATRIX NORTH AMERICA EQUITY TRACKER FUND
(CONTINUED)
as at 30 June 2019
Nominal Security Classification Fair Value
USD
% of
Net Assets
Financial assets at fair value through profit or loss (continued)
Equities - 100.48% (continued)
United States - 91.33% (continued)
79 Netapp Inc 4,874 0.09%
88 Netflix Inc 32,324 0.61%
176 Newmont Mining Corp 6,767 0.13%
212 News Corp - Class A 2,860 0.05%
87 Nextera Energy Inc 17,823 0.33%
257 Nike Inc -Cl B 21,575 0.40%
156 Noble Energy Inc 3,494 0.07%
35 Nordstrom Inc 1,115 0.02%
63 Norfolk Southern Corp 12,558 0.24%
60 Northern Trust Corp 5,400 0.10%
39 Northrop Grumman Corp 12,601 0.24%
68 Nucor Corp 3,747 0.07%
117 Nvidia Corp 19,215 0.36%
149 Occidental Petroleum Corp 7,492 0.14%
22 Okta Inc 2,717 0.05%
54 Omnicom Group 4,425 0.08%
102 Oneok Inc 7,019 0.13%
496 Oracle Corp 28,257 0.53%
19 O’Reilly Automotive Inc 7,017 0.13%
79 Paccar Inc 5,661 0.11%
28 Palo Alto Networks Inc 5,705 0.11%
37 Parker Hannifin Corp 6,290 0.12%
100 Paychex Inc 8,229 0.15%
11 Paycom Software Inc 2,494 0.05%
231 Paypal Holdings Inc 26,440 0.50%
277 Pepsico Inc 36,323 0.68%
1,060 Pfizer Inc Equity 45,919 0.86%
311 Philip Morris International 24,423 0.46%
105 Phillips 66 9,822 0.18%
36 Pioneer Natural Resources Co 5,539 0.10%
104 Pnc Financial Services Group 14,277 0.27%
74 Ppg Industries Inc 8,637 0.16%
136 Ppl Corp 4,217 0.08%
76 Principal Financial Group 4,402 0.08%
442 Procter & Gamble Co 48,465 0.91%
129 Progressive Corp 10,311 0.19%
164 Prologis Inc 13,136 0.25%
87 Prudential Financial Inc 8,787 0.16%
147 Public Service Enterprise Gp 8,647 0.16%

SANLAM UNIVERSAL FUNDS PLC
274
PORTFOLIO OF INVESTMENTS OF SATRIX NORTH AMERICA EQUITY TRACKER FUND
(CONTINUED)
as at 30 June 2019
Nominal Security Classification Fair Value
USD
% of
Net Assets
Financial assets at fair value through profit or loss (continued)
Equities - 100.48% (continued)
United States - 91.33% (continued)
39 Public Storage Reit 9,289 0.17%
109 Pulte Group Inc 3,447 0.06%
241 Qualcomm Inc 18,333 0.34%
44 Quest Diagnostics Inc 4,480 0.08%
72 Raytheon Company 12,519 0.23%
129 Realty Income Corp 8,897 0.17%
44 Red Hat Inc 8,261 0.15%
19 Regeneron Pharmaceuticals 5,947 0.11%
407 Regions Financial Corp 6,081 0.11%
99 Republic Services Inc 8,577 0.16%
33 Rockwell Automation Inc 5,406 0.10%
26 Roper Technologies Inc 9,523 0.18%
80 Ross Stores Inc 7,930 0.15%
60 S&P Global Inc 13,667 0.26%
169 Salesforce.Com Inc 25,642 0.48%
31 Sba Communications Corp 6,970 0.13%
268 Schwab (Charles) Corp 10,771 0.20%
58 Sempra Energy 7,972 0.15%
43 Servicenow Inc 11,807 0.22%
20 Sherwin-Williams Co 9,166 0.17%
68 Simon Property Group Inc 10,864 0.20%
480 Sirius Xm Holdings Inc 2,678 0.05%
39 Skyworks Solutions Inc 3,014 0.06%
184 Southern Co 10,172 0.19%
46 Splunk Inc 5,785 0.11%
584 Sprint Corp 3,837 0.07%
83 Square Inc - A 6,020 0.11%
38 Stanley Black & Decker Inc 5,495 0.10%
261 Starbucks Corp 21,880 0.41%
85 State Street Corp 4,765 0.09%
77 Stryker Corp 15,830 0.30%
130 Suntrust Banks Inc 8,170 0.15%
21 Svb Financial Group 4,716 0.09%
175 Symantec Corp 3,808 0.07%
157 Synchrony Financial 5,443 0.10%
101 Sysco Corp 7,143 0.13%
71 T Rowe Price Group Inc 7,789 0.15%
21 Take-Two Interactive Softwre 2,384 0.04%
66 Tapestry Inc 2,094 0.04%
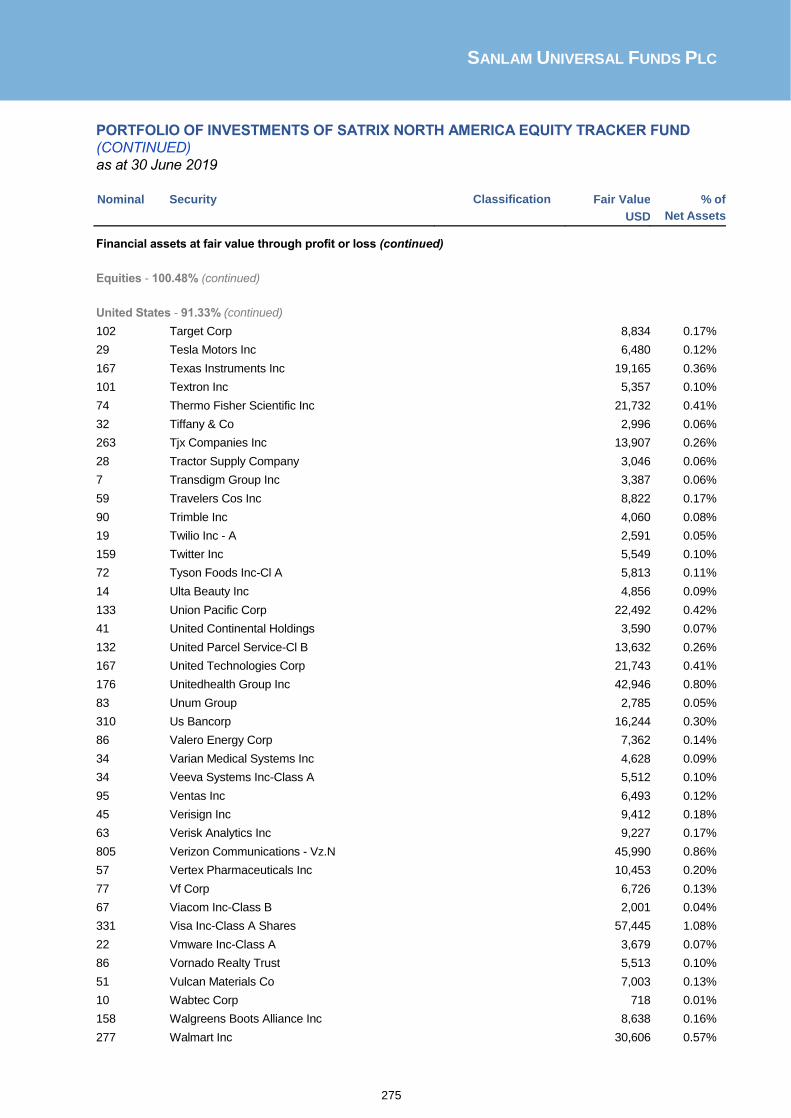
SANLAM UNIVERSAL FUNDS PLC
275
PORTFOLIO OF INVESTMENTS OF SATRIX NORTH AMERICA EQUITY TRACKER FUND
(CONTINUED)
as at 30 June 2019
Nominal Security Classification Fair Value
USD
% of
Net Assets
Financial assets at fair value through profit or loss (continued)
Equities - 100.48% (continued)
United States - 91.33% (continued)
102 Target Corp 8,834 0.17%
29 Tesla Motors Inc 6,480 0.12%
167 Texas Instruments Inc 19,165 0.36%
101 Textron Inc 5,357 0.10%
74 Thermo Fisher Scientific Inc 21,732 0.41%
32 Tiffany & Co 2,996 0.06%
263 Tjx Companies Inc 13,907 0.26%
28 Tractor Supply Company 3,046 0.06%
7 Transdigm Group Inc 3,387 0.06%
59 Travelers Cos Inc 8,822 0.17%
90 Trimble Inc 4,060 0.08%
19 Twilio Inc - A 2,591 0.05%
159 Twitter Inc 5,549 0.10%
72 Tyson Foods Inc-Cl A 5,813 0.11%
14 Ulta Beauty Inc 4,856 0.09%
133 Union Pacific Corp 22,492 0.42%
41 United Continental Holdings 3,590 0.07%
132 United Parcel Service-Cl B 13,632 0.26%
167 United Technologies Corp 21,743 0.41%
176 Unitedhealth Group Inc 42,946 0.80%
83 Unum Group 2,785 0.05%
310 Us Bancorp 16,244 0.30%
86 Valero Energy Corp 7,362 0.14%
34 Varian Medical Systems Inc 4,628 0.09%
34 Veeva Systems Inc-Class A 5,512 0.10%
95 Ventas Inc 6,493 0.12%
45 Verisign Inc 9,412 0.18%
63 Verisk Analytics Inc 9,227 0.17%
805 Verizon Communications - Vz.N 45,990 0.86%
57 Vertex Pharmaceuticals Inc 10,453 0.20%
77 Vf Corp 6,726 0.13%
67 Viacom Inc-Class B 2,001 0.04%
331 Visa Inc-Class A Shares 57,445 1.08%
22 Vmware Inc-Class A 3,679 0.07%
86 Vornado Realty Trust 5,513 0.10%
51 Vulcan Materials Co 7,003 0.13%
10 Wabtec Corp 718 0.01%
158 Walgreens Boots Alliance Inc 8,638 0.16%
277 Walmart Inc 30,606 0.57%

SANLAM UNIVERSAL FUNDS PLC
276
PORTFOLIO OF INVESTMENTS OF SATRIX NORTH AMERICA EQUITY TRACKER FUND
(CONTINUED)
as at 30 June 2019
Nominal Security Classification Fair Value
USD
% of
Net Assets
Financial assets at fair value through profit or loss (continued)
Equities - 100.48% (continued)
United States - 91.33% (continued)
351 Walt Disney Co 49,014 0.92%
119 Waste Management Inc 13,729 0.26%
23 Waters Corp 4,951 0.09%
12 Wayfair Inc- Class A 1,752 0.03%
836 Wells Fargo & Co 39,560 0.74%
101 Welltower Inc 8,235 0.15%
65 Western Digital Corp 3,091 0.06%
142 Western Union Co 2,824 0.05%
235 Weyerhaeuser Co 6,190 0.12%
28 Whirlpool Corp 3,986 0.07%
298 Williams Cos Inc 8,356 0.16%
39 Workday Inc-Class A 8,018 0.15%
71 Worldpay Inc - Cl A 8,701 0.16%
103 Wr Berkley Corp 6,791 0.13%
14 Ww Grainger Inc 3,755 0.07%
25 Wynn Resorts Ltd 3,100 0.06%
167 Xcel Energy Inc 9,935 0.19%
61 Xerox Corp 2,160 0.04%
64 Xilinx Inc 7,547 0.14%
90 Yum! Brands Inc 9,960 0.19%
53 Zillow Group Inc - C 2,459 0.05%
47 Zimmer Biomet Holdings Inc 5,534 0.10%
105 Zoetis Inc 11,916 0.22%
Total United States 4,874,860 91.33%
Total Equities 5,362,769 100.48%
Total financial assets at fair value through profit or loss 5,362,769 100.48%
Cash and cash equivalents 42,961 0.80%
Other net assets and liabilities (68,345) (1.28)%
Net assets attributable to holders of redeemable participating shares 5,337,385 100.00%

SANLAM UNIVERSAL FUNDS PLC
277
PORTFOLIO OF INVESTMENTS OF SATRIX NORTH AMERICA EQUITY TRACKER
FUND (CONTINUED)
as at 30 June 2019
Satrix North America Equity Tracker Fund Summary Classification Description Fair Value % of % of
USD Net
Assets Total
Assets
Transferable securities and money market instruments admitted to official stock exchange listing or traded on regulated market 5,362,769 100.48% 99.10%
A Transferable securities and money market instruments other than those referred above - - -
B UCITS and AIFs - - -
C Financial derivative instruments dealt in on a regulated market - - -
D Over the counter financial derivative instruments - - -
Cash and cash equivalents 42,961 0.80% 0.79%
Other net assets and liabilities (68,345) (1.28)% (1.26)%
Net assets attributable to holders of redeemable participating shares 5,337,385 100.00%

SANLAM UNIVERSAL FUNDS PLC
278
PORTFOLIO OF INVESTMENTS OF SATRIX UK EQUITY TRACKER FUND
as at 30 June 2019
Nominal Security Classification Fair Value
GBP
% of
Net Assets
Financial assets at fair value through profit or loss
Equities - 98.01%
Germany - 0.18%
1,897 Tui Ag-Di 14,652 0.18%
Total Germany 14,652 0.18%
Ireland - 0.37%
419 Dcc Plc 29,414 0.37%
Total Ireland 29,414 0.37%
Isle of Man - 0.52%
849 Coca-Cola Hbc Ag-Di 25,232 0.32%
2,497 Gvc Holdings Plc 16,276 0.20%
Total Isle of Man 41,508 0.52%
Jersey Channel Islands - 4.13%
3,857 Experian Plc 91,951 1.15%
987 Ferguson Plc 55,272 0.69%
47,327 Glencore Plc 129,368 1.62%
5,373 Wpp Plc 53,204 0.67%
Total Jersey Channel Islands 329,795 4.13%
United Kingdom - 92.81%
4,137 3I Group Plc 46,065 0.58%
793 Admiral Group Plc 17,509 0.22%
4,472 Anglo American Plc 100,374 1.26%
1,676 Antofagasta Plc 15,580 0.20%
2,017 Ashtead Group Plc 45,463 0.57%
1,517 Associated British Foods 37,364 0.47%
5,381 Astrazeneca Plc 346,429 4.34%
3,955 Auto Trader Group Plc 21,665 0.27%
16,622 Aviva Plc 69,231 0.87%
13,614 Bae Systems Plc 67,444 0.85%
72,946 Barclays Plc 109,273 1.37%
4,328 Barratt Developments Plc 24,782 0.31%
526 Berkeley Group Holdings 19,625 0.25%
8,968 Bhp Group Plc 180,705 2.26%
86,005 Bp Plc 471,823 5.91%
9,744 British American Tobacco 267,863 3.36%
3,886 British Land Co Plc 20,922 0.26%
35,873 Bt Group Plc 70,476 0.88%
1,434 Bunzl Plc 29,784 0.37%
1,760 Burberry Group Plc 32,771 0.41%

SANLAM UNIVERSAL FUNDS PLC
279
PORTFOLIO OF INVESTMENTS OF SATRIX UK EQUITY TRACKER FUND (CONTINUED)
as at 30 June 2019
Nominal Security Classification Fair Value
GBP
% of
Net Assets
Financial assets at fair value through profit or loss (continued)
Equities - 98.01% (continued)
United Kingdom - 92.81% (continued)
702 Carnival Plc 24,423 0.31%
24,367 Centrica Plc 21,389 0.27%
6,734 Compass Group Plc 127,071 1.59%
547 Croda International Plc 28,006 0.35%
10,261 Diageo Plc 347,232 4.35%
5,863 Direct Line Insurance Gr 19,453 0.24%
2,133 Evraz Plc 14,189 0.18%
944 Fresnillo Plc 8,215 0.10%
6,673 G4S Plc 13,880 0.17%
21,086 Glaxosmithkline Plc (Lse) 332,442 4.16%
1,615 Halma Plc 32,623 0.41%
1,209 Hargreaves Lansdown Plc 23,201 0.29%
85,197 Hsbc Holdings Plc 559,659 7.01%
4,066 Imperial Brands Plc 75,091 0.94%
5,305 Informa Plc 44,297 0.56%
731 Intercontinental Hotels Grou 37,807 0.47%
686 Intertek Group Plc 37,744 0.47%
2,947 Investec Plc 15,059 0.19%
15,525 Itv Plc 16,767 0.21%
831 Johnson Matthey Plc 27,664 0.35%
9,088 Kingfisher Plc 19,530 0.24%
3,001 Land Securities Group Pl 25,004 0.31%
25,413 Legal & General Group Pl 68,488 0.86%
303,448 Lloyds Banking Group Plc 171,721 2.15%
1,330 London Stock Exchange Gr 72,964 0.91%
8,411 Marks & Spencer Group Pl 17,722 0.22%
3,333 Meggitt Plc 17,465 0.22%
20,775 Melrose Industries Plc 37,572 0.47%
3,076 Merlin Entertainment 13,814 0.17%
1,455 Micro Focus International 30,031 0.38%
1,571 Mondi Plc 28,121 0.35%
14,499 National Grid Plc 121,183 1.52%
588 Next Plc 32,493 0.41%
384 Nmc Health Plc 9,227 0.12%
1,930 Ocado Group Plc 22,523 0.28%
3,329 Pearson Plc 27,278 0.34%
1,358 Persimmon Plc 27,119 0.34%
11,039 Prudential Plc 189,429 2.37%
3,006 Reckitt Benckiser Group 186,793 2.34%
8,325 Relx Plc 158,966 1.99%

SANLAM UNIVERSAL FUNDS PLC
280
PORTFOLIO OF INVESTMENTS OF SATRIX UK EQUITY TRACKER FUND (CONTINUED)
as at 30 June 2019
Nominal Security Classification Fair Value
GBP
% of
Net Assets
Financial assets at fair value through profit or loss (continued)
Equities - 98.01% (continued)
United Kingdom - 92.81% (continued)
7,845 Rentokil Initial Plc 31,184 0.39%
4,838 Rio Tinto Plc 236,119 2.96%
7,267 Rolls-Royce Holdings Plc 61,072 0.77%
1,121,201 Rolls-Royce Holdings-Ent 1,121 0.01%
20,569 Royal Bank Of Scotland G 45,211 0.57%
18,806 Royal Dutch Shell Plc-A 483,784 6.06%
15,912 Royal Dutch Shell Plc-B 410,689 5.15%
4,371 Rsa Insurance Group Plc 25,212 0.32%
4,608 Sage Group Plc 36,975 0.46%
7,592 Sainsbury (J) Plc 14,876 0.19%
531 Schroders Plc 16,195 0.20%
4,563 Segro Plc 33,319 0.42%
1,008 Severn Trent Plc Ord 20,644 0.26%
3,717 Smith & Nephew Plc 63,375 0.79%
1,691 Smiths Group Plc 26,464 0.33%
311 Spirax-Sarco Engineering Plc 28,565 0.36%
4,395 Sse Plc 49,312 0.62%
2,268 St James’S Place Plc 24,903 0.31%
11,969 Standard Chartered Plc 85,483 1.07%
10,652 Standard Life Aberdeen P 31,381 0.39%
13,991 Taylor Wimpey Plc 22,071 0.28%
41,643 Tesco Plc 94,405 1.18%
4,714 Unilever Plc 230,727 2.89%
2,901 United Utilities 22,709 0.28%
113,832 Vodafone Group Plc 147,208 1.84%
1,121 Weir Group Plc 17,336 0.22%
769 Whitbread Plc 35,597 0.45%
10,091 Wm Morrison Supermarkets 20,323 0.25%
2,923 Wood Group (John) Plc 13,212 0.17%
Total United Kingdom 7,408,275 92.81%
Total Equities 7,823,644 98.01%
Total financial assets at fair value through profit or loss 7,823,644 98.01%
Cash and cash equivalents 104,402 1.31%
Other net assets and liabilities 54,358 0.68%
Net assets attributable to holders of redeemable participating shares 7,982,454 100.00%

SANLAM UNIVERSAL FUNDS PLC
281
PORTFOLIO OF INVESTMENTS OF SATRIX UK EQUITY TRACKER FUND (CONTINUED)
as at 30 June 2019 Satrix UK Equity Tracker Fund
Summary
Classification Description Fair Value % of % of
GBP Net
Assets Total
Assets
Transferable securities and money market instruments admitted to official stock exchange listing or traded on regulated market 7,823,644 98.01% 97.71%
A Transferable securities and money market instruments other than those referred above - - -
B UCITS and AIFs - - -
C Financial derivative instruments dealt in on a regulated market - - -
D Over the counter financial derivative instruments - - -
Cash and cash equivalents 104,402 1.31% 1.30%
Other net assets and liabilities 54,358 0.68% 0.68%
Net assets attributable to holders of redeemable participating shares 7,982,404 100.00%

SANLAM UNIVERSAL FUNDS PLC
282
PORTFOLIO OF INVESTMENTS OF SATRIX EUROPE (EX-UK) EQUITY TRACKER FUND
as at 30 June 2019
Nominal Security Classification Fair Value
EUR
% of
Net Assets
Financial assets at fair value through profit or loss
Equities - 99.11%
Austria - 1.99%
2,360 Elisa Oyj 101,268 0.12%
4,314 Erste Group Bank Ag 140,809 0.16%
7,551 Fortum Oyj 146,754 0.17%
5,100 Kone Oyj-B 264,690 0.31%
1,627 Metso Oyj 56,213 0.06%
6,055 Neste Oil Oyj 180,681 0.21%
87,278 Nokia Oyj 381,056 0.44%
2,168 Nokian Renkaat Oyj 59,533 0.07%
2,303 Omv Ag 98,683 0.11%
2,039 Raiffeisen Bank Internat 42,065 0.05%
8,029 Upm-Kymmene Oyj 187,638 0.22%
2,349 Voestalpine Ag 63,822 0.07%
Total Austria 1,723,212 1.99%
Belgium - 1.04%
3,125 Ageas 142,844 0.16%
1,480 Groupe Bruxelles Lambert 127,694 0.15%
3,877 Kbc Group Nv 223,470 0.26%
2,356 Proximus 61,068 0.07%
1,243 Solvay Sa 113,237 0.13%
1,873 Ucb Sa 136,579 0.16%
3,560 Umicore 100,392 0.11%
Total Belgium 905,284 1.04%
Denmark - 3.72%
124 Ap Moeller-Maersk A/S-A 126,597 0.15%
41 Ap Moller-Maersk A/S-B 44,726 0.05%
1,676 Carlsberg As-B 195,407 0.23%
1,771 Chr Hansen Holding A/S 146,261 0.17%
1,916 Coloplast-B 190,427 0.22%
9,632 Danske Bank A/S 133,891 0.15%
2,873 Dsv Dkk1 248,126 0.29%
1,042 Genmab A/S 168,508 0.19%
1,117 H Lundbeck A/S 38,806 0.04%
3,050 Iss A/S 80,952 0.09%
26,190 Novo Nordisk A/S-B 1,173,756 1.36%
3,849 Novozymes A/S-B Shares 157,855 0.18%
3,207 Orsted A/S 243,886 0.28%
1,552 Pandora A/S 48,554 0.06%

SANLAM UNIVERSAL FUNDS PLC
283
PORTFOLIO OF INVESTMENTS OF SATRIX EUROPE (EX-UK) EQUITY TRACKER FUND
(CONTINUED)
as at 30 June 2019
Nominal Security Classification Fair Value
EUR
% of
Net Assets
Financial assets at fair value through profit or loss (continued)
Equities - 99.11% (continued)
Denmark - 3.72% (continued)
2,958 Vestas Wind Systems A/S 224,712 0.26%
Total Denmark 3,222,464 3.72%
Finland - 0.94%
47,523 Nordea Bank Abp 303,237 0.35%
1,840 Orion Corp 59,303 0.07%
6,482 Sampo Oyj-A Shs 269,003 0.31%
9,249 Stora Enso Oyj-R Shs 95,588 0.11%
6,572 Wartsila 83,826 0.10%
Total Finland 810,957 0.94%
France - 22.45%
2,844 Accor Sa 107,361 0.12%
6,553 Air Liquide Sa 806,347 0.93%
2,408 Alstom 98,246 0.11%
1,243 Arkema 101,653 0.12%
1,693 Atos 124,469 0.14%
29,666 Axa Sa 685,285 0.79%
17,441 Bnp Paribas 728,423 0.84%
18,149 Bollore 70,418 0.08%
3,300 Bouygues Sa 107,481 0.12%
4,786 Bureau Veritas Sa 103,952 0.12%
2,514 Capgemini Se 274,906 0.32%
9,496 Carrefour Sa 161,242 0.19%
7,698 Compagnie De Saint Gobai 263,849 0.31%
17,185 Credit Agricole Sa 181,216 0.21%
9,366 Danone 697,767 0.81%
2,082 Dassault Systemes Sa 292,105 0.34%
3,667 Edenred 164,502 0.19%
9,620 Edf 106,638 0.12%
1,409 Eiffage 122,498 0.14%
28,742 Engie 383,418 0.44%
4,252 Essilorluxottica 487,917 0.56%
3,300 Eutelsat Communications 54,252 0.06%
887 Gecina Sa 116,729 0.14%
8,205 Getlink Se 115,608 0.13%
519 Hermes International 329,150 0.38%
1,037 Ingenico Group 80,658 0.09%
727 Ipsen 87,240 0.10%

SANLAM UNIVERSAL FUNDS PLC
284
PORTFOLIO OF INVESTMENTS OF SATRIX EUROPE (EX-UK) EQUITY TRACKER FUND
(CONTINUED)
as at 30 June 2019
Nominal Security Classification Fair Value
EUR
% of
Net Assets
Financial assets at fair value through profit or loss (continued)
Equities - 99.11% (continued) France - 22.45% (continued)
1,161 Kering 603,836 0.70%
3,821 Klepierre 112,643 0.13%
4,403 Legrand Sa 283,113 0.33%
3,847 L’Oreal 963,673 1.11%
4,186 Lvmh Moet Hennessy Louis 1,566,820 1.81%
2,725 Michelin (Cgde) 303,974 0.35%
21,081 Natexis 74,606 0.09%
29,526 Orange Sa 409,378 0.47%
3,211 Pernod Ricard Sa 520,343 0.60%
9,567 Peugeot Sa 207,317 0.24%
3,421 Publicis Groupe 158,837 0.18%
3,067 Renault Stk 169,574 0.20%
4,989 Safran Sa 642,833 0.74%
16,909 Sanofi 1,283,562 1.48%
8,416 Schneider Elec Sa 671,260 0.78%
3,029 Scor Se 116,798 0.14%
442 Societe Bic Sa 29,636 0.03%
11,768 Societe Generale Sa 261,485 0.30%
1,365 Sodexo Sa 140,322 0.16%
6,569 Suez 83,361 0.10%
920 Teleperformance 162,104 0.19%
1,663 Thales Sa 180,685 0.21%
35,746 Total Sa 1,761,384 2.03%
1,246 Ubisoft Entertainment 85,775 0.10%
2,256 Unibail-Rodamco-Westfiel 297,228 0.34%
3,414 Valeo Sa 97,640 0.11%
8,407 Veolia Environnement 180,078 0.21%
7,882 Vinci Sa 709,853 0.82%
14,539 Vivendi Sa 351,989 0.41%
697 Wendel 83,570 0.10%
1,181 Worldline Sa 144A 75,584 0.09%
Total France 19,442,591 22.45%
Germany - 18.76%
2,741 Adidas Ag 744,181 0.86%
6,438 Allianz Se Registered 1,364,856 1.58%
14,091 Basf Se 900,697 1.04%
14,136 Bayer Ag-Reg 861,448 0.99%
6,056 Bayerische Motoren Werke 381,723 0.44%
1,561 Beiersdorf Ag 164,763 0.19%
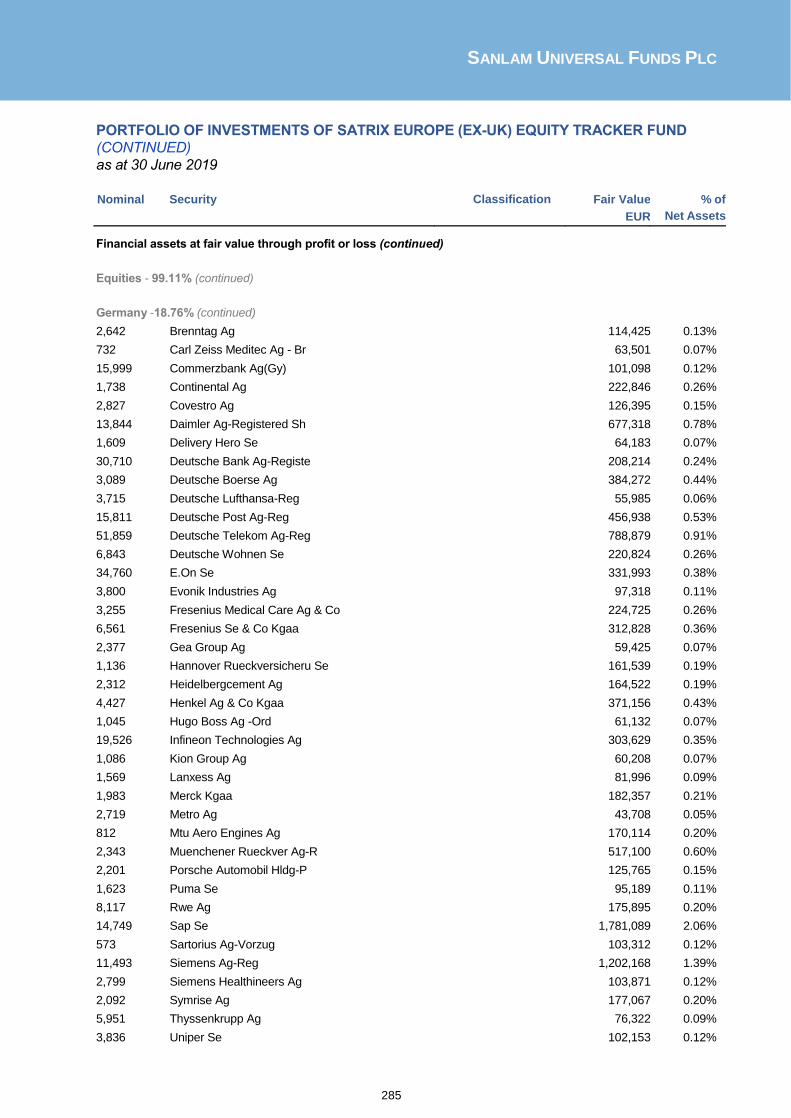
SANLAM UNIVERSAL FUNDS PLC
285
PORTFOLIO OF INVESTMENTS OF SATRIX EUROPE (EX-UK) EQUITY TRACKER FUND
(CONTINUED)
as at 30 June 2019
Nominal Security Classification Fair Value
EUR
% of
Net Assets
Financial assets at fair value through profit or loss (continued)
Equities - 99.11% (continued)
Germany -18.76% (continued)
2,642 Brenntag Ag 114,425 0.13%
732 Carl Zeiss Meditec Ag - Br 63,501 0.07%
15,999 Commerzbank Ag(Gy) 101,098 0.12%
1,738 Continental Ag 222,846 0.26%
2,827 Covestro Ag 126,395 0.15%
13,844 Daimler Ag-Registered Sh 677,318 0.78%
1,609 Delivery Hero Se 64,183 0.07%
30,710 Deutsche Bank Ag-Registe 208,214 0.24%
3,089 Deutsche Boerse Ag 384,272 0.44%
3,715 Deutsche Lufthansa-Reg 55,985 0.06%
15,811 Deutsche Post Ag-Reg 456,938 0.53%
51,859 Deutsche Telekom Ag-Reg 788,879 0.91%
6,843 Deutsche Wohnen Se 220,824 0.26%
34,760 E.On Se 331,993 0.38%
3,800 Evonik Industries Ag 97,318 0.11%
3,255 Fresenius Medical Care Ag & Co 224,725 0.26%
6,561 Fresenius Se & Co Kgaa 312,828 0.36%
2,377 Gea Group Ag 59,425 0.07%
1,136 Hannover Rueckversicheru Se 161,539 0.19%
2,312 Heidelbergcement Ag 164,522 0.19%
4,427 Henkel Ag & Co Kgaa 371,156 0.43%
1,045 Hugo Boss Ag -Ord 61,132 0.07%
19,526 Infineon Technologies Ag 303,629 0.35%
1,086 Kion Group Ag 60,208 0.07%
1,569 Lanxess Ag 81,996 0.09%
1,983 Merck Kgaa 182,357 0.21%
2,719 Metro Ag 43,708 0.05%
812 Mtu Aero Engines Ag 170,114 0.20%
2,343 Muenchener Rueckver Ag-R 517,100 0.60%
2,201 Porsche Automobil Hldg-P 125,765 0.15%
1,623 Puma Se 95,189 0.11%
8,117 Rwe Ag 175,895 0.20%
14,749 Sap Se 1,781,089 2.06%
573 Sartorius Ag-Vorzug 103,312 0.12%
11,493 Siemens Ag-Reg 1,202,168 1.39%
2,799 Siemens Healthineers Ag 103,871 0.12%
2,092 Symrise Ag 177,067 0.20%
5,951 Thyssenkrupp Ag 76,322 0.09%
3,836 Uniper Se 102,153 0.12%

SANLAM UNIVERSAL FUNDS PLC
286
PORTFOLIO OF INVESTMENTS OF SATRIX EUROPE (EX-UK) EQUITY TRACKER FUND
(CONTINUED)
as at 30 June 2019
Nominal Security Classification Fair Value
EUR
% of
Net Assets
Financial assets at fair value through profit or loss (continued)
Equities - 99.11% (continued)
Germany - 18.76% (continued)
2,648 United Internet Ag-Reg S 76,686 0.09%
977 Volkswagen Ag 147,673 0.17%
2,331 Volkswagenwerk Ag Prf 345,501 0.40%
7,836 Vonovia Se 329,112 0.38%
1,835 Wirecard Ag 271,672 0.31%
2,185 Zalando Se 85,259 0.10%
Total Germany 16,245,030 18.76%
India - 1.04%
11,542 Anheuser-Busch Inbev Sa/ 898,429 1.04%
Total India 898,429 1.04%
Ireland - 1.21%
14,072 Aib Group Plc 50,603 0.06%
17,430 Bank Of Ireland Group Pl 80,108 0.09%
11,987 Crh Plc 343,907 0.40%
2,519 Kerry Group Plc-A 264,495 0.31
2,616 Kingspan Group Plc 125,045 0.14%
1,395 Paddy Power Betfair Plc 92,265 0.10%
3,523 Smurfit Kappa Group Plc 93,747 0.11%
Total Ireland 1,050,170 1.21%
Italy - 3.97%
17,127 Assicurazioni Generali 283,623 0.33%
7,789 Atlantia Spa 178,446 0.21%
9,886 Davide Campari-Milano Spa 85,168 0.10%
124,268 Enel Spa 763,006 0.88%
37,745 Eni Spa 551,303 0.64%
9,430 Finecobank Spa 92,508 0.11%
217,604 Intesa Sanpaolo 409,531 0.47%
7,477 Leonardo Spa 83,331 0.10%
10,573 Mediobanca Spa 95,855 0.11%
3,073 Moncler Spa 115,545 0.13%
4,340 Prysmian Spa 78,771 0.09%
32,681 Snam Spa 142,849 0.17%
225,017 Telecom Italia Spa 108,053 0.12%
23,833 Terna Spa 133,465 0.15%
29,194 Unicredit Spa 316,054 0.36%
Total Italy 3,437,508 3.97%

SANLAM UNIVERSAL FUNDS PLC
287
PORTFOLIO OF INVESTMENTS OF SATRIX EUROPE (EX-UK) EQUITY TRACKER FUND
(CONTINUED)
as at 30 June 2019
Nominal Security Classification Fair Value
EUR
% of
Net Assets
Financial assets at fair value through profit or loss (continued)
Equities - 99.11% (continued)
Luxembourg - 0.54%
8,946 Arcelormittal 140,774 0.16%
215 Eurofins Scientific 83,635 0.10%
1,362 Millicom Intl Cellular-S 67,352 0.08%
5,495 Ses Fdr 75,556 0.09%
8,517 Tenaris Sa 98,031 0.11%
Total Luxembourg 465,348 0.54%
Netherlands - 9.93%
6,725 Abn Amro Group Nv-Cva 126,531 0.15%
159 Adyen Nv 144A 107,897 0.12%
27,031 Aegon Nv 118,342 0.14%
2,171 Aercap Holdings Nv 99,151 0.11%
8,799 Airbus Se 1,097,059 1.27%
3,274 Akzo Nobel N.V. 270,563 0.31%
6,364 Asml Holding Nv 1,169,321 1.35%
15,879 Cnh Industrial Nv 143,197 0.16%
1,808 Exor Nv 111,373 0.13%
1,915 Ferrari Nv 273,462 0.32%
15,831 Fiat Chrysler Automobiles Nv 194,183 0.22%
1,836 Heineken Holding Nv 169,463 0.20%
3,812 Heineken Nv 374,110 0.43%
57,822 Ing Groep Nv 589,553 0.68%
19,372 Koninklijke Ahold Delhaize N 383,139 0.44%
2,668 Koninklijke Dsm Nv 290,012 0.33%
55,195 Koninklijke Kpn Nv 149,027 0.17%
13,963 Koninklijke Philips Nv 533,177 0.62%
4,647 Nn Group Nv 164,504 0.19%
4,353 Nxp Semiconductors Nv 373,109 0.43%
3,568 Qiagen N.V. 127,342 0.15%
1,707 Randstad Nv 82,448 0.09%
11,470 Stmicroelectronics Nv 178,932 0.21%
21,448 Unilever Nv Cerificates 1,148,755 1.33%
1,133 Vopak 45,943 0.05%
4,433 Wolters Kluwer 283,801 0.33%
Total Netherlands 8,604,394 9.93%
Norway - 1.39%
14,760 Dnb Asa 241,250 0.28%
15,963 Equinor Asa 276,943 0.32%

SANLAM UNIVERSAL FUNDS PLC
288
PORTFOLIO OF INVESTMENTS OF SATRIX EUROPE (EX-UK) EQUITY TRACKER FUND
(CONTINUED)
as at 30 June 2019
Nominal Security Classification Fair Value
EUR
% of
Net Assets
Financial assets at fair value through profit or loss (continued)
Equities - 99.11% (continued)
Norway - 1.39% (continued)
6,684 Mowi Asa 137,302 0.16%
22,647 Norsk Hydro Asa 71,140 0.08%
11,922 Orkla Asa 92,926 0.11%
1,784 Schibsted Asa-B Shs 40,863 0.05%
11,915 Telenor Asa 222,237 0.25%
2,901 Yara International Asa 123,636 0.14%
Total Norway 1,206,297 1.39%
Portugal - 0.36%
47,120 Banco Espirito Santo-Reg - 0.00%
42,411 Edp-Energias De Portugal 141,738 0.16%
6,662 Galp Energia Sgps Sa B 90,103 0.11%
5,386 Jeronimo Martins 76,293 0.09%
Total Portugal 308,134 0.36%
Spain - 6.33%
3,589 Acs Actividades Cons Y S 126,010 0.14%
1,072 Aena Sme Sa 186,850 0.22%
6,503 Amadeus It Group Sa 452,999 0.52%
97,767 Banco Bilbao Vizcaya Arg 480,720 0.55%
101,314 Banco De Sabadell Sa 92,297 0.11%
241,593 Banco Santander Sa 985,820 1.14%
15,628 Bankia Sa 32,475 0.04%
12,874 Bankinter Sa 77,991 0.09%
56,329 Caixabank Sa 141,837 0.16%
3,558 Cellnex Telecom Sa 144A 115,777 0.13%
4,122 Enagas Sa 96,743 0.11%
5,269 Endesa Sa 119,132 0.14%
7,361 Ferrovial Sa 165,696 0.19%
4,403 Grifols Sa 114,478 0.13%
88,678 Iberdrola Sa 777,351 0.90%
15,906 Industria De Diseno Text 420,714 0.49%
4,862 Naturgy Energy Group Sa 117,806 0.14%
7,515 Red Electrica Corporacio 137,637 0.16%
21,108 Repsol Sa 290,974 0.34%
3,825 Siemens Gamesa Renewable 55,922 0.06%
68,386 Telefonica Sa 493,815 0.57%
Total Spain 5,483,044 6.33%

SANLAM UNIVERSAL FUNDS PLC
289
PORTFOLIO OF INVESTMENTS OF SATRIX EUROPE (EX-UK) EQUITY TRACKER FUND
(CONTINUED)
as at 30 June 2019
Nominal Security Classification Fair Value
EUR
% of
Net Assets
Financial assets at fair value through profit or loss (continued)
Equities - 99.11% (continued)
Sweden - 5.22%
5,091 Alfa Laval Ab 97,618 0.11%
16,107 Assa Abloy Ab-B 319,975 0.37%
15,815 Atlas Copco Ab-B Shs 398,742 0.46%
4,431 Boliden Ab 99,578 0.11%
4,084 Electrolux Ab-Ser B 91,722 0.11%
18,576 Epiroc Ab-B 161,709 0.19%
46,526 Ericsson Lm-B Shs 387,936 0.45%
9,646 Essity Aktiebolag-B 260,549 0.30%
11,998 Hennes & Mauritz Ab-B Sh 187,771 0.22%
4,017 Hexagon Ab-B Shs 196,022 0.23%
7,449 Investor Ab-B Shs 314,499 0.36%
4,806 Kinnevik Ab - B 109,847 0.13%
3,711 Lundin Petroleum Ab 101,116 0.12%
18,748 Sandvik Ab 302,707 0.35%
25,359 Skandinaviska Enskilda B 206,213 0.24%
5,328 Skanska Ab-B Shs 84,564 0.10%
7,268 Skf Ab-B Shares 117,453 0.13%
23,849 Svenska Handelsbanken-A 207,386 0.24%
13,690 Swedbank Ab - A Shares 180,680 0.21%
2,544 Swedish Match Ab 94,383 0.11%
7,605 Tele2 Ab-B Shs 97,528 0.11%
43,440 Telia Co Ab 169,550 0.19%
23,731 Volvo Ab-B Shs 330,944 0.38%
Total Sweden 4,518,492 5.22%
Switzerland - 19.92%
26,780 Abb Ltd-Reg 472,490 0.55%
2,348 Adecco Group Ag-Reg 124,047 0.14%
6,421 Alcon Inc 348,597 0.40%
845 Baloise Holding Ag 131,507 0.15%
43 Barry Callebaut Ag-Reg 75,828 0.09%
3 Chocoladefabriken Lindt- 214,531 0.25%
7,815 Cie Financiere Richemont 583,065 0.67%
37,405 Credit Suisse Group Ag-R 394,320 0.45%
560 Dufry Ag 41,700 0.05%
579 Geberit Ag-Reg 237,789 0.27%
147 Givaudan-Reg 364,875 0.42%
3,504 Julius Baer Group Ltd 137,152 0.16%
880 Kuehne + Nagel Intl Ag-R 114,842 0.13%

SANLAM UNIVERSAL FUNDS PLC
290
PORTFOLIO OF INVESTMENTS OF SATRIX EUROPE (EX-UK) EQUITY TRACKER FUND
(CONTINUED)
as at 30 June 2019
Nominal Security Classification Fair Value
EUR
% of
Net Assets
Financial assets at fair value through profit or loss (continued)
Equities - 99.11% (continued)
Switzerland - 19.92% (continued)
6,992 Lafargeholcim Ltd-Reg 300,189 0.35%
1,173 Lonza Group Ag-Reg 347,992 0.40%
46,058 Nestle Sa-Reg 4,192,106 4.84%
32,896 Novartis Ag-Reg 2,642,749 3.05%
316 Partners Group Holding Ag 218,288 0.25%
10,634 Roche Holding Ag-Genussc 2,630,414 3.04%
849 Schindler Holding-Part C 166,156 0.19%
83 Sgs Sa-Reg 185,910 0.21%
2,037 Sika Ag-Reg 305,643 0.35%
856 Sonova Holding Ag 170,995 0.20%
171 Straumann Holding Ag-Reg 132,663 0.15%
367 Swatch Group Ag-Br 92,384 0.11%
1,430 Swatch Group Ag-Reg 68,066 0.08%
590 Swiss Life Holding Ag-Re 257,078 0.30%
1,648 Swiss Prime Site-Reg 126,532 0.15%
4,563 Swiss Re Ltd 407,836 0.47%
455 Swisscom Ag-Reg 200,837 0.23%
925 Temenos Ag - Reg 145,498 0.17%
57,642 Ubs Group Ag-Reg 602,206 0.70%
655 Vifor Pharma Ag 83,207 0.10%
2,414 Zurich Insurance Group Ag 738,986 0.85%
Total Switzerland 17,256,478 19.92%
United Kingdom - 0.23%
3,963 Coca-Cola European Partners 196,619 0.23%
Total United Kingdom 196,619 0.23%
Virgin Islands - 0.07%
1,841 Andritz Ag 60,937 0.07%
Total Virgin Islands 60,937 0.07%
Total Equities 85,835,388 99.11%

SANLAM UNIVERSAL FUNDS PLC
291
PORTFOLIO OF INVESTMENTS OF SATRIX EUROPE (EX-UK) EQUITY TRACKER FUND
(CONTINUED)
as at 30 June 2019
Nominal Security Classification Fair Value
EUR
% of
Net Assets
Financial assets at fair value through profit or loss (continued) Derivative Financial Instruments
Rights - 0.02%
Spain - 0.02%
3,589 Acs Actividades De Construccio Rights Expire 07/08/2019 4,953 0.01%
21,108 Repsol Sa Rights Expire 07/04/2019 10,296 0.01%
Total Spain 15,249 0.02%
Total Rights 15,249 0.02%
Total financial assets at fair value through profit or loss 85,850,637 99.13%
Cash and cash equivalents 1,005,867 1.16%
Other net assets and liabilities (249,772) (0.29)%
Net assets attributable to holders of redeemable participating shares 86,606,732 100.00%
Satrix Europe (Ex-UK) Equity Tracker Fund Summary Classification Description Fair Value % of % of
EUR Net
Assets Total
Assets
Transferable securities and money market instruments admitted to official stock exchange listing or traded on regulated market 85,835,388 99.11% 98.09%
A Transferable securities and money market instruments other than those referred above - - -
B UCITS and AIFs - - -
C Financial derivative instruments dealt in on a regulated market - - -
D Over the counter financial derivative instruments 15,249 0.02% 0.02%
Cash and cash equivalents 1,005,867 1.16% 1.15%
Other net assets and liabilities (249,772) (0.29)% (0.29)%
Net assets attributable to holders of redeemable participating shares 86,606,732 100.00%
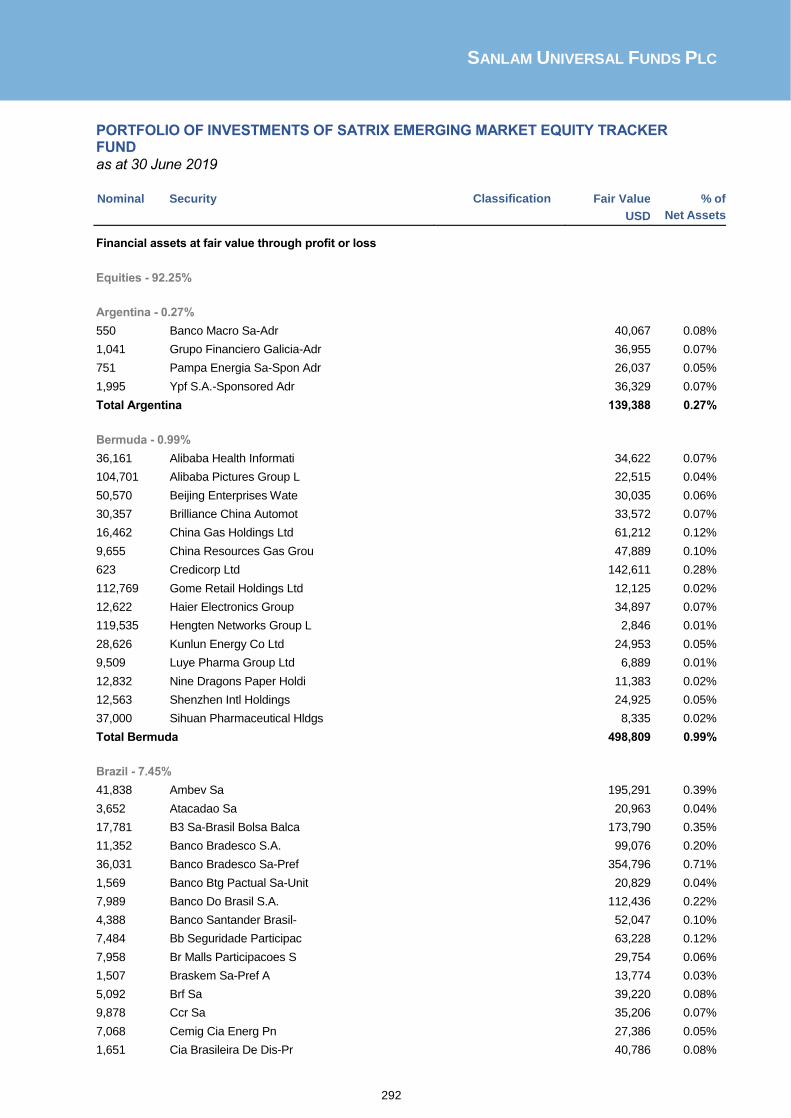
SANLAM UNIVERSAL FUNDS PLC
292
PORTFOLIO OF INVESTMENTS OF SATRIX EMERGING MARKET EQUITY TRACKER FUND
as at 30 June 2019
Nominal Security Classification Fair Value
USD
% of
Net Assets
Financial assets at fair value through profit or loss
Equities - 92.25%
Argentina - 0.27%
550 Banco Macro Sa-Adr 40,067 0.08%
1,041 Grupo Financiero Galicia-Adr 36,955 0.07%
751 Pampa Energia Sa-Spon Adr 26,037 0.05%
1,995 Ypf S.A.-Sponsored Adr 36,329 0.07%
Total Argentina 139,388 0.27%
Bermuda - 0.99%
36,161 Alibaba Health Informati 34,622 0.07%
104,701 Alibaba Pictures Group L 22,515 0.04%
50,570 Beijing Enterprises Wate 30,035 0.06%
30,357 Brilliance China Automot 33,572 0.07%
16,462 China Gas Holdings Ltd 61,212 0.12%
9,655 China Resources Gas Grou 47,889 0.10%
623 Credicorp Ltd 142,611 0.28%
112,769 Gome Retail Holdings Ltd 12,125 0.02%
12,622 Haier Electronics Group 34,897 0.07%
119,535 Hengten Networks Group L 2,846 0.01%
28,626 Kunlun Energy Co Ltd 24,953 0.05%
9,509 Luye Pharma Group Ltd 6,889 0.01%
12,832 Nine Dragons Paper Holdi 11,383 0.02%
12,563 Shenzhen Intl Holdings 24,925 0.05%
37,000 Sihuan Pharmaceutical Hldgs 8,335 0.02%
Total Bermuda 498,809 0.99%
Brazil - 7.45%
41,838 Ambev Sa 195,291 0.39%
3,652 Atacadao Sa 20,963 0.04%
17,781 B3 Sa-Brasil Bolsa Balca 173,790 0.35%
11,352 Banco Bradesco S.A. 99,076 0.20%
36,031 Banco Bradesco Sa-Pref 354,796 0.71%
1,569 Banco Btg Pactual Sa-Unit 20,829 0.04%
7,989 Banco Do Brasil S.A. 112,436 0.22%
4,388 Banco Santander Brasil- 52,047 0.10%
7,484 Bb Seguridade Participac 63,228 0.12%
7,958 Br Malls Participacoes S 29,754 0.06%
1,507 Braskem Sa-Pref A 13,774 0.03%
5,092 Brf Sa 39,220 0.08%
9,878 Ccr Sa 35,206 0.07%
7,068 Cemig Cia Energ Pn 27,386 0.05%
1,651 Cia Brasileira De Dis-Pr 40,786 0.08%
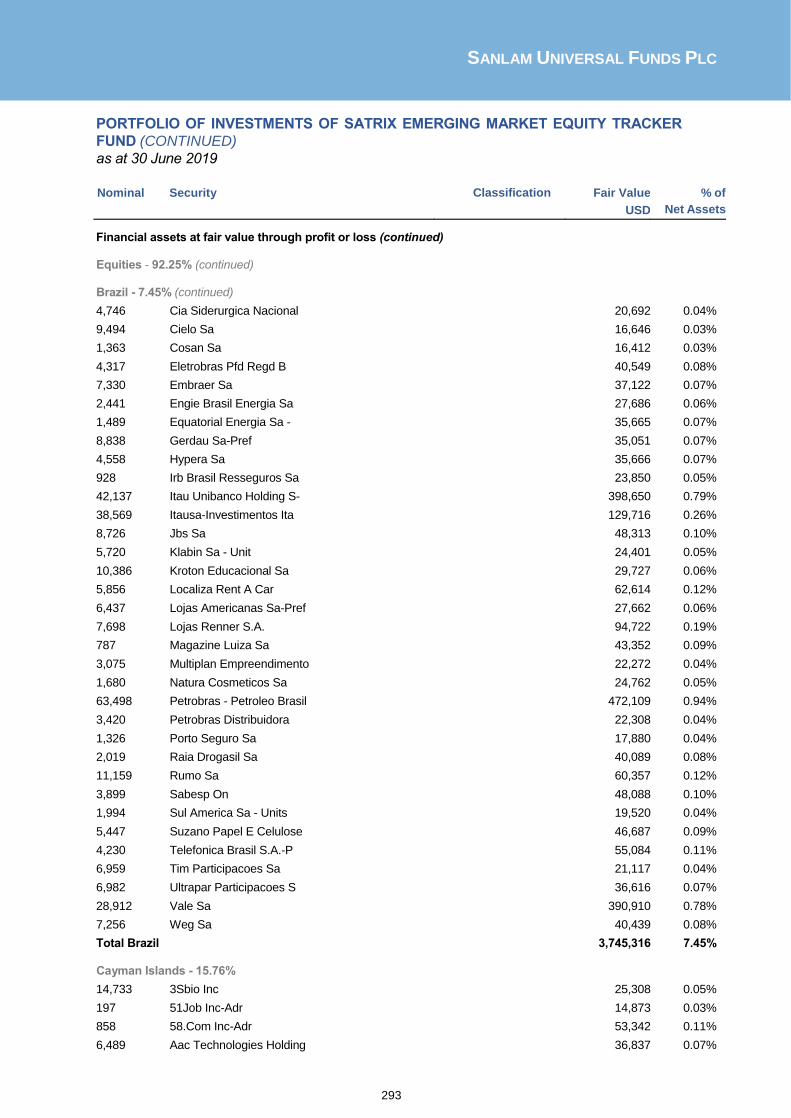
SANLAM UNIVERSAL FUNDS PLC
293
PORTFOLIO OF INVESTMENTS OF SATRIX EMERGING MARKET EQUITY TRACKER
FUND (CONTINUED)
as at 30 June 2019
Nominal Security Classification Fair Value
USD
% of
Net Assets
Financial assets at fair value through profit or loss (continued) Equities - 92.25% (continued) Brazil - 7.45% (continued)
4,746 Cia Siderurgica Nacional 20,692 0.04%
9,494 Cielo Sa 16,646 0.03%
1,363 Cosan Sa 16,412 0.03%
4,317 Eletrobras Pfd Regd B 40,549 0.08%
7,330 Embraer Sa 37,122 0.07%
2,441 Engie Brasil Energia Sa 27,686 0.06%
1,489 Equatorial Energia Sa - 35,665 0.07%
8,838 Gerdau Sa-Pref 35,051 0.07%
4,558 Hypera Sa 35,666 0.07%
928 Irb Brasil Resseguros Sa 23,850 0.05%
42,137 Itau Unibanco Holding S- 398,650 0.79%
38,569 Itausa-Investimentos Ita 129,716 0.26%
8,726 Jbs Sa 48,313 0.10%
5,720 Klabin Sa - Unit 24,401 0.05%
10,386 Kroton Educacional Sa 29,727 0.06%
5,856 Localiza Rent A Car 62,614 0.12%
6,437 Lojas Americanas Sa-Pref 27,662 0.06%
7,698 Lojas Renner S.A. 94,722 0.19%
787 Magazine Luiza Sa 43,352 0.09%
3,075 Multiplan Empreendimento 22,272 0.04%
1,680 Natura Cosmeticos Sa 24,762 0.05%
63,498 Petrobras - Petroleo Brasil 472,109 0.94%
3,420 Petrobras Distribuidora 22,308 0.04%
1,326 Porto Seguro Sa 17,880 0.04%
2,019 Raia Drogasil Sa 40,089 0.08%
11,159 Rumo Sa 60,357 0.12%
3,899 Sabesp On 48,088 0.10%
1,994 Sul America Sa - Units 19,520 0.04%
5,447 Suzano Papel E Celulose 46,687 0.09%
4,230 Telefonica Brasil S.A.-P 55,084 0.11%
6,959 Tim Participacoes Sa 21,117 0.04%
6,982 Ultrapar Participacoes S 36,616 0.07%
28,912 Vale Sa 390,910 0.78%
7,256 Weg Sa 40,439 0.08%
Total Brazil 3,745,316 7.45% Cayman Islands - 15.76%
14,733 3Sbio Inc 25,308 0.05%
197 51Job Inc-Adr 14,873 0.03%
858 58.Com Inc-Adr 53,342 0.11%
6,489 Aac Technologies Holding 36,837 0.07%

SANLAM UNIVERSAL FUNDS PLC
294
PORTFOLIO OF INVESTMENTS OF SATRIX EMERGING MARKET EQUITY TRACKER
FUND (CONTINUED)
as at 30 June 2019
Nominal Security Classification Fair Value
USD
% of
Net Assets
Financial assets at fair value through profit or loss (continued) Equities - 92.25% (continued) Cayman Islands - 15.76% (continued)
13,407 Agile Property Holdings Ltd 17,950 0.04%
12,627 Alibaba Group Holding-Sp Adr 2,139,645 4.25%
9,827 Anta Sports Products Ltd 67,484 0.13%
553 Autohome Inc-Adr 47,348 0.09%
2,539 Baidu Inc 297,977 0.59%
300 Baozun Inc-Spn Adr 14,958 0.03%
12,916 Chailease Holding Co Ltd 53,436 0.11%
12,561 China Aoyuan Group Ltd 17,654 0.03%
16,052 China Conch Venture Hold 56,708 0.11%
8,000 China Ding Yi Feng Holdings 23,634 0.05%
16,614 China Evergrande Group 46,572 0.09%
22,493 China First Capital Grou 6,708 0.01%
20,000 China Hongqiao Group Ltd 14,106 0.03%
57,400 China Huishan Dairy Hold 3,086 0.01%
11,891 China Medical System Hol 10,898 0.02%
25,636 China Mengniu Dairy Co 99,263 0.20%
20,095 China Resources Cement 19,471 0.04%
24,137 China Resources Land Ltd 106,280 0.21%
20,220 China State Construc Inter 20,757 0.04%
29,545 Cifi Holdings Group Co L 19,476 0.04%
66,538 Country Garden Holdings 101,180 0.20%
13,772 Country Garden Services 31,836 0.06%
3,551 Ctrip.Com International-Adr 131,067 0.26%
20,859 Dali Foods Group Co Ltd 13,857 0.03%
6,997 Enn Energy Holdings Ltd 68,067 0.14%
69,968 Fullshare Holdings Ltd 4,344 0.01%
17,029 Future Land Development Hold 22,407 0.04%
489 Gds Holdings Ltd - Adr 18,372 0.04%
43,423 Geely Automobile Holding 74,257 0.15%
11,382 Genscript Biotech Corp 28,584 0.06%
5,876 Haitian International Holdings Ltd 12,200 0.02%
6,861 Hengan Intl Group Co Ltd 50,453 0.10%
1,412 Huazhu Group Ltd-Adr 51,185 0.10%
400 Hutchison China Meditech-Adr 8,800 0.02%
909 Iqiyi Inc-Adr 18,771 0.04%
6,669 Jd.Com Inc-Adr 202,004 0.40%
17,799 Kaisa Group Holdings Ltd 8,794 0.02%
5,281 Kingboard Holdings Ltd 14,702 0.03%
10,845 Kingboard Laminates Hldg 9,939 0.02%
16,041 Kingdee International Sf 17,350 0.03%

SANLAM UNIVERSAL FUNDS PLC
295
PORTFOLIO OF INVESTMENTS OF SATRIX EMERGING MARKET EQUITY TRACKER
FUND (CONTINUED)
as at 30 June 2019
Nominal Security Classification Fair Value
USD
% of
Net Assets
Financial assets at fair value through profit or loss (continued) Equities - 92.25% (continued) Cayman Islands - 15.76% (continued)
6,650 Kingsoft Corp Ltd 14,385 0.03%
14,062 Lee & Man Paper Manufact 9,846 0.02%
17,929 Li Ning Co Ltd 42,272 0.08%
10,767 Logan Property Holdings 17,420 0.03%
15,239 Longfor Group Holdings L 57,445 0.11%
14,759 Meitu Inc 4,761 0.01%
8,943 Meituan Dianping-Class B Reg S 78,412 0.16%
1,340 Momo Inc-Spon Adr 47,972 0.10%
627 Netease Inc-Adr 160,368 0.32%
1,263 New Oriental Educatio-Sp Adr 121,981 0.24%
7,692 Nexteer Automotive Group 9,570 0.02%
5,914 Nio Inc - Adr 15,081 0.03%
245 Noah Holdings Ltd-Spon Ads 10,425 0.02%
1,553 Pinduoduo Inc-Adr 32,038 0.06%
29,146 Semiconductor Manufactur 32,457 0.06%
7,206 Shenzhou International G 99,062 0.20%
11,067 Shimao Property Holdings 33,715 0.07%
647 Sina Corp 27,905 0.06%
64,813 Sino Biopharmaceutical 66,286 0.13%
14,126 Ssy Group Ltd 12,765 0.03%
21,507 Sunac China Holdings Ltd 105,711 0.21%
6,404 Sunny Optical Tech 66,151 0.13%
3,136 Tal Education Group- Adr 119,482 0.24%
50,758 Tencent Holdings Ltd 2,290,851 4.55%
20,700 Tingyi (Cayman Isln) Hld 34,551 0.07%
4,496 Vipshop Holdings Ltd - Adr 38,800 0.08%
43,854 Want Want China Holdings 35,645 0.07%
543 Weibo Corp-Spon Adr 23,648 0.05%
4,801 Wuxi Biologics Cayman In 43,109 0.09%
34,449 Xiaomi Corp-Class B 144A 44,095 0.09%
4,259 Yihai International Holding 22,106 0.04%
13,458 Yuzhou Properties Co 6,322 0.01%
457 Yy Inc-Adr 31,848 0.06%
5,193 Zhongsheng Group Holding 14,457 0.03%
2,852 Zto Express Cayman Inc-Adr 54,530 0.11%
Total Cayman Islands 7,927,412 15.76% Chile - 0.95%
305,646 Banco De Chile 44,797 0.09%
424 Banco De Credito E Inver 29,507 0.06%
655,306 Banco Santander Chile 48,732 0.10%

SANLAM UNIVERSAL FUNDS PLC
296
PORTFOLIO OF INVESTMENTS OF SATRIX EMERGING MARKET EQUITY TRACKER
FUND (CONTINUED)
as at 30 June 2019
Nominal Security Classification Fair Value
USD
% of
Net Assets
Financial assets at fair value through profit or loss (continued) Equities - 92.25% (continued) Chile - 0.95% (continued)
12,640 Cencosud Sa 24,947 0.05%
1,775 Cia Cervecerias Unidas S 24,889 0.05%
84,700 Colbun Sa 17,337 0.03%
2,011 Empresa Nacional De Tele 20,438 0.04%
10,658 Empresas Cmpc Sa 28,980 0.06%
3,662 Empresas Copec Sa 39,622 0.08%
289,900 Enel Americas Sa 50,896 0.10%
224,430 Enel Chile Sa 21,403 0.04%
1,651,300 Itau Corpbanca 13,851 0.03%
2,943 Latam Airlines Group Sa 27,530 0.05%
7,972 S.A.C.I. Falabella 51,652 0.10%
1,051 Soc Quimica Y Minera Chile 32,633 0.07%
Total Chile 477,214 0.95%
China - 10.75%
254,369 Agricultural Bank Of Chi 106,469 0.21%
16,472 Air China Ltd-H 16,614 0.03%
61,061 Aluminum Corp Of China L 21,650 0.04%
12,004 Anhui Conch Cement Co Lt 75,212 0.15%
24,659 Avichina Industry & Tech 13,478 0.03%
16,296 Baic Motor Corp Ltd-H 10,221 0.02%
728,396 Bank Of China Ltd-H 307,674 0.61%
94,528 Bank Of Communications C 71,751 0.14%
18,700 Bank Of Communications Co-A 16,651 0.03%
18,564 Beijing Capital Intl Air 16,277 0.03%
5,781 Byd Co Ltd-H 34,890 0.07%
141,855 Cgn Power Co Ltd-H 39,039 0.08%
35,656 China Agri-Industries Hl 11,456 0.02%
96,756 China Cinda Asset Manage 22,293 0.04%
96,279 China Citic Bank Corp Lt 54,841 0.11%
44,713 China Communications Con 40,006 0.08%
23,501 China Communications Ser 18,229 0.04%
855,799 China Construction Bank- 737,220 1.47%
15,700 China Construction Bank-A 16,995 0.03%
21,336 China Eastern Airlines C 12,590 0.03%
9,500 China Film Co Ltd-A 21,646 0.04%
33,500 China Galaxy Securities 19,853 0.04%
22,900 China Gezhouba Group Co Lt-A 20,758 0.04%
93,561 China Huarong Asset Mana 16,287 0.03%
11,962 China International Capi 24,131 0.05%

SANLAM UNIVERSAL FUNDS PLC
297
PORTFOLIO OF INVESTMENTS OF SATRIX EMERGING MARKET EQUITY TRACKER
FUND (CONTINUED)
as at 30 June 2019
Nominal Security Classification Fair Value
USD
% of
Net Assets
Financial assets at fair value through profit or loss (continued) Equities - 92.25% (continued) China - 10.75% (continued)
70,343 China Life Insurance Co- 173,235 0.34%
35,613 China Longyuan Power Gro 22,838 0.05%
8,400 China Merchants Bank-A 43,974 0.09%
34,497 China Merchants Bank-H 171,988 0.34%
63,263 China Minsheng Banking C 43,808 0.09%
33,747 China Molybdenum Co Ltd- 10,669 0.02%
31,443 China National Building 27,569 0.05%
16,860 China Oilfield Services- 16,682 0.03%
23,182 China Pacific Insurance 90,651 0.18%
225,273 China Petroleum & Chemic 153,114 0.30%
21,300 China Railway Constructi 26,119 0.05%
29,104 China Railway Group Ltd 22,128 0.04%
30,487 China Shenhua Energy Co- 63,842 0.13%
12,176 China Southern Airlines 8,478 0.02%
39,700 China State Construction -A 33,213 0.07%
121,800 China Telecom Corp Ltd-H 61,270 0.12%
396,883 China Tower Corp Ltd-H 104,142 0.21%
6,000 China Vanke Co Ltd -A 24,278 0.05%
13,836 China Vanke Co Ltd-H 51,891 0.10%
10,100 China Yangtze Power Co Ltd-A 26,304 0.05%
25,376 Chongqing Rural Commerci 13,805 0.03%
16,571 Citic Securities Co Ltd- 34,531 0.07%
34,321 Crrc Corp Ltd - H 28,687 0.06%
23,025 Dongfeng Motor Grp Co Lt 18,862 0.04%
4,293 Fuyao Glass Industry Gro 13,325 0.03%
19,500 Gf Securities Co Ltd-A 38,983 0.08%
11,873 Gf Securities Co Ltd-H 14,118 0.03%
26,470 Great Wall Motor Company 18,940 0.04%
23,353 Guangzhou Automobile Gro 24,930 0.05%
14,869 Guangzhou R&F Properties 28,587 0.06%
31,966 Haitong Securities Co Ltd 35,843 0.07%
8,000 Hangzhou Hikvision Digital-A 32,102 0.06%
3,700 Hangzhou Robam Appliances-A 14,611 0.03%
33,061 Huaneng Power Intl Inc-H 19,466 0.04%
43,720 Huaneng Renewables Corp- 12,032 0.02%
14,900 Huatai Securities Co Ltd 25,633 0.05%
574,848 Ind & Comm Bk Of China-H 419,409 0.83%
12,600 Industrial Bank Co Ltd -A 33,530 0.07%
15,353 Jiangsu Express Co Ltd-H 21,853 0.04%
3,600 Jiangsu Hengrui Medicine C-A 34,570 0.07%

SANLAM UNIVERSAL FUNDS PLC
298
PORTFOLIO OF INVESTMENTS OF SATRIX EMERGING MARKET EQUITY TRACKER
FUND (CONTINUED)
as at 30 June 2019
Nominal Security Classification Fair Value
USD
% of
Net Assets
Financial assets at fair value through profit or loss (continued)
Equities - 92.25% (continued)
China - 10.75% (continued)
2,200 Jiangxi Ganfeng Lithium Co-A 7,500 0.01%
500 Kweichow Moutai Co Ltd-A 71,584 0.14%
3,324 Legend Holdings Corp-H 7,820 0.02%
7,954 New China Life Insurance 38,688 0.08%
95,836 People’S Insurance Co Gr 37,414 0.07%
184,914 Petrochina Co Ltd H 102,013 0.20%
60,997 Picc Property & Casualty 65,818 0.13%
13,600 Ping An Bank Co Ltd-A 27,267 0.05%
3,780 Ping An Insurance Group 48,734 0.10%
49,380 Ping An Insurance Group 592,876 1.18%
66,781 Postal Savings Bank Of C 39,663 0.08%
14,758 Shandong Weigao Gp Medic 13,374 0.03%
19,344 Shanghai Lujiazui Fin&Trad-B 23,406 0.05%
7,996 Shanghai Pharmaceuticals 15,721 0.03%
16,400 Shanghai Pudong Devel Bank-A 27,870 0.06%
30,300 Sinolink Securities Co Ltd-A 42,851 0.09%
15,079 Sinopec Engineering Grou 12,777 0.03%
35,174 Sinopec Shanghai Petroch 13,957 0.03%
23,100 Sinopec Shanghai Petrochem 17,343 0.03%
11,402 Sinopharm Group Co-H 40,135 0.08%
25,438 Sinotrans Limited-H 9,247 0.02%
2,600 Spring Airlines Co Ltd-A 17,023 0.03%
30,500 Tbea Co Ltd-A 32,173 0.06%
16,200 Transfar Zhilian Co Ltd-A 17,749 0.04%
9,477 Travelsky Technology -H 19,045 0.04%
3,895 Tsingtao Brewery Co Ltd- 24,803 0.05%
15,233 Weichai Power Co Ltd-H 25,738 0.05%
6,800 Weifu High-Technology Grp-A 18,363 0.04%
2,400 Wuliangye Yibin Co Ltd-A 41,187 0.08%
4,400 Xinjiang Goldwind Sci&Tech-A 7,958 0.02%
22,941 Yanzhou Coal Mining Co-H 21,436 0.04%
5,200 Youngor Group Co-A 4,804 0.01%
13,980 Zhejiang Expressway Co-H 14,727 0.03%
8,000 Zhongjin Gold Corp-A 11,954 0.02%
5,678 Zhuzhou Csr Times 29,907 0.06%
73,603 Zijin Mining Group Co Lt 29,865 0.06%
2,000 Zte Corp-A 9,466 0.02%
6,000 Zte Corp-H 17,318 0.03%
Total China 5,405,815 10.75%

SANLAM UNIVERSAL FUNDS PLC
299
PORTFOLIO OF INVESTMENTS OF SATRIX EMERGING MARKET EQUITY TRACKER
FUND (CONTINUED)
as at 30 June 2019
Nominal Security Classification Fair Value
USD
% of
Net Assets
Financial assets at fair value through profit or loss (continued) Equities - 92.25% (continued) Colombia - 0.40%
2,533 Bancolombia Sa 30,519 0.06%
4,016 Bancolombia Sa-Pref 51,092 0.10%
44,794 Ecopetrol Sa 40,785 0.08%
4,158 Grupo Argos Sa 22,430 0.04%
3,472 Grupo De Inv Suramerican 36,918 0.07%
4,133 Interconexion Electrica 23,017 0.05%
Total Colombia 204,761 0.40%
Czech Republic - 0.16%
1,915 Cez As 46,283 0.09%
899 Komercni Banka As 35,851 0.07%
Total Czech Republic 82,134 0.16%
Egypt - 0.14%
15,461 Commercial International 68,336 0.14%
Total Egypt 68,336 0.14%
Greece - 0.31%
11,712 Alpha Bank Ae 23,474 0.05%
28,326 Eurobank Ergasias Sa 27,903 0.06%
2,358 Hellenic Telecommun Orga 34,909 0.07%
2,928 Opap Sa 32,844 0.07%
1,558 Jumbo Sa 30,162 0.06%
Total Greece 149,292 0.31%
Hong Kong - 3.38%
5,395 Beijing Enterprises Holdings 27,415 0.05%
8,862 Byd Electronic Intl Co L 12,659 0.02%
122,070 China Common 27,970 0.06%
36,694 China Everbright Intl Lt 33,864 0.07%
11,911 China Everbright Ltd 17,594 0.03%
50,932 China Jinmao Holdings Gr 30,967 0.06%
12,989 China Merchants Port Hold 22,079 0.04%
54,448 China Mobile Ltd 495,869 0.99%
34,058 China Overseas Land & In 125,552 0.25%
14,557 China Resources Beer Hol 69,128 0.14%
17,232 China Resources Pharmace 19,432 0.04%
16,707 China Resources Power Ho 24,379 0.05%
16,006 China Taiping Insurance 42,819 0.08%
16,958 China Traditional Chines 8,248 0.02%
59,179 China Unicom Hong Kong L 64,917 0.13%

SANLAM UNIVERSAL FUNDS PLC
300
PORTFOLIO OF INVESTMENTS OF SATRIX EMERGING MARKET EQUITY TRACKER
FUND (CONTINUED)
as at 30 June 2019
Nominal Security Classification Fair Value
USD
% of
Net Assets
Financial assets at fair value through profit or loss (continued) Equities - 92.25% (continued) Hong Kong - 3.38% (continued)
59,532 Citic Ltd 85,802 0.17%
161,903 Cnooc Ltd 276,867 0.55%
41,248 Cspc Pharmaceutical Group 66,525 0.13%
28,913 Far East Horizon Ltd 29,570 0.06%
25,031 Fosun International Ltd 33,257 0.07%
27,843 Guangdong Investment Ltd 55,098 0.11%
70,302 Lenovo Group Ltd 54,442 0.11%
31,425 Mmg Limited 10,981 0.02%
14,641 Shanghai Industrial Hldg 31,747 0.06%
37,624 Sino-Ocean Group Holding 15,989 0.03%
19,354 Sun Art Retail Group Ltd 18,332 0.04%
Total Hong Kong 1,701,502 3.38% Hungary - 0.32%
13,746 Mol Hungarian Oil and Gas 41,658 0.08%
2,396 Otp Bank Plc 95,524 0.19%
1,378 Richter Gedeon Nyrt 25,451 0.05%
Total Hungary 162,633 0.32%
India - 8.77%
3,938 Adani Ports And Special 23,402 0.05%
6,050 Ambuja Cements Ltd 18,655 0.04%
9,570 Ashok Leyland Ltd 12,096 0.02%
3,031 Asian Paints Ltd 59,637 0.12%
1,873 Aurobindo Pharma Ltd 16,499 0.03%
1,388 Avenue Supermarts Ltd 28,109 0.06%
16,903 Axis Bank Ltd-Foreign 197,992 0.39%
738 Bajaj Auto Ltd 30,225 0.06%
1,628 Bajaj Finance Ltd 86,818 0.17%
311 Bajaj Finserv Ltd 38,407 0.08%
2,430 Bharat Forge Ltd 15,838 0.03%
5,261 Bharat Petroleum Corp Ltd 29,911 0.06%
16,895 Bharti Airtel Ltd-Foreig 84,845 0.17%
2,809 Bharti Infratel Ltd 10,867 0.02%
60 Bosch Ltd 14,202 0.03%
638 Britannia Industries Ltd 25,359 0.05%
2,850 Cipla Ltd 22,851 0.05%
11,845 Coal India Ltd 43,552 0.09%
5,556 Dabur India Ltd 32,236 0.06%
622 Divi’S Laboratories Ltd 14,390 0.03%
1,212 Dr. Reddy’S Laboratories 44,781 0.09%

SANLAM UNIVERSAL FUNDS PLC
301
PORTFOLIO OF INVESTMENTS OF SATRIX EMERGING MARKET EQUITY TRACKER
FUND (CONTINUED)
as at 30 June 2019
Nominal Security Classification Fair Value
USD
% of
Net Assets
Financial assets at fair value through profit or loss (continued) Equities - 92.25% (continued) India - 8.77% (continued)
114 Eicher Motors Ltd 31,608 0.06%
6,826 Gail India Ltd 30,848 0.06%
1,200 Glenmark Pharmaceuticals 7,707 0.02%
2,872 Godrej Consumer Prod 27,589 0.05%
3,251 Grasim Industries Ltd 43,052 0.09%
2,620 Havells India Ltd-Foreig 29,839 0.06%
5,132 Hcl Technologies Ltd 79,154 0.16%
460 Hero Motocorp Ltd 17,203 0.03%
11,897 Hindalco Industries Ltd 35,685 0.07%
4,866 Hindustan Petroleum Corp 20,447 0.04%
5,516 Hindustan Unilever Ltd 142,848 0.28%
14,385 Housing Development Finance 456,823 0.91%
20,992 Icici Bank Ltd 132,927 0.26%
1,033 Icici Lombard General Insura 144A 16,649 0.03%
2,657 Indiabulls Housing Finan 23,392 0.05%
18,038 Indian Oil Corp Ltd 40,739 0.08%
30,584 Infosys Ltd 324,327 0.64%
742 Interglobe Aviation Ltd 144A 16,747 0.03%
29,512 Itc Ltd 117,082 0.23%
8,401 Jsw Steel Ltd 33,664 0.07%
4,363 Larsen & Toubro Ltd 98,173 0.20%
3,345 Lic Housing Finance Ltd 26,907 0.05%
1,785 Lupin Ltd 19,517 0.04%
2,943 Mahindra & Mahindra Fin Secs 16,559 0.03%
6,707 Mahindra & Mahindra Ltd 63,677 0.13%
4,380 Marico Ltd 23,512 0.05%
943 Maruti Suzuki India Ltd 89,271 0.18%
10,152 Motherson Sumi Systems L 17,935 0.04%
240 Nestle India Ltd 41,419 0.08%
19,693 Ntpc Ltd 40,326 0.08%
23,750 Oil & Natural Gas Corp L 57,717 0.11%
59 Page Industries Ltd 17,592 0.04%
931 Pidilite Industries Ltd 16,380 0.03%
743 Piramal Healthcare Ltd 20,951 0.04%
18,768 Power Grid Corp Of India 56,254 0.11%
4,463 Petronet Lng Ltd 15,847 0.03%
25,138 Reliance Industries Ltd 456,346 0.91%
54 Shree Cement Ltd 17,070 0.03%
1,579 Shriram Transport-Foreig 24,715 0.05%
15,900 State Bank Of India 83,211 0.17%
7,529 Sun Pharmaceutical Indus 43,733 0.09%

SANLAM UNIVERSAL FUNDS PLC
302
PORTFOLIO OF INVESTMENTS OF SATRIX EMERGING MARKET EQUITY TRACKER
FUND (CONTINUED)
as at 30 June 2019
Nominal Security Classification Fair Value
USD
% of
Net Assets
Financial assets at fair value through profit or loss (continued) Equities - 92.25% (continued) India - 8.77% (continued)
7,919 Tata Consultancy Svcs Lt 255,510 0.51%
14,115 Tata Motors Ltd 33,239 0.07%
3,490 Tata Steel Ltd 25,502 0.05%
4,597 Tech Mahindra Ltd 47,057 0.09%
3,101 Titan Co Ltd-For 59,960 0.12%
950 Ultratech Cement Ltd 62,701 0.12%
2,410 United Spirits Ltd 20,423 0.04%
3,662 Upl Ltd 49,733 0.10%
18,463 Vedanta Ltd-Foreign 46,634 0.09%
10,375 Wipro Ltd 42,160 0.08%
14,839 Yes Bank Ltd 23,378 0.05%
3,775 Zee Entertainment Enterprise 18,520 0.04%
Total India 4,410,931 8.77% Indonesia - 2.05%
143,595 Adaro Energy TBank Pt 13,823 0.03%
181,231 Astra International TBank 95,570 0.19%
163,923 Bank Mandiri Persero TBank 93,115 0.19%
72,054 Bank Negara Indo 46,922 0.09%
490,805 Bank Rakyat Indonesia Pe 151,471 0.30%
57,701 Barito Pacific Tbank Pt 13,111 0.03%
74,720 Bumi Serpong Damai Pt 8,119 0.02%
65,112 Charoen Pokphand Indonesia 21,800 0.04%
4,455 Gudang Garam Tbank Pt 24,242 0.05%
71,909 Hm Sampoerna Tbank Pt 15,983 0.03%
31,493 Indah Kiat Pulp & Paper 20,899 0.04%
15,056 Indocement Tunggal Praka 21,314 0.04%
22,690 Indofood Cbp Sukses Makm 16,302 0.03%
41,170 Indofood Sukses Makmur T 20,472 0.04%
28,445 Jasa Marga (Persero) Tbank 11,527 0.02%
177,067 Kalbe Farma Tbank Pt 18,299 0.04%
94,040 Pt Bank Central Asia Tbank 199,529 0.40%
33,301 Semen Indonesia Persero 27,284 0.05%
51,400 Surya Citra Media Pt Tbank 5,858 0.01%
448,131 Telekomunikasi Indonesia 131,323 0.26%
14,590 Unilever Indonesia Tbank P 46,473 0.09%
15,339 United Tractors Tbank Pt 30,618 0.06%
Total Indonesia 1,034,054 2.05% Isle of Man - 0.07%
4,006 Nepi Rockcastle Plc 36,764 0.07%
Total Isle of Man 36,764 0.07%

SANLAM UNIVERSAL FUNDS PLC
303
PORTFOLIO OF INVESTMENTS OF SATRIX EMERGING MARKET EQUITY TRACKER
FUND (CONTINUED)
as at 30 June 2019
Nominal Security Classification Fair Value
USD
% of
Net Assets
Financial assets at fair value through profit or loss (continued) Equities - 92.25% (continued) Luxembourg - 0.11%
325 Globant Sa 32,841 0.06%
1,432 Reinet Investments Sca 23,071 0.05%
Total Luxembourg 55,912 0.11% Malaysia – 2.00%
16,468 Ammb Holdings Bhd 16,857 0.03%
27,722 Axiata Group Berhad 33,407 0.07%
44,157 Cimb Group Holdings Berhad 57,487 0.11%
40,017 Dialog Group Bhd 31,568 0.06%
28,738 Digi.Com Bhd 35,118 0.07%
16,661 Gamuda Bhd 15,159 0.03%
18,485 Genting Bhd 30,283 0.06%
30,297 Genting Malaysia Berhad 23,754 0.05%
5,935 Hong Leong Bank Berhad 27,287 0.05%
20,926 Ihh Healthcare Bhd 29,370 0.06%
29,028 Ijm Corp Bhd 16,858 0.03%
22,161 Ioi Corp Bhd 22,791 0.05%
3,652 Kuala Lumpur Kepong Bhd 21,704 0.04%
35,860 Malayan Banking Bhd 77,057 0.15%
10,827 Malaysia Airports Hldgs 22,348 0.04%
24,090 Maxis Bhd 32,470 0.06%
12,560 Misc Bhd 21,731 0.04%
732 Nestle (Malaysia) Berhad 26,410 0.05%
24,329 Petronas Chemicals Group 49,453 0.10%
6,417 Petronas Gas Bhd 26,957 0.05%
6,941 Ppb Group Berhad 31,409 0.06%
13,809 Press Metal Aluminium Holdings 14,703 0.03%
28,758 Public Bank Berhad 160,057 0.32%
6,000 Rhb Cap Unlisted /U1000/ - 0.00%
23,361 Sime Darby Berhad 12,776 0.03%
20,548 Sime Darby Plantation Bh 24,464 0.05%
29,171 Sime Darby Property Bhd 7,271 0.01%
8,500 Telekom Malaysia Bhd 8,227 0.02%
28,119 Tenaga Nasional Bhd 94,172 0.19%
12,456 Top Glove Corp Bhd 14,800 0.03%
50,876 Ytl Corp Berhad 13,789 0.03%
Total Malaysia 1,004,268 2.00% Mexico - 2.48%
31,041 Alfaa Sab De Cv 30,473 0.06%
304,609 America Movil Sab De Cv 221,500 0.44%

SANLAM UNIVERSAL FUNDS PLC
304
PORTFOLIO OF INVESTMENTS OF SATRIX EMERGING MARKET EQUITY TRACKER
FUND (CONTINUED)
as at 30 June 2019
Nominal Security Classification Fair Value
USD
% of
Net Assets
Financial assets at fair value through profit or loss (continued) Equities - 92.25% (continued) Mexico - 2.48% (continued)
4,304 Arca Continental Sab De 23,266 0.05%
17,684 Banco Santander Mexico-B 27,035 0.05%
127,088 Cemex Sab-Cpo 53,517 0.11%
5,240 Coca-Cola Femsa Sab De Cv 32,487 0.06%
2,215 El Puerto De Liverpool-C 12,322 0.02%
31,540 Fibra Uno Administracion 41,732 0.08%
16,603 Fomento Economico Mexica 160,709 0.32%
1,940 Gruma S.A.B.-B 18,191 0.04%
3,107 Grupo Aeroport Del Pacif 32,326 0.06%
1,993 Grupo Aeroport Del Sures 32,272 0.06%
14,960 Grupo Bimbo Sab Cv 31,171 0.06%
3,415 Grupo Carso Sab De Cv 12,720 0.03%
24,735 Grupo Financiero Banorte 143,376 0.29%
21,375 Grupo Financiero Inbursa Sab De Cv 30,886 0.06%
30,489 Grupo Mexico Sab De Cv-S 80,890 0.16%
21,253 Grupo Televisa Sab 35,898 0.07%
1,364 Industrias Penoles Sab De Cv 17,629 0.04%
4,554 Infraestructura Energeti 17,871 0.04%
12,531 Kimberly Clark De Mexico 23,279 0.05%
10,620 Mexichem Sab De Cv-* 22,272 0.04%
1,840 Promotora Y Operadora De 18,267 0.04%
45,310 Walmart De Mexico Sab De 123,584 0.25%
Total Mexico 1,243,673 2.48% Peru - 0.07%
2,180 Cia De Minas Buenaventur-Adr 36,341 0.07%
Total Peru 36,341 0.07% Philippines - 1.10%
17,960 Aboitiz Equity Ventures 19,280 0.04%
18,900 Aboitiz Power Corp 12,837 0.03%
31,672 Alliance Global Group In 9,545 0.02%
2,583 Ayala Corporation 45,071 0.09%
75,552 Ayala Land Inc 74,911 0.15%
8,149 Bank Of The Philippine I 12,486 0.02%
18,777 Bondo Unibank Inc 51,308 0.10%
44,430 Dmci Holdings Inc 8,932 0.02%
334 Globe Telecom Inc 14,746 0.03%
786 Gt Capital Holdings Inc 14,421 0.03%
8,637 Intl Container Term Svcs Inc 24,680 0.05%
23,596 Jg Summit Holdings Inc 31,041 0.06%

SANLAM UNIVERSAL FUNDS PLC
305
PORTFOLIO OF INVESTMENTS OF SATRIX EMERGING MARKET EQUITY TRACKER
FUND (CONTINUED)
as at 30 June 2019
Nominal Security Classification Fair Value
USD
% of
Net Assets
Financial assets at fair value through profit or loss (continued) Equities - 92.25% (continued) Philippines - 1.10% (continued)
5,257 Jollibee Foods Corp 28,914 0.06%
113,160 Metro Pacific Investment 10,602 0.02%
1,041 Pldt Inc 26,210 0.05%
4,202 Security Bank Corp 13,942 0.03%
2,585 Sm Investments Corp 48,890 0.10%
100,460 Sm Prime Holdings Inc 72,745 0.14%
8,740 Universal Robina Corp 28,317 0.06%
Total Philippines 548,878 1.10% Poland - 1.09%
7,039 Bank Millennium Sa 17,667 0.04%
1,697 Bank Pekao Sa 50,875 0.10%
210 Ccc Sa 9,494 0.02%
594 Cd Projekt Red Sa 34,294 0.07%
387 Dino Polska Sa 13,584 0.03%
960 Grupa Lotos Sa 21,804 0.04%
1,515 Kghm Polska Miedz Sa 42,047 0.08%
12 Lpp Sa 24,584 0.05%
179 Mbank Sa 20,640 0.04%
8,231 Pge Sa 21,171 0.04%
8,821 Pko Bank Polski Sa 101,286 0.20%
2,688 Polski Koncern Naftowy O 64,857 0.13%
21,103 Polskie Gornictwo Naftow 30,049 0.06%
5,648 Powszechny Zaklad Ubezpi 66,125 0.13%
295 Santander Bank Polska Sa 29,332 0.06%
Total Poland 547,809 1.09% Qatar - 0.97%
20,890 Commercial Bank Pqsc 26,333 0.05%
18,670 Industries Qatar 58,965 0.12%
41,430 Masraf Al Rayan 43,350 0.09%
39,320 Mesaieed Petrochemical Holding 28,184 0.06%
6,000 Qatar Electricity & Water 27,452 0.05%
3,960 Qatar Fuel Qsc 23,339 0.05%
1,710 Qatar Insurance Co 16,465 0.03%
11,200 Qatar Islamic Bank 51,090 0.10%
40,300 Qatar National Bank 210,617 0.42% Total Qatar 485,795 0.97% South Africa - 5.68%
6,311 Absa Group Ltd 78,769 0.16%
441 Anglo American Platinum Limited 26,174 0.05%
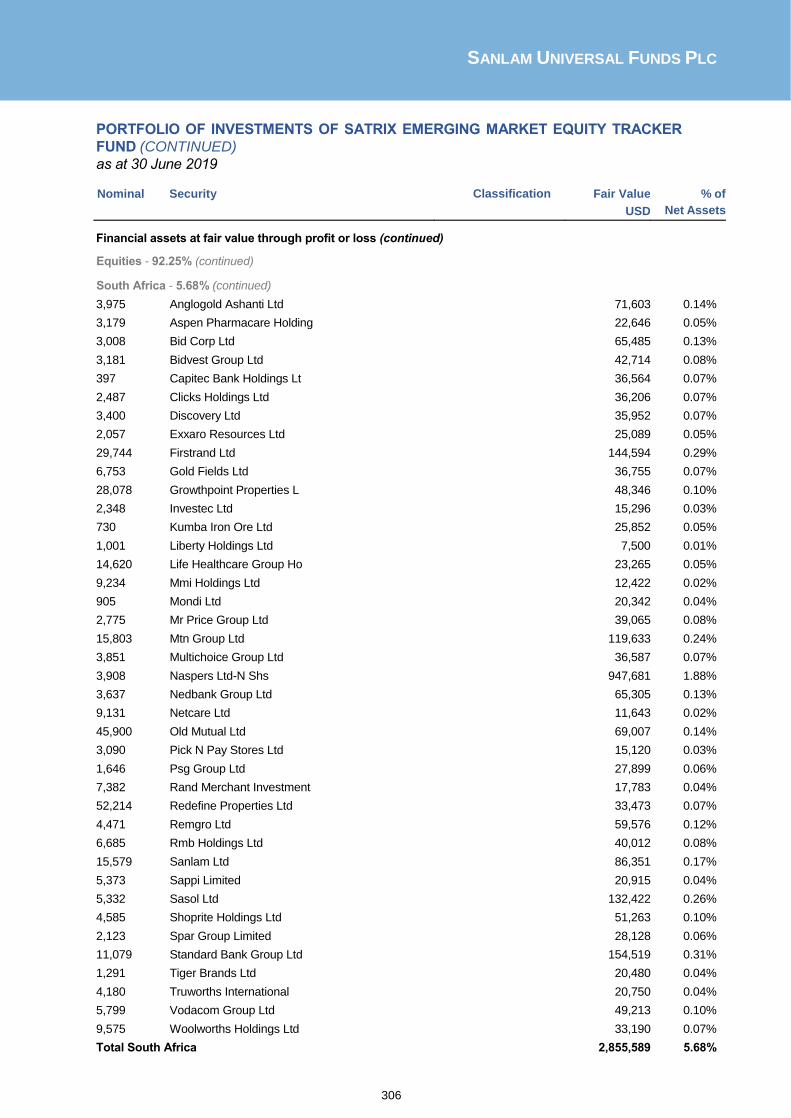
SANLAM UNIVERSAL FUNDS PLC
306
PORTFOLIO OF INVESTMENTS OF SATRIX EMERGING MARKET EQUITY TRACKER
FUND (CONTINUED)
as at 30 June 2019
Nominal Security Classification Fair Value
USD
% of
Net Assets
Financial assets at fair value through profit or loss (continued)
Equities - 92.25% (continued)
South Africa - 5.68% (continued)
3,975 Anglogold Ashanti Ltd 71,603 0.14%
3,179 Aspen Pharmacare Holding 22,646 0.05%
3,008 Bid Corp Ltd 65,485 0.13%
3,181 Bidvest Group Ltd 42,714 0.08%
397 Capitec Bank Holdings Lt 36,564 0.07%
2,487 Clicks Holdings Ltd 36,206 0.07%
3,400 Discovery Ltd 35,952 0.07%
2,057 Exxaro Resources Ltd 25,089 0.05%
29,744 Firstrand Ltd 144,594 0.29%
6,753 Gold Fields Ltd 36,755 0.07%
28,078 Growthpoint Properties L 48,346 0.10%
2,348 Investec Ltd 15,296 0.03%
730 Kumba Iron Ore Ltd 25,852 0.05%
1,001 Liberty Holdings Ltd 7,500 0.01%
14,620 Life Healthcare Group Ho 23,265 0.05%
9,234 Mmi Holdings Ltd 12,422 0.02%
905 Mondi Ltd 20,342 0.04%
2,775 Mr Price Group Ltd 39,065 0.08%
15,803 Mtn Group Ltd 119,633 0.24%
3,851 Multichoice Group Ltd 36,587 0.07%
3,908 Naspers Ltd-N Shs 947,681 1.88%
3,637 Nedbank Group Ltd 65,305 0.13%
9,131 Netcare Ltd 11,643 0.02%
45,900 Old Mutual Ltd 69,007 0.14%
3,090 Pick N Pay Stores Ltd 15,120 0.03%
1,646 Psg Group Ltd 27,899 0.06%
7,382 Rand Merchant Investment 17,783 0.04%
52,214 Redefine Properties Ltd 33,473 0.07%
4,471 Remgro Ltd 59,576 0.12%
6,685 Rmb Holdings Ltd 40,012 0.08%
15,579 Sanlam Ltd 86,351 0.17%
5,373 Sappi Limited 20,915 0.04%
5,332 Sasol Ltd 132,422 0.26%
4,585 Shoprite Holdings Ltd 51,263 0.10%
2,123 Spar Group Limited 28,128 0.06%
11,079 Standard Bank Group Ltd 154,519 0.31%
1,291 Tiger Brands Ltd 20,480 0.04%
4,180 Truworths International 20,750 0.04%
5,799 Vodacom Group Ltd 49,213 0.10%
9,575 Woolworths Holdings Ltd 33,190 0.07%
Total South Africa 2,855,589 5.68%

SANLAM UNIVERSAL FUNDS PLC
307
PORTFOLIO OF INVESTMENTS OF SATRIX EMERGING MARKET EQUITY TRACKER
FUND (CONTINUED)
as at 30 June 2019
Nominal Security Classification Fair Value
USD
% of
Net Assets
Financial assets at fair value through profit or loss (continued)
Equities - 92.25% (continued)
South Korea - 12.06%
372 Amorepacific Corp 52,998 0.11%
218 Amorepacific Group 11,762 0.02%
80 Bgf Retail Co Ltd 14,619 0.03%
2,402 Bnk Financial Group Inc 15,581 0.03%
507 Celltrion Healthcare Co 24,809 0.05%
805 Celltrion Inc 143,271 0.29%
128 Celltrion Pharm Inc 5,327 0.01%
889 Cheil Worldwide Inc 22,636 0.05%
77 Cj Cheiljedang Corp 19,806 0.04%
24 Cj Corp-Convert Pref 762 0.00%
102 Cj Logistics 11,881 0.02%
112 Cj O Shopping Co Ltd 17,169 0.03%
521 Coway Co Ltd 34,924 0.07%
321 Daelim Industrial Co Ltd 31,971 0.06%
461 Daum Kakao Corp 52,502 0.10%
513 Db Insurance Co Ltd 26,346 0.05%
165 E-Mart Inc 20,006 0.04%
400 Fila Korea Ltd 26,571 0.05%
463 Gs Engineering & Constru 16,180 0.03%
409 Gs Holdings 18,136 0.04%
240 Gs Retail Co Ltd 8,169 0.02%
2,626 Hana Financial Group 85,058 0.17%
737 Hankook Tire Co Ltd 22,404 0.04%
46 Hanmi Pharm Co Ltd 16,095 0.03%
106 Hanmi Science Co Ltd 6,261 0.01%
1,365 Hanon Systems 13,772 0.03%
1,026 Hanwha Chemical Corp 20,171 0.04%
375 Hanwha Corporation 8,671 0.02%
338 Hdc Hyundai Development 12,734 0.03%
228 Hlb Inc 6,970 0.01%
320 Hotel Shilla Co Ltd 26,883 0.05%
172 Hyundai Dept Store Co 12,319 0.02%
695 Hyundai Engineering & Co 32,263 0.06%
170 Hyundai Glovis Co Ltd Bs Apm 01/11/16 23,704 0.05%
548 Hyundai Heavy Industries 73,148 0.14%
600 Hyundai Marine & Fire In 14,784 0.03%
597 Hyundai Mobis Co Ltd 121,763 0.24%
1,322 Hyundai Motor Co 160,291 0.32%
205 Hyundai Motor Co Ltd-Prf 14,044 0.03%
395 Hyundai Mtr Co New Prf 29,523 0.06%
722 Hyundai Steel Co 26,137 0.05%

SANLAM UNIVERSAL FUNDS PLC
308
PORTFOLIO OF INVESTMENTS OF SATRIX EMERGING MARKET EQUITY TRACKER
FUND (CONTINUED)
as at 30 June 2019
Nominal Security Classification Fair Value
USD
% of
Net Assets
Financial assets at fair value through profit or loss (continued) Equities - 92.25% (continued) South Korea - 12.06% (continued)
2,431 Industrial Bank Of Korea 29,581 0.06%
1,179 Kangwon Land Inc 30,888 0.06%
3,796 Kb Financial Group Inc 150,735 0.30%
70 Kcc Corp 16,702 0.03%
2,455 Kia Motors Corp 93,552 0.19%
590 Korea Aerospace Industri 18,370 0.04%
2,396 Korea Electric Power Cor 53,018 0.11%
276 Korea Gas Corp 10,087 0.02%
461 Korea Investment Holding 32,220 0.06%
89 Korea Zinc Co Ltd 36,690 0.07%
330 Korean Air Lines Co Ltd 8,274 0.02%
1,023 Kt&G Corp 87,269 0.17%
154 Kumho Petro Chemical Co Ltd 12,991 0.03%
430 Lg Chem Ltd 132,018 0.26%
949 Lg Corp 63,204 0.13%
2,136 Lg Display Co Ltd 33,021 0.07%
947 Lg Electronics Inc 65,039 0.13%
89 Lg Household & Health Ca 101,206 0.20%
165 Lg Innotek Co Ltd 15,576 0.03%
1,210 Lg Uplus Ltd 15,195 0.03%
163 Lotte Chemical Corp 35,645 0.07%
319 Lotte Corp 12,156 0.02%
115 Lotte Shopping Co 15,985 0.03%
32 Medy-Tox Inc 12,471 0.03%
3,919 Mirae Asset Daewoo Co Ltd /Krw 27,764 0.06%
1,211 Naver Corp 119,563 0.24%
140 Ncsoft Corporation 57,836 0.12%
210 Netmarble Corp 20,552 0.04%
1,649 Nh Investment & Securiti 20,708 0.04%
140 Oci Company Ltd 11,313 0.02%
174 Orion Corp/Republic Of K 13,939 0.03%
44 Pearl Abyss Corp 8,090 0.02%
740 Posco 156,697 0.31%
170 S-1 Corporation 14,370 0.03%
149 Samsung Biologics Co Ltd 41,294 0.08%
690 Samsung C&T Corp 57,189 0.11%
400 Samsung Card Co 13,233 0.03%
502 Samsung Electro-Mechanic 42,520 0.08%
42,543 Samsung Electronics Co L 1,731,712 3.44%
7,260 Samsung Electronics Prf 240,501 0.48%

SANLAM UNIVERSAL FUNDS PLC
309
PORTFOLIO OF INVESTMENTS OF SATRIX EMERGING MARKET EQUITY TRACKER
FUND (CONTINUED)
as at 30 June 2019
Nominal Security Classification Fair Value
USD
% of
Net Assets
Financial assets at fair value through profit or loss (continued) Equities - 92.25% (continued) South Korea - 12.06% (continued)
1,163 Samsung Engineering Co L 17,274 0.03%
296 Samsung Fire & Marine In 68,703 0.14%
4,740 Samsung Heavy Industries 33,498 0.07%
695 Samsung Life Insurance C 50,320 0.10%
473 Samsung Sdi Co Ltd 96,882 0.19%
305 Samsung Sds Co Ltd 56,792 0.11%
4,039 Shinhan Financial Group 157,062 0.31%
70 Shinsegae Inc 18,248 0.04%
570 Sillajen Inc 24,387 0.05%
289 Sk Holdings Co Ltd 58,068 0.12%
4,884 Sk Hynix Inc 293,975 0.58%
479 Sk Innovation Co. Ltd 65,960 0.13%
190 Sk Telecom 42,619 0.09%
458 S-Oil Corp 33,200 0.07%
107 Viromed Co Ltd 15,624 0.03%
4,147 Woori Financial Group Inc 50,461 0.10%
101 Yuhan Corp 21,387 0.04% Total South Korea 6,066,055 12.06% Taiwan - 10.47%
25,369 Acer Inc 15,723 0.03%
2,742 Advantech Co Ltd 23,306 0.05%
30,679 Ase Technology Holding C 60,747 0.12%
20,841 Asia Cement Corp 31,906 0.06%
6,319 Asustek Computer Inc 45,369 0.09%
89,502 Au Optronics Corp 26,799 0.05%
5,920 Catcher Technology Co Lt 42,409 0.08%
66,012 Cathay Financial Holding 91,390 0.18%
44,293 Chang Hwa Commercial Bank 29,876 0.06%
20,915 Cheng Shin Rubber Ind Co 27,003 0.05%
5,250 Chicony Electronics Co L 12,914 0.03%
45,502 China Airlines Ltd 14,416 0.03%
125,256 China Development Financ 38,190 0.08%
20,199 China Life Insurance Co 16,161 0.03%
117,278 China Steel Corp 94,209 0.19%
32,726 Chunghwa Telecom Co Ltd 119,063 0.24%
35,742 Compal Electronics 23,418 0.05%
155,824 Ctbc Financial Holding C 107,112 0.21%
18,254 Delta Electronics Inc 92,564 0.18%
92,723 E.Sun Financial Holding 77,619 0.15%
2,140 Eclat Textile Company Lt 27,422 0.05%

SANLAM UNIVERSAL FUNDS PLC
310
PORTFOLIO OF INVESTMENTS OF SATRIX EMERGING MARKET EQUITY TRACKER
FUND (CONTINUED)
as at 30 June 2019
Nominal Security Classification Fair Value
USD
% of
Net Assets
Financial assets at fair value through profit or loss (continued)
Equities - 92.25% (continued)
Taiwan - 10.47% (continued)
26,518 Far Eastern New Century Corporation 28,602 0.06%
13,294 Far Eastone Telecomm Co 33,514 0.07%
2,975 Feng Tay Enterprise Co L 23,180 0.05%
93,092 First Financial Holding 68,336 0.14%
30,356 Formosa Chemicals & Fibr 100,667 0.20%
10,744 Formosa Petrochemical Co 38,224 0.08%
39,095 Formosa Plastics Corp 144,123 0.29%
59,465 Fubon Financial Holding 87,782 0.17%
3,880 Giant Manufacturing 30,356 0.06%
2,532 Globalwafers Co Ltd 25,638 0.05%
2,573 Hiwin Technologies Corp 21,539 0.04%
112,804 Hon Hai Precision Indust 281,107 0.56%
3,047 Hotai Motor Company Ltd 49,836 0.10%
72,805 Hua Nan Financial Holdin 48,873 0.10%
92,585 Innolux Corp 21,850 0.04%
20,979 Inventec Co Ltd 16,683 0.03%
949 Largan Precision Co Ltd 117,787 0.23%
21,660 Lite-On Technology Corp 31,730 0.06%
13,327 Mediatek Inc 134,731 0.27%
99,120 Mega Financial Holding C 98,611 0.20%
8,017 Micro-Star International 22,714 0.05%
45,395 Nan Ya Plastics Corp 114,878 0.23%
8,138 Nanya Technology Corpora 16,900 0.03%
1,488 Nien Made Enterprise Co 11,186 0.02%
4,736 Novatek Microelectronics 26,379 0.05%
22,975 Pegatron Corp 39,722 0.08%
1,651 Phison Electronics Corp 15,043 0.03%
24,051 Pou Chen 29,813 0.06%
6,162 Powertech Technology Inc 15,078 0.03%
5,463 President Chain Store Co 52,854 0.11%
25,119 Quanta Computer Inc 48,848 0.10%
4,717 Realtek Semiconductor Co 34,702 0.07%
101,429 Shin Kong Financial Hold 30,795 0.06%
108,212 Sinopac Financial Holdin 45,466 0.09%
11,828 Synnex Technology Intl C 14,852 0.03%
2,740 Taimed Biologics Inc 14,027 0.03%
81,773 Taishin Financial Holdin 37,649 0.08%
41,848 Taiwan Cement 62,045 0.12%
84,952 Taiwan Cooperative Finan 56,891 0.11%

SANLAM UNIVERSAL FUNDS PLC
311
PORTFOLIO OF INVESTMENTS OF SATRIX EMERGING MARKET EQUITY TRACKER
FUND (CONTINUED)
as at 30 June 2019
Nominal Security Classification Fair Value
USD
% of
Net Assets
Financial assets at fair value through profit or loss (continued)
Equities - 92.25% (continued)
Taiwan - 10.47% (continued)
19,743 Taiwan High Speed Rail Corp 29,049 0.06%
15,853 Taiwan Mobile Co Ltd 62,525 0.12%
218,983 Taiwan Semiconductor Man 1,685,054 3.35%
13,000 Tatung Co Ltd 7,848 0.02%
25,625 The Shanghai Commercial & Sa 46,367 0.09%
42,444 Uni-President Enterprise 113,013 0.22%
114,205 United Microelectronics 51,294 0.10%
7,580 Vanguard International 15,912 0.03%
2,432 Walsin Technology Corp 12,841 0.03%
24,173 Winbond Electronics Corp 11,830 0.02%
26,077 Wistron Corp 20,318 0.04%
13,336 Wpg Holdings Ltd 17,325 0.03%
2,787 Yageo Corporation 23,689 0.05%
97,251 Yuanta Financial Holding Co Ltd 58,395 0.12%
Total Taiwan 5,266,087 10.47%
Thailand - 2.93%
10,176 Advanced Info Service-Fo 72,336 0.14%
40,383 Airports Of Thailand Pcl 96,785 0.19%
2,608 Bangkok Bank Pcl-Foreign 16,753 0.03%
85,475 Bangkok Dusit Med Servic 72,466 0.14%
101,777 Bangkok Expressway And M 37,834 0.08%
42,480 Banpu Public Co Ltd-For Reg 20,778 0.04%
12,607 Berli Jucker Public Co 20,760 0.04%
78,008 Bts Group Holdings Pcl-F 30,524 0.06%
3,028 Bumrungrad Hospital 16,686 0.03%
20,304 Central Pattana Pub Co-F 49,655 0.10%
29,100 Charoen Pokphand Food-Fo 26,806 0.05%
51,781 Cp All Pcl Foreign 145,208 0.29%
2,613 Electricity Gen Pub Co-Forei 27,691 0.06%
15,880 Energy Absolute Pcl-Foreign 28,868 0.06%
67,042 Home Product Center Pcl- 38,257 0.08%
18,597 Indorama Ventures-Foreig 28,501 0.06%
19,777 Intouch Holdings Pcl-F 40,467 0.08%
120,482 Irpc Pcl - Foreign 19,643 0.04%
18,364 Kasikornbank Pcl-Foreign 112,576 0.22%
33,760 Krung Thai Bank Pub Co-F 21,466 0.04%
67,223 Land & Houses Pub Co-For Reg 24,331 0.05%
28,146 Minor International Pcl- 37,629 0.08%
16,435 Ptt Exploration & Prod-F 72,348 0.14%

SANLAM UNIVERSAL FUNDS PLC
312
PORTFOLIO OF INVESTMENTS OF SATRIX EMERGING MARKET EQUITY TRACKER
FUND (CONTINUED)
as at 30 June 2019
Nominal Security Classification Fair Value
USD
% of
Net Assets
Financial assets at fair value through profit or loss (continued)
Equities - 92.25% (continued)
Thailand - 2.93% (continued)
18,196 Ptt Global Chemical Pcl- 37,973 0.08%
101,057 Ptt Pcl/Foreign 160,643 0.32%
6,999 Siam Cement Pub Co-For R 107,721 0.21%
8,094 Siam Commercial Bank-For 36,818 0.07%
10,378 Thai Oil Pcl-Foreign 22,504 0.04%
31,585 Thai Union Group Pcl-F 18,848 0.04%
117,351 Tmb Bank Public Corp-For 7,500 0.02%
124,142 True Corp Pcl-Foreign 23,681 0.05%
Total Thailand 1,474,056 2.93%
Turkey - 0.51%
34,268 Akbank T.A.S. 40,287 0.08%
2,424 Arcelik A.S. 8,151 0.02%
3,400 Aselsan Elektronik Sanay 10,581 0.02%
1,834 Bim Birlesik Magazalar A 25,255 0.05%
18,616 Eregli Demir Ve Celik Fa 25,330 0.05%
10,831 Haci Omer Sabanci Holdings 16,085 0.03%
9,280 Koc Holding As 28,142 0.06%
1,346 Tupras-Turkiye Petrol Ra 26,762 0.05%
6,041 Turk Hava Yollari Ao 13,463 0.03%
11,797 Turkcell Iletisim Hizmet 26,107 0.05%
20,740 Turkiye Garanti Bankasi 32,630 0.07%
Total Turkey 252,793 0.51%
United States - 0.37%
900 Southern Copper Corp 34,965 0.07%
3,248 Yum China Holdings Inc 150,057 0.30%
Total United States 185,022 0.37%
United Arab Emirates - 0.67%
22,599 Abu Dhabi Commercial Bank 51,066 0.10%
46,361 Aldar Properties Pjsc 23,855 0.05%
1,700 Dp World Ltd 27,030 0.05%
34,139 Emaar Properties Pjsc 41,080 0.08%
17,555 Emirates Telecom Group Company 79,718 0.16%
28,400 First Abu Dhabi Bank Pjsc 114,894 0.23%
Total United Arab Emirates 337,643 0.67%
Total Equities 46,399,751 92.25%
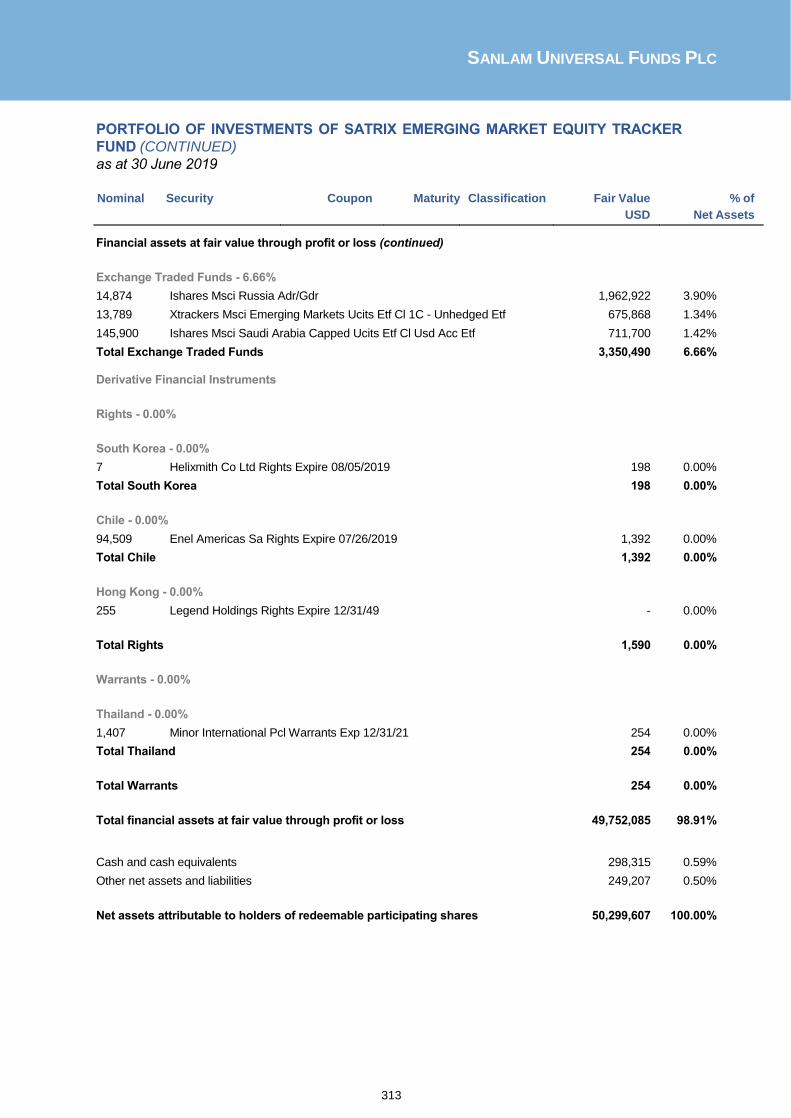
SANLAM UNIVERSAL FUNDS PLC
313
PORTFOLIO OF INVESTMENTS OF SATRIX EMERGING MARKET EQUITY TRACKER
FUND (CONTINUED)
as at 30 June 2019
Nominal Security Coupon Maturity Classification Fair Value % of
USD Net Assets
Financial assets at fair value through profit or loss (continued)
Exchange Traded Funds - 6.66%
14,874 Ishares Msci Russia Adr/Gdr 1,962,922 3.90%
13,789 Xtrackers Msci Emerging Markets Ucits Etf Cl 1C - Unhedged Etf 675,868 1.34%
145,900 Ishares Msci Saudi Arabia Capped Ucits Etf Cl Usd Acc Etf 711,700 1.42%
Total Exchange Traded Funds 3,350,490 6.66% Derivative Financial Instruments
Rights - 0.00%
South Korea - 0.00%
7 Helixmith Co Ltd Rights Expire 08/05/2019 198 0.00%
Total South Korea 198 0.00%
Chile - 0.00%
94,509 Enel Americas Sa Rights Expire 07/26/2019 1,392 0.00%
Total Chile 1,392 0.00%
Hong Kong - 0.00%
255 Legend Holdings Rights Expire 12/31/49 - 0.00%
Total Rights 1,590 0.00%
Warrants - 0.00%
Thailand - 0.00%
1,407 Minor International Pcl Warrants Exp 12/31/21 254 0.00%
Total Thailand 254 0.00%
Total Warrants 254 0.00%
Total financial assets at fair value through profit or loss 49,752,085 98.91%
Cash and cash equivalents 298,315 0.59%
Other net assets and liabilities 249,207 0.50%
Net assets attributable to holders of redeemable participating shares 50,299,607 100.00%

SANLAM UNIVERSAL FUNDS PLC
314
PORTFOLIO OF INVESTMENTS OF SATRIX EMERGING MARKET EQUITY TRACKER
FUND (CONTINUED)
as at 30 June 2019
Satrix Emerging Market Equity Tracker Fund Summary
Classification Description Fair Value % of % of
USD Net
Assets Total
Assets
Transferable securities and money market instruments admitted to official stock exchange listing or traded on regulated market 49,750,241 98.91% 98.71%
A Transferable securities and money market instruments other than those referred above - - -
B UCITS and AIFs - - -
C Financial derivative instruments dealt in on a regulated market - - -
D Over the counter financial derivative instruments 1,844 0.00% 0.00%
Cash and cash equivalents 298,315 0.59% 0.59%
Other net assets and liabilities 249,207 0.50% 0.49%
Net assets attributable to holders of redeemable participating shares 50,299,607 100.00%

SANLAM UNIVERSAL FUNDS PLC
315
PORTFOLIO OF INVESTMENTS OF SANLAM MANAGED RISK FUND
as at 30 June 2019
Nominal Security Classification Fair Value
USD
% of
Net Assets
Financial assets at fair value through profit or loss
Collective Investment Schemes - 91.60%
32,279,922 Satrix World Equity Tracker Fund 82,943,259 91.60%
Total Collective Investment Schemes 82,943,259 91.60% Derivative Financial Instruments
Buy Currency Buy Amount Sell currency Sell Amount Maturity Fair Value % of
USD Net Assets
Forward Contracts – 0.29%
GBP 13,428,128 USD (16,913,802) 19/07/2019 138,677 0.16% GBP 3,793,083 USD (4,777,692) 19/07/2019 39,173 0.05%
GBP 2,548,588 USD (3,210,150) 19/07/2019 26,320 0.03% GBP 2,140,866 USD (2,696,592) 19/07/2019 22,110 0.02%
GBP 892,067 USD (1,123,629) 19/07/2019 9,213 0.01% EUR 436,684 USD (490,726) 19/07/2019 7,022 0.01%
EUR 337,480 USD (379,245) 19/07/2019 5,427 0.01% EUR 280,417 USD (315,120) 19/07/2019 4,509 0.00%
AUD 218,897 USD (150,578) 19/07/2019 2,895 0.00% EUR 124,323 USD (139,709) 19/07/2019 1,999 0.00%
AUD 120,569 USD (82,939) 19/07/2019 1,595 0.00% AUD 79,945 USD (54,994) 19/07/2019 1,057 0.00%
USD 675,196 GBP (530,980) 19/07/2019 900 0.00% EUR 40,028 USD (44,981) 19/07/2019 644 0.00%
CHF 20,234 USD (20,317) 19/07/2019 471 0.00% SEK 95,020 USD (10,027) 19/07/2019 236 0.00%
GBP 13,000 USD (16,396) 19/07/2019 112 0.00% GBP 9,055 USD (11,412) 19/07/2019 87 0.00%
GBP 98,501 USD (125,081) 19/07/2019 6 0.00% GBP 49,988 USD (63,477) 19/07/2019 3 0.00%
CHF 86 USD (87) 19/07/2019 2 0.00% SEK 861 USD (91) 19/07/2019 2 0.00%
GBP 24,899 USD (31,618) 19/07/2019 1 0.00% USD 22 EUR (20) 19/07/2019 - 0.00%
GBP 2 USD (2) 19/07/2019 - 0.00% GBP - USD - 19/07/2019 - 0.00%
USD 215 GBP (170) 19/07/2019 - 0.00% EUR - USD - 19/07/2019 - 0.00%
USD 54 GBP (43) 19/07/2019 - 0.00% USD 30 GBP (23) 19/07/2019 - 0.00%
EUR 35 USD (40) 19/07/2019 - 0.00% USD 790 GBP (622) 19/07/2019 - 0.00%
USD 142 EUR (125) 19/07/2019 - 0.00% USD 124 GBP (98) 19/07/2019 - 0.00%
Total Forward Contracts 262,461 0.29% 1 Brown Brothers Harriman acts as counterparty to the open forward currency contracts at 30 June 2019.
Total financial assets at fair value through profit or loss 83,205,720 91.89%

SANLAM UNIVERSAL FUNDS PLC
316
PORTFOLIO OF INVESTMENTS OF SANLAM MANAGED RISK FUND (CONTINUED)
as at 30 June 2019
Buy Currency Buy Amount Sell currency Sell Amount Maturity Fair Value % of
USD Net Assets
Financial liabilities at fair value through profit or loss Derivative Financial Instruments
Nominal Security Coupon Maturity Classification Fair Value % of
USD Net Assets
Futures - (0.78)%
(476) S&P 500 Emini Future Sep19 (703,203) (0.78)%
Total Futures (703,203) (0.78)% 1BNP Paribas acts as the Fund’s clearing broker with respect to the open futures contracts at 30 June 2019.
Buy Currency Buy Amount Sell currency Sell Amount Maturity Fair Value % of
USD Net Assets
Forward Contracts – 0.00%
USD 460,917 GBP (365,922) 19/07/2019 (3,770) 0.00%
USD 129,164 GBP (102,543) 19/07/2019 (1,056) 0.00%
GBP 294,764 USD (375,292) 19/07/2019 (970) 0.00%
USD 88,601 GBP (70,340) 19/07/2019 (725) 0.00%
USD 74,718 GBP (59,318) 19/07/2019 (611) 0.00%
USD 30,714 GBP (24,384) 19/07/2019 (251) 0.00%
USD 24,284 GBP (19,269) 19/07/2019 (185) 0.00%
USD 17,921 EUR (15,820) 19/07/2019 (111) 0.00%
USD 22,203 GBP (17,513) 19/07/2019 (37) 0.00%
USD 1,561 EUR (1,389) 19/07/2019 (22) 0.00%
USD 1,123 AUD (1,632) 19/07/2019 (21) 0.00%
USD 12,930 GBP (10,199) 19/07/2019 (21) 0.00%
USD 1,023 EUR (910) 19/07/2019 (15) 0.00%
USD 826 EUR (735) 19/07/2019 (12) 0.00%
USD 648 AUD (941) 19/07/2019 (12) 0.00%
USD 425 AUD (617) 19/07/2019 (8) 0.00%
EUR 254,986 USD (290,649) 19/07/2019 (7) 0.00%
GBP 14,151 USD (17,976) 19/07/2019 (6) 0.00%
USD 432 EUR (384) 19/07/2019 (6) 0.00%
GBP 400 USD (511) 19/07/2019 (3) 0.00%
GBP 1,170 USD (1,487) 19/07/2019 (2) 0.00%
Total Forward Contracts (7,851) 0.00%
1 Brown Brothers Harriman acts as counterparty to the open forward currency contracts at 30 June 2019.

SANLAM UNIVERSAL FUNDS PLC
317
PORTFOLIO OF INVESTMENTS OF SANLAM MANAGED RISK FUND (CONTINUED)
as at 30 June 2019
Fair Value
USD
% of
Net Assets
Total financial liabilities at fair value through profit or loss (711,054) (0.79)%
Cash and cash equivalents 7,260,427 8.02%
Other net assets and liabilities 796,055 1.16%
Net assets attributable to holders of redeemable participating shares 90,551,148 100.00%
Sanlam Managed Risk Fund Summary Classification Description Fair Value % of % of
USD Net
Assets Total
Assets
Transferable securities and money market instruments admitted to official stock exchange listing or traded on regulated market - - -
A Transferable securities and money market instruments other than those referred above - - -
B UCITS and AIFs 82,943,259 91.60% 90.38%
C Financial derivative instruments dealt in on a regulated market
(703,203) (0.78)% (0.77)%
D Over the counter financial derivative instruments 254,610 0.28% 0.28%
Cash and cash equivalents 7,260,427 8.02% 7.91%
Other net assets and liabilities 796,055 0.88% 0.87%
Net assets attributable to holders of redeemable participating shares 90,551,148 100.00%

SANLAM UNIVERSAL FUNDS PLC
318
PORTFOLIO OF INVESTMENTS OF SANLAM GLOBAL HIGH QUALITY FUND
as at 30 June 2019
Nominal Security Classification Fair Value
GBP
% of
Net Assets
Financial assets at fair value through profit or loss
Equities - 82.13%
Cayman Islands - 3.46%
382,200 Tencent Holdings Ltd 13,600,989 3.46%
92 Tencent Music Entertainm-Adr 1,086 0.00%
Total Cayman Islands 13,602,075 3.46%
France - 2.37%
140,000 Danone 9,321,255 2.37%
Total France 9,321,255 2.37%
Germany - 7.41%
285,000 Bayer Ag-Reg 15,554,621 3.95%
220,230 Fresenius Medical Care Ag & Co 13,604,071 3.46%
Total Germany 29,158,692 7.41%
Ireland - 8.34%
115,000 Allergan Plc 15,046,619 3.82%
231,361 Medtronic Plc 17,775,118 4.52%
Total Ireland 32,821,737 8.34%
South Korea - 3.26%
16,000 Samsung Electr-Gdr Reg S 12,849,937 3.26%
Total South Korea 12,849,937 3.26%
Switzerland - 2.82%
50,320 Roche Holding Ag-Genussc 11,088,964 2.82%
Total Switzerland 11,088,964 2.82%
United Kingdom - 17.09%
350,000 British American Tobacco 9,661,750 2.46%
224,000 Diageo Plc 7,574,560 1.92%
406,000 Imperial Brands Plc 7,561,344 1.92%
190,000 Intercontinental Hotels Grou 9,834,400 2.50%
213,000 Reckitt Benckiser Group 13,159,140 3.34%
1,360,000 Sage Group Plc 10,939,840 2.78%
175,100 Unilever Plc 8,535,249 2.17%
Total United Kingdom 67,266,283 17.09%
United States - 37.38%
21,000 Alphabet Inc-Cl C 17,809,119 4.53%
120,000 Altria Group Inc 4,530,265 1.15%
92,370 American Express Co 9,022,965 2.29%
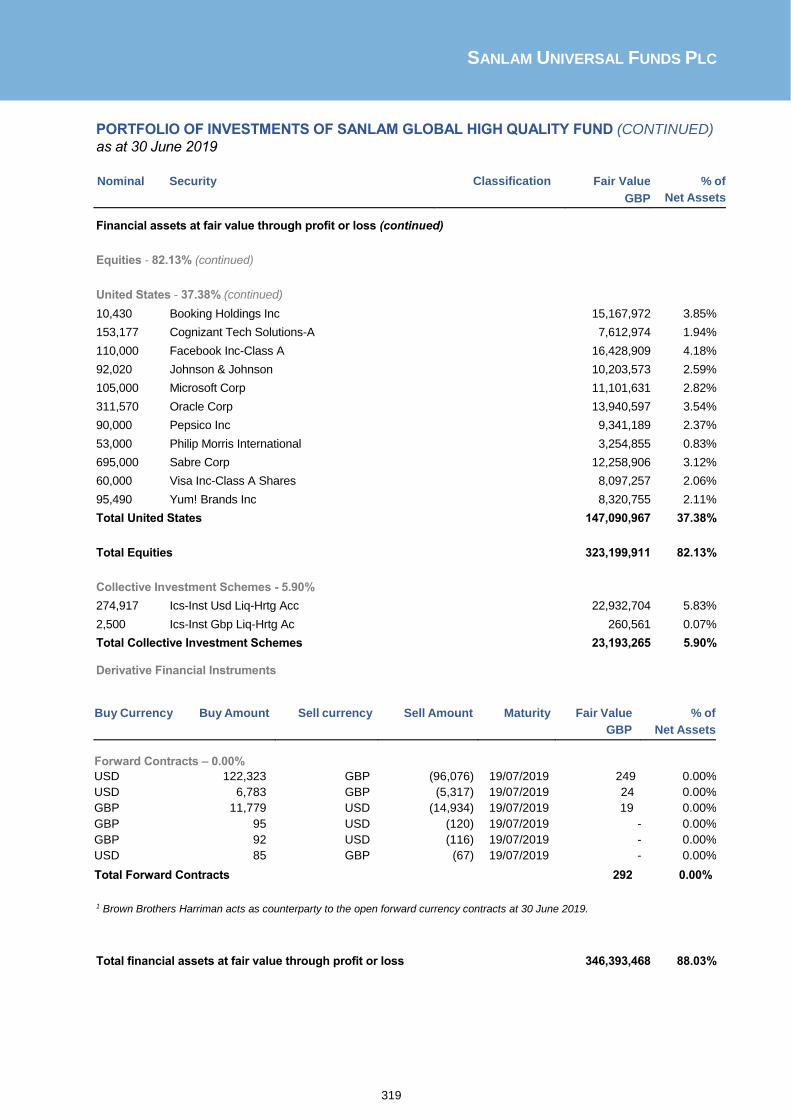
SANLAM UNIVERSAL FUNDS PLC
319
PORTFOLIO OF INVESTMENTS OF SANLAM GLOBAL HIGH QUALITY FUND (CONTINUED)
as at 30 June 2019
Nominal Security Classification Fair Value
GBP
% of
Net Assets
Financial assets at fair value through profit or loss (continued)
Equities - 82.13% (continued)
United States - 37.38% (continued)
10,430 Booking Holdings Inc 15,167,972 3.85%
153,177 Cognizant Tech Solutions-A 7,612,974 1.94%
110,000 Facebook Inc-Class A 16,428,909 4.18%
92,020 Johnson & Johnson 10,203,573 2.59%
105,000 Microsoft Corp 11,101,631 2.82%
311,570 Oracle Corp 13,940,597 3.54%
90,000 Pepsico Inc 9,341,189 2.37%
53,000 Philip Morris International 3,254,855 0.83%
695,000 Sabre Corp 12,258,906 3.12%
60,000 Visa Inc-Class A Shares 8,097,257 2.06%
95,490 Yum! Brands Inc 8,320,755 2.11%
Total United States 147,090,967 37.38%
Total Equities 323,199,911 82.13%
Collective Investment Schemes - 5.90%
274,917 Ics-Inst Usd Liq-Hrtg Acc 22,932,704 5.83%
2,500 Ics-Inst Gbp Liq-Hrtg Ac 260,561 0.07%
Total Collective Investment Schemes 23,193,265 5.90% Derivative Financial Instruments
Buy Currency Buy Amount Sell currency Sell Amount Maturity Fair Value % of
GBP Net Assets
Forward Contracts – 0.00%
USD 122,323 GBP (96,076) 19/07/2019 249 0.00%
USD 6,783 GBP (5,317) 19/07/2019 24 0.00%
GBP 11,779 USD (14,934) 19/07/2019 19 0.00%
GBP 95 USD (120) 19/07/2019 - 0.00%
GBP 92 USD (116) 19/07/2019 - 0.00%
USD 85 GBP (67) 19/07/2019 - 0.00%
Total Forward Contracts 292 0.00%
1 Brown Brothers Harriman acts as counterparty to the open forward currency contracts at 30 June 2019.
Total financial assets at fair value through profit or loss 346,393,468 88.03%

SANLAM UNIVERSAL FUNDS PLC
320
PORTFOLIO OF INVESTMENTS OF SANLAM GLOBAL HIGH QUALITY FUND
(CONTINUED)
as at 30 June 2019
Buy Currency Buy Amount Sell currency Sell Amount Maturity Fair Value % of
GBP Net Assets
Financial liabilities at fair value through profit or loss Derivative Financial Instruments Forward Contracts – (0.01)%
USD 4,084,913 GBP (3,243,076) 19/07/2019 (26,376) (0.01)%
USD 1,350,615 GBP (1,070,847) 19/07/2019 (7,293) 0.00%
GBP 1,157,965 USD (1,477,053) 19/07/2019 (5,153) 0.00%
USD 40,538 GBP (32,183) 19/07/2019 (261) 0.00%
GBP 42,846 USD (54,523) 19/07/2019 (89) 0.00%
GBP 12,646 USD (16,064) 19/07/2019 (4) 0.00%
Total Forward Contracts (39,176) (0.01)%
1 Brown Brothers Harriman acts as counterparty to the open forward currency contracts at 30 June 2019.
Total financial liabilities at fair value through profit or loss (39,176) (0.01%)
Cash and cash equivalents 44,255,322 11.25%
Other net assets and liabilities 2,900,568 0.74%
Net assets attributable to holders of redeemable participating shares 393,510,182 100.00%
Sanlam Global High Quality Fund Summary Classification Description Fair Value % of % of
GBP Net
Assets Total
Assets
Transferable securities and money market instruments admitted to official stock exchange listing or traded on regulated market 323,199,911 82.13% 81.90%
A Transferable securities and money market instruments other than those referred above - - -
B UCITS and AIFs 23,193,265 5.89% 5.88%
C Financial derivative instruments dealt in on a regulated market - - -
D Over the counter financial derivative instruments (38,884) (0.01)% (0.01)%
Cash and cash equivalents 44,255,322 11.25% 11.21%
Other net assets and liabilities 2,900,568 0.74% 0.74%
Net assets attributable to holders of redeemable participating shares 393,510,182 100.00%

SANLAM UNIVERSAL FUNDS PLC
321
PORTFOLIO OF INVESTMENTS OF SANLAM US DIVIDEND FUND
as at 30 June 2019
Nominal Security Classification Fair Value
USD
% of
Net Assets
Financial assets at fair value through profit or loss
Equities - 93.24%
Canada - 9.98%
243,100 Canadian Natural Resourc 6,568,862 1.58%
170,000 Empire Co Ltd ’A’ 4,290,492 1.03%
168,200 Enerflex Ltd 2,194,612 0.53%
365,900 Husky Energy Inc 3,474,895 0.84%
387,300 Imperial Oil Ltd 10,746,890 2.58%
126,600 Magna International Inc 6,312,803 1.52%
241,600 Power Corp Of Canada 5,215,639 1.25%
89,800 Tfi International Inc 2,723,378 0.65%
Total Canada 41,527,571 9.98%
Guernsey - 1.76%
118,000 Amdocs Ltd 7,326,620 1.76%
Total Guernsey 7,326,620 1.76%
United States - 81.50%
39,600 Altria Group Inc 1,875,060 0.45%
40,800 Amerisourcebergen Corp 3,478,608 0.84%
120,000 Arch Coal Inc - A 11,305,200 2.72%
89,400 At&T Inc 2,995,794 0.72%
75,100 Bank Of America Corp 2,177,900 0.52%
43,200 Best Buy Co Inc 3,012,336 0.72%
31,100 Carter’S Inc 3,033,494 0.73%
21,300 Celanese Corp 2,296,140 0.55%
63,800 Cheesecake Factory Inc/The 2,789,336 0.67%
323,000 Chemours Co/The 7,752,000 1.86%
46,800 Children’S Place Inc/The 4,463,784 1.07%
1,495,200 Cleveland-Cliffs Inc 15,953,784 3.84%
58,700 Comerica Inc 4,263,968 1.03%
89,200 Csg Systems Intl Inc 4,355,636 1.05%
97,300 Delta Air Lines Inc 5,521,775 1.33%
391,000 Dick’S Sporting Goods Inc 13,540,330 3.26%
15,900 Domtar Corp 708,027 0.17%
40,200 First American Financial 2,158,740 0.52%
138,200 First Merchants Corp 5,237,780 1.26%
493,800 Foot Locker Inc 20,700,096 4.98%
176,700 Gentex Corp 4,348,587 1.05%
329,800 Gilead Sciences Inc 22,281,288 5.36%
201,600 Goodyear Tire & Rubber Co 3,084,480 0.74%
173,600 Great Western Bancorp Inc 6,200,992 1.49%
201,000 H&R Block Inc 5,889,300 1.42%

SANLAM UNIVERSAL FUNDS PLC
322
PORTFOLIO OF INVESTMENTS OF SANLAM US DIVIDEND FUND (CONTINUED)
as at 30 June 2019
Nominal Security Classification Fair Value
USD
% of
Net Assets
Financial assets at fair value through profit or loss (continued)
Equities - 93.24% (continued)
United States - 81.50% (continued)
173,100 Hormel Foods Corp 7,017,474 1.69%
702,100 Hp Inc 14,596,659 3.51%
32,100 Kforce Inc 1,126,389 0.27%
655,900 Kroger Co 14,239,589 3.42%
37,100 Lear Corp 5,166,917 1.24%
35,100 Lincoln Electric Holdings 2,889,432 0.69%
22,700 Medifast Inc 2,912,410 0.70%
273,200 Metlife Inc 13,569,844 3.26%
177,400 Molson Coors Brewing Co -B 9,934,400 2.39%
31,000 Msc Industrial Direct Co-A 2,302,060 0.55%
23,500 Nu Skin Enterprises Inc - A 1,159,020 0.28%
194,400 Petmed Express Inc 3,046,248 0.73%
16,500 Proassurance Corp 595,815 0.14%
269,346 Ruth’S Hospitality Group Inc 6,116,848 1.47%
90,600 Skyworks Solutions Inc 7,000,662 1.68%
28,100 Snap-On Inc 4,654,484 1.12%
71,300 Solaris Oilfield Infrast-A 1,068,074 0.26%
198,200 State Street Corp 11,111,092 2.67%
152,100 Steel Dynamics Inc 4,593,420 1.10%
243,400 Sturm Ruger & Co Inc 13,260,432 3.19%
40,800 Td Ameritrade Holding Corp 2,036,736 0.49%
88,100 Thor Industries Inc 5,149,445 1.24%
69,900 Tyson Foods Inc-Cl A 5,643,726 1.36%
73,500 Universal Corp/Va 4,466,595 1.07%
334,000 Walgreens Boots Alliance Inc 18,259,780 4.39%
273,800 Wells Fargo & Co 12,956,216 3.12%
235,000 Western Union Co 4,674,150 1.12%
Total United States 338,972,352 81.50%
Total Equities 387,826,543 93.24%

SANLAM UNIVERSAL FUNDS PLC
323
PORTFOLIO OF INVESTMENTS OF SANLAM US DIVIDEND FUND (CONTINUED) as at 30 June 2019
Nominal Security Classification Fair Value
USD
% of
Net Assets
Financial assets at fair value through profit or loss (continued) Derivative Financial Instruments
Buy Currency Buy Amount Sell currency Sell Amount Maturity Fair Value % of
USD Net Assets
Forward Contracts – 0.04%
GBP 2,403,136 USD (3,026,941) 19/07/2019 34,214 0.01%
USD 55 GBP (43) 19/07/2019 - 0.00%
GBP 34,970 USD (43,965) 19/07/2019 580 0.00%
GBP 9,814 USD (12,380) 19/07/2019 120 0.00%
GBP 4,939 USD (6,267) 19/07/2019 24 0.00%
USD 232 GBP (182) 19/07/2019 - 0.00%
GBP 29 USD (36) 19/07/2019 - 0.00%
GBP 34 USD (43) 19/07/2019 - 0.00%
GBP 26,333 USD (33,467) 19/07/2019 77 0.00%
GBP 8,778,198 USD (11,056,842) 19/07/2019 124,977 0.03%
Total Forward Contracts 159,992 0.04%
1 Brown Brothers Harriman acts as counterparty to the open forward currency contracts at 30 June 2019.
Total financial assets at fair value through profit or loss 387,986,535 93.28%
Financial liabilities at fair value through profit or loss Derivative Financial Instruments Forward Contracts – 0.00%
USD 84,294 GBP (66,921) 19/07/2019 (951) 0.00%
USD 304,093 GBP (241,419) 19/07/2019 (3,431) 0.00%
GBP 27,886 USD (35,565) 19/07/2019 (44) 0.00%
Total Forward Contracts (4,426) 0.00%
1 Brown Brothers Harriman acts as counterparty to the open forward currency contracts at 30 June 2019.
Total financial liabilities at fair value through profit or loss (4,426) 0.00%
Cash and cash equivalents 24,357,876 5.86%
Other net assets and liabilities 3,592,290 0.86%
Net assets attributable to holders of redeemable participating shares 415,932,275 100.00%

SANLAM UNIVERSAL FUNDS PLC
324
PORTFOLIO OF INVESTMENTS OF SANLAM US DIVIDEND FUND (CONTINUED)
as at 30 June 2019 Sanlam US Dividend Fund Summary
Classification Description Fair Value % of % of
USD Net
Assets Total
Assets
Transferable securities and money market instruments admitted to official stock exchange listing or traded on regulated market 387,826,543 93.24% 91.79%
A Transferable securities and money market instruments other than those referred above - - -
B UCITS and AIFs - - -
C Financial derivative instruments dealt in on a regulated market - - -
D Over the counter financial derivative instruments 155,566 0.04% 0.04%
Cash and cash equivalents 24,357,876 5.86% 5.76%
Other net assets and liabilities 3,592,290 0.86% 0.85%
Net assets attributable to holders of redeemable participating shares 415,932,275 100.00%

SANLAM UNIVERSAL FUNDS PLC
325
PORTFOLIO OF INVESTMENTS OF HIGH STREET GLOBAL BALANCED FUND
as at 30 June 2019
Nominal Security Classification Fair Value
USD
% of
Net Assets
Financial assets at fair value through profit or loss
Equities - 62.00% Canada - 3.52%
93,800 Dream Global Real Estate Inv 979,812 3.52%
Total Canada 979,812 3.52%
Cayman Island - 1.72%
2,830 Alibaba Group Holding-Sp Adr 479,543 1.72%
Total Cayman Island 479,543 1.72%
Germany - 3.39%
8,333 Leg Immobilien Ag 941,370 3.39%
Total Germany 941,370 3.39%
Guernsey - 4.06%
1,330,338 Sirius Real Estate Ltd 1,127,619 4.06%
Total Guernsey 1,127,619 4.06%
India - 2.49%
7,826 Anheuser-Busch Inbev Sa/ 693,729 2.49%
Total India 693,729 2.49%
Switzerland - 3.05%
3,011 Roche Holding Ag-Genussc 848,176 3.05%
Total Switzerland 848,176 3.05%
United Kingdom - 3.52%
2,119 Royal Dutch Shell Plc-A 69,377 0.25%
27,726 Royal Dutch Shell Plc-B 910,754 3.27%
Total United Kingdom 980,131 3.52%
United States - 40.25%
880 Alphabet Inc-Cl C 951,201 3.42%
3,200 Apple Inc 633,344 2.28%
15,222 Bank Of America Corp 441,438 1.59%
5,500 Caterpillar Inc 749,595 2.69%
3,083 Corteva Inc 91,164 0.33%
3,083 Dow Inc 152,023 0.55%
3,083 Dupont De Nemours Inc 231,441 0.83%
44,982 Enterprise Products Partners 1,298,630 4.67%
8,025 Jpmorgan Chase & Co 897,195 3.22%
10,878 Lowe’S Cos Inc 1,097,699 3.95%
9,800 Microsoft Corp 1,312,808 4.72%
53,083 Public Storage 1,321,261 4.75
8,319 Visa Inc-Class A Shares 1,443,762 5.19%

SANLAM UNIVERSAL FUNDS PLC
326
PORTFOLIO OF INVESTMENTS OF HIGH STREET GLOBAL BALANCED FUND
(CONTINUED)
as at 30 June 2019
Nominal Security Classification Fair Value
USD
% of
Net Assets
Financial assets at fair value through profit or loss (continued) Equities - 62.00% (continued)
United States - 40.25% (continued)
4,100 Walt Disney Co 572,524 2.06%
Total United States 11,194,085 40.25%
Total Equities 17,244,465 62.00%
Exchange Traded Fund - 1.69%
6,150 Etfs Physical Platinum 469,811 1.69%
Total Exchange Traded Fund 469,811 1.69%
Nominal Security Coupon Maturity Classification Fair Value % of
USD Net Assets
Corporate Debt - 10.19%
Isle Of Man - 0.74% 200,000 Sasol Financing 4.500% 14/11/2022 206,378 0.74%
Total Isle Of Man 206,378 0.74%
United Kingdom- 7.01% 640,000 Barclays Bank 10.179% 12/06/2021 722,973 2.60% 300,000 Jaguar Land Rover 4.250% 15/11/2019 300,195 1.08% 908,000 Standard Bank 8.125% 02/12/2019 925,824 3.33% Total United Kingdom 1,948,992 7.01%
United States – 2.44% 660,000 Kraft Heinz Food 3.500% 06/06/2022 677,959 2.44% Total United States 677,959 2.44%
Total Corporate Debt 2,833,328 10.19%
Government Debt - 1.79%
United States – 1.79% 500,000 US Treasury Bill 0.000% 05/09/2019 498,086 1.79% Total United States 498,086 1.79%
Total Government Debt 498,086 1.79%
3
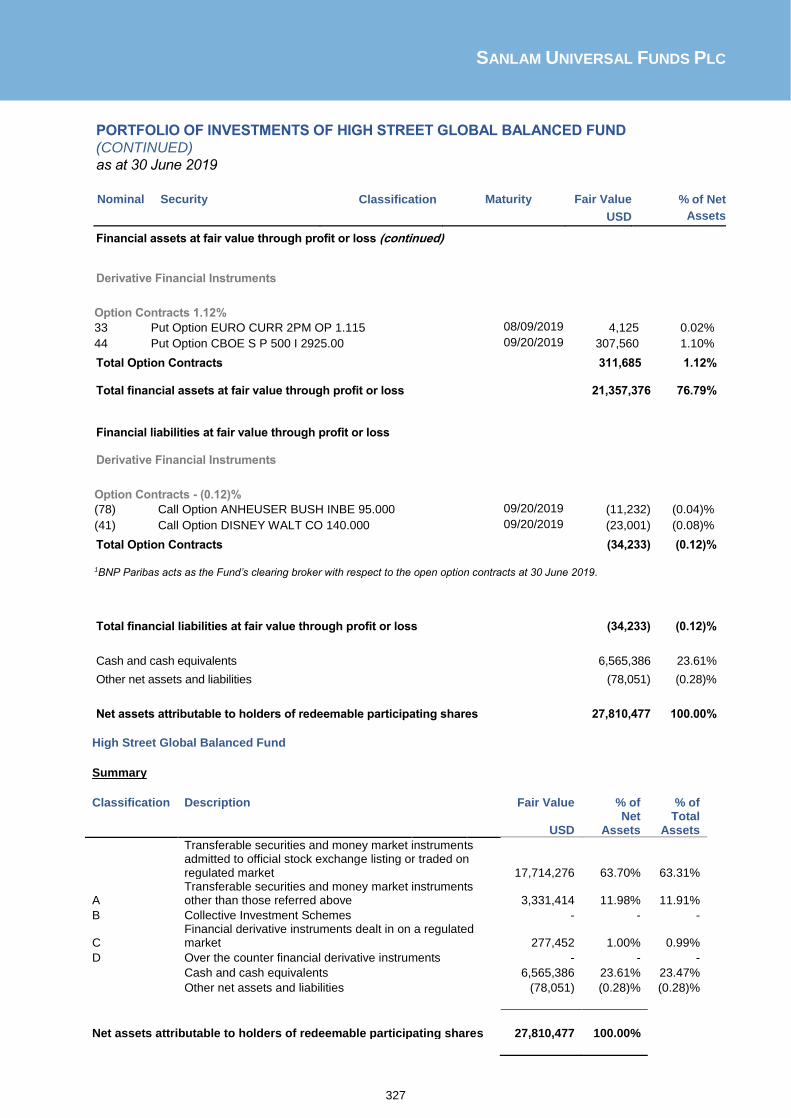
SANLAM UNIVERSAL FUNDS PLC
327
PORTFOLIO OF INVESTMENTS OF HIGH STREET GLOBAL BALANCED FUND
(CONTINUED)
as at 30 June 2019
Nominal Security Classification Maturity Fair Value
USD
% of Net
Assets
Financial assets at fair value through profit or loss (continued)
Derivative Financial Instruments
Option Contracts 1.12%
33 Put Option EURO CURR 2PM OP 1.115 08/09/2019 4,125 0.02%
44 Put Option CBOE S P 500 I 2925.00 09/20/2019 307,560 1.10%
Total Option Contracts 311,685 1.12% Total financial assets at fair value through profit or loss 21,357,376 76.79%
Financial liabilities at fair value through profit or loss Derivative Financial Instruments
Option Contracts - (0.12)%
(78) Call Option ANHEUSER BUSH INBE 95.000 09/20/2019 (11,232) (0.04)%
(41) Call Option DISNEY WALT CO 140.000 09/20/2019 (23,001) (0.08)%
Total Option Contracts (34,233) (0.12)%
1BNP Paribas acts as the Fund’s clearing broker with respect to the open option contracts at 30 June 2019.
Total financial liabilities at fair value through profit or loss (34,233) (0.12)%
Cash and cash equivalents 6,565,386 23.61%
Other net assets and liabilities (78,051) (0.28)%
Net assets attributable to holders of redeemable participating shares 27,810,477 100.00%
High Street Global Balanced Fund Summary
Classification Description Fair Value % of % of
USD Net
Assets Total
Assets
Transferable securities and money market instruments admitted to official stock exchange listing or traded on regulated market 17,714,276 63.70% 63.31%
A Transferable securities and money market instruments other than those referred above 3,331,414 11.98% 11.91%
B Collective Investment Schemes - - -
C Financial derivative instruments dealt in on a regulated market 277,452 1.00% 0.99%
D Over the counter financial derivative instruments - - -
Cash and cash equivalents 6,565,386 23.61% 23.47%
Other net assets and liabilities (78,051) (0.28)% (0.28)%
Net assets attributable to holders of redeemable participating shares 27,810,477 100.00%

SANLAM UNIVERSAL FUNDS PLC
328
PORTFOLIO OF INVESTMENTS OF SANLAM GLOBAL VALUE FUND
as at 30 June 2019
Nominal Security Classification Fair Value
USD
% of
Net Assets
Financial assets at fair value through profit or loss
Equities - 97.64%
Canada - 1.11%
99,034 Prairiesky Royalty Ltd 1,394,472 1.11%
Total Canada 1,394,472 1.11%
France - 5.62%
29,514 Danone 2,503,986 1.99%
30,351 Publicis Groupe 1,604,793 1.28%
52,703 Total Sa 2,957,396 2.35%
Total France 7,066,175 5.62%
Ireland - 6.39%
17,880 Allergan Plc 2,993,649 2.38%
30,557 Medtronic Plc 2,975,946 2.37%
10,750 Willis Towers Watson Plc 2,059,055 1.64%
Total Ireland 8,028,650 6.39%
Italy - 1.64%
958,592 Intesa Sanpaolo 2,054,475 1.64%
Total Italy 2,054,475 1.64%
Japan - 3.68%
48,940 Hitachi Ltd 1,793,800 1.43%
57,303 Honda Motor Co Ltd 1,481,241 1.18%
56,400 Thk Co Ltd 1,347,967 1.07%
Total Japan 4,623,008 3.68%
Jersey Channel Islands - 4.18%
136,700 Delphi Technologies Plc 2,734,000 2.18%
199,542 Wpp Plc 2,514,683 2.00%
Total Jersey Channel Islands 5,248,683 4.18%
Luxembourg - 2.17%
207,699 Tenaris Sa 2,722,433 2.17%
Total Luxembourg 2,722,433 2.17%
Netherlands - 5.18%
55,351 Exor Nv 3,882,877 3.09%
23,513 Heineken Nv 2,627,856 2.09%
Total Netherlands 6,510,733 5.18%

SANLAM UNIVERSAL FUNDS PLC
329
PORTFOLIO OF INVESTMENTS OF SANLAM GLOBAL VALUE FUND (CONTINUED)
as at 30 June 2019
Nominal Security Classification Fair Value
USD
% of
Net Assets
Financial assets at fair value through profit or loss (continued)
Equities - 97.64% (continued)
South Korea - 2.88%
109,094 Samsung Electronics Prf 3,613,948 2.88%
Total South Korea 3,613,948 2.88%
Switzerland - 5.41%
43,477 Adecco Group Ag-Reg 2,615,755 2.08%
9,434 Roche Holding Ag-Genussc 2,657,485 2.12%
127,989 Ubs Group Ag-Reg 1,522,741 1.21%
Total Switzerland 6,795,981 5.41%
United Kingdom - 9.91%
12,270 Aon Plc 2,367,865 1.89%
203,421 Bae Systems Plc 1,282,560 1.02%
70,023 British American Tobacco 2,449,861 1.95%
48,350 Imperial Brands Plc 1,136,429 0.90%
2,672,252 Lloyds Banking Group Plc 1,924,612 1.53%
20,795 Reckitt Benckiser Group 1,644,585 1.31%
101,552 Travis Perkins Plc 1,647,230 1.31%
Total United Kingdom 12,453,142 9.91%
United States - 47.52%
19,200 American Express Co 2,370,048 1.89%
43,714 Amerisourcebergen Corp 3,727,056 2.97%
35,250 Arrow Electronics Inc 2,512,267 2.00%
82,845 Bank Of America Corp 2,402,505 1.91%
17,300 Berkshire Hathaway Inc-Cl B 3,687,841 2.94%
59,457 Comcast Corp -Class A 2,513,842 2.00%
89,868 Corteva Inc 2,657,397 2.11%
24,431 Dow Inc 1,204,693 0.96%
33,168 Dupont De Nemours Inc 2,489,922 1.98%
101,847 Ebay Inc 4,022,956 3.20%
63,100 Hd Supply Holdings Inc 2,541,668 2.02%
110,346 Hewlett Packard Enterpris 1,649,673 1.31%
151,623 Hp Inc 3,152,242 2.51%
14,371 Jpmorgan Chase & Co 1,606,678 1.28%
19,250 Merck & Co. Inc. 1,614,112 1.28%
18,536 Microsoft Corp 2,483,083 1.98%
65,964 Oracle Corp 3,757,969 2.99%
22,434 Oshkosh Corp 1,873,015 1.49%
31,163 Spirit Aerosystems Hold-Cl A 2,535,733 2.02%
15,175 Unitedhealth Group Inc 3,702,852 2.95%

SANLAM UNIVERSAL FUNDS PLC
330
PORTFOLIO OF INVESTMENTS OF SANLAM GLOBAL VALUE FUND (CONTINUED)
as at 30 June 2019
Nominal Security Classification Fair Value
USD
% of
Net Assets
Financial assets at fair value through profit or loss (continued)
Equities - 97.64% (continued)
United States - 47.52% (continued)
39,467 Viacom Inc-Class B 1,178,879 0.94%
41,488 Wells Fargo & Co 1,963,212 1.56%
59,405 Western Digital Corp 2,824,708 2.25%
10,452 Zimmer Biomet Holdings Inc 1,230,618 0.98%
Total United States 59,702,969 47.52%
Virgin Islands - 1.95%
70,584 Capri Holdings Ltd 2,447,853 1.95%
Total Virgin Islands 2,447,853 1.95%
Total Equities 122,662,521 97.64%
Derivative Financial Instruments
Warrants - 0.00%
Singapore - 0.00%
3,017,562 Ezion Holdings Ltd Wt Ex 04/24/20 2,230 0.00%
12,137,361 War Ezion Holdings Ltd Wt Ex 04/16/23 - 0.00%
Total Singapore 2,230 0.00%
United Kingdom - 0.00%
903 Kenmare Warrants Expire 11/16/19 - 0.00%
Total United Kingdom - 0.00%
Total Warrants 2,230 0.00%
Total financial assets at fair value through profit or loss 122,664,751 97.64%
Cash and cash equivalents 861,457 0.69%
Other net assets and liabilities 2,102,222 1.67%
Net assets attributable to holders of redeemable participating shares 125,628,430 100.00%

SANLAM UNIVERSAL FUNDS PLC
331
PORTFOLIO OF INVESTMENTS OF SANLAM GLOBAL VALUE FUND (CONTINUED)
as at 30 June 2019
Sanlam Global Value Fund Summary
Classification Description Fair Value % of % of
USD Net
Assets Total
Assets
Transferable securities and money market instruments admitted to official stock exchange listing or traded on regulated market 122,662,521 97.64% 96.11%
A Transferable securities and money market instruments other than those referred above - - -
B Collective Investment Schemes - - -
C Financial derivative instruments dealt in on a regulated market - - -
D Over the counter financial derivative instruments 2,230 0.00% 0.00%
Cash and cash equivalents 861,457 0.69% 0.68%
Other net assets and liabilities 2,102,222 1.67% 1.65%
Net assets attributable to holders of redeemable participating shares 125,628,430 100.00%

SANLAM UNIVERSAL FUNDS PLC
332
PORTFOLIO OF INVESTMENTS OF SANLAM STABLE GLOBAL FUND
as at 30 June 2019
Nominal Security Classification Fair Value
USD
% of
Net Assets
Financial assets at fair value through profit or loss
Equities - 96.87%
France - 6.42%
40,996 Danone 3,478,125 4.60%
26,040 Publicis Groupe 1,376,852 1.82%
Total France 4,854,977 6.42%
Ireland - 11.38%
14,882 Allergan Plc 2,491,693 3.29%
33,698 Medtronic Plc 3,281,848 4.34%
14,801 Willis Towers Watson Plc 2,834,984 3.75%
Total Ireland 8,608,525 11.38%
Jersey Channel Islands - 3.82%
229,310 Wpp Plc 2,889,828 3.82%
Total Jersey Channel Islands 2,889,828 3.82%
Netherlands - 4.01%
27,168 Heineken Nv 3,036,345 4.01%
Total Netherlands 3,036,345 4.01%
Switzerland - 4.48%
12,049 Roche Holding Ag-Genussc 3,394,111 4.48%
Total Switzerland 3,394,111 4.48%
United Kingdom - 16.49%
19,953 Aon Plc 3,850,530 5.09%
82,946 British American Tobacco 2,901,992 3.83%
105,244 Imperial Brands Plc 2,473,678 3.27%
41,180 Reckitt Benckiser Group 3,256,744 4.30%
Total United Kingdom 12,482,944 16.49%
United States - 50.27%
44,920 Amerisourcebergen Corp 3,829,879 5.06%
21,800 Berkshire Hathaway Inc-Cl B 4,647,106 6.14%
60,800 Comcast Corp -Class A 2,570,624 3.40%
107,057 Ebay Inc 4,228,752 5.59%
125,415 Hp Inc 2,607,378 3.45%
17,517 Merck & Co. Inc. 1,468,800 1.94%
22,058 Microsoft Corp 2,954,890 3.90%
27,837 Nasdaq Inc 2,677,084 3.54%
56,430 Oracle Corp 3,214,817 4.25%
27,212 Procter & Gamble Co 2,983,796 3.94%
16,292 Unitedhealth Group Inc 3,975,411 5.25%
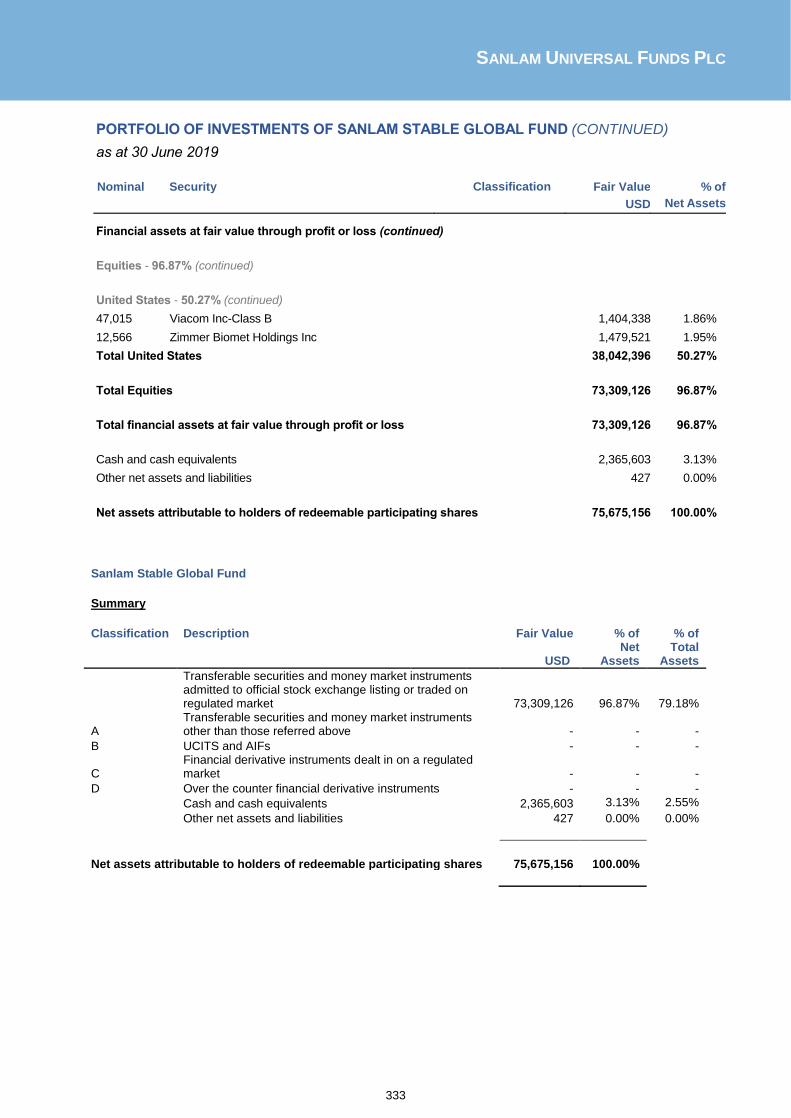
SANLAM UNIVERSAL FUNDS PLC
333
PORTFOLIO OF INVESTMENTS OF SANLAM STABLE GLOBAL FUND (CONTINUED)
as at 30 June 2019
Nominal Security Classification Fair Value
USD
% of
Net Assets
Financial assets at fair value through profit or loss (continued)
Equities - 96.87% (continued)
United States - 50.27% (continued)
47,015 Viacom Inc-Class B 1,404,338 1.86%
12,566 Zimmer Biomet Holdings Inc 1,479,521 1.95%
Total United States 38,042,396 50.27%
Total Equities 73,309,126 96.87%
Total financial assets at fair value through profit or loss 73,309,126 96.87%
Cash and cash equivalents 2,365,603 3.13%
Other net assets and liabilities 427 0.00%
Net assets attributable to holders of redeemable participating shares 75,675,156 100.00%
Sanlam Stable Global Fund Summary
Classification Description Fair Value % of % of
USD Net
Assets Total
Assets
Transferable securities and money market instruments admitted to official stock exchange listing or traded on regulated market 73,309,126 96.87% 79.18%
A Transferable securities and money market instruments other than those referred above - - -
B UCITS and AIFs - - -
C Financial derivative instruments dealt in on a regulated market - - -
D Over the counter financial derivative instruments - - -
Cash and cash equivalents 2,365,603 3.13% 2.55%
Other net assets and liabilities 427 0.00% 0.00%
Net assets attributable to holders of redeemable participating shares 75,675,156 100.00%
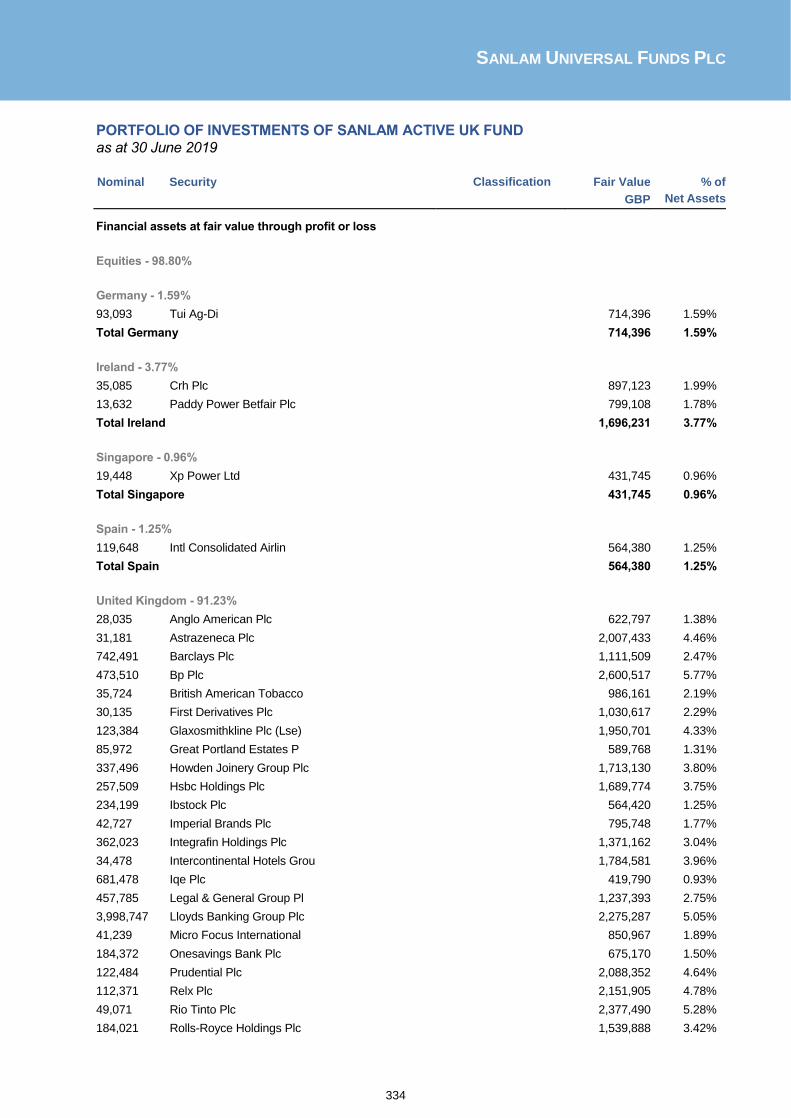
SANLAM UNIVERSAL FUNDS PLC
334
PORTFOLIO OF INVESTMENTS OF SANLAM ACTIVE UK FUND
as at 30 June 2019
Nominal Security Classification Fair Value
GBP
% of
Net Assets
Financial assets at fair value through profit or loss
Equities - 98.80%
Germany - 1.59%
93,093 Tui Ag-Di 714,396 1.59%
Total Germany 714,396 1.59%
Ireland - 3.77%
35,085 Crh Plc 897,123 1.99%
13,632 Paddy Power Betfair Plc 799,108 1.78%
Total Ireland 1,696,231 3.77%
Singapore - 0.96%
19,448 Xp Power Ltd 431,745 0.96%
Total Singapore 431,745 0.96%
Spain - 1.25%
119,648 Intl Consolidated Airlin 564,380 1.25%
Total Spain 564,380 1.25%
United Kingdom - 91.23%
28,035 Anglo American Plc 622,797 1.38%
31,181 Astrazeneca Plc 2,007,433 4.46%
742,491 Barclays Plc 1,111,509 2.47%
473,510 Bp Plc 2,600,517 5.77%
35,724 British American Tobacco 986,161 2.19%
30,135 First Derivatives Plc 1,030,617 2.29%
123,384 Glaxosmithkline Plc (Lse) 1,950,701 4.33%
85,972 Great Portland Estates P 589,768 1.31%
337,496 Howden Joinery Group Plc 1,713,130 3.80%
257,509 Hsbc Holdings Plc 1,689,774 3.75%
234,199 Ibstock Plc 564,420 1.25%
42,727 Imperial Brands Plc 795,748 1.77%
362,023 Integrafin Holdings Plc 1,371,162 3.04%
34,478 Intercontinental Hotels Grou 1,784,581 3.96%
681,478 Iqe Plc 419,790 0.93%
457,785 Legal & General Group Pl 1,237,393 2.75%
3,998,747 Lloyds Banking Group Plc 2,275,287 5.05%
41,239 Micro Focus International 850,967 1.89%
184,372 Onesavings Bank Plc 675,170 1.50%
122,484 Prudential Plc 2,088,352 4.64%
112,371 Relx Plc 2,151,905 4.78%
49,071 Rio Tinto Plc 2,377,490 5.28%
184,021 Rolls-Royce Holdings Plc 1,539,888 3.42%

SANLAM UNIVERSAL FUNDS PLC
335
PORTFOLIO OF INVESTMENTS OF SANLAM ACTIVE UK FUND (CONTINUED)
as at 30 June 2019
Nominal Security Classification Fair Value
GBP
% of
Net Assets
Financial assets at fair value through profit or loss (continued)
Equities - 98.80% (continued)
United Kingdom - 91.23% (continued)
6,287,902 Rolls-Royce Holdings-Ent 6,288 0.01%
89,182 Royal Dutch Shell Plc-A 2,303,125 5.11%
163,922 Sage Group Plc 1,318,589 2.93%
839,410 Taylor Wimpey Plc 1,329,625 2.95%
38,759 Unilever Plc 1,889,307 4.19%
29,247 Whitbread Plc 1,350,919 3.00%
102,631 Wood Group (John) Plc 465,842 1.03%
Total United Kingdom 41,098,255 91.23%
Total Equities 44,505,007 98.80%
Derivative Financial Instruments
Warrants - 0.00%
United Kingdom - 0.00%
500 Kenmare Warrants Expire11/16/19 - 0.00%
Total United Kingdom - 0.00%
Total Warrants - 0.00%
Total financial assets at fair value through profit or loss 44,505,007 98.80%
Cash and cash equivalents 233,039 0.52%
Other net assets and liabilities 308,725 0.69%
Net assets attributable to holders of redeemable participating shares 45,046,771 100.00%

SANLAM UNIVERSAL FUNDS PLC
336
PORTFOLIO OF INVESTMENTS OF SANLAM ACTIVE UK FUND (CONTINUED)
as at 30 June 2019
Sanlam Active UK Fund Summary
Classification Description Fair Value % of % of
GBP Net
Assets Total
Assets
Transferable securities and money market instruments admitted to official stock exchange listing or traded on regulated market 44,505,007 98.80% 98.55%
A Transferable securities and money market instruments other than those referred above - - -
B UCITS and AIFs - - -
C Financial derivative instruments dealt in on a regulated market - - -
D Over the counter financial derivative instruments - - -
Cash and cash equivalents 233,039 0.52% 0.52%
Other net assets and liabilities 308,725 0.69% 0.68%
Net assets attributable to holders of redeemable participating shares 45,046,771 100.00%
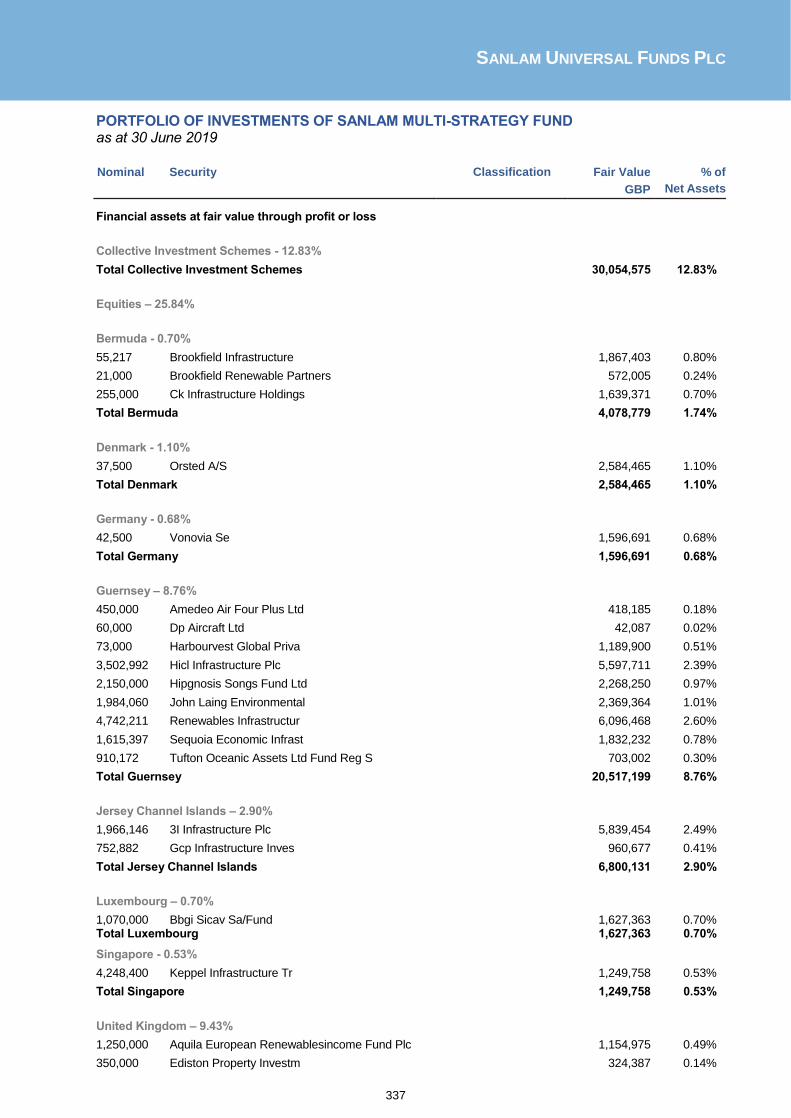
SANLAM UNIVERSAL FUNDS PLC
337
PORTFOLIO OF INVESTMENTS OF SANLAM MULTI-STRATEGY FUND as at 30 June 2019
Nominal Security Classification Fair Value
GBP
% of
Net Assets
Financial assets at fair value through profit or loss
Collective Investment Schemes - 12.83%
Total Collective Investment Schemes 30,054,575 12.83%
Equities – 25.84%
Bermuda - 0.70%
55,217 Brookfield Infrastructure 1,867,403 0.80%
21,000 Brookfield Renewable Partners 572,005 0.24%
255,000 Ck Infrastructure Holdings 1,639,371 0.70%
Total Bermuda 4,078,779 1.74%
Denmark - 1.10%
37,500 Orsted A/S 2,584,465 1.10%
Total Denmark 2,584,465 1.10%
Germany - 0.68%
42,500 Vonovia Se 1,596,691 0.68%
Total Germany 1,596,691 0.68%
Guernsey – 8.76%
450,000 Amedeo Air Four Plus Ltd 418,185 0.18%
60,000 Dp Aircraft Ltd 42,087 0.02%
73,000 Harbourvest Global Priva 1,189,900 0.51%
3,502,992 Hicl Infrastructure Plc 5,597,711 2.39%
2,150,000 Hipgnosis Songs Fund Ltd 2,268,250 0.97%
1,984,060 John Laing Environmental 2,369,364 1.01%
4,742,211 Renewables Infrastructur 6,096,468 2.60%
1,615,397 Sequoia Economic Infrast 1,832,232 0.78%
910,172 Tufton Oceanic Assets Ltd Fund Reg S 703,002 0.30%
Total Guernsey 20,517,199 8.76%
Jersey Channel Islands – 2.90%
1,966,146 3I Infrastructure Plc 5,839,454 2.49%
752,882 Gcp Infrastructure Inves 960,677 0.41%
Total Jersey Channel Islands 6,800,131 2.90%
Luxembourg – 0.70%
1,070,000 Bbgi Sicav Sa/Fund 1,627,363 0.70% Total Luxembourg 1,627,363 0.70%
Singapore - 0.53%
4,248,400 Keppel Infrastructure Tr 1,249,758 0.53%
Total Singapore 1,249,758 0.53%
United Kingdom – 9.43%
1,250,000 Aquila European Renewablesincome Fund Plc 1,154,975 0.49%
350,000 Ediston Property Investm 324,387 0.14%

SANLAM UNIVERSAL FUNDS PLC
338
PORTFOLIO OF INVESTMENTS OF SANLAM MULTI-STRATEGY FUND (CONTINUED)
as at 30 June 2019
Nominal Security Classification Fair Value
GBP
% of
Net Assets
Financial assets at fair value through profit or loss (continued) Equities – 25.84% (continued) United Kingdom – 9.43% (continued)
908,245 Empiric Student Property 830,136 0.35%
1,509,642 Grainger Plc 3,701,642 1.58%
4,488,041 Greencoat Uk Wind Plc 6,340,489 2.71%
450,000 Sdcl Energy Efficiency I 481,500 0.21%
284,000 Secure Income Reit Plc 1,136,142 0.48%
1,127,351 Supermarket Income Reit Plc 1,186,537 0.51%
2,508,278 Triple Point Social Hous 2,086,887 0.89%
2,061,252 Tritax Big Box Reit Plc 3,163,480 1.35%
173,000 Unite Group Plc 1,682,425 0.72%
Total United Kingdom 22,088,600 9.43%
Total Equities 60,542,986 13.01%
Nominal Security Coupon Maturity Classification Fair Value % of
GBP Net Assets
Corporate Debt - 63.62%
Australia – 2.43% 5,000,000 BHP Billiton V/R 6.500% 22/10/2077 5,692,385 2.43% Total Australia 5,692,385 2.43%
Bermuda – 1.69% 3,728,000 FIL Limited 6.750% 19/10/2020 3,963,832 1.69% Total Bermuda 3,963,832 1.69%
Canada – 3.15% 7,000,000 Glencore 7.375% 27/05/2020 7,379,106 3.15% Total Canada 7,379,106 3.15%
European Union – 2.57% 6,000,000 European Inv V/R 1.054% 17/02/2020 6,010,752 2.57% Total European Union 6,010,752 2.57%
Netherlands – 4.29% 3,000,000 Shell Interna 2.000% 20/12/2019 3,015,753 1.29% 4,000,000 Volkswage 1.875% 07/09/2021 4,021,128 1.72% 3,000,000 Volkswagen 1.500% 12/04/2021 2,995,920 1.28% Total Netherlands 10,032,801 4.29%
Spain – 1.53% 3,500,000 Abertis I 3.375% 3.375% 27/11/2026 3,587,251 1.53% Total Spain 3,587,251 1.53%

SANLAM UNIVERSAL FUNDS PLC
339
PORTFOLIO OF INVESTMENTS OF SANLAM MULTI-STRATEGY FUND (CONTINUED)
as at 30 June 2019
Nominal Security Coupon Maturity Classification Fair Value % of
GBP Net Assets
Financial assets at fair value through profit or loss (continued)
Corporate Debt - 63.62% (continued)
United Kingdom – 47.36% 5,000,000 3I Group 6.875% 09/03/2023 5,881,795 2.51% 3,000,000 Anglo Ameri 1.500% 01/04/2020 2,719,424 1.16% 2,600,000 Aviva Plc V/R 5.902% 27/07/2167 2,687,662 1.15% 3,400,000 Aviva Plc V/R 6.625% 03/06/2041 3,698,366 1.58% 3,000,000 Barclays Plc V/R 7.875% 15/12/2167 3,184,878 1.36% 2,200,000 Bat Intl 6.375% 12/12/2019 2,249,181 0.96% 3,800,000 Bat Intl F 1.750% 05/07/2021 3,822,720 1.63% 6,000,000 Gkn Holdi 5.375% 19/09/2022 6,545,796 2.79% 5,000,000 Grainger 3.375% 24/04/2028 5,173,960 2.21% 5,000,000 Intercont 3.875% 28/11/2022 5,379,550 2.30% 6,000,000 J Sainsbury Pl V/R 6.500% 30/07/2167 6,294,000 2.69% 3,500,000 Legal & Gene V/R 5.375% 27/10/2045 3,885,343 1.66% 10,000,000 Lloyds Bank V/R 0.000% 16/05/2024 10,021,580 4.28% 5,000,000 London Sto 4.750% 02/11/2021 5,385,090 2.30% 5,000,000 Marks & Spenc 3.000% 08/12/2023 5,121,238 2.19% 2,696,000 Ocado Group 4.000% 15/06/2024 2,798,920 1.19% 6,000,000 Santander Uk V/R 1.298% 08/07/2019 6,000,570 2.56% 2,000,000 Standard Chart V/R 7.750% 31/01/2168 2,301,250 0.98% 6,000,000 Tate & Lyl 6.750% 25/11/2019 6,135,768 2.62% 7,000,000 Tesco Plc 6.125% 24/02/2022 7,831,768 3.34% 4,500,000 Tsb Banking V/R 5.750% 06/05/2026 4,582,845 1.96% 4,000,000 Vodafone Gro V/R 4.875% 03/10/2078 4,095,220 1.75% 5,000,000 Whitbread 3.375% 16/10/2025 5,186,630 2.21% Total United Kingdom 110,983,553 47.36%
United States - 0.62% 1,400,000 Mcdonald’s 6.375% 03/02/2020 1,442,105 0.62% Total United States 1,442,105 0.62%
Total Corporate Debt 149,091,785 63.62%
Derivative Financial Instruments
Option Contracts - 0.28%
42 Call Option On S P 500 Index Sep 3050 75,076 0.03%
127 Put Option On Ftse 100 Index Dec 19 103,505 0.05%
76 Put Option On Ftse 100 Index Sep 19 9,120 0.00%
223 Put Option On Euro Stoxx 50 Price Oct19 68,016 0.03%
113 Call Option On Ftse 100 Index Oct 19 169,500 0.07%
34 Put Option On S P 500 Index Sep 2450 22,509 0.01%
75 Put Option On Ftse 100 Index Jul 19 1,500 0.00%
125 Put Option On Ftse 100 Index Dec 19 59,375 0.03%
300 Call Option On Euro Stoxx 50 Price Eur Dec 19 145,325 0.06%
Total Option Contracts 653,925 0.28%
1BNP Paribas acts as the Fund’s clearing broker with respect to the open option contracts at 30 June 2019.

SANLAM UNIVERSAL FUNDS PLC
340
PORTFOLIO OF INVESTMENTS OF SANLAM MULTI-STRATEGY FUND (CONTINUED)
as at 30 June 2019
Nominal Security Coupon Maturity Classification Fair Value % of
GBP Net Assets
Financial assets at fair value through profit or loss (continued)
Derivative Financial Instruments (continued)
Futures - 20.08%
17 US 10Yr Note Sep19 30,565 0.01%
207 S&P 500 Emini Futures Sep19 322,066 0.14%
259 Nikkei 225 Mini Sep19 27,130 0.01%
194 Euro Stoxx 50 Sep19 65,280 0.03%
25 S&P Mid 400 Emini Sep19 52,313 0.02%
89 Ftse 250 Index Future Sep19 19,313 0.01%
(12) Dax Index. Future Sep19 4,171 0.00%
Total Futures 520,839 0.22% 1BNP Paribas acts as the Fund’s clearing broker with respect to the open futures contracts at 30 June 2019.
Buy Currency Buy Amount Sell currency Sell Amount Maturity Fair Value % of
GBP Net Assets
Forward Contracts – 0.00%
GBP 34,083 USD (43,211) 19/07/2019 56 0.00% USD 3,333 GBP (2,625) 19/07/2019 - 0.00%
USD 44 GBP (35) 19/07/2019 - 0.00% USD 70 GBP (55) 19/07/2019 - 0.00%
GBP 9 USD (12) 19/07/2019 - 0.00% GBP 29 USD (37) 19/07/2019 - 0.00%
Total Forward Contracts 56 0.00% 1 Brown Brothers Harriman acts as counterparty to the open forward currency contracts at 30 June 2019.
Total financial assets at fair value through profit or loss 210,809,592 89.96%
Financial liabilities at fair value through profit or loss Derivative Financial Instruments
Nominal Security Classification Fair Value
GBP
% of
Net Assets
Option contracts - (0.04)%
(15) Call Option On Nikkei 225 Jul19 (18,116) (0.01)%
(76) Call Option On Euro Stoxx 50 Price Jul19 (19,772) (0.01)%
32) Call Option On Ftse 100 Index Jul19 (14,240) 0.00%
(30) Call Option On S P 500 Index Jul (42,087) (0.02)%
(300) Put Option On Euro Stoxx 50 Price Sep19 (6,459) 0.00%
Total Option contracts (100,674) (0.04)% 1BNP Paribas acts as the Fund’s clearing broker with respect to the open option contracts at 30 June 2019.
Futures - (0.01)%
8 Ftse 100 Idx Future Sep19 (410) 0.00%
31 Mdax Index Future Sep19 (15,712) (0.01)%
Total Futures (16,122) (0.01)% 1BNP Paribas acts as the Fund’s clearing broker with respect to the open futures contracts at 30 June 2019.

SANLAM UNIVERSAL FUNDS PLC
341
PORTFOLIO OF INVESTMENTS OF SANLAM MULTI-STRATEGY FUND (CONTINUED)
as at 30 June 2019
Buy Currency Buy Amount Sell currency Sell Amount Maturity Fair Value % of
GBP Net Assets
Financial liabilities at fair value through profit or loss (continued) Derivative Financial Instruments (continued) Forward Contracts – (0.04)%
USD 12,154,486 GBP (9,649,634) 19/07/2019 (78,479) (0.04)%
GBP 2,694,857 EUR (3,028,950) 06/09/2019 (28,635) 0.00%
USD 4,185,170 GBP (3,322,671) 19/07/2019 (27,023) 0.00%
GBP 1,155,022 USD (1,473,299) 19/07/2019 (5,140) 0.00%
USD 756,321 GBP (599,656) 19/07/2019 (4,084) 0.00%
USD 269,799 GBP (214,586) 19/07/2019 (2,130) 0.00%
USD 190,206 GBP (151,005) 19/07/2019 (1,225) 0.00%
USD 119,391 GBP (94,784) 19/07/2019 (769) 0.00%
GBP 35,092 USD (44,657) 19/07/2019 (73) 0.00%
GBP 16,102 USD (20,455) 19/07/2019 (5) 0.00%
GBP 611 USD (779) 19/07/2019 (3) 0.00%
Total Forward Contracts (147,566) (0.04)%
1 Brown Brothers Harriman acts as counterparty to the open forward currency contracts at 30 June 2019.
Total financial liabilities at fair value through profit or loss (3,415,026) (1.45%)
Cash and cash equivalents 21,349,048 9.11%
Other net assets and liabilities 2,440,359 1.04%
Net assets attributable to holders of redeemable participating shares 234,334,638 100.00%
Sanlam Multi-Strategy Fund Summary Classification Description Fair Value % of % of
GBP Net
Assets Total
Assets
Transferable securities and money market instruments admitted to official stock exchange listing or traded on regulated market 30,488,411 13.01% 12.97%
A Transferable securities and money market instruments other than those referred above 149,091,785 63.62% 63.44%
B UCITS and AIFs 30,054,576 12.83% 12.79%
C Financial derivative instruments dealt in on a regulated market 1,057,969 0.45% 0.45%
D Over the counter financial derivative instruments (147,510) (0.06)% (0.06)%
Cash and cash equivalents 21,349,048 9.11% 9.08%
Other net assets and liabilities 2,440,359 1.04% 1.04%
Net assets attributable to holders of redeemable participating shares 234,334,638 100.00%

SANLAM UNIVERSAL FUNDS PLC
342
PORTFOLIO OF INVESTMENTS OF ANCHOR GLOBAL STABLE FUND
as at 30 June 2019
Nominal Security Classification Fair Value
USD
% of
Net Assets
Financial assets at fair value through profit or loss Equities - 15.25% Cayman Island - 0.52%
2,900 Jd.Com Inc-Adr 87,841 0.52%
Total Cayman Island 87,841 0.52%
France - 0.82%
6,000 Credit Agricole Sa 72,052 0.42%
450 Unibail-Rodamco-Westfield 67,517 0.40%
Total France 139,569 0.82%
Germany - 0.65%
3,000 Deutsche Wohnen Se 110,247 0.65%
Total Germany 110,247 0.65%
Japan - 0.74%
2,750 Nintendo Co Ltd-Unspons Adr 125,867 0.74%
Total Japan 125,867 0.74%
Netherlands - 0.95%
2,635 Unilever Nv Cerificates 160,720 0.95%
Total Netherlands 160,720 0.95%
South Africa - 0.31%
30,958 Growthpoint Properties L 53,304 0.31%
Total South Africa 53,304 0.31%
United Kingdom - 2.56%
4,369 Admiral Group Plc 122,775 0.72%
10,000 British Land Co Plc 68,522 0.41%
2,750 Glaxo-Smithkline Plc Adr 110,055 0.65%
4,038 Royal Dutch Shell Plc-A 132,022 0.78%
Total United Kingdom 433,374 2.56%
United States - 8.70%
760 Berkshire Hathaway Inc-Cl B 162,009 0.95%
55 Booking Holdings Inc 103,109 0.61%
550 Boston Properties Inc 70,950 0.42%
400 Equity Residential 30,368 0.18%
620 Fedex Corp 101,798 0.60%
4,300 General Electric Co 45,150 0.27%
550 Goldman Sachs Group Inc 112,530 0.66%
550 Johnson & Johnson 76,604 0.45%
2,500 Liberty Property Trust 125,100 0.74%
1,225 Nike Inc -Cl B 102,839 0.61%

SANLAM UNIVERSAL FUNDS PLC
343
PORTFOLIO OF INVESTMENTS OF ANCHOR GLOBAL STABLE FUND (CONTINUED)
as at 30 June 2019
Nominal Security Classification Fair Value
USD
% of
Net Assets
Financial assets at fair value through profit or loss (continued)
Equities - 15.25% (continued)
United States - 8.70% (continued)
3,600 Synchrony Financial 124,812 0.74%
2,800 Us Bancorp 146,720 0.86%
23 Wabtec Corp 1,651 0.01%
1,210 Walt Disney Co 168,964 1.00%
2,150 Wells Fargo & Co 101,738 0.60%
Total United States 1,474,342 8.70%
Total Equities 2,585,264 15.25%
Exchange Traded Funds - 4.36%
5,000 Ishares Msci Japan Ucits Etf Usd Dist Etf 69,458 0.41%
5,000 Ishares Asia Property Yield Ucits Etf Etf 151,610 0.90%
1,600 Ishares J.P. Morgan Usd Em Bond Ucits Etf Etf 180,416 1.06%
1,500 Ubs Etfs Plc - Cmci Composite Sf Ucits Etf Etf 94,665 0.56%
3,100 Ishares Jp Morgan Em Local Government Bond Ucits Etf 191,673 1.13%
650 Market Access Rici Agriculture Index Ucits Etf Etf 51,164 0.30%
Total Exchange Traded Funds 738,986 4.36%
Nominal Security Coupon Maturity Classification Fair Value % of
USD Net Assets
Corporate Debt - 28.95%
Germany – 1.19% 200,000 Deutsche Bank N 4.250% 14/10/2021 202,596 1.19% Total Germany 202,596 1.19%
Switzerland – 2.15% 150,000 Credit Suisse Ne 5.400% 14/01/2020 152,211 0.90% 200,000 Ubs Ag 5.125% 15/05/2024 212,595 1.25% Total Switzerland 364,806 2.15%
United Kingdom – 2.67% 200,000 Barclays Plc 3.200% 10/08/2021 201,567 1.19% 250,000 Barclays Plc 3.250% 12/01/2021 251,948 1.49% Total United Kingdom 453,515 2.67%
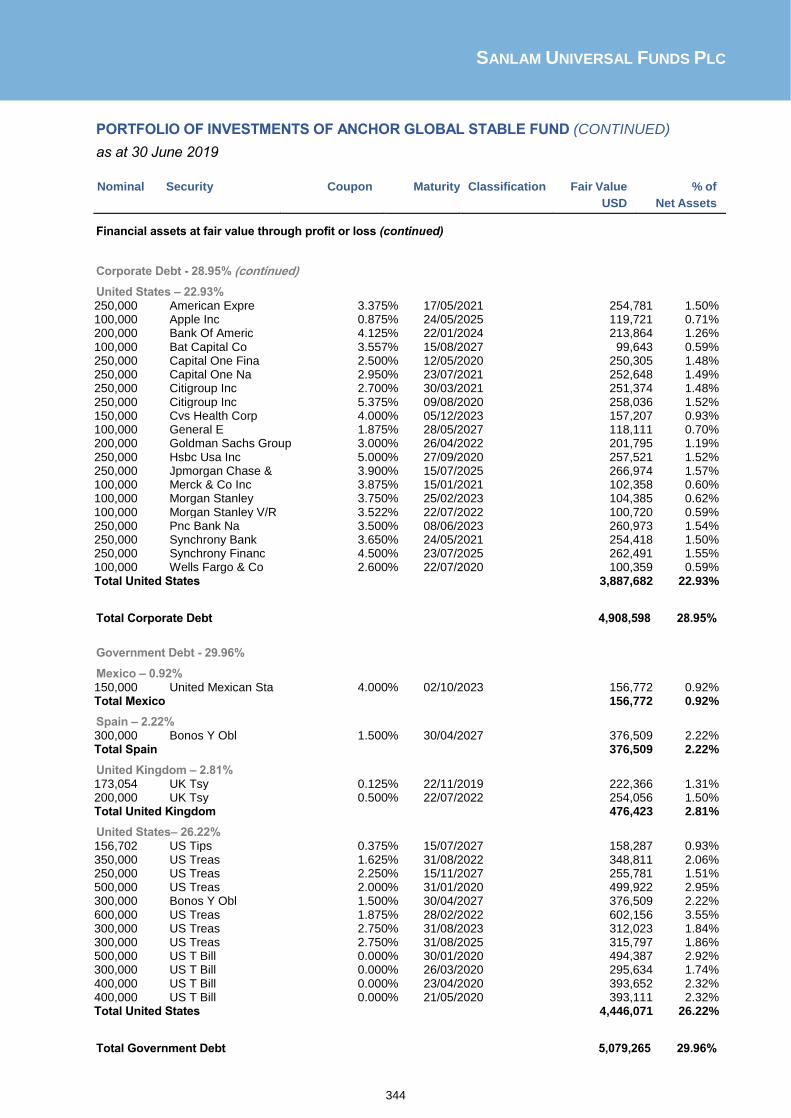
SANLAM UNIVERSAL FUNDS PLC
344
PORTFOLIO OF INVESTMENTS OF ANCHOR GLOBAL STABLE FUND (CONTINUED)
as at 30 June 2019
Nominal Security Coupon Maturity Classification Fair Value % of
USD Net Assets
Financial assets at fair value through profit or loss (continued)
Corporate Debt - 28.95% (continued)
United States – 22.93% 250,000 American Expre 3.375% 17/05/2021 254,781 1.50% 100,000 Apple Inc 0.875% 24/05/2025 119,721 0.71% 200,000 Bank Of Americ 4.125% 22/01/2024 213,864 1.26% 100,000 Bat Capital Co 3.557% 15/08/2027 99,643 0.59% 250,000 Capital One Fina 2.500% 12/05/2020 250,305 1.48% 250,000 Capital One Na 2.950% 23/07/2021 252,648 1.49% 250,000 Citigroup Inc 2.700% 30/03/2021 251,374 1.48% 250,000 Citigroup Inc 5.375% 09/08/2020 258,036 1.52% 150,000 Cvs Health Corp 4.000% 05/12/2023 157,207 0.93% 100,000 General E 1.875% 28/05/2027 118,111 0.70% 200,000 Goldman Sachs Group 3.000% 26/04/2022 201,795 1.19% 250,000 Hsbc Usa Inc 5.000% 27/09/2020 257,521 1.52% 250,000 Jpmorgan Chase & 3.900% 15/07/2025 266,974 1.57% 100,000 Merck & Co Inc 3.875% 15/01/2021 102,358 0.60% 100,000 Morgan Stanley 3.750% 25/02/2023 104,385 0.62% 100,000 Morgan Stanley V/R 3.522% 22/07/2022 100,720 0.59% 250,000 Pnc Bank Na 3.500% 08/06/2023 260,973 1.54% 250,000 Synchrony Bank 3.650% 24/05/2021 254,418 1.50% 250,000 Synchrony Financ 4.500% 23/07/2025 262,491 1.55% 100,000 Wells Fargo & Co 2.600% 22/07/2020 100,359 0.59% Total United States 3,887,682 22.93%
Total Corporate Debt 4,908,598 28.95%
Government Debt - 29.96%
Mexico – 0.92% 150,000 United Mexican Sta 4.000% 02/10/2023 156,772 0.92% Total Mexico 156,772 0.92%
Spain – 2.22% 300,000 Bonos Y Obl 1.500% 30/04/2027 376,509 2.22% Total Spain 376,509 2.22%
United Kingdom – 2.81% 173,054 UK Tsy 0.125% 22/11/2019 222,366 1.31% 200,000 UK Tsy 0.500% 22/07/2022 254,056 1.50% Total United Kingdom 476,423 2.81%
United States– 26.22% 156,702 US Tips 0.375% 15/07/2027 158,287 0.93% 350,000 US Treas 1.625% 31/08/2022 348,811 2.06% 250,000 US Treas 2.250% 15/11/2027 255,781 1.51% 500,000 US Treas 2.000% 31/01/2020 499,922 2.95% 300,000 Bonos Y Obl 1.500% 30/04/2027 376,509 2.22% 600,000 US Treas 1.875% 28/02/2022 602,156 3.55% 300,000 US Treas 2.750% 31/08/2023 312,023 1.84% 300,000 US Treas 2.750% 31/08/2025 315,797 1.86% 500,000 US T Bill 0.000% 30/01/2020 494,387 2.92% 300,000 US T Bill 0.000% 26/03/2020 295,634 1.74% 400,000 US T Bill 0.000% 23/04/2020 393,652 2.32% 400,000 US T Bill 0.000% 21/05/2020 393,111 2.32% Total United States 4,446,071 26.22%
Total Government Debt 5,079,265 29.96%

SANLAM UNIVERSAL FUNDS PLC
345
PORTFOLIO OF INVESTMENTS OF ANCHOR GLOBAL STABLE FUND (CONTINUED)
as at 30 June 2019
Nominal Security Coupon Maturity Classification Fair Value % of
USD Net Assets
Financial assets at fair value through profit or loss (continued) Derivative Financial Instruments Futures Contracts – 0.19%
10 S&P500 EMINI FUT SEP19 32,875 0.19%
Total Futures Contracts 32,875 0.19%
1BNP Paribas acts as the Fund’s clearing broker with respect to the open futures contracts at 30 June 2019.
Total financial assets at fair value through profit or loss 13,344,988 78.70%
Financial liabilities at fair value through profit or loss Derivative Financial Instruments
Futures Contracts – (0.01)%
(8) BP CURRENCY FUT SEP19 (100) 0.00%
(4) EURO FX CURR FUT SEP19 (2,100) (0.01)%
Total Futures Contracts (2,200) (0.01)%
1BNP Paribas acts as the Fund’s clearing broker with respect to the open futures contracts at 30 June 2019.
Total financial liabilities at fair value through profit or loss (2,200) (0.01)%
Cash and cash equivalents 3,591,593 21.18%
Other net assets and liabilities 21,711 0.13%
Net assets attributable to holders of redeemable participating shares 16,956,092 100.00%
Anchor Global Stable Fund Summary
Classification Description Fair Value % of % of
USD Net
Assets Total
Assets
Transferable securities and money market instruments admitted to official stock exchange listing or traded on regulated market 3,324,250 19.61% 19.52%
A Transferable securities and money market instruments other than those referred above 9,987,863 58.90% 58.64%
B UCITS and AIFs - - -
C Financial derivative instruments dealt in on a regulated market 30,675 0.18% 0.18%
D Over the counter financial derivative instruments - - -
Cash and cash equivalents 3,591,593 21.18% 21.09%
Other net assets and liabilities 21,711 0.13% 0.13%
Net assets attributable to holders of redeemable participating shares 16,956,092 100.00%
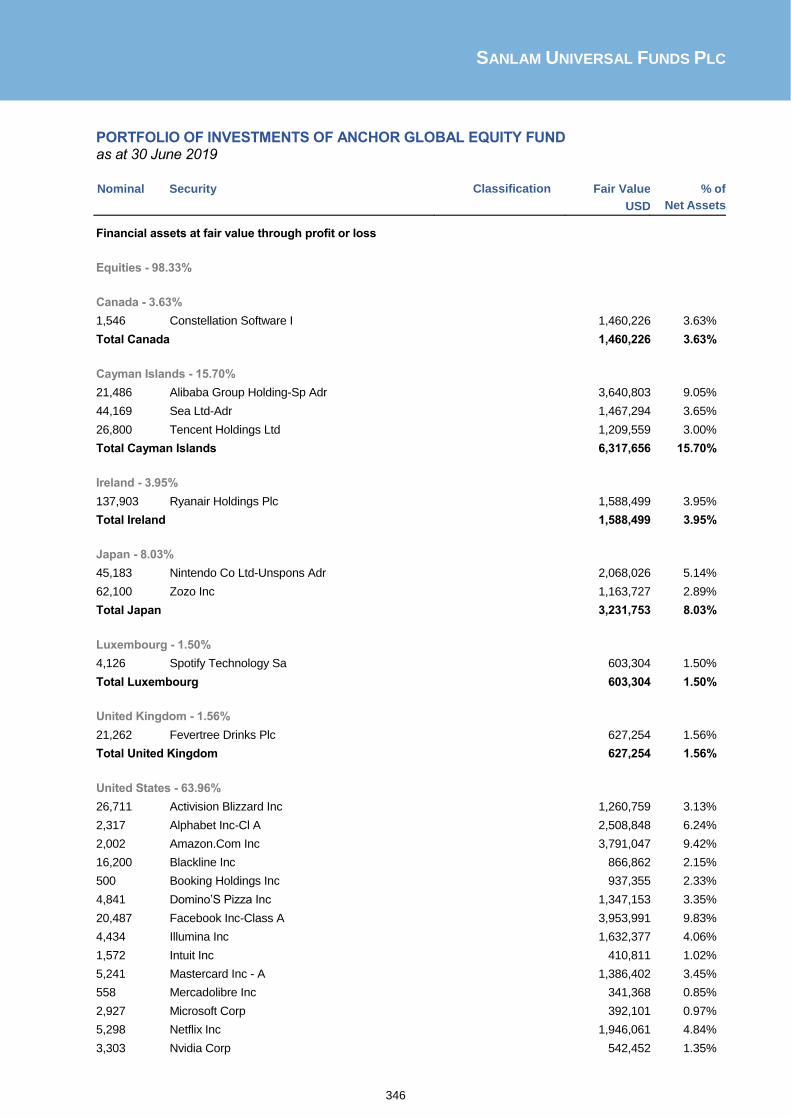
SANLAM UNIVERSAL FUNDS PLC
346
PORTFOLIO OF INVESTMENTS OF ANCHOR GLOBAL EQUITY FUND as at 30 June 2019
Nominal Security Classification Fair Value
USD
% of
Net Assets
Financial assets at fair value through profit or loss
Equities - 98.33%
Canada - 3.63%
1,546 Constellation Software I 1,460,226 3.63%
Total Canada 1,460,226 3.63%
Cayman Islands - 15.70%
21,486 Alibaba Group Holding-Sp Adr 3,640,803 9.05%
44,169 Sea Ltd-Adr 1,467,294 3.65%
26,800 Tencent Holdings Ltd 1,209,559 3.00%
Total Cayman Islands 6,317,656 15.70%
Ireland - 3.95%
137,903 Ryanair Holdings Plc 1,588,499 3.95%
Total Ireland 1,588,499 3.95%
Japan - 8.03%
45,183 Nintendo Co Ltd-Unspons Adr 2,068,026 5.14%
62,100 Zozo Inc 1,163,727 2.89%
Total Japan 3,231,753 8.03%
Luxembourg - 1.50%
4,126 Spotify Technology Sa 603,304 1.50%
Total Luxembourg 603,304 1.50%
United Kingdom - 1.56%
21,262 Fevertree Drinks Plc 627,254 1.56%
Total United Kingdom 627,254 1.56%
United States - 63.96%
26,711 Activision Blizzard Inc 1,260,759 3.13%
2,317 Alphabet Inc-Cl A 2,508,848 6.24%
2,002 Amazon.Com Inc 3,791,047 9.42%
16,200 Blackline Inc 866,862 2.15%
500 Booking Holdings Inc 937,355 2.33%
4,841 Domino’S Pizza Inc 1,347,153 3.35%
20,487 Facebook Inc-Class A 3,953,991 9.83%
4,434 Illumina Inc 1,632,377 4.06%
1,572 Intuit Inc 410,811 1.02%
5,241 Mastercard Inc - A 1,386,402 3.45%
558 Mercadolibre Inc 341,368 0.85%
2,927 Microsoft Corp 392,101 0.97%
5,298 Netflix Inc 1,946,061 4.84%
3,303 Nvidia Corp 542,452 1.35%

SANLAM UNIVERSAL FUNDS PLC
347
PORTFOLIO OF INVESTMENTS OF ANCHOR GLOBAL EQUITY FUND (CONTINUED)
as at 30 June 2019
Nominal Security Classification Fair Value
USD
% of
Net Assets
Financial assets at fair value through profit or loss (continued)
Equities - 98.33% (continued)
United States - 63.96% (continued)
41,711 Schwab (Charles) Corp 1,676,365 4.17%
3,895 Sherwin-Williams Co 1,785,039 4.44%
2,737 Ulta Beauty Inc 949,438 2.36%
Total United States 25,728,429 63.96%
Total Equities 39,557,121 98.33%
Total financial assets at fair value through profit or loss 39,557,121 98.33%
Cash and cash equivalents 785,657 1.95%
Other net assets and liabilities (114,396) (0.28)%
Net assets attributable to holders of redeemable participating shares 40,228,382 100.00%
Anchor Global Equity Fund Summary Classification Description Fair Value % of % of
USD Net
Assets Total
Assets
Transferable securities and money market instruments admitted to official stock exchange listing or traded on regulated market 39,557,121 98.33% 98.03%
A Transferable securities and money market instruments other than those referred above - - -
B UCITS and AIFs - - -
C Financial derivative instruments dealt in on a regulated market - - -
D Over the counter financial derivative instruments - - -
Cash and cash equivalents 785,657 1.95% 1.95%
Other net assets and liabilities (114,396) (0.28)% (0.28)%
Net assets attributable to holders of redeemable participating shares 40,228,382 100.00%

SANLAM UNIVERSAL FUNDS PLC
348
PORTFOLIO OF INVESTMENTS OF BRIDGE GLOBAL MANAGED GROWTH FUND
as at 30 June 2019
Nominal Security Classification Fair Value
USD
% of
Net Assets
Financial assets at fair value through profit or loss
Equities - 88.77%
France – 9.06%
5,300 Sanofi 458,165 2.63%
8,400 Total Sa 471,361 2.71%
1,311 Unibail-Rodamco-Westfield 196,698 1.13%
4,400 Vinci Sa 451,266 2.59%
Total France 1,577,490 9.06%
Germany - 2.77%
2,000 Allianz Se Registered 482,851 2.77%
Total Germany 482,851 2.77%
Switzerland - 11.43%
2,571 Chubb Ltd 378,682 2.17%
3,900 Nestle Sa-Reg 404,240 2.32%
4,355 Novartis Ag-Reg 398,427 2.29%
1,400 Roche Holding Ag-Genussc 394,369 2.27%
1,188 Zurich Insurance Group Ag 414,155 2.38%
Total Switzerland 1,989,873 11.43%
United Kingdom - 13.91%
25,000 British Land Co Plc 171,305 0.98%
9,100 Diageo Plc 391,920 2.25%
19,900 Glaxosmithkline Plc (Lse) 399,301 2.29%
42,753 Hammerson Plc 150,775 0.87%
14,800 Imperial Brands Plc 347,863 2.00%
16,000 Land Securities Group Pl 169,666 0.98%
27,700 Sse Plc 395,548 2.27%
240,200 Vodafone Group Plc 395,335 2.27%
Total United Kingdom 2,421,713 13.91%
United States - 51.60%
5,100 Abbvie Inc 370,872 2.13%
12,200 At&T Inc 408,822 2.35%
7,600 Coca-Cola Co 386,992 2.22%
5,300 Colgate-Palmolive Co 379,851 2.18%
3,300 Digital Realty Trust Inc 388,707 2.23%
5,300 Exxon Mobil Corporation 406,139 2.33%
11,700 Healthcare Realty Trust Inc 366,444 2.10%
8,700 Intel Corp 416,469 2.39%
14,300 Invitation Homes Inc 382,239 2.20%
2,900 Johnson & Johnson 403,912 2.32%
20,800 Kimco Realty Corp 384,384 2.21%

SANLAM UNIVERSAL FUNDS PLC
349
PORTFOLIO OF INVESTMENTS OF BRIDGE GLOBAL MANAGED GROWTH FUND
(CONTINUED)
as at 30 June 2019
Nominal Security Classification Fair Value
USD
% of
Net Assets
Financial assets at fair value through profit or loss (continued)
Equities - 88.77% (continued)
United States - 51.60% (continued)
7,800 Liberty Property Trust 390,312 2.24%
2,500 Mccormick & Co-Non Vtg Shrs 387,525 2.23%
1,900 Mcdonald’s Corp 394,554 2.27%
3,100 Microsoft Corp 415,276 2.38%
3,600 Procter & Gamble Co 394,740 2.27%
4,900 Prologis Inc 392,490 2.25%
1,600 Public Storage Reit 381,072 2.19%
2,300 Simon Property Group Inc 367,448 2.11%
8,600 Spirit Realty Capital Inc 366,876 2.11%
7,400 Us Bancorp 387,760 2.23%
3,700 Walmart Inc 408,813 2.35%
8,500 Wells Fargo & Co 402,220 2.31%
Total United States 8,983,917 51.60%
Total Equities 15,455,844 88.77%
Exchange Traded Funds - 5.45%
2,750 Ishares USD Corporate Bond 327,250 1.88%
3,130 Ishares Global High Yield Corp-Distr 303,885 1.74%
3,170 Ishares Global Corporate Bond 318,460 1.83%
Total Exchange Traded Funds 949,595 5.45%
Total financial assets at fair value through profit or loss 16,405,439 94.22%
Cash and cash equivalents 1,083,641 6.22%
Other net assets and liabilities (77,642) (0.45)%
Net assets attributable to holders of redeemable participating shares 17,411,438 100.00%

SANLAM UNIVERSAL FUNDS PLC
350
PORTFOLIO OF INVESTMENTS OF BRIDGE GLOBAL MANAGED GROWTH FUND
(CONTINUED)
as at 30 June 2019 Bridge Global Managed Growth Fund Summary
Classification Description Fair Value % of % of
USD Net
Assets Total
Assets
Transferable securities and money market instruments admitted to official stock exchange listing or traded on regulated market 16,405,439 94.22% 93.58%
A Transferable securities and money market instruments other than those referred above - - -
B UCITS and AIFs - - -
C Financial derivative instruments dealt in on a regulated market - - -
D Over the counter financial derivative instruments - - -
Cash and cash equivalents 1,083,641 6.22% 6.18%
Other net assets and liabilities (77,642) (0.45)% (0.44)%
Net assets attributable to holders of redeemable participating shares 17,411,438 100.00%

SANLAM UNIVERSAL FUNDS PLC
351
PORTFOLIO OF INVESTMENTS OF SANLAM GLOBAL EMERGING MARKETS FUND
as at 30 June 2019
Nominal Security Classification Fair Value
USD
% of
Net Assets
Financial assets at fair value through profit or loss
Equities - 96.01%
Brazil - 7.26%
131,959 Bb Seguridade Participac 1,114,851 1.02%
680,213 Itausa-Investimentos Ita 2,287,698 2.10%
774,991 Kroton Educacional Sa 2,218,217 2.04%
382,242 Qualicorp Consultoria E Corret 2,290,869 2.10%
Total Brazil 7,911,635 7.26%
Cayman Islands - 23.64%
26,498 Alibaba Group Holding-Sp Adr 4,490,086 4.12%
1,332,170 China Medical System Hol 1,220,907 1.12%
1,539,396 Dali Foods Group Co Ltd 1,022,652 0.94%
2,689,942 Fu Shou Yuan International 2,358,541 2.17%
77,130 Jd.Com Inc-Adr 2,336,268 2.14%
15,889 Netease Inc-Adr 4,063,929 3.73%
79,240 Noah Holdings Ltd-Spon Ads 3,371,662 3.09%
100,760 Tencent Holdings Ltd 4,547,581 4.17%
272,330 Vipshop Holdings Ltd - Adr 2,350,208 2.16%
Total Cayman Islands 25,761,834 23.64%
China - 2.10%
190,659 Ping An Insurance Group 2,289,128 2.10%
Total China 2,289,128 2.10%
Cyprus - 2.92%
162,437 Tcs Group Holding -Reg S 3,183,765 2.92%
Total Cyprus 3,183,765 2.92%
Hong Kong - 2.07%
2,906,552 Lenovo Group Ltd 2,250,834 2.07%
Total Hong Kong 2,250,834 2.07%
India - 9.78%
541,938 Alsea Sab De Cv 1,065,729 0.98%
25,026 Anheuser-Busch Inbev Sa/ 2,218,410 2.04%
4,316,139 Bank Rakyat Indonesia Pe 1,332,038 1.22%
102,442 Hcl Technologies Ltd 1,580,021 1.45%
80,360 Hdfc Bank Limited 2,844,949 2.61%
103,227 Shriram Transport-Foreig 1,615,756 1.48%
Total India 10,656,903 9.78%
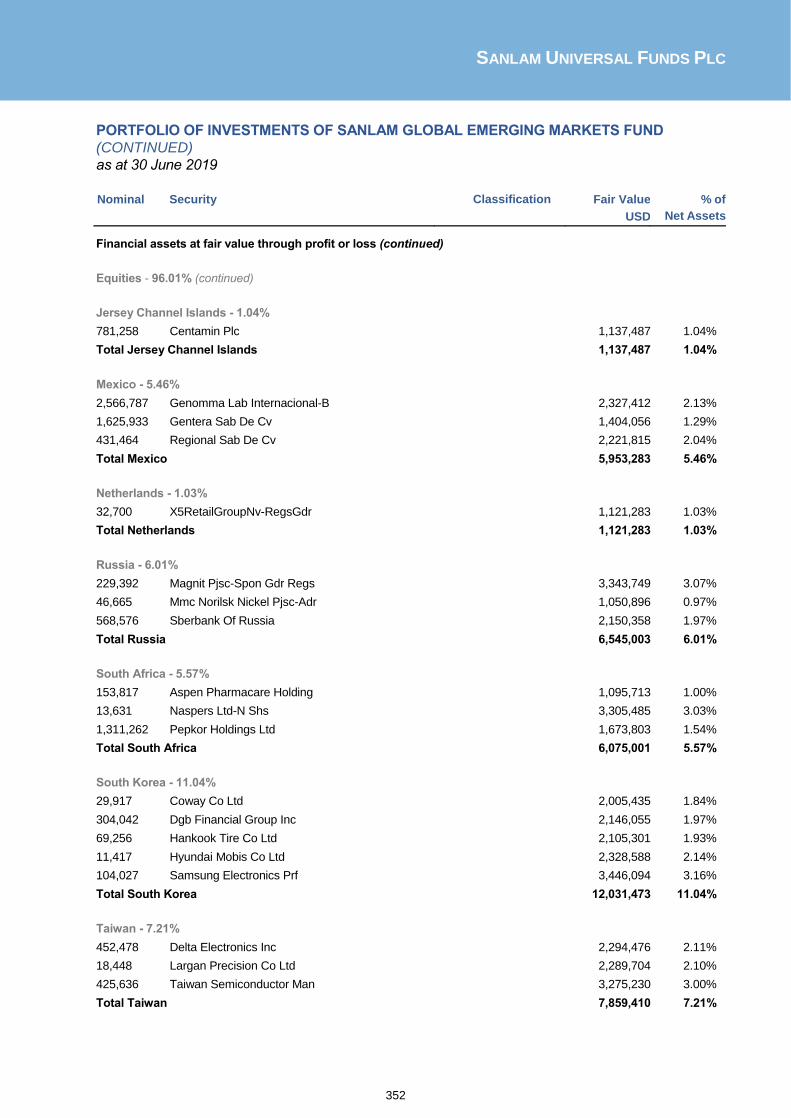
SANLAM UNIVERSAL FUNDS PLC
352
PORTFOLIO OF INVESTMENTS OF SANLAM GLOBAL EMERGING MARKETS FUND
(CONTINUED)
as at 30 June 2019
Nominal Security Classification Fair Value
USD
% of
Net Assets
Financial assets at fair value through profit or loss (continued)
Equities - 96.01% (continued)
Jersey Channel Islands - 1.04%
781,258 Centamin Plc 1,137,487 1.04%
Total Jersey Channel Islands 1,137,487 1.04%
Mexico - 5.46%
2,566,787 Genomma Lab Internacional-B 2,327,412 2.13%
1,625,933 Gentera Sab De Cv 1,404,056 1.29%
431,464 Regional Sab De Cv 2,221,815 2.04%
Total Mexico 5,953,283 5.46%
Netherlands - 1.03%
32,700 X5RetailGroupNv-RegsGdr 1,121,283 1.03%
Total Netherlands 1,121,283 1.03%
Russia - 6.01%
229,392 Magnit Pjsc-Spon Gdr Regs 3,343,749 3.07%
46,665 Mmc Norilsk Nickel Pjsc-Adr 1,050,896 0.97%
568,576 Sberbank Of Russia 2,150,358 1.97%
Total Russia 6,545,003 6.01%
South Africa - 5.57%
153,817 Aspen Pharmacare Holding 1,095,713 1.00%
13,631 Naspers Ltd-N Shs 3,305,485 3.03%
1,311,262 Pepkor Holdings Ltd 1,673,803 1.54%
Total South Africa 6,075,001 5.57%
South Korea - 11.04%
29,917 Coway Co Ltd 2,005,435 1.84%
304,042 Dgb Financial Group Inc 2,146,055 1.97%
69,256 Hankook Tire Co Ltd 2,105,301 1.93%
11,417 Hyundai Mobis Co Ltd 2,328,588 2.14%
104,027 Samsung Electronics Prf 3,446,094 3.16%
Total South Korea 12,031,473 11.04%
Taiwan - 7.21%
452,478 Delta Electronics Inc 2,294,476 2.11%
18,448 Largan Precision Co Ltd 2,289,704 2.10%
425,636 Taiwan Semiconductor Man 3,275,230 3.00%
Total Taiwan 7,859,410 7.21%

SANLAM UNIVERSAL FUNDS PLC
353
PORTFOLIO OF INVESTMENTS OF SANLAM GLOBAL EMERGING MARKETS FUND
(CONTINUED)
as at 30 June 2019
Nominal Security Classification Fair Value
USD
% of
Net Assets
Financial assets at fair value through profit or loss (continued) Equities - 96.01% (continued) Turkey - 3.04%
240,392 Bim Birlesik Magazalar A 3,310,377 3.04%
Total Turkey 3,310,377 3.04%
United Kingdom - 5.82%
86,232 British American Tob-Sp Adr 3,006,910 2.76%
109,021 Nmc Health Plc 3,334,187 3.06%
Total United Kingdom 6,341,097 5.82%
Virgin Islands - 2.02%
303,020 Arcos Dorados Holdings Inc-A 2,205,986 2.02%
Total Virgin Islands 2,205,986 2.02%
Total Equities 104,634,499 96.01%
Total financial assets at fair value through profit or loss 104,634,499 96.01%
Cash and cash equivalents 9,904,576 9.09%
Other net assets and liabilities (5,557,068) (5.10)%
Net assets attributable to holders of redeemable participating shares 108,982,007 100.00%
Sanlam Global Emerging Markets Fund
Summary
Classification Description Fair Value % of % of
USD Net
Assets Total
Assets
Transferable securities and money market instruments admitted to official stock exchange listing or traded on regulated market 104,634,499 96.01% 89.75%
A Transferable securities and money market instruments other than those referred above - - -
B UCITS and AIFs - - -
C Financial derivative instruments dealt in on a regulated market - - -
D Over the counter financial derivative instruments - - -
Cash and cash equivalents 9,904,576 9.09% 8.50%
Other net assets and liabilities (5,557,068) (5.10)% (4.77)%
Net assets attributable to holders of redeemable participating shares 108,982,007 100.00%
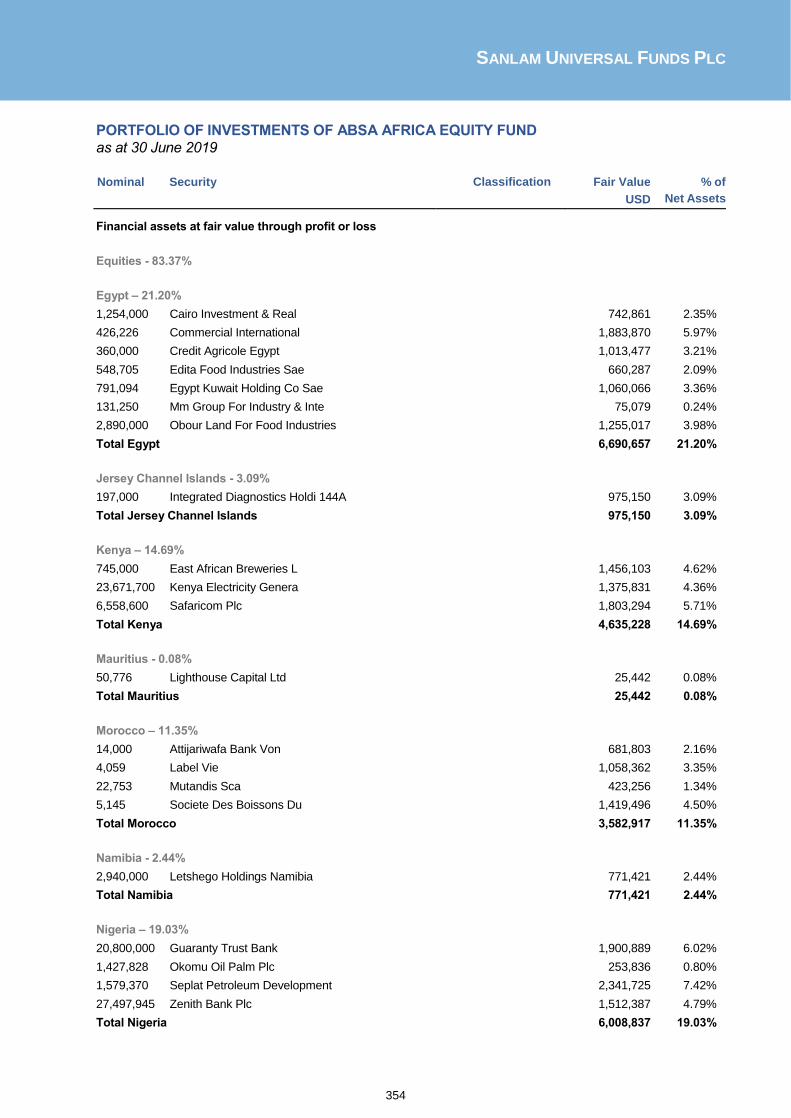
SANLAM UNIVERSAL FUNDS PLC
354
PORTFOLIO OF INVESTMENTS OF ABSA AFRICA EQUITY FUND
as at 30 June 2019
Nominal Security Classification Fair Value
USD
% of
Net Assets
Financial assets at fair value through profit or loss
Equities - 83.37%
Egypt – 21.20%
1,254,000 Cairo Investment & Real 742,861 2.35%
426,226 Commercial International 1,883,870 5.97%
360,000 Credit Agricole Egypt 1,013,477 3.21%
548,705 Edita Food Industries Sae 660,287 2.09%
791,094 Egypt Kuwait Holding Co Sae 1,060,066 3.36%
131,250 Mm Group For Industry & Inte 75,079 0.24%
2,890,000 Obour Land For Food Industries 1,255,017 3.98%
Total Egypt 6,690,657 21.20%
Jersey Channel Islands - 3.09%
197,000 Integrated Diagnostics Holdi 144A 975,150 3.09%
Total Jersey Channel Islands 975,150 3.09%
Kenya – 14.69%
745,000 East African Breweries L 1,456,103 4.62%
23,671,700 Kenya Electricity Genera 1,375,831 4.36%
6,558,600 Safaricom Plc 1,803,294 5.71%
Total Kenya 4,635,228 14.69%
Mauritius - 0.08%
50,776 Lighthouse Capital Ltd 25,442 0.08%
Total Mauritius 25,442 0.08%
Morocco – 11.35%
14,000 Attijariwafa Bank Von 681,803 2.16%
4,059 Label Vie 1,058,362 3.35%
22,753 Mutandis Sca 423,256 1.34%
5,145 Societe Des Boissons Du 1,419,496 4.50%
Total Morocco 3,582,917 11.35%
Namibia - 2.44%
2,940,000 Letshego Holdings Namibia 771,421 2.44%
Total Namibia 771,421 2.44%
Nigeria – 19.03%
20,800,000 Guaranty Trust Bank 1,900,889 6.02%
1,427,828 Okomu Oil Palm Plc 253,836 0.80%
1,579,370 Seplat Petroleum Development 2,341,725 7.42%
27,497,945 Zenith Bank Plc 1,512,387 4.79%
Total Nigeria 6,008,837 19.03%

SANLAM UNIVERSAL FUNDS PLC
355
PORTFOLIO OF INVESTMENTS OF ABSA AFRICA EQUITY FUND (CONTINUED)
as at 30 June 2019
Nominal Security Classification Fair Value
USD
% of
Net Assets
Financial assets at fair value through profit or loss (continued)
Equities - 83.37% (continued)
Rwanda - 0.94%
1,085,000 Bk Group Plc 297,260 0.94%
Total Rwanda 297,260 0.94%
Senegal - 2.36%
25,979 Sonatel 744,181 2.36%
Total Senegal 744,181 2.36%
Tanzania - 1.12%
1,016,000 Vodacom Tanzania Ltd 353,391 1.12%
Total Tanzania 353,391 1.12%
Togo - 7.07%
80,286,694 Ecobank Transnational Inc 2,230,158 7.07%
Total Togo 2,230,158 7.07%
Total Equities 26,314,642 83.37%
Nominal Security Coupon Maturity Classification Fair Value % of
USD Net Assets
Government Debt - 8.67%
Egypt - 8.67% 47,650,000 Egypt Treasury 0.000% 15/10/2019 2,737,947 8.67% Total Egypt 2,737,947 8.67%
Total Government Debt 2,737,947 8.67%
Total financial assets at fair value through profit or loss 29,052,589 92.04%
Cash and cash equivalents 1,626,509 5.15%
Other net assets and liabilities 884,750 2.80%
Net assets attributable to holders of redeemable participating shares 31,563,848 100.00%

SANLAM UNIVERSAL FUNDS PLC
356
PORTFOLIO OF INVESTMENTS OF ABSA AFRICA EQUITY FUND (CONTINUED)
as at 30 June 2019 ABSA Africa Equity Fund Summary Classification Description Fair Value % of % of
USD Net
Assets Total
Assets
Transferable securities and money market instruments admitted to official stock exchange listing or traded on regulated market 26,314,642 83.37% 81.86%
A Transferable securities and money market instruments other than those referred above 2,737,947 8.67% 8.52%
B UCITS and AIFs - - -
C Financial derivative instruments dealt in on a regulated market - - -
D Over the counter financial derivative instruments - - -
Cash and cash equivalents 1,626,509 5.15% 5.06%
Other net assets and liabilities 884,750 2.80% 2.75%
Net assets attributable to holders of redeemable participating shares 31,563,848 100.00%

SANLAM UNIVERSAL FUNDS PLC
357
PORTFOLIO OF INVESTMENTS OF SANLAM CENTRE AMERICAN SELECT EQUITY FUND
as at 30 June 2019
Nominal Security Classification Fair Value
USD
% of
Net Assets
Financial assets at fair value through profit or loss
Equities – 97.00%
Bermuda - 1.47%
216,170 Invesco Ltd 4,422,838 1.47%
Total Bermuda 4,422,838 1.47%
Canada - 3.99%
760,880 Barrick Gold Corp 11,999,078 3.99%
Total Canada 11,999,078 3.99%
Ireland - 3.96%
122,320 Medtronic Plc 11,912,745 3.96%
Total Ireland 11,912,745 3.96%
United States - 88.83%
77,870 Abbott Laboratories 6,548,867 2.18%
134,150 Activision Blizzard Inc 6,331,880 2.11%
12,340 Adobe Inc 3,635,981 1.21%
7,030 Alphabet Inc-Cl A 7,612,084 2.53%
7,907 Alphabet Inc-Cl C 8,546,755 2.84%
10,410 Amazon.Com Inc 19,712,688 6.56%
204,020 At&T Inc 6,836,710 2.27%
23,100 Berkshire Hathaway Inc-Cl B 4,924,227 1.64%
13,512 Boeing Co/The 4,918,503 1.64%
47,460 Boston Properties Inc 6,122,340 2.04%
110,900 Cisco Systems Inc 6,069,557 2.02%
94,700 Exxon Mobil Corporation 7,256,861 2.41%
58,919 Facebook Inc-Class A 11,371,367 3.78%
53,420 Hca Holdings Inc 7,220,781 2.40%
74,684 Intel Corp 3,575,123 1.19%
39,270 Johnson & Johnson 5,469,526 1.82%
392,300 Keycorp 6,963,325 2.32%
22,327 Mastercard Inc - A 5,906,161 1.96%
18,870 Mcdonald’S Corp 3,918,544 1.30%
135,230 Merck & Co. Inc. 11,339,036 3.77%
190,569 Microsoft Corp 25,528,623 8.49%
103,770 Molson Coors Brewing Co -B 5,811,120 1.93%
10,790 Netflix Inc 3,963,383 1.32%
53,930 Paypal Holdings Inc 6,172,828 2.05%
141,683 Pfizer Inc Equity 6,137,708 2.04%
97,090 Philip Morris International 7,624,478 2.54%
36,002 Procter & Gamble Co 3,947,619 1.31%
158,580 Quanta Services Inc 6,056,170 2.01%

SANLAM UNIVERSAL FUNDS PLC
358
PORTFOLIO OF INVESTMENTS OF SANLAM CENTRE AMERICAN SELECT EQUITY FUND
(CONTINUED)
as at 30 June 2019
Nominal Security Classification Fair Value
USD
% of
Net Assets
Financial assets at fair value through profit or loss (continued)
Equities – 97.00% (continued)
United States - 88.83% (continued)
47,350 Ralph Lauren Corp 5,378,487 1.79%
30,808 Raytheon Company 5,356,895 1.78%
402,450 Regions Financial Corp 6,012,603 2.00%
170,980 Twitter Inc 5,967,202 1.99%
101,280 Verizon Communications - Vz.N 5,786,126 1.92%
213,990 Viacom Inc-Class B 6,391,881 2.13%
43,350 Visa Inc-Class A Shares 7,523,393 2.50%
22,530 Walt Disney Co/The 3,146,089 1.05%
125,490 Wells Fargo & Co 5,938,187 1.98%
131,520 Zions Bancorp Na 6,047,290 2.01%
Total United States 267,070,398 88.83%
Total Equities 295,405,059 97.00% Derivative Financial Instruments
Option contracts - 0.27%
305 P/Option S&P 500 Index Dec 2500 814,350 0.27% Total Option contracts 814,350 0.27%
1Interactive Brokers acts as the Fund’s clearing broker with respect to the open option contracts at 30 June 2019.
Buy Currency Buy Amount Sell currency Sell Amount Maturity Fair Value % of
USD Net Assets
Forward Contracts – 0.00%
GBP 2 USD (2) 19/07/2019 - 0.00%
USD 3 GBP (2) 19/07/2019 - 0.00%
GBP 76 USD (96) 19/07/2019 1 0.00%
Total Forward Contracts 1 0.00%
1 Brown Brothers Harriman acts as counterparty to the open forward currency contracts at 30 June 2019.
Total financial assets at fair value through profit or loss 296,219,410 97.27%
Cash and cash equivalents 1,939,616 0.64%
Other net assets and liabilities 6,375,862 2.09%
Net assets attributable to holders of redeemable participating shares 304,534,888 100.00%

SANLAM UNIVERSAL FUNDS PLC
359
PORTFOLIO OF INVESTMENTS OF SANLAM CENTRE AMERICAN SELECT EQUITY FUND
(CONTINUED)
as at 30 June 2019 Sanlam Centre American Select Equity Fund Summary
Classification Description Fair Value % of % of
USD Net
Assets Total
Assets
Transferable securities and money market instruments admitted to official stock exchange listing or traded on regulated market 295,405,059 97.00% 96.98%
A Transferable securities and money market instruments other than those referred above - - -
B UCITS and AIFs - - -
C Financial derivative instruments dealt in on a regulated market 814,350 0.27% 0.27%
D Over the counter financial derivative instruments 1 0.00% 0.00%
Cash and cash equivalents 1,939,616 0.64% 0.64%
Other net assets and liabilities 6,375,862 2.09% 2.09%
Net assets attributable to holders of redeemable participating shares 304,534,888 100.00%

SANLAM UNIVERSAL FUNDS PLC
360
PORTFOLIO OF INVESTMENTS OF SANLAM GLOBAL CONVERTIBLE SECURITIES FUND
as at 30 June 2019
Nominal Security Classification Fair Value
USD
% of
Net Assets
Financial assets at fair value through profit or loss
Equities - 5.72%
Bermuda - 2.65%
11,890 Bunge Ltd Preferred 1,177,110 2.65%
Total Bermuda 1,177,110 2.65%
United States - 3.07%
13,000 Amg Capital 5.15% 10/15/37_Pfd 630,883 1.42%
280 Cowen Group Inc Ser A 254,376 0.57%
10,000 Ny Comm Cap 6% 11/1/51 Cv 481,000 1.08%
Total United States 1,366,259 3.07%
Total Equities 2,543,369 5.72%
Nominal Security Coupon Maturity Classification Fair Value % of
USD Net Assets
Corporate Debt - 92.12%
Bermuda – 2.07% 400,000 Jazz Investments I Ltd 1.500% 15/08/2024 393,354 0.89% 520,000 Ship Finance Intl Ltd 5.750% 15/10/2021 525,728 1.18% Total Bermuda 919,082 2.07%
Canada – 0.84% 350,000 First Majestic Silver 1.875% 01/03/2023 374,500 0.84% Total Canada 374,500 0.84%
Cayman Islands – 4.09% 440,000 Baozun Inc Convertible 1.625% 01/05/2024 512,596 1.15% 400,000 Ctrip.Com Intl Ltd Regd 1.990% 01/07/2025 435,808 0.98% 400,000 Theravance Biopharma Inc 3.250% 01/11/2023 346,914 0.78% 4,000,000 Zhongsheng Group 0.000% 23/05/2023 524,191 1.18% Total Cayman Islands 1,819,509 4.09%
China – 2.49% 1,000,000 China Railway Construct 0.000% 29/01/2021 1,107,680 2.49% Total China 1,107,680 2.49%
France – 7.12% 200,000 Carrefour Sa 0.000% 27/03/2024 196,556 0.44% 300,000 Lvmh Moet Hennessy Vuitt 0.000% 16/02/2021 539,068 1.21% 1,400,000 Total Sa 0.500% 02/12/2022 1,507,933 3.39% 800,000 Vinci Sa 0.375% 16/02/2022 923,336 2.08% Total France 3,166,893 7.12%
Hong Kong– 1.73% 700,000 Lenovo Group Ltd 3.375% 24/01/2024 767,729 1.73% Total Hong Kong 767,729 1.73%

SANLAM UNIVERSAL FUNDS PLC
361
PORTFOLIO OF INVESTMENTS OF SANLAM GLOBAL CONVERTIBLE SECURITIES FUND
(CONTINUED)
as at 30 June 2019
Nominal Security Classification Fair Value
USD
% of
Net Assets
Financial assets at fair value through profit or loss (continued) Corporate Debt - 92.12% (continued) Japan – 7.98% 40,000,000 Gmo Pmt Gtw Inc 0.000% 19/06/2023 451,279 1.02% 40,000,000 Nagoya Railroad 0.000% 11/12/2024 423,334 0.95% 30,000,000 Sbi Holdings Inc 0.000% 13/09/2023 305,739 0.69% 100,000,000 Sony Corporation 0.000% 30/09/2022 1,196,222 2.69% 110,000,000 Toray Industries Inc / 0.000% 31/08/2021 1,168,411 2.63% Total Japan 3,544,985 7.98%
Jersey Channel Islands – 2.09% 800,000 Tullow Oil Jersey Ltd 6.625% 12/07/2021 930,052 2.09%
Total Jersey Channel Islands 930,052 2.09%
Malaysia – 1.13% 500,000 Top Glove Labuan Ltd 2.000% 01/03/2024 500,208 1.13%
Total Malaysia 500,208 1.13%
sNetherlands – 10.75% 900,000 Airbus Se 0.000% 14/06/2021 1,136,395 2.56% 800,000 Qiagen 0.500% 13/09/2023 915,700 2.06% 200,000 Qiagen Nv 1.000% 13/11/2024 222,959 0.50% 500,000 Siemens Financieringsmat 1.650% 16/08/2019 536,025 1.21% 1,000,000 Siemens Financieringsmat 1.650% 16/08/2019 1,047,500 2.36% 800,000 Stmicroelectronics 0.250% 03/07/2024 916,760 2.06% Total Netherlands 4,775,339 10.75%
United Kingdom – 6.04% 700,000 Bp Capital Markets Plc 1.000% 28/04/2023 1,145,992 2.58% 400,000 Inmarsat Plc Convertible 3.875% 09/09/2023 590,306 1.33% 400,000 J Sainsbury Plc 2.875% 30/01/2168 513,466 1.16% 400,000 Polyus Finance Plc 1.000% 26/01/2021 433,372 0.98% Total United Kingdom 2,683,136 6.04%
United States – 44.34% 645,000 Air Transport Services G 1.125% 15/10/2024 647,380 1.46% 180,000 Altair Engineering Inc 0.250% 01/06/2024 195,884 0.44% 390,000 Arbor Realty Trust Inc 5.250% 01/07/2021 406,308 0.91% 950,000 Biomarin Pharmaceutical 0.599% 01/08/2024 987,763 2.22% 600,000 Cowen Inc 3.000% 15/12/2022 695,864 1.57% 550,000 Docusign Inc 0.500% 15/09/2023 568,843 1.28% 350,000 Extra Space Storage 3.125% 01/10/2035 416,848 0.94% 1,400,000 Glencore Funding Llc 0.000% 27/03/2025 1,242,360 2.80% 450,000 Greenbrier Cos Inc 2.875% 01/02/2024 433,382 0.98% 200,000 Helix Energy Solutions 4.125% 15/09/2023 241,257 0.54% 800,000 Ih Merger 3.500% 15/01/2022 980,576 2.21% 620,000 Interdigital Inc 2.000% 01/06/2024 632,192 1.42% 780,000 Kaman Corp 3.250% 01/05/2024 907,456 2.04% 250,000 Kbr Inc 2.500% 01/11/2023 291,050 0.65% 1,020,000 Liberty Interactive Llc 1.750% 30/09/2046 1,278,913 2.88%
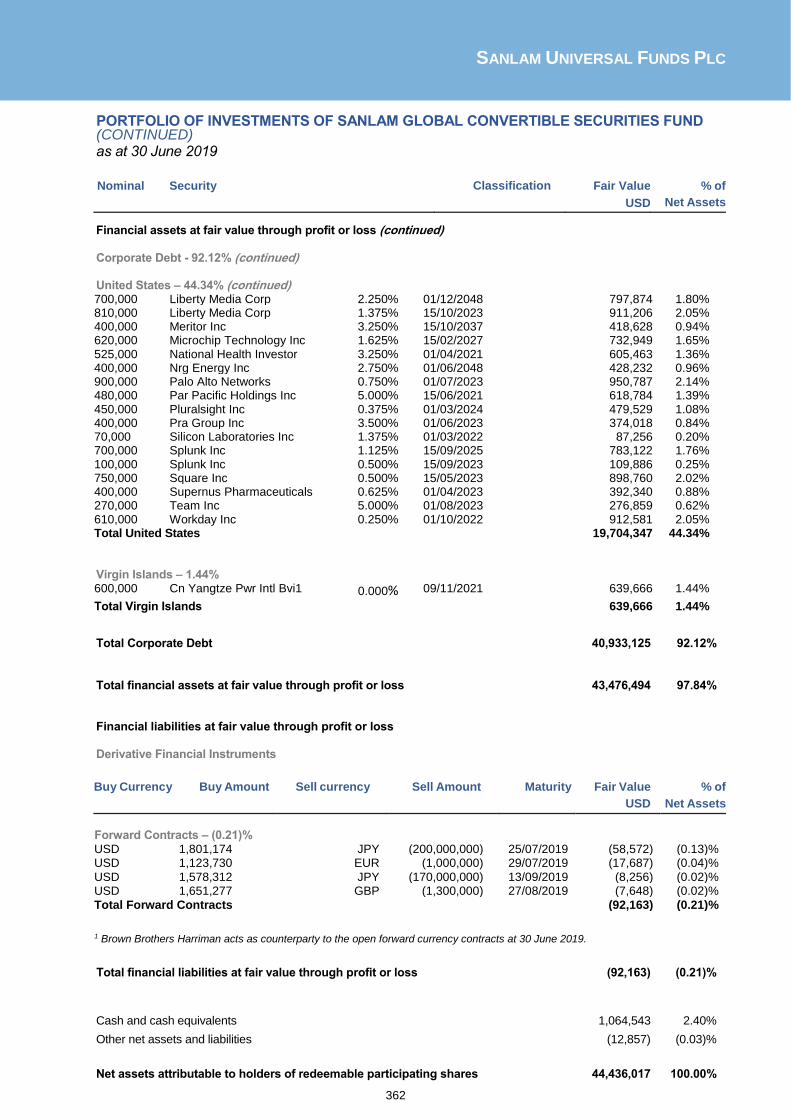
SANLAM UNIVERSAL FUNDS PLC
362
PORTFOLIO OF INVESTMENTS OF SANLAM GLOBAL CONVERTIBLE SECURITIES FUND (CONTINUED) as at 30 June 2019
Nominal Security Classification Fair Value
USD
% of
Net Assets
Financial assets at fair value through profit or loss (continued) Corporate Debt - 92.12% (continued) United States – 44.34% (continued) 700,000 Liberty Media Corp 2.250% 01/12/2048 797,874 1.80% 810,000 Liberty Media Corp 1.375% 15/10/2023 911,206 2.05% 400,000 Meritor Inc 3.250% 15/10/2037 418,628 0.94% 620,000 Microchip Technology Inc 1.625% 15/02/2027 732,949 1.65% 525,000 National Health Investor 3.250% 01/04/2021 605,463 1.36% 400,000 Nrg Energy Inc 2.750% 01/06/2048 428,232 0.96% 900,000 Palo Alto Networks 0.750% 01/07/2023 950,787 2.14% 480,000 Par Pacific Holdings Inc 5.000% 15/06/2021 618,784 1.39% 450,000 Pluralsight Inc 0.375% 01/03/2024 479,529 1.08% 400,000 Pra Group Inc 3.500% 01/06/2023 374,018 0.84% 70,000 Silicon Laboratories Inc 1.375% 01/03/2022 87,256 0.20% 700,000 Splunk Inc 1.125% 15/09/2025 783,122 1.76% 100,000 Splunk Inc 0.500% 15/09/2023 109,886 0.25% 750,000 Square Inc 0.500% 15/05/2023 898,760 2.02% 400,000 Supernus Pharmaceuticals 0.625% 01/04/2023 392,340 0.88% 270,000 Team Inc 5.000% 01/08/2023 276,859 0.62% 610,000 Workday Inc 0.250% 01/10/2022 912,581 2.05% Total United States 19,704,347 44.34%
Virgin Islands – 1.44% 600,000 Cn Yangtze Pwr Intl Bvi1 0.000% 09/11/2021 639,666 1.44%
Total Virgin Islands 639,666 1.44%
Total Corporate Debt 40,933,125 92.12%
Total financial assets at fair value through profit or loss 43,476,494 97.84% Financial liabilities at fair value through profit or loss Derivative Financial Instruments
Buy Currency Buy Amount Sell currency Sell Amount Maturity Fair Value % of
USD Net Assets
Forward Contracts – (0.21)%
USD 1,801,174 JPY (200,000,000) 25/07/2019 (58,572) (0.13)% USD 1,123,730 EUR (1,000,000) 29/07/2019 (17,687) (0.04)%
USD 1,578,312 JPY (170,000,000) 13/09/2019 (8,256) (0.02)% USD 1,651,277 GBP (1,300,000) 27/08/2019 (7,648) (0.02)%
Total Forward Contracts (92,163) (0.21)%
1 Brown Brothers Harriman acts as counterparty to the open forward currency contracts at 30 June 2019.
Total financial liabilities at fair value through profit or loss (92,163) (0.21)%
Cash and cash equivalents 1,064,543 2.40%
Other net assets and liabilities (12,857) (0.03)%
Net assets attributable to holders of redeemable participating shares 44,436,017 100.00%

SANLAM UNIVERSAL FUNDS PLC
363
PORTFOLIO OF INVESTMENTS OF SANLAM GLOBAL CONVERTIBLE SECURITIES FUND (CONTINUED) as at 30 June 2019 Sanlam Global Convertible Securities Fund Summary
Classification Description Fair Value % of % of
USD Net
Assets Total
Assets
Transferable securities and money market instruments admitted to official stock exchange listing or traded on regulated market 2,543,369 5.72% 5.62%
A Transferable securities and money market instruments other than those referred above 40,933,125 92.12% 90.43%
B UCITS and AIFs - - -
C Financial derivative instruments dealt in on a regulated market - - -
D Over the counter financial derivative instruments (92,163) (0.21)% (0.20)%
Cash and cash equivalents 1,064,543 2.40% 2.35%
Other net assets and liabilities (12,857) (0.03)% (0.03)%
Net assets attributable to holders of redeemable participating shares 44,436,017 100.00%

SANLAM UNIVERSAL FUNDS PLC
364
PORTFOLIO OF INVESTMENTS OF SANLAM JAPAN EQUITY FUND
as at 30 June 2019
Fair Value
USD
% of
Net Assets
Cash and cash equivalents 3,137,476 93.86%
Other net assets and liabilities 205,145 6.14%
Net assets attributable to holders of redeemable participating shares 3,342,621 100.00%
Sanlam Japan Equity Fund Summary Classification Description Fair Value % of % of
USD Net
Assets Total
Assets
Transferable securities and money market instruments admitted to official stock exchange listing or traded on regulated market - - -
A Transferable securities and money market instruments other than those referred above - - -
B UCITS and AIFs - - -
C Financial derivative instruments dealt in on a regulated market - - -
D Over the counter financial derivative instruments - - -
Cash and cash equivalents 3,137,476 93.86% 92.54%
Other net assets and liabilities 205,145 6.14% 6.05%
Net assets attributable to holders of redeemable participating shares 3,342,621 100.00%
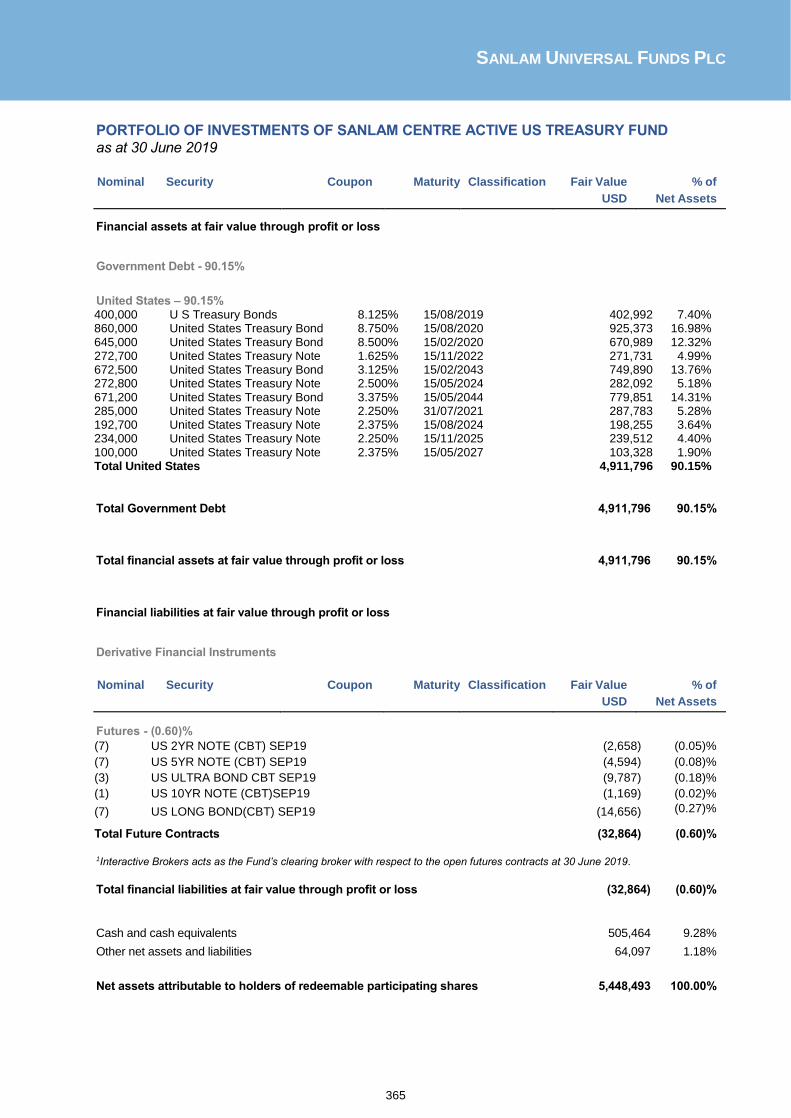
SANLAM UNIVERSAL FUNDS PLC
365
PORTFOLIO OF INVESTMENTS OF SANLAM CENTRE ACTIVE US TREASURY FUND
as at 30 June 2019
Nominal Security Coupon Maturity Classification Fair Value % of
USD Net Assets
Financial assets at fair value through profit or loss
Government Debt - 90.15%
United States – 90.15% 400,000 U S Treasury Bonds 8.125% 15/08/2019 402,992 7.40% 860,000 United States Treasury Bond 8.750% 15/08/2020 925,373 16.98% 645,000 United States Treasury Bond 8.500% 15/02/2020 670,989 12.32% 272,700 United States Treasury Note 1.625% 15/11/2022 271,731 4.99% 672,500 United States Treasury Bond 3.125% 15/02/2043 749,890 13.76% 272,800 United States Treasury Note 2.500% 15/05/2024 282,092 5.18% 671,200 United States Treasury Bond 3.375% 15/05/2044 779,851 14.31% 285,000 United States Treasury Note 2.250% 31/07/2021 287,783 5.28% 192,700 United States Treasury Note 2.375% 15/08/2024 198,255 3.64% 234,000 United States Treasury Note 2.250% 15/11/2025 239,512 4.40% 100,000 United States Treasury Note 2.375% 15/05/2027 103,328 1.90% Total United States 4,911,796 90.15%
Total Government Debt 4,911,796 90.15%
Total financial assets at fair value through profit or loss 4,911,796 90.15%
Financial liabilities at fair value through profit or loss
Derivative Financial Instruments
Nominal Security Coupon Maturity Classification Fair Value % of
USD Net Assets
Futures - (0.60)%
(7) US 2YR NOTE (CBT) SEP19 (2,658) (0.05)%
(7) US 5YR NOTE (CBT) SEP19 (4,594) (0.08)%
(3) US ULTRA BOND CBT SEP19 (9,787) (0.18)%
(1) US 10YR NOTE (CBT)SEP19 (1,169) (0.02)%
(7) US LONG BOND(CBT) SEP19 (14,656) (0.27)%
Total Future Contracts (32,864) (0.60)% 1Interactive Brokers acts as the Fund’s clearing broker with respect to the open futures contracts at 30 June 2019.
Total financial liabilities at fair value through profit or loss (32,864) (0.60)%
Cash and cash equivalents 505,464 9.28%
Other net assets and liabilities 64,097 1.18%
Net assets attributable to holders of redeemable participating shares 5,448,493 100.00%
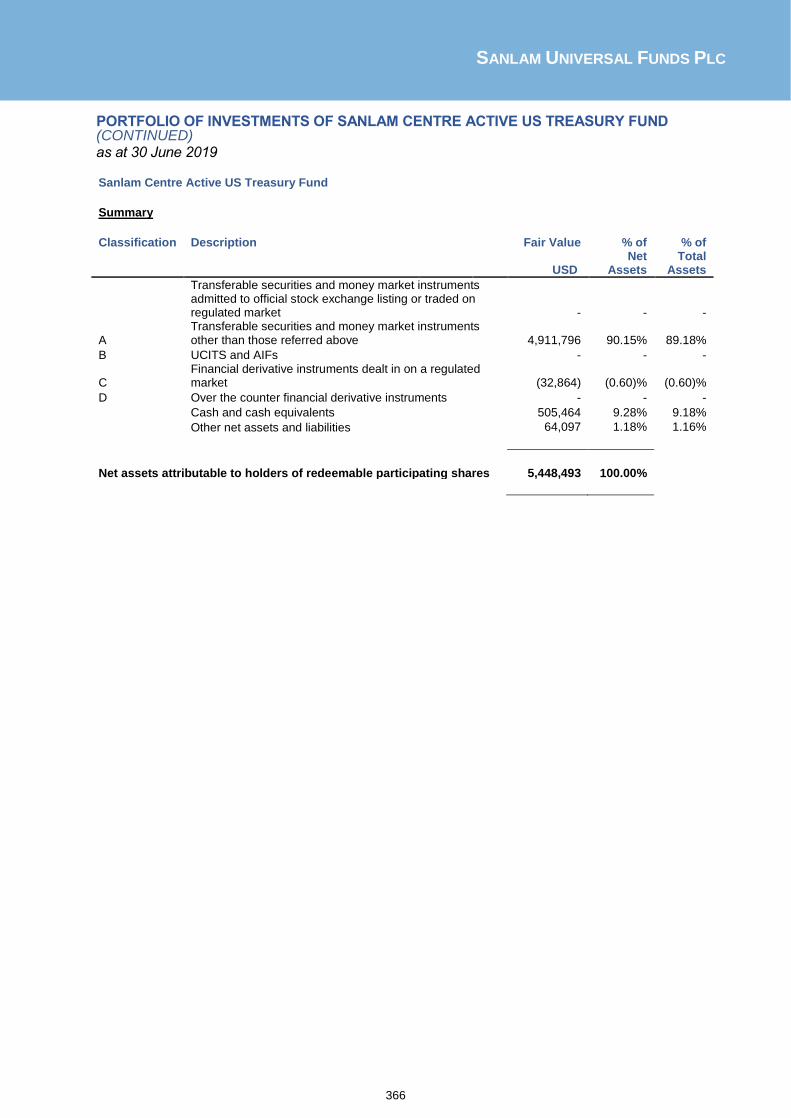
SANLAM UNIVERSAL FUNDS PLC
366
PORTFOLIO OF INVESTMENTS OF SANLAM CENTRE ACTIVE US TREASURY FUND (CONTINUED) as at 30 June 2019 Sanlam Centre Active US Treasury Fund Summary
Classification Description Fair Value % of % of
USD Net
Assets Total
Assets
Transferable securities and money market instruments admitted to official stock exchange listing or traded on regulated market - - -
A Transferable securities and money market instruments other than those referred above 4,911,796 90.15% 89.18%
B UCITS and AIFs - - -
C Financial derivative instruments dealt in on a regulated market (32,864) (0.60)% (0.60)%
D Over the counter financial derivative instruments - - -
Cash and cash equivalents 505,464 9.28% 9.18%
Other net assets and liabilities 64,097 1.18% 1.16%
Net assets attributable to holders of redeemable participating shares 5,448,493 100.00%
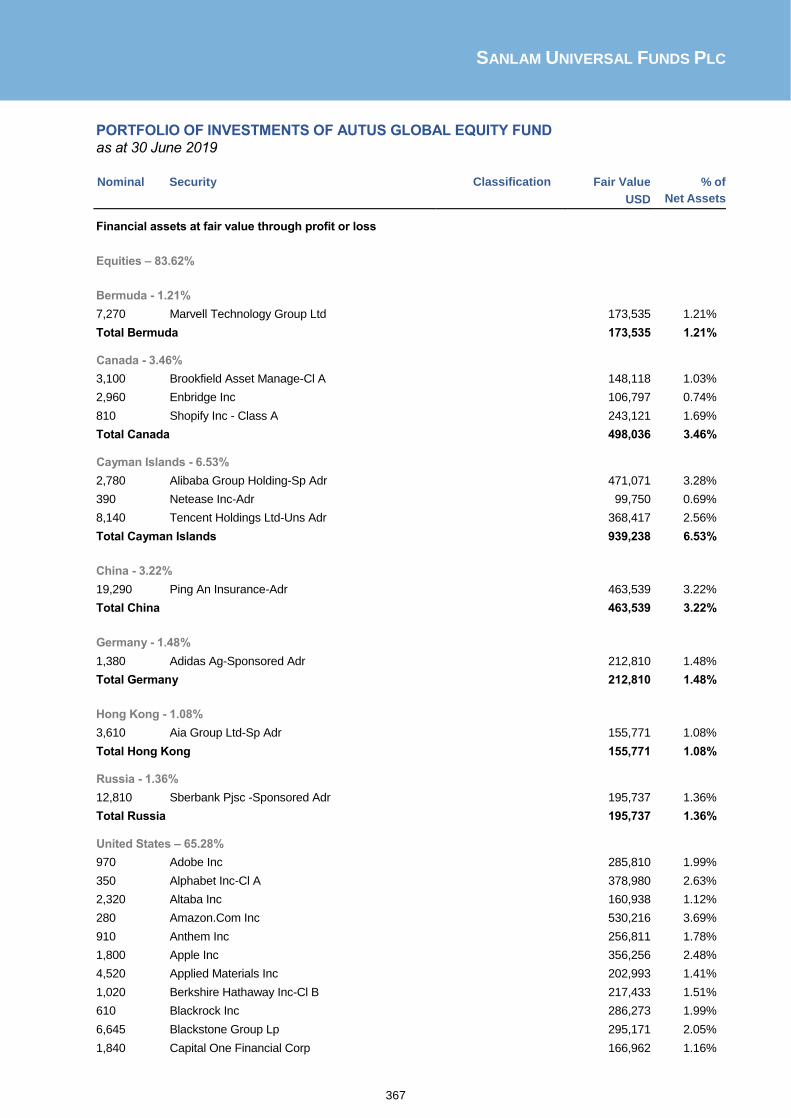
SANLAM UNIVERSAL FUNDS PLC
367
PORTFOLIO OF INVESTMENTS OF AUTUS GLOBAL EQUITY FUND
as at 30 June 2019
Nominal Security Classification Fair Value
USD
% of
Net Assets
Financial assets at fair value through profit or loss
Equities – 83.62%
Bermuda - 1.21%
7,270 Marvell Technology Group Ltd 173,535 1.21%
Total Bermuda 173,535 1.21% Canada - 3.46%
3,100 Brookfield Asset Manage-Cl A 148,118 1.03%
2,960 Enbridge Inc 106,797 0.74%
810 Shopify Inc - Class A 243,121 1.69%
Total Canada 498,036 3.46%
Cayman Islands - 6.53%
2,780 Alibaba Group Holding-Sp Adr 471,071 3.28%
390 Netease Inc-Adr 99,750 0.69%
8,140 Tencent Holdings Ltd-Uns Adr 368,417 2.56%
Total Cayman Islands 939,238 6.53%
China - 3.22%
19,290 Ping An Insurance-Adr 463,539 3.22%
Total China 463,539 3.22%
Germany - 1.48%
1,380 Adidas Ag-Sponsored Adr 212,810 1.48%
Total Germany 212,810 1.48%
Hong Kong - 1.08%
3,610 Aia Group Ltd-Sp Adr 155,771 1.08%
Total Hong Kong 155,771 1.08% Russia - 1.36%
12,810 Sberbank Pjsc -Sponsored Adr 195,737 1.36%
Total Russia 195,737 1.36%
United States – 65.28%
970 Adobe Inc 285,810 1.99%
350 Alphabet Inc-Cl A 378,980 2.63%
2,320 Altaba Inc 160,938 1.12%
280 Amazon.Com Inc 530,216 3.69%
910 Anthem Inc 256,811 1.78%
1,800 Apple Inc 356,256 2.48%
4,520 Applied Materials Inc 202,993 1.41%
1,020 Berkshire Hathaway Inc-Cl B 217,433 1.51%
610 Blackrock Inc 286,273 1.99%
6,645 Blackstone Group Lp 295,171 2.05%
1,840 Capital One Financial Corp 166,962 1.16%
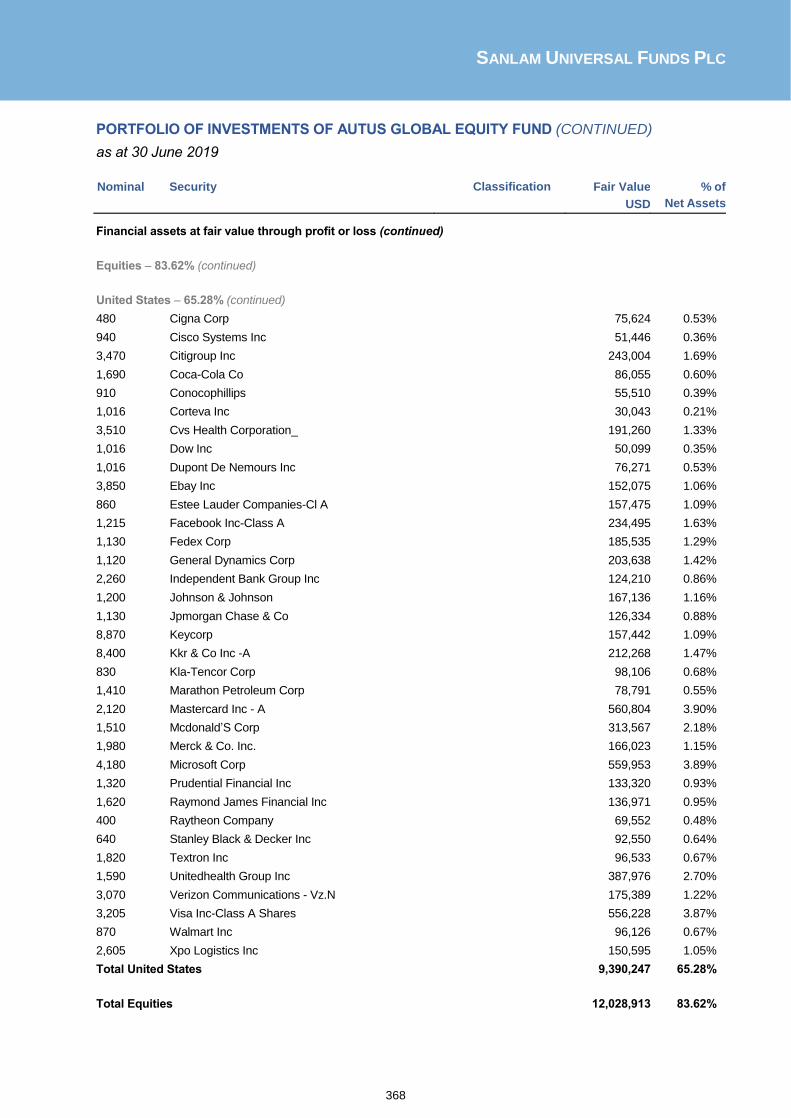
SANLAM UNIVERSAL FUNDS PLC
368
PORTFOLIO OF INVESTMENTS OF AUTUS GLOBAL EQUITY FUND (CONTINUED)
as at 30 June 2019
Nominal Security Classification Fair Value
USD
% of
Net Assets
Financial assets at fair value through profit or loss (continued)
Equities – 83.62% (continued)
United States – 65.28% (continued)
480 Cigna Corp 75,624 0.53%
940 Cisco Systems Inc 51,446 0.36%
3,470 Citigroup Inc 243,004 1.69%
1,690 Coca-Cola Co 86,055 0.60%
910 Conocophillips 55,510 0.39%
1,016 Corteva Inc 30,043 0.21%
3,510 Cvs Health Corporation_ 191,260 1.33%
1,016 Dow Inc 50,099 0.35%
1,016 Dupont De Nemours Inc 76,271 0.53%
3,850 Ebay Inc 152,075 1.06%
860 Estee Lauder Companies-Cl A 157,475 1.09%
1,215 Facebook Inc-Class A 234,495 1.63%
1,130 Fedex Corp 185,535 1.29%
1,120 General Dynamics Corp 203,638 1.42%
2,260 Independent Bank Group Inc 124,210 0.86%
1,200 Johnson & Johnson 167,136 1.16%
1,130 Jpmorgan Chase & Co 126,334 0.88%
8,870 Keycorp 157,442 1.09%
8,400 Kkr & Co Inc -A 212,268 1.47%
830 Kla-Tencor Corp 98,106 0.68%
1,410 Marathon Petroleum Corp 78,791 0.55%
2,120 Mastercard Inc - A 560,804 3.90%
1,510 Mcdonald’S Corp 313,567 2.18%
1,980 Merck & Co. Inc. 166,023 1.15%
4,180 Microsoft Corp 559,953 3.89%
1,320 Prudential Financial Inc 133,320 0.93%
1,620 Raymond James Financial Inc 136,971 0.95%
400 Raytheon Company 69,552 0.48%
640 Stanley Black & Decker Inc 92,550 0.64%
1,820 Textron Inc 96,533 0.67%
1,590 Unitedhealth Group Inc 387,976 2.70%
3,070 Verizon Communications - Vz.N 175,389 1.22%
3,205 Visa Inc-Class A Shares 556,228 3.87%
870 Walmart Inc 96,126 0.67%
2,605 Xpo Logistics Inc 150,595 1.05%
Total United States 9,390,247 65.28%
Total Equities 12,028,913 83.62%

SANLAM UNIVERSAL FUNDS PLC
369
PORTFOLIO OF INVESTMENTS OF AUTUS GLOBAL EQUITY FUND (CONTINUED) as
at 30 June 2019
Fair Value
USD
% of
Net Assets
Total financial assets at fair value through profit or loss 12,028,913 83.62%
Cash and cash equivalents 2,386,934 16.59%
Other net assets and liabilities (31,046) (0.22)%
Net assets attributable to holders of redeemable participating shares 14,384,801 100.00%
Autus Global Equity Fund Summary Classification Description Fair Value % of % of
USD Net
Assets Total
Assets
Transferable securities and money market instruments admitted to official stock exchange listing or traded on regulated market 12,028,913 83.62% 83.21%
A Transferable securities and money market instruments other than those referred above - - -
B UCITS and AIFs - - -
C Financial derivative instruments dealt in on a regulated market - - -
D Over the counter financial derivative instruments - - -
Cash and cash equivalents 2,386,934 16.59% 16.51%
Other net assets and liabilities (31,046) (0.22)% (0.21)%
Net assets attributable to holders of redeemable participating shares 14,384,801 100.00%

SANLAM UNIVERSAL FUNDS PLC
370
PORTFOLIO OF INVESTMENTS OF WISIAN CAPITAL SOUTH AFRICAN EQUITY FUND
as at 30 June 2019
Nominal Security Classification Fair Value
USD
% of
Net Assets
Financial assets at fair value through profit or loss
Equities - 89.01%
South Africa - 89.01%
13,655 Absa Group Ltd 170,430 2.58%
7,047 Aspen Pharmacare Holding 50,199 0.76%
1,684 Astral Foods Ltd 18,512 0.28%
30,982 Avi Ltd 200,728 3.04%
8,474 Barloworld Ltd 76,920 1.16%
13,215 Bidvest Group Ltd 177,450 2.69%
2,569 Capitec Bank Holdings Lt 236,608 3.58%
688 Cashbuild Ltd 13,034 0.20%
8,217 Clicks Holdings Ltd 119,625 1.81%
10,505 Coronation Fund Managers 33,300 0.50%
16,972 Curro Holdings Ltd 28,549 0.43%
18,544 Dis-Chem Pharmacies Pty 33,218 0.50%
20,914 Discovery Ltd 221,150 3.35%
1,547 Distell Group Holdings Ltd 14,229 0.22%
120,560 Firstrand Ltd 586,075 8.87%
12,416 Investec Ltd 80,882 1.22%
3,409 Jse Ltd 33,845 0.51%
55,307 Life Healthcare Group Ho 88,013 1.33%
11,293 Mondi Ltd 253,838 3.84%
12,384 Mr Price Group Ltd 174,335 2.64%
28,217 Mtn Group Ltd 213,610 3.23%
2,919 Multichoice Group Ltd 27,732 0.42%
2,644 Naspers Ltd-N Shs 641,164 9.70%
12,893 Nedbank Group Ltd 231,505 3.50%
58,365 Netcare Ltd 74,419 1.13%
867 Oceana Group Ltd 4,242 0.06%
123,197 Old Mutual Ltd 185,216 2.80%
14,083 Pick N Pay Stores Ltd 68,911 1.04%
5,889 Psg Group Ltd 99,816 1.51%
18,516 Rmb Holdings Ltd 110,824 1.68%
24,417 Sanlam Ltd 135,338 2.05%
933 Santam Ltd 19,849 0.30%
11,624 Sappi Limited 45,247 0.69%
13,046 Shoprite Holdings Ltd 145,862 2.21%
7,677 Spar Group Limited 101,714 1.54%
46,650 Standard Bank Group Ltd 650,627 9.85%
14,531 Super Group Ltd 33,892 0.51%
8,751 The Foschini Group Ltd 111,891 1.69%
3,354 Tiger Brands Ltd 53,207 0.81%
23,155 Truworths International 114,944 1.74%

SANLAM UNIVERSAL FUNDS PLC
371
PORTFOLIO OF INVESTMENTS OF WISIAN CAPITAL SOUTH AFRICAN EQUITY FUND
(CONTINUED)
as at 30 June 2019
Nominal Security Classification Fair Value
USD
% of
Net Assets
Financial assets at fair value through profit or loss (continued)
Equities - 89.01% (continued)
South Africa - 89.01% (continued)
20,686 Vodacom Group Ltd 175,551 2.66%
3,241 Wilson Bayly Holmes-Ovco 25,257 0.38%
Total South Africa 5,881,758 89.01%
Total Equities 5,881,758 89.01%
Derivative Financial Instruments
Buy Currency Buy Amount Sell currency Sell Amount Maturity Fair Value % of
USD Net
Assets Forward Contracts – 5.18% ZAR 99,407,032 USD (6,692,175) 19/07/2019 342,127 5.18%
Total Forward Contracts 342,127 5.18%
1 Brown Brothers Harriman acts as counterparty to the open forward currency contracts at 30 June 2019.
Total financial assets at fair value through profit or loss 6,223,885 94.18% Financial liabilities at fair value through profit or loss Derivative Financial Instruments
Forward Contracts – (6.71)% USD 13,384,349 ZAR (195,406,277) 19/07/2019 (443,111) (6.71)%
Total Forward Contracts (443,111) (6.71)%
1 Brown Brothers Harriman acts as counterparty to the open forward currency contracts at 30 June 2019.
Total financial liabilities at fair value through profit or loss (443,111) (6.71)%
Cash and cash equivalents 848,524 12.84%
Other net assets and liabilities (21,073) (0.32)%
Net assets attributable to holders of redeemable participating shares 6,608,225 100.00%

SANLAM UNIVERSAL FUNDS PLC
372
PORTFOLIO OF INVESTMENTS OF WISIAN CAPITAL SOUTH AFRICAN EQUITY FUND (CONTINUED)
as at 30 June 2019 Wisian Capital South African Equity Fund
Summary
Classification Description Fair Value % of % of
USD Net
Assets Total
Assets
Transferable securities and money market instruments admitted to official stock exchange listing or traded on regulated market 5,881,758 89.01% 82.89%
A Transferable securities and money market instruments other than those referred above - - -
B UCITS and AIFs - - -
C Financial derivative instruments dealt in on a regulated market - - -
D Over the counter financial derivative instruments (100,984) (1.53)% (1.42)%
Cash and cash equivalents 848,524 12.84% 11.96%
Other net assets and liabilities (21,073) (0.32)% (0.30)%
Net assets attributable to holders of redeemable participating shares 6,608,225 100.00%

SANLAM UNIVERSAL FUNDS PLC
373
PORTFOLIO OF INVESTMENTS OF CAMERON HUME GLOBAL FIXED INCOME ESG
FUND
as at 30 June 2019
Nominal Security Coupon Maturity Classification Fair Value % of
USD Net Assets
Financial assets at fair value through profit or loss
Corporate Debt - 35.83%
Australia – 3.34% 200,000 Apt Pipelines Ltd 2.000% 22/03/2027 243,823 0.24% 500,000 Aust & Nz Banking Grp 2.625% 09/11/2022 504,495 0.49% 300,000 Commonwealth Bank 1.936% 03/10/2029 349,119 0.34% 500,000 Fmg Resources Aug 4.750% 15/05/2022 511,368 0.50% 368,000 Macquarie Group Ltd 6.250% 14/01/2021 387,699 0.38% 150,000 Stockland Trust 1.625% 27/04/2026 176,311 0.17% 150,000 Transurban Finance Co 1.750% 29/03/2028 183,029 0.18% 200,000 Westpac B 7.250% 11/02/2020 145,229 0.14% 198,000 Westpac Banking Corp 3.350% 08/03/2027 206,752 0.20% 226,000 Westpac Banking Corp 4.322% 23/11/2031 233,653 0.23% 226,000 Woodside Finance Lt 3.700% 15/09/2026 228,904 0.22% 248,000 Woodside Finance Lt 3.650% 05/03/2025 254,723 0.25% Total Australia 3,425,105 3.34%
Austria – 0.01% 10,000 Energie Oberoesterreich 4.500% 04/03/2025 14,129 0.01% Total Austria 14,129 0.01%
Belgium – 0.13% 100,000 Anheuser-Busch Inbev Sa 2.750% 17/03/2036 132,500 0.13% Total Belgium 132,500 0.13%
Bermuda – 0.25% 250,000 Bacardi Ltd 5.300% 15/05/2048 262,608 0.25% Total Bermuda 262,608 0.25%
Canada – 0.93% 150,000 Bank Of Montreal 4.338% 05/10/2028 157,694 0.15% 100,000 Bombardier Inc 5.750% 15/03/2022 101,808 0.10% 20,000 General Elec Cap Canada 5.730% 22/10/2037 16,665 0.02% 91,000 Rogers Communications In 6.560% 22/03/2041 96,858 0.09% 102,000 Rogers Communications In 4.500% 15/03/2043 110,229 0.11% 182,000 Royal Bank Of Canada 4.930% 16/07/2025 161,022 0.16% 85,000 Telus Corp 4.850% 05/04/2044 73,578 0.07% 6,000 Toronto-Dominion Bank 3.226% 24/07/2024 4,849 0.00% 200,000 Toronto-Dominion Bank / 0.250% 12/01/2023 232,166 0.23% Total Canada 954,869 0.93%
China – 0.22% 200,000 Bank Of China/Luxembourg 0.750% 12/07/2021 230,418 0.22% Total China 230,418 0.22%
Denmark – 0.31% 250,000 Tdc A/S 5.000% 02/03/2022 315,980 0.31%
Total Denmark 315,980 0.31%
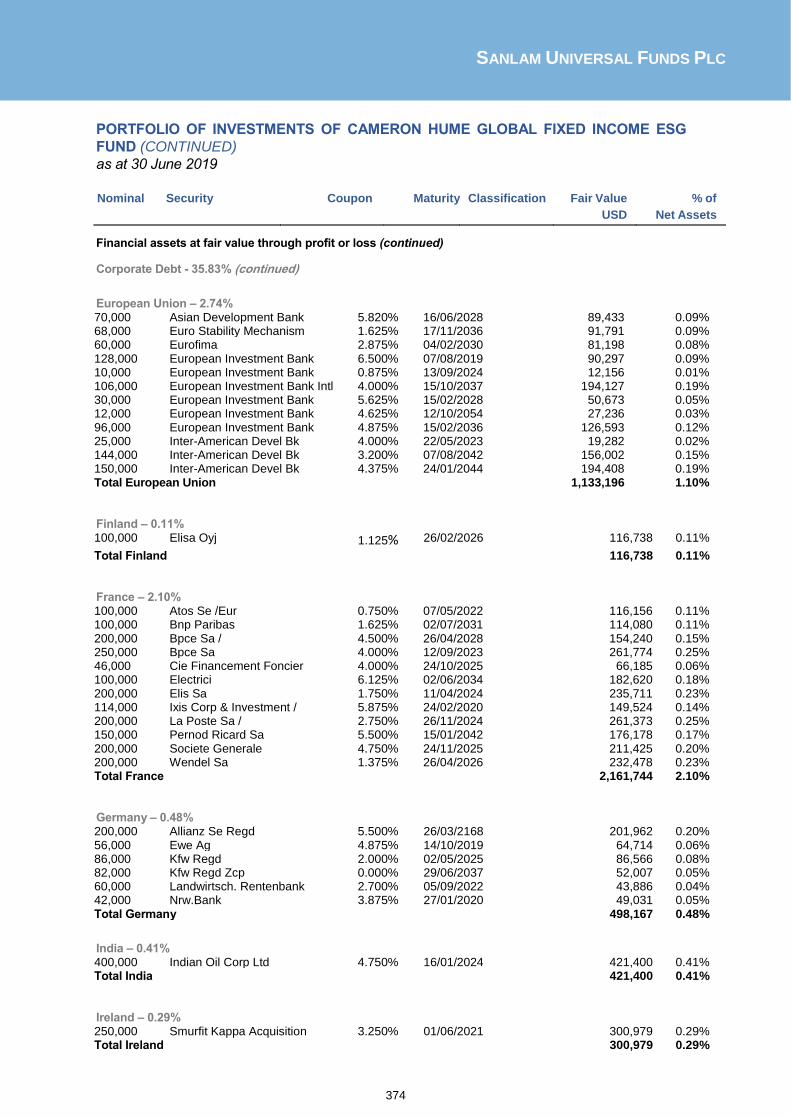
SANLAM UNIVERSAL FUNDS PLC
374
PORTFOLIO OF INVESTMENTS OF CAMERON HUME GLOBAL FIXED INCOME ESG
FUND (CONTINUED)
as at 30 June 2019
Nominal Security Coupon Maturity Classification Fair Value % of
USD Net Assets
Financial assets at fair value through profit or loss (continued)
Corporate Debt - 35.83% (continued)
European Union – 2.74% 70,000 Asian Development Bank 5.820% 16/06/2028 89,433 0.09% 68,000 Euro Stability Mechanism 1.625% 17/11/2036 91,791 0.09% 60,000 Eurofima 2.875% 04/02/2030 81,198 0.08% 128,000 European Investment Bank 6.500% 07/08/2019 90,297 0.09% 10,000 European Investment Bank 0.875% 13/09/2024 12,156 0.01% 106,000 European Investment Bank Intl 4.000% 15/10/2037 194,127 0.19% 30,000 European Investment Bank 5.625% 15/02/2028 50,673 0.05% 12,000 European Investment Bank 4.625% 12/10/2054 27,236 0.03% 96,000 European Investment Bank 4.875% 15/02/2036 126,593 0.12% 25,000 Inter-American Devel Bk 4.000% 22/05/2023 19,282 0.02% 144,000 Inter-American Devel Bk 3.200% 07/08/2042 156,002 0.15% 150,000 Inter-American Devel Bk 4.375% 24/01/2044 194,408 0.19% Total European Union 1,133,196 1.10%
Finland – 0.11% 100,000 Elisa Oyj 1.125% 26/02/2026 116,738 0.11%
Total Finland 116,738 0.11%
France – 2.10% 100,000 Atos Se /Eur 0.750% 07/05/2022 116,156 0.11% 100,000 Bnp Paribas 1.625% 02/07/2031 114,080 0.11% 200,000 Bpce Sa / 4.500% 26/04/2028 154,240 0.15% 250,000 Bpce Sa 4.000% 12/09/2023 261,774 0.25% 46,000 Cie Financement Foncier 4.000% 24/10/2025 66,185 0.06% 100,000 Electrici 6.125% 02/06/2034 182,620 0.18% 200,000 Elis Sa 1.750% 11/04/2024 235,711 0.23% 114,000 Ixis Corp & Investment / 5.875% 24/02/2020 149,524 0.14% 200,000 La Poste Sa / 2.750% 26/11/2024 261,373 0.25% 150,000 Pernod Ricard Sa 5.500% 15/01/2042 176,178 0.17% 200,000 Societe Generale 4.750% 24/11/2025 211,425 0.20% 200,000 Wendel Sa 1.375% 26/04/2026 232,478 0.23% Total France 2,161,744 2.10%
Germany – 0.48% 200,000 Allianz Se Regd 5.500% 26/03/2168 201,962 0.20% 56,000 Ewe Ag 4.875% 14/10/2019 64,714 0.06% 86,000 Kfw Regd 2.000% 02/05/2025 86,566 0.08% 82,000 Kfw Regd Zcp 0.000% 29/06/2037 52,007 0.05% 60,000 Landwirtsch. Rentenbank 2.700% 05/09/2022 43,886 0.04% 42,000 Nrw.Bank 3.875% 27/01/2020 49,031 0.05% Total Germany 498,167 0.48%
India – 0.41% 400,000 Indian Oil Corp Ltd 4.750% 16/01/2024 421,400 0.41% Total India 421,400 0.41%
Ireland – 0.29% 250,000 Smurfit Kappa Acquisition 3.250% 01/06/2021 300,979 0.29% Total Ireland 300,979 0.29%

SANLAM UNIVERSAL FUNDS PLC
375
PORTFOLIO OF INVESTMENTS OF CAMERON HUME GLOBAL FIXED INCOME ESG
FUND (CONTINUED)
as at 30 June 2019
Nominal Security Coupon Maturity Classification Fair Value % of
USD Net Assets
Financial assets at fair value through profit or loss (continued)
Corporate Debt - 35.83% (continued)
Jersey Channel Islands – 0.08% 80,000 Heathrow Funding Ltd 0.450% 15/10/2026 83,816 0.08% Total Jersey Channel Islands 83,816 0.08%
Luxembourg – 0.77% 200,000 Cnh Industrial Fin Eur S 1.750% 25/03/2027 234,535 0.23% 400,000 Millicom Intl Cellular 6.250% 25/03/2029 429,506 0.42% 100,000 Swiss Re Finance Lux 2.534% 30/04/2050 123,759 0.12% Total Luxembourg 787,799 0.77%
Netherlands – 1.94% 100,000 Abn Amro Bank Nv 1.000% 13/04/2031 122,944 0.12% 200,000 Bharti Airtel Internatio 3.375% 20/05/2021 239,368 0.23% 102,000 Enbw Intl 6.125% 07/07/2039 211,722 0.21% 400,000 Ing Groep Nv Regd V/R 6.000% 16/10/2167 404,750 0.39% 22,000 Innogy Finance Bv 1.875% 30/01/2020 25,355 0.02% 100,000 Ne Property B 3.750% 26/02/2021 118,834 0.12% 200,000 Nibc Bank Nv 2.000% 09/04/2024 234,852 0.23% 100,000 Rwe Ag /Eur/ Ser E Medium
Term Note 5.750% 14/02/2033 178,474 0.17% 166,000 Shell International Fin 4.375% 11/05/2045 191,457 0.19% 192,000 Shell International Fin 6.375% 15/12/2038 270,798 0.26% Total Netherlands 1,998,555 1.94%
New Zealand – 1.19% 400,000 Anz New Zealand Intl S 2.750% 22/01/2021 402,142 0.39% 350,000 Asb Bank Limited 3.750% 14/06/2023 364,378 0.35% 200,000 Bnz Intl Funding 0.125% 17/06/2021 229,829 0.22% 200,000 Westpac Sec Nz 0.300% 25/06/2024 228,137 0.22% Total New Zealand 1,224,486 1.19%
Norway – 0.39% 400,000 Sr-Boligkreditt As 2.500% 12/04/2022 404,108 0.39% Total Norway 404,108 0.39%
Portugal – 0.24% 200,000 Banco Santander Totta Sa 1.250% 26/09/2027 245,020 0.24% Total Portugal 245,020 0.24%
Spain – 2.26% 200,000 Banco Bilbao Vizcaya Arg 3.875% 30/01/2023 262,323 0.25% 400,000 Banco Bilbao Vizcaya Arg 8.875% 14/07/2167 508,652 0.49% 200,000 Banco Bilbao Vizcaya Arg 6.000% 29/06/2168 239,936 0.23% 500,000 Banco De Sabadell Sa 0.875% 05/03/2023 575,174 0.56% 100,000 Banco Santander Sa 2.000% 27/11/2034 137,344 0.13% 100,000 Bankia Sa 4.000% 03/02/2025 139,372 0.14% 300,000 Caixabank Sa 0.750% 18/04/2023 348,495 0.34% 100,000 Santan Consumer Finance 0.875% 24/01/2022 116,531 0.11% Total Spain 2,327,827 2.26%

SANLAM UNIVERSAL FUNDS PLC
376
PORTFOLIO OF INVESTMENTS OF CAMERON HUME GLOBAL FIXED INCOME ESG
FUND (CONTINUED)
as at 30 June 2019
Nominal Security Coupon Maturity Classification Fair Value % of
USD Net Assets
Financial assets at fair value through profit or loss (continued)
Corporate Debt - 35.83% (continued)
Sweden – 0.62% 200,000 Swedbank Ab Regd 2.800% 14/03/2022 200,533 0.19%
200,000 Swedish Covered Bond 0.500% 29/01/2025 236,384 0.23%
200,000 Swedish Export Credit 1.750% 18/05/2020 199,413 0.19%
Total Sweden 636,330 0.62%
Switzerland – 0.61% 200,000 Credit Suisse * 5.750% 18/09/2025 242,652 0.24%
40,000 Pfandbrief Schweiz Hypo 1.625% 15/03/2022 43,622 0.04%
120,000 Pfandbrief Schweiz Hypo 0.875% 25/06/2037 136,530 0.13%
200,000 Ubs Group Funding Switze 7.125% 19/02/2168 204,244 0.20%
Total Switzerland 627,048 0.61%
United Kingdom – 9.04% 232,000 Astrazeneca Plc Regd 4.375% 16/11/2045 258,758 0.25%
100,000 Easyjet Plc 0.875% 11/06/2025 113,871 0.11%
90,000 Glaxosmithkline Capital 5.250% 10/04/2042 167,697 0.16%
200,000 Investec Plc 4.500% 05/05/2022 271,907 0.26%
400,000 Itv Plc 2.125% 21/09/2022 474,843 0.46%
100,000 Lloyds Bank Plc 4.250% 28/08/2025 76,976 0.07%
50,000 London Stock Exchange Pl 9.125% 18/10/2019 65,122 0.06%
100,000 Natl Grid Elect Trans 4.000% 08/06/2027 149,687 0.15%
100,000 Natl Westminster Bank 5.125% 13/01/2024 149,479 0.14%
300,000,000 Natwest Markets Plc 0.737% 04/07/2022 2,784,370 2.70%
200,000,000 Natwest Markets Plc 0.000% 04/07/2024 1,856,395 1.80%
100,000 Network Rail Infra Fin 4.750% 22/01/2024 148,982 0.14%
202,000 Royal Mail Pl 2.375% 29/07/2024 242,938 0.24%
170,000 Santander Uk Plc 0.100% 12/05/2024 195,939 0.19%
225,000 Standard Chartered Plc 1.625% 13/06/2021 264,496 0.26%
100,000 Standard Chartered Plc 3.125% 19/11/2024 126,409 0.12%
300,000 Standard Chartered Plc 3.950% 11/01/2023 306,615 0.30%
300,000 Standard Chartered Plc 5.700% 26/03/2044 349,442 0.34%
200,000 Standard Chartered Plc 4.300% 19/02/2027 206,197 0.20%
92,000 Vodafone Group Plc 7.875% 15/02/2030 124,818 0.12%
200,000 Vodafone Group Plc Regd 6.250% 03/10/2078 207,347 0.20%
600,000 Wpp Finance 2010 4.750% 21/11/2021 629,088 0.61%
150,000 Wpp Finance 2010 3.750% 19/09/2024 155,291 0.15%
Total United Kingdom 9,326,664 9.04%

SANLAM UNIVERSAL FUNDS PLC
377
PORTFOLIO OF INVESTMENTS OF CAMERON HUME GLOBAL FIXED INCOME ESG
FUND (CONTINUED)
as at 30 June 2019
Nominal Security Coupon Maturity Classification Fair Value % of
USD Net Assets
Financial assets at fair value through profit or loss (continued)
Corporate Debt - 35.83% (continued)
United States – 19.22% 200,000 Amgen Inc 2.125% 13/09/2019 228,868 0.22% 300,000 Anheuser-Busch Inbev Fin 4.000% 17/01/2043 297,054 0.29% 80,000 Appalachian Power C 4.500% 01/03/2049 89,991 0.09% 100,000 At&T Inc 1.800% 05/09/2026 123,244 0.12% 246,000 At&T Inc Regd Ser * 4.100% 15/02/2028 260,524 0.25% 48,000 Bank Of America Corp 4.000% 01/04/2024 51,201 0.05% 54,000 Bank One Corp Regd 7.625% 15/10/2026 69,374 0.07% 150,000 Campbell Soup Co 4.800% 15/03/2048 152,818 0.15% 250,000 Cardinal Health Inc 3.410% 15/06/2027 249,448 0.24% 200,000 Cardinal Health Inc 3.500% 15/11/2024 205,473 0.20% 276,000 Caterpillar Finl Service 2.400% 09/08/2026 270,775 0.26% 88,000 Caterpillar Finl Service 3.250% 01/12/2024 91,750 0.09% 378,000 Caterpillar Inc 3.400% 15/05/2024 396,163 0.38%
146,000 Citigroup Commercial Mortgage Trust 3.818% 10/11/2048 156,940 0.15%
400,000 Cnh Industrial Cap Llc 3.875% 15/10/2021 409,990 0.40% 80,000 Comm Mortgage Trust 4.193% 10/09/2047 85,092 0.08% 30,000 Csmc Trust 3.795% 15/12/2049 32,100 0.03% 250,000 Dell Int Llc / Emc Corp 4.420% 15/06/2021 257,310 0.25% 250,000 Delta Air Lines Inc 3.400% 19/04/2021 253,414 0.25% 98,000 Dominion Energy Inc 4.900% 01/08/2041 110,936 0.11% 138,000 Dow Chemical Co 3.000% 15/11/2022 140,106 0.14% 400,000 Emc Corp 2.650% 01/06/2020 398,046 0.39% 300,000 Eqt Corp Regd 4.875% 15/11/2021 313,992 0.30% 96,578 Fannie Mae Pool 5.500% 01/11/2035 107,791 0.10% 108,761 Fannie Mae Pool 4.500% 01/05/2040 116,861 0.11% 717 Fannie Mae Pool 5.500% 01/03/2023 764 0.00% 11,119 Fannie Mae Pool 3.500% 01/06/2039 11,385 0.01% 7,180 Fannie Mae Pool 5.500% 01/12/2038 7,968 0.01% 17,659 Fannie Mae Pool 4.500% 01/08/2040 18,975 0.02% 140,082 Fannie Mae Pool 3.500% 01/03/2040 144,446 0.14% 56,208 Fannie Mae Pool 4.500% 01/02/2045 60,378 0.06% 304,200 Fannie Mae Pool 3.000% 01/09/2046 310,619 0.30% 115,289 Fannie Mae Pool 3.500% 01/05/2042 119,714 0.12% 263,752 Fannie Mae Pool 3.000% 01/11/2042 268,378 0.26% 199,483 Fannie Mae Pool 3.000% 01/07/2043 202,977 0.20% 59,825 Fannie Mae Pool 3.000% 01/11/2034 60,945 0.06% 46,962 Fannie Mae Pool 3.000% 01/06/2042 47,785 0.05% 319,906 Fannie Mae Pool 3.000% 01/10/2046 324,461 0.31% 351,271 Fannie Mae Pool 3.500% 01/01/2048 365,323 0.35% 660,386 Fannie Mae Pool 4.000% 01/02/2048 687,351 0.67% 343,740 Fannie Mae Pool 3.500% 01/04/2046 356,953 0.35% 416,800 Fannie Mae Pool 3.000% 01/12/2047 425,961 0.41% 28,351 Fannie Mae Pool 3.000% 01/09/2034 28,881 0.03% 647,304 Fannie Mae Pool 3.500% 01/06/2049 662,895 0.64% 140,000 Federal Home Loan Banks 3.000% 10/09/2021 143,440 0.14% 260,000 Federal Home Loan Banks 3.375% 12/06/2020 263,437 0.26%
104,000 Federal Home Loan Mortgage Corp 2.375% 13/01/2022 105,493 0.10%
128,000 Federal Home Loan Mortgage Corp 6.250% 15/07/2032 183,731 0.18%
200,000 Florida Power & Light Co 4.125% 01/02/2042 220,526 0.21% 80,234 Freddie Mac Gold Pool 3.000% 01/09/2027 82,187 0.08%

SANLAM UNIVERSAL FUNDS PLC
378
PORTFOLIO OF INVESTMENTS OF CAMERON HUME GLOBAL FIXED INCOME ESG
FUND (CONTINUED)
as at 30 June 2019
Nominal Security Coupon Maturity Classification Fair Value % of
USD Net Assets
Financial assets at fair value through profit or loss (continued)
Corporate Debt - 35.83% (continued)
United States – 19.22% 8,824 Freddie Mac Gold Pool 3.500% 01/10/2041 9,128 0.01% 168,200 Freddie Mac Gold Pool 4.000% 01/10/2044 177,297 0.17% 216,405 Freddie Mac Gold Pool 3.500% 01/04/2046 223,304 0.22% 115,677 Freddie Mac Gold Pool 3.000% 01/04/2028 118,493 0.11% 511,187 Freddie Mac Gold Pool 3.000% 01/04/2033 521,943 0.51% 381,675 Freddie Mac Gold Pool 3.000% 01/01/2047 388,892 0.38% 17,007 Freddie Mac Gold Pool 3.000% 01/09/2027 17,421 0.02% 38,874 Freddie Mac Gold Pool 3.500% 01/12/2044 40,219 0.04% 195,706 Freddie Mac Gold Pool 3.000% 01/07/2045 200,105 0.19% 702,372 Freddie Mac Gold Pool 2.500% 01/01/2029 709,261 0.69% 25,208 Ginnie Mae I Pool 4.000% 15/08/2041 26,781 0.03% 216,138 Ginnie Mae I Pool 3.500% 15/12/2041 224,473 0.22% 34,745 Ginnie Mae I Pool 2.500% 15/09/2042 34,912 0.03% 11,137 Ginnie Mae I Pool 4.000% 15/03/2044 11,806 0.01% 96,091 Ginnie Mae I Pool 4.000% 15/04/2044 101,728 0.10% 13,798 Ginnie Mae I Pool 4.000% 15/10/2044 14,549 0.01% 593,973 Ginnie Mae I Pool 3.000% 15/11/2046 608,132 0.59% 622,791 Ginnie Mae I Pool 3.000% 15/10/2046 637,248 0.62% 69,071 Ginnie Mae Ii Pool 4.000% 20/02/2041 73,183 0.07% 106,365 Ginnie Mae Ii Pool 4.500% 20/08/2043 112,745 0.11% 97,203 Ginnie Mae Ii Pool 4.500% 20/08/2043 104,158 0.10% 5,006 Ginnie Mae Ii Pool 4.000% 20/11/2044 5,281 0.01% 30,799 Ginnie Mae Ii Pool 2.500% 20/01/2045 31,160 0.03% 29,949 Ginnie Mae Ii Pool 4.500% 20/03/2046 31,643 0.03% 632,055 Ginnie Mae Ii Pool 4.500% 20/03/2048 662,713 0.64% 456,247 Ginnie Mae Ii Pool 4.000% 20/09/2048 473,168 0.46% 498,989 Ginnie Mae Ii Pool 3.500% 20/05/2049 515,829 0.50% 250,000 Goldman Sachs Group Inc 3.625% 22/01/2023 259,506 0.25% 50,000 Goldman Sachs Group Inc 6.250% 01/02/2041 67,020 0.06% 170,000 Gs Mortgage Securities Trust 3.964% 10/11/2047 179,609 0.17% 250,000 Harley-Davidson Finl Ser 4.050% 04/02/2022 257,763 0.25% 100,000 Harley-Davidson Finl Ser 2.400% 15/06/2020 99,688 0.10% 200,000 Harley-Davidson Inc 3.500% 28/07/2025 201,509 0.20% 115,000 Home Depot Inc 4.500% 06/12/2048 135,749 0.13% 150,000 Home Depot Inc 5.875% 16/12/2036 199,580 0.19% 102,000 Ibm Corp 5.600% 30/11/2039 128,867 0.12%
85,753 Jp Morgan Chase Commercial Mortgage Securities Trust
3.143% 15/12/2047 88,035 0.09%
192,000 Jp Morgan Chase Commercial Mortgage Securities Trust
4.166% 15/12/2046 206,014 0.20%
24,000 Jpmorgan Chase & Co 3.200% 25/01/2023 24,658 0.02% 9,000 Mcdonald'S Corp 2.750% 09/12/2020 9,060 0.01% 256,000 Microsoft Corp 2.400% 08/08/2026 257,396 0.25% 268,000 Microsoft Corp 4.100% 06/02/2037 305,748 0.30% 100,000 Mondelez International 3.875% 06/03/2045 142,603 0.14% 60,000 Oncor Electric Delivery 4.550% 01/12/2041 69,266 0.07% 100,000 Prologis Euro Finance 1.875% 05/01/2029 125,191 0.12% 100,000 Prologis Lp 2.250% 30/06/2029 128,849 0.12% 100,000 Prudential Financial Inc 4.350% 25/02/2050 112,311 0.11% 350,000 Ryder System Inc 3.500% 01/06/2021 357,392 0.35% 400,000 Santander Holdings 4.450% 03/12/2021 415,642 0.40% Total United States 19,821,262 19.22%
Total Corporate Debt 47,450,746 35.83%

SANLAM UNIVERSAL FUNDS PLC
379
PORTFOLIO OF INVESTMENTS OF CAMERON HUME GLOBAL FIXED INCOME ESG
FUND (CONTINUED)
as at 30 June 2019
Nominal Security Coupon Maturity Classification Fair Value % of
USD Net Assets
Financial assets at fair value through profit or loss (continued)
Government Debt - 61.35%
Australia – 2.83% 23,000 Australian Government 5.750% 15/05/2021 17,564 0.02% 13,000 Australian Government 4.500% 15/04/2020 9,369 0.01% 25,000 Australian Government 5.750% 15/07/2022 20,054 0.02% 200,000 Australian Government 4.750% 21/04/2027 177,077 0.17% 116,000 Australian Government 2.750% 21/04/2024 88,013 0.09% 22,000 Australian Government 3.250% 21/04/2029 18,167 0.02% 140,000 Australian Government 3.750% 21/04/2037 130,190 0.13% 966,000 Australian Government 3.000% 21/03/2047 834,310 0.81% 100,000 Australian Government 2.750% 21/11/2028 79,024 0.08% 1,550,000 Australian Government 0.981% 21/02/2050 1,286,802 1.25% 338,000 Queensland Treasury Co 3.250% 21/07/2026 263,558 0.26% Total Australia 2,924,128 2.83%
Austria – 0.56% 96,000 Republic Of Austria 3.150% 20/06/2044 174,871 0.17% 230,000 Republic Of Austria 6.250% 15/07/2027 400,601 0.39% Total Austria 575,472 0.56%
Belgium – 0.90% 41,000 Belgium Kingdom 3.000% 28/09/2019 47,098 0.05% 62,000 Belgium Kingdom 3.750% 22/06/2045 118,382 0.11% 110,000 Belgium Kingdom 1.250% 22/04/2033 140,494 0.14% 100,000 Belgium Kingdom 5.500% 28/03/2028 169,638 0.16% 300,000 Belgium Kingdom 4.500% 28/03/2026 452,723 0.44% Total Belgium 928,334 0.90%
Canada – 2.57% 174,000 British Columbia Prov Of 4.700% 18/06/2037 178,389 0.17% 170,000 British Columbia Prov Of 2.700% 18/12/2022 134,375 0.13% 52,000 British Columbia Prov Of 9.000% 23/08/2024 53,663 0.05% 203,000 Canadian Government 3.500% 01/12/2045 214,907 0.21% 24,000 Canadian Government 2.750% 01/06/2022 19,053 0.02% 740,000 Canadian Government 0.750% 01/03/2021 559,149 0.54% 158,000 Canadian Government 1.000% 01/06/2027 116,889 0.11% 212,000 Canadian Government 2.500% 01/06/2024 170,757 0.17% 140,000 Canadian Government 2.000% 01/06/2028 111,982 0.11% 72,000 Canadian Government 1.500% 01/03/2020 55,014 0.05% 40,000 Canadian Government 5.750% 01/06/2029 42,547 0.04% 144,000 Cdp Financial Inc 4.600% 15/07/2020 113,231 0.11% 200,000 Manitoba (Province Of) 0.750% 15/12/2021 252,552 0.24% 48,000 Ontario (Province Of) 2.100% 08/09/2019 36,749 0.04% 122,000 Ontario (Province Of) 6.200% 02/06/2031 131,727 0.13% 288,000 Ontario (Province Of) 4.700% 02/06/2037 291,727 0.28% 52,000 Province Of Alberta 3.300% 01/12/2046 45,638 0.04% 100,000 Province Of Quebec 0.875% 05/07/2028 120,861 0.12% Total Canada 2,649,210 2.57%

SANLAM UNIVERSAL FUNDS PLC
380
PORTFOLIO OF INVESTMENTS OF CAMERON HUME GLOBAL FIXED INCOME ESG FUND (CONTINUED) as at 30 June 2019
Nominal Security Coupon Maturity Classification Fair Value % of
USD Net Assets
Financial assets at fair value through profit or loss (continued) Government Debt - 61.35% (continued)
Cyprus – 0.21% 150,000 Republic Of Cyprus 2.375% 25/09/2028 197,506 0.19% 20,000 Republic Of Cyprus 0.625% 03/12/2024 23,373 0.02% Total Cyprus 220,879 0.21%
Czech Republic – 0.04% 820,000 Czech Republic 2.500% 25/08/2028 40,036 0.04% Total Czech Republic 40,036 0.04%
Denmark – 0.17% 820,000 Kingdom Of Denmark 1.500% 15/11/2023 137,269 0.13% 144,000 Kingdom Of Denmark 4.500% 15/11/2039 41,988 0.04% Total Denmark 179,257 0.17%
European Union – 0.65%
700,000 International Bank For Reconstruction & Development 2.500% 03/08/2023 552,586 0.54%
110,000 International Bank For Reconstruction & Development 0.000% 26/11/2021 115,155 0.11%
Total European Union 667,741 0.65%
Finland – 0.23% 200,000 Finnvera Plc 0.500% 13/04/2026 238,312 0.23% Total Finland 238,312 0.23%
France – 3.31% 92,885 France (Govt Of) 4.000% 25/04/2060 209,734 0.20% 206,000 France (Govt Of) 1.500% 25/05/2031 271,814 0.26% 456,000 France (Govt Of) 3.500% 25/04/2026 658,258 0.64% 300,000 France (Govt Of) 4.000% 25/10/2038 560,501 0.54% 492,000 France (Govt Of) 2.250% 25/05/2024 637,540 0.62% 104,000 France (Govt Of) 2.500% 25/05/2030 149,782 0.15% 285,000 France (Govt Of) 0.750% 25/11/2028 349,390 0.34% 100,000 Sncf Reseau 5.000% 10/10/2033 182,588 0.18% 100,000 Sncf Reseau 0.875% 22/01/2029 120,053 0.12% 100,000 Sncf Reseau 4.250% 07/10/2026 149,530 0.14% 100,000 Societe Du Grand Paris 1.125% 25/05/2034 122,225 0.12% Total France 3,411,415 3.31%
Germany – 2.11% 358,000 Bundesrepub. Deutschland 1.000% 15/08/2024 442,998 0.43% 98,000 Bundesrepub. Deutschland 5.500% 04/01/2031 187,365 0.18% 174,000 Bundesrepub. Deutschland 4.000% 04/01/2037 338,146 0.33% 150,000 Bundesrepub. Deutschland 4.750% 04/07/2040 337,819 0.33% 200,000 Bundesrepub. Deutschland 5.625% 04/01/2028 348,226 0.34% 200,000 Land Nordrhein-Westfalen 0.950% 13/03/2028 246,796 0.24% 50,000 Land Nordrhein-Westfalen 1.650% 22/02/2038 66,803 0.06% 8,000 Land Nordrhein-Westfalen 2.000% 15/10/2025 10,401 0.01% 200,000 Land Nordrhein-Westfalen 1.250% 16/09/2019 199,546 0.19% Total Germany 2,178,100 2.11%

SANLAM UNIVERSAL FUNDS PLC
381
PORTFOLIO OF INVESTMENTS OF CAMERON HUME GLOBAL FIXED INCOME ESG
FUND (CONTINUED)
as at 30 June 2019
Nominal Security Coupon Maturity Classification Fair Value % of
USD Net Assets
Financial assets at fair value through profit or loss (continued)
Government Debt - 61.35% (continued)
Greece – 7.39% 500,000 Hellenic Republic 3.450% 02/04/2024 626,072 0.61% 3,600,000 Hellenic Republic 4.375% 01/08/2022 4,529,613 4.39% 2,000,000 Hellenic Republic 3.500% 30/01/2023 2,471,663 2.40% Total Greece 7,627,349 7.39%
Israel – 0.01% 44,000 Israel Fixed Bond 1.750% 31/08/2025 12,977 0.01% Total Israel 12,977 0.01%
Italy – 2.67% 126,000 Buoni Poliennali Del Tes 5.500% 01/11/2022 165,024 0.16% 224,000 Buoni Poliennali Del Tes 4.750% 01/09/2044 335,417 0.33% 398,000 Buoni Poliennali Del Tes 4.500% 01/03/2024 519,314 0.50% 379,000 Buoni Poliennali Del Tes 3.500% 01/03/2030 485,828 0.47% 263,000 Buoni Poliennali Del Tes 2.150% 15/12/2021 311,053 0.30% 97,000 Buoni Poliennali Del Tes 4.250% 01/09/2019 111,271 0.11% 350,000 Buoni Poliennali Del Tes 4.500% 01/03/2026 471,052 0.46% 160,000 Buoni Poliennali Del Tes 5.000% 01/08/2034 239,399 0.23% 100,000 Cassa Depositi E Prestit 2.125% 27/09/2023 117,427 0.11% Total Italy 2,755,784 2.67%
Japan – 12.01% 39,100,000 Japan (10 Year Issue) 1.400% 20/09/2019 364,154 0.35% 77,700,000 Japan (10 Year Issue) 0.400% 20/09/2025 751,185 0.73% 75,900,000 Japan (10 Year Issue) 0.100% 20/03/2027 724,104 0.70% 58,800,000 Japan (10 Year Issue) 0.100% 20/03/2028 561,004 0.54% 76,900,000 Japan (20 Year Issue) 2.400% 20/06/2028 882,084 0.86% 47,000,000 Japan (20 Year Issue) 2.200% 20/12/2029 543,818 0.53% 85,000,000 Japan (20 Year Issue) 1.900% 20/03/2031 973,188 0.94% 59,600,000 Japan (20 Year Issue) 1.500% 20/03/2033 666,733 0.65% 51,500,000 Japan (20 Year Issue) 2.200% 20/09/2026 563,883 0.55% 128,700,000 Japan (30 Year Issue) 2.500% 20/09/2036 1,673,261 1.62% 63,400,000 Japan (30 Year Issue) 1.800% 20/03/2043 793,121 0.77% 104,050,000 Japan (30 Year Issue) 0.800% 20/03/2046 1,083,853 1.05% 73,350,000 Japan (40 Year Issue) 1.700% 20/03/2054 972,245 0.94% 400,000 Japan Fin Org Municipal 2.125% 13/04/2021 400,146 0.39% 400,000 Japan Fin Org Municipal 3.250% 24/04/2023 415,888 0.40% 200,000 Japan Fin Org Municipal 3.000% 12/03/2024 207,302 0.20% 400,000 Japan Fin Org Municipal 2.125% 12/02/2021 400,182 0.39% 200,000 Jpn Bank For Int'L Coop 2.375% 20/04/2026 201,250 0.20% 200,000 Jpn Bank For Int'L Coop 2.750% 21/01/2026 206,120 0.20% Total Japan 12,383,520 12.01%
Malaysia – 0.08% 92,000 Malaysia Government 3.418% 15/08/2022 22,294 0.02% 72,000 Malaysia Government 4.127% 15/04/2032 17,748 0.02% 82,000 Malaysia Government 4.709% 15/09/2026 21,180 0.02% 90,000 Malaysia Government 5.734% 30/07/2019 21,826 0.02% Total Malaysia 83,048 0.08%

SANLAM UNIVERSAL FUNDS PLC
382
PORTFOLIO OF INVESTMENTS OF CAMERON HUME GLOBAL FIXED INCOME ESG
FUND (CONTINUED)
as at 30 June 2019
Nominal Security Coupon Maturity Classification Fair Value % of
USD Net Assets
Financial assets at fair value through profit or loss (continued) Government Debt - 61.35% (continued)
Mexico – 0.32% 1,600,000 Mex Bonos Desarr Fix Rt 5.750% 05/03/2026 75,866 0.07% 2,600,000 Mex Bonos Desarr Fix Rt 6.500% 10/06/2021 132,884 0.13% 114,000 United Mexican States 4.750% 08/03/2044 119,203 0.12% Total Mexico 327,953 0.32%
Netherlands – 0.42% 100,000 Netherlands Government 3.750% 15/01/2042 202,692 0.20% 135,000 Netherlands Government 5.500% 15/01/2028 231,416 0.22% Total Netherlands 434,107 0.42%
New Zealand – 0.88% 290,000 New Zealand Government 5.500% 15/04/2023 225,919 0.22% 737,000 New Zealand Index Linked 2.500% 20/09/2040 677,477 0.66% Total New Zealand 903,396 0.88% Norway – 0.10% 840,000 Norwegian Government 3.000% 14/03/2024 106,324 0.10% Total Norway 106,324 0.10%
Philippines – 0.20% 200,000 Republic Of Philippines 3.000% 01/02/2028 205,803 0.20% Total Philippines 205,803 0.20% Poland – 0.35% 356,000 Poland Government Bond 5.750% 23/09/2022 107,316 0.10% 236,000 Republic Of Poland 4.000% 22/01/2024 254,367 0.25% Total Poland 361,682 0.35%
Portugal – 0.18% 100,000 Obrigacoes Do Tesouro 4.100% 15/02/2045 180,974 0.18% Total Portugal 180,974 0.18%
Singapore – 0.16% 214,000 Singapore Government 2.375% 01/06/2025 162,918 0.16% Total Singapore 162,918 0.16%
South Korea – 0.74% 200,000 Export-Import Bank Korea 0.375% 26/03/2024 231,807 0.22% 300,000 Export-Import Bank Korea 2.250% 21/01/2020 300,041 0.29% 119,540,000 Korea Treasury Bond 3.000% 10/09/2024 110,958 0.11% 45,580,000 Korea Treasury Bond 5.500% 10/12/2029 54,236 0.05% 64,020,000 Korea Treasury Bond 3.000% 10/12/2042 70,223 0.07% Total South Korea 767,264 0.74%

SANLAM UNIVERSAL FUNDS PLC
383
PORTFOLIO OF INVESTMENTS OF CAMERON HUME GLOBAL FIXED INCOME ESG
FUND (CONTINUED)
as at 30 June 2019
Nominal Security Coupon Maturity Classification Fair Value % of
USD Net Assets
Financial assets at fair value through profit or loss (continued) Government Debt - 61.35% (continued)
Spain – 1.97% 357,000 Bonos Y Oblig Del Estado 4.650% 30/07/2025 522,547 0.51% 148,000 Bonos Y Oblig Del Estado 3.450% 30/07/2066 263,728 0.26% 175,000 Bonos Y Oblig Del Estado 2.350% 30/07/2033 242,108 0.23% 213,000 Bonos Y Oblig Del Estado 6.000% 31/01/2029 372,247 0.36% 200,000 Bonos Y Oblig Del Estado 4.200% 31/01/2037 349,963 0.34% 200,000 Bonos Y Oblig Del Estado 4.800% 31/01/2024 280,469 0.27% 2,000 Bonos Y Oblig Del Estado 4.300% 31/10/2019 2,313 0.00% Total Spain 2,033,377 1.97%
Sweden – 0.06% 490,000 Swedish Government 2.250% 01/06/2032 66,520 0.06% Total Sweden 66,520 0.06%
Thailand – 0.27% 3,000,000 Thailand Government Bond 4.875% 22/06/2029 121,638 0.12% 2,472,000 Thailand Government Bond 3.625% 16/06/2023 86,187 0.08% 2,278,000 Thailand Government Bond 2.875% 17/06/2046 73,466 0.07% Total Thailand 281,291 0.27%
United Kingdom – 3.53% 152,000 Uk Tsy 1.500% 22/01/2021 196,115 0.19% 18,000 Uk Tsy 1.625% 22/10/2071 25,232 0.02% 150,000 Uk Tsy 1.750% 07/09/2022 198,029 0.19% 139,000 Uk Tsy 2.250% 07/09/2023 188,972 0.18% 52,000 Uk Tsy 2.750% 07/09/2024 73,341 0.07% 400,000 Uk Tsy 4.500% 07/12/2042 820,286 0.80% 240,000 Uk Tsy 4.250% 07/12/2027 393,516 0.38% 235,000 Uk Tsy 4.250% 07/12/2049 504,102 0.49% 233,000 Uk Tsy 4.750% 07/12/2030 419,137 0.41% 70,000 Uk Tsy 4.750% 07/12/2038 141,207 0.14% 100,000 Uk Tsy 4.000% 07/03/2022 138,943 0.13% 106,000 Uk Tsy 4.000% 22/01/2060 243,993 0.24% 190,000 Uk Tsy 5.000% 07/03/2025 300,588 0.29% Total United Kingdom 3,643,461 3.53%
United States – 6.24% 30,000 New York Ny Regd N/C B/E 5.206% 01/10/2031 35,786 0.03% 1,182,000 United States Treasury Bond 3.750% 15/08/2041 1,450,997 1.41% 810,000 United States Treasury Bond 2.500% 15/02/2046 805,507 0.78% 425,000 United States Treasury Bond 5.250% 15/02/2029 545,727 0.53% 143,000 United States Treasury Bond 5.375% 15/02/2031 191,955 0.19% 450,000 United States Treasury Bond 6.750% 15/08/2026 595,582 0.58% 791,000 United States Treasury Bond 4.500% 15/02/2036 1,043,131 1.01% 500,000 United States Treasury Note 2.250% 15/11/2025 511,777 0.50% 380,000 United States Treasury Note 2.375% 15/05/2027 392,647 0.38% 450,000 United States Treasury Note 2.500% 31/01/2025 466,506 0.45% 375,000 United States Treasury Note 2.750% 15/02/2028 398,496 0.39% Total United States 6,438,112 6.24%
Total Government Debt 52,788,743 61.35%
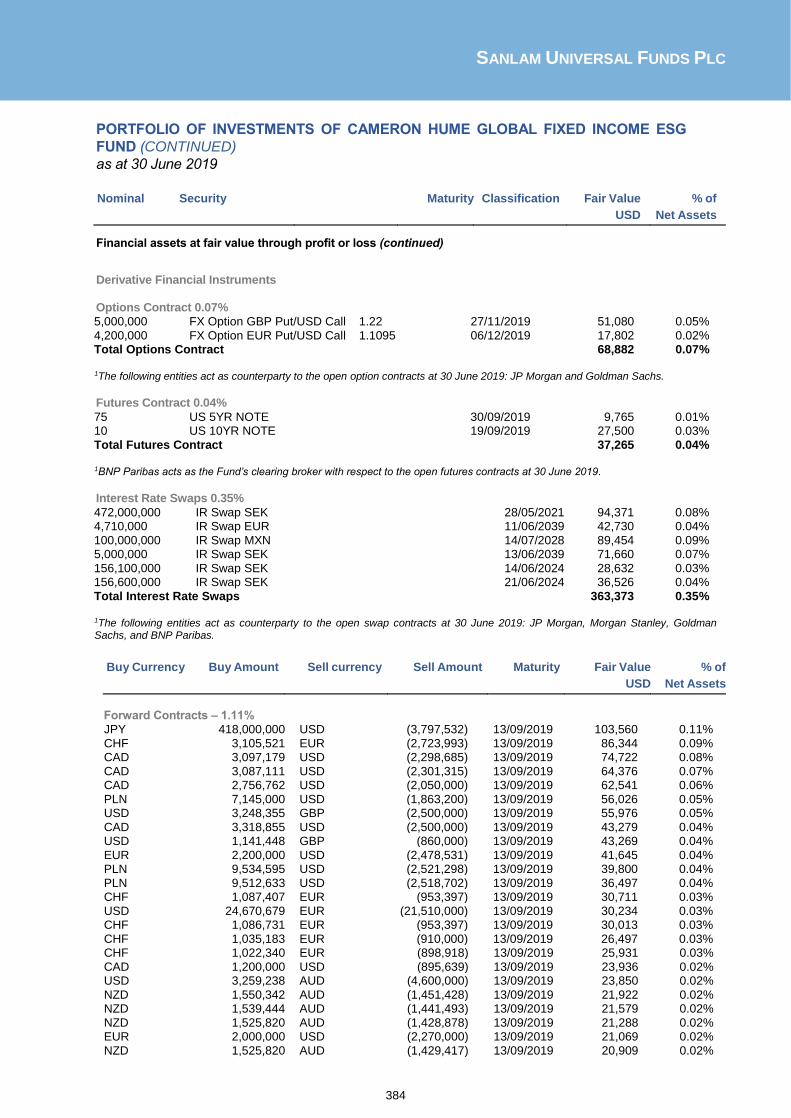
SANLAM UNIVERSAL FUNDS PLC
384
PORTFOLIO OF INVESTMENTS OF CAMERON HUME GLOBAL FIXED INCOME ESG
FUND (CONTINUED)
as at 30 June 2019
Nominal Security
Maturity Classification Fair Value % of
USD Net Assets
Financial assets at fair value through profit or loss (continued)
Derivative Financial Instruments Options Contract 0.07%
5,000,000 FX Option GBP Put/USD Call 1.22 27/11/2019 51,080 0.05%
4,200,000 FX Option EUR Put/USD Call 1.1095 06/12/2019 17,802 0.02% Total Options Contract 68,882 0.07% 1The following entities act as counterparty to the open option contracts at 30 June 2019: JP Morgan and Goldman Sachs. Futures Contract 0.04%
75 US 5YR NOTE 30/09/2019 9,765 0.01% 10 US 10YR NOTE 19/09/2019 27,500 0.03%
Total Futures Contract 37,265 0.04% 1BNP Paribas acts as the Fund’s clearing broker with respect to the open futures contracts at 30 June 2019.
Interest Rate Swaps 0.35%
472,000,000 IR Swap SEK 28/05/2021 94,371 0.08% 4,710,000 IR Swap EUR 11/06/2039 42,730 0.04%
100,000,000 IR Swap MXN 14/07/2028 89,454 0.09% 5,000,000 IR Swap SEK 13/06/2039 71,660 0.07%
156,100,000 IR Swap SEK 14/06/2024 28,632 0.03% 156,600,000 IR Swap SEK 21/06/2024 36,526 0.04%
Total Interest Rate Swaps 363,373 0.35% 1The following entities act as counterparty to the open swap contracts at 30 June 2019: JP Morgan, Morgan Stanley, Goldman Sachs, and BNP Paribas.
Buy Currency Buy Amount Sell currency Sell Amount Maturity Fair Value % of
USD Net Assets
Forward Contracts – 1.11%
JPY 418,000,000 USD (3,797,532) 13/09/2019 103,560 0.11%
CHF 3,105,521 EUR (2,723,993) 13/09/2019 86,344 0.09% CAD 3,097,179 USD (2,298,685) 13/09/2019 74,722 0.08%
CAD 3,087,111 USD (2,301,315) 13/09/2019 64,376 0.07% CAD 2,756,762 USD (2,050,000) 13/09/2019 62,541 0.06%
PLN 7,145,000 USD (1,863,200) 13/09/2019 56,026 0.05% USD 3,248,355 GBP (2,500,000) 13/09/2019 55,976 0.05%
CAD 3,318,855 USD (2,500,000) 13/09/2019 43,279 0.04% USD 1,141,448 GBP (860,000) 13/09/2019 43,269 0.04%
EUR 2,200,000 USD (2,478,531) 13/09/2019 41,645 0.04% PLN 9,534,595 USD (2,521,298) 13/09/2019 39,800 0.04%
PLN 9,512,633 USD (2,518,702) 13/09/2019 36,497 0.04% CHF 1,087,407 EUR (953,397) 13/09/2019 30,711 0.03%
USD 24,670,679 EUR (21,510,000) 13/09/2019 30,234 0.03% CHF 1,086,731 EUR (953,397) 13/09/2019 30,013 0.03%
CHF 1,035,183 EUR (910,000) 13/09/2019 26,497 0.03% CHF 1,022,340 EUR (898,918) 13/09/2019 25,931 0.03%
CAD 1,200,000 USD (895,639) 13/09/2019 23,936 0.02% USD 3,259,238 AUD (4,600,000) 13/09/2019 23,850 0.02%
NZD 1,550,342 AUD (1,451,428) 13/09/2019 21,922 0.02% NZD 1,539,444 AUD (1,441,493) 13/09/2019 21,579 0.02%
NZD 1,525,820 AUD (1,428,878) 13/09/2019 21,288 0.02% EUR 2,000,000 USD (2,270,000) 13/09/2019 21,069 0.02%
NZD 1,525,820 AUD (1,429,417) 13/09/2019 20,909 0.02%

SANLAM UNIVERSAL FUNDS PLC
385
PORTFOLIO OF INVESTMENTS OF CAMERON HUME GLOBAL FIXED INCOME ESG
FUND (CONTINUED)
as at 30 June 2019
Buy Currency Buy Amount Sell currency Sell Amount Maturity Fair Value % of
USD Net Assets
Financial assets at fair value through profit or loss (continued)
Derivative Financial Instruments (continued)
Forward Contracts – 1.11% (continued) NZD 1,498,573 AUD (1,403,474) 13/09/2019 20,829 0.02%
PLN 1,756,747 USD (457,000) 13/09/2019 14,882 0.01% USD 330,808 GBP (250,000) 13/09/2019 11,570 0.01%
CAD 678,000 USD (510,633) 13/09/2019 8,927 0.01% USD 432,401 NZD (630,000) 13/09/2019 8,656 0.01%
USD 596,112 NZD (874,000) 13/09/2019 8,250 0.01% CAD 381,000 USD (283,717) 13/09/2019 8,248 0.01%
JPY 46,300,000 USD (424,911) 13/09/2019 7,195 0.01% USD 262,533 GBP (200,000) 13/09/2019 7,143 0.01%
USD 302,626 CNY (2,040,000) 16/09/2019 5,594 0.01% JPY 221,349,600 EUR (1,800,000) 13/09/2019 3,840 0.00%
EUR 1,801,434 USD (2,059,930) 13/09/2019 3,674 0.00% USD 235,015 KRW (267,000,000) 16/09/2019 3,221 0.00%
CHF 83,000 USD (82,938) 13/09/2019 2,768 0.00% SEK 975,000 USD (103,182) 13/09/2019 2,467 0.00%
USD 2,600,000 JPY (278,343,000) 13/09/2019 2,293 0.00% AUD 5,840,000 USD (4,105,403) 13/09/2019 2,133 0.00%
AUD 297,000 USD (206,946) 13/09/2019 1,948 0.00% EUR 900,717 USD (1,030,407) 13/09/2019 1,396 0.00%
CAD 75,000 USD (56,232) 13/09/2019 1,241 0.00% USD 975,000 NOK (8,285,747) 13/09/2019 1,122 0.00%
USD 1,520,000 JPY (162,751,872) 13/09/2019 1,077 0.00% USD 919,217 NOK (7,812,204) 13/09/2019 998 0.00%
NOK 1,219,000 USD (142,336) 13/09/2019 941 0.00% USD 71,064 NOK (600,000) 13/09/2019 542 0.00%
USD 202,297 GBP (158,000) 13/09/2019 539 0.00% CHF 101,000 USD (103,795) 13/09/2019 498 0.00%
USD 28,710 NZD (42,000) 13/09/2019 460 0.00% USD 128,141 GBP (100,000) 13/09/2019 446 0.00%
USD 38,737 GBP (30,000) 13/09/2019 428 0.00% USD 176,953 DKK (1,150,000) 13/09/2019 369 0.00%
USD 217,030 SEK (2,000,000) 13/09/2019 314 0.00% USD 51,722 MXN (1,000,000) 13/09/2019 312 0.00%
USD 64,080 GBP (50,000) 13/09/2019 233 0.00% AUD 98,000 USD (68,795) 13/09/2019 133 0.00%
GBP 200,000 USD (255,258) 13/09/2019 132 0.00% EUR 820,000 USD (939,228) 13/09/2019 110 0.00%
USD 30,325 AUD (43,000) 13/09/2019 81 0.00% PLN 274,000 USD (73,528) 13/09/2019 72 0.00%
AUD 44,000 USD (30,886) 13/09/2019 62 0.00% USD 155,000 SEK (1,430,088) 13/09/2019 38 0.00%
USD 159,130 SGD (215,000) 13/09/2019 36 0.00% USD 46,684 JPY (5,000,000) 13/09/2019 20 0.00%
Total Forward Contracts 1,141,212 1.11%
1The following entities act as counterparty to the open forward currency contracts at 30 June 2019: Brown Brothers Harriman, JP Morgan, Goldman Sachs, Societe Generale, and StateStreet.
Total financial assets at fair value through profit or loss 101,850,221 98.74%

SANLAM UNIVERSAL FUNDS PLC
386
PORTFOLIO OF INVESTMENTS OF CAMERON HUME GLOBAL FIXED INCOME ESG
FUND (CONTINUED)
as at 30 June 2019
Nominal Security
Maturity Classification Fair Value % of
USD Net Assets
Financial liabilities at fair value through profit or loss
Derivative Financial Instruments
Options Contracts (0.27)%
(5,000,000) FX Option GBP Put/USD Call 1.18 27/11/2019 (25,791) (0.03%) (4,200,000) FX OPTION EUR Call/USD Put 1.176 06/12/2019 (36,652) (0.04%)
(88,000,000) Call Interest Swaption 1.5% 11/06/2020 (217,183) (0.22%) Total Options Contracts (279,626) (0.27)% 1The following entities act as counterparty to the open option contracts at 30 June 2019: JP Morgan and Goldman Sachs. Futures Contracts (0.01)%
107 US 2YR NOTE 30/09/2019 (3,687) (0.01)%
Total Futures Contracts (3,687) (0.01)%
1BNP Paribas acts as the Fund’s clearing broker with respect to the open futures contracts at 30 June 2019.
Interest rate swaps - (0.85)%
18,000,000 IR Swap SEK 05/03/2029 (766,105) (0.74)% 850,000,000 IR Swap SEK 06/05/2021 (74,890) (0.07)%
447,000,000 IR Swap SEK 14/05/2021 (36,531) (0.04)% Total Interest Rate Swaps (877,526) (0.85)%
1The following entities act as counterparty to the open swap contracts at 30 June 2019: JP Morgan, Morgan Stanley, Goldman Sachs, and BNP Paribas.
Buy Currency Buy Amount Sell currency Sell Amount Maturity Fair Value % of
USD Net Assets
Forward Contracts – (1.55)%
USD 14,063,225 JPY (1,545,000,000) 13/09/2019 (355,888) (0.36)%
USD 4,350,000 NOK (37,967,170) 13/09/2019 (112,527) (0.12)% USD 2,522,983 CAD (3,404,465) 13/09/2019 (85,901) (0.09)%
USD 5,099,020 EUR (4,510,000) 13/09/2019 (67,341) (0.08)% USD 2,535,910 PLN (9,689,585) 13/09/2019 (66,820) (0.07)%
USD 3,301,695 CAD (4,390,000) 13/09/2019 (62,416) (0.07)% AUD 7,236,720 NZD (7,657,000) 13/09/2019 (60,265) (0.07)%
EUR 2,095,858 CHF (2,381,088) 13/09/2019 (57,842) (0.07)% USD 3,734,627 EUR (3,300,000) 13/09/2019 (45,637) (0.04)%
EUR 1,633,136 CHF (1,855,422) 13/09/2019 (45,102) (0.04)% EUR 1,676,686 CHF (1,903,559) 13/09/2019 (44,919) (0.04)%
EUR 1,886,000 CAD (2,877,374) 13/09/2019 (44,489) (0.04)% USD 2,025,000 CAD (2,700,313) 13/09/2019 (44,283) (0.04)%
USD 2,000,000 PLN (7,602,808) 13/09/2019 (42,199) (0.04)% USD 1,540,000 PLN (5,890,192) 13/09/2019 (42,171) (0.04)%
USD 3,484,619 EUR (3,070,000) 13/09/2019 (32,172) (0.03)% USD 2,101,681 AUD (3,030,000) 13/09/2019 (29,455) (0.03)%
NOK 17,800,000 CAD (2,768,281) 13/09/2019 (29,219) (0.03)% EUR 1,034,320 CHF (1,175,144) 13/09/2019 (28,609) (0.03)%
USD 1,575,486 EUR (1,400,000) 13/09/2019 (28,262) (0.03)% USD 1,984,677 AUD (2,860,075) 13/09/2019 (26,942) (0.03)%
USD 1,020,000 CAD (1,365,929) 13/09/2019 (26,728) (0.03)% USD 4,217,334 EUR (3,700,000) 13/09/2019 (21,143) (0.02)%
USD 1,332,790 JPY (145,000,000) 13/09/2019 (20,459) (0.02)% USD 1,480,000 PLN (5,566,213) 13/09/2019 (15,147) (0.01)%
USD 474,546 NOK (4,150,000) 13/09/2019 (13,230) (0.01)% EUR 2,670,000 USD (3,070,887) 13/09/2019 (12,310) (0.01)%
EUR 3,420,000 USD (3,929,426) 13/09/2019 (11,698) (0.01)% NOK 25,863,997 USD (3,050,000) 13/09/2019 (10,037) (0.01)%

SANLAM UNIVERSAL FUNDS PLC
387
PORTFOLIO OF INVESTMENTS OF CAMERON HUME GLOBAL FIXED INCOME ESG
FUND (CONTINUED)
as at 30 June 2019
Buy Currency Buy Amount Sell currency Sell Amount Maturity Fair Value % of
USD Net Assets
Financial liabilities at fair value through profit or loss (continued) Derivative Financial Instruments (continued) Forward Contracts – (1.55)% (continued) USD 374,959 CAD (500,000) 13/09/2019 (8,197) (0.01)% GBP 200,000 EUR (229,628) 13/09/2019 (7,656) (0.01)%
USD 242,977 THB (7,660,000) 13/09/2019 (7,243) (0.01)% USD 299,700 CAD (400,000) 13/09/2019 (6,825) (0.01)%
USD 242,695 CHF (240,000) 13/09/2019 (5,130) 0.00% USD 338,558 EUR (300,000) 13/09/2019 (5,102) 0.00%
USD 115,828 THB (3,700,000) 13/09/2019 (5,036) 0.00% USD 281,590 EUR (250,000) 13/09/2019 (4,794) 0.00%
USD 277,117 CHF (273,000) 13/09/2019 (4,783) 0.00% USD 397,140 EUR (350,000) 13/09/2019 (3,797) 0.00%
NOK 15,375,485 USD (1,810,945) 13/09/2019 (3,765) 0.00% USD 166,213 MXN (3,300,000) 13/09/2019 (3,440) 0.00%
CNY 1,021,103 USD (151,859) 16/09/2019 (3,183) 0.00% USD 340,487 EUR (300,000) 13/09/2019 (3,174) 0.00%
CNY 1,028,897 USD (152,712) 16/09/2019 (2,901) 0.00% GBP 62,000 USD (81,778) 13/09/2019 (2,607) 0.00%
USD 140,000 CAD (185,984) 13/09/2019 (2,522) 0.00% USD 260,994 EUR (230,000) 13/09/2019 (2,479) 0.00%
USD 156,107 AUD (225,000) 13/09/2019 (2,146) 0.00% NZD 253,000 USD (172,280) 13/09/2019 (2,110) 0.00%
USD 82,255 NZD (125,000) 13/09/2019 (1,821) 0.00% USD 1,429,952 JPY (153,411,795) 13/09/2019 (1,803) 0.00%
USD 327,332 NOK (2,800,000) 13/09/2019 (1,770) 0.00% USD 102,463 AUD (148,046) 13/09/2019 (1,664) 0.00%
AUD 155,000 USD (110,667) 13/09/2019 (1,648) 0.00% USD 78,627 EUR (70,000) 13/09/2019 (1,560) 0.00%
USD 81,157 CHF (80,000) 13/09/2019 (1,451) 0.00% USD 55,487 JPY (6,100,000) 13/09/2019 (1,443) 0.00%
USD 73,117 AUD (106,000) 13/09/2019 (1,438) 0.00% USD 69,852 CAD (93,000) 13/09/2019 (1,415) 0.00%
USD 104,144 JPY (11,300,000) 13/09/2019 (1,316) 0.00% USD 61,025 CAD (81,234) 13/09/2019 (1,225) 0.00%
USD 61,528 JPY (6,700,000) 13/09/2019 (1,001) 0.00% USD 514,571 EUR (450,000) 13/09/2019 (920) 0.00%
USD 61,071 CHF (60,000) 13/09/2019 (885) 0.00% USD 126,830 GBP (100,000) 13/09/2019 (865) 0.00%
GBP 349,000 USD (446,473) 13/09/2019 (817) 0.00% EUR 1,030,000 USD (1,180,709) 13/09/2019 (808) 0.00%
USD 457,520 EUR (400,000) 13/09/2019 (694) 0.00% USD 56,611 EUR (50,000) 13/09/2019 (665) 0.00%
NOK 1,220,000 USD (143,997) 13/09/2019 (602) 0.00% USD 104,949 AUD (150,000) 13/09/2019 (553) 0.00%
USD 31,192 NOK (270,000) 13/09/2019 (542) 0.00% USD 39,811 CZK (900,000) 13/09/2019 (519) 0.00%
USD 191,028 GBP (150,000) 13/09/2019 (515) 0.00% NOK 373,000 USD (44,262) 13/09/2019 (421) 0.00%
USD 80,655 MYR (335,000) 13/09/2019 (310) 0.00% USD 150,914 AUD (215,000) 13/09/2019 (305) 0.00%
USD 20,982 JPY (2,280,000) 13/09/2019 (296) 0.00% USD 85,653 EUR (75,000) 13/09/2019 (262) 0.00%
USD 80,276 GBP (63,000) 13/09/2019 (172) 0.00% USD 12,610 GBP (10,000) 13/09/2019 (160) 0.00%
USD 24,484 AUD (35,000) 13/09/2019 (134) 0.00%

SANLAM UNIVERSAL FUNDS PLC
388
PORTFOLIO OF INVESTMENTS OF CAMERON HUME GLOBAL FIXED INCOME ESG
FUND (CONTINUED)
as at 30 June 2019
Buy Currency Buy Amount Sell currency Sell Amount Maturity Fair Value % of
USD Net Assets
Financial liabilities at fair value through profit or loss (continued)
Derivative Financial Instruments (continued) Forward Contracts – (1.55)% (continued) USD 24,662 ILS (88,000) 13/09/2019 (124) 0.00%
USD 80,098 MXN (1,560,000) 13/09/2019 (102) 0.00% USD 30,902 AUD (44,000) 13/09/2019 (45) 0.00%
USD 19,136 GBP (15,000) 13/09/2019 (18) 0.00% JPY 1,500,000 USD (13,937) 05/07/2019 (11) 0.00%
MXN 400,000 USD (20,572) 13/09/2019 (8) 0.00% Total Forwards Contracts (1,600,409) (1.55)%
1The following entities act as counterparty to the open forward currency contracts at 30 June 2019: Brown Brothers Harriman, JP Morgan, Goldman Sachs, Societe Generale, and StateStreet.
Total financial liabilities at fair value through profit or loss (2,761,248) (2.68)%
Cash and cash equivalents 33,785,147 3.67%
Other net assets and liabilities 273,244 0.26%
Net assets attributable to holders of redeemable participating shares 103,147,364 100.00%
Cameron Hume Global Fixed Income Fund
Summary Classification Description Fair Value % of % of
USD Net
Assets Total
Assets
Transferable securities and money market instruments admitted to official stock exchange listing or traded on regulated market - - -
A Transferable securities and money market instruments other than those referred above 100,239,489 97.18% 89.85%
B UCITS and AIFs - - -
C Financial derivative instruments dealt in on a regulated market 33,578 0.03% 0.03%
D Over the counter financial derivative instruments (1,184,094) (1.15)% (1.06)%
Cash and cash equivalents 3,785,147 3.67% 3.39%
Other net assets and liabilities 273,244 0.26% 0.24%
Net assets attributable to holders of redeemable participating shares 103,147,364 100.00%

SANLAM UNIVERSAL FUNDS PLC
389
PORTFOLIO OF INVESTMENTS OF SANLAM CENTRE GLOBAL LISTED INFRASTRUCTURE
FUND as at 30 June 2019
Nominal Security Classification Fair Value
USD
% of
Net Assets
Financial assets at fair value through profit or loss Equities - 97.77% Australia - 3.24%
5,400 Agl Energy Ltd 75,827 1.47%
8,880 Transurban Group 91,853 1.77%
Total Australia 167,680 3.24%
Bermuda - 3.30%
143,600 Beijing Enterprises Wate 85,287 1.65%
17,200 China Resources Gas Group 85,312 1.65%
Total Bermuda 170,599 3.30%
Brazil - 2.44%
10,360 Cia Saneamento Basico De-Adr 126,081 2.44%
Total Brazil 126,081 2.44%
Canada - 11.09%
8,140 Enbridge Inc 294,641 5.70%
2,000 Pembina Pipeline Corp 74,613 1.44%
560 Rogers Communications In 30,041 0.58%
3,510 Tc Energy Corp 174,378 3.37%
Total Canada 573,673 11.09%
Chile - 1.70%
9,910 Enel Americas Sa-Adr 87,902 1.70%
Total Chile 87,902 1.70%
France - 1.67%
2,500 Engie 37,979 0.73%
3,080 Orange Sa 48,632 0.94%
Total France 86,611 1.67%
Germany - 2.36%
5,150 Deutsche Telekom Ag-Reg 89,216 1.72%
3,020 E.On Se 32,847 0.64%
Total Germany 122,063 2.36%
Greece- 1.16%
8,310 Hellenic Telecom Org-Sp Adr 59,915 1.16%
Total Greece 59,915 1.16%
Hong Kong - 0.60%
13,926 Hong Kong & China Gas 30,873 0.60%
Total Hong Kong 30,873 0.60%
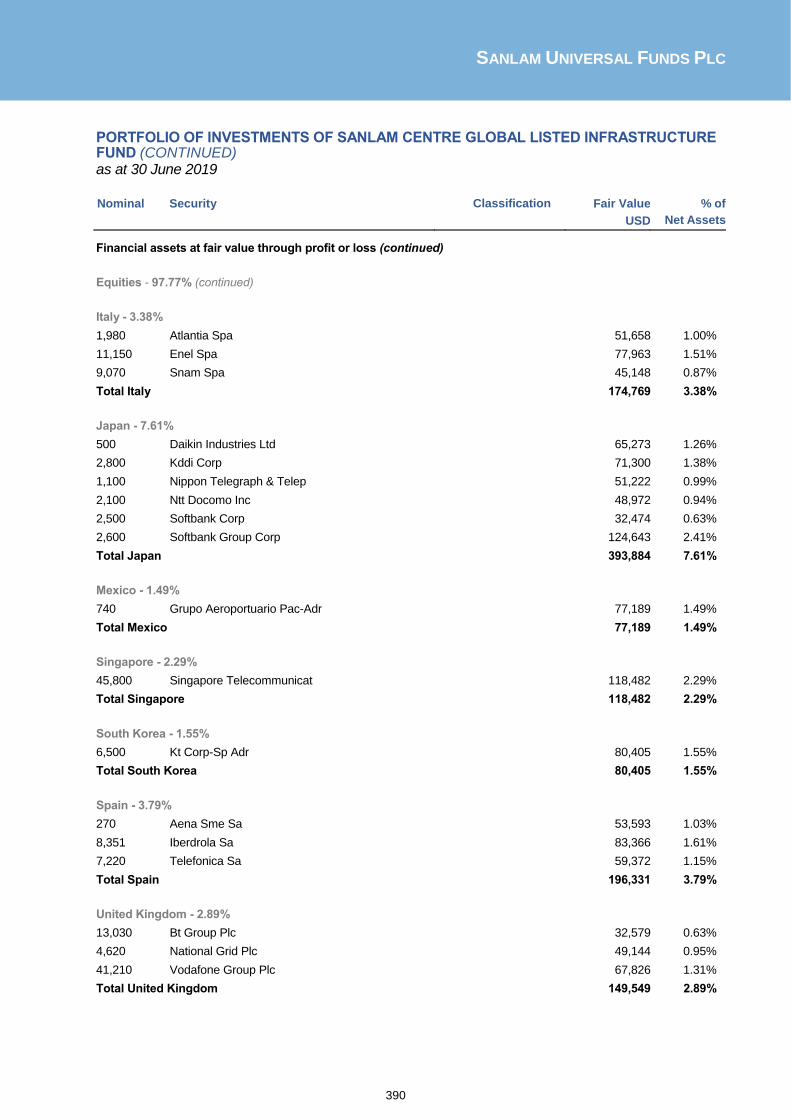
SANLAM UNIVERSAL FUNDS PLC
390
PORTFOLIO OF INVESTMENTS OF SANLAM CENTRE GLOBAL LISTED INFRASTRUCTURE FUND (CONTINUED) as at 30 June 2019
Nominal Security Classification Fair Value
USD
% of
Net Assets
Financial assets at fair value through profit or loss (continued)
Equities - 97.77% (continued)
Italy - 3.38%
1,980 Atlantia Spa 51,658 1.00%
11,150 Enel Spa 77,963 1.51%
9,070 Snam Spa 45,148 0.87%
Total Italy 174,769 3.38%
Japan - 7.61%
500 Daikin Industries Ltd 65,273 1.26%
2,800 Kddi Corp 71,300 1.38%
1,100 Nippon Telegraph & Telep 51,222 0.99%
2,100 Ntt Docomo Inc 48,972 0.94%
2,500 Softbank Corp 32,474 0.63%
2,600 Softbank Group Corp 124,643 2.41%
Total Japan 393,884 7.61%
Mexico - 1.49%
740 Grupo Aeroportuario Pac-Adr 77,189 1.49%
Total Mexico 77,189 1.49%
Singapore - 2.29%
45,800 Singapore Telecommunicat 118,482 2.29%
Total Singapore 118,482 2.29%
South Korea - 1.55%
6,500 Kt Corp-Sp Adr 80,405 1.55%
Total South Korea 80,405 1.55%
Spain - 3.79%
270 Aena Sme Sa 53,593 1.03%
8,351 Iberdrola Sa 83,366 1.61%
7,220 Telefonica Sa 59,372 1.15%
Total Spain 196,331 3.79%
United Kingdom - 2.89%
13,030 Bt Group Plc 32,579 0.63%
4,620 National Grid Plc 49,144 0.95%
41,210 Vodafone Group Plc 67,826 1.31%
Total United Kingdom 149,549 2.89%

SANLAM UNIVERSAL FUNDS PLC
391
PORTFOLIO OF INVESTMENTS OF SANLAM CENTRE GLOBAL LISTED INFRASTRUCTURE FUND (CONTINUED) as at 30 June 2019
Nominal Security Classification Fair Value
USD
% of
Net Assets
Financial assets at fair value through profit or loss (continued)
Equities - 97.77% (continued)
United States - 47.21%
670 American Electric Power 58,967 1.14%
11,210 At&T Inc 375,647 7.26%
810 Cheniere Energy Inc 55,445 1.07%
430 Consolidated Edison Inc 37,702 0.73%
890 Dominion Energy Inc 68,815 1.33%
250 Dte Energy Company 31,970 0.62%
960 Duke Energy Corp 84,710 1.64%
1,250 Edison International 84,262 1.63%
430 Eversource Energy 32,577 0.63%
1,320 Exelon Corp 63,281 1.22%
650 Firstenergy Corp 27,827 0.54%
1,120 Hca Holdings Inc 151,390 2.93%
7,920 Kinder Morgan Inc 165,370 3.20%
650 Nextera Energy Inc 133,159 2.57%
1,640 Oneok Inc 112,848 2.18%
950 Ppl Corp 29,460 0.57%
690 Public Service Enterprise Gp 40,586 0.78%
1,880 Quanta Services Inc 71,797 1.39%
330 Sempra Energy 45,355 0.88%
1,380 Southern Co 76,286 1.47%
870 Targa Resources Corp 34,156 0.66%
530 T-Mobile Us Inc 39,294 0.76%
350 Universal Health Services-B 45,637 0.88%
6,370 Verizon Communications - Vz.N 363,918 7.03%
430 Wec Energy Group Inc 35,849 0.69%
4,800 Williams Cos Inc 134,592 2.60%
700 Xcel Energy Inc 41,643 0.81%
Total United States 2,442,543 47.21%
Total Equities 5,058,549 97.77%
Total financial assets at fair value through profit or loss 5,058,549 97.77%
Cash and cash equivalents 149,750 2.89%
Other net assets and liabilities (34,502) (0.67)%
Net assets attributable to holders of redeemable participating shares 5,173,797 100.00%

SANLAM UNIVERSAL FUNDS PLC
392
PORTFOLIO OF INVESTMENTS OF SANLAM CENTRE GLOBAL LISTED INFRASTRUCTURE FUND (CONTINUED) as at 30 June 2019 Sanlam Centre Global Listed Infrastructure Fund
Summary
Classification Description Fair Value % of % of
USD Net
Assets Total
Assets
Transferable securities and money market instruments admitted to official stock exchange listing or traded on regulated market 5,058,549 97.77% 96.92%
A Transferable securities and money market instruments other than those referred above - - -
B UCITS and AIFs - - -
C Financial derivative instruments dealt in on a regulated market - - -
D Over the counter financial derivative instruments - - -
Cash and cash equivalents 149,750 2.89% 2.87%
Other net assets and liabilities (34,502) (0.67)% (0.66)%
Net assets attributable to holders of redeemable participating shares 5,173,797 100.00%
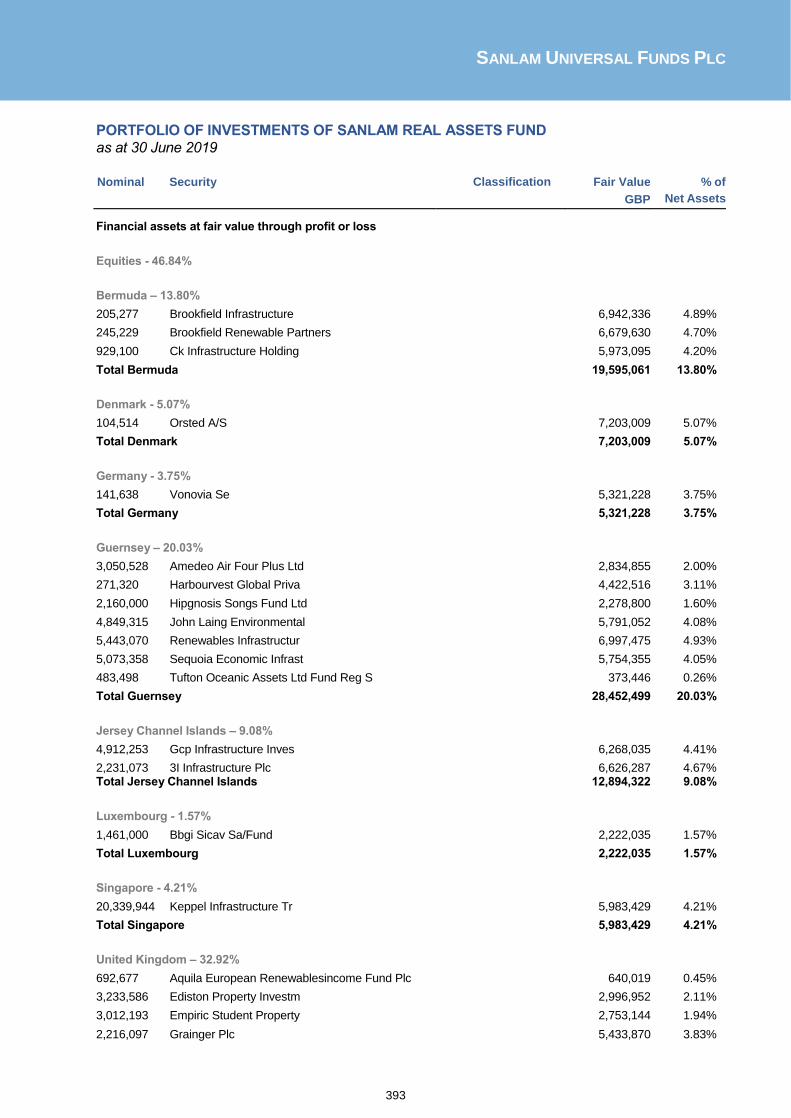
SANLAM UNIVERSAL FUNDS PLC
393
PORTFOLIO OF INVESTMENTS OF SANLAM REAL ASSETS FUND
as at 30 June 2019
Nominal Security Classification Fair Value
GBP
% of
Net Assets
Financial assets at fair value through profit or loss
Equities - 46.84%
Bermuda – 13.80%
205,277 Brookfield Infrastructure 6,942,336 4.89%
245,229 Brookfield Renewable Partners 6,679,630 4.70%
929,100 Ck Infrastructure Holding 5,973,095 4.20%
Total Bermuda 19,595,061 13.80%
Denmark - 5.07%
104,514 Orsted A/S 7,203,009 5.07%
Total Denmark 7,203,009 5.07%
Germany - 3.75%
141,638 Vonovia Se 5,321,228 3.75%
Total Germany 5,321,228 3.75%
Guernsey – 20.03%
3,050,528 Amedeo Air Four Plus Ltd 2,834,855 2.00%
271,320 Harbourvest Global Priva 4,422,516 3.11%
2,160,000 Hipgnosis Songs Fund Ltd 2,278,800 1.60%
4,849,315 John Laing Environmental 5,791,052 4.08%
5,443,070 Renewables Infrastructur 6,997,475 4.93%
5,073,358 Sequoia Economic Infrast 5,754,355 4.05%
483,498 Tufton Oceanic Assets Ltd Fund Reg S 373,446 0.26%
Total Guernsey 28,452,499 20.03%
Jersey Channel Islands – 9.08%
4,912,253 Gcp Infrastructure Inves 6,268,035 4.41%
2,231,073 3I Infrastructure Plc 6,626,287 4.67% Total Jersey Channel Islands 12,894,322 9.08%
Luxembourg - 1.57%
1,461,000 Bbgi Sicav Sa/Fund 2,222,035 1.57%
Total Luxembourg 2,222,035 1.57%
Singapore - 4.21%
20,339,944 Keppel Infrastructure Tr 5,983,429 4.21%
Total Singapore 5,983,429 4.21%
United Kingdom – 32.92%
692,677 Aquila European Renewablesincome Fund Plc 640,019 0.45%
3,233,586 Ediston Property Investm 2,996,952 2.11%
3,012,193 Empiric Student Property 2,753,144 1.94%
2,216,097 Grainger Plc 5,433,870 3.83%

SANLAM UNIVERSAL FUNDS PLC
394
PORTFOLIO OF INVESTMENTS OF SANLAM REAL ASSETS FUND (CONTINUED) as
at 30 June 2019
Nominal Security Classification Fair Value
GBP
% of
Net Assets
Financial assets at fair value through profit or loss (continued)
United Kingdom – 32.92% (continued)
4,296,771 Hicl Infrastructure Plc 6,866,154 4.83%
255,574 Sdcl Energy Efficiency I 273,464 0.19%
1,078,995 Secure Income Reit Plc 4,316,520 3.04%
1,343,149 Supermarket Income Reit Plc 1,413,664 0.99%
3,168,607 Triple Point Social Hous 2,636,281 1.86%
3,288,526 Tritax Big Box Reit Plc 5,047,023 3.55%
521,184 Unite Group Plc 5,068,514 3.57%
Total United Kingdom 46,757,582 32.92%
Total Equities 128,429,165 90.42% Derivative Financial Instruments
Buy Currency Buy Amount Sell currency Sell Amount Maturity Fair Value % of
GBP Net Assets
Forward Contracts – 0.00%
USD 577,994 GBP (454,999) 19/07/2019 147 0.00%
Total Forward Contracts 147 0.00%
1 Brown Brothers Harriman acts as counterparty to the open forward currency contracts at 30 June 2019.
Total financial assets at fair value through profit or loss 128,429,312 90.42% Financial liabilities at fair value through profit or loss Derivative Financial Instruments
Buy Currency Buy Amount Sell currency Sell Amount Maturity Fair Value % of
GBP Net Assets
Forward Contracts – (0.87)%
GBP 5,830,904 HKD (58,000,000) 25/07/2019 (16,541) (0.01)%
GBP 5,861,699 SGD (10,100,000) 25/07/2019 (17,251) (0.01)%
GBP 12,960,490 USD (16,500,000) 25/07/2019 (28,568) (0.02)%
GBP 5,736,960 EUR (6,400,000) 25/07/2019 (8,691) (0.01)%
GBP 7,267,267 DKK (60,500,000) 25/07/2019 (11,079) (0.01)%
USD 884,441 GBP (702,157) 19/07/2019 (5,696) 0.00%
USD 32,677,046 GBP (25,942,811) 19/07/2019 (210,990) (0.15)%
USD 58,150 GBP (45,867) 19/07/2019 (76) 0.00%
GBP 21,390 USD (27,200) 19/07/2019 (29) 0.00%
USD 5,602,955 GBP (4,442,351) 19/07/2019 (30,256) (0.02)%
USD 3,494,765 GBP (2,774,491) 19/07/2019 (22,508) (0.02)%
GBP 1,315,139 USD (1,679,543) 19/07/2019 (7,432) (0.01)%
USD 247,880 GBP (195,518) 19/07/2019 (323) 0.00%
USD 135,096,825 GBP (107,255,454) 19/07/2019 (872,292) (0.61)%
Total Forward Contracts (1,231,732) (0.87%) 1 Brown Brothers Harriman acts as counterparty to the open forward currency contracts at 30 June 2019.

SANLAM UNIVERSAL FUNDS PLC
395
PORTFOLIO OF INVESTMENTS OF SANLAM REAL ASSETS FUND (CONTINUED) as at 30 June 2019
Fair Value % of
GBP Net Assets
Total financial liabilities at fair value through profit or loss 128,429,165 90.42%
Cash and cash equivalents 16,709,654 11.76%
Other net assets and liabilities (1,867,865) (1.32)%
Net assets attributable to holders of redeemable participating shares 142,039,369 100.00%
Sanlam Real Assets Fund Summary Classification Description Fair Value % of % of
GBP Net
Assets Total
Assets
Transferable securities and money market instruments admitted to official stock exchange listing or traded on regulated market 128,429,165 90.42% 88.14%
A Transferable securities and money market instruments other than those referred above - - -
B UCITS and AIFs - - -
C Financial derivative instruments dealt in on a regulated market - - -
D Over the counter financial derivative instruments (1,231,585) (0.87)% (0.85)%
Cash and cash equivalents 16,709,654 11.76% 11.47%
Other net assets and liabilities (1,867,865) (1.32)% (1.28)%
Net assets attributable to holders of redeemable participating shares 142,039,369 100.00%
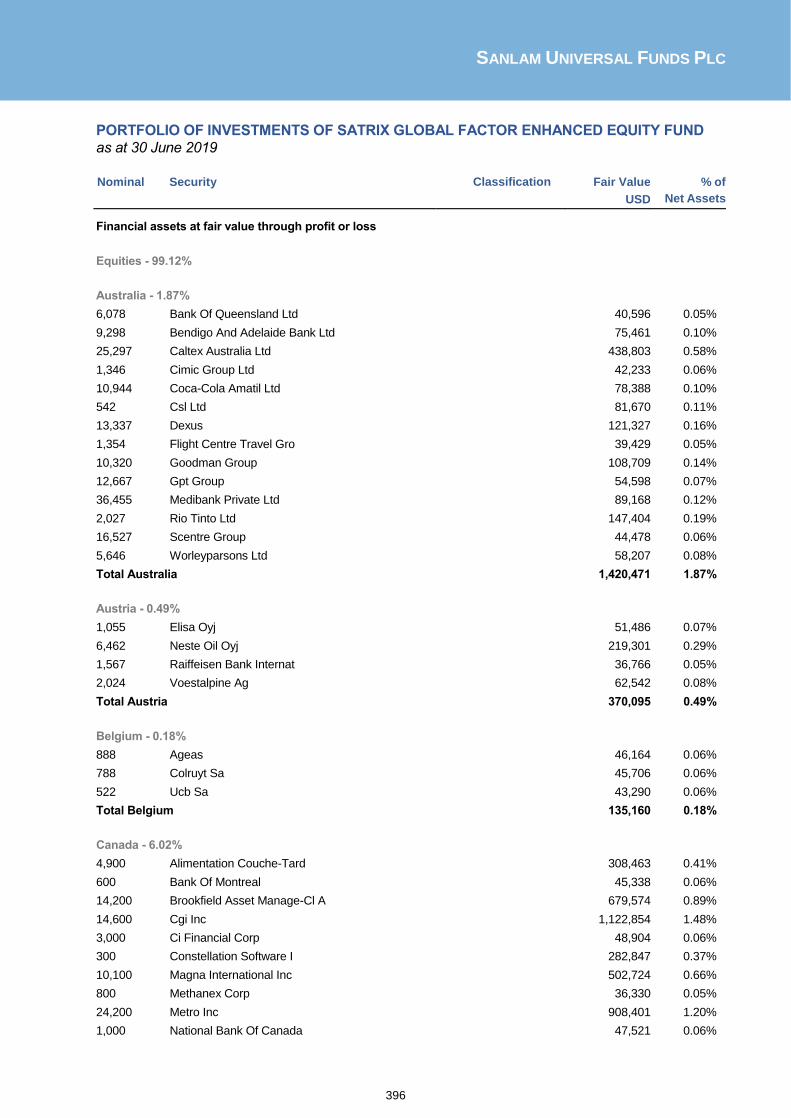
SANLAM UNIVERSAL FUNDS PLC
396
PORTFOLIO OF INVESTMENTS OF SATRIX GLOBAL FACTOR ENHANCED EQUITY FUND
as at 30 June 2019
Nominal Security Classification Fair Value
USD
% of
Net Assets
Financial assets at fair value through profit or loss
Equities - 99.12%
Australia - 1.87%
6,078 Bank Of Queensland Ltd 40,596 0.05%
9,298 Bendigo And Adelaide Bank Ltd 75,461 0.10%
25,297 Caltex Australia Ltd 438,803 0.58%
1,346 Cimic Group Ltd 42,233 0.06%
10,944 Coca-Cola Amatil Ltd 78,388 0.10%
542 Csl Ltd 81,670 0.11%
13,337 Dexus 121,327 0.16%
1,354 Flight Centre Travel Gro 39,429 0.05%
10,320 Goodman Group 108,709 0.14%
12,667 Gpt Group 54,598 0.07%
36,455 Medibank Private Ltd 89,168 0.12%
2,027 Rio Tinto Ltd 147,404 0.19%
16,527 Scentre Group 44,478 0.06%
5,646 Worleyparsons Ltd 58,207 0.08%
Total Australia 1,420,471 1.87%
Austria - 0.49%
1,055 Elisa Oyj 51,486 0.07%
6,462 Neste Oil Oyj 219,301 0.29%
1,567 Raiffeisen Bank Internat 36,766 0.05%
2,024 Voestalpine Ag 62,542 0.08%
Total Austria 370,095 0.49%
Belgium - 0.18%
888 Ageas 46,164 0.06%
788 Colruyt Sa 45,706 0.06%
522 Ucb Sa 43,290 0.06%
Total Belgium 135,160 0.18%
Canada - 6.02%
4,900 Alimentation Couche-Tard 308,463 0.41%
600 Bank Of Montreal 45,338 0.06%
14,200 Brookfield Asset Manage-Cl A 679,574 0.89%
14,600 Cgi Inc 1,122,854 1.48%
3,000 Ci Financial Corp 48,904 0.06%
300 Constellation Software I 282,847 0.37%
10,100 Magna International Inc 502,724 0.66%
800 Methanex Corp 36,330 0.05%
24,200 Metro Inc 908,401 1.20%
1,000 National Bank Of Canada 47,521 0.06%

SANLAM UNIVERSAL FUNDS PLC
397
PORTFOLIO OF INVESTMENTS OF SATRIX GLOBAL FACTOR ENHANCED EQUITY
FUND (CONTINUED)
as at 30 June 2019
Nominal Security Classification Fair Value
USD
% of
Net Assets
Financial assets at fair value through profit or loss (continued)
Equities - 99.12% (continued)
Canada - 6.02% (continued)
3,100 Quebecor Inc -Cl B 73,859 0.10%
6,600 Rogers Communications In 353,418 0.46%
3,000 Smartcentres Real Estate 76,106 0.10%
900 West Fraser Timber Co Lt 41,043 0.05%
900 Wsp Global Inc 49,562 0.07%
Total Canada 4,576,944 6.02%
Denmark - 0.91%
2,190 Coloplast-B 247,551 0.33%
539 Dsv Dkk1 52,944 0.07%
852 H Lundbeck A/S 33,665 0.04%
1,053 Novo Nordisk A/S-B 53,673 0.07%
9,368 Tryg A/S 304,632 0.40%
Total Denmark 692,465 0.91%
Finland - 0.40%
8,371 Orion Corp 306,840 0.40%
Total Finland 306,840 0.40%
France - 1.02%
1,977 Cnp Assurances 44,879 0.06%
2,027 Imerys Sa 107,473 0.14%
308 Ipsen 42,035 0.06%
15,635 Peugeot Sa 385,329 0.51%
1,742 Scor Se 76,394 0.10%
684 Sodexo Sa 79,970 0.10%
446 Ubisoft Entertainment 34,918 0.05%
Total France 770,998 1.02%
Germany - 2.01%
2,789 Bayerische Motoren Werke 173,187 0.23%
761 Covestro Ag 38,696 0.05%
2,070 Deutsche Lufthansa-Reg 35,478 0.05%
4,605 E.On Se 50,021 0.07%
10,511 Fuchs Petrolub Se -Pref 413,375 0.54%
333 Hannover Rueckversicheru Se 53,854 0.07%
1,670 Innogy Se 79,201 0.10%
4,928 Merck Kgaa 515,400 0.68%
228 Mtu Aero Engines Ag 54,324 0.07%

SANLAM UNIVERSAL FUNDS PLC
398
PORTFOLIO OF INVESTMENTS OF SATRIX GLOBAL FACTOR ENHANCED EQUITY
FUND (CONTINUED)
as at 30 June 2019
Nominal Security Classification Fair Value
USD
% of
Net Assets
Financial assets at fair value through profit or loss (continued)
Equities - 99.12% (continued)
Germany - 2.01% (continued)
317 Sartorius Ag-Vorzug 65,003 0.08%
5,179 Tui Ag-Di 50,811 0.07%
Total Germany 1,529,350 2.01%
Hong Kong - 1.79%
4,000 Clp Holdings Ltd 44,143 0.06%
73,000 Link Reit 897,208 1.18%
34,000 Swire Pacific Ltd - Cl A 417,878 0.55%
Total Hong Kong 1,359,229 1.79%
Ireland - 1.13%
3,394 Accenture Plc-Cl A 627,109 0.83%
528 Dcc Plc 47,081 0.06%
564 Eaton Corp Plc 46,970 0.06%
685 Ingersoll-Rand Plc 86,769 0.11%
1,045 Seagate Technology 49,240 0.07%
Total Ireland 857,169 1.13%
Israel - 1.74%
56,694 Bank Leumi Le-Israel 408,960 0.54%
159,588 Israel Chemicals Ltd 835,233 1.10%
3,415 Mizrahi Tefahot Bank Ltd 78,674 0.10%
Total Israel 1,322,867 1.74%
Italy - 0.21%
9,494 Mediobanca Spa 97,890 0.13%
6,148 Poste Italiane Spa 64,747 0.08%
Total Italy 162,637 0.21% Japan - 8.87%
6,300 Alfresa Holdings Corp 155,273 0.20%
2,200 Alps Alpine Co Ltd 37,046 0.05%
2,700 Astellas Pharma Inc 38,430 0.05%
1,200 Bandai Namco Holdings In 58,195 0.08%
900 Century Tokyo Leasing Corporation 37,929 0.05%
2,600 Dena Co Ltd 49,784 0.07%
1,200 Fuji Electric Company 41,337 0.05%
13,800 Fujitsu Ltd 961,246 1.26%
36,600 Hakuhodo Dy Holdings Inc 615,628 0.81%
1,400 Hitachi High-Technologie 71,918 0.09%
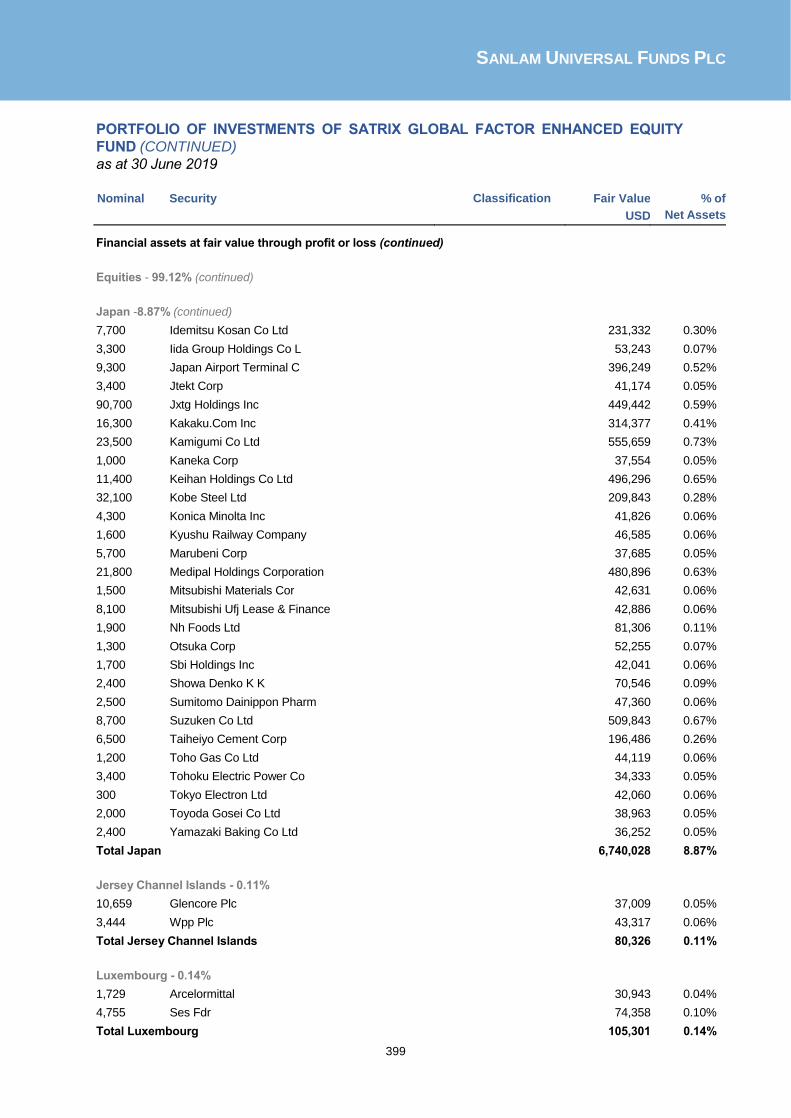
SANLAM UNIVERSAL FUNDS PLC
399
PORTFOLIO OF INVESTMENTS OF SATRIX GLOBAL FACTOR ENHANCED EQUITY
FUND (CONTINUED)
as at 30 June 2019
Nominal Security Classification Fair Value
USD
% of
Net Assets
Financial assets at fair value through profit or loss (continued)
Equities - 99.12% (continued)
Japan -8.87% (continued)
7,700 Idemitsu Kosan Co Ltd 231,332 0.30%
3,300 Iida Group Holdings Co L 53,243 0.07%
9,300 Japan Airport Terminal C 396,249 0.52%
3,400 Jtekt Corp 41,174 0.05%
90,700 Jxtg Holdings Inc 449,442 0.59%
16,300 Kakaku.Com Inc 314,377 0.41%
23,500 Kamigumi Co Ltd 555,659 0.73%
1,000 Kaneka Corp 37,554 0.05%
11,400 Keihan Holdings Co Ltd 496,296 0.65%
32,100 Kobe Steel Ltd 209,843 0.28%
4,300 Konica Minolta Inc 41,826 0.06%
1,600 Kyushu Railway Company 46,585 0.06%
5,700 Marubeni Corp 37,685 0.05%
21,800 Medipal Holdings Corporation 480,896 0.63%
1,500 Mitsubishi Materials Cor 42,631 0.06%
8,100 Mitsubishi Ufj Lease & Finance 42,886 0.06%
1,900 Nh Foods Ltd 81,306 0.11%
1,300 Otsuka Corp 52,255 0.07%
1,700 Sbi Holdings Inc 42,041 0.06%
2,400 Showa Denko K K 70,546 0.09%
2,500 Sumitomo Dainippon Pharm 47,360 0.06%
8,700 Suzuken Co Ltd 509,843 0.67%
6,500 Taiheiyo Cement Corp 196,486 0.26%
1,200 Toho Gas Co Ltd 44,119 0.06%
3,400 Tohoku Electric Power Co 34,333 0.05%
300 Tokyo Electron Ltd 42,060 0.06%
2,000 Toyoda Gosei Co Ltd 38,963 0.05%
2,400 Yamazaki Baking Co Ltd 36,252 0.05%
Total Japan 6,740,028 8.87%
Jersey Channel Islands - 0.11%
10,659 Glencore Plc 37,009 0.05%
3,444 Wpp Plc 43,317 0.06%
Total Jersey Channel Islands 80,326 0.11%
Luxembourg - 0.14%
1,729 Arcelormittal 30,943 0.04%
4,755 Ses Fdr 74,358 0.10%
Total Luxembourg 105,301 0.14%

SANLAM UNIVERSAL FUNDS PLC
400
PORTFOLIO OF INVESTMENTS OF SATRIX GLOBAL FACTOR ENHANCED EQUITY
FUND (CONTINUED)
as at 30 June 2019
Nominal Security Classification Fair Value
USD
% of
Net Assets
Financial assets at fair value through profit or loss (continued)
Equities - 99.12% (continued)
Netherlands - 2.43%
17,250 Exor Nv 1,208,495 1.59%
1,962 Koninklijke Ahold Delhaize N 44,132 0.06%
679 Koninklijke Dsm Nv 83,941 0.11%
1,176 Lyondellbasell Indu-Cl A 101,289 0.13%
1,013 Nn Group Nv 40,784 0.06%
6,657 Randstad Nv 365,680 0.48%
Total Netherlands 1,844,321 2.43%
New Zealand - 0.78%
13,765 Auckland Intl Airport Ltd 90,978 0.12%
188,098 Spark New Zealand Ltd 504,855 0.66%
Total New Zealand 595,833 0.78%
Norway - 0.27%
3,422 Mowi Asa 80,008 0.10%
4,845 Schibsted Asa-B Shs 126,313 0.17%
Total Norway 206,321 0.27%
Portugal - 0.29%
14,219 Galp Energia Sgps Sa B 218,716 0.29%
Total Portugal 218,716 0.29%
Singapore - 0.52%
27,240 Flex Ltd 260,687 0.34%
6,700 Venture Corp Ltd 80,643 0.11%
20,500 Wilmar International Ltd 56,044 0.07%
Total Singapore 397,374 0.52%
Spain - 0.65%
3,569 Acs Actividades Cons Y S 142,512 0.19%
4,913 Endesa Sa 126,334 0.16%
2,732 Grifols Sa 80,785 0.11%
50,198 Mapfre Sa 146,779 0.19%
Total Spain 496,410 0.65% Sweden - 4.36%
4,819 Atlas Copco Ab-B Shs 138,199 0.18%
24,997 Epiroc Ab-B 247,511 0.33%
40,691 Industrivarden Ab-C Shs 901,480 1.19%
33,476 Investor Ab-B Shs 1,607,600 2.11%

SANLAM UNIVERSAL FUNDS PLC
401
PORTFOLIO OF INVESTMENTS OF SATRIX GLOBAL FACTOR ENHANCED EQUITY
FUND (CONTINUED)
as at 30 June 2019
Nominal Security Classification Fair Value
USD
% of
Net Assets
Financial assets at fair value through profit or loss (continued)
Equities - 99.12% (continued)
Sweden - 4.36% (continued)
2,323 Lundbergs Ab-B Shs 86,924 0.11%
18,886 Securitas Ab-B Shs 331,187 0.44%
Total Sweden 3,312,901 4.36%
Switzerland - 2.15%
906 Adecco Group Ag-Reg 54,464 0.07%
34 Chocoladefabriken Lindt- 247,561 0.32%
358 Chubb Ltd 52,730 0.07%
1,056 Kuehne + Nagel Intl Ag-R 156,809 0.21%
958 Pargesa Holding Sa-Br 73,877 0.10%
449 Roche Holding Ag-Genussc 126,376 0.17%
207 Schindler Holding Ag-Reg 45,227 0.06%
3,571 Schindler Holding-Part C 795,223 1.04%
171 Swiss Life Holding Ag-Re 84,782 0.11%
Total Switzerland 1,637,049 2.15% United Kingdom - 3.70%
22,850 3I Group Plc 323,183 0.42%
49,160 Auto Trader Group Plc 342,063 0.45%
783 Carnival Plc 34,601 0.05%
9,726 Compass Group Plc 233,119 0.31%
10,515 Direct Line Insurance Gr 44,316 0.06%
51,412 Evraz Plc 434,399 0.57%
10,802 Johnson Matthey Plc 456,762 0.60%
7,186 Pearson Plc 74,792 0.10%
2,286 Royal Dutch Shell Plc-B 74,944 0.10%
13,624 Sainsbury (J) Plc 33,910 0.04%
47,152 Segro Plc 437,335 0.57%
1,848 Severn Trent Plc Ord 48,073 0.06%
2,470 Unilever Plc 153,560 0.20%
13,711 Wm Morrison Supermarkets 35,075 0.05%
15,339 Wood Group (John) Plc 88,066 0.12%
Total United Kingdom 2,814,198 3.70% United States - 56.99%
1,716 Acuity Brands Inc 236,654 0.31%
2,639 Advanced Micro Devices 80,146 0.11%
39,170 Aes Corp 656,489 0.86%
1,019 Aflac Inc 55,851 0.07%

SANLAM UNIVERSAL FUNDS PLC
402
PORTFOLIO OF INVESTMENTS OF SATRIX GLOBAL FACTOR ENHANCED EQUITY
FUND (CONTINUED)
as at 30 June 2019
Nominal Security Classification Fair Value
USD
% of
Net Assets
Financial assets at fair value through profit or loss (continued)
Equities - 99.12% (continued)
United States - 56.99% (continued)
200 Alphabet Inc-Cl A 216,560 0.28%
41 Alphabet Inc-Cl C 44,317 0.06%
328 Amazon.Com Inc 621,111 0.82%
10,233 Amerisourcebergen Corp 872,466 1.15%
400 Amgen Inc 73,712 0.10%
4,496 Annaly Capital Management Inc 41,048 0.05%
167 Anthem Inc 47,129 0.06%
417 Apple Inc 82,533 0.11%
1,280 Aramark 46,157 0.06%
13,548 Archer-Daniels-Midland Co 552,758 0.73%
22,151 Arrow Electronics Inc 1,578,702 2.08%
1,612 Arthur J Gallagher & Co 141,195 0.19%
781 Assurant Inc 83,083 0.11%
743 Atmos Energy Corp 78,431 0.10%
555 Autoliv Inc 39,133 0.05%
75 Autozone Inc 82,460 0.11%
3,727 Axa Equitable Holdings Inc 77,894 0.10%
1,160 Ball Corp 81,188 0.11%
955 Bb&T Corp 46,919 0.06%
2,544 Best Buy Co Inc 177,393 0.23%
1,342 Biogen Inc 313,854 0.41%
2,018 Boston Scientific Corp 86,734 0.11%
640 Broadridge Financial Solutio 81,715 0.11%
30,816 Brookfield Property Reit I-A 582,114 0.77%
927 Burlington Stores Inc 157,729 0.21%
5,110 C.H. Robinson Worldwide Inc 431,028 0.57%
8,765 Cadence Design Sys Inc 620,650 0.82%
3,769 Cardinal Health Inc 177,520 0.23%
450 Cboe Global Markets Inc 46,633 0.06%
9,589 Cbre Group Inc - A 491,916 0.65%
1,539 Cbs Corp-Class B Non Voting 76,796 0.10%
14,530 Cdw Corp/De 1,612,830 2.12%
1,325 Centene Corp 69,483 0.09%
2,726 Chemours Co 65,424 0.09%
321 Chipotle Mexican Grill Inc 235,254 0.31%
783 Church & Dwight Co Inc 57,206 0.07%
3,571 Cit Group Inc 187,620 0.25%
1,246 Citizens Financial Group 44,059 0.06%
438 Citrix Systems Inc 42,985 0.06%

SANLAM UNIVERSAL FUNDS PLC
403
PORTFOLIO OF INVESTMENTS OF SATRIX GLOBAL FACTOR ENHANCED EQUITY
FUND (CONTINUED)
as at 30 June 2019
Nominal Security Classification Fair Value
USD
% of
Net Assets
Financial assets at fair value through profit or loss (continued)
Equities - 99.12% (continued)
United States - 56.99% (continued)
305 Clorox Company 46,699 0.06%
1,273 Comcast Corp -Class A 53,822 0.07%
535 Comerica Inc 38,862 0.05%
1,177 Conocophillips 71,797 0.09%
314 Costco Wholesale Corp 82,978 0.11%
455 Cummins Inc 77,960 0.10%
4,008 Darden Restaurants Inc 487,894 0.64%
2,673 Discovery Communications Inc 82,061 0.11%
4,370 Dish Network Corp-A 167,852 0.22%
2,410 Dollar General Corp 325,736 0.43%
1,642 Domino’S Pizza Inc 456,936 0.60%
544 Dover Corp 54,509 0.07%
406 Dte Energy Company 51,919 0.07%
1,184 Dxc Technology Co 65,298 0.09%
8,123 Eaton Vance Corp 350,345 0.46%
5,316 Eli Lilly & Co 588,960 0.77%
625 Emerson Electric Co 41,700 0.05%
4,708 Erie Indemnity Company-Cl A 1,197,150 1.57%
355 Estee Lauder Companies-Cl A 65,004 0.09%
4,558 Exelon Corp 218,511 0.29%
666 Expeditors Intl Wash Inc 50,523 0.07%
925 F5 Networks Inc 134,708 0.18%
397 Facebook Inc-Class A 76,621 0.10%
260 Factset Research Systems Inc 74,506 0.10%
1,672 Fifth Third Bancorp 46,649 0.06%
582 Fiserv Inc 53,055 0.07%
1,741 Fluor Corp 58,654 0.08%
557 Fortinet Inc 42,794 0.06%
1,054 Fox Corp - Class A 38,619 0.05%
1,992 Fox Corp - Class B 72,768 0.10%
2,240 Franklin Resources Inc 77,952 0.10%
1,999 General Motors Co 77,021 0.10%
464 Genuine Parts Co 48,061 0.06%
6,438 H&R Block Inc 188,633 0.25%
4,313 Hanesbrands Inc 74,270 0.10%
1,374 Hca Holdings Inc 185,724 0.24%
11,131 Hershey Co 1,491,888 1.96%
8,029 Hollyfrontier Corp 371,582 0.49%
10,902 Hormel Foods Corp 441,967 0.58%
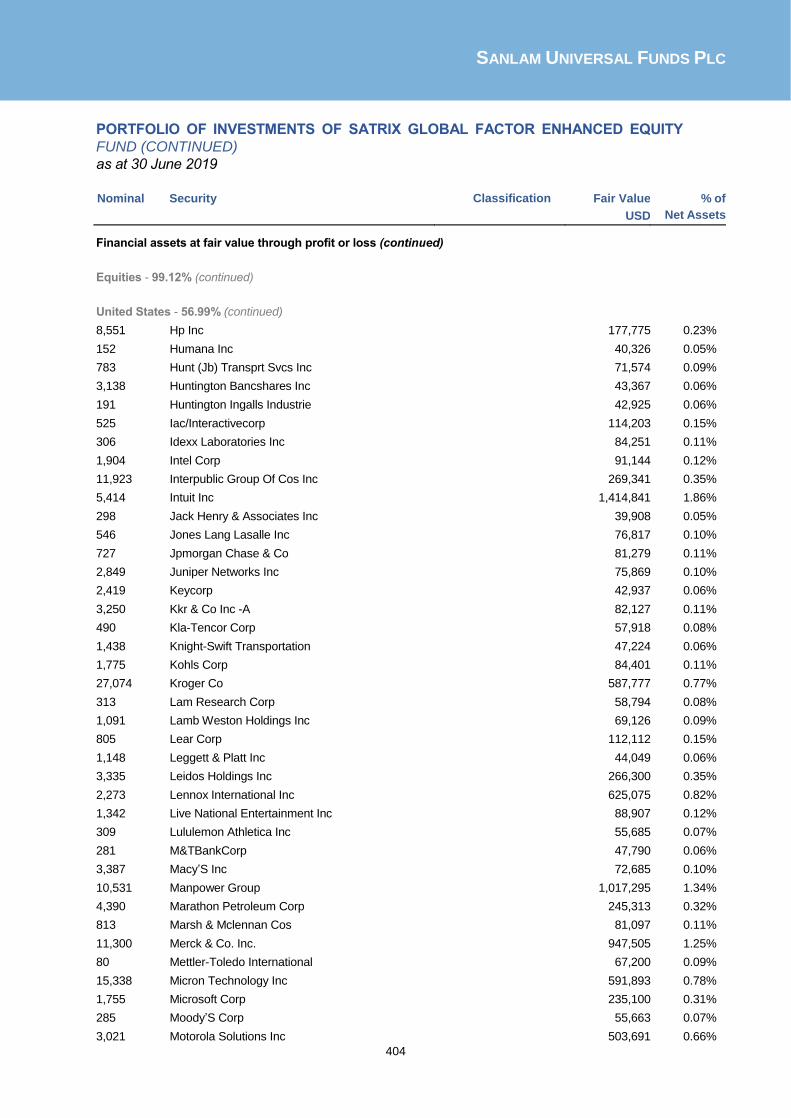
SANLAM UNIVERSAL FUNDS PLC
404
PORTFOLIO OF INVESTMENTS OF SATRIX GLOBAL FACTOR ENHANCED EQUITY
FUND (CONTINUED)
as at 30 June 2019
Nominal Security Classification Fair Value
USD
% of
Net Assets
Financial assets at fair value through profit or loss (continued)
Equities - 99.12% (continued)
United States - 56.99% (continued)
8,551 Hp Inc 177,775 0.23%
152 Humana Inc 40,326 0.05%
783 Hunt (Jb) Transprt Svcs Inc 71,574 0.09%
3,138 Huntington Bancshares Inc 43,367 0.06%
191 Huntington Ingalls Industrie 42,925 0.06%
525 Iac/Interactivecorp 114,203 0.15%
306 Idexx Laboratories Inc 84,251 0.11%
1,904 Intel Corp 91,144 0.12%
11,923 Interpublic Group Of Cos Inc 269,341 0.35%
5,414 Intuit Inc 1,414,841 1.86%
298 Jack Henry & Associates Inc 39,908 0.05%
546 Jones Lang Lasalle Inc 76,817 0.10%
727 Jpmorgan Chase & Co 81,279 0.11%
2,849 Juniper Networks Inc 75,869 0.10%
2,419 Keycorp 42,937 0.06%
3,250 Kkr & Co Inc -A 82,127 0.11%
490 Kla-Tencor Corp 57,918 0.08%
1,438 Knight-Swift Transportation 47,224 0.06%
1,775 Kohls Corp 84,401 0.11%
27,074 Kroger Co 587,777 0.77%
313 Lam Research Corp 58,794 0.08%
1,091 Lamb Weston Holdings Inc 69,126 0.09%
805 Lear Corp 112,112 0.15%
1,148 Leggett & Platt Inc 44,049 0.06%
3,335 Leidos Holdings Inc 266,300 0.35%
2,273 Lennox International Inc 625,075 0.82%
1,342 Live National Entertainment Inc 88,907 0.12%
309 Lululemon Athletica Inc 55,685 0.07%
281 M&TBankCorp 47,790 0.06%
3,387 Macy’S Inc 72,685 0.10%
10,531 Manpower Group 1,017,295 1.34%
4,390 Marathon Petroleum Corp 245,313 0.32%
813 Marsh & Mclennan Cos 81,097 0.11%
11,300 Merck & Co. Inc. 947,505 1.25%
80 Mettler-Toledo International 67,200 0.09%
15,338 Micron Technology Inc 591,893 0.78%
1,755 Microsoft Corp 235,100 0.31%
285 Moody’S Corp 55,663 0.07%
3,021 Motorola Solutions Inc 503,691 0.66%

SANLAM UNIVERSAL FUNDS PLC
405
PORTFOLIO OF INVESTMENTS OF SATRIX GLOBAL FACTOR ENHANCED EQUITY
FUND (CONTINUED)
as at 30 June 2019
Nominal Security Classification Fair Value
USD
% of
Net Assets
Financial assets at fair value through profit or loss (continued)
Equities - 99.12% (continued)
United States - 56.99% (continued)
295 Msci Inc 70,443 0.09%
2,612 Nektar Therapeutics 92,935 0.12%
263 Nextera Energy Inc 53,878 0.07%
596 Nike Inc -Cl B 50,034 0.07%
1,750 Nordstrom Inc 55,755 0.07%
10,771 Nucor Corp 593,482 0.78%
20 Nvr Inc 67,405 0.09%
1,224 Oge Energy Corp 52,093 0.07%
329 Old Dominion Freight Line 49,107 0.06%
1,540 Omnicom Group 126,203 0.17%
12,342 On Semiconductor Corp 249,432 0.33%
205 O’Reilly Automotive Inc 75,711 0.10%
719 Paccar Inc 51,524 0.07%
2,767 Peoples United Financial Inc 46,430 0.06%
1,250 Pepsico Inc 163,912 0.22%
1,835 Pfizer Inc Equity 79,492 0.10%
13,878 Phillips 66 1,298,148 1.71%
37,076 Plains Gp Holdings Lp-Cl A 925,788 1.22%
483 Polaris Industries Inc 44,064 0.06%
1,491 Procter & Gamble Co 163,488 0.21%
13,736 Progressive Corp 1,097,918 1.44%
1,947 Pulte Group Inc 61,564 0.08%
353 Ralph Lauren Corp 40,097 0.05%
513 Raymond James Financial Inc 43,374 0.06%
1,067 Regeneron Pharmaceuticals 333,971 0.44%
2,602 Regions Financial Corp 38,874 0.05%
435 Resmed Inc 53,083 0.07%
16,482 Robert Half Intl Inc 939,639 1.24%
773 Ross Stores Inc 76,620 0.10%
1,325 S&P Global Inc 301,822 0.40%
3,527 Sabre Corp 78,299 0.10%
1,407 Sei Investments Company 78,933 0.10%
264 Snap-On Inc 43,729 0.06%
905 Spirit Aerosystems Hold-Cl A 73,640 0.10%
5,419 Starbucks Corp 454,275 0.60%
15,431 Steel Dynamics Inc 466,016 0.61%
176 Svb Financial Group 39,528 0.05%
1,021 Sysco Corp 72,205 0.09%
7,104 T Rowe Price Group Inc 779,380 1.03%

SANLAM UNIVERSAL FUNDS PLC
406
PORTFOLIO OF INVESTMENTS OF SATRIX GLOBAL FACTOR ENHANCED EQUITY
FUND (CONTINUED)
as at 30 June 2019
Nominal Security Classification Fair Value
USD
% of
Net Assets
Financial assets at fair value through profit or loss (continued)
Equities - 99.12% (continued)
United States - 56.99% (continued)
2,629 Target Corp 227,698 0.30%
449 Texas Instruments Inc 51,527 0.07%
11,324 Tjx Companies Inc 598,813 0.79%
533 Torchmark Corp 47,682 0.06%
3,613 Tractor Supply Company 393,094 0.52%
1,984 Tripadvisor Inc 91,839 0.12%
2,180 Tyson Foods Inc-Cl A 176,013 0.23%
5,894 Ugi Corp 314,799 0.41%
2,652 Under Armour Inc-Class A 67,228 0.09%
1,323 United Continental Holdings 115,829 0.15%
5,433 United Therapeutics Corp 424,100 0.56%
172 Unitedhealth Group Inc 41,970 0.05%
363 Universal Health Services-B 47,332 0.06%
6,390 Valero Energy Corp 547,048 0.72%
426 Varian Medical Systems Inc 57,991 0.08%
10,456 Verizon Communications - Vz.N 597,351 0.79%
443 Vertex Pharmaceuticals Inc 81,237 0.11%
5,306 Viacom Inc-Class B 158,490 0.21%
440 Walt Disney Co 61,442 0.08%
2,182 Wayfair Inc- Class A 318,572 0.42%
3,891 Western Union Co 77,392 0.10%
3,949 Wr Berkley Corp 260,358 0.34%
245 Ww Grainger Inc 65,716 0.09%
640 Xilinx Inc 75,469 0.10%
6,068 Yum! Brands Inc 671,546 0.88%
931 Zions Bancorp Na 42,807 0.06%
757 Zoetis Inc 85,912 0.11%
Total United States 43,319,697 56.99%
Virgin Islands - 0.09%
1,021 Andritz Ag 38,435 0.05%
858 Capri Holdings Ltd 29,756 0.04%
Total Virgin Islands 68,191 0.09%
Total Equities 75,340,891 99.12%

SANLAM UNIVERSAL FUNDS PLC
407
PORTFOLIO OF INVESTMENTS OF SATRIX GLOBAL FACTOR ENHANCED EQUITY
FUND (CONTINUED)
as at 30 June 2019
Nominal Security Classification Fair Value
USD
% of
Net Assets
Financial assets at fair value through profit or loss (continued) Derivative Financial Instruments
Rights - 0.01%
Spain - 0.01%
3,569 Acs Actividades De Construccio Rights Expire 07/08/2019 5,601 0.01%
Total Spain 5,601 0.01%
Total Rights 5,601 0.01%
Total financial assets at fair value through profit or loss 75,346,492 99.13% Financial liabilities at fair value through profit or loss Derivative Financial Instruments Futures - 0.00%
6 Future Contract On Msci World Sep19 (2,880) 0.00%
Total Futures (2,880) 0.00% 1 Brown Brothers Harriman acts as counterparty to the futures contracts at 30 June 2019.
Total financial liabilities at fair value through profit or loss (2,880) 0.00%
Cash and cash equivalents 879,945 1.16%
Other net assets and liabilities (213,375) (0.29)%
Net assets attributable to holders of redeemable participating shares 76,010,182 100.00%

SANLAM UNIVERSAL FUNDS PLC
408
PORTFOLIO OF INVESTMENTS OF SATRIX GLOBAL FACTOR ENHANCED EQUITY
FUND (CONTINUED)
as at 30 June 2019 Satrix Global Factor Enhanced Equity Fund
Summary
Classification Description Fair Value % of % of
USD Net
Assets Total
Assets
Transferable securities and money market instruments admitted to official stock exchange listing or traded on regulated market 75,340,891 99.12% 98.67%
A Transferable securities and money market instruments other than those referred above - - -
B UCITS and AIFs - - -
C Financial derivative instruments dealt in on a regulated market (2,880) 0.00% 0.00%
D Over the counter financial derivative instruments 5,601 0.01% 0.01%
Cash and cash equivalents 879,945 1.16% 1.15%
Other net assets and liabilities (213,375) (0.28)% (0.28)%
Net assets attributable to holders of redeemable participating shares 76,010,182 100.00%

SANLAM UNIVERSAL FUNDS PLC
409
PORTFOLIO OF INVESTMENTS OF PERPETUA GLOBAL EQUITY UCITS FUND
as at 30 June 2019
Nominal Security Classification Fair Value
USD
% of
Net Assets
Financial assets at fair value through profit or loss
Equities - 97.33%
Bermuda - 0.72%
13,764 Textainer Group Holdings Ltd 138,741 0.72%
Total Bermuda 138,741 0.72%
Cayman Islands - 1.41%
6,012 Tencent Holdings Ltd 271,338 1.41%
Total Cayman Islands 271,338 1.41%
Denmark - 2.30%
12,415 Pandora A/S 442,311 2.30%
Total Denmark 442,311 2.30%
Germany - 6.55%
5,892 Bayer Ag-Reg 408,896 2.13%
3,624 Bayerische Motoren Werke 268,627 1.40%
2,267 Continental Ag 331,020 1.72%
3,744 Hugo Boss Ag -Ord 249,425 1.30%
Total Germany 1,257,968 6.55%
Hong Kong - 2.80%
49,864 Aia Group Ltd 537,733 2.80%
Total Hong Kong 537,733 2.80%
India - 3.25%
7,051 Anheuser-Busch Inbev Sa/ 625,030 3.25%
Total India 625,030 3.25%
Jersey Channel Islands - 2.60%
80,899 Glencore Plc 281,441 1.47%
3,673 Wns Holdings Ltd-Adr 217,442 1.13%
Total Jersey Channel Islands 498,883 2.60%
Luxembourg - 3.37%
100,440 Loccitane International Sa 198,502 1.03%
30,840 Reinet Investments Sca 449,543 2.34%
Total Luxembourg 648,045 3.37%
Netherlands - 2.42%
13,539 X5RetailGroupNv-RegsGdr 464,252 2.42%
Total Netherlands 464,252 2.42%

SANLAM UNIVERSAL FUNDS PLC
410
PORTFOLIO OF INVESTMENTS OF PERPETUA GLOBAL EQUITY UCITS FUND
(CONTINUED)
as at 30 June 2019
Nominal Security Classification Fair Value
USD
% of
Net Assets
Financial assets at fair value through profit or loss (continued) Equities - 97.33% (continued) Russia - 1.71%
22,513 Magnit Pjsc-Spon Gdr Regs 328,240 1.71%
Total Russia 328,240 1.71% South Korea - 2.74% 12,959 Samsung Electronics Co L 527,496 2.74%
Total South Korea 527,496 2.74% Spain - 0.82%
262,273 Distribuidora Internacional 158,299 0.82%
Total Spain 158,299 0.82%
Switzerland - 2.50%
74,844 Transocean Ltd 479,750 2.50%
Total Switzerland 479,750 2.50%
United Kingdom - 15.49%
20,349 British American Tobacco 711,941 3.71%
22,613 Ensco Rowan Plc - Class A 192,889 1.00%
136,666 Hastings Group Holdings Plc 144A 340,216 1.77%
65,600 Mediclinic International Plc 254,558 1.32%
25,566 Royal Dutch Shell Plc-A 835,879 4.35%
222,149 Tesco Plc 640,947 3.34%
Total United Kingdom 2,976,430 15.49% United States - 45.60%
4,652 Affiliated Managers Group 428,635 2.23%
8,069 American Express Co 996,037 5.18%
4,888 Apple Inc 967,433 5.04%
29,451 Bed Bath & Beyond Inc 342,221 1.78%
6,029 Berkshire Hathaway Inc-Cl B 1,285,202 6.69%
5,530 Dollar Tree Inc 593,867 3.09%
3,225 Facebook Inc-Class A 622,425 3.24%
27,235 Franklin Resources Inc 947,778 4.93%
2,560 Gilead Sciences Inc 172,954 0.90%
1,810 Ingredion Incorporated 149,307 0.78%
19,311 L Brands Inc 504,017 2.62%
33,668 Michaels Cos Inc 292,912 1.52%
10,965 Philip Morris International 861,081 4.48%
12,657 Wells Fargo & Co 598,929 3.12%
Total United States 8,762,798 45.60%

SANLAM UNIVERSAL FUNDS PLC
411
PORTFOLIO OF INVESTMENTS OF PERPETUA GLOBAL EQUITY UCITS FUND
(CONTINUED)
as at 30 June 2019
Nominal Security Classification Fair Value
USD
% of
Net Assets
Financial assets at fair value through profit or loss (continued)
Equities - 97.33% (continued)
Virgin Islands - 3.05%
16,874 Capri Holdings Ltd 585,190 3.05%
Total Virgin Islands 585,190 3.05%
Total Equities 18,702,504 97.33%
Total financial assets at fair value through profit or loss 18,702,504 97.33%
Cash and cash equivalents 436,344 2.27%
Other net assets and liabilities 76,225 0.40%
Net assets attributable to holders of redeemable participating shares 19,215,073 100.00%
Perpetua Global Equity UCITS Fund
Summary
Classification Description Fair Value % of % of
USD Net
Assets Total
Assets
Transferable securities and money market instruments admitted to official stock exchange listing or traded on regulated market 18,702,504 97.33% 96.37%
A Transferable securities and money market instruments other than those referred above - - -
B UCITS and AIFs - - -
C Financial derivative instruments dealt in on a regulated market - - -
D Over the counter financial derivative instruments - - -
Cash and cash equivalents 436,344 2.27% 2.25%
Other net assets and liabilities 76,225 0.40% 0.39%
Net assets attributable to holders of redeemable participating shares 19,215,073 100.00%

SANLAM UNIVERSAL FUNDS PLC
412
NOTES TO AND FORMING PART OF THE UNAUDITED CONDENSED INTERIM FINANCIAL STATEMENTS for the six months ended 30 June 2019 1 General – The Company
Sanlam Universal Funds Plc (the “Company”) is an investment company with variable capital and was incorporated on 9 June 1997 with registration number 267451 under the laws of Ireland and is authorised in Ireland as an undertaking for collective investment in transferable securities pursuant to the UCITS Regulations. The Company is domiciled in Ireland.
At 30 June 2019, the Company comprised fourty active separate investment sub-funds (“Fund(s)”). The Articles of Association of the Company provide segregated liability between the various Funds. A list of Funds active during the period and their status at the period end is set out below: Name Status at 30 June 2019 Bridge Global Property Income Fund Active P-Solve Inflation Plus Fund Closed - on 29 May 2019 Sanlam African Frontier Markets Fund Active Denker Global Equity Fund Active Sanlam Global Bond Fund Active Denker Global Financial Fund Active Sanlam Global Property Fund Active Sanlam World Equity Fund Active Satrix World Equity Tracker Fund Active SIIP India Opportunities Fund Active Denker Global Dividend Fund Active Sanlam Strategic Bond Fund Active Sanlam Accel Income Fund Active Satrix North America Equity Tracker Fund Active Satrix UK Equity Tracker Fund Active Satrix Europe (ex UK) Equity Tracker Fund Active Satrix Emerging Markets Equity Tracker Fund Active Sanlam Managed Risk Fund Active Sanlam Global High Quality Fund Active Sanlam US Dividend Fund Active
High Street Global Balanced Fund Active
Sanlam Global Value Fund Active
Sanlam Stable Global Fund Active
Sanlam Active UK Fund Active
Sanlam Multi-Strategy Fund Active
Anchor Global Stable Fund Active
Bridge Global Equity Income Growth Fund
Merged with Bridge Global Managed
Growth Fund on 12 April 2019
Anchor Global Equity Fund Active
Bridge Global Managed Growth Fund Active
Sanlam Global Emerging Markets Fund Active
ABSA Africa Equity Fund Active
Sanlam Centre American Select Equity Fund Active
Sanlam Japan Equity Fund Active
Sanlam Global Convertible Securities Fund Active
Sanlam Centre Active US Treasury Fund Active
Autus Global Equity Fund Active
Wisian Capital South African Equity Fund Active
Cameron Hume Global Fixed Income ESG Fund Active
Sanlam Centre Global Listed Infrastructure Fund Active
Sanlam Real Assets Fund Active
Satrix Global Factor Enhanced Equity Fund Active

SANLAM UNIVERSAL FUNDS PLC
413
NOTES TO AND FORMING PART OF THE UNAUDITED CONDENSED INTERIM FINANCIAL STATEMENTS (CONTINUED) for the six months ended 30 June 2019 1 General – The Company (continued)
Since 31 December 2018, a number of Funds had a change in name as follows: Name at 31 December 2018: Name changed to: Sanlam FOUR US Dividend Fund Sanlam US Dividend Fund Sanlam FOUR Global Equity Fund Sanlam Global Value Fund Sanlam FOUR Stable Global Equity Fund Sanlam Stable Global Fund Sanlam FOUR Active UK Equity Fund Sanlam Active UK Fund Sanlam FOUR Multi-Strategy Fund Sanlam Multiy Strategy Fund Denker Global Emerging Markets Fund Sanlam Global Emerging Markets Fund
Prices There is a single price for buying, selling and switching share classes in each Fund. This is represented by the Net Asset Value per share class of the relevant Fund. In the case of subscriptions, a preliminary charge of up to 5% may be added to the Net Asset Value per share of the classes of certain Funds, as set out in the relevant offering supplements. The Company may waive in whole or in part the preliminary charge.
A conversion fee of up to 2% may be charged on applications to convert shares of any class to shares of another class. A repurchase fee of up to 3% may be deducted from the Net Asset Value per share of the classes of certain Funds, as set out in the relevant offering supplements. The Company may waive in whole or in part the repurchase fee.
Dealing The Dealing Day is, except where otherwise clarified in the Prospectus or Fund supplement, any day other than Saturday or Sunday on which banks are open for business in Dublin or London. The valuation point is, except where otherwise clarified in the Prospectus or Fund supplement, the close of business in each relevant market on the business day immediately preceding a dealing day.
Shares Applications for shares, except where otherwise clarified in the Prospectus or sub-fund supplement, must be sent so as to arrive at the Registrar and Transfer Agent’s office, as detailed below, no later than 4.00pm (Irish time) on the business day preceding the relevant dealing day, or such later time as the Directors may from time to time permit. Applications which are received late, or Funds which are not cleared by the relevant time, will be held over and invested at the next dealing day.
Requests for repurchases, except where otherwise clarified in the Prospectus or sub-fund supplement, should be sent so as to arrive at the Registrar and Transfer Agent’s office by post, facsimile or telex by no later than 4.00pm (Irish time) on the business day preceding the relevant dealing day.
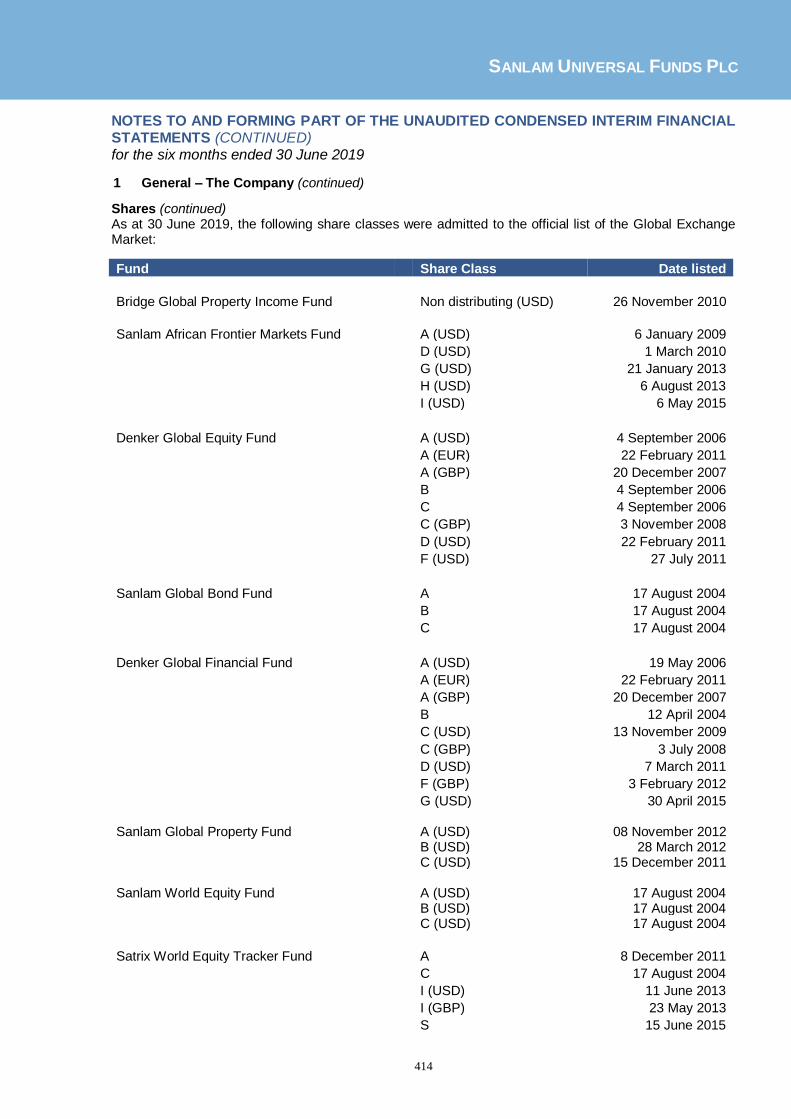
SANLAM UNIVERSAL FUNDS PLC
414
NOTES TO AND FORMING PART OF THE UNAUDITED CONDENSED INTERIM FINANCIAL STATEMENTS (CONTINUED) for the six months ended 30 June 2019
1 General – The Company (continued)
Shares (continued) As at 30 June 2019, the following share classes were admitted to the official list of the Global Exchange Market:
Fund Share Class Date listed
Bridge Global Property Income Fund Non distributing (USD) 26 November 2010
Sanlam African Frontier Markets Fund A (USD) 6 January 2009
D (USD) 1 March 2010
G (USD) 21 January 2013
H (USD) 6 August 2013
I (USD) 6 May 2015
Denker Global Equity Fund A (USD) 4 September 2006
A (EUR) 22 February 2011
A (GBP) 20 December 2007
B 4 September 2006
C 4 September 2006
C (GBP) 3 November 2008
D (USD) 22 February 2011
F (USD) 27 July 2011
Sanlam Global Bond Fund A 17 August 2004
B 17 August 2004
C 17 August 2004
Denker Global Financial Fund A (USD) 19 May 2006
A (EUR) 22 February 2011
A (GBP) 20 December 2007
B 12 April 2004
C (USD) 13 November 2009
C (GBP) 3 July 2008
D (USD) 7 March 2011
F (GBP) 3 February 2012
G (USD) 30 April 2015 Sanlam Global Property Fund A (USD) 08 November 2012 B (USD) 28 March 2012 C (USD) 15 December 2011 Sanlam World Equity Fund A (USD) 17 August 2004 B (USD) 17 August 2004 C (USD) 17 August 2004
Satrix World Equity Tracker Fund A 8 December 2011
C 17 August 2004
I (USD) 11 June 2013
I (GBP) 23 May 2013
S 15 June 2015

SANLAM UNIVERSAL FUNDS PLC
415
NOTES TO AND FORMING PART OF THE UNAUDITED CONDENSED INTERIM FINANCIAL STATEMENTS (CONTINUED) for the six months ended 30 June 2019 1 General – The Company (continued)
Shares (continued)
Fund Share Class Date listed
SIIP India Opportunities Fund A (USD) 14 September 2010
C (USD) 7 March 2012
D (USD) 25 August 2010
Denker Global Dividend Fund A (USD) 7 September 2012
A (GBP) 22 June 2016
B (USD) 21 October 2012
C (USD) 23 October 2012
C Accumulation (USD) 9 April 2015
C Accumulation (GBP) 13 May 2016
I (USD) 06 December 2012
Sanlam Strategic Bond Fund A Income (GBP) 8 March 2013 A Accumulation (GBP) 6 July 2012
I Income (GBP) 9 May 2014 I Income (EUR) 8 August 2017 I Income (USD) 8 August 2017 I Accumulation (GBP) 9 May 2014 I Accumulation (EUR) 29 August 2017 I Accumulation (USD) 8 March 2018 P Accumulation (USD) 29 May 2013 Sanlam Accel Income Fund A Net Accumulation 26 April 2013 A Net Income 12 March 2013 Satrix North America Equity Tracker Fund A (USD) 11 June 2013 I (USD) 11 June 2013 I (GBP) 11 June 2013
Satrix UK Equity Tracker Fund A (USD) 11 June 2013 C (USD) 11 July 2013 I (USD) 11 June 2013 I (GBP) 11 June 2013 Satrix Europe (ex UK) Equity Tracker Fund A (USD) 11 June 2013 C (USD) 11 July 2013 I (USD) 11 June 2013 I (GBP) 11 June 2013 Satrix Emerging Markets Equity Tracker Fund A (USD) 15 July 2013 I (USD) 11 June 2013 I (GBP) 11 June 2013

SANLAM UNIVERSAL FUNDS PLC
416
NOTES TO AND FORMING PART OF THE UNAUDITED CONDENSED INTERIM FINANCIAL STATEMENTS (CONTINUED) for the six months ended 30 June 2019 1 General – The Company (continued) Shares (continued)
Fund Share Class Date listed
Sanlam Managed Risk Fund A (USD) 2 January 2014
A (GBP) 10 July 2013
A (EUR) 14 July 2015
A (SEK) 19 January 2018
A (CHF) 27 March 2018
A (AUD) 11 June 2018
A2 (USD) 24 December 2018
I (USD) 5 July 2013
I (GBP) 10 July 2013
I (EUR) 12 May 2016
I2 (USD) 24 December 2018
N (USD) 11 June 2015
N (GBP) 11 June 2015
N (EUR) 12 May 2015
N (AUD) 23 November 2017
N2 (USD) 6 April 2018
N2 (EUR) 10 August 2018
N2 (AUD) 11 April 2018
L (USD) 17 April 2018
L (GBP) 19 June 2018
L (EUR) 19 June 2018
L (AUD) 11 June 2018 Sanlam Global High Quality Fund A Accumulation (GBP) 2 January 2015 C Accumulation (GBP) 3 March 2014 C Income (GBP) 3 March 2014 D Accumulation (USD) 3 March 2014 D Income (USD) 3 March 2014 E Accumulation (USD) 3 March 2014 E Income (USD) 3 March 2014 I Accumulation (GBP) 27 June 2016 I Accumulation (USD) 28 May 2018 I Income (GBP) 10 November 2015 G Accumulation (USD) 12 July 2016 Sanlam US Dividend Fund Accumulation A (GBP) 30 December 2014 Distribution A (GBP) 30 December 2014 Accumulation A (USD) 11 June 2015 Distribution A (USD) 5 March 2015 Accumulation B (USD) 17 December 2014 Distribution A (EUR) 5 March 2015 Accumulation B (GBP) 1 June 2016 Accumulation H (GBP) 30 April 2018 Distribution H (GBP) 4 July 2018
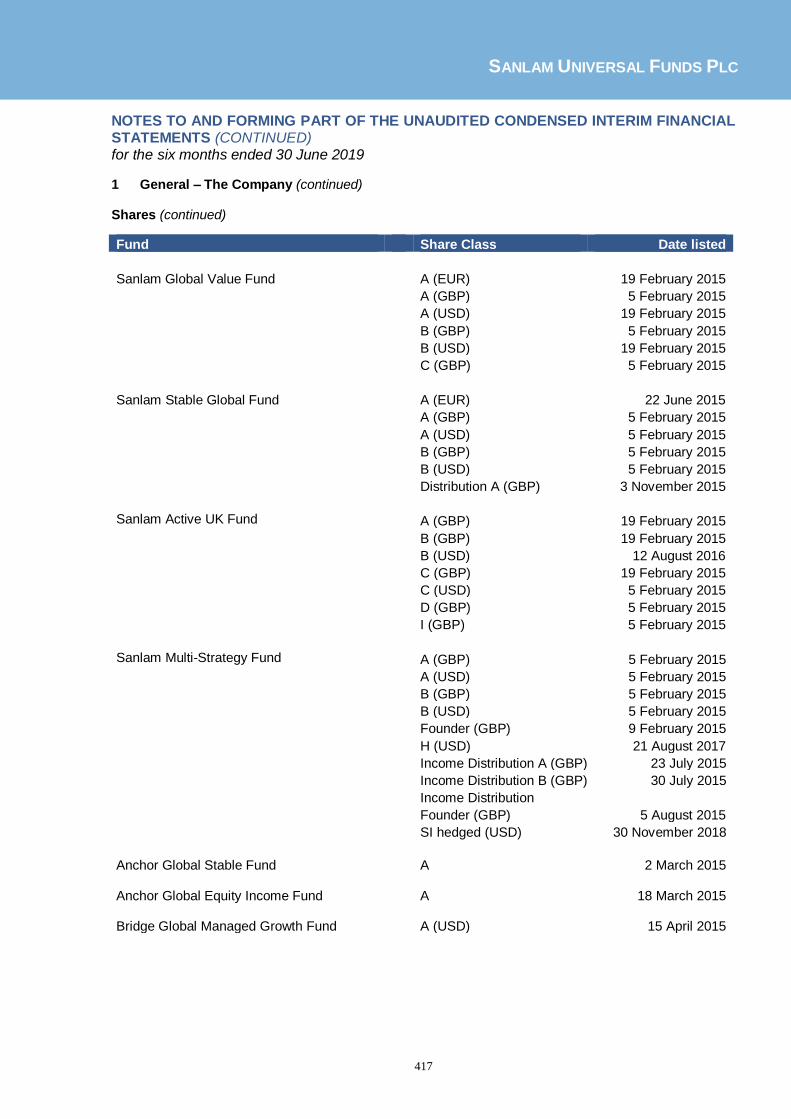
SANLAM UNIVERSAL FUNDS PLC
417
NOTES TO AND FORMING PART OF THE UNAUDITED CONDENSED INTERIM FINANCIAL STATEMENTS (CONTINUED) for the six months ended 30 June 2019
1 General – The Company (continued) Shares (continued)
Fund Share Class Date listed
Sanlam Global Value Fund A (EUR) 19 February 2015
A (GBP) 5 February 2015
A (USD) 19 February 2015
B (GBP) 5 February 2015
B (USD) 19 February 2015
C (GBP) 5 February 2015
Sanlam Stable Global Fund A (EUR) 22 June 2015
A (GBP) 5 February 2015
A (USD) 5 February 2015
B (GBP) 5 February 2015
B (USD) 5 February 2015
Distribution A (GBP) 3 November 2015
Sanlam Active UK Fund A (GBP) 19 February 2015 B (GBP) 19 February 2015 B (USD) 12 August 2016 C (GBP) 19 February 2015
C (USD) 5 February 2015 D (GBP) 5 February 2015
I (GBP) 5 February 2015
Sanlam Multi-Strategy Fund A (GBP) 5 February 2015 A (USD) 5 February 2015 B (GBP) 5 February 2015 B (USD) 5 February 2015 Founder (GBP) 9 February 2015 H (USD) 21 August 2017 Income Distribution A (GBP) 23 July 2015 Income Distribution B (GBP) 30 July 2015 Income Distribution
Founder (GBP) 5 August 2015 SI hedged (USD) 30 November 2018
Anchor Global Stable Fund A 2 March 2015 Anchor Global Equity Income Fund A 18 March 2015 Bridge Global Managed Growth Fund A (USD) 15 April 2015

SANLAM UNIVERSAL FUNDS PLC
418
NOTES TO AND FORMING PART OF THE UNAUDITED CONDENSED INTERIM FINANCIAL STATEMENTS (CONTINUED) for the six months ended 30 June 2019 1 General – The Company (continued) Shares (continued)
Fund Share Class Date listed Sanlam Global Emerging Markets Fund A1 (USD) 5 June 2015 B1 (USD) 23 November 2016 B2 (USD) 7 December 2016 C1 (USD) 5 June 2015 C2 (USD) 19 August 2016 C2 (GBP) 8 December 2017 D2 (USD) 12 March 2018 ABSA Africa Equity Fund A (USD) 16 November 2016 Sanlam Japan Equity Fund E (USD) 23 November 2016 Sanlam Centre American Select Equity Fund E (USD) 23 November 2016 C (GBP Unhedged) 13 February 2019 Sanlam Centre Active US Treasury Fund C (USD) 12 January 2018 E (USD) 12 January 2018 Sanlam Global Convertible Securities Fund A 28 November 2016 Cameron Hume Global Fixed Income ESG Fund E 26 July 2018 Sanlam Centre Global Listed Infrastructure Fund C (GBP) 10 September 2018 C (USD) 10 September 2018 E (USD) 13 August 2018 Sanlam Real Assets Fund SI Accumulation (USD) 23 August 2018 SR Accumulation (USD) 23 August 2018
Minimum Subscription
The minimum initial subscription amounts for the active classes of each Fund at 30 June 2019 are as follows:
Fund
Share Class
Minimum initial
investment
Bridge Global Property Income Fund Non distributing (USD) USD1,000
Sanlam African Frontier Markets Fund A (USD) USD1,000
D (USD) USD20,000,000
G (USD) USD50,000,000
H (USD) USD50,000,000
I (USD) USD1,000,000

SANLAM UNIVERSAL FUNDS PLC
419
NOTES TO AND FORMING PART OF THE UNAUDITED CONDENSED INTERIM FINANCIAL STATEMENTS (CONTINUED) for the six months ended 30 June 2019
1 General – The Company (continued)
Minimum Subscription (continued)
Fund
Share Class
Minimum initial
investment
Denker Global Equity Fund A (USD) USD1,000
A (GBP) GBP£1,000
A (EUR) EUR€1,000
B USD750,000
C USD1,000,000
C (GBP) GBP£5,000,000
D (USD) USD10,000,000
E None
F (USD) USD1,000
G (USD) USD1,000,000
Sanlam Global Bond Fund A USD1,000
B USD750,000
C USD1,000,000
D USD10,000,000
E (USD) None
E (GBP) None
Denker Global Financial Fund A (USD) USD1,000
A (GBP) GBP£1,000
A (EUR) EUR€1,000
B USD1,000,000
C (GBP) GBP£5,000,000
C (USD) USD5,000,000
D (USD) USD1,000
E None
F (GBP) GBP£1,000
F (EUR) EUR€1,000
G (USD) USD1,000,000
H (USD) USD10,000,000
I (USD) USD50,000,000
Sanlam Global Property Fund A (USD) USD1,000 B (USD) USD750,000 C (USD) USD1,000,000 E (USD) None
E (GBP) None F (GBP) None
Sanlam World Equity Fund A (USD) USD1,000 B (USD) USD750,000 C (USD) USD1,000,000 E (USD) None
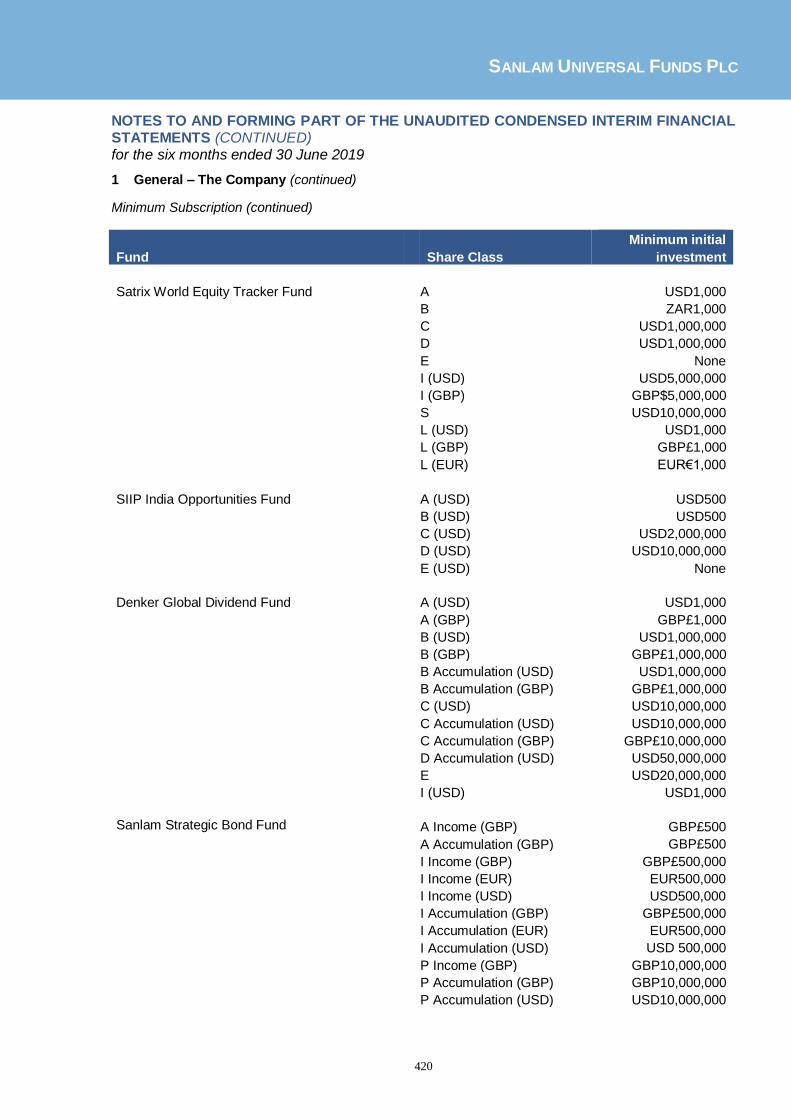
SANLAM UNIVERSAL FUNDS PLC
420
NOTES TO AND FORMING PART OF THE UNAUDITED CONDENSED INTERIM FINANCIAL STATEMENTS (CONTINUED) for the six months ended 30 June 2019
1 General – The Company (continued)
Minimum Subscription (continued)
Fund Share Class
Minimum initial
investment
Satrix World Equity Tracker Fund A USD1,000
B ZAR1,000 C USD1,000,000
D USD1,000,000 E None
I (USD) USD5,000,000
I (GBP) GBP$5,000,000
S USD10,000,000
L (USD) USD1,000
L (GBP) GBP£1,000
L (EUR) EUR€1,000
SIIP India Opportunities Fund A (USD) USD500
B (USD) USD500
C (USD) USD2,000,000
D (USD) USD10,000,000
E (USD) None
Denker Global Dividend Fund A (USD) USD1,000
A (GBP) GBP£1,000
B (USD) USD1,000,000
B (GBP) GBP£1,000,000
B Accumulation (USD) USD1,000,000
B Accumulation (GBP) GBP£1,000,000
C (USD) USD10,000,000
C Accumulation (USD) USD10,000,000
C Accumulation (GBP) GBP£10,000,000
D Accumulation (USD) USD50,000,000
E USD20,000,000
I (USD) USD1,000
Sanlam Strategic Bond Fund A Income (GBP) GBP£500
A Accumulation (GBP) GBP£500 I Income (GBP) GBP£500,000 I Income (EUR) EUR500,000 I Income (USD) USD500,000 I Accumulation (GBP) GBP£500,000 I Accumulation (EUR) EUR500,000 I Accumulation (USD) USD 500,000 P Income (GBP) GBP10,000,000 P Accumulation (GBP) GBP10,000,000 P Accumulation (USD) USD10,000,000

SANLAM UNIVERSAL FUNDS PLC
421
NOTES TO AND FORMING PART OF THE UNAUDITED CONDENSED INTERIM FINANCIAL STATEMENTS (CONTINUED) for the six months ended 30 June 2019
1 General – The Company (continued)
Minimum Subscription (continued)
Fund Share Class
Minimum initial
investment
Sanlam Accel Income Fund A Net Accumulation GBP£1,000 A Net Income GBP£1,000 Satrix North America Equity Tracker Fund A (USD) USD1,000 B (ZAR) ZAR1,000 C (USD) USD1,000,000 E (USD) None I (USD) USD10,000,000 I (GBP) GBP£10,000,000 Satrix UK Equity Tracker Fund A (USD) USD1,000 C (USD) USD1,000,000 E (USD) None E (GBP) None I (USD) USD10,000,000 I (GBP) GBP£10,000,000 Satrix Europe (ex UK) Equity Tracker Fund A (USD) USD1,000 C (USD) USD1,000,000 D (USD) USD1,000,000 E (USD) None E (EUR) None I (USD) USD10,000,000 I (GBP) GBP£10,000,000
Satrix Emerging Markets Equity Tracker Fund A (USD) USD1,000
D (USD) USD1,000,000
E (USD) None
I (USD) USD10,000,000
I (GBP) GBP£10,000,000
Sanlam Managed Risk Fund A (USD) USD10,000
A (GBP) GBP£10,000
A (EUR) EUR€10,000
A (CHF) CHF10,000
A (SEK) SEK10,000
A (AUD) AUD$10,000
A (CAD) CAD$10,000
A2 (USD) USD10,000
D (USD) USD10,000,000
D (GBP) GBP£10,000,000
D (EUR) EUR€10,000,000
I (USD) USD1,000,000
I (GBP) GBP£1,000,000

SANLAM UNIVERSAL FUNDS PLC
422
NOTES TO AND FORMING PART OF THE UNAUDITED CONDENSED INTERIM FINANCIAL STATEMENTS (CONTINUED) for the six months ended 30 June 2019 1 General – The Company (continued) Minimum Subscription (continued)
Minimum initial
Fund Share Class investment
Sanlam Managed Risk Fund (continued) I (EUR) EUR€1,000,000
I2 (USD) USD1,000,000
N (USD) USD10,000
N (GBP) GBP£10,000
N (EUR) EUR€10,000
N (AUD) AUD$10,000
N2 (USD) USD10,000,000
N2 (GBP) GBP£10,000,000
N2 (EUR) EUR€10,000,000
N2 (AUD) AUD$10,000,000
L (USD) USD100
L (GBP) GBP£100
L (EUR) EUR€100
L (AUD) AUD$100
Sanlam Global High Quality Fund A Accumulation (GBP) GBP£300 A Accumulation (USD) USD300 A Accumulation (EUR) EUR€300 A Accumulation (CHF) CHF300 B Accumulation (USD) USD300 C Income (GBP) GBP£10,000,000 C Accumulation (GBP) GBP£10,000,000 D Income (USD) USD10,000,000 D Accumulation (USD) USD10,000,000 E Income (USD) USD10,000,000 E Accumulation (USD) USD10,000,000 I Income (GBP) GBP£1,000,000 I Accumulation (GBP) GBP£1,000,000 I Accumulation (USD) USD1,000,000 I Accumulation (EUR) EUR€1,000,000 I Accumulation (CHF) CHF1,000,000 G Income (USD) USD1,000,000 G Accumulation (USD) USD1,000,000 Sanlam US Dividend Fund A Accumulation (GBP) GBP£1,000 A Accumulation (USD) USD1,000 A Accumulation (EUR) EUR€1,000 B Accumulation (USD) USD10,000 B Accumulation (GBP) GBP£10,000 H Accumulation (GBP) GBP£10,000 A Distribution (GBP) GBP£1,000 A Distribution (USD) USD1,000 A Distribution (EUR) EUR€1,000 H Distribution (GBP) GBP£1,000 SI (USD) None SR (USD) None

SANLAM UNIVERSAL FUNDS PLC
423
NOTES TO AND FORMING PART OF THE UNAUDITED CONDENSED INTERIM FINANCIAL STATEMENTS (CONTINUED) for the six months ended 30 June 2019 1 General – The Company (continued)
Minimum Subscription (continued)
Minimum initial
Fund Share Class investment
High Street Global Balanced Fund A (USD) USD50,000
B (USD) USD500,000
C (USD) USD50,000
Sanlam Global Value Fund A (EUR) EUR€1,000
A (GBP) GBP£1,000
A (USD) USD1,000
B (GBP) GBP£10,000
B (USD) USD10,000
C (GBP) GBP£1,000
C (USD) USD1,000
Sanlam Stable Global Fund A (EUR) EUR€1,000
A (GBP) GBP£1,000
A (USD) USD1,000
B (GBP) GBP£10,000
B (USD) USD10,000
Distribution A (GBP) GBP£1,000
SI (USD) None
SR (USD) None
Sanlam Active UK Fund A (GBP) GBP£1,000 B (GBP) GBP£10,000 B (USD) USD10,000 C (GBP) GBP£1,000
C (USD) USD1,000 D (GBP) GBP£45,000,000
I (GBP) GBP£1,000 Sanlam Multi-Strategy Fund A (EUR) EUR€1,000 A (GBP) GBP£1,000 B (GBP) GBP£10,000 B (USD) USD10,000 H (USD) USD1,000 Founder (GBP) GBP£1,000 Income Distribution A (GBP) GBP£1,000 Income Distribution B (GBP) GBP£1,000 Income Distribution Founder (GBP) GBP£1,000 SI Hedged (USD) None SR Hedged (USD) None
Anchor Global Stable Fund A USD1,000 B USD1,000

SANLAM UNIVERSAL FUNDS PLC
424
NOTES TO AND FORMING PART OF THE UNAUDITED CONDENSED INTERIM FINANCIAL STATEMENTS (CONTINUED) for the six months ended 30 June 2019 1 General – The Company (continued)
Minimum Subscription (continued)
Minimum initial
Fund Share Class investment Anchor Global Equity Income Fund A USD1,000 B USD1,000 Bridge Global Managed Growth Fund A (USD) USD1,000 Sanlam Global Emerging Markets Fund A1 (USD) USD1,000 A2 (USD) USD1,000 B1 (GBP) GBP£1,000 B1 (USD) USD1,000 B2 (GBP) GBP£1,000 B2 (USD) USD1,000 C1 (GBP) GBP£10,000,000 C1 (USD) USD10,000,000 C2 (GBP) GBP£10,000,000 C2 (USD) USD10,000,000 E USD1,000 D2 (USD) USD20,000,000
ABSA Africa Equity Fund A (EUR) EUR€100 A (GBP) GBP£100 A (USD) USD100 Sanlam Centre American Select Equity Fund C (USD) USD5,000 C (GBP) GBP£5,000 C (GBP Unhedged) GBP£5,000 E (USD) None A2 (USD) USD10,000 I2 (USD) USD1,000,000 L (USD) USD100 Sanlam Japan Equity Fund A (USD) USD1,000 B (USD) USD750,000 C (USD) USD1,000,000 E (GBP) None E (USD) None Sanlam Global Convertible Securities Fund A None E None Sanlam Centre Active US Treasury Fund A (USD) USD5,000 B (USD) None C (USD) USD5,000 E (USD) None Autus Global Equity Fund A (USD) USD1,000 B (USD) USD10,000,000
Wisian Capital South African Equity Fund A (Retail) Hedged USD1 B (Institutional) Hedged USD100,000
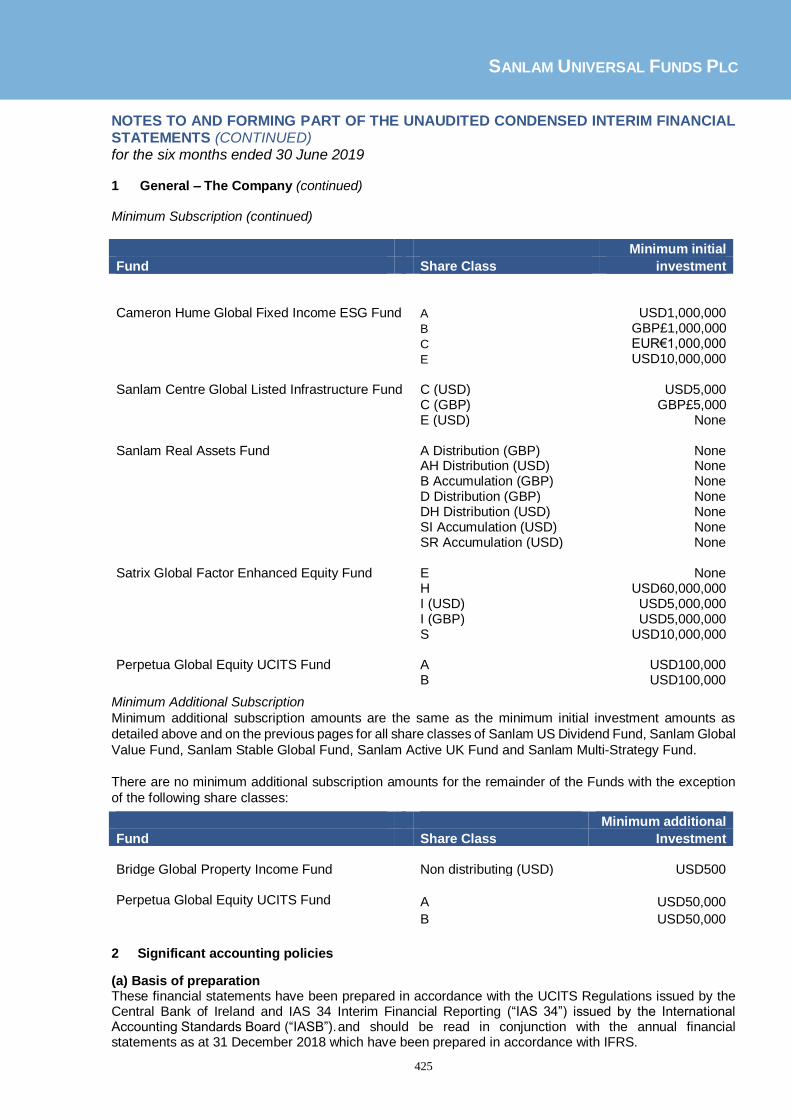
SANLAM UNIVERSAL FUNDS PLC
425
NOTES TO AND FORMING PART OF THE UNAUDITED CONDENSED INTERIM FINANCIAL STATEMENTS (CONTINUED) for the six months ended 30 June 2019 1 General – The Company (continued)
Minimum Subscription (continued)
Minimum initial
Fund Share Class investment
Cameron Hume Global Fixed Income ESG Fund A USD1,000,000 B GBP£1,000,000 C EUR€1,000,000 E USD10,000,000 Sanlam Centre Global Listed Infrastructure Fund C (USD) USD5,000 C (GBP) GBP£5,000 E (USD) None Sanlam Real Assets Fund A Distribution (GBP) None AH Distribution (USD) None B Accumulation (GBP) None D Distribution (GBP) None DH Distribution (USD) None SI Accumulation (USD) None SR Accumulation (USD) None Satrix Global Factor Enhanced Equity Fund E None H USD60,000,000 I (USD) USD5,000,000 I (GBP) USD5,000,000 S USD10,000,000 Perpetua Global Equity UCITS Fund A USD100,000 B USD100,000
Minimum Additional Subscription
Minimum additional subscription amounts are the same as the minimum initial investment amounts as
detailed above and on the previous pages for all share classes of Sanlam US Dividend Fund, Sanlam Global
Value Fund, Sanlam Stable Global Fund, Sanlam Active UK Fund and Sanlam Multi-Strategy Fund.
There are no minimum additional subscription amounts for the remainder of the Funds with the exception
of the following share classes:
Minimum additional
Fund Share Class Investment Bridge Global Property Income Fund Non distributing (USD) USD500 Perpetua Global Equity UCITS Fund A USD50,000 B USD50,000
2 Significant accounting policies
(a) Basis of preparation These financial statements have been prepared in accordance with the UCITS Regulations issued by the Central Bank of Ireland and IAS 34 Interim Financial Reporting (“IAS 34”) issued by the International Accounting Standards Board (“IASB”). and should be read in conjunction with the annual financial statements as at 31 December 2018 which have been prepared in accordance with IFRS.

SANLAM UNIVERSAL FUNDS PLC
426
NOTES TO AND FORMING PART OF THE UNAUDITED CONDENSED INTERIM FINANCIAL STATEMENTS (CONTINUED) for the six months ended 30 June 2019
2 Significant accounting policies (continued) (b) Significant change in accounting policies During the period ended 30 June 2019 the functional currency of two sub-funds of the Company, namely Sanlam Stable Global Fund and Sanlam Global Value Fund, changed from GBP to USD. The presentational currency of the sub-funds was also changed. The change in accounting policy has been applied retrospectively and the comparative results have been amended to reflect the change in functional and presentation currency of the two sub-funds. This change has not impacted on the reults or primary statements of the Company which continues to use USD as the and functional and presentational currency. There have been no other changes to the significant accounting policies since the last audited financial statements for the year ended 31 December 2018. Outlined below is a change in accounting policy that was adopted in the audited financial statements for the year ended 31 December 2018. The unaudited condensed interim financial statements have also adopted this change in accounting policy. As a result the comparative period in the unaudited condensed interim financial statements has been amended to reflect this change. Nature of change in accounting policy In the unaudited condensed interim financial statements of the Company for the period ended 30 June 2018, income equalisation was shown as a component of finance costs in the statement of comprehensive income of the Company together with the distributions to shareholders and formed part of the “change in net assets attributable to holders of redeemable participating shares”. Income equalisation in relation to subscriptions and redemptions of shares has been reclassified as a component of the issuance and cancellation of redeemable participating shares in the statement of change in net assets. Reasons for change in accounting policy Income equalisation is an allocation methodology to ensure that the level of income accrued within a Fund and attributable to each share is not affected by the issue or redemption of shares during a distribution period. The proportion of subscriptions and redemptions during the distribution period that relates to income earned since the last reporting period is allocated to income equalisation. In previous periods the Company’s approach to the classification of income equalisation was that it related to shareholder distributions and was classified in a similar manner. Following a review of this assessment it was determined that classifying income equalisation as components of the issuance and redemption of share capital in capital transactions within the statement of changes in net assets attributable to holders of redeemable participating shares more accurately reflects the economic substance of these transactions, in that income equalisation does not represent a separate component of the subscription and redemptions of shares but forms part of same. Impact of change in accounting policy The change in accounting policy has been applied retrospectively and the comparative results have been amended to reflect the change in classification. The application of this change in policy has resulted in a reclassification which decreased the profit before tax for the period ended 30 June 2018 by USD 5,932,989 and increased the value of capital transactions by the same amounts. The change had no impact on the Statement of Financial Position or the NAV of the Funds or the Company. (c) Standards, interpretations and amendments to published standards that are not yet effective There are no new standards, amendments to published standards and interpretations which are effective for the first time in the current period and that will have a material effect on the Company’s unaudited condensed interim financial statements.

SANLAM UNIVERSAL FUNDS PLC
427
NOTES TO AND FORMING PART OF THE UNAUDITED CONDENSED INTERIM FINANCIAL STATEMENTS (CONTINUED) for the six months ended 30 June 2019
3 Distributions per share
The total aggregate distributions per share class during the period ended 30 June 2019 were as follows:
P-Solve Inflation Plus
Fund Denker Global
Equity Fund Denker Global Financial Fund
Satrix World Equity Tracker
Fund
Distribution per share (in pence)
Share Class A (GBP) - £4.76 £2.53 -
Share Class B £0.26 - - -
Share Class C £1.13 - - -
Share Class C (GBP) - £2.71 £4.93 -
Share Class I (GBP) - - - £3.09
Denker Global Dividend Fund
Sanlam Strategic Bond
Fund Sanlam Accel Income Fund
Satrix North America
Equity Tracker Fund
Distribution per share (in cents/pence)
Share Class A (USD) $2.22 - - -
Share Class A (GBP) £2.39 - - -
Share Class A Income (GBP) - £2.46 £1.52 -
Share Class A Net Income - - £1.52 -
Share Class B (USD) $2.18 - - -
Share Class C (USD) $2.32 - - -
Share Class C (GBP) - - - -
Share Class P Income (GBP) - £2.57 - -
Share Class I (GBP) - - - £2.67
Share Class I Income (GBP) - £2.50 - -
Share Class I (Income) (USD) - $2.36 - -
Share Class I (Income) (EUR) - €2.26 - -
Satrix UK Equity Tracker
Fund
Satrix Europe (ex UK) Equity Tracker Fund
Satrix Emerging Markets Equity
Tracker Fund
Sanlam Global High Quality
Fund
Distribution per share (in pence)
Share Class C Income (GBP) - - - £0.96
Share Class D Income (USD) - - - $1.20
Share Class E Income (USD) - - - $1.21
Share Class G Income (GBP) - - - £0.51
Share Class I Income (GBP) - - - £0.64
Share Class I (GBP) £5.01 £3.40 £2.47 -

SANLAM UNIVERSAL FUNDS PLC
428
NOTES TO AND FORMING PART OF THE UNAUDITED CONDENSED INTERIM FINANCIAL STATEMENTS (CONTINUED) for the six months ended 30 June 2019
3 Distributions per share (continued)
The total aggregate distributions per share class during the period ended 30 June 2018 were as follows:
Sanlam US Dividend Fund
Sanlam Stable Global Fund
Sanlam Active UK Fund
Sanlam Multi-Strategy Fund
Distribution per share (in cent/pence)
Share Class A Distribution (EUR) €10.98 - - -
Share Class A Distribution (GBP) £12.71 £3.83 - -
Share Class A Distribution (USD) $10.53 - - -
Share Class A Income Distribution (GBP) - - - £15.60
Share Class B Income Distribution (GBP) - - - £16.20
Share Class Founder Income (GBP) - - - £15.66
Share Class I (GBP) - - £25.53 -
Share Class H Distribution (GBP) £7.74 - - -
Sanlam Global
Emerging Markets Fund
Absa Africa Equity Fund
Sanlam Centre Active US
Treasury Fund
Sanlam Centre Global Listed Infrastructure
Fund
Distribution per share (in cents)
Share Class A (USD) - $1.40 - -
Share Class B (USD) - - $0.13 -
Share Class C (USD) - - $1.74 $0.36
Share Class C (GBP) - - - £0.34
Share Class C2 (GBP) £0.83 - - -
Share Class E (USD) - - $2.00 $0.31
Sanlam Real Assets Fund
Distribution per share (in cents)
Share Class A Distribution (GBP) £17.81
Share Class D Distribution (GBP) £15.61
P-Solve Inflation Plus
Fund Denker Global
Equity Fund Denker Global Financial Fund
Satrix World Equity Tracker
Fund
Distribution per share (in pence)
Share Class A (GBP) - £1.03 £3.12 -
Share Class B (GBP) £0.34 - - -
Share Class C (GBP) £1.18 - - -
Share Class C (GBP) - £2.99 £6.76 -
Share Class I (GBP) - - - £2.57

SANLAM UNIVERSAL FUNDS PLC
429
NOTES TO AND FORMING PART OF THE UNAUDITED CONDENSED INTERIM FINANCIAL STATEMENTS (CONTINUED) for the six months ended 30 June 2019
3 Distributions per share (continued)
The total aggregate distributions per share class during the period ended 30 June 2018 were as follows
(continued):
Denker Global Dividend Fund
Sanlam Strategic Bond
Fund Sanlam Accel Income Fund
Satrix North America
Equity Tracker Fund
Distribution per share (in cents/pence)
Share Class A (USD) $1.76 - - -
Share Class A (GBP) £0.89 - - -
Share Class A Income (GBP) - £2.47 £2.03 -
Share Class A Net Income - - £2.03 -
Share Class B (USD) $1.69 - - -
Share Class C (USD) $1.80 - - -
Share Class C (GBP) - - £6.76 -
Share Class P Income (GBP) - £2.57 - -
Share Class I (GBP) - - - £2.07
Share Class I Income (GBP) - £2.50 - -
Share Class I (Income) (USD) - $2.33 - -
Share Class I (Income) (EUR) - €2.29 - -
Satrix UK Equity Tracker
Fund
Satrix Europe (ex UK) Equity Tracker Fund
Satrix Emerging Markets Equity
Tracker Fund
Sanlam Global High Quality
Fund
Distribution per share (in pence)
Share Class C Income (GBP) - - - £0.76
Share Class D Income (USD) - - - $1.09
Share Class E Income (USD) - - - $1.09
Share Class G Income (GBP) - - - £0.40
Share Class I Income (GBP) - - - £0.38
Share Class I (GBP) £4.52 £3.21 £2.30 -
Sanlam US
Dividend Fund Sanlam Stable
Global Fund Sanlam Active
UK Fund Sanlam Multi-Strategy Fund
Distribution per share (in cent/pence)
Share Class A Distribution (EUR) €13.88 - - -
Share Class A Distribution (GBP) £17.03 £12.75 - -
Share Class A Distribution (USD) $15.07 - - -
Share Class A Income Distribution (GBP) - - - £15.69
Share Class B Income Distribution (GBP) - - - £16.07
Share Class Founder Income (GBP) - - - £15.66
Share Class I (GBP) - - £23.39 -
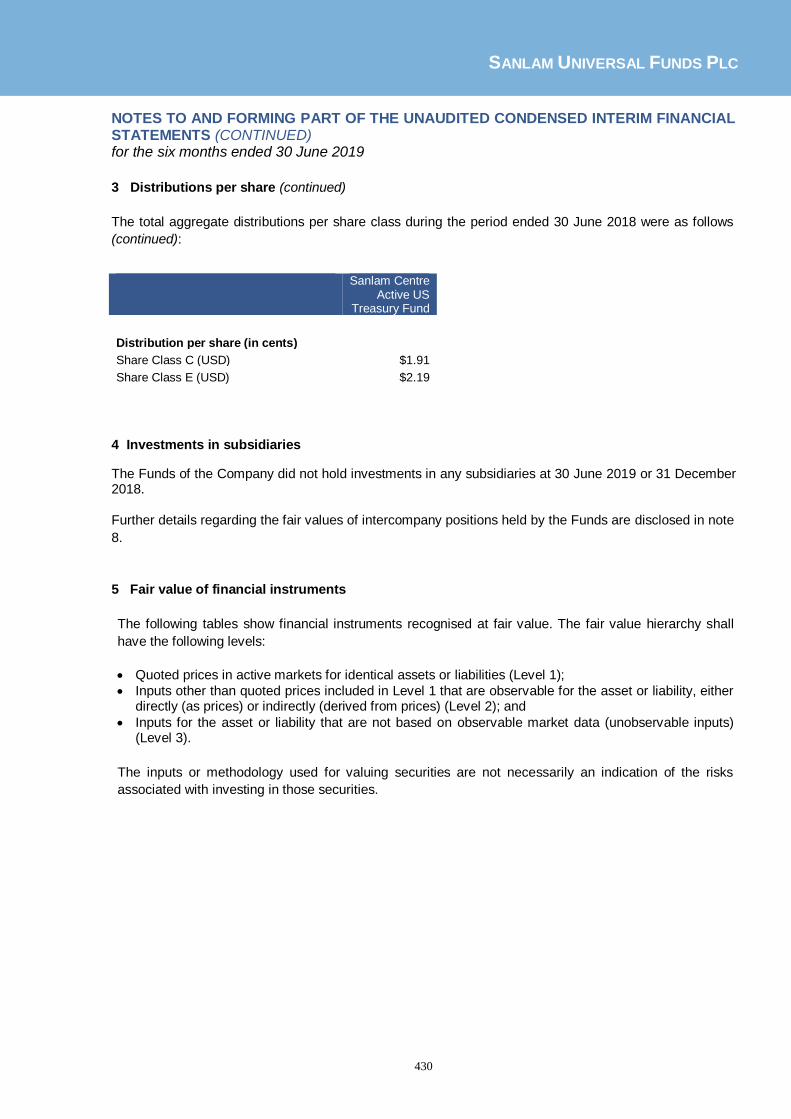
SANLAM UNIVERSAL FUNDS PLC
430
NOTES TO AND FORMING PART OF THE UNAUDITED CONDENSED INTERIM FINANCIAL STATEMENTS (CONTINUED) for the six months ended 30 June 2019
3 Distributions per share (continued)
The total aggregate distributions per share class during the period ended 30 June 2018 were as follows
(continued):
4 Investments in subsidiaries
The Funds of the Company did not hold investments in any subsidiaries at 30 June 2019 or 31 December 2018.
Further details regarding the fair values of intercompany positions held by the Funds are disclosed in note
8.
5 Fair value of financial instruments
The following tables show financial instruments recognised at fair value. The fair value hierarchy shall
have the following levels:
• Quoted prices in active markets for identical assets or liabilities (Level 1);
• Inputs other than quoted prices included in Level 1 that are observable for the asset or liability, either directly (as prices) or indirectly (derived from prices) (Level 2); and
• Inputs for the asset or liability that are not based on observable market data (unobservable inputs) (Level 3).
The inputs or methodology used for valuing securities are not necessarily an indication of the risks
associated with investing in those securities.
Sanlam Centre Active US
Treasury Fund
Distribution per share (in cents)
Share Class C (USD) $1.91
Share Class E (USD) $2.19

SANLAM UNIVERSAL FUNDS PLC
431
NOTES TO AND FORMING PART OF THE UNAUDITED CONDENSED INTERIM FINANCIAL STATEMENTS (CONTINUED) for the six months ended 30 June 2019
5 Fair value of financial instruments (continued)
Assets measured at fair value at 30 June 2019
The following tables analyse within the fair value hierarchy the Funds’ financial assets measured at fair
value through profit or loss at 30 June 2019:
Bridge Global Property Income Fund
Level 1 Level 2 Level 3 Total
USD USD USD USD
Equity 21,685,738 - - 21,685,738
Total financial assets at fair value through
profit or loss 21,685,738 - - 21,685,738
Sanlam African Frontier Markets Fund
Level 1 Level 2 Level 3 Total
USD USD USD USD
Equity 118,749,129 - - 118,749,129
Rights - 526,606 - 526,606
Total financial assets at fair value through
profit or loss 118,749,129 526,606 - 119,275,735
Denker Global Equity Fund
Level 1 Level 2 Level 3 Total
USD USD USD USD
Equity 96,056,390 - - 96,056,390
Total financial assets at fair value through
profit or loss 96,056,390 - - 96,056,390
Sanlam Global Bond Fund
Level 1 Level 2 Level 3 Total
USD USD USD USD
Bonds 304,468,875 263,106,570 - 567,575,445
Futures 60,219 - - 60,219
Forward Currency Contracts - 4,222,213 - 4,222,213
Swaps - 3,065,194 - 3,065,194
Total financial assets at fair value through
profit or loss 304,529,094 270,393,977 - 574,923,071
Denker Global Financial Fund
Level 1 Level 2 Level 3 Total
USD USD USD USD
Equity 125,245,972 - - 125,245,972
Total financial assets at fair value through
profit or loss 125,245,972 - - 125,245,972
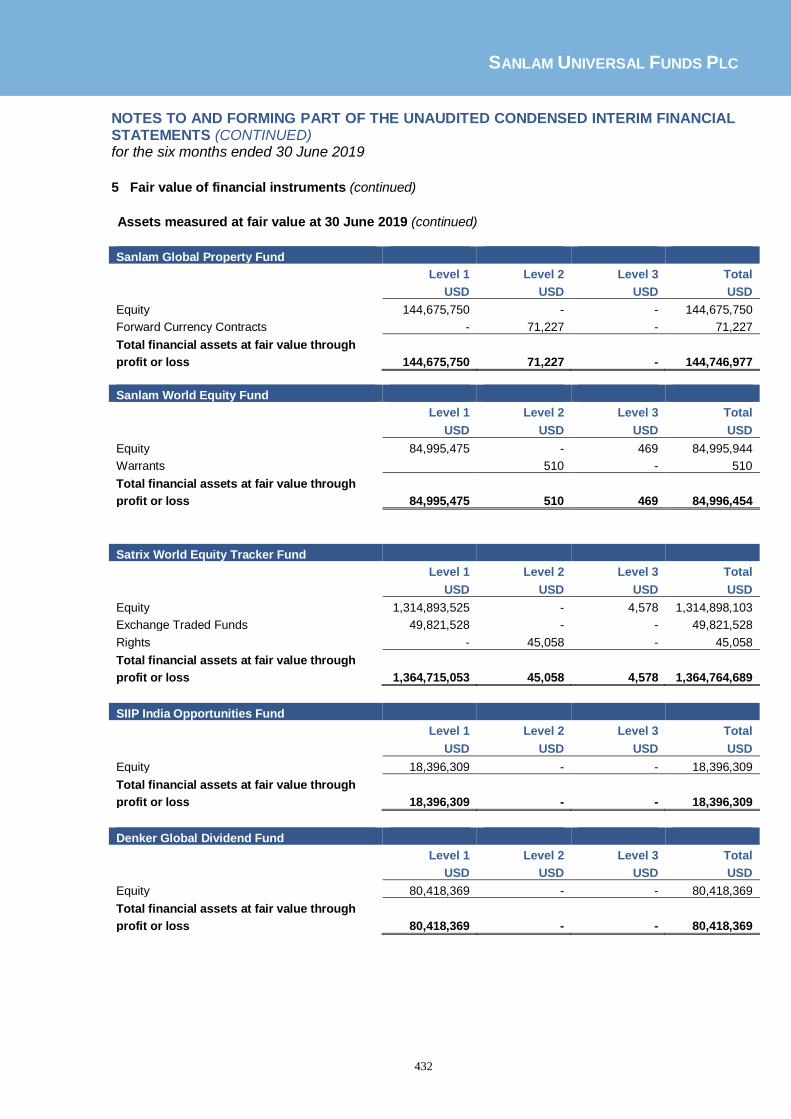
SANLAM UNIVERSAL FUNDS PLC
432
NOTES TO AND FORMING PART OF THE UNAUDITED CONDENSED INTERIM FINANCIAL STATEMENTS (CONTINUED) for the six months ended 30 June 2019
5 Fair value of financial instruments (continued)
Assets measured at fair value at 30 June 2019 (continued)
Sanlam Global Property Fund
Level 1 Level 2 Level 3 Total
USD USD USD USD
Equity 144,675,750 - - 144,675,750
Forward Currency Contracts - 71,227 - 71,227
Total financial assets at fair value through
profit or loss 144,675,750 71,227 - 144,746,977
Sanlam World Equity Fund
Level 1 Level 2 Level 3 Total
USD USD USD USD
Equity 84,995,475 - 469 84,995,944
Warrants 510 - 510
Total financial assets at fair value through
profit or loss 84,995,475 510 469 84,996,454
Satrix World Equity Tracker Fund
Level 1 Level 2 Level 3 Total
USD USD USD USD
Equity 1,314,893,525 - 4,578 1,314,898,103
Exchange Traded Funds 49,821,528 - - 49,821,528
Rights - 45,058 - 45,058
Total financial assets at fair value through
profit or loss 1,364,715,053 45,058 4,578 1,364,764,689
SIIP India Opportunities Fund
Level 1 Level 2 Level 3 Total
USD USD USD USD
Equity 18,396,309 - - 18,396,309
Total financial assets at fair value through
profit or loss 18,396,309 - - 18,396,309
Denker Global Dividend Fund
Level 1 Level 2 Level 3 Total
USD USD USD USD
Equity 80,418,369 - - 80,418,369
Total financial assets at fair value through
profit or loss 80,418,369 - - 80,418,369

SANLAM UNIVERSAL FUNDS PLC
433
NOTES TO AND FORMING PART OF THE UNAUDITED CONDENSED INTERIM FINANCIAL STATEMENTS (CONTINUED) for the six months ended 30 June 2019
5 Fair value of financial instruments (continued)
Assets measured at fair value at 30 June 2019 (continued)
Sanlam Strategic Bond Fund
Level 1 Level 2 Level 3 Total
GBP GBP GBP GBP
Bonds 109,149,732 252,592,526 - 361,742,258
Equity 28,253,591 - - 28,253,591
Forward Currency Contracts - 246,384 - 246,384
Total financial assets at fair value through
profit or loss 137,403,323 252,838,910 - 390,242,233
Sanlam Accel Income Fund
Level 1 Level 2 Level 3 Total
GBP GBP GBP GBP
Collective Investment Schemes 26,599,913 - - 26,599,913
Total financial assets at fair value through
profit or loss 26,599,913 - - 26,599,913
Satrix North America Equity Tracker Fund
Level 1 Level 2 Level 3 Total
USD USD USD USD
Equity 5,362,769 - - 5,362,769
Total financial assets at fair value through
profit or loss 5,362,769 - - 5,362,769
Satrix UK Equity Tracker Fund
Level 1 Level 2 Level 3 Total
GBP GBP GBP GBP
Equity 7,822,433 - 1,211 7,823,644
Total financial assets at fair value through
profit or loss 7,822,433 - 1,211 7,823,644
Satrix Europe (ex-UK) Equity Tracker Fund
Level 1 Level 2 Level 3 Total
EUR EUR EUR EUR
Equity 85,835,388 - - 85,835,388
Rights - 15,249 - 15,249
Total financial assets at fair value through
profit or loss 85,835,388 15,249 - 85,850,637

SANLAM UNIVERSAL FUNDS PLC
434
NOTES TO AND FORMING PART OF THE UNAUDITED CONDENSED INTERIM FINANCIAL STATEMENTS (CONTINUED) for the six months ended 30 June 2019
5 Fair value of financial instruments (continued)
Assets measured at fair value at 30 June 2019 (continued)
Satrix Emerging Markets Equity Tracker Fund
Level 1 Level 2 Level 3 Total
USD USD USD USD
Equity 46,399,751 - - 46,399,751
Exchange Traded Funds 3,350,490 - - 3,350,490
Rights - 1,590 - 1,590
Warrants - 254 - 254
Total financial assets at fair value through
profit or loss 49,750,241 1,844 - 49,752,085
Sanlam Managed Risk Fund
Level 1 Level 2 Level 3 Total
USD USD USD USD
Collective investment schemes 82,943,259 - - 82,943,259
Forward Currency Contracts - 262,461 - 262,461
Total financial assets at fair value through
profit or loss 82,943,259 262,461 - 83,205,720
Sanlam Global High Quality Fund
Level 1 Level 2 Level 3 Total
GBP GBP GBP GBP
Collective investment schemes 23,193,265 - - 23,193,265
Equity 323,199,911 - - 323,199,911
Forward Currency Contracts - 292 - 292
Total financial assets at fair value through
profit or loss 346,393,176 292 - 346,393,468
Sanlam US Dividend Fund
Level 1 Level 2 Level 3 Total
USD USD USD USD
Equity 387,826,543 - - 387,826,543
Forward Currency Contracts - 159,992 - 159,992
Total financial assets at fair value through
profit or loss 387,826,543 159,992 - 387,986,535

SANLAM UNIVERSAL FUNDS PLC
435
NOTES TO AND FORMING PART OF THE UNAUDITED CONDENSED INTERIM FINANCIAL STATEMENTS (CONTINUED) for the six months ended 30 June 2019
5 Fair value of financial instruments (continued)
Assets measured at fair value at 30 June 2019 (continued)
High Street Global Balanced Fund
Level 1 Level 2 Level 3 Total
USD USD USD USD
Bonds 498,086 2,833,328 - 3,331,414
Exchange Traded Funds 469,811 - - 469,811
Equity 17,244,465 - - 17,244,465
Options 311,685 - - 311,685
Total financial assets at fair value through
profit or loss 18,524,047 2,833,328 - 21,357,375
Sanlam Global Value Fund
Level 1 Level 2 Level 3 Total
USD USD USD USD
Equity 122,662,521 - - 122,662,521
Warrants - 2,230 - 2,230
Total financial assets at fair value through
profit or loss 122,662,521 2,230 - 122,664,751
Sanlam Stable Global Fund
Level 1 Level 2 Level 3 Total
USD USD USD USD
Equity 73,309,126 - - 73,309,126
Total financial assets at fair value through
profit or loss 73,309,126 - - 73,309,126
Sanlam Active UK Fund
Level 1 Level 2 Level 3 Total
GBP GBP GBP GBP
Equity 44,498,719 - 6,288 44,505,007
Total financial assets at fair value through
profit or loss 44,498,719 - 6,288 44,505,007
Sanlam Multi-Strategy Fund
Level 1 Level 2 Level 3 Total
GBP GBP GBP GBP
Bonds - 149,091,785 - 149,091,785
Equity 60,542,987 - - 60,542,987
Options 653,925 - - 653,925
Futures 520,839 - - 520,839
Forward currency contracts - 56 - 56
Total financial assets at fair value through
profit or loss 61,717,751 149,091,841 - 210,809,592
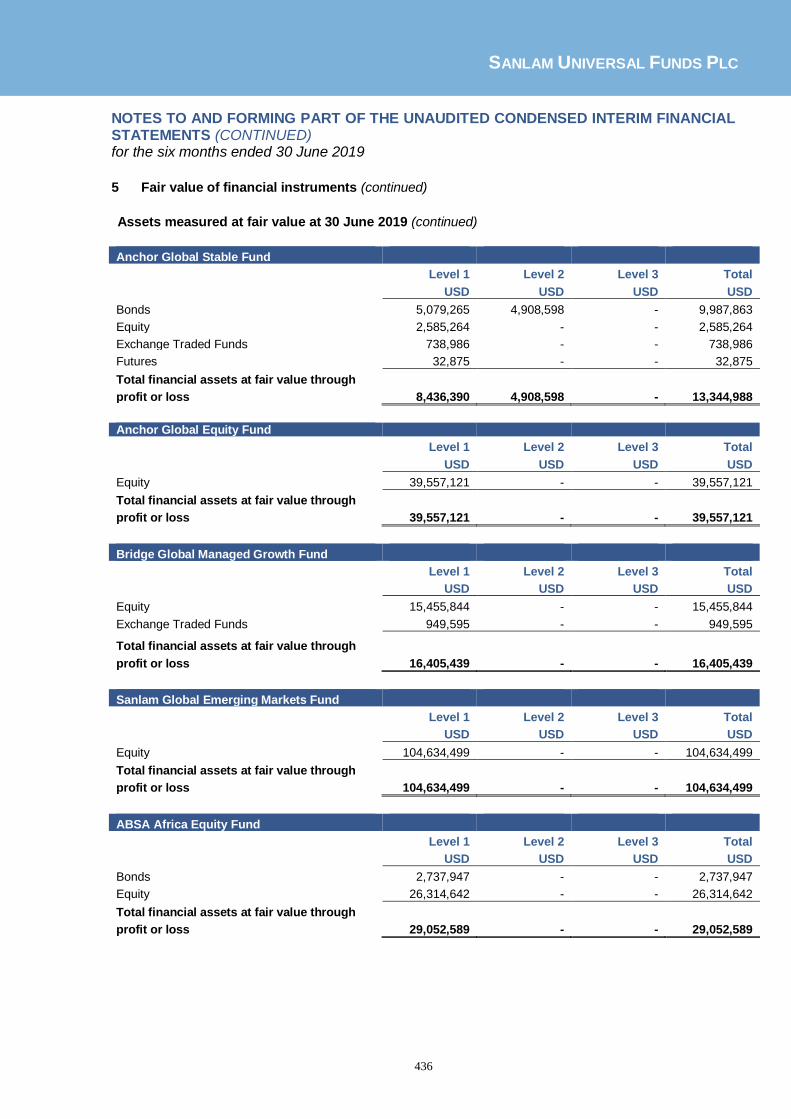
SANLAM UNIVERSAL FUNDS PLC
436
NOTES TO AND FORMING PART OF THE UNAUDITED CONDENSED INTERIM FINANCIAL STATEMENTS (CONTINUED) for the six months ended 30 June 2019
5 Fair value of financial instruments (continued)
Assets measured at fair value at 30 June 2019 (continued)
Anchor Global Stable Fund
Level 1 Level 2 Level 3 Total
USD USD USD USD
Bonds 5,079,265 4,908,598 - 9,987,863
Equity 2,585,264 - - 2,585,264
Exchange Traded Funds 738,986 - - 738,986
Futures 32,875 - - 32,875
Total financial assets at fair value through
profit or loss 8,436,390 4,908,598 - 13,344,988
Anchor Global Equity Fund
Level 1 Level 2 Level 3 Total
USD USD USD USD
Equity 39,557,121 - - 39,557,121
Total financial assets at fair value through
profit or loss 39,557,121 - - 39,557,121
Bridge Global Managed Growth Fund
Level 1 Level 2 Level 3 Total
USD USD USD USD
Equity 15,455,844 - - 15,455,844
Exchange Traded Funds 949,595 - - 949,595
Total financial assets at fair value through
profit or loss 16,405,439 - - 16,405,439
Sanlam Global Emerging Markets Fund
Level 1 Level 2 Level 3 Total
USD USD USD USD
Equity 104,634,499 - - 104,634,499
Total financial assets at fair value through
profit or loss 104,634,499 - - 104,634,499
ABSA Africa Equity Fund
Level 1 Level 2 Level 3 Total
USD USD USD USD
Bonds 2,737,947 - - 2,737,947
Equity 26,314,642 - - 26,314,642
Total financial assets at fair value through
profit or loss 29,052,589 - - 29,052,589

SANLAM UNIVERSAL FUNDS PLC
437
NOTES TO AND FORMING PART OF THE UNAUDITED CONDENSED INTERIM FINANCIAL STATEMENTS (CONTINUED) for the six months ended 30 June 2019
5 Fair value of financial instruments (continued)
Assets measured at fair value at 30 June 2019 (continued)
Sanlam Centre American Select Equity Fund
Level 1 Level 2 Level 3 Total
USD USD USD USD
Equity 295,405,059 - - 295,405,059
Options 814,350 - - 814,350
Forward contracts - 1 - 1
Total financial assets at fair value through
profit or loss 296,219,409 1 - 296,219,410
Sanlam Global Convertible Securities Fund
Level 1 Level 2 Level 3 Total
USD USD USD USD
Bonds - 40,933,125 - 40,933,125
Equity 2,543,369 - - 2,543,369
Total financial assets at fair value through
profit or loss 2,543,369 40,933,125 - 43,476,494
Sanlam Centre Active U.S Treasury Fund
Level 1 Level 2 Level 3 Total
USD USD USD USD
Bonds 4,911,796 - - 4,911,796
Total financial assets at fair value through
profit or loss 4,911,796 - - 4,911,796
Autus Global Equity Fund
Level 1 Level 2 Level 3 Total
USD USD USD USD
Equity 12,028,913 - - 12,028,913
Total financial assets at fair value through
profit or loss 12,028,913 - - 12,028,913
Wisian Capital South African Equity Fund
Level 1 Level 2 Level 3 Total
USD USD USD USD
Equity 5,881,758 - - 5,881,758
Forward Currency Contracts - 342,127 - 342,127
Total financial assets at fair value through
profit or loss 5,881,758 342,127 - 6,223,885
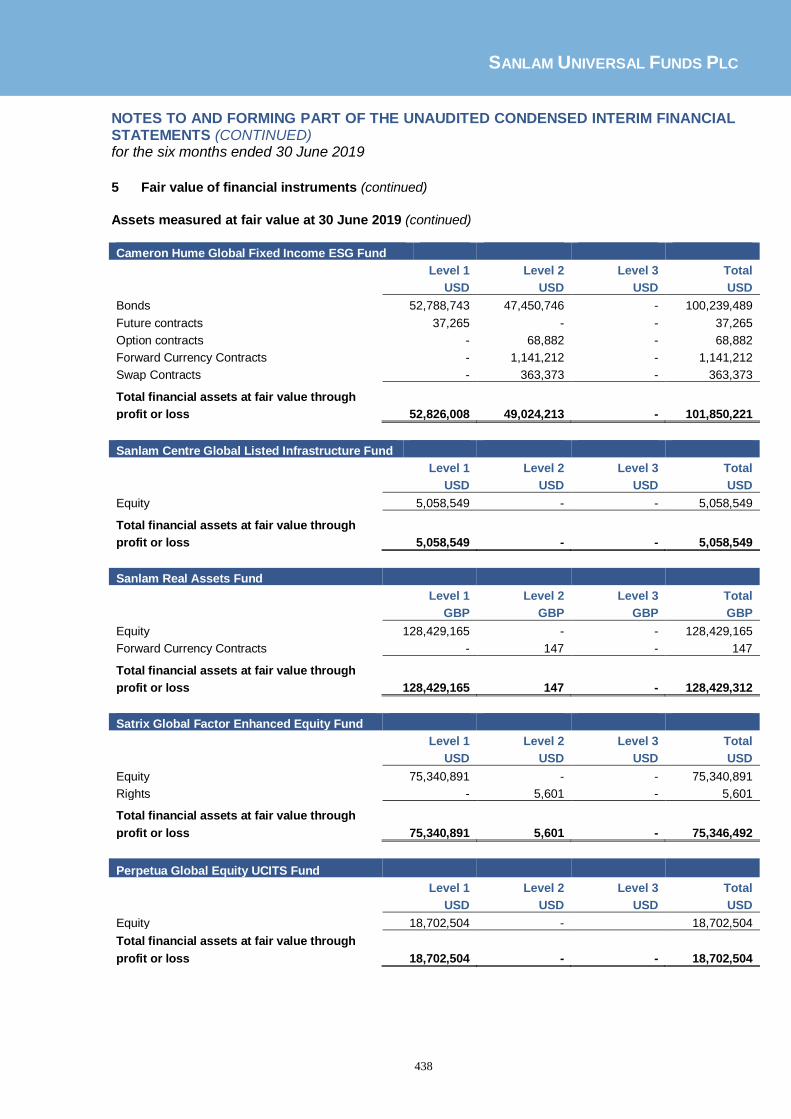
SANLAM UNIVERSAL FUNDS PLC
438
NOTES TO AND FORMING PART OF THE UNAUDITED CONDENSED INTERIM FINANCIAL STATEMENTS (CONTINUED) for the six months ended 30 June 2019
5 Fair value of financial instruments (continued)
Assets measured at fair value at 30 June 2019 (continued)
Cameron Hume Global Fixed Income ESG Fund
Level 1 Level 2 Level 3 Total
USD USD USD USD
Bonds 52,788,743 47,450,746 - 100,239,489
Future contracts 37,265 - - 37,265
Option contracts - 68,882 - 68,882
Forward Currency Contracts - 1,141,212 - 1,141,212
Swap Contracts - 363,373 - 363,373
Total financial assets at fair value through
profit or loss 52,826,008 49,024,213 - 101,850,221
Sanlam Centre Global Listed Infrastructure Fund
Level 1 Level 2 Level 3 Total
USD USD USD USD
Equity 5,058,549 - - 5,058,549
Total financial assets at fair value through
profit or loss 5,058,549 - - 5,058,549
Sanlam Real Assets Fund
Level 1 Level 2 Level 3 Total
GBP GBP GBP GBP
Equity 128,429,165 - - 128,429,165
Forward Currency Contracts - 147 - 147
Total financial assets at fair value through
profit or loss 128,429,165 147 - 128,429,312
Satrix Global Factor Enhanced Equity Fund
Level 1 Level 2 Level 3 Total
USD USD USD USD
Equity 75,340,891 - - 75,340,891
Rights - 5,601 - 5,601
Total financial assets at fair value through
profit or loss 75,340,891 5,601 - 75,346,492
Perpetua Global Equity UCITS Fund
Level 1 Level 2 Level 3 Total
USD USD USD USD
Equity 18,702,504 - 18,702,504
Total financial assets at fair value through
profit or loss 18,702,504 - - 18,702,504
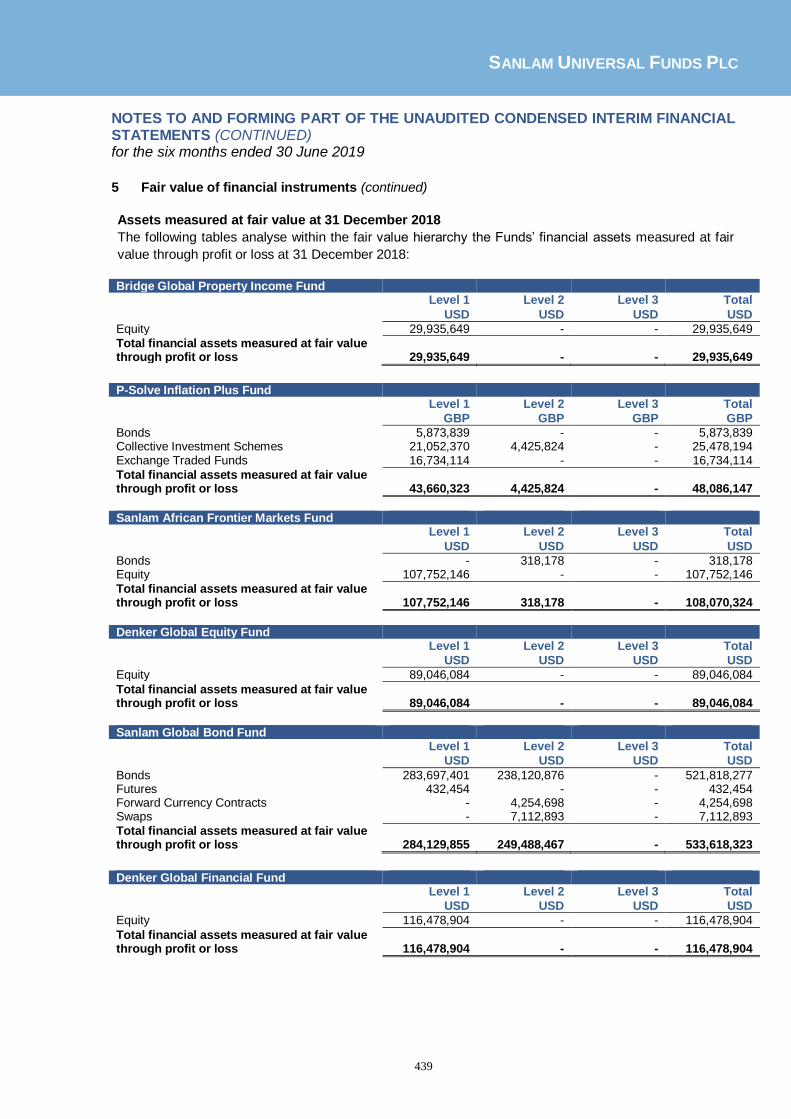
SANLAM UNIVERSAL FUNDS PLC
439
NOTES TO AND FORMING PART OF THE UNAUDITED CONDENSED INTERIM FINANCIAL STATEMENTS (CONTINUED) for the six months ended 30 June 2019
5 Fair value of financial instruments (continued)
Assets measured at fair value at 31 December 2018
The following tables analyse within the fair value hierarchy the Funds’ financial assets measured at fair
value through profit or loss at 31 December 2018:
Bridge Global Property Income Fund
Level 1 Level 2 Level 3 Total
USD USD USD USD
Equity 29,935,649 - - 29,935,649
Total financial assets measured at fair value through profit or loss 29,935,649 - - 29,935,649
P-Solve Inflation Plus Fund
Level 1 Level 2 Level 3 Total
GBP GBP GBP GBP
Bonds 5,873,839 - - 5,873,839 Collective Investment Schemes 21,052,370 4,425,824 - 25,478,194 Exchange Traded Funds 16,734,114 - - 16,734,114
Total financial assets measured at fair value through profit or loss 43,660,323 4,425,824 - 48,086,147
Sanlam African Frontier Markets Fund
Level 1 Level 2 Level 3 Total
USD USD USD USD
Bonds - 318,178 - 318,178 Equity 107,752,146 - - 107,752,146
Total financial assets measured at fair value through profit or loss 107,752,146 318,178 - 108,070,324
Denker Global Equity Fund
Level 1 Level 2 Level 3 Total
USD USD USD USD
Equity 89,046,084 - - 89,046,084
Total financial assets measured at fair value through profit or loss 89,046,084 - - 89,046,084
Sanlam Global Bond Fund
Level 1 Level 2 Level 3 Total
USD USD USD USD
Bonds 283,697,401 238,120,876 - 521,818,277 Futures 432,454 - - 432,454 Forward Currency Contracts - 4,254,698 - 4,254,698 Swaps - 7,112,893 - 7,112,893
Total financial assets measured at fair value through profit or loss 284,129,855 249,488,467 - 533,618,323
Denker Global Financial Fund
Level 1 Level 2 Level 3 Total
USD USD USD USD
Equity 116,478,904 - - 116,478,904
Total financial assets measured at fair value through profit or loss 116,478,904 - - 116,478,904
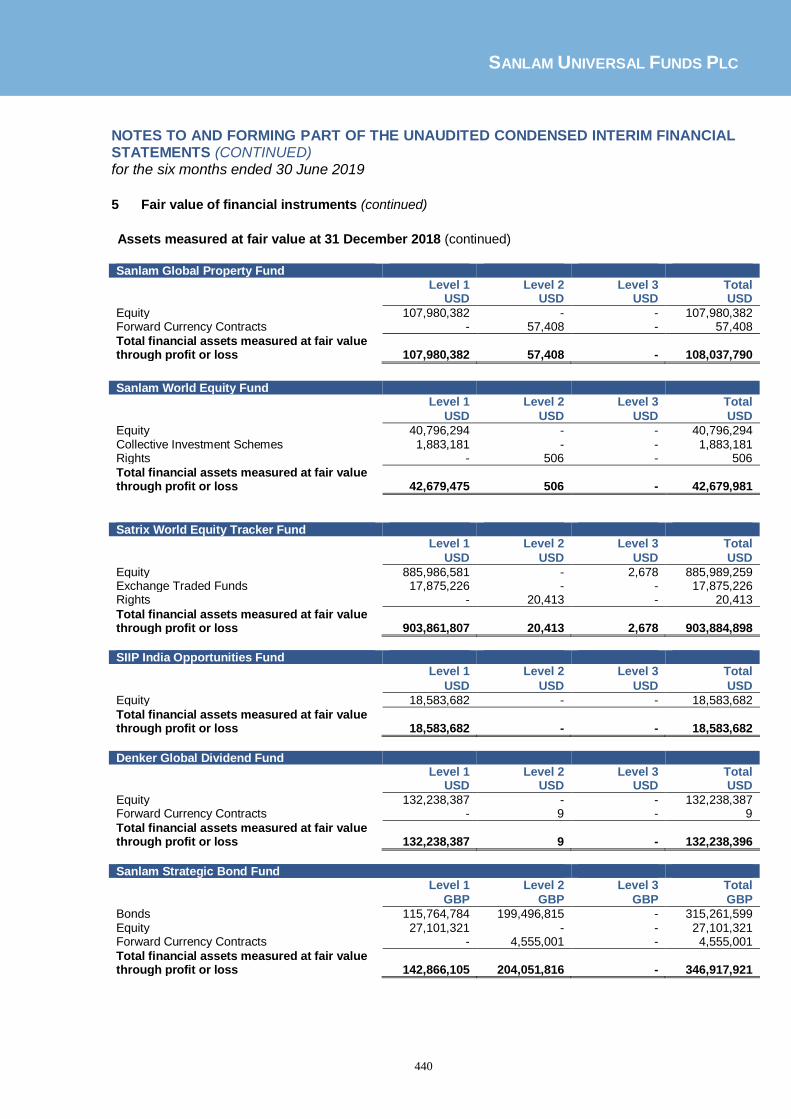
SANLAM UNIVERSAL FUNDS PLC
440
NOTES TO AND FORMING PART OF THE UNAUDITED CONDENSED INTERIM FINANCIAL STATEMENTS (CONTINUED) for the six months ended 30 June 2019
5 Fair value of financial instruments (continued)
Assets measured at fair value at 31 December 2018 (continued)
Sanlam Global Property Fund Level 1 Level 2 Level 3 Total USD USD USD USD
Equity 107,980,382 - - 107,980,382 Forward Currency Contracts - 57,408 - 57,408
Total financial assets measured at fair value through profit or loss 107,980,382 57,408 - 108,037,790
Sanlam World Equity Fund
Level 1 Level 2 Level 3 Total
USD USD USD USD
Equity 40,796,294 - - 40,796,294 Collective Investment Schemes 1,883,181 - - 1,883,181 Rights - 506 - 506
Total financial assets measured at fair value through profit or loss 42,679,475 506 - 42,679,981
Satrix World Equity Tracker Fund
Level 1 Level 2 Level 3 Total
USD USD USD USD
Equity 885,986,581 - 2,678 885,989,259 Exchange Traded Funds 17,875,226 - - 17,875,226 Rights - 20,413 - 20,413
Total financial assets measured at fair value through profit or loss 903,861,807 20,413 2,678 903,884,898
SIIP India Opportunities Fund
Level 1 Level 2 Level 3 Total
USD USD USD USD
Equity 18,583,682 - - 18,583,682
Total financial assets measured at fair value through profit or loss 18,583,682 - - 18,583,682
Denker Global Dividend Fund Level 1 Level 2 Level 3 Total USD USD USD USD
Equity 132,238,387 - - 132,238,387 Forward Currency Contracts - 9 - 9
Total financial assets measured at fair value through profit or loss 132,238,387 9 - 132,238,396
Sanlam Strategic Bond Fund
Level 1 Level 2 Level 3 Total
GBP GBP GBP GBP
Bonds 115,764,784 199,496,815 - 315,261,599 Equity 27,101,321 - - 27,101,321 Forward Currency Contracts - 4,555,001 - 4,555,001
Total financial assets measured at fair value through profit or loss 142,866,105 204,051,816 - 346,917,921

SANLAM UNIVERSAL FUNDS PLC
441
NOTES TO AND FORMING PART OF THE UNAUDITED CONDENSED INTERIM FINANCIAL STATEMENTS (CONTINUED) for the six months ended 30 June 2019
5 Fair value of financial instruments (continued)
Assets measured at fair value at 31 December 2018 (continued) Sanlam Accel Income Fund
Level 1 Level 2 Level 3 Total
GBP GBP GBP GBP
Collective Investment Schemes 28,172,114 - - 28,172,114
Total financial assets measured at fair value through profit or loss 28,172,114 - - 28,172,114
Satrix North America Equity Tracker Fund
Level 1 Level 2 Level 3 Total
USD USD USD USD
Equity 91,208,456 - - 91,208,456
Total financial assets measured at fair value through profit or loss 91,208,456 - - 91,208,456
Satrix UK Equity Tracker Fund Level 1 Level 2 Level 3 Total GBP GBP GBP GBP
Equity 37,003,333 - 2,142 37,005,475
Total financial assets measured at fair value through profit or loss 37,003,333 - 2,142 37,005,475
Satrix Europe (ex-UK) Equity Tracker Fund Level 1 Level 2 Level 3 Total EUR EUR EUR EUR
Equity 184,774,584 - - 184,774,584 Rights - 20,184 - 20,184 Forward Currency Contracts - 146 - 146
Total financial assets measured at fair value through profit or loss 184,774,584 20,330 - 184,794,914
Sanlam Equity Allocation Fund Level 1 Level 2 Level 3 Total USD USD USD USD
Equity 26 - 426 452
Total financial assets measured at fair value through profit or loss 26 - 426 452
Satrix Emerging Markets Equity Tracker Fund Level 1 Level 2 Level 3 Total USD USD USD USD
Equity 39,868,407 - - 39,868,407 Options 118 - - 118 Forward Currency Contracts - 44 - 44 Exchange Traded Funds 1,532,959 - - 1,532,959
Total financial assets measured at fair value through profit or loss 41,401,484 44 - 41,401,528
Sanlam Managed Risk Fund Level 1 Level 2 Level 3 Total USD USD USD USD
Collective Investment Schemes 69,696,549 - - 69,696,549 Futures 341,875 - - 341,875 Forward Currency Contracts - 323,156 - 323,156
Total financial assets measured at fair value through profit or loss 70,038,424 323,156 - 70,361,580
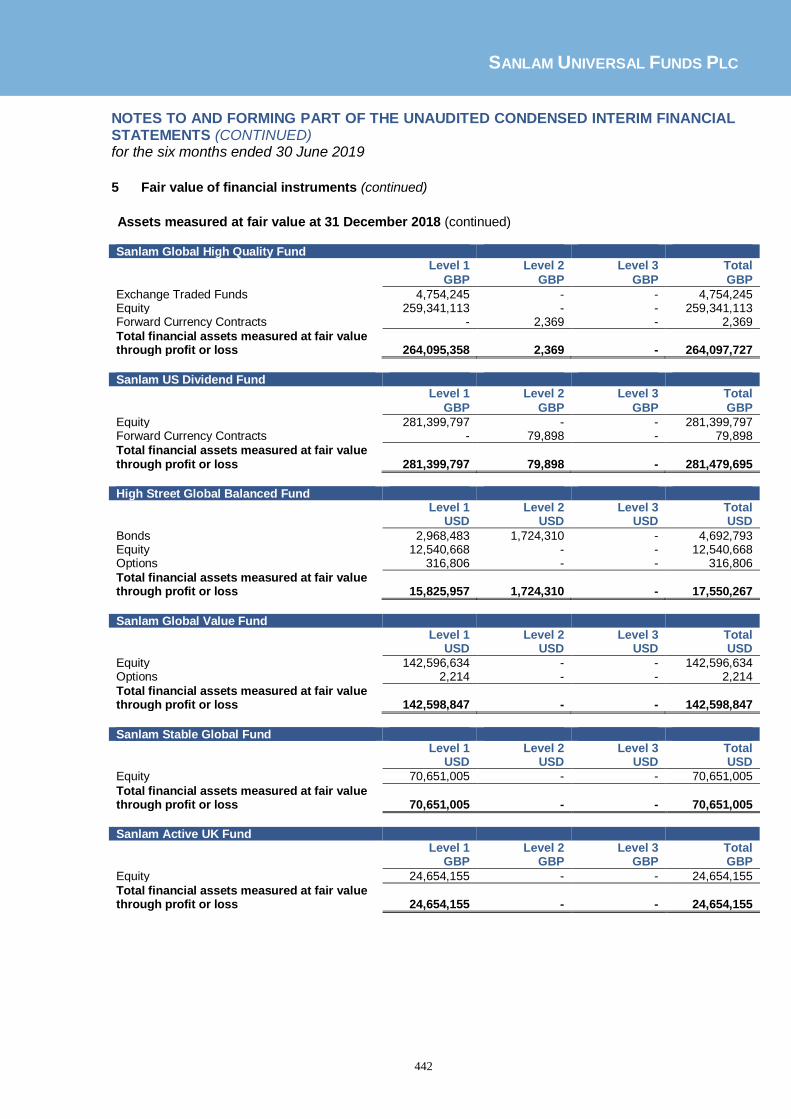
SANLAM UNIVERSAL FUNDS PLC
442
NOTES TO AND FORMING PART OF THE UNAUDITED CONDENSED INTERIM FINANCIAL STATEMENTS (CONTINUED) for the six months ended 30 June 2019
5 Fair value of financial instruments (continued)
Assets measured at fair value at 31 December 2018 (continued) Sanlam Global High Quality Fund
Level 1 Level 2 Level 3 Total
GBP GBP GBP GBP
Exchange Traded Funds 4,754,245 - - 4,754,245 Equity 259,341,113 - - 259,341,113 Forward Currency Contracts - 2,369 - 2,369
Total financial assets measured at fair value through profit or loss 264,095,358 2,369 - 264,097,727
Sanlam US Dividend Fund
Level 1 Level 2 Level 3 Total
GBP GBP GBP GBP
Equity 281,399,797 - - 281,399,797 Forward Currency Contracts - 79,898 - 79,898
Total financial assets measured at fair value through profit or loss 281,399,797 79,898 - 281,479,695
High Street Global Balanced Fund Level 1 Level 2 Level 3 Total USD USD USD USD
Bonds 2,968,483 1,724,310 - 4,692,793 Equity 12,540,668 - - 12,540,668 Options 316,806 - - 316,806
Total financial assets measured at fair value through profit or loss 15,825,957 1,724,310 - 17,550,267
Sanlam Global Value Fund
Level 1 Level 2 Level 3 Total
USD USD USD USD
Equity 142,596,634 - - 142,596,634 Options 2,214 - - 2,214
Total financial assets measured at fair value through profit or loss 142,598,847 - - 142,598,847
Sanlam Stable Global Fund Level 1 Level 2 Level 3 Total USD USD USD USD
Equity 70,651,005 - - 70,651,005
Total financial assets measured at fair value through profit or loss 70,651,005 - - 70,651,005
Sanlam Active UK Fund
Level 1 Level 2 Level 3 Total
GBP GBP GBP GBP
Equity 24,654,155 - - 24,654,155
Total financial assets measured at fair value through profit or loss 24,654,155 - - 24,654,155

SANLAM UNIVERSAL FUNDS PLC
443
NOTES TO AND FORMING PART OF THE UNAUDITED CONDENSED INTERIM FINANCIAL STATEMENTS (CONTINUED) for the six months ended 30 June 2019
5 Fair value of financial instruments (continued)
Assets measured at fair value at 31 December 2018 (continued)
Sanlam Multi-Strategy Fund
Level 1 Level 2 Level 3 Total
GBP GBP GBP GBP
Bonds - 108,373,533 - 108,373,533 Equity 43,595,934 - - 43,595,934 Forward Currency Contracts - 17,495 - 17,495 Futures 102,499 - - 102,499 Options 2,005,846 - - 2,005,846
Total financial assets measured at fair value through profit or loss 45,704,279 108,391,028 - 154,095,307
Anchor Global Stable Fund Level 1 Level 2 Level 3 Total USD USD USD USD
Bonds 4,946,757 4,031,948 - 8,978,705 Equity 2,628,216 - - 2,628,216 Exchange Traded Funds 964,624 - - 964,624 Futures 1,550 - - 1,550
Total financial assets measured at fair value through profit or loss 8,541,147 4,031,948 - 12,573,095
Bridge Global Equity Income Growth Fund
Level 1 Level 2 Level 3 Total
USD USD USD USD
Equity 3,746,738 - - 3,746,738
Total financial assets measured at fair value through profit or loss 3,746,738 - - 3,746,738
Anchor Global Equity Fund
Level 1 Level 2 Level 3 Total
USD USD USD USD
Equity 32,464,196 - - 32,464,196
Total financial assets measured at fair value through profit or loss 32,464,196 - - 32,464,196
Bridge Global Managed Growth Fund
Level 1 Level 2 Level 3 Total
USD USD USD USD
Equity 9,079,587 - - 9,079,587 Exchange Traded Funds 880,476 - - 880,476
Total financial assets measured at fair value through profit or loss 9,960,063 - - 9,960,063
Sanlam Global Emerging Markets Fund
Level 1 Level 2 Level 3 Total
USD USD USD USD
Equity 104,940,142 - - 104,940,142
Total financial assets measured at fair value through profit or loss 104,940,142 - - 104,940,142

SANLAM UNIVERSAL FUNDS PLC
444
NOTES TO AND FORMING PART OF THE UNAUDITED CONDENSED INTERIM FINANCIAL STATEMENTS (CONTINUED) for the six months ended 30 June 2019
5 Fair value of financial instruments (continued)
Assets measured at fair value at 31 December 2018 (continued)
ABSA Africa Equity Fund
Level 1 Level 2 Level 3 Total
USD USD USD USD
Bonds 4,616,009 - - 4,616,009 Equity 27,785,786 - - 27,785,786
Total financial assets measured at fair value through profit or loss 32,401,795 - - 32,401,795
Sanlam Centre American Select Equity Fund
Level 1 Level 2 Level 3 Total
USD USD USD USD
Equity 133,617,363 - - 133,617,363 Options 3,032,100 - - 3,032,100
Total financial assets measured at fair value through profit or loss 136,649,463 - - 136,649,463
Sanlam Japan Equity Fund
Level 1 Level 2 Level 3 Total
USD USD USD USD
Equity 46,976,211 - - 46,976,211
Total financial assets measured at fair value through profit or loss 46,976,211 - - 46,976,211
Sanlam Global Convertible Securities Fund
Level 1 Level 2 Level 3 Total
USD USD USD USD
Bonds - 36,219,748 - 36,219,748 Equity 3,204,142 - - 3,204,142 Forward Currency Contracts - 4,453 - 4,453
Total financial assets measured at fair value through profit or loss 3,204,142 36,224,201 - 39,428,343
Sanlam Centre Active US Treasury Fund
Level 1 Level 2 Level 3 Total
USD USD USD USD
Bonds 4,969,332 - - 4,969,332
Total financial assets measured at fair value through profit or loss 4,969,332 - - 4,969,332
Autus Global Equity Fund
Level 1 Level 2 Level 3 Total
USD USD USD USD
Equity 11,598,919 - - 11,598,919
Total financial assets measured at fair value through profit or loss 11,598,919 - - 11,598,919

SANLAM UNIVERSAL FUNDS PLC
445
NOTES TO AND FORMING PART OF THE UNAUDITED CONDENSED INTERIM FINANCIAL STATEMENTS (CONTINUED) for the six months ended 30 June 2019
5 Fair value of financial instruments (continued)
Assets measured at fair value at 31 December 2018 (continued)
Wisian Capital South African Equity Fund
Level 1 Level 2 Level 3 Total
USD USD USD USD
Exchange Traded Funds - 3,808 - 3,808 Equity 5,531,556 - - 5,531,556
Total financial assets measured at fair value through profit or loss 5,531,556 3,808 - 5,535,364
Cameron Hume Global Fixed Income ESG Fund
Level 1 Level 2 Level 3 Total
USD USD USD USD
Bonds 55,687693 39,236,335 - 94,924,028 Forward Currency Contracts - 1,818,811 - 1,818,811 Options 324,961 - - 324,961 Futures 240,645 - - 240,645 Swaps - 2,093,185 - 2,093,185
Total financial assets measured at fair value through profit or loss 56,253,299 43,148,331 - 99,401,630
Sanlam Centre Global Listed Infrastructure Fund
Level 1 Level 2 Level 3 Total
USD USD USD USD
Equity 4,375,569 - - 4,375,569
Total financial assets measured at fair value through profit or loss 4,375,569 - - 4,375,569
Sanlam Real Assets Fund
Level 1 Level 2 Level 3 Total
GBP GBP GBP GBP
Exchange Traded Funds 31,368,290 - - 31,368,290 Equity 37,656,167 - - 37,656,167 Forward Currency Contracts - 137,094 - 137,094
Total financial assets measured at fair value through profit or loss 69,024,457 137,094 - 69,161,551
Satrix Global Factor Enhanced Equity Fund
Level 1 Level 2 Level 3 Total
USD USD USD USD
Equity 48,464,488 - - 48,464,488 Forward Currency Contracts - 635 - 635
Total financial assets measured at fair value through profit or loss 48,464,488 635 - 48,465,123
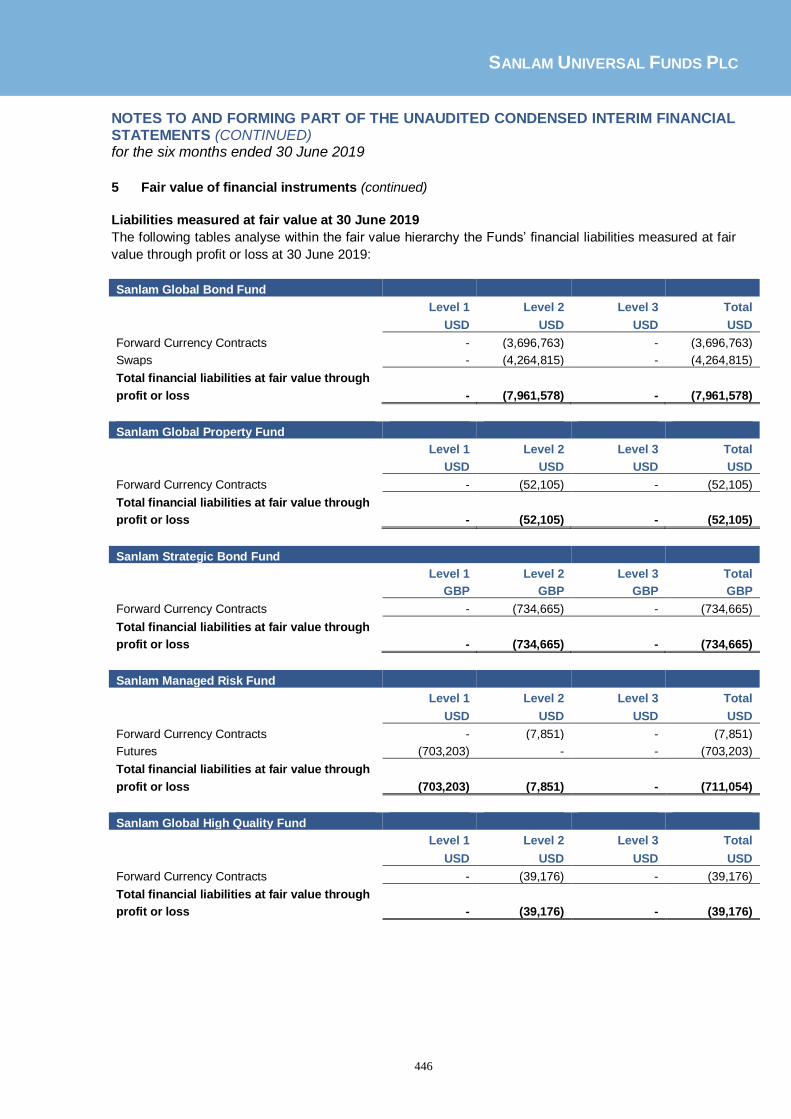
SANLAM UNIVERSAL FUNDS PLC
446
NOTES TO AND FORMING PART OF THE UNAUDITED CONDENSED INTERIM FINANCIAL STATEMENTS (CONTINUED) for the six months ended 30 June 2019
5 Fair value of financial instruments (continued)
Liabilities measured at fair value at 30 June 2019
The following tables analyse within the fair value hierarchy the Funds’ financial liabilities measured at fair
value through profit or loss at 30 June 2019:
Sanlam Global Bond Fund
Level 1 Level 2 Level 3 Total
USD USD USD USD
Forward Currency Contracts - (3,696,763) - (3,696,763)
Swaps - (4,264,815) - (4,264,815)
Total financial liabilities at fair value through
profit or loss - (7,961,578) - (7,961,578)
Sanlam Global Property Fund
Level 1 Level 2 Level 3 Total
USD USD USD USD
Forward Currency Contracts - (52,105) - (52,105)
Total financial liabilities at fair value through
profit or loss - (52,105) - (52,105)
Sanlam Strategic Bond Fund
Level 1 Level 2 Level 3 Total
GBP GBP GBP GBP
Forward Currency Contracts - (734,665) - (734,665)
Total financial liabilities at fair value through
profit or loss - (734,665) - (734,665)
Sanlam Managed Risk Fund
Level 1 Level 2 Level 3 Total
USD USD USD USD
Forward Currency Contracts - (7,851) - (7,851)
Futures (703,203) - - (703,203)
Total financial liabilities at fair value through
profit or loss (703,203) (7,851) - (711,054)
Sanlam Global High Quality Fund
Level 1 Level 2 Level 3 Total
USD USD USD USD
Forward Currency Contracts - (39,176) - (39,176)
Total financial liabilities at fair value through
profit or loss - (39,176) - (39,176)

SANLAM UNIVERSAL FUNDS PLC
447
NOTES TO AND FORMING PART OF THE UNAUDITED CONDENSED INTERIM FINANCIAL STATEMENTS (CONTINUED) for the six months ended 30 June 2019
5 Fair value of financial instruments (continued)
Liabilities measured at fair value at 30 June 2019 (continued)
Sanlam US Dividend Fund
Level 1 Level 2 Level 3 Total
USD USD USD USD
Forward Currency Contracts - (4,426) - (4,426)
Total financial liabilities at fair value through
profit or loss - (4,426) - (4,426)
High Street Global Balanced Fund
Level 1 Level 2 Level 3 Total
USD USD USD USD
Options (34,233) - - (34,233)
Total financial liabilities at fair value through
profit or loss (34,233) - - (34,233)
Sanlam Multi-Strategy Fund
Level 1 Level 2 Level 3 Total
GBP GBP GBP GBP
Forward Currency Contracts - (147,566) - (147,566)
Futures (16,122) - - (16,122)
Options (100,673) - - (100,673)
Total financial liabilities at fair value through
profit or loss (116,795) (147,566) - (264,361)
Anchor Global Stable Fund
Level 1 Level 2 Level 3 Total
USD USD USD USD
Futures (2,200) - - (2,200)
Total financial liabilities at fair value through
profit or loss (2,200) - - (2,200)
Sanlam Global Convertible Securities Fund
Level 1 Level 2 Level 3 Total
USD USD USD USD
Forward Currency Contracts - (92,163) - (92,163)
Total financial liabilities at fair value through
profit or loss - (92,163) - (92,163)
Sanlam Centre Active US Treasury Fund
Level 1 Level 2 Level 3 Total
USD USD USD USD
Futures - (32,864) - (32,864)
Total financial liabilities at fair value through
profit or loss - (32,864) - (32,864)
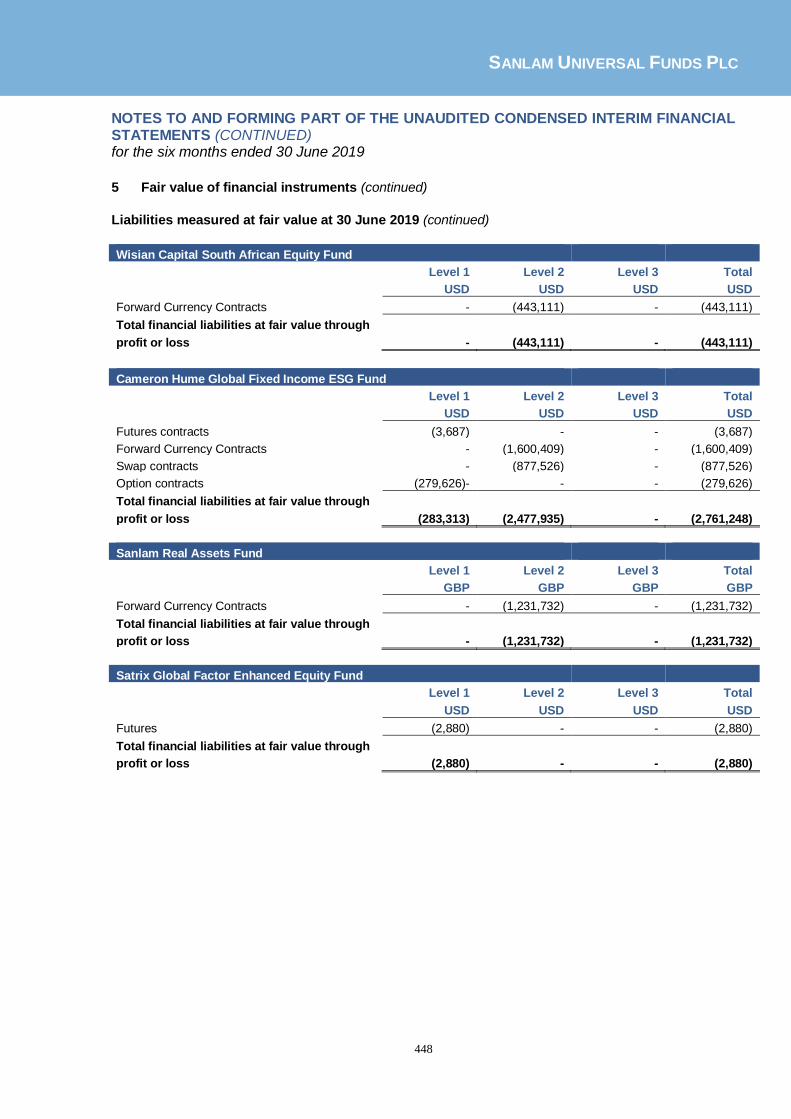
SANLAM UNIVERSAL FUNDS PLC
448
NOTES TO AND FORMING PART OF THE UNAUDITED CONDENSED INTERIM FINANCIAL STATEMENTS (CONTINUED) for the six months ended 30 June 2019
5 Fair value of financial instruments (continued)
Liabilities measured at fair value at 30 June 2019 (continued)
Wisian Capital South African Equity Fund
Level 1 Level 2 Level 3 Total
USD USD USD USD
Forward Currency Contracts - (443,111) - (443,111)
Total financial liabilities at fair value through
profit or loss - (443,111) - (443,111)
Cameron Hume Global Fixed Income ESG Fund
Level 1 Level 2 Level 3 Total
USD USD USD USD
Futures contracts (3,687) - - (3,687)
Forward Currency Contracts - (1,600,409) - (1,600,409)
Swap contracts - (877,526) - (877,526)
Option contracts (279,626)- - - (279,626)
Total financial liabilities at fair value through
profit or loss (283,313) (2,477,935) - (2,761,248)
Sanlam Real Assets Fund
Level 1 Level 2 Level 3 Total
GBP GBP GBP GBP
Forward Currency Contracts - (1,231,732) - (1,231,732)
Total financial liabilities at fair value through
profit or loss - (1,231,732) - (1,231,732)
Satrix Global Factor Enhanced Equity Fund
Level 1 Level 2 Level 3 Total
USD USD USD USD
Futures (2,880) - - (2,880)
Total financial liabilities at fair value through
profit or loss (2,880) - - (2,880)

SANLAM UNIVERSAL FUNDS PLC
449
NOTES TO AND FORMING PART OF THE UNAUDITED CONDENSED INTERIM FINANCIAL STATEMENTS (CONTINUED) for the six months ended 30 June 2019
5 Fair value of financial instruments (continued)
Liabilities measured at fair value at 31 December 2018
The following tables analyse within the fair value hierarchy the Funds’ financial liabilities measured at fair
value through profit or loss at 31 December 2018:
Sanlam Global Bond Fund
Level 1 Level 2 Level 3 Total
USD USD USD USD
Forward Currency Contracts - (2,814,293) - (2,814,293) Futures (302,571) - - (302,571) Swaps - (9,964,806) - (9,964,806)
Total financial liabilities measured at fair value through profit or loss (302,571) (12,779,099) - (13,081,671)
Sanlam Global Property Fund Level 1 Level 2 Level 3 Total USD USD USD USD
Forward Currency Contracts - (90,165) - (90,165)
Total financial liabilities measured at fair value through profit or loss - (90,165) - (90,165)
Satrix World Equity Tracker Fund Level 1 Level 2 Level 3 Total USD USD USD USD
Forward Currency Contracts - (13) - (13)
Total financial liabilities measured at fair value through profit or loss - (13) - (13)
Sanlam Strategic Bond Fund Level 1 Level 2 Level 3 Total GBP GBP GBP GBP
Forward Currency Contracts - (4,479,204) - (4,479,204)
Total financial liabilities measured at fair value through profit or loss - (4,479,204) - (4,479,204)
Satrix UK Equity Tracker Fund Level 1 Level 2 Level 3 Total GBP GBP GBP GBP
Forward Currency Contracts - (2,452) - (2,452)
Total financial liabilities measured at fair value through profit or loss - (2,452) - (2,452)
Satrix Emerging Markets Equity Tracker Fund Level 1 Level 2 Level 3 Total GBP GBP GBP GBP
Forward Currency Contracts - (2) - (2)
Total financial liabilities measured at fair value through profit or loss - (2) - (2)
Sanlam Managed Risk Fund
Level 1 Level 2 Level 3 Total
USD USD USD USD
Forward Currency Contracts - (21,993) - (21,993)
Total financial liabilities measured at fair value through profit or loss - (21,993) - (21,993)

SANLAM UNIVERSAL FUNDS PLC
450
NOTES TO AND FORMING PART OF THE UNAUDITED CONDENSED INTERIM FINANCIAL STATEMENTS (CONTINUED) for the six months ended 30 June 2019
5 Fair value of financial instruments (continued)
Liabilities measured measured at fair value at 31 December 2018 (continued) High Street Global Balanced Fund Level 1 Level 2 Level 3 Total USD USD USD USD
Options (137,770) - - (137,770)
Total financial liabilities measured at fair value through profit or loss (137,770) - - (137,770)
Sanlam Multi-Strategy Fund
Level 1 Level 2 Level 3 Total
GBP GBP GBP GBP
Forward Currency Contracts - (144,719) - (144,719) Futures (424,914) - - (424,914) Options (260,740) - - (260,740)
Total financial liabilities measured at fair value through profit or loss (685,654) (144,719) - (830,373)
Anchor Global Stable Fund
Level 1 Level 2 Level 3 Total
USD USD USD USD
Futures (56,025) - - (56,025)
Total financial liabilities measured at fair value through profit or loss (56,025) - - (56,025)
Sanlam Global Convertible Securities Fund Level 1 Level 2 Level 3 Total USD USD USD USD
Forward Currency Contracts - (69,231) - (69,231)
Total financial liabilities measured at fair value through profit or loss - (69,231) - (69,231)
Cameron Hume Global Fixed Income ESG Fund Level 1 Level 2 Level 3 Total USD USD USD USD
Options (539,249) - - (539,249) Futures (160,014) - - (160,014) Forward Currency Contracts - (1,096,602) - (1,096,602) Swaps - (4,178,885) - (4,178,885)
Total financial liabilities measured at fair value through profit or loss (699,263) (5,275,487) - (5,974,750)
Sanlam Real Assets Fund Level 1 Level 2 Level 3 Total USD USD USD USD
Forward Currency Contracts - (859,963) - (859,963)
Total financial liabilities measured at fair value through profit or loss - (859,963) - (859,963)

SANLAM UNIVERSAL FUNDS PLC
451
NOTES TO AND FORMING PART OF THE UNAUDITED CONDENSED INTERIM FINANCIAL STATEMENTS (CONTINUED) for the six months ended 30 June 2019
5 Fair value of financial instruments (continued)
Investments whose values are based on quoted market prices in active markets, and therefore classified
within level 1, include active listed equities, exchange traded funds, exchange traded derivatives,
government bonds, futures contracts, exchange traded option contracts and collective investment schemes.
The Fund does not adjust the quoted price for these instruments nor does it apply a discount to securities
where the volume traded in the market is low to the Fund’s holding.
Financial instruments that trade in markets that are not considered to be active but are valued based on
quoted market prices, dealer quotations or alternative pricing sources supported by observable inputs are
classified within level 2. Over-the-counter derivatives such as interest rate swaps and forward currency
contracts are classified within level 2. As level 2 investments include positions that are not traded in active
markets and/or are subject to transfer restrictions, valuations may be adjusted to reflect illiquidity and/or
non-transferability, which are generally based on available market information.
Investments classified within level 3 have significant unobservable inputs, as they trade infrequently. Level
3 instruments include illiquid equities.
Significant transfers between levels 1, 2 and 3
There were no significant transfers between levels during the period ended 30 June 2019.
The following tables show significant transfers between level 3 and level 2 of the fair value hierarchy for
financial assets recognised at fair value for the year ended 31 December 2018:
Sanlam World Equity Fund – 2018
Financial assets held for trading:
Transfer from level 3 to level 2
Warrants 504
Sanlam Global Value Fund – 2018
Financial assets held for trading:
Transfer from level
3 to level 2
Warrants 2,317
Sanlam World Equity Fund and Sanlam Global Value Fund held a position in Ezion Holdings Ltd. Trading of the company’s shares were suspended in August 2017. A decision was taken by the Valuation Committee to write down the value of this position by 30%. As a result, the position was transferred from level 1 to level 3 of the fair value hierarchy. The suspension was lifted in April 2018 and the shares resumed trading. The Funds disposed of their equity holding in Ezion Holdings Limited. However, the Funds continue to hold a related warrant on the stock. The warrants were transferred from level 3 to level 2 of the fair value hierarchy during the period ended 31 December 2018.

SANLAM UNIVERSAL FUNDS PLC
452
NOTES TO AND FORMING PART OF THE UNAUDITED CONDENSED INTERIM FINANCIAL STATEMENTS (CONTINUED) for the six months ended 30 June 2019
5 Fair value of financial instruments (continued)
Level 3 Assets measured at fair value reconciliation The following tables show a reconciliation of all movements in the fair value of financial instruments categorised within Level 3 between 1 January and 30 June 2018:
Denker Global Equity Fund
The level 3 position held by the Denker Global Equity Fund at 30 June 2019 and 31 December 2018 is the Accident Exchange Group Plc which is valued at USD Nil (2018: USD Nil) Accident Exchange Group Plc is a delisted security and classified as level 3 due to its trading status. There has been no movement in the value of the position in the period ended 30 June 2019 or the comparative period. For the purpose of IFRS 7 for the reconciliation showing the change in fair value due to a change in inputs used, changes to one or more of the inputs to reasonably alternative assumptions, is irrelevant as there does not exist a reasonable alternative inputs.
Denker Global Financial Fund
The level 3 position held by the Denker Global Financial Fund at 30 June 2019 and 31 December 2018 is the Accident Exchange Group Plc which is valued at USD Nil (2018: USD Nil). Accident Exchange Group Plc is a delisted security and classified as level 3 due to its trading status.
There has been no movement in the value of the positions during the period ended 30 June 2019 or the
comparative period.
For the purpose of IFRS 7 for the reconciliation showing the change in fair value due to a change in inputs used, changes to one or more of the inputs to reasonably alternative assumptions, is irrelevant as there does not exist a reasonable alternative inputs.
Sanlam World Equity Fund
Investment in securities
2019 2018
Balance as at 1 January - 383,984
Realised gains/(losses) (6) (1,338,556)
Change in unrealised - 1,377,601
Gross Purchases 944 -
Gross Sales (469) (422,525)
Transfers in and out of level 3 - (504)
Balance as at 30 June/ 31 December 469 -
Total unrealised gains and losses for the period/year included in profit or
loss for level 3 assets held at period/year end - -

SANLAM UNIVERSAL FUNDS PLC
453
NOTES TO AND FORMING PART OF THE UNAUDITED CONDENSED INTERIM FINANCIAL STATEMENTS (CONTINUED) for the six months ended 30 June 2019
5 Fair value of financial instruments (continued)
Level 3 Assets measured at fair value reconciliation (continued)
Sanlam World Equity Fund
At 30 June 2019 the Sanlam World Equity Fund holds a position in Rolls-Royce Holding which is valued at USD 469. The securities are thinly traded and are classified as level 3 due to their trading status. In 2018 the Fund also held a position in Ezion Holdings Ltd which was classified as Level 3 at the beginning of the year. Trading of the company’s shares were suspended in August 2017. A decision was taken by the Valuation Committee to write down the value of this position by 30%. As a result, the position was transferred from level 1 to level 3 of the fair value hierarchy. The suspension was lifted in April 2018 and the shares resumed trading. The Fund disposed of its equity holding in Ezion Holdings Limited. However, the Fund continued to hold a related warrant on the stock. The warrants were transferred from level 3 to level 2 of the fair value hierarchy during the year ended 31 December 2018. IFRS 7 requires a reconciliation showing the change in fair value due to a change in inputs used, where one or more of the inputs changes to reasonable alternative assumptions. As no reasonable alternative exists a reconciliation has not been provided.
Satrix World Equity Tracker Fund
Investment in securities
2019 2018
Balance as at 1 January 4,282 2,846
Realised gains/(losses) - 2,852
Change in unrealised (4,340) 1,436
Gross Purchases 4,636 -
Gross Sales - (2,852)
Transfers in and out of level 3 - -
Balance as at 30 June/31 December 4,578 4,282
Total unrealised gains and losses for the period/year included in profit or
loss for level 3 assets held at period/year end - -
The level 3 position held by the Satrix World Equity Tracker Fund at 30 June 2019 is Rolls-Royce Holding Pfd which is valued at USD 4,578 (2018: USD 4,282). This security is thinly traded and is classified as level 3 due to its trading status. IFRS 7 requires a reconciliation showing the change in fair value due to a change in inputs used, where one or more of the inputs changes to reasonable alternative assumptions. As no reasonable alternative exists a reconciliation has not been provided.

SANLAM UNIVERSAL FUNDS PLC
454
NOTES TO AND FORMING PART OF THE UNAUDITED CONDENSED INTERIM FINANCIAL STATEMENTS (CONTINUED) for the six months ended 30 June 2019
5 Fair value of financial instruments (continued) Level 3 Assets measured at fair value reconciliation (continued)
Satrix UK Equity Tracker Fund
Investment in securities
2019 2018
Balance as at 1 January 2,142 2,063
Realised gains/(losses) - 2,063
Change in unrealised (2,142) 79
Gross Purchases 1,473 -
Gross Sales (352) (2,063)
Transfers in and out of level 3 - -
Balance as at 30 June/31 December 1,121 2,142
Total unrealised gains and losses for the period/year included in profit or
loss for level 3 assets held at period/year end - -
The level 3 position held by the Satrix UK Equity Tracker Fund at 30 June 2019 is Rolls-Royce Holding which is valued at GBP 1,121 (2018: GBP 2,142). This security is thinly traded and is classified as level 3 due to its trading status. For the purpose of IFRS 7 for the reconciliation showing the change in fair value due to a change in inputs used, changes to one or more of the inputs to reasonably alternative assumptions, is irrelevant as there does not exist a reasonable alternative inputs.
Satrix Europe (ex-UK) Equity Tracker Fund
The level 3 position held by the Satrix Europe (ex-UK) Equity Tracker Fund at 30 June 2019 is Banco Espirito Santo SA which is valued at EUR Nil (2018: EUR Nil). Trading was suspended on this security during 2014 and the position is classified as level 3 due to its trading status. The position was written down to zero on 29 April 2015 pending further news and financial information from the company. There has been no movement in the value of the position during the period ended 30 June 2019 or the comparative period. For the purpose of IFRS 7 for the reconciliation showing the change in fair value due to a change in inputs used, changes to one or more of the inputs to reasonably alternative assumptions, is irrelevant as there does not exist a reasonable alternative inputs.

SANLAM UNIVERSAL FUNDS PLC
455
NOTES TO AND FORMING PART OF THE UNAUDITED CONDENSED INTERIM FINANCIAL STATEMENTS (CONTINUED) for the six months ended 30 June 2019
5 Fair value of financial instruments (continued) Level 3 Assets measured at fair value reconciliation (continued)
Sanlam Equity Allocation Fund
Investment in securities
2019 2018
Balance as at 1 January 426 1,548
Realised gains/(losses) - 1,552
Change in unrealised - (1,122)
Gross Purchases - -
Gross Sales (426) (1,552)
Transfers in and out of level 3 - -
Balance as at 30 June/31 December - 426
Total unrealised gains and losses for the period/year included in profit or
loss for level 3 assets held at period/year end -
The Sanlam Equity Allocation Fund did not hold any Level 3 positions at 30 June 2019.
The level 3 position held by the Sanlam Equity Allocation Fund at 31 December 2018 was Rolls-Royce Holding Pfd which was valued at GBP 426. This security is thinly traded and is classified as level 3 due to its trading status. The position was disposed of during the period ended 30 June 2019. For the purpose of IFRS 7 for the reconciliation showing the change in fair value due to a change in inputs used, changes to one or more of the inputs to reasonably alternative assumptions, is irrelevant as there does not exist a reasonable alternative inputs.
Sanlam Active UK Fund
Investment in securities
2019 2018
Balance as at 1 January - 3,067
Realised gains/(losses) - -
Change in unrealised - -
Gross Purchases 6,288 -
Gross Sales - (3,067)
Transfers in and out of level 3 - -
Balance as at 30 June/31 December 6,288 -
Total unrealised gains and losses for the period/year included in profit or
loss for level 3 assets held at period/year end -
At 30 June 2019 the Fund held a position in Rolls-Royce Holding which was valued at GBP 6,288. The securities are thinly traded and are classified as level 3 due to their trading status. For the purpose of IFRS 7 for the reconciliation showing the change in fair value due to a change in inputs used, changes to one or more of the inputs to reasonably alternative assumptions, is irrelevant as there does not exist a reasonable alternative inputs.

SANLAM UNIVERSAL FUNDS PLC
456
NOTES TO AND FORMING PART OF THE UNAUDITED CONDENSED INTERIM FINANCIAL STATEMENTS (CONTINUED) for the six months ended 30 June 2019
5 Fair value of financial instruments (continued) Level 3 Assets measured at fair value reconciliation (continued)
Sanlam Global Value Fund
Investment in securities
2019 2018
Balance as at 1 January - 2,133,929
Realised gains/(losses) - (5,393,228)
Change in unrealised - 5,429,741
Gross Purchases - 0
Gross Sales - (2,168,125)
Transfers in and out of level 3 - (2,317)
Balance as at 31 December/1 January - -
Total unrealised gains and losses for the year included in profit or loss
for level 3 assets held at year end - -
The Sanlam Global Value Fund did not hold any Level 3 positions at 30 June 2019. In 2018 Sanlam Global Value Fund held a position in Ezion Holdings Ltd which was classified as Level 3 at the beginning of 2018. Trading of the company’s shares were suspended in August 2017. A decision was taken by the Valuation Committee to write down the value of this position by 30%. As a result, the position was transferred from level 1 to level 3 of the fair value hierarchy. The suspension was lifted in April 2018 and the shares resumed trading. The Fund disposed of its equity holding in Ezion Holdings Limited. However, the Fund continued to hold a related warrant on the stock. The warrants were transferred from level 3 to level 2 of the fair value hierarchy during 2018. For the purpose of IFRS 7 for the reconciliation showing the change in fair value due to a change in inputs used, changes to one or more of the inputs to reasonably alternative assumptions, is irrelevant as there does not exist a reasonable alternative inputs.

SANLAM UNIVERSAL FUNDS PLC
457
NOTES TO AND FORMING PART OF THE UNAUDITED CONDENSED INTERIM FINANCIAL STATEMENTS (CONTINUED) for the six months ended 30 June 2019
6 Assets and liabilities not carried at fair value but for which fair value is disclosed
For all non-financial assets and liabilities at fair value through profit and loss, their carrying values are a reasonable approximation of fair value.
7 Exchange rates
The following period end USD exchange rates have been used in this report:
1 USD = 30 June 2019 31 December 2018 30 June 2018
AED 3.6732 n/a 3.6730
AUD 1.4250 1.4205 1.3524
BRL 3.8327 3.8758 3.8633
CAD 1.3068 1.3658 1.3145
CHF 0.9750 0.9858 0.9920
CLP 678.9500 694.0000 653.0800
CNY 6.8730 n/a 7.8462
COP 3,207.0000 3,247.5000 2926.2306
CZK 22.3158 22.5141 22.2580
DKK 6.5125 6.5280 6.3804
EGP 16.6950 17.9200 17.8936
EUR 0.8781 0.8748 0.8564
GBP 0.7857 0.7852 0.7579
HKD 7.8125 7.8294 7.8462
HUF 283.4344 280.6281 282.4600
IDR 14,127.5000 14,380.000 14273.0012
ILS 3.5503 3.7368 3.6560
INR 69.0275 69.8150 68.4749
JPY 107.7400 109.7150 110.7800
KES 102.2000 101.8500 100.9000
KRW 1,154.6500 1,115.8000 1113.3403
MAD 9.5688 9.5743 9.4848
MUR 35.5000 - 34.8235
MXN 19.2117 19.6938 19.7998
MYR 4.1325 4.1325 4.0316
NGN 360.0000 363.5000 361.500
NOK 8.5080 8.6592 8.1566
NZD 1.4889 1.4913 1.4771
PHP 51.2350 - 53.3690
PLN 3.7229 3.7568 3.7479
QAR 3.6413 3.6413 3.6520
RUB 63.7540 69.3725 62.7385
SEK 9.2782 8.8659 8.9524
SGD 1.3530 1.3630 1.3629
THB 30.6675 32.5600 33.0400
TND 2.8744 n/a n/a
TRY 5.7840 5.3199 4.5954
TWD 31.0595 30.7370 30.4530
TZS 2,300.0000 2,300.0000 2268.2900
UGX n/a n/a 3880.0000
USD 1.0000 1.0000 1.0000
XOF 576.0072 573.8154 561.8957
ZAR 14.1013 14.3850 13.7561
ZMW n/a 11.9250 9.9875

SANLAM UNIVERSAL FUNDS PLC
458
NOTES TO AND FORMING PART OF THE UNAUDITED CONDENSED INTERIM FINANCIAL STATEMENTS (CONTINUED) for the six months ended 30 June 2019
7 Exchange rates (continued) The following average USD exchange rates have been used in this report:
1 USD =
30 June 2019 31 December 2018 30 June 2018
EUR 0.8852 0.8708 0.8271 GBP 0.7733 0.7662 0.7274
8 Related party transactions and significant agreements All related party transactions have been entered into and conducted under normal market conditions.
Significant Agreements
Directors’ interests
At 30 June 2019 and 31 December 2018, Haydn Franckeiss had an interest of 183,154 shares in Denker Global Dividend Fund. The other Directors who held office on 30 June 2019 had no interest in the shares of the Company or Funds at that date or at any time during the financial period. None of the Directors has a service contract with the Company.
Manager
Pursuant to the Amended and Restated Management and Administration Agreement effective 29 August 2014, SAMI acts as both Manager and Administrator to the Company. SAMI is an ultimate subsidiary company of Sanlam Limited. Sanlam Life, a fellow subsidiary, is a significant indirect shareholder of the Company. The Manager is entitled to receive a management fee (a percentage of the net assets per annum) from each of the Funds as follows:
Fund
Share Class Rate of
Management fees
Bridge Global Property Income Fund2
Non distributing (USD) 0.20%
P-Solve Inflation Plus Fund1,3
A 1.25% B 0.60% B Accumulation 0.60%
C None
D 0.35%
Sanlam African Frontier Markets Fund1 A (USD) 1.75%
D (USD) 0.75%
G (USD) 1.50%
H (USD) None
I (USD) 1.00%
1 For these Funds, the Manager will pay, out of the management fee, the fees of the Investment Manager(s) and, where applicable, the fees of the Investment Allocation Manager and Investment Advisors also. 2 For these Funds, the fees of the fees of the Investment Manager(s), the Investment Allocation Manager and Investment Advisors (as
applicable) are paid directly by the Fund. 3 P-Solve Inflation Plus Fund closed during the period ended 30 June 2019.
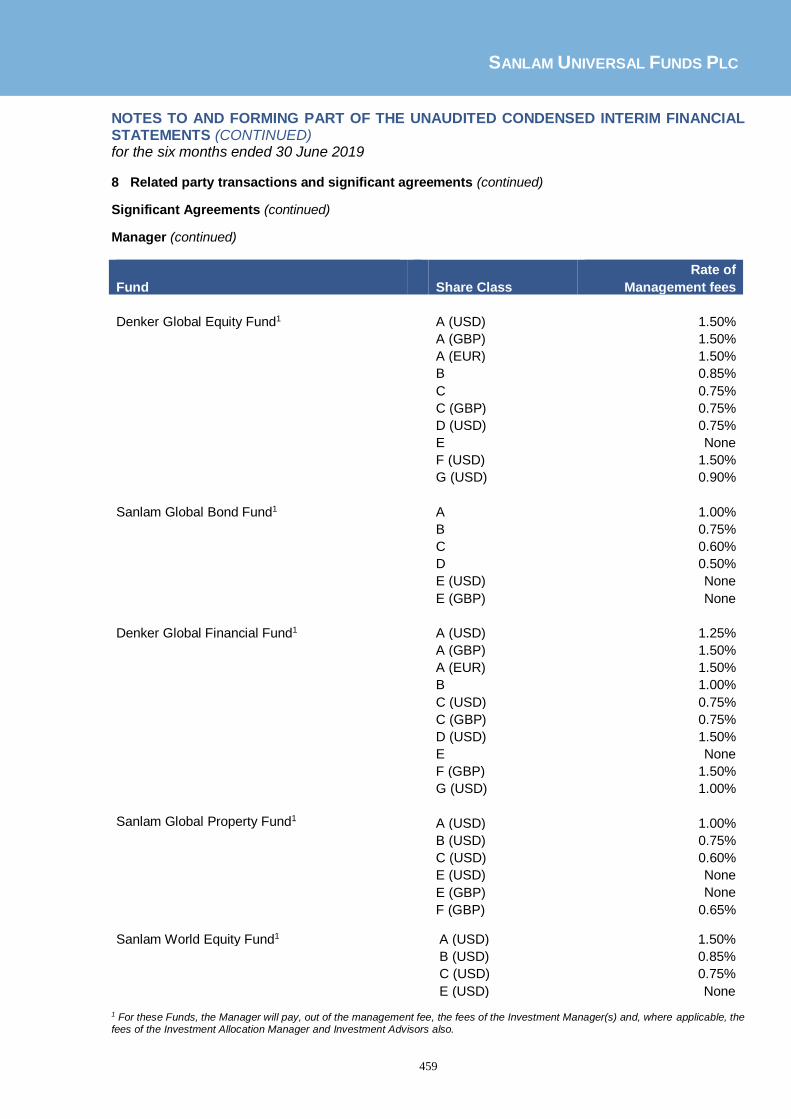
SANLAM UNIVERSAL FUNDS PLC
459
NOTES TO AND FORMING PART OF THE UNAUDITED CONDENSED INTERIM FINANCIAL STATEMENTS (CONTINUED) for the six months ended 30 June 2019
8 Related party transactions and significant agreements (continued)
Significant Agreements (continued)
Manager (continued)
Fund
Share Class
Rate of
Management fees
Denker Global Equity Fund1 A (USD) 1.50%
A (GBP) 1.50%
A (EUR) 1.50%
B 0.85%
C 0.75%
C (GBP) 0.75%
D (USD) 0.75%
E None
F (USD) 1.50%
G (USD) 0.90%
Sanlam Global Bond Fund1 A 1.00%
B 0.75%
C 0.60%
D 0.50%
E (USD) None
E (GBP) None
Denker Global Financial Fund1 A (USD) 1.25%
A (GBP) 1.50%
A (EUR) 1.50%
B 1.00%
C (USD) 0.75%
C (GBP) 0.75%
D (USD) 1.50% E None
F (GBP) 1.50%
G (USD) 1.00%
Sanlam Global Property Fund1 A (USD) 1.00% B (USD) 0.75% C (USD) 0.60% E (USD) None E (GBP) None F (GBP) 0.65%
Sanlam World Equity Fund1 A (USD) 1.50%
B (USD) 0.85%
C (USD) 0.75%
E (USD) None
1 For these Funds, the Manager will pay, out of the management fee, the fees of the Investment Manager(s) and, where applicable, the fees of the Investment Allocation Manager and Investment Advisors also.

SANLAM UNIVERSAL FUNDS PLC
460
NOTES TO AND FORMING PART OF THE UNAUDITED CONDENSED INTERIM FINANCIAL STATEMENTS (CONTINUED) for the six months ended 30 June 2019
8 Related party transactions and significant agreements (continued)
Significant Agreements (continued)
Manager (continued)
Fund
Share Class
Rate of
Management fees
Satrix World Equity Tracker Fund1 A 0.50%
B 0.40% C 0.75%
D 0.60% E None I (USD) 0.30% I (GBP) 0.30%
S 0.20%
L (USD) 0.15%
L (GBP) 0.15%
L (EUR) 0.15%
SIIP India Opportunities Fund1 A (USD) 1.50%
B (USD) 1.10% C (USD) 0.75% D (USD) 0.75% E None
Denker Global Dividend Fund1 A (USD) 1.25%
A (GBP) 1.25%
B (USD) 1.00%
B (GBP) 1.00%
B Accumulation (USD) 1.00%
B Accumulation (GBP) 1.00% C (USD) 0.75%
C Accumulation (USD) 0.75%
C Accumulation (GBP) 0.75%
D Accumulation (USD) 0.55% E None I (USD) 1.25%
Sanlam Strategic Bond Fund2 A Income (GBP) 1.00% A Accumulation (GBP) 1.00% I Income (GBP) 0.58% I Income (EUR) 0.58% I Income (USD) 0.58% I Accumulation (GBP) 0.58% I Accumulation (EUR) 0.58% I Accumulation (USD) 0.58% P Income (GBP) 0.35% P Accumulation (GBP) 0.35% P Accumulation (USD) 0.35%
1 For these Funds, the Manager will pay, out of the management fee, the fees of the Investment Manager(s) and, where applicable, the
fees of the Investment Allocation Manager and Investment Advisors also. 2 For these Funds, the fees of the fees of the Investment Manager(s), the Investment Allocation Manager and Investment Advisors (as applicable) are paid directly by the Fund.

SANLAM UNIVERSAL FUNDS PLC
461
NOTES TO AND FORMING PART OF THE UNAUDITED CONDENSED INTERIM FINANCIAL STATEMENTS (CONTINUED) for the six months ended 30 June 2019
8 Related party transactions and significant agreements (continued)
Significant Agreements (continued)
Manager (continued)
Fund
Share Class
Rate of
Management fees Sanlam Accel Income Fund1 A Net Accumulation 1.00% A Net Income 1.00% Satrix North America Equity Tracker Fund1 A (USD) 0.50% B (ZAR) 0.40% C (USD) 0.75% E None I (USD) 0.30% I (GBP) 0.30% Satrix UK Equity Tracker Fund1 A (USD) 0.50% C (USD) 0.75% E (USD) None E (GBP) None I (USD) 0.30% I (GBP) 0.30% Satrix Europe (ex UK) Equity Tracker Fund1
A (USD) 0.50% C (USD) 0.75% E (EUR) None E (USD) None I (USD) 0.30% I (GBP) 0.30%
Satrix Emerging Markets Equity Tracker Fund1 A (USD) 0.75% E (USD) None I (USD) 0.30% I (GBP) 0.30%
Sanlam Managed Risk Fund1 A (USD) 1.75%
A (GBP) 1.75% A (EUR) 1.75% A (CHF) 1.75% A (SEK) 1.75% A (AUD) 1.75% A (CAD) 1.75% A2 (USD) 1.95% D (USD) 0.50% D (GBP) 0.50% D (EUR) 0.50%
1 For these Funds, the Manager will pay, out of the management fee, the fees of the Investment Manager(s) and, where applicable, the
fees of the Investment Allocation Manager and Investment Advisors also.

SANLAM UNIVERSAL FUNDS PLC
462
NOTES TO AND FORMING PART OF THE UNAUDITED CONDENSED INTERIM FINANCIAL STATEMENTS (CONTINUED) for the six months ended 30 June 2019
8 Related party transactions and significant agreements (continued)
Significant Agreements (continued)
Manager (continued)
Fund
Share Class
Rate of
Management fees Sanlam Managed Risk Fund (continued) I (USD) 0.75% I (GBP) 0.75% I (EUR) 0.75% I2 (USD) 1.15% N (USD) 1.75% N (GBP) 1.75% N (EUR) 1.75% N (AUD) 1.75% N2 (USD) 1.75% N2 (GBP) 1.75% N2 (EUR) 1.75% N2 (AUD) 1.75% L (USD) 2.50% L (GBP) 2.50% L (EUR) 2.50% L (AUD) 2.50% Sanlam Global High Quality Fund1 A Accumulation (GBP) 1.60% A Accumulation (USD) 1.60% A Accumulation (EUR) 1.60% A Accumulation (CHF) 1.60% B Accumulation (USD) 1.60% C Accumulation (GBP) 0.55% C Income (GBP) 0.55% D Accumulation (USD) 0.75% D Income (USD) 0.75% E Accumulation (USD) 1.25% E Income (USD) 1.25% I Income (GBP) 0.75% I Accumulation (GBP) 0.75% I Accumulation (USD) 0.75% I Accumulation (EUR) 0.75% I Accumulation (CHF) 0.75% G Income (USD) 0.75% G Accumulation (USD) 0.75%
1 For these Funds, the Manager will pay, out of the management fee, the fees of the Investment Manager(s) and, where applicable, the fees of the Investment Allocation Manager and Investment Advisors also.
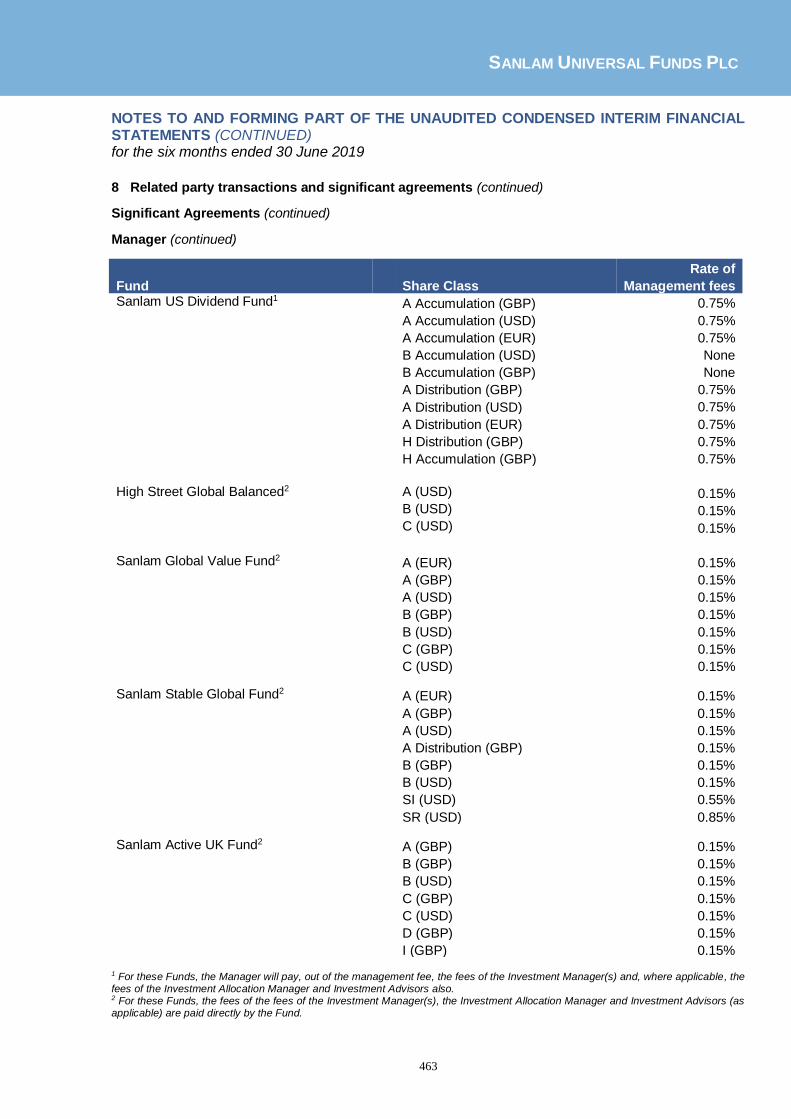
SANLAM UNIVERSAL FUNDS PLC
463
NOTES TO AND FORMING PART OF THE UNAUDITED CONDENSED INTERIM FINANCIAL STATEMENTS (CONTINUED) for the six months ended 30 June 2019
8 Related party transactions and significant agreements (continued)
Significant Agreements (continued)
Manager (continued)
Fund
Share Class
Rate of
Management fees Sanlam US Dividend Fund1 A Accumulation (GBP) 0.75% A Accumulation (USD) 0.75% A Accumulation (EUR) 0.75% B Accumulation (USD) None
B Accumulation (GBP) None A Distribution (GBP) 0.75% A Distribution (USD) 0.75% A Distribution (EUR) 0.75% H Distribution (GBP) 0.75% H Accumulation (GBP) 0.75% High Street Global Balanced2 A (USD) 0.15% B (USD) 0.15% C (USD) 0.15% Sanlam Global Value Fund2 A (EUR) 0.15% A (GBP) 0.15% A (USD) 0.15% B (GBP) 0.15% B (USD) 0.15% C (GBP) 0.15% C (USD) 0.15%
Sanlam Stable Global Fund2 A (EUR) 0.15% A (GBP) 0.15% A (USD) 0.15% A Distribution (GBP) 0.15% B (GBP) 0.15% B (USD) 0.15% SI (USD) 0.55% SR (USD) 0.85%
Sanlam Active UK Fund2 A (GBP) 0.15% B (GBP) 0.15% B (USD) 0.15% C (GBP) 0.15% C (USD) 0.15% D (GBP) 0.15% I (GBP) 0.15%
1 For these Funds, the Manager will pay, out of the management fee, the fees of the Investment Manager(s) and, where applicable, the fees of the Investment Allocation Manager and Investment Advisors also. 2 For these Funds, the fees of the fees of the Investment Manager(s), the Investment Allocation Manager and Investment Advisors (as applicable) are paid directly by the Fund.

SANLAM UNIVERSAL FUNDS PLC
464
NOTES TO AND FORMING PART OF THE UNAUDITED CONDENSED INTERIM FINANCIAL STATEMENTS (CONTINUED) for the six months ended 30 June 2019
8 Related party transactions and significant agreements (continued)
Significant Agreements (continued)
Manager (continued)
Fund
Share Class
Rate of
Management fees Sanlam Multi-Strategy Fund2
A (EUR) 0.15% A (GBP) 0.15% A (USD) 0.15% B (GBP) 0.15%
B (USD) 0.15%
H (USD) 0.15% Founder (GBP) 0.15% Income Distribution A (GBP) 0.15% Income Distribution B (GBP) 0.15% Income Distribution Founder
(GBP) 0.15% SI Hedged (USD) 0.55% SR Hedged 0.85% Anchor Global Stable Fund2 A 0.20% B 0.20% Bridge Global Equity Income Growth Fund2,3 A (USD) 0.20% Anchor Global Equity Fund2 A 0.20% B 0.20%
Bridge Global Managed Growth Fund2 A (USD) 0.20% Sanlam Global Emerging Markets Fund2 A1 (USD) 0.95% A2 (USD) 1.25% B1 (GBP) 0.70% B1 (USD) 0.70% B2 (GBP) 1.00% B2 (USD) 1.00% C1 (GBP) 0.55% C1 (USD) 0.55% C2 (GBP) 0.85% C2 (USD) 0.85% D2 (USD) 0.55% E None
1 For these Funds, the Manager will pay, out of the management fee, the fees of the Investment Manager(s) and, where applicable, the fees of the Investment Allocation Manager and Investment Advisors also. 2 For these Funds, the fees of the fees of the Investment Manager(s), the Investment Allocation Manager and Investment Advisors (as applicable) are paid directly by the Fund. 3 At an EGM on 25 March 2019, shareholders of Bridge Global Equity Income Growth Fund approved the merger of the fund into Bridge
Global Managed Growth Fund. The merger took effect from 23.59pm on Friday 12 April 2019.
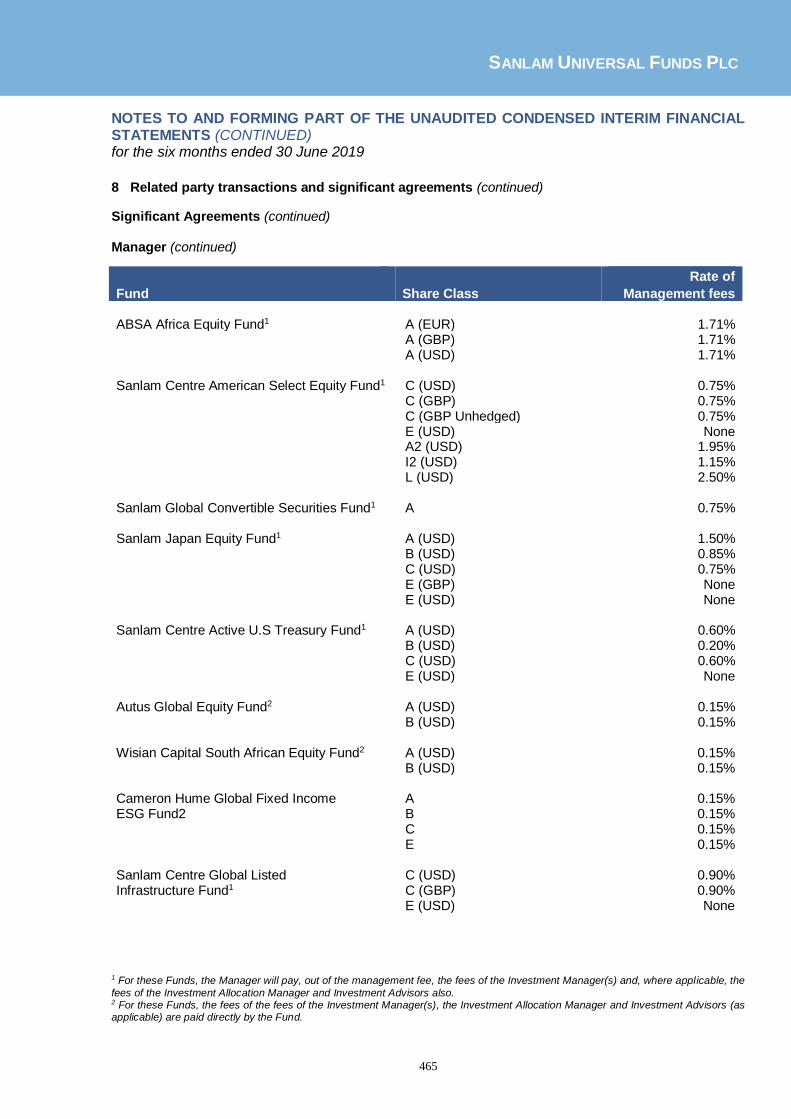
SANLAM UNIVERSAL FUNDS PLC
465
NOTES TO AND FORMING PART OF THE UNAUDITED CONDENSED INTERIM FINANCIAL STATEMENTS (CONTINUED) for the six months ended 30 June 2019
8 Related party transactions and significant agreements (continued)
Significant Agreements (continued) Manager (continued)
Fund
Share Class
Rate of
Management fees ABSA Africa Equity Fund1 A (EUR) 1.71% A (GBP) 1.71% A (USD) 1.71% Sanlam Centre American Select Equity Fund1 C (USD) 0.75% C (GBP) 0.75% C (GBP Unhedged) 0.75%
E (USD) None A2 (USD) 1.95% I2 (USD) 1.15% L (USD) 2.50%
Sanlam Global Convertible Securities Fund1 A 0.75% Sanlam Japan Equity Fund1 A (USD) 1.50% B (USD) 0.85% C (USD) 0.75% E (GBP) None E (USD) None Sanlam Centre Active U.S Treasury Fund1 A (USD) 0.60% B (USD) 0.20% C (USD) 0.60% E (USD) None Autus Global Equity Fund2 A (USD) 0.15% B (USD) 0.15%
Wisian Capital South African Equity Fund2 A (USD) 0.15% B (USD) 0.15% Cameron Hume Global Fixed Income A 0.15% ESG Fund2 B 0.15% C 0.15% E 0.15% Sanlam Centre Global Listed C (USD) 0.90% Infrastructure Fund1 C (GBP) 0.90% E (USD) None
1 For these Funds, the Manager will pay, out of the management fee, the fees of the Investment Manager(s) and, where applicable, the
fees of the Investment Allocation Manager and Investment Advisors also. 2 For these Funds, the fees of the fees of the Investment Manager(s), the Investment Allocation Manager and Investment Advisors (as applicable) are paid directly by the Fund.

SANLAM UNIVERSAL FUNDS PLC
466
NOTES TO AND FORMING PART OF THE UNAUDITED CONDENSED INTERIM FINANCIAL STATEMENTS (CONTINUED) for the six months ended 30 June 2019
8 Related party transactions and significant agreements (continued)
Significant Agreements (continued) Manager (continued)
Fund
Share Class
Rate of
Management fees Sanlam Real Assets Fund2 A Distribution (GBP) 0.15% AH Distribution (USD) 0.15% B Accumulation (GBP) 0.15% D Distribution (GBP) 0.15% DH Distribution (USD) 0.15% SI Accumulation (USD) 0.85% SR Accumulation (USD) 0.55% Satrix Global Factor Enhanced Equity Fund E None H 0.20% I (USD) 0.55% I (GBP) 0.55% S 0.40% Perpetua Global Equity UCITS Fund2 A 0.15% B 0.15%
1 For these Funds, the Manager will pay, out of the management fee, the fees of the Investment Manager(s) and, where applicable, the
fees of the Investment Allocation Manager and Investment Advisors also. 2 For these Funds, the fees of the fees of the Investment Manager(s), the Investment Allocation Manager and Investment Advisors (as applicable) are paid directly by the Fund. Management fees earned by the Manager during the period ending 30 June 2019 are disclosed as part of the summary of management and investment management fees on pages 474 to 485.
SANLAM UNIVERSAL FUNDS PLC
467
NOTES TO AND FORMING PART OF THE UNAUDITED CONDENSED INTERIM FINANCIAL STATEMENTS (CONTINUED) for the six months ended 30 June 2019
8 Related party transactions and significant agreements (continued)
Significant Agreements (continued) Performance Fee For certain share classes of SIIP India Opportunities Fund, Sanlam Global Property Fund, Denker Global Financial Fund, Denker Global Equity Fund, Sanlam African Frontier Markets Fund, High Street Global Balanced Fund, Anchor Global Stable Fund, Anchor Global Equity Fund and Sanlam Global Emerging Markets Fund, Sanlam Global Convertible Securities Fund, Autus Global Equity Fund and and Wisian Capital South African Equity Fund, the Manager shall also be entitled to receive out of the assets of the Funds a performance fee in respect of each performance period. The performance periods for Sanlam African Frontier Markets Fund, Denker Global Financial Fund, Denker Global Equity Fund, Sanlam Global Property Fund, SIIP India Opportunities Fund and Sanlam Global Convertible Securities Fund comprise each successive six month period from 1 January to 30 June and from 1 July to 31 December. The performance periods for Anchor Global Equity Fund, Anchor Global Stable Fund, Autus Global Equity Fund and Wisian Capital South African Equity Fund comprise each annual period from 1 January to 31 December. The performance periods for High Street Global Balanced Fund comprise each calendar quarterly period, and the performance periods for Sanlam Global Emerging Markets Fund comprise each calendar monthly period.
(a) The performance fee shall be equal to 10% to 20% (depending on the fund) of the difference between the percentage movement in the Net Asset Value per Share (A) being the Initial Issue Price for the first performance period and the percentage movement in the relevant index as set out in the prospectus (the “Index”) (B) during the performance period multiplied by the average of the Net Asset Value of the Fund as at each Valuation Point during the performance period prior to any accrual for performance fees but after accruing for all other fees and expenses.
(b) Where the Fund has underperformed the Index during a performance period (where A-B is a negative number), the Manager will not repay any amounts of performance fee paid by the Fund in respect of previous performance periods but no further performance fees will be charged until such time as any underperformance is recaptured by the Fund (until A-B measured since the end of the last performance period in respect of which a performance fee was paid becomes positive).
(c) For the performance period in which any underperformance is first recaptured, the performance fee
will be calculated in accordance with paragraph (b) above, except that the performance fee will only take into account any subsequent outperformance (A-B will be measured since the end of the last performance period in respect of which a performance fee was paid). Performance fee calculations in subsequent performance periods will revert to being based on the performance over the relevant performance period as calculated in accordance with paragraph (a) above.
(d) The performance fee shall be calculated by the Administrator (subject to verification by the
Depositary) and accrued in the Net Asset Value calculated in respect of each Dealing Day based on the performance to date of the Fund during that performance period.
Net realised and unrealised capital gains plus net realised and unrealised capital losses as of the relevant Valuation Point shall be taken into account in calculating the Net Asset Value per Share. As a result, performance fees may be paid on unrealised gains which may subsequently never be realised. Benchmarks will take account of income and capital gains/losses.

SANLAM UNIVERSAL FUNDS PLC
468
NOTES TO AND FORMING PART OF THE UNAUDITED CONDENSED INTERIM FINANCIAL STATEMENTS (CONTINUED) for the six months ended 30 June 2019
8 Related party transactions and significant agreements (continued)
Significant Agreements (continued) Administrator In its role as the Administrator, Brown Brothers Harriman Fund Administration Services (Ireland) Limited is entitled to receive out of the assets of each Fund an annual fee ranging from 0.00% - 0.15% of the net assets of the Fund. Certain Funds are also subject to a minimum annual fee and/or additional annual fee ranging from USD 10,000 – 25,000 per annum. In addition, the Administrator is entitled to receive its reasonable costs and expenses incurred in the performance of its duties as Administrator of the Company. These fees shall accrue and be calculated on each dealing day and shall be payable monthly in arrears. The administration fees earned by the administrator during the period and outstanding at the year end date are presented in the Statement of Comprehensive Income and Statement of Financial Position, respectively. Prior to 1 October 2018, SAMI was the Administrator of the Company. SAMI was entitled to receive out of the assets of each Fund an annual fee based on the same terms as outlined above. Investment Managers, Investment Advisors and Investment Allocation Manager The Investment Managers are appointed by the Manager. For certain Funds, as noted on pages 458 to 466, the Manager will pay out of its fees, the fees of the Investment Managers, Investment Allocation Manager and Investment Advisors (as applicable) appointed to those Funds. For the remaining Funds of the Company, the fees of the appointed Investment Managers, Investment Allocation Manager and Investment Advisors (as applicable) are paid directly by the Fund. The table below sets out the rates for the annual Investment Management fees paid directly by these Funds to the Investment Managers (in respect of each share class of the relevant Fund). These fees are payable monthly in arrears and accrued by reference to the net assets of the relevant share class on each dealing day.
Bridge Global
Property
Income Fund
Sanlam Strategic Bond
Fund
High Street Global Balanced
Fund Sanlam Active
UK Fund
Class A (USD) - - 1.00% -
Class A (GBP) - - - 0.75%
Class B (USD) - - 0.50% None
Class B (GBP) - - - None
Class C (USD) - - 1.50% 1.50%
Class C (GBP) - - - 1.50%
Class D (GBP) - - - 0.45%
Class P Income (GBP) - 0.20% - -
Class P Accumulation (GBP) - 0.20% - -
Class P Accumulation (USD) - 0.20% - -
Class I (GBP) - - - 0.75%
Class I Income (GBP) - 0.43% - -
Class I Income (EUR) - 0.43% - -
Class I Income (USD) - 0.43% - -
Class I Accumulation (GBP) - 0.43% - -
Class I Accumulation (USD) - 0.43% - -
Non Distributing Class (USD) 1.25% - - -

SANLAM UNIVERSAL FUNDS PLC
469
NOTES TO AND FORMING PART OF THE UNAUDITED CONDENSED INTERIM FINANCIAL STATEMENTS (CONTINUED) for the six months ended 30 June 2019
8 Related party transactions and significant agreements (continued)
Significant Agreements (continued) Investment Managers, Investment Advisors and Investment Allocation Manager (continued)
Sanlam Global
Value Fund
Sanlam Stable Value Fund
Sanlam Multi-Strategy Fund
Anchor Global Stable Fund
Class A (USD) 0.75% 0.75% 0.75% 1.25%
Class A (GBP) 0.75% 0.75% 0.75% -
Class A (EUR) 0.75% 0.75% 0.75% -
Class A Distribution (GBP) - 0.75% -
Class B (USD) None None None No fee
Class B (GBP) None None None -
Class C (USD) 1.50% - - -
Class C (GBP) 1.50% - - -
Class H (USD) - - 0.75% -
Class Founder (GBP) - - 0.50% -
Class Income Distribution A (GBP) - - 0.75% -
Class Income Distribution B (GBP) - - None -
Class Income Distribution Founder (GBP) - - 0.50% -
Bridge Global
Equity Income
Fund1
Anchor Global Equity
Fund Bridge Global
Managed Fund1 Autus Global Equity Fund
Class A (USD) 1.00% 1.25% 0.75% 1.50%
Class B Shares (USD) - None - 1.00%
Wisian Capital
South African
Equity Fund
Cameron Hume Global Fixed Income Fund
Sanlam Real Assets Fund
Perpetua Global Equity UCITS
Fund
Class A Shares (USD) 1.50% 0.30% - 0.75%
Class A Distribution (GBP) - - 0.75% -
Class AH Distribution (USD) - - 0.75% -
Class B Shares (USD) None 0.30% - None
Class B Accumulation (GBP) - - None -
Class D Distribution (GBP) - - 0.50% -
Class DH Distribution (USD) - - 0.53% -
Class C Shares (USD) - 0.30% - -
Class E Shares (USD) - None - -
Class SI Accumulation (USD) - - None -
Class SR Accumulation (USD) - - None -
1 At an EGM on 25 March 2019, shareholders of Bridge Global Equity Income Growth Fund approved the merger of the fund into Bridge
Global Managed Growth Fund. The merger took effect from 23.59pm on Friday 12 April 2019. Fees paid directly to the appointed Investment Managers, Investment Allocation Manager and Investment Advisors (as applicable) by these Funds during the period ending 30 June 2019 are disclosed as part of the summary of management and investment management fees on pages 445 to 466. Four of the appointed Investment Managers, Sanlam Investments UK Limited, Sanlam Investment Management (Pty) Limited, Sanlam Private Investments (UK) Limited and Centre Asset Management LLC are related parties to the Company and the Manager. Sanlam Investments UK Limited is also the appointed Investment Allocation Manager for a number of the Funds.

SANLAM UNIVERSAL FUNDS PLC
470
NOTES TO AND FORMING PART OF THE UNAUDITED CONDENSED INTERIM FINANCIAL STATEMENTS (CONTINUED) for the six months ended 30 June 2019
8 Related party transactions and significant agreements (continued)
Significant Agreements (continued) Securities Lending Pursuant to the Securities Lending Agency Agreement, SAMI was appointed as securities lending agent to the Company. Pursuant to the Securities Lending Sub-Agency Agreement, effective 24 February 2016 Brown Brothers Harriman & Co. was appointed by SAMI as securities lending sub-agent to the Company. The securities lending agent and securities lending sub-agent receive remuneration for their services provided as part of the Company’s securities lending arrangements, the terms of which are set out in the agreements referenced above. The securities lending sub-agent is not a related party to the Company. Further details on the Company’s securities lending activity are disclosed in note 13. Registrar and Transfer Agent Brown Brothers Harriman Fund Administration (Ireland) Limited is the appointed Registrar and Transfer Agent to the Company. Transfer agency fees are charged at normal commercial rates. The Registrar and Transfer Agent is not a related party of the Company. Depositary Brown Brothers Harriman Trustee Services (Ireland) Limited is the appointed Depositary to the Company. The Depositary is not a related party to the Company or to the Administrator. The Depositary will be entitled to receive from the Company, out of the assets of the Fund, an annual fee which will not exceed 0.02% of the net assets of the Fund (plus VAT, if any) together with reasonable costs and expenses incurred by the Depositary in the performance of its duties as Depositary of the Fund. These fees shall accrue and be calculated on each Dealing Day and shall be payable monthly in arrears. The Depositary shall also be entitled to be reimbursed out of the assets of the Fund all agreed transaction charges (which will be charged at normal commercial rates).
Distributors
The Distributors are appointed and paid by the Manager. Sanlam Investments UK Limited, Sanlam Investment Management (Pty) Limited and Sanlam Global Investment Solutions Ltd are related parties to the Company and the Manager.

SANLAM UNIVERSAL FUNDS PLC
471
NOTES TO AND FORMING PART OF THE UNAUDITED CONDENSED INTERIM FINANCIAL STATEMENTS (CONTINUED) for the six months ended 30 June 2019
8 Related party transactions and significant agreements (continued)
Significant shareholders at period end
Shareholder Fund % held at
30/06/2019 % held at
31/12/2018
Agulhas Nominees (Pty) Ltd Bridge Global Property Income Fund 18.28% 13.35%
FRB ITF Bridge Global Property Income*** 61.88% n/a
Allfunds Bank International SA 5.08% n/a
SGSS Bridge Global Property Income Fund*** Bridge Global Property Income Fund n/a 52.31%
Nortrust Nominees Limited Bridge Global Property Income Fund 8.85% 19.95%
KAS Nominees P-Solve Inflation Plus Fund n/a 83.44%
Standard Life Investment Funds P-Solve Inflation Plus Fund n/a 15.44%
Pictet & Cie (Europe) SA Luxembourg Sanlam African Frontier Markets Fund 40.54% 39.44%
Clearstream Banking SA FBO 64450 Sanlam African Frontier Markets Fund 16.02% 15.58%
Sanlam Life Insurance Ltd** Sanlam African Frontier Markets Fund 14.17% 16.59%
Municipal Gratuity Fund Sanlam African Frontier Markets Fund 20.58% 19.96%
Consolidated Retirement Fund for Local Government
Sanlam African Frontier Markets Fund 6.53% 6.35%
Post Office Retirement Fund Denker Global Equity Fund 32.30% 31.34%
Fundsettle EOC Nominees Ltd Denker Global Equity Fund 9.01% 9.01%
Agulhas Nominees (Pty) Ltd for SPI Denker Global Equity Fund 6.38% 7.63%
SBSA ITF Sanlam Value Fund*** Denker Global Equity Fund 6.08% 5.88%
SBSA ITF Denker Sanlam Collective*** Denker Global Equity Fund 36.83% 37.13%
Clearstream Banking SA AFS Sanlam Global Bond Fund 46.15% 32.90%
BBH & Co ACF Sanlam Global Funds Plc* Sanlam Global Bond Fund 13.74% 12.68%
BBH & CO ACF Sanlam Qualifying Investors Funds Plc*
Sanlam Global Bond Fund 14.12% 11.34%
Sanlam Life & Pensions** Sanlam Global Bond Fund 21.14% 37.91%
Agulhas Nominees (Pty) Ltd for SPI Denker Global Financial Fund 16.61% 17.54%
SBSA ITF Sanlam Value Fund*** Denker Global Financial Fund 8.10% 7.65%
SBSA ITF SIM Balanced Fund*** Denker Global Financial Fund 20.34% 19.30%
SBSA ITF Prudential Dividend*** Denker Global Financial Fund n/a 9.24%
SBSA I.T.F. Denker SCI Global Financial*** Denker Global Financial Fund 10.06% 9.88%
Bank Lombard Odier & Co Ltd Denker Global Financial Fund 8.57% 10.13%
Sanlam Life Insurance Ltd** Sanlam Global Property Fund 51.17% 35.88%
Sanlam Life & Pensions** Sanlam Global Property Fund 22.45% 33.83%
Standard Bank of SA Ltd Sanlam Global Property Fund 7.64% 8.93%
SBSA ITF SIM Inflation Plus Fund*** Sanlam Global Property Fund n/a 8.59%
Standard Bank In Trust For Sanlam Sanlam World Equity Fund n/a 11.51%
BBH & Co ACF Sanlam Global Funds Plc* Sanlam World Equity Fund 93.92% 76.17%
SBSA ITF SIM Balanced Fund*** Sanlam World Equity Fund n/a 6.44%
Sanlam Investment Management (Pty) Ltd** Satrix World Equity Tracker Fund 48.36% 6.97%
SCB ATF Satrix MSCI World*** Satrix World Equity Tracker Fund n/a 22.77%
Botswana Insurance Fund Management Satrix World Equity Tracker Fund 36.44% 5.13%
SBSA ITF SIM Inflation Plus Fund*** Satrix World Equity Tracker Fund n/a 8.61%
BBH & CO ACF Sanlam Universal Funds Plc* Satrix World Equity Tracker Fund n/a 7.67%
BBH & Co ACF Sanlam Global Funds Plc* Satrix World Equity Tracker Fund n/a 27.50%
SBSA ITF Sanlam India Opportunitie*** SIIP India Opportunities Fund 98.74% n/a
Standard Bank of South Africa SIIP India Opportunities Fund n/a 99.02%
Fundsettle EOC Nominees Ltd Denker Global Dividend Fund 7.46% n/a
SBSA ITF Sim Inflation Plus Fund*** Denker Global Dividend Fund 12.91% 6.66%
Sanlam Life Insurance Ltd Denker Global Dividend Fund 50.94% 71.21%
*At 30 June 2019, Brown Brothers Harriman Trustee Services (Ireland) Limited held the Class E shares in each of these Funds on behalf of certain Funds of Sanlam Global Funds Plc, Sanlam Qualifying Investors Funds Plc and Sanlam Universal Funds Plc.
**These significant shareholders are related parties to the Company and the Manager. ***These are investments by South African Unit Trusts. These Unit Trusts are managed by related parties to the Manager.

SANLAM UNIVERSAL FUNDS PLC
472
NOTES TO AND FORMING PART OF THE UNAUDITED CONDENSED INTERIM FINANCIAL STATEMENTS (CONTINUED) for the six months ended 30 June 2019
8 Related party transactions and significant agreements (continued)
Significant shareholders at the period end (continued)
Shareholder Fund
% held at
30/06/2019
% held at
31/12/2018
Principal Nominees Ltd Sanlam Strategic Bond Fund 21.46% 26.28%
Fundssettle EOC Nominees Sanlam Strategic Bond Fund 7.79% n/a
Clearstream Banking SA Sanlam Strategic Bond Fund 21.88% 23.38%
Minster Nominees Limited Sanlam Strategic Bond Fund 10.08% 11.11%
Fundsettle EOC Nominees Sanlam Accel Income Fund 5.08% n/a
Minster Nominees Limited Sanlam Accel Income Fund 88.92% 89.68%
BBH & Co ACF Sanlam Global Funds Plc* Satrix North America Equity Tracker Fund 80.25% 97.52%
Allfunds Bank International SA Satrix UK Equity Tracker Fund 5.47% n/a
Sanlam Investment Management (Pty) Ltd** Satrix UK Equity Tracker Fund 9.76% n/a
BBH & CO ACF Sanlam Global Funds Plc/* Satrix UK Equity Tracker Fund n/a 12.68%
BBH & CO ACF Sanlam Qualifying Investors Funds Plc*
Satrix UK Equity Tracker Fund 59.19% 79.05%
SBSA ITF SIM Balanced Fund*** Satrix UK Equity Tracker Fund 16.96% n/a
Sanlam Investment Management (Pty) Ltd** Satrix European (ex UK) Equity Tracker Fund 8.55% n/a
BBH & CO ACF Sanlam Qualifying Investors Funds Plc*
Satrix European (ex UK) Equity Tracker Fund 18.05% 45.59%
SBSA ITF SIM Inflation Plus Fund*** Satrix European (ex UK) Equity Tracker Fund 26.47% 14.24%
BBH & Co ACF Sanlam Global Funds Plc* Satrix European (ex UK) Equity Tracker Fund 17.53% 25.00%
SCB ATF Satrix Balanced Index Fund*** Satrix Emerging Market Equity Tracker Fund 13.92% 12.96%
SBSA ITF SIM Inflation Plus Fund*** Satrix Emerging Market Equity Tracker Fund 28.43% 31.16%
Sanlam Investment Management** Satrix Emerging Market Equity Tracker Fund 10.44% 12.55%
Sanlam Life Insurance Ltd** Satrix Emerging Market Equity Tracker Fund 10.13% n/a
Standard Bank In Trust For Sanlam** Satrix Emerging Market Equity Tracker Fund 5.62% 6.16%
Sanlam Developing Markets Ltd*** Satrix Emerging Market Equity Tracker Fund 5.16% 5.66%
Minster Nominees Limited Satrix Emerging Market Equity Tracker Fund 17.95% 19.74%
Old Mutual International Isle of Man Ltd Sanlam Managed Risk Fund 8.84% 9.75%
Sanlam Life Insurance Ltd** Sanlam Managed Risk Fund 10.44% 10.76%
Fundsettle Nominees Ltd Sanlam Managed Risk Fund 50.56% 47.30%
Allfunds Bank International SA Sanlam Managed Risk Fund 8.69% 8.37%
RBC IS GFP*** Sanlam Managed Risk Fund 12.48% 15.13%
Agulhas Nominees (Pty) Ltd Sanlam Global High Quality Fund 51.28% 55.13%
Minster Nominees Limited Sanlam Global High Quality Fund n/a 5.42%
Principal Nominees Limited Sanlam Global High Quality Fund 7.14% 8.69%
SBSA ITF SIM Balanced Fund*** Sanlam Global High Quality Fund 10.36% 11.55%
SBSA I.T.F. Sim General Equity Fund*** Sanlam Global High Quality Fund 6.51% n/a
BBH & Co ACF Sanlam Global Funds Plc* Sanlam US Dividend Fund 23.93% 31.75%
SBSA ITF SIM Balanced Fund*** Sanlam US Dividend Fund 12.49% 14.67%
Clearstream Banking S.A. FBO 55234 Sanlam US Dividend Fund 6.01% 7.76%
Clearstream Banking SA FBO 23490 Sanlam US Dividend Fund 4.00% 7.06%
Clearstream Banking SA FBO 15888-34419 Sanlam US Dividend Fund 34.60% 15.25%
Nortrust Nominees Limited Sanlam US Dividend Fund 5.43% 6.61%
Fundsettle EOC Nominees LTD High Street Global Fund 55.54% 55.87%
Pieter Mackenzie High Street Global Fund n/a 5.12%
BBH & CO ACF Sanlam Global Funds Plc* Sanlam Global Value Fund 95.14% 95.41%
Sanlam Life Insurance Ltd** Sanlam Stable Global Fund n/a 7.77%
SBSA ITF SIM Balanced Fund*** Sanlam Stable Global Fund 52.46% 59.18%
SBSA I.T.F. Sim General Equity Fund*** Sanlam Stable Global Fund 30.05% 16.98%
Sanlam Investment Management (Pty) Ltd** Sanlam Stable Global Fund 8.23% 9.70%
*At 30 June 2019, Brown Brothers Harriman Trustee Services (Ireland) Limited held the Class E shares in each of these Funds on behalf of certain Funds of Sanlam Global Funds Plc, Sanlam Qualifying Investors Funds Plc and Sanlam Universal Funds Plc.
**These significant shareholders are related parties to the Company and the Manager. ***These are investments by South African Unit Trusts. These Unit Trusts are managed by related parties to the Manager.

SANLAM UNIVERSAL FUNDS PLC
473
NOTES TO AND FORMING PART OF THE UNAUDITED CONDENSED INTERIM FINANCIAL STATEMENTS (CONTINUED) for the six months ended 30 June 2019
8 Related party transactions and significant agreements (continued)
Significant shareholders at the period end (continued)
Shareholder Fund
% held at
30/06/2019
% held at
31/12/2018
JPMI Re: Sanlam Life and Pensions** Sanlam Active UK Fund 96.10% 87.52%
BBH & CO ACF Sanlam Global Funds Plc* Sanlam Active UK Fund n/a 5.83%
Clearstream Banking Sanlam Multi-Strategy Fund 55.51% n/a
Sanlam Life & Pensions** Sanlam Multi-Strategy Fund 9.40% 68.05%
Principal Nominees Limited Sanlam Multi-Strategy Fund 8.39% 8.24%
Minster Nominees Limited Sanlam Multi-Strategy Fund 6.07% 5.55%
Capital International (Nominees) Ltd Anchor Global Stable Fund 89.71% 91.52%
Fundsettle EOC Nominees Limited Anchor Global Stable Fund 7.14% 6.61%
Bridge Pension Fund*** Bridge Global Equity Income Growth Fund n/a 44.20%
SGSS Bridge Balanced Fund*** Bridge Global Equity Income Growth Fund n/a 45.05%
Capital International (Nominees) Ltd Anchor Global Equity Fund 58.38% 58.88%
Fundsettle EOC Nominees Ltd Anchor Global Equity Fund 5.97% 5.18%
SBSA ITF Anchor BCI Global Equity Feeder*** Anchor Global Equity Fund 14.59% 15.28%
SBS Nominees Limited Anchor Global Equity Fund n/a 9.73%
Grindrod Pension Fund Bridge Global Managed Growth Fund 15.26% n/a
FRB ITF Bridge Global Managed Growth*** Bridge Global Managed Growth Fund 64.74% n/a
FRB ITF Bridge Balanced Fund*** Bridge Global Managed Growth Fund 15.86% n/a
SGSS ITF Bridge Global Managed Growth*** Bridge Global Managed Growth Fund n/a 97.84%
SGSS Bridge Global Income Growth*** Bridge Global Managed Growth Fund n/a n/a
Sanlam Life Insurance Ltd** Sanlam Global Emerging Markets Fund 13.26% 12.27%
Agulhas Nominees (Pty) Ltd for SPI Sanlam Global Emerging Markets Fund 8.72% 11.07%
BBH & CO ACF Sanlam Global Funds Plc* Sanlam Global Emerging Markets Fund 12.57% 11.54%
Sanlam Investment Management (Pty) Ltd** Sanlam Global Emerging Markets Fund 6.98% 6.22%
SBSA ITF SIM Balanced Fund*** Sanlam Global Emerging Markets Fund 46.44% 42.80%
SGSS ITF ABSA Africa Equity Fund*** ABSA Africa Equity Fund 100.00% 100.00%
BBH & CO ACF Sanlam Global Funds Plc* Sanlam Centre American Select Equity Fund 29.37% 70.05%
Clearstream Banking SA FBO 15888-34419 Sanlam Centre American Select Equity Fund 70.63% 29.95%
Sanlam Life Insurance Ltd** Sanlam Global Convertible Securities Fund 99.89% 99.89%
BBH & CO ACF Sanlam Global Funds Plc* Sanlam Japan Equity Fund 100.00% 100.00%
SBSA ITF Autus BCI Global Equity Fund*** Autus Global Equity Fund 98.79% 99.24%
Sanlam Life Insurance Ltd** Sanlam Centre Active U.S. Treasury Fund 98.49% 96.72%
Allfunds Bank SA Wisian Capital South African Equity Fund 100.00% 100.00%
BBH & CO ACF Sanlam Qualifying Investors* Cameron Hume Global Fixed Income ESG Fund 100.00% 100.00%
Sanlam Life Insurance Ltd** Sanlam Centre Global Listed Infrastructure Fund 100.00%
Sanlam Life Insurance Ltd** Sanlam Real Assets Fund 7.89% 9.87%
SBSA ITF SIM Balanced Fund*** Sanlam Real Assets Fund 39.09% 62.75%
SBSA ITF SIM Inflation Plus Fund*** Sanlam Real Assets Fund 11.53% 7.46%
Sanlam Investment Management** Sanlam Real Assets Fund 11.04% 12.31%
Sanlam Life Insurance Limited** Satrix Global Factor Enhanced Equity Fund 99.22% 99.26%
Telkom Retirement Fund Perpetua Global Equity UCITS Fund 95.31% n/a
*At 30 June 2019, Brown Brothers Harriman Trustee Services (Ireland) Limited held the Class E shares in each of these Funds on behalf of certain Funds of Sanlam Global Funds Plc, Sanlam Qualifying Investors Funds Plc and Sanlam Universal Funds Plc.
**These significant shareholders are related parties to the Company and the Manager. ***These are investments by South African Unit Trusts. These Unit Trusts are managed by related parties to the Manager.

SANLAM UNIVERSAL FUNDS PLC
474
NOTES TO AND FORMING PART OF THE UNAUDITED CONDENSED INTERIM FINANCIAL STATEMENTS (CONTINUED) for the six months ended 30 June 2019
8 Related party transactions and significant agreements (continued)
Management and investment management fees The Manager may rebate a portion of its fees to certain of the Funds of Sanlam Universal Funds plc, Sanlam Global Funds plc and Sanlam Qualifying Investors Funds plc where those Funds are themselves invested into Funds of the Company or enter into special fee arrangements and/or rebate agreements, in its sole discretion, with certain shareholders who may be affiliates of the Manager, including Botswana Insurance Fund Management, Sanlam Private Investments (Pty) Limited, Sanlam Life Insurance Limited, Sanlam Life & Pensions (UK) Limited and Sanlam Collective Investments Limited. With the exception of P-Solve Inflation Plus Fund (subsequently closed), rebate income earned by each of the Funds of the Company, as disclosed on the Statement of Comprehensive Income, was paid from the profits of the Manager. A summary of management and investment management fees earned during the period ending 30 June 2019 is as follows:
Bridge Global Property
Income Fund
P-Solve Inflation Plus
Fund
Sanlam African Frontier
Markets Fund Denker Global
Equity Fund
USD GBP USD USD
Fees incurred during the period ended 30/06/2019
Class A Management Fees - - (3,567) (72,612)
Class A (EUR) Management Fees - - - (2)
Class A (GBP) Management Fees - - - (777)
Class B Management Fees - (20,027) - (135,079)
Class C Management Fees - - - (69,353)
Class C (GBP) Management Fees - - - (40)
Class D Management Fees - - (12,831) -
Class F Management Fees - - - (47)
Class G Management Fees - - (50,829) -
Class I Management Fees - - (66,643) -
Non-Distributing Class Management Fees (194,488) - - -
(194,488) (20,027) (133,870) (277,910)
Sanlam Global Bond
Fund
Denker Global Financial
Fund
Sanlam Global
Property Fund Sanlam World
Equity Fund
USD USD USD USD
Fees incurred during the period ended 30/06/2019 Class A Management Fees (45) (163,871) (1,391) (826)
Class A (EUR) Management Fees - (1,311) - -
Class A (GBP) Management Fees - (2,305) - -
Class B Management Fees (913) (164,895) (79,130) (1,878)
Class C Management Fees (177,113) (32,667) (186,634) (170,426)
Class C (GBP) Management Fees - (9,518) - -
Class D Management Fees - (9,798) - -
Class F (GBP) Management Fees - (1,080) - -
Class G Management Fees - (214,053) - -
(178,071) (599,498) (267,155) (173,130)

SANLAM UNIVERSAL FUNDS PLC
475
NOTES TO AND FORMING PART OF THE UNAUDITED CONDENSED INTERIM FINANCIAL STATEMENTS (CONTINUED) for the six months ended 30 June 2019
8 Related party transactions and significant agreements (continued)
Management and investment management fees (continued)
A summary of management and investment management fees earned during the period ending 30 June 2019 is as follows (continued):
Satrix World Equity Tracker
Fund
SIIP India Opportunities
Fund
Denker Global
Dividend Fund
Sanlam Strategic
Bond Fund
USD USD USD GBP
Fees incurred during the period ended 30/06/2019
Class A Management Fees (63,828) (1,488) (59,256) -
Class A (GBP) Management Fees - - (104) -
Class A Accumulation Management Fees - - - (15,835)
Class A Income Management Fees - - - (2,997)
Class B Management Fees - - (234) -
Class C Management Fees (127,177) (66,034) (17,746) -
Class C Accumulation Management Fees - - (348,643) -
Class C (GBP) Accumulation Management Fees - - (335) -
Class D Management Fees (341,435) (47) - -
Class I Management Fees (786,907) - (22,481) -
Class I (GBP) Management Fees (2,015) - - -
Class I Accumulation (USD) Management Fees - - - (1,925)
Class I Accumulation Management Fees - - - (227,933)
Class I Accumulation (EUR) Management Fees - - - (2,374)
Class I Income Management Fees - - - (197,317)
Class I Income (EUR) Management Fees - - - (4,877)
Class I Income (USD) Management Fees - - - (9,633)
Class P Income Management Fees - - - (222,428)
Class P Accumulation Management Fees - - - (103,428)
Class P (USD) Accumulation Management Fees - - - (31,214)
Class S Management Fees (19,989) - - -
(1,341,351) (67,569) (448,799) (819,961)
Sanlam Accel Income Fund
Satrix North America Equity
Tracker Fund
Satrix UK Equity
Tracker Fund
Satrix Europe (ex UK) Equity Tracker Fund
GBP USD GBP EUR
Fees incurred during the period ended 30/06/2019
Class A Management Fees - (185) - (9,851)
Class A Accumulation Management Fees (46,110) - - -
Class A Income Management Fees (86,869) - - -
Class C Management Fees - - - (8,465)
Class D Management Fees - - - (19,394)
Class I Management Fees - (2,257) (2,685) (57,409)
Class I (GBP) Management Fees - (713) (1,084) (638)
(132,979) (3,155) (3,769) (95,757)

SANLAM UNIVERSAL FUNDS PLC
476
NOTES TO AND FORMING PART OF THE UNAUDITED CONDENSED INTERIM FINANCIAL STATEMENTS (CONTINUED) for the six months ended 30 June 2019
8 Related party transactions and significant agreements (continued)
Management and investment management fees (continued)
A summary of management and investment management fees earned during the period ending 30 June 2019 is as follows (continued):
Satrix Emerging
Market Equity Tracker Fund
Sanlam Managed Risk
Fund
Sanlam Global High
Quality Fund
Sanlam US Dividend
Fund
USD USD GBP USD
Fees incurred during the period ended 30/06/2019 Class A Management Fees (18,720) (61,667) - - Class A (AUD) Management Fees - (910) - - Class A (CHF) Management Fees - (175) - - Class A (EUR) Management Fees - (4,120) - - Class A (GBP) Management Fees - (43,655) - - Class A (SEK) Management Fees - (89) - - Class A (USD) Accumulation Management Fees - - - (390,127) Class A (GBP) Accumulation Management Fees - - (11,455) (129,123) Class A (USD) Distribution Management Fees - - - (14,079) Class A (EUR) Distribution Management Fees - - - (789) Class A (GBP) Distribution Management Fees - - - (150,998) Class B (GBP) Accumulation Management Fees - - (26) (37,750) Class B (USD) Accumulation Management Fees - - - (62,724) Class C (GBP) Accumulation Management Fees - - (200,376) - Class C (GBP) Income Management Fees - - (72,067) - Class D Management Fees (14,335) - - - Class D (USD) Accumulation Management Fees - - (550,301) - Class D (USD) Income Management Fees - - (9,235) - Class E (USD) Accumulation Management Fees - - (437,101) - Class G Accumulation Management Fees - - (51,594) - Class G (USD) Income Management Fees - - (602) - Class H (GBP) Distribution Management Fees - - - (42,429) Class H (GBP) Accumulation Management Fees - - - (13,345) Class I Management Fees (41,535) (152,961) - - Class I (EUR) Management Fees - (1,199) - - Class I (GBP) Management Fees (13,614) (62,464) - - Class I Accumulation (USD) Management Fees - - (11,761) - Class I (GBP) Accumulation Management Fees - - (14,916) - Class I (GBP) Income Management Fees - - (7,063) - Class L Management Fees - (10,423) - - Class L (AUD) Management Fees - (1,130) - - Class L (EUR) Management Fees - (1,711) - - Class L (GBP) Management Fees - (11,575) - - Class N Management Fees - (44,213) - - Class N (AUD) Management Fees - (475) - - Class N (EUR) Management Fees - (2,813) - - Class N (GBP) Management Fees - (23,000) - - Class N2 Management Fees - (23,089) - -
Class N2 (AUD) Management Fees - (1,169) - -
Class N2 (EUR) Management Fees - (199) - -
Class N2 (GBP) Management Fees - (26,180) - -
(88,204) (473,217) (1,366,497) (841,364)
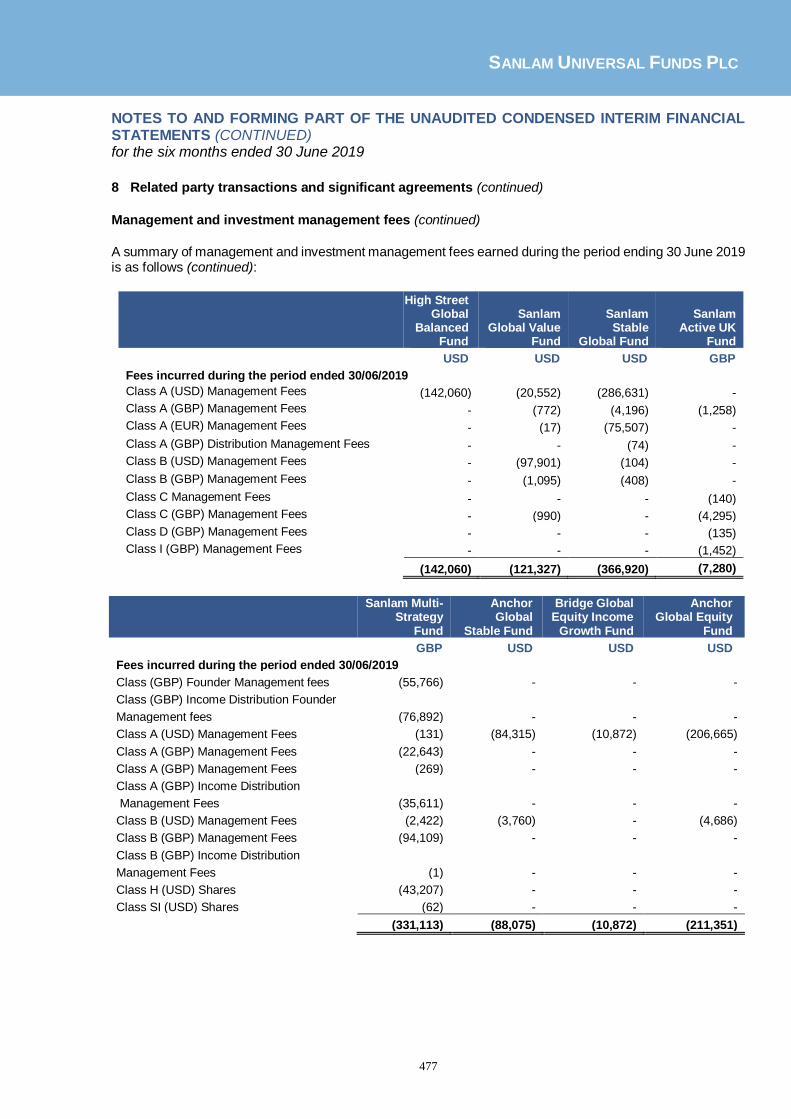
SANLAM UNIVERSAL FUNDS PLC
477
NOTES TO AND FORMING PART OF THE UNAUDITED CONDENSED INTERIM FINANCIAL STATEMENTS (CONTINUED) for the six months ended 30 June 2019
8 Related party transactions and significant agreements (continued)
Management and investment management fees (continued)
A summary of management and investment management fees earned during the period ending 30 June 2019 is as follows (continued):
High Street Global
Balanced Fund
Sanlam Global Value
Fund
Sanlam Stable
Global Fund
Sanlam Active UK
Fund
USD USD USD GBP
Fees incurred during the period ended 30/06/2019
Class A (USD) Management Fees (142,060) (20,552) (286,631) -
Class A (GBP) Management Fees - (772) (4,196) (1,258)
Class A (EUR) Management Fees - (17) (75,507) -
Class A (GBP) Distribution Management Fees - - (74) -
Class B (USD) Management Fees - (97,901) (104) -
Class B (GBP) Management Fees - (1,095) (408) -
Class C Management Fees - - - (140)
Class C (GBP) Management Fees - (990) - (4,295)
Class D (GBP) Management Fees - - - (135)
Class I (GBP) Management Fees - - - (1,452)
(142,060) (121,327) (366,920) (7,280)
Sanlam Multi-Strategy
Fund
Anchor Global
Stable Fund
Bridge Global Equity Income
Growth Fund
Anchor Global Equity
Fund
GBP USD USD USD
Fees incurred during the period ended 30/06/2019
Class (GBP) Founder Management fees (55,766) - - -
Class (GBP) Income Distribution Founder
Management fees (76,892) - - -
Class A (USD) Management Fees (131) (84,315) (10,872) (206,665)
Class A (GBP) Management Fees (22,643) - - -
Class A (GBP) Management Fees (269) - - -
Class A (GBP) Income Distribution
Management Fees (35,611) - - -
Class B (USD) Management Fees (2,422) (3,760) - (4,686)
Class B (GBP) Management Fees (94,109) - - -
Class B (GBP) Income Distribution
Management Fees (1) - - -
Class H (USD) Shares (43,207) - - -
Class SI (USD) Shares (62) - - -
(331,113) (88,075) (10,872) (211,351)

SANLAM UNIVERSAL FUNDS PLC
478
NOTES TO AND FORMING PART OF THE UNAUDITED CONDENSED INTERIM FINANCIAL STATEMENTS (CONTINUED) for the six months ended 30 June 2019
8 Related party transactions and significant agreements (continued)
Management and investment management fees (continued)
A summary of management and investment management fees earned during the period ending 30 June 2019 is as follows (continued):
Bridge Global Managed
Growth Fund
Sanlam Global Emerging
Markets Fund ABSA Africa Equity Fund
Sanlam Global Convertible
Securities Fund
USD USD USD USD
Fees incurred during the period ended 30/06/2019
Class A Management Fees (63,501) (27,612) (126,943)
Class A1 Management Fees - (15,309) - -
Class A2 Management Fees - (973) - -
Class B1 Management Fees - (2,546) - -
Class B2 Management Fees - (79,652) - -
Class C1 Management Fees - (43,601) - -
Class C2 Management Fees - (85,860) - -
Class C2 (GBP) Management Fees - (1,315) - -
Class D2 Management Fees - (161,943) - -
(63,501) (391,199) (27,612) (126,943)
Sanlam Centre Active US
Treasury Fund Autus Global Equity Fund
Wisian Capital South African
Equity Fund
Cameron Hume Global Fixed Income
ESG Fund
USD USD USD Fees incurred during the period ended 30/06/2019
Class A Management Fees - (1,254) (44,039) -
Class B Management Fees - (81,741) (960) -
Class C Management Fees (369) - - -
Class E Management Fees - - - (75,184)
(369) (82,995) (44,999) (75,184)
Sanlam Centre Global Listed
Infrastructrure Fund
Sanlam Real Assets Fund
Satrix Global Factor
Enhanced Equity Fund
Perpetua
Global Equity UCITS Fund
USD USD USD USD Fees incurred during the period ended 30/06/2019
Class A Management Fees - - - (67,324)
Class A Distribution (GBP) Shares - (61) - -
Class B Accumulation (GBP) Shares - (176) - -
Class D Distribution (GBP) Shares - (2,070) - -
Class SI Accumulation Shares - (206,611) - -
Class SR Accumulation Shares - (85,814) - -
Class C Management Fees (23) - - -
Class C (GBP) Management Fees (21) - - -
Class H Management Fees - - (68,827) -
(44) (294,732) (68,827) (67,324)

SANLAM UNIVERSAL FUNDS PLC
479
NOTES TO AND FORMING PART OF THE UNAUDITED CONDENSED INTERIM FINANCIAL STATEMENTS (CONTINUED) for the six months ended 30 June 2019
8 Related party transactions and significant agreements (continued)
Management and investment management fees (continued)
A summary of management and investment management fees earned during the period and outstanding accrued fees as at 30 June 2018 is as follows:
Bridge Global Property
Income Fund
P-Solve Inflation Plus
Fund
Sanlam African Frontier
Markets Fund
USD GBP USD
Fees accrued at 30/06/2018 Class A Management Fees (227,296) (115) (21,421)
Class B Management Fees - (24,809) (65,161)
Class B (Accumulation) Management Fees - - -
Class C Management Fees - - -
Class D Management Fees - - -
Class F Management Fees - - (3,698)
Class G Management Fees - - (223,681)
Non-Distributing Class Management Fees - - -
(227,296) (24,924) (313,961)
Denker Global Equity
Fund
Sanlam Global Bond
Fund
Denker Global
Financial Fund
Sanlam Global
Property Fund
USD USD USD USD
Fees incurred during the period ended 30/06/2018 Class A Management Fees (94,567) (55) (193,679) (306)
Class A (EUR) Management Fees (2) - (1,940) -
Class A (GBP) Management Fees (992) - (4,527) -
Class B Management Fees (178,121) (945) (191,286) (89,529)
Class C Management Fees (72,406) (195,826) (40,581) (150,723)
Class C (GBP) Management Fees (8) - (11,225) -
Class D Management Fees - - (4,831) -
Class F Management Fees (65) - - -
Class F (GBP) Management Fees - - (1,217) -
Class G Management Fees - - (185,590) -
(346,161) (196,826) (634,876) (240,558)

SANLAM UNIVERSAL FUNDS PLC
480
NOTES TO AND FORMING PART OF THE UNAUDITED CONDENSED INTERIM FINANCIAL STATEMENTS (CONTINUED) for the six months ended 30 June 2019
8 Related party transactions and significant agreements (continued)
Management and investment management fees (continued)
A summary of management and investment management fees earned during the period and outstanding accrued fees as at 30 June 2018 is as follows (continued):
Sanlam World Equity Fund
Satrix World Equity Tracker
Fund
SIIP India Opportunities
Fund
Denker Global
Dividend Fund
USD USD USD USD
Fees incurred during the period ended 30/06/2018
Class A Management Fees (871) (181,361) (1,219) (66,230)
Class A (GBP) Management Fees - - - (122)
Class B Management Fees (128,156) - - (323)
Class C Management Fees (1,020,828) (249,587) (83,328) (21,612)
Class C Accumulation Management Fees - - - (487,092)
Class C (GBP) Accumulation Management Fees - - - (360)
Class D Management Fees - - (83) -
Class I Management Fees - (733,297) - (37,149)
Class I (GBP) Management Fees - (1,439) - -
Class S Management Fees - (34,624) - -
(1,149,855) (1,200,308) (84,630) (612,888)

SANLAM UNIVERSAL FUNDS PLC
481
NOTES TO AND FORMING PART OF THE UNAUDITED CONDENSED INTERIM FINANCIAL STATEMENTS (CONTINUED) for the six months ended 30 June 2019
8 Related party transactions and significant agreements (continued)
Management and investment management fees (continued)
A summary of management and investment management fees earned during the period and outstanding accrued fees as at 30 June 2018 is as follows (continued):
Sanlam Strategic
Bond Fund Sanlam Accel Income Fund
Satrix North America
Equity Tracker Fund
Satrix UK Equity
Tracker Fund
GBP GBP USD GBP
Fees incurred during the period ended 30/06/2018
Class A Management Fees - - (481) (46)
Class A Accumulation Management Fees (4,884) (16,571) - -
Class A Income Management Fees (1,439) (31,364) - -
Class C (GBP) Accumulation Management
Fees (54) - - -
Class I Management Fees - - (1,997) (14,651)
Class I (GBP) Management Fees - - (753) (1,104)
Class I Accumulation Management Fees (64,799) - - -
Class I Accumulation (EUR) Management
Fees (1,757)
- - -
Class I Income Management Fees (41,669) - - -
Class I Income (EUR) Management Fees (2,187) - - -
Class I Income (USD) Management Fees (15,193) - - -
Class P Income Management Fees (190,345) - - -
Class P Accumulation Management Fees (73,991) - - -
Class P (USD) Accumulation Management
Fees (26,826)
- - -
(423,144) (47,935) (3,231) (15,801)

SANLAM UNIVERSAL FUNDS PLC
482
NOTES TO AND FORMING PART OF THE UNAUDITED CONDENSED INTERIM FINANCIAL STATEMENTS (CONTINUED) for the six months ended 30 June 2019
8 Related party transactions and significant agreements (continued)
Management and investment management fees (continued)
A summary of management and investment management fees earned during the period and outstanding accrued fees as at 30 June 2018 is as follows (continued):
Satrix Europe (ex UK) Equity Tracker Fund
Sanlam Equity
Allocation Fund
Satrix Emerging
Market Equity Tracker Fund
Sanlam Managed Risk Fund
EUR USD USD USD
Fees incurred during the period ended 30/06/2018
Class A Management Fees (23,276) - (61,344) (5,516)
Class A (EUR) Management Fees - - - (258)
Class A (GBP) Management Fees - - - (25,596)
Class C Management Fees (14,418) - - -
Class I Management Fees (93,650) - (42,417) (148,680)
Class I (GBP) Management Fees (987) - (18,782) (51,003)
Class I (EUR) Management Fees - - - (933)
Class N Management Fees - - - (7,671)
Class N (EUR) Management Fees - - - (1,807)
Class N (GBP) Management Fees - - - (6,456)
(132,331) - (122,543) (247,920)

SANLAM UNIVERSAL FUNDS PLC
483
NOTES TO AND FORMING PART OF THE UNAUDITED CONDENSED INTERIM FINANCIAL STATEMENTS (CONTINUED) for the six months ended 30 June 2019
8 Related party transactions and significant agreements (continued)
Management and investment management fees (continued)
A summary of management and investment management fees earned during the period and outstanding accrued fees as at 30 June 2018 is as follows (continued):
Sanlam Global High Quality
Fund
Sanlam US Dividend
Fund
High Street Global
Balanced Fund
GBP USD USD
Fees incurred during the period ended 30/06/2018
Class A Management Fees - (139,047) (98,923)
Class A (GBP) Management Fees - - -
Class A (EUR) Management Fees - - - Class A (USD) Accumulation Management Fees - -
-
Class A (GBP) Accumulation Management Fees (10,143) -
-
Class A (USD) Distribution Management Fees - - -
Class A (EUR) Distribution Management Fees - - -
Class A (GBP) Distribution Management Fees - - -
Class B Management Fees - - -
Class B (GBP) Management Fees - - -
Class B (EUR) Management Fees - - - Class B (USD) Accumulation Management Fees - (105,128)
-
Class C (GBP) Management Fees (82,578) (234,217) - Class C (GBP) Accumulation Management Fees (47,768) -
-
Class C (GBP) Income Management Fees - - - Class D (USD) Accumulation Management Fees (449,579)
(1,125) -
Class E (USD) Accumulation Management Fees (365,993)
- -
Class F (GBP) Accumulation Management Fees (5,096)
(47,087) -
Class F (GBP) Income Management Fees (6,725) (10,039) -
Class G Accumulation Management Fees (28,020) - -
Class G Income Management Fees (588) - -
(996,490) (536,643) (98,923)

SANLAM UNIVERSAL FUNDS PLC
484
NOTES TO AND FORMING PART OF THE UNAUDITED CONDENSED INTERIM FINANCIAL STATEMENTS (CONTINUED) for the six months ended 30 June 2019
8 Related party transactions and significant agreements (continued) Management and investment management fees (continued) A summary of management and investment management fees earned during the period and outstanding accrued fees as at 30 June 2018 is as follows (continued):
Sanlam Global Value
Fund
Sanlam Stable
Global Fund Sanlam Active
UK Fund Sanlam Multi-Strategy Fund
USD USD GBP GBP
Fees incurred during the period ended 30/06/2018
Class (GBP) Founder Management fees - - - -
Class (GBP) Income Distribution Founder
Management fees - - - -
Class A (USD) Management Fees (20,743) (104,349) - (6,642)
Class A (GBP) Management Fees (3,866) (5,683) (2,451) -
Class A (EUR) Management Fees (17) (34,910) - -
Class A (GBP) Distribution Management
Fees - (69) - (12,123)
Class B (USD) Management Fees (123,109) (88,617) (3,552) (14,876)
Class B (GBP) Management Fees (7,088) (488) (61,492) -
Class C Management Fees (13) - (5,953) (31,864)
Class C (GBP) Management Fees (1,076) - (181) -
Class D (GBP) Management Fees - - (175) -
Class I (GBP) Management Fees - - (2,122) (142)
(155,912) (234,116) (75,926) 65,647

SANLAM UNIVERSAL FUNDS PLC
485
NOTES TO AND FORMING PART OF THE UNAUDITED CONDENSED INTERIM FINANCIAL STATEMENTS (CONTINUED) for the six months ended 30 June 2019
8 Related party transactions and significant agreements (continued)
Management and investment management fees (continued)
A summary of management and investment management fees earned during the period and outstanding accrued fees as at 30 June 2018 is as follows (continued):
Anchor Global Stable
Fund
Bridge Global Equity Income
Growth Fund Anchor Global
Equity Fund
Bridge Global Managed
Growth Fund
USD USD USD USD
Fees incurred during the period ended 30/06/2018
Class A Management Fees (90,110) (19,736) (200,870) (44,376)
(90,110) (19,736) (200,870) (44,376)
Sanlam Global
Emerging Markets Fund
ABSA Africa Equity Fund
Sanlam Centre American
Select Equity Fund
Sanlam Global Convertible
Securities Fund
USD USD USD USD
Fees incurred during the period ended 30/06/2018
Class A Management Fees (89,131) (141,873) (25) (156,847)
Class A1 Management Fees (18,665) - - -
Class A2 Management Fees (888) - - -
Class B1 Management Fees (2,009) - - -
Class B2 Management Fees (168,329) - - -
Class C Management Fees - - (23) -
Class C (GBP) Management Fees - - (25) -
Class C1 Management Fees (90,194) - - -
Class C2 Management Fees (177,313) - - -
Class E Management Fees (2,308) - - -
(548,837) (141,873) (73) (156,847)
Sanlam Centre American US
Treasury Fund Autus Global Equity Fund
Wisian Capital South African
Equity Fund
USD USD USD Fees incurred during the period ended 30/06/2018
Class A Management Fees - (175) (23,066)
Class B Management Fees - (95,792) -
Class C Management Fees (4,496) - -
(4,496) (95,967) (23,066)
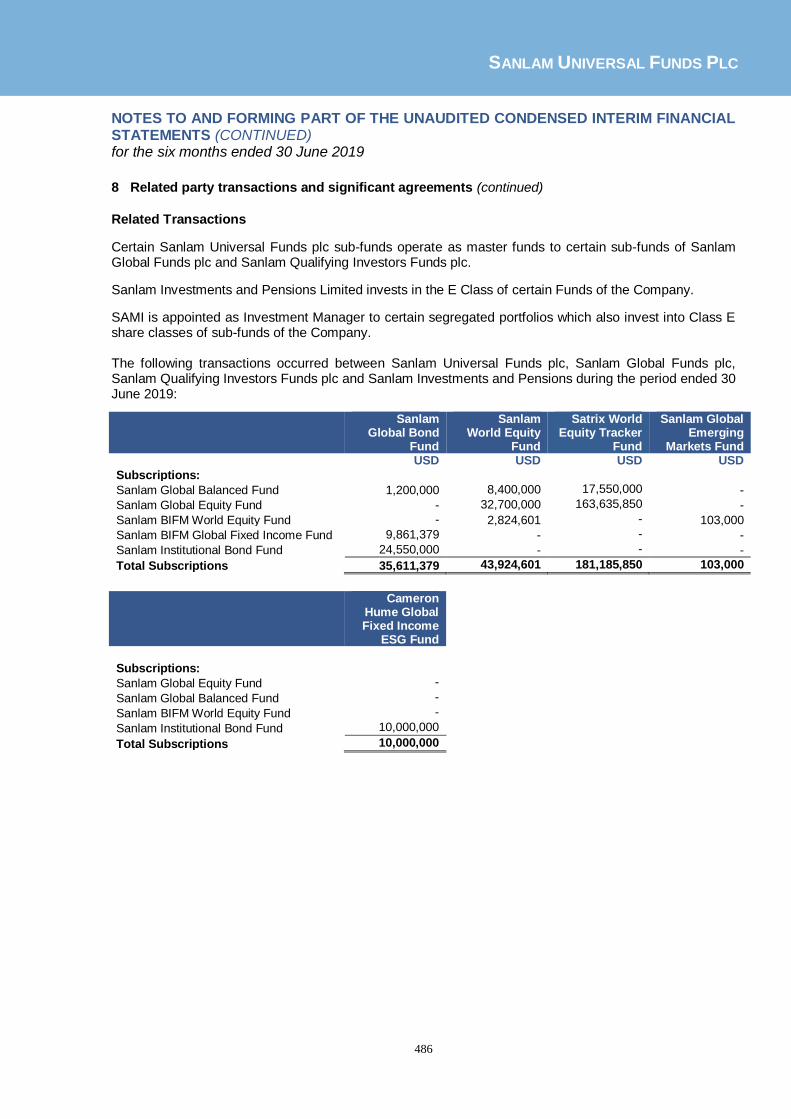
SANLAM UNIVERSAL FUNDS PLC
486
NOTES TO AND FORMING PART OF THE UNAUDITED CONDENSED INTERIM FINANCIAL STATEMENTS (CONTINUED) for the six months ended 30 June 2019
8 Related party transactions and significant agreements (continued)
Related Transactions
Certain Sanlam Universal Funds plc sub-funds operate as master funds to certain sub-funds of Sanlam Global Funds plc and Sanlam Qualifying Investors Funds plc.
Sanlam Investments and Pensions Limited invests in the E Class of certain Funds of the Company.
SAMI is appointed as Investment Manager to certain segregated portfolios which also invest into Class E share classes of sub-funds of the Company. The following transactions occurred between Sanlam Universal Funds plc, Sanlam Global Funds plc, Sanlam Qualifying Investors Funds plc and Sanlam Investments and Pensions during the period ended 30 June 2019:
Sanlam Global Bond
Fund
Sanlam World Equity
Fund
Satrix World Equity Tracker
Fund
Sanlam Global Emerging
Markets Fund USD USD USD USD
Subscriptions:
Sanlam Global Balanced Fund 1,200,000 8,400,000 17,550,000 -
Sanlam Global Equity Fund - 32,700,000 163,635,850 -
Sanlam BIFM World Equity Fund - 2,824,601 - 103,000
Sanlam BIFM Global Fixed Income Fund 9,861,379 - - -
Sanlam Institutional Bond Fund 24,550,000 - - -
Total Subscriptions 35,611,379 43,924,601 181,185,850 103,000
Cameron Hume Global Fixed Income
ESG Fund
Subscriptions:
Sanlam Global Equity Fund -
Sanlam Global Balanced Fund -
Sanlam BIFM World Equity Fund -
Sanlam Institutional Bond Fund 10,000,000
Total Subscriptions 10,000,000

SANLAM UNIVERSAL FUNDS PLC
487
NOTES TO AND FORMING PART OF THE UNAUDITED CONDENSED INTERIM FINANCIAL STATEMENTS (CONTINUED) for the six months ended 30 June 2019
8 Related party transactions and significant agreements (continued)
Related Transactions (continued)
Sanlam
Global Bond
Fund
Sanlam
Global
Property
Fund
Sanlam World
Equity
Fund
Satrix World
Equity Tracker
Fund
USD USD USD USD
Redemptions:
Sanlam Global Balanced Fund (1,150,000) (350,000) - -
Sanlam Global Equity Fund - - - (4,000,000)
Sanlam BIFM World Equity Fund - - (153,000) -
Sanlam BIFM Global Fixed Income Fund (160,000) - - -
Sanlam Institutional Bond Fund (5,500,000) - - -
Total Redemptions (6,810,000) (350,000) (153,000) (4,000,000)
Satrix North
America
Equity
Tracker Fund
Satrix UK
Equity Tracker
Fund
Sanlam Europe
(ex UK) Equity
Tracker Fund
Sanlam US
Dividend Fund
USD USD USD USD
Redemptions:
Sanlam Global Balanced Fund (10,500,000) (8,909,928) - (3,200,000)
Sanlam Global Equity Fund (87,740,784) (38,795,066) - (6,660,000)
Sanlam Institutional Equity Flexible Fund - - (125,181,450) -
Total Redemptions (98,240,784) (47,704,994) (125,181,450) (9,860,000)
Sanlam Global Value Fund
Sanlam Active UK Fund
Sanlam Centre American
Select Equity Fund
Sanlam Japan Equity Fund
USD USD USD USD
Redemptions:
Sanlam Global Balanced Fund (700,000) (822,463) (5,900,000) (6,325,000)
Sanlam Global Equity Fund (36,700,000) (1,190,033) (11,640,000) (40,875,000)
Total Redemptions (37,400,000) (2,012,497) (17,540,000) (47,200,000)
Cameron Hume Global Fixed Income
ESG Fund USD
Redemptions:
Sanlam Institutional Bond Fund (13,200,000)
Total Redemptions (13,200,000)

SANLAM UNIVERSAL FUNDS PLC
488
NOTES TO AND FORMING PART OF THE UNAUDITED CONDENSED INTERIM FINANCIAL STATEMENTS (CONTINUED) for the six months ended 30 June 2019
8 Related party transactions and significant agreements (continued)
Related Transactions (continued) The following transactions occurred between Sanlam Universal Funds plc, Sanlam Global Funds plc, Sanlam Qualifying Investors Funds plc and Sanlam Investments and Pensions during the period ended 30 June 2018:
Sanlam
Global Bond Fund
Sanlam World Equity
Fund
Satrix World Equity Tracker
Fund
Sanlam Strategic Bond
Fund USD USD USD USD
Subscriptions:
Sanlam Global Equity Fund - - 118,000,000 -
Sanlam BIFM World Equity Fund - 75,275 - -
Sanlam BIFM Global Fixed Income Fund 43,101 - - -
Total Subscriptions 43,101 75,275 118,000,000 -
Sanlam
Accel Income
Fund
Satrix North
America
Equity
Tracker
Satrix UK
Equity Tracker
Fund
Satrix Europe
(ex UK) Equity
Tracker Fund
USD USD USD USD
Subscriptions:
Sanlam Global Balanced Fund - - - 7,847
Sanlam Global Equity Fund - 3,000,000 - 104,522
Total Subscriptions - 3,000,000 - 112,369
Sanlam Global High Quality
Fund Sanlam US
Dividend Fund
Sanlam FOUR Active
European (ex-UK) Equity
Fund Sanlam Stable
Global Fund USD USD USD USD
Subscriptions:
Sanlam Global Balanced Fund - 21,012 1,588 25,746
Sanlam Global Equity Fund 26,850 222,131 - 312,882
Total Subscriptions 26,850 243,143 1,588 254,021
Sanlam Active UK Fund
Sanlam Multi-Strategy Fund
Sanlam Global Emerging
Markets Fund
Sanlam Japan Equity
Fund USD USD USD USD
Subscriptions:
Sanlam Global Equity Fund 30,664 - - 12,000,000
Sanlam Global Balanced Fund - 12,133 - -
Sanlam BIFM World Equity Fund - - 457,652 -
Total Subscriptions 30,664 12,133 457,652 12,000,000

SANLAM UNIVERSAL FUNDS PLC
489
NOTES TO AND FORMING PART OF THE UNAUDITED CONDENSED INTERIM FINANCIAL STATEMENTS (CONTINUED) for the six months ended 30 June 2019
8 Related party transactions and significant agreements (continued)
Related Transactions (continued)
Sanlam FOUR Enhanced
Income Fund
Sanlam Global Value
Fund USD USD
Subscriptions:
Sanlam Global Equity Fund 184,355 232,949
Sanlam Global Balanced Fund - 19,739
Total Subscriptions 184,355 252,688
Sanlam
Global Bond
Fund
Sanlam
Global
Property
Fund
Sanlam World
Equity
Fund
Satrix World
Equity Tracker
Fund
USD USD USD USD
Redemptions:
Sanlam Global Balanced Fund (1,400,000) (300,000) - -
Sanlam BIFM World Equity Fund - - (12,261,857) -
Sanlam BIFM Global Fixed Income Fund (4,171,112) - - -
Mpile Global Equity Fund - - - (9,433,755)
Total Redemptions (5,571,112) (300,000) (12,261,857) (9,433,755)
Satrix North
America
Equity
Tracker Fund
Satrix Europe
(ex UK) Equity
Tracker Fund
Sanlam US
Dividend Fund
Sanlam Global
Value Fund
USD EUR USD USD
Redemptions:
Sanlam Global Balanced Fund (1,000,000) (1,000,000) (1,500,000) -
Sanlam Global Equity Fund (1,500,000) (7,517,223) (5,000,000) (5,000,000)
Mpile Global Equity Fund - - - -
Total Redemptions (2,500,000) (8,517,223) (6,500,000) (5,000,000)
Sanlam Stable Global Fund
Sanlam Active UK Fund
Sanlam Multi-Strategy Fund
Sanlam Global Emerging
Markets Fund USD USD USD USD
Redemptions:
Sanlam Global Balanced Fund (2,800,000) - (6,125) -
Sanlam Global Equity Fund (99,400,000) (4,340) - -
Mpile Global Equity Fund (8,540,626) - - -
Sanlam BIFM World Equity Fund - - - (5,064,353)
Total Redemptions (110,740,626) (4,340) (6,125) (5,064,353)
Sanlam Centre American
Select Equity Fund
Sanlam Japan Equity Fund
USD USD
Redemptions:
Sanlam Global Equity Fund (4,000,000) (9,600,000)
Total Redemptions (4,000,000) (9,600,000)

SANLAM UNIVERSAL FUNDS PLC
490
NOTES TO AND FORMING PART OF THE UNAUDITED CONDENSED INTERIM FINANCIAL STATEMENTS (CONTINUED) for the six months ended 30 June 2019
8 Related party transactions and significant agreements (continued)
Related Transactions (continued)
Salam Four Active
European (ex UK) Equity
Fund
Bridge Global Property
Income Fund
Sanlam Centre
American Select Equity
Fund Sanlam Active
UK Fund USD USD USD USD
Redemptions:
Sanlam Global Balanced Fund 11,949,366 400,000 -
Sanlam Global Equity Fund 108,769,776 - 14,600,000 18,950,000
Total Redemptions 120,719,142 400,000 14,600,000 18,950,000
Sanlam US Dividend Fund
Sanlam Japan Equity Fund
USD USD
Redemptions:
Sanlam Global Equity Fund 8,250,000 8,700,000
Total Redemptions 8,250,000 8,700,000
In-specie transfers
The following in-specie transfers occurred during the period ended 30 June 2019:
Redemptions from P-Solve Inflation Plus Fund by the shareholder, PSigma Ericsson, were made by means
of a transfer of assets with a fair value at date of transfer of GBP 43,828,369.
A subscription on 26 June 2019 for shares in Sanlam Centre American Select Equity Fund was made by
means of transfer of assets with a fair value at date of transfer of USD 137,489,373
Sanlam Global Equity Fund, a feeder fund to a number of the sub-funds of the Company divested and
reinvested in sub-funds of the Company by means of transferring assets between sub-funds as follows:
Fund Fair value
Satrix Europe ex UK Equity Tracker Fund USD (21,320,210)
Satrix North America Equity Tracker Fund USD (87,740,784)
Satrix UK Equity Tracker Fund USD (4,794,530)
Satrix World Equity Tracker Fund USD (113,855,524)
Sanlam Global Balanced Fund, a feeder fund to a number of the sub-funds of the Company divested and
reinvested in sub-funds of the Company by means of transferring assets between sub-funds as follows:
Fund Fair value
Satrix Europe ex UK Equity Tracker Fund USD (2,800,000)
Satrix North America Equity Tracker Fund USD (9,800,000)
Satrix UK Equity Tracker Fund USD (800,000)
Satrix World Equity Tracker Fund USD 13,400,000

SANLAM UNIVERSAL FUNDS PLC
491
NOTES TO AND FORMING PART OF THE UNAUDITED CONDENSED INTERIM FINANCIAL STATEMENTS (CONTINUED) for the six months ended 30 June 2019
8 Related party transactions and significant agreements (continued)
Related Transactions (continued)
In-specie transfers (continued) At an EGM on 25 March 2019, shareholders of Bridge Global Equity Income Growth Fund approved the merger of the fund into Bridge Global Managed Growth Fund. The merger took effect from 23.59pm on Friday 12 April 2019. As part of the merger assets of Bridge Global Equity Income Growth Fund were transferred to Bridge Global Managed Growth Fund. The fair value of the assets at the date of transfer was USD 4,305,286. There were no in-specie transfers during the period ended 30 June 2018.
Cross Investments
The following are the fair values of intercompany positions held by Funds within the Company at 30 June
2019:
Fund Name Position Held Fair Value at 30 June 2019
Sanlam Accel Income Fund Sanlam US Dividend Fund GBP 1,676,260
Sanlam Accel Income Fund Sanlam Strategic Bond Fund GBP 1,669,674
Sanlam Managed Risk Fund Satrix World Equity Tracker Fund USD 82,943,260
The following are the fair values of intercompany positions held by Funds within the Company at 31
December 2018:
Fund Name Position Held
Fair Value at 31 December
2018
Sanlam Accel Income Fund Sanlam US Dividend Fund GBP 1,492,167
Sanlam Accel Income Fund Sanlam Strategic Bond Fund GBP 1,789,692
Sanlam Managed Risk Fund Satrix World Equity Tracker Fund USD 69,696,549
The Sanlam Accel Income Fund maintains an investment policy whereby if the Funds invest in shares of a collective investment scheme managed by the same management company or by an associated or related company, the manager of the scheme in which the investment is being made must waive the preliminary/initial/redemption charge and any management fee which it would normally charge. The Sanlam Managed Risk Fund’s investment objective is achieved by investing in Satrix World Equity Tracker Fund. The Fund invests no less than 85% of its net asset value in the shares of the Satrix World Equity Tracker Fund. The Manager has put in place internal conduct of business rules in relation to the investment in the Satrix World Equity Tracker Fund. Details of the Managers policies with respect to cross investment are documented in the Prospectus of the Company and the offering supplements of applicable Funds. Further details regarding the intercompany positions as disclosed above and the investment strategies of the relevant funds are disclosed in the portfolio of investments and the reports of the investments managers.
SANLAM UNIVERSAL FUNDS PLC
492
NOTES TO AND FORMING PART OF THE UNAUDITED CONDENSED INTERIM FINANCIAL STATEMENTS (CONTINUED) for the six months ended 30 June 2019
9 Transactions in Financial Derivative Instruments
The Funds may engage in transactions in Financial Derivative Instruments (FDI) for the purposes of efficient portfolio management, investment and/or to protect against risks within the conditions and limits laid down by the Central Bank from time to time. Hedging is used by the Funds to limit or control risks, such as adverse movements in exchange rates and interest returns. By purchasing certain instruments, the Funds may more effectively achieve the desired portfolio characteristics that assist the Funds in meeting their investment objectives. The relevant Investment Manager will look to ensure that the techniques and instruments used are economically appropriate in that they will be realised in a cost-effective way. Specific instruments At 30 June 2019, 22 Funds hold derivative financial instruments, namely forward currency contracts, futures contracts, interest rate swaps, warrants and option contracts. Details of the open derivative financial instruments at the reporting date are included in the Portfolio of Investment for each Fund.
Forward currency contracts Certain of the Funds may invest in Forward currency contracts. As part of its investment policy, a Fund may enter into transactions which alter the currency exposure of underlying assets in which the Fund is invested from time to time where the Investment Manager considers it appropriate to retain the currency exposure consistent with the Fund's investment objective. This may involve a Fund investing in an asset denominated in currency (X) where the Investment Manager wishes to translate the currency denomination of that asset (X) into a third party currency (Y) that may be different to the base currency through the use of forward currency contracts. There can be no guarantees that the practice of investing in an uncorrelated currency (Y) will be effective and there is a risk of loss in the event of adverse currency movements relative to both the currency of denomination and the base currency. Investment in FDI permits the Fund to manage risk and invest more efficiently to achieve the investment objective of the Fund. These strategies include increasing the level of exposure to non-base currency in the Fund’s portfolio in response to the Investment Manager’s views on market prospects and prices and values. Gains and losses arising from such transactions are reflected at Fund level in the Statement of Comprehensive Income. Where a Fund utilises FDI which alter the currency exposure characteristics of transferable securities held by that Fund, the performance of that Fund may be strongly influenced by movements in foreign exchange rates because currency positions held by the Fund may not correspond with the securities positions held. Futures contracts Certain of the Funds may invest in Futures contracts for hedging or investment purposes. Futures contracts allow investors to hedge against market risk or modify exposure to the underlying market. They can also be used to "equitise" cash balances as described in note 10. Using futures to achieve a particular strategy instead of transacting the underlying or related equity security or equity index, can result in both lower transaction costs as well as more timely execution of portfolio strategy. Since these contracts are marked to market daily, investors can, by closing out their position, exit from their obligation to buy or sell the underlying assets prior to the contract's delivery date. Futures contracts are valued based upon their quoted daily settlement prices. Changes in the value of open futures contracts are recognised as unrealised gains or losses on futures contracts until the contracts are terminated, at which time realised gains and losses are recognised.

SANLAM UNIVERSAL FUNDS PLC
493
NOTES TO AND FORMING PART OF THE UNAUDITED CONDENSED INTERIM FINANCIAL STATEMENTS (CONTINUED) for the six months ended 30 June 2019
9 Transactions in Financial Derivative Instruments (continued)
Interest rate swaps Interest rate swaps may be used for hedging against adverse movements in interest rate. Interest rate swaps involve the exchange by a Fund with a counterparty of their respective commitments to pay or receive interest. The differential to be paid or received on the interest rate swap is recognised over the life of the agreement as a realised gain or loss with payments made or received on a net basis on the stated payment dates. The interest rate swap agreements are stated at fair value. Unrealised gains/losses are reported in the Statement of Comprehensive Income.
Option contracts Put options are contracts sold for a premium that gives one party (the buyer) the right, but not the obligation, to sell to the other party (the seller) of the contract, a currency at a specified rate. Call options are similar contracts sold for a premium that gives the buyer the right, but not the obligation, to buy from the seller of the option. A Fund, where permitted to use options, may be a seller or buyer of put and call options. Options are liquid and traded efficiently. Changes in the value of open options contracts are recognised as unrealised gains or losses in the Statement of Comprehensive Income until the contracts are terminated, at which time realised gains and losses are recognised. All open option positions as at 30 June 2018 are covered and are not used for the purposes of obtaining leverage. Risks Market risk This is the general risk attendant to all investments that the value of a particular investment will change in a way detrimental to the portfolio’s interest. Management risk FDI are highly specialised instruments that require investment techniques and risk analyses different from those associated with stocks and bonds. The successful use of FDI draws upon the Investment Manager’s special skills and experience and usually depends on the Investment Manager’s ability to forecast price movements, interest rates, or currency exchange rate movements correctly. Should prices, interest rates, or exchange rates move unexpectedly, a portfolio may not achieve the anticipated benefits of the transactions or may realise losses and thus be in a worse position than if such strategies had not been used. The use of FDI requires an understanding not only of the underlying instrument but also of the FDI itself, without the benefit of observing the performance of the FDI under all possible market conditions. In particular, the use and complexity of FDI require the maintenance of adequate controls to monitor the transactions entered into, the ability to assess the risk that an FDI adds to a portfolio and the ability to forecast price, interest rate or currency exchange rate movements correctly. Counterparty and Credit Risk This is the risk that a loss may be sustained by a portfolio as a result of the failure of a counterparty to an FDI to comply with the terms of the FDI contract. The credit risk for exchange-traded FDI is generally less than for privately negotiated FDI, since the clearing house, which is the issuer or counterparty to each exchange-traded FDI, provides a guarantee of performance. This guarantee is supported by a daily payment system (i.e., margin requirements) operated by the clearing house in order to reduce overall credit risk. For privately negotiated FDI, there is no similar clearing agency guarantee. Therefore, the Investment Manager will consider the creditworthiness of each counterparty to a privately negotiated FDI in evaluating potential credit risk.
Liquidity Risk Liquidity risk exists when a particular instrument is difficult to purchase or sell. If an FDI transaction is particularly large or if the relevant market is illiquid (as is the case with many privately negotiated FDI), it may not be possible to initiate a transaction or liquidate a position at an advantageous price.

SANLAM UNIVERSAL FUNDS PLC
494
NOTES TO AND FORMING PART OF THE UNAUDITED CONDENSED INTERIM FINANCIAL STATEMENTS (CONTINUED) for the six months ended 30 June 2019
9 Transactions in Financial Derivative Instruments (continued)
Legal Risk The use of OTC FDI, such as forward contracts, swap agreements and CFDs, will expose the Fund to the risk that the legal documentation of the relevant OTC contract may not accurately reflect the intention of the parties. Other risks Other risks in using FDI include the risk of mispricing or improper valuation of FDI and the inability of FDI to correlate perfectly with underlying assets, rates and indices. Many FDI, in particular privately negotiated FDI, are complex and often valued subjectively. Improper valuations can result in increased cash payment requirements to counterparties or a loss of value to the portfolio concerned. FDI do not always perfectly or even closely track the value of the assets, rates or indices they are designed to track. Consequently, a portfolio’s use of FDI may not always be an effective means of, and sometimes could be counterproductive to, furthering the portfolio’s investment objective.
Collateral At 31 June 2019 and 31 December 2018, the Funds have not received any non-cash assets as collateral with respect to the open FDIs. Margin accounts, as disclosed in the Statement of Financial Position, represent cash deposited with brokers transferred against open FDIs. The balances may be restricted.
Gains and losses on Financial Derivative Instruments Details of the net unrealised gains/(losses) on open forward currency contracts, interest rate swaps, futures and options if any, are disclosed in the Portfolio of investments of each Fund. Net realised and change in unrealised gains/(losses) on FDI’s are included in the Statement of Comprehensive Income of each Fund within Net gains/(losses) on financial assets and liabilities at fair value through profit or loss.

SANLAM UNIVERSAL FUNDS PLC
495
NOTES TO AND FORMING PART OF THE UNAUDITED CONDENSED INTERIM FINANCIAL STATEMENTS (CONTINUED) for the six months ended 30 June 2019
10 Efficient portfolio management
The Company on behalf of a Fund may employ techniques and instruments relating to transferable securities, money market instruments and/or other financial instruments in which it invests for efficient portfolio management purposes. Use of such techniques and instruments should be in line with the best interests of Shareholders and will generally be made for one or more of the following reasons: (a) the reduction of risk; (b) the reduction of cost; or (c) the generation of additional capital or income for the relevant Fund with an appropriate level of risk, taking into account the risk profile of the Fund and the risk diversification rules set out in the Central Bank Rules.
The Funds may engage in transactions in Financial Derivative Instruments (FDI) for the purposes of efficient
portfolio management. Further details on the Funds’ investments in FDIs are disclosed in note 9.
The Funds may enter into forward foreign currency contracts for efficient portfolio management purposes. Forward foreign currency exchange contracts are used to hedge against anticipated future changes in exchange rates which otherwise might either adversely affect the value of the Fund’s portfolio securities or adversely affect the price of securities which the Funds intend to purchase at a later date. The Funds may also enter into futures contracts for efficient portfolio management purposes. The primary purpose for which the Funds use futures contracts are cash equalisation, hedging and return enhancement. The purpose of cash equalisation is to expose uninvested cash within the Funds to equity market-like returns and ensure that the Funds’ liquid assets are utilised as though invested in the markets.
Interest rate swaps are used for hedging against adverse movements in interest rates. Options offer the ability, when used as a hedging tool to be utilised in efficient portfolio management, to provide offsetting insurance of asset value in an uncertain or highly volatile market environment. The Funds, where permitted, may use options to hedge or achieve exposure to a particular currency, underlying security or equity index. By purchasing certain instruments, the Funds may more effectively achieve the desired portfolio characteristics that assist the Funds in meeting their investment objectives.
The Funds also engage in securities lending activities for efficient portfolio management purposes, details
of which are set out in note 13. Disclosures in accordance with the EU Securities Financing Transactions
Regulation (“SFTR”) are set out in the schedules attached to these unaudited condensed interim financial
statements.
11 Soft commissions
During the period, Investment Manager and connected persons to the Sanlam World Equity Fund have entered into soft commission arrangements with brokers in respect of which certain goods and services used to support the investment decision process were received. The Investment Manager and connected persons do not make direct payment for these services but do transact an agreed amount of business with the brokers on behalf of the Company and commission is paid on these transactions.
The goods and services utilised for the Company include computer hardware and software used for economic and political analysis, portfolio analysis including valuation and performance measurement, market analysis, data and quotation services and investment related publications. The Investment Manager considers these arrangements are to the benefit of the Company and has satisfied itself that it obtains best execution on behalf of the Company and the brokerage rates are not in excess of customary institutional full service brokerage rates.

SANLAM UNIVERSAL FUNDS PLC
496
NOTES TO AND FORMING PART OF THE UNAUDITED CONDENSED INTERIM FINANCIAL STATEMENTS (CONTINUED) for the six months ended 30 June 2019
12 Contingent and cross liability of funds
The Directors are not aware of any such existing or contingent liability at 30 June 2019. The Company’s amended Articles provide for segregated liability between the various Funds. These provisions, and the Fund’s application of them may not yet have been fully tested by Irish or foreign courts. Accordingly, while the liabilities of one Fund will not generally impact on or be paid out of the assets of another Fund, it is not entirely free from doubt that the assets of any Fund are protected from the liabilities of other Funds of the Company.
As at 30 June 2019 and 31 December 2018, there were no cross liabilities held between the Funds.
13 Securities lending activities
Securities lending activities are conducted through SAMI and Brown Brothers Harriman & Co pursuant to the Securities Lending Agency Agreement and Securities Lending Sub-Agency Agreement dated 24 February 2016. In this arrangement, the Company transfers securities to a counterparty, in return for which it is agreed that securities of the same kind and amount should be transferred back to the Company at a later date. The arrangement has the substance of a loan of the Company’s securities in return for collateral. Aggregate income arising from securities lending activities consists of fees charged to counterparty, where the counterparty has provided collateral other than cash, plus net realised income derived from investments of cash collateral less any rebate payable to counterparty on cash collateral less any commissions or similar transaction costs.
The tables overleaf disclose the income arising from securities lending activities, the costs and fees incurred, the exposure at the reporting date and the amount of collateral held.
At 30 June 2019, all collateral is in the form of high quality government bonds.
At 30 June 2019, the counterparties to the Funds’ outstanding securities lending activities are BNP Paribas, Citigroup Global Markets Limited, Credit Suisse Securities (Europe) Ltd, Deutsche Bank, HSBC Bank Plc, JP Morgan Securities Plc, Merrill Lynch International, Morgan Stanley & Co International Plc and UBS AG.
The Funds incurred the following costs and fees in relation to securities lending activities for the period ended 30 June 2019:
Bridge
Global
Property
Income Fund
P-Solve
Inflation Plus
Fund
Sanlam
African
Frontiers
Market Fund
Denker Global
Dividend
Fund
Sanlam
Global
Bond Fund
Denker Global
Financial
Fund
USD GBP USD USD USD USD
Securities lending
sub-agent fees - 147 34 1,111 - 7,241
Manager fees - 73 17 556 - 3,621
Sanlam
Global
Property Fund
Sanlam World
Equity Fund
Satrix
World Equity
Tracker Fund
SIIP India
Opportunities
Fund
Denker Global
Dividend
Fund
Sanlam
Strategic
Bond Fund
USD USD USD USD USD GBP
Securities lending
sub-agent fees 5 2,015 43,424 - 2,052 -
Manager fees 3 1,007 21,712 - 1,026 -

SANLAM UNIVERSAL FUNDS PLC
497
NOTES TO AND FORMING PART OF THE UNAUDITED CONDENSED INTERIM FINANCIAL STATEMENTS (CONTINUED) for the six months ended 30 June 2019
13 Securities lending activities (continued)
The Funds incurred the following costs and fees in relation to securities lending activities for the period
ended 30 June 2019 (continued):
Sanlam
Accel
Income
Fund
Satrix North
America
Equity
Tracker Fund
Satrix UK
Equity
Tracker
Fund
Satrix Europe
(ex UK)
Equity
Tracker Fund
Sanlam Equity
Allocation
Fund
Satrix
Emerging
Market Equity
Tracker Fund
GBP USD GBP EUR USD USD
Securities lending
sub-agent fees - 4,689 259 5,687 - 307
Manager fees - 2,344 130 2,844 - 153
Sanlam
Managed
Risk Fund
Sanlam
Global High
Quality Fund
Sanlam US
Dividend
Fund
High Street
Global
Balanced
Fund
Sanlam
Global Value
Fund
Sanlam Stable
Global Fund
USD GBP USD USD USD USD
Securities lending
sub-agent fees - 2,117 14,544 193 1,644 894
Manager fees - 1,088 7,272 96 822 447
Sanlam
Active UK
Fund
Sanlam Multi-
Strategy Fund
Anchor Global
Stable Fund
Bridge Global
Equity Income
Growth Fund
Anchor Global
Equity Fund
Bridge Global
Managed
Fund
GBP GBP USD USD USD USD
Securities lending
sub-agent fees 3,507 279 6 - 5 -
Manager fees 1,753 139 3 - 3 -
Sanlam
Global
Emerging
Market Fund
ABSA Africa
Equity Fund
Sanlam
Centre
American
Select Equity
Fund
Sanlam Global
Convertible
Securities
Fund
Sanlam Japan
Equity Fund
Sanlam
Centre Active
US Treasury
Fund
USD USD USD USD USD USD
Securities lending
sub-agent fees 5,753 - 1,820 - 336 -
Manager fees 2,876 - 910 - 168 -
Autus Global
Equity Fund
Sanlam FOUR
Enhanced
Income Fund
Wisian Capital
South African
Equity Fund
Cameron
Hume Global
Fixed Income
ESG Fund
Sanlam Centre
Global Listed
Infrastructure
Fund
USD USD USD USD USD
Securities lending sub-agent fees - - - - -
Manager fees - - - - -
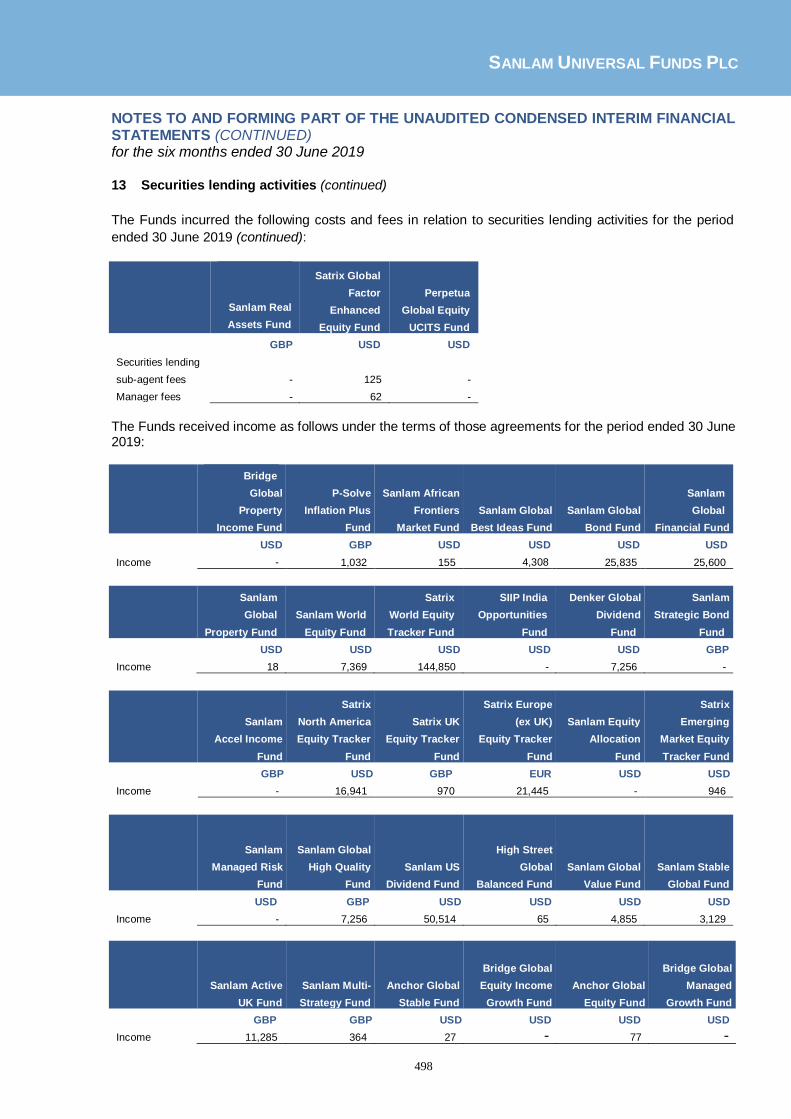
SANLAM UNIVERSAL FUNDS PLC
498
NOTES TO AND FORMING PART OF THE UNAUDITED CONDENSED INTERIM FINANCIAL STATEMENTS (CONTINUED) for the six months ended 30 June 2019
13 Securities lending activities (continued)
The Funds incurred the following costs and fees in relation to securities lending activities for the period
ended 30 June 2019 (continued):
Sanlam Real
Assets Fund
Satrix Global
Factor
Enhanced
Equity Fund
Perpetua
Global Equity
UCITS Fund
GBP USD USD
Securities lending
sub-agent fees - 125 -
Manager fees - 62 -
The Funds received income as follows under the terms of those agreements for the period ended 30 June 2019:
Bridge
Global
Property
Income Fund
P-Solve
Inflation Plus
Fund
Sanlam African
Frontiers
Market Fund
Sanlam Global
Best Ideas Fund
Sanlam Global
Bond Fund
Sanlam
Global
Financial Fund
USD GBP USD USD USD USD
Income - 1,032 155 4,308 25,835 25,600
Sanlam
Global
Property Fund
Sanlam World
Equity Fund
Satrix
World Equity
Tracker Fund
SIIP India
Opportunities
Fund
Denker Global
Dividend
Fund
Sanlam
Strategic Bond
Fund
USD USD USD USD USD GBP
Income 18 7,369 144,850 - 7,256 -
Sanlam
Accel Income
Fund
Satrix
North America
Equity Tracker
Fund
Satrix UK
Equity Tracker
Fund
Satrix Europe
(ex UK)
Equity Tracker
Fund
Sanlam Equity
Allocation
Fund
Satrix
Emerging
Market Equity
Tracker Fund
GBP USD GBP EUR USD USD
Income - 16,941 970 21,445 - 946
Sanlam
Managed Risk
Fund
Sanlam Global
High Quality
Fund
Sanlam US
Dividend Fund
High Street
Global
Balanced Fund
Sanlam Global
Value Fund
Sanlam Stable
Global Fund
USD GBP USD USD USD USD
Income - 7,256 50,514 65 4,855 3,129
Sanlam Active
UK Fund
Sanlam Multi-
Strategy Fund
Anchor Global
Stable Fund
Bridge Global
Equity Income
Growth Fund
Anchor Global
Equity Fund
Bridge Global
Managed
Growth Fund
GBP GBP USD USD USD USD
Income 11,285 364 27 - 77 -

SANLAM UNIVERSAL FUNDS PLC
499
NOTES TO AND FORMING PART OF THE UNAUDITED CONDENSED INTERIM FINANCIAL STATEMENTS (CONTINUED) for the six months ended 30 June 2019
13 Securities lending activities (continued)
The Funds received income as follows under the terms of those agreements for the period ended 30 June 2019:
Sanlam Global
Emerging
Markets Fund
ABSA Africa
Equity Fund
Sanlam Centre
American
Select Equity
Fund
Sanlam Global
Convertible
Securities Fund
Sanlam Japan
Equity Fund
Sanlam Centre
Active US
Treasury Fund
USD USD USD USD USD USD
Income 4,618 - 6,369 - 856 -
Autus Global
Equity Fund
Sanlam Four
Enhanced
Income Fund
Wisian Capital
South African
Equity Fund
Cameron Hume
Global Fixed
Income ESG
Fund
Sanlam Centre
Global Listed
Infrastructure
Fund
Sanlam Real
Assets Fund
USD USD USD USD USD USD
Income - - - - - -
Satrix Global
Factor
Enhanced
Equity Fund
Perpetua
Global Equity
UCITS Fund
USD USD
Income 437 -

SANLAM UNIVERSAL FUNDS PLC
500
NOTES TO AND FORMING PART OF THE UNAUDITED CONDENSED INTERIM FINANCIAL STATEMENTS (CONTINUED) for the six months ended 30 June 2019
13 Securities lending activities (continued)
Summary of collateral as at 30 June 2019:
Bridge
Global
Property
Income Fund
P-Solve
Inflation Plus
Fund
Sanlam
African
Frontiers
Market
Fund
Denker Global
Equity Fund
USD GBP USD USD
Aggregate value of securities on loan at the period end - - - -
Aggregate value of collateral held in respect of the
loans
- -
- -
Collateral % - - - -
Sanlam
Global
Bond Fund
Denker Global
Financial Fund
Sanlam
Global
Property
Fund
Sanlam World
Equity Fund
USD USD USD USD
Aggregate value of securities on loan at the period end - 3,049,646 - -
Aggregate value of collateral held in respect of the loans - 3,202,129 - -
Collateral % - 105% - -
Satrix
World Equity
Tracker Fund
SIIP India
Opportunities
Fund
Denker
Global
Dividend
Fund
Sanlam
Strategic
Bond Fund
USD USD USD GBP
Aggregate value of securities on loan at the period end 8,725,245 - - -
Aggregate value of collateral held in respect of the loans 9,696,732 - - -
Collateral % 111% - - -
Sanlam
Accel
Income
Fund
Satrix North
America
Equity
Tracker Fund
Satrix UK
Equity
Tracker
Fund
Satrix Europe
(ex UK) Equity
Tracker Fund
GBP USD GBP EUR
Aggregate value of securities on loan at the period end - 25,440 - 522,708
Aggregate value of collateral held in respect of the loans - 26,712 - 648,844
Collateral % - 105% - 105%
Sanlam
Equity
Allocation
Fund
Satrix
Emerging
Market
Equity
Tracker Fund
Sanlam
Managed Risk
Fund
Sanlam
Global High
Quality Fund
USD USD USD GBP
Aggregate value of securities on loan at the period end - 171,886 - 1,070
Aggregate value of collateral held in respect of the loans - 200,468 - 1,123
Collateral % - 117% - 105%

SANLAM UNIVERSAL FUNDS PLC
501
NOTES TO AND FORMING PART OF THE UNAUDITED CONDENSED INTERIM FINANCIAL STATEMENTS (CONTINUED) for the six months ended 30 June 2019
13 Securities lending activities (continued)
Summary of collateral as at 30 June 2019: (continued)
Sanlam US
Dividend
Fund
High Street
Global
Balanced
Fund
Sanlam
Global Value
Fund
Sanlam Stable
Global Fund
USD USD USD USD
Aggregate value of securities on loan at the period end 18,312,641 57,029 1,389,030 -
Aggregate value of collateral held in respect of the loans 19,228,275 59,880 1,458,482 -
Collateral % 105% 105% 105% -
Sanlam
Active UK
Fund
Sanlam
Multi-
Strategy
Fund
Anchor
Global
Stable Fund
Bridge Global
Equity Income
Growth Fund
GBP GBP USD USD
Aggregate value of securities on loan at the period end - 444,165 1,520 -
Aggregate value of collateral held in respect of the loans - 466,374 1,596 -
Collateral % - 105% 105% -
Anchor
Global
Equity Fund
Bridge
Global
Managed
Growth Fund
Sanlam
Global
Emerging
Markets
Fund
ABSA Africa
Equity Fund
USD USD USD USD
Aggregate value of securities on loan at the period end - - - -
Aggregate value of collateral held in respect of the loans - - - -
Collateral % - - - -
Sanlam
Centre
American
Select Equity
Fund
Sanlam
Global
Convertibles
Securities
Fund
Sanlam
Japan Equity
Fund
Sanlam
Centre Active
US Treasury
Fund
USD USD USD USD
Aggregate value of securities on loan at the period end - - 153,767 -
Aggregate value of collateral held in respect of the loans - - 161,455 -
Collateral % - - 105% -
Autus Global
Equity Fund
Sanlam Four
Enhanced
Income Fund
Wisian
Capital South
African
Equity Fund
Cameron
Hume Global
Fixed Income
ESG Fund
USD USD USD USD
Aggregate value of securities on loan at the period end - - - -
Aggregate value of collateral held in respect of the loans - - - -
Collateral % - - - -

SANLAM UNIVERSAL FUNDS PLC
502
NOTES TO AND FORMING PART OF THE UNAUDITED CONDENSED INTERIM FINANCIAL STATEMENTS (CONTINUED) for the six months ended 30 June 2019
13 Securities lending activities (continued)
Summary of collateral as at 30 June 2019: (continued)
Sanlam Centre
Global Listed
Infrastructure
Fund
Sanlam Real
Assets Fund
Satrix Global
Factor
Enhanced
Equity Fund
Perpetua
Global
UCITS
Equity Fund
USD USD USD USD
Aggregate value of securities on loan at the period end - - - -
Aggregate value of collateral held in respect of the loans - - - -
Collateral % - - - -
The Funds incurred the following costs and fees in relation to securities lending activities for the period ended 30 June 2018:
Bridge
Global
Property
Income Fund
P-Solve
Inflation Plus
Fund
Sanlam
African
Frontiers
Market Fund
Sanlam
Global
Best Ideas
Fund
Sanlam
Global
Bond Fund
Denker Global
Financial
Fund
USD GBP USD USD USD USD
Securities lending
sub-agent fees - 465 177 1,976
- 1,633
Manager fees - 233 88 988 - 816
Sanlam Global
Property Fund
Sanlam World
Equity Fund
Satrix
World Equity
Tracker Fund
SIIP India
Opportunities
Fund
SIM Global
Equity Income
Fund
Sanlam
Strategic
Bond Fund
USD USD USD USD USD GBP
Securities lending
sub-agent fees 35 6,818 11,503
- 2,902
-
Manager fees 17 3,409 5,752 - 1,451 -
Sanlam
Accel
Income
Fund
Satrix North
America
Equity
Tracker Fund
Satrix UK
Equity
Tracker
Fund
Satrix Europe
(ex UK)
Equity
Tracker Fund
Sanlam Equity
Allocation
Fund
Satrix
Emerging
Market Equity
Tracker Fund
GBP USD GBP EUR USD USD
Securities lending
sub-agent fees - 496 577 12,710 3,484 700
Manager fees - 248 288 6,355 1,742 350

SANLAM UNIVERSAL FUNDS PLC
503
NOTES TO AND FORMING PART OF THE UNAUDITED CONDENSED INTERIM FINANCIAL STATEMENTS (CONTINUED) for the six months ended 30 June 2019
13 Securities lending activities (continued)
Sanlam
Managed
Risk Fund
Sanlam
Global High
Quality Fund
Sanlam US
Dividend
Fund
High Street
Global
Balanced
Fund
Sanlam
Global Value
Fund
Sanlam Stable
Global Fund
USD GBP USD USD USD USD
Securities lending
sub-agent fees - 2,088 3,762 247
- -
Manager fees - 1,044 1,881 123 - -
Sanlam
Active UK
Fund
Sanlam Multi-
Strategy Fund
Anchor Global
Stable Fund
Bridge Global
Equity Income
Growth Fund
Anchor Global
Equity Fund
Bridge Global
Managed
Fund
GBP GBP USD USD USD USD
Securities lending
sub-agent fees - - 8
- 2,357
-
Manager fees - - 4 - 1,178 -
SIM Global
Emerging
Market Fund
ABSA Africa
Equity Fund
Sanlam
Centre
American
Select Equity
Fund
Sanlam Japan
Equity Fund
Wisian Capital
South African
Equity Fund
Sanlam
Global
Convertible
Securities Fund
USD USD USD USD USD USD
Securities lending
sub-agent fees 873
- - - - -
Manager fees 437 - - - - -
Sanlam Centre
Active US
Treasury Fund
Autus Global
Equity Fund
Sanlam FOUR
Enhanced
Income Fund
USD USD GBP
Securities lending sub-agent fees - - -
Manager fees - - -

SANLAM UNIVERSAL FUNDS PLC
504
NOTES TO AND FORMING PART OF THE UNAUDITED CONDENSED INTERIM FINANCIAL STATEMENTS (CONTINUED) for the six months ended 30 June 2019
13 Securities lending activities (continued)
The Funds received income as follows under the terms of those agreements for the period ended 30 June 2018:
Bridge
Global
Property
Income Fund
P-Solve
Inflation Plus
Fund
Sanlam African
Frontiers
Market Fund
Sanlam Global
Best Ideas Fund
Sanlam Global
Bond Fund
Sanlam
Global
Financial Fund
USD GBP USD USD USD USD
Income - 2,426 617 6,800 - 4,905
Sanlam
Global
Property Fund
Sanlam World
Equity Fund
Satrix
World Equity
Tracker Fund
SIIP India
Opportunities
Fund
SIM Global
Equity Income
Fund
Sanlam
Strategic Bond
Fund
USD USD USD USD USD GBP
Income 860 22,517 37,655 - 10,157 -
Sanlam
Accel Income
Fund
Satrix
North America
Equity Tracker
Fund
Satrix UK
Equity Tracker
Fund
Satrix Europe
(ex UK)
Equity Tracker
Fund
Sanlam Equity
Allocation
Fund
Satrix
Emerging
Market Equity
Tracker Fund
GBP USD GBP EUR USD USD
Income - 1,755 1,939 47,886 14,392 2,637
Sanlam
Managed Risk
Fund
Sanlam Global
High Quality
Fund
Sanlam US
Dividend Fund
High Street
Global
Balanced Fund
Sanlam Global
Value Fund
Sanlam Stable
Global Fund
USD GBP USD USD USD USD
Income - 7,279 - -- - -
Sanlam Active
UK Fund
Sanlam Multi-
Strategy Fund
Anchor Global
Stable Fund
Bridge Global
Equity Income
Growth Fund
Anchor Global
Equity Fund
Bridge Global
Managed
Growth Fund
GBP GBP USD USD USD USD
Income - - 25 - 2,546 -
Sanlam Global
Emerging
Markets Fund
ABSA Africa
Equity Fund
Sanlam Centre
American
Select Equity
Fund
Sanlam Japan
Equity Fund
Sanlam Global
Convertible
Securities Fund
Sanlam Centre
Active US
Treasury Fund
USD USD USD USD USD USD
Income 2,625 - - - - -

SANLAM UNIVERSAL FUNDS PLC
505
NOTES TO AND FORMING PART OF THE UNAUDITED CONDENSED INTERIM FINANCIAL STATEMENTS (CONTINUED) for the six months ended 30 June 2019
13 Securities lending activities (continued)
The Funds received income as follows under the terms of those agreements for the period ended 30 June 2018: (continued)
Autus Global
Equity Fund
Wisian Capital
South African
Equity Fund
Sanlam
FOUR
Enhanced
Income Fund
USD USD GBP
Income - - -
Summary of collateral as at 30 June 2018:
Bridge
Global
Property
Income Fund
P-Solve
Inflation Plus
Fund
Sanlam
African
Frontiers
Market
Fund
Denker Global
Equity Fund
USD GBP USD USD
Aggregate value of securities on loan at the period end - 242,449 - 4,327,609
Aggregate value of collateral held in respect of the
loans
- 254,575
- 4,563,732
Collateral % - 105.00% - 105.00%
Sanlam
Global
Bond Fund
Denker Global
Financial Fund
Sanlam
Global
Property
Fund
Sanlam World
Equity Fund
USD USD USD USD
Aggregate value of securities on loan at the period end - 6,174,605 - 445,194
Aggregate value of collateral held in respect of the loans - 6,529,613 - 470,416
Collateral % - 106.00% - 106.00%
Satrix
World Equity
Tracker Fund
SIIP India
Opportunities
Fund
SIM Global
Equity
Income
Fund
Sanlam
Strategic
Bond Fund
USD USD USD GBP
Aggregate value of securities on loan at the period end 8,558,548 - - 131
Aggregate value of collateral held in respect of the loans 9,035,898 - - 138
Collateral % 106.00% - - 105.00%
Sanlam
Accel
Income
Fund
Satrix North
America
Equity
Tracker Fund
Satrix UK
Equity
Tracker
Fund
Satrix Europe
(ex UK) Equity
Tracker Fund
GBP USD GBP EUR
Aggregate value of securities on loan at the period end - 552,038 489,809 1,803,961
Aggregate value of collateral held in respect of the loans - 581,624 514,300 1,894,160
Collateral % - 105.00% 105.00% 105.00%

SANLAM UNIVERSAL FUNDS PLC
506
NOTES TO AND FORMING PART OF THE UNAUDITED CONDENSED INTERIM FINANCIAL STATEMENTS (CONTINUED) for the six months ended 30 June 2019
13 Securities lending activities (continued)
Summary of collateral as at 30 June 2018: (continued)
Sanlam
Equity
Allocation
Fund
Satrix
Emerging
Market
Equity
Tracker Fund
Sanlam
Managed Risk
Fund
High Street
Global
Balanced
Fund
USD USD USD USD
Aggregate value of securities on loan at the period end 253,744 2,039,869 - 484,315
Aggregate value of collateral held in respect of the loans 266,432 2,184,125 - 508,531
Collateral % 105.00% 107.00% - 105.00%
Sanlam
Global Value
Fund
Sanlam
Stable
Global Fund
Sanlam
Active UK
Fund
Sanlam Multi-
Strategy Fund
USD USD GBP GBP
Aggregate value of securities on loan at the period end - - - -
Aggregate value of collateral held in respect of the loans - - - -
Collateral % - - - -
Anchor
Global
Stable Fund
Bridge
Global
Equity
Income
Growth Fund
Anchor
Global
Equity Fund
Bridge Global
Managed
Growth Fund
USD USD USD USD
Aggregate value of securities on loan at the period end - - 1,951,740 -
Aggregate value of collateral held in respect of the loans - - 2,081,597 -
Collateral % - - 107.00% -
Sanlam
Global
Emerging
Markets
Fund
ABSA Africa
Equity Fund
Sanlam
Centre
American
Select Equity
Fund
Sanlam Japan
Equity Fund
USD USD USD USD
Aggregate value of securities on loan at the period end 8,494,808 - - -
Aggregate value of collateral held in respect of the loans 9,104,644 - - -
Collateral % 107.00% - - -
Sanlam
Global
Convertibles
Securities
Fund
Sanlam
Centre
Active US
Treasury
Fund
Wisian
Capital
South
African
Equity Fund
Autus Global
Equity Fund
USD USD USD USD
Aggregate value of securities on loan at the period end - - - -
Aggregate value of collateral held in respect of the loans - - - -
Collateral % - - - -
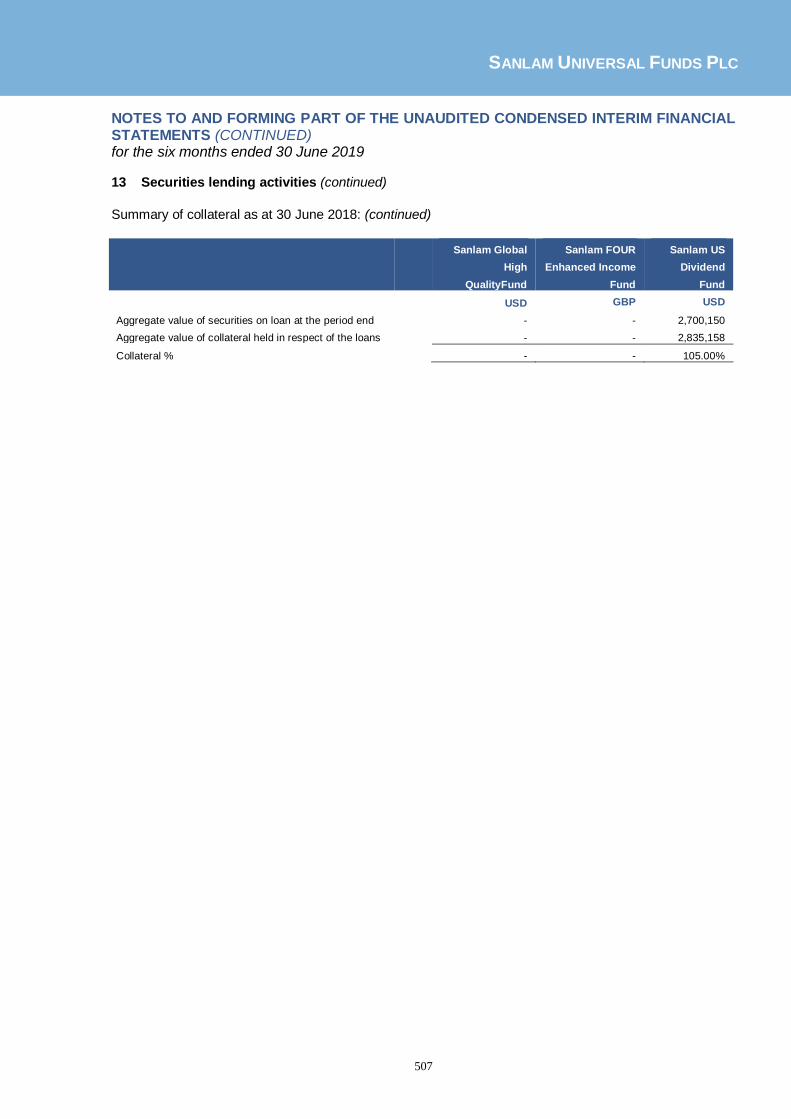
SANLAM UNIVERSAL FUNDS PLC
507
NOTES TO AND FORMING PART OF THE UNAUDITED CONDENSED INTERIM FINANCIAL STATEMENTS (CONTINUED) for the six months ended 30 June 2019
13 Securities lending activities (continued)
Summary of collateral as at 30 June 2018: (continued)
Sanlam Global
High
QualityFund
Sanlam FOUR
Enhanced Income
Fund
Sanlam US
Dividend
Fund
USD GBP USD
Aggregate value of securities on loan at the period end - - 2,700,150
Aggregate value of collateral held in respect of the loans - - 2,835,158
Collateral % - - 105.00%

SANLAM UNIVERSAL FUNDS PLC
508
NOTES TO AND FORMING PART OF THE UNAUDITED CONDENSED INTERIM FINANCIAL STATEMENTS (CONTINUED) for the six months ended 30 June 2019
14 Fees of underlying investments
The table below and overleaf summarises the collective investment schemes and exchange traded funds in which the Funds of the Company hold investments at 30 June 2019 and details the investment management fees and incentive fees incurred by those investments:
Period ended 30 June 2019
Fund Name
Collective Investment Scheme
Name
Collective
Investment
Scheme
Type
Investment
Management
Fees (%)1
Incentive
Fees (%)2
Satrix World Equity Tracker Fund iShares Core MSCI World ETF 0.00% -
Sanlam Accel Income Fund
PFS Twentyfour Investment
Funds– Dynamic Bond UK UCITS 0.75% -
Sanlam Accel Income Fund
Blackrock Continental European
Income Fund UK UCITS 0.75% -
Sanlam Accel Income Fund
Unicorn UK Income – Institutional
Bond Fund UK UCITS 0.75% -
Sanlam Accel Income Fund Guinness Asia Equity Income Irish UCITS 0.74% -
Sanlam Accel Income Fund Fidelity Enhanced Income UK UCITS 0.75% -
Sanlam Accel Income Fund Sanlam US Dividend Fund Irish UCITS 0.75% -
Sanlam Accel Income Fund
JP Morgan Sterling Corporate
Bond Fund UK UCITS 0.50% -
Sanlam Accel Income Fund
Fidelity Institutional UK Corporate
Bond UK UCITS 0.35% -
Sanlam Accel Income Fund
Lazard Investment Funds - Global
Equity Income Fund UK UCITS 0.75% -
Sanlam Accel Income Fund
M&G Short Dated Corporate Bond
Fund UK UCITS 0.25% -
Sanlam Accel Income Fund Vanguard UK Government Bond Irish UCITS 0.15% -
Sanlam Accel Income Fund
Veritas Funds Plc Global Equity
Income Fund Irish UCITS 0.75% -
Sanlam Accel Income Fund Sanlam Strategic Bond Fund Irish UCITS 0.35% -
Sanlam Accel Income Fund Schroder Strategic Credit Fund UK UCITS 0.50% -
Sanlam Accel Income Fund PFS Chelverton UK Equity Fund UK UCITS 0.75% -
Sanlam Accel Income Fund Invesco UK Corporate Bond Fund UK UCITS 0.91% -
Sanlam Accel Income Fund Artemis Income Fund UK UCITS 0.75% -
Sanlam Accel Income Fund Artemis Strategic Bond Fund UK UCITS 0.50% -
Sanlam Accel Income Fund Schroder Income Maximiser Fund UK UCITS 0.75% -
Sanlam Accel Income Fund Artemis Global Income Fund UK UCITS 0.75% -
Sanlam Accel Income Fund
Jan Hnd Strategy Bond Fund
Income UK UCITS 0.60% -
Sanlam Accel Income Fund
Trojan Investment Funds - Trojan
Income Fund UK UCITS 1.00% -
1 % of net assets 2 % of the gains in net assets above the benchmark

SANLAM UNIVERSAL FUNDS PLC
509
NOTES TO AND FORMING PART OF THE UNAUDITED CONDENSED INTERIM FINANCIAL STATEMENTS (CONTINUED)for the six months ended 30 June 2019
14 Fees of underlying investments (continued)
Period ended 30 June 2019
Fund Name
Collective Investment
Scheme Name
Collective
Investment
Scheme
Type
Investment
Management
Fees (%)1
Incentive
Fees (%)2
Sanlam Accel Income Fund
Muzinich Emerging Markets
Short Duration Fund Irish UCITS 0.80% -
Satrix Emerging Markets Equity
Tracker Fund Ishares MSCI Russia Adr/Gdr ETF 0.65% -
Satrix Emerging Markets Equity
Tracker Fund
X-Trackers MSCI Emerging
Markets ETF
0.10% -
Satrix Emerging Markets Equity
Tracker Fund
Ishares Msci Saudi Arabia
Capped ETF
0.60% -
Sanlam Managed Risk Fund
Satrix World Equity Tracker
Fund Irish UCITS 0.00% -
Sanlam Global High Quality Fund Institutional Cash Series Plc Irish UCITS 0.13% -
Sanlam Global High Quality Fund
Institutional Sterling Liquidity
Heritage - A Irish UCITS 0.13% -
High Street Global Balanced Fund ETFS Platinum ETF 0.49% -
Anchor Global Stable Fund iShares MSCI Japan ETF 0.59% -
Anchor Global Stable Fund Ishares Asia Property Yield ETF 0.00% -
Anchor Global Stable Fund
Ishares JP Morgan USD
Emerging Bond ETF 0.45% -
Anchor Global Stable Fund
Ishares JP Morgan Emerging
Local Government Bond ETF 0.50% -
Anchor Global Stable Fund
RBS Market Access Rici
Agriculture Index ETF ETF 0.25% -
Anchor Global Stable Fund UBS ETF CMCI Compos USD ETF 0.36% -
Bridge Global Managed Growth Fund Ishares USD Corporate Bond ETF 0.20% -
Bridge Global Managed Growth Fund Ishares Global Corporate Bond ETF 0.20% -
Bridge Global Managed Growth Fund
Ishares Global High Yield
Corporate Bond ETF ETF 0.50% -
1 % of net assets 2 % of the gains in net assets above the benchmark

SANLAM UNIVERSAL FUNDS PLC
510
NOTES TO AND FORMING PART OF THE UNAUDITED CONDENSED INTERIM FINANCIAL STATEMENTS (CONTINUED)for the six months ended 30 June 2019
14 Fees of underlying investments (continued) The table below and overleaf summarises the collective investment schemes and exchange traded funds in which the Funds of the Company hold investments at 31 December 2018 and details the investment management fees and incentive fees incurred by those investments:
Year ended 31 December 2018
Collective Investment
Scheme Name
Collective
Investment
Scheme
Type
Investment
Management
Fees (%)1
Incentive
Fees (%)2 Fund Name
P Solve Inflation Plus Fund iShares Core FTSE 100 ETF 0.07% -
P Solve Inflation Plus Fund iShares MSCI Ac Far East X ETF 0.74% -
P Solve Inflation Plus Fund ETFS Brent 1Mth Oil Securities ETF 0.49% -
P Solve Inflation Plus Fund Vanguard S&P500 USD ETF 0.07% -
P Solve Inflation Plus Fund iShares MSCI World Islam ETF 0.60% -
P Solve Inflation Plus Fund iShares MSCI Japan GBP-H ETF 0.64% -
P Solve Inflation Plus Fund X S&P 500 GBP ETF 0.01% -
P Solve Inflation Plus Fund X MSCI Emu GBP ETF 0.07% -
P Solve Inflation Plus Fund Vanguard FTSE Japan USD ETF 0.19% -
P Solve Inflation Plus Fund Vanguard FTSE Emerging Markets ETF 0.25% -
P Solve Inflation Plus Fund Vanguard FTSE Developed ETF 0.18% -
P Solve Inflation Plus Fund X MSCI Canada ETF 0.15% -
P Solve Inflation Plus Fund iShares Edge MSCI USA Quality ETF 0.15% -
P Solve Inflation Plus Fund
Vanguard FTSE Asia Pacific Ex
Japan ETF 0.22% -
P Solve Inflation Plus Fund
Morgan Stanley Investment
Funds Global Brands
Luxembourg
UCITS 0.75% -
P Solve Inflation Plus Fund Insight Sterling Liquidity Fund Irish UCITS 0.10% -
P Solve Inflation Plus Fund
Pimco US High Yield Bond
Institutional Sterling Irish UCITS 0.55% -
P Solve Inflation Plus Fund
Pimco Emerging Local Bond-
Gins Irish UCITS 0.89% -
P Solve Inflation Plus Fund Nomura-Us High Yield Bond Irish UCITS 0.50% -
P Solve Inflation Plus Fund
Pimco Emerging Markets Bond
Institutional Irish UCITS 0.79% -
P Solve Inflation Plus Fund MW Liquid Alpha Fund Irish UCITS 1.50% -
P Solve Inflation Plus Fund Schroder European Fund I ACC UK UCITS 0.75% -
P Solve Inflation Plus Fund Global Franchise I Accumulation
Luxembourg
UCITS 0.75% -
P Solve Inflation Plus Fund Fundsmith Equity Fund UK UCITS 0.90% -
P Solve Inflation Plus Fund Morant Wright Fuji Yield Global Irish UCITS 1.00% -
P Solve Inflation Plus Fund Institutional Sterling Liquidity Fund Irish UCITS 0.13% -
1 % of net assets 2 % of the gains in net assets (above a benchmark if applicable)

SANLAM UNIVERSAL FUNDS PLC
511
NOTES TO AND FORMING PART OF THE UNAUDITED CONDENSED INTERIM FINANCIAL STATEMENTS (CONTINUED)for the six months ended 30 June 2019 14 Fees of underlying investments (continued)
Year ended 31 December 2018
Fund Name
Collective Investment
Scheme Name
Collective
Investment
Scheme
Type
Investment
Management
Fees (%)1
Incentive
Fees (%)2
P Solve Inflation Plus Fund
Blackrock Global Funds Asian
Growth Leaders
Luxembourg
UCITS 1.50% -
P Solve Inflation Plus Fund
T Rowe Price Funds Emerging
Market Bond
Luxembourg
UCITS 0.65% -
Sanlam World Equity Fund
Blackrock Global Funds Asian
Growth Leaders
Luxembourg
UCITS 0.00% -
Satrix World Equity Tracker Fund iShares Core MSCI World ETF 0.00% -
Sanlam Accel Income Fund
PFS Twentyfour Investment
Funds– Dynamic Bond UK UCITS 0.75% -
Sanlam Accel Income Fund
Blackrock Continental European
Income Fund UK UCITS 0.75% -
Sanlam Accel Income Fund
Unicorn UK Income –
Institutional Bond Fund UK UCITS 0.75% -
Sanlam Accel Income Fund Guinness Asia Equity Income Irish UCITS 0.74% -
Sanlam Accel Income Fund Fidelity Enhanced Income UK UCITS 0.75% -
Sanlam Accel Income Fund Sanlam US Dividend Fund Irish UCITS 0.75% -
Sanlam Accel Income Fund
JP Morgan Sterling Corporate
Bond Fund UK UCITS 0.50% -
Sanlam Accel Income Fund
Fidelity Institutional UK
Corporate Bond UK UCITS 0.35% -
Sanlam Accel Income Fund
Lazard Investment Funds -
Global Equity Income Fund UK UCITS 0.75% -
Sanlam Accel Income Fund
M&G Short Dated Corporate
Bond Fund UK UCITS 0.25% -
Sanlam Accel Income Fund Vanguard UK Government Bond Irish UCITS 0.15% -
Sanlam Accel Income Fund
Veritas Funds Plc Global Equity
Income Fund Irish UCITS 0.75% -
Sanlam Accel Income Fund Sanlam Strategic Bond Fund Irish UCITS 0.35% -
Sanlam Accel Income Fund Schroder UK Alpha Income Fund UK UCITS 0.75% -
Sanlam Accel Income Fund Schroder Strategic Credit Fund UK UCITS 0.50% -
Sanlam Accel Income Fund PFS Chelverton UK Equity Fund UK UCITS 0.75% -
Sanlam Accel Income Fund Invesco UK Corporate Bond Fund UK UCITS 0.91% -
Sanlam Accel Income Fund Artemis Income Fund UK UCITS 0.75% -
Sanlam Accel Income Fund Artemis Strategic Bond Fund UK UCITS 0.50% -
Sanlam Accel Income Fund
Schroder Income Maximiser
Fund UK UCITS 0.75% -
Sanlam Accel Income Fund Artemis Global Income Fund UK UCITS 0.75% -
Sanlam Accel Income Fund Jupiter Strategic Bond II UK UCITS 0.50% -
1 % of net assets 2 % of the gains in net assets above the benchmark
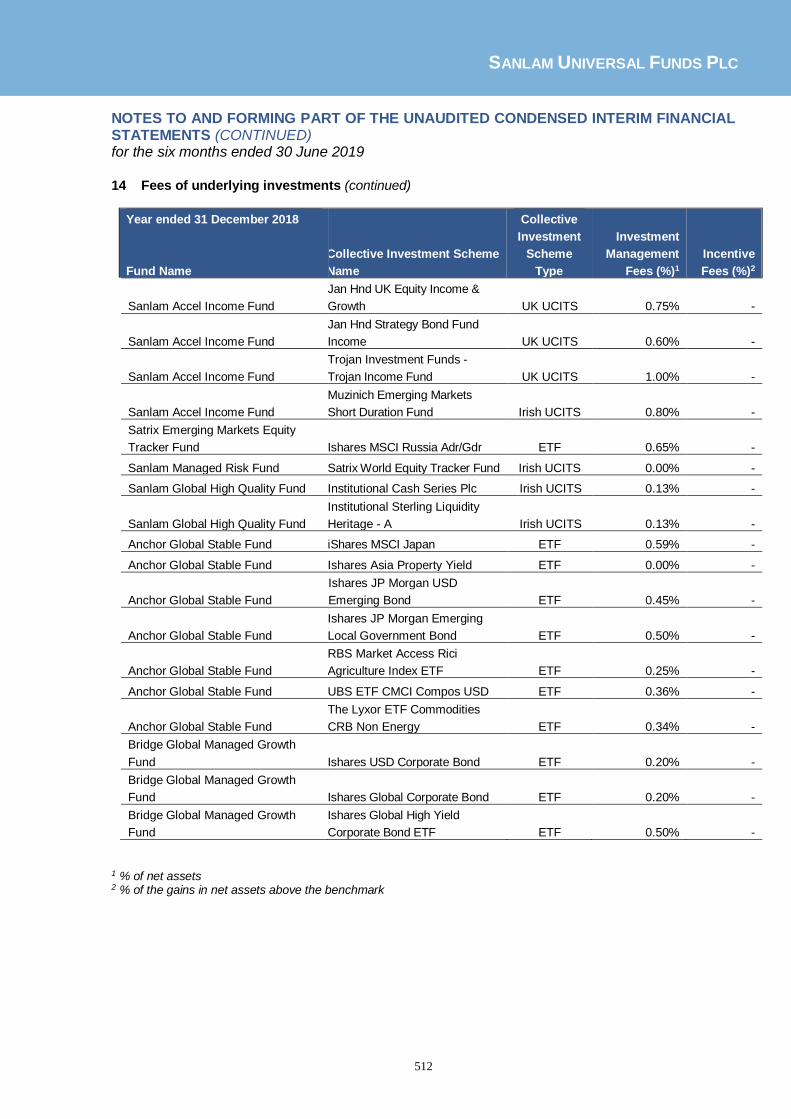
SANLAM UNIVERSAL FUNDS PLC
512
NOTES TO AND FORMING PART OF THE UNAUDITED CONDENSED INTERIM FINANCIAL STATEMENTS (CONTINUED)for the six months ended 30 June 2019
14 Fees of underlying investments (continued)
Year ended 31 December 2018
Fund Name
Collective Investment Scheme
Name
Collective
Investment
Scheme
Type
Investment
Management
Fees (%)1
Incentive
Fees (%)2
Sanlam Accel Income Fund
Jan Hnd UK Equity Income &
Growth UK UCITS 0.75% -
Sanlam Accel Income Fund
Jan Hnd Strategy Bond Fund
Income UK UCITS 0.60% -
Sanlam Accel Income Fund
Trojan Investment Funds -
Trojan Income Fund UK UCITS 1.00% -
Sanlam Accel Income Fund
Muzinich Emerging Markets
Short Duration Fund Irish UCITS 0.80% -
Satrix Emerging Markets Equity
Tracker Fund Ishares MSCI Russia Adr/Gdr ETF 0.65% -
Sanlam Managed Risk Fund Satrix World Equity Tracker Fund Irish UCITS 0.00% -
Sanlam Global High Quality Fund Institutional Cash Series Plc Irish UCITS 0.13% -
Sanlam Global High Quality Fund
Institutional Sterling Liquidity
Heritage - A Irish UCITS 0.13% -
Anchor Global Stable Fund iShares MSCI Japan ETF 0.59% -
Anchor Global Stable Fund Ishares Asia Property Yield ETF 0.00% -
Anchor Global Stable Fund
Ishares JP Morgan USD
Emerging Bond ETF 0.45% -
Anchor Global Stable Fund
Ishares JP Morgan Emerging
Local Government Bond ETF 0.50% -
Anchor Global Stable Fund
RBS Market Access Rici
Agriculture Index ETF ETF 0.25% -
Anchor Global Stable Fund UBS ETF CMCI Compos USD ETF 0.36% -
Anchor Global Stable Fund
The Lyxor ETF Commodities
CRB Non Energy ETF 0.34% -
Bridge Global Managed Growth
Fund Ishares USD Corporate Bond ETF 0.20% -
Bridge Global Managed Growth
Fund Ishares Global Corporate Bond ETF 0.20% -
Bridge Global Managed Growth
Fund
Ishares Global High Yield
Corporate Bond ETF ETF 0.50% -
1 % of net assets 2 % of the gains in net assets above the benchmark

SANLAM UNIVERSAL FUNDS PLC
513
NOTES TO AND FORMING PART OF THE UNAUDITED CONDENSED INTERIM FINANCIAL STATEMENTS (CONTINUED) for the six months ended 30 June 2019
15 Net asset value per share
Bridge Global Property Income Fund
30 June 31 December 30 June
2019 2018 2018 Share class Non-Distributing
Net Asset Value USD 22,462,150 USD 27,509,970 USD 32,703,421
Number of Shares in Issue 15,611,725 21,470,358 22,887,851
Net Asset Value per Share USD 1.4388 USD 1.2813 USD 1.4289
P-Solve Inflation Plus Fund
30 June 31 December 30 June
2019 2018 2018 Share class A
Net Asset Value - GBP 134 GBP 140
Number of Shares in Issue - 67 67
Net Asset Value per Share - GBP 1.9933 GBP 2.077
Share class B
Net Asset Value - GBP 8,075,151 GBP 8,310,674 Number of Shares in Issue - 3,884,712 3,826,574
Net Asset Value per Share - GBP 2.0787 GBP 2.1718
Share class C
Net Asset Value - GBP 40,690,873 GBP 42,386,307
Number of Shares in Issue - 27,053,303 27,053,303 Net Asset Value per Share - GBP 1.5041 GBP 1.5668
Share class D
Net Asset Value USD 2,107,801 USD 4,610,299 USD 14,691,864
Number of Shares in Issue 2,007,621 4,279,495 12,050,634
Net Asset Value per Share USD 1.0499 USD 1.0773 USD 1.2192
Share class G
Net Asset Value USD 6,511,957 USD 6,700,274 USD 7,657,186
Number of Shares in Issue 7,170,180 7,163,004 7,206,860
Net Asset Value per Share USD 0.9082 USD 0.9354 USD 1.0625
Sanlam African Frontiers Markets Fund
30 June 31 December 30 June
2019 2018 2018
Share class A
Net Asset Value USD 397,219 USD 367,758 USD 246,443
Number of Shares in Issue 383,194 344,021 202,863
Net Asset Value per Share USD 1.0366 USD 1.069 USD 1.2148

SANLAM UNIVERSAL FUNDS PLC
514
NOTES TO AND FORMING PART OF THE UNAUDITED CONDENSED INTERIM FINANCIAL STATEMENTS (CONTINUED) for the six months ended 30 June 2019
15 Net asset value per share (continued)
Share class H
Net Asset Value USD 58,200,211 USD 59,759,820 USD 61,170,202
Number of Shares in Issue 61,121,835 61,392,870 55,736,307
Net Asset Value per Share USD 0.9522 USD 0.9734 USD 1.0975
Share class I
Net Asset Value USD 12,820,559 USD 13,181,057 USD 14,942,550
Number of Shares in Issue 14,305,466 14,305,466 14,232,949
Net Asset Value per Share USD 0.8962 USD 0.9214 USD 1.0499
Share class A Net Asset Value USD 9,271,000 USD 9,496,344 USD 11,819,190 Number of Shares in Issue 4,185,553 4,967,486 5,514,506
Net Asset Value per Share USD 2.2150 USD 1.9117 USD 2.1433
Share class A (EUR) Net Asset Value EUR 143 EUR 122 EUR 135
Number of Shares in Issue 112 112 112 Net Asset Value per Share EUR 1.2373 EUR 1.0986 EUR 1.2108
Share class C (GBP)
Net Asset Value GBP 60,350 GBP 209 GBP 249
Number of Shares in Issue 29,943 117 130
Net Asset Value per Share GBP 2.0155 GBP 1.7844 GBP 1.9183
Sanlam African Frontiers Markets Fund (continued)
30 June 31 December 30 June
2019 2018 2018
Denker Global Equity Fund
30 June 31 December 30 June
2019 2018 2018
Share class A (GBP)
Net Asset Value GBP 85,788 GBP 73,589 GBP 84,026
Number of Shares in Issue 61,581 59,814 63,365
Net Asset Value per Share GBP 1.3931 GBP 1.2303 GBP 1.3261
Share class B
Net Asset Value USD 32,454,541 USD 29,199,956 USD 38,984,136
Number of Shares in Issue 13,498,543 14,117,853 16,865,628
Net Asset Value per Share USD 2.4043 USD 2.0683 USD 2.3115
Share class C
Net Asset Value USD 19,343,638 USD 16,766,967 USD 18,787,829
Number of Shares in Issue 7,934,224 7,998,744 8,023,680
Net Asset Value per Share USD 2.4380 USD 2.0962 USD 2.3415

SANLAM UNIVERSAL FUNDS PLC
515
NOTES TO AND FORMING PART OF THE UNAUDITED CONDENSED INTERIM FINANCIAL STATEMENTS (CONTINUED) for the six months ended 30 June 2019
15 Net asset value per share (continued)
Share class D
Net Asset Value USD 128 USD 108 USD 120
Number of Shares in Issue 99 98 98
Net Asset Value per Share USD 1.2893 USD 1.1036 USD 1.2267
Share class E
Net Asset Value USD 38,974,787 USD 33,441,037 USD 37,881,756
Number of Shares in Issue 25,824,799 25,867,139 26,332,291
Net Asset Value per Share USD 1.5092 USD 1.2928 USD 1.4386
Share class F
Net Asset Value USD 6,665 USD 5,751 USD 8,479
Number of Shares in Issue 6,464 6,464 8,501
Net Asset Value per Share USD 1.0311 USD 0.8897 USD 0.9974
Share class A
Net Asset Value USD 7,256 USD 10,796 USD 15,046
Number of Shares in Issue 5,115 8,019 11,034
Net Asset Value per Share USD 1.4186 USD 1.3464 USD 1.3636
Share class B
Net Asset Value USD 246,356 USD 250,324 USD 256,355
Number of Shares in Issue 170,571 182,852 185,114
Net Asset Value per Share USD 1.4443 USD 1.369 USD 1.3848
Share class C
Net Asset Value USD 69,960,802 USD 56,599,450 USD 58,193,967
Number of Shares in Issue 48,392,337 41,334,587 42,043,043
Net Asset Value per Share USD 1.4457 USD 1.3693 USD 1.3842
Share class E
Net Asset Value USD 436,946,842 USD 393,904,097 USD 473,120,273
Number of Shares in Issue 278,753,966 266,115,456 317,159,525
Net Asset Value per Share USD 1.5675 USD 1.4802 USD 1.4917
Denker Global Equity Fund (continued)
30 June 31 December 30 June
2019 2018 2018
Sanlam Global Bond Fund
30 June 31 December 30 June
2019 2018 2018
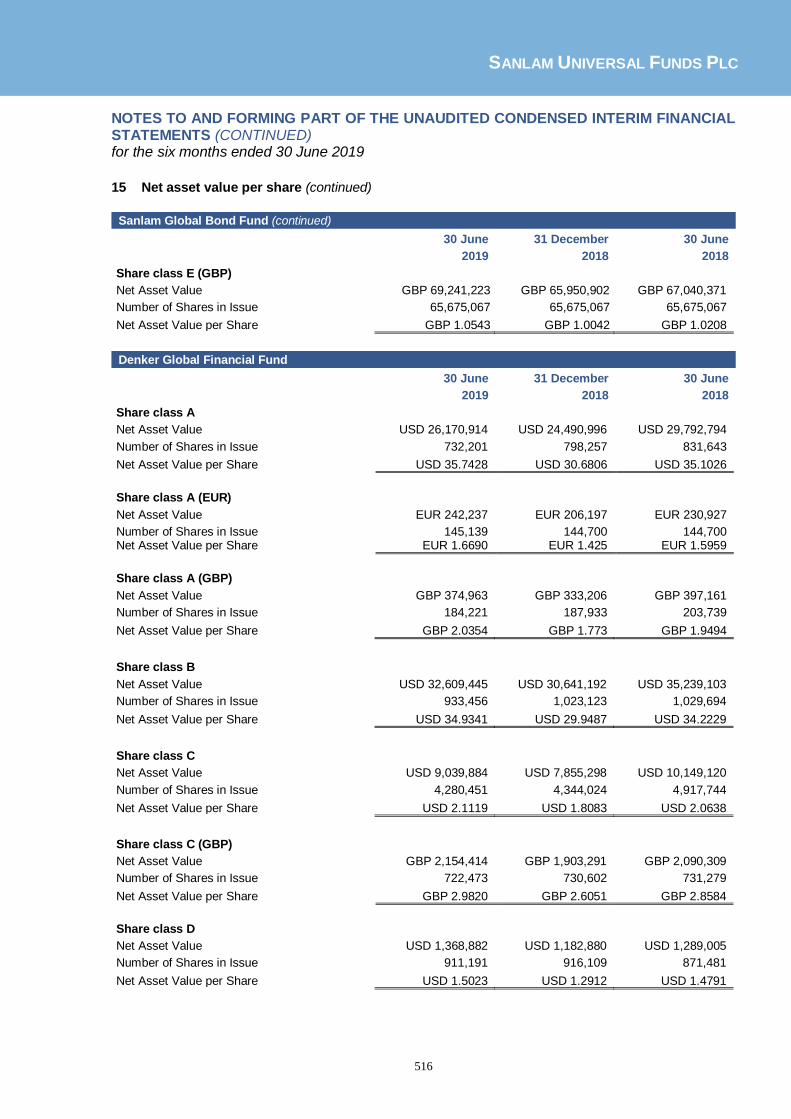
SANLAM UNIVERSAL FUNDS PLC
516
NOTES TO AND FORMING PART OF THE UNAUDITED CONDENSED INTERIM FINANCIAL STATEMENTS (CONTINUED) for the six months ended 30 June 2019
15 Net asset value per share (continued)
Share class E (GBP)
Net Asset Value GBP 69,241,223 GBP 65,950,902 GBP 67,040,371
Number of Shares in Issue 65,675,067 65,675,067 65,675,067
Net Asset Value per Share GBP 1.0543 GBP 1.0042 GBP 1.0208
Share class A
Net Asset Value USD 26,170,914 USD 24,490,996 USD 29,792,794
Number of Shares in Issue 732,201 798,257 831,643
Net Asset Value per Share USD 35.7428 USD 30.6806 USD 35.1026
Share class A (EUR)
Net Asset Value EUR 242,237 EUR 206,197 EUR 230,927
Number of Shares in Issue 145,139 144,700 144,700 Net Asset Value per Share EUR 1.6690 EUR 1.425 EUR 1.5959
Share class A (GBP)
Net Asset Value GBP 374,963 GBP 333,206 GBP 397,161
Number of Shares in Issue 184,221 187,933 203,739
Net Asset Value per Share GBP 2.0354 GBP 1.773 GBP 1.9494
Share class B
Net Asset Value USD 32,609,445 USD 30,641,192 USD 35,239,103
Number of Shares in Issue 933,456 1,023,123 1,029,694
Net Asset Value per Share USD 34.9341 USD 29.9487 USD 34.2229
Share class C
Net Asset Value USD 9,039,884 USD 7,855,298 USD 10,149,120
Number of Shares in Issue 4,280,451 4,344,024 4,917,744
Net Asset Value per Share USD 2.1119 USD 1.8083 USD 2.0638
Share class C (GBP)
Net Asset Value GBP 2,154,414 GBP 1,903,291 GBP 2,090,309
Number of Shares in Issue 722,473 730,602 731,279
Net Asset Value per Share GBP 2.9820 GBP 2.6051 GBP 2.8584
Share class D
Net Asset Value USD 1,368,882 USD 1,182,880 USD 1,289,005
Number of Shares in Issue 911,191 916,109 871,481
Net Asset Value per Share USD 1.5023 USD 1.2912 USD 1.4791
Sanlam Global Bond Fund (continued)
30 June 31 December 30 June
2019 2018 2018
Denker Global Financial Fund
30 June 31 December 30 June
2019 2018 2018

SANLAM UNIVERSAL FUNDS PLC
517
NOTES TO AND FORMING PART OF THE UNAUDITED CONDENSED INTERIM FINANCIAL STATEMENTS (CONTINUED) for the six months ended 30 June 2019
15 Net asset value per share (continued)
Share class E
Net Asset Value USD 12,017,721 USD 10,189,830 USD 14,681,207
Number of Shares in Issue 575,873 572,440 725,375 Net Asset Value per Share USD 20.8687 USD 17.8007 USD 20.2395
Share class F (GBP)
Net Asset Value GBP 118,748 GBP 102,403 GBP 113,640
Number of Shares in Issue 61,356 61,356 61,825 Net Asset Value per Share GBP 1.9354 GBP 1.669 GBP 1.8381
Share class G (USD)
Net Asset Value USD 44,257,690 USD 39,124,213 USD 46,332,758
Number of Shares in Issue 33,309,016 34,346,600 35,590,421
Net Asset Value per Share USD 1.3287 USD 1.1391 USD 1.3018
30 June 31 December 30 June
2019 2018 2018
Share class A
Net Asset Value USD 638,887 USD 73,965 USD 79,962
Number of Shares in Issue 395,816 52,768 53,219
Net Asset Value per Share USD 1.6141 USD 1.4017 USD 1.5025
Share class B
Net Asset Value USD 21,461,313 USD 22,194,297 USD 24,572,908
Number of Shares in Issue 12,603,543 15,027,623 15,541,585
Net Asset Value per Share USD 1.7028 USD 1.4769 USD 1.5811
Share class C
Net Asset Value USD 86,916,799 USD 46,826,875 USD 52,323,695
Number of Shares in Issue 43,259,406 26,891,906 28,088,453
Net Asset Value per Share USD 2.0092 USD 1.7413 USD 1.8628
Share class E
Net Asset Value USD 35,649,514 USD 38,170,705 USD 53,845,358
Number of Shares in Issue 19,411,660 24,053,630 31,814,441
Net Asset Value per Share USD1.8365 USD 1.5869 USD 1.6925
Share class E (GBP)
Net Asset Value GBP 1,186,858 GBP 1,035,634 GBP 1,113,022
Number of Shares in Issue 1,014,929 1,014,929 1,014,929
Net Asset Value per Share GBP 1.1694 GBP 1.0204 GBP 1.0967
Denker Global Financial Fund(continued)
30 June 31 December 30 June
2019 2018 2018
Sanlam Global Property Fund

SANLAM UNIVERSAL FUNDS PLC
518
NOTES TO AND FORMING PART OF THE UNAUDITED CONDENSED INTERIM FINANCIAL STATEMENTS (CONTINUED) for the six months ended 30 June 2019
15 Net asset value per share (continued)
30 June 31 December 30 June
2019 2018 2018
Share class A
Net Asset Value USD 114,549 USD 101,106 USD 114,870
Number of Shares in Issue 54,628 55,492 55,522
Net Asset Value per Share USD 2.0969 USD 1.822 USD 2.0689
Share class B
Net Asset Value USD 349,214 USD 496,568 USD 2,688,065
Number of Shares in Issue 159,977 262,651 1,256,168
Net Asset Value per Share USD 2.1829 USD 1.8906 USD 2.1399
Share class C (USD)
Net Asset Value USD 47,058,465 USD 42,411,634 USD 105,375,525
Number of Shares in Issue 21,231,937 22,105,511 48,547,181
Net Asset Value per Share USD 2.2164 USD 1.9186 USD 2.1706
Share class E
Net Asset Value USD 42,654,478 USD 156 USD 175
Number of Shares in Issue 17,159,946 73 73
Net Asset Value per Share USD 2.4857 USD 2.143 USD 2.4112
30 June 31 December 30 June
2019 2018 2018
Share class A
Net Asset Value USD 30,384,904 USD 20,589,032 USD 71,663,901
Number of Shares in Issue 14,890,911 11,849,121 37,201,473
Net Asset Value per Share USD 2.0405 USD 1.7376 USD 1.9264
Share class C
Net Asset Value USD 32,126,649 USD 31,413,846 USD 63,151,787
Number of Shares in Issue 12,958,997 14,861,314 26,915,246
Net Asset Value per Share USD 2.4791 USD 2.1138 USD 2.3463
Sanlam World Equity Fund
Satrix World Equity Tracker Fund
Share class D
Net Asset Value USD 138,975,491 USD 34,291,467 -
Number of Shares in Issue 127,911,174 37,047,826 -
Net Asset Value per Share USD 1.0865 USD 0.9256 -
Share class E
Net Asset Value USD 562,209,018 USD 319,448,214 USD 298,396,826
Number of Shares in Issue 217,648,956 145,594,191 122,982,568
Net Asset Value per Share USD 2.5831 USD 2.1941 USD 2.4263

SANLAM UNIVERSAL FUNDS PLC
519
NOTES TO AND FORMING PART OF THE UNAUDITED CONDENSED INTERIM FINANCIAL STATEMENTS (CONTINUED) for the six months ended 30 June 2019
15 Net asset value per share (continued)
30 June 31 December 30 June
2019 2018 2018
Share class I
Net Asset Value USD 546,192,699 USD 465,895,306 USD 523,674,593
Number of Shares in Issue 332,496,925 333,425,396 338,421,437
Net Asset Value per Share USD 1.6427 USD 1.3973 USD 1.5474
Share class I (GBP)
Net Asset Value GBP 1,178,651 GBP 1,074,942 GBP 912,948
Number of Shares in Issue 688,585 722,310 576,209
Net Asset Value per Share GBP 1.7117 GBP 1.4882 GBP 1.5844
Share class S
Net Asset Value USD 62,881,038 USD 35,282,023 USD 44,736,242
Number of Shares in Issue 46,968,209 31,014,436 35,528,302
Net Asset Value per Share USD 1.3388 USD 1.1376 USD 1.2592
30 June 31 December 30 June
2019 2018 2018
Share class A
Net Asset Value USD 222,752 USD 166,334 USD 162,009
Number of Shares in Issue 185,056 151,309 142,097
Net Asset Value per Share USD 1.2037 USD 1.0993 USD 1.1401
Share class C
Net Asset Value USD 18,021,813 USD 18,188,167 USD 19,758,030
Number of Shares in Issue 11,044,808 12,251,224 12,879,821
Net Asset Value per Share USD 1.6317 USD 1.4846 USD 1.5340
Share class D
Net Asset Value USD 7,450 USD 13,433 USD 13,879
Number of Shares in Issue 5,676 11,249 11,249
Net Asset Value per Share USD 1.3125 USD 1.1942 USD 1.2339
Share class E
Net Asset Value USD 143 USD 130 USD 133
Number of Shares in Issue 93 93 93
Net Asset Value per Share USD 1.5430 USD 1.3931 USD 1.4287
30 June 31 December 30 June
2019 2018 2018
Share class A
Net Asset Value USD 9,490,487 USD 9,367,744 USD 10,701,043
Number of Shares in Issue 8,149,139 8,983,260 9,097,513
Net Asset Value per Share USD 1.1646 USD 1.0428 USD 1.1763
Satrix World Equity Tracker Fund (continued)
SIIP India Opportunities Fund
Denker Global Dividend Fund
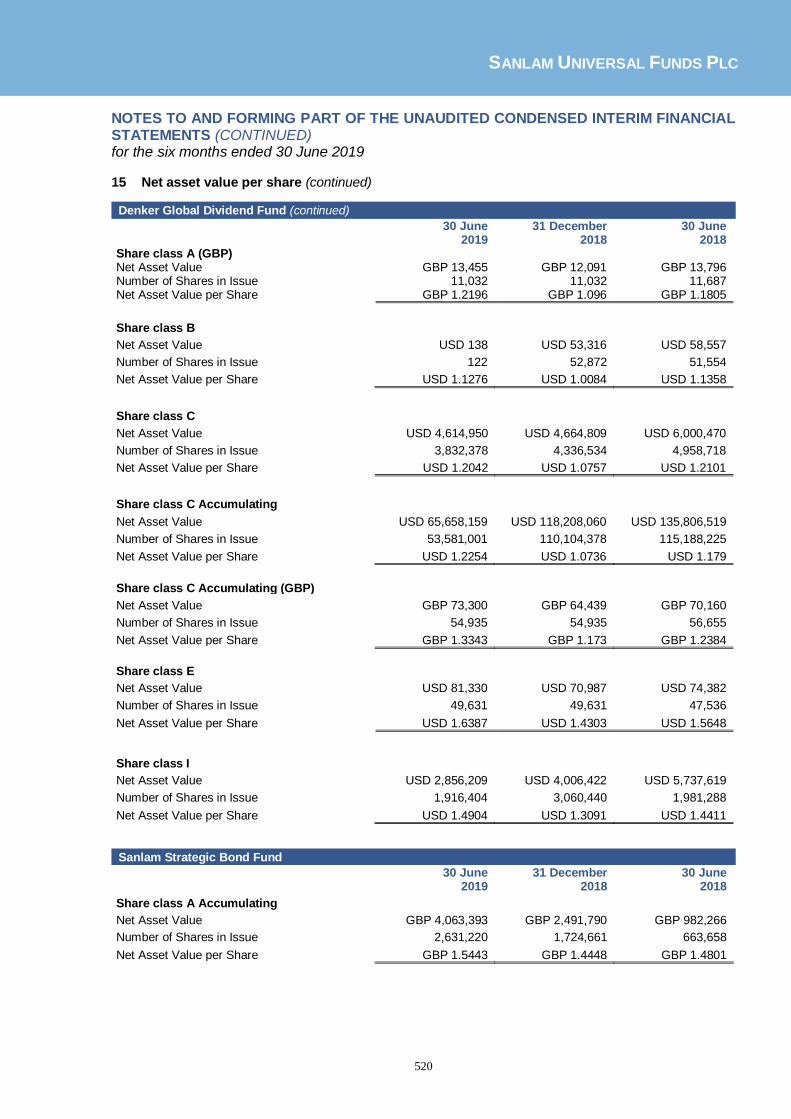
SANLAM UNIVERSAL FUNDS PLC
520
NOTES TO AND FORMING PART OF THE UNAUDITED CONDENSED INTERIM FINANCIAL STATEMENTS (CONTINUED) for the six months ended 30 June 2019
15 Net asset value per share (continued)
30 June 31 December 30 June
2019 2018 2018 Share class A (GBP) Net Asset Value GBP 13,455 GBP 12,091 GBP 13,796 Number of Shares in Issue 11,032 11,032 11,687 Net Asset Value per Share GBP 1.2196 GBP 1.096 GBP 1.1805
Share class B
Net Asset Value USD 138 USD 53,316 USD 58,557
Number of Shares in Issue 122 52,872 51,554
Net Asset Value per Share USD 1.1276 USD 1.0084 USD 1.1358
Share class C
Net Asset Value USD 4,614,950 USD 4,664,809 USD 6,000,470
Number of Shares in Issue 3,832,378 4,336,534 4,958,718
Net Asset Value per Share USD 1.2042 USD 1.0757 USD 1.2101
Share class C Accumulating
Net Asset Value USD 65,658,159 USD 118,208,060 USD 135,806,519
Number of Shares in Issue 53,581,001 110,104,378 115,188,225
Net Asset Value per Share USD 1.2254 USD 1.0736 USD 1.179
Share class C Accumulating (GBP)
Net Asset Value GBP 73,300 GBP 64,439 GBP 70,160
Number of Shares in Issue 54,935 54,935 56,655
Net Asset Value per Share GBP 1.3343 GBP 1.173 GBP 1.2384
Share class E
Net Asset Value USD 81,330 USD 70,987 USD 74,382
Number of Shares in Issue 49,631 49,631 47,536
Net Asset Value per Share USD 1.6387 USD 1.4303 USD 1.5648
Share class I
Net Asset Value USD 2,856,209 USD 4,006,422 USD 5,737,619
Number of Shares in Issue 1,916,404 3,060,440 1,981,288
Net Asset Value per Share USD 1.4904 USD 1.3091 USD 1.4411
30 June 31 December 30 June
2019 2018 2018
Share class A Accumulating
Net Asset Value GBP 4,063,393 GBP 2,491,790 GBP 982,266
Number of Shares in Issue 2,631,220 1,724,661 663,658
Net Asset Value per Share GBP 1.5443 GBP 1.4448 GBP 1.4801
Denker Global Dividend Fund (continued)
Sanlam Strategic Bond Fund

SANLAM UNIVERSAL FUNDS PLC
521
NOTES TO AND FORMING PART OF THE UNAUDITED CONDENSED INTERIM FINANCIAL STATEMENTS (CONTINUED) for the six months ended 30 June 2019
15 Net asset value per share (continued)
30 June 31 December 30 June
2019 2018 2018
Share class A Income
Net Asset Value GBP 665,098 GBP 519,092 GBP 352,830
Number of Shares in Issue 624,681 508,864 329,403
Net Asset Value per Share GBP 1.0647 GBP 1.0201 GBP 1.0711
Share class P Accumulating (USD)
Net Asset Value USD 23,723,468 USD 23,234,455 USD 22,668,035
Number of Shares in Issue 15,767,292 16,695,017 16,084,668
Net Asset Value per Share USD 1.5046 USD 1.3917 USD 1.4093
Share class P Accumulating
Net Asset Value GBP 61,402,863 GBP 58,684,331 GBP 50,764,556
Number of Shares in Issue 37,018,667 37,939,185 32,140,907
Net Asset Value per Share GBP 1.6587 GBP 1.5468 GBP 1.5794
Share class P Income
Net Asset Value GBP 130,002,253 GBP 124,498,600 GBP 117,992,150
Number of Shares in Issue 116,499,913 116,823,309 105,770,700
Net Asset Value per Share GBP 1.1159 GBP 1.0657 GBP 1.1155
Share class I Accumulating
Net Asset Value GBP 86,074,973 GBP 70,236,217 GBP 34,088,957
Number of Shares in Issue 60,188,080 52,603,518 24,975,119
Net Asset Value per Share GBP 1.4301 GBP 1.3352 GBP 1.3649
Share class I Income
Net Asset Value GBP 66,550,483 GBP 64,889,349 GBP 21,714,526
Number of Shares in Issue 61,546,734 62,761,726 20,042,460
Net Asset Value per Share GBP 1.0813 GBP 1.0339 GBP 1.0834
Share class I Accumulating
Net Asset Value EUR 21,861,740 EUR 798,872 EUR 806,485
Number of Shares in Issue 21,053,294 819,103 803,660
Net Asset Value per Share EUR 1.0384 EUR 0.9753 EUR 1.0035
Share class I Income
Net Asset Value EUR 2,570,655 EUR 1,940,356 EUR 1,362,515
Number of Shares in Issue 2,636,029 2,067,949 1,376,199
Net Asset Value per Share EUR 0.9752 EUR 0.9383 EUR 0.9901
Share class I Accumulating
Net Asset Value USD 1,222,201 USD 619,928 USD 8,287,122
Number of Shares in Issue 1,128,012 618,197 8,150,609
Net Asset Value per Share USD 1.0835 USD 1.0028 USD 1.0167
Sanlam Strategic Bond Fund (continued)

SANLAM UNIVERSAL FUNDS PLC
522
NOTES TO AND FORMING PART OF THE UNAUDITED CONDENSED INTERIM FINANCIAL STATEMENTS (CONTINUED) for the six months ended 30 June 2019
15 Net asset value per share (continued)
30 June 31 December 30 June
2019 2018 2018
Share class I Income
Net Asset Value USD 3,479,782 USD 8,790,320 -
Number of Shares in Issue 3,374,825 8,988,057 -
Net Asset Value per Share USD 1.0311 USD 0.978 -
30 June 31 December 30 June
2019 2018 2018
Share class A Net Income
Net Asset Value GBP 17,708,245 GBP 19,204,964 GBP 21,827,423
Number of Shares in Issue 16,454,418 18,988,495 20,028,705
Net Asset Value per Share GBP 1.0762 GBP 1.0114 GBP 1.0898
Share class A Net Accumulation
Net Asset Value GBP 9,655,653 GBP 10,008,922 GBP 11,641,875
Number of Shares in Issue 7,113,868 7,961,914 8,755,947
Net Asset Value per Share GBP 1.3573 GBP 1.2571 GBP 1.3296
30 June 31 December 30 June
2019 2018 2018
Share class A
Net Asset Value USD 47,213 USD 139,331 USD 194,448
Number of Shares in Issue 26,276 92,260 117,385
Net Asset Value per Share USD 1.7968 USD 1.5102 USD 1.6565
Share class E
Net Asset Value USD 4,283,953 USD 88,824,388 USD 80,388,650
Number of Shares in Issue 2,317,780 57,317,150 47,410,925
Net Asset Value per Share USD 1.8483 USD 1.5497 USD 1.6956
Share class I
Net Asset Value USD 814,847 USD 1,474,219 USD 1,536,767
Number of Shares in Issue 442,299 954,311 908,041
Net Asset Value per Share USD 1.8423 USD 1.5448 USD 1.6924
Share class I (GBP)
Net Asset Value GBP 150,249 GBP 503,329 GBP 539,135
Number of Shares in Issue 71,893 282,531 287,339
Net Asset Value per Share GBP 2.0899 GBP 1.7815 GBP 1.8763
Sanlam Strategic Bond Fund (continued)
Sanlam Accel Income Fund
Satrix North America Equity Tracker Fund

SANLAM UNIVERSAL FUNDS PLC
524
NOTES TO AND FORMING PART OF THE UNAUDITED CONDENSED INTERIM FINANCIAL STATEMENTS (CONTINUED) for the six months ended 30 June 2019
15 Net asset value per share (continued)
30 June 31 December 30 June
2019 2018 2018
Share class A (USD)
Net Asset Value USD 217 USD 246 USD 25,436
Number of Shares in Issue 247 247 22,085
Net Asset Value per Share USD 0.8805 USD 0.9972 USD 1.1517
Share class C (USD)
Net Asset Value USD 113 USD 101 USD 116
Number of Shares in Issue 96 96 96
Net Asset Value per Share USD 1.1742 USD 1.0469 USD 1.2078
Share class E (USD)
Net Asset Value USD 7,007,579 USD 45,265,603 USD 57,477,657
Number of Shares in Issue 6,317,118 45,796,847 50,430,606
Net Asset Value per Share USD 1.1093 USD 0.9884 USD 1.1397
Share class E (GBP)
Net Asset Value GBP 136 GBP 122 GBP 134
Number of Shares in Issue 100 100 100
Net Asset Value per Share GBP 1.3626 GBP 1.2165 GBP 1.3481
Share class I (USD)
Net Asset Value USD 2,196,371 USD 2,245,029 USD 13,466,065
Number of Shares in Issue 1,938,716 2,221,701 11,542,031
Net Asset Value per Share USD 1.1329 USD 1.0105 USD 1.1667
Share class I (GBP)
Net Asset Value GBP 750,301 GBP 685,501 GBP 746,346
Number of Shares in Issue 676,312 660,342 647,693
Net Asset Value per Share GBP 1.1094 GBP 1.0381 GBP 1.1523
30 June 31 December 30 June
2019 2018 2018
Share class A (USD)
Net Asset Value USD 4,561,503 USD 4,271,040 USD 11,257,669
Number of Shares in Issue 3,430,475 3,771,670 8,740,711
Net Asset Value per Share USD 1.3297 USD 1.1324 USD 1.288
Share class C (USD)
Net Asset Value USD 2,202,417 USD 2,917,985 USD 4,510,025
Number of Shares in Issue 1,621,093 2,518,979 3,427,038
Net Asset Value per Share USD 1.3586 USD 1.1584 USD 1.3193
Share class D (USD)
Net Asset Value USD 7,607,691 USD 7,117,062 -
Number of Shares in Issue 6,843,911 7,514,583 -
Net Asset Value per Share USD 1.1116 USD 0.9471 -
Satrix UK Equity Tracker Fund
Satrix Europe (ex-UK) Equity Tracker Fund

SANLAM UNIVERSAL FUNDS PLC
525
NOTES TO AND FORMING PART OF THE UNAUDITED CONDENSED INTERIM FINANCIAL STATEMENTS (CONTINUED)
for the six months ended 30 June 2019
15 Net asset value per share (continued)
30 June 31 December 30 June
2019 2018 2018
Share class E (USD)
Net Asset Value USD 39,277,934 USD 150,883,185 USD 217,140,025
Number of Shares in Issue 28,974,575 131,031,859 166,211,578
Net Asset Value per Share USD 1.3556 USD 1.1515 USD 1.3064
Share class E (EUR)
Net Asset Value EUR 156 EUR 132 EUR 147
Number of Shares in Issue 100 100 100
Net Asset Value per Share EUR 1.5631 EUR 1.3226 EUR 1.4705
Share class I (USD)
Net Asset Value USD 44,496,313 USD 45,383,710 USD 65,293,811
Number of Shares in Issue 32,804,713 39,337,531 49,819,568
Net Asset Value per Share USD 1.3564 USD 1.1537 USD 1.3106
Share class I (GBP)
Net Asset Value GBP 403,756 GBP 347,569 GBP 547,878
Number of Shares in Issue 275,545 271,369 410,976
Net Asset Value per Share GBP 1.4653 GBP 1.2808 1.3988
30 June 31 December 30 June
2019 2018 2018 Share class E
Net Asset Value - - USD 75,808,236
Number of Shares in Issue - - 62,595,861
Net Asset Value per Share - - USD 1.2111
30 June 31 December 30 June
2019 2018 2018
Share class A
Net Asset Value USD 5,101,969 USD 4,693,379 USD 11,102,835
Number of Shares in Issue 4,286,288 4,349,346 9,325,354
Net Asset Value per Share USD 1.1903 USD 1.0791 USD 1.1906
Share class D
Net Asset Value USD 4,989,029 USD 4,490,538 -
Number of Shares in Issue 4,596,912 4,567,732 -
Net Asset Value per Share USD 1.0853 USD 0.9831 -
Share class E Net Asset Value USD 7,729 USD 6,981 USD 7,672
Number of Shares in Issue 6,676 6,676 6,675 Net Asset Value per Share USD 1.1578 USD 1.0457 USD 1.1493
Satrix Europe (ex-UK) Equity Tracker Fund (continued)
Sanlam Equity Allocation Fund
Satrix Emerging Markets Equity Tracker Fund

SANLAM UNIVERSAL FUNDS PLC
525
NOTES TO AND FORMING PART OF THE UNAUDITED CONDENSED INTERIM FINANCIAL STATEMENTS (CONTINUED) for the six months ended 30 June 2019
15 Net asset value per share (continued)
30 June 31 December 30 June
2019 2018 2018
Share class I
Net Asset Value USD 30,302,114 USD 23,548,815 USD 24,475,381
Number of Shares in Issue 24,993,496 21,480,266 20,292,795
Net Asset Value per Share USD 1.2124 USD 1.0963 USD 1.2061
Share class I (GBP)
Net Asset Value GBP 7,777,093 GBP 6,384,640 GBP 8,947,269
Number of Shares in Issue 5,830,342 5,543,997 20,292,795
Net Asset Value per Share GBP 1.3339 GBP 1.2328 GBP 1.3039
30 June 31 December 30 June
2019 2018 2018 Share class A (USD)
Net Asset Value USD 8,519,644 USD 4,615,304 USD 916,711
Number of Shares in Issue 7,080,821 4,084,340 772,165
Net Asset Value per Share USD 1.2032 USD 1.13 USD 1.1872
Share class A2 (USD)
Net Asset Value USD 105 USD 100 -
Number of Shares in Issue 100 100 -
Net Asset Value per Share USD 1.0538 USD 1 -
Share class A (GBP)
Net Asset Value GBP 3,825,805 GBP 4,035,392 GBP 2,026,085
Number of Shares in Issue 3,091,310 3,438,180 1,628,615
Net Asset Value per Share GBP 1.2376 GBP 1.1737 GBP 1.2441
Share class A (EUR)
Net Asset Value EUR 439,190 EUR 434,986 EUR 21,521
Number of Shares in Issue 358,669 372,037 17,269
Net Asset Value per Share EUR 1.2245 EUR 1.1692 EUR 1.2462
Share class A (AUD)
Net Asset Value USD 121,645 USD 105,810 -
Number of Shares in Issue 90,041 83,021 -
Net Asset Value per Share USD 1.3510 USD 1.2745 -
Share class A (CHF)
Net Asset Value CHF 20,504 CHF 19,619 -
Number of Shares in Issue 15,626 15,626 -
Net Asset Value per Share CHF 1.3122 CHF 1.2555 -
Satrix Emerging Markets Equity Tracker Fund
Sanlam Managed Risk Fund

SANLAM UNIVERSAL FUNDS PLC
526
NOTES TO AND FORMING PART OF THE UNAUDITED CONDENSED INTERIM FINANCIAL STATEMENTS (CONTINUED) for the six months ended 30 June 2019
15 Net asset value per share (continued)
30 June 31 December 30 June
2019 2018 2018 Share class A (SEK)
Net Asset Value SEK 97,551 SEK 93,080 -
Number of Shares in Issue 75,381 75,381 -
Net Asset Value per Share SEK 1.2941 SEK 1.2348 -
Share class I (USD)
Net Asset Value USD 42,470,012 USD 40,941,616 USD 27,258,907
Number of Shares in Issue 30,988,699 31,933,247 20,337,588
Net Asset Value per Share USD 1.3705 USD 1.2821 USD 1.3403
Share class I2 (USD)
Net Asset Value USD 107 USD 100 -
Number of Shares in Issue 100 100 -
Net Asset Value per Share USD 1.0722 USD 1 -
Share class I (GBP)
Net Asset Value GBP 12,814,011 GBP 12,932,174 GBP 16,338,182
Number of Shares in Issue 10,032,893 10,727,644 12,844,368
Net Asset Value per Share GBP 1.6205 GBP 1.2055 GBP 1.272
Share class I (EUR)
Net Asset Value EUR 578,911 EUR 245,744 EUR 202,907
Number of Shares in Issue 455,441 203,582 158,406
Net Asset Value per Share EUR 1.2711 EUR 1.2071 EUR 1.2809
Share class L (AUD)
Net Asset Value AUD 218,909 AUD 62,118 -
Number of Shares in Issue 163,377 48,966 -
Net Asset Value per Share AUD 1.3399 AUD 1.2686 -
Share class L (EUR)
Net Asset Value EUR 124,999 EUR 119,794 -
Number of Shares in Issue 96,050 96,050 -
Net Asset Value per Share EUR 1.3014 EUR 1.2472 -
Sanlam Managed Risk Fund (continued)

SANLAM UNIVERSAL FUNDS PLC
527
NOTES TO AND FORMING PART OF THE UNAUDITED CONDENSED INTERIM FINANCIAL STATEMENTS (CONTINUED) for the six months ended 30 June 2019
15 Net asset value per share (continued)
30 June 31 December 30 June
2019 2018 2018 Share class L (GBP)
Net Asset Value GBP 864,365 GBP 539,468 -
Number of Shares in Issue 653,238 428,421 -
Net Asset Value per Share GBP 1.3232 GBP 1.2592 -
Share class L (USD)
Net Asset Value USD 995,241 USD 720,991 -
Number of Shares in Issue 740,782 568,605 -
Net Asset Value per Share USD 1.3435 USD 1.268 -
Share class N (USD)
Net Asset Value USD 5,341,006 USD 4,666,772 USD 3,338,202
Number of Shares in Issue 4,340,517 3,915,735 2,625,959
Net Asset Value per Share USD 1.2305 USD 1.1918 USD 1.2712
Share class N2 (USD)
Net Asset Value USD 2,997,713 USD 2,327,206 -
Number of Shares in Issue 2,295,515 1,848,897 -
Net Asset Value per Share USD 1.3059 USD 1.2587 -
Share class N (AUD)
Net Asset Value AUD 79,969 AUD 75,421 -
Number of Shares in Issue 60,082 60,082 -
Net Asset Value per Share AUD 1.3310 AUD 1.2553 -
Share class N2 (AUD)
Net Asset Value AUD 205,824 AUD 145,296 -
Number of Shares in Issue 153,474 114,840 -
Net Asset Value per Share AUD 1.3411 AUD 1.2652 -
Share class N (EUR)
Net Asset Value EUR 282,010 EUR 283,332 EUR 261,560
Number of Shares in Issue 239,296 251,806 217,764
Net Asset Value per Share EUR 1.1785 EUR 1.1252 EUR 1.2011
Share class N2 (EUR)
Net Asset Value EUR 40,097 EUR 13,892 -
Number of Shares in Issue 30,342 11,012 -
Net Asset Value per Share EUR 1.3215 EUR 1.2616 -
Sanlam Managed Risk Fund

SANLAM UNIVERSAL FUNDS PLC
528
NOTES TO AND FORMING PART OF THE UNAUDITED CONDENSED INTERIM FINANCIAL STATEMENTS (CONTINUED) for the six months ended 30 June 2019
15 Net asset value per share (continued)
30 June 31 December 30 June
2019 2018 2018
Share class N (GBP)
Net Asset Value GBP 2,092,113 GBP 1,884,653 GBP 1,338,137
Number of Shares in Issue 1,814,653 1,674,800 1,101,836
Net Asset Value per Share GBP 1.1529 GBP 1.1253 GBP 1.2145
Share class N2 (GBP)
Net Asset Value GBP 2,542,220 GBP 1,962,796 GBP 1,553,534
Number of Shares in Issue 2,373,245 1,884,224 1,387,039
Net Asset Value per Share GBP 1.0712 GBP 1.0417 GBP 1.12
30 June 31 December 30 June
2019 2018 2018 Share class A Accumulating
Net Asset Value GBP 1,546,669 GBP 1,325,150 GBP 1,366,811
Number of Shares in Issue 851,315 839,021 827,864
Net Asset Value per Share GBP 1.8168 GBP 1.5794 GBP 1.651
Share class B Accumulating
Net Asset Value USD 4,814 USD 3,320 -
Number of Shares in Issue 4,546 3,584 -
Net Asset Value per Share USD 1.0590 USD 0.9264 -
Share class C Accumulating
Net Asset Value GBP 94,152,646 GBP 60,312,786 GBP 46,781,363
Number of Shares in Issue 43,973,960 32,571,575 24,293,742
Net Asset Value per Share GBP 2.1411 GBP 1.8517 GBP 1.9257
Share class C Income
Net Asset Value GBP 27,262,003 GBP 25,803,552 GBP 30,560,626
Number of Shares in Issue 13,343,450 14,531,482 16,491,643
Net Asset Value per Share GBP 2.0431 GBP 1.7757 GBP 1.8531
Share class D Accumulating
Net Asset Value USD 202,824,913 USD 166,382,703 USD 176,751,934
Number of Shares in Issue 126,276,250 118,895,743 117,905,839
Net Asset Value per Share USD 1.6062 USD 1.3994 USD 1.4991
Share class D Income
Net Asset Value USD 6,709,149 USD 145 USD 155
Number of Shares in Issue 4,343,616 107 106
Net Asset Value per Share USD 1.5446 USD 1.354 USD 1.455
Sanlam Managed Risk Fund (continued)
Sanlam Global High Quality Fund

SANLAM UNIVERSAL FUNDS PLC
529
NOTES TO AND FORMING PART OF THE UNAUDITED CONDENSED INTERIM FINANCIAL STATEMENTS (CONTINUED) for the six months ended 30 June 2019
15 Net asset value per share (continued)
30 June 31 December 30 June
2019 2018 2018
Share class E Accumulating
Net Asset Value USD 97,115,034 USD 80,975,382 USD 84,291,696
Number of Shares in Issue 62,113,869 59,300,902 57,480,309
Net Asset Value per Share USD 1.5635 USD 1.3655 USD 1.4664
Share class E Income
Net Asset Value USD 167 USD 145 USD 155
Number of Shares in Issue 108 107 106
Net Asset Value per Share USD 1.5463 USD 1.354 USD 1.455
Share class G Accumulating
Net Asset Value USD 22,764,505 USD 16,332,843 USD 18,940,707
Number of Shares in Issue 16,605,518 13,674,517 14,806,606
Net Asset Value per Share USD 1.3709 USD 1.1944 USD 1.2792
Share class G Income
Net Asset Value USD 218,336 USD 190,989 USD 205,219
Number of Shares in Issue 169,964 169,964 169,964
Net Asset Value per Share USD 1.2846 USD 1.1237 USD 1.2074
Share class I Accumulating
Net Asset Value GBP 5,461,221 GBP 2,353,476 -
Number of Shares in Issue 3,405,388 1,695,221 -
Net Asset Value per Share GBP 1.6037 GBP 1.3883 -
Share class I Accumulating
Net Asset Value USD 4,047,710 USD 7,295,911 -
Number of Shares in Issue 3,490,308 7,323,741 -
Net Asset Value per Share USD 1.1597 USD 0.9962 -
Share class I Income
Net Asset Value GBP 2,059,905 GBP 1,758,801 -
Number of Shares in Issue 1,234,141 1,212,381 -
Net Asset Value per Share GBP 1.6691 GBP 1.4507 -
Sanlam Global High Quality Fund (continued)

SANLAM UNIVERSAL FUNDS PLC
530
NOTES TO AND FORMING PART OF THE UNAUDITED CONDENSED INTERIM FINANCIAL STATEMENTS (CONTINUED) for the six months ended 30 June 2019
15 Net asset value per share (continued)
30 June 31 December 30 June
2019 2018 2018
Share class A (GBP) Distributing
Net Asset Value GBP 28,582,181 GBP 24,855,321 GBP 22,851,266
Number of Shares in Issue 1,760,919 1,720,234 1,482,286
Net Asset Value per Share GBP 16.2314 GBP 14.4488 GBP 15.4162
Share class A (USD) Distributing
Net Asset Value GBP 3,002,187 USD 3,226,491 USD 2,714,805
Number of Shares in Issue 225,956 272,593 207,510
Net Asset Value per Share GBP 13.2866 USD 11.8363 USD 13.0828
Share class A (EUR) Distributing
Net Asset Value EUR 190,627 EUR 120,527 EUR 120,632
Number of Shares in Issue 14,618 10,410 9,633
Net Asset Value per Share EUR 13.0406 EUR 11.5785 EUR 12.5226
Share class H (GBP) Distributing
Net Asset Value GBP 8,915,380 GBP 5,105,234 -
Number of Shares in Issue 888,517 565,614 -
Net Asset Value per Share GBP 10.0340 GBP 9.026 -
Share class A (GBP) Accumulating
Net Asset Value GBP 22,224,153 GBP 22,074,787 GBP 120,632
Number of Shares in Issue 1,250,100 1,406,700 9,633
Net Asset Value per Share 17.7779 GBP 15.6926 GBP 12.5226
Share class A (USD) Accumulating
Net Asset Value USD91,351,188 USD 88,896,240 USD 34,728,132
Number of Shares in Issue 6,267,190 6,904,294 2,469,045
Net Asset Value per Share USD 14.5761 USD 12.8755 USD 14.0654
Share class B (GBP) Accumulating
Net Asset Value GBP 112,175,582 GBP 36,456,046 GBP 38,264,287
Number of Shares in Issue 6,989,699 2,583,025 2,580,659
Net Asset Value per Share GBP 16.0487 GBP 14.1137 GBP 14.8273
Share class B (USD) Accumulating
Net Asset Value USD 99,513,679 USD 96,676,811 USD 172,011,574
Number of Shares in Issue 6,463,816 7,135,452 11,665,139
Net Asset Value per Share USD 15.3955 USD 13.5488 USD 14.7458
Sanlam US Dividend Fund

SANLAM UNIVERSAL FUNDS PLC
531
NOTES TO AND FORMING PART OF THE UNAUDITED CONDENSED INTERIM FINANCIAL STATEMENTS (CONTINUED) for the six months ended 30 June 2019
15 Net asset value per share (continued)
30 June 31 December 30 June
2019 2018 2018
Share class H (GBP) Accumulating
Net Asset Value GBP 2,398,424 GBP 2,246,370 -
Number of Shares in Issue 227,272 238,549 -
Net Asset Value per Share GBP 10.5531 GBP 9.4168 -
High Street Global Balanced Fund
30 June 31 December 30 June
2019 2018 2018
Share class A (USD)
Net Asset Value USD 27,803,478 USD 21,670,263 USD 20,390,134
Number of Shares in Issue 23,947,871 20,224,230 18,581,590
Net Asset Value per Share USD 1.1610 USD 1.0715 USD 1.0973
Sanlam Global Value Fund
30 June 31 December 30 June
2019 2018 2018
Share class A (USD)
Net Asset Value USD 4,832,587 USD 4,224,021 USD 45,195,514
Number of Shares in Issue 287,871 287,102 268,507
Net Asset Value per Share USD 16.7915 USD 14.7126 USD 16.382
Share class A (EUR)
Net Asset Value EUR 3,384 EUR 2,954 EUR 3,307
Number of Shares in Issue 290 290 290
Net Asset Value per Share EUR 11.6687 EUR 10.1851 EUR 11.4032
Share class A (GBP)
Net Asset Value GBP 129,282 GBP 135,595 GBP 129,738
Number of Shares in Issue 7,358 8,814 7,637
Net Asset Value per Share GBP 17.5693 GBP 15.3834 GBP 16.9886
Share class B (USD)
Net Asset Value USD 119,552,786 USD 139,257,908 USD181,585,263
Number of Shares in Issue 6,600,677 8,807,660 10,072,480
Net Asset Value per Share USD 18.1122 USD 15.811 USD 18.0209
Sanlam US Dividend Fund (continued)

SANLAM UNIVERSAL FUNDS PLC
532
NOTES TO AND FORMING PART OF THE UNAUDITED CONDENSED INTERIM FINANCIAL STATEMENTS (CONTINUED) for the six months ended 30 June 2019
15 Net asset value per share (continued)
Sanlam Global Value Fund (continued)
30 June 31 December 30 June
2019 2018 2018
Share class B (GBP)
Net Asset Value GBP 765,869 GBP 1,718,702 GBP 3,484,911
Number of Shares in Issue 40,885 105,180 193,844
Net Asset Value per Share GBP 18.7321 GBP 16.3406 GBP 17.9779
Share class C (GBP)
Net Asset Value GBP 99,219 GBP 87,182 GBP 101,613
Number of Shares in Issue 5,982 5,981 6,288
Net Asset Value per Share GBP 16.5876 GBP 14.5777 GBP 16.1594
Share class C (USD)
Net Asset Value - USD 16 USD 1,632
Number of Shares in Issue - 2 153
Net Asset Value per Share - USD 9.2833 USD 10.6383
Sanlam Stable Global Fund
30 June 31 December 30 June
2019 2018 2018
Share class A (USD)
Net Asset Value USD 52,313,707 USD 60,084,735 USD 70,031,791
Number of Shares in Issue 3,655,055 4,751,096 5,330,153
Net Asset Value per Share USD 14.3127 USD 12.6465 USD 13.1389
Share class A (EUR)
Net Asset Value EUR 19,974,046 EUR 11,087,704 EUR 6,964,728
Number of Shares in Issue 1,715,674 1,081,981 668,223
Net Asset Value per Share EUR 11.6421 EUR 10.2476 EUR 10.4228
Share class A (GBP)
Net Asset Value GBP 119,504 GBP 788,112 GBP 971,364
Number of Shares in Issue 7,867 58,760 72,216
Net Asset Value per Share GBP 15.1903 GBP 13.4123 GBP 13.4508

SANLAM UNIVERSAL FUNDS PLC
533
NOTES TO AND FORMING PART OF THE UNAUDITED CONDENSED INTERIM FINANCIAL STATEMENTS (CONTINUED) for the six months ended 30 June 2019
15 Net asset value per share (continued)
Sanlam Stable Global Fund (continued)
30 June 31 December 30 June
2019 2018 2018
Share class A (GBP) Distributing
Net Asset Value GBP 13,228 GBP 12,650 GBP 12,614
Number of Shares in Issue 975 1,048 1,030
Net Asset Value per Share GBP 13.5689 GBP 12.0696 GBP 12.2383
Share class B (USD)
Net Asset Value USD 157,455 USD 138,610 USD 55,766,011
Number of Shares in Issue 8,129 8,129 3,159,483
Net Asset Value per Share USD 19.3698 USD 17.0515 USD 17.6504
Share class B (GBP)
Net Asset Value GBP 247,135 GBP 587,963 GBP 577,047
Number of Shares in Issue 13,591 36,756 36,106
Net Asset Value per Share GBP 18.1843 GBP 15.9964 GBP 15.9821
Sanlam Active UK Fund
30 June 31 December 30 June
2019 2018 2018
Share class A (GBP)
Net Asset Value GBP 336,397 GBP 319,276 GBP 403,230
Number of Shares in Issue 18,692 20,023 22,119
Net Asset Value per Share GBP 17.9965 GBP 15.9453 GBP 18.2301
Share class B (USD)
Net Asset Value - USD 1,841,732 USD 3,208,756
Number of Shares in Issue - 163,593 243,172
Net Asset Value per Share - USD 11.258 USD 13.1955
Share class B (GBP)
Net Asset Value GBP 43,745,073 GBP 22,066,563 GBP 36,963,452
Number of Shares in Issue 2,757,575 1,576,498 2,319,535
Net Asset Value per Share GBP 15.8636 GBP 13.9972 GBP 15.9357
Share class C (USD)
Net Asset Value - USD 22,533 USD 26,615
Number of Shares in Issue - 2,879 2,879
Net Asset Value per Share - USD 7.8274 USD 9.2452

SANLAM UNIVERSAL FUNDS PLC
534
NOTES TO AND FORMING PART OF THE UNAUDITED CONDENSED INTERIM FINANCIAL STATEMENTS (CONTINUED) for the six months ended 30 June 2019
15 Net asset value per share (continued)
Sanlam Active UK Fund (continued)
30 June 31 December 30 June
2019 2018 2018
Share class C (GBP)
Net Asset Value GBP 519,747 GBP 548,018 GBP 68,7948
Number of Shares in Issue 34,124 40,458 44,256
Net Asset Value per Share GBP 15.2312 GBP 13.5454 GBP 15.5446
Share class D (GBP)
Net Asset Value GBP 53,895 GBP 42,712 GBP 48,758
Number of Shares in Issue 4,155 3,722 3,722
Net Asset Value per Share GBP 12.9700 GBP 11.4746 GBP 13.0988
Share class I (GBP)
Net Asset Value GBP 395,115 GBP 357,800 GBP 415,302
Number of Shares in Issue 34,707 34,704 34,702
Net Asset Value per Share GBP 11.3854 GBP 10.31 GBP 11.9675
Sanlam Multi-Strategy Fund
30 June 31 December 30 June
2019 2018 2018
Share class Founder (GBP)
Net Asset Value GBP 19,718,821 GBP 14,612,773 GBP 12,963,592
Number of Shares in Issue 1,587,475 1,245,050 1,089,629
Net Asset Value per Share GBP 12.4215 GBP 11.7367 GBP 11.8972
Share class A (USD)
Net Asset Value USD 63,751 USD 6 USD 6
Number of Shares in Issue 8,315 1 1
Net Asset Value per Share USD 7.6670 USD 7.423 USD 7.7789
Share class A (GBP)
Net Asset Value GBP 10,974,180 GBP 920,125 GBP 1,656,334
Number of Shares in Issue 932,069 82,611 146,521
Net Asset Value per Share GBP 11.7740 GBP 11.138 GBP 11.3044
Share class A (EUR)
Net Asset Value EUR 249,686 - -
Number of Shares in Issue 24,889 - -
Net Asset Value per Share EUR 10.0320 - -

SANLAM UNIVERSAL FUNDS PLC
535
NOTES TO AND FORMING PART OF THE UNAUDITED CONDENSED INTERIM FINANCIAL STATEMENTS (CONTINUED) for the six months ended 30 June 2019
15 Net asset value per share (continued)
Sanlam Multi-Strategy Fund (continued)
30 June 31 December 30 June
2019 2018 2018
Share class B (USD)
Net Asset Value USD 4,325,869 USD 4,042,191 USD 4,303,635
Number of Shares in Issue 340,794 340,794 361,707
Net Asset Value per Share USD 12.6935 USD 11.8611 USD 11.8981
Share class B (GBP)
Net Asset Value GBP 155,229,247 GBP 114,957,666 GBP 116,084,875
Number of Shares in Issue 12,102,890 9,509,436 109
Net Asset Value per Share GBP 12.8258 GBP 12.0888 GBP 12.2235
Share class Founder (GBP) Income Distributing
Net Asset Value GBP 26,513,057 GBP 11,500,351 GBP 6,142,312
Number of Shares in Issue 2,501,751 1,131,401 587,509
Net Asset Value per Share GBP 10.5978 GBP 10.1647 GBP 10.4548
Share class A (GBP) Income Distributing
Net Asset Value GBP 8,868,744 GBP 8,141,879 GBP 4,650,554
Number of Shares in Issue 838,533 801,626 444,408
Net Asset Value per Share GBP 10.5765 GBP 10.1567 GBP 10.4646
Share class B (GBP) Income Distributing
Net Asset Value GBP 1,238 GBP 1,160 GBP 1,173
Number of Shares in Issue 113 111 109
Net Asset Value per Share GBP 10.9537 GBP 10.4754 GBP 10.7453
Share class H (USD)
Net Asset Value USD 11,826,138 USD 12,588,550 USD 11,353,693
Number of Shares in Issue 1,076,307 1,220,909 1,093,593
Net Asset Value per Share USD 10.9877 USD 10.3108 USD 10.382
Share class SI (USD)
Net Asset Value USD 27,687 USD 22,927 -
Number of Shares in Issue 2,618 2,316 -
Net Asset Value per Share USD 10.5756 USD 9.9006 -

SANLAM UNIVERSAL FUNDS PLC
536
NOTES TO AND FORMING PART OF THE UNAUDITED CONDENSED INTERIM FINANCIAL STATEMENTS (CONTINUED) for the six months ended 30 June 2019
15 Net asset value per share (continued)
Anchor Global Stable Fund
30 June 31 December 30 June
2019 2018 2018
Share class A
Net Asset Value USD 12,512,203 USD 11,497,791 USD 13,720,766
Number of Shares in Issue 12,467,321 12,294,473 14,101,564
Net Asset Value per Share USD 1.0036 USD 0.9352 USD 0.973
Share class B
Net Asset Value USD 4,440,097 USD 3,192,351 USD 3,071,382
Number of Shares in Issue 4,276,726 3,320,869 3,089,742
Net Asset Value per Share USD 1.0382 USD 0.9613 USD 0.9941
Bridge Global Equity Income Growth Fund
30 June 31 December 30 June
2019 2018 2018
Share class A (USD)
Net Asset Value - USD 3,903,515 USD 4,024,511
Number of Shares in Issue - 3,637,267 3,637,477
Net Asset Value per Share - USD 1.0732 USD 1.1064
Anchor Global Equity Fund
30 June 31 December 30 June
2019 2018 2018
Share class A
Net Asset Value USD 32,432,010 USD 26,446,316 USD 28,963,152
Number of Shares in Issue 24,855,924 24,709,255 21,942,387
Net Asset Value per Share USD 1.3048 USD 1.0703 USD 1.32
Share class B
Net Asset Value USD 7,795,189 USD 6,299,773 USD 6,814,735
Number of Shares in Issue 5,857,081 5,807,313 5,134,039
Net Asset Value per Share USD 1.3309 USD 1.0848 USD 1.3274
Bridge Global Managed Growth Fund
30 June 31 December 30 June
2019 2018 2018
Share class A (USD)
Net Asset Value USD 17,408,952 USD 10,314,093 USD 9,871,092
Number of Shares in Issue 14,902,373 9,861,452 8,969,655
Net Asset Value per Share USD 1.1682 USD 1.0459 USD 1.1005

SANLAM UNIVERSAL FUNDS PLC
537
NOTES TO AND FORMING PART OF THE UNAUDITED CONDENSED INTERIM FINANCIAL STATEMENTS (CONTINUED) for the six months ended 30 June 2019
15 Net asset value per share (continued)
Sanlam Global Emerging Markets Fund
30 June 31 December 30 June
2019 2018 2018
Share class A1 (USD)
Net Asset Value USD 2,569,860 USD 2,945,162 USD 3,193,793
Number of Shares in Issue 2,214,633 2,840,353 2,590,040
Net Asset Value per Share USD 1.1604 USD 1.0369 USD 1.2331
Share class A2 (USD)
Net Asset Value USD 179,523 USD 94,582 USD 100,617
Number of Shares in Issue 177,728 104,626 93,433
Net Asset Value per Share USD 1.0101 USD 0.904 USD 1.0769
Share class B1 (USD)
Net Asset Value USD 1,018,254 USD 391,108 USD 397,204
Number of Shares in Issue 922,415 396,983 339,458
Net Asset Value per Share USD 1.1039 USD 0.9852 USD 1.1701
Share class B2 (USD)
Net Asset Value USD 15,154,571 USD 14,577,251 USD 17,210,522
Number of Shares in Issue 13,596,421 14,631,387 14,519,017
Net Asset Value per Share USD 1.1146 USD 0.9963 USD 1.1854
Share class C1 (USD)
Net Asset Value USD 13,052,115 USD 14,802,798 USD 17,117,123
Number of Shares in Issue 10,739,830 13,658,238 13,306,799
Net Asset Value per Share USD 1.2153 USD 1.0838 USD 1.2863
Share class C2 (USD)
Net Asset Value USD 16,937,439 USD 19,281,142 USD 22,742,480
Number of Shares in Issue 15,652,379 19,949,449 19,792,438
Net Asset Value per Share USD 1.0821 USD 0.9665 USD 1.149
Share class C2 (GBP)
Net Asset Value GBP 246,749 GBP 220,568 GBP 250,787
Number of Shares in Issue 286,684 283,252 281,751
Net Asset Value per Share GBP 0.8607 GBP 0.7787 GBP 0.8901
Share class D (USD)
Net Asset Value USD 59,665,425 USD 53,224,549 USD 415,457
Number of Shares in Issue 78,342,207 78,363,589 371,589
Net Asset Value per Share USD 0.7616 USD 0.6792 USD 1.1181
Share class E (USD)
Net Asset Value USD 72,669 USD 447,535 -
Number of Shares in Issue 68,394 473,582 -
Net Asset Value per Share USD 1.0625 USD 0.945 -

SANLAM UNIVERSAL FUNDS PLC
538
NOTES TO AND FORMING PART OF THE UNAUDITED CONDENSED INTERIM FINANCIAL STATEMENTS (CONTINUED) for the six months ended 30 June 2019
15 Net asset value per share (continued)
ABSA Africa Equity Fund
30 June 31 December 30 June
2019 2018 2018
Share class A (USD)
Net Asset Value USD 31,586,634 USD 34,418,851 USD 38,692,883
Number of Shares in Issue 24,638,560 28,872,453 28,599,424
Net Asset Value per Share USD 1.2820 USD 1.1921 USD 1.3529
Sanlam Centre American Select Equity Fund
30 June 31 December 30 June
2019 2018 2018
Share class C (USD)
Net Asset Value USD 166 USD 148 USD 6,360
Number of Shares in Issue 136 136 5,218
Net Asset Value per Share USD 1.2231 USD 1.0821 USD 1.2189
Share class C (GBP)
Net Asset Value GBP 76 GBP 77 GBP 4,847
Number of Shares in Issue 64 64 4,083
Net Asset Value per Share GBP 1.1814 GBP 1.1884 GBP 1.1872
Share class E (USD)
Net Asset Value USD 304,504,796 USD 135,752,274 USD 194,687,581
Number of Shares in Issue 227,327,209 114,510,564 146,744,119
Net Asset Value per Share USD 1.3395 USD 1.1855 USD 1.3267
Share class C (GBP Unhedged)
Net Asset Value GBP 107 - -
Number of Shares in Issue 100 - -
Net Asset Value per Share GBP 1.0683 - -
Sanlam Global Convertible Securities Fund
30 June 31 December 30 June
2019 2018 2018
Share class A
Net Asset Value USD 44,434,349 USD 39,653,461 USD 43,030,064
Number of Shares in Issue 39,042,570 38,937,020 38,955,513
Net Asset Value per Share USD 1.1381 USD 1.0184 USD 1.1046
Sanlam Japan Equity Fund
30 June 31 December 30 June
2019 2018 2018
Share class E (USD)
Net Asset Value USD 3,342,236 USD 47,477,177 USD 77,547,651
Number of Shares in Issue 2,924,603 44,214,171 60,136,616
Net Asset Value per Share USD 1.1428 USD 1.0738 USD 1.2895

SANLAM UNIVERSAL FUNDS PLC
539
NOTES TO AND FORMING PART OF THE UNAUDITED CONDENSED INTERIM FINANCIAL STATEMENTS (CONTINUED) for the six months ended 30 June 2019
15 Net asset value per share (continued)
Sanlam Centre Active U.S Treasury Fund
30 June 31 December 30 June
2019 2018 2018
Share class B (USD)
Net Asset Value USD 100 - -
Number of Shares in Issue 100 - -
Net Asset Value per Share USD 1.0023 - -
Share class C (USD)
Net Asset Value USD 82,113 USD 180,319 USD 258,191
Number of Shares in Issue 86,072 186,724 268,174
Net Asset Value per Share USD 0.9540 USD 0.9657 USD 0.9628
Share class E (USD)
Net Asset Value USD 5,366,104 USD 5,319,555 USD 10,178,303
Number of Shares in Issue 5,667,023 5,549,295 10,649,377
Net Asset Value per Share USD 0.9469 USD 0.9586 USD 0.9558
Autus Global Equity Fund
30 June 31 December 30 June
2019 2018 2018
Share class A (USD)
Net Asset Value USD 172,879 USD 109,220 USD 51,124
Number of Shares in Issue 154,785 117,353 48,961
Net Asset Value per Share USD 1.1169 USD 0.9307 USD 1.0442
Share class B (USD)
Net Asset Value USD 14,121,486 USD 14,227,467 USD 16,630,719
Number of Shares in Issue 10,946,040 13,257,051 13,813,834
Net Asset Value per Share USD 1.2901 USD 1.0732 USD 1.2039
Sanlam Four Enhanced Income Fund
30 June 31 December 30 June
2019 2018 2018
Share class A Accumulation (GBP)
Net Asset Value - - GBP 101
Number of Shares in Issue - - 10
Net Asset Value per Share - - GBP 10.092

SANLAM UNIVERSAL FUNDS PLC
540
NOTES TO AND FORMING PART OF THE UNAUDITED CONDENSED INTERIM FINANCIAL STATEMENTS (CONTINUED) for the six months ended 30 June 2019
15 Net asset value per share (continued)
Wisian Capital South African Equity Fund
30 June 31 December 30 June
2019 2018 2018
Share class A Retail Hedged
Net Asset Value USD 5,322,567 USD 5,359,485 USD 1,412,171
Number of Shares in Issue 6,257,426 6,257,426 1,500,000
Net Asset Value per Share USD 0.8506 USD 0.8565 USD 0.9414
Share class B Institutional Hedged
Net Asset Value USD 1,280,700 USD 1,279,650 USD 1,412,171
Number of Shares in Issue 1,500,000 1,500,000 1,500,000
Net Asset Value per Share USD 0.8538 USD 0.8531 USD 0.9414
Cameron Hume Global Fixed Income ESG Fund
30 June 31 December 30 June
2019 2018 2018
Share class E
Net Asset Value USD 103,181,316 USD 99,413,538 -
Number of Shares in Issue 9,671,858 9,984,587 -
Net Asset Value per Share USD 10.6682 USD 9.9567 -
Sanlam Centre Global Listed Infrastructure Fund
30 June 31 December 30 June
2019 2018 2018
Share class C (USD)
Net Asset Value USD 5,260 USD 4,500 -
Number of Shares in Issue 5,020 5,002 -
Net Asset Value per Share USD 1.0478 USD 0.8996 -
Share class C (GBP)
Net Asset Value GBP 3,979 GBP 3,441 -
Number of Shares in Issue 3,876 3,863 -
Net Asset Value per Share GBP 1.0267 GBP 0.8907 -
Share class E (USD)
Net Asset Value USD 5,163,192 USD 4,420,806 -
Number of Shares in Issue 5,021,583 4,996,391 -
Net Asset Value per Share USD 1.0282 USD 0.8848 -
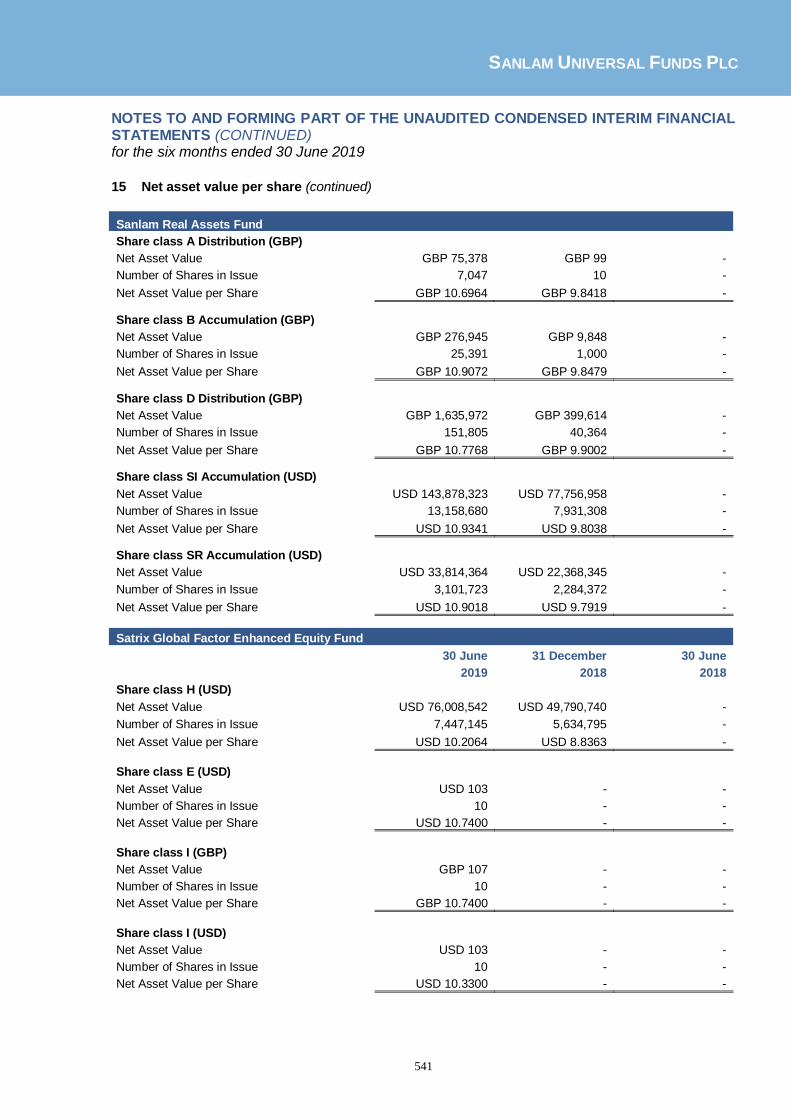
SANLAM UNIVERSAL FUNDS PLC
541
NOTES TO AND FORMING PART OF THE UNAUDITED CONDENSED INTERIM FINANCIAL STATEMENTS (CONTINUED) for the six months ended 30 June 2019
15 Net asset value per share (continued)
Sanlam Real Assets Fund
Share class A Distribution (GBP)
Net Asset Value GBP 75,378 GBP 99 -
Number of Shares in Issue 7,047 10 -
Net Asset Value per Share GBP 10.6964 GBP 9.8418 -
Share class B Accumulation (GBP)
Net Asset Value GBP 276,945 GBP 9,848 -
Number of Shares in Issue 25,391 1,000 -
Net Asset Value per Share GBP 10.9072 GBP 9.8479 -
Share class D Distribution (GBP)
Net Asset Value GBP 1,635,972 GBP 399,614 -
Number of Shares in Issue 151,805 40,364 -
Net Asset Value per Share GBP 10.7768 GBP 9.9002 -
Share class SI Accumulation (USD)
Net Asset Value USD 143,878,323 USD 77,756,958 -
Number of Shares in Issue 13,158,680 7,931,308 -
Net Asset Value per Share USD 10.9341 USD 9.8038 -
Share class SR Accumulation (USD)
Net Asset Value USD 33,814,364 USD 22,368,345 -
Number of Shares in Issue 3,101,723 2,284,372 -
Net Asset Value per Share USD 10.9018 USD 9.7919 -
Satrix Global Factor Enhanced Equity Fund
30 June 31 December 30 June
2019 2018 2018
Share class H (USD)
Net Asset Value USD 76,008,542 USD 49,790,740 -
Number of Shares in Issue 7,447,145 5,634,795 -
Net Asset Value per Share USD 10.2064 USD 8.8363 -
Share class E (USD)
Net Asset Value USD 103 - -
Number of Shares in Issue 10 - -
Net Asset Value per Share USD 10.7400 - -
Share class I (GBP)
Net Asset Value GBP 107 - -
Number of Shares in Issue 10 - -
Net Asset Value per Share GBP 10.7400 - -
Share class I (USD)
Net Asset Value USD 103 - -
Number of Shares in Issue 10 - -
Net Asset Value per Share USD 10.3300 - -

SANLAM UNIVERSAL FUNDS PLC
542
NOTES TO AND FORMING PART OF THE UNAUDITED CONDENSED INTERIM FINANCIAL STATEMENTS (CONTINUED) for the six months ended 30 June 2019
15 Net asset value per share (continued)
30 June 31 December 30 June
2019 2018 2018
Satrix Global Factor Enhanced Equity Fund (continued)
Share class S (USD)
Net Asset Value USD 103 - -
Number of Shares in Issue 10 - -
Net Asset Value per Share USD 10.3300 - -
Perpetua Global Equity UCITS Fund
30 June 31 December 30 June
2019 2018 2018
Share class A (USD)
Net Asset Value USD 18,316,165 - -
Number of Shares in Issue 17,674,578 - -
Net Asset Value per Share USD 1.0363 - -
Share class B (USD)
Net Asset Value USD 898,649 - -
Number of Shares in Issue 900,360 - -
Net Asset Value per Share USD 0.9981 - -

SANLAM UNIVERSAL FUNDS PLC
543
NOTES TO AND FORMING PART OF THE UNAUDITED CONDENSED INTERIM FINANCIAL STATEMENTS (CONTINUED) for the six months ended 30 June 2019
16 Significant events during the period The following are the significant events that occurred during the period ended 30 June 2019:
• The Company launched one new sub-fund during the period, namely Perpetua Global Equity UCITS Fund.
• The Company closed one sub-fund during the period, namely P-Solve Inflation Plus Fund.
• At an EGM on 25 March 2019, shareholders of Bridge Global Equity Income Growth Fund approved the merger of the fund into Bridge Global Managed Growth Fund. The merger took effect from 23.59pm on Friday 12 April 2019.
• During the period ended 30 June 2019, a number of Funds had a change in name as follows:
Name at 31 December 2018: Name changed to: Sanlam FOUR US Dividend Fund Sanlam US Dividend Fund Sanlam FOUR Global Equity Fund Sanlam Global Value Fund Sanlam FOUR Stable Global Equity Fund Sanlam Stable Global Fund Sanlam FOUR Active UK Equity Fund Sanlam Active UK Fund Sanlam FOUR Multi-Strategy Fund Sanlam Multiy Strategy Fund Denker Global Emerging Markets Fund Sanlam Global Emerging Markets Fund
• Denker Capital (Pty) Ltd was replaced by Sanlam Investment Management (Pty) Limited as Investment Manager of Sanlam Global Emerging Markets Fund
• The base currency of two sub-funds namely, Sanlam Global Value Fund and Sanlam Stable Global Fund was changed from GBP to USD.
• New Offering Supplements were issued with respect to the following sub-funds:
Sanlam Active UK Fund
Centre American Select Equity Fund
Sanlam Global Value Fund
Sanlam Multi-Strategy Fund
Sanlam Stable Global Fund
Sanlam US Dividend Fund
Satrix Emerging Market Equity Tracker Fund Sanlam Global Emerging Markets Fund
There were no other significant events during the period.

SANLAM UNIVERSAL FUNDS PLC
544
NOTES TO AND FORMING PART OF THE UNAUDITED CONDENSED INTERIM FINANCIAL STATEMENTS (CONTINUED) for the six months ended 30 June 2019
17 Index Tracking Tracking error is the volatility of the difference between the return of the Index tracking UCITS and the return of the index or indices tracked. The Company has five index-tracking Funds in existence at 30 June 2019. The table below compares the anticipated tracking error (disclosed as a range in the prospectus on an ex ante basis) against the actual realised tracking error of the Funds for the 12 month period ending 30 June 2019. An explanation of the difference, if any is provided on the table below:
Fund Name
Benchmark Index
Anticipated
Tracking
Error
Realised
Tracking
Error
% %
Satrix World Equity Tracker Fund
MSCI World Index (Developed
Markets) in US Dollars
Unhedged with income
reinvested (or another
appropriate major world index
selected by the Manager) +/- 1.00 0.13
Satrix North America Equity Tracker Fund MSCI North America Index +/- 0.45 -0.25
Satrix UK Equity Tracker Fund
MSCI UK Daily Net Total Return
Index
+/- 0.90 -0.53
Satrix Europe (ex UK) Equity Tracker Fund MSCI Europe ex UK Index +/- 0.50 0.30
Satrix Emerging Markets Equity Tracker Fund MSCI Emerging Markets Index +/- 1.00 -0.46
Fund Name Explanation of difference
Satrix World Equity Tracker Fund The Fund has tracked its benchmark index within the anticipated tracking error range.
Satrix North America Equity Tracker Fund The Fund has tracked its benchmark index within the anticipated tracking error range.
Satrix UK Equity Tracker Fund
The Fund has tracked its benchmark index within the anticipated
tracking error range.
Satrix Europe (ex UK) Equity Tracker Fund
The Fund has tracked its benchmark index within the anticipated
tracking error range.
Satrix Emerging Markets Equity Tracker Fund
The Fund has tracked its benchmark index within the anticipated
tracking error range.
Tracking difference is defined as the difference in the annual return of the Index-tracking UCITS and the annual return of the tracked index. The realised Fund performance against the performance of the relevant benchmark index during the period ended 30 June 2019 is set out in the Investment Manager’s report for each of the index- tracking Funds.
18 Significant events since the end of the period
There were no significant events from 30 June 2019 to the date of approval of these financial statements.

SANLAM UNIVERSAL FUNDS PLC
545
NOTES TO AND FORMING PART OF THE UNAUDITED CONDENSED INTERIM FINANCIAL STATEMENTS (CONTINUED) for the six months ended 30 June 2019
19 Off balance sheet arrangements
The Company was not party to off balance sheet arrangements for the six months from 1 January 2019 to 30 June 2019.
20 Approval of unaudited condensed interim financial statements
The unaudited condensed interim financial statements were approved by the Board of Directors on 29
August 2019.
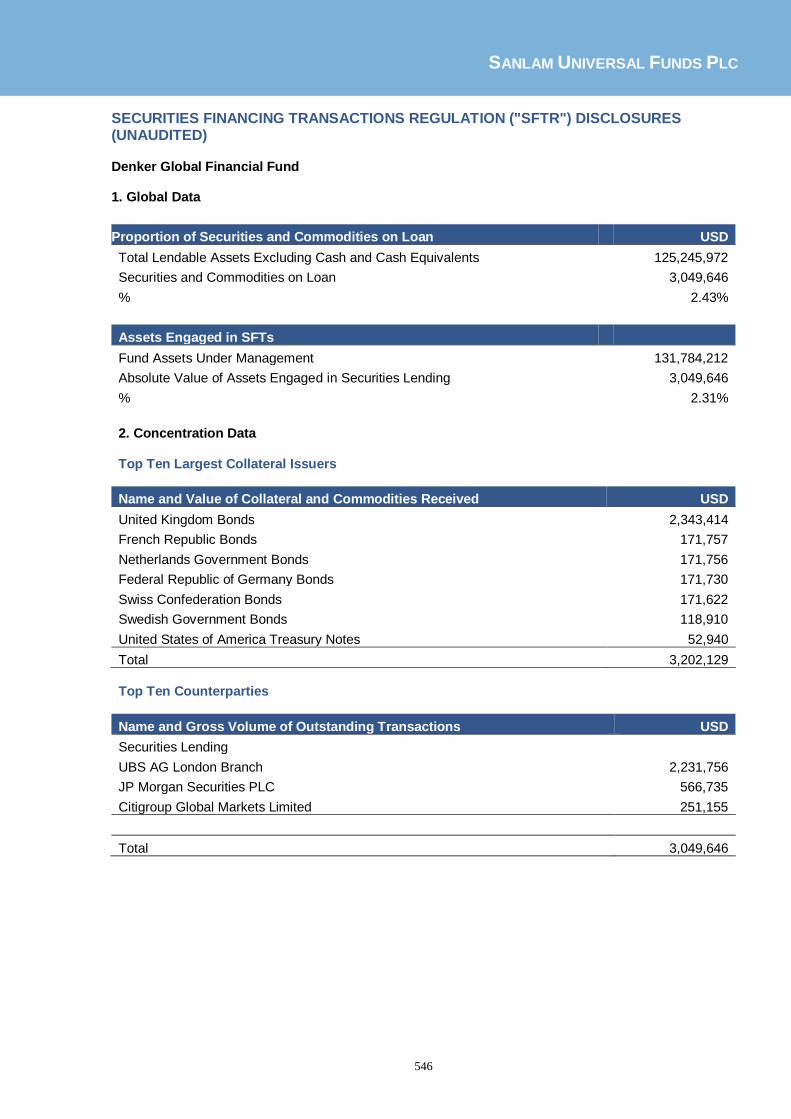
SANLAM UNIVERSAL FUNDS PLC
546
SECURITIES FINANCING TRANSACTIONS REGULATION ("SFTR") DISCLOSURES (UNAUDITED) Denker Global Financial Fund 1. Global Data
Proportion of Securities and Commodities on Loan USD
Total Lendable Assets Excluding Cash and Cash Equivalents 125,245,972
Securities and Commodities on Loan 3,049,646
% 2.43%
Assets Engaged in SFTs
Fund Assets Under Management 131,784,212
Absolute Value of Assets Engaged in Securities Lending 3,049,646
% 2.31%
2. Concentration Data Top Ten Largest Collateral Issuers
Name and Value of Collateral and Commodities Received USD
United Kingdom Bonds 2,343,414
French Republic Bonds 171,757
Netherlands Government Bonds 171,756
Federal Republic of Germany Bonds 171,730
Swiss Confederation Bonds 171,622
Swedish Government Bonds 118,910
United States of America Treasury Notes 52,940
Total 3,202,129
Top Ten Counterparties
Name and Gross Volume of Outstanding Transactions USD
Securities Lending
UBS AG London Branch 2,231,756
JP Morgan Securities PLC 566,735
Citigroup Global Markets Limited 251,155
Total 3,049,646
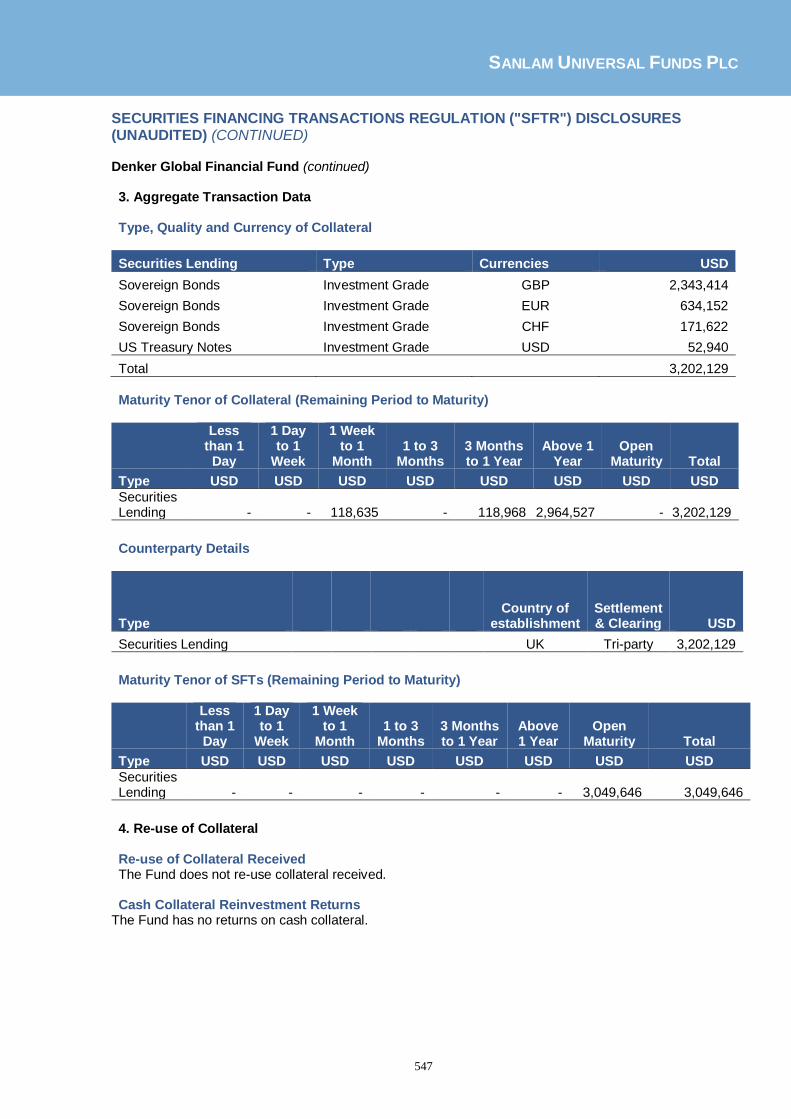
SANLAM UNIVERSAL FUNDS PLC
547
SECURITIES FINANCING TRANSACTIONS REGULATION ("SFTR") DISCLOSURES (UNAUDITED) (CONTINUED) Denker Global Financial Fund (continued) 3. Aggregate Transaction Data Type, Quality and Currency of Collateral
Securities Lending Type Currencies USD
Sovereign Bonds Investment Grade GBP 2,343,414
Sovereign Bonds Investment Grade EUR 634,152
Sovereign Bonds Investment Grade CHF 171,622
US Treasury Notes Investment Grade USD 52,940
Total 3,202,129
Maturity Tenor of Collateral (Remaining Period to Maturity)
Less than 1
Day
1 Day to 1
Week
1 Week to 1
Month 1 to 3
Months 3 Months to 1 Year
Above 1 Year
Open Maturity Total
Type USD USD USD USD USD USD USD USD
Securities Lending
-
- 118,635 - 118,968 2,964,527 - 3,202,129
Counterparty Details
Type Country of
establishment Settlement & Clearing USD
Securities Lending UK Tri-party 3,202,129
Maturity Tenor of SFTs (Remaining Period to Maturity)
Less than 1
Day
1 Day to 1
Week
1 Week to 1
Month 1 to 3
Months 3 Months to 1 Year
Above 1 Year
Open Maturity Total
Type USD USD USD USD USD USD USD USD
Securities Lending
-
-
-
-
-
- 3,049,646 3,049,646
4. Re-use of Collateral Re-use of Collateral Received The Fund does not re-use collateral received. Cash Collateral Reinvestment Returns
The Fund has no returns on cash collateral.

SANLAM UNIVERSAL FUNDS PLC
548
SECURITIES FINANCING TRANSACTIONS REGULATION ("SFTR") DISCLOSURES (UNAUDITED) (CONTINUED) Denker Global Financial Fund (continued) 5. Safekeeping of Collateral Received
Names and Value of Custodians Safekeeping Collateral USD
Brown Brothers Harriman & Co 3,202,129
Number of Custodians Safekeeping Collateral 1 6. Safekeeping of Collateral Granted The Fund does not borrow stock from counterparties therefore no collateral has been granted. 7. Securities Lending Income and Costs
Information in respect to income, costs and fees incurred by the Fund in relation to securities lending activities is set out in Note 18 to the financial statements.

SANLAM UNIVERSAL FUNDS PLC
549
SECURITIES FINANCING TRANSACTIONS REGULATION (“SFTR”) DISCLOSURES (UNAUDITED) (CONTINUED) Sanlam World Equity Tracker Fund
1. Global Data
Proportion of Securities and Commodities on Loan USD
Total Lendable Assets Excluding Cash and Cash Equivalents 1,364,719,631
Securities and Commodities on Loan 8,725,245
% 0.64%
Assets Engaged in SFTs
Fund Assets Under Management 1,377,948,560
Absolute Value of Assets Engaged in Securities Lending 8,725,245
% 0.63%
2. Concentration Data
Top Ten Largest Collateral Issuers
Name and Value of Collateral and Commodities Received USD
United Kingdom Bonds 2,859,076
Federal Republic of Germany Bonds 2,378,367
French Republic Bonds 2,328,641
United States of America Treasury Notes 717,033
Netherlands Government Bonds 697,846
Swiss Confederation Government Bonds 696,439
Swedish Government Bonds 19,330
Total 9,696,732
Top Ten Counterparties
Name and Gross Volume of Outstanding Transactions USD
Securities Lending UBS AG 2,703,674
Citigroup Global Markets Limited 2,116,640
HSBC Bank Plc 1,581,481
BNP Paribas Arbitrage 1,534,838
Merrill Lynch International 695,238
Deutsche Bank AG 93,374
Total 8,725,245
3. Aggregate Transaction Data
Type, Quality and Currency of Collateral
Securities Lending Type Currencies USD
Sovereign Bonds Investment Grade EUR 5,424,184
Sovereign Bonds Investment Grade GBP 2,859,076
US Treasury Notes Investment Grade USD 717,033
Sovereign Bonds Investment Grade CHF 696,439
Total 9,696,732

SANLAM UNIVERSAL FUNDS PLC
550
SECURITIES FINANCING TRANSACTIONS REGULATION (“SFTR”) DISCLOSURES (UNAUDITED) (CONTINUED)
Sanlam World Equity Tracker Fund (continued) 3. Aggregate Transaction Data (continued) Maturity Tenor of Collateral (Remaining Period to Maturity)
Less than 1
Day
1 Day to 1
Week
1 Week to 1
Month 1 to 3
Months 3 Months to 1 Year
Above 1 Year
Open Maturity Total
Type USD USD USD USD USD USD USD USD
Securities Lending
-
- - - 24,243 9,672,488 - 9,696,732
Counterparty Details
Type Country of
establishment Settlement & Clearing USD
Securities Lending UK Tri-party 8,725,245
Maturity Tenor of SFTs (Remaining Period to Maturity)
Less than 1
Day
1 Day to 1
Week
1 Week to 1
Month 1 to 3
Months 3 Months to 1 Year
Above 1 Year
Open Maturity Total
Type USD USD USD USD USD USD USD USD
Securities Lending
-
-
-
-
-
-
4. Re-use of Collateral Re-use of Collateral Received The Fund does not re-use collateral received. Cash Collateral Reinvestment Returns The Fund has no returns on cash collateral. 5. Safekeeping of Collateral Received
Names and Value of Custodians Safekeeping Collateral USD
Brown Brothers Harriman & Co 8,725,245
Number of Custodians Safekeeping Collateral 1 6. Safekeeping of Collateral Granted The Fund does not borrow stock from counterparties therefore no collateral has been granted. 7. Securities Lending Income and Costs
Information in respect to income, costs and fees incurred by the Fund in relation to securities lending activities is set out in Note 18 to the financial statements.
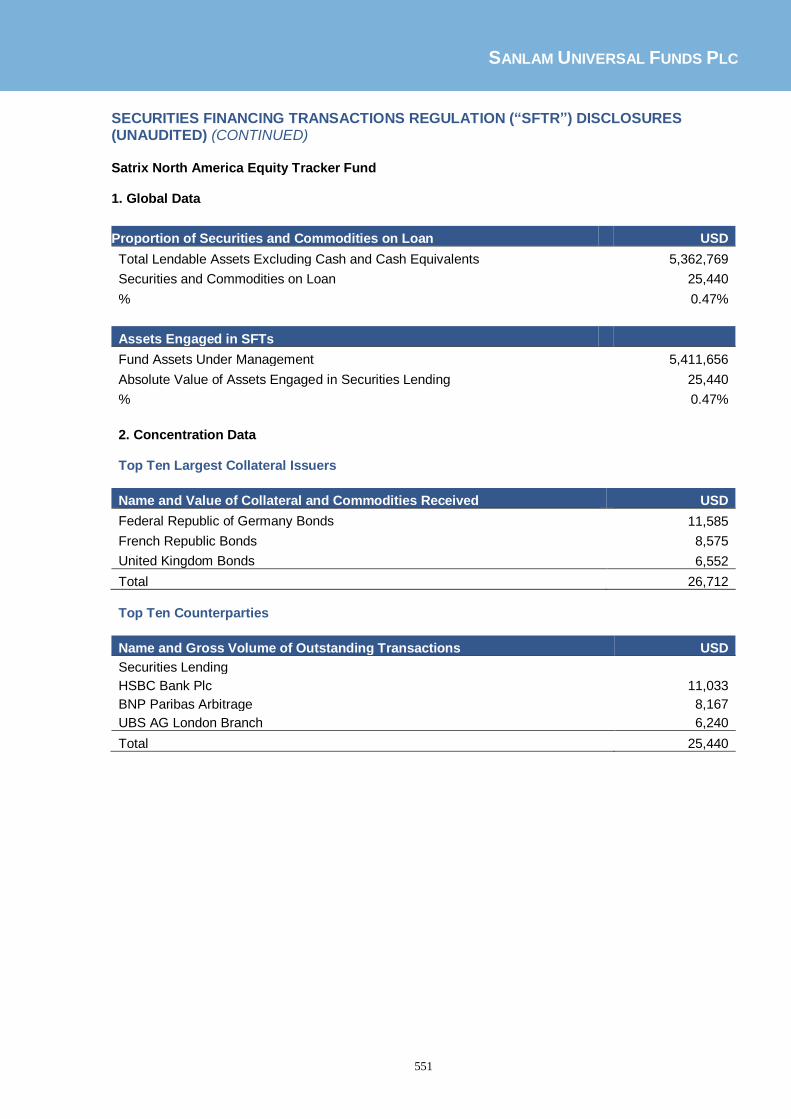
SANLAM UNIVERSAL FUNDS PLC
551
SECURITIES FINANCING TRANSACTIONS REGULATION (“SFTR”) DISCLOSURES (UNAUDITED) (CONTINUED) Satrix North America Equity Tracker Fund 1. Global Data
Proportion of Securities and Commodities on Loan USD
Total Lendable Assets Excluding Cash and Cash Equivalents 5,362,769
Securities and Commodities on Loan 25,440
% 0.47%
Assets Engaged in SFTs
Fund Assets Under Management 5,411,656
Absolute Value of Assets Engaged in Securities Lending 25,440
% 0.47%
2. Concentration Data Top Ten Largest Collateral Issuers
Name and Value of Collateral and Commodities Received USD
Federal Republic of Germany Bonds 11,585
French Republic Bonds 8,575
United Kingdom Bonds 6,552
Total 26,712
Top Ten Counterparties
Name and Gross Volume of Outstanding Transactions USD
Securities Lending
HSBC Bank Plc 11,033
BNP Paribas Arbitrage 8,167
UBS AG London Branch 6,240
Total 25,440
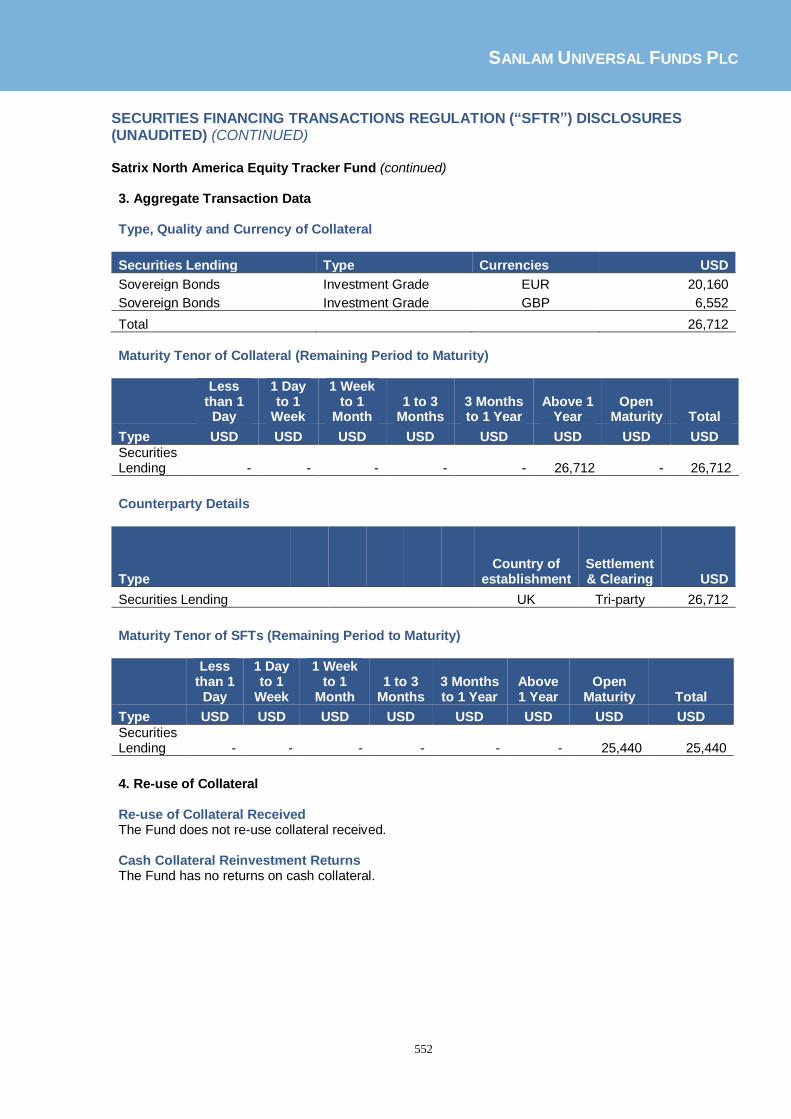
SANLAM UNIVERSAL FUNDS PLC
552
SECURITIES FINANCING TRANSACTIONS REGULATION (“SFTR”) DISCLOSURES (UNAUDITED) (CONTINUED) Satrix North America Equity Tracker Fund (continued) 3. Aggregate Transaction Data Type, Quality and Currency of Collateral
Securities Lending Type Currencies USD
Sovereign Bonds Investment Grade EUR 20,160
Sovereign Bonds Investment Grade GBP 6,552
Total 26,712
Maturity Tenor of Collateral (Remaining Period to Maturity)
Less than 1
Day
1 Day to 1
Week
1 Week to 1
Month 1 to 3
Months 3 Months to 1 Year
Above 1 Year
Open Maturity Total
Type USD USD USD USD USD USD USD USD
Securities Lending
-
- - - - 26,712 - 26,712
Counterparty Details
Type Country of
establishment Settlement & Clearing USD
Securities Lending UK Tri-party 26,712
Maturity Tenor of SFTs (Remaining Period to Maturity)
Less than 1
Day
1 Day to 1
Week
1 Week to 1
Month 1 to 3
Months 3 Months to 1 Year
Above 1 Year
Open Maturity Total
Type USD USD USD USD USD USD USD USD
Securities Lending
-
-
-
-
-
- 25,440 25,440
4. Re-use of Collateral Re-use of Collateral Received The Fund does not re-use collateral received. Cash Collateral Reinvestment Returns The Fund has no returns on cash collateral.
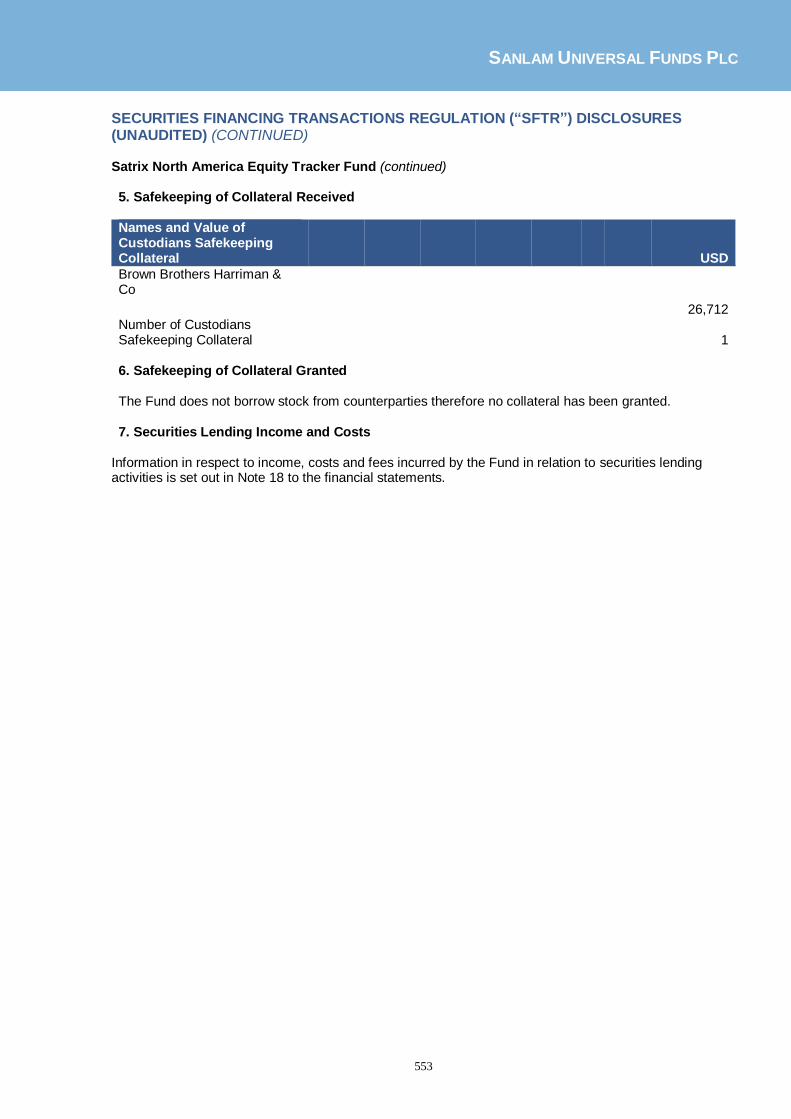
SANLAM UNIVERSAL FUNDS PLC
553
SECURITIES FINANCING TRANSACTIONS REGULATION (“SFTR”) DISCLOSURES (UNAUDITED) (CONTINUED) Satrix North America Equity Tracker Fund (continued) 5. Safekeeping of Collateral Received Names and Value of Custodians Safekeeping Collateral USD
Brown Brothers Harriman & Co
26,712 Number of Custodians Safekeeping Collateral 1 6. Safekeeping of Collateral Granted The Fund does not borrow stock from counterparties therefore no collateral has been granted. 7. Securities Lending Income and Costs
Information in respect to income, costs and fees incurred by the Fund in relation to securities lending activities is set out in Note 18 to the financial statements.

SANLAM UNIVERSAL FUNDS PLC
554
SECURITIES FINANCING TRANSACTIONS REGULATION (“SFTR”) DISCLOSURES (UNAUDITED) (CONTINUED) Satrix Europe (ex-UK) Equity Tracker Fund 1. Global Data
Proportion of Securities and Commodities on Loan EUR
Total Lendable Assets Excluding Cash and Cash Equivalents 85,835,388
Securities and Commodities on Loan 591,300
% 0.69%
Assets Engaged in SFTs
Fund Assets Under Management 87,510,445
Absolute Value of Assets Engaged in Securities Lending 591,300
% 0.07%
2. Concentration Data Top Ten Largest Collateral Issuers
Name and Value of Collateral and Commodities Received EUR
United Kingdom Bonds 497,295
Federal Republic of Germany Bonds 82,379
French Republic Bonds 41,192
Total 620,866
Top Ten Counterparties
Name and Gross Volume of Outstanding Transactions EUR
Securities Lending
UBS AG London Branch 395,162
Morgan Stanley & Co. International Plc 196,138
Total 591,300
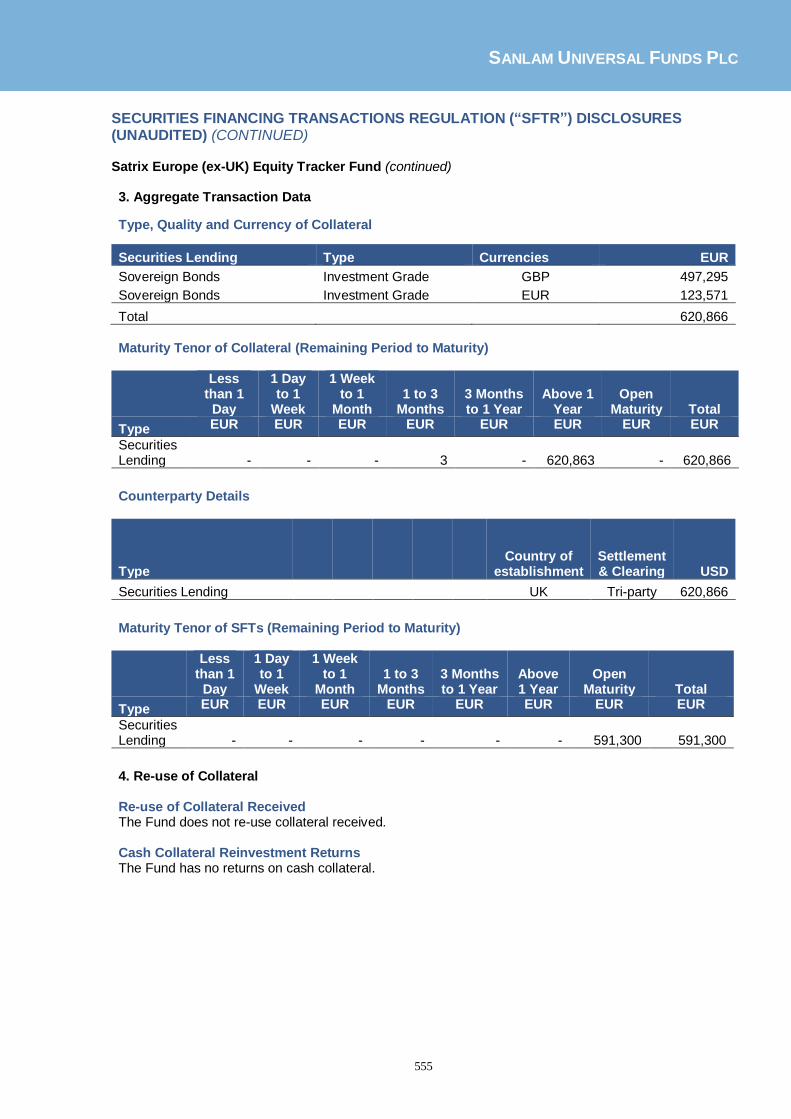
SANLAM UNIVERSAL FUNDS PLC
555
SECURITIES FINANCING TRANSACTIONS REGULATION (“SFTR”) DISCLOSURES (UNAUDITED) (CONTINUED) Satrix Europe (ex-UK) Equity Tracker Fund (continued) 3. Aggregate Transaction Data
Type, Quality and Currency of Collateral
Securities Lending Type Currencies EUR
Sovereign Bonds Investment Grade GBP 497,295
Sovereign Bonds Investment Grade EUR 123,571
Total 620,866
Maturity Tenor of Collateral (Remaining Period to Maturity)
Less than 1
Day
1 Day to 1
Week
1 Week to 1
Month 1 to 3
Months 3 Months to 1 Year
Above 1 Year
Open Maturity Total
Type EUR EUR EUR EUR EUR EUR EUR EUR
Securities Lending
-
- - 3 - 620,863 - 620,866
Counterparty Details
Type Country of
establishment Settlement & Clearing USD
Securities Lending UK Tri-party 620,866
Maturity Tenor of SFTs (Remaining Period to Maturity)
Less than 1
Day
1 Day to 1
Week
1 Week to 1
Month 1 to 3
Months 3 Months to 1 Year
Above 1 Year
Open Maturity Total
Type EUR EUR EUR EUR EUR EUR EUR EUR
Securities Lending
-
-
-
-
-
- 591,300 591,300
4. Re-use of Collateral Re-use of Collateral Received The Fund does not re-use collateral received. Cash Collateral Reinvestment Returns The Fund has no returns on cash collateral.

SANLAM UNIVERSAL FUNDS PLC
556
SECURITIES FINANCING TRANSACTIONS REGULATION (“SFTR”) DISCLOSURES (UNAUDITED) (CONTINUED) Satrix Europe (ex-UK) Equity Tracker Fund (continued) 5. Safekeeping of Collateral Received
Names and Value of Custodians Safekeeping Collateral EUR
Brown Brothers Harriman & Co 620,866
Number of Custodians Safekeeping Collateral 1 6. Safekeeping of Collateral Granted The Fund does not borrow stock from counterparties therefore no collateral has been granted. 7. Securities Lending Income and Costs
Information in respect to income, costs and fees incurred by the Fund in relation to securities lending activities is set out in Note 18 to the financial statements.
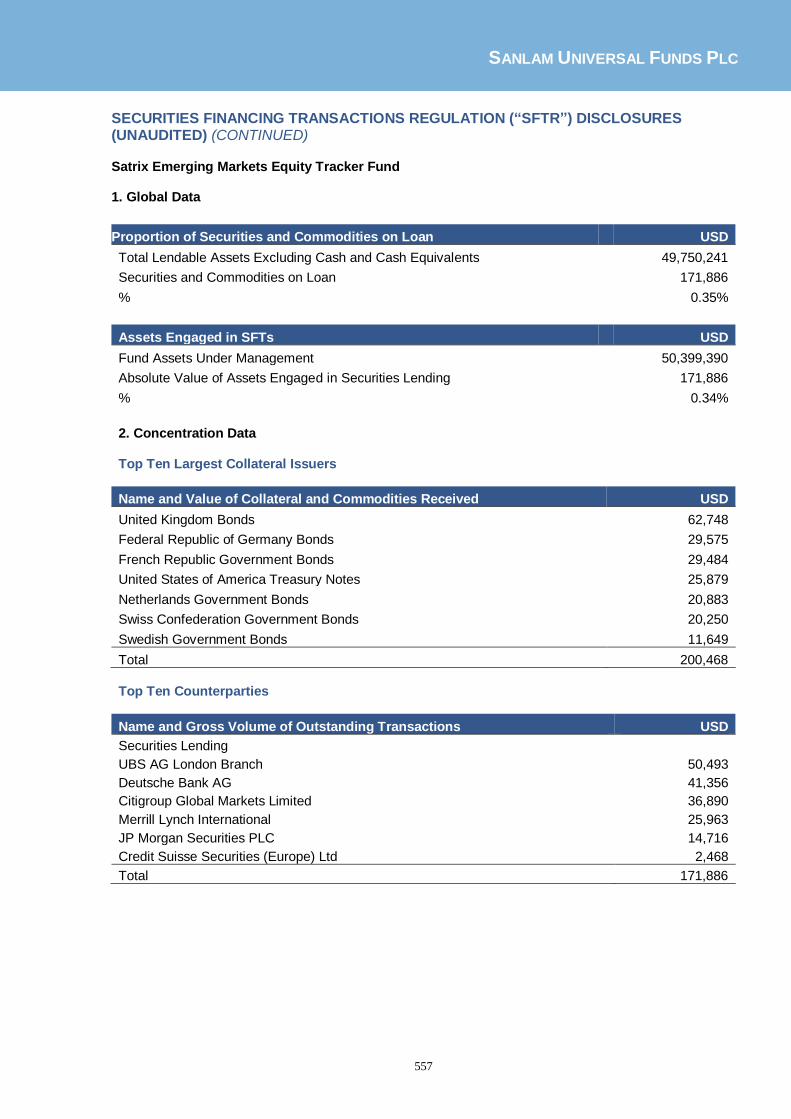
SANLAM UNIVERSAL FUNDS PLC
557
SECURITIES FINANCING TRANSACTIONS REGULATION (“SFTR”) DISCLOSURES (UNAUDITED) (CONTINUED) Satrix Emerging Markets Equity Tracker Fund 1. Global Data
Proportion of Securities and Commodities on Loan USD
Total Lendable Assets Excluding Cash and Cash Equivalents 49,750,241
Securities and Commodities on Loan 171,886
% 0.35%
Assets Engaged in SFTs USD
Fund Assets Under Management 50,399,390
Absolute Value of Assets Engaged in Securities Lending 171,886
% 0.34%
2. Concentration Data Top Ten Largest Collateral Issuers
Name and Value of Collateral and Commodities Received USD
United Kingdom Bonds 62,748
Federal Republic of Germany Bonds 29,575
French Republic Government Bonds 29,484
United States of America Treasury Notes 25,879
Netherlands Government Bonds 20,883
Swiss Confederation Government Bonds 20,250
Swedish Government Bonds 11,649
Total 200,468
Top Ten Counterparties
Name and Gross Volume of Outstanding Transactions USD
Securities Lending UBS AG London Branch 50,493
Deutsche Bank AG 41,356
Citigroup Global Markets Limited 36,890
Merrill Lynch International 25,963
JP Morgan Securities PLC 14,716
Credit Suisse Securities (Europe) Ltd 2,468
Total 171,886

SANLAM UNIVERSAL FUNDS PLC
558
SECURITIES FINANCING TRANSACTIONS REGULATION (“SFTR”) DISCLOSURES (UNAUDITED) (CONTINUED)
Satrix Emerging Markets Equity Tracker Fund (continued) 3. Aggregate Transaction Data Type, Quality and Currency of Collateral
Securities Lending Type Currencies USD
Sovereign Bonds Investment Grade EUR 91,591
Sovereign Bonds Investment Grade GBP 62,748
US Treasury Notes Investment Grade USD 25,879
Sovereign Bonds Investment Grade CHF 20,250
Total 200,468
Maturity Tenor of Collateral (Remaining Period to Maturity)
Less than 1
Day
1 Day to 1
Week
1 Week to 1
Month 1 to 3
Months 3 Months to 1 Year
Above 1 Year
Open Maturity Total
Type USD USD USD USD USD USD USD USD
Securities Lending
-
-
3,081 62 - 197,325 - 200,468
Counterparty Details
Type Country of
establishment Settlement & Clearing GBP
Securities Lending UK Tri-party 200,468
Maturity Tenor of SFTs (Remaining Period to Maturity)
Less than 1
Day
1 Day to 1
Week
1 Week to 1
Month 1 to 3
Months 3 Months to 1 Year
Above 1 Year
Open Maturity Total
Type USD USD USD USD USD USD USD USD
Securities Lending
-
-
-
-
-
- 171,886 171,886
4. Re-use of Collateral Re-use of Collateral Received The Fund does not re-use collateral received. Cash Collateral Reinvestment Returns The Fund has no returns on cash collateral.

SANLAM UNIVERSAL FUNDS PLC
559
SECURITIES FINANCING TRANSACTIONS REGULATION (“SFTR”) DISCLOSURES (UNAUDITED) (CONTINUED)
Satrix Emerging Markets Equity Tracker Fund (continued) 5. Safekeeping of Collateral Received
Names and Value of Custodians Safekeeping Collateral USD
Brown Brothers Harriman & Co 200,468
Number of Custodians Safekeeping Collateral 1 6. Safekeeping of Collateral Granted The Fund does not borrow stock from counterparties therefore no collateral has been granted. 7. Securities Lending Income and Costs
Information in respect to income, costs and fees incurred by the Fund in relation to securities lending activities is set out in Note 18 to the financial statements.

SANLAM UNIVERSAL FUNDS PLC
560
SECURITIES FINANCING TRANSACTIONS REGULATION (“SFTR”) DISCLOSURES (UNAUDITED) (CONTINUED) Sanlam Global High Quality Fund 1. Global Data
Proportion of Securities and Commodities on Loan GBP
Total Lendable Assets Excluding Cash and Cash Equivalents 323,199,911
Securities and Commodities on Loan 1,070
% 0.00%
Assets Engaged in SFTs GBP
Fund Assets Under Management 394,627,032
Absolute Value of Assets Engaged in Securities Lending 1,070
% 0.00%
2. Concentration Data Top Ten Largest Collateral Issuers
Name and Value of Collateral and Commodities Received GBP
French Republic Government Bonds 225
Netherlands Government Bonds 225
Federal Republic of Germany Bonds 225
Swedish Government Bonds 224
Swiss Confederation Bonds 224
Total 1,123
Top Ten Counterparties
Name and Gross Volume of Outstanding Transactions GBP
Securities Lending JP Morgan Securities PLC 1,070
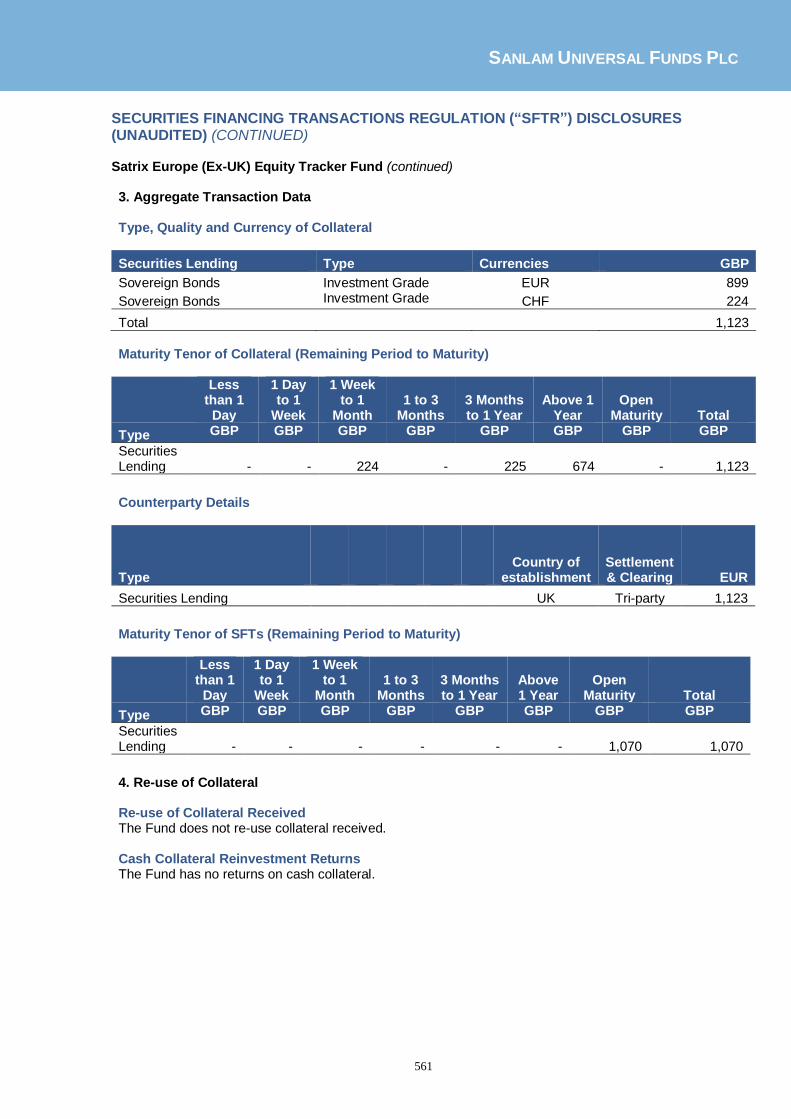
SANLAM UNIVERSAL FUNDS PLC
561
SECURITIES FINANCING TRANSACTIONS REGULATION (“SFTR”) DISCLOSURES (UNAUDITED) (CONTINUED) Satrix Europe (Ex-UK) Equity Tracker Fund (continued) 3. Aggregate Transaction Data Type, Quality and Currency of Collateral
Securities Lending Type Currencies GBP
Sovereign Bonds Investment Grade EUR 899
Sovereign Bonds Investment Grade CHF 224
Total 1,123
Maturity Tenor of Collateral (Remaining Period to Maturity)
Less than 1
Day
1 Day to 1
Week
1 Week to 1
Month 1 to 3
Months 3 Months to 1 Year
Above 1 Year
Open Maturity Total
Type GBP GBP GBP GBP GBP GBP GBP GBP
Securities Lending
-
- 224 - 225 674 - 1,123
Counterparty Details
Type Country of
establishment Settlement & Clearing EUR
Securities Lending UK Tri-party 1,123
Maturity Tenor of SFTs (Remaining Period to Maturity)
Less than 1
Day
1 Day to 1
Week
1 Week to 1
Month 1 to 3
Months 3 Months to 1 Year
Above 1 Year
Open Maturity Total
Type GBP GBP GBP GBP GBP GBP GBP GBP
Securities Lending
-
-
-
-
-
- 1,070 1,070
4. Re-use of Collateral Re-use of Collateral Received The Fund does not re-use collateral received. Cash Collateral Reinvestment Returns The Fund has no returns on cash collateral.
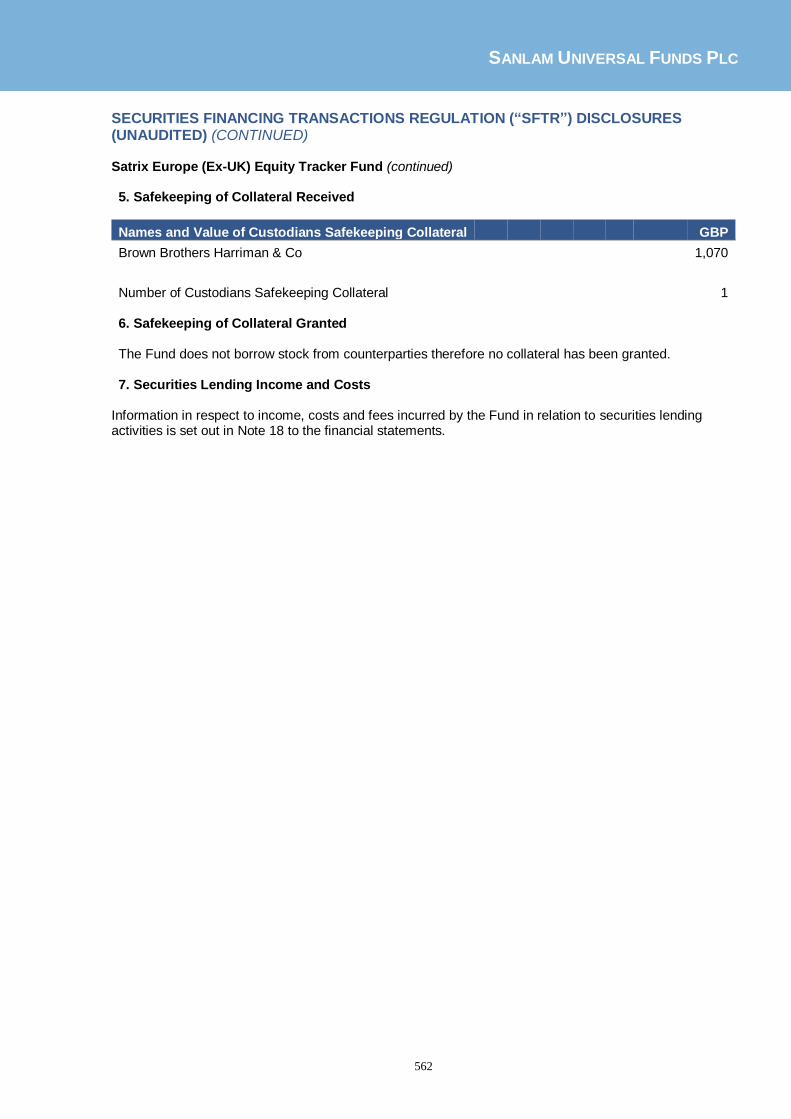
SANLAM UNIVERSAL FUNDS PLC
562
SECURITIES FINANCING TRANSACTIONS REGULATION (“SFTR”) DISCLOSURES (UNAUDITED) (CONTINUED) Satrix Europe (Ex-UK) Equity Tracker Fund (continued) 5. Safekeeping of Collateral Received
Names and Value of Custodians Safekeeping Collateral GBP
Brown Brothers Harriman & Co 1,070
Number of Custodians Safekeeping Collateral 1 6. Safekeeping of Collateral Granted The Fund does not borrow stock from counterparties therefore no collateral has been granted. 7. Securities Lending Income and Costs
Information in respect to income, costs and fees incurred by the Fund in relation to securities lending activities is set out in Note 18 to the financial statements.

SANLAM UNIVERSAL FUNDS PLC
563
SECURITIES FINANCING TRANSACTIONS REGULATION (“SFTR”) DISCLOSURES (UNAUDITED) (CONTINUED) Sanlam US Dividend Fund 1. Global Data
Proportion of Securities and Commodities on Loan USD
Total Lendable Assets Excluding Cash and Cash Equivalents 387,826,543
Securities and Commodities on Loan 18,312,641
% 4.72%
Assets Engaged in SFTs
Fund Assets Under Management 422,531,985
Absolute Value of Assets Engaged in Securities Lending 18,312,641
% 4.33%
2. Concentration Data Top Ten Largest Collateral Issuers
Name and Value of Collateral and Commodities Received USD
United Kingdom Bonds 5,029,189
Federal Republic of Germany Bonds 4,057,650
French Republic Bonds 3,778,063
Netherlands Government Bonds 3,498,650
Swiss Confederation Bonds 1,431,333
Swedish Government Bonds 1,163,304
United States of America Treasury Notes 270,086
Total 19,228,275
Top Ten Counterparties
Name and Gross Volume of Outstanding Transactions USD
Securities Lending Credit Suisse Securities (Europe) Limited 11,169,882
JP Morgan Securities Plc 5,544,419
Citigroup Global Markets Limited 1,276,787
UBS AG London Branch 321,553
Total 18,312,641

SANLAM UNIVERSAL FUNDS PLC
564
SECURITIES FINANCING TRANSACTIONS REGULATION (“SFTR”) DISCLOSURES (UNAUDITED) (CONTINUED) Sanlam US Dividend Fund (continued) 3. Aggregate Transaction Data Type, Quality and Currency of Collateral
Securities Lending Type Currencies U12,497,667SD
Sovereign Bonds Investment Grade EUR 12,497,667
Sovereign Bonds Investment Grade GBP 5,029,189
Sovereign Bonds Investment Grade CHF 1,431,333
US Treasury Notes Investment Grade USD 270,086
Total 19,228,275
Maturity Tenor of Collateral (Remaining Period to Maturity)
Less than 1
Day
1 Day to 1
Week
1 Week to 1
Month 1 to 3
Months 3 Months to 1 Year
Above 1 Year
Open Maturity Total
Type USD USD USD USD USD USD USD USD
Securities Lending
-
- - - 1,443,563 17,784,711 - 19,228,275
Counterparty Details
Type Country of
establishment Settlement & Clearing USD
Securities Lending UK Tri-party 19,228,275
Maturity Tenor of SFTs (Remaining Period to Maturity)
Less than 1
Day
1 Day to 1
Week
1 Week to 1
Month 1 to 3
Months 3 Months to 1 Year
Above 1 Year
Open Maturity Total
Type USD USD USD USD USD USD USD USD
Securities Lending
-
-
-
-
-
- 18,312,641 18,312,641
4. Re-use of Collateral Re-use of Collateral Received The Fund does not re-use collateral received. Cash Collateral Reinvestment Returns The Fund has no returns on cash collateral.

SANLAM UNIVERSAL FUNDS PLC
565
SECURITIES FINANCING TRANSACTIONS REGULATION (“SFTR”) DISCLOSURES (UNAUDITED) (CONTINUED) Sanlam US Dividend Fund (continued) 5. Safekeeping of Collateral Received
Names and Value of Custodians Safekeeping Collateral USD
Brown Brothers Harriman & Co 18,312,641
Number of Custodians Safekeeping Collateral 1 6. Safekeeping of Collateral Granted The Fund does not borrow stock from counterparties therefore no collateral has been granted. 7. Securities Lending Income and Costs
Information in respect to income, costs and fees incurred by the Fund in relation to securities lending activities is set out in Note 18 to the financial statements.

SANLAM UNIVERSAL FUNDS PLC
566
SECURITIES FINANCING TRANSACTIONS REGULATION (“SFTR”) DISCLOSURES (UNAUDITED) (CONTINUED) High Street Global Balanced Fund 1. Global Data
Proportion of Securities and Commodities on Loan USD
Total Lendable Assets Excluding Cash and Cash Equivalents 21,045,691
Securities and Commodities on Loan 57,029
% 0.27%
Assets Engaged in SFTs
Fund Assets Under Management 27,978,558
Absolute Value of Assets Engaged in Securities Lending 57,029
% 0.20%
2. Concentration Data
Top Ten Largest Collateral Issuers
Name and Value of Collateral and Commodities Received USD
French Republic Bonds 11,976
Netherlands Government Bonds 11,976
Federal Republic of Germany Bonds 11,971
Swiss Confederation Bonds 11,966
United States of America Treasury Notes 11,975
United Kingdom Bonds 16
Total 59,880
Top Ten Counterparties
Name and Gross Volume of Outstanding Transactions USD
Securities Lending Citigroup Global Markets Limited 57,029 3. Aggregate Transaction Data
Type, Quality and Currency of Collateral
Securities Lending Type Currencies USD
Sovereign Bonds Investment Grade EUR 35,923
US Treasury Notes Investment Grade USD 11,975
Sovereign Bonds Investment Grade CHF 11,966
Sovereign Bonds Investment Grade GBP 16
Total 59,880

SANLAM UNIVERSAL FUNDS PLC
567
SECURITIES FINANCING TRANSACTIONS REGULATION (“SFTR”) DISCLOSURES (UNAUDITED) (CONTINUED) High Street Global Balanced Fund (continued) 3. Aggregate Transaction Data (continued) Maturity Tenor of Collateral (Remaining Period to Maturity)
Less than 1
Day
1 Day to 1
Week
1 Week to 1
Month 1 to 3
Months 3 Months to 1 Year
Above 1 Year
Open Maturity Total
Type USD USD USD USD USD USD USD USD
Securities Lending
-
- - - - 59,880 - 59,880
Counterparty Details
Type Country of
establishment Settlement & Clearing USD
Securities Lending UK Tri-party 59,880
Maturity Tenor of SFTs (Remaining Period to Maturity)
Less than 1
Day
1 Day to 1
Week
1 Week to 1
Month 1 to 3
Months 3 Months to 1 Year
Above 1 Year
Open Maturity Total
Type USD USD USD USD USD USD USD USD
Securities Lending
-
-
-
-
-
- 57,029 57,029
4. Re-use of Collateral Re-use of Collateral Received The Fund does not re-use collateral received. Cash Collateral Reinvestment Returns The Fund has no returns on cash collateral. 5. Safekeeping of Collateral Received
Names and Value of Custodians Safekeeping Collateral USD
Brown Brothers Harriman & Co 57,029
Number of Custodians Safekeeping Collateral 1 6. Safekeeping of Collateral Granted The Fund does not borrow stock from counterparties therefore no collateral has been granted. 7. Securities Lending Income and Costs
Information in respect to income, costs and fees incurred by the Fund in relation to securities lending activities is set out in Note 18 to the financial statements.

SANLAM UNIVERSAL FUNDS PLC
568
SECURITIES FINANCING TRANSACTIONS REGULATION (“SFTR”) DISCLOSURES (UNAUDITED) (CONTINUED) Sanlam Global Value Fund 1. Global Data
Proportion of Securities and Commodities on Loan USD
Total Lendable Assets Excluding Cash and Cash Equivalents 122,662,521
Securities and Commodities on Loan 1,389,030
% 1.13%
Assets Engaged in SFTs
Fund Assets Under Management 6,270,484
Absolute Value of Assets Engaged in Securities Lending 1,389,030
% 22.15%
2. Concentration Data Top Ten Largest Collateral Issuers
Name and Value of Collateral and Commodities Received USD
French Republic Bonds 1,458,460
United Kingdom Bonds 21
Federal Republic of Germany Bonds 1
Total 1,458,482
Top Ten Counterparties
Name and Gross Volume of Outstanding Transactions USD
Securities Lending BNP Paribas Arbitrage 1,389,030 3. Aggregate Transaction Data Type, Quality and Currency of Collateral
Securities Lending Type Currencies USD
Sovereign Bonds Investment Grade EUR 1,458,461
Sovereign Bonds Investment Grade GBP 21
Total 1,458,482

SANLAM UNIVERSAL FUNDS PLC
569
SECURITIES FINANCING TRANSACTIONS REGULATION (“SFTR”) DISCLOSURES (UNAUDITED) (CONTINUED) Sanlam Global Value Fund (continued) 3. Aggregate Transaction Data (continued) Maturity Tenor of Collateral (Remaining Period to Maturity)
Less than 1
Day
1 Day to 1
Week
1 Week to 1
Month 1 to 3
Months 3 Months to 1 Year
Above 1 Year
Open Maturity Total
Type USD USD USD USD USD USD USD USD
Securities Lending
-
-
-
- - 1,458,482 - 1,458,482
Counterparty Details
Type Country of
establishment Settlement & Clearing USD
Securities Lending UK Tri-party 1,458,482
Maturity Tenor of SFTs (Remaining Period to Maturity)
Less than 1
Day
1 Day to 1
Week
1 Week to 1
Month 1 to 3
Months 3 Months to 1 Year
Above 1 Year
Open Maturity Total
Type USD USD USD USD USD USD USD USD
Securities Lending
-
-
-
-
-
- 1,389,030 1,389,030
4. Re-use of Collateral Re-use of Collateral Received The Fund does not re-use collateral received. Cash Collateral Reinvestment Returns The Fund has no returns on cash collateral. 5. Safekeeping of Collateral Received
Names and Value of Custodians Safekeeping Collateral USD
Brown Brothers Harriman & Co 1,389,030
Number of Custodians Safekeeping Collateral 1 6. Safekeeping of Collateral Granted The Fund does not borrow stock from counterparties therefore no collateral has been granted. 7. Securities Lending Income and Costs
Information in respect to income, costs and fees incurred by the Fund in relation to securities lending activities is set out in Note 18 to the financial statements.
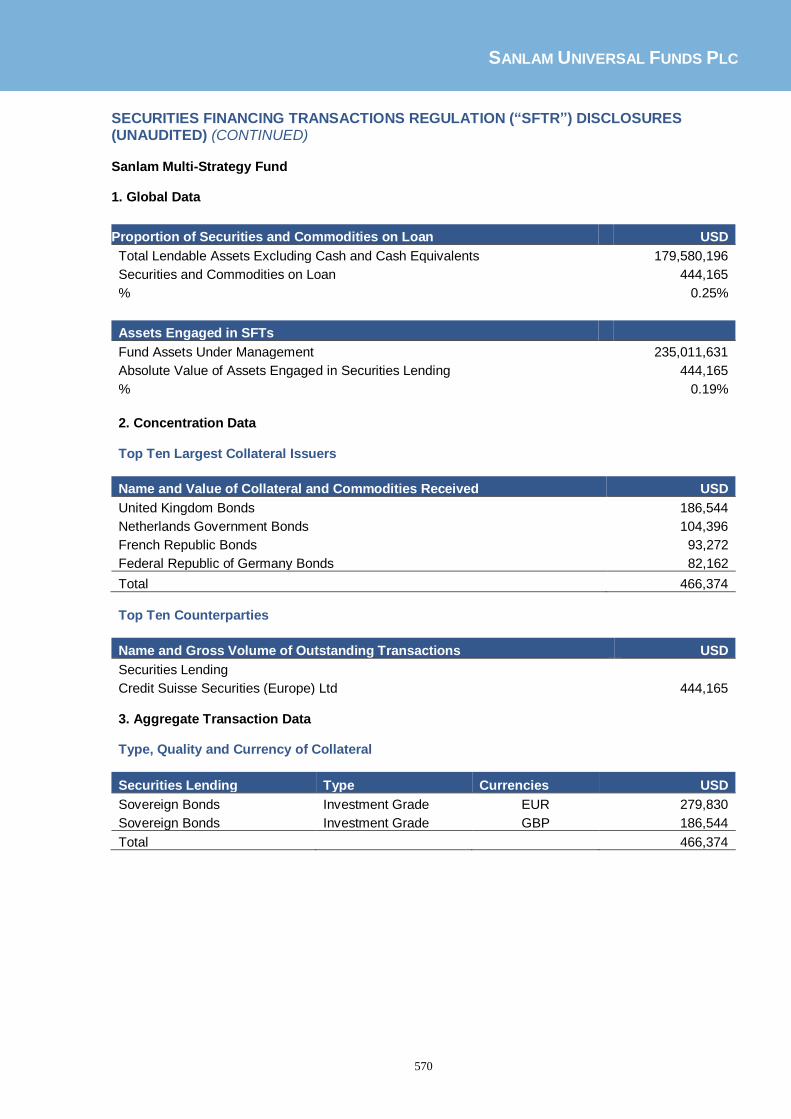
SANLAM UNIVERSAL FUNDS PLC
570
SECURITIES FINANCING TRANSACTIONS REGULATION (“SFTR”) DISCLOSURES (UNAUDITED) (CONTINUED) Sanlam Multi-Strategy Fund 1. Global Data
Proportion of Securities and Commodities on Loan USD
Total Lendable Assets Excluding Cash and Cash Equivalents 179,580,196
Securities and Commodities on Loan 444,165
% 0.25%
Assets Engaged in SFTs
Fund Assets Under Management 235,011,631
Absolute Value of Assets Engaged in Securities Lending 444,165
% 0.19%
2. Concentration Data Top Ten Largest Collateral Issuers
Name and Value of Collateral and Commodities Received USD
United Kingdom Bonds 186,544
Netherlands Government Bonds 104,396
French Republic Bonds 93,272
Federal Republic of Germany Bonds 82,162
Total 466,374
Top Ten Counterparties
Name and Gross Volume of Outstanding Transactions USD
Securities Lending Credit Suisse Securities (Europe) Ltd 444,165 3. Aggregate Transaction Data Type, Quality and Currency of Collateral
Securities Lending Type Currencies USD
Sovereign Bonds Investment Grade EUR 279,830
Sovereign Bonds Investment Grade GBP 186,544
Total 466,374

SANLAM UNIVERSAL FUNDS PLC
571
SECURITIES FINANCING TRANSACTIONS REGULATION (“SFTR”) DISCLOSURES (UNAUDITED) (CONTINUED) Sanlam Multi-Strategy Fund (continued) 3. Aggregate Transaction Data (continued) Maturity Tenor of Collateral (Remaining Period to Maturity)
Less than 1
Day
1 Day to 1
Week
1 Week to 1
Month 1 to 3
Months 3 Months to 1 Year
Above 1 Year
Open Maturity Total
Type USD USD USD USD USD USD USD USD
Securities Lending
-
-
-
- 11,122 455,252 - 466,374
Counterparty Details
Type Country of
establishment Settlement & Clearing USD
Securities Lending UK Tri-party 466,374
Maturity Tenor of SFTs (Remaining Period to Maturity)
Less than 1
Day
1 Day to 1
Week
1 Week to 1
Month 1 to 3
Months 3 Months to 1 Year
Above 1 Year
Open Maturity Total
Type USD USD USD USD USD USD USD USD
Securities Lending
-
-
-
-
-
- 444,165 444,165
4. Re-use of Collateral Re-use of Collateral Received The Fund does not re-use collateral received. Cash Collateral Reinvestment Returns The Fund has no returns on cash collateral. 5. Safekeeping of Collateral Received
Names and Value of Custodians Safekeeping Collateral USD
Brown Brothers Harriman & Co 444,165
Number of Custodians Safekeeping Collateral 1 6. Safekeeping of Collateral Granted The Fund does not borrow stock from counterparties therefore no collateral has been granted. 7. Securities Lending Income and Costs
Information in respect to income, costs and fees incurred by the Fund in relation to securities lending activities is set out in Note 18 to the financial statements.

SANLAM UNIVERSAL FUNDS PLC
572
SECURITIES FINANCING TRANSACTIONS REGULATION (“SFTR”) DISCLOSURES (UNAUDITED) (CONTINUED) Anchor Global Stable Fund 1. Global Data
Proportion of Securities and Commodities on Loan USD
Total Lendable Assets Excluding Cash and Cash Equivalents 13,312,113
Securities and Commodities on Loan 1,520
% 0.01%
Assets Engaged in SFTs
Fund Assets Under Management 17,032,256
Absolute Value of Assets Engaged in Securities Lending 1,520
% 0.00%
2. Concentration Data Top Ten Largest Collateral Issuers
Name and Value of Collateral and Commodities Received USD
United Kingdom Bonds 1,596
Total 1,596
Top Ten Counterparties
Name and Gross Volume of Outstanding Transactions USD
Securities Lending UBS AG London Branch 1,520 3. Aggregate Transaction Data Type, Quality and Currency of Collateral
Securities Lending Type Currencies USD
Sovereign Bonds Investment Grade GBP 1,596
Total 1,596

SANLAM UNIVERSAL FUNDS PLC
573
SECURITIES FINANCING TRANSACTIONS REGULATION ("SFTR") DISCLOSURES (UNAUDITED) (CONTINUED) Anchor Global Stable Fund (continued) 3. Aggregate Transaction Data (continued) Maturity Tenor of Collateral (Remaining Period to Maturity)
Less than 1
Day
1 Day to 1
Week
1 Week to 1
Month 1 to 3
Months 3 Months to 1 Year
Above 1 Year
Open Maturity Total
Type USD USD USD USD USD USD USD USD
Securities Lending
-
-
-
- - 1,596 - 1,596
Counterparty Details
Type Country of
establishment Settlement & Clearing USD
Securities Lending UK Tri-party 1,596
Maturity Tenor of SFTs (Remaining Period to Maturity)
Less than 1
Day
1 Day to 1
Week
1 Week to 1
Month 1 to 3
Months 3 Months to 1 Year
Above 1 Year
Open Maturity Total
Type USD USD USD USD USD USD USD USD
Securities Lending
-
-
-
-
-
- 1,520 1,520
4. Re-use of Collateral Re-use of Collateral Received The Fund does not re-use collateral received. Cash Collateral Reinvestment Returns The Fund has no returns on cash collateral. 5. Safekeeping of Collateral Received
Names and Value of Custodians Safekeeping Collateral USD
Brown Brothers Harriman & Co 1,520
Number of Custodians Safekeeping Collateral 1 6. Safekeeping of Collateral Granted The Fund does not borrow stock from counterparties therefore no collateral has been granted. 7. Securities Lending Income and Costs
Information in respect to income, costs and fees incurred by the Fund in relation to securities lending activities is set out in Note 18 to the financial statements.

SANLAM UNIVERSAL FUNDS PLC
574
SECURITIES FINANCING TRANSACTIONS REGULATION ("SFTR") DISCLOSURES (UNAUDITED) (CONTINUED) Sanlam Japan Equity Fund 1. Global Data
Proportion of Securities and Commodities on Loan USD
Total Lendable Assets Excluding Cash and Cash Equivalents -
Securities and Commodities on Loan 153,767
% -
Assets Engaged in SFTs
Fund Assets Under Management 3,390,251
Absolute Value of Assets Engaged in Securities Lending 153,767
% 4.54%
2. Concentration Data Top Ten Largest Collateral Issuers
Name and Value of Collateral and Commodities Received USD
United Kingdom Bonds 161,455
Total 161,455
Top Ten Counterparties
Name and Gross Volume of Outstanding Transactions USD
Securities Lending UBS AG London Branch 153,767 3. Aggregate Transaction Data Type, Quality and Currency of Collateral
Securities Lending Type Currencies USD
Sovereign Bonds Investment Grade GBP 161,455
Total 161,455

SANLAM UNIVERSAL FUNDS PLC
575
SECURITIES FINANCING TRANSACTIONS REGULATION ("SFTR") DISCLOSURES (UNAUDITED) (CONTINUED) Sanlam Japan Equity Fund (continued) 3. Aggregate Transaction Data (continued) Maturity Tenor of Collateral (Remaining Period to Maturity)
Less than 1
Day
1 Day to 1
Week
1 Week to 1
Month 1 to 3
Months 3 Months to 1 Year
Above 1 Year
Open Maturity Total
Type USD USD USD USD USD USD USD USD
Securities Lending
-
-
-
- - 161,455 - 161,455
Counterparty Details
Type Country of
establishment Settlement & Clearing USD
Securities Lending UK Tri-party 161,455
Maturity Tenor of SFTs (Remaining Period to Maturity)
Less than 1
Day
1 Day to 1
Week
1 Week to 1
Month 1 to 3
Months 3 Months to 1 Year
Above 1 Year
Open Maturity Total
Type USD USD USD USD USD USD USD USD
Securities Lending
-
-
-
-
-
- 153,767 153,767
4. Re-use of Collateral Re-use of Collateral Received The Fund does not re-use collateral received. Cash Collateral Reinvestment Returns The Fund has no returns on cash collateral. 5. Safekeeping of Collateral Received
Names and Value of Custodians Safekeeping Collateral USD
Brown Brothers Harriman & Co 153,767
Number of Custodians Safekeeping Collateral 1 6. Safekeeping of Collateral Granted The Fund does not borrow stock from counterparties therefore no collateral has been granted. 7. Securities Lending Income and Costs
Information in respect to income, costs and fees incurred by the Fund in relation to securities lending activities is set out in Note 18 to the financial statements.

SANLAM UNIVERSAL FUNDS PLC
576
PURCHASES AND SALES FOR THE PERIOD ENDED 30 JUNE 2019 (UNAUDITED) Bridge Global Property Income Fund Purchases Cost (USD) (being the largest purchases during the period ended 30 June 2019)
Macerich Co 192,916
CubeSmart 95,052
Liberty Property Trust 60,541
Equity Residential 57,318
Healthcare Realty Trust Inc 47,982
Columbia Property Trust Inc 34,393
Digital Realty Trust Inc 34,013
Simon Property Group Inc 33,027
SL Green Realty Corp 27,209
Sales Proceeds (USD) (being the largest sales during the period ended 30 June 2019)
Tower Property Fund (487,424)
Sun Communities Inc (452,321)
General Property Group (412,127)
Prologis Inc (393,013)
Growthpoint Properties Australia (386,640)
Public Storage Inc (381,174)
Mid-America Apartments (365,315)
Invitation Homes Inc (361,246)
AvalonBay Communities Inc. (358,497)
RioCan Real Estate Investment Trust (343,581)
Digital Realty Trust Inc (337,993)
Duke Realty Corp (337,078)
Kimco Realty Corp (335,930)
Spirit Realty Cap Inc (314,032)
Boston Properties Inc (295,251)
CubeSmart (281,056)
Hudson Pacific Properties Inc (277,195)
Federal Realty Inv Trust (267,421)
Liberty Property Trust (259,862)
Equity Residential (257,855)
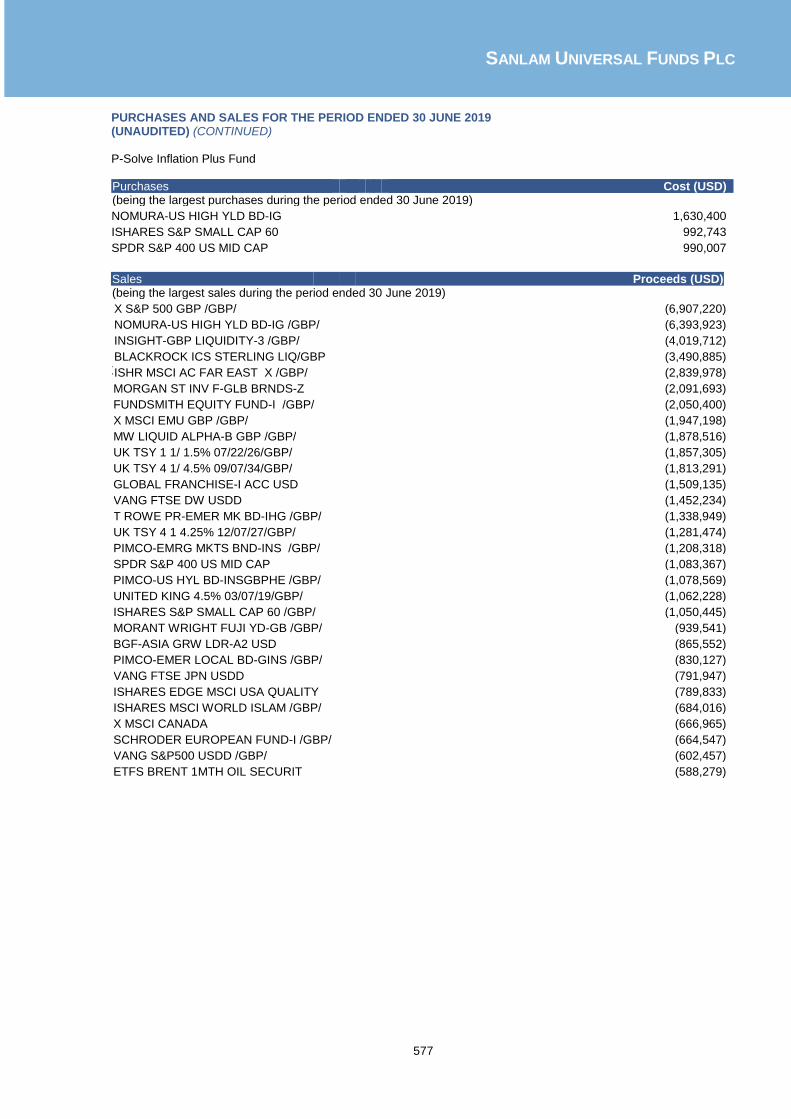
SANLAM UNIVERSAL FUNDS PLC
577
PURCHASES AND SALES FOR THE PERIOD ENDED 30 JUNE 2019 (UNAUDITED) (CONTINUED) P-Solve Inflation Plus Fund Purchases Cost (USD) (being the largest purchases during the period ended 30 June 2019)
NOMURA-US HIGH YLD BD-IG 1,630,400
ISHARES S&P SMALL CAP 60 992,743
SPDR S&P 400 US MID CAP 990,007
Sales Proceeds (USD) (being the largest sales during the period ended 30 June 2019) X S&P 500 GBP /GBP/ (6,907,220) NOMURA-US HIGH YLD BD-IG /GBP/ (6,393,923) INSIGHT-GBP LIQUIDITY-3 /GBP/ (4,019,712) BLACKROCK ICS STERLING LIQ/GBP (3,490,885)
X ISHR MSCI AC FAR EAST X /GBP/ (2,839,978) MORGAN ST INV F-GLB BRNDS-Z (2,091,693) FUNDSMITH EQUITY FUND-I /GBP/ (2,050,400) X MSCI EMU GBP /GBP/ (1,947,198) MW LIQUID ALPHA-B GBP /GBP/ (1,878,516)
UK TSY 1 1/ 1.5% 07/22/26/GBP/ (1,857,305) UK TSY 4 1/ 4.5% 09/07/34/GBP/ (1,813,291) GLOBAL FRANCHISE-I ACC USD (1,509,135)
VANG FTSE DW USDD (1,452,234) T ROWE PR-EMER MK BD-IHG /GBP/ (1,338,949)
UK TSY 4 1 4.25% 12/07/27/GBP/ (1,281,474) PIMCO-EMRG MKTS BND-INS /GBP/ (1,208,318) SPDR S&P 400 US MID CAP (1,083,367)
PIMCO-US HYL BD-INSGBPHE /GBP/ (1,078,569) UNITED KING 4.5% 03/07/19/GBP/ (1,062,228) ISHARES S&P SMALL CAP 60 /GBP/ (1,050,445) MORANT WRIGHT FUJI YD-GB /GBP/ (939,541) BGF-ASIA GRW LDR-A2 USD (865,552) PIMCO-EMER LOCAL BD-GINS /GBP/ (830,127) VANG FTSE JPN USDD (791,947) ISHARES EDGE MSCI USA QUALITY (789,833) ISHARES MSCI WORLD ISLAM /GBP/ (684,016) X MSCI CANADA (666,965) SCHRODER EUROPEAN FUND-I /GBP/ (664,547) VANG S&P500 USDD /GBP/ (602,457) ETFS BRENT 1MTH OIL SECURIT (588,279)

SANLAM UNIVERSAL FUNDS PLC
578
PURCHASES AND SALES FOR THE PERIOD ENDED 30 JUNE 2019 (UNAUDITED) (CONTINUED) Sanlam African Frontier Markets Fund Purchases Cost (USD) (being the largest purchases during the period ended 30 June 2019) Delta Corporation Ltd 2,095,769
Old Mutual Ltd 1,625,053
Econet Wireless Zimbabwe Ltd 443,636
Sales Proceeds (USD) (being the largest sales during the period ended 30 June 2019)
Commercial International Bank Egypt SAE (CIB) (1,241,478)
Vivo Energy Plc (1,073,845)
United Bank For Africa Plc (921,041)
Zenith Bank Plc (636,095)
Maroc Telecom (626,732)
Cassava Smartech Ltd (452,119)
Attijariwafa Bank (305,684)
Old Mutual Ltd (142,385)
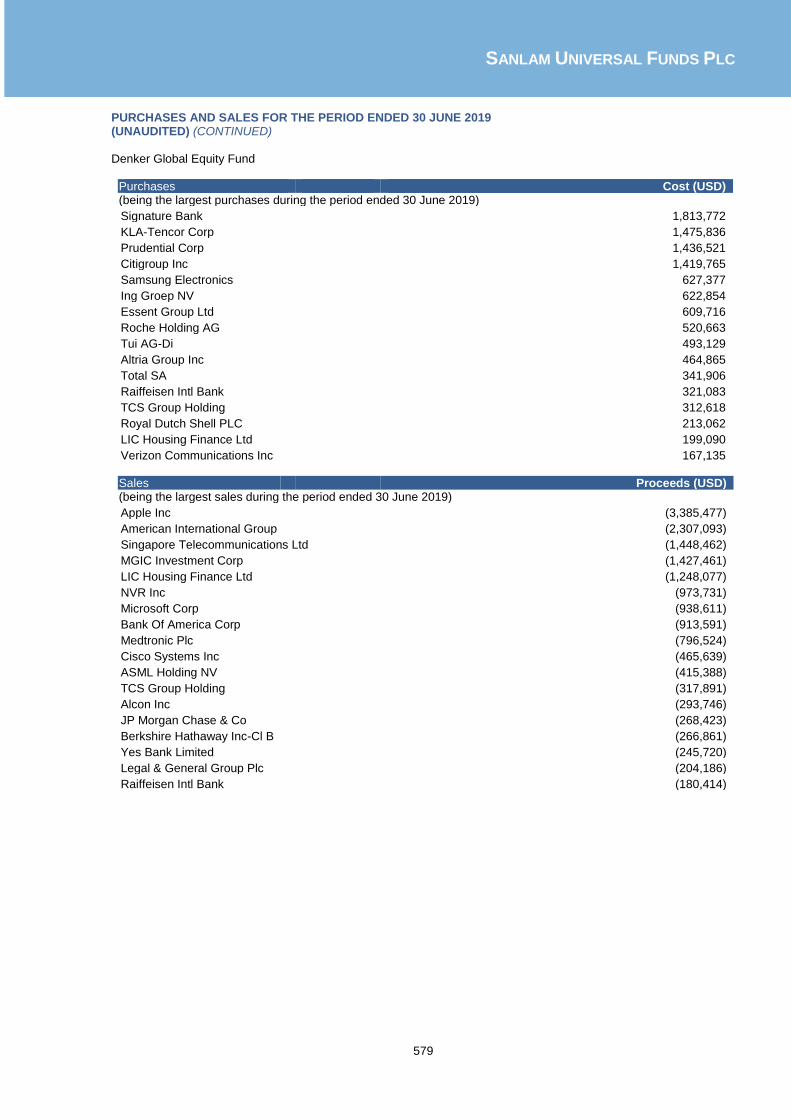
SANLAM UNIVERSAL FUNDS PLC
579
PURCHASES AND SALES FOR THE PERIOD ENDED 30 JUNE 2019 (UNAUDITED) (CONTINUED) Denker Global Equity Fund
Purchases Cost (USD) (being the largest purchases during the period ended 30 June 2019)
Signature Bank 1,813,772
KLA-Tencor Corp 1,475,836
Prudential Corp 1,436,521
Citigroup Inc 1,419,765
Samsung Electronics 627,377
Ing Groep NV 622,854
Essent Group Ltd 609,716
Roche Holding AG 520,663
Tui AG-Di 493,129
Altria Group Inc 464,865
Total SA 341,906
Raiffeisen Intl Bank 321,083
TCS Group Holding 312,618
Royal Dutch Shell PLC 213,062
LIC Housing Finance Ltd 199,090
Verizon Communications Inc 167,135
Sales Proceeds (USD) (being the largest sales during the period ended 30 June 2019)
Apple Inc (3,385,477)
American International Group (2,307,093)
Singapore Telecommunications Ltd (1,448,462)
MGIC Investment Corp (1,427,461)
LIC Housing Finance Ltd (1,248,077)
NVR Inc (973,731)
Microsoft Corp (938,611)
Bank Of America Corp (913,591)
Medtronic Plc (796,524)
Cisco Systems Inc (465,639)
ASML Holding NV (415,388)
TCS Group Holding (317,891)
Alcon Inc (293,746)
JP Morgan Chase & Co (268,423)
Berkshire Hathaway Inc-Cl B (266,861)
Yes Bank Limited (245,720)
Legal & General Group Plc (204,186)
Raiffeisen Intl Bank (180,414)

SANLAM UNIVERSAL FUNDS PLC
580
PURCHASES AND SALES FOR THE PERIOD ENDED 30 JUNE 2019 (UNAUDITED) (CONTINUED) Sanlam Global Bond Fund
Purchases Cost (USD) (being the largest purchases during the period ended 30 June 2019)
IRS Rjy6Mp00.05 033021 Mslngb2X Long 276,211,593
IRS Rni3Mp01.80 050621 Bnpafrppx Long 268,559,152
IRS Rbw3Mp01.44 040521 Gsilgb2X Long 150,642,743
IRS Rjy6Mp00.06 040321 Gsilgb2X Long 144,334,532
IRS Rni3Mp01.79 051421 Jpmsgb2Lx Long 143,419,637
IRS R01.32Pbw3M 042721 Mslngb2Xx Long 142,559,484
IRS R02.13Pcd03 030121 Jpmsgb2Lx Long 141,907,711
IRS R02.31Pcd03 012321 Jpmsgb2Lx Long 141,209,943
IRS R00.09Pst3M 052821 Mslngb2XLong 140,455,171
IRS Rso/Np00.95 022821 Jpmsgb2Lx Long 139,660,497
IRS R00.23Pst3M 030521 Jpmsgb2Lx Long 135,279,189
IRS R00.16Pst3M 030221 Gsilgb2X Long 135,142,440
IRS Rbw3Mp01.72 030822 Jpmsgb2Lx Long 95,775,832
IRS R01.69Pni6M 032521 Jpmsgb2Lx Long 91,471,331
IRS Rnd3Mp01.79 032721 Jpmsgb2Lx Long 71,575,416
IRS Rni6Mp01.96 012223 Bnpafrppx Long 70,236,228
IRS Rso/Np00.73 032621 Jpmsgb2Lx Long 66,064,998
IRS R02.57Pbw6M 041729 Gsilgb2X Long 64,427,007
IRS R01.58Pbp6M 013129 Bnpafrppx Long 63,194,216
IRS Rcd03P02.21 030124 Jpmsgb2Lx Long 58,454,799
Sales Proceeds (USD) (being the largest sales during the period ended 30 June 2019)
IRS Rjy6Mp00.05 033021 Mslngb2X Long (282,948,394)
IRS R02.35Pcd03 121820 Bnpafrppx Long (276,002,376)
IRS Reonip00.17 121820 Mslngb2XLong (268,865,223)
IRS Rbw3Mp01.44 040521 Gsilgb2XxLong (152,101,449)
IRS Rjy6Mp00.06 040321 Gsilgb2X Long (149,010,397)
IRS Rcd03P02.55 121622 Jpmsgb2Lx Long (143,457,141)
IRS R02.31Pcd03 012321 Jpmsgb2Lx Long (141,958,771)
IRS R02.13Pcd03 030121 Jpmsgb2Lx Long (141,643,638)
IRS R01.32Pbw3M 042721 Mslngb2X Long (140,020,745)
IRS R02.57Pcd03 061920 Jpmsgb2Lx Long (134,982,759)
IRS R00.23Pst3M 030521 Jpmsgb2Lx Long (134,839,313)
IRS R00.16Pst3M 030221 Gsilgb2X Long (131,246,784)
IRS R00.94Pso/N 091820 Gsilgb2X Long (128,791,514)
IRS Rbw3Mp01.72 030822 Jpmsgb2Lx Long (95,182,197)
IRS R01.69Pni6M 032521 Jpmsgb2Lx Long (88,631,763)
IRS R02.42Pbw3M 121621 Gsilgb2X Long (77,911,350)
IRS R02.38Pbw3M 110521 Gsilgb2X Long (73,973,489)
IRS R01.97Pbw3M 120721 Jpmsgb2Lx Long (72,468,147)
IRS Rso/Np00.95 022821 Jpmsgb2Lx Long (72,337,850)
IRS Rcd03P02.75 121622 Gsilgb2X Long (71,237,201)

SANLAM UNIVERSAL FUNDS PLC
581
PURCHASES AND SALES FOR THE PERIOD ENDED 30 JUNE 2019 (UNAUDITED) (CONTINUED) Denker Global Financial Fund Purchases Cost (USD) (being the largest purchases during the period ended 30 June 2019)
Shriram Transport Finance Co Ltd 1,755,060
Citigroup Inc 1,666,181
Housing Development Finance Corp 1,626,879
Banco Del Bajio SA 1,465,849
Prudential Corp 1,137,189
TCS Group Holding -Reg S 1,059,282
Ing Groep NV 894,943
Indiabulls Housing Finance Ltd 833,382
Qualitas Controladora SAB 778,167
HDFC Bank Limited 772,627
LIC Housing Finance Ltd 769,836
Nova Ljubljanska Bank 754,835
JP Morgan Chase & Co 699,318
Regional SAB De CV 650,424
Kasikornbank 645,410
Signature Bank 604,981
Indusind Bank Ltd 530,664
AXA SA 384,447
Bank Of Georgia Group PLC 379,030
Vostok New Ventures Ltd 377,063 Sales Proceeds (USD) (being the largest sales during the period ended 30 June 2019)
Indiabulls Housing Finance Ltd (3,301,664)
Banco Bradesco SA (3,123,968)
Bank Negara Indonesia (2,619,123)
AXA SA (1,566,893)
Renaissancere Holdings Ltd (1,537,115)
Yes Bank Limited (1,348,773)
Indusind Bank Ltd (1,263,241)
JP Morgan Chase & Co (1,180,240)
TCS Group Holding (1,099,267)
UBS Group AG (1,094,759)
Bank Rakyat Indonesia (1,028,054)
Banco Commercial Portugues SA (869,388)
Prudential Corp (765,589)
Intercontinental Exchange Inc (644,882)
Sberbank of Russia (638,980)
MGIC Investment Corp (638,377)
Warsaw Stock Exchange (558,871)
Shriram City Union-Finance Ltd (554,831)
TBC Bank Group Plc (536,380)
Raiffeisen Intl Bank (520,519)

SANLAM UNIVERSAL FUNDS PLC
582
PURCHASES AND SALES FOR THE PERIOD ENDED 30 JUNE 2019 (UNAUDITED) (CONTINUED) Sanlam Global Property Fund Purchases Cost (USD) (being the largest purchases during the period ended 30 June 2019)
Sun Hung Kai Properties 3,603,794
Prologis Inc 2,101,007
Apartment Investment & Management Co 2,071,968
Retail Properties Of America - A 1,944,426
Cousins Properties Inc 1,855,114
Japan Hotel Reit Inv Co 1,670,891
Unibail Rodamco-Westfield 1,668,351
Americold Realty Trust 1,666,970
Mitsui Fudosan Co Ltd 1,572,499
Ado Properties SA 1,553,527
New World Development 1,356,234
Omega Healthcare Investors 1,312,375
CK Asset Holdings Ltd 1,293,392
Link Reit 1,214,295
TLG Immobilien AG 1,213,965
Simon Property Group Inc 1,151,955
Brixmor Property Group Inc 1,055,623
Site Centers Corp 1,000,717
Assura Plc 965,549
Vonovia SE 943,940 Sales Proceeds (USD) (being the largest sales during the period ended 30 June 2019)
Simon Property Group Inc (3,331,434)
Deutsche Wohnen AG (2,208,663)
Duke Realty Corp (1,848,084)
Aroundtown SA (1,594,662)
Sun Hung Kai Properties (1,509,312)
Sabra Health Care Reit Inc (1,348,279)
Sumitomo Realty & Develop. (1,345,930)
Unibail Rodamco Westfield (1,269,081)
CK Asset Holdings Ltd (1,157,622)
Brandywine Realty Trust (1,001,672)
Prologis Inc (982,939)
Equinix Inc (933,211)
British Land Co Plc (887,588)
Ichigo Real Estate Inv (833,155)
Highwoods Properties Inc (795,647)
American Campus Communities (681,471)
Essential Properties Realty (674,795)
Killam Apartment Real Estate Investment Trust (645,954)
Eurocommercial Properties (644,263)
Champion Reit (610,707)

SANLAM UNIVERSAL FUNDS PLC
583
PURCHASES AND SALES FOR THE PERIOD ENDED 30 JUNE 2019 (UNAUDITED) (CONTINUED) Sanlam World Equity Fund
Purchases Cost (USD) (being the largest purchases during the period ended 30 June 2019)
Alphabet Inc-Cl C 4,516,223
Facebook Inc-Class A 4,238,715
Medtronic Plc 4,066,713
Booking Holdings Inc 3,908,745
Bayer AG 3,796,631
Reckitt Benckiser Group 3,615,240
Fresenius Medical Care 3,542,610
Oracle Corp 3,519,357
Tencent Holdings Ltd 3,409,682
Samsung Electr 3,068,213
Allergan Plc 2,995,255
Sabre Corp 2,951,649
Roche Holding 2,903,188
British American Tobacco 2,805,968
Microsoft Corp 2,796,857
Intercontinental Hotels 2,664,902
Johnson & Johnson 2,658,895
Pepsico Inc 2,587,923
Sage Group Plc 2,364,971
Danone 2,350,034 Sales Proceeds (USD) (being the largest sales during the period ended 30 June 2019)
Amazon.Com Inc (1,972,957)
Blackrock Global Fund-Asia Growth (1,956,188)
Yum China Holdings Inc (1,728,586)
Apple Inc (1,597,968)
Microsoft Corp (1,279,109)
Tyson Foods Inc-Cl A (977,463)
Molson Coors Brewing Co -B (960,070)
Pfizer Inc (911,204)
Alphabet Inc-Cl A (846,050)
Nestle SA (844,824)
Bristol-Myers Squibb Co (839,692)
Cisco Systems Inc (839,284)
AT&T Inc (837,910)
J.P Morgan Chase & Co (787,974)
Gilead Sciences Inc (785,702)
Wells Fargo & Co (780,780)
Conocophillips Co (760,456)
Exxon Mobil Corp (695,858)
Merck & Co. Inc. (675,704)
Viacom Inc-Class B (619,297)

SANLAM UNIVERSAL FUNDS PLC
584
PURCHASES AND SALES FOR THE PERIOD ENDED 30 JUNE 2019 (UNAUDITED) (CONTINUED) Satrix World Equity Tracker Fund Purchases Cost (USD) (being the largest purchases during the period ended 30 June 2019)
iShares Core MSCI World 92,470,956
Amazon.Com Inc 8,108,489
Microsoft Corp 6,055,528
Apple Inc 5,001,233
Facebook Inc-Class A 2,945,332
Johnson & Johnson 2,701,576
Alphabet Inc-Cl C 2,397,836
Alphabet Inc-Cl A 2,260,757
Verizon Communications Inc 2,185,866
Exxon Mobil Corp 2,034,227
J.P Morgan Chase & Co 1,986,454
Nestle SA 1,917,538
Procter & Gamble 1,912,055
Berkshire Hathaway Inc-Cl B 1,875,331
Pfizer Inc 1,873,939
Cisco Systems Inc 1,873,407
United Healthcare Corp 1,842,809
Visa Inc-Class A Shares 1,736,936
Bank Of America Corp 1,692,922
Walt Disney Co 1,603,594 Sales Proceeds (USD) (being the largest sales during the period ended 30 June 2019)
iShares Core MSCI World (67,652,978)
Amazon.Com Inc (3,122,435)
Kerry Group Plc-A (787,403)
Takeda Pharmaceutic-Co (783,334)
Intl Consolidated Airlines Grp (306,259)
Brookfield Property Reit I-A (266,239)
Mattel Inc (241,486)
Goodyear Tire & Rubber Co (221,746)
Osram Licht AG (160,924)
Edenred SA (141,181)
PG&E Corp (97,910)
Turquoise Hill Resources Ltd (97,835)
Kontoor Brands Inc (69,683)
Royal Dutch Shell Plc-A (45,816)
Drilling Company of 1972 (42,197)
Boliden AB (26,144)
Arc Resources Ltd (25,429)
Prosiebensat.1 Media SE (20,115)
Rexel SA (11,341)
Hammerson Plc (7,354)

SANLAM UNIVERSAL FUNDS PLC
585
PURCHASES AND SALES FOR THE PERIOD ENDED 30 JUNE 2019 (UNAUDITED) (CONTINUED) SIIP India Opportunities Fund Purchases Cost (USD) (being the largest purchases during the period ended 30 June 2019)
Indusind Bank Ltd 236,860
Shree Cement Ltd 180,394
Ultratech Cement Ltd 147,423
TTK Prestige Ltd 137,803
GMM Pfaudler Ltd 137,131
Havells India Ltd-Foreign 132,989
State Bank Of India 129,376
Divi'S Laboratories Ltd 104,778
ICICI Bank Ltd 104,489
Ujjivan Financial Services Limited 101,514
DCB Bank Ltd 94,063
Axis Bank Ltd-Foreign 89,852
Aarti Industries Limited 73,128
Cholamandalam Investment and Finance Company 69,552
Titan Co Ltd-For 67,590
Vinati Organics Ltd 53,048
Sterlite Technologies Lt 40,921
Rbl Bank Ltd 40,456
Reliance Industries Ltd 36,332
Axis Bank Ltd 34,905 Sales Proceeds (USD) (being the largest sales during the period ended 30 June 2019)
Maruti Suzuki India Ltd (573,969)
ITC Ltd (310,069)
Page Industries Ltd (268,447)
Sun Pharmaceutical Industries Ltd (220,008)
Bajaj Finserv Ltd (184,573)
Indusind Bank Ltd (172,820)
Sterlite Technologies Ltd (166,689)
Cadila Healthcare Ltd (152,884)
HDFC Bank Ltd (148,559)
Indiabulls Housing Finance (147,063)
Sundram Fasteners Ltd (134,469)
Avenue Supermarts Ltd (116,850)
Kotak Mahindra Bank Ltd (109,646)
Tata Consultancy Services Ltd (104,404)
Gail India Ltd (104,043)
Mahindra & Mahindra Ltd (98,663)
Infosys Ltd (92,764)
Tech Mahindra Ltd (90,672)
Minda Industries Ltd (87,847)
Natco Pharma Ltd (87,759)

SANLAM UNIVERSAL FUNDS PLC
586
PURCHASES AND SALES FOR THE PERIOD ENDED 30 JUNE 2019 (UNAUDITED) (CONTINUED) Denker Global Dividend Fund Purchases Cost (USD) (being the largest purchases during the period ended 30 June 2019)
Tui AG 605,206
Roche Holding AG 493,647
Carnival Corp 252,385
Koninklijke Ahold Delhaize NV 187,522 Sales Proceeds (USD) (being the largest sales during the period ended 30 June 2019)
Cisco Systems Inc (3,870,096)
Micro Focus International (3,066,877)
Legal & General Group Plc (3,053,781)
Boeing Co (2,993,399)
McDonald’s Corp (2,926,685)
Royal Dutch Shell Plc-B (2,871,777)
AXA SA (2,603,555)
Unilever Plc (2,581,712)
Ageas SA (2,532,679)
SCOR SE (2,418,395)
Singapore Telecommunications Ltd (2,283,635)
Procter & Gamble (1,947,659)
Total SA (1,943,120)
Novartis AG (1,860,760)
British American Tobacco (1,838,012)
Altria Group Inc (1,816,812)
Roche Holding AG (1,668,950)
Vodafone Group Plc (1,606,020)
BP Plc (1,586,625)
Sparebank 1 Nord-Norge (1,499,010)
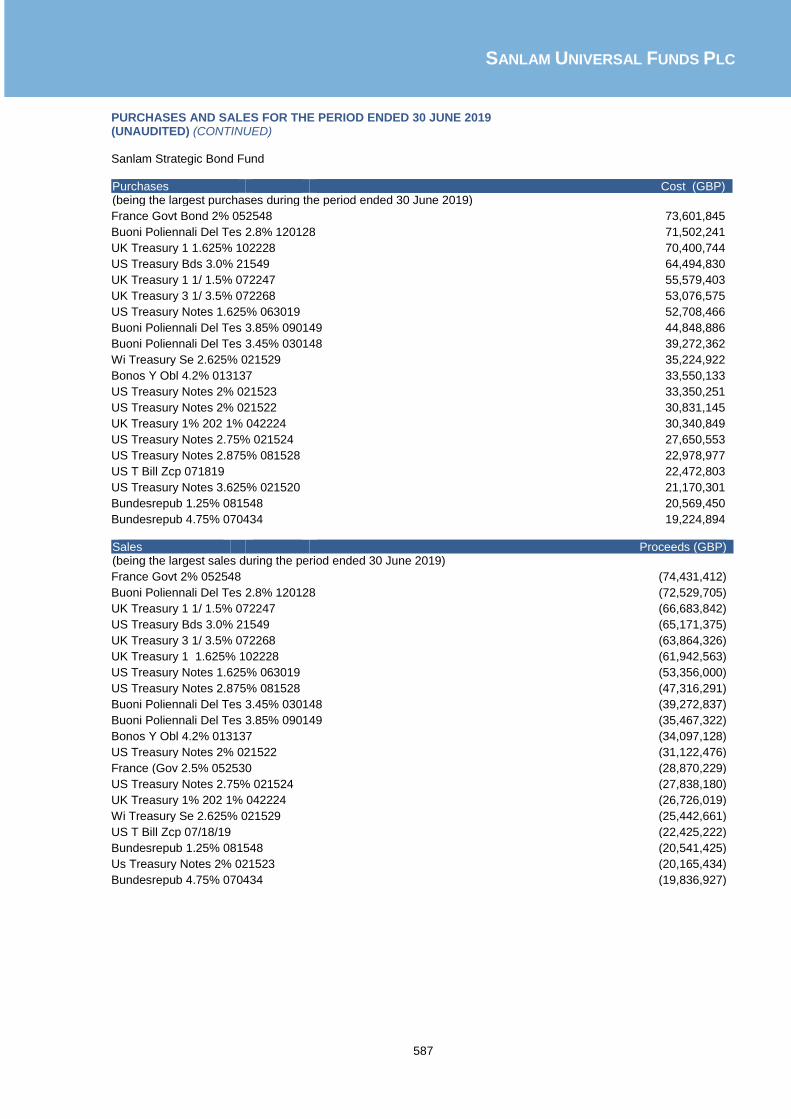
SANLAM UNIVERSAL FUNDS PLC
587
PURCHASES AND SALES FOR THE PERIOD ENDED 30 JUNE 2019 (UNAUDITED) (CONTINUED) Sanlam Strategic Bond Fund Purchases Cost (GBP) (being the largest purchases during the period ended 30 June 2019)
France Govt Bond 2% 052548 73,601,845
Buoni Poliennali Del Tes 2.8% 120128 71,502,241
UK Treasury 1 1.625% 102228 70,400,744
US Treasury Bds 3.0% 21549 64,494,830
UK Treasury 1 1/ 1.5% 072247 55,579,403
UK Treasury 3 1/ 3.5% 072268 53,076,575
US Treasury Notes 1.625% 063019 52,708,466
Buoni Poliennali Del Tes 3.85% 090149 44,848,886
Buoni Poliennali Del Tes 3.45% 030148 39,272,362
Wi Treasury Se 2.625% 021529 35,224,922
Bonos Y Obl 4.2% 013137 33,550,133
US Treasury Notes 2% 021523 33,350,251
US Treasury Notes 2% 021522 30,831,145
UK Treasury 1% 202 1% 042224 30,340,849
US Treasury Notes 2.75% 021524 27,650,553
US Treasury Notes 2.875% 081528 22,978,977
US T Bill Zcp 071819 22,472,803
US Treasury Notes 3.625% 021520 21,170,301
Bundesrepub 1.25% 081548 20,569,450
Bundesrepub 4.75% 070434 19,224,894 Sales Proceeds (GBP) (being the largest sales during the period ended 30 June 2019)
France Govt 2% 052548 (74,431,412)
Buoni Poliennali Del Tes 2.8% 120128 (72,529,705)
UK Treasury 1 1/ 1.5% 072247 (66,683,842)
US Treasury Bds 3.0% 21549 (65,171,375)
UK Treasury 3 1/ 3.5% 072268 (63,864,326)
UK Treasury 1 1.625% 102228 (61,942,563)
US Treasury Notes 1.625% 063019 (53,356,000)
US Treasury Notes 2.875% 081528 (47,316,291)
Buoni Poliennali Del Tes 3.45% 030148 (39,272,837)
Buoni Poliennali Del Tes 3.85% 090149 (35,467,322)
Bonos Y Obl 4.2% 013137 (34,097,128)
US Treasury Notes 2% 021522 (31,122,476)
France (Gov 2.5% 052530 (28,870,229)
US Treasury Notes 2.75% 021524 (27,838,180)
UK Treasury 1% 202 1% 042224 (26,726,019)
Wi Treasury Se 2.625% 021529 (25,442,661)
US T Bill Zcp 07/18/19 (22,425,222)
Bundesrepub 1.25% 081548 (20,541,425)
Us Treasury Notes 2% 021523 (20,165,434)
Bundesrepub 4.75% 070434 (19,836,927)

SANLAM UNIVERSAL FUNDS PLC
588
PURCHASES AND SALES FOR THE PERIOD ENDED 30 JUNE 2019 (UNAUDITED) (CONTINUED) Sanlam Accel Income Fund Sales Proceeds (USD) (being the largest sales during the period ended 30 June 2019)
M&G Short Dated Corporate Bond Fund (500,000)
Jan Hnd UK Eq Inc & Grw- (472,194)
Schroder UK Alpha Inc (429,768)
Jupiter Strategic Bond-II (334,943)
JP Morgan ICVC Sterling Corporate Bond (300,000)
Unicorn UK Income-Inst B (250,000)
Blackrock Cont Eur Inc-D (200,000)
Fidelity-Enhanced Income (200,000)
Invesco Corp Bond (200,000)
Lazard Investment Funds – Global Equity Income Fund (200,000)
Sanlam Strategic Bond Fund (200,000)

SANLAM UNIVERSAL FUNDS PLC
589
PURCHASES AND SALES FOR THE PERIOD ENDED 30 JUNE 2019 (UNAUDITED) (CONTINUED) Satrix North America Equity Tracker Fund Purchases Cost (USD) (being the largest purchases during the period ended 30 June 2019)
FleetCor Technologies Inc 3,218
TransDigm Group Inc 3,126
Harris Corp 2,995
Copart Inc 2,578
Twilio Inc - A 2,557
Barrick Gold Corp 2,467
Exact Sciences Corp 2,435
Okta Inc 2,402
Arista Networks Inc 2,311
Paycom Software Inc 2,291
First Data Corp- Class A 2,247
Take-Two Interactive Software 2,223
Hilton Worldwide 2,079
Dexcom Inc 2,025
MarketAxess Holdings Inc 2,020
Wayfair Inc- Class A 1,731
Shopify Inc - Class A 1,677
Liberty Global Plc- C 1,573 Sales Proceeds (USD) (being the largest sales during the period ended 30 June 2019)
Microsoft Corp (3,411,131)
Apple Inc (3,285,607)
Amazon.Com Inc (2,886,573)
Facebook Inc-Class A (1,675,170)
Alphabet Inc-Cl C (1,487,179)
Johnson & Johnson (1,347,600)
J.P Morgan Chase & Co (1,308,612)
Exxon Mobil Corp (1,173,946)
Alphabet Inc-Cl A (1,120,583)
Visa Inc-Class A Shares (1,113,007)
Bank Of America Corp (988,537)
Walt Disney Co (974,643)
Berkshire Hathaway Inc-Cl B (961,499)
Cisco Systems Inc (957,833)
Verizon Communications Inc (921,383)
Procter & Gamble (902,648)
Chevron Corp (881,914)
Mastercard Inc - A (880,568)
United Healthcare Corp (862,492)
Pfizer Inc (858,198)

SANLAM UNIVERSAL FUNDS PLC
590
PURCHASES AND SALES FOR THE PERIOD ENDED 30 JUNE 2019 (UNAUDITED) (CONTINUED) Satrix UK Equity Tracker Fund Purchases Cost (USD) (being the largest purchases during the period ended 30 June 2019)
HSBC Holdings Plc 81,786
Royal Dutch Shell Plc-A 66,608
BP Plc 64,805
Royal Dutch Shell Plc-B 62,330
Astrazeneca Plc 49,896
GlaxoSmithKline Plc 48,192
Rentokil Initial Plc 46,306
Halma Plc 45,887
Diageo Plc 40,770
British American Tobacco 40,697
Spirax-Sarco Engineering 40,671
Ocado Group Plc 35,940
Rio Tinto Plc 35,206
Unilever Plc 31,210
Vodafone Group Plc 30,475
BHP Group Plc 30,278
RELX Plc NV 25,559
National Grid Plc 25,518
Prudential Plc 20,664
EVRAZ Plc 19,652 Sales Proceeds (GBP) (being the largest sales during the period ended 30 June 2019)
HSBC Holdings Plc (2,363,818)
Royal Dutch Shell Plc-A (2,075,479)
BP Plc (1,991,623)
Royal Dutch Shell Plc-B (1,694,952)
Diageo Plc (1,422,372)
Astrazeneca Plc (1,415,099)
GlaxoSmithKline Plc (1,412,506)
British American Tobacco (1,226,354)
Rio Tinto Plc (963,047)
Unilever Plc (927,536)
Lloyds Banking Group Plc (780,803)
Prudential Plc (756,488)
Reckitt Benckiser Group (749,914)
Bhp Group Plc (701,278)
Vodafone Group Plc (684,523)
RELX Plc NV (641,876)
Glencore Plc (619,179)
National Grid Plc (538,324)
Compass Group Plc (506,202)
Barclays Plc (501,554)

SANLAM UNIVERSAL FUNDS PLC
591
PURCHASES AND SALES FOR THE PERIOD ENDED 30 JUNE 2019 (UNAUDITED) (CONTINUED) Satrix Europe (ex UK) Equity Tracker Fund Purchases Cost (USD) (being the largest purchases during the period ended 30 June 2019)
Kerry Group Plc-A 608,214
Edenred 286,985
Adyen NV 138,937
Cellnex Telecom SA 131,567
Kingspan Group Plc 118,671
Boliden AB 97,253
Elisa Corporation 94,560
Davide Campari-Milano SP 89,150
Delivery Hero SE 88,692
Finecobank SPA 88,347
Worldline SA 83,820
Carl Zeiss Meditec AG 62,957
Voestalpine AG 26,374
Infineon Technologies AG 26,156
Andritz AG 26,028
Bayerische Motoren Werke 25,989
Atos 25,949
United Internet AG 25,853
Volvo AB-B 25,852
Banco De Sabadell SA 25,806 Sales Proceeds (USD) (being the largest sales during the period ended 30 June 2019)
Nestle SA (5,697,403)
Novartis AG (3,734,030)
Roche Holding AG (3,720,541)
Total SA (2,606,942)
SAP SE (2,298,419)
Lvmh Moet Hennessy Louis (1,987,290)
Allianz SE (1,931,921)
Sanofi (1,913,010)
Novo Nordisk AS-B (1,824,024)
Unilever (1,804,616)
Siemens AG (1,714,841)
Airbus SE (1,478,254)
Banco Santander SA (1,475,371)
ASML Holding (1,453,010)
BASF SE (1,302,662)
L'Oreal (1,290,062)
Bayer AG (1,232,544)
Anheuser-Busch Inbev SA (1,192,269)
Deutsche Telekom AG (1,118,646)
Air Liquide SA (1,067,952)

SANLAM UNIVERSAL FUNDS PLC
592
PURCHASES AND SALES FOR THE PERIOD ENDED 30 JUNE 2019 (UNAUDITED) (CONTINUED) Satrix Emerging Markets Equity Tracker Fund Purchases Cost (USD) (being the largest purchases during the period ended 30 June 2019)
X MSCI Emerging Markets 1,527,024
Ishares MSCI Saudi Cap 689,491
Alibaba Group Holding-SP 256,608
Tencent Holdings Ltd 145,120
Samsung Electronics Co L 122,613
Taiwan Semiconductor Man 116,727
Ishares MSCI Russia 93,677
Meituan Dianping-Class B 67,816
Zto Express Cayman Inc 56,051
Naspers Ltd-N 55,622
Ping An Insurance Group 54,986
Siam Cement Pub Co-For R 54,103
Xiaomi Corp-Class B 52,272
China Construction Bank 51,329
The Shanghai Commercial 46,820
Pinduoduo Inc 46,534
Petrobras - Petroleo Bra 42,026
China Merchants Bank-A 41,823
Reliance Industries Ltd 41,457
Sinolink Securities Co L 41,160
Sales Proceeds (USD) (being the largest sales during the period ended 30 June 2019)
X MSCI Emerging Markets (801,005)
Ishares MSCI Russia (151,831)
Samsung Electronics Co L (76,401)
Taiwan Semiconductor Man (70,460)
Tencent Holdings Ltd (68,316)
Ind & Comm Bk Of China-H (47,431)
Haitong Securities Co Ltd (46,379)
Bank Of China Ltd-A (37,154)
Citic Securities Co-A (33,479)
Siam Commercial Bank- (31,222)
NetEase Inc (29,263)
Hynix Semiconductor Inc (28,837)
Poly Developments (26,460)
Alibaba Group Holding-SP (24,744)
Bank Danamon Indonesia T (24,598)
Hartalega Holdings (24,327)
Hap Seng Consolidated (23,964)
Companhia Siderurgica Nacional (23,422)
Samsung Electronics Prf (22,389)
JG Summit Holdings Inc (22,193)

SANLAM UNIVERSAL FUNDS PLC
593
PURCHASES AND SALES FOR THE PERIOD ENDED 30 JUNE 2019 (UNAUDITED) (CONTINUED) Sanlam Managed Risk Fund
Purchases Cost (USD) (being the largest purchases during the period ended 30 June 2019)
Satrix World Equity Tracker-Fund 9,033,685
Sales Proceeds (USD) (being the largest sales during the period ended 30 June 2019)
Satrix World Equity Tracker-Fund (7,886,038)

SANLAM UNIVERSAL FUNDS PLC
594
PURCHASES AND SALES FOR THE PERIOD ENDED 30 JUNE 2019 (UNAUDITED) (CONTINUED)
Sanlam Global High Quality Fund Purchases Cost (GBP) (being the largest purchases during the period ended 30 June 2019) Blackrock Inc 17,848,061
Bayer AG 15,600,560
Intercontinental Hotels 9,454,405
Sabre Corp 6,437,339
Fresenius Medical Care 4,224,134
Yum China Holdings Inc 3,680,256
Allergan Plc 3,557,636
Alphabet Inc-Cl C 3,449,305
Cognizant Tech Solutions-A 3,267,071
Imperial Brands Plc 3,251,445
Booking Holdings Inc 2,979,492
American Express Co 2,552,425
British American Tobacco 2,500,336
Samsung Electronics 2,345,242
Reckitt Benckiser Group 1,783,586
Medtronic Plc 1,343,477
Tencent Holdings Ltd 1,231,611
Tencent Music 935 Sales Proceeds (GBP) (being the largest sales during the period ended 30 June 2019) Yum China Holdings Inc (17,071,925)
Netease Inc (10,401,405)
Moody'S Corp (7,408,966)
Waters Corp (5,195,468)
Pepsico Inc (4,377,430)
Sage Group (2,386,719)
Oracle Corp (1,709,877)
Tencent Holdings Ltd (575,869)

SANLAM UNIVERSAL FUNDS PLC
595
PURCHASES AND SALES FOR THE PERIOD ENDED 30 JUNE 2019 (UNAUDITED) (CONTINUED)
Sanlam US Dividend Fund Purchases Cost (USD) (being the largest purchases during the period ended 30 June 2019) Foot Locker Inc 23,099,543
Gilead Sciences Inc 23,050,229
Walgreens Boots Alliance Inc 20,289,379
Cleveland-Cliffs Inc 19,383,468
Kroger Co 17,514,871
MetLife Inc 14,963,149
State Street Corp 13,991,330
Wells Fargo & Co 13,383,495
Dick'S Sporting Goods Inc 12,938,957
HP Inc 12,140,189
Arch Coal Inc - A 11,934,372
Apple Inc 11,412,821
Canadian Natural Resources 11,371,455
Skyworks Solutions Inc 11,181,495
Imperial Oil Ltd 11,039,522
Thor Industries Inc 11,014,024
Steel Dynamics Inc 10,667,531
Amdocs Ltd 10,413,027
Hormel Foods Corp 9,914,696
Chemours Co 9,620,868 Sales Proceeds (USD) (being the largest sales during the period ended 30 June 2019) Tyson Foods Inc-Cl A (22,618,724)
Bristol-Myers Squibb Co (20,575,311)
Altria Group Inc (19,818,667)
Federated Investors Inc-Cl B (18,216,381)
Western Digital Corp (13,972,928)
Apple Inc (12,222,488)
Skyworks Solutions Inc (12,015,316)
Suncor Energy Inc (11,520,296)
Seagate Technology (11,128,920)
Empire Co Ltd 'A' (9,932,513)
First American Financial (8,994,771)
Pinnacle West Capital (8,520,153)
Canadian Natural Resources (8,056,379)
Chevron Corp (7,552,450)
BCE Inc (7,050,320)
Stewart Information Services (6,884,558)
Gentex Corp (6,847,293)
Domtar Corp (6,787,604)
Canadian Western Bank (6,747,687)
L Brands Inc (6,691,731)

SANLAM UNIVERSAL FUNDS PLC
596
PURCHASES AND SALES FOR THE PERIOD ENDED 30 JUNE 2019 (UNAUDITED) (CONTINUED)
High Street Global Balanced Fund Purchases Cost (USD) (being the largest purchases during the period ended 30 June 2019) Microsoft Corp 1,078,000
Dream Global Real Estate 1,001,606
Enterprise Products Partners 862,638
Kraft Heinz Food 3.5% 060622 664,627
Public Storage 605,199
Apple Inc 544,000
ETFs Physical Platinum 500,995
Us T Bill Z cp 090519 498,445
Aberdeen Standard Physical P 491,054
Barclays Bank 10.179% 061221 432,163
Cboe S&P 500 I Sep 2925.00 PO 409,402
Cboe S&P 500 I Apr 2700.00 PO 162,307
Cboe S&P 500 Index Jun 2780.00 CO 154,438
Sirius Real Estate Ltd 23,633
P/O Euro Currency 2Pm Op Aug19 1.115 22,889
Royal Dutch Shell Plc-B 12,402
Royal Dutch Shell Plc-A 1,528
Sales Proceeds (USD) (being the largest sales during the period ended 30 June 2019) US T Bill Z cp 060619 (2,486,467)
CubeSmart (1,076,641)
Celgene Corp (551,244)
Aberdeen Standard Physical P (488,290)
Cboe S P 500 Index Jun 2780.00 CO (295,579)
Apple Inc Mar 195.000 CO (5,101)
Euro Currency 2Pm Mar19 1.13 PO 0
Apple Inc Mar 170.000 CO 96
Microsoft Corp Mar 110.000 CO 294
BP Currency 2Pm Op Dec18 129 PO 25,953

SANLAM UNIVERSAL FUNDS PLC
597
PURCHASES AND SALES FOR THE PERIOD ENDED 30 JUNE 2019 (UNAUDITED) (CONTINUED)
Sanlam Global Value Fund Purchases Cost (GBP) (being the largest purchases during the period ended 30 June 2019) Berkshire Hathaway Inc-Cl B 4,564,746
Exor NV 4,132,470
Tenaris SA 3,703,453
DowDuPont Inc 3,495,866
HD Supply Holdings Inc 3,451,047
Heineken NV 3,117,449
Adecco Group AG 3,105,791
Comcast Corp-Class A 3,006,085
Lloyds Banking Group Plc 2,730,248
American Express Co 2,701,250
Spirit Aerosystems Hold-Cl A 2,593,524
Delphi Technologies Plc 2,504,389
Travis Perkins Plc 2,276,830
Corteva Inc 1,394,429
Cigna Corp 1,147,756
Allergan Plc 1,016,219
Capri Holdings Ltd 895,842
Dow Inc 729,945
Samsung Electronics 676,893
Danone 669,533
Sales Proceeds (GBP) (being the largest sales during the period ended 30 June 2019) Anadarko Petroleum Corp (4,956,832)
Eni SPA (4,270,238)
Norwegian Cruise Line Holding (3,311,884)
American International Group (3,120,214)
SIM Holdings Ltd (2,950,149)
Imperial Brands Plc (2,903,996)
MS&AD Insurance Group Holdings (2,782,378)
BNP Paribas (2,725,501)
NN Group NV (2,619,383)
Cigna Corp (2,565,941)
Bank Of America Corp (2,427,871)
Microsoft Corp (2,279,686)
Oracle Corp (2,175,272)
Vista Land & Lifescapes (2,103,353)
Airbus SE (2,012,211)
WPP Plc (1,840,566)
ESR-Reit (1,767,313)
Japan Tobacco Inc (1,754,396)
Malaysia Airports Holdings BHD (1,708,442)
eBay Inc (1,674,113)

SANLAM UNIVERSAL FUNDS PLC
598
PURCHASES AND SALES FOR THE PERIOD ENDED 30 JUNE 2019 (UNAUDITED) (CONTINUED)
Sanlam Stable Global Equity Fund Purchases Cost (GBP) (being the largest purchases during the period ended 30 June 2019) Berkshire Hathaway Inc-Cl B 5,622,787
Heineken NV 3,577,863
Comcast Corp-Class A 2,843,236
Reckitt Benckiser Group 1,860,824
British American Tobacco 1,634,727
Danone 1,388,050
HP Inc 715,654
WPP Plc 686,666
Cigna Corp 670,916
Willis Towers Watson Plc 628,314
eBay Inc 586,663
Microsoft Corp 558,523
Oracle Corp 558,376
United Healthcare Corp 554,004
AON Plc 534,912
Imperial Brands Plc 517,304
Amerisourcebergen Corp 510,689
Roche Holding AG 481,241
Procter & Gamble 478,883
Medtronic Plc 439,507 Sales Proceeds (GBP) (being the largest sales during the period ended 30 June 2019) Cigna Corp (2,315,025)
Oracle Corp (2,262,036)
Japan Tobacco Inc (2,049,835)
Microsoft Corp (2,002,248)
Esr Reit (1,937,827)
Tupperware Brands Corp (1,536,882)
Gilead Sciences Inc (1,509,884)
Zimmer Biomet Holdings Inc (1,410,895)
eBay Inc (1,276,260)
WPP Plc (1,086,958)
Berkshire Hathaway Inc-Cl B (1,060,795)
Procter & Gamble (1,008,739)
Merck & Co (1,005,272)
United Healthcare Corp (908,279)
AON Plc (865,404)
Amerisourcebergen Corp (862,712)
Danone (775,017)
Roche Holding AG (752,141)
Medtronic Plc (739,457)
Reckitt Benckiser Group (722,832)

SANLAM UNIVERSAL FUNDS PLC
599
PURCHASES AND SALES FOR THE PERIOD ENDED 30 JUNE 2019 (UNAUDITED) (CONTINUED)
Sanlam Active UK Fund Purchases Cost (GBP) (being the largest purchases during the period ended 30 June 2019) Astrazeneca Plc 1,939,452
Intercontinental Hotels 1,689,628
Rolls-Royce Holdings Plc 1,657,619
Lloyds Banking Group Plc 1,055,708
BP Plc 1,026,954
Rio Tinto Plc 920,817
Unilever Plc 919,962
Royal Dutch Shell Plc-A 905,805
RELX Plc 855,412
Integrafin Holdings Plc 823,664
Taylor Wimpey Plc 813,493
Prudential Plc 802,752
GlaxoSmithKline Plc 785,406
Howden Joinery Group Plc 680,665
HSBC Holdings Plc 670,467
First Derivatives Plc 564,142
Whitbread Plc 538,924
Sage Group Plc 505,454
Legal & General Group Pl 488,174
Tui AG 479,694 Sales Proceeds (GBP) (being the largest sales during the period ended 30 June 2019) BT Group Plc (560,111)
Hipgnosis Songs Fund Ltd (528,171)
ITV Plc (509,399)
Bloomsbury Publishing Plc (370,146)
Anglo American Plc (335,126)
GlaxoSmithKline Plc (318,719)
Sophos Group Plc (313,759)
John Laing Group Plc (313,626)
HSBC Holdings Plc (291,919)
Crest Nicholson Holdings (262,696)
Kenmare Resources Plc (247,311)
Great Portland Estates P (145,315)
Avon Rubber Plc (138,828)
Taylor Wimpey Plc (128,845)
Micro Focus International (77,475)
Whitbread Plc (65,193)

SANLAM UNIVERSAL FUNDS PLC
600
PURCHASES AND SALES FOR THE PERIOD ENDED 30 JUNE 2019 (UNAUDITED) (CONTINUED)
Sanlam Multi-Strategy Fund
Purchases Cost (GBP) (being the largest purchases during the period ended 30 June 2019) Lloyds Bank V/R 051624 10,023,000
Glencore 7.375% 052720 7,448,800
Vodafone Gro V/R 100378 6,440,000
Tate & Lyle 6.75% 112519 6,194,700
Whitbread 3.375% 101625 5,177,500
Marks & Spencer 3% 120823 4,955,000
Volkswagen 1.875% 090721 4,016,000
Fil Limited 6.75% 101920 4,001,416
Legal & Gene V/R 102745 3,858,000
Abertis I 3.375% 112726 3,561,250
Tesco Plc 6.125% 022422 3,325,324
Grainger 3.375% 042428 2,976,700
GKN Holdings 5.375% 091922 2,173,000
Volkswagen 1.5% 041221 1,795,500
BBGI SICAV SA 1,688,657
McDonald’s Corp 6.375% 020320 1,463,896
Orsted AS 1,234,309
3I Group 6.875% 030923 1,174,500
Supermarket Income Reit 1,153,776
Aquila European Renewables 1,107,473
Sales Proceeds (USD) (being the largest sales during the period ended 30 June 2019)
Vodafone Gro V/R 10/03/78/ (2,552,286)
Euro STOXX 50 Sep19 32000 CO (588,695)
Hong Kong Hang Mar19 27800 CO (405,915)
S&P 500 Index March 268000 CO (356,390)
S&P 500 Index May 287500 CO (147,467)
FTSE 100 Index June19 6000 PO (32,230)
S&P 500 Index March 26750 PO (19,843)
FTSE 100 Index March196900 PO (10,453)
S&P 500 Index March 255000 PO (3,550)

SANLAM UNIVERSAL FUNDS PLC
601
PURCHASES AND SALES FOR THE PERIOD ENDED 30 JUNE 2019 (UNAUDITED) (CONTINUED)
Anchor Global Stable Fund Purchases Cost (USD) (being the largest purchases during the period ended 30 June 2019) US T BILL ZCP 013020 488,149
US T BILL ZCP 042320 391,500
US T BILL ZCP 052120 390,819
US T BILL ZCP 032620 293,146
Citigroup Inc 5.375% 080920 258,500
HSBC USA Inc 5% 092720 257,625
Synchrony Bank 3.65% 052421 253,625
American Express 3.375% 051721 253,125
Barclays Plc 3.25% 011221 251,000
Capital One Na 2.95% 072321 250,875
Citigroup Inc 2.7% 033021 249,625
Capital One Fina 2.5% 051220 249,375
Sales Proceeds (USD) (being the largest sales during the period ended 30 June 2019) Simon Property G 3.3% 011526 (294,075)
Wells Fargo & Comp 3% 042226 (290,325)
American Express C 3% 103024 (251,125)
Buoni Poliennali 2% 020128 (219,455)
Us Treasury Notes 2.875% 043025 (206,986)
Ishares JPM EM Lcl Gov Bond (177,547)
Bank Of America 4.25% 102226 (152,301)
Morgan Stanley 3.95% 042327 (148,243)
Euronext NV (128,617)
Digital Realty Trust Inc (121,902)
JP Morgan 0.625% 012524 (113,354)
Boston Properties 3.65% 020126 (100,689)
Blackstone Group (73,635)
Bayer AG (63,031)
Lyxor Tr Core Commo Ex-E (52,637)
Camden Property Trust (40,619)
British American Tobacco (37,572)
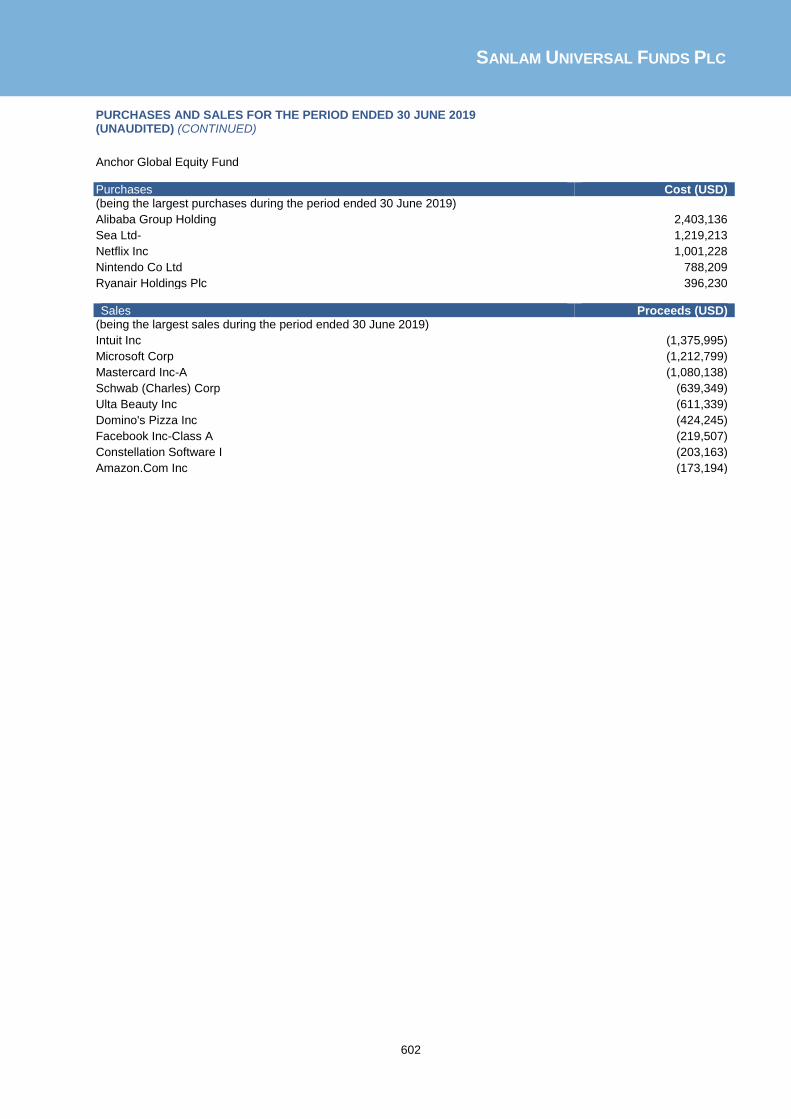
SANLAM UNIVERSAL FUNDS PLC
602
PURCHASES AND SALES FOR THE PERIOD ENDED 30 JUNE 2019 (UNAUDITED) (CONTINUED)
Anchor Global Equity Fund Purchases Cost (USD) (being the largest purchases during the period ended 30 June 2019) Alibaba Group Holding 2,403,136
Sea Ltd- 1,219,213
Netflix Inc 1,001,228
Nintendo Co Ltd 788,209
Ryanair Holdings Plc 396,230 Sales Proceeds (USD)
(being the largest sales during the period ended 30 June 2019) Intuit Inc (1,375,995)
Microsoft Corp (1,212,799)
Mastercard Inc-A (1,080,138)
Schwab (Charles) Corp (639,349)
Ulta Beauty Inc (611,339)
Domino's Pizza Inc (424,245)
Facebook Inc-Class A (219,507)
Constellation Software I (203,163)
Amazon.Com Inc (173,194)

SANLAM UNIVERSAL FUNDS PLC
603
PURCHASES AND SALES FOR THE PERIOD ENDED 30 JUNE 2019 (UNAUDITED) (CONTINUED)
Bridge Global Managed Growth Fund
Purchases Cost (USD) (being the largest purchases during the period ended 30 June 2019) Invitation Homes Inc 381,810
Simon Property Group Inc 145,816
Digital Realty Trust Inc 125,324
Spirit Realty Capital Inc 112,416
Total Sa 112,299
Vodafone Group Plc 110,466
Imperial Brands Plc 103,568
Healthcare Realty Trust Inc 97,363
Kimco Realty Corp 95,345
AbbVie Inc 91,878
Public Storage Reit 86,184
Liberty Property Trust 83,476
Sanofi 81,582
Prologis Inc 76,171
Wells Fargo & Co 75,979
Allianz Se Registered 68,759
SSE Plc 47,711
Exxon Mobil Corp 39,298
Vinci Sa 37,490
AT&T Inc 36,754
Us Bancorp 17,061
GlaxoSmithKline Plc 13,745
Intel Corp 12,508
Johnson & Johnson 11,575 Sales Proceeds (USD)
(being the largest sales during the period ended 30 June 2019) Procter & Gamble Co (100,321)
McDonald’s Corp (85,543)
McCormick & Co- (77,145)
Nestle SA (74,979)
Microsoft Corp (73,490)
Land Securities Group Plc (71,307)
Diageo Plc (69,394)
British Land Co Plc (53,080)
Alcon Inc (51,409)
Coca-Cola (43,554)
Roche Holding AG (41,552)
Walmart Inc (33,938)
Colgate-Palmolive Co (28,439)

SANLAM UNIVERSAL FUNDS PLC
604
PURCHASES AND SALES FOR THE PERIOD ENDED 30 JUNE 2019 (UNAUDITED) (CONTINUED)
Denker Global Emerging Markets Fund Purchases Cost (USD) (being the largest purchases during the period ended 30 June 2019) Noah Holdings Ltd-Spon Ads 3,240,390
NMC Health Plc 3,181,499
Taiwan Semiconductor Man 3,153,301
British American Tobacco 3,144,856
Regional Sab De Cv 3,036,937
Fu Shou Yuan International 2,306,455
Swatch Group Ag/ 2,294,205
Genomma Lab Internacional 2,256,149
Delta Electronics Inc 2,183,755
Largan Precision Co Ltd 2,172,398
Qualicorp Conssultoria 2,154,911
Yes Bank Ltd 2,151,465
Lenovo Group Ltd 2,148,557
Ping An Insurance Group 2,136,961
Hyundai Mobis Co Ltd 2,134,205
Hankook Tire & Technology 2,122,070
Anheuser-Busch Inbev Sa 2,121,527
Coway Co Ltd 2,074,352
Naspers Ltd 2,073,939
JD.Com Inc 2,073,587
Sales Proceeds (USD) (being the largest sales during the period ended 30 June 2019) X 5 Retail Group (6,344,138)
Vipshop Holdings Ltd (5,964,526)
AIA Group Ltd (5,916,670)
Alibaba Group Holding (4,562,167)
Kasikornbank PCL (3,755,596)
Matahari Department Store (3,510,803)
Netease Inc (3,479,874)
Samsung Electronics (3,421,919)
Estacio Participacoes SA (3,125,857)
TCS Group Holding (3,053,259)
Tencent Holdings Ltd (2,965,529)
Turkiye Garanti Bankasi (2,909,629)
Mediatek Inc (2,871,498)
Yes Bank Ltd (2,804,284)
Jeronimo Martins (2,802,502)
Brilliance China Automotive Ltd. (2,762,182)
The Swatch Group (2,756,563)
Cia Hering (2,391,781)
Bank Rakyat Indonesia Pe (2,360,679)
Odontoprev S.A. (2,237,917)

SANLAM UNIVERSAL FUNDS PLC
605
PURCHASES AND SALES FOR THE PERIOD ENDED 30 JUNE 2019 (UNAUDITED) (CONTINUED)
ABSA Africa Equity Fund Purchases Cost (USD) (being the largest purchases during the period ended 30 June 2019)
Commercial International 2,782,746
Safaricom Plc 2,248,085
East African Breweries L 1,990,769
Zenith Bank Plc 1,294,108
MCB Group Ltd 1,166,286
Guaranty Trust Bank 1,004,105
Integrated Diagnostics Holding 808,913
Edita Food Industries 717,490
Attijariwafa Bank 678,059
United Bank For Africa 544,528
Vivo Energy Plc 459,651
Commercial Intl Bank 448,298
EFG Hermes Holding 406,602
GB Auto 406,448
MM Group For Industry 357,174
Seplat Petroleum Develop 324,238
Sales Proceeds (USD) (being the largest sales during the period ended 30 June 2019) Commercial International (3,439,902)
Egypt Treasury Zcp 091719 (2,620,528)
Ades International Holding 144A (1,179,533)
MCB Group Ltd (1,112,473)
Obour Land For Food Industry (1,014,052)
Seplat Petroleum Development (805,134)
Ibnsina Pharma Sae (705,884)
Cairo Investment & Real (583,160)
Stanbic Bank Uganda Ltd (565,615)
East African Breweries L (564,738)
Egypt Kuwait Holding Co (560,518)
Safaricom Plc (559,653)
Okomu Oil Palm Plc (552,882)
Vivo Energy Plc (483,425)
United Bank For Africa (454,500)
Commercial Intl Bank (447,882)
Edita Food Industries SA (422,228)
EFG Hermes Holding SAE (374,240)
Six Of October Development (371,647)
GB Auto (350,780)
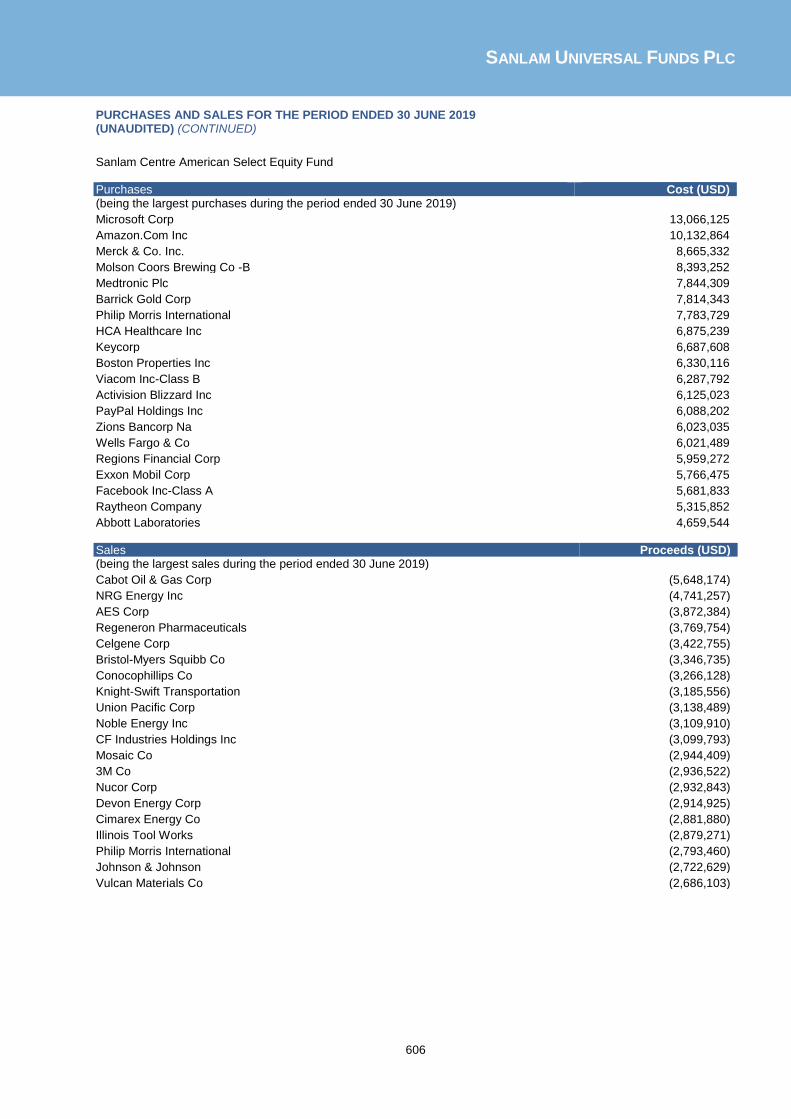
SANLAM UNIVERSAL FUNDS PLC
606
PURCHASES AND SALES FOR THE PERIOD ENDED 30 JUNE 2019 (UNAUDITED) (CONTINUED)
Sanlam Centre American Select Equity Fund Purchases Cost (USD) (being the largest purchases during the period ended 30 June 2019)
Microsoft Corp 13,066,125
Amazon.Com Inc 10,132,864
Merck & Co. Inc. 8,665,332
Molson Coors Brewing Co -B 8,393,252
Medtronic Plc 7,844,309
Barrick Gold Corp 7,814,343
Philip Morris International 7,783,729
HCA Healthcare Inc 6,875,239
Keycorp 6,687,608
Boston Properties Inc 6,330,116
Viacom Inc-Class B 6,287,792
Activision Blizzard Inc 6,125,023
PayPal Holdings Inc 6,088,202
Zions Bancorp Na 6,023,035
Wells Fargo & Co 6,021,489
Regions Financial Corp 5,959,272
Exxon Mobil Corp 5,766,475
Facebook Inc-Class A 5,681,833
Raytheon Company 5,315,852
Abbott Laboratories 4,659,544 Sales Proceeds (USD) (being the largest sales during the period ended 30 June 2019) Cabot Oil & Gas Corp (5,648,174)
NRG Energy Inc (4,741,257)
AES Corp (3,872,384)
Regeneron Pharmaceuticals (3,769,754)
Celgene Corp (3,422,755)
Bristol-Myers Squibb Co (3,346,735)
Conocophillips Co (3,266,128)
Knight-Swift Transportation (3,185,556)
Union Pacific Corp (3,138,489)
Noble Energy Inc (3,109,910)
CF Industries Holdings Inc (3,099,793)
Mosaic Co (2,944,409)
3M Co (2,936,522)
Nucor Corp (2,932,843)
Devon Energy Corp (2,914,925)
Cimarex Energy Co (2,881,880)
Illinois Tool Works (2,879,271)
Philip Morris International (2,793,460)
Johnson & Johnson (2,722,629)
Vulcan Materials Co (2,686,103)
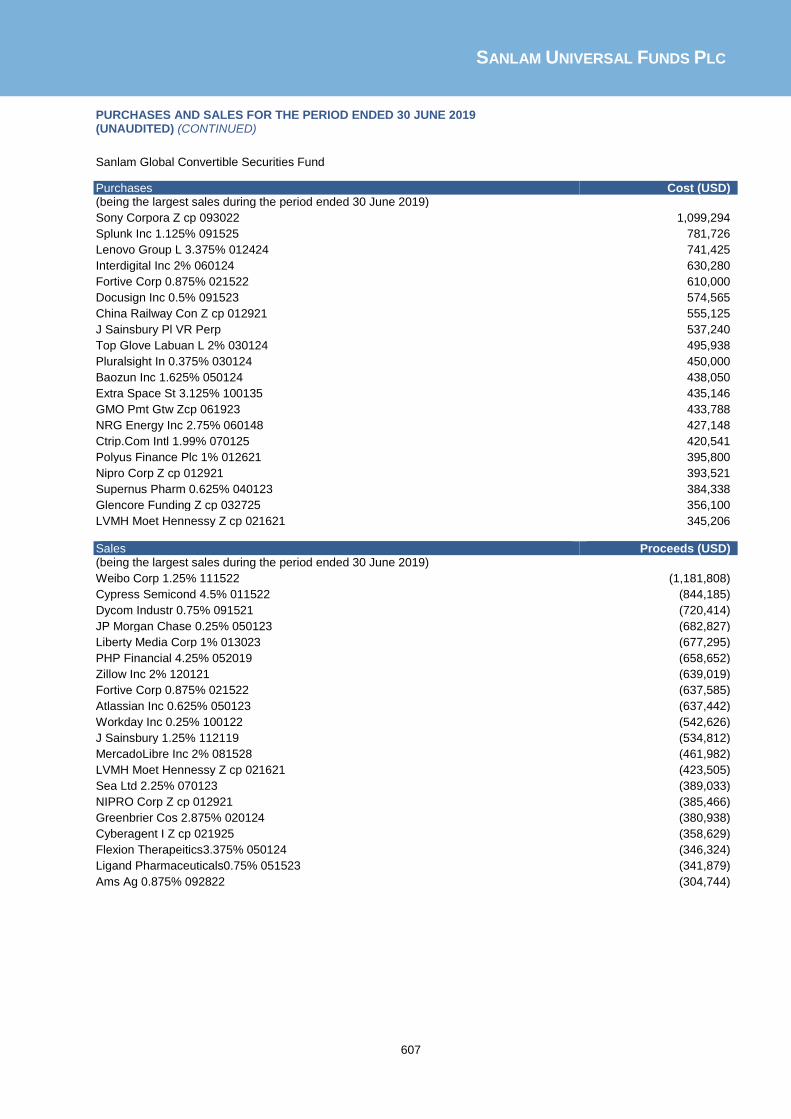
SANLAM UNIVERSAL FUNDS PLC
607
PURCHASES AND SALES FOR THE PERIOD ENDED 30 JUNE 2019 (UNAUDITED) (CONTINUED)
Sanlam Global Convertible Securities Fund
Purchases Cost (USD) (being the largest sales during the period ended 30 June 2019) Sony Corpora Z cp 093022 1,099,294
Splunk Inc 1.125% 091525 781,726
Lenovo Group L 3.375% 012424 741,425
Interdigital Inc 2% 060124 630,280
Fortive Corp 0.875% 021522 610,000
Docusign Inc 0.5% 091523 574,565
China Railway Con Z cp 012921 555,125
J Sainsbury Pl VR Perp 537,240
Top Glove Labuan L 2% 030124 495,938
Pluralsight In 0.375% 030124 450,000
Baozun Inc 1.625% 050124 438,050
Extra Space St 3.125% 100135 435,146
GMO Pmt Gtw Zcp 061923 433,788
NRG Energy Inc 2.75% 060148 427,148
Ctrip.Com Intl 1.99% 070125 420,541
Polyus Finance Plc 1% 012621 395,800
Nipro Corp Z cp 012921 393,521
Supernus Pharm 0.625% 040123 384,338
Glencore Funding Z cp 032725 356,100
LVMH Moet Hennessy Z cp 021621 345,206 Sales Proceeds (USD) (being the largest sales during the period ended 30 June 2019) Weibo Corp 1.25% 111522 (1,181,808)
Cypress Semicond 4.5% 011522 (844,185)
Dycom Industr 0.75% 091521 (720,414)
JP Morgan Chase 0.25% 050123 (682,827)
Liberty Media Corp 1% 013023 (677,295)
PHP Financial 4.25% 052019 (658,652)
Zillow Inc 2% 120121 (639,019)
Fortive Corp 0.875% 021522 (637,585)
Atlassian Inc 0.625% 050123 (637,442)
Workday Inc 0.25% 100122 (542,626)
J Sainsbury 1.25% 112119 (534,812)
MercadoLibre Inc 2% 081528 (461,982)
LVMH Moet Hennessy Z cp 021621 (423,505)
Sea Ltd 2.25% 070123 (389,033)
NIPRO Corp Z cp 012921 (385,466)
Greenbrier Cos 2.875% 020124 (380,938)
Cyberagent I Z cp 021925 (358,629)
Flexion Therapeitics3.375% 050124 (346,324)
Ligand Pharmaceuticals0.75% 051523 (341,879)
Ams Ag 0.875% 092822 (304,744)

SANLAM UNIVERSAL FUNDS PLC
608
PURCHASES AND SALES FOR THE PERIOD ENDED 30 JUNE 2019 (UNAUDITED) (CONTINUED)
Sanlam Japan Equity Fund Purchases Cost (USD) (being the largest purchases during the period ended 30 June 2019)
Softbank Group Corp 663,606
Taiyo Yuden Co Ltd 623,165
Recruit Holdings Co Ltd 588,038
Sumitomo Corp 547,393
Rengo Co Ltd 486,290
SCSK Corporation 429,114
Kubota Corp 384,703
Hoya Corp 353,515
Mitsui Chemicals Inc 327,004
Taiheiyo Cement Corp 269,144
Murata Manufacturing Co 258,978
Meiko Electronics Co Ltd 252,061
ORIX Corp 246,570
Isuzu Motors Ltd 243,820
Hitachi Ltd 238,009
Hitachi High-Technologies 237,328
Komatsu Ltd 220,264
Kyudenko Corp 191,849
Subaru Corp 185,098
Nippon Suisan Kaisha Ltd 177,626 Sales Proceeds (USD) (being the largest sales during the period ended 30 June 2019) Sony Corp (2,655,664)
Suzuki Motor Corp (2,316,783)
Central Japan Railway Co (1,835,555)
Softbank Group Corp (1,515,677)
Nippon Telegraph & Telephone (1,462,024)
Daiichi Sankyo Co Ltd (1,304,227)
ORIX Corp (1,302,326)
Pan Pacific International (1,295,300)
Sumitomo Mitsui Financial (1,276,566)
Murata Manufacturing Co (1,229,776)
Hitachi Ltd (1,222,338)
Seven & I Holdings Co Lt (1,191,999)
Showa Denko K.K. (1,172,450)
Sumitomo Corp (1,056,227)
Mitsubishi Corp (1,038,113)
NTT Data Corp (1,027,152)
Otsuka Holdings Co Ltd (1,010,250)
Keisei Electric Railway (989,756)
Sompo Holdings Inc (985,187)
Tokyo Tatemono Co Ltd (942,478)

SANLAM UNIVERSAL FUNDS PLC
609
PURCHASES AND SALES FOR THE PERIOD ENDED 30 JUNE 2019 (UNAUDITED) (CONTINUED)
Sanlam Centre Active U.S Treasury Fund
Sales Cost (USD) (being the largest sales during the period ended 30 June 2019)
UST BDS 8 1/8% Due 81519 (185,250)

SANLAM UNIVERSAL FUNDS PLC
610
PURCHASES AND SALES FOR THE PERIOD ENDED 30 JUNE 2019 (UNAUDITED) (CONTINUED)
Autus Global Equity Fund Purchases Cost (USD) (being the largest purchases during the period ended 30 June 2019)
Enbridge Inc 111,433
CVS Health Corporation 109,407
Coca-Cola 75,635
Johnson & Johnson 75,634
Anthem Inc 74,886
Cigna Corp 73,629
Raytheon Company 72,633
Conocophillips Co 58,872
Thermo Fisher Scientific Inc 57,477
Merck & Co 48,480 Sales Proceeds (USD) (being the largest sales during the period ended 30 June 2019) Broadcom Inc (232,315)
Boeing (195,896)
American Tower Corp (192,812)
State Street Corp (173,715)
Cisco Systems Inc (168,587)
Sberbank (168,153)
Health Insurance Innovation (160,540)
Celgene Corp (134,157)
Mastercard Inc - A (112,777)
KLA-Tencor Corp (101,592)
Marvell Technology Group Ltd (99,037)
Allergan Plc (95,691)
Netflix Inc (94,261)
General Motors Co (87,147)
Comcast Corp-Class A (85,117)
AMETEK Inc (83,752)
Anadarko Petroleum Corp (80,973)
Encana Corp (79,391)
Lowe's Companies Inc (77,852)
Estee Lauder Companies-Cl A (72,424)

SANLAM UNIVERSAL FUNDS PLC
611
PURCHASES AND SALES FOR THE PERIOD ENDED 30 JUNE 2019 (UNAUDITED) (CONTINUED) Wisian Capital South African Equity Fund Purchases Cost (USD) (being the largest purchases during the period ended 30 June 2019)
Absa Group Ltd 187,536
MTN Group Ltd 174,197
Mr Price Group Ltd 34,734
Truworths International 34,723
Shoprite Holdings Ltd 20,627
Distell Group Holdings L 14,629 Sales Cost (USD) (being the largest purchases during the period ended 30 June 2019)
Naspers Ltd-N (134,721)
Clicks Holdings Ltd (67,898)
Standard Bank Group Ltd (36,742)
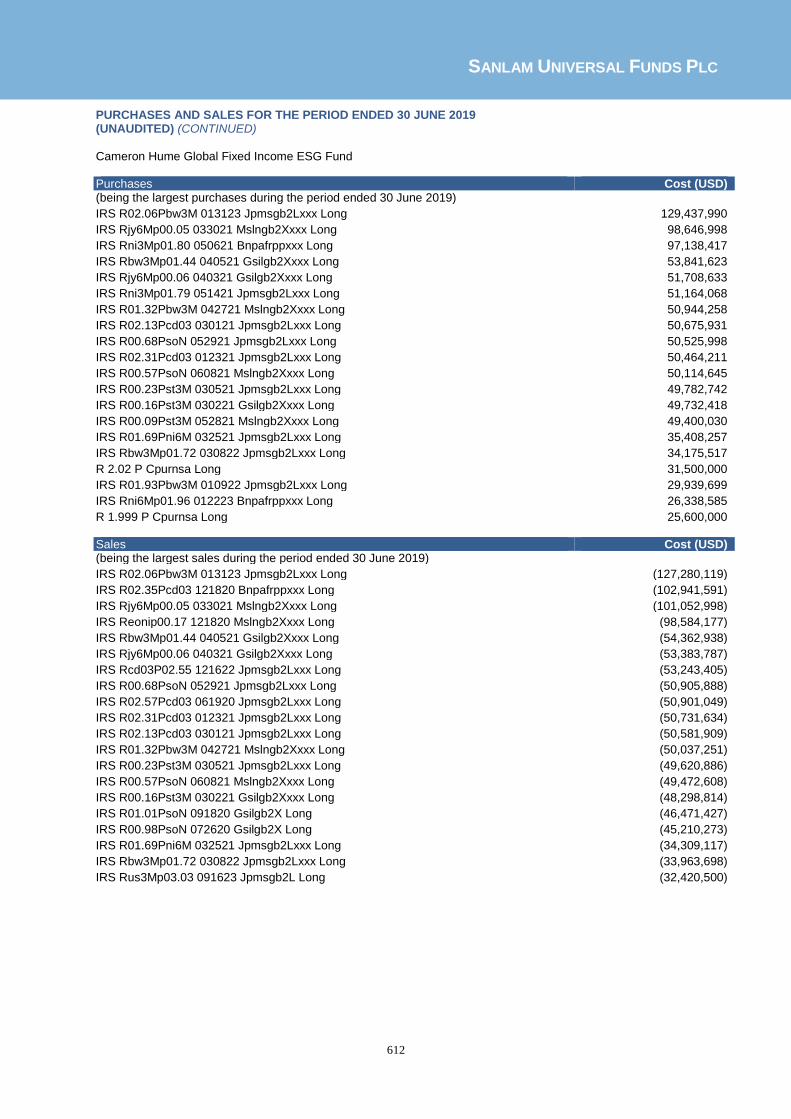
SANLAM UNIVERSAL FUNDS PLC
612
PURCHASES AND SALES FOR THE PERIOD ENDED 30 JUNE 2019 (UNAUDITED) (CONTINUED) Cameron Hume Global Fixed Income ESG Fund Purchases Cost (USD) (being the largest purchases during the period ended 30 June 2019)
IRS R02.06Pbw3M 013123 Jpmsgb2Lxxx Long 129,437,990
IRS Rjy6Mp00.05 033021 Mslngb2Xxxx Long 98,646,998
IRS Rni3Mp01.80 050621 Bnpafrppxxx Long 97,138,417
IRS Rbw3Mp01.44 040521 Gsilgb2Xxxx Long 53,841,623
IRS Rjy6Mp00.06 040321 Gsilgb2Xxxx Long 51,708,633
IRS Rni3Mp01.79 051421 Jpmsgb2Lxxx Long 51,164,068
IRS R01.32Pbw3M 042721 Mslngb2Xxxx Long 50,944,258
IRS R02.13Pcd03 030121 Jpmsgb2Lxxx Long 50,675,931
IRS R00.68PsoN 052921 Jpmsgb2Lxxx Long 50,525,998
IRS R02.31Pcd03 012321 Jpmsgb2Lxxx Long 50,464,211
IRS R00.57PsoN 060821 Mslngb2Xxxx Long 50,114,645
IRS R00.23Pst3M 030521 Jpmsgb2Lxxx Long 49,782,742
IRS R00.16Pst3M 030221 Gsilgb2Xxxx Long 49,732,418
IRS R00.09Pst3M 052821 Mslngb2Xxxx Long 49,400,030
IRS R01.69Pni6M 032521 Jpmsgb2Lxxx Long 35,408,257
IRS Rbw3Mp01.72 030822 Jpmsgb2Lxxx Long 34,175,517
R 2.02 P Cpurnsa Long 31,500,000
IRS R01.93Pbw3M 010922 Jpmsgb2Lxxx Long 29,939,699
IRS Rni6Mp01.96 012223 Bnpafrppxxx Long 26,338,585
R 1.999 P Cpurnsa Long 25,600,000 Sales Cost (USD) (being the largest sales during the period ended 30 June 2019)
IRS R02.06Pbw3M 013123 Jpmsgb2Lxxx Long (127,280,119)
IRS R02.35Pcd03 121820 Bnpafrppxxx Long (102,941,591)
IRS Rjy6Mp00.05 033021 Mslngb2Xxxx Long (101,052,998)
IRS Reonip00.17 121820 Mslngb2Xxxx Long (98,584,177)
IRS Rbw3Mp01.44 040521 Gsilgb2Xxxx Long (54,362,938)
IRS Rjy6Mp00.06 040321 Gsilgb2Xxxx Long (53,383,787)
IRS Rcd03P02.55 121622 Jpmsgb2Lxxx Long (53,243,405)
IRS R00.68PsoN 052921 Jpmsgb2Lxxx Long (50,905,888)
IRS R02.57Pcd03 061920 Jpmsgb2Lxxx Long (50,901,049)
IRS R02.31Pcd03 012321 Jpmsgb2Lxxx Long (50,731,634)
IRS R02.13Pcd03 030121 Jpmsgb2Lxxx Long (50,581,909)
IRS R01.32Pbw3M 042721 Mslngb2Xxxx Long (50,037,251)
IRS R00.23Pst3M 030521 Jpmsgb2Lxxx Long (49,620,886)
IRS R00.57PsoN 060821 Mslngb2Xxxx Long (49,472,608)
IRS R00.16Pst3M 030221 Gsilgb2Xxxx Long (48,298,814)
IRS R01.01PsoN 091820 Gsilgb2X Long (46,471,427)
IRS R00.98PsoN 072620 Gsilgb2X Long (45,210,273)
IRS R01.69Pni6M 032521 Jpmsgb2Lxxx Long (34,309,117)
IRS Rbw3Mp01.72 030822 Jpmsgb2Lxxx Long (33,963,698)
IRS Rus3Mp03.03 091623 Jpmsgb2L Long (32,420,500)

SANLAM UNIVERSAL FUNDS PLC
613
PURCHASES AND SALES FOR THE PERIOD ENDED 30 JUNE 2019 (UNAUDITED) (CONTINUED) Sanlam Centre Global Listed Infrastructure Fund Purchases Cost (USD) (being the largest purchases during the period ended 30 June 2019)
Beijing Enterprises Water 77,057
Singapore Telecommunication 76,913
Grupo Aeroportuario Pac 66,735
Daikin Industries Ltd 56,085
Hellenic Telecom Org-SP 51,424
Edison International 50,112
Enbridge Inc 49,197
Softbank Corp 29,931
KT Corp- 19,027 Sales Cost (USD) (being the largest sales during the period ended 30 June 2019)
BOC Aviation Ltd (92,535)
New Relic Inc (84,209)
Dassault Systemes (55,784)
GDS Holdings Ltd (54,467)
Mitek Systems Inc (44,750)
Talend SA (42,827)
CLP Holdings Ltd (25,324)
Enagas SA (25,017)
Inter Pipeline Ltd (23,966)
CenturyLink Inc (21,789)

SANLAM UNIVERSAL FUNDS PLC
614
PURCHASES AND SALES FOR THE PERIOD ENDED 30 JUNE 2019 (UNAUDITED) (CONTINUED) Sanlam Real Assets Fund Purchases Cost (USD) (being the largest purchases during the period ended 30 June 2019)
Brookfield Infrastructure 3,036,210
Greencoat UK Wind Plc 2,821,453
Vonovia SE 2,758,646
GCP Infrastructure Inves 2,589,367
Grainger Plc 2,474,125
Brookfield Renewable Partners 2,370,990
3I Infrastructure Plc 2,367,995
Bbgi Sicav SA 2,295,094
Unite Group Plc 2,293,123
Hicl Infrastructure Plc 2,102,021
Renewables Infrastructure 2,047,680
Ck Infrastructure Holdings 2,007,918
Orsted A/S 2,002,223
Harbourvest Global Priva 1,845,225
Secure Income Reit Plc 1,840,393
Tritax Big Box Reit Plc 1,811,305
Sequoia Economic Infrast 1,754,038
John Laing Environmental 1,561,804
Supermarket Income Reit 1,393,336
Keppel Infrastructure Trust 1,389,394 Sales Cost (USD) (being the largest sales during the period ended 30 June 2019)
Empiric Student Property (355,486)

SANLAM UNIVERSAL FUNDS PLC
615
PURCHASES AND SALES FOR THE PERIOD ENDED 30 JUNE 2019 (UNAUDITED) (CONTINUED) Satrix Global Factor Enhanced Equity Fund Purchases Cost (USD) (being the largest purchases during the period ended 30 June 2019)
Investor Ab-B 1,608,045
Hershey Co 1,513,906
Brookfield Property Reit 1,241,348
Erie Indemnity Company-Cl A 1,011,820
Fujitsu Ltd 911,525
Merck & Co. Inc. 905,649
Plains GP Holdings LP-Cl A 863,920
Industrivarden AB-C 863,198
Arrow Electronics Inc 853,890
Berkshire Hathaway Inc-Cl B 821,155
Eli Lilly & Co 666,912
Manpower Group 637,667
Israel Chemicals Ltd 615,346
AES Corp 595,439
Brookfield Asset Manage- 577,193
Dell Technologies -C 572,694
Phillips 66 536,371
Yum! Brands Inc 522,940
Pfizer Inc 497,580
Cadence Design Sys Inc 491,628 Sales Cost (USD) (being the largest sales during the period ended 30 June 2019)
Berkshire Hathaway Inc-Cl B (909,027)
Zoetis Inc (741,553)
Swedish Match Ab (728,443)
Koninklijke DSM NV (676,148)
Dell Technologies (626,812)
Apple Inc (602,462)
Pfizer Inc (563,699)
Brookfield Property Reit I-A (551,728)
Archer-Daniels-Midland Co (493,839)
Broadridge Financial Solutions (491,184)
Schaeffler AG (450,340)
Innogy SE (423,857)
Avnet Inc (419,909)
Fairfax Financial Holdings (417,392)
Domino’s Pizza Inc (410,432)
Chugoku Electric Power C (407,684)
Costco Wholesale Corp (393,960)
CSL Ltd (371,399)
T Rowe Price Group Inc (366,898)
Segro Plc (364,268)

SANLAM UNIVERSAL FUNDS PLC
616
PURCHASES AND SALES FOR THE PERIOD ENDED 30 JUNE 2019 (UNAUDITED) (CONTINUED) Perpetua Global Equity UCITS Fund Purchases Cost (USD) (being the largest purchases during the period ended 30 June 2019)
Berkshire Hathaway Inc-Cl B 1,447,094
American Express Company 1,081,988
Apple Inc 1,081,227
Philip Morris International 850,475
Franklin Resources Inc 817,656
Royal Dutch Shell Plc-A 800,945
British American Tobacco 732,098
Capri Holdings Ltd 721,389
Tesco Plc 676,387
Dollar Tree Inc 629,323
Wells Fargo & Co 587,443
Facebook Inc-Class A 544,337
L Brands Inc 544,298
Pandora A/S 542,212
Tencent Holdings Ltd 541,721
Anheuser-Busch Inbev Sa 540,214
Samsung Electronics Co L 527,776
Reinet Investments SCA 478,576
Transocean Ltd 472,161
Affiliated Managers Group 464,519 Sales Cost (USD) (being the largest sales during the period ended 30 June 2019)
Universal Display Corp (510,481)
Hennes & Mauritz Ab-B (307,369)
Apple Inc (303,994)
Tencent Holdings Ltd (289,771)
American Express Co (281,669)
Berkshire Hathaway Inc-Cl B (193,342)
Carlisle Cos Inc (116,649)
Dollar Tree Inc (103,707)
Distribuidora Internacional (78,168)

SANLAM UNIVERSAL FUNDS PLC
576
Issued by
Sanlam Asset Management (Ireland) Limited Beech Hill House Beech Hill Road Dublin 4 Ireland


