Embed Size (px)
Citation preview
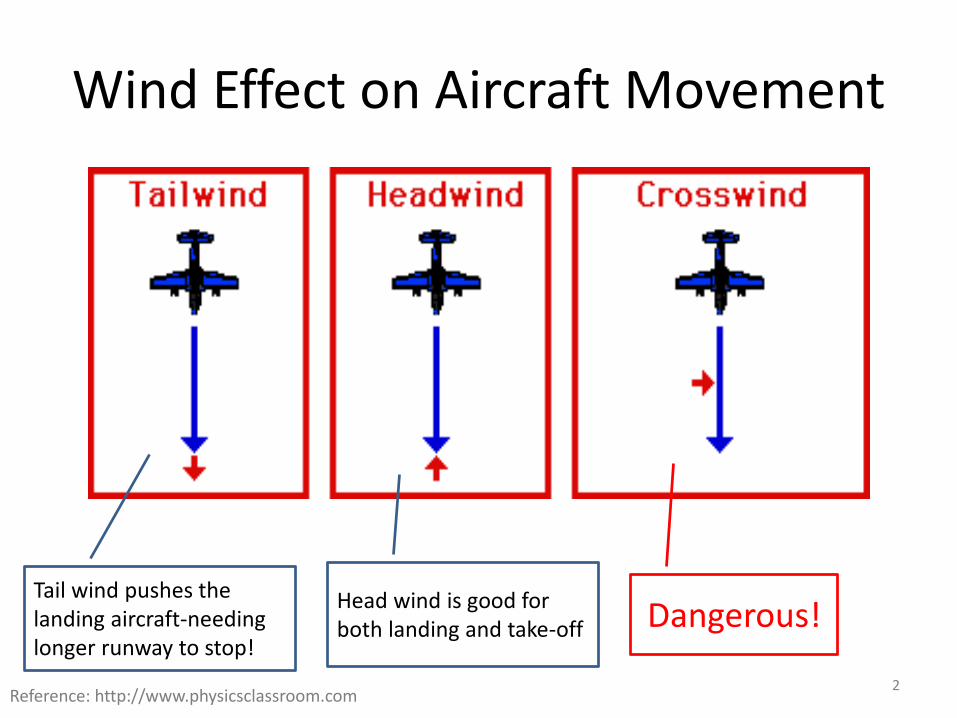
Wind Effect on Aircraft Movement
Head wind is good for both landing and take-off Dangerous!
Reference: http://www.physicsclassroom.com
Tail wind pushes the landing aircraft-needing longer runway to stop!
2

In landing, headwind provides necessary drag force to slow down aircraft
3
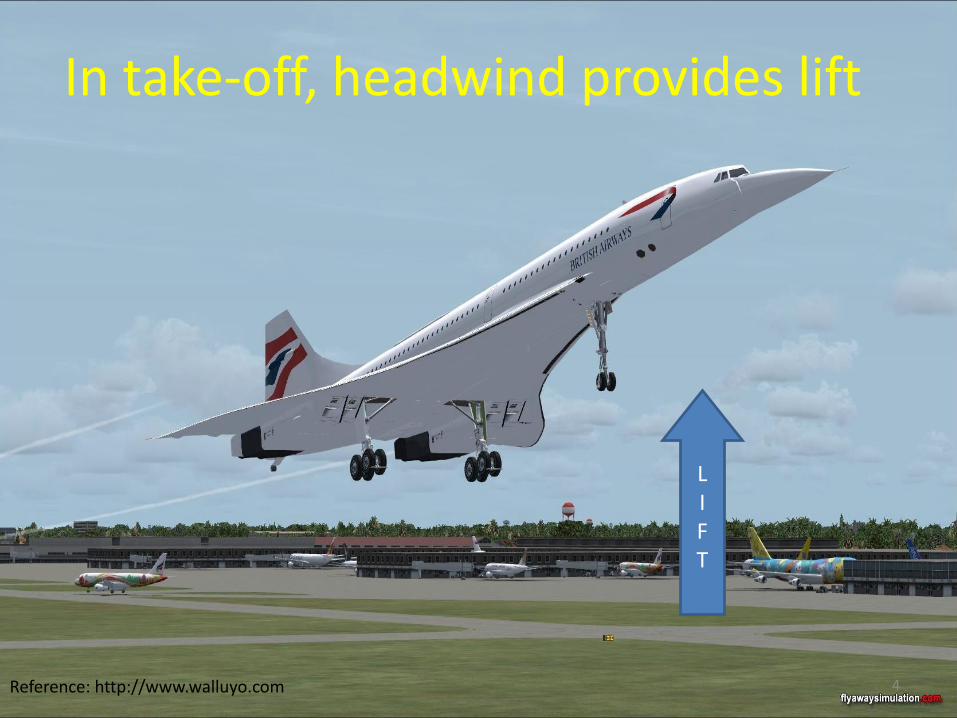
In take-off, headwind provides lift
LIFT
Reference: http://www.walluyo.com 4
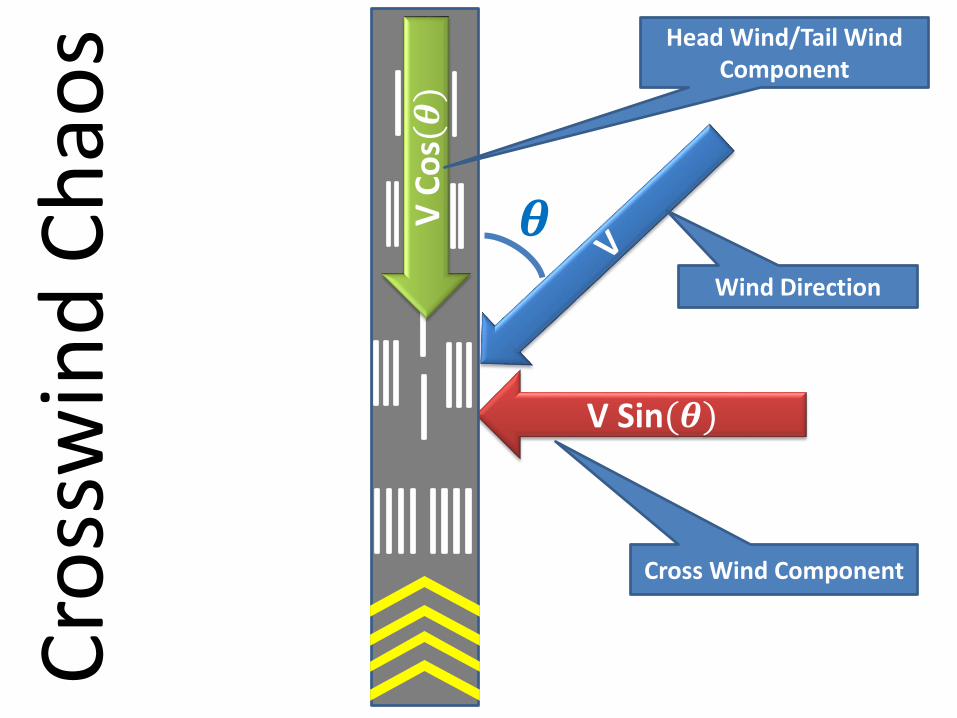
V Sin(𝜽)
𝜽
Cross Wind Component
Wind Direction
Cro
ssw
ind
Ch
aos
V C
os(𝜽)
Head Wind/Tail Wind Component
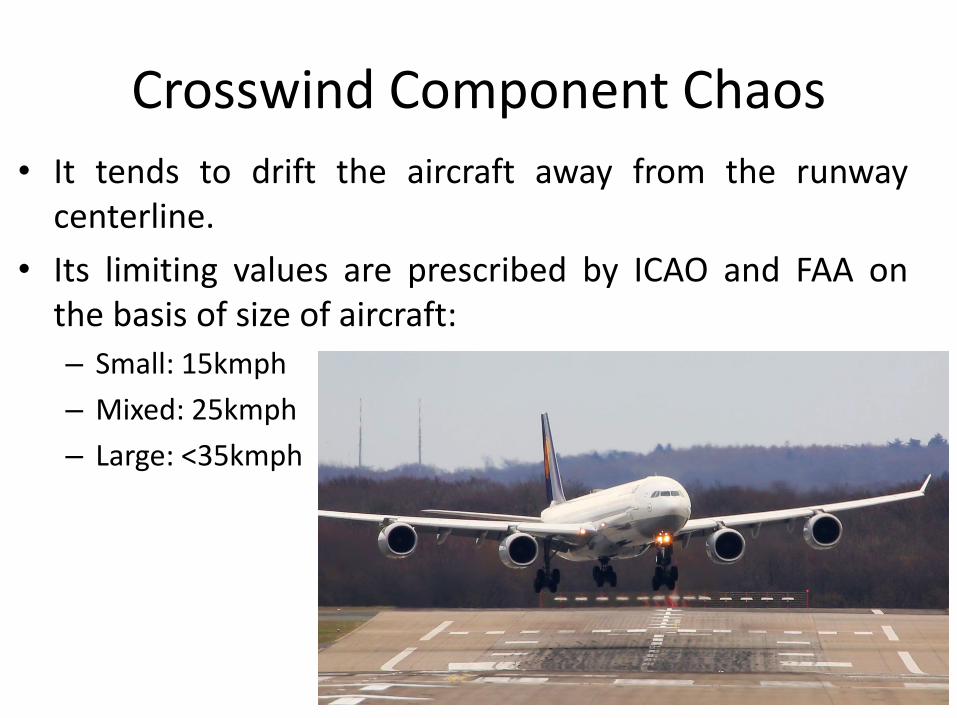
Crosswind Component Chaos
• It tends to drift the aircraft away from the runwaycenterline.
• Its limiting values are prescribed by ICAO and FAA onthe basis of size of aircraft:
– Small: 15kmph
– Mixed: 25kmph
– Large: <35kmph
6
Runway Orientation
• For runway orientation wind data is utilized
• Wind data comprises of:
– wind intensity,
– duration of movement of wind
– direction of movement of wind
7
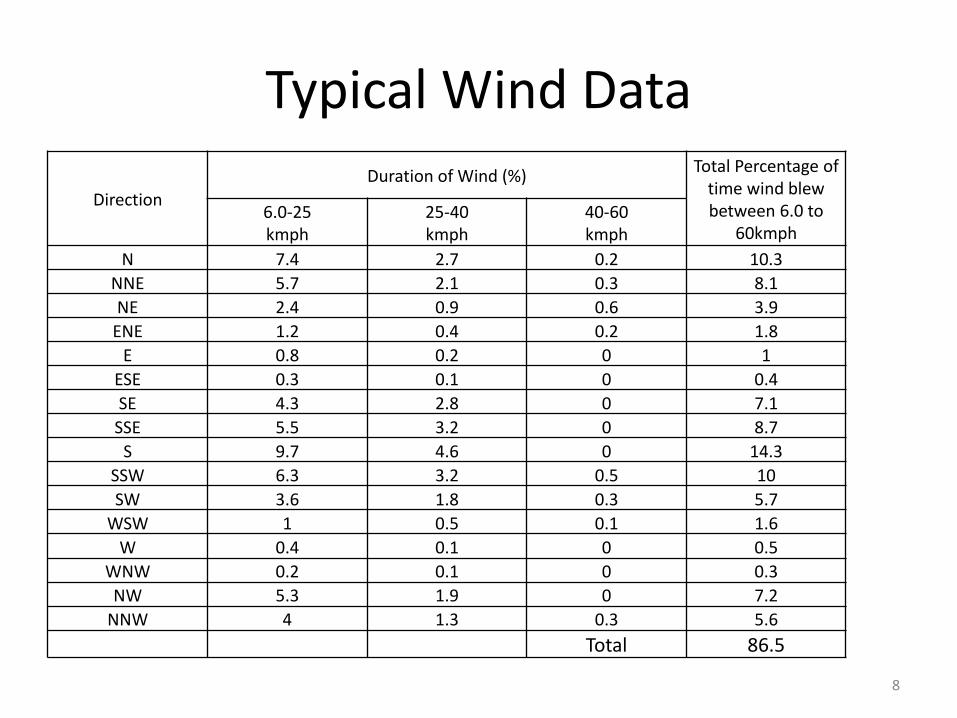
Typical Wind Data
Direction
Duration of Wind (%)Total Percentage of
time wind blew between 6.0 to
60kmph6.0-25kmph
25-40kmph
40-60kmph
N 7.4 2.7 0.2 10.3
NNE 5.7 2.1 0.3 8.1
NE 2.4 0.9 0.6 3.9
ENE 1.2 0.4 0.2 1.8
E 0.8 0.2 0 1
ESE 0.3 0.1 0 0.4
SE 4.3 2.8 0 7.1
SSE 5.5 3.2 0 8.7
S 9.7 4.6 0 14.3
SSW 6.3 3.2 0.5 10
SW 3.6 1.8 0.3 5.7
WSW 1 0.5 0.1 1.6
W 0.4 0.1 0 0.5
WNW 0.2 0.1 0 0.3
NW 5.3 1.9 0 7.2
NNW 4 1.3 0.3 5.6
Total 86.5
8
Wind Data: Collection and Application
• Data collected over a period of, typically, 10
years.
• Systematically arranged on Wind Rose diagram.
9
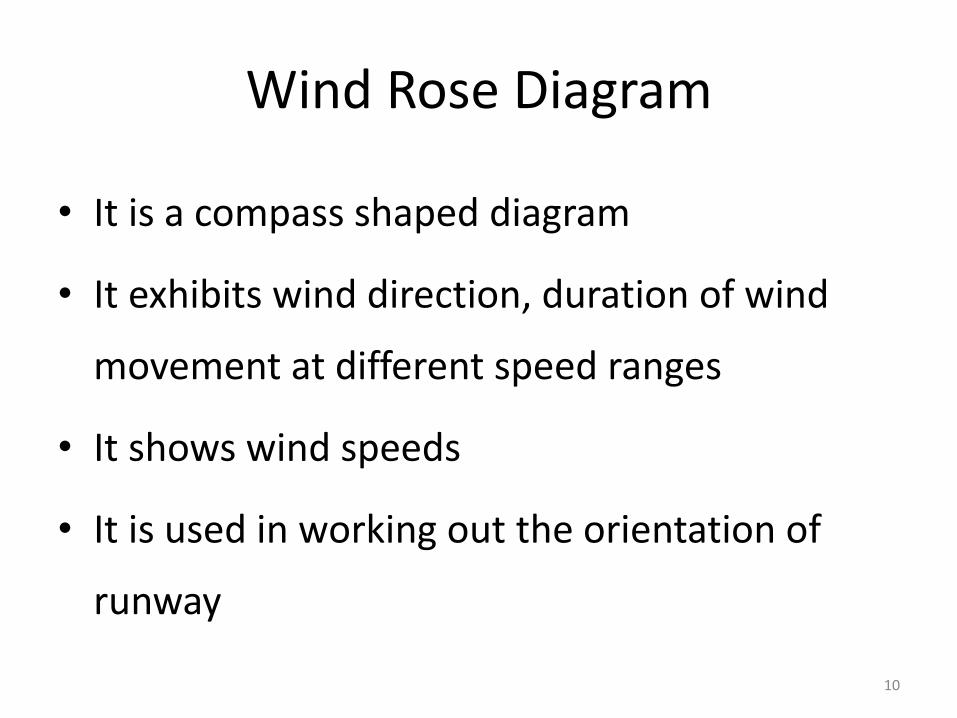
Wind Rose Diagram
• It is a compass shaped diagram
• It exhibits wind direction, duration of wind
movement at different speed ranges
• It shows wind speeds
• It is used in working out the orientation of
runway
10
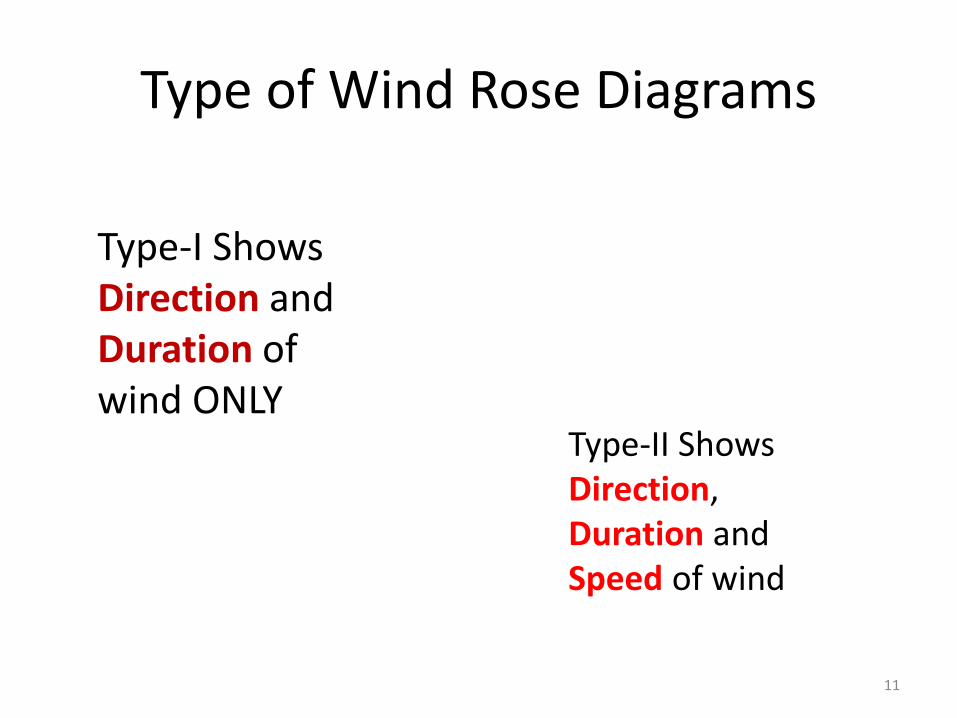
Type of Wind Rose Diagrams
Type-I Shows Direction and Duration of wind ONLY
Type-II Shows Direction, Duration and Speed of wind
11
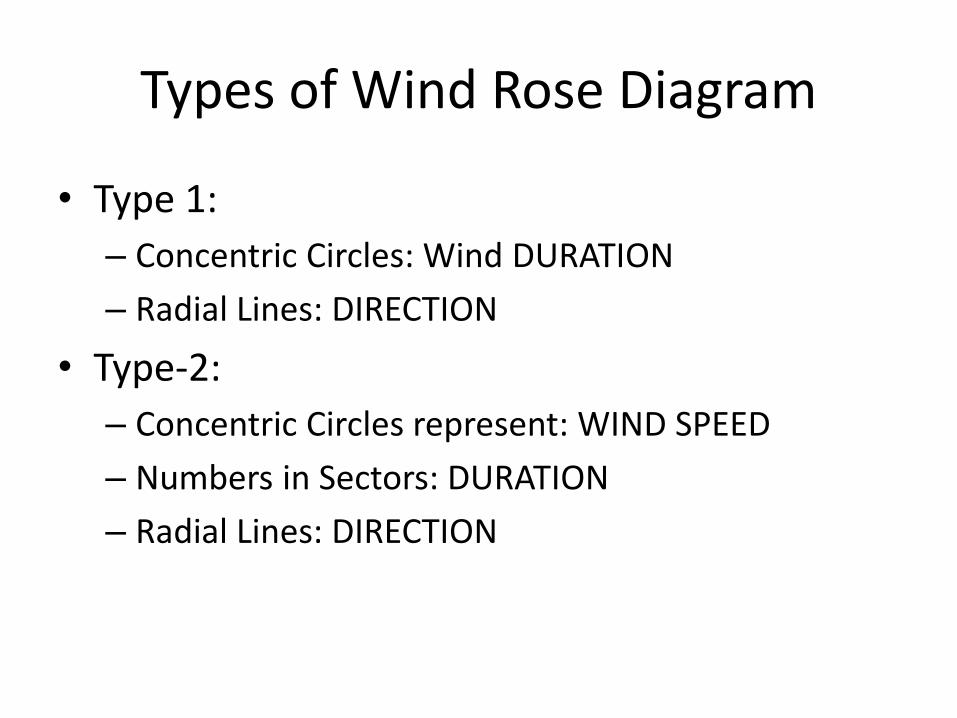
Types of Wind Rose Diagram
• Type 1:
– Concentric Circles: Wind DURATION
– Radial Lines: DIRECTION
• Type-2:
– Concentric Circles represent: WIND SPEED
– Numbers in Sectors: DURATION
– Radial Lines: DIRECTION
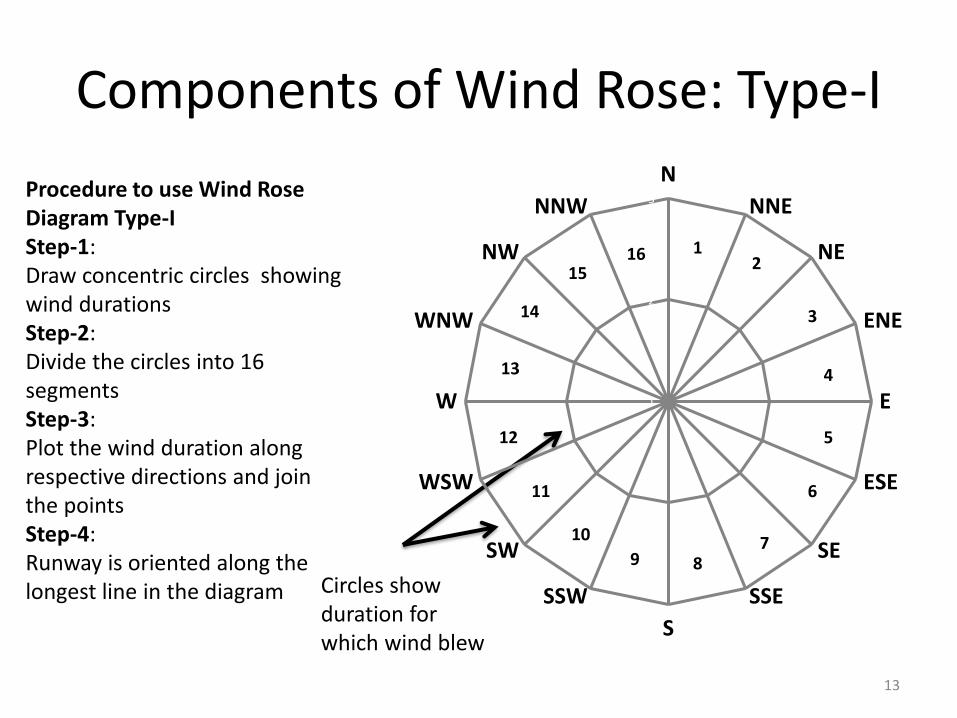
Components of Wind Rose: Type-I
Circles show duration for which wind blew
1
2
3
N
NNE
NE
ENE
E
ESE
SE
SSE
S
SSW
SW
WSW
W
WNW
NW
NNW
15
14
16
13
12
3
4
5
6
89
10
11
12
7
Procedure to use Wind Rose Diagram Type-IStep-1: Draw concentric circles showing wind durationsStep-2: Divide the circles into 16 segmentsStep-3: Plot the wind duration along respective directions and join the pointsStep-4:Runway is oriented along the longest line in the diagram
13
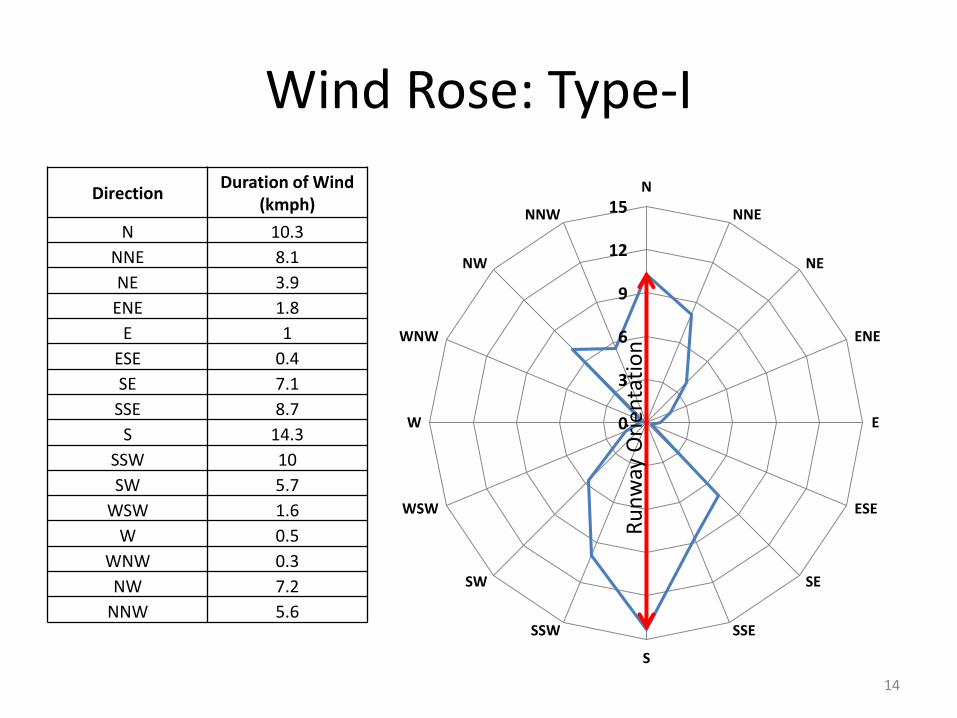
Wind Rose: Type-I
DirectionDuration of Wind
(kmph)
N 10.3
NNE 8.1
NE 3.9
ENE 1.8
E 1
ESE 0.4
SE 7.1
SSE 8.7
S 14.3
SSW 10
SW 5.7
WSW 1.6
W 0.5
WNW 0.3
NW 7.2
NNW 5.6
0
3
6
9
12
15N
NNE
NE
ENE
E
ESE
SE
SSE
S
SSW
SW
WSW
W
WNW
NW
NNW
Ru
nw
ay O
rien
tati
on
14
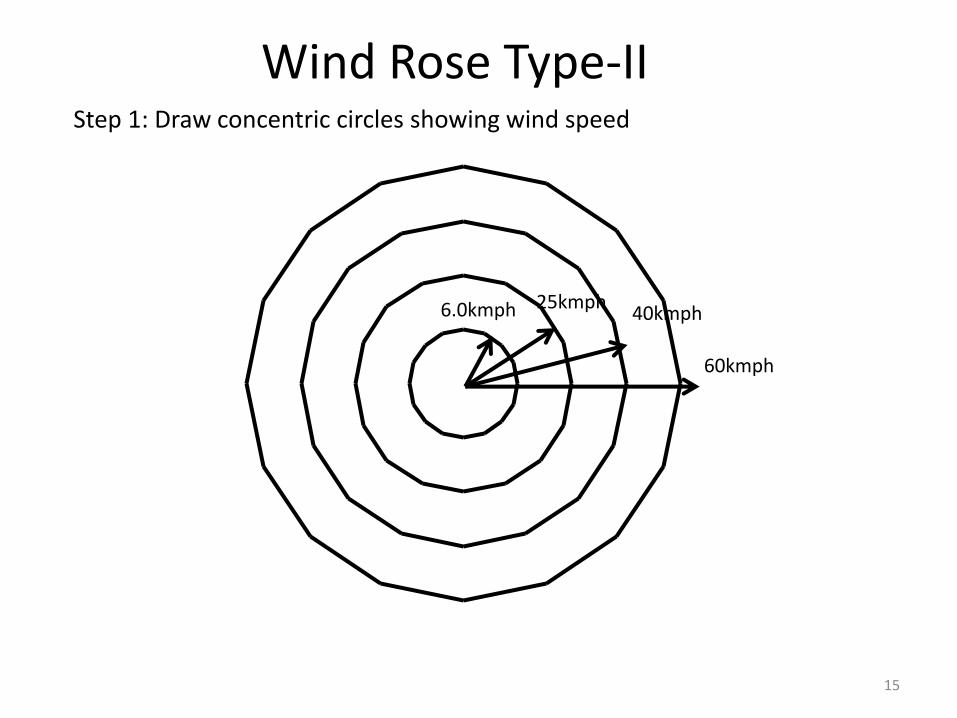
60kmph
6.0kmph 25kmph40kmph
Wind Rose Type-IIStep 1: Draw concentric circles showing wind speed
15
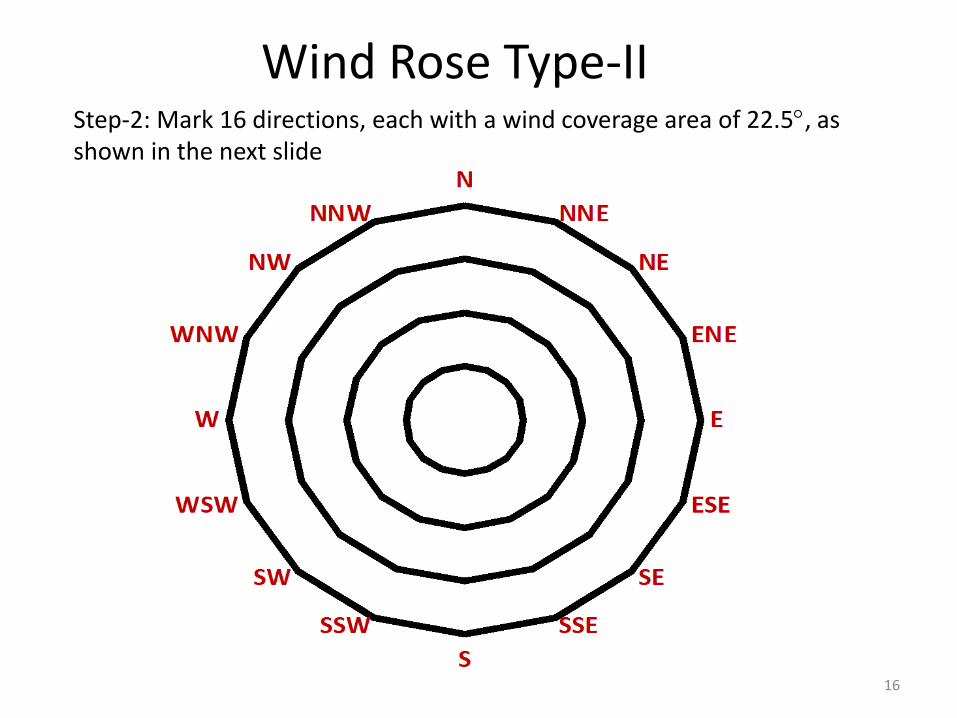
Wind Rose Type-IIStep-2: Mark 16 directions, each with a wind coverage area of 22.5, as shown in the next slide
16
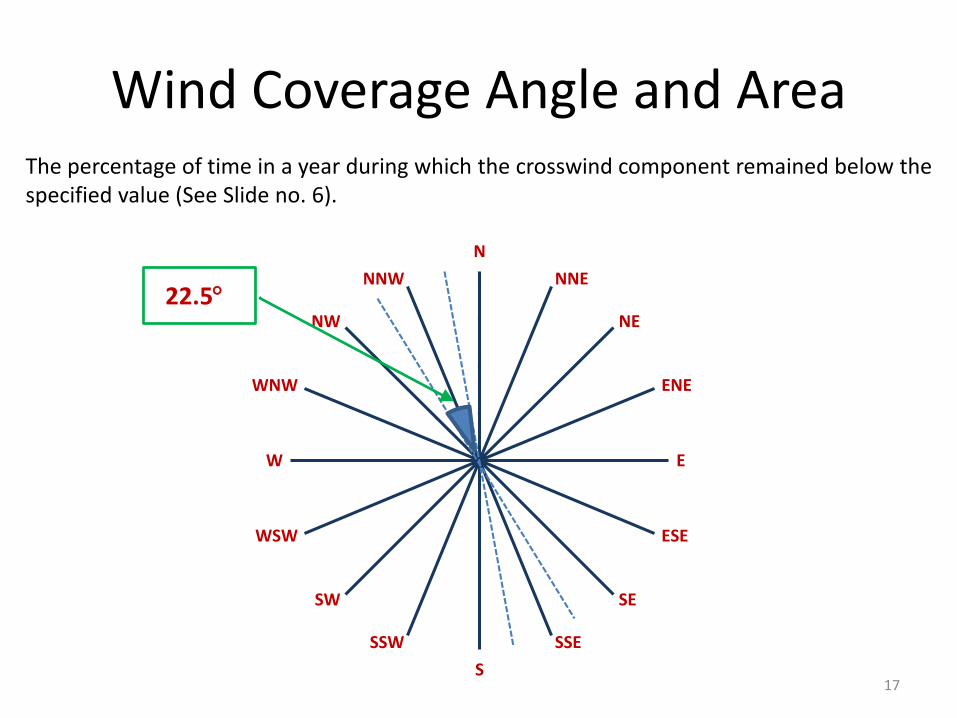
Wind Coverage Angle and Area
1
2
3
4
5
N
NNE
NE
ENE
E
ESE
SE
SSE
S
SSW
SW
WSW
W
WNW
NW
NNW22.5
17
The percentage of time in a year during which the crosswind component remained below the specified value (See Slide no. 6).
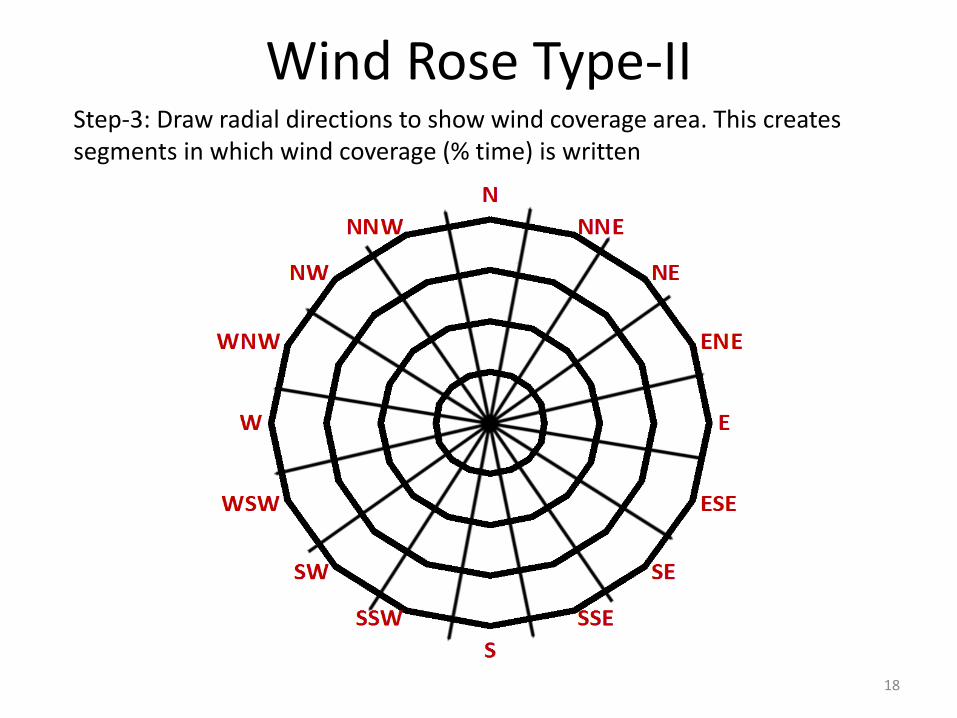
Wind Rose Type-II Step-3: Draw radial directions to show wind coverage area. This creates segments in which wind coverage (% time) is written
18
Wind Rose Type-II
19
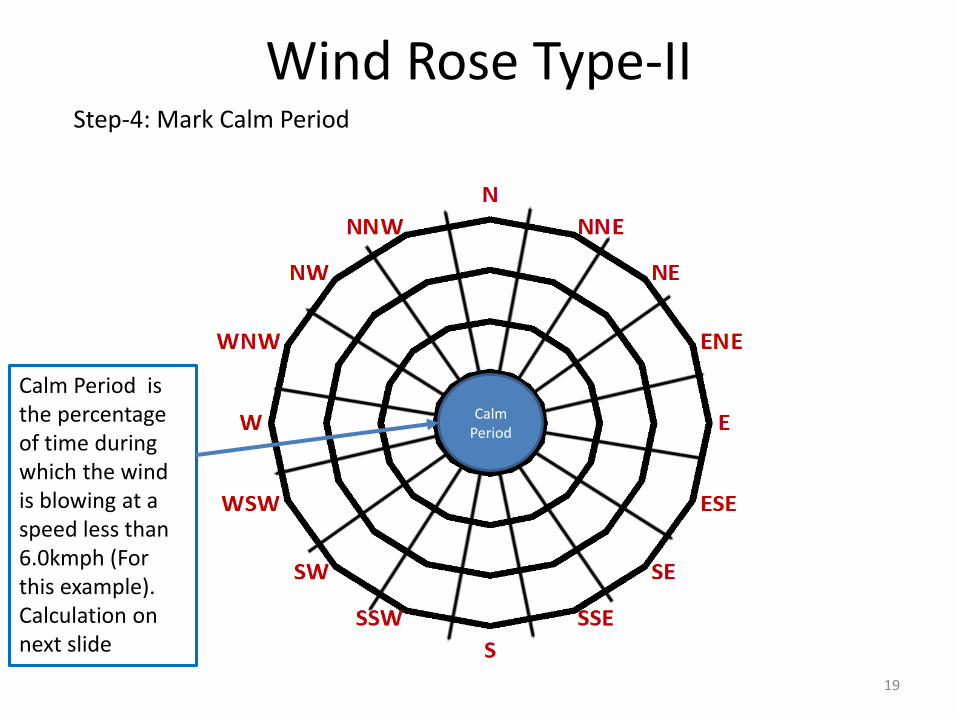
Calm Period
Calm Period is the percentage of time during which the wind is blowing at a speed less than 6.0kmph (For this example). Calculation on next slide
Step-4: Mark Calm Period
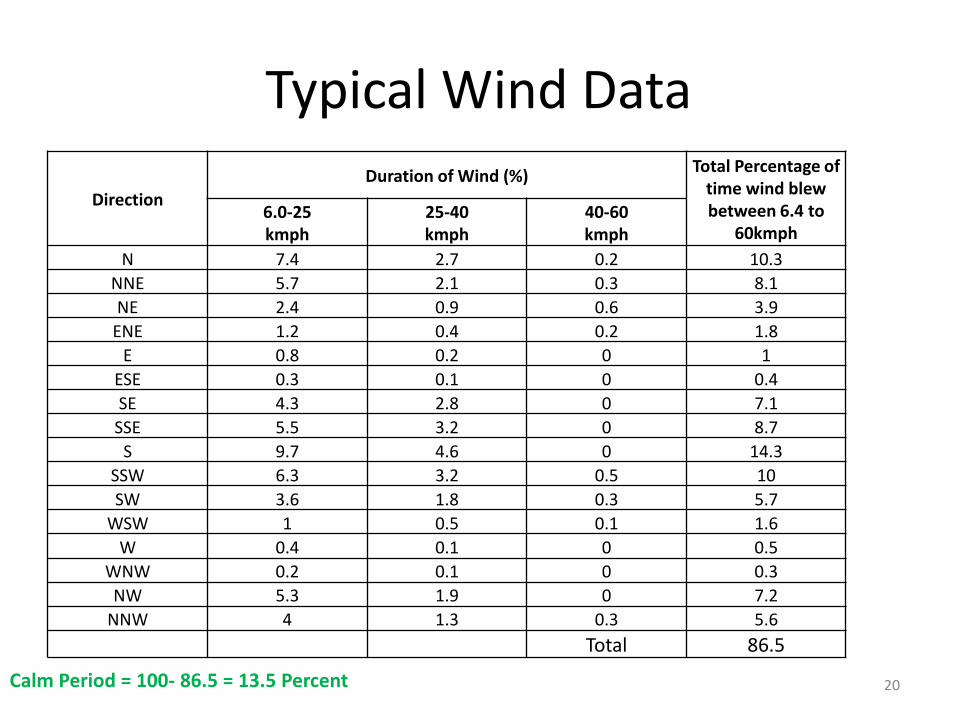
Typical Wind Data
Direction
Duration of Wind (%)Total Percentage of
time wind blew between 6.4 to
60kmph6.0-25kmph
25-40kmph
40-60kmph
N 7.4 2.7 0.2 10.3
NNE 5.7 2.1 0.3 8.1
NE 2.4 0.9 0.6 3.9
ENE 1.2 0.4 0.2 1.8
E 0.8 0.2 0 1
ESE 0.3 0.1 0 0.4
SE 4.3 2.8 0 7.1
SSE 5.5 3.2 0 8.7
S 9.7 4.6 0 14.3
SSW 6.3 3.2 0.5 10
SW 3.6 1.8 0.3 5.7
WSW 1 0.5 0.1 1.6
W 0.4 0.1 0 0.5
WNW 0.2 0.1 0 0.3
NW 5.3 1.9 0 7.2
NNW 4 1.3 0.3 5.6
Total 86.5
Calm Period = 100- 86.5 = 13.5 Percent 20
7.45.7
2.4
1.2
0.8
0.3
4.35.5
9.76.3
3.6
1.0
0.4
0.2
5.34.0
Calm Period0.1
2.7 2.1
0.9
0.4
0.2
0.1
2.8
3.24.6
3.2
1.8
0.5
0.1
1.9
1.3
0.0
0.20.3
0.6
0.2
0.0
0.0
0.0
0.00.5
0.3
0.0
0.1
0.0
0.0
0.3
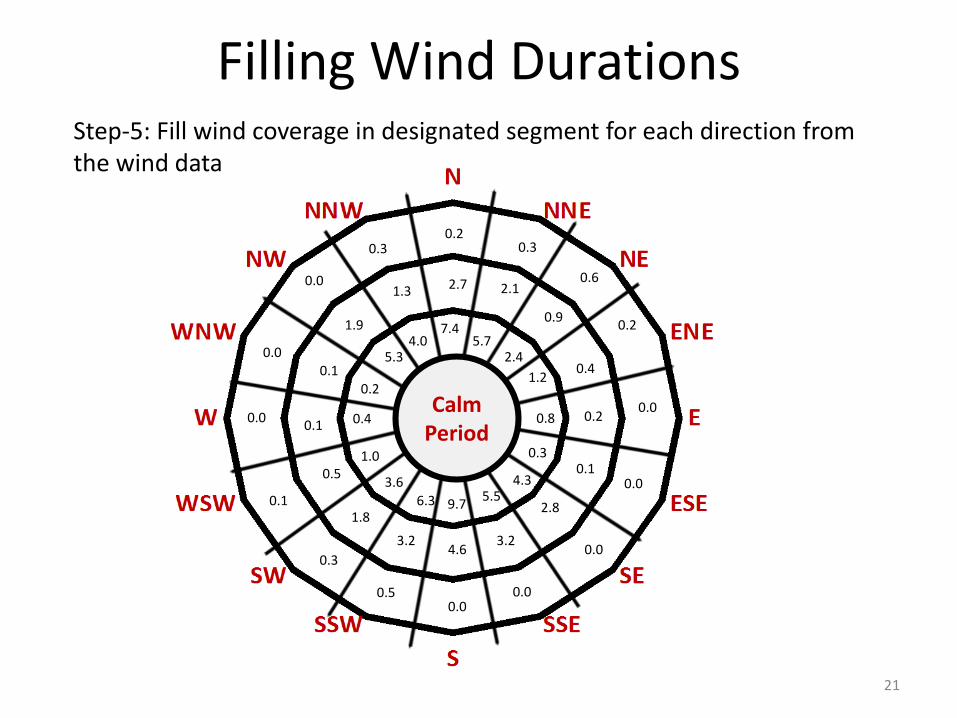
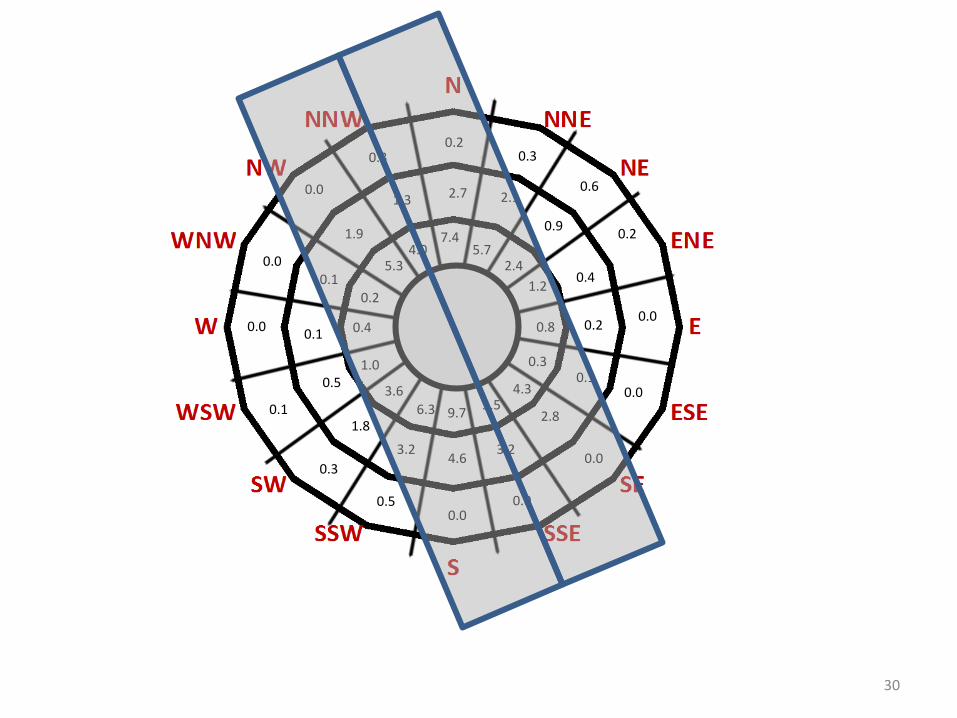
Filling Wind DurationsStep-5: Fill wind coverage in designated segment for each direction from the wind data
21
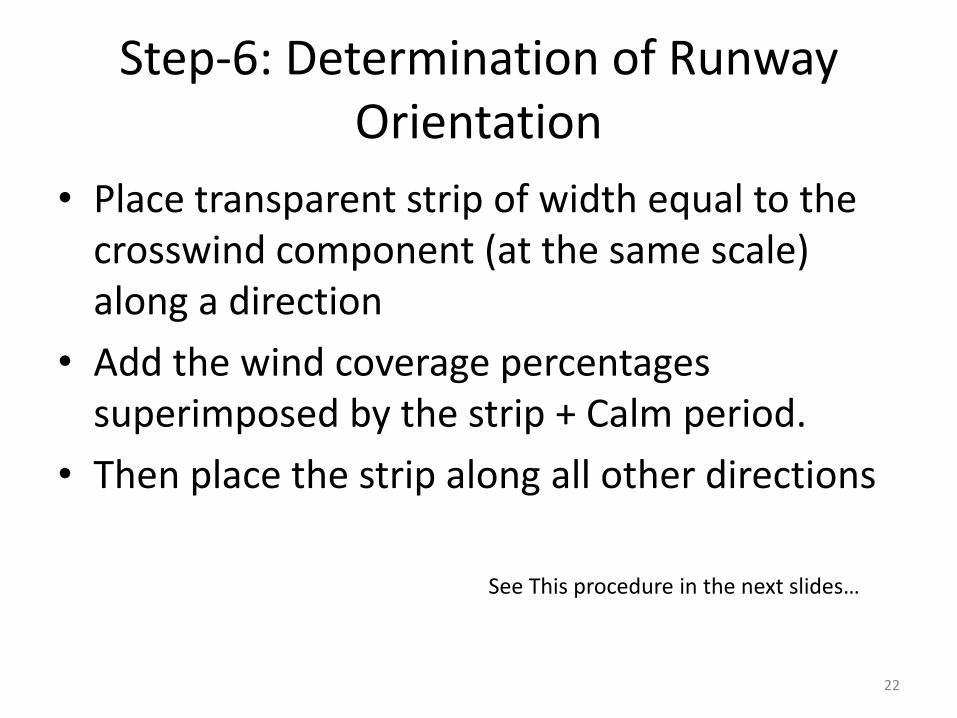
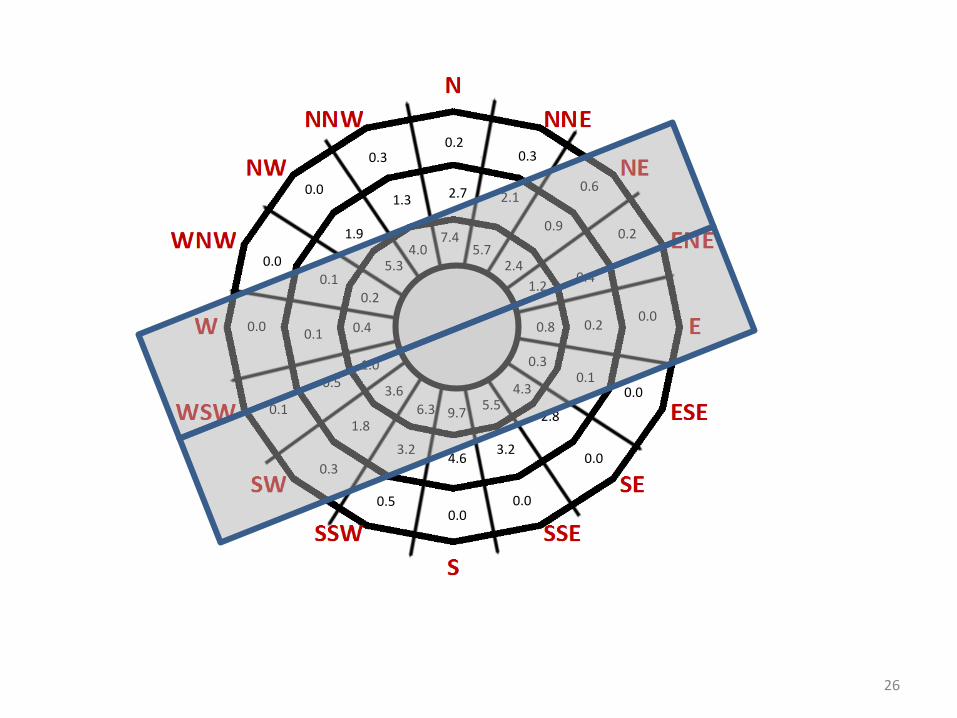
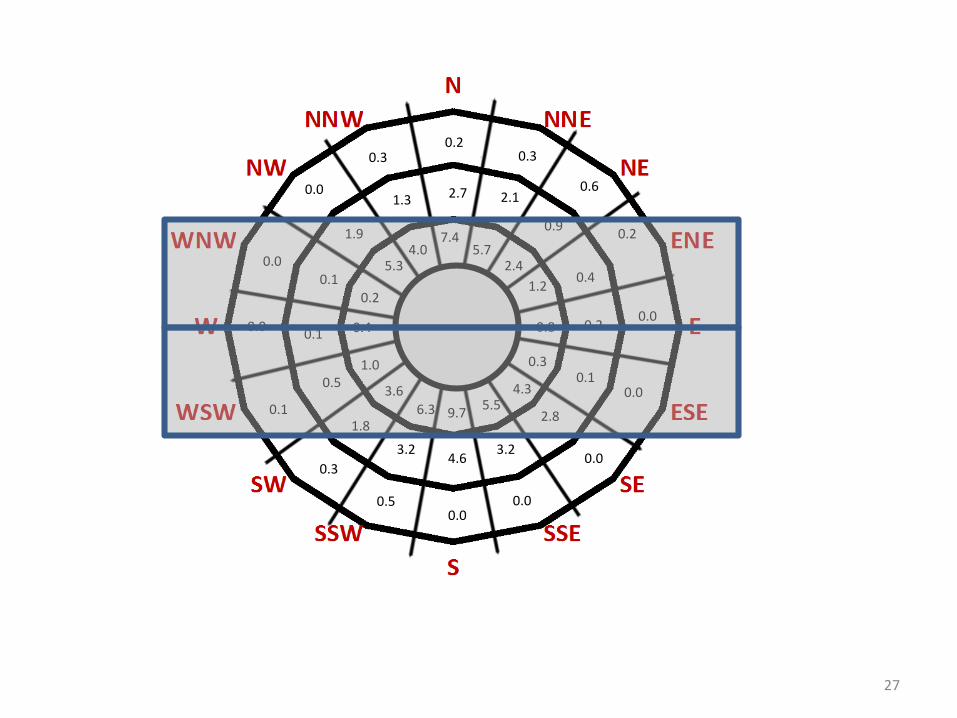
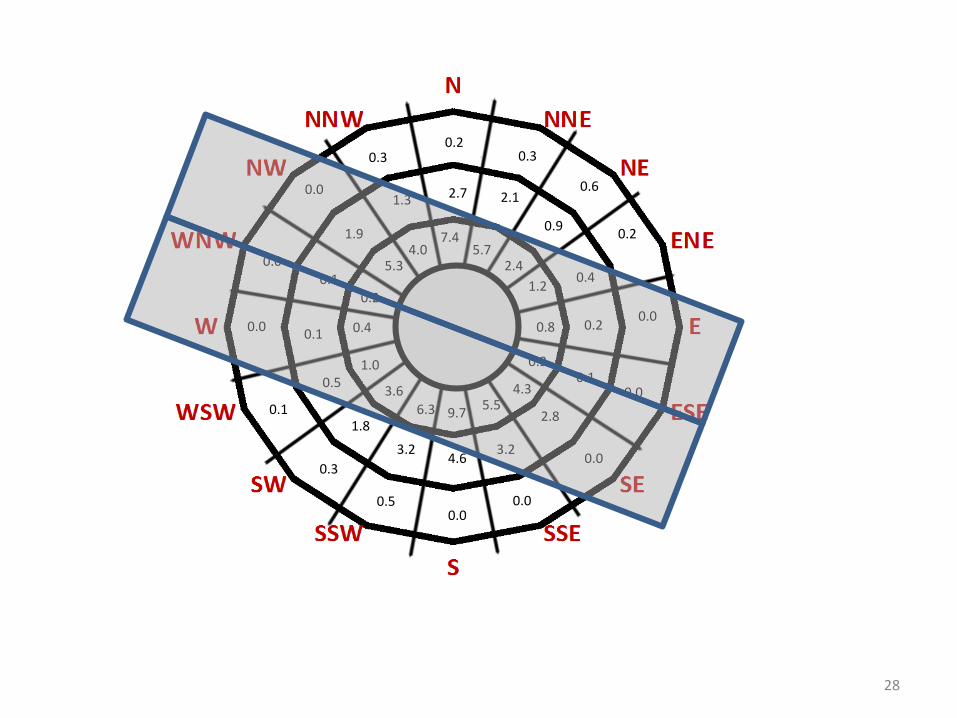
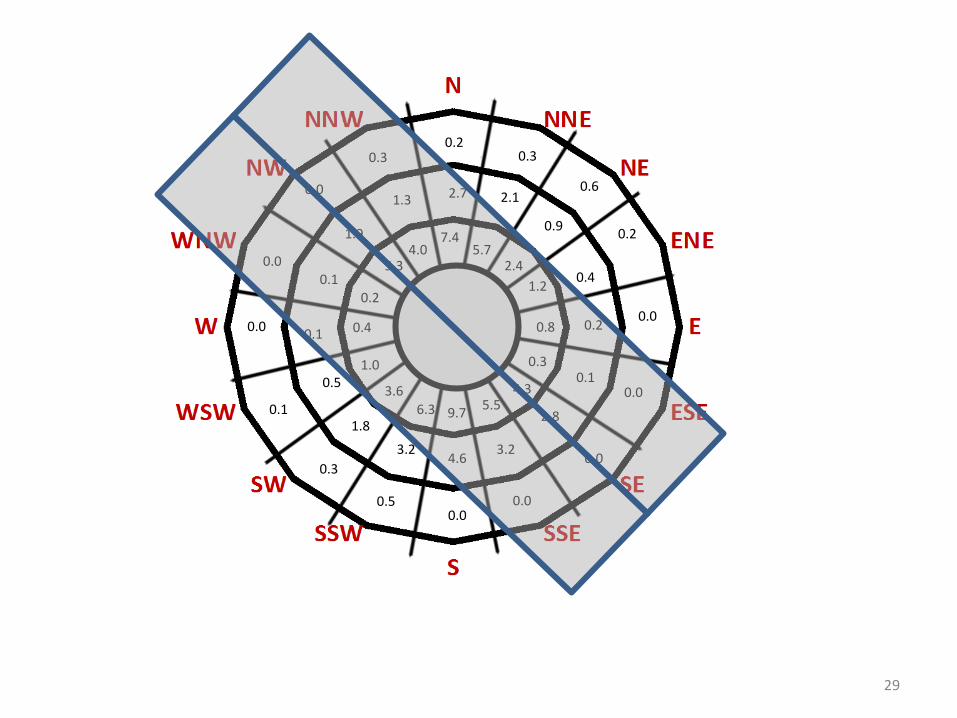
Step-6: Determination of Runway Orientation
• Place transparent strip of width equal to the crosswind component (at the same scale) along a direction
• Add the wind coverage percentages superimposed by the strip + Calm period.
• Then place the strip along all other directions
See This procedure in the next slides…
22
7.45.7
2.4
1.2
0.8
0.3
4.35.5
9.76.3
3.6
1.0
0.4
0.2
5.34.0
0.1
2.7 2.1
0.9
0.4
0.2
0.1
2.8
3.24.6
3.2
1.8
0.5
0.1
1.9
1.3
0.0
0.20.3
0.6
0.2
0.0
0.0
0.0
0.00.5
0.3
0.0
0.1
0.0
0.0
0.3
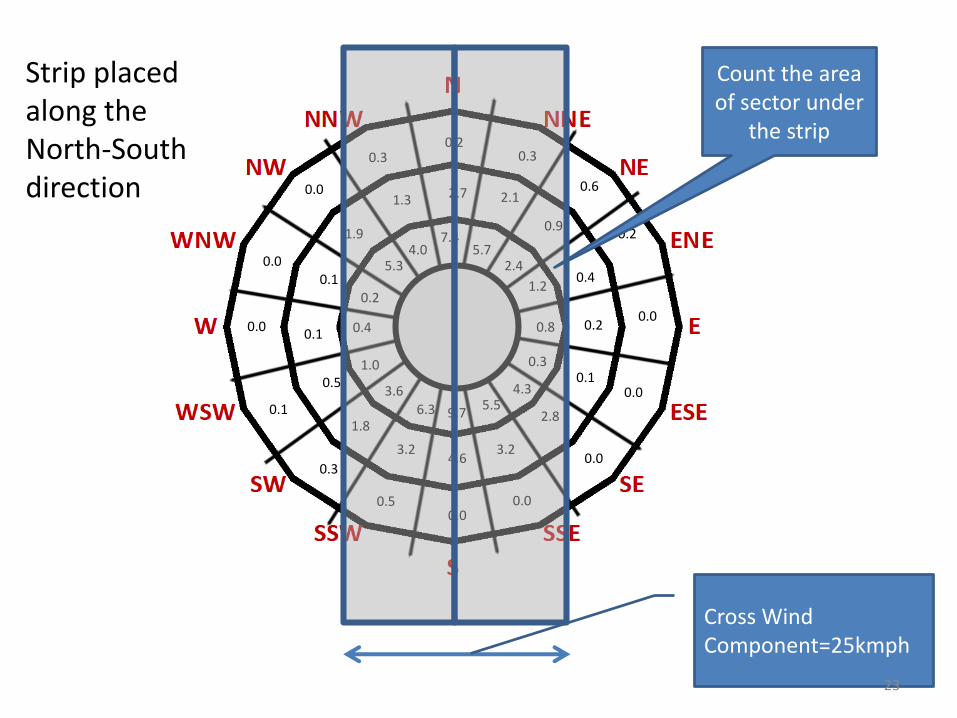
Cross Wind Component=25kmph
Strip placed along the North-South direction
23
Count the area of sector under
the strip
7.45.7
2.4
1.2
0.8
0.3
4.35.5
9.76.3
3.6
1.0
0.4
0.2
5.34.0
0.1
2.7 2.1
0.9
0.4
0.2
0.1
2.8
3.24.6
3.2
1.8
0.5
0.1
1.9
1.3
0.0
0.20.3
0.6
0.2
0.0
0.0
0.0
0.00.5
0.3
0.0
0.1
0.0
0.0
0.3
24
7.45.7
2.4
1.2
0.8
0.3
4.35.5
9.76.3
3.6
1.0
0.4
0.2
5.34.0
0.1
2.7 2.1
0.9
0.4
0.2
0.1
2.8
3.24.6
3.2
1.8
0.5
0.1
1.9
1.3
0.0
0.20.3
0.6
0.2
0.0
0.0
0.0
0.00.5
0.3
0.0
0.1
0.0
0.0
0.3
25
7.45.7
2.4
1.2
0.8
0.3
4.35.5
9.76.3
3.6
1.0
0.4
0.2
5.34.0
0.1
2.7 2.1
0.9
0.4
0.2
0.1
2.8
3.24.6
3.2
1.8
0.5
0.1
1.9
1.3
0.0
0.20.3
0.6
0.2
0.0
0.0
0.0
0.00.5
0.3
0.0
0.1
0.0
0.0
0.3
26
7.45.7
2.4
1.2
0.8
0.3
4.35.5
9.76.3
3.6
1.0
0.4
0.2
5.34.0
0.1
2.7 2.1
0.9
0.4
0.2
0.1
2.8
3.24.6
3.2
1.8
0.5
0.1
1.9
1.3
0.0
0.20.3
0.6
0.2
0.0
0.0
0.0
0.00.5
0.3
0.0
0.1
0.0
0.0
0.3
27
7.45.7
2.4
1.2
0.8
0.3
4.35.5
9.76.3
3.6
1.0
0.4
0.2
5.34.0
0.1
2.7 2.1
0.9
0.4
0.2
0.1
2.8
3.24.6
3.2
1.8
0.5
0.1
1.9
1.3
0.0
0.20.3
0.6
0.2
0.0
0.0
0.0
0.00.5
0.3
0.0
0.1
0.0
0.0
0.3
28
7.45.7
2.4
1.2
0.8
0.3
4.35.5
9.76.3
3.6
1.0
0.4
0.2
5.34.0
0.1
2.7 2.1
0.9
0.4
0.2
0.1
2.8
3.24.6
3.2
1.8
0.5
0.1
1.9
1.3
0.0
0.20.3
0.6
0.2
0.0
0.0
0.0
0.00.5
0.3
0.0
0.1
0.0
0.0
0.3
29
7.45.7
2.4
1.2
0.8
0.3
4.35.5
9.76.3
3.6
1.0
0.4
0.2
5.34.0
0.1
2.7 2.1
0.9
0.4
0.2
0.1
2.8
3.24.6
3.2
1.8
0.5
0.1
1.9
1.3
0.0
0.20.3
0.6
0.2
0.0
0.0
0.0
0.00.5
0.3
0.0
0.1
0.0
0.0
0.3
30
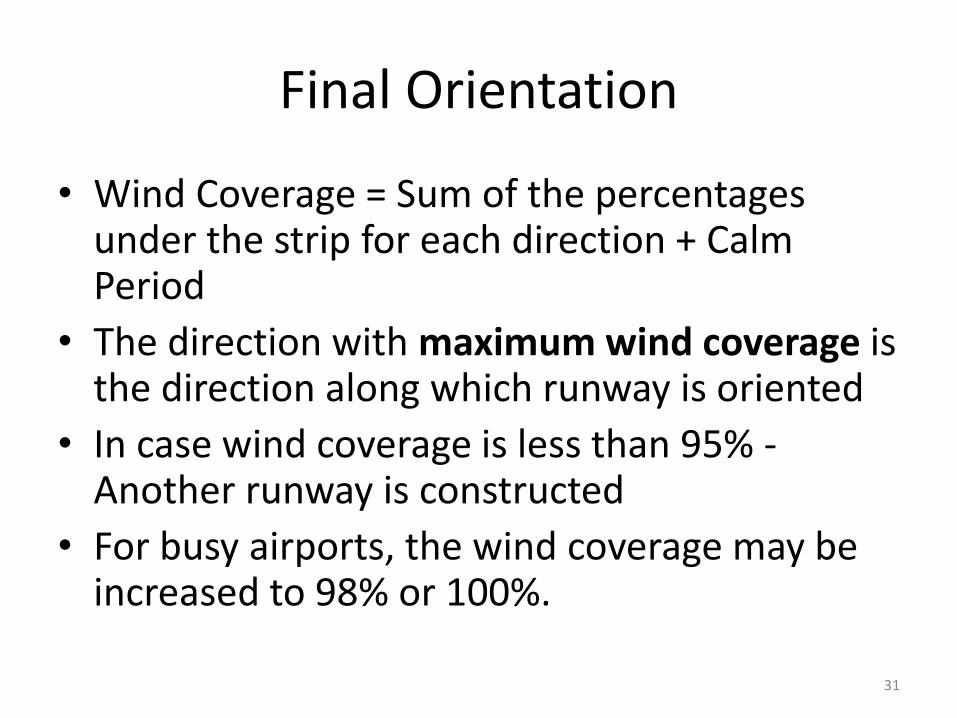
Final Orientation
• Wind Coverage = Sum of the percentages under the strip for each direction + Calm Period
• The direction with maximum wind coverage is the direction along which runway is oriented
• In case wind coverage is less than 95% -Another runway is constructed
• For busy airports, the wind coverage may be increased to 98% or 100%.
31
www.flightglobal.com