Embed Size (px)
Citation preview

1
Published by Oxford University Press on behalf of the Annals of Botany Company.
This is an Open Access article distributed under the terms of the Creative Commons
Attribution License (http://creativecommons.org/licenses/by/4.0/), which permits
unrestricted reuse, distribution, and reproduction in any medium, provided the original
work is properly cited.
OPEN ACCESS – RESEARCHARTICLE
Root hydraulic conductivity and adjustments in stomatal
conductance: hydraulic strategy in response to salt stress in a
halotolerant species
Victoria Vitali1, Jorge Bellati1, Gabriela Soto2, Nicolás D. Ayub2 and
Gabriela Amodeo1*
1Departamento de Biodiversidad y Biología Experimental, Facultad de Ciencias
Exactas y Naturales, Instituto de Biodiversidad y Biología Experimental,
Universidad de Buenos Aires and Consejo Nacional de Investigaciones
Científicas y Técnicas, Buenos Aires, Argentina.
2Instituto de Genética “Ewald A. Favret”, CICVyA, INTA-Castelar and Consejo
Nacional de Investigaciones Científicas y Técnicas, Buenos Aires, Argentina.
*Corresponding author
AoB PLANTS Advance Access published November 24, 2015 by guest on N
ovember 30, 2015
http://aobpla.oxfordjournals.org/D
ownloaded from

2
Corresponding author’s e-mail address: [email protected]
Running head: Root hydraulic conductivity adjustments in response to salt
tolerance
Received: 02 April 2015; Revised: 31 July 2015; Accepted: 07 November 2015
by guest on Novem
ber 30, 2015http://aobpla.oxfordjournals.org/
Dow
nloaded from

3
ABSTRACT
Recent advances at the molecular level are introducing a new scenario that
needs to be integrated into the analysis of plant hydraulic properties. Although it
is not yet clear to what extent this scenario alters the current proposal for the
hydraulic circuit models, it introduces new insights when studying plants that are
able to easily overcome water restrictions. In this context, our aim was to
explore water adjustments in a halotolerant model (Beta vulgaris) by studying
the coordination between the root in terms of root hydraulic conductivity (Lpr) and
the shoot as reflected in the stomatal conductance (gs). The root water
pathways were also analyzed in terms of root suberization (apoplastic barrier)
and aquaporin transcript levels (cell-to-cell pathway). B. vulgaris showed the
ability to rapidly lose (4h) and gain turgor (24 h) when submitted to salt stress
(200 mM). The reduction profile observed in Lpr and gs was consistent with a
coupled process. The tuning of the root water flow involved small variations in
the studied aquaporin’s transcripts before anatomical modifications occurred.
Exploring Lpr enhancement after halting the stress contributed to show not only a
different profile in restoring Lpr but also the capacity to uncouple Lpr from gs. B.
vulgaris root plays a key role and can anticipate water loss before the aerial
water status is affected.
KEYWORDS: Aquaporins; Beta vulgaris; root hydraulic conductivity; salt stress;
soil-plant-atmosphere continuum; stomatal conductance; suberization; water
relations.
by guest on Novem
ber 30, 2015http://aobpla.oxfordjournals.org/
Dow
nloaded from
4
INTRODUCTION
Water flow through plants has been described as a passive mechanism
(diffusion and bulk flow) based on the analogy with Ohm's law (Van der Honert
1948). The movement of water along a hydraulic circuit with resistances (R, m-3
s MPa) to the water flow at the root, shoot and canopy levels is known as the
soil-plant-atmosphere continuum or SPAC (Tardieu and Davies 1993; Suku et
al. 2014). Given a water potential gradient (ΔΨ, MPa), an increase or decrease
in the water flow (Jv, m-3 s-1) will reflect a change in the hydraulic conductance
(Lo¸ m3 s-1 MPa-1) along the plant’s hydraulic circuit. In this model, the daytime
transpiration demand of the aerial part of the plant -modulated by stomatal
conductance (gs, mmol m-2 s-1)- is the main contributor to the driving force that
ensures water entry through the roots (Sack and Holbrook 2006).
Thus, hydraulic integration can be considered to be a trait with important
implications for plant structure and function (Schenk et al. 2008). In the last
decade, considerable attention has been given to discover how root hydraulic
properties impact the overall water uptake. Despite analyzing changes in the
absorbing surface area or modifications in the driving force, a new approach is
provided that considers the intrinsic water uptake properties of the root
(hydraulic conductivity, Lpr) as a key component of the capacity to transport
water per unit surface and per driving force (Steudle and Peterson 1998;
Steudle 2000; Tyree 2003). The discovery of aquaporins has contributed to a
reconsideration of the paradigm of the membrane transport capacity in terms of
water and/or certain solutes or gases (Maurel 1997; Javot and Maurel 2002;
Tyerman et al. 2002; Hachez and Chaumont 2010; Alleva et al. 2012; Chaumont
by guest on Novem
ber 30, 2015http://aobpla.oxfordjournals.org/
Dow
nloaded from

5
and Tyerman 2014). According to the ‘composite transport model’ (Steudle
2000), the magnitude of the osmotic and hydrostatic forces will determine which
path is the primary contributor to water flow: the apoplastic pathway (with low
resistance) and/or the cell-to-cell pathway (i.e. symplastic plus transcellular, with
high resistance) (Steudle and Peterson 1998; Suku et al. 2014). However, it is
not only a question of how limiting the radial water flow could be but also to what
extent these two pathways can be modified to rapidly adjust the Lpr. Recent
findings emphasize that aquaporins might substantially contribute to water
uptake (e.g., barley: Knipfer and Fricke 2011; soybean: Vandeleur et al. 2014).
Evidence for the contribution of the radial water flow has been identified by
applying hydrostatic pressure to the root medium (Boursiac et al. 2005; Hachez
et al. 2012; Vandeleur et al. 2014) or by dissecting the hydrostatic and osmotic
gradients in the entire plant (Fritz et al. 2010; Fricke et al. 2013; Gambetta et al.
2013).
The impact of the radial water flow on the hydraulic circuit could be
analyzed by studying the response of plants in conditions where the hydraulic
driving force limits water absorption. For instance, salt stress is a condition in
which both the excessive Na+ in the soil environment and the water deficit act as
linked factors that severely affects the plant growth rate. High salt concentration
reduces soil water potential and not only makes water absorption harder for the
roots but also introduces toxicity through a gradual accumulation of ions in the
plant tissues (Munns and Tester 2008). Thus, the fine regulation between the
ion redistribution and the water flow pathways is crucial in the tolerance
response. The relevance of membrane pathways involved in ion redistribution -
particularly between Na+ and K+- has been well described (Niu et al. 1995; Peng
by guest on Novem
ber 30, 2015http://aobpla.oxfordjournals.org/
Dow
nloaded from

6
et al. 2004, Karley and White 2009, Shabala et al. 2010, Gajdanowicz et al.
2011). It is still necessary to understand how water pathway resistances (or
conductances) contribute to improve plant salt tolerance.
Beta vulgaris -a member of the Chenopodiaceaea family- is considered a
halotolerant (Clarke et al. 1993) or moderately salt tolerant glycophyte (Bartels
and Sunkar 2005; Bartels and Dinakar 2013). This behavior among beet
subspecies is related to their versatile ability to accomplish a rapid osmotic
adjustment by regulating their ion and water uptake (Daoud et al. 2008). In
these plants, the decrease in the water potential imposed by salinity is
overcome by osmotic regulatory mechanisms, and the plants gain the capacity
to take up water from the saline medium and maintain their turgor. An isolated
enriched fraction of B. vulgaris plasma membrane shows very high water
permeability (Pf= 542 m s-1; Alleva et al. 2006) that favors a highly permeable
cell-to-cell pathway. To date, three B. vulgaris plasma membrane intrinsic
proteins (BvPIP1;1, BvPIP2;1 and BvPIP2;2) have been described (Qi et al.
1995; Barone et al. 1997, 1998) and characterized in a heterologous system
(Bellati et al. 2010; Jozefkowicz et al. 2013). Because the B. vulgaris genome
was very recently announced (Dohm et al. 2014), transcriptome global
sequencing (Mutasa-Göttgens et al. 2012) as well as EST libraries provide
excellent sources for ORF identification for tissue and/or different growth
conditions (http://compbio.dfci.harvard.edu).The latter sources are precise
enough to provide confidence that, to date, the three identified BvPIPs
described in this work remain the consistently abundant and highly expressed
ones (Skorupa-Kłaput et al. 2015).
by guest on Novem
ber 30, 2015http://aobpla.oxfordjournals.org/
Dow
nloaded from

7
In an environmental condition with low water availability in the soil, the
root water pathways can combine anatomical/architectural changes with the
adjustment of aquaporin contribution which might finally be reflected in the Lpr
(Hachez et al. 2006; Maurel et al. 2010; Chaumont and Tyerman 2014). In
particular, plants under salt stress might decrease Lpr by means of different
strategies, including i) the modulation of aquaporin by post-transductional
mechanisms (Boursiac et al. 2005, 2008; Luu et al. 2012) or by transcriptional
changes (Jang et al. 2004; Mahdieh et al. 2008; Muries et al. 2011; Horie et al.
2011; Liu et al. 2012) and ii) changes in the root architectural arrangement
(Galvan-Ampudia and Testerink 2011; Horie et al. 2012) and/or anatomical
changes (Bramley et al. 2009), including suberin deposition (Krishnamurthy et
al. 2011; Sutka et al. 2011). Thus far, the above-mentioned mechanisms
described in (i) are associated with faster and reversible responses (hours -
days), while those described in (ii) are related to long and irreversible
acclimation triggered days after the onset of the stress (Horie et al. 2012; Munns
and Tester 2008).
The aim of this work was to explore how hydraulic adjustments improve
the tolerance response in a halotolerant species by analyzing Lpr and gs
changes. The dynamics of root water adjustment (including water pathways)
was explored under two salt treatments (200 mM NaCl and 200 mM KCl). Na+
was replaced with K+ to provide a source of a different monovalent cation as an
inorganic osmolyte (Rahnama et al. 2010). This experimental design (NaCl vs.
KCl) was introduced because the ion redistribution is different, i.e., Na+ linked to
the apoplast versus K+ linked to the transcelullar pathway (Tester and
Davenport 2003; Shabala and Cuin 2008).These redistributions will impact not
by guest on Novem
ber 30, 2015http://aobpla.oxfordjournals.org/
Dow
nloaded from
8
only the water fluxes but also the water pathways involved. Our working
hypothesis is that changes in resistances (or conductances) should also be
accomplished to rapidly adjust the plant hydraulics. Although ABA and signaling
crosstalk have been extensively addressed in the literature (Finkelstein 2013;
Geng et al. 2013; Mittler and Blumwald 2015), the contribution of our work is to
analyze in detail the hydraulic continuum associated with tolerance by
performing a biophysical study to quantify the water adjustments.
To achieve this goal our experimental design (NaCl versus KCl salt
treatment) included i) exploration of the plant hydraulic dynamics analyzing two
conditions that reflect different root-shoot water status in Beta vulgaris (loss of
turgor and gain of turgor) after being submitted to salt treatments and ii)
exploration of the hydraulic adjustment capacity to recover after the salt
treatment is halted, thus assessing the contribution of the water pathways. We
analyzed physiological parameters linked to the water adjustment capacity at
the whole plant level: water potential, stomatal conductance and root hydraulic
conductivity, together with the amount of BvPIPs aquaporin’s transcripts and
root anatomical modifications. Our hypothesis is that the tolerance of B. vulgaris
to salt stress may be explained in terms of a high capacity to perform hydraulic
adjustments and that this capacity might quantitatively reflect root plasticity that
functions as a rheostat in the SPAC (Maurel et al. 2010).
METHODS
Characterization of a new state for B. vulgaris under salt stress
Plant growth and experimental design. B. vulgaris was grown under
controlled environmental conditions with a 16/8 h light/dark cycle in a 21ºC
conditioned growth chamber (light intensity conditions were 148 ± 10 µmol m-2 s-
by guest on Novem
ber 30, 2015http://aobpla.oxfordjournals.org/
Dow
nloaded from

9
1). Red beet seeds were germinated in plastic containers filled with sterilized
sand and moistened with hydroponic culture: 1.25 mM KNO3, 0.75 mM MgSO4,
1.5 mM Ca(NO3)2, 0.5 mM KH2PO4, 50 μM FeEDTA, 50 μM H3BO3, 12 μM
MnSO4, 0.70 μM CuSO4, 1 μM ZnSO4, 0.24 μM Na2MoO4, and 100 μM Na2SiO3
(Javot et al. 2003). Ten days after germination, the healthy seedlings were
transplanted into aerated hydroponic culture containers. Distilled water was
added on the tenth day to compensate for the losses by evapotranspiration. For
all of the studied parameters, a nutrient solution was complemented or not with
NaCl or KCl (200 mM) at 21 days after planting, i.e. when the first true leaf was
completely mature. The treatments were always started at the beginning of the
light cycle (9:00 AM), which was considered to be time 0 h. The subsequent
harvest time(s), where any parameter was measured and/or samples taken, are
in reference to this initial (t= 0 h) time. All treatments were applied in a
completely randomized design. At least 3-4 independent biological replicates
were used in each experiment. Data are expressed as the mean of three
performed independent experiments. The final salt concentration was selected
by analyzing the plant’s response to different NaCl treatments (50, 100, 250,
500 mM) [see SUPPORTING INFORMATION]. Our strategy was to find a
physiological condition where hydroponically grown plants were able to rapidly
show a clear change in their phenotype (loss of turgor), followed by a gain of
turgor after the onset of salt stress. This phenotype change was remarkable at
200 mM NaCl (Ψmedium= -0.90 MPa).
Relative water content. The first true leaf was collected from different plants at
different time intervals after treatment and employed to determine RWC, as
described by Turner (1981). The turgid weight (TW) was measured on the same
by guest on Novem
ber 30, 2015http://aobpla.oxfordjournals.org/
Dow
nloaded from
10
leaves after immersing them for 24h (until the final weight value was constant) in
distilled water, and the oven-dry weight (DW) was obtained after drying them at
70°C for 24h (until the final weight value was constant).
Transpiration rate. The volume of water transpired per plant was measured
gravimetrically. The plants were grown as follows: one day before the treatment
was applied each plant was moved to an individual plastic container, which was
sealed to prevent evaporation. Every plant was weighed every hour between
9:00 AM and 5:00 PM during four consecutive days. In each plant, the slope of
mass= f(time) was employed to calculate the average mass lost per hour per
leaf area per day for all treatments (6-9 plants). In all cases, we determined the
leaf area only on the 4th day, and this value was used to calculate the
transpiration rate.
Relative growth rate of leaf area. The leaf blades (first true leaf) of the plants
were photographed with a digital camera, and the leaf area was measured with
image analysis software (Image J ver 1.37; http://rsb.info.nih.gov/ij). The relative
growth rate (RGR) was calculated with respect to the ratio of Ai (leaf area in a
given time) and Ao (leaf area at the beginning of experiment) and the results
were expressed as the natural logarithm of the relative leaf area (Ai/Ao) as a
function of time (from t= 0 h -onset of the salt treatment- up to 48 h).The slope of
the curve estimates RGR.
Shoot/root ratio. To analyze the biomass distribution, the shoot/root ratio was
determined from the fresh weight in each experimental condition (Control, 200
mM NaCl, 200 mM KCl at 0, 4, 8, 24, 48 h of the imposed treatment).
Apparent leaf water potential (Ψ’leaf). The leaves of the treated or control
plants were placed in a plastic bag covered with Parafilm® foil prior to
by guest on Novem
ber 30, 2015http://aobpla.oxfordjournals.org/
Dow
nloaded from
11
measurement in a Scholander pressure chamber (Biocontrol Model 4,
Argentina) to determine Ψleaf (Scholander et al. 1965). The measured leaf water
potential in this work is referred to as the apparent leaf water potential (Ψ’leaf)
because in species such as B. vulgaris -which shows halotolerant features- the
osmotic potential of the xylem is not negligible (Boyer 1969; Kaplan and Gale
1974). It is therefore considered as an estimator of the water potential (Turner
1981).
Apparent turgor-pressure component (Ψ’p). The pressure component of the
water potential (Ψ’p) in the leaf was calculated as Ψ’p=Ψ´leaf-Ψosm. In another set
of leaves, we determined the osmotic potential (Ψosm) following a freezing
protocol as previously described (Mahdieh et al. 2008). The osmolality of each
sample was measured in a vapor pressure osmometer (Vapro 5520, Wescor,
USA) [See SUPPORTING INFORMATION].
Linking root hydraulic response to the overall SPAC
Stomatal conductance measurements. Stomatal conductance (gs) was
measured with a steady state porometer (SC-1 Decagon devices, Pullman,
Washington, USA) on the first true leaf in each plant, a completely expanded
mature one. To avoid time consuming measurements, we first demonstrated
that the measurement of one leaf was sufficient per plant; i.e., the gs profile was
similar between leaves in each plant during the day (data not shown).
Lpr measurement. Measurements were performed as previously described
(Javot et al. 2003; Boursiac et al. 2005). In these experiments, the entire root
system of a freshly detopped plant was inserted into a 50-mL tube filled with the
same nutrient solution bathing the intact plant, and the root was then placed
inside the pressure chamber (BioControl, Model 2, Argentina). The hypocotyl
by guest on Novem
ber 30, 2015http://aobpla.oxfordjournals.org/
Dow
nloaded from
12
was carefully connected to a glass capillary tube using a low-viscosity dental
paste (A+ Silicone, Densell) and was then threaded through the metal lid of the
chamber. We determined the exudated flow (Jv) induced by the pressure.
Briefly, the excised roots were subjected to three pressures in a stepwise
manner: 0.3, 0.4, and 0.2 MPa. The exudated flow was constant in all time
periods of measurement (5-10 min in each pressure). After measurements, the
dry weight of the root (DW) was obtained. The hydraulic conductivity of each
individual root system (Lpr; in mL mg-1 h-1 MPa-1) was calculated from the slope
of a plot of flow (Jv) versus pressure divided by the DW of the root system [see
SUPPORTING INFORMATION]. Diurnal effects were discarded measuring both
properties during the day in control plants. The change in treated plants was
statistically significant and independent of the time of the day.
Exploring root adjustments in terms of water pathways
Root anatomy. As described by Sharp et al. (2004) roots were cut in an
equivalent position respect to both root meristem and whole root length to
warranty identical ontogenetic state for all the treatments. Fresh roots were cut
into pieces 10 mm in length and incubated in 0.3% w/v Sudan IV (Sigma
Aldrich) (in ethanol 70%, v/v) for 1 h (Sutka et al. 2011). The root fragments
were then rinsed in distilled water and finely chopped using a razor blade. The
samples were mounted on slides in glycerol and observed with a microscope
(Zeiss Axioskop 2, Japan). We found a better pattern for the Sudan IV red-
stained root with respect to autofluorescence in the free-hand cross sections,
and measurements of Lpr can be made in the same sample without fixing the
material.
by guest on Novem
ber 30, 2015http://aobpla.oxfordjournals.org/
Dow
nloaded from

13
Quantitative real-time PCR (qRT-PCR) for aquaporin gene expression
The roots were carefully and quickly harvested, frozen in liquid nitrogen, and
stored at -70ºC. The total RNA was isolated from 70-80 mg of tissue using
"RNeasyPlantExtraction kit" with "Plant RNA Isolation Aid" (Ambion, Austin, TX,
USA) according to the manufacturer's recommendation, ending the isolation with
a digestion with DNaseI. For each sample, 500 ng of total RNA was converted
into cDNA using oligo (dT) and M-MLV reverse transcriptase (Promega,
Madison, WI, USA) according to the manufacturer's recommendation.
The transcript expression of BvPIP2;1, BvPIP2;2, BvPIP1;1, BvUBIep
and BvGAPDH genes were studied by real-time PCR. The primers were
designed based on published sequences of the aquaporins found in B. vulgaris
[see SUPPORTING INFORMATION]. The selection of BvUBlep and BvGAPDH
as the housekeeping genes was based on genes reported in B. vulgaris and
information available in the literature (Reid et al. 2006; Wan et al. 2010). The
mRNA abundance of BvGAPDH and BvUBIep was not significantly different
between the treatments (data not shown).
Quantitative PCR was performed with a MyiQ cycler (Bio-Rad) in a
reaction volume of 25 µL containing 12.5 µL of IQ Sybr Green Super Mix (Bio-
Rad), 320 nM primers, and 5 µl of a 1/500 dilution of cDNA. The real time qPCR
conditions comprised 1 cycle at 95ºC for 5 min, and 34 cycles at 95ºC for 45 s,
60ºC for 30 s, and 72ºC for 1 min. Amplification data were collected during the
extension step (72ºC). The efficiency of the primer binding was determined by
linear regression by plotting the cycle threshold (CT) value versus the log of the
cDNA dilution (Soto et al. 2010). The absolute RNA amount for each gene was
determined in every quantitative PCR experiment. The relative gene expression
by guest on Novem
ber 30, 2015http://aobpla.oxfordjournals.org/
Dow
nloaded from

14
was calculated as the ratio of the initial gene quantity to the initial mean quantity
of the housekeeping genes (Soto et al. 2011). qPCR experiments were
independently performed three times with comparable results. The three PCR
reactions were carried out in duplicate. The transcript levels of the three studied
aquaporins under salt treatments were compared to an osmotic treatment
imposed by a non-charge and non-permeable solute (PEG6000) at a
concentration of 23% (p/v), which induces a Ψmedium of -0.90 MPa. The purpose
was to contrast aquaporin transcripts between ion signals (NaCl and KCl)
versus non-charged non-permeable osmolyte (data not shown).
Restoring salt treated plants to control medium: Lpr and gs recovery profile
To measure the Lpr and gs recovery profiles, the plants were first
submitted to a salt treatment (200 mM NaCl or KCl) for 4 h or 24 h and then
transferred to a control solution (considered now t=0 h). Lpr and gs were then
measured at different time intervals (0, 1 and 24 h) to characterize the plant’s
capacity to restore Lpr and gs when the salt treatment was halted. As a control,
we first determined the Lpr values immediately after changing the detopped roots
to a control medium. This protocol was crucial to discard the flows that could be
artifacts due to injury exacerbated with the salinity treatment. Lpr values in
control medium were not significantly different from those measured in the
saline treatment [See SUPPORTING INFORMATION]. All values shown are the
average of three independent experiments. In each experiment, gs was
measured in one leaf per plant in three different plants and two or three roots
were detopped for measuring Lpr under each condition.
by guest on Novem
ber 30, 2015http://aobpla.oxfordjournals.org/
Dow
nloaded from

15
Statistical analysis
Statistical analysis was performed using software GraphPad Prism 5.00
for Windows, GraphPad Software, San Diego California USA,
www.graphpad.com. Differences were accepted as significant with at least
P<0.05 employing ANOVA and Bonferroni tests as indicated in the figure
legends.
RESULTS
Characterization of a new state for B. vulgaris under salt stress
Salt stress was achieved by the addition of 200 mM NaCl (Ψmedium= -0.90
MPa). Under this condition, plants were able to rapidly show a clear change in
their phenotype (loss of turgor) followed by a gain in turgor in less than 24 hours
(Fig. 1). The phenotype observed in plants exposed to 200 mM KCl was
indistinguishable from the NaCl treatment (Fig. 1A), and no chlorosis symptoms
were observed in the leaf. As expected, the tolerant phenotype shows a
reduction in transpiration rate and in the leaf relative growth rate in both salt
treatments, although growth was not arrested [see SUPPORTING
INFORMATION]. Moreover, during the whole experiment, the shoot/root ratio
was not significantly modified, so the growth rate changes in the leaf were also
translated to the root growth rate (Fig. 1B).
The water status of the hydroponically grown B. vulgaris plants was
characterized. The relative water content (RWC) was reduced according to the
phenotype observed (Fig. 1C). The apparent leaf water potential (Ψ´leaf) was
analyzed at different time intervals (0; 4; 8; 24 and 48 h) for the control and
treated plants. The mean Ψ´leaf in the control plants was -0.17 ± 0.02 MPa and
remained constant during the whole experiment (Fig. 1D). When Ψ´leaf was
by guest on Novem
ber 30, 2015http://aobpla.oxfordjournals.org/
Dow
nloaded from

16
measured after 4 h of the onset of the stress treatment, its mean value was
significantly reduced in the NaCl condition (-0.20 ± 0.03 to -0.74 ± 0.01 MPa)
and in the KCl condition (-0.19 ± 0.02 to -0.79 ± 0.01 MPa). The initial drop in
Ψ´leaf is well correlated with plant turgor loss in both salt treatments (Fig. 1A).
The Ψ´leaf remained at these low values up to 48 h although the turgid
phenotype changed (Fig. 1). The leaf osmotic potential (Ψosm) remained
constant in the control plants and showed a reduction in the plants submitted to
stress after 24 h [see SUPPORTING INFORMATION]. The patterns of Ψp vs
time were well correlated with the observed phenotype of loss and gain in turgor
(Fig. 1A, E).
All of these parameters allowed us to define two distinguishable time
intervals in terms of water adjustment during salt stress response, 4 h, where
there is loss of turgor and 24 h, where there is gain of turgor. Our next step was
to analyze these two conditions in terms of overall hydraulic adjustments.
Linking root hydraulic response to the overall SPAC
As expected, the salt added to the medium triggered a rapid decrease in
gs, which remained low even up to 24 h (Fig. 2A). In the control conditions, the
plants showed mean Lpr values of 72.3 ± 21.1 mL g-1 h-1 MPa-1 (Fig. 2B). Both
salt treatments induced a rapid and indistinguishable decrease in Lpr. The Lpr
inhibition was 80% compared to the control condition after 4 h of treatment, and
this low Lpr value was maintained up to 24 h of treatment. The gs modifications
are similar to the profile shown by Lpr, suggesting that the change in the root
water flow is coupled to gs.
by guest on Novem
ber 30, 2015http://aobpla.oxfordjournals.org/
Dow
nloaded from

17
Exploring root adjustments in terms of water pathways
The anatomical changes and the presence of aquaporins provide some
insight into the putative involvement of the different water pathways at the root
level for the two selected time intervals (4h and 24h of treatment in 200 mM
NaCl or 200 mM KCl). We therefore incubated root sections in the presence of
Sudan IV in order to check suberization (Fig. 3). The plant roots challenged by
either NaCl or KCl for a period of 4 h showed undetectable suberization
changes of the endodermis and/or exodermis, as in the control plants. For
longer exposures (24 h), the suberization of the endodermis increased
independently of the ion treatment (Fig. 3E, F), whereas the control roots do not
present enhanced intensity for Sudan IV. Similar results were observed when
the autofluorescence of the cell wall was analyzed (data not shown). These
clear changes observed in the endodermis suberization were not observed in
the exodermis. The exodermis suberization was very low and random, mostly
attributable to higher thickness in the fresh cuts (Fig. 3A).
Quantitative RT-PCR analysis was performed to accurately determine the
transcript levels of the PIP genes BvPIP2;1, BvPIP2;2 and BvPIP1;1 in whole
roots under salt stress (NaCl or KCl, Fig. 4) at different time intervals. BvPIP2;1
might have a circadian behavior as described in other PIPs (Takase et al. 2011;
Caldeira et al. 2014).The studied aquaporins showed a subtle down-regulation
profile, except the relative expression level of BvPIP2;1, which did not decrease
at all, independently of the treatment (Fig. 4A, see [SUPPORTING
INFORMATION] for the statistical analyses). Interestingly, the profile of the
BvPIP2;2 and BvPIP1;1 expressions for the NaCl stress condition did not show
down-regulation at the same pace as observed in the KCl stress (Fig. 4B, C).
by guest on Novem
ber 30, 2015http://aobpla.oxfordjournals.org/
Dow
nloaded from
18
The differences of the ion treatments became more evident for BvPIP1;1, which
showed down-regulation at 24 h when the plants were exposed to KCl, while the
decrease became significant at 48h under NaCl stress (Fig. 4C and see
[SUPPORTING INFORMATION] for the statistical analyses).
To determine whether the lack of a strong down regulation of these three
aquaporins is only observed under salt treatment, the salt was replaced by a
non-permeable and non-charged molecule as PEG. The plants submitted to
Ψmedium = -0.90 MPa generated with PEG triggered a expression decrease of 56-
67 % in these aquaporins after 4 h of treatment, a strong transcript down-
regulation compared with both salt treatment (NaCl vs PEG P<0.001, KCl vs.
PEG P<0.05, Bonferroni post- test).
Restoring salt treated plants to control medium: Lpr and gs recovery
Our results confirm that the root water pathways are different in the two
selected intervals (4 h and 24 h) and that the three studied aquaporins are
relatively stable upon salt treatments and only strongly down-regulated when a
non-charge solute is imposed. However, the results do not allow us to
completely dissociate the water pathways and ion redistribution (NaCl versus
KCl). We decided to explore if halting the salt treatment allow us to describe the
shoot-root water dynamics through the analysis of gs and Lpr recovery.
As shown in Fig. 5, the gs recovery profile of the plants returned to the
control medium reflected dependence of the time of the preceding salt-treatment
and dependence of the ion involved in the salt-treatment. Thus, gs recovered
faster in the 4 h-salt-treated plants than in the 24 h-salt-treated plants (Fig. 5A,
B). The 4h-salt-treated plants restored to the control solution for one hour were
able to increase gs50% with respect to the gs values before halting the
by guest on Novem
ber 30, 2015http://aobpla.oxfordjournals.org/
Dow
nloaded from

19
treatment (Fig. 5A). In this analyzed point (4h of salt-treatment before the
halting), the recovery trend is independent of the involved cation (NaCl versus
KCl; F(1,22)=3.06; P:0.0940 two-ways ANOVA). The plants subjected for 24 h to
NaCl or KCl differed in their kinetic to increase gs when they were restored to the
control medium. In this condition (24h of salt-treatment) the ion involved in the
salt stress significantly affects the recovery profile of gs (ion accounts for 13.25%
of total variance, F(1,16)=12.99, P=0.0024, two-ways ANOVA). Even though gs
reached the same final value after 24h of recovery in control solution, the
recovery trend of gs is much faster in NaCl-treated plants than in KCl-treated
plants (Fig. 5B).
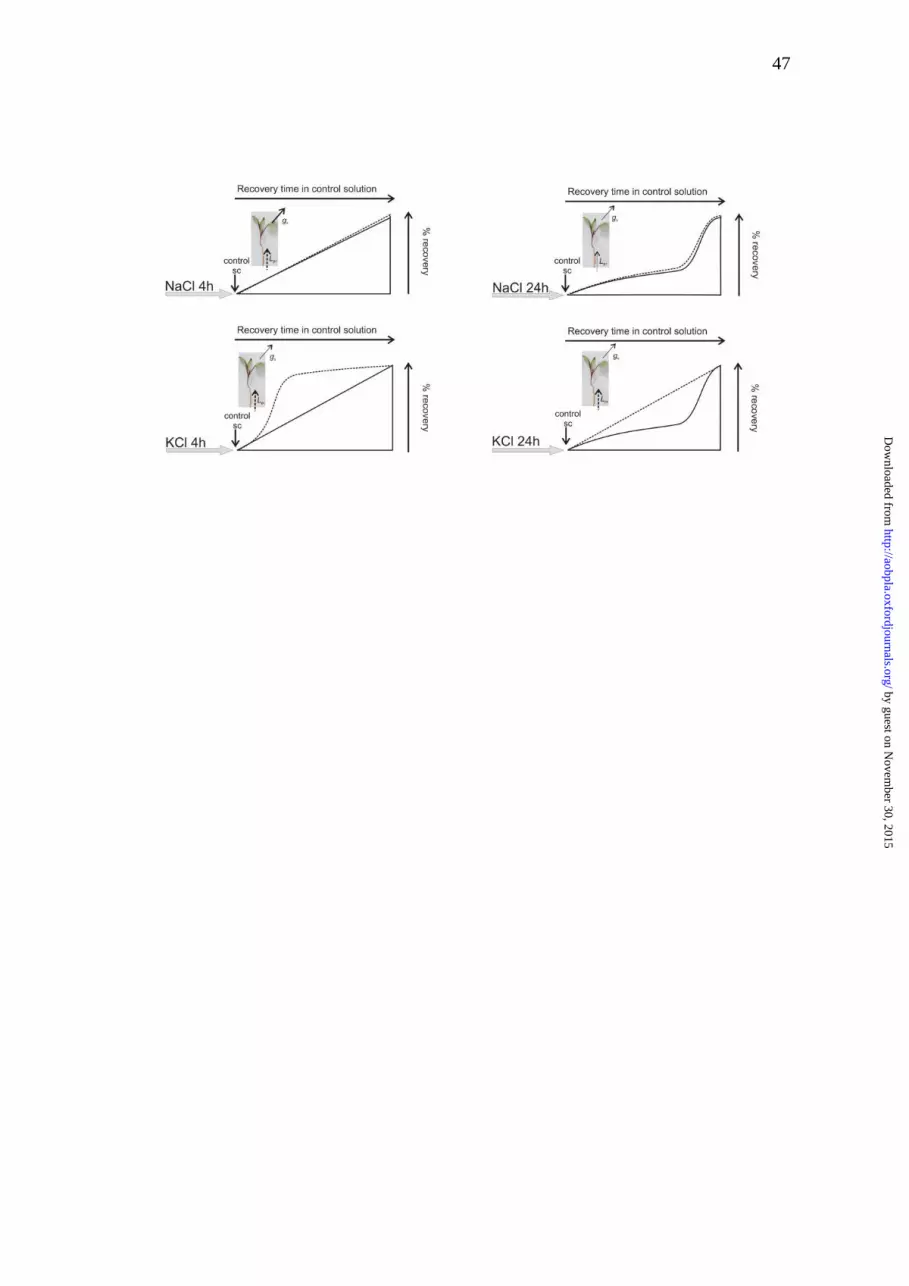
Conversely, the Lpr recovery profile of the plants restored to the control
medium reflected a completely different strategy in terms of time dependence
and ion dependence with respect to gs. Moreover, the recovery patterns of both
hydraulic parameters (gs and Lpr) seem to be uncoupled although both
presented a coupled reduction in salt treatment (Fig. 5, 6). In the first analyzed
condition (4h of salt-treatment) the recovery trend of Lpr is significantly affected
by the ion involved before halting stress (Fig. 5C, F(1,17)=8.62 P=0.0092). The
4h-KCl-treated plants turned into control solution showed a quick Lpr increment
that remained unchanged for 24h. In 4h-NaCl-treated plants Lpr gradually rose to
higher values (* P<0.001; Bonferroni test). For the 24h-treated plants, the trend
of Lpr increment was independent of the salt-treatment (F(1,16)=0.58, P=0.4588,
Fig. 5D). In the case of the NaCl treated plants, Lpr recovery was affected by the
extension of treatment (4 h versus 24 h; Fig. 5C,D).The 4h-salt-treated plants
presented a significantly higher Lpr value (P<0.05; Bonferroni test)after 24 h of
restoring the plants to the control solution. On the contrary, in the case of the
by guest on Novem
ber 30, 2015http://aobpla.oxfordjournals.org/
Dow
nloaded from
20
KCl-treated plants the Lpr recovery profile is independent of the extension of the
treatment, i.e. 4 h or 24 h (Fig. 5C, D). The 4-h-treated and 24-h-treated plants
presented a similar Lpr value after 1 h of restoring the plants to the control
solution, which was significantly different from the Lpr value observed under salt
stress. Fig. 6 illustrates gs and Lpr recovery profile observed for the four
conditions (NaCl or KCl; and/or the selected time points, 4h and 24h).
DISCUSSION
Water homeostasis is linked to ion redistribution in plants as an important
defense strategy against salt stress (Tester and Davenport 2003; Shabala and
Cuin 2008; Shabala 2013; Flowers and Colmer 2015). B. vulgaris showed great
plasticity reflecting its ability to rapidly gain turgor due to osmotic adjustment,
consistent with the maintenance of a low Ψ´leaf during the entire treatment (Fig.
1). Under our experimental conditions, low RWC values -even for plants gaining
turgor after 24 h of salt treatment- might be associated with an underestimation
of the relative water content as a result of an osmotic adjustment [See
SUPPORTING INFORMATION].The gain of turgor under salt treatment requires
solute synthesis and/or recirculation of cations and this should also be reflected
in the obtained RWC values (Weatherley 1950; Boyer 2008).The aerial parts
only modified 1% of the water content (data not shown), even in the phenotype
that lost turgor (4 h of salt-treatment; Fig. 1), a trait consistent with an isohydric-
like behavior (Sade et al. 2014). Thus, the overall strategy is successful for the
adjustment of the water content. These data are supported by other studies
performed using members of the Chenopodiaceae family under salt stress
(Lindhauer et al. 1990; Ghoulam et al. 2002; Pakniyat and Armion 2007; Abbas
et al. 2012) where osmotic potential is the key element in turgor recovery. In our
by guest on Novem
ber 30, 2015http://aobpla.oxfordjournals.org/
Dow
nloaded from

21
experimental design, the analyses were performed at 4 h (loss of turgor) and 24
h (gain of turgor) of salt-treatment because these are two distinguishable
transition states before a new water plant status is achieved.
The transpiration rate and Lpr have not always been reported as a
coupled process. For instances, changes in shoot transpiration are not reflected
by changes in Lpr in Lotus japonicus (Henzler et al. 1999) while in wheat it was
reported an important correlation between increasing Lpr, the cortex cell
hydraulic conductivity, transpiration and the root expression of aquaporins -
TaPIP1;2 and TaPIP2;5- (Wang et al. 2013). Our results clearly showed that
under salt treatment there is a correlated decrease in stomatal conductance (gs)
and root hydraulic properties (Lpr) (Fig. 2), as both parameters presented an
80% reduction compared to the control condition. The decrease in gs (Fig. 2A)
remained low even up to 24 h, which is consistent with the decrease in the leaf
water potential values (Fig. 1D). This occurs for both NaCl and KCl treatments
and is in agreement with observations performed in other species, such as
wheat, that similarly decreased their stomatal conductance when exposed to
either NaCl or KCl (Rahanama et al. 2010). The transition of the phenotypes -
loss (4h) and gain (24h) of turgor- is not reflected in the two key water balance
modulators (Lpr and gs) that remained coupled and similarly low. The hydraulic
parameters only reflect a centered strategy of water loss avoidance.
Thus, it is necessary to explore how the root copes with water loss not
only in terms of hydraulic properties but also in the analysis of the water
pathways. The Lpr decrease (Fig. 2B) in our experimental set-up was consistent
with other observations for different species (Martínez Ballesta et al. 2003;
Boursiac et al. 2005; Postaire et al. 2010; Muries et al. 2011). The roots showed
by guest on Novem
ber 30, 2015http://aobpla.oxfordjournals.org/
Dow
nloaded from

22
a marked ability to adjust their hydraulic conductivity (Lpr) during the first 4h of
treatment (our first hydraulic transition point) even before plants display any
anatomical or morphological change (Fig. 3). It is consistent with faster
responses that are usually present in the initial time lapse response to tolerance
(Horie 2012). In both 4h salt-treatments (NaCl and KCl), the suberization is
indistinguishable from the control plants. The root apoplastic pathways were not
modified, so the cell-to-cell pathway could be limiting (or maximizing) root
resistance to the water flows both in favor of (or restricting) water entry and/or
exit. Thus, membrane permeability not only to ions but also to water can
contribute to plasticity together with the change in xylem tension as a
consequence of the decrease in leaf water potential.
In our second hydraulic transition point (24 h treatment), the low Lpr
values involved also an anatomical restriction enhancing the hydraulic
resistance to water flows along the roots, suggesting an increment in the water
flows through the cell-to-cell pathways (a more resistive pathway).The increase
in suberization observed after 24 h-treatment can be attributed to a completely
different strategy. This is consistent with recent reports demonstrating that the
cell-to-cell pathway might contribute significantly to the radial water uptake
particularly during development (Knipfer and Fricke 2010; Knipfer et al. 2011;
Gambetta et al. 2012, 2013; Caldeira et al. 2014; Suku et al. 2014). In wheat
plants, a non-membranous pathway (apoplast) contributes to increase radial
water uptake in the control but not in the NaCl-stressed plants (Fricke et al.
2013).
It is possible that the effectiveness of B. vulgaris to tolerate the saline
stress could be associated with its capacity to maintain the expression level of
by guest on Novem
ber 30, 2015http://aobpla.oxfordjournals.org/
Dow
nloaded from

23
the AQPs in the salt treatments (Fig. 4), as reported for other specific proteins
strictly involved in salt tolerance (Chinnusamy et al. 2004, 2006). This statement
cannot be made with certainty because aquaporin activity and protein
expression were not tested here. The root strategy to maintain water flow is
based on water and ion redistribution and adjusting the cell-to-cell pathway by
means of its selected membrane permeability (Steudle 2000). A solely osmotic
stress (PEG solute) shuts down the transcripts of the BvPIP characterized in
less than 4h of treatment, which might contribute by increasing the root cell
resistance to the water pathway. On the contrary, the cell-to-cell pathway in salt-
treated B. vulgaris plants might contribute by increasing the capability to
regulate water transfers because water permeability can be tuned to limiting (or
maximizing) the resistance in concert with ion redistribution.
We could experimentally dissociate Lpr from gs employing two strategies:
i) different cations -Na+ versus K+- to promote the stress and ii) analyzing Lpr
enhancement when the salt treatment is interrupted (Fig. 5). Most of the studies
in the literature are based on the analysis of Lpr decrease by means of an
imposed stress condition or the presence of aquaporin inhibitors (e.g. Ehlert et
al. 2009; Vandeleur et al. 2009). To our knowledge, this is the first work that
explored altogether Lpr decrease and enhancement, as most of the works show
Lpr inhibition and not its recovery. Whereas K+ and Na+ have distinct
redistribution profiles, different Lpr recovery pathways for water are expected to
be involved even in the presence of an equivalent change in the driving force
along the SPAC for both situations. After stress treatments, the recovery of both
hydraulic parameters (Lpr and gs) denoted two different strategies (Fig. 6). The
enhancement in Lpr shows a profile (Fig. 5C and Fig. 6) that is linked to ion
by guest on Novem
ber 30, 2015http://aobpla.oxfordjournals.org/
Dow
nloaded from

24
redistribution (Na+ versus K+) and this is part of the root plasticity to prevent
water loss. In the first transition point (4h of salt-treatment) the cation
dependence of the Lpr profile highlights the participation of membrane
permeability in root plasticity together with the change in xylem tension. On the
other hand, Lpr recovery profiles observed after 24h of salt-treatment suggest
that under our experimental conditions root resistance to water flow does not
differ between the ion source of the stress (Na+ or K+). This is consistent with an
increase in the total root resistance and the observed strong endodermis
suberization in both salt-treatments (Fig. 3E, F). The recovery profile of NaCl
treatments shows a coupled temporal dependence strategy where gs and Lpr
increase at the same rate. Both parameters increase at a slower pace when the
plants were treated for 24 h compared to 4h. Conversely, gs and Lpr
enhancement are clearly uncoupled in the KCl-treatments (Fig. 6). The root
shows the capacity to restore the water transport capacity before the water is
transpired through stomata. It is well described in the literature that under salt
stress, Na+ is redistributed to avoid toxicity, while K+ functions as an
interchangeable ion all along the vasculature (particularly phloem) (Peng et al.
2004; Munns and Tester 2008; Karley and White 2009; Shabala et al. 2010;
Flowers and Colmer 2015). In this context, the potassium gradient might be
crucial in the root-shoot hydraulic signaling (Gajdanowicz et al. 2011). The
profiles observed in Fig. 6 are consistent with sustaining a “hydraulic”
adjustment in the presence of NaCl compared to a “tuned” adjustment caused
by the redistribution in the case of KCl, which is clearly reflected in gs and Lpr
different changes.
by guest on Novem
ber 30, 2015http://aobpla.oxfordjournals.org/
Dow
nloaded from

25
The proposed initial two set points -4 h and 24 h extension in the imposed salt
treatment- were selected because of the triggered distinguishable phenotypes in
B. vulgaris. At 4h of an imposed 200 mM salt-stress plants have lost turgor and
osmotic adjustment has not been completed. In this situation the Lpr recovery
profile suggest a much higher root tuning-capacity to modulate the water
dynamics that impacts the whole plant water loss avoidance strategy. At 24 h of
200 mM salt-stress plants are gaining turgor and the Lpr recovery profile suggest
the root versatility is more restricted as tolerance has already been triggered.
CONCLUSIONS
Tolerance involves limiting water movement by increasing the total plant
hydraulic resistance. B. vulgaris osmotic adjustment is sustained by tuning Lpr
and gs. Our work presents a quantitative analysis of the coordinated link
between Lpr and gs when the ion and water redistribution strategy takes place.
Even when the xylem tension and apoplast pathway mediate plant water flows,
the cell-to-cell pathway contributes as a key component to the capacity to
transport water per unit surface and driving force in the SPAC (nicely
demonstrated in the enhacement of Lpr after halting KCl-treatment). Future
research should explore the molecular basis for the different strategies that
plants use to regulate their water balance and identify the imposed threshold of
the cell-to-cell pathways in terms of hydraulic resistance.
SUPPORTING INFORMATION
The following [SUPPORTING INFORMATION] is available in the online version
of this article:
by guest on Novem
ber 30, 2015http://aobpla.oxfordjournals.org/
Dow
nloaded from

26
File 1. Photos. Different concentration of salt-treatments.
File 2. Table S1. Osmotic potential measured for the leaf sap.
File 3. Graph S1. Lpr determination.
File 4. Table S2. Accession number of genes and sequences of primers pairs
used for qRT-PCR.
File 5. Graph S2. Lpr determination after halting salt-treatment.
File 6. Graph S3. Plant transpiration rate and relative growth rate of leaf area.
File 7. Table S3-S5. qRT-PCR statistical analysis.
SOURCES OF FUNDING
This work was supported by the Agencia Nacional para la Promoción
Científica y Técnica [Préstamo BID PICT11-2239 and PICT14-0744]; Consejo
de Investigaciones Científicas y Técnicas (CONICET) Proyecto de Investigación
Plurianual (PIP12-14) and Universidad de Buenos Aires UBACyT14-17, all
grants to G.A.
CONTRIBUTIONS BY AUTHORS
V.V., J.B. and G.A. were involved in the study conception and design, V.V. and
J.B. planned and performed experiments and analysed data. J.B., G.S. and N.A.
additionally participated in the design and data acquisition of the qRT-PCR
experiments. V.V and G.A. were involved in the analysis and interpretation of
the data, discussion and writing the manuscript. All authors had intellectual input
into the project.
CONFLICTS OF INTEREST
No conflicts of interest.
by guest on Novem
ber 30, 2015http://aobpla.oxfordjournals.org/
Dow
nloaded from

27
ACKNOWLEDGEMENTS
We thank Milena Manzur, Moira Sutka, Agustín Yaneff, Esteban Tubert, Karina
Alleva and Cintia Jozefkowicz for critical comments in the ms. We also would
like to thank the anonymous reviewers and all the editors for their helpful
comments and suggestions on this paper.
LITERATURE CITED
Abbas F, Mohanna A, Al-Lahham Gh, Al-Jbawi E. 2012. Osmotic adjustment in
sugar beet plant under salinity stress. Journal of Sugar Beet 28:37-43.
Alleva K, Chara O, Amodeo G. 2012. Aquaporins: another piece in the osmotic
puzzle. FEBS Letters 586:2991-2999.
Alleva K, Niemietz CM, Sutka M, Maurel C, Parisi M, Tyerman SD, Amodeo G.
2006. Plasma membrane of Beta vulgaris storage root shows high water
channel activity regulated by cytoplasmic pH and a dual range of calcium
concentrations. Journal of Experimental Botany 57:609-21.
Barone LM, Mu HH, Shih CJ, Kashlan KB, Wasserman BP. 1998. Distinct
biochemical and topological properties of the 31- and 27- kilodalton plasma
membrane intrinsic protein subgroups from red beet. Plant Physiology 118:315-
22.
Barone LM, Shih C, Wasserman BP. 1997. Mercury-induced conformational
changes and identification of conserved surface loops in plasma membrane
aquaporins from higher plants. Topology of PMIP31 from Beta vulgaris L.
Journal of Biological Chemistry 272:30672-77.
Bartels D, Sunkar R. 2005. Drought and salt tolerance in plants.CRC Critical
Reviews in Plant Science 24:23-58.
by guest on Novem
ber 30, 2015http://aobpla.oxfordjournals.org/
Dow
nloaded from
28
Bartels D, Dinakar C. 2013. Balancing salinity stress responses in halophytes
and non-halophytes: a comparison between Thellungiella and Arabidopsis
thaliana. Functional Plant Biology 40:819-31.
Bellati J, Alleva K, Soto G, Vitali V, Jozefkowicz C, Amodeo G. 2010.
Intracellular pH sensing is altered by plasma membrane PIP aquaporin co-
expression. Plant Molecular Biology 74:105-18.
Boursiac Y, Boudet J, Postaire O, Luu DT, Tournaire-Roux C, Maurel C. 2008.
Stimulus-induced downregulation of root water transport involves reactive
oxygen species-activated cell signalling and plasma membrane intrinsic protein
internalization. Plant Journal 56:207-18.
Boursiac Y, Chen S, Luu DT, Sorieul M, van den Dries N, Maurel C. 2005. Early
effects of salinity on water transport in Arabidopsis roots. Molecular and cellular
features of aquaporin expression. Plant Physiology 139:790-805.
Boyer JS. 1969. Free-energy transfer in plants. Science 163:1219-20.
Boyer JS, James RA, Munns R, Condon AG, Passioura JB. 2008. Osmotic
adjustment leads to anomalously low estimates of relative water content in
wheat and barley. Functional Plant Biology 35:1172-1182.
Bramley H, Turner NC, Turner DW, Tyerman SD. 2009. Roles of morphology,
anatomy, and aquaporins in determining contrasting hydraulic behavior of roots.
Plant Physiology 150:348-64.
Caldeira CF, Bosio M, Parent B, Jeanguenin L, Chaumont F, Tardieu F. 2014. A
hydraulic model is compatible with rapid changes in leaf elongation under
fluctuating evaporative demand and soil water status. Plant Physiology
164:1718-30.
by guest on Novem
ber 30, 2015http://aobpla.oxfordjournals.org/
Dow
nloaded from

29
Chaumont F, Tyerman SD. 2014. Aquaporins: highly regulated channels
controlling plant water relations. Plant Physiology 164:1600-18.
Chinnusamy V, Schumaker K, Zhu JK. 2004. Molecular genetic perspectives on
cross-talk and specificity in abiotic stress signaling in plants. Journal of
Experimental Botany 55:225-36.
Chinnusamy V, Zhu J, Zhu JK. 2006. Salt stress signaling and mechanisms of
plant salt tolerance. Genetic Engeneering (NY) 27:141-77.
Clarke NA, Hetschkun H, Jones C, Boswell E, Marfaing H. 1993. Identification of
stress tolerance traits in sugar beet. In: Jackson MB, Black CR (eds) Interaction
stresses on plants in a changing climate. Springer Verlag, Berlin, 511-29.
Daoud S, Harrouni C, Huchzermeyer B, Koyro HW. 2008. Comparison of salinity
tolerance of two related subspecies of Beta vulgaris: the sea beet (Beta vulgaris
ssp. maritima) and the sugar beet (Beta vulgaris ssp. vulgaris). In Biosaline
Agriculture and High Salinity Tolerance.Edited by Abdelly, Öztürk, Ashraf and
Grignon. Birkhäuser Publisher, Basel, Part Section I, 115-29.
Dohm JC, Minoche AE, Holtgräwe D, et al. 2014.The genome of the recently
domesticated crop plant sugar beet (Beta vulgaris). Nature. 505:546-9.
Ehlert C, Maurel C, Tardieu F, Simonneau T. 2009. Aquaporin-mediated
reduction in maize root hydraulic conductivity impacts cell turgor and leaf
elongation even without changing transpiration. Plant Physiology 150:1093-104.
Finkelstein R. 2013. Abscisic acid synthesis and response.The Arabidopsis
Book. American Society of Plant Biologists,11:e0166 doi: 10.1199/tab.0166.
Flowers TJ, Colmer TD. 2015. Plant salt tolerance: adaptations in
halophytes.Annals of Botany 115:327-31.
by guest on Novem
ber 30, 2015http://aobpla.oxfordjournals.org/
Dow
nloaded from

30
Fricke W, Bijanzadeh E, Emam Y, Knipfer T. 2013. Root hydraulics in salt-
stressed wheat. Functional Plant Biology 41:366-78.
Fritz M, Lorenzen S, Popova M, Ehwald R. 2010. Transient and permanent
changes of xylem sap exudation by root systems of Zea mays after application
of hydrostatic and osmotic forces. Functional Plant Biology 37: 813–27.
Gajdanowicz P, Michard E, Sandmann M, et al. 2011. Potassium (K+) gradients
serve as a mobile energy source in plant vascular tissues. Procceding of the
National Academy of Science 108:864-69.
Galvan-Ampudia CS, Testerink C. 2011. Salt stress signals shape the plant root.
Current Opinion in Plant Biology 14:296-302.
Gambetta GA, Fei J, Rost TL, Knipfer T, Matthews MA, Shackel KA, Walker MA,
McElrone AJ. 2013. Water uptake along the length of grapevine fine roots:
developmental anatomy, tissue-specific aquaporin expression, and pathways of
water transport. Plant Physiology 163:1254-65.
Gambetta GA, Manuck CM, Drucker ST, Shaghasi T, Fort K, Matthews MA,
Walker MA, McElrone AJ. 2012. The relationship between root hydraulics and
scion vigour across Vitis rootstocks: what role do root aquaporins play? Journal
of Experimental Botany 63:6445-55.
Geng Y, Wu R, Wee CW, et al. 2013. A spatio-temporal understanding of
growth regulation during the salt stress response in Arabidopsis. The Plant Cell
25:2132-2154.
Ghoulam C, Foursy A, Fares K. 2002. Effects of salt stress on growth, inorganic
ions and proline accumulation in relation to osmotic adjustment in five sugar
beet cultivars. Environmental and Experimental Botany 47:39-50.
by guest on Novem
ber 30, 2015http://aobpla.oxfordjournals.org/
Dow
nloaded from

31
Hachez C, Chaumont F. 2010. Aquaporins: a family of highly regulated
multifunctional channels. Advances in Experimental Medicine and Biology
679:1-17.
Hachez C, Veselov D, Ye Q, Reinhardt H, Knipfer T, Fricke W, Chaumont F.
2012. Short-term control of maize cell and root water permeability through
plasma membrane aquaporin isoforms. Plant and Cell Environment 35:185-98.
Hachez C, Zelazny E, Chaumont F. 2006. Modulating the expression of
aquaporin genes in planta: A key to understand their physiological functions?
Biochimica and Biophysical Acta 1758:1142-56.
Henzler T, Waterhouse RN, Smyth AJ, Carvajal M, Cooke DT, Schäffner AR,
Steudle E, Clarkson DT. 1999. Diurnal variations in hydraulic conductivity and
root pressure can be correlated with the expression of putative aquaporins in the
roots of Lotus japonicus. Planta 210:50–60.
Horie T, Kaneko T, Sugimoto G, Sasano S, Panda SK, Shibasaka M, Katsuhara
M. 2011. Mechanisms of water transport mediated by PIP aquaporins and their
regulation via phosphorylation events under salinity stress in barley roots. Plant
Cell and Physiology 52:663-75.
Horie T, Karahara I, Katsuhara M. 2012. Salinity tolerance mechanisms in
glycophytes: An overview with the central focus on rice plants. Rice 5:11.
Jang JY, Kim DG, Kim YO, Kim JS, Kang H. 2004. An expression analysis of a
gene family encoding plasma membrane aquaporins in response to abiotic
stresses in Arabidopsis thaliana. Plant Molecular Biology 54:713-25.
Javot H, Lauvergeat V, Santoni V, et al. 2003. Role of a single aquaporin
isoform in root water uptake. Plant Cell 15:509-22.
by guest on Novem
ber 30, 2015http://aobpla.oxfordjournals.org/
Dow
nloaded from

32
Javot H, Maurel C. 2002. The role of aquaporins in root water uptake. Annals of
Botany 90:301-13.
Jozefkowicz C, Rosi P, Sigaut L, Soto G, Pietrasanta LI, Amodeo G, Alleva K.
2013. Loop A is critical for the functional interaction of two Beta vulgaris PIP
aquaporins. PLoS One 8: e57993.doi: 10.1371/journal.pone.0057993.
Kaplan A, Gale J. 1974. Modification of the pressure-bomb technique for
measurement of osmotic potential in halophytes. Journal of Experimental
Botany 25:663-68.
Karley AJ, White PJ. 2009. Moving cationic minerals to edible tissues:
potassium, magnesium, calcium. Current Opinion in Plant Biology 12:291-8.
Knipfer T, Besse M, Verdeil JL, Fricke W. 2011. Aquaporin-facilitated water
uptake in barley (Hordeum vulgare L.) roots. Journal of Experimental Botany
62:4115-26.
Knipfer T, Fricke W. 2010. Root pressure and a solute reflection coefficient
close to unity exclude a purely apoplastic pathway of radial water transport in
barley (Hordeum vulgare). New Phytology 187:159-170.
Knipfer T, Fricke W. 2011. Water uptake by seminal and adventitious roots in
relation to whole-plant water flow in barley (Hordeum vulgare L.). Journal of
Experimental Botany 62:717-33.
Krishnamurthy P, Ranathunge K, Nayak S, Schreiber L, and Mathew MK. 2011.
Root apoplastic barriers block Na+ transport to shoots in Rice (Oryza sativa L.)
Journal of Experimental Botany 62:4215-28.
Lindhauer MG, Haeder HE, Beringer. 1990. Osmotic potentials and solute
concentrations in sugar beet plants cultivated with varying potassium/sodium
ratios. Journal of Plant Nutrition and soil Science 153:25–32.
by guest on Novem
ber 30, 2015http://aobpla.oxfordjournals.org/
Dow
nloaded from

33
Liu C, Li C, Liang D, Wei Z, Zhou S, Wang R, Ma F. 2012. Differential
expression of ion transporters and aquaporins in leaves may contribute to
different salt tolerance in Malus species. Plant Physiology and Biochemistry
58:159-65.
Luu DT, Martinière A, Sorieul M, Runions J, Maurel C. 2012. Fluorescence
recovery after photobleaching reveals high cycling dynamics of plasma
membrane aquaporins in Arabidopsis roots under salt stress. Plant Journal
69:894-905.
Mahdieh M, Mostajeran A, Horie T, Katsuhara M. 2008. Drought stress alters
water relations and expression of PIP-type aquaporin genes in Nicotiana
tabacum plants. Plant and Cell Physiology 49:801-13.
Martínez Ballesta MC, Aparicio F, Pallas V, Martínez V, Carvajal M.
2003.Influence of saline stress on root hydraulic conductance and PIP
expression in Arabidopsis. Journal of Plant Physiology 160:689-97.
Maurel C. 1997. Aquaporins and water permeability of plant membranes. Annual
Review of Plant Physiology and Plant Molecular Biology 48:399-429.
Maurel C, Simonneau T, Sutka M. 2010. The significance of roots as hydraulic
rheostats. Journal of Experimental Botany 61:3191-98.
Mittler R, Blumwald E. 2015. The roles of ROS and ABA in systemic acquired
acclimation. Plant Cell 27:64-70.
Munns R, Tester M. 2008. Mechanisms of salinity tolerance. Annual Review of
Plant Biology 59:651-81.
Muries B, Faize M, Carvajal M, Martínez-Ballesta MC. 2011.Identification and
differential induction of the expression of aquaporins by salinity in broccoli
plants. Molecular BioSystems 7:1322-35.
by guest on Novem
ber 30, 2015http://aobpla.oxfordjournals.org/
Dow
nloaded from

34
Mutasa-Göttgens ES, Joshi A, Holmes HF, Hedden P, Göttgens B. 2012. A new
RNASeq-based reference transcriptome for sugar beet and its application in
transcriptome-scale analysis of vernalization and gibberellin responses. BMC
Genomics 13:99.
Niu X1, Bressan RA, Hasegawa PM, Pardo JM. 1995. Ion Homeostasis in NaCl
stress environments. Plant Physiology 109:735-42.
Pakniyat and Armion M. 2007.Sodium and proline accumulation as
osmoregulators in tolerance of sugar beet genotypes to salinity. Pakistan
Journal of Biological Sciences 10:4081-86.
Peng Y, Zhu Y, Mao Y, Wang S, Su W, Tang Z. 2004.Alkali grass resists salt
stress through high [K+] and an endodermis barrier to Na+. Journal of
Experimental Botany 55:939-49.
Postaire O, Tournaire-Roux C, Grondin A, Boursiac Y, Morillon R, Schäffner AR,
Maurel C. 2010. A PIP1 aquaporin contributes to hydrostatic pressure-induced
water transport in both the root and rosette of Arabidopsis. Plant Physiology
152:1418-30.
Qi X, Tai CY, Wasserman BP. 1995. Plasma membrane intrinsic proteins of
Beta vulgaris L. Plant Physiology 108:387-92.
Rahnama A, James R, Poustini K, Munns R. 2010. Stomatal conductance as a
screen for osmotic stress tolerance in durum wheat growing in saline soil.
Functional Plant Biology 37:255-63.
Reid KE, Olsson N, Schlosser J, Peng F, Lund ST. 2006. An optimized
grapevine RNA isolation procedure and statistical determination of reference
genes for real-time RT-PCR during berry development. BMC Plant Biology 6:27.
doi:10.1186/1471-2229-6.
by guest on Novem
ber 30, 2015http://aobpla.oxfordjournals.org/
Dow
nloaded from

35
Sade N, Moshelion M. 2014. The dynamic isohydric-anisohydric behavior of
plants upon fruit development: taking a risk for the next generation. Tree
Physiology 11:1199-202.
Sack L, and Holbrook NM. 2006. Leaf hydraulics. Annual Review of Plant
Biology 57:361-81.
Schenk HJ, Espino S, Goedhart CM, Nordenstahl M, Cabrera HI, Jones CS.
2008. Hydraulic integration and shrub growth form linked across continental
aridity gradients. Proceedings of the National Academy of Science 105:11248-
53.
Scholander PF, Hammel HT, Bradstreet ED, Hemmings en EA. 1965. Sap
pressure in vascular plants. Science 148:339-46.
Shabala S. 2013. Learning from halophytes: physiological basis and strategies
to improve abiotic stress tolerance in crops. Annals of Botany 112:1209-21.
Shabala S, Cuin TA. 2008. Potassium transport and plant salt tolerance.
Physiologia Plantarum 133:651-69.
Shabala S, Shabala S, Cuin TA et al. 2010. Xylem ionic relations and salinity
tolerance in barley. The Plant Journal 61:839-53.
Sharp RE, Poroyko V, Hejlek LG, Spollen WG, Springer GK, Bohnert HJ,
Nguyen HT. 2004. Root growth maintenance during water deficits: physiology to
functional genomics. Journal of Experimental Botany 55:2343-51.
Skorupa-Kłaput, M., Szczepanek, J., Kurnik, K., et al. 2015. The expression
patterns of plasma membrane aquaporins in leaves of sugar beet and its
halophyte relative, Beta vulgaris ssp. maritima, in response to salt stress.
Biologia 70:467-477.
by guest on Novem
ber 30, 2015http://aobpla.oxfordjournals.org/
Dow
nloaded from
36
Soto G, Fox R, Ayub N, Alleva K, Guaimas F, Erijman EJ, Mazzella A, Amodeo
G, Muschietti J. 2010. TIP5;1 is an aquaporin specifically targeted to pollen
mitochondria and is probably involved in nitrogen remobilization in Arabidopsis
thaliana. The Plant Journal 64:1038-47.
Soto G, Stritzler M, Lisi C, Alleva K, Pagano ME, Ardila F, Mozzicafreddo M,
Cuccioloni M, Angeletti M, Ayub N. 2011. Acetoacetyl-CoA thiolase regulates
the mevalonate pathway during abiotic stress adaptation. Journal of
Experimental Botany 62:5699-711.
Steudle E. 2000. Water uptake by plant roots: an integration of views. Plant Soil
226:45-56.
Steudle E, Peterson CA. 1998. How does water get through roots? Journal of
Experimental Botany 49:775-788.
Suku S, Knipfer T, Fricke W. 2014. Do root hydraulic properties change during
the early vegetative stage of plant development in barley (Hordeum vulgare)?
Annals of Botany 113:385-402.
Sutka M, Li G, Boudet J, Boursiac Y, Doumas P, Maurel C. 2011. Natural
variation of root hydraulics in Arabidopsis grown in normal and salt-stressed
conditions. Plant Physiology 155:1264-76.
Takase T, Ishikawa H, Murakami H, Kikuchi J, Sato-Nara K, Suzuki H. 2011.The
circadian clock modulates water dynamics and aquaporin expression in
Arabidopsis roots. Plant Cell Physiology 52:373-83.
Tardieu F, Davies WJ. 1993. Integration of hydraulic and chemical signaling in
the control of stomatal conductance and water status of droughted plants. Plant
Cell and Environment 16:341-49.
by guest on Novem
ber 30, 2015http://aobpla.oxfordjournals.org/
Dow
nloaded from

37
Tester M, Davenport R. 2003. Na+ tolerance and Na+ transport in higher plants.
Annals of Botany 91:503-27.
Turner NC. 1981. Techniques and experimental approaches for the
measurement of plant water. Plant Soil 58:339-66.
Tyerman SD, Niemietz CM, Bramley H. 2002. Plant aquaporins: multifunctional
water and solute channels with expanding roles. Plant and Cell Environment
25:173-94.
Tyree MT. 2003. Hydraulic properties of roots. In: EJW Visser, H de Kroon, eds,
Root Ecology 125-50.
Van den Honert TH. 1948. Water transport in plants as a catenary process.
Discussions of the Faraday Society 3:146-153.
Vandeleur RK, Mayo G, Shelden MC, Gilliham M, Kaiser BN, Tyerman SD.
2009. The role of plasma membrane intrinsic protein aquaporins in water
transport through roots: diurnal and drought stress responses reveal different
strategies between isohydric and anisohydric cultivars of grapevine. Plant
Physiology 149:445-60.
Vandeleur RK, Sullivan W, Athman A, Jordans C, Gilliham M, Kaiser BN,
Tyerman SD. 2014. Rapid shoot-to-root signalling regulates root hydraulic
conductance via aquaporins. Plant Cell Environ 37:520-38.
Wan H, Zhao Z, Qian C, Sui Y, Malik AA, Chen J. 2010. Selection of appropriate
reference genes for gene expression studies by quantitative real-time
polymerase chain reaction in cucumber. Analytical Biochemistry 15:257-61.
Wang W, Yang X, Zhang S, Sun Y. 2013. The root cortex cell hydraulic
conductivity is enhanced with increasing chromosome ploidy in wheat. Plant
Physiology and Biochemistry 68:37-43.
by guest on Novem
ber 30, 2015http://aobpla.oxfordjournals.org/
Dow
nloaded from

38
Weatherley, PE. 1950. Studies in the water relations of the cotton plant.
I. The field measurement of water deficits in leaves. New Phytologist 49:81-87.
by guest on Novem
ber 30, 2015http://aobpla.oxfordjournals.org/
Dow
nloaded from

39
FIGURE LEGENDS
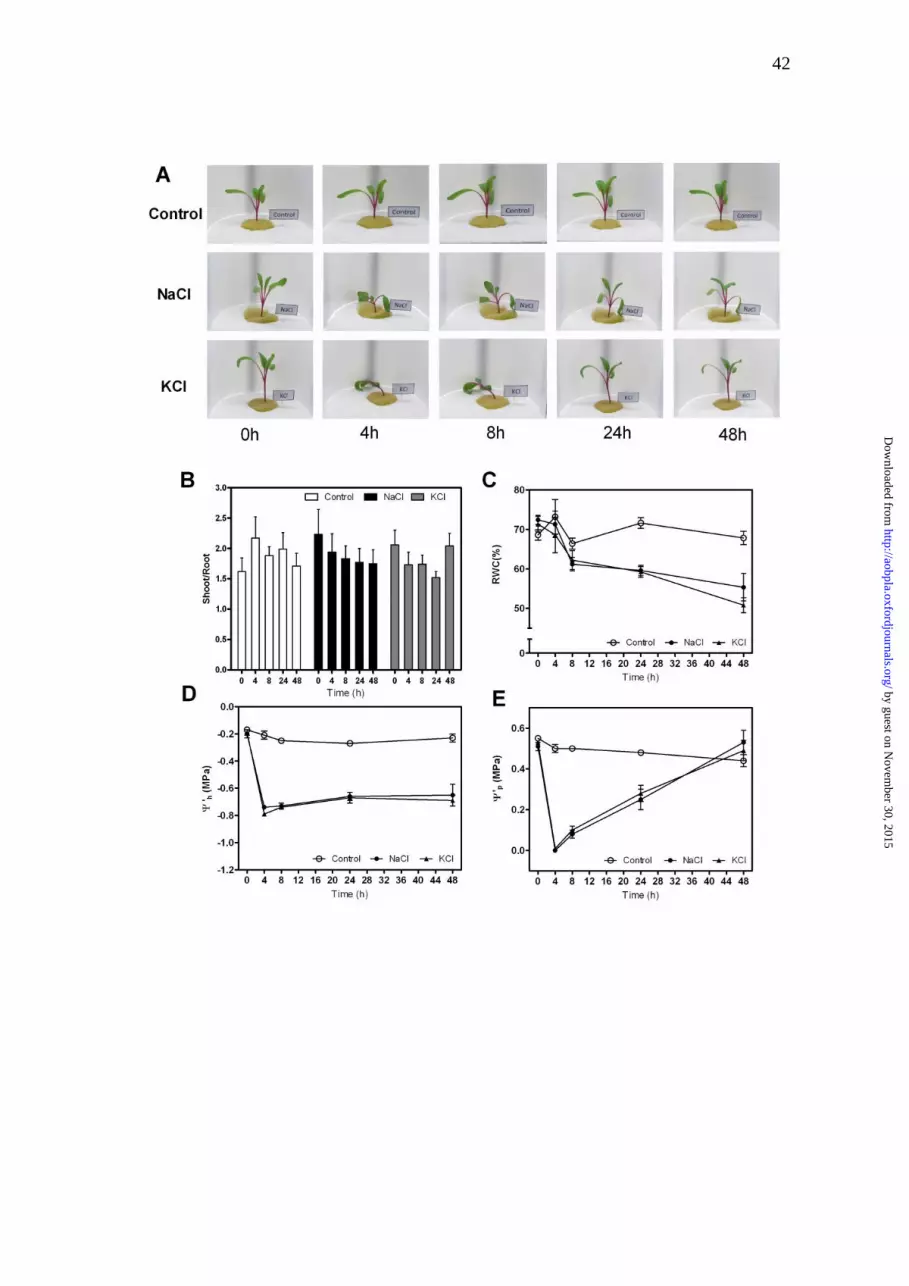
Figure 1. Effect of salinity treatments on Beta vulgaris plants: control (Ψmedium =
-0.04 MPa); 200 mM NaCl (Ψmedium= -0.90 MPa) or 200 mM KCl; (Ψmedium= -0.90
MPa). A. Images of the same hydroponically grown plant taken in each
condition at the indicated times after the onset of the treatment. B. Shoot/root
ratio values are given as bars representing mean ± s.e. of three independent
experiments (n=3). The biological replicates were 5-6 plants per treatment in
each experiment. No differences were observed between treatments
(F(2,68)=0.16, P=0.8513). C. Relative water content values are expressed as
mean ± s.e. of three independent experiments (n=3). The biological replicates
were three plants per treatment in each experiment, and two leaves per plant
were analyzed as a duplicate. D. The apparent leaf water potential values (in
MPa) measured at each indicated time are expressed as mean ± s.e. of three
independent experiments. E. The calculated apparent leaf pressure potential
(Ψ’p in MPa) is expressed as mean values ± s.e.
Figure 2. Integrating SPAC key points: stomatal conductance and root hydraulic
conductivity. A. Stomatal conductance values (gs: in mmolm-2s-1) are given as
bars representing mean ± s.e. of three performed independent experiments (at
least three plants per treatment). Different letters indicate statistical differences
between treatments (P<0.001; Bonferroni test).B. Hydraulic conductivity values
(Lpr; in mL mg-1 h-1 MPa-1) are given as bars representing mean ± s.e. of three
performed independent experiments (in each one 2-3 individual root systems
by guest on Novem
ber 30, 2015http://aobpla.oxfordjournals.org/
Dow
nloaded from

40
were measured). Different letters indicate statistical differences between
treatments (P<0.001; Bonferroni test).
Figure 3. Photograph of Beta vulgaris fresh roots cross sections stained with
Sudan IV, the bar represents 20 µm. A and D are control root cuts indicating (C)
cortex, (en) endodermis, (ex) exodermis; B and C are representative cuts of
roots from plants treated for 4 hours with 200 mM NaCl and 200 mM KCl
respectively; E and F are representative cuts of roots from plants treated for 24
hours with 200 mM NaCl and 200 mM KCl respectively. The arrows show
suberization of endodermis. The images are one sample per condition of ten
independent experiments (n=10).
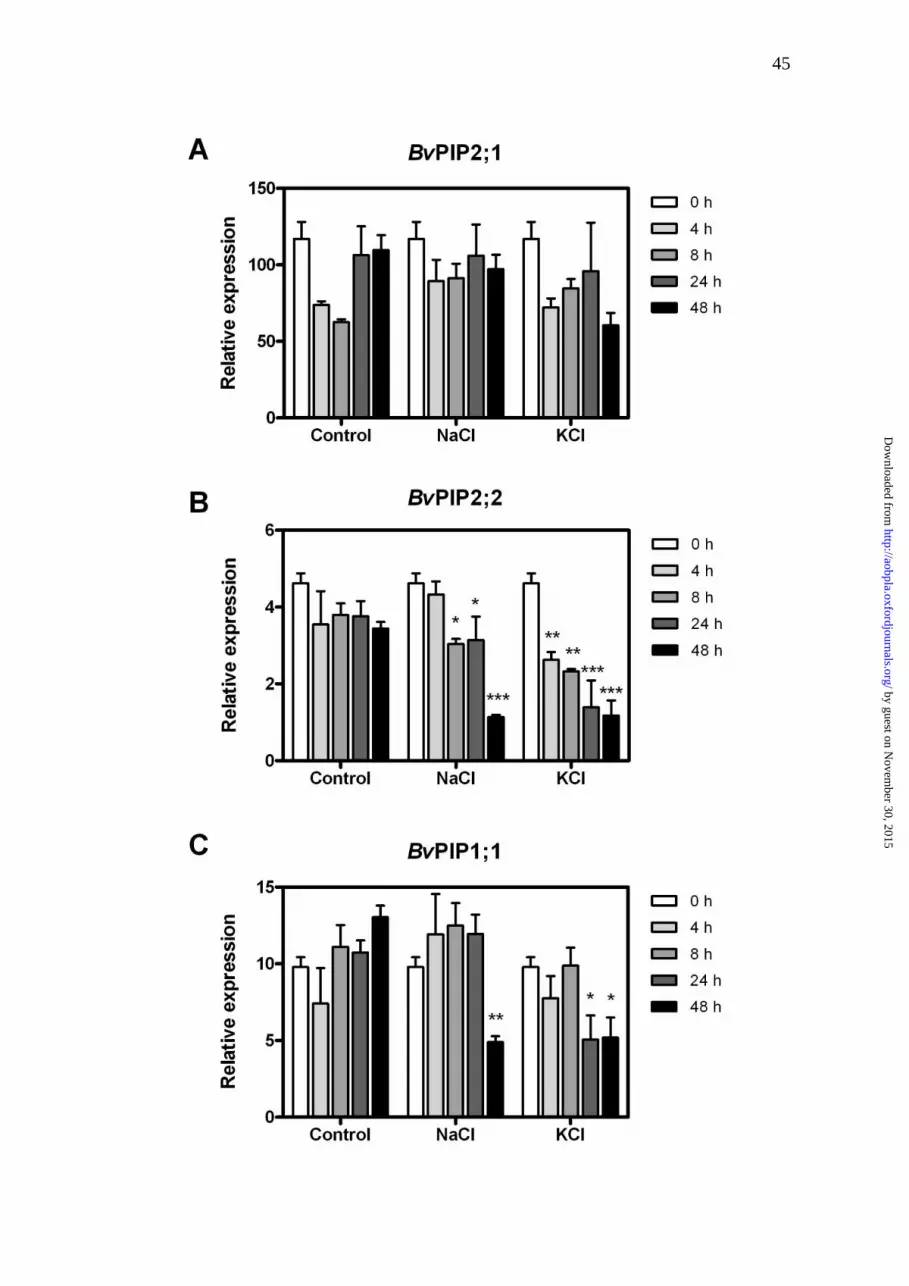
Figure 4. Relative gene expression of BvPIP2;1 (A), BvPIP2;2 (B) and
BvPIP1;1 (C) in roots from control, 200 mM NaCl or 200 mM KCl treatments.
Data are given as bars representing mean values ± s.e. of three independent
experiments (n=3), asterisks indicate statistical differences from initial condition
(t=0h) for each treatment (**P<0.05; ** P<0.01; *** P<0.001; Bonferroni test)
[see SUPPORTING INFORMATION] for statistical analysis.
Figure 5. Recovery profile of stomatal conductance (gs; A and B) and root
hydraulic conductivity (Lpr; C and D) after halting the salt treatment (st). The
recovery profiles are separated for plant initially submitted to short salt
treatments (t=4 h, A and C) versus a longer interval period (t=24 h, B and D).
Data are expressed as mean values ± s.e. of 3-4 independent experiments (in
each one 3-4 plants were measured). Different letters indicate statistical
differences between bars (P<0.05; Bonferroni test) and * indicates differences
between bars from different salt-treatments (P<0.001, Bonferroni test).
by guest on Novem
ber 30, 2015http://aobpla.oxfordjournals.org/
Dow
nloaded from
41
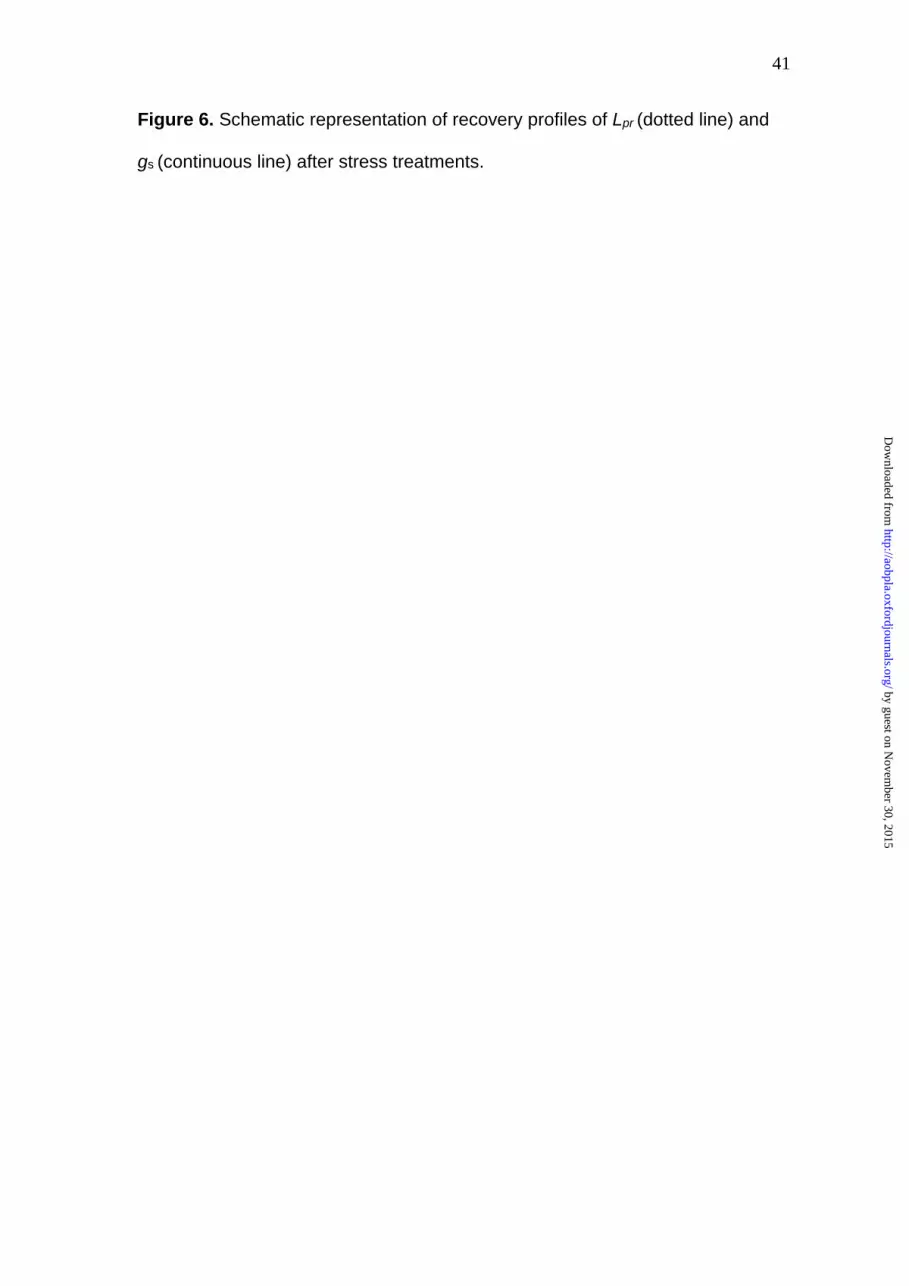
Figure 6. Schematic representation of recovery profiles of Lpr (dotted line) and
gs (continuous line) after stress treatments.
by guest on Novem
ber 30, 2015http://aobpla.oxfordjournals.org/
Dow
nloaded from
42
by guest on Novem
ber 30, 2015http://aobpla.oxfordjournals.org/
Dow
nloaded from

43
by guest on Novem
ber 30, 2015http://aobpla.oxfordjournals.org/
Dow
nloaded from

44
by guest on Novem
ber 30, 2015http://aobpla.oxfordjournals.org/
Dow
nloaded from
45
by guest on Novem
ber 30, 2015http://aobpla.oxfordjournals.org/
Dow
nloaded from

46
by guest on Novem
ber 30, 2015http://aobpla.oxfordjournals.org/
Dow
nloaded from
47
by guest on Novem
ber 30, 2015http://aobpla.oxfordjournals.org/
Dow
nloaded from


![Stomatal index responses of Agrostis canina to CO2 and sulphur dioxide: implications for palaeo-[CO2] using the stomatal proxy](https://img.dokumen.tips/doc/110x75/6351f5c485f87b9f8602ac53/stomatal-index-responses-of-agrostis-canina-to-co2-and-sulphur-dioxide-implications.jpg)


