Embed Size (px)
Citation preview

HYDRAULIC ANALYSIS REPORT
PREPARED FOR
REPLACEMENT OF MASONRY CULVERT STRUCTURE MNRR NEW HAVEN MAINLINE AT MP 65.60 MILFORD, CONNECTICUT
STATE PROJECT NO. 301-175
DATE: APRIL 3, 2017 REVISED: NOVEMBER 9, 2017 REVISED: AUGUST 3, 2018
PREPARED BY: Brandon Handfield, PE
CHECKED BY: David Miroslaw, PE
APPROVED BY: Brandon Handfield, PE

STATE PROJECT NO. 301-0175 CULVERT REPLACEMENT MNRR NEW HAVEN MAINLINE M.P. 65.60, MILFORD, CONN.
TOC
TABLE OF CONTENTS EXECUTIVE SUMMARY ........................................................................................................................ 1
LOCATION MAP ...................................................................................................................................... 2
INTRODUCTION ...................................................................................................................................... 3
PROPOSED ALTERNATIVE ......................................................................................................... 3
HYDRAULIC DESIGN CRITERIA ................................................................................................ 3
FLOOD INSURANCE STUDY ....................................................................................................... 4
HISTORIC FLOODING ................................................................................................................... 4
HYDROLOGY ........................................................................................................................................... 4
ROUTING ANALYSIS.............................................................................................................................. 4
PROPOSED STRUCTURE DESCRIPTION ............................................................................................. 5
COMPARISION ......................................................................................................................................... 6
WATER SURFACE ELEVATIONS ............................................................................................... 7
VELOCITIES ................................................................................................................................... 7
WATER HANDLING ................................................................................................................................ 8
CULVERT PROFILES .............................................................................................................................. 9
CONCLUSION ......................................................................................................................................... 10
APPENDICES
APPENDIX A: HYDROLOGY REPORT
APPENDIX B: PHOTOGRAPHS
APPENDIX C: MAPS
APPENDIX D: ROUTING COMPUTATIONS
APPENDIX E: TEMPORARY FACILITIES & FLOOD CONTINGENCY
APPENDIX F: CHANNEL DESIGN
TABLES
TABLE 1: PEAK FLOW RATES .............................................................................................................. 4
TABLE 2: ROUTING RESULTS .............................................................................................................. 6
TABLE 3: ROUTING COMPARISON ..................................................................................................... 6
TABLE 4: WATER SURFACE ELEVATIONS AT PEPES FARM ROAD ............................................ 7
FIGURES
FIGURE 1: LOCATION MAP ................................................................................................................... 2
FIGURE 2: CULVERT PROFILES ........................................................................................................... 9

STATE PROJECT NO. 301-0175 CULVERT REPLACEMENT MNRR NEW HAVEN MAINLINE M.P. 65.60, MILFORD, CONN.
1
EXECUTIVE SUMMARY
An existing 90-foot long, 2’ wide rectangular stone masonry culvert structure carries stormwater runoff from the Eastern Steel Road commercial and industrial area under the Metro North Railroad (MNRR) New Haven Mainline at approximate mile post 65.60. Based on visual inspections, the inlet and outlet of the existing structure are partially collapsed, resulting in a reduction of the hydraulic capacity of the structure. The outlet structure deterioration has also resulted in sloughing of the railroad embankment. Internal dimensions and conditions of the culvert could not be evaluated due to the deteriorated end conditions and standing water.
In response to the noted deterioration, loss of hydraulic capacity, and potential for flooding of upstream properties, the Connecticut Department of Transportation (CTDOT) has identified this structure for full replacement. H.W. Lochner, Inc. (Lochner) was contracted to provide consulting engineering services for the replacement and Yantic River Consultants, LLC (YRC) was subcontracted to perform hydrologic and hydraulic analysis services.
YRC performed a detailed flood routing analysis of the contributing watershed to evaluate the effect of temporary upstream ponding caused by the backwater from the existing culvert. This flood routing methodology was also used to analyze and design the replacement culverts. Twin 48-inch diameter reinforced concrete pipe culverts (RCP) are proposed to replace the existing stone masonry structure. The proposed culvert has been sized to pass the 100-year design frequency storm, provide a minimum of 1-foot of freeboard to the approximate finish floor elevation of upstream buildings, and provide a maximum headwater depth no greater than 1.5 times the pipe diameter.
The increased hydraulic opening of the replacement structure has the potential to increase flooding on downstream properties and two (2) existing culvert crossings carrying Pepes Farm Road. To mitigate any potential increase in flooding downstream, CTDOT has required that the hydraulic opening of the proposed culvert be restricted to generally match original culvert conditions. Therefore, to satisfy this requirement, interim structure modifications will be implemented, including installation of full blocking of the upstream end of the southern RCP cell and installation of a slide gate to partially block the upstream end of the northern RCP cell. These interim measures will provide a hydraulic opening comparable to the original 2’ x 2’ stone masonry structure and will remain until downstream structures are upgraded.
Until the flow restriction measures are removed, the replacement structure will be hydraulically inadequate. This report contains the information in accordance with Section 9.3.9 of the CTDOT Drainage Manual for request of a Design Exception.
The analysis was performed in accordance with the CTDOT Drainage Manual and to satisfy the requirements of Section 13a-94 and Sections 25-68b through 25-68h of the Connecticut General Statutes, as revised.
All elevations within this report are 1988 North American Vertical Datum (NAVD88).

SH
LA
NE
ROSES
MAXW
ELL DRIVE
ROAD
CA
RO
LIN
E
CHERRY
-
WO
OD DR. R
OA
D
KINDEL
DR.
TU
MBLEBRO
OK DR.
E
LA.
OO
K
DR
.
River
ClarkPond
WOO
DMO
NT
MIL
L
WIL
D
FL
OW
ER
DR.
TO
M
AHAWK
LA.
BROOKLAWN
CT.
BROOKLAWN
DRIVE
ROSEBROOK RD.
PL.
QU
AR
RY
RO
AD
LAKEVIE
W
DR.AM
ERIC
AN
WA
Y
ROAD
ROSES
RD.
MILLMIL
L P
ON
D
CL
OS
EP
EC
K
CLAUDIA
CLAUD IA
DR.
PL.
Rose Mill Pond
Indian Lake
TUR
NPIK
E
OL
D
GATE
LANE
GATE
LA
NE
RO
A
D
#1
EAS
TE
RN S
TE
EL
RD.
LA
NE
PO
ND
HO
ER
M
ARIN
O
LIN
DY
STRE
ET
BA
RT
ON
RO
AD
MO
RRIS
LA.
TERRACERO
AD
HIL
L
FO
WLER
TE
R.
LUDLOWDR.
LA
NE
ASTER RD.
DRIV
E
DA
LT
ON
RO
AD
FREEMONT AVE.
ME
ETIN
G
HOUSELA.
SP
AR
RO
W
BUSH
LA
.
KERRYCT.
FU
RNIT
URE NEW
HA
VEN
AVENUE
NEW
HAVEN
EE
LS
HIL
LR
D
TAPPIN
G
CIR.
PL.
TIMBER
IN
GE
RSO
L
RD. TR.
PE
PE'S
RO
AD
QUIR
K
CHELSEA
CIR.
RO
AD
Quirk Pd.
ELGINROAD
ME
RC
UR
YD
R .
COLUMBIA
KENWOOD RD.
AS
HW
OO
D
RD.
WHIP
PO
OR
WIL
LDRIV
E
PRINDLEDR.
RD.
TY
LE
R
ANS
ANTA
WA
E
ROAD
BL
UE J
AY
DR.
ROAD
WA
TR
OUS
LA
NE
#1
WA
TR
OU
S
LA. #2
BR
EW
ST
ER
RD.
AVENUE
RAILR
OAD
40
40
162
POST
RO
AD
95
708
LA
MBERT DR.
QU
AK
ER
AR
RO
WH
E-
AD
DR.
HA
R- LE
Y
RD.
ST.DAW
ES
O V
RO
W
.
WHIT-
MA
N
DR.
SWANSON DR.
LY
DA
DR.
ST.
COLONY RD.
SQ UIR
EC
T
.
LONDONBERRY
LA.
BR
EW
ST
ER
SERVICE
AREA
RO
AD
RE
SE
AR
CH
DRIV
E40.7540.751
41.08
41.24
41.4
39.66
39.79
39.85
40.1
40.26
40.46
40.78
40.96
41.33
41.36
2.66 2.692.7
2.75
2.963.02
3.073.2
3.33
3.35
3.45 3.48
3.66
3.693.743.773.793.791
3.88
4 4.014.011
2.59 2.732.74
2.79
33.06 3.11
3.24
3.373.39 3.49
3.52
3.73.73
3.783.813.833.831
3.92
4.044.054.051
0
0.13
0.21
0.32
CA
SC
AD
E
ROCK
HEENAN
DR.
QU
AR
RY
RD.
SE
TT
LE
R'S
RID
GE
VERNALPASS
C
IRC
LE
STA
GE
CO
AC
H
SH
AD
OW
SE
ND
LA.
ELLE
N
DRIV
EFRANKLIN ROAD
HU
NT
ER
SR
UNH
IIGGIN
S
DR.
WOODMONT
ANDERSON
WO
OD
MO
NT
RD.
#2
RD.#1
FARM
631 590E
E095 13
7
E095 1
38
E095 13
9
CULVERT REPLACEMENT
CONNECTICUT DEPARTMENT OF TRANSPORTATION
SITE LOCATION MAP www.yanticriverconsultants.comWeb:
(860) 367-7264Phone:
LEBANON, CONN 06249
191 NORWICH AVENUE
YANTIC RIVER CONSULTANTS, LLC
CONTACT INFORMATION
DATE
3/24/17 MILFORD, CTNEW HAVEN MAINLINE
SHEET
2
SCALE: 1"=1000'
1000 0 1000
EXISTING CULVERT LOCATION

STATE PROJECT NO. 301-0175 CULVERT REPLACEMENT MNRR NEW HAVEN MAINLINE M.P. 65.60, MILFORD, CONN.
3
INTRODUCTION
An existing 2’ masonry culvert structure carries stormwater runoff from the Eastern Steel Road commercial and industrial area under the MNRR New Haven Mainline at approximate mile post 65.60. Based on visual inspections, the inlet and outlet of the existing structure are partially collapsed, resulting in a reduction of the hydraulic capacity of the structure. The outlet structure deterioration has also resulted in sloughing of the railroad embankment.
The 2’ masonry culvert discharges to a wetland system that is situated between the MNRR railroad corridor to the north and Pepes Farm Road to the south. Commercial and industrial buildings and land uses are adjacent to the wetland areas. Stormwater runoff is conveyed under Pepes Farm Road through an existing twin 42” diameter RCP culvert.
PROPOSED REPLACEMENT
Twin 48-inch diameter reinforced concrete pipe (RCP) culverts are proposed to replace the existing stone masonry culvert structure. The RCP culvert will be set to maintain existing flow lines of the watercourse at the upstream and downstream face of the railroad embankment. To mitigate any potential increase in flooding downstream, interim structure modifications will be implemented, including installation of full blocking of the upstream end of the southern RCP cell and installation of a slide gate to partially block the upstream end of the northern RCP cell. These interim measures will provide a hydraulic opening comparable to the original 2’ x 2’ stone masonry structure and will remain until downstream structures are upgraded.
The pipes will be jacked through the existing railroad embankment to minimize impact to the railroad service above. This replacement alternative was selected based on constructability and improved hydraulic capacity. The interim structure modifications were selected to meet the CTDOT requirement to generally match original culvert flow conditions and also allow for routine access, inspection, and maintenance by CTDOT and MNRR personnel.
HYDRAULIC DESIGN CRITERIA
The existing culvert structure has a drainage area of less than 1.0 square mile with an established watercourse and is classified as a “Small” culvert structure per Section 8.3.11 of the CTDOT Drainage Manual. Minimum design criteria is a 50-year design frequency, a 100-year check frequency and a minimum of 1.0’ of freeboard to the upstream design control.
Based on CTDOT requirements for this specific rail project, the culvert will be designed to accommodate a 100-year frequency storm event. The upstream design control was selected as the approximate finish floor elevation (±35.0 NAVD) of the existing building(s) located to the northwest of the culvert with headwater depths not to exceed HW/D < 1.5.
The increased hydraulic opening of the replacement structure has the potential to increase flooding on downstream properties and two (2) existing culvert crossings carrying Pepes Farm Road. As stated above, CTDOT has required that the hydraulic opening of the proposed culvert be restricted to generally match original culvert conditions until downstream structures are upgraded. Until the flow restriction measures are removed, the replacement structure will be hydraulically inadequate and a design exception is required in accordance with Section 9.3.9 of the CTDOT Drainage Manual.

STATE PROJECT NO. 301-0175 CULVERT REPLACEMENT MNRR NEW HAVEN MAINLINE M.P. 65.60, MILFORD, CONN.
4
FLOOD INSURANCE STUDY
The culvert site is not located within a designated Special Flood Hazard Area based on FEMA Flood Insurance Rate Map (FIRM) No. 09009C0532J for New Haven County, Connecticut.
HISTORIC FLOODING
Based on information provided by CTDOT staff, the low-lying developed areas immediately upstream of the subject culvert have a history of flooding. Due to the partial collapse of the outlet, the frequency of flooding has increased.
In a phone conversation between Richard Bray, PE of Lochner and James Connors of Connors Properties, LLC, owner of the parcels upstream of the subject culvert, Mr. Connors confirmed that the area has a long history of flooding, a condition that has worsened since the partial collapse of the outlet.
HYDROLOGY
The design flows used in the hydraulic analysis were presented in the Hydrology Report Prepared for Replacement of Masonry Culvert Structure, MNRR New Haven Mainline at MP 65.60, Milford, Conn., State Project No. 301-0175, dated November 2015 as revised March 2016, prepared by Yantic River Consultants, LLC. The Hydrology Report was approved by CTDOT in a letter to Mr. Jayantha Mather, Transportation Principal Engineer, from Mr. Michael E. Maysayda, Transportation Principal Engineer, dated May 18, 2016. The approved design flows are summarized in the table below.
AVG. RECURRENCE INTERVAL (STORM)
PEAK FLOW RATE (CFS) TR-55 METHOD
Avg. Day 0.2 Avg. Spring 0.4
1-year 86 2-year 111 5-year 153 10-year 188 25-year 235 50-year 271 100-year 307 500-year 427
TABLE 1: PEAK FLOW RATES
ROUTING ANALYSIS YRC performed a detailed flood routing analysis of the contributing watershed to evaluate the effect of temporary upstream ponding caused by the backwater from the existing culvert and design the replacement culverts. Using Bentley Systems CivilStorm v8i, unit hydrographs and peak flows were generated for the watershed for the 1, 2, 10, 25, 50, 100, and 500-year frequency events and run through the existing and proposed conditions.
The routing analysis consisted of two (2) catchment areas delineated based on a combination of topographic information obtained from CTDOT survey and NOAA LiDAR.

STATE PROJECT NO. 301-0175 CULVERT REPLACEMENT MNRR NEW HAVEN MAINLINE M.P. 65.60, MILFORD, CONN.
5
• CM-1 is located to the north of the MNRR corridor and delineates the watershed draining to the culvert under the railroad. This subarea contains storage area PO-1, which includes areas within the natural bank and wetland limits and surrounding low-lying developed areas that may be subjected to flooding.
• CM-2 is located to the south of the MNRR corridor and delineates the watershed draining to the culvert under Pepes Farm Road. This subarea contains storage area PO-2, which consists of the area within the natural bank limits of the channel and surrounding wetland area.
Curve numbers (CN) were assigned for each catchment area based on the Hydrologic Soil Group (HSG) and land use. Soils within CM-1 have a HSG Rating of D and within CM-2 a Rating of B or D. Land use within CM-1 consists of impervious surfaces, open space (apparent landscaped areas), woods and the railroad corridor as determined from the 2016 NOAA Aerial Imagery. The composite CN for CM-1 is 91.0, which is consistent for an industrial developed area. Land use within CM-2 generally consists of a mix of industrial, residential ¼ acre and woods along the railroad corridor. The composite CN for CM-2 is 83.
Time of concentration (Tc) for CM-1 was determined using the SCS TR-55 Method where the flow path is divided into three categories: sheet or overland, shallow concentrated and channel flow. Given the similarities in basin development and topography, CM-2 was assigned a Tc value of 30 minutes which is comparable to the calculated Tc for CM-1.
24-hour precipitation rates from NOAA Atlas 14 Volume 10: Precipitation-Frequency Atlas of the United States, Northeastern States were used in the analysis from the nearest published station, Bridgeport Sikorsky Memorial Airport, Station ID 06-0806.
PROPOSED STRUCTURE DESCRIPTION
The existing stone culvert will be replaced with twin 48” RCP Culvert Pipes, each with a total length of 101’, and upstream invert of 28.10 and a downstream invert of 27.60 to match existing grades within the channel. The culverts will be installed via pipe jacking to minimize disturbance of the active rail above and maintain the top of rail elevation of ±43.1. Cast-in-place or precast concrete headwalls will be constructed at each culvert end.
INTERIM STRUCTURE MODIFICATION To mitigate any potential increase in flooding downstream, CTDOT has required that the hydraulic opening of the proposed culvert be restricted to generally match original culvert conditions. To satisfy this requirement, the southern RCP cell will be fully blocked and the northern RCP cell will be partially blocked with a slide gate, which will provide a hydraulic opening comparable to the original 2’ x 2’ stone structure.
These interim modifications will remain in place until downstream structures are upgraded. The slide gate position will be set in the field, documented, and recorded for future inspection and reference. In addition, the gate mechanism will be locked to prohibit unauthorized modification and/or operation.

STATE PROJECT NO. 301-0175 CULVERT REPLACEMENT MNRR NEW HAVEN MAINLINE M.P. 65.60, MILFORD, CONN.
6
COMPARISON A comparison of computed water surface elevations and velocities for existing, proposed, and interim conditions are provided in the table below.
STORM EVENT
W.S. ELEVATIONS¹ (NAVD) UPSTREAM OF MNRR
W.S. ELEVATIONS¹ (NAVD) DOWNSTREAM OF MNRR
EXISTING PROPOSED INTERIM EXISTING PROPOSED INTERIM 1-year 33.33 30.05 32.72 30.22 29.78 30.33 2-year 33.96 30.13 33.26 30.42 29.86 30.49 5-year 35.03 30.78 34.39 30.77 30.02 30.78
10-year 35.56 31.05 34.95 30.94 30.11 30.94 25-year 36.24 31.15 35.63 31.16 30.21 31.14 50-year 36.72 31.48 36.08 31.31 30.38 31.26 100-year 37.18 31.66 36.50 31.46 30.40 31.38 500-year 38.00² 32.76 38.00² - 30.74 -
STORM EVENT
VELOCITY³ (FT/S) UPSTREAM OF MNRR
VELOCITY³ (FT/S) DOWNSTREAM OF MNRR
EXISTING PROPOSED INTERIM EXISTING PROPOSED INTERIM 1-year 8.57 6.75 9.54 8.57 5.87 13.92 2-year 9.15 8.18 10.70 9.15 7.16 14.70 5-year 10.05 8.47 12.45 10.05 9.55 15.53
10-year 10.46 9.22 13.06 10.46 11.00 15.51 25-year 10.98 11.24 13.78 10.98 13.29 15.46 50-year 11.32 11.79 14.23 11.32 14.33 15.41 100-year 11.65 12.70 14.64 11.65 15.95 15.36 500-year -4 15.70 -4 -4 18.66 -4 ¹ WS elevation obtained from hydraulic grades at MNRR Conduit Report In & Out ² The culvert is at full capacity and fills the storage area; elevation defaults to 38.00 & model terminates 3 Velocity obtained from MNRR Conduit Report In & Out
4 No velocity reported due to model limitations & varying times to maximum flow vs. hydraulic grade under full capacity
TABLE 2: ROUTING RESULTS STORM EVENT
UPSTREAM OF MNRR DOWNSTREAM OF MNRR
PR vs EX INT vs EX PR vs EX INT vs EX WS ELEV. VEL. WS ELEV. VEL. WS ELEV. VEL. WS ELEV. VEL.
1-year -3.28 -1.82 -0.61 0.97 -0.44 -2.70 0.11 5.35 2-year -3.83 -0.97 -0.70 1.55 -0.56 -1.99 0.07 5.55 5-year -4.25 -1.58 -0.64 2.40 -0.75 -0.50 0.01 5.48 10-year -4.51 -1.24 -0.61 2.60 -0.83 0.54 0.00 5.05 25-year -5.09 0.26 -0.61 2.80 -0.95 2.31 -0.02 4.48 50-year -5.24 0.47 -0.64 2.91 -0.93 3.01 -0.05 4.09 100-year -5.52 1.05 -0.68 2.99 -1.06 4.30 -0.08 3.71 500-year -5.24 - 0.00 - - - - -
TABLE 3: ROUTING COMPARISON

STATE PROJECT NO. 301-0175 CULVERT REPLACEMENT MNRR NEW HAVEN MAINLINE M.P. 65.60, MILFORD, CONN.
7
STORM EVENT
W.S. ELEVATIONS¹ (NAVD) COMPARISON UPSTREAM OF PEPES FARM RD.
EXISTING PROPOSED INTERIM PR VS. EX INT VS. EX 1-year 26.49 26.92 26.70 0.43 0.21 2-year 26.69 27.22 26.93 0.53 0.24 5-year 27.10 27.72 27.33 0.62 0.23 10-year 27.32 28.00 27.54 0.68 0.22 25-year 27.59 28.42 27.81 0.83 0.22 50-year 27.77 28.72 27.99 0.95 0.22 100-year 27.94 29.02 28.16 1.08 0.22 500-year 28.47 29.82 28.10 1.35 -0.37 ¹ WS elevation obtained from hydraulic grades at PO-2
TABLE 4: WATER SURFACE ELEVATIONS AT PEPES FARM ROAD
WATER SURFACE ELEVATIONS:
For the 100-year design storm, the proposed replacement culvert reduces water surfaces elevations upstream and downstream. The twin 48” RCP culvert is a hydraulically adequate structure with over 1’ of freeboard to the upstream buildings (±35.0) and meets the 1.5 Hw/D ratio. However, due to an existing downstream restriction at Pepes Farm Road, the proposed structure results in an increase in water surface elevations in the wetland and natural overbanks above Pepes Farm Road.
Under the 500-year storm event the culvert is at full capacity. At full capacity, elevations are well below the top of rail elevation of ±43.1 and will continue to provide adequate freeboard to the upstream buildings. An increase in water surface elevations above Pepes Farm Road also occurs.
For both storm events, the increase downstream is contained within the wetlands and natural overbanks depicted on the Storage (Pond) Volume Map. To mitigate any potential increase in flooding downstream, CTDOT has required the hydraulic opening for the proposed replacement structure be reduced until the Pepes Farm Road crossing can be upgraded.
The interim structure modifications, which reduce the hydraulic opening to meet CTDOT requirements, result in water surface elevations comparable to existing conditions under both the 100-year and 500-year events with minor increases and decreases. These variations are attributed to improved roughness coefficients. These interim structure modifications maintain a hydraulically inadequate structure.
Culvert profiles are provided in Figure 2.
VELOCITIES:
Improved roughness coefficients, increased hydraulic capacity, and reduction of backwater conditions at MNRR under larger storm events result in an increase in velocities under larger storm events for proposed conditions. The interim structure modifications result in increased velocities under all storm events as the structure remains hydraulically inadequate with improved roughness coefficients.
Although no velocity is reported for the 500-year storm under Existing and the Interim Structure Modifications due to the limitations of the model, it is anticipated an increase in velocity, consistent with the 100-year storm will occur.

STATE PROJECT NO. 301-0175 CULVERT REPLACEMENT MNRR NEW HAVEN MAINLINE M.P. 65.60, MILFORD, CONN.
8
Installation of revetment at the inlet and outlet is recommended to provide scour protection. See Appendix F: Channel Design for further discussion.
WATER HANDLING
The 48” pipes will be jacked through the existing railroad embankment to minimize impact to the railroad service above. Existing flow will be diverted through the existing culvert using bypass pipes and cofferdams. Design Plans, provided under separate cover, detail the method of construction to accomplish the work, provide protection of the work during construction and minimize impacts to the natural resources.
For a complete discussion, see Appendix E: Temporary Facilities & Flood Contingency.
All construction activities will be performed in accordance with CTDOT Form 817, supplemented as needed with project specific special provisions. Proper erosion and sedimentation controls will be installed and maintained throughout the duration of the project so as not to increase turbidity levels.

STATE PROJECT NO. 301-0175 CULVERT REPLACEMENT MNRR NEW HAVEN MAINLINE M.P. 65.60, MILFORD, CONN.
9
FIGURE 2: MNRR Culvert Profiles

STATE PROJECT NO. 301-0175 CULVERT REPLACEMENT MNRR NEW HAVEN MAINLINE M.P. 65.60, MILFORD, CONN.
10
CONCLUSION Twin 48” RCP culverts are recommended for replacement to provide over 1’ of freeboard to the upstream buildings (±35.0) and meet the 1.5 Hw/D ratio. The RCP culvert will be set to maintain existing flow lines of the watercourse. To mitigate any potential increase in flooding downstream, interim structure modifications will be installed to restrict the hydraulic opening of the proposed culvert cells and generally match original culvert conditions until downstream structures are upgraded.
The restriction results in a minor increase in water surface elevation upstream of Pepes Farm Road; however, the increase is contained within the general limits of channel, wetlands and natural overbanks areas and will not increase the potential for flooding or adversely impact public safety and downstream properties.
The Twin 48” RCP culverts with interim structure modifications will maintain current hydraulic capacity, provide a hydraulically adequate structure at a future date, and meet constructability and water handling needs.

STATE PROJECT NO. 301-0175 CULVERT REPLACEMENT MNRR NEW HAVEN MAINLINE M.P. 65.60, MILFORD, CONN.
APPENDIX A
HYDROLOGY REPORT
Approval Memo Report Narrative, March 2016

STATE OF CONNECTICUT subject: Project No. 301-0175
DEPARTMENT OF TRANSPORTATION Revised Hydrologic Report Review
MNRR New Haven Mainline
Culvert Replacement (MP 65.6)
M E M O R A N D U M Milford
date: May 18, 2016
_________________________________________________________________________________________ to: Mr. Jayantha Mather from: Michael E. Masayda Trans. Principal Engineer Trans. Principal Engineer
Office of Rail Hydraulics and Drainage
Design and Construction Bureau of Engineering
Bureau of Public Transportation and Construction
_________________________________________________________________________________________
The Hydraulics and Drainage Section has reviewed the Hydrology Report (revised March 2016) for the subject
project, and has no further comments.
Neal Cianciolo:
cc: Theodore H. Nezames-Michael E. Masayda-Chong Lung Chow
Andrew H. Davis
Haresh Dholakia-Jay Young-Abraham Monger

HYDROLOGY REPORT
PREPARED FOR
REPLACEMENT OF MASONRY CULVERT STRUCTURE MNRR NEW HAVEN MAINLINE AT MP 65.60 MILFORD, CONNECTICUT
STATE PROJECT NO. 301-175
DATE: NOVEMBER, 2015 REVISED: MARCH, 2016
PREPARED BY: Brandon Handfield, PE
CHECKED BY: David Miroslaw, PE
APPROVED BY: Brandon Handfield, PE

STATE PROJECT NO. 301-0175 CULVERT REPLACEMENT MNRR NEW HAVEN MAINLINE M.P. 65.60, MILFORD, CONN.
TOC
TABLE OF CONTENTS EXECUTIVE SUMMARY ........................................................................................................................ 1
LOCATION MAP ...................................................................................................................................... 2
INTRODUCTION ...................................................................................................................................... 3
HYDROLOGY
WATERSHED PROPERTIES ......................................................................................................... 3
PREVIOUS STUDIES...................................................................................................................... 3
HISTORIC FLOODING ................................................................................................................... 4
PEAK FLOW METHODS
RATIONAL METHOD ....................................................................................................... 4
TR-55 METHOD ................................................................................................................. 5
PEAK FLOW COMPARISON .................................................................................................................. 5
RECOMMENDED FLOWS ...................................................................................................................... 6
APPENDICES
PHOTOGRAPHS ....................................................................................................................... APPENDIX A
WATERSHED DATA ................................................................................................................ APPENDIX B
HYDROLOGIC CALCULATIONS .......................................................................................... APPENDIX C

STATE PROJECT NO. 301-0175 CULVERT REPLACEMENT MNRR NEW HAVEN MAINLINE M.P. 65.60, MILFORD, CONN.
1
EXECUTIVE SUMMARY
An existing 90-foot long, 2’ wide rectangular stone masonry culvert structure carries stormwater runoff from the Eastern Steel Road commercial and industrial area under the Metro North Railroad (MNRR) New Haven Mainline at approximate mile post 65.60. Based on visual inspections, the inlet and outlet of the existing structure are partially collapsed, resulting in a reduction of the hydraulic capacity of the structure. The outlet structure deterioration has also resulted in sloughing of the railroad embankment. Internal dimensions and conditions of the culvert could not be evaluated due to the deteriorated end conditions and standing water.
In response to the noted deterioration, loss of hydraulic capacity, and potential for flooding of upstream properties, the Connecticut Department of Transportation (CTDOT) has identified this structure for full replacement. H.W. Lochner, Inc. (Lochner) was contracted to provide consulting engineering services for the replacement and Yantic River Consultants, LLC (YRC) was subcontracted to perform hydrologic and hydraulic analysis services.
YRC performed a hydrologic analysis for the watershed draining to the existing culvert to determine peak flow rates in accordance with the procedures outline in the CTDOT Drainage Manual. Peak flow rates were calculated using both the Rational Method and the NRCS TR-55 methodology with consideration of existing soils, land uses, topography and rainfall data published for Bridgeport Sikorsky Memorial Airport by NOAA Atlas 14 Volume 10. Each method produced comparable flow rates with the TR-55 method producing slightly more conservative values.
Based on hydrologic calculations, field observations, historical flooding and Milford map research, YRC recommends that the peak flow rates calculated utilizing the TR-55 be used for hydraulic analysis of existing and proposed conditions to allow for evaluation of available storage within the upstream basin. The calculated peak flow rates for the TR-55 Method are provided in the table below, with the recommended 100-year design flow in bold.
AVG. RECURRENCE INTERVAL (STORM)
PEAK FLOW RATE (CFS)
TR-55 METHOD Avg. Day 0.2
Avg. Spring 0.4 1-year 86 2-year 111 5-year 153
10-year 188 25-year 235 50-year 271 100-year 307 500-year 427

SH
LA
NE
ROSES
MAXW
ELL DRIVE
ROAD
CA
RO
LIN
E
CHERRY
-
WO
OD DR. R
OA
D
KINDEL
DR.
TU
MBLEBRO
OK DR.
E
LA.
OO
K
DR
.
River
ClarkPond
WOO
DMO
NT
MIL
L
WIL
D
FL
OW
ER
DR.
TO
M
AHAWK
LA.
BROOKLAWN
CT.
BROOKLAWN
DRIVE
ROSEBROOK RD.
PL.
QU
AR
RY
RO
AD
LAKEVIE
W
DR.AM
ERIC
AN
WA
Y
ROAD
ROSES
RD.
MILLMIL
L P
ON
D
CL
OS
EP
EC
K
CLAUDIA
CLAUD IA
DR.
PL.
Rose Mill Pond
Indian Lake
TUR
NPIK
E
OL
D
GATE
LANE
GATE
LA
NE
RO
A
D
#1
EAS
TE
RN S
TE
EL
RD.
LA
NE
PO
ND
HO
ER
M
ARIN
O
LIN
DY
STRE
ET
BA
RT
ON
RO
AD
MO
RRIS
LA.
TERRACERO
AD
HIL
L
FO
WLER
TE
R.
LUDLOWDR.
LA
NE
ASTER RD.
DRIV
E
DA
LT
ON
RO
AD
FREEMONT AVE.
ME
ETIN
G
HOUSELA.
SP
AR
RO
W
BUSH
LA
.
KERRYCT.
FU
RNIT
URE NEW
HA
VEN
AVENUE
NEW
HAVEN
EE
LS
HIL
LR
D
TAPPIN
G
CIR.
PL.
TIMBER
IN
GE
RSO
L
RD. TR.
PE
PE'S
RO
AD
QUIR
K
CHELSEA
CIR.
RO
AD
Quirk Pd.
ELGINROAD
ME
RC
UR
YD
R .
COLUMBIA
KENWOOD RD.
AS
HW
OO
D
RD.
WHIP
PO
OR
WIL
LDRIV
E
PRINDLEDR.
RD.
TY
LE
R
ANS
ANTA
WA
E
ROAD
BL
UE J
AY
DR.
ROAD
WA
TR
OUS
LA
NE
#1
WA
TR
OU
S
LA. #2
BR
EW
ST
ER
RD.
AVENUE
RAILR
OAD
40
40
162
POST
RO
AD
95
708
LA
MBERT DR.
QU
AK
ER
AR
RO
WH
E-
AD
DR.
HA
R- LE
Y
RD.
ST.DAW
ES
O V
RO
W
.
WHIT-
MA
N
DR.
SWANSON DR.
LY
DA
DR.
ST.
COLONY RD.
SQ UIR
EC
T
.
LONDONBERRY
LA.
BR
EW
ST
ER
SERVICE
AREA
RO
AD
RE
SE
AR
CH
DRIV
E40.7540.751
41.08
41.24
41.4
39.66
39.79
39.85
40.1
40.26
40.46
40.78
40.96
41.33
41.36
2.66 2.692.7
2.75
2.963.02
3.073.2
3.33
3.35
3.45 3.48
3.66
3.693.743.773.793.791
3.88
4 4.014.011
2.59 2.732.74
2.79
33.06 3.11
3.24
3.373.39 3.49
3.52
3.73.73
3.783.813.833.831
3.92
4.044.054.051
0
0.13
0.21
0.32
CA
SC
AD
E
ROCK
HEENAN
DR.
QU
AR
RY
RD.
SE
TT
LE
R'S
RID
GE
VERNALPASS
C
IRC
LE
STA
GE
CO
AC
H
SH
AD
OW
SE
ND
LA.
ELLE
N
DRIV
EFRANKLIN ROAD
HU
NT
ER
SR
UNH
IIGGIN
S
DR.
WOODMONT
ANDERSON
WO
OD
MO
NT
RD.
#2
RD.#1
FARM
631 590E
E095 13
7
E095 1
38
E095 13
9
400 0 400 800
CULVERT REPLACEMENT - MP 65.60
CONNECTICUT DEPARTMENT OF TRANSPORTATION
SITE LOCATION MAP www.yanticriverconsultants.comWeb:
(860) 367-7264Phone:
LEBANON, CONN 06249
191 NORWICH AVENUE
YANTIC RIVER CONSULTANTS, LLC
CONTACT INFORMATION
DATE
11/11/15 MILFORD, CT
SCALE: 1"= 400'
NEW HAVEN MAINLINE
PAGE
2
EXISTING CULVERT LOCATION

STATE PROJECT NO. 301-0175 CULVERT REPLACEMENT MNRR NEW HAVEN MAINLINE M.P. 65.60, MILFORD, CONN.
3
INTRODUCTION
An existing 90-foot long, 2’ wide rectangular stone masonry culvert structure carries stormwater runoff from the Eastern Steel Road commercial and industrial area under the MNRR New Haven Mainline at approximate mile post 65.60. Based on visual inspections, the inlet and outlet of the existing structure are partially collapsed, resulting in a reduction of the hydraulic capacity of the structure. The outlet structure deterioration has also resulted in sloughing of the railroad embankment. Internal dimensions and conditions of the culvert could not be evaluated due to the deteriorated end conditions and standing water.
YRC performed a hydrologic analysis for the watershed draining to the existing culvert to determine peak flow rates in accordance with the procedures outline in the CTDOT Drainage Manual.
HYDROLOGY
WATERSHED PROPERTIES
The existing culvert has a total drainage area of 67.14 acres (0.10 mi²) measured using a compilation of the following mapping, as confirmed through field observation.
1. CTDOT Survey Data (SV_D3_300_175_Milford_Metro_North_Culvert_GRN.dgn) 2. 2011 FEMA Lidar: Quinnipiac River Watershed (CT) contour data obtained from
NOAA Office for Coastal Management Digital Coast Data Access Viewer 3. 2010 Coastal CT ADS40 4 Band aerial imagery obtained from NOAA Office for
Coastal Management Digital Coast Data Access Viewer 4. Stormwater System mapping obtained from Milford Engineering Department
The watershed, which lies in the Indian River subregional drainage basin 5306, is part of the South Central Coast major drainage basin number 5. Located in the southeastern portion of Milford, the watershed can be characterized as dense commercial and industrial development with sparse areas of vegetation and woods.
The area consists of moderate sloping terrain directing runoff through a series of stormwater collection systems to the south towards the MNRR corridor and the subject culvert. The stormwater networks ultimately flow to a wooded wetland area that forms a natural stormwater detention basin prior to discharging to the culvert. Based upon a report prepared by Connecticut Ecosystems LLC, dated November 12, 2015, groundwater discharges were evident within the defined channel and wetland area in the vicinity of the culvert, even during drier times of the year, signifying a perennial or mostly perennial flow.
Other than the natural stormwater detention basin described above, there are no significant waterbodies or major flood retention structures within the watershed. Based on Town of Milford mapping, there appear to be underground detention and/or infiltration structures serving a few properties and/or developments. As a conservative measure, these mapped underground storage structures were disregarded in the hydrologic analyses.
Drainage area maps and watershed data provided in Appendix B.

STATE PROJECT NO. 301-0175 CULVERT REPLACEMENT MNRR NEW HAVEN MAINLINE M.P. 65.60, MILFORD, CONN.
4
PREVIOUS STUDIES
The site is not located within a FEMA Special Flood Hazard Area with no published hydrologic studies of
the watershed draining to the subject culvert.
HISTORIC FLOODING
Based on information provided by CTDOT staff, the low-lying developed areas immediately upstream of the subject culvert have a history of flooding. Due to the partial collapse of the outlet, the frequency of flooding has increased.
In a phone conversation between Richard Bray, PE of Lochner and James Connors of Connors Properties, LLC, owner of the parcels upstream of the subject culvert, Mr. Connors confirmed that the area has a long history of flooding, a condition that has worsened since the partial collapse of the outlet.
PEAK FLOW METHODS
Peak flow rates for the contributing watershed were calculated using the Rational Method and Technical Release TR-55 as described below.
RATIONAL METHOD: In accordance with Section 6.9 of the CTDOT Drainage Manual, the Rational Method was used to calculated peak runoff rates for watersheds up to 200 acres in size using the following parameters.
RUNOFF COEFFICIENT: A composite runoff coefficient (C) was calculated for the watershed based on land uses, as determined from the 2011 NOAA Aerial Imagery, and runoff values for various landuses and surface materials provided in Table 6-4 and 6-5 in the CTDOT Drainage Manual. The composite C for the watershed is 0.69.
TIME OF CONCENTRATION: Time of concentration (Tc) was determined using the SCS method, with a combination of sheet flow and shallow concentrated flow from the hydraulically most distant point of the watershed to the approximate limits of backwater inundation resulting from the existing culvert. The calculated Tc for the watershed is 0.457 hours or 27.4 minutes.
RAINFALL INTENSITY: As required in the CTDOT Engineering Bulletin EB-2015-2, dated November 3, 2015, precipitation frequency estimates (rainfall data) were obtained from NOAA Atlas 14 Volume 10: Precipitation-Frequency Atlas of the United States, Northeastern States. The nearest published station is Bridgeport Sikorsky Memorial Airport, Station ID 06-0806. Rainfall intensity rates were interpolated from the published data based on a calculated Tc of 27.1 minutes.
Storm 1-Year 2-Year 5-Year 10-Year 25-Year 50-Year 100-Year Intensity (in/hr) 1.74 2.09 2.68 3.17 3.84 4.35 4.87
INFREQUENT STORMS: In order to account for a reduction in the impact of infiltration and other losses for less frequent, higher intensity storms greater than the 10-year, Frequency Factors (Cf) were applied to the rational formula as follows:
Storm 1-Year 2-Year 5-Year 10-Year 25-Year 50-Year 100-Year Cf 1.0 1.0 1.0 1.0 1.1 1.2 1.25

STATE PROJECT NO. 301-0175 CULVERT REPLACEMENT MNRR NEW HAVEN MAINLINE M.P. 65.60, MILFORD, CONN.
5
TR-55 METHOD: Technical Release 55 (TR-55), developed by the USDA Natural Resources Conservation Service (NRCS) for urban and urbanizing watersheds, is a procedure for estimating storm runoff volume and peak discharge rates in small watersheds utilizing 24-hour rainfall data, runoff curve numbers (CN), and time of concentration (Tc). Bentley PondPack v8i was used to generate peak flows from the watershed with the following parameters:
RAINFALL: Similar to the Rational Method, NOAA Atlas 14 Volume 10 rainfall data was used for the nearest published station in Bridgeport Sikorsky Memorial Airport, Station ID 06-0806. 24-hour rainfall depths are provided in the table below.
Storm 1-Year 2-Year 5-Year 10-Year 25-Year 50-Year 100-Year Depth (in.) 2.81 3.44 4.46 5.31 6.48 7.38 8.29
CURVE NUMBER: Curve numbers (CN) were assigned based on the hydrologic soil group and land use. Based on USDA NRCS Web Soil Survey, soils within the subject watershed consist of Urban Land, Map Unit 307, with a Hydrologic Soil Group Rating of D. Landuse within the watershed consists of impervious (roads, sidewalks, driveways, parking areas, loading areas and buildings), open space (apparent landscaped areas), woods and the railroad corridor as determined from the 2011 NOAA Aerial Imagery. The composite CN for the watershed is 91.0.
TIME OF CONCENTRATION: A time of concentration (Tc) of 0.457 hours or 27.4 minutes was used to match the approach used in the Rational Method.
PEAK FLOW COMPARISON As shown in the table below, the Rational and TR-55 Methods produced similar peak flow rates, with the TR-55 Method producing slightly higher, more conservative rates for all storms.
AVG. RECURRENCE INTERVAL (STORM)
PEAK FLOW RATE (CFS) TR-55 RATIONAL METHOD
Avg. Day 0.2 0.2 Avg. Spring 0.4 0.4
1-year 86 80 2-year 111 97 5-year 153 124
10-year 188 147 25-year 235 195 50-year 271 241
100-year 307 282 500-year 427 369

STATE PROJECT NO. 301-0175 CULVERT REPLACEMENT MNRR NEW HAVEN MAINLINE M.P. 65.60, MILFORD, CONN.
6
RECOMMENDED FLOWS
Per the CTDOT Drainage Manual, a culvert conveying an established watercourse with a drainage area less than 1.0 square mile is considered a “Small” structure, with a recommended 50-year storm design flow and a 100-year check flow. However, per the CTDOT Office of Rail Drainage Facility Practices, culverts carrying railroad lines with regularly scheduled passenger services shall be designed to accommodate a 100-year storm regardless of watershed size. In recognition of the Office of Rail requirements, a 100-year design storm is recommended.
As described in the Peak Flow Comparison section above, the calculated flows for the TR-55 and Rational Methods were comparable, with the TR-55 flows ranging from 8% to 30% higher than the Rational Method depending on the storm event. For the 100-year design storm, the calculated flows for each method are within 10% and therefore, either method appears to provide a reasonable flow for analysis and design purposes for the subject culvert.
Beyond the calculated peak flow rates, consideration was also given to the complexity of the watershed and the nature of documented flooding problems in the vicinity of the subject culvert. The flooding appears to be the result of increased development within the watershed and a deterioration of the existing culvert structure. As a result, runoff exceeds the capacity of the existing culvert, resulting in backwater that inundates a large storage area along the northern embankment of the railroad before water surface elevations reach the finish floors of adjacent buildings. In order to properly evaluate existing conditions and the proposed improvement, the available flood storage immediately upstream of the existing culvert should be considered in addition to the hydraulic capacity improvements offered by a replacement structure.
Therefore, based on the hydrologic calculations, field observations, historical flooding, and Milford map research, YRC recommends that the peak flow rates calculated utilizing the TR-55 Method be used for hydraulic analysis of existing and proposed conditions. The calculated peak flow rates for the TR-55 Method are summarized in the table below, with the recommended 100-year design flow in bold.
AVG. RECURRENCE INTERVAL (STORM)
PEAK FLOW RATE (CFS)
RATIONAL METHOD Avg. Day 0.2
Avg. Spring 0.4 1-year 86 2-year 111 5-year 153
10-year 188 25-year 235 50-year 271 100-year 307 500-year 427

STATE PROJECT NO. 301-0175 CULVERT REPLACEMENT MNRR NEW HAVEN MAINLINE M.P. 65.60, MILFORD, CONN.
APPENDIX A
PHOTOGRAPHS

STATE PROJECT NO. 301-0175 CULVERT REPLACEMENT MNRR NEW HAVEN MAINLINE M.P. 65.60, MILFORD, CONN.
3
282 Woodmont Road looking north
Eastern Steel Road looking northwest towards 465 Old Gate Lane

STATE PROJECT NO. 301-0175 CULVERT REPLACEMENT MNRR NEW HAVEN MAINLINE M.P. 65.60, MILFORD, CONN.
4
Intersection of Research Drive and Woodmont Road
Upstream Railroad Embankment at Culvert

STATE PROJECT NO. 301-0175 CULVERT REPLACEMENT MNRR NEW HAVEN MAINLINE M.P. 65.60, MILFORD, CONN.
5
Downstream Embankment at culvert – note sloughing
Downstream outlet – note collapsed structure

STATE PROJECT NO. 301-0175 CULVERT REPLACEMENT MNRR NEW HAVEN MAINLINE M.P. 65.60, MILFORD, CONN.
APPENDIX B
WATERSHED DATA

400 0 400 800
CULVERT REPLACEMENT - MP 65.60
CONNECTICUT DEPARTMENT OF TRANSPORTATION
WATERSHED MAP www.yanticriverconsultants.comWeb:
(860) 367-7264Phone:
LEBANON, CONN 06249
191 NORWICH AVENUE
YANTIC RIVER CONSULTANTS, LLC
CONTACT INFORMATION
DATE
3/2/16 MILFORD, CT
SCALE: 1"= 400'
NEW HAVEN MAINLINE
SHEET
1OF 3
50
60
50
4050
60
80
80
40
50
60
70
80
50
60
70
70
40
54
50
78
60
50
70
WATERSHED TABLE
MAP REFERENCES
AERIAL IMAGERY OBTAINED FROM NOAA2.)
CONTOUR DATA OBTAINED FROM NOAA1.)
67.14 AC.DRAINAGE AREA
2.90 AC.RAILROAD
10.58 AC.WOODS
9.40 AC.LANDSCAPE
12.86 AC.BUILDING
31.40 AC.IMPERVIOUS
EXISTING CULVERT LOCATION

BRASS DISK IN LEDGE OUTCROP
CAT TOWER BASE #952
DRILL HOLE IN SW COR
DRILL HOLE IN SE COR
CAT TOWER BASE #951
B.M. 1
Elev. 41.823
NAVD 1988
B.M. 2
Elev. 43.644
NAVD 1988
CP-3
GR
AS
S
OAK
36"
MAPLE
14"
1-STORY BLOCK
BUILDING #95
GR
AS
S
CP-4
STORAGECONC BLOCK
#6886UI
BLO
CK
WALL
BLO
CK
WALL
ST
RE
AM
STREA
M
ST
RE
AM
STREAM
MAPLE
4"
MAPLE
4"
15'' CPVC
152 PEPES FARM RD
168 PEPES F
AR
M
RD
206 PEPES FARM RD
230 PEPES FARM RD
50 EASTERN STEEL RD
75 EASTERN STEEL RD
59 EASTERN STEEL RD
CP-2
B.M.#2
CAT#9
52
CAT#9
52
CAT#9
51
CAT#9
51
B.M.#1
RIP
RA
P
RIP
RA
P
SOUTH OF CULVERT
2821+00
2822+0
0
2823+0
0
2824+0
0
2825+0
0
2826+0
0
2827+0
0
2828+0
0
2829+0
0
2830+0
0
2831+00
2832+0
0
2833+0
0
2834+0
0
2835+0
0
2836+0
0
V 53
55
64
1-STORY BLOCK
BUILDING #101
1-ST
OR
Y STEEL B
UIL
DIN
G
1150
25.378
1148
999
25.681
1153
999
25.883
1147
999
26.025
789
999
26.461
1366
999
26.500
1146
999
26.620
1154
999
26.679
795
999
26.761
800
999
26.793
1351
1352
1354
1364
999
999
999
999
26.800
26.800
26.800
26.800
777
999
26.848
1350
1363
999 ST
999 ST
26.850
26.850
1370
999
26.860
940
419 CL
26.875
783
999
26.880
1353
1356
1358
1368
999
999
999
999
26.900
26.900
26.900
26.900
1365
999
26.908
794
999
26.908
1145
999
26.952
989
999
27.088
782
999
27.118
1357
1369
999
999
27.130
27.130
1157
999
27.156
769
999
27.167
776
999
27.168
1371
1359
999
999
27.180
27.180
1152
999
27.226
770
999
27.226
1149
999
27.228
1360
1373999
99927.240
27.240
788
999
27.286
1355
1367
999
999
27.300
27.300
1155
999
27.334
1361
1374
999
999
27.400
27.400
749
27.407
1142
999 ST
27.491
1144
999
27.492
799
27.510
1156
999
27.534
609
27.565
750
118 552 ST
27.566
999
27.572
796
27.574
1372
999
27.590
988
999
27.686
1377
1399
999 ST
999
27.700
27.700
987
999
27.716
999 ST
27.717
13781398
999999
27.72027.720
793
27.754
778
27.776
787
27.780
740
27.826
746
27.827
747
27.842
790
27.844
27.867
807
27.882
1375 1376
999 999
27.900 27.900
743
27.933
768
999 ST
27.964
744
27.968
748
27.969
1362
999
27.980
882
903 ST
28.009
784
28.034
808
28.060
809
28.068
118 ST
28.085
745
28.108
879
28.108803
28.118
28.127
737
28.149
754
28.150
886
903
28.152
883
903
28.154
604
28.159
804
28.160
28.166
764
118 ST JPT 610
28.185
1158
999
28.190
863
28.210
742
28.212
877
28.225
869
28.239
755
28.255
805
28.266
860
28.274
850
28.277
870
28.280
878
28.291
738
28.293
606
28.299
28.307
775
28.311
28.319
1159
999
28.319
802
28.321
880
28.325
890
903
28.336
887
903
28.358
876
28.362
767
28.370
28.373
739
28.383
797
903
28.405
28.406
873
28.409
780
903
28.414
872
28.430
875
28.434
806
28.435
867
28.444
859
28.445
605
28.456
862
28.460
884
903
28.464
28.470
864
28.471
858
28.485
857
28.487
28.490
28.493
849
28.522
888
903
28.528
28.530
28.536
868
28.545
874
28.566
792
903
28.570
865
28.586
1143
999
28.598
847
28.602
798
903
28.607
904
28.627
848
28.652
552
28.662
786
903
28.663
772
28.680
854
28.686
1100
999
28.713
852
28.714
856
28.721
866
28.722
853
28.744
1339
999
28.750
28.755
752
552
28.774
999 ST
28.780
889
903
28.797
28.803
779
903
28.806
28.817
603
28.826
839
28.831
785
903
28.832
904
28.856
1099
999
28.872
1338
999
28.900
1134
118 904
28.902
608
28.909
846
28.915
840
28.917
903
28.925
885
903
28.932
1135
904 118 JPT 969
28.935
1137
904
28.946
1136
904 ST
28.961
1132
118 904
28.969
1139
904
28.986
1337
999
29.000
845
29.001
844
29.004
1035
29.005
1349
999
29.010
709
999 ST
29.022
736
118 ST JPT 709
29.028
930
29.029
855
29.049
29.051
904
29.055
934
29.076
607
29.080
756
552
29.083
1023
29.084
774
903
29.116
835
29.122
1133
118 904
29.139
842
29.145
1028
29.145
999
29.153
936
29.162
29.166
29.168
1138
904
29.172
29.196
1024
29.199
937
118 419 ST
29.201
1140
904
29.209
1108
29.210
29.212
933
29.217
602
29.228
29.238
757
552
29.238
1020
118 552
29.243
904 CL
29.255
1109
29.257
773
903
29.267
1107
29.273
969
118 ST
29.280
999 CL
29.285
1120
29.288
823
29.297
1046
29.318
822
29.324
600
29.324
758
552
29.331
999
29.347
970
29.348
118 904
29.355
832
29.361
29.378
29.393
29.395
29.403
766
903
29.414
1106
29.419
1037
29.420
753
552
29.423
1103
999
29.439
1045
29.445
699
903
29.451
833
29.461
1038
29.463
843
29.464
1340
999
29.470
1126
29.485
834
29.488
1040
29.502
1047
29.505
726
29.514
759
552
29.517
1019
118 ST 552 ST
29.520
1049
29.523
1130
118 904
29.544
29.548
1036
29.548
29.550
1050
29.554
1073
29.556
904
29.566
1051
29.572
1129
29.575
29.581
596
29.586
1039
118 552
29.596
1048
29.600
986
999
29.610
1104
999
29.618
13971379
999999
29.62029.620
723
29.623
29.626
722
29.640
700
903
29.641
762
552
29.646
1076
29.658
724
29.660
1125
29.665
820
904 JPT 656
29.681
552
29.696
622
29.725
599
29.737
695
29.747
972
29.752
1389
999
29.759
1014
999
29.759
824
29.770
903
29.771
765
903 ST
29.772
1128
904
29.788
1087
999
29.791
29.795
656
904 ST
29.808
29.812
929
29.813
29.820
1105
29.820
696
29.823
29.848
1332
999
29.850
692
29.857
725
29.860
735
29.864
1094
999
29.868
1043
118 552
29.876
734
29.885
730
29.885
594
29.889
1052
29.894
1074
29.900
1335
999
29.900
763
552
29.908
1097
29.918
1347
999
29.920
29.923
727
29.923
693
29.930
1075
29.936
760
552
29.942
698
903
29.945
728
29.963
1127
904
29.968
657
904
29.980
1044
118 552
29.990
30
30
30
30
30
30
3030
30
30
30
3030
30
999 ST
30.013
1388
999 ST
30.013
1029
904 ST
30.013
30.024
625
30.025
720
30.026
30.031
729
30.034
624
30.035
1345
999
30.050
1091
999
30.058
694
30.070
30.071
504
30.082
733
30.091
1072
30.091
1334
1346
999
999
30.100
30.100
592
30.108
1391
999
30.114
1018
999
30.114
697
903 ST
30.120
30.123
689
30.123
598
30.123
690
30.133
1387
999 JPT 1018
30.150
1390
999
30.151
1015
999
30.151
30.158
985
999
30.166
620
30.169
1042
118 552
30.170
1380
1396
999
999
30.180
30.180
979
999 ST
30.186
1385
1386
999
999 ST
30.190
30.190
1098
30.192
1102
30.204
595
30.205
660
904
30.224
1124
904
30.224
732
30.233
1041
118 552
30.244
30.260
980
999
30.262
593
30.279
1090
999
30.285
1183
30.296
1333
999
30.300
623
30.314
903
30.320
626
30.329
597
30.334
1384
999
30.350
1071
30.354
670
30.377
1057
999 ST
30.384
1186
903
30.392
578
552
30.397
30.397
1058
999
30.405
973
416 ST 118
30.410
1095
999
30.417
999
30.418
1392
1336
999
999
30.420
30.420
702
903
30.426
1348
999
30.430
685
30.431
903
30.448
590
30.454
982
999
30.463
687
30.464
1383
1393999
99930.470
30.470
1096
30.471
1185
903
30.486
1030
904
30.512
688
30.513
1089
30.515
552 ST
30.521
1086
999
30.533
708
903
30.535
1331
1344
999
999
30.550
30.550
904 ST
30.553
983
999
30.562
984
999
30.568
1382
1394
999
999
30.570
30.570
589
118 ST
30.571
579
552
30.583
1034
552
30.584
904
30.590
1395
999
30.590
577
552
30.602
947
30.603
1381
999
30.650
666
904 ST
30.658
1053
30.660
1093
30.672
629
999
30.675
576
552 ST
30.682
999 ST
30.692
682
904
30.703
686
30.710
1066
30.720
926
30.725
1168
30.728
684
30.739
669
904
30.750
1059
999
30.755
939
30.788
1070
30.799
1092
30.808
1067
30.816
945
30.857
1069
30.858
1123
904
30.862
1062
999 CL
30.869
928
903
30.874
664
904
30.882
1085
30.889
1068
30.894
1088
30.899
588
30.923
944
999 CL
30.976
942
999
30.986
903 CL
30.993
1056
220
30.995
683
904
31.014
31.015
1122
904 ST
31.021
894
552
31.024
118 ST
31.032
1182
903
31.051
520
903
31.080
978
31.081
1184
903 ST
31.081
904 ST
31.101
903
31.107
522
903
31.110
1343
999
31.130
943
999
31.130
580
552
31.143
667
904
31.182
628
999
31.193
935
903
31.199
1167
31.205
1084
31.205
1330
999
31.207
1083
999
31.209
1342
999
31.230
1169
31.254
1065
31.323
1022
903
31.324
938
31.326
974
31.379
627
999 ST
31.380
1082
999 ST
31.401
1180
903
31.405
903
31.405
1179
903
31.425
1064
31.434
975
31.438
1341
1329
999 ST
999 ST
31.450
31.450
904
31.466
1021
552 903 ST
31.473
893
552
31.492
1007
31.509
903 ST
31.515675
31.518
703
903
31.519
903
31.524
31.526
31.546
1178
903 ST
31.549
903
31.555
949
31.564
903
31.570
673
31.598
523
903 904
31.611
1006
118 ST
31.633
672
31.665
932
903
31.666
895
552
31.677
976
31.683
925
31.687
1009
31.689
1081
118 ST
31.693
922
31.701
674
31.701
977
31.743
1008
31.743
904
31.746
31.763
958
31.767
31.771
1063
118 ST
31.808
678
31.813
946
31.814
1033
552
31.829
31.843
1016
31.844
31.848
904 ST
31.850
1010
31.858
948
31.877
1017
31.879
31.914
1055
220
31.916
896
552
31.942
892
552
31.951
31.968
1166
32.019
957
32.085
1026
32.101
587
32.136
1060
999
32.166
1027
903
32.199
967
32.251
1061
999
32.289
1025
903
32.299
679
32.316
903 ST
32.318
920
903
32.320
927
903
32.331
1031
903
32.333
1013
32.358
924
903
32.372
903 PT
32.402
905
904
32.410
552
32.423
504 ST 903
32.437
903
904 ST
32.615
668
32.621
907
904
32.730
665
32.731
1012
32.734
586
32.786
32.831
906
904
32.831
897
552
32.852
956
32.856
904
904
32.885
999
32.887
677
32.888
32.911
950
32.921
904
32.927
923
903
32.928
959
33.015
968
33.022
1162
904
33.030
676
33.083
1170
33.093
1160
904 ST
33.209
1054
220 ST
33.227
1032
552 904
33.287
1165
33.289
963
33.319
585
552
33.324
964
33.338
902
33.377
908
903 ST
33.664
836
33.693
966
33.716
898
552
33.720
528
33.818
680
33.8401163
904
33.845
633
420
33.971
899
552
34.033
900
552
34.054
960
34.115
634
34.317
582
552
34.335
584
552
34.384
837
34.414
420
34.423
632
420
34.474
903
34.503
953
34.532
34.589
903
34.609
965
34.637
903
34.712
909
903
34.733
962
34.817
952
34.843
663
34.844
1164
904
34.877
838
34.883
1172
903 ST
34.903
35
35
35
35
35
35
35
35
35
35
35
35
35
35
35
35
903
35.057
903
35.142
630
420 ST
35.164
903
35.196
707
903
35.374
507
504 PT 903 PT
35.393
635
420
35.396
583
552
35.525
506
903 504
35.736
655
35.827
955
35.868
508
903 PC
35.956
529
35.965
954
36.020
505
903 504
36.182
527
36.234
509
36.282
999
36.305
659
36.353
504 904
36.460
530
36.634
540
36.659
662
36.923
485
36.925
658
36.925
468
36.971
504
903 504
37.076
104 ST
37.196
472
905 ST
37.306
503
903 504
37.481
427
37.546
487
37.551486
101 PC
37.599
704
903
37.656
469
37.719
525
37.722
470
37.748
474
104 PC
37.763
460
504 904
37.889526
37.899
483
104 101 ST
37.937
466
101 PT NT
37.957
478
37.977
482
104 PT
37.978
488
38.009
475
38.010
479
38.043
636
420
38.052
473
905 PC
38.080
1080
203
38.102
203
38.109
830
203
38.116
575
203
38.117
322322322322322322
38.12438.12438.12438.12438.12438.124
502
903 PC 504 PC
38.139
1173
903
38.154
537
38.199
535
38.199
38.204
465
38.217467
602
38.225
997
38.288
476
905
38.295
484
905
38.364
996
38.393
477
905
38.407
1288
104 PT
38.455
905 PT
38.462
480
905
38.498
524
38.498
536
38.533
1287
38.546
464
101 PC NT
38.574
38.585
1004
38.588
459
504 ST PC 904 ST PC
38.595
992
416 ST JPT 459
38.656
1312
38.705
489
38.725
1284
38.791
1291
104 PC NT
38.795
994
38.808
1289
905 PT
38.811
1314
38.863
1177
903
38.868
1283
104 PC
38.886
1310
38.901
428
38.922
998
101 ST
38.940
1292
38.951
1000
38.959
706
903
38.969
38.999
1286
905
38.999
1309
39.007
1175
903
39.012
532
39.014
1174
903
39.018
1313
39.020
999
39.033
1188
409
39.047
903 504
39.068
1280
104 PC
39.099
538
39.149
566
39.156
993
39.172
458
201 ST
39.214
1005
39.219
1003
39.222
1285
905
39.239
463
101 ST
39.278
500
504 ST 903 ST
39.282
1317
39.301
1290
905 PC
39.311
995
39.316
1293
104 PT NT
39.327
1315
39.333
462
39.336
1176
903
39.341
539
39.360
1282
905 PC
39.374
204
916 CL
39.375
1295
905
39.419
533
39.427
1268
39.429
200
999
39.439
1208
104 PT
39.443
1242
39.450
1275
39.475
1209
39.477
1239
145 ST
39.485
1204
39.488
GG
534
403
39.501
495
145 ST
39.502
1279
39.508
1240
39.522
1316
39.532
1265
145 ST
39.537
1214
104 PC NT
39.538
705
903
39.543
1205
39.552
542
39.554
1243
145 ST
39.555
426
39.560
1281
905 PC
39.590
224
999
39.605
1201
104 ST PC
39.606
565
104 145 ST
39.607
1264
145 ST
39.620
490
39.628
1262
145 ST
39.632
1305
39.635
1276
104 ST
39.642
1244
39.663
1241
145 ST
39.663
1228
39.670
1215
39.689
1261
145 ST
39.715
1225
104 ST PC
39.720
1267
145 ST
39.733
1229
104 PT PC
39.753
1232
39.772
1216
39.778
990
39.781
1306
39.782
553
39.786
1233
39.788
1296
905 PT NT
39.791
1299
39.799
1207
905 PT
39.815
1304
102 ST
39.817
1260
39.819
1189
407
39.819
1313A
102 CL
39.820
WG
1223
39.821
1308
39.827
1307
39.830
1218
503
39.832
1254
39.870
1219
503
39.879
916 ST
39.894
1274
39.897
104 145 ST
39.898
562
999
39.900
39.900
1266
39.902
1245
39.906
1210
905
39.918
1278
905
39.933
1255
39.944
1222
201 JPT 462
39.945
543
39.946
999
39.949
1300
145 ST
39.950
494
39.962
1263
39.963
546
39.965
905 PC NT
39.971
104 ST JPT 1257
39.974
1203
905
39.978
547
104 PT
39.994
40
40
40
40
40
40
40
40
40
40
40
1206
905
40.001
1221
503
40.004
1251
145 ST
40.013
1257
104 ST JPT 556
40.013
1259
145 ST
40.037
1303
40.038
550
40.041
1250
104 ST
40.042
542B
104 ST PC
40.042
1202
905 ST PC
40.042
1253
145 ST
40.045
999
40.059
564
905
40.061
1226
905 ST PC
40.067
1220
503
40.090
1277
905 ST
40.094
1227
905
40.136
1217
503
40.141
1238
40.149
1252
40.158
1224
40.160
1212
905
40.194
1230
905 PT PC
40.199
1213
905
40.207
1231
905
40.218
B.M. 77
457
40.232
1234
905
40.233
552
905
40.262
563
905
40.328
497
336
40.352
1294
40.395
498
336
40.407
560
905 ST JPT 1258
40.410
1273
40.414
499
40.419
637
420
40.432
101 PT NT
40.435
1187
505 ST
40.437
1271
40.439
545
905
40.466
202
40.468
544
905
40.474
548
905 PT
40.475
1298
145 ST
40.486
496
40.487
1258
905 ST JPT 557
40.503
493
145 ST
40.503
1270
40.524
1272
40.528
555
40.534
568
150 DNC
40.540
1249
905 ST
40.552
542A
905 ST PC
40.552
549
905
40.553
492
101 201 ST
40.561
223
904
40.563
203
40.575
1269
40.600
556
104 ST
40.619
WG
1248
40.649
1256
304
40.661
1301
40.678
567
150 DNC
40.687
40.693
1192
505 ST
40.702
1302
145 ST
40.726
1190
505
40.752
1195
505 ST
40.758
505
40.767
1193
505
40.778
654
504
40.788
1196
505
40.817
1297
905
40.846
649
504 ST
40.848
999
40.853
999
40.882
554
905
40.887
557
905 ST
40.956
904
40.972
999
41.036
322322322322322
41.03641.03641.03641.03641.036
904
41.040
226
999 ST
41.088
1236
150 DNC
41.109
999
41.113
653
504
41.119
1247
41.167
444
999
41.172
904
41.244
999
41.275
233
999
41.288
1235
150 DNC
41.308
904
41.344
999
41.349
229
102 ST
41.362
41.383
1002
201 ST JPT 458
41.418
222
903
41.419
236
999
41.424
243
999
41.445
41.479
916 ST
41.481
225
153 ST
41.481
230
41.486
1237
150 DNC
41.490
1001
41.503
904
41.518
41.523
456
999
41.528
999 ST
41.529
453
999
41.547
356
41.565
429
916 CL 999
41.591
353
41.597
904
41.600
903
41.608
999
41.626
239
41.626
234
41.640
999
41.642
41.643
367
916 ST
41.663
425
999 916 ST
41.664
1318
999 ST
41.664
41.670
246
999
41.685
41.716
999
41.721
253
999
41.722
1246
150 DNC
41.730
432
41.734
443
999
41.739
430
915 ST
41.743
433
915 CL
41.745
235
41.759
240
41.762
1319
999
41.773
903
41.777
434
240
41.798
41.810207
41.811
349
41.813
209
41.820
206
41.823
205
915 ST
41.829
208
915 CL
41.829
41.836
424
999
41.850
352
41.864
1320
999
41.874
249
41.878
999 ST
41.893
904
41.914
240
41.917
916 CL
41.936
244
41.937
256
999
41.952
348
41.978
41.983
903
41.987
228
1112 ST
41.992
227
112 ST
41.994
42.008
903
42.023
250
42.024
345
42.046
1194
150 DNC
42.070
904
42.073
263
999
42.076
245
42.076
423
999
42.087
904
42.095
220
42.109
42.109
42.114
449
42.120
232
42.121
42.126
42.128
452
42.141
266
999
42.145
259
42.153
322
42.162
42.179
355
42.188
344
42.203
354
42.215
368
42.216
448
42.222
903
42.225
254
42.226
445
42.236
916 904
42.241
238
42.241
273
999
42.245
237
42.246
42.263
42.265
260
42.294
340
42.305
42.307
42.309
652
504
42.314
903
42.321
999
42.333
337
42.353
403
999
42.357
439
42.361
242
42.380
42.381
276
999
42.392
255
42.396
999
42.400
442
42.402
904
42.425
916 904
42.432
269
42.444
350
42.444
42.457
42.464
42.472
42.474
333
42.476
903
42.497
247
42.498
248
42.499
336
42.510
438
42.519
283
999
42.522
435
42.534
42.534
264
42.552
270
42.593
332
42.600
384
999
42.603
347
42.613
42.618
42.629
252
42.634
42.634
42.638
346
42.643
329
42.645
265
42.683
42.685
903
42.694
422
42.699
42.707
450
42.737
279
42.745
42.761
325
42.762
904
42.764
42.764
286
999
42.769
342
42.774
257
42.780
258
42.784
343
42.807
328
42.810
42.811
42.820
42.831
42.835
404
999
42.836
274
42.845
447
42.848
903
42.852
446
42.862
394
999
42.881
280
42.897
324
42.903
262
42.908
42.910
42.911
366
999
904 ST
42.919
42.919
42.920
339
42.933
42.954
42.955
409
42.960
338
42.971
42.986
440
42.996
43.004
275
43.011
43.013
289
43.022
43.039
267
43.044
268
43.060
43.062
43.072
320
43.081
408
43.099
334
43.103
904
43.108
903
43.118
335
43.123
405
43.134
293
999
43.146
437
43.149
436
43.149
903
43.172
290
43.176
43.176
43.187
284
43.194
43.197
43.207
272
43.210
43.211
650
504
43.211
296
999
43.213
43.224
455
999
43.226
43.230
43.240
399
43.248
330
43.269
402
43.294
420
43.311
285
309
43.317
43.317
43.320
362
999
43.333
102 ST
43.338
43.339
393
999
43.345
277
43.352
43.354
278
43.359
299
43.371
43.374
398
43.393
43.394
999 ST
43.401
326
43.402
373
43.407
374
915 CL
43.414
395
375
240
43.417
43.417
327
43.429
370
916 CL
43.435
372
43.436
43.444
43.456
915 ST
43.471
294
43.477
369
43.496
282
43.501
43.508
903 ST
43.517
43.517
308
43.520
43.528
323
43.533
363
999
43.533
389
43.537
903
43.543
43.552
305
43.557
392
43.562
322
43.567
43.594
43.613
43.618
915 CL
43.63043.632
295
43.636
102 ST
43.641
287
43.647
288
43.652
915 ST
43.660
153 ST
43.662
43.664
43.670
43.675
43.682
304
109 ST
43.682
388
43.694
43.709
648
43.709
385
43.726
407
43.728
300
240
43.746
406
43.753
454
999 ST
43.771
1322
999
43.771
43.792
1323
999
43.796
292
43.799
1324
999
43.800
1321
999
43.824
43.827
365
999
43.831
380
43.842
43.851
504
43.858
43.867
43.870
400
43.875
383
43.877
43.893
364
999
43.921
644
43.950
43.956
43.984
297
43.989
298
43.991
43.996
43.999
376
44.009
379
44.011
397
44.019
396
44.038
357
102 ST
44.110
360
109 ST
44.141
307
44.147
44.149
44.152
390
44.165
306
44.166
44.182
1112 ST
44.252
302
112 ST
44.274
112 ST
44.277
303
1112 ST
44.297
387
44.319
386
44.341
44.470
382
44.492
377
44.635
378
44.640
645
44.677
358
112 ST
44.743
359
1112 ST
44.768
45
45
646
45.067
638
420 113 ST
45.074
647
45.602
639
45.783
1325
999
45.852
642
45.896
1326
999
45.932
1327
999
45.934
640
113 201 ST
46.547
46.709
643
46.828
150 0 150 300
CULVERT REPLACEMENT - MP 65.60
CONNECTICUT DEPARTMENT OF TRANSPORTATION
PO-1 ELEVATION AREA MAP www.yanticriverconsultants.comWeb:
(860) 367-7264Phone:
LEBANON, CONN 06249
191 NORWICH AVENUE
YANTIC RIVER CONSULTANTS, LLC
CONTACT INFORMATION
DATE
3/2/16 MILFORD, CT
SCALE: 1"= 400'
NEW HAVEN MAINLINE
SHEET
2OF 3
60
40
50
40
54
50
ELEVATION-AREA TABLE
AREA (AC)AREA (SF)ELEV.
4.713220530936
1.77927750434
0.70033050332
0.30341321730
0.0266116029
0.011650428
0.003113627
0.00052226
ELEV. 38
ELEV. 36
ELEV. 34
ELEV. 32 ELEV. 30
ELEV. 29
ELEV. 28
ELEV. 27
EXISTING 2' STONE CULVERT LOCATION

400 0 400 800
CULVERT REPLACEMENT - MP 65.60
CONNECTICUT DEPARTMENT OF TRANSPORTATION
Tc MAP www.yanticriverconsultants.comWeb:
(860) 367-7264Phone:
LEBANON, CONN 06249
191 NORWICH AVENUE
YANTIC RIVER CONSULTANTS, LLC
CONTACT INFORMATION
DATE
3/2/16 MILFORD, CT
SCALE: 1"= 400'
NEW HAVEN MAINLINE
SHEET
3OF 3
50
60
50
4050
60
80
80
40
50
60
70
80
50
60
70
70
40
54
50
78
60
50
70
EXISTING CULVERT LOCATION
60' WOODS @ 0.03
40' WOODS @ 0.20
500' PAVEMENT @ 0.008
1320' PAVEMENT @ 0.025

Hydrologic Soil Group—State of Connecticut(301-175 Hydrologic Soil Group Map)
Natural ResourcesConservation Service
Web Soil SurveyNational Cooperative Soil Survey
11/11/2015Page 1 of 4
4566
200
4566
300
4566
400
4566
500
4566
600
4566
700
4566
800
4566
900
4567
000
4567
100
4567
200
4567
300
4567
400
4567
500
4566
200
4566
300
4566
400
4566
500
4566
600
4566
700
4566
800
4566
900
4567
000
4567
100
4567
200
4567
300
4567
400
4567
500
665600 665700 665800 665900 666000 666100 666200 666300 666400 666500 666600
665600 665700 665800 665900 666000 666100 666200 666300 666400 666500 666600
41° 14' 32'' N73
° 1
' 28'
' W41° 14' 32'' N
73° 0
' 41'
' W
41° 13' 46'' N
73° 1
' 28'
' W
41° 13' 46'' N
73° 0
' 41'
' W
N
Map projection: Web Mercator Corner coordinates: WGS84 Edge tics: UTM Zone 18N WGS840 300 600 1200 1800
Feet0 100 200 400 600
MetersMap Scale: 1:6,950 if printed on A portrait (8.5" x 11") sheet.

MAP LEGEND MAP INFORMATION
Area of Interest (AOI)Area of Interest (AOI)
SoilsSoil Rating Polygons
A
A/D
B
B/D
C
C/D
D
Not rated or not available
Soil Rating LinesA
A/D
B
B/D
C
C/D
D
Not rated or not available
Soil Rating PointsA
A/D
B
B/D
C
C/D
D
Not rated or not available
Water FeaturesStreams and Canals
TransportationRails
Interstate Highways
US Routes
Major Roads
Local Roads
BackgroundAerial Photography
The soil surveys that comprise your AOI were mapped at 1:12,000.
Please rely on the bar scale on each map sheet for mapmeasurements.
Source of Map: Natural Resources Conservation ServiceWeb Soil Survey URL: http://websoilsurvey.nrcs.usda.govCoordinate System: Web Mercator (EPSG:3857)
Maps from the Web Soil Survey are based on the Web Mercatorprojection, which preserves direction and shape but distortsdistance and area. A projection that preserves area, such as theAlbers equal-area conic projection, should be used if more accuratecalculations of distance or area are required.
This product is generated from the USDA-NRCS certified data as ofthe version date(s) listed below.
Soil Survey Area: State of ConnecticutSurvey Area Data: Version 14, Sep 22, 2015
Soil map units are labeled (as space allows) for map scales 1:50,000or larger.
Date(s) aerial images were photographed: Jun 27, 2014—Jul 22,2014
The orthophoto or other base map on which the soil lines werecompiled and digitized probably differs from the backgroundimagery displayed on these maps. As a result, some minor shiftingof map unit boundaries may be evident.
Hydrologic Soil Group—State of Connecticut(301-175 Hydrologic Soil Group Map)
Natural ResourcesConservation Service
Web Soil SurveyNational Cooperative Soil Survey
11/11/2015Page 2 of 4

Hydrologic Soil Group
Hydrologic Soil Group— Summary by Map Unit — State of Connecticut (CT600)
Map unit symbol Map unit name Rating Acres in AOI Percent of AOI
60B Canton and Charltonsoils, 3 to 8 percentslopes
B 23.1 10.2%
73C Charlton-Chatfieldcomplex, 3 to 15percent slopes, veryrocky
B 0.1 0.0%
306 Udorthents-Urban landcomplex
B 17.6 7.8%
307 Urban land D 186.2 82.0%
Totals for Area of Interest 227.0 100.0%
Hydrologic Soil Group—State of Connecticut 301-175 Hydrologic Soil Group Map
Natural ResourcesConservation Service
Web Soil SurveyNational Cooperative Soil Survey
11/11/2015Page 3 of 4

Description
Hydrologic soil groups are based on estimates of runoff potential. Soils areassigned to one of four groups according to the rate of water infiltration when thesoils are not protected by vegetation, are thoroughly wet, and receive precipitationfrom long-duration storms.
The soils in the United States are assigned to four groups (A, B, C, and D) andthree dual classes (A/D, B/D, and C/D). The groups are defined as follows:
Group A. Soils having a high infiltration rate (low runoff potential) when thoroughlywet. These consist mainly of deep, well drained to excessively drained sands orgravelly sands. These soils have a high rate of water transmission.
Group B. Soils having a moderate infiltration rate when thoroughly wet. Theseconsist chiefly of moderately deep or deep, moderately well drained or well drainedsoils that have moderately fine texture to moderately coarse texture. These soilshave a moderate rate of water transmission.
Group C. Soils having a slow infiltration rate when thoroughly wet. These consistchiefly of soils having a layer that impedes the downward movement of water orsoils of moderately fine texture or fine texture. These soils have a slow rate of watertransmission.
Group D. Soils having a very slow infiltration rate (high runoff potential) whenthoroughly wet. These consist chiefly of clays that have a high shrink-swellpotential, soils that have a high water table, soils that have a claypan or clay layerat or near the surface, and soils that are shallow over nearly impervious material.These soils have a very slow rate of water transmission.
If a soil is assigned to a dual hydrologic group (A/D, B/D, or C/D), the first letter isfor drained areas and the second is for undrained areas. Only the soils that in theirnatural condition are in group D are assigned to dual classes.
Rating Options
Aggregation Method: Dominant Condition
Component Percent Cutoff: None Specified
Tie-break Rule: Higher
Hydrologic Soil Group—State of Connecticut 301-175 Hydrologic Soil Group Map
Natural ResourcesConservation Service
Web Soil SurveyNational Cooperative Soil Survey
11/11/2015Page 4 of 4

11/11/2015 Precipitation Frequency Data Server
http://hdsc.nws.noaa.gov/hdsc/pfds/pfds_printpage.html?st=ct&sta=06-0806&data=depth&units=english&series=pds 1/4
NOAA Atlas 14, Volume 10, Version 2BRIDGEPORT SIKORSKY MEM A
Station ID: 06-0806 Location name: Stratford, Connecticut, US*
Latitude: 41.1583°, Longitude: -73.1289° Elevation:
Elevation (station metadata): 5 ft** source: Google Maps
POINT PRECIPITATION FREQUENCY ESTIMATES
Sanja Perica, Sandra Pavlovic, Michael St. Laurent, Carl Trypaluk, Dale Unruh, Orlan Wilhite
NOAA, National Weather Service, Silver Spring, Maryland
PF_tabular | PF_graphical | Maps_&_aerials
PF tabularPDS-based point precipitation frequency estimates with 90% confidence intervals (in inches)1
DurationAverage recurrence interval (years)
1 2 5 10 25 50 100 200 500 1000
5-min0.345
(0.280‑0.419)0.416
(0.337‑0.506)0.533
(0.430‑0.651)0.629
(0.504‑0.773)0.762
(0.587‑0.982)0.865
(0.650‑1.14)0.968
(0.702‑1.33)1.10
(0.747‑1.54)1.26
(0.824‑1.85)1.39
(0.882‑2.08)
10-min0.488
(0.396‑0.594)0.589
(0.478‑0.717)0.754
(0.609‑0.922)0.891
(0.715‑1.10)1.08
(0.832‑1.39)1.23
(0.921‑1.62)1.37
(0.994‑1.88)1.55
(1.06‑2.18)1.79
(1.17‑2.62)1.97
(1.25‑2.94)
15-min0.574
(0.466‑0.698)0.693
(0.562‑0.844)0.888
(0.716‑1.08)1.05
(0.841‑1.29)1.27
(0.979‑1.64)1.44
(1.08‑1.90)1.61
(1.17‑2.21)1.83
(1.24‑2.57)2.11
(1.37‑3.08)2.32
(1.47‑3.46)
30-min0.802
(0.650‑0.974)0.967
(0.783‑1.18)1.24
(0.998‑1.51)1.46
(1.17‑1.80)1.77
(1.36‑2.28)2.01
(1.51‑2.65)2.25
(1.63‑3.08)2.54
(1.73‑3.58)2.94
(1.91‑4.29)3.24
(2.05‑4.83)
60-min1.03
(0.835‑1.25)1.24
(1.00‑1.51)1.59
(1.28‑1.94)1.87
(1.50‑2.30)2.27
(1.75‑2.92)2.57
(1.94‑3.39)2.88
(2.09‑3.95)3.26
(2.22‑4.59)3.77
(2.45‑5.50)4.15
(2.63‑6.19)
2-hr1.34
(1.09‑1.61)1.62
(1.32‑1.96)2.08
(1.69‑2.52)2.46
(1.98‑3.00)2.98
(2.31‑3.83)3.39
(2.57‑4.45)3.79
(2.77‑5.19)4.33
(2.96‑6.04)5.03
(3.29‑7.30)5.57
(3.53‑8.24)
3-hr1.55
(1.27‑1.86)1.87
(1.53‑2.26)2.41
(1.96‑2.91)2.85
(2.31‑3.47)3.47
(2.70‑4.43)3.94
(2.99‑5.15)4.41
(3.23‑6.01)5.04
(3.46‑7.01)5.88
(3.85‑8.49)6.51
(4.14‑9.60)
6-hr1.96
(1.61‑2.33)2.37
(1.95‑2.83)3.05
(2.50‑3.66)3.61
(2.94‑4.36)4.38
(3.44‑5.57)4.98
(3.81‑6.48)5.58
(4.12‑7.57)6.40
(4.40‑8.84)7.48
(4.91‑10.7)8.30
(5.29‑12.1)
12-hr2.41
(2.00‑2.86)2.92
(2.42‑3.47)3.76
(3.10‑4.48)4.46
(3.65‑5.34)5.41
(4.26‑6.82)6.15
(4.73‑7.94)6.88
(5.11‑9.28)7.91
(5.46‑10.8)9.26
(6.10‑13.2)10.3
(6.58‑14.9)
24-hr2.81
(2.35‑3.32)3.44
(2.87‑4.06)4.46
(3.71‑5.29)5.31
(4.38‑6.33)6.48
(5.14‑8.13)7.38
(5.72‑9.50)8.29
(6.20‑11.1)9.60
(6.65‑13.1)11.3
(7.48‑16.0)12.6
(8.12‑18.2)
2-day3.13
(2.63‑3.66)3.88
(3.26‑4.55)5.12
(4.29‑6.03)6.15
(5.11‑7.28)7.57
(6.05‑9.46)8.66
(6.76‑11.1)9.75
(7.37‑13.1)11.5
(7.96‑15.5)13.7
(9.08‑19.2)15.4
(9.93‑22.1)
3-day3.38
(2.85‑3.94)4.21
(3.55‑4.91)5.56
(4.67‑6.52)6.69
(5.57‑7.88)8.24
(6.61‑10.3)9.43
(7.39‑12.1)10.6
(8.07‑14.3)12.5
(8.73‑16.9)15.1
(9.99‑21.0)17.0
(10.9‑24.2)
4-day3.62
(3.07‑4.21)4.50
(3.80‑5.23)5.92
(4.99‑6.92)7.10
(5.94‑8.35)8.73
(7.03‑10.8)9.99
(7.85‑12.7)11.2
(8.56‑15.0)13.3
(9.25‑17.8)15.9
(10.6‑22.2)17.9
(11.6‑25.5)
7-day4.34
(3.69‑5.01)5.27
(4.48‑6.10)6.80
(5.75‑7.90)8.07
(6.78‑9.43)9.81
(7.92‑12.1)11.2
(8.79‑14.1)12.5
(9.53‑16.6)14.6
(10.2‑19.5)17.4
(11.6‑24.0)19.5
(12.6‑27.5)
10-day5.02
(4.29‑5.79)6.00
(5.12‑6.91)7.58
(6.44‑8.78)8.90
(7.50‑10.4)10.7
(8.67‑13.1)12.1
(9.55‑15.2)13.5
(10.3‑17.7)15.6
(11.0‑20.7)18.4
(12.3‑25.3)20.4
(13.3‑28.7)
20-day7.06
(6.07‑8.08)8.12
(6.98‑9.30)9.86
(8.43‑11.3)11.3
(9.58‑13.1)13.3
(10.8‑16.0)14.8
(11.7‑18.3)16.3
(12.4‑21.0)18.3
(12.9‑24.1)20.9
(14.0‑28.5)22.8
(14.9‑31.8)
30-day8.75
(7.56‑9.97)9.88
(8.52‑11.3)11.7
(10.1‑13.4)13.2
(11.3‑15.3)15.4
(12.5‑18.4)17.0
(13.4‑20.8)18.6
(14.1‑23.6)20.4
(14.5‑26.8)22.9
(15.4‑31.1)24.8
(16.1‑34.3)
45-day10.9
(9.41‑12.3)12.1
(10.4‑13.7)14.0
(12.1‑16.0)15.7
(13.4‑18.0)17.9
(14.6‑21.3)19.6
(15.5‑23.8)21.4
(16.1‑26.8)23.1
(16.5‑30.1)25.4
(17.2‑34.3)27.2
(17.8‑37.6)
60-day12.6
(11.0‑14.3)13.9
(12.1‑15.7)15.9
(13.8‑18.1)17.7
(15.1‑20.2)20.0
(16.4‑23.7)21.8
(17.3‑26.4)23.6
(17.8‑29.5)25.4
(18.1‑32.9)27.6
(18.7‑37.1)29.3
(19.2‑40.4)
1 Precipitation frequency (PF) estimates in this table are based on frequency analysis of partial duration series (PDS).Numbers in parenthesis are PF estimates at lower and upper bounds of the 90% confidence interval. The probability that precipitation frequency estimates(for a given duration and average recurrence interval) will be greater than the upper bound (or less than the lower bound) is 5%. Estimates at upperbounds are not checked against probable maximum precipitation (PMP) estimates and may be higher than currently valid PMP values.Please refer to NOAA Atlas 14 document for more information.
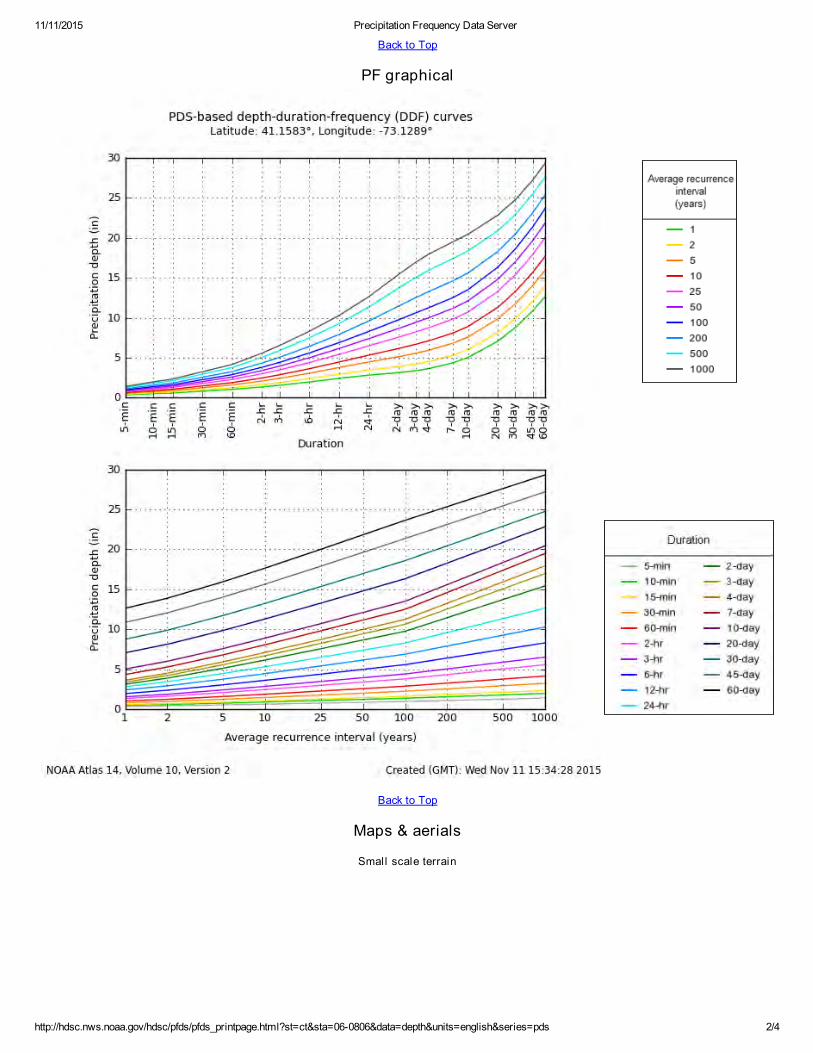
11/11/2015 Precipitation Frequency Data Server
http://hdsc.nws.noaa.gov/hdsc/pfds/pfds_printpage.html?st=ct&sta=06-0806&data=depth&units=english&series=pds 2/4
Back to Top
PF graphical
Back to Top
Maps & aerials
Small scale terrain

11/11/2015 Precipitation Frequency Data Server
http://hdsc.nws.noaa.gov/hdsc/pfds/pfds_printpage.html?st=ct&sta=06-0806&data=depth&units=english&series=pds 3/4
Large scale terrain
Large scale map
Large scale aerial
Map data ©2015 GoogleReport a map error50 km
Map data ©2015 GoogleReport a map error2 km
Map data ©2015 GoogleReport a map error2 km

11/11/2015 Precipitation Frequency Data Server
http://hdsc.nws.noaa.gov/hdsc/pfds/pfds_printpage.html?st=ct&sta=06-0806&data=depth&units=english&series=pds 4/4
Back to Top
US Department of CommerceNational Oceanic and Atmospheric Administration
National Weather ServiceOffice of Hydrologic Development
1325 East West HighwaySilver Spring, MD 20910
Questions?: [email protected]
Disclaimer
Imagery ©2015 TerraMetricsReport a map error2 km

3/31/2016 Precipitation Frequency Data Server
http://hdsc.nws.noaa.gov/hdsc/pfds/pfds_printpage.html?st=ct&sta=06-0806&data=intensity&units=english&series=pds 1/4
NOAA Atlas 14, Volume 10, Version 2BRIDGEPORT SIKORSKY MEM A
Station ID: 06-0806 Location name: Stratford, Connecticut, US*
Latitude: 41.1583°, Longitude: -73.1289° Elevation:
Elevation (station metadata): 5 ft** source: Google Maps
POINT PRECIPITATION FREQUENCY ESTIMATES
Sanja Perica, Sandra Pavlovic, Michael St. Laurent, Carl Trypaluk, Dale Unruh, Orlan Wilhite
NOAA, National Weather Service, Silver Spring, Maryland
PF_tabular | PF_graphical | Maps_&_aerials
PF tabularPDS-based point precipitation frequency estimates with 90% confidence intervals (in inches/hour)1
DurationAverage recurrence interval (years)
1 2 5 10 25 50 100 200 500 1000
5-min4.14
(3.36‑5.03)4.99
(4.04‑6.07)6.40
(5.16‑7.81)7.55
(6.05‑9.28)9.14
(7.04‑11.8)10.4
(7.80‑13.7)11.6
(8.42‑15.9)13.2
(8.96‑18.5)15.2
(9.89‑22.2)16.7
(10.6‑24.9)
10-min2.93
(2.38‑3.56)3.53
(2.87‑4.30)4.52
(3.65‑5.53)5.35
(4.29‑6.58)6.48
(4.99‑8.35)7.35
(5.53‑9.70)8.23
(5.96‑11.3)9.31
(6.35‑13.1)10.8
(7.00‑15.7)11.8
(7.49‑17.7)
15-min2.30
(1.86‑2.79)2.77
(2.25‑3.38)3.55
(2.86‑4.34)4.20
(3.36‑5.16)5.08
(3.92‑6.55)5.77
(4.34‑7.60)6.45
(4.68‑8.85)7.30
(4.98‑10.3)8.44
(5.49‑12.3)9.29
(5.88‑13.9)
30-min1.60
(1.30‑1.95)1.93
(1.57‑2.35)2.47
(2.00‑3.02)2.92
(2.34‑3.59)3.54
(2.73‑4.56)4.01
(3.02‑5.29)4.49
(3.26‑6.16)5.09
(3.47‑7.15)5.88
(3.82‑8.58)6.47
(4.10‑9.66)
60-min1.03
(0.835‑1.25)1.24
(1.00‑1.51)1.59
(1.28‑1.94)1.87
(1.50‑2.30)2.27
(1.75‑2.92)2.57
(1.94‑3.39)2.88
(2.09‑3.95)3.26
(2.22‑4.59)3.77
(2.45‑5.50)4.15
(2.63‑6.19)
2-hr0.669
(0.546‑0.808)0.810
(0.660‑0.978)1.04
(0.844‑1.26)1.23
(0.992‑1.50)1.49
(1.16‑1.91)1.70
(1.28‑2.22)1.90
(1.39‑2.59)2.16
(1.48‑3.02)2.52
(1.64‑3.65)2.78
(1.77‑4.12)
3-hr0.515
(0.422‑0.619)0.624
(0.511‑0.752)0.803
(0.654‑0.970)0.950
(0.769‑1.16)1.15
(0.898‑1.48)1.31
(0.996‑1.72)1.47
(1.08‑2.00)1.68
(1.15‑2.34)1.96
(1.28‑2.83)2.17
(1.38‑3.20)
6-hr0.326
(0.269‑0.390)0.396
(0.326‑0.473)0.509
(0.418‑0.611)0.603
(0.491‑0.728)0.732
(0.574‑0.930)0.832
(0.636‑1.08)0.932
(0.688‑1.26)1.07
(0.735‑1.48)1.25
(0.820‑1.79)1.39
(0.884‑2.03)
12-hr0.200
(0.166‑0.237)0.243
(0.201‑0.288)0.312
(0.258‑0.372)0.370
(0.303‑0.444)0.449
(0.354‑0.566)0.510
(0.392‑0.659)0.571
(0.424‑0.770)0.656
(0.453‑0.900)0.768
(0.506‑1.09)0.853
(0.546‑1.24)
24-hr0.117
(0.098‑0.138)0.143
(0.120‑0.169)0.186
(0.155‑0.220)0.221
(0.183‑0.264)0.270
(0.214‑0.339)0.308
(0.238‑0.396)0.345
(0.258‑0.464)0.400
(0.277‑0.545)0.472
(0.312‑0.667)0.527
(0.338‑0.760)
2-day0.065
(0.055‑0.076)0.081
(0.068‑0.095)0.107
(0.089‑0.126)0.128
(0.106‑0.152)0.158
(0.126‑0.197)0.180
(0.141‑0.231)0.203
(0.154‑0.273)0.239
(0.166‑0.323)0.286
(0.189‑0.401)0.321
(0.207‑0.460)
3-day0.047
(0.040‑0.055)0.058
(0.049‑0.068)0.077
(0.065‑0.091)0.093
(0.077‑0.109)0.114
(0.092‑0.143)0.131
(0.103‑0.168)0.148
(0.112‑0.198)0.174
(0.121‑0.235)0.209
(0.139‑0.292)0.236
(0.152‑0.336)
4-day0.038
(0.032‑0.044)0.047
(0.040‑0.055)0.062
(0.052‑0.072)0.074
(0.062‑0.087)0.091
(0.073‑0.113)0.104
(0.082‑0.133)0.117
(0.089‑0.157)0.138
(0.096‑0.186)0.166
(0.110‑0.231)0.187
(0.121‑0.265)
7-day0.026
(0.022‑0.030)0.031
(0.027‑0.036)0.040
(0.034‑0.047)0.048
(0.040‑0.056)0.058
(0.047‑0.072)0.066
(0.052‑0.084)0.074
(0.057‑0.099)0.087
(0.061‑0.116)0.103
(0.069‑0.143)0.116
(0.075‑0.164)
10-day0.021
(0.018‑0.024)0.025
(0.021‑0.029)0.032
(0.027‑0.037)0.037
(0.031‑0.043)0.045
(0.036‑0.055)0.050
(0.040‑0.063)0.056
(0.043‑0.074)0.065
(0.046‑0.086)0.076
(0.051‑0.105)0.085
(0.055‑0.120)
20-day0.015
(0.013‑0.017)0.017
(0.015‑0.019)0.021
(0.018‑0.024)0.024
(0.020‑0.027)0.028
(0.022‑0.033)0.031
(0.024‑0.038)0.034
(0.026‑0.044)0.038
(0.027‑0.050)0.043
(0.029‑0.059)0.048
(0.031‑0.066)
30-day0.012
(0.010‑0.014)0.014
(0.012‑0.016)0.016
(0.014‑0.019)0.018
(0.016‑0.021)0.021
(0.017‑0.026)0.024
(0.019‑0.029)0.026
(0.020‑0.033)0.028
(0.020‑0.037)0.032
(0.021‑0.043)0.034
(0.022‑0.048)
45-day0.010
(0.009‑0.011)0.011
(0.010‑0.013)0.013
(0.011‑0.015)0.014
(0.012‑0.017)0.017
(0.014‑0.020)0.018
(0.014‑0.022)0.020
(0.015‑0.025)0.021
(0.015‑0.028)0.024
(0.016‑0.032)0.025
(0.016‑0.035)
60-day0.009
(0.008‑0.010)0.010
(0.008‑0.011)0.011
(0.010‑0.013)0.012
(0.011‑0.014)0.014
(0.011‑0.016)0.015
(0.012‑0.018)0.016
(0.012‑0.020)0.018
(0.013‑0.023)0.019
(0.013‑0.026)0.020
(0.013‑0.028)
1 Precipitation frequency (PF) estimates in this table are based on frequency analysis of partial duration series (PDS).Numbers in parenthesis are PF estimates at lower and upper bounds of the 90% confidence interval. The probability that precipitation frequency estimates (for agiven duration and average recurrence interval) will be greater than the upper bound (or less than the lower bound) is 5%. Estimates at upper bounds are notchecked against probable maximum precipitation (PMP) estimates and may be higher than currently valid PMP values.Please refer to NOAA Atlas 14 document for more information.
27.1 Min.

3/31/2016 Precipitation Frequency Data Server
http://hdsc.nws.noaa.gov/hdsc/pfds/pfds_printpage.html?st=ct&sta=06-0806&data=intensity&units=english&series=pds 2/4
Back to Top
PF graphical
Back to Top
Maps & aerials
Small scale terrain

3/31/2016 Precipitation Frequency Data Server
http://hdsc.nws.noaa.gov/hdsc/pfds/pfds_printpage.html?st=ct&sta=06-0806&data=intensity&units=english&series=pds 3/4
Large scale terrain
Large scale map
Large scale aerial
Map data ©2016 GoogleReport a map error50 km
Map data ©2016 GoogleReport a map error2 km
Map data ©2016 GoogleReport a map error2 km

3/31/2016 Precipitation Frequency Data Server
http://hdsc.nws.noaa.gov/hdsc/pfds/pfds_printpage.html?st=ct&sta=06-0806&data=intensity&units=english&series=pds 4/4
Back to Top
US Department of CommerceNational Oceanic and Atmospheric Administration
National Weather ServiceNational Water Center
1325 East West HighwaySilver Spring, MD 20910
Questions?: [email protected]
Disclaimer
Imagery ©2016 TerraMetricsReport a map error2 km

STATE PROJECT NO. 301-0175 CULVERT REPLACEMENT MNRR NEW HAVEN MAINLINE M.P. 65.60, MILFORD, CONN.
APPENDIX C
HYDROLOGIC CALCULATIONS
Average Daily & Spring Flows TR-55 Method (Pondpack)
Rational Method

STATE PROJECT NO. 301-0175 CULVERT REPLACEMENT MNRR NEW HAVEN MAINLINE M.P. 65.60, MILFORD, CONN.
APPENDIX C1
AVERAGE DAILY & SPRING FLOWS

STATE PROJECT NO. 301-175CULVERT REPLACEMENT
MNRR NEW HAVEN MAINLINEM.P. 65.60, MILFORD, CONN.
Q =
A =
Q avg. daily = (A0.98)*1.87
Q avg. spring = (A0.988)*3.62
A = 0.105 square miles
Q avg. daily = 0.2 cfs
Q avg. spring = 0.4 cfs
BJH11/11/2015
PREPARED BY: DATE:
EQUATIONS
AVERAGE DAILY FLOW
AVERAGE SPRING FLOW
Flow (cfs)
Contributing Drainage Area (Square Miles)
AVERAGE DAILY AND SPRING FLOWS
SYMBOLS
CALCULATIONS

STATE PROJECT NO. 301-0175 CULVERT REPLACEMENT MNRR NEW HAVEN MAINLINE M.P. 65.60, MILFORD, CONN.
APPENDIX C2
TR-55 METHOD (Pondpack)

Project Summary
301-175 Existing ConditionsTitle
Brandon Handfield, PEEngineer
Yantic River Consultants, LLCCompany
11/11/2015Date
Existing Conditions analysis of watershed draining to 2' masonry culvert under MNRR MP 65.60 in the vicinity of Eastern Steel Road, Milford, CT.Notes
Page 1 of 7927 Siemon Company Drive Suite 200 W Watertown, CT 06795 USA +1-203-755-1666
11/11/2015
Bentley PondPack V8i[08.11.01.54]
Bentley Systems, Inc. Haestad Methods Solution Center
20151104_301-175 Culvert Replacement EXISTING.ppc

47Time vs. Elevation
1-YearPO-1 (OUT)
46Addition Summary
45Addition Summary
44Addition Summary
43Addition Summary
42Addition Summary
41Addition Summary
40Addition Summary
39Addition Summary
1-YearO-1
37Unit Hydrograph Summary
35Unit Hydrograph Summary
33Unit Hydrograph Summary
31Unit Hydrograph Summary
29Unit Hydrograph Summary
27Unit Hydrograph Summary
25Unit Hydrograph Summary
23Unit Hydrograph Summary
1-YearCM-1
22Runoff CN-AreaCM-1
20Time of Concentration CalculationsCM-1
18Time-Depth Curve
16Time-Depth Curve
14Time-Depth Curve
12Time-Depth Curve
10Time-Depth Curve
8Time-Depth Curve
6Time-Depth Curve
4Time-Depth Curve
100-YearNOAA Bridgeport
2Master Network Summary
Table of Contents

Table of Contents
76Composite Rating Curve
74Individual Outlet Curves
71Outlet Input Data
2-YearEX_MNRR Culvert
68Time vs. Elevation
65Time vs. Elevation
62Time vs. Elevation
59Time vs. Elevation
56Time vs. Elevation
53Time vs. Elevation
50Time vs. Elevation

Subsection: Master Network Summary
Catchments SummaryPeak Flow
(ft³/s)Time to Peak
(hours)Hydrograph
Volume(ac-ft)
Return Event
(years)
ScenarioLabel
85.6312.30010.5551NOAA 1-YearCM-1111.4012.30013.8422NOAA 2-YearCM-1153.0912.30019.2795NOAA 5-YearCM-1187.6512.30023.87410NOAA 10-YearCM-1234.9212.30030.25525NOAA 25-YearCM-1271.0612.30035.19150NOAA 50-YearCM-1307.4512.30040.199100NOAA 100-YearCM-1426.9512.30056.836500NOAA 500-YearCM-1
Node SummaryPeak Flow
(ft³/s)Time to Peak
(hours)Hydrograph
Volume(ac-ft)
Return Event
(years)
ScenarioLabel
26.6512.9009.7841NOAA 1-YearO-130.4312.95013.0212NOAA 2-YearO-134.5513.05018.3855NOAA 5-YearO-136.3712.70023.27810NOAA 10-YearO-136.3712.45029.95425NOAA 25-YearO-136.3712.35034.83150NOAA 50-YearO-136.3712.30038.907100NOAA 100-YearO-136.3712.10043.855500NOAA 500-YearO-1
Pond SummaryMaximum
Pond Storage(ac-ft)
Maximum Water
Surface Elevation
(ft)
Peak Flow(ft³/s)
Time to Peak(hours)
Hydrograph Volume(ac-ft)
Return Event
(years)
ScenarioLabel
(N/A)(N/A)85.6312.30010.5551NOAA 1-YearPO-1 (IN)4.31834.3926.6512.9009.7841NOAA 1-YearPO-1 (OUT)(N/A)(N/A)111.4012.30013.8422NOAA 2-YearPO-1 (IN)5.79534.9530.4312.95013.0212NOAA 2-YearPO-1 (OUT)(N/A)(N/A)153.0912.30019.2795NOAA 5-YearPO-1 (IN)8.30935.6634.5513.05018.3855NOAA 5-YearPO-1 (OUT)(N/A)(N/A)187.6512.30023.87410NOAA 10-YearPO-1 (IN)9.79736.0036.3712.70023.27810NOAA 10-YearPO-1 (OUT)(N/A)(N/A)234.9212.30030.25525NOAA 25-YearPO-1 (IN)9.79736.0036.3712.45029.95425NOAA 25-YearPO-1 (OUT)(N/A)(N/A)271.0612.30035.19150NOAA 50-YearPO-1 (IN)9.79736.0036.3712.35034.83150NOAA 50-YearPO-1 (OUT)
(N/A)(N/A)307.4512.30040.199100NOAA 100-YearPO-1 (IN)
9.79736.0036.3712.30038.907100NOAA 100-YearPO-1 (OUT)
Page 2 of 7927 Siemon Company Drive Suite 200 W Watertown, CT 06795 USA +1-203-755-1666
11/11/2015
Bentley PondPack V8i[08.11.01.54]
Bentley Systems, Inc. Haestad Methods Solution Center
20151104_301-175 Culvert Replacement EXISTING.ppc

Subsection: Master Network Summary
Pond SummaryMaximum
Pond Storage(ac-ft)
Maximum Water
Surface Elevation
(ft)
Peak Flow(ft³/s)
Time to Peak(hours)
Hydrograph Volume(ac-ft)
Return Event
(years)
ScenarioLabel
(N/A)(N/A)426.9512.30056.836500NOAA 500-YearPO-1 (IN)
9.79736.0036.3712.10043.855500NOAA 500-YearPO-1 (OUT)
Page 3 of 7927 Siemon Company Drive Suite 200 W Watertown, CT 06795 USA +1-203-755-1666
11/11/2015
Bentley PondPack V8i[08.11.01.54]
Bentley Systems, Inc. Haestad Methods Solution Center
20151104_301-175 Culvert Replacement EXISTING.ppc

Storm Event: 100-YearLabel: NOAA BridgeportReturn Event: 100 yearsSubsection: Time-Depth Curve
Time-Depth Curve: 100-Year
100-Year Label
hours0.000Start Time
hours0.100Increment
hours24.000End Time
years100Return Event
CUMULATIVE RAINFALL (in)Output Time Increment = 0.100 hours
Time on left represents time for first value in each row.Depth(in)
Depth(in)
Depth(in)
Depth(in)
Depth(in)
Time(hours)
0.00.00.00.00.00.0000.10.10.10.00.00.5000.10.10.10.10.11.0000.20.10.10.10.11.5000.20.20.20.20.22.0000.20.20.20.20.22.5000.30.30.30.30.33.0000.30.30.30.30.33.5000.40.40.40.40.44.0000.50.40.40.40.44.5000.50.50.50.50.55.0000.60.60.60.50.55.5000.70.60.60.60.66.0000.70.70.70.70.76.5000.80.80.80.80.87.0000.90.90.90.90.87.5001.01.01.01.00.98.0001.21.11.11.11.18.5001.31.31.31.21.29.0001.51.51.41.41.49.5001.71.71.71.61.610.0002.02.01.91.81.810.5002.42.32.22.12.111.0003.43.12.82.62.511.5005.75.55.24.84.112.0006.26.16.05.95.812.5006.46.46.36.36.213.0006.76.66.66.56.513.5006.96.86.86.86.714.0007.17.07.06.96.914.5007.27.27.17.17.115.0007.37.37.37.37.215.5007.47.47.47.47.316.0007.57.57.57.57.416.5007.67.67.67.67.517.0007.77.77.77.67.617.500
Page 4 of 7927 Siemon Company Drive Suite 200 W Watertown, CT 06795 USA +1-203-755-1666
11/11/2015
Bentley PondPack V8i[08.11.01.54]
Bentley Systems, Inc. Haestad Methods Solution Center
20151104_301-175 Culvert Replacement EXISTING.ppc

Storm Event: 100-YearLabel: NOAA BridgeportReturn Event: 100 yearsSubsection: Time-Depth Curve
CUMULATIVE RAINFALL (in)Output Time Increment = 0.100 hours
Time on left represents time for first value in each row.Depth(in)
Depth(in)
Depth(in)
Depth(in)
Depth(in)
Time(hours)
7.77.77.77.77.718.0007.87.87.87.87.818.5007.97.97.87.87.819.0007.97.97.97.97.919.5008.08.08.07.97.920.0008.08.08.08.08.020.5008.18.18.18.08.021.0008.18.18.18.18.121.5008.28.28.18.18.122.0008.28.28.28.28.222.5008.28.28.28.28.223.0008.38.38.38.38.323.500
(N/A)(N/A)(N/A)(N/A)8.324.000
Page 5 of 7927 Siemon Company Drive Suite 200 W Watertown, CT 06795 USA +1-203-755-1666
11/11/2015
Bentley PondPack V8i[08.11.01.54]
Bentley Systems, Inc. Haestad Methods Solution Center
20151104_301-175 Culvert Replacement EXISTING.ppc

Storm Event: 10-YearLabel: NOAA BridgeportReturn Event: 10 yearsSubsection: Time-Depth Curve
Time-Depth Curve: 10-Year
10-Year Label
hours0.000Start Time
hours0.100Increment
hours24.000End Time
years10Return Event
CUMULATIVE RAINFALL (in)Output Time Increment = 0.100 hours
Time on left represents time for first value in each row.Depth(in)
Depth(in)
Depth(in)
Depth(in)
Depth(in)
Time(hours)
0.00.00.00.00.00.0000.00.00.00.00.00.5000.10.10.10.10.11.0000.10.10.10.10.11.5000.10.10.10.10.12.0000.20.20.10.10.12.5000.20.20.20.20.23.0000.20.20.20.20.23.5000.30.20.20.20.24.0000.30.30.30.30.34.5000.30.30.30.30.35.0000.40.40.40.30.35.5000.40.40.40.40.46.0000.50.50.40.40.46.5000.50.50.50.50.57.0000.60.60.60.60.57.5000.70.60.60.60.68.0000.80.70.70.70.78.5000.90.80.80.80.89.0001.01.00.90.90.99.5001.11.11.11.01.010.0001.31.31.21.21.110.5001.51.51.41.41.311.0002.22.01.81.71.611.5003.63.53.33.12.712.0003.93.93.83.83.712.5004.14.14.14.04.013.0004.34.34.24.24.213.5004.44.44.44.34.314.0004.54.54.54.54.414.5004.64.64.64.64.515.0004.74.74.74.64.615.5004.84.74.74.74.716.0004.84.84.84.84.816.5004.94.94.94.84.817.0004.94.94.94.94.917.500
Page 6 of 7927 Siemon Company Drive Suite 200 W Watertown, CT 06795 USA +1-203-755-1666
11/11/2015
Bentley PondPack V8i[08.11.01.54]
Bentley Systems, Inc. Haestad Methods Solution Center
20151104_301-175 Culvert Replacement EXISTING.ppc

Storm Event: 10-YearLabel: NOAA BridgeportReturn Event: 10 yearsSubsection: Time-Depth Curve
CUMULATIVE RAINFALL (in)Output Time Increment = 0.100 hours
Time on left represents time for first value in each row.Depth(in)
Depth(in)
Depth(in)
Depth(in)
Depth(in)
Time(hours)
5.05.04.94.94.918.0005.05.05.05.05.018.5005.05.05.05.05.019.0005.15.15.15.15.019.5005.15.15.15.15.120.0005.15.15.15.15.120.5005.25.25.25.25.121.0005.25.25.25.25.221.5005.25.25.25.25.222.0005.35.35.25.25.222.5005.35.35.35.35.323.0005.35.35.35.35.323.500
(N/A)(N/A)(N/A)(N/A)5.324.000
Page 7 of 7927 Siemon Company Drive Suite 200 W Watertown, CT 06795 USA +1-203-755-1666
11/11/2015
Bentley PondPack V8i[08.11.01.54]
Bentley Systems, Inc. Haestad Methods Solution Center
20151104_301-175 Culvert Replacement EXISTING.ppc

Storm Event: 1-YearLabel: NOAA BridgeportReturn Event: 1 yearsSubsection: Time-Depth Curve
Time-Depth Curve: 1-Year
1-Year Label
hours0.000Start Time
hours0.100Increment
hours24.000End Time
years1Return Event
CUMULATIVE RAINFALL (in)Output Time Increment = 0.100 hours
Time on left represents time for first value in each row.Depth(in)
Depth(in)
Depth(in)
Depth(in)
Depth(in)
Time(hours)
0.00.00.00.00.00.0000.00.00.00.00.00.5000.00.00.00.00.01.0000.10.10.00.00.01.5000.10.10.10.10.12.0000.10.10.10.10.12.5000.10.10.10.10.13.0000.10.10.10.10.13.5000.10.10.10.10.14.0000.20.20.10.10.14.5000.20.20.20.20.25.0000.20.20.20.20.25.5000.20.20.20.20.26.0000.20.20.20.20.26.5000.30.30.30.30.37.0000.30.30.30.30.37.5000.40.30.30.30.38.0000.40.40.40.40.48.5000.50.40.40.40.49.0000.50.50.50.50.59.5000.60.60.60.50.510.0000.70.70.60.60.610.5000.80.80.70.70.711.0001.21.01.00.90.811.5001.91.91.81.61.412.0002.12.12.02.02.012.5002.22.22.12.12.113.0002.32.32.22.22.213.5002.32.32.32.32.314.0002.42.42.42.42.314.5002.42.42.42.42.415.0002.52.52.52.52.415.5002.52.52.52.52.516.0002.52.52.52.52.516.5002.62.62.62.62.617.0002.62.62.62.62.617.500
Page 8 of 7927 Siemon Company Drive Suite 200 W Watertown, CT 06795 USA +1-203-755-1666
11/11/2015
Bentley PondPack V8i[08.11.01.54]
Bentley Systems, Inc. Haestad Methods Solution Center
20151104_301-175 Culvert Replacement EXISTING.ppc

Storm Event: 1-YearLabel: NOAA BridgeportReturn Event: 1 yearsSubsection: Time-Depth Curve
CUMULATIVE RAINFALL (in)Output Time Increment = 0.100 hours
Time on left represents time for first value in each row.Depth(in)
Depth(in)
Depth(in)
Depth(in)
Depth(in)
Time(hours)
2.62.62.62.62.618.0002.62.62.62.62.618.5002.72.72.72.72.719.0002.72.72.72.72.719.5002.72.72.72.72.720.0002.72.72.72.72.720.5002.72.72.72.72.721.0002.82.72.72.72.721.5002.82.82.82.82.822.0002.82.82.82.82.822.5002.82.82.82.82.823.0002.82.82.82.82.823.500
(N/A)(N/A)(N/A)(N/A)2.824.000
Page 9 of 7927 Siemon Company Drive Suite 200 W Watertown, CT 06795 USA +1-203-755-1666
11/11/2015
Bentley PondPack V8i[08.11.01.54]
Bentley Systems, Inc. Haestad Methods Solution Center
20151104_301-175 Culvert Replacement EXISTING.ppc

Storm Event: 25-YearLabel: NOAA BridgeportReturn Event: 25 yearsSubsection: Time-Depth Curve
Time-Depth Curve: 25-Year
25-Year Label
hours0.000Start Time
hours0.100Increment
hours24.000End Time
years25Return Event
CUMULATIVE RAINFALL (in)Output Time Increment = 0.100 hours
Time on left represents time for first value in each row.Depth(in)
Depth(in)
Depth(in)
Depth(in)
Depth(in)
Time(hours)
0.00.00.00.00.00.0000.10.10.00.00.00.5000.10.10.10.10.11.0000.10.10.10.10.11.5000.20.10.10.10.12.0000.20.20.20.20.22.5000.20.20.20.20.23.0000.30.30.30.20.23.5000.30.30.30.30.34.0000.40.30.30.30.34.5000.40.40.40.40.45.0000.50.40.40.40.45.5000.50.50.50.50.56.0000.60.60.50.50.56.5000.60.60.60.60.67.0000.70.70.70.70.77.5000.80.80.80.80.78.0000.90.90.90.90.88.5001.01.01.01.00.99.0001.21.21.11.11.19.5001.41.31.31.31.210.0001.61.51.51.41.410.5001.91.81.71.71.611.0002.72.42.22.01.911.5004.44.34.13.83.212.0004.84.84.74.64.512.5005.05.05.04.94.913.0005.25.25.25.15.113.5005.45.35.35.35.314.0005.55.55.55.45.414.5005.65.65.65.65.515.0005.75.75.75.75.615.5005.85.85.85.85.716.0005.95.95.95.85.816.5005.95.95.95.95.917.0006.06.06.06.06.017.500
Page 10 of 7927 Siemon Company Drive Suite 200 W Watertown, CT 06795 USA +1-203-755-1666
11/11/2015
Bentley PondPack V8i[08.11.01.54]
Bentley Systems, Inc. Haestad Methods Solution Center
20151104_301-175 Culvert Replacement EXISTING.ppc

Storm Event: 25-YearLabel: NOAA BridgeportReturn Event: 25 yearsSubsection: Time-Depth Curve
CUMULATIVE RAINFALL (in)Output Time Increment = 0.100 hours
Time on left represents time for first value in each row.Depth(in)
Depth(in)
Depth(in)
Depth(in)
Depth(in)
Time(hours)
6.16.06.06.06.018.0006.16.16.16.16.118.5006.16.16.16.16.119.0006.26.26.26.26.219.5006.26.26.26.26.220.0006.36.36.36.36.220.5006.36.36.36.36.321.0006.36.36.36.36.321.5006.46.46.46.46.422.0006.46.46.46.46.422.5006.46.46.46.46.423.0006.56.56.56.56.523.500
(N/A)(N/A)(N/A)(N/A)6.524.000
Page 11 of 7927 Siemon Company Drive Suite 200 W Watertown, CT 06795 USA +1-203-755-1666
11/11/2015
Bentley PondPack V8i[08.11.01.54]
Bentley Systems, Inc. Haestad Methods Solution Center
20151104_301-175 Culvert Replacement EXISTING.ppc

Storm Event: 2-YearLabel: NOAA BridgeportReturn Event: 2 yearsSubsection: Time-Depth Curve
Time-Depth Curve: 2-Year
2-Year Label
hours0.000Start Time
hours0.100Increment
hours24.000End Time
years2Return Event
CUMULATIVE RAINFALL (in)Output Time Increment = 0.100 hours
Time on left represents time for first value in each row.Depth(in)
Depth(in)
Depth(in)
Depth(in)
Depth(in)
Time(hours)
0.00.00.00.00.00.0000.00.00.00.00.00.5000.00.00.00.00.01.0000.10.10.10.10.11.5000.10.10.10.10.12.0000.10.10.10.10.12.5000.10.10.10.10.13.0000.10.10.10.10.13.5000.20.20.20.20.14.0000.20.20.20.20.24.5000.20.20.20.20.25.0000.20.20.20.20.25.5000.30.30.30.30.26.0000.30.30.30.30.36.5000.30.30.30.30.37.0000.40.40.40.40.37.5000.40.40.40.40.48.0000.50.50.50.50.48.5000.60.50.50.50.59.0000.60.60.60.60.69.5000.70.70.70.70.710.0000.80.80.80.80.710.5001.00.90.90.90.911.0001.41.31.21.11.011.5002.42.32.22.01.712.0002.62.52.52.52.412.5002.72.72.62.62.613.0002.82.82.72.72.713.5002.92.82.82.82.814.0002.92.92.92.92.914.5003.03.03.03.02.915.0003.03.03.03.03.015.5003.13.13.13.13.016.0003.13.13.13.13.116.5003.23.13.13.13.117.0003.23.23.23.23.217.500
Page 12 of 7927 Siemon Company Drive Suite 200 W Watertown, CT 06795 USA +1-203-755-1666
11/11/2015
Bentley PondPack V8i[08.11.01.54]
Bentley Systems, Inc. Haestad Methods Solution Center
20151104_301-175 Culvert Replacement EXISTING.ppc

Storm Event: 2-YearLabel: NOAA BridgeportReturn Event: 2 yearsSubsection: Time-Depth Curve
CUMULATIVE RAINFALL (in)Output Time Increment = 0.100 hours
Time on left represents time for first value in each row.Depth(in)
Depth(in)
Depth(in)
Depth(in)
Depth(in)
Time(hours)
3.23.23.23.23.218.0003.23.23.23.23.218.5003.33.33.33.23.219.0003.33.33.33.33.319.5003.33.33.33.33.320.0003.33.33.33.33.320.5003.43.33.33.33.321.0003.43.43.43.43.421.5003.43.43.43.43.422.0003.43.43.43.43.422.5003.43.43.43.43.423.0003.43.43.43.43.423.500
(N/A)(N/A)(N/A)(N/A)3.424.000
Page 13 of 7927 Siemon Company Drive Suite 200 W Watertown, CT 06795 USA +1-203-755-1666
11/11/2015
Bentley PondPack V8i[08.11.01.54]
Bentley Systems, Inc. Haestad Methods Solution Center
20151104_301-175 Culvert Replacement EXISTING.ppc

Storm Event: 500-YearLabel: NOAA BridgeportReturn Event: 500 yearsSubsection: Time-Depth Curve
Time-Depth Curve: 500-Year
500-Year Label
hours0.000Start Time
hours0.100Increment
hours24.000End Time
years500Return Event
CUMULATIVE RAINFALL (in)Output Time Increment = 0.100 hours
Time on left represents time for first value in each row.Depth(in)
Depth(in)
Depth(in)
Depth(in)
Depth(in)
Time(hours)
0.00.00.00.00.00.0000.10.10.10.10.10.5000.20.10.10.10.11.0000.20.20.20.20.21.5000.30.30.20.20.22.0000.30.30.30.30.32.5000.40.40.40.40.33.0000.50.50.40.40.43.5000.50.50.50.50.54.0000.60.60.60.60.64.5000.70.70.70.70.65.0000.80.80.80.70.75.5000.90.90.90.80.86.0001.01.01.00.90.96.5001.11.11.11.01.07.0001.31.21.21.21.17.5001.41.41.31.31.38.0001.61.61.51.51.58.5001.81.81.71.71.69.0002.12.02.01.91.99.5002.42.32.32.22.110.0002.72.72.62.52.410.5003.23.13.02.92.811.0004.74.23.83.63.411.5007.77.57.16.65.612.0008.48.38.28.17.912.5008.88.78.68.68.513.0009.19.09.08.98.913.5009.49.39.39.29.214.0009.69.69.59.59.414.5009.89.89.79.79.715.000
10.010.09.99.99.815.50010.110.110.110.010.016.00010.310.210.210.210.216.50010.410.310.310.310.317.00010.510.410.410.410.417.500
Page 14 of 7927 Siemon Company Drive Suite 200 W Watertown, CT 06795 USA +1-203-755-1666
11/11/2015
Bentley PondPack V8i[08.11.01.54]
Bentley Systems, Inc. Haestad Methods Solution Center
20151104_301-175 Culvert Replacement EXISTING.ppc

Storm Event: 500-YearLabel: NOAA BridgeportReturn Event: 500 yearsSubsection: Time-Depth Curve
CUMULATIVE RAINFALL (in)Output Time Increment = 0.100 hours
Time on left represents time for first value in each row.Depth(in)
Depth(in)
Depth(in)
Depth(in)
Depth(in)
Time(hours)
10.610.510.510.510.518.00010.610.610.610.610.618.50010.710.710.710.710.719.00010.810.810.810.810.719.50010.910.910.810.810.820.00010.910.910.910.910.920.50011.011.011.011.011.021.00011.111.111.011.011.021.50011.111.111.111.111.122.00011.211.211.211.211.122.50011.211.211.211.211.223.00011.311.311.311.311.323.500
(N/A)(N/A)(N/A)(N/A)11.324.000
Page 15 of 7927 Siemon Company Drive Suite 200 W Watertown, CT 06795 USA +1-203-755-1666
11/11/2015
Bentley PondPack V8i[08.11.01.54]
Bentley Systems, Inc. Haestad Methods Solution Center
20151104_301-175 Culvert Replacement EXISTING.ppc

Storm Event: 50-YearLabel: NOAA BridgeportReturn Event: 50 yearsSubsection: Time-Depth Curve
Time-Depth Curve: 50-Year
50-Year Label
hours0.000Start Time
hours0.100Increment
hours24.000End Time
years50Return Event
CUMULATIVE RAINFALL (in)Output Time Increment = 0.100 hours
Time on left represents time for first value in each row.Depth(in)
Depth(in)
Depth(in)
Depth(in)
Depth(in)
Time(hours)
0.00.00.00.00.00.0000.10.10.10.00.00.5000.10.10.10.10.11.0000.10.10.10.10.11.5000.20.20.20.20.12.0000.20.20.20.20.22.5000.30.30.20.20.23.0000.30.30.30.30.33.5000.40.30.30.30.34.0000.40.40.40.40.44.5000.50.50.40.40.45.0000.50.50.50.50.55.5000.60.60.60.50.56.0000.70.60.60.60.66.5000.70.70.70.70.77.0000.80.80.80.80.87.5000.90.90.90.90.88.0001.01.01.01.00.98.5001.21.21.11.11.19.0001.41.31.31.31.29.5001.61.51.51.41.410.0001.81.71.71.61.610.5002.12.02.01.91.811.0003.12.82.52.32.211.5005.14.94.64.33.712.0005.55.45.35.35.212.5005.75.75.65.65.513.0005.95.95.95.85.813.5006.16.16.16.06.014.0006.36.26.26.26.214.5006.46.46.46.36.315.0006.56.56.56.56.415.5006.66.66.66.66.516.0006.76.76.76.66.616.5006.86.86.76.76.717.0006.86.86.86.86.817.500
Page 16 of 7927 Siemon Company Drive Suite 200 W Watertown, CT 06795 USA +1-203-755-1666
11/11/2015
Bentley PondPack V8i[08.11.01.54]
Bentley Systems, Inc. Haestad Methods Solution Center
20151104_301-175 Culvert Replacement EXISTING.ppc

Storm Event: 50-YearLabel: NOAA BridgeportReturn Event: 50 yearsSubsection: Time-Depth Curve
CUMULATIVE RAINFALL (in)Output Time Increment = 0.100 hours
Time on left represents time for first value in each row.Depth(in)
Depth(in)
Depth(in)
Depth(in)
Depth(in)
Time(hours)
6.96.96.96.96.818.0007.06.96.96.96.918.5007.07.07.07.07.019.0007.17.07.07.07.019.5007.17.17.17.17.120.0007.17.17.17.17.120.5007.27.27.27.27.221.0007.27.27.27.27.221.5007.37.37.37.27.222.0007.37.37.37.37.322.5007.37.37.37.37.323.0007.47.47.47.47.323.500
(N/A)(N/A)(N/A)(N/A)7.424.000
Page 17 of 7927 Siemon Company Drive Suite 200 W Watertown, CT 06795 USA +1-203-755-1666
11/11/2015
Bentley PondPack V8i[08.11.01.54]
Bentley Systems, Inc. Haestad Methods Solution Center
20151104_301-175 Culvert Replacement EXISTING.ppc

Storm Event: 5-YearLabel: NOAA BridgeportReturn Event: 5 yearsSubsection: Time-Depth Curve
Time-Depth Curve: 5-Year
5-Year Label
hours0.000Start Time
hours0.100Increment
hours24.000End Time
years5Return Event
CUMULATIVE RAINFALL (in)Output Time Increment = 0.100 hours
Time on left represents time for first value in each row.Depth(in)
Depth(in)
Depth(in)
Depth(in)
Depth(in)
Time(hours)
0.00.00.00.00.00.0000.00.00.00.00.00.5000.10.10.10.00.01.0000.10.10.10.10.11.5000.10.10.10.10.12.0000.10.10.10.10.12.5000.20.20.10.10.13.0000.20.20.20.20.23.5000.20.20.20.20.24.0000.20.20.20.20.24.5000.30.30.30.30.35.0000.30.30.30.30.35.5000.40.30.30.30.36.0000.40.40.40.40.46.5000.40.40.40.40.47.0000.50.50.50.50.57.5000.60.50.50.50.58.0000.60.60.60.60.68.5000.70.70.70.70.79.0000.80.80.80.80.79.5000.90.90.90.90.810.0001.11.11.01.01.010.5001.31.21.21.11.111.0001.91.71.51.41.311.5003.12.92.82.62.212.0003.33.33.23.23.112.5003.53.43.43.43.313.0003.63.63.53.53.513.5003.73.73.73.63.614.0003.83.83.83.73.714.5003.93.93.83.83.815.0003.93.93.93.93.915.5004.04.04.04.04.016.0004.04.04.04.04.016.5004.14.14.14.14.117.0004.14.14.14.14.117.500
Page 18 of 7927 Siemon Company Drive Suite 200 W Watertown, CT 06795 USA +1-203-755-1666
11/11/2015
Bentley PondPack V8i[08.11.01.54]
Bentley Systems, Inc. Haestad Methods Solution Center
20151104_301-175 Culvert Replacement EXISTING.ppc

Storm Event: 5-YearLabel: NOAA BridgeportReturn Event: 5 yearsSubsection: Time-Depth Curve
CUMULATIVE RAINFALL (in)Output Time Increment = 0.100 hours
Time on left represents time for first value in each row.Depth(in)
Depth(in)
Depth(in)
Depth(in)
Depth(in)
Time(hours)
4.24.24.24.14.118.0004.24.24.24.24.218.5004.24.24.24.24.219.0004.34.34.34.24.219.5004.34.34.34.34.320.0004.34.34.34.34.320.5004.34.34.34.34.321.0004.44.44.44.44.321.5004.44.44.44.44.422.0004.44.44.44.44.422.5004.44.44.44.44.423.0004.54.54.44.44.423.500
(N/A)(N/A)(N/A)(N/A)4.524.000
Page 19 of 7927 Siemon Company Drive Suite 200 W Watertown, CT 06795 USA +1-203-755-1666
11/11/2015
Bentley PondPack V8i[08.11.01.54]
Bentley Systems, Inc. Haestad Methods Solution Center
20151104_301-175 Culvert Replacement EXISTING.ppc

Storm Event: 2-YearLabel: CM-1Return Event: 100 yearsSubsection: Time of Concentration Calculations
Time of Concentration Results
Segment #1: TR-55 Sheet Flow
ft60.00Hydraulic Length
0.400Manning's n
ft/ft0.030Slope
in3.32 Year 24 Hour Depth
ft/s0.08Average Velocity
hours0.199Segment Time of Concentration
Segment #2: TR-55 Sheet Flow
ft40.00Hydraulic Length
0.400Manning's n
ft/ft0.200Slope
in3.32 Year 24 Hour Depth
ft/s0.16Average Velocity
hours0.067Segment Time of Concentration
Segment #3: TR-55 Shallow Concentrated Flow
ft500.00Hydraulic Length
TrueIs Paved?
ft/ft0.008Slope
ft/s1.82Average Velocity
hours0.076Segment Time of Concentration
Segment #4: TR-55 Shallow Concentrated Flow
ft1,320.00Hydraulic Length
TrueIs Paved?
ft/ft0.025Slope
ft/s3.21Average Velocity
hours0.114Segment Time of Concentration
Time of Concentration (Composite)
hours0.457Time of Concentration (Composite)
Page 20 of 7927 Siemon Company Drive Suite 200 W Watertown, CT 06795 USA +1-203-755-1666
11/11/2015
Bentley PondPack V8i[08.11.01.54]
Bentley Systems, Inc. Haestad Methods Solution Center
20151104_301-175 Culvert Replacement EXISTING.ppc

Storm Event: 2-YearLabel: CM-1Return Event: 100 yearsSubsection: Time of Concentration Calculations
==== SCS Channel Flow
R = Qa / WpV = (1.49 * (R**(2/3)) * (Sf**-0.5)) / n
(Lf / V) / 3600
Tc =
R= Hydraulic radiusAq= Flow area, square feetWp= Wetted perimeter, feetV= Velocity, ft/secSf= Slope, ft/ftn= Manning's nTc= Time of concentration, hoursLf= Flow length, feet
Where:
==== SCS TR-55 Shallow Concentration FlowUnpaved surface:V = 16.1345 * (Sf**0.5)
Paved Surface:V = 20.3282 * (Sf**0.5)
(Lf / V) / 3600
Tc =
V= Velocity, ft/secSf= Slope, ft/ftTc= Time of concentration, hoursLf= Flow length, feet
Where:
Page 21 of 7927 Siemon Company Drive Suite 200 W Watertown, CT 06795 USA +1-203-755-1666
11/11/2015
Bentley PondPack V8i[08.11.01.54]
Bentley Systems, Inc. Haestad Methods Solution Center
20151104_301-175 Culvert Replacement EXISTING.ppc

Storm Event: 2-YearLabel: CM-1Return Event: 100 yearsSubsection: Runoff CN-Area
Runoff Curve Number DataAdjusted CNUC
(%)C
(%)Area
(acres)CNSoil/Surface Description
98.0000.00.031.40098.000Impervious Areas - Paved parking lots, driveways, streets and roads - Soil D
80.0000.00.09.40080.000Open space (Lawns,parks etc.) - Good condition; grass cover > 75% - Soil D
77.0000.00.010.58077.000Woods - good - Soil D
80.0000.00.02.90080.000Open space (Railroad Corridor) - Good condition; - Soil D
98.0000.00.012.86098.000Impervious Areas - Buildings - Soil D91.393(N/A)(N/A)67.140(N/A)COMPOSITE AREA & WEIGHTED CN --->
Page 22 of 7927 Siemon Company Drive Suite 200 W Watertown, CT 06795 USA +1-203-755-1666
11/11/2015
Bentley PondPack V8i[08.11.01.54]
Bentley Systems, Inc. Haestad Methods Solution Center
20151104_301-175 Culvert Replacement EXISTING.ppc

Storm Event: 1-YearLabel: CM-1Return Event: 1 yearsSubsection: Unit Hydrograph Summary
1-YearStorm Event
years1Return Event
hours24.000Duration
in2.8Depth
hours0.457Time of Concentration (Composite)
acres67.140Area (User Defined)
hours0.061Computational Time Increment
hours12.309Time to Peak (Computed)
ft³/s86.11Flow (Peak, Computed)
hours0.050Output Increment
hours12.300Time to Flow (Peak Interpolated Output)
ft³/s85.63Flow (Peak Interpolated Output)
Drainage Area
91.000SCS CN (Composite)
acres67.140Area (User Defined)
in1.0Maximum Retention (Pervious)
in0.2Maximum Retention (Pervious, 20 percent)
Cumulative Runoff
in1.9Cumulative Runoff Depth (Pervious)
ac-ft10.601Runoff Volume (Pervious)
Hydrograph Volume (Area under Hydrograph curve)
ac-ft10.555Volume
SCS Unit Hydrograph Parameters
hours0.457Time of Concentration (Composite)
hours0.061Computational Time Increment
483.432Unit Hydrograph Shape Factor
0.749K Factor
1.670Receding/Rising, Tr/Tp
ft³/s166.45Unit peak, qp
hours0.305Unit peak time, Tp
Page 23 of 7927 Siemon Company Drive Suite 200 W Watertown, CT 06795 USA +1-203-755-1666
11/11/2015
Bentley PondPack V8i[08.11.01.54]
Bentley Systems, Inc. Haestad Methods Solution Center
20151104_301-175 Culvert Replacement EXISTING.ppc

Storm Event: 1-YearLabel: CM-1Return Event: 1 yearsSubsection: Unit Hydrograph Summary
SCS Unit Hydrograph Parameters
hours1.219Unit receding limb, Tr
hours1.523Total unit time, Tb
Page 24 of 7927 Siemon Company Drive Suite 200 W Watertown, CT 06795 USA +1-203-755-1666
11/11/2015
Bentley PondPack V8i[08.11.01.54]
Bentley Systems, Inc. Haestad Methods Solution Center
20151104_301-175 Culvert Replacement EXISTING.ppc

Storm Event: 2-YearLabel: CM-1Return Event: 2 yearsSubsection: Unit Hydrograph Summary
2-YearStorm Event
years2Return Event
hours24.000Duration
in3.4Depth
hours0.457Time of Concentration (Composite)
acres67.140Area (User Defined)
hours0.061Computational Time Increment
hours12.309Time to Peak (Computed)
ft³/s111.97Flow (Peak, Computed)
hours0.050Output Increment
hours12.300Time to Flow (Peak Interpolated Output)
ft³/s111.40Flow (Peak Interpolated Output)
Drainage Area
91.000SCS CN (Composite)
acres67.140Area (User Defined)
in1.0Maximum Retention (Pervious)
in0.2Maximum Retention (Pervious, 20 percent)
Cumulative Runoff
in2.5Cumulative Runoff Depth (Pervious)
ac-ft13.900Runoff Volume (Pervious)
Hydrograph Volume (Area under Hydrograph curve)
ac-ft13.842Volume
SCS Unit Hydrograph Parameters
hours0.457Time of Concentration (Composite)
hours0.061Computational Time Increment
483.432Unit Hydrograph Shape Factor
0.749K Factor
1.670Receding/Rising, Tr/Tp
ft³/s166.45Unit peak, qp
hours0.305Unit peak time, Tp
Page 25 of 7927 Siemon Company Drive Suite 200 W Watertown, CT 06795 USA +1-203-755-1666
11/11/2015
Bentley PondPack V8i[08.11.01.54]
Bentley Systems, Inc. Haestad Methods Solution Center
20151104_301-175 Culvert Replacement EXISTING.ppc

Storm Event: 2-YearLabel: CM-1Return Event: 2 yearsSubsection: Unit Hydrograph Summary
SCS Unit Hydrograph Parameters
hours1.219Unit receding limb, Tr
hours1.523Total unit time, Tb
Page 26 of 7927 Siemon Company Drive Suite 200 W Watertown, CT 06795 USA +1-203-755-1666
11/11/2015
Bentley PondPack V8i[08.11.01.54]
Bentley Systems, Inc. Haestad Methods Solution Center
20151104_301-175 Culvert Replacement EXISTING.ppc

Storm Event: 5-YearLabel: CM-1Return Event: 5 yearsSubsection: Unit Hydrograph Summary
5-YearStorm Event
years5Return Event
hours24.000Duration
in4.5Depth
hours0.457Time of Concentration (Composite)
acres67.140Area (User Defined)
hours0.061Computational Time Increment
hours12.309Time to Peak (Computed)
ft³/s153.79Flow (Peak, Computed)
hours0.050Output Increment
hours12.300Time to Flow (Peak Interpolated Output)
ft³/s153.09Flow (Peak Interpolated Output)
Drainage Area
91.000SCS CN (Composite)
acres67.140Area (User Defined)
in1.0Maximum Retention (Pervious)
in0.2Maximum Retention (Pervious, 20 percent)
Cumulative Runoff
in3.5Cumulative Runoff Depth (Pervious)
ac-ft19.356Runoff Volume (Pervious)
Hydrograph Volume (Area under Hydrograph curve)
ac-ft19.279Volume
SCS Unit Hydrograph Parameters
hours0.457Time of Concentration (Composite)
hours0.061Computational Time Increment
483.432Unit Hydrograph Shape Factor
0.749K Factor
1.670Receding/Rising, Tr/Tp
ft³/s166.45Unit peak, qp
hours0.305Unit peak time, Tp
Page 27 of 7927 Siemon Company Drive Suite 200 W Watertown, CT 06795 USA +1-203-755-1666
11/11/2015
Bentley PondPack V8i[08.11.01.54]
Bentley Systems, Inc. Haestad Methods Solution Center
20151104_301-175 Culvert Replacement EXISTING.ppc

Storm Event: 5-YearLabel: CM-1Return Event: 5 yearsSubsection: Unit Hydrograph Summary
SCS Unit Hydrograph Parameters
hours1.219Unit receding limb, Tr
hours1.523Total unit time, Tb
Page 28 of 7927 Siemon Company Drive Suite 200 W Watertown, CT 06795 USA +1-203-755-1666
11/11/2015
Bentley PondPack V8i[08.11.01.54]
Bentley Systems, Inc. Haestad Methods Solution Center
20151104_301-175 Culvert Replacement EXISTING.ppc

Storm Event: 10-YearLabel: CM-1Return Event: 10 yearsSubsection: Unit Hydrograph Summary
10-YearStorm Event
years10Return Event
hours24.000Duration
in5.3Depth
hours0.457Time of Concentration (Composite)
acres67.140Area (User Defined)
hours0.061Computational Time Increment
hours12.309Time to Peak (Computed)
ft³/s188.46Flow (Peak, Computed)
hours0.050Output Increment
hours12.300Time to Flow (Peak Interpolated Output)
ft³/s187.65Flow (Peak Interpolated Output)
Drainage Area
91.000SCS CN (Composite)
acres67.140Area (User Defined)
in1.0Maximum Retention (Pervious)
in0.2Maximum Retention (Pervious, 20 percent)
Cumulative Runoff
in4.3Cumulative Runoff Depth (Pervious)
ac-ft23.966Runoff Volume (Pervious)
Hydrograph Volume (Area under Hydrograph curve)
ac-ft23.874Volume
SCS Unit Hydrograph Parameters
hours0.457Time of Concentration (Composite)
hours0.061Computational Time Increment
483.432Unit Hydrograph Shape Factor
0.749K Factor
1.670Receding/Rising, Tr/Tp
ft³/s166.45Unit peak, qp
hours0.305Unit peak time, Tp
Page 29 of 7927 Siemon Company Drive Suite 200 W Watertown, CT 06795 USA +1-203-755-1666
11/11/2015
Bentley PondPack V8i[08.11.01.54]
Bentley Systems, Inc. Haestad Methods Solution Center
20151104_301-175 Culvert Replacement EXISTING.ppc

Storm Event: 10-YearLabel: CM-1Return Event: 10 yearsSubsection: Unit Hydrograph Summary
SCS Unit Hydrograph Parameters
hours1.219Unit receding limb, Tr
hours1.523Total unit time, Tb
Page 30 of 7927 Siemon Company Drive Suite 200 W Watertown, CT 06795 USA +1-203-755-1666
11/11/2015
Bentley PondPack V8i[08.11.01.54]
Bentley Systems, Inc. Haestad Methods Solution Center
20151104_301-175 Culvert Replacement EXISTING.ppc

Storm Event: 25-YearLabel: CM-1Return Event: 25 yearsSubsection: Unit Hydrograph Summary
25-YearStorm Event
years25Return Event
hours24.000Duration
in6.5Depth
hours0.457Time of Concentration (Composite)
acres67.140Area (User Defined)
hours0.061Computational Time Increment
hours12.309Time to Peak (Computed)
ft³/s235.87Flow (Peak, Computed)
hours0.050Output Increment
hours12.300Time to Flow (Peak Interpolated Output)
ft³/s234.92Flow (Peak Interpolated Output)
Drainage Area
91.000SCS CN (Composite)
acres67.140Area (User Defined)
in1.0Maximum Retention (Pervious)
in0.2Maximum Retention (Pervious, 20 percent)
Cumulative Runoff
in5.4Cumulative Runoff Depth (Pervious)
ac-ft30.368Runoff Volume (Pervious)
Hydrograph Volume (Area under Hydrograph curve)
ac-ft30.255Volume
SCS Unit Hydrograph Parameters
hours0.457Time of Concentration (Composite)
hours0.061Computational Time Increment
483.432Unit Hydrograph Shape Factor
0.749K Factor
1.670Receding/Rising, Tr/Tp
ft³/s166.45Unit peak, qp
hours0.305Unit peak time, Tp
Page 31 of 7927 Siemon Company Drive Suite 200 W Watertown, CT 06795 USA +1-203-755-1666
11/11/2015
Bentley PondPack V8i[08.11.01.54]
Bentley Systems, Inc. Haestad Methods Solution Center
20151104_301-175 Culvert Replacement EXISTING.ppc

Storm Event: 25-YearLabel: CM-1Return Event: 25 yearsSubsection: Unit Hydrograph Summary
SCS Unit Hydrograph Parameters
hours1.219Unit receding limb, Tr
hours1.523Total unit time, Tb
Page 32 of 7927 Siemon Company Drive Suite 200 W Watertown, CT 06795 USA +1-203-755-1666
11/11/2015
Bentley PondPack V8i[08.11.01.54]
Bentley Systems, Inc. Haestad Methods Solution Center
20151104_301-175 Culvert Replacement EXISTING.ppc

Storm Event: 50-YearLabel: CM-1Return Event: 50 yearsSubsection: Unit Hydrograph Summary
50-YearStorm Event
years50Return Event
hours24.000Duration
in7.4Depth
hours0.457Time of Concentration (Composite)
acres67.140Area (User Defined)
hours0.061Computational Time Increment
hours12.309Time to Peak (Computed)
ft³/s272.12Flow (Peak, Computed)
hours0.050Output Increment
hours12.300Time to Flow (Peak Interpolated Output)
ft³/s271.06Flow (Peak Interpolated Output)
Drainage Area
91.000SCS CN (Composite)
acres67.140Area (User Defined)
in1.0Maximum Retention (Pervious)
in0.2Maximum Retention (Pervious, 20 percent)
Cumulative Runoff
in6.3Cumulative Runoff Depth (Pervious)
ac-ft35.321Runoff Volume (Pervious)
Hydrograph Volume (Area under Hydrograph curve)
ac-ft35.191Volume
SCS Unit Hydrograph Parameters
hours0.457Time of Concentration (Composite)
hours0.061Computational Time Increment
483.432Unit Hydrograph Shape Factor
0.749K Factor
1.670Receding/Rising, Tr/Tp
ft³/s166.45Unit peak, qp
hours0.305Unit peak time, Tp
Page 33 of 7927 Siemon Company Drive Suite 200 W Watertown, CT 06795 USA +1-203-755-1666
11/11/2015
Bentley PondPack V8i[08.11.01.54]
Bentley Systems, Inc. Haestad Methods Solution Center
20151104_301-175 Culvert Replacement EXISTING.ppc

Storm Event: 50-YearLabel: CM-1Return Event: 50 yearsSubsection: Unit Hydrograph Summary
SCS Unit Hydrograph Parameters
hours1.219Unit receding limb, Tr
hours1.523Total unit time, Tb
Page 34 of 7927 Siemon Company Drive Suite 200 W Watertown, CT 06795 USA +1-203-755-1666
11/11/2015
Bentley PondPack V8i[08.11.01.54]
Bentley Systems, Inc. Haestad Methods Solution Center
20151104_301-175 Culvert Replacement EXISTING.ppc

Storm Event: 100-YearLabel: CM-1Return Event: 100 yearsSubsection: Unit Hydrograph Summary
100-YearStorm Event
years100Return Event
hours24.000Duration
in8.3Depth
hours0.457Time of Concentration (Composite)
acres67.140Area (User Defined)
hours0.061Computational Time Increment
hours12.309Time to Peak (Computed)
ft³/s308.62Flow (Peak, Computed)
hours0.050Output Increment
hours12.300Time to Flow (Peak Interpolated Output)
ft³/s307.45Flow (Peak Interpolated Output)
Drainage Area
91.000SCS CN (Composite)
acres67.140Area (User Defined)
in1.0Maximum Retention (Pervious)
in0.2Maximum Retention (Pervious, 20 percent)
Cumulative Runoff
in7.2Cumulative Runoff Depth (Pervious)
ac-ft40.345Runoff Volume (Pervious)
Hydrograph Volume (Area under Hydrograph curve)
ac-ft40.199Volume
SCS Unit Hydrograph Parameters
hours0.457Time of Concentration (Composite)
hours0.061Computational Time Increment
483.432Unit Hydrograph Shape Factor
0.749K Factor
1.670Receding/Rising, Tr/Tp
ft³/s166.45Unit peak, qp
hours0.305Unit peak time, Tp
Page 35 of 7927 Siemon Company Drive Suite 200 W Watertown, CT 06795 USA +1-203-755-1666
11/11/2015
Bentley PondPack V8i[08.11.01.54]
Bentley Systems, Inc. Haestad Methods Solution Center
20151104_301-175 Culvert Replacement EXISTING.ppc

Storm Event: 100-YearLabel: CM-1Return Event: 100 yearsSubsection: Unit Hydrograph Summary
SCS Unit Hydrograph Parameters
hours1.219Unit receding limb, Tr
hours1.523Total unit time, Tb
Page 36 of 7927 Siemon Company Drive Suite 200 W Watertown, CT 06795 USA +1-203-755-1666
11/11/2015
Bentley PondPack V8i[08.11.01.54]
Bentley Systems, Inc. Haestad Methods Solution Center
20151104_301-175 Culvert Replacement EXISTING.ppc

Storm Event: 500-YearLabel: CM-1Return Event: 500 yearsSubsection: Unit Hydrograph Summary
500-YearStorm Event
years500Return Event
hours24.000Duration
in11.3Depth
hours0.457Time of Concentration (Composite)
acres67.140Area (User Defined)
hours0.061Computational Time Increment
hours12.309Time to Peak (Computed)
ft³/s428.48Flow (Peak, Computed)
hours0.050Output Increment
hours12.300Time to Flow (Peak Interpolated Output)
ft³/s426.95Flow (Peak Interpolated Output)
Drainage Area
91.000SCS CN (Composite)
acres67.140Area (User Defined)
in1.0Maximum Retention (Pervious)
in0.2Maximum Retention (Pervious, 20 percent)
Cumulative Runoff
in10.2Cumulative Runoff Depth (Pervious)
ac-ft57.036Runoff Volume (Pervious)
Hydrograph Volume (Area under Hydrograph curve)
ac-ft56.836Volume
SCS Unit Hydrograph Parameters
hours0.457Time of Concentration (Composite)
hours0.061Computational Time Increment
483.432Unit Hydrograph Shape Factor
0.749K Factor
1.670Receding/Rising, Tr/Tp
ft³/s166.45Unit peak, qp
hours0.305Unit peak time, Tp
Page 37 of 7927 Siemon Company Drive Suite 200 W Watertown, CT 06795 USA +1-203-755-1666
11/11/2015
Bentley PondPack V8i[08.11.01.54]
Bentley Systems, Inc. Haestad Methods Solution Center
20151104_301-175 Culvert Replacement EXISTING.ppc

Storm Event: 500-YearLabel: CM-1Return Event: 500 yearsSubsection: Unit Hydrograph Summary
SCS Unit Hydrograph Parameters
hours1.219Unit receding limb, Tr
hours1.523Total unit time, Tb
Page 38 of 7927 Siemon Company Drive Suite 200 W Watertown, CT 06795 USA +1-203-755-1666
11/11/2015
Bentley PondPack V8i[08.11.01.54]
Bentley Systems, Inc. Haestad Methods Solution Center
20151104_301-175 Culvert Replacement EXISTING.ppc

Storm Event: 1-YearLabel: O-1Return Event: 1 yearsSubsection: Addition Summary
Summary for Hydrograph Addition at 'O-1'
Upstream NodeUpstream LinkPO-1EX_Outlet-1
Node Inflows
Flow (Peak)(ft³/s)
Time to Peak(hours)
Volume(ac-ft)
ElementInflow Type
26.6512.9009.784EX_Outlet-1Flow (From)26.6512.9009.784O-1Flow (In)
Page 39 of 7927 Siemon Company Drive Suite 200 W Watertown, CT 06795 USA +1-203-755-1666
11/11/2015
Bentley PondPack V8i[08.11.01.54]
Bentley Systems, Inc. Haestad Methods Solution Center
20151104_301-175 Culvert Replacement EXISTING.ppc

Storm Event: 2-YearLabel: O-1Return Event: 2 yearsSubsection: Addition Summary
Summary for Hydrograph Addition at 'O-1'
Upstream NodeUpstream LinkPO-1EX_Outlet-1
Node Inflows
Flow (Peak)(ft³/s)
Time to Peak(hours)
Volume(ac-ft)
ElementInflow Type
30.4312.95013.021EX_Outlet-1Flow (From)30.4312.95013.021O-1Flow (In)
Page 40 of 7927 Siemon Company Drive Suite 200 W Watertown, CT 06795 USA +1-203-755-1666
11/11/2015
Bentley PondPack V8i[08.11.01.54]
Bentley Systems, Inc. Haestad Methods Solution Center
20151104_301-175 Culvert Replacement EXISTING.ppc

Storm Event: 5-YearLabel: O-1Return Event: 5 yearsSubsection: Addition Summary
Summary for Hydrograph Addition at 'O-1'
Upstream NodeUpstream LinkPO-1EX_Outlet-1
Node Inflows
Flow (Peak)(ft³/s)
Time to Peak(hours)
Volume(ac-ft)
ElementInflow Type
34.5513.05018.385EX_Outlet-1Flow (From)34.5513.05018.385O-1Flow (In)
Page 41 of 7927 Siemon Company Drive Suite 200 W Watertown, CT 06795 USA +1-203-755-1666
11/11/2015
Bentley PondPack V8i[08.11.01.54]
Bentley Systems, Inc. Haestad Methods Solution Center
20151104_301-175 Culvert Replacement EXISTING.ppc

Storm Event: 10-YearLabel: O-1Return Event: 10 yearsSubsection: Addition Summary
Summary for Hydrograph Addition at 'O-1'
Upstream NodeUpstream LinkPO-1EX_Outlet-1
Node Inflows
Flow (Peak)(ft³/s)
Time to Peak(hours)
Volume(ac-ft)
ElementInflow Type
36.3712.70023.278EX_Outlet-1Flow (From)36.3712.70023.278O-1Flow (In)
Page 42 of 7927 Siemon Company Drive Suite 200 W Watertown, CT 06795 USA +1-203-755-1666
11/11/2015
Bentley PondPack V8i[08.11.01.54]
Bentley Systems, Inc. Haestad Methods Solution Center
20151104_301-175 Culvert Replacement EXISTING.ppc

Storm Event: 25-YearLabel: O-1Return Event: 25 yearsSubsection: Addition Summary
Summary for Hydrograph Addition at 'O-1'
Upstream NodeUpstream LinkPO-1EX_Outlet-1
Node Inflows
Flow (Peak)(ft³/s)
Time to Peak(hours)
Volume(ac-ft)
ElementInflow Type
36.3712.45029.954EX_Outlet-1Flow (From)36.3712.45029.954O-1Flow (In)
Page 43 of 7927 Siemon Company Drive Suite 200 W Watertown, CT 06795 USA +1-203-755-1666
11/11/2015
Bentley PondPack V8i[08.11.01.54]
Bentley Systems, Inc. Haestad Methods Solution Center
20151104_301-175 Culvert Replacement EXISTING.ppc

Storm Event: 50-YearLabel: O-1Return Event: 50 yearsSubsection: Addition Summary
Summary for Hydrograph Addition at 'O-1'
Upstream NodeUpstream LinkPO-1EX_Outlet-1
Node Inflows
Flow (Peak)(ft³/s)
Time to Peak(hours)
Volume(ac-ft)
ElementInflow Type
36.3712.35034.831EX_Outlet-1Flow (From)36.3712.35034.831O-1Flow (In)
Page 44 of 7927 Siemon Company Drive Suite 200 W Watertown, CT 06795 USA +1-203-755-1666
11/11/2015
Bentley PondPack V8i[08.11.01.54]
Bentley Systems, Inc. Haestad Methods Solution Center
20151104_301-175 Culvert Replacement EXISTING.ppc

Storm Event: 100-YearLabel: O-1Return Event: 100 yearsSubsection: Addition Summary
Summary for Hydrograph Addition at 'O-1'
Upstream NodeUpstream LinkPO-1EX_Outlet-1
Node Inflows
Flow (Peak)(ft³/s)
Time to Peak(hours)
Volume(ac-ft)
ElementInflow Type
36.3712.30038.907EX_Outlet-1Flow (From)36.3712.30038.907O-1Flow (In)
Page 45 of 7927 Siemon Company Drive Suite 200 W Watertown, CT 06795 USA +1-203-755-1666
11/11/2015
Bentley PondPack V8i[08.11.01.54]
Bentley Systems, Inc. Haestad Methods Solution Center
20151104_301-175 Culvert Replacement EXISTING.ppc

Storm Event: 500-YearLabel: O-1Return Event: 500 yearsSubsection: Addition Summary
Summary for Hydrograph Addition at 'O-1'
Upstream NodeUpstream LinkPO-1EX_Outlet-1
Node Inflows
Flow (Peak)(ft³/s)
Time to Peak(hours)
Volume(ac-ft)
ElementInflow Type
36.3712.10043.855EX_Outlet-1Flow (From)36.3712.10043.855O-1Flow (In)
Page 46 of 7927 Siemon Company Drive Suite 200 W Watertown, CT 06795 USA +1-203-755-1666
11/11/2015
Bentley PondPack V8i[08.11.01.54]
Bentley Systems, Inc. Haestad Methods Solution Center
20151104_301-175 Culvert Replacement EXISTING.ppc

Storm Event: 1-YearLabel: PO-1 (OUT)Return Event: 1 yearsSubsection: Time vs. Elevation
Time vs. Elevation (ft)
Output Time increment = 0.050 hoursTime on left represents time for first value in each row.
Elevation(ft)
Elevation(ft)
Elevation(ft)
Elevation(ft)
Elevation(ft)
Time(hours)
26.0026.0026.0026.0026.000.00026.0026.0026.0026.0026.000.25026.0026.0026.0026.0026.000.50026.0026.0026.0026.0026.000.75026.0026.0026.0026.0026.001.00026.0026.0026.0026.0026.001.25026.0026.0026.0026.0026.001.50026.0026.0026.0026.0026.001.75026.0026.0026.0026.0026.002.00026.0026.0026.0026.0026.002.25026.0026.0026.0026.0026.002.50026.0026.0026.0026.0026.002.75026.0026.0026.0026.0026.003.00026.0026.0026.0026.0026.003.25026.0026.0026.0026.0026.003.50026.0026.0026.0026.0026.003.75026.0026.0026.0026.0026.004.00026.0026.0026.0026.0026.004.25026.0026.0026.0026.0026.004.50026.0026.0026.0026.0026.004.75026.0026.0026.0026.0026.005.00026.0026.0026.0026.0026.005.25026.0026.0026.0026.0026.005.50026.0026.0026.0026.0026.005.75026.0826.0426.0226.0126.006.00026.6526.5426.4026.2626.156.25027.2727.1527.0526.9326.776.50027.8127.7027.6127.5227.406.75028.2928.1928.1128.0327.927.00028.7328.6528.5728.4928.397.25029.0729.0429.0128.9228.827.50029.2729.2329.1929.1529.117.75029.5129.4629.4129.3629.328.00029.6129.5929.5629.5429.528.25029.7329.7129.6829.6529.638.50029.8929.8529.8229.7929.768.75030.0430.0229.9929.9629.929.00030.1830.1530.1230.1030.079.25030.3430.3030.2730.2430.219.50030.5230.4830.4530.4130.379.75030.6930.6530.6230.5830.5510.00030.8930.8530.8130.7730.7310.25031.0931.0531.0130.9730.9310.500
Page 47 of 7927 Siemon Company Drive Suite 200 W Watertown, CT 06795 USA +1-203-755-1666
11/11/2015
Bentley PondPack V8i[08.11.01.54]
Bentley Systems, Inc. Haestad Methods Solution Center
20151104_301-175 Culvert Replacement EXISTING.ppc

Storm Event: 1-YearLabel: PO-1 (OUT)Return Event: 1 yearsSubsection: Time vs. Elevation
Time vs. Elevation (ft)
Output Time increment = 0.050 hoursTime on left represents time for first value in each row.
Elevation(ft)
Elevation(ft)
Elevation(ft)
Elevation(ft)
Elevation(ft)
Time(hours)
31.2731.2331.2031.1631.1210.75031.4631.4231.3931.3531.3111.00031.6531.6131.5731.5431.5011.25031.8731.8231.7731.7331.6911.50032.2732.1732.0832.0131.9411.75033.1032.9032.7132.5532.4012.00033.9633.8233.6633.5033.2912.25034.3234.2834.2234.1534.0712.50034.3934.3934.3834.3734.3512.75034.3234.3434.3634.3734.3813.00034.2134.2434.2634.2834.3013.25034.0834.1134.1334.1634.1913.50033.9333.9734.0034.0334.0613.75033.7633.8033.8333.8733.9014.00033.6033.6333.6633.7033.7314.25033.4233.4633.5033.5333.5714.50033.2533.2833.3233.3533.3914.75033.0933.1233.1533.1833.2215.00032.9532.9833.0133.0433.0715.25032.8032.8332.8632.8932.9215.50032.6732.6932.7232.7432.7715.75032.5532.5732.6032.6232.6416.00032.4332.4632.4832.5132.5316.25032.3232.3432.3632.3832.4116.50032.2232.2432.2632.2832.3016.75032.1432.1532.1732.1932.2017.00032.0632.0832.0932.1132.1217.25032.0032.0132.0332.0432.0517.50031.9331.9531.9631.9731.9917.75031.8731.8831.8931.9131.9218.00031.8131.8231.8431.8531.8618.25031.7731.7831.7831.7931.8018.50031.7331.7331.7431.7531.7618.75031.6931.7031.7031.7131.7219.00031.6631.6731.6731.6831.6819.25031.6431.6431.6531.6531.6619.50031.6131.6231.6231.6331.6319.75031.5931.6031.6031.6031.6120.00031.5831.5831.5831.5931.5920.25031.5631.5631.5731.5731.5720.50031.5531.5531.5531.5531.5620.75031.5331.5331.5431.5431.5421.00031.5231.5231.5331.5331.5321.250
Page 48 of 7927 Siemon Company Drive Suite 200 W Watertown, CT 06795 USA +1-203-755-1666
11/11/2015
Bentley PondPack V8i[08.11.01.54]
Bentley Systems, Inc. Haestad Methods Solution Center
20151104_301-175 Culvert Replacement EXISTING.ppc

Storm Event: 1-YearLabel: PO-1 (OUT)Return Event: 1 yearsSubsection: Time vs. Elevation
Time vs. Elevation (ft)
Output Time increment = 0.050 hoursTime on left represents time for first value in each row.
Elevation(ft)
Elevation(ft)
Elevation(ft)
Elevation(ft)
Elevation(ft)
Time(hours)
31.5131.5131.5131.5231.5221.50031.5031.5031.5031.5131.5121.75031.4931.4931.4931.4931.5022.00031.4831.4831.4831.4831.4922.25031.4631.4731.4731.4731.4722.50031.4531.4531.4631.4631.4622.75031.4431.4431.4531.4531.4523.00031.4331.4331.4331.4431.4423.25031.4231.4231.4231.4231.4323.50031.4131.4131.4131.4131.4223.750(N/A)(N/A)(N/A)(N/A)31.4024.000
Page 49 of 7927 Siemon Company Drive Suite 200 W Watertown, CT 06795 USA +1-203-755-1666
11/11/2015
Bentley PondPack V8i[08.11.01.54]
Bentley Systems, Inc. Haestad Methods Solution Center
20151104_301-175 Culvert Replacement EXISTING.ppc

Storm Event: 2-YearLabel: PO-1 (OUT)Return Event: 2 yearsSubsection: Time vs. Elevation
Time vs. Elevation (ft)
Output Time increment = 0.050 hoursTime on left represents time for first value in each row.
Elevation(ft)
Elevation(ft)
Elevation(ft)
Elevation(ft)
Elevation(ft)
Time(hours)
26.0026.0026.0026.0026.000.00026.0026.0026.0026.0026.000.25026.0026.0026.0026.0026.000.50026.0026.0026.0026.0026.000.75026.0026.0026.0026.0026.001.00026.0026.0026.0026.0026.001.25026.0026.0026.0026.0026.001.50026.0026.0026.0026.0026.001.75026.0026.0026.0026.0026.002.00026.0026.0026.0026.0026.002.25026.0026.0026.0026.0026.002.50026.0026.0026.0026.0026.002.75026.0026.0026.0026.0026.003.00026.0026.0026.0026.0026.003.25026.0026.0026.0026.0026.003.50026.0026.0026.0026.0026.003.75026.0026.0026.0026.0026.004.00026.0026.0026.0026.0026.004.25026.0026.0026.0026.0026.004.50026.0026.0026.0026.0026.004.75026.0026.0026.0026.0026.005.00026.0426.0126.0026.0026.005.25026.5526.4126.2526.1526.085.50027.1727.0726.9526.7926.665.75027.7227.6227.5427.4227.296.00028.2028.1128.0327.9327.826.25028.6428.5728.4928.3928.296.50029.0329.0028.9128.8228.736.75029.2229.1829.1429.1029.077.00029.4629.4129.3629.3129.277.25029.5829.5629.5429.5229.507.50029.7029.6829.6529.6329.617.75029.8429.8129.7829.7529.738.00030.0029.9629.9329.9029.878.25030.1230.0930.0730.0430.028.50030.2630.2330.2030.1730.148.75030.4330.3930.3630.3230.299.00030.6030.5630.5330.5030.469.25030.7830.7430.7030.6730.639.50030.9830.9430.9030.8630.829.75031.1631.1231.0931.0531.0210.00031.3331.2931.2631.2231.1910.25031.5131.4731.4331.4031.3610.500
Page 50 of 7927 Siemon Company Drive Suite 200 W Watertown, CT 06795 USA +1-203-755-1666
11/11/2015
Bentley PondPack V8i[08.11.01.54]
Bentley Systems, Inc. Haestad Methods Solution Center
20151104_301-175 Culvert Replacement EXISTING.ppc

Storm Event: 2-YearLabel: PO-1 (OUT)Return Event: 2 yearsSubsection: Time vs. Elevation
Time vs. Elevation (ft)
Output Time increment = 0.050 hoursTime on left represents time for first value in each row.
Elevation(ft)
Elevation(ft)
Elevation(ft)
Elevation(ft)
Elevation(ft)
Time(hours)
31.6631.6331.6031.5731.5410.75031.8231.7931.7531.7231.6911.00032.0031.9631.9231.8931.8511.25032.2032.1532.1132.0732.0311.50032.6132.5132.4132.3332.2611.75033.4833.2633.0732.9032.7412.00034.3734.2334.0833.8933.6812.25034.7534.7034.6534.5834.5012.50034.8334.8334.8234.8034.7812.75034.7934.8134.8234.8234.8313.00034.7034.7234.7434.7634.7813.25034.6034.6234.6434.6634.6813.50034.4834.5134.5334.5534.5713.75034.3334.3634.3934.4234.4514.00034.1734.2034.2334.2634.2914.25034.0234.0534.0834.1134.1414.50033.8533.8833.9233.9633.9914.75033.6733.7133.7433.7833.8115.00033.5033.5433.5733.6033.6415.25033.3133.3533.3833.4233.4615.50033.1433.1733.2133.2433.2815.75032.9933.0233.0533.0833.1116.00032.8232.8632.8932.9232.9616.25032.6832.7132.7432.7732.7916.50032.5632.5832.6132.6332.6616.75032.4432.4732.5032.5232.5417.00032.3332.3532.3732.4032.4217.25032.2332.2532.2732.2932.3117.50032.1432.1632.1832.1932.2117.75032.0732.0832.1032.1132.1318.00032.0132.0232.0332.0432.0618.25031.9431.9531.9631.9831.9918.50031.8831.8931.9031.9131.9218.75031.8331.8431.8531.8631.8719.00031.7931.7931.8031.8131.8219.25031.7531.7631.7631.7731.7819.50031.7231.7331.7331.7431.7419.75031.6931.7031.7031.7131.7120.00031.6731.6731.6831.6831.6920.25031.6531.6531.6531.6631.6620.50031.6331.6331.6431.6431.6420.75031.6131.6131.6231.6231.6221.00031.6031.6031.6031.6031.6121.250
Page 51 of 7927 Siemon Company Drive Suite 200 W Watertown, CT 06795 USA +1-203-755-1666
11/11/2015
Bentley PondPack V8i[08.11.01.54]
Bentley Systems, Inc. Haestad Methods Solution Center
20151104_301-175 Culvert Replacement EXISTING.ppc

Storm Event: 2-YearLabel: PO-1 (OUT)Return Event: 2 yearsSubsection: Time vs. Elevation
Time vs. Elevation (ft)
Output Time increment = 0.050 hoursTime on left represents time for first value in each row.
Elevation(ft)
Elevation(ft)
Elevation(ft)
Elevation(ft)
Elevation(ft)
Time(hours)
31.5831.5831.5931.5931.5921.50031.5731.5731.5731.5831.5821.75031.5631.5631.5631.5631.5722.00031.5531.5531.5531.5531.5522.25031.5331.5431.5431.5431.5422.50031.5231.5331.5331.5331.5322.75031.5131.5231.5231.5231.5223.00031.5031.5131.5131.5131.5123.25031.4931.5031.5031.5031.5023.50031.4831.4831.4931.4931.4923.750(N/A)(N/A)(N/A)(N/A)31.4824.000
Page 52 of 7927 Siemon Company Drive Suite 200 W Watertown, CT 06795 USA +1-203-755-1666
11/11/2015
Bentley PondPack V8i[08.11.01.54]
Bentley Systems, Inc. Haestad Methods Solution Center
20151104_301-175 Culvert Replacement EXISTING.ppc

Storm Event: 5-YearLabel: PO-1 (OUT)Return Event: 5 yearsSubsection: Time vs. Elevation
Time vs. Elevation (ft)
Output Time increment = 0.050 hoursTime on left represents time for first value in each row.
Elevation(ft)
Elevation(ft)
Elevation(ft)
Elevation(ft)
Elevation(ft)
Time(hours)
26.0026.0026.0026.0026.000.00026.0026.0026.0026.0026.000.25026.0026.0026.0026.0026.000.50026.0026.0026.0026.0026.000.75026.0026.0026.0026.0026.001.00026.0026.0026.0026.0026.001.25026.0026.0026.0026.0026.001.50026.0026.0026.0026.0026.001.75026.0026.0026.0026.0026.002.00026.0026.0026.0026.0026.002.25026.0026.0026.0026.0026.002.50026.0026.0026.0026.0026.002.75026.0026.0026.0026.0026.003.00026.0026.0026.0026.0026.003.25026.0026.0026.0026.0026.003.50026.0026.0026.0026.0026.003.75026.0026.0026.0026.0026.004.00026.0126.0026.0026.0026.004.25026.3726.2226.1226.0626.024.50027.1026.9926.8126.6526.534.75027.7227.6127.5227.3727.235.00028.2528.1528.0627.9627.845.25028.7328.6428.5628.4728.355.50029.0729.0429.0128.9128.825.75029.2729.2329.1929.1529.116.00029.5029.4629.4129.3629.326.25029.6029.5829.5629.5429.526.50029.7229.7029.6729.6529.636.75029.8629.8329.8029.7829.757.00030.0229.9929.9629.9329.897.25030.1430.1130.0930.0630.047.50030.2730.2430.2130.1930.167.75030.4230.3930.3630.3330.308.00030.5830.5530.5230.4930.468.25030.7430.7130.6830.6430.618.50030.9330.9030.8630.8230.788.75031.1131.0831.0431.0130.979.00031.2831.2431.2131.1831.149.25031.4431.4131.3831.3431.319.50031.5931.5631.5431.5131.489.75031.7331.7031.6731.6531.6210.00031.8631.8431.8131.7831.7510.25032.0131.9831.9531.9231.8910.500
Page 53 of 7927 Siemon Company Drive Suite 200 W Watertown, CT 06795 USA +1-203-755-1666
11/11/2015
Bentley PondPack V8i[08.11.01.54]
Bentley Systems, Inc. Haestad Methods Solution Center
20151104_301-175 Culvert Replacement EXISTING.ppc

Storm Event: 5-YearLabel: PO-1 (OUT)Return Event: 5 yearsSubsection: Time vs. Elevation
Time vs. Elevation (ft)
Output Time increment = 0.050 hoursTime on left represents time for first value in each row.
Elevation(ft)
Elevation(ft)
Elevation(ft)
Elevation(ft)
Elevation(ft)
Time(hours)
32.1432.1132.0932.0632.0310.75032.2832.2532.2232.1932.1611.00032.4532.4132.3832.3432.3111.25032.6632.6132.5732.5332.4911.50033.1032.9932.8832.7932.7211.75034.0533.8133.6033.4133.2412.00034.9834.8334.6634.4934.2612.25035.3835.3335.2635.1835.0912.50035.5035.4935.4835.4535.4212.75035.4935.5035.5035.5135.5113.00035.4335.4535.4635.4735.4813.25035.3535.3635.3835.4035.4113.50035.2535.2735.2935.3135.3313.75035.1535.1735.1935.2135.2314.00035.0435.0735.0935.1135.1314.25034.9234.9534.9735.0035.0214.50034.7834.8134.8434.8634.8914.75034.6534.6734.7034.7334.7515.00034.5134.5434.5734.5934.6215.25034.3434.3834.4134.4434.4815.50034.1734.2034.2434.2734.3115.75034.0134.0434.0734.1134.1416.00033.8133.8533.8933.9333.9716.25033.6133.6533.6933.7333.7716.50033.4233.4633.5033.5433.5816.75033.2233.2633.3033.3433.3817.00033.0533.0933.1233.1533.1917.25032.8932.9232.9632.9933.0217.50032.7332.7632.7932.8232.8517.75032.6032.6232.6532.6732.7018.00032.4832.5032.5332.5532.5718.25032.3532.3832.4032.4232.4518.50032.2532.2732.2932.3132.3318.75032.1632.1832.2032.2132.2319.00032.0932.1132.1232.1332.1519.25032.0332.0432.0632.0732.0819.50031.9831.9932.0032.0132.0219.75031.9331.9431.9531.9631.9720.00031.8831.8931.9031.9131.9220.25031.8431.8531.8631.8631.8720.50031.8131.8131.8231.8331.8320.75031.7831.7831.7931.7931.8021.00031.7531.7631.7631.7731.7721.250
Page 54 of 7927 Siemon Company Drive Suite 200 W Watertown, CT 06795 USA +1-203-755-1666
11/11/2015
Bentley PondPack V8i[08.11.01.54]
Bentley Systems, Inc. Haestad Methods Solution Center
20151104_301-175 Culvert Replacement EXISTING.ppc

Storm Event: 5-YearLabel: PO-1 (OUT)Return Event: 5 yearsSubsection: Time vs. Elevation
Time vs. Elevation (ft)
Output Time increment = 0.050 hoursTime on left represents time for first value in each row.
Elevation(ft)
Elevation(ft)
Elevation(ft)
Elevation(ft)
Elevation(ft)
Time(hours)
31.7331.7331.7431.7431.7521.50031.7131.7131.7231.7231.7221.75031.6931.6931.7031.7031.7022.00031.6731.6731.6831.6831.6822.25031.6531.6631.6631.6631.6722.50031.6431.6431.6531.6531.6522.75031.6231.6331.6331.6331.6423.00031.6131.6131.6231.6231.6223.25031.6031.6031.6031.6131.6123.50031.5831.5931.5931.5931.5923.750(N/A)(N/A)(N/A)(N/A)31.5824.000
Page 55 of 7927 Siemon Company Drive Suite 200 W Watertown, CT 06795 USA +1-203-755-1666
11/11/2015
Bentley PondPack V8i[08.11.01.54]
Bentley Systems, Inc. Haestad Methods Solution Center
20151104_301-175 Culvert Replacement EXISTING.ppc

Storm Event: 10-YearLabel: PO-1 (OUT)Return Event: 10 yearsSubsection: Time vs. Elevation
Time vs. Elevation (ft)
Output Time increment = 0.050 hoursTime on left represents time for first value in each row.
Elevation(ft)
Elevation(ft)
Elevation(ft)
Elevation(ft)
Elevation(ft)
Time(hours)
26.0026.0026.0026.0026.000.00026.0026.0026.0026.0026.000.25026.0026.0026.0026.0026.000.50026.0026.0026.0026.0026.000.75026.0026.0026.0026.0026.001.00026.0026.0026.0026.0026.001.25026.0026.0026.0026.0026.001.50026.0026.0026.0026.0026.001.75026.0026.0026.0026.0026.002.00026.0026.0026.0026.0026.002.25026.0026.0026.0026.0026.002.50026.0026.0026.0026.0026.002.75026.0026.0026.0026.0026.003.00026.0026.0026.0026.0026.003.25026.0026.0026.0026.0026.003.50026.0526.0226.0126.0026.003.75026.6726.5426.3726.2126.114.00027.4627.2927.1527.0326.844.25028.0727.9627.8227.6927.584.50028.6028.5128.4028.2828.174.75029.0429.0128.9028.8028.705.00029.2629.2129.1629.1229.085.25029.5129.4629.4129.3529.305.50029.6129.5929.5729.5529.535.75029.7329.7129.6829.6629.636.00029.8729.8429.8129.7829.766.25030.0230.0029.9729.9329.906.50030.1430.1130.0930.0730.046.75030.2730.2430.2230.1930.167.00030.4330.3930.3630.3330.307.25030.5830.5530.5230.4930.467.50030.7430.7130.6830.6430.617.75030.9230.8830.8530.8130.788.00031.0831.0531.0230.9930.958.25031.2431.2131.1731.1431.118.50031.3931.3631.3331.3031.278.75031.5531.5231.4931.4631.439.00031.6831.6531.6331.6031.579.25031.8131.7931.7631.7331.719.50031.9531.9231.8931.8731.849.75032.0732.0532.0232.0031.9810.00032.1832.1632.1432.1132.0910.25032.3132.2932.2632.2332.2110.500
Page 56 of 7927 Siemon Company Drive Suite 200 W Watertown, CT 06795 USA +1-203-755-1666
11/11/2015
Bentley PondPack V8i[08.11.01.54]
Bentley Systems, Inc. Haestad Methods Solution Center
20151104_301-175 Culvert Replacement EXISTING.ppc

Storm Event: 10-YearLabel: PO-1 (OUT)Return Event: 10 yearsSubsection: Time vs. Elevation
Time vs. Elevation (ft)
Output Time increment = 0.050 hoursTime on left represents time for first value in each row.
Elevation(ft)
Elevation(ft)
Elevation(ft)
Elevation(ft)
Elevation(ft)
Time(hours)
32.4632.4332.4032.3732.3410.75032.6032.5732.5432.5232.4911.00032.7632.7232.6932.6532.6211.25033.0032.9432.8932.8432.8011.50033.4733.3333.2233.1333.0611.75034.4634.2234.0133.7933.6112.00035.4035.2535.0934.9034.6812.25035.8335.7835.7135.6335.5312.50035.9835.9635.9435.9235.8812.75035.9935.9935.9935.9935.9913.00035.9535.9635.9735.9835.9913.25035.8935.9035.9135.9335.9413.50035.8135.8335.8435.8635.8713.75035.7335.7535.7635.7835.8014.00035.6435.6635.6835.7035.7114.25035.5535.5735.5935.6135.6214.50035.4535.4735.4935.5135.5314.75035.3335.3535.3735.4035.4215.00035.2135.2335.2635.2835.3015.25035.0935.1135.1435.1635.1815.50034.9634.9935.0135.0435.0615.75034.8034.8334.8634.8934.9216.00034.6534.6834.7134.7434.7716.25034.5034.5334.5634.5934.6216.50034.3134.3434.3834.4234.4616.75034.1334.1634.2034.2334.2717.00033.9433.9934.0234.0634.0917.25033.7433.7833.8233.8633.9017.50033.5433.5833.6233.6633.7017.75033.3333.3733.4133.4633.5018.00033.1433.1733.2133.2533.2918.25032.9733.0133.0433.0733.1018.50032.8032.8332.8632.9032.9318.75032.6632.6832.7132.7432.7719.00032.5432.5632.5832.6032.6319.25032.4232.4432.4732.4932.5119.50032.3132.3332.3532.3732.3919.75032.2232.2432.2532.2732.2920.00032.1532.1632.1732.1932.2020.25032.0832.1032.1132.1232.1320.50032.0332.0432.0532.0632.0720.75031.9831.9932.0032.0132.0221.00031.9431.9531.9531.9631.9721.250
Page 57 of 7927 Siemon Company Drive Suite 200 W Watertown, CT 06795 USA +1-203-755-1666
11/11/2015
Bentley PondPack V8i[08.11.01.54]
Bentley Systems, Inc. Haestad Methods Solution Center
20151104_301-175 Culvert Replacement EXISTING.ppc

Storm Event: 10-YearLabel: PO-1 (OUT)Return Event: 10 yearsSubsection: Time vs. Elevation
Time vs. Elevation (ft)
Output Time increment = 0.050 hoursTime on left represents time for first value in each row.
Elevation(ft)
Elevation(ft)
Elevation(ft)
Elevation(ft)
Elevation(ft)
Time(hours)
31.9031.9031.9131.9231.9321.50031.8631.8731.8731.8831.8921.75031.8331.8431.8431.8531.8522.00031.8031.8131.8131.8231.8222.25031.7831.7831.7931.7931.8022.50031.7531.7631.7631.7731.7722.75031.7331.7431.7431.7531.7523.00031.7131.7231.7231.7331.7323.25031.7031.7031.7031.7131.7123.50031.6831.6831.6831.6931.6923.750(N/A)(N/A)(N/A)(N/A)31.6724.000
Page 58 of 7927 Siemon Company Drive Suite 200 W Watertown, CT 06795 USA +1-203-755-1666
11/11/2015
Bentley PondPack V8i[08.11.01.54]
Bentley Systems, Inc. Haestad Methods Solution Center
20151104_301-175 Culvert Replacement EXISTING.ppc

Storm Event: 25-YearLabel: PO-1 (OUT)Return Event: 25 yearsSubsection: Time vs. Elevation
Time vs. Elevation (ft)
Output Time increment = 0.050 hoursTime on left represents time for first value in each row.
Elevation(ft)
Elevation(ft)
Elevation(ft)
Elevation(ft)
Elevation(ft)
Time(hours)
26.0026.0026.0026.0026.000.00026.0026.0026.0026.0026.000.25026.0026.0026.0026.0026.000.50026.0026.0026.0026.0026.000.75026.0026.0026.0026.0026.001.00026.0026.0026.0026.0026.001.25026.0026.0026.0026.0026.001.50026.0026.0026.0026.0026.001.75026.0026.0026.0026.0026.002.00026.0026.0026.0026.0026.002.25026.0026.0026.0026.0026.002.50026.0026.0026.0026.0026.002.75026.0026.0026.0026.0026.003.00026.0026.0026.0026.0026.003.25026.2226.1126.0526.0226.013.50027.0726.9026.7126.5626.403.75027.7727.6427.5327.3727.204.00028.3928.2728.1528.0527.924.25028.9428.8228.7128.6128.524.50029.1929.1529.1029.0629.024.75029.4629.4029.3529.2929.245.00029.5929.5729.5529.5329.515.25029.7229.7029.6729.6429.625.50029.8729.8429.8129.7829.755.75030.0230.0029.9729.9329.906.00030.1430.1130.0930.0630.046.25030.2730.2430.2130.1930.166.50030.4230.3930.3630.3330.306.75030.5830.5530.5230.4930.457.00030.7430.7030.6730.6430.617.25030.9130.8830.8430.8130.777.50031.0831.0531.0230.9830.957.75031.2231.2031.1731.1431.118.00031.3731.3431.3131.2831.258.25031.5231.4931.4631.4331.408.50031.6431.6231.5931.5731.548.75031.7731.7531.7231.6931.679.00031.9131.8831.8531.8331.809.25032.0332.0131.9931.9631.939.50032.1532.1232.1032.0832.069.75032.2632.2432.2232.1932.1710.00032.3932.3632.3432.3132.2910.25032.5232.5032.4732.4432.4210.500
Page 59 of 7927 Siemon Company Drive Suite 200 W Watertown, CT 06795 USA +1-203-755-1666
11/11/2015
Bentley PondPack V8i[08.11.01.54]
Bentley Systems, Inc. Haestad Methods Solution Center
20151104_301-175 Culvert Replacement EXISTING.ppc

Storm Event: 25-YearLabel: PO-1 (OUT)Return Event: 25 yearsSubsection: Time vs. Elevation
Time vs. Elevation (ft)
Output Time increment = 0.050 hoursTime on left represents time for first value in each row.
Elevation(ft)
Elevation(ft)
Elevation(ft)
Elevation(ft)
Elevation(ft)
Time(hours)
32.6532.6232.6032.5732.5510.75032.8032.7732.7432.7132.6811.00032.9832.9432.9032.8632.8311.25033.2133.1533.1033.0633.0211.50033.7033.5733.4633.3633.2811.75034.7134.5034.2634.0533.8612.00035.6835.5435.3635.1634.9512.25036.0036.0036.0035.9235.8112.50036.0036.0036.0036.0036.0012.75036.0036.0036.0036.0036.0013.00036.0036.0036.0036.0036.0013.25036.0036.0036.0036.0036.0013.50036.0036.0036.0036.0036.0013.75036.0036.0036.0036.0036.0014.00036.0036.0036.0036.0036.0014.25036.0036.0036.0036.0036.0014.50036.0036.0036.0036.0036.0014.75035.9135.9335.9535.9735.9915.00035.8035.8235.8435.8635.8815.25035.6935.7235.7435.7635.7815.50035.5835.6135.6335.6535.6715.75035.4735.4935.5235.5435.5616.00035.3335.3635.3835.4135.4416.25035.1935.2235.2535.2735.3016.50035.0535.0835.1135.1435.1616.75034.9034.9334.9735.0035.0317.00034.7334.7734.8034.8334.8717.25034.5734.6134.6434.6734.7017.50034.3934.4334.4734.5134.5417.75034.2034.2434.2734.3134.3518.00034.0134.0534.0934.1234.1618.25033.7933.8433.8833.9333.9718.50033.5933.6333.6733.7133.7518.75033.3833.4233.4733.5133.5519.00033.1833.2233.2533.2933.3319.25033.0133.0433.0733.1133.1419.50032.8432.8732.9032.9432.9819.75032.6932.7132.7432.7732.8020.00032.5632.5932.6132.6332.6620.25032.4532.4732.5032.5232.5420.50032.3432.3632.3832.4032.4220.75032.2432.2632.2832.3032.3221.00032.1732.1832.2032.2132.2321.250
Page 60 of 7927 Siemon Company Drive Suite 200 W Watertown, CT 06795 USA +1-203-755-1666
11/11/2015
Bentley PondPack V8i[08.11.01.54]
Bentley Systems, Inc. Haestad Methods Solution Center
20151104_301-175 Culvert Replacement EXISTING.ppc

Storm Event: 25-YearLabel: PO-1 (OUT)Return Event: 25 yearsSubsection: Time vs. Elevation
Time vs. Elevation (ft)
Output Time increment = 0.050 hoursTime on left represents time for first value in each row.
Elevation(ft)
Elevation(ft)
Elevation(ft)
Elevation(ft)
Elevation(ft)
Time(hours)
32.1032.1232.1332.1432.1521.50032.0532.0632.0732.0832.0921.75032.0032.0132.0232.0332.0422.00031.9631.9731.9831.9932.0022.25031.9131.9231.9331.9431.9522.50031.8831.8831.8931.9031.9122.75031.8431.8531.8631.8631.8723.00031.8131.8231.8331.8331.8423.25031.7931.7931.8031.8031.8123.50031.7631.7731.7731.7831.7823.750(N/A)(N/A)(N/A)(N/A)31.7624.000
Page 61 of 7927 Siemon Company Drive Suite 200 W Watertown, CT 06795 USA +1-203-755-1666
11/11/2015
Bentley PondPack V8i[08.11.01.54]
Bentley Systems, Inc. Haestad Methods Solution Center
20151104_301-175 Culvert Replacement EXISTING.ppc

Storm Event: 50-YearLabel: PO-1 (OUT)Return Event: 50 yearsSubsection: Time vs. Elevation
Time vs. Elevation (ft)
Output Time increment = 0.050 hoursTime on left represents time for first value in each row.
Elevation(ft)
Elevation(ft)
Elevation(ft)
Elevation(ft)
Elevation(ft)
Time(hours)
26.0026.0026.0026.0026.000.00026.0026.0026.0026.0026.000.25026.0026.0026.0026.0026.000.50026.0026.0026.0026.0026.000.75026.0026.0026.0026.0026.001.00026.0026.0026.0026.0026.001.25026.0026.0026.0026.0026.001.50026.0026.0026.0026.0026.001.75026.0026.0026.0026.0026.002.00026.0026.0026.0026.0026.002.25026.0026.0026.0026.0026.002.50026.0026.0026.0026.0026.002.75026.0126.0026.0026.0026.003.00026.5626.3826.2026.1026.043.25027.4127.2327.0826.9226.713.50028.1127.9927.8327.6927.563.75028.7128.6028.5028.3528.224.00029.1129.0729.0228.9528.824.25029.3829.3229.2729.2129.164.50029.5729.5529.5229.5029.444.75029.7029.6829.6529.6229.605.00029.8629.8329.7929.7629.735.25030.0230.0029.9629.9329.895.50030.1430.1230.0930.0730.055.75030.2830.2530.2230.2030.176.00030.4330.4030.3730.3430.316.25030.5830.5530.5230.5030.466.50030.7430.7130.6830.6430.616.75030.9230.8830.8530.8130.787.00031.0831.0531.0230.9930.957.25031.2331.2031.1731.1431.117.50031.3831.3531.3231.2931.267.75031.5131.4931.4631.4331.408.00031.6331.6131.5831.5631.548.25031.7531.7231.7031.6831.658.50031.8731.8531.8231.8031.778.75032.0031.9831.9531.9231.909.00032.1132.0932.0732.0532.039.25032.2332.2132.1832.1632.149.50032.3532.3332.3032.2832.259.75032.4832.4532.4332.4032.3810.00032.5932.5732.5532.5332.5110.25032.7232.6932.6732.6432.6210.500
Page 62 of 7927 Siemon Company Drive Suite 200 W Watertown, CT 06795 USA +1-203-755-1666
11/11/2015
Bentley PondPack V8i[08.11.01.54]
Bentley Systems, Inc. Haestad Methods Solution Center
20151104_301-175 Culvert Replacement EXISTING.ppc

Storm Event: 50-YearLabel: PO-1 (OUT)Return Event: 50 yearsSubsection: Time vs. Elevation
Time vs. Elevation (ft)
Output Time increment = 0.050 hoursTime on left represents time for first value in each row.
Elevation(ft)
Elevation(ft)
Elevation(ft)
Elevation(ft)
Elevation(ft)
Time(hours)
32.8732.8332.8032.7832.7510.75033.0333.0032.9632.9332.9011.00033.1933.1633.1233.0933.0511.25033.4533.3933.3333.2833.2411.50033.9833.8333.7033.6133.5311.75035.0134.7634.5434.3234.1412.00035.9935.8335.6535.4635.2312.25036.0036.0036.0036.0036.0012.50036.0036.0036.0036.0036.0012.75036.0036.0036.0036.0036.0013.00036.0036.0036.0036.0036.0013.25036.0036.0036.0036.0036.0013.50036.0036.0036.0036.0036.0013.75036.0036.0036.0036.0036.0014.00036.0036.0036.0036.0036.0014.25036.0036.0036.0036.0036.0014.50036.0036.0036.0036.0036.0014.75036.0036.0036.0036.0036.0015.00036.0036.0036.0036.0036.0015.25036.0036.0036.0036.0036.0015.50036.0036.0036.0036.0036.0015.75036.0036.0036.0036.0036.0016.00035.9836.0036.0036.0036.0016.25035.8635.8835.9135.9335.9616.50035.7435.7635.7935.8135.8416.75035.6135.6435.6635.6935.7117.00035.4935.5235.5435.5735.5917.25035.3435.3735.4035.4335.4617.50035.2035.2335.2535.2835.3117.75035.0535.0835.1135.1435.1718.00034.8834.9234.9634.9935.0218.25034.7134.7534.7834.8134.8518.50034.5434.5834.6134.6434.6818.75034.3534.3934.4334.4734.5119.00034.1634.1934.2334.2734.3119.25033.9634.0134.0434.0834.1219.50033.7533.7933.8333.8833.9219.75033.5433.5833.6233.6633.7020.00033.3333.3733.4133.4633.5020.25033.1433.1733.2133.2533.2920.50032.9733.0133.0433.0733.1020.75032.8032.8332.8632.9032.9321.00032.6632.6832.7132.7432.7721.250
Page 63 of 7927 Siemon Company Drive Suite 200 W Watertown, CT 06795 USA +1-203-755-1666
11/11/2015
Bentley PondPack V8i[08.11.01.54]
Bentley Systems, Inc. Haestad Methods Solution Center
20151104_301-175 Culvert Replacement EXISTING.ppc

Storm Event: 50-YearLabel: PO-1 (OUT)Return Event: 50 yearsSubsection: Time vs. Elevation
Time vs. Elevation (ft)
Output Time increment = 0.050 hoursTime on left represents time for first value in each row.
Elevation(ft)
Elevation(ft)
Elevation(ft)
Elevation(ft)
Elevation(ft)
Time(hours)
32.5432.5632.5832.6132.6321.50032.4232.4532.4732.5032.5221.75032.3232.3432.3632.3832.4022.00032.2332.2432.2632.2832.3022.25032.1532.1732.1832.2032.2122.50032.0932.1032.1232.1332.1422.75032.0432.0532.0632.0732.0823.00031.9932.0032.0132.0232.0323.25031.9531.9531.9631.9731.9823.50031.9031.9131.9231.9331.9423.750(N/A)(N/A)(N/A)(N/A)31.8924.000
Page 64 of 7927 Siemon Company Drive Suite 200 W Watertown, CT 06795 USA +1-203-755-1666
11/11/2015
Bentley PondPack V8i[08.11.01.54]
Bentley Systems, Inc. Haestad Methods Solution Center
20151104_301-175 Culvert Replacement EXISTING.ppc

Storm Event: 100-YearLabel: PO-1 (OUT)Return Event: 100 yearsSubsection: Time vs. Elevation
Time vs. Elevation (ft)
Output Time increment = 0.050 hoursTime on left represents time for first value in each row.
Elevation(ft)
Elevation(ft)
Elevation(ft)
Elevation(ft)
Elevation(ft)
Time(hours)
26.0026.0026.0026.0026.000.00026.0026.0026.0026.0026.000.25026.0026.0026.0026.0026.000.50026.0026.0026.0026.0026.000.75026.0026.0026.0026.0026.001.00026.0026.0026.0026.0026.001.25026.0026.0026.0026.0026.001.50026.0026.0026.0026.0026.001.75026.0026.0026.0026.0026.002.00026.0026.0026.0026.0026.002.25026.0026.0026.0026.0026.002.50026.0626.0226.0126.0026.002.75026.8326.6426.5026.2826.143.00027.6827.5527.3727.1927.043.25028.3928.2528.1228.0027.833.50029.0128.8928.7628.6428.533.75029.2729.2129.1629.1029.064.00029.5329.5129.4629.3929.334.25029.6729.6429.6129.5829.564.50029.8329.8029.7629.7329.704.75030.0129.9829.9429.9029.875.00030.1430.1130.0930.0630.045.25030.2830.2530.2230.2030.175.50030.4430.4130.3830.3530.325.75030.6030.5730.5430.5130.486.00030.7630.7230.6930.6630.636.25030.9330.9030.8630.8330.796.50031.0931.0631.0331.0030.976.75031.2431.2131.1831.1531.127.00031.3831.3631.3331.3031.277.25031.5231.5031.4731.4431.417.50031.6431.6231.5931.5731.557.75031.7531.7331.7031.6831.668.00031.8631.8431.8131.7931.778.25031.9831.9531.9331.9131.888.50032.0932.0632.0432.0232.008.75032.2032.1732.1532.1332.119.00032.3232.2932.2732.2432.229.25032.4532.4232.3932.3732.349.50032.5632.5432.5232.5032.479.75032.6832.6532.6332.6132.5910.00032.8032.7732.7532.7232.7010.25032.9432.9132.8832.8632.8310.500
Page 65 of 7927 Siemon Company Drive Suite 200 W Watertown, CT 06795 USA +1-203-755-1666
11/11/2015
Bentley PondPack V8i[08.11.01.54]
Bentley Systems, Inc. Haestad Methods Solution Center
20151104_301-175 Culvert Replacement EXISTING.ppc

Storm Event: 100-YearLabel: PO-1 (OUT)Return Event: 100 yearsSubsection: Time vs. Elevation
Time vs. Elevation (ft)
Output Time increment = 0.050 hoursTime on left represents time for first value in each row.
Elevation(ft)
Elevation(ft)
Elevation(ft)
Elevation(ft)
Elevation(ft)
Time(hours)
33.0933.0633.0333.0132.9810.75033.2433.2133.1833.1533.1211.00033.4433.4033.3533.3233.2811.25033.7033.6433.5833.5433.4911.50034.2534.1133.9933.8833.7811.75035.2835.0534.8234.6134.4312.00036.0036.0035.9635.7435.5312.25036.0036.0036.0036.0036.0012.50036.0036.0036.0036.0036.0012.75036.0036.0036.0036.0036.0013.00036.0036.0036.0036.0036.0013.25036.0036.0036.0036.0036.0013.50036.0036.0036.0036.0036.0013.75036.0036.0036.0036.0036.0014.00036.0036.0036.0036.0036.0014.25036.0036.0036.0036.0036.0014.50036.0036.0036.0036.0036.0014.75036.0036.0036.0036.0036.0015.00036.0036.0036.0036.0036.0015.25036.0036.0036.0036.0036.0015.50036.0036.0036.0036.0036.0015.75036.0036.0036.0036.0036.0016.00036.0036.0036.0036.0036.0016.25036.0036.0036.0036.0036.0016.50036.0036.0036.0036.0036.0016.75036.0036.0036.0036.0036.0017.00036.0036.0036.0036.0036.0017.25036.0036.0036.0036.0036.0017.50036.0036.0036.0036.0036.0017.75035.8735.9035.9335.9535.9818.00035.7435.7735.7935.8235.8518.25035.6135.6435.6635.6935.7118.50035.4835.5135.5335.5635.5818.75035.3235.3535.3835.4135.4419.00035.1735.2035.2335.2635.2919.25035.0235.0535.0835.1135.1419.50034.8534.8834.9234.9534.9919.75034.6734.7134.7434.7834.8120.00034.5134.5434.5734.6134.6420.25034.3034.3434.3834.4234.4720.50034.1134.1534.1834.2234.2620.75033.9133.9534.0034.0334.0721.00033.6933.7333.7833.8233.8621.250
Page 66 of 7927 Siemon Company Drive Suite 200 W Watertown, CT 06795 USA +1-203-755-1666
11/11/2015
Bentley PondPack V8i[08.11.01.54]
Bentley Systems, Inc. Haestad Methods Solution Center
20151104_301-175 Culvert Replacement EXISTING.ppc

Storm Event: 100-YearLabel: PO-1 (OUT)Return Event: 100 yearsSubsection: Time vs. Elevation
Time vs. Elevation (ft)
Output Time increment = 0.050 hoursTime on left represents time for first value in each row.
Elevation(ft)
Elevation(ft)
Elevation(ft)
Elevation(ft)
Elevation(ft)
Time(hours)
33.4933.5333.5733.6133.6521.50033.2733.3133.3633.4033.4421.75033.0933.1233.1633.2033.2322.00032.9232.9532.9933.0333.0622.25032.7632.7932.8232.8532.8822.50032.6232.6432.6732.7032.7322.75032.5032.5332.5532.5732.5923.00032.3832.4132.4332.4532.4823.25032.2832.3032.3232.3432.3623.50032.1932.2132.2332.2432.2623.750(N/A)(N/A)(N/A)(N/A)32.1824.000
Page 67 of 7927 Siemon Company Drive Suite 200 W Watertown, CT 06795 USA +1-203-755-1666
11/11/2015
Bentley PondPack V8i[08.11.01.54]
Bentley Systems, Inc. Haestad Methods Solution Center
20151104_301-175 Culvert Replacement EXISTING.ppc

Storm Event: 500-YearLabel: PO-1 (OUT)Return Event: 500 yearsSubsection: Time vs. Elevation
Time vs. Elevation (ft)
Output Time increment = 0.050 hoursTime on left represents time for first value in each row.
Elevation(ft)
Elevation(ft)
Elevation(ft)
Elevation(ft)
Elevation(ft)
Time(hours)
26.0026.0026.0026.0026.000.00026.0026.0026.0026.0026.000.25026.0026.0026.0026.0026.000.50026.0026.0026.0026.0026.000.75026.0026.0026.0026.0026.001.00026.0026.0026.0026.0026.001.25026.0026.0026.0026.0026.001.50026.1126.0426.0126.0026.001.75027.1526.9426.6826.5026.252.00028.1427.9827.7627.5827.372.25028.9928.8128.6528.5128.312.50029.3529.2729.1929.1229.062.75029.6129.5829.5429.5129.443.00029.8229.7729.7329.6929.653.25030.0430.0129.9729.9229.873.50030.2230.1930.1530.1130.083.75030.4330.3930.3430.3030.264.00030.6330.5930.5630.5230.484.25030.8530.8030.7630.7230.674.50031.0531.0230.9830.9330.894.75031.2331.1931.1631.1231.095.00031.3931.3631.3331.2931.265.25031.5431.5231.4931.4631.425.50031.6631.6431.6131.5931.575.75031.7731.7531.7331.7031.686.00031.8731.8531.8331.8131.796.25031.9831.9531.9331.9131.896.50032.0732.0532.0332.0132.006.75032.1632.1432.1232.1032.097.00032.2532.2332.2232.2032.187.25032.3532.3332.3132.2932.277.50032.4632.4432.4232.3932.377.75032.5532.5332.5232.5032.488.00032.6432.6232.6032.5932.578.25032.7532.7332.7032.6832.668.50032.8732.8532.8232.8032.778.75033.0132.9832.9532.9332.909.00033.1333.1133.0833.0633.039.25033.2733.2433.2233.1933.169.50033.4233.3933.3633.3333.309.75033.5633.5433.5133.4833.4510.00033.7233.6833.6533.6233.5910.25033.9033.8633.8233.7933.7510.500
Page 68 of 7927 Siemon Company Drive Suite 200 W Watertown, CT 06795 USA +1-203-755-1666
11/11/2015
Bentley PondPack V8i[08.11.01.54]
Bentley Systems, Inc. Haestad Methods Solution Center
20151104_301-175 Culvert Replacement EXISTING.ppc

Storm Event: 500-YearLabel: PO-1 (OUT)Return Event: 500 yearsSubsection: Time vs. Elevation
Time vs. Elevation (ft)
Output Time increment = 0.050 hoursTime on left represents time for first value in each row.
Elevation(ft)
Elevation(ft)
Elevation(ft)
Elevation(ft)
Elevation(ft)
Time(hours)
34.1034.0634.0333.9933.9510.75034.3134.2734.2234.1834.1411.00034.5634.5234.4734.4134.3611.25034.8734.8034.7334.6734.6111.50035.4435.2935.1635.0634.9611.75036.0036.0036.0035.7935.6012.00036.0036.0036.0036.0036.0012.25036.0036.0036.0036.0036.0012.50036.0036.0036.0036.0036.0012.75036.0036.0036.0036.0036.0013.00036.0036.0036.0036.0036.0013.25036.0036.0036.0036.0036.0013.50036.0036.0036.0036.0036.0013.75036.0036.0036.0036.0036.0014.00036.0036.0036.0036.0036.0014.25036.0036.0036.0036.0036.0014.50036.0036.0036.0036.0036.0014.75036.0036.0036.0036.0036.0015.00036.0036.0036.0036.0036.0015.25036.0036.0036.0036.0036.0015.50036.0036.0036.0036.0036.0015.75036.0036.0036.0036.0036.0016.00036.0036.0036.0036.0036.0016.25036.0036.0036.0036.0036.0016.50036.0036.0036.0036.0036.0016.75036.0036.0036.0036.0036.0017.00036.0036.0036.0036.0036.0017.25036.0036.0036.0036.0036.0017.50036.0036.0036.0036.0036.0017.75036.0036.0036.0036.0036.0018.00036.0036.0036.0036.0036.0018.25036.0036.0036.0036.0036.0018.50036.0036.0036.0036.0036.0018.75036.0036.0036.0036.0036.0019.00036.0036.0036.0036.0036.0019.25036.0036.0036.0036.0036.0019.50036.0036.0036.0036.0036.0019.75036.0036.0036.0036.0036.0020.00036.0036.0036.0036.0036.0020.25036.0036.0036.0036.0036.0020.50036.0036.0036.0036.0036.0020.75036.0036.0036.0036.0036.0021.00036.0036.0036.0036.0036.0021.250
Page 69 of 7927 Siemon Company Drive Suite 200 W Watertown, CT 06795 USA +1-203-755-1666
11/11/2015
Bentley PondPack V8i[08.11.01.54]
Bentley Systems, Inc. Haestad Methods Solution Center
20151104_301-175 Culvert Replacement EXISTING.ppc

Storm Event: 500-YearLabel: PO-1 (OUT)Return Event: 500 yearsSubsection: Time vs. Elevation
Time vs. Elevation (ft)
Output Time increment = 0.050 hoursTime on left represents time for first value in each row.
Elevation(ft)
Elevation(ft)
Elevation(ft)
Elevation(ft)
Elevation(ft)
Time(hours)
36.0036.0036.0036.0036.0021.50036.0036.0036.0036.0036.0021.75036.0036.0036.0036.0036.0022.00036.0036.0036.0036.0036.0022.25036.0036.0036.0036.0036.0022.50036.0036.0036.0036.0036.0022.75036.0036.0036.0036.0036.0023.00036.0036.0036.0036.0036.0023.25036.0036.0036.0036.0036.0023.50036.0036.0036.0036.0036.0023.750(N/A)(N/A)(N/A)(N/A)36.0024.000
Page 70 of 7927 Siemon Company Drive Suite 200 W Watertown, CT 06795 USA +1-203-755-1666
11/11/2015
Bentley PondPack V8i[08.11.01.54]
Bentley Systems, Inc. Haestad Methods Solution Center
20151104_301-175 Culvert Replacement EXISTING.ppc

Storm Event: 2-YearLabel: EX_MNRR CulvertReturn Event: 100 yearsSubsection: Outlet Input Data
Requested Pond Water Surface Elevations
ft26.00Minimum (Headwater)
ft0.50Increment (Headwater)
ft36.00Maximum (Headwater)
Outlet Connectivity
E2(ft)
E1(ft)
OutfallDirectionOutlet IDStructure Type
36.0030.90TWForwardEX_CV1Culvert-Box(N/A)(N/A)TailwaterTailwater Settings
Page 71 of 7927 Siemon Company Drive Suite 200 W Watertown, CT 06795 USA +1-203-755-1666
11/11/2015
Bentley PondPack V8i[08.11.01.54]
Bentley Systems, Inc. Haestad Methods Solution Center
20151104_301-175 Culvert Replacement EXISTING.ppc

Storm Event: 2-YearLabel: EX_MNRR CulvertReturn Event: 100 yearsSubsection: Outlet Input Data
Structure ID: EX_CV1Structure Type: Culvert-Box
1Number of Barrels
ft2.00Width
ft2.00Height
ft90.00Length
ft90.06Length (Computed Barrel)
ft/ft0.037Slope (Computed)
Outlet Control Data
0.013Manning's n
0.500Ke
0.012Kb
0.000Kr
ft0.00Convergence Tolerance
Inlet Control Data
Form 1Equation Form
0.0610K
0.7500M
0.0423C
0.8200Y
1.225T1 ratio (HW/D)
1.478T2 ratio (HW/D)
-0.500Slope Correction Factor
Use unsubmerged inlet control 0 equation below T1 elevation.Use submerged inlet control 0 equation above T2 elevation
In transition zone between unsubmerged and submerged inlet control,interpolate between flows at T1 & T2...
ft33.35T1 Elevation ft³/s19.80T1 Flowft33.86T2 Elevation ft³/s22.63T2 Flow
Page 72 of 7927 Siemon Company Drive Suite 200 W Watertown, CT 06795 USA +1-203-755-1666
11/11/2015
Bentley PondPack V8i[08.11.01.54]
Bentley Systems, Inc. Haestad Methods Solution Center
20151104_301-175 Culvert Replacement EXISTING.ppc

Storm Event: 2-YearLabel: EX_MNRR CulvertReturn Event: 100 yearsSubsection: Outlet Input Data
Structure ID: TWStructure Type: TW Setup, DS Channel
Free OutfallTailwater Type
Convergence Tolerances
30Maximum Iterations
ft0.01Tailwater Tolerance (Minimum)
ft0.50Tailwater Tolerance (Maximum)
ft0.01Headwater Tolerance (Minimum)
ft0.50Headwater Tolerance (Maximum)
ft³/s0.001Flow Tolerance (Minimum)
ft³/s10.000Flow Tolerance (Maximum)
Page 73 of 7927 Siemon Company Drive Suite 200 W Watertown, CT 06795 USA +1-203-755-1666
11/11/2015
Bentley PondPack V8i[08.11.01.54]
Bentley Systems, Inc. Haestad Methods Solution Center
20151104_301-175 Culvert Replacement EXISTING.ppc

Storm Event: 2-YearLabel: EX_MNRR CulvertReturn Event: 100 yearsSubsection: Individual Outlet Curves
RATING TABLE FOR ONE OUTLET TYPEStructure ID = EX_CV1 (Culvert-Box)---------------------------------------Mannings open channel maximum capacity: 66.81 ft³/sUpstream ID = (Pond Water Surface)Downstream ID = Tailwater (Pond Outfall)
Convergence Error(ft)
Tailwater Elevation(ft)
Flow(ft³/s)
Water Surface Elevation
(ft)
0.00(N/A)0.0026.000.00(N/A)0.0026.500.00(N/A)0.0027.000.00(N/A)0.0027.500.00(N/A)0.0028.000.00(N/A)0.0028.500.00(N/A)0.0029.000.00(N/A)0.0029.500.00(N/A)0.0030.000.00(N/A)0.0030.500.00(N/A)0.0030.900.00(N/A)0.1631.000.00(N/A)2.2731.500.00(N/A)5.6532.000.00(N/A)9.9132.500.00(N/A)14.9033.000.00(N/A)20.5633.500.00(N/A)23.7934.000.00(N/A)27.4834.500.00(N/A)30.7335.000.00(N/A)33.6635.500.00(N/A)36.3736.00
Computation Messages
Upstream HW & DNstream TW < Inv.ElUpstream HW & DNstream TW < Inv.ElUpstream HW & DNstream TW < Inv.ElUpstream HW & DNstream TW < Inv.ElUpstream HW & DNstream TW < Inv.ElUpstream HW & DNstream TW < Inv.ElUpstream HW & DNstream TW < Inv.ElUpstream HW & DNstream TW < Inv.ElUpstream HW & DNstream TW < Inv.ElUpstream HW & DNstream TW < Inv.ElUpstream HW & DNstream TW < Inv.ElCRIT.DEPTH CONTROL Vh= .029ft Dcr= .057ft CRIT.DEPTH Hev= .00ftCRIT.DEPTH CONTROL Vh= .171ft Dcr= .343ft CRIT.DEPTH Hev= .00ft
Page 74 of 7927 Siemon Company Drive Suite 200 W Watertown, CT 06795 USA +1-203-755-1666
11/11/2015
Bentley PondPack V8i[08.11.01.54]
Bentley Systems, Inc. Haestad Methods Solution Center
20151104_301-175 Culvert Replacement EXISTING.ppc

Storm Event: 2-YearLabel: EX_MNRR CulvertReturn Event: 100 yearsSubsection: Individual Outlet Curves
RATING TABLE FOR ONE OUTLET TYPEStructure ID = EX_CV1 (Culvert-Box)---------------------------------------Mannings open channel maximum capacity: 66.81 ft³/sUpstream ID = (Pond Water Surface)Downstream ID = Tailwater (Pond Outfall)
Computation MessagesCRIT.DEPTH CONTROL Vh= .314ft Dcr= .628ft CRIT.DEPTH Hev= .00ftCRIT.DEPTH CONTROL Vh= .457ft Dcr= .914ft CRIT.DEPTH Hev= .00ftCRIT.DEPTH CONTROL Vh= .600ft Dcr= 1.200ft CRIT.DEPTH Hev= .00ftCRIT.DEPTH CONTROL Vh= .743ft Dcr= 1.486ft CRIT.DEPTH Hev= .00ftINLET CONTROL... Submerged: HW =3.10INLET CONTROL... Submerged: HW =3.60INLET CONTROL... Submerged: HW =4.10INLET CONTROL... Submerged: HW =4.60INLET CONTROL... Submerged: HW =5.10
Page 75 of 7927 Siemon Company Drive Suite 200 W Watertown, CT 06795 USA +1-203-755-1666
11/11/2015
Bentley PondPack V8i[08.11.01.54]
Bentley Systems, Inc. Haestad Methods Solution Center
20151104_301-175 Culvert Replacement EXISTING.ppc

Storm Event: 2-YearLabel: EX_MNRR CulvertReturn Event: 100 yearsSubsection: Composite Rating Curve
Composite Outflow Summary
Convergence Error(ft)
Tailwater Elevation(ft)
Flow(ft³/s)
Water Surface Elevation
(ft)
0.00(N/A)0.0026.000.00(N/A)0.0026.500.00(N/A)0.0027.000.00(N/A)0.0027.500.00(N/A)0.0028.000.00(N/A)0.0028.500.00(N/A)0.0029.000.00(N/A)0.0029.500.00(N/A)0.0030.000.00(N/A)0.0030.500.00(N/A)0.0030.900.00(N/A)0.1631.000.00(N/A)2.2731.500.00(N/A)5.6532.000.00(N/A)9.9132.500.00(N/A)14.9033.000.00(N/A)20.5633.500.00(N/A)23.7934.000.00(N/A)27.4834.500.00(N/A)30.7335.000.00(N/A)33.6635.500.00(N/A)36.3736.00
Contributing Structures
None ContributingNone ContributingNone ContributingNone ContributingNone ContributingNone ContributingNone ContributingNone ContributingNone ContributingNone ContributingNone ContributingEX_CV1EX_CV1EX_CV1EX_CV1EX_CV1EX_CV1EX_CV1EX_CV1EX_CV1EX_CV1
Page 76 of 7927 Siemon Company Drive Suite 200 W Watertown, CT 06795 USA +1-203-755-1666
11/11/2015
Bentley PondPack V8i[08.11.01.54]
Bentley Systems, Inc. Haestad Methods Solution Center
20151104_301-175 Culvert Replacement EXISTING.ppc

Storm Event: 2-YearLabel: EX_MNRR CulvertReturn Event: 100 yearsSubsection: Composite Rating Curve
Composite Outflow Summary
Contributing StructuresEX_CV1
Page 77 of 7927 Siemon Company Drive Suite 200 W Watertown, CT 06795 USA +1-203-755-1666
11/11/2015
Bentley PondPack V8i[08.11.01.54]
Bentley Systems, Inc. Haestad Methods Solution Center
20151104_301-175 Culvert Replacement EXISTING.ppc

O-1 (Addition Summary, 2 years)...40
O-1 (Addition Summary, 100 years)...45
O-1 (Addition Summary, 10 years)...42
O-1 (Addition Summary, 1 years)...39
O
NOAA Bridgeport (Time-Depth Curve, 500 years)...14, 15
NOAA Bridgeport (Time-Depth Curve, 50 years)...16, 17
NOAA Bridgeport (Time-Depth Curve, 5 years)...18, 19
NOAA Bridgeport (Time-Depth Curve, 25 years)...10, 11
NOAA Bridgeport (Time-Depth Curve, 2 years)...12, 13
NOAA Bridgeport (Time-Depth Curve, 100 years)...4, 5
NOAA Bridgeport (Time-Depth Curve, 10 years)...6, 7
NOAA Bridgeport (Time-Depth Curve, 1 years)...8, 9
N
Master Network Summary...2, 3
M
EX_MNRR Culvert (Outlet Input Data, 100 years)...71, 72, 73
EX_MNRR Culvert (Individual Outlet Curves, 100 years)...74, 75
EX_MNRR Culvert (Composite Rating Curve, 100 years)...76, 77
E
CM-1 (Unit Hydrograph Summary, 500 years)...37, 38
CM-1 (Unit Hydrograph Summary, 50 years)...33, 34
CM-1 (Unit Hydrograph Summary, 5 years)...27, 28
CM-1 (Unit Hydrograph Summary, 25 years)...31, 32
CM-1 (Unit Hydrograph Summary, 2 years)...25, 26
CM-1 (Unit Hydrograph Summary, 100 years)...35, 36
CM-1 (Unit Hydrograph Summary, 10 years)...29, 30
CM-1 (Unit Hydrograph Summary, 1 years)...23, 24
CM-1 (Time of Concentration Calculations, 100 years)...20, 21
CM-1 (Runoff CN-Area, 100 years)...22
C
Index
Page 78 of 7927 Siemon Company Drive Suite 200 W Watertown, CT 06795 USA +1-203-755-1666
11/11/2015
Bentley PondPack V8i[08.11.01.54]
Bentley Systems, Inc. Haestad Methods Solution Center
20151104_301-175 Culvert Replacement EXISTING.ppc

PO-1 (OUT) (Time vs. Elevation, 500 years)...68, 69, 70
PO-1 (OUT) (Time vs. Elevation, 50 years)...62, 63, 64
PO-1 (OUT) (Time vs. Elevation, 5 years)...53, 54, 55
PO-1 (OUT) (Time vs. Elevation, 25 years)...59, 60, 61
PO-1 (OUT) (Time vs. Elevation, 2 years)...50, 51, 52
PO-1 (OUT) (Time vs. Elevation, 100 years)...65, 66, 67
PO-1 (OUT) (Time vs. Elevation, 10 years)...56, 57, 58
PO-1 (OUT) (Time vs. Elevation, 1 years)...47, 48, 49
P
O-1 (Addition Summary, 500 years)...46
O-1 (Addition Summary, 50 years)...44
O-1 (Addition Summary, 5 years)...41
O-1 (Addition Summary, 25 years)...43
Page 79 of 7927 Siemon Company Drive Suite 200 W Watertown, CT 06795 USA +1-203-755-1666
11/11/2015
Bentley PondPack V8i[08.11.01.54]
Bentley Systems, Inc. Haestad Methods Solution Center
20151104_301-175 Culvert Replacement EXISTING.ppc

STATE PROJECT NO. 301-0175 CULVERT REPLACEMENT MNRR NEW HAVEN MAINLINE M.P. 65.60, MILFORD, CONN.
APPENDIX C3
RATIONAL METHOD

STATE PROJECT NO. 301-175CULVERT REPLACEMENT
MNRR NEW HAVEN MAINLINEM.P. 65.60, MILFORD, CONN.
DETERMINE RUNOFF COEFFICIENT (C)
C (low) C (high)
Streets / Walks 31.40 0.70 0.95 0.90 0.42Buildings 12.86 0.75 0.95 0.95 0.18Landscape 9.40 0.10 0.30 0.30 0.04Woods / Undisturbed 10.58 0.10 0.30 0.20 0.03Railroad Corridor 2.90 0.20 0.40 0.30 0.01
Total Area (A) = 67.14 0.69
DETERMINE TIME OF CONCENTRATION (Tc)
Surface Length Slope n 2-Yr 24 Hr Tt Unit
Woods 60 0.03 0.4 3.44 0.195 HoursWoods 40 0.2 0.4 3.44 0.066 Hours
Surface Length Slope Paved Tt Unit
Paved Driveway 500 0.008 yes 0.076 HoursPaved Roads 1320 0.025 yes 0.114 Hours
0.452 Hours27.1 Minutes
DETERMINE RAINFALL INTENSITY (I) Storm 1 2 5 10 25 50 100
NOAA (Duration Low) 15 15 15 15 15 15 15NOAA (Intensity Low) 2.3 2.77 3.55 4.2 5.08 5.77 6.45Tc (Duration) 27.1 27.1 27.1 27.1 27.1 27.1 27.1Interpolated Intensity (I) 1.74 2.09 2.68 3.17 3.84 4.35 4.87NOAA (Duration High) 30 30 30 30 30 30 30NOAA (Intensity High) 1.6 1.93 2.47 2.92 3.54 4.01 4.49
FREQUENCY FACTORS (Cf)Storm 1 2 5 10 25 50 100Cf 1 1 1 1 1.1 1.2 1.25
CALCULATE PEAK DISCHARGE (Q = C x Cf x I x A)Storm 1 2 5 10 25 50 100Q 80.3 96.9 124.0 146.6 195.4 241.7 281.7
HYDROLOGIC CALCULATIONS - RATIONAL METHOD
PREPARED BY:DATE:
BJH3/2/2016
Comp. CSurface
Composite Roughness (C) =
Sheet Flow
Shallow Concentrated Flow
Time of ConcentrationTime of Concentration
Roughness RangeArea C

Hydrology 6.9-5
December 2003 ConnDOT Drainage Manual
The final element to be factored into the determination of runoff coefficients is the land slope.As the slope of the drainage basin increases, the selected C value should also increase. This iscaused by the fact that as the slope of the drainage area increases, the velocity of overland andchannel flow will increase allowing less opportunity for water to infiltrate the ground surface. Thus,more of the rainfall will become runoff from the drainage area.
In summary, it should be reiterated that in assigning a value to the runoff coefficient for use inthe rational method, the engineer must rely heavily on experience and judgement.
Table 6-3 Recommended Coefficient Of Runoff For Pervious Surfaces By Selected Hydrologic Soil Groupings And Slope Ranges
Slope A B C DFlat 0.04-0.09 0.07-0.12 0.11-0.16 0.15-0.20(0 - 1%)Average 0.09-0.14 0.12-0.17 0.16-0.21 0.20-0.25(2 - 6%)Steep 0.13-0.18 0.18-0.24 0.23-0.31 0.28-0.38(Over 6%)Source: Storm Drainage Design Manual, Erie and Niagara Counties Regional Planning Board.
Table 6-4 Recommended Coefficient Of Runoff Values For Various Selected Land Uses
Description of Area Runoff Coefficients
Business: Downtown areas 0.70-0.95Neighborhood areas 0.50-0.70Residential: Single-family areas 0.30-0.50
Multi units, detached 0.40-0.60Multi units, attached 0.60-0.75Suburban 0.25-0.40
Residential (0.5 ha (1.2 ac) lots or more) 0.30-0.45Apartment dwelling areas 0.50-0.70Industrial: Light areas 0.50-0.80
Heavy areas 0.60-0.90Parks, cemeteries 0.10-0.25Playgrounds 0.20-0.40Railroad yard areas 0.20-0.40Unimproved areas 0.10-0.30

6.9-6 Hydrology
ConnDOT Drainage Manual December 2003
Table 6-5 Coefficients For Composite Runoff Analysis
Surface Runoff Coefficients
Street: Asphalt 0.70-0.95Concrete 0.80-0.95
Drives and walks 0.75-0.85Roofs 0.75-0.95


STATE PROJECT NO. 301-0175 CULVERT REPLACEMENT MNRR NEW HAVEN MAINLINE M.P. 65.60, MILFORD, CONN.
APPENDIX B
PHOTOGRAPHS

STATE PROJECT NO. 301-0175 CULVERT REPLACEMENT MNRR NEW HAVEN MAINLINE M.P. 65.60, MILFORD, CONN.
3
282 Woodmont Road looking north
Eastern Steel Road looking northwest towards 465 Old Gate Lane

STATE PROJECT NO. 301-0175 CULVERT REPLACEMENT MNRR NEW HAVEN MAINLINE M.P. 65.60, MILFORD, CONN.
4
Intersection of Research Drive and Woodmont Road
Upstream Railroad Embankment at Culvert

STATE PROJECT NO. 301-0175 CULVERT REPLACEMENT MNRR NEW HAVEN MAINLINE M.P. 65.60, MILFORD, CONN.
5
Downstream Embankment at culvert – note sloughing
Downstream outlet – note collapsed structure

STATE PROJECT NO. 301-0175 CULVERT REPLACEMENT MNRR NEW HAVEN MAINLINE M.P. 65.60, MILFORD, CONN.
6
Channel section within downstream wetland area
Channel section within downstream wetland area

STATE PROJECT NO. 301-0175 CULVERT REPLACEMENT MNRR NEW HAVEN MAINLINE M.P. 65.60, MILFORD, CONN.
7
Wetland & storage area immediately upstream of Pepes Farm Road
Twin 42” RCP culvert at Pepes Farm Road

STATE PROJECT NO. 301-0175 CULVERT REPLACEMENT MNRR NEW HAVEN MAINLINE M.P. 65.60, MILFORD, CONN.
APPENDIX C
MAPS
Catchment Area Map CN Area Map
Storage Volume Map Inundation Area Map
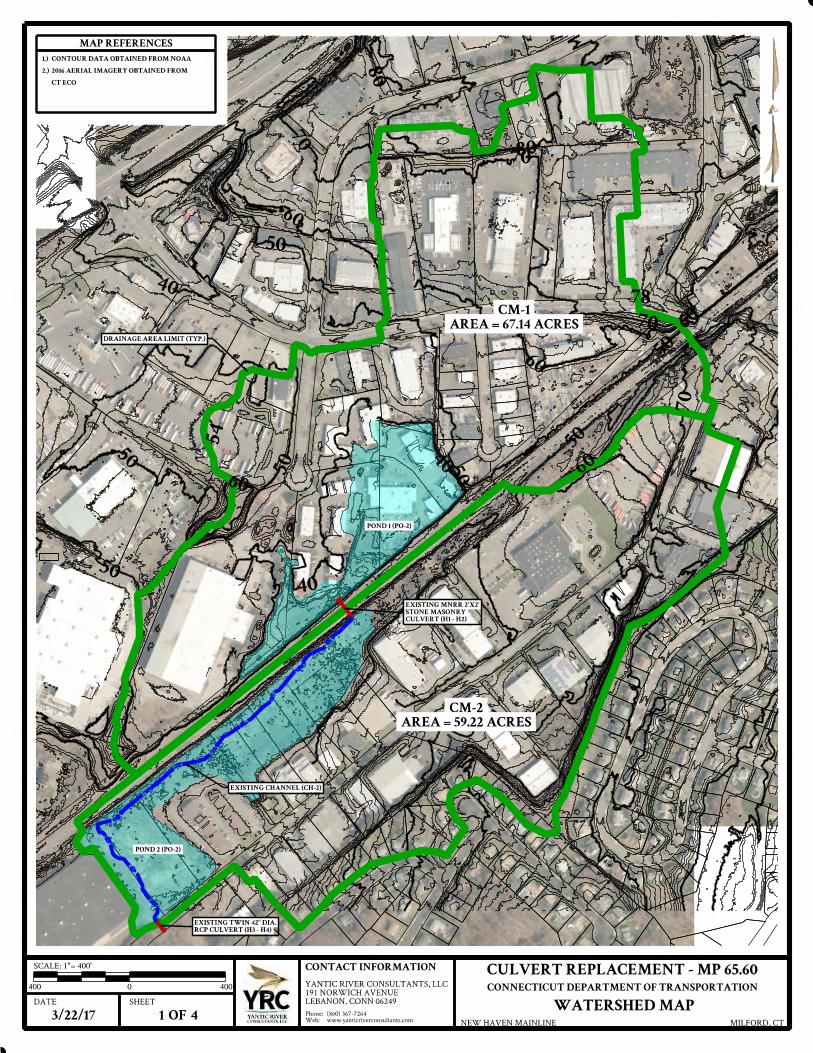
CULVERT REPLACEMENT - MP 65.60
CONNECTICUT DEPARTMENT OF TRANSPORTATION
WATERSHED MAP www.yanticriverconsultants.comWeb:
(860) 367-7264Phone:
LEBANON, CONN 06249
191 NORWICH AVENUE
YANTIC RIVER CONSULTANTS, LLC
CONTACT INFORMATION
DATE
3/22/17 MILFORD, CTNEW HAVEN MAINLINE
SHEET
1OF 4
SCALE: 1"= 400'
400 0 400
50
60
50
4050
60
80
40
50
60
70
80
50
60
70
70
40
54
50
78
60
50
70
MAP REFERENCES
CT ECO
2016 AERIAL IMAGERY OBTAINED FROM2.)
CONTOUR DATA OBTAINED FROM NOAA1.)
AREA = 67.14 ACRES
CM-1
AREA = 59.22 ACRES
CM-2
DRAINAGE AREA LIMIT (TYP.)
RCP CULVERT (H3 - H4)
EXISTING TWIN 42" DIA.
CULVERT (H1 - H2)
STONE MASONRY
EXISTING MNRR 2'X2'
EXISTING CHANNEL (CH-2)
POND 2 (PO-2)
POND 1 (PO-2)

CULVERT REPLACEMENT - MP 65.60
CONNECTICUT DEPARTMENT OF TRANSPORTATION
LANDUSE / CN MAP www.yanticriverconsultants.comWeb:
(860) 367-7264Phone:
LEBANON, CONN 06249
191 NORWICH AVENUE
YANTIC RIVER CONSULTANTS, LLC
CONTACT INFORMATION
DATE
3/22/17 MILFORD, CTNEW HAVEN MAINLINE
SHEET
2OF 4
SCALE: 1"= 400'
400 0 400
WATERSHED TABLE
CM-1
CM-2
CATCHMENT #1 (CM-1)
CATCHMENT #2 (CM-2)
8467.14 AC.DRAINAGE AREA
392.90 AC.RAILROAD
6010.58 AC.WOODS (FAIR)
619.40 AC.LANDSCAPE
9812.86 AC.BUILDING
9831.40 AC.IMPERVIOUS
CNAREALANDUSE
7959.22TOTAL
391.72 AC.RAILROAD
5512.32AC.WOODS (GOOD)
754.03 AC.RESIDENTIAL (1/4 AC.)
8841.16 AC.INDUSTRIAL
CNAREALANDUSE

CULVERT REPLACEMENT - MP 65.60
CONNECTICUT DEPARTMENT OF TRANSPORTATION
STORAGE (POND) VOLUME MAP www.yanticriverconsultants.comWeb:
(860) 367-7264Phone:
LEBANON, CONN 06249
191 NORWICH AVENUE
YANTIC RIVER CONSULTANTS, LLC
CONTACT INFORMATION
DATE
3/22/17 MILFORD, CTNEW HAVEN MAINLINE
SHEET
3OF 4
SCALE: 1"= 400'
400 0 400
AREA = 67.14 ACRES
CM-1
AREA = 59.22 ACRES
CM-2
DRAINAGE AREA LIMIT (TYP.)
EXISTING CHANNEL (CH-2)
POND 2 (PO-2)
POND 1 (PO-2)
ELEVATION-AREA TABLE
ELEV. 32
ELEV. 34
ELEV. 36
ELEV. 38 ELEV. 30
ELEV. 29
ELEV. 28
POND #1 (PO-1)
POND #2 (PO-2)
ELEV. 24.50
ELEV. 25
9.2640350030
8.1235380028
3.3214480027
1.416150026
0.19820025
0.10430024.5
AREA (AC)AREA (SF)ELEV.
ELEV. 26
ELEV. 27
ELEV. 28
ELEV. 30
H4 = 24.35 (ASSUMED)
H3 = 24.50 (ASSUMED)
EXISTING TWIN 42" DIA. RCP CULVERT
H2 = 27.60 (ASSUMED @ GRADE)
H1 = 28.90 (ASSUMED)
CULVERT
STONE MASONRY
EXISTING MNRR 2'X2'
6.33027600038
4.713220530936
1.77927750434
0.70033050332
0.30341321730
0.0266116029
0.011650428
0.003113627
0.00052226
AREA (AC)AREA (SF)ELEV.

CULVERT REPLACEMENT - MP 65.60
CONNECTICUT DEPARTMENT OF TRANSPORTATION
INUNDATION AREA MAP www.yanticriverconsultants.comWeb:
(860) 367-7264Phone:
LEBANON, CONN 06249
191 NORWICH AVENUE
YANTIC RIVER CONSULTANTS, LLC
CONTACT INFORMATION
DATE
3/22/17 MILFORD, CTNEW HAVEN MAINLINE
SHEET
4OF 4
SCALE: 1"= 400'
400 0 400
60
40
50
60
40
54
50
AREA = 67.14 ACRES
CM-1
AREA = 59.22 ACRES
CM-2
DRAINAGE AREA LIMIT (TYP.)
H2 = 27.60
H1 = 28.10
RCP CULVERT
PROPOSED TWIN 48" DIA.
ELEV. = 31.7 (APPROX.)
100-YEAR STORM EVENT
PROPOSED LIMIT OF INUNDATION
ELEV. = 37.2 (APPROX.)
100-YEAR STORM EVENT
EXISTING LIMIT OF INUNDATION

STATE PROJECT NO. 301-0175 CULVERT REPLACEMENT MNRR NEW HAVEN MAINLINE M.P. 65.60, MILFORD, CONN.
APPENDIX D
ROUTING COMPUTATIONS
Existing Conditions Alternate 1: Twin 48” RCP Culvert
Alternate 2: Twin 48” RCP Culvert with Restrictions

STATE PROJECT NO. 301-0175 CULVERT REPLACEMENT MNRR NEW HAVEN MAINLINE M.P. 65.60, MILFORD, CONN.
APPENDIX D1
Existing Conditions (CivilStorm)

Scenario: NOAA Base
Page 1 of 127 Siemon Company Drive Suite 200 W Watertown, CT 06795 USA +1-203-755-1666
3/25/2017
Bentley CivilStorm V8i (SELECTseries 5)[08.11.05.113]
Bentley Systems, Inc. Haestad Methods Solution Center20170327_301-175 EXISTING 24in BOX.stsw

Calculation Executive SummaryScenario
NOAA 1-YearLabel
Storm Event
NOAA 1-Year - Rainfall
Runoff Alternative -
1
Label
years1Return Event
NOAA Bridgeport (1
-Year) - 1 Year
Global Storm Event
Calculation Executive Summary
ft³732,755.4Total Inflow Volume ft³11,187.0Total System Volume Changeft³681,077.7Total System Outflow Volume %5.5Continuity Error
ft³0.0Total System Overflow Volume
ft³0.0Total Pond Infiltration Volume
ft³(N/A)Total Gutter Volume Change 2028Total N-R Iterations
Page 1 of 127 Siemon Company Drive Suite 200 W Watertown, CT 06795 USA +1-203-755-1666
3/25/2017
Bentley CivilStorm V8i (SELECTseries 5)[08.11.05.113]Bentley Systems, Inc. Haestad Methods Solution Center20170327_301-175 EXISTING 24in BOX.stsw

Calculation Detailed Summary<General>
Base Calculation
OptionsLabel
hours0.050Output Increment
hours0.025Calculation Time Step hours24.000Duration
Implicit Engine
ft0.040Virtual Flow Depth 0.700NR Weighting Coefficientft0.03Y Iteration Tolerance 0.600Relaxation Weighting
Coefficient1.000LPI Coefficient ft50.00Computation Distance
Inlets
FalseNeglect Side Flow? Grate and Curb
Active Components for Combination Inlets In Sag
FalseNeglect Gutter Cross Slope For Side Flow?
Grate and Curb
Active Components for Combination Inlets on Grade
Catchment Calculation Summary
Time (Maximum Flow)
(hours)
Flow (Maximum)(cfs)
Volume (Total Runoff)
(ft³)
Area (User Defined)(acres)
Total Rainfall Depth(in)
Loss MethodRunoff MethodLabel
12.30085.22457,543.067.1402.8SCS CNUnit HydrographCM-112.40049.28275,080.059.2202.8SCS CNUnit HydrographCM-2
General Calculation Summary
Hydraulic Grade (Maximum)
(ft)
Velocity (Maximum Calculated)
(ft/s)
Flow (Maximum)(cfs)
Time (Maximum Flow)
(hours)
BranchElement TypeLabel
33.338.5734.2812.7501ConduitMNRR 2X226.496.2054.2313.9501ConduitPEPES 4229.082.4234.2612.8501ChannelCH-233.33---------1PondPO-1
Page 1 of 227 Siemon Company Drive Suite 200 W Watertown, CT 06795 USA +1-203-755-1666
3/25/2017
Bentley CivilStorm V8i (SELECTseries 5)[08.11.05.113]Bentley Systems, Inc. Haestad Methods Solution Center20170327_301-175 EXISTING 24in BOX.stsw

General Calculation Summary
Hydraulic Grade (Maximum)
(ft)
Velocity (Maximum Calculated)
(ft/s)
Flow (Maximum)(cfs)
Time (Maximum Flow)
(hours)
BranchElement TypeLabel
26.49---------1PondPO-2
Node Calculation Summary
Flow (Captured Maximum)
(cfs)
Time To Maximum
Captured Flow(hours)
Flow (Surface Maximum)
(cfs)
Time To Maximum Inlet
Flow(hours)
Flow (Total In Maximum)
(cfs)
Time to Maximum Inflow
(hours)
BranchElement TypeLabel
------------(N/A)(N/A)0OutfallO-1------------84.8312.3001PondPO-1------------77.5912.4001PondPO-2
Flow (Overflow Maximum)
(cfs)
Time to Maximum Overflow(hours)
(N/A)(N/A)0.000.0000.000.000
Gutter Calculation Summary
Velocity (Maximum Calculated)
(ft/s)
Time (Maximum Flow)
(hours)
Flow (Maximum)(cfs)
Gutter ShapeLabel
Page 2 of 227 Siemon Company Drive Suite 200 W Watertown, CT 06795 USA +1-203-755-1666
3/25/2017
Bentley CivilStorm V8i (SELECTseries 5)[08.11.05.113]Bentley Systems, Inc. Haestad Methods Solution Center20170327_301-175 EXISTING 24in BOX.stsw

FlexTable: Conduit ReportCurrent Time: 12.800 hours
Flow (Maximum)(cfs)
Span(ft)
Rise(ft)
Diameter(in)
Length (User Defined)
(ft)
Manning's nMaterialConduit Description
Label
34.282.02.090.00.019Stone masonryBox - 2.0 x 2.0 ftMNRR 2X254.2342.050.00.013ConcreteCircle - 42.0 inPEPES 42
Velocity (Out)(ft/s)
Velocity (In)(ft/s)
Hydraulic Grade Line (Out)
(ft)
Hydraulic Grade Line (In)
(ft)
Hydraulic Grade (Maximum)
(ft)
Time to Maximum
Hydraulic Grade(hours)
8.578.5730.2233.3333.3312.8005.924.2525.8926.4926.4912.800
Page 1 of 127 Siemon Company Drive Suite 200 W Watertown, CT 06795 USA +1-203-755-1666
4/1/2017
Bentley CivilStorm V8i (SELECTseries 5)[08.11.05.113]Bentley Systems, Inc. Haestad Methods Solution Center20170327_301-175 EXISTING 24in BOX.stsw

Calculation Executive SummaryScenario
NOAA 2-YearLabel
Storm Event
NOAA 2-Year - Rainfall
Runoff Alternative -
1
Label
years2Return Event
NOAA Bridgeport (2
-Year) - 2 Year
Global Storm Event
Calculation Executive Summary
ft³932,645.3Total Inflow Volume ft³12,504.2Total System Volume Changeft³859,398.1Total System Outflow Volume %6.5Continuity Error
ft³0.0Total System Overflow Volume
ft³0.0Total Pond Infiltration Volume
ft³(N/A)Total Gutter Volume Change 2601Total N-R Iterations
Page 1 of 127 Siemon Company Drive Suite 200 W Watertown, CT 06795 USA +1-203-755-1666
3/25/2017
Bentley CivilStorm V8i (SELECTseries 5)[08.11.05.113]Bentley Systems, Inc. Haestad Methods Solution Center20170327_301-175 EXISTING 24in BOX.stsw

Calculation Detailed Summary<General>
Base Calculation
OptionsLabel
hours0.050Output Increment
hours0.025Calculation Time Step hours24.000Duration
Implicit Engine
ft0.040Virtual Flow Depth 0.700NR Weighting Coefficientft0.03Y Iteration Tolerance 0.600Relaxation Weighting
Coefficient1.000LPI Coefficient ft50.00Computation Distance
Inlets
FalseNeglect Side Flow? Grate and Curb
Active Components for Combination Inlets In Sag
FalseNeglect Gutter Cross Slope For Side Flow?
Grate and Curb
Active Components for Combination Inlets on Grade
Catchment Calculation Summary
Time (Maximum Flow)
(hours)
Flow (Maximum)(cfs)
Volume (Total Runoff)
(ft³)
Area (User Defined)(acres)
Total Rainfall Depth(in)
Loss MethodRunoff MethodLabel
12.300105.67570,887.067.1403.3SCS CNUnit HydrographCM-112.35065.21361,597.059.2203.3SCS CNUnit HydrographCM-2
General Calculation Summary
Hydraulic Grade (Maximum)
(ft)
Velocity (Maximum Calculated)
(ft/s)
Flow (Maximum)(cfs)
Time (Maximum Flow)
(hours)
BranchElement TypeLabel
33.969.1536.5812.8501ConduitMNRR 2X226.694.9959.3312.8001ConduitPEPES 4229.132.4536.5712.9001ChannelCH-233.96---------1PondPO-1
Page 1 of 227 Siemon Company Drive Suite 200 W Watertown, CT 06795 USA +1-203-755-1666
3/25/2017
Bentley CivilStorm V8i (SELECTseries 5)[08.11.05.113]Bentley Systems, Inc. Haestad Methods Solution Center20170327_301-175 EXISTING 24in BOX.stsw

General Calculation Summary
Hydraulic Grade (Maximum)
(ft)
Velocity (Maximum Calculated)
(ft/s)
Flow (Maximum)(cfs)
Time (Maximum Flow)
(hours)
BranchElement TypeLabel
26.69---------1PondPO-2
Node Calculation Summary
Flow (Captured Maximum)
(cfs)
Time To Maximum
Captured Flow(hours)
Flow (Surface Maximum)
(cfs)
Time To Maximum Inlet
Flow(hours)
Flow (Total In Maximum)
(cfs)
Time to Maximum Inflow
(hours)
BranchElement TypeLabel
------------(N/A)(N/A)0OutfallO-1------------105.0712.3001PondPO-1------------94.9312.3501PondPO-2
Flow (Overflow Maximum)
(cfs)
Time to Maximum Overflow(hours)
(N/A)(N/A)0.000.0000.000.000
Gutter Calculation Summary
Velocity (Maximum Calculated)
(ft/s)
Time (Maximum Flow)
(hours)
Flow (Maximum)(cfs)
Gutter ShapeLabel
Page 2 of 227 Siemon Company Drive Suite 200 W Watertown, CT 06795 USA +1-203-755-1666
3/25/2017
Bentley CivilStorm V8i (SELECTseries 5)[08.11.05.113]Bentley Systems, Inc. Haestad Methods Solution Center20170327_301-175 EXISTING 24in BOX.stsw

FlexTable: Conduit ReportCurrent Time: 12.850 hours
Flow (Maximum)(cfs)
Span(ft)
Rise(ft)
Diameter(in)
Length (User Defined)
(ft)
Manning's nMaterialConduit Description
Label
36.582.02.090.00.019Stone masonryBox - 2.0 x 2.0 ftMNRR 2X259.3342.050.00.013ConcreteCircle - 42.0 inPEPES 42
Velocity (Out)(ft/s)
Velocity (In)(ft/s)
Hydraulic Grade Line (Out)
(ft)
Hydraulic Grade Line (In)
(ft)
Hydraulic Grade (Maximum)
(ft)
Time to Maximum
Hydraulic Grade(hours)
9.159.1530.4233.9633.9612.8506.434.6726.0526.6826.6912.800
Page 1 of 127 Siemon Company Drive Suite 200 W Watertown, CT 06795 USA +1-203-755-1666
4/1/2017
Bentley CivilStorm V8i (SELECTseries 5)[08.11.05.113]Bentley Systems, Inc. Haestad Methods Solution Center20170327_301-175 EXISTING 24in BOX.stsw

Calculation Executive SummaryScenario
NOAA 5-YearLabel
Storm Event
NOAA 5-Year - Rainfall
Runoff Alternative -
1
Label
years5Return Event
NOAA Bridgeport (5
-Year) - 5 Year
Global Storm Event
Calculation Executive Summary
ft³1,432,320.3Total Inflow Volume ft³16,484.5Total System Volume Changeft³1,347,459.3Total System Outflow Volume %4.8Continuity Error
ft³0.0Total System Overflow Volume
ft³0.0Total Pond Infiltration Volume
ft³(N/A)Total Gutter Volume Change 3361Total N-R Iterations
Page 1 of 127 Siemon Company Drive Suite 200 W Watertown, CT 06795 USA +1-203-755-1666
3/25/2017
Bentley CivilStorm V8i (SELECTseries 5)[08.11.05.113]Bentley Systems, Inc. Haestad Methods Solution Center20170327_301-175 EXISTING 24in BOX.stsw

Calculation Detailed Summary<General>
Base Calculation
OptionsLabel
hours0.050Output Increment
hours0.025Calculation Time Step hours24.000Duration
Implicit Engine
ft0.040Virtual Flow Depth 0.700NR Weighting Coefficientft0.03Y Iteration Tolerance 0.600Relaxation Weighting
Coefficient1.000LPI Coefficient ft50.00Computation Distance
Inlets
FalseNeglect Side Flow? Grate and Curb
Active Components for Combination Inlets In Sag
FalseNeglect Gutter Cross Slope For Side Flow?
Grate and Curb
Active Components for Combination Inlets on Grade
Catchment Calculation Summary
Time (Maximum Flow)
(hours)
Flow (Maximum)(cfs)
Volume (Total Runoff)
(ft³)
Area (User Defined)(acres)
Total Rainfall Depth(in)
Loss MethodRunoff MethodLabel
12.300154.72849,177.067.1404.5SCS CNUnit HydrographCM-112.350105.26582,912.059.2204.5SCS CNUnit HydrographCM-2
General Calculation Summary
Hydraulic Grade (Maximum)
(ft)
Velocity (Maximum Calculated)
(ft/s)
Flow (Maximum)(cfs)
Time (Maximum Flow)
(hours)
BranchElement TypeLabel
35.0310.0540.1912.9501ConduitMNRR 2X227.106.1188.7812.8001ConduitPEPES 4229.222.4840.2113.0501ChannelCH-235.03---------1PondPO-1
Page 1 of 227 Siemon Company Drive Suite 200 W Watertown, CT 06795 USA +1-203-755-1666
3/25/2017
Bentley CivilStorm V8i (SELECTseries 5)[08.11.05.113]Bentley Systems, Inc. Haestad Methods Solution Center20170327_301-175 EXISTING 24in BOX.stsw

General Calculation Summary
Hydraulic Grade (Maximum)
(ft)
Velocity (Maximum Calculated)
(ft/s)
Flow (Maximum)(cfs)
Time (Maximum Flow)
(hours)
BranchElement TypeLabel
27.10---------1PondPO-2
Node Calculation Summary
Flow (Captured Maximum)
(cfs)
Time To Maximum
Captured Flow(hours)
Flow (Surface Maximum)
(cfs)
Time To Maximum Inlet
Flow(hours)
Flow (Total In Maximum)
(cfs)
Time to Maximum Inflow
(hours)
BranchElement TypeLabel
------------(N/A)(N/A)0OutfallO-1------------153.5912.3001PondPO-1------------137.6112.3501PondPO-2
Flow (Overflow Maximum)
(cfs)
Time to Maximum Overflow(hours)
(N/A)(N/A)0.000.0000.000.000
Gutter Calculation Summary
Velocity (Maximum Calculated)
(ft/s)
Time (Maximum Flow)
(hours)
Flow (Maximum)(cfs)
Gutter ShapeLabel
Page 2 of 227 Siemon Company Drive Suite 200 W Watertown, CT 06795 USA +1-203-755-1666
3/25/2017
Bentley CivilStorm V8i (SELECTseries 5)[08.11.05.113]Bentley Systems, Inc. Haestad Methods Solution Center20170327_301-175 EXISTING 24in BOX.stsw

FlexTable: Conduit ReportCurrent Time: 12.950 hours
Flow (Maximum)(cfs)
Span(ft)
Rise(ft)
Diameter(in)
Length (User Defined)
(ft)
Manning's nMaterialConduit Description
Label
40.192.02.090.00.019Stone masonryBox - 2.0 x 2.0 ftMNRR 2X288.7842.050.00.013ConcreteCircle - 42.0 inPEPES 42
Velocity (Out)(ft/s)
Velocity (In)(ft/s)
Hydraulic Grade Line (Out)
(ft)
Hydraulic Grade Line (In)
(ft)
Hydraulic Grade (Maximum)
(ft)
Time to Maximum
Hydraulic Grade(hours)
10.0510.0530.7735.0335.0312.9507.425.7626.4127.0727.1012.750
Page 1 of 127 Siemon Company Drive Suite 200 W Watertown, CT 06795 USA +1-203-755-1666
4/1/2017
Bentley CivilStorm V8i (SELECTseries 5)[08.11.05.113]Bentley Systems, Inc. Haestad Methods Solution Center20170327_301-175 EXISTING 24in BOX.stsw

Calculation Executive SummaryScenario
NOAA 10-YearLabel
Storm Event
NOAA 10-Year -
Rainfall Runoff
Alternative - 1
Label
years10Return Event
NOAA Bridgeport (10-Year) -
10 Year
Global Storm Event
Calculation Executive Summary
ft³1,775,199.4Total Inflow Volume ft³14,423.6Total System Volume Changeft³1,780,045.6Total System Outflow Volume %1.1Continuity Error
ft³0.0Total System Overflow Volume
ft³0.0Total Pond Infiltration Volume
ft³(N/A)Total Gutter Volume Change 2957Total N-R Iterations
Page 1 of 127 Siemon Company Drive Suite 200 W Watertown, CT 06795 USA +1-203-755-1666
3/25/2017
Bentley CivilStorm V8i (SELECTseries 5)[08.11.05.113]Bentley Systems, Inc. Haestad Methods Solution Center20170327_301-175 EXISTING 24in BOX.stsw

Calculation Detailed Summary<General>
Base Calculation
OptionsLabel
hours0.050Output Increment
hours0.025Calculation Time Step hours24.000Duration
Implicit Engine
ft0.040Virtual Flow Depth 0.700NR Weighting Coefficientft0.03Y Iteration Tolerance 0.600Relaxation Weighting
Coefficient1.000LPI Coefficient ft50.00Computation Distance
Inlets
FalseNeglect Side Flow? Grate and Curb
Active Components for Combination Inlets In Sag
FalseNeglect Gutter Cross Slope For Side Flow?
Grate and Curb
Active Components for Combination Inlets on Grade
Catchment Calculation Summary
Time (Maximum Flow)
(hours)
Flow (Maximum)(cfs)
Volume (Total Runoff)
(ft³)
Area (User Defined)(acres)
Total Rainfall Depth(in)
Loss MethodRunoff MethodLabel
12.300187.251,037,602.067.1405.3SCS CNUnit HydrographCM-112.350132.64737,319.059.2205.3SCS CNUnit HydrographCM-2
General Calculation Summary
Hydraulic Grade (Maximum)
(ft)
Velocity (Maximum Calculated)
(ft/s)
Flow (Maximum)(cfs)
Time (Maximum Flow)
(hours)
BranchElement TypeLabel
35.5610.4641.8613.0501ConduitMNRR 2X227.326.67105.4212.7001ConduitPEPES 4229.262.4841.9013.1001ChannelCH-235.56---------1PondPO-1
Page 1 of 227 Siemon Company Drive Suite 200 W Watertown, CT 06795 USA +1-203-755-1666
3/25/2017
Bentley CivilStorm V8i (SELECTseries 5)[08.11.05.113]Bentley Systems, Inc. Haestad Methods Solution Center20170327_301-175 EXISTING 24in BOX.stsw

General Calculation Summary
Hydraulic Grade (Maximum)
(ft)
Velocity (Maximum Calculated)
(ft/s)
Flow (Maximum)(cfs)
Time (Maximum Flow)
(hours)
BranchElement TypeLabel
27.32---------1PondPO-2
Node Calculation Summary
Flow (Captured Maximum)
(cfs)
Time To Maximum
Captured Flow(hours)
Flow (Surface Maximum)
(cfs)
Time To Maximum Inlet
Flow(hours)
Flow (Total In Maximum)
(cfs)
Time to Maximum Inflow
(hours)
BranchElement TypeLabel
------------(N/A)(N/A)0OutfallO-1------------185.7512.3001PondPO-1------------163.5012.3501PondPO-2
Flow (Overflow Maximum)
(cfs)
Time to Maximum Overflow(hours)
(N/A)(N/A)0.000.0000.000.000
Gutter Calculation Summary
Velocity (Maximum Calculated)
(ft/s)
Time (Maximum Flow)
(hours)
Flow (Maximum)(cfs)
Gutter ShapeLabel
Page 2 of 227 Siemon Company Drive Suite 200 W Watertown, CT 06795 USA +1-203-755-1666
3/25/2017
Bentley CivilStorm V8i (SELECTseries 5)[08.11.05.113]Bentley Systems, Inc. Haestad Methods Solution Center20170327_301-175 EXISTING 24in BOX.stsw

FlexTable: Conduit ReportCurrent Time: 13.050 hours
Flow (Maximum)(cfs)
Span(ft)
Rise(ft)
Diameter(in)
Length (User Defined)
(ft)
Manning's nMaterialConduit Description
Label
41.862.02.090.00.019Stone masonryBox - 2.0 x 2.0 ftMNRR 2X2105.4242.050.00.013ConcreteCircle - 42.0 inPEPES 42
Velocity (Out)(ft/s)
Velocity (In)(ft/s)
Hydraulic Grade Line (Out)
(ft)
Hydraulic Grade Line (In)
(ft)
Hydraulic Grade (Maximum)
(ft)
Time to Maximum
Hydraulic Grade(hours)
10.4610.4630.9435.5635.5613.0507.806.1926.5727.2627.3212.750
Page 1 of 127 Siemon Company Drive Suite 200 W Watertown, CT 06795 USA +1-203-755-1666
4/1/2017
Bentley CivilStorm V8i (SELECTseries 5)[08.11.05.113]Bentley Systems, Inc. Haestad Methods Solution Center20170327_301-175 EXISTING 24in BOX.stsw

Calculation Executive SummaryScenario
NOAA 25-YearLabel
Storm Event
NOAA 25-Year -
Rainfall Runoff
Alternative - 1
Label
years25Return Event
NOAA Bridgeport (25-Year) -
25 Year
Global Storm Event
Calculation Executive Summary
ft³2,298,204.3Total Inflow Volume ft³23,974.5Total System Volume Changeft³2,276,292.0Total System Outflow Volume %0.1Continuity Error
ft³0.0Total System Overflow Volume
ft³0.0Total Pond Infiltration Volume
ft³(N/A)Total Gutter Volume Change 3276Total N-R Iterations
Page 1 of 127 Siemon Company Drive Suite 200 W Watertown, CT 06795 USA +1-203-755-1666
3/25/2017
Bentley CivilStorm V8i (SELECTseries 5)[08.11.05.113]Bentley Systems, Inc. Haestad Methods Solution Center20170327_301-175 EXISTING 24in BOX.stsw

Calculation Detailed Summary<General>
Base Calculation
OptionsLabel
hours0.050Output Increment
hours0.025Calculation Time Step hours24.000Duration
Implicit Engine
ft0.040Virtual Flow Depth 0.700NR Weighting Coefficientft0.03Y Iteration Tolerance 0.600Relaxation Weighting
Coefficient1.000LPI Coefficient ft50.00Computation Distance
Inlets
FalseNeglect Side Flow? Grate and Curb
Active Components for Combination Inlets In Sag
FalseNeglect Gutter Cross Slope For Side Flow?
Grate and Curb
Active Components for Combination Inlets on Grade
Catchment Calculation Summary
Time (Maximum Flow)
(hours)
Flow (Maximum)(cfs)
Volume (Total Runoff)
(ft³)
Area (User Defined)(acres)
Total Rainfall Depth(in)
Loss MethodRunoff MethodLabel
12.300235.721,322,678.067.1406.5SCS CNUnit HydrographCM-112.350174.05975,179.059.2206.5SCS CNUnit HydrographCM-2
General Calculation Summary
Hydraulic Grade (Maximum)
(ft)
Velocity (Maximum Calculated)
(ft/s)
Flow (Maximum)(cfs)
Time (Maximum Flow)
(hours)
BranchElement TypeLabel
36.2410.9843.9213.1501ConduitMNRR 2X227.597.03120.6512.7501ConduitPEPES 4229.312.4743.9813.2001ChannelCH-236.24---------1PondPO-1
Page 1 of 227 Siemon Company Drive Suite 200 W Watertown, CT 06795 USA +1-203-755-1666
3/25/2017
Bentley CivilStorm V8i (SELECTseries 5)[08.11.05.113]Bentley Systems, Inc. Haestad Methods Solution Center20170327_301-175 EXISTING 24in BOX.stsw

General Calculation Summary
Hydraulic Grade (Maximum)
(ft)
Velocity (Maximum Calculated)
(ft/s)
Flow (Maximum)(cfs)
Time (Maximum Flow)
(hours)
BranchElement TypeLabel
27.59---------1PondPO-2
Node Calculation Summary
Flow (Captured Maximum)
(cfs)
Time To Maximum
Captured Flow(hours)
Flow (Surface Maximum)
(cfs)
Time To Maximum Inlet
Flow(hours)
Flow (Total In Maximum)
(cfs)
Time to Maximum Inflow
(hours)
BranchElement TypeLabel
------------(N/A)(N/A)0OutfallO-1------------233.6912.3001PondPO-1------------200.2612.3001PondPO-2
Flow (Overflow Maximum)
(cfs)
Time to Maximum Overflow(hours)
(N/A)(N/A)0.000.0000.000.000
Gutter Calculation Summary
Velocity (Maximum Calculated)
(ft/s)
Time (Maximum Flow)
(hours)
Flow (Maximum)(cfs)
Gutter ShapeLabel
Page 2 of 227 Siemon Company Drive Suite 200 W Watertown, CT 06795 USA +1-203-755-1666
3/25/2017
Bentley CivilStorm V8i (SELECTseries 5)[08.11.05.113]Bentley Systems, Inc. Haestad Methods Solution Center20170327_301-175 EXISTING 24in BOX.stsw

FlexTable: Conduit ReportCurrent Time: 13.150 hours
Flow (Maximum)(cfs)
Span(ft)
Rise(ft)
Diameter(in)
Length (User Defined)
(ft)
Manning's nMaterialConduit Description
Label
43.922.02.090.00.019Stone masonryBox - 2.0 x 2.0 ftMNRR 2X2120.6542.050.00.013ConcreteCircle - 42.0 inPEPES 42
Velocity (Out)(ft/s)
Velocity (In)(ft/s)
Hydraulic Grade Line (Out)
(ft)
Hydraulic Grade Line (In)
(ft)
Hydraulic Grade (Maximum)
(ft)
Time to Maximum
Hydraulic Grade(hours)
10.9810.9831.1636.2436.2413.1508.226.5226.7327.5027.5912.800
Page 1 of 127 Siemon Company Drive Suite 200 W Watertown, CT 06795 USA +1-203-755-1666
4/1/2017
Bentley CivilStorm V8i (SELECTseries 5)[08.11.05.113]Bentley Systems, Inc. Haestad Methods Solution Center20170327_301-175 EXISTING 24in BOX.stsw

Calculation Executive SummaryScenario
NOAA 50-YearLabel
Storm Event
NOAA 50-Year -
Rainfall Runoff
Alternative - 1
Label
years50Return Event
NOAA Bridgeport (50-Year) -
50 Year
Global Storm Event
Calculation Executive Summary
ft³2,695,044.0Total Inflow Volume ft³27,619.7Total System Volume Changeft³2,651,631.8Total System Outflow Volume %0.6Continuity Error
ft³0.0Total System Overflow Volume
ft³0.0Total Pond Infiltration Volume
ft³(N/A)Total Gutter Volume Change 3248Total N-R Iterations
Page 1 of 127 Siemon Company Drive Suite 200 W Watertown, CT 06795 USA +1-203-755-1666
3/25/2017
Bentley CivilStorm V8i (SELECTseries 5)[08.11.05.113]Bentley Systems, Inc. Haestad Methods Solution Center20170327_301-175 EXISTING 24in BOX.stsw

Calculation Detailed Summary<General>
Base Calculation
OptionsLabel
hours0.050Output Increment
hours0.025Calculation Time Step hours24.000Duration
Implicit Engine
ft0.040Virtual Flow Depth 0.700NR Weighting Coefficientft0.03Y Iteration Tolerance 0.600Relaxation Weighting
Coefficient1.000LPI Coefficient ft50.00Computation Distance
Inlets
FalseNeglect Side Flow? Grate and Curb
Active Components for Combination Inlets In Sag
FalseNeglect Gutter Cross Slope For Side Flow?
Grate and Curb
Active Components for Combination Inlets on Grade
Catchment Calculation Summary
Time (Maximum Flow)
(hours)
Flow (Maximum)(cfs)
Volume (Total Runoff)
(ft³)
Area (User Defined)(acres)
Total Rainfall Depth(in)
Loss MethodRunoff MethodLabel
12.300271.861,537,726.067.1407.4SCS CNUnit HydrographCM-112.350205.181,156,918.059.2207.4SCS CNUnit HydrographCM-2
General Calculation Summary
Hydraulic Grade (Maximum)
(ft)
Velocity (Maximum Calculated)
(ft/s)
Flow (Maximum)(cfs)
Time (Maximum Flow)
(hours)
BranchElement TypeLabel
36.7211.3245.3013.2501ConduitMNRR 2X227.777.27130.4112.8501ConduitPEPES 4229.342.4145.3813.3001ChannelCH-236.72---------1PondPO-1
Page 1 of 227 Siemon Company Drive Suite 200 W Watertown, CT 06795 USA +1-203-755-1666
3/25/2017
Bentley CivilStorm V8i (SELECTseries 5)[08.11.05.113]Bentley Systems, Inc. Haestad Methods Solution Center20170327_301-175 EXISTING 24in BOX.stsw

General Calculation Summary
Hydraulic Grade (Maximum)
(ft)
Velocity (Maximum Calculated)
(ft/s)
Flow (Maximum)(cfs)
Time (Maximum Flow)
(hours)
BranchElement TypeLabel
27.77---------1PondPO-2
Node Calculation Summary
Flow (Captured Maximum)
(cfs)
Time To Maximum
Captured Flow(hours)
Flow (Surface Maximum)
(cfs)
Time To Maximum Inlet
Flow(hours)
Flow (Total In Maximum)
(cfs)
Time to Maximum Inflow
(hours)
BranchElement TypeLabel
------------(N/A)(N/A)0OutfallO-1------------269.4312.3001PondPO-1------------227.8012.3001PondPO-2
Flow (Overflow Maximum)
(cfs)
Time to Maximum Overflow(hours)
(N/A)(N/A)0.000.0000.000.000
Gutter Calculation Summary
Velocity (Maximum Calculated)
(ft/s)
Time (Maximum Flow)
(hours)
Flow (Maximum)(cfs)
Gutter ShapeLabel
Page 2 of 227 Siemon Company Drive Suite 200 W Watertown, CT 06795 USA +1-203-755-1666
3/25/2017
Bentley CivilStorm V8i (SELECTseries 5)[08.11.05.113]Bentley Systems, Inc. Haestad Methods Solution Center20170327_301-175 EXISTING 24in BOX.stsw

FlexTable: Conduit ReportCurrent Time: 13.250 hours
Flow (Maximum)(cfs)
Span(ft)
Rise(ft)
Diameter(in)
Length (User Defined)
(ft)
Manning's nMaterialConduit Description
Label
45.302.02.090.00.019Stone masonryBox - 2.0 x 2.0 ftMNRR 2X2130.4142.050.00.013ConcreteCircle - 42.0 inPEPES 42
Velocity (Out)(ft/s)
Velocity (In)(ft/s)
Hydraulic Grade Line (Out)
(ft)
Hydraulic Grade Line (In)
(ft)
Hydraulic Grade (Maximum)
(ft)
Time to Maximum
Hydraulic Grade(hours)
11.3211.3231.3136.7236.7213.2508.496.7926.8427.6527.7712.800
Page 1 of 127 Siemon Company Drive Suite 200 W Watertown, CT 06795 USA +1-203-755-1666
4/1/2017
Bentley CivilStorm V8i (SELECTseries 5)[08.11.05.113]Bentley Systems, Inc. Haestad Methods Solution Center20170327_301-175 EXISTING 24in BOX.stsw

Calculation Executive SummaryScenario
NOAA 100-YearLabel
Storm Event
NOAA 100-Year -
Rainfall Runoff
Alternative - 1
Label
years100Return Event
NOAA Bridgeport
(100-Year) - 100 Year
Global Storm Event
Calculation Executive Summary
ft³3,094,598.0Total Inflow Volume ft³23,500.6Total System Volume Changeft³3,096,972.5Total System Outflow Volume %0.8Continuity Error
ft³0.0Total System Overflow Volume
ft³0.0Total Pond Infiltration Volume
ft³(N/A)Total Gutter Volume Change 3508Total N-R Iterations
Page 1 of 127 Siemon Company Drive Suite 200 W Watertown, CT 06795 USA +1-203-755-1666
3/25/2017
Bentley CivilStorm V8i (SELECTseries 5)[08.11.05.113]Bentley Systems, Inc. Haestad Methods Solution Center20170327_301-175 EXISTING 24in BOX.stsw

Calculation Detailed Summary<General>
Base Calculation
OptionsLabel
hours0.050Output Increment
hours0.025Calculation Time Step hours24.000Duration
Implicit Engine
ft0.040Virtual Flow Depth 0.700NR Weighting Coefficientft0.03Y Iteration Tolerance 0.600Relaxation Weighting
Coefficient1.000LPI Coefficient ft50.00Computation Distance
Inlets
FalseNeglect Side Flow? Grate and Curb
Active Components for Combination Inlets In Sag
FalseNeglect Gutter Cross Slope For Side Flow?
Grate and Curb
Active Components for Combination Inlets on Grade
Catchment Calculation Summary
Time (Maximum Flow)
(hours)
Flow (Maximum)(cfs)
Volume (Total Runoff)
(ft³)
Area (User Defined)(acres)
Total Rainfall Depth(in)
Loss MethodRunoff MethodLabel
12.300307.851,753,487.067.1408.3SCS CNUnit HydrographCM-112.350236.281,340,658.059.2208.3SCS CNUnit HydrographCM-2
General Calculation Summary
Hydraulic Grade (Maximum)
(ft)
Velocity (Maximum Calculated)
(ft/s)
Flow (Maximum)(cfs)
Time (Maximum Flow)
(hours)
BranchElement TypeLabel
37.1811.6546.5913.3001ConduitMNRR 2X227.947.53139.6912.8501ConduitPEPES 4229.372.2146.7013.3501ChannelCH-237.18---------1PondPO-1
Page 1 of 227 Siemon Company Drive Suite 200 W Watertown, CT 06795 USA +1-203-755-1666
3/25/2017
Bentley CivilStorm V8i (SELECTseries 5)[08.11.05.113]Bentley Systems, Inc. Haestad Methods Solution Center20170327_301-175 EXISTING 24in BOX.stsw

General Calculation Summary
Hydraulic Grade (Maximum)
(ft)
Velocity (Maximum Calculated)
(ft/s)
Flow (Maximum)(cfs)
Time (Maximum Flow)
(hours)
BranchElement TypeLabel
27.94---------1PondPO-2
Node Calculation Summary
Flow (Captured Maximum)
(cfs)
Time To Maximum
Captured Flow(hours)
Flow (Surface Maximum)
(cfs)
Time To Maximum Inlet
Flow(hours)
Flow (Total In Maximum)
(cfs)
Time to Maximum Inflow
(hours)
BranchElement TypeLabel
------------(N/A)(N/A)0OutfallO-1------------305.0112.3001PondPO-1------------255.2312.3001PondPO-2
Flow (Overflow Maximum)
(cfs)
Time to Maximum Overflow(hours)
(N/A)(N/A)0.000.0000.000.000
Gutter Calculation Summary
Velocity (Maximum Calculated)
(ft/s)
Time (Maximum Flow)
(hours)
Flow (Maximum)(cfs)
Gutter ShapeLabel
Page 2 of 227 Siemon Company Drive Suite 200 W Watertown, CT 06795 USA +1-203-755-1666
3/25/2017
Bentley CivilStorm V8i (SELECTseries 5)[08.11.05.113]Bentley Systems, Inc. Haestad Methods Solution Center20170327_301-175 EXISTING 24in BOX.stsw

FlexTable: Conduit ReportCurrent Time: 13.300 hours
Flow (Maximum)(cfs)
Span(ft)
Rise(ft)
Diameter(in)
Length (User Defined)
(ft)
Manning's nMaterialConduit Description
Label
46.592.02.090.00.019Stone masonryBox - 2.0 x 2.0 ftMNRR 2X2139.6942.050.00.013ConcreteCircle - 42.0 inPEPES 42
Velocity (Out)(ft/s)
Velocity (In)(ft/s)
Hydraulic Grade Line (Out)
(ft)
Hydraulic Grade Line (In)
(ft)
Hydraulic Grade (Maximum)
(ft)
Time to Maximum
Hydraulic Grade(hours)
11.6511.6531.4637.1837.1813.3008.727.0626.9427.8127.9412.850
Page 1 of 127 Siemon Company Drive Suite 200 W Watertown, CT 06795 USA +1-203-755-1666
4/1/2017
Bentley CivilStorm V8i (SELECTseries 5)[08.11.05.113]Bentley Systems, Inc. Haestad Methods Solution Center20170327_301-175 EXISTING 24in BOX.stsw

Calculation Executive SummaryScenario
NOAA 500-YearLabel
Storm Event
NOAA 500-Year -
Rainfall Runoff
Alternative - 1
Label
years500Return Event
NOAA Bridgeport
(500-Year) - 500 Year
Global Storm Event
Calculation Executive Summary
ft³4,438,639.5Total Inflow Volume ft³116,701.4Total System Volume Changeft³4,213,922.0Total System Outflow Volume %2.4Continuity Error
ft³1,223.4Total System Overflow Volume
ft³0.0Total Pond Infiltration Volume
ft³(N/A)Total Gutter Volume Change 3962Total N-R Iterations
Page 1 of 127 Siemon Company Drive Suite 200 W Watertown, CT 06795 USA +1-203-755-1666
3/25/2017
Bentley CivilStorm V8i (SELECTseries 5)[08.11.05.113]Bentley Systems, Inc. Haestad Methods Solution Center20170327_301-175 EXISTING 24in BOX.stsw

Calculation Detailed Summary<General>
Base Calculation
OptionsLabel
hours0.050Output Increment
hours0.025Calculation Time Step hours24.000Duration
Implicit Engine
ft0.040Virtual Flow Depth 0.700NR Weighting Coefficientft0.03Y Iteration Tolerance 0.600Relaxation Weighting
Coefficient1.000LPI Coefficient ft50.00Computation Distance
Inlets
FalseNeglect Side Flow? Grate and Curb
Active Components for Combination Inlets In Sag
FalseNeglect Gutter Cross Slope For Side Flow?
Grate and Curb
Active Components for Combination Inlets on Grade
Catchment Calculation Summary
Time (Maximum Flow)
(hours)
Flow (Maximum)(cfs)
Volume (Total Runoff)
(ft³)
Area (User Defined)(acres)
Total Rainfall Depth(in)
Loss MethodRunoff MethodLabel
12.300426.952,475,795.067.14011.3SCS CNUnit HydrographCM-112.350339.411,962,221.059.22011.3SCS CNUnit HydrographCM-2
General Calculation Summary
Hydraulic Grade (Maximum)
(ft)
Velocity (Maximum Calculated)
(ft/s)
Flow (Maximum)(cfs)
Time (Maximum Flow)
(hours)
BranchElement TypeLabel
38.0012.6150.4213.2501ConduitMNRR 2X228.478.51163.8012.9001ConduitPEPES 4229.460.7051.0213.2501ChannelCH-238.00---------1PondPO-1
Page 1 of 227 Siemon Company Drive Suite 200 W Watertown, CT 06795 USA +1-203-755-1666
3/25/2017
Bentley CivilStorm V8i (SELECTseries 5)[08.11.05.113]Bentley Systems, Inc. Haestad Methods Solution Center20170327_301-175 EXISTING 24in BOX.stsw

General Calculation Summary
Hydraulic Grade (Maximum)
(ft)
Velocity (Maximum Calculated)
(ft/s)
Flow (Maximum)(cfs)
Time (Maximum Flow)
(hours)
BranchElement TypeLabel
28.47---------1PondPO-2
Node Calculation Summary
Flow (Captured Maximum)
(cfs)
Time To Maximum
Captured Flow(hours)
Flow (Surface Maximum)
(cfs)
Time To Maximum Inlet
Flow(hours)
Flow (Total In Maximum)
(cfs)
Time to Maximum Inflow
(hours)
BranchElement TypeLabel
------------(N/A)(N/A)0OutfallO-1------------422.8012.3001PondPO-1------------370.4312.3001PondPO-2
Flow (Overflow Maximum)
(cfs)
Time to Maximum Overflow(hours)
(N/A)(N/A)0.1212.6500.000.000
Gutter Calculation Summary
Velocity (Maximum Calculated)
(ft/s)
Time (Maximum Flow)
(hours)
Flow (Maximum)(cfs)
Gutter ShapeLabel
Page 2 of 227 Siemon Company Drive Suite 200 W Watertown, CT 06795 USA +1-203-755-1666
3/25/2017
Bentley CivilStorm V8i (SELECTseries 5)[08.11.05.113]Bentley Systems, Inc. Haestad Methods Solution Center20170327_301-175 EXISTING 24in BOX.stsw

FlexTable: Conduit ReportCurrent Time: 12.650 hours
Flow (Maximum)(cfs)
Span(ft)
Rise(ft)
Diameter(in)
Length (User Defined)
(ft)
Manning's nMaterialConduit Description
Label
50.422.02.090.00.019Stone masonryBox - 2.0 x 2.0 ftMNRR 2X2163.8042.050.00.013ConcreteCircle - 42.0 inPEPES 42
Velocity (Out)(ft/s)
Velocity (In)(ft/s)
Hydraulic Grade Line (Out)
(ft)
Hydraulic Grade Line (In)
(ft)
Hydraulic Grade (Maximum)
(ft)
Time to Maximum
Hydraulic Grade(hours)
12.2512.2531.7538.0038.0012.6509.408.3327.2528.4028.4712.900
Page 1 of 127 Siemon Company Drive Suite 200 W Watertown, CT 06795 USA +1-203-755-1666
4/1/2017
Bentley CivilStorm V8i (SELECTseries 5)[08.11.05.113]Bentley Systems, Inc. Haestad Methods Solution Center20170327_301-175 EXISTING 24in BOX.stsw

STATE PROJECT NO. 301-0175 CULVERT REPLACEMENT MNRR NEW HAVEN MAINLINE M.P. 65.60, MILFORD, CONN.
APPENDIX D2
Alternate 1: Twin 48” RCP Culvert (CivilStorm)
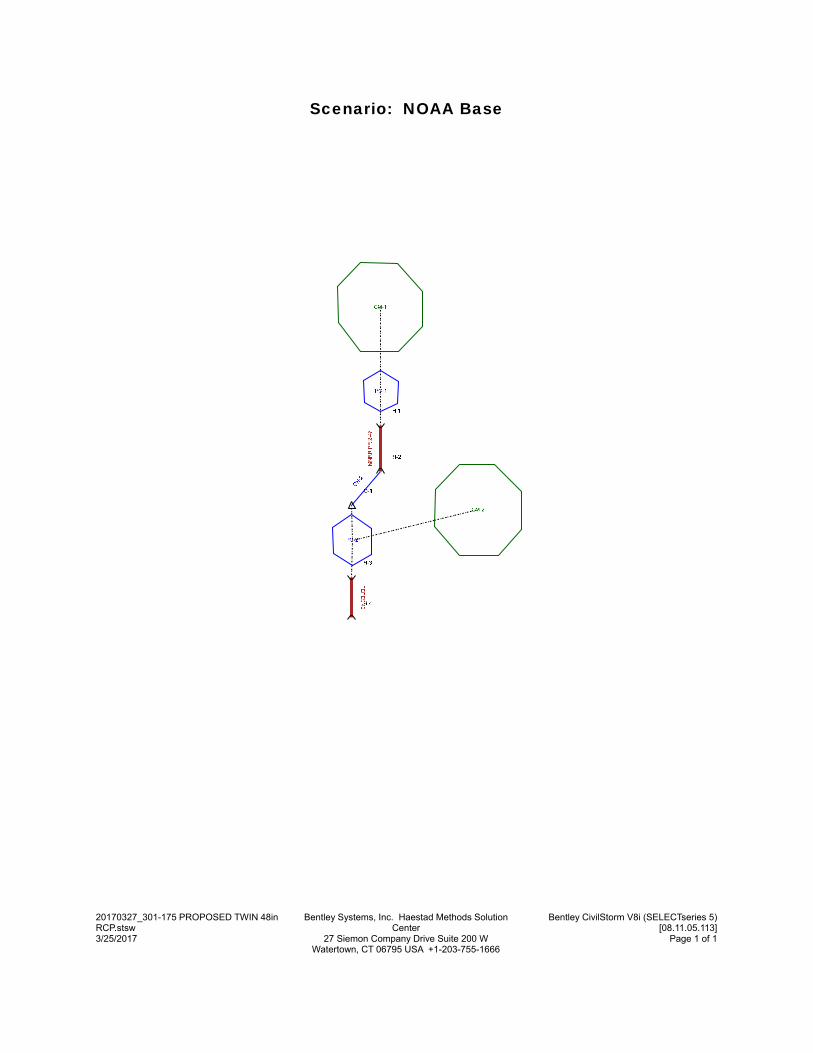
Scenario: NOAA Base
Page 1 of 127 Siemon Company Drive Suite 200 W Watertown, CT 06795 USA +1-203-755-1666
3/25/2017
Bentley CivilStorm V8i (SELECTseries 5)[08.11.05.113]
Bentley Systems, Inc. Haestad Methods Solution Center
20170327_301-175 PROPOSED TWIN 48in RCP.stsw

Calculation Executive SummaryScenario
NOAA 1-YearLabel
Storm Event
NOAA 1-Year - Rainfall
Runoff Alternative -
1
Label
years1Return Event
NOAA Bridgeport (1
-Year) - 1 Year
Global Storm Event
Calculation Executive Summary
ft³732,818.9Total Inflow Volume ft³9,731.4Total System Volume Changeft³657,771.6Total System Outflow Volume %8.9Continuity Error
ft³0.0Total System Overflow Volume
ft³0.0Total Pond Infiltration Volume
ft³(N/A)Total Gutter Volume Change 2680Total N-R Iterations
Page 1 of 127 Siemon Company Drive Suite 200 W Watertown, CT 06795 USA +1-203-755-1666
3/25/2017
Bentley CivilStorm V8i (SELECTseries 5)[08.11.05.113]Bentley Systems, Inc. Haestad Methods Solution Center20170327_301-175 PROPOSED TWIN 48in RCP.stsw

Calculation Detailed Summary<General>
Base1 Calculation
OptionsLabel
hours0.100Output Increment
hours0.050Calculation Time Step hours24.000Duration
Implicit Engine
ft0.040Virtual Flow Depth 0.700NR Weighting Coefficientft0.03Y Iteration Tolerance 0.600Relaxation Weighting
Coefficient1.000LPI Coefficient ft50.00Computation Distance
Inlets
FalseNeglect Side Flow? Grate and Curb
Active Components for Combination Inlets In Sag
FalseNeglect Gutter Cross Slope For Side Flow?
Grate and Curb
Active Components for Combination Inlets on Grade
Catchment Calculation Summary
Time (Maximum Flow)
(hours)
Flow (Maximum)(cfs)
Volume (Total Runoff)
(ft³)
Area (User Defined)(acres)
Total Rainfall Depth(in)
Loss MethodRunoff MethodLabel
12.30085.22457,492.067.1402.8SCS CNUnit HydrographCM-112.40049.28275,081.059.2202.8SCS CNUnit HydrographCM-2
General Calculation Summary
Hydraulic Grade (Maximum)
(ft)
Velocity (Maximum Calculated)
(ft/s)
Flow (Maximum)(cfs)
Time (Maximum Flow)
(hours)
BranchElement TypeLabel
30.056.7182.2612.4001ConduitMNRR PR 2-4826.925.5574.0112.7001ConduitPEPES 4229.773.3082.3512.4001ChannelCH-230.05---------1PondPO-1
Page 1 of 227 Siemon Company Drive Suite 200 W Watertown, CT 06795 USA +1-203-755-1666
3/25/2017
Bentley CivilStorm V8i (SELECTseries 5)[08.11.05.113]Bentley Systems, Inc. Haestad Methods Solution Center20170327_301-175 PROPOSED TWIN 48in RCP.stsw

General Calculation Summary
Hydraulic Grade (Maximum)
(ft)
Velocity (Maximum Calculated)
(ft/s)
Flow (Maximum)(cfs)
Time (Maximum Flow)
(hours)
BranchElement TypeLabel
26.92---------1PondPO-2
Node Calculation Summary
Flow (Captured Maximum)
(cfs)
Time To Maximum
Captured Flow(hours)
Flow (Surface Maximum)
(cfs)
Time To Maximum Inlet
Flow(hours)
Flow (Total In Maximum)
(cfs)
Time to Maximum Inflow
(hours)
BranchElement TypeLabel
------------(N/A)(N/A)0OutfallO-1------------85.2212.3001PondPO-1------------128.2112.4001PondPO-2
Flow (Overflow Maximum)
(cfs)
Time to Maximum Overflow(hours)
(N/A)(N/A)0.000.0000.000.000
Gutter Calculation Summary
Velocity (Maximum Calculated)
(ft/s)
Time (Maximum Flow)
(hours)
Flow (Maximum)(cfs)
Gutter ShapeLabel
Page 2 of 227 Siemon Company Drive Suite 200 W Watertown, CT 06795 USA +1-203-755-1666
3/25/2017
Bentley CivilStorm V8i (SELECTseries 5)[08.11.05.113]Bentley Systems, Inc. Haestad Methods Solution Center20170327_301-175 PROPOSED TWIN 48in RCP.stsw

FlexTable: Conduit ReportCurrent Time: 12.400 hours
Flow (Maximum)(cfs)
Span(ft)
Rise(ft)
Diameter(in)
Length (User Defined)
(ft)
Manning's nMaterialConduit Description
Label
82.2648.0101.00.013ConcreteCircle - 48.0 inMNRR PR 2-4874.0142.050.00.013ConcreteCircle - 42.0 inPEPES 42
Velocity (Out)(ft/s)
Velocity (In)(ft/s)
Hydraulic Grade Line (Out)
(ft)
Hydraulic Grade Line (In)
(ft)
Hydraulic Grade (Maximum)
(ft)
Time to Maximum
Hydraulic Grade(hours)
5.876.7529.7830.0530.0512.4006.414.7425.9726.5726.9212.700
Page 1 of 127 Siemon Company Drive Suite 200 W Watertown, CT 06795 USA +1-203-755-1666
4/1/2017
Bentley CivilStorm V8i (SELECTseries 5)[08.11.05.113]Bentley Systems, Inc. Haestad Methods Solution Center20170327_301-175 PROPOSED TWIN 48in RCP.stsw

Calculation Executive SummaryScenario
NOAA 2-YearLabel
Storm Event
NOAA 2-Year - Rainfall
Runoff Alternative -
1
Label
years2Return Event
NOAA Bridgeport (2
-Year) - 2 Year
Global Storm Event
Calculation Executive Summary
ft³932,410.6Total Inflow Volume ft³7,078.0Total System Volume Changeft³936,629.2Total System Outflow Volume %1.2Continuity Error
ft³0.0Total System Overflow Volume
ft³0.0Total Pond Infiltration Volume
ft³(N/A)Total Gutter Volume Change 8390Total N-R Iterations
Page 1 of 127 Siemon Company Drive Suite 200 W Watertown, CT 06795 USA +1-203-755-1666
3/25/2017
Bentley CivilStorm V8i (SELECTseries 5)[08.11.05.113]Bentley Systems, Inc. Haestad Methods Solution Center20170327_301-175 PROPOSED TWIN 48in RCP.stsw

Calculation Detailed Summary<General>
Base Calculation
OptionsLabel
hours0.025Output Increment
hours0.013Calculation Time Step hours24.000Duration
Implicit Engine
ft0.040Virtual Flow Depth 0.700NR Weighting Coefficientft0.03Y Iteration Tolerance 0.600Relaxation Weighting
Coefficient1.000LPI Coefficient ft50.00Computation Distance
Inlets
FalseNeglect Side Flow? Grate and Curb
Active Components for Combination Inlets In Sag
FalseNeglect Gutter Cross Slope For Side Flow?
Grate and Curb
Active Components for Combination Inlets on Grade
Catchment Calculation Summary
Time (Maximum Flow)
(hours)
Flow (Maximum)(cfs)
Volume (Total Runoff)
(ft³)
Area (User Defined)(acres)
Total Rainfall Depth(in)
Loss MethodRunoff MethodLabel
12.300105.67570,882.067.1403.3SCS CNUnit HydrographCM-112.35065.21361,597.059.2203.3SCS CNUnit HydrographCM-2
General Calculation Summary
Hydraulic Grade (Maximum)
(ft)
Velocity (Maximum Calculated)
(ft/s)
Flow (Maximum)(cfs)
Time (Maximum Flow)
(hours)
BranchElement TypeLabel
30.138.14104.5812.3251ConduitMNRR PR 2-4827.226.5499.7012.7001ConduitPEPES 4229.853.61104.4012.3751ChannelCH-230.13---------1PondPO-1
Page 1 of 227 Siemon Company Drive Suite 200 W Watertown, CT 06795 USA +1-203-755-1666
3/25/2017
Bentley CivilStorm V8i (SELECTseries 5)[08.11.05.113]Bentley Systems, Inc. Haestad Methods Solution Center20170327_301-175 PROPOSED TWIN 48in RCP.stsw

General Calculation Summary
Hydraulic Grade (Maximum)
(ft)
Velocity (Maximum Calculated)
(ft/s)
Flow (Maximum)(cfs)
Time (Maximum Flow)
(hours)
BranchElement TypeLabel
27.22---------1PondPO-2
Node Calculation Summary
Flow (Captured Maximum)
(cfs)
Time To Maximum
Captured Flow(hours)
Flow (Surface Maximum)
(cfs)
Time To Maximum Inlet
Flow(hours)
Flow (Total In Maximum)
(cfs)
Time to Maximum Inflow
(hours)
BranchElement TypeLabel
------------(N/A)(N/A)0OutfallO-1------------105.6012.3001PondPO-1------------168.2412.3751PondPO-2
Flow (Overflow Maximum)
(cfs)
Time to Maximum Overflow(hours)
(N/A)(N/A)0.000.0000.000.000
Gutter Calculation Summary
Velocity (Maximum Calculated)
(ft/s)
Time (Maximum Flow)
(hours)
Flow (Maximum)(cfs)
Gutter ShapeLabel
Page 2 of 227 Siemon Company Drive Suite 200 W Watertown, CT 06795 USA +1-203-755-1666
3/25/2017
Bentley CivilStorm V8i (SELECTseries 5)[08.11.05.113]Bentley Systems, Inc. Haestad Methods Solution Center20170327_301-175 PROPOSED TWIN 48in RCP.stsw

FlexTable: Conduit ReportCurrent Time: 12.325 hours
Flow (Maximum)(cfs)
Span(ft)
Rise(ft)
Diameter(in)
Length (User Defined)
(ft)
Manning's nMaterialConduit Description
Label
104.5848.0101.00.013ConcreteCircle - 48.0 inMNRR PR 2-4899.7042.050.00.013ConcreteCircle - 42.0 inPEPES 42
Velocity (Out)(ft/s)
Velocity (In)(ft/s)
Hydraulic Grade Line (Out)
(ft)
Hydraulic Grade Line (In)
(ft)
Hydraulic Grade (Maximum)
(ft)
Time to Maximum
Hydraulic Grade(hours)
7.168.1829.8630.1330.1312.3257.176.1626.2526.6927.2212.725
Page 1 of 127 Siemon Company Drive Suite 200 W Watertown, CT 06795 USA +1-203-755-1666
4/1/2017
Bentley CivilStorm V8i (SELECTseries 5)[08.11.05.113]Bentley Systems, Inc. Haestad Methods Solution Center20170327_301-175 PROPOSED TWIN 48in RCP.stsw

Calculation Executive SummaryScenario
NOAA 5-YearLabel
Storm Event
NOAA 5-Year - Rainfall
Runoff Alternative -
1
Label
years5Return Event
NOAA Bridgeport (5
-Year) - 5 Year
Global Storm Event
Calculation Executive Summary
ft³1,431,944.5Total Inflow Volume ft³3,159.7Total System Volume Changeft³1,427,455.4Total System Outflow Volume %0.1Continuity Error
ft³0.0Total System Overflow Volume
ft³0.0Total Pond Infiltration Volume
ft³(N/A)Total Gutter Volume Change 10302Total N-R Iterations
Page 1 of 127 Siemon Company Drive Suite 200 W Watertown, CT 06795 USA +1-203-755-1666
3/25/2017
Bentley CivilStorm V8i (SELECTseries 5)[08.11.05.113]Bentley Systems, Inc. Haestad Methods Solution Center20170327_301-175 PROPOSED TWIN 48in RCP.stsw

Calculation Detailed Summary<General>
Base Calculation
OptionsLabel
hours0.025Output Increment
hours0.013Calculation Time Step hours24.000Duration
Implicit Engine
ft0.040Virtual Flow Depth 0.700NR Weighting Coefficientft0.03Y Iteration Tolerance 0.600Relaxation Weighting
Coefficient1.000LPI Coefficient ft50.00Computation Distance
Inlets
FalseNeglect Side Flow? Grate and Curb
Active Components for Combination Inlets In Sag
FalseNeglect Gutter Cross Slope For Side Flow?
Grate and Curb
Active Components for Combination Inlets on Grade
Catchment Calculation Summary
Time (Maximum Flow)
(hours)
Flow (Maximum)(cfs)
Volume (Total Runoff)
(ft³)
Area (User Defined)(acres)
Total Rainfall Depth(in)
Loss MethodRunoff MethodLabel
12.300154.72849,171.067.1404.5SCS CNUnit HydrographCM-112.350105.26582,912.059.2204.5SCS CNUnit HydrographCM-2
General Calculation Summary
Hydraulic Grade (Maximum)
(ft)
Velocity (Maximum Calculated)
(ft/s)
Flow (Maximum)(cfs)
Time (Maximum Flow)
(hours)
BranchElement TypeLabel
30.789.66151.5212.3501ConduitMNRR PR 2-4827.727.20127.6312.8001ConduitPEPES 4229.954.16151.1512.3751ChannelCH-230.78---------1PondPO-1
Page 1 of 227 Siemon Company Drive Suite 200 W Watertown, CT 06795 USA +1-203-755-1666
3/25/2017
Bentley CivilStorm V8i (SELECTseries 5)[08.11.05.113]Bentley Systems, Inc. Haestad Methods Solution Center20170327_301-175 PROPOSED TWIN 48in RCP.stsw

General Calculation Summary
Hydraulic Grade (Maximum)
(ft)
Velocity (Maximum Calculated)
(ft/s)
Flow (Maximum)(cfs)
Time (Maximum Flow)
(hours)
BranchElement TypeLabel
27.72---------1PondPO-2
Node Calculation Summary
Flow (Captured Maximum)
(cfs)
Time To Maximum
Captured Flow(hours)
Flow (Surface Maximum)
(cfs)
Time To Maximum Inlet
Flow(hours)
Flow (Total In Maximum)
(cfs)
Time to Maximum Inflow
(hours)
BranchElement TypeLabel
------------(N/A)(N/A)0OutfallO-1------------154.5012.3001PondPO-1------------245.1912.3751PondPO-2
Flow (Overflow Maximum)
(cfs)
Time to Maximum Overflow(hours)
(N/A)(N/A)0.000.0000.000.000
Gutter Calculation Summary
Velocity (Maximum Calculated)
(ft/s)
Time (Maximum Flow)
(hours)
Flow (Maximum)(cfs)
Gutter ShapeLabel
Page 2 of 227 Siemon Company Drive Suite 200 W Watertown, CT 06795 USA +1-203-755-1666
3/25/2017
Bentley CivilStorm V8i (SELECTseries 5)[08.11.05.113]Bentley Systems, Inc. Haestad Methods Solution Center20170327_301-175 PROPOSED TWIN 48in RCP.stsw

FlexTable: Conduit ReportCurrent Time: 12.350 hours
Flow (Maximum)(cfs)
Span(ft)
Rise(ft)
Diameter(in)
Length (User Defined)
(ft)
Manning's nMaterialConduit Description
Label
151.5248.0101.00.013ConcreteCircle - 48.0 inMNRR PR 2-48127.6342.050.00.013ConcreteCircle - 42.0 inPEPES 42
Velocity (Out)(ft/s)
Velocity (In)(ft/s)
Hydraulic Grade Line (Out)
(ft)
Hydraulic Grade Line (In)
(ft)
Hydraulic Grade (Maximum)
(ft)
Time to Maximum
Hydraulic Grade(hours)
9.558.4730.0230.7830.7812.3507.756.0026.5227.2427.7212.775
Page 1 of 127 Siemon Company Drive Suite 200 W Watertown, CT 06795 USA +1-203-755-1666
4/1/2017
Bentley CivilStorm V8i (SELECTseries 5)[08.11.05.113]Bentley Systems, Inc. Haestad Methods Solution Center20170327_301-175 PROPOSED TWIN 48in RCP.stsw

Calculation Executive SummaryScenario
NOAA 10-YearLabel
Storm Event
NOAA 10-Year -
Rainfall Runoff
Alternative - 1
Label
years10Return Event
NOAA Bridgeport (10-Year) -
10 Year
Global Storm Event
Calculation Executive Summary
ft³1,774,790.3Total Inflow Volume ft³17,415.9Total System Volume Changeft³1,737,010.9Total System Outflow Volume %1.1Continuity Error
ft³0.0Total System Overflow Volume
ft³0.0Total Pond Infiltration Volume
ft³(N/A)Total Gutter Volume Change 9450Total N-R Iterations
Page 1 of 127 Siemon Company Drive Suite 200 W Watertown, CT 06795 USA +1-203-755-1666
3/25/2017
Bentley CivilStorm V8i (SELECTseries 5)[08.11.05.113]Bentley Systems, Inc. Haestad Methods Solution Center20170327_301-175 PROPOSED TWIN 48in RCP.stsw

Calculation Detailed Summary<General>
Base Calculation
OptionsLabel
hours0.025Output Increment
hours0.013Calculation Time Step hours24.000Duration
Implicit Engine
ft0.040Virtual Flow Depth 0.700NR Weighting Coefficientft0.03Y Iteration Tolerance 0.600Relaxation Weighting
Coefficient1.000LPI Coefficient ft50.00Computation Distance
Inlets
FalseNeglect Side Flow? Grate and Curb
Active Components for Combination Inlets In Sag
FalseNeglect Gutter Cross Slope For Side Flow?
Grate and Curb
Active Components for Combination Inlets on Grade
Catchment Calculation Summary
Time (Maximum Flow)
(hours)
Flow (Maximum)(cfs)
Volume (Total Runoff)
(ft³)
Area (User Defined)(acres)
Total Rainfall Depth(in)
Loss MethodRunoff MethodLabel
12.300187.251,037,595.067.1405.3SCS CNUnit HydrographCM-112.350132.64737,318.059.2205.3SCS CNUnit HydrographCM-2
General Calculation Summary
Hydraulic Grade (Maximum)
(ft)
Velocity (Maximum Calculated)
(ft/s)
Flow (Maximum)(cfs)
Time (Maximum Flow)
(hours)
BranchElement TypeLabel
31.0510.73182.9712.3501ConduitMNRR PR 2-4828.007.63142.9412.8251ConduitPEPES 4230.004.47182.5012.3751ChannelCH-231.05---------1PondPO-1
Page 1 of 227 Siemon Company Drive Suite 200 W Watertown, CT 06795 USA +1-203-755-1666
3/25/2017
Bentley CivilStorm V8i (SELECTseries 5)[08.11.05.113]Bentley Systems, Inc. Haestad Methods Solution Center20170327_301-175 PROPOSED TWIN 48in RCP.stsw

General Calculation Summary
Hydraulic Grade (Maximum)
(ft)
Velocity (Maximum Calculated)
(ft/s)
Flow (Maximum)(cfs)
Time (Maximum Flow)
(hours)
BranchElement TypeLabel
28.00---------1PondPO-2
Node Calculation Summary
Flow (Captured Maximum)
(cfs)
Time To Maximum
Captured Flow(hours)
Flow (Surface Maximum)
(cfs)
Time To Maximum Inlet
Flow(hours)
Flow (Total In Maximum)
(cfs)
Time to Maximum Inflow
(hours)
BranchElement TypeLabel
------------(N/A)(N/A)0OutfallO-1------------186.9112.3001PondPO-1------------295.9612.3751PondPO-2
Flow (Overflow Maximum)
(cfs)
Time to Maximum Overflow(hours)
(N/A)(N/A)0.000.0000.000.000
Gutter Calculation Summary
Velocity (Maximum Calculated)
(ft/s)
Time (Maximum Flow)
(hours)
Flow (Maximum)(cfs)
Gutter ShapeLabel
Page 2 of 227 Siemon Company Drive Suite 200 W Watertown, CT 06795 USA +1-203-755-1666
3/25/2017
Bentley CivilStorm V8i (SELECTseries 5)[08.11.05.113]Bentley Systems, Inc. Haestad Methods Solution Center20170327_301-175 PROPOSED TWIN 48in RCP.stsw

FlexTable: Conduit ReportCurrent Time: 12.350 hours
Flow (Maximum)(cfs)
Span(ft)
Rise(ft)
Diameter(in)
Length (User Defined)
(ft)
Manning's nMaterialConduit Description
Label
182.9748.0101.00.013ConcreteCircle - 48.0 inMNRR PR 2-48142.9442.050.00.013ConcreteCircle - 42.0 inPEPES 42
Velocity (Out)(ft/s)
Velocity (In)(ft/s)
Hydraulic Grade Line (Out)
(ft)
Hydraulic Grade Line (In)
(ft)
Hydraulic Grade (Maximum)
(ft)
Time to Maximum
Hydraulic Grade(hours)
11.009.2230.1131.0531.0512.3508.186.4026.6927.4828.0012.825
Page 1 of 127 Siemon Company Drive Suite 200 W Watertown, CT 06795 USA +1-203-755-1666
4/1/2017
Bentley CivilStorm V8i (SELECTseries 5)[08.11.05.113]Bentley Systems, Inc. Haestad Methods Solution Center20170327_301-175 PROPOSED TWIN 48in RCP.stsw

Calculation Executive SummaryScenario
NOAA 25-YearLabel
Storm Event
NOAA 25-Year -
Rainfall Runoff
Alternative - 1
Label
years25Return Event
NOAA Bridgeport (25-Year) -
25 Year
Global Storm Event
Calculation Executive Summary
ft³2,297,702.8Total Inflow Volume ft³15,323.9Total System Volume Changeft³2,284,816.0Total System Outflow Volume %0.1Continuity Error
ft³0.0Total System Overflow Volume
ft³0.0Total Pond Infiltration Volume
ft³(N/A)Total Gutter Volume Change 8356Total N-R Iterations
Page 1 of 127 Siemon Company Drive Suite 200 W Watertown, CT 06795 USA +1-203-755-1666
3/25/2017
Bentley CivilStorm V8i (SELECTseries 5)[08.11.05.113]Bentley Systems, Inc. Haestad Methods Solution Center20170327_301-175 PROPOSED TWIN 48in RCP.stsw

Calculation Detailed Summary<General>
Base Calculation
OptionsLabel
hours0.025Output Increment
hours0.013Calculation Time Step hours24.000Duration
Implicit Engine
ft0.040Virtual Flow Depth 0.700NR Weighting Coefficientft0.03Y Iteration Tolerance 0.600Relaxation Weighting
Coefficient1.000LPI Coefficient ft50.00Computation Distance
Inlets
FalseNeglect Side Flow? Grate and Curb
Active Components for Combination Inlets In Sag
FalseNeglect Gutter Cross Slope For Side Flow?
Grate and Curb
Active Components for Combination Inlets on Grade
Catchment Calculation Summary
Time (Maximum Flow)
(hours)
Flow (Maximum)(cfs)
Volume (Total Runoff)
(ft³)
Area (User Defined)(acres)
Total Rainfall Depth(in)
Loss MethodRunoff MethodLabel
12.300235.721,322,669.067.1406.5SCS CNUnit HydrographCM-112.325174.05975,179.059.2206.5SCS CNUnit HydrographCM-2
General Calculation Summary
Hydraulic Grade (Maximum)
(ft)
Velocity (Maximum Calculated)
(ft/s)
Flow (Maximum)(cfs)
Time (Maximum Flow)
(hours)
BranchElement TypeLabel
31.1512.48231.1412.3501ConduitMNRR PR 2-4828.428.39161.4312.8501ConduitPEPES 4230.074.89230.8612.3751ChannelCH-231.15---------1PondPO-1
Page 1 of 227 Siemon Company Drive Suite 200 W Watertown, CT 06795 USA +1-203-755-1666
3/25/2017
Bentley CivilStorm V8i (SELECTseries 5)[08.11.05.113]Bentley Systems, Inc. Haestad Methods Solution Center20170327_301-175 PROPOSED TWIN 48in RCP.stsw

General Calculation Summary
Hydraulic Grade (Maximum)
(ft)
Velocity (Maximum Calculated)
(ft/s)
Flow (Maximum)(cfs)
Time (Maximum Flow)
(hours)
BranchElement TypeLabel
28.42---------1PondPO-2
Node Calculation Summary
Flow (Captured Maximum)
(cfs)
Time To Maximum
Captured Flow(hours)
Flow (Surface Maximum)
(cfs)
Time To Maximum Inlet
Flow(hours)
Flow (Total In Maximum)
(cfs)
Time to Maximum Inflow
(hours)
BranchElement TypeLabel
------------(N/A)(N/A)0OutfallO-1------------235.2212.3001PondPO-1------------374.4512.3501PondPO-2
Flow (Overflow Maximum)
(cfs)
Time to Maximum Overflow(hours)
(N/A)(N/A)0.000.0000.000.000
Gutter Calculation Summary
Velocity (Maximum Calculated)
(ft/s)
Time (Maximum Flow)
(hours)
Flow (Maximum)(cfs)
Gutter ShapeLabel
Page 2 of 227 Siemon Company Drive Suite 200 W Watertown, CT 06795 USA +1-203-755-1666
3/25/2017
Bentley CivilStorm V8i (SELECTseries 5)[08.11.05.113]Bentley Systems, Inc. Haestad Methods Solution Center20170327_301-175 PROPOSED TWIN 48in RCP.stsw

FlexTable: Conduit ReportCurrent Time: 12.350 hours
Flow (Maximum)(cfs)
Span(ft)
Rise(ft)
Diameter(in)
Length (User Defined)
(ft)
Manning's nMaterialConduit Description
Label
231.1448.0101.00.013ConcreteCircle - 48.0 inMNRR PR 2-48161.4342.050.00.013ConcreteCircle - 42.0 inPEPES 42
Velocity (Out)(ft/s)
Velocity (In)(ft/s)
Hydraulic Grade Line (Out)
(ft)
Hydraulic Grade Line (In)
(ft)
Hydraulic Grade (Maximum)
(ft)
Time to Maximum
Hydraulic Grade(hours)
13.2911.2430.2131.1531.1512.3508.707.0826.9427.8128.4212.850
Page 1 of 127 Siemon Company Drive Suite 200 W Watertown, CT 06795 USA +1-203-755-1666
4/1/2017
Bentley CivilStorm V8i (SELECTseries 5)[08.11.05.113]Bentley Systems, Inc. Haestad Methods Solution Center20170327_301-175 PROPOSED TWIN 48in RCP.stsw

Calculation Executive SummaryScenario
NOAA 50-YearLabel
Storm Event
NOAA 50-Year -
Rainfall Runoff
Alternative - 1
Label
years50Return Event
NOAA Bridgeport (50-Year) -
50 Year
Global Storm Event
Calculation Executive Summary
ft³2,694,471.0Total Inflow Volume ft³8,119.7Total System Volume Changeft³2,684,752.8Total System Outflow Volume %0.1Continuity Error
ft³0.0Total System Overflow Volume
ft³0.0Total Pond Infiltration Volume
ft³(N/A)Total Gutter Volume Change 5864Total N-R Iterations
Page 1 of 127 Siemon Company Drive Suite 200 W Watertown, CT 06795 USA +1-203-755-1666
3/25/2017
Bentley CivilStorm V8i (SELECTseries 5)[08.11.05.113]Bentley Systems, Inc. Haestad Methods Solution Center20170327_301-175 PROPOSED TWIN 48in RCP.stsw

Calculation Detailed Summary<General>
Base Calculation
OptionsLabel
hours0.025Output Increment
hours0.013Calculation Time Step hours24.000Duration
Implicit Engine
ft0.040Virtual Flow Depth 0.700NR Weighting Coefficientft0.03Y Iteration Tolerance 0.600Relaxation Weighting
Coefficient1.000LPI Coefficient ft50.00Computation Distance
Inlets
FalseNeglect Side Flow? Grate and Curb
Active Components for Combination Inlets In Sag
FalseNeglect Gutter Cross Slope For Side Flow?
Grate and Curb
Active Components for Combination Inlets on Grade
Catchment Calculation Summary
Time (Maximum Flow)
(hours)
Flow (Maximum)(cfs)
Volume (Total Runoff)
(ft³)
Area (User Defined)(acres)
Total Rainfall Depth(in)
Loss MethodRunoff MethodLabel
12.300271.861,537,716.067.1407.4SCS CNUnit HydrographCM-112.325205.341,156,918.059.2207.4SCS CNUnit HydrographCM-2
General Calculation Summary
Hydraulic Grade (Maximum)
(ft)
Velocity (Maximum Calculated)
(ft/s)
Flow (Maximum)(cfs)
Time (Maximum Flow)
(hours)
BranchElement TypeLabel
31.4812.95267.0412.3251ConduitMNRR PR 2-4828.729.20177.1212.8751ConduitPEPES 4230.115.16266.5812.3751ChannelCH-231.48---------1PondPO-1
Page 1 of 227 Siemon Company Drive Suite 200 W Watertown, CT 06795 USA +1-203-755-1666
3/25/2017
Bentley CivilStorm V8i (SELECTseries 5)[08.11.05.113]Bentley Systems, Inc. Haestad Methods Solution Center20170327_301-175 PROPOSED TWIN 48in RCP.stsw

General Calculation Summary
Hydraulic Grade (Maximum)
(ft)
Velocity (Maximum Calculated)
(ft/s)
Flow (Maximum)(cfs)
Time (Maximum Flow)
(hours)
BranchElement TypeLabel
28.72---------1PondPO-2
Node Calculation Summary
Flow (Captured Maximum)
(cfs)
Time To Maximum
Captured Flow(hours)
Flow (Surface Maximum)
(cfs)
Time To Maximum Inlet
Flow(hours)
Flow (Total In Maximum)
(cfs)
Time to Maximum Inflow
(hours)
BranchElement TypeLabel
------------(N/A)(N/A)0OutfallO-1------------271.2412.3001PondPO-1------------433.3612.3501PondPO-2
Flow (Overflow Maximum)
(cfs)
Time to Maximum Overflow(hours)
(N/A)(N/A)0.000.0000.000.000
Gutter Calculation Summary
Velocity (Maximum Calculated)
(ft/s)
Time (Maximum Flow)
(hours)
Flow (Maximum)(cfs)
Gutter ShapeLabel
Page 2 of 227 Siemon Company Drive Suite 200 W Watertown, CT 06795 USA +1-203-755-1666
3/25/2017
Bentley CivilStorm V8i (SELECTseries 5)[08.11.05.113]Bentley Systems, Inc. Haestad Methods Solution Center20170327_301-175 PROPOSED TWIN 48in RCP.stsw

FlexTable: Conduit ReportCurrent Time: 12.325 hours
Flow (Maximum)(cfs)
Span(ft)
Rise(ft)
Diameter(in)
Length (User Defined)
(ft)
Manning's nMaterialConduit Description
Label
267.0448.0101.00.013ConcreteCircle - 48.0 inMNRR PR 2-48177.1242.050.00.013ConcreteCircle - 42.0 inPEPES 42
Velocity (Out)(ft/s)
Velocity (In)(ft/s)
Hydraulic Grade Line (Out)
(ft)
Hydraulic Grade Line (In)
(ft)
Hydraulic Grade (Maximum)
(ft)
Time to Maximum
Hydraulic Grade(hours)
14.3311.7930.3831.4831.4812.3258.877.3227.0227.9328.7212.875
Page 1 of 127 Siemon Company Drive Suite 200 W Watertown, CT 06795 USA +1-203-755-1666
4/1/2017
Bentley CivilStorm V8i (SELECTseries 5)[08.11.05.113]Bentley Systems, Inc. Haestad Methods Solution Center20170327_301-175 PROPOSED TWIN 48in RCP.stsw

Calculation Executive SummaryScenario
NOAA 100-YearLabel
Storm Event
NOAA 100-Year -
Rainfall Runoff
Alternative - 1
Label
years100Return Event
NOAA Bridgeport
(100-Year) - 100 Year
Global Storm Event
Calculation Executive Summary
ft³3,093,946.0Total Inflow Volume ft³10,079.8Total System Volume Changeft³3,082,230.0Total System Outflow Volume %0.1Continuity Error
ft³0.0Total System Overflow Volume
ft³0.0Total Pond Infiltration Volume
ft³(N/A)Total Gutter Volume Change 9275Total N-R Iterations
Page 1 of 127 Siemon Company Drive Suite 200 W Watertown, CT 06795 USA +1-203-755-1666
3/25/2017
Bentley CivilStorm V8i (SELECTseries 5)[08.11.05.113]Bentley Systems, Inc. Haestad Methods Solution Center20170327_301-175 PROPOSED TWIN 48in RCP.stsw

Calculation Detailed Summary<General>
Base Calculation
OptionsLabel
hours0.025Output Increment
hours0.013Calculation Time Step hours24.000Duration
Implicit Engine
ft0.040Virtual Flow Depth 0.700NR Weighting Coefficientft0.03Y Iteration Tolerance 0.600Relaxation Weighting
Coefficient1.000LPI Coefficient ft50.00Computation Distance
Inlets
FalseNeglect Side Flow? Grate and Curb
Active Components for Combination Inlets In Sag
FalseNeglect Gutter Cross Slope For Side Flow?
Grate and Curb
Active Components for Combination Inlets on Grade
Catchment Calculation Summary
Time (Maximum Flow)
(hours)
Flow (Maximum)(cfs)
Volume (Total Runoff)
(ft³)
Area (User Defined)(acres)
Total Rainfall Depth(in)
Loss MethodRunoff MethodLabel
12.300307.851,753,476.067.1408.3SCS CNUnit HydrographCM-112.325236.611,340,658.059.2208.3SCS CNUnit HydrographCM-2
General Calculation Summary
Hydraulic Grade (Maximum)
(ft)
Velocity (Maximum Calculated)
(ft/s)
Flow (Maximum)(cfs)
Time (Maximum Flow)
(hours)
BranchElement TypeLabel
31.6614.23300.1012.3501ConduitMNRR PR 2-4829.029.95191.5312.8751ConduitPEPES 4230.154.91299.6612.3751ChannelCH-231.66---------1PondPO-1
Page 1 of 227 Siemon Company Drive Suite 200 W Watertown, CT 06795 USA +1-203-755-1666
3/25/2017
Bentley CivilStorm V8i (SELECTseries 5)[08.11.05.113]Bentley Systems, Inc. Haestad Methods Solution Center20170327_301-175 PROPOSED TWIN 48in RCP.stsw

General Calculation Summary
Hydraulic Grade (Maximum)
(ft)
Velocity (Maximum Calculated)
(ft/s)
Flow (Maximum)(cfs)
Time (Maximum Flow)
(hours)
BranchElement TypeLabel
29.02---------1PondPO-2
Node Calculation Summary
Flow (Captured Maximum)
(cfs)
Time To Maximum
Captured Flow(hours)
Flow (Surface Maximum)
(cfs)
Time To Maximum Inlet
Flow(hours)
Flow (Total In Maximum)
(cfs)
Time to Maximum Inflow
(hours)
BranchElement TypeLabel
------------(N/A)(N/A)0OutfallO-1------------307.1012.3001PondPO-1------------483.7812.3251PondPO-2
Flow (Overflow Maximum)
(cfs)
Time to Maximum Overflow(hours)
(N/A)(N/A)0.000.0000.000.000
Gutter Calculation Summary
Velocity (Maximum Calculated)
(ft/s)
Time (Maximum Flow)
(hours)
Flow (Maximum)(cfs)
Gutter ShapeLabel
Page 2 of 227 Siemon Company Drive Suite 200 W Watertown, CT 06795 USA +1-203-755-1666
3/25/2017
Bentley CivilStorm V8i (SELECTseries 5)[08.11.05.113]Bentley Systems, Inc. Haestad Methods Solution Center20170327_301-175 PROPOSED TWIN 48in RCP.stsw

FlexTable: Conduit ReportCurrent Time: 12.350 hours
Flow (Maximum)(cfs)
Span(ft)
Rise(ft)
Diameter(in)
Length (User Defined)
(ft)
Manning's nMaterialConduit Description
Label
300.1048.0101.00.013ConcreteCircle - 48.0 inMNRR PR 2-48191.5342.050.00.013ConcreteCircle - 42.0 inPEPES 42
Velocity (Out)(ft/s)
Velocity (In)(ft/s)
Hydraulic Grade Line (Out)
(ft)
Hydraulic Grade Line (In)
(ft)
Hydraulic Grade (Maximum)
(ft)
Time to Maximum
Hydraulic Grade(hours)
15.9512.7030.4031.6631.6612.3509.217.9427.1728.2029.0212.875
Page 1 of 127 Siemon Company Drive Suite 200 W Watertown, CT 06795 USA +1-203-755-1666
4/1/2017
Bentley CivilStorm V8i (SELECTseries 5)[08.11.05.113]Bentley Systems, Inc. Haestad Methods Solution Center20170327_301-175 PROPOSED TWIN 48in RCP.stsw

Calculation Executive SummaryScenario
NOAA 500-YearLabel
Storm Event
NOAA 500-Year -
Rainfall Runoff
Alternative - 1
Label
years500Return Event
NOAA Bridgeport
(500-Year) - 500 Year
Global Storm Event
Calculation Executive Summary
ft³4,437,748.0Total Inflow Volume ft³26,097.8Total System Volume Changeft³4,478,719.0Total System Outflow Volume %1.5Continuity Error
ft³0.0Total System Overflow Volume
ft³0.0Total Pond Infiltration Volume
ft³(N/A)Total Gutter Volume Change 12209Total N-R Iterations
Page 1 of 127 Siemon Company Drive Suite 200 W Watertown, CT 06795 USA +1-203-755-1666
3/25/2017
Bentley CivilStorm V8i (SELECTseries 5)[08.11.05.113]Bentley Systems, Inc. Haestad Methods Solution Center20170327_301-175 PROPOSED TWIN 48in RCP.stsw

Calculation Detailed Summary<General>
Base Calculation
OptionsLabel
hours0.025Output Increment
hours0.013Calculation Time Step hours24.000Duration
Implicit Engine
ft0.040Virtual Flow Depth 0.700NR Weighting Coefficientft0.03Y Iteration Tolerance 0.600Relaxation Weighting
Coefficient1.000LPI Coefficient ft50.00Computation Distance
Inlets
FalseNeglect Side Flow? Grate and Curb
Active Components for Combination Inlets In Sag
FalseNeglect Gutter Cross Slope For Side Flow?
Grate and Curb
Active Components for Combination Inlets on Grade
Catchment Calculation Summary
Time (Maximum Flow)
(hours)
Flow (Maximum)(cfs)
Volume (Total Runoff)
(ft³)
Area (User Defined)(acres)
Total Rainfall Depth(in)
Loss MethodRunoff MethodLabel
12.300426.952,475,782.067.14011.3SCS CNUnit HydrographCM-112.325340.311,962,220.059.22011.3SCS CNUnit HydrographCM-2
General Calculation Summary
Hydraulic Grade (Maximum)
(ft)
Velocity (Maximum Calculated)
(ft/s)
Flow (Maximum)(cfs)
Time (Maximum Flow)
(hours)
BranchElement TypeLabel
32.7616.01394.5312.4001ConduitMNRR PR 2-4829.8216.44316.3912.8251ConduitPEPES 4230.462.91386.4812.3751ChannelCH-232.76---------1PondPO-1
Page 1 of 227 Siemon Company Drive Suite 200 W Watertown, CT 06795 USA +1-203-755-1666
3/25/2017
Bentley CivilStorm V8i (SELECTseries 5)[08.11.05.113]Bentley Systems, Inc. Haestad Methods Solution Center20170327_301-175 PROPOSED TWIN 48in RCP.stsw

General Calculation Summary
Hydraulic Grade (Maximum)
(ft)
Velocity (Maximum Calculated)
(ft/s)
Flow (Maximum)(cfs)
Time (Maximum Flow)
(hours)
BranchElement TypeLabel
29.82---------1PondPO-2
Node Calculation Summary
Flow (Captured Maximum)
(cfs)
Time To Maximum
Captured Flow(hours)
Flow (Surface Maximum)
(cfs)
Time To Maximum Inlet
Flow(hours)
Flow (Total In Maximum)
(cfs)
Time to Maximum Inflow
(hours)
BranchElement TypeLabel
------------(N/A)(N/A)0OutfallO-1------------425.8012.3001PondPO-1------------626.8812.3251PondPO-2
Flow (Overflow Maximum)
(cfs)
Time to Maximum Overflow(hours)
(N/A)(N/A)0.000.0000.000.000
Gutter Calculation Summary
Velocity (Maximum Calculated)
(ft/s)
Time (Maximum Flow)
(hours)
Flow (Maximum)(cfs)
Gutter ShapeLabel
Page 2 of 227 Siemon Company Drive Suite 200 W Watertown, CT 06795 USA +1-203-755-1666
3/25/2017
Bentley CivilStorm V8i (SELECTseries 5)[08.11.05.113]Bentley Systems, Inc. Haestad Methods Solution Center20170327_301-175 PROPOSED TWIN 48in RCP.stsw

FlexTable: Conduit ReportCurrent Time: 12.400 hours
Flow (Maximum)(cfs)
Span(ft)
Rise(ft)
Diameter(in)
Length (User Defined)
(ft)
Manning's nMaterialConduit Description
Label
394.5348.0101.00.013ConcreteCircle - 48.0 inMNRR PR 2-48316.3942.050.00.013ConcreteCircle - 42.0 inPEPES 42
Velocity (Out)(ft/s)
Velocity (In)(ft/s)
Hydraulic Grade Line (Out)
(ft)
Hydraulic Grade Line (In)
(ft)
Hydraulic Grade (Maximum)
(ft)
Time to Maximum
Hydraulic Grade(hours)
18.6615.7030.7432.7632.7612.40010.2210.0027.6529.0329.8212.800
Page 1 of 127 Siemon Company Drive Suite 200 W Watertown, CT 06795 USA +1-203-755-1666
4/1/2017
Bentley CivilStorm V8i (SELECTseries 5)[08.11.05.113]Bentley Systems, Inc. Haestad Methods Solution Center20170327_301-175 PROPOSED TWIN 48in RCP.stsw

STATE PROJECT NO. 301-0175 CULVERT REPLACEMENT MNRR NEW HAVEN MAINLINE M.P. 65.60, MILFORD, CONN.
APPENDIX D3
Alternate 2: Twin 48” RCP Culvert with Restrictions (CivilStorm)

Scenario: NOAA Base
Page 1 of 127 Siemon Company Drive Suite 200 W Watertown, CT 06795 USA +1-203-755-1666
3/25/2017
Bentley CivilStorm V8i (SELECTseries 5)[08.11.05.113]
Bentley Systems, Inc. Haestad Methods Solution Center
20170327_301-175 PROPOSED TWIN 48in RCP GATE.stsw

Calculation Executive SummaryScenario
NOAA 1-YearLabel
Storm Event
NOAA 1-Year - Rainfall
Runoff Alternative -
1
Label
years1Return Event
NOAA Bridgeport (1
-Year) - 1 Year
Global Storm Event
Calculation Executive Summary
ft³732,562.1Total Inflow Volume ft³10,553.9Total System Volume Changeft³689,277.6Total System Outflow Volume %4.5Continuity Error
ft³0.0Total System Overflow Volume
ft³0.0Total Pond Infiltration Volume
ft³(N/A)Total Gutter Volume Change 3565Total N-R Iterations
Page 1 of 127 Siemon Company Drive Suite 200 W Watertown, CT 06795 USA +1-203-755-1666
3/25/2017
Bentley CivilStorm V8i (SELECTseries 5)[08.11.05.113]Bentley Systems, Inc. Haestad Methods Solution Center20170327_301-175 PROPOSED TWIN 48in RCP GATE.stsw

Calculation Detailed Summary<General>
Base Calculation
OptionsLabel
hours0.025Output Increment
hours0.013Calculation Time Step hours24.000Duration
Implicit Engine
ft0.040Virtual Flow Depth 0.700NR Weighting Coefficientft0.03Y Iteration Tolerance 0.600Relaxation Weighting
Coefficient1.000LPI Coefficient ft50.00Computation Distance
Inlets
FalseNeglect Side Flow? Grate and Curb
Active Components for Combination Inlets In Sag
FalseNeglect Gutter Cross Slope For Side Flow?
Grate and Curb
Active Components for Combination Inlets on Grade
Catchment Calculation Summary
Time (Maximum Flow)
(hours)
Flow (Maximum)(cfs)
Volume (Total Runoff)
(ft³)
Area (User Defined)(acres)
Total Rainfall Depth(in)
Loss MethodRunoff MethodLabel
12.30085.22457,539.067.1402.8SCS CNUnit HydrographCM-112.40049.28275,080.059.2202.8SCS CNUnit HydrographCM-2
General Calculation Summary
Hydraulic Grade (Maximum)
(ft)
Velocity (Maximum Calculated)
(ft/s)
Flow (Maximum)(cfs)
Time (Maximum Flow)
(hours)
BranchElement TypeLabel
32.729.9153.0812.6001ConduitMNRR PR 2-48 Gate
26.705.1361.4312.9251ConduitPEPES 4229.502.8152.9112.6751ChannelCH-2
Page 1 of 227 Siemon Company Drive Suite 200 W Watertown, CT 06795 USA +1-203-755-1666
3/25/2017
Bentley CivilStorm V8i (SELECTseries 5)[08.11.05.113]Bentley Systems, Inc. Haestad Methods Solution Center20170327_301-175 PROPOSED TWIN 48in RCP GATE.stsw

General Calculation Summary
Hydraulic Grade (Maximum)
(ft)
Velocity (Maximum Calculated)
(ft/s)
Flow (Maximum)(cfs)
Time (Maximum Flow)
(hours)
BranchElement TypeLabel
32.72---------1PondPO-126.70---------1PondPO-2
Node Calculation Summary
Flow (Captured Maximum)
(cfs)
Time To Maximum
Captured Flow(hours)
Flow (Surface Maximum)
(cfs)
Time To Maximum Inlet
Flow(hours)
Flow (Total In Maximum)
(cfs)
Time to Maximum Inflow
(hours)
BranchElement TypeLabel
------------(N/A)(N/A)0OutfallO-1------------85.2112.3001PondPO-1------------92.8812.4751PondPO-2
Flow (Overflow Maximum)
(cfs)
Time to Maximum Overflow(hours)
(N/A)(N/A)0.000.0000.000.000
Gutter Calculation Summary
Velocity (Maximum Calculated)
(ft/s)
Time (Maximum Flow)
(hours)
Flow (Maximum)(cfs)
Gutter ShapeLabel
Page 2 of 227 Siemon Company Drive Suite 200 W Watertown, CT 06795 USA +1-203-755-1666
3/25/2017
Bentley CivilStorm V8i (SELECTseries 5)[08.11.05.113]Bentley Systems, Inc. Haestad Methods Solution Center20170327_301-175 PROPOSED TWIN 48in RCP GATE.stsw

FlexTable: Conduit ReportCurrent Time: 12.625 hours
Flow (Maximum)(cfs)
Span(ft)
Rise(ft)
Diameter(in)
Length (User Defined)
(ft)
Manning's nMaterialConduit Description
Label
53.083.81.4101.00.013ConcreteRectangular-Round - 3.8 x 2 ft
MNRR PR 2-48 Gate
61.4342.050.00.013ConcreteCircle - 42.0 inPEPES 42Velocity (Out)
(ft/s)Velocity (In)
(ft/s)Hydraulic Grade
Line (Out)(ft)
Hydraulic Grade Line (In)
(ft)
Hydraulic Grade (Maximum)
(ft)
Time to Maximum
Hydraulic Grade(hours)
13.929.5430.3332.7232.7212.6256.244.4125.9626.5926.7012.925
Page 1 of 127 Siemon Company Drive Suite 200 W Watertown, CT 06795 USA +1-203-755-1666
4/1/2017
Bentley CivilStorm V8i (SELECTseries 5)[08.11.05.113]Bentley Systems, Inc. Haestad Methods Solution Center20170327_301-175 PROPOSED TWIN 48in RCP GATE.stsw

Calculation Executive SummaryScenario
NOAA 2-YearLabel
Storm Event
NOAA 2-Year - Rainfall
Runoff Alternative -
1
Label
years2Return Event
NOAA Bridgeport (2
-Year) - 2 Year
Global Storm Event
Calculation Executive Summary
ft³932,410.6Total Inflow Volume ft³7,554.6Total System Volume Changeft³962,939.5Total System Outflow Volume %4.0Continuity Error
ft³0.0Total System Overflow Volume
ft³0.0Total Pond Infiltration Volume
ft³(N/A)Total Gutter Volume Change 3643Total N-R Iterations
Page 1 of 127 Siemon Company Drive Suite 200 W Watertown, CT 06795 USA +1-203-755-1666
3/25/2017
Bentley CivilStorm V8i (SELECTseries 5)[08.11.05.113]Bentley Systems, Inc. Haestad Methods Solution Center20170327_301-175 PROPOSED TWIN 48in RCP GATE.stsw

Calculation Detailed Summary<General>
Base Calculation
OptionsLabel
hours0.025Output Increment
hours0.013Calculation Time Step hours24.000Duration
Implicit Engine
ft0.040Virtual Flow Depth 0.700NR Weighting Coefficientft0.03Y Iteration Tolerance 0.600Relaxation Weighting
Coefficient1.000LPI Coefficient ft50.00Computation Distance
Inlets
FalseNeglect Side Flow? Grate and Curb
Active Components for Combination Inlets In Sag
FalseNeglect Gutter Cross Slope For Side Flow?
Grate and Curb
Active Components for Combination Inlets on Grade
Catchment Calculation Summary
Time (Maximum Flow)
(hours)
Flow (Maximum)(cfs)
Volume (Total Runoff)
(ft³)
Area (User Defined)(acres)
Total Rainfall Depth(in)
Loss MethodRunoff MethodLabel
12.300105.67570,882.067.1403.3SCS CNUnit HydrographCM-112.35065.21361,597.059.2203.3SCS CNUnit HydrographCM-2
General Calculation Summary
Hydraulic Grade (Maximum)
(ft)
Velocity (Maximum Calculated)
(ft/s)
Flow (Maximum)(cfs)
Time (Maximum Flow)
(hours)
BranchElement TypeLabel
33.2610.9459.5212.6501ConduitMNRR PR 2-48 Gate
26.936.2885.1012.8251ConduitPEPES 4229.622.9259.4412.7001ChannelCH-2
Page 1 of 227 Siemon Company Drive Suite 200 W Watertown, CT 06795 USA +1-203-755-1666
3/25/2017
Bentley CivilStorm V8i (SELECTseries 5)[08.11.05.113]Bentley Systems, Inc. Haestad Methods Solution Center20170327_301-175 PROPOSED TWIN 48in RCP GATE.stsw

General Calculation Summary
Hydraulic Grade (Maximum)
(ft)
Velocity (Maximum Calculated)
(ft/s)
Flow (Maximum)(cfs)
Time (Maximum Flow)
(hours)
BranchElement TypeLabel
33.26---------1PondPO-126.93---------1PondPO-2
Node Calculation Summary
Flow (Captured Maximum)
(cfs)
Time To Maximum
Captured Flow(hours)
Flow (Surface Maximum)
(cfs)
Time To Maximum Inlet
Flow(hours)
Flow (Total In Maximum)
(cfs)
Time to Maximum Inflow
(hours)
BranchElement TypeLabel
------------(N/A)(N/A)0OutfallO-1------------105.6012.3001PondPO-1------------114.1012.4251PondPO-2
Flow (Overflow Maximum)
(cfs)
Time to Maximum Overflow(hours)
(N/A)(N/A)0.000.0000.000.000
Gutter Calculation Summary
Velocity (Maximum Calculated)
(ft/s)
Time (Maximum Flow)
(hours)
Flow (Maximum)(cfs)
Gutter ShapeLabel
Page 2 of 227 Siemon Company Drive Suite 200 W Watertown, CT 06795 USA +1-203-755-1666
3/25/2017
Bentley CivilStorm V8i (SELECTseries 5)[08.11.05.113]Bentley Systems, Inc. Haestad Methods Solution Center20170327_301-175 PROPOSED TWIN 48in RCP GATE.stsw

FlexTable: Conduit ReportCurrent Time: 12.650 hours
Flow (Maximum)(cfs)
Span(ft)
Rise(ft)
Diameter(in)
Length (User Defined)
(ft)
Manning's nMaterialConduit Description
Label
59.523.81.4101.00.013ConcreteRectangular-Round - 3.8 x 2 ft
MNRR PR 2-48 Gate
85.1042.050.00.013ConcreteCircle - 42.0 inPEPES 42Velocity (Out)
(ft/s)Velocity (In)
(ft/s)Hydraulic Grade
Line (Out)(ft)
Hydraulic Grade Line (In)
(ft)
Hydraulic Grade (Maximum)
(ft)
Time to Maximum
Hydraulic Grade(hours)
14.7010.7030.4933.2633.2612.6507.296.0826.3426.8426.9312.950
Page 1 of 127 Siemon Company Drive Suite 200 W Watertown, CT 06795 USA +1-203-755-1666
4/1/2017
Bentley CivilStorm V8i (SELECTseries 5)[08.11.05.113]Bentley Systems, Inc. Haestad Methods Solution Center20170327_301-175 PROPOSED TWIN 48in RCP GATE.stsw

Calculation Executive SummaryScenario
NOAA 5-YearLabel
Storm Event
NOAA 5-Year - Rainfall
Runoff Alternative -
1
Label
years5Return Event
NOAA Bridgeport (5
-Year) - 5 Year
Global Storm Event
Calculation Executive Summary
ft³1,431,987.0Total Inflow Volume ft³14,942.7Total System Volume Changeft³1,412,675.0Total System Outflow Volume %0.3Continuity Error
ft³0.0Total System Overflow Volume
ft³0.0Total Pond Infiltration Volume
ft³(N/A)Total Gutter Volume Change 3293Total N-R Iterations
Page 1 of 127 Siemon Company Drive Suite 200 W Watertown, CT 06795 USA +1-203-755-1666
3/25/2017
Bentley CivilStorm V8i (SELECTseries 5)[08.11.05.113]Bentley Systems, Inc. Haestad Methods Solution Center20170327_301-175 PROPOSED TWIN 48in RCP GATE.stsw

Calculation Detailed Summary<General>
Base Calculation
OptionsLabel
hours0.025Output Increment
hours0.013Calculation Time Step hours24.000Duration
Implicit Engine
ft0.040Virtual Flow Depth 0.700NR Weighting Coefficientft0.03Y Iteration Tolerance 0.600Relaxation Weighting
Coefficient1.000LPI Coefficient ft50.00Computation Distance
Inlets
FalseNeglect Side Flow? Grate and Curb
Active Components for Combination Inlets In Sag
FalseNeglect Gutter Cross Slope For Side Flow?
Grate and Curb
Active Components for Combination Inlets on Grade
Catchment Calculation Summary
Time (Maximum Flow)
(hours)
Flow (Maximum)(cfs)
Volume (Total Runoff)
(ft³)
Area (User Defined)(acres)
Total Rainfall Depth(in)
Loss MethodRunoff MethodLabel
12.300154.72849,171.067.1404.5SCS CNUnit HydrographCM-112.350105.26582,912.059.2204.5SCS CNUnit HydrographCM-2
General Calculation Summary
Hydraulic Grade (Maximum)
(ft)
Velocity (Maximum Calculated)
(ft/s)
Flow (Maximum)(cfs)
Time (Maximum Flow)
(hours)
BranchElement TypeLabel
34.3912.7369.2312.7251ConduitMNRR PR 2-48 Gate
27.336.61104.8812.9251ConduitPEPES 4229.703.0969.2112.7751ChannelCH-2
Page 1 of 227 Siemon Company Drive Suite 200 W Watertown, CT 06795 USA +1-203-755-1666
3/25/2017
Bentley CivilStorm V8i (SELECTseries 5)[08.11.05.113]Bentley Systems, Inc. Haestad Methods Solution Center20170327_301-175 PROPOSED TWIN 48in RCP GATE.stsw

General Calculation Summary
Hydraulic Grade (Maximum)
(ft)
Velocity (Maximum Calculated)
(ft/s)
Flow (Maximum)(cfs)
Time (Maximum Flow)
(hours)
BranchElement TypeLabel
34.39---------1PondPO-127.33---------1PondPO-2
Node Calculation Summary
Flow (Captured Maximum)
(cfs)
Time To Maximum
Captured Flow(hours)
Flow (Surface Maximum)
(cfs)
Time To Maximum Inlet
Flow(hours)
Flow (Total In Maximum)
(cfs)
Time to Maximum Inflow
(hours)
BranchElement TypeLabel
------------(N/A)(N/A)0OutfallO-1------------154.5012.3001PondPO-1------------162.3512.3751PondPO-2
Flow (Overflow Maximum)
(cfs)
Time to Maximum Overflow(hours)
(N/A)(N/A)0.000.0000.000.000
Gutter Calculation Summary
Velocity (Maximum Calculated)
(ft/s)
Time (Maximum Flow)
(hours)
Flow (Maximum)(cfs)
Gutter ShapeLabel
Page 2 of 227 Siemon Company Drive Suite 200 W Watertown, CT 06795 USA +1-203-755-1666
3/25/2017
Bentley CivilStorm V8i (SELECTseries 5)[08.11.05.113]Bentley Systems, Inc. Haestad Methods Solution Center20170327_301-175 PROPOSED TWIN 48in RCP GATE.stsw

FlexTable: Conduit ReportCurrent Time: 12.725 hours
Flow (Maximum)(cfs)
Span(ft)
Rise(ft)
Diameter(in)
Length (User Defined)
(ft)
Manning's nMaterialConduit Description
Label
69.233.81.4101.00.013ConcreteRectangular-Round - 3.8 x 2 ft
MNRR PR 2-48 Gate
104.8842.050.00.013ConcreteCircle - 42.0 inPEPES 42Velocity (Out)
(ft/s)Velocity (In)
(ft/s)Hydraulic Grade
Line (Out)(ft)
Hydraulic Grade Line (In)
(ft)
Hydraulic Grade (Maximum)
(ft)
Time to Maximum
Hydraulic Grade(hours)
15.5312.4530.7834.3934.3912.7257.876.1826.5927.3027.3312.925
Page 1 of 127 Siemon Company Drive Suite 200 W Watertown, CT 06795 USA +1-203-755-1666
4/1/2017
Bentley CivilStorm V8i (SELECTseries 5)[08.11.05.113]Bentley Systems, Inc. Haestad Methods Solution Center20170327_301-175 PROPOSED TWIN 48in RCP GATE.stsw

Calculation Executive SummaryScenario
NOAA 10-YearLabel
Storm Event
NOAA 10-Year -
Rainfall Runoff
Alternative - 1
Label
years10Return Event
NOAA Bridgeport (10-Year) -
10 Year
Global Storm Event
Calculation Executive Summary
ft³1,774,797.0Total Inflow Volume ft³7,277.0Total System Volume Changeft³1,766,937.6Total System Outflow Volume %0.0Continuity Error
ft³0.0Total System Overflow Volume
ft³0.0Total Pond Infiltration Volume
ft³(N/A)Total Gutter Volume Change 4755Total N-R Iterations
Page 1 of 127 Siemon Company Drive Suite 200 W Watertown, CT 06795 USA +1-203-755-1666
3/25/2017
Bentley CivilStorm V8i (SELECTseries 5)[08.11.05.113]Bentley Systems, Inc. Haestad Methods Solution Center20170327_301-175 PROPOSED TWIN 48in RCP GATE.stsw

Calculation Detailed Summary<General>
Base Calculation
OptionsLabel
hours0.025Output Increment
hours0.013Calculation Time Step hours24.000Duration
Implicit Engine
ft0.040Virtual Flow Depth 0.700NR Weighting Coefficientft0.03Y Iteration Tolerance 0.600Relaxation Weighting
Coefficient1.000LPI Coefficient ft50.00Computation Distance
Inlets
FalseNeglect Side Flow? Grate and Curb
Active Components for Combination Inlets In Sag
FalseNeglect Gutter Cross Slope For Side Flow?
Grate and Curb
Active Components for Combination Inlets on Grade
Catchment Calculation Summary
Time (Maximum Flow)
(hours)
Flow (Maximum)(cfs)
Volume (Total Runoff)
(ft³)
Area (User Defined)(acres)
Total Rainfall Depth(in)
Loss MethodRunoff MethodLabel
12.300187.251,037,595.067.1405.3SCS CNUnit HydrographCM-112.350132.64737,318.059.2205.3SCS CNUnit HydrographCM-2
General Calculation Summary
Hydraulic Grade (Maximum)
(ft)
Velocity (Maximum Calculated)
(ft/s)
Flow (Maximum)(cfs)
Time (Maximum Flow)
(hours)
BranchElement TypeLabel
34.9513.3672.6612.7751ConduitMNRR PR 2-48 Gate
27.546.91116.9312.9001ConduitPEPES 4229.723.1572.6512.8251ChannelCH-2
Page 1 of 227 Siemon Company Drive Suite 200 W Watertown, CT 06795 USA +1-203-755-1666
3/25/2017
Bentley CivilStorm V8i (SELECTseries 5)[08.11.05.113]Bentley Systems, Inc. Haestad Methods Solution Center20170327_301-175 PROPOSED TWIN 48in RCP GATE.stsw

General Calculation Summary
Hydraulic Grade (Maximum)
(ft)
Velocity (Maximum Calculated)
(ft/s)
Flow (Maximum)(cfs)
Time (Maximum Flow)
(hours)
BranchElement TypeLabel
34.95---------1PondPO-127.54---------1PondPO-2
Node Calculation Summary
Flow (Captured Maximum)
(cfs)
Time To Maximum
Captured Flow(hours)
Flow (Surface Maximum)
(cfs)
Time To Maximum Inlet
Flow(hours)
Flow (Total In Maximum)
(cfs)
Time to Maximum Inflow
(hours)
BranchElement TypeLabel
------------(N/A)(N/A)0OutfallO-1------------186.9112.3001PondPO-1------------189.8012.3501PondPO-2
Flow (Overflow Maximum)
(cfs)
Time to Maximum Overflow(hours)
(N/A)(N/A)0.000.0000.000.000
Gutter Calculation Summary
Velocity (Maximum Calculated)
(ft/s)
Time (Maximum Flow)
(hours)
Flow (Maximum)(cfs)
Gutter ShapeLabel
Page 2 of 227 Siemon Company Drive Suite 200 W Watertown, CT 06795 USA +1-203-755-1666
3/25/2017
Bentley CivilStorm V8i (SELECTseries 5)[08.11.05.113]Bentley Systems, Inc. Haestad Methods Solution Center20170327_301-175 PROPOSED TWIN 48in RCP GATE.stsw

FlexTable: Conduit ReportCurrent Time: 12.775 hours
Flow (Maximum)(cfs)
Span(ft)
Rise(ft)
Diameter(in)
Length (User Defined)
(ft)
Manning's nMaterialConduit Description
Label
72.663.81.4101.00.013ConcreteRectangular-Round - 3.8 x 2 ft
MNRR PR 2-48 Gate
116.9342.050.00.013ConcreteCircle - 42.0 inPEPES 42Velocity (Out)
(ft/s)Velocity (In)
(ft/s)Hydraulic Grade
Line (Out)(ft)
Hydraulic Grade Line (In)
(ft)
Hydraulic Grade (Maximum)
(ft)
Time to Maximum
Hydraulic Grade(hours)
15.5113.0630.9434.9534.9512.7758.256.5626.7527.5227.5412.925
Page 1 of 127 Siemon Company Drive Suite 200 W Watertown, CT 06795 USA +1-203-755-1666
4/1/2017
Bentley CivilStorm V8i (SELECTseries 5)[08.11.05.113]Bentley Systems, Inc. Haestad Methods Solution Center20170327_301-175 PROPOSED TWIN 48in RCP GATE.stsw

Calculation Executive SummaryScenario
NOAA 25-YearLabel
Storm Event
NOAA 25-Year -
Rainfall Runoff
Alternative - 1
Label
years25Return Event
NOAA Bridgeport (25-Year) -
25 Year
Global Storm Event
Calculation Executive Summary
ft³2,297,702.8Total Inflow Volume ft³3,609.9Total System Volume Changeft³2,291,387.0Total System Outflow Volume %0.1Continuity Error
ft³0.0Total System Overflow Volume
ft³0.0Total Pond Infiltration Volume
ft³(N/A)Total Gutter Volume Change 4004Total N-R Iterations
Page 1 of 127 Siemon Company Drive Suite 200 W Watertown, CT 06795 USA +1-203-755-1666
3/25/2017
Bentley CivilStorm V8i (SELECTseries 5)[08.11.05.113]Bentley Systems, Inc. Haestad Methods Solution Center20170327_301-175 PROPOSED TWIN 48in RCP GATE.stsw

Calculation Detailed Summary<General>
Base Calculation
OptionsLabel
hours0.025Output Increment
hours0.013Calculation Time Step hours24.000Duration
Implicit Engine
ft0.040Virtual Flow Depth 0.700NR Weighting Coefficientft0.03Y Iteration Tolerance 0.600Relaxation Weighting
Coefficient1.000LPI Coefficient ft50.00Computation Distance
Inlets
FalseNeglect Side Flow? Grate and Curb
Active Components for Combination Inlets In Sag
FalseNeglect Gutter Cross Slope For Side Flow?
Grate and Curb
Active Components for Combination Inlets on Grade
Catchment Calculation Summary
Time (Maximum Flow)
(hours)
Flow (Maximum)(cfs)
Volume (Total Runoff)
(ft³)
Area (User Defined)(acres)
Total Rainfall Depth(in)
Loss MethodRunoff MethodLabel
12.300235.721,322,669.067.1406.5SCS CNUnit HydrographCM-112.325174.05975,179.059.2206.5SCS CNUnit HydrographCM-2
General Calculation Summary
Hydraulic Grade (Maximum)
(ft)
Velocity (Maximum Calculated)
(ft/s)
Flow (Maximum)(cfs)
Time (Maximum Flow)
(hours)
BranchElement TypeLabel
35.6314.1076.6612.8501ConduitMNRR PR 2-48 Gate
27.817.33132.5412.9751ConduitPEPES 4229.743.2176.6612.9001ChannelCH-2
Page 1 of 227 Siemon Company Drive Suite 200 W Watertown, CT 06795 USA +1-203-755-1666
3/25/2017
Bentley CivilStorm V8i (SELECTseries 5)[08.11.05.113]Bentley Systems, Inc. Haestad Methods Solution Center20170327_301-175 PROPOSED TWIN 48in RCP GATE.stsw

General Calculation Summary
Hydraulic Grade (Maximum)
(ft)
Velocity (Maximum Calculated)
(ft/s)
Flow (Maximum)(cfs)
Time (Maximum Flow)
(hours)
BranchElement TypeLabel
35.63---------1PondPO-127.81---------1PondPO-2
Node Calculation Summary
Flow (Captured Maximum)
(cfs)
Time To Maximum
Captured Flow(hours)
Flow (Surface Maximum)
(cfs)
Time To Maximum Inlet
Flow(hours)
Flow (Total In Maximum)
(cfs)
Time to Maximum Inflow
(hours)
BranchElement TypeLabel
------------(N/A)(N/A)0OutfallO-1------------235.2212.3001PondPO-1------------228.7212.3251PondPO-2
Flow (Overflow Maximum)
(cfs)
Time to Maximum Overflow(hours)
(N/A)(N/A)0.000.0000.000.000
Gutter Calculation Summary
Velocity (Maximum Calculated)
(ft/s)
Time (Maximum Flow)
(hours)
Flow (Maximum)(cfs)
Gutter ShapeLabel
Page 2 of 227 Siemon Company Drive Suite 200 W Watertown, CT 06795 USA +1-203-755-1666
3/25/2017
Bentley CivilStorm V8i (SELECTseries 5)[08.11.05.113]Bentley Systems, Inc. Haestad Methods Solution Center20170327_301-175 PROPOSED TWIN 48in RCP GATE.stsw

FlexTable: Conduit ReportCurrent Time: 12.850 hours
Flow (Maximum)(cfs)
Span(ft)
Rise(ft)
Diameter(in)
Length (User Defined)
(ft)
Manning's nMaterialConduit Description
Label
76.663.81.4101.00.013ConcreteRectangular-Round - 3.8 x 2 ft
MNRR PR 2-48 Gate
132.5442.050.00.013ConcreteCircle - 42.0 inPEPES 42Velocity (Out)
(ft/s)Velocity (In)
(ft/s)Hydraulic Grade
Line (Out)(ft)
Hydraulic Grade Line (In)
(ft)
Hydraulic Grade (Maximum)
(ft)
Time to Maximum
Hydraulic Grade(hours)
15.4613.7831.1435.6335.6312.8508.687.0226.9327.8027.8112.950
Page 1 of 127 Siemon Company Drive Suite 200 W Watertown, CT 06795 USA +1-203-755-1666
4/1/2017
Bentley CivilStorm V8i (SELECTseries 5)[08.11.05.113]Bentley Systems, Inc. Haestad Methods Solution Center20170327_301-175 PROPOSED TWIN 48in RCP GATE.stsw

Calculation Executive SummaryScenario
NOAA 50-YearLabel
Storm Event
NOAA 50-Year -
Rainfall Runoff
Alternative - 1
Label
years50Return Event
NOAA Bridgeport (50-Year) -
50 Year
Global Storm Event
Calculation Executive Summary
ft³2,694,471.0Total Inflow Volume ft³19,281.3Total System Volume Changeft³2,678,231.5Total System Outflow Volume %0.1Continuity Error
ft³0.0Total System Overflow Volume
ft³0.0Total Pond Infiltration Volume
ft³(N/A)Total Gutter Volume Change 4270Total N-R Iterations
Page 1 of 127 Siemon Company Drive Suite 200 W Watertown, CT 06795 USA +1-203-755-1666
3/25/2017
Bentley CivilStorm V8i (SELECTseries 5)[08.11.05.113]Bentley Systems, Inc. Haestad Methods Solution Center20170327_301-175 PROPOSED TWIN 48in RCP GATE.stsw

Calculation Detailed Summary<General>
Base Calculation
OptionsLabel
hours0.025Output Increment
hours0.013Calculation Time Step hours24.000Duration
Implicit Engine
ft0.040Virtual Flow Depth 0.700NR Weighting Coefficientft0.03Y Iteration Tolerance 0.600Relaxation Weighting
Coefficient1.000LPI Coefficient ft50.00Computation Distance
Inlets
FalseNeglect Side Flow? Grate and Curb
Active Components for Combination Inlets In Sag
FalseNeglect Gutter Cross Slope For Side Flow?
Grate and Curb
Active Components for Combination Inlets on Grade
Catchment Calculation Summary
Time (Maximum Flow)
(hours)
Flow (Maximum)(cfs)
Volume (Total Runoff)
(ft³)
Area (User Defined)(acres)
Total Rainfall Depth(in)
Loss MethodRunoff MethodLabel
12.300271.861,537,716.067.1407.4SCS CNUnit HydrographCM-112.325205.341,156,918.059.2207.4SCS CNUnit HydrographCM-2
General Calculation Summary
Hydraulic Grade (Maximum)
(ft)
Velocity (Maximum Calculated)
(ft/s)
Flow (Maximum)(cfs)
Time (Maximum Flow)
(hours)
BranchElement TypeLabel
36.0814.5579.1612.9001ConduitMNRR PR 2-48 Gate
27.997.61142.2913.0001ConduitPEPES 4229.752.5579.1512.9501ChannelCH-2
Page 1 of 227 Siemon Company Drive Suite 200 W Watertown, CT 06795 USA +1-203-755-1666
3/25/2017
Bentley CivilStorm V8i (SELECTseries 5)[08.11.05.113]Bentley Systems, Inc. Haestad Methods Solution Center20170327_301-175 PROPOSED TWIN 48in RCP GATE.stsw

General Calculation Summary
Hydraulic Grade (Maximum)
(ft)
Velocity (Maximum Calculated)
(ft/s)
Flow (Maximum)(cfs)
Time (Maximum Flow)
(hours)
BranchElement TypeLabel
36.08---------1PondPO-127.99---------1PondPO-2
Node Calculation Summary
Flow (Captured Maximum)
(cfs)
Time To Maximum
Captured Flow(hours)
Flow (Surface Maximum)
(cfs)
Time To Maximum Inlet
Flow(hours)
Flow (Total In Maximum)
(cfs)
Time to Maximum Inflow
(hours)
BranchElement TypeLabel
------------(N/A)(N/A)0OutfallO-1------------271.2412.3001PondPO-1------------257.4212.3251PondPO-2
Flow (Overflow Maximum)
(cfs)
Time to Maximum Overflow(hours)
(N/A)(N/A)0.000.0000.000.000
Gutter Calculation Summary
Velocity (Maximum Calculated)
(ft/s)
Time (Maximum Flow)
(hours)
Flow (Maximum)(cfs)
Gutter ShapeLabel
Page 2 of 227 Siemon Company Drive Suite 200 W Watertown, CT 06795 USA +1-203-755-1666
3/25/2017
Bentley CivilStorm V8i (SELECTseries 5)[08.11.05.113]Bentley Systems, Inc. Haestad Methods Solution Center20170327_301-175 PROPOSED TWIN 48in RCP GATE.stsw

FlexTable: Conduit ReportCurrent Time: 12.900 hours
Flow (Maximum)(cfs)
Span(ft)
Rise(ft)
Diameter(in)
Length (User Defined)
(ft)
Manning's nMaterialConduit Description
Label
79.163.81.4101.00.013ConcreteRectangular-Round - 3.8 x 2 ft
MNRR PR 2-48 Gate
142.2942.050.00.013ConcreteCircle - 42.0 inPEPES 42Velocity (Out)
(ft/s)Velocity (In)
(ft/s)Hydraulic Grade
Line (Out)(ft)
Hydraulic Grade Line (In)
(ft)
Hydraulic Grade (Maximum)
(ft)
Time to Maximum
Hydraulic Grade(hours)
15.4114.2331.2636.0836.0812.9008.947.3927.0427.9927.9912.950
Page 1 of 127 Siemon Company Drive Suite 200 W Watertown, CT 06795 USA +1-203-755-1666
4/1/2017
Bentley CivilStorm V8i (SELECTseries 5)[08.11.05.113]Bentley Systems, Inc. Haestad Methods Solution Center20170327_301-175 PROPOSED TWIN 48in RCP GATE.stsw

Calculation Executive SummaryScenario
NOAA 100-YearLabel
Storm Event
NOAA 100-Year -
Rainfall Runoff
Alternative - 1
Label
years100Return Event
NOAA Bridgeport
(100-Year) - 100 Year
Global Storm Event
Calculation Executive Summary
ft³3,093,946.0Total Inflow Volume ft³13,961.4Total System Volume Changeft³3,079,679.5Total System Outflow Volume %0.0Continuity Error
ft³0.0Total System Overflow Volume
ft³0.0Total Pond Infiltration Volume
ft³(N/A)Total Gutter Volume Change 4546Total N-R Iterations
Page 1 of 127 Siemon Company Drive Suite 200 W Watertown, CT 06795 USA +1-203-755-1666
3/25/2017
Bentley CivilStorm V8i (SELECTseries 5)[08.11.05.113]Bentley Systems, Inc. Haestad Methods Solution Center20170327_301-175 PROPOSED TWIN 48in RCP GATE.stsw

Calculation Detailed Summary<General>
Base Calculation
OptionsLabel
hours0.025Output Increment
hours0.013Calculation Time Step hours24.000Duration
Implicit Engine
ft0.040Virtual Flow Depth 0.700NR Weighting Coefficientft0.03Y Iteration Tolerance 0.600Relaxation Weighting
Coefficient1.000LPI Coefficient ft50.00Computation Distance
Inlets
FalseNeglect Side Flow? Grate and Curb
Active Components for Combination Inlets In Sag
FalseNeglect Gutter Cross Slope For Side Flow?
Grate and Curb
Active Components for Combination Inlets on Grade
Catchment Calculation Summary
Time (Maximum Flow)
(hours)
Flow (Maximum)(cfs)
Volume (Total Runoff)
(ft³)
Area (User Defined)(acres)
Total Rainfall Depth(in)
Loss MethodRunoff MethodLabel
12.300307.851,753,476.067.1408.3SCS CNUnit HydrographCM-112.325236.611,340,658.059.2208.3SCS CNUnit HydrographCM-2
General Calculation Summary
Hydraulic Grade (Maximum)
(ft)
Velocity (Maximum Calculated)
(ft/s)
Flow (Maximum)(cfs)
Time (Maximum Flow)
(hours)
BranchElement TypeLabel
36.5014.9781.4412.9501ConduitMNRR PR 2-48 Gate
28.167.89150.8112.9251ConduitPEPES 4229.761.7181.4313.0001ChannelCH-2
Page 1 of 227 Siemon Company Drive Suite 200 W Watertown, CT 06795 USA +1-203-755-1666
3/25/2017
Bentley CivilStorm V8i (SELECTseries 5)[08.11.05.113]Bentley Systems, Inc. Haestad Methods Solution Center20170327_301-175 PROPOSED TWIN 48in RCP GATE.stsw

General Calculation Summary
Hydraulic Grade (Maximum)
(ft)
Velocity (Maximum Calculated)
(ft/s)
Flow (Maximum)(cfs)
Time (Maximum Flow)
(hours)
BranchElement TypeLabel
36.50---------1PondPO-128.16---------1PondPO-2
Node Calculation Summary
Flow (Captured Maximum)
(cfs)
Time To Maximum
Captured Flow(hours)
Flow (Surface Maximum)
(cfs)
Time To Maximum Inlet
Flow(hours)
Flow (Total In Maximum)
(cfs)
Time to Maximum Inflow
(hours)
BranchElement TypeLabel
------------(N/A)(N/A)0OutfallO-1------------307.1012.3001PondPO-1------------285.6612.3251PondPO-2
Flow (Overflow Maximum)
(cfs)
Time to Maximum Overflow(hours)
(N/A)(N/A)0.000.0000.000.000
Gutter Calculation Summary
Velocity (Maximum Calculated)
(ft/s)
Time (Maximum Flow)
(hours)
Flow (Maximum)(cfs)
Gutter ShapeLabel
Page 2 of 227 Siemon Company Drive Suite 200 W Watertown, CT 06795 USA +1-203-755-1666
3/25/2017
Bentley CivilStorm V8i (SELECTseries 5)[08.11.05.113]Bentley Systems, Inc. Haestad Methods Solution Center20170327_301-175 PROPOSED TWIN 48in RCP GATE.stsw

FlexTable: Conduit ReportCurrent Time: 12.950 hours
Flow (Maximum)(cfs)
Span(ft)
Rise(ft)
Diameter(in)
Length (User Defined)
(ft)
Manning's nMaterialConduit Description
Label
81.443.81.4101.00.013ConcreteRectangular-Round - 3.8 x 2 ft
MNRR PR 2-48 Gate
150.8142.050.00.013ConcreteCircle - 42.0 inPEPES 42Velocity (Out)
(ft/s)Velocity (In)
(ft/s)Hydraulic Grade
Line (Out)(ft)
Hydraulic Grade Line (In)
(ft)
Hydraulic Grade (Maximum)
(ft)
Time to Maximum
Hydraulic Grade(hours)
15.3614.6431.3836.5036.5012.9509.167.8427.1428.1628.1612.975
Page 1 of 127 Siemon Company Drive Suite 200 W Watertown, CT 06795 USA +1-203-755-1666
4/1/2017
Bentley CivilStorm V8i (SELECTseries 5)[08.11.05.113]Bentley Systems, Inc. Haestad Methods Solution Center20170327_301-175 PROPOSED TWIN 48in RCP GATE.stsw

Calculation Executive SummaryScenario
NOAA 500-YearLabel
Storm Event
NOAA 500-Year -
Rainfall Runoff
Alternative - 1
Label
years500Return Event
NOAA Bridgeport
(500-Year) - 500 Year
Global Storm Event
Calculation Executive Summary
ft³4,437,751.0Total Inflow Volume ft³937,287.1Total System Volume Changeft³2,026,214.4Total System Outflow Volume %33.1Continuity Error
ft³4,559.0Total System Overflow Volume
ft³0.0Total Pond Infiltration Volume
ft³(N/A)Total Gutter Volume Change 17197Total N-R Iterations
Page 1 of 127 Siemon Company Drive Suite 200 W Watertown, CT 06795 USA +1-203-755-1666
3/25/2017
Bentley CivilStorm V8i (SELECTseries 5)[08.11.05.113]Bentley Systems, Inc. Haestad Methods Solution Center20170327_301-175 PROPOSED TWIN 48in RCP GATE.stsw

Calculation Detailed Summary<General>
Base Calculation
OptionsLabel
hours0.025Output Increment
hours0.013Calculation Time Step hours24.000Duration
Implicit Engine
ft0.040Virtual Flow Depth 0.700NR Weighting Coefficientft0.03Y Iteration Tolerance 0.600Relaxation Weighting
Coefficient1.000LPI Coefficient ft50.00Computation Distance
Inlets
FalseNeglect Side Flow? Grate and Curb
Active Components for Combination Inlets In Sag
FalseNeglect Gutter Cross Slope For Side Flow?
Grate and Curb
Active Components for Combination Inlets on Grade
Catchment Calculation Summary
Time (Maximum Flow)
(hours)
Flow (Maximum)(cfs)
Volume (Total Runoff)
(ft³)
Area (User Defined)(acres)
Total Rainfall Depth(in)
Loss MethodRunoff MethodLabel
12.300426.952,475,782.067.14011.3SCS CNUnit HydrographCM-112.325340.311,962,220.059.22011.3SCS CNUnit HydrographCM-2
General Calculation Summary
Hydraulic Grade (Maximum)
(ft)
Velocity (Maximum Calculated)
(ft/s)
Flow (Maximum)(cfs)
Time (Maximum Flow)
(hours)
BranchElement TypeLabel
38.001.821.842.7751ConduitMNRR PR 2-48 Gate
28.107.80148.1212.7751ConduitPEPES 4228.220.355.9613.6501ChannelCH-2
Page 1 of 227 Siemon Company Drive Suite 200 W Watertown, CT 06795 USA +1-203-755-1666
3/25/2017
Bentley CivilStorm V8i (SELECTseries 5)[08.11.05.113]Bentley Systems, Inc. Haestad Methods Solution Center20170327_301-175 PROPOSED TWIN 48in RCP GATE.stsw

General Calculation Summary
Hydraulic Grade (Maximum)
(ft)
Velocity (Maximum Calculated)
(ft/s)
Flow (Maximum)(cfs)
Time (Maximum Flow)
(hours)
BranchElement TypeLabel
38.00---------1PondPO-128.10---------1PondPO-2
Node Calculation Summary
Flow (Captured Maximum)
(cfs)
Time To Maximum
Captured Flow(hours)
Flow (Surface Maximum)
(cfs)
Time To Maximum Inlet
Flow(hours)
Flow (Total In Maximum)
(cfs)
Time to Maximum Inflow
(hours)
BranchElement TypeLabel
------------(N/A)(N/A)0OutfallO-1------------427.4412.3001PondPO-1------------308.5812.3251PondPO-2
Flow (Overflow Maximum)
(cfs)
Time to Maximum Overflow(hours)
(N/A)(N/A)0.1112.1750.000.000
Gutter Calculation Summary
Velocity (Maximum Calculated)
(ft/s)
Time (Maximum Flow)
(hours)
Flow (Maximum)(cfs)
Gutter ShapeLabel
Page 2 of 227 Siemon Company Drive Suite 200 W Watertown, CT 06795 USA +1-203-755-1666
3/25/2017
Bentley CivilStorm V8i (SELECTseries 5)[08.11.05.113]Bentley Systems, Inc. Haestad Methods Solution Center20170327_301-175 PROPOSED TWIN 48in RCP GATE.stsw

FlexTable: Conduit ReportCurrent Time: 12.175 hours
Flow (Maximum)(cfs)
Span(ft)
Rise(ft)
Diameter(in)
Length (User Defined)
(ft)
Manning's nMaterialConduit Description
Label
1.843.81.4101.00.013ConcreteRectangular-Round - 3.8 x 2 ft
MNRR PR 2-48 Gate
148.1242.050.00.013ConcreteCircle - 42.0 inPEPES 42Velocity (Out)
(ft/s)Velocity (In)
(ft/s)Hydraulic Grade
Line (Out)(ft)
Hydraulic Grade Line (In)
(ft)
Hydraulic Grade (Maximum)
(ft)
Time to Maximum
Hydraulic Grade(hours)
-0.30-0.3038.0638.0038.0012.1757.656.0726.5727.2328.1012.775
Page 1 of 127 Siemon Company Drive Suite 200 W Watertown, CT 06795 USA +1-203-755-1666
4/1/2017
Bentley CivilStorm V8i (SELECTseries 5)[08.11.05.113]Bentley Systems, Inc. Haestad Methods Solution Center20170327_301-175 PROPOSED TWIN 48in RCP GATE.stsw

STATE PROJECT NO. 301-0175 CULVERT REPLACEMENT MNRR NEW HAVEN MAINLINE M.P. 65.60, MILFORD, CONN.
APPENDIX E
TEMPORARY FACILITIES & FLOOD CONTINGENCY

STATE PROJECT NO. 301-0175 CULVERT REPLACEMENT MNRR NEW HAVEN MAINLINE M.P. 65.60, MILFORD, CONN.
TEMPORARY FACILITIES
TEMPORARY FACILITIES
The 48” pipes will be jacked through the existing railroad embankment to minimize impact to the railroad service above. Work will be completed in two (2) stages. Design Plans, provided under separate cover, detail the method of construction to accomplish the work, provide protection of the work during construction and minimize impacts to the natural resources.
STAGE 1
Stage 1 consists of the installation of access roads, jacking of both 48” RCP culvert cells, construction of new headwall and endwall structures, installation of interim structure modifications, and installation of precast concrete block revetment. This stage is anticipated to be completed in 4-6 weeks, with the critical pipe jacking phase to be completed in less than 2 weeks.
Upstream of the railroad corridor, flows will be diverted through the construction site using 24” bypass pipes and cofferdams and will discharge to the existing 2’ stone culvert. Cofferdams will be set at elevation 31.50 to divert flows into the bypass pipe and contain water surface elevations within the surrounding stream channel and wetland areas. Higher flows will be allowed to overtop the cofferdams to minimize any increase in upstream flooding.
The existing 2’ stone culvert will discharge to a 24” bypass pipe and cofferdam system to direct flow through the construction site. At the upstream side, the water diversion barrier top elevation will be set to 31.50. At the outlet of the 24” bypass pipe, a water diversion barrier will be set to a top elevation of 29.4.
STAGE 2
Stage 2 consists relocating cofferdams and rerouting bypass piping through the newly installed 48” culvert pipes to allow for placement of streambed material, abandoning the existing 2’ stone culvert and regrading railroad embankment slopes.
The same 24” diameter HDPE bypass piping and cofferdam heights will be used as Stage 1.
HYDRAULIC MODELING
As temporary facilities will utilize the existing culvert, a modified existing conditions model was created to analyze the temporary conditions. The watershed was divided into 2 subareas, CM-1A, which consists of the western portion of the watershed draining to the 24” bypass pipe through the pipe jacking area, and CM-1B, which consists of the eastern portion of the watershed draining to the existing 2’ stone culvert.
In accordance with the Chapter 6, Appendix F of the Drainage Manual, “Hydrology for Temporary Facilities,” the temporary design frequency for in-stream work (10 weeks) was estimated to be slightly less than a 2-year design frequency. For this location, discharge through the existing 2’ stone culvert is the only feasible option for water handing and use of a 2-year design frequency for temporary conditions would result in unreasonable backwater elevations and the potential for flooding of private property upstream.
Further analysis was performed to determine the water handling needs for the duration of critical work items, such as pipe jacking and installation of the headwall and endwall, and the associated

STATE PROJECT NO. 301-0175 CULVERT REPLACEMENT MNRR NEW HAVEN MAINLINE M.P. 65.60, MILFORD, CONN.
design risk. The estimated duration to complete the critical work items included under Stage 1 is 4 – 6 weeks. These critical items can be further broken down into specific items that will need to be completed in sequence with minimal risk of flooding. These items include:
• Installation of pipe jacking pit – 1 week max.
• Pipe jacking – 2 week max.
• Installation of headwall and endwall – 3 week max.
• Installation of interm structure modifications – 1 week max.
• Installation of concrete block revetment – 1 week max.
Each of the above items can be scheduled by the contractor to accommodate seasonal flows and projected storm events to ensure minimal disruption to operations.
Therefore, the water handling plan has been designed to accommodate flows less than a 2-year design storm. Consideration was given to a flow ten times the Average Spring Flow of 4.0 CFS (0.4 CFS x 10). However, as precipitation rates are not published for storm events <1-year, a storm event with a precipitation depth of 1.50” over a 24-hour period was used as a conservative measure.
Under the resulting temporary storm event, the 24” bypass pipe will accommodate a flow of 10.33 cfs with an upstream water surface elevation of 31.12 and the existing 2’ stone culvert will accommodate a flow of 24.12 cfs at a water surface elevation of 31.03. Temporary cofferdams, such as sand bags, will be set at elevation 31.50 and will allow for overtopping under larger events.
WATER HANDLING
Proper sediment and erosion control measures will be installed and maintained until the project site is completely stabilized. Dewatering activities from the jacking pits will be discharged into a sedimentation basin. The sedimentation basin will be located outside of the channel and wetlands.
Water handling will be administered during construction under the Best Management Practices outlined in CTDOT Form 817.

STATE PROJECT NO. 301-0175 CULVERT REPLACEMENT MNRR NEW HAVEN MAINLINE M.P. 65.60, MILFORD, CONN.
FLOOD CONTINGENCY
GENERAL
During construction of the twin 48” RCP pipe culvert, the hydraulic capacity of the existing structure and bypass piping will not provide for large storm events at times. This flood contingency plan has been developed for general safety.
Construction Flood Contingency Operation Plan
All construction activities will be in accordance with CTDOT Form 817 section 1.10.03 Environmental Compliance “Required Best Management Practices” including but not limited to Item No. 9 which states:
“Whenever possible, work within or adjacent to watercourses shall be conducted during periods of low flow. The Engineer shall remain aware of flow conditions during the conduct of such work, and shall order such work stopped if flow conditions threaten to cause excessive erosion, siltation or turbidity. Before predicted major storms (i.e., a storm predicted by NOAA Weather Service, with warnings of flooding, severe thunderstorms, or similarly severe weather conditions or effects), the Contractor shall make every effort to secure the Site to the satisfaction of the Engineer. Unless allowed by a DEEP permit, the Contractor shall store no materials and place no staging areas below the 100-year elevation. The Contractor shall not store below the 500-year flood level any materials which are buoyant, hazardous, flammable, explosive, soluble, expansive, radioactive, and any other materials that could be injurious to human, animal or plant life in the event of a flood.”
The following Operation Plan shall be implemented:
a. The Office of Rail or Representative Engineer shall monitor weather conditions when a storm is forecasted.
b. The Contractor shall be immediately notified of the possibility of flooding conditions at the project site.
c. The Contractor shall make every effort to secure the work site prior to the onset of flooding.
Post Construction Flood Contingency Operation Plan
The proposed culvert is designed to pass the 100-year storm without overtopping the railroad. In the situation that a storm event greater than the 100-year frequency storm should occur, appropriate measures should be taken to ensure the safety of daily trains, surrounding properties, and downstream roadway crossings. During such a storm event, the channel and the subject crossing should be monitored. In the instance that the River should present a direct hazard to residents, travelers by or the railroad, notification should be made and the line temporarily shut down until water recedes.

Hydrology 6.F-1
December 2003 ConnDOT Drainage Manual
Appendix F – Hydrology for Temporary Facilities
Step 1: Determine Impact Ratings
The following selection factors are rated considering their severity as 1, 2, or 3 for low,medium or high conditions.
Potential Loss of Life - If inhabited structures, permanent or temporary, can be inundated or arein the path of a flood wave caused by an embankment failure, then this item will have a multiple of15 applied. If no possibility of the above exists, then loss of life will be the same as the severityused for the A.D.T.
Property Damages - Private and public structures (houses, commercial, or manufacturing);appurtenances such as sewage treatment and water supply; utility structures either above or belowground, are to have a multiple of 10 applied. Active cropland, parking lots, recreational areas are tohave a multiple of 5 applied. All other areas shall use the severity determined by site conditions.
Traffic Interruption - Includes consideration for emergency supplies and rescue; delays;alternate routes; busses; etc. Short duration flooding of a low volume roadway might be acceptable.If the duration of flooding is long (more than a day), and there is a nearby good quality alternateroute, then the flooding of a higher volume highway might also be acceptable. The severity of thiscomponent is determined by the detour length multiplied by the average daily traffic projected forbi-directional travel.
Detour Length - The length in kilometers (miles) of an emergency detour by other roads shouldthe temporary facility fail.
Height Above Streambed - The difference in elevation in meters (feet) between the traveledroadway and the bed of the waterway.
Drainage Area - The total area contributing runoff to the temporary facility, in km2 (mi2).Average Daily Traffic - The average amount of vehicles traveling bi-directional through the area
in a 24-h period.
RATING SELECTION
Factor Rating 1 2 3
Loss of Life See InstructionsProperty Damage See InstructionsTraffic Interruptions < 2000 2000-4000 > 4000Detour Length, km (mi) < 8 (< 5) 8-16 (5-10) > 16 (> 10)Height Above Streambed, m (ft) < 3 (< 10) 3-6 (10-20) > 6 (> 20)Drainage Area, km2 (mi2) < 2.6 (< 1) 2.6-26.0 (1-10) > 26.0 (> 10)Rural ADT < 400 400-1500 > 1500Suburban ADT < 750 750-1500 > 1500Urban ADT < 1500 1500-3000 > 3000

6.F-2 Hydrology
ConnDOT Drainage Manual December 2003
IMPACT RATING TABLE
Loss of Life Rating (See Instructions)= __________Property Damage Rating (See Instructions) = __________Traffic Interruption Rating = __________Detour Length Rating = __________Height Above Streambed Rating = __________Drainage Area Rating = __________Average Daily Traffic Rating = __________
Total Impact Rating = (sum of the above) = __________
Step 2: Determine risk percentage Step 3: Determine Temporary Design Frequency
Percent Design Risk = _________ Design Frequency = __________ years
Step 4: Determine Temporary Design Discharge
A. If sufficient discharges have been developed either by the designer or a Flood Insurance Study,then the Temporary Design Discharge should be taken either directly or from a frequency curveplot of the data, based on the design frequency determined in Step 3. Enter the TemporaryDesign Discharge below. If Discharge – Frequency information is unavailable, proceed to Step4 B.
Temporary Design Discharge = _________________ m3/s ( cfs)
TOTAL IMPACT RATING
(for temporary facility)
3333213
18
2710x Avg. Spng
10 x 0.4 = 40.11

CULVERT REPLACEMENT - MP 65.60
CONNECTICUT DEPARTMENT OF TRANSPORTATION
AREA MAP - TEMP CCONDITIONS www.yanticriverconsultants.comWeb:
(860) 367-7264Phone:
LEBANON, CONN 06249
191 NORWICH AVENUE
YANTIC RIVER CONSULTANTS, LLC
CONTACT INFORMATION
DATE
11/8/17 MILFORD, CTNEW HAVEN MAINLINE
SHEET
1OF 1
SCALE: 1"= 400'
400 0 400
CM-2
48.14 ACRES
CM-1A
19.00 ACRES
CM-1B
DRAINING TO 24" HDPE BYPASS
2'X2' STONE CULVERT
DRAINING TO EXISTING

Scenario: NOAA Temp1.5
Page 1 of 127 Siemon Company Drive Suite 200 W Watertown, CT 06795 USA +1-203-755-1666
11/15/2017
Bentley CivilStorm V8i (SELECTseries 5)[08.11.05.113]
Bentley Systems, Inc. Haestad Methods Solution Center20171102_301-175 TEMPORARY.stsw

Calculation Executive SummaryScenario
NOAA Temp1.5Label
Storm Event
NOAA Temp1.5 -
Rainfall Runoff
Alternative - 1
Label
years0Return Event
NOAA Bridgeport
(Temporary 1.5in) - 0
Year
Global Storm Event
Calculation Executive Summary
ft³260,262.1Total Inflow Volume ft³5,173.8Total System Volume Changeft³255,317.5Total System Outflow Volume %0.1Continuity Error
ft³0.0Total System Overflow Volume
ft³0.0Total Pond Infiltration Volume
ft³(N/A)Total Gutter Volume Change 2683Total N-R Iterations
Page 1 of 127 Siemon Company Drive Suite 200 W Watertown, CT 06795 USA +1-203-755-1666
11/13/2017
Bentley CivilStorm V8i (SELECTseries 5)[08.11.05.113]Bentley Systems, Inc. Haestad Methods Solution Center20171102_301-175 TEMPORARY.stsw

Calculation Detailed Summary<General>
Base Calculation
OptionsLabel
hours0.025Output Increment
hours0.013Calculation Time Step hours24.000Duration
Implicit Engine
ft0.040Virtual Flow Depth 0.700NR Weighting Coefficientft0.03Y Iteration Tolerance 0.600Relaxation Weighting
Coefficient1.000LPI Coefficient ft50.00Computation Distance
Inlets
FalseNeglect Side Flow? Grate and Curb
Active Components for Combination Inlets In Sag
FalseNeglect Gutter Cross Slope For Side Flow?
Grate and Curb
Active Components for Combination Inlets on Grade
Catchment Calculation Summary
Time (Maximum Flow)
(hours)
Flow (Maximum)(cfs)
Volume (Total Runoff)
(ft³)
Area (User Defined)(acres)
Total Rainfall Depth(in)
Loss MethodRunoff MethodLabel
12.32524.07128,653.048.1401.5SCS CNUnit HydrographCM-1A12.40013.1280,785.059.2201.5SCS CNUnit HydrographCM-212.22510.7750,850.019.0001.5SCS CNUnit HydrographCM-1B
General Calculation Summary
Hydraulic Grade (Maximum)
(ft)
Velocity (Maximum Calculated)
(ft/s)
Flow (Maximum)(cfs)
Time (Maximum Flow)
(hours)
BranchElement TypeLabel
31.036.0524.1212.5501ConduitMNRR 2X225.844.3628.2412.8251ConduitPEPES 4231.123.7710.3312.2251ConduitCO-4
Page 1 of 227 Siemon Company Drive Suite 200 W Watertown, CT 06795 USA +1-203-755-1666
11/13/2017
Bentley CivilStorm V8i (SELECTseries 5)[08.11.05.113]Bentley Systems, Inc. Haestad Methods Solution Center20171102_301-175 TEMPORARY.stsw

General Calculation Summary
Hydraulic Grade (Maximum)
(ft)
Velocity (Maximum Calculated)
(ft/s)
Flow (Maximum)(cfs)
Time (Maximum Flow)
(hours)
BranchElement TypeLabel
28.792.2024.0212.6251ChannelCH-231.03---------1PondPO-125.84---------1PondPO-2
Node Calculation Summary
Flow (Captured Maximum)
(cfs)
Time To Maximum
Captured Flow(hours)
Flow (Surface Maximum)
(cfs)
Time To Maximum Inlet
Flow(hours)
Flow (Total In Maximum)
(cfs)
Time to Maximum Inflow
(hours)
BranchElement TypeLabel
------------(N/A)(N/A)0OutfallO-1------------33.5812.3001PondPO-1------------34.6612.5501PondPO-2
Flow (Overflow Maximum)
(cfs)
Time to Maximum Overflow(hours)
(N/A)(N/A)0.000.0000.000.000
Gutter Calculation Summary
Velocity (Maximum Calculated)
(ft/s)
Time (Maximum Flow)
(hours)
Flow (Maximum)(cfs)
Gutter ShapeLabel
Page 2 of 227 Siemon Company Drive Suite 200 W Watertown, CT 06795 USA +1-203-755-1666
11/13/2017
Bentley CivilStorm V8i (SELECTseries 5)[08.11.05.113]Bentley Systems, Inc. Haestad Methods Solution Center20171102_301-175 TEMPORARY.stsw

FlexTable: Conduit ReportCurrent Time: 12.300 hours
Flow (Maximum)(cfs)
Span(ft)
Rise(ft)
Diameter(in)
Length (User Defined)
(ft)
Manning's nMaterialConduit Description
Label
24.122.02.090.00.019Stone masonryBox - 2.0 x 2.0 ftMNRR 2X228.2442.050.00.013ConcreteCircle - 42.0 inPEPES 42
10.3324.050.00.012Corrugated HDPE (Smooth Interior)
Circle - 24.0 inCO-4
Velocity (Out)(ft/s)
Velocity (In)(ft/s)
Hydraulic Grade Line (Out)
(ft)
Hydraulic Grade Line (In)
(ft)
Hydraulic Grade (Maximum)
(ft)
Time to Maximum
Hydraulic Grade(hours)
6.175.5129.2230.7231.0312.5503.742.9925.1025.3925.8412.9003.183.5130.7331.1231.1212.300
Page 1 of 127 Siemon Company Drive Suite 200 W Watertown, CT 06795 USA +1-203-755-1666
11/13/2017
Bentley CivilStorm V8i (SELECTseries 5)[08.11.05.113]Bentley Systems, Inc. Haestad Methods Solution Center20171102_301-175 TEMPORARY.stsw

FlexTable: Conduit ReportCurrent Time: 12.550 hours
Flow (Maximum)(cfs)
Span(ft)
Rise(ft)
Diameter(in)
Length (User Defined)
(ft)
Manning's nMaterialConduit Description
Label
24.122.02.090.00.019Stone masonryBox - 2.0 x 2.0 ftMNRR 2X228.2442.050.00.013ConcreteCircle - 42.0 inPEPES 42
10.3324.050.00.012Corrugated HDPE (Smooth Interior)
Circle - 24.0 inCO-4
Velocity (Out)(ft/s)
Velocity (In)(ft/s)
Hydraulic Grade Line (Out)
(ft)
Hydraulic Grade Line (In)
(ft)
Hydraulic Grade (Maximum)
(ft)
Time to Maximum
Hydraulic Grade(hours)
6.706.0329.4031.0331.0312.5503.982.9625.3225.7125.8412.9001.912.1231.0431.0831.1212.300
Page 1 of 127 Siemon Company Drive Suite 200 W Watertown, CT 06795 USA +1-203-755-1666
11/13/2017
Bentley CivilStorm V8i (SELECTseries 5)[08.11.05.113]Bentley Systems, Inc. Haestad Methods Solution Center20171102_301-175 TEMPORARY.stsw

STATE PROJECT NO. 301-0175 CULVERT REPLACEMENT MNRR NEW HAVEN MAINLINE M.P. 65.60, MILFORD, CONN.
APPENDIX F
CHANNEL DESIGN

STATE PROJECT NO. 301-0175 CULVERT REPLACEMENT MNRR NEW HAVEN MAINLINE M.P. 65.60, MILFORD, CONN.
CHANNEL DESIGN
STORM EVENT
VELOCITY¹ (FT/S) UPSTREAM OF MNRR
VELOCITY¹ (FT/S) DOWNSTREAM OF MNRR
EXISTING ALT 1: (2) 48” ALT 2: GATE EXISTING ALT 1: (2) 48” ALT 2: GATE 1-year 8.57 6.75 9.54 8.57 5.87 13.92 2-year 9.15 8.18 10.70 9.15 7.16 14.70 5-year 10.05 8.47 12.45 10.05 9.55 15.53 10-year 10.46 9.22 13.06 10.46 11.00 15.51 25-year 10.98 11.24 13.78 10.98 13.29 15.46 50-year 11.32 11.79 14.23 11.32 14.33 15.41 100-year 11.65 12.70 14.64 11.65 15.95 15.36 500-year - ² 15.70 - ² - ² 18.66 - ² ¹ Velocity obtained from MNRR Conduit Report In & Out
² No velocity reported at full capacity
To address increases in velocity resulting from improved roughness coefficients, increased hydraulic capacity, and reduction of backwater conditions at MNRR, revetment is required at the inlet and outlet. Design considerations in selecting the revetment included material sizing, maintenance and channel disturbance/wetland impact.
Articulating concrete blocks (ACB) with an open-cell block are proposed to meet the project needs. The blocks significantly reduce the required thickness of revetment and resulting disturbance as compared to rip rap and open-cell construction will promote growth of natural vegetation in the overbank conditions. The ACB system will be placed on a geotextile and granular fill to match the existing channel grade, extend up the side slopes of the channel and natural floodplain, and terminated at the ends to minimize the potential for erosion or scour to undermine the ends.
The proposed precast concrete block revetment system will consist of Armorflex Class 50 Large ACB’s tied with a revetment cable to create a continuous mat. Calculations, installation guide and Armorflex ACB System Specifications follow. Plans and details are provided under separate cover.

Factor of Safety Hydraulic Analysis
Modified from Julien (2010)Culvert Replacement
Preliminary Block Sizing Calculations
These calculations are an application of the Moment Stability Analysis technique presented in Julien (2010) andas illustrated in the NCMA Manual (2010), listed in the References.The factor of safety method is used in the selection of block sizes for ACB’s for revetments or bed armor.The following assumes that hydraulic testing has been performed for the block system to quantify acritical shear stress; the use of Manning's equation conservatively assumes normal depth and critical velocity.
References1. Julien, Pierre Y. (2010) "Erosion and Sedimentation", 2nd Edition, Cambridge University Press
2. National Concrete Masonry Association (2010), "Design Manual for Articulating Concrete Block (ACB) Revetment Systems", NCMA Publication TR220A.
3. USDOT Federal Highway Administration Hydraulic Engineering Circular No. 15, Third Edition (2005) "Design of Roadside Channels with Flexible Linings", National Highway Institute.
4. FHWA Hydraulic Engineering Circular No. 23: Bridge Scour and Stream Instability Countermeasures: Experience, Selection and Design Guidance - Third Edition, Volume II, Design Guideline 8.
5. ASTM D 7276 & D7277 Testing and Analysis Compliant

Factor of Safety Hydraulic Analysis
Modified from Julien (2010)Culvert Replacement
Preliminary Block Sizing Calculations
Channel Bottom Width, B 8 ftBed Slope, So 0.006 ft/ft
0.006 ft/ftLeft Side Slope, ZL 2 (_H:1V)
Right Side Slope, ZR 2 (_H:1V)Bend Radius, r 0 ft
Depth of Flow d 3.42 ft
Top Surface Width ,T 21.68 ft
Unit Weight of Water, γ 62.4 pcfUnit Wt. of Concrete, Dry-Cast 130 pcf
Sp. Gr. Of Concrete, Sc 2.083 --Gravitational Constant, g 32.2 ft/s2
Calculated Channel Geometry FactorsFlow Area, A 50.78 ft2 Volumetric Flow Rate, Q 307.00 cfs
Wetted Perimeter, P 23.30 ftHydraulic Radius = RH = A/P = 2.18 ft
Bend Coefficient, Kb 1 --Froude Number, Fr 1.52 -- 15.95 ft/sec
Flow Type Supercritical
Largest Side Slope Angle, θ1 26.565 °Bed Slope Angle, θ0 0.344 °
ArmorFlex Block parametersϑ1 0.250 ft Weight 116.0 lbs
Class 50-L ϑ2 1.222 ft Width 1.967 ftSF 1.83 ϑ3 0.400 ft τc 22.1 psf
ϑ4 1.222 ft ∆Z 0.5 inn 0.032 --
Project Data
The Volumetric Flow Rate is determined using Manning's equation:
Q = 1.486 / (n * A * R 2/3 * S 1/2 )
The Depth of Flow is varied iteratively to obtain a given volumetric flow rate.
Friction Slope, S
Other Constants
Velocity, V

Factor of Safety Hydraulic Analysis
Modified from Julien (2010)Culvert Replacement
Preliminary Block Sizing Calculations
Detailed Calculations REFERENCEFlow Area, A = AL + AB + AR
AL = ½ * d2 * ZL = 11.70 ft2
AB = B * d = 27.37 ft2
AR = ½ * d2 * ZR = 11.70 ft2
A = 50.78 ft2
Wetted Perimeter, P = PL + PB + PR
PL = d * (ZL2 +1)0.5 = 7.65 ftPB = B = 8 ft
PR = d * (ZR2 +1)0.5 = 7.65 ft
P = 23.30 ft
Volumetric Flow Rate, QQ = 1.486 / n * A * RH
2/3 * S1/2 = 307.00 cfs (Ref. 3 Eqn. 2.1)
Compute Factor of Safety ParametersSubmerged Weight, Ws Ws = W * ((Sc – 1) / Sc) = 60.3 lb (Ref. 2 Eqn 4.13a)Applied Shear Stress, τo τ o = γ * d * S o = 1.28 psf (Ref. 3 Eqn. 2.4)
Bend Coefficient Calculation X = r/B = (Constrained to between 1.984 and 10) 1.984 --
Calculated Kb = 2.38-0.206(X)+0.0073(X)2 = 2.00 -- (Ref. 3 Eqn. 3.7)Constrained Kb: 1.05 ≤ Kb ≤ 2 → 1.00
(If no bend radius is present, K b = 1)
Step 1: Compute Factor of Safety Parameters(Design Shear Stress) τo = Kb γ y sin (tan-1 So) = 1.28 lbs/ft2 (Ref. 3 Eqn 3.1 & 3.6)(Stability Number for Horizontal Surface) ηo = τ0 / τc = 0.06 -- (Ref. 2 Eqn 4.12a)
aθ = (cos2 θ1 – sin2 θ0)1/2 = 0.89 o (Ref. 2 Eqn 4.10a)
θ = arctan ((sin θ0 * cos θ1) / (sin θ1 * cos θ0) = 0.7 o (Ref. 2 Eqn 4.9a)8.87 o (Ref. 2 Eqn 4.8a)
(Stability Number for Slope Surface)η1 = ((ϑ4 / ϑ3 + sin (θ0 + θ + β)) / (ϑ4 / ϑ3 + 1)) * ηo = 0.05 -- (Ref. 2 Eqn 4.7a)
δ = 90o - β - θ = 80.44 o (Ref. 2 Eqn 4.6a)
Step 2: Consider Effects for Specified Projection (Assumes lift and drag forces are equal)FL
’= FD’= 0.5∆ZbρVdes
2 = 20.22 lbs (Ref. 2 Eqn. 2.2)
Step 3: Compute Factor of SafetySF = (ϑ2/ϑ1 * aθ) / ((1 - aθ
2)1/2 * cos β + η1 * (ϑ2/ϑ1) + (ϑ3 * FD’ * cos δ + ϑ4 * FL
’) / (ϑ1 * Ws)) =1.83 -- (Ref. 2 Eqn 4.5a)
β = arctan ((cos (θ0 + θ) / ((ϑ4 / ϑ3 +1) * (1 - aθ2)1/2 / (ηo *ϑ2/ϑ1) + sin (θ0 + θ)) =

Factor of Safety Hydraulic Analysis
Modified from Julien (2010)Culvert Replacement
Preliminary Block Sizing Calculations
If H = horizontal component of side slope, then θ1 = tan-1 (1/H)If S = bed slope, then θ0 = tan –1 (S)
For τo: tan-1 So = 0.34 sin (tan-1 So) = 0.006
For aθ: cos θ1 = 0.894 cos2 θ1 = 0.800
sin θ0 = 0.006 sin2 θ0= 0.000
For θ: sin θ0 * cos θ1 = 0.005 (sin θ0 * cos θ1) / (sin θ1 * cos θ0) = 0.012
sin θ1 = 0.447cos θ0 = 1.000
sin θ1 * cos θ0 = 0.447
For β: cos (θ0 + θ) = 1.000 (ϑ4 / ϑ3 +1) * (1 - aθ
2)1/2 / (ηo *ϑ2 / ϑ1) = 6.3876ϑ4 / ϑ3 + 1 = 4.055 (ϑ4 / ϑ3 +1) * (1 - aθ
2)1/2 / (ηo *ϑ2 / ϑ1) + sin (θ0 + θ) = 6.406(1 - aθ
2)1/2 = 0.447 cos (θ0 + θ) / ((ϑ4 / ϑ3 +1) * (1 - aθ2)1/2 / (ηo *ϑ2 / ϑ1) + sin (θ0 + θ)) = 0.1561
ηo *ϑ2 / ϑ1 = 0.284sin (θ0 + θ) = 0.018
For η1: ϑ4 / ϑ3 = 3.055 ϑ4 / ϑ3 + sin (θ0 + θ + β) = 3.227
sin (θ0 + θ + β) = 0.172 (ϑ4 / ϑ3 + sin (θ0 + θ + β)) / (ϑ4 / ϑ3 + 1) = 0.7958ϑ4 / ϑ3 + 1 = 4.055
ηo = 0.058
For SF: ϑ2/ϑ1 * aθ = 4.372 (ϑ3 * FD
’ * cos δ + ϑ4 * FL’) / (ϑ1 * Ws) = 1.727
(1 - aθ2)1/2 * cos β = 0.442 (1 - aθ
2)1/2 * cos β + η1 * (ϑ2/ϑ1) + (ϑ3 * FD’ * cos δ + ϑ4 * FL
’) / (ϑ1 * Ws) = 2.3953η1 * (ϑ2/ϑ1) = 0.226
cos δ = 0.166ϑ3 * FD
’ * cos δ + ϑ4 * FL’= 26.054
ϑ1 * Ws = 15.082
Detailed Calculations

ArmorFlex® Installation Guide

2
ArmorFlex® Installation GuideThe purpose of the ArmorFlex Installation Guide is to provide recommendations for the proper installation of Articulating Concrete Block (ACB) revetment systems. While this guide offers a set of instructions for performing those operations that are critical for the proper functioning of ACB revetment systems, fi nal preparation and installation is the responsibility of the end user. Additional information is contained in ASTM D6884 Standard Practice for Installation of Articulating Concrete Block (ACB) Revetment Systems.
The proper installation of ACB revetment systems is important to achieving the intended hydraulic performance and maintaining stability against the erosive forces of fl owing water. An ACB revetment system consists of a suitably prepared and compacted subgrade, a suitable site-specifi c fi lter fabric and properly sized ACB block mattresses placed in “intimate contact” with the fi lter fabric and subgrade. Each individual site will vary so it is important to follow the engineering project drawings as designed and sealed by a registered Professional Engineer; particularly as they relate to standard termination details. All illustrations and photographs used in this guide are examples of typical situations.
It is the Contractor’s responsibility to maintain safe work practices consistent with OSHA (Occupational Safety and Health Administration) regulations and other prevailing safe work practices. This guide is intended to be used in conjunction with all applicable safety regulations and safe work practices and is in no way a replacement thereof.
Site Planning & PreparationFoundation Preparation Areas on which fi lter fabric and ACB units are to be placed shall be constructed to the lines and grades shown on the contract drawings to the tolerances specifi ed in the contract documents and approved by the engineer. All areas to receive the ACB shall be compacted and graded smooth to facilitate the installation of the articulated concrete block system and ensure that intimate contact (between the slope face, the fi lter fabric and the entire bottom surface of the ACB units) is maintained throughout the system.
Unsatisfactory soils (soils having excessive in-place moisture content, soils containing clods, roots, or other organic material that impair the local slope face) must be removed, replaced with approved material and compacted to a minimum 90% of Standard Proctor density (Test Method D698).
Holes, “pockmarks”, slope board teeth marks, footprints or other voids greater than 1 inch in depth normal to the local slope face shall not be permitted. No grooves or depressions greater than 0.5 inches in depth normal to the local slope face with a dimension exceeding 1 foot in any direction shall be permitted. Where such areas are evident, they shall be brought to grade by placing compacted homogeneous material. The slope and slope face shall be uniformly compacted, and the Engineer shall determine the depth of layers, homogeneity of soil, and amount of compaction required. If differing block heights are used — the slope is to be prepared so that the tops of the blocks are fl ush.
Care shall be exercised so as not to excavate below the grades shown on the Engineer's Contract Drawings, unless directed by the Engineer to remove unsatisfactory materials. Excavation of subgrade shall not be more than 2 inches (50 mm) below specifi ed grade. In such areas, placing and compacting approved material, in order to get up to specifi ed grade, in layers not exceeding 6 inches (150 mm) is required. In such areas where subgrade is above specifi ed grade, they shall be brought to grade by removing material or reworking existing material and compacting.
Proper excavation, grading and compaction is critical to the performance of the ACB system.

3
When working in an underwater application, it is the contractor’s responsibility to assess the jobsite conditions and the means of achieving proper subgrade preparation, per the Engineer’s Contract drawings, specifi cations, and tolerances.
Placement of Filter Fabric The subgrade shall be inspected immediately prior to fi lter fabric and ACB placement for proper preparation. The fi lter fabric shall be placed directly on the prepared subgrade, in intimate contact with the subgrade and free of folds, wrinkles or excess tension. The fi lter fabric shall not be walked on or disturbed in a manner resulting in the loss of intimate contact between the fi lter frabric, the ArmorFlex block and subgrade soils.
The fi lter fabric shall be placed so that upstream sections overlap downstream sections and so that upslope sections overlap downslope sections (“shingle effect”). Overlaps shall be in the direction of fl ow wherever possible. The longitudinal and transverse joints shall be overlapped at least 3 feet (91 cm) for below-water installations and at least 2 feet (60 cm) for dry installations. The fi lter fabric shall extend at least 1 foot beyond the top, bottom, and fl anking revetment termination points.
Product Delivery and HandlingDeliveries are typically scheduled to accommodate the overall installation sequence requested though the stacking of mats on an individual load is limited to larger mats towards the bottom and smaller mats toward the top of the trailer.
Deliveries are typically made on 48’ fl at beds with over-the-road tractors, so adequate truck access and turnaround room at the jobsite must be provided by the Contractor. The trucks and drivers are typically contract carriers (not CONTECH trucks).
The drivers are not expected to have any special certifi cations, jobsite training or equipment. In the case special requirements are needed, the terms and conditions will need to be negotiated
and established at the time of the order. Drivers will untie their loads but are not qualifi ed to help with any rigging, unloading or installation.
CONTECH requires at least a full 4 day notice to schedule trucks (Example: notifi cation on Monday for Friday delivery).
For staging mats (offl oading for installation later) allow approximately 30-45 minutes to offl oad each truck. Staging of mats on-site is highly recommended, especially if your company has never installed ArmorFlex in the past.
Timing is everything. Be prepared to unload the mats when the trucks arrive. If applicable, the fi rst load will have the Spreader Bar and fi lter fabric, along with the fi rst sequence of mats. For installation off the truck, allow 45-60 minutes for direct installation off the truck. Additional time between loads should be considered for inexperienced crews.
CONTECH loads typically allow 2 hours for unloading time. Detention may apply after this 2 hour period and will be charged to the contractor. Loads are typically pre-loaded the day before in order to arrive fi rst thing in the morning.
Each load will have a Bill of Lading (BOL) that has the load number with unloading dates and times.
All mats will be marked on the side of each mat with one of the following descriptions:1. Rectangle mats will be marked with the size
(Example: 8’ W x 20’ L).
2. Angle/Pie shape mats will be marked with the mat number per the Mat Layout Spreadsheet.
CONTECH requires notifi cation of any changes or cancellation of scheduled deliveries during normal business hours the day prior to loading in order to avoid any cancellation charges.
Fabric shall have the proper overlap and be free of any holes or tears.
The use of a crane is optimal for fast and safe unloading and installation of the mats.

4
26' Min. Length
2 Part Line
Provided By OthersMust match Mat length
Only one 2 part line to be used at a time.
The 2 part line shall be attached directly above the Hook Tube Assembly placement.
20' Min. Length
16' Min. Length
Hook Tube Assembly
Main Lifting Beam
*16'
*20'
*26'
*See table 1 for the 2640 Series end bar increments.
Spreader Bar OverviewThis instruction content is for informational purposes and should not be considered to be used in lieu of consultation with a professional rigger. Distribute this guide as a procedure for rigging and handling CONTECH supplied Spreader Bars (See Detail A). Notwithstanding the instructions contained in this guide, it is the responsibility of the customer or customer’s agent to handle CONTECH products in a safe and effi cient manner. For additional information, refer to safety standard ASME B30.20, Below-the-Hook Lifting Devices.
InspectionThe operator or other designated personnel should visually inspect the unit before every lift, as well as during operation in the event that damage occurs during a lift. Connector Links, Eye Hooks with Snap Lock and Screw Pin Shackles should engage properly and be free of damage (see Detail B).
The unit shall be free of structural deformation, cracks or excessive wear of any part of the Main Lifting Beam and the Hook Tube Assemblies. The operator should check for loose or missing fasteners, including Connector Links (12), Eye Hooks with Snap Lock (12) and Screw Pin Shackles (2). Welds should also be inspected for signs of obvious cracking.
Spreader Bar Rigging Diagram
1626 Series
DETAIL A
MaintenanceAny observed damage to the Connector Links, Eye Hooks with Snap Lock and Screw Pin Shackles or hazardous conditions found during an inspection shall be corrected before the Spreader Bar is put back into service. Adjustments and repairs shall only be done by a qualifi ed person, and the following process shall be followed by the contractor or their designee:
1. Contact a CONTECH Project Manager before any repair work is performed.
2. The Spreader Bar shall be tagged “OUT OF SERVICE.”
3. Replacement parts shall be equal and/or exceed the original manufacturer’s specifi cations (see "Spreader Bar Parts List").
4. Personnel working on the device must be qualifi ed to make the given repair.
When structural damage of the unit is noted or repairs are needed (except for Connector Link, Eye Hooks with Snap Lock, Screw Pin Shackle), the contractor shall halt use of the Spreader Bar, tag the bar "OUT OF SERVICE” and contact the CONTECH Project Manager for further instruction. No welding whatsoever shall be performed on the Spreader Bar unit.
Bar Increments
Spreader Bar Min. Med. Max.
1626 Series 16' 20' 26'
2640 Series 26' 32' 40'Table 1Table 1

5
Equipment Needs
Prior to delivery, review the heaviest lift and highest pick in order to properly size the equipment used for the offl oad and the installation of the mats.
Total pick weight will include the weight of each mat AND Spreader Bar. Estimated Spreader Bar weight is 2,600 lbs for 26’ bars and 3,500 lbs for 40’ bars.
Total vertical lift height typically ranges between 30’ - 65’ and is determined by the following variables:
Setting Mats with a Crane or Excavator
1. “Walking” mats with an excavator or using more than one piece of equipment to pick is not recommended and can result in unsafe working conditions and/or damage to the ACB mattresses.
2. Proper lifting with the Spreader Bar ensures the 5:1 working load factor of the cable is preserved.
3. Single end picks (picking up the mat from one end) are not allowed.
4. Identify and avoid obstructions that may hinder reach height (Example: Power lines).
Main Lifting Beam
Hook Tube Assembly
Supplied by CONTECH
Supplied by CONTECH
Eye Hook w/ Snap Lock
Connector Link
Supplied by CONTECHScrew Pin Shackle
DETAIL B
Spreader Bar Detail
At Hook Tube Assembly
Is the reach of your crane or excavator
suffi cient to set the mats?
CAUTION: Consult the load chart for the machine to verify its load rating is not exceeded.
Supplied by OTHERSScrew Pin Shackle
EQUIPMENT PICK HEIGHT IMPACT
Flatbed Trailer 5'
Sag of Mat 5'-20'
2-Part Line 15'-35'
Height of Spreader Bar 4'
Total Vertical Lift Range 30'-65'
SPREADER BAR PARTS LIST
Qty. Description
1 Main Lifting Beam
2 Hook Tube Assembly
12 Connector Link, Lok-A-Loy 6-5/8", 16,500 lb Crosby #1014459
12 Eye Hook w/ Snap Lock - 2 ton S-320C Crosby #1022233
2 1" Screw Pin Shcackle 20,000 lb Columbus McKinnon #600-02515
Replacement Latch Kit - Crosby #1096468

6
Installation Instructions Placement of ArmorFlex UnitsCare shall be taken while installing the system in order to avoid damage to the fi lter fabric or the underlying subgrade. The ArmorFlex units shall be placed on the fi lter fabric in such a manner as to produce a smooth plane surface in intimate contact with the fi lter fabric.
The preferred method is to start installation of the ACB system at the downstream end and proceed upstream, taking care to protect the leading edge against erosive forces. These erosive forces could potentially undermine the system if proper installation procedures are not followed.
No individual unit within the plane of the system shall exceed a
0.5 inch protrusion or greater protrusion than is specifi ed in the contract drawings. The units shall be placed side by side so that the blocks abut. Termination trenches typically consist of a 2-block toe-in, including the top of slope, the toe of slope and fl anks unless otherwise directed by the EOR. This design is typical of an ACB system to protect all sides from erosive factors.
Subgrade preparation, placement of fi lter fabric, placement of the ArmorFlex concrete units and the fi nal completed project shall be inspected and approved by the Contractor and EOR.
DO NOT: Exceed the rated load or lift loads not specifi ed in this guide.
DO NOT: Operate a damaged or malfunctioning unit or a unit with missing parts.
DO NOT: Lift people.
DO NOT: Leave suspended loads unattended.
DO NOT: Remove or obscure warning labels.
DO NOT: Operate without having read and understood the operating guide.
DO NOT: Stand under or near suspended load.
DO NOT: Lift loads higher than necessary.
DO NOT: Make alterations or modifi cations to a Spreader Bar.
WARNING NOTES & SAFETY INSTRUCTIONSOnly trained and authorized equipment operators are to be permitted to use CONTECH supplied Spreader Bars. Failure to follow these instructions
can result in serious injury or death and/or damage to the product.
Earth Anchors (if required):
1. Anchors shall be installed per the manufacturer's instructions.
2. Anchor penetrations through the fi lter fabric shall be grouted with approved material to prevent migration of subsoil through the penetration point.
To assist in aligning the unit being placed, use of a pry bar may be necessary.

7
FINISHINGGrouting
4,000 psi non-shrinking grout or 4,000 psi concrete shall be placed where the loop ends of the mats meet, or wherever there is greater than a 2-inch gap between adjacent mats or structures. Grout to the top of the block or slightly lower (not above). Grouting of seams is meant to provide a hydraulic connection, not necessarily a structural connection between mats.
Backfi ll
Backfi ll of the block shall be specifi ed by the Engineer of Record (EOR). Typical backfi ll is either suitable soil for revegatation or .375 to .750 inch (10 to 20 mm) diameter crushed stone. Backfi lling should occur as early as possible to protect the fi lter fabric from UV damage. The exposed edges shall be backfi lled until fl ush, ensuring the integrity of a soil backfi ll is maintained.
Termination trenches shall be backfi lled as shown on the approved contract drawings. This backfi ll material shall be approved by the EOR. It is Armortec’s recommendation that this non-erodible backfi ll be 4,000 psi non-shrinking grout or concrete.
Repair of Damaged Units
In the event that a damaged concrete unit exists prior to the placement or after the mat has been installed, the concrete unit can be repaired in one of the following acceptable manners; unit to be completely removed and then backfi lled with 4,000 psi grout/concrete or, replaced with a new block unit.
Depending on the size of the crack or chip, the perimeter and void areas of the block can be fi lled with grout up to or just below the top grade of the block.
Chipping resulting in a weight loss exceeding 10% of the average weight of a concrete unit shall be repaired. Surface chipping (i.e. weight loss of less than 10%) resulting from customary handling methods generally do not require repair.
Tool and Material Checklist
Two-part line for attachment to the Spreader Bar's Main Lifting Beam. Each leg of the two-part line needs to be equal to or greater than the longest mat to be picked to achieve an angle no less than 60 degrees between the bar and line. (See Detail A).
Supplied by others
Chokers or Straps for ease of Spreader Bar adjustment, recommend: 6 chokers each 2’, 5’, 8’ or 1-2 nylon straps each 2’, 5’, 8’. Supplied by others
Swivel Clevis for picking point of equipment Supplied by others
Three heavy duty rock bar or pry bars (5 feet length is optimal). Supplied by others
Upside down marking paint (for alignment markings on the mats or ground during installation). Supplied by others
100’ measuring tape. Supplied by others
Amortec's Mat Layout Plan Drawings and Mat Layout Spreadsheet with mat numbers and sizes. Have these documents on-site at ALL times for reference. Supplied by CONTECH
Grout to the top of the block or slightly lower — not above.
Backfilling should occur as early as possible to protect the filter fabric from UV damage.

©2011 CONTECH Construction Products Inc.
armorfl ex_install PDF 4/11
Notes: —————————————————————————————————————————————————————
—————————————————————————————————————————————————————————
—————————————————————————————————————————————————————————
—————————————————————————————————————————————————————————
—————————————————————————————————————————————————————————
—————————————————————————————————————————————————————————
—————————————————————————————————————————————————————————
—————————————————————————————————————————————————————————
—————————————————————————————————————————————————————————
—————————————————————————————————————————————————————————
—————————————————————————————————————————————————————————
—————————————————————————————————————————————————————————
—————————————————————————————————————————————————————————
—————————————————————————————————————————————————————————
—————————————————————————————————————————————————————————
—————————————————————————————————————————————————————————
—————————————————————————————————————————————————————————
—————————————————————————————————————————————————————————
SupportIf you need guidance please, call your local sales representative or our corporate headquarters at 1.800.338.1122 and ask for a representative.
• Drawings and specifi cations are available at www.contech-cpi.com.• Site-specifi c design support is available from CONTECH representatives.
CONTECH Construction Products Inc. provides site solutions for the civil engineering industry. CONTECH’s portfolio includes bridges, drainage, sanitary sewer, stormwater and earth stabilization products.
Nothing in this catalog should be construed as an expressed warranty or an implied warranty of merchantability or fi tness for any particular purpose. See the CONTECH standard quotation or acknowledgement for applicable warranties and other terms and conditions of sale.
For information on other CONTECH offerings, visit contech-cpi.com or call 800.338.1122

1
ARTICULATING CONCRETE BLOCK (ACB) SYSTEM SPECIFICATIONS – ARMORFLEX®
GENERAL Scope of Work
The contractor shall furnish all labor, materials, equipment, and incidentals required for, and perform all operations in connection with, the installation of the ArmorFlex® Articulating Concrete Block (ACB) system in accordance with the lines, grades, design and dimensions shown on the Contract Drawings and as specified herein.
Submittal
The Contractor shall submit to the Engineer of Record (EOR) evidence of full-scale hydraulic testing in accordance with ASTM D-7277, and if necessary, Factor of Safety (FoS) calculations in support of the proposed ACB system stamped and signed by a Professional Engineer licensed to practice in the state where the project is located. The Contractor shall also submit to the EOR an appropriate geotextile, selected for the site being protected on the basis of the gradation and permeability of the surface soils, which information shall have been provided by the EOR or the designated geotechnical engineer. The Contractor shall furnish manufacturer's certificates of compliance for ACB/mats, revetment cable, geotextile, and any revetment cable fittings and connectors. The Contractor shall also furnish the manufacturer's specifications, literature, preliminary shop drawings for the layout of the mats, installation and safety instructions, and any recommendations, if applicable, that are specifically related to the project. If a color has been specified for the block, the Contractor shall submit a color chart indicating the specified standard color. Alternative materials from qualified suppliers may be considered; to qualify, proposed alternative suppliers must own and operate their own manufacturing facility, and shall directly employ a minimum of five (5) registered Professional Engineers. Full documentation consistent with the foregoing must be submitted in writing to the EOR a minimum of twenty (20) business days prior to bid date, and must be pre-approved in writing as an addendum to the bid documents and drawings by the EOR at least ten (10) business days prior to bid date. Submittal packages must also include, as a minimum, the following:
1. Evidence of satisfactory full-scale laboratory testing in accordance with ASTM D 7277, Standard
Test Method for Performance Testing of Articulating Concrete Block (ACB) Revetment Systems for Hydraulic Stability in Open Channel Flow, performed on behalf the submitting manufacturer on a qualifying test flume of sufficient length for the test flows to achieve normal depth in all cases, and associated engineered calculations quantifying the FoS of the proposed ACB system under the design conditions of the specific project, stamped and signed by a registered Professional Engineer residing in and licensed to practice in the state where the project is located;
2. A list of 5 comparable projects, in terms of size and applications, in the United States, where the satisfactory performance of the specific alternate ACB system can be verified after a minimum of five (5) years of service life;

2
3. Information about, or certifications of, all materials associated with the ACB system as detailed
above, including (but not limited to) cable, fittings, geotextile, and any other materials required for satisfactory installation in accordance with ASTM D 6884, Standard Practice for Installation of Articulating Concrete Block (ACB) Revetment Systems;
4. The names and contact information (phone numbers and e-mail addresses, at a minimum) for the suppliers’ representatives, for technical, production or logistics questions, at least one of whom must reside in the state where the project is located.
PRODUCT General
All ACB mats shall be prefabricated as an assembly of concrete blocks having specific hydraulic capacities, and laced with revetment cables. The ACB system may also be assembled on-site by hand-placing the individual units either with or without subsequent insertion of cables. Individual units in the system shall be staggered and interlocked for enhanced stability. The mats shall be constructed of open and/or closed cell units as shown on the contract drawings. The open cell units have two (2) vertical openings of rectangular cross section with sufficient wall thickness to resist cracking during shipping and installation. Parallel strands of cable shall extend through two (2) cable ducts in each block allowing for longitudinal binding of the units within a mat. Each row of units shall be laterally offset by one-half of a block width from the adjacent row so that any given block is cabled to four other blocks (two in the row above and two in the row below). Half-blocks, if used, are always closed-cell units and need not be specified separately as such. Each block shall incorporate interlocking surfaces that minimize lateral displacement of the blocks within the mats when they are lifted by the longitudinal revetment cables. The interlocking surfaces must not protrude beyond the perimeter of the blocks to such an extent that they reduce the flexibility or articulation capability of the ACB mats or become damaged or broken when the mats are lifted during shipment or placement. Once the mats are in place, the interlocking surfaces shall minimize the lateral displacement of the blocks even if the cables should become damaged or removed. The mats must be able to flex a minimum of 18° between any given row or column of blocks in the uplift direction and 45° in the downward direction. The cables inserted into the mats shall form lifting loops at one end of the mat with the corresponding cable ends spliced together to form a lifting loop at the other end of the mat. The EOR shall approve appropriate sleeves for use in order to splice the lifting loop. The cables shall be inserted after sufficient time has been allowed for the concrete to complete the curing process. The ACB mats shall be placed on a filter fabric as specified herein. Under no circumstances shall the filter fabric be permanently affixed or otherwise adhered to the blocks or mats; i.e., the filter fabric shall be independent of the block system. Certification (Open-Channel Flow): ACB mats will only be accepted when accompanied by documented hydraulic performance characteristics that are derived from tests under controlled flow conditions. Testing shall conform to ASTM D 7277, Standard Test Method for Performance Testing

3
of Articulating Concrete Block (ACB) Revetment Systems for Hydraulic Stability in Open Channel Flow, as amended and updated. Note that all hydraulic performance testing shall be performed in a 2H:1V flume, and that the tested length be long enough that the test flows achieve normal depth in all cases. Analysis and interpretation of the test data shall conform to the guidance contained in ASTM D 7276, Standard Guide for Analysis and Interpretation of Test Data for Articulating Concrete Block (ACB) Revetment Systems in Open Channel Flow, as amended and updated. Performance (Open-Channel Flow): The design of the ACB mats shall be in accordance with the Factor-of-Safety design methodology as described in "Erosion and Sedimentation" by Pierre Julien, Cambridge University Press, Second Ed. 2010. The minimum designed safety factor shall be 1.5 by utilizing the following equation. SF = ((ϑ2 / ϑ1) αθ) / ((1 - αθ2)0.5 cos β + η (ϑ2 / ϑ1) + (ϑ3 Fd
’ cos δ + ϑ4 Fl’) / ϑ1Ws) ≥ 1.5
where ϑ1, ϑ2, ϑ3, & ϑ4 are geometric properties of the block, αθ, β, & δ are angles characteristic of the site and application, η is the stability number for a sloped surface, Fd & Fl are the drag and lift forces, respectively, and Ws is the submerged weight of the block. ArmorFlex block geometric parameters are available upon request. The analysis shall be performed based upon the stability of the ACBs due to gravity forces alone, neglecting conservative forces added by cabling, mechanical anchorage, contact with adjacent blocks, or other restraints not attributable to gravity based forces. The analysis must account for a 0.5-inch block projection, in accordance with ASTM D 6884, Standard Practice for Installation of Articulating Concrete Block (ACB) Revetment Systems, Section 6.3.3. Site grading requirements may not be used to omit this requirement for standard (non-tapered) block. In order to analyze the performance of the unit, the hydraulic information listed below is required:
ACB HYDRAULIC INFORMATION
Design Volumetric Flow Rate (ft3/sec) 307
Minimum Shear Stress (lb/ft2) 15.95
Channel Friction or Bed Slope (ft/ft) 0.006 Channel Side Slopes (_H:1V) 2:1
Channel Bottom Width (ft) 8 Allowable Unit Protrusion (in) 0.5
Articulating Concrete Blocks
Scope: This specification covers ACB mats used for general erosion control, slope stabilization, channel armoring and channel protection. Installations may be exposed to infrequent and/or light-duty vehicular loading, such as for low-water crossings or boat ramps, by specifying a minimum thickness of 6”. Concrete units covered by this specification are made from lightweight or normal weight aggregates, or both. The values stated in U.S. customary units are to be regarded as the standard.

4
Materials: Cementitious Materials - Materials shall conform to the following applicable ASTM specifications: 1. Portland Cements - Specification C 150, for Portland Cement. 2. Blended Cements - Specification C 595, for Blended Hydraulic Cements. 3. Hydrated Lime Types - Specification C 207, for Hydrated Lime Types. 4. Pozzolans - Specification C 618, for Fly Ash and Raw or Calcined Natural Pozzolans for use in
Portland Cement Concrete. 5. Aggregates – Specification C 33, for Concrete Aggregates, except that grading requirements
shall not necessarily apply. Casting: The ACB units shall be produced using a dry cast method. Dry cast units obtain strength more quickly than wet cast blocks, and will also achieve a greater uniformity of quality and greater durability. Physical Requirements: At the time of delivery to the work site, the ACB units shall conform to the physical requirements prescribed in Table 2 listed below.
PHYSICAL REQUIREMENTS Compressive Strength Net Area
Min. p.s.i (mPa) Water Absorption Max. lb/ft3 (kg/m3)
Avg. of 3 units Individual Unit Avg. of 3 units Individual Unit 4,000 (27.6) 3,500 (24.1) 9.1 (160) 11.7 (192)
Units will be sampled and tested in accordance with ASTM D 6684, Standard Specification for Materials and Manufacture of Articulating Concrete Block (ACB) Revetment Systems. Visual Inspection: All units shall be sound and free of defects which would interfere with the proper placement of the unit, or which would impair the performance of the system. Surface cracks incidental to the usual methods of manufacture, or surface chipping resulting from customary methods of handling in shipment and delivery, shall not be deemed grounds for rejection. Cracks exceeding 0.25 inches (.635 cm) in width and/or 1.0 inch (2.54 cm) in depth shall be deemed grounds for rejection. Chipping resulting in a weight loss exceeding 10% of the average weight of a concrete unit shall be deemed grounds for rejection. Blocks rejected prior to delivery from the point of manufacture shall be replaced at the manufacturer's expense. Blocks rejected at the job site shall be repaired with structural grout or replaced upon request at the expense of the contractor. Sampling and Testing: The purchaser (or their authorized representative) shall be accorded access to the relevant manufacturing facility or facilities, if desired, in order to inspect and/or sample the ACB units from lots ready for delivery prior to release for delivery to the job site. Such inspections are at the sole expense of the requesting entity. Field installation shall be consistent with the way the system was installed in preparation for hydraulic testing pursuant to ASTM D 7277, Standard Test Method for Performance Testing of Articulating Concrete Block (ACB) Revetment Systems for Hydraulic Stability in Open Channel Flow.

5
Any external restraints, anchors, or other ancillary components (such as synthetic drainage mediums) shall be employed as they were during testing; e.g., if the hydraulic testing installation utilized a drainage layer, then the field installation must also utilize a drainage layer. This does not preclude the use of other section components for other purposes, e.g., a geogrid for strengthening the subgrade for vehicular loading, or an intermediate filter layer of sand to protect very fine-grained native soils. Hydraulic testing shall be conducted on the thinnest block in a “family” of similar blocks (i.e., same footprint but different thicknesses), with the tested critical shear value then converted to a critical shear at 0° before extrapolation to thicker blocks within the same family. Such extrapolation may not be made from a thicker block to a thinner block. The extrapolation method is detailed in the National Concrete Masonry Association (NCMA) “Design Manual for Articulated Concrete Block (ACB) Revetment Systems”, section 4.2. Purchaser may request additional testing other than that provided by the manufacturer as needed. Such requested testing will extend any stated lead times for manufacturing and delivery, if the results of such testing are a prerequisite to approval (i.e., approval for release to manufacturing). Costs associated with such testing shall be borne by the purchaser.
Manufacturer: Articulating concrete blocks (ACB’s) shall be ArmorFlex® as manufactured and sold by: ARMORTEC, A Contech Company Phone: 1-800-645-7000 9025 Centre Pointe Dr., Suite 400 Fax: 1-513-645-7993 West Chester, OH 45269 URL: http://www.conteches.com/Products/Erosion-Control/Hard-Armor/ArmorFlex
The selected ARMORFLEX® blocks shall have the following nominal characteristics:
STANDARD SIZES OF ARMORFLEX® BLOCKS
CLASS TYPE MIN.
WEIGHT (lbs)
BLOCK SIZE OPEN AREA % Length
(in) Width
(in) Height*
(in) 50L Open 115 17.4 23.6 6.0 20
*Block height may vary based on local manufacture’s capabilities. Revetment Cable and Fittings
Option 1. Polyester Revetment Cable and Fittings: Revetment cable shall be constructed of high tenacity, low elongating, and continuous filament polyester fibers. Cable shall consist of a core construction comprised of parallel fibers contained within an outer jacket or cover. The size of the revetment cable shall be selected such that the minimum acceptable strength is at least five (5) times that required for lifting of the mats, in accordance with ASTM D-6684 paragraph 5.5.2. Elongation requirements specified below are based upon stabilized new, dry cable. Stabilization refers to a process in which the cable is cycled fifty (50) times between a load corresponding to 200D
2 and a load equal to 10%, 20% or 30% of the cable's approximate average breaking strength.
Relevant elongation values are as shown in the table below. The tolerance on these values is + 5%.

6
ELASTIC ELONGATION at Percentage of Break Strength
10% 20% 30% 0.6 1.4 2.2
The revetment cable shall exhibit resistance to most concentrated acids, alkalis and solvents. Cable shall be impervious to rot, mildew and degradation associated with marine organisms. The materials used in the construction of the cable shall not be affected by continuous immersion in fresh or salt water. Selection of cable and fittings shall be made in a manner that insures a safe design factor for mats being lifted from both ends, thereby forming a catenary. Consideration shall be taken for the bending of the cables around hooks or pins during lifting. Fittings such as sleeves and stops shall be aluminum and washers shall be plastic unless otherwise shown on the Contract Drawings. Option 2. Galvanized Steel Revetment Cable and Fittings: Revetment cable shall be constructed of preformed galvanized aircraft cable (GAC). The cables shall be made from individual wires and strands that have been formed during the manufacture into the shape they have in finished cable. Cable shall consist of a core construction comprised of seven (7) wires wrapped within seven (7) or nineteen (19) wire strands. The size of the revetment cable shall be selected such that the minimum acceptable strength is at least five (5) times that required for lifting of the mats. The revetment cable shall exhibit resistance to mild concentrations of acids, alkalis, and solvents. Fittings such as sleeves and stops shall be aluminum, and the washers shall be galvanized steel or plastic. Furthermore, depending on material availability, the cable type (7x7 or 7x19) can be interchanged while always ensuring the required factor of safety for the cable. Selection of cable and fittings shall be made in a manner that insures a safe design factor for mats being lifted from both ends, thereby forming a catenary. Consideration shall be taken for the bending of the cables around hooks or pins during lifting. Revetment cable splicing fittings shall be selected so that the resultant splice shall provide a minimum of 75% of the minimum rated cable strength.
Anchors The specifying EOR may require, at his/her discretion, permanent anchoring of the mats, e.g., by the use of ancillary earth anchors or attachment to other structures using the lifting cable loops, or through the open cells of an open-cell block. The design of the ArmorFlex system is intended to provide hydraulic stability without the use of such anchors; consequently, any such anchor design shall be by others as approved by the EOR.
Filter Fabric
The geotextile filter shall meet the minimum physical requirements listed in Table No. 3 of these Specifications. Consultation with the manufacturer is recommended; the standard for sizing geotextile for these applications is AASHTO M-288, Permanent Erosion Control. Either woven or non-woven geotextile are acceptable, as long as they meet the other project requirements.
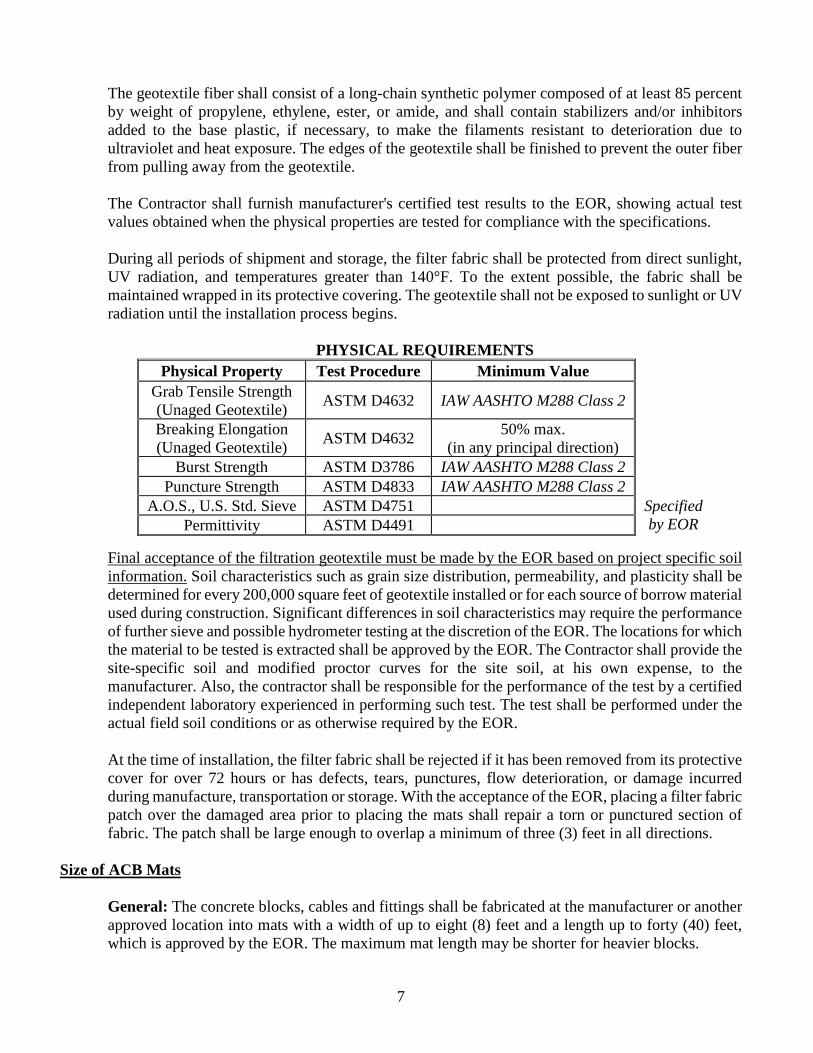
7
The geotextile fiber shall consist of a long-chain synthetic polymer composed of at least 85 percent by weight of propylene, ethylene, ester, or amide, and shall contain stabilizers and/or inhibitors added to the base plastic, if necessary, to make the filaments resistant to deterioration due to ultraviolet and heat exposure. The edges of the geotextile shall be finished to prevent the outer fiber from pulling away from the geotextile. The Contractor shall furnish manufacturer's certified test results to the EOR, showing actual test values obtained when the physical properties are tested for compliance with the specifications. During all periods of shipment and storage, the filter fabric shall be protected from direct sunlight, UV radiation, and temperatures greater than 140°F. To the extent possible, the fabric shall be maintained wrapped in its protective covering. The geotextile shall not be exposed to sunlight or UV radiation until the installation process begins.
PHYSICAL REQUIREMENTS Physical Property Test Procedure Minimum Value
Grab Tensile Strength (Unaged Geotextile) ASTM D4632 IAW AASHTO M288 Class 2
Breaking Elongation (Unaged Geotextile) ASTM D4632 50% max.
(in any principal direction)
Burst Strength ASTM D3786 IAW AASHTO M288 Class 2 Puncture Strength ASTM D4833 IAW AASHTO M288 Class 2
A.O.S., U.S. Std. Sieve ASTM D4751 Specified by EOR Permittivity ASTM D4491
Final acceptance of the filtration geotextile must be made by the EOR based on project specific soil information. Soil characteristics such as grain size distribution, permeability, and plasticity shall be determined for every 200,000 square feet of geotextile installed or for each source of borrow material used during construction. Significant differences in soil characteristics may require the performance of further sieve and possible hydrometer testing at the discretion of the EOR. The locations for which the material to be tested is extracted shall be approved by the EOR. The Contractor shall provide the site-specific soil and modified proctor curves for the site soil, at his own expense, to the manufacturer. Also, the contractor shall be responsible for the performance of the test by a certified independent laboratory experienced in performing such test. The test shall be performed under the actual field soil conditions or as otherwise required by the EOR. At the time of installation, the filter fabric shall be rejected if it has been removed from its protective cover for over 72 hours or has defects, tears, punctures, flow deterioration, or damage incurred during manufacture, transportation or storage. With the acceptance of the EOR, placing a filter fabric patch over the damaged area prior to placing the mats shall repair a torn or punctured section of fabric. The patch shall be large enough to overlap a minimum of three (3) feet in all directions.
Size of ACB Mats General: The concrete blocks, cables and fittings shall be fabricated at the manufacturer or another approved location into mats with a width of up to eight (8) feet and a length up to forty (40) feet, which is approved by the EOR. The maximum mat length may be shorter for heavier blocks.

8
Mat Length: The ACB mats shall have the ability for fabrication in various lengths, widths, and in combinations of length and/or widths. Special mats are a combination of two opposing dimensions either in the longitudinal or transverse direction of the mats. The special mats are available in various dimensions that allow for a custom fit to a site-specific project. Obstructions, such as manholes, pipe outfalls, or other fixed structures, will be accommodated to the extent that accurate information is provided about them prior to the preparation of mat layout drawings.
FOUNDATION PREPARATION, GEOTEXTILE AND MAT PLACEMENT Subgrade Preparation
General: All subgrade preparation shall be performed in accordance with ASTM D 6884, Standard Practice for Installation of Articulating Concrete Block (ACB) Revetment Systems, as updated and amended. Grading: The slope shall be graded to a smooth plane surface to ensure that intimate contact is achieved between the slope face and the geotextile (filter fabric), and between the geotextile and the entire bottom surface of the individual ACBs. All slope deformities, roots, grade stakes, and stones which project normal to the local slope face must be re-graded or removed. No holes, "pockmarks", slope board teeth marks, footprints, or other voids greater than 0.5 inch in depth normal to the local slope face shall be permitted. No grooves or depressions greater than 0.5 inches in depth normal to the local slope face with a dimension exceeding 1.0 foot in any direction shall be permitted. Where such areas are evident, they shall be brought to grade by placing compacted homogeneous material. The slope and slope face shall be uniformly compacted, and the depth of layers, homogeneity of soil, and amount of compaction shall be as required by the EOR. Excavation and preparation for all termination trenches or aprons shall be done in accordance to the lines, grades and dimensions shown in the Contract Drawings. The termination trench hinge-point at the top of the slope shall be uniformly graded so that no dips or bumps greater than 0.5 inches over or under the local grade occur. The width of the termination trench hinge-point shall also be graded uniformly to assure intimate contact between all ACBs and the underlying grade at the hinge-point. Inspection: Immediately prior to placing the filter fabric and ACB mats, the prepared subgrade shall be inspected by the EOR as well as the owner's representative. No fabric or blocks shall be placed thereon until that area has been approved by each of these parties.
Placement of Geotextile Filter Fabric General: All placement and preparation should be performed in accordance with ASTM D 6884, Standard Practice for Installation of Articulating Concrete Block (ACB) Revetment Systems, as updated and amended. Filter Fabric, or filtration geotextile, as specified elsewhere, will be placed within the limits of ACBs shown on the Contract Drawings. Placement: The filtration geotextile will be placed directly on the prepared area, in intimate contact with the subgrade, and free of folds or wrinkles. The geotextile will not be walked on or disturbed when the result is a loss of intimate contact between the ACB and the geotextile or between the geotextile and the subgrade. The geotextile filter fabric will be placed so that the upstream strip of fabric overlaps the downstream strip. The longitudinal and transverse joints will be overlapped at

9
least one and a half (1.5) feet for dry installations and at least three (3) feet for below-water installations. The geotextile will extend at least one (1) foot beyond the top and bottom revetment termination points, or as required by the EOR. If ACBs are assembled and placed as large mattresses, the top lap edge of the geotextile should not occur in the same location as a space between ACB mats unless the space is concrete filled.
Placement of ACBs/Mats General: ACB placement and preparation should be performed in accordance with ASTM D 6884, Standard Practice for Installation of Articulating Concrete Block (ACB) Revetment Systems, as amended and updated. ACB block/mats, as specified in Part 2:A of these Specifications, will be constructed within the specified lines and grades shown on the Contract Drawings. Placement: The subgrade shall be prepared in such a manner as to produce a smooth plane surface prior to placement of the ACBs or mats. No individual block within the plane of placed ACBs will protrude more than one-half inch or as otherwise specified by the EOR. ACBs should be flush and develop intimate contact with the subgrade section, as approved by the EOR. Proposed hand placing is only to be used in limited areas, specifically identified by the EOR or manufacturers’ mat layout drawings, as approved by the EOR. If assembled and placed as large mattresses, the ACB mats will be attached to a spreader bar or other approved device to aid in the lifting and placing of the mats in their proper position by the use of a crane or other approved equipment. The equipment used should have adequate capacity to place the mats without bumping, dragging, tearing or otherwise damaging the underlying fabric. The mats will be placed side-by-side, so that the mats abut each other, and/or end-to-end. Mat seams or openings between mats greater than two (2) inches will be backfilled with 4000 p.s.i. non-shrink grout, concrete or other material approved by the EOR. Whether placed by hand or in large mattresses, distinct changes in grade that results in a discontinuous revetment surface in the direction of flow will require backfill at the grade change location so as to produce a continuous surface. Termination trenches will be backfilled and compacted flush with the top of the blocks. The integrity of the trench backfill must be maintained so as to ensure a surface that is flush with the top surface of the ACBs for its entire service life. Termination trenches will be backfilled as shown on the Contract Drawings. Backfilling and compaction of trenches will be completed in a timely fashion. No more than 500 linear feet of placed ACBs with non-completed termination trenches will be permitted at any time. Finishing: The cells or openings in the ACBs will be backfilled and compacted with suitable material, as specified by the EOR. Backfilling and compaction will be completed in a timely manner so that no more than 500 feet of exposed mats exist at any time. Finishing requirements are explicitly at the discretion of the EOR. Consultation: The manufacturer of the ACBs/mats shall provide design and construction advice during the design and initial installation phases of the project when required or as necessary, at the discretion of the EOR. The ACB supplier shall provide, at a minimum, one full day or two half-days of on-site project support upon request.


