Embed Size (px)
Citation preview

Role of Glomerular Proteoglycans in IgA NephropathyKerstin Ebefors1*, Anna Granqvist1, Madeleine Ingelsten2, Johan Molne3, Borje Haraldsson1, Jenny
Nystrom4
1 Department of Molecular and Clinical Medicine – Nephrology, Institute of Medicine, The Sahlgrenska Academy, University of Gothenburg, Gothenburg, Sweden,
2 Institute of Biomedicine, Department of Infectious Medicine, The Sahlgrenska Academy, University of Gothenburg, Gothenburg, Sweden, 3 Department of Pathology,
Institute of Biomedicine, The Sahlgrenska Academy, University of Gothenburg, Gothenburg, Sweden, 4 Department of Physiology, Institute of Neuroscience and
Physiology, The Sahlgrenska Academy, University of Gothenburg, Gothenburg, Sweden
Abstract
Mesangial matrix expansion is a prominent feature of the most common form of glomerulonephritis, IgA nephropathy(IgAN). To find molecular markers and improve the understanding of the disease, the gene and protein expression ofproteoglycans were investigated in biopsies from IgAN patients and correlated to clinical and morphological data. Wecollected and microdissected renal biopsies from IgAN patients (n = 19) and from healthy kidney donors (n = 14). Patientswere followed for an average time of 4 years and blood pressure was according to target guidelines. Distinct patterns ofgene expression were seen in glomerular and tubulo-interstitial cells. Three of the proteoglycans investigated were found tobe of special interest and upregulated in glomeruli: perlecan, decorin and biglycan. Perlecan gene expression negativelycorrelated to albumin excretion and progress of the disease. Abundant decorin protein expression was found in scleroticglomeruli, but not in unaffected glomeruli from IgAN patients or in controls. Transforming growth factor beta (TGF-b),known to interact with perlecan, decorin and biglycan, were upregulated both on gene and protein level in the glomeruli.This study provides further insight into the molecular mechanisms involved in mesangial matrix expansion in IgAN. Weconclude that perlecan is a possible prognostic marker for patients with IgAN. In addition, the up-regulation of biglycan anddecorin, as well as TGF-b itself, indicate that regulation of TGF-b, and other profibrotic markers plays a role in IgANpathology.
Citation: Ebefors K, Granqvist A, Ingelsten M, Molne J, Haraldsson B, et al. (2011) Role of Glomerular Proteoglycans in IgA Nephropathy. PLoS ONE 6(4): e18575.doi:10.1371/journal.pone.0018575
Editor: Stuart E. Dryer, University of Houston, United States of America
Received January 5, 2011; Accepted March 4, 2011; Published April 6, 2011
Copyright: � 2011 Ebefors et al. This is an open-access article distributed under the terms of the Creative Commons Attribution License, which permitsunrestricted use, distribution, and reproduction in any medium, provided the original author and source are credited.
Funding: This study was supported by the Swedish Medical Research Council 9898 and 14764, VINNOVA, the National Association for Kidney Diseases, the IngaBritt and Arne Lundberg Research Foundation, Wennerstrom Foundation and the Sahlgrenska University Hospital Grant LUA-7545. The funders had no role instudy design, data collection and analysis, decisions to publish, or preparation of the manuscript.
Competing Interests: The authors have declared that no competing interests exist.
* E-mail: [email protected]
Introduction
IgA nephropathy (IgAN) is a poorly understood disease with a
largely unknown molecular background. It is the most common
type of glomerular nephritis and, although it is considered benign,
the majority of patients will eventually develop chronic kidney
disease stage V. Hence, it is of vital importance to understand the
pathogenesis in order to predict the risk of progression and
improve treatment strategies. Morphologically, IgAN is charac-
terized by the presence of immunoglobulin A (IgA) deposits in the
mesangial region, proliferation of mesangial cells and expanded
mesangial matrix [1]. The mesangial matrix is synthesized by
mesangial cells and consists of a mix of glycoproteins and various
negatively charged proteoglycans (PGs) [2]. Proteoglycans are
complex molecules with properties determined by their glycos-
aminoglycan chains as well as their core protein. Their functions
range from structural roles in the extracellular matrix to
involvement in cell signaling, both by acting as binding sites,
controlling growth factor gradients, and as signaling molecules
[3,4]. We have previously investigated the role and function of
proteoglycans in various diseases and disease models and found
them to be of importance both for the development of nephrotic
syndrome and normal function of the glomerular filtration barrier
[5,6,7,8,9]. Proteoglycans also contribute significantly to the
charge-selective properties of the barrier [10,11], although
debated [12]. PGs occur not only in the mesangial matrix but
also in the glomerular endothelial glycocalyx [7,8,13], the
basement membrane [14], and the podocytes [9]. In IgAN, PGs
are thought to be of pathophysiological relevance, both as
biomarkers and actually affecting clinical outcome of the disease
[15,16,17,18]. In the present study, we investigated the gene
expression of PGs and PG modulators, separately in the
glomerular and tubular parts of kidney biopsies. The expression
of transforming growth factor beta (TGF-b), nephrin and VEGF
was investigated as well. TGF-b and VEGF have both been
implicated to play a role in IgAN and they are also known to
interact with PGs [19,20,21]. Nephrin is a protein crucial for
podocyte function and damage and therefore of interest in IgAN
[22]. We then linked the gene expression results to clinical and
morphological data in order to learn more about the underlying
molecular mechanisms of IgAN.
Results
Characteristics of patientsClinical data at the time of biopsy are presented in table 1. All
patients’ progress and mean arterial blood pressure were followed
for an average time period of 4 years. All patients with IgAN had a
PLoS ONE | www.plosone.org 1 April 2011 | Volume 6 | Issue 4 | e18575

well-maintained blood pressure during the follow-up period, and
there was no correlation between the progress of the disease and
the mean arterial blood pressure.
Gene expression in the glomerular and tubulo-interstitialcompartments
The expression levels of several of the PGs and PG related
genes investigated were altered (figure 1) in patients with IgAN
compared to healthy controls. More of the investigated genes
were affected, and to a higher degree, in the glomerular than the
tubulo-interstitial compartment of the biopsy.
Glomerular gene expression in IgAN. Perlecan expression
in glomeruli was increased by 87.0% (+33.8, 228.6, p,0.01,
n = 18). Glomerular expression of the two small leucine rich PGs,
biglycan and decorin, was increased by 136.6% (+21.9, 220.0,
p,0.001, n = 18), and 45.1% (+23.9, 220.5, p,0.05, n = 18),
respectively. The enzyme N-deacetylase/N-sulfotransferase 1
(NDST1), crucial for heparan sulfate production, increased by
Table 1. Clinical characteristics of patients with IgAN at time of biopsy.
patient ID Sex Age GFRSerumcreatinine (mmol/L)
Serumalbumin (g/L)
Albumin excretion(mg/24H)
MAP(mm Hg)
BPmedication
RAASinhibitors
1 M 33 61 149 41 - 118 Yes Yes
2 M 37 97 105 41 18 95 No No
3 F 41 91 89 29 178 107 No No
4 M 31 99 84 47 654 107 No No
5 F 36 111* 54 37 334 95 No No
6 F 30 80 73 37 1100{ 86 Yes Yes
7 M 47 63 117 40 1081 93 Yes Yes
8 F 40 76 114 37 1100 88 Yes Yes
9 M 24 100* 82 30 335 82 No No
10 M 60 23 222 31 1100{ 93 No Yes
11 F 43 85* 66 34 799 77 No No
12 M 57 51 104 39 690 110 Yes Yes
13 M 66 24 160 39 83 105 Yes Yes
14 M 55 61* 109 46 34 107 Yes Yes
15 M 40 60* 117 39 392 102 Yes No
16 M 49 97 124 34 1029 95 No No
17 M 35 65 109 36 1119 104 No No
18 M 33 45 124 44 71 103 Yes Yes
19 M 69 47 153 33 1991 95 Yes Yes
Abbreviations; GFR, glomerular filtration rate; MAP, mean arterial pressure; BP, blood pressure; RAAS, Renin-angiotensin-aldosterone system.*estimated GFR calculated using MDRD formula (ml/min/1.73 m2), the other GFRs presented in the table are determined using 51Cr-EDTA clearance.{calculated from tU-protein.doi:10.1371/journal.pone.0018575.t001
*
*****
***
**
**
*****
A B
Figure 1. Relative gene expression of proteoglycan core proteins and enzymes in glomeruli (A) and tubulo-interstitialcompartment (B) of biopsies from IgAN patients compared to controls. Controls values are defined as 1, and higher values indicate up-regulation while lower values indicate down-regulation. Error bars represent SEM. *p,0.05, **p,0.01, ***p,0.001.doi:10.1371/journal.pone.0018575.g001
Proteoglycans in IgA Nephropathy
PLoS ONE | www.plosone.org 2 April 2011 | Volume 6 | Issue 4 | e18575

Proteoglycans in IgA Nephropathy
PLoS ONE | www.plosone.org 3 April 2011 | Volume 6 | Issue 4 | e18575
37.6% (+13.4, 212.2, p,0.01, n = 18). In addition, TGF- b was
elevated by 149.6% (+27.2, 224.6 p,0.001, n = 12) compared to
control. Glomerular gene expression of the proteoglycan syndecan-
1 was decreased by 272.1% (+20.6, 211.9 p,0.01 n = 18).
Glomerular nephrin expression did not change significantly.
Tubular gene expression in IgAN. Tubular perlecan
expression was decreased by 238.2% (+9.7, 28.4, p,0.01, n = 15),
while no significant changes were found in NDST1, TGF-b, biglycan,
decorin and syndecan-1. Expression of vascular endothelial growth
factor (VEGF) was significantly reduced, 256% (+6.2, 25.4, p,0.001
n = 18), in the tubulo-interstitial part of the biopsy.
Correlation of glomerular and tubular mRNA expressionThe investigated genes showed completely different expression
patterns in glomerular and tubulo-interstitial cells. This is illustrated
in figure 2.
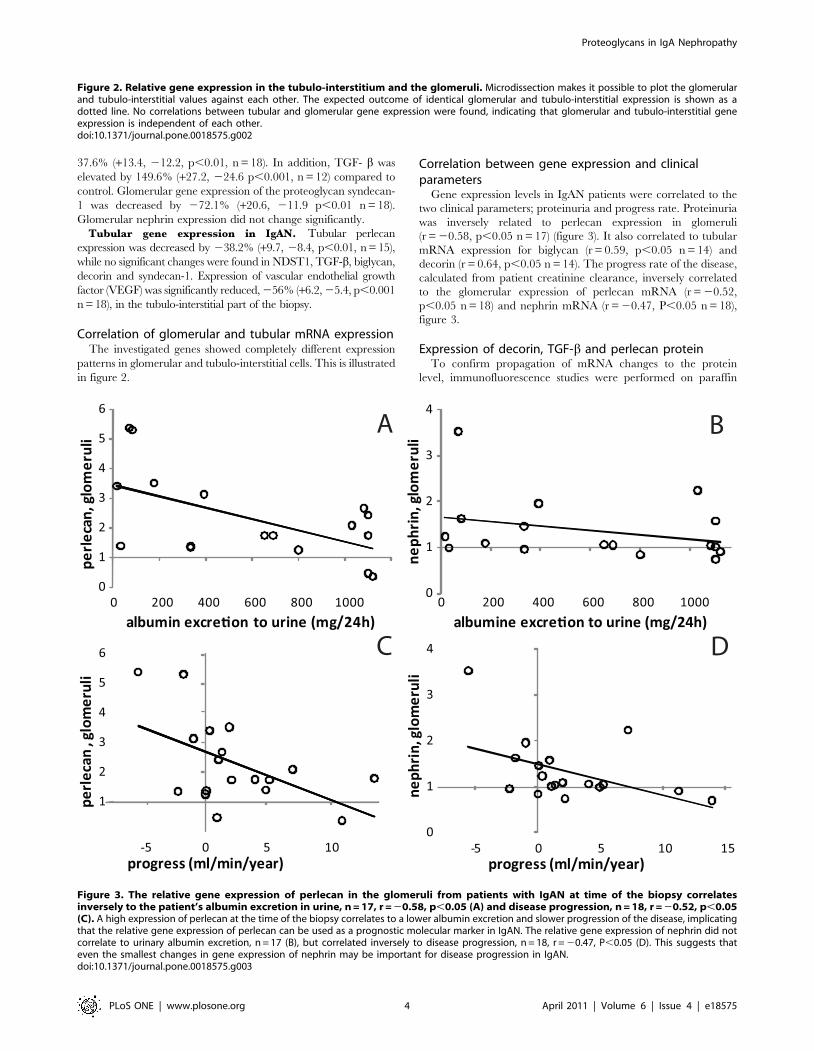
Correlation between gene expression and clinicalparameters
Gene expression levels in IgAN patients were correlated to the
two clinical parameters; proteinuria and progress rate. Proteinuria
was inversely related to perlecan expression in glomeruli
(r = 20.58, p,0.05 n = 17) (figure 3). It also correlated to tubular
mRNA expression for biglycan (r = 0.59, p,0.05 n = 14) and
decorin (r = 0.64, p,0.05 n = 14). The progress rate of the disease,
calculated from patient creatinine clearance, inversely correlated
to the glomerular expression of perlecan mRNA (r = 20.52,
p,0.05 n = 18) and nephrin mRNA (r = 20.47, P,0.05 n = 18),
figure 3.
Expression of decorin, TGF-b and perlecan proteinTo confirm propagation of mRNA changes to the protein
level, immunofluorescence studies were performed on paraffin
Figure 2. Relative gene expression in the tubulo-interstitium and the glomeruli. Microdissection makes it possible to plot the glomerularand tubulo-interstitial values against each other. The expected outcome of identical glomerular and tubulo-interstitial expression is shown as adotted line. No correlations between tubular and glomerular gene expression were found, indicating that glomerular and tubulo-interstitial geneexpression is independent of each other.doi:10.1371/journal.pone.0018575.g002
Figure 3. The relative gene expression of perlecan in the glomeruli from patients with IgAN at time of the biopsy correlatesinversely to the patient’s albumin excretion in urine, n = 17, r = 20.58, p,0.05 (A) and disease progression, n = 18, r = 20.52, p,0.05(C). A high expression of perlecan at the time of the biopsy correlates to a lower albumin excretion and slower progression of the disease, implicatingthat the relative gene expression of perlecan can be used as a prognostic molecular marker in IgAN. The relative gene expression of nephrin did notcorrelate to urinary albumin excretion, n = 17 (B), but correlated inversely to disease progression, n = 18, r = 20.47, P,0.05 (D). This suggests thateven the smallest changes in gene expression of nephrin may be important for disease progression in IgAN.doi:10.1371/journal.pone.0018575.g003
Proteoglycans in IgA Nephropathy
PLoS ONE | www.plosone.org 4 April 2011 | Volume 6 | Issue 4 | e18575

sections from IgAN and control biopsies. There was no
immunofluorescence staining for decorin in histologically normal
glomeruli from either control or IgAN patients, but sclerotic
glomeruli stained for decorin in both groups, see figure 4 for
expression in an IgAN patient. There was also staining for
decorin in the renal interstitium in both IgAN and controls,
but no detectable difference between the groups, data not
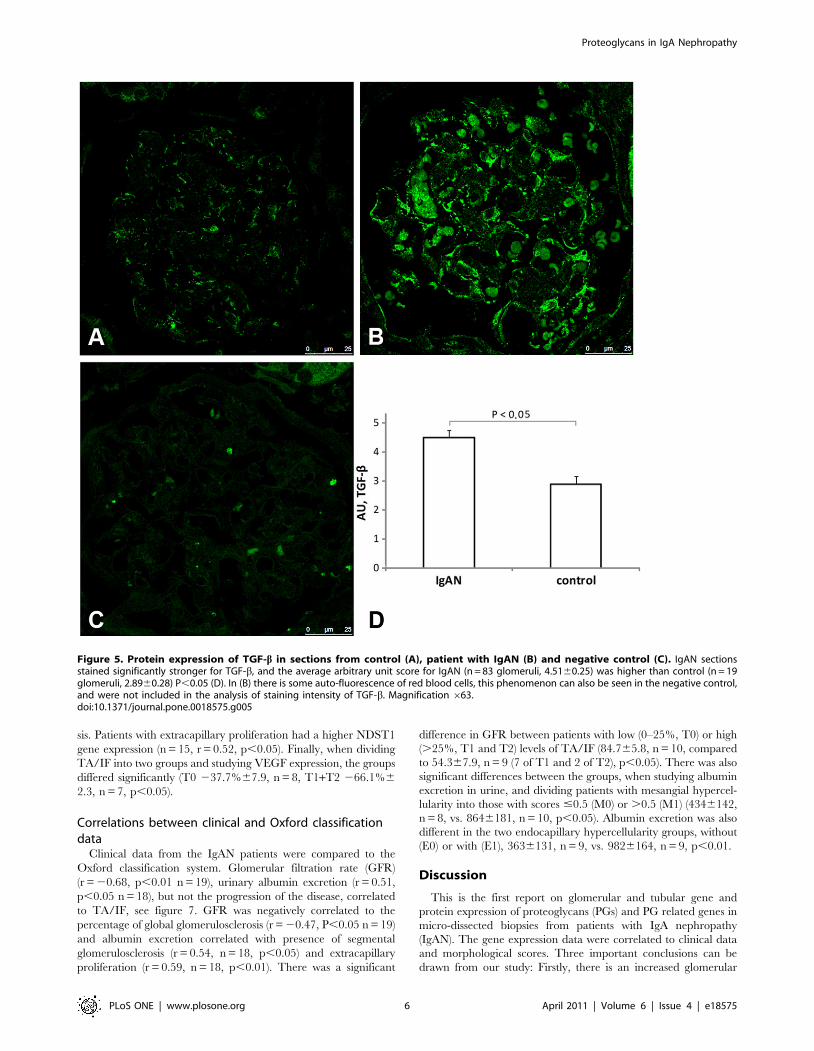
shown. IgAN glomeruli stained more intensely for TGF-bcompared to controls, as seen in figure 5. The average arbi-
trary unit score for IgAN (n = 83, 4.5160.25) was significantly
higher than control (n = 19, 2.8960.28), P,0.05. Immunofluo-
rescence studies of perlecan were performed on frozen biopsy
sections from another set of patients and controls, see figure 6.
The staining was more intense in glomeruli from patients with
IgAN (n = 45, 9.460.7%) than controls (n = 30, 6.360.7%),
P,0.01.
Oxford classificationPatients with IgAN were classified using the Oxford classifica-
tion system according to the international IgA Nephropathy
Network and the Renal Pathology Society [23,24]. By transform-
ing the pathologists primary data into a scoring system, shown in
table 2, patients were grouped according to a mesangial
hypercellularity score of #0.5 (M0) or .0.5 (M1), without (E0)
or with (E1) endocapillary hypercellularity, and without (S0) or
with (S1) segmental glomerulosclerosis and tubular atrophy/
interstitial fibrosis (TA/IF), 0–25% (T0), 26–50% (T1) and .50%
(T2).
Correlation between gene expression and Oxfordclassification data
The percentage of glomeruli with global glomerulosclerosis in
each biopsy specimen correlated to the expression of the
proteoglycan glypican-1 in the glomerular fraction (r = 0.57,
n = 18, p,0.05). When classifying the patients according to
absence or presence of endocapillary hypercellularity, glomerular
glypican-1 expression was significantly different between the
groups (E0: 45.4%617.8 n = 10 vs E1: 29.8%615.8 n = 8,
p,0.05). Similarly, glomerular gene expression of VEGF was
higher in the group with segmental glomerulosclerosis (S1:
74.9%629.4, n = 12), than in the group without (S0:
23.7%615.4, n = 6, p,0.05).
When comparing the gene expression data from the tubulo-
interstitial compartment to the TA/IF score, a correlation was
found for four of the proteoglycans. Thus, TA/IF correlated to the
expression of biglycan (n = 15, r = 0.61, p,0.05), decorin (n = 15,
r = 0.61, p,0.05), perlecan (n = 15, r = 0.52, p,0.05) and
glypican-1 (n = 15, r = 0.57, p,0.05) as well as the enzyme
NDST1 (n = 15, r = 0.65, p,0.01) and TGF-b (n = 15, r = 0.76,
p,0.001). Decorin (n = 15, r = 0.64, p,0.05) and glypican-1
(n = 15, r = 0.79, p,0.001) gene expression in the tubulo-
interstitium also correlated to presence of global glomerulosclero-
Figure 4. PAS staining of sclerotic glomeruli from a representative IgAN patient (A), and the consecutive section stained for decorin(B) shows overlap of the sclerotic area and decorin staining. PAS staining of glomeruli without sclerosis (C) and consecutive section showingno staining for decorin (D) in the same patient. Decorin is abundantly expressed in sclerotic glomeruli both in controls and patients with IgAN, butnot in non-sclerotic glomeruli. Magnification 663.doi:10.1371/journal.pone.0018575.g004
Proteoglycans in IgA Nephropathy
PLoS ONE | www.plosone.org 5 April 2011 | Volume 6 | Issue 4 | e18575
sis. Patients with extracapillary proliferation had a higher NDST1
gene expression (n = 15, r = 0.52, p,0.05). Finally, when dividing
TA/IF into two groups and studying VEGF expression, the groups
differed significantly (T0 237.7%67.9, n = 8, T1+T2 266.1%6
2.3, n = 7, p,0.05).
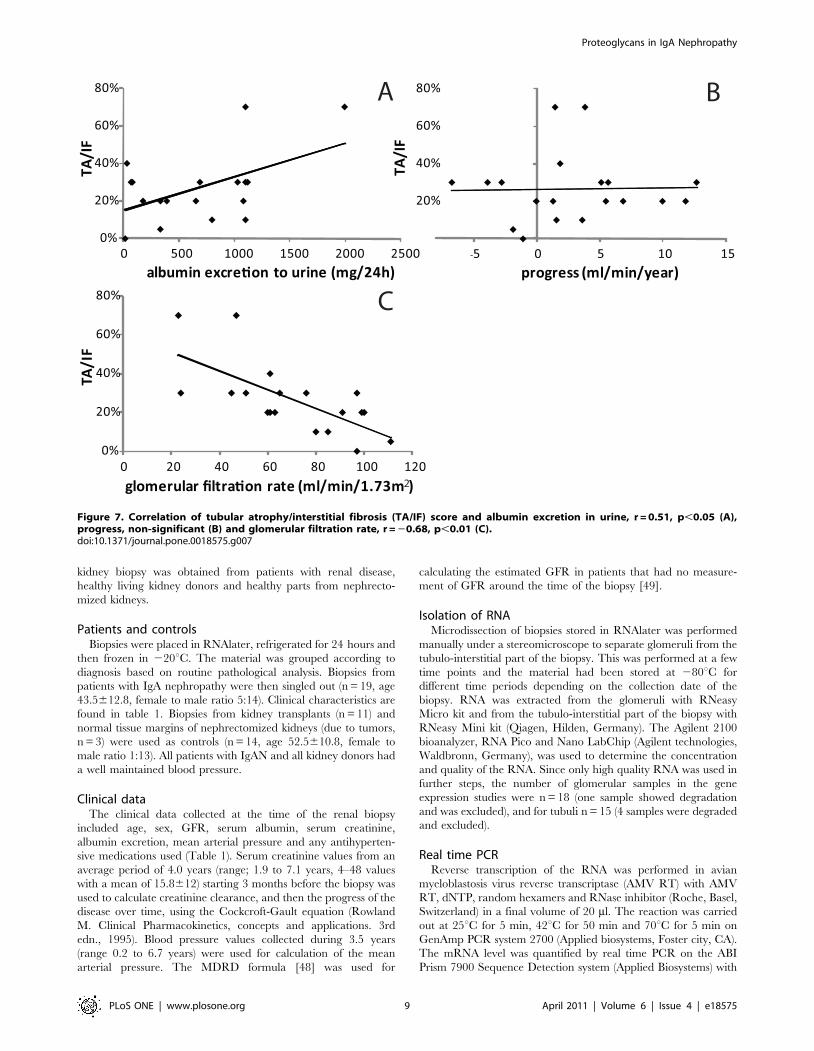
Correlations between clinical and Oxford classificationdata
Clinical data from the IgAN patients were compared to the
Oxford classification system. Glomerular filtration rate (GFR)
(r = 20.68, p,0.01 n = 19), urinary albumin excretion (r = 0.51,
p,0.05 n = 18), but not the progression of the disease, correlated
to TA/IF, see figure 7. GFR was negatively correlated to the
percentage of global glomerulosclerosis (r = 20.47, P,0.05 n = 19)
and albumin excretion correlated with presence of segmental
glomerulosclerosis (r = 0.54, n = 18, p,0.05) and extracapillary
proliferation (r = 0.59, n = 18, p,0.01). There was a significant
difference in GFR between patients with low (0–25%, T0) or high
(.25%, T1 and T2) levels of TA/IF (84.765.8, n = 10, compared
to 54.367.9, n = 9 (7 of T1 and 2 of T2), p,0.05). There was also
significant differences between the groups, when studying albumin
excretion in urine, and dividing patients with mesangial hypercel-
lularity into those with scores #0.5 (M0) or .0.5 (M1) (4346142,
n = 8, vs. 8646181, n = 10, p,0.05). Albumin excretion was also
different in the two endocapillary hypercellularity groups, without
(E0) or with (E1), 3636131, n = 9, vs. 9826164, n = 9, p,0.01.
Discussion
This is the first report on glomerular and tubular gene and
protein expression of proteoglycans (PGs) and PG related genes in
micro-dissected biopsies from patients with IgA nephropathy
(IgAN). The gene expression data were correlated to clinical data
and morphological scores. Three important conclusions can be
drawn from our study: Firstly, there is an increased glomerular
Figure 5. Protein expression of TGF-b in sections from control (A), patient with IgAN (B) and negative control (C). IgAN sectionsstained significantly stronger for TGF-b, and the average arbitrary unit score for IgAN (n = 83 glomeruli, 4.5160.25) was higher than control (n = 19glomeruli, 2.8960.28) P,0.05 (D). In (B) there is some auto-fluorescence of red blood cells, this phenomenon can also be seen in the negative control,and were not included in the analysis of staining intensity of TGF-b. Magnification 663.doi:10.1371/journal.pone.0018575.g005
Proteoglycans in IgA Nephropathy
PLoS ONE | www.plosone.org 6 April 2011 | Volume 6 | Issue 4 | e18575

mRNA expression of several PGs in biopsies from IgAN patients.
Also, expression of NDST1 was increased. NDST1 is an enzyme
essential for adding sulphate (and thereby negative charge) to the
glycosaminoglycan chains of perlecan [25] and other PGs. TGF-b,
a pro-fibrotic growth factor known to affect PGs was up-regulated
as well. Secondly, tubular cells demonstrate a different pattern,
with down-regulation of perlecan as well as VEGF, while all other
investigated genes were unaffected. Thus, our results clearly show
that the composition of glomerular matrix PGs is altered in
patients with IgAN. Thirdly, these results correlate with clinical
data, where increased perlecan expression correlates with a better
outcome for the patient (less albumin excretion in urine, slower
progression of disease and a lower TA/IF score).
Perlecan is a highly negatively charged PG found at all levels of
the filtration barrier [8,9], and is one of the most common PGs in
the basement membrane [26]. In this study, patients with IgAN
had an increased expression of perlecan in the glomerular portion,
and a reduced gene expression in the tubulo-interstitial portion of
the biopsy. The increased expression of perlecan in glomeruli was
confirmed on the protein level. The group of van den Born et al.
found an increased expression of perlecan in the mesangial area in
IgAN compared to control, but not in the basement membrane
[27]. We found that patients with an increased perlecan expression
in glomeruli had a lower urinary albumin excretion and a slower
progress of the disease. These data from our study indicate that
perlecan is a possible prognostic marker for patients with IgAN,
and that patients with high perlecan expression have slower
deterioration of renal function and therefore better prognosis.
This, however, might not be due to the charge-selective properties
of perlecan. Both the perlecan core protein and the GAG chains
are able to interact with diverse extracellular matrix molecules,
such as basement membrane components, growth factors and
receptors [28][29]. The increase in perlecan could be an effort to
regenerate the function and structure of the matrix in the
glomeruli. Earlier studies of the amount of anionic sites in IgAN
have shown a decrease in anionic sites [30,31], or an unaltered
Figure 6. Protein expression of perlecan in sections from control (A), a patient with IgAN (B), and a negative control (C). Proteinexpression of Perlecan in frozen biopsy sections from another set of patients with IgAN stained significantly stronger for perlecan (n = 45, 6.360.7%)than controls (n = 30, 9.460.7%) P,0.01. Magnification 663.doi:10.1371/journal.pone.0018575.g006
Proteoglycans in IgA Nephropathy
PLoS ONE | www.plosone.org 7 April 2011 | Volume 6 | Issue 4 | e18575

staining for the heparan sulfate chains [27]. The negative charge
of all PGs comes from the sugar-based side chains to the core
protein. We have only investigated the core protein and not the
charge and number of side chains. Such changes in the
carbohydrate moiety could of course lead to substantially altered
properties of PGs.
Another important protein for regulating matrix composition is
TGF-b. We found a 2.5 fold increase of glomerular TGF-b gene
expression in patients with IgAN, and this was confirmed on
protein level. Renal TGF-b production is considered to be
increased in IgAN [21] and diabetic nephropathy [32]. In the
gene expression study of Waga et al, where biopsies from 12
patients were analyzed without microdissection, TGF-ß was
unchanged to slightly down-regulated for mild to severe IgAN
[33]. This is in agreement with our findings for the expression in
the tubulo-interstitial compartment, which indeed is known to
represent 90–95% of renal cortex mRNA. Thus, without
microdissection the up-regulation of glomerular TGF-b seen in
the present study would have been undetected. Mesangial cells in
the glomerulus are affected by TGF-b, and podocytes treated with
TGF-b increase their production of biglycan as well as fibronectin
and type IV collagen [34]. In an animal model of acute mesangial
proliferative glomerulonephritis, the injured glomeruli expressed
more TGF-b and synthesized more fibronectin and proteoglycans
than normal glomeruli [35]. The TGF-b induced deposition of
extracellular matrix can lead to scarring and fibrosis. Thus, the
increased TGF-b we found in patients with IgAN may be one
pathological factor that leads to altered matrix production and
composition.
The small leucine rich proteoglycans (SLRPs), decorin and
biglycan, which we found to be upregulated in glomeruli in IgAN
patients, have been suggested to play a major role in modulating
the activity of growth factors. Decorin neutralizes the activity of
TGF-b [36] and both biglycan and decorin can bind TGF-b [37].
Decorin is also thought to protect against the progression of
diabetic kidney disease [38]. In a model of anti-Thy-1-initiated
glomerulonephritis, injections with decorin suppressed the TGF-bactivity [39]. Decorin, and its increased mRNA expression in
IgAN, can therefore be protective for the glomeruli. In normal
adult human kidneys only trace amounts or no protein expression
of decorin has been found in glomeruli [40,41], and this is in
accordance with our findings. However, in glomeruli showing
sclerosis we found abundant staining for decorin, see figure 4, this
was seen both in glomeruli from patients with IgAN and normal
controls. Decorin has been demonstrated at sites of glomerular
fibrosis [41] and at elevated levels in the skin from patients with
nephrogenic systemic fibrosis [42]. The other SLRP, biglycan, can
also bind TGF-b and in addition toll-like receptor 4. The latter
protein is important for the innate immune response and is
increased in leukocytes from patients with IgAN [43]. Biglycan is
one of the key predictive proteins for kidney disease progression
found by Ju et al. [18] The upregulation of decorin and biglycan
seen in this study indicates that SLRPs are also important in IgAN.
When correlating gene expression data with the clinical
parameters, not only perlecan but also nephrin strongly
correlated with disease progression. Nephrin is a podocyte-
specific protein situated in the slit diaphragm between the
podocyte foot processes and is vital for a maintained glomerular
permselectivity [44]. The correlation of the gene expression of
nephrin with the progress of the disease might be due to loss of
podocytes as presented by Xu et al in patients with IgAN [45] or
the podocyte flattening sometime seen in IgAN [46][47],
confirming that even small changes in nephrin gene expression
may be of importance.
In order to improve diagnostic precision, and to enable
forecasting of individual patient outcomes, the Oxford classifica-
tion of IgAN was introduced in 2009. We used this classification
system [23,24] to compare gene expression and clinical data from
our patients. In our patient group, the most powerful parameter in
terms of predicting clinical outcome was the tubular atrophy/
interstitial fibrosis (TA/IF) score. TA/IF correlates well with
tubular expression data for perlecan, biglycan, decorin, glypican-1,
NDST1 and TGF-b. Patients with higher TA/IF scores had
reduced GFR. This reveals that not only glomerular anomalies,
but also morphological alterations in the tubular parts of the
nephron, are important for the development of proteinuria.
Although IgAN is considered a glomerular disease, the damage
occurring in the glomerulus with matrix expansion and sclerosis
ultimately leads to tubular damage.
In conclusion, glomerular gene expression of proteoglycans was
markedly changed in patients with IgAN. These changes
correlated with clinical and morphological data showing that
proteoglycans are important in the development and progress of
IgAN, probably by alterations in the composition and production
of the mesangial matrix. Further studies of molecular markers,
such as perlecan and biglycan, are required to shed more light on
the underlying mechanisms causing IgAN.
Materials and Methods
Ethic statementAfter written informed consent and approval by the local ethical
board of West Sweden (653-05, S 552-02, R110-98), one extra
Table 2. Summary of key pathological features according tothe Oxford classification system.
Patient IDMesangialscore
SegmentalGS
Endocapillaryhypercellularity TA/IF
1 1 0 0 0
2 0 0 0 0
3 0 0 0 0
4 0 1 0 0
5 1 1 0 0
6 1 1 1 0
7 1 1 1 0
8 1 1 0 1
9 1 1 1 0
10 1 0 1 2
11 0 0 0 0
12 0 1 1 1
13 1 1 0 1
14 0 0 0 1
15 1 1 1 0
16 0 1 1 1
17 1 1 1 1
18 0 1 0 1
19 1 1 1 2
Mesangial score #0.5 (M0) or .0.5 (M1).Segmental glomerulosclerosis, absent (S0) or present (S1).Endocapillary hypercellularity, absent (E0) or present (E1).TA/IF #25% (T0), 26–50% (T1), or .50% (T2).doi:10.1371/journal.pone.0018575.t002
Proteoglycans in IgA Nephropathy
PLoS ONE | www.plosone.org 8 April 2011 | Volume 6 | Issue 4 | e18575
kidney biopsy was obtained from patients with renal disease,
healthy living kidney donors and healthy parts from nephrecto-
mized kidneys.
Patients and controlsBiopsies were placed in RNAlater, refrigerated for 24 hours and
then frozen in 220uC. The material was grouped according to
diagnosis based on routine pathological analysis. Biopsies from
patients with IgA nephropathy were then singled out (n = 19, age
43.5612.8, female to male ratio 5:14). Clinical characteristics are
found in table 1. Biopsies from kidney transplants (n = 11) and
normal tissue margins of nephrectomized kidneys (due to tumors,
n = 3) were used as controls (n = 14, age 52.5610.8, female to
male ratio 1:13). All patients with IgAN and all kidney donors had
a well maintained blood pressure.
Clinical dataThe clinical data collected at the time of the renal biopsy
included age, sex, GFR, serum albumin, serum creatinine,
albumin excretion, mean arterial pressure and any antihyperten-
sive medications used (Table 1). Serum creatinine values from an
average period of 4.0 years (range; 1.9 to 7.1 years, 4–48 values
with a mean of 15.8612) starting 3 months before the biopsy was
used to calculate creatinine clearance, and then the progress of the
disease over time, using the Cockcroft-Gault equation (Rowland
M. Clinical Pharmacokinetics, concepts and applications. 3rd
edn., 1995). Blood pressure values collected during 3.5 years
(range 0.2 to 6.7 years) were used for calculation of the mean
arterial pressure. The MDRD formula [48] was used for
calculating the estimated GFR in patients that had no measure-
ment of GFR around the time of the biopsy [49].
Isolation of RNAMicrodissection of biopsies stored in RNAlater was performed
manually under a stereomicroscope to separate glomeruli from the
tubulo-interstitial part of the biopsy. This was performed at a few
time points and the material had been stored at 280uC for
different time periods depending on the collection date of the
biopsy. RNA was extracted from the glomeruli with RNeasy
Micro kit and from the tubulo-interstitial part of the biopsy with
RNeasy Mini kit (Qiagen, Hilden, Germany). The Agilent 2100
bioanalyzer, RNA Pico and Nano LabChip (Agilent technologies,
Waldbronn, Germany), was used to determine the concentration
and quality of the RNA. Since only high quality RNA was used in
further steps, the number of glomerular samples in the gene
expression studies were n = 18 (one sample showed degradation
and was excluded), and for tubuli n = 15 (4 samples were degraded
and excluded).
Real time PCRReverse transcription of the RNA was performed in avian
myeloblastosis virus reverse transcriptase (AMV RT) with AMV
RT, dNTP, random hexamers and RNase inhibitor (Roche, Basel,
Switzerland) in a final volume of 20 ml. The reaction was carried
out at 25uC for 5 min, 42uC for 50 min and 70uC for 5 min on
GenAmp PCR system 2700 (Applied biosystems, Foster city, CA).
The mRNA level was quantified by real time PCR on the ABI
Prism 7900 Sequence Detection system (Applied Biosystems) with
Figure 7. Correlation of tubular atrophy/interstitial fibrosis (TA/IF) score and albumin excretion in urine, r = 0.51, p,0.05 (A),progress, non-significant (B) and glomerular filtration rate, r = 20.68, p,0.01 (C).doi:10.1371/journal.pone.0018575.g007
Proteoglycans in IgA Nephropathy
PLoS ONE | www.plosone.org 9 April 2011 | Volume 6 | Issue 4 | e18575
low density arrays as described previously allowing analyses of
several genes at the same time with as little as 10 ng of cDNA
without amplification [9]. Three different setups of low density
arrays were used, the first one with 23 different genes analyzed in
duplicate in one run. The second array setup runs 16 different
genes in triplicate by the same principle and the third array setup
had 48 genes in singles. GAPDH was selected as endogenous
control as it proved most stable, which is consistent with the
literature [50]. The software allows combination of results run on
different setups of arrays if the same genes are used. The
comparative DDCT method in the software (Applied Biosystems)
was used to calculate the difference in gene expression between
controls and patients with IgAN. The entire control group was
used as calibrator sample.
Tissue processing and Oxford classification of IgAnephropathy
For light microscopy, serial paraffin sections, 3 mm in thickness,
were produced at three levels. All biopsy specimens were stained
with Masson trichrome, eosin, elastin, Jones silver and periodic
acid Schiff (2 slides), a total of 18 sections for each biopsy. Separate
sections were digested in protease, immuno-stained using a panel
of antibodies to IgG, IgA, IgM, lambda, kappa, C1q, C3c, C5b-9
and fibrinogen/fibrin (all from Dako A/S, Copenhagen, Den-
mark) and processed in a computer-controlled immunostainer,
TechMate 500 (Dako) using a detection kit, Dako ChemMate
EnVision. All biopsies diagnosed for IgAN were classified
according to Oxford Classification by a pathologist blinded to
the clinical and molecular data.
ImmunofluorescenceParaffin-embedded or frozen biopsy sections from patients with
IgAN and healthy kidney transplants were blocked with 2% FCS,
2%BSA and goat IgG at a dilution of 1:1000 or 1% of donkey
serum. As primary antibodies we used anti-decorin (R&D
Systems, Minneapolis, MN), anti-TGF-b (Abcam, Cambridge,
MA) and anti-perlecan (Invitrogen, Carlsbad, CA) diluted 1:100.
Secondary antibodies were anti-goat, anti-rabbit and anti-mouse
Alexa Fluor 488 (Invitrogen). Sections were mounted using
ProLong Gold antifade reagent (Invitrogen) and analyzed with a
Leica TCS SP5 confocal microscope (Leica Microsystems
GmbH, Wetzler, Germany).Glomeruli from biopsy sections
stained for TGF-b from patients with IgAN (n = 84) and controls
(n = 19) were classified according to a 10 step scale in a blinded
fashion. Glomeruli from frozen biopsy sections stained for
perlecan from patients with IgAN (n = 45) and controls (n = 30)
were analyzed using the biopix software (Biopix AB, Gothenburg,
Sweden). The total area of the glomeruli was compared to the
perlecan-stained area of the glomeruli. Paraffin-embedded biopsy
sections were stained with PAS and hematoxylin (Merck,
Darmstadt, Germany) to show sclerotic areas and histology of
the glomeruli.
StatisticsWilcoxon’s signed rank sum test was used to test differences
between control and IgAN groups. Pearson’s correlation coeffi-
cient was used for comparing mRNA expression to clinical data
and Oxford classification data. Students t-test was used for
comparing protein expression of TGF-b and perlecan in IgAN
and control. Data are presented as harmonic mean 6 SEM for the
gene expression and mean 6 SEM for TGF-b and perlecan
expression in biopsies. P,0.05 was considered statistically
significant.
Author Contributions
Conceived and designed the experiments: KE AG MI JM BH JN.
Performed the experiments: KE AG MI JM. Analyzed the data: KE AG
MI JM BH JN. Contributed reagents/materials/analysis tools: KE AG MI
JM BH JN. Wrote the paper: KE AG MI JM BH JN.
References
1. Donadio JV, Grande JP (2002) IgA nephropathy. N Engl J Med 347: 738–748.
2. Rupprecht HD, Schocklmann HO, Sterzel RB (1996) Cell-matrix interactions in
the glomerular mesangium. Kidney Int 49: 1575–1582.
3. Babelova A, Moreth K, Tsalastra-Greul W, Zeng-Brouwers J, Eickelberg O,
et al. (2009) Biglycan, a danger signal that activates the NLRP3 inflammasome
via toll-like and P2X receptors. J Biol Chem 284: 24035–24048.
4. Schaefer L, Schaefer RM (2010) Proteoglycans: from structural compounds to
signaling molecules. Cell Tissue Res 339: 237–246.
5. Jeansson M, Bjorck K, Tenstad O, Haraldsson B (2009) Adriamycin Alters
Glomerular Endothelium to Induce Proteinuria. J Am Soc Nephrol 20:
114–122.
6. Jeansson M, Granqvist AB, Nystrom JS, Haraldsson B (2006) Functional and
molecular alterations of the glomerular barrier in long-term diabetes in mice.
Diabetologia 49: 2200–2209.
7. Jeansson M, Haraldsson B (2003) Glomerular size and charge selectivity in the
mouse after exposure to glucosaminoglycan-degrading enzymes. J Am Soc
Nephrol 14: 1756–1765.
8. Bjornson A, Moses J, Ingemansson A, Haraldsson B, Sorensson J (2005) Primary
human glomerular endothelial cells produce proteoglycans, and puromycin
affects their posttranslational modification. Am J Physiol Renal Physiol 288:
F748–756.
9. Bjornson Granqvist A, Ebefors K, Saleem MA, Mathieson PW, Haraldsson B,
et al. (2006) Podocyte proteoglycan synthesis is involved in the development of
nephrotic syndrome. Am J Physiol Renal Physiol 291: F722–730.
10. Haraldsson B, Nystrom J, Deen WM (2008) Properties of the glomerular barrier
and mechanisms of proteinuria. Physiol Rev 88: 451–487.
11. Morita H, Yoshimura A, Inui K, Ideura T, Watanabe H, et al. (2005) Heparan
sulfate of perlecan is involved in glomerular filtration. J Am Soc Nephrol 16:
1703–1710.
12. Goldberg S, Harvey SJ, Cunningham J, Tryggvason K, Miner JH (2009)
Glomerular filtration is normal in the absence of both agrin and perlecan-
heparan sulfate from the glomerular basement membrane. Nephrol Dial
Transplant 24: 2044–2051.
13. Singh A, Satchell SC, Neal CR, McKenzie EA, Tooke JE, et al. (2007)
Glomerular endothelial glycocalyx constitutes a barrier to protein permeability.
J Am Soc Nephrol 18: 2885–2893.
14. Kanwar YS, Farquhar MG (1979) Presence of heparan sulfate in the glomerular
basement membrane. Proc Natl Acad Sci U S A 76: 1303–1307.
15. Celie JW, Reijmers RM, Slot EM, Beelen RH, Spaargaren M, et al. (2008)
Tubulointerstitial heparan sulfate proteoglycan changes in human renal diseases
correlate with leukocyte influx and proteinuria. Am J Physiol Renal Physiol 294:
F253–263.
16. Kuroda M, Sasamura H, Kobayashi E, Shimizu-Hirota R, Nakazato Y, et al.
(2004) Glomerular expression of biglycan and decorin and urinary levels of
decorin in primary glomerular disease. Clin Nephrol 61: 7–16.
17. Yung S, Woods A, Chan TM, Davies M, Williams JD, et al. (2001) Syndecan-4
up-regulation in proliferative renal disease is related to microfilament
organization. FASEB J 15: 1631–1633.
18. Ju W, Eichinger F, Bitzer M, Oh J, McWeeney S, et al. (2009) Renal gene and
protein expression signatures for prediction of kidney disease progression.
Am J Pathol 174: 2073–2085.
19. Amore A, Conti G, Cirina P, Peruzzi L, Alpa M, et al. (2000) Aberrantly
glycosylated IgA molecules downregulate the synthesis and secretion of vascular
endothelial growth factor in human mesangial cells. Am J Kidney Dis 36:
1242–1252.
20. Border WA, Okuda S, Languino LR, Ruoslahti E (1990) Transforming growth
factor-beta regulates production of proteoglycans by mesangial cells. Kidney Int
37: 689–695.
21. Chihara Y, Ono H, Ishimitsu T, Ono Y, Ishikawa K, et al. (2006) Roles of TGF-
beta1 and apoptosis in the progression of glomerulosclerosis in human IgA
nephropathy. Clin Nephrol 65: 385–392.
22. Tryggvason K (1999) Unraveling the mechanisms of glomerular ultrafiltration:
nephrin, a key component of the slit diaphragm. J Am Soc Nephrol 10: 2440–2445.
23. Cattran DC, Coppo R, Cook HT, Feehally J, Roberts IS, et al. (2009) The
Oxford classification of IgA nephropathy: rationale, clinicopathological
correlations, and classification. Kidney Int 76: 534–545.
Proteoglycans in IgA Nephropathy
PLoS ONE | www.plosone.org 10 April 2011 | Volume 6 | Issue 4 | e18575

24. Roberts IS, Cook HT, Troyanov S, Alpers CE, Amore A, et al. (2009) The
Oxford classification of IgA nephropathy: pathology definitions, correlations,
and reproducibility. Kidney Int 76: 546–556.
25. Salmivirta M, Lidholt K, Lindahl U (1996) Heparan sulfate: a piece of
information. FASEB J 10: 1270–1279.
26. Harvey SJ, Miner JH (2008) Revisiting the glomerular charge barrier in the
molecular era. Curr Opin Nephrol Hypertens 17: 393–398.
27. van den Born J, van den Heuvel LP, Bakker MA, Veerkamp JH, Assmann KJ,
et al. (1993) Distribution of GBM heparan sulfate proteoglycan core protein and
side chains in human glomerular diseases. Kidney Int 43: 454–463.
28. Whitelock JM, Melrose J, Iozzo RV (2008) Diverse cell signaling events
modulated by perlecan. Biochemistry 47: 11174–11183.
29. Knox SM, Whitelock JM (2006) Perlecan: how does one molecule do so many
things? Cell Mol Life Sci 63: 2435–2445.
30. Okada K, Kawakami K, Yano I, Funai M, Kagami S, et al. (1989)
Ultrastructural alterations of glomerular anionic sites in IgA nephropathy. Clin
Nephrol 31: 96–102.
31. Tomino Y, Yagame M, Eguchi K, Miyazaki M, Nomoto Y, et al. (1989)
Detection of anionic sites and immunoglobulin A deposits in the glomerular
capillary walls from patients with IgA nephropathy. J Clin Lab Anal 3: 101–107.
32. Sharma K, Ziyadeh FN, Alzahabi B, McGowan TA, Kapoor S, et al. (1997)
Increased renal production of transforming growth factor-beta1 in patients with
type II diabetes. Diabetes 46: 854–859.
33. Waga I, Yamamoto J, Sasai H, Munger WE, Hogan SL, et al. (2003) Altered
mRNA expression in renal biopsy tissue from patients with IgA nephropathy.
Kidney Int 64: 1253–1264.
34. Nakamura T, Miller D, Ruoslahti E, Border WA (1992) Production of
extracellular matrix by glomerular epithelial cells is regulated by transforming
growth factor-beta 1. Kidney Int 41: 1213–1221.
35. Okuda S, Languino LR, Ruoslahti E, Border WA (1990) Elevated expression of
transforming growth factor-beta and proteoglycan production in experimental
glomerulonephritis. Possible role in expansion of the mesangial extracellular
matrix. J Clin Invest 86: 453–462.
36. Ruoslahti E, Yamaguchi Y (1991) Proteoglycans as modulators of growth factor
activities. Cell 64: 867–869.
37. Hildebrand A, Romaris M, Rasmussen LM, Heinegard D, Twardzik DR, et al.
(1994) Interaction of the small interstitial proteoglycans biglycan, decorin and
fibromodulin with transforming growth factor beta. Biochem J 302(Pt 2):
527–534.
38. Williams KJ, Qiu G, Usui HK, Dunn SR, McCue P, et al. (2007) Decorin
deficiency enhances progressive nephropathy in diabetic mice. Am J Pathol 171:1441–1450.
39. Border WA, Noble NA, Yamamoto T, Harper JR, Yamaguchi Y, et al. (1992)
Natural inhibitor of transforming growth factor-beta protects against scarring inexperimental kidney disease. Nature 360: 361–364.
40. Schaefer L, Grone HJ, Raslik I, Robenek H, Ugorcakova J, et al. (2000) Smallproteoglycans of normal adult human kidney: distinct expression patterns of
decorin, biglycan, fibromodulin, and lumican. Kidney Int 58: 1557–1568.
41. Stokes MB, Holler S, Cui Y, Hudkins KL, Eitner F, et al. (2000) Expression ofdecorin, biglycan, and collagen type I in human renal fibrosing disease. Kidney
Int 57: 487–498.42. Gambichler T, Kreuter A, Skrygan M, Burkert B, Altmeyer P, et al. (2009)
Decorin is significantly overexpressed in nephrogenic systemic fibrosis. Am J ClinPathol 132: 139–143.
43. Coppo R, Camilla R, Amore A, Peruzzi L, Dapra V, et al. (2010) Toll-like
receptor 4 expression is increased in circulating mononuclear cells of patientswith immunoglobulin A nephropathy. Clin Exp Immunol 159: 73–81.
44. Kestila M, Lenkkeri U, Mannikko M, Lamerdin J, McCready P, et al. (1998)Positionally cloned gene for a novel glomerular protein–nephrin–is mutated in
congenital nephrotic syndrome. Mol Cell 1: 575–582.
45. Xu L, Yang HC, Hao CM, Lin ST, Gu Y, et al. (2010) Podocyte numberpredicts progression of proteinuria in IgA nephropathy. Mod Pathol 23:
1241–1250.46. Choi SY, Suh KS, Choi DE, Lim BJ (2010) Morphometric analysis of podocyte
foot process effacement in IgA nephropathy and its association with proteinuria.Ultrastruct Pathol 34: 195–198.
47. van den Berg JG, van den Bergh Weerman MA, Assmann KJ, Weening JJ,
Florquin S (2004) Podocyte foot process effacement is not correlated with thelevel of proteinuria in human glomerulopathies. Kidney Int 66: 1901–1906.
48. Levey AS, Coresh J, Greene T, Stevens LA, Zhang YL, et al. (2006) Usingstandardized serum creatinine values in the modification of diet in renal disease
study equation for estimating glomerular filtration rate. Ann Intern Med 145:
247–254.49. Jones GR, Imam SK (2009) Validation of the revised MDRD formula and the
original Cockcroft and Gault formula for estimation of the glomerular filtrationrate using Australian data. Pathology 41: 379–382.
50. Koop K, Eikmans M, Baelde HJ, Kawachi H, De Heer E, et al. (2003)Expression of podocyte-associated molecules in acquired human kidney diseases.
J Am Soc Nephrol 14: 2063–2071.
Proteoglycans in IgA Nephropathy
PLoS ONE | www.plosone.org 11 April 2011 | Volume 6 | Issue 4 | e18575


