Embed Size (px)
Citation preview
CHAPTER 2 UNDERSTANDING DISASTER RISK: RISK ASSESSMENT METHODOLOGIES AND EXAMPLES
37
Understanding disaster risk: risk assessment methodologies and examples
2ChapterChapter
DavidC.SimmonsCoordinating lead author
DavidC.SimmonsLead author 2.1
RudiDauweRichardGowlandZsuzsannaGyenesAlanG.KingDurkRiedstraStefanSchneiderbauer
ChristinaCorbaneLead author 2.2
PaoloGambaMartinoPesaresiMassimilianoPittoreMarcWieland
StefanSchneiderbauerLead author 2.3
ElisaCalliariUnniEidsvigMichaelHagenlocher
SciraMenoniLead author 2.4
CostanzaBonadonnaMarianoGarcía-FernándezReimundSchwarze
JochenZschauLead author 2.5
38
2 Understanding disaster risk: risk assessment methodologies and examples
Introduction . . . . . . . . . . . . . . . . . . . . . . . . . . . . . . . . . . . . . . . . . . . . . . . . . . . . . . . . . . . . . . . . . . . . . .402.1 Qualitative and quantitative approaches to risk assessment . . . . . . . . . . . . . . . . . . . . . . . . .44
2.1.1 Risk assessment. . . . . . . . . . . . . . . . . . . . . . . . . . . . . . . . . . . . . . . . . . . . . . . . . . . . . . . . . . . . . . . . . . . .442.1.1.1 The importance of risk assessment . . . . . . . . . . . . . . . . . . . . . . . . . . . . . . . . . . . . . . . . . . . . . . .442.1.1.2 Example: catastrophe risk and the insurance industry . . . . . . . . . . . . . . . . . . . . . . . . . . . . . .442.1.1.3 The key elements of risk assessment . . . . . . . . . . . . . . . . . . . . . . . . . . . . . . . . . . . . . . . . . . . . .462.1.1.4 Risk tolerance . . . . . . . . . . . . . . . . . . . . . . . . . . . . . . . . . . . . . . . . . . . . . . . . . . . . . . . . . . . . . . . . . .46
2.1.2 Risk identification process . . . . . . . . . . . . . . . . . . . . . . . . . . . . . . . . . . . . . . . . . . . . . . . . . . . . . . . . . . .472.1.2.1 The importance of risk identification . . . . . . . . . . . . . . . . . . . . . . . . . . . . . . . . . . . . . . . . . . . . . .472.1.2.2 What if . . . . . . . . . . . . . . . . . . . . . . . . . . . . . . . . . . . . . . . . . . . . . . . . . . . . . . . . . . . . . . . . . . . . . . . .482.1.2.3 Failure mode and effect analysis (FMEA) . . . . . . . . . . . . . . . . . . . . . . . . . . . . . . . . . . . . . . . . . .482.1.2.4 Hazard and operability study (HAZOP). . . . . . . . . . . . . . . . . . . . . . . . . . . . . . . . . . . . . . . . . . . . .49
2.1.3 Risk analysis methodologies . . . . . . . . . . . . . . . . . . . . . . . . . . . . . . . . . . . . . . . . . . . . . . . . . . . . . . . . .492.1.3.1 Types of risk analysis . . . . . . . . . . . . . . . . . . . . . . . . . . . . . . . . . . . . . . . . . . . . . . . . . . . . . . . . . . .502.1.3.2 Deterministic methods . . . . . . . . . . . . . . . . . . . . . . . . . . . . . . . . . . . . . . . . . . . . . . . . . . . . . . . . . .502.1.3.3 Semi-quantitative risk analysis . . . . . . . . . . . . . . . . . . . . . . . . . . . . . . . . . . . . . . . . . . . . . . . . . . .512.1.3.4 Probabilistic risk analysis . . . . . . . . . . . . . . . . . . . . . . . . . . . . . . . . . . . . . . . . . . . . . . . . . . . . . . . .54
2.1.4 Conclusions and key messages. . . . . . . . . . . . . . . . . . . . . . . . . . . . . . . . . . . . . . . . . . . . . . . . . . . . . . .572.2 Current and innovative methods to define exposure . . . . . . . . . . . . . . . . . . . . . . . . . . . . . . . . .59
2.2.1 What is exposure? . . . . . . . . . . . . . . . . . . . . . . . . . . . . . . . . . . . . . . . . . . . . . . . . . . . . . . . . . . . . . . . . . .592.2.2 Why do we need exposure? . . . . . . . . . . . . . . . . . . . . . . . . . . . . . . . . . . . . . . . . . . . . . . . . . . . . . . . . . .602.2.3 Land-cover and land-use products as proxies to exposure . . . . . . . . . . . . . . . . . . . . . . . . . . . . . .61
2.2.3.1 European land-use and land-cover (LU/LC) products . . . . . . . . . . . . . . . . . . . . . . . . . . . . . . . .622.2.3.2 Global land-use and land-cover products . . . . . . . . . . . . . . . . . . . . . . . . . . . . . . . . . . . . . . . . .63
2.2.4 Status of population exposure at the EU and global levels. . . . . . . . . . . . . . . . . . . . . . . . . . . . . . .642.2.4.1 European-wide population grids . . . . . . . . . . . . . . . . . . . . . . . . . . . . . . . . . . . . . . . . . . . . . . . . . .652.2.4.2 Global human exposure . . . . . . . . . . . . . . . . . . . . . . . . . . . . . . . . . . . . . . . . . . . . . . . . . . . . . . . . .66
2.2.5 Exposure data describing the building stock . . . . . . . . . . . . . . . . . . . . . . . . . . . . . . . . . . . . . . . . . . .662.2.5.1 EU-wide building inventory databases. . . . . . . . . . . . . . . . . . . . . . . . . . . . . . . . . . . . . . . . . . . . .662.2.5.2 Global building inventory databases . . . . . . . . . . . . . . . . . . . . . . . . . . . . . . . . . . . . . . . . . . . . . .66
2.2.6 Future trends in exposure mapping: towards a dynamic exposure modelling . . . . . . . . . . . . . . .672.2.7 Conclusions and key messages . . . . . . . . . . . . . . . . . . . . . . . . . . . . . . . . . . . . . . . . . . . . . . . . . . . . . .68
CONTENTS
CHAPTER 2 UNDERSTANDING DISASTER RISK: RISK ASSESSMENT METHODOLOGIES AND EXAMPLES
39
2.3 The most recent view of vulnerability . . . . . . . . . . . . . . . . . . . . . . . . . . . . . . . . . . . . . . . . . . . . .702.3.1 The importance of vulnerability for disaster risk assessment . . . . . . . . . . . . . . . . . . . . . . . . . . . .70
2.3.1.1 Vulnerability: a key component to determine risks . . . . . . . . . . . . . . . . . . . . . . . . . . . . . . . . . .702.3.1.2 Conceptual issues and dimensions of vulnerability. . . . . . . . . . . . . . . . . . . . . . . . . . . . . . . . . .722.3.1.3 State of the art and research gaps . . . . . . . . . . . . . . . . . . . . . . . . . . . . . . . . . . . . . . . . . . . . . . .73
2.3.2 System and systemic vulnerability. . . . . . . . . . . . . . . . . . . . . . . . . . . . . . . . . . . . . . . . . . . . . . . . . . . .742.3.2.1 System dynamics affecting vulnerability. . . . . . . . . . . . . . . . . . . . . . . . . . . . . . . . . . . . . . . . . . .742.3.2.2 System criticality . . . . . . . . . . . . . . . . . . . . . . . . . . . . . . . . . . . . . . . . . . . . . . . . . . . . . . . . . . . . . . .742.3.2.3 State of the art and research gaps . . . . . . . . . . . . . . . . . . . . . . . . . . . . . . . . . . . . . . . . . . . . . . .75
2.3.3 Vulnerability within the context of changing climate conditions . . . . . . . . . . . . . . . . . . . . . . . . . .752.3.3.1 Vulnerability and climate change in Europe . . . . . . . . . . . . . . . . . . . . . . . . . . . . . . . . . . . . . . . .762.3.3.2 State of the art and research gap . . . . . . . . . . . . . . . . . . . . . . . . . . . . . . . . . . . . . . . . . . . . . . . .77
2.3.4 Approaches to assess vulnerability . . . . . . . . . . . . . . . . . . . . . . . . . . . . . . . . . . . . . . . . . . . . . . . . . . .782.3.4.1 Quantitative vulnerability functions . . . . . . . . . . . . . . . . . . . . . . . . . . . . . . . . . . . . . . . . . . . . . . .802.3.4.2 State of the art and research gaps . . . . . . . . . . . . . . . . . . . . . . . . . . . . . . . . . . . . . . . . . . . . . . .81
2.3.5 How vulnerability information is used in practice . . . . . . . . . . . . . . . . . . . . . . . . . . . . . . . . . . . . . . .812.3.5.1 Vulnerability in disaster risk management: from knowledge to action . . . . . . . . . . . . . . . . . . .812.3.5.2 Conclusions and key messages . . . . . . . . . . . . . . . . . . . . . . . . . . . . . . . . . . . . . . . . . . . . . . . . . . . . .83
2.4 Recording disaster losses for improving risk modelling capacities . . . . . . . . . . . . . . . . . . . . .852.4.1 Relationship between pre-event risk modelling and post-disaster loss data. . . . . . . . . . . . . . . .852.4.2 How post-disaster damage has been used to develop risk models: state of the art in a nutshell . . . . . . . . . . . . . . . . . . . . . . . . . . . . . . . . . . . . . . . . . . . . . . . . . . . . . . . . . . . . . . . . . . . . . . . . . . . . . . . .86
2.4.2.1 State of the art of risk models . . . . . . . . . . . . . . . . . . . . . . . . . . . . . . . . . . . . . . . . . . . . . . . . . . .862.4.2.2 Key aspects of currently used vulnerability and damage curves . . . . . . . . . . . . . . . . . . . . . .892.4.2.3 Use of post-event damage data for evaluating the reliability of risk models results . . . .90
2.4.3 Damage and losses to multiple sectors: relevance for more comprehensive risk assessments . . . . . . . . . . . . . . . . . . . . . . . . . . . . . . . . . . . . . . . . . . . . . . . . . . . . . . . . . . . . . . . . . . . . . . . . . . . .91
2.4.3.1 Damage to tangibles. . . . . . . . . . . . . . . . . . . . . . . . . . . . . . . . . . . . . . . . . . . . . . . . . . . . . . . . . . . .922.4.3.2 Damage to intangibles . . . . . . . . . . . . . . . . . . . . . . . . . . . . . . . . . . . . . . . . . . . . . . . . . . . . . . . . . .922.4.3.3 Historical examples of permanent relocation. . . . . . . . . . . . . . . . . . . . . . . . . . . . . . . . . . . . . . .93
2.4.4 The relevance of indirect damage and losses to account for the complexity of events . . . . . .932.4.4.1 Indirect damage due to ripple effects in complex systems . . . . . . . . . . . . . . . . . . . . . . . . . . .932.4.4.2 Indirect economic damage . . . . . . . . . . . . . . . . . . . . . . . . . . . . . . . . . . . . . . . . . . . . . . . . . . . . . . .942.4.4.3 Changes needed to improve post-disaster damage and loss data availability and quality . . . . . . . . . . . . . . . . . . . . . . . . . . . . . . . . . . . . . . . . . . . . . . . . . . . . . . . . . . . . . . . . . . . . . . . . . . . . . . .95
2.4.5 Conclusions and key messages. . . . . . . . . . . . . . . . . . . . . . . . . . . . . . . . . . . . . . . . . . . . . . . . . . . . . . .962.5 Where are we with multihazards, multirisks assessment capacities?. . . . . . . . . . . . . . . . . . .98
2.5.1.Why do we need a change in the way we assess natural risks?. . . . . . . . . . . . . . . . . . . . . . . . . . .982.5.1.1 Multirisk assessment versus single-risk assessment for disaster risk management . . . . .982.5.1.2 Emerging challenges: risk globalization and climate change . . . . . . . . . . . . . . . . . . . . . . . . .99
2.5.2 Towards multirisk assessment methodology: where do we stand? . . . . . . . . . . . . . . . . . . . . . . . .1002.5.2.2 Multilayer single-risk assessments: harmonisation for risk comparability . . . . . . . . . . . . . .1012.5.2.3 Hazard interactions: cascading events and Co. . . . . . . . . . . . . . . . . . . . . . . . . . . . . . . . . . . . . .1052.5.2.4 Dynamic vulnerability: time- and state-dependent . . . . . . . . . . . . . . . . . . . . . . . . . . . . . . . . .110
2.5.3 Implementation of MRA into DRM: Present state, benefits and barriers . . . . . . . . . . . . . . . . . . . .1132.5.3.1 State of implementation. . . . . . . . . . . . . . . . . . . . . . . . . . . . . . . . . . . . . . . . . . . . . . . . . . . . . . . . .1132.5.3.2 Expected benefits . . . . . . . . . . . . . . . . . . . . . . . . . . . . . . . . . . . . . . . . . . . . . . . . . . . . . . . . . . . . . . .1132.5.3.3 Barriers . . . . . . . . . . . . . . . . . . . . . . . . . . . . . . . . . . . . . . . . . . . . . . . . . . . . . . . . . . . . . . . . . . . . . . .113
2.5.4 Conclusions and key messages. . . . . . . . . . . . . . . . . . . . . . . . . . . . . . . . . . . . . . . . . . . . . . . . . . . . . . .114Recommendations . . . . . . . . . . . . . . . . . . . . . . . . . . . . . . . . . . . . . . . . . . . . . . . . . . . . . . . . . . . . . . . . .116References . . . . . . . . . . . . . . . . . . . . . . . . . . . . . . . . . . . . . . . . . . . . . . . . . . . . . . . . . . . . . . . . . . . . . . .119
40
Definition of risk
There is no commonly accepted definition of risk. According to the United Kingdom’s Royal Society (1992), risk is ‘the probability that a particular adverse event occurs during a stated period of time, or results from a particular challenge’. By contrast, the latest UNISDR’s
definition (2017) of disaster risk is ‘the potential loss of life, injury, destroyed or damaged assets which could occur to a system, society or a community in a specific period of time, determined probabilistically as a function of hazard, exposure, vulnerability and capacity’.
Disaster risk is not just about the likelihood and severity of the hazard event but also about what is exposed to that hazard and how vulnerable that expo-sure is. A severe earthquake in a relatively uninhabited region can be of far less consequence than a relatively minor one near a large conurbation. Similarly, a severe earthquake in an area known to be prone to earthquakes and so with strict design and construction standards can cause fewer fatalities and less dam-age than an unexpected, much smaller one in an unprepared area with poor building standards.
Following the Sendai disaster risk definition, we may consider risk to comprise of three elements.1. Hazard: the adverse event causing the loss.2. Exposure: the property, people, plant or environment that are threatened
by the event.3. Vulnerability: how the exposure at risk is vulnerable to an adverse event
of that kind.
Note that the forth Sendai element; capacity, the ability of the system to re-spond after the event to mitigate the loss, is generally considered to be a com-ponent of vulnerability. Loss suffered, that is the damage caused to the expo-sure at risk to a defined hazardous event, will depend upon these elements.
Risk complexity and dependencySingle events may have no one single cause. For example a major flood could be caused by a combination of one or more of heavy rain, unseasonably high temperatures causing snow to melt fast, baked land from a prior dry spell or conversely saturated soil from earlier continuous rains, which both increase run-off, high tides and storm surge.
Whilst it is sometimes difficult to consider risks from a single hazard, what of their combinations? The major cause of death and damage following the Great Kantō earthquake affecting Tokyo in 1923, an event that left more than
Introduction
CHAPTER 2 UNDERSTANDING DISASTER RISK: RISK ASSESSMENT METHODOLOGIES AND EXAMPLES
41
140 000 people dead or missing, was not from building collapse due to ground shaking but from fire storms provoked by cooking equipment knocked over in the event. Similarly, earthquakes may cause tsunamis, landslides, dam failures or avalanches and windstorms may cause landslides, storm surge, floods or flash floods. Vetere Arellano et al. (2004) includes a fascinating example of cascad-ing risk following an earthquake in Turkey in 1999.
Human action can also affect the loss. For example, canalising rivers or build-ing on historical floodplains can give excess flood water nowhere to go; wide-scale concreting over gardens to provide hard standing for motor cars prevents water absorption, perhaps exacerbated by inadequate or poorly maintained drains. What historically would have been a benign event can now become a calamitous one.
Uncertainty and subjectivityRisk includes elements of the scientific and the subjective. In some hazards or sectors, risk can be clearly defined. For example in the insurance industry, the ‘risk business’ defines property or people who are normally insured against defined hazards with payment made upon financial loss suffered. As we will discuss later, this has led to an explosion in risk analytics over the last 30 years, leading to a far more technically sophisticated but also financially secure insur-ance industry.
However, even here there are limits in what we know. We may feel we know how well a particular building will react to an earthquake of a certain intensity, but do we know it was built to the right standard or correctly maintained? We may feel we can reasonably estimate the damage that a flood with a depth of 1 metre can do to an industrial plant, but how well can we estimate the firm’s economic loss related to this damage, which will depend on how quickly the plant may be repaired or replaced, on whether it has any other factories avail-able to take some of the strain and on whether business temporarily lost can ever be fully regained.
There is an inherent uncertainty, as by definition catastrophes are rare events; data to describe their effects may be partial, at best. However, as we will discuss later on, the process to understand and model risk sheds light on areas where data are lacking and therefore where additional focus is required. Subjective assumptions, perhaps currently unstated, must be made explicit and so held up for discussion.
Risk is not static but rather dynamic and dependent upon changes to hazard, exposure and vulnerability. Anthropogenic climate change is accepted as scien-tific fact, but its consequences on a local level and for a particular hazard may not be clear. Historical observations are often limited, partial and contaminated with natural variation and underlying factors that may not be fully understood. But clearly there is a public and therefore political pressure for governments

42
to protect their populations against the impacts of climate change. In practice, though, the risk as it is now is very often not properly understood, and still less how it may worsen (or conversely improve) under different climate change assumptions in 30 years’ time; understanding current risk is fundamental to understanding how that risk may change in the future.
Risk perceptionWhen we begin to move into exposure, such as the preservation of habitat and/or animal population, it may be harder to place an agreed value on pres-ervation or qualification of damage if either is impaired, even where there is common acceptance of the importance of the risk to society. A common risk metric must be agreed in order to allow, for example, the relative social and environmental cost of sacrificing an important ecological habitat to protect the human population of a city.
Humans have short memories; current risk concerns may be driven by recent experience rather than underlying loss potential. Few were concerned with tsu-nami risk until the tragic events of 2004 and 2011 — the risks were theoretical-ly known but were rare, and crucially as no significant tsunami had been filmed until 2004, the risk was difficult to relate to and was often overlooked.
Indeed, perception of risk drives policy (Klinke and Renn 2002). For example, many more die on the road than in train crashes, but these deaths tend to come in ones and twos at any time, rather than several casualties, as in rail crashes. Post-loss this may lead to calls to improve the already relatively safe rail system when a similar amount spent on the road network may save more lives.
The public purse is not unlimited. Should the politician react to the public perception of risk by spending on risk prevention in areas of known public concern or try to assess the range of risks the population face and prioritise spending on a more rational cost/benefit approach? In the short term, pre-event, the former will be more electorally advantageous but the post-event failure to react to an unrecognised hazardous eventcould have enormous po-litical as well as human consequences. It is vital to consider not just what has happened but what could happen; taking action to minimise loss in advance and not just reacting to events as they occur.
Recognising risk may also have its consequences. Many societies have a pres-sure on housing. Flood plains offer an easy solution, the land drained, defences constructed and houses built, which is popular as people like living near water. But how robust are the new properties in a changing climate? Can risk be overlooked if there is a social need? Certainly before the event, but what about after? What if the properties become uninsurable and so unsaleable?
The importance of understanding disaster riskRisk is complicated, but understanding risk is vital to the proper protection
CHAPTER 2 UNDERSTANDING DISASTER RISK: RISK ASSESSMENT METHODOLOGIES AND EXAMPLES
43
of society and the environment. Without proper risk analysis, can appropriate policy decisions be made?
In an increasingly litigious society, could governments and officials not have a proper risk assessment methodology? It is vital to understand and use the best science, but ultimately policymakers will also necessarily react to stakeholder perception. It is hoped that scientific fact, properly presented, will drive per-ception, but ultimately risk management decisions are necessarily political.
Those decisions need to be made in a transparent manner; open to scrutiny, challenge and debate. It is impossible to completely eliminate risk, even with an unlimited public purse. In reality, budgets are under pressure, with many calls upon limited funds: spending money on preparing for an event that will prob-ably not even occur within a politician’s period of office may not be as high a priority as trying to address an immediate social need.
However, there is a duty of care to protect the citizens and the natural envi-ronment of Europe. Modern risk assessment, coupled with risk and financial modelling, provides the framework to make the right decisions for both now and the future.
44
2.1 Qualitative and quantitative approaches to risk assessmentDavidC.Simmons, Rudi Dauwe, Richard Gowland, Zsuzsanna Gyenes, Alan G. King, Durk Riedstra, Stefan Schneiderbauer
2.1.1Risk assessment
2.1.1.1 The importance of risk
assessment
Risk assessment is a means not only to understand the risks that society (or a family or business) faces, with their potential probabilities and impacts, but also to provide a framework to determine the effectiveness of disas-ter risk management, risk prevention and/or risk mitigation.
It would be spurious to pretend that we fully understand all the hazards that society faces and their poten-tial consequences. The process of risk assessment requires a structured approach. Without such a process, risks may be overlooked or implic-it assumptions may be made. A risk assessment process requires transpar-ency, opening up assumptions and options to challenge, discussion and review.
A structured approach is required to understand all
the hazards that society faces and their potential
consequences. This requires transparency,
opening up assumptions to challenge, discussion
and review.
Risk assessment and mapping guide-lines for disaster management (Euro-pean Commission, 2010) and Over-view of natural and man-made disaster risks in the EU (European Commis-sion, 2014), provide a solid outline of the issues in a European context. The first outlines ‘the processes and meth-ods of national risk assessments and mapping in the prevention, prepared-ness and planning stages, as carried out within the broader framework of disaster risk management’, whereas
the second paper analyses 18 national contributions, identifying 25 hazards, both natural and man-made (mali-cious and non-malicious).
However, as an example of the im-portance of risk assessment, the ex-perience of the insurance industry is presented, an industry that has been transformed by the adoption of an increasingly rigorous risk assessment and modelling process over the last 30 years. The lessons learnt are relevant to policymakers and practitioners in government.
2.1.1.2 Example: catastrophe risk and the insurance
industry
As recently as the 1980s, the insurance industry’s catastrophe risk assessment was almost entirely based on histori-cal experience or ‘rule of thumb’ as-sumptions. Catastrophes are, by defi-nition, rare events. It is very unlikely that a mega event will have occurred in recent years and, even if that were
CHAPTER 2 UNDERSTANDING DISASTER RISK: RISK ASSESSMENT METHODOLOGIES AND EXAMPLES
45
the case, it may have had unique fea-tures that may not reoccur. If we had a historical event, would it cause simi-lar damage if it reoccurred? The glob-al population is growing and getting wealthier, with the majority now con-centrated in cities. Pressure of popu-lation growth has created the need to build on land that was wisely avoided by our forefathers. Growth may be unplanned with infrastructure, such as drainage not keeping up with the rate of development. People like liv-ing close to water, potential loss may be more than just scaling the historical loss by population change and wealth.
The need for a better approach was clear. In 1984 Don Friedman pub-lished a paper that would form the template for modelling insurance catastrophe risk over the following 30 years, breaking the process into hazard, exposure, vulnerability and financial loss. The first United States hurricane model to this template was produced by the reinsurance bro-ker E.W. Blanch in 1987 (White and Budde, 2001), followed by the United States earthquake in 1988. Reinsur-ance brokers and reinsurers also lead the field in Europe; however, the early 1990s saw the rise of three major ca-tastrophe modelling firms, which still dominated the industry in 2016.
These models were stochastic models — based not on a few historic haz-ard events but rather on a synthetic event made of many thousands of events that attempt to represent the range of possible events with their associated probabilities. The mod-els required knowledge not only of what properties were insured and their value but also of their location, construction type and occupation.
Engineering principles augmented by historical loss analysis attempted to understand the relationship between the event’s manifestation at a particu-lar location (e.g., peak ground acceler-ation, peak gust speed and maximum flood depth) and its likely damage. From this an overall damage estimate for any given property portfolio for each of the synthetic events could be calculated. If the probability of each synthetic event is then applied, we could understand the distribution off loss to the overall portfolio, for example what the annual average loss is and how big a loss from that hazard type can be expected every 5, 10, 20, 50 and 100 years.
The process of modelling catastrophe risk has
transformed the reinsurance industry by
increasing knowledge, scientific engagement, technical competence
and, most importantly, the resilience of the
industry — its ability to pay claims.
Decisions could be made based on ‘objective fact’, not subjective opin-ion. Underwriters now had much more information to appropriately rate individual policies and to decide how much total risk they could accept across their portfolio and how much to off lay. The concept of risk/re-turn entered the market. Firms began
to clearly define their risk appetite to ensure appropriate levels of financial security and then seek to maximise re-turn within that appetite.
It has not been a painless process. In-itially, many saw the models as a pan-acea to the market’s problems. There was a tendency by those unaware of the complexity of the models to be-lieve the results. Arguably, the mod-els were oversold and overbought: the vendors sold the models on their technical capabilities and the buyers bought them seeking certainty, but neither publically faced up to the in-herent uncertainty within the models, despite growing pains in the process. However, this information has trans-formed the industry. Twenty years ago the most technical reinsurance broker had perhaps 3 % of staff engaged in risk analytics, whereas now this has become 25 % to 30 %. Chief risk of-ficers were virtually unknown in the insurance industry 20 years ago; now they are embedded.
The models became a mechanism to raise debate above vague opinion to a discussion of the veracity of assump-tions within the model. The models’ data requirements led to a massive increase in the quality and quantity of data captured, leading in turn to improved models. Knowledge of ca-tastrophe risk has grown immeasura-bly; firms have become smarter, more financially robust and therefore more likely to meet their claim obligations.
Whilst such modelling originally ap-plied to catastrophe risk only, it has been extended to cover man-made hazards such as terrorism and more esoteric risk such as pandemic. In-deed, the EU’s solvency II (Directive
46
2009/138/EC) an insurance regula-tory regime, requires firms to under-stand all the risk they face, insurance and non-insurance (e.g., market risk, counterparty risk and operational risk), with the carrot that if they can demonstrate that they can adequately model their risks, then they may be al-lowed to use the capital requirement implied by their model rather than the standard formula. Regulators rather smartly realise that any firm willing and able to demonstrate such capacity and understanding is less likely to fail.
2.1.1.3 The key elements of risk
assessment
Whilst the insurance industry is a spe-cial case, others are noticing that the same methods can be used to manage risks to governments, cities and com-munities. They can drive not only a better understanding of the risks that society faces but also a means to de-termine and justify appropriate risk planning, risk management strategies as well as public and investment de-cisions.
Risk assessment requires the identification of
potential hazards as well as a knowledge of those hazard including
their probability, what is exposed to that hazard
and the vulnerability of that exposure to the
hazard.
Indeed, it can be argued that the pro-cess of risk assessment and modelling is more important than the results ob-tained. Risk assessment does not need to be as complex as a full stochastic model to add real value. Similarly, it is a common misunderstanding that a lack of good-quality, homogeneous data invalidates risk assessment. Any risk assessment methodology requires assumptions to be brought to light and so opened to challenge. Assump-tions can then be reviewed, compared and stressed, identifying areas of in-consistency, illogicality, sensitivity and where further research should be con-centrated.
The key steps in risk assessment are the following.• Identify the hazards which might
affect the system or environment being studied A brain-storming session to identify all potential hazards should be done at an ini-tial stage. It is important to think beyond events or combinations of events that have occurred in order to consider those that may occur.
• Assess the likelihood or probability that hazards might occur: inputs to this process include history, mod-elling, experience, corporate mem-ory, science, experimentation and testing. In practice, events with a very, very low probability (e.g. me-teor strike) are ignored, focussing on ones more likely to occur and can be either prevented, managed or mitigated.
• Determine the exposure to the hazard, i.e. who or what is at risk.
• Estimate the vulnerability of that hazard to the entity exposed in
order to calculate the physical or financial impact upon that entity should the event occur. This may be obtained by a review of histor-ical events, engineering approaches and/or expert opinion and may include the ability of the system to respond after the event so as to mitigate the loss.
• Estimate the potential financial and/or social consequences of events of different magnitudes.
2.1.1.4Risk tolerance
The likelihood of the hazard and its consequences needs to be compared with the norms of tolerability/ac-ceptability criteria that society or an organisation has formulated. If these criteria are met, the next step would be to manage the risk so that it is at least kept within these criteria and ideally lowered with continuous im-provement.
If the risk criteria are not met, the next step would be risk reduction by either reducing exposure to the haz-ard or by reducing vulnerability by preventative measures or financial hedging, typically through traditional indemnity insurance that pays upon proof of loss, but also increasing-ly through parametric insurance that pays upon proof of a defined event occurring. Insurance-like products can also be obtained from the finan-cial markets by means of catastrophe or resilience bonds.
In industry, reducing event likelihood is normally the preferred method, since this dimension is amenable to improving reliability and enhancing

CHAPTER 2 UNDERSTANDING DISASTER RISK: RISK ASSESSMENT METHODOLOGIES AND EXAMPLES
47
the protective measures available. In many cases, these can be tested, so are therefore often a dominant feature of risk reduction. Estimating the poten-tial severity of the hazard is harder and often leaves much to expert opinion. If risk cannot be credibly reduced in industry, it may lead to the cessation of an activity. Ideally, a hazard would be completely avoided: a fundamental step in the design of inherently safer processes.
However, for natural hazards and climate risk, where hazard likelihood reduction is often impossible, it is re-quired to work on exposure and vul-nerability. Building codes, for example the EU standard Eurocodes, encour-age appropriate resilience in design and construction and can include ‘build back better’ after an event. Spatial planning and the delineation of hazard zones of various levels can promote development in areas less exposed to risk.
Risks can never be eliminated but they can
be managed and their consequences reduced, at a cost. Defining risk
tolerance allows informed, cost-effective risk
management decisions.
The insurance mechanism can be used to encourage appropriate risk behaviours, penalising poor construc-tion, maintenance or location by re-duced cover or higher premiums and rewarding mitigation measures, e.g.
retro-fitting roof ties in tropical cy-clone-exposed areas or installing irri-gation systems for crops by premium reductions.
2.1.2Risk identification
process
2.1.2.1The importance of risk identification
It is necessary to identify unwanted hazardous events (i.e., atypical sce-narios) and their consequences. It is very important to include all these in a study. If a possible hazard is over-looked, it will never be assessed. Un-fortunately, there are many examples of this failure (Gowland, 2012).
In all risk assessment methods, the failure to include these ‘atypical’ sce-narios will present problems. Exam-ples include the major fire and explo-sion at Buncefield (December 2005) and the tsunami that inundated the Fukushima nuclear power station (March 2011). Identification of all potential hazards is absolutely funda-mental in ensuring success.
The United Kingdom Health and Safety Executive has identified and reviewed almost 40 hazard identifica-tion methods.
The scope and depth of study is im-portant and relevant to purpose and the needs of users of the assessment. It is necessary to identify all hazards so that a proper risk assessment may be made. When we are open to con-sidering potential deviations we need
to make sure that we are open-mind-ed enough to consider all possibilities even when they may seem to be re-mote.
It is important to consider all poten-tial hazards, natural and man-made, and their possible interactions and consequences. The process should not be limited to events known to have happened in the past, but also to consider what could happen.
Methods in use greatly depend on the experience of the persons carry-ing out the study. This is normally a team activity, and how it is made up is important and should be drawn from persons familiar with the technology or natural phenomena and the loca-tion being considered. Techniques adopted range from relatively un-structured ‘brainstorming’ through to the more structured ‘what if ’ analysis.
Potential risks may not be obvious and may not have
occurred in the past. It is vital to seek to identify
what could occur as well as the consequences.
Other more formalised processes ex-ist in industry, though, including fail-ure mode and effect analysis (FMEA) and the highly structured hazard and operability (HAZOP) study, both of which look to identify hazardous events and to locate causes, conse-quences and the existing preventive measures. FMEA was developed for the automobile industry and HAZOP
48
was developed for the chemical and process industry. However, similar studies can be applied to any field of risk. For example, the HAZOP (Tyler et al., 2015) use of guide words and deviations, which might seem to be limited to the industry where first ap-plied, can be adjusted or replaced with those relevant to the field being stud-ied; this has been demonstrated in the mining industry in Australia, where modified chemical industry methods have proved useful.
2.1.2.2What if
This is a form of structured team brainstorming. Once the team under-stands the process or system being assessed and the kind of risks (po-tential exposures and vulnerabilities), each discreet part or step is examined to identify things that can go wrong and to estimate their possible conse-quences.
A team of experts brainstorming is one way
to flush out potential risks, but it is important
to use a panel of experts whose experience covers
all aspects of risk.
In order to carry this out successful-ly, we must stress the need for the team to be properly qualified and to have a full set of data relating to the system being studied. This would in-clude operating instructions, process
flow sheets, physical and hazardous properties of the materials involved, potentially exposed persons, environ-ment or assets, protective systems. Most users will simply estimate the likelihood and severity of conse-quences in a similar way to that used in risk matrix applications.
A brainstorming exercise has the side benefit of encouraging a wide partic-ipation in the risk identification and assessment process, increasing own-ership of the ultimate conclusions.
2.1.2.3Failure mode and effect
analysis (FMEA)
FMEA is a rigorous, step-by-step process to discover everything that could go wrong in a task or process,
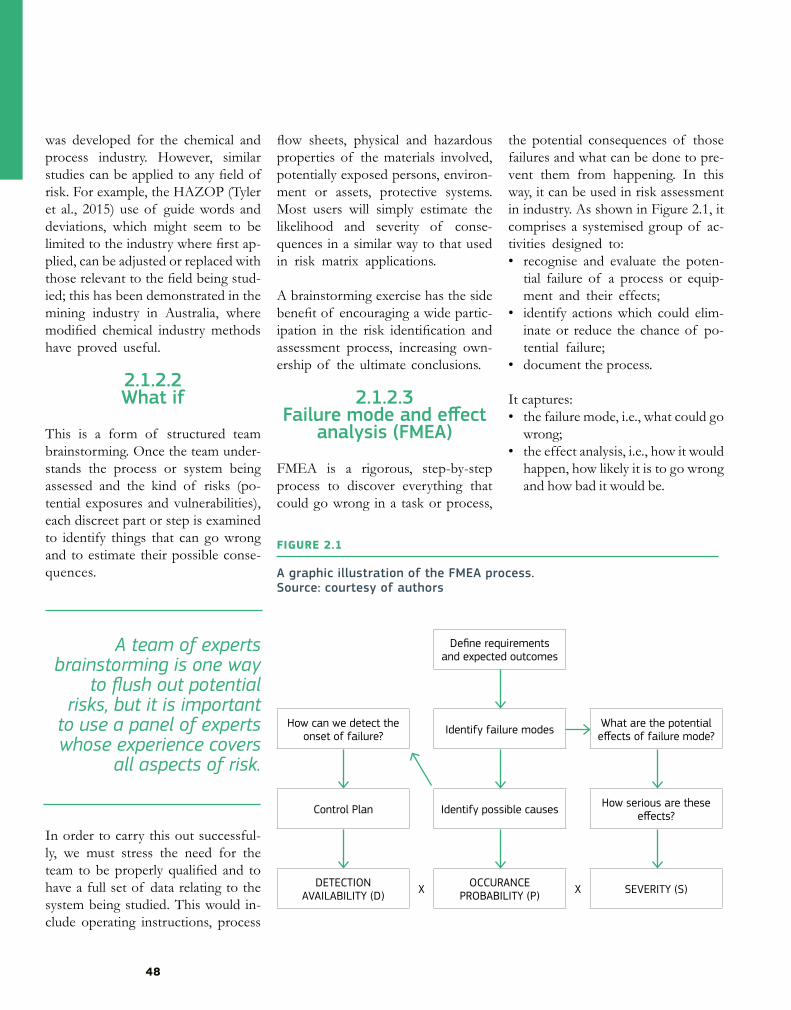
the potential consequences of those failures and what can be done to pre-vent them from happening. In this way, it can be used in risk assessment in industry. As shown in Figure 2.1, it comprises a systemised group of ac-tivities designed to:• recognise and evaluate the poten-
tial failure of a process or equip-ment and their effects;
• identify actions which could elim-inate or reduce the chance of po-tential failure;
• document the process.
It captures:• the failure mode, i.e., what could go
wrong;• the effect analysis, i.e., how it would
happen, how likely it is to go wrong and how bad it would be.
A graphic illustration of the FMEA process.Source: courtesy of authors
FIGURE 2.1
Define requirements and expected outcomes
How can we detect the onset of failure? Identify failure modes What are the potential
effects of failure mode?
Control Plan Identify possible causes How serious are these effects?
DETECTION AVAILABILITY (D) X OCCURANCE
PROBABILITY (P) X SEVERITY (S)
CHAPTER 2 UNDERSTANDING DISASTER RISK: RISK ASSESSMENT METHODOLOGIES AND EXAMPLES
49
A very good example of a high-risk and high-priority project is the space shuttle where we put fragile human lives in a tin can and send them to space, hoping to get them home safe-ly. Considering the complexity of the shuttle, there are many possible items which can fail, and they all have in-dividual failure modes and effects. Lives are at risk and space shuttles are expensive. FMEA is a tool used to provide a structured process to un-derstand and thereby minimise risk.
FMEA is a structured what-if process widely
used in the process industries and provides
a template for other potential applications.
The three distinct assessments for each of the three strands of this methodology, detection availability, occurrence probability and severity, are each given a rating: D, P and D, respectively. Risk ranking is calculated by multiplying these factors to give a single rating D x P x S. A risk matrix may be used to illustrate this process (see Chapter 2.1.4.3.).
2.1.2.4Hazard and operability
study (HAZOP)
The technique of HAZOP has been used and developed since the 1970s for identifying potential hazards and operability problems caused by ‘devia-tions’ from the design intent of a part
of a production process or a proce-dure for new and existing operations. The technique is most associated with identifying hazardous deviations from the desired state, but it also greatly assists the operability of a process. In this mode it is very helpful when writing operating procedures and job safety analysis (Tyler et al., 2015).
Processes and procedures all have a design intent which is the desired nor-mal state where operations proceed in a good way to make products in a safe way.
With this in mind, equipment is de-signed and constructed, which, when it is all assembled and working to-gether, will achieve the desired state. In order to achieve this, each item of equipment will need to consistently function as designed. This is known as the ‘design intent’ for that particu-lar item or section of the process.
HAZOP is a what-if process identifying
potential hazards caused by ‘deviations’ from the
design intent of a part of a production process or
procedures.
Each part of this design intent speci-fies a ‘parameter’ of interest. For ex-ample, for a pump this could be flow, temperature or pressure. With a list of ‘parameters’ of interest, we can then apply ‘guide words’ to show de-viations from the design intent. Inter-esting deviations from the design in-
tent in the case of our cooling facility could include less or no flow of wa-ter, high temperature or low (or high) pressure. When these deviations are agreed, all the causes associated with them are listed. For example, for no or less flow, causes will include pump failure, power failure, line blockage, etc.
The possible hazardous consequenc-es can now be addressed, usually in a qualitative manner without significant calculation or modelling. In the exam-ple, these might be, for example, for line blockage pump overheats or loss of cooling to process, leading to high temperature problems with product.
These simple principles of the meth-od are part of the study normally carried out by a team that includes designers, production engineers, tech-nology specialists and, very impor-tantly, operators. The study is record-ed in a chart as in the study record. A decision can then be made about any available safeguards or extra ones that might be needed — based on the severity or importance of the conse-quence.
It is believed that the HAZOP meth-odology is perhaps the most widely used aid to loss prevention in indus-try. The reason for this can be sum-marised as follows:• it is easy to learn;• it can be easily adapted to almost all
the operations that are carried out within process industries;
• no special level of academic quali-fication is required.
50
2.1.3Risk analysis
methodologies
2.1.3.1Types of risk analysis
Risk analysis is a complex field requir-ing specialist knowledge and expertise but also common sense. It is not just a pure scientific field but will neces-sarily include judgements over issues such as risk appetite and risk manage-ment strategy. It is vital that the pro-cess be as comprehensive, consistent, transparent and accessible as possible. If a risk cannot be properly under-stood or explained, then it is difficult if not impossible for policymakers, companies and individuals to make rational choices.
The appropriate form of risk analysis will depend on the purpose and the
data available from simple scenarios to full
probabilistic analysis, but all can lead to
better decision-making.
Currently, there is no universally agreed risk analysis method applied to all phenomena and uses, but the methods used rather are determined by a variety of users, such as indus-trial and transport companies, regula-tors and insurers. They are selected on the basis of their perceived relevance, utility and available resources. For
example, a method adopted in indus-try may not be suitable in the field of natural hazards. Legal requirements may also dictate the degree of study as well as such factors as the ‘allowa-ble’ threat to the community. This last matter is common in ‘deterministic’ risk analysis where the requirement may be that there is no credible risk for a community in the location of an industrial operation.
Deterministic methods consider the consequences of defined events or combinations of events but do not necessarily consider the probability of these events or guarantee that all pos-sible events are captured within the deterministic event set. Often this is the starting point for risk analysis. At the other extreme, stochastic or prob-abilistic analysis attempts to capture all possible outcomes with their prob-abilities; clearly coming with a much higher data and analytical requirement and, if correct, forming the basis for a sophisticated risk assessment process.
2.1.3.2Deterministic methods
Deterministic methods seek to con-sider the impact of defined risk events and thereby prove that consequenc-es are either manageable or capable of being managed. They may be appro-priate where a full stochastic model is impossible due to a lack of data; pro-viding real value whilst a more robust framework is constructed.
Risk standards may be set at nation-al and international level and, if fully complied with, are believed to prevent a hazard that could impact the com-munity. This is akin to the managing of risk in the aviation industry, where
adherence to strict rules on the design and operation of aircraft and flights has produced a very safe industry. The same approach to rule- based op-erations exists in some countries and companies.
How are deterministic events framed? For example, to check the safety of an installation against a severe flood, severity is assessed according to the worst recently seen, the worst seen in the last 20 years or the worst that may be expected every 100 years based on current climatic conditions and cur-rent upstream land use. A different choice of event will have a different outcome and potentially a very differ-ent conclusion about manageability. Can we ensure that all deterministic events used in risk assessment across hazards are broadly equivalent in probability? If not, assessments and conclusions may be skewed.
Deterministic methods seek to consider the
impact of defined risk events and thereby prove
that consequences are either manageable
or capable of being managed.
In recent times there has been a shift from a totally rule- based system to one where an element of qualitative, semi- quantitative and quantitative risk assessment (QRA) may influence decisions. But deterministic risk as-sessment is also carried out as a reali-
CHAPTER 2 UNDERSTANDING DISASTER RISK: RISK ASSESSMENT METHODOLOGIES AND EXAMPLES
51
ty check for more complex stochastic models and to test factors that may not be adequately modelled within these models.
For example, over the past 20 years the insurance industry has enthusias-tically embraced advances risk assess-ment techniques, but deterministic assessment of the form ‘if this hap-pens, this is the consequence’ is still required by regulators. They may be referred to as:• a scenario test, where a defined
event or series of events is pos-tulated and the consequences as-sessed;
• a stress test, where pre-agreed as-sumptions of risk, for example implied within a business plan (e.g. interest rate assumptions), are stressed and challenged to deter-mine their impact on results and company sustainability;
• a reverse stress test, where events or combinations of events are pos-tulated that could cause insolvency of the firm if unhedged.
Scenario, stress and reverse stress tests may be informed by science and modelling or expert opinion, or both, and often an assessment of probabili-ty will be estimated. Insurance regula-tors often focus on a 0.5 % probabili-ty level as a benchmark, i.e. the worse that may be expected every 200 years. If stress and scenario tests give num-bers for an estimated 1 in 200 events that the stochastic model says could happen, say, every 10 years, then it casts doubt on the assumptions with-in the model or the test itself — they could be assessed and challenged. Similarly, the framing of multievent
reverse stress tests may challenge as-sumptions about dependency and correlation within the model.
Realistically, deterministic methods are not 100 % reliable, taking as they do only a subset of potential events, but their practical performance in preventing hazard -impacting com-munities is as good and in some cas-es even better than other methods. If properly presented they can be clear, transparent and understandable. The process of developing deterministic stress and scenario sets can also be a means to engage a range of experts and stakeholders in the risk analysis process, gaining buy-in to the process.
Whether rules and standards derived from such tests work may depend on the risk culture of the region or firm where the risk is managed. Some risk cultures have a highly disciplined approach to rules, whereas others al-low or apparently tolerate a degree of flexibility. Furthermore, the ef-fort required to create, maintain and check for compliance where technical standards are concerned is consider-able and may be beyond the capacity of those entrusted with enforcement.
2.1.3.3Semi-quantitative
risk analysis
Semi-quantitative risk analysis seeks to categorise risks by comparative scores rather than by explicit proba-bility and financial or other measur-able consequences. It is thus more rigorous than a purely qualitative ap-proach but falls short of a full com-prehensive quantitative risk analysis. But rather like deterministic methods, it can complement a full stochas-
tic risk analysis by inserting a reality check. Semi-quantitative methods can be used to illustrate comparative risk and consequences in an accessible way to users of the information. Indeed, some output from complex stochas-tic models may be presented in forms similar to that used in semi-quanti-tative risk analysis, e.g., risk matrices and traffic light rating systems (for ex-ample where red is severe risk, orange is medium risk, yellow is low risk and green is very low risk).
Semi-quantitative risk analysis seeks
to categorise risks by comparative scores
rather than by explicit probability and financial
or other measurable consequences.
A risk matrix is a means to commu-nicate a semi-quantitative risk assess-ment: a combination of two dimen-sions of risk, severity and likelihood, which allows a simple visual compari-son of different risks.
Severity can be considered for any unwanted consequence such as fire, explosion, toxic release, impact of natural hazards (e.g. floods and tsu-namis) with their effects on workers and the community, environmental damage, property damage or asset loss. A severity scale from minor to catastrophic can be estimated or cal-culated, perhaps informed by some form of model. Normal risk matri-
52
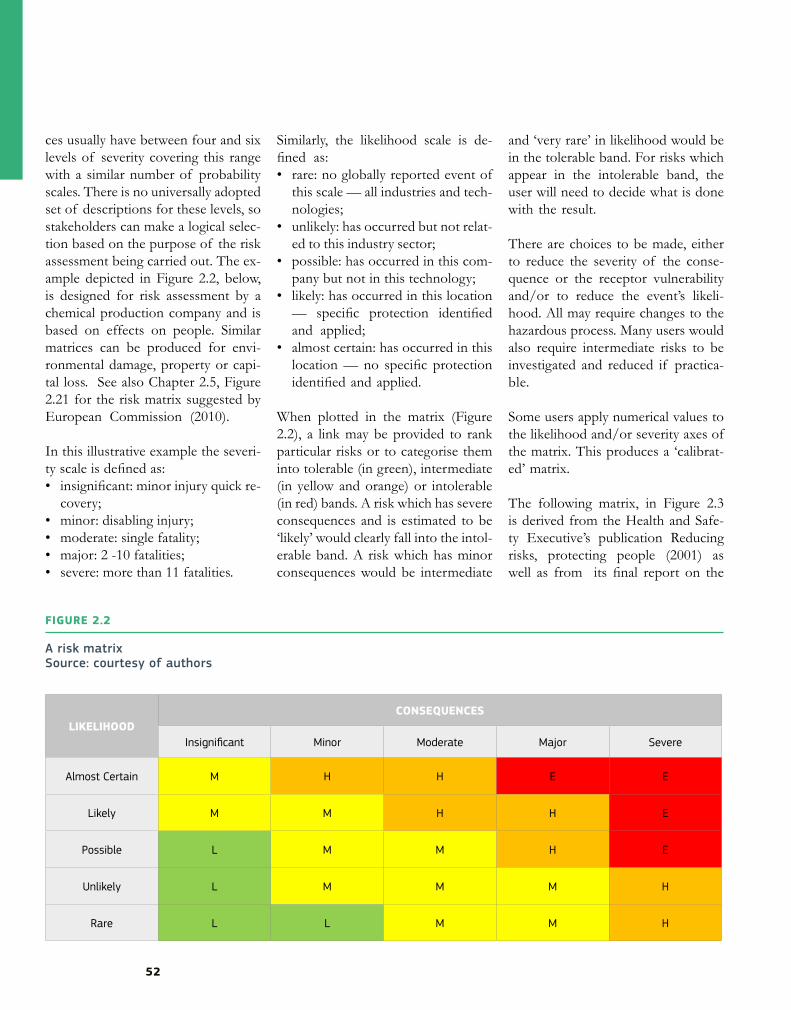
ces usually have between four and six levels of severity covering this range with a similar number of probability scales. There is no universally adopted set of descriptions for these levels, so stakeholders can make a logical selec-tion based on the purpose of the risk assessment being carried out. The ex-ample depicted in Figure 2.2, below, is designed for risk assessment by a chemical production company and is based on effects on people. Similar matrices can be produced for envi-ronmental damage, property or capi-tal loss. See also Chapter 2.5, Figure 2.21 for the risk matrix suggested by European Commission (2010).
In this illustrative example the severi-ty scale is defined as: • insignificant: minor injury quick re-
covery;• minor: disabling injury;• moderate: single fatality;• major: 2 -10 fatalities;• severe: more than 11 fatalities.
Similarly, the likelihood scale is de-fined as:• rare: no globally reported event of
this scale — all industries and tech-nologies;
• unlikely: has occurred but not relat-ed to this industry sector;
• possible: has occurred in this com-pany but not in this technology;
• likely: has occurred in this location— specific protection identified and applied;
• almost certain: has occurred in thislocation — no specific protection identified and applied.
When plotted in the matrix (Figure 2.2), a link may be provided to rank particular risks or to categorise them into tolerable (in green), intermediate (in yellow and orange) or intolerable (in red) bands. A risk which has severe consequences and is estimated to be ‘likely’ would clearly fall into the intol-erable band. A risk which has minor consequences would be intermediate
and ‘very rare’ in likelihood would be in the tolerable band. For risks which appear in the intolerable band, the user will need to decide what is done with the result.
There are choices to be made, either to reduce the severity of the conse-quence or the receptor vulnerability and/or to reduce the event’s likeli-hood. All may require changes to the hazardous process. Many users would also require intermediate risks to be investigated and reduced if practica-ble.
Some users apply numerical values to the likelihood and/or severity axes of the matrix. This produces a ‘calibrat-ed’ matrix.
The following matrix, in Figure 2.3 is derived from the Health and Safe-ty Executive’s publication Reducing risks, protecting people (2001) as well as from its final report on the
A risk matrixSource: courtesy of authors
FIGURE 2.2
LIKELIHOODCONSEQUENCES
Insignificant Minor Moderate Major Severe
Almost Certain M H H E E
Likely M M H H E
Possible L M M H E
Unlikely L M M M H
Rare L L M M H

CHAPTER 2 UNDERSTANDING DISASTER RISK: RISK ASSESSMENT METHODOLOGIES AND EXAMPLES
53
Buncefield fire and explosion, Safety and environmental standards for fuel storage sites (2009).
Sometimes matrices are used to com-pare different risk types as per this example from the United Kingdom’s National risk register of civil emer-gencies report (2015). Such matrices are intuitively attractive, but in prac-tice they can be misleading (Cox, 2008).
Very often an assessment of both frequency and severity is highly sub-jective and so can greatly differ , even when produced by two people with similar experiences; the impact of expert judgement can be profound (Skjong and Wentworth, 2001). It is vital for reasoning to be given for any
A comparative risk matrixSource: United Kingdom Cabinet Office (2015)
A calibrated risk matrixSource: Health and Safety Executive (2001, 2009)
FIGURE 2.4
FIGURE 2.3
FREQUENCy/LIKELIHOOD
SINGLE FATALITy
2 - 10 FATALITIES
11 - 50 FATALITIES
51 - 100 FATALITIES
101+ FATALITIES
Likely >10-2/yr Intolerable Intolerable Intolerable Intolerable Intolerable
Unlikely>10-4/yr but <10-
2/yr
Tolerable (but
intolerable if individual
risk of fatality
>10-3/yr)
Tolerable (but
intolerable if individual
risk of fatality
>10-3/yr)
Intolerable Intolerable Intolerable
Very unlikely
>10-6/yr but <10-
4/yrTolerable Tolerable Tolerable Tolerable Intolerable
Remote>10-8/yr but <10-
6/yr
Broadly Acceptible
Broadly Acceptible Tolerable Tolerable Tolerable
OV
ERAL
L RE
LATI
VE
IMPA
CT S
CORE
5 Pandemic Influenza
4Coastal Flooding
Widespread electricty failure
3Major transport accidentsMajor industrial accidents
Effusive volcanic eruptions Emerging infectuaous
diseases Inland flooding
Severe space weather Low temperatures/heavy snow
Heatwaves Poor air quality events
2Public disorder Severe wildfires
Animal diseases Drought
Explosive volcanic eruptionStorms and gales
1 Disruptive industrial action
Between 1 in 20,000 and 1 in 2,000
Between 1 in 2,000 and 1 in 200
Between 1 in 200 and 1 in 20
Between 1 in 20 and 1 in 2 Greater than 1 in 2
RELATIVE LIKELIHOOD OF OCCURING IN NEXT 5 yEARS
54
assessment, therefore allowing debate and challenge.
If subject to a full probabilistic mod-elling exercise, we would not just have one value for coastal flooding but rather a complete distribution of coastal floods from frequent but very low severity to rare but very high se-verity.
Which point of the curve should be picked for each peril? Different selec-tions will give very different impres-sions of comparative risk.
Semi-quantitative methods can be a useful stepping stone towards a full quantitative system, particularly where detailed data are lacking, and can be used as a means to capture subjective opinion and hold it up to challenge, opening debate and be-coming a framework to identify where additional analytical effort is required.
2.1.3.4Probabilistic risk
analysisThis method originated in the Cold War nuclear arms race, later adopted
by the civil nuclear industry. It typi-cally attempts to associate probability distributions to frequency and severi-ty elements of hazards and then run many thousands of simulated events or years in order to assess the likeli-hood of loss at different levels. The method is often called Monte Carlo modelling after the gaming tables of the principality’s casinos. These meth-ods have been widely adopted by the insurance industry, particularly where problems are too complicated to be represented by simple formulae, in-cluding catastrophic natural hazard risks.
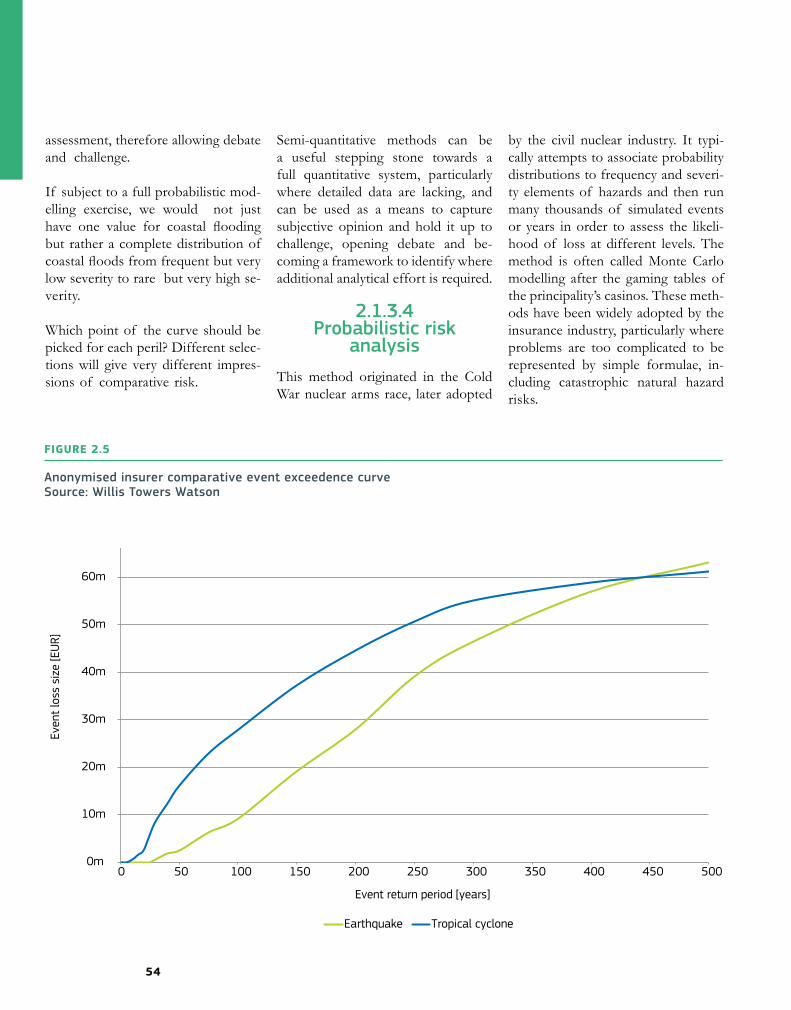
Anonymised insurer comparative event exceedence curve Source: Willis Towers Watson
FIGURE 2.5
0m
10m
20m
30m
40m
50m
60m
70m
0 50 100 150 200 250 300 350 400 450 500
Event return period [years]
Even
t los
s si
ze [E
UR]
Earthquake Tropical cyclone
CHAPTER 2 UNDERSTANDING DISASTER RISK: RISK ASSESSMENT METHODOLOGIES AND EXAMPLES
55
A commonly used generic term for these methods is QRA or probabil-istic or stochastic risk modelling. To-day it is frequently used by industry and regulators to determine individ-ual and societal risks from industries which present a severe hazard con-sequence to workers, the community and the environment. EU legislation such as the Seveso III directive (Di-rective 2012/18/EU) requires risks to be mapped and managed to a tol-erable level. These industrial require-ments have resulted in the emergence of organisations, specialists and con-sultants who typically use specially designed software models. The use of probabilistic methods is spreading from the industrial field to others, for example the Netherlands flood de-fence planning.
Probabilistic or stochastic risk analysis seeks to
understand and model all potential events with their
associated probabilities and outcomes, allowing a sophisticated cost/benefit
analysis of different risk management strategies.
Stochastic risk modelling has been wholeheartedly embraced by the re/insurance industry over the past 30 years, particularly for natural ca-tastrophes, though increasingly for all types of risks. EU solvency II regu-lation (Directive 2009/138/EC), a manifestation of the advisory insur-ance core principles for regulators set
by the International Association of Insurance Supervisors in Basel (IAIS, 2015), allows companies to substitute some or all of their regulatory capital calculation with their own risk models if approved by their regulatory and subject to common European rules.
The main advantage of a quantitative method is that it considers frequency and severity together in a more com-prehensive and complex way than other methods. The main problem is that it can be very difficult to ob-tain data on risks: hazard, exposure, vulnerability and consequential se-verity. If it is difficult to understand and represent the characteristics of a single risk then it is even harder to understand their interdependencies. There is inevitably a high level of sub-jectivity in the assumptions driving an ‘objective’ quantitative analysis. A paper by Apostolakis (2004) on QRA gives a coherent argument for appro-priate review and critique of model assumptions. The level of uncertainty inherent in the model may not always be apparent or appreciated by the ul-timate user, but the results of a fully quantitative analysis, if properly pre-sented, enhance risk understanding for all stakeholders.
Often the process of building a probabilistic model is as valuable as the results of the model, forcing a structured view of what is known, unknown and uncertain and bringing assumptions that may otherwise be unspoken into the open and thereby challenging them.
Typically for a full stochastic mod-el, severities for each peril would be compared for different probability levels, often expressed as a return pe-
riod; the inverse of annual probability, i.e. how many years would be expect-ed to pass before a loss of a given size occurred.
Figure 5 gives an example of output of such a model, here showing the size of individual loss for two differ-ent perils with return periods of up to the worst that may be expected every 500 years. Note that a return period is a commonly used form of probability notation. A 1-in-200 year loss is the worst loss that can be expected every 200 years, i.e. a loss with a return pe-riod of 200 years. A return period is the inverse of probability; a 1- in -200 year event has a 0.5 % probability (1/200).
We can see that, for example, every 100 years the worst tropical cy-clone loss we can expect is over EUR 28 million compared to the worst earthquake loss we can expect every 100 years of EUR 10 million.
In fact, a tropical cyclone gives rise to significantly higher economic loss than an earthquake, up until the 1 -in- 450-year probability level. But which is the most dangerous? A more likely event probabilities tropical cyclone is much more damaging, but at very remote probabilities it is earthquake. Notice too the very significant dif-ferences in loss estimate for the prob-ability buckets used in the National risk register for civil emergencies re-port (United Kingdom Cabinet Office 2015) risk matrix example in Figure 2.4. The national risk register looks at the probability of an event occurring in a 5-year period, but compares the 1-in-40-year loss to the 1-in-400-year loss, broadly equivalent to the 1-in-200 to 1-in-2 000 5-year bucket: the
56
loss for both perils at these probabili-ty levels is very different.
Terms like ‘1-in-100 storm’ or ‘1-in -100 flood’ are often used in the pop-ular press, but it is important to define what is meant by these terms. Is this the worst flood that can be expected every 100 years in that town, valley, region or country? It is also impor-tant not just to look at the probabili-ty of single events as per Figure 2.5, an occurrence exceedance probability curve, but also annual aggregate loss from hazards of that type, i.e. an an-nual aggregate exceedance probabil-
ity curve. For a given return period the aggregate exceedance probability value will clearly be greater or at least equal to the occurrence exceedance probability — the 1 in 200 worst ag-gregate exceedance probability could be a year of one mega event or a year of five smaller ones that are individ-ually unexceptional but cumulatively significant.
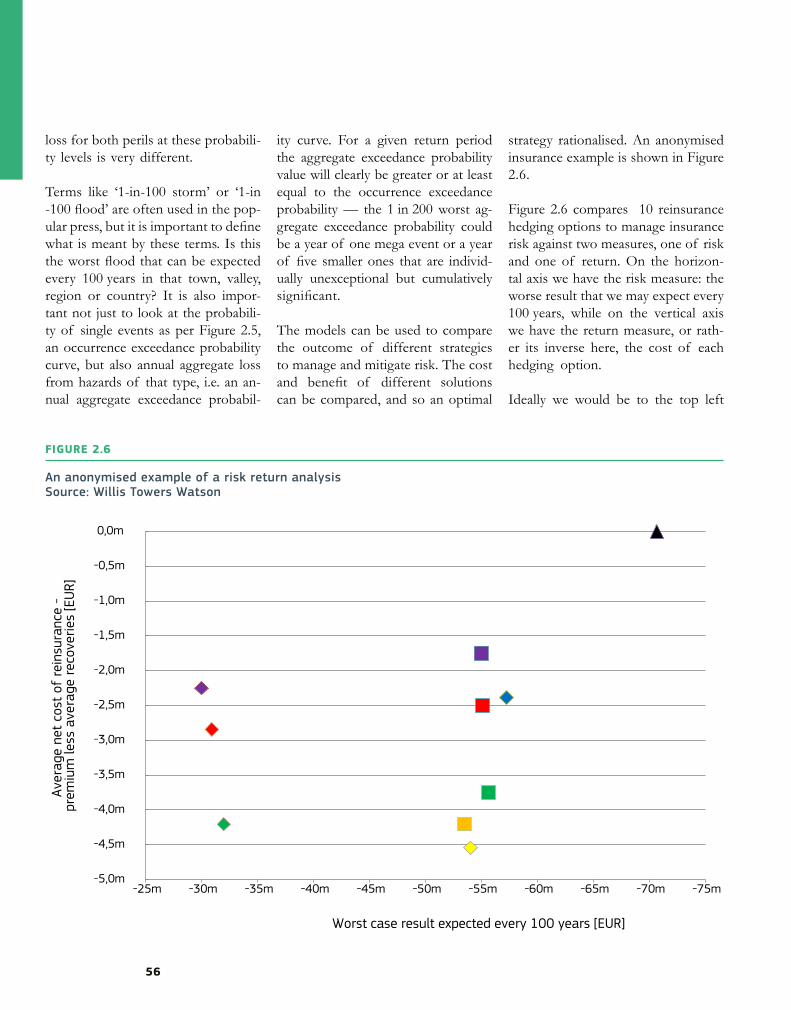
The models can be used to compare the outcome of different strategies to manage and mitigate risk. The cost and benefit of different solutions can be compared, and so an optimal
strategy rationalised. An anonymised insurance example is shown in Figure 2.6.
Figure 2.6 compares 10 reinsurance hedging options to manage insurance risk against two measures, one of risk and one of return. On the horizon-tal axis we have the risk measure: the worse result that we may expect every 100 years, while on the vertical axis we have the return measure, or rath-er its inverse here, the cost of each hedging option.
Ideally we would be to the top left
An anonymised example of a risk return analysisSource: Willis Towers Watson
FIGURE 2.6
-5,0m
-4,5m
-4,0m
-3,5m
-3,0m
-2,5m
-2,0m
-1,5m
-1,0m
-0,5m
0,0m
-75m-70m-65m-60m-55m-50m-45m-40m-35m-30m-25m
Worst case result expected every 100 years [EUR]
Aver
age
net
cost
of
rein
sura
nce
- pr
emiu
m le
ss a
vera
ge r
ecov
erie
s [E
UR]
CHAPTER 2 UNDERSTANDING DISASTER RISK: RISK ASSESSMENT METHODOLOGIES AND EXAMPLES
57
of the chart: low risk but low cost. The ‘do nothing’ option is the black triangle at the top right: high risk (a EUR 70 million 1-in-100 year loss) but zero additional cost. The nine re-insurance hedging options fall into two clusters on the chart.
The purple diamond option to the ex-treme left has the least risk, reducing the 1-in-100 loss to EUR 30 million, but at an annual cost of EUR 2.25 mil-lion. The other two options in that cluster cost more and offer less ben-efit so can be ignored. The best opin-ion of the middle group is the purple square, reducing the 1-in-100 loss to EUR 55 million but at an annual aver-age cost of EUR 1.75 million. Again, this option clearly offers the best risk return characteristics of all the others in the middle group, so the others in that group may be discounted.
Therefore, from 10 options including the ‘do nothing’, option we have a shortlist of three: • black triangle: high risk
(EUR 70 million 1-in-100 loss), zero cost;
• purple square: medium risk (EUR 55 million 1-in-100 loss), medium cost (EUR 1.75 million);
• purple diamond: lowest risk (EUR 30 million 1-in-100 loss), highest cost (EUR 2.25 million).
Which to pick depends on the risk ap-petite of the firm. If they are uncom-fortable with the unhedged risk then the purple diamond seems to offer much better protection than the pur-ple square option for comparatively little additional cost.
Similar methods can be used to com-pare options for, say, managing flood
risk in a particular location and/or process risk for a particular plant. The same metrics can be used to look at and compare different perils and combinations of perils. The methods make no moral judgements but allow-ing the cost of a particular strategy to be compared against the reduction is a risk as defined by a specific risk meas-ure. It is at this point that more sub-jective, political decisions can be made on an informed, objective basis.
An example of a comparative peril analysis for a European city is out-lined in a paper by Grünthal et al. (2006) on the city of Cologne.
It must always be remembered that models advise, not decide. Such charts and analyses should not be considered definitive assessments; like any model they are based upon a set of defined assumptions.
2.1.4Conclusions and key
messages
PartnershipThe process of risk assessment acts as a catalyst to improve risk understand-ing and so to encourage a process of proactive risk management. An early adapter of these methods, the glob-al catastrophe insurance and reinsur-ance industry has been transformed by the process and has become more technically adept, more engaged with science and more financially secure, providing more resilience for society. Similarly, the manufacturing and pro-cess industries have embraced struc-tured risk identification and assess-ment techniques to improve the safety
of the manufacturing process and the safety of the consumer.
Disaster risk assessment requires a combination of skills, knowledge and data that will not be held within one firm, one industry, one institution, one discipline, one country, or neces-sarily one region. Risk assessment re-quires input from a variety of experts in order to identify potential hazards, those that could occur as well as those in the historical record.
Rigorous approaches to risk assess-ment require scientific modelling and a precise understanding of risk and probability. Scientific models can be compared in order to challenge the underlying assumptions of each and lead to better, more transparent deci-sions.
As risk assessments get more quan-titative, scientific, and technical, it is important that policymakers are able to interpret them. The assumptions within models must be transparent, and qualitative risk assessment (such as deterministic scenario impacts or risk matrixes) can be useful and complementary to stochastic model-ling. It is important that policymak-ers can demonstrate that appropriate expertise and rigor has been engaged to found risk management decisions firmly.
The practitioner lies in the centre of the many opportunities for partner-ships in disaster risk assessment. In order to think beyond accepted ways of working and challenge ingrained assumptions, links between other practitioners in familiar fields as well as other sectors and industries and ac-ademia are extremely valuable.

58
KnowledgeThe risk assessment process is struc-tured and covers risk identification, hazard assessment, determining expo-sure and understanding vulnerability. Depending on the objective of risk assessment and data availability, risk assessment methods can range in for-malization and rigor. There are more subjective scenario based determinis-tic models, semi quantitative risk anal-yses such as risk matrixes, and fully quantitative risk assessment; probabil-istic or stochastic risk modelling. The more qualitative approaches to risk add value through the process of de-veloping a framework to capture sub-jective risk perception and serve as a starting point for a discussion about assumptions and risk recognition en-gaging a wide variety of experts and stakeholders in the process. They also provide a means to reality check more theoretical models. Probabilistic and stochastic analyses provide the poten-tial to perform cost/benefit or risk/return analysis, creating an objective basis for decision making.
Rigorous quantitative approaches to risk assessment and probabilistic analysis raise awareness of the need for further scientific input and the re-quirement to transfer of knowledge and engagement between science and practitioners.
Risk assessment and analysis provides a framework to weigh decisions, and risk models provide an objective ba-sis against which policy decisions can be made and justified. However, it is important that the limitations of modelling are recognized and inher-ent uncertainty is understood. Having
the ability to compare and challenge assumptions, as well as requiring evi-dence based analysis, is required.
Risk perception is subjective, but practitioners have valuable informa-tion in the fields of data, methodol-ogies and models that further solidify frameworks through which hazards can be understood and compared in an objective fashion.
InnovationInnovation is required to meet the challenges of lack of data and partial information in risk identification and modelling. Creative approaches can be made to capture and challenges assumptions implicitly or explicitly made and so test them against availa-ble data and defined stresses.
.
Risk analysis creates a framework; a starting
point for debate about policy, risk and what we know and cannot know.
This leads to greater understanding and
better, more transparent decision-making.
No model is perfect. New scientif-ic input can improve and challenge models – testing sensitivity to prior assumption, so leading to a great-er understanding of disaster events which in turn leads to safer compa-nies, communities and countries A deeper understanding of the quantita-tive and qualitative approaches to risk
management can help innovate ways of thinking about subjective public risk perception, and risk assessment frameworks can develop a more ob-jective understanding of risk and risk-informed decision making.
Risk assessment and associated mod-elling contain inherent uncertainty and are not fully complete. It is important to innovate in areas where hazards are less known and capable of anticipa-tion; truly “unknown unknowns” and “known unknowns” must be consid-ered. Similarly assumptions held for “known knowns” should be contin-uously challenged and tested as new information arises.
CHAPTER 2 UNDERSTANDING DISASTER RISK: RISK ASSESSMENT METHODOLOGIES AND EXAMPLES
59
2.2 Current and innovativemethods to define expo-sureChristinaCorbane, Paolo Gamba, Martino Pesaresi, Massi-miliano Pittore, Marc Wieland
2.2.1What is exposure?
Exposure with vulnerability (see Chapter 2.3) and hazard (see Chapter 3) is used to measure disaster risk (seeChapter 2.3). It is reported that expo-sure has been trending upwards over the past several decades, resulting in an overall increase in risk observed worldwide, and that trends need to be better quantified to be able to address risk reduction measures. Particular at-tention to understanding exposure is required for the formulation of poli-cies and actions to reduce disaster risk (UNISDR, 2015a), as highlighted by the Sendai Framework for Disaster Risk Reduction (UNISDR, 2015b): ‘Policies and practices for disaster risk management should be based on an understanding of disaster risk in all its dimensions of vulnerability, capacity, exposure of persons and assets, haz-ard characteristics and the environ-ment. Such knowledge can be lever-aged for the purpose of pre -disaster risk assessment, for prevention and
mitigation and for the development and implementation of appropriate preparedness and effective response to disasters.
Exposure is a necessary, but not suffi-cient, determinant of risk (Cardona et al., 2012) (see Chapter 2.1). Accord-ing to available global statistics, least developed countries represent 11 % of the population exposed to hazards but account for 53 % of casualties, while the most developed countries account for 1.8 % of all victims (Pe-duzzi et al., 2009) with a population exposure of 15 %. These figures show that similar exposures with con-trasting levels of development, of land- use planning and of mitigation measures lead to drastically different tolls of casualties. Hence it is possi-ble to be exposed, but not vulnerable; however, it is necessary to also be ex-posed to be vulnerable to an extreme event (Cardona et al., 2012).
Due to its multidimensional nature, exposure is highly dynamic, varying across spatial and temporal scales:
depending on the spatial basic units at which the risk assessment is per-formed, exposure can be character-ised at different spatial scales (e.g. at the level of individual buildings or administrative units).
Exposure represents the people and assets at risk
of potential loss or that may suffer damage to
hazard impact. It covers several dimensions like
the physical (e.g. building stock and infrastructure),
the social (e.g. humans and communities) and the
economic dimensions.
Population demographic and mobility, economic development and structural changes in the society transform expo-sure over time. The quantification of
60
exposure is challenging because of its interdependent and dynamic dimen-sions. The tools and methods for de-fining exposure need to consider the dynamic nature of exposure, which evolves over time as a result of often unplanned urbanisation, demograph-ic changes, modifications in building practice and other socioeconomic, in-stitutional and environmental factors (World Bank, GFDRR, 2014). Various alternative or complementary tools and methods are followed to collect exposure-related data; they include rolling census and digital in situ field surveys. When the amount, spatial coverage and/or quality of the infor-mation collected in the ground is in-sufficient for populating exposure da-tabases, the common practice is then to infer characteristics on exposed assets from several indicators, called proxies. Exposure modelling also has a key role to play in risk assessment, especially for large- scale disaster risk models (regional to global risk model-ling (De Bono and Chatenoux, 2015; De Bono and Mora ,2014)). Among the different tools for collecting in-formation on exposure, Earth obser-vation represents an invaluable source of up-to-date information on the ex-tent and nature of the built-up envi-ronments, ranging from the city lev-el (using very high spatial resolution data) to the global level (using global coverage of satellite data) (Deich-mann et al., 2011; Dell’Acqua et al. ,2013; Ehrlich and Tenerelli, 2013). Besides, change -detection techniques based on satellite images can provide timely information about changes to the built-up environment (Bouziani et al., 2010).The choice of the approach determines the resolution (spatial de-tail) and the extent (spatial coverage) of the collected exposure data. It also
influences the quality of the collected information.
Despite the general conceptual and theoretical understanding of disaster exposure and the drivers for its dy-namic variability, few countries have developed multihazard exposure da-tabases to support policy formulation and disaster risk- reduction research. Existing exposure databases are often hazard specific (earthquakes, floods and cyclones), sector specific (infra-structure and economic) or target specific (social, ecosystems and cul-tural) (Basher et al., 2015). They are often static, offering one-time views of the baseline situation, and cannot be easily integrated with vulnerability analysis.
This chapter reviews the current in-itiatives for defining and mapping exposure at the EU and global levels. It places emphasis on remote sensing- based products developed for phys-ical and population exposure map-ping. Innovative approaches based on probabilistic models for generating dynamic exposure databases are also presented together with a number of concrete recommendations for priority areas in exposure research. The broader aspects of exposure, in-cluding environment (e.g. ecosystem services) and agriculture (e.g. crops, supply chains and infrastructures), de-serve to be addressed in a dedicated future chapter and will not be covered by the current review.
2.2.2Why do we need
exposure?
There is a high demand for exposure
data by the communities that address disaster risk reduction (DRR). Na-tional governments and local author-ities need to implement DRR pro-grammes; the insurance community needs to set premiums and manage their aggregate exposures; civil society and the aid community need to identi-fy the regions of the world that most urgently require DRR measures (Ehr-lich and Tenerelli, 2013). Effective adaptation and disaster risk manage-ment (DRM) strategies and practices depend on a rigorous understanding of the dimensions of exposure (i.e. physical and economic) as well as a proper assessment of changes and uncertainties in those dimensions (Cardona et al., 2012).
Both the scope and the scale of the
natural hazard impact assessment determine
the type of exposure data to be collected.
Risk models require detailed exposure data (e.g. with information on build-ings, roads and other public assets) to produce as outputs risk metrics such as the annual expected loss and the probable maximum loss (see Chapter 2.4). For instance, catastrophe mod-els commonly used by the insurance industry include an exposure module, which represents either a building of specific interest, a dwelling represent-ative of the average construction type in a given area or an entire portfolio of buildings with different characteristics
CHAPTER 2 UNDERSTANDING DISASTER RISK: RISK ASSESSMENT METHODOLOGIES AND EXAMPLES
61
(e.g. an entire city). The characteristics may include physical characteristics like building height, occupancy rate, usage (private, public like commer-cial, industrial, etc.), construction type (e.g. wood or concrete) and age, and also non-physical characteristics like the replacement cost which is need-ed for calculating the loss at a certain location (Michel-Kerjan et al., 2013). Besides, insurance companies need to assess and model the business inter-ruption that represents a major part of the total economic loss. To quan-tify loss due to business interruption, exposure databases need to include information on building contents and business information for different types of properties (Rose and Huyck 2016). These industry exposure data-bases are often proprietary and use heterogeneous taxonomies and classi-fication systems which hinder efforts of merging independently developed datasets (GFDRR, 2014). However, the Oasis (OASIS, 2016) community and the recently established Insur-ance Development Forum are dedi-cating special efforts to exposure data harmonisation, sourcing, structuring and maintenance at the global levels. Moreover, an initiative lead by Perils is offering de facto standard indus-try exposure databases for property across Europe at an aggregated spa-tial level (PERILS, 2016).
If the aim is to know whether a par-ticular feature is likely to be affected or not by a certain level of hazard, then it is enough to simply identify the location of that feature (e.g. build-ing location and building footprint) or group of features (e.g. building stock). Whereas if the purpose is to under-stand the potential economic impacts or human loss, then other attributes
of the feature or group of features need to described (e.g. the type of construction materials, population density and the replacement value). Exposure databases detailed to single building units are seldom available for disaster modellers. Instead, the expo-sure data are more often available in an aggregated level for larger spatial units related to arbitrary areal subdivi-sion of the settlements, census block, postal codes, city blocks or more reg-ular gridded subdivision. A spatial unit may contain a statistic summary of building information such as aver-age size and average height, density or even relative distribution of building types (Ehrlich and Tenerelli, 2013). For optimal results the choice of the attribute and its granularity should be aligned with the scale and the purpose of the risk assessment. To a certain extent, the requirements in terms of granularity also depend on the peril being modelled: e.g. flood models re-quire detailed information on the lo-cation and building type. By contrast, windstorm models arguably need to be less precise. Detailed gust speeds will not be known at a precise loca-tion level but rather estimated on a broader spatial scale. There are clearly many attributes that can be attached to exposure data. Developing such databases requires a multidiscipli-nary team of construction engineers, economists, demographers and statis-ticians.
In recent years, several exposure data-sets with regional or global coverage have attempted to generate detailed building inventories and compile ex-posure data despite the challenges re-lated to the heterogeneous mapping schemas, the different typologies and the varying resolutions. In the follow-
ing sections, we review the existing initiatives at EU and global levels that have made a first step in overcoming these obstacles either i) by using ex-posure proxies such as land -use and land- cover products, ii) by using Earth observation technologies for mapping human settlements and pop-ulation or iii) by integrating existing information from different acquisi-tion techniques, scales and accuracies for characterising the assets at risk and for describing the building stock. We purposely limit the review here to large -scale exposure datasets that have a spatial component (i.e. associ-ated with a geographic location) and that are open, hence ensuring repli-cability and a better understanding of risk (World Bank, 2014).
2.2.3Land-cover and
land-use productsas proxies to
exposure
These products outline areas with different uses, including ‘industrial’, ‘commercial’ and ‘residential’ classes, as well as non-impervious areas (e.g. green spaces).
Land- use and land- cover (LU/LC) information products that are usually
derived from remote sensing data may provide
information on buildings and thus on exposure.
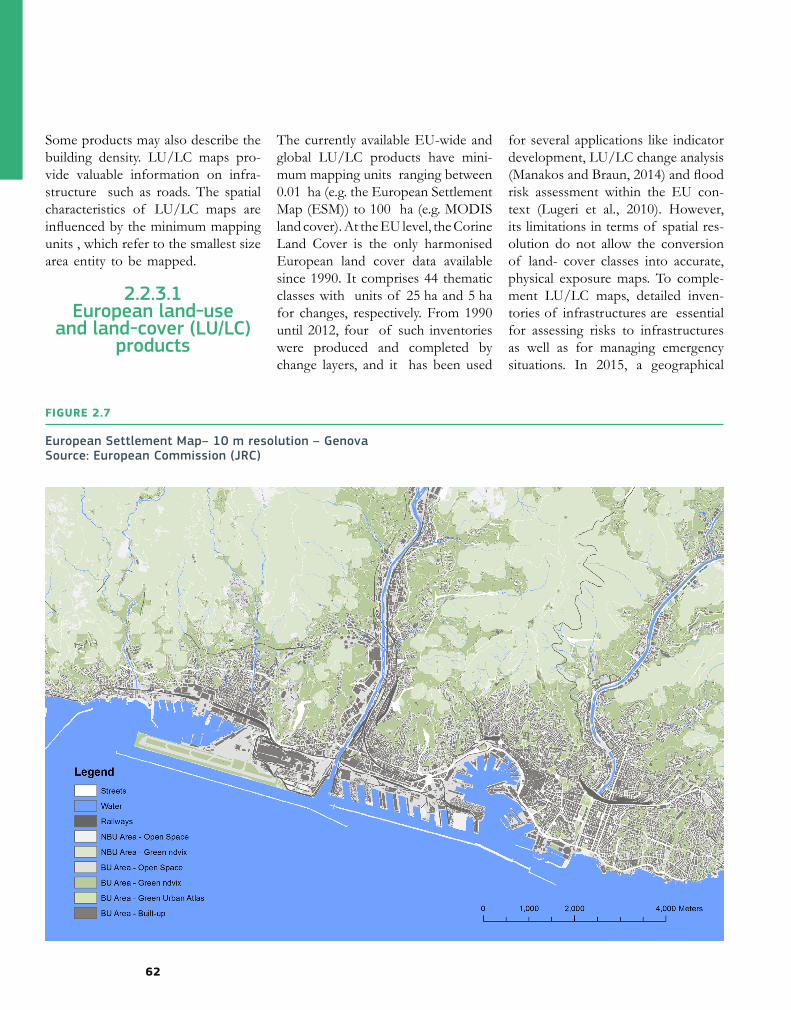
62
Some products may also describe the building density. LU/LC maps pro-vide valuable information on infra-structure such as roads. The spatial characteristics of LU/LC maps are influenced by the minimum mapping units , which refer to the smallest size area entity to be mapped.
2.2.3.1European land-use
and land-cover (LU/LC) products
The currently available EU-wide and global LU/LC products have mini-mum mapping units ranging between 0.01 ha (e.g. the European Settlement Map (ESM)) to 100 ha (e.g. MODIS land cover). At the EU level, the Corine Land Cover is the only harmonised European land cover data available since 1990. It comprises 44 thematic classes with units of 25 ha and 5 ha for changes, respectively. From 1990 until 2012, four of such inventories were produced and completed by change layers, and it has been used
for several applications like indicator development, LU/LC change analysis (Manakos and Braun, 2014) and flood risk assessment within the EU con-text (Lugeri et al., 2010). However, its limitations in terms of spatial res-olution do not allow the conversion of land- cover classes into accurate, physical exposure maps. To comple-ment LU/LC maps, detailed inven-tories of infrastructures are essential for assessing risks to infrastructures as well as for managing emergency situations. In 2015, a geographical
European Settlement Map– 10 m resolution – GenovaSource: European Commission (JRC)
FIGURE 2.7
CHAPTER 2 UNDERSTANDING DISASTER RISK: RISK ASSESSMENT METHODOLOGIES AND EXAMPLES
63
database of infrastructure in Europe was developed including transport networks, power plants and industry locations. (Marin Herrera et al., 2015). The database was successfully used in a comprehensive multihazard and multisector risk assessment for Eu-rope under climate change (Forzieri et al., 2015).
The Urban Atlas is another pan-Eu-ropean LU/LC product describing, in a consistent way, all major Eu-ropean cities’ agglomerations with more than 100 000 inhabitants. The current specifications of the Urban Atlas fulfil the condition of a mini-mum mapping unit of 0.25 ha, al-lowing the capture of urban, built-up areas in sufficient thematic and geo-graphic detail (Montero et al., 2014). The Urban Atlas cities are mapped in 20 classes, of which 17 are urban classes. It is a major initiative dealing with the monitoring of urban sprawl in Europe, designed to capture ur-ban land use, including low- density urban fabric, and in this way it offers a far more accurate picture of exposure in urban landscapes than the Corine Land Cover does. Despite its accuracy and relevance for risk modelling, the main limitation of this product is its spatial coverage, as it is restricted to large urban zones and their surround-ings (more than 100 000 inhabitants).
Currently, the continental map of built-up areas with the highest reso-lution so far produced is the ESM (Florczyk et al., 2016). The ESM (Fig-ure 2.7) is a 10 metre x 10 metre ras-ter map expressing the proportion of the remote sensing image pixel area covered by buildings; it was pro-duced in 2013-2014. It was developed jointly by two services of Europe-
an Commission (JRC and REGIO). The ESM is distributed as a building density product at both 10 metre x 10 metre and 100 metre x 100 metre resolutions, each supporting specific types of applications. For a pan-Eu-ropean risk assessment (Haque et al. 2016), the coarser (100 metre) resolu-tion is sufficient, whereas the 10 me-tre product would be necessary for local to regional risk assessment.
2.2.3.2Global land-use and land-cover products
A number of global land- cover products covering different time pe-riods and different spatial resolutions have been created from remote sens-ing, e.g. MODIS (Friedl et al., 2010), Africover, GLC-SHARE of 2014 (Latham et al., 2014), GLC2000 (Fritz et al., 2010), IGBP (Loveland et al., 2000) and GlobCover (Arino et al., 2012). Many of these products are based on coarse resolution sensors, e.g. GLC2000 is at 1 km, MODIS is at 500 metre and GlobCover is at 300 metre resolution, which hampers the potential to provide accurate ex-posure data that can directly feed into risk assessment models.
The first high- resolution (30 me-tres) global land -cover product is the GlobeLand30, which comprises 10 types of land cover including artifi-cial surfaces for years 2000 and 2010 (Chen et al., 2015). However, the ‘ar-tificial surfaces’ class consists of ur-ban areas, roads, rural cottages and mines impeding the straightforward conversion of the data into physical exposure maps.
The Global Urban Footprint de-
scribing built-up areas is being de-veloped by the German Aerospace Centre and is based on the analysis of radar and optical satellite data. The project intends to cover the extent of the large urbanised areas of megaci-ties for four -time slices: 1975, 1990, 2000 and 2010 at a spatial resolution of 12 metre x 12 metre (Esch et al., 2012). Once available, this dataset will allow effective comparative analyses of urban risks and their dynamics among different regions of the world.
The global human settlement layer (GHSL) is the first global, fine- scale, multitemporal, open data on the phys-ical characteristics of human settle-ments. It was produced in the frame-work of the GHSL project, which is supported by the European Commis-sion. The data have been released on the JRC open data catalogue (Glob-al Human Settlement Layer, 2016). The main product, GHS Built-up, is a multitemporal built-up grid (built-up classes: 1975, 1990, 2000 and 2014 ), which has been produced at high resolution (approximately 38 metre x 38 metre). The GHS Built-up grid was obtained from the processing of the global Landsat archived data in the last 40 years in order to under-stand global human settlement evolu-tion. The target information collected by the GHSL project is the built-up structure or building aggregated in built-up areas and then settlements according to explicit spatial composi-tion laws. They are the primary sign and empirical evidences of human presence on the global surface that are observable by current remote sens-ing platforms. As opposed to stand-ard remote sensing practices based on urban land cover or impervious surface notions, the GHSL semantic
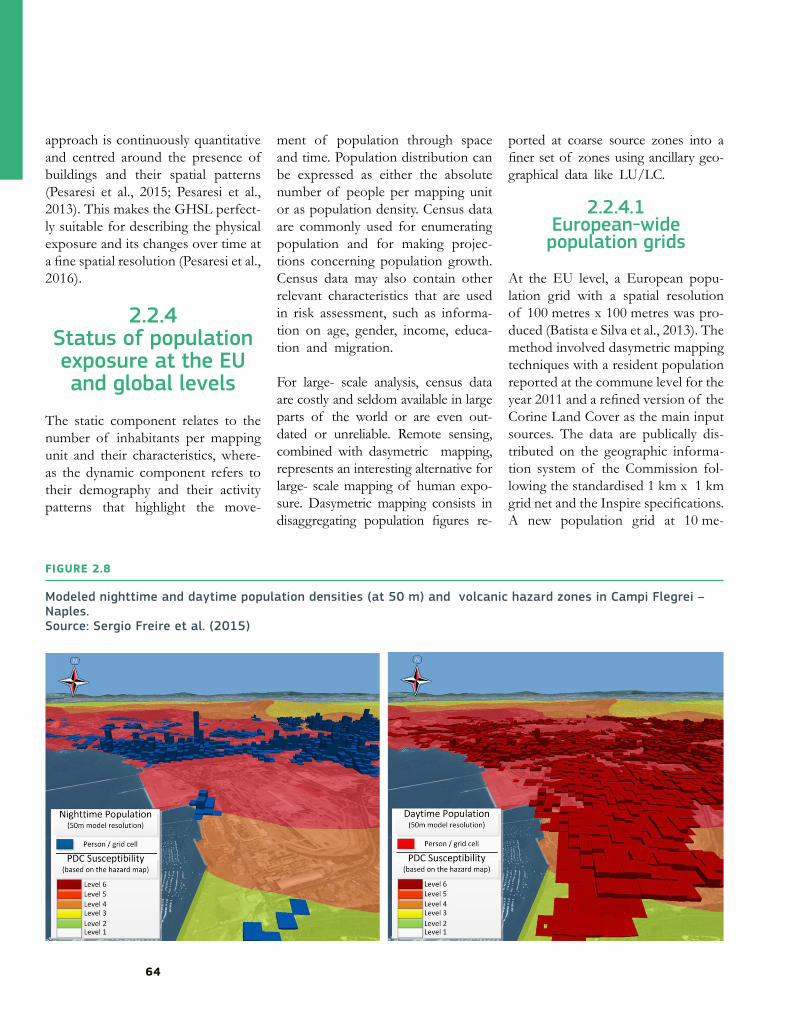
64
approach is continuously quantitative and centred around the presence of buildings and their spatial patterns (Pesaresi et al., 2015; Pesaresi et al., 2013). This makes the GHSL perfect-ly suitable for describing the physical exposure and its changes over time at a fine spatial resolution (Pesaresi et al., 2016).
2.2.4Status of population exposure at the EU and global levels
The static component relates to the number of inhabitants per mapping unit and their characteristics, where-as the dynamic component refers to their demography and their activity patterns that highlight the move-
ment of population through space and time. Population distribution can be expressed as either the absolute number of people per mapping unit or as population density. Census data are commonly used for enumerating population and for making projec-tions concerning population growth. Census data may also contain other relevant characteristics that are used in risk assessment, such as informa-tion on age, gender, income, educa-tion and migration.
For large- scale analysis, census data are costly and seldom available in large parts of the world or are even out-dated or unreliable. Remote sensing, combined with dasymetric mapping, represents an interesting alternative for large- scale mapping of human expo-sure. Dasymetric mapping consists in disaggregating population figures re-
ported at coarse source zones into a finer set of zones using ancillary geo-graphical data like LU/LC.
2.2.4.1European-wide population grids
At the EU level, a European popu-lation grid with a spatial resolution of 100 metres x 100 metres was pro-duced (Batista e Silva et al., 2013). The method involved dasymetric mapping techniques with a resident population reported at the commune level for the year 2011 and a refined version of the Corine Land Cover as the main input sources. The data are publically dis-tributed on the geographic informa-tion system of the Commission fol-lowing the standardised 1 km x 1 km grid net and the Inspire specifications.A new population grid at 10 me-
Modeled nighttime and daytime population densities (at 50 m) and volcanic hazard zones in Campi Flegrei – Naples.Source: Sergio Freire et al. (2015)
FIGURE 2.8
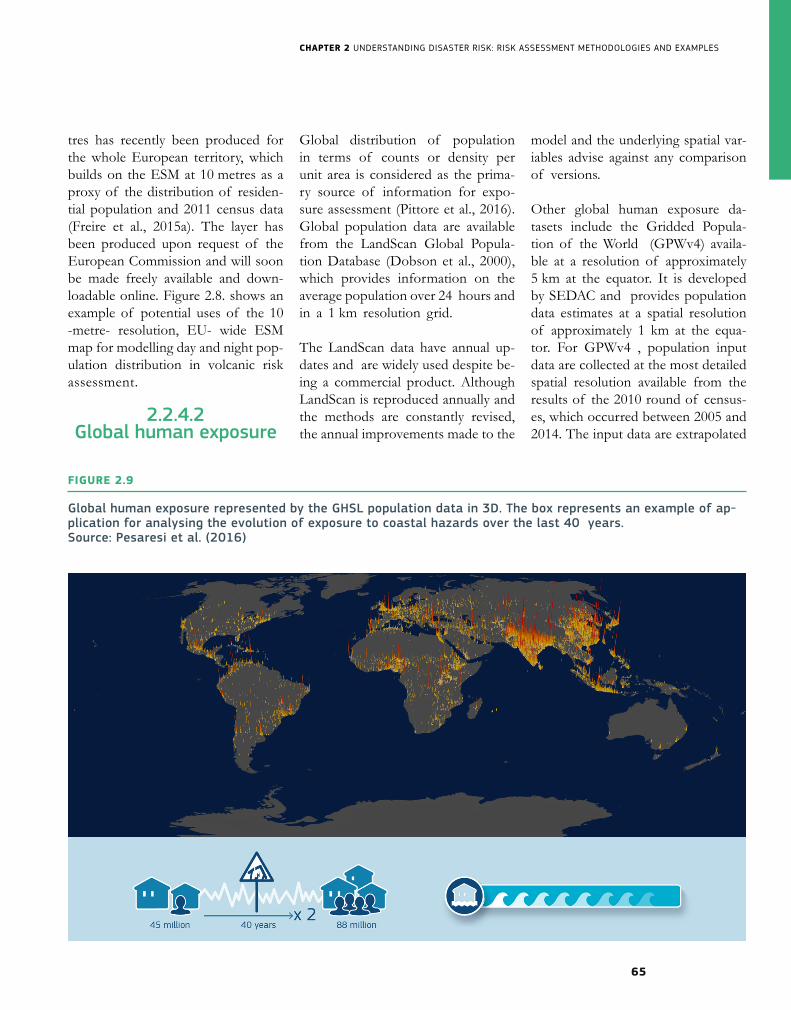
CHAPTER 2 UNDERSTANDING DISASTER RISK: RISK ASSESSMENT METHODOLOGIES AND EXAMPLES
65
tres has recently been produced for the whole European territory, which builds on the ESM at 10 metres as a proxy of the distribution of residen-tial population and 2011 census data (Freire et al., 2015a). The layer has been produced upon request of the European Commission and will soon be made freely available and down-loadable online. Figure 2.8. shows an example of potential uses of the 10 -metre- resolution, EU- wide ESM map for modelling day and night pop-ulation distribution in volcanic risk assessment.
2.2.4.2Global human exposure
Global distribution of population in terms of counts or density per unit area is considered as the prima-ry source of information for expo-sure assessment (Pittore et al., 2016). Global population data are available from the LandScan Global Popula-tion Database (Dobson et al., 2000), which provides information on the average population over 24 hours and in a 1 km resolution grid.
The LandScan data have annual up-dates and are widely used despite be-ing a commercial product. Although LandScan is reproduced annually and the methods are constantly revised, the annual improvements made to the
model and the underlying spatial var-iables advise against any comparison of versions.
Other global human exposure da-tasets include the Gridded Popula-tion of the World (GPWv4) availa-ble at a resolution of approximately 5 km at the equator. It is developed by SEDAC and provides population data estimates at a spatial resolution of approximately 1 km at the equa-tor. For GPWv4 , population input data are collected at the most detailed spatial resolution available from the results of the 2010 round of census-es, which occurred between 2005 and 2014. The input data are extrapolated
Global human exposure represented by the GHSL population data in 3D. The box represents an example of ap-plication for analysing the evolution of exposure to coastal hazards over the last 40 years. Source: Pesaresi et al. (2016)
FIGURE 2.9
66
to produce population estimates for the years 2000, 2005, 2010, 2015, and 2020 (Neumann et al., 2015).
The open WorldPop is another in-itiative providing estimated popu-lation counts at a spatial resolution of 100 metres x 100 metres through the integration of census surveys, high- resolution maps and satellite data (Lloyd et al., 2017) . Within the WorldPop project, population counts and densities are being produced for 2000-2020; the available data current-ly essentially cover America, Asia and Africa.
People present the most important elements-at-
risk with a static and dynamic component.
Recently, within the framework of the GHSL, an improved global lay-er called GHS-POP, which maps the distribution of the population with unprecedented spatio-temporal cov-erage and detail, has been released. The data have been produced from the best available global built-up layer (GHS-BU) and from census geospa-tial data derived from GPWv4. The population grids correspond to res-idential-based population estimates in built-up areas and not ‘residential population’ or ‘population in their place of residence’, for which consid-eration of land use would be required (Freire et al., 2015b).
The multitemporal data are available free of charge at a spatial resolution
of 250 metres x 250 metres for 1975, 1990, 2000 and 2015. It has already successfully been used in the context of global risk assessment for the anal-ysis of the increase in population ex-posure to coastal hazards over the last 40 years (Pesaresi et al., 2016).
2.2.5Exposure data describing the building stock
Several exposure databases attempt to characterise the assets at risk by including physical exposure infor-mation. The latter is often derived from the integration of a large vari-ety of possible exposure information sources using different modelling ap-proaches. We review here the existing initiatives that describe the building stock through a variety of attributes (e.g. height, construction material and replacement value).
2.2.5.1EU-wide building
inventory databases
The European Union’s seventh framework programme for research and technological development (FP7) project, the NERA (Network of Eu-ropean Research Infrastructure for Earthquake Risk Assessment and Mitigation) initiated the development of a European building inventory da-tabase to feed into the Global Expo-sure Database (GED) (see Chapter 2.2.5.2). The database builds upon the outcomes of NERIES project (Net-work of Research Infrastructures for European Seismology) to compile building inventory data for many Eu-ropean countries and Turkey (Erdik
et al., 2010). The European building inventory is a database that describes the number and area of different European building typologies within each cell of a grid, with a resolution of at least 30 arc seconds (approximately 1 km2 at the equator) for use in the seismic risk assessment of European buildings (Crowley et al., 2012). The database includes building/dwelling counts and a number of attributes that are compatible with the Glob-al earthquake model’s basic building taxonomy (i.e. material, lateral load, number of storeys, date of construc-tion, structural irregularity, occupancy class, etc.). This inventory contains useful information for the assessment of risk assessment and for the estima-tion of economic loss at the EU level.
2.2.5.2Global building
inventory databases
The prompt assessment of glob-al earthquakes for response (PAG-ER) (Jaiswal et al., 2010), the GED for GAR 2013 (GEG-2013) and the GED for the Global earthquake model (GED4GEM) are examples of global exposure databases that specif-ically include physical exposure in-formation.
On a country-by-country level, the PAGER (Jaiswal et al., 2010) con-tains estimates of the distribution of building types categorised by material, lateral force resisting system and oc-cupancy type (residential or non-resi-dential, urban or rural). The database draws on and harmonises numerous sources: (1) United Nations statistics, (2) the United Nations habitat’s de-mographic and health survey data-base, (3) national housing censuses,
CHAPTER 2 UNDERSTANDING DISASTER RISK: RISK ASSESSMENT METHODOLOGIES AND EXAMPLES
67
(4) the world housing encyclopae-dia project and (5) other literature. PAGER provides a powerful basis for inferring structural types globally. The database is freely available for public use, subject to peer review, scrutiny and open enhancement.
The GEC-2013 (De Bono and Chate-noux, 2015) is a global exposure da-taset at 5 km spatial resolution which integrates population and coun-try-specific building typology, use and value. It has been developed for the global risk assessment 2013 with the primary aim of assessing the risk of economic loss as a consequence of natural hazards at a global scale. The development of GEG-2013 is based on a top-down or ‘downscaling’ ap-proach, where information including socioeconomic, building type and capital stock at a national scale are transposed onto a regular grid, using geographic population and gross do-mestic product distribution models as proxies. GEG-2013 is limited in some important ways: i) it was fun-damentally constructed using national indicators that were successively dis-aggregated onto a 5 × 5 km grid; and ii) the capital stock in each cell is dis-tributed on the basis of the number of persons living in that cell and does not take into account the real value of the assets of the cell. The data can be downloaded from the GAR risk data platform.
The GED4GEM is a spatial invento-ry of exposed assets for the purpos-es of catastrophe modelling and loss estimation (Dell’Acqua et al., 2013, Gamba et al., 2012). It provides infor-mation about two main assets at risk: residential population and residential buildings. Potentially, it can also in-
clude information about non-residen-tial population and buildings, although the amount of information for these two additional assets is currently quite limited. In general, the GED is divid-ed into four different levels, which are populated from different data sourc-es and use different techniques. Each level has a different geographical scale as for the statistical consistency of the data it contains as well as a different level of completeness. Each level is thus appropriate for a different use: • Level 0 — A representation of the
population and buildings on a 30-arc seconds grid with informationabout the buildings coming fromstatistics available at the countrylevel. The building distribution isthus the same for each element ofthe grid belonging to a given coun-try, with a binary difference be-tween ‘rural’ and ‘urban’ areas.
• Level 1 — A representation ofpopulation and buildings on a 30-arc seconds grid with informationabout the buildings that is availa-ble using the subnational statistics(e.g. for regions, states, provincesor municipalities according to thedifferent countries).
• Level 2 — A representation whereeach element of the same 30 -arcseconds grid includes enough in-formation to be consistent by itself,and no distribution on a bigger ge-ographical scale is used. This casecorresponds to the situation whenall building counts are actually ob-tained, not by means of a disaggre-gation of a distribution availableon a wider area on the elements ofthe grid but by aggregating build-ing -level data, possibly availablefor the area of interest.
• Level 3 — A representation at thesingle building level, including allthe possible information abouteach building, such as structural,occupancy and economic variables.
The first version of the GED con-tains aggregate information on pop-ulation and the number/built area/reconstruction cost of residential and non-residential buildings at a 1 km resolution. Detailed datasets on single buildings are available for a selected number of areas and will increase over time.
2.2.6Future trends in
exposure mapping: towards a dynamic exposure modelling
The review of existing initiatives for defining and mapping exposure shows that there is a clear trend to-wards the use of satellite data in combination with statistical model-ling (top-down and bottom-up ap-proaches) for building exposure data: remotely sensed data sourcing for ex-posure is particularly useful in low-in-come and emerging economies which lack well-established data collection resources, frameworks and agencies. These economies are often also un-dergoing rapid urbanisation with dra-matically changing exposure concen-trations over short periods of time.
In parallel, over the last 5 years, the field of risk assessment has been in-creasingly driven by open data and open -source modelling, as highlight-ed in the report Understanding risk in an evolving world (GFDRR, 2014).

68
Open data initiatives such as the Hu-manitarian OpenStreetMap Team has contributed significantly to the collec-tion of exposure data in vulnerable countries: in a little over a year, more than 160 000 individual buildings were mapped through crowdsourcing and in situ surveys.
At present, one of the most challeng-ing aspects of exposure modelling is to implement multihazard exposure models through dynamic, scalable frameworks. The dynamic nature of such frameworks in this context re-flects the need to explicitly account for both the time variability of the exposed assets and the constant evo-lution of their representation in the model, which is seldom complete and exhaustive.
Remote sensing, combined with dynamic exposure modelling and bottom-up approaches
such as citizen mapping initiatives, can be an
effective way to build large exposure databases
.
In a dynamic, multiresolution expo-sure model, two basic types of entities should therefore coexist: atomic data and statistical (aggregated) models. Atomic data refer to physical struc-tures such as buildings or bridges that have been analysed individually and possibly not fully enumerated. Statis-tical models are aggregated descrip-tions defined over specific geographic
boundaries and possibly influenced by atomic data. Atomic data and sta-tistical models are closely related and mutually interactive, with both having geometric properties and attributes. Compound models accommodat-ing both atomic data and statistical models would be able to optimally exploit direct, in situ information ob-tained from specialised surveys, even if not complete and exhaustive, by constraining a set of statistical distri-butions describing the assets’ attrib-utes at the atomic level (e.g. material properties for a single building) or at the aggregation boundary level (for instance the expected number of sto-reys of different building types based on empirical observations in a city dis-trict). At atomic level, this can be ob-tained for instance by modelling the (in)dependence relationships among different assets’ attributes and with external covariates (e.g. geographical location, altitude, terrain slope, etc.).
An example for a probabilistic infor-mation integration approach is given in Pittore and Wieland (2013), where Bayesian networks are proposed for their sound treatment of uncertain-ties and for the possibility of seamless merging of different data sources, in-cluding legacy data, expert judgement and data mining- based inferences. Due to the increasingly large varie-ty of possible exposure information sources including sparse and incom-plete data available at small- scale res-olution, the issue of the need for the flexible integration of existing infor-mation at different scales and accura-cies in order not to discard available information needs to be confronted.
To exploit the full capabilities of the available information in combined
spatio-temporal approaches, a da-tabase is needed that allows one to model and query complex data types composed of multiple spatial and temporal dimensions. Information ex-tracted from a satellite image or man-ually sampled in situ show different degrees of quality in terms of relia-bility and accuracy. Therefore, a prob-abilistic framework for information integration, updating and refinement is required, as exemplified in Pittore and Wieland (2013). During monitor-ing activities, the resulting informa-tion model continuously evolves and a dynamic exposure database should be able to track an object’s evolution over space and time while accounting for its identity which is the lifespan of an object. To this regard, Pittore et al. (2015) propose a novel approach to prioritise exposure data collection based on available information and additional constraints. They utilise the concept of focus maps (Pittore, 2015), which combine different infor-mation layers into a single raster rep-resenting the probability of the point being selected for surveying, condi-tional on the sampling probability of each of the other layers. Based on a focus map, a set of sampling points is generated and suitably routed on the existing road network. This al-lows one to realise a further optimi-sation of the overall data collection by including additional survey con-straints in the routing algorithm and which drives the in situ data collec-tion phase. Iteratively repeating this process allows for an efficient model updating which can be optimised to fit the available time and resources.
CHAPTER 2 UNDERSTANDING DISASTER RISK: RISK ASSESSMENT METHODOLOGIES AND EXAMPLES
69
2.2.7Conclusions and key
messages
The increasing availability of detailed and harmonised hazard datasets is calling for parallel efforts in the pro-duction of standardised multihazard exposure information for disaster risk models. GEDs can be a possible solu-tion for harmonisation and for mov-ing beyond single-hazard databases. Several recommendations can be distilled from this overview and are provided here to develop a roadmap towards the effective implementation of global, dynamic exposure data-bases. Finally, exposure data collec-tion should be regarded as a contin-uous process sustaining a continuous re-evaluation of risks to enable an ef-fective DRR.
PartnershipAuthoritative and non-authoritative sources should be integrated in order to ensure quality standards and com-pliance with the disaster risk- reduc-tion purposes. Within this context, it becomes important to harvest data from crowd-sourced information and exploit volunteered geographic in-formation to augment authoritative sources and involve communities and experts, especially in data-poor coun-tries.
KnowledgeThe need for quality assessment and an analysis of the uncertainty in the exposure data to avoid error propaga-tion. Quantification of exposure data uncertainty is useful for anatomising the structure of the total uncertainty in the risk assessment into individual uncertainties associated with the risk
components (exposure uncertainty compared to that of hazard and vul-nerability). In addition, the communi-cation of uncertainty to the users of the exposure databases is also essen-tial to ensure local understanding and trust in the data.
InnovationData and (statistical) models have to coexist in a statistically sound frame-work in order to overcome the im-practicality of having a complete and fully enumerated global dynamic ex-posure database. Flexible integration of existing information at different scales and accuracies in order not to discard available information needs to be confronted. To this regard, rapid, large-scale data collection based on remote sensing should be fully ex-ploited and be complemented when-ever possible by information collected in situ using suitable sampling meth-odologies.
70
2.3.1The importance of vulnerability for
disaster risk assessment
2.3.1.1 Vulnerability: a key
component to determine risks
Disaster risk is determined by the combination of physical hazards and the vulnerabilities of exposed ele-ments. Vulnerability relates to the sus-ceptibility of assets such as objects, systems (or part thereof) and popula-tions exposed to disturbances, stress-ors or shocks as well as to the lack of capacity to cope with and to adapt to these adverse conditions. Vulnerabili-ty is dynamic, multifaceted and com-posed of various dimensions, all of which have to be considered within a holistic vulnerability assessment.
Vulnerability plays a fundamental role
for understanding, assessing and re-ducing risks. When a hazardous event occurs — be it of natural, technolog-ical or man-made origin — the vul-nerability of exposed people, objects (e.g. critical infrastructure, etc.) and systems (e.g. socioecological systems) at different scales is key to determine the severity of the impact. Though this fact has been widely accepted, the definition of vulnerability and the components it comprises varies between different authors and disci-plines.
The United Nations Office for Disas-ter Risk Reduction (UNISDR Termi-nology, 2017) defines vulnerability as ‘the characteristics and circumstances of a community, system or asset that make it susceptible to the damaging effects of a hazard. This definition reflects the last decades’ shift in the understanding of vulnerability from a focused concept (for example limit-ed to physical resistance of engineer-ing structures) to a more holistic and systemic approach. At the same time, it does not provide reference to the
political/institutional situation and does not account for power relations or the heterogeneity within commu-nities, which are aspects considered as important and included in the defini-tions proposed by other authors (Car-dona et al., 2012; Alexander, 2013; Birkmann et al., 2013; Wisner, 2016)
Vulnerability represents a fundamental
component of risk. A proper understanding of vulnerability comprising
its dimensions as well as its root causes is
important for effective risk assessment and risk
reduction.
The significance of vulnerability for assessing risk is emphasised by the fact that the consequences of a haz-
2.3 The most recent view of vulnerabilityStefanSchneiderbauer, Elisa Calliari, Unni EidsvigMichael Hagenlocher
CHAPTER 2 UNDERSTANDING DISASTER RISK: RISK ASSESSMENT METHODOLOGIES AND EXAMPLES
71
ardous event largely depend on hu-man factors. That is, the hazardous event itself may be predominantly an external phenomena out of the con-trol of those affected; any devastating impact caused by this event, however, is mainly influenced by inherent soci-etal conditions and processes.
The L’Aquila earthquake in April 2009 in Italy is an example of a me-dium-power seismic event that had a disproportionately large human im-pact. It caused 308 fatalities, most of which were the young and elderly, as well as women. The death toll is par-tially linked to the high vulnerability of building stock in the mountains of
Abruzzo. It is in part explained by the risk perception among female victims, who tend to be more fatalistic than men and who perceived their homes as a refuge, instead of leaving it (Al-exander, 2010; Alexander and Magni, 2013).
The degree of vulnerability within a society or a population group is usu-ally not homogenously distributed; social class, ethnic origin, age and gender may determine a lower or higher probability of being affected. Evidence of this fact has been shown by the impact of Hurricane Katrina, which caused a disproportionately high number of victims amongst the
poor black and elderly population in New Orleans in 2005 (Cutter et al., 2006).
Addressing vulnerability — together with exposure — represents the gate-way for risk reduction measures. Con-sequently, the importance of vulner-ability for DRM is underlined by the Sendai framework for disaster risk re-duction, claiming that understanding disaster risk (Priority 1) and develop-ing related policies and practices need to consider the various dimensions of vulnerability (UNISDR, 2015a).
Resilience and capacitiesBesides the notion of ‘vulnerability’ there are other terms and concepts addressing the possibility of harm to a system, people or specific ob-jects by certain events and process-es. Vulnerability – understood as a holistic and systemic concept – is closely related to and partly over-laps, for example, with the concepts of resilience and of coping and adaptive capacity.
‘Resilience’ is a term that has been widely used over the last years to describe characteristics related to the ability to absorb stresses, to respond to changes and to recov-er from shocks. Some authors see resilience as the positive flipside of vulnerability. A broader under-
standing of resilience incorporates the ability and willingness to learn, to reorganise and to undertake crit-ical self-reflection (Alexander 2013; Kelman et al., 2016). Climate resil-ience has emerged into a new doc-trine under the umbrella of which communities define the activities to combat the impending implications of climate change.
There are numerous related ac-tivities within Europe, for example the RESIN project is investigating climate resilience in European cit-ies, the European Commission’s FP7 project emBRACE has focused on community resilience and de-veloped a set of key indicators for assessing it, and the Commission’s
Horizon 2020 project ‘resilens’ is scrutinising the resilience of Euro-pean critical infrastructure.
Just as the term ‘resilience’, the concept of capacities relates to the possibilities and abilities to reduce harm under hazardous conditions. Hereby, ‘coping capacity’ rather deals with the short-term conser-vation and protection of the current system and institutional settings, whilst ‘adapting capacity’ denotes a longer-term and constantly unfold-ing process of learning (Birkmann et al., 2013).
BOX 2.1
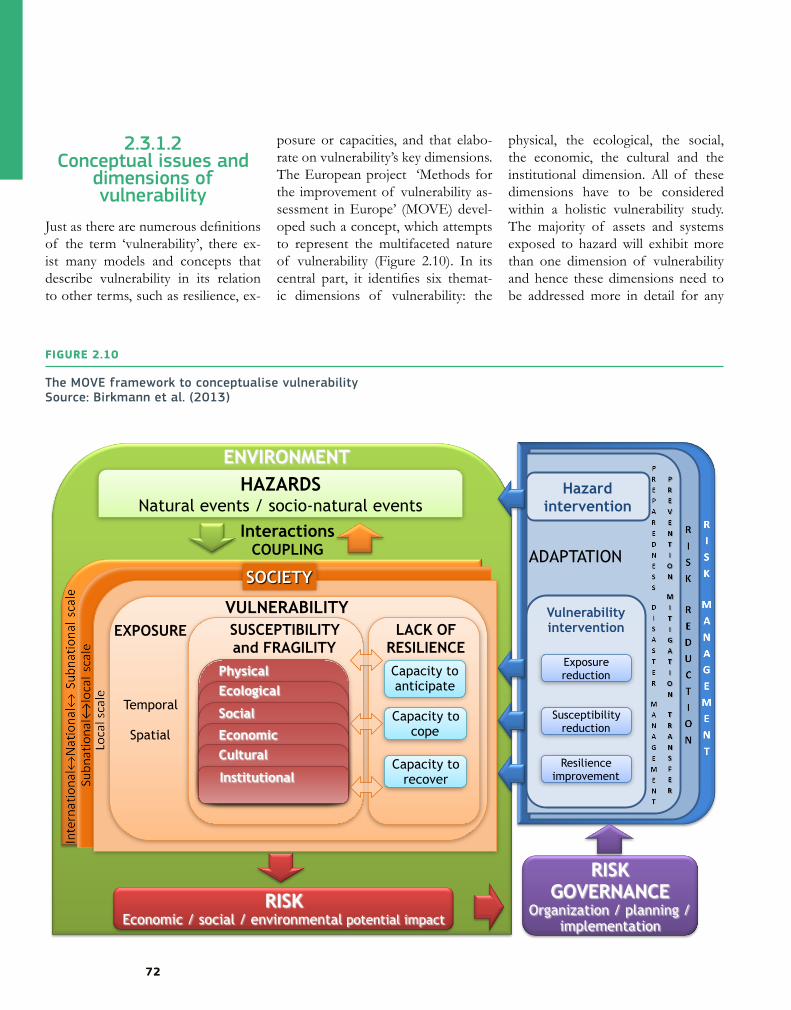
72
2.3.1.2 Conceptual issues and
dimensions of vulnerability
Just as there are numerous definitions of the term ‘vulnerability’, there ex-ist many models and concepts that describe vulnerability in its relation to other terms, such as resilience, ex-
posure or capacities, and that elabo-rate on vulnerability’s key dimensions. The European project ‘Methods for the improvement of vulnerability as-sessment in Europe’ (MOVE) devel-oped such a concept, which attempts to represent the multifaceted nature of vulnerability (Figure 2.10). In its central part, it identifies six themat-ic dimensions of vulnerability: the
physical, the ecological, the social, the economic, the cultural and the institutional dimension. All of these dimensions have to be considered within a holistic vulnerability study. The majority of assets and systems exposed to hazard will exhibit more than one dimension of vulnerability and hence these dimensions need to be addressed more in detail for any
The MOVE framework to conceptualise vulnerabilitySource: Birkmann et al. (2013)
FIGURE 2.10
ENVIRONMENT
RISK Economic / social / environmental potential impact
Hazard intervention
Vulnerability intervention
Susceptibility reduction
Exposure reduction
Resilience improvement
RISK GOVERNANCE
Organization / planning / implementation
Interactions COUPLING ADAPTATION
SOCIETY
VULNERABILITYEXPOSURE
Temporal
Spatial
LACK OF RESILIENCECapacity to anticipate
Capacity to cope
Capacity to recover
HAZARDS Natural events / socio-natural events
SUSCEPTIBILITY and FRAGILITY
PhysicalEcological
Social
EconomicCultural
Institutional
CHAPTER 2 UNDERSTANDING DISASTER RISK: RISK ASSESSMENT METHODOLOGIES AND EXAMPLES
73
assessment (Birkmann et al., 2013). This framework is particularly useful within the context of disaster risk since it embeds vulnerability in the wider framework of risk governance/management and emphasises the var-ious intervention opportunities that may be taken to reduce risk.
A key initial question when scruti-nising vulnerability is who or what is vulnerable to what type of threat or hazard. This leads to the question of how the interactions between hazards and vulnerabilities look like. In fact, there are significant differences in the way the various factors that determine vulnerability are linked or connected to different types of hazards. Typi-cally, physical characteristics of ele-ments at risk are directly linked to a particular hazard. For example, the degree to which a building withstands an earthquake is directly linked to the type of building material used. How-ever, a great level of resistance related to earthquakes as a result of building material does not automatically imply that the ability to resist a flood event is similarly high. On the other hand, the predisposition to be adversely affected due to the economic, sociocultural or political-institutional susceptibilities is to a large degree hazard independ-ent. A community, for instance, with a well-working emergency response system and a strong social network is better forearmed against any type of hazardous event than a communi-ty with corrupt public authorities and disrupted internal linkages (Brooks, 2003; Schneiderbauer and Ehrlich, 2006; Cardona et al., 2012).
Transferring these rather theoretical concepts into operational vulnerabil-ity assessments in practice results in
a number of challenges. Most impor-tantly, the majority of non-physical aspects of vulnerability are not meas-urable in the way in that we are able to determine temperature or people’s income. Consequently, alternative methods for assessing vulnerability are applied. They can be quantitative or qualitative or a mix of both (see Chapter 2.3.4). Widely applied and accepted tools comprise vulnerability curves predominantly used for assess-ing physical vulnerabilities and the use of (proxy-) indicators, particu-larly to estimate the vulnerability of non-physical dimensions (for example social, economic or institutional vul-nerabilities). Here, indicators are used to communicate simplified informa-tion about specific circumstances that are not directly measurable or can only be measured with great difficul-ty (Meyer, 2011). At local level, where spatial data and statistics often do not exist in sufficient resolution, expert opinions as well as participatory, com-munity- based approaches play a ma-jor role in vulnerability assessments.
Power relations, cultural beliefs, the attitude towards risk- reduction ef-forts or the willingness and capacity to learn from previous events are es-sential for the degree of preparedness of a population. Related information can be found in story lines rather than in statistics. Another challenge lies in providing evidence about the degree of vulnerability and its causes. Vul-nerability bears witness only in the aftermath of an event when damage and loss are realised. Loss and damage data, though strongly depending on the magnitude of the hazard itself, are therefore important data sources for vulnerability assessments and/or for the validation of assessment attempts
(see Chapter 2.4).
Due to the conceptual complexity and methodological challenges connected with vulnerability, the uncertainties of vulnerability assessments and their re-sults is a topic of ongoing discussion. The uncertainties are an aggregation of uncertainties from several sources. They include limitations in knowledge about the socioecological systems that the vulnerable elements are part of as well as inaccuracies of empirical data and limitations of models applied for vulnerability assessments.
Uncertainty can be classified in many different ways. One possibility is to subdivide it into ‘aleatory uncertain-ty’, which represents the variability of the properties of concern, and ‘epis-temic uncertainty’, which stems from limited knowledge. A sophisticated estimation of uncertainties is usually a difficult and costly exercise. Hence, the level of complexity and sophisti-cation and the effort and resources to be spent should be in line with the risk management issue and correspond to the level of detail needed.
2.3.1.3 State of the art and
research gaps
The number of existing theoretical frameworks and concepts related to various aspects of vulnerability is striking. Future work should focus on the translation of these concepts into action, namely by developing easy-to-use tools to implement vulnerability studies that yield useful results for the stakeholder and user. At least within Europe, a set of standardised meth-ods for defined purposes at certain scales would help to monitor changes

74
over time and to compare vulnerabil-ity patterns spatially. The respective activities need to consider the devel-opments of other relevant fields of action such as climate change adapta-tion or sustainable development.
The awareness of the significance of vulnerability for DRM has significant-ly increased over the last decades. Nevertheless, the importance of un-derlying triggering factors of vulnera-bility and not directly tangible aspects such as the cultural and institutional dimension requires further attention.
2.3.2System and
systemic vulnerability
In order to advance the understand-ing of vulnerability and its dynamics as well as to set appropriate policy agendas, it is crucial to look at how the vulnerability dimensions interact at different spatial, temporal and func-tional scales (Cardona et al., 2012).
The fact that our modern world is increasingly
interconnected calls for systemic approaches
when assessing vulnerabilities and risks, which take into account
feedback loops and cascading chains of
impacts
In particular, analysing vulnerability in the framework of sustainable devel-opment or climate change adaptation requires considering the interactions between human and natural systems.
2.3.2.1 System dynamics
affecting vulnerability
Vulnerability is a dynamic concept (Cardona et al., 2012) and thus varies in space and time. Trends in exposure and vulnerability are influenced by changes in the demographic, econom-ic, social, institutional, governance, cultural and environmental patterns of a system (Oppenheimer et al., 2014). Taking demography as an example, the current trend of an ageing pop-ulation that characterises developed countries has considerably influenced people’s vulnerability to heat stress, as shown by the high death toll paid by the elderly during the 2003 heatwave event in Europe (Robine et al., 2008).
Another example is the concentra-tion of assets and settlements (and economic activities) in hazard-prone areas due to population growth and the lack of related spatial planning. At a first view this phenomena simply represents increased exposure values. At a closer look, it is strongly linked to vulnerability. Hazard-prone areas are in general characterised by lower land values and are thus occupied by low-income households. The scarcity or non-existence of infrastructure, services, social protection and securi-ty in these sites eventually leads to ‘so-cially segregated’ urban development, which in turn generates new patterns of vulnerability and risk (UNISDR, 2015b).
For instance, the most damaged ar-eas during the 2010 floods in Bursa (Turkey) were those neighbourhoods characterised by the presence of in-formal settlements and occupied by low-income families (Tas et al., 2013).
Another aspect of systemic vulnera-bility is the dependence of human so-cieties on ecosystem services, particu-larly those regulating climate, diseases and providing buffer zones (Millen-nium Ecosystem Assessment, 2005). For example, coastal wetlands increase energy dissipation of storm surges, dampen wind-driven surface waves, modify wind fields and reduce the ex-posure of (and thus protect) people and physical assets in the hinterland. Moreover, provisioning services in-clude food, raw materials, fresh water and medicinal resources, the availa-bility of which determines well-being and thus can strongly influence the socioeconomic vulnerability profile of a community. Consequently, eco-system-based adaptation approaches have been applied in DRM to address potentially hazardous processes such as flash floods, heat waves, sea level rise, increasing water scarcity, etc.
2.3.2.2 System criticality
Globalisation has made communi-ties and nations interdependent in a number of realms, including politics, economy, culture and technology. A systemic view postulates to consid-er those linkages within and without a socioecological system that may affect its vulnerability, thus drawing atten-tion to wider human and environmen-tal processes and phenomena (Turner et al., 2003). In concrete terms, this means that systems and their popula-
CHAPTER 2 UNDERSTANDING DISASTER RISK: RISK ASSESSMENT METHODOLOGIES AND EXAMPLES
75
tions are not only affected by hazards to which they are physically exposed but also — by means of cascading effects — to those experienced else-where. Recent disasters such as the eruption of Eyjafjallajökull in Iceland (2010), the floods in Thailand (2011), the Great East Japan Earthquake (2011) and Hurricane Sandy in the United States (2013) called attention to the severe effects of such cascades of disasters.
Cascading disasters can be exempli-fied by the vulnerability of critical infrastructure (Pescaroli & Alexander, 2016). When in 2003 a tree fell on a Swiss power line, causing a fault in the transmission system, 56 million people in Italy suffered the effects of the worse blackout in the country’s history. 30 000 people were trapped on trains and many commercial and residential users suffered disruption in their power supplies for up to 48 hours (Johnson, 2007). At a larg-er scale, failures in the global supply chain highlight how the vulnerability of one system may depend on the re-silience of another system working in far spatial distance.
The Swedish company Ericsson ex-perienced substantial loss due to the vulnerability of a subsupplier. A 10-minute fire at Philips’ plant in New Mexico, caused by a lighting hitting the electric line, translated into a loss in phone sales of about EUR 375 mil-lion (Jansson, 2004).
This was mainly because Ericsson took no action after Philips’ reas-surance about production returning on track in a week — which was not the case. On the contrary, Nokia, an-other big Philips customer, promptly
switched supplier and it even re-engi-neered some of its phones to accept both American and Japanese chips. By doing so, it raised its profits by 42 % that year and managed to ac-quire new market shares (Economist Intelligence Unit, 2009). The Erics-son–Nokia example underscores the fundamental role played by coping ca-pacity in reducing the adverse effects of experienced hazards. Moreover, it calls for drawing attention not only to the triggering event when considering cascading disasters, but more impor-tantly to how vulnerabilities of differ-ent system’s components may align and thus amplify impacts (Pescaroli & Alexander, 2016).
2.3.2.3 State of the art and
research gaps
Disaster risk research often remains fragmented in a number of disciplines and focused on single hazards (Cutter et al., 2015), with limited interaction with other relevant communities. Re-search adopting a coupled human-en-vironmental system approach in fram-ing vulnerability has contributed to the integration of separate domains (Cardona et al., 2012).
Namely, the approach of ecosys-tem-based adaptation has transferred this holistic view into practice. Yet, the level of trans- and interdisciplinarity that would be required to implement truly systemic approaches in vulner-ability assessment is rarely achieved. Hence, future applied research should follow an approach of coproduction of knowledge and need to integrate relevant disciplines. Relevant universi-ty education and training programmes should prepare young scientists and
practitioners accordingly.
2.3.3Vulnerability
within the context of changing climate
conditions
Climate change is one of the most prominent examples of an external biophysical stressor putting coupled human-natural systems at risk and the vulnerabilities to changing cli-mate conditions has been the focus of many assessment studies. Originally, the understanding of ‘vulnerability’ in the community of climate scientists differed from that of the disaster risk research by encompassing the hazard component itself. That is, the project-ed change of relevant climate param-eters was seen as part of the system’s vulnerability to climate change (IPCC, 2007).
Knowledge on climate change is growing
fast, but standardised vulnerability assessment approaches are lacking.
Vulnerability assessment must consider changing socioeconomic, political
and organisational conditions that determine
possible vulnerability pathways.
The Intergovernmental Panel on Cli-mate Change (IPCC) special report,

76
Managing the risks of extreme events and disasters to advance climate change adaptation (IPCC, 2012a), and later on its fifth assessment report (IPCC, 2013) have introduced the concept of ‘climate risks’ and have hence worked towards converging the concepts of both communities. The currently ongoing integration of cli-mate change adaptation and disaster risk- reduction approaches leads to an increase of knowledge and has the potential to foster network building and to develop more efficient policies. A respective report is under prepara-tion under the lead of the European Environment Agency (EEA).
The IPCC’s fifth assessment report identifies several ways in which in-creasing warming and climate-relat-ed extremes can have an impact on a socioecological system and focuses in particular on those complex interac-tions between climate and such sys-tems that increase vulnerability and risk synergistically (Oppenheimer et al., 2014). One of them is the negative effect of climate change on human health, which results from a number of direct and indirect pathways.
Direct biological consequences to human health can derive from heat-waves, extreme weather events and temperature-related concentrations of pollutants; yet most of the impacts will be indirectly triggered by warm-ing-induced changes in environmen-tal and social conditions (Mc Michael, 2013) and are hence in their extent de-termined by respective vulnerabilities. Moreover, climate change induced ad-verse impacts on crop yields’ quantity and quality can exacerbate malnutri-tion (Met Office & WFP, 2014) and thus contribute to new or stronger
vulnerabilities to a range of diseases.
The assessment of climate-related risks and the identification of respec-tive key vulnerabilities needs to con-sider the variety of these possible di-rect and indirect impacts. Useful tools to tackle this challenge are so-called impact chains, which represent cas-cading cause-effect relationships and allow for structuring assessment pro-cesses and the prioritisation of fields of action (Schneiderbauer et al., 2013; Fritzsche et al., 2014). Impact chains have, for example, been developed
and applied by the ci:grasp adaptation support platform (n.d.) and the latest German climate change vulnerability study (Buth et al., 2015).
2.3.3.1 Vulnerability and climate
change in Europe
At European level, climate change is recognised as an important driver of risk due to both climate extremes (for example heavy precipitation events or storms) and slow onset events of long-term duration (for example sea
Global maps of vulnerability index calculated by INFORM (upper left) and WorldRiskIndex (upper right). The respective underlying conceptual approaches and the identified sub-components of risk and vulnerability are shown in the lower part representing the INFORM index on the bottom left and the WorldRiskIndex on the bottom right. Source: BEH and UNU-EHS (2016), INFORM (n.d.)
FIGURE 2.11
Very Low Low Medium High Very High Not included in INFORM
INFORMHazards & Exposure Vulnerability Lack of Coping
Capacity
Nat
ural
Hum
an
Soci
o-ec
onom
ic
Vuln
erab
le
grou
ps
Inst
itutio
nal
Infr
astr
uctu
re
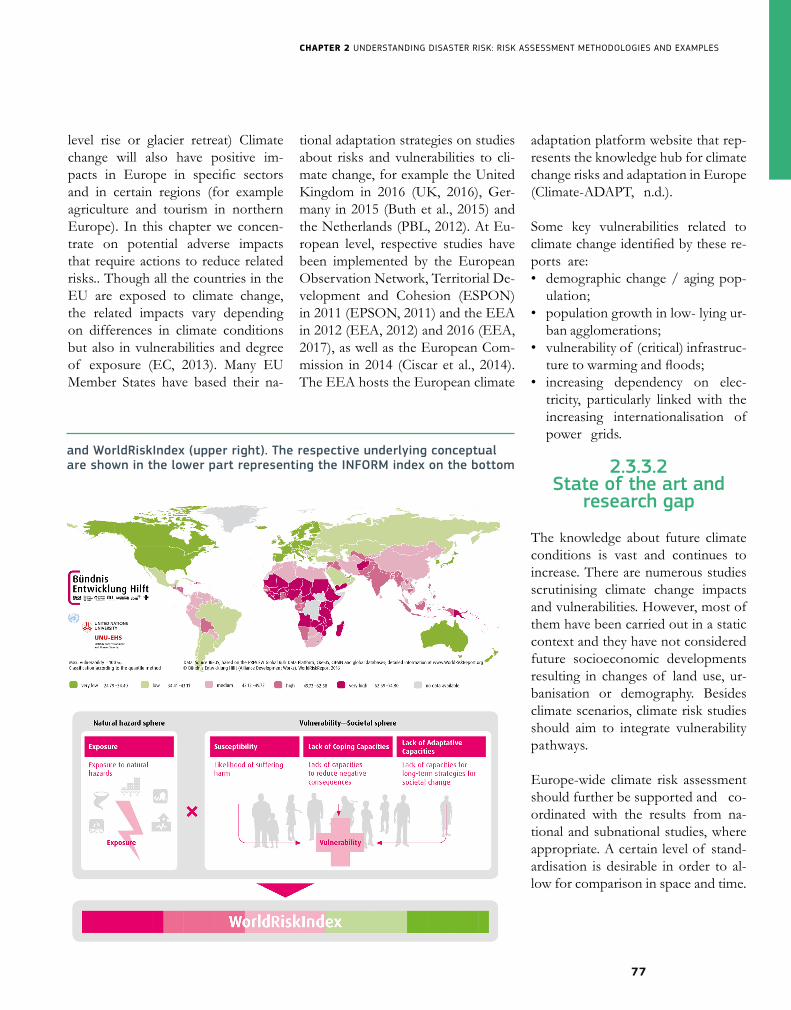
CHAPTER 2 UNDERSTANDING DISASTER RISK: RISK ASSESSMENT METHODOLOGIES AND EXAMPLES
77
level rise or glacier retreat) Climate change will also have positive im-pacts in Europe in specific sectors and in certain regions (for example agriculture and tourism in northern Europe). In this chapter we concen-trate on potential adverse impacts that require actions to reduce related risks.. Though all the countries in the EU are exposed to climate change, the related impacts vary depending on differences in climate conditions but also in vulnerabilities and degree of exposure (EC, 2013). Many EU Member States have based their na-
tional adaptation strategies on studies about risks and vulnerabilities to cli-mate change, for example the United Kingdom in 2016 (UK, 2016), Ger-many in 2015 (Buth et al., 2015) and the Netherlands (PBL, 2012). At Eu-ropean level, respective studies have been implemented by the European Observation Network, Territorial De-velopment and Cohesion (ESPON) in 2011 (EPSON, 2011) and the EEA in 2012 (EEA, 2012) and 2016 (EEA, 2017), as well as the European Com-mission in 2014 (Ciscar et al., 2014). The EEA hosts the European climate
adaptation platform website that rep-resents the knowledge hub for climate change risks and adaptation in Europe (Climate-ADAPT, n.d.).
Some key vulnerabilities related to climate change identified by these re-ports are:• demographic change / aging pop-
ulation;• population growth in low- lying ur-
ban agglomerations;• vulnerability of (critical) infrastruc-
ture to warming and floods;• increasing dependency on elec-
tricity, particularly linked with the increasing internationalisation of power grids.
2.3.3.2 State of the art and
research gap
The knowledge about future climate conditions is vast and continues to increase. There are numerous studies scrutinising climate change impacts and vulnerabilities. However, most of them have been carried out in a static context and they have not considered future socioeconomic developments resulting in changes of land use, ur-banisation or demography. Besides climate scenarios, climate risk studies should aim to integrate vulnerability pathways.
Europe-wide climate risk assessment should further be supported and co-ordinated with the results from na-tional and subnational studies, where appropriate. A certain level of stand-ardisation is desirable in order to al-low for comparison in space and time.
Global maps of vulnerability index calculated by INFORM (upper left) and WorldRiskIndex (upper right). The respective underlying conceptual approaches and the identified sub-components of risk and vulnerability are shown in the lower part representing the INFORM index on the bottom left and the WorldRiskIndex on the bottom right. Source: BEH and UNU-EHS (2016), INFORM (n.d.)
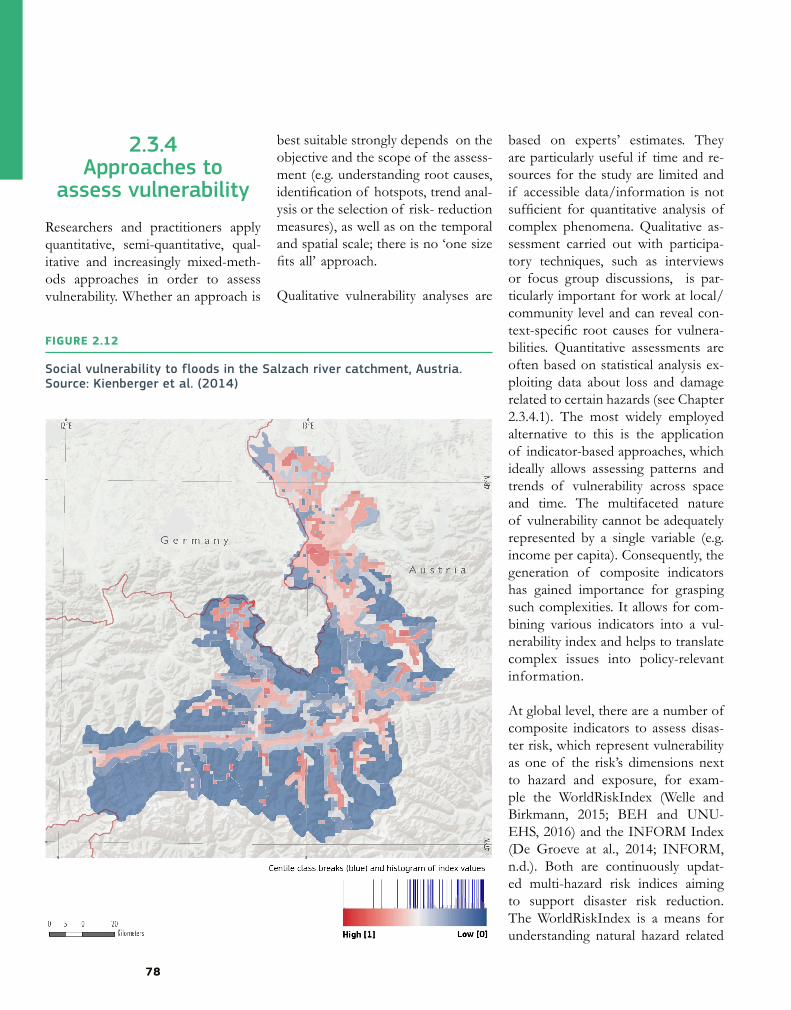
78
2.3.4Approaches to
assess vulnerability
Researchers and practitioners apply quantitative, semi-quantitative, qual-itative and increasingly mixed-meth-ods approaches in order to assess vulnerability. Whether an approach is
best suitable strongly depends on the objective and the scope of the assess-ment (e.g. understanding root causes, identification of hotspots, trend anal-ysis or the selection of risk- reduction measures), as well as on the temporal and spatial scale; there is no ‘one size fits all’ approach.
Qualitative vulnerability analyses are
based on experts’ estimates. They are particularly useful if time and re-sources for the study are limited and if accessible data/information is not sufficient for quantitative analysis of complex phenomena. Qualitative as-sessment carried out with participa-tory techniques, such as interviews or focus group discussions, is par-ticularly important for work at local/community level and can reveal con-text-specific root causes for vulnera-bilities. Quantitative assessments are often based on statistical analysis ex-ploiting data about loss and damage related to certain hazards (see Chapter 2.3.4.1). The most widely employed alternative to this is the application of indicator-based approaches, which ideally allows assessing patterns and trends of vulnerability across space and time. The multifaceted nature of vulnerability cannot be adequately represented by a single variable (e.g. income per capita). Consequently, the generation of composite indicators has gained importance for grasping such complexities. It allows for com-bining various indicators into a vul-nerability index and helps to translate complex issues into policy-relevant information.
At global level, there are a number of composite indicators to assess disas-ter risk, which represent vulnerability as one of the risk’s dimensions next to hazard and exposure, for exam-ple the WorldRiskIndex (Welle and Birkmann, 2015; BEH and UNU-EHS, 2016) and the INFORM Index (De Groeve at al., 2014; INFORM, n.d.). Both are continuously updat-ed multi-hazard risk indices aiming to support disaster risk reduction. The WorldRiskIndex is a means for understanding natural hazard related
Social vulnerability to floods in the Salzach river catchment, Austria. Source: Kienberger et al. (2014)
FIGURE 2.12

CHAPTER 2 UNDERSTANDING DISASTER RISK: RISK ASSESSMENT METHODOLOGIES AND EXAMPLES
79
risks including the adverse effects of climate changes whilst INFORM is a tool for understanding risks to hu-manitarian crises and disasters. Con-ceptually, both indices are very similar. Their methodologies are presented in Figure 2.11. In the WorldRiskIndex, the vulnerability part comprises the components of susceptibility, cop-ing capacity and adaptive capacity, which are represented by 23 indica-tors. In INFORM, vulnerability and lack of coping capacity are divided into two separate dimensions, which are described by 31 indicators. Fig-ure 2.11 shows the countries' vul-nerability scores based on data from 2016 calculated using the INFORM approach (left) and the WorldRisk-Index approach (right). Below these maps, the respective approaches and sub-components are visualised. Both indices started with an approach at nation-state resolution and global scale but strive for more sub-nation-al applications of their methodology (Wannewitz et al., 2016).
In Europe, a range of assessments have used spatial approaches, such as spatial multicriteria analysis or composite indicators to create maps at subnational level that facilitate the identification of hotspots and offer information for place-based interven-tion planning. For instance, a number of studies have investigated vulnera-bility in the context of river floods at different spatial scales. Examples in-clude assessments: (1) in Vila Nova de Gaia, a flood-prone municipality in northern Portugal (Fernandez et al., 2016); (2) along the rivers Rhine, Danube and Elbe in Germany (Fekete, 2009); or (3) in the Salzach catchment in Austria (Kienberger et al., 2014) (Figure 2.12). Using indicator-based
approaches, the three case studies identify a set of social (e.g. age, edu-cation and gender), economic (e.g. in-come, employment and dependency), organisational and institutional (e.g. early warning systems (EWS), access to health services, proximity to first responders, etc.) indicators and aggre-gate them into a composite index of vulnerability.
Composite indicators have the advan-tage to represent complex phenome-na in a single value. If necessary, the underlying indicators or subcompo-nents of the index can be visualised separately to support the understand-ing of which factors contribute most to a positive or negative situation in the aggregated result (Hagenlocher et
al., 2013). On the other hand, com-posite indicators are always data driv-en and might conceal crucial aspects that are not or cannot be expressed in numbers and statistics.
In recent years, there is an increasing number of studies aiming to under-stand and analyse vulnerability in mul-tihazard settings. For example, Welle et al. (2014) present an approach for the assessment of social vulnerability to heat waves and floods as well as in-stitutional vulnerability to earthquakes in the city of Cologne, Germany. While different sets of vulnerability indicators are used and aggregated to assess vulnerability to heat waves (e.g. age, unemployment, place of origin, etc.) and floods (age and occupan-
Generic quantitative vulnerability functions showing vulnerability (i.e. de-gree of loss) as a function of hazard intensity. The red curve represents a more vulnerable element and the blue curve a less vulnerable element.Source: courtesy of authors
FIGURE 2.13
0,0
0,1
0,2
0,3
0,4
0,5
0,6
0,7
0,8
0,9
1,0
)ssol fo eergeD( ytilibarenluV
Hazard intensity
More vulnerable Less vulnerable
80
cy rates per household), institution-al vulnerability was evaluated using qualitative information obtained from a series of stakeholder consultations. Acknowledging the fact that commu-nities are often affected by multiple hazards — combined, sequentially or as a cascading effect —, these stud-ies present an important step towards providing solutions for real-world challenges.
2.3.4.1 Quantitative
vulnerability functions
Potential damage to physical assets and loss of human lives are often as-sessed using quantitative vulnerability functions. These functions take into account the intensity of the hazard and the properties of the exposed elements. The intensity expresses the damaging potential of the hazard. Properties represent the resistance of the exposed elements such as build-ing material and maintenance level. Vulnerability functions are widely applied to illustrate the relationship between hazard characteristics and fatalities and damage. Generic vulner-ability functions are shown in Figure 2.13 and refer to physical vulnerabili-ty, described as ‘the degree of loss to a given element, or set of elements, within the area affected by a hazard. It is expressed on a scale of 0 (no loss) to 1 (total loss)’ (UNDRO, 1984).
Vulnerability functions may be sub-divided into fatality/mortality func-tions and damage functions (the latter denoted and formulated in different ways, e.g. loss functions, susceptibil-ity functions and fragility functions). Damage functions are mainly based on empirical data collected in the af-
termath of an event. Damage func-tions, in particular functions relat-ing building damage to water depth, have a long tradition in the context of flood damage evaluation (Mey-er et al., 2013). Physical vulnerability of buildings can also be assessed by physical models or by use of expert judgement. For some hazard types, fa-tality or mortality functions are devel-oped to determine the death ratio for a single hazard parameter, e.g. water depth or earthquake magnitude. This allows the estimation of numbers of fatalities occurring at, for example, a certain water level. However, the de-velopment of fatality functions goes along with a high degree of uncer-tainty, which stems from the variety of physical and human parameters influencing the loss of life. For exam-ple, water depth may not be the only and most relevant intensity measure. Aspects such as flow rate, flood du-ration or sediment transport might be equally as important.
The most appropriate methodology to assess
vulnerability strongly depends on the purpose and the context, as well
as the temporal and spatial scales; there is no
‘one size fits all’ approach.
For quantitative physical vulnerabili-ty assessment, one can apply existing vulnerability curves, which are appro-priate for the specific hazard and the
exposed elements (e.g. building types) in study. Vulnerability curves have been developed for several types of natural hazards, such as wind storms, landslides, floods, tsunamis and earth-quakes. There are curves expressing loss within the built environment as well as loss of human lives. Most of the curves are developed from empir-ical data and accordingly fit well with previous events in the area where the data was collected. For other loca-tions a calibration or validation of the model is necessary prior to use. Vali-dation is also needed for physical or analytical vulnerability functions.
Application of vulnerability functions is useful in several phases of the risk management, such as risk assessment and risk treatment. Risk analysts, scientists, stakeholders and deci-sion-makers could be users of vulner-ability functions with the purpose to provide input to:• decisions about the question of whether risks need to be treated or about issues such as the prioritisation of risk treatment options of different areas and of different hazard types;
• identification of appropriate and optimal risk- reduction measures;
• financial appraisals during and im-mediately after a disaster as well as budgeting and coordination of com-pensation (Merz et al., 2010).
Alternatives to vulnerability curves are fragility curves, which also express the uncertainty in the physical vul-nerability. Fragility curves have been widely applied in probabilistic risk and vulnerability assessment, in particular for earthquake risk (Hazus n.d.), but
CHAPTER 2 UNDERSTANDING DISASTER RISK: RISK ASSESSMENT METHODOLOGIES AND EXAMPLES
81
recently also for landslide risk assess-ment. These functions describe the probability of exceeding different damage states for various intensities. In a recent study on seismic risks in the city of Barcelona, Spain, a physi-cal vulnerability assessment approach was first carried out based on vulner-ability functions for different building types (e.g. unreinforced masonry or reinforced concrete, steel and wood buildings). In a second step this was combined with a probabilistic analysis of the seismic hazard into a seismic risk assessment for buildings across the city (Carreño et al., 2014). The authors also considered conditions related to social fragility and lack of resilience that favour second order effects when a city is hit by an earth-quake. Factors such as population density, population with poor health or social disparity were used as prox-ies for social fragility. In addition, the operating capacity in case of an emer-gency, the state of development or the access to health services were used as indicators of lack of resilience and combined in an overall urban seismic risk index (Carreño et al., 2007). The results show that the population in the central parts of Barcelona lives at a considerably higher risk than those living on the outskirts of the city.
2.3.4.2 State of the art and
research gaps
Indicator-based assessment methods have proved to support the drafting and prioritisation of disaster risk- re-duction measures and strategies as well as the allocation of resources. Several challenges exist with respect to the dependency on data availability and quality, the validation of the ap-
plied methodology and related uncer-tainty analysis (Hinkel, 2011).
Vulnerability curves are widely applied for physical vulnerability assessment. Future activities should focus on the development of a repository of vul-nerability curves with user guidelines for different hazard types and differ-ent types of assets. Research should work on the development and use of multiparameter vulnerability func-tions that are transferable, i.e. valid for different building types, and appli-cable for vulnerability changing over time and for multirisk scenarios.
In order to fill these gaps, more data are required for improving and cali-brating existing models as well as for proposing new empirical vulnerability models (see Chapter 2.4). Data collec-tion and analysis should be extended and streamlined through the use of remotely sensed data and geographic information system technology. The potential of Copernicus services and particularly of Sentinel data has not been fully exploited by the disaster risk community.
An additional challenge lies in the forward-looking nature of vulnerabil-ity. That is, vulnerability assessment needs to take into account those fac-tors and processes that may not yet have become evident in past disaster situations. This is particularly valid in highly dynamic environments where both socio-natural hazards and vul-nerability patterns might undergo rapid changes in the near- and mid-term future (Garschagen, 2014).
The importance to integrate uncer-tainty in vulnerability assessment has often been underlined but remains an
issue of concern still today.
2.3.5How vulnerability
information is used in practice
The IPCC acknowledges DRM as a process that goes beyond DRR (IPCC, 2012b). Decisions to reduce disaster risk must be based on a sound understanding of the related vulnera-bilities.
A requirement that has clearly been articulated in the SFDRR (UNISDR, 2015b) as one of four main priorities for action in the years to come.
2.3.5.1 Vulnerability in disaster risk management: from
knowledge to action
Complementing hazard analysis, vul-nerability studies generate informa-tion of relevance for various aspects of risk reduction and adaptation strat-egies, emergency management and sustainable territorial planning. They are of importance for all phases of the DRM cycle covering short-term response as well as long-term prepar-edness or recovery. Correspondingly large is the field of potential users of vulnerability information, includ-ing public administration staff who are responsible for civil protection or spatial planning, actors in the field of insurance, private companies running critical infrastructure, the civil society and, finally, any individual. One way of grouping the various purposes of vulnerability studies and their main users is to classify them according to
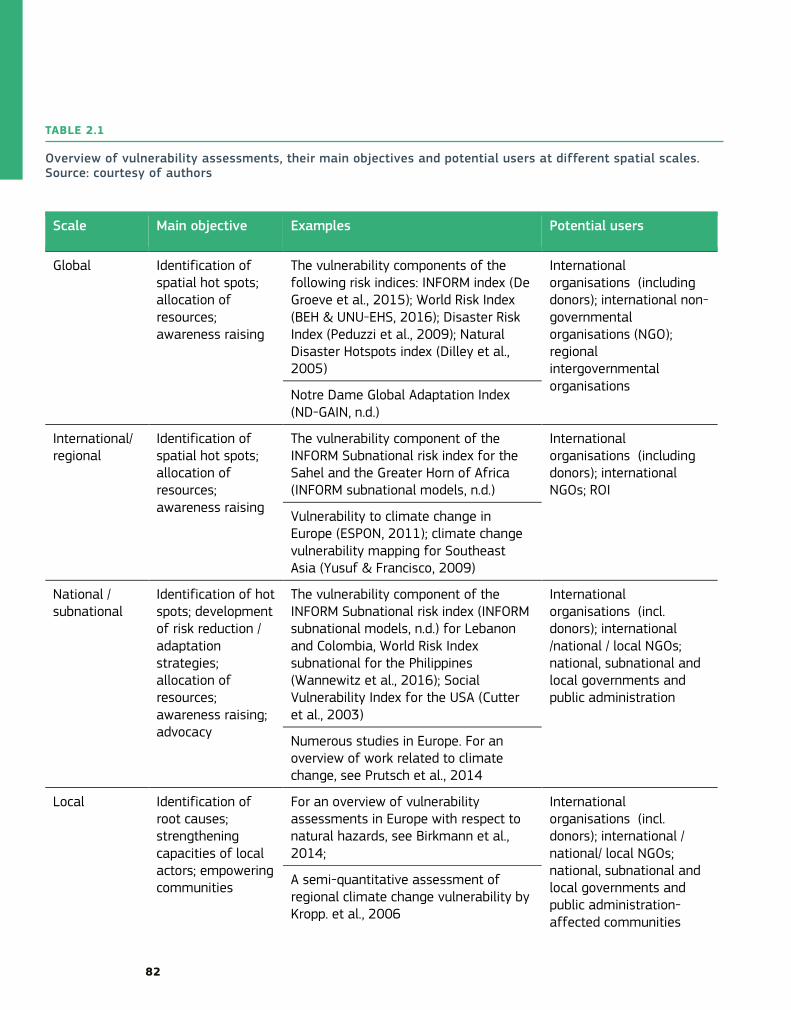
82
Overview of vulnerability assessments, their main objectives and potential users at different spatial scales.Source: courtesy of authors
TABLE 2.1
Scale Main objective Examples Potential users
Global Identification of spatial hot spots; allocation of resources; awareness raising
The vulnerability components of the following risk indices: INFORM index (De Groeve et al., 2015); World Risk Index (BEH & UNU-EHS, 2016); Disaster Risk Index (Peduzzi et al., 2009); Natural Disaster Hotspots index (Dilley et al., 2005)
International organisations (including donors); international non-governmental organisations (NGO); regional intergovernmental organisations
Notre Dame Global Adaptation Index (ND-GAIN, n.d.)
International/ regional
Identification of spatial hot spots; allocation of resources; awareness raising
The vulnerability component of the INFORM Subnational risk index for the Sahel and the Greater Horn of Africa (INFORM subnational models, n.d.)
International organisations (including donors); international NGOs; ROI
Vulnerability to climate change in Europe (ESPON, 2011); climate change vulnerability mapping for Southeast Asia (Yusuf & Francisco, 2009)
National / subnational
Identification of hot spots; development of risk reduction / adaptation strategies; allocation of resources; awareness raising; advocacy
The vulnerability component of the INFORM Subnational risk index (INFORM subnational models, n.d.) for Lebanon and Colombia, World Risk Index subnational for the Philippines (Wannewitz et al., 2016); Social Vulnerability Index for the USA (Cutter et al., 2003)
International organisations (incl. donors); international /national / local NGOs; national, subnational and local governments and public administration
Numerous studies in Europe. For an overview of work related to climate change, see Prutsch et al., 2014
Local Identification of root causes; strengthening capacities of local actors; empowering communities
For an overview of vulnerability assessments in Europe with respect to natural hazards, see Birkmann et al., 2014;
International organisations (incl. donors); international / national/ local NGOs; national, subnational and local governments and public administration- affected communities
A semi-quantitative assessment of regional climate change vulnerability by Kropp. et al., 2006

CHAPTER 2 UNDERSTANDING DISASTER RISK: RISK ASSESSMENT METHODOLOGIES AND EXAMPLES
83
spatial scale. Extending the examples presented above, Table 2.1 provides an illustrative overview of selected vulnerability assessments, their main purposes and potential users at differ-ent spatial scales.
Vulnerability assessment is used to support stakeholders and
policymakers in prioritising various risks,
in identifying root causes and spatial hotspots
and in developing risk reduction strategies and
measures.
The complexity of vulnerability and the wide range of possible appli-cations of assessment studies re-quire considerable effort to define the studies’ scope (objective, target groups, spatial and temporal scale, spatial resolution of results, etc.). In practice, vulnerability studies have benefited from pursuing a process of co-production of knowledge. The integration of scientists, practition-ers and potential users in the process of a vulnerability assessment right from the beginning usually results in a higher level of acceptance of their results. They are also more likely to be used in decision- and policymaking. An example is the latest vulnerability assessment for Germany within the scope of which a network of nation-al authorities was created and which participated in all important decisions (Greiving et al., 2015).
2.3.5.2 Conclusions and key
messages
Over the past decades, vulnerability research has made considerable pro-gress in understanding some of the root causes and dynamic pressures that influence the progression of vul-nerability and raised awareness that disasters are not natural but predom-inantly a product of social, economic and political conditions (Wisner et al., 2004).
Vulnerability assessments are a re-sponse to the call for evidence by de-cision-makers for use in pre-disaster risk assessment, prevention and re-duction, as well as the development and implementation of appropriate preparedness and effective disaster response strategies by providing in-formation on people, communities or regions at risk.
The following steps are proposed to further improve vulnerability research and related applications with the final aim to inform policymakers to most appropriately:• co-produce knowledge in a trans-
disciplinary environment;• evaluate and present inherent un-
certainties;• integrate intangible but crucial fac-
tors into quantitative assessments;• develop and apply methods that al-
low for considering cascading and multirisks;
• combine vulnerability scenarios with (climate-) hazard scenarios when assessing future risks;
• empower communities to better understand and reduce their vul-nerability in order to make them
more resilient to identified hazards;• design and facilitate multilevel and
cross-sectoral feedback loops be-tween public, practitioners and pol-icymaking bodies (local, regional, national and European) and other stakeholders;
• standardise vulnerability assess-ment approaches in order to allow for more comparison (in space and time);
• work on improved evidence with-in vulnerability assessment — this requires continuous effort to im-prove loss and damage data.
PartnershipThe comprehensive analysis and as-sessment of vulnerability requires an interdisciplinary approach involving both natural and social sciences. In addition, in order to foster sustainable and efficient vulnerability reduction strategies and measures, an approach to produce knowledge co-productive-ly is desirable. This calls for a part-nership with affected communities, practitioners and decision-makers. A stronger link and enhanced interac-tion with other relevant communities is desirable, namely climate change adaptation, natural resource manage-ment, public health, spatial planning and development.
Knowledge The determination of risk often re-mains hazard centred and hazard specific and does not consider vul-nerability appropriately. Vulnerability assessment has tended to be mostly quantitative in nature. Cultural as-pects as well as formal (procedures, laws and regulations) and tacit infor-mal (values, norms and traditions) institutions play a fundamental role as both enabling or limiting factors
84
of resilience and have not gained sufficient attention. A challenge is the need to consider local data and information in order to account for small-scale specificities of vulnerabil-ity. Present databases on damage and loss caused by natural hazards should be standardised and extended to sup-port evidence building in vulnerability assessment. Existing barriers in the co-production, exchange and use of knowledge have to be understood and minimised.
InnovationIn recent years, improved approach-es to assess vulnerability by statistical analyses or indices have been estab-lished. Fostering the integration of Earth observation data and technol-ogy to detect changes would improve the possibility to represent some of the dynamic aspects of vulnerability. Further improvement requires en-hanced event and damage databases and more sophisticated methods for potential future vulnerability path-ways and their integration into risk scenarios. The challenge to integrate qualitative information, which of-ten contains crucial facts, needs to be addressed. Observation data and technology to detect changes would improve the possibility to represent some of the dynamic aspects of vul-nerability. Further improvements re-quire enhanced event and damage databases and more sophisticated methods for potential future vulner-ability pathways and their integration into risk scenarios. The challenge to integrate qualitative information, which often contains crucial facts, need to be addressed.
CHAPTER 2 UNDERSTANDING DISASTER RISK: RISK ASSESSMENT METHODOLOGIES AND EXAMPLES
85
2.4 Recording disaster losses for improving risk modelling capacitiesSciraMenoni, Costanza Bonadonna, Mariano García-Fernández,Reimund Schwarze
2.4.1Relationship
between pre-event risk modelling and
post-disaster loss data
Pre-event risk assessment and post-event damage estimation are more linked than is generally thought. As shown in Figure 2.14, either prob-abilistic or deterministic damage forecasts are appraised in pre-event risk assessment, whilst in the after-math of the event, the scenario that occurred is analysed. Both modelled and estimated damage can regard one or few exposed items or multi-ple sectors ranging from businesses to lifelines (available in fewer cases). Damage can be expressed as physical damage to items and/or monetary costs of repair or as loss to individual economic sectors or to a given econo-my and society as a whole.
In the case of the pre-event assess-
ment, hazard, exposure and vulnera-bility are the components that need to be evaluated and combined in order to obtain a risk assessment. In the post-event analysis, the estimated damage must be described on the basis of the observed hazard features, on the con-figuration of exposed systems and on their vulnerability at the time of the event.
Pre- and post-damage assessment have more in
common than generally perceived; in both
cases there is a need to understand the relative contribution of hazard,
exposure and vulnerability factors on the overall
damage.
There is still a debate on the mean-ing of damage and losses and which
types should be considered; here, an interpretation based on previous EU projects and available literature is pro-posed (Merz et al., 2010; Meyers et al., 2015; Van der Veen and Logtmeijer, 2005). As can be seen in Figure 2.15, damage due to natural hazards is gen-erally divided into damage to tangible objects and assets, meaning those for which a monetary assessment is eas-ily obtained and not controversial, and damage to intangibles, meaning values such as human life, historic heritage or natural assets for which monetisation is either extremely dif-ficult or controversial. Damage to both tangibles and intangibles can be direct, meaning the damage provoked by the hazardous stressor, or indirect, which is consequent upon the direct damage (e.g. production loss due to damaged machinery) or upon ripple effects due to the interdependency of economic systems, both forward and backward linkages. Whilst direct damage generally occurs locally, indi-rect damage can develop over much greater time and space scales, also far from the event’s ‘epicentre’ and long

86
after the event has occurred. In some methodologies, damage and losses are distinct: the first term refers to affect-ed infrastructure and buildings, whilst the second refers to economic losses (GFDRR, 2013). In the following sec-tions, the link between pre- and post-event damage and loss assessment is discussed, showing the contribution that enhanced post-disaster analysis can make in terms of knowledge and information to improve the quality and comprehensiveness of pre-event risk models.
Examples will be taken from three dis-tinct hazard domains, such as earth-quakes, floods and volcanic eruptions,
in order to provide evidence for more theoretical assumptions. These natu-ral disasters were chosen because of their diversity, the difference in terms of types and the extent of damage they produce. However, their use is just paradigmatic. Experts in other fields will be able to find correspond-ences to the hazard risk they are more familiar with.
2.4.2How post-disaster damage has been
used to develop risk models: state of the
art in a nutshell
2.4.2.1 State of the art of
risk models Expected damage can be assessed using quantitative, qualitative and semi-quantitative risk models (Figure 2.14, see also Chapter 2.1). Quanti-tative risk assessments dominate in
Pre - and post - disaster damage assessmentsSource: courtesy of authors
FIGURE 2.14
Modelled Physical damage to one or few sectors
Modelled losses to multiple sectors
Modelled impact on economy and resources
Observed Physical damage to one or few sectors
Observed losses to multiple sectors
Observed/Modelled impact on economy and resources
Hazard variables
Exposed systemsdescription (values)
Vulnerability assessment (functions)
Hazard feature
Exposed systemsconfiguration
Vulnerability conditions
inpu
t
Pre-event forecasted damage
Probabilistic Risk Assessment
Deterministic Scenarios
Post-event estimated damage
Occurred Scenario
Data and information for validation; knowledge regarding systemic and indirect damage occurring in complex systems across time and space
due
to
Semi-quantitative QualitativeQuantitative Semi-quantitative QualitativeQuantitative
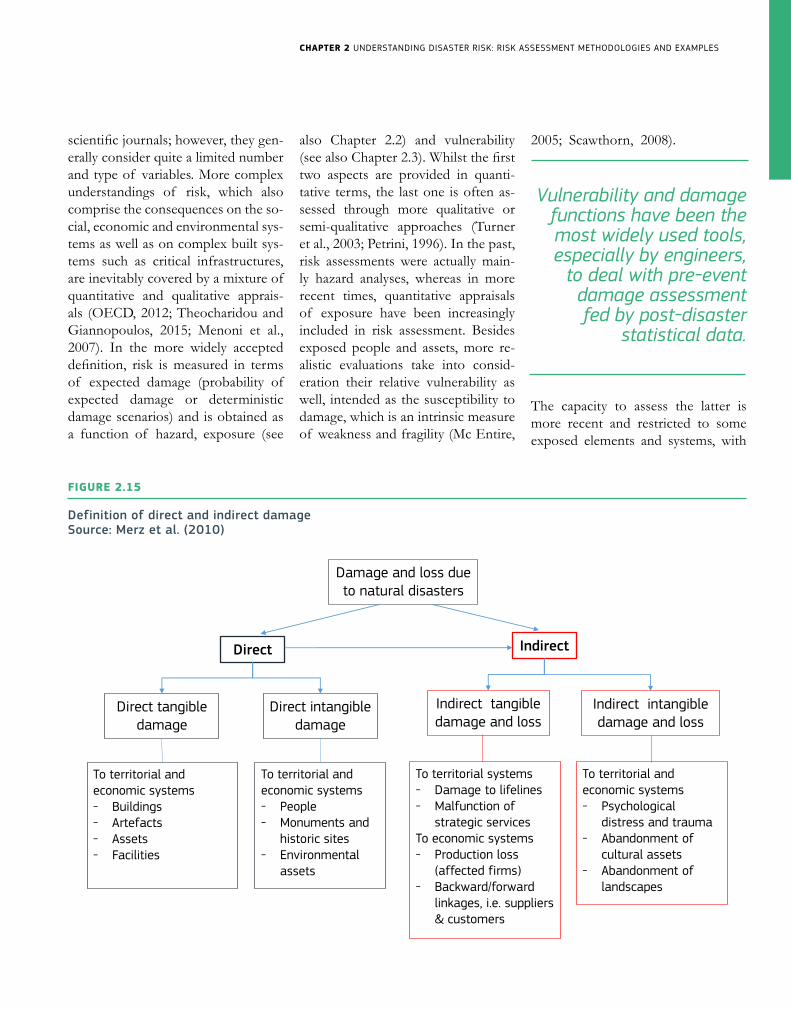
CHAPTER 2 UNDERSTANDING DISASTER RISK: RISK ASSESSMENT METHODOLOGIES AND EXAMPLES
87
scientific journals; however, they gen-erally consider quite a limited number and type of variables. More complex understandings of risk, which also comprise the consequences on the so-cial, economic and environmental sys-tems as well as on complex built sys-tems such as critical infrastructures, are inevitably covered by a mixture of quantitative and qualitative apprais-als (OECD, 2012; Theocharidou and Giannopoulos, 2015; Menoni et al., 2007). In the more widely accepted definition, risk is measured in terms of expected damage (probability of expected damage or deterministic damage scenarios) and is obtained as a function of hazard, exposure (see
also Chapter 2.2) and vulnerability (see also Chapter 2.3). Whilst the first two aspects are provided in quanti-tative terms, the last one is often as-sessed through more qualitative or semi-qualitative approaches (Turner et al., 2003; Petrini, 1996). In the past, risk assessments were actually main-ly hazard analyses, whereas in more recent times, quantitative appraisals of exposure have been increasingly included in risk assessment. Besides exposed people and assets, more re-alistic evaluations take into consid-eration their relative vulnerability as well, intended as the susceptibility to damage, which is an intrinsic measure of weakness and fragility (Mc Entire,
2005; Scawthorn, 2008).
Vulnerability and damage functions have been the most widely used tools, especially by engineers,
to deal with pre-event damage assessment fed by post-disaster
statistical data.
The capacity to assess the latter is more recent and restricted to some exposed elements and systems, with
Definition of direct and indirect damage Source: Merz et al. (2010)
FIGURE 2.15
Damage and loss due to natural disasters
Direct Indirect
Direct tangibledamage
Direct intangibledamage
To territorial and economic systems- Buildings- Artefacts- Assets- Facilities
To territorial and economic systems- People- Monuments and
historic sites- Environmental
assets
To territorial systems- Damage to lifelines- Malfunction of
strategic servicesTo economic systems- Production loss
(affected firms)- Backward/forward
linkages, i.e. suppliers & customers
Indirect tangibledamage and loss
To territorial and economic systems- Psychological
distress and trauma- Abandonment of
cultural assets- Abandonment of
landscapes
Indirect intangibledamage and loss

88
the obvious difficulty of constructing a comprehensive and coherent picture of what the total effect of a disaster in a given area may be (Barbat et al., 2010).
In the following section, the state of the art in vulnerability or damage functions in the field of seismic, vol-canic and flood hazards are provided, highlighting similarities and differenc-es. Vulnerability or damage functions are used to correlate hazard indicators (such as acceleration or water depth) with damage (such as damage index or monetary cost of repair and recov-ery).
2.4.2.1.1 How vulnerability/damage
curves have been developed for seismic risk
Seismic engineers have started devel-oping vulnerability curves long before
colleagues in other natural hazards fields, coherent with the fact that the only possible protection measure against earthquakes is reducing build-ings’ vulnerability. Early seismic vul-nerability methods were proposed in the seventies in Japan and the Unit-ed States, and were being developed during the eighties in Europe (Cor-sanego, 1991; Senouci et al., 2013). Main European seismic vulnerability methods include GNDT (Benedetti et al. 1988), Risk-UE (Lagomarsino and Giovinazzi, 2006) and Vulner-alp (Guéguen et al., 2007). Thus, the seismic field set the floor for a gener-al methodology that was followed in other fields as well; it can also be con-sidered as having general relevance.First, damage after earthquakes was observed in a very large number of cases and in structures differing in their layout, material, typology, age, resistant systems, etc. Two relevant re-sults were achieved: on the one hand,
a very large database with hundreds of failure cases was developed, and on the other hand, the specific factors determining buildings’ response to earthquakes were identified. Such fac-tors have been translated into param-eters, as in the example provided in Table 2.2 (Zonno et al., 1998). In the practical application of the latter, the vulnerability of buildings is obtained from the weighed sum of the score assigned to each parameter, ranging from A (no vulnerability) to D (very high vulnerability), and multiplied by a weight expressing the relative rele-vance of the parameter.
Second, vulnerability curves are com-piled by plotting seismic severity (on the horizontal x axis), expressed, for example, as acceleration, versus the percentage of damage or a damage index between 0 and 1 (on the vertical y axis). At maximal stress, any build-ing is expected to collapse, whereas at no stress no building is expected to be damaged; anything in between, the intrinsic vulnerability of buildings is likely to produce differential damage. As a third step, a comparison between modelled damage based on vulnera-bility curves and post-event observed damage should be carried out as dis-cussed in Chapter 2.3.
2.4.2.1.2 How vulnerability/damage
curves have been developed for volcanic risk
Vulnerability curves in volcanology have been developed much more re-cently and are available only for some of the hazards that may be triggered by an explosive eruption. More specif-ically, vulnerability curves describing the collapse of roofs are available for
Indicators to assess seismic risk Source: Zonno et al. (1998)
TABLE 2.2
PARAMETERS VULNERABILITy CLASS WEIGHT
A B C D
1 Organization of resistant elements 0 5 20 45 1
2 Quality of resistant elements 0 5 25 45 0.25
3 Conventional Strenght 0 5 25 45 1.5
4 Building position and foundations 0 5 25 45 0.75
5 Floors 0 5 15 45 var
6 Plan Shape 0 5 20 45 0.5
7 Elevation Shape 0 5 20 45 var
8 Maximum distance between walls 0 5 20 45 0.25
9 Roof 0 15 20 45 var
10 Non structural elements 0 0 20 45 0.25
11 Maintenance conditions 0 5 20 45 1
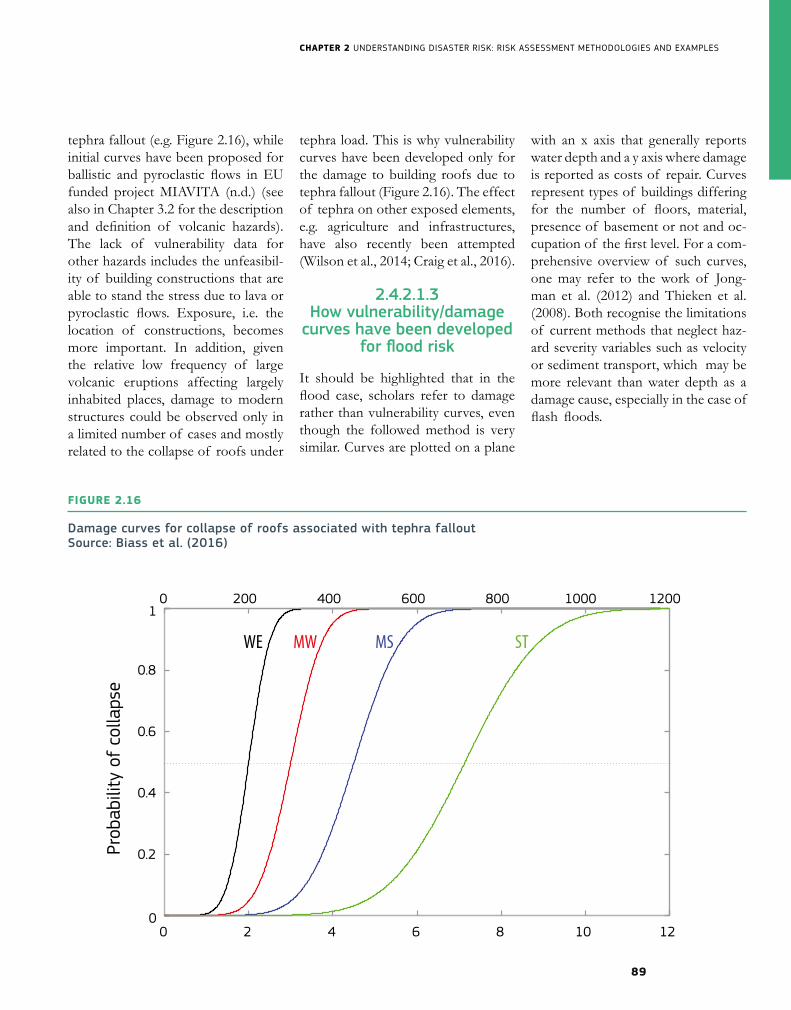
CHAPTER 2 UNDERSTANDING DISASTER RISK: RISK ASSESSMENT METHODOLOGIES AND EXAMPLES
89
tephra fallout (e.g. Figure 2.16), while initial curves have been proposed for ballistic and pyroclastic flows in EU funded project MIAVITA (n.d.) (see also in Chapter 3.2 for the description and definition of volcanic hazards). The lack of vulnerability data for other hazards includes the unfeasibil-ity of building constructions that are able to stand the stress due to lava or pyroclastic flows. Exposure, i.e. the location of constructions, becomes more important. In addition, given the relative low frequency of large volcanic eruptions affecting largely inhabited places, damage to modern structures could be observed only in a limited number of cases and mostly related to the collapse of roofs under
tephra load. This is why vulnerability curves have been developed only for the damage to building roofs due to tephra fallout (Figure 2.16). The effect of tephra on other exposed elements, e.g. agriculture and infrastructures, have also recently been attempted (Wilson et al., 2014; Craig et al., 2016).
2.4.2.1.3 How vulnerability/damage
curves have been developed for flood risk
It should be highlighted that in the flood case, scholars refer to damage rather than vulnerability curves, even though the followed method is very similar. Curves are plotted on a plane
with an x axis that generally reports water depth and a y axis where damage is reported as costs of repair. Curves represent types of buildings differing for the number of floors, material, presence of basement or not and oc-cupation of the first level. For a com-prehensive overview of such curves, one may refer to the work of Jong-man et al. (2012) and Thieken et al. (2008). Both recognise the limitations of current methods that neglect haz-ard severity variables such as velocity or sediment transport, which may be more relevant than water depth as a damage cause, especially in the case of flash floods.
Damage curves for collapse of roofs associated with tephra fallout Source: Biass et al. (2016)
FIGURE 2.16
0 2 4 6 8 10 120
0.2
0.4
0.6
0.8
1
Tephra fall load (kPa)
Prob
abili
ty o
f co
llaps
e
0 200 400 600 800 1000 1200
Tephra mass accumulation (kg/m 2)
WE MW MS ST
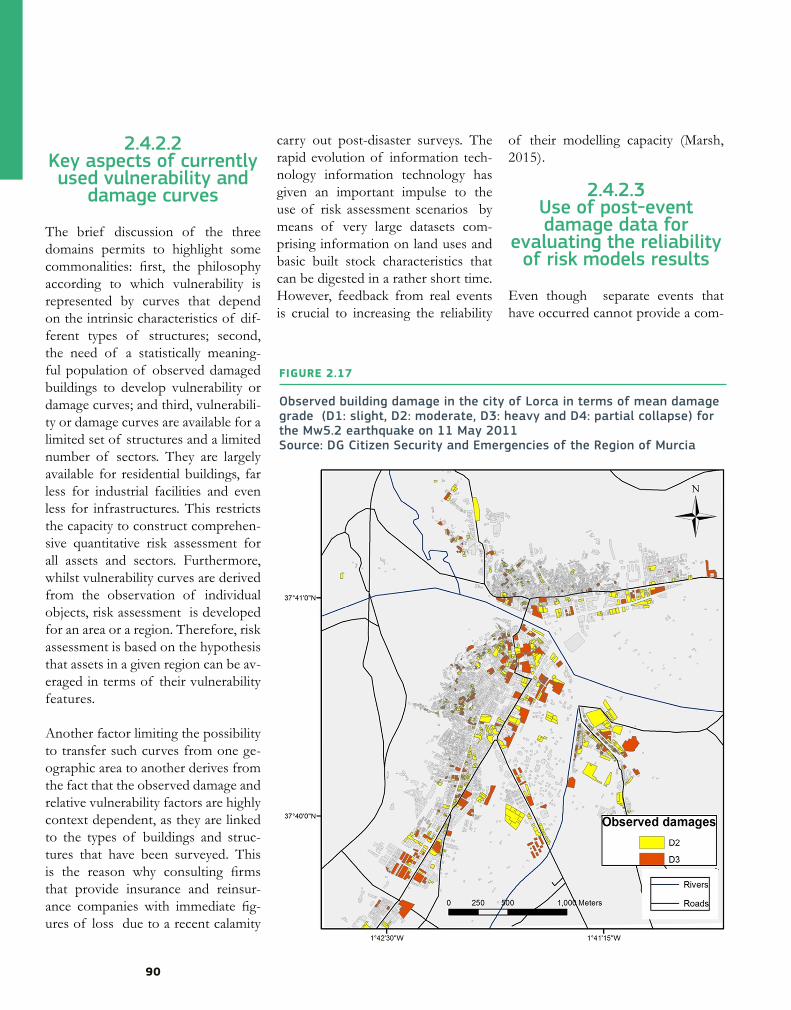
90
2.4.2.2 Key aspects of currently used vulnerability and
damage curves
The brief discussion of the three domains permits to highlight some commonalities: first, the philosophy according to which vulnerability is represented by curves that depend on the intrinsic characteristics of dif-ferent types of structures; second, the need of a statistically meaning-ful population of observed damaged buildings to develop vulnerability or damage curves; and third, vulnerabili-ty or damage curves are available for a limited set of structures and a limited number of sectors. They are largely available for residential buildings, far less for industrial facilities and even less for infrastructures. This restricts the capacity to construct comprehen-sive quantitative risk assessment for all assets and sectors. Furthermore, whilst vulnerability curves are derived from the observation of individual objects, risk assessment is developed for an area or a region. Therefore, risk assessment is based on the hypothesis that assets in a given region can be av-eraged in terms of their vulnerability features.
Another factor limiting the possibility to transfer such curves from one ge-ographic area to another derives from the fact that the observed damage and relative vulnerability factors are highly context dependent, as they are linked to the types of buildings and struc-tures that have been surveyed. This is the reason why consulting firms that provide insurance and reinsur-ance companies with immediate fig-ures of loss due to a recent calamity
carry out post-disaster surveys. The rapid evolution of information tech-nology information technology has given an important impulse to the use of risk assessment scenarios by means of very large datasets com-prising information on land uses and basic built stock characteristics that can be digested in a rather short time. However, feedback from real events is crucial to increasing the reliability
of their modelling capacity (Marsh, 2015).
2.4.2.3 Use of post-event damage data for
evaluating the reliability of risk models results
Even though separate events that have occurred cannot provide a com-
Observed building damage in the city of Lorca in terms of mean damage grade (D1: slight, D2: moderate, D3: heavy and D4: partial collapse) for the Mw5.2 earthquake on 11 May 2011Source: DG Citizen Security and Emergencies of the Region of Murcia
FIGURE 2.17
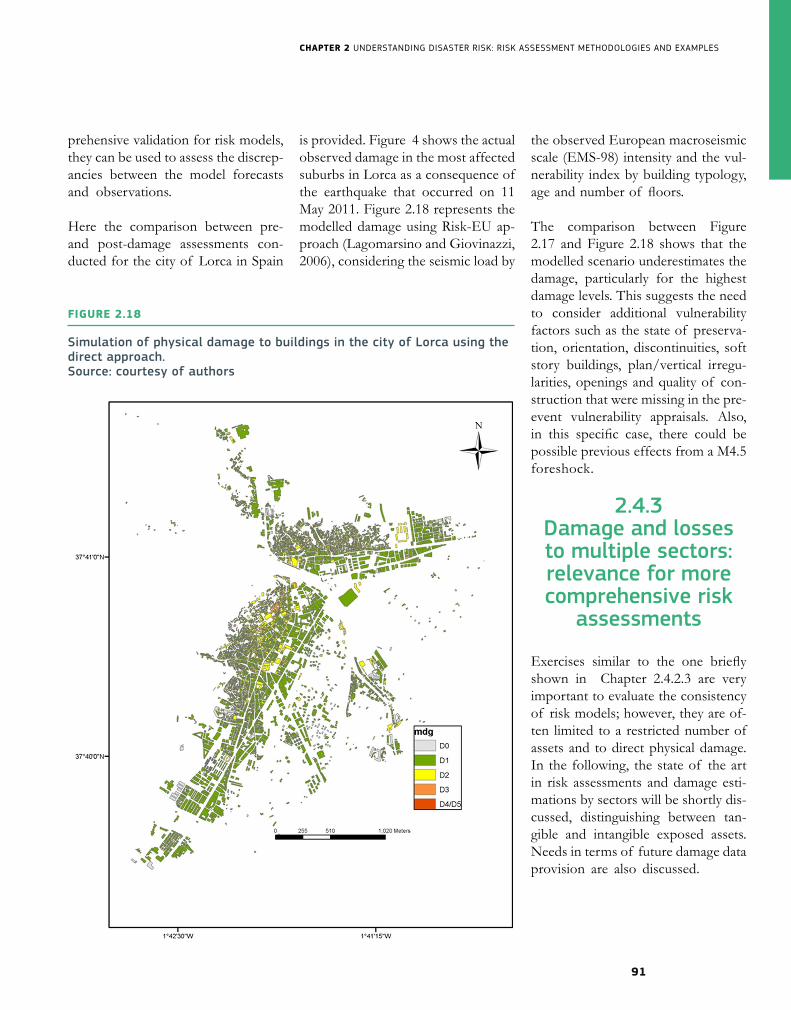
CHAPTER 2 UNDERSTANDING DISASTER RISK: RISK ASSESSMENT METHODOLOGIES AND EXAMPLES
91
prehensive validation for risk models, they can be used to assess the discrep-ancies between the model forecasts and observations.
Here the comparison between pre- and post-damage assessments con-ducted for the city of Lorca in Spain
is provided. Figure 4 shows the actual observed damage in the most affected suburbs in Lorca as a consequence of the earthquake that occurred on 11 May 2011. Figure 2.18 represents the modelled damage using Risk-EU ap-proach (Lagomarsino and Giovinazzi, 2006), considering the seismic load by
the observed European macroseismic scale (EMS-98) intensity and the vul-nerability index by building typology, age and number of floors.
The comparison between Figure 2.17 and Figure 2.18 shows that the modelled scenario underestimates the damage, particularly for the highest damage levels. This suggests the need to consider additional vulnerability factors such as the state of preserva-tion, orientation, discontinuities, soft story buildings, plan/vertical irregu-larities, openings and quality of con-struction that were missing in the pre-event vulnerability appraisals. Also, in this specific case, there could be possible previous effects from a M4.5 foreshock.
2.4.3Damage and losses to multiple sectors: relevance for more comprehensive risk
assessments
Exercises similar to the one briefly shown in Chapter 2.4.2.3 are very important to evaluate the consistency of risk models; however, they are of-ten limited to a restricted number of assets and to direct physical damage. In the following, the state of the art in risk assessments and damage esti-mations by sectors will be shortly dis-cussed, distinguishing between tan-gible and intangible exposed assets. Needs in terms of future damage data provision are also discussed.
Simulation of physical damage to buildings in the city of Lorca using the direct approach.Source: courtesy of authors
FIGURE 2.18

92
2.4.3.1Damage to tangibles
2.4.3.1.1 Agriculture
As suggested by Brémond et al. (2013), damage to agriculture should comprise different elements: crops, soil, infrastructures and storage facil-ities, which are differently exposed and vulnerable to various hazards such as earthquakes, volcanic erup-tions and floods (FAO, 2015).
Post-event damage assessment can provide a more comprehensive
understanding of damage to multiple sectors
including agriculture, infrastructure, services
and industrial and commercial activities,
overcoming the narrow approach taken so far.
Earthquakes have usually been associ-ated with potential damage to storage facilities for animals or machinery; not much thought has been given to infrastructures used in agriculture. Nonetheless, the 2012 earthquake in Italy proved to be devastating for hydraulic infrastructures needed for irrigation that was halted for sever-al days with heavy consequences for production.
Damage due to volcanic hazard, in
particular gas and tephra, is associat-ed with animals, crops, irrigation wa-ter and soil that can be devastated for a long time (Craig et al., 2016).
Floods may affect all above men-tioned components differently, but as mentioned by Brémond et al. (2013), this is not reflected in currently avail-able damage curves.
2.4.3.1.2 Industries and commercial
businesses
Industries and commercial business-es are often treated as buildings, even though they differ from the latter in many regards. A first difference is the large space usually necessary for activities that make these facilities more vulnerable to earthquakes. Sec-ondly, potential damage to machinery and raw and finished products may be more relevant than damage to structures, particularly in the case of floods, where damage to structures is generally low.
Thirdly, businesses present a very large combination of buildings, machinery, activities and processes that make it hard to standardise vulnerability as-sessment. Information on damage suffered by industries and factors that make them vulnerable are available for flood risk and earthquakes (Su-zuki, 2008; Krausman, 2010). Dam-age to business can sometimes turn into a severe secondary hazard (risk cascade), when dangerous plants are affected by natural hazards producing the so called Natech hazards (Cozzani et al., 2010; Ministère chargé de l’en-vironnement, 2005; see also Chapter 3.14).
2.4.3.2Damage to intangibles
Damage to intangibles is that which affects people and artefacts that are considered of incommensurable val-ue, i.e. it is very difficult or controver-sial to monetise. Consideration in this paper will be limited to three exam-ples, one for each hazard.
2.4.3.2.1 Loss of cultural heritage due
to earthquakes
Earthquakes occurring in historic towns often affect ancient buildings and monuments more permanently and dramatically. Their vulnerability is due to several factors including con-struction material, type of resistant technology, lack of maintenance and poor or totally lacking seismic retro-fitting. Furthermore, historic centres in Mediterranean areas, e.g. Greece, Spain, southern France, Italy and Slovenia, are characterised by com-plex urban blocks. The vulnerability of these blocks is exacerbated by the presence of shared structural com-ponents between adjacent buildings, topographic layout and the recent in-troduction of infrastructures, without taking seismic risk into sufficient con-sideration. From a cultural perspec-tive, it is very difficult to assess the value of lost heritage. Methods are available but evaluations are always heavily loaded with societal and emo-tional concerns that are hard to repre-sent in formalised quantitative terms.
CHAPTER 2 UNDERSTANDING DISASTER RISK: RISK ASSESSMENT METHODOLOGIES AND EXAMPLES
93
2.4.3.2.2 Loss of natural assets
and soil as a consequence of floods
Floods may damage, for example, parks and natural preserves in differ-ent ways (Gautak and Van der Hoek, 2003): light structures used for visit-ing such areas may be destroyed and contamination due to toxic and dan-gerous substances carried out by in-undating waters may occur with dif-ferent degrees of severity, while fauna and flora may also be affected. When a post-flood damage assessment was conducted it was observed that cer-tain species of birds abandoned the area due to the loss of nutrients in the soil and water (Menoni et al., 2017). Time is required in order to assess whether or not such damage is permanent and whether or not even-tual substituting species are as rich in biodiversity as those they have sub-stituted. Similar considerations may regard the soil itself for agricultural purposes. Salinisation resulting from coastal inundations and loss of fertile soil may be more or less permanent. Those observations should lead to enhanced risk models that provide an output to show not only the immedi-ate damage due to the event, but also its evolution and dynamic over time, which may require years to appraise the real, longer-term effects.
2.4.3.3 Historical examples of permanent relocation
Loss of social capital as a result of temporary or long-term relocation is an issue that should be considered whenever such a measure is exam-
ined. Sometimes during volcanic cri-ses, such a decision is inevitable to safeguard people’s life. Examples of past relocations such as those associ-ated with the 1982 El Chichón erup-tion in Mexico (Marrero et al., 2013), the 1991 Pinatubo eruption in the Philippines (Newhall and Punong-bayan, 1997), the 1991 Hudson vol-cano eruption in Chile (Wilson et al., 2012) and the 2010 Merapi eruption in Indonesia (Mei et al., 2013) suggest that without careful planning, com-munities can be largely disrupted. In all these examples, people were de-tached from their source of income and from the territory that is often a fundamental component of their live-lihood and identity.
2.4.4The relevance of
indirect damage and losses to account for the complexity
of events
Literature on direct, indirect and sec-ondary damage is rather significant and there is still no perfect consensus on what those terms mean; howev-er, larger convergence by the scientif-ic and practitioner communities has been achieved in more recent years thanks to efforts at the European and international levels.
At the former level, one may consid-er the results of the Conhaz project (Meyer et al., 2015), the Nedies pro-ject (Van der Veen et al., 2003) and, lately, the work carried out by the European Commission on disaster loss data (De Groeve et al., 2013; EU technical working group, 2015). At
the international level, the work car-ried out within ECLAC (Cepal, 2014) and the post-disaster needs assess-ment (PDNA) (GFDRR, 2013) has provided relevant approaches to pave the way for the SFDRR.
2.4.4.1 Indirect damage due to ripple effects in complex systems
The need to consider other types of damage as well as damage to multi-ple systems stems from the recogni-tion that real events are much more complex than the representation of physical damage to few assets. Cas-cading effects, enchained failures, malfunctions of critical lifelines and inaccessibility to facilities and affect-ed areas may be more severe in terms of impact and victims than the phys-ical damage itself (Park et al., 2013). This can be considered as the system-ic facet of indirect damage due to the interconnection and interdependency of urban and regional systems as well as among components of complex systems (Pitilakis et al., 2014).
As for systemic aspects, there have so far been few and partial attempts to model them to make them part of a more complete risk assessment (Bruneau et al., 2003). The MATRIX (2013) and the Syner-G (2014) pro-jects can be recalled here, in particular with reference to the work done on modelling lifeline disruption due to natural disasters. By analysing in detail the models provided by both projects, it is evident that even though they are rather formalised, expert decisions must be provided at crucial nodes in order to run them. This is consistent with the fact that there is not enough
94
statistical evidence for each type of malfunction of complex lifeline systems to allow for a more general formalisation of the evaluation pro-cedure. In fact, until recently, only anecdotic narrative was available, ac-companied by a few numerical figures. Few written reports regarding damage suffered by lifelines in case of floods are available (Pitt, 2008; Ministère de l’écologie, 2005). As for earthquakes, only recently the EERI reports pro-viding first reconnaissance analysis of events have introduced a more in-depth section on lifelines. For the vol-canic risk a rather interesting work has been conducted upon observations for a few eruptions, e.g. the Puye-hue-Cordón Caulle 2011 eruption in Chile (Wilson et al., 2013; Craig et al., 2016; Elissondo et al., 2016) and the Shinmoedake 2011 eruption in Japan (Magill et al., 2013). Such efforts have not produced the number and exten-sive data available for physical dam-age, yet they represent an important first step that would require more fo-cus on future efforts of collecting and analysing post- disaster damage data.
2.4.4.2 Indirect economic
damage
Even less evidence is available for in-direct damage on economic systems induced by direct damage, lifelines failures, and losses due to business interruption. Such damage and loss-es include induced production losses suffered by suppliers and custom-ers of affected companies, the costs of traffic disruption or the costs of emergency services. Evidence to date suggests that indirect damage is more important in big disasters than in more trivial ones. For example,
Hallegatte (2008) demonstrates that significant indirect loss for the state of Louisiana only arises when direct losses exceed EUR 50 billion. In a separate study, he also demonstrates that indirect impacts are greater if a natural disaster affects the economy during the expansion phase of its business cycle than if it touches it during a recession phase (Hallegatte et al., 2007).
Systemic interconnections and complexity of
modern societies require new approaches of
damage analysis and representation with
respect to the ones that have been in use so
far. Post-event damage assessment can provide
key knowledge regarding multiple types of failures and indirect damage and
loss.
Compared to direct physical effects, indirect economic losses are much more difficult to measure. Addition-ally, there are limited available sources of data for measuring indirect loss-es. It seems that defined and agreed- upon protocols for identifying and collecting useful data in this domain are still missing or are still in their ear-ly stages. Insurance data on business interruption are of limited value for that purpose, as most indirect effects, for example power outage, do not qualify for compensation under busi-ness interruption insurance. Moreo-
ver, insurance data must be indexed by insurance market characteristics (e.g. market penetration and average deductibles) to allow correct data in-terpretation and cross-country inves-tigations. Also, until recently, most insurance companies tended to treat this data as private asset.
The limitation of accessible primary data have led to attempts to measure indirect losses using economic mod-els of the type that have long been utilised for economic forecasting, such as: • simultaneous equation economet-
ric models (Ellison et al., 1984; Guimares et al., 1993; West and Lenze, 1994),
• input-output models (e.g. Rose and Benavides, 1997; Boisevert, 1992; Cochrane, 1997),
• computable general equilibrium models (Brookshire and McKee, 1992; Boisevert, 1995).
Studies evaluating model-based es-timates (Kimbell and Bolton, 1994; Bolton and Kimbell, 1995; West, 1996) show that models developed for traditional economic forecasting tend to overstate the indirect effects. Differences to observed impacts from post- event economic surveys are by 70 % to 85 % (West and Lenze, 1994). The reason for this overestimation of both indirect regional economic loss-es from natural disasters and indirect regional economic gains from recon-struction is that statistically based economic models have been designed primarily to forecast the effects of a lasting impact.
The historical interlinkages embodied in these models are likely to be sub-stantially disturbed and temporarily
CHAPTER 2 UNDERSTANDING DISASTER RISK: RISK ASSESSMENT METHODOLOGIES AND EXAMPLES
95
changed during a disaster. Dynamic adjustment features such as recovery, resilience, interregional substitution, inventory adjustments, changes in labour supply, number of displaced, etc. are not reflected in these models. In short, these models must be sub-stantially revised in order to produce reliable estimates of indirect effects. Computational algorithms modelling supply shocks, post- event supply constraints and time- phased recon-struction in disaggregated spatial set-tings (as, for example, applied in van der Veen and Logtmeijer, 2005 and Yamano et al., 2007) seem promising to overcome this methodological gap.
2.4.4.3 Changes needed to
improve post-disaster damage and loss data availability and quality
In order to obtain a more compre-hensive and satisfactory overview of damage to assets, systems and sectors following a disaster, more consistent and systematically gathered data to address the complexity of real events are needed. Furthermore, as already suggested by the World Meteorolog-ical Organisation guidelines (2007), efforts of data collection should be reiterated in the same areas in order to detect trends that cannot be seen a few hours or days after the event and to monitor the rehabilitation and re-covery process.
To achieve such a goal of obtaining and maintaining a more robust repos-itory of different types of damage to multiple sectors, a standardised re-porting system, similar to the PDNA or to the so- called Retour of Experi-ence in France (Direction territoriale
Méditerranée du Cerema, 2014) would provide significant advantages. First, because they will permit comparison between cases across geographic re-gions and time; it will then be easier to recognise similarities among cases and aspects that are specific to each case. Second, data collected and processed in the same way for key variables will allow us to obtain statistical evidence for some variables that at present are described only in a qualitative way. Third, more comprehensive and com-parable reports will permit the build-ing of a body of knowledge on differ-ent types of damage to several sectors that can support decision-making for a more resilient recovery and to feed pre-event modelling, as suggested in Figure 2.14.
2.4.4.3.1 Costs versus physical
damage
Another field that would require sub-stantial advancement relates to the reconciliation between different ways of representing damage and losses. Engineers generally provide a physi-cal representation of damage in terms of affected buildings, bridges, lifelines and plants (and related components). Costs of asset repair or substitution can then be estimated. It is less easy than generally perceived to find an exact match between the estimated repair and substitution costs and the real expenses that are declared for the reconstruction of the same items (Comerio, 1996). This can be due to the fact that costs of amelioration are included too or that, if not gov-erned, the process may lead to some distortions where someone takes un-due advantage of the disaster. Extra costs may be due also to the exces-
sive amount of needed repair mate-rial or workers from other areas to be recruited as local capacities are over-whelmed.
Furthermore, there are spatial and temporal scale issues that cannot be neglected; for example, the shift from individual items that are assessed to entire sector categories, like the shift between individual residential build-ings to residential land uses. For an attempt of alignment, one may con-sider the recent work carried out by Amadio et al. (2015).
More comprehensive post-event damage analysis
will provide fundamental knowledge to a variety of stakeholders. Innovation
is needed to reconcile the ‘engineering’
representation of the physical damage and the
economic assessment of direct and indirect
damage and loss
The economic damage, however, is not restricted to the translation of physical damage or services malfunc-tion into monetary terms. Instead, it reflects the economist’s perspective, according to which loss goes beyond repair and reconstruction needs and comprises the total effect the damage will have on a given economy (either local or national) in terms of lost re-sources and assets (Pesaro, 2007).
96
Such resources can be linked to ma-terial damage, to business and service interruption or to the fact that cus-tomers will be lost as a consequence of prolonged businesses’ interrup-tion, etc. Systemic effects due to the failure or malfunction of lifelines and services can be described in terms of numbers (days/hours of interruption, number of customers without ser-vice) or in terms of the economic loss that has been caused by such a failure. The two representations of damage and losses do not fully coincide; in-stead it would be very important to find correspondences between them.
2.4.5Conclusions and key
messages
Partnership A stronger partnership among a va-riety of stakeholders is required to achieve a more comprehensive and realistic picture of complex disasters’ impact on society. Despite claims re-lated to the usefulness of risk models for decision-making, researchers de-voted attention to models that were already satisfactorily developed and to sectors for which it was relatively easy to get data (Grandjean, 2014). In fact, the focus of many scientific studies is improving the quality and the re-liability of models, independently of completeness in terms of covered sectors and types of item. Complete-ness is important, however, for deci-sion-makers. Local and regional gov-ernments are certainly interested in assessing not only the potential phys-ical damage to buildings and a limited number of assets, but also the larger systemic effects, potential disruption
of services and businesses and overall impacts on the regional economy. De-pending on whether their role is man-aging prevention or emergencies, they are keen to know which sectors de-serve more resources to reduce future risk and how expected damage will be distributed in space and in time.
Insurers are also interested in en-hanced damage modelling and in a wider view of impacts that may shape the environment in which the damage they will have to compensate for oc-curs. In fact, duration of interrup-tion is a crucial factor, particularly for businesses. In recent years, insurance companies have become more active in supporting their customers after an event to reduce such a duration. Knowing in advance what ‘external factors’ may impact on the capacity to return to normal operations will al-low us to better tailor advice for mit-igation that is increasingly recognised as part of insurers’ work to diminish their own financial exposure.
Ultimately, we conclude that improved risk models supported by larger and more refined evidence derived from the observation of what actually hap-pens after real events is for the benefit of risk mitigation measures, be they structural or non -structural.
Knowledge The potential benefits for risk model-ling that may be provided by enhanced damage data collection and analysis is still an open issue for both academic researchers and practitioners. Fol-lowing a review of existing methods of damage modelling in Europe and the United States, Hubert and Ledoux (1999) had already suggested that post -event surveys may provide more ‘re-
ality’ to assessments by subtracting the field of imagined and hypothesised damage and providing more evidence from observed and surveyed damage. They suggest this is necessary, particu-larly for those sectors such as lifelines and industries, for which risk models are still in their infancy in terms of robustness and completeness. In fact, as shown in this chapter, knowledge is more advanced in the field of direct physical damage to certain assets, in particular buildings, while less so with respect to other sectors and different types of damage.
Innovation Multiple innovations are needed to enhance our capacity for damage modelling . First, there is the need to substantially improve post- disaster event and damage data collection and analysis (Barredo, 2009) to account for the different types of damage to multiple sectors that are currently missing. Second, there is a need to reconcile different interpretations of damage, not only in terms of defi-nitions, a field where significant ad-vances have been achieved, but also in terms of adopted units of measure and methods to aggregate cost at dif-ferent scales.
Closer interaction between engineers, volcanologists, geophysicists, geog-raphers and economists has to be sought in order to understand the im-plications and the links between dif-ferent ways of accounting for and re-porting damage and loss. This would permit an advancement of risk mod-elling by overcoming the apparent randomness of current assessments, which for some risks and for some assets are provided as damage index, and for others as costs.

CHAPTER 2 UNDERSTANDING DISASTER RISK: RISK ASSESSMENT METHODOLOGIES AND EXAMPLES
97
Also, a more comprehensive frame-work considering spatial and tempo-ral scales should be adopted in risk as-sessment. As for the former, it would be established looking at the chain of potential impacts, physical and systemic, and the quality and quanti-ty of exposed elements and systems (including economic systems). There-fore, damage should not be consid-ered only in the core area, where most physical damage has occurred, but case by case in the area of relevance, which can range from local to global in some extreme instances (Nanto et al., 2011). As for the temporal scale, it is key to reiterate the data collection at time intervals relevant for the type of event that has occurred. This will help to provide risk assessments with a clearer timestamp. A shift from a static representation of damage, de-fined in a pre-assigned time (often not made explicit), to more dynamic representations is necessary to show how damage changes and what type of damage becomes more prominent at each stage of the disaster event (impact, emergency or recovery).
98
2.5 Where are we withmultihazards, multirisks assessment capacities?JochenZschau
2.5.1Why do we need a
change in the way we assess natural risks?
2.5.1.1 Multirisk assessment
versus single-risk assessment for disaster
risk management
A given location on Earth may be threatened by more than one hazard. One of the challenges of disaster risk management (DRM) is to prior-itise the risks originating from these different hazards to enable decisions on appropriate and cost-effective mitigation or preparedness measures. However, comparability between risks associated with different types of nat-ural hazards is hampered by the dif-ferent procedures and metrics used for risk assessment in different hazard types (Marzocchi et al., 2012). A com-mon multirisk framework is needed being designed around a homogene-
ous methodology for all perils. In ad-dition, many of the natural processes involve frequent and complex interac-tions between hazards. Examples in-clude the massive landslides triggered by an earthquake or floods and debris flows triggered by an extreme storm event.
Risk globalisation and climate change are great
challenges that require a shift in the way we
assess natural risks from a single-risk to a multirisk
perspective.
The chain of events — referred to as cascade or domino effects — can in-crease the total risk, and the second-ary events may be more devastating than the original trigger, as shown in the 2004 Indian Ocean tsunami or the
2011 tsunami in Japan (Zschau and Fleming, 2012). Even independent events, if they occur at the same time and at the same place (e.g. hurricanes and earthquakes), may generate great-er loss than the sum of totally sepa-rated single events.
The consequences of disastrous events are often propagated through the human-made system, causing in-terrelated technological, economic and financial disruptions, which may also result in social and political up-heavals on all spatial scales. Even worldwide economies could poten-tially be disrupted by major disasters through their impact upon global supply chains (Zschau and Fleming, 2012). In addition, the impact of one hazard may increase the potential harmful effect of another hazard. For example, by changing vegetation and soil properties, forest fires may increase the probability of debris and flash floods (Cannon and De Graff, 2009). Similarly, a building’s vulnera-bility to ground shaking may increase due to additional structural loads

CHAPTER 2 UNDERSTANDING DISASTER RISK: RISK ASSESSMENT METHODOLOGIES AND EXAMPLES
99
following volcanic ash fall or heavy snowfall (Lee and Rosowsky, 2006; Zuccaro et al., 2008; Selva, 2013). Vulnerability in these cases would be highly time variant.
Multihazard risk approaches start from single-hazard risk assessments. Figure 2.19 attempts to capture the transition from single-hazard to mul-tihazard risk as well as the definitions used. Single-hazard risk is the most common method.
2.5.1.2 Emerging challenges: risk globalization and
climate change
The risks arising from natural hazards
have become globally interdependent and, therefore, not yet fully under-stood. The ongoing ‘urban explo-sion’, particularly in the Third World, an increasingly complex cross-linking of critical infrastructure and lifelines in the industrial nations as well as an increasing vulnerability due to climate change and growing globalisation of the world’s economy, communication and transport systems, may play a ma-jor part (Zschau and Fleming, 2012, Gencer, 2013). These factors are re-sponsible for high-risk dynamics and also constitute some of the major driving forces for disaster risk glo-balisation. Communities are affected by extreme events in their own coun-tries and become more vulnerable to those occurring outside their national territories. The effects of a destruc-
tive earthquake in Tokyo, for instance, may influence London through shaky global markets and investments; or a disaster in a global city such as Los Angeles may affect developing econ-omies like Mexico and can put the already vulnerable poor into further poverty (Gencer, 2013). In addition, the increased mobility of people can spatially enlarge the scale of natural disasters. This was demonstrated, for example, by the fatal tsunami disas-ter of 2004 along the coasts of the Indian Ocean, where the victims did not only come from the neighbouring countries, but included nearly 2 000 citizens from Europe, for instance, most of whom had been visiting re-sorts in the affected region during their Christmas holidays when the tsunami struck. Globalisation is not
From ‘single-hazard’ to ‘multirisk’ assessment and terminology adopted here.Source: courtesy of author
FIGURE 2.19
Single-hazard Only one hazard considered
Single-risk Risk in a single-hazard framework
Multilayer single-hazardMore than one hazardNo hazard interactions
Single-risk Risk in a multilayer single-hazard framework
No interactions on the vulnerability level
MultihazardMore than one hazard
Hazard interactions considered
Multihazard risk Risk in a multihazard framework
No interactions on the vulnerability level
Multirisk Risk in a multihazard framework
Interactions on the vulnerability level considered
100
the only reason for the growing inter-dependencies and the high dynamics seen in the risks from natural hazards. Climate change may be another im-portant factor. According to IPCC (2014), it is very likely that extreme events will occur with higher fre-quency, longer duration and different spatial distribution. Climate change is also projected to increase the dis-placement of people, which will lead to an increase of exposure to extreme events. They will be exposed to dif-ferent climate change impacts and consequences such as storms, coast-al erosion, sea level rise and saltwater intrusion (Nicholls and Cazenave, 2010).
A multirisk modelling approach will be required in order to capture the dynamic nature and various inter-actions of the hazard and risk-relat-ed processes driven by both climate change and globalisation. Moreover, the sought-after solutions for risk as-sessments are no longer exclusively aiming at the best possible quantifica-tion of the present risks, but also at keeping an eye on their changes with time and allowing to project these into the future.
2.5.2Towards multirisk
assessment methodology: where
do we stand?
2.5.2.1Sources of our present knowledge: the role of
EU-funded projects
The Agenda 21 for Sustainable De-velopment (UNEP, 1992), the Jo-hannesburg Plan for Implementation (UN 2002), the Hyogo Framework for Action (UNISDR, 2005) and the Sendai Framework for Disaster Risk Reduction (UNISDR, 2015) promote multihazard risks of natural hazards. Together with the International Dec-ade for Natural Disaster Reduction (IDNDR) from 1990 to 1999 and the following permanently installed International Strategy for Disaster Reduction (ISDR), they constitute a worldwide political framework for the initiation of a multitude of scientific projects in the risk research commu-nity (Zentel and Glade, 2013). These projects include global index-based multihazard risk analysis such as Nat-ural Disaster Hotspots (Dilley et al., 2005) or INFORM (De Groeve et al., 2015). They also include regional multihazard initiatives like the cities project for geohazards in Australi-an urban communities (Middelmann and Granger, 2000), the Risk Scape project in New Zealand (Schmidt et al., 2011) and the platforms HAZUS (FEMA, 2011) and CAPRA (Maru-landa et al., 2013) for the automated computation of multihazard risks in the United States and Central Ameri-ca, respectively.
The European Union funded pro-jects on multihazard and multirisk assessment within its framework pro-grammes FP4, FP5, FP6 and FP7. The TIGRA project (Del Monaco et al., 1999) and the TEMRAP project (European Commission, 2000) were among the first attempts to homog-enise the existing risk assessment methodologies among individual perils. The European Spatial Plan-
ning Observation Network (ESPON) compiled aggregated hazard maps weighting the individual hazards by means of expert opinion and tak-ing into account various natural and technological hazards in Europe (Schmidt-Thomé, 2005).
A multirisk assessment framework should allow
for the comparison of risks and account for
dynamic vulnerability as well as complex chain reactions on both the
hazard and vulnerability levels
Quantitative, fully probabilistic meth-ods for multihazard and multirisk as-sessment were developed in a series of FP6 and FP7 projects: Na.R.As. 2004-2006 (Marzocchi et al., 2009), ARMONIA 2004-2007 (Del Monaco et al., 2007) and MATRIX 2010-2013 (Liu et al., 2015). Their results allow independent extreme events (coincid-ing or not coinciding) as well as de-pendent ones, including cascades, to be treated on both the hazard and the vulnerability levels. Moreover, these projects have time-dependent vul-nerability taken into account. Their methods were applied in the CLUVA project 2010-2013 to future projec-tions of the influence of climate change on natural hazards and urban risks in Africa (Bucchignani et al., 2014; Garcia-Aristizabal et al., 2015 a, b, 2016) as well as in the CRISMA project 2012-2015 to crisis scenario
CHAPTER 2 UNDERSTANDING DISASTER RISK: RISK ASSESSMENT METHODOLOGIES AND EXAMPLES
101
modelling for improved action and preparedness(Garcia-Aristizabal et al., 2014).
In addition, projects in Europe fund-ed on a national or regional basis have contributed significantly to our pres-ent knowledge on multirisk assess-ment. The German Research Network for Natural Disasters (DFNK), which had undertaken comparative multirisk assessments for the city of Cologne (Grünthal et al., 2006), gives an exam-ple of this. The Piedmont region pro-ject in Italy, with a focus on a meth-odological approach for the definition of multirisk maps (Carpignano et al., 2009), and the ByMuR project 2011-2014 on the application of the Bayes-ian probabilistic multirisk assessment approach to natural risks in the city of Naples (Selva, 2013) are two oth-er examples. Furthermore, the Centre for Risk Studies of the University of Cambridge in the United Kingdom is presently one of the first to systemat-ically address the globalisation aspect of risk. The centre is currently setting up a global threat taxonomy and a risk assessment framework aiming at mac-ro-catastrophe threats that have the potential to cause large-scale damage and disruption to social and econom-ic networks in the modern globalised world (Coburn et al., 2014).
2.5.2.2 Multilayer single-risk
assessments: harmonisation for risk
comparability
In order to assist decision-makers in the field of DRM in their prioritising of mitigation actions, one has to un-derstand the relative importance of different hazards and risks for a given
region. This requires the threats aris-ing from different perils to be compa-rable with each other. However, this is difficult, because different hazards differ in their nature, return period and intensity, as well as the effects they may have on exposed elements. Moreover, the reference units, such as ground acceleration or macroseismic intensity for earthquakes, discharge or inundation depth for floods and wind speed for storms, are different among the hazards. This does not only ham-per the comparability between the threats, but it also makes it difficult to aggregate the single perils in a mean-ingful way in order to assess the total threat coming from all the hazards in a region. These problems exist inde-pendently of whether hazard inter-actions and/or interactions on the vulnerability level are important or not. Thus, to overcome them, and as a first step towards a full multirisk as-sessment, one may treat them in the context of a multilayer single-hazard/risk assessment approach, ignoring the interactions but harmonising and standardising the assessment proce-dures among the different perils.
Three major standardisation schemes can be distinguished in this context (Kappes et al., 2012; Papathoma-Köh-le, 2016). They make use of:• matrices — hazard matrix, vulnera-
bility matrix and risk matrix;• indices — hazard index, vulnerabil-
ity index and risk index; and• curves — hazard curves, vulnera-
bility curves and risk curves.
They are applicable on all three as-sessment levels: hazard, vulnerability and risk, respectively.
MatricesA hazard matrix applies a colour code to classify certain hazards by the in-tensity and frequency (occurrence probabilities) determined qualitative-ly, for instance ‘low’, ‘moderate’ and ‘high (Figure 2.20). Based on this, one can compare the importance of haz-ards and one may derive the overall hazard map by overlaying the classi-fication results of all single hazards. An example of this approach is the risk management of natural hazards in Switzerland (Figure 2.20, redrawn from Kunz and Hurni, 2008; see also Loat, 2010). The European Commis-sion-funded Armonia project (Ap-plied Multi-Risk Mapping of Natu-ral Hazards for Impact Assessment) has proposed a similar classification scheme (Del Monaco et al., 2007). Likewise, the French risk prevention plans (Cariam, 2006) follow this kind of approach.
Like in the ‘hazard case’, overarch-ing matrix schemes also exist on the vulnerability level. So-called damage matrices, for example, are discrete ap-proaches to vulnerability assessment that oppose relative damage or dam-age grades to classified hazard intensi-ties in a matrix. The resulting vulner-ability (fragility) is either qualitatively described (few, many or most), for in-stance as the proportion of buildings that belong to each damage grade for various levels of intensity (see Grün-thal, 1998 in relation to the European macroseismic scale), or quantitatively described as the probability to reach a certain damage grade (Tyagunov et al., 2006).
For the aim of comparing and ag-gregating risks coming from multiple
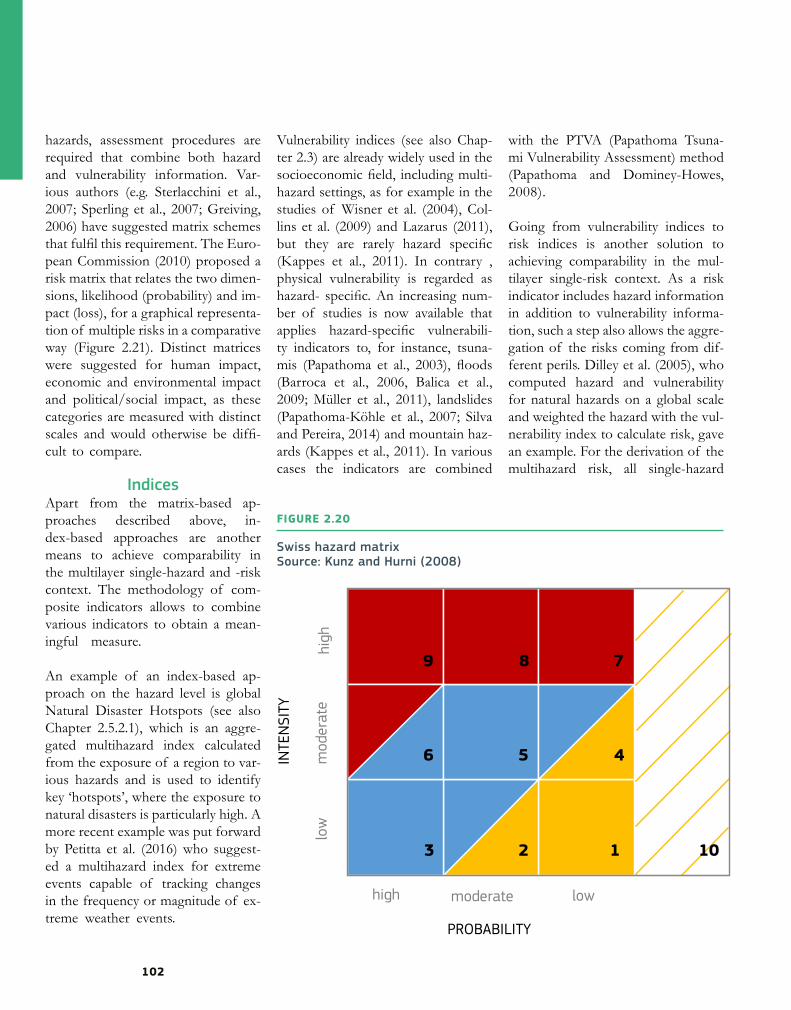
102
hazards, assessment procedures are required that combine both hazard and vulnerability information. Var-ious authors (e.g. Sterlacchini et al., 2007; Sperling et al., 2007; Greiving, 2006) have suggested matrix schemes that fulfil this requirement. The Euro-pean Commission (2010) proposed a risk matrix that relates the two dimen-sions, likelihood (probability) and im-pact (loss), for a graphical representa-tion of multiple risks in a comparative way (Figure 2.21). Distinct matrices were suggested for human impact, economic and environmental impact and political/social impact, as these categories are measured with distinct scales and would otherwise be diffi-cult to compare.
IndicesApart from the matrix-based ap-proaches described above, in-dex-based approaches are another means to achieve comparability in the multilayer single-hazard and -risk context. The methodology of com-posite indicators allows to combine various indicators to obtain a mean-ingful measure.
An example of an index-based ap-proach on the hazard level is global Natural Disaster Hotspots (see also Chapter 2.5.2.1), which is an aggre-gated multihazard index calculated from the exposure of a region to var-ious hazards and is used to identify key ‘hotspots’, where the exposure to natural disasters is particularly high. A more recent example was put forward by Petitta et al. (2016) who suggest-ed a multihazard index for extreme events capable of tracking changes in the frequency or magnitude of ex-treme weather events.
Vulnerability indices (see also Chap-ter 2.3) are already widely used in the socioeconomic field, including multi-hazard settings, as for example in the studies of Wisner et al. (2004), Col-lins et al. (2009) and Lazarus (2011), but they are rarely hazard specific (Kappes et al., 2011). In contrary , physical vulnerability is regarded as hazard- specific. An increasing num-ber of studies is now available that applies hazard-specific vulnerabili-ty indicators to, for instance, tsuna-mis (Papathoma et al., 2003), floods (Barroca et al., 2006, Balica et al., 2009; Müller et al., 2011), landslides (Papathoma-Köhle et al., 2007; Silva and Pereira, 2014) and mountain haz-ards (Kappes et al., 2011). In various cases the indicators are combined
with the PTVA (Papathoma Tsuna-mi Vulnerability Assessment) method (Papathoma and Dominey-Howes, 2008).
Going from vulnerability indices to risk indices is another solution to achieving comparability in the mul-tilayer single-risk context. As a risk indicator includes hazard information in addition to vulnerability informa-tion, such a step also allows the aggre-gation of the risks coming from dif-ferent perils. Dilley et al. (2005), who computed hazard and vulnerability for natural hazards on a global scale and weighted the hazard with the vul-nerability index to calculate risk, gave an example. For the derivation of the multihazard risk, all single-hazard
Swiss hazard matrix Source: Kunz and Hurni (2008)
FIGURE 2.20
mod
erat
elo
w
high moderate low
PROBABILITY
high
INTE
NSI
TY
1 10
8 7
6 5 4
3 2
9
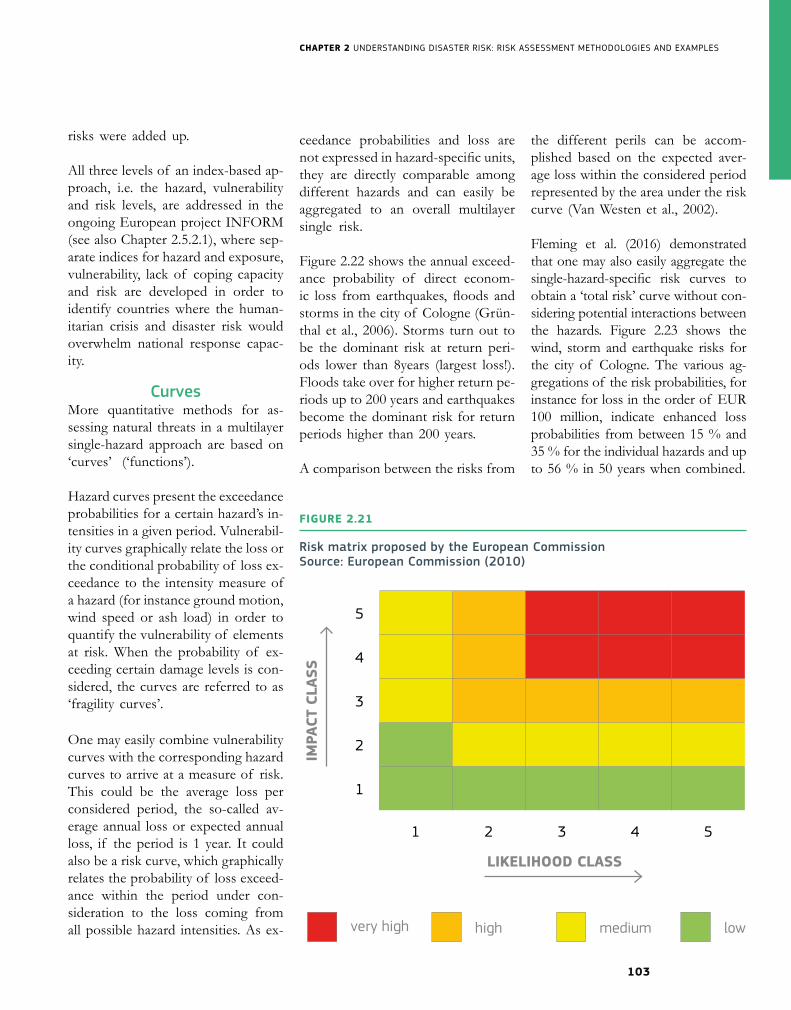
CHAPTER 2 UNDERSTANDING DISASTER RISK: RISK ASSESSMENT METHODOLOGIES AND EXAMPLES
103
risks were added up.
All three levels of an index-based ap-proach, i.e. the hazard, vulnerability and risk levels, are addressed in the ongoing European project INFORM (see also Chapter 2.5.2.1), where sep-arate indices for hazard and exposure, vulnerability, lack of coping capacity and risk are developed in order to identify countries where the human-itarian crisis and disaster risk would overwhelm national response capac-ity.
CurvesMore quantitative methods for as-sessing natural threats in a multilayer single-hazard approach are based on ‘curves’ (‘functions’).
Hazard curves present the exceedance probabilities for a certain hazard’s in-tensities in a given period. Vulnerabil-ity curves graphically relate the loss or the conditional probability of loss ex-ceedance to the intensity measure of a hazard (for instance ground motion, wind speed or ash load) in order to quantify the vulnerability of elements at risk. When the probability of ex-ceeding certain damage levels is con-sidered, the curves are referred to as ‘fragility curves’.
One may easily combine vulnerability curves with the corresponding hazard curves to arrive at a measure of risk. This could be the average loss per considered period, the so-called av-erage annual loss or expected annual loss, if the period is 1 year. It could also be a risk curve, which graphically relates the probability of loss exceed-ance within the period under con-sideration to the loss coming from all possible hazard intensities. As ex-
ceedance probabilities and loss are not expressed in hazard-specific units, they are directly comparable among different hazards and can easily be aggregated to an overall multilayer single risk.
Figure 2.22 shows the annual exceed-ance probability of direct econom-ic loss from earthquakes, floods and storms in the city of Cologne (Grün-thal et al., 2006). Storms turn out to be the dominant risk at return peri-ods lower than 8years (largest loss!). Floods take over for higher return pe-riods up to 200 years and earthquakes become the dominant risk for return periods higher than 200 years.
A comparison between the risks from
the different perils can be accom-plished based on the expected aver-age loss within the considered period represented by the area under the risk curve (Van Westen et al., 2002).
Fleming et al. (2016) demonstrated that one may also easily aggregate the single-hazard-specific risk curves to obtain a ‘total risk’ curve without con-sidering potential interactions between the hazards. Figure 2.23 shows the wind, storm and earthquake risks for the city of Cologne. The various ag-gregations of the risk probabilities, for instance for loss in the order of EUR 100 million, indicate enhanced loss probabilities from between 15 % and 35 % for the individual hazards and up to 56 % in 50 years when combined.
Risk matrix proposed by the European CommissionSource: European Commission (2010)
FIGURE 2.21
5
4
3
2
1
1 2 3 4 5
IMPA
CT C
LASS
LIKELIHOOD CLASS
very high high medium low
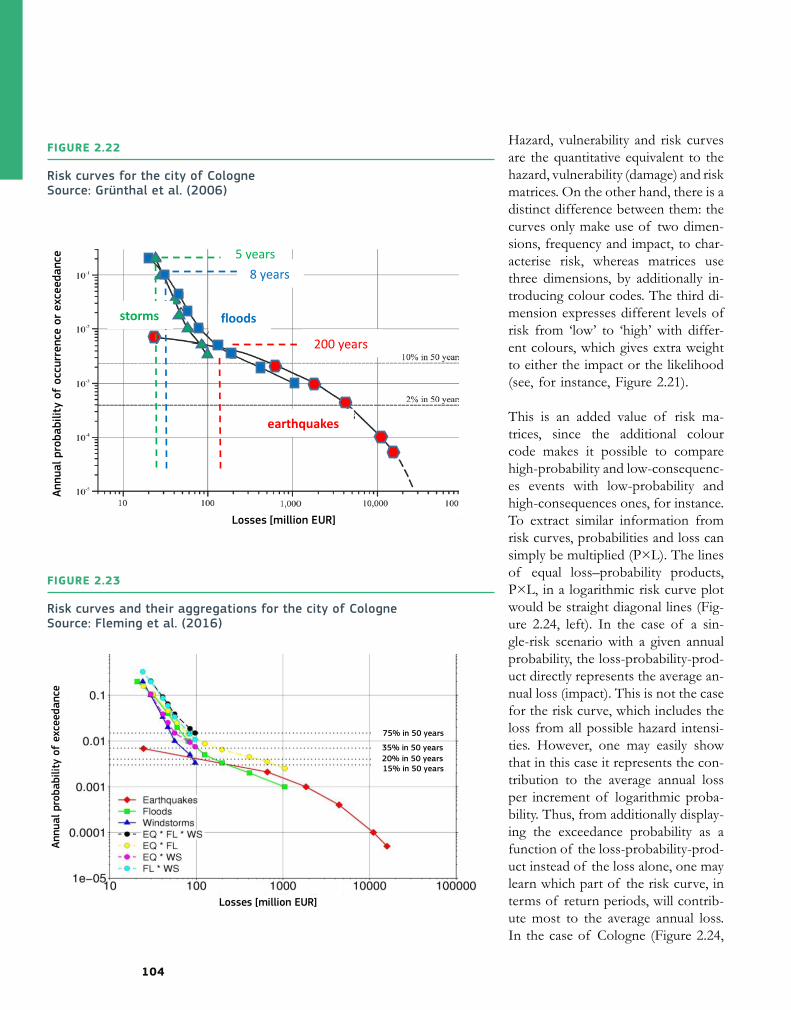
104
Hazard, vulnerability and risk curves are the quantitative equivalent to the hazard, vulnerability (damage) and risk matrices. On the other hand, there is a distinct difference between them: the curves only make use of two dimen-sions, frequency and impact, to char-acterise risk, whereas matrices use three dimensions, by additionally in-troducing colour codes. The third di-mension expresses different levels of risk from ‘low’ to ‘high’ with differ-ent colours, which gives extra weight to either the impact or the likelihood (see, for instance, Figure 2.21).
This is an added value of risk ma-trices, since the additional colour code makes it possible to compare high-probability and low-consequenc-es events with low-probability and high-consequences ones, for instance.To extract similar information from risk curves, probabilities and loss can simply be multiplied (P×L). The lines of equal loss–probability products, P×L, in a logarithmic risk curve plot would be straight diagonal lines (Fig-ure 2.24, left). In the case of a sin-gle-risk scenario with a given annual probability, the loss-probability-prod-uct directly represents the average an-nual loss (impact). This is not the case for the risk curve, which includes the loss from all possible hazard intensi-ties. However, one may easily show that in this case it represents the con-tribution to the average annual loss per increment of logarithmic proba-bility. Thus, from additionally display-ing the exceedance probability as a function of the loss-probability-prod-uct instead of the loss alone, one may learn which part of the risk curve, in terms of return periods, will contrib-ute most to the average annual loss. In the case of Cologne (Figure 2.24,
Risk curves for the city of CologneSource: Grünthal et al. (2006)
FIGURE 2.22
Risk curves and their aggregations for the city of CologneSource: Fleming et al. (2016)
FIGURE 2.23
75% in 50 years 35% in 50 years 15% in 50 years 20% in 50 years
Annu
al p
roba
bilit
y of
exc
eeda
nce
Losses [million EUR]
storms floods
earthquakes
5 years 8 years
200 years
Annu
al p
roba
bilit
y of
occ
urre
nce
or e
xcee
danc
e
Losses [million EUR]

CHAPTER 2 UNDERSTANDING DISASTER RISK: RISK ASSESSMENT METHODOLOGIES AND EXAMPLES
105
right), storms and floods contribute the most in the range of small return periods, whereas for earthquakes the return periods of around 1 000 years have the highest contribution to the average annual loss.
The probabilistic concept of risk curves is used for both economic losses of a potential disaster and the indirect, socioeconomic impacts, as long as these are tangible. As exam-ples, Garcia-Aristizabal et al. (2015a) mention losses in work productivity, losses due to missing income, costs of evacuation and the costs of medical assistance as well as effects of the loss of functionality of systems and net-works including disruptions of pro-ductivity and the means of produc-tion. Garcia-Aristizabal et al. (2015a) also describe how the information from the socioeconomic context can be integrated straightforwardly into the quantitative multi-layer risk frame-
work by harmonizing the metrics of the different loss indicators and producing the single loss exceedance curves and their sum, respectively, equivalent to the methodology used for direct losses. However, this needs to introduce quantitative vulnera-bility/fragility information for each of the different indicators or even their respective vulnerability/fragility curves, which still is the bottleneck of the method.
2.5.2.3 Hazard interactions:
cascading events and Co.
Multilayer single-risk assessments, as described in the previous section, analyse the risks coming from differ-ent perils separately. Assuming inde-pendence between the hazard-specif-ic risks, they simply add them up to obtain the overall hazard in a region.
However, in a complex system like nature, processes are very often de-pendent on each other, and interact. There are various kinds of interac-tions between hazards that often lead to significantly more severe negative consequences for the society than when they act separately. A multilayer single-risk perspective does not con-sider this, but a multihazard approach does.
Classification of hazard interactions
The complexity of interactions be-tween hazards has led to a multitude of terms in use for describing differ-ent types of interdependencies. The term ‘cascades’ has been used, for instance, by Carpignano et al. (2009), Zuccaro and Leone (2011), Choine et al. (2015) and Pescarol and Alexander (2015); ‘chains’ by Xu et al. (2014), among others; and ‘interaction haz-ard networks’ by Gill and Malamud
Risk curves and P x L - curves for the city of Cologne (Exceedance probability versus loss (left) and versus its product with loss (right)Source: courtesy of author
FIGURE 2.24
Losses [million EUR] P x L [million EUR/year]
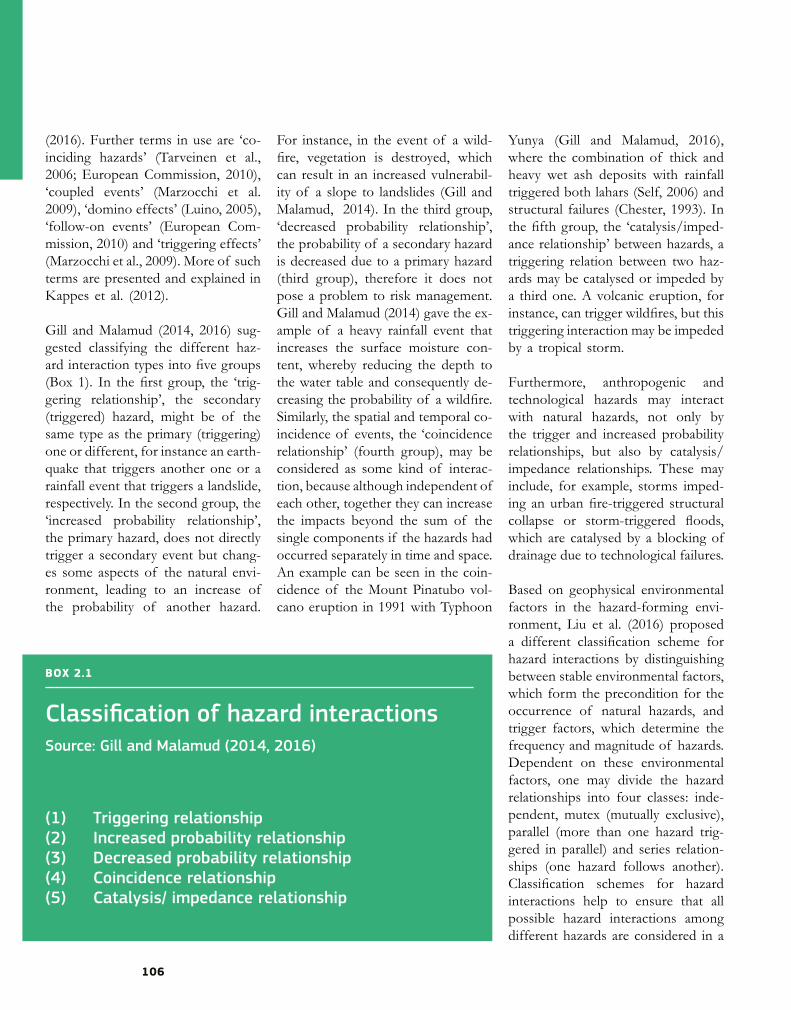
106
(2016). Further terms in use are ‘co-inciding hazards’ (Tarveinen et al., 2006; European Commission, 2010), ‘coupled events’ (Marzocchi et al. 2009), ‘domino effects’ (Luino, 2005), ‘follow-on events’ (European Com-mission, 2010) and ‘triggering effects’ (Marzocchi et al., 2009). More of such terms are presented and explained in Kappes et al. (2012).
Gill and Malamud (2014, 2016) sug-gested classifying the different haz-ard interaction types into five groups (Box 1). In the first group, the ‘trig-gering relationship’, the secondary (triggered) hazard, might be of the same type as the primary (triggering) one or different, for instance an earth-quake that triggers another one or a rainfall event that triggers a landslide, respectively. In the second group, the ‘increased probability relationship’, the primary hazard, does not directly trigger a secondary event but chang-es some aspects of the natural envi-ronment, leading to an increase of the probability of another hazard.
For instance, in the event of a wild-fire, vegetation is destroyed, which can result in an increased vulnerabil-ity of a slope to landslides (Gill and Malamud, 2014). In the third group, ‘decreased probability relationship’, the probability of a secondary hazard is decreased due to a primary hazard (third group), therefore it does not pose a problem to risk management. Gill and Malamud (2014) gave the ex-ample of a heavy rainfall event that increases the surface moisture con-tent, whereby reducing the depth to the water table and consequently de-creasing the probability of a wildfire. Similarly, the spatial and temporal co-incidence of events, the ‘coincidence relationship’ (fourth group), may be considered as some kind of interac-tion, because although independent of each other, together they can increase the impacts beyond the sum of the single components if the hazards had occurred separately in time and space. An example can be seen in the coin-cidence of the Mount Pinatubo vol-cano eruption in 1991 with Typhoon
Yunya (Gill and Malamud, 2016), where the combination of thick and heavy wet ash deposits with rainfall triggered both lahars (Self, 2006) and structural failures (Chester, 1993). In the fifth group, the ‘catalysis/imped-ance relationship’ between hazards, a triggering relation between two haz-ards may be catalysed or impeded by a third one. A volcanic eruption, for instance, can trigger wildfires, but this triggering interaction may be impeded by a tropical storm.
Furthermore, anthropogenic and technological hazards may interact with natural hazards, not only by the trigger and increased probability relationships, but also by catalysis/impedance relationships. These may include, for example, storms imped-ing an urban fire-triggered structural collapse or storm-triggered floods, which are catalysed by a blocking of drainage due to technological failures.
Based on geophysical environmental factors in the hazard-forming envi-ronment, Liu et al. (2016) proposed a different classification scheme for hazard interactions by distinguishing between stable environmental factors, which form the precondition for the occurrence of natural hazards, and trigger factors, which determine the frequency and magnitude of hazards. Dependent on these environmental factors, one may divide the hazard relationships into four classes: inde-pendent, mutex (mutually exclusive), parallel (more than one hazard trig-gered in parallel) and series relation-ships (one hazard follows another). Classification schemes for hazard interactions help to ensure that all possible hazard interactions among different hazards are considered in a
Classification of hazard interactions Source: Gill and Malamud (2014, 2016)
(1) Triggering relationship(2) Increased probability relationship(3) Decreased probability relationship(4) Coincidence relationship(5) Catalysis/ impedance relationship
BOX 2.1
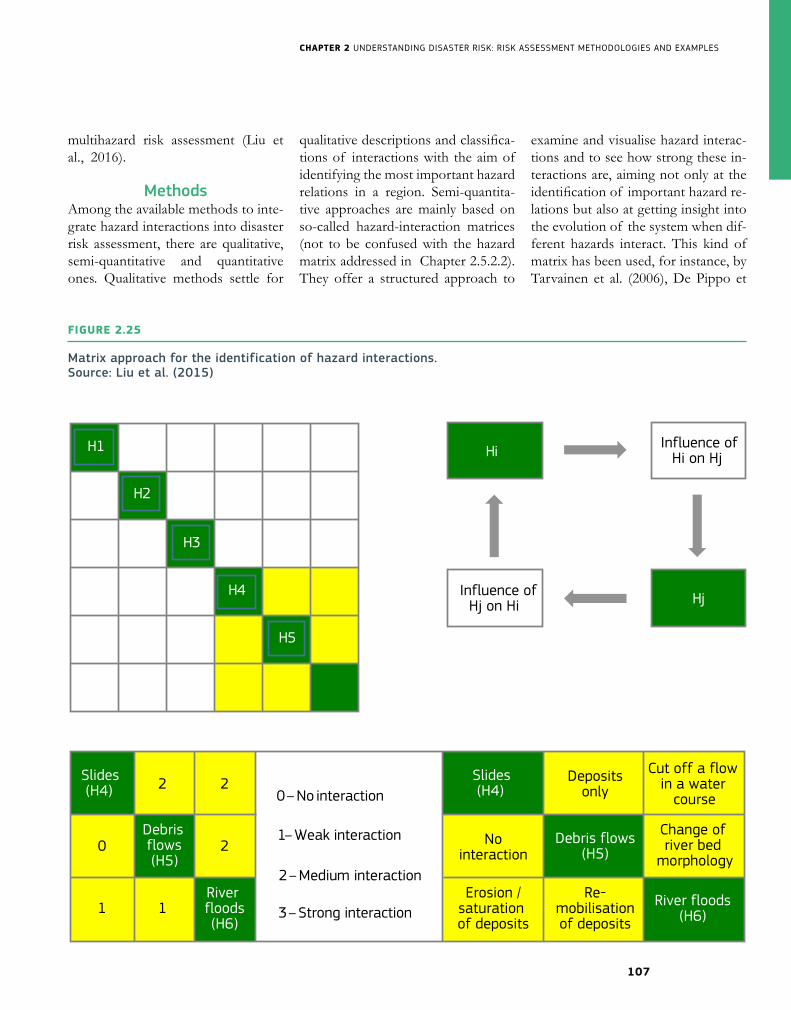
CHAPTER 2 UNDERSTANDING DISASTER RISK: RISK ASSESSMENT METHODOLOGIES AND EXAMPLES
107
multihazard risk assessment (Liu et al., 2016).
MethodsAmong the available methods to inte-grate hazard interactions into disaster risk assessment, there are qualitative, semi-quantitative and quantitative ones. Qualitative methods settle for
qualitative descriptions and classifica-tions of interactions with the aim of identifying the most important hazard relations in a region. Semi-quantita-tive approaches are mainly based on so-called hazard-interaction matrices (not to be confused with the hazard matrix addressed in Chapter 2.5.2.2). They offer a structured approach to
examine and visualise hazard interac-tions and to see how strong these in-teractions are, aiming not only at the identification of important hazard re-lations but also at getting insight into the evolution of the system when dif-ferent hazards interact. This kind of matrix has been used, for instance, by Tarvainen et al. (2006), De Pippo et
H1
H2
H3
H4
H5
Hi
Hj
Slides (H4)
Nointeraction
Erosion /saturation of deposits
Re-mobilisationof deposits
Depositsonly
Influence ofHi on Hj
Influence ofHj on Hi
Cut off a flow in a water course
Change ofriver bed
morphology
Slides (H4) 2
11
0
2
2Debris flows (H5)
River floods(H6)
Debris flows(H5)
River floods(H6)
0 – No interaction
1– Weak interaction
2 – Medium interaction
3 – Strong interaction
Matrix approach for the identification of hazard interactions.Source: Liu et al. (2015)
FIGURE 2.25

108
al. (2008), Kappes et al. (2010), Gill and Malamud (2014), Mignan et al (2014) and Liu et al. (2015). Figure 2.25 gives an example of how this matrix approach can be used in mul-tihazard assessment: first, the matrix is set up in a way that all potentially interacting hazards in the region un-der consideration are occurring in the matrix’s diagonal (Figure 2.25a). The possible interactions are described in a clockwise scheme (Figure 2.25b), which results in the influences of a hazard on the system appearing in the related matrix row and the influ-ences of the system on the hazard in the hazard’s column (Figure 2.25c). In addition, a coding between 0 and 3 is used (Figure 2.25d) to semi-quan-titatively describe how strong the in-teractions are between the different hazards, respectively, and are entered into the matrix (Figure 2.25e). Liu et al. (2015) propose this scheme to be used as second level in their three-lev-el framework from qualitative to quantitative multirisk assessment in order to decide whether it is justified to go to the third quantitative level of assessment or not.
Gill and Malamud (2014) have used a similar kind of matrix to characterise the interaction relationships between 21 natural hazards, both qualitative-ly as well as semi-quantitatively. This matrix identifies and describes haz-ard relations and potential cascades as well as characterises the different relationships between the intensity of the primary hazard and the poten-tial intensity of the secondary hazard in both the triggering and increased probability cases. Moreover, they were able to indicate the spatial overlap and temporal likelihood of each triggering relationship.
Quantitative methods for integrating hazard interactions into disaster risk assessment are mainly based on event tree and fault tree strategies (see the event tree example in Figure 2.26 for volcano eruption forecasting) com-bined with probabilistic approaches for quantifying each branch of the tree. Among them, the concept of Bayesian event trees, where the weight assigned to a branch of a node in the tree is not a fixed single value but a random variable drawn from a proba-bility distribution function, is of par-ticular interest. It allows the rigorous propagation of uncertainties through the different computation layers when simulating all the hazard relations in a complex chain. The event tree struc-ture (Newhall and Hoblitt, 2002; Mar-zocchi et al., 2004, 2008, 2010; Selva et al., 2012) is particularly suitable for describing scenarios composed by event chains. Neri et al. (2008), for in-stance, compiled a probability tree for future scenarios at the volcano Mount Vesuvius, including various eruption styles and secondary hazards associat-ed with them. Marzocchi et al. (2009, 2012) also employed a probabilistic event tree to analyse triggering ef-fects in a risk assessment framework. Moreover, Neri et al. (2013) used a probability/scenario tree for multi-hazard mapping around the Kanlaon volcano in the Philippines. However, the available quantitative studies in this field that explicitly consider haz-ard interactions remain rare (Liu et al., 2015).
The probabilistic framework to be combined with an event tree strategy for quantifying hazard interactions has been discussed in Marzocchi et al. (2004, 2008, 2010 and 2012); Sel-va (2013); Garcia-Aristizabal and
Marzocchi (2013); Gasparini and Garcia-Aristizabal (2014); and Gar-cia-Aristizabal et al. (2015a). It is equivalent to the probabilistic frame-work for the multilayer hazard assess-ment introduced in Chapter 2.5.2.2, where the single hazards are quanti-fied by their hazard curves, respective-ly, and are combined with vulnerabil-ity curves to obtain the probability of potential loss. The difference, howev-er, is that in the case of interactions between two perils, the secondary hazard’s probabilities for all possible intensity scenarios will form a hazard surface rather than a hazard curve (Figure 2.27).
So far, vulnerability has been considered as
static. Like exposure, vulnerability is also
highly dynamic regardless of whether it is physical, functional or
socioeconomic
This is because the probability of a hazard event that has been affected by another one depends on the intensi-ties of both the primary and second-ary events.
Long-term event databases on a cer-tain hazard may already contain the secondary events arising from inter-actions with other primary hazards (Marzocchi et al., 2012). Hence, for long-term problems, e.g. when the tsunami hazard over the next 50 years
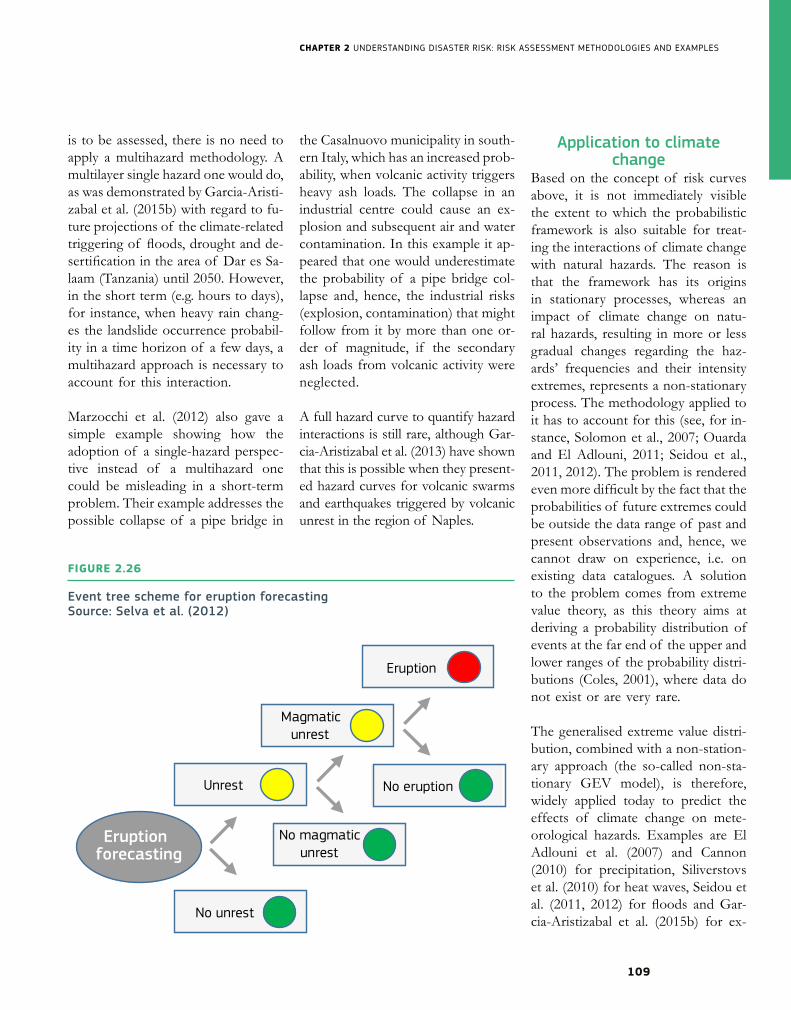
CHAPTER 2 UNDERSTANDING DISASTER RISK: RISK ASSESSMENT METHODOLOGIES AND EXAMPLES
109
is to be assessed, there is no need to apply a multihazard methodology. A multilayer single hazard one would do, as was demonstrated by Garcia-Aristi-zabal et al. (2015b) with regard to fu-ture projections of the climate-related triggering of floods, drought and de-sertification in the area of Dar es Sa-laam (Tanzania) until 2050. However, in the short term (e.g. hours to days), for instance, when heavy rain chang-es the landslide occurrence probabil-ity in a time horizon of a few days, a multihazard approach is necessary to account for this interaction.
Marzocchi et al. (2012) also gave a simple example showing how the adoption of a single-hazard perspec-tive instead of a multihazard one could be misleading in a short-term problem. Their example addresses the possible collapse of a pipe bridge in
the Casalnuovo municipality in south-ern Italy, which has an increased prob-ability, when volcanic activity triggers heavy ash loads. The collapse in an industrial centre could cause an ex-plosion and subsequent air and water contamination. In this example it ap-peared that one would underestimate the probability of a pipe bridge col-lapse and, hence, the industrial risks (explosion, contamination) that might follow from it by more than one or-der of magnitude, if the secondary ash loads from volcanic activity were neglected.
A full hazard curve to quantify hazard interactions is still rare, although Gar-cia-Aristizabal et al. (2013) have shown that this is possible when they present-ed hazard curves for volcanic swarms and earthquakes triggered by volcanic unrest in the region of Naples.
Application to climate change
Based on the concept of risk curves above, it is not immediately visible the extent to which the probabilistic framework is also suitable for treat-ing the interactions of climate change with natural hazards. The reason is that the framework has its origins in stationary processes, whereas an impact of climate change on natu-ral hazards, resulting in more or less gradual changes regarding the haz-ards’ frequencies and their intensity extremes, represents a non-stationary process. The methodology applied to it has to account for this (see, for in-stance, Solomon et al., 2007; Ouarda and El Adlouni, 2011; Seidou et al., 2011, 2012). The problem is rendered even more difficult by the fact that the probabilities of future extremes could be outside the data range of past and present observations and, hence, we cannot draw on experience, i.e. on existing data catalogues. A solution to the problem comes from extreme value theory, as this theory aims at deriving a probability distribution of events at the far end of the upper and lower ranges of the probability distri-butions (Coles, 2001), where data do not exist or are very rare.
The generalised extreme value distri-bution, combined with a non-station-ary approach (the so-called non-sta-tionary GEV model), is therefore, widely applied today to predict the effects of climate change on mete-orological hazards. Examples are El Adlouni et al. (2007) and Cannon (2010) for precipitation, Siliverstovs et al. (2010) for heat waves, Seidou et al. (2011, 2012) for floods and Gar-cia-Aristizabal et al. (2015b) for ex-
Unrest
No unrest
Magmaticunrest
No magmaticunrest
Eruption
No eruption
Eruptionforecasting
Event tree scheme for eruption forecastingSource: Selva et al. (2012)
FIGURE 2.26
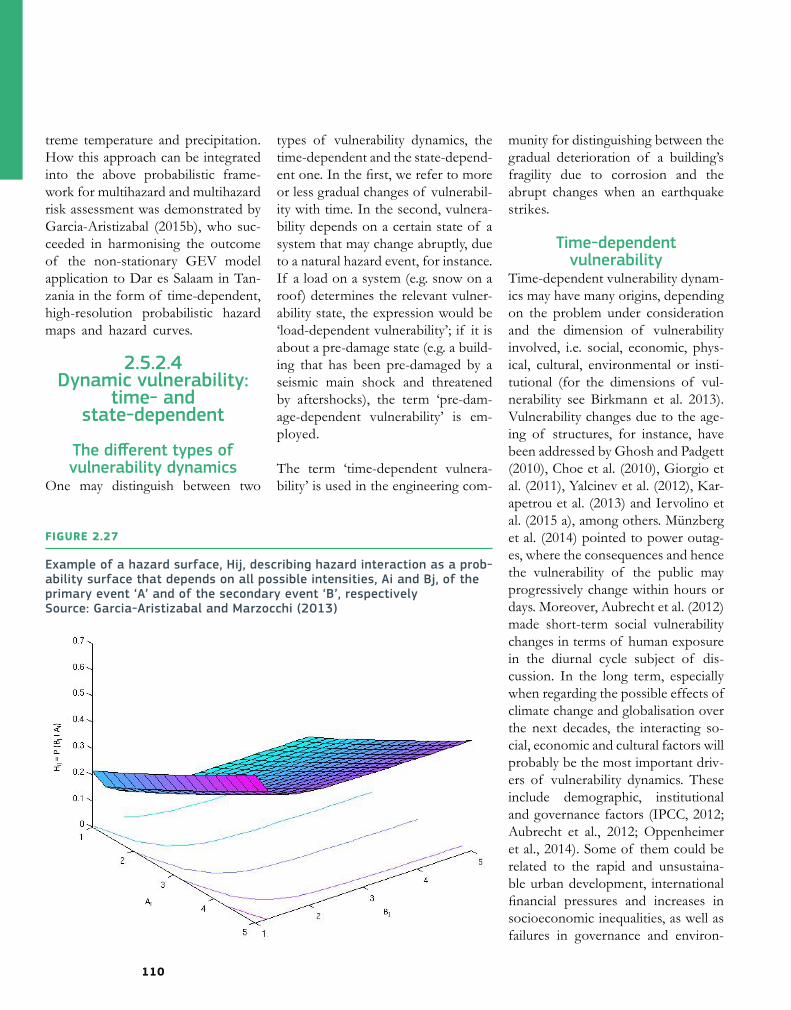
110
treme temperature and precipitation. How this approach can be integrated into the above probabilistic frame-work for multihazard and multihazard risk assessment was demonstrated by Garcia-Aristizabal (2015b), who suc-ceeded in harmonising the outcome of the non-stationary GEV model application to Dar es Salaam in Tan-zania in the form of time-dependent, high-resolution probabilistic hazard maps and hazard curves.
2.5.2.4Dynamic vulnerability:
time- and state-dependent
The different types of vulnerability dynamics
One may distinguish between two
types of vulnerability dynamics, the time-dependent and the state-depend-ent one. In the first, we refer to more or less gradual changes of vulnerabil-ity with time. In the second, vulnera-bility depends on a certain state of a system that may change abruptly, due to a natural hazard event, for instance. If a load on a system (e.g. snow on a roof) determines the relevant vulner-ability state, the expression would be ‘load-dependent vulnerability’; if it is about a pre-damage state (e.g. a build-ing that has been pre-damaged by a seismic main shock and threatened by aftershocks), the term ‘pre-dam-age-dependent vulnerability’ is em-ployed.
The term ‘time-dependent vulnera-bility’ is used in the engineering com-
munity for distinguishing between the gradual deterioration of a building’s fragility due to corrosion and the abrupt changes when an earthquake strikes.
Time-dependent vulnerability
Time-dependent vulnerability dynam-ics may have many origins, depending on the problem under consideration and the dimension of vulnerability involved, i.e. social, economic, phys-ical, cultural, environmental or insti-tutional (for the dimensions of vul-nerability see Birkmann et al. 2013). Vulnerability changes due to the age-ing of structures, for instance, have been addressed by Ghosh and Padgett (2010), Choe et al. (2010), Giorgio et al. (2011), Yalcinev et al. (2012), Kar-apetrou et al. (2013) and Iervolino et al. (2015 a), among others. Münzberg et al. (2014) pointed to power outag-es, where the consequences and hence the vulnerability of the public may progressively change within hours or days. Moreover, Aubrecht et al. (2012) made short-term social vulnerability changes in terms of human exposure in the diurnal cycle subject of dis-cussion. In the long term, especially when regarding the possible effects of climate change and globalisation over the next decades, the interacting so-cial, economic and cultural factors will probably be the most important driv-ers of vulnerability dynamics. These include demographic, institutional and governance factors (IPCC, 2012; Aubrecht et al., 2012; Oppenheimer et al., 2014). Some of them could be related to the rapid and unsustaina-ble urban development, international financial pressures and increases in socioeconomic inequalities, as well as failures in governance and environ-
Example of a hazard surface, Hij, describing hazard interaction as a prob-ability surface that depends on all possible intensities, Ai and Bj, of the primary event ‘A’ and of the secondary event ‘B’, respectivelySource: Garcia-Aristizabal and Marzocchi (2013)
FIGURE 2.27

CHAPTER 2 UNDERSTANDING DISASTER RISK: RISK ASSESSMENT METHODOLOGIES AND EXAMPLES
111
mental degradation (Oppenheimer et al. 2014).
State-dependent vulnerability
The more abrupt state-dependent vulnerability changes occur when two hazards interact on the vulnerability level and the first one alters the expo-sure or the state of exposed elements in a way that changes the response of the elements to the second one. This second event may or may not be of the same hazard type as the former, and is either independent or depend-ent on the first one. An example for load-dependent vulnerability can be found in Lee and Rosowsky (2006), who discussed the case of a wood-frame building loaded by snow and exposed to an earthquake. According-
ly, Zuccaro et al. (2008), Marzocchi et al. (2012), Garcia-Aristizabal et al. (2013) and Selva (2013) gave the ex-ample of the seismic vulnerability of buildings loaded by ash due to volcan-ic activity (Figure 2.28, below). In ad-dition, Selva (2013) presented an ex-ample for state-dependent exposure. In this case, strong local earthquakes changed the exposure to a tsunami by people escaping from their damaged buildings and concentrating in sea-side areas, which is where tsunamis hit. Pre-damage-dependent seismic vulnerability/fragility is important for earthquake aftershock risk assessment (Figure 2.28, above) and so has been addressed by Bazurro et al. (2004), Sanchez-Silva et al. (2011), Polese et al. (2012, 2015) and Iervolino et al. (2015a, 2015b), among others.
Integration into a probabilistic framework
In the case of the ageing of struc-tures, whereas one may easily inte-grate time-dependent vulnerability into a probabilistic multirisk assess-ment approach, for instance by means of time-dependent fragility functions (see Ghosh and Padgett, 2010; Kara-petrou et al., 2013), this is not the case for the long-term vulnerability chang-es relevant to climate change and glo-balisation. Despite the existence of a few studies in the climate change re-search community that have made an attempt to project probabilistic risk curves into the future (e.g. Jenkins et al., 2014), the use of vulnerability/fragility curves does not seem to be common. According to Jurgilevich et al. (2017), the main bottleneck in as-sessing vulnerability and exposure dy-namics and projecting them into the future is poor availability of data, par-ticularly for socioeconomic data. An-other bottleneck relates to the uncer-tainty and accuracy of the projections. Whilst one might have data about the future population, these data are often useless for assessing the future levels of education, income, health and oth-er important socioeconomic aspects. This may be the reason why vulner-ability assessments are still mostly based on present socioeconomic data, whereas current climate change pro-jections go up to the year 2100 (Car-dona et al., 2012). In light of the signif-icant uncertainties involved in future projections of vulnerability, climate change-related literature has suggest-ed the production of a range of alter-native future pathways instead of one most plausible vulnerability scenario (Dessai et al., 2009; Haasnoot et al., 2012, O’Neill et al., 2014, among oth-
Two examples of state-dependent seismic vulnerability: pre-damage-de-pendent vulnerability (above) and load-dependent vulnerability (below)Source: Mignan (2013)
FIGURE 2.28
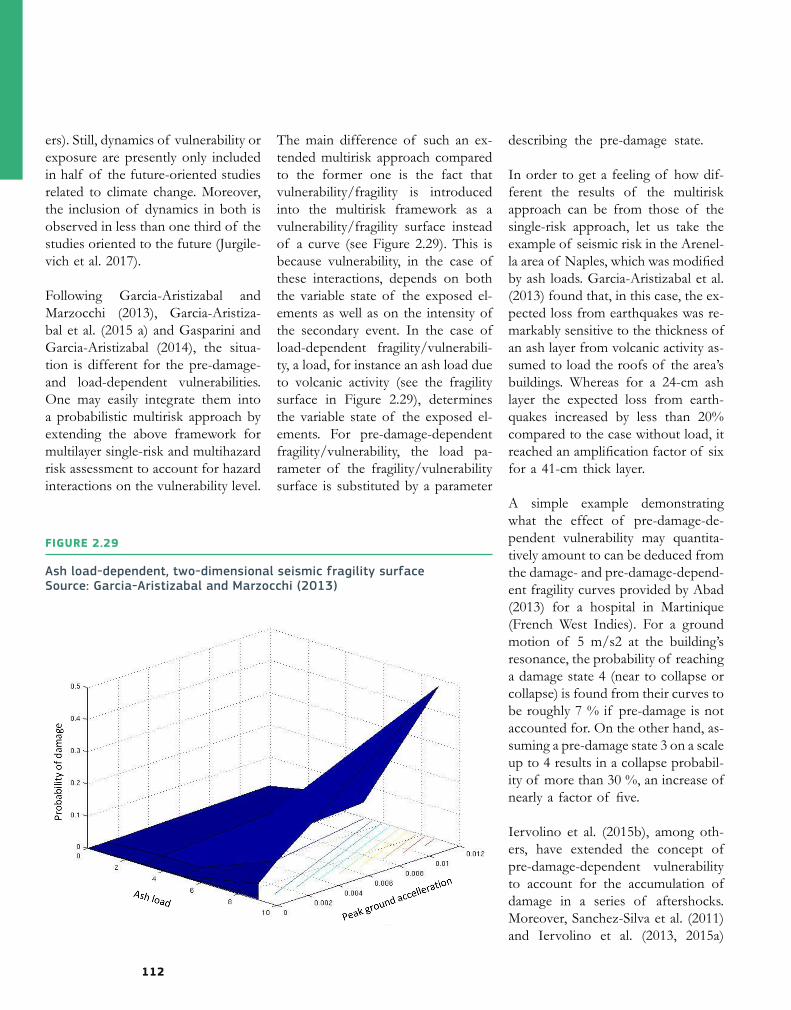
112
ers). Still, dynamics of vulnerability or exposure are presently only included in half of the future-oriented studies related to climate change. Moreover, the inclusion of dynamics in both is observed in less than one third of the studies oriented to the future (Jurgile-vich et al. 2017).
Following Garcia-Aristizabal and Marzocchi (2013), Garcia-Aristiza-bal et al. (2015 a) and Gasparini and Garcia-Aristizabal (2014), the situa-tion is different for the pre-damage- and load-dependent vulnerabilities. One may easily integrate them into a probabilistic multirisk approach by extending the above framework for multilayer single-risk and multihazard risk assessment to account for hazard interactions on the vulnerability level.
The main difference of such an ex-tended multirisk approach compared to the former one is the fact that vulnerability/fragility is introduced into the multirisk framework as a vulnerability/fragility surface instead of a curve (see Figure 2.29). This is because vulnerability, in the case of these interactions, depends on both the variable state of the exposed el-ements as well as on the intensity of the secondary event. In the case of load-dependent fragility/vulnerabili-ty, a load, for instance an ash load due to volcanic activity (see the fragility surface in Figure 2.29), determines the variable state of the exposed el-ements. For pre-damage-dependent fragility/vulnerability, the load pa-rameter of the fragility/vulnerability surface is substituted by a parameter
describing the pre-damage state.
In order to get a feeling of how dif-ferent the results of the multirisk approach can be from those of the single-risk approach, let us take the example of seismic risk in the Arenel-la area of Naples, which was modified by ash loads. Garcia-Aristizabal et al. (2013) found that, in this case, the ex-pected loss from earthquakes was re-markably sensitive to the thickness of an ash layer from volcanic activity as-sumed to load the roofs of the area’s buildings. Whereas for a 24-cm ash layer the expected loss from earth-quakes increased by less than 20% compared to the case without load, it reached an amplification factor of six for a 41-cm thick layer.
A simple example demonstrating what the effect of pre-damage-de-pendent vulnerability may quantita-tively amount to can be deduced from the damage- and pre-damage-depend-ent fragility curves provided by Abad (2013) for a hospital in Martinique (French West Indies). For a ground motion of 5 m/s2 at the building’s resonance, the probability of reaching a damage state 4 (near to collapse or collapse) is found from their curves to be roughly 7 % if pre-damage is not accounted for. On the other hand, as-suming a pre-damage state 3 on a scale up to 4 results in a collapse probabil-ity of more than 30 %, an increase of nearly a factor of five.
Iervolino et al. (2015b), among oth-ers, have extended the concept of pre-damage-dependent vulnerability to account for the accumulation of damage in a series of aftershocks. Moreover, Sanchez-Silva et al. (2011) and Iervolino et al. (2013, 2015a)
Ash load-dependent, two-dimensional seismic fragility surfaceSource: Garcia-Aristizabal and Marzocchi (2013)
FIGURE 2.29
CHAPTER 2 UNDERSTANDING DISASTER RISK: RISK ASSESSMENT METHODOLOGIES AND EXAMPLES
113
proposed to take into account both age-dependent and state-dependent vulnerabilities in one model of the time-variant failure probability of structures.
Matrix cityThe ‘Matrix city’ framework, pro-posed by Mignan et al. (2014) for a quantitative multihazard and mul-tirisk assessment that accounts for interactions on both the hazard and the vulnerability levels and considers time-dependent vulnerability, is con-ceptually quite different from the one introduced so far. It consists of a core simulation algorithm based on the Monte Carlo method. This method simulates a large number of stochastic hazard-intensity scenarios, thereby al-lowing for a probabilistic assessment of the risk and for the recognition of more or less probable risk paths. As each scenario is represented by a time series, the method is also appropri-ate for assessing the risks associated with non-stationary processes, such as the hazards and/or vulnerabilities under climate change. Intra- as well as interhazard intensity interactions are introduced by a so-called hazard cor-relation matrix.
This matrix is of the same type as the hazard interaction matrix used by Gill and Malamud (2014) for qualitatively and semi-quantitatively characteris-ing interaction relationships between natural hazards, but by entering the one-to-one conditional probabilities of the secondary hazards it is applied in a quantitative way. For creating a hazard/risk scenario, the Monte Carlo method draws the probabilities from a Poisson distribution. So far, Matrix city has only been used with generic data to demonstrate the theoretical
benefits of multihazard and multirisk assessment and to show how multirisk contributes to the emergence of ex-tremes. It has been successfully test-ed, but ‘identifying their real-world practicality will still require the appli-cation of the proposed framework to real test sites’ (Mignan et al., 2014).
2.5.3Implementation of
MRA into DRM: Present state,
benefits and barriers2.5.3.1
State of implementation
Multirisk is not systematically ad-dressed among DRM in EU countries (Komendantova et al., 2013a, 2013b, 2014, 2016; Scolobig et al., 2013, 2014a, 2014b). Single-hazard maps are still the decision support tool most often used in DRM, even more often than single-risk maps. Along with the missing link between scientific multi-risk assessment and decision-making in DRM comes a general lack of inte-grated practices for multirisk govern-ance.
2.5.3.2Expected benefits
The practitioners involved in the Ma-trix study emphasised the following benefits:• ranking and comparison of risks.• Improvement of land-use plan-
ning, particularly as the multirisk approach provides a holistic view of all possible risks. It may influ-ence decisions about building re-strictions, which themselves may influence urban and economic
planning, for example by regulating the construction of new houses and/or economic activities.
• Enhanced response capacity, be-cause a multirisk approach would allow planning for potential dam-age to critical infrastructure from secondary events and preparation for response actions.
• Improvements in the efficiency of proposed mitigation actions, cost reductions, encouraging awareness of secondary risks and the devel-opment of new partnerships be-tween agencies working on differ-ent types of risk.
2.5.3.3Barriers
Barriers to effectively implementing multirisk assessment into DRM are found in both the science and prac-tice domains as well as between them. In addition, individual perceptual and cognitive barriers may play a role in both domains (Komendantova et al., 2016).
Barriers in the science domain mainly relate to an unavailability of common standards for multirisk assessment across disciplines. Different disciplines use different risk concepts, databases, methodologies, classification of the risk levels and uncertainties in the hazard- and risk-quantification pro-cess. There is also an absence of clear definitions of terms commonly agreed across disciplines, including the term ‘multirisk’ itself, for which there is no consensus as regards its definition. These differences make it hard for var-ious risk communities to share results, and hence represent a barrier to dia-logue on multirisk assessment.
114
A lack of quantitative information on the added value of multirisk assess-ment is perhaps more worrying for risk managers than for scientists. The risk managers who participated in the Matrix study pointed out that there are not enough quantitative multirisk scenarios or their comparisons with single risk ones available from which they could learn about the added value of multirisk. Furthermore, they miss criteria or guidelines that would help them to select the scenarios to be in-cluded in a multirisk assessment. Most worrying for them, however, seem to be the strong limitations quantitative multirisk assessment methods, in their opinion, have when one regards their user friendliness. According to them, a high degree of expertise is often required to use the scientific tools, resulting in a restriction of their ap-plication to only a narrow number of experts.
Multirisk is presently not systematically addressed
among DRM in EU countries. The barriers to the implementation
of MRA include a lack of agreed definitions
Moreover, poor cooperation between institutions and personnel, especially when risks are managed by authori-ties acting at different governmental levels, was identified as a major rea-son for a lack of integrated practic-es for multirisk governance in the practical domain (Scolobig et al.,
2014a). Decentralised and central-ised governance systems have their own weaknesses and strengths in this regard (Komendantova et al., 2013a; Scolobig et al., 2014b). Furthermore, in some cases a multirisk approach is perceived as competing with rath-er than complementing single-risk approaches. The Matrix study also argued that in many European coun-tries the responsibility for DRM has steadily been shifted to the local level (often to the municipal level) without providing sufficient financial, techni-cal and personnel resources for im-plementing necessary programmes (Scolobig et al., 2014a). This is a clear obstacle for implementing multirisk methodologies.
Finally, there are individual cognitive barriers to implementing multirisk as-sessment approaches into the DRM decision-making processes, i.e. barri-ers related to how people perceive the problem of multirisk. Komendanto-va et al. (2016) presented the case of the 1995 Kobe earthquake in Japan, where the hazard was underestimat-ed, simply because large earthquakes had been absent during the previous decades. Similar consequences are ob-served when building codes for earth-quake-resistant structures are not fol-lowed, a problem that still exists all over the world, including in Europe. Individual cognitive barriers may only be overcome by raising awareness.
Overcoming these barriers will re-quire a long-term commitment on be-half of risk modellers and officials as well as strong partnerships for a ‘step-by-step’ approach to progressively implementing multirisk methodology into practice.
2.5.4Conclusions and key
messages
Partnership A better integration of scientific knowledge of multirisk assessment into developing policies and practic-es will require a long-term commit-ment from both sides, science and practice, and building new partner-ships between them. Such partner-ships should enhance the knowledge transfer between science and prac-tice and, among others, should help involve practitioners as well as their requirements in the scientific devel-opment of multirisk methodology at an early stage. Common efforts will be particularly necessary for simplify-ing existing methods for practical use. Furthermore, scientists are asked to provide practitioners with more sce-narios demonstrating the added value of multirisk assessments in various situations, and together they should collaborate in establishing criteria for appropriate scenarios to be included in a multirisk assessment.
More specifically, it might also be worthwhile considering the common development of a multirisk rapid re-sponse tool for assessing potential secondary hazards after a primary hazard has occurred. As lack of data is a crucial weakness in multirisk as-sessments, partnerships should also extend their collaboration to sharing data and building common integrat-ed databases, in particular for demo-graphic, socioeconomic and environ-mental data.
Such partnerships could be realised with common projects or by creat-

CHAPTER 2 UNDERSTANDING DISASTER RISK: RISK ASSESSMENT METHODOLOGIES AND EXAMPLES
115
ing so-called multirisk platforms for common methods and data, and/or establishing so-called local multirisk commissions, institutional areas with an interdisciplinary and multisector character for discussing and acting on multirisk issues.
KnowledgeAlthough a theoretical framework for multirisk assessment and scenar-io development is in place, there is still a need for further harmonisation of methods and particularly terms across the scientific disciplines. More-over, more quantitative scenarios on present and future risks in a multirisk environment are needed, particularly with regard to potential indirect ef-fects and chain-shaped propagations of damage into and within the soci-oeconomic system. Such scenarios are still rare, mainly because of two reasons. First, the comprehensive da-tabases needed for a multirisk assess-ment either do not exist, are not freely available or are insufficient; there is a need for establishing such databas-es between the disciplines. Second, quantitative fragility/vulnerability in-formation, in particular fragility/vul-nerability curves and surfaces, respec-tively, have so far been developed only for a few specific cases, mostly related to the direct impact of a disaster, but hardly to its indirect consequences; these, however, in many cases may be more important than the direct ones.
Therefore, the scientific knowledge base needs to be extended to quan-titative vulnerability information, vulnerability curves and surfaces for indirect disaster impacts as, for in-stance, the loss in work productivity, loss of the functionality of systems and networks, costs of evacuation,
costs of medial assistances and much more.
InnovationA multi-risk modelling approach will be required in order to capture the dynamic nature and the various inter-actions of the hazard and risk relat-ed processes driven by both climate change and globalization. Moreover, solutions for risk assessments are needed that are no longer exclusively aiming at the best possible quantifica-tion of the present risks but also keep an eye on their changes with time and allow to project these into the future.
The future challenges have two dimensions, one
focused on empowering good decisions in practice and another on improving
our knowledge base for better understanding
present and future risks
Developing an integrative model for future risk that considers not only the potential climate change-induced haz-ard dynamics, but also the potential dynamics of complex vulnerability components and the involved uncer-tainties will require the expertise of all these disciplines. A strong partner-ship will be required between the nat-ural sciences, the social and economic sciences, as well as the climate change research community.
116
DRM requires a combination of skills knowledge and data that will not be held within one firm, one industry, one institution, one discipline, one country or even necessarily one region. Europe contains a concentration of expertise on DRM, perhaps unique in the world; the opportunities here are greatest and should be seized.
Historically, many in industry and the private and public sectors found it chal-lenging to engage with academia. For example, industry often works within tight timescales, wanting to hear a single right answer with certainty, wanting dissemination of what is known now as opposed to new research and wanting it in a form that can be easily incorporated into existing models and processes not requiring detailed assessment, adjustment and review. But there is an in-creasing awareness of what science has to offer, which often leads to an even greater demand for collective engagement. This engagement has been encour-aged by EU research projects encouraging public/private/academic linkages all involved in DRM, where practitioners, scientists and policymakers need to actively seek engagement with others working in the broad DRM space: within their organisation and within their sector, as well as more broadly. This is easy to say but rather more difficult to do.
Only positive interaction will make the practitioner aware of what is possible: what new data, models and techniques are available and how these may be adapted for practical use within their organisation or department. The practi-tioner lies in the centre of the process. It is they that understand the gaps of knowledge and data, where true value for additional research lies. But often un-consciously there may be ‘group think’ — an accepted way of working that is not adequately challenged. It is healthy to develop links with other practitioners in their field, in other sectors or industries and in academia. Increasing knowl-edge and expertise can be both a push and a pull: both learning from others and also using in-house expertise to drive knowledge for the common good.
Areas where other practitioners or academics may have valuable information include the fields of data, methodologies and models. Knowledge may be si-loed: restricted to particular risks, hazard or exposure types. The practitioner is in a position to break down these silos, spotting where data or processes in one area may have value in another. This is particularly true when looking at the interaction of hazards, secondary hazards and non-physical impacts such as business interruption and broader economic loss.
It is important to learn from other sectors facing similar issues and learn from their experience. For example, methods have been developed in the insurance industry to model and manage catastrophe risk that can be applied almost di-
Recommendations

CHAPTER 2 UNDERSTANDING DISASTER RISK: RISK ASSESSMENT METHODOLOGIES AND EXAMPLES
117
rectly to societal risk including to people, property and the environment. There are quick wins available; early adopters are not starting from a clean sheet but building on a framework that is already well founded. No innovation is risk free, but development of a risk management strategy for a city, for example; is based upon well-developed methodologies and so is very likely to deliver real value and be seen to deliver real value.
Science can respond to identified needs but only if it hears the call, as it were. Very often the need is not for new research but for directed application of what is known within academia, not elsewhere. Information and data need to be offered in forms that are accessible, appropriate and affordable. More work is required to build publicly available datasets and models (for example the global earthquake model initiative). Where governments hold data, it is impor-tant to balance the desire to exploit that data for profit against the greater good of making the information available to all those who can use it to develop tools that ultimately benefit and protect the broader European population.
Before embarking on a DRM project, like for any other project it is important to understand what the objectives of the project are: what needs to be done and when it needs to be done. DRM is an area where there is always a need for further understanding and knowledge in each of the three pillars of risk assessment: hazard, exposure and vulnerability. Each element requires different skills, different data and different techniques; the process can seem daunting. There are many real examples of best practice, methodologies, data sources and assessment and analytical techniques to act as a template. The process will not necessarily be smooth, but the process of developing understanding and awareness is arguably where the real value lies. It is important not to let the fear of lack of knowledge or data prevent this vital work from commencing. Innovative thinking is required to meet the challenges of a lack of data and partial information endemic in the process, for example new methods to assess exposure by remote sensing or vulnerability, particularly to economies and eco-systems. The challenge is to focus innovation on where it has the most value, a proper risk assessment process will provide a guide to where the greatest requirement for innovation and further research lies.
Risk assessment and analysis provides an objective basis against which policy decisions can be made and transparently justified and the cost and benefits of different strategies and options can be compared in an objective way, open to scrutiny and challenge. All models are assumption dependent, but it is impor-tant that the policymaker has some knowledge of the limitations of the model-ling done and the key assumptions upon which it depends. The issue is balance: clearly a policymaker cannot be expected to be a risk management expert, but uncritically relying on one source of information can lead to political as well as practical risk — a culture of challenge and evidence- based analysis is required. It is important that policymakers are able to interpret the risk assessments giv-en to them. European insurance regulators demand that directors of insurance companies are able to understand and defend risk assumptions and decisions
118
made within the firm; they cannot hide behind the judgement of employees or consultants however well qualified. The same scrutiny is applied to policymak-ers and practitioners in the public sector who respond to disasters. Whilst not hiding behind experts, it is important that policymakers can demonstrate that appropriate expertise has been engaged and risk management decisions have been made firmly founded.
At its best, DRM not only adds to the information available to policymakers, but it also creates a new way of looking at risk within organisations. Risk man-agement should not be seen as just the responsibility of a risk management department but should be understood by all those involved in decision-making. Embracing risk management and risk modelling has transformed the insurance industry in the last 30 years, making it infinitely more aware of the risks that it and its clients face and much more able to meet their needs (and pay their claims). It is a virtuous circle: greater knowledge feeds an understanding of what is missing and a drive to fill those gaps; it demands an engagement with academia, the adoption of best science and the development of best practice via interaction with other practitioners. The process of improvement becomes self-sustaining, increasing knowledge and understanding to the benefit of all. Europe demands better DRM, so the opportunity must be seized.
CHAPTER 2 UNDERSTANDING DISASTER RISK: RISK ASSESSMENT METHODOLOGIES AND EXAMPLES
119
REFERENCES CHAPTER 2
IntroductionKlinke, A., Renn, O., 2002. A new approach to risk evaluation and management: risk-based, precaution-based, and discourse-based
strategies. Risk Analysis 22(6), 1071-1094.The Royal Society, ‘Risk analysis, perception and management’, 1992.UNISDR Terminology, 2017.https://www.unisdr.org/we/inform/terminology, [accessed 04 April, 2017].Vetere Arellano, A. L., Cruz, A. M., Nordvik, P.. Pisano, F. (eds.). 2004. Analysis of Natech (natural hazard triggering technological
disasters) disaster management. Nedies workshop proceedings, Italy, 2003. EUR 21054EN, Publications Office of the European Union, Luxembourg.
2.1. Qualitative and quantitative approaches to risk assessmentApostolakis, G. E., 2004. How useful is quantitative risk assessment? Risk Analysis 24(3),515-520.Cox, T., 2008. What’s wrong with risk matrices. Risk Analysis 28(2), 497-512.Directive 2009/138/EC of the European Parliament and of the Council of 25 November 2009 on the taking-up and pursuit of the
business of Insurance and Reinsurance (Solvency II). Official Journal of the European Union L 335, 17.12.2009, pp 1–155.Directive 2012/18/EU of the European Parliament and of the Council of 4 July 2012 on the control of major-accident hazards
involving dangerous substances, amending and subsequently repealing Council Directive 96/82/EC. Official Journal of the Eu-ropean Union L 197, 24.7.2012,pp.1-37.
Eurocode website, n.d. The EN Eurocodes. http://eurocodes.jrc.ec.europa.eu/, [accessed 04 April, 2017].European Commission, 2014. Overview of natural and man-made disaster risks in the EU. Staff working document, SWD(2014)
134 final of 8.4.2014. European Commission, 2010. Risk assessment and mapping guidelines for disaster management. Staff Working Paper, SEC(2010)
1626 final of 21.12.2010.Friedman, D. G., 1984. Natural hazard risk assessment for an insurance programme. The Geneva Papers on Risk and Insurance,
9(3), 57-128.Gowland, R., 2012. The work of the european process safety centre (EPSC) technical Steering committee working group: ‘atypical
scenarios’. Hazards XXIII, symposium series No 158, Institute of Chemical Engineers.Grünthal, G., Thieken, A. H., Schwarz, J., Radtke, K. S., Smolka, A., Merz, B., 2006. Comparative risk assessments for the city of Co-
logne, Germany — storms, floods, earthquakes. Natural Hazards 38(1-2), 21-44.Health and Safety Executive, 2001. Reducing risks, protecting eople — HSE’s decision-making process, Her Majesty’s Stationary
Office, United Kingdom, www.hse.gov.uk/risk/theory/r2p2.pdf, [accessed 04 April, 2017].Health and Safety Executive, 2009. Safety and environmental standards for fuel storage sites — Process Safety Leadership Group
— Final report, United Kingdom, www.hse.gov.uk/comah/buncefield/fuel-storage-sites.pdf, [accessed 04 April, 2017].Health and Safety Laboratory, 2005. Review of hazard identification techniques. Sheffield, United Kingdom, 2005, www.hse.gov.uk/
research/hsl_pdf/2005/hsl0558.pdfHoogheemraadschap van Rijnland, 2009. Flood control in the Netherlands — A strategy for dike reinforcement and climate ad-
aptation.IAIS International Association of Insurance Supervisors, 2015. Insurance core principles. www.iaisweb.org/file/58067/insur-
ance-core-principles-updated-november-2015, [accessed 04 April, 2017].Simmons, D. C., 2016. How catastrophe and financial modelling revolutionised the insurance industry. Willis Towers Watson, https://
understandrisk.org/wp-content/uploads/Simmons.pdf. [accessed 04 April, 2017].Skjong, R., Wentworth, B. H., 2001. Expert judgment and risk perception. In Proceedings of the Offshore and Polar Engineering
Conference. ISOPE IV, 17-22 June, Stavanger, pp. 537-544.Stamatis, D. H., 2003. Failure mode and effect analysis: FMEA from theory to execution, ASQ Quality Press.Tyler, B., Crawley, F., Preston, M., 2015. HAZOP: guide to best practice, 3rd ed., Institute of Chemical Engineers.United Kingdom Cabinet Office, 2015. National risk register of civil emergencies. www.gov.uk/government/publications/nation-
al-risk-register-for-civil-emergencies-2015-editionWhite, C. S. and Budde, P. E., 2001. Perfecting the storm: the evolution of hurricane models. www.contingencies.org/marapr01/
perfecting.pdf, [accessed 04 April, 2017].
2.2. Current and innovative methods to define exposureArino, O., Ramos Perez, J.J., Kalogirou, V., Bontemps, S., Defourny, P., Van Bogaert, E., 2012. Global Land Cover Map for 2009 (Glob-
Cover 2009). © Eur. Space Agency ESA Univ. Cathol. Louvain UCL. Basher, R., Hayward, B., Lavell, A., Martinelli, A., Perez, O., Pulwarty, R., Sztein, E., Ismail-Zadeh, A., Batista e Silva, F., Lavalle, C., Koomen, E., 2013. A procedure to obtain a refined European land use/cover map. Journal of Land Use
Science 8(3), 255–283. Bouziani, M., Goïta, K., He, D.C., 2010. Automatic change detection of buildings in urban environment from very high spatial reso-
lution images using existing geodatabase and prior knowledge. ISPRS Journal of Photogrammetry and Remote Sensing 65(1), 143–153.
Cardona, O.D., Van Aalst, M., Birkmann, J., Fordham, M., McGregor, G., Perez, R., Pulwarty, R., Schipper, L., Sinh, B., 2012. Determinants of risk: exposure and vulnerability. In: Field, C.B., Barros, V., Stocker, T.F., Qin, D., Ebi, K.L., Mastrandrea, M.D., Mach, K.J., Plattner,
120
G.-K., Allen, S.K., Tignor, M., Midgley, P.M. (Eds.), Managing the Risks of Extreme Events and Disasters to Advance Climate Change Adaptation. Cambridge University Press, Cambridge, pp. 65–108.
Chen, J., Chen, J., Liao, A., Cao, X., Chen, L., Chen, X., He, C., Han, G., Peng, S., Lu, M., Zhang, W., Tong, X., Mills, J., 2015. Global land cover mapping at 30m resolution: A POK-based operational approach. ISPRS Journal of Photogrammetry and Remote Sensing, 103, 7–27.
Crowley, H., Ozcebe, S., Spence, R., Foulset-Piggott, R., Erdik, M., Alten, K., 2012. Development of a European Building Inventory Database. In: Proceedings of 12th World Conference on Earthquake Engineering.
World Bank 2014. Open Data for Resilience Field Guide. Washington, DC: World Bank.De Bono, A., Chatenoux, B., 2015. A Global Exposure Model for GAR 2015, UNEP-GRID, GAR 2015 Background Papers for Global
Risk Assessment, 20 p.De Bono, A., Mora, M.G., 2014. A global exposure model for disaster risk assessment. International Journal of Disaster Risk Reduc-
tion 10, 442–451. Deichmann, U., Ehlrich, D., Small, C., Zeug, G., 2011. Using high resolution satellite data for the identification of urban natural dis-
aster risk. World Bank and European Union Report.Dell’Acqua, F., Gamba, P., Jaiswal, K., 2013. Spatial aspects of building and population exposure data and their implications for
global earthquake exposure modeling. Natural Hazards 68(3), 1291–1309. Dobson, J.E., Bright, E.A., Coleman, P.R., Durfee, R.C., Worley, B.A., 2000. LandScan: A global population database for estimating
populations at risk. Photogrammetric Engineering & Remote Sensing. 66(7), 849–857.Ehrlich, D., Tenerelli, P., 2013. Optical satellite imagery for quantifying spatio-temporal dimension of physical exposure in disaster
risk assessments. Natural Hazards, 68(3), 1271–1289. Erdik, M., Sesetyan, K., Demircioglu, M., Hancilar, U., Zulfikar, C., Cakti, E., Kamer, Y., Yenidogan, C., Tuzun, C., Cagnan, Z., Harmandar,
E., 2010. Rapid earthquake hazard and loss assessment for Euro-Mediterranean region. Acta Geophysica 58. Esch, T., Taubenböck, H., Roth, A., Heldens, W., Felbier, A., Thiel, M., Schmidt, M., Müller, A., Dech, S., 2012. TanDEM-X mission—
new perspectives for the inventory and monitoring of global settlement patterns. Journal of Applied Remote Sensing 6(1), 061702–1.
Florczyk, A.J., Ferri, S., Syrris, V., Kemper, T., Halkia, M., Soille, P., Pesaresi, M., 2016. A New European Settlement Map From Optical Remotely Sensed Data. IEEE Journal of Selected Topics in Applied Earth Observations and Remote Sensing 9(5), 1978–1992.
Forzieri, G., Bianchi, A., Marin Herrera, M.A., Batista e Silva, F., Feyen, L., Lavalle, C., 2015. Resilience of large investments and critical infrastructures in Europe to climate change. EUR 27598 EN, Luxembourg: Publications Office of the European Union.
Freire, S., Halkia, M., Ehlrich, D., Pesaresi, M., 2015a. Production of a population grid in Europe. EUR 27482 EN, Luxembourg: Publi-cations Office of the European Union.
Freire, S., Kemper, T., Pesaresi, M., Florczyk, A., Syrris, V., 2015b. Combining GHSL and GPW to improve global population mapping. IEEE International Geoscience & Remote Sensing Symposium, 2541-2543.
Friedl, M.A., Sulla-Menashe, D., Tan, B., Schneider, A., Ramankutty, N., Sibley, A., Huang, X., 2010. MODIS Collection 5 global land cover: Algorithm refinements and characterization of new datasets. Remote Sens. Environ. 114 (1), 168–182.
Fritz, S., See, L., Rembold, F., 2010. Comparison of global and regional land cover maps with statistical information for the agricul-tural domain in Africa. International Journal of Remote Sensing 31 (9), 2237–2256.
Gamba, P., Cavalca, D., Jaiswal, K., Huyck, C., Crowley, H., 2012. The GED4GEM project: development of a global exposure database for the global earthquake model initiative. In: 15th World Conference on Earthquake Engineering, Lisbon, Portugal.
Haque, U., Blum, P., da Silva, P.F., Andersen, P., Pilz, J., Chalov, S.R., Malet, J.-P., Auflič, M.J., Andres, N., Poyiadji, E., Lamas, P.C., Zhang, W., Peshevski, I., Pétursson, H.G., Kurt, T., Dobrev, N., García-Davalillo, J.C., Halkia, M., Ferri, S., Gaprindashvili, G., Engström, J., Keellings, D., 2016. Fatal landslides in Europe. Landslides.
Jaiswal, K., Wald, D., Porter, K., 2010. A Global Building Inventory for Earthquake Loss Estimation and Risk Management. Earthquake Spectra 26 (3), 731–748.
Latham, J., Cumani, R., Rosati, I., Bloise, M., 2014. Global Land Cover SHARE (GLC-SHARE) database Beta-Release Version 1.0.Lloyd, C.T., Sorichetta, A., Tatem, A.J., 2017. High resolution global gridded data for use in population studies. Scientific Data 4,
170001.Loveland, T.R., Reed, B.C., Brown, J.F., Ohlen, D.O., Zhu, Z., Yang, L., Merchant, J.W., 2000. Development of a global land cover char-
acteristics database and IGBP DISCover from 1 km AVHRR data. International Journal of Remote Sensing 21(6-7), 1303–1330. Lugeri, N., Kundzewicz, Z.W., Genovese, E., Hochrainer, S., Radziejewski, M., 2010. River flood risk and adaptation in Europe—assess-
ment of the present status. Mitigation and Adaptation Strategies for Global Change 15, 621–639. Manakos, I., Braun, M. (Eds.), 2014. Land Use and Land Cover Mapping in Europe, Remote Sensing and Digital Image Processing.
Springer Netherlands, Dordrecht.Marin Herrera, M., Bianchi, A., Filipe Batista e Silva, F., Barranco, R., Lavalle, C., 2015. A geographical database of infrastructures in
Europe: a contribution to the knowledge base of the LUISA modelling platform. Luxembourg: Publications Office of the European Union.
Michel-Kerjan, E., Hochrainer-Stigler, S., Kunreuther, H., Linnerooth-Bayer, J., Mechler, R., Muir-Wood, R., Ranger, N., Vaziri, P., Young, M., 2013. Catastrophe Risk Models for Evaluating Disaster Risk Reduction Investments in Developing Countries: Evaluating Disaster Risk Reduction Investments. Risk Analysis 33, 984–999.
Montero, E., Van Wolvelaer, J., Garzón, A., 2014. The European Urban Atlas, in: Manakos, I., Braun, M. (Eds.), Land Use and Land Cover Mapping in Europe. Springer Netherlands, Dordrecht, pp. 115–124.
Neumann, B., Vafeidis, A.T., Zimmermann, J., Nicholls, R.J., 2015. Future Coastal Population Growth and Exposure to Sea-Level Rise and Coastal Flooding — A Global Assessment. PLOS ONE 10, e0118571.
Peduzzi, P., Dao, H., Herold, C., Mouton, F., 2009. Assessing global exposure and vulnerability towards natural hazards: the Disaster Risk Index. Natural Hazards and Earth System Sciences 9, 1149–1159.
Pesaresi, M., Ehrlich, D., Ferri, S., Florczyk, A., Freire, S., Haag, F., Halkia, M., Julea, A.M., Kemper, T., Soille, P., 2015. Global Human Settlement Analysis for Disaster Risk Reduction. In: The International Archives of the Photogrammetry, Remote Sensing and
CHAPTER 2 UNDERSTANDING DISASTER RISK: RISK ASSESSMENT METHODOLOGIES AND EXAMPLES
121
Spatial Information Sciences, XL-7/W3, 36th International Symposium on Remote Sensing of Environment, 11–15 May 2015, Berlin, German
Academic paper: Global Human Settlement Analysis for Disaster Risk Reduction. Available from: https://www.researchgate.net/pub-lication/277360201_Global_Human_Settlement_Analysis_for_Disaster_Risk_Reduction [accessed Apr 6, 2017]. ISPRS — Int. Arch. Photogramm. Remote Sens. Spat. Inf. Sci. XL-7/W3, 837–843.
Pesaresi, M., Guo Huadong, Blaes, X., Ehrlich, D., Ferri, S., Gueguen, L., Halkia, M., Kauffmann, M., Kemper, T., Linlin Lu, Marin-Herrera, M.A., Ouzounis, G.K., Scavazzon, M., Soille, P., Syrris, V., Zanchetta, L., 2013. A Global Human Settlement Layer From Optical HR/VHR RS Data: Concept and First Results. IEEE Journal of Selected Topics in Applied Earth Observations and Remote Sensing, 6(5), 2102–2131.
Pesaresi, M., Melchiorri, M., Siragusa, A., Kemper, T., 2016. Atlas of the Human Planet — Mapping Human Presence on Earth with the Global Human Settlement Layer. EUR 28116 EN. Luxembourg: Publications Office of the European Union.
Pittore, M., 2015. Focus maps: a means of prioritizing data collection for efficient geo-risk assessment. Annals of Geophysics 58(1). Pittore, M., Wieland, M., 2013. Toward a rapid probabilistic seismic vulnerability assessment using satellite and ground-based
remote sensing. Natural Hazards 68(1), 115–145. Pittore, M., Wieland, M., Errize, M., Kariptas, C., Güngör, I., 2015. Improving Post-Earthquake Insurance Claim Management: A Novel
Approach to Prioritize Geospatial Data Collection. ISPRS International Journal of Geo-Information 4(4), 2401–2427. Pittore, M., Wieland, M., Fleming, K., 2016. Perspectives on global dynamic exposure modelling for geo-risk assessment. Natural
Hazards 86(1), 7-30. Rose, A., Huyck, C.K., 2016. Improving Catastrophe Modeling for Business Interruption Insurance Needs: Improving Catastrophe
Modeling for Business Interruption. Risk Analysis 36(10), 1896–1915. UNISDR, 2015a. Making Development Sustainable: The Future of Disaster Risk Management. Global Assessment Report on Disaster
Risk Reduction. United Nations Office for Disaster Risk Reduction, Geneva, Switzerland.UNISDR, 2015b. Sendai framework for disaster risk reduction 2015–2030. United Nations International Strategy for Disaster
Reduction. http://www.wcdrr.org/uploads/Sendai_Framework_for_Disaster_Risk_Reduction_2015-2030.pdf, [accessed 04 April 2016].
GFDRR, 2014. Understanding risk in an evolving world, A policy Note. Global facility for disaster reduction and recovery. World Bank, Washington DC, USA, 16pp.
2.3. The most recent view of vulnerabilityAlexander, D. and Magni, M., 2013. Mortality in the L ’ Aquila ( Central Italy ) Earthquake of 6 April 2009. PLOS Current Disasters,
(April 2009).Alexander, D., 2010. The L’Aquila Earthquake of 6 April 2009 and Italian Government Policy on Disaster Response. Journal of Nat-
ural Resources Policy Research, 2(4), 325–342.Alexander, D., 2013. Resilience and disaster risk reduction: An etymological journey. Natural Hazards and Earth System Sciences,
13 (11), 2707–2716.BEH and UNU-EHS, 2016. WorldRiskReport 2016. Berlin and Bonn: Bündnis Entwicklung Hilft and United Nations University – EHS.Birkmann, J., Cardona, O.D., Carreno, M.L., Barbat, A.H., Pelling, M., Schneiderbauer, S., Kienberger, S., M.Keiler, Alexander, D., Zeil, P.,
and T., W., 2013. Framing vulnerability, risk and societal responses : the MOVE framework. Nat Hazards, 67, 193–211.Birkmann, J., Kienberger, S., and Alexander, D., 2014. Assessment of vulnerability to natural hazards : a European perspective. San
Diego and Waltham, USA: Elsevier Inc.Brooks, N., 2003. A conceptual framework Vulnerability , risk and adaptation : A conceptual framework. No. 3.Buth, M., Kahlenborn, W., Savelsberg, J., Becker, N., Bubeck, P., Kabisch, S., Kind, C., Tempel, A., Tucci, F., Greiving, S., Fleischhauer, M.,
Lindner, C., Lückenkötter, J., Schonlau, M., Schmitt, H., Hurth, F., Othmer, F., Augustin, R., Becker, D., Abel, M., Bornemann, T., Stein-er, H., Zebisch, M., Schneiderbauer, S., and Kofler, C., 2015. Germany’s vulnerability to Climate Change. Summary. Dessau-Roßla.
Cardona, O.D., Aalst, M.K. van, Birkmann, J., Fordham, M., McGregor, G., Perez, R., Pulwarty, R.S., Schipper, E.L.F., and Sinh, B.T., 2012. Determinants of Risk : Exposure and Vulnerability. In: C. B. Field, V. Barros, T.F. Stocker, D. Qin, D.J. Dokken, K.L. Ebi, M.D. Mastran-drea, K.J. Mach, G.-K. Plattner, S.K. Allen, M. Tignor, and P.M. Midgley, eds. Managing the Risks of Extreme Events and Disasters to Advance Climate Change Adaptation. A Special Report of Working Groups I and II of the Intergovernmental Panel on Climate Change (IPCC). Cambridge University Press, Cambridge, UK, and New York, NY, USA, 65–108.
Carreño, M.L., Barbat, A.H., Cardona, O.D., and Marulanda, M.C., 2014. Holistic Evaluation of Seismic Risk in Barcelona. In: Assess-ment of Vulnerability to Natural Hazards. 21–52.
Carreño, M.-L., Cardona, O.D., and Barbat, A.H., 2007. Urban Seismic Risk Evaluation: A Holistic Approach. Natural Hazards, 40(1), 137–172.
CI:GRASP, n.d. The Climate Impacts: Global and Regional Adaptation Support Platform. http://www.pik-potsdam.de/cigrasp-2/index.html, [accessed 06 April, 2017].
Ciscar, J.C., Feyen, L., Soria, A., Lavalle, C., Raes, F., Perry, M., Nemry, F., Demirel, H., Rozsai, M., Dosio, A., Donatelli, M., Srivastava, A., Fumagalli, D., Niemeyer, S., Shrestha, S., Ciaian, P., Himics, M., Van Doorslaer, B., Barrios, S., Ibáñez, N., Forzieri, G., Rojas, R., Bianchi, A., Dowling, P., Camia, A., Libertà, G., San Miguel, J., de Rigo, D., Caudullo, G., Barredo, J., Paci, D., Pycroft, J., Saveyn, B., Van Regemorter, D., Revesz, T., Vandyck, T., Vrontisi, Z., Baranzelli, C., Vandecasteele, I., Batista e Silva, F., and Ibarreta, D., 2014. Climate Impacts in Europe: The JRC PESETA II Project. JRC Scientific and Policy Reports. Seville, Spain: Joint Research Centre, Institute for Prospective Technological Studies.
Climate-ADAPT, n.d. European climate adaptation platform. http://climate-adapt.eea.europa.eu, [accessed 06 April, 2017].Cutter, S., Emrich, C.T., Mitchell, J.T., Boruff, B.J., Gall, M., Schmidtlein, M.C., and Burton, G.C., 2006. The Long Road Home: Race, Class,
and Recovery from Hurricane Katrina. Environment, 48(2), 8–20.Cutter, S.L., Boruff, B.J., and Shirley, W.L., 2003. Social Vulnerability to Environmental Hazards. Social Science Quarterly, 84(2),
242–261.
122
Cutter, S.L., Ismail-Zadeh, A., Alcántara-Ayala, I., Altan, O., Baker, D.N., Briceño, S., Gupta, H., Holloway, A., Johnston, D., McBean, G.A., Ogawa, Y., Paton, D., Porio, E., Silbereisen, R.K., Takeuchi, K., Valsecchi, G.B., Vogel, C., and Wu, G., 2015. Pool knowledge to stem losses from disasters. Nature, (55), 277–279.
De Groeve, T., Poljansek, K., Vernaccini, L., 2015. Index for Risk Management - INFORM. Concept and Methodology. EUR 26528EN, Luxembourg, Publications Office of the European Union.
Dilley, M., Chen, R.S., Deichmann, U., Lerner-Lam, A.L., Arnold, M., Agwe, J., Buys, P., Kjekstad, O., Lyon, B., and Gregory, Y., 2005. Natural Disaster Hotspots A Global Risk. Disaster Risk Management Series. Washington DC, USA.
EC, 2013. EU Strategy on adaptation to climate change.Economist Intelligence Unit, 2009. Managing supply-chain risk for reward. London. New York, Hong Kong.EEA, 2012. Climate change, impacts and vulnerability in Europe: An indicator-based report. Copenhagen, Denmark: European En-
vironment Agency.EEA, 2017. Climate change, impacts and vulnerability in Europe: An indicator-based report. Luxembourg: Publications Office of the
European Union.ESPON, 2011. ESPON CLIMATE-Climate Change and Territorial Effects on Regions and Local Economies. Luxembourg.Fekete, A., 2009. Validation of a social vulnerability index in context to river-floods in Germany. Natural Hazards and Earth System
Science, 9 (2), 393–403.Fernandez, P., Mourato, S., and Moreira, M., 2016. Social vulnerability assessment of flood risk using GIS-based multicriteria deci-
sion analysis. A case study of Vila Nova de Gaia (Portugal). Geomatics, Natural Hazards and Risk, 7 (4), 1367–1389.Fritzsche, K., Schneiderbauer, S., Bubeck, P., Kienberger, S., Buth, M., Zebisch, M., and Kahlenborn, W., 2014. The Vulnerability Source-
book: Concept and guidelines for standardised vulnerability assessments. Bonn and Eschborn.Garschagen, M., 2014. Risky Change? Vulnerability and adaptation between climate change and transformation dynamics in Can
Tho City, Vietnam. Stuttgart, Germany: Franz Steiner Verlag.Greiving, S., Zebisch, M., Schneiderbauer, S., Fleischhauer, M., Lindner, C., Lückenkötter, J., Buth, M., Kahlenborn, W., and Schauser,
I., 2015. A consensus based vulnerability assessment to climate change in Germany. International Journal of Climate Change Strategies and Management, 7(3), 306–326.
Hagenlocher, M., Delmelle, E., Casas, I., Kienberger, S., 2013. Assessing socioeconomic vulnerability to dengue fever in Cali, Colom-bia: statistical vs expert-based modeling. International Journal of Health Geographics, 12- 36.
Hazus, n.d. Hazus: FEMA's Methodology for Estimating Potential Losses from Disasters. https://www.fema.gov/hazus, [accessed 06 April, 2017].
Hinkel, J., 2011. ‘Indicators of vulnerability and adaptive capacity’: Towards a clarification of the science–policy interface. Global Environmental Change, 21(1), 198–208.
INFORM subnational models, n.d. INFORM Subnational risk index. http://www.inform-index.org/Subnational, [accessed 06 April, 2017].
INFORM, n.d. Index For Risk Management. http://www.inform-index.org/, [accessed 06 April, 2017]. IPCC, 2007. Climate Change 2007: Impacts, Adaptation and Vulnerability. Contribution of Working Group II to the Fourth Assess-
ment Report of the Intergovernmental Panel on Climate Change, 2007.IPCC, 2012a. Managing the Risks of Extreme Events and Disasters to Advance Climate Change Adaptation. Cambridge UK: Cam-
bridge University Press.IPCC, 2012b. Summary for policymakers - Special report on managing the risk of extreme events and disasters to advance climate
change adaptation (SREX). Intergovernmental Panel on Climate Change.IPCC, 2013. Climate Change 2013: The Physical Science Basis. Summary for Policymakers.Jansson, N.A.U., 2004. Ericsson’s proactive supply chain risk management approach after a serious sub-supplier accident. Interna-
tional Journal of Physical Distribution & Logistics Management, 34, 434–456.Johnson, C.W., 2007. Analysing the Causes of the Italian and Swiss Blackout, 28th September 2003. In: Tony Cant, ed. 12th Austral-
ian Conference on Safety Critical Systems and Software Conference. Adelaide, Australia: Australian Computer Society.Kelman, I., Gaillard, J.C., Lewis, J., and Mercer, J., 2016. Learning from the history of disaster vulnerability and resilience research
and practice for climate change. Natural Hazards, 82(1), 129–143.Kienberger, S., Contreras, D., and Zeil, P., 2014. Spatial and Holisitc Assessment of Social, Economic, and Environmental Vulnerabili-
ty to Floods – Lessons from the Salzach River Basin, Austria. In: J. Birkmann, S. Kienberger, and D. E. Alexander, eds. Assessment of Vulnerability to Natural Hazards: A European Perspective. Amsterdam, The Netherlands: Elsevier, 53–73.
Kropp, J. p., Block, A., Reusswig, F., Zickfeld, K., and Schellnhuber, H.J., 2006. Semiquantitative Assessment of Regional Climate Vulnerability: The North-Rhine Westphalia Study. Climatic Change, 76 (3-4), 265–290.
Mc Michael, A.J., 2013. Globalization, Climate Change, and Human Health. The New England Journal of Medicine, 368, 1335–1343.Merz, B., Kreibich, H., Schwarze, R., and Thieken, A., 2010. Assessment of economic flood damage. Natural Hazards And Earth Sys-
tem Sciences, 10(8), 1697–1724.Met Office and WFP, 2014. Climate impacts on food security and nutrition. A review of existing knowledge. Rome, Italy.Meyer, V., Becker, N., Markantonis, V., Schwarze, R., van den Bergh, J.C.J.M., Bouwer, L.M., Bubeck, P., Ciavola, P., Genovese, E.,
Green, C., Hallegatte, S., Kreibich, H., Lequeux, Q., Logar, I., Papyrakis, E., Pfurtscheller, C., Poussin, J., Przylusky, V., Thieken, A.H., and Viavattene, C., 2013. Review article : Assessing the costs of natural hazards – state of the art and knowledge gaps, 13, 1351–1373.
Meyer, W., 2011. Measurement: Indicators – Scales – Indices – Interpretations. In: R. Stockmann, ed. A Practitioner Handbook on Evaluation. Cheltenham, UK and Northampton, MA, USA: Edward Elgar Publishing, 189–219.
Millennium Ecosystem Assessment, 2005. Ecosystems and Human Well-being: Synthesis. Washington, DC.ND-GAIN , n.d. Notre Dame Global Adaptation Initiative (ND-GAIN). http://index.gain.org, [accessed 06 April, 2017].Oppenheimer, M., Campos, M., R.Warren, Birkmann, J., Luber, G., O’Neill, B., and Takahashi, K., 2014. Emergent Risks and Key Vul-
nerabilities. In: C. B. Field, V.R. Barros, D.J. Dokken, K.J. Mach, M.D. Mastrandrea, T.E. Bilir, M. Chatterjee, K.L. Ebi, Y.O. Estrada, R.C. Genova, B. Girma, E.S. Kissel, A.N. Levy, S. MacCracken, P.R. Mastrandrea, and L.L.White, eds. Climate Change 2014: Impacts,
CHAPTER 2 UNDERSTANDING DISASTER RISK: RISK ASSESSMENT METHODOLOGIES AND EXAMPLES
123
Adaptation, and Vulnerability. Part A: Global and Sectoral Aspects. Contribution of Working Group II to the Fifth Assessment Report of the Intergovernmental Panel on Climate Change. Cambridge University Press, Cambridge, UK, and New York, NY, USA,: Cambridge University Press, 1039–1099.
PBL, 2012. Effect of climate changes on waterborne disease in The Netherlands. The Hague.Peduzzi, P., Dao, H., Herold, C., and Mouton, F., 2009. Assessing global exposure and vulnerability towards natural hazards: the
Disaster Risk Index. Natural Hazards and Earth System Science, 9 (4), 1149–1159.Pescaroli, G. and Alexander, D., 2016. Critical infrastructure, panarchies and the vulnerability paths of cascading disasters. Natural
Hazards, 82(1), 175–192.Prutsch, A., Torsten Grothmann, Sabine McCallum, Inke Schauser, and Rob Swart, 2014. Climate change adaptation manual : les-
sons learned from European and other industrialised countries. Oxford, UK: Routledge.Robine, J.-M., Cheung, S.L.K., Le Roy, S., Van Oyen, H., Griffiths, C., Michel, J.-P., and Herrmann, F.R., 2008. Death toll exceeded 70,000
in Europe during the summer of 2003. Comptes rendus biologies, 331 (2), 171–8.Schneiderbauer, S. and Ehrlich, D., 2006. Social Levels and Hazard (in)-Dependence. In: J. Birkmann, ed. Measuring Vulnerability to
Natural Hazards: Towards Disaster Resilient Societies. Tokyo, Japan: United Nations University Press, 78–102.Schneiderbauer, S., Zebisch, M., Kass, S., and Pedoth, L., 2013. Assessment of vulnerability to natural hazards and climate change
in mountain environments. In: J. Birkmann, ed. Measuring Vulnerability to Natural Hazards: Towards Disaster Resilient Societies. Tokyo, Japan: United Nations University Press, 349 – 380.
Tas, M., Tas, N., Durak, S., and Atanur, G., 2013. Flood disaster vulnerability in informal settlements in Bursa, Turkey. Environment and Urbanization, 25(2), 443–463.
Turner, B.L., Kasperson, R.E., Matson, P.A., Mccarthy, J.J., Corell, R.W., Christensen, L., Eckley, N., Kasperson, J.X., Luers, A., Martello, M.L., Polsky, C., Pulsipher, A., and Schiller, A., 2003. A framework for vulnerability analysis in sustainability science. Proceedings of the National Academy of Sciences, 100(14), 8074–8079.
UK, 2016. UK Climate Change Risk Assessment 2017. Synthesis Report. London, UK.UNDRO, 1984. Disaster Prevention and Mitigation: a Compendium of Current Knowledge. Volume 11. Geneva: United Nations, Office
of the United Nations Disaster Relief Co-ordinator.UNISDR, 2015a. Sendai framework for disaster risk reduction 2015–2030. United Nations International Strategy for Disaster
Reduction. http://www.wcdrr.org/uploads/Sendai_Framework_for_Disaster_Risk_Reduction_2015-2030.pdf, [accessed 04 April 2016].
UNISDR Terminology, 2017.https://www.unisdr.org/we/inform/terminology, [accessed 04 April, 2017].UNISDR, 2015b. Global Assessment Report on Disaster Risk Reduction.Wannewitz, S., Hagenlocher, M., Garschagen, M., 2016. Development and validation of a sub-national multi-hazard risk index for
the Philippines. GI_Forum – Journal for Geographic Information Science, 1, 133-140.Welle, T. and Birkmann, J., 2015. The World Risk Index – An Approach to Assess Risk and Vulnerability on a Global Scale. Journal
of Extreme Events, 02 (01), 1550003.Welle, T., Depietri, Y., Angignard, M., Birkmann, J., Renaud, F., and Greiving, S., 2014. Vulnerability Assessment to Heat Waves, Floods,
and Earthquakes Using the MOVE Framework: Test Case Cologne, Germany. In: J. Birkmann, S. Kienberger, and D. E. Alexander, eds. Assessment of Vulnerability to Natural Hazards: A European Perspective. Amsterdam, The Netherlands: Elsevier, 91–124.
Wisner, B., 2016. Vulnerability as Concept , Model , Metric , and Tool. In: Oxford Research Encyclopedia of Natural Hazard Science. Oxford University Press, 1–58.
Wisner, B., Blaikie, P., Cannon, T., and Davis, I., 2004. At risk: natural hazards, people’s vulnerability, and disasters. 2nd ed. Oxford, UK: Routledge.
Yusuf, A.A. and Francisco, H., 2009. Climate Change Vulnerability Mapping for Southeast Asia. Singapore.
2.4. Recording disaster losses for improving risk modellingAmadio, M., Mysiak, J., CarreraL., Koks, E., 2015. Improvements in Flood Risk Assessment: Evidence from Northern Italy. Review of
Environment, Energy and Economics (Re3).Barbat, A., Carrenoa, M., Pujadesb, L., Lantadab, N., Cardona, O., Marulanda, M., 2010. Seismic vulnerability and risk evaluation
methods for urban areas. A review with application to a pilot area. Structure and Infrastructure Engineering 6(1–2), 17–38.Barredo, J., 2009. Normalised flood losses in Europe: 1970–2006. Natural Hazards and Earth System Sciences 9, 97–104.Benedetti, D., Benzoni, G., Parisi, M.A., 1988. Seismic vulnerability and risk evaluation for old urban nuclei, Earthquake Engineering
& Structural Dynamics 16(2), 183–201.Biass, S, Bonadonna, C, Di Traglia, F, Pistolesi, M, Rosi, M, Lestuzzi, P., 2016. Probabilistic evaluation of the physical impact of future
tephra fallout events for the Island of Vulcano, Italy. Bulletin of Volcanology 78, 37.Cochrane, H. 1997. Indirect economic losses. In Development of Standardized Earthquake Loss Estimation Methodology. Vol. II.
Washington, D.C.: National Institute for Building Sciences.Boisevert, R., 1992. Indirect losses from a catastrophic earthquake and the local, regional, and national interest. In Indirect Eco-
nomic Consequences of a Catastrophic Earthquake. Washington, D.C.: FEMA, National Earthquake Hazard Reduction Program.Bolton, N. and L. Kimbell. 1995. The Economic and Demographic Impact of the Northridge Earthquake. Paper presented at the
annual meeting of the Population Association of America.Brémond, P., Grelot, F., Agenais, A.L., 2013. Review Article: economic evaluation of flood damage to agriculture — review and
analysis of existing methods. Natural Hazards and Earth System Sciences, European Geosciences Union, 13, 2493 — 2512.Brookshire, D.S. and M. McKee. 1992. Other indirect costs and losses from earthquakes: issues and estimation. In Indirect Economic
Consequences of a Catastrophic Earthquake. Washington, D.C.: FEMA, National Earthquake Hazards Reduction Program.Bruneau, M., Chang, S., Eguchi, R., Lee, G., O’Rourke, T., Reinhorn, A., Shinozuka, M., Tierney, K., Wallace, W., Von Winterfeldt, D., 2003.
A framework to quantitatively assess and enhance the seismic resilience of communities. Earthquake Spectra 19(4), 733–752.Cepal NU, 2014. Handbook for disaster assessment, ECLAC.Comerio, M., 1996. Disaster Hits Home. New Policy for Urban Housing Recovery. University of California Press.

124
Conhaz project, 2016. https://www.ufz.de/index.php?en=35939, [accessed 06 April, 2017].Corsanego, A., 1991. Seismic vulnerability evaluation for risk assessment in Europe. Fourth International Conference on Seismic
Zonation, Standford.Cozzani, V., Campedel, M., Renni, E., Krausmann, E., 2010. Industrial accidents triggered by flood events: Analysis of past accidents.
Journal of Hazardous Materials 175(1-3), 501–509.Craig, H., Wilson, T., Stewart, C., Outes, V., Villarosa, G., Baxter, P., 2016. Impacts to agriculture and critical infrastructure in Argentina
after ashfall from the 2011 eruption of the Cordón Caulle volcanic complex: an assessment of published damage and function thresholds, Journal of Applied Volcanology, 5(1), 7.
De Groeve, T., Poljansek, K., Ehrlich, D., 2013. Recording Disasters Losses: Recommendation for a European Approach. EUR 26111 EN, Luxembourg: Publications Office of the European Union. http://publications.jrc.ec.europa.eu/repository/bit-stream/111111111/29296/1/lbna26111enn.pdf, [accessed 06, April].
Direction Territoriale Méditerranée du Cerema, 2014. Retour d’expérience sur les inondations du département du Var les 18 et 19 janvier 2014 Volet 2 — Conséquences et examen des dommages. http://observatoire-regional-risques-paca.fr/sites/default/files/rapport_rex83_2014_dommages_sept14_0.pdf, [accessed: 14 May 2015]
Elissondo, M., Baumann, V., Bonadonna, C., Pistolesi, M., Cioni, R., Bertagnini, A., Biass, S., Herrero, JC., Gonzalez, R., 2016. Chronology and impact of the 2011 Cordón Caulle eruption, Chile. Natural Hazards and Earth System Sciences 16, 675–704.
Ellison, R., J.W. Milliman, and R.B. Roberts. 1984. Measuring the regional economic effects of earthquakes and earthquake predic-tions. Journal of Regional Science 24, 559–579.
EU expert working group on disaster damage and loss data, 2015. Guidance for recording and sharing disaster damage and loss data. Towards the development of operational indicators to translate the Sendai Framework into action, EUR 27192 EN, Lux-embourg: Publications Office of the European Union.
FAO, 2015. The impact of disasters on agriculture and food security. Food and Agriculture Organization of the United Nations.Gautak, K., Van der Hoek, E., 2003. Literature study on environmental impact of floods, GeoDelft internal publication. http://
repository.tudelft.nl/islandora/object/uuid%3A4080519e-a46d-4e96-8524-62ee8fd93712?collection=research, [accessed 03 January, 2017].
GFDRR, 2013. Post-disaster needs assessment, Volume A, Guidelines, https://www.gfdrr.org/sites/gfdrr/files/PDNA-Volume-A.pdf, [accessed 12 January, 2017].
Grandjean. P., 2014. Science for precautionary decision-making, In: EEA, Some emerging issues, Late lessons from early warnings: science, precaution, innovation.
Green, C., Viavattene, C., and Thompson, P.: Guidance for assessing flood losses, CONHAZ Report, http://conhaz.org/ CONHAZ %20REPORT %20WP06 1.pdf, 2011, [accessed 12 January, 2017].
Guéguen P., Michel C., LeCorre L., 2007. A simplified approach for vulnerability assessment in moderate-to-low seismic hazard regions: application to Grenoble (France). Bulletin of Earthquake Engineering 5(3), 467–490.
Guimares, P., Hefner, F.L., Woodward, D.P., 1993. Wealth and income effects of natural disasters: an econometric analysis of Hur-ricane Hugo. Review of Regional Studies 23, 97–114.
Hallegatte, S. 2008. An adaptive regional input-output model and its application to the assessment of the economic cost of Katrina. Risk Analysis 28(3), 779–799.
Hallegatte, S., Hourcade, J.-C., Dumas, P. 2007. Why economic dynamics matter in assessing climate change damages: illustration on extreme events, Ecological Economics 62(2), 330-340.
Hubert, G., Ledoux, B., 1999. Le coût du risque… L’évaluation des impacts socio-économiques des inondations, Presses de l’Ecole nationale Ponts et Chaussées, Paris [in French].
Idea, 2015. www.ideaproject.polimi.it, [accessed 06 April, 2017].Jongman, B., Kreibich, H., Apel, H., Barredo, J.I., Bates, P.D., Feyen, L., Gericke, A., Neal, J., Aerts, C.J.H., Ward, P.J., 2012. Comparative
flood damage model assessment: towards a European approach. Natural Hazards and Earth System Sciences 12, 3733–3752.Kimbell, L., Bolton, N., 1994. The impact of the Northridge Earthquake on the economies of California and Los Angeles. Paper pre-
sented to the Seismic Safety Commission of the State of California, Burbank.Krausmann, E., Cruz, A.M., Affeltranger, B., 2010. The impact of the 12 May 2008 Wenchuan earthquake on industrial facilities, Loss
Prevention in the Process Industry.Lagomarsino, S. and Giovinazzi, S., 2006. Macroseismic and mechanical models for the vulnerability and damage assessment of
current buildings. Bulletin of Earthquake Engineering 4, 415-443.Magill, C., Wilson, T.M., Okada, T., 2013. Observations of tephra fall impacts from the 2011 Shinmoedake eruption, Japan. The
Earth, Planets and Space 65, 677–698. Marrero, J. M., García, A., Llinares, A., De la Cruz-Reyna, S., Ramos, S., Ortiz, R., 2013. Virtual tools for volcanic crisis management,
and evacuation decision support: applications to El Chichón volcano (Chiapas, México). Natural hazards, 68(2), 955-980.Marsh, A., 2015. Decade of Advances In Catastrophe Modeling and Risk Financing, Insights. http://www.oliverwyman.com/content/
dam/marsh/Documents/PDF/US-en/A %20Decade %20of %20Advances %20In %20Catastrophe %20Modeling %20and %20Risk %20Financing-10-2015.pdf, [accessed 17 February, 2017].
MATRIX project, 2013. http://matrix.gpi.kit.edu/, [accessed 06 April, 2017].McEntire, D., 2005. Why vulnerability matters: Exploring the merit of an inclusive disaster reduction concept. Disaster Prevention
and Management: An International Journal 14(2), 206 — 222.Mei, E., Lavigne, F., Picquout, A., de Bélizal, E., Brunstein, D., Grancher, D., Sartohadi, J., Cholik, N., Vidal, C., 2013. Lessons learned
from the 2010 evacuations at Merapi volcano. Journal of Volcanology and Geothermal Research 261, 348–365.Menoni, S., Atun, F., Molinari, D., Minucci, G., Berni, N., 2017. Defining complete post flood scenarios to support risk mitigation strate-
gies. In Molinari, D., Ballio, F., Menoni, S. (Eds.). Flood Damage Survey and Assessment: New Insights from Research and Practice. Wiley, AGU (American Geophysical Union) series.
Menoni, S., Pergalani, F., Boni, M. P., Petrini, V., 2007. Lifelines earthquake vulnerability assessment: a systemic approach, In: Linkov, I., Wenning, R., Kiker, G. (Eds). Risk Management Tools For Port Security, Critical Infrastructure, and Sustainability, pp. 111-132.
CHAPTER 2 UNDERSTANDING DISASTER RISK: RISK ASSESSMENT METHODOLOGIES AND EXAMPLES
125
Merz, B., Kreibich, H., Schwarze, R., Thieken, A., 2010. Assessment of economic flood damage, Natural Hazards and Earth System Sciences 10, 1697–1724.
Meyer, V., Schwarze, R., Becker, N., Markantonis, V., van den Bergh, J.C.J.M., Bouwer, L.M., Bubeck, P., Ciavola, P., Genovese, E., Green, C., Hallegatte, S., Kreibich, H., Lequeux, Q., Logar, I., Papyrakis, E., Pfurtscheller, C., Poussin, J., Przyluski, V., Thieken, A., Viavattene, C., 2015. Assessing the Costs of Natural Hazards — State of the Art and the Way Forward. Wiley&Sons.
Miavita project, n.d. http://miavita.brgm.fr/default.aspx, [accessed 06 April, 2017].Ministère chargé de l’environnement-DPPR / SEI / BARPI, 2005. Inspection des installations classées, L’impact des inondations sur
des établissements SEVESO, Séries d’événements de 1993 à 2003 Provence-Alpes-Côte d’Azur, Languedoc-Roussillon, France.Ministére de l’Ecologie et du Développement Durable, 2005. Réduire la vulnérabilité des reseaux urbains aux inondations, Rapport,
Novembre.Nanto, D., Cooper, W., Donnelly, M., Johnson, R. (2011). Japan’s 2011 Earthquake and Tsunami: Economic Effects and Implications
for the United States. CRS Report for Congress, Congressional Research Service, 7-5700 -www.crs.gov-R41702.Newhall, C.G. and Punongbayan R.S. (Eds.), 1997. Fire and Mud. Eruptions and Lahars of Mount Pinatubo, Philippines, University of
Washington Press.OECD, 2012. Global Modelling of Natural Hazard Risks. Enhancing Existing Capabilities to Address New Challenges. Organisation
for Economic Co-operation and Development.Park, J., Seager, T. P., Rao, P.S.C., Convertino, M., Linkov, I., 2013. Integrating Risk and Resilience Approaches to Catastrophe Manage-
ment in Engineering Systems, Risk Analysis 33(3).Pesaro, G., 2007. Prevention and mitigation of the territorial impacts of natural hazards: The contribution of economic and pub-
lic-private cooperation instruments. In: Aven, T., Vinnem, E., (Eds.). Risk, Reliability and Societal Safety, Chapter: Volume 1 — Specialisation Topics. Publisher: Taylor&Francis, pp.603-612.
Petrini, V., 1996. Overview report in vulnerability assessment. In: Proceedings of the Fifth International Conference on Seismic Zonation, Nice, France, October 1995, Edition Ouést, Paris.
Pitilakis, K.P., Franchin,B., Khazai, H., Wenzel, H., (Eds.), 2014. SYNER-G: Systemic Seismic Vulnerability and Risk Assessment of Complex Urban, Utility, Lifeline systems, and critical facilities. Methdologies and Applications. Springer.
Pitt, M., 2008. The Pitt review: learning lessons from the 2007 floods. http://archive.cabinetoffice.gov.uk/pittreview/thepittreview/final_report.html, [accessed 05 May 2015].
Rose, A. and J. Benavides. 1997. Inter-industry models for analyzing the economic impact of earthquakes and recovery policies: Illustrative examples [7/93; revised 11/93]. In Advances in Social Science Analysis of Earthquakes, B. Jones, ed. Buffalo, N.Y.: National Center for Earthquake Engineering Research.
Scawthorn, C., 2008. A Brief History of Seismic Risk Assessment. In: Bostrom, A., French, S., Gottlieb, S., (Eds.), Risk Assessment, Modeling, and Decision Support, Strategic Directions. Springer.
Senouci, A., Bard, Y., Naboussi Farsi, M., Beck, E., Cartier, S., 2013. Robustness and uncertainties of seismic damage estimates at urban scale: a methodological comparison on the example of the city of Oran (Algeria). Bulletin of Earthquake Engineering 11, 1191–1215.
Spence, R., Kelman, I., Baxter, P., Zuccaro, G., Petrazzuoli, S., 2005. Residential building and occupant vulnerability to tephra fall. Natural Hazards and Earth System Sciences 5:4, 477-494
Spence, R., Pomonis, A., Baxter, P.J., Coburn, A., White, M., Dayrit, M., and Field Epidemiology Training Program Team, 1997. Building Damage Caused by the Mount Pinatubo Eruption of June 15, 1991, In: Newhall, C.G. and Punongbayan R.S. (Eds.), 1997. Fire and Mud. Eruptions and Lahars of Mount Pinatubo, Philippines. University of Washington Press.
Suzuki, K., 2008. Earthquake damage to industrial facilities and development of seismic and vibration control technology. Journal of System design and dynamics 2(1), 2-11.
Syner-G project, 2014. http://www.vce.at/SYNER-G/, [accessed 06 April, 2017].Theocharidou, M., Giannopoulos, G., 2015. Risk assessment methodologies for critical infrastructure protection. Part II: A new ap-
proach. EUR 27332 EN. Luxembourg: Publications Office of the European Union.Thieken, A. H., Olschewski, A., Kreibich, H., Kobsch, S., Merz, B., 2008. Development and evaluation of FLEMOps — a new Flood Loss
Estimation Model for the private sector. In: Proverbs, D., Brebbia, C. A., Penning-Rowsell E., (Eds.) Flood recovery, innovation and response, WIT Press, Southampton, UK.
Turner, B.L., Kasperson, R.E., Matson, P.A., McCarthy, J.J., Corell, R.W., Christensen, L., Eckley, N. Kasperson, J.X., Luers, A., Martello, M.L., Polsky, C., Pulsipher, A., Schiller A., 2003. A framework for vulnerability analysis in sustainable science. PNAS, 100(14), 8074-8079.
Van der Veen, A., Logtmeijer, C. 2005. Economic hotspots: visualizing vulnerability to flooding. Natural hazards 36 (1-2), 65-80.Van der Veen, A., Vetere Arellano, L., Nordvik, J.P., (Eds.), 2003. In search of a common methodology on damage estimation, EUR
20997 EN, European Communities, Italy West, C.T., 1996. Indirect economic impacts of natural disasters: policy implications of recent research and experience. In: Proceed-
ings of Analyzing Economic Impacts and Recovery from Urban Earthquakes: Issues for Policy Makers. Conference presented by Earthquake Engineering Research Institute and Federal Emergency Management Agency, Pasadena, Calif.
West, C.T., and D.C. Lenze. 1994. Modeling the regional impact of natural disaster and recovery: a general framework and an ap-plication to Hurricane Andrew. International Regional Science Review 17,121–150
Wilson, G., Wilson, T.M., Deligne, N.I., Cole, J.W., 2014. Volcanic hazard impacts to critical infrastructure: A review, Journal of Volcan-ology and Geothermal Research, 286, 148-182.
Wilson, T., Cole, J., Johnston, D., Cronin, S., Stewart C., Dantas A., 2012. Short- and long-term evacuation of people and livestock during a volcanic crisis: lessons from the 1991 eruption of Volcán Hudson, Chile. Journal of Applied Volcanology Society and Volcanoes 1(2).
Wilson, T., Stewart, C., Bickerton, H., Baxter, P., Outes, V., Villarosa, G., Rovere, E., 2013. Impacts of the June 2011 Puyehue-Cordón Caulle volcanic complex eruption on urban infrastruc-ture, agriculture and public health, GNS Science, New Zealand, GNS Sci-ence Report 2012/20, 88 pp.
126
WMO, 2007. Conducting flood loss assessment. A tool for integrated flood management. APFM Technical Document n.7, Flood Management Tools Series, World Meteorological Organisation.
Yamano, N., Kajitani, Y., Shumuta, Y., 2007. Modeling the Regional Economic Loss of Natural Disasters: The Search for Economic Hotspots, Economic Systems Research 19(2), 163-181.
Zonno, G., Cella, F., Luzi L., Menoni, S., Meroni, F., Ober, G., Pergalani, F., Petrini, V., Tomasoni, R., Carrara, P., Musella, D., García-Fernán-dez, M., Jiménez, M.J., Canas, J.A., Alfaro, A.J., Barbat, A.H., Mena, U., Pujades, L.G., Soeters, R., Terlien, M.T.J., Cherubini, A., An-geletti, P., Di Benedetto, A., Caleffi, M., Wagner, J.J. and Rosset, P., 1998. Assesing seismic risk at different geographical scales: concepts, tools and procedures. In: Bisch, Ph., Labbé, P., Pecker, A. (eds). Proc. of the XI Conference on Earthquake Engineering, CD-ROM, Balkema, Rotterdam.
2.5. Where are we with multihazards and multirisks assessment capacities?Abad, J.,2013. Fragility of pre-damaged elements: realisation of fragility functions of elements pre-damaged by other past events
and demonstration on a scenario. European Commission project MATRIX (New methodologies for multi-hazard and multi-risk assessment methods for Europe), Project No 265138, D4.2.
Aubrecht, C., Freire, S., Neuhold, C., Curtis, A., Steinnocher, K., 2012. Introducing a temporal component in spatial vulnerability anal-ysis. Disaster Advances, 5(2), 48-53.
Balica, S.F., Douben, N., Wright, N.G., 2009. Flood vulnerability indices at varying spatial scales. Water Science and Technology 60(10), 2571-2580.
Barroca, B., Bernardara, P., Mouchel, J.M., Hubert, G., 2006. Indicators for identification of urban flooding vulnerability. Natural Haz-ards and Earth System Sciences 6, 553-561.
Bazzurro, P., Cornell, C.A., Menun, C.Motahari, M. 2004. Guidelines for seismic assessment of damaged buildings. 13th World Con-ference on Earthquake Engineering, Vancouver, BC, Canada, Paper 1708.
Birkmann, J., Cardona, O. D., Carreno, M. L., Barbat, A. H., Pelling, M., Schneiderbauer, S., Kienberger, S., Keiler, M., Alexander, D., Zeil, P. Welle, T. 2013. Framing vulnerability, risk and societal responses: the MOVE framework. Natural Hazards 67(2), 193-211.
Bucchignani, E., Garcia-Aristizabal, A., Montesarchio, M. 2014. Climate-related extreme events with high-resolution regional simu-lations: assessing the effects of climate change scenarios in Ouagadougou, Burkina Faso. Vulnerability, Uncertainty, and Risk, 1351-1362.
Cannon, A., 2010. A flexible nonlinear modelling framework for nonstationary generalised extreme value analysis in hydroclimatol-ogy. Hydrological Processes 24(6), 673-685.
Cannon, S., De Graff, J., 2009. The increasing wildfire and post-fire debris-flow threat in western USA, and implications for conse-quences of climate change. In: Sassa, K., Canuti, P.(eds). Landslides — disaster risk reduction, Springer, 177-190.
Cardona, O. D., Van Aalst, M.M., Birkmann, J., Fordham, M., McGregor, G., Perez, R., Puhwarty, R.S., Schipper, E.L.F., Sinh, B.T., 2012. Determinants of risk: exposure and vulnerability. In: Managing the risks of extreme events and disasters to advance climate change adaptation. Field, C.B., Barros, V., Stocker, T.F., Qin, D., Dokken, D.J., Ebi, K.L., Mastrandrea, M.D., Mach, K.J., Plattner, G.-K., Allen, S.K., Tignor, M.,Midgley, P.M. (eds.).A Special Report of Working Groups I and II of the Intergovernmental Panel on Climate Change (IPCC). Cambridge University Press, Cambridge, UK, and New York, NY, USA, 65-108.
Cariam, 2006. Plans de prévention des risques naturels prévisibles (ppr) — Cahier de recommandations sur le contenu des ppr. Tech. rep., Ministère de l’Écologie et du Développement Durable (in French).
Carpignano, A., Golia, E., Di Mauro, C., Bouchon, S., Nordvik, J.-P. 2009. A methodological approach for the definition of multi-risk maps at regional level: first application. Journal of Risk Research 12(3-4), 513.
Chester, D.K. 1993. Volcanoes and society, E. Arnold, London, United Kingdom.Choe, D.E., Gardoni, P., Rosowski, D., 2010. Fragility increment functions for deteriorating reinforced concrete bridge columns.
Journal of Engineering Mechanics 136(8), 969.Choine, M.N., O’Connor, A., Gehl, P., D’Ayala, D., Garcia-Fernández, M., Jiménez, M., Gavin, K., Van Gelder, P., Salceda, T., Power, R.,
2015. A multihazard risk assessment methodology accounting for cascading hazard events. 12th International Conference on Applications of Statistics and Probability in Civil Engineering, ICASP12, Vancouver, Canada.
Coburn, A.W., Bowman, G., Ruffle, S.J., Foulser-Piggott, R., Ralph, D., Tuveson, M., 2014. A taxonomy of threats for complex risk management. Cambridge Risk Framework series, Centre for Risk Studies, University of Cambridge, United Kingdom.
Coles, S., 2001. An introduction to statistical modelling of extreme values. Springer Series in Statistics, Springer, London, United Kingdom, limited.
Collins, T., Grinseki, S., Romo Aguilar, M. 2009. Vulnerability to environmental hazards in the Ciudad Juárez (Mexico) — El Paso (USA) metropolis: a model for spatial risk assessment in transnational context. Applied Geography 29, 448.
De Groeve, T., Poljansek, K., Vernaccini, L., 2015. Index for risk management — INFORM: concept and methodology, Version 2016. EUR 27521 EN. Luxembourg: Publications Office of the European Union.
Del Monaco, G., Margottini, C., Serafini, S., 1999. Multi-hazard risk assessment and zoning: an integrated approach for incorporating natural disaster reduction into sustainable development. TIGRA project (ENV4-CT96-0262) summary report.
Del Monaco, G., Margottini, C., Spizzichino, D., 2007. Armonia methodology for multi-risk assessment and the harmonisation of different natural risk maps. In: Armonia: applied multi-risk mapping of natural hazards for impact assessment, European Com-mission project, Contract 511208.
De Pippo, T., Donadio, C., Pennetta, M., Petrosino, C., Terizzi, F., Valente, A., 2008. Coastal hazard assessment and mapping in north-ern Campania, Italy. Geomorphology 97(3-4), 451-466.
Dessai, S., Hulme, M., Lempert, R. Pielke, R., 2009. Climate prediction: a limit to adaptation. In: Adger, N., Lorenzoni, I. and O’Brien, K.(Eds.). Adapting to climate change: thresholds, values, governance. Cambridge University Press, Cambridge, United Kingdom.
Dilley, M., Chen, U., Deichmann, R.S., Lerner-Lam, A. Arnold, M., 2005. Natural disaster hotspots: global risk analysis. Disaster Risk Management Series 5, The World Bank.
El Adlouni, S., Ouarda, T., Zhang, X., Roy, R., Bobée, B. 2007. Generalised maximum likelihood estimators for the nonstationary gen-
CHAPTER 2 UNDERSTANDING DISASTER RISK: RISK ASSESSMENT METHODOLOGIES AND EXAMPLES
127
eralized extreme value model. Water Resources Research 43(3), 410.European Commission, 2000. Temrap: the European multi-hazard risk assessment project. DG XII, Environment and Climate Pro-
gramme, contract ENV4-CT97-0589.European Commission, 2010. Risk assessment and mapping guidelines for disaster management. Staff Working Paper, SEC(2010)
1626 final.FEMA, 2011. Getting started with HAZUS-MH 2.1. Tech. rep. United States Department of Homeland Security, Federal Emergency
Management Agency.Fleming, K., Parolai, S., Garcia-Aristizabal, A., Tyagunov S., Vorogushyn, S., Kreibich, H., Mahlke, H., 2016. Harmonising and compar-
ing single-type natural hazard risk estimations. Annals of Geophysics 59(2), So216.Garcia-Aristizabal, A., Almeida, M., Aubrecht, C., Polese, M., Ribeiro, L.M., Viegas D. Zuccaro, G. 2014. Assessment and management
of cascading effects triggering forest fires. In: Viegas, D. Advances in forest fire research, 1073.Garcia-Aristizabal, A., Bucchignani, E., Manzi, M. 2016. Patterns in climate-related parameters as proxy for rain-fall deficiency and
aridity: application to Burkina Faso. ASCE-ASME Journal of Risk and Uncertainty in Engineering Systems, Part A: Civil Engineer-ing 3(1).
Garcia-Aristizabal, A., Bucchignani, E., Palazzi, E., D’Onofrio, D., Gasparini, P., Marzocchi, W., 2015b. Analysis of non-stationary cli-mate-related extreme events considering climate change scenarios: an application for multi-hazard assessment in the Dar Es Salaam region, Tanzania. Natural Hazards 75(1), 289-320.
Garcia-Aristizabal, A., Di Ruocco, A., Marzocchi, W., 2013. Naples test case. European Commission project MATRIX, Project No. 265138, D7.3.
Garcia-Aristizabal, A., Gasparini, P., Uhinga, G. 2015a. Multi-risk assessment as a tool for decision-making. In: Pauleit et al. (Eds). Urban vulnerability and climate change in Africa: a multidisciplinary approach. Future City 4(7), Springer, 229-258.
Garcia-Aristizabal, A., Marzocchi, W., 2013. Software for multi-hazard assessment. European Commission project MATRIX, Project No. 265138, D 3.5.
Gasparini, P., Garcia-Aristizabal, A., 2014. Seismic risk assessment, cascading effects. In: Beer, M., Patelli, E., Kougioumtzoglou, I., Au, I. (Eds.).Encyclopedia of earthquake engineering, Springer, Berlin/Heidelberg, 1-20.
Gencer, E. A. 2013. The impact of globalisation on disaster risk trends: macro- and urban-scale analysis. Background paper pre-pared for the Global Assessment Report on Disaster Risk Reduction 2013, UNISDR, Geneva.
Ghosh, J., Padgett, J.E., 2010. Aging considerations in the development of time-dependent seismic fragility curves. Journal of Structural Engineering 136(12), 1497.
Gill, J.C., Malamud, B.D., 2014. Reviewing and visualising the interactions of natural hazards. Reviews of Geophysics 52, 680.Gill, J.C., Malamud, B.D., 2016. Hazard Interactions and interaction networks (cascades) within multi-hazard methodologies, Earth
System Dynamics 7, 659.Giorgio, M., Guida, M. Pulcini, G., 2011. An age- and state-dependent Markov model for degradation processes. IIE Transaction
43(9), 621.Greiving, S., 2006. Integrated risk assessment of multi-hazards: a new methodology. In: Schmidt-Thomé, P. (Ed.). Natural and
Technological Hazards and Risks Affecting the Spatial Development of European Regions. Geological Survey of Finland 42, 75.Grünthal, G., 1998. European macroseismic scale. Cahiers du Centre Europeén de Géodynamique et de Séismologie 15, Luxem-
bourg.Grünthal, G., Thieken, A., Schwarz, J., Radtke, K., Smolka, A. Merz, B. 2006. Comparative risk assessment for the city of Cologne —
Storms, floods, earthquakes. Natural Hazards 38(1-2), 21-44.Haasnoot, M., Middelkoop, H., Offermans, A., van Beek, E., Van Deursen, W.P.A., 2012. Exploring pathways for sustainable water
management in river deltas in a changing environment. Climate Change 115(3), 795-819.Iervolino, I., Giorgio, M., Chioccarelli, E., 2013. Gamma degradation models for earthquake-resistant structures. Structural . Safety
45, 48-58.Iervolino, I., Giorgio, M., Chioccarelli, E., 2015a. Age- and state-dependent seismic reliability of structures. 12th International Con-
ference on Applications of Statistics and Probability in Civil Engineering. ICASP12, Vancouver, Canada.Iervolino, I., Giorgio, M., Polidoro, B., 2015b. Reliability of structures to earthquake clusters. Bulletin of Earthquake Engineering
13, 983-1002.IPCC, 2012. Managing the risks of extreme events and disasters to advance climate change adaptation. A special report of Working
Groups I and II of the Intergovernmental Panel on Climate Change. Field, C.B., Barros, V., Stocker, T.F., Qin, D., Dokken, D.J., Ebi, K.L., Mastrandrea, M.D., Mach, K.J., Plattner, G.-K., Allen, S.K., Tignor, M., Midgley, P.M. (Eds.).Cambridge University Press.
IPCC, 2014. Climate change 2014: mitigation of climate change. Contribution of Working Group III to the Fifth Assessment Report of the Intergovernmental Panel on Climate Change, Cambridge University Press.
Jenkins, K., Hall, J., Glenis, V., Kilsby, C., McCarthy, M., Goodess, C., Smith, D., Malleson, N., Birkin, M., 2014. Probabilistic spatial risk assessment of heat impacts and adaptations for London. Climate Change 124(1), 105-117.
Jurgilevich, A., Räsänen, A., Groundstroem F., Juhola, S., 2017. A systematic review of dynamics in climate risk and vulnerability assessments. Environmental Research Letters 12(1), 013002.
Kappes, S.M., Keiler, M., Von Elverfeldt, K. Glade, T., 2012. Challenges of analysing multi-hazard risk: a review. Natural Hazards 64(2), 1925-1958.
Kappes, S.M., Keiler, M., Glade, T., 2010. From single- to multi-hazard risk analyses: a concept addressing emerging challenges. In:Malet, J.P., Glade, T., Casagli, N., (Eds.). Mountain risks: bringing science to society. CERG Editions, Strasbourg, France, p.351.
Kappes, S.M., Papathoma-Köhle, M., Keiler, M., 2011. Assessing physical vulnerability for multi-hazards using an indicator- based methodology. Applied Geography 32(2), 577-590.
Karapetrou, S.T., Filippa, A.M., Fotopoulou, S.D., Pitilakis, 2013. Time-dependent vulnerability assessment of rc-buildings considering ssi and aging effects. In Papadrakis, M., Papadopoulos, V. and Plevris V., (Eds.). 4th Eccomas Thematic Conference on Computa-tional Methods in Structural Dynamics and Earthquake Engineering.
Komendantova, N., Mrzyglocki, R., Mignan, A., Khazai, B., Wenzel, F., Patt, A., Fleming, K., 2014. Multi-hazard and multi-risk deci-

128
sion-support tools as a part of participatory risk governance: feedback from civil protection stakeholders. International Journal of Disaster Risk Reduction 8, 50-67.
Komendantova, N., Scolobig, A., Vinchon, C., 2013a. Multi-risk approach in centralized and decentralized risk governance systems: case studies of Naples, Italy and Guadeloupe, France. International Relations and Diplomacy 1(3), 224-239.
Komendantova, N., Scolobig, A., Monfort, D., Fleming, K., 2016. Multi-risk approach and urban resilience Multi-risk approach and urban resilience. International Journal of Disaster Resilience in the Built Environment 7(2), 114-132.
Komendantova, N., van Erp, N., van Gelder, P., Patt, A., 2013 b. Individual and cognitive barriers to effective multi-hazard and mul-ti-risk decision-making governance. European Commission project MATRIX, Project N 265138, D 6.2.
Kunz, M., Hurni, L., 2008. Hazard maps in Switzerland: state-of-the-art and potential improvements. In: Proceedings of the 6th ICA Mountain Cartography Workshop. Lenk, Switzerland.
Lazarus, N., 2011. Coping capacities and rural livelihoods: challenges to community risk management in southern Sri Lanka. Ap-plied Geography 31(1), 20-34.
Lee, K., Rosowsky, D., 2006. Fragility analysis of woodframe buildings considering combined snow and earthquake loading. Struc-tural Safety 28(3), 289-303.
Liu, B., Siu, Y.L., Mitchell, G., 2016. Hazard interaction analysis for multi-hazard risk assessment: a systematic classification based on hazard-forming environment. Natural Hazards and Earth System Sciences 16, 629-642.
Liu, Z., Nadim, F., Garcia-Aristizabal, A., Mignan, A., Fleming, K., Luna, B., 2015. A three-level framework for multi-risk assessment. Georisk: Assessment and Management of Risk for Engineered Systems and Geohazards 9(2), 59-74.
Loat, R., 2010. Risk management of natural hazards in Switzerland. Tech. rep. Federal Office for the Environment FOEN.Luino, F., 2005. Sequence of instability processes triggered by heavy rainfall in the northern Italy. Geomorphology 66(1-4), 13-39.Marulanda, M.C., Tibaduiza, M.L.C., Cardona, O.D., Barbat, A.H., 2013. Probabilistic earthquake risk assessment using CAPRA: appli-
cation to the city of Barcelona, Spain. Natural Hazards, 69(1), 59-84.Marzocchi, W., Garcia-Aristizabal, A., Gasparini, P., Mastellone, M. L., Di Ruocco, A., 2012. Basic principles of multi-risk assessment:
a case study in Italy. Natural Hazards 62(2), 551-573.Marzocchi, W., Mastellone, M., Di Ruocco, A., Novelli, P., Romeo, E., Gasparini, P., 2009. Principles of multi-risk assessment: interac-
tions amongst natural and man-induced risks. Tech. rep. European Commission, Directorate-General for Research, Environment Directorate.
Marzocchi, W., Sandri, L, Gasparini, P., Newhall, C., Boschi, E., 2004. Quantifying probabilities of volcanic events: the example of volcanic hazard at Mount Vesuvius. Journal of Geophysical Research 109, B11201.
Marzocchi, W., Sandri, L., Selva, J., 2008. BET_EF: a probabilistic tool for long- and short-term eruption forecasting. Bulletin of Volcanology Bulletin of Volcanology 70, 623.
Marzocchi, W., Sandri, L., Selva, J., 2010. BET_VH: a probabilistic tool for long-term volcanic hazard assessment. Bulletin of Vol-canology 72, 717.
Middelmann, M., Granger, K., 2000. Community Risk in Mackay: a multi-hazard risk assessment. Tech. rep., Australian Geological Survey Organisation (AGSO).
Mignan, A., 2013. MATRIX -CITY user manual. European Commission project MATRIX, Project No 265138, D 7.2.Mignan, A., Wiemer, S., Giardini, D., 2014. The quantification of low-probability-high-consequences events: Part 1, a generic mul-
ti-risk approach. Natural Hazards 73(3), 1999-2022.Müller, A., Reiter, J., Weiland, U., 2011. Assessment of urban vulnerability towards floods using an indicator-based approach - a case
study for Santiago de Chile. Natural Hazards and Earth System Sciences, 11, 2107.Münzberg, T., Wiens, M., Schultmann, F., 2014. Dynamic-spatial vulnerability assessments: a methodical review for decision support
in emergency planning for power outages. Procedia Engineering 78, 78-87.Neri, M., Aspinall, W., Bertagnini, A., Baxter, P.J., Zuccaro, G., Andronico, D., Barsotti, S., D Cole, P., Ongaro, T.E., Hincks, T., Macedonio,
G., Papale, P. Rosi, M., Santacroce, R., Woo, G., 2008. Developing an event tree for probabilistic hazard and risk assessment at Vesuvius. Journal of Volcanology and Geothermal Research 178(3), 397-415.
Neri, M., Le Cozannet, G., Thierry, P., Bignami, C., Ruch, J., 2013. A method for multi-hazard mapping in poorly known volcanic areas: an example from Kanlaon (Philippines). Natural Hazards and Earth System Sciences 13,1929-2013.
Newhall, C., Hoblitt, R., 2002. Constructing event trees for volcanic crises. A method for multi-hazard mapping in poorly known volcanic areas: an example from Kanlaon (Philippines). Bulletin of Volcanology 64, 3.
Nicholls, R. J., Cazenave, A., 2010. Sea-level rise and its impact on coastal zones. Science 328 (5985), 1517-1520.O ´Neill, B.C., Kriegler, E., Riahi, K., Ebi, K.L., Hallegatte, S., Carter, T.R., Mathur, R., 2014. A new scenario framework for climate
change research: the concept of shared socioeconomic pathways. Climate Change, 122(3), 387-400.Oppenheimer, M., Campos, M., Warren, R., Birkmann, J., Luber, G., O ´Neill, B., Takahashi, K., 2014. Emergent risks and key vulner-
abilities. In Climate change 2014: impacts, adaptation, and vulnerability. Part A. global and sectoral aspects. Contribution of Working Group II to the Fifth Assessment Report of the Intergovernmental Panel on Climate Change. Field, C.B., Barros, V.R., Dokken, D.J., Mach, K.J., Mastrandrea, M.D., Bilir, T.E., Chatterjee, M., Ebi, K.L., Estrada, Y.O., Genova, R.C., Girma, B., Kissel, E.S., Levy, A.H., MacCracken, S., Mastrandrea, P.R., White, L.L., (Eds.). Cambridge University Press, Cambridge, United Kingdom and New York, New York, United States, pp1039.
Ouarda, T., El Adlouni, S., 2011. Bayesian nonstationary frequency analysis of hydrological variables. Journal of the American Water Resources Association 47(3), 496-505.
Papathoma, M., Dominey-Howes, D., 2003. Tsunami vulnerability assessment and its implications for coastal hazard analysis and disaster management planning, Gulf of Corinth, Greece. Natural Hazards and Earth System Sciences 3, 733-747.
Papathoma, M., Dominey-Howes, D., Zong, Y., Smith, D., 2003. Assessing tsunami vulnerability, an example from Herakleio, Crete. Natural Hazards and Earth System Sciences 3, 377-389.
Papathoma-Köhle, M., 2016. Vulnerability curves vs. vulnerability indicators: application of an indicator-based methodology for debris-flow hazards. Natural Hazards and Earth System Sciences 16, 1771-1790.
Papathoma-Köhle, M., Neuhäuser, B., Ratzinger, K., Wenzel, H., Dominey-Howes, D., 2007. Elements at risk as a framework for as-
CHAPTER 2 UNDERSTANDING DISASTER RISK: RISK ASSESSMENT METHODOLOGIES AND EXAMPLES
129
sessing the vulnerability of communities to landslides. Natural Hazards and Earth System Sciences 7, 765-779.Pescaroli, G., Alexander, D., 2015. A definition of cascading disasters and cascading effects: going beyond the ‘ toppling dominos’
metaphor. Planet@Risk 3(1), 58.Petitta, M., Calmanti, S., Cucchi, M., 2016. The extreme climate index: a novel and multi-hazard index for extreme wheather events.
Geophysical Research Abstracts 18, EGU2016 — 13861, EGU General Assembly 2016.Polese, M., Di Ludovico, M., Prota, A., Manfredi, G., 2012. Damage-dependent vulnerability curves for existing buildings. Earthquake
Engineering & Structural Dynamics 42(6), 853–870.Polese, M., Marcolini, M., Zuccaro, G., Cacace F., 2015. Mechanism based assessment of damage-dependent fragility curves for rc
building classes. Bulletin of Earthquake Engineering 13(5), 1323–1345.Sanchez-Silva, M., Klutke, G.A., Rosowsky, D.V., 2011. Life-Cycle Performance of Structures Subject to Multiple Deterioration Mech-
anisms. Structural Safety 33(3), 206–217.Schmidt, J., Matcham, I., Reese, S., King, A., Bell, R., Smart, G., Cousins, J., Smith, W., Heron, D., 2011. Quantitative Multi-Risk Analysis
for Natural Hazards: A Framework for Multi-Risk Modelling. Natural Hazards 58, 1169.Schmidt-Thomé, P., (Ed.), 2005. The Spatial Effects of Management of Natural and Technological Hazards in Europe — Final Report
of the European Spatial Planning and Observation Network (ESPON) Project 1.3.1. Geological Survey of Finland.Scolobig, A., Garcia-Aristizabal, A., Komendantova, N., Patt, A., Di Ruocco, A., Gasparini, P., Monfort, D., Vinchon, C., Bengoubou-Vale-
rius, M., Mrzyglocki, R., Fleming, K., 2013. From Multi-Risk Assessment to Multi-Risk Governance: Recommendations for Future Directions. Chapter prepared for the Global Assessment Report on Disaster Risk Reduction 2015, UNISDR.
Scolobig, A., Garcia-Aristizabal, A., Komendantova, N., Patt, A., Di Ruocco, A., Gasparini, P., Monfort, D., Vinchon, C., Bengoubou-Vale-rius, M., Mrzyglocki, R., Fleming, K., 2014a. From Multi-Risk Assessment to Multi-Risk Governance: Recommendations for Future Directions. In: Understanding Risk: The Evolution of Disaster Risk Assessment. International Bank for Reconstruction and Devel-opment, Washington DC, Chapter 3-20, pp163.
Scolobig, A., Komendantova, N., Patt, A., Vinchon, C., Monfort-Climent, D., Begoubou-Valerius, M., Gasparini, P., Di Ruocco, A., 2014b. Multi-Risk Governance for Natural Hazards in Naples and Guadeloupe. Natural Hazards 73(3), 1523-1545.
Seidou, O., Ramsay, A., Nistor, I., 2011. Climate Change Impacts on Extreme Floods II: Improving Flood Future Peaks Simulation Using Non-Stationary Frequency Analysis. Natural Hazards 60(2), 715–726.
Seidou, O., Ramsay, A., Nistor, I., 2012. Climate Change Impacts on Extreme Floods I: Combining Imperfect Deterministic Simula-tions and Non-Stationary Frequency Analysis. Natural Hazards, 61(2), 647-659.
Self, S., 2006. The Effects and Consequences of Very Large Explosive Volcanic Eruptions. Philosophical Transactions of the Royal Society A: Mathematical, Physical and Engineering Sciences 364(1845), 2073.
Selva, J., 2013. Long-Term Multi-Risk Assessment: Statistical Treatment of Interaction among Risks. Natural Hazards 67(2), 701-722.
Selva, J., Marzocchi, W., Papale, P., Sandri, L., 2012. Operational Eruption Forecasting at High-Risk Volcanoes: The Case of Campi Flegrei, Naples. Journal of Applied Volcanology, Society and Volcanoes, 1, 5.
Siliverstovs, B., Ötsch, R., Kemfert, C., Jaeger, C.C., Haas, A., Kremers, H., 2010. Climate Change and Modelling of Extreme Temper-atures in Switzerland. Stochastic Environmental Research and Risk Assessment 24(2), 311-326.
Silva, M., Pareira, S., 2014. Assessment of Physical Vulnerability and Potential Losses of Buildings due to Shallow Slides. Natural Hazards 72(2), 1029-1050.
Solomon, S., Qin, D., Manning, M., Chen, Z., Marquis, M., Averyt, K.B., Tignor, M., Miller, H.L., (Eds.), 2007. Climate Change 2007: The Physical Science Basis. Cambridge University Press, Cambridge, MA.
Sperling, M., Berger, E., Mair, V., Bussadori, V., Weber, F., 2007. Richtlinien zur Erstellung der Gefahrenzonenpläne (GZP) und zur Klassifizierung des spezifischen Risikos (KSR). Tech. rep., Autonome Provinz Bozen, (in German).
Sterlacchini, S., Frigerio, S., Giacomelli, P., Brambilla, M., 2007. Landslide Risk Analysis: A Multi-Disciplinary Methodological Ap-proach. Natural Hazards and Earth System Sciences 7, 657-675.
Tarvainen, T., Jarva, J., Greiving, S., 2006. Spatial Pattern of Hazards and Hazard Interactions in Europe. In: Natural and Technolog-ical Hazards and Risks Affecting the Spatial Development of European Regions. Schmidt-Thomé, P. (Ed.), Geological Survey of Finland, Special Paper 42, 83.
Tyagunov, S., Grünthal, G., Wahlström, R., Stempniewski, L., Zschau, J., 2006. Seismic Risk Mapping for Germany. Natural Hazards and Earth System Sciences 6, 573-586.
UN, 2002, Johannesburg Plan of Implementation of the World Summit on Sustainable Development. Tech. rep. United Nations.UNEP, 1992. Agenda 21. Tech. rep. United Nations Environment Programme.UNISDR, 2005. Hyogo Framework for Action 2005-2015: Building the resilience of nations and communities to disasters. http://
www.unisdr.org/files/1037_hyogoframeworkforactionenglish.pdf, [accessed 04 April 2016].UNISDR, 2015. Sendai framework for disaster risk reduction 2015–2030. United Nations International Strategy for Disaster Reduc-
tion. http://www.wcdrr.org/uploads/Sendai_Framework_for_Disaster_Risk_Reduction_2015-2030.pdf, [accessed 04 April 2016]. Van Westen, C., Montoya, A., Boerboom, L., Badilla Coto, E., 2002. Multi-Hazard Risk Assessment Using GIS in Urban Areas: A Case
Study for the City of Turrialba, Costa Rica. In:Regional Workshop on Best Practices in Disaster Mitigation: Lessons Learned from the Asian Urban Disaster Mitigation Program and other Initiatives. Proceedings, Bali, Indonesia, pp120.
Wisner, B., Blaikie, P., Cannon, T., Davis, I., 2004. At Risk: Natural Hazards, People`s Vulnerability and Disasters. New York, Routledge.Xu, L., Meng, X., Xu, X., 2014. Natural Hazard Chain Research in China: A Review. Natural Hazards 70(2), 1631-1659.Yalciner, H., Sensoy, S., Eren, O., 2012. Time-Dependent Seismic Performance Assessment of a Single-Degree-of-Freedom Frame
Subject to Corrosion. Engineering Failure Analysis, 19, 109.Zentel, K.-O., Glade, T., 2013. International Strategies for Disaster Reduction (IDNDR and ISDR). In:Encyclopedia of Natural Hazards.
Bobrowsky, P.T., (Ed.), pp552.Zschau, J., Fleming, K., (2012). Natural Hazards: Meeting the Challenges of Risk Dynamics and Globalisation, in ‘ Improving the
Assessment of Disaster Risks to Strengthen Financial Resilience’, World Bank and Government of Mexico, Editors, Chapter 9, Germany, ‘Experiences in Disaster Risk Management within the German Development Cooperation’, Neutze F., Lutz, W., (Eds.),
130
pp163.Zuccaro, G., Gacace, F., Spence, R., Baxter, P., 2008. Impact of Explosive Eruption Scenarios at Vesuvius. Journal of Volcanology and
Geothermal Research 178(3), 416-453.Zuccaro, G., Leone, M., 2011. Volcanic Crisis Management and Mitigation Strategies: A Multi-Risk Framework Case Study. Earthzine
4.