Embed Size (px)
Citation preview
RESPONSIVENESS SUMMARYHUDSON RIVER PCBs SITE RECORD OF DECISION
JANUARY 2002
For
U.S. Environmental Protection AgencyRegion 2
andU.S. Army Corps of Engineers
Kansas City District
BOOK 1 OF 3
COMMENTS & RESPONSES
TAMS Consultants, Inc.
RESPONSIVENESS SUMMARY HUDSON RIVER PCBs SITE RECORD OF DECISION
TABLE OF CONTENTS
Responsiveness Summary Hudson River PCBs Site Record of Decision
i
Page TABLE OF CONTENTS Book 1 of 3........................................................................................................................... i Book 2 of 3...........................................................................................................................v Book 3 of 3......................................................................................................................... ix List of Acronyms and Abbreviations.............................................................................. xxv EXECUTIVE SUMMARY .........................................................................Executive Summary-1 INTRODUCTION TO THE RESPONSIVENESS SUMMARY .........................Introduction-1 COMMENTS & RESPONSES (BOOK 1 of 3) 1. LEGAL AND POLICY ISSUES 1.1 ARARs and TBCs............................................................................................................ 1-1 1.2 Policy Issues................................................................................................................... 1-23
1.2.1 CERCLA Requirements and Issues ................................................................... 1-23 1.2.2 Applicability of the NAS Report ....................................................................... 1-30 1.3 Public/Citizen Participation Process ............................................................................. 1-35 1.3.1 Peer Review Process ......................................................................................... 1-51 2. BACKGROUND AND REMEDIAL INVESTIGATION 2.1 Sources of PCBs to the Upper Hudson River .................................................................. 2-1 2.2 Validity of the Low Resolution Sediment Coring Report ............................................. 2-31 2.3 Other Geochemistry Issues ............................................................................................ 2-44 2.4 Baseline Modeling Assumptions ................................................................................... 2-53 2.4.1 HUDTOX........................................................................................................... 2-55 2.4.2 FISHRAND........................................................................................................ 2-56 2.4.3 Farley Model ...................................................................................................... 2-62 2.5 PCB Transport to the Lower Hudson River................................................................... 2-63 2.6 Long-Term Trends in PCB Concentrations ................................................................... 2-64 2.7 Adequacy of RI Data Collection to Support the FS....................................................... 2-77 3. BASELINE RISK ASSESSMENTS AND PRGS 3.1 Baseline Human Health Risk Assessment ....................................................................... 3-1 3.1.1 PCB Toxicity ....................................................................................................... 3-1 3.1.1.1 PCB Toxicity – Cancer ............................................................................ 3-1 3.1.1.2 PCB Toxicity – Non-Cancer ................................................................... 3-9 3.1.2 Fish Consumption (Rate and Species Mix) ....................................................... 3-19 3.1.3 Exposed Population ........................................................................................... 3-24 3.1.4 Sensitive Populations and Additional Exposure Routes.................................... 3-27 3.2 Baseline Ecological Risk Assessment ........................................................................... 3-30 3.2.1 Ecological Toxicity of PCBs ............................................................................. 3-35 3.2.2 Field Studies....................................................................................................... 3-41
RESPONSIVENESS SUMMARY HUDSON RIVER PCBs SITE RECORD OF DECISION
TABLE OF CONTENTS
Responsiveness Summary Hudson River PCBs Site Record of Decision
ii
Book 1 of 3 Page 3.2.3 Ecological Risk Assumptions ........................................................................... 3-54 3.3 Preliminary Remediation Goals (PRGs)/Fish Concentration Targets ........................... 3-55 4. REMEDIAL ACTION OBJECTIVES AND SELECTION OF TARGET AREAS 4.1 Attainment of RAOs ........................................................................................................ 4-1 4.2 Determination of Target Areas and Volumes .................................................................. 4-1 4.2.1 PCB Mass vs. Surface Concentration ................................................................ 4-16 4.2.2 Cohesive vs. Non-Cohesive sediments .............................................................. 4-17 4.2.3 Minimum Target Area for Dredging (50,000 sq ft minimum) .......................... 4-19 4.3 Use of Mass per Unit Area (MPA) as a Criterion.......................................................... 4-21 4.4 Section-Specific Target Criteria ................................................................................... 4-24 4.5 Habitat-Based Targeting ............................................................................................... 4-28 5. TECHNOLOGY EVALUATION AND REMEDIAL ALTERNATIVE DEVELOPMENT 5.1 Technology Evaluation .................................................................................................... 5-1 5.1.1 Capping/AquablokTM ........................................................................................... 5-1 5.1.2 Treatment/Vitrification ........................................................................................ 5-2 5.1.3 Dredging Technologies........................................................................................ 5-5 5.2 Remedial Alternative Development............................................................................... 5-11 5.3 Comparison of MNA vs. Active Sediment Remediation .............................................. 5-17 6. MODELING ASSUMPTIONS AND INTERPRETATION 6.1 Fate and Transport Modeling .......................................................................................... 6-1 6.1.1 External PCB Loads to the Model .......................................................................... 6-4 6.1.2 Spatial Resolution of Modeling ........................................................................... 6-7 6.1.3 Post-Remediation Sediment Residuals .............................................................. 6-10 6.1.4 Resuspension ..................................................................................................... 6-12 6.2 Bioaccumulation Modeling............................................................................................ 6-16 6.3 Lower Hudson River Modeling ..................................................................................... 6-20 6.4 Interpretation and Use of Model Results ....................................................................... 6-25 6.4.1 Presentation of Model Results ........................................................................... 6-26 6.4.2 Use of Upper Bound Estimates ......................................................................... 6-26 6.4.3 Comparison of EPA and GE Models ................................................................. 6-29 7. ALTERNATIVE-SPECIFIC RISK ESTIMATES 7.1 Alternative-Specific HHRA Issues .................................................................................. 7-1 7.2 Alternative-Specific ERA Issues .................................................................................... 7-9 8. COMMUNITY IMPACTS 8.1 Transportation (Infrastructure)......................................................................................... 8-1 8.1.1 Rail....................................................................................................................... 8-6 8.1.2 River..................................................................................................................... 8-7 8.1.3 Road/Highway ..................................................................................................... 8-8
RESPONSIVENESS SUMMARY HUDSON RIVER PCBs SITE RECORD OF DECISION
TABLE OF CONTENTS
Responsiveness Summary Hudson River PCBs Site Record of Decision
iii
Book 1 of 3 Page Page 8.2 Noise .............................................................................................................................. 8-10 8.3 Lighting.......................................................................................................................... 8-16 8.3.1 Impact of Lighting on Livestock........................................................................ 8-16 8.3.2 Impact of Lighting on Community .................................................................... 8-19 8.3.3 Impact of Lighting on Agriculture and Ecological Resources........................... 8-21 8.4 Air Emissions................................................................................................................. 8-24 8.4.1 Odor ................................................................................................................... 8-24 8.4.2 Diesel ................................................................................................................. 8-27 8.4.3 PCB Transport (Particulates; Volatilization) ..................................................... 8-27 8.5 Socioeconomic Issues .................................................................................................... 8-29 8.5.1 Aesthetics and Tourism...................................................................................... 8-29 8.5.2 Economics.......................................................................................................... 8-36 8.5.3 Quality of Life.................................................................................................... 8-48 8.5.4 Historic and Cultural Resources ........................................................................ 8-51 8.6 Siting of the Facilities .................................................................................................... 8-55 8.6.1 Site Selection Criteria ........................................................................................ 8-55 8.6.2 Implications of the Facilities.............................................................................. 8-57 8.7 Facility Operation ......................................................................................................... 8-57 8.7.1 Staging of Dredged Sediments........................................................................... 8-57 8.7.2 Processing .......................................................................................................... 8-58 8.8 Remedy Health and Safety Issues.................................................................................. 8-61 9. IN-RIVER IMPACTS (SHORT- AND LONG-TERM) 9.1 Issues Related to SAV and other Ecological Resources.................................................. 9-1 9.2 Effect on Water Quality ................................................................................................ 9-12 9.3 Habitat Replacement ..................................................................................................... 9-27 9.4 Time to Recovery........................................................................................................... 9-41 9.5 Effect on Navigation Channel/Bathymetry.................................................................... 9-44 10. IMPLEMENTABILITY OF REMEDIAL ALTERNATIVES 10.1 Dredging Schedule and Production Rates...................................................................... 10-1 10.2 Monitoring ..................................................................................................................... 10-7 10.3 Resuspension and Residual PCB Concentration.......................................................... 10-12 10.4 Backfilling and Shoreline Restoration ......................................................................... 10-20 10.5 Dredged Materials Disposal......................................................................................... 10-23 10.6 Safety Concerns ........................................................................................................... 10-27 11. SELECTION OF THE PREFERRED REMEDY 11.1 Overall Protection of Human Health and Environment ................................................ 11-1 11.2 Cost ................................................................................................................................ 11-3 11.3 Long-term Effectiveness and Permanence..................................................................... 11-6 11.4 Comparison Issues ......................................................................................................... 11-8 11.5 Benefits vs. Risks......................................................................................................... 11-12
RESPONSIVENESS SUMMARY HUDSON RIVER PCBs SITE RECORD OF DECISION
TABLE OF CONTENTS
Responsiveness Summary Hudson River PCBs Site Record of Decision
iv
Book 1 of 3 Page 11.6 Other ............................................................................................................................ 11-17 INDEX.................................................................................................................................. Index-1
RESPONSIVENESS SUMMARY HUDSON RIVER PCBs SITE RECORD OF DECISION
TABLE OF CONTENTS
Responsiveness Summary Hudson River PCBs Site Record of Decision
v
WHITE PAPERS (BOOK 2 of 3) CONTAMINANT RISKS AND GEOCHEMISTRY
PCB Carcinogenicity (MASTER COMMENT/RESPONSE 362702)
PCB Non-Cancer Health Effects
(MASTER COMMENT/RESPONSE 362704) Relationship Between Tri+ and Total PCBs
(MASTER COMMENT/RESPONSE 424694) Relationship Between PCB Concentration In Surface Sediments and Upstream Sources
(MASTER COMMENT/RESPONSE 255353) Sediment PCB Inventory Estimates
(MASTER COMMENT/RESPONSE 363334) Metals Contamination
(MASTER COMMENT/RESPONSE 253002) Dioxin Contamination
(Master Comment/Response 860) Model Forecasts for Additional Simulations in the Upper Hudson River
(MASTER COMMENT/RESPONSE 363150) Application of the Depth of Scour Model (DOSM) in the Thompson Island Pool for Alternative Flooding Assumptions
(Master Comment/Response 407426) Trends in PCB Concentrations in Fish in the Upper Hudson River
(MASTER COMMENT/RESPONSE 312627) Relative Reduction of Human Health and Ecological Risks in the Mid- and Lower Hudson River
(MASTER COMMENT/RESPONSE 313699) Resuspension of PCBs During Dredging
(MASTER COMMENT/RESPONSE 336740) Human Health and Ecological Risk Reduction Under Phased Implementation
(MASTER COMMENT/RESPONSE 363176)
RESPONSIVENESS SUMMARY HUDSON RIVER PCBs SITE RECORD OF DECISION
TABLE OF CONTENTS
Responsiveness Summary Hudson River PCBs Site Record of Decision
vi
Book 2 of 3 ENGINEERING FEASIBILITY
Example Sediment Processing/Transfer Facilities
(MASTER COMMENT/RESPONSE 253216) Dredging Productivity and Schedule
(MASTER COMMENT/RESPONSE 253090) Delays and Downtime
(MASTER COMMENT/RESPONSE 313398) Post-Dredging PCB Residuals
(MASTER COMMENT/RESPONSE 312663)
Estimate of Dredged Material Exceeding TSCA Criteria (MASTER COMMENT/RESPONSE 424851)
Rail Operations
(MASTER COMMENT/RESPONSE 312991) Off-Site Disposal Of Processed Sediments
(MASTER COMMENT/RESPONSE 253477)
Additional Technology Evaluation (MASTER COMMENT/RESPONSE 255314)
POTENTIAL IMPACTS OF THE SELECTED REMEDY
Potential Impacts to Water Resources
(MASTER COMMENT/RESPONSE 312851)
Coastal Zone Management (MASTER COMMENT/RESPONSE 253238)
PCB Releases to Air
(MASTER COMMENT/RESPONSE 253202) Air Quality Evaluation
(MASTER COMMENT/RESPONSE 313846) Odor Evaluation
(MASTER COMMENT/RESPONSE 255361)
RESPONSIVENESS SUMMARY HUDSON RIVER PCBs SITE RECORD OF DECISION
TABLE OF CONTENTS
Responsiveness Summary Hudson River PCBs Site Record of Decision
vii
Book 2 of 3
Noise Evaluation
(MASTER COMMENT/RESPONSE 312685) Project-Related Traffic
(MASTER COMMENT/RESPONSE 253245) River Traffic
(MASTER COMMENT/RESPONSE 337804) Socioeconomics
(MASTER COMMENT/RESPONSE 313617)
INDEX

RESPONSIVENESS SUMMARY HUDSON RIVER PCBs SITE RECORD OF DECISION
TABLE OF CONTENTS
Responsiveness Summary Hudson River PCBs Site Record of Decision
viii
This page left blank intentionally
RESPONSIVENESS SUMMARY HUDSON RIVER PCBs SITE RECORD OF DECISION
TABLE OF CONTENTS
Responsiveness Summary Hudson River PCBs Site Record of Decision
ix
FIGURES, TABLES and APPENDICES (BOOK 3 of 3) RESPONSES Section 2 BACKGROUND AND REMEDIAL INVESTIGATION
Figure 573-1 Mass Fraction of PCB Homologue Groups in Water Column Samples from Transect 4 at Rogers Island During High Flow
Figure 573-2 Water Column Total PCB Annual Load at Fort Edward, TI Dam, and Schuylerville from GE Data (Ratio Estimator)
Figure 577-1 Net Annual Release to Total PCBs from Thompson Island Pool Sediments Figure 617-1 PCB Load at Rt. 197 and Load Gain across the TIP (from GE data) Figure 621-1 Cumulative Total PCB Load at River Mile 194.2 (Rogers Island) and
River Mile 188.5 (TID-WEST), Estimated from GE Monitoring Data for April 1991-March 2000
Figure 621-2 Shift in PCB Homologue Pattern across the Thompson Island Pool, Summer 1996
Figure 621-3 Summer Water Column Concentration at TID West versus Monthly Average Flow at Fort Edward, 1996-1999
Figure 623-1 PCB Homologue Shift across the TIP, June-August 1997 GE Observations Figure 623-2 Summer 1997 Water Column Relative PCB Congener Concentrations near
the Thompson Island Dam, Compared to Aroclor 1242 Figure 623-3 Congener Pattern in TIP Sediment Compared to Aroclor 1242 Figure 623-4 MDPR versus Total PCB Concentration for GE 0-5 cm Sediment
Concentrations in the Thompson Island Pool Figure 623-5 Relative Percent Patterns in Water Column Gain at TIP-18C, Surface
Sediment, and Surface Sediment Porewater Figure 623-6 Sediment Congener Pattern Derived from Summer 1997 Gain at TIP-18C
Attributed to Porewater Flux Figure 623-7 Sediment Relative Concentrations Required to Support Observed Water
Column Concentrations via Porewater Flux Figure 623-8 Concentrations at TID-West Predicted as a Mixture of Porewater and
Sediment Exchange Figure 623-9 Concentration Gain at TIP-18C Predicted as a Mixture of Porewater and
Sediment Exchange Figure 623-10 Relative Concentration Gain at TID-West, 1991-1997 Figure 623-11 1991-1997 Composite Congener Concentrations in TIP Load Gain
Predicted as a Mixture of Porewater and Surface Sediment Figure 629-1 Concentration Trends in Brown Bullhead, Including 2000 Data Figure 631-1 Ratio of Tri+ at Center Channel to TID-West, Plotted against Upstream
Flow and Concentration Figure 631-2 Monthly Total PCB Loads at Rt. 197 (Fort Edward) and Rt. 29
(Schuylerville) Estimated from GE Data
RESPONSIVENESS SUMMARY HUDSON RIVER PCBs SITE RECORD OF DECISION
TABLE OF CONTENTS
Responsiveness Summary Hudson River PCBs Site Record of Decision
x
Book 3 of 3
Figure 633-1 Cumulative Frequency Distribution of Total PCB Concentration in
Surface Sediments in the Thompson Island Pool, 1991 and 1998 GE Data Figure 633-2 Cumulative Frequency Distribution of MDPR in Surface Sediments in the
Thompson Island Pool, 1991 and 1998 GE Data Figure 635-1 Annual Average PCB Tri+ Concentrations from USGS Monitoring at
Waterford and Stillwater Figure 641-1 Reproduction of Figure 3 from GE Comments, Appendix F.1 Figure 779-1 Total Organic Carbon in Sediment at RM 189 (TIP) Figure 779-2 Brown Bullhead: Sediment Accumulation Factors Figure 313787-1 Forecasts of White Perch Tri+ PCB Body Burdens from Farley Model Figure 313787-2 Forecasts of White Perch Tri+ PCB Body Burdens from FISHRAND Figure 313787-3 Forecasts of Largemouth Bass Tri+ PCB Body Burdens from FISHRAND Figure 313787-4 Forecasts of Brown Bullhead Tri+ PCB Body Burdens from FISHRAND Figure 313787-5 Forecasts of Yellow Perch Tri+ PCB Body Burdens from FISHRAND Table 313787-1 Comparison of Tri+ PCB Concentrations-Water Column
Section 3 BASELINE RISK ASSESSMENTS AND PRGS Figure 811-1 Risk Functions for Female Eagle Exposed to PCBs Figure 811-2 Risk Functions for Female Mink Exposed to PCBs Figure 811-3 Risk Functions for Female Otter Exposed to PCBs Table 811-1 Summary of Measured PCB Concentrations in Liver of Mink and Otter
Caught within 5 Miles of the Hudson River as Compared to TRVs Table 811-2 Summary of Distributions and Distribution Parameters Used in Joint Probability Analysis
Section 4 REMEDIAL ACTION OBJECTIVES AND SELECTION OF TARGET
AREAS
Figure 597-1 Correlations Among PCB Metrics for 1984 NYSDEC Sediment Survey Figure 597-2 Correlations Among PCB Metrics for USEPA Low Resolution Sediment Coring Survey Figure 597-3 Correlation of Surface Concentration and MPA for GE 1991 Composite Samples Figure 597-4 Assessment of the Capture Efficiency for the Expanded Hotspot Remediation Tri+ PCB Concentration and MPA Histograms for 1984 NYSDEC Data Within and Outside of Remedial Area Figure 597-5 Assessment of the Capture Efficiency for the Expanded Hotspot Remediation Total PCB Concentration and MPA Histograms for 1984 NYSDEC Data Within and Outside of Remedial Area Figure 313219-1 Methodology for Volume Estimation
RESPONSIVENESS SUMMARY HUDSON RIVER PCBs SITE RECORD OF DECISION
TABLE OF CONTENTS
Responsiveness Summary Hudson River PCBs Site Record of Decision
xi
Book 3 of 3 Section 5 TECHNOLOGY EVALUATION AND REMEDIAL ALTERNATIVE
DEVELOPMENT
Figure 405965-1 Total PCB Content in Sediment vs. River Mile
Section 6 MODELING ASSUMPTIONS AND INTERPRETATION
Table 799-1 Mid Hudson River Species-Weighted Fish Fillet Average PCB Concentration (in mg/kg) Table 799-2 Human Health Based Target Levels – Year Reached Comparison of Feasibility Study Alternatives – Mid-Hudson River Table 799-3 Long-term Fish Ingestion Non-Cancer Hazards Reasonable Maximum Exposure and Central Tendency Mid-Hudson River-Adult Angler Table 799-4 Long-Term Fish Ingestion Cancer Risks Reasonable Maximum Exposure and Central Tendency Mid-Hudson River – Adult Angler Table 799-5 PCB Toxicity Quotients-Ecological Receptors 2011 on (25- Year Average) Mid to Lower Hudson River Table 799-6 PCB Risk Reduction – Ecological Receptors (25-Year Average) Mid to Lower Hudson
Section 7 ALTERNATIVE-SPECIFIC RISK ESTIMATES
Table 797-1 Extended Dredging Fish Ingestion Non-cancer Health Hazards Reasonable Maximum Exposure and Central Tendency-Extended Dredging Upper Hudson River Fish-Adult Angler Table 797-2 Extended Dredging Fish Ingestion Cancer Risks Reasonable Maximum Exposure and Central Tendency Upper Hudson River Fish-Adult Angler
Section 9 IN-RIVER IMPACTS (SHORT- AND LONG-TERM) Figure 803-1 Average Monthly TSS Concentrations (mg/L)
Section 11 SELECTION OF THE PREFERRED REMEDY Table 337780-1 Annual Tri+ PCB Loads at the Thompson Island, Northumberland, and Federal Dams for Selected Years Table 337780-2 Cumulative Tri+ and Total PCB Loads at the Thompson Island, Northumberland, and Federal Dams (2004-2067)
RESPONSIVENESS SUMMARY HUDSON RIVER PCBs SITE RECORD OF DECISION
TABLE OF CONTENTS
Responsiveness Summary Hudson River PCBs Site Record of Decision
xii
Book 3 of 3
WHITE PAPERS CONTAMINANT RISKS AND GEOCHEMISTRY Relationship Between Tri + and Total PCBs
Figure 424694-1 Relationship Between Ratio of Total PCBs to Tri+ and Tri+ Concentration in HR, LRC and GE Cores
Figure 424694-2 Estimation of Relationship Between the Ratio of Total PCBs to Tri+ and Tri+ Concentration
Table 424694-1 Total PCB to Tri+ for Upper Hudson Water Column Samples Table 424694-2 Total PCB to Tri+ Ratios for the Sediments of the Upper Hudson Table 424694-3 Homologue Fractions in 1993 Phase 2 Fish Results
Relationship Between PCB Concentrations in Surface Sediments and Upstream Sources Figure 255353-1 PCB Concentration in High Resolution Sediment Cores in the Upper
Hudson Figure 255353-2 Expanded Scale PCB Concentration in High Resolution Sediment Cores in
the Upper Hudson
Sediment PCB Inventory Estimates Table 363334-1 PCB Mass Estimates using 1984 Thiessen Polygons, 1994 Phase 2 LRC
and GE 1991 Composite Samples Table 363334-2 Mean Length-Weighted Average Concentration Estimates using 1984
Thiessen Polygons, 1994 LRC and GE 1991 Composite Samples Table 363334-3 REM/0/0/3 in Section 1, In Situ Mass Table 363334-4 REM 0/0/3 in Section 1, In Situ Average Concentration Table 363334-5 Average Surface Concentration Estimates of Cohesive Sediments, in REM
3/10/Select Table 363334-6 Dredge Material Average Concentration Estimates
Metals Contamination Figure 253002-1 Metals and Total PCBs in Two Dated Cores in Thompson Island Pool Figure 253002-2 Metal Concentrations in Fish Table 253002-1 Summary of Metal Levels in 1977 NYSDOH Sediment Samples
(Tofflemire & Quinn, 1979)(mg/kg) Table 253002-2 Summary of Metal Levels in Upper Hudson 1984 Cores (as reported by
Brown et al., 1988) (mg/kg)
RESPONSIVENESS SUMMARY HUDSON RIVER PCBs SITE RECORD OF DECISION
TABLE OF CONTENTS
Responsiveness Summary Hudson River PCBs Site Record of Decision
xiii
Book 3 of 3
Table 253002-3 Summary of Metal Levels in 1986 and 1987 Hot Spot 3, 8, and 20 Cores
(as reported by Brown et al., 1988) (mg/kg) Table 253002-4 Metal and PCB Concentrations in Bopp Sediment Cores (mg/kg) Table 253002-4a Comparison of Surface Concentrations Between 1991 (RM 188.6) and
1993 (RM 203.3) data (mg/kg) Table 253002-5 1983 and 1991 Thompson Island Pool Cores (as reported by McNulty,
1997) (mg/kg) Table 253002-6 Comparison of Metals Concentrations to Background Levels in 1993
Samples (mg/kg) Table 253002-7 Selected Physical Parameters and Mean Metal Concentrations (1993 Data) Table 253002-8 1993 Ecological Risk Assessment Sediment Samples (0-5 cm) (mg/kg) Table 253002-9 Results of Toxicity Characteristic Leaching Procedure (TCLP) on 1984
and 1986 Sediment Samples Table 253002-10 NYSDEC 1998 Fish Data-Selected Metals (ppm) Table 253002-11 Summary of All Sediment Data Sets (1977-1993) (mg/kg) Table 253002-12 Summary of Lower Interval 1983 Core and Baseline Sample
Dioxin Contamination Table 860-1 Dioxins/Furans Concentration in the Bopp 1991 Core (RM 188.6) with
Respect to TEQ Levels and Landfill Requirements (data provided by Bill Ports of NYSDEC)
Table 860-2 Results of TCDD, TCDF, and PCB Analyses of Sediments Collected in 1983 from the Upper Hudson Rover (Brown et al., 1988)
Table 860-3 Results of 1987 TCDD, TCDF and PCB Analysis of HS 20 (Sample 1 & 2), HS 8 (Samples 3 & 4), and HS 3 (Samples 5 & 6) (Brown et al., 1988)
Table 860-4 Hudson River Fish Dioxin/Furan Data
Model Forecasts for Additional Simulations in the Upper Hudson River Figure 363150-1 Comparison Between Upper Hudson River Remediation Forecasts for
Thompson Island Pool Cohesive Surficial Sediments Figure 363150-2 Comparison Between Upper Hudson River Remediation Forecasts for
Thompson Island Pool Non-Cohesive Surficial Sediments Figure 363150-3 Comparison Between Upper Hudson River Remediation Forecasts for
Schuylerville Cohesive Surficial Sediments Figure 363150-4 Comparison Between Upper Hudson River Remediation Forecasts for
Schuylerville Non-Cohesive Surficial Sediments Figure 363150-5 Comparison Between Upper Hudson River Remediation Forecasts for
Stillwater Cohesive Surficial Sediments Figure 363150-6 Comparison Between Upper Hudson River Remediation Forecasts for
Stillwater Non-Cohesive Surficial Sediments
RESPONSIVENESS SUMMARY HUDSON RIVER PCBs SITE RECORD OF DECISION
TABLE OF CONTENTS
Responsiveness Summary Hudson River PCBs Site Record of Decision
xiv
Book 3 of 3
Figure 363150-7 Comparison Between Upper Hudson River Remediation Forecasts for
Waterford Cohesive Surficial Sediments Figure 363150-8 Comparison Between Upper Hudson River Remediation Forecasts for
Waterford Non-Cohesive Surficial Sediments Figure 363150-9 Comparison Between Upper Hudson River Remediation Forecasts for
Federal Dam Non-Cohesive Surficial Sediments Figure 363150-10 Comparison Between Upper Hudson River Remediation Forecasts for
Thompson Island Dam Annual Average Tri+ PCB Water Column Concentration
Figure 363150-11 Comparison Between Upper Hudson River Remediation Forecasts for Schuylerville Annual Average Tri+ PCB Water Column Concentration
Figure 363150-12 Comparison Between Upper Hudson River Remediation Forecasts for Stillwater Annual Average Tri+ PCB Water Column Concentration
Figure 363150-13 Comparison Between Upper Hudson River Remediation Forecasts for Waterford Annual Average Tri+ PCB Water Column Concentration
Figure 363150-14 Comparison Between Upper Hudson River Remediation Forecasts for Federal Dam Annual Average Tri+ PCB Water Column Concentration
Figure 363150-15 Predicted Fish Body Burdens 2004 - 2010 Figure 363150-16 Predicted Fish Body Burdens 2004 - 2067 Figure 363150-17 Predicted Fish Body Burdens for White Perch Figure 363150-18 Comparison of Predicted Species-Weighted Fish Body Burdens Across
Different Assumptions of the Selected Remedy 2004 - 2064 Figure 363150-19 Comparison of Predicted Species-Weighted Fish Body Burdens Across
Different Scenarios 2004 - 2064 Figure 363150-20 Comparison of Predicted Species-Weighted Fish Body Burdens Across
Different Scenarios 2004 – 2010 (2015 for RM 154) Table 363150-1 Comparison of HUDTOX Modeling Scenarios Conducted to Evaluate
Alternative Selected Remedy (REM-3/10/Select) Assumptions Table 363150-2 REM-3/10/Select Remedial Scenario Dredging Sequence Information
Used to Develop HUDTOX Inputs for 5-Year and 6-Year Implementation Periods
Table 363150-3 Dredging-Induced Daily Tri+ PCB Load for REM-3/10/Select and a Five-Year Implementation Schedule (Run R14RS) Input to HUDTOX Water Column Segments
Table 363150-4 Dredging-Induced Daily Tri+ PCB Load for REM-3/10/Select and a Six-Year Implementation Schedules (Runs R20RS @0.13% and R20RX @2.5%) Input to HUDTOX Water Column Segments
Table 363150-5 Tri+ PCB Load Over Thompson Island Dam Table 363150-6 Tri+ PCB Load Over Northumberland Dam Table 363150-7 Tri+ PCB Load Over Federal Dam
RESPONSIVENESS SUMMARY HUDSON RIVER PCBs SITE RECORD OF DECISION
TABLE OF CONTENTS
Responsiveness Summary Hudson River PCBs Site Record of Decision
xv
Book 3 of 3 Application of the Depth of Scour Model (DOSM) in the Thompson Island Pool for Alternative Flooding Assumptions
Table 407426-1 Summary of Hydrodynamic Model Predictions for RBMR (47,330 cfs) and Estimated Upper Limit (61,835 cfs) 100-Year Peak Flows
Table 407426-2 Poolwide Thompson Island Pool Average Surficial Sediment Concentrations
Table 407426-3 Shear Stresses at High-Resolution Core Locations Table 407426-4 Erosion Depth Comparison at High-Resolution Core Locations Table 407426-5 Thompson Island Pool Expected Values of Solids Erosion and Mean
Depth of Scour Table 407426-6 Thompson Island Pool (TIP) Expected Values of Tri+ PCB Erosion in
Comparison to PCB Inventory Estimates Table 407426-7 Thompson Island Pool (TIP) Expected Values of Total PCB Erosion in
Comparison to PCB Inventory Estimates Trends in PCB Concentrations in Fish in the Upper Hudson River
Figure 312627-1 Lipid-based Tri+ PCB Concentrations in Fish, Thompson Island Pool (RM 189) (Revised) Figure 312627-2 Lipid-based Tri+ PCB Concentrations in Fish, Stillwater Reach (Revised) Table 312627-1 Half-Life Comparison of Model and Data Lipid-Based Annual Average
PCB Concentrations in Fish
Relative Reduction of Human Health and Ecological Risks in the Mid- and Lower Hudson River
Table 313699-1 Mid-Hudson River Species-Weighted Fish Fillet Average PCB Concentrations (mg/kg)
Table 313699-2 Long-Term Fish Ingestion Cancer Risks Mid-Hudson River – Adult Angler
Table 313699-3 Long-Term Fish Ingestion Non-Cancer Hazard Indices Mid-Hudson River – Adult Angler
Table 313699-4 Modeled Times (Years) of Compliance with Human Health Risk-Based Concentrations Mid-Hudson River
Table 313699-5 Lower Hudson River Whole Fish Largemouth Bass Average PCB Concentrations (mg/kg)
Table 313699-6 Lower Hudson River Whole Fish Spottail Shiner Average PCB Concentrations (mg/kg)
Table 313699-7 Average (25-year) PCB Toxicity Quotients – Ecological Receptors Table 313699-8 Modeled Times of Compliance with Ecological RGs and Risk-Based
Concentrations
RESPONSIVENESS SUMMARY HUDSON RIVER PCBs SITE RECORD OF DECISION
TABLE OF CONTENTS
Responsiveness Summary Hudson River PCBs Site Record of Decision
xvi
Book 3 of 3 Resuspension of PCBs During Dredging
Figure 336740-1 Fraction of Total Constituent Loss in Dissolved Form (Kd=105 L/kg) Figure 336740-2 Typical Silt Curtin Response to Current Figure 336740-3 Frequency Distribution of Resuspension Rates for Cutterhead Dredging
Operations Figure 336740-4 Location of SMU 56/57 and Sample-Collection Sites Figure 336740-5 Dissolved-Phase PCB Congener Distribution for the Upstream and
Downstream Sites, Fox River, Wis. Figure 336740-6 Mean Dissolved and Particulate Effluent PCB Congener Concentrations
on the Fox River, Wis. Figure 336740-7 PCB Concentrations at the Upstream and Downstream Transects Before
and During Dredging Operations, Fox River, Wis. Figure 336740-8 Daily Mean Total Suspended Solids Concentrations for Upstream and
Downstream Transects, Fox River, Wis. Figure 336740-9 Daily Water-Column PCB Load in the Deposit Area During the Dredging
Operation on the Fox River, Wis. Figure 336740-10 New Bedford Harbor Monitoring Stations Figure 336740-11 General Electric Company-Hudson River Project Post-Construction
Remnant Deposit Monitoring Program – Pump House Sediment Removal Interim Remedial Measures Site Map
Figure 336740-12 Homologue Distribution from Hudson Falls IRM Monitoring Activities Figure 336740-13 Resuspension Rate for Open Clamshell Bucket Dredges with Water Depth Table 336740-1 Estimation of the Rate of Downstream Transport due to Resuspension Table 336740-2 Characteristics of Cutterhead Field Studies Used to Estimate Resuspension
Rates Table 336740-3 Summary of PCB Concentration (ppm)1 in Sediment After Dredging Table 336740-4 Cumulative PCB Mass Transport (kg) Table 336740-5 Summary of Estimated Resuspension Losses from Clamshell (open)
Bucket Operations Human Health and Ecological Risk Reduction Under Phased Implementation
Table 363176-1 Selected Remedy (REM-3/10/Select) Upper Hudson Species-Weighted Fish Fillet Average PCB Concentration (mg/kg)
Table 363176-2 Selected Remedy (REM-3/10/Select) Scenarios Post-Remediation PCB Concentrations in Fish-Upper Hudson River
Table 363176-3 Selected Remedy (REM-3/10/Select) Scenarios – Long-Term Fish Ingestion Reasonable Maximum Exposure and Central Tendency Cancer Risks Upper Hudson River Fish – Adult Angler
Table 363176-4 Selected Remedy (REM-3/10/Select) Scenarios – Long-Term Fish Ingestion Reasonable Maximum Exposure and Central Tendency PCB Non-Cancer Hazard Indices Upper Hudson River Fish – Adult Angler
RESPONSIVENESS SUMMARY HUDSON RIVER PCBs SITE RECORD OF DECISION
TABLE OF CONTENTS
Responsiveness Summary Hudson River PCBs Site Record of Decision
xvii
Book 3 of 3
Table 363176-5 Modeled Times (Years) of Compliance with Human Health Risk-Based
Concentrations Selected Remedy (REM-3/10/Select) Scenarios Table 363176-6 Largemouth Bass Whole Body Average PCB Concentrations (mg/kg) Table 363176-7 Spottail Shiner Whole Body Average PCB Concentrations (mg/kg) Table 363176-8 Selected Remedy (REM-3/10/Select) Scenarios Average PCB Toxicity
Quotients Ecological Receptors (25-Year Time Frame) Table 363176-9 Modeled Times of Compliance with Ecological Risk-Based
Concentrations Selected Remedy (REM-3/10/Select) Scenarios ENGINEERING FEASIBILITY Example Sediment Processing/Transfer Facilities
Figure 253216-1 Example Northern Sediment Processing and Transfer Facility Site -Existing Conditions
Figure 253216-2 Example Southern Sediment Processing and Transfer Facility Site – Existing Conditions
Figure 253216-3 Example Northern Sediment Processing and Transfer Facility - Layout for Mechanical Dredging
Figure 253216-4 Example Southern Sediment Processing and Transfer Facility - Layout for Mechanical Dredging
Figure 253216-5 Example Northern Sediment Processing and Transfer Facility - Layout for Hydraulic Dredging
Dredging Productivity and Schedule
Table 253090-1 “Other Projects” (Hydraulic) Referenced in Comments
Delays and Downtime Table 313398-1 Analysis of Daily Temperature Information Table 313398-2 Analysis of River Flow Delays
Estimate of Dredged Material Exceeding TSCA Criteria Figure 424851-1 Cumulative Percentage of Sediment Volume Removal based on Total
PCB Concentration with TI Pool Table 424851-1 Percentage of Material Exceeding TSCA Criterion of 32 mg/kg
Additional Technology Evaluation
Table 255314-1 List of Process Options for Bioremediation
RESPONSIVENESS SUMMARY HUDSON RIVER PCBs SITE RECORD OF DECISION
TABLE OF CONTENTS
Responsiveness Summary Hudson River PCBs Site Record of Decision
xviii
Book 3 of 3 POTENTIAL IMPACTS OF THE SELECTED REMEDY Potential Impacts to Water Resources
Figure 312851-1 Typical Total Nitrogen and Total PCB Profiles in the Upper Hudson River High Resolution Core Samples
Figure 312851-2 Hudson River PCBs Site Existing Discharge Locations to the Upper Hudson
Table 312851-1 Model-Based Estimates of TSS from Resuspension for the Hudson River Table 312851-2 Estimated Total Nitrogen Increase in the Water Column during Dredging Table 312851-3 Estimate Total Phosphorous Increase in the Water Column during
Dredging Table 312851-4 Estimated Flux of Metals to the Water Column, Based on the
Resuspension Model at 10 Meters Downstream of the Dredge Head Table 312851-5 Estimated Concentrations for Metals in the Water Column Table 312851-6 Estimated Flux of PAHs to Water Column, Based on the Resuspension
Model at 10 Meters Downstream of the Dredge Head Table 312851-7 Estimated Concentrations for PAHs in the Water Column at the Waterford
Intake Table 312851-8 Estimated Dissolved Oxygen Impacts Due to Dredging
Coastal Zone Management
Figure 253238-1 Project site relative to the New York State-designated coastal zone Figure 253238-2 Average Monthly TSS concentrations for Schuylerville, Stillwater and
Waterford New York plotted against the estimated project-related fully mixed TSS concentration for hydraulic and mechanical dredging (0.50 mg/L and 1.1 mg/L) for River Sections 2 and 3
Table 253238-1 Freshwater, Brackish Water, and Salt Water Habitats
PCB Releases to Air
Table 253202-1 Estimated Transfer Area of the Components for Mechanical Dredging at the Sediment Processing/Transfer Facility
Table 253202-2 Estimated Transfer Area of the Components for Hydraulic Dredging at the Sediment Processing/Transfer Facility
Table 253202-3 ISCST3 Model Options Table 253202-4 Calculated PCB Loss from the Sediment Treatment/Transfer Facilities Table 253202-5 Predicted PCB Levels at the Modeled Receptor Locations and Associated
Standards Table 253202-6 Predicted PCB Levels at the Modeling Receptor Locations Near Dredging
Site and the Ambient Standard Table 253202-7 Outside Facility Boundary Cancer Risks to Residents
RESPONSIVENESS SUMMARY HUDSON RIVER PCBs SITE RECORD OF DECISION
TABLE OF CONTENTS
Responsiveness Summary Hudson River PCBs Site Record of Decision
xix
Book 3 of 3
Table 253202-8 Outside Facility Boundary Non-Cancer Hazards to Residents Table 253202-9 Inside Facility Boundary Cancer Risks to Adult Workers Table 253202-10 Inside Facility Boundary Non-Cancer Hazards to Adult Workers
Air Quality Evaluation
Table 313846-1 National and New York Ambient Air Quality Standards Table 313846-2 Diesel Equipment Emission Rates Table 313846-3 Truck Emission Rate Table 313846-4 Sediment Handling Emission Rate Table 313846-5 ISCST3 Model Options Table 313846-6 Worst-Case Total Impact from Mechanical Dredging at NTF Table 313846-7 Worst-Case Total Impact from Hydraulic Dredging at NTF Table 313846-8 Worst-Case Total Impact Along the Hudson River from a Stationary
Booster Near Glenn Falls Area Table 313846-9 Worst-Case Total Impact Along the Hudson River from a Stationary
Booster Near Albany Area Table 313846-10 Calculated Metals Concentrations Associated with Airborne Suspended
Particles
Odor Evaluation
Table 255361-1 Calculated H2S Levels and Relevant Standards Table 255361-2 Calculated NH3 Levels and Relevant Standards
Noise Evaluation
Table 312685-1 FHWA Noise Abatement Criteria Table 312685-2 Typical Peak Noise Emission Levels for Construction Equipment Table 312685-3 Long-term Noise Levels from Sediment Processing and Transfer Facilities Table 312685-4 Long-term Noise Levels from Stationary Booster Table 312685-5 Predicted Short-term Leq(1) (dBA) Noise Levels from Mechanical
Dredging Process (worst-case ten weeks) Table 312685-6 Predicted Short-term Leq(1) (dBA) Noise Levels from Hydraulic Dredging
Process (worst-case nine weeks) Project-Related Traffic
Table 253245-1 Fuel Deliveries Required Per Week Table 253245-2 Truck Deliveries for the Northern Transfer Facility Table 253245-3 Estimate of Traffic from Northern Transfer Facility
RESPONSIVENESS SUMMARY HUDSON RIVER PCBs SITE RECORD OF DECISION
TABLE OF CONTENTS
Responsiveness Summary Hudson River PCBs Site Record of Decision
xx
Book 3 of 3 River Traffic
Table 337804-1 Recent Trends in Bulk Commodity Traffic on the Upper Hudson River Table 337804-2 Projected Mechanical Dredging Equipment Requirements Table 337804-3 Projected Hydraulic Dredging Equipment Requirements Table 337804-4 1999 Champlain Canal Traffic Data Table 337804-5 Available Lockages for 2001 Operating Season on the Hudson River (per
lock) Table 337804-6 Available Lockages Assuming 24 Hours of Operation Table 337804-7 Daily Lockages at Lock 5-Schuylerville-Based on Peak Month (July 1999) Table 337804-8 Daily Lockages at Lock 6-Fort Miller-Based on Peak Month (July 1999) Table 337804-9 Estimated Lock Traffic at Lock 5 and 6 During Mechanical Dredging
Removal Operations Occurring in River Section 1 and River Section 2 Table 337804-10 Daily Lockages (July 1999) vs. Daily Proposed Project Lockages, Lock 6
– Mechanical Dredging Table 337804-11 Daily Lockages (July 1999) vs. Daily Proposed Project Lockages, Lock 5
– Mechanical Dredging Table 337804-12 Daily Lockages (July 1999) vs. Daily Proposed Project Lockages, Lock 6
– Hydraulic Dredging Socioeconomics
Figure 313617-1 Unemployment Rates Figure 313617-2 Unemployed Figure 313617-3 Construction Employment 1989-1998 Table 313617-1 Input Expenditures Table 313617-2 Output Impacts – Five-County Region Table 313617-3 Earning Impacts – Five-County Region Table 313617-4 Employment Impacts – Five-County Region Table 313617-5 Tourism Employment and Wages 1988-1999 Table 313617-6 Studies on Property Value Impacts
NO FIGURES OR TABLES
Rail Operations (MASTER COMMENT/RESPONSE 312991) PCB Carcinogenicity (MASTER COMMENT/RESPONSE 362702) PCB Non-Cancer Health Effects (MASTER COMMENT/RESPONSE 362704
RESPONSIVENESS SUMMARY HUDSON RIVER PCBs SITE RECORD OF DECISION
TABLE OF CONTENTS
Responsiveness Summary Hudson River PCBs Site Record of Decision
xxi
Book 3 of 3
Off-Site Disposal Of Processed Sediments (MASTER COMMENT/RESPONSE 253477) Post Dredging PCB Residuals
(Master Comment/Response 312663)
APPENDICES APPENDIX A - HUDSON RIVER PCBs SUPERFUND SITE NEW YORK
PRELIMINARY WETLANDS ASSESSMENT APPENDIX B - HUDSON RIVER PCBs SUPERFUND SITE NEW YORK
PRELIMINARY FLOODPLAINS ASSESSMENT
APPENDIX C - STAGE 1A CULTURAL RESOURCES SURVEY
Page ABSTRACT ......................................................................................................................... C-1 1. INTRODUCTION ................................................................................................................ C-2
1.1 Site Description......................................................................................................... C-2 1.2 Site History ............................................................................................................... C-3 1.3 Goals of Remedial Action......................................................................................... C-3 1.4 General Objectives and Organization of Document ................................................. C-4
2. REGULATORY FRAMEWORK ......................................................................................... C-5
2.1 Applicable Statutes and Regulations ........................................................................ C-5 2.2 Survey Methods ........................................................................................................ C-8
3. REMEDIAL ACTION ALTERNATIVES......................................................................... C-13
3.1 Description of Alternatives ..................................................................................... C-13 3.2 General Removal Information ................................................................................ C-15 3.3 Selected Remedy..................................................................................................... C-18
4. ENVIRONMENTAL SETTING ......................................................................................... C-21
4.1 Physiology............................................................................................................... C-21 4.2 Glacial History........................................................................................................ C-22 4.3 Hydrology ............................................................................................................... C-24 4.4 Sediments................................................................................................................ C-25
5. PREHISTORIC AND HISTORIC BACKGROUND ........................................................ C-27
5.1 Prehistoric Period.................................................................................................... C-27 5.2 Pre-Industrial Era, ca. 1609-1815 ........................................................................... C-34 5.3 19th Century, ca. 1820-1900 ................................................................................... C-43
RESPONSIVENESS SUMMARY HUDSON RIVER PCBs SITE RECORD OF DECISION
TABLE OF CONTENTS
Responsiveness Summary Hudson River PCBs Site Record of Decision
xxii
Book 3 of 3 Page
5.4 20th Century, ca. 1900-1945 .................................................................................. C-55 5.5 20th Century, 1945-Present ..................................................................................... C-61
6. RESULTS OF SURVEY .................................................................................................... C-67
6.1 National Register-Listed Resources........................................................................ C-67 6.2 National Register-Eligible Resources ..................................................................... C-68 6.3 Unevaluated Resources........................................................................................... C-69 6.4 Previous Studies...................................................................................................... C-71 6.5 Other Resources ...................................................................................................... C-79
7. POTENTIAL EFFECTS OF SELECTED REMEDY........................................................ C-81
7.1 Effects to Known National Register-Listed and Eligible Resources ...................... C-83 7.2 Effects to Archaeological Resources ...................................................................... C-87 7.3 Effects to Other Resources...................................................................................... C-88
8. FUTURE STEPS ................................................................................................................ C-89
8.1 Identification and Evaluation Efforts...................................................................... C-89 8.2 Mitigation of Adverse Effects................................................................................. C-90 8.3. Coordination .......................................................................................................... C-91
BIBLIOGRAPHY......................................................................................................................C-93 APPENDIX C TABLES & FIGURES
Figure C.1-1 Overview of Upper Hudson River Glen Falls to Federal Dam Figure C.2-1 Upper Hudson River APE Figure C.3-1 A & B Alternative REM-3/10/Select Removal Areas and Depths Figure C.3-1 C & D Alternative REM-3/10/Select Removal Areas and Depths Figure C.3-1 E & F Alternative REM-3/10/Select Removal Areas and Depths Figure C.3-1 G Alternative REM-3/10/Select Removal Areas and Depths Figure C.3-1 H Alternative REM-3/10/Select Removal Areas and Depths Figure C.3-1 I & J Alternative REM-3/10/Select Removal Areas and Depths Figure C.3-1 K & L Alternative REM-3/10/Select Removal Areas and Depths Figure C.4-1 Land Form Regions for New York State Figure C.4-2 Land Form Categories for New York State Figure C.4-3 Hydrography on Upper Hudson River Figure C.4-4 Underlying Rock Formation for New York State Figure C.5-1 New Netherlands and New England, 1635 Figure C.5-2 New Netherland, 1621 Figure C.5-3 Major Land Grants and Patents of Colonial New York Figure C.5-4 New York Counties, Colonial Era, 1776 Figure C.5-5 Northern Campaigns of the Revolutionary War
RESPONSIVENESS SUMMARY HUDSON RIVER PCBs SITE RECORD OF DECISION
TABLE OF CONTENTS
Responsiveness Summary Hudson River PCBs Site Record of Decision
xxiii
Book 3 of 3 Figure C.5-6 Confluence of Hudson and Mohawk Valleys, 1843 Figure C.5-7 Canals of New York in 1855 Figure C.5-8 Upper Hudson River & Surrounding Region, 1880 Figure C.5-9 West Shore and New York Central Railroad Figure C.5-10 Delaware and Hudson Railroad Figure C.5-11 Upper Hudson River, 1921 Figure C.5-12 New York State Barge Canal System, 1925 Figure C.5-13 Hudson River Valley Electric Railway, 1906 Figure C.6-1 A Architectural & Archaeological Resources in Upper Hudson River
APE Figure C.6-1 B Architectural & Archaeological Resources in Upper Hudson River
APE Figure C.6-1 C Architectural & Archaeological Resources in Upper Hudson River
APE Figure C.6-1 D Architectural & Archaeological Resources in Upper Hudson River
APE Table C-1a National Register-Listed Resources in Albany County Table C-1b National Register-Listed Resources in Rensselaer County Table C-1c National Register-Listed Resources in Saratoga County Table C-1d National Register-Listed Resources in Warren County Table C-1e National Register-Listed Resources in Washington County Table C-2 Previously-Identified Archaeological Sites in Area of Potential Effect Table C-3 Prior Archaeological Surveys
APPENDIX D - COMPENDIUM OF PUBLIC COMMENTS APPENDIX D COMPACT DISKS Database of Public Comments ........................................................................Compact Disk D1 Public Comment Documents ............................................................... Compact Disks D2 – D6

RESPONSIVENESS SUMMARY HUDSON RIVER PCBs SITE RECORD OF DECISION
TABLE OF CONTENTS
Responsiveness Summary Hudson River PCBs Site Record of Decision
xxiv
This page left blank intentionally
LIST OF ACRONYMS AND ABBREVIATIONS
xxv
Responsiveness Summary Hudson River PCBs Site Record of Decision
ACGIH American Conference of Governmental Industrial Hygienists ACHP Advisory Council on Historic Preservation AGC Annual Guideline Concentration AOC Administrative Order on Consent ANOVA Analysis of Variance APEG Alkaline (Alkali Metal Hydroxide) Polyethylene Glycol ARAR Applicable or Relevant and Appropriate Requirement ARCC Adirondack Regional Chambers of Commerce ARCS Assessment and Remediation of Contaminated Sediments Program ATSDR Agency for Toxic Substance and Disease Registry AWQC Ambient Water Quality Criterion BAT Best Achievable Technology BBL Blasland, Bouck, and Lee BCD Base-Catalyzed Decomposition BMR Baseline Modeling Report CADD Computer-Aided Drafting and Design CDF Confined Disposal Facility CDI Chronic Daily Intake CERCLA Comprehensive Environmental Response, Compensation, and Liability Act CFR Code of Federal Regulations cfs cubic feet per second CIP Community Interaction Program CLU-IN Hazardous Waste Clean-up Information (EPA web site) COC Chemical(s) of Concern COPC Chemical(s) of Potential Concern CSF Cancer Slope Factor CSM Conceptual Site Model CT Central Tendency CWA Clean Water Act CZM Coastal Zone Management DEIR Data Evaluation and Interpretation Report DMR Discharge Monitoring Report DNAPL Dense Non-Aqueous Phase Liquid DOC Dissolved Organic Carbon DOSM Depth of Scour Model DOT Department of Transportation DRE Destruction and Removal Efficiency ECD Electron Capture Detector ECL Environmental Conservation Law (New York) EE/CA Engineering Evaluation/Cost Analysis EEC Extreme Effect Concentration EIS Environmental Impact Statement EO Executive Order EPA Environmental Protection Agency EPC Exposure Point Concentration ERA Ecological Risk Assessment ESA Endangered Species Act ETWG Engineering/Technology Work Group FAIR Farmers Against Irresponsible Remediation
LIST OF ACRONYMS and ABBREVIATIONS (cont’d)
xxvi
Responsiveness Summary Hudson River PCBs Site Record of Decision
FDA Food and Drug Administration FEMA Federal Emergency Management Agency FR Federal Register FRTR Federal Remediation Technologies Roundtable FS Feasibility Study FSSOW Feasibility Study Scope of Work FWIA Fish & Wildlife Impact Analysis g/m2 Grams per meter squared GAC Granular Activated Carbon GC Gas Chromatography GCL Geosynthetic Clay Liner GE General Electric Company GIS Geographic Information System GLNPO (EPA’s) Great Lakes National Program Office GRA General Response Action HDPE High Density Polyethylene HHRA Human Health Risk Assessment HHRASOW Human Health Risk Assessment Scope of Work HI Hazard Index HMTA Hazardous Materials Transportation Act hp Horsepower HQ Hazard Quotient HROC Hudson River PCB Oversight Committee HSI Habitat Suitability Index HTTD High Temperature Thermal Desorption HUDTOX Upper Hudson River Toxic Chemical Model IBI Index of Biotic Integrity IRIS Integrated Risk Information System ITT Innovative Treatment Technologies (database) kg Kilogram KPEG Potassium polyethylene glycol LOAEL Lowest Observed Adverse Effect Level LRC, LRCR Low Resolution Sediment Coring Report LTI LimnoTech, Inc. LTTD Low Temperature Thermal Desorption LWA Length-Weighted Average MANOVA Multivariate Analysis of Variance M&E Metcalf and Eddy MBI Macroinvertebrate Biotic Index MCA Menzie-Cura and Associates MCACES Cost Estimating Software (USACE) MCL Maximum Contaminant Level MCLG Maximum Contaminant Level Goal MDEQ Michigan Department of Environmental Quality MDPR Molar Dechlorination Product Ratio MEC Mid-Range Effects Concentration mg/kg Milligrams per Kilogram (generally equivalent to parts per million, or ppm) mg/L Milligrams per Liter (generally equivalent to ppm) MNA Monitored Natural Attenuation MPA Mass per Unit Area
LIST OF ACRONYMS and ABBREVIATIONS (cont’d)
xxvii
Responsiveness Summary Hudson River PCBs Site Record of Decision
MS Mass Spectroscopy NAAQS National Ambient Air Quality Standards NAICS North American Industry Coding System NAS National Academy of Sciences NCP National Oil Spill and Hazardous Substances Pollution Contingency Plan NEPA National Environmental Policy Act ng/L Nanograms per Liter, parts per trillion NHPA National Historic Preservation Act NiMo Niagara Mohawk Power Company NOAA National Oceanic and Atmospheric Administration NOAEL No Observed Adverse Effect Level NPL National Priorities List NRC National Research Council NTCRA Non-Time Critical Removal Action NYCRR New York Code of Rules and Regulations NYSDEC New York State Department of Environmental Conservation NYSDOH New York State Department of Health NYSDOL New York State Department of Labor NYSDOT New York State Department of Transportation NYSPDES New York State Pollutant Discharge Elimination System O&M Operation and Maintenance OPRHP Office of Parks, Recreation, and Historic Preservation OSHA Occupational Safety and Health Administration OSWER Office of Solid Waste and Emergency Response (EPA) OU Operable Unit PCB Polychlorinated Biphenyl PCRDMP Post-Construction Remnant Deposit Monitoring Plan PEL Probable Effects Level PMCR Preliminary Modeling Calibration Report ppm part(s) per million (mg/kg or mg/L) PRG Preliminary Remediation Goal PSG Project Sponsor Group PVC Polyvinyl Chloride RAMP Remedial Action Master Plan RAO Remedial Action Objective RBC Risk-Based Concentration RBMR Revised Baseline Modeling Report REACH IT Remediation and Characterization Innovative Technologies (EPA database) RfD Reference Dose RI/FS Remedial Investigation/Feasibility Study RI Remedial Investigation RIMS Remediation Information Management System RM River Mile RME Reasonable Maximum Exposure ROD Record of Decision SARA Superfund Amendments and Reauthorization Act of 1986 SAV Submerged Aquatic Vegetation SEC Sediment Effect Concentration SHPO State Historic Preservation Office SITE Superfund Innovative Technology Evaluation Program SPDES State Pollution Discharge Elimination System
LIST OF ACRONYMS and ABBREVIATIONS (cont’d)
xxviii
Responsiveness Summary Hudson River PCBs Site Record of Decision
SQRT Screening Quick Reference Tables STC Scientific and Technical Committee T&E Threatened and Endangered TAG Technical Assistance Grant TAGM Technical Assistance Guidance Memorandum (NYSDEC) TBC To-be-considered TCDD 2,3,7,8-Tetrachlorodibenzo-p-dioxin TCP 2,4,6-Trichlorophenol TEC Threshold Effect Concentration TEF Toxicity Equivalency Factor TEQ (Dioxin-like) Toxic Equivalent Quotient TI Thompson Island TID Thompson Island Dam TIN Triangulated Irregular Network TIP Thompson Island Pool TLV Threshold Limit Value TOC Total Organic Carbon TOGS Technical and Operational Guidance Series (NYSDEC) TOPS Trace Organics Platform Sampler TQ Toxicity Quotient TR Target Risk TRV Toxicity Reference Value TSCA Toxic Substances Control Act TWA Time-Weighted Average UCL Upper Confidence Limit UET Upper Effects Threshold µg/kg Micrograms per Kilogram, (generally equivalent to parts per billion, or ppb) µg/L Micrograms per Liter, (generally equivalent to parts per billion, or ppb) USACE United States Army Corps of Engineers USBEA United States Bureau of Economic Analysis USBLS United States Bureau of Labor Statistics USC United States Code USDOC United States Department of Commerce USDOD United States Department of Defense USDOE United States Department of Energy USDOI United States Department of Interior USFWS United States Fish and Wildlife Service USGS United States Geological Survey VISITT Vendor Information System for Innovative Treatment Technologies (EPA Program) VLDPE Very Low Density Polyethylene WHO World Health Organization
Responsiveness Summary Hudson River PCBs Site Record of Decision
Executive Summary-1
Hudson River PCBs Site Record of Decision Responsiveness Summary
EXECUTIVE SUMMARY
INTRODUCTION Since its inception in 1990, EPA’s Reassessment Remedial Investigation/Feasibility Study (RI/FS) has had the benefit of an extensive public-involvement program. Even before the initiation of the formal public comment period on the Proposed Plan for the Hudson River PCBs Superfund Site and the supporting analysis and information, there had been over 65 meetings/forums with the public, involving many issues, people, and places. It was through this extensive effort that EPA determined that local landfilling of dredged materials would not be an option in the event that a dredging remedy were selected. EPA opened the formal public comment period with the release of the Hudson River PCBs Superfund Site Proposed Plan on December 12, 2000. The Proposed Plan presented EPA’s preferred remedy and the rationale for its selection. The preferred remedy consisted of removal (targeted dredging) of 2.65 million cubic yards of contaminated sediments containing over 150,000 pounds of PCBs from the Upper Hudson River using environmental dredging techniques that would minimize adverse environmental impacts, including the resuspension of sediments. The comment period, originally scheduled to close on February 16, 2001, was extended to April 17, 2001. During the comment period, EPA chaired 11 public meetings that were attended by thousands of individuals, several hundred of whom provided oral comment. By the close of the comment period, EPA had received 73,215 discrete submissions of comments, of which nearly half were e-mails. As multiple individuals signed some submissions, the number of commenters is recorded as over 90,000 individuals. The results of this public involvement program and EPA’s response to the concerns raised are clearly evident in the Record of Decision (ROD), which is being released at this time. Some of the more notable examples of decisions that reflect public comment on the Proposed Plan include:
• A commitment to develop (with input from the affected public) a comprehensive public involvement program to be employed throughout the design and construction phases of the project.
• A commitment to develop, during the design phase (with input from State and federal
agencies, as well as the public), performance standards for key project aspects, including sediment resuspension and dredging production rates.
• A commitment to perform the construction in a phased manner whereby a first phase of
construction (one construction season) will precede the full-scale, five-year construction period.
Responsiveness Summary Hudson River PCBs Site Record of Decision
Executive Summary-2
• A commitment to include in the first phase, in addition to project shakedown, the field verification of various project assumptions.
• A commitment to move dredged materials and backfill within the Upper Hudson River area
by barge or rail to ensure that disruption of traffic patterns in neighboring communities does not occur.
The aforementioned are some of the more significant aspects of the decision or ROD that have been aimed at responding to concerns raised throughout the public comment period. Other quality-of-life factors, such as noise, odor, maintenance of navigation, water supply protection, construction lighting, air quality, aesthetics, maintenance of recreational opportunities, and impacts on farm activities, also have been taken into account within the selected remedy and are addressed in detail within this Responsiveness Summary (RS). What follows in this Executive Summary is an abbreviated discussion of some of these issues. For each, a more detailed discussion can be found within the main body of the RS. PUBLIC INVOLVEMENT IN DESIGN AND CONSTRUCTION A number of comments dealt with the necessity of developing and implementing a comprehensive and detailed public involvement plan for the remedial design and implementation phases of the Hudson River PCBs Site cleanup. Since the beginning of the Reassessment, EPA has been committed to a public process that is fully open to any interested party. The original community interaction plan (CIP) was designed to be flexible so that it could be modified in response to changes dictated by the project or requested by the participants. Since 1990, EPA has modified not only the CIP but also certain aspects of the RI/FS itself, as well as the selected remedy, based on public input. EPA continues to be committed to involving the public, this time throughout the project's design (including development of performance standards and the sediment processing/transfer facility siting process) and construction phases. In the near future, EPA will involve the community in the development of a project-tailored public process that allows for incorporation of public involvement throughout the design and construction phases of the project and fully considers input received. RESUSPENSION Many comments addressed the potential for PCB release to the water column during remedial dredging operations. Concerns over the extent and impact of releases caused by resuspension of contaminated sediments on public health and the environment have been raised. In reviewing these concerns, EPA agrees that such releases must be carefully balanced with impacts associated with ongoing PCB releases to the water column from the sediments and existing impacts to the aquatic biota. After a thorough review of available dredging equipment, EPA concludes that conventional hydraulic cutterhead dredges and enclosed environmental bucket dredges are best suited to the selected remedial dredging activity. Data from projects using these dredges were used as the basis for estimating water quality impacts that would result during dredging operations. These data show loss rates adjacent to the dredge head of 0.35 percent (by mass of fine sediments) for a conventional

Responsiveness Summary Hudson River PCBs Site Record of Decision
Executive Summary-3
hydraulic cutterhead dredge and 0.3 percent (by mass of fine sediments) for an environmental bucket dredge. During the first year of project design, with input from State and federal agencies as well as the public, EPA will develop the details of performance standards and performance monitoring that will be utilized during the first phase of project construction to field verify and modify, as appropriate, project operations. PROJECT SEQUENCE AND SCHEDULE Many commenters questioned the viability of EPA’s schedule for accomplishing the selected remedy. EPA will begin the initial steps toward implementation once the ROD is signed. These pre-remediation activities, including project design, are scheduled for completion by Spring 2005, and many of these activities will be performed simultaneously. They include the following:
• Development of performance standards. • Additional sediment sampling and analysis. • Evaluation and selection of dredging technologies. • Selection of contractor(s). • Sediment processing/transfer facility siting and construction. • Finalization of agreements with landfills, rail companies, backfill material suppliers, and
energy providers. • Mobilization (e.g., assembling of equipment, planning the materials-handling operation, and
arranging for sediment transportation and disposal). Dredging operations will commence during the 2005 canal season. Some commenters requested that EPA consider smaller, more focused projects, or perform a demonstration dredging project, to determine the feasibility of the selected remedy. EPA did, in fact, consider the possibilities of a short-term demonstration project and smaller-scale remedial efforts in the Upper Hudson River. Modeling indicated that smaller-scale efforts would not substantially reduce the PCB concentrations in fish. In the Proposed Plan for this project, EPA proposed a five-year schedule for the work, beginning in the year 2004. However, given the concerns expressed by commenters, the Agency has decided to implement the project using a phased approach. Performing dredging operations in this manner provides the opportunity to evaluate overall project performance more intensively at the beginning and, as appropriate, refine the operations, which are now planned over a six-year period. The selected remedy will be conducted in two phases over the six-year schedule. The first phase of dredging, to begin in 2005, will be implemented during the first construction season. The dredging during that year will be implemented initially at less than full-scale operation, and will include an extensive monitoring program based on performance standards that will address (but may not be limited to):
Responsiveness Summary Hudson River PCBs Site Record of Decision
Executive Summary-4
• Resuspension rates during dredging. • Production rates. • Residuals after dredging. • Community impacts (e.g., noise, air, odor, navigation).
Data gathered during this first phase will enable EPA to determine if adjustments are needed to operations in the succeeding phase of dredging or if performance standards need to be reevaluated. The current schedule assumes that, after the phased-in operations of 2005, dredging operations will proceed at full scale in the years 2006, 2007, 2008, and 2009, with completion of remaining work in 2010. Similarly, commenters questioned the plausibility of achieving targeted dredging rates with the dredging equipment selected. EPA considered available technologies in combination with a series of Site-specific factors such as sediment characteristics, river geometry, in-river transportation systems, and environmental constraints in arriving at likely production rates. EPA concludes that the production rates generated by examination of these factors are considered practical and attainable. Commenters also compared EPA’s productivity estimates to lower rates actually attained at other Superfund sites. EPA believes that project scale and Site-specific conditions render such comparisons technically invalid. QUALITY OF LIFE FACTORS With regard to concerns expressed about the potential for negative impacts to the quality of life of people residing near or utilizing the river in the vicinity of the remediation, EPA has made every effort to fully assess and address such issues. They are summarized below in the categories of traffic, noise, construction lighting, air quality, odor, aesthetics, and recreation. While there may be short-term impacts with respect to some of these issues, the project will follow strict guidelines to minimize and mitigate potential impacts to the maximum extent practicable. It is EPA’s belief that any temporary impacts are manageable and far outweighed by the long-term benefits of the remediation on human health and the environment. Traffic Commenters raised concerns about the ability of the existing infrastructure to accommodate project-related increases in vehicular and truck traffic, and the potential disruption to regional roadways that could result from these increases. In response to these concerns, EPA has determined that dredged materials will be taken from the Site by barge and/or rail, rather than by truck. Likewise, material used for project backfill will be transported within the Upper Hudson River area by barge and/or rail. While the location(s) of the sediment processing/transfer facilities have not yet been determined, for purposes of the FS and Responsiveness Summary, northern and southern facility sites were assumed.
Responsiveness Summary Hudson River PCBs Site Record of Decision
Executive Summary-5
Impacts from vehicle and truck traffic caused by both worker commutation and construction of dredged-material processing facilities were the key elements of concern remaining, once trucking of dredged material and backfill was eliminated. At the southern sediment processing/transfer facility site, impacts will be easily manageable, because much of that locale is currently highly industrialized and experiences much greater activity than would be generated by project operations. For the northern facility, estimates of the project-related road traffic were evaluated in the context of current traffic volumes and road capacities. During peak traffic conditions, it was concluded that employee traffic generated by the project will not be disruptive to the area’s local communities, because the volume increase on nearby roadways will be minor (i.e., less than 10 percent). Given that this increase in road usage is relatively small, it is unlikely that there will be an escalation in road hazards or a need for increased road maintenance as a result of implementing the selected remedy. Noise The short-term noise associated with construction of the sediment processing/transfer facilities and hydraulic and mechanical dredging operations will not exceed the New York State Department of Transportation- (NYSDOT) established construction impact guidelines. With respect to noise associated with operation of the sediment processing/transfer facilities, such noise levels will comply with applicable federal and State criteria, including the Federal Highway Administration (FHWA) Noise Abatement Criteria (NAC). While the long-term noise associated with stationary booster pump operations under the hydraulic dredging option could, if not mitigated, exceed FHWA NAC in areas within an 800-ft radius of the booster, a series of mitigation measures (e.g., noise attenuation shrouds, optimizing locations of the booster stations to avoid populated areas to the extent practicable, or use of electric pumps) can be implemented as appropriate to mitigate the impact. Construction Lighting Artificial lighting systems will be used to illuminate nighttime dredging and in-river transport operations, as well as land-based sediment processing/transfer facility operations. EPA has examined the types of artificial lighting that will likely be used in support of the project. Positioning of lights, brightness, and direction are key factors in minimizing the potential for off-site impacts. While nighttime lighting requirements for the proposed work will conform to established industry safety standards, it will not be necessary to use high-mast lighting systems at dredging sites or at the sediment processing/transfer facilities. The lighting required for in-river transport will conform to the Coast Guard and New York Navigation Law standards for commercial towboats and barges and is not expected to be disruptive. Lighting at the land-based sediment processing/transfer facilities will meet OSHA standards for construction. Lighting will be directed toward work areas and away from neighboring properties. In addition, the use of low-mast lights will limit off-site glare.
Responsiveness Summary Hudson River PCBs Site Record of Decision
Executive Summary-6
Odor The two potential sources of odor from the project are the construction equipment and the dredged material from the river itself. Nuisance odors from construction equipment are not anticipated to be a significant problem, because such equipment is used routinely on most construction projects with few complaints. Although sulfur in a reduced form is present in the river sediments, concentrations are sufficiently low so as to preclude the generation of noticeable and persistent odors from hydrogen sulfide in dredged material. Further, no significant ammonia-related odor will be generated during dredging operations. Should any odor be encountered, strategies will be implemented to mitigate adverse effects.
Air Quality The total concentration of pollutants from the dredging and sediment processing/transfer facility operations will not exceed the National Ambient Air Quality Standards (NAAQS) established by EPA to protect public health. It is not anticipated that the project will have a significant air quality impact. The cancer risks associated with inhalation of volatilized PCBs in air by residents living near the river or near the sediment processing/transfer facilities are projected to be about an order of magnitude below the most stringent acceptable level. With respect to workers at the Site, the estimated cancer risk is within the acceptable risk range. Air monitoring, engineering controls, appropriate personal-protection equipment for workers, and standard safety procedures will be used to protect the on-site workers and nearby communities. With the public involved, EPA will develop and implement a comprehensive community health and safety plan, including air monitoring, to address any potential risk associated with dredging and processing of the PCB-contaminated sediment. Aesthetics Potential aesthetic and visual impacts from the dredging will apply to only a small portion of the 40 miles of river and, where they do occur, will be very temporary. Such potential impacts from the sediment processing/transfer facilities will be limited by the siting of these facilities in industrial or commercial regions and apply only to areas of close proximity; these impacts will be minimized, to the extent practicable, by careful siting and design of these sites. For travelers on the river or moving along adjacent roadways, project-generated visual intrusion will be short-term and limited to within several hundred feet of the work area. Recreation Because of the relatively small area of the river that will be affected by dredging at any given time, the recreational experience on the river will remain substantially unaffected in areas not immediately adjacent to the dredging operation. In fact, it is expected that the project will improve recreational conditions. Few adverse impacts are anticipated for recreational boaters during implementation of
Responsiveness Summary Hudson River PCBs Site Record of Decision
Executive Summary-7
the selected remedy. A significant portion of the dredging is oriented to navigational dredging that, when completed, will provide an expanded and safer capacity for recreational use of the river. The risk of swimming in the Hudson River, as discussed in the baseline Human Health Risk Assessment (HHRA), is considered to be within the acceptable range. It is anticipated that during the remediation project, PCB concentrations in the river will remain at or near current levels. Therefore, during the project, as now, the risk of swimming in the river will remain within the acceptable range. It is anticipated that the impact on recreational fishing will be minimal during the remediation. Anglers will be able to find alternate sites to fish where the dredging and backfill operations are not proximate; impacts to fish habitat will be temporary and will affect only limited areas and certain species; and minor, temporary resuspension of PCBs during dredging should not affect catch-and-release fishing. In fact, the PCB remediation offers long-term prospects of renewed and enhanced recreational fishing. SEDIMENT PROCESSING/TRANSFER FACILITY SITING AND DESIGN EPA has not yet determined the location(s) of sediment processing/transfer facilities necessary to implement the selected remedy. For purposes of the FS, example locations were identified from an initial list of candidate sites based on screening-level field observations that considered potential facility locations from an engineering perspective. In the FS, it was necessary to assume the locations of sediment processing/transfer facilities in order to develop conceptual engineering plans, analyze equipment requirements, and develop cost estimates for the remedial alternatives. For this purpose, two example locations were identified: one at the northern end of the project area in the vicinity of the Old Moreau Dredge Spoil Area site and another at the southern end of the project area near the Port of Albany. Each of these example locations fulfills many of the desired engineering characteristics for such a facility to support the remedial work, and is representative of reasonable assumptions with regard to distance from the dredging work and cost. Other locations, both within the Upper Hudson River area and farther downstream, are possible. The example facility locations presented in the FS have also been used in this Responsiveness Summary in order to clarify material presented in the FS and Proposed Plan and in connection with additional noise, odor, and other analyses that were performed in order to respond to public comments. EPA will not determine the actual facility location(s) until after EPA performs additional analyses and holds a public comment period on proposed locations and considers public input in the final siting decision. Thus, all information provided in this Responsiveness Summary relative to potential impacts of the sediment processing/transfer facilities on communities, residents, agriculture, the environment, and businesses should likewise be considered representative and illustrative. Further specific assessment of and, as necessary, mitigation of, potential impacts will be addressed during design. The general engineering characteristics that can be useful in identifying a potential site include a waterfront location so that barges and other floating equipment may be accessed; an existing heavy-duty bulkhead; fairly level topography to keep transfer operations, material processing, and rail facilities at approximately the same elevation; an industrial or commercial site, to avoid impacting residential, recreational, and institutional land uses; access to areas for storage of project-related
Responsiveness Summary Hudson River PCBs Site Record of Decision
Executive Summary-8
equipment; roadway access for both construction equipment and employees that avoids densely populated residential communities; two-lane roadways to accommodate truck traffic, or direct connection to such routes; and rail access to facilitate hauling and reduce overall transportation costs. Already-developed industrial areas are preferable for consideration in siting these facilities. It is not anticipated that residences will be affected by processing/transfer of dredged material at these sites. Potential impacts from the facilities on surroundings will be mitigated by attention to facility design and layout; lighting; screening and buffering of the facility; and minimization of truck traffic, among other considerations. Although it is expected that these facilities will be land-based, water-based facilities will also be evaluated. PCB TRENDS IN FISH AND WATER COLUMN While it is true that levels of PCB contamination in all Upper Hudson River media have declined relative to the early 1980s, most of the decline was prior to 1985. In recent years there has been limited improvement and, in fact, PCB levels have remained relatively consistent. The conditions in the river were extremely poor in the late 1970s, largely due to events such as the breaching of the Fort Edward Dam. After the resulting massive influx of PCBs, EPA has documented that PCB levels in the river declined until 1985, which was approximately the time the Agency issued its original plan for the river – no action – in the hope that levels would continue to decline. Since that time, however, the rate of improvement has leveled off, and substantial further improvement via natural attenuation does not appear to be occurring. For this reason, EPA has concluded that active remediation is needed to restore the Hudson River to a healthy ecosystem. To support this conclusion, further information on PCB concentrations in specific media is presented below.
• Water column concentrations: In general, PCB concentrations in the water column declined between 1991 and 1995 due to source control but, due to the continued, unabated input of PCBs from the sediment, little change has occurred over the past five years.
• Sediment concentrations: While sediment PCB concentrations have slowly declined on
average, the response is very heterogeneous and does not solve the contamination problem. Even though concentrations have declined in some areas, high concentrations remain at or near the surface in many of the hot spots. The stability of PCBs that are currently buried in sediment cannot be assured, and it is the position of both EPA and an independent peer-review panel that the sediments of the Upper Hudson River do not represent a secure location for the long-term storage of PCBs.
Examination of PCB stability in sediment is complicated by the fact that modeling cannot accurately compensate for the variety of conditions within a river reach. For example, while the Thompson Island Pool is considered to be net depositional, specific highly contaminated areas are clearly not consistently depositional. Further, the presence of deposition does not ensure the stability and sequestration of the PCBs contained within the contaminated sediments. Evidence from multiple sources indicates that PCBs are not being safely buried to
Responsiveness Summary Hudson River PCBs Site Record of Decision
Executive Summary-9
a degree sufficient to remove them from interaction with the Hudson River.
• Fish concentrations: Despite the leakage of unweathered PCB oil from the vicinity of the GE Hudson Falls facility having been largely controlled, PCB concentrations in fish tissue have shown little decline in recent years (up to the year 2000). Sampling studies and modeling of such concentrations indicate continuing exposure through sediment food-chain pathways.
BENEFITS OF PROJECT EPA’s decision to pursue the selected remedy balanced short-term impacts against long-term benefits. In doing so, the Agency examined three active remediation alternatives and two more-passive options: the No Action and the Monitored Natural Attenuation (MNA) Alternatives. Under the “overall protection of human health and the environment” criterion (40 CFR § 300.430[e][9][iii][A]), EPA evaluated the degree to which the remedial alternatives provide adequate protection of human health and the environment from unacceptable risks posed by PCBs at the Site, and compared the relative protection afforded by each alternative. Based on the comparative analysis of alternatives, EPA determined that active remediation of contaminated sediments is necessary in order to significantly reduce the human health and environmental risks at the Site. Unlike the selected remedy, the alternatives that do not require removal of PCB-contaminated sediments are not sufficiently protective. Similarly, EPA’s analysis of the more extensive remedy (REM-0/0/3) found the differential in protection from that afforded by the selected remedy was insufficient to justify the greater cost of REM-0/0/3. There may be short-term impacts as a result of implementation of the selected remedy, including potential transportation, noise, odor, and lighting impacts, as well as potential impacts from construction and operation of the sediment processing/transfer facilities. However, these temporary impacts are expected to be manageable through appropriate controls. Consequently, EPA has determined that the potential short-term impacts of the selected remedy, which can be minimized, are substantially outweighed by the remedy’s benefits to human health and the environment. Projected PCB Trends in Fish Because PCBs bioaccumulate in fatty tissue, PCB levels in fish of the Hudson River has been a critical factor in this project and a critical issue for the public. Commenters frequently asked how many years would be required to attain the preliminary remediation goal (PRG) for human health, which is 0.05 ppm (mg/kg) PCBs in fish or other target levels. Commenters also observed that, and at times questioned why, this goal is 40 times stricter than the US Food and Drug Administration's commercial fish limit of 2.0 ppm. Others asked when the fish would be ‘edible.’ Attainment of Target Levels The time it takes to achieve the Remediation Goal of 0.5 mg/kg PCBs in fish fillet and other risk-based PCB concentrations in fish (i.e., 0.4 mg/kg and 0.2 mg/kg) is species- and location-specific. Some fish will achieve these concentrations sooner than others, based on feeding and habitat preferences. The modeling projects that the selected remedy will attain the PCB concentration of 0.4
Responsiveness Summary Hudson River PCBs Site Record of Decision
Executive Summary-10
mg/kg in fish fillet, which is protective of the average adult who consumes one Hudson River fish meal every two months, in River Sections 1 and 2 within 20 years after the start of active remediation and earlier for River Section 3. The modeling also projects that the target PCB concentration of 0.2 mg/kg in fish fillet, which is protective of an adult who consumes one fish meal from the Hudson River per month, is expected to be attained in River Section 2 within 35 years of the start of active remediation. These time periods are significantly shorter than the time periods projected for attaining these targets under the No Action and the MNA Alternatives. Moreover, the actual time differentials may be greater than those calculated by EPA’s models, as evidenced by the trend analysis of recent PCB concentrations in fish tissue. The selected remedy is projected to meet the Remediation Goal for human consumption of fish, 0.05 mg/kg, in River Section 3 within 41 years of completion of active remediation. As a result, the remediation goal of 0.05 mg/kg, or one fish meal per week for an adult, also is expected to be attained in the majority of the Lower Hudson River within this time frame, due to the lower initial concentration of PCBs in the Lower Hudson compared to the Upper Hudson. Because of the continuing Tri+ PCB load of 2 ng/L assumed after implementation of the source control action in the vicinity of the GE Hudson Falls plant, the PCB concentration in fish averaged over the Upper Hudson is expected to be reduced to a range of 0.09 to 0.14 mg/kg within the 70-year modeled time period, which is slightly above the PRG of 0.05 mg/kg. However, the protectiveness of the selected remedy is further enhanced through continuation of institutional controls, such as the fish consumption advisories and fishing restrictions. In the ROD, EPA has adopted the 0.05 mg/kg concentration in species-weighted fish fillet as a final Remediation Goal for the Site. If upstream source control is more successful than currently projected (i.e., less than 0.025 kg/day), then the time frames identified above would be shorter and the Remediation Goal of 0.05 mg/kg may be met within the modeling time period in River Sections 1 and 2. FDA Limit/Establishment of Target Level The FDA tolerance level of 2.0 ppm is based on a "market basket" of commercially caught fish obtained from supermarkets. The "market basket" concept assumes that fish purchased from a market come from varied sources, rather than from a sole source, such as fish taken from the Hudson River. The 2.0 ppm tolerance level in commercially marketed fish is an average PCB concentration, and assumes that consumers are buying a variety of different species from a variety of different locations. The Remediation Goal of 0.05 mg/kg PCBs in fish fillet represents an average PCB concentration in fish and takes into account the specific expected reasonable maximum exposure (RME) consumption rate of anglers who consume fish caught only from the Hudson River. These consumption rates reflect the habits reported by anglers in New York State and what would be expected in the absence of fish consumption advisories. It should also be noted that the Remediation Goal of 0.05 mg/kg is consistent with the Great Lakes Sport Fish Advisory level, which is used by the eight states bordering the Great Lakes. Downstream Transport PCBs are transported from the Upper Hudson River to the Lower Hudson River (i.e., south of the
Responsiveness Summary Hudson River PCBs Site Record of Decision
Executive Summary-11
Federal Dam at Troy). The mass of PCBs transported over the Federal Dam to the Lower Hudson declined from about 3,000 to 4,000 kg/year Tri+ PCBs (6,610 to 8,820 lbs/year) in the late 1970s to about 150 to 500 kg/year Tri+ PCBs (331 to 1,100 lbs/year) by the late 1980s or early 1990s. The most recent estimate of Tri+ PCBs, based on 1998 GE data from a monitoring station at Schuylerville, is 214 kg/year (472 lbs/year); the estimated (modeled) average for the 1990s is about 290 kg/yr (639 lbs/year) over Federal Dam, with a modeled daily average Tri+ PCB water column concentration of 30 ng/L. It is projected that the selected remedy will reduce downstream transport by approximately 40 percent. GE SOURCE CONTROL ACTIVITIES Over a 30-year period, GE discharged a significant amount of PCBs into the river from its Hudson Falls and Fort Edward plants. At the Hudson Falls plant location, leakage of PCB-bearing oils through bedrock to the river continues to be a source of PCB contamination. The selected remedy accounts for the fact that some source control measures are already in place near the GE Hudson Falls plant. Additionally, pursuant to a Consent Order with the NYSDEC, additional source-control work is to be carried out by GE near its Hudson Falls plant because PCBs continue to leak from that facility into the Upper Hudson River. Therefore, the selected remedy also assumes reasonable further reduction in PCBs entering the river through bedrock at Bakers Falls near the Hudson Falls plant, as a result of the implementation of these additional source control measures. Through detailed monitoring, EPA found that PCB levels in the water column (and consequently, PCB mass load) increase more than threefold as the water passes through the Thompson Island Pool. The PCB source available in this location is the contaminated sediments that lie on the pool’s bottom. Concerns about Identification of Additional Sources As reflected in the Phase 1 Report, EPA recognized the importance of upstream sources of PCBs from the outset of the Reassessment. From an analysis of sampling data gathered by GE’s monitoring program in accordance with an EPA Consent Order, EPA has established that the GE facilities are the only significant external source of PCBs to the Upper Hudson River. Modeling efforts, including use of the HUDTOX and FISHRAND models, indicate that control of upstream sources is critical. However, recognition of these upstream sources does not in any way negate the findings of recent EPA reports noting that the sediments continue to release large amounts of PCBs. As described in the FS, control of the upstream source is an important adjunct to the active remediation of the contaminated river sediment. The anticipated controls at GE’s Hudson Falls facility and remediation in the vicinity of the Fort Edward 004 outfall should reduce that input within the next few years. EPA acknowledges the importance of further remediation of upstream sources and will work with NYSDEC and GE to control these sources to the extent practicable. However, given existing PCB sediment loads, complete control of these upstream sources is not necessary prior to sediment removal.
Responsiveness Summary Hudson River PCBs Site Record of Decision
Executive Summary-12
WHY A MORE AGGRESSIVE REMEDY WAS NOT SELECTED EPA’s analysis found that:
• The incremental increase in water column loading from the sediments decreases as the water moves downstream from the Thompson Island Pool. This suggests that there is less sediment involved in PCB release in the downstream river sections relative to the Thompson Island Pool.
• The model forecasts showed little improvement in recovery of the river for REM-0/0/3 as
compared to the selected remedy. This analysis suggests that little benefit comes from the additional dredging.
• As described in the FS and in this Responsiveness Summary, the targeted areas include more
than 85 percent of the areas with PCB concentrations greater than 10 ppm and more than 75 percent of the areas with PCB concentrations greater than 3.2 ppm. Going beyond this one would encounter problems such as greater access limitations and shallow underlying bedrock, which greatly increase costs while yielding little additional public health or environmental benefit.
After considering all these factors, EPA decided upon the selected remedy as an appropriate balance among these issues, reconciling the desire to remove contamination with the uncertainties associated with each river section. Note, however, that the final areas and boundaries will be refined during remedial design. RAIL TRANSPORT EPA is committed to avoiding large increases in the volume of heavy truck traffic in communities of the Upper Hudson River valley. The selected remedy provides for rail transport or barge transport. The necessity for rail access at sediment processing/transfer facility sites has been incorporated into the facility-planning process. In studying rail transport of the processed materials, EPA estimated the rail movement that will occur in order to implement the selected remedy in the context of the capacity and current operation of the regional rail line operated by the Canadian Pacific Railroad (CPR). Increased train volumes are not expected to impact passenger or non-project-related freight service in the region. There are currently six passenger trains and up to 14 freight trains per day (through and local) operating along the Fort Edward/Albany rail corridor. This level of activity does not approach the capacity of the line. After speaking with representatives of the CPR, it has been determined that the current Fort Edward/Albany rail line, dominated by freight service, has additional capacity available on the line. With regard to rail-yard requirements for the northern processing/transfer facility, it would be necessary to store 16 gondola cars on-site. There would be daily pickups of these gondolas by the railroad. It is expected that existing rail yards in the project vicinity can be used to store rail cars and
Responsiveness Summary Hudson River PCBs Site Record of Decision
Executive Summary-13
assemble larger trainloads for movement to remote landfill sites; CPR has indicated that their existing rail yard facilities can accommodate gondola cars generated by the project, as well as the daily transport and assembly of these railcars into unit trains. No new rail yards are expected to have to be constructed in the region to support the proposed activities. The availability of rail cars/gondolas in the region has also been assessed, with the determination that the number of gondolas required for the project can be obtained by leasing them on the open market; therefore, CPR will not necessarily provide them. It has also been determined that current rail car leasing costs are low due to market demand; many are actually being scrapped at this time. The shipping of three commodities, specifically Toxic Substances Control Act (TSCA)- regulated materials, non-TSCA materials and backfill, adds moderately to the project's complexity, but will be manageable.

Responsiveness Summary Hudson River PCBs Site Record of Decision
Executive Summary-14
This page left blank intentionally
Responsiveness Summary Hudson River PCBs Site Record of Decision
Introduction-1
INTRODUCTION TO THE RESPONSIVENESS SUMMARY By the conclusion of the public comment period on April 17, 2001, EPA received nearly 73,000 separate, individual statements providing comment on its December 2000 Proposed Plan for the Hudson River PCBs Site. This number includes several thousand replicate statements, which are identical pieces submitted by multiple individuals, or petitions signed by multiple individuals, but does not include carbon copies or duplicates of the same message sent to multiple recipients within EPA or to other agencies. Of these 73,000 statements, approximately 35,000 were in the form of e-mails directed to EPA’s project team. The remainder was received in the form of letters (some typed, but many handwritten), post cards, form letters, multi-page documents and technical reports, videotaped statements, and petitions on various media. A number of the technical reports contain appendices covering specific issues in depth. The largest body of comment was received from General Electric Company and occupies 19 volumes. Given these circumstances, three basic steps have been followed in preparing a Responsiveness Summary that is responsive to all significant public comments received during the public comment period: (1) all comment documents were reviewed and catalogued, (2) the material was organized for content, all significant comments were identified, and each such comment was either individually adopted as a “master comment,” or was combined with other significant comments (addressing similar issues) which were then collectively distilled into a single master comment, and (3) a response was prepared for each master comment. A quality assurance program was implemented to verify that the full body of significant comment is accurately represented in the master comments, the responses are technically sound and the entire summary is internally consistent. The process by which these three steps and the attendant quality assurance processes were accomplished is summarized as follows. Each of the comment letters and other documents was reviewed, and individual significant comments within each comment document were delimited (i.e., identified). A single comment document may contain as few as one or as many as several hundred delimited comments. Each of the unique comment source documents was assigned a bar-coded identification number which was affixed to the document1 and was then scanned as an image into an electronic file compatible with Adobe Acrobat ReaderTM software (i.e., “pdf” format), effectively creating an electronic “photocopy.” Approximately 18,000 unique significant comments were delimited from the source documents.2 Because of the large number of comments to manage, each of the delimited comments was also assigned representative keywords (or key phrases) and entered into an electronic database for sorting and processing.
1 Only a single example of each set of perfectly identical submittals (i.e., replicates – for example, postcards provided to its members by an organization) was bar-coded for entry to the database. However, a record was compiled of the names and, where supplied, addresses of all commenters. Such mailings were individually bar-coded in those instances where additional comment was added to the text by the commenter. True duplicates (i.e., multiple copies of the same document sent by the same individual, sometimes transmitted to multiple recipients) were bar-coded only once and the identity of the commenter recorded only once. 2 While some documents yielded multiple delimited comments, others were replicates of other identical documents which together yielded a single comment. This total represents the number of “unique” significant comments.
Responsiveness Summary Hudson River PCBs Site Record of Decision
Introduction-2
Some comments were received electronically or could readily be scanned (via optical character recognition, or OCR) for entry into the database. Many delimited significant comments, however, required manual entry. Quality assurance reviews were conducted to ensure that all comments were entered in the database. There is a high degree of confidence that all significant comments were identified and captured. Due to the large volume of comments received, it is not possible to present these documents as physical (hard copy) attachments to the Responsiveness Summary, as has customarily been done for previous Hudson River PCBs Site Responsiveness Summary reports. Each comment is, however, provided in electronic format on a set of CDs in Appendix D, along with tables identifying authors and showing the relationships between authors, delimited significant comments and master comments. For copies of the Responsiveness Summary provided entirely on CD, the comments are included as separate files. Similar or related delimited comments were combined into master comments in various topical areas capturing the significant issues raised by each of the source comments.3 A total of 274 master comments were synthesized from the roughly 18,000 comments initially delimited. These master comments were then reviewed for accuracy and thoroughness to ensure that they represent each of the associated delimited comments. In addition, a review was conducted to verify that all delimited comments were associated with at least one master comment. Because of the several threads of thought sometimes inextricably combined, an individual delimited comment may be, on occasion, associated with multiple master comments. This process has provided a means for all significant comments to be included and to receive due consideration in preparing the Responsiveness Summary. Master comments have been organized according to topical areas for presentation in this volume (Book 1) of the Responsiveness Summary, as shown in the Table of Contents. A response has been prepared for (and is presented immediately following) each of the master comments, drawing from material presented in the Proposed Plan, the FS, or other previous project reports, other literature, remedial projects and individuals, and EPA policy, as well as additional technical analyses performed specifically to address comments or questions raised during the public comment period.4 Methodologies used and results obtained from additional technical analyses are presented as “white papers” in a separate volume (designated as Book 2 of this document). These papers cover a variety of topical areas, providing more in-depth analysis and supporting detail concerning topics addressed in various comments. Many responses draw upon these white papers and may utilize the conclusions or quantitative results of various modeling efforts (for noise or air emissions, for example) or extended series of calculations, without encumbering the text with voluminous detail. Each of the responses and white papers has been reviewed for technical quality by senior professionals within the project team.
3 Master comments were assigned a three- or six-digit identification number by the database program sequentially upon creation; these numbers are used to identify the master comments, the associated responses, and any companion tables and figures throughout the Responsiveness Summary, regardless of the final order of presentation in the document. White papers are similarly identified. 4 Additional technical analyses were performed for several reasons, including refinement or clarification of work performed in the FS, gathering and evaluating additional data from outside sources and other projects to clarify or support conclusions or statements made in the FS, and providing information not ordinarily presented in an FS but which is appropriate to address public comment germane to the community acceptance criterion of the remedy selection analysis.
Responsiveness Summary Hudson River PCBs Site Record of Decision
Introduction-3
While some smaller tables have been embedded in the text of a response or white paper, most larger tables and figures have been placed in a separate volume dedicated to that purpose (designated as Book 3 of this document). This allows the reader (if using the printed version of the document) to view the associated tables and figures alongside the text, without having to turn back and forth in the document. Book 3 also contains Appendices to the Responsiveness Summary. These include a Preliminary Wetlands Assessment (Appendix A), a Preliminary Floodplains Assessment (Appendix B), and a Stage 1A Cultural Resources Survey (Appendix C). These Appendices provide additional information relating to potential impacts of the selected remedy on wetlands, floodplains, and cultural resources. The Appendices also are pertinent to issues addressed in Book 1 of the Responsiveness Summary. Appendix D is described below. Significant effort has been made to make this document as user-friendly as practicable, while covering the full body of significant comment. It is anticipated that many readers will want to find where their particular comment or concern is addressed. An important tool in this search is the Index at the end of this volume. The Index allows a reader to identify master comments and responses of interest, based on keywords or key phrases. While an attempt has been made to cover a comprehensive range of subjects and as much detail as practicable in the Index, it is not intended to be exhaustive. Despite the topical arrangement of the document, and provision of the Index, some readers may need to resort to the comment database to identify the code associated with a comment of interest, and then track this code through a table of associations between delimited significant public comments and master comments provided on CD# D1 in Appendix D in Book 3 of the Responsiveness Summary. While neither the Index nor the table of associations is a perfect tool, together they provide a reliable means of finding the responses to particular comments. Appendix D, Compendium of Public Comments, provides a compilation of the public comments in electronic database form. Appendix D consists of a set of instructions to the database as well as a set of six CDs, which contain the database of authors and comments (Disk D1) and scanned images of the public comments (Disk D2 to D6).

Responsiveness Summary Hudson River PCBs Site Record of Decision
Introduction-4
This page left blank intentionally
1-1
Responsiveness Summary Hudson River PCBs Site Record of Decision
1. LEGAL AND POLICY ISSUES 1.1 ARARs and TBCs Master Comment 375 Commenters argued that EPA inappropriately usurps NY State’s responsibility for issuing fish consumption advisories in New York waters. It is arbitrary and capricious for EPA to select a risk-based remedial goal of 0.05 ppm fish PCB concentration, and fish PCB target concentrations of 0.4 and 0.2 ppm because such levels are inconsistent with the FDA tolerance level of 2 ppm, and with the State fish consumption advisories, which also are triggered at 2 ppm PCBs in fish. Response to Master Comment 375 In accordance with CERCLA and the NCP, EPA has determined that the Remediation Goal of 0.05 mg/kg total PCBs in fish fillet is protective of human health based on the reasonable maximum exposure (RME) consumption rate of about one half-pound fish meal per week. The target concentration of 0.2 mg/kg total PCBs in fish fillet is protective of human health at a fish consumption rate of about one meal per month, and 0.4 mg/kg total PCBs in fish fillet is protective of the average (central tendency [CT]) angler, who consumes about one fish meal every two months. EPA also has determined that a concentration of 0.3 to 0.03 mg/kg total PCBs in largemouth bass (whole fish) is protective of the environment based on the LOAEL and NOAEL for consumption of fish by the river otter, an upper-trophic level piscivorous mammal that was found to be at greatest risk (Hudson River PCBs Reassessment RI/FS Phase 3 Report: Feasibility Study [EPA 2000a], Section 3.2 [Calculation of Risk-Based Concentrations for Human Health and Ecological Receptors]). EPA’s remedial action objectives for PCB concentrations in fish were developed in accordance with the Agency’s obligation under CERCLA Section 121(b)(1) to select remedies that are protective of human health and the environment. EPA’s decision does not usurp or otherwise affect New York State’s responsibilities with respect to establishing fish consumption advisories. A remedial action objective of 2 ppm in fish would not be protective of human health or the environment at the Site. Using the RME exposure presented in the Revised Baseline Human Health Risk Assessment (EPA, 2000b) and PCB concentration in fish fillet of 2 mg/kg, the calculated total cancer risk exceeds 1 x 10⁻³, or more than one in one thousand. This excess cancer risk is more than 1,000 times greater than EPA’s goal of protection, and more than 10 times higher than the highest cancer risk level allowed under the National Oil and Hazardous Substances Pollution Contingency Plan (NCP) (40 CFR § 300.430(e)(2)(i)(A)(2)). For non-cancer health effects at the RME exposure level, a 2 ppm PCB concentration in fish fillet yields a hazard index of 71 for a child, which is 71 times higher than EPA’s reference level (hazard index [HI]) of one. As per 40 CFR § 300.430(e)(2)(i)(A)(1), for systemic toxicants, acceptable exposure levels shall represent concentration levels to which the human population may be exposed without adverse effect during a lifetime or part of a lifetime, incorporating an adequate
1-2
Responsiveness Summary Hudson River PCBs Site Record of Decision
margin of safety. For adolescents and adults, the 2 ppm level results in hazard indices of 49.5 and 45.6, which are 49.5 and 45.6 times higher, respectively, than EPA’s reference level of one. A 2 ppm PCB concentration in fish fillet, therefore, is not protective of human health. A 2 ppm PCB concentration in whole fish also is not protective of the environment, because it would exceed the risk-based remedial action objective of between 0.3 to 0.03 ppm total PCBs in largemouth bass (whole fish), which EPA has determined is protective of the environment. Moreover, the commenter misconstrues the significance of the 2 ppm FDA tolerance level. The FDA’s tolerance level (codified at 21 CFR § 109.30) is not a purely risk-based standard, but was based on weighing the results of a risk assessment against the magnitude of potential food loss (i.e., fish that could not be sold in interstate commerce) that would result from a lower tolerance level (44 Fed. Reg. 38330, 38334 [June 29, 1979]). The FDA level was developed under different legislation and regulatory responsibilities in 1979 using FDA guidance, and is not based on current toxicity information for PCBs. The Preamble to the FDA’s Final Rule establishing the 2 ppm tolerance level states that the 2 ppm level is intended to apply to fish and shellfish that are shipped in interstate commerce, and may not be adequately protective of individuals who consume above-average amounts of locally caught fish from contaminated waters (44 Fed. Reg. 38334-35). Consistent with the NCP and EPA policy, the Revised Baseline Human Health Risk Assessment conducted for the Reassessment evaluated consumption of fish from the Upper and Mid-Hudson River, which are the parts of the river most affected by Site-related PCBs. The fact that EPA’s risk-based remedial action objectives for the Site are lower than the FDA tolerance level, or that the State of New York may consider the 2 ppm FDA level (among other factors) when establishing consumption advisories, does not preclude EPA from establishing lower risk-based levels in order to protect human health and the environment at the Site in accordance with CERCLA. Neither the FDA tolerance level nor the State’s policy of considering the 2 ppm level when establishing fish consumption advisories is an applicable or relevant and appropriate requirement (ARAR) for the Site, and therefore need not be met (or waived) as part of EPA’s remedy selection process. The FDA tolerance level is not an ARAR for the Hudson River PCBs Site because the statute under which the FDA tolerance level was promulgated, the Federal Food, Drug and Cosmetic Act, 21 U.S.C. 301-393, is not a Federal environmental law or a State environmental law or facility siting law. The New York State Department of Health’s policy of considering the 2 ppm level when establishing fish consumption advisories is not a "promulgated standard, requirement, criteria, or limitation under a State environmental or facility siting law that is more stringent than any Federal standard...," and is, therefore, not a State ARAR (42 U.S.C. § 9621(d)(2)). The State’s authority to set consumption advisories and regulate fisheries will not be impacted by the selected remedy. Where ARARs do not exist for an exposure medium (such as at the Hudson River PCBs Site, where there are no ARARs for PCB levels in fish), EPA must use other information to set remediation goals that will ensure protection of human health and the environment as required by statute. Development of such remediation goals will focus on EPA-developed toxicity information (cancer potency factors and the reference doses for noncarcinogenic effects) (55 Fed. Reg. 8666, 8713 [March 8, 1990]). The Hudson River PCBs Site remediation goals for PCB levels in fish were developed using toxicity and exposure information as described in the FS (Section 3.2).
1-3
Responsiveness Summary Hudson River PCBs Site Record of Decision
Moreover, even if the 2 ppm level were an ARAR (which it is not), EPA is required by CERCLA and the NCP to select remedies that are protective of human health and the environment, and may select remedies with remedial action objectives that are more stringent than even the most stringent federal and State ARARs (40 CFR 300.430(f)(1)(i)(A): all CERCLA remedies must be protective of human health and the environment and comply with ARARs [unless a specific ARAR is waived]). EPA’s risk-based remedial action objectives for the Site, therefore, are not arbitrary and capricious, as the comment argues, but rather are consistent with EPA’s obligation to select protective remedies under CERCLA and the NCP. One comment argues that EPA’s "Guidance for Assessing Chemical Contaminant Data for Use in Fishing Advisories, Volume 3: Overview of Risk Management" (EPA 823-B-96-006) (EPA, 1996) requires EPA to consider "social, economic, cultural, and nutritional aspects of limiting fish consumption" when establishing remedial action objectives for PCB concentrations in fish at the Site. EPA's Guidance for Assessing Chemical Contaminant Data for Use in Fishing Advisories was developed to provide State, local, and tribal agencies with risk-management guidance for developing fish advisories. It is, therefore, not applicable to the development of remedial action objectives for the Site. References US Environmental Protection Agency (USEPA) 2000a. Phase 3 Report: Feasibility Study, Hudson River PCBs Reassessment RI/FS. Prepared for EPA Region 2 and the US Army Corps of Engineers (USACE), Kansas City District by TAMS Consultants, Inc. December. USEPA. 2000b. Phase 2 Report, Further Site Characterization and Analysis. Volume 2F - Revised Baseline Human Health Risk Assessment, Hudson River PCBs Reassessment RI/FS. Prepared for EPA Region 2 and USACE, Kansas City District by TAMS Consultants, Inc. and Gradient Corporation. November. USEPA. 1996. Guidance for Assessing Chemical Contaminant Data for Use in Fishing Advisories, Volume 3: Overview of Risk Management" (EPA 823-B-96-006). Master Comment 381 Commenters argued that the Feasibility Study does not adequately address requirements of the Federal Farmland Protection Policy Act and the New York Agriculture and Markets law. Response to Master Comment 381 The dredging called for in the ROD will not result in the conversion of farmland to nonagricultural uses, and therefore is not subject to the Federal Farmland Protection Policy Act (7 CFR § 658.3(c)). In connection with the remedy, EPA also does not expect to locate any dewatering/transfer facilities in areas that will result in the conversion of farmland to nonagricultural uses.
1-4
Responsiveness Summary Hudson River PCBs Site Record of Decision
The New York State Agriculture and Markets Law does not contain provisions that are applicable to the federal government. Further, that law is not an ARAR for this project. First, it is not an environmental or facility siting law for purposes of CERCLA § 121(d)(2). Second, it was not identified by the State of New York as being an ARAR for this project. In any event, as noted above, EPA does not intend to convert any agricultural land to non-agricultural uses in the performance of the selected remedy at this Site. Master Comment 383 A commenter argues that “the Agency must use the best available science, a standard that is properly measured according to Daubert v. Merrell Dow Pharmaceuticals, Inc., [509 U.S. 579 (1993)], and its progeny, e.g., General Electric Co. v. Joiner [522 U.S. 136 (1997)] . . . These cases are relevant to EPA’s assessment of PCB toxicity because, in many decisions, the courts have applied these standards to reject claims that PCBs have caused injuries in humans. See e.g., Joiner, 522 U.S. at 518-19 (rejecting expert testimony claiming correlation between PCB exposure and alleged injuries); Nelson v. Tennessee Gas Pipeline Co., 2001 WL 227426 (6th Cir. 2001) (same); In re: Paoli Railroad Yard PCB Litigation, 2000 WL 274262 (E.D. Pa. 2000) (same); Mercer v. Rockwell Int'l, 24 F.Supp.2d 735 (W.D. Ky. 1998) (finding no scientific basis for expert opinion that any additional PCB exposure increases risk to human health).” The commenter argues that, based on these court decisions, when measured against the Daubert standards, the science suggesting that PCBs cause injury in humans fails to pass scientific muster. Response to Master Comment 383 EPA’s cancer and non-cancer toxicity values for PCBs are based on a weight-of-evidence approach that considers both human epidemiological evidence and animal bioassay data, and are scientifically valid. The Agency’s toxicity values were developed in accordance with Agency cancer and non-cancer guidelines which had undergone external peer review, review by the EPA Science Advisory Board, and internal Agency review (USEPA, 1976, 1984, 1986a-c, 1991, 1992, 1994b, 1996a,d,e 1998). The EPA PCB toxicity values for cancer were themselves subjected to external peer review in 1996, as was EPA’s reference dose for PCB Aroclor 1016 (USEPA, 1994a, 1996b-c). EPA’s conclusion that exposure to PCBs at the Site through consumption of PCB-contaminated fish can cause adverse cancer and non-cancer health effects on humans is amply supported by the Revised Baseline Human Health Risk Assessment and other scientific information in the administrative record for the Site (White Paper – PCB Carcinogenicity and White Paper – PCB Non-Cancer Health Effects). EPA disagrees that the cases cited in this comment support a conclusion that "the science suggesting that PCBs cause injury in humans fails to pass scientific muster." The US Supreme Court’s decision in Daubert v. Merrell Dow Pharmaceuticals, Inc., 509 U.S. 579 (1993), addresses the standard for admitting expert scientific testimony in a federal trial, and is not relevant to the issue of whether information contained in the administrative record for the Hudson River PCBs Site supports EPA’s determination that exposure to PCBs through
1-5
Responsiveness Summary Hudson River PCBs Site Record of Decision
consumption of fish from the Site presents unacceptable human health and ecological risks. The commenter’s conclusion likewise is not supported by any of the post-Daubert cases cited in the comment. Each of the cited cases addresses the admissibility and/or adequacy of evidence offered by plaintiffs in support of particular claims for damages resulting from PCB exposure. None of those decisions held, as a general matter, that PCB exposure cannot result in unacceptable risks to human health and the environment. EPA also notes that the National Research Council’s report, “A Risk-Management Strategy for PCB-Contaminated Sediments” (March 2001), which includes a discussion of recent information on PCB toxicity, supports EPA’s conclusion that exposure to PCBs may result in chronic effects in humans and/or wildlife. References USEPA. 1976. Interim procedures and guidelines for health risk and economic impact assessments of suspected carcinogens. Federal Register 41:21402-21405. USEPA. 1984. Proposed guidelines for carcinogen risk assessment. Federal Register 49:46294. November 23. USEPA. 1986a. The Risk Assessment Guidelines for 1986. Office of Health and Environmental Assessment, Washington, D.C. EPA/600/8-89/043, July. USEPA. 1986b. Guidelines for carcinogen risk assessment. Federal Register 51:33992-34003. USEPA. 1986c. Guidelines for the Health Assessment of Suspect Developmental Toxicants. Federal Register 51 (185) 34028-34040. September 24. USEPA. 1991. Guidelines for Developmental Toxicity Risk Assessment. Federal Register 56 (234) 63798-63826. December 5. USEPA. 1992. Guidelines for Exposure Assessment. Federal Register 57 (104) 22888-22938. May 29. USEPA. 1994a. Report on the Technical Review Workshop on the Reference Dose for Aroclor 1016. USEPA, Risk Assessment Forum, Office of Research and Development, Washington, D.C. EPA/630/R-94/006. November. USEPA. 1994b. "Report on the Workshop on Cancer Risk Assessment Guidelines Issues." Office of Research and Development, Risk Assessment Forum, Washington, D.C. EPA/630/R-94/005a. USEPA. 1996a. Proposed guidelines for carcinogen risk assessment. Federal Register 61 (79) 17960-18011. April 23. USEPA. 1996b. "Report on Peer-Review Workshop on PCBs: Cancer-Dose Response Assessment and Application to Environmental Mixtures." National Center for Environmental Assessment, Office of Research and Development, Washington, D.C.
1-6
Responsiveness Summary Hudson River PCBs Site Record of Decision
USEPA. 1996c. "PCBs: Cancer Dose-Response Assessment and Application to Environmental Mixtures." National Center for Environmental Assessment, Washington, D.C. USEPA/600/P-96/001F. September. USEPA. 1996d. Revisions to the cancer guidelines (proposed). Federal Register 61 (79):17960-18011. USEPA. 1996e. Guidelines for Reproductive Toxicity Risk Assessment. Federal Register 61 (212) 56274-56322. October 31. USEPA. 1998. "Guidelines for Neurotoxicity Risk Assessment. Federal Register 63 (93) 26926-26954, 14 May 1998. Master Comment 385 A commenter argued that EPA should conduct analyses required by the Regulatory Flexibility Act and the Unfunded Mandates Act, and Executive Order 12866. The siting of dewatering/transfer facilities raises takings implications under Executive Order 12630. EPA’s decision to establish remedial action objectives for the Site using risk-based concentrations may violate Executive Order 13132. Response to Master Comment 385 Regulatory Flexibility Act The Regulatory Flexibility Act (RFA), as amended by the Small Business Regulatory Enforcement Fairness Act of 1996, 5 U.S.C. §§ 601 - 612, requires agencies to prepare for public comment a regulatory flexibility analysis describing the impact of a proposed rule on small businesses whenever the agency is required by Section 553 of the Administrative Procedure Act (APA) or another law to publish general notice of proposed rulemaking for any proposed rule. 5 U.S.C. § 603(a). EPA’s selection of a remedy for the Hudson River PCBs Site is not an agency rulemaking, however, and the RFA is therefore inapplicable to the remedy selection process (United States v. Iron Mountain Mines, 987 F. Supp. 1250, 1259 (E.D. Cal 1997): remedy selection under CERCLA does not involve rulemaking). Unfunded Mandates Reform Act The Unfunded Mandates Reform Act of 1995 (UMRA), Pub.L. 104-4, 109 Stat. 48 (codified in scattered sections of 2 U.S.C.) requires, among other things, that federal agencies prepare and consider estimates of the budgetary impact of regulations containing federal mandates upon State, local, and tribal governments and the private sector before adopting such regulations. 2 U.S.C. § 1501(7)(B). As indicated above, the remedy selection process for the Site is not an agency rulemaking. The UMRA is therefore inapplicable to the remedy selection process for the Site.
1-7
Responsiveness Summary Hudson River PCBs Site Record of Decision
Executive Order 12866, Regulatory Planning and Review (September 30, 1993) Executive Order 12866 requires federal agencies to, among other things, assess the costs and benefits of intended regulations. This Executive Order does not apply to the CERCLA remedy selection process because, as indicated above, selection of a remedy under CERCLA is not an agency rulemaking. Executive Order 12630, Governmental Actions and Interference with Constitutionally Protected Property Rights (March 15, 1988) Executive Order 12630 requires Executive Branch departments and agencies, as part of their internal management processes, to assess the takings implications of proposed policies and actions on private property interests protected by the Fifth Amendment. The commenter suggests that the siting of dewatering/transfer facilities raises takings implications under this Executive Order. EPA has not yet determined dewatering/transfer facility location(s), and will only select such locations as part of the public process outlined in the ROD. As appropriate, EPA will conduct a takings assessment as part of the dewatering/transfer facility site selection process. Executive Order 13132, Federalism (August 4, 1999) Executive Order 13132 applies to rules with federalism implications, defined in the Order as “substantial direct effect[s] on States, on the relationship between the national government and the States, or on the distribution of power and responsibilities among the various levels of government.” The commenter argues that EPA’s decision to establish remedial action objectives for the Site based on risk-based concentrations may violate this Executive Order by inappropriately “usurp[ing] New York State’s responsibility in this area.” EPA’s remedial action objectives for PCB concentrations in fish were developed in accordance with the Agency’s obligation under CERCLA Section 121(b)(1) to select remedies that are protective of human health and the environment, and do not usurp or otherwise affect the State’s responsibilities with respect to establishing fish consumption advisories. In any event, EPA consulted with the State of New York in the development of the selected remedy for the Site. Master Comment 387 A commenter noted that additional water quality criteria, which were not identified in the Feasibility Study, have been developed pursuant to the Clean Water Act. According to the 1998 Federal Register (Vol 63, No. 237, Dec. 10, 1998), the criteria continuous concentration (chronic) for PCBs is 0.014 µg/L in freshwater and 0.03 µg/L in saltwater. The criterion for protection of human health from consumption of water and organisms or organisms only is 0.00017 µg/L.
1-8
Responsiveness Summary Hudson River PCBs Site Record of Decision
Response to Master Comment 387 The federal water quality criteria (FWQC) cited in the comment were published by EPA in the Federal Register (63 Fed. Reg. 68354 [December 10, 1998]) pursuant to Section 304(a)(1) of the Clean Water Act. Section 304(a) requires the Agency to develop and publish, and from time to time revise, criteria for water quality accurately reflecting the latest scientific knowledge. Section 304(a) criteria provide, among other things, guidance to States and tribes in adopting water quality standards that ultimately provide a basis for controlling discharges or releases of pollutants. Criteria continuous concentrations are water quality criteria to protect against chronic effects in aquatic life. The State of New York has promulgated enforceable water quality criteria (WQC) at 6 NYCRR § 703.5 which have been identified as ARARs for the Site. The New York State WQCs for PCBs are 0.09 µg/l [90 ng/L] (New York State standard for protection of human health and drinking
water sources); 1.2 x 10⁻⁴ µg/l [0.12 ng/L] (New York State standard for protection of wildlife);
and 1 x 10⁻⁶ µg/l [0.001 ng/L] (one part per quadrillion total PCBs) (New York State water quality standard for the protection of the health of human consumers of fish). Two of the New York State WQC (i.e., the New York State standard for protection of wildlife and the New York State water quality standard for the protection of the health of human consumers of fish) are not expected to be met by any of the alternatives during the 70-year forecast period of EPA’s model, and are therefore being waived for the selected remedy based on technical impracticability (Declaration and Section 14.2 of the ROD and Response to Master Comment 401 in Chapter 1 of this Responsiveness Summary). The FWQC criteria cited in the comment are nonenforceable guidance, and therefore are not applicable requirements for the Site. At the same time, the 0.014 µg/L [14 ng/L] FWQC in freshwater and 0.03 µg/L [30 ng/L] FWQC in saltwater are relevant and appropriate under the circumstances at the Site, and are therefore ARARs for the Site, because there are no comparable New York State WQC for protection of aquatic life that are more stringent than the FWQC. (CERCLA Section 121(d)(2) and 40 CFR 300.400(g)(2): Identification of applicable or relevant and appropriate requirements.) The FWQC of 0.00017 µg/L [0.17 ng/L] for protection of human health from consumption of water and organisms or organisms only is not an ARAR for the Site because New York State has promulgated a more stringent water quality standard for the protection of the health of human consumers of fish (0.001 ng/L), which is an ARAR for the Site. Master Comment 391 Commenters requested that EPA identify ARARs and other regulations concerning artificial lighting that are applicable to the project, and asked whether the remedy would comply with "laws, regulations, guidelines, permit requirements, and ordinances" regarding artificial lighting.
1-9
Responsiveness Summary Hudson River PCBs Site Record of Decision
Response to Master Comment 391 Lighting is addressed in OSHA regulations at 29 CFR 1926.56 (Occupational Health and Environmental Controls) and US Coast Guard regulations at 33 CFR 154.570 (Facilities Transferring Oil or Hazardous Material in Bulk). 33 U.S.C. § 2020 (Inland Navigational Rules) and the New York State Navigation Law § 43 address the lighting requirements for vessels. These laws will be complied with during implementation of the selected remedy. Local regulations are not ARARs under CERCLA. However, EPA will consider pertinent local regulations concerning lighting impacts (if such regulations exist) during the design phase for the sediment processing and transfer facility(ies). Master Comment 393 A commenter requested identification of the applicable federal, State, and local laws and regulations that govern the emission of nuisance level odors. The commenter further asked whether EPA’s remedy would comply with such requirements. Response to Master Comment 393 EPA has identified the New York State Environmental Conservation Law Article 19, Title 3 - Air Pollution Control Law (promulgated pursuant to the federal Clean Air Act, 42 U.S.C. § 7401, et seq.) as an ARAR for the Site. Regulations issued under this provision (6 NYCRR § 211.2) prohibit the emissions of air contaminants to the outdoor atmosphere which are injurious to human, plant or animal life or to property, or which unreasonably interfere with the comfortable enjoyment of life or property. The selected remedy will comply with applicable or relevant and appropriate provisions of the Air Pollution Control Law. EPA has not identified any federal or State permit requirements regarding nuisance level odors. In any event, in accordance with CERCLA Section 121(e), no federal, State, or local permits are required for CERCLA response actions that are conducted on-site, although the selected remedy will comply with substantive federal and State requirements, including those pertaining to air emissions. Any dredging activity and sediment processing/transfer facility for the Hudson River PCBs remedy would be considered "on-site." Local laws, ordinances and regulations are not ARARs under CERCLA. However, EPA will consider pertinent local laws, ordinances and regulations concerning odors (if such regulations exist) during the design phase for the sediment processing/transfer facility(ies). Master Comment 395 Commenters argued that EPA has arbitrarily selected applicable or relevant and appropriate requirements (ARARs) and TBC (to-be-considered) criteria to support a predetermined remedy, and that EPA’s ARAR development and evaluation is inadequate.
1-10
Responsiveness Summary Hudson River PCBs Site Record of Decision
Response to Master Comment 395 EPA disagrees that its ARARs development and evaluation for the Site was arbitrary or inadequate. The ARARs were identified consistent with CERCLA Section 121(d). EPA identified the ARARs and TBCs for the Site after review of potentially applicable laws, regulations, and other criteria. Consistent with the NCP, EPA also solicited a list of potential State ARARs from the New York State Department of Environmental Conservation (NYSDEC). Moreover, EPA published a list of potential ARARs in the FS for public comment before determining the ARARs for the selected remedy in the ROD. EPA’s selected remedy complies with ARARs (or waives them), and is protective of human health and the environment. Master Comment 495 A commenter noted that regulatory requirements should include outflow water discharging to surface water (citing Feasibility Study page 4-80, section 4.3.8.1 [sic]). Response to Master Comment 495 The referenced FS section does not exist; EPA could not locate the piece of text on which the comment was based. Therefore, no specific response is possible. However, the FS Report (Section 2.3.1 [Federal Chemical-Specific ARARs] and Section 2.5.3 [Action-Specific Criteria, Advisories, and Guidance to be Considered]) includes requirements that would apply to discharges to the Hudson River. Tables 2-1a, 2-3a, and 2-3b of the FS identify several laws and regulations that would be potentially applicable to discharges to the Hudson River or to wetlands, to control contravention of water quality criteria, and other deleterious effects. These include, but are not limited to: Chemical-Specific ARARs (FS, Table 2-1a): 40 CFR § 129.105(a)(4) (promulgated pursuant to federal Clean Water Act, 33 U.S.C. §§ 1251 - 1387); 40 CFR § 141.61 (promulgated pursuant to federal Safe Drinking Water Act, 42 U.S.C. §§ 300f-300j-26); and 6 NYCRR Parts 700 through 706 (promulgated pursuant to New York State Environmental Conservation Law (NY ECL) §§ 3-0301(2)(m), 15-0313, 17-0301, 17-0303, 17-0809). Action-Specific ARARs (FS, Table 2-3a): 40 CFR Parts 230 (promulgated pursuant to federal Clean Water Act, 33 U.S.C. § 1344(b)); 40 CFR Part 231 and 33 CFR Parts 320, 323, and 325 (promulgated pursuant to federal Clean Water Act, 33 U.S.C. § 1344(c)); 6 NYCRR Part 608 (promulgated pursuant to NY ECL §§ 3-0301(2)(m),15-0501, 15-0503, 15-0505, 17-0303(3)) and 6 NYCRR Parts 750 - 758 (promulgated pursuant to NY ECL Article 3, Title 3 and Article 17, Titles 1, 3, and 8). The commenter is also referred to Tables 14-1, 14-2, and 14-3 of the Record of Decision, in which EPA has identified the ARARs for the selected remedy, including ARARs regarding discharges to surface water.
1-11
Responsiveness Summary Hudson River PCBs Site Record of Decision
Please note that two additional chemical-specific ARARs (0.014 µg/L total PCBs criteria continuous concentration (CCC) Federal Water Quality Criterion (FWQC) for freshwater; and 0.03 µg/L total PCBs CCC FWQC for saltwater) were identified after the Proposed Plan and FS were issued for public comment in December 2000 (Response to Master Comment 387, above). Further discussion of discharge water quality is provided in White Paper – Potential Impacts to Water Resources and further information on the water treatment facility may be found in White Paper – Example Sediment Processing/Transfer Facilities. Master Comment 497 A commenter requested that the original investigator be cited for National Oceanic and Atmospheric Administration’s (NOAA’s) Screening Quick Reference Table (SQRT) values. Response to Master Comment 497 Table 2-1b of the FS contains screening levels for PCBs in freshwater sediment and cites the NOAA SQRT for Organics as the source. While the NOAA SQRT does contain the screening values, the original source for these values is a 1996 EPA document entitled, "Calculation and evaluation of sediment effect concentrations for the amphipod Hyalella azteca and the midge Chironomus riparius," (EPA 905-R96-008, Chicago, IL). The screening values were also published in a peer-reviewed scientific journal, in a paper with the same title by C.G. Ingersoll, P.S. Haverland, E.L. Brunson, T.J. Canfield, F.J. Dwyer, C.E. Henke, and N.E. Kemble (J. Great Lakes Res. 22:602-623). Master Comment 313682 Several commenters argued that, according to the FS, there would be no difference between the MNA Alternative and EPA's preferred remedy in meeting chemical-specific applicable or relevant and appropriate requirements (ARARs) for the Site. Two chemical-specific ARARs for surface water would be met by both MNA and the preferred remedy, while the remaining three chemical-specific ARARs for the surface water would not be met by either alternative within the 70-year modeling time frame. Response to Master Comment 313682 Although it is correct that two chemical-specific ARARs for surface water identified in the Feasibility Study and Proposed Plan (federal Safe Drinking Water Act MCL of 0.5 µg/L [500 ng/L] and 0.09 µg/L [90 ng/L] New York State standard for protection of human health and drinking water sources) are projected to be met by both MNA and the selected remedy, while three of the chemical-specific ARARs for surface water identified in those documents (1 ng/L federal Ambient Water Quality Criterion; 0.12 ng/L NYS standard for protection of wildlife; and 0.001 ng/L NYS standard for human consumers of fish) are not projected to be met by any of the remedial alternatives that were evaluated in the Detailed Analysis of Alternatives (FS, Chapter 8)
1-12
Responsiveness Summary Hudson River PCBs Site Record of Decision
within the 70-year modeling time frame, the modeling indicates that there will be a considerable improvement in the water quality (by almost a factor of two) for the dredging options relative to MNA throughout the 40-mile stretch of the upper river for 20 years of the forecast period. It is very clear that source control alone is not as effective in improving water quality as the dredging options (Figures 6-33 through 6-37 in Book 2 of the FS Report). This conclusion does not change materially under the new model runs presented in White Paper – Model Forecasts for Additional Simulations in the Upper Hudson River. For example, at the Thompson Island Dam in 2008, the concentration of total PCBs is projected to be approximately 30 ng/L for the MNA Alternative, whereas the concentration of total PCBs is projected to be approximately 16 ng/L for REM-3/10/Select. After the Proposed Plan was issued in December 2000, EPA identified two additional chemical-specific ARARs for the Site: the 14 ng/L criteria continuous concentration (CCC) Federal Water Quality Criterion (FWQC) for freshwater; and the 30 ng/L CCC FWQC for saltwater. Both of these FWQC ARARs will be met by the selected remedy. Master Comment 313765 A commenter noted that the statement from Page 29 of the Proposed Plan ("The preferred alternative, REM-3/10/Select, is similar to the REM-0/0/3 alternative in terms of reductions of risk to human health and the environment") downplays the additional reduction in PCB loading over the Federal Dam and the halving of time to reach 0.4 ppm PCBs in fish in the Upper Hudson achieved with the REM-0/0/3 Alternative. Response to Master Comment 313765 EPA agrees that Alternative REM-0/0/3 provides an additional reduction in the PCB load over the Federal Dam, based on EPA’s modeling, and a halving of the time to reach the target concentration of 0.4 ppm PCBs in fish as compared to Alternative REM-3/10/Select. It was not EPA's intent to downplay these reductions, which are also described in other portions of the Proposed Plan (pages 19 and 20). EPA was referring to the tables on page 28 (Cancer Risks and Non-Cancer Health Hazards for Adults from Fish Ingestion, and Ecological Toxicity Quotients - River Otter and Mink) when making the statement on page 29. Nevertheless, EPA has determined that the additional reductions in PCB load over the Federal Dam, and the time to reach PCB target levels under REM-0/0/3, do not justify the additional $110 million cost for that alternative. Master Comment 358464 A commenter argued that EPA has failed to conduct the consultation procedures required by the Federal Endangered Species Act (ESA). CERCLA Section 121(e) does not exempt EPA from the consultation requirements of the Federal Endangered Species Act. The commenter argues that EPA has failed to comply with the ESA because: (1) EPA has not prepared a biological assessment analyzing whether the proposed plan may adversely affect federally-listed threatened
1-13
Responsiveness Summary Hudson River PCBs Site Record of Decision
or endangered species, which include the short-nosed sturgeon and bald eagle; and (2) the proposed remedy may adversely affect these species’ habitat and mating behavior, resulting in a "take" under the ESA. Likewise, EPA also has not complied with the New York State Endangered Species Act, and implementation of the remedy may result in a "take" under NYS law in the vicinity of processing facilities. Response to Master Comment 358464 CERCLA requires EPA to comply only with the substantive, and not the procedural, requirements of other environmental laws for CERCLA response actions that are conducted on-site (Response to Master Comment 475, Section 1.2.1). The consultation requirements of the Endangered Species Act are procedural/administrative requirements from which on-site CERCLA response actions are exempt. The substantive requirements of the Endangered Species Act are an ARAR for the Site, however, and the selected remedy will comply with such requirements. EPA initiated informal consultation with the National Marine Fisheries Service (NMFS) and the Fish and Wildlife Service (FWS) by letters dated October 16, 1991. FWS responded to EPA by letter dated November 13, 1991, in which FWS indicated that no federally listed or proposed endangered or threatened species under FWS jurisdiction were known to exist within the project impact area (i.e., the Upper and Lower Hudson River). In an October 21, 1991 letter to EPA, NMFS indicated that the range of the shortnose sturgeon (Acipenser brevirostrum) includes the Hudson River PCBs Site, and that the shortnose sturgeon is at risk from PCBs in the surface sediments and in faunal organisms. NMFS recommended that EPA consider the potential impacts of remedial action (which at the time had not been proposed) on the shortnose sturgeon. After issuing the Proposed Plan, in a February 16, 2001 letter EPA contacted NMFS again, and requested a written statement from NMFS as to whether EPA’s preferred remedy for the Site may result in impacts to the shortnose sturgeon or its critical habitats. In a May 7, 2001 letter to EPA, NMFS requested additional information about whether resuspended contaminated sediments will be carried past the Federal Dam and into sturgeon habitat under the preferred remedy, and on any post-dredging monitoring of downstream areas. On June 29, 2001, EPA reinitiated informal consultation with FWS under the Endangered Species Act to determine whether additional species have been listed as endangered since 1991. EPA provided FWS with details concerning the preferred remedy, and requested a written statement from FWS as to whether any endangered species that are listed or proposed to be listed are located in the project area. EPA also requested the range of territory covered by any federally listed endangered species that may be found in the area, and whether the proposed remedial action may impact endangered species or their critical habitats. In an August 17, 2001 response, FWS identified the bald eagle (Haliaeetus leucocephalus) as a federally-listed threatened species that is known to occur in the area of the proposed Hudson River remediation, and the Karner blue butterfly (Lycaeides melissa samuelis) and Indiana bat (Myotis sodalis) as federally-listed endangered species that may be found within or adjacent to the project area.
1-14
Responsiveness Summary Hudson River PCBs Site Record of Decision
EPA will conduct biological assessments (BAs) for the bald eagle and shortnose sturgeon, as they have been identified as being in the project area. Because the sediment processing and transfer facilities have not been sited or designed, it cannot be determined at this time if the Karner blue butterfly or Indiana bat, or potential suitable habitat for either species, may be affected by the selected remedy. Nevertheless, once the locations for the transfer facilities and other necessary land-based infrastructure have been established, EPA will evaluate the habitat that will be affected to determine if it is suitable to support either species. If suitable habitat is found, additional biological assessment work will be conducted for these species. Any completed BAs will include an effects determination, which will state what conclusions regarding potential impacts to the local population of the species discussed can be supported from the information presented in the BAs. The BAs will be submitted to the FWS or NMFS for review and a final determination of effect. The BAs will be completed before remedial construction, and the remedial design will reflect appropriate measures to protect these species that result from the consultation process. The New York State Endangered Species Act prohibits the Ataking, importation, transportation, possession or sale of any endangered or threatened species” without a permit (NY ECL ' 11-0535). On-site CERCLA response actions, however, are exempt from federal, State, and local permit requirements under CERCLA Section 121(e)(1). CERCLA requires EPA to comply only with the substantive, and not the procedural, requirements of other environmental laws for CERCLA response actions that are conducted on-site (see first paragraph of this Response to Master Comment). The permit requirement of the New York State Endangered Species Act is a procedural requirement from which EPA=s on-site response activities are exempt. Nevertheless, if EPA determines, during remedial design, that implementation of the selected remedy may cause a "taking" of any endangered or threatened species, EPA will consult with NYSDEC with respect to the substantive requirements that NYSDEC would consider in determining whether to issue a permit in similar circumstance. Copies of EPA’s informal consultation letters to FWS and NMFS, and the associated responses, are included in the Administrative Record. Master Comment 313723 Commenters expressed concern that there had been an alleged lack of analysis of short-term impacts such as risks to workers, community, and the environment from the project. According to one comment, the alleged failure to analyze these issues with respect to the short term is “particularly surprising” given the fact that the various alternatives provide similar long-term effectiveness in protecting human health and compliance with ARARs. The comment also notes that EPA’s Guidance for Conducting Remedial Investigations and Feasibility Studies under CERCLA states that short-term effectiveness and the other balancing criteria generally "require the most discussion because the major tradeoffs among alternatives will most frequently relate to one or more of these five [balancing criteria]" (EPA 1988, Section 6.2.5).
1-15
Responsiveness Summary Hudson River PCBs Site Record of Decision
Response to Master Comment 313723 EPA disagrees with the underlying premise of the comment that EPA’s Feasibility Study failed to analyze potential short-term impacts of the preferred remedy to workers, the community and environment. Please see the analyses of short-term impacts presented in the Feasibility Study (FS Section 8.5.2.5 (short-term impacts of REM-3/10/Select) and 9.5 (comparative analysis of short-term impacts of remedial alternatives). Please also see Response to Master Comment 421 in Chapter 11, and the additional analyses of various community impacts that have been prepared by EPA as part of this Responsiveness Summary (e.g., responses to comments in Chapter 8; White Paper - Socioeconomics; White Paper - Project-Related Traffic; White Paper - Rail Operations; White Paper - Example Sediment Processing/Transfer Facilities; White Paper - Remobilization of PCBs during Dredging; White Paper - Potential Impacts to Water Resources; White Paper - River Traffic; White Paper - Odor Evaluation; and White Paper - Noise Evaluation). EPA also disagrees with the statement that “the various alternatives provide similar long-term effectiveness in protecting human health.” As explained in Section 11.3 of the ROD, there are substantial differences in the long-term effectiveness and permanence afforded by the selected remedy as compared to the No Action or the Monitored Natural Attenuation Alternatives. The No Action and MNA Alternatives result in a continuation of the degraded condition of the sediments and surface water quality of the Upper Hudson River, especially in the Thompson Island Pool, for at least several decades, regardless of any reduced PCB concentrations in the upstream water quality. The No Action and MNA Alternatives do not remove any PCBs from the river (although the MNA Alternative assumes additional control of the continuing release of PCBs at Hudson Falls), and fish PCB target concentrations are not met within a reasonable time under either MNA or No Action Alternatives. For the selected remedy, risk is reduced through the removal of 2.65 million cubic yards of sediments containing approximately 150,000 lbs (70,000 kg) Total PCBs over an area of 493 acres. The reduction in cancer risks through fish consumption ranges from 76 percent to 85 percent compared to the No Action Alternative and from 50 percent to 80 percent compared to the MNA Alternative. The reduction in non-cancer hazard indices ranges from 71 percent to 79 percent compared to the No Action Alternative and from 58 percent to 75 percent compared to the MNA Alternative. EPA has determined that the potential short-term impacts of the selected remedy, which are either insignificant or can be minimized, are substantially outweighed by the overall protection of human health and the environment afforded by the selected remedy (Responses to Master Comments 421 and 485, Chapter 11). Master Comment 397 Some comments argue that remedial alternative REM-0/0/3 is more cost-effective than REM-3/10/Select because the increased cost of REM-0/0/3 over REM-3/10/Select is only 24 percent, whereas relatively greater health risk reductions (e.g., 30-40 percent) and greater PCB removal (approximately 50 percent) would be obtained.
1-16
Responsiveness Summary Hudson River PCBs Site Record of Decision
Response to Master Comment 397 It is true that, based on EPA’s modeling, REM-0/0/3 provides approximately 30 percent more cancer risk reduction as compared to the REM-3/10/Select Alternative for the RME individual, and approximately 42 percent more non-cancer risk reduction when compared to REM-3/10/Select for the RME individual. However, EPA believes a more appropriate comparison would be to evaluate REM-3/10/Select and REM-0/0/3 against a common baseline (i.e., the MNA Alternative) in order to compare the relative risk reduction that would be achieved under each remedial alternative after considering the effects of the separate source control action to address the Hudson Falls source of PCBs. Using the approach outlined in the preceding paragraph, EPA has determined that the selected remedy is more cost-effective than the REM-0/0/3 Alternative. For example, compared with the MNA Alternative, REM-0/0/3 provides 63 to 85 percent reduction in cancer risks to the RME individual, while REM-3/10/Select provides 50 to 80 percent reduction, according to EPA’s model. Thus, REM-0/0/3 provides an incremental reduction in cancer risks of only approximately five to 13 percent over the selected remedy, when compared to the MNA Alternative. For non-cancer health hazards, REM-0/0/3 yields hazard indices that offer 72 to 83 percent reduction compared to the MNA alternative, while REM-3/10/Select yields hazard indices that offer 58 to 75 percent reduction compared to the MNA Alternative, according to EPA’s model. REM-0/0/3, therefore, provides approximately eight to 14 percent greater reduction in non-cancer hazard indices than REM-3/10/Select, compared to the MNA Alternative. The selected remedy is approximately $110 million less expensive than REM-0/0/3, without substantial improvement over the selected remedy in the amount of human health or ecological risk reduction. EPA has determined that the incremental improvement in risk reduction for cancer and non-cancer health effects projected under REM-0/0/3 does not justify the additional $110 million cost of that alternative. Commenters have stated that REM-0/0/3 is more cost-effective than REM-3/10/Select based on the fact that the more aggressive remedy removes approximately 40 percent more PCBs, for approximately 24 percent greater cost. As explained above and in the Response to Master Comments 369451 and 595 in Chapter 4, EPA believes that REM-3/10/Select is a more appropriate remedy than REM-0/0/3. In particular, refined estimates of PCB mass removal show that REM-0/0/3 would double the area affected, while only increasing the PCB mass removed by 20 percent more than the mass removed under REM-3/10/Select (see Master Comment 369451 and White Paper – Sediment PCB Inventory Estimates). Master Comment 399 A commenter stated that New Yorkers have a common-law right to fish, which implicitly includes the right to eat the fish one catches. Recent studies show that despite the existence of
1-17
Responsiveness Summary Hudson River PCBs Site Record of Decision
New York State Department of Health advisories, recreational anglers regularly eat fish from the river and that many share the fish with family members. This activity increases with distance down river: that is, downstate anglers are more likely to eat the fish than upstate anglers are. A study undertaken by the New York State Department of Health found that between Catskill and the Tappan Zee Bridge, almost half of the anglers fishing said food was one of their reasons for fishing, with 15 percent stating that catching fish for food was their primary reason for fishing. A third of the anglers conceded that they kept some of the fish caught: that they ate fish from the Hudson: and that they shared their catch with others. Further, a 1992 study conducted by the Hudson River Sloop Clearwater showed that approximately 50 percent of downstate anglers reported sharing Hudson River fish with the most at-risk population, women and children. Response to Master Comment 399 EPA has determined that it is necessary to remove PCB-contaminated sediments from the Upper Hudson River in order to protect human health and the environment as required by CERCLA Section 121. EPA made this determination pursuant to CERCLA, and not State common law. Nevertheless, the studies cited in the comment that conclude that people continue to consume fish caught from the Hudson despite the fish consumption advisories are evidence that there is not complete compliance with the advisories, and that the risks to human health from the Site persist despite the existence of the consumption advisories. Thus, EPA has determined that the selected remedy, which reduces PCB levels in fish more quickly than remedial alternatives that do not include active remediation of contaminated sediments, is necessary. The selected remedy will reduce PCB concentrations in fish to levels at which the consumption advisories and fishing restrictions may be relaxed or lifted. Master Comment 401 A commenter said that CERCLA Section 121(d)(2) requires EPA to select a remedial approach that maximizes the probability that ARARs will eventually be achieved. EPA should select a remedy that comes as close as reasonably possible to achieving New York State Water Quality Standards promulgated at 6 NYCRR Part 703. Response to Master Comment 401 Four chemical-specific ARARs for surface water (federal Safe Drinking Water Act MCL of 0.5 µg/L [500 ng/L]; 0.09 µg/L [90 ng/L] New York State standard for protection of human health and drinking water sources; 0.014 µg/L [14 ng/L] criteria continuous concentration (CCC) Federal Water Quality Criterion (FWQC) for freshwater; and 0.03 µg/L [30 ng/L] CCC FWQC for saltwater) would be met by all remedial alternatives that were evaluated in the Detailed Analysis of Alternatives (FS Chapter 8), although three chemical-specific surface water ARARs (1 ng/L federal Ambient Water Quality Criterion; 0.12 ng/L NYS standard for protection of wildlife; and 0.001 ng/L NYS standard for human consumers of fish) are not expected to be met by any of the alternatives during the 70-year forecast period of EPA’s model. These three chemical-specific ARARs are being waived for the selected remedy based on technical impracticability (Declaration and Section 14.2 of the ROD).
1-18
Responsiveness Summary Hudson River PCBs Site Record of Decision
Nevertheless, the selected remedy achieves a more rapid decline in PCB surface water concentrations than remedial alternatives that do not include active remediation of contaminated sediments, and EPA believes that this is an important factor in why active remediation of the sediments is a better choice than either No Action or MNA. The benefits of active remediation of the sediments are readily apparent in the differences in the rates of decline for the selected remedy and the MNA and No Action Alternatives. During the first 20 years of the forecast period (between 2006 and 2025), the PCB water column concentration for the selected remedy is substantially improved when compared to the water column PCB concentrations under the No Action or MNA scenarios. As expected, the water quality is best for the REM-0/0/3 Alternative and substantially improved for the selected remedy (REM-3/10/Select) and the CAP-3/10/Select Alternative. While the water quality is projected to be improved under REM-0/0/3 relative to REM-3/10/Select, EPA selected REM-3/10/Select based on the nine criteria for Superfund remedy selection in the NCP. Master Comment 403 A commenter argued that the determination by Hudson River Trustees that the Hudson River fishery has suffered "injury" within the meaning of the statute should be a factor in EPA's remedy selection (i.e., to reduce future duration of the injury). Response to Master Comment 403 The remedial action objectives for the selected remedy include (i) reduce the cancer risks and non-cancer hazard indices for people eating fish from the Hudson River by reducing the concentration of PCBs in fish; and (ii) reduce the risks to ecological receptors by reducing the concentration of PCBs in fish (see ROD Section 9.1). By reducing human exposure to PCBs due to the consumption of fish, EPA's selected remedy is expected to allow fish-consumption advisories to be relaxed as conditions improve. This will provide benefits to the industries of both recreational and commercial fishing (see the Response to Master Comment 399, above). Master Comment 407 A commenter argued that failure to dredge may violate the Equal Protection Clause of the 14th Amendment. Response to Master Comment 407 The comment is unclear as to why the commenter believes that failure to dredge may violate the Fourteenth Amendment. Nevertheless, EPA has selected a remedy that requires dredging.
1-19
Responsiveness Summary Hudson River PCBs Site Record of Decision
Master Comment 503 A commenter argued that failure to dredge may violate the Fourth Amendment. Response to Master Comment 503 The comment is unclear as to why the commenter believes that failure to dredge may violate the Fourth Amendment. Nonetheless, EPA has selected a remedy that requires dredging. Master Comment 365246 A commenter argued that EPA’s proposed remedy is not likely to comply with laws and regulations regarding wetlands protection, including 40 CFR Part 230, 33 CFR Parts 320-329, Executive Order 11990, and the New York State Freshwater Wetlands Act. The Monitored Natural Attenuation Alternative is a practicable alternative to the selected remedy with far fewer adverse impacts on the aquatic ecosystem. Response to Master Comment 365246 EPA has determined that active remediation of PCB-contaminated sediments at the Site is necessary in order to address, within an acceptable time frame, the unacceptable risks to human health and the environment from consumption of PCB-contaminated fish by human and ecological receptors. As discussed in the FS, the ROD, and elsewhere in this Responsiveness Summary, the No Action and MNA Alternatives, which do not include active remediation of contaminated sediments, are not sufficiently protective of human health and the environment and thus would not be consistent with CERCLA. EPA also has determined that remedies that include capping of contaminated sediments are not appropriate because of, among other things, long-term operation and maintenance concerns associated with maintaining a cap in perpetuity. EPA therefore has determined that there is no practicable alternative to the selected remedy that would not require access or discharge to special aquatic sites in the Upper Hudson River, including wetlands (i.e., the selected remedy is “water-dependent”), or which would have less adverse impact on the aquatic ecosystem, within the meaning of 40 CFR § 230.10(a). The dredging called for by the ROD, and the placement of backfill material in the Upper Hudson following the dredging thus are not prohibited by 40 CFR § 230.10(a). In addition, as discussed in the ROD and elsewhere in this Responsiveness Summary, EPA has determined that the selected remedy’s benefits to human health and the environment outweigh its potential short-term impacts, including potential impacts to the river ecosystem (33 CFR § 320.4(b) and Response to Master Comment 421, Chapter 11). EPA notes that one objective of its backfill program for the selected remedy will be to assist in the restoration of wetlands of the Upper Hudson River following dredging. Nevertheless, in accordance with 40 CFR Part 230, EPA will undertake appropriate measures to minimize adverse impacts of any discharge on the aquatic ecosystem and to mitigate impacts to wetlands after dredging.
1-20
Responsiveness Summary Hudson River PCBs Site Record of Decision
Implementation of the selected remedy will result in unavoidable impacts to wetlands, although most, if not all, of such impacts would be temporary because of the restoration measures to be undertaken following dredging. In accordance with Executive Order 11990 and 40 CFR Part 6, Appendix A, EPA will avoid, to the extent possible, adversely impacting wetlands through implementation of the remedy and/or through appropriate restoration measures. The selected remedy includes a habitat replacement program that is intended to restore wetlands impacted by the remedy to conditions that existed before remediation. This program is expected to include, during remedial design, the collection and documentation of extensive hydrology, soil, and biological data on the pre-remediation conditions of the wetlands, including the physical, chemical, and biological components of the aquatic environment in accordance with 40 CFR § 230.11. EPA will also conduct a wetland delineation, if appropriate, for the dewatering/transfer facility location(s) after such location(s) are determined, so that potential adverse impacts (if any) to wetlands associated with such facilities can be avoided or minimized. Measures to restore the Hudson River environment after dredging are presented in Appendix E.8 (Technical Memorandum: Habitat Replacement/River Bank Restoration Concept Development) and Appendix F (Habitat Replacement Program Description) of the Feasibility Study. All dredging performed in order to implement the selected remedy, as well as the sediment processing/transfer facilities that are necessary to implement the remedy, will be considered “on-site” for purposes of the permit exemption of Section 121(e)(1) of CERCLA, 42 U.S.C. § 9621(e)(1). The permit requirements of the New York State Freshwater Wetlands Act (NY Environmental Conservation Law § 24-0107) therefore do not apply to implementation of the selected remedy. The selected remedy will comply with applicable or relevant and appropriate substantive requirements of the New York State Freshwater Wetlands Act. Master Comment 358807 A commenter argued that EPA has not demonstrated compliance with the Coastal Zone Management Act. Response to Master Comment 358807 The Federal Coastal Zone Management Act (CZMA) requires federal agencies that conduct or support activities that directly affect a coastal use or resource to support or conduct those activities in a manner that is consistent, to the maximum extent practicable, with approved State coastal zone management programs. New York State’s coastal zone along the Hudson River extends from Federal Dam in Troy to New York City. In accordance with the CZMA and CERCLA, EPA will ensure that on-site response activities, including the dredging and transfer facilities, will comply to the maximum extent practicable with substantive requirements of the State’s Coastal Zone Management (CZM) program, including local policies that are part of State-approved Local Waterfront Revitalization
1-21
Responsiveness Summary Hudson River PCBs Site Record of Decision
Programs. New York State’s Department of State (NYSDOS) has developed and manages the New York CZM program. EPA is not required to comply with the consultation requirements of the CZMA with respect to on-site CERCLA response actions. CERCLA requires EPA to comply only with the substantive, and not the procedural, requirements of other environmental laws for CERCLA response actions that are conducted on-site (e.g., Section 121(d)(2)(A) of CERCLA, 42 U.S.C. § 9621(d)(2)(A); Section 121(e) of CERCLA, 42 U.S.C. § 9621(e); 40 CFR 300.5 [definitions of “applicable requirements” and “relevant and appropriate requirements”]; and State of Ohio v. U.S. E.P.A., 997 F.2d 1520, 1526 [D.C. Cir. 1993] [ARARs include only substantive, and not procedural, requirements]). The consultation requirements of the CZMA are procedural/administrative requirements from which on-site CERCLA response actions are exempt. NYSDOS and NYSDEC believe it would be premature to perform a CZM consistency analysis at this juncture, although the State believes that such an analysis should be performed after the ROD is issued, but before the remedial design is finalized. Nevertheless, EPA has reviewed the selected remedy against applicable NYSDOS policies in the White Paper – Coastal Zone Management, and has determined that the dredging component of the selected remedy will be consistent with New York State CZM programs. In this analysis (which EPA has shared separately with NYSDOS and NYSDEC), EPA indicates that there will be no significant short-term impacts on water quality in the coastal zone as a result of the dredging, and that in the long-term the remedy will have a beneficial impact on the coastal zone, because the remedy will reduce the water column PCB load to the coastal zone. A CZM analysis as to the sediment processing/transfer facility(ies) will be done after the locations of those facilities are determined, but before the remedial design is finalized. Master Comment 358802 A commenter argued that EPA has not complied with the Fish and Wildlife Coordination Act. Response to Master Comment 358802 CERCLA requires EPA to comply only with the substantive, and not the procedural, requirements of other environmental laws for CERCLA response actions that are conducted on-site (see, for example, Response to Master Comment 358464). The coordination requirements of the Fish and Wildlife Coordination Act, 16 U.S.C. §§ 661-666c, are procedural/administrative requirements from which on-site CERCLA response actions are exempt (55 Fed. Reg. 8666, 8756 [March 8, 1990]) ("administrative requirements include the approval of, or consultation with, administrative bodies, issuance of permits, documentation, and reporting and recordkeeping"). Any dredging activity and dewatering/transfer facility for the Hudson River PCBs remedy would be considered "on-site" (40 CFR 300.400(e)(1): “The term on-site means the areal extent of contamination and all suitable areas in very close proximity to the contamination necessary for implementation of the response action.”). The selected remedy will comply with substantive requirements of the Fish and Wildlife Coordination Act.
1-22
Responsiveness Summary Hudson River PCBs Site Record of Decision
Nevertheless, during the Reassessment RI/FS, EPA consulted with the Biological Technical Assistance Group, which includes representatives of the US Fish and Wildlife Service (FWS) and NYSDEC, on issues including potential environmental impacts of various remedial alternatives (including dredging and No Action). EPA will also voluntarily engage in appropriate future consultation with FWS and NYSDEC under the Fish and Wildlife Coordination Act in the development of measures to prevent, mitigate, or compensate for project-related losses of fish and wildlife resources (CERCLA Compliance with Other Laws Manual: Part II, Section 4.5). The purpose of such coordination will be to determine how substantive requirements of the Fish and Wildlife Coordination Act will be met at the Site. Measures to prevent, mitigate, or compensate for project-related losses of fish and wildlife resources are expected to include backfilling of dredged areas and replacement of river bank habitats, rooted aquatic vegetation, emergent wetlands, and marshes (FS, Appendix F). Master Comment 407625 Commenters asked whether the selected remedy will satisfy New York State requirements which are more stringent than federal regulations (i.e., State requirements concerning spills, handling of waste, waste disposal, permits etc.). Response to Master Comment 407625 CERCLA remedial actions must comply with applicable or relevant and appropriate requirements (ARARs), which include State environmental or facility siting laws that are (i) promulgated; (ii) more stringent than Federal laws; and (iii) are identified by the State in a timely manner (CERCLA Section 121(d)(2)(A)). ARARs may be waived in six specific circumstances in accordance with CERCLA Section 121(d)(4). The selected remedy will comply with New York State applicable or relevant and appropriate requirements for the Site that are identified in Tables 14-1, 14-2 and 14-3 of the Record of Decision, except for two chemical-specific New York State ARARs (0.12 ng/L - New York State standard for protection of wildlife, and 0.001 ng/L - New York State standard for protection of human consumers of fish), which are waived in the ROD because of technical impracticability. New York State ARARs with which the selected remedy will comply include applicable, or relevant and appropriate provisions of 6 NYCRR Part 376 (Land Disposal Restrictions) and 6 NYCRR Part 373 (Hazardous Waste Management Facilities). EPA will conduct appropriate monitoring of the implementation of the selected remedy in order to ensure compliance with ARARs. In accordance with CERCLA Section 121(e), no federal, State or local permits are required for remedial actions that are conducted entirely on-site. The dredging and sediment processing and transfer facilities required for the selected remedy will be considered "on-site" for purposes of the permit exemption of CERCLA Section 121(e). Nevertheless, EPA does intend to comply with the substantive requirements of NYSDEC permits that, but for the CERCLA permit exemption, would be required for the remedy.
1-23
Responsiveness Summary Hudson River PCBs Site Record of Decision
1.2 Policy Issues
1.2.1 CERCLA Requirements and Issues Master Comment 413 Commenters stated that EPA must consider the impacts to the tidal, estuarine (160-mile) portion of Site. There were several comments regarding the need for protection of the mid- and lower river ecosystem and its inhabitants; commenters also noted the greater human population (2-3 million persons, not including NYC) in the lower river region. Response to Master Comment 413 EPA has considered the impacts of remediation on the Lower Hudson River. The Agency calculated the relative human health and ecological risks in the Mid- and Lower Hudson River, respectively, under the various remedial alternatives (Response to Master Comment 799, Chapter 6). Consistent with EPA guidance, risk assessments are used to calculate risk to an individual human or ecological receptor, rather than to a population. The overall findings for the Mid- and Lower Hudson are consistent with those for the Upper Hudson River: the REM-3/10/Select and other active alternatives show substantial human health and ecological risk reduction compared to the No Action and MNA Alternatives, and the selected remedy is protective of human health and the environment. EPA identified REM-3/10/Select as the preferred alternative in the Proposed Plan based on a detailed analysis of remedial alternatives (FS, Chapter 8) and a comparative analysis and cost sensitivity analysis (FS, Chapter 9), as required by CERCLA and the NCP. Consideration of the human health and ecological risk reduction in the Mid- and Lower Hudson River, respectively, does not change the results of the evaluation of alternatives presented in the FS, or the conclusion that REM-3/10/Select is the most appropriate alternative for the Site under the criteria prescribed in CERCLA. Master Comment 475 Commenters argued that EPA’s FS did not comply with the requirements of the National Environmental Policy Act (NEPA). The FS also is not the functional equivalent of a NEPA Environmental Impact Statement because it does not provide details concerning, or provide adequate opportunity for public comment on, among other things, potential noise, light, odor, air emission, and transportation impacts of the preferred remedy, or the locations of potential dewatering/transfer facility(ies). The FS also does not comply with the NY State Environmental Quality Review Act (SEQRA).
1-24
Responsiveness Summary Hudson River PCBs Site Record of Decision
Response to Master Comment 475 CERCLA requires EPA to comply only with the substantive, and not the procedural, requirements of other environmental laws for CERCLA response actions that are conducted on-site (Section 121(d)(2)(A) of CERCLA, 42 U.S.C. § 9621(d)(2)(A); Section 121(e) of CERCLA, 42 U.S.C. § 9621(e); 40 CFR § 300.5 [definitions of “applicable requirements” and “relevant and appropriate requirements”]; and State of Ohio v. U.S. E.P.A., 997 F.2d 1520, 1526 [D.C. Cir. 1993] [ARARs include only substantive, and not procedural, requirements]. See also EPA guidance document CERCLA Compliance with Other Laws Manual: Part II. Clean Air Act and Other Environmental Statutes and State Requirements (OSWER Directive 9234.1-02 [August 1989], p. 4-1). NEPA’s requirements are procedural, and, therefore, do not apply to on-site CERCLA response actions. Any dredging activity and dewatering/transfer facility for the Hudson PCBs remedy would be considered on-site (40 CFR 300.400(e)(1): “The term on-site means the areal extent of contamination and all suitable areas in very close proximity to the contamination necessary for implementation of the response action.”) Moreover, EPA considers the procedures established by CERCLA for investigation and response at hazardous waste sites, which are further detailed in the NCP, and which were complied with during the Hudson River PCBs Reassessment, to be the functional equivalent of NEPA. This consideration is based on the extensive analysis of alternatives and environmental impacts, and the aggressive community involvement program, established by CERCLA. As a number of courts have held, where the authorizing statute (in this case, CERCLA) already provides for a detailed analysis of environmental impacts, EPA will satisfy necessary environmental review requirements by following CERCLA, and will not have to separately comply with NEPA (e.g., State of Alabama ex rel. Siegelman v. EPA, 911 F.2d 499 [11th Cir. 1990]). Functional equivalence does not mean structural or literal equivalence, and does not require EPA to consider every point or issue that would otherwise be addressed in an environmental impact statement (State of Alabama ex rel. Siegelman, 911 F.2d 504-505). CERCLA’s substantive and procedural requirements, followed here, nevertheless ensure that EPA considers appropriate environmental issues relating to remedy selection, and allows the public to participate in the remedy selection process. Some comments argue that CERCLA and the NCP require EPA to provide detailed analyses of potential noise, odor, lighting, transportation, and resuspension impacts of the preferred remedy, and to identify the locations of the proposed dewatering/transfer facility(ies), and that such information should have been included in the FS in order to satisfy the functional equivalence standard. The analysis of potential short-term impacts of the preferred remedy in the FS, however, was performed in accordance with CERCLA and the NCP, and is, therefore, functionally equivalent to a NEPA analysis. EPA’s analysis of potential short-term impacts was also consistent with EPA’s “Guidance for Conducting Remedial Investigations and Feasibility Studies under CERCLA” (OSWER 9355.3-01) (October 1988). Response to Master Comment 421, Chapter 11, contains additional information concerning EPA’s analysis of potential short-term impacts of the preferred remedy. Response to Master
1-25
Responsiveness Summary Hudson River PCBs Site Record of Decision
Comment 313728, Section 1.3 contains details concerning the information provided by EPA to the public in order for the public to provide comments on the preferred remedy. With respect to the comment that EPA should prepare an environmental impact analysis under the New York State SEQRA, SEQRA requires State and municipal agencies to prepare environmental impact statements for actions they propose or approve which may have a significant effect on the environment. This law does not apply to actions that are proposed or approved by the federal government (NY ECL §§ 8-0105, 8-0109). Master Comment 415 Several comments argue that the Hudson River PCBs Site is limited to the 40-mile stretch of the Hudson River between Hudson Falls and Troy, New York. Response to Master Comment 415 The Hudson River PCBs Superfund Site includes the Hudson River from Hudson Falls to the Battery in New York Harbor, a stretch of nearly 200 river miles (322 km), and is not limited to the 40-mile reach of the river between Hudson Falls and the Federal Dam at Troy, New York. EPA has consistently defined the Site to include the Lower Hudson River (south of Troy) since at least 1984, when the Agency issued its first Feasibility Study for the Site and before the Site was placed on the National Priorities List (codified at 40 CFR Part 300, Appendix B). In its September 25, 1984, Record of Decision, EPA defined the Site as the entire 200-mile stretch of the Hudson River from Hudson Falls to the Battery in New York City, plus the remnant deposits. In addition, during the Reassessment RI/FS, EPA has consistently defined the Site as including the Upper and Lower Hudson River (e.g., Scope of Work for the Hudson River Reassessment RI/FS [December 1990] and the Phase 1 Report for the Reassessment RI/FS [August 1991]). Master Comment 721 Commenters argued that EPA has, at various times, described "on-site" for the Hudson River Superfund Site as including "a corridor that extends two miles" from the east and west banks of the Hudson River. There are concerns that EPA in this way will attempt to avoid its obligation to obtain needed permits for the proposed processing facilities. Other concerns are that with the four-mile swath of land along the river being defined as "on-site," many private land parcels within this area will bear the stigma of being identified as part of a Superfund Site. One commenter asked EPA to define "off-site" for purposes of the remedy. Response to Master Comment 721 The NCP defines “on-site” as “the areal extent of contamination and all suitable areas in very close proximity to the contamination necessary for implementation of the response action” (40
1-26
Responsiveness Summary Hudson River PCBs Site Record of Decision
CFR § 300.5). Any dredging activity and dewatering/transfer facility for the Hudson PCBs remedy would be considered on-site for purposes of this definition, and for the permit exemption of CERCLA Section 121(e)(1). See 40 CFR § 300.400(e)(1): “The term on-site means the areal extent of contamination and all suitable areas in very close proximity to the contamination necessary for implementation of the response action.” EPA has not, however, defined the Hudson River PCBs Superfund Site as including a two-mile corridor on either side of the Upper Hudson River, nor has the Agency defined this corridor as “on-site” for purposes of CERCLA Section 121(e)(1) and 40 CFR § 300.400(e)(1). In the Feasibility Study Scope of Work (FSSOW), EPA used the term “on-site” to refer to land extending for two miles from either bank of the Upper Hudson River. As explained in the Responsiveness Summary for the Phase 3 FSSOW, “on-site” was used in the FSSOW as a synonym for “near-river” in describing potential locations for processing/transfer facilities that may be needed for remedies which include the removal of PCB-contaminated sediments from the Upper Hudson River. The two-mile corridor was based on engineering considerations (because it represents an area that encompasses a variety of locations for such facilities located within a reasonable hauling distance from the river), and was not intended to define the boundaries of the Hudson River PCBs Superfund Site, or to provide a legal definition of “on-site” for purposes of the permit exemption of CERCLA Section 121(e)(1). “Off-site” areas are those locations that EPA has determined are not (i) within the areal extent of the contamination, or (ii) suitable areas in very close proximity to the contamination necessary for implementation of the response action. Master Comment 362908 EPA has received a number of comments regarding funding of, and liability for, implementation of the project. Some comments argue that the federal and State governments, to the extent that they allowed GE and others to discharge PCBs, should share in some reasonable proportion the cost of improving the public health and the environment. Other comments argue that GE should bear the full cost of implementing the remedy, while others assert that GE is not the only company that disposed of hazardous substances in the Hudson River, and therefore should not be the only company to shoulder the burden of implementing or funding the remedy. Still other comments asked whether EPA has the authority to implement the selected remedy, and suggested that EPA should fund the project. Response to Master Comment 362908 The purpose of this Responsiveness Summary is to respond to significant public comments on EPA’s preferred remedy for the Site, and not to address funding- or liability-related issues concerning implementation of the ROD. EPA notes, however, that the overwhelming majority of General Electric Company’s PCB discharges to the Upper Hudson River did not occur pursuant to a federal or State permit. These unpermitted discharges include the continuing release of PCBs to the river from bedrock in the vicinity of GE’s Hudson Falls facility. EPA has the legal authority to implement remedial actions under CERCLA.
1-27
Responsiveness Summary Hudson River PCBs Site Record of Decision
Master Comment 365240 A commenter noted that EPA expects that technical impracticability ARAR waivers will be required for three chemical specific ARARs, the federal Ambient Water Quality Criterion, New York State's standard for protection of wildlife and the New York State standard for protection of human consumers of fish. According to the commenter, waiving the ARARs should not be done for several reasons. Since the ARARs apply to water bodies, waiving ARARs would remove any need to take action to reduce PCB concentrations in the water body because there would be no standards in effect for that water body. This is obviously contradictory to what is trying to be accomplished. Waiving ARARs also presents a dilemma for NYSDEC since the substantive conditions for a discharge permit are the effluent limitations that in part are based on water quality standards. The commenter wondered, if EPA waives the water quality standards, how NYSDEC will derive the effluent limitations that EPA desires to implement the remedy, or whether EPA is expecting NYSDEC to put on blinders and calculate effluent limitations as if the standards still exist. The commenter wanted to know if that is the case then why EPA would waive the standards to begin with. Response to Master Comment 365240 The selected remedy will comply with the location-specific and action-specific ARARs identified for the Site, as well as four of the seven identified chemical-specific ARARs. Although the selected remedy will reduce water column PCB concentrations and approach some of these numbers, three of the chemical-specific ARARs are not expected to be met because the Tri+ PCB contamination entering the Upper Hudson River from above Rogers Island (even after source control at Hudson Falls) will likely exceed those ARARs. Therefore, technical impracticability ARAR waivers are required for three chemical-specific ARARs (1 ng/L federal Ambient Water Quality Criterion; 0.12 ng/L New York State standard for protection of wildlife; and 0.001 ng/L New York State standard for protection of human consumers of fish). Even the most aggressive removal alternative, REM-0/0/3, would require these same waivers.
It is not correct that waiving the three ARARs referred to above would remove any need to take action to reduce PCB concentrations in the Hudson. Regardless of the ARAR waiver, EPA still is required by CERCLA to select a remedy that is protective of human health and the environment, and this Record of Decision does so. The portion of the comment that deals with NYSDEC's future issuance of water discharge permits is beyond the scope of this Responsiveness Summary. EPA's waiver of the three aforementioned ARARs has no impact on the validity, force, and effect of these standards for any purpose other than the selected remedy for this Superfund Site.
1-28
Responsiveness Summary Hudson River PCBs Site Record of Decision
Master Comment 424915 Several commenters asked how EPA will acquire access to land required for the sediment processing and treatment facilities, and whether EPA will acquire such property through eminent domain. Response to Master Comment 424915 Issues concerning access to land required for the sediment processing/transfer facilities will be addressed during remedial design. EPA will not determine the final location(s) of the facility(ies) until after the ROD is issued, and after the public process described in Section 13.3 of the ROD. Public input will be considered in connection with facility siting decisions. Master Comment 424920 A commenter argues that EPA’s decision to exclude disposal of sediment in local facilities because of local unpopularity, prior to issuance of the Proposed Plan, is inconsistent with the remedy selection provisions of the NCP. Response to Master Comment 424920 EPA determined in the FS that construction of a PCB landfill in the Hudson River Valley may not be administratively feasible in accordance with 40 CFR § 300.430(e)(9)(iii)(F), under which EPA considers, among other things, the time required to obtain any necessary approvals and permits from other agencies for off-site response actions when evaluating remedial alternatives. In the Feasibility Study, EPA concluded that, while technically feasible, the siting of a new landfill to receive PCB-contaminated sediments from the Hudson River may not be administratively feasible given local opposition to a dredged material disposal facility in this area and the need to obtain New York State Hazardous Waste Facility Siting Board approval for a new facility in New York State, if such a facility is not located “on-site” as defined in 40 CFR § 300.5 (FS, Section 4.3.8). Because the need to acquire approval for, and to construct, a disposal facility in the Hudson Valley could significantly delay implementation of any remedial action that includes disposal of PCB-contaminated sediments, EPA determined that a disposal facility in the Hudson Valley may not be administratively feasible. The FS therefore did not further consider the use of such facilities (FS, Section 4.3.8). Master Comment 424926 A commenter argued that under the NCP, land disposal should consistently rank at the bottom of remedial alternatives because land disposal is not treatment, but is simply mass transfer and entombing. The proposed remedy moves the PCBs from point A to point B at a tremendous cost and risk relative to even the No Action Alternative.
1-29
Responsiveness Summary Hudson River PCBs Site Record of Decision
Response to Master Comment 424926 EPA is not precluded from selecting remedies that include land disposal without treatment. In addition, EPA disagrees with the comment that REM-3/10/Select “moves the PCBs from point A to point B at a tremendous cost and risk relative to even the No Action Alternative.” EPA has determined that remedial alternatives that do not include removal of PCB-contaminated sediments from the Upper Hudson River are not sufficiently protective of human health and the environment (ROD, Sections 11.1 and 14.3). PCB-contaminated sediments can be safely transported to licensed off-site disposal facilities that are equipped with measures including special liners, leachate collection systems, and daily maintenance to prevent leakage and contamination in the area surrounding the landfill (see the Response to Master Comment 405890, Chapter 10). The off-site transport and disposal of PCB-contaminated sediments under the selected remedy therefore is not expected to result in any significant risks to human health or the environment. The selected remedy permanently removes large volumes of PCBs from the river, although it does not satisfy the statutory preference for treatment as a principal element of the remedy. Given the volume of material to be removed, treatment of the dredged material prior to off-site disposal would not be cost-effective, other than the stabilization of the sediments for handling purposes. However, to the extent that some of the removed sediments could be put to beneficial use (i.e., used for the manufacture of higher-value commercial products) if treated, then treatment of some of the removed sediments might be determined to be cost-effective and be carried out. Such a decision would be made during the remedial design phase. Master Comment 423154 A commenter asked whether changes or clarifications to the Proposed Plan noted during public meetings will be memorialized in a written document that will be circulated for public comment prior to the issuance of the ROD. Response to Master Comment 423154 Clarifications of the Proposed Plan that were noted during public meetings did not need to be and were not circulated for public comment prior to issuing the Record of Decision. EPA has determined that no significant changes to the remedy, as originally identified in the Proposed Plan, are necessary or appropriate. At the same time, the Record of Decision (Section 15) highlights certain items that were not included in the Proposed Plan. These items are not significant changes for purposes of Section 117(b) of CERCLA. Master Comment 424247 Several commenters alleged that EPA's Reassessment Remedial Investigation/Feasibility Study and Proposed Plan are biased, punitive, pre-determined, or otherwise not impartial.
1-30
Responsiveness Summary Hudson River PCBs Site Record of Decision
Response to Master Comment 424247 EPA strongly disagrees with these comments. The Proposed Plan, and the Reassessment Remedial Investigation and Feasibility Study upon which it is based, were conducted in a impartial, scientifically sound manner. The preferred remedy was neither biased, punitive, pre-determined, nor otherwise not impartial. Rather, after conducting a detailed analysis of remedial alternatives, EPA determined that the proposed remedy was the most appropriate response to the unacceptable risks to human health and the environment at the Site, based on the evaluation criteria set forth in CERCLA and the NCP. The remedy is well supported by the data collection and analysis performed for the Reassessment (Response to Master Comment 313799, Chapter 2). Moreover, EPA’s major Reassessment reports were peer-reviewed by independent experts who generally agreed with EPA’s science, or requested revisions. EPA issued Responses to Peer Review Comments for each of the peer reviews as well as a Revised Baseline Human Health Risk Assessment and a Revised Baseline Ecological Risk Assessment which include all changes made to address the peer review comments on those reports. EPA stands by the impartiality and science behind its reports and conclusions. Master Comment 423426 Commenters asked who will be responsible for damages to real or personal property that directly result from implementation of the remedy. Response to Master Comment 423426 In the unlikely event that implementation of the remedy results in accidental or other unintended damages to real or personal property, the question of compensation for those damages is a complex one that will depend on a number of factors, such as whether EPA or GE is performing the remedy, the nature and extent of the damages at a given location, and the specific circumstances that led to such damages. Sometimes, it is necessary to remove or otherwise affect private real or personal property in order to implement a remedy under CERCLA. In such cases, it is EPA’s general practice to replace or restore such property to its original condition to the extent practicable, or to require the potentially responsible party responsible for implementation of the remedy to do so. 1.2.2 Applicability of the NAS Report Master Comment 409 A number of commenters called for the remedy to be implemented without delay. Some urged EPA to maintain or accelerate the schedule originally announced for issuing the ROD. Some asserted that implementation of a remedy was long overdue. At least one commenter was concerned that EPA not defer implementation to future generations. Some also contended that further delays would result in further negative consequences for the environment and for people
1-31
Responsiveness Summary Hudson River PCBs Site Record of Decision
of the communities near the river. At least one comment stated that EPA should not delay a Record of Decision to consider the NRC/NAS report. Response to Master Comment 409 EPA agrees with comments stating that there should be no unnecessary delays in the implementation of the selected remedy. It has not been necessary for EPA to delay issuance of the Record of Decision in order to consider the recommendations of the National Research Council Report “A Risk-Management Strategy for PCB-Contaminated Sediments” (NRC Report). As discussed in Response to Master Comment 411, immediately following, EPA carefully considered the NRC Report in the decision-making process for the Hudson River PCBs Site. Master Comment 411 Several comments argue that EPA’s remedial decision-making process for the Hudson River PCBs Site does not follow the recommendations of the recent National Research Council Report “A Risk-Management Strategy for PCB-Contaminated Sediments” (NRC Report). These comments assert that: The FS and Proposed Plan do not include a balanced evaluation of multiple remedial options, including consideration of cost-effectiveness, or the uncertainties of the effectiveness of remedies in achieving remedial goals. EPA’s FS and Proposed Plan also do not adequately consider the risks of implementation associated with a dredging remedy including sediment resuspension, worker safety, and ecological damage EPA did not consider the potential social and economic impacts of the preferred remedy, including potential impacts to the agricultural community that would result from the siting of a toxic waste dump in an agricultural district. The NRC Report admonishes the EPA to listen to the concerns and desires of the river communities, the people most affected by their decision to undertake the most extensive, invasive and costly remediation plan in the EPA's history. Response to Master Comment 411 EPA disagrees with comments suggesting that EPA’s evaluation and selection of remedial alternatives for the Hudson River PCBs Site has been inconsistent with the recommendations of the National Research Council’s report, “A Risk-Management Strategy for PCB-Contaminated Sediments” (March 2001) (NRC Report). EPA carefully considered the NRC Report’s recommendations before making a final remedial decision for the Hudson River PCBs Superfund Site.
1-32
Responsiveness Summary Hudson River PCBs Site Record of Decision
EPA agrees with the NRC Report’s conclusions that “exposure to PCBs may result in chronic effects (e.g., cancer, immunological, developmental, reproductive, neurological) in humans and/or wildlife,” and that “the presence of PCBs in sediments may pose long-term public health and ecosystem risks.” NRC Report at p. 4. EPA also agrees with the NRC recommendation that there should be no presumption of a preferred or default risk-management option that is applicable to all PCB-contaminated sediment sites. EPA’s selected remedy for the Hudson River PCBs Site includes a combination of remedial activities that were tailored to the conditions at the Site, including targeted removal of contaminated sediments using environmental dredging techniques, and monitored natural attenuation of residual PCB contamination in the remediated areas and unremediated areas until PCB concentrations in fish tissue are at an acceptable level. Institutional controls such as fish consumption advisories and fishing restrictions will remain in place (although perhaps in a modified form) until these acceptable levels are reached. In the Feasibility Study, EPA conducted a balanced evaluation of remedial alternatives in accordance with CERCLA and the NCP. In the FS, EPA evaluated numerous remedial options to address the risks to human health and the environment at the Site including No Action, MNA, capping, and sediment removal (i.e., dredging). In accordance with the NCP and EPA’s Guidance for Conducting Remedial Investigations and Feasibility Studies under CERCLA (OSWER 9355.3-01) (October 1988), remedial action alternatives were screened in the Feasibility Study based on the criteria of effectiveness, implementability and cost in order to develop a list of five viable remedial alternatives (No Action, MNA, Cap-3/10/Select, REM-3/10/Select and REM-0/0/3) that were then reviewed against the remedy selection criteria of the NCP (40 CFR § 300.430(e)(9)) in the detailed analysis of alternatives (FS, Chapter 6 [Screening of Remedial Action Alternatives] and Chapter 8 [Detailed Analysis of Remedial Alternatives]). In the comparative analysis of alternatives (FS, Chapter 9), the five alternatives were compared against one another using the NCP’s two threshold remedy selection criteria (overall protection of human health and the environment, and compliance with ARARs) and five balancing criteria (long-term effectiveness and permanence, reduction of toxicity, mobility, or volume through treatment, short-term effectiveness, implementability, and cost). EPA’s evaluation of remedial alternatives for the Site pursuant to the NCP was consistent with the NRC recommendations that management strategies should consider the relative risks to humans and the environment of each remedial alternative, including potential risks associated with PCB remobilization from resuspension, and should also consider the long- and short-term risks posed by remedial alternatives. Under the “overall protection of human health and the environment” criterion in the NCP (40 CFR § 300.430(e)(9)(iii)(A)), EPA concluded that the overall protection of human health and the environment afforded by remedial alternatives that include active remediation of contaminated sediments, including the selected remedy, is “considerably more than that achieved by the No Action and MNA alternatives.” (see FS, Section 9.1.1.1).
1-33
Responsiveness Summary Hudson River PCBs Site Record of Decision
Under the short-term effectiveness criterion for remedy selection (40 CFR § 300.430(e)(9)(iii)(E)), USEPA evaluated and compared the potential short-term impacts of the remedial alternatives, including (i) short-term risks that might be posed to the community during implementation; (ii) potential impacts on workers during implementation, including protective measures; (iii) potential adverse environmental impacts resulting from construction and implementation, and the effectiveness of mitigative measures; and (iv) time until remedial response objectives are achieved. The assessment of short-term effectiveness included general discussions of how certain short-term risks would be sufficiently mitigated during implementation of the remedy (FS, Sections 8.5.2.5 and 9.5.1). For example, potential occupational risks to workers would be addressed through a Site-specific health and safety plan, compliance with OSHA health and safety procedures, and use of appropriate personal protection equipment (FS, Sections 8.5.2.5 [Short-Term Effectiveness evaluation of REM-3/10/Select]and 9.5.1 [Comparative Analysis of Alternatives, Short-Term Effectiveness]). With respect to potential environmental impacts, the FS included an assessment of potential impacts to the environment of the selected remedy, including impacts associated with PCB resuspension (FS, Section 8.5.2.5.), in which EPA concluded that it appears unlikely that removal of PCB-contaminated sediments would yield significantly higher PCB concentrations in Upper Hudson River fish during remedial construction. Anticipated PCB resuspension during dredging operations was discussed in greater detail in Appendix E.6 of the FS (Semi-Quantitative Assessment of Water Quality Impacts Associated with Dredging Activities). The FS also included discussions of post-dredging site reconstruction and habitat replacement (FS, Section 5.2.6), and provided a proposed Habitat Replacement/River Bank Restoration Concept (Appendix E.8) and Habitat Replacement Program Description (Appendix F) for restoration of dredged areas following remediation. We therefore disagree that the Agency did not evaluate project-related short-term risks as part of EPA’s analysis of remedial alternatives. These issues are also discussed elsewhere in this Responsiveness Summary (e.g., White Paper –Remobilization of PCBs during Dredging; White Paper – Potential Impacts to Water Resources; and Responsiveness Summary Chapter 8 [Community Impacts] and Chapter 9 [In-River Impacts]). EPA will also take potential short-term impacts into account in the preparation of the remedial design, and will give the public an opportunity to provide input into the ways that the remedy will address such possible impacts (Response to Master Comment 441, Section 1.3). All CERCLA remedial actions must be cost-effective, which means that remedies must provide a degree of overall protectiveness that is proportional to their costs. In accordance with the NCP, EPA therefore evaluated the cost-effectiveness of remedial alternatives for the Site. For example, cost is one of the three screening criteria (in addition to effectiveness and implementability) used to screen remedial alternatives in Chapter 6 of the Feasibility Study. The “cost” criterion of the screening analysis was used to screen out alternatives that had much higher costs than other alternatives, without providing a comparative increase in protection (FS, Section 6.1.3). EPA further considered the costs of remedial alternatives in the detailed analysis of alternatives (FS, Chapter 8) and compared the relative costs of the five alternatives in Chapter 9. In addition, in the Proposed Plan and ROD, EPA determined that REM-3/10/Select is more cost-effective than alternative REM-0/0/3 because REM-3/10/Select is approximately $110 million less expensive
1-34
Responsiveness Summary Hudson River PCBs Site Record of Decision
than the more aggressive alternative, without substantial differences in the amount of human health or ecological risk reduction. EPA recognizes that there is some uncertainty in the ability of the various remedial alternatives to meet remediation goals. For this reason, EPA did not base the proposed remedy on a single analytical tool, but instead developed the remedy on a weight-of-evidence approach which incorporated several analytical tools and factual databases, including data projections, geochemical analyses, and mathematical modeling. Notwithstanding the uncertainties associated with these tools, each of the referenced analyses is consistent with and supports the Agency’s conclusion that active remediation of PCB-contaminated sediments in the Upper Hudson River is necessary in order to reduce PCB concentrations in fish, and therefore protect human health and the environment at the Site, within an acceptable time frame. EPA agrees with the NRC recommendation that “long-term monitoring and evaluation of PCB-contaminated sediment sites should be conducted in order to evaluate the effectiveness of the management approach and to ensure adequate, continuous protection of humans and the environment.” The selected remedy includes monitoring of fish, water, and sediment to determine when remediation goals are reached. The first phase of implementation of the remedy will include an extensive monitoring program of all operations. Monitoring data will be compared to performance standards identified in the ROD or developed during the remedial design with input from the public and in consultation with the State and federal natural resource trustees. In the ROD, EPA has identified performance standards that address air and noise emissions from the dredging operations and the sediment processing/transfer facilities. Performance standards that will be developed during the remedial design phase will address (but may not be limited to) dredging resuspension, production rates, PCB residuals after dredging (or dredging with backfill, as appropriate), PCB air emissions, and community impacts (e.g., odor). The information and experience gained during the first phase of dredging will be used to evaluate and determine compliance with the performance standards. Further, the data gathered will enable EPA to determine if adjustments are needed to operations in the succeeding phase of dredging or if performance standards need to be reevaluated. EPA will make the data, as well as its final report evaluating the work with respect to the performance standards, available to the public. The second phase will be the remainder of the operation, which will be conducted at full-scale. During the full-scale remedial dredging, EPA will continue to evaluate performance data and make necessary adjustments. Potential social and economic impacts of remedial alternatives is not one of the remedy selection criteria established by CERCLA or the NCP, and EPA therefore did not collect data on such issues prior to the Proposed Plan. Nevertheless, EPA can address public comments concerning potential social and economic impacts of a remedy under the “community acceptance” criterion, although community acceptance cannot be fully assessed until after the public comment period on the draft RI/FS and proposed plan is completed (55 Fed. Reg. 8666, 8719 [March 8, 1990]). Potential social and economic impacts of the preferred remedy are extensively addressed in Chapter 8 of this Responsiveness Summary, and in White Paper – Socioeconomics. As indicated in the white paper and Response to Master Comment 689 (Chapter 8), the selected remedy is likely to result in a notable improvement in the Upper Hudson River region’s economy,
1-35
Responsiveness Summary Hudson River PCBs Site Record of Decision
particularly with respect to recreation and tourism, expanding employment and earnings in the many sectors of the economy that relate to these activities. This in turn will likely improve the property values in the region and especially along the river. In addition, as explained in the Feasibility Study, EPA will not site a near-river facility for disposal of PCB-contaminated sediments (FS, Section 4.3.8). Disposal of dredged materials will occur only at licensed, off-site facilities. EPA has listened to the concerns of affected communities throughout the Reassessment via the extensive community interaction program (“CIP”) that was established for the Site at the beginning of the Reassessment in 1990. EPA’s CIP is consistent with the NRC recommendation that all affected parties and communities should be involved early and actively in the process. The purpose of the CIP was to create a community participation program in which interested members of the public would have an opportunity to obtain information concerning the Reassessment and to express their opinions concerning the Reassessment directly to EPA. To this end, EPA held over 75 meetings to which the public was invited and provided with an opportunity to express their views. The participants in EPA’s CIP included various levels of the public including citizens, environmentalists, farmers, elected officials, State and federal representatives, GE, and members of the scientific and academic community. In addition, EPA conducted a number of one-on-one meetings with various CIP members including environmental organizations, individuals, and GE, often at their behest; took several fact-finding community interview trips; met with and briefed numerous federal and State elected officials; conducted availability sessions in which EPA made itself available to members of the public who wanted to meet with Agency personnel on a one-on-one basis; and sponsored several special events including a telephone call-in availability session utilizing a toll-free number and a riverbank sediment coring demonstration. EPA also issued each of the major Reassessment RI/FS reports for public comment, and published responsiveness summaries in which the Agency responded to public comments on those reports. This is above and beyond what is usually done at Superfund sites and what is required by CERCLA and the NCP. Moreover, the Agency has made information concerning the Site available to the public in sixteen information repositories, as well as on the internet at www.EPA.gov/hudson. 1.3 Public/Citizen Participation Process Master Comment 427 Commenters asserted that EPA has deliberately kept its description of the project vague to unlawfully avoid close public scrutiny and comment. EPA refuses to disclose the location of the hazardous waste treatment, storage, and dewatering facilities so the public can comment and evaluate the impacts. EPA refuses to disclose the location of the source or sources of backfill for the river. EPA failed to provide an opportunity for meaningful public participation as required by the NCP because the proposed plan and FS lack sufficient detail to enable adequate comments.
1-36
Responsiveness Summary Hudson River PCBs Site Record of Decision
EPA's failure to provide the public with detailed disclosure and analysis of impacts and risks deprives the public of meaningful public participation. Response to Master Comment 427 Since the inception of the community interaction program, EPA has made numerous attempts to provide the interested public with the technical information needed for intelligent analysis and comment. The Proposed Plan grew out of the various assessments that EPA completed and documented in the final FS report. EPA conducted studies and analyses required by CERCLA to enable development of this plan, and provided the public with sufficient information to provide meaningful comments on the Proposed Plan (Response to Master Comment 313728 in this section). Additional details such as the location of possible processing/transfer facilities and the acquisition of construction materials are correctly a part of the remedial design process, and will take into consideration various concerns identified by the public during the comment period on the Proposed Plan, as well as public input received during the remedial design phase. EPA has not yet selected the sources of backfill needed for the remedy, and therefore did not identify such sources in the Feasibility Study. At least five large suppliers/distributors of sand and gravel were identified and contacted at various times during the course of the Reassessment, and there is sufficient backfill for the selected remedy available from existing commercial suppliers/distributors. No backfill mines will need to be created for this project, and backfill will not be excavated from agricultural land in the vicinity of the Site. According to the USGS report titled "The Mineral Industry of New York" the total sand and gravel annual production in the eastern part of New York State, north of Ulster and Duchess counties, is approximately 7,500,000 metric tons. The project backfill requirement represents only on the order of three percent of the regional production. It is important to note that EPA has not yet determined the locations of sediment processing and transfer facilities necessary to implement the selected remedy. For purposes of the Feasibility Study, example locations were identified from an initial list of candidate sites based on screening-level field observations which considered potential facility locations from an engineering perspective. In the Feasibility Study, it was necessary to assume the locations of sediment processing and transfer facilities in order to develop conceptual engineering plans, analyze equipment requirements, and develop cost estimates for the remedial alternatives. For this purpose, two example locations were identified: one at the northern end of the project area in the vicinity of the Old Moreau Dredge Spoils Area, and one at the southern end of the project area near the Port of Albany. Each of these example locations fulfills many of the desired engineering characteristics for such a facility to support the remedial work, and is representative of reasonable bounding assumptions with regard to distance from the dredging work and cost. Other locations, both within the Upper Hudson River valley and farther downstream, are possible. As discussed in Response to Master Comment 313728 in this section, however, it was not necessary for the FS to identify the specific location(s) for the transfer facility(ies) that would be used for the targeted dredging remedy called for by the Proposed Plan.
1-37
Responsiveness Summary Hudson River PCBs Site Record of Decision
The example facility locations presented in the Feasibility Study have also been used in the Responsiveness Summary in order to clarify material presented in the Feasibility Study and Proposed Plan and in connection with additional noise, odor and other analyses that were performed in order to respond to public comments. EPA will not determine the actual facility location(s) until after EPA holds a public comment period on proposed locations and considers public input in the final siting decision. Thus, some of the information provided in this Responsiveness Summary relative to potential impacts of the sediment processing and transfer facilities on communities, residents, agriculture, the environment and businesses should likewise be considered representative and illustrative. Further specific assessment of and, as necessary, mitigation of, potential impacts will be addressed during the remedial design phase. Master Comment 431 A commenter argues that EPA's failure to discuss key elements of the proposed plan until after the Feasibility Study is inconsistent with EPA’s 1998 Contaminated Sediment Management Strategy (CSMS), in which the Agency states that it will “demonstrate the Agency’s commitment and accountability to sediment management efforts through consistent involvement of the public in reviewing major actions under the [CSMS],” and “provide information at a level of detail that allows the public to formulate decisions.” Response to Master Comment 431 The level of information available in the FS is consistent with the public outreach principles articulated in EPA's 1998 Contaminated Sediment Management Strategy, including the Agency's intention to "provide public information [concerning the management of contaminated sediments] that allows the public to formulate decisions" (p. 89). As indicated previously in this section in Response to Master Comment 411, and further on in Response to Master Comment 313728, EPA sponsored over 75 meetings to which the public was invited during the Reassessment, sought and responded to public comments on all major Reassessment reports, and held eleven public meetings to accept comments on the Agency’s preferred remedy. The level of public involvement during the Reassessment was therefore consistent with the CSMS recommendations cited in the comment. The analysis in the FS of potential short-term impacts of the preferred remedy, and of the available mitigation measures, is also consistent with the requirements of CERCLA, the NCP, and EPA policy, and provided the public with sufficient information upon which to provide meaningful comments on EPA's preferred remedy. Response to Master Comment 313728, below, contains further specifics on the level of information provided in the FS. Master Comment 437 Commenters argued that the “dark of night” siting process has eroded public confidence in EPA, as evidenced by 60 communities passing resolutions opposing EPA's approach.
1-38
Responsiveness Summary Hudson River PCBs Site Record of Decision
Response to Master Comment 437 There has been no “dark of night” siting process. As discussed in Response to Master Comment 427, above, EPA has made numerous attempts to provide the interested public with the technical information needed for intelligent analysis and comment. As EPA has previously indicated, in the early stages of the FS, EPA conducted a screening-level survey of sites where a landfill or treatment facility could potentially be located should that become necessary as part of the selected remedy. The purpose of the survey was to determine, from an engineering perspective, whether there is land available that could potentially be used for the construction of disposal or transfer facilities for dredged river sediments. This information was needed for EPA’s analysis in the Feasibility Study of whether a remedy that includes removal of PCB-contaminated sediments is feasible. Dredging and near-river treatment or disposal of dredge spoils was one alternative remedy for consideration from an engineering standpoint pursuant to CERCLA. Later, EPA rejected the option of siting a landfill in this area (see FS, Section 4.3.8). While many municipalities have passed resolutions expressing opposition to a dredging remedy, many other municipalities have passed resolutions expressing support for it. EPA is committed to involving the public throughout the project's design, including the siting of sediment processing/transfer facility(ies), and during remedial construction. Following issuance of the ROD, EPA will develop a project-tailored community involvement program (Response to Master Comment 441, immediately following, and ROD Section 13.3). Master Comment 441 Commenters stated that there is an urgent need to develop a comprehensive and detailed public involvement plan for the remedial design and implementation phases of the Hudson River PCB cleanup. EPA should incorporate this plan into the ROD. Some rethinking of the community interaction program (CIP) liaison group structure needs to occur to be sure all interested parties feel they can be a part of the implementation process. The views of the entire affected community must be considered, including the dense population in the middle and lower Hudson River regions to whom the river and its fish are vital resources. The CIP should not be dominated by any one stakeholder. Alleged public participation/CIP failures and shortcomings are documented in the NRC/NAS reports. In the public process for the next phase of the project, EPA should give special attention to those most at risk, including women and children and communities that subsistence fish (i.e., rely on fish for food), primarily the environmental justice community (i.e. minority and/or low income populations that bear a disproportionate amount of adverse health and environmental effects); consider NRC/NAS report recommendations; and consider such suggestions as establishing local staffed public information centers and a revised oversight committee with working subcommittees. Response to Master Comment 441 The original CIP was designed to be flexible so that it could be modified in response to changes dictated by the project or requested by the participants. Since 1990, EPA has, in fact, modified not only the CIP but also certain aspects of the RI/FS itself, based on public input. EPA is
1-39
Responsiveness Summary Hudson River PCBs Site Record of Decision
committed to continuing to involve the public throughout the project's design, sediment processing/transfer facility siting, and construction phases and, upon issuance of a ROD, will develop a project-tailored public process to do so. As indicated in the ROD (Section 13.3), the post-ROD community interaction program will build on the existing, extensive public process used for the Reassessment RI/FS. EPA will hold a series of public meetings to discuss and take comment on a proposed post-ROD outreach program before it is finalized. The enhanced post-ROD community involvement program will remain active throughout the subsequent construction and post-construction monitoring phases of the project. EPA anticipates that the post-ROD community involvement program will include frequent and regular interaction with municipal governments and communities through general meetings as well as meetings focused on specific issues of concern (such as the sediment processing/transfer facilities and potential short-term impacts of the remedy), and a notable EPA presence in the upriver community (i.e., a field office that will be established during the remedial design phase and be staffed on a full-time basis during the remedial construction period). EPA also will consider appropriate NRC/NAS Report recommendations in the development of this program. These measures will enable EPA to take municipal and community input into consideration during the remedial design and implementation. Master Comment 445 Many commenters expressed support for EPA's proposed plan, including individual communities and municipalities; residents of the Upper Hudson Valley project area and citizens throughout the Hudson Valley; businesses; more than 150 organizations; environmental advocacy groups; State and regional labor leaders and union members; and State and federal agencies. Some commenters commended EPA for the extensive efforts it has made to engage the public in its Reassessment of the Hudson River PCBs Superfund Site, through public meetings, public availability sessions, and ample opportunity to have input to EPA reports. Response to Master Comment 445 EPA acknowledges all the comments in support of its Proposed Plan. The Agency encourages all interested parties to remain involved and continue to provide frank and candid comments during the post-ROD community interaction program. Master Comment 313749 Commenters suggested that in the event additional model runs change the outcome of the existing analysis, EPA should disclose the information to the public for review and comment prior to the issuance of the ROD. Response to Master Comment 313749 EPA performed additional model runs in order to explore the implications of (i) dredging-induced resuspension of PCBs; (ii) upstream source control reducing future PCB loading to zero;
1-40
Responsiveness Summary Hudson River PCBs Site Record of Decision
(iii) a revised schedule for implementation of the REM-3/10/Select Alternative which extends the remediation effort over six years, versus the five year schedule proposed in the FS; and (iv) a revised estimated 100-year flow of 61,835 cubic feet per second (CFS) based on concerns raised by NYSDEC regarding uncertainties in the development of the 47,330 CFS 100-year flood peak flow value used in the Revised Baseline Modeling Report, and the potential for a new licensing agreement between the State of New York and Orion Power Holdings, Inc. for operation of the Sacandaga Reservoir (renamed Great Sacandaga Lake), which would increase maximum Hudson River flood flows. The results of these model runs are presented in White Paper – Model Forecasts for Additional Simulations in the Upper Hudson River and White Paper - Application of the Depth of Scour Model (DOSM) in the Thompson Island Pool for Alternative Flooding Assumptions. The additional model runs have not substantively changed the results of EPA’s analyses that were performed for the FS, and EPA does not believe it was necessary or appropriate to issue the results of the additional model runs for public comment prior to issuing the ROD. Master Comment 313728 Commenters argued that the Reassessment RI/FS did not provide the public with sufficient information upon which to provide meaningful comments on EPA’s preferred remedy because the FS allegedly did not:
i. Contain adequate information concerning risks associated with the excavation, transportation, and redisposal, or containment of hazardous substances at the Site.
ii. Disclose the locations of potential transfer facilities and "soil/gravel extraction mines" necessary to implement the preferred remedy.
iii. Assess the impacts of the remedy on the community, such as those relating to transportation, noise, odors, and PCB resuspension.
One comment requests that EPA revise the Feasibility Study to include the information requested in this comment, and then re-issue the revised FS for public comment before issuing a ROD. Response to Master Comment 313728 The analysis in the FS of potential short-term impacts of the preferred remedy, and of available mitigation measures, is consistent with the requirements of CERCLA, the NCP, and EPA policy, and provided the public with sufficient information upon which to submit meaningful comments on EPA’s preferred remedy. The level of information available in the FS also is consistent with the public outreach principles articulated in EPA’s 1998 Contaminated Sediment Management Strategy, including the Agency’s agreement to "provide public information [concerning management of contaminated sediments] that allows the public to formulate decisions" (p. 89). EPA therefore does not believe it is necessary or appropriate to revise and reissue the Reassessment Feasibility Study for additional public comment. EPA disagrees with comments suggesting that the FS did not contain sufficiently detailed information concerning the preferred remedy for members of the public to provide meaningful
1-41
Responsiveness Summary Hudson River PCBs Site Record of Decision
comments on potential short-term impacts of the preferred remedy, including noise, odor, light, transportation, and such environmental impacts as resuspension and impacts to submerged aquatic vegetation. The FS includes, for example: Proposed design requirements of transfer facilities (Section 5.2, Figure 5-1, Appendix E.9, Appendix H). The number of dredges, barge loads/day, and rail cars/day expected to be needed for the proposed remedy under both hydraulic and mechanical dredging scenarios (Tables 8-10a and 8-10b, Appendix H). Analyses of resuspension anticipated to occur during dredging (Section 8.5.2.5, Section 8.5.2.6, Appendix E.6). Detailed summaries of the equipment requirements (including transfer facilities, dredges, barges, rail and truck) for implementation of the preferred remedy under mechanical dredging, hydraulic dredging and beneficial use scenarios (Appendices I.7, I.8 and I.11). The FS also included two appendices that discuss habitat replacement and riverbank restoration to be implemented following dredging (Appendix E.8 and Appendix F). Information contained in sections of the FS such as those sections cited in this paragraph provided the public with a basis to provide meaningful comments on the noise, odor, and other potential short-term impacts of the preferred remedy. EPA’s evaluation of the short-term impacts of the preferred remedy is presented in Section 8.5.2.5 of the Feasibility Study. Section 9.5 of the FS presents a comparison of the potential short-term impacts of each remedial alternative that was evaluated in the Detailed Analysis of Alternatives (FS Chapter 8). In accordance with CERCLA and the NCP, EPA evaluated and compared the potential short-term impacts of remedial alternatives, including:
• Short-term risks that might be posed to the community during implementation. • Potential impacts on workers during implementation. • Potential adverse environmental impacts resulting from construction and implementation. • Time until remedial response objectives are achieved (40 CFR § 300.430(e)(9)(iii)(E)).
The FS also describes ways in which potential short-term impacts of remedial alternatives, including impacts to the community, workers, and the environment, could be mitigated during implementation of the remedy (FS, Section 8.5.2.5). For example, the discussion of short-term effectiveness of REM-3/10/Select includes an analysis of potential adverse environmental impacts, including PCB resuspension, that may result from construction and implementation of that remedial option, and measures that would be taken to minimize such impacts. Additional analysis of resuspension is provided in FS Appendix E.9 (Technical Memorandum: Semi-Quantitative Assessment of Water Quality Impacts Associated with Dredging Activities), and a discussion of turbidity barriers available to control the migration of resuspended materials is discussed in Appendix E.5 (Technical Memorandum: Applicability of Turbidity Barriers for Remediation). Proposed measures to restore the river bottom after dredging are discussed in detail in Section 5.2.6 (Backfilling and Site Reconstruction), Appendix E.8 (Technical
1-42
Responsiveness Summary Hudson River PCBs Site Record of Decision
Memorandum: Habitat Replacement/River Bank Restoration Concept) and Appendix F (Habitat Replacement Program Description). Transportation risks associated with the preferred remedy are addressed in Sections 6.2.4.2 (acknowledging risks associated with transportation of contaminated materials) and 8.5.2.5 (road traffic, barge traffic). The analysis of alternatives in the FS is consistent with EPA’s Guidance for Conducting Remedial Investigations and Feasibility Studies under CERCLA (OSWER Directive 9355.3-01, 1988) (RI/FS Guidance), and provides the Agency with "information sufficient to support an informed risk management decision regarding which remedy appears to be appropriate" for the Site (RI/FS Guidance at 1.1). The detailed information requested by some commenters in their responses to the Proposed Plan, including information concerning the specific State, county, and local roads that will be used in connection with implementation of the remedy, the rail lines to be employed to transport sediment from the treatment facilities to the disposal facilities and to transport backfill, and specific information concerning potential noise, "nuisance-level odor," and artificial lighting at the transfer facilities, is considerably beyond what is required for a feasibility study. Analysis of specific noise, odor, and lighting impacts would require EPA to (i) determine the location of potential transfer facilities prior to selection of the remedy, because noise, odor, and lighting impacts will depend on the locations of receptors in relation to the facilities, and then (ii) design each of the facilities, since the air, odor, and light emissions from the facilities also are contingent upon their design. As stated previously, such information is appropriately developed during "remedial design," which is the post-ROD "technical analysis and procedures which follow the selection of remedy for a site and result in a detailed set of plans and specifications for implementation of the remedial action" (40 CFR § 300.5). Moreover, in view of the public’s expressed interest in the locations of the proposed transfer facilities, EPA believes it would be more appropriate to determine the location(s) of the sediment processing/transfer facility(ies) in conjunction with a public process that the Agency will provide during remedial design. In Chapter 8 and in several white papers of this Responsiveness Summary, EPA has provided analyses of noise, light, and other potential impacts of example transfer facilities in order to respond to public comments relating to such potential impacts. While the assumptions in the white papers regarding processing/transfer facility design are representative of the facility(ies) required to implement the selected remedy, EPA will not determine the final location(s) of these facility(ies) until after the ROD is issued, and after the public process as described in the ROD. EPA also will not finalize the design of the facility(ies) until after the Agency, as a matter of policy, accepts public input on design aspects of the facility(ies) related to potential noise, lighting, and other impacts, as also described in the ROD. Moreover, as also stated previously, it was not necessary for the FS to identify specific location(s) for the processing/transfer facility(ies) that would be used for the targeted dredging remedy called for by the Proposed Plan. Prior to issuance of the Proposed Plan, EPA conducted a survey of properties along the Upper Hudson River to determine whether there is land available that would meet necessary engineering criteria should EPA select a remedy that requires the siting of a transfer facility(ies) (Memorandum entitled "Sediment Transfer and Processing Sites," prepared by TAMS Consultants, Inc. [January 17, 2001], a copy of which was made available to
1-43
Responsiveness Summary Hudson River PCBs Site Record of Decision
the public during the public comment period for the Proposed Plan, and which has been included in the Administrative Record for the Site). Evaluating the availability of processing/transfer facility locations, but not selecting such locations in the FS, is consistent with 40 CFR § 300.430(e)(9)(iii)(F), which requires EPA to consider, as appropriate, the availability of services and materials, including off-site treatment capacity, during a feasibility study, without requiring EPA to actually identify such facilities before a remedy is selected.1 In response to comments suggesting that the FS should have evaluated "soil/gravel mines necessary to implement the remedy," the FS did not include such an evaluation because, among other things, EPA believes that sufficient backfill material is available from existing commercial operations, and that no mines will need to be created for purposes of implementing the remedy (Response to Master Comment 653, Chapter 10). EPA’s community relations program for the Hudson River PCBs also complied with, and indeed far exceeded, the community relations requirements of CERCLA and the NCP. CERCLA and the NCP require the lead agency (in this case, EPA) to, among other things, publish a brief notice of a CERCLA proposed plan, make the proposed plan available to the public for comment for at least 30 days, and hold a public meeting at or near the Site during the public comment period (CERCLA Section 117(a) and 40 CFR § 300.430(f)(3)). For the Hudson River PCBs Site, EPA held more than 75 meetings to which the public was invited, including 11 public meetings for the Proposed Plan. The Agency also accepted public comments on nine Reassessment Remedial Investigation reports (not including the FS), and issued responsiveness summaries in which EPA responded to public comments received on those reports. EPA disagrees with comments suggesting that the FS did not contain sufficiently detailed information concerning the preferred remedy for members of the public to provide meaningful comments on potential noise, odor, light, transportation, and environmental impacts of the preferred remedy. The FS includes, for example, proposed design requirements of transfer facilities (Section 5.2, Figure 5-1, Appendix E.9, Appendix H); the number of dredges, barge loads/day, and rail cars/day expected to be needed for the proposed remedy under both hydraulic and mechanical dredging scenarios (Tables 8-10a and 8-10b, Appendix H); analyses of resuspension anticipated to occur during dredging (Section 8.5.2.5, Section 8.5.2.6, Appendix E.6); as well as detailed summaries of the equipment requirements (including transfer facilities, dredges, barges, rail, and truck) for implementation of the preferred remedy under mechanical dredging, hydraulic dredging and beneficial use scenarios (Appendices I.7, I.8, and I.11). The FS also included two appendices which discuss habitat replacement and river bank restoration to be implemented following dredging (Appendix E.8 and Appendix F). Information contained in sections of the FS such as those cited in this paragraph provided the public with a basis to provide meaningful comments on the noise, odor, and other potential short-term impacts of the preferred remedy.
1 EPA expects that the sediment processing and transfer facility(ies) will be considered "on-site" for purposes of the NCP and CERCLA Section 121(e)(1), 42 U.S.C. § 9621(e)(1). See 40 CFR 300.400(e)(1) (“The term on-site means the areal extent of contamination and all suitable areas in very close proximity to the contamination necessary for implementation of the response action.”) and FS Section 8.5.2.6.
1-44
Responsiveness Summary Hudson River PCBs Site Record of Decision
One comment argues that the Reassessment RI/FS should have included detailed data regarding the extent of submerged aquatic vegetation (SAV) in the Upper Hudson River in order to evaluate and inform the public of the potential environmental impacts that could result from destruction of significant amounts of SAV as a result of the preferred remedy. This comment further argues that a lack of detailed data concerning the extent of SAV in the Hudson “undermines EPA’s analysis” of potential impacts to SAV and the feasibility of restoring it, and that the functional equivalence doctrine and CERCLA require that [such data] be made available for public comment before a decision is made, not after” (emphasis in original). In the FS (Section 5.2.6.3), EPA acknowledges that active remediation of river sediments may result in impacts to aquatic habitat, including loss of submerged plant communities, and includes a proposal to replace SAV and other habitat following remediation (FS, Appendix E.8, Habitat Replacement/River Bank Restoration Concept Development, and Appendix F, Habitat Replacement Program Description). The level of detail presented in the FS concerning potential removal of SAV and the Agency’s habitat replacement program presented in the FS provide sufficient information upon which the public was able to submit meaningful comments on potential impacts to SAV that may result from remediation. Moreover, the level of detail in the FS concerning potential impacts to SAV and available restoration measures provide sufficient information to support an informed risk-management decision for the Site, consistent with the NCP and EPA policy (e.g., the RI/FS Guidance). EPA has determined that remedial alternatives that do not include active remediation of PCB-contaminated sediments are not sufficiently protective of human health and the environment at the Site. Further, the potential impacts to SAV can be minimized through appropriate restoration measures (FS, Appendix F). Consequently, EPA has determined that the potential impacts to SAV from the preferred remedy, which can be minimized, are substantially outweighed by the remedy’s benefits to human health and the environment, and do not justify the selection of a remedy such as MNA that provides substantially less protection of human health and the environment. EPA has provided additional information concerning potential impacts to SAV, and measures available to replace SAV that is removed during remediation, in Chapter 9 of this Responsiveness Summary. Master Comment 313388 Many commenters expressed opposition to EPA's Proposed Plan, including some Hudson River area residents and activist groups, the PRP, elected officials, businesses, and organizations. Response to Master Comment 313388 EPA acknowledges all the comments in opposition to its Proposed Plan. The Agency encourages all interested parties to remain involved and continue to provide frank and candid comments during the post-ROD community interaction program.
1-45
Responsiveness Summary Hudson River PCBs Site Record of Decision
Master Comment 313333 Commenters suggested that EPA should provide at least two technical assistance grants (TAGs) so that different or divergent viewpoints can provide input. Issuance of a TAG grant to a downriver environmental group was evidence that EPA's public outreach/participation program did not sufficiently include Upper Hudson River communities. Response to Master Comment 313333 No more than one TAG grant may be awarded for any site (40 CFR § 35.4085(c)). EPA announced the availability of a TAG grant at the first "kick-off" meeting on the Reassessment held in Saratoga Springs in December of 1990. EPA's Community Relations Coordinator for the Site discussed the availability of the TAG with members of Upper Hudson/TI Pool-area communities throughout the seven-year period before the grant was issued to Scenic Hudson and repeatedly encouraged groups to consider submitting an application. Scenic Hudson applied for and was issued a TAG in 1997, a full seven years after its availability was announced. Additionally, upon receiving Scenic Hudson’s TAG application, EPA, in accordance with federal requirements, published public notices in Hudson Valley newspapers announcing the application in order to give other groups an opportunity to apply or share in the grant with Scenic Hudson. No indication of interest in obtaining a TAG was ever made to EPA by Upper Hudson groups prior to issuance of the TAG to Scenic Hudson. Master Comment 713 A commenter argued that EPA proposes a massive data collection and analysis exercise as part of the remedial design for the project after it issues the ROD. In essence, EPA is attempting to conduct a new RI after it issues the ROD. This is a demonstration of the deficiency of EPA's work during the Reassessment and unlawfully deprives GE and the rest of the public of their statutory right to comment on the Agency's proposal. Had EPA collected the necessary data and conducted the required analysis, the only reasonable and supportable conclusion it could have reached would be that the adverse environmental and human health impacts of its project clearly outweigh its estimated benefits. Response to Master Comment 713 EPA has conducted the Reassessment RI/FS in accordance with the 1988 RI/FS Guidance and the Scope of Work for the Reassessment. EPA disagrees with the statements that it has not collected the necessary data or has not conducted the required analyses. EPA also disagrees with the statement that GE and the public have been deprived of their statutory right to comment on the Agency's proposal. Throughout the Reassessment, EPA's documents have been peer-reviewed and numerous public meetings have been held near the Site to allow full participation by GE, the public, and other interested parties. For the Proposed Plan and FS, EPA held a public comment period which initially ran from December 12, 2000 to February 16, 2001, and was extended until April 17, 2001 in order to accommodate the significant public interest expressed on EPA’s proposed remedy. EPA held eleven public meetings throughout the region during the comment
1-46
Responsiveness Summary Hudson River PCBs Site Record of Decision
period. This is not typically done for most Superfund sites. The various Reassessment reports have also been posted on EPA's Hudson River PCBs website. EPA made sufficient information available in order for the public to provide meaningful comments on EPA’s Proposed Plan (Response to Master Comment 313728, above) . The future data collection referred to in the FS and this comment is not for the purposes of conducting another RI. The pre-design field studies as described in the FS are typically conducted at most Superfund sites after the ROD is signed; for example, to determine exact limits of contamination for preparing specifications for removal (excavation, dredging) operations. The same process will be followed by the Agency for this Site. EPA also disagrees with the premise of the comment that the adverse environmental and human health impacts of EPA's proposed remedy will outweigh the benefits. EPA's extensive analyses, which have been presented in the entire series of Reassessment RI/FS documents, including the environmental and human health risk assessments and the FS, clearly show that the long-term benefits far outweigh any short-term adverse impacts Responses to Master Comments 421 and 485 in Chapter 11. This view is also supported by the Trustees of this natural resource, NYSDEC, NOAA, and the US Fish and Wildlife Service (USFWS). Master Comment 471 Several commenters argued that EPA's public outreach/participation program has failed. According to the comments: EPA has failed to meet public outreach benchmarks of open-mindedness, keeping the public fully informed, inspiring confidence, fostering a reasonable dialogue between the Agency and those affected by the Proposed Plan, and providing the public with enough detail to allow meaningful comment. EPA did not consult with Water Commissioners of the Town of Waterford as part of the community interviews required by 40 CFR § 300.430(c)(2)(i). The Upper Hudson communities, including members of the agricultural community, were deprived of their right to have a voice in the remedy selection process. The Agricultural Liaison Group was burdened with review of technical studies far removed from agricultural issues or concerns, and attempts to provide meaningful input were diffused by EPA. EPA is being coerced by the downstate lobby of environmental elitists who have no personal or economic stake in the local impact of dredging. Only two of EPA's eleven meetings to take comment on the Proposed Plan were held near the affected communities. EPA's press conferences to announce findings at major milestones were not open to the public, and were held only hours before the public meeting so the public had no time to understand or formulate questions on the information delivered. Responsiveness summaries may or may not contain responses to specific questions, and often misconstrued questions.
1-47
Responsiveness Summary Hudson River PCBs Site Record of Decision
EPA is determining how the Upper Hudson will be managed for at least a decade, and it is doing so without understanding the wishes of those who should benefit from the management. There was no informative dialogue with the public; EPA made no effort to learn from the citizens those things that only those who use the Upper River and live near it could tell the Agency. The public, including GE, was limited to providing “passive” input on terms unilaterally established by the Agency. Concerns of the elected officials within Saratoga, Washington, and Rensselaer Counties have been uniformly ignored. The Government Liaison Group's voices have not been heard or considered. An arrogant federal government agency has gone through the motions of a community involvement program in order to get to its pre-ordained "promised land" of a dredging project. Response to Master Comment 471 EPA's CIP has gone well beyond the requirements for community participation in Superfund. Throughout the 10 years of the Reassessment, EPA's CIP has provided an open and meaningful avenue of public participation for concerned parties. Particularly in reference to the liaison groups, numerous meetings were held with liaison group members in order to discuss and clarify technical issues. EPA has encouraged liaison groups to hold individual liaison group meetings, and several have done so, often inviting parties with opinions different from EPA's to give presentations and critique EPA's work. The agricultural community has been especially active via the Agricultural Liaison Group, providing public comment on every major EPA report. EPA actively solicited agenda items from this group, as well as from the other liaison groups, for discussion at Liaison Group, Steering Committee, and Hudson River PCBs Oversight Committee (HROC) meetings. The Agricultural Liaison Group brought many of their specific issues to the fore at those meetings. EPA has also encouraged the group to meet on their own; the group has often done so, with EPA providing support in the form of mailing out meeting announcements to the membership at large. EPA is committed to equal treatment of all interested parties through the CIP, and offered the same opportunities for involvement to environmental organizations as to agricultural groups. In addition, while the agricultural community cites concerns of negative impacts stemming from a clean up project as their economic "stake" in the Hudson – environmental organizations cite the loss of the commercial fishery in the Hudson south of Troy and the negative impacts to commerce and tourism due to health advisories on sportfishing in that portion of the river. EPA held a total of eleven public meetings after the issuance of the Proposed Plan. Because the Site is delineated as the Hudson River from its outfall at Hudson Falls to the Battery in New York City, these public meetings were located throughout the delineated geographic area. As the upper 40 miles of the Hudson River is the area specifically being considered for remediation, five of these meetings were in Albany, New York, or areas to the north. Two meetings were held in Washington County, and one each in Saratoga, Albany, and Rensselaer Counties. It should also be noted that, throughout the project, EPA has held more than 75 public forums and numerous
1-48
Responsiveness Summary Hudson River PCBs Site Record of Decision
individual interviews with members of the community, especially in Washington and Saratoga Counties. Also, public comment has been taken on all major reports issued by EPA throughout the Reassessment, as opposed to taking comment only with the issuance of a Proposed Plan, which is usual in the Superfund process. EPA held press conferences open to members of the press and elected officials, including an elected official who is a member of the Agricultural Liaison Group. The press conferences were conducted to enable EPA to clearly explain its findings and supporting data and to take questions from the press. Although the general public was usually not invited to the press conferences, public meetings were held shortly afterward on the same day and public availability sessions were often scheduled for a week or two later so that the public could have time to read the report in question, digest the information given at the meetings, explore the reports in detail, and then speak with EPA individually regarding specific concerns and questions. In accordance with 40 CFR 300.430(c)(2)(i), EPA conducted numerous interviews with “local officials, community residents, public interest groups, [and] other interested parties, as appropriate, to solicit their concerns and information needs” concerning the project, and to learn how and when citizens would like to be involved in the Reassessment. EPA regularly engaged the citizens of the Upper Hudson via the CIP for the ten-year duration of the Reassessment, with the bulk of CIP membership residing in the Upper Hudson community. This engagement took a number of forms – in addition to the over 75 public forums previously mentioned, EPA conducted dozens of individual community interviews with community members in their homes, on their farms, at local restaurants, at county offices, and even at the Washington County Fair. A Water Commissioner of the Town of Waterford joined EPA’s Citizens Liaison Group early in the Reassessment, and has remained on EPA’s mailing list for the Site since that time. EPA sends notices of public meetings to all Liaison Group members, and regularly published notices of public meetings in the Albany Times Union and Schenectady Gazette, both of which are available in Waterford. GE was included in the outreach program throughout the Reassessment, and was represented on and frequently made presentations at both Hudson River PCBs Oversight Committee and Scientific and Technical Committee meetings. GE has often spoken at individual meetings of specific liaison groups for which EPA provided mailings of meeting notices on behalf of the Liaison Group involved, mentioning GE as a guest speaker. Elected officials at all levels throughout the Hudson Valley have been encouraged to participate in the Reassessment process. Many, in fact, have provided input to EPA during the project. EPA has met with many elected officials from the local level to State and federal representatives, and has specifically sought out officials from Washington and Saratoga Counties. A number of elected officials, particularly from northern counties, are members of the Governmental Liaison Group, although many chose not to participate actively in CIP meetings during the Reassessment. It should also be noted that despite criticisms of the CIP by some liaison group members, there are other liaison group members who support the CIP process. EPA has given serious consideration to all public comments on the FS and Proposed Plan, as well as public comments submitted during the earlier public comment periods for the Reassessment. Also, as noted in Master Comment 445, some commenters commended EPA’s community outreach program during the Reassessment.
1-49
Responsiveness Summary Hudson River PCBs Site Record of Decision
Master Comment 433 One commenter argued that EPA failed to achieve goals of the draft Public Participation Policy. According to the comment, EPA did not (i) foster a spirit of mutual trust, confidence and openness between the Agency and the public; (ii) fulfill legal requirements imposed by CERCLA and the NCP; (iii) provide the public with information at a time and in a form that it needed to participate in a meaningful way; (iv) keep the public informed about significant issues; or (v) understand public goals and concerns, or was not responsive to them. Response to Master Comment 433 EPA disagrees with this comment. As previously discussed in Response to Master Comments 313728 and 429, EPA has conducted an open process since the beginning of the Reassessment, regularly providing information on the project to the public through numerous reports, meetings, mailings, and fact sheets. EPA encouraged public comment throughout the project and, in fact, added new work and changed planned work at times based on those comments. The issues EPA addressed and presented to the public through the FS stage of the process fully met, and indeed far exceeded, the public participation requirements of CERCLA and the NCP. Additional issues naturally associated with the design phase, and concerns and questions raised by the public during the comment period on the Proposed Plan that concern the remedial design, will be addressed as part of that process. Master Comment 429 Commenters contended that the FS does not contain a coherent description of the project; information appears to be disorganized, contradictory, and, in some cases, missing. Some say EPA's description of the project at public hearings has varied from its written description, causing confusion; if the statements at the public meetings are intended to modify the Agency's proposal, then EPA is not providing adequate notice and opportunity for full and informed public comment on its proposal. Response to Master Comment 429 It is possible that oral remarks differed in presentation from written statements in the FS or Proposed Plan; many questions were asked that required answers that went beyond or built upon the written report. Some of the clarifications provided during the public meetings, such as the decision not to use trucks to transport backfill materials within the Upper Hudson River area, or to transport dewatered sediments for off-site disposal, were made in response to public comments. The basic information and conclusions noted at the public meetings, however, were consistent with the FS Report and Proposed Plan. During the four-month public comment period, EPA did not announce any significant changes to the scope, performance, or cost of the preferred remedy that would have impaired the public's ability to submit informed comments on the Proposed Plan.
1-50
Responsiveness Summary Hudson River PCBs Site Record of Decision
The FS and the Proposed Plan were based in part on Phase 1 and Phase 2 work performed for the Reassessment. EPA provided the public with a continual flow of information on all work throughout Phases 1 and 2, in the form of reports, meetings of all types, fact sheets, telephone conversations with individual members of the public, press releases, and information repositories. In addition to the formal public comment period associated with the Proposed Plan, EPA has encouraged comment throughout the project so that the Agency could be aware at all times of any concerns, questions, or need for clarification raised by the public. EPA disagrees with comments arguing that the FS Report was not coherent. The FS Report was prepared in accordance with EPA's RI/FS Guidance. Master Comment 377 Commenters argued that there is no justification for abandoning the 1984 Record of Decision. They claimed that EPA must demonstrate that new information or conditions have fundamentally changed the basis for EPA’s 1984 decision. The reasons that EPA gave to reject dredging in 1984 remain true today. The selected remedy will cause environmental devastation, the effectiveness and feasibility of dredging technology continues to remain unproven, the feasibility of constructing materials handling facilities remains as unlikely today as it was in 1984, and PCB levels in fish, water, and sediment continue to decline. Response to Master Comment 377 EPA believes that No Action is no longer the appropriate remedy for PCB-contaminated sediments in the Upper Hudson River. EPA has determined that remedial alternatives that do not include active remediation of PCB-contaminated sediments in the Upper Hudson River are not sufficiently protective of human health and the environment. It has been approximately 17 years since the 1984 ROD was issued, and yet PCB levels in fish at the Site continue to remain at levels which present unacceptable risks to human health and the environment. The geochemical, mathematical modeling, risk assessment, and other studies performed for the Reassessment Remedial Investigation, and the evaluation of remedial alternatives and other analyses in the Reassessment Feasibility Study, provide reasoned bases for EPA’s determination. Reasons cited in the 1984 ROD in support of the interim No Action decision do not justify a No Action remedy for the sediments in the current ROD. Among other things, there are dredging technologies currently available that can effectively remove PCB-contaminated sediments without causing excessive resuspension of contaminants (FS, Section 4.2.6.2 and Table 4-7, responses to comments in Chapter 10 of this Responsiveness Summary, and White Paper - Remobilization of PCBs during Dredging), and operational controls and sediment resuspension barriers can further limit resuspension and the downstream migration of PCBs during dredging (FS, Section 8.5.2.6, Appendix E.5); PCB levels in fish remain at unacceptable levels, are not declining at the rapid rate seen in the late 1970s and early 1980s, and will not reach acceptable levels under either continued No Action or MNA within a reasonable time frame (FS, Section 1.3.5, Section 8.2, Section 9.1, Appendix D); and EPA has determined that the siting of necessary dewatering/transfer facilities is technically and administratively feasible (FS Section
1-51
Responsiveness Summary Hudson River PCBs Site Record of Decision
8.5.2.6, ROD Section 11.6). There also is sufficient capacity at off-site landfills to accept sediments dredged from the Upper Hudson River (FS, Section 8.5.2.6, Appendix E.11). In addition, the targeted dredging required by the selected remedy will not be “ecologically devastating” to the river. As explained in the FS (Sections 5.2.6 and 8.5.2.5, Appendix E.8, Appendix F), the ROD (Section 11.5), and responses to comments in Chapter 9 of this Responsiveness Summary, EPA believes that effective habitat restoration measures can be implemented following dredging. EPA also notes that the referenced statement in the 1984 ROD that “bank-to-bank dredging could be environmentally devastating to the river ecosystem and cannot be considered to adequately protect the environment" is taken from a discussion of the "option of bank to bank dredging of the entire river" (emphasis added). The selected remedy does not call for bank-to-bank dredging of the entire Upper Hudson River, but instead calls for targeted remediation of about 12.6 percent (approximately 493 of 3,900 acres) of the Upper Hudson River bottom. The 1984 ROD’s discussion of a more limited dredging program – in which 20 to 40 of the NYSDEC hot spots would be removed – did not raise similar concerns about environmental damage from dredging. 1.3.1 Peer Review Process Master Comment 465 Commenters noted that the peer review criticisms (of the Ecological Risk Assessment) were based on the fact that there were insufficient data. This has since been addressed by new NYSDEC data that supports EPA's conclusions. Response to Master Comment 465 Peer reviewers generally felt that more data should have been included in the Baseline Ecological Risk Assessment (USEPA, 2000a). To address this concern, the discussion of ecosystems/ecological resources of the Hudson River was expanded in the Revised Baseline Ecological Risk Assessment (RBERA) (Section 2.1; USEPA, 2000b) and new data from USFWS/NYSDEC were added (USEPA, 2000b, Sections 5.5.3.1 and 5.8.3.1). Additional avian and other ecological data are expected from USFWS/NYSDEC in the future. At the time that the RBERA was released (November 2000), NYSDEC preliminary mink and river otter data were not yet released. These data may now be cited and are discussed in the response to comment 811 (Chapter 3). A comparison of the recently released NYSDEC data to National Academy of Sciences (NAS) toxicity reference values (TRVs) for total PCBs in otters shows that all river otters captured within five miles of the Hudson River exceeded TRVs (Responsiveness Summary Table 811-01). Two of these animals exceeded the LOAELs 20 to 40 times, and these high concentrations are observed in animals that were caught on land, closest to the river, rather than to a tributary. Responsiveness Summary Table 811-01 also shows a comparison of NAS referenced TRVs (Kannan et al., 2000) to measured PCB concentrations in
1-52
Responsiveness Summary Hudson River PCBs Site Record of Decision
mink liver from animals trapped within five miles of the Hudson River. Measured concentrations consistently exceeded the NOAEL, and two of the animals exceeded the LOAEL as well. References Kannan, K., A.L. Blankenship, P.D. Jones, and J.P. Giesy. 2000. Toxicity reference values for the toxic effects of polychlorinated biphenyls to aquatic mammals. Human and Ecological Risk Assessment 6(1):181-201. USEPA. 2000a. Response to Peer Review Comments on the Baseline Ecological Risk Assessment, Hudson River PCBs Reassessment RI/FS. Prepared for EPA Region 2 and USACE, Kansas City District by TAMS Consultants, Inc. and Menzie-Cura & Associates, Inc. November. USEPA. 2000b. Phase 2 Report, Further Site Characterization and Analysis, Revised Baseline Ecological Risk Assessment, Hudson River PCBs Reassessment RI/FS. Prepared for EPA Region 2 and USACE, Kansas City District by TAMS Consultants, Inc. and Menzie-Cura & Associates, Inc. November. Master Comment 467 A number of comments presented opinions on the peer review process:
• EPA’s peer review process did not provide a satisfactory method to ensure that the agency relied on the best science.
• The Agency “seriously constrained” the scope of the panelists’ review to a circumscribed
list of questions provided by EPA.
• The peer reviewers were not instructed to address what was the best science available to answer central questions, and were not permitted to review alternative hypotheses or science, such as GE’s mass-balance models.
• The panelists were not given an adequate opportunity to interact among themselves or
with the public.
• By having separate peer review panels review different reports, EPA limited the ability of the panels to understand the overall significance of what they were reviewing, or how individual reports may have conflicted with other Agency work.
• EPA did not tell the peer review panels that EPA’s and GE’s models demonstrate the
stability of the sediments and contradict the findings of the Low Resolution Sediment Coring Report.
1-53
Responsiveness Summary Hudson River PCBs Site Record of Decision
Several public comments suggest that EPA’s analysis was not “supported by scientific evidence,” while other public comments requested additional independent scientific review beyond that provided in the peer review process. Response to Master Comment 467 EPA disagrees with the criticisms of the peer review expressed in this comment. In accordance with the December 1998 and December 2000 editions of EPA’s Peer Review Handbook, the purpose of the peer review was to have independent experts review EPA’s Phase 2 science in order to evaluate whether that science is technically adequate, competently performed, properly documented, and satisfies established quality requirements. (USEPA (2000a) at Section 1.2.3). The peer review accomplished this purpose. The peer review was never intended to be, and did not need to be, a forum in which reviewers would judge among several different scientific approaches to the Reassessment, or to offer advice on how they might have conducted the Phase 2 scientific analyses differently. Nevertheless, the expert panelists for the Revised Baseline Modeling Report (RBMR) peer review were provided with copies of GE’s modeling for use as background information, in case the reviewers thought that consideration of GE’s modeling report would assist their review of the RBMR. While EPA did not ask the panelists to review GE’s modeling report as part of their review, EPA never instructed the reviewers not to review GE’s report or any other materials that they believed would assist in their review of EPA’s science. We also note that, after EPA publicly announced the names of peer review panelists, GE sent materials to them with a request that they consider GE’s information as part of their review. EPA also placed absolutely no constraints on the ability of the panelists to interact among themselves. EPA also provided the public with an opportunity to make presentations to each of the peer review panels. A five-minute time limit for individual public presentations was sufficient time for the public to express opinions to the panels without taking away time needed for the panelists to perform their work. EPA’s request that the peer review panelists respond to a list of specific charge questions is a normal procedure for scientific peer reviews, and is consistent with EPA’s peer review policy (Section 3.2). The public was invited to submit proposed charge questions to EPA for consideration before the final charge questions were developed. In addition, each of the panels was given an "open" charge question in which they were invited to address other issues that were not specifically included in their respective charges. We therefore disagree that EPA "seriously constrained" the scope of the panels’ reviews. The statement in one comment that "[w]hen the panel members had questions about the reports, EPA typically refused to provide answers" is inaccurate. EPA and its consultants responded to essentially all requests for clarification from the panels. The peer review panelists were selected from pools of qualified candidates by Eastern Research Group, a private firm that conducted the peer review under a contract with EPA. Each of EPA’s Phase 2 Reports covers a range of scientific topics, and it is not reasonable to expect each peer review panelist to be an expert on every subject addressed in the reports. However, each panelist was a qualified expert in issues addressed by reports that they reviewed, and each of the Peer
1-54
Responsiveness Summary Hudson River PCBs Site Record of Decision
Review panels as a whole provided a thorough review of the issues addressed by the charge for each peer review. In addition, each of the Phase 2 Reports addresses discrete issues that we believe were competently addressed by the respective peer review panels, without the need for the same experts to participate in multiple panels. Nevertheless, continuity among panels was provided by several independent experts who served on more than one peer review panel (Dr. Per Larsson [Geochemical and Revised Baseline Modeling Report peer review panels]; Dr. Ellen Bentzen [Modeling Approach and Revised Baseline Modeling Report peer review panels]; and Dr. Ross Norstrom [Revised Baseline Modeling Report and Ecological Risk Assessment peer review panels]). EPA also disagrees with the comment that the peer review panel for the Revised Baseline Modeling Report was not asked to address the consistency of the findings of the Revised Baseline Modeling Report and the Low Resolution Sediment Coring Report with respect to sediment stability. Charge Question 11 for the Revised Baseline Modeling Report peer review specifically asked the reviewers to comment on whether there is "an inherent conflict between the modeling and the [Low Resolution Sediment Coring Report] conclusions [with respect to sediment stability in the Thompson Island Pool], or whether the differences are attributable to the respective spatial scales of the two analyses." In a presentation to the Revised Baseline Modeling Report Peer Review Panel, a GE consultant also argued that the Low Resolution Sediment Coring Report is "inconsistent with the [Baseline Modeling Report’s] finding that ‘‘PCBs are being buried’’ without a 'significant redistribution of PCB inventory'" (USEPA, 2000b, Appendix F). The experts did not find any significant inconsistencies between EPA’s modeling and the Low Resolution Sediment Coring Report. EPA is confident that its decision is found on firm scientific evidence. This scientific evidence has been reviewed and validated by an extensive peer review process. Where shortcomings were identified during the peer review process appropriate changes have been made and documented in the responses to peer review recommendations. Selection of a remedy for this Site did not require additional independent scientific review beyond that already supplied in the peer review process. References USEPA 2000a, United States Environmental Protection Agency, Science Policy Council Peer Review Handbook, Second Edition (EPA 100-B-00-001) (December 2000)
USEPA 2000b, Report on the Peer Review of the Revised Baseline Modeling Report for the Hudson River PCBs Superfund Site. Prepared for EPA Region 2 by Eastern Research Group, Inc. May 10.

Responsiveness Summary Hudson River PCBs Site Record of Decision
2-1
2. BACKGROUND AND REMEDIAL INVESTIGATION Master Comment 459 One comment said that GE has been released by NYSDEC from further responsibility for PCBs in the Hudson River in exchange for $4 million and commitments to eliminate use of PCBs and reduce discharges of PCBs. Response to Master Comment 459 The federal government was not a party to the 1976 settlement. The settlement is not binding on EPA or any other part of the federal government. 2.1 Sources of PCBs to the Upper Hudson River Master Comment 573 Commenters claim that the EPA did not adequately investigate the benefits of source control as a stand-alone remedy. Commenters also state that all sources should be identified and controlled prior to dredging or instead of dredging, and that the remnant deposits and sediments in the vicinity of the GE Fort Edward Plant discharge pipe (004 outfall) may be sources and should also be removed. Some contend that EPA should take a more aggressive approach in removing sediment sources. Commenters questioned the age and/or the concentration of the surface PCBs based on the degree (or lack) of dechlorination, as well as these PCBs acting as a source to the water column. Comments suggested that there is a large pool of PCBs underneath the Fort Edward site that is not planned for remediation and that EPA should add "and the two GE facilities" to the last sentence of section 1.3.2.6 (page 1-30) of the FS. Response to Master Comment 573 As noted in the Phase 1 Report (USEPA, 1991), EPA recognized the importance of upstream sources of PCBs from the outset of the Reassessment. However, recognition of these upstream sources does not invalidate the findings of the Reassessment RI/FS reports, which state that the sediments continue to release large amounts of PCBs. GE’s historical and ongoing discharge of PCBs from its capacitor manufacturing plants in Hudson Falls and Fort Edward that has contaminated the Hudson throughout its length and breadth. EPA has extensively documented the nature and magnitude of the sources upstream of Rogers Island. By requiring GE to monitor for PCBs at Rogers Island as well as locations upstream, a large database of information on PCB sources to the Upper Hudson has been established. This database represents over 10 years of monitoring results. Each of the Phase 2 sampling events examines PCB loads and concentrations originating above Rogers Island. From the analysis of these data as well as sediment coring results (USEPA, 1997), EPA has established that the GE facilities are the only significant external source of PCBs to the Upper Hudson. Additionally, the
Responsiveness Summary Hudson River PCBs Site Record of Decision
2-2
data suggest that the current loads at Rogers Island are primarily derived from contamination originating at the Hudson Falls facility. In particular, the dearth of dechlorination products in the samples and their close similarity to an unmodified mixture of Aroclors 1242 and 1254 (USEPA, 1997, Section 3.3) indicates that the PCBs found at Rogers Island represents unaltered PCBs. The most likely source of this material is the bedrock seeps of PCB-bearing dense non-aqueous phase liquid (DNAPL) found at the base of the facility. There is the possibility of other sources between Bakers Falls and Rogers Island such as the Fort Edward plant site and the remnant deposits but, based on hydrologic data, it is unlikely that these are currently as substantive contributors to the PCB load. These sources may become more significant to the load at Rogers Island subsequent to remediation of the river and improvements in source control in the vicinity of the GE Hudson Falls plant. Remediation of the Fort Edward 004 Outfall is being addressed by the State of New York. The identification of sources is also discussed elsewhere in Section 2.1 (Response to Master Comment 643). The remnant deposits represent older sediments contaminated with PCBs. These materials do not contain the fresh "Aroclor-like" material found in the water measured at Rogers Island. Thus they do not represent a substantive source to the Hudson. Indeed, in light of the measures taken to secure the remnant deposits, the only available pathway to the river from these deposits is via groundwater (with the possible exception of Remnant Deposit 1 [which has not been remediated/controlled/capped] during flood events). A groundwater pathway involving historical PCB deposits would not yield the patterns seen at Rogers Island. The remnant deposits (via groundwater) would be adding dissolved PCBs to the water column. The remnant deposits could be considered an “infinite reservoir” with respect to sediment-water partitioning; therefore the source would be constantly supplying the same PCB congener pattern. Therefore, if the remnant deposits were a significant source of PCBs at Rogers Island, a dissolved-phase pattern would dominate the entire PCB spectrum at this monitoring location. Data from Figure 3-43 of the Responsiveness Summary for the Low Resolution Coring (LRC) Report (USEPA, 1999) are reproduced as Figure 573-1. As shown in Figure 573-1, the patterns in the unfiltered sample and dissolved phase are not similar and therefore the remnant deposits cannot be considered a significant source of PCBs to the water column. Congener signatures are further discussed in Section 2.1 (Response to Master Comment 623). Due in part to the efforts of GE to stem the PCB leakage from the bedrock below the Hudson Falls facility, the total PCB load at Rogers Island from 1996 to 1999 represents just one-fifth of that originating from the sediments of the Upper Hudson between Rogers Island and Schuylerville. In fact, the annual load from the sediments as recorded by the regular monitoring at the TI Dam and Schuylerville is relatively consistent over the entire period of record, despite the occurrence and partial remediation of loads originating above Rogers Island. To illustrate the relative importance of the upstream source in controlling current conditions, Figure 5-1 from the Peer Review Responsiveness Summary for the Data Evaluation and Interpretation Report (DEIR) (USEPA, 2000) and LRC Report has been reproduced here as Figure 573-2. This figure clearly illustrates the small fraction of total PCB load currently contributed by the upstream sources, as well as the consistency of the sediment-derived loads. An initial analysis of data for 2000 suggests an even smaller contribution from upstream, with concentrations at Rogers Island largely non-detect and loads at TI Dam essentially unchanged.
Responsiveness Summary Hudson River PCBs Site Record of Decision
2-3
The importance of upstream source control has also been extensively evaluated via the use of the HUDTOX and FISHRAND models. The MNA Alternative was presented and discussed throughout the FS. This alternative was shown to reduce PCB exposure but not as effectively or efficiently as sediment remediation. Time to achieve acceptable levels in fish typically lagged by a generation (20 years) or more. The importance of upstream control has been further examined in two of the white papers provided in Volume 3 of this RS, White Papers – Model Forecasts for Additional Simulations in the Upper Hudson River and Trends in PCB Concentrations in Fish in the Upper Hudson River, in which one of the additional modeling runs eliminates the upstream source contribution (R14S0). When the upstream source contribution is set to zero ng/L of Tri+ PCB, it can be seen that recovery times are dependent on interactions between the sediments and the water column. Thus, EPA has extensively studied and considered the importance of the upstream load. As described in the FS, the selected remedy assumes control of the upstream source, at least to the level at which PCB concentrations in newly deposited sediments would be less than or equal to one mg/kg (1 ppm) Tri+ PCB in four inches of residual after dredging. As noted in White Paper – Relationship between PCB Concentrations in Surface Sediments and Upstream Sources, recently deposited sediments contaminated by sources upstream of Rogers Island are already close to this value (one to two mg/kg). Anticipated controls at the GE Hudson Falls facility and remediation in the vicinity of the Fort Edward 004 outfall should reduce this concentration within the next few years. EPA acknowledges the importance of further remediation of upstream sources and will work with NYSDEC and GE to control these sources. (Note that although current loads at Rogers Island produce sediments at 1 to 2 mg/kg Tri+ PCB, these concentrations do not represent current surface concentrations. High concentrations of PCBs from historical deposition are already found at the surface sediments in some locations. In addition, processes such as resuspension and biological activity serve to renew the surface sediment PCB inventory with more contaminated sediments from below. Hence, surface sediment Tri+ PCB concentrations are well above the one- to two-mg/kg levels generated by the load at Rogers Island. Similarly, it is these same processes that have maintained the PCB load from the sediments at a relatively constant annual level despite the large reduction in PCB loads from upstream. Based on the evidence from water column, sediment cores, and fish, the PCB loads from the sediments appear largely unabated since the late 1980s.) Given that current loads at Rogers Island yield sediments at 1 to 2 mg/kg Tri+ PCBs, complete control of these upstream sources is not necessary prior to sediment removal. EPA will consider remediation of other upstream sources if deemed appropriate at some future time. However, remediation of the other sources is not required prior to remediation of the Upper Hudson sediments. References US Environmental Protection Agency (USEPA). 1991. Phase 1 Report – Review Copy – Interim Characterization and Evaluation, Hudson River PCB Reassessment RI/FS. Prepared for USEPA Region 2 by TAMS Consultants, Inc. and Gradient Corporation. August.
Responsiveness Summary Hudson River PCBs Site Record of Decision
2-4
USEPA. 1997. Phase 2 Report, Further Site Characterization and Analysis. Volume 2C – Data Evaluation and Interpretation Report (DEIR), Hudson River PCBs Reassessment RI/FS. Prepared for USEPA Region 2 and the US Army Corps of Engineers (USACE), Kansas City District by TAMS Consultants, Inc., The Cadmus Group, Inc., and Gradient Corporation. February. USEPA. 1999. Responsiveness Summary for Volume 2C-A Low Resolution Sediment Coring Report (LRC Report), Addendum to the DEIR and Interpretation Report, Hudson River PCBs Reassessment RI/FS. Prepared for USEPA Region 2 and USACE, Kansas City District by TAMS Consultants, Inc., and TetraTech, Inc. February. USEPA. 2000. Response to Peer Review Comments on Volume 2C-(DEIR) and 2C-A-(LRC Report), Hudson River PCBs Reassessment RI/FS. Prepared for USEPA Region 2 and USACE, Kansas City District by TAMS Consultants, Inc. November 2000. Master Comment 617 Most comments agree that the ultimate source of the majority of the PCB load in the Upper Hudson River is the historical and continuing discharge of PCBs from the GE facilities at Hudson Falls and Fort Edward, although some focused on the role of the removal of the Fort Edward dam in releasing contamination to the remainder of the river. Several comments addressed the characterization of pre-1990 releases: e.g., downstream loads prior to the dam removal in 1973 were minimal; GE's PCB discharges were "almost all" Aroclor 1242 or Aroclor 1016. Other comments addressed the characterization of the releases in the 1990s associated with the failure of the gate structure at the Allen Mill, adjacent to GE's Hudson Falls plant: EPA did not adequately investigate the relationship of these releases to environmental PCB concentrations and did not demonstrate a sufficient understanding of the upstream releases to make a sound remedial decision. Finally, it was suggested that EPA has not adequately incorporated recent source control work by GE into the analysis and modeling. Response to Master Comment 617 EPA concludes that the vast majority of the PCBs within the Upper Hudson River are ultimately attributable to discharges from the GE facilities at Hudson Falls and Fort Edward, New York. The two GE plants began to use PCBs in the mid-1940s and discontinued their use in 1977. Throughout this period the facilities discharged large amounts of PCBs to the Hudson River concomitant to the capacitor manufacturing process (USEPA, 1991). The discharges were essentially unregulated until 1975, at which time GE received a permit to discharge 30 pounds of PCBs per day. Discharges during the period 1957 to 1975 are believed to have been of a similar magnitude. After 1977, PCB releases from the GE facilities continued, but were dominated by unpermitted releases, including erosion of contaminated soils and sediment, contaminated stormwater runoff, and seepage of PCB oils from bedrock. These releases are discussed in Section 2.2.1 of the FS. Response to Master Comment 643 in Section 2.1 of this Responsiveness Summary contains a discussion of other sources.
Responsiveness Summary Hudson River PCBs Site Record of Decision
2-5
Historical (pre-1990) releases of PCBs from the GE facilities are difficult to quantify, as releases prior to 1990 are not well documented and in-stream water column monitoring is relatively sparse. Evidence on the patterns of historic PCB release is provided by the high resolution dated sediment cores collected by EPA and others, as well as the water column monitoring data. The DEIR (USEPA, 1997) summarized available information and concluded that the vast majority of PCB mass in the Upper Hudson River was derived from the GE facilities, either by direct release or through the remobilization of material stored in contaminated sediments and ultimately derived from GE. Much of the PCB mass released by the GE facilities prior to 1973 was stored in the pool of the former Fort Edward Dam. A key event in the contamination of the Hudson River was the removal of the Fort Edward Dam in 1973, which facilitated the downstream movement of contaminated sediments. Unfortunately, neither the health risks associated with PCBs nor the extent of contamination in the former dam pool were well understood at the time the deteriorating dam was removed. It was not until after the dam removal that the extent of PCB contamination in the Hudson River was recognized. Several comments on the FS, each of which are addressed in the following paragraphs, reflect an inaccurate picture of the earlier PCB releases. One comment claimed that "almost all" of the PCBs discharged from the GE facilities were Aroclor 1242 or Aroclor 1016. This is incorrect. As discussed by Brown et al. (1984), purchase records show that the GE facilities used predominantly Aroclor 1254 up through 1955, and continued to use small amounts of Aroclor 1254 (five percent or less) through 1971. Aroclor 1254 contains a higher percentage of highly chlorinated PCB congeners than Aroclors 1242 and 1016. The presence of Aroclor 1254 in the sediments stored behind the Fort Edward dam and later released from the dam pool contributed to an enrichment of more highly chlorinated PCB congeners in the downstream sediments. The congener composition of the sediments does show that the total PCB loading was dominated by Aroclor 1242 and Aroclor 1016, but the presence of smaller amounts of Aroclor 1254 in the mix should not be overlooked. The dated sediment core at RM 177.8 near Stillwater shows surface sediments contain a mixture of congeners that is equivalent to a mix of Aroclors 1242, 1254, and 1260 in a ratio of 82:16:2 (USEPA 1997, p. 3-145). Another comment proposed that, "Until 1973, most of the PCBs discharged from the plants were trapped in sediments behind the Fort Edward Dam..." This characterization is also misleading. It is certainly true that massive quantities of PCBs were stored in sediments behind the Fort Edward Dam, but it is also clear that significant quantities of PCBs derived from the GE plants were transported downstream prior to 1973. As no water column monitoring is available for this period, the evidence comes from dated sediment cores. Dated cores from the TI Pool (Figure 3-53 in USEPA, 1997) confirm that peak total PCB deposition into the sediment occurred after the 1963 Cesium-137 maximum, and apparently coincides with scour of contaminated sediment after the removal of the Fort Edward Dam. PCBs are, however, present in deeper, older sediments, and the occurrence of detectable concentrations of PCBs coincides approximately with the detectable presence of Cesium-137, dateable to approximately 1954. The evidence thus shows that PCB discharges from the GE facilities were contributing to increased environmental concentrations of PCBs in the Hudson River
Responsiveness Summary Hudson River PCBs Site Record of Decision
2-6
downstream of the Fort Edward Dam from 1954 onward, in agreement with the earlier analyses of Bopp et al. (1982). More recent (post-1990) releases of PCBs from the GE facilities have been dominated by the discharge of PCB oils from the bedrock surrounding the GE Hudson Falls plant. Frequent monitoring at low detection limits for PCBs in the water column of the Upper Hudson was commenced by GE in 1991 and augmented by EPA's Phase 2 sampling effort in 1993-1994. As described in the DEIR, monitoring data at the upstream (Rogers Island) and downstream (TI Dam) ends of the TI Pool show that a large total PCB load originated upstream of the TI Pool. Additional monitoring, primarily by GE, between Rogers Island and Bakers Falls confirmed that this PCB load came primarily from the area of the GE Hudson Falls plant. Releases in this area reached a peak following the reported failure of a wooden gate structure in a tunnel at the Allen Mill, adjacent to the GE Hudson Falls plant, in September 1991. GE subsequently identified and photographed direct seeps of PCB oils into the river within the Bakers Falls plunge pool. Similar releases were also likely occurring before 1991, although sufficient monitoring or visual observation is not available to confirm specific events. A NOAA comment states that the important conclusion that upstream loads are dominated by the Hudson Falls source is poorly substantiated in the FS, and questioned whether loads might be in part derived from the remnant deposit areas. These issues are discussed in detail in the DEIR (USEPA, 1997) and Revised Baseline Modeling Report (RBMR, USEPA, 2000a), as well as by QEA (1999). EPA believes that the majority of the upstream load in recent years derives from the Hudson Falls facility, with only minor inputs from other sources between Bakers Falls and Rogers Island. Additional points of clarification on this topic are provided in the next paragraph. GE's investigations in the reach between the GE Hudson Falls facility and Rogers Island suggested that loads upstream of Rogers Island are primarily due to the Hudson Falls facility. Average total and Tri+ PCB concentrations are found to increase between the station above the remnant deposits (RM 196.8) and Rogers Island (RM 194.3), but this may be a result of incomplete lateral and vertical mixing of the PCB NAPL load from the Hudson Falls source before flow reaches the remnant deposits. EPA concurs with GE's assessment (QEA, 1999) that upstream loads are dominated by the Hudson Falls source, because the congener pattern at Rogers Island predominantly reflects a "fresh," unweathered Aroclor 1242 pattern and does not show the weathered pattern expected for release from the remnant deposits. This is in sharp contrast to the shift in PCB congener pattern seen across the TI Pool. EPA acknowledges that some additional PCB load could derive from the uncontrolled Remnant Deposit 1, but believes this is not a significant fraction of the total PCB load above Rogers Island (FS, Appendix A.3). GE states that EPA "failed to conduct the monitoring necessary" to test the hypothesis that most PCBs in the river derive from the GE plants. In fact, the point of view that GE discharges are the ultimate source of the vast majority of the PCBs in the upper Hudson River is espoused and documented by GE's consultants (c.f. QEA, 1999), and is implicitly reflected in numerous other GE comments that emphasize the benefits to be obtained through GE source control in this area. Further, EPA did not itself need to conduct the detailed monitoring necessary to prove this
Responsiveness Summary Hudson River PCBs Site Record of Decision
2-7
contention because GE did collect such data, and provided it to EPA. EPA's 1993 sampling generally confirmed the results reported by GE. The same comment also suggests that EPA has treated the upstream source "in an inconsistent fashion," claiming that it is recognized by EPA as important to an evaluation of the validity of the model, but is "considered of limited importance in evaluating the trends in PCB concentrations." EPA has clearly represented that the upstream source is important to both the model and observed trends through evaluations in the DEIR (USEPA 1997), RBMR (USEPA 2000a), and the FS. The existence of intermittent upstream loads presented a considerable challenge to model calibration, and was therefore addressed in detail in the RBMR (USEPA 2000a). Trends in fish and the environment below Rogers Island reflect both the upstream source and loading derived from contaminated sediments below Rogers Island. Upstream-downstream monitoring since 1991 (USEPA 1997, Section 3.4.4) demonstrates a strong and consistent load increase in water column total PCB concentrations across the TI Pool. One of the most notable observations for the period after the Allen Mill source was controlled (i.e., post-1994) is that upstream loads to the TI Pool decreased dramatically, but the total PCB load gain across the TI Pool, total PCB concentrations in water at the TI Dam, and the total PCB concentrations in biota did not exhibit commensurate decreases. Figure 617-1, PCB Load at Rt. 197 and Load Gain across the TIP (TI Pool), shows moving averages through estimates of upstream total PCB load at Rt. 197 and total PCB load gain across the TI Pool. These are derived from GE monitoring data through March of 2000 for the Rogers Island station at the upstream end of the TI Pool and the downstream station near TI Dam (TID-West). (It should be noted that there is some evidence that the load estimates derived from the TID-WEST station may be biased upward by about 17 percent or so (Response to Master Comment 623 in this section), but a correction for this bias, if needed, would not change the finding of a consistent load gain.) While the upstream total PCB loads into the TI Pool have decreased dramatically since 1993, the apparent total PCB load gain from within the pool has remained relatively stable, with some seasonal fluctuations. This discrepancy between upstream load control and environmental response is key to understanding the dynamics of PCBs in the Hudson River. These observations were taken into account in both the mass balance modeling and the geochemical analysis presented by EPA. In sum, EPA's analysis fully recognizes that the Hudson Falls source has a major effect on downstream fish concentrations, which is in agreement with GE's comment, but also recognizes that reductions in the upstream source do not provide a complete explanation of subsequent observations in water, sediment, and fish. EPA disagrees that this represents an "inconsistency" in the analyses. A related comment claims that "EPA appears to have made no specific evaluation of the results of GE work to date," and "does not appear to have made any adjustment to HUDTOX reflecting the fact that model calibration was made before GE source control was in effect." The first statement is simply incorrect: EPA worked closely with GE consultants, and made use of all data collected by GE that was provided to EPA in a timely enough fashion to incorporate it into the RBMR (USEPA 2000a). Response to Master Comment 627 in Section 2.7 contains further details.
Responsiveness Summary Hudson River PCBs Site Record of Decision
2-8
It is true that model calibration had to rely primarily on data that were collected prior to the completion of GE's source control efforts at the Hudson Falls site. This is a simple result of data availability, as the majority of monitoring data was collected during periods in which GE failed to control the continuing release of PCBs from the Hudson Falls plant. EPA did, however, validate the model to conditions through December of 1999, well after the major source control efforts were in place. EPA's HUDTOX model provided an excellent fit to observed water column Tri+ PCB concentration data for this period (USEPA, 2000b, Appendix A). The model thus performs well both during periods in which the upstream source is documented to be active (1991-1993) and during periods in which the upstream source was largely controlled (1995-1999). This validation exercise shows that EPA's model calibration is acceptable, and that further adjustments to the calibration to account for source control are not needed. References Bopp, R.F., H.J. Simpson, S.R. Olsen, R.M. Trier, and N. Kostyk. 1982. Chlorinated hydrocarbons and radionuclide chronologies in sediments in the Hudson River and Estuary. Environ. Sci. Technol., 16: 666-672. Brown, J.F., Jr., R.E. Wagner, D.L. Bedard, M.J. Brennan, J.C. Carnahan, and R.J. May. 1984. PCB transformations in Upper Hudson sediments. Northeastern Environmental Science, 3(3/4): 166-178. QEA. 1999. PCBs in the Upper Hudson River. Prepared for General Electric, Albany, New York by Quantitative Environmental Analysis, LLC. USEPA. 1991. Phase 1 Report – Review Copy, Interim Characterization and Evaluation, Hudson River PCBs Reassessment RI/FS. Prepared for USEPA Region 2 by TAMS Consultants, Inc. and Gradient Corporation. August. USEPA. 1997. Phase 2 Report, Further Site Characterization and Analysis. Volume 2C – Data Evaluation and Interpretation Report (DEIR), Hudson River Reassessment PCBs RI/FS. Prepared for USEPA Region 2 and USACE, Kansas City District by TAMS Consultants, Inc., The Cadmus Group, Inc., and Gradient Corporation. February. USEPA. 2000a. Phase 2 Report, Further Site Characterization and Analysis. Volume 2D – Revised Baseline Modeling Report (RBMR), Hudson River PCBs Reassessment RI/FS. Prepared for USEPA Region 2 and USACE, Kansas City District by TAMS Consultants, Inc., Limno-Tech, Inc., Menzie-Cura & Associates, and Tetra Tech, Inc., January. USEPA. 2000b. Response to Peer Review Comments on the Revised Baseline Modeling Report (RBMR), Hudson River PCBs Reassessment RI/FS. Prepared for USEPA Region 2 and USACE Kansas City District by TAMS Consultants, Inc., Limno-Tech, Inc., Menzie-Cura & Associates, and Tetra Tech, Inc., November.
Responsiveness Summary Hudson River PCBs Site Record of Decision
2-9
Master Comment 619 Comments presented opposing viewpoints as to whether the vast reserves of PCBs now stored within sediments of the river can be assured to remain sequestered from the food chain. For example, opposing comments were received that the stability of sediment PCB stores can/cannot be guaranteed and that there is/is not evidence of redistribution of buried PCBs into the bioavailable zone. Comments included the following:
• EPA’s argument for lack of stability is based on the LRC analysis, which is open to question, subject to statistical bias, and does not provide insight on sediment stability.
• Interpretation of water column data does not provide evidence of instability. • The "vast majority" of core data supports an interpretation that burial of PCBs is
widespread (and presumably assured to be irreversible). • Analysis of suspended sediment data does not indicate any significant change in bed
erosion since the early 1980s, and the PCB-containing sediments are therefore sequestered and stable.
• EPA's concerns over sediment stability are in contradiction to both the EPA and GE modeling results.
• Scour features interpreted from the side-scan sonar results cover a relatively small area and do not indicate any significant long-term instability.
Response to Master Comment 619 Commenters raised several issues concerning the "stability" of the sediments of the TI Pool, suggesting that if the sediments could be shown to be "stable," they would not pose a long-term problem. It is EPA's position, and that of the peer review panel that reviewed the DEIR and LRC Report, that the sediments of the Upper Hudson do not represent a secure location for the long-term storage of PCB contamination. This issue is independent of the physical nature of the sediments themselves, although, as shown below, there is evidence to suggest reworking of the sediments over time as well. EPA agrees that a significant proportion of the historically deposited PCB mass contained within Hudson River sediments is currently buried below the bioactive zone (an average depth of about 10 cm), and thus may not be actively contributing PCBs to the food chain at this time (Response to Master Comment 637, Section 2.3). There is also evidence that the TI Pool is, as a whole, net depositional. This means that on average, historical PCB-contaminated sediment should continue to be buried at a slow rate. However, a reach-averaged trend does not guarantee that all historically deposited PCBs in the sediment are sequestered from the food chain and can be guaranteed to remain sequestered from the food chain. There are several interconnected issues that must be addressed here:
• Reach-averaged versus point conditions. • Potential for future destabilization of buried deposits. • Stability of PCBs versus stability of sediment.
Responsiveness Summary Hudson River PCBs Site Record of Decision
2-10
Reach-Averaged versus Point Conditions The majority of comments on the issue of sediment stability appear to be based on the assumption that average conditions across a reach are applicable to all points within a reach. It is true that both the EPA and GE models suggest that most of the reaches of the Upper Hudson River are net depositional over time. This observation is borne out by the majority of the core data, which shows some sediment deposition over time. This does not mean, however, that PCB contamination is consistently being buried at all locations. For instance, both the EPA and GE models indicate significant variability in sediment scour/deposition patterns across the TI Pool. Further, neither PCB model has the spatial resolution or data support to accurately predict what happens at the scale of individual hotspots. Core Data Examples that demonstrate that not all historically deposited PCBs are being buried are readily available from the data. In 1998 GE undertook selective sediment sampling at a number of locations in the Upper Hudson (O'Brien & Gere, 1999). These included a large number of samples in the area near Hot Spot 14, opposite Griffin Island, which is one of the areas of the TI Pool where surface sediment concentrations were at their highest in 1984 (USEPA, 1997). GE sample BS-14F-200 (a composite of nine cores) showed total PCB concentrations of 129 mg/kg within the 0-2 cm top section. Of these PCBs, 72 percent were mono- and dichlorobiphenyls, indicating a strongly dechlorinated pattern. The combination of strong dechlorination and high concentrations compared to surface sediment in adjacent areas outside the hot spot (generally less than 15 mg/kg total PCBs) demonstrate that these concentrations are due to historically deposited PCBs. Similarly, at Hot Spot 8, sample BS-08F-200 had 42 mg/kg total PCBs in the 0-2 cm top section, of which 57 percent were mono- and dichlorobiphenyls. This sample was also subjected to radionuclide analysis, which found beryllium-7 to be non-detectable, indicating the lack of significant recent deposition. A sample from Hot Spot 10 (BS-10T-100) had 90 mg/kg total PCBs in the 0-2 cm top section, of which 72.9 percent were mono- and dichlorobiphenyls (radionuclides were not analyzed for this core). Similar results are also found downstream of the TI Pool. For instance, GE focused sample FS-28-1, taken below Lock 6, had 53 mg/kg total PCBs (54.3 percent mono- and dichlorobiphenyls) and no detectable beryllium-7 in the 0-1 cm layer. Thus even the relatively limited sampling undertaken by GE in 1998 demonstrates that dechlorinated, historically deposited PCBs remain at the surface in a number of the hot spot areas; this sampling does not show evidence of active burial. Comments received from Scenic Hudson support EPA's conclusions and summarize evidence that high PCB concentrations are not being universally buried in the river. GE comments state that a majority of the PCB inventory in the TI Pool ("greater than 80% [sic]") is buried below 10 cm, with only "about 20% [sic]" of the inventory in the top 10 cm. This conclusion is based on finely segmented cores that were purposely selected to be from consistently depositional areas where radionuclide chronologies could be established, and thus are biased toward areas of enhanced burial rates. These cores serve an important purpose in establishing the history of PCB contamination in the Upper Hudson, but are not representative of
Responsiveness Summary Hudson River PCBs Site Record of Decision
2-11
the TI Pool as a whole. In fact, they over estimate the fraction of the PCB mass that is buried below 10 cm because they are, by definition, located in consistently depositional areas. Further, even if the highly optimistic estimate that 20 percent of the fraction of the PCB inventory lies within the bioactive zone is accepted, this still amounts to an enormous mass of PCBs. The revised estimate of the Tri+ PCB inventory in the TI Pool in 1984 given in the FS is 14,500 kg (FS, p. 1-37), and 20 percent of 14,500 kg is still 2,900 kg (nearly 7,000 pounds). White Paper – Sediment PCB Inventory Estimates contains further details on the total PCB inventory in the TI Pool. It should also be noted that a long-term average net-depositional pattern does not mean that PCBs are sequestered from the surface. Where the net deposition occurs as a sequence of erosive and depositional events, the end result is a mixing of PCBs toward the new surface level. This fits with both GE's and EPA's observations from core data that the PCB and Cesium-137 maximum is rarely found at the sediment surface, but in many hotspot areas, concentrations of weathered PCBs at and near the surface remain above what would be expected if burial were an effective mechanism of natural attenuation. Side-Scan Sonar Data Figure 3-8 in the FS identifies lineated sediment structures in the TI Pool that were revealed in the side-scan sonar survey. These are interpreted as areas likely to have been undergoing active scour in the period preceding the survey. The comment is correct in stating that these areas appear to constitute a small portion of the total surface area of the TI Pool. On the other hand, the lineated features include some of the sediment areas with the highest observed surface sediment total PCB concentrations (e.g., Hot Spot 14), indicating that these areas should not be considered stable. In addition, the side-scan sonar results are a snapshot in time, representing the combined effects of hydrology and channel morphology in the period preceding the survey. The fact that an area did not exhibit lineated features in the side-scan sonar survey cannot be taken as an assurance that scour will not occur with other combinations of upstream flow and sediment load or following changes in channel morphology over time. Potential for Future Destabilization of Buried Deposits In many of the hotspot areas the maximum PCB concentration is found at a depth greater than can reasonably be assumed to be readily accessible to the food chain (i.e., greater than 10 cm depth). Further, both EPA's modeling (USEPA, 2000) and GE's modeling suggest that much of the PCB mass buried in cohesive sediments in the TI Pool is unlikely to be exposed by hydrodynamic scour at flood flows up to 47,330 cfs, which was the estimated 100-year flood based on past gage data. Some comments questioned whether the magnitude of the 100-year flood might actually be larger. In order assess this possibility more rigorously, an analysis of flood scour potential was conducted at a flow rate of 61,835 cfs (White Paper – Application of the Depth of Scour Model [DOSM] in the TI Pool for Alternative Flooding Assumptions). Modeling of this larger flood found only a small additional increase in sediment and PCB erosion beyond what might be expected for a reasonable range of annual peak flows.
Responsiveness Summary Hudson River PCBs Site Record of Decision
2-12
In evaluating these results, it is important to note that the model analyses address only hydrodynamic scour. Other factors can also uncover buried sediments. Among these are mechanical abrasion by ship grounding, ice scour and uprooting of macrophytes by ice in shallow waters, mechanical scour by submerged logs, sloughing of submerged banks along the canal dredge cut margin, and (non-remedial) engineering/construction activities. Several public comments also raised the possibility of alteration of bed stability by earthquakes. In addition, there is a risk that model predictions of stability under hydrodynamic scour may be incorrect. None of these factors is expected to affect large areas in any given year, but the cumulative effect over time could be important. In sum, although many of these buried deposits appear stable under current conditions, their future stability cannot be assured. Also, as previously noted, there is a small, but non-zero, probability that much larger flood events could occur in response to unusual weather events or, in the worst case, dam failure (although no such events are known to have occurred since the installation of the gaging stations in the 1970s). Even if highly unlikely, such events could remobilize large quantities of PCBs that are currently sequestered from the food chain and spread them throughout the Hudson River. Were such an event to occur, in the aftermath it would be even more difficult to recover and remove the toxins from the river than under current conditions Stability of PCBs versus Stability of Sediment Several of the comments make the assumption that stability of the sediments is equivalent to stability of the PCB stores within those sediments. This is not correct. Although PCBs are lipophilic and thus somewhat resistant to desorption, high PCB concentrations are found in sediment porewater. Results reported by GE (O'Brien & Gere, 1993) show total PCB concentrations in subsurface porewater up to 48 µg/L. As porewater can move in response to hydraulic head differences, the presence of high PCB concentrations in porewater provides a mechanism by which even deeply buried sediment may contribute to surface water. In addition, the movement of porewater through the sediment profile can replenish PCB concentrations in near-surface sediments. It is incorrect to conclude that stability of sediment ensures the stability of associated PCBs. The average rate at which PCBs move to the surface from buried sediments may be quite slow, however, due to retardation of the concentration breakthrough, relative to the flux of water, in response to sorption to organic carbon in the sediments. The slow rate of propagation of the PCB concentration in porewater flux has two consequences: (1) the porewater flux from deeper sediments to the water column under present conditions is likely to be small, but (2) the flux is likely to increase in future decades as porewater reflecting the concentrations in the older, more highly contaminated sediments reaches the surface. Stability and the LRC Analysis GE states that EPA's concern over the stability of sediments is based on the low resolution coring (LRC) analysis, and that the LRC analysis is statistically biased. The issue of potential bias in the LRC analysis is addressed in detail in Response to Master Comment 625 in Section 2.2. EPA has
Responsiveness Summary Hudson River PCBs Site Record of Decision
2-13
considered the comment and concluded that the findings of the LRC Report remain valid, but have been misinterpreted by various commenters. More to the point of this response, the analysis presented in the LRC Report is not the sole basis for EPA's concerns about stability of buried PCB stores, but only one among many lines of evidence. What the LRC analysis shows is that the total PCB mass present within many of the hot spot areas appears to have declined since 1984. GE rightly points out that the estimated amount of mass loss from the hot spots is greater than the estimated PCB mass transported downstream. EPA therefore concludes that lateral redistribution or spreading of PCBs is occurring in many of the hot spot areas. This localized instability is not unexpected: areas that are characterized as hot spots include locations in which large masses of contaminated sediment were deposited following the removal of the Fort Edward Dam, altering the bottom topography of the river. These areas cannot be expected to exhibit the same degree of long-term stability as the gradually deposited cohesive sediments that are more typical of the river as a whole. Evidence from Water Column Data GE states that comparison of high-flow rating curves at Stillwater and Waterford "suggests that no significant change in bed erosion has occurred since the early 1980s," and claims this as evidence that "bed instability following removal of the Fort Edward Dam is not supported by the data." EPA has reviewed the rating curve analysis conducted by GE, and finds that it does not support this conclusion. The areas contained within PCB hot spots in the TI Pool constitute a small portion of the total bed area of the Upper Hudson River, and the sediment loads observed at high flow at Stillwater and Waterford are largely representative of tributary sediment loads during high flow events, with only a small portion due to the erosion of all sediments within the TI Pool. As shown in Figure 6-16 of the RBMR (USEPA, 2000) the total sediment load at Waterford is more than five times the load at the TI Dam. Sediment load gain within the TI Pool accounts for only about six percent of the total sediment load at Stillwater and three percent of the load at Waterford. Therefore, the comparison of rating curves provides essentially no evidence relative to the stability of the hotspots within the TI Pool. GE states that high (total) PCB levels in the water column during the 1993 high flow event do not provide evidence that the sediment deposits are being eroded away, as they show a relatively undechlorinated pattern. EPA sampled two high flow events in 1993. Transect 3 represents a late winter transition from low flow to high flow, while Transect 4 represents spring flood high flow conditions. EPA agrees that PCB congeners observed in the 1993 Transect 4 samples are not dominated by erosion of historic dechlorinated sediments from the TI Pool. The 1993 sampling took place during a period of elevated releases from the Hudson Falls plant, and the Transect 4 high flow samples from the pool predominantly reflect the movement of these newly-released, undechlorinated PCBs from the Hudson Falls area. Flows were already elevated at the start of this sampling event, and most of the erosion of in-place sediments associated with this spring flood had likely already occurred on the rising limb of the hydrograph. Transect 3, collected in late winter, tells a somewhat different story. During this sampling event, the river flow was low when sampling occurred north of Schuylerville, but the flow increased for
Responsiveness Summary Hudson River PCBs Site Record of Decision
2-14
sampling at locations south of Schuylerville. PCB congeners observed in the water column in the TI Pool area exhibited a predominance of mono- and dichlorobiphenyls, reflecting releases from in-place, dechlorinated sediments. Between Schuylerville and Stillwater the total PCB load doubled during this event, but the homologue pattern was little changed and continued to reflect a dechlorinated pattern. Thus, this sampling event appears to show scour of historically deposited, dechlorinated PCB congeners from the sediments on the rising limb of the spring hydrograph. It should also be recalled, as previously, noted, that hydrodynamic scour at high flow does not appear to be the dominant factor in releasing PCBs from the sediments. Instead, it is under summer low flow conditions that the majority of weathered, historically deposited PCBs are released from the TI Pool sediments. A detailed analysis of the total PCB load gain from the TI Pool sediments is provided in Response to Master Comment 623 (Section 2.1). Both the consistency of the load gain and analysis of the dechlorinated congener signature of the summer load from the TI Pool indicate that PCBs are derived from buried sediments Summary EPA agrees that the majority of the sediment areas in the TI Pool are net depositional. However, certain highly contaminated areas are clearly not consistently depositional, as shown by the evidence from 1998 GE cores in Hot Spots 8, 10, and 14 cited in the foregoing text. Further, the presence of deposition does not ensure the stability and sequestration of the PCBs contained within the contaminated sediments. Evidence from multiple sources indicates that PCBs are not being safely buried to a degree sufficient to remove them from interaction with the Hudson River. There are also significant risks for future destabilization of buried PCBs by mechanisms other than hydrodynamic scour. EPA concludes that the sediments of the Upper Hudson do not represent a secure location for the long-term storage of massive amounts of PCB contamination. References O'Brien & Gere. 1999. 1998 Upper Hudson River Sediment Coring Program. Report to General Electric Company Corporate Environmental Programs, Albany, New York. O'Brien & Gere Engineers, Inc., January. O'Brien & Gere. 1993. Data Summary Report, Hudson River Project, Sampling and Analysis Program, 1991 Sediment Sampling and Analysis Program. Report to General Electric Company, Albany, NY. O'Brien & Gere Engineers, Inc., Syracuse, NY, May. USEPA. 1997. Phase 2 Report, Further Site Characterization and Analysis. Volume 2C - Data Evaluation and Interpretation Report (DEIR), Hudson River PCBs Reassessment RI/FS. Prepared for USEPA Region 2 and USACE, Kansas City District by TAMS Consultants, Inc., The Cadmus Group, Inc. and Gradient Corporation. February.
Responsiveness Summary Hudson River PCBs Site Record of Decision
2-15
USEPA. 2000. Phase 2 Report, Further Site Characterization and Analysis. Volume 2 - Revised Baseline Modeling Report, Hudson River PCBs RI/FS. Prepared for USEPA Region 2 and USACE, Kansas City District by TAMS Consultants, Inc., Limno-Tech, Inc., Menzie-Cura & Associates, and Tetra Tech, Inc. January. Master Comment 623 Some commenters said that the source of the load gain observed across the TI Pool is predominantly from freshly deposited PCBs and not from in-place sediment sources, based on an analysis of congener signatures and dechlorination status that differs from EPA's interpretation. Commenters contended that EPA's analysis of the composition of the PCBs in the water at the TI Dam is incorrect and requires an unrealistically high amount of sediment resuspension. Some said that EPA's analysis underestimates the importance of recently deposited PCBs in the load originating from the TI Pool. Response to Master Comment 623 This response adds to the information provided in Response to Master Comment 621 (Section 2.1). It focuses on the congener signature interpretation from the PCB load gain across the TI Pool and provides evidence that the majority of the PCB load gain occurs from dechlorinated PCBs that generally lie within the top 10 cm of the TI Pool sediments. GE's comments state that EPA claims that "PCBs in buried sediments migrate to the surficial sediments through some unidentified mechanism" that is a "deus ex machina." This characterization is incorrect. In fact, EPA's analysis, as explained in further detail below, does not require any mechanisms for sediment migration or mixing other than those that are included in GE's own fate and transport modeling. EPA's analysis of sources of PCB load within the TI Pool is entirely consistent with the theoretical modeling framework. EPA's position differs from that advanced by GE in that EPA provides evidence demonstrating that buried, dechlorinated sediments contribute the bulk of the load gain seen across the TI Pool, and that these apparent load gains cannot be passed off as simple transmission of pulse loadings of unaltered Aroclor 1242 from the Hudson Falls source. Contrary to the characterization provided by GE, EPA does not claim that deeply buried sediments engage in direct exchange with the water column, although sediment at a depth of up to 10 cm (or more) may contribute PCB load via bioturbation. As is discussed further below, neither EPA's geochemical analysis nor modeling posit direct mixing of PCBs from below an average mixing depth of 10 cm, nor do they require the assumption of excessive sediment resuspension. What is clear is that the TI Pool load gain arises in large part from PCBs that have been buried at a sufficient depth to undergo anaerobic dechlorination. EPA's analysis concluded that sediment stores of PCBs within the TI Pool are responsible for the major portion of the observed PCB load gain across the TI Pool. The primary lines of evidence supporting this conclusion are:
Responsiveness Summary Hudson River PCBs Site Record of Decision
2-16
• PCB load gain across the TI Pool has been relatively constant over time since 1991, despite the initial rapid increase and subsequent control and decline in magnitude of the upstream source. As the cumulative load leaving the TI Pool over this whole period exceeds the load entering the TI Pool, additional load must be contributed by the PCBs already stored within the sediments of the TI Pool. Evidence for this contention is discussed in detail in Response to Master Comment 621 in this section.
• The congener signature of the PCB load gain across the TI Pool is distinctive. Unlike
the upstream source, which consists of relatively unweathered PCBs with a congener pattern similar to Aroclor 1242, the load gain from the TI Pool shows contributions from a highly weathered PCB source, consistent with loading from sediment-stored PCBs that have undergone anaerobic dechlorination.
GE comments, and accompanying detailed analysis on pp. 150-153, contend that the composition of PCBs entering the water column from the TI Pool sediments is consistent with the composition of PCBs within the porewater of the top 2 cm of sediment, with the implication that this porewater represents temporary storage of upstream PCB releases, but is not consistent with the bulk of the PCB inventory in the sediments. These comments do not directly address the question of whether the PCB load generated in the TI Pool consists of "new" PCBs arriving from upstream that will respond directly to source mitigation. Given the low rates of sediment deposition predicted for the TI Pool, much older, historically deposited PCBs may lie within several centimeters of the surface at many locations, and porewater can move PCBs from deeper to shallower sediments. In fact, GE's analysis of PCB congener signatures in the TI Pool load gain is biased by the fact that the only means of transfer from the sediment that was considered was diffusive mass transfer of porewater, which does not account for bioturbation and other mechanisms of exchange. Further, GE's conclusions are supported only by the graphical presentation of back-estimated sediment source congener pattern interpreted as DB-1 gas chromatograph (GC) peaks, contrasted to 0-2 and 5-23 cm averaged sediment PCB data. While this presentation appears to show a better fit to the 0-2 cm data, it does not take into account important information contained in the ratios between different DB-1 peaks, nor does it consider the congener pattern exhibited in PCBs at shallower, but non-surface bioactive depths (e.g., ca. 5 cm). Finally, the GE analysis ignores the role of competitive sorption to dissolved organic carbon (DOC), which has been shown to play an important role in the behavior of PCBs in porewater and the water column (USEPA 1997, Butcher et al. 1998). EPA's detailed analysis of TI Pool congener signatures is based on summer 1997 data (June through August). Data from 1997 were selected for two reasons: First, observations are available for both the TID-West (nearshore) and TIP-18C (center channel) stations near the TI Dam, allowing examination of the importance of the potential sampling bias among stations. Second, upstream loads and concentrations at Rogers Island were very low during this period, enabling a more direct interpretation of the TI Pool load congener signal. Homologue patterns at Rogers Island (Rt. 197) and TID-West (TI Dam) during summer 1997 are shown in Figure 623-1, PCB Homologue Shift across the TIP, June-August 1997 GE Observations, and exhibit the typical strong shift to a mono- through trichlorobiphenyl pattern.
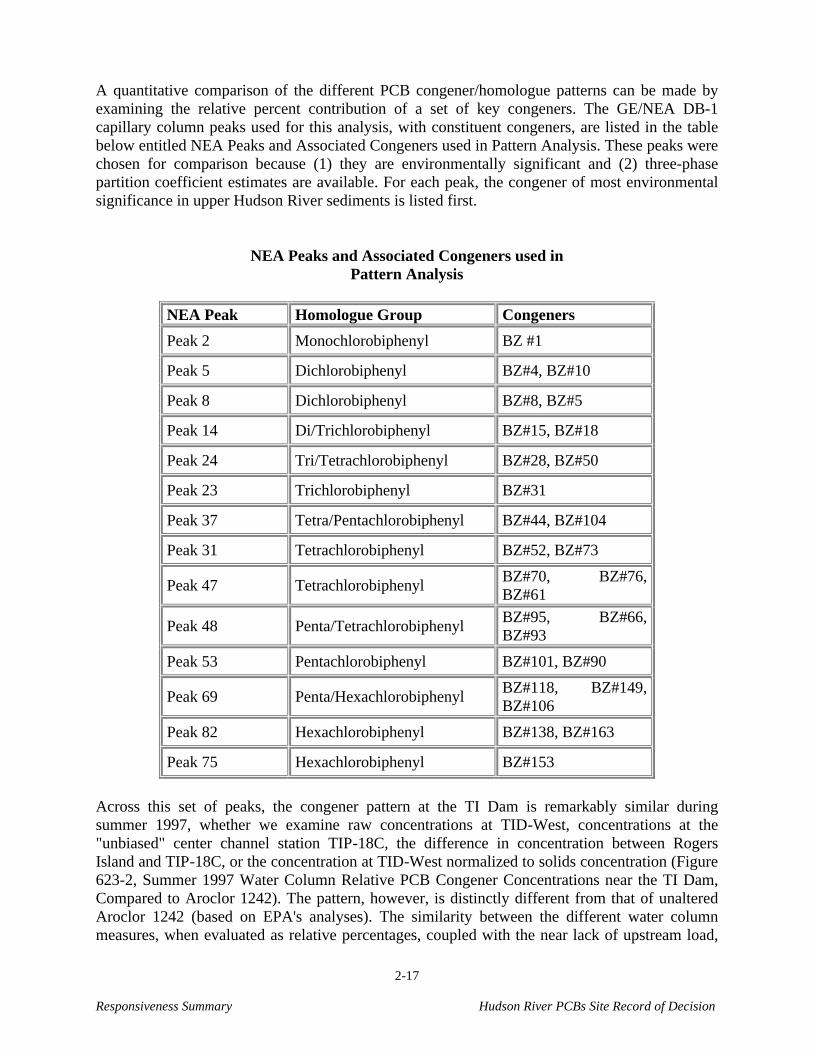
Responsiveness Summary Hudson River PCBs Site Record of Decision
2-17
A quantitative comparison of the different PCB congener/homologue patterns can be made by examining the relative percent contribution of a set of key congeners. The GE/NEA DB-1 capillary column peaks used for this analysis, with constituent congeners, are listed in the table below entitled NEA Peaks and Associated Congeners used in Pattern Analysis. These peaks were chosen for comparison because (1) they are environmentally significant and (2) three-phase partition coefficient estimates are available. For each peak, the congener of most environmental significance in upper Hudson River sediments is listed first.
NEA Peaks and Associated Congeners used in Pattern Analysis
NEA Peak Homologue Group Congeners
Peak 2 Monochlorobiphenyl BZ #1
Peak 5 Dichlorobiphenyl BZ#4, BZ#10
Peak 8 Dichlorobiphenyl BZ#8, BZ#5
Peak 14 Di/Trichlorobiphenyl BZ#15, BZ#18
Peak 24 Tri/Tetrachlorobiphenyl BZ#28, BZ#50
Peak 23 Trichlorobiphenyl BZ#31
Peak 37 Tetra/Pentachlorobiphenyl BZ#44, BZ#104
Peak 31 Tetrachlorobiphenyl BZ#52, BZ#73
Peak 47 Tetrachlorobiphenyl BZ#70, BZ#76, BZ#61
Peak 48 Penta/Tetrachlorobiphenyl BZ#95, BZ#66, BZ#93
Peak 53 Pentachlorobiphenyl BZ#101, BZ#90
Peak 69 Penta/Hexachlorobiphenyl BZ#118, BZ#149, BZ#106
Peak 82 Hexachlorobiphenyl BZ#138, BZ#163
Peak 75 Hexachlorobiphenyl BZ#153
Across this set of peaks, the congener pattern at the TI Dam is remarkably similar during summer 1997, whether we examine raw concentrations at TID-West, concentrations at the "unbiased" center channel station TIP-18C, the difference in concentration between Rogers Island and TIP-18C, or the concentration at TID-West normalized to solids concentration (Figure 623-2, Summer 1997 Water Column Relative PCB Congener Concentrations near the TI Dam, Compared to Aroclor 1242). The pattern, however, is distinctly different from that of unaltered Aroclor 1242 (based on EPA's analyses). The similarity between the different water column measures, when evaluated as relative percentages, coupled with the near lack of upstream load,
Responsiveness Summary Hudson River PCBs Site Record of Decision
2-18
removes a number of confounding issues (such as whether the TI Pool represents a net addition or a replacement of the upstream load) and greatly simplifies the analysis. Measures of congener concentration in the TI Pool sediments are also available in a number of variations. Figure 623-3, Congener Pattern in TIP Sediment Compared to Aroclor 1242, compares, for the selected GE peaks, the congener pattern found in the surface 0-2 cm layer of USEPA Phase 2 cores 18, 19, and 20 (analyzed as sum of quantitated congeners associated with each GE/NEA peak); the pattern found in the top 0-5 cm layer of the GE 1991 composite sediment samples; and, as an example of a more extensively dechlorinated pattern, the 8-12 cm layer of Phase 2 core 18. The unweathered Aroclor 1242 pattern is also shown in this figure. In this figure, the patterns in the Phase 2 and GE surface sediments are similar, except that the relative contribution of BZ#4+BZ#10 appears elevated in the GE results. The 8-12 cm layer of Core 18 is clearly more dechlorinated, as shown by the depletion of BZ#5+BZ#8, BZ#15+BZ#18, and BZ#28 relative to BZ#1 and BZ#4+BZ#10. More noticeable, however, is the fact that all the sediment patterns appear to be significantly dechlorinated relative to unweathered Aroclor 1242. In addition to increased concentrations in dechlorination end products, many of the near-surface sediment samples show reduction in the more readily degradable congeners. This is best summarized through the molar dechlorination product ratio, or MDPR (USEPA, 1997), which gives the fraction of dechlorination end products in the total PCB concentration. MDPR values for the 1991 GE 0-5 cm samples from the TI Pool show a strong correlation to total PCB concentration (Figure 623-4, MDPR versus Total PCB Concentration for GE 0-5 cm Sediment Concentrations in the TI Pool). Those few samples with total PCB concentrations less than 4 ppm show MDPR values in the range of 0.2 to 0.3, which is consistent with recent deposition of a relatively unaltered Aroclor 1242 source. But most of the samples have higher PCB concentrations and higher MDPRs. Thirty-two percent of the samples have total PCB concentrations greater than 25 ppm, with a geometric mean MDPR of 0.54 (range 0.36 to 0.69). Results from the 0-5 cm range for GE 1998 sampling in the TI Pool are almost identical: 28 percent of the samples had total PCB concentrations greater than 25 ppm, with a geometric mean MDPR of 0.52. Sediments with concentrations and MDPR this high are characteristic of historically deposited PCBs, likely dating prior to 1981 (USEPA, 1997, Figure 4-36). As exchange from the sediment to water is driven by concentration gradient, it is these old, highly weathered PCBs which continue to lie near the surface in the TI Pool that will dominate PCB releases to the water column. Insights on the probable mechanisms of release can be obtained through analysis of the congener patterns in the water column, pore water, and sediment, using equilibrium partitioning assumptions. EPA's analysis used three-phase partitioning in the sediment, based on in situ partition coefficient estimates obtained from the GE 1991 data (O'Brien & Gere, 1993). Because of the analytical corrections made to the GE congener in mid 1997 (HydroQual, 1997), the three phase sediment partition coefficient estimates reported in the DEIR (USEPA, 1997) are no longer valid, and were re-estimated. Three different methods of fitting these coefficients were used in the DEIR. For application to the TI Pool sediment pattern matching, it appeared desirable to use estimates obtained by a consistent method. Accordingly, optimization method 3 (USEPA,
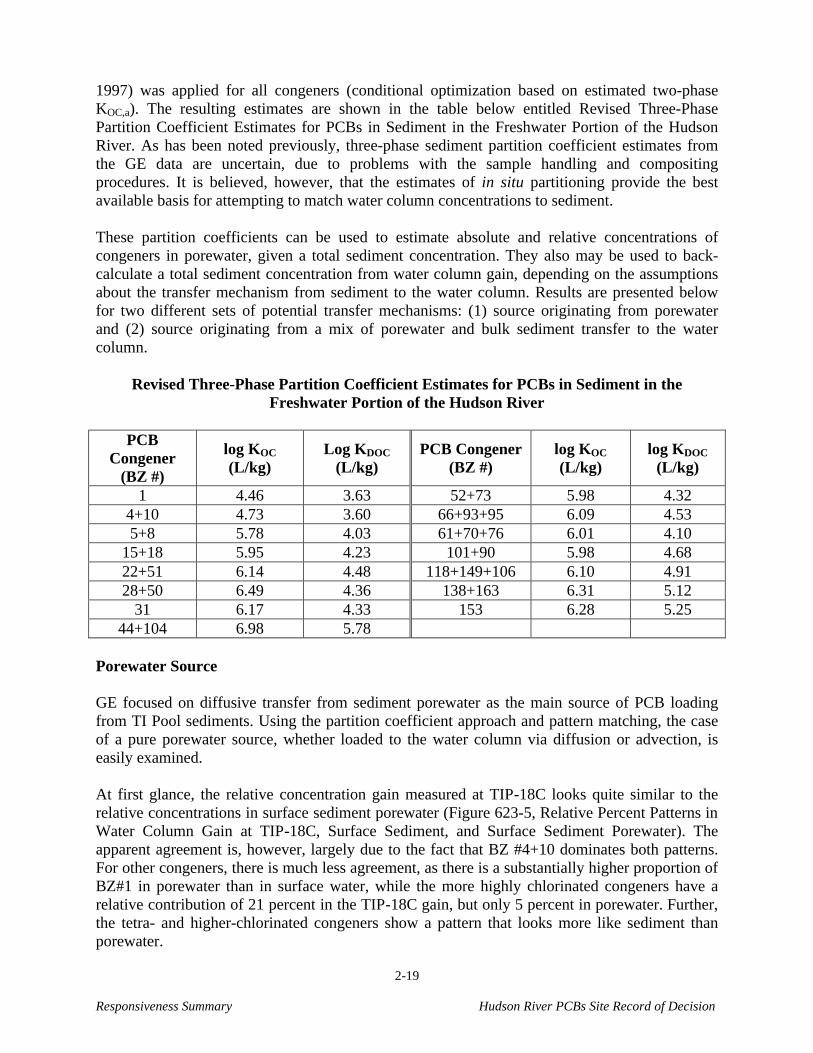
Responsiveness Summary Hudson River PCBs Site Record of Decision
2-19
1997) was applied for all congeners (conditional optimization based on estimated two-phase KOC,a). The resulting estimates are shown in the table below entitled Revised Three-Phase Partition Coefficient Estimates for PCBs in Sediment in the Freshwater Portion of the Hudson River. As has been noted previously, three-phase sediment partition coefficient estimates from the GE data are uncertain, due to problems with the sample handling and compositing procedures. It is believed, however, that the estimates of in situ partitioning provide the best available basis for attempting to match water column concentrations to sediment. These partition coefficients can be used to estimate absolute and relative concentrations of congeners in porewater, given a total sediment concentration. They also may be used to back-calculate a total sediment concentration from water column gain, depending on the assumptions about the transfer mechanism from sediment to the water column. Results are presented below for two different sets of potential transfer mechanisms: (1) source originating from porewater and (2) source originating from a mix of porewater and bulk sediment transfer to the water column.
Revised Three-Phase Partition Coefficient Estimates for PCBs in Sediment in the Freshwater Portion of the Hudson River
PCB
Congener (BZ #)
log KOC (L/kg)
Log KDOC
(L/kg) PCB Congener
(BZ #) log KOC (L/kg)
log KDOC
(L/kg)
1 4.46 3.63 52+73 5.98 4.32 4+10 4.73 3.60 66+93+95 6.09 4.53 5+8 5.78 4.03 61+70+76 6.01 4.10
15+18 5.95 4.23 101+90 5.98 4.68 22+51 6.14 4.48 118+149+106 6.10 4.91 28+50 6.49 4.36 138+163 6.31 5.12
31 6.17 4.33 153 6.28 5.25 44+104 6.98 5.78
Porewater Source GE focused on diffusive transfer from sediment porewater as the main source of PCB loading from TI Pool sediments. Using the partition coefficient approach and pattern matching, the case of a pure porewater source, whether loaded to the water column via diffusion or advection, is easily examined. At first glance, the relative concentration gain measured at TIP-18C looks quite similar to the relative concentrations in surface sediment porewater (Figure 623-5, Relative Percent Patterns in Water Column Gain at TIP-18C, Surface Sediment, and Surface Sediment Porewater). The apparent agreement is, however, largely due to the fact that BZ #4+10 dominates both patterns. For other congeners, there is much less agreement, as there is a substantially higher proportion of BZ#1 in porewater than in surface water, while the more highly chlorinated congeners have a relative contribution of 21 percent in the TIP-18C gain, but only 5 percent in porewater. Further, the tetra- and higher-chlorinated congeners show a pattern that looks more like sediment than porewater.
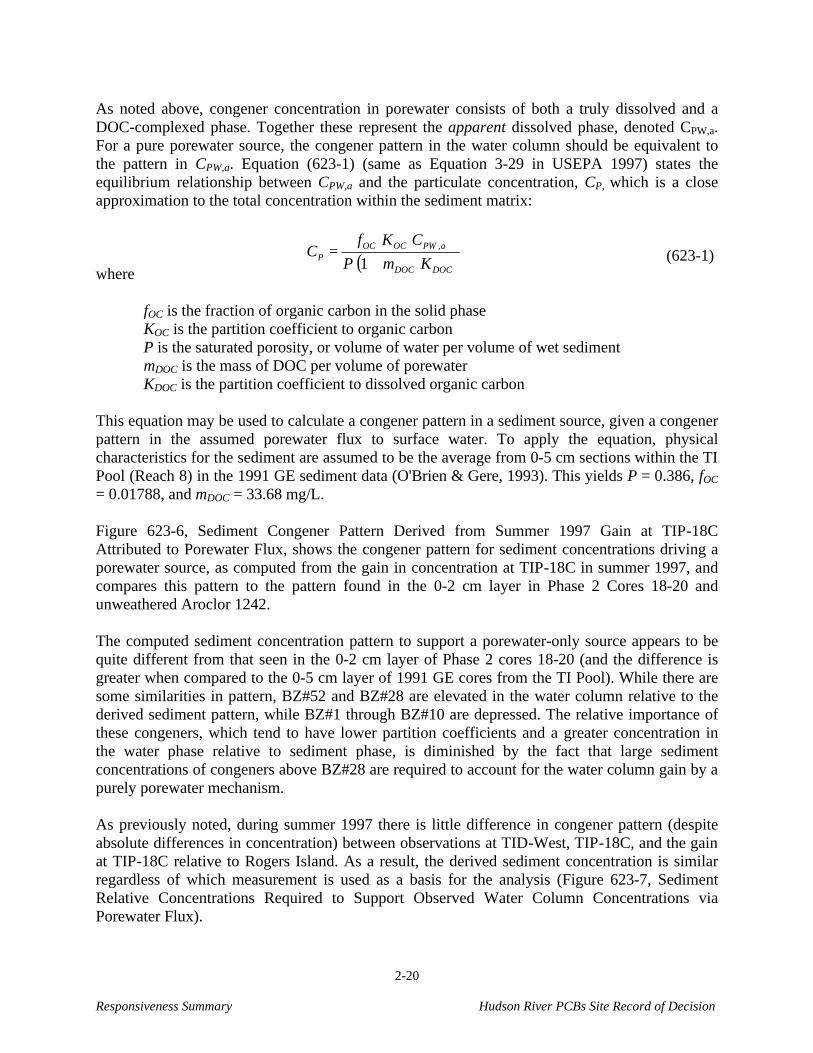
Responsiveness Summary Hudson River PCBs Site Record of Decision
2-20
As noted above, congener concentration in porewater consists of both a truly dissolved and a DOC-complexed phase. Together these represent the apparent dissolved phase, denoted CPW,a. For a pure porewater source, the congener pattern in the water column should be equivalent to the pattern in CPW,a. Equation (623-1) (same as Equation 3-29 in USEPA 1997) states the equilibrium relationship between CPW,a and the particulate concentration, CP, which is a close approximation to the total concentration within the sediment matrix: (623-1) where
fOC is the fraction of organic carbon in the solid phase KOC is the partition coefficient to organic carbon P is the saturated porosity, or volume of water per volume of wet sediment mDOC is the mass of DOC per volume of porewater KDOC is the partition coefficient to dissolved organic carbon
This equation may be used to calculate a congener pattern in a sediment source, given a congener pattern in the assumed porewater flux to surface water. To apply the equation, physical characteristics for the sediment are assumed to be the average from 0-5 cm sections within the TI Pool (Reach 8) in the 1991 GE sediment data (O'Brien & Gere, 1993). This yields P = 0.386, fOC = 0.01788, and mDOC = 33.68 mg/L. Figure 623-6, Sediment Congener Pattern Derived from Summer 1997 Gain at TIP-18C Attributed to Porewater Flux, shows the congener pattern for sediment concentrations driving a porewater source, as computed from the gain in concentration at TIP-18C in summer 1997, and compares this pattern to the pattern found in the 0-2 cm layer in Phase 2 Cores 18-20 and unweathered Aroclor 1242. The computed sediment concentration pattern to support a porewater-only source appears to be quite different from that seen in the 0-2 cm layer of Phase 2 cores 18-20 (and the difference is greater when compared to the 0-5 cm layer of 1991 GE cores from the TI Pool). While there are some similarities in pattern, BZ#52 and BZ#28 are elevated in the water column relative to the derived sediment pattern, while BZ#1 through BZ#10 are depressed. The relative importance of these congeners, which tend to have lower partition coefficients and a greater concentration in the water phase relative to sediment phase, is diminished by the fact that large sediment concentrations of congeners above BZ#28 are required to account for the water column gain by a purely porewater mechanism. As previously noted, during summer 1997 there is little difference in congener pattern (despite absolute differences in concentration) between observations at TID-West, TIP-18C, and the gain at TIP-18C relative to Rogers Island. As a result, the derived sediment concentration is similar regardless of which measurement is used as a basis for the analysis (Figure 623-7, Sediment Relative Concentrations Required to Support Observed Water Column Concentrations via Porewater Flux).
( )DOCDOC
aPWOCOCP KmP
CKfC
+=
1,
Responsiveness Summary Hudson River PCBs Site Record of Decision
2-21
In sum, the available evidence contained in congener patterns does not appear to support a theory of near-surface porewater flux (either diffusion or advection) as the sole source of PCB load gain in the TI Pool, unless the congener pattern is strongly shifted in the water column by some unspecified mechanism. Clearly, porewater constitutes part of the source of PCBs to the TI Pool, but apparently not the only source. It also does not appear that unweathered Aroclor 1242 makes up the missing part of the source.
Source Originating from Mixed Porewater Flux and Sediment Exchange
During a typical summer period there appears to be insufficient shear stress at the sediment-water interface to scour significant quantities of PCB-contaminated sediment. Lack of significant erosion of pool sediments during summer is also consistent with observed solids concentrations. Nonetheless, the congener pattern observed in the water column is consistent with a source partially composed of PCBs on bulk sediment, rather than PCBs partitioned from sediment into porewater. A mechanism alternative to hydrodynamic scour for introducing PCBs on sediments into the water column is provided by localized disturbances that result in mixing of contaminated sediment to the sediment water-interface or into the water column, followed by equilibration and exchange of PCBs between sediment and water. Data suggest that most of the sediment introduced into the water column at non-scouring flows settles out quickly, as there is little net increase in solids load across the TI Pool at low flow. Localized, non-hydrodynamic scour disturbances that mix sediment to the sediment water interface or into the water column during summer low flow periods include:
• Bioturbation by benthic organisms and demersal fish. • Fish nesting. • Mechanical scour by propwash and by grounding of boats and floating debris in
shallow areas. • Uprooting of macrophytes by flow, wind, or biological action.
The seasonal pattern of load gain, with a maximum in early summer and low values in the winter (USEPA, 2000), suggests that biological mechanisms play an important role in the exchange process. The availability of PCBs in subsurface sediments to biota is addressed in greater detail in Response to Master Comment 637 in Section 2.3. To test this hypothesis, numerical experiments were performed to reproduce the observed water column concentrations by a weighted combination of near-surface sediment (0-5 cm) and surface sediment porewater concentrations. Direct combination of sediment and water, which would be consistent with net solids loading from TIP sediments to the water column coupled with porewater exchange, does not yield a close fit to the observed congener pattern. However, a very close fit is obtained under an assumption of direct sediment-sorbed PCB exchange with the water column at the sediment-water interface. To provide a gross representation of the fractionation that occurs during the exchange process, it is simply assumed that, within the water column and at the sediment-water interface, sediment-
Responsiveness Summary Hudson River PCBs Site Record of Decision
2-22
sorbed PCBs re-equilibrate to reproduce the average water column phase distribution shown in Table 3-8 of the DEIR (USEPA, 1997), following which the dissolved and DOC fractions remain in the water column. This fractionation would result in 91 percent of the BZ#4 desorbing from sediment and remaining in the water column, but only 22 percent of BZ#118. Using these assumptions, water column concentrations observed at TID-West can be closely predicted as a mixture of porewater loading and water column exchange with shallow sub-surface sediments, using average 0-5 cm concentrations in the TI Pool for sediment and porewater from the GE 1991 data (Figure 623-8, Concentrations at TID-West Predicted as a Mixture of Porewater and Sediment Exchange). In contrast, porewater alone provides a much poorer fit. Very similar results are obtained by fitting a mixture to the estimated gain at the center channel station TIP-18C (Figure 623-9, Concentration Gain at TIP-18C Predicted as a Mixture of Porewater and Sediment Exchange). In the case of TID-West, the best fit coefficient on porewater concentration (ng/L) is 0.0034 and that on sediment concentration (µg/kg) is 0.0058; for gain evaluated at TIP-18C the coefficient on porewater concentration is 0.0011 and that on sediment concentration is 0.0038. In sum, observation of congener patterns in the TI Pool load gain suggests that this load is driven by a mix of porewater flux (advection plus dispersion) and direct exchange of sediment with the water column. The sediment exchange portion is likely driven in large part by biomixing of sediments to the surface from a depth sufficient for anaerobic dechlorination to have occurred. Application to 1991-1997 Observations The discussions above suggest that a mixed sediment-porewater source derived from dechlorinated sediment deposits near, but not at the surface, is applicable to 1997 data. The same conclusions apply to other years. Summer concentration gain across the TI Pool varies widely from year to year, reflecting variations in flow and other conditions; however, examination of the relative percent concentration of congeners in the summer gain shows a high similarity from year to year (Figure 623-10, Relative Concentration Gain at TID-West, 1991-1997). The remaining variability is within the range of analytical and sampling uncertainty. Therefore, the multi-year series can be fit on a normalized (percent) basis. The optimized fit to a mixed porewater-sediment source provides a very close match to the composite congener fractions observed in the TI Pool gain from 1991 to 1997 (Figure 623-11, 1991-97 Composite Congener Concentrations in TIP Load Gain Predicted as a Mix of Porewater and Surface Sediment). The sediment indicated as a source of the load gain has a dechlorinated congener pattern consistent with buried deposits of PCBs. It is not consistent with the congener pattern expected from temporary storage of recent releases of unweathered PCBs from the upstream source. At the same time, mass transport of PCBs out of the TI Pool has consistently been greater than the upstream input throughout the 1990s. It therefore appears that the monitoring data from the TI Pool are consistent with PCB load gain from sediment stores of dechlorinated PCBs within the 10-cm sediment mixing depth represented by EPA's model. These sediment stores contribute PCBs to the water column via both porewater flux and sediment mixing (bioturbation) pathways. Further, the concentrations and dechlorination status of the sediment source are consistent with historically deposited PCBs,
Responsiveness Summary Hudson River PCBs Site Record of Decision
2-23
and have exhibited little change between 1991 and 1998. The PCB load gain from the TI Pool cannot be adequately explained as a phenomenon of short-term storage and release of unweathered PCBs from the Hudson Falls source. References Butcher, J.B., E.A. Garvey, and V.J. Bierman. 1998. Equilibrium partitioning of PCB congeners in the water column: field measurements from the Hudson River. Chemosphere, 36(15): 3149-3166. HydroQual. 1997. Development of Corrections for Analytical Biases in the 1991-1997 GE Hudson River PCB Database. Report to General Electric Company, Albany, NY. HydroQual, Inc., Camillus, NY, June. O'Brien & Gere. 1993. Data Summary Report, Hudson River Project, Sampling and Analysis Program, 1991 Sediment Sampling and Analysis Program. Report to General Electric Company, Albany, NY. O'Brien & Gere Engineers, Inc., Syracuse, NY, May. USEPA. 1997. Phase 2 Report, Further Site Characterization and Analysis. Volume 2C - Data Evaluation and Interpretation Report (DEIR), Hudson River PCBs Reassessment RI/FS. Prepared for USEPA Region 2 and USACE, Kansas City District by TAMS Consultants, Inc., The Cadmus Group, Inc., and Gradient Corporation. February. USEPA. 2000. Phase 2 Report, Further Site Characterization and Analysis. Volume 2D - Revised Baseline Modeling Report (RBMR), Hudson River PCBs Reassessment RI/FS. Prepared for USEPA Region 2 and USACE, Kansas City District by TAMS Consultants, Inc., Limno-Tech, Inc., Menzie-Cura & Associates, and Tetra Tech, Inc., January 2000. Master Comment 643 Commenters said that significant sources of PCBs other than GE are ignored in the FS and that EPA failed to adequately identify all significant sources of PCBs to the Upper Hudson. Some contend that a remedial decision cannot be made until all external sources of PCBs are identified and controlled, and, as a consequence, EPA's planned remediation will not be effective. Response to Master Comment 643 EPA has invested considerable effort in the attempt to identify other sources. These efforts have included inventorying potential sources (USEPA, 1991), sampling at numerous points along the length of the river, and sampling of tributaries (USEPA, 1997). Results are summarized in Section 1.3.2 of the FS. There is no evidence for other sources of PCBs to the Upper Hudson that are of significance relative to the loads discharged by GE (including both the ongoing discharges from the Hudson Falls plant and the re-release of historically discharged PCBs from contaminated sediments downstream of the GE facilities).
Responsiveness Summary Hudson River PCBs Site Record of Decision
2-24
Potential loads from upstream of Bakers Falls were cited in several comments. GE observations at Fenimore Bridge, just above Bakers Falls (FS, Appendix A.2), revealed that 80 percent of observations from April 1, 1991 to March 8, 2000 were non-detect at a detection level of 11 ng/L total PCBs. A few higher-concentration spikes were observed, but all these occurred prior to December of 1995. Further, the PCB homologue distribution within the observations with detectable PCBs at Fenimore Bridge resembles Aroclor 1242, and is not characteristic of the more highly chlorinated PCBs found upstream at the Feeder Dam and Sherman Island Pool. Given 1) the proximity of the Fenimore Bridge to the Hudson Falls plant, 2) the fact that sediments above Bakers Falls dam near the GE Hudson Falls pump house and former outfall were found to contain up to 22,000 ppm of PCBs, and 3) the record of historic discharges of PCBs from GE via the Village of Hudson Falls wastewater treatment plant, it appears that a significant portion of the load at Fenimore Bridge may also be attributable to GE operations. The comment specifically cites as support a statement in Appendix A.3, p. 5 of the FS that refers to an unknown source in the Bakers Falls area. The commenter has taken this sentence out of context. The sentence refers to the state of knowledge in 1993 during GE's first phase Interim Remedial Measure at the Hudson Falls OU2A/B site. The source remained unknown only until GE’s investigations of 1994, which documented the seepage of PCB oil from the bedrock in the Bakers Falls wing dam area. In sum, EPA is confident that all significant sources of PCBs to the Upper Hudson River have been identified. The information is sufficient to select an appropriate remedy. References USEPA. 1991. Phase 1 Report – Interim Characterization and Evaluation, Hudson River PCB Reassessment RI/FS. Prepared for USEPA Region 2 by TAMS Consultants, Inc. and Gradient Corporation, August. USEPA. 1997. Phase 2 Report, Further Site Characterization and Analysis. Volume 2C – Data Evaluation and Interpretation Report (DEIR), Hudson River PCBs Reassessment RI/FS. Prepared for USEPA Region 2 and USACE, Kansas City District by TAMS Consultants, Inc., The Cadmus Group, Inc., and Gradient Corporation. February. Master Comment 422386 Comments suggested that GE continues to discharge PCBs without a permit. The commenters questioned if current leaks from GE are entering the water table and nearby soil. The commenters wanted to know if it was possible that the plants they consume may be contaminated. Response to Master Comment 422386 There are ongoing PCB releases from GE’s Hudson Falls facility and its vicinity that are unpermitted. GE is currently working with NYSDEC and EPA to eliminate or significantly

Responsiveness Summary Hudson River PCBs Site Record of Decision
2-25
reduce the leakages. In fact, EPA’s selected remedy assumes that upstream source control will occur. As discussed in Section 9.2 (Response to Master Comment 253421), the river is a region of net groundwater discharge and not recharge. Thus, contaminants released or discharged to the river tend to remain in the water or the sediments, which line the river bottom. Like the PCB contamination already coating the river bottom, it is unlikely that leakages from the GE facility into the river are significantly impacting groundwater in the vicinity of the river. In addition, since the existing sediment contamination is so much greater than the level of sediment PCB contamination being generated by the leakages at the GE facilities, if any risk is posed to groundwater it would be due to the existing sediment burden and not the current leakages. This is further discussed in Section 9.2 (Response to Master Comment 253421). Given PCBs’ great affinity for the sediment and soils, it is highly unlikely that significant groundwater contamination could be generated from riverine PCB contamination. It is therefore unlikely that crops or other plants will be contaminated by riverine PCBs via groundwater. The main PCB groundwater contamination problems in the Upper Hudson are those around the GE facility themselves (i.e., the discharges at Hudson Falls), where free PCB oil has saturated the local aquifers and continues to migrate to the river. In these areas, groundwater impacts may be severe but they are unrelated to the river and the riverine PCB contamination, and as such have not been addressed under the Reassessment. Master Comment 313444 In connection with evaluation of the Contained Aquatic Disposal technology (FS, Section 4.2.9.2, page 4-55, paragraph 2), a commenter requested that the location of historic 'wet dump grounds' should be displayed on Figure 3-1 and noted when coincident with a NYSDEC hot spot. Response to Master Comment 313444 The source of the information cited in the FS is a 1984 report by Malcolm Pirnie (Malcolm Pirnie, 1984) prepared for NYS Department of Transportation (at that time the overseer of the canal system) in regard to the proposed Maintenance Dredging Program for 1985 through 1995. The locations of some 16 historical wet dump grounds between Federal Dam and Fort Edward are shown on Table B-1B and an accompanying map having a scale on the order of 1/4 inch to the mile. The scale of the information prohibits transfer of the shape, size, or locations of the wet dump grounds to project mapping with an acceptable degree of accuracy or reliability. However, the information may be relevant in selecting sampling locations for refining target areas during remedial design. EPA will take this into consideration and will pursue more accurate information at that time for this purpose.
Responsiveness Summary Hudson River PCBs Site Record of Decision
2-26
Reference Malcolm Pirnie, Inc. 1984. New York State Barge Canal - Maintenance Dredging Program: 1985 – 1995. Volume 1 (Text) and Volume 2 (Appendices). Prepared for NYS Department of Transportation. Master Comment 621 Commenters asserted that EPA presented insufficient data and analysis to credibly claim that the historically buried PCBs replenish the surficial layer. Some claimed that justification of EPA's sediment remediation is based on unsubstantiated conclusions that natural sedimentation and burial are ineffective in abating the sediment source, and that PCB-containing sediments are not stable. Some commenters contended that EPA's argument fails to address the PCBs source at Hudson Falls. An alternative interpretation of the mass balance was presented that involves greater replenishment of surface sediment concentrations in the TI Pool from the upstream source and continuous burial within the TI Pool, and contends that EPA's analysis relies on an unknown, unseen mechanism that brings buried PCBs to the sediment surface. Response to Master Comment 621 This response addresses the specific issue of PCB release from TI Pool sediments, which is one of the common themes contained within all the associated comments. Other aspects of these comments are addressed separately in other responses. The reader is particularly referred to Response to Master Comment 623 (Section 2.1), which provides an analysis of the congener signature of the TI Pool load gain and documents evidence that this load gain occurs from buried sediments. EPA's analysis demonstrates that a consistent gain in total and Tri+ PCB load and water column concentration occurs across the TI Pool (USEPA, 1997; USEPA 2000, Appendix 3; Response to Master Comment 577, Section 2.2). This load gain occurs regardless of whether the upstream source load is large or small in a given year, although its importance as a percentage of total load is obviously dependent on the magnitude of the upstream load. A consistent load gain is documented up through the most recent monitoring available (Response to Master Comment 631, Section 2.6, table entitled Recent Summer Water Column Total PCB Concentrations and Loads in the TI Pool). The contribution of TI Pool sediments to PCBs in the water column of the Hudson River is verified both by load gains and by the congener signature of the load passing the TI Dam. As pointed out in comments, the statement on p. 1-43 of the FS that "PCB concentrations in water are driven by PCBs stored in sediments" is not completely correct. The statement should have said, "PCB concentration gain relative to the upstream boundary concentration is driven by PCBs stored in sediments..." In recent years under summer low flow conditions the bulk of the PCB load seen at TI Dam and downstream is indeed derived from PCBs in the sediments. As the upstream boundary concentration derived from the Hudson Falls facility decreases, the importance of the PCB release from the sediments becomes greater.
Responsiveness Summary Hudson River PCBs Site Record of Decision
2-27
GE questions the importance of the TI Pool sediments on two grounds, stating (1) that the EPA position requires migration of PCBs from buried sediments that relies on "an unknown, unseen mechanism," and (2) that any load gain that does occur from TI Pool sediments is due to the storage and subsequent release of PCBs derived from the upstream source. EPA believes that the existence of a consistent load gain across the TI Pool is firmly documented and provides incontrovertible evidence of the importance of contributions of PCBs from the TI Pool sediments (Response to Master Comment 631, Section 2.6), regardless of the mechanism. The two counter arguments advanced by GE are discussed in detail in the following text. GE's first argument is based on a false dichotomy. While EPA analyses demonstrate the existence of PCB flux from buried sediments, EPA is not contending that deeply buried sediments are directly contributing PCBs to the water column. It is clear that sediment PCBs with a dechlorinated congener signature are contributing to the load from the TI Pool. These PCB loads must arise from below the oxic-anoxic boundary in the sediment to have experienced sufficient dechlorination, but this boundary can be only a few centimeters deep in cohesive sediments. Transport of PCBs from these sediments does not require any "unknown, unseen mechanism," although the primary mechanism does not seem to be hydrodynamic scour. Instead, the exchange occurs through a combination of the flux of porewater and localized disturbances that result in temporary mixing at the sediment-water interface, followed by equilibration and exchange of PCBs into the water column. Localized, non-hydrodynamic disturbances that may mix sediment to the sediment-water interface in either cohesive or non-cohesive sediment areas during summer low flow periods include:
• Bioturbation by benthic organisms. • Bioturbation by demersal fish. • Mechanical scour by propwash. • Mechanical scour by boats and floating debris in shallow/nearshore areas. • Uprooting of macrophytes by flow, wind, or biological action.
In addition, during low flow periods, the daily changes in water level due to peaking hydropower releases from Lake Sacandaga may enhance PCB releases from nearshore sediments. These mechanisms occur at too fine a spatial scale to be explicitly represented in reach-scale models, but this does not mean that they are not important. They are therefore represented in the model through use of an empirical mass transfer coefficient. Indeed, GE's consultant adopted a representation of "non-hydrodynamically-induced [sic] sediment-water exchange" that is nearly identical to that used by EPA. As stated in QEA (1999, p. 4-23): "While the processes controlling sediment-water exchange are generally understood, a mechanistic representation of each of these processes with appropriate Hudson River-specific parameterization is not feasible because data do not exist to support such representation in the model. Therefore, the combined effect of these sediment-water exchange processes was modeled empirically by a lumped sediment-water exchange coefficient that is calibrated to seasonal sediment PCB loadings under low flow conditions."
Responsiveness Summary Hudson River PCBs Site Record of Decision
2-28
The second argument advanced by GE (that load gain across the TI Pool is due to storage and release of load from upstream) is not borne out by the available evidence. The empirical evidence available from GE monitoring data clearly shows that the TI Pool sediments remain an important source of PCB loading to the water column. Certainly, there is a possibility that some of the upstream PCB load will be stored in surface sediments of the TI Pool, although model results suggest that this fraction is small during the 1990s. Two lines of evidence show that the recent load gain across the TI Pool is not due primarily to upstream loading: analysis of cumulative load gain from the TIP and analysis of congener signatures. Analysis of Cumulative Load Gain from the TIP An estimate of the total PCB load gain across the TIP of 0.56 kg/d was presented in the DEIR (USEPA 1997). Minor revisions to this estimate are appropriate based on three considerations:
• Release of additional GE monitoring data. • Revision by GE of certain PCB results to correct analytical biases. • Potential corrections to account for sampling bias associated with the TID-West
sampling station. Analytical corrections to the GE monitoring data are documented by HydroQual (1997). These corrections address use of an inappropriate calibration standard and resolution of co-elution biases. One of the effects of these corrections is to increase the estimated concentration of mono- and dichlorobiphenyls. As the PCB signature from the TI Pool is enriched in these homologues, the net effect of these analytical corrections is to increase the estimated load gain across the TI Pool and to further emphasize the distinctive signature of the PCB load derived from the pool. GE also determined that the nearshore observations taken at TID-West may be biased high relative to center-channel observations (Rhea, 1997), and might therefore over-estimate load leaving the TI Pool. GE collected a number of concurrent samples between 1996 and 1998 at TID-West, the center channel above the dam (TID-Center), and downstream of the dam (TIDPRW). EPA's analysis of these samples suggests that a bias between the nearshore and center channel stations exists primarily at low flow conditions when lateral mixing is minimized. Over the full set of 1996-1998 samples, the average ratio of total PCBs at TID-Center (or TIDPRW when TID-Center is not available) samples to TID-West samples is 0.86. (This is much higher than the ratio of 0.62 originally mentioned by Rhea (1997), based on limited preliminary data). Total PCB loads were recalculated through November 2000 using the revised GE data and employing the averaging estimator as described in USEPA (1997). Results are omitted for February 1999 and December 2000 on, as flow estimates at Fort Edward are incomplete. Comparison of load estimates upstream of the TI Pool at Rogers Island with load estimates at the downstream end of the pool at TID-West for April 1991 through November 2000 yields an estimated average net total PCB gain across the pool of 0.85 kg/day (1.9 lb/d). If the factor of 0.86 for sample-location bias is applied, this number would be adjusted to 0.73 kg/d (1.6 lb/d). Thus, the net effect of the analytical corrections and sample bias corrections is an estimated load gain across the TI Pool greater than that reported in the DEIR (USEPA, 1997).
Responsiveness Summary Hudson River PCBs Site Record of Decision
2-29
Figure 621-1 (Cumulative Total PCB Load at River Mile 194.2 [Rogers Island] and River Mile 188.5 [TID-WEST)] Estimated from GE Monitoring Data for April 1991-March 2000) shows cumulative total PCB loads at Rogers Island and the TI Dam, calculated from the GE data. The rate of increase in loads appears nearly constant across this period, as shown by the steady divergence of the two lines. Indeed, the total PCB load gain calculated for January 1997-November 2000 is 0.88 kg/d (0.76 kg/d with bias correction), which is nearly identical to that for the entire 1991-2000 time period. The fact that a steady load gain applies across the whole period of record strongly suggests that the increased output at the TI Dam is not due to short-term storage of load pulses from upstream. In contrast, GE's comments (Figure III-13) imply that the Total PCB load gain across the TI Pool between August 1997 and December 2000 amounted to only 80 kg in total (0.15 kg/d), based on monitoring below the dam. It should be noted, however, that this estimate was created with non-detected values set to the GE reporting limit of 11 ng/L, whereas the convention is to set these values to half of the reporting limit (i.e., 5.5 ng/L). During this period, PCBs were generally not detected in samples collected at Rogers Island, while PCBs were detected in most samples collected at the TI Dam. Assigning the upstream values to the reporting limit (11 ng/L) serves to artificially bias upward the estimated load at Rogers Island, and decreases the apparent load gain across the pool. In addition, the statistical methods used to convert point-in-time concentration measurements to continuous load estimates are not documented by GE. Another comment compared both EPA's and GE's estimates of upstream PCB loading above Rogers Island with estimates of PCB load crossing the Troy Dam and concluded that, regardless of whether the EPA or GE calculations are used, there is a substantial incremental PCB load that must arise from the sediments of the Upper Hudson. EPA agrees with this analysis: while there is uncertainty in the exact magnitude of the load, the majority of the PCBs transported from the Upper to the Lower Hudson in recent years derive from PCBs stored in the sediments of the Upper Hudson River. Source control at the GE plant sites alone will not redress this condition; both source control and remediation of river sediments are necessary to facilitate the river's recovery. Analysis of Congener Signatures Examination of congener signatures or homologue patterns also indicates that the TI Pool sediments are a source of PCB load distinct from the upstream source. Throughout the period of GE monitoring, samples taken at TI Dam during summer low flow conditions show a strong shift to a less-chlorinated congener mixture, dominated by mono- and dichlorobiphenyls, relative to the upstream source. Typical results, for summer 1996, are shown in Figure 621-2 (Shift in PCB Homologue Pattern across the Thompson Island Pool, Summer 1996). At Fort Edward (Rt. 197) trichlorobiphenyl and tetrachlorobiphenyl homologues predominate, with almost no monochlorobiphenyl and small amounts of dichlorobiphenyl. In contrast, concentrations at the TI Dam (TID-WEST) are much higher, and shifted toward monochlorobiphenyl through trichlorobiphenyl homologues. This shift in homologue pattern provides another line of evidence that the PCBs exiting the TI Pool are not the same as those entering the pool. Coupled with the increase in concentration and load across the pool, this indicates the addition of load from a relatively dechlorinated sediment
Responsiveness Summary Hudson River PCBs Site Record of Decision
2-30
source, which must arise within oxygen-depleted sediments, and not simply through-transmission of the upstream, unweathered PCB source. Interpretation of the congener signature of the TI Pool load gain is addressed in further detail in Response to Master Comment 623 in Section 2.1. GE comments claim that EPA's interpretation of the importance of TI Pool loads is based on "a new and untested hypothesis: that water column PCB concentrations in the TI Pool during summer low-flow achieve a maximum concentration that is in steady-state with the sediment PCB levels." The comment claims that this cannot be so, because "if the water column PCBs were at steady-state with the sediment PCBs during summer low-flow conditions, both would have the same dissolved PCB concentration." These comments reflect a misinterpretation of EPA's position. EPA does not contend that water column concentrations and sediment porewater concentrations should be equal, which is clearly at odds with the data. Instead, EPA has observed that summer low flow concentrations in recent years appear to be independent of the upstream load. A likely explanation is that the water column concentrations at low flow are controlled by rates of exchange with the sediment. This leads to a quasi-steady state equilibrium condition in which the water column concentrations remain approximately constant. Water column concentrations are not expected to be equal to porewater concentrations due to the large dilution expected for porewater entering the water column and the preferential affinity of PCBs for particulate matter in the sediments and dissolved organic carbon in the porewater. EPA's observation regarding summer low flow concentrations also points out the continuing importance of in-place sediment PCBs in determining water column exposure concentrations. It is worth highlighting some of the information presented in Appendix D.1 of the FS that supports this contention, based on the monitoring data provided by GE. Figure 621-3, Summer Water Column Concentration at TID-WEST versus Monthly Average Flow at Fort Edward, 1996-1999 (a copy of Figure 11 in Appendix D.1 of the FS) shows the mean monthly total PCB and Tri+ PCB concentrations at the TID-West station for the summer of 1996 through 1999, plotted as a function of flow. This figure shows that, within any given month, the water column concentration remains approximately constant over time. This is clearly seen for July, August, and September. June exhibits slightly more variability largely due to conditions in 1998. Typically, concentrations vary about +20 percent while flow varies by more than a factor of three (+58 percent) for the 1996-1998 period. These results indicate that the TI Pool water column PCB concentrations are effectively in equilibrium with sediment sources, given that flows remain relatively low. This system is able to maintain similar conditions over a relatively wide range in flow (1500 to 5500 cfs). This suggests in turn that this system is not undergoing a rapid rate of decline and has a sufficiently large reservoir of available sediment-bound PCBs such that no decline in surface water conditions is in evidence over the last four years. This is noteworthy given that the upstream loads have declined more than an order of magnitude during the period 1992 to 1999.
Responsiveness Summary Hudson River PCBs Site Record of Decision
2-31
References HydroQual. 1997. Development of Corrections for Analytical Biases in the 1991-1997 GE Hudson River PCB Database. Prepared for General Electric Company, Albany, NY by HydroQual, Inc. June. QEA. 1999. PCBs in the Upper Hudson River. Prepared for General Electric, Albany, New York by Quantitative Environmental Analysis, LLC. Rhea, J. 1997. Memorandum Re: TIP Time of Travel Surveys to J. Haggard, GE, October 6, 1997. HydroQual, Inc. USEPA. 1997. Phase 2 Report, Further Site Characterization and Analysis. Volume 2C – Data Evaluation and Interpretation Report (DEIR), Hudson River PCBs Reassessment RI/FS. Prepared for USEPA Region 2 and USACE, Kansas City District by TAMS Consultants, Inc., The Cadmus Group, Inc., and Gradient Corporation. February. USEPA. 2000. Response to Peer Review Comments on the Revised Baseline Modeling Report (RBMR), Hudson River PCBs Reassessment RI/FS. Prepared for USEPA Region 2 and USACE Kansas City District by TAMS Consultants, Inc., Limno-Tech, Inc., Menzie-Cura & Associates, and Tetra Tech, Inc., November 2000. 2.2 Validity of the Low Resolution Sediment Coring Report Master Comment 577 Commenters raised several questions and issues with regard to the stability of the Upper Hudson River sediments. Commenters questioned whether the sediments were dynamic and unstable or net-depositional, sequestered, and stable. Comments suggested that greater than 80 percent of the Tri+ PCB inventory is below the biologically active depth of 10 cm. Commenters both agreed and disagreed with the analyses presented in the DEIR and LRC Report to support the EPA's conclusion that sediments in the TI Pool act as a source of PCB loadings to the water column. Commenters stated that sedimentation and burial are effectively reducing the contribution of PCBs from sediments to fish, and the net depositional nature of the Upper Hudson serves to sequester the PCB inventory from further interaction with the biota. Response to Master Comment 577 The analysis of the security of the PCB inventory of the Upper Hudson River sediments presented in the LRC Report was questioned. Several issues were raised concerning the "stability" of the sediments of the TI Pool, suggesting that if the sediments could be shown to be "stable" then they would not pose a long-term problem. It is the conclusion of the EPA as well as the peer review panel for the LRC Report that the sediments of the Upper Hudson do not represent a secure location for the long-term storage of PCB contamination. This issue is
Responsiveness Summary Hudson River PCBs Site Record of Decision
2-32
independent of the physical nature of the sediments themselves, although, as shown below, there is evidence to suggest reworking of the sediments over time as well. Evidence that the sediments continue to release PCBs to the water column is quite strong. Evidence indicates that over the last five years (1996 to 2000) the sediments released approximately 1.5 pounds per day of total PCBs. This is the net release of PCB from the sediments above the 0.2 to 0.5 lb/day (average of 0.34 lb/day) coming from upstream. This sediment load clearly represents the dominant source of PCBs to the water column and to any downstream receptors. Over the same five-year period, the annual net release of PCBs from the sediments of the Upper Hudson has represented approximately 2,700 lbs, well over a ton of total PCBs. The upstream source contribution during this period amounted to less than a quarter of that from the sediments (615 lbs). Effectively, the sediments released over a ton of PCBs from the existing sediment inventory between 1996 and 2000. This is assuming that all upstream loads are merely transmitted through the river. To the extent that there is any storage of the upstream load within the sediments during this period, the actual sediment release is greater by the same amount. Examining the entire period of record for GE monitoring, the picture remains the same. Using a ratio estimator calculation as was done in the DEIR (USEPA, 1997), it is possible to calculate the net load gain across the TI Pool from 1991 through 2000. During this period, the upstream loads, principally the leakage from the GE Hudson Falls facility, totaled approximately 5,600 lbs total PCBs. Note that this includes the entire Allen Mill event. During the same period, the net contribution from the sediments represented 4,800 lbs. Thus, over the period of time including the large Allen Mill event, the sediments were still responsible for 46 percent of the total PCB load originating in the Upper Hudson. When examined on an annual basis, it is clear that the sediment source has continued largely unabated throughout the 1990s. Figure 577-1 shows the net load gain across the TI Pool based on the corrected results for the TI Dam monitoring station. While noting that there is some uncertainty in the use of this monitoring location, the results for the location strongly correlate with those observed at Schuylerville. Thus to the extent that the TI Dam West site is an upper bound on TI Pool loads, it is a fairly accurate representation of the loads at Schuylerville. This aspect of the monitoring station is discussed in the DEIR, the LRC Report Responsiveness Summary and Appendix D1 of the FS. Whether it represents TI Dam or Schuylerville most accurately is a minor issue since in either case it can be used to calculate the net sediment contribution. Figure 577-1 clearly shows some variation but no clear increasing or decreasing trend in the net contribution by the sediments over time. The contribution from the sediments has remained relatively constant at over one lb/day for the entire study period. Thus, the sediment source to the river is largely unabated despite the dramatic changes seen in the upstream loads over the same period. It is important to note here that the figure represents the net gain from the sediments to the water column. That is, effectively, all of the PCBs released from the sediments from 1991 to 1999 were in fact deposited prior to 1991. The total PCB inventory of the TI Pool sediments declined by over two tons (4,800 lbs) during this period via release to the water column.
Responsiveness Summary Hudson River PCBs Site Record of Decision
2-33
Evidence is available as recently as April 2001 showing the importance of the sediments (K. Farrar, pers. comm., 2001). The relatively small spring flood event (recurrence frequency of less than five years) lasted only three days but yielded over 70 pounds of total PCBs from the sediments. This release overshadows the contribution for the same period from upstream sources of 17 pounds of PCBs. From this most recent data alone it is clear that the sediment inventory of PCBs is not sequestered. While it is clear that the sediments remain the most important source to water column and therefore to locations downstream, it is less clear how the release occurs. Several mechanisms are undoubtedly involved, including geochemical, biological, and hydrodynamic processes. While the modeling analyses have attempted to characterize these processes through various algorithms and expressions, these expressions represent simplifications of our understanding of the actual processes involved. Rather than dwell on the various nuances of our understanding, it is much more instructive to simply observe the conditions of the river and note their ramifications. For example, mean surface concentrations on the river bottom are clearly above those that are produced by the upstream load at Rogers Island. This is discussed in detail in White Paper – Relationship between PCB Concentrations in Surface Sediments and Upstream Sources. For this response, it is sufficient to note that suspended matter at Rogers Island has averaged roughly 1 to 2 mg/kg Total PCBs. Thus, it would be anticipated that surface sediments originating from these solids would also contain 1 to 2 mg/kg. Variations in depositional area could possibly explain some localized variation in concentration, but it is EPA's opinion that this would yield individual concentrations varying by no more than an order of magnitude. Both individual cores and core composites collected by GE in 1998 and 1999 clearly show surface concentrations higher than these values. These data indicate the presence of historical sediments at the surface. For example, the mean composite fine-grained sediment core result for 0-2 cm in 1998 was 24 mg/kg Total PCBs, well above the calculated mean of 1 to 2 mg/kg for the years 1996 and 1997, the two years prior to sample collection. Individual cores showed values as high as 625 mg/kg within the top 5 cm. These high values clearly exceed any values produced by the upstream load in the years immediately prior to the sample collection, indicating that the surface sediments represent historical sediment contamination. The possibility remains that these materials might have been produced in the early 1990s during the Allen Mill event. This would still make these materials six to seven years old at the time of collection. Further review of the coring data suggests a much greater age for these materials. Specifically, the high resolution cores collected by the USEPA in 1992 and by GE in 1998 show no evidence of a major PCB release anytime during the 1990s. That is, these cores show a significant PCB peak associated with the early 1970s and a decline to a relatively low but recently constant value through the 1990s. Since these cores represent unique, continuously depositional environments, they record the nature of the PCB deposition over time. These cores do not reflect an order of magnitude increase and decrease in the upstream load over the 1990s. Rather, they show depositional concentrations to be relatively constant over this period. These results suggest that the internal (i.e., inside the TI Pool) processes of sediment reworking and PCB release currently control the nature of PCB contamination in the Upper Hudson. Thus, it
Responsiveness Summary Hudson River PCBs Site Record of Decision
2-34
can be concluded that the elevated PCBs levels found in the surficial fine-grained sediments probably represent historical materials first deposited in the 1970s and 1980s. The assertion in a comment that the high resolution core profiles can be used as evidence to suggest that 80 percent of the Upper Hudson's PCB inventory lies below 120 cm is an inappropriate application of the core data. As extensively discussed in the DEIR, LRC Report, and related responsiveness summaries, these cores do not represent the vertical extent of PCB contamination in the river but rather the nature of the sediments being deposited. These cores typically represent small areas of high deposition, not typical of the remainder of the Upper Hudson. The only data set with a sufficient number of samples to assess depth of contamination was the LRC program. As discussed at length previously (USEPA, 1998), the results showed that the maximum PCB concentration layer was the top layer (typically 0 - 23 cm) for the areas studied. While these cores cannot be considered representative of all areas of the Upper Hudson, for the fine-grained areas they indicate that PCBs remain close to the surface. This is consistent with the surface concentrations described above which indicate that much of the surface inventory of PCBs had to have been deposited in the 1970s and 1980s. Finally, one last observation should be made concerning the nature of the PCB deposits of the Upper Hudson. The fine-grained PCB-bearing deposits were not created as the result of a gentle and gradual deposition process as might normally occur in a river with run-of-the-river dams. While this system is certainly no series of reservoirs (the linear velocities frequently exceed several feet per second during high flow), the dams should serve to create more depositional environments than in a "normal" river. Nonetheless, it is important to note that the majority of the PCB inventory of the Upper Hudson was probably deposited in a two- to four-year period subsequent to the removal of the dam at Fort Edward. This massive movement of sediments and PCBs blanketed the Upper Hudson and affected PCB inventories throughout the Hudson, as can be seen in high-resolution cores obtained anywhere in the river. Thus it is incorrect to assert that these catastrophically created deposits are now safely sequestered when they are so new geologically and clearly in evidence on the sediment surface. EPA cannot ignore their potential for continued long-term contamination of the Hudson throughout its length. Ultimately, it may be that the strongest evidence to be seen are the fish body burdens themselves, which show little improvement since the late 1980s. This evidence in conjunction with the issues discussed in the foregoing text indicates that the EPA cannot accept the premise that the PCBs of the Hudson have been or will soon be permanently sequestered within the sediments. References Farrar, Kevin. NYSDEC. 2001. Personal communication from Kevin Farrar to Doug Tomchuk, USEPA Region 2. Re: Resuspension of PCBs during high flow. June 21. USEPA. 1997. Phase 2 Report, Further Site Characterization and Analysis. Volume 2C – Data Evaluation and Interpretation Report (DEIR), Hudson River PCBs Reassessment RI/FS. Prepared for USEPA Region 2 and USACE, Kansas City District by TAMS Consultants, Inc., The Cadmus Group, Inc., and Gradient Corporation. February.
Responsiveness Summary Hudson River PCBs Site Record of Decision
2-35
USEPA. 1998. Phase 2 Report, Further Site Characterization and Analysis. Volume 2C-A, Low Resolution Sediment Coring Report. Addendum to the Data Evaluation and Interpretation Report, Hudson River PCBs Reassessment RI/FS. Prepared for USEPA Region 2 and USACE, Kansas City District by TAMS Consultants, Inc., Gradient Corporation, and Tetra Tech, Inc. July 1998. Master Comment 641 Commenters contended that the low-resolution coring (LRC) study conclusions are based on faulty statistical analyses and provide no credible insights about sediment stability. Some say that the LRC sampling plan resulted in a statistical bias that must be accounted for, and that EPA has not adequately quantified uncertainties in the LRC estimates of PCB inventory change. Faults cited include inadequate quantification of uncertainties and a sampling bias toward areas with high PCB mass. A "corrected" statistical analysis provided by GE (its Appendix F.1) concludes that the LRC data "do not provide a basis for inferring a statistically significant change at the TIP" between sediment PCB data collected in 1984 and 1994. Response to Master Comment 641 Several criticisms of the LRC study conclusions are based on the analyses provided in Appendix F.1 of GE's comments. The primary theory advanced in GE's Appendix F.1 is that the locations selected for the LRC analysis are biased high relative to the bulk of 1984 sediment samples, resulting in a regression toward the mean. This phenomenon reflects the fact that, for any pair of measurements subject to uncertainty, initial high values will tend to decrease on resampling, while initial low values will tend to increase, as the resampled values are expected to be more like the local mean value than the original measurement. Further, a bias or difference in the mean of the sample relative to the population mean of the data will amplify this effect. This would cause an analysis of differences between 1984 and 1994 sediment data to show an apparent decline in high mass areas, and an apparent increase in low mass areas. GE Appendix F.1 characterizes this as "the principal statistical error," and provides a correction that purports to show no statistically-significant change between results for 1984 and 1994 in TI Pool sediments. The "regression toward the mean" issue was initially raised in a more qualitative manner in comments on the LRC Report (USEPA, 1998), and was answered at length by EPA in response to comment LG-1.37 (USEPA, 1999). That response acknowledged the existence of the regression toward the mean problem, but concluded that it did not invalidate the LRC conclusions. Comments received from GE on the FS in GE Appendix F.1 differ from the earlier comments in that a more quantitative analysis was applied, and a correction proposed. The proposed correction takes the following form, based on analysis of a bivariate normal problem (Equation 2 in GE Appendix F.1, with streamlined notation):
E(D) = E(d) - b * (E(X) - Mx)
Responsiveness Summary Hudson River PCBs Site Record of Decision
2-36
in which
E is the expectation operator (equivalent to "estimate" or "ave" in the original notation of GE Appendix F.1,) D is the "object of the comparison" defined as the difference between 1984 average
values for the whole TIP and the 1994 average values for the whole TIP [log scale] d is the observed difference between 1984 and 1994 values for matched sample pairs X is the 1984 PCB value at a given location Mx is the average value for the initial population, defined in GE Appendix F.1 as the
average of all samples taken in the TIP in 1984 [log scale] b is a bias correction factor.
From this equation, the expectation of the observed change in PCB mass must be adjusted by a bias correction that depends on the difference between the expectation or mean of the selected sample set and the average of the population of the starting data. EPA agrees that the form of this proposed correction is appropriate (given the assumption of lognormality) for the problem that is posed in GE Appendix F.1. The construct is misleading, however, because the problem that is posed in GE Appendix F.1 is not the one that is addressed in the LRC. That is, D, "the object of the comparison," is defined as the difference between the 1984 and 1994 average values for PCB mass in the whole of the TI Pool (Table 1 in GE Appendix F.1). In fact, the objective of the LRC was never to completely reevaluate the sediment PCB inventory throughout the TI Pool. Rather, it was to assess whether the 1984 data were still appropriate for estimating sediment inventory through evaluation of changes in inventory documented in 1984 in specific locations. Therefore, the definition of D, which is at the heart of the analysis presented in GE Appendix F.1, is inappropriate and not relevant to the LRC results. As is evident from Equation 2 in GE Appendix F.1, the bias correction disappears if E(X), the average value of sample locations selected for analysis, is equal to Mx, defined as the average value for the initial population. For the LRC, the correct interpretation of D, or the "object of comparison," is the difference in PCB mass not across the entire TI Pool but within the selected areas included in the LRC sampling. The majority of the LRC samples were selected to lie within selected PCB hotspots as defined by NYSDEC based on the 1984 sampling, specifically hot spots 8, 9, 10 14 and 16. Most of those samples that were not located in hot spots were still in fine-grained (cohesive) areas of the TI Pool. Sixty-three of the 70 cores obtained for the LRC program were classified as fine-grained (LRC Responsiveness Summary, Table A-3). In the absence of locational error, resampling at these sites has an expected value [E(X)] that is exactly equal to the population mean of the selected sites (Mx). Further, if PCB MPA within the boundaries of a given hotspot is considered to be randomly distributed, as appears reasonable, locational error within a hotspot introduces no bias, as E(X) is still equal to Mx. Given that some small locational error is unavoidable and the exact boundaries of the cohesive areas are subject to some uncertainty, some of the new (1994) samples may be from a different population than the original 1984 samples. However, as discussed at length in prior responses, this issue was minimized in the selection of the sampling areas for study by the low resolution coring program, a fact that is ignored by GE's
Responsiveness Summary Hudson River PCBs Site Record of Decision
2-37
comments. Specifically, the sites selected exhibited relatively low variability in PCB mass (typical range within a selected 1984 cluster was a factor of two between the minimum and maximum). Additionally, the 1992 side-scan sonar data were used to further refine the selected clusters so as to choose those clusters exhibiting a consistent sediment texture within the area enclosed by the 1984 sampling points. As noted in the DEIR (USEPA, 1997), the side scan sonar images are well correlated with the 1984 PCB measurements. Thus the cluster choices made by EPA served to minimize the variance within each cluster for both the 1984 and 1994 sampling, and thereby enable a direct comparison of the cluster results. This would introduce a small amount of sampling bias, but should not effect the conclusions of the LRC unless a large proportion of the 1984 samples were mis-located relative to sediment boundaries defined by the side scan sonar survey, an unlikely occurrence given the noted correlation between the two results. Therefore, the "regression toward the mean" effect is not expected to have a significant effect on LRC conclusions, as long as these conclusions are properly framed as representative of temporal trends for specific sample cohesive sediment areas, rather than average changes across the TI Pool as a whole. GE's analysis is also based on the difference in log space of the molar concentrations between 1994 and 1984, and thus differs from EPA's analysis, which was based on the relative fractional change in mass and moles per unit area with post-transformation to a logarithmic basis. Essentially, GE is examining the log transform of the ratio of 1984 to 1994 sample results, whereas EPA examined the log transform of the ratio of the arithmetic difference (1994 minus 1984) to the original 1984 result. Because GE's analysis does not address the same quantity as the EPA analysis in the LRC, its applicability to the EPA results is unclear. Despite these fundamental differences in approach, GE applied the proposed bias correction method and concluded that the 95 percent confidence interval on D included zero, and thus concluded that "the bias-corrected conditional analysis of the survey data does not support rejection of the hypothesis of no change between 1984 and 1994." It is worth noting, however, that the central estimate of the range for D provided by GE is a loss of 22 percent. GE's analysis and redefinition of the target quantity of interest has thus expanded the confidence interval, reducing the statistical certainty of the result, yet still provides a best estimate result that is qualitatively consistent with EPA's analysis. GE's Appendix 3.1 develops the bias correction factor based on a regression of the 1984 to 1994 change [log 10 scale] versus the 1984 MPA of a sample location [log 10 scale, evaluated as moles/m2]. The relationship proposed by GE is shown in Figure 641-1 (Reproduction of Figure 3 from GE Comments, Appendix F.1). Examination of this figure is enlightening. First, the figure is structured so that a value greater than 0 on the y-axis is equivalent to a net mass loss from 1984 to 1994, and all samples with a 1984 MPA greater than -1.8 (log 10 moles/m2) are shown to have an estimate loss of mass. GE fit a linear regression to these data, and determined a statistically significant slope, indicating a bias. It is obvious, however, that the statistical significance of the slope is due almost entirely to the high leverage exerted by three points, all of which had an initial log 10 MPA less than -2.3, and all of which were estimated to have experienced mass gains. These three points were, by definition, not hot spot samples, and are likely not relevant to analysis of change over time in the hot spot areas. (GE does not provide any leverage diagnostics or other careful examination relative to these influential points.) When
Responsiveness Summary Hudson River PCBs Site Record of Decision
2-38
the right-hand half of the graph is examined (those points with initial MPA greater than -1.5), it is evident that the distribution against original MPA is nearly random, and that there is no significant regression slope. This would imply that b is actually near zero for all the hot spot samples, and thus the bias correction is also near zero. GE does present results for a high-low split of the data, but applies the single bias correction factor b to both groups. GE's figure clearly suggests that this is not appropriate. GE's Appendix 3.1 also presents a similar "bias correction" analysis of the cluster mean data as a commentary on the alternative analysis of the LRC data presented by EPA in Appendix A of USEPA, 1999. (Note that the cluster mean analysis is clearly presented as "an alternate basis to examine the change in the PCB sediment inventory between 1984 and 1994" (USEPA, 1999, p. A-1) and does not replace EPA's earlier point-to-point analysis.) GE's analysis of the cluster mean data is subject to problems similar to those noted for the point-to-point analysis. Most importantly, the quantity of interest examined by GE (an estimate of the PCB inventory for the entire TI Pool) is not the one that is addressed in the LRC. Part 6 of GE's Appendix 3.1 discusses a number of additional potential adjustments for data imprecision. The two issues addressed are the assignment of an effective contamination depth to grab samples and the assignment of PCB concentrations to mass spectrometer ranges. GE treats these two sources of uncertainty as multiplicative (additive in log space), although no justification for this error structure is provided. Because the majority of the grab samples and the majority of the core sections screened by mass spectrometry only represent analyses that have lower PCB concentrations than the mean, the effect of this is to increase the spread of the low mass sample points and decrease the overall mean value for the TI Pool. Because GE's bias correction factor depends on the difference between the mean of the samples used in the LRC and the overall mean of TI Pool samples, inclusion of the proposed analytical errors results in an increase in the potential bias and a reduction in the estimated mass loss. But, as noted above, EPA believes that GE is focusing on the wrong "object of comparison" (D), and these calculations are thus not relevant to the LRC conclusions. It is worth noting that Table 5 in GE Appendix F.1, which incorporates all of the statistical methodologies identified by GE for reducing the estimate of mass loss, still reports a central tendency estimate that loss has occurred (D = 0.90), although the value is not reported as significantly different from zero. Indeed, Appendix F.1 does not deny the existence of mass loss, but concludes that "the TIP did not experience a PCB change large enough to be detected by the survey design that was used." GE's key misconception is captured in the wording "the TIP." As noted above, the LRC does not purport to show a net mass loss from the sediments of the TI Pool taken as a whole. Rather, it should be interpreted as demonstrating mass loss from the specific cohesive sediment areas investigated in the LRC. To the extent that the areas selected for study by the LRC are reflective of the fine-grained sediments of the TI Pool as a whole, PCB losses would be expected from these areas as well. This is not to say that the entire TI Pool has experienced PCB mass loss as a whole, since this issue was not examined by the LRC program. Nor can it be concluded that all fine-grained areas of the TI Pool have experienced PCB loss. Ultimately, the LRC analysis comes down to the following: 13 areas of the TI Pool were sampled and compared with historical data from the
Responsiveness Summary Hudson River PCBs Site Record of Decision
2-39
same areas. All but three of these areas exhibited a mass loss of Tri+ PCBs. After correcting for dechlorination losses, the estimated average mass loss of Tri+ PCBs for the entire set of study areas was 43 percent, with 95 percent confidence limits on the mean ranging from a loss of 58 percent to a gain of 1 percent. The mean mass loss of Tri+ PCBs, excluding dechlorination, is statistically different from zero at the 90 percent confidence level (USEPA, 1999, p. A-10). EPA has used the results of the LRC as one among several lines of evidence to conclude that the PCBs in the fine-grained sediments of the TI Pool have not been permanently sequestered. Response to Master Comment 619 in Section 2.1 contains a complete review of the evidence suggesting lack of sequestration of sediment PCB inventories. The PCB inventories in some, and perhaps many, fine-grained areas of the pool continue to decline with time. In fact, as noted in White Paper – Relationship Between PCB Concentrations in Surface Sediments and Upstream Sources, portions of the historical inventory of PCBs remain at the sediment surface and serve as a continuing source of PCBs to the water column and biota. Clear evidence for this provided by the observation that PCB concentrations in the water column during summer and in biota have remained approximately constant from 1995 to 2000, despite remedial actions to control the upstream sources (Response to Master Comment 631, Section 2.6; White Paper – Trends in PCB Concentrations in Fish in the Upper Hudson River). References USEPA. 1997. Phase 2 Report, Further Site Characterization and Analysis. Volume 2C – Data Evaluation and Interpretation Report (DEIR), Hudson River PCBs Reassessment RI/FS. Prepared for USEPA Region 2 and USACE, Kansas City District by TAMS Consultants, Inc., The Cadmus Group, Inc., and Gradient Corporation. February. USEPA. 1998. Phase 2 Report, Further Site Characterization and Analysis. Volume 2C-A, Low Resolution Sediment Coring Report. Addendum to the Data Evaluation and Interpretation Report, Hudson River PCBs Reassessment RI/FS. Prepared for USEPA Region 2 and USACE, Kansas City District by TAMS Consultants, Inc., Gradient Corporation, and Tetra Tech, Inc. July. USEPA. 1999. Responsiveness Summary for Volume 2C-A, Low Resolution Sediment Coring Report. Addendum to the Data Evaluation and Interpretation Report, Hudson River PCBs Reassessment RI/FS. Prepared for USEPA Region 2 and USACE, Kansas City District by TAMS Consultants, Inc. and Tetra Tech, Inc., February. Master Comment 625 Commenters said that the conceptual design of the sampling plan for EPA's low-resolution sediment coring (LRC) effort was inadequate and not properly designed to evaluate changes over time. Commenters claimed that the interpretations and conclusions in the LRC and FS regarding loss of PCB mass from the hot spots are incorrect. Commenters also stated that mass balance analysis of PCB loading past the TI Dam conflicts with EPA interpretations of redistribution of PCBs out of previously-identified hot spot areas.
Responsiveness Summary Hudson River PCBs Site Record of Decision
2-40
Response to Master Comment 625 This response is one of two addressing a set of comments on EPA's LRC effort. The focus of this response is on interpretation of the LRC results. Response to Master Comment 641 (Section 2.2) addresses comments regarding statistical procedures used in the LRC analysis. Conceptual Design GE states that "EPA collected 63 'low resolution' sediment cores with the intent of comparing these cores to the 1,109 cores and grab samples collected by NYSDEC in 1984 to measure any change in PCB mass during that period." The comment continues to state that "EPA took an insufficient number of samples to do a fair comparison to NYSDEC's large database." Further, the sampling was "biased to areas where high concentrations of PCBs had been found in 1984." These statements are misleading, and have already been answered in USEPA, 1999. The objective of the LRC was never to completely reevaluate the sediment PCB inventory throughout the TI Pool. Rather, it was to assess changes in inventory documented in 1984 in specific locations. In fact, the 60 LRC sample locations used for analysis in the TI Pool were located in 16 discrete areas of the pool and were collected at exactly the same sampling density as originally performed by NYSDEC, with samples collected at approximately the same locations as those occupied by NYSDEC. These 16 areas were selected from throughout the TI Pool and represent a range of contamination and sediment textures, although they focus principally on fine-grained sediments. The data set is sufficient for the purpose for which it was intended, i.e., assessment of the direction and approximate magnitude of the change in sediment inventory at these locations between 1984 and 1994. EPA agrees that the sampling was focused on high concentration areas. This was intentional and does not represent a flaw, as the primary intention of the LRC was to examine changes in inventory within identified hotspot areas (and thus was "biased" toward these areas). EPA examined a representative subset of the previously quantified fine-grained sediment areas within the TI Pool, and the main conclusions of the LRC apply to such areas, and not to the pool itself. This point is clearly made both in the LRC Report (USEPA, 1998) and in the Responsiveness Summary (USEPA, 1999). Sampling GE states that "EPA attempted to take its cores from the same points where NYSDEC found higher concentrations. EPA was unable to take cores from exactly the same points at which NYSDEC took cores." The comment continues to state that EPA could not match its cores with "sufficient precision" to those taken by NYSDEC. EPA agrees that it was not possible to exactly match LRC sample locations to the 1984 cores taken by NYSDEC, although the spatial error is believed to be low, with 93 percent of the paired
Responsiveness Summary Hudson River PCBs Site Record of Decision
2-41
locations separated by less than eight feet (USEPA, 1999, Response to LG-1.9). The presence of a small amount of locational error is not a bar to the analysis, although it contributes to uncertainty. Since EPA's evaluation is based on the average difference between the sixty 1984-1994 sample pairs, it is only necessary that the two data sets represent unbiased samples of the same underlying "population" of PCB concentrations in specific sediment areas. The use of geophysical information in screening sample sites helped to ensure that both the 1984 and 1994 members of sample pairs are indeed samples from the same sediment structure. Further, by examining the average difference of pairs and testing for its statistical difference from zero, the analysis is not dependent upon the absolute accuracy of any individual measurement. Uncertainty Comment 04-0287-016 states that the LRC "was not properly designed for any analysis of the components of variance, and consequently provided no estimates of error," citing comments of "several peer reviewers." "Overlapping subject studies by GE" are claimed to provide error estimates and "dispute all of the LRC conclusions." The LRC was designed primarily for pair-wise comparison between 1984 and 1994 cores. Information on the uncertainty in LRC results is summarized in Table 4-7 of USEPA (1998) and is discussed at length in USEPA (1999). An alternative analysis, presented in Appendix A of USEPA, 1999, examined the data on a grouped or stratified basis. GE has submitted analyses that suggest that the magnitude of estimated PCB loss is over- estimated in both USEPA, 1998 and USEPA, 1999. However, the data continue to show a trend of loss of mass from hotspot areas in the TI Pool between 1984 and 1994. Response to Master Comment 631, Section 2.2, contains additional relevant discussion. The reference to "overlapping subject studies by GE" is obscure, but presumably refers to GE's effort to reoccupy some of the LRC sites in 1998. In comments on the LRC (LG-1.17A), GE supplied a comparison between 1994 and 1998 estimates, but the data set used in the comparison was quite small (12 locations) and insufficient to estimate differences between 1994 and 1998. The extensive comments on the FS submitted by GE do not contain any additional attempts to estimate sediment PCB loss rates based on GE data. LRC Conclusions GE comment 11-0101-028 states that the conclusion of significant mass loss between 1984 and 1994 is "false and unsupportable" due to the use of incorrect statistical procedures. The statistical issues are addressed in Response to Master Comment 641 (Section 2.2), which demonstrates that the statistical procedures are correct. As noted therein, EPA believes that the LRC data do indeed demonstrate a mass loss from sampled cohesive sediment areas in the TI Pool between 1984 and 1994. The comment also characterizes the LRC conclusions as stating that 40 percent of the PCB mass in the TI Pool hot spots had been "lost," that there was no widespread burial of PCBs, and that
Responsiveness Summary Hudson River PCBs Site Record of Decision
2-42
"PCBs were being redistributed within the sediments by some unidentified, magical mechanism." The "40 percent" number presented in the LRC is a best estimate of an uncertain rate of PCB Tri+ mass loss between 1984 and 1994 that is acknowledged by EPA to have a wide range, but to be greater than zero. (The re-evaluation of the data in USEPA, 1999, Appendix A, presents a 95-percent confidence range on the mean change in PCB Tri+ inventory in the sampled areas from a loss of 58 percent to a gain of 1 percent. This re-evaluation notes, however, that the mean loss is significantly different from zero at the 90-percent confidence level.) The estimated mass loss correctly applies only to the cohesive sediment areas actually sampled by EPA in 1994. EPA believes that lack of "widespread burial" is evident from multiple sources, including the EPA high resolution cores, the EPA low resolution cores, and the GE 1998 sediment sampling. Interpretation is subjective, however, depending on what is meant by "widespread" and what is meant by "burial." EPA's assertion should be understood to mean that high concentrations of historically deposited PCB mass remain near the surface and potentially bioavailable (within 10 cm) at many (but not all) of the PCB hot spots identified by NYSDEC in 1984. Further evidence for this assertion, based on the most recent GE sediment data, is provided in Response to Master Comment 637 in Section 2.3. Finally, GE comment 11-0101-028 states that EPA did not collect data appropriate to determine changes in surface concentrations over time, whereas GE did collect such data, which "show a continuing decline in PCB concentrations in surface sediments." Comment 22-0019-23B notes that the LRC cores do not have sufficient resolution to determine surface PCB concentrations, and claims that EPA uses these cores to claim that the LRC cores "show the majority of the PCB inventory is in the active surface layer." As discussed in Response to Master Comment 627 (Section 2.7), the database for the Reassessment RI/FS includes data collected by EPA, GE, NYSDEC, USGS, NOAA, and others. EPA used sediment data collected by GE as soon as such data were made available. The evidence contained in the GE 1998 sediment sampling does not clearly show a "continuing decline." Declines are evident in some sample locations, but other contaminated locations do not show a significant decline in surface sediment concentrations since the 1991 GE sampling. Indeed, some locations appear to show an increase. Responses to Master Comments 619 (Section 2.1), 621 (Section 2.1), 633 (Section 2.6), and 637 (Section 2.3) contain further details. The LRC cores themselves do not show that the majority of the PCB inventory is in the "active" surface layer, if "active" is defined as the zone subject to bioturbation and ready exchange with the water column. Instead, the LRC cores merely show that a large portion of the PCB inventory in the sampled areas remains within a small distance of the surface. Other sediment data, with finer vertical resolution, confirm that high concentrations of PCBs do remain within the currently active surface layer. Mass Balance Analysis of PCB Loads GE comments 11-0103-034 and 11-0103-035 state that estimates of mass loss from the TI Pool obtained from GE's model for 1983 to 2000 account for about four percent of the entire
Responsiveness Summary Hudson River PCBs Site Record of Decision
2-43
estimated 1984 Tri+ PCB inventory. This is contrasted to the LRC conclusions and presented as "strong contradictory evidence." The LRC should not be construed to indicate that the PCB mass loss rate estimated for sampled cohesive sediment areas is equivalent to PCB mass mixed into the water column and transported downstream. The estimated mass loss rate from these selected areas cannot be applied to the whole TI Pool inventory and compared to water column mass transport estimates. This issue was addressed at length in USEPA, 1999. First, EPA's mass loss estimates properly apply only to the types of sediment areas that were sampled in 1994, not to the entire inventory. Second, EPA's conclusion was that PCB mass had moved out of many of the previously defined hotspot areas, not that it had been transported downstream. This includes PCBs redistributed by bulk movement of sediment and PCBs that were mobilized into the water column but redeposited within the TI Pool. Use of the LRC Results in the FS Comment 04-0287-016 states that EPA used the LRC as the basis for erroneously concluding that buried PCB mass contributes to water column loading and therefore must be removed from the river to prevent further release. Similarly, Appendix F.1 to GE's comments contends that statements in the FS "lead the reader to believe that the LRC study produced unequivocal evidence leading to the Agency's conclusion that the Upper Hudson River sediments are unstable." The LRC is not the primary basis for determining the need for remediation or for evaluating remedial options. The need for remediation is based on a number of factors, including the fact that risk-based concentrations are not met under current conditions and are not expected to be met for many decades under No Action, based on EPA's fate and transport modeling, (which, in fact, does not depend on the LRC). The comparative evaluation of remedial options is also based in part on the modeling. In Section 3.5.1 of the FS, the results of the LRC are cited as one among 16 "lines of evidence" in the determination of target area selection criteria. Similarly, the LRC results are only one among many lines of evidence regarding the lack of assured stability for buried PCBs in Hudson River sediments (Response to Master Comment 619). The general conclusions of the LRC are appropriate and have been supported by the peer review on the DEIR and LRC. But, even if the LRC results were dismissed entirely, the many other lines of evidence would still lead to the same identification of target areas.
Responsiveness Summary Hudson River PCBs Site Record of Decision
2-44
References USEPA. 1998. Phase 2 Report, Further Site Characterization and Analysis. Volume 2C-A, Low Resolution Sediment Coring Report. Addendum to the Data Evaluation and Interpretation Report, Hudson River PCBs Reassessment RI/FS. Prepared for USEPA Region 2 and USACE, Kansas City District by TAMS Consultants, Inc., Gradient Corporation, and Tetra Tech, Inc. July. USEPA. 1999. Responsiveness Summary for Volume 2C-A, Low Resolution Sediment Coring Report. Addendum to the Data Evaluation and Interpretation Report, Hudson River PCBs Reassessment RI/FS. Prepared for USEPA Region 2 and USACE, Kansas City District by TAMS Consultants, Inc. and Tetra Tech, Inc., February. 2.3 Other Geochemistry Issues Master Comment 575 Commenters stated that EPA needs to make a more thorough effort of examining PCB release mechanisms. Commenters claim that EPA failed to collect data to determine the reason for the declining trend in PCBs that it identified in the Phase 1 report. Commenters also state that the FS does not look beyond the water column in its analysis, and that EPA should conduct a closer examination of the uptake of PCBs by submerged rooted macrophytes and subsequent translocation of PCB concentration and possible diminished summer PCB levels in sediments. Commenters also state that temporal trends are only discussed qualitatively and poor statistical trend analysis had been performed. Response to Master Comment 575 In the Phase 1 Report, EPA noted that loads and concentrations in the late 1980s were substantially lower than those seen in the mid-1970s. However, the EPA also noted that conditions had not changed much during the late 1980s, roughly from 1985 to 1990. Thus the question at the end of Phase 1 was not "Why were PCB levels declining?" but rather, "What was keeping conditions so constant?" To address this question, EPA undertook a series of sampling studies to elucidate the current sources of PCBs responsible for maintaining the conditions observed. Since it was unclear at the time of the Phase 1 Report (1991) where PCBs originated, it would have been inappropriate to begin a study of mechanisms for PCB release. A study of mechanisms rather than sources might have easily yielded much data about unimportant processes without ever identifying the important sources. Thus the Phase 2 efforts focused on loads and sources. This is not to say that EPA did not examine historical records. In fact, EPA collected a series of dated sediment cores to study and confirm the general lack of recovery in the system to that point in time. Only by understanding the sources and confirming the observed trends could the EPA hope to estimate future conditions.
Responsiveness Summary Hudson River PCBs Site Record of Decision
2-45
To this end, EPA's studies, along with the federally mandated monitoring conducted by GE, clearly documented the importance of the sediments to the PCB budget. Despite the occurrence of the Allen Mill event, both the EPA and GE data show the sediments to be the major source of PCBs (currently more than 80 percent) to the water column. This information, along with the various ecological studies which link the sediment and biota PCB contamination, form an important component in the EPA's decision to remove the contaminated sediments. Detailed discussions on PCB trends in fish tissue, the water column, and surface sediments are provided in Section 2.6 (Responses to Master Comments 629, 631, and 633 respectively), and a general discussion of PCB trends is also provided in Section 2.6 (Response to Master Comment 635). The initial decline in PCB loads and concentrations in the Upper Hudson may be attributable to several different coincident occurrences of the late 1970s. Among them are:
• A decline in the erosion of the remnant deposits resulting from almost continuous erosion after the dam was removed.
• Cessation of PCB discharges at the GE plant sites. • Cessation of navigational dredging activities in 1979.
In every case, the mixture of PCBs involved would be very similar. Thus, no PCB fingerprint could tease out one effect from another. EPA attempted to evaluate historical transport through high resolution cores and evaluation of historical data, but these were insufficient to distinguish which of the above-mentioned occurrences were responsible for the historical declines. More to the point, there was little need for such elucidation since it was clear at the start of the Reassessment that the decline seen in the late 1970s and early 1980s was no longer occurring (Responses to Master Comments 629, 631, 633, and 635, Section 2.6). Rather, as discussed above, the EPA focused on identifying the current sources responsible for the extensive PCB contamination still present in the Upper Hudson and impacting the region downstream. In this regard, the EPA has conducted an extensive series of statistical analyses on the water column, sediments, and biota of the Upper Hudson. These analyses were neither simple nor statistically inadequate. These analyses included linear regression, test of means, ANOVA, MANOVA, kriging, and principal components analysis, among others. In every report, the EPA makes use of statistical analyses to support its assertions. This is not to say that the EPA has not examined the PCB release mechanisms involved. EPA's HUDTOX and DOSM models have extensively examined PCB release processes throughout the Upper Hudson. To this end, the models explicitly represent resuspension, porewater diffusion, dissolution, and other geochemical mechanisms. These models rely on the long series of historical records of PCB levels in the Upper Hudson to establish the importance of the mechanisms they represent. The HUDTOX model in particular represents many complicated mechanisms governing PCB transport. In fact, the simulations from the HUDTOX model document the importance of the unknown summertime sediment release process, since the model is unable to achieve a mass balance without it. Further discussion on the evidence and possible processes for this mechanism as well as its importance to PCB loads in the Upper Hudson can be
Responsiveness Summary Hudson River PCBs Site Record of Decision
2-46
found in Section 2.1, Responses to Master Comments 621 and 623, as well as in Section 2.3, Response to Master Comment 637. Commenters suggest one potential mechanism in particular, the release of PCB from the sediments via large aquatic plants or macrophytes, as warranting further exploration. The roots of these plants exist largely within the contaminated sediments of the Upper Hudson and may represent an important pathway for PCB release. Given that the main PCB loads from the sediments occur during the warmest periods of the year (May through October), such a mechanism would be temporally consistent with the observations. Evidence for such release for nutrients was found by Templer et al., 1997. With regard to subsequent study of release mechanisms such as a plant root pathway, the EPA does not feel that further study, with the associated delay, is warranted or necessary in order to achieve the desired reduction in PCB levels in fish, water, and sediment. The data set is sufficient to identify the sediments of the Upper Hudson as the major source of PCBs to the water column and the biota, with the fine-grained (cohesive) sediments as the most important areas for the biota. The modeling analyses clearly identify the occurrence of such a release. Whether the mechanism is plant roots or benthic invertebrate activities, it is clearly the near-shore sediments that are responsible (FS, Appendix D1). Concentrations in surface sediments in many locations are clearly too high to have been deposited anytime in the last five years and possibly the last 15 years in some cases, thus eliminating the process of deposition and burial as a rapid means of isolating PCB from the environment. While further study can always improve the understanding, the current understanding is sufficient to warrant implementation of the selected remedy. Reference Templer, P., S. Findlay and C. Wigand. 1997. Sediment Nutrient Chemistry Associated with Native and Non-native Emergent Macrophytes of a Hudson River Marsh Ecosystem. Institute of Ecosystem Studies, Millbrook, NY. Master Comment 253430 Commenters state that naturally occurring bacteria from the Hudson could destroy lightly chlorinated PCBs. Commenters also state that the dechlorinated PCBs are less toxic and less bioaccumulative. Response to Master Comment 253430 The EPA is aware of the scientific literature that documents the degradation of selected PCB congeners under aerobic conditions in laboratory settings or in the environment (for example, see Williams and May, 1997 and Mohn et al., 1997). In general, these congeners tend to be the less-chlorinated PCBs produced under anaerobic dechlorination. Alternatively, these processes tend to be very slow and do not represent a significant rate of loss. As part of the Phase 2 investigation, EPA considered the importance of aerobic degradation in two separate reports. The
Responsiveness Summary Hudson River PCBs Site Record of Decision
2-47
Revised Baseline Modeling Report discusses aerobic degradation but does not include it in the model simulation because of its apparent small scale relative to other processes. EPA also directly examined the degree of aerobic degradation occurring within the water column of the Upper Hudson during the transport of PCBs from the TI Pool to Waterford (USEPA, 2000). In this analysis, EPA examined transport and gas exchange and found evidence for the loss of only two of the lightest congeners (BZ#1 and BZ#8). The vast majority of the congeners saw no change in water column inventory beyond that expected from gas exchange. Thus, aerobic degradation was not a significant loss process for the PCB congeners during the study intervals. This is not to say that aerobic degradation was not occurring, but simply that it was small in relation to advection and gas exchange. On the basis of this analysis EPA concluded that the vast majority of the PCBs found in the water column were transmitted to the Lower Hudson or released via gas exchange. Since the sediments of the Upper Hudson are largely anaerobic, the water column represents the main aerobic environment for PCB fate. Given the absence of substantive degradation within the water column, aerobic degradation does not appear to be an important process for PCB destruction in the Upper Hudson in general. It is EPA's position that these less chlorinated congeners are still toxic and that toxicity is reflected in the cancer slope factors and reference doses. This is further discussed in Responses to Master Comments 541 and 571 (Chapter 3). References Mohn, W. W., K. Westerberg, W. R. Cullen, K. J. Reimer. 1997. Aerobic Biodegradation of Biphenyl and Polychlorinated Biphenyls by Arctic Soil Microorganisms. Applied and Environmental Microbiology, pp 3378 - 3384. Williams, W.A. and R.J. May. 1997. Low-Temperature Microbial Aerobic Degradation of PCB in Sediment. Environmental Science & Technology, Vol. 31, No. 12. USEPA. 2000. Response to Peer Review Comments on the Data Evaluation and Interpretation Report (DEIR) and the Low Resolution Sediment Coring Report (LRC), Hudson River PCBs Reassessment RI/FS. Prepared for USEPA Region 2 and USACE, Kansas City District by TAMS Consultants, Inc. and Tetra Tech, Inc., November. Master Comment 253424 Commenters state that EPA is convinced that buried sediments control the PCB release processes, and that EPA does not consider the importance of sediment/water interface geochemical processes such as dissolution, suspension, adsorption, diffusion, emulsion formation, etc. in arriving at its decision to remediate the “buried” PCBs. Thus, commenters state that EPA has targeted PCB mass, and not PCB concentrations, in its selection of target areas.
Responsiveness Summary Hudson River PCBs Site Record of Decision
2-48
Response to Master Comment 253424 EPA agrees that a variety of complex geochemical phenomena control PCB exchange at the sediment-water interface. Over the short term, these phenomena may well describe loading of PCBs into the water column by abiotic processes, although the data do not exist to adequately quantify the mechanisms responsible for these processes in the Hudson River. Two facts are important to note:
• Exchange of PCBs from the sediment to the water column appears to be driven to a large extent by biological processes, including bioturbation and excretion of fecal pellets by benthic organisms, as described in Response to Master Comment 621 (Section 2.1). These processes do not depend solely on rate-transfer kinetics at the sediment-water interface, and may operate to depths of 10 cm or more (Response to Master Comment 637, Section 2.3).
• The net results of the processes cited in the comment are well documented in observational data (Response to Master Comment 623, Section 2.1). It is neither necessary nor appropriate to derive a dynamic, kinetic model of short-time-frame kinetic exchange processes at the sediment-water interface. Over the long time horizons addressed in the HUDTOX modeling, the net effect of the mechanisms of exchange are well summarized by an empirical exchange coefficient, as was done in the RBMR (USEPA, 2000). GE handled such exchange in a similar manner in its model.
EPA has never stated or inferred that PCBs in sediments well below the surface are responsible for the contamination of the water column and biota, although PCBs buried in sediment up to depths of 10 cm or more may contribute to this contamination (Response to Master Comment 637). Further, as discussed at length in Response to Master Comment 607 in Chapter 4 of this document, as well as in the DEIR (USEPA, 1997), the current levels of PCBs within the surface sediments could not have been achieved within the last 10 to 15 years solely as a result of the upstream source. Thus, historical deposited PCBs remain at the sediment surface, unsequestered by burial in many locations. The commenter incorrectly equates historical deposits to buried deposits. Recognizing that the sediment/water interface in a river is not a stagnant boundary where the net sediment movement is always downward, EPA cannot assume that deeper PCB contamination will always remain buried. Response to Master Comment 619 in Section 2.1 contains additional discussion of this issue. Intrinsic in the nature of a river is the constant reworking of its bed. Thus, sediments at depth, while not active today, may be made available at some later date. EPA, in selecting its target areas, recognized the potential for deeper PCBs to be unearthed and placed at the sediment/water interface. As noted in Response to Master Comment 597 in Chapter 4 of this document, the EPA used several different criteria in its selection of target areas. As can be seen in Figures 597-1 through 597-5, surface PCB concentrations and sediment PCB mass (as MPA) are correlated. Thus, the areas identified by surface concentration are similar to those identified by MPA. More to the point, the targeting criteria used by EPA more efficiently captured high surface concentrations than high MPA values. This is a direct impact of EPA’s recognition of the importance of surface
Responsiveness Summary Hudson River PCBs Site Record of Decision
2-49
sediments in controlling current PCB release and exposure. By also recognizing the importance of in-place inventories through the use of MPA, EPA recognizes the dynamic and temporary nature of the PCB storage within the riverbed. References USEPA. 1997. Phase 2 Report, Further Site Characterization and Analysis. Volume 2C – Data Evaluation and Interpretation Report (DEIR), Hudson River PCBs Reassessment RI/FS. Prepared for USEPA Region 2 and USACE, Kansas City District by TAMS Consultants, Inc., The Cadmus Group, Inc., and Gradient Corporation. February. USEPA. 2000. Phase 2 Report, Further Site Characterization and Analysis. Volume 2D – Revised Baseline Modeling Report (RBMR), Hudson River PCBs Reassessment RI/FS. Prepared for USEPA Region 2 and USACE, Kansas City District by TAMS Consultants, Inc., Limno-Tech, Inc., Menzie-Cura & Associates, and Tetra Tech, Inc., January. Master Comment 637 Some commenters suggested that sediment cores demonstrate that the "vast bulk" of historically deposited PCBs are sequestered and not bioavailable, because they are buried too deeply. It was also suggested that EPA use sediment profile imaging to estimate bioturbation depth. Response to Master Comment 637 Detectable PCB contamination occurs across a wide range of sediment depths in the Hudson River. It is not only those PCBs that lie at the sediment surface that are directly available to the food chain. Organisms that bury and feed in the sediments can access PCBs buried below the surface, and can play a significant role in transporting hydrophobic contaminants into the water column and the food chain (Reible et al., 1996; Menzie, 1980; Robbins, 1982). Feeding activities of organisms such as tubificid oligochaetes have been shown to efficiently rework and mix freshwater sediments to depths of 6 to 9 cm or more (Fisher and Lick, 1980; Karickhoff and Morris, 1985). By feeding at depth and excreting fecal pellets at the surface, these organisms create a "conveyor belt" that transports contaminants to the surface where it is also available to non-burrowing organisms. It is true that a portion of the PCBs stored in the sediments of the Upper Hudson River currently may lie at a greater depth than is readily available to benthic organisms. This fact is largely irrelevant, however, to the assessment of risks in the Hudson, given that the PCB mass that does lie within the bioavailable zone is sufficient to result in unacceptable concentrations of PCBs in benthic organisms and fish. Further, the fact that PCBs are buried now does not necessarily mean that they will always remain deeply buried. Response to Master Comment 619 in Section 2.1 contains further details on the stability of buried PCB sources. Defining the exact fraction of the sediment PCB mass that is bioavailable under current conditions is difficult because bioavailability depends on the depth of benthic biological activity,
Responsiveness Summary Hudson River PCBs Site Record of Decision
2-50
which varies at a fine spatial scale according to characteristics of the sediment and the types of benthic organisms present. Modeling conducted in support of the FS assumed that it is predominantly the PCBs present in the top 5 cm of the sediment that influence the food chain in the upper Hudson River; however, a portion of the PCBs in biota may also derive from greater depths. EPA's model represents this by calculating sediment-based bioaccumulation from the top two sediment layers (approximately 5 cm), while specifying a cohesive sediment mixed layer depth of 10 cm. As a result, while only PCBs in the top 5 cm are directly bioavailable in the EPA models, PCBs in the top 10 cm (in cohesive sediments) can influence the food chain by mixing with and replenishing PCBs in the top layers. Little direct evidence on bioturbation mixing depths in the Upper Hudson is available at this time, but the assumption that the most important contribution is from the 0-5-cm active zone is consistent with observations from lakes indicating maximum tubificid activity at depths from 2 to 9 cm and maximum oligochaete activity at depths from 1 to 3 cm (Fisher and Lick, 1980; Milbrink, 1973; Krezoski et al., 1978). However, there is also evidence for benthic activity to much greater depths. Millbrink (1973) noted tubificid penetration in lake muds up to 15 cm. Chironomus, which is abundant in the Hudson River, can burrow as deep as 50 cm (Charbonneau and Hare, 1998). Hexagenia limbata is reported as routinely burrowing to depths of 10 cm and can excavate 52 cm3 per m2 per day (Charbonneau and Hare, 1998). A number of megadrile oligochaetes are routinely reported at depths of 10 cm, while certain tubificids have been collected at depths greater than 1 m (personal communication from Ken Fritz, Aquatic Ecology Laboratory, Department of Biological Sciences, Auburn University, Auburn, AL to Ken Cerretto, Menzie-Cura & Associates, 2001). It is therefore appropriate to assume that the most bioavailable PCBs in sediments are those lying at a depth up to 5 cm, but that a reduced level of bioavailability extends much deeper. Fine-scale cores collected by GE in 1998 and segmented at 1 cm intervals over the top 5 cm generally show little trend in concentration from 0 to 5 cm, consistent with efficient bioturbation of this zone. Mixing of sediments by benthic organisms is likely to occur up to at least 10 cm, and some mixing may occur to much greater depths under favorable conditions. EPA believes that the representation used in the model (direct bioavailability to benthic organisms to a depth of about 5 cm, with mixing down to 10 cm) is an appropriate average representation of typical conditions in the contaminated cohesive sediment areas of the TI Pool. NOAA comments suggested the use of sediment profile imaging to obtain measurements of average bioturbation depth, and noted that bioturbation depth might increase as conditions at the Site improve. EPA appreciates this suggestion, and will consider the use of this technique in the monitoring program. There are concerns, however, as to the accuracy of reach-scale estimates that could be obtained in the highly heterogeneous sediment of the Upper Hudson. Finally, it should be remembered that PCBs that are buried below the bioavailable zone are not sequestered from the environment, even if they lie in thoroughly stable sediment deposits. Movement of porewater is driven by diffusion, benthic invertebrate activity (e.g., burrowing), desorption, groundwater movement through sediments, bioturbation, and processes in the rhizosphere (e.g., uptake of water by plant roots, which causes cracks in the sediment) (Weiner,
Responsiveness Summary Hudson River PCBs Site Record of Decision
2-51
2000; DePinto et al., 1994). This movement will gradually transport dissolved and colloid-sorbed PCBs from deeper to shallower sediment zones and, over time, will replenish PCBs in the bioavailable zone unless active remediation is undertaken. References Charbonneau, P. and L. Hare. 1998. Burrowing behavior and biogenetic structures of mud-dwelling insects. J. N. Am. Benthol. Soc., 17(2): 239-249. DePinto, J.V., W. Lick, and J.F. Paul. eds. 1994. Transport and Transformation of Contaminants near the Sediment-water Interface. Lewis Publishers, Boca Raton, Florida. Fisher, J.B. and W.L. Lick. 1980. Vertical mixing of lake sediments by tubificid oligochaetes. J. Geophysical Res., 85(C7): 3997-4006. Karickhoff, S.W. and K.R. Morris. 1985. Impact of tubificid oligochaetes on pollutant transport in bottom sediments. Environ. Sci. Technol., 19: 51-56. Krezoski, J.R., S.C. Mozley, and J.A. Robbins. 1978. Influence of benthic macroinvertebrates on mixing of profundal sediments in southeastern Lake Huron. Limnol. Oceanogr., 23: 1011-1016. Menzie, C.A. 1980. Potential significance of insects in the removal of contaminants from aquatic systems. Water, Air, and Soil Pollution, 13: 473-479. Millbrink, G. 1973. On the Vertical Distribution of Oligochaetes in Lakes Sediments. Report No. 53. Institute of Freshwater Research, Fishery Board of Sweden. Reible, D.D., V. Popov, K.T. Valsaraj, L.J. Thibodeaux, F. Lin, M. Dikshit, M.A. Todaro, and J.W. Fleeger. 1996. Contaminant fluxes from sediment due to tubificid oligochaete bioturbation. Wat. Res., 30(3): 704-714. Robbins, J.A. 1982. Stratigraphic and dynamic effects of sediment reworking by Great Lakes zoobenthos. Hydrobiologia, 92: 611-622. Weiner, E.R. 2000. Applications of Environmental Chemistry: A Practical Guide for Environmental Professionals. Lewis Publishers, Boca Raton, Florida. Master Comment 639 Commenters observed that research by EPA, GE, and others demonstrates that anaerobic dechlorination of certain PCB congeners occurs in sediments of the Hudson under the proper conditions. One comment asked why EPA "does not fully examine how rapidly and to what extent natural decay would care for the residual contamination in the river south of Fort Edward." Differing viewpoints were presented as to whether this process is or is not reducing the mass of PCBs and the exposure to PCBs in the Hudson.
Responsiveness Summary Hudson River PCBs Site Record of Decision
2-52
Response to Master Comment 639 EPA has examined the extent of PCB dechlorination in both of its geochemical reports (USEPA, 1997, USEPA, 1998). As discussed in these reports, the extent of dechlorination varies with initial PCB concentration such that the most contaminated sediments typically exhibit the greatest degree of dechlorination. Within the Upper Hudson, many sediments exhibit high degrees of dechlorination. However, these sediments still contain significant fractions of their original mixture, thus they still exhibit much of their original toxicity. This issue raised relative to natural decay and residual contamination is addressed at length in Section 4.3.2 of the DEIR (USEPA 1997). EPA established that:
(1) Anaerobic dechlorination does not result in the destruction of PCBs; rather, it results in the selective removal of chlorine atoms from individual PCB congeners.
(2) Significant dechlorination in Hudson River sediments appears to occur only
above an initial concentration of about 30 ppm total PCBs.
(3) The potential extent of natural anaerobic dechlorination in the Hudson River is limited to a mass loss of 23 percent for Aroclor 1242, the mass represented by meta- and para-chlorines. (In practice, some of the dechlorination products are not reported in the Phase 2 database, so the apparent limit of dechlorination in the Phase 2 data is 26.1 percent). No molar loss of PCBs occurs as a result of this dechlorination.
(4) Most dechlorination in Hudson River sediments occurs rapidly after
deposition, followed by only limited subsequent dechlorination. These points from the DEIR (USEPA, 1997) are also supported by experimental work (e.g., Liu et al., 1996). As a result, EPA concludes that essentially all the dechlorination of historically deposited PCBs in the Upper Hudson that will occur has already occurred, and any further anaerobic dechlorination that does occur will not reduce the molar concentration of total PCBs in the sediments. Therefore, natural decay will not remedy the residual contamination in the river, nor is it likely to result in significant reductions in future exposure concentrations. Additional comments addressed potential changes in toxicity of the PCB mixture following anaerobic dechlorination. These issues are addressed in Responses to Master Comments 541 and 571 in Chapter 3. The potential for aerobic destruction of PCBs is addressed in Response to Master Comment 253430 in this section. References Liu, X., R.C. Sokol, O.-S. Kwon, C,M, Bethoney, and G.-Y. Rhee. 1996. An investigation of factors limiting the reductive dechlorination of polychlorinated biphenyls. Environ. Toxicol. Chem., 15(10): 1738-1744.
Responsiveness Summary Hudson River PCBs Site Record of Decision
2-53
USEPA. 1997. Phase 2 Report, Further Site Characterization and Analysis. Volume 2C – Data Evaluation and Interpretation Report (DEIR), Hudson River PCBs Reassessment RI/FS. Prepared for USEPA Region 2 and USACE, Kansas City District by TAMS Consultants, Inc., The Cadmus Group, Inc., and Gradient Corporation. February. USEPA. 1998. Phase 2 Report, Further Site Characterization and Analysis. Volume 2C-A, Low Resolution Sediment Coring Report. Addendum to the Data Evaluation and Interpretation Report, Hudson River PCBs Reassessment RI/FS. Prepared for USEPA Region 2 and USACE, Kansas City District by TAMS Consultants, Inc., Gradient Corporation, and Tetra Tech, Inc. July 1998. 2.4 Baseline Modeling Assumptions Master Comment 363193 A commenter observed that bed load transport is mentioned in the FS, but not in earlier documents. The commenter asked how much transport is expected by this mechanism and whether it is accounted for in EPA's model. Response to Master Comment 363193 Bed load represents the transport of solids that roll or saltate along the river bottom without being brought into suspension in the water column. Bed load can be an important part of the overall mass transport of coarser-grained solids in many rivers. In the Hudson, its importance is lessened because the river is controlled by a series of low-head dams. These dams will effectively trap bed load. As a result, bed load is a mechanism that can move some sediment within reaches defined by dams in the Hudson, but is not a significant component of long-range transport through the Upper Hudson. Bed load transport is expected primarily for coarser-grained, non-cohesive sediments. The HUDTOX model does not explicitly simulate bed load as a separate component of solids transport, and no site-specific monitoring data are available with which to develop and calibrate a bed load model. The issue of bed load transport was addressed in detail in Response 3d to the RBMR Peer Review (USEPA, 2000a). Past model simulation efforts for the Hudson that included a bed load component (Tofflemire and Quinn, 1979) demonstrated that bed load in the TI Pool area accounts for less than one percent of the total solids load at a flow of 10,000 cfs and about four percent at 100,000 cfs. It was therefore concluded that it was not necessary to include an explicit representation of bed load transport in the HUDTOX transport and fate model to answer the principal Reassessment questions. While HUDTOX does not contain a bed load component, it does, however, implicitly represent bed load transport:
Responsiveness Summary Hudson River PCBs Site Record of Decision
2-54
• First, the representation of erosion from non-cohesive areas is based on shear stress using the Borah formulation applied to site-specific particle size distribution data (see USEPA, 2000b, Section 4.3.3). This relationship represents the scour or removal of sediment, and does not specify whether this scoured sediment goes into suspension or bed load transport.
• Second, the primary calibration targets for solids mass transport in HUDTOX are
water column solids loads and water column solids concentrations at the TI Dam, Schuylerville, Stillwater, and Waterford. Each of these sampling points is at or near a dam. The calibration samples are thus from locations where bed load is not a significant part of solids transport.
As the scour portion of the model includes sediment liberated to both suspension and bed load, while the transport portion is calibrated to suspended load only, mass balance closure is achieved by setting non-cohesive sediment deposition rates in a manner that accounts for both deposition of suspended load and trapping of bed load. In sum, the HUDTOX model implicitly represents both the erosion of solids into bed load and the deposition of bed load. This approach is expected to provide an accurate representation at the reach-averaged scale of the model. Neither EPA's nor GE's PCB models are able to represent the sub-reach movement of bed load. At the sub-reach scale, bed load transport may represent an important mechanism for the mixing and redistribution of non-cohesive sediments. In addition, significant amounts of non-cohesive sediment are scoured and redeposited within a single model reach. These solids may pick up additional PCBs in the water column if water column concentrations are high. Over the long term, this process results in the mixing of PCBs released from cohesive sediment hot spots into the surficial non-cohesive sediments of the river. References Tofflemire, T.J. and S.O. Quinn. 1979. PCB in the Upper Hudson River: Mapping and Sediment Relationships. NYSDEC Technical Paper No. 56. March 1979. NYSDEC, Albany, New York. USEPA. 2000a. Response to Peer Review Comments on the Revised Baseline Modeling Report, Hudson River PCBs Reassessment RI/FS. Prepared for USEPA Region 2 and USACE, Kansas City District by TAMS Consultants, Inc., Limno-Tech, Inc., Menzie-Cura & Associates, and Tetra Tech, Inc., November. USEPA. 2000b. Phase 2 Report, Further Site Characterization and Analysis. Volume 2D – Revised Baseline Modeling Report (RBMR), Hudson River PCBs Reassessment RI/FS. Prepared for USEPA Region 2 and USACE, Kansas City District by TAMS Consultants, Inc., Limno-Tech, Inc., Menzie-Cura & Associates, and Tetra Tech, Inc., January 2000.
Responsiveness Summary Hudson River PCBs Site Record of Decision
2-55
2.4.1 HUDTOX Master Comment 833 One commenter questioned why, in the EPA transport and fate model, were lower sediment mixing depths and slower sediment mixing rates chosen for non-cohesive sediments with increasing distance downstream in the Upper Hudson River. Another commenter asserted that the model does not include PCBs from sediment depths greater than 5 cm that are mobilized into the food chain because the GE surficial sediment data did not extend below 5 cm. Response to Master Comment 833 Sediment particle mixing in HUDTOX, the EPA fate and transport model, was determined on the basis of observed sediment core depth profiles, judgments on spatial distributions of biological activity, and model calibration to long-term Tri+ PCB concentration trajectories in the surface sediments. Sediment organic carbon was used as a surrogate for biological activity. In turn, sediment mixed depth and particle-mixing rates were assumed to be proportional to biological activity. Particle-mixing depths in the model calibration were 10 cm in all cohesive sediment areas, both in TI Pool and in downstream reaches. This was consistent with inspection of sediment core depth profiles (USEPA 1997; QEA 1999) and with reported results for a large number of sites worldwide (Boudreau 1998). For non-cohesive sediment areas, particle-mixing depths were 6 cm in TI Pool and 4 cm in downstream reaches. There is more uncertainty in mixing depths in downstream reaches than in TI Pool. Some downstream reaches achieved calibration constraints better with a 4-cm depth of mixing, while other areas were better at 6 cm of mixing. To avoid use of different parameters for individual reaches downstream of TI Pool, without supporting data or a clear scientific justification, 4 cm was used for all downstream reaches (USEPA, 2000). Lower sediment-mixing depths and slower sediment-mixing rates were used for non-cohesive sediments in downstream reaches for two reasons. First, sediment organic-carbon concentrations (and, hence, levels of biological activity) tended to be lower in downstream reaches than in TI Pool, and second, overall model calibration results were judged to be better with lower values for these parameters in downstream reaches. Based on results from sensitivity analyses conducted with the calibrated HUDTOX model, a mixing depth of 6 cm for non-cohesive sediments in all downstream reaches appears reasonable and may represent an alternate choice for the historical calibration. The extent to which this alternate calibration would have any significant impact on forecasted levels of PCBs in fish is limited because the EPA bioaccumulation model (FISHRAND) includes sediment exposures from both cohesive and non-cohesive sediment areas. The cohesive sediment areas are more highly contaminated and represent the primary sediment-exposure route, especially at localized spatial scales and in the vicinity of hot spots. The model includes all PCBs to a depth of 26 cm in the Upper Hudson River (Figures 7-17 through 7-19, RBMR, USEPA, 2000). As discussed in the foregoing text, the surface mixed
Responsiveness Summary Hudson River PCBs Site Record of Decision
2-56
layer is 10 cm deep in all cohesive sediment areas and between 4-6 cm deep in noncohesive sediment areas. Furthermore, deeper sediment layers may become "active" if overlying material is removed due to erosion. With respect to the food chain, PCBs to a depth of approximately 5 cm are directly bioavailable and PCBs in the top 10 cm in cohesive sediment areas can influence the food chain by mixing with and replenishing PCBs in the top layer. Response to Master Comment 637, Chapter 2 contains more information on depth of bioavailable PCBs in the sediments and how this depth was represented in the EPA models. References Boudreau, B.P. 1998. Mean mixed depth of sediments: The wherefore and the why. Limnology and Oceanography. 43(3):624-526. Quantitative Environmental Analysis (QEA). 1999. PCBs in the Upper Hudson River: Volume 2, A Model of PCB Fate, Transport and Bioaccumulation. Prepared for General Electric, Albany, New York. USEPA. 1997. Phase 2 Report, Further Site Characterization and Analysis. Volume 2C – Data Evaluation and Interpretation Report (DEIR), Hudson River PCBs Reassessment RI/FS. Prepared for USEPA Region 2 and USACE, Kansas City District by TAMS Consultants, Inc., the Cadmus Group, Inc., and Gradient Corporation. February. USEPA. 2000. Phase2 Report, Further Site Characterization and Analysis. Volume 2D – Revised Baseline Modeling Report (RBMR), Hudson River PCBs Reassessment RI/FS. Prepared for USEPA Region 2 and USACE, Kansas City District by TAMS Consultants, Inc., Limno-Tech, Inc., Menzie-Cura & Associates, Inc., and Tetra-Tech, Inc. January. 2.4.2 FISHRAND Master Comment 779 Some commenters say that the FISHRAND model contains several errors or incorrect parameterizations leading it to predict greater (or lesser) declines in surface sediment associated aquatic organisms (such as brown bullhead) than should have been predicted, including:
• Total organic carbon values used in FISHRAND as compared to the values used in the HUDTOX model.
• Growth rates for fish that are higher than observed (particularly for brown bullhead). • Exposure zones for only small portions of sediments in each pool. • Specific values for Log Kow.
Other commenters note that the parameterization of FISHRAND minimizes the differences between any remedy and No Action because perhaps predicted fish body burdens (and surface sediment concentrations) decline too quickly in the No Action model runs.
Responsiveness Summary Hudson River PCBs Site Record of Decision
2-57
Response to Master Comment 779 EPA disagrees with comments implying that the FISHRAND model contains significant errors and/or incorrect parameterizations. Each of the issues raised by commenters is described individually below. Total organic carbon in sediment: TOC Total organic carbon (TOC) is specified by reach-specific distributions in the FISHRAND model. In developing these distributions, EPA relied primarily on TOC data from the EPA Phase 2 ecological sampling program. Those data best reflect the TOC experienced by benthic invertebrates and the food web generally, as these sediment samples were taken at the same time and place as the benthic invertebrate samples that form the base of the food web. It has been found that organic carbon is one of the most important factors (and more important than grain size) in determining field distributions of benthic invertebrates, because organic matter is a prominent source of food for deposit feeders (Sims, 1996). TOC is a measure of bioavailability of PCBs and need not necessarily be the same between the physical and biological models. In fact, differences are expected. Figure 779-1 provides a histogram of the TOC data from the EPA Phase 2 dataset for n=27 in the TI Pool. The distribution for TOC in the TI Pool used in the FISHRAND model is specified as triangular with parameters minimum, mode, and maximum (0.5, 4.7, 10.0). As can be seen in Figure 779-1, the values in the calibrated FISHRAND model correspond very closely to the observed values. For the area below the TI Pool and above the Federal Dam, there are nine data points for TOC from the Phase 2 biological sampling program. Four data points are from RM 169.5 (3.4, 3.6, 4.9, 4.2) and five are from RM 159 (1.1, 1.5, 1.6, 1.8, 1.9). These nine data points were combined to represent the area below the TI Pool, and taken together, are consistent with the larger General Electric (GE) TOC dataset. An example of the way in which TOC is a measure of bioavailability of PCBs in sediment is given by the following exercise. Individual measured brown bullhead concentrations (mg/kg lipid normalized) were divided by the mean organic carbon normalized sediment concentrations predicted by the HUDTOX model (Table 4-8 of the RBMR, USEPA, 2000), yielding the following results:
Brown Bullhead: Sediment Accumulation Factors
Parameter River Mile 189 River Mile 168 Average 0.7 1.7 Standard Deviation 0.7 1.4 Minimum 0.2 0.1 Maximum 4.9 15.2
These results are presented as a histogram in Figure 779-2. There is a much greater range and the mean accumulation factor at RM 168 is actually higher than at RM 189 (TI Pool), suggesting a
Responsiveness Summary Hudson River PCBs Site Record of Decision
2-58
different relationship between brown bullhead body burdens and sediment concentrations. The brown bullhead is an opportunistic feeding fish (assumed in FISHRAND to be primarily a bottom feeder), with approximately 90 percent of its diet derived from sediment sources. Note that TOC is specified as a point estimate (mean) in the HUDTOX model while it is specified as a distribution in the FISHRAND model. The distribution assigns a probability of each TOC value, including the mean value used in the HUDTOX model. Also note that although HUDTOX and FISHRAND both used available data to specify TOC on a reach-specific basis, there is not a one-to-one correspondence between HUDTOX sediment segments and the sediment segments used to specify sediment exposure concentrations to FISHRAND. Only selected HUDTOX sediment segments were used to specify sediment exposure concentrations, and these selections were based on known distributions of benthic invertebrates and on spatial distributions of TOC. Finally, it is important to note that the linkages between the GE model components and the EPA model components differ significantly, which impacts the choice of TOC. The EPA models were linked via selected groups of HUDTOX sediment segments in both cohesive and non-cohesive sediment areas. The GE models were linked via all sediment segments in cohesive areas and no segments in non-cohesive areas. The incorporation of both cohesive and non-cohesive sediment segments influences the choice of TOC. Response to Master Comment 847 in Chapter 6 provides additional information on the ability of the models to determine the relative impact of remediation at the scale of individual sediment deposits. Growth Rate First, the model used as a starting point the growth rates reported in Burkhard (1998) rather than the growth rates originally reported in the development of the Gobas model. However, there are differences between individual growth rates (such as are obtained from length-weight-age field observations) and the "population" growth rate as it used in the FISHRAND model. Individual growth rates are not directly comparable to the growth rate as it is implemented in the FISHRAND model. The "population" growth rate shows larger seasonal variation due to active seasons of fish spawning and breeding (that is, the population growth rate takes into account not only changes in individual growth rates during warm periods, but also variations in fish numbers in the population as a whole). Individual field-based growth rate observations are not in the form required for the model. This is true for all species, including the brown bullhead. Growth rate is a temperature-dependent parameter, and individual-based field observations do not provide this temperature dependency, introducing further uncertainty. In addition, measurements are not available for all fish types and the data that are available are not sufficient to describe growth rate as a distribution for each species. In particular, the tails of these distributions would be inaccurately specified which (in a probabilistic model) could affect the predicted central tendency. Finally, the growth rate is independent of all other parameters in the model, making it a good choice for the Bayesian updating procedure followed in the calibration.
Responsiveness Summary Hudson River PCBs Site Record of Decision
2-59
The population growth rate in FISHRAND can be represented by:
1/N*dM/dt where N is the size of the whole fish population, and M is the collective mass of the population.
The growth of the population mass has two components:
• The growth of each individual fish – DM1. • The difference in biomass between fish mortality and birth of fish – DM2.
Thus, the equation becomes: 1/N*(DM1/DT + DM2/DT). The model assumes that the average fish population is stable, expressed as <DM2/DT>=0 where <> is time averaging. But the model does not assume that DM2=0 in any given month. Biologically, we expect that DM2 is greater than 0 in spring due to spawning, and DM2 is less than 0 during over-wintering. Consequently, in principle it is possible that DM2 makes an even larger contribution to dM/dt than DM1. Exposure Zones The sediment exposure regime within each pool used to drive the FISHRAND model was selected so as to achieve a correspondence with the sampling locations for the available fish monitoring data. This information, together with knowledge of the biology of the fish species and physical attributes of the river (e.g., presence of dams and locks, etc.), guided the segmentation of the HUDTOX model and subsequent correspondence to exposure zones in the FISHRAND model. In the TI Pool, the HUDTOX model is gridded to include nearshore and channel areas and it was the nearshore segments that were selected to represent exposure to fish in the FISHRAND model. The HUDTOX model is not as finely gridded below the TI Pool, but the lateral gradient in sediment and water PCB concentrations observed in the pool is less downstream of the pool, as discussed in Section 6.3.1.1 of the RBMR (USEPA, 2000). For the FS, the RM 189 (TI Pool) and RM 154 (Waterford) segments were maintained to be consistent with the RBMR and to be able to compare the impact of alternatives across a consistent set of assumptions. In addition, instead of modeling the Stillwater reach (RM 168), the FS includes results for the reach just above Northumberland Dam, or RM 184. This area, although not a historical fish monitoring location, is more highly contaminated than the Schuylerville sampling location. Modeling this location for the FS more appropriately reflects the impact and potential risk reduction that would occur as a result of remediation. The GE model uses only cohesive sediments to obtain exposure concentrations for fish. In River Section 3, the Waterford reach, this corresponds to a very small area representing only two percent of the sediments. The biology and foraging strategies of the modeled fish species show that these fish integrate exposure over spatial scales on the order of a mile or more, and given that sediments in River Section 3 are predominantly non-cohesive, it is inappropriate to assume such localized exposure.
Responsiveness Summary Hudson River PCBs Site Record of Decision
2-60
Responses to Master Comments 843 and 847 in Chapter 6 provide additional information on differences between the GE and EPA models in terms of exposure averaging and the ability of the models to determine the relative impact of remediation at the scale of individual sediment deposits. Additional information relating to bioavailability of sediments is discussed in the Response to Master Comment 637 (Section 2.3), and in Response to Master Comment 619 and 621 (both in Section 2.1). Octanol-Water Partition Coefficient: Log Kow
The distributions used for Kow in the FISHRAND model are appropriate and should be specified separately for each reach of the river.
• First, Appendix K of the Ecological Risk Assessment as well as NOAA (1997) found that the mix of individual congeners in the Tri+ mixture shifts moving downriver. Since each individual congener contributes to the apparent Kow of the entire mixture, it follows that if the contribution of each individual congener changes, so does the partitioning behavior of the mixture as a whole.
• Second, the partitioning behavior of individual PCB congeners within the Tri+
mixture is a temperature dependent process, as shown in the DEIR (USEPA, 1997). Changes in temperature between segments may amplify the differences in Kow attributable to changes in the congener mixture.
• Third, since Tri+ is modeled as a mixture, the effective Kow of the mixture is not
known, except for the limited locations and times where congener-specific analyses are available.
Log Kow was chosen as a calibration parameter within constraints because Kow represents a particularly important and sensitive parameter in the model, and plays a role in several different rate constants simultaneously. The purpose of the Bayesian Updating calibration procedure is to focus on highly uncertain variables; the true Kow of the Tri+ mixture is highly uncertain given the change in individual congener contribution to the overall mixture as well as the effect of changes in temperature. Finally, only the mode of the triangular distribution of Kow is varied between segments, 6.47 as compared to 6.6 (the minimum and maximum are identical). Note also that in response to peer review comments, congener-specific modeling in FISHRAND was done using a fixed Kow. These results are found in USEPA, 2000, under the response to comment 10 starting on page 28. Rate of Decline Some commenters suggested that fish show too fast a rate of decline and that this underestimates the effects of No Action, while other commenters suggested that the fast rate of decline overestimates the benefits of dredging. The rate of response to changes in sediment and water exposures is not concentration dependent; that is, the mechanisms responsible for PCB uptake and depuration are consistent across all alternatives. This means that even if the predicted rate of
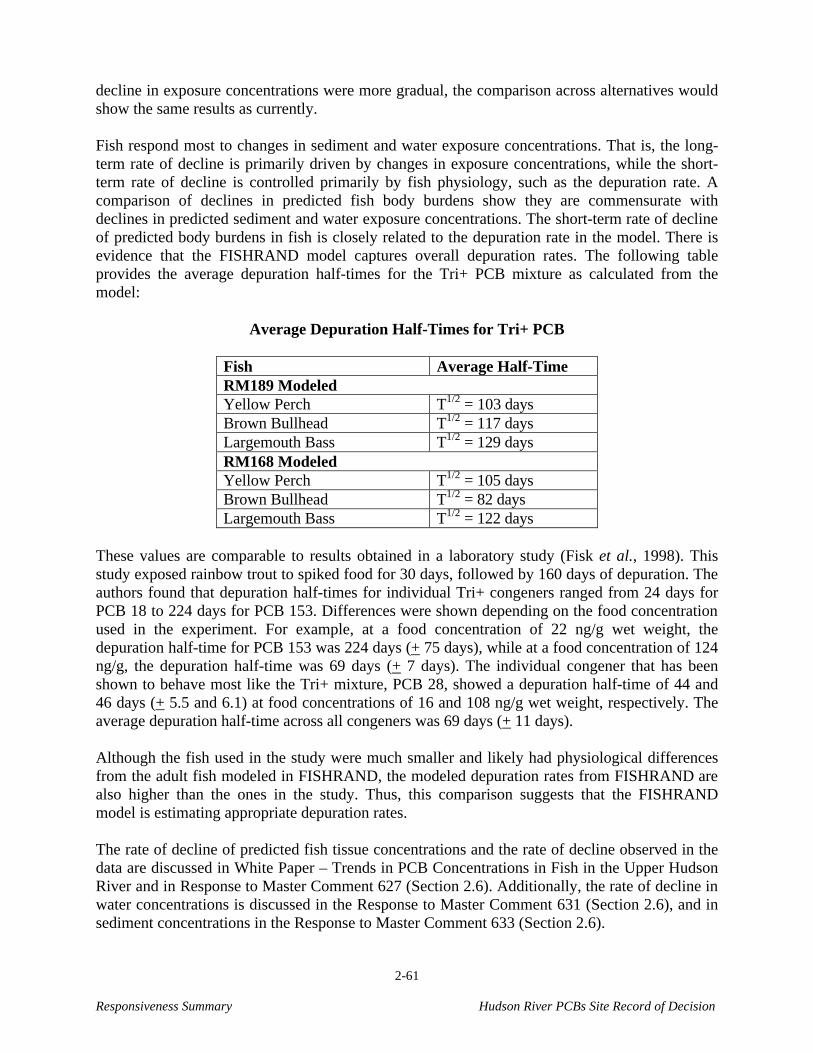
Responsiveness Summary Hudson River PCBs Site Record of Decision
2-61
decline in exposure concentrations were more gradual, the comparison across alternatives would show the same results as currently. Fish respond most to changes in sediment and water exposure concentrations. That is, the long-term rate of decline is primarily driven by changes in exposure concentrations, while the short-term rate of decline is controlled primarily by fish physiology, such as the depuration rate. A comparison of declines in predicted fish body burdens show they are commensurate with declines in predicted sediment and water exposure concentrations. The short-term rate of decline of predicted body burdens in fish is closely related to the depuration rate in the model. There is evidence that the FISHRAND model captures overall depuration rates. The following table provides the average depuration half-times for the Tri+ PCB mixture as calculated from the model:
Average Depuration Half-Times for Tri+ PCB
Fish Average Half-Time RM189 Modeled Yellow Perch T1/2 = 103 days Brown Bullhead T1/2 = 117 days Largemouth Bass T1/2 = 129 days RM168 Modeled Yellow Perch T1/2 = 105 days Brown Bullhead T1/2 = 82 days Largemouth Bass T1/2 = 122 days
These values are comparable to results obtained in a laboratory study (Fisk et al., 1998). This study exposed rainbow trout to spiked food for 30 days, followed by 160 days of depuration. The authors found that depuration half-times for individual Tri+ congeners ranged from 24 days for PCB 18 to 224 days for PCB 153. Differences were shown depending on the food concentration used in the experiment. For example, at a food concentration of 22 ng/g wet weight, the depuration half-time for PCB 153 was 224 days (+ 75 days), while at a food concentration of 124 ng/g, the depuration half-time was 69 days (+ 7 days). The individual congener that has been shown to behave most like the Tri+ mixture, PCB 28, showed a depuration half-time of 44 and 46 days (+ 5.5 and 6.1) at food concentrations of 16 and 108 ng/g wet weight, respectively. The average depuration half-time across all congeners was 69 days (+ 11 days). Although the fish used in the study were much smaller and likely had physiological differences from the adult fish modeled in FISHRAND, the modeled depuration rates from FISHRAND are also higher than the ones in the study. Thus, this comparison suggests that the FISHRAND model is estimating appropriate depuration rates. The rate of decline of predicted fish tissue concentrations and the rate of decline observed in the data are discussed in White Paper – Trends in PCB Concentrations in Fish in the Upper Hudson River and in Response to Master Comment 627 (Section 2.6). Additionally, the rate of decline in water concentrations is discussed in the Response to Master Comment 631 (Section 2.6), and in sediment concentrations in the Response to Master Comment 633 (Section 2.6).
Responsiveness Summary Hudson River PCBs Site Record of Decision
2-62
References Burkhard, L.P. 1998. Comparison of two models for predicting bioaccumulation of hydrophobic organic chemicals in a Great Lakes food web. Environ. Toxicol. Chem. 17: 383-393. Fisk, A.T., Norstrom, R.J., Cymbalisty, C.D., and D.C.G. Muir. 1998. Dietary accumulation and depuration of hydrophobic organochlorines: bioaccumulation parameters and their relationship with the octanol/water partition coefficient. Env. Toxicol. Chem. 17(6):951-961. National Oceanographic and Atmospheric Administration (NOAA). 1997. Hudson River Congener-specific Analysis, Data Summary and Analysis Report. Prepared by EVS Environmental Consultants. July. Sims, J.G. 1996. Grain size and total organic carbon effects on benthic organisms. US Army Corps of Engineers, Waterways Experiment Station, Environmental Effects of Dredging Technical Notes, EEDP-01-37, March. USEPA. 1997. Phase 2 Report, Further Site Characterization and Analysis. Volume 2C – Data Evaluation and Interpretation Report (DEIR), Hudson River PCBs Reassessment RI/FS. Prepared for USEPA Region 2 and USACE, Kansas City District by TAMS Consultants, Inc., the Cadmus Group, Inc., and Gradient Corporation. February. US Environmental Protection Agency. 2000. Response to Peer Review Comments on the Revised Baseline Modeling Report, Hudson River PCBs Reassessment RI/FS. Prepared for USEPA Region 2 and USACE, Kansas City District by TAMS Consultants, Limno-Tech, Menzie-Cura & Associates, and TetraTech, November. 2.4.3 Farley Model Master Comment 313787 The commenter noted that there is a strong correlation between PCB levels in the water column and in fish tissue, and it is possible that a claimed 40- to 60-percent reduction of PCBs in the water column of the Lower Hudson will result in reductions of the same order in fish tissue over the forecast period. However, the commenter noted that there are no comparisons of remedial alternatives for the Lower Hudson River. Response to Master Comment 313787 In response to this comment, an estimation of water column and sediment concentrations of the Lower Hudson River was performed using the model developed by Farley et al., (1999) for the No Action (NA), Monitored Natural Attenuation (MNA), REM-3/10/S, CAP-3/10/S, and REM-0/0/3 Alternatives. The Farley model takes the flux of PCBs over the Federal Dam computed by the EPA’s Upper Hudson River fate and transport model of (HUDTOX) (USEPA, 1999), as an external input.
Responsiveness Summary Hudson River PCBs Site Record of Decision
2-63
The water and sediment concentrations from the Farley fate-and-transport model are used as input for the USEPA bioaccumulation model (FISHRAND) to generate the PCB body burdens for all fish species examined in the Lower Hudson. The Farley bioaccumulation model was also applied to yield PCB concentrations in white perch. In summary, this analysis predicted that the selected remedy would reduce the concentrations of PCBs in the water column by about 70 percent compared to the No Action Alternative in 2029. In comparison to MNA, the selected remedy is predicted to reduce the water column concentrations by about 30 percent (see Table 313787-1). By 2029, the CAP-3/10/S Alternative was predicted to result in a 69 percent water column concentration reduction compared to the No Action Alternative and a 27 percent reduction compared to the MNA Alternative. Reductions of the water column concentrations for the REM-0/0/3 alternative were projected at 74 percent and 38 percent in 2029 compared to the No Action and MNA Alternatives, respectively. The strong correlation between the PCB levels in the water column and in the fish tissue can be seen from the Farley model and FISHRAND results. Farley model results for the selected remedy indicate that in 2029, the selected remedy reduced the white perch body burden by 70 percent compared to the No Action Alternative and by 30 percent compared to the MNA Alternative (Figure 313787-1). The Farley model predicted that the CAP-3/10/S Alternative results in the white perch body burden reduction of 69 percent compared to the No Action Alternative, and reduction of 28 percent compared to the MNA Alternative. For the REM-0/0/3 Alternative, the Farley models predicted a reduction of 74 percent compared to the No Action Alternative and a reduction of 39 percent compared to the MNA Alternative. Similarly, FISHRAND results predicted about the same amount of reductions in white perch body burdens (Figure 313787-2) and in other fishes (Figures 313787-3 through 313787-5). References Farley, K.J., R.V. Thomann, T.F. Cooney, D.R. Damiani, and J.R. Wand. 1999. An Integrated Model of Organic Chemical Fate and Bioaccumulation in the Hudson River Estuary. Prepared for the Hudson River Foundation. Manhattan College, Riverdale, NY. USEPA. 1999. Phase 2 Report, Further Site Characterization and Analysis. Volume 2E – Baseline Ecological Risk Assessment, Hudson River PCBs Reassessment RI/FS. Prepared for USEPA, Region 2 and USACE, Kansas City District by TAMS/MCA. August. 2.5 PCB Transport to the Lower Hudson River Master Comment 423847 A commenter requested the EPA to consider an additional model for determining the solute dynamics for the Lower Hudson.
Responsiveness Summary Hudson River PCBs Site Record of Decision
2-64
Response to Master Comment 423847 The EPA used the most appropriate model for the Lower Hudson River known to be available at the time the work was done. This is the model of Farley et al. (1999), developed for the Hudson River Foundation. In response to comments, EPA has expanded and revised the lower river simulation using the Farley model (Response to Master Comment 313787, this section). EPA does not feel that it is necessary to construct an additional model for simulation of the lower Hudson. It should be noted that the Lower Hudson model was not a key factor in the remedy selection process, as the remedy is focused on the Upper Hudson River sediments. The model was used to provide information on PCB fate and transport in order to calculate risks from consumption of fish to the Lower Hudson River communities. Therefore, the development of another model would not enhance the attainment of this objective. References Farley, K.J., R.V. Thomann, T.F. Cooney, D.R. Damiani, and J.R. Wand. 1999. An Integrated Model of Organic Chemical Fate and Bioaccumulation in the Hudson River Estuary. Prepared for the Hudson River Foundation. Manhattan College, Riverdale, NY. 2.6 Long-Term Trends in PCB Concentrations Master Comment 629 Commenters contended that EPA's interpretation of trends in fish tissue PCB concentrations contradicts the sediment and water column trends, uses too short a period of data, and should have used different time intervals for the analysis. Commenters also stated that apparent increasing trends in recent years in some species reported by EPA are unreliable. A detailed reanalysis of trends presented by GE (including year 2000 data that were not available at the time the FS was completed) contends that PCB levels in TI Pool fish are declining at a rate between 7 and 16 percent per year, and that this conclusion is consistent with the NAS analysis of natural recovery. Other commenters noted that PCB levels in upper Hudson River fish are no longer declining; despite initial late-1970s declines, PCB concentrations in fish have leveled off and remain unacceptably high. Commenters further stated that, given the high levels of PCBs in Hudson River fish, reported PCB annual rates of decrease of three or four percent in the upper and lower Hudson would still equate to many generations for fish to reach more acceptable levels. Response to Master Comment 629 In the FS, EPA noted that fish tissue PCB concentrations in certain species and at certain locations did not show evidence of a decreasing trend in the latter half of the 1990s, after the leakage of unweathered PCB oil from the vicinity of the GE Hudson Falls facility had largely been controlled. This evidence is important, because EPA's reach-scale model suggests that
Responsiveness Summary Hudson River PCBs Site Record of Decision
2-65
tissue concentrations in all fish species should be decreasing along a family of exponential decay curves. Evidence from NYSDEC fish monitoring data suggests that EPA's models present too optimistic a picture for natural attenuation or that events at the spatial scales of fish foraging areas associated with specific sample locations may deviate from the reach-average trend predicted by the model, or both. EPA believes that the fate and transport model captures reach-averaged trends, but recovery of fish species at specific historic sampling locations, particularly those whose food chain pathways are closely associated with the sediment, may occur at rates slower than the reach average. This in turn suggested that it was appropriate to consider an upper bound calculation, including modeled water column concentrations and more slowly decreasing sediment concentrations, to evaluate the range of possible responses of target fish at specific locations. The analyses presented in Appendix D.1 of the FS used data available at the time of writing. These included complete NYSDEC data through 1998 and preliminary 1999 results. Since that section was written, NYSDEC has released an update of their database, including final 1999 and 2000 sample results. In addition, most of the brown bullhead and largemouth bass samples collected in 1998 through 2000 at RM 189 and at RM 176 were split between NYSDEC and GE, with GE's samples being subjected to capillary column GC at North Eastern Analytical (NEA) with homologue/congener identification. Because NYSDEC switched contract laboratories for the 1999 data, and because there are unanswered questions remaining regarding the consistent interpretation of earlier NYSDEC Aroclor-based packed column GC analyses, it is prudent to rely on the NEA results for Tri+ in the 1998-2000 results for brown bullhead and largemouth bass in the TI Pool at Griffin Island (RM 189) and at Stillwater/Coveville (RM 176) to provide a consistent basis for comparison to earlier results converted to a consistent Tri+ basis. It should be noted that the change of laboratories by NYSDEC in 1999 came only after a long, careful process of inter-laboratory comparisons and performance evaluations, and that even with the switch in laboratories the NYSDEC results are consistent with earlier data in terms of total PCBs and Aroclor quantitations. Conclusions drawn on the 25 years of NYSDEC data do not change because of the shift in analytical techniques. An update to Section 2.1 of Appendix D.1 of the FS, incorporating the 2000 data, is provided as White Paper – Trends in PCB Concentrations in Fish in the Upper Hudson River. Examination of the 2000 data on a lipid basis yields results that are lower than the 1999 data for both largemouth bass and brown bullhead at both Griffin Island and Stillwater/Coveville. On the other hand, the 1999 data were elevated relative to the previous few years, and year 2000 results were generally similar to 1998. (Note: As in the FS and many supporting analyses, it is most informative to examine trends in PCB concentration in fish on a lipid basis. This is because PCBs preferentially accumulate in fatty [lipid] tissue, and the wet-weight concentration of PCBs in fish is thus subject to variability due to changes in the lipid content of the fish sampled. Risks to consumers of fish [human or animal], however, are based on the wet-weight concentration.) As to the question of whether inclusion of the 2000 data changes the analysis presented in Appendix D.1, the answer, in general, is no. For 1995-2000, largemouth bass at Griffin Island
Responsiveness Summary Hudson River PCBs Site Record of Decision
2-66
show a slowly decreasing trend with a half-life of 11.6 years, still much slower than the model-predicted rate of 3.6 years. For largemouth bass at Stillwater and brown bullhead at Griffin Island, inclusion of the 2000 data actually increases estimated half-lives. The case of brown bullhead is particularly important, as this species feeding habits tie it closely to the surface sediment. For the period of 1995-2000, Tri+ PCB concentrations in brown bullhead at Griffin Island exhibit a half-life of 578 years, while at Stillwater the trend in brown bullhead remains one of general increase. Thus, inclusion of the 2000 data in no way changes the observations noted in Appendix D.1 of the FS. Rather, the longer period of data further supports the observation that fish tissue concentrations at the specific locations of NYSDEC sampling appear to be decreasing at substantially slower rates than is predicted by the model. The brown bullhead results, including year 2000 data, are summarized in Figure 629-1, Concentration Trends in Brown Bullhead, Including 2000 Data. For complete details, see White Paper – Trends in PCB Concentrations in Fish in the Upper Hudson River. GE's comments (GE, Appendix H) contain a detailed, alternative analysis of concentration trends in fish, with results more favorable to natural attenuation as a remedial option. This analysis is based on a selective reading and interpretation of the data, and does not invalidate EPA's analysis. A full review of GE's alternative analysis is provided in White Paper – Trends in PCB Concentrations in Fish in the Upper Hudson River. Specific Comments GE contested EPA's interpretation that consistent decreases in fish tissue concentrations are not seen in the last five years, and stated that EPA's interpretation is "spurious" for four reasons. Each of these objections can be directly refuted: 1. GE noted that EPA documented apparent interruptions to trends in fish tissue concentration in 1989 in pumpkinseed and in 1990/91 for largemouth bass, "yet included these data in the evaluation of trends prior to the Allen Mill event." This objection has no bearing on the analysis of trends after the upstream source was controlled. There may have been "interruptions" in the declining trends in fish tissue prior to 1991, or individual samples may be anomalous. This is relevant to the variability in fish response from year to year, but is irrelevant to the analysis of later trends. 2. GE commented that EPA's analysis of the post-Allen Mill period consisted of only a four-year period, and may be influenced by a 1998 event due to sediment and debris removal in the vicinity of the Hudson Falls pump house. In fact, EPA's analysis in the FS included data through 1999. With the availability of new data for 2000, this objection is lessened. Only data from 1995 on are relevant to analysis of conditions after primary control of the upstream source, so the estimate that is provided is the best that is available at this time. It should also be noted that there was little increase in PCB load past Rogers Island during the GE Hudson Falls pump house interim remedial measure.
Responsiveness Summary Hudson River PCBs Site Record of Decision
2-67
3. GE stated that the trend reported for brown bullhead in the 1980s "is contradictory to the trends reported for largemouth bass and pumpkinseed." The time course of observed trends in brown bullhead in the 1980s does appear to differ somewhat from trends observed for largemouth bass and pumpkinseed (they are smoother, with less year to year variability). EPA believes that this does not represent a contradiction. Rather, it reflects the fact that tissue concentrations in brown bullhead are closely tied to surface sediment concentrations, whereas concentrations in pumpkinseed and largemouth bass are more strongly driven by both water column and surface sediment concentrations, with the water column concentration exhibiting greater year-to-year variability (USEPA, 2000). 4. GE states that the change in brown bullhead trends between the 1980s and 1990s requires some unexplained change in underlying mechanisms. EPA disagrees that there is a qualitative change in trends in brown bullhead between the 1980s and 1990s. Rather, the sampling results reflect a situation in which the bullhead are closely tied to surface sediment concentrations. During the 1980s these concentrations declined relatively rapidly, as erodable contaminated sediment deposits upstream washed out. During the later 1990s, the decline in bullhead tissue concentrations appears to have stopped, presumably because the concentrations now seen reflect food chain contributions from contaminated sediment areas that are not being buried or otherwise naturally remediated. GE also stated that trends in fish tissue concentration should be evaluated over the period 1994-2000, rather than 1995-1998. As noted above, EPA has now extended the end date for evaluation of trends to 2000 with the availability of new data. This does not change the conclusions presented in the FS. As to the choice of a starting period for the trend analysis, it is true that 1994 fish results in the TI Pool (but not Stillwater) were much higher in 1994 than in 1995, thus beginning the analysis in 1994 provides a much greater rate of decline for fish concentrations in the TI Pool. EPA's position is that it is inappropriate to start the analysis in 1994, as most fish samples were collected in the spring, and samples collected in the spring of 1994 (particularly largemouth bass) are likely to reflect the effects of the high upstream loads released by the GE Hudson Falls facility during 1993. If the drop in TI Pool fish concentrations between spring 1993 and spring 1994 was a valid predictor of the subsequent trend, a similar rate of decline would be expected to continue in subsequent years, which it does not. GE cites the recent National Academy of Sciences (NAP, 2001) study observation of long-term rates of decrease in Hudson River fish tissue concentrations over the period 1983-1998, and states that "this finding contradicts EPA's conclusion." GE's synopsis is incorrect, as there is no contradiction. As noted above, strong declines are evident over the period of record, but most of these declines occurred during the early 1980s. The NAS finding of long-term decline since 1983 has little bearing on rates of decline in fish tissue concentrations from 1995 onward.
Responsiveness Summary Hudson River PCBs Site Record of Decision
2-68
Another commenter also mentions the NAS report, but notes "that over the past 5 to 6 years, PCB levels in upper Hudson River fish are no longer declining," citing a personal communication from Dr. Ron Sloan at NYSDEC. References National Academy Press. 2001. A Risk Management Strategy for PCB-Contaminated Sediments. Committee on Remediation of PCB-Contaminated Sediments, Board on Environmental Studies and Toxicology, National Research Council. 452 pages. USEPA. 2000. Phase 2 Report, Further Site Characterization and Analysis. Volume 2D – Revised Baseline Modeling Report (RBMR), Hudson River PCBs Reassessment RI/FS. Prepared for USEPA Region 2 and USACE, Kansas City District by TAMS Consultants, Inc., Limno-Tech, Inc., Menzie-Cura & Associates, and Tetra Tech, Inc., January. Master Comment 633 Some commenters opined that EPA examined only a small subset of the available sediment data in evaluating trends in sediment PCB concentrations. Commenters suggested that additional sediment cores with finer-scaled vertical segmentation should be collected from multiple locations, without compositing. Commenters contended that EPA relied on the small number of samples collected in 1994 for the low resolution coring study, plus a few high resolution cores to evaluate trends, and that this subset of the data is an inadequate basis for examining trends. Some contend that EPA's conclusion that surface sediment PCB levels have shown little decline in the 1990s is not valid and conflicts with the evidence provided by larger data sets. One comment further states that the 1976-78, 1991, and 1998 sediment sampling results for the top 5 cm "provide a basis to examine trends." Response to Master Comment 633 The implication that EPA ignored portions of the available sediment data is unfounded. In fact, all sediment data available were used to the maximum extent possible in both the modeling and data analysis. For instance, the 1976-78, 1991, and 1998 data all provided important constraints in the development of the fate and transport model (USEPA, 2000). It was not possible to include the limited 1998 GE sampling results in those reports, such as the DEIR and LRC Report, which were released before the 1998 data became available. EPA admits that the availability of data to assess trends in surface sediment concentration is limited. The largest sediment data set, collected by NYSDEC in 1984, generally used a coarse vertical scale that is not sufficient to resolve concentrations in the top few centimeters. Many samples from 1976-78 do include shallow samples, but there is considerable uncertainty regarding the interpretation of the analytical methods, as the packed column GC quantitation methodology used for this study was non-standard and is not well documented. GE sampling in 1991 (prior to the Allen Mill gate failure) did include 0-5 cm sections and covered a large portion of the Upper Hudson River. The results of this sampling are obscured,
Responsiveness Summary Hudson River PCBs Site Record of Decision
2-69
however, by the fact that almost all samples were analyzed as composites of many individual samples (O'Brien & Gere, 1993), and these composites were formed across broad spatial scales. Furthermore, the compositing appears to have often mixed samples from highly contaminated and less-contaminated areas. The 1998 GE sampling was limited in scope, and many of these samples were also composites, but the composites were not designed to match the composites obtained in 1991. In contrast, EPA's LRC sampling was designed to match sample locations occupied in 1984, thus providing a clearer basis for examining trends over time. EPA agrees with NOAA comments that the limited amount of sediment data at fine vertical scales is a source of uncertainty in the modeling, and that it would be desirable to have additional individual sediment cores with finer-scaled vertical segmentation, without compositing. EPA also believes, however, that the existing data are sufficient to enable an evaluation of trends in surface sediment concentration and to develop input for the HUDTOX model. Despite uncertainties regarding the interpretation of the 1976-78 results, it is clear that surface sediment concentrations declined markedly between this period and 1998. EPA's data analysis, observations of water column and fish tissue concentrations, and modeling are all in agreement on this point. Indeed, this result is not surprising, as the 1976-78 samples were taken soon after the massive remobilization of contaminated sediments following the removal of the Fort Edward Dam. EPA's fate and transport model suggests that average cohesive sediment surface Tri+ PCB concentrations in the TI Pool declined from 103 to 13 ppm (87 percent) between 1977 and 1998, while average non-cohesive sediment surface concentrations declined from 33 to 6 ppm (81 percent). More than half of this decline, however, occurred prior to 1984. EPA anticipates that the decline in average surface concentrations will continue at a slow rate. Note that the fate and transport modeling results apply to reach-averaged concentrations. It is important to realize that the average is not necessarily representative of what happens at specific locations. Direct comparison of the GE 1991 and 1998 sediment sampling results is fraught with difficulties, due to the differing compositing techniques and differing spatial coverage between the two sampling campaigns. In addition, there is a possibility that the Allen Mill event may have reset surface sediment concentrations shortly after the 1991 sampling, although such an effect is not clearly visible in high-resolution cores. A direct comparison of the results (without correction for different sample support) reveals little change between the two dates. For the near surface sediments (all samples from 0 to 5 cm), the geometric mean concentration in the TI Pool in 1991 was 15.9 mg/kg, while in the 1998 samples the geometric mean concentration was 11.8 mg/kg Tri+ PCBs. An examination of the cumulative frequency distributions, however, reveals that most of the change occurred in the lower 60 percent of the distribution (Figure 633-1, Cumulative Frequency Distribution of Total PCB Concentration in Surface Sediments in the TI Pool, 1991 and 1998 GE Data). In other words, the surface concentrations have remained high in many of the more-contaminated areas. At the same time, the molar dechlorination product ratio (MDPR) appears to have experienced a small increase across the entire distribution (Figure 633-2, Cumulative Frequency Distribution of MDPR in Surface Sediments in the TI Pool, 1991 and 1998 GE Data). This is consistent with either some continuing dechlorination or the mixing of
Responsiveness Summary Hudson River PCBs Site Record of Decision
2-70
lighter congener dechlorination products toward the surface; it is not consistent with extensive replenishment of the sediment by unweathered Aroclor 1242 from the upstream source. As noted above, the average rate of change in surface sediment concentrations is not necessarily representative of what happens at specific locations. The data collected by both EPA and GE indicate that PCB concentrations near the sediment surface remain highly elevated in certain areas, such as hot spots 8, 10, and 14 (Response to Master Comment 619, Section 2.1). To test rates of change in surface sediment concentrations in specific locations it is necessary to match the location of sediment samples over time. This was first done in the LRC Report (USEPA, 1998), in which samples taken by EPA in 1994 were matched to samples collected by NYSDEC in 1984 and 1976-78. These sampling campaigns do not generally provide a fine enough vertical resolution to assess concentration trends in sediment samples in the top few centimeters. The data most appropriate for this task are the GE samples collected in 1991 and 1998. Appendix D.1 of the FS presents a comparison of matched samples between 1991 and 1998. Although there is considerable uncertainty inherent in the matching, due to the method of compositing used by GE in 1991, 11 approximately co-located sample groups were identified. Within the TI Pool, observed changes in surface sediment Tri+ PCB concentration ranged from -61.6 percent to +82.0 percent with a median of -33 percent. As described in FS Appendix D.1, the data suggest that a statistically significant decline in average surface cohesive sediment concentration did occur between 1991 and 1998; however, there was also a significant amount of local variability, including some locations where concentrations apparently increased. For example, Tri+ PCB concentrations in fine sediment below Lock 6 appear to have increased from 26.3 to 26.6 mg/kg, while concentrations at Hot Spot 14 (the most contaminated area sampled by GE) declined by less than 10 percent, from 40.7 to 36.9 mg/kg (see Table 5 in Appendix D.1 of the FS). The spatial variability in response is important: It means that reducing the average surface sediment concentration in a reach does not guarantee a reduction in all surface sediment exposure concentrations. As a result, biota that accumulate PCBs from food chain pathways tied to the sediment may reflect conditions in the sampling location that differ from reach-average predictions. In sum, EPA has used all available data to evaluate changes in sediment PCB concentrations over time. These data are sufficient to conclude that surface sediment PCB concentrations in the Upper Hudson do not exhibit a comprehensive and significant decline. Instead, some areas appear to show slow declines in concentration in the 1990’s, while other locations, including some of the most contaminated areas of the TI Pool, show little decline or increases. References O'Brien & Gere. 1993. Data Summary Report, Hudson River Project, Sampling and Analysis Program, 1991 Sediment Sampling and Analysis Program. Report to General Electric Company, Albany, NY. O'Brien & Gere Engineers, Inc., Syracuse, NY, May 1993.
Responsiveness Summary Hudson River PCBs Site Record of Decision
2-71
USEPA. 1998. Phase 2 Report, Further Site Characterization and Analysis. Volume 2C-A, Low Resolution Sediment Coring Report. Addendum to the Data Evaluation and Interpretation Report, Hudson River PCBs Reassessment RI/FS. Prepared for USEPA Region 2 and USACE, Kansas City District by TAMS Consultants, Inc., Gradient Corporation, and Tetra Tech, Inc. July 1998. USEPA. 2000. Phase 2 Report, Further Site Characterization and Analysis. Volume 2 – Revised Baseline Modeling Report, Hudson River PCBs Reassessment RI/FS. Prepared for USEPA Region 2 and USACE Kansas City District by TAMS Consultants, Inc., Limno-Tech, Inc., Menzie-Cura & Associates, and Tetra Tech, Inc. January 2000. Master Comment 635 Numerous commenters felt that since 1984, conditions in the river have improved dramatically, and that the Hudson is healthier than it has been in decades. Fish and wildlife were noted as abundant. PCB levels in fish, sediment, and water continue to decline, they say, whereas EPA claims that the data do not show continuing declines in PCB levels. It was said that EPA's analysis of trends conflicts with mass-balance modeling results, and that the models provide the best tools for evaluating historic trends. Other commenters say that temporal trends are discussed qualitatively in the Feasibility Study and proper statistical analysis should be applied. Some comments noted that fish concentrations show little evidence of decline since 1995. Response to Master Comment 635 This response is one of four addressing the analysis of recent trends in PCB concentrations in the Hudson River, and covers the subject of trend analysis in general. Further details on trends in fish, sediment, and water are provided in Responses to Master Comments 629, 631, and 633, respectively, all in Section 2.6. A number of comments expressed a general position that PCB levels in the environment had declined dramatically over time, and that the river was therefore cleaning itself. The trends derived from the environmental time series are, however, very much dependent on which time interval is examined. This point is well illustrated through an examination of annual average water-column concentrations. USGS monitoring at Stillwater and Waterford constitutes two of the longer-running data series, collected at consistent locations and analyzed by known methods, that are available for the Upper Hudson. These data are available for 1977 through 1997. Figure 635-1 (Annual Average PCB Tri+ Concentrations from USGS Monitoring at Waterford and Stillwater) displays the annual average water-column concentrations. These concentrations were obtained from the whole of the data with a minimum of processing other than conversion of individual data points to a consistent PCB Tri+ concentration to account for changes in analytical methods over time, as described in the RBMR (USEPA, 2000).
Responsiveness Summary Hudson River PCBs Site Record of Decision
2-72
The figure shows a series of events in the history of PCB contamination. In the 1970s, concentrations were very high, reflecting the rapid redistribution of the unstable PCB-contaminated deposits left behind when the Fort Edward Dam was removed, due to high flows in subsequent years and navigational dredging. The water column Tri+ PCB concentrations generally declined through 1988, with an interruption due to the high-flow event of spring 1983. Concentrations increased in the early 1990s, reflecting increased loads from the Hudson Falls plant. In 1994, the upstream seeps were largely controlled, and concentrations dropped back to levels similar to those seen in 1988 and 1989. For 1994 through 1997 the trend is essentially flat. One can interpret this graph in various ways. On the one hand, one could say that the 1997 concentration at Stillwater is only four percent of the 1977 concentration. Or, as per GE comments, one could observe that PCB levels in the water column now are lower than those in 1984. Finally, one could note that the 1997 concentration is greater than the 1989 concentration. It is clear that environmental concentrations of PCBs in the Hudson River have declined markedly since the disastrous conditions of the late 1970s, as is fully acknowledged and documented by EPA (USEPA, 1997). Conditions were still improving in 1984, when EPA issued its original interim No Action decision. However, only slight improvement has been seen after 1984, which is one reason why it is now appropriate to revisit the interim No Action determination. In sum, EPA agrees with comments that point out that there has been a massive reduction in environmental exposure concentrations of PCBs since the 1970s, but notes that almost all of this reduction occurred prior to 1987, with little improvement since. Similar conclusions can be drawn regarding PCB concentrations in fish tissue, water-column loads, and PCB concentrations in surface sediment. These are addressed in greater detail in Responses to Master Comments 629, 631, and 633, respectively, all in Section 2.6. GE also claimed that the data-based trend analyses produced inconsistent results between different media, and, therefore, recommended that the GE and EPA models provided the best tools for evaluating trends. EPA disagrees with this comment. First, the data-based analyses are not inconsistent with one another, but rather represent different spatial and temporal scales. Second, if the data and models differ, the data should not be rejected out of hand in favor of the models without strong supporting evidence. It is of the utmost importance to examine the data directly, independent of the models. EPA believes that its model represents the best available summary of conditions and trends in the Hudson River at broad spatial and temporal scales. However, potential inaccuracies in the model as well as conditions that occur at localized spatial scales not captured by the model must be taken into consideration in the selection of a remedy. These issues are discussed at length in Appendix D.1 of the FS. Comments received from NOAA on the discussion of trends in the main text (FS, pp. 1-39 to 1-40) question the qualitative presentation of temporal trends. EPA provided both a qualitative and a quantitative presentation in the FS. A qualitative presentation was provided in the main text for
Responsiveness Summary Hudson River PCBs Site Record of Decision
2-73
reasons of simplicity and readability. A quantitative, statistical evaluation of the data on temporal trends is provided in Appendix D.1 of the FS. Additional information on the analysis of trends may be found in Responses to Master Comments 629, 631, and 633 in Section 2.6. In particular, Response to Master Comment 629 documents that fish tissue concentrations have not exhibited a consistent decline in recent years. Response to Master Comment 633 shows that surface sediment concentrations have declined in some areas, but not in others. Finally, Response to Master Comment 631 shows that the summer water column concentrations in the TI Pool have remained approximately constant over the last five years. Various public comments offered qualitative observations that fish and wildlife populations were more numerous now than in previous decades. These observations are not directly relevant to the assessment of risks posed by PCBs in the Hudson River. First, fish generally exhibit lower sensitivity to environmental concentrations of PCBs compared to humans and piscivorous avian and mammalian wildlife. The ecological and human health risks posed by PCBs in the Hudson are driven by fish tissue concentrations of PCBs, rather than by direct impacts on the fish population itself (Response to Master Comment 313320, Chapter 11). In addition, the current status of fish populations integrates many different factors. Both reductions in discharges of conventional pollutants and limitations on fishing in the Hudson are believed to have improved the status of many fish species. As discussed further in Response to Master Comment 819, Chapter 3, available population level data are not sufficient to confirm or reject a link between PCB exposure and population abundance in the Hudson River. EPA agrees that conditions in the upper Hudson River have improved dramatically since the 1970s and 1980s. However, the rate of improvement in PCB concentrations in the environment and in biota has leveled off in recent years, and substantial further improvement by natural attenuation cannot be guaranteed (Response to Master Comment 405926, Chapter 4). For this reason, EPA believes that active remediation is needed to restore the Hudson River. References USEPA. 1997. Phase 2 Report, Further Site Characterization and Analysis. Volume 2C – Data Evaluation and Interpretation Report (DEIR), Hudson River PCBs Reassessment RI/FS. Prepared for USEPA Region 2 and USACE, Kansas City District by TAMS Consultants, Inc., the Cadmus Group, Inc., and Gradient Corporation. February. USEPA. 2000. Phase 2 Report, Further Site Characterization and Analysis. Volume 2 – Revised Baseline Modeling Report, Hudson River PCBs Reassessment RI/FS. Prepared for USEPA Region 2 and USACE, Kansas City District by TAMS Consultants, Inc., Limno-Tech, Inc., Menzie-Cura & Associates, and Tetra Tech, Inc. January. Master Comment 631 Some commenters say that PCB concentrations in water are declining at rates faster than stated by EPA. Some contend that EPA's analysis of trends in water is based on an incorrect
Responsiveness Summary Hudson River PCBs Site Record of Decision
2-74
hypothesis: water column PCB concentrations in the TI Pool during summer low flow achieve a maximum concentration that is in steady-state with PCB levels in the sediments, and that recent load reductions reflect low flows in recent years. Comments also state that EPA's analysis relies on data from the TID-West station, which is biased. It was suggested that trends should be evaluated from the "unbiased" Schuylerville station, which shows a 40 percent reduction in load from 1991 to 2000. Response to Master Comment 631 Recent Water Column PCB Concentration Trends Water column concentrations of PCBs declined significantly from late 1991 to 1995. However, the concentrations in late 1991 were elevated over those seen in the 1980s due to increased releases in the vicinity of the GE Hudson Falls plant, and a major part of the decline from 1991 to 1995 is attributable to the partial control of that Hudson Falls source. Concentrations in the water column in the late 1990s are similar to those seen in 1989. Over the same 1991-1995 time period, the load gain from the TI Pool sediments appears to have been nearly constant (Response to Master Comment 621, Section 2.1). Analysis of congener signatures links this load gain to sub-surface sediments in hot spot areas (Response to Master Comment 623, Section 2.1). Recent monitoring data received from GE (running through 5/9/01) show little change in summer water column total PCB concentrations at the TID-West station near the TI Dam over the past five years. Table below shows the average water column concentrations at the TI Dam for June to August from 1996 to 2000, as well as the estimated total PCB load gain between Rogers Island and TI Dam (without correction for potential sampling station bias, which is discussed below). The summer average concentrations have remained relatively constant, between 100 and 165 ng/L total PCBs. The 1999 summer average concentrations were higher than 1996, but load was low due to low flows in this year. These data do not provide a basis for concluding that summer PCB concentrations in water continue to exhibit a steady decline.
Recent Summer Water Column Total PCB Concentrations and Loads in the Thompson Island Pool
Year June-August Total PCB Concentration (ng/L)
June-August Total PCB Load Gain across TI Pool (kg)
1996 139.4 128.0 1997 164.8 102.5 1998 101.9 95.7 1999 157.8 55.5 2000 124.2 143.5 A discussion of mechanisms of release of PCBs from the sediments of the TI Pool, as well as a response to comments regarding summer "steady state" concentrations is found in Response to Master Comment 621 in Section 2.1. GE questions EPA's "hypothesis that water column PCB concentrations in the TI Pool during summer low-flow achieve a maximum concentration that is in steady-state with the sediment PCB levels."
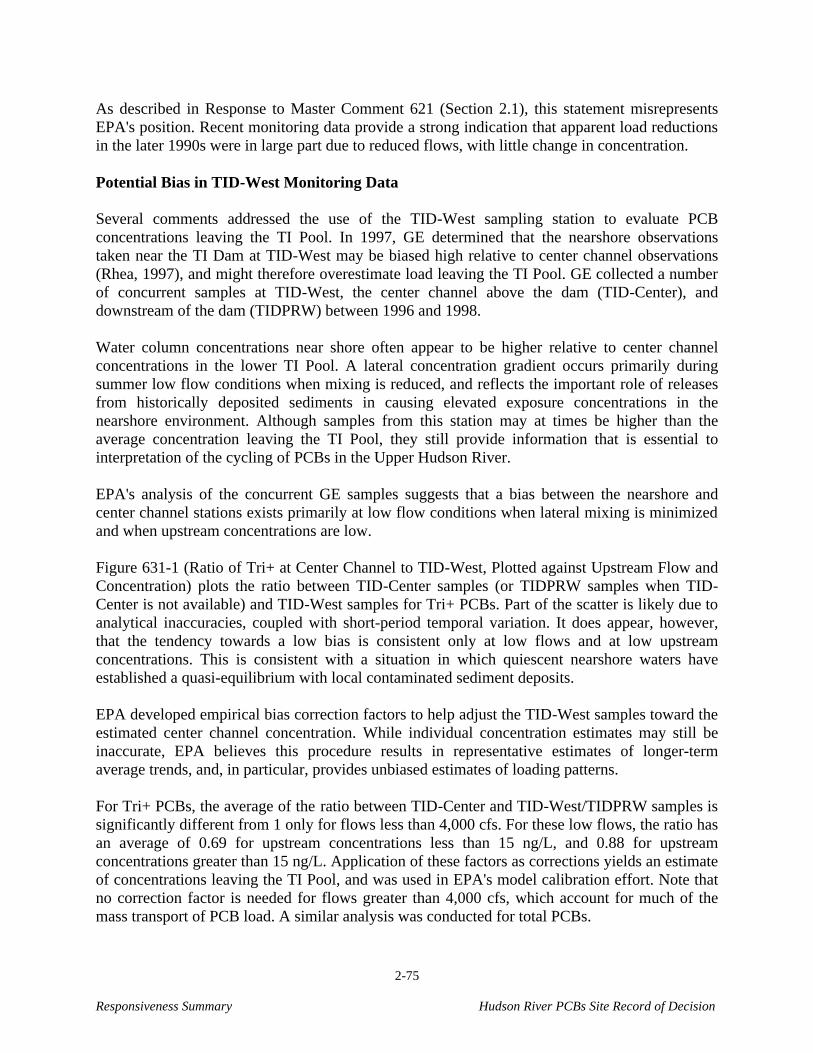
Responsiveness Summary Hudson River PCBs Site Record of Decision
2-75
As described in Response to Master Comment 621 (Section 2.1), this statement misrepresents EPA's position. Recent monitoring data provide a strong indication that apparent load reductions in the later 1990s were in large part due to reduced flows, with little change in concentration. Potential Bias in TID-West Monitoring Data Several comments addressed the use of the TID-West sampling station to evaluate PCB concentrations leaving the TI Pool. In 1997, GE determined that the nearshore observations taken near the TI Dam at TID-West may be biased high relative to center channel observations (Rhea, 1997), and might therefore overestimate load leaving the TI Pool. GE collected a number of concurrent samples at TID-West, the center channel above the dam (TID-Center), and downstream of the dam (TIDPRW) between 1996 and 1998. Water column concentrations near shore often appear to be higher relative to center channel concentrations in the lower TI Pool. A lateral concentration gradient occurs primarily during summer low flow conditions when mixing is reduced, and reflects the important role of releases from historically deposited sediments in causing elevated exposure concentrations in the nearshore environment. Although samples from this station may at times be higher than the average concentration leaving the TI Pool, they still provide information that is essential to interpretation of the cycling of PCBs in the Upper Hudson River. EPA's analysis of the concurrent GE samples suggests that a bias between the nearshore and center channel stations exists primarily at low flow conditions when lateral mixing is minimized and when upstream concentrations are low. Figure 631-1 (Ratio of Tri+ at Center Channel to TID-West, Plotted against Upstream Flow and Concentration) plots the ratio between TID-Center samples (or TIDPRW samples when TID-Center is not available) and TID-West samples for Tri+ PCBs. Part of the scatter is likely due to analytical inaccuracies, coupled with short-period temporal variation. It does appear, however, that the tendency towards a low bias is consistent only at low flows and at low upstream concentrations. This is consistent with a situation in which quiescent nearshore waters have established a quasi-equilibrium with local contaminated sediment deposits. EPA developed empirical bias correction factors to help adjust the TID-West samples toward the estimated center channel concentration. While individual concentration estimates may still be inaccurate, EPA believes this procedure results in representative estimates of longer-term average trends, and, in particular, provides unbiased estimates of loading patterns. For Tri+ PCBs, the average of the ratio between TID-Center and TID-West/TIDPRW samples is significantly different from 1 only for flows less than 4,000 cfs. For these low flows, the ratio has an average of 0.69 for upstream concentrations less than 15 ng/L, and 0.88 for upstream concentrations greater than 15 ng/L. Application of these factors as corrections yields an estimate of concentrations leaving the TI Pool, and was used in EPA's model calibration effort. Note that no correction factor is needed for flows greater than 4,000 cfs, which account for much of the mass transport of PCB load. A similar analysis was conducted for total PCBs.
Responsiveness Summary Hudson River PCBs Site Record of Decision
2-76
Interpretation of Schuylerville Monitoring Data GE contends that the data from the TID-West station should not be used to analyze trends in water column PCB concentration or load. After dismissing the TID-West station, GE claims that only the Schuylerville station (Rt. 29) provides valid data for assessing trends in the 1990s. GE states that the summer load at this station declined 40 percent from 1991 conditions to 1998-2000 conditions. Unfortunately, GE did not sample the Schuylerville station from July 1992 through September 1997. An examination of the load series at the Schuylerville (Rt. 29) station and at Fort Edward (Rt. 197) shows that the statement made by GE about a 40 percent decline is uninformative and incorrect (Figure 631-2, Monthly Total PCB Loads at Rt. 197 (Fort Edward) and Rt. 29 (Schuylerville) Estimated from GE Data). That is, loads at the Schuylerville station did decline, but by a small amount, while the upstream loads at Fort Edward declined much more dramatically. Thus, most of the reduction of the load at Schuylerville noted by GE is attributable to differences in the upstream load between 1991 and recent conditions. EPA also recomputed summer loads at the Fort Edward and Schuylerville stations using the averaging estimator approach described in the DEIR (USEPA, 1997) and defining summer as June through August only. The September 1991 monthly averaging results cannot be used in the comparison as they are inflated by the failure of the Allen Mill gate structure; September is also omitted from the 1998-2000 results for consistency of comparison. During this period, the total PCB summer loads at Schuylerville did decline, but only by 4 percent, from 0.91 kg/d in 1991 to 0.87 kg/d total PCBs in 1998-2000. Meanwhile, the upstream load at Fort Edward (Rt. 197) declined by 66 percent, from 0.38 to 0.13 kg/d total PCBs. The difference in load between Fort Edward and Schuylerville (load gain) actually increased, from 0.53 kg/d in 1991 to 0.75 kg/d total PCBs in 1998-2000. Over all months for which PCB monitoring is available at both Fort Edward and Schuylerville, as well as USGS provisional flows, the estimated load gain between Fort Edward and Schuylerville is approximately 0.97 kg/day (2.13 lb/d) total PCBs. For these periods of concurrent monitoring (April 1991 through June 1992, October 1997 through November 2000) the sediments appear to have contributed 64 percent of the total PCB load passing Schuylerville. For the October 1997 to November 2000 period, the Hudson River sediments contributed 84 percent of the total PCB load passing Schuylerville. References Rhea, J. 1997. Memorandum Re: TIP Time of Travel Surveys to J. Haggard, GE, October 6, 1997. HydroQual, Inc. USEPA. 1997. Phase 2 Report, Further Site Characterization and Analysis. Volume 2C – Data Evaluation and Interpretation Report (DEIR), Hudson River PCBs RI/FS. Prepared for USEPA Region 2 and USACE, Kansas City District by TAMS Consultants, Inc., The Cadmus Group, Inc. and Gradient Corporation. February.
Responsiveness Summary Hudson River PCBs Site Record of Decision
2-77
2.7 Adequacy of RI Data Collection to Support the FS Master Comment 627 A set of comments questioned the adequacy of the data collection effort undertaken by EPA to support the Reassessment RI/FS. Commenters stated that little or no data were collected by EPA itself on most lower trophic level aquatic organisms, subaquatic vegetation, and fish, and that most of the data on water column and sediment PCB concentrations were collected by organizations other than EPA. Specifically, comments stated that EPA
• Collected no data or inadequate data on primary aquatic biota in the Hudson River food chain and on submerged aquatic vegetation, but GE did (GE comment 11-0101-022).
• Collected fish data only in 1993, whereas NYSDEC has collected data since the 1970s "with significant funding from GE" (GE comment 11-0101-026).
• Collected water column data only in 1993, whereas GE has conducted routine water column sampling since 1991 (GE comment 11-0101-027).
It was suggested that much of EPA's work did not follow the scientific method and did not rigorously evaluate and test hypotheses. Response to Master Comment 627 Characterization of the Phase 2 Sampling Effort Throughout the Phase 2 and Phase 3 efforts, EPA has relied on all available, quality-assured sources of data, including data collected by GE, NYSDEC, USGS, NOAA, and others, in addition to the data collected by EPA itself. All parties have frequently exchanged data, and analyzed and commented upon other parties' sampling plans and data quality assurance procedures. The data set on which the Hudson River PCBs Reassessment RI/FS is based is the sum total of the data collected by all parties. For this reason, the official database for the project (USEPA, 2000a; USEPA, 1995) includes data from GE, NYSDEC, USGS, NOAA, and NYSDOH, as well as data collected by USEPA. In fact, the EPA Phase 2 sampling effort was never designed to be a stand-alone effort. The Phase 2 sampling plan (USEPA, 1992) recognizes this, and devotes a section (4.1) to the acquisition and processing of data being collected by GE, USGS, NYSDEC, and others. At the time the Phase 2 effort was planned, GE had already begun its remnant deposit monitoring program and its temporal water column-monitoring program. The remnant deposit monitoring program was being conducted pursuant to the Consent Decree between EPA and GE for capping of the remnant deposits. EPA was aware that these data would also be valuable to the reassessment of the interim No-Action alternative for the PCB-contaminated sediments in the Upper Hudson.
Responsiveness Summary Hudson River PCBs Site Record of Decision
2-78
In general, EPA's Phase 2 data collection effort was designed to answer a number of specific questions regarding PCB fate and transport in the river; to provide a higher-resolution analysis of PCB congeners in water, sediment, and fish than was being provided by the GE, USGS, and NYSDEC analytical programs; and to provide a quality/usability check on data collected and submitted by GE. Because GE's analytical data were found to be generally of adequate quality, as acknowledged in USEPA, 1997, it was not necessary for EPA to replicate efforts such as, for example, GE's water column monitoring required by the Consent Decree for the remnant deposit capping, except insofar as needed to determine comparability of results. In sum, the data available for the Hudson River PCBs Site should be viewed as a whole, and are more than adequate to support the Feasibility Study. As GE points out in their comments, data collected by other parties has served to fill in many gaps in EPA's Phase 2 sampling effort. Use of Phase 2 versus GE Data EPA has made full use of data collected by its own contractors, by GE, by NYSDEC, by NOAA, and by other parties in completing the DEIR (USEPA, 1997), the Revised Model Calibration Report (USEPA, 2000b), the Feasibility Study, and other project documents. In general, all the data sources complement one another to form a consistent picture of the history and dynamics of PCBs in the Hudson River. In the few cases where conflicting analytical evidence is available from different sources, EPA has preferred data generated by the Phase 2 program, as these data were collected and analyzed under Quality Assurance/Quality Control procedures that were more rigorous and better documented than those for any of the other sources of data. GE implies that EPA reached various "broad conclusions" in the DEIR (USEPA, 1997) "on the basis of its water column data" alone. This is incorrect. First, EPA used multiple lines of evidence from monitoring in the water column, sediment, and biota to evaluate PCBs in the Hudson River. The DEIR makes full use of water column data collected by EPA, GE, and USGS. However, only the EPA water column data provide certain types of information, including "transect" sampling designed to follow a parcel of water through the entire length of the upper river from Fort Edward to Waterford, flow-averaged sampling designed to evaluate cumulative PCB loads over time, and full separation of PCB analyses into dissolved and particulate components. In contrast, most of the GE water column monitoring has involved analysis for total PCBs (as measured by peak-specific PCB analysis) at fixed sites and at fixed intervals, except for some special studies in the reaches between Bakers Falls and the TI Dam. In addition, EPA used a larger sampling volume and achieved lower detection limits and resolution of more individual congeners than did GE. As a result, the Phase 2 results contain important information that is not available from GE monitoring. Nonetheless, obtaining a complete picture of PCBs in the Upper Hudson has required combination of both EPA and GE monitoring results. GE claims (in part) that EPA's analysis was based primarily on 1993 Phase 2 data, and that "[d]ata for the previous 15 years were ignored, [and] a single statement about trends was made on the basis of a few years of recent data."
Responsiveness Summary Hudson River PCBs Site Record of Decision
2-79
As stated repeatedly above, EPA has thoroughly evaluated data collected by other sources, such as GE, NYSDEC, USGS, NOAA, NYSDOH, and others. These data are included in EPA's database. EPA does believe that data collected since 1991 and analyzed to the congener level by capillary column GC (by both EPA and GE) are of greater reliability than data analyzed by packed column GC against Aroclor standards. However, the entire span of available data has been used by EPA in the analyses presented in the DEIR (USEPA, 1997), the RBMR (USEPA, 2000b), and the Feasibility Study. The DEIR (USEPA, 1997) contains a detailed analysis of trends in water column concentrations and loads since the earliest data from the 1970s, and also re-examines the 1984 sediment data and historic sediment cores. The entire period of available biotic PCB data is examined in detail, including trend analysis, in the RBMR (USEPA, 2000b) and again in the Feasibility Study. Finally, EPA's modeling effort (USEPA, 2000b) makes full use of all the data available from the 1970s, 1980s, and 1990s to derive a model that provides a best representation of the history and causal factors of PCB contamination in the Hudson River. The Scientific Method GE states, "The Scientific Method was not consistently applied or used...EPA's Phase 2 work plan...did not evaluate specific hypotheses. As a result, EPA failed to collect the data necessary... This led to a reliance on an inadequate data set and untested hypotheses to determine the need for and benefits of sediment remediation." EPA disagrees with this comment. The series of technical reports produced by EPA was subjected to a rigorous, independent peer review process that generally validated the scientific approach used by EPA. Where significant shortcomings were identified by the peer review, these were subsequently addressed. Response to Master Comment 467 in Chapter 1 contains a more detailed discussion of the peer review process. In contrast to the description provided by GE, the Phase 2 sampling effort was carefully designed to test specific hypotheses reflecting the state of understanding of the problem at the end of Phase 1. These included the following eight hypotheses:
1. PCB load in the Upper Hudson is a combination of load derived from historically emplaced sediments and a (then) unknown source upstream of Rogers Island. This hypothesis arose directly from the Phase 1 analysis, at which time the existence of the massive PCB seeps around the GE Hudson Falls facility was unknown. 2. PCB loads in the Upper Hudson are primarily due to releases from the GE facilities. Sampling upstream of GE and in tributaries to the Upper Hudson should reveal minimal PCB contributions. 3. PCB loads derived from historically emplaced sediments can be distinguished from unweathered PCB loads by a careful analysis of the congeners present in the
Responsiveness Summary Hudson River PCBs Site Record of Decision
2-80
environment. In addition, congener analysis can resolve different Aroclor contributions as sources. 4. Extensive PCB contamination of the Upper Hudson began with GE's capacitor manufacturing operation. Loads peaked with the spring floods following the removal of the Fort Edward Dam. The signature of this loading history should be discernible in dateable sediment cores from consistently depositional areas. 5. The PCB loads in the water column at Stillwater and Waterford are essentially the same PCB load that leaves the TI Pool (as represented in early GE sampling and USGS sampling at Fort Miller). This hypothesis should be answerable through tracking of a parcel of water at multiple stations throughout the Upper Hudson. 6. PCB concentrations in biota likely represent an integration of water and sediment exposure pathways, which are not necessarily in equilibrium. Identification of congener signatures in fish, water, and sediment should help resolve the factors that control PCB body burden in fish and enable calibration of a predictive model to guide remediation efforts. 7. The majority of the PCB loads to the freshwater portion of the Lower Hudson are due to GE loads. Loads in the saline portion of the Lower Hudson represent a combination of upstream GE loads and loads derived from the New York metropolitan area. Confirmation of this hypothesis should be available through analysis of datable sediment cores. 8. Massive stores of PCBs remain buried within the sediments of the TI Pool. The bulk of these PCBs remains there (as of 1991) but is at risk of being remobilized by a large flood event.
EPA believes that the Phase 2 sampling effort, when combined with the known ongoing monitoring efforts by GE, NYSDEC, and USGS, was well designed to test these hypotheses. In fact, the sampling effort and subsequent analyses, as reported in DEIR (USEPA, 1997) and RBMR (USEPA, 2000b), have conclusively confirmed the first seven hypotheses that guided the Phase 2 sampling effort. The eighth hypothesis (imminent risk) was rejected based on data analysis and modeling (USEPA, 2000b). Further investigation of flood remobilization of buried PCB contamination, based on revised information on potential 100-year flood magnitudes provided by NYSDEC, was also conducted (Response to Master Comment 364582, Chapter 6). Of course, when conducting environmental investigations, many unanticipated conditions arise. In this way, investigations of environmental problems differ markedly from controlled laboratory experiments to test hypotheses. In the Hudson River, the major unanticipated factor was the massive release of unaltered PCBs from the GE Hudson Falls site between 1991 and 1994. This circumstance could not be foreseen in the planning for the Phase 2 sampling effort. As a result, EPA's data, collected in 1993, were
Responsiveness Summary Hudson River PCBs Site Record of Decision
2-81
used to examine a variety of questions that were not anticipated in the sampling plan. Similarly, GE conducted a variety of new, previously unplanned analyses during the 1990s. All these data were incorporated into EPA's analyses leading to the Feasibility Study. EPA believes that its conclusions in the FS are well founded in a massive data set (collected by EPA, GE, and others) that is more extensive and detailed than that available for almost any other CERCLA site. Specific Comments GE claims that EPA's characterization of submerged aquatic vegetation and benthic macroinvertebrates is inadequate. This topic is discussed in further detail in Response to Master Comment 815 in Chapter 3. GE claims that EPA "failed to collect data to determine the reason for the declining trends in PCBs that it identified in the Phase 1 Report," specifically referring to the evaluation of data. Although PCB levels declined over the time period from the late-1970s to 1989, data from the last 10 to 15 years show that PCB levels have remained essentially unchanged, except for the perturbations introduced by releases from the GE Hudson Falls facility. It is not possible to go back and collect more data from past decades. In any case, the question is moot; whatever the mechanisms may have been for the rapid declines seen in previous decades, the fact is that those mechanisms no longer exist under the current conditions in the Hudson River. A second problem for investigating earlier conditions in the river was caused by the failure of the Allen Mill gate structure at GE's Hudson Falls Plant in September 1991. This event released large quantities of unweathered PCBs into the river and made difficult any examination of the factors controlling PCB distribution prior to 1991. One source of new data that does provide a historical record is dated sediment cores. EPA invested considerable effort in locating and analyzing high-resolution sediment cores with datable radionuclide chronologies (USEPA, 1997). These cores, coupled with results from cores collected earlier by other researchers, provided considerable insight into historical trends in PCB contamination in the Hudson River. NOAA pointed out that additional PCB surface sediment data from the early 1990s collected by NOAA NS&T, EPA EMAP, and EPA R-EMAP are available in NOAA's Newark Bay watershed database at http://response.restoration.noaa.gov/cpr/watershed/watershedtools.html. However, as they concern New York Harbor sediment concentrations they are primarily relevant to the discussion of current PCB concentrations in the Lower Hudson, and do not have a direct bearing on the selection of a remedial action for the Upper Hudson. References USEPA. 1992. Final Phase 2 Work Plan and Sampling Plan, Hudson River PCBs Reassessment RI/FS. Prepared for USEPA Region 2 by TAMS Consultants, Inc. and Gradient Corporation. September.
Responsiveness Summary Hudson River PCBs Site Record of Decision
2-82
USEPA. 1995. Phase 2 Report, Further Site Characterization and Analysis. Database Report, Hudson River PCBs Reassessment RI/FS. Prepared for USEPA Region 2 by TAMS Consultants, Inc. and Gradient Corporation. October. USEPA. 1997. Phase 2 Report, Further Site Characterization and Analysis. Volume 2C – Data Evaluation and Interpretation Report (DEIR), Hudson River PCBs Reassessment RI/FS. Prepared for USEPA Region 2 and USACE, Kansas City District by TAMS Consultants, Inc., The Cadmus Group, Inc. and Gradient Corporation. February. USEPA. 2000a. Database for the Hudson River PCBs Reassessment RI/FS, Release 5.0. Compact Disk. Prepared for USEPA Region 2 and USACE, Kansas City District by TAMS Consultants, Inc. October. USEPA. 2000b. Phase 2 Report, Further Site Characterization and Analysis. Volume 2D – Revised Baseline Modeling Report (RBMR), Hudson River PCBs Reassessment RI/FS. Prepared for USEPA Region 2 and USACE, Kansas City District by TAMS Consultants, Inc., Limno-Tech, Inc., Menzie-Cura & Associates, and Tetra Tech, Inc., January. Master Comment 313799 Some commenters contended that EPA's data collection, analysis, and risk evaluation in the FS was deficient and inadequate for EPA to select a remedy. In a similar vein, several commenters suggested that more study should be conducted, or that there should be a moratorium on remediation while the status and trends in the river were monitored. Response to Master Comment 313799 EPA strongly disagrees. In addition to a significant sampling event conducted by USEPA and its contractors, EPA also reviewed and utilized data from many agencies and others including USGS, NYSDEC, NOAA, and GE, ultimately developing a database spanning approximately 25 years and including over one million records. EPA has revised and updated risk assessments, both ecological and human health, since the initial preliminary risk assessments presented in the Phase 1 Report. These risk assessments have been peer reviewed as well as made available for public comment. In addition, EPA has also engaged specialized technical consultants to assist in fate and transport modeling and other technical aspects of the FS that were the basis for the proposed remedy. Therefore, EPA does not agree that the risk assessments or the data or its evaluation are insufficient. Rather, the database developed for this project is comprehensive in terms of the time span covered, the area covered, and the types and amount of data generated and utilized in the analysis and evaluation. Therefore, the information provided in the Reassessment RI/FS is sufficient to support an appropriate risk management decision in accordance with 40 CFR 300.430(e)(9) and the 1988 USEPA RI/FS guidance (USEPA, 1988). Specific issues raised by commenters regarding the analysis, evaluation, and interpretation of the data are discussed in greater detail in subsequent chapters of this responsiveness summary.
Responsiveness Summary Hudson River PCBs Site Record of Decision
2-83
Specifically, comments regarding the adequacy of the human health and ecological risk assessment are addressed as follows:
• Chapter 3 – the baseline conditions. • Chapter 7 – risk estimates used to evaluate specific alternatives and use and
interpretation of the various models. • Chapter 11 – use of the FS results in the detailed analysis of remedial alternatives, the
step immediately preceding the identification of the selected remedy (i.e., the risk management decision).
Finally, EPA disagrees with the suggestion that additional study be conducted, or that the remediation should be delayed. As noted above, the selected remedy was identified following an extensive reassessment RI/FS program that took 10 years to complete and included the analysis of data spanning a 25-year period. The reader is also referred to the Response to Master Comment 485 in Chapter 11 of this Responsiveness Summary in which EPA states that the administrative record supports its decision, and to Response to Master Comment 377, Chapter 1, in which EPA summarizes the rationale for its determination that the 1984 Interim No Action decision is no longer appropriate. Reference USEPA. 1988. Guidance for Conducting Remedial Investigations and Feasibility Studies under CERCLA (OSWER Directive 9355.3-01 [1988]).
Responsiveness Summary Hudson River PCBs Site Record of Decision
3-1
3. BASELINE RISK ASSESSMENTS AND PRGS 3.1 Baseline Human Health Risk Assessment 3.1.1 PCB Toxicity 3.1.1.1 PCB Toxicity – Cancer Master Comment 571 Several comments stated that EPA estimated PCB carcinogenicity based on animal bioassays that substantially overstate the toxicity of PCBs to humans based on the cancer slope factor. These comments also state that a formal weight of evidence review of the human epidemiological studies shows that there is no credible evidence that PCBs cause cancer in humans. Other comments suggest that cancer risks may be underpredicted because effects from dioxin-like congeners were not fully considered. Several comments were received indicating that dechlorination of PCBs in the environment would alter the carcinogenicity of the dechlorinated PCB mixture. Other comments state that EPA’s guidance prohibits EPA from applying the toxicity values in the Agency’s Integrated Risk Information System (IRIS) database without first carefully considering the evidence of lower toxicity values submitted by GE. One comment provided calculations of the PCB body burdens based on EPA’s Proposed Plan, suggesting that the potential body burdens are below those found in the worker population. Some comments stated that EPA has not performed research on PCBs. Other comments agree with EPA’s classification of PCBs as a probable human carcinogen. These comments highlight the exposures of the population to a combination of chemicals each day, stating that it is not possible in most cases to definitively conclude that a specific chemical has caused a specific cancer. A comment also quoted conclusions from the Toxicological Profile for Polychlorinated Biphenyls (Update), developed by the Agency for Toxic Substances and Disease Registry (ATSDR) and subsequently externally peer reviewed, as additional support for the conclusions that PCBs are probable human carcinogens (ATSDR, 2000 and Johnson et al., 1999). Another comment reviewed the study by Kimbrough et al. (1999a), recommending that “the data from Kimbrough require that PCBs be reclassified as a known human carcinogen.” Response to Master Comment 571
Overview EPA received numerous comments relating to the carcinogenicity of PCBs (i.e., the ability of PCBs to cause cancer) and their cancer potencies (the numerical estimates of dose-response, which are quantified as cancer slope factors). The following response presents an overview of the Agency’s process for assessing PCB carcinogenicity and cancer potencies, a review of recent human epidemiological studies, a discussion of some of the uncertainties related to PCB carcinogenicity, and a discussion of the
Responsiveness Summary Hudson River PCBs Site Record of Decision
3-2
cancer slope factors used in the Revised HHRA (USEPA, 2000a). White Paper – PCB Carcinogenicity discusses all of these issues in more detail and provides a more complete reference list. EPA has conducted significant research on the mechanisms of action of PCBs and has worked with other federal agencies (i.e., National Institutes of Environmental Health Sciences [NIEHS] of the National Institutes of Health [NIH] and others) to further support EPA’s PCB research effort. The National Academy of Science’s report on PCB-contaminated sediments (NAP, 2001) also concluded that PCBs may pose long-term health effects to humans, including cancer. At this time, studies of the mechanisms of action of PCBs are areas of ongoing research.
EPA Process for Assessing Carcinogens EPA’s process for evaluating human epidemiological and animal evidence to determine the carcinogenicity and cancer potencies of chemicals, including PCBs, is set forth in Agency guidelines (USEPA, 1976, 1984, 1986, 1994, 1996a). The guidelines were developed within the Agency, published in the Federal Register for external comment, and peer reviewed by a panel of expert scientists in the fields of carcinogenesis, toxicity, exposure, and related scientific disciplines from universities, environmental groups, industry, labor, and other governmental agencies. EPA responded to comments on the draft guidelines and made changes based on a review of the comments submitted by these groups and individuals. The guidelines were also submitted for review to EPA’s Science Advisory Board, an external scientific review panel. Agency guidelines for assessing carcinogens are consistent with the scientific approaches that are used by national and international agencies (e.g., the National Toxicology Program [NTP, 1984] and the International Agency for Research on Cancer [IARC, 1987]) for evaluating the carcinogenicity of chemicals. Carcinogenicity Weight of Evidence EPA classified PCBs as probable human carcinogens in 1988 (USEPA, 1988) and reaffirmed this classification in 1996 (USEPA, 1996b). EPA’s classification is based on a formal weight-of-evidence approach described in the 1986 Carcinogen Guidelines (USEPA, 1986) and the proposed 1996 Carcinogen Guidelines (USEPA, 1996a). Using the formal weight-of-evidence approach, EPA evaluated human epidemiological evidence, animal bioassay data, and other supporting studies (e.g., mutagenicity tests and metabolism data) (USEPA, 1996b). EPA concluded that there was sufficient evidence of carcinogenicity from animal studies to document PCBs as known animal carcinogens. EPA also concluded that there was “limited to inadequate evidence” of carcinogenicity from human epidemiological studies, resulting in an overall classification of PCBs as probable human carcinogens. The results of this analysis were externally peer reviewed and this information was made available through IRIS and supporting documents. The external peer reviewers supported EPA’s conclusions (USEPA, 1996c). Other national and international agencies have reached similar conclusions independently regarding the carcinogenicity of PCBs, also using a weight-of-evidence approach. Such agencies include IARC, part of the World Health Organization; the NTP, part of the National Institutes of
Responsiveness Summary Hudson River PCBs Site Record of Decision
3-3
Environmental Health Sciences of the National Institutes of Health; and the National Institute of Occupational Safety and Health (NIOSH); part of the Centers for Disease Control and Prevention (CDC). One comment suggested that EPA conduct a cancer epidemiological study of residents living near the Site using data from the Glens Falls Hospital to evaluate the potential carcinogenicity of PCBs. EPA does not conduct epidemiological studies of residents living in the vicinity of Superfund sites for use in HHRAs. Rather, EPA relies on nationally developed toxicity values and weight of evidence classifications for chemicals, as discussed. EPA used the information from the 1996 PCB Cancer Reassessment in developing the HHRA for the Hudson River. The use of data from IRIS was evaluated by the external peer reviewers for the HHRA, who agreed with EPA’s use of this data with some updates in the HHRA (ERG, 2000). The HHRA evaluates both current and future cancer risks and non-cancer health hazards under baseline conditions, i.e., in the absence of remedial action and institutional controls, consistent with Agency guidance, policies, and guidelines.
Cancer Slope Factors In 1996, EPA revised the cancer slope factors (CSFs) for PCBs (USEPA, 1996b) that were developed in 1988 (USEPA, 1988) consistent with the Agency’s carcinogen guidelines (USEPA, 1986 and 1996a) based on human epidemiological evidence and animal bioassay data. These data included the GE-funded rat carcinogenicity study (Brunner et al., 1996 later published as Mayes et al., 1998) and other reports submitted to EPA. EPA developed separate CSFs for inhalation, ingestion, and provided a recommendation for dermal assessments. The current CSFs are based on studies using a number of different Aroclor mixtures (i.e., the commercial formulation of PCBs including Aroclor 1016, 1242, 1254, and 1260), which together span the range of congeners most frequently found in environmental mixtures (USEPA, 1996b). To the extent that a congener is present in the Aroclor mixture tested in the animal studies that serve as the basis of the CSF, it was evaluated in the PCB carcinogenicity assessment in the HHRA. Therefore, even though EPA used Tri+ PCBs in the HHRA because they were the best indicator of total PCB concentrations in fish tissues, the adverse effects of mono- and dichlorobiphenyl congeners were not overlooked in the assessment because these congeners were present in the Aroclor mixtures upon which the CSFs were based. The PCB CSFs were revised downward from those developed in 1988 (USEPA, 1988) based on the reevaluation of rat liver tumor data, use of a new cross-species scaling factor (USEPA, 1992), and not using a time-weighted average dose. The results from several animal studies in both males and females, using a variety of dose levels including doses below the maximum tolerated dose, were considered in deriving the CSFs (Norback and Weltman, 1985 and Brunner et al., 1996). Based on the GE-funded rat carcinogenicity bioassay study, the dose-response curve was quite shallow, suggesting that cancer risks do not fall off rapidly at the lowest dose tested (USEPA, 1996b). Consistent with EPA’s Carcinogen Guidelines (USEPA, 1986, 1996a), benign and malignant tumors were evaluated and determined to be related to PCB exposures, based on the fact that benign tumors progressed to malignant tumors in multiple studies using different strains of rats, varying dose levels, and less-than-lifetime exposures (USEPA, 1996b).
Responsiveness Summary Hudson River PCBs Site Record of Decision
3-4
The external peer reviewers for EPA’s 1996 PCB cancer reassessment (USEPA, 1996c) supported EPA’s derivation of the revised CSF values. Although in general EPA favors dose-response assessments based on human epidemiological studies, both EPA and the external peer reviewers for EPA’s 1996 PCB reassessment concluded that due to the inadequacies and limitations of the human epidemiological data (e.g., limited exposure information, differences in occupational and environmental exposures), they could not be used as the basis for deriving quantitative toxicity values for PCBs. In fact, the external peer reviewers concluded that the current methodologies used in the reported epidemiological studies were inadequate to show associations between exposure to PCBs and development of cancer in populations, and recommended another epidemiological study design to evaluate these associations (USEPA, 1996c). New Epidemiological and Toxicological Information Published Following the Completion of the Integrated Risk Information System (IRIS) File Consistent with the procedures set forth in USEPA’s 1993 guidance (USEPA, 1993), prior to issuance of the HHRA, EPA evaluated the latest cancer toxicity data for PCBs in coordination with its National Center for Environmental Assessment in the Office of Research and Development, which is responsible for IRIS. The Revised HHRA summarized recent epidemiological and toxicological information published since 1996 and concluded that this new information does not change either the carcinogenicity classification or the current CSFs for PCBs. The development of site-specific CSFs for PCBs is not appropriate because cancer toxicity is an inherent property of a chemical and does not change on a site-specific basis. The peer reviewers of the HHRA recommended that EPA revise the toxicity section of the report to more fully discuss the recently published human epidemiological studies (ERG, 2000). In response, EPA updated the list of human epidemiological studies in Appendix D of the Revised HHRA (USEPA, 2000b). EPA identified a number of limitations with these newer human epidemiological studies, including:
• Lack of sufficient exposure information. • Failure to adequately account for co-exposures to other chemical compounds. • Questions about the appropriateness of the control populations. • The influence of timing of exposure, especially at critical periods during a lifetime. • Questions about whether blood PCB levels were measured at the appropriate time to
represent critical periods of exposure (i.e., puberty for breast cancer in women). • Inconsistency between study results.
One study that was identified in the comments is a study of workers at two capacitor plants in New York State published by Dr. Kimbrough and colleagues (Kimbrough et al., 1999a). EPA evaluated this study and concluded that it does not change the Agency’s weight-of-evidence classification for PCBs and cannot be used to develop a CSF for PCBs. EPA is not alone in identifying the limitations of the Kimbrough et al. (1999a) study for assessing PCB carcinogenicity, as indicated by two letters to the editor of the Journal of Occupational and Environmental Medicine (Bove et al., 1999 and Frumkin and Orris, 1999). In addition, ATSDR’s Toxicological Profile for PCBs (ATSDR, 2000), which was also externally peer reviewed in 1999, reached similar conclusions regarding the limitations of the Kimbrough et al. (1999a)
Responsiveness Summary Hudson River PCBs Site Record of Decision
3-5
study. Dr. Kimbrough and colleagues responded to the letters to the editors (Kimbrough et al., 1999b), and the response was reviewed by EPA. Other human epidemiological studies (e.g., Hardell et al., 1996, Hoyer et al., 1998) have similar limitations for the purpose of assessing the carcinogenicity of PCBs. Cancer Slope Factors Used in the Revised HHRA EPA places its carcinogenicity information, including the CSFs, into IRIS, the Agency’s consensus database for toxicity values (USEPA, 1999). EPA periodically updates IRIS with important new scientific information that significantly changes the existing conclusions regarding the toxicity of a chemical. IRIS chemical files undergo an external peer review, followed by an internal Agency consensus review, before files are loaded onto the website (www.epa.gov/iris) (USEPA, 1996b, 1999). Consistent with EPA guidance and policy, the cancer slope factors in IRIS are the preferred toxicity values for Superfund risk assessments unless revised by the Agency based on new toxicological studies (USEPA, 1989 and 1993). The PCB cancer slope factors in IRIS were used in the Revised HHRA. The CSFs used in the HHRA were selected based on exposure pathways (USEPA, 1996b). The inhalation CSF was used for exposure to volatilized PCBs in air. A specific oral CSF was used for ingestion of fish. Appropriate dermal adsorption factors associated with CSFs were used for direct contact with sediment and water. EPA recognizes that environmental processes can alter the congener composition of a PCB mixture (e.g., dechlorination, bioaccumulation). IRIS provides for using a lower CSF for risk calculations when congener analysis demonstrates a predominance of the lower chlorinated congeners (i.e., when congener or isomer analysis verifies that congeners with more than four chlorine atoms comprise less than 0.5 percent of the total PCBs). This lower CSF was not used in the HHRA based on congener analysis of Hudson River fish, which showed a predominance of Tri+ PCBs. The peer reviewers of the HHRA agreed with EPA’s use of toxicity information from IRIS (ERG, 2000). Dioxin-Like PCBs Following EPA guidance and procedures (USEPA, 1996b), EPA evaluated cancer risks from exposure to dioxin-like PCBs using the latest scientific consensus on toxicity equivalence factors (TEFs) for dioxin-like PCBs (USEPA, 1996b) as an additional consideration for the risk manager. Risks from dioxin-like PCBs were not combined with non-dioxin-like PCBs; EPA is currently working to develop a method for combining these risks. Blood PCB Levels Research has shown that PCBs are probable human carcinogens and may cause non-cancer health effects. The fact that blood PCB levels in capacitor workers were elevated in the past and may be declining now is not relevant to the assessment of cancer risks and non-cancer health hazards for individuals consuming fish from the Hudson River. Capacitor workers were primarily exposed to PCB congeners by dermal contact and inhalation, while people eating fish are exposed to different PCB congeners by ingestion. In addition, sensitive populations (i.e.,
Responsiveness Summary Hudson River PCBs Site Record of Decision
3-6
infants, young children, the elderly, and people with pre-existing medical conditions) may have a reduced ability to metabolize and eliminate PCBs compared to healthy worker populations. The fact that the blood PCB levels of health workers may decline with time does not address the potential current and future risks from PCB exposure associated with ingestion of fish that were evaluated in the baseline risk assessment. EPA’s goal is to remediate the contaminated sediments so that future exposures to PCBs through fish ingestion are prevented or minimized. Conclusion EPA followed appropriate guidance, policies, and guidelines in performing a weight of evidence evaluation of the carcinogenicity of PCBs, concluding that PCBs are probable human carcinogens. Other national and international agencies agree with EPA’s conclusion (i.e., IARC, NTP, and NIOSH). The cancer slope factors used in calculating risks in the HHRA reflect the application of EPA’s 1986 Carcinogen Guidelines and the proposed 1996 Guidelines, and the evaluation of an extensive animal bioassay that included the range of congeners found in the environment (i.e., Brunner et al., 1996 later published as Mayes et al., 1998). EPA’s evaluation of the more recent studies of human epidemiological carcinogenicity (i.e., Kimbrough et al., 1999a) and other studies indicates that many of the limitations identified in EPA’s earlier evaluations of human epidemiological studies still exist. Based on these limitations, EPA does not change its conclusion that PCBs are probable human carcinogens. Based on this evaluation, EPA used the consensus values presented in IRIS that were also externally peer reviewed, published in a peer-reviewed journal, and presented to Congress. Following EPA’s evaluation of PCB carcinogenicity, the risks from exposure to dioxin-like PCBs were also evaluated in the HHRA to provide additional information for consideration by the risk manager. Information on blood PCB levels presented in comments does not change EPA’s conclusions regarding the baseline cancer risks from consumption of PCB-contaminated fish under current and future exposures, as detailed in the HHRA. References Agency for Toxic Substances and Disease Registry (ATSDR). 2000. Toxicological Profile for Polychlorinated Biphenyls. Agency for Toxic Substances and Disease Registry, Atlanta, Georgia. November 2000. Bove, F.J., B.A. Slade, and R.A. Canady. 1999. Evidence of excess cancer mortality in a cohort of workers exposed to polychlorinated biphenyls. J. Occup. Environ. Med. 41(9):739-740. Brunner, M.J., T.M. Sullivan, N.W. Singer, M.J. Ryan, J.D. Toft, II, R.S. Menton, S.W. Graves, and A.C. Peters. 1996. An Assessment of the Chronic Toxicity and Oncogenicity of Aroclor 1016, Aroclor 1242, Aroclors 1254, and Aroclor 1260 Administered in Diet to Rats. Columbus, Ohio. Battelle Study #SC920192. Chronic toxicity and oncogenicity report.
Eastern Research Group, Inc. (ERG). 2000. Report on the Peer Review of the Hudson River PCBs Human Health Risk Assessment. Prepared for U. S. Environmental Protection Agency, Region 2. September. Final Report.
Responsiveness Summary Hudson River PCBs Site Record of Decision
3-7
Frumkin, H. and P. Orris. 1999. Evidence of excess cancer mortality in a cohort of workers exposed to polychlorinated biphenyls. J. Occup. Environ. Med. 41(9):739-745. Hardell, L., B. Van Bavel, G. Lindstrom. 1996. Higher concentrations of specific polychlorinated biphenyl congeners in adipose tissue from non-Hodgkin's lymphoma patients compared with controls without a malignant disease. Int. J. Oncol. 9(4):603-608. Hoyer, A.P., P. Grandjean, T., Jorgensen, J.W., Brock, and H. B. Hartvig. 1998. Organochlorine exposure and risk of breast cancer. Lancet 352:1816-1820. International Agency for Research on Cancer (IARC, 1987). "IARC Monographs on the Evaluation of Carcinogenic Risks to Humans, Supplement 7, Overall Evaluations of Carcinogenicity: An Updating of IARC Monographs Volumes 1-42." Lyon, France. Johnson, B.L. Hicks, H.E., Cibulas, W., Faroon, O., Ashizawa, A.E., DeRosa, C.T., Cogliano, V.J., and Clark, M. 1999. Public Health Implications of Exposure to Polychlorinated Biphenyls (PCBs). Agency for Toxic Substances and Disease Registry. Online at: http://www.atsdr.cdc.gov/DT/pcb007.html. Kimbrough, R.D., M. LO. Doemland, and M. E. LeVois. 1999a. Mortality in male and female capacitor workers exposed to polychlorinated biphenyls. J. Occup. Environ. Medic. 41(3):161-171. Kimbrough, R.D., Doemland, M.L., and LeVois, M.E. 1999b. The authors reply. J. Occup. Environ. Medic. 41(3):742-745. Mayes, B.A., E.E. McConnell, B.H. Neal, M.J. Brunner, S.B. Hamilton, T.M. Sullivan, A.C. Peters, M.J. Ryan, J.D. Toft, A.W. Singer, J.F. Brown Jr., R.G. Menton, and J.A. Moore. 1998. Comparative carcinogenicity in Sprague-Dawley rats of the polychlorinated biphenyl mixtures Aroclors 1016, 1242, 1254, and 1260. Toxicol. Sci. 41(1):62-76. January. National Academy Press (NAP). 2001. A Risk Management Strategy for PCB-Contaminated Sediments. Committee on Remediation of PCB-Contaminated Sediments, Board on Environmental Studies and Toxicology, National Research Council. 452 pages. National Toxicology Program (NTP). 1981. "Second Annual Report on Carcinogens: Summary 1981." Research Triangle Park, NC: US Department of Health and Human Service, Public Health Service, National Toxicology Program. NTP. 1984. Report of the Ad Hoc Panel on Chemical Carcinogenesis Testing and Evaluation of the National Toxicology Program, Board of Scientific Counselors. Available from: US Government Printing Office, Washington, D.C. 1984-421-132:4726. Norback, D.H. and R.H. Weltman. 1985. Polychlorinated biphenyl induction of hepatocellular carcinoma in the Sprague-Dawley rat. Environ. Health Perspect. 60:97-105.
Responsiveness Summary Hudson River PCBs Site Record of Decision
3-8
US Environmental Protection Agency (USEPA). 1976. Interim procedures and guidelines for health risk and economic impact assessments of suspected carcinogens. Federal Register 41:21402-21405. USEPA. 1984. Proposed guidelines for carcinogen risk assessment. Federal Register 49:46294. November 23. USEPA. 1986. Guidelines for carcinogen risk assessment. Federal Register 51:33992-34003. USEPA. 1988. "Drinking Water Criteria Document for Polychlorinated Biphenyls (PCBs)." Environmental Criteria and Assessment Office, Office of Research and Development, Cincinnati, Ohio. ECAO-CIN-414. USEPA. 1989. Risk Assessment Guidance for Superfund (RAGS), Volume I. Human Health Evaluation Manual (Part A). USEPA, Office of Emergency and Remedial Response, Washington, D.C. USEPA/540/I-89/002, December. USEPA. 1992. "Draft Report. A Cross-Species Scaling Factor for Carcinogen Risk Assessment Based on Equivalence of mg/kg3/4-day. Notice." Federal Registry 57(109):24152-24173. USEPA. 1993. Memorandum from William H. Farland, Director of the Office of Health and Environmental Assessment and Henry L. Longest, II, Director of the Office of Emergency and Remedial Response to: Directors of the Waste Management Divisions, Emergency and Remedial Response Divisions, Hazardous Waste Management Division and Hazards Waste Division. Subject: Use of IRIS Values in Superfund Risk Assessment. OSWER Directive #9285.7-16. December 21. USEPA. 1994. "Report on the Workshop on Cancer Risk Assessment Guidelines Issues." Office of Research and Development, Risk Assessment Forum, Washington, D.C. EPA/630/R-94/005a. USEPA. 1996a. Proposed guidelines for carcinogen risk assessment. Federal Register 61 (79) 17960-18011. April 23.
USEPA. 1996b. "PCBs: Cancer Dose-Response Assessment and Application to Environmental Mixtures." National Center for Environmental Assessment, Washington, D.C. USEPA/600/P-96/001F. September. USEPA. 1996c. "Report on Peer-Review Workshop on PCBs: Cancer-Dose Response Assessment and Application to Environmental Mixtures." National Center for Environmental Assessment, Office of Research and Development, Washington, D.C. USEPA. 1999. Integrated Risk Information System (IRIS) Chemical File for PCBs. National Center for Environmental Assessment, Office of Research and Development, Cincinnati, Ohio. USEPA. 2000a. Further Site Characterization and Analysis, Revised Human Health Risk Assessment (HHRA) Volume 2F, Hudson River PCBs Reassessment RI/FS. Prepared for the
Responsiveness Summary Hudson River PCBs Site Record of Decision
3-9
USEPA Region 2 and USACE by TAMS Consultants, Inc. and Gradient Corporation. November 2000. USEPA. 2000b. Response to Peer Review Comments on the Human Health Risk Assessment, Hudson River PCBs Reassessment RI/FS. Prepared for USEPA Region 2 and the US Army Corps of Engineers (USACE) by TAMS Consultants, Inc. and Gradient Corporation. November. 3.1.1.2 PCB Toxicity – Non-Cancer Master Comment 541 Several comments indicate that EPA has overestimated the reference dose (RfD) for non-cancer health hazards. In part, this contention is based on EPA’s use of monkey studies (i.e., rhesus monkeys) as the critical study and the conclusion that monkeys are more sensitive to the effects of PCBs than humans. Other comments indicate that EPA has used excessive uncertainty factors (i.e., factors of 3 rather than 1) for both extrapolating from animals to humans and extrapolating from subchronic exposure to chronic exposures. The comments suggest that EPA should use a new RfD of 2 x 10E-4 mg/kg-day, which is 10 times higher than EPA’s current RfD for Aroclor 1254 of 2 x 10E-5 mg/kg-day, and that this new value should be used in the HHRA. Other comments suggest that EPA’s RfD is not adequately protective of human health based on several neurobehavioral studies conducted in children of mothers who consumed fish and other food products that contained PCBs. These studies evaluated the effects of PCBs on groups of children exposed to varying levels of PCBs over time (i.e., as the children mature). The comments also suggest that EPA has not considered the effects of PCBs on pregnant or nursing mothers, and the health impacts of PCBs on developing fetuses. Several comments were received indicating that dechlorination of PCBs would alter the toxicity of the dechlorinated PCB mixture. Comments were also received indicating that EPA’s use of Tri+ PCBs in the assessment overlooks the adverse effects of mono- and dichlorobiphenyl congeners in the assessment. Other comments indicate that the averaging times used in the calculation of Average Daily Dose may be too long. Response to Master Comment 541 Overview This is a general response to the comments listed above with more details provided in White Paper – PCB Non-Cancer Health Effects. As background to understanding this issue, an RfD is defined as “an estimate (with uncertainty spanning perhaps an order of magnitude or greater) of a daily exposure level for the human population, including sensitive subpopulations, that is likely to be without an appreciable risk of deleterious effects during a lifetime (USEPA, 2000a, p. 63).” This response describes EPA’s process for evaluating non-cancer health effects; summarizes RfD development; discusses the RfDs for PCBs; discusses EPA’s ongoing reassessment of non-
Responsiveness Summary Hudson River PCBs Site Record of Decision
3-10
cancer health effects associated with PCBs; and also discusses use of chemical toxicity information from IRIS, PCB blood levels, and non-cancer hazard calculations. EPA Process for Assessing Non-Cancer Toxicity EPA’s process for evaluating human epidemiological and animal evidence to determine the non-cancer toxicity of chemicals, including PCBs, is set forth in the Agency’s guidelines (USEPA, 1986a-b, 1991, 1992, 1993a, 1996, 1998) and the background document on non-cancer toxicity provided on IRIS (USEPA, 1993b). The guidelines cover a variety of health endpoints, including Developmental Toxicity (USEPA, 1986b, 1991); Reproductive Toxicity (USEPA, 1996); Neurotoxicity (USEPA, 1998); Female Reproductive Risk (USEPA, 1986a); and Male Reproductive Risk (USEPA, 1986a). The guidelines were developed within the Agency, published in the Federal Register for external comment, and peer reviewed by a panel of expert scientists from universities, environmental groups, industry, labor, and other governmental agencies working in various fields associated with non-cancer toxicity, including developmental toxicity, neurological toxicity, endocrine effects, etc. EPA responded to comments on the draft guidelines and made changes based on a review of the comments submitted by these groups or individuals. The guidelines were also submitted for review to EPA’s Science Advisory Board, an external scientific review panel. On September 14 and 15, 1992, EPA convened a Risk Assessment Forum (RAF) Colloquium to evaluate the developmental neurotoxic effects of PCB exposure (USEPA, 1993a). The workshop papers discuss the principles and methods for evaluating data from animal and human studies. The report concluded that the currently available data are sufficient for risk assessment, stating:
“The sense of the meeting seemed to be that, at least in qualitative terms, the available data are sufficient. In other words, based on an evaluation of the strengths and weaknesses in the data and on the consistency of effects seen in all species tested, including humans, there is sufficient information to indicate that PCBs cause developmental neurotoxicity. Interestingly, the data suggest that prenatal exposure to PCBs may be more detrimental than postnatal exposure, even though the level of exposure via breast milk is much greater than that occurring via placental transfer.”
On May 24 and 25, 1994, EPA convened an RAF Workshop to assess whether the RfD for Aroclor 1016 (USEPA, 1994) represents a full consideration of the available scientific data and whether that analysis is clearly articulated in the RfD entry on IRIS. The results from this workshop were used in finalizing the RfD for Aroclor 1016 (USEPA, 1999a) currently listed on IRIS. The IRIS chemical files for both Aroclor 1016 (USEPA, 1999a) and Aroclor 1254 (USEPA, 1999b) represent the consensus of the Reference Dose/Reference Concentration Workgroup, responsible for reaching consensus on non-cancer toxicity values, that was in existence when the files were completed. EPA is not alone in its concern regarding the non-cancer toxicity of PCBs. The National Academy of Science (NAP, 2001) concluded:
“The Committee’s review of recent scientific information supports the conclusion that exposure to PCBs may result in chronic effects (e.g., cancer, immunological,
Responsiveness Summary Hudson River PCBs Site Record of Decision
3-11
developmental, reproductive, and neurological effects) in humans and/or wildlife. Therefore, the committee considers that the presence of PCBs in sediments may pose long-term public health and ecosystem risks.”
RfD Development and RfDs for PCBs
EPA derives RfDs (USEPA, 1993b) by first identifying the highest dose level that does not cause observable adverse effects (i.e., the non-observed-adverse-effect-level or NOAEL). If a NOAEL is not identified, the lowest-observed-adverse-effect-level, or LOAEL, may be used. The dose level is then divided by uncertainty factors to calculate an RfD. The four standard uncertainty factors that can be used when calculating an RfD range from 1 to 10 and account for:
• Variation in sensitivity among members of the human population. • Uncertainty involved in extrapolating from animal data to humans. • Uncertainty involved in extrapolating from less than chronic NOAELs to chronic
NOAELs. • Uncertainty involved in extrapolating from LOAELs to NOAELs.
An additional modifying factor can also be applied to the calculation for the RfD. The modifying factor is an additional uncertainty factor that is greater than zero and less than or equal to 10. The magnitude of the modifying factor depends upon an assessment of the scientific uncertainties of both the study and the database used in deriving the RfD that are not explicitly treated in the uncertainty factors, e.g., completeness of the overall database and number of species tested. The RfDs for Aroclor 1254 (USEPA, 1999b) and Aroclor 1016 (USEPA, 1999a) were developed following USEPA guidance and policies (see above), considering human epidemiological evidence and animal toxicity information. The RfD for non-cancer health effects of Aroclor 1016, derived in 1993, is based on reduced birth weights in monkey reproductive studies. The RfD for Aroclor 1254, derived in 1994, is based on immunologic and clinical changes in monkeys. Together, Aroclor 1016 and Aroclor 1254 span a range of congeners (including varying percentages of mono- and dichlorobiphenyls), and include the congeners most frequently found in environmental mixtures. To the extent that a congener is present in the Aroclor mixture tested in the animal studies that serve as the basis of the reference dose, it was evaluated in the non-cancer toxicity assessment in the HHRA. Therefore, even though EPA used Tri+ PCBs in the HHRA because they were the best indicator of total PCB concentrations in fish tissues, the adverse effects of mono- and dichlorobiphenyl congeners were not overlooked in the assessment because these congeners were present in the Aroclor mixtures upon which the RfDs were based. Some of the research papers identified in the comments to support a reduction in the uncertainty factors for interspecies and subchronic to chronic extrapolation from 3 to 1 were evaluated as part of the development of the RfDs for Aroclors 1016 and 1254. At that time, EPA concluded that monkeys are not less sensitive than humans, and therefore the uncertainty factor of 3 applied for extrapolation from monkeys to humans is appropriate (USEPA, 1999a,b). Similar adverse health effects (ocular and dermal effects, neurobehavioral effects, decreased birth weight, etc.) have been found in exposed human populations and monkey studies. The uncertainty factor of 3 applied for extrapolation from subchronic to chronic exposures is appropriate; the exposures in the critical studies continued for approximately 25 percent of the lifespan of the monkeys, and
Responsiveness Summary Hudson River PCBs Site Record of Decision
3-12
the immunologic and clinical changes that were observed did not appear to be dependent upon exposure duration. Tilson et al. (1990) performed a cross-species analysis of the effect of PCBs and concluded that humans are more sensitive to the effects of PCBs than monkeys. ATSDR used similar uncertainty factors in its development of health protective intermediate and chronic minimal risk levels (MRLs) for non-cancer effects of PCBs (ATSDR, 2000). In deriving the RfDs for Aroclors 1016 and 1254, EPA concluded that the available human data were useful only in a qualitative manner. The IRIS file makes similar statements for both Aroclor 1016 (USEPA, 1999a) and Aroclor 1254 (USEPA, 1999b). The summary from the Aroclor 1254 (USEPA, 1999b) chemical file states:
“Human data available for risk assessment of Aroclor 1254 are useful only in a qualitative manner. Studies of the general population who were exposed to PCBs by consumption of contaminated food, particularly neurobehavioral evaluations of infants exposed in utero and/or through lactation, have been reported, but the original PCB mixtures, exposure levels and other details of exposure are not known (Kreiss et al., 1981; Humphrey, 1983; Fein et al., 1984a,b; Jacobson et al., 1984a, 1985, 1990a,b; Rogan et al., 1986; Gladen et al., 1988). Most of the information on health effects of PCB mixtures in humans is available from studies of occupational exposure. Some of these studies examined workers who had some occupational exposure to Aroclor 1254, but sequential or concurrent exposure to other Aroclor mixtures nearly always occurred, exposure involved dermal as well as inhalation routes (relative contribution by each route not known), and monitoring data are lacking or inadequate (Alvares et al., 1977; Brown and Jones, 1981; Colombi et al., 1982; Fischbein et al., 1979, 1982, 1985; Fischbein, 1985; Warshaw et al., 1979; Smith et al., 1982; Taylor et al., 1984; Lawton et al., 1985). Insufficient data are available in these studies to determine possible contributions of Aroclor 1254 alone, extent of direct skin exposure and possible contaminants. However, it is relevant to note that dermal and ocular effects, including skin irritation, chloracne, hyperpigmentation and eyelid and conjunctival irritation, have been observed in humans occupationally exposed to Aroclor 1254 and other Aroclor formulations.”
Reassessment of PCB Non-Cancer Effects EPA updates their IRIS chemical files and other documents to reflect new scientific information, following appropriate procedures for internal and external peer review. EPA's National Center for Environmental Assessment (NCEA) is currently in the process of reassessing PCB non-cancer toxicity. As part of this reassessment, EPA will use a weight-of-evidence approach to critically evaluate all available non-cancer toxicity information (including newly published human epidemiological studies, neurobehavioral studies in monkeys, other animal studies, metabolism data, and mechanistic data) to develop a new RfD or reaffirm the current RfD. EPA will also evaluate any newly available toxicity studies on particular PCB congener groups (e.g., mono- and dichlorobiphenyl PCBs) as part of the non-cancer toxicity reassessment.
EPA is aware that a number of recent human epidemiological studies, updated studies of the cohorts originally described in 1993/1994 IRIS chemical files, and laboratory studies in infant and young monkeys have been published since the RfDs for Aroclors 1016 and 1254 were developed. Neurobehavioral alterations have been reported following exposure to PCBs in both
Responsiveness Summary Hudson River PCBs Site Record of Decision
3-13
the human studies and the rat and monkey studies. As mentioned above, the results of many of the new studies are described in Appendix D of the Revised HHRA (USEPA, 2000b). These newer studies are being considered as part of EPA's on-going reassessment of PCB non-cancer toxicity. The data from these studies may aid in understanding the mechanisms of action of PCBs on the central nervous system. However, at this point, it is premature to determine whether the results from these newly published human epidemiological or animal studies will result in revisions to EPA's RfDs for PCBs, and if so, in which direction. As a point of comparison, ATSDR has developed intermediate and chronic PCB MRLs. The intermediate MRL (ATSDR, 2000) is based on several recent neurobehavioral studies in monkeys (Rice, 1997, 1998, 1999; Rice and Hayward, 1997, 1999). The chronic MRL is based on studies by Tryphonas et al. (1989, 1991a) that were also the basis for EPA’s RfD for Aroclor 1254 (ATSDR, 2000). ATSDR's calculated intermediate MRL is slightly higher than the chronic MRL (i.e., 0.00003 mg/kg-day vs. 0.00002 mg/kg-day). The chronic oral MRL for PCBs was the same as EPA's chronic oral RfD for Aroclor 1254 (0.00002 mg/kg-day). These results indicate that the neurobehavioral effects used in the development of ATSDR's toxicity value occur at a slightly higher LOAEL dose level (0.0075 mg/kg/day) than the LOAEL based on immunotoxicity endpoints (0.005 mg/kg-day) used in development of EPA's chronic RfD and ATSDR’s chronic MRL.
Use of IRIS Values in the HHRA At the time they were developed, the IRIS values were evaluated by the RfD/RfC Workgroup, and the RfD for Aroclor 1016 was externally peer reviewed through the Risk Assessment Forum (USEPA, 1994). A colloquia on developmental neurotoxic effects of PCBs was also held (USEPA, 1993a). Based on this information, these RfDs are the preferred toxicity values for use in risk assessments, as indicated in EPA’s risk assessment guidance (USEPA, 1989). Consistent with this USEPA guidance and CERCLA and NCP policies, the information on PCB non-cancer health effects and the RfDs (described above) presented in USEPA’s IRIS system was used in the HHRA. The use of IRIS data in the evaluation of chemical toxicity at Superfund sites addresses EPA’s goal of using consistent toxicity information at Superfund sites across the country. In addition, many of the studies presented in the comments were previously evaluated as part of the development of the RfDs for Aroclors 1016 and 1254 as described above. EPA’s 1993 memo (USEPA, 1993c) on the use and updating of IRIS toxicity values indicates that it is not necessary for EPA to re-evaluate information previously considered in the development of EPA’s toxicity values. In the HHRA, EPA used the RfD for Aroclor 1016 for water and sediment exposure and the RfD for Aroclor 1254 for the fish ingestion pathway. The RfDs were selected based on congener-specific analyses, and therefore address the extent to which dechlorinated PCBs are present in water, sediment, and fish in the Hudson River. EPA specifically charged the external peer reviewers of the HHRA for the Hudson River to evaluate whether use of the IRIS values was appropriate (USEPA, 2000c). The peer reviewers for the HHRA agreed with EPA’s use of non-cancer toxicity information from IRIS, but
Responsiveness Summary Hudson River PCBs Site Record of Decision
3-14
recommended that EPA also provide a discussion of the more recently published studies on non-cancer endpoints to determine what effect these studies might have on risk estimates. In response, EPA made the appropriate changes to the document and summarized a number of newly published human epidemiological studies on the non-cancer effects of PCBs identified in the IRIS files for Aroclors 1016 and 1254, including updates of the neurodevelopmental studies in cohorts of children and adults. This information is in Appendix D of the HHRA (USEPA, 2000a). Based on an evaluation of this data, EPA concludes that the toxicity values in IRIS are still appropriate for the HHRA. Blood PCB Levels The fact that blood PCB levels in capacitor workers were elevated in the past and may be declining now is not necessarily relevant to individuals consuming fish from the Hudson River, since workers were exposed to different PCB congeners through different routes of exposure (dermal and inhalation as opposed to ingestion). Also, sensitive groups (i.e., children, adolescents, those with pre-existing conditions, etc.) may have a reduced ability to metabolize and eliminate PCBs compared to healthy worker populations. Thus, the rate of decline of blood PCB levels in fish-eating populations may be slower than that for workers. Hovinga et al. (1992) found that the blood PCB levels of individuals exposed to PCBs through fish decreased slightly from 1977 to 1985 (approximately 1.5 ppb). However, this time period showed the largest declines in PCB concentrations in fish, and fish tissue concentrations have not exhibited a consistent decline in recent years (Response to Master Comment 629, Chapter 2). EPA evaluates non-cancer health hazards based on current and future exposures to PCBs under the baseline risk assessment, and thus consideration of past exposure to higher or lower concentrations of contaminants is not appropriate under this paradigm (USEPA, 1989). Non-Cancer Hazard Calculations
The non-cancer assessment in the HHRA used an averaging time that is equivalent to the exposure duration x 365 days/year, consistent with EPA risk assessment guidance (USEPA, 1989). The peer reviewers agreed that EPA’s selection of averaging times was appropriate, with a caveat to evaluate the effects of PCBs to pregnant and nursing women using a shorter exposure duration (USEPA, 2000c). The non-cancer hazards to the fetus and infant were addressed qualitatively in the Revised HHRA, based on the lack of an approved methodology for modeling the effects of PCBs on the fetus and for calculating the PCB levels in breast milk based on the mother’s body burden.
Conclusions The RfDs for Aroclors 1016 and 1254 are appropriate for use in the HHRA and are protective of sensitive populations. Many of the studies identified in the comments were previously evaluated in the development of the RfDs and newer studies, such as those summarized in the HHRA (Appendix D). Based on this prior review, it is not appropriate to modify the uncertainty factors used in calculating the RfD. EPA will evaluate the new data presented in the comments as part of the non-cancer RfD reassessment for PCBs. The reassessment will be made available for public review, after which there will be an external peer-review and an internal IRIS consensus review.
Responsiveness Summary Hudson River PCBs Site Record of Decision
3-15
References Agency for Toxic Substances and Disease Registry (ATSDR). 2000. Toxicological Profile for Polychlorinated Biphenyls. Agency for Toxic Substances and Disease Registry, Atlanta, Georgia. November 2000. Alvares, A.P., A. Fischbein, K.E. Anderson. 1977. Alterations in drug metabolism in workers exposed to polychlorinated biphenyls. Clin. Pharmacol. Ther. 22(2): 140-146. Arnold, D.L., F. Bryce, R. Stapley. 1993a. Toxicological consequences of Aroclor 1254 ingestion by female Rhesus (Macaca mulatta) monkeys, Part 1A: Prebreeding phase - clinical health findings. Food Chem. Toxicol. 31: 799-810. Arnold, D.L., F. Bryce, K. Karpinski. 1993b. Toxicological consequences of Aroclor 1254 ingestion by female Rhesus (Macaca mulatta) monkeys, Part 1B: Prebreeding phase -clinical and analytical laboratory findings. Food Chem. Toxicol. 31: 811-824. Barsotti, D.A. and J.P. van Miller. 1984. Accumulation of a commercial polychlorinated biphenyl mixture (Aroclor 1016) in adult rhesus monkeys and their nursing infants. Toxicology. 30: 31-44. Brown, D.P. and M. Jones. 1981. Mortality and industrial hygiene study of workers exposed to polychlorinated biphenyls. Arch. Environ. Health. 36(3):120-129. Colombi, A., M. Maroni, A. Ferioli. 1982. Increase in urinary porphyrin excretion in workers exposed to polychlorinated biphenyls. J. Appl. Toxicol. 2(3): 117-121 Fein, G.G., J.L. Jacobson, S.W. Jacobson. 1984a. Intrauterine exposure of humans to PCBs: Newborn effects. USEPA, Duluth, MN. EPA 600/53-84-060. Fein, G.G., J.L. Jacobson, S.W. Jacobson. 1984b. Prenatal exposure to polychlorinated biphenyls: Effects on birth size and gestation age. J. Pediatr. 105: 315-320. Fischbein, A. 1985. Liver function tests in workers with occupational exposure to polychlorinated biphenyls (PCBs): Comparison with Yusho and Yu-Cheng. Environ. Health Perspect. 60: 145-150. Fischbein, A., M.S. Wolff, R. Lilis. 1979. Clinical findings among PCB-exposed capacitor manufacturing workers. Ann. NY Acad. Sci. 320: 703-715. Fischbein, A., M.S. Wolff, J. Bernstein. 1982. Dermatological findings in capacitor manufacturing workers exposed to dielectric fluids containing polychlorinated biphenyls PCBs). Arch. Environ. Health. 37(2): 69-74. Fischbein, A., J.N. Rizzo, S.J. Solomon. 1985. Oculodermatological findings in workers with occupational exposure to polychlorinated biphenyls (PCBs). Br. J. Ind. Med. 42: 426-430.
Responsiveness Summary Hudson River PCBs Site Record of Decision
3-16
Gladen, B.C., W.J. Rogan, P. Hardy. 1988. Development after exposure to polychlorinated biphenyls and dichlorobiphenyl dichloroethene transplacentally and through human milk. J. Pediatr. 113: 991-995. Hovinga, M.E., Sowers, M., Humphrey, H.E.B. (1992). Historical changes in serum PCB and DDT levels in an environmentally exposed cohort. Arch. Environ. Contam. Toxicol. 27:362-366. Humphrey, H.E.B. 1983. Population studies of PCBs in Michigan residents. In: PCBs: Human and Environmental Hazards, F.M. D'Itri and M. Kamrin, Ed. Butterworth, Boston, MA. p. 299-310. Jacobson, J.L., S.W. Jacobson, P.M. Schwartz. 1984a. Prenatal exposure to an environmental toxin: A test of the multiple effects model. Develop. Psychobiol. 20(4): 523-532. Jacobson, J.L., G.G. Fein, S.W. Jacobson. 1984b. The transfer of polychlorinated biphenyls (PCBs) and polybrominated biphenyls (PBBs) across the human placenta and into maternal milk. J. Public Health. 74(4): 378-379. Jacobson, S.W., G.G. Fein, J.L. Jacobson. 1985. The effect of intrauterine PCB exposure on visual recognition memory. Child Develop. 56:856-860. Jacobson, J.L., S.W. Jacobson and H.E.B. Humphrey. 1990a. Effects of in utero exposure to polychlorinated-biphenyls and related contaminants on cognitive-functioning in young children. J. Pediatr. 116: 38-45. Jacobson, J.L., S.W. Jacobson and H.E.B. Humphrey. 1990b. Effects of exposure to PCBs and related compounds on growth and activity in children. Neurotoxicol. Teratol. 12: 319-326. Kreiss, K., M.M. Zack, R.D. Kimbrough. 1981. Association of blood pressure and polychlorinated biphenyl levels. J. Am. Med. Assoc. 245(24):2505-2509. Lawton, R.W., M.R. Ross, J. Feingold. 1985. Effects of PCB exposure on biochemical and hematological findings in capacitor workers. Environ. Health Perspect. 60: 165-184. Levin, E.D., S.L. Schantz and R.E Bowman. 1988. Delayed spatial alternation deficits resulting from perinatal PCB exposure in monkeys. Arch. Toxicol. 62: 267-273. National Academy Press (NAP). 2001. A Risk Management Strategy for PCB-Contaminated Sediments. Committee on Remediation of PCB-Contaminated Sediments, Board on Environmental Studies and Toxicology, National Research Council. 452 pages.
Rice, D.C. 1997. Effect of postnatal exposure to a PCB mixture in monkeys on multiple fixed interval-fixed ratio performance. Neurotoxicol. Teratol. 19(6):429-434. Rice, D.C. 1998. Effects of postnatal exposure of monkeys to PCB mixture on spatial discrimination reversal and DRL performance. Neurotoxicol. Teratol. 20(4):391-400.
Responsiveness Summary Hudson River PCBs Site Record of Decision
3-17
Rice, D.C. 1999. Behavioral impairment produced by low-level postnatal PCB exposure in monkeys. Environ. Res. 80:8113-8121. Rice, D.C. and Hayward, S. 1997. Effects of postnatal exposure to a PCB mixture in monkeys on nonspatial discrimination reversal and delayed alternation performance. Neurotoxiclogoy. 18(2):479-494. Rice, D.C. Hayward, S. 1999. Effects of postnatal exposure of monkeys to a PCB mixture on concurrent random interval-random interval and progressive ratio performance. Neurotoxicol. Teratol. 21(1):47-58. Rogan, W.J., B.C. Gladen, J.D. McKinney. 1986. Neonatal effects of transplacental exposure to PCBs and DDE. J. Pediatr. 109: 335-341. Schantz, S.L., E.D. Levin, R.E. Bowman. 1989. Effects of perinatal PCB exposure on discrimination-reversal learning in monkeys. Neurotoxicol. Teratol. 11: 243-250. Schantz, S.L., E.D. Levin and R.E. Bowman. 1991. Long-term neurobehavioral effects of prenatal polychlorinated biphenyl (PCB) exposure in monkeys. Environ. Toxicol. Chem. 10: 747-756. Smith, A.B., J. Schloemer, L.K. Lowry. 1982. Metabolic and health consequences of occupational exposure to polychlorinated biphenyls. Br. J. Ind. Med. 39: 361-369. Taylor, P.R., C.E. Lawrence, H.L. Hwang. 1984. Polychlorinated biphenyls: Influence on birth weight and gestation. Am. J. Public Health. 74(10): 1153-1154. Tilson, H., Jacobson, J., and Rogan, W. 1990. Polychlorinated biphenyls and the developing nervous system: cross-species comparisons. Neurotox. Teratol. 12:239-248. Tryphonas, H., S. Hayward, L. O'Grady. 1989. Immunotoxicity studies of PCB (Aroclor 1254) in the adult rhesus (Macaca mulatta) monkey – preliminary report. Int. J. Immunopharmacol. 11: 199-206. Tryphonas, H., M.I. Luster, G. Schiffman. 1991a. Effect of chronic exposure of PCB (Aroclor 1254) on specific and nonspecific immune parameters in the Rhesus (Macaca mulatta) monkey. Fund. Appl. Toxicol. 16(4): 773-786. Tryphonas, H., M.I. Luster, K.L. White. 1991b. Effects of PCB (Aroclor 254) on non-specific immune parameters in Rhesus (Macaca mulatta) monkeys. Int. J. Immunopharmacol. 13: 639-648. USEPA. 1986a. The Risk Assessment Guidelines for 1986. Office of Health and Environmental Assessment, Washington, D.C. EPA/600/8-89/043, July.
Responsiveness Summary Hudson River PCBs Site Record of Decision
3-18
USEPA. 1986b. Guidelines for the Health Assessment of Suspect Developmental Toxicants. Federal Register 51 (185) 34028-34040, 24 September 1986. USEPA. 1989. Risk Assessment Guidance for Superfund (RAGS), Volume I. Human Health Evaluation Manual (Part A). USEPA, Office of Emergency and Remedial Response, Washington, D.C. USEPA/540/I-89/002, December. USEPA. 1991. Guidelines for Developmental Toxicity Risk Assessment. Federal Register 56 (234) 63798-63826, 5 December 1991 USEPA. 1992. Guidelines for Exposure Assessment. Federal Register 57 (104) 22888-22938, 29 May 1992
USEPA. 1993a. Workshop Report on Developmental Neurotoxic Effects Associated with Exposure to PCBs. U. S. EPA, Risk Assessment Forum, Office of Research and Development, Washington, D.C. EPA/630/R-92/004, May, 1993. USEPA. 1993b. Reference Dose (RfD): Description and Use in Health Risk Assessments. Background Document 1A. USEPA, National Center for Environmental Assessment (NCEA), Office of Research and Development, Washington, D.C. March 15, 1993. USEPA. 1993c. Memorandum from William H. Farland, Director of the Office of Health and Environmental Assessment and Henry L. Longest, II, Director of the Office of Emergency and Remedial Response to: Directors of the Waste Management Divisions, Emergency and Remedial Response Divisions, Hazardous Waste Management Division and Hazards Waste Division. Subject: Use of IRIS Values in Superfund Risk Assessment. OSWER Directive #9285.7-16. December 21. USEPA. 1994. Report on the Technical Review Workshop on the Reference Dose for Aroclor 1016. USEPA, Risk Assessment Forum, Office of Research and Development, Washington, D.C. EPA/630/R-94/006, November. USEPA. 1996. Guidelines for Reproductive Toxicity Risk Assessment. Federal Register 61 (212) 56274-56322, 31 October 1996 USEPA. 1998. Guidelines for Neurotoxicity Risk Assessment. Federal Register 63 (93) 26926-26954, 14 May 1998. USEPA. 1999a. Integrated Risk Information System Chemical File for Aroclor 1016. USEPA, National Center for Environmental Assessment, Office of Research and Development, Cincinnati, Ohio. USEPA. 1999b. Integrated Risk Information System Chemical File for Aroclor 1254. USEPA, National Center for Environmental Assessment, Office of Research and Development, Cincinnati, Ohio.
Responsiveness Summary Hudson River PCBs Site Record of Decision
3-19
USEPA. 2000a. Phase 2 Report, Further Site Characterization and Analysis. Volume 2F-Human Health Risk Assessment (HHRA), Hudson River PCB Reassessment RI/FS. Prepared for USEPA Region 2 and the USACE, Kansas City District by TAMS Consultants, Inc. and Gradient Corporation. November. USEPA. 2000b. Further Site Characterization and Analysis, Revised Human Health Risk Assessment (Revised HHRA) Volume 2F, Hudson River PCBs Reassessment RI/FS. Prepared for the USEPA Region 2 and USACE by TAMS Consultants, Inc. and Gradient Corporation. November 2000. USEPA. 2000c. Peer Review Responsiveness Summary for Volume 2F - Human Health Risk Assessment, Hudson River PCBs Reassessment RI/FS. Prepared for USEPA Region 2 and the USACE, Kansas City District by TAMS Consultants, Inc. and Gradient Corporation. March. Warshaw, R., A. Fischbein, J. Thornton. 1979. Decrease in vital capacity in PCB-exposed workers in a capacitor manufacturing facility. Ann. NY Acad. Sci. 320: 277-283. 3.1.2 Fish Consumption (Rate and Species Mix) Master Comment 569 Some comments stated that EPA's fish ingestion rates are too high, which results in overestimated cancer risks and non-cancer health hazards due to fish consumption. Comments stated that EPA should have conducted a study of Upper Hudson anglers to determine site-specific fish ingestion rates. Comments stated that the 1991 New York Angler survey should not have been used as the basis for EPA's estimate of fish ingestion rates because it is not representative of actual anglers in the Upper Hudson region. Comments stated that the fish consumption rates used for the Hudson River are too high because most anglers fish in more than one location (i.e., in areas other than Hudson River and in different areas within the Hudson). One commenter (GE, Appendix J) used the 1992 Lake Ontario angler survey (Connelly et al., 1996) in a "micro-exposure" Monte Carlo analysis to derive fish ingestion rates that are three to five times lower than the rates used by EPA. Other comments stated that EPA's fish ingestion rates for the Site are too low, which underestimates of the cancer risks and non-cancer health hazards from eating PCB-contaminated fish. Comments stated that EPA's fish ingestion rates should be higher to include subsistence anglers. Comments suggested that EPA should evaluate fish consumed by non-anglers, especially women and children who may receive fish from anglers and who are sensitive subpopulations. A third group of comments expressed support for the fish ingestion rates used by EPA stating that the fish ingestion rates are reasonable point estimates for adults.
Responsiveness Summary Hudson River PCBs Site Record of Decision
3-20
Response to Master Comment 569 With respect to the comments that EPA's fish ingestion rates are too high, in the HHRA EPA reviewed the major angler surveys published in the scientific literature and fish ingestion data in EPA’s Exposure Factors Handbook (USEPA, 1997). EPA selected the 1991 New York State Angler survey for use in deriving the fish ingestion rates for the point estimate calculations because, among other reasons, it was conducted in New York State, it provided the opportunity to compare species specific ingestion rates for similar water bodies without fish advisories, and it included a large sample size. The demographics of the 1991 New York Angler survey are reasonably similar overall to the demographics of the Upper Hudson angler population as reported in the 1996 Survey of Hudson River Anglers (NYSDOH, 1999). Although there are some differences in household income and age distribution, the two survey populations had very similar general and racial compositions (HHRA, p. 43). EPA’s rationale for using the 1991 New York Angler survey as the basis for its point estimate fish ingestion rate and for the base case of the Monte Carlo analysis is presented in the HHRA (pp. 41-44). GE identified the 1992 Lake Ontario Diary Study (Connelly et al., 1996) as its preferred survey. EPA did not use the 1992 Lake Ontario Diary Study to develop the fish ingestion rates for the point estimate calculations in part because the survey showed that the fish consumption advisories in place at the time of the survey reduced fish consumption by the participants (HHRA, p. 39-40). This means that fish ingestion rates derived from the 1992 Lake Ontario Diary Study would not be representative of the baseline conditions of the HHRA for the reasonably maximally exposed individual and would not be representative of the No Action Alternative (absence of fishing restrictions and fish consumption advisories). Similarly, EPA did not collect Site-specific information on fish consumption due to the fish consumption advisories that have been in place for the Hudson River since 1975 (refer also to GE Appendix J, p. 29). The HHRA peer reviewers agreed that Site-specific data regarding fish consumption would be difficult to interpret in light of the fish consumption advisories and the fishing restrictions in the Upper Hudson. It is important to note that the cancer risks and non-cancer hazards calculated by GE using the 1992 Lake Ontario Diary Study are still above acceptable levels. EPA quantitatively assessed the effect of selecting the 1991 New York Angler survey in its Monte Carlo calculations, which considered the 1991 New York Angler survey (base case) and three other independent surveys as a sensitivity analysis. Those three surveys are the 1992 Maine Angler Survey (Ebert et al., 1993), the 1992 Lake Ontario Diary Study (Connelly et al., 1996), and the 1989 Michigan Sport Angler Survey (West et al., 1989) (HHRA, p. 44-45 and Table 3-2). EPA’s sensitivity analysis of fish ingestion rates showed that even using the survey that provided the lowest fish ingestion rates (i.e., the 1992 Maine Angler Survey), cancer risks and non-cancer health hazards are above acceptable levels. EPA’s assumption that all fish consumed by anglers are caught in the Hudson River is protective of human health and is reasonable in light of the large geographic area encompassed by the Site (HHRA, p. 22 and 80). The assumption is also supported by the fact that 56.5 percent of the respondents in the 1991 New York Angler survey reported that they fished in only one or two locations (35.5 percent in one location, 21 percent in two locations).
Responsiveness Summary Hudson River PCBs Site Record of Decision
3-21
As for fishing along different sections of the Hudson River, in the HHRA EPA did not assume fish were caught in the same location year after year. For the point estimate calculations and the base case Monte Carlo analysis, EPA evaluated consumption of fish caught from the entire Upper Hudson River (i.e., average of three locations within 40-mile Upper Hudson, see HHRA, pp. 14 and 59). As a sensitivity analysis in the Monte Carlo calculations, EPA considered the effects of catching fish in the upstream end of the Upper Hudson only (the Thompson Island Pool) and in the downstream end of the Upper Hudson (the Waterford/Federal Dam area). This analysis showed that the cancer risks and non-cancer health hazards for the specific reaches of the Hudson River were unacceptable for each area (HHRA, p. 81). Further, the Monte Carlo analysis did not assume that fish species were always caught and consumed in the same proportions by all anglers. Rather, a range of fish species consumption fractions among different anglers were selected randomly from a distribution based on the 1991 New York Angler survey responses (HHRA, p. 49 and HHRA Table 3.1). Microexposure Event Analysis EPA reviewed the “microexposure” Monte Carlo analysis presented in Appendix J of GE’s comments. The table below provides a comparison of the cancer risks and non-cancer health hazards from fish ingestion calculated by GE’s “microexposure” analysis and by EPA’s Monte Carlo analysis. GE’s “microexposure” analysis yielded cancer risks and non-cancer health hazards that range from three to five times lower than EPA’s estimates. Most of the difference is due to GE’s use of the Lake Ontario Diary Study to derive fish ingestion rates that are on average four-fold lower than those used by EPA in its base case Monte Carlo analysis. To a much lesser extent, the difference is due to GE’s later starting date of 2004, compared to the 1999 start date used in EPA’s HHRA. EPA prefers its Monte Carlo analysis to GE’s “microexposure” analysis. As discussed above in this response, EPA believes its peer-reviewed fish ingestion rates derived from the 1991 New York Angler survey are more appropriate for this Site than the fish ingestion rates derived by GE from the 1992 Lake Ontario Diary Study. In addition, GE limited the uncertainty analysis in its “microexposure” analysis to the uncertainty associated with a single angler survey, and did not evaluate uncertainty using several angler surveys, thereby ignoring published studies indicating higher rates of fish consumption compared to those in the 1992 Lake Ontario survey (Connelly et al., 1996). In contrast, EPA conducted a sensitivity analysis of fish ingestion rates, using the results of four independent angler surveys. Moreover, EPA’s review of the “microexposure” analysis was hampered by insufficient disclosure of the information used to generate many of the exposure factor distributions (e.g., procedures for selecting and excluding data, range of estimates, and distribution fitting procedures). Nonetheless, the different methods used by GE and EPA yield very similar results, and both show that cancer risks and non-cancer health hazards from eating fish are above acceptable levels.
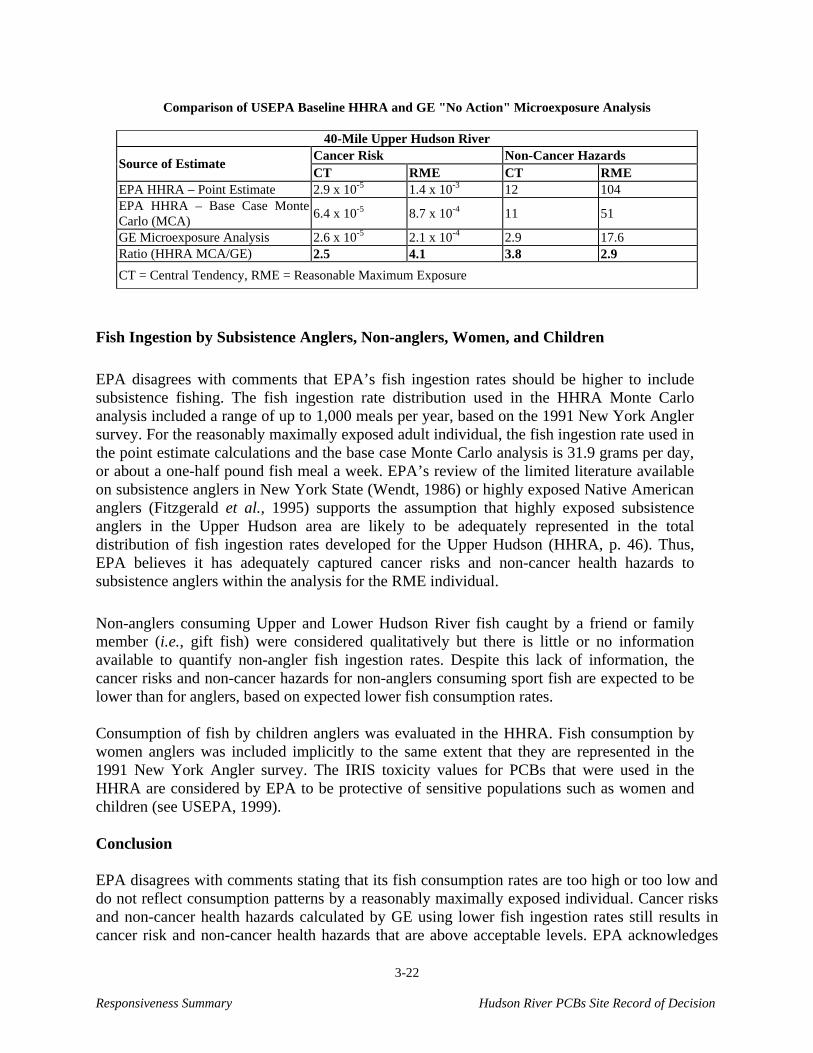
Responsiveness Summary Hudson River PCBs Site Record of Decision
3-22
Comparison of USEPA Baseline HHRA and GE "No Action" Microexposure Analysis
40-Mile Upper Hudson River
Cancer Risk Non-Cancer Hazards Source of Estimate
CT RME CT RME EPA HHRA – Point Estimate 2.9 x 10⁻⁵ 1.4 x 10⁻³ 12 104 EPA HHRA – Base Case Monte Carlo (MCA)
6.4 x 10⁻⁵ 8.7 x 10⁻⁴ 11 51
GE Microexposure Analysis 2.6 x 10⁻⁵ 2.1 x 10⁻⁴ 2.9 17.6 Ratio (HHRA MCA/GE) 2.5 4.1 3.8 2.9
CT = Central Tendency, RME = Reasonable Maximum Exposure
Fish Ingestion by Subsistence Anglers, Non-anglers, Women, and Children
EPA disagrees with comments that EPA’s fish ingestion rates should be higher to include subsistence fishing. The fish ingestion rate distribution used in the HHRA Monte Carlo analysis included a range of up to 1,000 meals per year, based on the 1991 New York Angler survey. For the reasonably maximally exposed adult individual, the fish ingestion rate used in the point estimate calculations and the base case Monte Carlo analysis is 31.9 grams per day, or about a one-half pound fish meal a week. EPA’s review of the limited literature available on subsistence anglers in New York State (Wendt, 1986) or highly exposed Native American anglers (Fitzgerald et al., 1995) supports the assumption that highly exposed subsistence anglers in the Upper Hudson area are likely to be adequately represented in the total distribution of fish ingestion rates developed for the Upper Hudson (HHRA, p. 46). Thus, EPA believes it has adequately captured cancer risks and non-cancer health hazards to subsistence anglers within the analysis for the RME individual.
Non-anglers consuming Upper and Lower Hudson River fish caught by a friend or family member (i.e., gift fish) were considered qualitatively but there is little or no information available to quantify non-angler fish ingestion rates. Despite this lack of information, the cancer risks and non-cancer hazards for non-anglers consuming sport fish are expected to be lower than for anglers, based on expected lower fish consumption rates. Consumption of fish by children anglers was evaluated in the HHRA. Fish consumption by women anglers was included implicitly to the same extent that they are represented in the 1991 New York Angler survey. The IRIS toxicity values for PCBs that were used in the HHRA are considered by EPA to be protective of sensitive populations such as women and children (see USEPA, 1999).
Conclusion EPA disagrees with comments stating that its fish consumption rates are too high or too low and do not reflect consumption patterns by a reasonably maximally exposed individual. Cancer risks and non-cancer health hazards calculated by GE using lower fish ingestion rates still results in cancer risk and non-cancer health hazards that are above acceptable levels. EPA acknowledges
Responsiveness Summary Hudson River PCBs Site Record of Decision
3-23
comments stating its peer-reviewed fish consumption rates are appropriate. These same ingestion rates were used in the development of the preliminary remediation goals (PRGs) in the Feasibility Study and the remediation goals (RGs) in the ROD.
References
Connelly, N.A., B.A. Knuth, and C.A. Bisogni. 1992. Effects of the Health Advisory Changes on Fishing Habits and Fish Consumption in New York Sport Fisheries. Human Dimension Research Unit, Department of Natural Resources, New York State, College of Agriculture and Life Sciences, Fernow Hall, Cornell University, Ithaca, New York. Report for the New York Sea Grant Institute Project No. R/FHD-2-PD, September. (Raw survey data also received electronically from study authors.) Connelly, N.A., B.A. Knuth, and T. Brown. 1996. Sportfish consumption patterns of Lake Ontario anglers and the relationship to health advisories. N. Am. J. Fisheries Management 16:90.
Ebert, E.S., N.W. Harrington, K.J. Boyle, J.W. Knight, and R.E. Keenan. 1993. Estimating consumption of freshwater fish among Maine Anglers. North American Journal of Fisheries Management 13:737-745.
Fitzgerald, E.F., S.A. Hwang, K.A. Brix, B. Bush, K. Cook, and P. Worswick. 1995. Fish PCB concentrations and consumption patterns among Mohawk women at Akwesasne. J Exposure Anal Environ Epidem 5(1):1-19.
New York State Department of Health (NYSDOH). 1999. Health Consultation: 1996 Survey of Hudson River Anglers, Hudson Falls to Tappan Zee Bridge at Tarrytown, New York. February. (Raw survey data received electronically from Edward Horn of NYSDOH in June, 1998.)
USEPA. 1997. Exposure Factors Handbook, Volume I-III. Office of Research and Development, USEPA/600/P-95/002Fa, August.
USEPA. 1999. "Integrated Risk Information System Chemical File for Polychlorinated Biphenyls." National Center for Environmental Assessment, Cincinnati, Ohio. USEPA. 2000. Phase 2 Report. Further Site Characterization and Analysis. Volume 2F - Revised Human Health Risk Assessment (HHRA), Hudson River PCBs Reassessment RI/FS. Prepared for USEPA Region 2 and the USACE, Kansas City District by TAMS Consultants, Inc. and Gradient Corporation. November. Wendt, M.E. 1986. Low income families’ consumption of freshwater fish caught from New York State waters. Thesus. Cornell University, August.
Responsiveness Summary Hudson River PCBs Site Record of Decision
3-24
West, P.C., M.J. Fly, R. Marans, and F. Larkin. 1989. "Michigan Sport Anglers Fish Consumption Survey. A Report to the Michigan Toxic Substance Control Commission." Michigan Department of Management and Budget Contract No. 87-20141. 3.1.3 Exposed Population Master Comment 543 Comments stated that the fish consumption advisories (along with source control/natural attenuation) are sufficient to protect public health. The ban on the consumption of fish is widely known and obeyed by anglers in the Upper Hudson. A recent survey (NYSDOH, 1999) showed that anglers never ate the fish they caught from the Hudson River. The existence of fishing advisories and the absence of a commercial fishery should be factored into the EPA analysis of risk. Given the existence of alternative fishing locations (other than the Upper Hudson River) in New York and the growing popularity of catch and release fishing, EPA overstated the risks of fish ingestion from the Upper Hudson River. EPA should have collected data to characterize the size of the potentially impacted angler population. Other comments stated that the fish consumption advisories are insufficient to protect public health. Reports show that anglers and their families continue to consume fish from the Hudson River despite the fish consumption advisories. New Yorkers have a long-standing common law right to fish, grounded in public trust, which implicitly includes the right to eat the fish one catches. Another comment asked why EPA focused on Upper and Mid-Hudson anglers and did not include those who fish in the Lower Hudson. Response to Master Comment 543 EPA disagrees with comments suggesting that the fish consumption advisories alone are sufficient to protect public health. Neither does EPA agree that the effect of the current institutional controls such as fish consumption advisories and fishing restrictions (e.g., catch and release only in Upper Hudson, ban on commercial fishing of all but three fish species in the Lower Hudson) on the consumption of fish from the Site should have been factored into its baseline risk analysis. Consistent with EPA policy and guidance (USEPA 1989, 1990, 1992a, 1992b, 1995), the HHRA is a baseline risk assessment and thus evaluates current and future cancer risks and non-cancer health hazards to the reasonably maximally exposed individual and the central tendency (i.e., average) individual based on the assumption of no remediation or institutional controls, such as the fish consumption advisories currently in place (see, for example, HHRA [USEPA, 2000], pp. ES-1, 1 and 41).
Responsiveness Summary Hudson River PCBs Site Record of Decision
3-25
As stated in the NCP preamble,
“The baseline risk assessment is essentially an evaluation of the no-action alternative. Institutional controls, while not actively cleaning up the contamination at the Site, can control exposure and, therefore, are considered to be limited action alternatives. The effectiveness of the institutional controls in controlling risk may appropriately be considered in evaluating the effectiveness of a particular remedial alternative, but not as part of the baseline risk assessment.” (USEPA, 1990, p. 8711).
The baseline cancer risks and non-cancer health hazards were properly presented in the HHRA and FS No Action Alternative without consideration of the existing institutional controls. The MNA, capping, and removal alternatives evaluated in detail in the FS include the institutional controls to reduce the cancer risks and non-cancer health hazards associated with consumption of fish from the Site. The No Action Alternative is not protective of human health because the baseline cancer risks and non-cancer health hazards are above acceptable levels. The MNA Alternative is not sufficiently protective of human health and the environment because, among other things, it relies more heavily on institutional controls than the active remedial alternatives. This is a result of the significantly longer time required to achieve target PCB concentrations in fish under MNA. Institutional controls do not completely eliminate human exposure to the PCB-contaminated fish and do not address risks to ecological receptors. According to the 1991-1992 and 1996 survey data summarized in NYSDOH (1999), most Upper Hudson respondents (almost 92 percent) never eat their catch and most (88 percent) are aware of the official health warnings against eating fish. Looked at another way, however, these surveys show that approximately 8 percent of Upper Hudson respondents do eat their catch and some 12 percent are unaware of the fish consumption advisories. The 1991-1992 survey (Barclay, 1993) found the same number of anglers unaware of the advisories as aware. Both the 1991-1992 and the 1996 surveys found that anglers eat and share their catch with others, whether or not they are aware of the advisories. These surveys also showed that none of the survey respondents reported knowledge of the "eat none" advisory for women of childbearing age and children under the age of 15 years. The raw survey data from the state-wide 1991 New York Angler survey (Connelly, et al., 1992) showed no significant difference in the mean number of freshwater fish meals eaten when comparing New York waterbodies with full, partial, or no advisories, despite the expectation that the fishing advisories would likely suppress fish ingestion rates to some degree (e.g., Lake Ontario). Thus, the available data confirm that fish consumption advisories are not 100 percent effective in preventing or limiting fish consumption. EPA disagrees with comments suggesting that it has overestimated Site risks given the existence of alternative fishing locations in New York (other than the Upper Hudson River) and the growing popularity of catch and release fishing. As previously discussed in this response, institutional controls are not fully effective in preventing or limiting fish consumption. The suggestion that anglers should avoid the Hudson River and seek alternative fishing locations is simply another way of imposing a restriction on fishing in the Hudson River. An important goal of the selected remedy is to improve conditions in the Hudson River such that PCB levels in fish are reduced to the point where the existing fishing advisories can be relaxed and perhaps ultimately removed (lifted) from the river.
Responsiveness Summary Hudson River PCBs Site Record of Decision
3-26
Several comments suggested that EPA should have collected Site-specific data to characterize the size of the potentially impacted angler population information for its HHRA. As was discussed in the HHRA and in Section 3.1.2 (Master Comment 569), in light of the fish consumption advisories that are in place, it would be difficult to assess the size of the potentially impacted angler population from data collected on the Hudson. Consistent with CERCLA policy and guidance, EPA assessed cancer risks and non-cancer health hazards to the reasonably maximally exposed and central tendency (i.e., average) individual and did not conduct a population risk assessment. However, in response to a recommendation of the HHRA peer reviewers, EPA provided perspective on the approximate size of the exposed population in the HHRA (p. 8). For example, the total population of the five counties surrounding the Upper Hudson is about 750,000 (US Census Bureau, 1990), and an estimated 78,628 fishing licenses were issued to anglers in these five counties during the 1998-1999 fishing season (NYSDEC, 2000). This number of fishing licenses, though, does not include children under the age of 15 for whom licenses to fish in the Upper Hudson are not required, or friends and families who eat fish caught by an angler. EPA focused the HHRA on Upper and Mid-Hudson sport anglers and did not include those who fish in the Lower Hudson below RM 64, just south of Poughkeepsie, because concentrations of PCBs in fish generally decrease with river mile. Due to this decrease, cancer risks and non-cancer health hazards for anglers below the Poughkeepsie area are expected to be lower than for Upper and Mid-Hudson anglers. EPA encourages all anglers to abide by applicable laws and regulations and to follow the fish consumption advisories, regardless of whether they believe there is a long-standing common law right to eat self-caught fish. As has been stated, fish consumption advisories and regulations prohibiting fish harvesting in the Upper Hudson are institutional controls and do not correspond to baseline conditions under CERCLA. A goal of the selected remedy is to reduce levels of PCBs in fish such that the Site-related fish consumption advisories and the regulations against fish harvesting can be reduced and eliminated. References Barclay, B. 1993. "Hudson River Angler Survey." Hudson River Sloop Clearwater, Inc., Poughkeepsie, New York. Connelly, N.A., B.A. Knuth, and C.A. Bisogni. 1992. Effects of the Health Advisory Changes on Fishing Habits and Fish Consumption in New York Sport Fisheries. Human Dimension Research Unit, Department of Natural Resources, New York State, College of Agriculture and Life Sciences, Fernow Hall, Cornell University, Ithaca, New York. Report for the New York Sea Grant Institute Project No. R/FHD-2-PD, September. (Raw survey data also received electronically from study authors.) New York State Department of Environmental Conservation (NYSDEC). 2000. Resident and non-resident hunting, fishing and trapping licenses by type - New York State by county. Licenses year ended September 30, 1999. Sporting License Bureau, February 2, 2000.
Responsiveness Summary Hudson River PCBs Site Record of Decision
3-27
New York State Department of Health (NYSDOH). 1999. Health Consultation: 1996 Survey of Hudson River Anglers, Hudson Falls to Tappan Zee Bridge at Tarrytown, New York. February. (Raw survey data received electronically from Edward Horn of NYSDOH in June, 1998.) United States Census Bureau. 1990. Census summary tape File 3. - Sample count - all socioeconomic and demographic variables. http://venus.census.gov/cdrom/lookup. USEPA. 1989. Risk Assessment Guidance for Superfund (RAGS), Volume I. Human Health Evaluation Manual (Part A). USEPA, Office of Emergency and Remedial Response, Washington, D.C. USEPA/540/I-89/002, December. USEPA. 1990. National Oil and Hazardous Substances Pollution Contingency Plan, Final Rule, codified as amended at 40 CFR. Part 300. USEPA. 1992a. Guidelines for exposure assessment. Federal Register 57(104), May 29. USEPA. 1992b. "Guidance on Risk Characterization for Risk Managers and Risk Assessors." Memorandum from F. Henry Habicht, III Deputy Administrator to Assistant Administrators and Regional Administrators. USEPA, Office of the Administrator, Washington, DC. USEPA. 1995. "USEPA Risk Characterization Program." Memorandum from Administrator Carol M. Browner to Assistant Administrators, Associate Administrators, Regional Administrators, General Counsel and Inspector General on March 21, 1995, Washington, D.C. USEPA. 2000. Phase 2 Report. Further Site Characterization and Analysis. Volume 2F - Revised Human Health Risk Assessment (HHRA), Hudson River PCBs Reassessment RI/FS. Prepared for USEPA Region 2 and the USACE, Kansas City District by TAMS Consultants, Inc. and Gradient Corporation. November. 3.1.4 Sensitive Populations and Additional Exposure Routes Master Comment 567 A number of comments suggest that risks associated with the consumption of PCB-contaminated fish from the Hudson River are underestimated because the HHRA did not sufficiently consider risks to certain sub-populations (e.g., subsistence anglers), sensitive populations (e.g., women and children), and Lower Hudson anglers. Other comments indicate that EPA underestimated the non-cancer health hazards for inhalation of PCBs because there is no Reference Concentration (RfC) for PCBs that permits quantification of this hazard. Other comments indicate that recently released data show high levels of PCBs in the floodplains of the Upper Hudson, which could imply greater risk to the avid recreator. Other comments indicate EPA underestimated both cancer risks and non-cancer hazards through ingestion of surface water while swimming, since these risks were not quantified in the HHRA.
Responsiveness Summary Hudson River PCBs Site Record of Decision
3-28
Response to Master Comment 567 Cancer risks and non-cancer health hazards were not specifically quantified for subsistence anglers, unlicensed anglers, or other subpopulations of anglers who may be highly exposed. Although no distinct highly exposed subpopulations have been identified, the question exists as to whether these subpopulations have been adequately addressed in the Revised HHRA (USEPA, 2000a). However, based on consideration of fish ingestion rates among low income families (Wendt, 1986), fish ingestion rates reported for licensed and non-licensed anglers from the Hudson River angler surveys (Barclay, 1993; NYSDOH, 1999), and fish ingestion rates for angler populations in other areas of the country (see Table 3-2 in the Revised HHRA), it appears likely that any highly exposed subpopulations are represented within the upper percentiles of the fish ingestion rate distribution used in the Monte Carlo analysis, as discussed in Section 3.2.1.4 of the Revised HHRA The issue regarding effects to pregnant and lactating women is discussed in the Revised HHRA (Section 4.5.2). For reasons discussed there, no generally accepted method exists to quantify PCB effects specifically for pregnant women, in utero exposures, or exposures to nursing infants. Cancer risks and non-cancer hazards to women and young children were quantitatively assessed in the Revised HHRA. The toxicity values in IRIS that were used in the HHRA (USEPA, 2000b) are considered to be protective of sensitive populations such as women and children (USEPA, 1999). The approach used in the Revised HHRA is consistent with the external peer reviewers comments that suggested this analysis be evaluated either quantitatively or qualitatively. The inhalation route of exposure for non-cancer effects could not be evaluated due to the lack of a reference concentration (RfC) for PCBs in IRIS. Cancer risks associated with exposure to PCBs through inhalation are considered low (i.e., 1 in 1,000,000 to the RME resident, based on exposure for 350 days/year for 40 years). This risk includes young children, adolescent, and adult life stages. Given this low risk, it is unlikely that the non-cancer hazards from this exposure would exceed a HI of 1, as indicated in EPA’s response to comments (page 36, Response to HS-1.15) (USEPA, 2000c). A preliminary screening level calculation using a route-to-route extrapolation from the oral RfD for PCBs to an inhalation RfC indicates that the estimated non-cancer hazard index would be 0.02 for the RME adult individual (page 36, Response to HS-1.15). While some commenters have noted that this may cause the overall non-cancer hazards to be underestimated, it must be kept in perspective that cancer risks and non-cancer hazards associated with the ingestion of fish far outweigh risks from all other pathways: the HI for adult ingestion of fish is 65, compared to an HI of 0.2 through inhalation. The cancer risks due to inhalation of PCBs in air were evaluated based on historical measurements of PCBs in air as well as modeled concentrations of PCBs volatilized from river water into air (Revised HHRA, pp. 16-21 and Appendix B). PCB-contaminated sediments and floodplain soil also potentially contribute to PCBs in air. EPA did not quantify the contribution of PCBs in air from contaminated sediment and floodplain soil because:
a) The contribution is expected to be minor compared to the concentration of PCBs in air that were used in the HHRA, which were obtained during periods of high activity (i.e., during the Remnant Deposit remediation).
Responsiveness Summary Hudson River PCBs Site Record of Decision
3-29
b) The calculated cancer risks from inhalation of volatilized PCBs were de minimus (i.e., the risk to the RME individual was 1 in 1,000,000, which is not considered significant).
c) Consistent with the scope of the Reassessment RI/FS, the HHRA addresses
the cancer risks and non-cancer hazards from PCBs in Hudson River water and sediments, not floodplain soils. The uncertainty associated with concentrations of PCBs in air from all sources, which could include river sediments periodically exposed to air, is acknowledged in the HHRA.
Incidental ingestion of river water while swimming was not quantitatively evaluated because the river water meets federal drinking water standards for PCBs established under the Safe Drinking Water Act (SWDA). The SDWA standards are based on an ingestion of 2 liters/day of water, and it is anticipated that while swimming, an individual will ingest only 50 ml/hour, or approximately 2.5 percent of the amount assumed under the SDWA. Therefore, the cancer risks and non-cancer health hazards are less than EPA's risk range (i.e., less than 1 in 1,000,000 for cancer and less than a HI of 1 for non-cancer). In addition, as discussed in the baseline HHRA, dermal contact while swimming does not pose a health threat to recreators; the risk is within acceptable range. Finally, as discussed in the Feasibility Study and Responsiveness Summary, releases of PCBs during remediation are not expected to elevate PCB concentrations in the river. References Barclay, B. 1993. "Hudson River Angler Survey." Hudson River Sloop Clearwater, Inc., Poughkeepsie, New York. New York State Department of Health (NYSDOH). 1999. Health Consultation: 1996 Survey of Hudson River Anglers, Hudson Falls to Tappan Zee Bridge at Tarrytown, New York. February. (Raw survey data received electronically from Edward Horn of NYSDOH in June, 1998.) USEPA. 1999. "Integrated Risk Information System Chemical File for Polychlorinated Biphenyls." National Center for Environmental Assessment, Cincinnati, Ohio. USEPA. 2000a. Phase 2 Report, Further Site Characterization and Analysis. Volume 2F - Revised Human Health Risk Assessment (Revised HHRA), Hudson River PCBs Reassessment RI/FS. Prepared for USEPA Region 2 and the USACE, Kansas City District by TAMS Consultants, Inc. and Gradient Corporation. November. USEPA. 2000b. Phase 2 Report, Further Site Characterization and Analysis. Volume 2F-Human Health Risk Assessment (HHRA), Hudson River PCB Reassessment RI/FS. Prepared for USEPA Region 2 and the USACE, Kansas City District by TAMS Consultants, Inc. and Gradient Corporation. November.
Responsiveness Summary Hudson River PCBs Site Record of Decision
3-30
USEPA. 2000c. Responsiveness Summary for Volume 2F. Human Health Risk Assessment, Hudson River PCBs Reassessment RI/FS. Prepared for USEPA Region 2 and the USACE, Kansas City District by TAMS Consultants, Inc. and Gradient Corporation. March. Wendt, M.E. 1986. Low Income Families’ Consumption of Freshwater Fish Caught from New York State Waters. Thesis, Cornell University. August. 3.2 Baseline Ecological Risk Assessment Master Comment 811
A number of comments were received on the Revised Baseline Ecological Risk Assessment (RBERA) (USEPA, 2000a). Opposing viewpoints were received as to whether the RBERA did or did not fulfill baseline risk assessment requirements. It was suggested that EPA did not revise the risk assessment in accordance with the peer reviewers' evaluation, or did so incorrectly, and that EPA produced only a "flawed screening level assessment" of ecological risk using conservative assumptions. Other commenters maintained that the RBERA used solid science to show significant risks to Hudson River receptors from exposure to PCBs; some believe that risks may in fact have been underestimated in the BERA. Response to Master Comment 811 EPA prepared the Response to Peer Review Comments on the Baseline Ecological Risk Assessment (USEPA, 2000b) and issued the Revised Baseline Ecological Risk Assessment (RBERA) (USEPA, 2000a). specifically in response to the peer reviewers’ comments on the original Baseline Ecological Risk Assessment (BERA) (USEPA, 1999). The methodology followed in the RBERA is not a screening level approach. Extensive Site-specific information was obtained with regard to exposure factors, and species-specific information was preferentially used in developing toxicity reference values (TRVs). A joint probability analysis, which provides information on the potential for population-level effects, was conducted to complement the toxicity quotient (TQ) approach. There is additional evidence since the publication of the RBERA that shows that the results of the TQ approach are valid. The recently published National Academy of Sciences (NAP, 2001) report provides data from semi-field investigations, and also provides recommended TRVs for total PCBs in otter liver on a NOAEL basis of 170 ng/g wet weight or 4 ug/g lipid normalized, and on a LOAEL basis of 460 ng/g wet weight or 11 ug/g lipid normalized. A comparison of the recently released NYSDEC data shows that otter captured within five miles of the Hudson River exceed these values (Table 811-1). Two of these animals exceed the TRVs 20 to 40 times, and these high concentrations are observed in animals that were caught on land, closest to the river rather than to a tributary. Although the NAS report does not recommend a particular TRV for concentrations in mink liver, they reference Kannan et al. (2000) as an authoritative source. Kannan et al. (2000) recommend TRVs for total PCBs in mink liver on a NOAEL basis of 0.10 ug/g wet weight or 2.03 ug/g lipid normalized, and on a LOAEL basis of 2.22 ug/g wet weight or 44.4 ug/g lipid normalized. Table
Responsiveness Summary Hudson River PCBs Site Record of Decision
3-31
811-1 shows a comparison of these TRVs to measured PCB concentrations in mink liver from animals trapped within five miles of the Hudson River. Measured concentrations consistently exceed the NOAEL, and two of the animals exceed the LOAEL as well. The Responses to Master Comments 815 and 819 in Section 3.2.2 provide additional detail on wildlife data collected from the area surrounding the Hudson River. Additional specific comments related to TRVs are addressed in the Response to Master Comment 813 in Section 3.2.1. Specific comments related to the area use factors are provided in Response to Master Comment 793 in Section 3.2.3. The remainder of this response addresses the issue of population-level risks. One commenter states "in light of the fact that EPA failed to demonstrate any population-level risks, any removal of sediments would most likely have far greater adverse effects on fish and wildlife than the contaminants." EPA disagrees with this statement because the joint probability analysis showed that populations of ecological receptors, particularly otter and mink, are significantly at risk now and into the future under current conditions. However, one commenter raises several issues related to the joint probability analyses that are addressed next. One commenter was able to successfully reproduce the cumulative density functions of exposure, but was unable to reproduce the dose-response functions as reported by Moore et al. (1999). For the analysis presented in the RBERA, USEPA obtained discrete values directly from Dr. Moore for ED01 through ED99. These were combined with the exposure-concentration functions to obtain the final response curves. However, in a validation exercise, the probit model presented in Moore et al. (1999) was programmed in Visual Basic as a Microsoft Excel add-in and found to reproduce the results exactly. Note that Moore et al. (1999) state that the toxicity data for both the mammalian and avian receptors represent mean responses rather than individual responses. As one commenter pointed out, it is important to distinguish sources of uncertainty (Thompson and Graham, 1996; Vorhees et al., 1998). Typically two sources of uncertainty are quantitatively identified: uncertainty that arises from lack of knowledge (e.g., uncertainty in the true mean exposure concentration) and uncertainty that arises from variability, or population heterogeneity. Variability cannot be reduced, only better understood, because it refers to the heterogeneity of values in the population. For example, body weight is predominantly described by variability. In the analysis presented in the RBERA, all distributions were specified as variable, when in fact the environmental concentrations (e.g., fish, sediment, benthic invertebrates, and water) are properly described as uncertain. All other exposure parameters (e.g., body weight, ingestion rate, proportion of dietary items, and area use factor) are properly described as variable (von Stackelberg et al., 2001; Kelly and Campbell, 2000). The joint probability analysis was rerun using exactly the same exposure distributions as in the RBERA with one addition: the area use factor (or temporal habitat factor in the exposure tables) was specified as a triangular distribution with parameters, minimum, mode, and maximum (0.5, 0.75, 1.0). The justification for all the parameters is provided in the exposure concentration tables (Tables 3-69 to 3-70 in the RBERA). Typically, triangular distributions are appropriate for situations in which there are limited data with which to characterize a more refined distribution shape. The final column for these tables provides ranges for the exposure variables. These were
Responsiveness Summary Hudson River PCBs Site Record of Decision
3-32
specified as triangular with the point estimate specified as the mode. This was done because there was not enough information available to more precisely define the distribution shape. The uncertain distributions in the joint probability analysis (sediment, water, fish, and benthic invertebrate predicted concentrations) were described as lognormal. Data for the Hudson River in these four media based on the Phase 2 dataset show that these concentrations are typically lognormally distributed in the environment, and other studies have conducted this kind of analysis in a similar manner (Cohen et al., 1996; Moore et al., 1999). Moreover, a lognormal specification is appropriate for variables bounded by zero and with skewed right tails. An uncertainty evaluation conducted as part of the Revised Baseline Modeling Report showed that model predictions are typically within a factor of two across the modeling results. This factor of two was used to construct the distributions shown in Table 3-103 of the RBERA and presented here as Table 811-2. Mean predicted environmental media concentrations were obtained from the HUDTOX and FISHRAND modeling results. Results Figures 811-1 through 811-3 present the results of the revised joint probability analysis for bald eagle, mink, and river otter, respectively. These graphs show that including a distribution for area use factor and separating uncertain and variable parameters still results in the potential for significant population-level effects. The graphs include three curves for each year and river mile, the lower confidence limit or 5th percentile (5 percent LCL), the best estimate, and the 95th percentile or upper confidence limit (95 percent UCL). Figure 811-1 presents the results for the bald eagle. At RM 189 (Thompson Island Pool, TIP), the results for 1993 show that there is virtually a 100 percent probability of 80 to 100 percent reduction in fecundity. By 2015, there is a 50 percent probability of a 50 to 75 percent reduction in fecundity, and an 80 percent probability of a 40 to 65 percent reduction in fecundity. At RM 168 (Stillwater), the results for 1993 show an 80 percent probability of a reduction in fecundity ranging from 72 to 90 percent. This range decreases by 2015 to from 20 to 35 percent. At RM 154 (Waterford), there is a 50 percent probability in 1993 of a reduction in fecundity ranging from 43 to 63 percent. By 2015, there is an 80 percent probability of a reduction on the order of 10 to 15 percent. Figure 811-2 presents the results for the mink. At RM 189 (TIP), the results for 1993 show that there is virtually a 100 percent probability of 80 to 100 percent reduction in fecundity. By 2015, there is a 50 percent probability of a 50 to 75 percent reduction in fecundity, and an 80 percent probability of a 40 to 65 percent reduction in fecundity. At RM 168 (Stillwater), the results for 1993 show an 80 percent probability of a reduction in fecundity ranging from 72 to 90 percent. This range decreases by 2015 to from 20 to 35 percent. At RM 154 (Waterford), there is a 50 percent probability in 1993 of a reduction in fecundity ranging from 43 to 63 percent. By 2015, there is an 80 percent probability of a reduction on the order of 10 to 15 percent. Figure 811-3 presents the results for the river otter. At RM 189 (TIP), the results for 1993 show that there is virtually a 100 percent probability of 80 to 100 percent reduction in fecundity. By 2015, there is still an 80 percent probability of an 85 to 97 percent reduction in fecundity. At RM 168 (Stillwater), the results for 1993 show virtually a 100 percent probability of an 80 to 95 percent reduction in fecundity. In 2015, there is still a 50 percent probability of a reduction in
Responsiveness Summary Hudson River PCBs Site Record of Decision
3-33
fecundity ranging from 56 to 75 percent. At RM 154 (Waterford), there is an 80 percent probability in 1993 of a reduction in fecundity ranging from 75 to 92 percent. By 2015, there is a 50 percent probability of a reduction on the order of 25 to 43 percent and a 20 percent probability of a reduction in fecundity ranging from 35 to 55 percent. These results show that under the baseline No Action Alternative, significant population-level risks exist for the piscivorous birds and mammals. Implications for Feasibility Study Results The most optimistic result (5 percent LCL) from the No Action Alternative showed a 90 percent probability of at least an 80 percent reduction in fecundity in 2015 at RM 189. The highest predicted risk, or 95 percent UCL, shows a 90 percent probability of a 40 percent reduction in fecundity in 2021. Although 2021 is just a few years later than 2015, the smallest possible difference between No Action and the selected remedy is still 40 percent. The FS presents results for the joint probability analyses conducted for the different alternatives in Figures 7-9 to 7-11. The results shown in those figures correspond approximately to the 95 percent UCL in the current analysis. The modeling results across all alternatives, including No Action, show that the ratio between the 5 percent LCL and the 95 percent UCL is approximately 0.5. The modeling results for the alternatives presented in the FS can thus be multiplied by 0.5 to obtain lower confidence limits across all alternatives. Conclusions The RBERA, which was prepared in response to peer review comments, is not a screening level document. Consistent with USEPA guidance, the approach taken in the risk assessment is an appropriate method for evaluating potential future risks for which data are obviously unavailable. In addition, the risk assessment is used to compare risk reductions among remedial alternatives. The risk assessment represents a well-established and robust framework for evaluating potential future risks as compared to current risks, as well as for comparing the expected effects of remedial alternatives under a consistent set of modeling assumptions. References Cohen, J.T., Lampson, M.A., and T.S. Bowers. 1996. The Use of Two-stage Monte Carlo Simulation Techniques to Characterize Variability and Uncertainty in Risk Analysis, Human and Ecological Risk Assessment 2:939-971. Kannan, K., A.L. Blankenship, P.D. Jones, and J.P. Giesy. 2000. Toxicity reference values for the toxic effects of polychlorinated biphenyls to aquatic mammals Human and Ecological Risk Assessment 6(1):181-201. Kelly, E.J. and K. Campbell. 2000. Separating Variability and Uncertainty in an Environmental Risk Assessment. Making Choices. Human Ecol. Risk Assess. 6:1-13.
Responsiveness Summary Hudson River PCBs Site Record of Decision
3-34
Moore, D.R.J., Sample, B.E., Suter, G.W., Parkhurst, B.R. and R.S. Teed. 1999. A probabilistic risk assessment of the effects of methylmercury and PCBs on mink and kingfishers along East Fork Poplar Creek, Oak Ridge, Tennessee, USA. Environ. Tox. Chem. 18(12):2941-2953. National Academy Press (NAP). 2001. A Risk-Management Strategy for PCB-Contaminated Sediments. Committee on Remediation of PCB-Contaminated Sediments, Board on Environmental Studies and Toxicology, National Research Council. 452 pages. von Stackelberg, K., Burmistrov, D., Vorhees, D.J., Bridges, T.S. and I. Linkov. 2001. Importance of uncertainty and variability to predicted risks from trophic transfer of PCBs in dredged sediments. Submitted to Risk Analysis. Thompson, K.M. and J.D. Graham. 1996. Going Beyond the Single Number: Using Probabilistic Risk Assessment to Improve Risk Management, Human and Ecological Risk Assessment 2:1008-1034. USEPA. 1999. Further Site Characterization and Analysis, Volume 2E - Baseline Ecological Risk Assessment (BERA), Hudson River PCBs Reassessment RI/FS. Prepared for USEPA Region 2 and USACE, Kansas City District by TAMS Consultants, Inc. and Menzie-Cura & Associates, Inc. August 1999. USEPA. 2000a. Phase 2 Report, Further Site Characterization and Analysis. Volume 2E- Revised Baseline Ecological Risk Assessment (RBERA), Hudson River PCBs Reassessment RI/FS. Prepared for USEPA Region 2 and the USACE, Kansas City District by TAMS/MCA. November 2000. USEPA. 2000b. Response to Peer Review Comments on the Baseline Ecological Risk Assessment, Hudson River PCBs Reassessment RI/FS. Prepared for the USEPA Region 2 and USACE by TAMS Consultants, Inc. and Menzie-Cura & Associates, Inc. November 2000. Vorhees, D.J., Kane Driscoll, S.B., von Stackelberg, K., and T.S. Bridges. 1998. Improving Dredged Material Management Decisions with Uncertainty Analysis, Dredging Operations and Environmental Research Program, Technical Report DOER-3. Master Comment 801 Commenters stated that dredging of PCBs will protect resources in the upper river and downstream. One commenter noted that the federal trustees for natural resources, the US Department of the Interior (DOI) and the National Oceanic and Atmospheric Administration (NOAA), (together, "the Trustees") are in the process of investigating natural resource injuries caused by PCBs. The Trustees have recently determined that the Hudson River fishery has suffered "injury," as authorized by Section 107(f) of CERCLA. The Trustees have further concluded that this injury will continue into the future unless PCB contamination in fish is reduced. Dredging will protect not just the upper river, but lower river resources as well. Curtailing the flow of PCBs over the Troy Dam will protect Hudson River resources for the 150-mile stretch to the Battery and will also protect New York Harbor's resources. Ultimately, a
Responsiveness Summary Hudson River PCBs Site Record of Decision
3-35
comprehensive approach will prevent the gradual dissipation and redistribution of these PCBs to the Atlantic Ocean and beyond. Response to Master Comment 801 EPA concurs that dredging will protect ecological resources (and also human health) in the upper and lower river by reducing PCB concentrations in fish. Therefore, a dredging remedy (REM-3/10/S - now the selected remedy) was chosen to reduce concentrations of this bioaccumulative contaminant. Long-term natural resource and human health benefits are considered to outweigh short-term impacts. 3.2.1 Ecological Toxicity of PCBs Master Comment 813 Comments stated that overly conservative TRVs were used in the Revised Baseline Ecological Risk Assessment (mammals and fish) (USEPA, 2000a), and that the study used to develop mink and otter TRVs is inappropriate. Under alternative assumptions, risks are lower using source control in the lower two sections (34 of 40 miles) of the upper river (GE, Appendix N). Response to Master Comment 813 Toxicity Reference Values (TRVs) for Mammals As described in the following text, EPA changed the field study used to develop the TRV for the mink and river otter in the 2000 Revised Baseline Ecological Risk Assessment (RBERA) (USEPA, 2000a) in response to peer reviewer's comments that EPA's methodology for deriving TRVs was too conservative. The rationale for this change is described below. The methodology, described on page 80 of Section 4.2.1 of the 1999 Baseline Ecological Risk Assessment (BERA) (USEPA, 1999), states that the lowest appropriate NOAEL and corresponding LOAEL were selected for the development of TRVs. The peer reviewers pointed out that the lowest appropriate LOAEL in the dataset, rather than the lowest appropriate NOAEL, is a more appropriate basis upon which to develop a TRV. EPA concurred that the study that reported the lowest appropriate LOAEL, the study that reported the lowest dose or body burden at which significant adverse effects on growth, reproduction, or mortality were observed, should be selected for development of the TRV. This revised methodology is described on page 99 of Section 4.2.1 of the 2000 RBERA. Consequently, the mink TRV for the 1999 BERA, which was based on the lowest appropriate NOAEL in the dataset (NOAEL=0.004 mg/kg bw/day from Heaton et al., 1995), was replaced in the 2000 RBERA with the study that reported the lowest appropriate LOAEL in the dataset (LOAEL= 0.04 mg/kg bw/day from Restum et al. 1998). As noted in Appendix N of the GE comments, the reported LOAEL for the Restum et al. (1998) study is three times lower than the LOAEL reported in the Heaton et al (1995) study. However, it
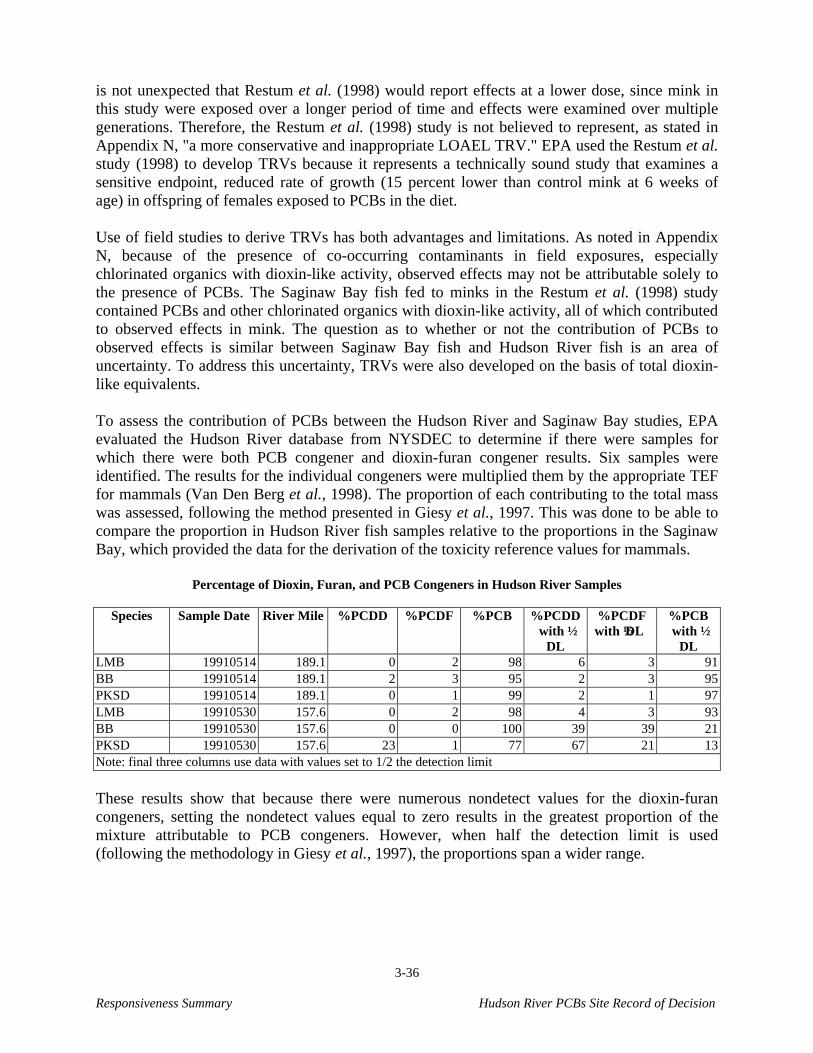
Responsiveness Summary Hudson River PCBs Site Record of Decision
3-36
is not unexpected that Restum et al. (1998) would report effects at a lower dose, since mink in this study were exposed over a longer period of time and effects were examined over multiple generations. Therefore, the Restum et al. (1998) study is not believed to represent, as stated in Appendix N, "a more conservative and inappropriate LOAEL TRV." EPA used the Restum et al. study (1998) to develop TRVs because it represents a technically sound study that examines a sensitive endpoint, reduced rate of growth (15 percent lower than control mink at 6 weeks of age) in offspring of females exposed to PCBs in the diet. Use of field studies to derive TRVs has both advantages and limitations. As noted in Appendix N, because of the presence of co-occurring contaminants in field exposures, especially chlorinated organics with dioxin-like activity, observed effects may not be attributable solely to the presence of PCBs. The Saginaw Bay fish fed to minks in the Restum et al. (1998) study contained PCBs and other chlorinated organics with dioxin-like activity, all of which contributed to observed effects in mink. The question as to whether or not the contribution of PCBs to observed effects is similar between Saginaw Bay fish and Hudson River fish is an area of uncertainty. To address this uncertainty, TRVs were also developed on the basis of total dioxin-like equivalents. To assess the contribution of PCBs between the Hudson River and Saginaw Bay studies, EPA evaluated the Hudson River database from NYSDEC to determine if there were samples for which there were both PCB congener and dioxin-furan congener results. Six samples were identified. The results for the individual congeners were multiplied them by the appropriate TEF for mammals (Van Den Berg et al., 1998). The proportion of each contributing to the total mass was assessed, following the method presented in Giesy et al., 1997. This was done to be able to compare the proportion in Hudson River fish samples relative to the proportions in the Saginaw Bay, which provided the data for the derivation of the toxicity reference values for mammals.
Percentage of Dioxin, Furan, and PCB Congeners in Hudson River Samples
Species Sample Date River Mile %PCDD %PCDF %PCB %PCDD with ½
DL
%PCDF with ½ DL
%PCB with ½
DL LMB 19910514 189.1 0 2 98 6 3 91 BB 19910514 189.1 2 3 95 2 3 95 PKSD 19910514 189.1 0 1 99 2 1 97 LMB 19910530 157.6 0 2 98 4 3 93 BB 19910530 157.6 0 0 100 39 39 21 PKSD 19910530 157.6 23 1 77 67 21 13 Note: final three columns use data with values set to 1/2 the detection limit
These results show that because there were numerous nondetect values for the dioxin-furan congeners, setting the nondetect values equal to zero results in the greatest proportion of the mixture attributable to PCB congeners. However, when half the detection limit is used (following the methodology in Giesy et al., 1997), the proportions span a wider range.
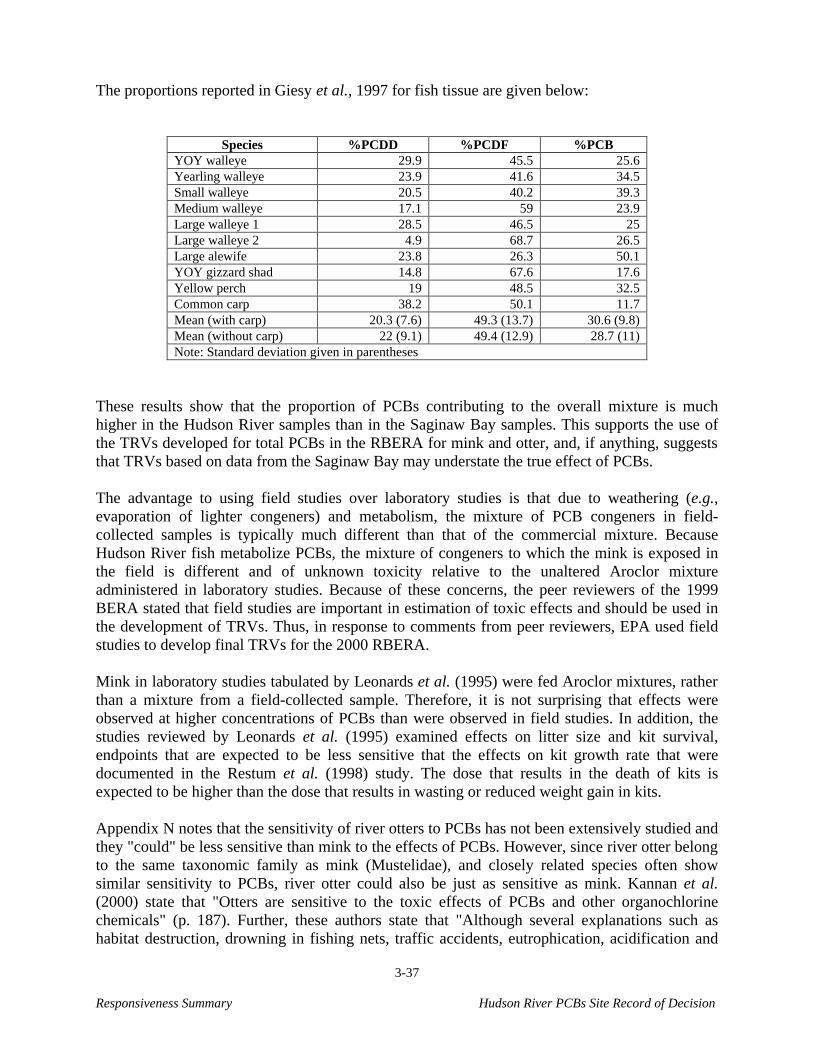
Responsiveness Summary Hudson River PCBs Site Record of Decision
3-37
The proportions reported in Giesy et al., 1997 for fish tissue are given below:
Species %PCDD %PCDF %PCB YOY walleye 29.9 45.5 25.6 Yearling walleye 23.9 41.6 34.5 Small walleye 20.5 40.2 39.3 Medium walleye 17.1 59 23.9 Large walleye 1 28.5 46.5 25 Large walleye 2 4.9 68.7 26.5 Large alewife 23.8 26.3 50.1 YOY gizzard shad 14.8 67.6 17.6 Yellow perch 19 48.5 32.5 Common carp 38.2 50.1 11.7 Mean (with carp) 20.3 (7.6) 49.3 (13.7) 30.6 (9.8) Mean (without carp) 22 (9.1) 49.4 (12.9) 28.7 (11) Note: Standard deviation given in parentheses
These results show that the proportion of PCBs contributing to the overall mixture is much higher in the Hudson River samples than in the Saginaw Bay samples. This supports the use of the TRVs developed for total PCBs in the RBERA for mink and otter, and, if anything, suggests that TRVs based on data from the Saginaw Bay may understate the true effect of PCBs. The advantage to using field studies over laboratory studies is that due to weathering (e.g., evaporation of lighter congeners) and metabolism, the mixture of PCB congeners in field-collected samples is typically much different than that of the commercial mixture. Because Hudson River fish metabolize PCBs, the mixture of congeners to which the mink is exposed in the field is different and of unknown toxicity relative to the unaltered Aroclor mixture administered in laboratory studies. Because of these concerns, the peer reviewers of the 1999 BERA stated that field studies are important in estimation of toxic effects and should be used in the development of TRVs. Thus, in response to comments from peer reviewers, EPA used field studies to develop final TRVs for the 2000 RBERA. Mink in laboratory studies tabulated by Leonards et al. (1995) were fed Aroclor mixtures, rather than a mixture from a field-collected sample. Therefore, it is not surprising that effects were observed at higher concentrations of PCBs than were observed in field studies. In addition, the studies reviewed by Leonards et al. (1995) examined effects on litter size and kit survival, endpoints that are expected to be less sensitive that the effects on kit growth rate that were documented in the Restum et al. (1998) study. The dose that results in the death of kits is expected to be higher than the dose that results in wasting or reduced weight gain in kits. Appendix N notes that the sensitivity of river otters to PCBs has not been extensively studied and they "could" be less sensitive than mink to the effects of PCBs. However, since river otter belong to the same taxonomic family as mink (Mustelidae), and closely related species often show similar sensitivity to PCBs, river otter could also be just as sensitive as mink. Kannan et al. (2000) state that "Otters are sensitive to the toxic effects of PCBs and other organochlorine chemicals" (p. 187). Further, these authors state that "Although several explanations such as habitat destruction, drowning in fishing nets, traffic accidents, eutrophication, acidification and
Responsiveness Summary Hudson River PCBs Site Record of Decision
3-38
toxic chemicals have been suggested for the otter population decline, PCB pollution is considered to be one of the major factors in this decline" (ibid.). The mink TRV of 0.04 mg/kg bw-day corresponds to a 25 percent effect level in the dose-response function from Moore et al., 1999. A TRV of 0.13 mg/kg bw-day corresponds to a 50 percent effect level in the same dose-response function. The interpretation is that 50 percent of the mink population experienced adverse reproductive effects at a concentration of 0.13 mg/kg bw-day. Kannan et al. recommend a dietary dose NOAEL for mink of 0.004 mg/kg bw-day and a LOAEL of 0.13 mg/kg bw-day based on reproductive effects. This study is further cited in the NAS report (NAP, 2001). Also, note that while reproductive effects generally resulted in the most sensitive endpoint relative to the survival and growth endpoints examined, other endpoints not evaluated in the BERA might serve as more sensitive endpoints to organisms exposed to PCBs. Such endpoints include immunological effects or effects on enzyme levels. This would have the effect of lowering the TRVs from their current levels. TRVs for Fish The observation in Appendix N of the GE comments that interspecies uncertainty factors were not used to develop final TRVs for the 2000 RBERA is correct. Although the use of uncertainty factors is common practice when deriving TRVs (e.g., NAP, 2001, pp. 171 and 386), they were not used to derive the RBERA TRVs, because peer reviewers felt that their use was overly conservative. However, the suggestion in Appendix N of GE's comments that EPA attempted to offset the removal of uncertainty factors by developing new and lower TRVs for certain species is incorrect. As described in the Responsiveness Summary for Volume 2E-Baseline Ecological Risk Assessment (USEPA, 2000b, pp. 66-67), the study by Hansen et al. (1974) that was used in the 2000 RBERA to develop fish TRVs was not originally identified in the literature search that was conducted for the BERA, presumably because the paper was published in a journal with a limited distribution. This paper was provided to EPA by NOAA in their comments on the 1999 BERA as a more appropriate study upon which to base the development of TRVs. Upon review, EPA concurred that the Hansen et al. (1974) study was the more appropriate study for the development of a fish TRV for total PCBs. The rationale for this finding is discussed in the following text. Bengtsson (1980), the study that was used in the 1999 BERA, reported that exposure to Clophen A50 resulted in significantly reduced hatchability at 170 mg PCBs/kg body weight, but not at 15 mg PCBs/kg body weight. Significantly reduced hatching times were observed at 15 mg PCBs/kg body weight, but not at 1.6 mg PCB/kg body weight. (Note that units are mg PCBs/kg body wt, not mg PCB/kg-body wt/day as reported in GE, Appendix N, page 10. Reported units represent measured concentrations of PCBs in tissue, not daily dietary doses, which are reported in mg/kg-body wt/day.) Reduced hatching time was reported to result in premature death of the fry, although statistics were not reported for fry survival. The 1999 BERA did not use the reduced hatching time endpoint for development of TRVs because the association with the endpoints of concern (growth, reproduction, and mortality) is uncertain. Premature death of fry, which was reported to be associated with premature hatching, was not used because no statistics were provided for this endpoint.
Responsiveness Summary Hudson River PCBs Site Record of Decision
3-39
The Hansen et al (1974) study reported significantly reduced survival of fry at concentrations of 9.3 mg PCBs/kg body weight, but not at 1.9 mg PCBs/kg body weight. Note that these concentrations are very similar to concentrations that resulted in significantly reduced hatching time and associated reduced fry survival in the Bengtsson study (LOAEL = 15 mg PCBs/kg bw, NOAEL = 1.6 mg PCBs/kg bw). In conclusion, EPA selected the study by Hansen et al. (1974) because it reported significant adverse effects on an ecologically important endpoint, fry survival. The revised TRVs were not developed to offset the removal of uncertainty factors. References Bengtsson, B.E. 1980. Long-term effects of PCB (Clophen A50) on growth, reproduction and swimming performance in the minnow, Phoxinus phoxinus. Water Research, Vol. 1, pp. 681-687. Giesy, J.P., D.J. Jude, D.E. Tillitt, R.W. Gale, J.C. Meadows, J.L. Zajieck, P.H. Peterman, D.A. Verbrugge, J.T. Sanderon, T.R. Schwartz, and M.L. Tuchman. 1997. Polychlorinated dibenzo-p-dioxins, dibenzofurans, biphenyls and 2,3,7,8- tetrachlorodibenzo-p-dioxin equivalents in fishes from Saginaw Bay, Michigan. Environ. Tox. Chem. 16(4):713-724. Hansen, D.J., Parrish, P.R., and Forester, J. 1974. Aroclor 1016: toxicity to and uptake by estuarine animals. Environmental Research, Vol. 7, pp 363-373. Heaton, S.N., S.J. Bursian, J.P. Giesy, D.E. Tillitt, J.A. Render, P.D. Jones, D.A. Verbrugge, T.J. Kubiak, and R.J. Aulerich. 1995. Dietary exposure of mink to carp from Saginaw Bay, Michigan. 1. Effects on reproduction and survival, and the potential risk to wild mink populations. Archives of Environmental Contamination and Toxicology. 28:334-343. Kannan, K., A.L. Blankenship, P.D. Jones, and J.P. Giesy. 2000. Toxicity reference values for the toxic effects of polychlorinated biphenyls to aquatic mammals Human and Ecological Risk Assessment 6(1):181-201. Leonards, P.E.G., .H. de Vries, W. Minnaard, S. Stuijfzand, P. de Voogt, W.P. Cofino, N.M. van Straalen, and B. van Hattum. 1995. Assessment of experimental data on PCB-induced reproduction inhibition in mink, based on an isomer-and congener-specific approach using 2,3,7,8-tetrachlorodibenzo-p-dioxin toxic equivalency. Environ. Toxicol. Chem. 14(4):639-652. Moore, D.R.J., Sample, B.E., Suter, G.W., Parkhurst, B.R. and R.S. Teed. 1999. A probabilistic risk assessment of the effects of methylmercury and PCBs on mink and kingfishers along East Fork Poplar Creek, Oak Ridge, Tennessee, USA. Environ. Tox. Chem. 18(12):2941-2953. National Academy Press (NAP). 2001. A Risk Management Strategy for PCB-Contaminated Sediments. Committee on Remediation of PCB-Contaminated Sediments, Board on Environmental Studies and Toxicology, National Research Council. 452 pages.
Responsiveness Summary Hudson River PCBs Site Record of Decision
3-40
Restum, J.C., S.J. Bursian, J.P. Giesy, J.A. Render, W.G. Helferich, E.B. Shipp, and D.A. Verbrugge. 1998. Multigenerational study of the effects of consumption of PCB-contaminated carp from Saginaw Bay, Lake Huron, on mink. 1. Effects on mink reproduction, kit growth and survival, and selected biological parameters. Journal of Toxicology and Environmental Health, Part A, 54:343-375. USEPA. 1999. Phase 2 Report, Further Site Characterization and Analysis. Volume 2E - Baseline Ecological Risk Assessment (BERA), Hudson River PCBs Reassessment RI/FS. Prepared for USEPA Region 2 and the USACE, Kansas City District by TAMS/MCA. August 1999. USEPA. 2000a. Phase 2 Report, Further Site Characterization and Analysis. Volume 2E- Revised Baseline Ecological Risk Assessment (RBERA), Hudson River PCBs Reassessment RI/FS. Prepared for USEPA Region 2 and the USACE, Kansas City District by TAMS/MCA. November 2000. USEPA. 2000b. Responsiveness Summary for Volume 2E – Baseline Ecological Risk Assessment. Prepared for USEPA Region 2 and the USACE, Kansas City District by TAMS Consultants, Inc. and Menzie-Cura Associates, Inc. March 2000. Van den Berg, M., L. Birnbaum, A.T.C. Bosveld, B. Brunstrom, P. Cook, M. Feeley, J.P. Giesy, A. Hanberg, R. Hasegawa, S.W. Kennedy, T. Kubiak, J. C. Larsen, F.X. Rolaf van Leeuwen, A.K. Jjien Liem, C. Nolt, R.E. Peterson, L. Poellinger, S. Safe, D. Schrenk, D. Tillitt, M. Tyslind, M. Younges, F. Waern, and T. Zacharewski. 1998. Toxic equivalency factors (TEFs) for PCBs, PCDDs, PCDFs for humans and wildlife. Environmental Health Perspectives. Vol. 106 (12):775-792. Master Comment 359281 Commenters pointed out that field and laboratory animal studies support the conclusion that exposure to PCBs can adversely affect wildlife and humans. Other commenters felt that there was not conclusive evidence showing that PCBs are harmful to living creatures. Response to Master Comment 359281 As discussed in Chapter 4 of the Revised Baseline Ecological Risk Assessment (RBERA) (USEPA, 2000a), the toxicity of PCBs has been shown to manifest itself in many different ways among various species of animals. Typical responses to PCB exposure in animals include wasting syndrome, hepatotoxicity, immunotoxicity, neurotoxicity, reproductive and developmental effects, gastrointestinal effects, respiratory effects, dermal toxicity, and mutagenic and carcinogenic effects. Some of these effects are manifested through endocrine disruption. Table 4-1 of the RBERA provides a summary of the common effects documented to occur in animals as a result of PCB exposure.
Ecological exposure to PCBs is primarily an issue of bioaccumulation resulting in chronic effects rather than direct toxicity (NAP, 2001). PCBs bioaccumulate directly by bioconcentration and
Responsiveness Summary Hudson River PCBs Site Record of Decision
3-41
biomagnification, thereby posing the greatest risk to animals at the top of the food chain. Reproductive effects tend to be the most sensitive endpoint for animals exposed to PCBs. Toxicity studies in vertebrates indicate a relationship between PCB exposure and functions such as reproductive success that are mediated by the endocrine system. The link between PCBs and adverse effects in humans was described in Chapter 4 of the Revised Human Health Risk Assessment (Revised HHRA) (USEPA, 2000b), and is further addressed in the Responses to Master Comments 541 (Section 3.1.1.2) and 571 (Section 3.1.1.1), in White Paper – PCB Non-Cancer Health Effects, and in White Paper – PCB Carcinogenicity. The collective body of evidence that PCBs can adversely affect wildlife and humans is strong enough to merit the inclusion of PCBs in the Stockholm Convention on Persistent Organic Pollutants (POPs), which was signed by the USA on May 24, 2001. This international agreement restricts the use of 12 dangerous POPs. As President Bush stated in his remarks on April 19, 2001, “Concerns over the hazards of PCBs, DDT and the other toxic chemicals covered by the agreement are based on solid scientific information. These pollutants are linked to developmental defects of cancer and other grave problems in humans and animals. The risks are great and the need for action is clear: We must work to eliminate or at least to severely restrict the release of these toxins without delay.” References National Academy Press (NAP). 2001. A Risk Management Strategy for PCB-Contaminated Sediments. Committee on Remediation of PCB-Contaminated Sediments, Board on Environmental Studies and Toxicology, National Research Council. 452 pages. USEPA. 2000a. Phase 2 Report, Further Site Characterization and Analysis. Volume 2E- Revised Baseline Ecological Risk Assessment (RBERA), Hudson River PCBs Reassessment RI/FS. Prepared for USEPA Region 2 and the USACE, Kansas City District by TAMS/MCA. November. USEPA. 2000b. Phase 2 Report. Further Site Characterization and Analysis. Volume 2F - Revised Human Health Risk Assessment (Revised HHRA), Hudson River PCBs Reassessment RI/FS. Prepared for USEPA Region 2 and the USACE, Kansas City District by TAMS Consultants, Inc. and Gradient Corporation. November. 3.2.2 Field Studies Master Comment 815 Some commenters contended that EPA collected no data and did no analysis of the location or abundance of the primary aquatic biota in the Hudson River food chain that would allow one to characterize the present state of the Upper Hudson or to evaluate the effect of remedial alternatives. No data were collected on subaquatic vegetation, wetlands, insects, or fish.
Responsiveness Summary Hudson River PCBs Site Record of Decision
3-42
Response to Master Comment 815 The general vegetation and biota of the Upper Hudson River have been characterized in several studies: the Baseline Ecological Risk Assessment (BERA) (USEPA, 1999 Appendices A, C, D, E, F, G, and H) and Revised Baseline Ecological Risk Assessment (RBERA) (USEPA, 2000a pp. 15-27 and Tables 2-1 to 2-9), NYSDEC studies and data collection (Hudson River Database, USEPA, 2000b); NYSDOH (NYSDOH, 1974); and other studies (e.g., Saratoga National Historic Park [SNHP], 1981, 2000); as well as studies commissioned by GE (Exponent, 1998a, 1998b,). Throughout the Reassessment RI/FS, EPA has considered and used, as appropriate, all available quality-assured sources of data, including data collected by EPA, NYSDEC, USGS, NOAA, GE, and others, as described in the Response to Master Comment 627 (Chapter 2). All parties have frequently exchanged data and metadata, and have analyzed and commented upon other parties’ sampling plans and data quality assurance procedures. Submerged aquatic vegetation (SAV) has not been mapped to date, as it was not a critical component of the RBERA. However, SAV will be characterized during the remedial design, as described in the Response to Master Comment 507 (Chapter 9). NYSDEC and federal National Wetland Inventory (NWI) wetlands have been mapped (see RBERA Plate 1, sheets 1-17), and it is recognized that field verification and further delineation are needed prior to the start of remediation. Aquatic insects were characterized in EPA's benthic invertebrate study (BERA, Appendix H). The benthic macroinvertebrate study was designed and conducted scientifically. EPA disagrees with the suggestion that its benthic macroinvertebrate study was “conducted in an inept manner.” In the BERA Responsiveness Summary (USEPA, 2000c), EPA noted that effects of environmental variables such as site depth, grain size, total organic carbon (TOC), and other potential toxic chemicals could not be clearly separated. Therefore benthic community structure was one of three lines of evidence used to evaluate the benthic community measurement endpoint (USEPA, 2000c, p. 74). The inability to separate the effects of a large number of variables is a reality of much of today’s science. NYSDEC has studied fish in the Hudson River extensively for over 20 years and provided its data to EPA for use in the Hudson River PCBs Reassessment RI/FS. In addition, EPA provided some funds to NYSDEC and NOAA for congener-specific PCB analyses in fish in 1993. NOAA and NYSDEC also conducted congener-specific analyses in 1995. Both sets of data were used in the Reassessment RI/FS. The effect of the remedial alternatives on wildlife was evaluated using alternative-specific ecological toxicity modeling for the mink and river otter (Response to Master Comment 819 in this section). The federal Trustees (FWS and NOAA) concur that adverse impacts of the selected remedy on river habitat will be temporary, and that this temporary loss will be greatly offset by the accelerated recovery of the entire Hudson River. In fact, the Trustees support implementing a more comprehensive remedy than the one selected. There is a large amount of Site-specific data available regarding the Hudson River, and because that is so, the present state of the river can be generally characterized. This level of characterization is appropriate for the conceptual design contained in the FS. This baseline
Responsiveness Summary Hudson River PCBs Site Record of Decision
3-43
characterization of ecological resources will assist in evaluating effects of remedial actions on specific contaminated areas selected for cleanup. As stated previously, a detailed characterization of submerged aquatic vegetation, wetlands, and associated biota will be performed prior to the initiation of any remedial work. References Exponent. 1998a. Data Documentation and Interpretation Report: Submerged Aquatic Vegetation and Fish Community Analysis. Prepared for General Electric Company. Exponent. 1998b. Data report: Macroinvertebrate communities and diets of selected fish species in the Upper Hudson River, Volumes I and II. Prepared for General Electric Company. General Electric (GE). 1999. Comments of the General Electric Company on Volume 2E- Baseline Ecological Risk Assessment Hudson River PCBs Reassessment RI/FS. Prepared by LWB Environmental Services, Inc. and Quantitative Environmental Analysis, Inc. September 7, 1999. New York State Department of Health (NYSDOH). 1974. Macroinvertebrate Survey of the Upper Hudson River New York - 1972. Environmental Health Report No. 2. By K. Simpson, T.B. Lyons, and S.P. Allen. October 1974. Saratoga National Historic Park (SNHP). 1981. Vegetation Map for Saratoga National Park. US Department of the Interior, National Park Service. SNHP. 2000. Mammalian, Avian, and Herpetological Species Lists for Saratoga National Historic Park. US Department of the Interior, National Park Service. USEPA. 1999. Phase 2 Report, Further Site Characterization and Analysis. Volume 2E- Baseline Ecological Risk Assessment (BERA). Hudson River PCBs Reassessment RI/FS. Prepared for USEPA Region 2 and the USACE, Kansas City District by TAMS/MCA. August. USEPA. 2000a. Phase 2 Report, Further Site Characterization and Analysis. Volume 2E- Revised Baseline Ecological Risk Assessment (RBERA), Hudson River PCBs Reassessment RI/FS. Prepared for USEPA Region 2 and the USACE, Kansas City District by TAMS/MCA. November. USEPA. 2000b. Database for the Hudson River PCBs Reassessment RI/FS. Release 5.0 (Compact Disk). Prepared for USEPA, Region 2 and the USACE, Kansas City District by TAMS Consultants, Inc. October. USEPA. 2000c. Responsiveness Summary for Volume 2E - Baseline Ecological Risk Assessment, Hudson River PCBs Reassessment RI/FS. Prepared for USEPA Region 2 and the USACE, Kansas City District by TAMS/MCA. March.
Responsiveness Summary Hudson River PCBs Site Record of Decision
3-44
Master Comment 819 Some commenters stated that EPA collected no usable data on wildlife populations in or near the Hudson River. Some said that available field data were disregarded by EPA, including the tree swallow study, fish species abundance data in the Lower Hudson River, and the bald eagle work. Further, it was said that apart from work in 1993, EPA has not collected data on PCB concentrations in fish in the Hudson, which has been done routinely by NYSDEC since the 1970s. Other commenters stated that EPA did use available field data to support its conclusions, and that recent data (NYSDEC, 2001) confirm that PCBs pose a risk to wildlife, especially to piscivorous species. Response to Master Comment 819 EPA used observed concentrations of PCBs in benthic invertebrates and fish in the Hudson River and field studies of birds and mammals in and along the Hudson to characterize risks to ecological receptors in the Revised Baseline Risk Assessment (RBERA, Sections 3.4.1 [benthic invertebrates], 3.5.1 [fish], 3.6.1 [birds], 3.7.1 [mammals], and 5.0 Risk Characterization) (USEPA, 2000a). Throughout the Phase 2 and Phase 3 efforts, EPA has relied on all available quality-assured sources of data, including data collected by GE, NYSDEC, USGS, NOAA, and others in addition to the data collected by EPA itself. All parties have frequently exchanged data and analyzed and commented upon other parties' sampling plans and data quality assurance procedures. Studies conducted by NYSDEC, NOAA, and USFWS have generally found elevated concentrations of PCBs in wildlife and indications of behavioral or reproductive effects, confirming the ecological modeling results contained in the RBERA, as noted by several commenters. This includes the USFWS tree swallow work (Response to Master Comment 253462). Recent tissue, blood, egg, and prey samples taken from Hudson River avian receptors (i.e., tree swallow, great blue heron, and bald eagle) by NYSDEC and USFWS show considerable concentrations of PCBs in samples taken in the upper and lower river (Table 3-20a of RBERA). Bald eagle blood serum taken from individuals in the lower river showed concentrations as high as 14,240 ng/g, and eagles wintering in the upper river may have even higher concentrations of PCBs, due to higher concentrations in prey. Recent NYSDEC mink and otter data show that most mink and all river otter captured near the Hudson River had tissue concentrations above the NOAEL (Table 811-1 of this RS). Some individuals also had PCB levels above the LOAEL. The limitations of the extensive observational data for fish in the Lower Hudson were discussed in the Responsiveness Summary for the BERA (pg. 81) (USEPA, 2000b). As noted therein, population level data are only available for the Lower Hudson River, not the Upper Hudson River, and these were collected specifically to evaluate the impact of power plant discharges on fish population parameters. These data are not directly relevant to the BERA, which assesses ecological risks posed by PCBs in the river, because they do not establish a link between PCB exposure and population abundance. In addition, biological changes may not respond to an outside factor in a linear or consistently predictable manner, as discussed in the Response to Master Comment 253462 in this chapter. Retrospective evaluations of population abundance
Responsiveness Summary Hudson River PCBs Site Record of Decision
3-45
prior to the occurrence of PCBs for each of the receptors of concern cannot be performed for obvious reasons. References New York State Department of State (NYSDOS). 1987. Hudson River Significant Habitats, Habitat documentation. November 15, 1987. USEPA. 1999. Phase 2 Report, Further Site Characterization and Analysis. Volume 2E- Baseline Ecological Risk Assessment (BERA), Hudson River PCBs Reassessment RI/FS. Prepared for USEPA Region 2 and the USACE, Kansas City District by TAMS/MCA. August. USEPA. 2000a. Phase 2 Report, Further Site Characterization and Analysis. Volume 2E- Revised Baseline Ecological Risk Assessment (RBERA), Hudson River PCBs Reassessment RI/FS. Prepared for USEPA Region 2 and the USACE, Kansas City District by TAMS/MCA. November. USEPA. 2000b. Responsiveness Summary for Volume 2E - Baseline Ecological Risk Assessment. Prepared for USEPA Region 2 and the USACE, Kansas City District by TAMS/MCA. March. Master Comment 253462 GE's analysis of the USFWS tree swallow data (GE, Appendix O) found no indication of adverse effects to tree swallows along the Hudson River on any endpoint evaluated, including reproductive, plumage development, behavioral, or genetic endpoints. Response to Master Comment 253462 EPA, after its review of GE’s analysis and in consultation with the study authors (Secord, 2001), disagrees with the findings of GE’s analysis of the tree swallow data. Summary and Study Design 1) GE's analysis (Appendix O) does not fully and accurately summarize the conclusions of the Hudson River Tree Swallow project. GE incorrectly suggests that the project concluded that PCBs caused the patterns reported. The McCarty and Secord papers published in the peer reviewed literature explicitly state that the study authors have not established a causal link between PCBs and any of the anomalies described in Hudson River tree swallows. They clearly state that the design and goals of their study "make it impossible for us to unequivocally assign PCBs a causal role in any of the patterns observed here." (McCarty and Secord, 1999b, p. 1438). 2) GE’s analysis accurately summarized the shortcomings of the Lock 9 (Champlain) reference site in 1994, as reported in the McCarty and Secord publications. EPA finds it reasonable that sample sites in a field investigation cannot all have identical conditions (e.g., topography, slope, soils, vegetation, and size). GE’s analysis fails to point out that the study authors did not use
Responsiveness Summary Hudson River PCBs Site Record of Decision
3-46
reproductive success data from the Lock 9 (Champlain) site in their peer-reviewed publications. (Similarly, GE refers to data from the Saratoga Inland site without noting that data from this location were not used in any of the McCarty and Secord peer reviewed publications.) Further, GE’s analysis mentions that eggs at the Champlain site had higher than expected concentrations of PCBs, but does not reflect that these data support a hypothesis that adults nesting at the Lock 9 sites arrived with high PCB body burdens that were transferred to eggs. These high body burdens in adults may have been accumulated during migration up the Hudson River. 3) GE’s analysis of the Ithaca site states that "very limited information" is available about this site (Appendix O, p. 3). In fact, the Ithaca site is described in McCarty (1995) and in numerous papers published in the scientific literature. Moreover, GE’s analysis does not reflect data presented in McCarty and Secord (1999b, p. 1434) that show elevated levels of PCBs in Ithaca tree swallow eggs (103 ng/g) and nestlings (6 ng/g). Further, although GE’s analysis criticizes comparisons between tree swallows from Ithaca, New York, and the Hudson River, GE uses tree swallow data collected at sites as distant as British Columbia and as long ago as 1932 (Appendix A of GE’s Appendix O). 4) GE’s analysis comments on expected concentration-response relationships, without recognizing that biological changes may not respond to an outside factor in a linear or consistently predictable manner. Such comments are unsupported, given that the dose-response relationship for PCBs vs. reproductive success in tree swallows has not been characterized, and the shape of any dose-response curve (and where on any hypothetical curve the Hudson River study population may lie) is unknown (see also discussion of Type II statistical errors noted below).
Effects on Reproduction
GE’s analysis presents a compilation of published and unpublished data on tree swallow reproduction across the species range. However, there is insufficient information presented to thoroughly evaluate GE's analysis. For example, Appendix A (of Appendix O) does not provide complete references for the majority of studies cited in the comparison to the Hudson River data, so the sources of these data are not always clear. In addition, the rationale for the criteria used to select studies, as well as the application of the criteria, are not clear. For example, the biological basis for including a study site located 1.9 km from a wetland but excluding one 2.1 km from the ocean is unclear. It is unclear why a sewage lagoon is listed as the nearest body of water for Hussell and Quinney in 1985 (Appendix A of Appendix O). It is also unclear how GE determined that reference sites were "not located on an industrially polluted waterway." Some would consider Lake Erie polluted and many of the northern lakes (such as those around Sudbury) have elevated levels of mercury. GE’s approach seems to be based on comparing the mean values of reproductive parameters from Hudson River sites to the distribution of mean values from a variety of years and populations studied elsewhere. GE’s analysis is problematic. It appears that in many instances GE included means for different years from the same study site (e.g., 17 yearly means for Chapman's study at Princeton). These observations may not be independent, and thus all 17 means probably should not be included in analyses as independent observations. Moreover, GE’s analysis asks a subtly different question than that asked by the FWS Hudson River project. GE’s
Responsiveness Summary Hudson River PCBs Site Record of Decision
3-47
approach of examining the distributions of means of reproductive parameters for populations addresses how population averages vary. In contrast, McCarty and Secord use reproductive success data from other populations (e.g., McCarty and Secord 1999b, Table 2) to address the distribution of variation among individuals. While GE's approach may be valid for the question of variability among populations, it is unable to evaluate the variability among individuals, which seems to drive some of the patterns seen in Hudson River birds. GE's evaluation focuses primarily on mean clutch size, number of chicks hatched per nest, and number of chicks fledged per nest (Appendix O, p. 8). Earlier work published in the scientific literature also found that these variables are similar between Hudson River birds and tree swallows breeding elsewhere (e.g., McCarty and Secord 1999b, page 1,435). However, it is inappropriate to conclude, as GE has, that the lack of a relationship between PCB concentration and reproductive success is the same as evidence of no relationship. GE’s conclusion is further weakened by the small sample size and low statistical power available for an analysis. Mainstream ecologists have become increasingly aware of "type II" errors in making these comparisons, that is, failure to detect a relationship that in fact exists. A variety of measures of statistical power are widely available and could have been applied by GE. McCarty and Secord (1999b) specifically noted that there was a high incidence of unexplained nest abandonment and egg burial among Hudson River tree swallows studied. This is an important point given the pattern established in the literature between chlorinated hydrocarbons and aberrant reproductive behavior in a variety of bird species. The fact that this aberrant behavior did not always affect overall reproductive success was also noted in that publication. Effects on Plumage Development The evaluation of the patterns of plumage color in female tree swallows focuses solely on the pilot data from 1994 presented in Secord and McCarty (1997). GE failed to analyze the full data set presented in McCarty and Secord (2000) that supercedes the discussion of female plumage in Secord and McCarty (1997), although that data set is referenced. Since GE's analysis of the 1994 data is no longer relevant, that part of their report was not critiqued. Without consideration of McCarty and Secord (2000) and the data within it, GE’s arguments are incomplete. Some of the general criticisms of the plumage color work presented by GE are addressed in McCarty and Secord (2000) and are not repeated here (e.g., the irrelevance of the age of the females). GE focuses extensively on the question of female age, but fails to note that the question of whether second-year Hudson River females have advanced plumage or whether older females have retarded plumage development is secondary. The suggestion that "skull pneumatization [sic]" should have been used to measure female age is misleading. Skull pneumaticization is a useful technique for determining the ages of passerines at certain times of year. However, careful reading of the standard reference book by Pyle (1997), which updates and corrects Pyle et al., 1987, cited by GE) reveals that this would not, in fact, lead to reliable aging of females in the breeding season. Pyle (1997) clearly states that skull pneumaticization in tree swallows may be complete in individuals as young as six months or may not be complete even into the third year. GE’s discussion of Control of Plumage Development suggests that they accept that the pattern of plumage color is abnormal in Hudson River females, but that they question the mechanism
Responsiveness Summary Hudson River PCBs Site Record of Decision
3-48
behind this change. The McCarty and Secord (2000) discussion of these patterns states that "The hormonal basis for subadult plumage in tree swallows has not been studied, but sex-specific differences in plumage generally are under hormonal control" (page 993) based on studies of other species that almost always involve the endocrine system. The discussion of the mechanisms guiding plumage development in birds presented by GE has the following basic flaws:
• First, the focus of GE on estrogen misses the basic fact that the endocrine system
produces numerous biologically active compounds, and chemical such as PCBs interfere with the normal functioning of the endocrine system. Thus, any number of hormonal pathways could be abnormal in the Hudson River birds.
• Second, it appears that GE has misinterpreted the categories of plumage dimorphism
presented in Owens and Short (1995). Owen and Short do review some of the evidence for mechanisms that produce plumage dimorphism in birds; however, their attempt to categorize different species is directed primarily at understanding differences between male and female plumage, not delayed plumage maturation, nor the unusual case of delayed female plumage maturation seen in tree swallows. GE states that: "it has already been established that tree swallows fit in [Owens and Short's] category #2" [page 29], but this conclusion is simply not defensible. GE concludes that plumage color in tree swallows is not in any way influenced by hormones, but is the result of the "difference in chromosomal balance between the homogametic male and the heterogametic female, rather than hormone production" [page 29], despite the lack of empirical evidence.
• Third, GE's conclusion that the subadult plumage of female tree swallows is
completely under genetic control raises some interesting questions. Assuming that GE is proposing a mechanism where there are sets of genes on the female sex chromosomes under control of a clock that causes them to produce brown plumage the first time a female molts and blue-green plumage during subsequent molts, why does such a high percentage of Hudson River females have plumage intermediate between the two types? Perhaps GE is suggesting that something special in the Hudson River valley is producing a high incidence of a very specific mutation in the genes for female plumage color.
• Finally, GE also raises a question about Secord and McCarty's 1997 assumption "that
tree swallows breeding along the Hudson River are contaminated with PCBs" [page 30]. While it is true that Secord and McCarty do not have data on PCB body burdens for the females used in the plumage study, it is reasonable to assume based on their other published work showing PCB body burdens in Hudson River tree swallows that these individuals are exposed to PCBs along the river.
Effects on Parental Behavior GE's discussion of the tree swallow project's paper on nest quality (McCarty and Secord 1999a) appears to accept that behavior of adult swallows on the Hudson River is abnormal, and
Responsiveness Summary Hudson River PCBs Site Record of Decision
3-49
discusses whether measuring behavior via one endpoint (amount of nest material) or another (time-activity budgets) is more appropriate (page 36). Most of their critique focuses on implications of the behavioral differences for reproductive success (e.g., whether the abnormal nests built by Hudson River tree swallows are actually of lower "quality"). However, there are a number of errors in their critique (detailed below) that together affect their analysis.
Page 31, paragraph 2: GE seems to suggest that there is not a direct relationship between nest volume and nest mass. This would be of concern if the materials used to construct nests varied widely in density (i.e., across orders of magnitude), but since grass is used as the primary material for almost all tree swallow nests, Lombardo's (1994) results are indeed relevant to the Hudson River study. Page 32, paragraph 3: The study conducted by Winkler (1993) was not performed at the same site as used in McCarty and Secord (1999a), but at a larger site approximately two km away. David Winkler did provide the nest quality data for the Ithaca site used in both McCarty and Secord 1999a and 1999b. Page 33 bottom to top of page 34: GE questions using an experimental approach (e.g., Winkler, 1993 and Lombardo et al., 1995) to determine the effect of feathers on reproductive success. The experimental approach is consistent with the majority of mainstream ecologists. GE also states that "it is reasonable to expect that the experimental adults would not be able to feed their nestlings as much as control birds if they are spending time searching for replacement feathers." Winkler considered this idea in his paper; his data indicate that adults do not search for feathers when they have nestlings to feed. Page 35, paragraph 1 and page 36, paragraph 2: GE notes that McCarty and Secord (1999b) did not quantify feathers at their sites and suggests that the mechanism behind the lower numbers of feathers in the nests of tree swallows at more contaminated sites may be that less availability of feathers these sites. The hypothesis that high levels of PCBs in the environment near the GE plants may result in lower numbers of birds and, hence, fewer feathers available to tree swallows is plausible, especially since many species of birds are much more sensitive to PCBs than swallows and may not be able to survive in the conditions created along the Upper Hudson River. However, GE did not consider the strength of the data in Austin and Low (1932) and Schaeffer (1971), which indicate that it is more likely that the lower number of feathers in tree swallow nests at contaminated sites are a function of altered behavior. Page 35, paragraph 2: The implication that thermoregulation is only important during the nestling phase is not correct. Feathers may provide important insulation both to the incubating female and to eggs left unattended earlier in the breeding cycle.
PCB Bioaccumulation in Hudson River Tree Swallows GE notes that PCBs accumulated in nestlings even at sites that are not adjacent to commonly recognized deposition zones. Insects emerging from the Hudson River at these sites also had high levels of PCBs. GE's observation emphasizes that PCBs released from GE's plants are at
Responsiveness Summary Hudson River PCBs Site Record of Decision
3-50
high concentrations over a much wider area than is generally discussed. This is especially evident at the remnant site where adult insects were collected after they emerged from the river, but prior to their first flights. Secord and McCarty (1997) observed tree swallows foraging in large numbers over the Hudson River adjacent to the Remnant 4 site. Based on a food habit study, they determined that 98 percent of the insects eaten by tree swallows from this site were of aquatic origin, and the Hudson River was the only aquatic habitat within two km of the study colony. It can therefore be concluded with a high degree of certainty that the Hudson River is a significant source of food for the Remnant 4 site tree swallows. It seems reasonable that sediments in the vicinity of the Remnant 4 site are highly contaminated with PCBs. GE maintains that it is speculative to extrapolate measured TEQ concentrations in swallows to other bird species. However, it is scientifically appropriate and defensible to use existing data in the literature to estimate PCB uptake by species that are not directly studied. For example, a study was conducted at Green Bay to evaluate PCB uptake by closely located tree swallows, red-winged blackbirds, common terns, and Forster's terns (Ankley et al., 1993). Although the PCB congener patterns differ between the Hudson River and Green Bay, PCB uptake relationships demonstrated in this study can be used to estimate PCB uptake by fish-eating birds along the Hudson River, combined with data on tree swallow PCB accumulation. As with all modeling efforts, there is acknowledged uncertainty associated with these estimates. It is not surprising that other studies have failed to show a relationship between PCB concentrations and biological effects in tree swallows, since the Hudson River tree swallows are more highly contaminated than those from most other studies. During the Hudson River tree swallow studies, Secord and McCarty did detect some deformities that have not been reported in the literature. These include one cross-billed adult female in 1995, and in 1998, two nestlings with deformed legs, one nestling with small eyes, and one nestling with a crossed bill. They also detected obvious abdominal edema in two nestlings in 1998, and there may have been more subtle manifestations of edema in other nestlings in all years of their study. References Ankley, G.T., G.J. Niemi, K.B. Lodge, H.J. Harris, D.C. Beaver, D.E. Tillett, T.R. Schwartz, J.P. Giesy, P.D. Jones, and C. Hagley. 1993. Uptake of planar polychlorinated biphenyls and 2,3,7,8-substituted polychlorinated dibenzofurans and dibenzo-p-dioxins by birds nesting in lower Fox River and Green Bay, WI, USA. Arch. Environ. Contam. Toxicol. 24:332-344. Austin, Jr., O.L., and S.H. Low. 1932. Notes on the breeding of the tree swallow. Bird Banding 3:39-44. General Electric. 2001. Evaluation of the US Fish and Wildlife Service Tree Swallow Studies along the Hudson River. Appendix O of Comments of General Electric Company on the Feasibility Study and Proposed Plan for the Hudson River PCBs Superfund Site (December 2000). General Electric Company, Albany, NY. April 17, 2001.
Responsiveness Summary Hudson River PCBs Site Record of Decision
3-51
Lombardo, M.P. 1994. Nest architecture and reproductive performance in tree swallows (Tachycineta bicolor). Auk 111(4):814-824. Lombardo, M.P, R.M. Bosman, C.A. Faro, S.G. Houtteman, and T.S. Kluisza. 1995. Effect of feathers as nest insulation on incubation behavior and reproductive performance of tree swallows (Tachycineta bicolor). Auk 112(4):973¨C981. McCarty, J.P. 1995. Effects of short-term changes in environmental conditions on the foraging ecology and reproductive success of tree swallows, Tachycineta bicolor. Dissertation presented to Graduate School of Cornell University, Ithaca NY. McCarty, J. P. and A. L. Secord. 1999a. Nest building behavior in PCB contaminated Tree Swallows (Tachycineta bicolor). Auk 116:55-63. McCarty, J. P. and A. L. Secord. 1999b. Reproductive ecology of Tree Swallows (Tachycineta bicolor) with high levels of PCB contamination. Environmental Toxicology and Chemistry 18:1433-1439. McCarty, J. P. and A. L. Secord. 2000. Female plumage color, PCB contamination, and reproductive success in Hudson River Tree Swallows (Tachycineta bicolor). Auk 117:987-995. Owens, I.P.F., and R.V. Short. 1995. Hormonal Basis of Sexual Dimorphism in Birds: Implications for New Theories of Sexual Selection. TREE 10(1):44–47. Pyle, P. 1997. Identification Guide to North American Birds. Part 1. Slate Creek Press, Bolinas CA. Pyle, P., S.N.G. Howell, R.P. Yunick, and D.F. DeSante. 1987. Identification Guide to North American Passerines. Slate Creek Press, Bolinas CA. Schaeffer, F.S. 1971. Tree swallow breeding biology at a coastal and inland area. EBBA News 34:216-222. Secord, A. L., J. P. McCarty. 1997. Polychlorinated biphenyl contamination of tree swallows in the Upper Hudson River Valley, New York. US Fish and Wildlife Service, Cortland, NY. Secord, A. L., J. P. McCarty, K. R. Echols, J. C. Meadows, R. W. Gale, and D. E. Tillitt. 1999. Polychlorinated Biphenyls and 2,3,7,8-Tetrachlorodibenzo-p-dioxin Equivalents in Tree Swallows from the Upper Hudson River, New York State, USA. Environmental Toxicology and Chemistry 18:2519-2525. Secord, A.L., 2001. E-mail to H. Chernoff, TAMS Consultants, Inc. June 11, 2001. Winkler, D.W. 1993. Use and importance of feathers as nest lining in tree swallows (Tachycineta bicolor). Auk 110(1):29-36.
Responsiveness Summary Hudson River PCBs Site Record of Decision
3-52
Master Comment 809 Some commenters assert that contamination of the floodplain of the Upper Hudson River was not addressed, and that floodplain exposure pathways should have been evaluated for ecological receptors. This is especially true, according to the comments, since recent data show high levels of PCBs in soils, shrews, mink, and otter along the Upper Hudson floodplain. In addition, other commenters questioned why remediation of the floodplain had not been considered. Response to Master Comment 809 The Baseline Ecological Risk Assessment (BERA) (USEPA, 1999a) and Revised Baseline Ecological Risk Assessment (RBERA) (USEPA, 2000a) did not quantify risks to terrestrial receptors on the floodplain. This is because these documents are limited to risks associated with PCBs in the sediment, water, and biota in the Hudson River, which is consistent with the focus of the Reassessment RI/FS. In addition there were insufficient data available to characterize the nature and extent of PCBs in floodplain soils (Responsiveness Summary for BERA p. 20 [USEPA, 2000b]; BERA, p. 14; Responsiveness Summary for BERA Scope of Work, p. 21 [USEPA, 1999b]). To address concerns regarding this issue, EPA qualitatively addressed ecological risks associated with exposure to PCBs in floodplain soils as a source of uncertainty (RBERA, p. 193 and BERA, p. 156). The lack of quantification of risks to floodplain receptors does not indicate a lack of risk. However, risks are expected to be highest for receptors (e.g., aquatic or piscivorous animals) that derive the bulk of their exposure to PCBs from Hudson River sources. NYSDEC, in association with the NOAA and the USFWS, has analyzed soil and short-tailed shrews for PCBs as part of a Natural Resource Damages Assessment (NRDA) for PCB contamination of the Hudson River. They detected PCBs in floodplain soils from 11 locations in the Upper Hudson River Valley between Stillwater in Saratoga County and Fort Edward in Washington County. PCB levels detected ranged from 0.018 ppm to 360 ppm, with levels generally highest in low-lying areas adjacent to the river and in areas closer to Fort Edward (NYSDEC, 2001). Oak Ridge National Laboratory (ORNL) has developed a soil screening level of 40 ppm for total PCBs based on effects on terrestrial plants (Efroymson et al., 1997). Out of the 143 NYSDEC soil samples, 11 showed concentrations higher than this screening level. EPA (1999c) provides recommended soil screening levels of 10 ppm based on effects in soybean shoots, and 2.5 ppm based on an acute LC50 (the lethal concentration that kills 50 percent of the organisms) for earthworms. These values are exceeded 30 and 54 times, respectively. An analysis of short-tailed shrews living on the floodplain showed PCB levels ranging from 0.05 ppm to 38 ppm. Shrews feed on earthworms and other animals and serve as prey for raptors, owls, and other wildlife. The recent NYSDEC data for mink and otter are discussed in Response to Master Comment 811 in Section 3.2 (Table 811-1). Many of these animals had PCB tissue concentrations above TRVs and were caught within several miles of the Hudson River (e.g., within the floodplain). However,
Responsiveness Summary Hudson River PCBs Site Record of Decision
3-53
mink and otter are more likely to derive exposure to PCB from aquatic sources rather than the floodplain, as these animals preferentially feed on fish and aquatic invertebrates living in or near river sediment. EPA's Reassessment focused on PCB contamination of the river sediments, water, and fish, which resulted in the "eat none" fish consumption advisory in place in the Upper Hudson River since 1976. While the Reassessment investigations were ongoing, EPA undertook cleanup actions at Rogers Island in the Upper Hudson River to address human health concerns regarding levels of PCBs in the floodplain soils there. EPA will continue to review new data collected on floodplain soils and will take action as necessary to protect human health and the environment. Response to Master Comment 821 in Chapter 6 further discusses the issue of floodplain soils as a potential source of PCB loading to the Upper Hudson River in developing the fate and transport models used in the Reassessment. References Efroymson, R.A., M.E. Will, G.W. Suter II, and A.C. Wooten. 1997. Toxicological Benchmarks for Screening Contaminants of Potential Concern for Effects on Terrestrial Plants: 1997 Revision. Oak Ridge National Laboratory. NYSDEC. 2001. Press Release DEC: Mammals, Soil Near Hudson River Have Elevated PCB Levels. Monday April 2, 2001. http://www.dec.state.ny.website/press/pressrel/2001-52.html USEPA. 1999a. Phase 2 Report, Further Site Characterization and Analysis. Volume 2E- Baseline Ecological Risk Assessment (BERA), Hudson River PCBs Reassessment RI/FS. Prepared for USEPA Region 2 and the USACE, Kansas City District by TAMS/MCA. August. USEPA. 1999b. Responsiveness Summary for Phase 2 - Ecological Risk Assessment Scope of Work. Prepared for USEPA Region 2 and the USACE, Kansas City District by TAMS/MCA. April. USEPA, 1999c. Screening Level Ecological Risk Assessment Protocol for Hazardous Waste Combustion Facilities, Appendix E: Toxicity Reference Values. Peer Review Draft. EPA530-D-99-001C, Office of Solid Waste and Emergency Response. August. USEPA. 2000a. Phase 2 Report, Further Site Characterization and Analysis. Volume 2E- Revised Baseline Ecological Risk Assessment (RBERA), Hudson River PCBs Reassessment RI/FS. Prepared for USEPA Region 2 and the USACE, Kansas City District by TAMS/MCA. November. USEPA. 2000b. Responsiveness Summary for Volume 2E - Baseline Ecological Risk Assessment. Prepared for USEPA Region 2 and the USACE, Kansas City District by TAMS/MCA. March.
Responsiveness Summary Hudson River PCBs Site Record of Decision
3-54
3.2.3 Ecological Risk Assumptions Master Comment 793 Some comments said that area use assumptions used for the mink and otter are not appropriate. It was suggested that conservative area use factors (AUFs) were used in the Revised Baseline Ecological Risk Assessment (RBERA) (USEPA, 2000a), and that "more appropriate" AUFs show no significant differences in ecological risk reduction between source control and dredging. Response to Master Comment 793 The AUF is an adjustment to the dose of a contaminant that an ecological receptor receives through its diet. The AUF addresses the proportion of the receptor’s diet that is assumed to consist of prey (e.g., fish) from the contaminated area and considers the size of the receptor’s home range compared to the size of the Site (USEPA, 1998). In the point estimate calculations in the Revised Baseline Ecological Risk Assessment (RBERA) (USEPA, 2000a), EPA retained AUFs of one (i.e., continuous spatial exposure duration) for the mink and river otter (Response to Peer Review Comments on the BERA, p. 9 [USEPA, 2000b]), because it is reasonable that a receptor could use and forage entirely within the large size of the Site. The home ranges of these receptors are less than the size of the 200-mile long Hudson River PCBs Site, so these receptors would be expected to use and forage entirely within the Site (Tables 3-69 and 3-70 of the RBERA). While the foraging territories for all ecological receptors are well within the spatial scale modeled for the Upper Hudson River, EPA also evaluated the possibility that an individual may forage in nearby tributaries (assumed to be uncontaminated) as well as in the Hudson River. In the probabilistic risk calculations, EPA used AUFs between 0.5 and 1.0 (Master Comment 811 and Table 811-1, in this chapter). The results of the probabilistic analysis confirm that Upper Hudson River otter and mink may experience adverse effects from PCB exposure (Figures 811-1, 811-2, and 811-3) using an AUF less than one, contrary to the results calculated by the commenter. As discussed in White Paper – Model Forecasts for Additional Simulations in the Upper Hudson River, predicted fish concentrations under the MNA Alternative are significantly higher than predicted fish concentrations under the selected remedy (including using different assumptions as to timing of remediation and remobilization of sediments). Assuming that the same AUF is applied to the modeling results from both scenarios, the difference between the MNA Alternative and the selected remedy would still be the same regardless of the AUF that is used. References USEPA. 1998. Guidelines for Ecological Risk Assessment. Federal Register 63(93):26846-26924. May 14, 1998.
Responsiveness Summary Hudson River PCBs Site Record of Decision
3-55
USEPA. 2000a. Phase 2 Report, Further Site Characterization and Analysis. Volume 2E- Revised Baseline Ecological Risk Assessment (RBERA), Hudson River PCBs Reassessment RI/FS. Prepared for USEPA Region 2 and the USACE, Kansas City District by TAMS/MCA. November. USEPA. 2000b. Responsiveness Summary for Volume 2E - Baseline Ecological Risk Assessment. Prepared for USEPA Region 2 and the USACE, Kansas City District by TAMS/MCA. March. 3.3 Preliminary Remediation Goals (PRGs)/Fish Concentration Targets Master Comment 545 Comments indicate that the fish concentration Preliminary Remediation Goals (PRGs) may underestimate risks because their underlying assumptions are less than fully protective of public health. More specifically, commenters said that PRGs were based on adult exposures and underlying assumptions did not consider sensitive populations (e.g., women, children, infants, and fetuses). Other commenters felt that more protective PRGs were required because the current ones do not consider background body burdens, and because some anglers return to the same fishing spot along the Hudson year after year and catch and consume the contaminated fish. Some comments indicated that the target should be a PCB level of 0.01 ppm in fish. Some commenters suggested that the PRG is less than fully protective of public health, because the PRG represents a cancer risk of over one per hundred thousand and a hazard index of just over one, rather than being based on a one per million cancer risk and hazard index of one or less. Many comments were received supporting EPA's protective target level of 0.05 ppm, with intermediate targets of 0.2 ppm and 0.4 ppm PCBs in fish fillets. Other comments indicate that there was no basis for setting the PRG at 0.05 ppm PCBs; the PRG should be fourfold higher than calculated by EPA, based on a higher fish consumption rate (Master Comment 569, Section 3.1.2) Other comments indicated that the 2.0 ppm tolerance standard established for fish by the Food and Drug Administration (FDA) should be used. Response to Master Comment 545 The risk-based PRG of 0.05 ppm PCBs in fish fillet was calculated based on the reasonable maximum exposure (RME) for adults, assuming the same exposure factors used in the Revised Human Health Risk Assessment (HHRA), e.g., a fish consumption rate of one half-pound meal per week (USEPA, 2000). EPA chose the PRG of 0.05 ppm PCBs in fish fillets as a reasonable goal, one that falls within EPA's acceptable cancer risk range. Also, calculations indicate that non-cancer hazards associated with that PRG would be essentially equivalent to a hazard index (HI) of 1, which is EPA’s goal for protection. Other target concentrations are 0.2 ppm and 0.4 ppm PCBs in fish fillet, which are protective at a fish consumption rate of one half-pound meal per month and one half-pound meal every two months, respectively. These target concentrations could aid in the relaxation of fish advisories along the Hudson, following review by NYSDEC.
Responsiveness Summary Hudson River PCBs Site Record of Decision
3-56
Although EPA did not include the target populations of developing fetuses and infants in setting the PRG, the Agency did evaluate exposures to developing fetuses and infants in a qualitative manner (Master Comment 541, in this chapter). However, due to uncertainty and method limitations, they were not factored into the PRG quantitatively. With regard to consideration of subpopulations, these groups are incorporated into the PRG calculation to the extent that they are represented in the 1991 New York Angler survey (Connelly et al., 1992) (Master Comment 567, in this chapter). Background body burdens were not considered in defining the PRG because the risk assessment under baseline conditions addresses risks under current and future conditions, rather than prior conditions. This procedure is also consistent with the recommendations of the external HHRA peer review panel (ERG, 2000). Specifically, the expert panel that reviewed the current PCB cancer slope factors did not support adjusting for internal dose to reflect previous PCB exposure and current body burdens because the data were not available to determine the appropriate dosimetric for PCB carcinogenicity based on existing PCB body burdens. Therefore, EPA did not increase the average daily dose in the HHRA to account for existing body burdens of PCBs. In addition, although some anglers return to the same fishing spot along the Hudson year after year and catch and consume contaminated fish, EPA does not feel that a much lower target fish concentration (e.g., 0.01 ppm) is appropriate. While it is likely that different anglers may fish in different locations of the Upper Hudson River, there is little information available to quantify these differences, and the presence of current fishing restrictions preclude gathering such information. Nonetheless, an analysis of the risks associated with a possible population of anglers who fish predominantly in particular stretches in the Upper Hudson River is presented in the HHRA (Section 5.3.1). As the comparison shows, the cancer risks and non-cancer health hazards are highest at the furthest point upstream (Thompson Island Pool), approximately twofold higher than the central tendency and RME scenarios presented in the HHRA, and they decrease downstream with river mile. The less stringent FDA tolerance level of 2.0 ppm PCB proposed by some commenters as a PRG is not an Applicable or Relevant and Appropriate Requirement (ARAR) with respect to the Hudson River PCBs Site, because the FDA tolerance level is not a standard, requirement, criterion, or limitation promulgated under a federal environmental law, or a more stringent state environmental or facility siting law. See also the Response to Master Comment 447 in this section. In addition, this FDA tolerance level is based on a "market basket" approach, in which consumers purchase a variety of fish from a variety of sources and the average concentration is less than 2 ppm. Therefore, this approach is not protective of recreational anglers or subsistence fishers who frequently consume fish from one single source, such as the Hudson River. EPA does not agree with the suggestions that fish ingestion rates are too high by fourfold, and therefore the PRG for the average angler should be fourfold higher (i.e., 1.6 ppm instead of 0.4 ppm). For reasons discussed in Master Comment 569 in this chapter, EPA believes the fish ingestion rates used to develop the PRGs are based on appropriate and sound fish ingestion rate studies, and therefore no changes to the PRG are required.
Responsiveness Summary Hudson River PCBs Site Record of Decision
3-57
References Connelly, N.A., B.A. Knuth, and C.A. Bisogni. 1992. Effects of the Health Advisory Changes on Fishing Habits and Fish Consumption in New York Sport Fisheries. Human Dimension Research Unit, Department of Natural Resources, New York State, College of Agriculture and Life Sciences, Fernow Hall, Cornell University, Ithaca, New York. Report for the New York Sea Grant Institute Project No. R/FHD-2-PD, September. (Raw survey data also received electronically from study authors.) Eastern Research Group (ERG). 2000. Report on the Peer Review of the Hudson River Human Health Risk Assessment. Prepared for the US Environmental Protection Agency, Region 2. September 2000. USEPA. 2000. Phase 2 Report, Further Site Characterization and Analysis. Volume 2F - Revised Human Health Risk Assessment (HHRA), Hudson River PCBs Reassessment RI/FS. Prepared for USEPA Region 2 and the USACE, Kansas City District by TAMS Consultants, Inc. and Gradient Corporation. November. Master Comment 447 Some commenters felt that the ARARs/health risk PRG are too stringent; they claim that it is absurd to allow restaurants to serve fish at the FDA standard of 2 ppm but require a lower standard for the Hudson River. In addition, a commenter noted that PCB concentrations in fish in some monitored lakes in New York exceed PRGs. Response to Master Comment 447 The ARARs, which are applicable or relevant and appropriate federal environmental laws and regulations, and also include State environmental and facility siting laws and regulations that are more stringent than the federal requirements, are not established by the FS. Rather, in the FS process, the universe of potentially applicable State and federal requirements is reviewed and compiled. CERCLA remedies must comply with ARARs unless a waiver is justified. The human health-based PRGs are also developed to reflect risk-based considerations, in this case, the Human Health Risk Assessment (HHRA). The risk-based PRGs for fish are based on reasonable maximum exposure assumptions developed in the HHRA, not worst-case assumptions. The HHRA was peer reviewed. The fact that PCB concentrations in fish in some lakes in New York exceed PRGs is not an appropriate reason for setting the PRGs for Hudson River fish at higher concentrations. The FDA "standard" is not a "standard" per se, and is not an ARAR. Rather, it is a criterion set by the FDA for commercially caught fish. This distinction is important because implicit in the FDA's criterion is that when brought to market, fish with 2 ppm PCBs will be 'mixed' with fish from non-contaminated sources and therefore the consumer exposure will be to fish with average PCB concentrations substantially below the 2 ppm criterion. This FDA assumption reflects a completely different exposure pattern (exposure scenario) than that on which the HHRA is
Responsiveness Summary Hudson River PCBs Site Record of Decision
3-58
based; i.e., that recreational anglers will consume fish caught in the Hudson on a regular basis (also see Master Comment 545 in this chapter). References USEPA. 2000a. Phase 2 Report, Further Site Characterization and Analysis. Volume 2F-Human Health Risk Assessment (HHRA), Hudson River PCB Reassessment RI/FS. Prepared for USEPA Region 2 and the USACE, Kansas City District by TAMS Consultants, Inc. and Gradient Corporation. November. USEPA. 2000b. Response to Peer Review Comments on the Human Health Risk Assessment, Hudson River PCBs Reassessment RI/FS. Prepared for USEPA Region 2 and the US Army Corps of Engineers (USACE) by TAMS Consultants, Inc. and Gradient Corporation. November. USEPA. 2000c. Further Site Characterization and Analysis, Revised Human Health Risk Assessment (Revised HHRA) Volume 2F, Hudson River PCBs Reassessment RI/FS. Prepared for the USEPA Region 2 and USACE by TAMS Consultants, Inc. and Gradient Corporation. November 2000. Master Comment 313300
Commenters suggested that the effectiveness criterion discussed in Section 6.1.1 of the FS, i.e., the effectiveness of a remedial alternative to protect human health and the environment, should also compare PCB fish concentrations to risk-based PRGs for ecological receptors.
Response to Master Comment 313300
Risks to ecological receptors are discussed in detail in Section 7 of the FS, including a discussion of the time to reach ecological-based fish target levels (FS, Section 7.3 and Table 7-8). EPA has compared future PCB concentrations in largemouth bass fillet to the risk-based PRGs for ecological receptors (0.3 to 0.03 ppm PCBs in whole body fish equivalent to 0.12 to 0.012 ppm PCBs in fish fillet). These PRGs are based on the river otter, which is the receptor found to be at greatest risk at the Site. The comparison is presented in the ROD. Master Comment 362555 Some commenters felt that given the serious threat to human health and the environment, REM-0/0/3 or additional targeted dredging are the best alternatives for achieving PRGs. Response to Master Comment 362555 Although REM-0/0/3 achieves the fish target concentrations of 0.4 and 0.2 ppm PCBs in the shortest time frames, EPA has determined that the selected remedy is more cost-effective (Master Comment 397, Chapter 1). EPA does not believe that the incremental improvement in risk reduction obtained under REM-0/0/3 justifies the additional $110 million cost of that
Responsiveness Summary Hudson River PCBs Site Record of Decision
3-59
alternative. Areas targeted for remediation will be refined during the design phase to obtain the appropriate PCB removal consistent with the selected remedy. Master Comment 313297 A number of specific comments were made on the fish/biological monitoring program. These comments are addressed individually in the response below. Response to Master Comment 313297 Comments on the Fish/Biological Monitoring Program: Main FS Text Page 5-45: Does the third bullet signify that only striped bass will be collected for PCB analysis in the Lower Hudson? If so, the Lower River sampling should be expanded beyond striped bass collections since health advisories below Federal Dam are not limited to striped bass. The current NYSDOH advisory recommends no consumption of numerous species in the estuary, some of which are more contaminated than striped bass. Response: As noted in the FS text, the fish monitoring program proposed under MNA is based on the sampling program assembled by NYSDEC in 1997 (included in Appendix G, Part E). This program includes striped bass among other fish for PCB monitoring in the Lower Hudson River (Table 1 of Appendix G, Part E). One of the principal objectives of the NYSDEC program is “to ascertain PCB concentrations in the striped bass recreational and commercial fisheries for purpose of providing health advice through the New York State Department of Health and for regulating commercial fisheries when PCB levels exceed the accepted US Food and Drug Administration tolerance of 2 ppm.” The other main objective of the NYSDEC fish monitoring program that necessitates the sampling of other species deals with the assessment of spatial and temporal trends of PCB contamination. All fish data are evaluated by the NYSDOH for establishing and maintaining consumption advisories. Due to their migratory nature, striped bass usually cannot be considered a good indicator of local PCB contamination, but through use of relatively large sample sizes to counteract significant data variability, striped bass may be an indicator of relatively large scale spatial and temporal patterns of PCB contamination. However, the main focus of the striped bass analysis has been to provide information for the proper regulation of the commercial fisheries. Future monitoring of striped bass will continue to provide this information. Page 5-46 to 5-52: Additional monitoring tasks that would strengthen the investigation include the collection of samples from the exposure pathways of non-piscivorous avian and terrestrial receptors, such as tree swallows and floodplain soil and biota. Response: EPA notes that recent USFWS and NOAA data have confirmed the presence of PCBs in floodplain soil and biota. However, the focus of the EPA Hudson River PCBs Reassessment has been on the river itself, as described in the Response to Master Comment 809 in this chapter;
Responsiveness Summary Hudson River PCBs Site Record of Decision
3-60
therefore, additional monitoring of non-piscivorous avian and terrestrial receptors is not currently included in the monitoring plan. EPA will, however, work with the NYSDEC on a floodplain sampling program. Page 5-51, Paragraph 1: Post-construction monitoring is scheduled for 10 years for the sediment removal alternatives and 25 years for the capping alternatives. Model results suggest that the time to achieve target concentrations in fish averaged over the entire Upper Hudson River is 20 to more than 67 years for the REM- or CAP-3/10/Select scenario. This time period is reduced for REM-0/0/3, but the approximate number of years to achieve target levels remains greater than the 10 years of monitoring for fish concentrations of 0.05 and 0.2 ppm PCBs. Response: As noted in paragraphs 3 and 4 of page 5-51 (Section 5.2.7.4) and Appendix G of the FS (Section G.5.2), fish body burdens are not predicted to meet PRGs over the model forecast period, even under the most extensive remedial alternatives. Therefore, the fish monitoring program may be required indefinitely. Costs for the fish monitoring program were estimated for a 25-year period. In addition to the regular fish monitoring described above, caged fish may also be deployed and collected in the post-construction period to monitor the impacts of water-column exposures to fish after construction. These data would provide a basis for establishing the impact of the upstream dredging efforts on downstream fish exposure. Page 6-8, Top: "Monitoring includes measurements of...the migration or harvesting of contaminated organisms." Monitoring should include measurements of fish and piscivorous wildlife to assess whether fish PRGs are being approached or achieved, and whether adverse effects are detected in piscivorous organisms. Response: Monitoring will include measurement of fish, as described in Appendix G of the FS (Part A). The ecological PRGs will be used as a guide to determine whether adverse effects are likely to occur in piscivorous wildlife, although it is recognized that testing of piscivorous wildlife directly would provide another monitoring endpoint. Page 8-22, Top; and elsewhere: Target fish species collected for tissue analysis should, at a minimum, include those evaluated in the ERA (pumpkinseed, yellow perch, white perch, spottail shiner, striped bass, brown bullhead, largemouth bass). Response: The resident target fish species (note that the striped bass is covered under migratory fish) monitored historically by NYSDEC are the largemouth bass, brown bullhead, white perch, and goldfish/carp, in addition to yearling pumpkinseed. These species have remained relatively available and their data supplement and substantiate the yearling pumpkinseed data. Although a larger number of fish species was evaluated in the Baseline Ecological Risk Assessment, these four species together are considered to provide a good indication of PCB contamination in the river. Appendix G Table G-1b: Resident species should include at least three species per location below Catskill.
Responsiveness Summary Hudson River PCBs Site Record of Decision
3-61
Response: As noted in the response to the previous comment, resident fish monitoring includes largemouth bass, brown bullhead, and white perch plus goldfish/carp, in addition to yearling pumpkinseed. However, not all species are collected at each sampling station. At the present time, only two species are planned for collection at the Poughkeepsie and Tappan Zee stations; the need for a third resident species will be re-examined during the preparation of a final sampling plan. Page 5, Paragraph 3: Striped bass are the only species identified for PCB analysis in the Lower Hudson. Additional species should be analyzed at less frequent intervals, including those affected by an existing NYSDOH fish consumption advisory. Targeted species should include American eel, blue crab, white perch, largemouth bass, and white catfish. Response: Resident fish will be collected in addition to striped bass, although the species (i.e., largemouth bass, brown bullhead, and white perch, and goldfish/carp, in addition to yearling pumpkinseed) were not individually listed in this paragraph. As described in NYSDEC’s sampling program, locations principally targeting white perch, white catfish, and American eel were added in 1997 to better correlate with the striped bass locations and their sampling locations (Appendix G, Part E). Addition of these species - white perch, white catfish, and American eel - to the monitoring program is dependent on the availability of species and the results of current sampling. The blue crab has not been historically sampled as part of the NYSDEC Hudson River fish sampling program, and was therefore not added to the list of species sampled. In 1999 and 2000, NYSDEC implemented a supplemental sampling project to gather data on over three dozen fish species from five locations. Much of that data were included in the update to the Hudson River database. Page 8, Fish Monitoring: The caged fish study should be extended throughout the freshwater Hudson (Albany, Catskill, Poughkeepsie), at least during one season, to coincide with the water column float survey. Response: Comment is acknowledged and will be considered during final design of the monitoring program. References USEPA. 1999. Phase 2 Report, Further Site Characterization and Analysis. Volume 2E- Baseline Ecological Risk Assessment (BERA), Hudson River PCBs Reassessment RI/FS. Prepared for USEPA Region 2 and the USACE, Kansas City District by TAMS/MCA. August. USEPA. 2000. Phase 2 Report, Further Site Characterization and Analysis. Volume 2E- Revised Baseline Ecological Risk Assessment (RBERA), Hudson River PCBs Reassessment RI/FS. Prepared for USEPA Region 2 and the USACE, Kansas City District by TAMS/MCA. November.
Responsiveness Summary Hudson River PCBs Site Record of Decision
3-62
Master Comment 795 Commenters suggested that the Proposed Plan would not meet consensus guidelines (i.e., sediment effect concentrations). Adverse effects to sediment and biota occur at PCB concentrations below that which will be achieved by EPA's proposed remedy based on consensus-based guidelines. Response to Master Comment 795 Consensus-based sediment effect concentrations (SECs) for PCBs in the Hudson River Basin were developed to support an assessment to sediment-dwelling organisms (NOAA, 1999). These NOAA Damage Assessment Center SECs have been subsequently published in peer-reviewed literature (MacDonald et al., 2000). The consensus-based SECs provide a unifying synthesis of existing sediment quality guidance (SQG); reflect causal rather than correlative effect; and account for the effects of PCB mixtures. The Hudson River PCB threshold effect concentration (TEC) of 0.04 mg/kg dry weight is intended to identify the concentration of total PCBs below which adverse population-level effects (e.g., mortality, decreased growth, and reproductive failure) on sediment-dwelling organisms are unlikely to be observed (NOAA, 1999). The mid-range effect concentration (MEC) of 0.4 mg/kg dry weight represents the concentration of total PCBs above which adverse effects on sediment-dwelling organisms are expected to be frequently observed. Adverse effects are expected to be usually or always observed at PCB concentrations exceeding the extreme effect concentration (EEC) of 1.7 mg/kg dry weight. The FS does not contain a Remedial Action Objective (RAO) based on specific sediment concentrations. The results of the Revised Human Health Risk Assessment (HHRA) (USEPA, 2000) were used to calculate risk-based concentrations (RBCs) of PCBs corresponding to various cancer risks and non-cancer health hazards. The results of the RBERA were used to calculate toxicity quotients (TQs) for ecological receptors, based on NOAELs and LOAELs (summarized in Section 1.5 of the FS). PRGs (ARARs and RBCs that are protective of human health and the environment) were then developed to meet RAOs. Numerical PRGs were developed for fish and water concentrations. Two general RAOs were developed pertaining directly to sediments: reduce the inventory (mass) of PCBs in sediment that are or may be bioavailable, and minimize the long-term downstream transport of PCBs in the river. These RAOs resulted in the selection of two mass per unit area criteria (3 g/m2 and 10 g/m2) for the selection of remedial areas. These criteria do not allow for direct comparison with the SECs, but it is acknowledged that the TEC of 0.04 mg/kg dry weight would not be met under the selected remedy. The decrease in the mass per unit area of PCBs will result in a decrease of PCB concentrations in the sediment, and SECs will come closer to being attained by the selected remedy, as opposed to the MNA Alternative.
Responsiveness Summary Hudson River PCBs Site Record of Decision
3-63
References MacDonald, D.D., L.M. DiPinto, J. Field, C.G. Ingersoll, E.R. Long, and R.C. Swartz. 2000. Development and Evaluation of Consensus-Based Sediment Effect Concentrations for Polychlorinated Biphenyls. Environ. Toxicol. Chem. 19(5): 1403-1413. National Oceanic and Atmospheric Administration (NOAA). 1999. Development and Evaluation of Consensus-Based Sediment Effect Concentrations for PCBs in the Hudson River. Prepared for NOAA Damage Assessment Center, Silver Spring, MD. Prepared through Industrial Economics by MacDonald Environmental Sciences Ltd. March 1999. USEPA. 2000. Further Site Characterization and Analysis, Revised Human Health Risk Assessment (Revised HHRA) Volume 2F, Hudson River PCBs Reassessment RI/FS. Prepared for the USEPA Region 2 and USACE by TAMS Consultants, Inc. and Gradient Corporation. November 2000.
Responsiveness Summary Hudson River PCBs Site Record of Decision
4-1
4. REMEDIAL ACTION OBJECTIVES AND SELECTION OF TARGET AREAS 4.1 Attainment of RAOs Master Comment 853 Commenters asked when EPA expects the FDA 2 ppm limit to be achieved under the MNA and REM-3/10/Select Alternatives. Response to Master Comment 853 EPA’s model, FISHRAND, predicts that it will take about 10 years longer to achieve 2 mg/kg under the MNA alternative than under the REM-3/10/Select Alternative (i.e., the selected remedy). Because PCB concentrations vary by location and fish species, the year in which the FDA tolerance level is expected to be met depends on the specific species and location considered. FISHRAND forecasts that, under the selected remedy, largemouth bass will achieve 2.0 mg/kg in approximately 2006 at RM 189 and in 2008 at RM 184. At RM 154, concentrations in largemouth bass are already approximately 2 mg/kg. Brown bullhead is forecast to achieve 2.0 mg/kg in approximately 2007 at RM 189 and in 2009 at RM 184 under the selected remedy. At RM 154, brown bullhead concentrations are already 2.0 mg/kg. Note that the FDA tolerance level is not protective of human health at the Site (see, for example, Response to Comment 375, Chapter 1). The benefits from implementation of the selected remedy compared to the MNA Alternative are likely to be greater than estimated from FISHRAND results. Based on a trend analysis of recent fish data, EPA expects that PCB concentrations in fish under the MNA Alternative would decline more slowly than predicted by FISHRAND, as a result of localized exposure conditions. Because the selected remedy removes sediments (which serve as an additional ongoing source of PCBs to the system and create the localized exposure conditions) and leaves a relatively homogeneous river bottom with respect to PCB concentrations, there is less uncertainty in the predicted rate of decline for the active remedial alternatives. The forecasts for the selected remedy include resuspension effects and a six-year implementation schedule. The forecasts for both the selected remedy and MNA alternative assume additional source control near the GE Hudson Falls plant in approximately 2006. 4.2 Determination of Target Areas and Volumes Master Comment 605 A comment contended that there is a bias in the selection of remedial areas due to limited sediment data. Further, the comment suggested that the areas that have the greatest amount of data are those most likely to be selected for remediation.
Responsiveness Summary Hudson River PCBs Site Record of Decision
4-2
Response to Master Comment 605 The selection process for target area identification under EPA’s selected remedy considered the full suite of available data for each section of the river. EPA recognizes that more data is available for some areas relative to others, but this reflects to a large degree the relative levels of PCB contamination of those areas. As a general rule, the fine-grained sediment areas of the river have more samples than the neighboring coarse-grained sediment. The fine-grained areas are also more likely to be targeted for remediation. There is a bias in sampling toward areas known or suspected to have a tendency toward greater contamination for scientifically valid reasons. Sample locations were not randomly selected. In a similar manner, the extent of targeted area and the number of samples decrease from upstream to downstream. This again reflects the recognition by both the samplers and the remediation planners that sediment contamination generally decreases downstream. In the selection of target areas, this trend is also supported by the fact that most of the water column load originates within the upper sections of the remedial area. Thus, it is not surprising that both sampling and remediation have focused on the same areas. However, it is important to remember that EPA has used the existing historical data set only as a general guide to help in the identification of sediments for remediation and to estimate the nature and volume of material to be treated. As outlined in Appendix G of the FS, it is EPA’s intention to conduct an extensive round of sampling for the purposes of the remedial design. As part of this data collection effort, EPA will evaluate and refine its remedial target areas. This sampling will cover both target areas as well as the areas outside the current target area boundaries. In this manner, EPA will produce a current contamination map of the Site on which to finalize its target area selection. Master Comment 313219 Calculations performed by a commenter resulted in an estimate of the total removal volume that was 387,900 cy less than the amount calculated in the FS. It was suggested that the bathymetric data used below Lock 5 could limit the accuracy of volume estimates. Commenters also argued that below the TI Pool, equal areas were created for each sample location and grouped together. Concern was expressed that since the groups were assigned a common depth, the volume to be removed will be overestimated because sediments below the removal criterion will also be removed. Response to Master Comment 313219 The total volume estimation calculations (Appendix B in the FS) involved two different methods based on the bathymetry information available for the sediment volume above and the sediment volume below Lock 5. Above Lock 5, where detailed bathymetry information was available, sediment volumes were calculated based on a dredging surface specified as an absolute elevation, not by a depth of sediment. This calculation was intended to represent the sediment volume for the likely form of the dredging specification.
Responsiveness Summary Hudson River PCBs Site Record of Decision
4-3
The engineering requirements of dredging suggest that a dredge operation for the removal of contaminated sediment will be performed to a specified elevation. That is, sediments will be removed to a pre-specified elevation and not a water depth or sediment thickness. Thus the volume of sediments to be removed was estimated as the difference between the river bottom surface and a deeper surface derived as described below. The river bottom topography was developed using the GIS software 3D Analyst (ESRI, 1999). In 3D Analyst, a triangulated irregular network (TIN) was created from the original elevation contour lines derived from the Phase 2 geophysical survey. Only these lines were used (i.e., no spot elevation data were used) in order to recreate a similar surface as represented by the contour lines on the original “River Bottom Geometry” map. The original TIN (from which the contour lines were extracted) had been created using a different software package and the elevation contour lines generated were then modified using routines specific to the software. This surface formed the river bottom. The dredge surface was defined by subtracting the proposed depth of removal at each location from the river bottom surface. However, unlike the river bottom whose depth varies continuously, the “dredge-to” surface was only allowed discrete values in terms of feet above barge canal datum. This was done to conservatively reflect the outcome of a dredging specification to discrete depths. The difference between these surfaces at each contour interval forms a cross-sectional trapezoid of sediments to be removed. The trapezoid is defined from the existing sediment surface topography by subtracting the depth of removal from the deeper contour (i.e., lower elevation) and defining a horizontal surface towards the shore, until it passes beneath the next elevation contour (Figure 313219-1). This removal surface, defined by the bottom edge of the trapezoidal shape, was converted to a grid cover with a 1 x 1 ft. cell size. This approach was used for all dredge volume estimates above Lock 5. Below Lock 5 (i.e., River Section 3), the only elevation or bathymetric data available consisted of approximate locations of 6-foot and 12-foot bathymetric contours with no elevation information. In this section, the best estimate of the volume was calculated using the proposed depth of removal multiplied by the area to be removed. Thus, bathymetry was not included in the calculations for River Section 3. This limits these calculations to some degree, making them less accurate then those for River Sections 1 and 2. Overall, however, the lack of good bathymetric data for defining the dredging volume in Section 3 does not represent a large source of uncertainty since less than 20 percent of the removal volume under the selected remedy is located below Lock 5. The volume calculations yielded a volume estimate of 2,651,700 cy for the selected remedy. This number is about fourteen percent higher than a volume estimate based on depth of contamination and removal area alone. This value (2,651,700cy) represents a conservative estimate of the removal volume. It is important to note that the term “equal areas” used by a commenter refers to the assumption that all cores in an area below the TI Dam are equally representative of the contamination in that area. Thus, the dredging area is not literally divided into polygons of equal areas; rather it is assumed that each core represents an equal area for the hot spot in which it is located. Essentially, each core contained within a hot spot is considered equally representative of that hot
Responsiveness Summary Hudson River PCBs Site Record of Decision
4-4
spot and used in the calculation of the mean value. This calculation process is the same as the one used in the Low Resolution Sediment Coring Report (USEPA, 1998). EPA recognizes that this approach will tend to overestimate the volume for removal; however, this approach will generate a conservative estimate for engineering purposes as well as ensure that the residual PCB concentration goal is achieved. References Environmental Systems Research Institute, Inc. (ESRI), 1999. Arcview 3D AnalystTM for Arcview GIS 3.2a. USEPA, 1998. Further Site Characterization and Analysis. Volume 2C-A Low Resolution Sediment Coring Report (LRC), Addendum to the Data Evaluation and Interpretation Report, Hudson River PCBs Reassessment RI/FS. Prepared for USEPA Region 2 and USACE, Kansas City District by TAMS Consultants, Inc., Gradient Corporation, and TetraTech, Inc. July. Master Comment 313280 Commenters asked about distribution of material that would require handling under the Toxic Substances Control Act (TSCA). A larger portion of the sediment removed below the Thompson Island Dam (TI Dam) requires special handling under TSCA than the sediments to be removed above the dam. For the 10 g/m2 removal scenario, approximately 77 percent of the removed sediment below the dam would be classified as TSCA material. Under the same removal scenario only 37 percent of the sediment from the Thompson Island Pool (TI Pool) is estimated to require TSCA handling. This distribution of TSCA material seems contrary to the perception of contaminant distribution in the Upper Hudson. Response to Master Comment 313280 Sediments that exceed a PCB threshold of 50 mg/kg are regulated under TSCA. TSCA regulations address, among other things, the handling and disposal of such sediments. There are two basic reasons for the large difference between River Sections 1 and 2 in the fraction of TSCA-classified material. The first and main reason arises from the different data sets used in each region and the nature of the calculation process. The second reason results from the difference in contaminant distribution in each section. These are further discussed below. The original estimate for TSCA and non-TSCA material has been updated for this Responsiveness Summary, as described in White Paper – Estimate of Dredged Material Exceeding TSCA Criteria. Nonetheless, the commenter’s observations still apply. The TSCA fraction estimated for the TI Pool is still much smaller than that estimated for downstream sections for the same threshold of removal. (It should be noted that the analyses in the FS and presented below were performed for the purpose of estimating costs, and not to specify dredging sequences or procedures.) The original estimate for TSCA and non-TSCA material in the TI Pool, as presented in the FS, was based on the sum of Aroclors as reported by NYSDEC for the 1984 survey (Brown et al.,
Responsiveness Summary Hudson River PCBs Site Record of Decision
4-5
1988). The original calculation did not account for any overcut, nor did it include the channel area. Neither did it account for the unmeasured monochloro and dichloro homologue fractions believed present in the sediments. The use of the sum of Aroclors results without correcting for the unmeasured monochloro and dichloro homologue fractions and the exclusion of the volume of overcut material in the estimation process represented a simplified basis to estimate the TSCA fraction. These assumptions work in opposite directions with respect to the TSCA estimate. It was anticipated that the exclusion of the overcut material would have a greater effect on the estimate than the failure to represent the monochloro and dichloro homologue fractions. Thus excluding them both was expected to yield an estimate that was conservative but not overly so. As it turned out the effects were of similar magnitude, resulting in a one-third decrease in the estimated fraction of TSCA material for Section 1 when these issues were explicitly included in the calculation (White Paper – Estimate of Dredged Material Exceeding TSCA Criteria). By comparison, for those areas downstream, the sediment classifications were based on total PCBs as measured by EPA in Phase 2 of the Reassessment. Thus the entire spectrum of PCBs was represented in the concentrations. However, like the River Section 1 estimate, the Section 2 estimate did not include the overcut material in estimating the fraction of TSCA material. Thus Section 1 had two important simplifying assumptions that tended to counteract each other, while Section 2 estimates included only one major assumption that tended to drive the estimate to higher values. The importance of these assumptions becomes clearer when the calculations explicitly correct for the issue. In Section 1, the overcut serves to increase the dredged volume nearly threefold. Mathematically blending the overcut with the overlying contaminated sediments and reexamining the distribution of PCB concentrations yields a decrease in the fraction of the TSCA-listed materials to one third of the original estimate. Conversely, inclusion of the mass of monochloro and dichloro homologues in the concentration data for River Section1 without correcting for the overcut increased the fraction of TSCA-listed waste from 28 percent to 52 percent. Combining the two factors reduces the original estimate of 28 percent TSCA-listed waste in the selected remedy (i.e., the 3 g/m2 scenario for Section 1) to 20 percent. This number represents a best estimate of this fraction in the material to be removed from the TI Pool during dredging under the selected remedy. In the original estimates for River Section 2 (i.e., the 3 g/m2 and the 10 g/m2 scenarios), the calculations had only one of the two limitations described above, that is, the impact of overcut had not been included in the estimates. There was no concern over the quantitation of total PCBs since the values used were derived from the Phase 2 data set. Thus only one assumption impacted this calculation. In fact, this issue still remains since there is no means to estimate the PCB distribution in the sediments after the overcut. This is a result of the more limited data set for the lower sections, which was deemed insufficient to create a polygonal declustering coverage (statistical analysis). Such a coverage is needed to best represent the distribution of PCBs after incorporating the overcut materials in the TSCA estimation process. Even after the refinement presented in White Paper – Estimate of Dredged Material Exceeding TSCA Criteria, there is still no means to accomplish this directly. Thus the value given in the white paper is quite similar to that of the FS at 77 percent TSCA-listed waste. Unlike the estimate for River Section 1, however, this value represents an upper bound and not a best estimate. This upper bound was used in estimating the costs of the remediation to provide conservatism. For both the
Responsiveness Summary Hudson River PCBs Site Record of Decision
4-6
original estimate of TSCA material and the current one, therefore, the River Section 1 estimate was a lower value and a better estimate than the River Section 2 estimate. Similar limitations for the data for River Section 3 restrict the reported TSCA fraction for the section to an upper bound estimate as well. Using the estimates derived in the TI Pool, it is possible to derive a “better” estimate for the lower sections based on TI Pool relationships observed. Specifically, the inclusion of the overcut materials for River Section 2 would serve to increase the volume of sediments to be removed by 2.4-fold (similar to the threefold increase estimated for River Section 1). In River Section 1, the threefold increase in volume yielded a similar level of reduction in the TSCA fraction. Applying this relationship to River Section 2 reduces the estimated TSCA fraction of 77 percent by 2.4-fold to 32 percent TSCA-listed materials, much closer to that predicted for River Section 1. Note that these estimates apply to different thresholds (i.e., 10 g/m2 in River Section 2 and 3 g/m2 in River Section 1), so an exact match would be unexpected. The foregoing discussion reflects the impact of the available data sets and the analyses they support on the estimation process. A second factor is believed to have influenced the estimate of the fraction of TSCA-listed material as well. This is the distribution of contamination itself. In particular, Hot Spot 28 located in River Section 2 represents the single greatest area of PCB concentration found to date. It contains both high concentrations as well as thick layers of PCB-contaminated sediment. Its presence in River Section 2 is expected to contribute to a disproportionate fraction of TSCA-listed material in this section. For the areas below TI Dam, the length of each core was used to calculate the percentage of TSCA and non-TSCA sediments, by using the following equation:
Percentage of sediments greater than 32 mg/kg =
Sum of the length in cores with a concentration greater than 32 mg/kg Total Length (for all concentrations)
This approach provides an upper-bound estimate of TSCA and non-TSCA material. Further discussion can be found in White Paper – Estimate of Dredged Material Exceeding TSCA Criteria. Reference Brown, M.P., M.B. Werner, C.R. Carusone and M. Klein. 1988. Distribution of PCBs in the Thompson Island Pool of the Hudson River: Final Report of the Hudson River PCB Reclamation Demonstration Project Sediment Survey. Prepared for NYSDEC. Albany, NY Master Comment 369451 Commenters assert that removal of 40 to 50 percent of the PCB inventory of the Upper Hudson is not sufficient to significantly change the river condition and reduce PCB-related health risks to people and wildlife in this region. Some argue that the percentage is too small and as a result the
Responsiveness Summary Hudson River PCBs Site Record of Decision
4-7
project will be ineffectual and should be abandoned. Others argue that further remediation should be done to bring the total mass of PCB removed closer to 100 percent. In some cases, commenters argue that EPA's proposed plan will not remove a sufficient mass of PCB given the disruption it will cause. Response to Master Comment 369451 In the Phase 2 analyses and the FS, the 1984 NYSDEC survey (Brown et al., 1988) formed the basis for the estimates of PCB inventory in the TI Pool. This data set was considered to be a good representation of the Tri+ inventory in the sediments, but could only provide a lower bound estimate of the Total PCB inventory in this river section. Using the various sediment data sets obtained by EPA and GE during the Phase 2 investigation, it has been possible to develop an estimate of the Total PCB inventory of the TI Pool by combining the recent data with the original 1984 NYSDEC survey. This calculation is described in White Paper – Sediment PCB Inventory Estimates. This calculation basically corrected for the monochloro and dichloro homologues that were largely under-represented in the quantitation techniques that NYSDEC used. This calculation yielded an estimate for Total PCBs in the TI Pool that was three times greater than the Tri+ inventory. Based on this revision, the estimate for the percentage of Total PCBs removed by the selected remedy (REM-3/10/Select) was increased to about 65 percent of the Total PCB contamination in the Upper Hudson. Examining the implications of this revision more closely within the main source areas above Schuylerville (River Sections 1 and 2), about 82 percent of the Total PCB inventory will be removed by the selected remedy. Thus, in the areas of greatest PCB concentration, the selected remedy will greatly reduce the PCB inventory as well. The main reason for a lower overall removal percentage when including River Section 3 is that PCB concentrations are generally much lower and distributed over a large area (2900 acres) in River Section 3. Only a few areas meet the target criteria for concentration and inventory, and therefore, only five percent of the area in River Section 3 is selected for remediation. Also, as described in the FS and in Response to Master Comment 597, Section 4.3, the targeted areas under the selected remedy include more than 85 percent of the areas with PCB concentrations greater than 10 mg/kg and more than 75 percent of the areas greater than 3.2 mg/kg. These percentages are not higher due to the difficulty of sediment removal in the remaining areas. Access limitations, shallow underlying bedrock, and small, isolated locations of contamination were some of the primary reasons these areas were excluded. As a result, many of these areas cannot be added without a disproportionate increase in cost and an increased risk of higher sediment resuspension. EPA concurs that dredging will protect ecological resources (and also human health) in the upper and lower river by reducing PCB concentrations in fish. Based on the FS analyses and those presented in White Papers – Resuspension of PCBs during Dredging, Model Forecasts for Additional Simulations in the Upper Hudson River, and Trends in PCB Concentrations in Fish in the Upper Hudson River, it appears unlikely that the removal of sediments associated with the selected remedy will yield substantively higher PCB concentrations in the Upper Hudson during dredging. Similarly, temporary effects of implementation of the selected remedy on PCB body burdens in fish tissue will be insignificant (see White Paper – Human Health and Ecological Risk
Responsiveness Summary Hudson River PCBs Site Record of Decision
4-8
Reduction under Phased Implementation). Rather, model forecasts show that increases in fish PCB body burdens will occur only during the years of the most intense dredging, and will not rise above current levels. Following the completion of the dredging operations, concentrations of PCBs in the water column and fish tissue will rapidly decline and show significant improvement relative to the No Action and MNA Alternatives. Risks to humans posed by consumption of PCB-contaminated fish will be reduced far more rapidly under the selected remedy than under the No Action and MNA Alternatives. Modeling results show that the Hudson River will see significant benefits associated with the selected remedy. Human health cancer risks and non-cancer health hazards, as well as risks to ecological receptors, will be significantly reduced as a result of remedial dredging. Because the selected remedy is targeting higher concentration areas in general, the vast majority of the PCB inventory will be removed in the most contaminated areas of the Upper Hudson. This approach serves to greatly reduce risks due to PCB exposure while keeping the areas subjected to remediation to less than half of the total acreage in River Sections 1 and 2. EPA has determined that the incremental risk reduction achieved under the more aggressive alternative, REM-0/0/3, does not justify the additional $110 million present worth cost of that alternative. Doubling the amount of remedial area in these sections (REM-0/0/3 vs. REM-3/10/Select) would be expected to yield no more than an additional 20 percent of the total PCB inventory, based on the revised estimates for the Upper Hudson (see White Paper – Sediment PCB Inventory Estimates). Furthermore, these additional areas tend to be coarse-grained or inaccessible areas with relatively little biological value. Hence their remedial value is expected to be relatively low. For the Upper Hudson as a whole, the model forecasts showed a disproportionately smaller improvement in recovery of the river when compared to the far greater area of disturbance for the REM-0/0/3 Alternative as compared to the selected remedy. Reference Brown, M.P., M.B. Werner, C.R. Carusone and M. Klein. 1988. Distribution of PCBs in the Thompson Island Pool of the Hudson River: Final Report of the Hudson River PCB Reclamation Demonstration Project Sediment Survey. Prepared for NYSDEC. Albany, NY. Master Comment 313391 Commenters expressed concern that if additional data are collected to further delineate removal areas, the locations and associated volumes may change substantially. Response to Master Comment 313391 Many factors were considered during the process of delineating the target areas presented in the FS. These factors include the inventory of PCBs in the sediment (NYSDEC 1977 and 1984 cores; 1994 Low Resolution sediment cores collected by USEPA; and 1991 and 1998 GE data) as well as surface sediment concentrations, sediment texture (from the side-scan sonar analysis), bathymetry, and deposition (whether or not the PCB contamination is buried by greater than 12
Responsiveness Summary Hudson River PCBs Site Record of Decision
4-9
inches of “clean” sediment). The data available was judged to be sufficient to define the nature and extent of PCB contamination. In particular, the EPA has found that areas of fine-grained sediments are typically much more contaminated than other areas. Additionally, fine-grained sediments (cohesive) are considered to be the major source of PCBs to the water column and biota. EPA’s selection of remedial zones has been developed from both chemical and physical data that define these areas. In particular, the remedial area selection process recognized the importance of these areas and targeted them in general. Although the exact inventories of PCBs in these sediments may be refined during further sampling, the physical description of these areas obtained by side-scan sonar is not expected to change greatly. That is, areas found to be fine-grained now are expected to remain fine-grained in the future. These areas are also expected to be a continued source of PCB contamination in the future. Thus the volume estimates of River Sections 1 and 2, which are tied to the side-scan sonar data, are not expected to change substantively upon further investigation. These sections contain the majority of remedial zones for the selected remedy. Changes in remedial zones in River Section 3, where side-scan sonar data are lacking, will not greatly affect the size of the program since remediation will be much more limited in this section. During the design support program, a new side-scan sonar survey will be performed to aid in refining the removal boundaries. Although some boundary locations might vary slightly, volume estimates and areas to be remediated are not expected to significantly change. References Brown, M.P., M.B. Werner, C.R. Carusone and M. Klein. 1988. Distribution of PCBs in the Thompson Island Pool of the Hudson River: Final Report of the Hudson River PCB Reclamation Demonstration Project Sediment Survey. Prepared for NYSDEC. Albany, NY. Tofflemire, T.J. and S.O. Quinn. 1979. PCB in the Upper Hudson River: Mapping and Sediment Relationships. NYSDEC Technical Paper No. 56, Albany, NY USEPA, 1998. Further Site Characterization and Analysis. Volume 2C-A Low Resolution Sediment Coring Report (LRC), Addendum to the Data Evaluation and Interpretation Report, Hudson River PCBs Reassessment RI/FS. Prepared for USEPA Region 2 and USACE, Kansas City District by TAMS Consultants, Inc., Gradient Corporation, and TetraTech, Inc. July. QEA, 2001. General Electric Database Transmittal from Michael Werth (QEA) to Doug Tomchuk (USEPA). June 1, 2001. Master Comment 313224 A commenter has expressed concerns regarding the excessive dredge cut used in some areas (i.e., eight feet), and questioned the minimum depth of cut defined for each one of the three target areas (i.e., where depth of contamination is less than one foot; a one-foot removal depth is used; expanded hot spot areas have a minimum of two-foot cuts; and hot spot areas have a minimum 2.5-foot cut depths). A comment was also made on the fact that Option 5 should have shown a
Responsiveness Summary Hudson River PCBs Site Record of Decision
4-10
"diminishing return" (i.e., a lower yield of PCBs per mass of sediment removed) than the preferred remedy. Response to Master Comment 313224 The issue of remediation depth was originally described in the FS. The following discussion is intended to further illustrate the approach used by EPA. In defining the remedial areas, EPA has utilized both the vertical and horizontal extent of the data to estimate the volume of sediment to be removed. As described in the FS, Chapter 3, and in Response to Master Comment 597 below, the horizontal extent of remediation was determined based on concentration and total sediment mass, with threshold value criteria (e.g., 10 mg/kg or 3 g/m2). For the vertical extent of contamination, a depth of remediation was set only after an area was selected for remediation. Thus no areas were selected or rejected on the basis of the depth of contamination. Once an area was selected, the goal for remediation is to remove all of the PCB-contaminated sediment within the target area; the target concentration is zero. It is anticipated that such a goal will leave a mean residual concentration of approximately 1 mg/kg Tri+ PCBs. In order to set the depth of remediation, the various sediment data sets were examined to establish the depth of PCB contamination. Historical data sets from NYSDEC (1977 and 1984) represent the most spatially extensive data sets and were estimated to have detection limits of around 1 mg/kg as the sum of Aroclors. Using these data, the depth of contamination was estimated for each core location. As discussed below, sampling locations within a remedial area were then examined to estimate the depth of removal for the entire area. For coring locations, the depth of contamination was assigned as the top of the core segment that first attained a non-detect level or a value less than 1 mg/kg PCB as reported. All reported deeper layers must also be non-detect or less than 1 mg/kg. EPA's 1994 core data as well as the GE core data were also considered in estimating the depth of contamination. These data sets have lower detection limits, thus, instead of non-detect levels, just the 1 mg/kg Total PCB threshold was used. That is, the top of the first core segment to fall below 1 mg/kg was selected as the depth of contamination. The EPA data set formed the main data set for the major cohesive sediment areas below TI Dam. The GE data set provided only limited coverage for this purpose and was used largely as confirmation of the other data. In order to use all available data, incomplete cores were included in the analysis, with the exception of 1977 incomplete cores. Incomplete cores were defined as those cores whose lowest segment did not fall below 1 mg/kg. To estimate the additional material to be removed at the bottom of an incomplete core in order to attain non-detect PCB levels, existing complete cores were examined and grouped based on maximum PCB concentrations in the core and the distance between the maximum and the depth of contamination in the core. This analysis showed that where the maximum concentration in a core is less than 100 mg/kg, the distance between the depth of the maximum PCB concentration and the bottom of contamination in the core is generally less than one foot; and where the maximum concentration is greater 100 mg/kg, this distance is generally more than one foot. Therefore, to calculate the depth of contamination in an incomplete core, if the concentration at the bottom of an incomplete core ranged from 1-100 mg/kg, then 1 foot was added to the core length as an estimate of the remediation depth. If the concentration was greater than 100 mg/kg, then 1.5 feet were added to the core length.
Responsiveness Summary Hudson River PCBs Site Record of Decision
4-11
For grab samples, no information is available on the depth of contamination. For these sites and for shallow cores where the depth of contamination was found to be less than one foot, the depth of contamination at the location was assigned as follows:
• Beginning with the shallow core sites and grab sample locations with MPA greater than 10 g/m2, a depth of 2.5 feet was assigned to these locations. This was based on the average depth of contamination for cores from similar sites (both complete and “corrected” incomplete cores, as noted in the foregoing text) of 2.2 feet in hot spot remediation areas.
• For the shallow core and grab sample sites falling between 3 and 10 g/m2, a value of 2
feet was assigned based on the average depth of contamination for cores falling between 3 and 10 g/m2 of 1.6 feet in the three river sections.
• For sites falling below 3 g/m2, a depth of one foot was assigned. This was selected
because it represents the minimum dredging depth achievable by the dredging equipment. It was also selected recognizing the general absence of coring locations in the low MPA areas, which is at least partially indicative of the shallow extent of sediments in these areas (generally non-cohesive).
As applied, the minimum depths reflect the fact that as the MPA values increased from 0 to 3 to 10, so did the average depth of contamination. EPA also notes that for grab samples with high MPA values, the assigned depths of 2 to 2.5 feet are substantially greater that the 1 to 1.25 feet nominally assigned by NYSDEC in Brown et al., 1988. This represents a substantial increase in volume relative to NYSDEC’s assigned depth of contamination. However, based on the large data set of cores with similar PCB inventories, this depth assignment is considered to be a conservative best estimate. Since so many of the 1984 samples in the TI Pool are grab samples, this approach adds to the apparent overcut. In reality, it is anticipated that the depth of contaminated sediment as estimated from the grab samples from the NYSDEC survey probably underestimates the actual depth of contamination. The evidence from the core samples is expected to provide a much better estimate of the actual contamination depth, hence its application to determine the minimum depth of removal as well as individual target area dredge depths (see below). This approach also best serves EPA’s main goal, which is to achieve less than 1 mg/kg Tri+ residual concentrations in the sediment prior to backfill. This goal is best served by designing some degree of overcut into all remedial dredging depths. This approach generated a set of data that described a best estimate of the depth of contamination at the historical sampling locations. These data were applied to the estimation of depth of removal on a target area basis, not individually. Specifically, the target areas were defined based on both the extent of contamination in an area and the depth of contamination. Thus individual targets were created from clusters of samples with similar levels and depths of contamination. As noted in the FS, no target area was less than 50,000 sq ft. Within each target area, the core site with the greatest depth of contamination set the depth for the entire area. In this manner, the target areas were designed to minimize unneeded sediment removal while still maximizing the likelihood that the residual PCB concentration in each area would be close to the dredging goal of zero mg/kg. In this manner, areas with at least one core were set by a core-based depth. For
Responsiveness Summary Hudson River PCBs Site Record of Decision
4-12
those areas, which consisted exclusively of grab sample sites or shallow cores, the depth of removal was set by the approach described above. Thus while grab sample sites represent a large portion of the available data, EPA has used several approaches to refine the estimation process and minimize their impact on the FS volume estimates. A further conservative assumption resulted from the dredging specification process. Specifically, by requiring dredging to a specific elevation at each location, the specifications effectively add an additional 0.5 feet, on average, to each target area. This is described in Response to Master Comment 313219, Chapter 4. This represents an average overcut of 10 to 20 percent of what should be clean, pre-1945 sediment, helping to further the goal of a low PCB residual. In general, relatively short cores, on the order of two to three feet of contamination, were used to determine the depth of removal in most areas. However, 23 percent of all the cores used had depths ranging from two to seven feet. Furthermore, at least 10cores had depths of contamination greater than 4.5 feet, and several of these were incomplete. As explained above, one foot to 1.5 feet was added to the depth of contamination for these cores to be conservative with respect to sediment removal. This is why, on plate 17 (sheet one), there are two deeper areas next to the mouth of the Moses Kill with removal depths of six and eight feet. The six-foot area was assigned based on a 1984 sample (Sample ID: 32848). This core was 56 inches deep and the deepest measurement had a concentration of 5 mg/kg. Therefore, because the core was incomplete (from the criteria cited above), one foot was added to produce a six-foot depth. The area assigned eight feet was based on a 1977 core (Sample ID: 32152) that was incomplete at 84 inches with a concentration of 3 mg/kg, and therefore another foot of depth was added. Areas with six- and eight-foot depth above Northumberland Dam were assigned these depths based on the 1999 Canal Corporation Sweep Data, which indicated such depths were required for navigational purposes. A commenter has also suggested that the REM-0/0/3 Alternative showed a higher yield of PCBs per cubic yard removed than the selected remedy (REM-3/10/Select). However, TI Pool estimates of the PCB inventories in sediments were revised based on additional data and a subsequent analysis of the relationship between Total PCB and Tri+. These revised numbers as well as the amount of mass removed per cubic yard are presented in the following table.
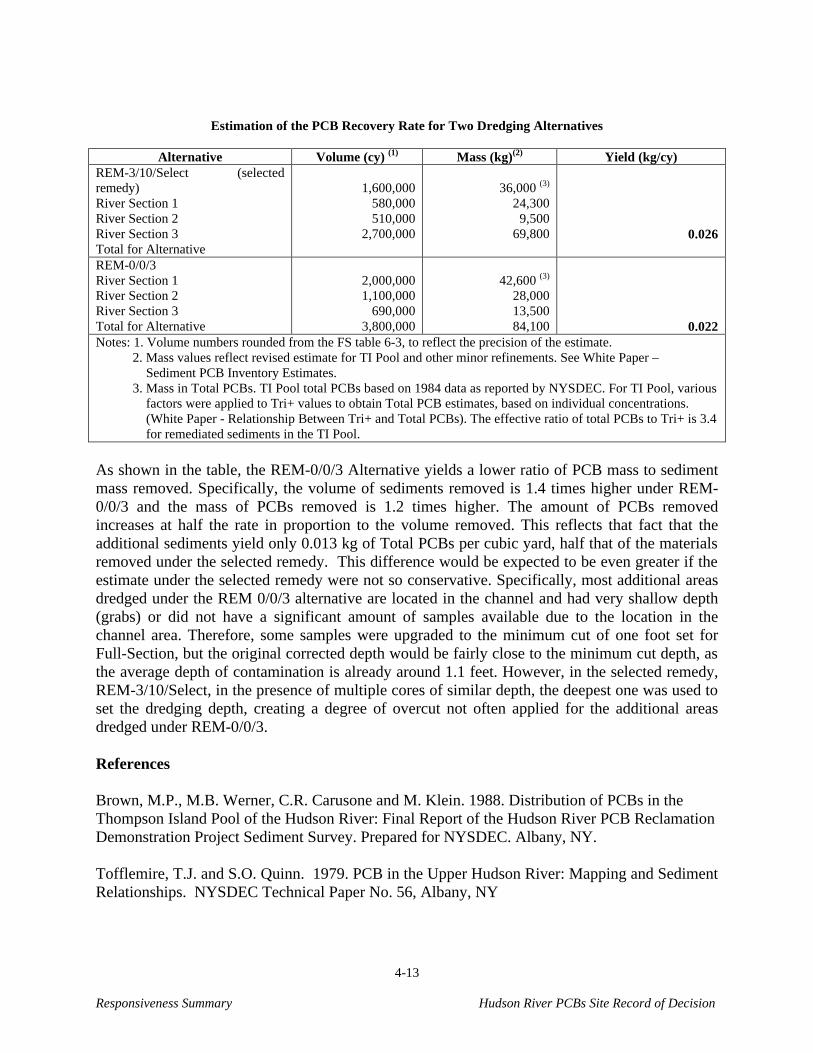
Responsiveness Summary Hudson River PCBs Site Record of Decision
4-13
Estimation of the PCB Recovery Rate for Two Dredging Alternatives
Alternative Volume (cy) (1) Mass (kg)(2) Yield (kg/cy) REM-3/10/Select (selected remedy) River Section 1 River Section 2 River Section 3 Total for Alternative
1,600,000
580,000 510,000
2,700,000
36,000 (3)
24,300 9,500
69,800
0.026
REM-0/0/3 River Section 1 River Section 2 River Section 3 Total for Alternative
2,000,000 1,100,000
690,000 3,800,000
42,600 (3)
28,000 13,500 84,100
0.022 Notes: 1. Volume numbers rounded from the FS table 6-3, to reflect the precision of the estimate. 2. Mass values reflect revised estimate for TI Pool and other minor refinements. See White Paper – Sediment PCB Inventory Estimates. 3. Mass in Total PCBs. TI Pool total PCBs based on 1984 data as reported by NYSDEC. For TI Pool, various factors were applied to Tri+ values to obtain Total PCB estimates, based on individual concentrations. (White Paper - Relationship Between Tri+ and Total PCBs). The effective ratio of total PCBs to Tri+ is 3.4 for remediated sediments in the TI Pool. As shown in the table, the REM-0/0/3 Alternative yields a lower ratio of PCB mass to sediment mass removed. Specifically, the volume of sediments removed is 1.4 times higher under REM-0/0/3 and the mass of PCBs removed is 1.2 times higher. The amount of PCBs removed increases at half the rate in proportion to the volume removed. This reflects that fact that the additional sediments yield only 0.013 kg of Total PCBs per cubic yard, half that of the materials removed under the selected remedy. This difference would be expected to be even greater if the estimate under the selected remedy were not so conservative. Specifically, most additional areas dredged under the REM 0/0/3 alternative are located in the channel and had very shallow depth (grabs) or did not have a significant amount of samples available due to the location in the channel area. Therefore, some samples were upgraded to the minimum cut of one foot set for Full-Section, but the original corrected depth would be fairly close to the minimum cut depth, as the average depth of contamination is already around 1.1 feet. However, in the selected remedy, REM-3/10/Select, in the presence of multiple cores of similar depth, the deepest one was used to set the dredging depth, creating a degree of overcut not often applied for the additional areas dredged under REM-0/0/3. References Brown, M.P., M.B. Werner, C.R. Carusone and M. Klein. 1988. Distribution of PCBs in the Thompson Island Pool of the Hudson River: Final Report of the Hudson River PCB Reclamation Demonstration Project Sediment Survey. Prepared for NYSDEC. Albany, NY. Tofflemire, T.J. and S.O. Quinn. 1979. PCB in the Upper Hudson River: Mapping and Sediment Relationships. NYSDEC Technical Paper No. 56, Albany, NY
Responsiveness Summary Hudson River PCBs Site Record of Decision
4-14
Master Comment 607 Commenters claimed that EPA has used the low resolution coring (LRC) study as the basis for erroneously concluding that buried PCB mass participates in, or determines, water column loading to the extent that this mass must be removed to reduce loading. Commenters also stated that the reported loss of 40+ percent of PCBs between 1984 and 1994 in the TI Pool from the LRC Report is unverified. Response to Master Comment 607 The comment's implication that the LRC study is the sole basis for concluding that buried PCB mass must be removed from the Hudson River is false. The LRC is one among many mutually supporting and consistent lines of evidence that lead to this conclusion. Even without the LRC, EPA believes it would be evident that remediation of sediment PCBs is needed. Key results of other lines of evidence are presented in the FS and summarized in other comment responses. Among these are the following:
• As noted in Chapter 2 in Responses to Master Comments 577, 621, and 631, the sediments of the TI Pool have continued to release a significant amount of PCBs each year. More than two tons of PCBs have been released from the sediments of the TI Pool alone since GE began monitoring in 1991. Nearly half of that occurred since the Allen Mill leakages were greatly reduced in 1996. Thus, the finding of PCB loss from the fine-grained sediments is not surprising and is in fact expected.
• As also noted in Response to Master Comment 577, the TI Pool has been a net source
of PCBs for the entire period of GE monitoring. Thus, the entire two tons of net release from the sediments had to have been deposited in the sediments prior to 1991.
• As summarized in Response to Master Comment 619, also in Chapter 2, data from
multiple sources, including GE sediment sampling, demonstrate that the stability of currently buried PCBs in sediment cannot be assured.
Therefore, based on both water column monitoring and sediment studies conducted by both EPA and GE, EPA concludes that the sediments have been and will continue to be a significant source of PCBs to the Upper Hudson. EPA does not agree with the commenters' assertion that the conclusions of the LRC Report are not valid and rejects the implication that the LRC report is the basis for "erroneously concluding" that buried sediments should be remediated. The findings of the LRC Report have been misinterpreted and incorrectly summarized by several of the commenters. The conclusions are repeated here below as well as in Chapter 2 in Responses to Master Comments 577, 625, and 641. As it pertains to the comment above and reflecting the peer review input, EPA concluded:
• The fine-grained sediment areas of the TI Pool examined as part of the LRC program saw a decline in the Tri+ PCB inventory over the period 1984 to 1994. The degree of
Responsiveness Summary Hudson River PCBs Site Record of Decision
4-15
loss varied but the mean loss was 45 percent, with a possible range of 4 to 59 percent. Excluding dechlorination losses, the mean loss was 43 percent.
• In the hot spots below the TI Dam, PCB loss was documented in a number of
locations although the exact amount of PCB loss is less certain.
• To the extent that these areas are representative of the fine-grained areas as a whole, similar mass losses would be expected in some areas while others will see deposition and possibly burial.
• Burial of PCB-contaminated sediment is not occurring everywhere. Of the areas
studied, more areas saw PCB loss than gain, implying that burial was not preventing the re-release of PCBs from the sediments in those areas.
It is also important to note what the EPA did not conclude in the LRC Report:
• The EPA did not conclude that all the sediments of the TI Pool lost 43 percent of their PCB inventory. The LRC Report only examined sediments from the 30 percent of the sediments of the TI Pool that are fine-grained (cohesive).
• The EPA did not conclude that deep sediments participate directly in the control of
water column loads and biological exposure. EPA has consistently stated that the biologically active zone is approximately 10 and perhaps as great as 15 cm deep (Response to Master Comment 637, Chapter 2).
However, EPA did conclude that much of the sediment at the surface of the TI Pool is not recently deposited because the PCB levels they contain could not have been generated by the upstream sources any time in the last 10 to 15 years. (USEPA, 1997, Section 4 and White Paper – Relationship Between PCB Concentrations in Surface Sediments and Upstream Sources). Thus the PCBs controlling the water column and biological exposures are part of historical deposits, probably created in the 1970s, which have remained at or near the surface. These historical PCBs are responsible for the continued high concentrations that are found in surficial sediments of the Upper Hudson. EPA recognizes that there may be higher concentrations at depth in some locations; nonetheless, it is EPA’s conclusion that much of the existing surface contamination represents historical material. To put it simply, historical deposits of PCBs remain at the surface in many areas of the Upper Hudson. It is largely these deposits which EPA addresses in the selected remedy. Finally, EPA agrees that the best estimate of 43 percent mass loss from selected fine-grained sediment areas in the TI Pool is subject to uncertainty. Evaluation of the uncertainty in this estimate is discussed at length in Response to Master Comment 641, Chapter 2. While the exact number cannot be verified from currently available data, EPA concludes that the data do conclusively demonstrate that a mass loss has occurred.
Responsiveness Summary Hudson River PCBs Site Record of Decision
4-16
References USEPA, 1997. Phase 2 Report, Further Site Characterization and Analysis. Volume 2C - Data Evaluation and Interpretation Report (DEIR), Hudson River PCBs Reassessment RI/FS. Prepared for USEPA Region 2 and USACE, Kansas City District by TAMS Consultants, Inc., The Cadmus Group, Inc., and Gradient Corporation. February. USEPA, 1998. Phase 2 Report, Further Site Characterization and Analysis. Volume 2C-A - Low Resolution Sediment Coring Report (LRC), Addendum to the Data Evaluation and Interpretation Report, Hudson River PCBs Reassessment RI/FS. Prepared for USEPA Region 2 and USACE, Kansas City District by TAMS Consultants, Inc., Gradient Corporation, and TetraTech, Inc. July. 4.2.1 PCB Mass vs. Surface Concentration Master Comment 313214 Commenters noted that the Proposed Plan lists two different values for the estimated mass of PCBs removed under the REM-0/0/3 Alternative: 63,500 kg (p.25) and 70,150 kg (p.17). The mass difference and percentages calculated use both these numbers relative to the 45,600 kg PCBs estimated to be removed under the REM-3/10/Select Alternative. Resolve the correct value. Response to Master Comment 313214 EPA’s current estimate of PCB mass removed under the REM-0/0/3 is 84,000 kg. The derivation of this value is presented in White Paper – Sediment PCB Inventory Estimates. The original value for the estimated mass of PCBs to be removed under the REM-0/0/3 Alternative was 63,500 kg. The previous value (70,150 kg) was an earlier estimate based on a slightly different set of assumptions and was inadvertently included in the text. The revised PCB mass estimate reflects an improved understanding of the PCB inventory of the TI Pool sediments. The estimated total PCB mass to be removed from River Section 1 was recalculated integrating the 1984 NYSDEC sediment cores with the new information. Various factors were applied to Tri+ values to obtain total PCB estimates, based on individual concentrations. White Paper – Relationship Between Tri+ and Total PCBs contains a further explanation. The value for River Section 1 under the REM-0/0/3 Alternative is now 42,600 kg. The total PCB mass for the remedial target areas in River Section 2 was determined from the Phase 2 1994 low-resolution cores (USEPA, 1998). A revised estimate for the unremediated areas that yields a minor change in the inventory for this section is given in White Paper – Sediment PCB Inventory Estimates. The revised estimate of PCB mass for Section 2 under REM-0/0/3 was calculated by combining the original mass estimate based on the 1994 data for areas greater than 10 g/m2 plus the navigational dredging with a mass estimate for the coarse-grained areas of the section derived from the GE 1991 composite samples. This yielded a value of 28,000 kg as a best estimate of the remediated mass of Total PCBs in Section 2 under REM-
Responsiveness Summary Hudson River PCBs Site Record of Decision
4-17
0/0/3. This number is presented in Table 363334-3. The Total PCB inventory for the entire river section was estimated at 28,200 kg. The Total PCB mass for Section 3 was calculated from the low resolution cores for the identified hot spots in this area. Thus the mass of total PCBs removed under the 3 g/m2 threshold is unchanged at 13,500 kg. Therefore, the revised estimate for total PCB mass removed under REM 0/0/3 is now 84,000 kg. To place this revised value in context, the revised estimate of the total PCB mass removed under the selected remedy (REM-3/10/Select) is 69,800 kg. Reference USEPA, 1998. Further Site Characterization and Analysis. Volume 2C-A Low Resolution Sediment Coring Report (LRC), Addendum to the Data Evaluation and Interpretation Report, Hudson River PCBs Reassessment RI/FS. Prepared for USEPA Region 2 and USACE, Kansas City District by TAMS Consultants, Inc., Gradient Corporation, and TetraTech, Inc. July. 4.2.2 Cohesive vs. Non-Cohesive sediments Master Comment 313266 Commenters assert that the models indicate that a majority of the PCBs come from the non-cohesive sediment. Commenters contend that EPA's focus on the fine-grained sediments is not because they control PCBs in fish but to push the view that buried PCBs do not, in most cases, stay buried. If PCBs are not being buried and isolated by less contaminated sediments, why is EPA proposing to cover dredged surfaces with fill to isolate PCBs? Response to Master Comment 313266 EPA agrees that the non-cohesive sediments play an important role in the long-term PCB dynamics of the upper Hudson River. EPA is not unduly focused on the fine-grained sediments. Instead, the information and analyses contained in the FS demonstrate that remediation of both cohesive and non-cohesive sediments will be needed in the Thompson Island Pool. As stated in the FS, “extensive remediation of diffuse contamination is required in River Section 1 to achieve a substantial decline in Tri+ PCB concentrations in water, sediment, and fish.” Indeed, in the selected remedy, approximately half of the sediment area targeted for removal consists of non-cohesive sediment. The non-cohesive sediments of the TI Pool have, on average, much lower total and Tri+ PCB concentrations than many of the cohesive sediments. Despite this, the non-cohesive sediments play an important role in mediating long-term transport out of the TI Pool. The reasons that they play such an important role in determining the long-term average concentrations leaving the pool are threefold:
• The non-cohesive sediments constitute the majority of the sediment surface area of the pool (Table 5-1 and Figure 5-8 in USEPA, 2000).
Responsiveness Summary Hudson River PCBs Site Record of Decision
4-18
• The non-cohesive sediments are generally at greater risk of hydrodynamic scour during high flow than cohesive sediments, and thus more readily release PCBs via scour during flood periods.
• The non-cohesive sediments have lower concentrations of organic carbon, and thus less ability to retain PCBs by sorption.
While the non-cohesive sediments play an important role in releases of PCBs during high flows, the cohesive sediments store the highest concentrations of PCBs and play the greater role in controlling exposure to biota. Specifically:
• The cohesive sediment areas contain the highest near-surface total and Tri+ PCB concentrations, which provide a direct route of exposure to biota.
• The role of non-cohesive sediments in the mass balance is most important during
flood events when scour may occur. Such flood events, typically in the spring, may move a large percentage of the annual PCB load. The most important exposure to biota, however, occurs during the summer low-flow period. During this period, the water column exposure concentration in the areas of the TI Pool in which most fish species forage is most affected by releases from high-concentration cohesive-sediment hot spots that appear to be driven by biological processes (Response to Master Comment 621, Chapter 2.).
• The cohesive sediments are the areas of greatest biological activity and constitute the
primary forage area for many fish species. They are also the areas of greatest benthic macroinvertebrate activity. Thus, exposure to cohesive sediments by biota is amplified relative to their horizontal extent, and it is appropriate to conclude that PCBs in fine-grained sediment are an important control on PCBs in fish in the Thompson Island Pool.
• Cohesive sediments contain the majority of the total and Tri+ PCB mass within the TI
Pool sediments. For 1984, 58 percent of the total PCB mass in the TI Pool is estimated to have been in the cohesive sediment areas, based on the revised estimates presented in Appendix B, Table B-2 of USEPA, 1999. The calculations in White Paper – Sediment PCB Inventory Estimates indicate this fraction to be 62 percent (Table 363334-1).
• A portion of the PCBs released from cohesive sediments by biological activity is
likely to be temporarily stored in surficial non-cohesive sediments, from whence it may be subsequently released and transported downstream.
As discussed in Response to Master Comment 637 (Chapter 2), PCBs within cohesive sediments to depths of up to approximately 10 cm contribute directly to the food chain. Further, EPA concludes that the stability of more deeply buried PCBs in sediments cannot be reasonably assured (Response to Master Comment 619, Chapter 2). As described in the FS, it will be necessary to remediate both cohesive and non-cohesive sediment areas within River Section 1 to achieve remedial goals.
Responsiveness Summary Hudson River PCBs Site Record of Decision
4-19
EPA notes that the statement on p. 5-56 of the FS that “[c]oncentrations of Tri+ PCBs in the water column at the TI Dam are most strongly related to the non-cohesive sediment concentrations” requires clarification. Loading from cohesive sediments appears to control the PCB concentration at the dam during summer low flow conditions with high biological activity, while releases from non-cohesive sediments appear to be more important during the spring flood events that may move a large proportion of the total annual PCB flux across the dam. EPA’s plan to cover dredged areas with fill is not in conflict with EPA’s determination of the instability of existing sediment stores. First, natural sedimentation is a heterogeneous and uncontrolled process that provides a less reliable barrier than an engineered placement of backfill. Second, EPA does not contend that backfill will completely isolate any and all residual contamination, although backfill will help reduce the flux of any residual PCBs into the water column. The important point is that the residual concentrations after remediation will be much lower than the current surface sediment concentrations, and will thus contribute less PCBs to the water column, regardless of the efficacy of the backfill in controlling flux. As described in Section 5.2.6 of the FS, placement of clean backfill serves a number of important purposes in remediation of the riverbed, including isolation of any dredging residuals, mitigation of potential bathymetric changes in shallow areas, and habitat replacement. While isolation of dredging residuals is a principal purpose for the use of backfill, the type of backfill selected is dictated by habitat replacement goals. References USEPA, 1999. Responsiveness Summary for Volume 2C-A, Low Resolution Sediment Coring Report. Addendum to the Data Evaluation and Interpretation Report, Hudson River PCBs Reassessment RI/FS. Prepared for USEPA Region 2 and USACE, Kansas City District by TAMS Consultants, Inc. and Tetra Tech, Inc., February 1999. USEPA, 2000. Phase 2 Report, Further Site Characterization and Analysis. Volume 2D - Revised Baseline Modeling Report (RBMR), Hudson River PCBs Reassessment RI/FS. Prepared for USEPA Region 2 and USACE, Kansas City District by TAMS Consultants, Inc., Limno-Tech, Inc., Menzie-Cura & Associates, and Tetra Tech, Inc., January. 4.2.3 Minimum Target Area for Dredging (50,000 sq ft minimum) Master Comment 599 Commenters note that neither the Expanded Hot Spot Remediation nor the Hot Spot Remediation will remove all sediments at a mass per unit area (MPA) higher than 3 g/m2 or 10 g/m2, respectively. About 15 percent of locations with MPA greater than 3 g/m2 fall outside the boundaries of the Expanded Hot Spot Remediation area. About 27 percent of locations with MPA greater than 10 g/m2 fall outside the Hot Spot Remediation area. Commenters question why the preferred alternative is not achieving closer to 100 percent inclusion of areas with an MPA greater than 3 g/m2. Comments state that the reasons for including or excluding some areas from the removal plan are not explicitly stated (for example not all hot spots are targeted for removal).
Responsiveness Summary Hudson River PCBs Site Record of Decision
4-20
It appears that the smaller hot spots are not being removed because they represent areas less than 1.15 acres (50,000 sq. ft.). Other hot spots appear to be excluded because of sediment grain size (in general, the non-cohesive areas are not targeted for removal). These non-cohesive sediments serve as substrate for several species of submerged aquatic vegetation, which serve as important fish feeding, spawning and refuge areas. At a minimum, these highly contaminated areas should be remediated as well as all contaminated fine-grained nearshore sediments, especially those contiguous with known hot spots. Response to Master Comment 599 Taking into consideration the available data for each river section, criteria were defined for the selection of the remedial target boundaries. Thus both MPA and surface concentrations were considered in defining remediation areas. Both parameters were used to identify remedial areas where elevated levels of PCBs are characteristic of the river sediment. A list of these criteria was provided for each remediation threshold (Full-Section, Expanded Hot Spots [greater than 3 g/m2] and Hot Spots [greater than 10 g/m2]). However, as already explained in Chapter 3 of the FS report, these criteria were applied more as guidelines rather than absolute rules. Specifically, it is not appropriate to apply the criteria on a strict basis because of the high degree of variability of the sediment contamination; an isolated high value in the middle of a region of low contamination does not represent an appropriate remediation target. In this instance, the area of high contamination is likely to be “small” both horizontally and vertically since it is uncharacteristic of the area (i.e., it is an isolated high value). Thus the area associated with the isolated high value would not be targeted because of engineering considerations. Ultimately, however, the dredging boundaries will be defined based on the remedial design sampling program and not on the historical data sets. Thus, the boundaries drawn for the FS represent general guides, useful for identifying likely areas for remediation and estimates of sediment mass and volume for the purposes of engineering estimates. Chapter 3 of the FS report describes the selection criteria for each removal scenario (pages 3-42 to 3-44). The chapter also provides examples (page 3-45 through 3-52) of remediation area selections and describes the approach behind the decision/selection process for each example. EPA did not describe the selection process for each sampling location since such a process is inherently tedious in nature and is not easily summarized except as presented in the FS. In a similar fashion, the EPA did not provide a sample-by-sample discussion of the excluded locations for the same reason, and will not provide one here. There are nearly 3000 historical sampling locations, including NYSDEC, EPA, and GE data, so that such a discussion is not appropriate. More to the point, as mentioned above, the areas identified for the FS serve as general guides and not final boundaries. Thus the selection process used here will not yield the final remediation area boundaries. These final boundaries will be identified during the remedial design. The issue of sample area requirements is further clarified here. The threshold of 50,000 sq ft. applies only to isolated locations, not clusters or groups of samples. Thus, clusters of locations meeting the criteria were selected even if their individual areas did not represent 50,000 sq ft. each. In this regard, additional information such as sediment type, bathymetry, and proximity to shore were also considered. That is, an individual high value was more likely to have been selected as a target if it was located in an area of fine-grained (cohesive) sediments, located in
Responsiveness Summary Hudson River PCBs Site Record of Decision
4-21
shallow water or located close to shore. An isolated high value in the middle of the river in the channel in an area of coarse (non-cohesive) sediment was less likely to have been selected. This is not to imply that coarse-grained sediments have been ignored. Rather, in these areas, clusters of elevated contamination were identified and selected for remediation as well. As evidence of this, note that under the Expanded Hot Spot threshold, 282 acres of the TI Pool were identified for remediation, including navigational areas. Slightly more than half of this area, 155 acres, were non-cohesive sediments. Of the remainder, 123 acres were cohesive sediments and 4 acres represent mounds and structural areas. This represents 44 percent of the non-cohesive sediment area and 84 percent of the cohesive sediment area of the TI Pool, as identified by side-scan sonar. The approach applied by EPA serves to yield remediation areas of sufficient size to permit an efficient engineering operation. As can be seen in Figures 597-4 and 597-5, the Expanded Hot Spot threshold captures most (greater than 85 percent) locations meeting the concentration and MPA criteria. At higher concentrations, the capture “efficiency” increases even further. As a direct result of the heterogeneity of the sediment and the consideration of other criteria (such as sediment type), however, many low-level sites are selected for remediation as well (Figures 597-4 and 597-5). The approach used by EPA serves to identify all substantial areas of contaminated sediment for remediation, emphasizing those areas of fine-grained sediment. As noted by the percentages given above, nearly all fine-grained areas of the TI Pool have been slated for remediation. Similarly, areas of elevated PCB contamination have been selected regardless of the sediment type. Isolated sediment contamination or small, isolated areas of fine-grained sediments have been excluded because of the reality of the engineering solutions available for the remediation of Hudson River sediments. As noted in Response to Master Comment 597 in Section 4.3, the boundaries and estimates provided in the FS serve as a general guide for engineering estimates and subsequent remedial design sampling. The final selection of sediment areas for remediation will be done during the remedial design, incorporating the results of the remedial design sampling as well as any other appropriate data. 4.3 Use of Mass per Unit Area (MPA) as a Criterion Master Comment 597 Commenters stated that the MPA criterion has no direct relevance to exposure. As a result, the preferred remedy is not extensive enough and should be made more comprehensive in order to better protect natural resources. Comments state that effectively, the MPA approach taken by EPA is based on engineering decisions and does not fully account for the threat to ecological receptors. Many commenters would like an explanation of MPA as an alternative selection criterion.
Responsiveness Summary Hudson River PCBs Site Record of Decision
4-22
Response to Master Comment 597 Although the MPA variable was used in the naming of the various remedial alternatives, it was one of up to a dozen different measurements of five principal variables considered for area selection. In the selection process, there were five major criteria that were examined in selecting remedial areas. These criteria were defined in Section 3.5 of the FS and are repeated here in summary form. The overall basis for selection of sediment areas considered geochemical and statistical interpretation of the data, including observations concerning PCB transport as seen in the water column monitoring data, changes in sediment inventory over time (i.e., between sediment surveys), the local density and homogeneity of the sediment PCB distribution both within and among various sediment surveys, and impacts on the biota. The available parameters that best represented these considerations were PCB inventory, PCB concentration, sediment texture (defined by the side-scan sonar survey), proximity to shore, and river bathymetry. The PCB inventory was best characterized by the mass per unit area (MPA) estimate. PCB concentrations were examined in three forms: the surface concentrations, maximum concentrations, and the length-weighted average (LWA) concentrations. Each of these parameters provides a different perspective on the extent of contamination and thus all were useful in the classification of remedial areas. For further detail on the means for selection of remedial areas, see Section 3.5 of the FS, most particularly Section 3.5.4. Figures 3-15 to 3-21 provide detailed examples of the application of the above criteria and the suite of data sets considered in the selection of target areas in the vicinity of six major hot spots (i.e., Hot Spots 8, 14, 28, 34, 35, and 36). Five criteria were established for both the Expanded Hot Spot Remediation (the “3” in 3/10/Select), and the Hot Spot Remediation (the “10” in 3/10/Select). Two of the five criteria set values for the MPA and surface concentrations, two more involved the size of target areas, and the fifth was the criterion for the target boundaries based on sediment texture bounds and bathymetry where appropriate. The MPA was chosen as a target area criterion since it provides a basis to estimate total PCB mass contained in a large area. The MPA is a two-dimensional variable, reducing each core or grab to an area-based measurement by integrating over the depth of the sample. Its application here is in part because of the two dimensional nature of defining the target areas. The process of selecting targets is to specify areas for remediation. Once selected, the goal for the residual concentration in the area is zero, not some depth at which the concentration drops below a threshold. Thus for the purposes of naming the scenarios, the MPA is most reflective of the nature of the remediation. That is, select all areas where the MPA exceeds the threshold (e.g., 3 g/m2) and then remove all contamination to be found. This measure is most appropriate for a man-made chemical like PCBs where the background concentration in the sediment is truly zero (i.e., pre-1945 sediment). Setting a strict concentration criterion would imply that dredging would occur to some depth and then stop once concentrations were low enough, that is, when the background concentration is some real value. In this sense then the MPA nomenclature more closely reflects the ideal goal of the remediation, that is, to leave a zero residual.
Responsiveness Summary Hudson River PCBs Site Record of Decision
4-23
(It is noted here while it is EPA's goal to remove all PCB-contaminated sediment at a given location [i.e., removal to “zero” PCBs], EPA recognizes that some PCB residual is likely. This residual is estimated to be 1 ppm Tri+ PCBs or less prior to the application of backfill.) Surface concentrations alone would not be sufficient to select remediation areas, since factors that affect the PCB inventory can affect the MPA and surface concentration in different ways. For example, losses via porewater migration or resuspension will decrease the MPA but will not necessarily affect the surface concentration. Depending on the variation of concentration with depth, the concentration may increase or decrease. Burial by less contaminated sediments would decrease the surface concentration but increase the MPA by adding more PCB mass to the location along with the settling sediments. When both MPA and concentration are considered together, a more extensive understanding of the sediments and their importance as sources is achieved. For both the 1984 and 1994 data sets, MPA was found to correlate strongly with surface concentration. Therefore, an appropriate MPA criterion would also yield an appropriate surface concentration criterion. The correlation of MPA and surface concentration is exhibited on a Tri+ basis in Figures 3-10 and 3-11 of the FS. These figures are repeated in the Responsiveness Summary as 597-1 and 597-2. The figures represent the relationships among MPA and surface concentration for both cohesive and non-cohesive sediments on a Tri+ basis. As might be expected, the length-weighted average correlates more closely with MPA, since both MPA and the length-weighted average account for all core segments, as well as considering core length. Nonetheless, surface concentration is still correlated with MPA, such that the consideration of both factors for target area selection should identify the worst contamination for both short-term and long-term impacts. A similar relationship can be seen for the 1991 GE surface sediment composites. This is illustrated in Figure 597-3. Here again, both surface concentration (0-5 cm) and MPA are correlated. These confirm the findings from the 1984 and 1994 data sets; that is, that sites with high MPA also tend to be sites with high surface concentrations. This is consistent with the EPA's finding that elevated surface concentrations are the result of historical contamination still present at the sediment surface. That is, elevated surface concentrations reflect the presence of historical sediment contamination at the surface and the absence of significant burial of sediment PCBs by “cleaner” sediments. Thus the inventory of PCBs at a location and the surface concentration of PCB are found to correlate. The correlation between MPA and surface concentration is further illustrated in Figures 597-4 and 597-5. In these figures, the “capture efficiency” of the Expanded Hot Spot Remediation is represented for both Tri+ and total PCB for the Thompson Island Pool. The capture efficiency is the percentage of all sampling locations actually selected versus the entire set of samples above a given threshold. Thus, given a set of 100 locations with an MPA greater than 3 g/m2, a capture efficiency of 85 percent at an MPA 3 g/m2 would mean that 85 of the 100 locations were contained within the target areas. The sampling locations considered here are from the NYSDEC 1984 sediment survey, and the remediation areas correspond to the proposed remediation in the TI Pool (Expanded Hot Spot Remediation), which targets a Tri+ MPA of 3 g/m2 and a Tri+ surface concentration of 10
Responsiveness Summary Hudson River PCBs Site Record of Decision
4-24
mg/kg. As further demonstration of EPA's consideration of multiple criteria, note that while the capture efficiencies for both the MPA and the surface concentration criteria are high, the capture efficiency of the proposed remediation is measurably higher for the surface concentration criteria. For Tri+, the capture efficiency for locations with MPAs greater than 3 g/m2 is 85 percent, while the capture efficiency for locations with Tri+ surface concentrations greater than 10 ppm is 87 percent. When Total PCBs are considered, the capture efficiency for locations with a Total PCB MPA of 3 g/m2 is 84 percent, and the capture efficiency for locations with total PCB surface concentrations greater than 10 ppm is 86 percent. Thus the targeted areas are more successful at capturing surface sediment locations above the criteria than they are at capturing MPA exceedances. Overall, 76 percent of the sample locations from 1984 are within the proposed remediation areas. The fact that there are some locations above the criteria that are not targeted is a reflection of the heterogeneity of the sediment contamination. This is expressed as the less-than-100-percent efficiency above the threshold criteria as well as the high percentage removal below the threshold. Note that overall, the targeted areas under the selected remedy will remove 76 percent of all 1984 sampling locations, regardless of concentration (effectively, a 76 percent capture efficiency at the 0 g/m2 threshold). Limitations of dredging equipment, availability of sediment in and among rocks and rock outcrops, and similar factors guarantee that no operation could remove all contamination. In its selected remedy, EPA recognizes this and strikes a balance between engineering limitations and the desire to achieve the RAOs as quickly as possible. Notably, the selection of areas for remediation presented in the FS represents only an initial analysis prepared for the purposes of the engineering analysis. Thus the foregoing discussion serves to illustrate how the existing data were applied to the remediation area selection process. These areas provide a general guide as to where the final remediation areas are likely to be found. Ultimately, however, the remediation areas will be refined based on the sediment sampling and side-scan sonar investigations to be conducted during the remedial design. It is expected that some adjustments will be made to the remediation areas described in the FS, but that the total sediment area and volume estimates developed for the FS and this Responsiveness Summary are good approximations of the final values. 4.4 Section-Specific Target Criteria Master Comment 595 Many commenters felt that the selected remedy is not sufficiently protective of natural resources, nor does it adequately address the threat to ecological receptors from sediment contamination. In particular, comments stated that the mass per unit area (MPA) approach taken by EPA was based on engineering considerations and does not fully account for the threat to ecological receptors from sediment contamination because it does not directly consider risk reduction benefits. Commenters stated that the natural resource benefits that will accrue from additional remediation warrant the incremental costs of achieving a greater degree of protectiveness. Commenters suggested that implementing a more comprehensive remedy, such as the REM-0/0/3 Alternative or the REM-3+ selected areas/3/3 scenario, does not result in any diminishing returns in terms of the benefits of the remedial action. To the contrary, comments suggested that substantial
Responsiveness Summary Hudson River PCBs Site Record of Decision
4-25
additional benefits would result from the incremental cost of additional remediation. Commenters wanted clarification on why Hot Spot 38 and others are not slated for remediation under EPA's preferred remedy. Response to Master Comment 595 The EPA recognizes that some additional areas could be targeted at relatively low cost based on the estimated cost per ton of contaminated sediment for the FS. However, there were several criteria that EPA had to balance in developing the selected remedy, not just the incremental cost of dredging. Besides the additional dredging costs, EPA had to consider the following issues:
• The incremental increase in water column loading from the sediments decreases as the water moves downstream from the TI Pool. This suggests that there are fewer sediments involved in PCB release in the downstream river sections relative to the TI Pool.
• The model forecasts showed relatively little improvement in recovery of the river for
the REM-0/0/3 Alternative as compared to the selected remedy (REM-3/10/Select). This analysis suggests that little benefit comes from the additional dredging. For the REM-3+Select/3/3 scenario, the expected improvement would be even less than the REM-0/0/3 Alternative.
• The model shows little improvement in River Sections 2 and 3 for the REM-3/3/3
scenario as compared to the selected remedy (REM-3/10/Select). Some of this is undoubtedly due to the reduced resolution of the model in this reach, which in turn is related to the reduced amount of available data. Nevertheless, EPA believes that its target area criteria for River Sections 2 and 3 are appropriate because there has been no sediment survey akin to the 1984 survey in this region since 1978. Thus, the degree of uncertainty for both the PCB inventory and the outcome of any dredging in this region is greater. The level of uncertainty increases further into River Section 3. There is little side-scan sonar data for Section 3.
• As described in the FS and in the foregoing Response to Master Comment 597, the
targeted areas include more than 85 percent of the areas with PCB concentrations greater than 10 ppm and more than 75 percent of the areas greater than 3.2 ppm. The reason that these percentages are not higher is the difficulty of sediment removal in the remaining areas. Access limitations, shallow underlying bedrock, and small areas (less than 50,000 sq ft) were some of the primary reasons these areas were excluded. As a result, many of these areas cannot be added without a disproportionate increase in cost. Special provisions and equipment would have to be made to remediate these areas. Thus, the incremental costs to remediate many of the areas suggested by the commenters would not simply be increments of the estimated cost per cubic yard under the selected remedy.
Responsiveness Summary Hudson River PCBs Site Record of Decision
4-26
After considering all these issues, EPA selected the REM-3/10/Select Alternative. Note, however, that the final areas and boundaries will be refined during remedial design. This program will resolve many of the uncertainties in River Sections 2 and 3 with regard to sediment concentration and inventory. In regard to the specific reference to Hot Spot 38, EPA’s decision not to include it in the selected remedy is based on several considerations. EPA’s main goal in this river section was to identify the likely volume of sediment with the potential to release a significant mass of PCB in the future. Unlike Sections 1 and 2, no side-scan sonar data were available to discern fine-grained and coarse-grained areas. EPA also recognizes that the data obtained in the 1976-1978 NYSDEC survey have analytical limitations due to the age of the analyses, among other factors. Additionally, EPA anticipates that many areas originally surveyed have since been modified by natural geochemical and hydrodynamic processes. EPA concluded that one hot spot in this area had lost a significant portion of its PCB inventory although the exact magnitude of the change was unclear. In view of these uncertainties, EPA opted to select a subset of the original hot spots in the section. The two hot spots examined by EPA in Phase 2 (Hot Spots 37 and 39) plus 36 were selected to best estimate the likely volume of material to be removed from this River Section. Like River Sections 1 and 2, the final area selected for removal will be decided on the basis of the remedial design sampling. Master Comment 359303 Commenters expressed concern about not dredging Hot Spot 39 in its entirety. Commenters noted that the EPA's Proposed Plan calls for removal of only a portion of Hot Spot 39; however, the overall PCB inventory of this Hot Spot is documented as 25 percent of the TIP PCB inventory. Commenters feel that the entire hot spot should be remediated. Since Hot Spot 39 is downgradient from the confluence of the Hudson and Hoosic Rivers, possible high-flow events may redistribute PCB sediment inventories if they are not all removed. Commenters also questioned the amount of sediment deposition occurring in Hot Spot 39, as well as the PCB concentrations of these newly deposited sediments. Response to Master Comment 359303 The selected remedy includes the removal of selected areas of elevated PCB contamination in River Section 3, which is the section that contains Hot Spot 39. The selected areas of Hot Spot 39 were identified for remediation because of the presence of elevated PCB concentrations (greater than 30 mg/kg) in the upper sediments (0-12 inches) that may be lost to the water column or taken up by biota. Cores from the selected areas were generally considered “complete” or “nearly complete” in that they had decreasing PCB or cesium-137 levels with depth and probably represented the entire thickness of post-1950 contaminated sediment (see Chapter 3 of USEPA, 1998 for further discussion). This condition is typical of many of the areas selected for remediation throughout the Upper Hudson. The area defined as "the southern portion of Hot Spot 39" and included in the selected areas for River Section 3, is primarily located to the south of the NYSDEC boundary for Hot Spot 39. Within this area, the central portion has not been identified for remediation based on currently
Responsiveness Summary Hudson River PCBs Site Record of Decision
4-27
available data (see Sheet 6 of 7 of Plate 17 in the FS). Additionally, the northern portion of the hot spot as originally delineated is not currently identified for remediation. The portions of Hot Spot 39 that have not been selected are not characterized by elevated PCB levels in the surface sediments (0-12 in). In the northern portion of Hot Spot 39, the four 1994 low resolution cores yielded relatively low values for surface concentrations in this area (1 to 20 mg/kg), below the 30 mg/kg threshold. These cores also had low MPA values as well, with three of the four cores exhibiting little PCB mass below the top core segment. On the basis of these cores, this area of Hot Spot 39 was not selected for remediation since both its surface concentration and PCB inventory were below threshold considerations. The three cores located in the excluded central area show low Total PCB concentrations (about 5 mg/kg) in the 0-12 inch interval. Additionally, and more importantly for this area, these cores show a PCB maximum concentration in the deepest core segment, nominally 24 to 40 inches. These cores were considered to be “incomplete” with higher levels of both PCBs and cesium-137 with depth. These cores are indicative of high rates of deposition, essentially burying the PCB inventory. Locations that have PCB maximum concentrations at depth are atypical of the remedial target areas of the Upper Hudson where elevated concentrations and the majority of the PCB inventory are close to the sediment/water interface. These conditions led to the conclusion that this portion of Hot Spot 39 was undergoing rapid burial and could be left in place. While the 1994 EPA data were the basis for the exclusion of these portions of Hot Spot 39, these data were also the basis for including an extensive area of contamination not originally identified by NYSDEC in 1979. Specifically, the southernmost portion of the river shoreline near Hot Spot 39 as well as an adjacent cove were included in the selected area for remediation based on the 1994 core samples. These areas represent areas of high surface concentration and high PCB inventory. (These areas are illustrated on Sheet 6 of 7 of Plate 17 of the FS.) The Total PCB surface concentrations in the excluded portions of Hot Spot 39 under the selected remedy are fairly well defined. In the northern portion, the four 1994 cores all yielded values at 20 mg/kg or less. In fact, two of the cores had surface concentrations less than 2 mg/kg. In the excluded area, the reported 1994 PCB concentrations of roughly 5 mg/kg in each of the three cores collected in this area indicate a fairly thick layer of relatively clean material in each location. The fact that all three cores yielded nearly the same value provides further support for the occurrence of extensive burial within that portion of Hot Spot 39. It is not likely that the excluded portions of Hot Spot 39 would be subject to a resuspension event such as the one that was observed during the Reassessment Remedial Investigation in sampling Transect 3. Hot Spot 39 is considered to be far enough downstream of the confluence with the Hoosic that resuspension due to cross-currents caused by the Hoosic is unlikely. The confluence is located 3.2 miles upstream at RM 167.3. Both the intervening distance and the dam at Lock 3 should serve to minimize any Hoosic River flow impacts. No other major tributaries are located in the area. The resuspension event observed in Transect 3 was most likely associated with sediments further upstream closer to the confluence, such as Hot Spot 37. Notably, the deep location of the PCB maxima in these cores suggests there has been little or no erosion by high flows in this area since the highly contaminated material was deposited, probably 20 years prior to EPA’s low resolution core collection program.
Responsiveness Summary Hudson River PCBs Site Record of Decision
4-28
While the excluded central area of Hot Spot 39 would meet the mass-per-unit-area (MPA) criteria for removal used for River Sections 1 and 2 (it has an MPA of greater than 10 g/m2), EPA has determined that it is not necessary to remediate that portion of Hot Spot 39 based on the clear evidence for PCB burial in this area. In any event, the majority of the PCB inventory in the vicinity of Hot Spot 39 will be removed through the remediation of the other portions of the hot spot. EPA will conduct additional sampling in Hot Spot 39 (as well as in other portions of the Upper Hudson) during remedial design to better define the areas to be dredged. Reference USEPA, 1998. Further Site Characterization and Analysis. Volume 2C-A Low Resolution Sediment Coring Report (LRC), Addendum to the Data Evaluation and Interpretation Report, Hudson River PCBs Reassessment RI/FS. Prepared for USEPA Region 2 and USACE, Kansas City District by TAMS Consultants, Inc., Gradient Corporation, and TetraTech, Inc. July. 4.5 Habitat-Based Targeting Master Comment 453 Commenters suggested that EPA add an additional RAO to reduce risks to non-piscivorous wildlife by directly reducing concentrations of PCBs in sediment and water and indirectly reducing PCBs in their diet. Response to Master Comment 453 Although ecological risks are not limited to piscivorous receptors, those receptors are at the greatest risk. In addition to piscivorous birds and mammals, future risks were calculated for the benthivorous mallard, omnivorous raccoon, and insectivorous little brown bat. As discussed in the Response to Master Comment 817 (Chapter 7), most risks to ecological receptors are based on a toxic equivalency (TEQ) measure, which quantifies the toxicity of PCB congeners relative to the toxicity of the potent dioxin 2,3,7,8-TCDD (RBERA, Section 3.1.2). Exposures based on Tri+ PCB calculations (which are nearly equal to total PCBs in most Phase 2 biota samples) have greater compatibility with the current knowledge of PCBs in the Hudson River as well as less uncertainty associated with them than the TEQ estimates. The only non-piscivorous receptor with toxicity quotients greater than one (i.e., unacceptable risks) on a Tri+ PCB basis was the little brown bat, whose future risks were less than three on a NOAEL basis. As risks to non-piscivorous wildlife were not uniformly seen, a separate RAO was not included for these receptors. Reference USEPA, 2000q. Further Site Characterization and Analysis, Revised Baseline Ecological Risk Assessment (RBERA), Volume 2E. Prepared for USEPA Region 2 by TAMS Consultants, Inc. and Menzie-Cura & Associates, November 2000.
Responsiveness Summary Hudson River PCBs Site Record of Decision
4-29
Master Comment 593 Commenters stated that the fine-grained nearshore environment (i.e., within 50 feet of the shoreline) in the Thompson Island Pool was two to three times more contaminated (135-264 ppm) than previously described (66 ppm) in the Phase 1 Report. Some commenters pointed out that these nearshore and vegetated areas are especially important since they can act as a continuing source of contamination and may compromise remedial efforts if excluded from remediation. It was suggested that specific degraded habitats should be targeted for remediation because of the functions they provide or because remobilization of PCBs from these areas can impact important adjacent or downstream areas. The critical habitat that yields fish with exceptionally high PCB concentrations is replaceable and should be sacrificed to eliminate the residual PCB in sediments that could recontaminate downstream remediated areas. Areas in the TI Pool, near Griffin Island, and in River Sections 2 and 3 that support vegetation and fish habitat are not being fully remediated. Response to Master Comment 593 Many nearshore and vegetated areas function as important habitats for fish and macroinvertebrates. In turn, fish and macroinvertebrates serve as prey to a variety of wildlife. Because many vegetated (e.g., SAV) areas are depositional, PCBs tend to concentrate in these areas. PCBs bioaccumulated by aquatic organisms can subsequently be transferred to predators living in and near the river and also to predators outside of the immediate vicinity of the river. They can also be transported downriver in sediments and water. EPA recognizes that nearshore areas, in particular vegetated areas, are some of the most productive but most contaminated areas in the river (FS, Chapter 3). In addition, the main PCB flux from the sediments appears to be biologically mediated, originating from the near-shore environment that supports a high density of plants and animals. EPA concurs with the Federal Trustees for Natural Resources (2001), responsible for the protection of these nearshore areas, who state that “Adverse impacts associated with remediation of these areas will be temporary. The temporary loss will be greatly offset by the accelerated recovery of these areas”. Therefore, EPA considers remediation of these “critical” habitat areas necessary. The selected remedy will remediate 61 percent (63,200 feet of 104,000 feet) of shoreline (i.e., nearshore) area in River Section 1, including island shorelines (e.g., Griffin Island), based on the areas selected in the FS. In River Section 2, 18 percent (15,700 feet of 85,800 ft) of nearshore areas will be remediated, and in River Section 3, 3 percent (11,700 feet of 394,000 feet) will be remediated. Overall, 15 percent (90,600 feet of 585,000 feet) of the nearshore area in the upper river from Fort Edward to the Federal Dam at Troy will be remediated. As noted in the FS (Section 3.5.3), the anticipated remedial operations are not “surgical” in nature and thus it is not appropriate or productive to attempt to remove all sediments exceeding a specified threshold value. It is important to recognize that the purpose of remediation is not to remove all PCB-contaminated sediments exceeding some specified threshold. Given the importance of the near-shore environment to both ecological exposures and PCB release from
Responsiveness Summary Hudson River PCBs Site Record of Decision
4-30
the sediment, the focus of the application of each remediation threshold will be sufficient reduction of PCB mass and concentration to achieve the RAOs, not to target every isolated contaminated area. Detailed data will be collected prior to remediation (Response to Master Comment 507, Chapter 9), and precise dredging locations will be determined during the preparation of the remedial design. Reference Federal Trustees for Natural Resources, 2001. The Federal Trustees for Natural Resources, the United States Department of the Interior (DOI) and the National Oceanic and Atmospheric Administration (NOAA), (together “the Trustees”) comment on the Proposed Plan submitted to the USEPA on April 16, 2001.
Responsiveness Summary Hudson River PCBs Site Record of Decision
5-1
5. TECHNOLOGY EVALUATION AND REMEDIAL ALTERNATIVE DEVELOPMENT 5.1 Technology Evaluation 5.1.1 Capping/AquablokTM Master Comment 651 Commenters stated that there was insufficient information to support AquaBlokTM's use on the scale required in the Upper Hudson. They were concerned that there may be potential problems with hydration, potential problems with aquatic revegetation, and root penetration problems. Commenters felt that there were uncertainties concerning the reliability of the CAP scenarios. Commenters questioned (1) why only mechanical dredges were proposed for CAP-3/10/Select while both mechanical and hydraulic equipment was proposed for REM- 3/10/Select and REM-0/0/3; (2) how hydraulic dredges used either alone or with mechanical dredges would alter estimated costs for the capping alternative; and (3) whether the anticipated placement rate of the cap material is correct. It was also suggested that EPA should use a thin-layer cap over contaminated riverbed sediments at selected locations. Response to Master Comment 651
EPA did not choose CAP-3/10/Select because of concerns about the long-term stability of a cap and the need to monitor and maintain it indefinitely. EPA is also concerned that in the event of a major flood, the cap might be eroded and contaminated sediments would be spread within the sensitive ecosystem. As explained in Chapter 4 of the FS Report, AquaBlokTM is a capping system consisting of gravel particles to which bentonite clay is bonded. Pilot tests of a sufficiently large scale for comparison to the selected remedy for the Upper Hudson River are in progress (e.g., Ottawa River in Ohio and Fort Richardson in Alaska) that do not show problems with proper hydration of the cap material in forming a continuous layer. It should be noted that for CAP-3/10/Select, 12 inches of backfill (consisting of sand, silt, and gravel, as appropriate) will be placed in areas that are dredged but not capped. Areas capped with AquaBlokTM would be backfilled with six inches of sand, silt, and gravel mixture. The main root zone for most aquatic plants is typically within the top six inches. Therefore, revegetation problems would not be expected, since these plants would be primarily established within the backfill materials. It is possible that some of the deeper roots of some aquatic plants could extend up to 15 inches from the surface of the backfill and partially penetrate into the cap materials. The proposed cap is 18 inches thick; therefore even in instances where there is some root penetration, it is expected there would be at least three inches of an impervious AquaBlokTM layer.
It should be noted that mechanical dredges were proposed for CAP-3/10/Select because dredging is only performed in targeted areas between the shoreline and the six-foot navigation contour, and the volume of sediments to be removed for this alternative is relatively small compared to the volume tom be removed for the REM alternatives. The
Responsiveness Summary Hudson River PCBs Site Record of Decision
5-2
use of hydraulic dredges for the capping alternative would not be expected to alter the costs significantly.
As explained in Chapter 4 of the FS, EPA evaluated and rejected a number of capping alternatives including thin layer, multi-layer, and active systems. These systems were generally determined to be inapplicable to the Hudson River due either to problems with placement of the cap material in a riverine environment or to the potential for significant erosion of the cap by river hydraulic forces.
Master Comment 423258 Page 8-34, Paragraph 1: "...in River Section about 1,160 acres of PCB-contaminated sediments are capped". Should it read "...in River Section 1 about 160 acres…."? Response to Master Comment 423258 Yes, the statement on page 8-34, paragraph 1 should read, "...in River Section 1, about 160 acres.…" 5.1.2 Treatment/Vitrification Master Comment 253189 Commenters cited several proven alternative PCB treatment technologies, including beneficial reuse and bioremediation, which may be applicable to the proposed sediment treatment and disposal. They suggested that these technologies could help reduce transportation costs and the amount of hazardous sediments in need of disposal. Several commenters suggested that these technologies need to be re-evaluated before a final remedy is selected.
Response to Master Comment 253189 EPA has, in fact, as suggested by commenters, reviewed the technologies that were previously considered by EPA in the FS Report as well as other technologies that were identified in submittals from vendors during the public comment period. The findings of EPA's current review are the same as those documented in the FS Report. As indicated in the Chapter 4 of FS, the following publications, databases, and technical reports were reviewed as part of the Agency's thorough search to identify and evaluate remedial technologies for possible use at the Hudson River PCBs Site:
• Superfund Innovative Technology Evaluation (SITE) Program (USEPA, 1999). • Selecting Remediation Techniques for Contaminated Sediment (USEPA, 1993). • Assessment and Remediation of Contaminated Sediments (ARCS) Program
Remediation Guidance Document (USEPA, 1994). • USEPA Hazardous Waste Clean-up Information (CLU-IN) website (USEPA, 2000a).
Responsiveness Summary Hudson River PCBs Site Record of Decision
5-3
• USEPA Remediation and Characterization Innovative Technologies (USEPA REACH IT) database (USEPA, 2000b).
• Federal Remediation Technologies Roundtable (FRTR, 1999) website. • Remediation Technologies Network (RTN) Remediation Information Management
System (RIMS, 2000) Database.
These resources identified a number of potential remedial technologies or process options available to treat PCBs at the Site. As an initial screening, each of the potentially applicable remedial technologies was evaluated in terms of effectiveness and technical implementability at the Site. Technologies that were retained after the initial screening were evaluated in a second round of the screening process. The evaluation criteria included effectiveness, implementability, and costs. Technologies that were retained after the second screening were then used to develop remedial alternatives for the Site, as discussed in the FS. For purposes of the detailed analyses in Chapters 8 and 9, certain process options (i.e., hydraulic and mechanical dredging/dewatering/stabilization/beneficial use) were selected for cost analysis/comparison purposes. During the remedial design phase of the project, treatability studies may be conducted to refine the required engineering parameters. White Paper – Additional Technology Evaluation contains additional information relative to evaluation of the submittals from vendors during the public comment period. References Federal Remediation Technologies Roundtable (FRTR) Website. 1999. Information obtained from http://www.frtr.gov. Remediation Technologies Network Remediation Information Management System (RIMS) Database. 2000. Owned and Operated by the Research Technologies Network, L.L.C. provided on http://www. enviroglobe.com. USEPA. 1993. Selecting Remediation Techniques for Contaminated Sediment. EPA/823/B93/001. June 1993. USEPA. 1994. Assessment and Remediation of Contaminated Sediments (ARCS) Program Remediation Guidance Document. Great Lakes National Program Office. EPA-905-B94-003. USEPA. 1999. The Superfund Innovative Technology Evaluation (SITE) Program: Technology Profiles, Tenth Edition. EPA/540/R-99/500. USEPA. 2000a. Hazardous Waste Clean-up Information (CLU-IN) Website. Provided at http://www.clu-in.org. USEPA. 2000b. Remediation and Characterization Innovative Technologies (USEPA REACH IT) Database (includes VISITT; Vendor FACTS; and ITT). Provided at http://www.epareachit.org.
Responsiveness Summary Hudson River PCBs Site Record of Decision
5-4
Master Comment 313704 A commenter indicated that dewatering of the mechanically dredged material was not included in Figure 5-1 of the FS. The commenter also asked about the area requirement of the sediment transfer/processing facility. Response to Master Comment 313704 Assuming that a mechanical dredging technology is selected, hopper and/or deck barges will be used to transport the dredged sediments to the processing/transfer facility. Prior to unloading barges, excess water that would accumulate above the incoming sediments would be pumped off, treated, and discharged back to the river. Once the dredged material has been off-loaded, it will be discharged into a hopper through a series of racks and screens. The dredged material will then be blended with Portland cement (or other stabilizing agent) in a pug mill. The stabilized sediments will be placed into a temporary staging area prior to being loaded into the trucks by either conveyors or front-end loaders for delivery to the rail car loading area. The conceptual unit processes have been presented in Figure 5.1 of the FS. White Paper – Example Sediment Processing/Transfer Facilities contains a preliminary facility layout for treating the mechanically dredged sediment. For the mechanically dredged sediment processing facility, the treatment plant and the associated rail transfer facility will require about 10 to 15 acres of land area (Montgomery, 1985). For the hydraulically dredged sediment processing facility, the treatment plant and the rail transfer facility will require about 15 to 20 acres of land area. Reference Montgomery, J.M. (1985) Water Treatment Principles and Design, John Wiley & Sons, New York, NY. Master Comment 313758 A commenter indicated that thermal destruction should be retained as an option for dealing with dredged material. Response to Master Comment 313758 Thermal destruction is an effective process (Destruction / Removal Efficiency = 99.9999) that uses high temperatures to destroy hazardous contaminants. The technology theoretically could be used at a near-river or off-site location. In accordance with CERCLA Section 121(e)(1), federal, State, and local permits are not required for remedial actions undertaken entirely on site, including incineration, although an on-site incinerator would still need to comply with the substantive requirements of federal and State permitting laws. In any event, numerous on-site
Responsiveness Summary Hudson River PCBs Site Record of Decision
5-5
incineration projects have experienced long delays due to local opposition. The use of existing off-site facilities would avoid such issues but would require transportation of the material. One of the key factors that must be considered in the selection of treatment technologies for PCB-contaminated sediments is what happens to the sediments after treatment is completed. EPA's FS report does retain thermal destruction under the high-value beneficial use option, where manufacture of commercial products is involved (Table 4-13 of the FS). However, EPA's FS report does not retain thermal destruction if the sediments will be disposed of in a landfill after treatment is completed, because such an option would not be cost-effective. That option requires payment of both treatment and disposal costs. Thermal destruction costs in general are moderate to very high compared to other technologies (approximately $560-$900/ton). The high energy requirements and necessary emission controls are the primary contributors to the high costs. For disposal at an off-site incinerator, significant transportation costs may be incurred in addition to treatment costs. Therefore, near-river as well as off-site incineration of PCB-contaminated sediments was not retained for further consideration. A detailed analysis of the treatment options is presented in Chapter 4 of the FS Report. 5.1.3 Dredging Technologies Master Comment 657 Questions have been raised as to whether or not advances in dredging technologies have occurred over the last 10 years or so. Some of the comments suggest that there have been no recent technological advances, and others suggest that numerous innovations have occurred. Response to Master Comment 657 Chapter 5 in the Feasibility Study and FS Appendix H summarize the principal changes that have taken place in both mechanical and hydraulic dredging technologies over the last 10 years. In fact, it is reasonable to conclude that attainment of goals specified for the Hudson River remedy, i.e., removal of targeted sediments without causing significant additional impact, are achievable as a result of the technical advances that have taken place over the last decade. The following paragraphs detail several of the principal changes that have occurred in mechanical and hydraulic dredging systems. The emphasis is on the two variants of mechanical and hydraulic dredging systems that have been identified as preferred for use on the upper Hudson: an excavator fitted with a horizontal profiler-type bucket and an appropriately configured cutterhead suction dredge. There have also been numerous advances in specialty dredging equipment that can be applied to removal work in shallow areas. These systems are discussed in FS Chapter 4 and are not addressed further here.
Responsiveness Summary Hudson River PCBs Site Record of Decision
5-6
Mechanical Dredges
Following is a discussion of some of the major innovations in mechanical dredging systems. Various types of enclosures have been added to clamshell buckets to limit the release of excavated sediments. Examples of systems that employ sophisticated enclosing mechanisms include the Cable Arm bucket (suspended from a barge-mounted crane) and the Horizontal Profiling bucket (attached to a hydraulic excavator). Ten years ago enclosures were, in fact, being added to clamshell buckets to reduce spillage during navigational dredging work. However, those enclosures were essentially retrofits to existing buckets, whereas the Cable Arm and Horizontal Profiling systems are completely new concepts developed specifically to limit contaminated sediment release. In addition to incorporating enclosures in a new bucket design, the Cable Arm and Profiler have incorporated numerous auxiliary devices that further control sediment release. These auxiliaries include vents or valves that allow water to be released as the bucket closes, gaskets to enhance bucket sealing, and sensors to provide information on bucket closure. Each of these auxiliary features enhances the performance of the mechanical dredging system and either was not available or not being applied 10 years ago. One of the most significant, and perhaps least appreciated, recent modifications to the clamshell bucket has been to its cutting profile. The ability of the new bucket systems to take wide, flat sediment cuts has enormous advantage for Superfund-type work, where most contamination is in the upper few feet of sediment. First, the flat cut improves efficiency in areas where only two or three feet of sediment are targeted. Additionally, when coupled with electronic positioning capability, the flat cut allows for development of innovative dredging plans that allows removal work to be phased in horizontal and vertical patterns that would not have been considered 10 years ago. Another major development in the last 10 years has been the application of digital geographic positioning and electronic monitoring technologies to dredging and other earth moving construction equipment. With the use of these digital electronic systems, it has become possible to remove sediments to within several inches of planned targets. Such precise targeting both improves efficiency and allows for real-time tracking of ongoing work by the dredge operator and the construction management team. The recent coupling of micro-processor-based computer systems with remote sensing information from multi-beam sonar and other technologies has allowed contractors to display, in real time, digital terrain information for the work site. With that information, the contractor is able to know the configuration of the river bottom; the targeted dredging limits in relationship to existing bottom; the quantity and location of material that must be removed to achieve project goals; and the mass that has already been excavated. New developments in these digital materials accounting systems are occurring at a rapid pace and undoubtedly will continue into the future.
Responsiveness Summary Hudson River PCBs Site Record of Decision
5-7
Hydraulic Dredges Numerous new approaches to hydraulic dredge design have also occurred over the last 10 years or so. The most significant of these technological improvements have occurred in instrumentation and dredge positioning capability. Also, improvements in dredging equipment - pumps, pipelines, ancillary equipment, and the materials from which they are constructed - have resulted in marked increases in dredging production and efficiency. A brief description of several notable advances in hydraulic dredging technology follows. The swinging ladder is an example of the type of innovative thinking that can potentially be applied to the Hudson River. A swinging ladder is not a new piece of equipment, but it is one that is not commonly used, particularly in Superfund work. In the conventional hydraulic dredge, the ladder is fixed laterally to the hull and “swings” as the hull swings. The dredge completes its swing width by moving the entire dredge hull in one direction then in another. In the newer configuration of the swinging ladder, only the ladder swings from side to side. A swinging ladder can be a more stable and flexible platform, especially if the hull is held in place by spuds rather than anchors. A gooseneck cutterhead dredge is another example of flexible and adaptable technology that has specific applications and is designed to maximize efficiency of the system. On a gooseneck cutterhead dredge, the ladder and cutterhead are angled with respect to the vertical axis of the ladder, so as to keep the cutterhead in a more parallel position with respect to the bed of the river. Different arrangements of the ladder and cutterhead angle might be required as the nominal river depth varies along the river. The impact of technology is most readily appreciated in the computerization of standard operations. Modern dredges have highly instrumented systems for locating and positioning the dredge, as well as for monitoring and documenting dredge production and dredge efficiency. Examples of this increasing automation include pipeline flow meters, slurry density meters, depth sounders, and ladder position indicators. Global positioning systems (GPS) technology and computerized surveying of the river bottom are also used as part of the overall dredging system. Dredge operations management based on information obtained from electronic instrumentation systems is also common today. Detailed real-time reports on virtually all aspects of operations are instantly available, including fuel consumption and status, engine horsepower, and electrical motor operational status. New digital control systems are now being developed that integrate electronic information from dredge operations, process instrumentation, and geographic positioning systems to enable both remote monitoring and control of dredging operations. Finally, considerable knowledge has been gained over the last 10 years with regard to processing sediment slurries generated by hydraulic dredges. Much of this experience comes from sites designated for remediation by EPA under the Superfund program. Since sediments removed from Superfund sites cannot be disposed in an uncontrolled manner, it has proven necessary to develop systems to process these slurries as a first step to either landfilling or treatment. As a result, not only have advances been made in equipment for separating, stabilizing, dewatering, and otherwise improving sediment handling characteristics, but considerable experience has now also been gained in designing entire processing trains that can achieve the level of reliability needed to successfully implement large dredging programs.
Responsiveness Summary Hudson River PCBs Site Record of Decision
5-8
Master Comment 364760 A question was posed relative to the text on page 5-11, in paragraph 1: Limitations are imposed on dredging equipment depending on the option categories. For example, Option Categories B and E are selected if mechanical dredging is performed, while Option Categories A and D are selected if hydraulic dredging is performed. Commenters wondered what dredging equipment will be associated with the selection of Option Category H, and whether defining the equipment for a particular option category may ultimately restrict the selection in the design phase. Response to Master Comment 364760 The commenter has misunderstood the discussion in Section 5.1.2 of the FS. The options listed identify what can potentially happen to the Hudson River sediments after they are dredged, i.e. , disposal with or without treatment or manufacture of commercial products after treatment. EPA assumed that the disposal would be performed at an off-site location because of opposition from the local near-river communities (Chapter 4). The treatment can be performed at a near-river location or at an off-site location. As explained in the text, the particular ex situ treatment considered in the FS prior to disposal is stabilization in order to improve the transportation and handling characteristics of the dredged sediments. The type of dredging equipment used (mechanical or hydraulic) will dictate the choice of the post-removal option categories and not vice versa. Therefore, the FS does not restrict selection of dredging equipment. This selection will be performed during the design phase of the project. Hydraulically dredged does not require stabilization and Option H is one possible post-removal option for the hydraulically dredged sediments. Stabilization (blending with Portland cement or other such additives) may potentially interfere with the manufacturing process for some commercial products that might otherwise present possibilities for beneficial reuse. Master Comment 366358 Commenters have suggested that dredging is not an effective technology and is not guaranteed to work. They feel the technology is not advanced enough yet and that EPA should wait until a less disruptive/destructive technology is developed. In addition, commenters expressed the opinion that the limitations of dredging technology will prevent the EPA from successfully removing the amount of PCBs necessary to have a beneficial effect on the river system. Response to Master Comment 366358 Two dredging technologies have been identified (Feasibility Study, Chapter 5) as being applicable to removal of contaminated sediments within the upper Hudson River. These are 1) a mechanical dredging system utilizing a hydraulic excavator fitted with a European-style horizontal profiling bucket and 2) a cutterhead hydraulic dredge outfitted with a cutterhead and ladder configured specifically for work on the Upper Hudson.
Responsiveness Summary Hudson River PCBs Site Record of Decision
5-9
As stated in Response to Master Comment 657, there have been numerous advances in mechanical and hydraulic dredging systems over the last fifteen years. These advances allow for better monitoring of operations, more precise control of dredge position, and increases in machine productivity. Overall, as a result of the many advances in dredging technology, it is expected that modern dredging equipment will generate markedly reduced levels of suspended sediment in comparison to equipment available in the 1980s. The enhanced ability of modern dredging equipment to limit resuspension will in turn lead to lower water column levels of trace contaminants and reduced impacts to various water quality parameters (White Paper – Potential Impacts to Water Resources). EPA has estimated the quantity of sediment that is expected to be resuspended when either hydraulic or mechanical dredges operate on the upper Hudson (White Paper – Resuspension of PCBs during Dredging). The rates of resuspension are generally predicted to be lower than the natural variation in the river's suspended solids load. As part of EPA's selected remedy, an in-river monitoring program will be conducted to confirm the acceptability of releases from dredging operations. Results of that program can also be used to adjust various dredging parameters (operating speed, production rate, etc.) to further limit releases during dredging. Thus, it is expected that much river disruption can be avoided by selecting appropriate dredging equipment at the outset and then monitoring and adjusting its actual performance. Both the mechanical and hydraulic dredging systems described in the FS have been scaled (sized) to remove the quantity of dredged material necessary to achieve the project's risk reduction targets. Production rates to be achieved by the selected mechanical and hydraulic systems are discussed in White Paper – Dredging Productivity and Schedule. The planned production levels will enable remedial work to be accomplished in six construction seasons from 2005 to 2010. Risk reduction benefits of EPA's selected remedy have been estimated on the basis of a six-year construction period beginning in 2004 and found to be significant. Before EPA initiates dredging operations, considerable additional data will be collected for purposes of designing an environmentally sound project. That data will be used to select final dredging target areas and to create detailed dredging plans and schedules. In addition, EPA will consider the many public concerns related to dredging and will address those concerns as part of the public process that will accompany the project planning. This will be accomplished, in part, by placing numerous constraints on the dredging work, including limits on sediment resuspension and increases in other water quality parameters. As mentioned above, the contractor's work will be monitored to ascertain compliance with the project's technical specifications. Thus by taking a measured and systematic approach to accomplishing the selected remedy, EPA expects to conduct the project without the problems raised as concerns by commenters. In addition, EPA has indicated that, as the project proceeds, there will be considerable opportunity for public review and input both to the planning and the work-in-progress. Given the overall approach being taken to implement the selected remedy, it is not likely that significant unplanned disturbance to the river will occur; should a disturbance arise it will be quickly observed and controlled in accordance with strategies adopted at the outset of work.
Responsiveness Summary Hudson River PCBs Site Record of Decision
5-10
Master Comment 423845 Some commenters have suggested unique alternatives to dredging contaminated sediments. Response to Master Comment 423845 EPA has given some consideration to several of these concepts (e.g., dry excavation) as part of a general review of applicable technologies. EPA has selected dredging as the preferred method of removing contaminated sediments from the upper Hudson in light of the numerous environmental and other constraints posed by river conditions. It is EPA's view that dredging the river will enable effective removal of targeted sediments and, thereby, result in significant reductions of health and environmental risks. None of the technologies suggested by commenters appears to offer the same certainty that project goals can be attained. Master Comment 366262 A number of commenters recommended that hydraulic dredging should be the selected remedy because it will minimize resuspension. Response to Master Comment 366262 Hydraulic dredging technology has advanced to a point where it can, and does, effectively control resuspension of sediments during dredging. Numerous improvements have also been made to mechanical dredging systems to the point where EPA now views this technology as a potential candidate as well (Response to Master Comment 657). To the extent that commenters' concerns relate to sediment resuspension, reference should be made to Response to Master Comment 583 and White Paper – Resuspension of PCBs during Dredging. While control of resuspension will be a major factor in selecting a final dredging technology, some consideration needs to be given to the overall processing and handling of dredged materials. The two dredging technologies described in the FS present substantially different logistical issues for EPA and, consequently, an entire range of unique riverine and community issues. EPA will consider both the in-river and out-of-river aspects of the selected remedy when choosing a dredging technology. Finally, commenters should note that it may be beneficial to utilize both technologies, but in different river segments, to optimize results in an environmentally protective manner.
Master Comment 423609
A commenter contended that it is unrealistic for EPA to assume, as presented in the FS, that the slurry resulting from hydraulic dredging will be approximately 20 percent solids before dewatering. A better estimate, it was suggested, would be on the order of two to five percent solids before dewatering, and perhaps up to 10 percent with the addition of a coagulating agent during initial gravity thickening operations. As a result [of this unrealistic assumption], the FS underestimated the quantity of wastewater that will be generated and require treatment.
Responsiveness Summary Hudson River PCBs Site Record of Decision
5-11
Response to Master Comment 423609
The solids content of hydraulically dredged slurry will vary with time and is a function of suction pipeline inlet velocity, the physical characteristics of the in situ material, and the effective operational controls (Souder et al., 1978). As cited in the ARCS Remediation Guidance Document (USEPA, 1994), typical dredged material solids content varies between 10 to 20 percent by weight (Herbich and Brahme; 1991; Herbich, 1992). The Feasibility Study (Appendix H - Hydraulic Dredging Report) describes specific aspects, properties and characteristics of the materials anticipated during hydraulic removal of contaminated sediments from the Upper Hudson River. An actual solids content of 12 to 13 percent was assumed for estimating the volume of water that is generated and that will require treatment. This information was obtained from actual sediment samples taken from the targeted areas of similar remediation projects.
References
Herbich, D.F. 1992. Handbook of dredging engineering. First Edition. McGraw-Hill Book Company, New York, NY. Herbich, J.B., and S.B. Brahme. 1991. Literature review and technical evaluation of sediment resuspension during dredging. Contract Report HL-91-1. Prepared for the US Army Engineer Waterways Experiment Station, Vicksburg, MS. Texas A&M University, College Station, TX. Souder, P.S., Jr., L. Tobias, J.F. Imperial, and F.C. Mushal. 1978. Dredged material transport systems for inland disposal and/or productive use concepts, June 1978. Dredged Material Research Program Technical Report D-78-28. US Army Engineer Waterways Experiment Station, Vicksburg, MS. US Environmental Protection Agency (USEPA). 1994. ARCS Remediation Guidance Document, EPA-905-B94-003. 5.2 Remedial Alternative Development Master Comment 255302 EPA should adopt a more comprehensive remediation alternative than that identified as EPA's selected remedy (3/10/Select) in the Proposed Plan. NRDC and Scenic Hudson have identified an alternative labeled "3+select/3/3" and Hudson River Sloop Clearwater has identified an alternative labeled "3+/0/3+" which they believe will remove more PCBs from the Upper Hudson River and also address EPA's concerns about cost-effectiveness and cost. These parties believe that EPA's selected remedy is too timorous both in terms of PCB mass removed and cost-effectiveness.
Responsiveness Summary Hudson River PCBs Site Record of Decision
5-12
Response to Master Comment 255302 EPA acknowledges the desire of some commenters for a more aggressive remedy. EPA considered and modeled a wide range of remedial alternatives during the FS, and these are listed in Section 5.3.1.6 of the FS Report. These model runs included alternatives that can be defined as "REM-0/3/3" and "REM-3/3/3." REM-0/3/3 is clearly more aggressive than the "3+select/3/3" alternative proposed by NRDC and Scenic Hudson, and REM-3/3/3 is somewhat less aggressive than the "3+select/3/3" alternative proposed by NRDC and Scenic Hudson. EPA did not select an alternative more aggressive than REM 3/10/Select for the reasons described below. As part of the alternatives evaluation process, EPA noted that:
• At the scale of the model segments, long-term predictions of Tri+ PCB concentrations in River Sections 1, 2, and 3 are controlled by assumptions of boundary conditions for upstream Tri+ PCB loads.
• Predictions of non-cohesive sediment Tri+ PCB concentrations are strongly
dependent on the target threshold boundaries (degree of remediation); extensive remediation of diffuse contamination in River Section 1 (as was selected in the 3 g/m2 target areas), as well as tight control of the upstream loads is required to achieve a substantial decline in Tri+ PCB concentrations in these sediments. Downstream of the TI Dam, the concentration of Tri+ PCBs in the water column at the TI Dam is the most important factor controlling water column exposure.
• As was illustrated in Appendix D3, Figures RE-128 through 130 of the FS, there is a relatively minor improvement in fish body burdens between the selected remedy and the most aggressive scenario, REM 0/0/3. Much larger declines in fish body burdens occur in the REM scenarios relative to the MNA with source control. Thus, less aggressive scenarios proposed by the commenters will fall within the relatively narrow difference between the selected remedy and the full section removal.
EPA also noted that based on the model, it was important to perform the most extensive remediation in River Section 1 relative to the other sections, and that it was possible to perform less extensive remediation in River Sections 2 and 3 and still achieve comparable results for reductions in fish tissue PCB concentrations. EPA believes that it is not desirable to choose a remedial scheme like the "3+/0/3+" alternative proposed by Hudson River Sloop Clearwater for all of the reasons outlined. In the Proposed Plan and FS, EPA has explained the Agency's rationale for selecting the particular degree of remediation for each river section for the selected remedy. EPA's selected remedy was chosen to reduce to acceptable levels the risks to human health and the environment from the consumption of PCB-contaminated fish. These risk reductions are presented in Chapter 7 of the FS. Chapters 8 and 9 of the FS contain EPA's detailed analysis for all the alternatives that passed the initial screening (for effectiveness, implementability, and cost) using seven of the nine NCP criteria (the two threshold criteria and the five balancing criteria). EPA believes that the selected remedy significantly reduces the mass of bioavailable PCBs and is
Responsiveness Summary Hudson River PCBs Site Record of Decision
5-13
cost-effective. As noted in the FS and the ROD, additional data will be collected during the design that will help to refine the areas targeted for remediation. As part of the comments received from Scenic Hudson, a list of remedial zones was suggested. The following discussion describes EPA’s analysis relative to each zone. River Section 1
• Map ID A - North of Rogers Island. The region is difficult to dredge since the river is fairly shallow and rocky. Also, currents may be strong.
• Map ID B - Area west of Lock 7 and south of the tip of Rogers Island. This region consists largely of isolated data points with no consistent pattern. Some data points have been included already, although the large associated polygons were not included, recognizing the large uncertainty in those areas due to the extrapolation made via the use of Theissen polygons.
• Map ID C - Area north of D3-4 and Hot Spot 5. The sampling location was included. Again, the entire polygon associated with the data point was not included, recognizing the large uncertainty associated with the extrapolation made using the Theissen polygons.
• Map ID D - Area north of mile 191 between D3-6 and D3-7 along west shoreline of river. The 1994 data do not indicate substantive contamination (5 samples < 10 ppm) in this area.
• Map ID E - Area north of mile 191 just east of Area E in the channel. The region is non-cohesive, within the channel and has surface concentrations < 10 ppm.
• Map ID F - Area extending east from Griffin Island located just to southwest of removal zone D3-10. This polygon is due to a single data point in a rocky area. The data point is included in EPA’s proposed dredged area, but the large associated polygon is not included.
• Map ID G - Area just below Griffin Island in channel. Data points are included within the remediation zone but again, the entire polygons associated with data points not included recognizing the large uncertainty associated with the extrapolation made by the Theissen polygons.
• Map ID H - North of Thompson Island Dam East Channel (northward to D3-11). EPA had made an initial decision not to dredge the land-cut part of the channel since little or no data are available for this area. It will be explored further under remedial design.
River Section 2
• Area D3-14. This area is in a land-locked section, behind rocky areas. This area is expected to have potential accessibility problems. It does not meet the 10 g/m2 criterion.
• Area D3-16. Area D3-16 is a non-cohesive area. The 1994 data from the area does not indicate high contamination. Thus, it does not meet the 10 g/m2 criterion.
• Area D3-17. It does not meet the 10 g/m2 criterion.
Responsiveness Summary Hudson River PCBs Site Record of Decision
5-14
• Area D3-18. Hot spot 27 does not appear to exist any longer, based on the absence of cohesive material and the presence of rocks or rock outcrops as observed in 1994. It will be further explored under remedial design.
• Area D3-19. It does not meet the 10 g/m2 criterion. • Area D3-20. It does not meet the 10 g/m2 criterion. • Area D3-21. It does not meet the 10 g/m2 criterion. • Area D3-22. It does not meet the 10 g/m2 criterion.
River Section 3
• Area D3-29. Data uncertainties in this region are great. Additional areas may be included after remedial design sampling.
• Area D3-30. The area was not included in the proposed dredged areas due to the occurrence of deeply buried contamination (greater than two to three feet based on 1994 samples).
• Area D3-26. Data uncertainties in this region are great. Additional areas may be included after remedial design sampling.
Master Comment 313803 A commenter indicated that Option Categories C and F include off-site ex situ treatment, rather than the near-river ex situ treatment as stated in the FS. Response to Master Comment 313803 EPA concurs with the reviewer. The post-removal Option Categories C and F for the removed sediment include off-site ex situ treatment as stated on page 5-8 of FS. Master Comment 313983 It was suggested that screening of remedial action alternatives should include REM-0/3/3 and REM-0/0/0. It was also suggested that REM-0/3/3 and REM-0/0/0 be added to the list of removal alternatives retained for detailed analysis. Response to Master Comment 313983 Alternative REM-0/3/3 was among the large number of alternatives that were modeled by EPA. (FS, Section 5.3.1.6 and Response to Master Comment 255302, Section 5.2). The selection of sediment target areas for remediation is described in Section 3.5 of the FS Report. This section describes the available data sets and the selection criteria. It also indicates that full-section remediation is not anticipated for River Section 3. The REM-0/0/0 alternative is not consistent with EPA's selection of target areas for remediation. Therefore, EPA does not agree with addition of the REM-0/0/0 alternative to the list of alternatives retained for screening or detailed analysis, as suggested in the comment.
Responsiveness Summary Hudson River PCBs Site Record of Decision
5-15
Master Comment 314017 On Page 6-40, for Insert Section 6.4.2.3, a commenter recommended adding REM-0/3/Select as a refined remedial alternative. Response to Master Comment 314017 REM-0/3/Select is a more aggressive remedy than the selected remedy; EPA acknowledges the desire among numerous commenters for a more aggressive remedy. EPA considered and modeled a large range of remedial alternatives during the FS process; these are listed in Section 5.3.1.6 of the FS Report. These model runs included alternatives that can be defined as REM-0/3/3 and REM-3/3/3. REM-0/3/3 is more aggressive than the REM-0/3/Select alternative proposed in the comment, and REM-3/3/3 is somewhat less aggressive than the REM-0/3/Select alternative proposed in the comment. These alternatives bracket the REM-0/3/Select alternative and, therefore, although EPA did not specifically evaluate the REM-0/3/Select alternative under Detailed Analysis in the FS, the outcome of such an evaluation is bracketed by those performed. Additional explanation of the reasons such an alternative was not selected is described under the Response to Master Comment 255302, above. Master Comment 405965 Commenters wanted to know why the EPA is not planning to dredge the entire Hudson River. Response to Master Comment 405965 The Hudson River PCBs Reassessment Feasibility Study, released in December 2000, focused on the Upper Hudson River sediments, since data have shown that these sediments contain a substantial portion of the PCBs released from the GE facilities. Figure 405965-1 illustrates historical PCB concentrations relative to river mile in the entire Hudson River PCBs Site. There is a clear decrease in concentration of PCBs heading down river toward RM 0 at the lower limit of the Hudson River PCBs Site. The 1975 through 1981 data show a decrease in PCB concentrations toward RM 0 of up to three orders of magnitude, relative to Upper Hudson River sediment concentrations. The 1991 and 1992 data show that the Lower Hudson River still has substantially lower PCB concentrations as compared to the Upper Hudson sediments. Addressing the PCB-contaminated sediments above the Federal Dam with the targeted dredging in the selected remedy will bring the greatest benefit in the most cost-effective manner. The geochemical and physical properties of the tidally influenced Lower Hudson River have thoroughly mixed the PCBs with cleaner sediments from the various tributaries and dispersed them throughout the Lower Hudson River. As a result, the Lower Hudson River is not an environment of focused PCB hot spot concentrations as is the Upper Hudson. While sediment concentrations vary from location to location, the Lower Hudson River sediments consistently show lower PCB concentrations relative to the Upper Hudson River sediments (Figure 405965-1) and they are generally below the target thresholds prescribed for the Upper Hudson. In
Responsiveness Summary Hudson River PCBs Site Record of Decision
5-16
addition, there are numerous other active sources of PCBs in the Lower Hudson, so, cleaning up the sediments would not only be very costly and time-consuming, but would also have a limited impact on achieving the fish goal and targets. The selected remedy, which removes the bulk of the historic PCBs in the Upper Hudson sediments, along with source control measures to eliminate the input of fresh PCBs from the two GE facilities, will be beneficial to the Lower Hudson River. Master Comment 313835 It was suggested that CAP-0/0/0 should be added to the list of Capping with Dredging Alternatives retained for detailed analysis. Response to Master Comment 313835 The selection of sediment target areas for remediation is described in Section 3.5 of the FS Report. This section describes the available data sets and the selection criteria. It also indicates that full-section remediation is not anticipated for River Section 3. The CAP-0/0/0 alternative is not consistent with EPA's selection of target areas for remediation. Therefore, EPA does not agree with retention of the CAP-0/0/0 alternative for detailed analysis as suggested in the comment. Master Comment 313459 In FS Section 6.3.2, Evaluation of REM Alternatives, Figures 6-7 through 6-23 were used to compare modeling results for several alternatives. A commenter suggested that the evaluation would benefit from tabular presentation of data gleaned from the figures regarding time required to achieve a PRG and the forecasted concentration if the PRG is not met. Response to Master Comment 313459 During this screening stage of the FS process for evaluation of alternatives, both figures and tables were used to perform the screening evaluations. Tables 6-1 and 6-2 and Figures 6-7 through 6-23 were used to perform this evaluation. EPA does not believe that the screening level evaluation would gain additional benefit from the tabular representation of when specific PRGs would be achieved. It should be noted that the figures presented in the FS are, in fact, a graphical representation of massive tables covering the entire time period of 67 years that were generated by the modeling effort. EPA feels that the tabular representation suggested in the comment is better applied to the detailed evaluation of the alternatives that were retained after this screening process. In fact, EPA did use such a tabular representation at that stage of the FS process for evaluating alternatives (Tables 7-4 and 7-8).
Responsiveness Summary Hudson River PCBs Site Record of Decision
5-17
5.3 Comparison of MNA vs. Active Sediment Remediation
Master Comment 362912
Commenters said that the cost of dredging demonstrates that it is not the proper remedy because source control alone (MNA) achieves similar results to dredging. It is appropriate to compare the costs of dredging and to consider the cost-effectiveness of the two remedies. Cost is one of the five balancing criteria to be considered in the comparison and selection of remedial alternatives. "Although cost cannot be used to justify the selection of a remedy that is not protective of human health and the environment, it can be considered in selecting from options that are adequately protective." Ohio v. E.P.A., 997 F.2d 1520, 1533 (D.C. Cir. 1993) (rejecting a broad challenge by several states to the NCP that cost should not be considered in determining exposure levels of a remedy). Indeed, "there is nothing in section 121 [of CERCLA] to suggest that selecting permanent remedies is more important than selecting cost-effective remedies." CERCLA, under 42 U.S.C. § 9621(b)(1) "places as much emphasis on the selection of cost effective [sic] remedies as it does on the selection of permanent remedies." Id. at 1532. Dredging does not satisfy the cost-effectiveness criteria under CERCLA or NCP. 40 C.F.R. § 300.430(f)(1)(D) (2000) (providing that the remedy selected "shall be cost-effective, provided that it first satisfies the threshold criteria"). According to the NCP, "costs that are grossly excessive compared to the overall effectiveness of alternatives may be considered as one of several factors used to eliminate alternatives." 40 C.F.R. § 300.430(e)(7)(iii) (2000). Dredging the upper Hudson is projected to cost $460 million, but could cost over $700 million. Source control would cost only $39 million but would achieve nearly identical results. Assessment of the benefits of dredging in the face of its adverse impacts and its marginal improvements in PCB concentration over source control demonstrates that its costs are "grossly excessive compared to [its] overall effectiveness." Id. A balancing of the costs of dredging and monitored natural attenuation therefore favors the latter. Therefore, dredging does not satisfy the cost-effectiveness criteria of CERCLA and the NCP and may not be selected as the remedy. Response to Master Comment 362912 EPA strongly disagrees with the comment, which incorrectly assumes that MNA is substantially as effective as the selected remedy in protecting human health and the environment. EPA’s analyses of data collected by EPA, NYSDEC, and GE during the Reassessment RI/FS unequivocally show that control of the Hudson Falls source alone, without any remediation of the PCB-contaminated sediments (i.e., monitored natural attenuation) is considerably less protective of human health and the environment than remedial alternatives that include remediation of the sediments, including the selected remedy (FS, Section 8.3.2, Section 8.5.2, Section 9.1 and Appendix D). For example, the fish PCB target concentration of 0.2 mg/kg (1 meal/month) averaged over the entire Upper Hudson River is expected to be achieved at least 25 years more quickly under REM-3/10/Select, than under MNA. (FS Section 9.1.1.1.) EPA’s model also predicts that the 0.4 mg/kg PCB target fish concentration averaged over the entire Upper Hudson River is achieved at least 14 years, and possibly more than 47 years, sooner under REM-3/10/Select, the selected
Responsiveness Summary Hudson River PCBs Site Record of Decision
5-18
remedy, than under MNA. The shorter time periods required to achieve these fish PCB target levels under the selected remedy represent a significant improvement in protectiveness of human health, given that people continue to eat fish caught in the Upper Hudson River. EPA also determined that remedies involving active remediation of contaminated sediments show greater reductions in risks to piscivorous mammals (river otter and mink) than MNA (FS Section 9.1.2); these environmental receptors are not at all protected by the fish consumption advisories. Further, EPA’s modeling indicates that for the first 25 years, as shown in Figures 6-33 through 6-37 of the FS, the water quality for the dredging alternatives is significantly better than that achieved by the MNA (or source control) Alternative. As expected, the greatest improvement in water quality as a result of dredging is seen at the TI Dam. Moreover, as stated in the Feasibility Study (Appendix D), the ROD, and elsewhere in this Responsiveness Summary, EPA’s modeling may be overly optimistic with respect to the rate of decline of PCBs in fish predicted for the MNA Alternative, in which case the relative benefits of dredging over MNA are even greater. In White Paper – Model Forecasts for Additional Simulations in the Upper Hudson River and White Paper – Human Health and Ecological Risk Reduction under Phased Implementation, EPA presents the results of additional model runs that were performed after issuance of the Proposed Plan. These model runs reflect the revised remediation schedule of six years (versus five years in the FS and Proposed Plan) and possible impacts of PCBs being remobilized during dredging. No significant differences in human health or ecological risk reduction were seen between the original five-year and the new extended phasing time frames. The new model runs are consistent with EPA’s determination in the FS and the Proposed Plan that active remediation will substantially reduce risks to humans and wildlife, and allow fish target concentrations to be met more quickly, than without active sediment remediation. EPA also has determined that the selected remedy is cost effective, which means that the overall effectiveness of the remedy is proportional to its cost. In sum, it is abundantly clear that the assertion that source control and dredging achieve similar results is false. The difference in cost between MNA and the selected remedy does not justify the selection of MNA, which is significantly less protective of human health and the environment than REM-3/10/Select. Master Comment 369325 Commenters suggested that the project is too costly and that the money that would be spent on implementing the selected remedy should be used for other purposes to benefit the Upper Hudson Valley, for example State parks or education programs in the Upper Hudson Valley. Response to Master Comment 369325 EPA has determined that the selected remedy is necessary to address the unacceptable risks to human health and the environment posed by PCB-contaminated sediments at the Site. EPA also has determined that the selected remedy is cost-effective, which means that the costs of the remedy are proportional to its overall effectiveness. Overall effectiveness of the remedy is determined based on an evaluation of the remedy against the following three criteria: long-term
Responsiveness Summary Hudson River PCBs Site Record of Decision
5-19
effectiveness and permanence; reduction of toxicity, mobility, or volume through treatment; and short-term effectiveness. 40 CFR § 300.430(f)(1)(ii)(C)(6). EPA disagrees with the comment because the expenditures suggested by the commenter would not address the unacceptable human health and ecological risks at the Site. Master Comment 405888 Several public comments state support for "GE's plan" (involving upstream source control alone) as opposed to EPA's Proposed Plan. Response to Master Comment 405888 The Monitored Natural Attenuation (MNA) Alternative relies on naturally occurring attenuation processes to reduce the toxicity, mobility, or volume of PCBs in the Upper Hudson River sediments, and assumes a separate source control removal action near the GE Hudson Falls plant. Therefore, the MNA alternative and source control are not differentiated in the FS. For a discussion concerning natural attenuation processes, refer to Master Comment 405926, Chapter 11. Control of PCB loadings from upstream sources is required of GE and will proceed independently of any sediment remediation activities in the Hudson River. GE has discussed an approach with NYSDEC and EPA for terminating PCB releases near the Hudson Falls plant. For purposes of modeling for the FS, EPA has assumed that a source control system will be in place, which will reduce PCB loads originating from the plant site to 0.0256 kg/day by January 1, 2005. EPA has determined that MNA (with source control alone) would not be sufficient to reduce the current level of PCB exposure to the Hudson River ecosystem and to human consumers of fish from the river. Discussions related specifically to source control occur in other chapters of this RS. The relative benefits of MNA (with source control) versus active remediation are discussed in Response to Master Comment 573 in Chapter 2, which demonstrates the need for active remediation. As explained in Response to Master Comment 405926, Chapter 11, EPA disagrees with commenters' claims that the river is cleaning itself, and that, therefore, active remediation is not needed. As discussed in Response to Master Comment 823 in Chapter 6, EPA disagrees with other comments that the selected remedy would not result in significant improvement relative to MNA, based on modeling work presented by GE. EPA believes that the results presented by GE are based on an arbitrary and inappropriate specification of model inputs and parameters that are designed to minimize the apparent effectiveness of active remediation.
Responsiveness Summary Hudson River PCBs Site Record of Decision
6-1
6. MODELING ASSUMPTIONS AND INTERPRETATION Master Comment 451
One commenter stated that EPA's dismissal of its model is arbitrary and capricious. This comment was made in regard to EPA's discussion of multiple lines of evidence for selection of the remedy, which included the results of modeling as well as other analyses, such as the analysis of recent trends in fish tissue concentrations in NYSDEC sampling. Response to Master Comment 451 EPA did not dismiss its models when developing the selected remedy for the Site. As stated in the Rationale for Selection of Preferred Alternative section of the December 2000 Proposed Plan, "USEPA's comparison of the relative effectiveness of the [remedial] alternatives is based on the results of modeling each remedial alternative as well as data projections." The models are an important part of EPA's decision-making. However, EPA also considered recent data trends for PCB concentrations in fish, which suggest that the models may be overly optimistic with regard to the rate of PCB decline in fish predicted under the No Action and Monitored Natural Attenuation (MNA) Alternatives (i.e., the models predict that PCB levels in fish decline more rapidly under the MNA and No Action scenarios than is suggested by recent data trends for PCB concentrations in fish), and that the relative benefits of active sediment remediation are likely to be greater than suggested by the models. White Paper – Trends in PCB Concentrations in Fish in the Upper Hudson River contains further details. It is entirely appropriate for the Agency to consider multiple lines of evidence and analyses when making a remedial decision for the Site. 6.1 Fate and Transport Modeling Master Comment 823 Comments contend that under more realistic assumptions, source control alone will lower PCB levels in fish more quickly in most of the Upper Hudson River and will lower the mass of PCBs entering the Lower Hudson River, as compared to the proposed EPA dredging plan. Response to Master Comment 823 EPA does not agree that the assumptions used by GE upon which this comment is based are “more realistic.” These assumptions include resuspension and release of 2.5 percent of target PCB mass during dredging, a project implementation period of 10 years, and residual PCB concentrations of 5 ppm in dredged areas that are not backfilled. EPA believes that the assumptions in the Feasibility Study on PCB resuspension during dredging, project implementation period, and residual PCB concentrations are reasonable and technically defensible. Under the FS assumptions, the selected remedy adds significantly to the benefit that can be achieved by source control alone.
Responsiveness Summary Hudson River PCBs Site Record of Decision
6-2
As part of the Responsiveness Summary, EPA has provided additional information to support the assumptions and interpretations in the Feasibility Study, and strengthen its position that the GE assumptions are not “more realistic.” Refer to White Paper – Resuspension of PCBs during Dredging for supporting information on PCB resuspension and release during dredging. Refer to White Paper – Dredging Productivity and Schedule for supporting information on project implementation period. Finally, refer to White Paper – Post-Dredging PCB Residuals for supporting information on residual PCB concentrations in dredged areas that are not backfilled. EPA has performed analyses to assess the impact that higher losses of PCBs during dredging would have on the levels of PCBs in fish in the Upper Hudson River and the loss of PCBs to the Lower River. EPA has also revised the schedule from five to six years to allow additional time for phased implementation of the remedy. Response to Master Comment 423154 in Chapter 1 of this document contains information on the rationale for phasing of the remediation schedule. White Paper – Model Forecasts for Additional Simulations in the Upper Hudson River contains results from model forecast simulations with higher losses of PCBs during dredging and phasing of the remediation schedule. White Paper – Human Health and Ecological Risk Reduction under Phased Implementation contains details on evaluation of risks associated with higher losses of PCBs during dredging and phasing of the remediation schedule. It should be added that source control and active remediation are not mutually exclusive alternatives. Control of PCB loadings from upstream sources is important to the overall recovery of the river. EPA has determined, however, the control of the upstream source without active remediation of contaminated sediments is not sufficiently protective of human health and the environment. Master Comment 849 Commenters suggested that the EPA mass balance models will need to be updated and new projection simulations conducted after EPA collects additional sediment data during the design phase of the proposed dredging project. Response to Master Comment 849 Additional sediment data to be collected during remedial design of the selected remedy are not expected to change the basic calibration of the EPA models to historical data, nor are they expected to change the forecasting ability of the models to such a degree that it will change the outcome of the FS. Refinements to models will, of course, be made if water quality, geochemical, or fish data indicate this is appropriate. The primary purpose of the additional sediment data collection is to provide detailed information necessary to refine estimates of sediment volumes to be removed. Master Comment 364582 Some commenters expressed concern that deeply-buried PCBs could become "reactivated" in the event of a large flood in the Upper Hudson River, and that the depth of scour analysis conducted
Responsiveness Summary Hudson River PCBs Site Record of Decision
6-3
by EPA for a 100-year peak flow did not represent a sufficiently large flood. In particular, the EPA depth of scour analysis was conducted for a 100-year peak flow of 47,330 cfs at Fort Edward. It was asserted that proposed new Sacandaga Reservoir management practices could result in the release of higher flows from the Sacandaga Reservoir during an extreme event that are more than the 8,000 cfs that EPA assumed in its flood frequency analysis. Commenters requested that a higher 100-year peak flow be evaluated due to Sacandaga Reservoir operational changes that may result from the relicensing agreement reached between Orion Power and NYSDEC. Response to Master Comment 364582 An important question in the Hudson River PCBs Reassessment was whether there are contaminated sediments now buried that are likely to become “reactivated” following a major flood, possibly resulting in contamination of the fish population. To address this question, a depth of scour model (DOSM) was developed to provide estimates of sediment erodibility in response to large floods. In the Revised Baseline Modeling Report (RBMR, USEPA, 2000) the DOSM was applied to a 100-year peak flow estimated to be 47,330 cfs, based on available historical data. To respond to the concerns expressed in this comment, the DOSM was reapplied to a new higher estimate of 61,835 cfs for this 100-year peak flow. This higher flow value is considered to be an upper limit for the peak flow that could occur during a 100-year flood. White Paper – Application of the Depth of Scour Model (DOSM) in the Thompson Island Pool for Alternative Flooding Assumptions contains complete details of this analysis. Results from reapplication of the DOSM to the new higher estimate for the 100-year peak flow indicate that:
• Average bottom shear stress on cohesive sediments increase by 27 percent for the upper limit flood peak versus the lower flow analyzed in the RBMR (21.3 dynes/cm2 versus 16.8 dynes/cm2).
• Average erosion depth in cohesive sediments is approximately 2.27 times greater for
the upper limit flood peak than for the lower flow analyzed in the RBMR (0.719 cm versus 0.317 cm).
• The 95th percentile maximum scour depth for the upper limit 100-year flood peak
flow is less than the depth of peak PCB concentrations at the same four of five high-resolution sediment core locations in the TI Pool that were analyzed for the lower flow in the RBMR.
• Using 1991 surficial sediment data representing average PCB concentrations in the
top 5 cm of the sediments across the entire TI Pool, a low-end estimate of PCB mass scour can be made. This estimate indicates that an additional 30 kg of Tri+ PCBs would be scoured for the upper limit flood peak flow than for the lower flow analyzed in the RBMR (60 kg versus 30 kg). On a total PCB-basis, the increase in estimated scour for the upper limit flood peak would be 60 kg (120 kg versus 60 kg).
Responsiveness Summary Hudson River PCBs Site Record of Decision
6-4
• Using 1984 sediment data representing average PCB concentrations in the top 30 cm of the cohesive sediments in TI Pool, a high-end estimate of PCB mass scour can be made. This high-end estimate indicates that an additional 101 kg of Tri+ PCBs would be scoured for the upper limit flood peak flow than for the lower flow analyzed in the RBMR (190 kg versus 89 kg). On a total PCB-basis, the increase in estimated scour for the upper limit flood peak would be 350 kg (650 kg versus 300 kg).
• The predicted mass of PCBs resuspended on either a Tri+ or total PCB basis for the
upper limit peak flow is small, ranging from 0.2 to 3 percent of the mass inventory estimated to reside in the cohesive sediments of the TIP.
In summary, the major RBMR findings related to the assessment of flood-induced sediment PCB resuspension are not significantly altered based on the results from a reapplication of the DOSM to the upper limit estimate of 61,835 cfs for the 100-year peak flood flow. The details of this analysis are presented in White Paper – Application of the Depth of Scour Model (DOSM) in the Thompson Island Pool for Alternative Flooding Assumptions. EPA continues to believe that the 47,330 cfs flood analyzed in the RBMR is the most relevant indicator of risk of PCB resuspension associated with large flood events, although the possibility of a larger flood must also be addressed. As discussed in the RBMR, it does not appear that large flood events are likely to "remobilize" large quantities of PCB mass that are currently buried in cohesive sediments. This does not, however, mean that these currently buried PCBs are safely sequestered. Rather than catastrophic mobilization during a single flood event (as analyzed in the White Paper – Application of the Depth of Scour Model (DOSM) in the Thompson Island Pool for Alternative Flooding Assumptions), it appears that gradual resuspension of buried PCBs is of greater concern. This gradual resuspension occurs through a number of processes, including the cumulative effect of many smaller flood events, non-hydrodynamic disturbance of sediment (including bioturbation, uprooting of macrophytes, ice scour, and other forms of physical disturbance), and porewater transport. The issue of the ultimate stability of currently buried PCB stores is addressed in greater detail in Response to Master Comment 619 in Chapter 2. Reference USEPA. 2000. Phase 2 Report, Further Site Characterization and Analysis. Volume 2D – Revised Baseline Modeling Report (RBMR), Hudson River PCBs Reassessment RI/FS. Prepared for USEPA Region 2 and USACE, Kansas City District by TAMS Consultants, Inc., Limno-Tech, Inc., Menzie-Cura & Associates, and Tetra Tech, Inc., January.
6.1.1 External PCB Loads to the Model Master Comment 821 Commenters cited evidence of PCB contamination of floodplain soils and noted that the EPA modeling effort did not address PCB loading from the floodplain to the river.
Responsiveness Summary Hudson River PCBs Site Record of Decision
6-5
Response to Master Comment 821 The objectives of the EPA modeling effort were to focus on evaluations of PCBs in the water, sediments, and fish. The HUDTOX fate and transport model was designed to simulate PCB contamination inside the normal shoreline boundaries of the Upper Hudson River. This is consistent with the overall objective of determining the appropriate course of action to address PCB contamination in the sediments of the Upper Hudson River. PCBs in floodplain soil were not explicitly included in the HUDTOX model because insufficient data were available to characterize the nature and extent of PCBs in floodplain soils, or to determine whether these PCBs constituted significant sources to the river. EPA has assumed that the contributions of floodplain soil to the river are of secondary significance relative to the loads originating from sediment within the river and from the Hudson Falls area. Processes such as PCB deposition in the floodplain and subsequent erosion back into the river are accounted for implicitly in the model to the extent that the water column solids and PCB data used to calibrate the model reflect the impacts of such processes. Also included implicitly are any PCB inputs to the river from floodplain soils that were contaminated prior to 1977, or to new external sources of floodplain soil contamination after 1977. Data are not available to determine the existence or magnitude of these potential additional PCB sources. Response to Master Comment 809 in Chapter 3 of this document contains information on floodplain exposure pathways as they relate to ecological receptors. Master Comment 825 It was suggested that EPA should have assumed the presence of some PCBs in tributary inflows during its model projections when comparing the benefits of source control to its proposed dredging plan, as opposed to assuming that PCBs will enter the Site only from upstream. Response to Master Comment 825 EPA assumed the presence of some PCBs in tributary inflows during model calibration, but not during forecast simulations for No Action, MNA, or any of the active remediation scenarios. This was done because the primary interest from a regulatory decision-making perspective was to determine the incremental benefits from remediating the sediments. Omission of PCBs in tributary inflows allowed differences between and among the various scenarios to be more clearly distinguished. In terms of their magnitudes, tributary loadings of PCBs were relatively small during the model calibration period and it is reasonable to assume that they will continue to decline slowly over time as the atmospheric background decreases (RBMR, Figure 6-51; USEPA, 2000) and readily-transportable PCBs on land are exhausted. In the final calibration year (1997) for the HUDTOX fate and transport model, PCB loadings from all tributaries except the Mohawk River were less than nine percent of the PCB loading across the upstream boundary at Fort Edward. The Mohawk River enters the Upper Hudson River below Waterford and just before Federal Dam at Troy. Consequently, PCB loadings from the Mohawk do not influence PCB concentrations in water, sediments, or fish in most of the upper river.
Responsiveness Summary Hudson River PCBs Site Record of Decision
6-6
It is not inconsistent to omit tributary loadings of PCBs, but to include PCB loadings across the upstream boundary at Fort Edward in the model forecast simulations. Tributary PCB loadings are relatively small and are expected to decline slowly over time as atmospheric background concentrations decline. PCB loadings at Fort Edward are controlled primarily by continuing inputs from bedrock seepage under the General Electric Plant at Hudson Falls, not by inputs from atmospheric background. After source control at Hudson Falls, EPA has assumed a continuing upstream load at Rogers Island equivalent to an average concentration of 2 ng/L Tri+ PCBs. Assumptions on tributary PCB loads will not affect comparisons among different remedial alternatives if the same assumptions are used across all forecast simulations, nor will they affect reductions in risk for any individual alternative relative to No Action. Differences in presence or absence of tributary PCBs will affect time-to-target, loading over Federal Dam, and the ultimate, long-term levels of PCBs in the water, sediments, and fish for any individual alternative. Reference USEPA. 2000. Phase 2 Report, Further Site Characterization and Analysis. Volume 2D – Revised Baseline Modeling Report (RBMR), Hudson River PCBs Reassessment RI/FS. Prepared for USEPA Region 2 and USACE, Kansas City District by TAMS Consultants, Inc., Limno-Tech, Inc., Menzie-Cura & Associates, and Tetra Tech, Inc., January. Master Comment 835 Commenters asked, if the PCB load from GE plant sites is negligible, i.e., 0 ng/l, what the estimated PCB load over the Federal Dam would be in the year 2035. Response to Master Comment 835 This comment refers specifically to the CAP-3/10/Select and REM-3/10/Select (selected remedy) scenarios. The HUDTOX model was run for REM-3/10/Select with an upstream boundary concentration of 0 ng/l, beginning in 2005 (White Paper – Model Forecasts for Additional Simulations in the Upper Hudson River). The estimated Tri+ PCB loads over Federal Dam can be highly variable from year to year due to changes in hydrological inputs among the different years and predicted sediment “spikes” in some downstream areas. For this particular run, the estimated Tri+ PCB load over Federal Dam in 2035 was 12.2 kg and the median load for the eleven-year period from 2030-2040 was 7.6 kg. For comparison, the Tri+ PCB load over Federal Dam for the selected remedy (REM-3/10/Select) was 19.6 kg in 2035 and the median load for the 11-year period from 2030-2040 was 13.9 kg. The HUDTOX model was not run for CAP-3/10/Select with an upstream boundary concentration of 0 ng/l. It should be noted that even if the Tri+ PCB load from the GE plant sites were negligible (i.e., 0 ng/L), the total upstream boundary load would not be zero because there is a small, ongoing background load from upstream of the GE plants. By the year 2030, however, it is reasonable to assume that this upstream background load will have declined to an insignificant level as
Responsiveness Summary Hudson River PCBs Site Record of Decision
6-7
atmospheric background decreases (RBMR, Figure 6-51; USEPA, 2000) and readily transportable PCBs on land are exhausted. It is inappropriate to consider percent reductions in Tri+ PCB loads over Federal Dam without clearly stating that Tri+ loads from tributaries were assumed to be zero in all of the forecast simulations with the HUDTOX model. Response to Master Comment 825 above contains more information on tributary loadings. It is also inappropriate to consider percent reductions in Tri+ PCB loads over Federal Dam without clearly stating the assumptions used for the upstream boundary. In all of the HUDTOX forecast simulations, Tri+ PCB loads over Federal Dam originate from two sources: the sediments and the upstream boundary. Consequently, changes in Tri+ PCB loads over Federal Dam can be due to changes in the upstream boundary and/or changes in sediments due to active remediation. Differences in Tri+ PCB loads over Federal Dam between any two forecast simulations can only be attributed to active remediation if the upstream boundary conditions were the same for both simulations. Reference USEPA. 2000. Phase 2 Report, Further Site Characterization and Analysis. Volume 2D – Revised Baseline Modeling Report (RBMR), Hudson River PCBs Reassessment RI/FS. Prepared for USEPA Region 2 and USACE, Kansas City District by TAMS Consultants, Inc., Limno-Tech, Inc., Menzie-Cura & Associates, and Tetra Tech, Inc., January. 6.1.2 Spatial Resolution of Modeling Master Comment 787 Some commenters say that EPA's methodology for identifying sediment areas for remediation is flawed and inadequate because it fails to consider whether and how different sediment areas contribute to PCB levels in fish. They contend that sedimentation rates, sediment stability, and PCB concentrations in the bioavailable surface sediments influence food chain exposures. Several comments suggest that a smaller dredging project could be just as effective as a larger one. On the other hand, other comments suggest that the preferred remedy does not dredge a large enough area and does not account for sub-reach scale exposures because these cannot be captured in the modeling. Response to Master Comment 787 Fish integrate exposure over temporal and spatial scales depending on species-specific foraging strategies and ranges, prey availability, substrate requirements, and ecological competitiveness. The foraging ranges and habitat and foraging preferences for each of the modeled fish species was discussed in Appendix A of the RBMR and incorporated into the modeling assumptions. Fish exposure is influenced by both sediment and water column pathways, and, in fact, the water column pathway is significant for both pumpkinseed and spottail shiner (forage fish), which in turn are consumed by largemouth bass. Therefore, it is necessary to achieve a general reduction in water column exposure concentrations in addition to reducing sediment exposure concentrations. To achieve both of these goals, PCB concentrations in both cohesive and non-
Responsiveness Summary Hudson River PCBs Site Record of Decision
6-8
cohesive sediments in the TI Pool must be reduced. In addition, there is a continued and significant interaction between sediments at depth below the surface layer and the surface sediments to which the food web is directly exposed. This issue is discussed further in Responses to Master Comments 619, 621, and 637 in Chapter 2. The sediment exposure regime within each pool used to drive the FISHRAND model was selected during the calibration phase of model development to achieve a correspondence with the sampling locations for the available fish monitoring data. This information, together with knowledge of the biology of the fish species and of the physical attributes of the river (e.g., presence of dams and locks etc.), guided the segmentation of the HUDTOX model and subsequent correspondence to exposure zones in the FISHRAND model. In the TI Pool, the HUDTOX model is gridded to include nearshore and channel areas and it was the nearshore segments that were selected to represent exposure to fish in the FISHRAND model. The HUDTOX model is not as finely gridded below the TI Pool, but the lateral gradient in sediment and water PCB concentrations observed in the TI Pool is less downstream of the pool, as discussed in Section 6.3.1.1 of the RBMR. Further discussion on the exposure zones selected to drive the FISHRAND model is provided in Response to Master Comment 779 in Chapter 2. Note that it would be very difficult for any model to determine the relative impact of remediation at the scale of individual sediment deposits, and it is not biologically realistic to do so. The available data for solids burial rates, sediment mixing depths, and surface sediment PCB concentrations are spatially limited and are not sufficient to calibrate either the EPA or GE fate and transport models at this level of detail. Additional detail on sedimentation/burial and sediment stability is provided in Response to Master Comments 577 and 619 in Chapter 2. Also in Chapter 2, bioavailable PCB concentrations are discussed in Response to Master Comment 637 and Response to Master Comment 633 discusses trends in surface sediment concentrations. Neither the GE bioaccumulation model nor FISHRAND operates on fine spatial scales, but instead use reach-average PCB exposure concentrations in the water column and sediments to compute PCB body burdens in fish. This is consistent with the life histories of the modeled fish species, which have documented foraging and habitat ranges on the order of a mile or more. There are numerous criteria by which the selected remedy was chosen. Smaller-scale dredging projects were evaluated but rejected as not sufficiently protective, and this issue is discussed further in Response to Master Comment 601 in Chapter 11. Master Comment 847 A commenter contended that the GE model has the ability to determine the relative impact of remediation at the scale of individual sediment deposits. It was suggested that EPA could and should have used this model to evaluate sediment remediation at various scales, and to develop a rigorous assessment of the benefits and impacts of a broad range of remedial options. Response to Master Comment 847 The GE PCB fate and transport model does not have the ability to determine the relative impact of remediation at the scale of individual sediment deposits. The PCB modeling by GE does not
Responsiveness Summary Hudson River PCBs Site Record of Decision
6-9
achieve a spatial resolution that is any finer than that provided by the EPA HUDTOX fate and transport model. The GE hydrodynamic and sediment transport models are specified at finer spatial and temporal scales than the EPA HUDTOX model. However, outputs from these models are not used at these finer scales, but are spatially and temporally collapsed before passing them forward for use in the GE PCB fate and transport model. Calibration of the GE PCB fate and transport model occurred at this coarser spatial scale. There is additional spatial collapsing when results from the GE fate and transport model are passed forward to the GE bioaccumulation model. The GE fate and transport model computes sediment PCB concentrations for multiple sediment segments within each reach of the river. These results are spatially collapsed into a single reach-average PCB concentration before passing them forward for use in the GE bioaccumulation model. In addition, sediment PCB concentrations in only the cohesive sediment areas are passed forward to the bioaccumulation model. The GE bioaccumulation model assumes that fish are not exposed to PCB concentrations in any of the non-cohesive sediment areas in the Upper Hudson River. Finally, with respect to representation of solids, cohesive and non-cohesive solids components in the GE sediment transport model are lumped into a single solids component in the GE PCB fate and transport model. Apart from model representations, it is important to note that the available data for solids burial rates, sediment mixed depths, and surface sediment PCB concentrations in the Upper Hudson River are spatially limited and are not sufficient to calibrate either the GE or EPA models at the scale of individual sediment deposits. EPA raised a number of technical questions about the GE models in the Responsiveness Summary for the Baseline Modeling Report (USEPA, 2000). GE presented modifications to its original model (QEA, 1999) in its comments (Appendix L1); however, these modifications did not address the principal EPA technical concerns. These concerns are:
• The GE fate and transport model fails to account for PCB mass stored in noncohesive sediments at depths below 5 cm.
• The GE bioaccumulation model was calibrated to data reported as PCB Aroclor sums
in fish without proper adjustments to account for known changes in analytical methods over time.
• These PCB Aroclor sums are not directly comparable to Tri+ PCB, the calibration
target for the GE fate and transport model.
• A significant downward adjustment was necessary to the Tri+ PCB water column concentrations computed by the GE fate and transport model during 1984-1989 to improve the apparent fit of the bioaccumulation model to the fish data.
Responsiveness Summary Hudson River PCBs Site Record of Decision
6-10
• The assumed trapping efficiencies used to estimate tributary solids loads appear inconsistent with long-term estimates of solids trapping efficiencies computed by the GE sediment transport model.
In sum, the GE PCB fate and transport and bioaccumulation models have a spatial resolution that is similar to the EPA HUDTOX model, but somewhat less precise because only the cohesive sediment concentrations are ultimately used to predict fish body burden. EPA does not believe that the GE model has the ability to determine the relative impact of remediation at the scale of individual sediment deposits, nor that it is a better tool than the EPA model for developing a rigorous assessment of the benefits and impacts of a broad range of remedial options. References Quantitative Environmental Analysis (QEA). 1999. PCBs in the Upper Hudson River, Volume 2 – A Model of PCB Fate, Transport and Bioaccumulation. Prepared for General Electric, Albany, New York. May. USEPA. 2000. Responsiveness Summary for Volume 2D – Baseline Modeling Report, Hudson River PCBs Reassessment RI/FS. Prepared for USEPA Region 2 and USACE, Kansas City District by TAMS Consultants, Inc., Limno-Tech, Inc., Menzie-Cura & Associates, Inc., and Tetra-Tech, Inc. February. 6.1.3 Post-Remediation Sediment Residuals Master Comment 837 Commenters suggested that EPA should have provided a summary of sensitivity analyses on residual surface concentrations post-remediation, improper cap placement, and changes in upstream boundary conditions. Response to Master Comment 837 Sufficient sensitivity analyses were conducted to establish the technical defensibility of the selected remedy. As part of the refined engineering modeling, EPA conducted sensitivity analyses on residual surface concentration after dredging and improper cap placement. These runs are listed in Section 5.3.1.6 of the FS and results are shown in Appendix D. Figures RE85-RE98 of the FS contain results for residual surface concentration. The range of residual surface concentrations in these analyses was between 0 and 5 ppm, and was selected to bound a reasonable range of possibilities. Results for improper cap placement are shown in Figures RE99-RE112 of the FS. It should be noted that the 1 ppm residual surface concentration in the selected remedy is highly conservative. The targeted fine-grained sediment areas in the Upper Hudson River are generally underlain by older, fine-grained sediments, thus permitting sufficient overcutting to reach relatively pristine sediments. When overlaid with 12 inches of clean backfill material, final residual surface concentrations are expected to be even lower than the target surface
Responsiveness Summary Hudson River PCBs Site Record of Decision
6-11
concentration of 1 ppm after dredging. Response to Master Comment 579 in Chapter 10 and White Paper – Post-Dredging PCB Residuals contain additional details. In response to concerns about assumptions on source control in the selected remedy, sensitivity analyses were conducted for MNA and the selected remedy in which the upstream boundary Tri+ PCB load was reduced to zero upon commencement of dredging activities. Results indicated that elimination of the upstream boundary Tri+ PCB load does not diminish the relative separation between the selected remedy and MNA for Tri+ PCB concentrations in water, surficial sediments, or fish. White Paper – Model Forecasts for Additional Simulations in the Upper Hudson River contains additional information. Master Comment 407876 Commenters noted that the sediments may contain contaminants other than just PCBs. In particular, commenters mentioned heavy metals, pesticides, and dioxins. Questions were raised regarding the fact that these other contaminants were in the same Upper Hudson sediments, and yet they were not being targeted for remediation. Many commenters suggested that the metals and other contaminants are safely buried and were concerned that the removal of sediments under the preferred remedy would result in residual concentrations of metals that would pose an environmental and human health hazard. Response to Master Comment 407876 Upper Hudson River sediment collection and analysis have shown that some metals such as cadmium, chromium, mercury, and lead are contained within the same sediments as the PCBs at levels exceeding background concentrations (White Paper – Metals Contamination). However, the data also suggest (Figure 253002-1 in the white paper) that elevated concentrations of heavy metals found in these sediments coincide with those of PCBs. This co-depositional pattern observed in Figure 253002-1 is based on the coincidence of elevated metal and PCB concentrations from each of the two cores analyzed. Due to this coincidence of the heavy metals and PCBs, the implementation of the selected remedy will effectively remove the heavy metals at the same time the PCB contaminated sediments are removed. Table 253002-12 in White Paper – Metals Contamination illustrates that the residual metal concentrations after the targeted PCB sediments are removed will be near, or in some cases below, background levels. NYSDEC sampled selected metals (e.g., mercury, cadmium, chromium, mercury, nickel, lead, strontium, and vanadium) in fish above (RM 201.3) and adjacent to the Hercules/Ciba-Geigy paint factory (RMs 198.3 and 198.2) to determine concentrations of selected metals in fish (Table 253002-10). In 1988, elevated concentrations of cadmium and chromium were detected in carp liver tissue samples collected near the paint factory. NYSDEC analyzed mercury and cadmium in selected 1997 and 1998 fish samples from RMs 201 and 189 and did not detect any cadmium, although no liver samples were analyzed. A NYSDEC memo (Sloan, 1999) concluded that other contaminants (e.g., DDT, mercury, PAHs, dioxins, and dibenzofurans) are present in the Hudson River, but do not represent as great a problem as PCBs. Remediation of PCB-contaminated sediments will not only lower the
Responsiveness Summary Hudson River PCBs Site Record of Decision
6-12
concentrations of PCBs to which fish are exposed, but will also reduce levels of metals and dioxins, since these co-occurring contaminants will be removed with PCBs. Current fish advisories in the Hudson River are based upon PCB concentrations. Modifications in these advisories will be based upon reductions in PCBs, rather than on other contaminant concentrations. Dioxins were detected in four samples from the sediment core collected in 1991 at RM 188.6 (White Paper – Dioxin Contamination, Table 860-1), two samples collected in 1983 from RM 188.5 and RM 191.1 (Table 860-2), and in Hot Spot 8 from sediment collected in 1987 (Table 860-3). Based on the limited data found in the foregoing referenced tables, the dioxin and furans seem to coincide with the PCBs, similar to the metals. However, additional sediment sampling and analyses need to be implemented during the selected remedy design phase in order to better understand the extent of dioxins and furans within the Upper Hudson River sediments. NYSDEC fish dioxin/furan data show the presence of dioxins/furans in some upper river fish; however, detection frequencies and concentrations are higher in the lower river, indicating the influence of independent contaminant sources (White Paper – Dioxin Contamination, Table 860-4). The data available for metals and dioxins/furans indicate that the implementation of the selected remedy will also remediate the bulk of contaminants other than PCBs at the same time that the targeted PCBs are being removed. Residual concentrations for both metals and dioxins/furans are expected to be near background levels and well within acceptable levels after active remediation. Reference Sloan, R. 1999. Briefing on 1997 striped bass PCB results. Sent to J. Colquhoun, NYSDEC. February 11. 6.1.4 Resuspension Master Comment 591 It was claimed that EPA uses reduction in the transport of PCBs to the Lower Hudson River to justify dredging, without quantifying actual risk reductions to the Lower Hudson. A commenter contended that evaluation of the model results illustrates that the dredging alternative will provide a 15 percent reduction in the PCB load over the source control alternative, but using "more realistic" dredging assumptions actually shows a 15 percent increase in the PCB load to the Lower Hudson. Response to Master Comment 591 EPA does not agree that the dredging assumptions on which this comment is based and which lead to conclusions of an increase in PCB load to the Lower Hudson River, relative to source control are "more realistic." These assumptions include resuspension and release of 2.5 percent of target PCB mass during dredging, a project implementation period of 10 years, and residual
Responsiveness Summary Hudson River PCBs Site Record of Decision
6-13
concentrations of 5 ppm in dredged areas that are not backfilled. EPA believes that the dredging assumptions in the Feasibility Study are reasonable and technically defensible; under these dredging assumptions, the selected remedy will reduce the PCB load to the Lower Hudson River, relative to source control alone. Nevertheless, as described in Response to Master Comment 823 elsewhere in Section 6.1 of the Responsiveness Summary, EPA has performed sensitivity analyses for PCB loss during dredging. EPA did quantify the relative human health and ecological risks in the Mid- and Lower Hudson River, respectively, under the various remedial alternatives (Response to Master Comment 413, Chapter 1). In response to comments received on the Feasibility Study, EPA calculated Mid-Hudson human health cancer risks and non-cancer hazard indices and Lower Hudson River ecological toxicity quotients (TQs) for the remedial alternatives in the Feasibility Study (Response to Master Comment 799, Section 6.3). Human health and ecological risks associated with additional selected remedy assumptions are described in White Paper – Relative Reduction of Human Health and Ecological Risks in the Mid- and Lower Hudson River. Master Comment 363207 Commenters stated that EPA did not include a resuspension flux from dredging in its model forecasts. Resuspension from dredging will yield a significant PCB flux to the river. Inclusion of resuspension in the forecasts will slow the rate of recovery of the river. Response to Master Comment 363207 Possible impacts of resuspension of PCBs during dredging have been incorporated into model simulations for the revised remedy schedule through inclusion of two different estimated dredging-induced PCB resuspension rates during the proposed dredging season each year. The assumed resuspension rates for these simulations were 0.13 percent (as derived in Appendix E.6 of the FS report and described in the White Paper – Resuspension of PCBs during Dredging) and 2.5 percent sediment mass loss to the water column. However, EPA believes that the 2.5 percent loss rate is unrealistically high and that the 0.13 percent loss rate is a justifiably conservative estimate (FS, Appendix E.6 and White Paper – Resuspension of PCBs during Dredging). The implications of resuspension PCB flux from dredging the river and a revised schedule for the sediment removal are covered in detail in White Paper – Model Forecasts for Additional Simulations in the Upper Hudson River. The model results demonstrated that while dredging-induced resuspension of sediment will likely increase PCB levels in the water column (as measured by either concentration or load passing a given location) and in fish, the impacts will largely be confined to the years during which the active remedy is implemented, regardless of whether the loss rate applied is 0.13 percent or 2.5 percent. Impacts from dredging-induced resuspension (at either rate) are also predicted to occur in downstream surficial sediments, but the increases in concentration are small relative to existing PCB contamination levels. While the 0.13 percent loss rate shows a negligible increase in predicted fish PCB body burdens for the period of dredging, a loss rate of 2.5 percent shows a notable increase for the period of dredging, but quickly drops following dredging to levels commensurate with the other active remediation modeling scenarios.
Responsiveness Summary Hudson River PCBs Site Record of Decision
6-14
The effects of the dredging-induced resuspension of PCB on the fish were modeled using FISHRAND. The FISHRAND model used the averaged sediment and water concentrations from the HUDTOX model for each modeling segment as inputs. A detailed description of the FISHRAND modeling results can be found in White Paper – Model Forecasts for Additional Simulations in the Upper Hudson River, and are summarized as follows. A comparison of the five-year implementation of the selected remedy without dredging-induced PCB resuspension (model simulation run R14S2, presented in the FS) and the selected remedy including the section-specific loss estimate (0.13 percent) for dredging-induced PCB resuspension (model simulation run R14RS) shows that the difference in predicted fish body burdens is no more than approximately 15 percent and typically less than 10 percent for all species and locations in the Upper Hudson River. A comparison of predicted body burdens under the five-year versus six-year implementation schedule, both assuming the section-specific loss rate (0.13 percent) for dredging-induced PCB resuspension, shows that PCB resuspension has the greatest effect on brown bullhead, with an increase in PCB body burden as high as 100 percent at RM 189 (White Paper – Model Forecasts for Additional Simulations in the Upper Hudson River). The differences among predicted fish concentrations are typically greater for fish species in which PCB bioaccumulation has a significant component associated with water column exposure pathways than for species in which bioaccumulation is primarily driven by sediment exposure pathways. Thus, greater impacts of dredging-induced resuspension are predicted for largemouth bass and yellow perch, both of which accumulate a portion of their PCB body burdens via food chain pathways that ultimately derive from the water column. In contrast, brown bullhead, which derive a larger proportion of their PCB body burden from sediment-associated food chain pathways, exhibit a smaller response to dredging-induced resuspension. At RM 189, the predicted differences in brown bullhead body burden from the longer implementation schedule are greater than the predicted differences between the two resuspension assumptions. For largemouth bass and yellow perch, the 2.5 percent resuspension assumption has a greater effect than the difference between the implementation schedules. At RM 154, the effects of resuspension on fish body burden are similar, but last slightly longer than at locations farther upstream. In summary, resuspension has a limited, temporary effect on fish PCB body burdens. Ecological and human health risk evaluation of the selected remedy with dredging-induced resuspension PCB inclusion is presented in the White Paper – Human Health and Ecological Risk Reduction under Phased Implementation. No major differences in human health or ecological risk were seen among the various alternatives with PCB resuspension inclusion. In general, target concentrations were achieved within a short time frame and risks were similar. Increased resuspension results in approximately a one-year delay in achieving target concentrations.
Responsiveness Summary Hudson River PCBs Site Record of Decision
6-15
Master Comment 407907 Commenters expressed concerns about the effects of an earthquake on PCB contamination. They state that the Hudson lies on a fault line. Response to Master Comment 407907 The Upper Hudson valley is not an area containing major active fault zones. The northeast region of the United States is a passive continental margin whose seismic activity declined greatly more than 100 million years ago. The rifts and faults in the Hudson valley are remnant terranes associated with Mesozoic rifting. Most notable among these are the Hartford rift basin in central Connecticut and central Massachusetts, and the Newark rift basin in the greater New York City area. These fault zones are largely limited to the Lower Hudson and cross the river (i.e., the river is sub-perpendicular to the faults). Geological features such as these are "scars" of ancient geological episodes throughout New England and adjacent areas; nonetheless, it has been hard to find any unequivocal relationship between these geological features and seismicity in this area. The risk of earthquakes in New England and the Hudson River valley is not zero (over 1,000 earthquakes have hit the Northeast over the last 360 years, according to the USGS, 2001). The bedrock in this area, however, is composed mainly of stable basement rocks such as ancient granites, as well as other igneous intrusives and massive metamorphic rocks and poses little, if any, threat of tectonic activity. The Upper Hudson extends into the Adirondack Mountains, which are over 500 million years old and seismically quite inactive. Earthquake hazard maps provide an estimate of the level and frequency of expected geologic activity. Hazard maps for New York show a 90-percent likelihood that no earthquake larger than 0.19 G will strike the Hudson Valley in the next 250 years. And it is also ninety percent likely that no earthquake larger than 0.09 G will strike the Hudson Valley in the next 50 years. A 0.19 G earthquake could cause older structures including dams to fail. A 0.09 G earthquake would probably cause only minor damage and old structures, including dams, should remain in place. (Note that the values given here represent an acceleration relative to the earth's gravity [G]. This is not the same scale as the Richter scale values given in the following text.) The last significant earthquake in the northeastern United States was a magnitude 5.2 on the Richter scale centered in Pymatuning Reservoir, Pennsylvania, in 1998. The last significant earthquake near the Hudson Valley was a magnitude 5.6 centered in Massena, New York in 1944. These represent extreme events in the region. Earthquakes of this size can topple chimneys, but they are insufficient to move large masses of earth. The geologic stability of the eastern North American Plate is not conducive to mudslides or landslides as a result of seismic activity. Notably, the Champlain Canal itself and many of its structures predate the event at Massena, and thereby have withstood the largest recorded earthquake in the region. Therefore, it is judged unlikely that a seismic event would reintroduce previously-removed material containing PCBs to the Hudson River.
Responsiveness Summary Hudson River PCBs Site Record of Decision
6-16
References Lamont-Doherty Cooperative Seismographic Network. 2001. Web page accessed Sept. 24, 2001. http://www.ldeo.columbia.edu/LCSN Weston Observatory – Boston College. 2001. Web page accessed Sept. 24, 2001 http://www2.bc.edu/~kafka/Why_Quakes/why_quakes.html . USGS. 2001. Web pages accessed Sept. 24, 2001 http://geology.cr.usgs.gov/pub/i-maps/i-2737/; http://geohazards.cr.usgs.gov/eq/html/genmap.html. 6.2 Bioaccumulation Modeling Master Comment 785 Commenters state that an unexplained factor in the behavior of the FISHRAND model is the very sudden (almost vertical in some cases) drop in fish PCB concentrations as soon as dredging is completed. Commenters say the sudden decrease is questionable and request EPA to provide more detail on why the EPA model predicts this behavior. Response to Master Comment 785 Predicted fish body burdens predominantly reflect sediment and water exposure concentrations. Although the model is designed to simulate changes in predicted fish body burdens on monthly time scales, the results are presented as annual averages, which integrates the variation in the month-specific predicted body burdens. In the model calculations, the assumption is that the upstream source is controlled at approximately the same time that dredging is completed; thus, the fish experience the effects of source reduction and remediation simultaneously, accounting for a dramatic decrease in predicted fish concentrations. In addition, the "near vertical drop" is also a function of the scale of the graphs presented in the report. The decrease reflects remediation and source control effects imposed on top of already declining body burden trends. The depuration rate computed by the FISHRAND model is compared to observed depuration rates from a laboratory study in Response to Master Comment 779 (Chapter 2) and found to be comparable. White Paper – Model Forecasts for Additional Simulations in the Upper Hudson River provides the results and a discussion of predicted fish body burdens across No Action, Monitored Natural Attenuation, and various assumptions under the selected remedy. The rate of decline in predicted fish tissue concentrations relative to the rate of decline observed from the data is discussed in White Paper – Trends in PCB Concentrations in Fish in the Upper Hudson River and in Response to Master Comment 627, Chapter 2. Additionally, Responses to Master Comments 631 and 633, also in Chapter 2, discuss the rate of decline in water concentrations and in sediment concentrations, respectively.
Responsiveness Summary Hudson River PCBs Site Record of Decision
6-17
Master Comment 789 Comments were received suggesting that it is not possible to discern differences in projected fish body burdens based on the observed variability from monitoring data. Commenters said that the period of time when one can have confidence that the projected fish concentrations are different is when the 95 percent confidence interval for dredging is not intersected by the 95 percent confidence interval for source control. When this uncertainty is taken into account, it is apparent that for all practical purposes, one cannot distinguish between the results expected from EPA's dredging project and from source control. In fact, commenters say, EPA has seriously overstated the uncertainty associated with the models and the availability of data to test those models. Response to Master Comment 789 EPA believes that projected fish body burdens of PCBs for the selected remedy are significantly different from those for the MNA Alternative. Comments questioning the existence of significant differences are largely based on Appendix I of GE's comments. This appendix presents a methodology for estimating the expected "variability" in projected fish body burdens presented in the FS. It concludes that "the differences between source control (MNA) and dredging plus source control (REM 3/10/S) will not be significant for most of the model projection time frames." EPA disagrees with this conclusion, and finds that the analysis presented in GE’s Appendix I is invalid due to serious conceptual and technical flaws. Reasons for EPA’s disagreement are presented below. Model Projection Basis Although GE’s Appendix I is concerned with estimating the variability in EPA’s model projections, the study does not use EPA’s model results. Instead, it is based on a rerun of EPA’s model projections "using several realistic assumptions" that increase the time required for dredging, the dredging resuspension rate, and the residual surface concentration. EPA believes that these assumptions are not more "realistic," as described in Response to Master Comment 823 in Section 6.1. In any case, it is important to note that GE’s Appendix I does not address uncertainty in the EPA model predictions, but rather uncertainty associated with an alternative GE model application. Sources of Uncertainty GE’s Appendix I notes that the variability in environmental measurements is due to the combination of natural environmental variability and analytical uncertainty. The focus of its analysis, however, is on the analytical uncertainty. That is, GE is not estimating the "variability" associated with the model projections, but rather the variability associated with potential confirmatory samples subject to analytical error as described by two standard errors on the mean. This is not the relevant measure. If two potential actions have different results, EPA would like to choose the better one, regardless of analytical variability. Analytical variability can usually be reduced. It has no bearing on the uncertainty in the population mean; rather, it affects the ability to test and confirm changes in the population mean. The natural environmental variability and the uncertainty in the model itself are the relevant sources of variability for the analysis, but GE does not address these.
Responsiveness Summary Hudson River PCBs Site Record of Decision
6-18
Basis for Evaluating Analytical Uncertainty GE’s Appendix I uses the historical NYSDEC fish data to evaluate sample variability. While this is a large and valuable database for estimating the mean PCB concentrations in fish in the Hudson River, it is not an appropriate basis for estimating variability in future samples. The NYSDEC fish data have been analyzed using packed column GC, and quantitated against Aroclor standards using a limited subset of chromatogram peaks. As discussed in the RBMR (USEPA, 2000), this approach can introduce substantial error into the estimation of total PCBs or Tri+ PCBs. Further, NYSDEC’s laboratories have changed methods, standards, and reference peaks over time, so that the data over time are not expected to possess constant error characteristics. Modern capillary column GC methods, such as those used by EPA for the Phase 2 sampling effort (Data Evaluation and Interpretation Report [DEIR], USEPA, 1997), substantially reduce the analytical uncertainty. Wet Weight Basis The analyses in GE’s Appendix I are concerned solely with the variability in samples analyzed on a wet weight basis. As GE itself states in Appendix H of its comments, much of the variability in wet weight PCB concentrations is due to variability in lipid content, and "lipid normalization reduces variability." GE continues to state that "lipid-based values are used to provide a more accurate interpretation of long-term trends than wet weight-based values can provide." EPA agrees with these specific statements made by GE in its Appendix H. The analysis of uncertainty in GE’s Appendix I should have been conducted on a lipid basis, with transformation back to wet weight values if necessary. In small samples, the distribution of fish lipid content may not be representative of the population mean. The analysis of model uncertainty based directly on wet weight values is inappropriate and serves to artificially inflate the estimates of variability. Statistical Approach GE’s Appendix I notes that the standard error of fish samples appears to increase with the mean of total PCBs. It then proposes to evaluate the standard error of future samples based on a linear regression of the standard error on the sample mean. This approach is misguided on several accounts. First, the observation of increasing variance with increasing mean is a common phenomenon in environmental data, known as heteroscedasticity. A variety of statistical tests are available for heteroscedasticity, but none was documented by GE. In many cases, heteroscedasticity can be reduced or eliminated through use of a suitable transformation of the data, such as a logarithmic transformation. Use of simple linear regression to estimate the standard error from the mean is not valid. Both the standard error (the dependent variable in the regression) and the mean (the supposedly independent variable) are quantities calculated from the observations. Indeed, the standard error can be written in terms of the mean. Clearly, the uncertainty in estimating the standard error is correlated with the mean. The presence of contemporaneous correlation means that the ordinary least squares linear regression estimate is biased, even asymptotically (Kennedy, 1979). In addition, the interpretation of the R2 value is incorrect.
Responsiveness Summary Hudson River PCBs Site Record of Decision
6-19
Determination of Overlap GE’s Appendix I uses a graphical method to compare the period "when overlap is expected" between the MNA and REM-3/10/Select Alternatives, stating "that the projected intervals are expected to be different when both upper and lower bounds of MNA are lower than the lower bounds of REM 3/10/S, or when both upper an lower bounds of REM 3/10/S are lower than the lower bound of MNA." The bounds selected by GE are the 95 percent confidence intervals. In other words, GE has constructed a hypothesis test based on the following expression:
(M1 – M2) ± z x (SE1 + SE2) in which
M1 is the mean of projection 1 M2 is the mean of series 2 SE1 and SE2 are the corresponding standard errors z is the value of the standard normal distribution at the appropriate confidence level
The null hypothesis that the two means are the same cannot be rejected if the interval estimate covers 0. (Note that GE uses a value of z equal to 2, rather than the correct value of 1.96, further inflating the estimate). GE has not constructed the correct hypothesis test. As shown in Wonnacott and Wonnacott, (1977), the correct hypothesis test for the difference in two means is given by the following expression, with a pooled variance estimator:
(M1 – M2) ± z x (SE12 + SE2
2)0.5
The sum of the standard errors is not equal to the square root of the sum of the squared standard errors. In fact, the simple sum used by GE will tend to be much larger. For instance, if SE1 = 2 and SE2 = 4, then: (SE1 + SE2) = 6 while (SE1
2 + SE22)0.5 = 4.472.
As a result, GE’s Appendix I assigns an overlap between model projections that is much larger than is appropriate for comparison of two means. Summary The information presented in GE’s Appendix I is based on a faulty premise, that analytical variability in historical NYSDEC fish sampling results is a relevant measure of the uncertainty in model projections, and uses incorrect statistical tests. In general, the uncertainty in predictions from complex environmental models is difficult to evaluate quantitatively. The major relevant sources of uncertainty are:
Responsiveness Summary Hudson River PCBs Site Record of Decision
6-20
• Uncertainty in the future values of external forcing functions, such as flows. • Uncertainty in the calibrated values of model parameters. • Any errors in model specification.
Given the complexity of the model and the many sources of uncertainty, the best basis for evaluating net prediction uncertainty is through the use of sensitivity analyses. These are presented in the RBMR (USEPA, 2000), and referenced in the FS. As is acknowledged in the FS, Section 8.1.5.4, "It is important to remember that forecasts are subject to considerable uncertainty. Therefore, the estimate year of target attainment should be considered as a general guide. The estimates serve best as a basis for comparison among alternatives where large differences (5 to 10 years or more) among alternatives in attaining a PRG can be identified." References Kennedy, P. 1979. A Guide to Econometrics. The MIT Press, Cambridge, MA. USEPA. 1997. Phase 2 Report, Further Site Characterization and Analysis. Volume 2C – Data Evaluation and Interpretation Report (DEIR), Hudson River PCBs Reassessment RI/FS. Prepared for USEPA Region 2 and USACE, Kansas City District by TAMS Consultants, Inc., The Cadmus Group, Inc. and Gradient Corporation. February. USEPA. 2000. Phase 2 Report, Further Site Characterization and Analysis. Volume 2 – Revised Baseline Modeling Report, Hudson River PCBs Reassessment RI/FS. Prepared for USEPA Region 2 and USACE, Kansas City District by TAMS Consultants, Inc., Limno-Tech, Inc., Menzie-Cura & Associates, and Tetra Tech, Inc. January. Wonnacott, T.H. and R.J. Wonnacott. 1977. Introductory Statistics, Third Edition. John Wiley & Sons, New York. 6.3 Lower Hudson River Modeling Master Comment 799 Some commenters requested that alternative-specific modeling be performed for the Lower Hudson River for both human health and ecological risks. Some commenters contended that resources downstream in the Lower Hudson will be protected by dredging. Response to Master Comment 799 In response to comments received, EPA calculated Mid-Hudson human health cancer risks and non-cancer hazard indices and Lower Hudson River ecological TQs for alternatives evaluated in the FS (i.e., No Action, MNA, CAP-3/10/S, the selected remedy [REM-3/10/Select], and REM-0/0/3 Alternatives), using the same assumptions as in the FS. Human health and ecological risks associated with additional selected remedy assumptions are described in White Paper – Relative Reduction of Human Health and Ecological Risks in the Mid- and Lower Hudson River.
Responsiveness Summary Hudson River PCBs Site Record of Decision
6-21
Risk Evaluation The locations modeled in the lower river (below Federal Dam at RM 153.9) are consistent with those modeled in the Revised Human Health Risk Assessment (RHHRA; USEPA, 2000a) and the Revised Baseline Ecological Risk Assessment (RBERA; USEPA, 2000b). The lower river was divided into four segments for evaluating conditions. These segments are located at RM 152 (encompassing RM 153.5 – 123.5); RM 113 (encompassing RM 123.5 – 93.5); RM 90 (encompassing RM 93.5 – 63.5); and RM 50 (encompassing RM 63.5 – 33.5). This covers the Hudson River from below Albany to Ossining, a river length of about 120 miles. The assigned river mile for each segment corresponds to the historical NYSDEC monitoring location in that region. This comparison uses the same methodology and assumptions that were used in the RHHRA (USEPA, 2000a) and RBERA (USEPA, 2000b). Exposure parameters, toxicity values, and time frames used herein are consistent with those used to model future PCB concentrations in both reports. However, for all alternatives considered here, sediment concentrations were calculated using the 0-2.5 cm layer, as discussed in White Paper – Relative Reduction of Human Health and Ecological Risks in the Mid- and Lower Hudson River. The start years used to calculate risks are based on the five-year dredging period used in the FS for REM-3/10/S and CAP-3/10/S and a seven-year dredging period for REM-0/0/3. A start date of 2010, the year immediately after the equilibration period following completion of the preferred remedy, was used to calculate human and ecological risk. The REM-0/0/3 Alternative was anticipated to take two years longer for completion; therefore, a start date of 2012 was used. No Action and MNA Alternatives were calculated for both start years, so that comparisons of active alternatives to passive alternatives are made on the same basis. The exposure periods used in the RHHRA and RBERA are used for this analysis, extending up to 2049/2051 for human health risks and to 2034/2036 for ecological risks. As modeling for the lower river was only performed through 2046, the concentrations calculated for 2046 were used to estimate fish concentrations beyond 2046 for the 40-year RME cancer exposure. The equations and methodology used to calculate risks and risk reduction are described in Chapter 7 of the FS (USEPA, 2000c). Relative reductions in cancer risks, non-cancer health hazards, and ecological TQs are calculated to provide an estimate of risk reduction under the preferred and other alternatives. Cancer Risks and Non-Cancer Health Hazards and Relative Reductions Time to Reach Human Health-Based Fish Target Levels The species-weighted fish fillet average PCB concentrations calculated for each of the three Mid-Hudson River sections (RMs 152, 113, and 90) for the final alternatives examined in the FS are presented in Table 799-1. This table highlights the preliminary remediation goals (PRG of 0.05 ppm PCBs wet weight in fillet with additional target concentrations of 0.2 ppm and 0.4 ppm PCBs wet weight) reached within the modeling time-frame. At RM 152, the 0.4 ppm target is achieved in 2010 – 2012 for the active alternatives, in 2016 for MNA, and in 2019 for NA (Table 799-2). The 0.2 ppm target concentration is achieved in 2016 –
Responsiveness Summary Hudson River PCBs Site Record of Decision
6-22
2018 for the active alternatives, in 2023 for MNA, and beyond 2046 for NA. The target concentration of 0.05 ppm is not reached by 2046 for any alternative. At RM 113, the 0.4 ppm target is reached by all alternatives prior to the completion of remediation between 2007 and 2009, the 0.4 ppm target concentrations is reached by the active alternatives between 2011 and 2012, for MNA in 2016, and for NA in 2022. The 0.05 ppm target is reached only by the REM-0/0/3 Alternative in 2033. At RM 90, the 0.4 ppm target concentration is reached by alternatives in 2006 prior to the completion of remediation. The 0.2 ppm target concentration is achieved by active alternatives between 2011-2012, for MNA in 2014, and for NA in 2019. The 0.05 ppm target is reached only by the REM-0/0/3 Alternative in 2028. Non-Cancer Health Hazards Non-cancer No Action Alternative health hazard indices for the central tendency (CT) and reasonable maximum exposure (RME) range from:
• 0.8 – 11 for the Mid-Hudson average. • 1.4 – 19 at RM 152. • 0.6 – 8.3 at RM 113. • 0.5 – 6.5 at RM 90, using start years of 2010 and 2012 (Table 799-3).
MNA hazard indices for the 2010/2012 CT and RME scenarios range between:
• 0.5 – 7.5 for the Mid-Hudson average. • 0.8 – 12 at RM 152. • 0.4 – 5.5 at RM 113. • 0.3 – 4.7 at RM 90.
The CAP-3/10/S hazard quotients for the CT and RME scenarios, respectively, are:
• 0.4 and 5.5 for the Mid-Hudson average. • 0.7 and 8.6 at RM 152. • 0.3 and 4.1 at RM 113. • 0.3 and 3.8 at RM 90.
The selected remedy hazard quotients for the CT and RME scenarios are:
• 0.4 and 5.3 for the Mid-Hudson average. • 0.6 and 8.2 at RM 152. • 0.3 and 4.0 at RM 113. • 0.3 and 3.7 at RM 90.
Responsiveness Summary Hudson River PCBs Site Record of Decision
6-23
The REM-0/0/3 Alternative yields hazard quotients of:
• 0.3 and 3.7 for the mid-Hudson average. • 0.4 and 5.5 at RM 152. • 0.2 and 2.8 at RM 113. • 0.2 and 2.7 at RM 90.
Hazard quotients under the central tendency scenario are all below the target level of one, with the exception of the No Action Alternative at RM 152, which has a hazard quotient of about 1.5. The MNA Alternative shows a 28 to 40 percent reduction in non-cancer hazards as compared to the No Action Alternative, depending on the river section and time frame examined (Table 799-3). CAP-3/10/S achieves a 42 to 54 percent RME hazard index reduction compared to No Action. Comparisons to the CT scenario show slightly higher risk reductions, ranging from 46 to 57 percent. There is a 19 to 31 percent risk reduction when CAP-3/10/S is compared to the MNA Alternative. The selected remedy achieves a 42 to 56 percent RME hazard index reduction compared to No Action. Comparisons to the CT scenario show slightly higher risk reductions, ranging from 47 to 58 percent. There is a 21 to 33 percent risk reduction when the selected remedy is compared to the MNA Alternative. REM-0/0/3 achieves a 55 to 65 percent RME hazard index reduction compared to No Action. Comparisons to the CT scenario show slightly higher risk reductions, ranging from 57 to 67 percent. There is a 32 to 45 percent risk reduction when REM-0/0/3 is compared to the MNA Alternative. The largest reductions in hazards are seen at RM 152, the location closest to the source. Hazard reductions are lower downriver, as transport of PCBs is greatest near the Thompson Island Pool and concentrations of those PCBs that are transported downriver are diluted by the larger volume of water in the lower river. Cancer Risks Incremental cancer risks under the No Action Alternative (start year 2010/2012) range from:
• 2.9 x 10⁻⁶ - 1.6 x 10⁻⁴ for the Mid-Hudson average. • 4.6 x 10⁻⁶ - 2.7 x 10⁻⁴ at RM 152. • 2.1x 10⁻⁶ - 1.2 x 10⁻⁴ at RM 113. • 1.8 x 10⁻⁶ - 9.7 x 10⁻⁵ at RM 90 (Table 799-4).
Under the MNA Alternative (start year 2010/2012) risks are:
• 1.7 x 10⁻⁶ - 8.2 x 10⁻⁵ for the Mid-Hudson average. • 2.8 x 10⁻⁶ - 1.2 x 10⁻⁴ at RM 152. • 1.3 x 10⁻⁶ - 6.2 x 10⁻⁵ at RM 113. • 1.1 x 10⁻⁶ - 5.3 x 10⁻⁵ at RM 90.
Responsiveness Summary Hudson River PCBs Site Record of Decision
6-24
CAP-3/10/S yields RME and CT risks of:
• 1.5 x 10⁻⁶ and 6.4 x 10⁻⁵ for the Mid-Hudson average. • 2.3 x 10⁻⁶ and 9.9 x 10⁻⁵ at RM 152. • 1.1 x 10⁻⁶ and 4.8 x 10⁻⁵ at RM 113. • 1.1 x 10⁻⁶ and 4.4 x 10⁻⁵ at RM 90.
The selected remedy yields RME and CT risks of:
• 1.5 x 10⁻⁶ and 6.2 x 10⁻⁵ for the Mid-Hudson average. • 2.2 x 10⁻⁶ and 9.6 x 10⁻⁵ at RM 152. • 1.1 x 10⁻⁶ and 4.7 x 10⁻⁵ at RM 113. • 1.0 x 10⁻⁶ and 4.3 x 10⁻⁵ at RM 90.
REM-0/0/3 would result in CT and RME risks of:
• x 10-6 and 5.1 x 10⁻⁵ for the Mid-Hudson average. • 1.5 x 10⁻⁶ and 7.8 x 10⁻⁵ at RM 152. • 7.9 x 10⁻⁷ and 3.9 x 10⁻⁵ at RM 113. • 7.6 x 10⁻⁷ and 3.6 x 10⁻⁵ at RM 90.
The MNA Alternative shows a 32 to 53 percent reduction in risk as compared to No Action, depending on the river section and time frame examined (Table 799-4). CAP-3/10/S as compared to NA results in a risk reduction of 55 to 64 percent under the RME scenario and 46 to 57 percent under the CT scenario. There is an 18 to 31 percent risk reduction when CAP-3/10/S is compared to the MNA Alternative. The selected remedy achieves a 56 to 65 percent RME incremental cancer risk reduction compared to No Action. Comparisons to the CT scenario show slightly lower risk reductions, ranging from 47 to 58 percent. There is a 20 to 33 percent risk reduction when the selected remedy is compared to the MNA Alternative. REM-0/0/3 achieves a 62 to 70 percent RME reduction as compared to No Action. Comparisons to the CT scenario range from 57 to 67 percent reduction. There is a 28 to 45 percent risk reduction when REM-0/0/3 is compared to the MNA Alternative. The largest reductions in risk are again seen at RM 152, the most upstream location. Ecological Toxicity Quotients and Relative Reductions Mink lowest-observed-adverse-effect-level (LOAEL) TQs are below one at all river miles for all alternatives, except No Action at RMs 152 and 113 (Table 799-5). All mink no-observed-adverse-effect-level (NOAEL) TQs are greater than one. Toxicity quotients for the river otter are above one for all alternatives on a NOAEL and LOAEL basis at all river miles (Table 799-5). Under the CAP-3/10/S Alternative, the percent risk reduction for the mink and river otter is between 43 and 63 percent as compared to No Action, and between 18 and 31 percent as compared to MNA (Table 799-6). Reductions in TQs between the preferred and No Action Alternatives for the mink and river otter range from 43 to 63 percent. When compared to the MNA Alternative, risk reduction ranges from 18 to 31 percent. The REM-0/0/3 Alternative shows reductions of 51 to 70 percent as compared to No Action and reductions ranging from 26
Responsiveness Summary Hudson River PCBs Site Record of Decision
6-25
to 44 percent as compared to the MNA Alternative. The highest percent risk reduction for all active alternatives as compared to the NA and MNA Alternatives is seen at RM 152, with progressively less reduction downriver. Summary This analysis shows that the Mid- and Lower Hudson River will also benefit from remedial action in the upper river. Human health non-cancer hazards and cancer risks will be reduced, as will risks to ecological receptors. References USEPA. 2000a. Phase 2 Report, Further Site Characterization and Analysis. Volume 2F - Revised Human Health Risk Assessment (HHRA), Hudson River PCBs Reassessment RI/FS. Prepared for USEPA Region 2 and USACE, Kansas City District by TAMS Consultants, Inc. and Gradient Corporation. November. USEPA. 2000b. Phase 2 Report, Further Site Characterization and Analysis. Volume 2E - Revised Baseline Ecological Risk Assessment (ERA), Hudson River PCBs Reassessment RI/FS. Prepared for USEPA Region 2 and USACE, Kansas City District by TAMS Consultants, Inc. and Menzie-Cura & Associates, November. USEPA. 2000c. Phase 3 Report, Feasibility Study. Hudson River PCBs Reassessment RI/FS. Prepared for USEPA Region 2 and USACE, Kansas City District, by TAMS Consultants, Inc., December. 6.4 Interpretation and Use of Model Results Master Comment 589 Several commenters agreed that EPA’s model supports the need to remove contaminated sediment from the Hudson River. However, these commenters felt that the model underestimates the risk and recovery time of the non-removal alternatives. The comments expressed concern that this underestimation may lead to a failure to move quickly on the removal program. Response to Master Comment 589 EPA’s combined modeling pair (HUDTOX and FISHRAND) represents one of the most sophisticated model simulations of any Superfund site to date. EPA is satisfied with the forecasts created by the model for the purposes of evaluating alternatives. Nonetheless, the EPA recognizes that any model has its limitations, especially when used as a forecast tool. There are many assumptions, both internal and external to the model, that will influence the forecast. Any deviations from the set of assumptions will result in a different outcome than that predicted by the model. Recognizing these limitations, EPA has performed several sensitivity analyses as presented in the FS and in the RBMR (USEPA, 2000). EPA has also created an upper bound
Responsiveness Summary Hudson River PCBs Site Record of Decision
6-26
estimate for localized areas of contamination (FS, Appendix D1). A more detailed discussion of the upper bound estimate can be found in the Response to Master Comment 609 in this chapter. In its selection of the remedy, EPA has considered the available model forecasts, data trend analyses, geochemical findings, and risk assessments. Each of these components weighs into the decision and no one component overrides the others. It is EPA’s intention to move forward quickly in the implementation of the selected remedy. Reference USEPA. 2000. Phase 2 Report, Further Site Characterization and Analysis. Volume 2D - Revised Baseline Modeling Report (RBMR), Hudson River PCBs Reassessment RI/FS. Prepared for USEPA Region 2 and USACE, Kansas City District by TAMS Consultants, Inc., Limno-Tech, Inc., Menzie-Cura & Associates, Inc., and Tetra-Tech, Inc. January 2000. 6.4.1 Presentation of Model Results Master Comment 313990 A commenter said that the table on page 6-33 should include the REM-3/10/Select Alternative. Response to Master Comment 313990 This table does not include alternative REM-3/10/Select because select areas are defined in a later section (Section 6.4.1.1, page 6-36). 6.4.2 Use of Upper Bound Estimates Master Comment 609 Commenters criticized EPA's presentation of an upper bound estimate of concentration trends in fish, which yielded a PCB half-life of 50 years for brown bullhead in TI Pool. Commenters characterized this calculation as arbitrary and capricious because it was calculated using only a subset of the available data. Commenters also noted that this calculation does not account for resuspension. Finally, a comment asked why the calculation was only done for the No Action and MNA Alternatives, but not for the capping and removal scenarios. Response to Master Comment 609 EPA does not agree with the commenter's characterization of EPA's use of the bounding calculation. The bounding calculation was designed as a data-based, semi-empirical analysis of PCB trends in fish to address the possibility that the model predictions regarding natural recovery may be overly optimistic.
Responsiveness Summary Hudson River PCBs Site Record of Decision
6-27
EPA continues to believe that the HUDTOX/FISHRAND model projections provide the best available tool for evaluating remedial alternatives in the Hudson River. These forecasts, however, are subject to uncertainty, and limitations in the data available for calibration raises the possibility that the model “best estimate” of trends could be overly optimistic for both the No Action and MNA Alternatives. This is particularly likely at localized spatial scales at which fish feed, and may be reflected in the lack of a clear declining trend in recent fish data collected by NYSDEC in the TI Pool and in the Stillwater-Coveville area. It is thus prudent to consider a reasonable upper bound on the rate of natural recovery. EPA’s calculation of an upper bound estimate represents an interpretation of the recent fish body burden data which reflects the recent trends and events in the Upper Hudson. The calculation is based on the data collected annually by the NYSDEC, a long and well-established data set. It is neither arbitrary nor capricious since it uses the available monitoring data, together with model projections of water column and non-cohesive sediment concentrations, and extrapolates the current trends out into the future. Due to local variability in the rate of decline in bioavailable PCB contamination in cohesive sediments, there are expected to be localized areas where the rate of improvement will significantly lag behind that of the river as a whole. That is, in areas such as the hot spots, the rate of recovery is expected to be much slower than for the river section as a whole. The upper bound calculation is directly based on the regular NYSDEC fish monitoring data collected near RM 189 in the TI Pool in the vicinity of Griffin Island and hot spots 13, 14, and 15, as well as data collected from the Stillwater-Coveville area. The upper bound calculation also makes use of recent sediment data collected by GE, which clearly demonstrates that surface sediment PCB concentrations in certain hot spot areas of the TI Pool are not declining as fast as the reach-averaged rates of decline predicted by the model (Response to Master Comment 633, Chapter 2). In particular, surface sediment concentrations have remained elevated in the area of hot spot 14, near where NYSDEC fish samples are collected in the TI Pool. These elevated sediment exposure concentrations appear to explain the slow rate of decline in fish tissue concentrations at the TI Pool collection point, which is most notable in brown bullhead, the sampled species whose PCB body burdens are expected to be most closely tied to sediment concentrations. Accordingly, the upper bound calculation is based on the following assumptions:
• The HUDTOX model provides the best available projection of water column and non-cohesive sediment exposure concentrations, as these exposure concentrations are likely to show less local variability than cohesive sediment exposure concentrations.
• Cohesive sediment exposure concentrations at specific localized areas such as Hot
Spot 14 are likely to decline at rates that are slower than reach-averaged model projections. The rate of decline in these exposure concentrations is assumed to be equal to the rate of decline in PCB tissue concentrations observed in brown bullhead since control of the upstream source.
Responsiveness Summary Hudson River PCBs Site Record of Decision
6-28
The calculation of the upper bound estimate was based on all available fish and sediment monitoring data collected since the PCB seeps at the Hudson Falls plant were largely controlled. Examination of earlier data shows an increase in fish body burdens following the Allen Mill event, followed by a sharp decline as the Hudson Falls seeps were controlled. Only those data collected since the effective reduction in the Hudson Falls seep (from about 1995 onward) were used for this extrapolation of trends into the future. Including data from the earlier 1990s would increase the apparent rate of decline in fish tissue concentration, as the data from prior to 1995 show the response of fish to the reduction in the upstream load and water column exposure concentrations, and not the natural rate of attenuation of in-place sediment exposure concentrations. Examining only the post-1995 data and excluding the temporary impact of the Allen Mill event, it is quite clear that the fish PCB levels obtained from NYSDEC’s monitoring location in the TI Pool decline only very gradually. These observations provide direct evidence on the rates of decline that occur under conditions of reduced, relatively stable upstream water column concentrations and naturally attenuating sediment exposure concentrations. A detailed discussion of the trends in fish body burdens, including the most recent (year 2000) data from NYSDEC is included in White Paper – Trends in PCB Concentrations in Fish in the Upper Hudson River). Note that the most recent data reaffirm the analysis included in Appendix D1 of the FS. The upper bound estimate is based on a subset of the data, but not an arbitrary subset. In keeping with the stated purposes of calculating an upper bound, attention is focused on the species (brown bullhead) and location (NYSDEC’s TI Pool fish collection site) for which fish tissue concentrations are shown by the data to be declining at rates slower than predicted by the model on a reach-averaged basis. It is quite likely that there are other locations, as well as other biota, that have not been sampled but for which rates of decline under natural attenuation will be even slower. EPA has chosen, however, to rely on the observed data to calculate an upper bound, rather than extrapolate to unmonitored areas. The calculation of the upper bound estimate is consistent with the observations of sediment concentrations both in surface sediment composites and in high resolution cores. Both data sets show only a gradual decline in the PCB concentrations of surface sediment and recently deposited sediments, respectively. In the high resolution sediment core data, the most recently deposited layers in both the EPA (1992) collection and the GE (1998) collection show little impact of the Allen Mill event. On this basis it appears likely that this event had little impact on the fine-grained sediments of the TI Pool. Further, comparison of GE 1991 sediment samples (obtained before the Allen Mill event) to those collected in 1998 shows that the near-surface, bioavailable PCB concentrations have declined only slowly, if at all, in several of the TI Pool hot spot areas. Further discussion on the trends in the sediments can be found in Response to Master Comments 633, Chapter 2, and White Paper – Relationship between PCB Concentrations in Surface Sediments and Upstream Sources. EPA did not calculate an upper bound for the capping and removal alternatives. As stated in the Proposed Plan (see pg. 18; USEPA, 2000), the over-optimism associated with modeling of the active alternatives is eliminated wherever PCBs are removed or capped, because model-projected sediment concentrations are replaced by specified concentrations (residual levels) in the remediated areas. Therefore, it was not necessary for EPA to calculate an upper bound for the
Responsiveness Summary Hudson River PCBs Site Record of Decision
6-29
active remedial scenarios in order to account for the over optimistic declines of surface sediment concentrations. It should be noted, though, that the EPA did examine the sensitivity of the model outcome to the mean residual concentration (FS, Chapter 9). This can be considered an upper bound on the forecast but does not represent localized heterogeneity. The Agency's comparison of the relative effectiveness of the remedial alternatives in the FS was based on the results of modeling each remedial alternative as well as on data projections (Proposed Plan, section entitled Rationale for Selection of Preferred Alternative, December, 2000). EPA disagrees that it is arbitrary and capricious to consider data trends for PCB concentrations in fish as part of the remedial decision-making process. Comparisons of the model outputs to such recent data trends suggest that the models may be overly optimistic with regard to the rate of PCB decline in fish predicted under the No Action and MNA Alternatives, and that the models may therefore underestimate the benefits of active remediation. It is entirely appropriate for the Agency to consider multiple lines of evidence and analyses when making a remedial decision for the Site. Reference USEPA. 2000. Superfund Proposed Plan, Hudson River PCBs Superfund Site. EPA Region 2, New York. December. 6.4.3 Comparison of EPA and GE Models Master Comment 843 Some commenters noted that predictions from the EPA and GE models are dramatically different. For example, the GE model predicts that fish would meet the present regulatory PCB limit for consumption (i.e., the 2 ppm FDA tolerance level) in a much shorter time span than the EPA model. Also, EPA does not appear to have made any adjustment to its HUDTOX fate and transport model to reflect the fact that model calibration was conducted before GE source control was in effect. Other commenters noted that although there are differences between the EPA and GE models, they use similar approaches and produce fundamentally the same key results: source control is essential to reducing PCB levels in fish; the Upper Hudson River, and particularly the TI Pool, is net depositional; PCBs in the Upper Hudson River are being buried and sequestered by clean sediment; and a 100-year flood will not materially delay continued reduction of PCB levels in fish. Elsewhere it was recommended that a comparison test of the two models be made by an appropriate impartial source to ensure that EPA has applied the best science available before making any decision about remedial alternatives. Response to Master Comment 843 Predictions from the EPA and GE PCB mass balance and bioaccumulation models are very similar when both sets of models are run using the same sets of assumptions. Predictions from these models are different when different assumptions are used to drive the models.
Responsiveness Summary Hudson River PCBs Site Record of Decision
6-30
The EPA fate and transport model results differ from GE predictions when the EPA models are run using the assumptions in the Feasibility Study for PCB resuspension during dredging, project implementation period, and residual concentrations in dredged areas that are not backfilled. In contrast, GE presents a different set of assumptions that include greater PCB resuspension, longer implementation time, and greater residual concentrations, all of which lead to a greater relative benefit for monitored natural attenuation. EPA is confident that the assumptions used to drive the simulations presented in the FS are reasonable and appropriate. Additional information to support these assumptions is provided in Response to Master Comment 823 in Section 6.1. During both the calibration period (1977-1997) and the validation period (1998-1999), EPA's HUDTOX model included specification of upstream boundary PCB loadings using actual measured data at Fort Edward (USEPA, 2000a). These data included the impacts of whatever GE source controls were in effect during these two periods, to the extent that the available water column data represented these impacts. Both the GE and EPA bioaccumulation models produce results for PCB concentrations in fish that are in general agreement with each other when the models are similarly parameterized. Specific model parameterizations for the FISHRAND bioaccumulation model are discussed in Response to Master Comment 779 in Chapter 2. A discussion of uncertainty in the modeling and variability in observed fish concentrations is provided in Response to Master Comment 789 in Section 6.2. The results from the EPA and GE models differ primarily due to different assumptions in the fate and transport modeling regarding resuspension, dredging implementation time, and residual concentrations present after dredging (White Paper – Relative Reduction of Human Health and Ecological Risks in the Mid- and Lower Hudson River. There are some important differences in the technical approaches between the EPA and GE bioaccumulation models. FISHRAND is a probabilistic population model; that is, the objective of the model is to generate population distributions of predicted fish body burdens. Appropriate statistics can be obtained from these distributions, such as the median, or mean. The GE bioaccumulation model simulates bioaccumulation in an individual fish, but the same equation (QEA, 1999, Equation 5-3) is used to describe the average concentration in the fish population. Use of this equation to predict the average concentration in a population of fish is problematic. If this equation is solved for an average fish (e.g., using average weight, lipid content, etc.) and compared to the average of solutions for 100 individual fish (e.g., each with different individual parameters), the results will likely be very different. This is a source of model uncertainty in the GE model that was not evaluated. Calibration of the FISHRAND model took into account year-to-year fluctuations in lipid content by incorporating a distribution rather than the actual observed lipid content in any given year, as the GE model does. Using the actual observed lipid content in any given year naturally minimizes the difference between predicted and observed body burdens, and creates the impression that the model is very precise. However, in predicting future concentrations, first it is necessary to predict a fish lipid content, and future predictions can vary considerably depending on the value that is selected. The FISHRAND model simply draws from the same distributions that were used for the calibration period, which means that the model incorporates both the mean and variance in lipid content. In contrast, the GE model assumes a constant lipid concentration for future years.
Responsiveness Summary Hudson River PCBs Site Record of Decision
6-31
There are also differences in the way in which the bioaccumulation models are linked to the sediment fate and transport models. These are discussed in Response to Master Comment 779 in Chapter 2 and Response to Master Comment 787 in Section 6.1.2. In addition, EPA did not discard any data as outliers during calibration, unlike the calibration procedure followed for the GE model. In sum, EPA is confident that its bioaccumulation model provides a valid tool for forecasting future PCB concentrations in fish, and corrects a number of deficiencies present in the GE bioaccumulation model. EPA disagrees with the interpretation of the bioaccumulation model results presented in comments, which suggested that the selected remedy would not result in an appreciable reduction in fish tissue concentrations relative to source control. While source control is important in reducing fish body burdens in the long term, removal of contaminated sediments removes that ongoing source of PCBs to the system as soon as dredging is completed. The FISHRAND model shows that fish body burdens approach asymptotic values driven by the upstream boundary condition (e.g., the ongoing source at the upstream boundary). Under the selected remedy, predicted fish concentrations decrease dramatically following dredging and achieve concentrations on the order of 10 years that would take forty years to achieve under MNA (and source control) alone. Comments regarding the role of burial in reducing PCB exposure to fish are overstated. Although the Upper Hudson River may be net depositional, this does not mean that sediments below the surface layer are sequestered from the surface layer and the water column. See Response to Master Comment 637 in Chapter 2. EPA does concur that a 100-year flood event will not significantly impact predicted fish body burdens (Response to Master Comment 364582, Section 6.1. The EPA models have been peer-reviewed by an independent panel of scientists (USEPA, 2000c). This peer review included examination of key variables in the models and model sensitivity. Subsequent to this peer review, the HUDTOX fate and transport model was further tested by successful validation to additional data collected by GE during 1999 (USEPA 2000d, Appendix A). Finally, EPA has already reviewed the GE model in detail and compared results from the two models (USEPA, 2000b), and thus further comparison tests are not needed. EPA concluded that the GE fate and transport model is more notable for similarities than for differences from the HUDTOX model, and differences in results between the GE and EPA fate and transport model applications are primarily due to differences in data and interpretation. References Quantitative Environmental Analysis (QEA). 1999. PCBs in the Upper Hudson River, Volume 2 - A Model of PCB Fate, Transport and Bioaccumulation. Prepared for General Electric, Albany, New York. May 1999.
Responsiveness Summary Hudson River PCBs Site Record of Decision
6-32
USEPA. 2000a. Phase 2 Report, Further Site Characterization and Analysis. Volume 2D – Revised Baseline Modeling Report (RBMR), Hudson River PCBs Reassessment RI/FS. Prepared for USEPA Region 2 and USACE, Kansas City District by TAMS Consultants, Inc., Limno-Tech, Inc., Menzie-Cura & Associates, Inc., and Tetra-Tech, Inc. January. USEPA. 2000b. Responsiveness Summary for Volume 2D – Baseline Modeling Report. Hudson River PCBs Reassessment RI/FS. Prepared for USEPA Region 2 and USACE, Kansas City District by TAMS Consultants, Inc., Limno-Tech, Inc., Menzie-Cura & Associates, Inc., and Tetra-Tech, Inc. February. USEPA. 2000c. Report on the Peer Review of the Revised Baseline Modeling Report for the Hudson River PCBs Superfund Site. Prepared for USEPA Region 2 by Eastern Research Group, Inc. May. USEPA. 2000d. Response to Peer Review Comments on the Revised Baseline Modeling Report. Hudson River PCBs Reassessment RI/FS. Prepared for USEPA Region 2 and USACE, Kansas City District, by TAMS Consultants, Inc., Limno-Tech, Inc., Menzie-Cura & Associates, Inc., and Tetra-Tech, Inc. November.
Responsiveness Summary Hudson River PCBs Site Record of Decision
7-1
7. ALTERNATIVE-SPECIFIC RISK ESTIMATES 7.1 Alternative-Specific HHRA Issues Master Comment 549 One commenter wanted to know whether the reference to Table 7-3 (Modeled Post-Remediation PCB Concentrations in Fish - Upper Hudson River) at top of page 7-9 in the FS Report should actually be to Table 7-4 (Species-Weighted Fish Fillet Average PCB Concentration). No mention of Table 7-4 was found in the text by the commenter, who also requested clarification of these two tables. Response to Master Comment 549 Tables 7-3 and 7-4 of the FS Report both contain information on forecasted PCB (Tri+) concentrations in fish fillets. The difference between these two tables is in the time period covered. Table 7-3 presents the annual mean concentrations in fish used to calculate average PCB concentrations in fish over the various multi-year time frames (7, 12, or 40 years) for non-cancer health hazards and cancer risks. As explained in the Revised Human Health Risk Assessment (USEPA, 2000), the point estimate exposure point concentrations in fish were derived using species ingestion fractions from the 1991 New York Angler Survey. Table 7-4 presents the species-weighted exposure point concentrations by year for the duration of the modeling period (1998-2068), and is referred to in Section 7.3.5.1 of the FS, Time to Reach Human Health Target Levels. Reference USEPA. 2000. Further Site Characterization and Analysis, Revised Human Health Risk Assessment (Revised HHRA) Volume 2F, Hudson River PCBs Reassessment RI/FS. Prepared for the USEPA Region 2 and USACE by TAMS Consultants, Inc. and Gradient Corporation. November 2000. Master Comment 547 With reference to a statement on page 15 of the Superfund Proposed Plan, "The model did not show substantial benefits from remediation in River Section 3," it was suggested that the basis for this statement is not clear. According to the table on page 19 of the Superfund Proposed Plan, the time to reach an average fish concentration of 0.4 ppm in the upper river is reduced by almost 50 percent in REM-0/0/3 compared to the preferred remedy. Response to Master Comment 547 It is true that the model predicts that the REM-0/0/3 alternative accelerates the time to achieve the 0.4 ppm concentration in fish, relative to the selected remedy when evaluated for the Upper Hudson River as a whole. However, when River Section 3 is compared by itself, there is no real difference in the year in which the 0.4 ppm concentration benchmark is reached for the selected
Responsiveness Summary Hudson River PCBs Site Record of Decision
7-2
remedy versus REM-0/0/3 (Table 7-4 of the FS). Note that much of the improvement in the Upper Hudson River as a whole from the REM-0/0/3 alternative is due to the more aggressive removal in River Sections 1 and 2, rather than the removal in River Section 3. Master Comment 561 A commenter cited page 6-11 of the FS, Conclusions: "Risks ...will continue to remain above target concentrations for at least the next 40 to 45 years, and longer for the PRG (0.05 ppm PCB in fish fillet)" and said the statement appears to be incorrect. Risks remain above target concentrations up to more than 67 years at 0.05, 0.2, or 0.4 ppm PCB target concentrations in fish fillet. Response to Master Comment 561 This comment is in reference to the Monitored Natural Attenuation (MNA) alternative. The conclusion should in fact state that risks will remain above the 0.4 ppm target concentration for 34 to more than 67 years, above the 0.2 ppm target concentration for 60 to more than 67 years, and above the PRG of 0.05 ppm for more than 67 years. Refer to page 19 of Proposed Plan or the table on page 9-2 of the Feasibility Study. Risks remain above target concentrations up to more than 67 years at 0.05, 0.2, or 0.4 ppm PCB target concentrations in fish fillet only for the No Action (NA) alternative. Master Comment 841 One commenter noted that page 9-6 of the FS Report, paragraph 2 says, "... health hazard reduction under the REM-0/0/3 alternative represents approximately a 10-percentage-point advantage over the REM-3/10/Select alternative." The contention is that the reduction discussed is substantially less than that derived from the table on page 9-5 over the entire Upper Hudson River. Those figures suggest a 30 to 42 percent range in additional reduction in non-cancer health hazards and cancer risks with REM-0/0/3 compared to REM-3/10/Select. The additional risk reduction is in the range of 33 to 47 percent when REM-0/0/3 is compared to CAP-3/10/Select. Response to Master Comment 841 The comparisons made in paragraph 2 on page 9-6 of the FS were based on reductions in risk between active alternatives and the NA and MNA alternatives. Both non-cancer health hazard and cancer risk reductions for REM-3/10/Select (selected remedy) and REM-0/0/3 alternatives, as compared to NA and MNA alternatives (considering the Upper Hudson as a whole), are within ten percentage points (see Tables 7-6a and 7-7a of the FS). The comparisons in this comment are made between two of the active remedial alternatives, REM-3/10/Select (selected remedy) and REM-0/0/3. Please see Responses to Master Comment 565 in Section 7.1, and Master Comment 397 in Chapter 1 for additional discussion of the relative risk reduction of the selected remedy and REM-0/0/3.
Responsiveness Summary Hudson River PCBs Site Record of Decision
7-3
Master Comment 551 With reference to page 9-26 of the FS Report, Section 9.5.4, paragraph 1, third sentence, the following comment was made: "The alternative target concentration of 0.4 ppm PCBs in fish fillets is met in River Sections 1 and 2 in the short term by REM-0/0/3. The 0.4 ppm target level is attained two (for River Section 1) to five years (for River Section 2) after the remedy is completed." Response to Master Comment 551 For the REM-0/0/3 alternative, the target concentration of 0.4 ppm PCBs in fish fillets is estimated to be met in year 2013 for River Section 1, year 2015 for River Section 2, and year 2010 for River Section 3. Master Comment 553 Commenters said that EPA's proposed plan would result in increased risk in the short term to human health and the environment due to PCB resuspension. Several contended that the project will not accelerate the date at which fish caught between Troy and the Northumberland Dam can be eaten. Response to Master Comment 553 Based on the modeling done to estimate long-term effects, a qualitative evaluation of short-term cancer risks and non-cancer health hazards can be made (FS, Section 7.3.1.3). PCB concentrations in fish for the short-term period beginning in 2004 are above all target levels, with the exception of the 0.4 ppm fish concentration target level in River Section 3 for the MNA, CAP-3/10/S, and REM-0/0/3 alternatives, and REM-3/10/Select (selected remedy), (Table 7-4 of the FS). Target levels in fish will be reached first in River Section 3, below the Northumberland Dam. The selected remedy accelerates the time when fish caught between Troy and the Northumberland Dam (i.e., River Section 3) can be consumed at the following rates as compared to the No Action and MNA alternatives (based upon Table 7-4 of the FS):
• One fish meal per week (Remediation Goal of 0.05 ppm) – goal reached more than 17 years before NA and eight years before MNA.
• One fish meal per month (Remediation Goal of 0.2 ppm) –goal reached more than 54 years before NA and six years before MNA.
• One fish meal every two months (Remediation Goal of 0.4 ppm) – goal reached four years before NA and one year before MNA.
White Paper – Human Health and Ecological Risk Reduction under Phased Implementation contains an analysis of expected impacts under various conditions for the selected remedy. As PCB concentrations are highest in the initial modeling years, it is apparent that most target non-cancer health hazards and cancer risk levels will not be achieved in the short term under any alternative; also, there may be a relatively short-term increase in fish body burdens immediately
Responsiveness Summary Hudson River PCBs Site Record of Decision
7-4
after dredging is completed. Overall, however, based on EPA’s modeling, remediation is predicted to result in lower, rather than elevated, body burdens in fish, as the removal of PCB-contaminated sediment far outweighs the amount of PCBs that will be resuspended. In the long term, significant reductions in fish body burdens are expected both within the areas that are remediated as well as in downstream areas. Further discussion can be found in the Responses to Master Comments 583 (Chapter 10), 587 (Chapter 9), and 365942 (also Chapter 10). Finally, as noted elsewhere in this Responsiveness Summary and in the Record of Decision, the results of EPA’s modeling of the No Action and MNA alternatives may overestimate the rate of decline of PCBs in fish. Thus, the actual benefits of the selected remedy relative to No Action and MNA may be even greater than the percentage figures set forth in the preceding text. Studies have consistently shown that dredging has beneficial results and does not increase the amount of contamination in an area (Response to Master Comment 337860, Chapter 11). For example, a US Army Corps of Engineers' Vicksburg District dredging project in the Steele Bayou in 1994 has shown significant short-term decreases in the concentration of DDT in sediment and fish (USACE, 2001). Since fish testing began at that Site, DDT concentrations in fish tissue have decreased by more than 85 percent. Both PCBs and DDT have a strong affinity to bioaccumulate in fish, thus the findings of reduced DDT concentrations in fish after dredging at Steele Bayou provides evidence from field studies that dredging bioaccumulative chemicals from sediments is expected to yield reduced concentrations of these chemicals in fish. Reference US Army Corps of Engineers (USACE). 2001. Press Release. Corps Test Results: Dredging Decreases DDT in Fish Tissue. June 26, 2001. Master Comment 559 Regarding the table entitled Years to Reach PCB Target Concentration in Fish Averaged Over Entire Upper Hudson River on page 9-2 of the FS, one commenter wanted clarification on whether the years to reach PCB target concentrations in fish include years prior to initiation of construction and until completion of construction. Response to Master Comment 559 The years to reach PCB target concentrations in fish are calculated beginning from the year of the FS until the end of the modeling run (2067), and include the years prior to the initiation of remediation through the completion of remediation. Master Comment 831 The question was raised as to how many years are required to attain the PRG of 0.05 ppm PCBs in fish in the Lower Hudson River. Commenters said that this goal has been cited as being 40 times stricter than the Federal Food and Drug Administration's commercial fish limit of 2.0 ppm. A number of other commenters questioned when the fish would be "edible." Other commenters
Responsiveness Summary Hudson River PCBs Site Record of Decision
7-5
questioned in what year(s) would average fish concentrations over the Upper Hudson expect to be reduced to 0.09 to 0.14 ppm. Response to Master Comment 831 The time it takes to achieve particular PRGs or target levels in fish is species- and location-specific for a given upstream PCB boundary condition. Some fish will achieve target levels sooner than others based on feeding and habitat preferences. The yellow perch, brown bullhead, white perch, and striped bass were modeled in the lower river using the results of the Farley model for input into the FISHRAND model (White Paper –– Relative Reduction of Human Health and Ecological Risks in the Mid- and Lower Hudson River). EPA’s FISHRAND modeling predicts that a concentration at or below the PRG of 0.05 ppm wet weight under the selected remedy in the Lower Hudson River will be achieved as follows:
• Yellow perch: in 2022 at RM 152, in 2019 at RMs 113 and 90, and in 2020 at RM 50. • Brown bullhead: in 2028 at RM 113, in 2033 at RM 90, in 2029 at RM 50, and a
concentration of approximately 0.06 ppm at RM 152 in 2046. • White perch: in 2033 at RM 90, in 2029 at RM 50, and concentrations of approximately
0.09 and 0.06 ppm at RMs 152 and 133, respectively, in 2046. • Largemouth bass: largemouth bass in the Lower Hudson River will not achieve 0.05 ppm
prior to the end of modeling in 2046. Concentrations at that time are estimated to be 0.12 ppm at RM 152, 0.10 ppm at RM 113, and 0.09 ppm at RMs 90 and 50.
Under the No Action alternative, Lower Hudson River fish concentrations do not achieve 0.05 ppm for any of the fish species within the modeling time frame and are several times higher than under the selected remedy. The different timing (e.g., five-year versus six-year implementation schedule) and sediment resuspension (e.g., 0.13 percent or 2.5 percent) assumptions do not appreciably impact the time to achieve target levels as predicted fish body burdens stabilize rapidly following dredging. The FDA Tolerance Level of 2 ppm is based on a "market basket" of commercially caught fish obtained from supermarkets, and is an upper bound, not an average PCB concentration in commercially marketed fish. Therefore, this level is not protective of recreational anglers or subsistence fishers who frequently consume fish from one single source, such as the Hudson River (Responses to Master Comments 545 and 447, Chapter 3). The time required to achieve between 0.09 and 0.14 ppm in fish tissue in the Upper Hudson River under the selected remedy depends on the fish species and location being modeled. Predicted largemouth bass body burdens are approximately 0.38 ppm in the Thompson Island Pool (RM 189) by 2067, and achieve 0.14 ppm in approximately 2044 at RM 184. At RM 154, largemouth bass are expected to achieve 0.14 ppm by 2015 and 0.09 ppm by 2023. Brown bullheads achieve 0.14 ppm in approximately 2060 at RM 189. At RM 184, predicted brown bullhead body burdens are approximately 0.2 ppm by the end of the modeling period (2067). At RM 154, brown bullheads are expected to achieve 0.14 ppm by 2021 and 0.09 ppm by 2028. Under the No Action alternative, concentrations of 0.09 and 0.14 ppm are not achieved in the upper river at any river mile (i.e., 189, 184, and 154) for any of the three fish species modeled
Responsiveness Summary Hudson River PCBs Site Record of Decision
7-6
(i.e., largemouth bass, brown bullhead, and yellow perch). Concentrations for some species at the end of the modeling period in 2067 under the No Action alternative are up to an order of magnitude higher under the selected remedy. Results of additional simulations for the selected remedy under different assumptions are provided in White Paper – Model Forecasts for Additional Simulations in the Upper Hudson River and White Paper – Relative Reduction of Human Health and Ecological Risks in the Mid- and Lower Hudson River. Human health and ecological risks are discussed in White Paper – Human Health and Ecological Risk Reduction under Phased Implementation, the Response to Master Comment 799 (Chapter 6), and White Paper – Relative Reduction of Human Health and Ecological Risks in the Mid- and Lower Hudson River. Master Comment 565 Commenters contend that EPA's preferred alternative did not offer significant human health risk reduction; the remedy may increase the amount of time that would be necessary to achieve target PRGs relative to the source control (MNA) alternative. Comments stated that the risk reduction achieved by EPA's remedy cannot be distinguished from the risk reduction for other alternatives examined by EPA because of the inability to demonstrate statistically significant differences in modeled future PCB trends in fish consumed by anglers. Other comments argued that unrealistic assumptions were adopted regarding dredging operations, and that fish ingestion rates were overstated, thus target PRGs should be raised (fourfold increase suggested). It was suggested that when "realistic" assumptions regarding the timing and ultimate effects of dredging are considered, and adjustments to EPA's risk analysis are made, source control will lower PCB concentrations in fish more quickly than dredging in most of the Site, and the proposed dredging remedy will do more harm than good. Furthermore, commenters said that the current fish advisories render any risk reduction hypothetical because significant populations of anglers are not currently consuming fish. Other commenters said that EPA should provide further detail and comparisons of predicted PCB concentrations in fish over time for the remedial alternatives examined in the FS. Comments in support of EPA's proposed remedy indicated the remedy would hasten the reduction of PCBs in fish, thereby reducing human exposure to PCBs, accelerating the time to achieve human health risk objectives, and accelerating the time to when less stringent fishing advisories may be required. Some commenters feel that EPA should select a more aggressive alternative that includes greater sediment removal, thereby further hastening the time to achieve target PRGs and providing greater risk reduction than EPA's proposed remedy. These commenters indicated that the greater PCB removal would also accelerate the time when fishing advisories might be removed or lessened.
Responsiveness Summary Hudson River PCBs Site Record of Decision
7-7
Response to Master Comment 565 EPA believes it has developed a balanced approach and plan for remediation and has appropriately considered both the technical feasibility of the selected remedy and the degree of risk reduction expected to result from the remediation. As first described in the FS, and further supported in this responsiveness summary, EPA has adopted reasonable and technically feasible assumptions regarding the operational conditions associated with the selected remedy (e.g., expected duration of dredging operations, degree of sediment resuspension, etc.). The models used to generate sediment, water, and fish concentrations used in hazard and risk calculation have been peer reviewed by a panel of independent experts (USEPA, 2000a). Consequently, EPA does not agree with the comments that the hydrodynamic fate and bioaccumulation models used to project PCB concentrations in fish predict unrealistic or unattainable reductions in PCBs. A sensitivity analysis of model parameters (e.g., surrogate for conditions during active remediation alternatives) was performed in the FS to examine a range of conditions, and even under conditions of greater sediment/PCB release than expected, significant reductions in risk will be achieved by the selected remedy. In addition, as discussed in Response to Master Comment 789 in Chapter 6, the claim that model predictions show little if any statistical difference across alternatives is based on an inaccurate methodology. It is not appropriate to use the measure of variability from observed fish concentrations in estimating uncertainty in future model predictions. In fact, on a relative basis, comparison of modeling results across different modeling assumptions effectively reduces uncertainty. Model uncertainty applies to all predictions, such that there is greater uncertainty in absolute predicted values than there is in comparing predicted values. The risk assessment methods adopted for the baseline HHRA (USEPA, 2000b) and the assessment of future risks under each of the remedial alternatives are fully consistent with CERCLA and the NCP goal of protecting the Reasonable Maximum Exposure (RME) individual. The methods adopted for the baseline HHRA (which were also used for the FS) were subject to external peer review, and found to be consistent with EPA Superfund practice. As discussed in the Response to Master Comment 569 in Chapter 3, the methods employed by EPA in its Monte Carlo risk analysis in the HHRA yield results quite comparable to those of GE’s microexposure risk analysis. EPA disagrees with the comments indicating that risks have been overstated in the HHRA and FS by adopting fish ingestion rates that are too high (fourfold too high, as suggested by one commenter). EPA also disagrees with other commenters who hold the opposing view that the fish ingestion rates are perhaps too low. As discussed in the Response to Master Comment 569 and the HHRA, EPA developed risk estimates based on RME assumptions for its exposure parameters, including the fish ingestion rate. The RME approach, which is consistent with CERCLA and the NCP, protects for exposures to individuals at the high end of the exposure distribution within a population, yet is not set to the maximum exposure within a population. Furthermore, during the peer review of the HHRA, the reviewers found the fish ingestion rate adopted by EPA to be appropriate for this Site (USEPA, 2000c). The 1996 and 1991-1992 Hudson angler surveys have shown that the risk from fish ingestion is not a hypothetical risk (RHHRA. p. 40 and NYSDOH, 1999).
Responsiveness Summary Hudson River PCBs Site Record of Decision
7-8
It is recognized that there is inherent statistical variability and/or uncertainty in observational data (i.e., fish monitoring data). Uncertainty is also introduced by the use of models. Yet, the hydrodynamic models and the bioaccumulation models have consistently been used as appropriate tools for comparison among different remediation scenarios. While one can argue about the accuracy of their predictions on an absolute scale, the relative predictions when run with different PCB removal scenarios is considered to be an appropriate use of the models. The selected remedy (REM-3/10/Select) achieves a 71 to 79 percent RME non-cancer hazard index reduction compared to No Action, and a 58 to 75 percent RME hazard index reduction compared to MNA in the upper river. Comparisons to the central tendency (CT) scenario and comparisons by river section show similar reductions in hazard indices in River Sections 1 and 2. Reductions are lower in River Section 3, where risks are lower. The RME non-cancer time frame covers a 7-year period for the RME scenario and 12-year period for the CT period, beginning in 2010 after the completion of the 6-year dredging program. For further information on risk see White Paper – Human Health and Ecological Risk Reduction under Phased Implementation. For cancer risk reduction, the selected remedy achieves a 76 to 85 percent RME risk reduction compared to No Action and a 50 to 80 percent RME cancer risk reduction compared to MNA in the upper river. Comparisons to the CT scenario and comparisons by river section show similar reductions in cancer risk in River Sections 1 and 2 and lower reductions in River Section 3. The RME cancer time frame covers a 40-year period for the RME scenario and 12-year period for the CT period, beginning in 2010 after the completion of the 6-year dredging program. Based on these non-cancer health hazard and cancer risk reductions, the implementation of the selected remedy would provide significant human health benefits. EPA disagrees that the selected remedy will do more harm than good; see Response to Master Comment 485 in Chapter 11. References New York State Department of Health (NYSDOH). 1999. Health Consultation: 1996 Survey of Hudson River Anglers, Hudson Falls to Tappan Zee Bridge at Tarrytown, New York. February. (Raw survey data received electronically from Edward Horn of NYSDOH in June, 1998.) USEPA. 2000a. Response to Peer Review Comments on the Revised Baseline Modeling Report (RMBR), Hudson River PCBs Reassessment RI/FS. Prepared for the USEPA Region 2 and USACE by TAMS Consultants, Inc., Limno-Tech, Inc., Menzie Cura & Associates, Inc. and Tetra-Tech, Inc. November 2000. USEPA. 2000b. Further Site Characterization and Analysis, Revised Human Health Risk Assessment (HHRA/RHHRA) Volume 2F, Hudson River PCBs Reassessment RI/FS. Prepared for the USEPA Region 2 and USACE by TAMS Consultants, Inc. and Gradient Corporation. November 2000. USEPA. 2000c. Peer Review Responsiveness Summary for Volume 2F - Human Health Risk Assessment, Hudson River PCBs Reassessment RI/FS. Prepared for USEPA Region 2 and the USACE, Kansas City District by TAMS Consultants, Inc. and Gradient Corporation. March.
Responsiveness Summary Hudson River PCBs Site Record of Decision
7-9
Master Comment 797 Commenters said that increased dredging time will decrease risk reduction between alternatives. Some cite the most significant factor that would impact the time differences between alternatives as an increase in the time to complete dredging, and contend that EPA's dredge times appear unrealistically short and have not been justified. Since it is felt that longer dredge times would reduce already marginal risk reductions, commenters suggested that EPA show the impacts of longer dredge times on PCB concentrations in fish and risks. Response to Master Comment 797 As discussed in the Response to Master Comment 671 (Chapter 10), White Paper – Dredging Productivity and Schedule, and White Paper – Delays and Downtime, a phased six-year dredging period is a realistic time frame. However, even if dredging does extend beyond the envisioned time frame, risk reductions are expected to stay relatively constant. Tables 797-1 and 797-2 show non-cancer hazard indices and cancer risks, respectively, using the assumption that dredging extends to a period of ten years. Hazard indices and cancer risks are slightly lower than calculated for the phased six-year dredging time frame, but relative risk reductions are within a few percentage points (in both directions) of the original estimates. The non-cancer hazard indices and cancer risks shown in Tables 797-1 and 797-2 were estimated by calculating average PCB concentrations beginning ten years after initiation of remediation. The model projections used were those estimated for a six-year remediation, and the exposure point concentrations were calculated by starting the averaging four years later than those calculated for a six-year remediation period (i.e., the bioaccumulation model was not rerun for a ten-year period). Future PCB concentrations in fish were provided in Table 7-4 of the FS, which showed that reductions in PCB concentrations begin before the completion of remediation. 7.2 Alternative-Specific ERA Issues Master Comment 817 Some commenters asserted that risks to other ecological receptors (in addition to the mink and otter) should have been described in the FS, as ecological risks are not limited to piscivorous birds and mammals. It was suggested that a more complete description of the risk reduction to receptors in addition to otter and mink would demonstrate a shorter recovery time for other receptors and more benefit from any remedial action. Response to Master Comment 817 Receptors selected for use in the FS were based on the results of the Revised Baseline Ecological Risk Assessment (RBERA) (USEPA, 2000). The RBERA modeled future risks for insectivorous, omnivorous, and piscivorous birds and mammals. For 2010 and beyond (the year remediation is scheduled for completion), toxicity quotients (TQs) above one were calculated for the mallard, belted kingfisher, great blue heron, bald eagle, little brown bat, raccoon, mink, and river otter.
Responsiveness Summary Hudson River PCBs Site Record of Decision
7-10
Both Total PCBs and toxic equivalencies (TEQs) were calculated (RBERA, pp. 58- 61). The total PCBs calculations have greater compatibility and less uncertainty associated with them than the TEQ estimates. Future total PCB risks for eggs of piscivorous birds (i.e., belted kingfisher, great blue heron, and bald eagle), little brown bat, mink, and river otter are above the no-observed-adverse-effect-level (NOAEL) basis for 2010 and for subsequent years modeled in the RBERA. The insectivorous little brown bat was not evaluated in the FS because risks 2010 and beyond were less than three on a NOAEL basis. Piscivorous mammals (mink and river otter) were selected to show risk reduction in the FS rather than piscivorous birds, which showed risks for eggs but not for adults. There is greater uncertainty in modeling risks to eggs due to the use of a biomagnification factor to estimate egg concentrations (RBERA, pp. 79-80). The results of the RBERA show that species other than piscivorous birds and mammals may be at risk from PCB exposure. Reductions in PCB concentrations in the Hudson River sediments will reduce risks to biota living or foraging in the river. Reference USEPA. 2000. Phase 2 Report, Further Site Characterization and Analysis. Volume 2E- Revised Baseline Ecological Risk Assessment (RBERA), Hudson River PCBs Reassessment RI/FS. Prepared for USEPA Region 2 and the USACE, Kansas City District by TAMS/MCA. November 2000. Master Comment 313261 Some commenters attributed a large part of the projected decline in fish concentrations in the Upper Hudson for the No Action alternative to transport of PCBs from the Upper Hudson to the Lower Hudson, or other losses of PCBs to the environment. PCBs do not readily degrade, so natural attenuation is actually just another way of saying that they will end up somewhere else within the environment, either in the New York Harbor, in the fatty tissue of fish and mammals of the Upper Hudson, or on the floodplain. Much of the PCBs lost from the Upper Hudson will be transported downriver and redistributed, and will contribute to sediment concentrations and bioconcentration all the way to New York Harbor. Thus, the "recovery" of the Upper Hudson River under the No Action and MNA alternatives has negative consequences for downstream ecosystems and communities. Response to Master Comment 313261 Declines of PCB concentrations in fish forecasted by EPA’s peer-reviewed fate and transport and bioaccumulation models of the Upper Hudson River, HUDTOX and FISHRAND, are a result of calibration of the models to the historical dataset, which shows long-term downward trends of PCB concentrations in river water and fish. The historical downward trends are due mostly to reduction and eliminations of PCB sources to the river and dilution of PCB concentrations in sediment through burial and mixing. EPA’s analysis of recent fish data shows little or no
Responsiveness Summary Hudson River PCBs Site Record of Decision
7-11
reduction in PCB concentrations in the past five or more years (FS, Appendix D.1), suggesting that the models may overpredict the future benefits of natural attenuation processes. Natural attenuation processes that may contribute to a downward trend in the future include biodegradation, biotransformation, bioturbation, diffusion, dilution, adsorption, volatilization, chemical reaction or destruction, resuspension, downstream transport, and burial by clean material, as described in the FS (Section 4.2.2). There is evidence for some aerobic destruction of PCBs (Response to Master Comment 613, Chapter 2), and burial accounts for much of the benefit attributed to MNA. MNA allows greater PCB mass transport downstream than the active capping or removal alternatives (FS, Table 8-3). This increased mass results in higher fish concentrations (Table 799-1, Chapter 6) and higher risks to downstream receptors (Table 799-4, Chapter 6). The selected remedy shows up to an 87 percent reduction in risks to ecological receptors when compared to No Action and up to a 71 percent reduction when compared to the MNA alternative. Master Comment 364780 A number of commenters contended that the CAP-3/10/Select alternative is not as protective of ecological and human health as the other active remedial alternatives. They stated that the CAP-3/10/Select alternative will leave almost half of all PCBs in place, and flooding and scouring may damage the cap. Some commenters said that there appears to be a typographical error in the FS report stating that it will take 45 years to achieve the LOAEL for mink in River Section 1 for this alternative versus 22 years for the MNA alternative. Response to Master Comment 364780 EPA concurs that the CAP-3/10/Select remedy is not as protective of human health and the environment as the other active remedies. EPA agrees that there is also the possibility of cap damage with this alternative. Therefore, CAP-3/10/Select was not selected as the preferred alternative. Table 7-8 of the FS clearly lists the CAP-3/10/Select alternative as requiring 5 (not 45) years to reach the mink LOAEL in River Section 1. This is in contrast to the No Action alternative, which does not meet the LOAEL within the 60-year modeling time frame, and to the MNA alternative, which would take 22 to more than 60 years to achieve the LOAEL (FS, Sections 7.3.2.4 and 7.3.3.4).
Responsiveness Summary Hudson River PCBs Site Record of Decision
8-1
8. COMMUNITY IMPACTS 8.1 Transportation (Infrastructure) Master Comment 649 Some comments ask whether there are sufficient energy resources in the region needed for the proposed plan. Commenters to EPA's Feasibility Study (FS) have suggested that it will be difficult to meet the energy needs of the proposed remedial plan and have expressed concerns about effects on local energy consumers as well as spill response procedures. Response to Master Comment 649 Energy for the selected remedy will consist mainly of diesel fuel, gasoline, and electricity. Prior to addressing the energy requirements of the project in the following text, it is important to note that EPA has not yet determined the locations of sediment processing/transfer facilities necessary to implement the selected remedy. For purposes of the Feasibility Study, example locations were identified from an initial list of candidate sites based on screening-level field observations which considered potential facility locations from an engineering perspective. In the FS, it was necessary to assume the locations of sediment processing/transfer facilities in order to develop conceptual engineering plans, analyze equipment requirements, and develop cost estimates for the remedial alternatives. For this purpose, two example locations were identified: one at the northern end of the project area in the vicinity of the Old Moreau Dredge Spoils Area, and one at the southern end of the project area near the Port of Albany. Each of these example locations fulfills many of the desired engineering characteristics for such a facility to support the remedial work, and is representative of reasonable assumptions with regard to distance from the dredging work and cost. Other locations, both within the upper Hudson River valley and farther downstream, are possible. Petroleum Products It is assumed here that fuel will be delivered to a northern sediment processing/transfer facility by truck and staged there for distribution. An alternative assumption would be that fuel is delivered by barge from the areas downriver and either offloaded at a northern facility or stored in and distributed from the delivery barge. The total diesel fuel requirements for this project under the mechanical dredging alternative are approximately 550,000 gallons per season for a northern facility and 875,000 gallons for a southern facility. Under the hydraulic alternative the seasonal estimate is 630,000 gallons and 960,000 gallons at the northern and southern facilities, respectively. Assuming that all fuel is delivered from outside the region, under the hydraulic alternative there would be a maximum of approximately four fuel deliveries per week at a northern facility and six trucks per week at a southern facility. Based on the actual requirements, it is likely that at least part of the fuel for the project can be obtained locally without affecting the area consumers. In fact, it is expected that these local energy purchases will constitute a benefit to the local economy. A southern sediment processing/transfer facility is expected to be located in a more urbanized area; as a result, there should be sufficient fuel available locally.
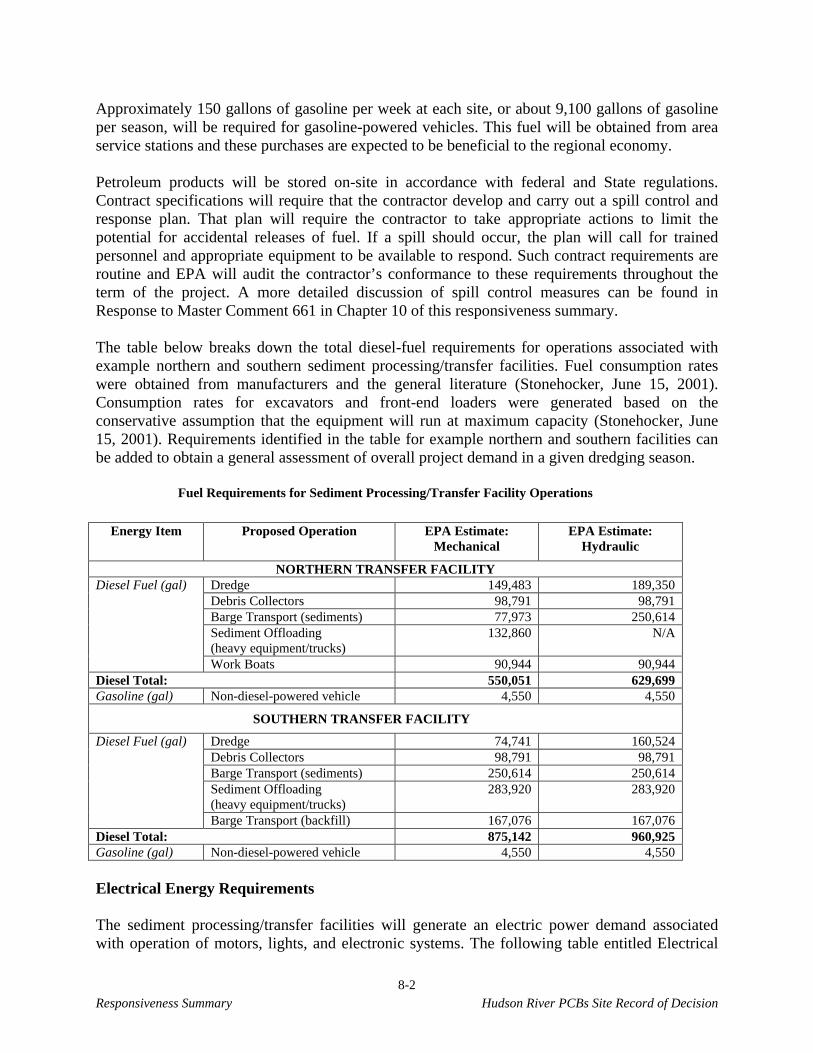
Responsiveness Summary Hudson River PCBs Site Record of Decision
8-2
Approximately 150 gallons of gasoline per week at each site, or about 9,100 gallons of gasoline per season, will be required for gasoline-powered vehicles. This fuel will be obtained from area service stations and these purchases are expected to be beneficial to the regional economy. Petroleum products will be stored on-site in accordance with federal and State regulations. Contract specifications will require that the contractor develop and carry out a spill control and response plan. That plan will require the contractor to take appropriate actions to limit the potential for accidental releases of fuel. If a spill should occur, the plan will call for trained personnel and appropriate equipment to be available to respond. Such contract requirements are routine and EPA will audit the contractor’s conformance to these requirements throughout the term of the project. A more detailed discussion of spill control measures can be found in Response to Master Comment 661 in Chapter 10 of this responsiveness summary. The table below breaks down the total diesel-fuel requirements for operations associated with example northern and southern sediment processing/transfer facilities. Fuel consumption rates were obtained from manufacturers and the general literature (Stonehocker, June 15, 2001). Consumption rates for excavators and front-end loaders were generated based on the conservative assumption that the equipment will run at maximum capacity (Stonehocker, June 15, 2001). Requirements identified in the table for example northern and southern facilities can be added to obtain a general assessment of overall project demand in a given dredging season.
Fuel Requirements for Sediment Processing/Transfer Facility Operations
Energy Item Proposed Operation EPA Estimate: Mechanical
EPA Estimate: Hydraulic
NORTHERN TRANSFER FACILITY Dredge 149,483 189,350 Debris Collectors 98,791 98,791 Barge Transport (sediments) 77,973 250,614 Sediment Offloading (heavy equipment/trucks)
132,860 N/A
Diesel Fuel (gal)
Work Boats 90,944 90,944 Diesel Total: 550,051 629,699 Gasoline (gal) Non-diesel-powered vehicle 4,550 4,550
SOUTHERN TRANSFER FACILITY
Dredge 74,741 160,524 Debris Collectors 98,791 98,791 Barge Transport (sediments) 250,614 250,614 Sediment Offloading (heavy equipment/trucks)
283,920 283,920
Diesel Fuel (gal)
Barge Transport (backfill) 167,076 167,076 Diesel Total: 875,142 960,925 Gasoline (gal) Non-diesel-powered vehicle 4,550 4,550 Electrical Energy Requirements The sediment processing/transfer facilities will generate an electric power demand associated with operation of motors, lights, and electronic systems. The following table entitled Electrical
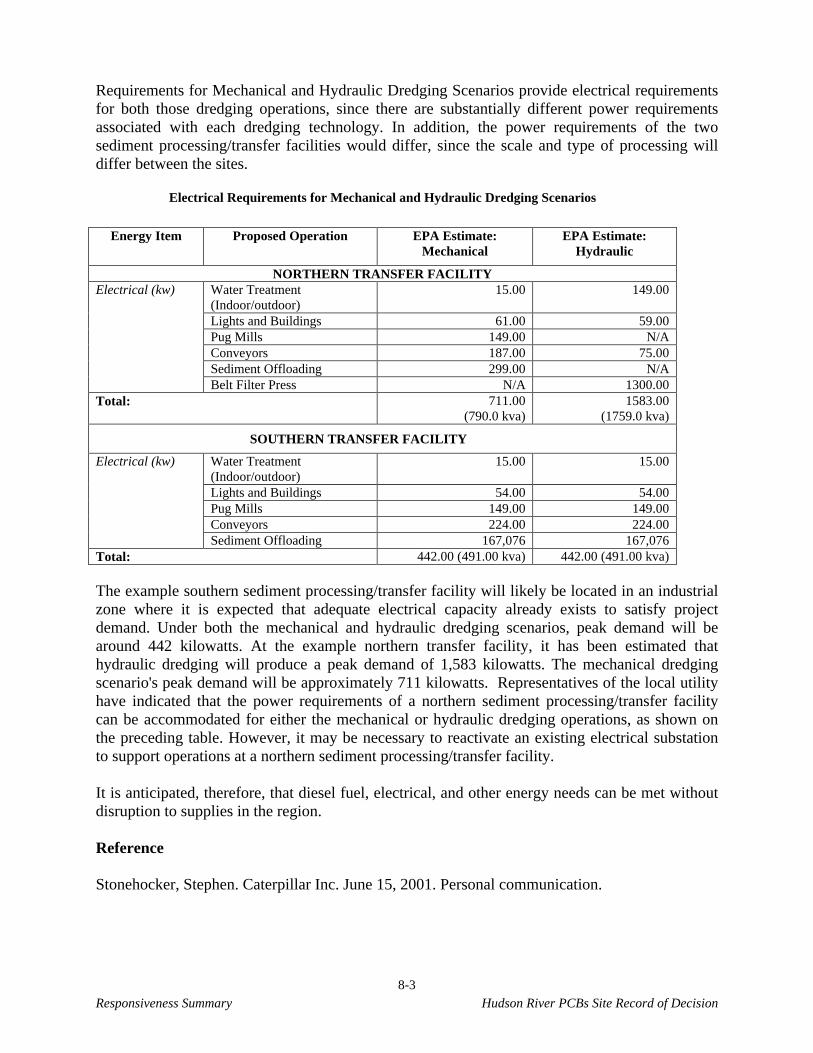
Responsiveness Summary Hudson River PCBs Site Record of Decision
8-3
Requirements for Mechanical and Hydraulic Dredging Scenarios provide electrical requirements for both those dredging operations, since there are substantially different power requirements associated with each dredging technology. In addition, the power requirements of the two sediment processing/transfer facilities would differ, since the scale and type of processing will differ between the sites.
Electrical Requirements for Mechanical and Hydraulic Dredging Scenarios
Energy Item Proposed Operation EPA Estimate: Mechanical
EPA Estimate: Hydraulic
NORTHERN TRANSFER FACILITY Water Treatment (Indoor/outdoor)
15.00 149.00
Lights and Buildings 61.00 59.00 Pug Mills 149.00 N/A Conveyors 187.00 75.00 Sediment Offloading 299.00 N/A
Electrical (kw)
Belt Filter Press N/A 1300.00 Total: 711.00
(790.0 kva) 1583.00
(1759.0 kva)
SOUTHERN TRANSFER FACILITY
Water Treatment (Indoor/outdoor)
15.00 15.00
Lights and Buildings 54.00 54.00 Pug Mills 149.00 149.00 Conveyors 224.00 224.00
Electrical (kw)
Sediment Offloading 167,076 167,076 Total: 442.00 (491.00 kva) 442.00 (491.00 kva) The example southern sediment processing/transfer facility will likely be located in an industrial zone where it is expected that adequate electrical capacity already exists to satisfy project demand. Under both the mechanical and hydraulic dredging scenarios, peak demand will be around 442 kilowatts. At the example northern transfer facility, it has been estimated that hydraulic dredging will produce a peak demand of 1,583 kilowatts. The mechanical dredging scenario's peak demand will be approximately 711 kilowatts. Representatives of the local utility have indicated that the power requirements of a northern sediment processing/transfer facility can be accommodated for either the mechanical or hydraulic dredging operations, as shown on the preceding table. However, it may be necessary to reactivate an existing electrical substation to support operations at a northern sediment processing/transfer facility. It is anticipated, therefore, that diesel fuel, electrical, and other energy needs can be met without disruption to supplies in the region. Reference Stonehocker, Stephen. Caterpillar Inc. June 15, 2001. Personal communication.
Responsiveness Summary Hudson River PCBs Site Record of Decision
8-4
Master Comment 705 Numerous commenters raised concerns that implementation of the selected remedy would be generally disruptive to communities in the project vicinity. One major source of disruption was thought to be project-generated traffic, including truck, rail, and vessel movements. Response to Master Comment 705 Estimates of project-generated truck, rail, and vessel movements have been presented in a series of white papers (White Paper – Project-Related Traffic, White Paper – Rail Operations, and White Paper – River Traffic). The quantitative analyses in these white papers were developed using generalized engineering concepts for each principal component of the selected remedy. (e.g., transfer facility concepts). Using the generalized concepts, estimates were developed for the number of trucks that the project would require both during mobilization and during dredging operations. Similarly, estimates were made of rail movements to landfills and barge movements to processing/transfer facilities.
In addition to enabling estimates of road, rail, and river traffic, the generalized concepts were also used to evaluate other potential project impacts. Among these other impacts are project-related noise and air emissions, project energy and lighting requirements, and project odor potential. These potential impacts are addressed in Responses to Comments. In addition, the following white papers contain discussions of some of these other project effects: White Paper – Noise Evaluation, White Paper – Air Quality Evaluation, and White Paper – Odor Evaluation.
The following summarizes the principal findings of the analysis conducted for project traffic. It is concluded that project-generated traffic will not be disruptive to local communities. Project Truck and Auto Traffic EPA’s selected remedy would generate truck and auto traffic both during the mobilization phase and during operations. Expected traffic generators include workers, construction equipment, maintenance equipment, and project supplies (e.g., stabilization agent), among others. EPA assessed the load this traffic would place on nearby roads and determined, based on available traffic data, that the increased burden on local roads would be relatively modest. The most intense project-related vehicular activity would occur at entrances to transfer and processing sites. At these locations there may be a need to install temporary traffic control devices.
Further, EPA has made several publicly stated commitments with regard to the project that contribute to minimization of project-related traffic. EPA has stated that stabilized or dewatered sediments would not be shipped via road to final disposal facilities. In addition, a commitment has been made that backfill material would be transported within the Upper Hudson River area by rail or barge. Thus, the two potentially most significant generators of truck movements have been eliminated as a result of the approach EPA has taken to project implementation. EPA has concluded, therefore, demonstrated by the foregoing discussion and further described in White Paper – Project-Related Traffic, that project-related vehicular traffic would not be significantly disruptive to local communities.
Responsiveness Summary Hudson River PCBs Site Record of Decision
8-5
River Traffic EPA has also evaluated movements of barges, towboats, and other vessels that would need to operate on the Upper Hudson River. Operation and movement of project-related equipment within the river is not expected to interfere significantly with other uses of the Hudson River and Champlain Canal. This is principally due to the fact that project equipment will be dispersed over a considerable length of river and is therefore unlikely to impede other users of the system. There is some possibility that congestion may occur at several canal locks during the peak recreational boating period. At such times it will be possible for project-related barge movements to be staged to non-operating hours on the Champlain Canal. Consequently, in-river equipment movements associated with the selected remedy are not likely to be disruptive to local communities (White Paper – River Traffic). Rail Traffic Concerns have been expressed that the freight rail system serving the Upper Hudson River would be overtaxed as a result of project-related shipments. However, based on conversations with operators of the principal rail freight line in the project area, it has been determined that sufficient capacity exists to accommodate project-generated rail movements, including capacity on the main freight corridor and capacity at local rail yards. In addition, the mode of operation planned by EPA is considered compatible with operations of the principal freight railroad in the upper Hudson River valley. Thus, it not expected that project rail activity would be disruptive to local communities (White Paper – Rail Operations). Master Comment 709 Commenters say that EPA's project will bring massive damage, disruption, and injury to those who use and live near the river, contending that the communities between Fort Edward and the Northumberland Dam, an agricultural region of beauty, full of the values of the scenic Hudson, will endure the loss of those values to an industrial construction project with noise, lights, smell, inevitable rail and road traffic, and boat congestion on the river 24 hours per day, 6 days a week, 30 weeks a year, during the period that EPA plans to work. Construction and disruption will start every year about the time one is ready to open the windows and enjoy the spring, and end each year when the first snows are threatening. Response to Master Comment 709 EPA and the Natural Resource Trustees believe that active remediation of contaminated sediments in the Upper Hudson River is necessary in order to address the continued unacceptable threat to human health and the environment posed by the PCBs in the river sediments, and to restore this natural resource for the use and enjoyment of all citizens in the region, both upriver and downriver. EPA strongly disagrees with the premise of the comments. Much time has been spent analyzing such concerns, and these analyses are reflected in the white papers related to specific subject
Responsiveness Summary Hudson River PCBs Site Record of Decision
8-6
areas. Please refer to the following white papers for further discussions related to potential impacts identified: White Paper – Example Sediment Processing/Transfer Facilities; White Paper – Air Quality Evaluation; White Paper – Odor Evaluation; White Paper – Project-Related Traffic; White Paper – River Traffic; White Paper – Noise Evaluation; White Paper – Socioeconomics; White Paper – Rail Operations. Responses to Master Comments throughout this chapter also contain additional discussion on these subjects. 8.1.1 Rail Master Comment 312982 Some commenters have raised concerns about the ability of the existing infrastructure to accommodate project-related increases in freight train traffic, and the effects of this increased volume on the region. Commenters are concerned that the additional freight train traffic could interfere with passenger train service, potentially affect availability of non-project related freight train service, and result in an increased need for maintenance along rail lines. In addition, there is concern about the availability of a sufficient number of rail cars and the size of the rail yards required at the transfer facilities. Response to Master Comment 312982 EPA has estimated the rail movement that will occur in order to implement the selected remedy in the context of the capacity and current operation of the regional rail line operated by the Canadian Pacific Railroad (CPR). This analysis can be found in White Paper – Rail Operations. After speaking with representatives of the CPR, it has been determined that the current Ft. Edward/Albany rail line is dominated by freight service, and that there is additional capacity available on the line. Increased train volumes are not expected to impact passenger or non-project-related freight service in the region. There are currently six passenger trains and up to 14 freight trains per day (through and local) operating along this corridor. This level of activity does not approach the capacity of the line. With regard to rail yard requirements for a northern transfer facility, it would be necessary to store 16 gondolas on site. There will be daily pick-ups of these gondolas by the railroad. It is expected that existing rail yards in the project vicinity can be used to store rail cars and assemble larger trainloads for movement to remote landfill sites. CPR has indicated that their existing rail yard facilities can accommodate gondola cars generated by the project, as well as the daily transport and assembly of these railcars into unit trains. No new rail yards will have to be constructed in the region to support the remedial activities. The availability of rail cars/gondolas in the region has also been assessed. The number of gondolas required for the project can be obtained by leasing them on the open market, and will not necessarily be provided by CPR. Current rail car leasing costs are low due to market demand; many are actually being scrapped at this time. The shipping of two commodities, specifically TSCA and non-TSCA materials, will moderately increase the project's complexity, but will still be manageable. The CPR and, it should be assumed, any rail carrier, routinely maintains its track system and all associated equipment. This maintenance is schedule-oriented, dictated by stringent regulatory
Responsiveness Summary Hudson River PCBs Site Record of Decision
8-7
and safety requirements, and is impacted only by significant increases in volume of rail traffic. Therefore, addition of project-related rail traffic to existing rail lines is not anticipated to have any adverse impact on, or to add any costs to, any railroad's ongoing maintenance program. White Paper – Rail Operations contains extensive additional detail.
8.1.2 River Master Comment 312942 Concerns have been raised about the potential of the selected remedy to create vessel traffic congestion on the Upper Hudson in the form of bottlenecks at various locks along the Champlain Canal. Commenters have suggested that this work may also interfere with routine passage of vessels along the canal navigational channel, potentially resulting in a disruption to recreational traffic. Specific questions have been raised about the effects of a hydraulic dredge's pipeline and booster pump on river traffic. Some ask whether the resulting congestion and dredging activity would allow clear and safe passage of other vessels. A number of other comments argue that the selected remedy will result in benefits to the canal system and ultimately to the economy of the area. Response to Master Comment 312942 The potential impacts of EPA’s remedy on river traffic are discussed in greater detail in White Paper – River Traffic. The analysis presented in this white paper indicates that the greatest movement of pleasure crafts typically occurs in July and August. During these months, Locks 5 and 6 are the most heavily used in the entire canal system. The white paper provides an estimate of the number of project-related vessels expected to move through the Champlain canal locks on a daily basis. At Lock 6, for instance, the remedy would add approximately nine vessels per day under a mechanical dredging alternative and approximately three vessels per day under a hydraulic dredging alternative. There is a potential for congestion to occur at Locks 5 and 6 during the peak canal season. However, if project-related vessels utilize the locks after hours, lock congestion as a result of EPA's remedy is reduced, if not eliminated. With regard to concern that work will interfere with routine passage of vessels, it should be noted that most work will take place outside of the navigation channel, and the width of the river in most targeted areas can accommodate both project equipment and current vessel traffic. EPA will expect contractors to arrange equipment such that non-project-related vessels have clear and safe passage through the canal. However, some work will occur in the channel itself. This work is not very different from the navigational dredging done by the Canal Corporation prior to the time the PCB problems were known. When work is occurring in the channel, warning lights and buoys will be placed around the work area. The contractor will be expected to configure equipment in order to provide sufficient room for passage of pleasure vessels. For instance, the contractor could position the materials-handling barge either upstream or downstream of the dredge instead of along side the dredge to eliminate channel blockage.
Responsiveness Summary Hudson River PCBs Site Record of Decision
8-8
Some concerns have been raised about the potential for interference between the hydraulic pipeline (if one is used) and booster pumps with non-project-related vessels. The pipeline and booster pumps may be located on land or in the river. If they are located in the river, there are several approaches that could be implemented in areas where it is determined that navigation may be impeded, including pipeline re-routing (overland in some areas) and pipeline burial. Removal operations associated with the remedy include both remedial dredging and navigational dredging. Historically, the Canal Corporation routinely dredged the canal to maintain a water depth of 12 feet. Dredging in the project area has not occurred since 1979, with the exception of the area where the Hoosic River discharges coarse grain materials into the canal between Locks 3 and 4. Since this time, the Canal Corporation has performed annual canal sweeps to determine areas of increased sedimentation and decreased water depth in the navigation channel. The most recent canal sweep data collected during the 2000 river season concluded that in the vicinity of buoy R160, located north of Lock 5 and south of the Route 4 bridge, as little as four feet of water exists along the west side of the river and on average, only seven feet of water is available for vessel passage. This implies that movement from the north and south of this area is significantly impeded by current conditions. Conversations with Canal Corporation representatives indicated that vessels must swing to the east side of the channel to allow passage in this relatively narrow area, resulting in some risk to passage. The remedy will require removal of sediments down to depths of six and eight feet from the current river bottom at this location. Given the existing water level in this area, this dredging activity would return the channel in the vicinity of buoy R160 to its intended depth of 12 feet, thus greatly increasing navigability of the river at this location. Similar sedimentation has occurred in other river sections, according to the 2000 canal sweep data, though to a lesser degree. Removal of these sediments would re-open portions of the river and allow commercial traffic to pass from Lake Champlain south to Albany with no draft limitations. It is expected that opening the canal will increase recreational and commercial traffic, thus promoting commerce at ports and marinas located along the river, as detailed in White Paper – River Traffic.
8.1.3 Road/Highway Master Comment 663 Commenters have raised concerns about the ability of the existing infrastructure to accommodate project-related increases in vehicular and truck traffic, and the potential disruption to regional roadways that could result from these increases. Concerns have been expressed that implementation of the selected remedy will generate additional truck and auto trips principally in the vicinity of the processing facilities. It has been suggested that project-related traffic will create congestion on adjoining roadways at these locations and increase the need for road maintenance, and that increases in road hazards resulting from increased truck traffic need to be addressed.
Responsiveness Summary Hudson River PCBs Site Record of Decision
8-9
Response to Master Comment 663 It is important to note that EPA has not yet determined the location(s) of sediment processing/transfer facilities necessary to implement the selected remedy. For purposes of the Feasibility Study, example locations were identified from an initial list of candidate sites based on screening-level field observations which considered potential facility locations from an engineering perspective. In the FS, it was necessary to assume the locations of sediment processing/transfer facilities in order to develop conceptual engineering plans, analyze equipment requirements, and develop cost estimates for the remedial alternatives. For this purpose, two example locations were identified: one at the northern end of the project area in the vicinity of the Old Moreau Dredge Spoils Area, and one at the southern end of the project area near the Port of Albany. Each of these example locations fulfills many of the desired engineering characteristics for such a facility to support the remedial work, and is representative of reasonable assumptions with regard to distance from the dredging work and cost. Other locations, both within the upper Hudson River valley and farther downstream, are possible. The example facility locations presented in the FS have also been used in this Responsiveness Summary in order to clarify material presented in the FS and Proposed Plan, and in connection with additional noise, odor and other analyses that were performed in order to respond to public comments. EPA will not determine the actual facility location(s) until after the Agency performs additional analyses and holds a public comment period on proposed locations and considers public input in the final siting decision. Thus, all information provided in this Responsiveness Summary relative to potential impacts of the sediment processing/transfer facilities on communities, residents, agriculture, the environment, and businesses should likewise be considered representative and illustrative. Further specific assessment of and, as necessary, mitigation of, potential impacts will be addressed during design. Impacts from vehicle and truck traffic at a southern processing/transfer facility site are not anticipated to be significant, since much of that locale is already highly industrialized and experiences much greater activity than would be generated by Hudson River PCB remedial project operations. EPA has estimated the project-related road traffic that will be generated by the selected remedy and evaluated it in the context of current volumes and capacities of roads in the vicinity of a northern processing/transfer facility. These analyses can be found in White Paper – Project-Related Traffic; the results are discussed in the following text. Initial Construction Phase It has been estimated that 34 truckloads/day of construction materials will be required during the first three months of construction and five truckloads/day will be required over the remaining six months of construction in order to develop a northern processing/transfer facility. It is not expected that the 34 arriving trucks will create congestion on local roadways, as there is substantial existing capacity for additional movements along roads in the vicinity of a northern processing/transfer facility. In addition, in the design phase, operational parameters can be established to see that material deliveries occur primarily during the workday and not during
Responsiveness Summary Hudson River PCBs Site Record of Decision
8-10
peak commuting hours when roads are the most used. Employment is expected to average 50 workers over the nine-month construction period for this facility. Operational Phase Dredging is expected to occur over a six-year period between May and November. There will be daily truck deliveries of supplies required during the seven-month operation of the processing facilities. The number of deliveries required at a northern facility, assuming a six-day work week, will be approximately nine trucks per day. Trucks are not expected to contribute to roadway congestion because the numbers are low relative to the capacity of the roadways in the area assumed for a northern facility. In addition, truck deliveries would not likely be made at peak commuter hours. It should be noted, as stated by EPA, that backfill and dredged sediment will not be transported within the Upper Hudson River area by trucks. It is estimated that there will be 106 employees commuting in the vicinity of the TI Pool. During peak traffic conditions, when transfer facility work shifts change, approximately 53 employees will be arriving at, and 53 will be departing from, the facility (assume between 5:00 PM and 6:00 PM). Using available traffic data, analysis conducted for select roadways in the general area assumed for the northern processing/transfer facility has shown that project-related employee traffic will not be disruptive to local communities, as the volume increase on nearby roadways will be minor, less than 10 percent (White Paper – Project-Related Traffic). Because the increase in road usage is relatively small, it is not likely that there will be an increase in road hazards or a need for increased road maintenance as a result of implementing the selected remedy. 8.2 Noise Master Comment 699 Commenters say that long-term dredging and sediment processing operations would contribute intrusive, repetitive, jarring noise for 24 hours a day, 6 days per week, 30 weeks a year each year for the duration of the project. The increased river, rail, and roadway traffic and the operation of various equipment would result in disruptive long-term noise, especially during evening and night hours in local communities. It was suggested that EPA should conduct and make publicly available an acoustical study of noise generated by the project. Some particular questions/comments regarding noise are as follows:
• Will the planned project comply with federal, State, and local laws, regulations,
guidelines, permit requirements and ordinances regarding noise? • What are expected decibel levels of dredging, barging, and treatment/processing
operations, and what are existing noise levels in project areas? • What measures will be employed to monitor and mitigate noise impacts associated with
the project?
Responsiveness Summary Hudson River PCBs Site Record of Decision
8-11
Response to Master Comment 699 The potential noise impacts during both short-term dredging activities and long-term sediment processing/transfer operations were evaluated using the applicable federal and State noise impact criteria and noise analysis guidelines. A detailed analysis is presented in White Paper – Evaluation of Noise. In the white paper, decibel levels were identified for various major noise sources associated with the proposed short- or longer-term operations, and these decibel levels were then used for estimating noise levels at the representative noise receptor locations. Following are the estimates of noise levels associated with the proposed sediment processing/transfer facility operations:
• Hydraulic dredging (short-term). At a location 50 feet landward of the shoreline, noise from hydraulic dredging operations could reach levels as high as 79 dBA (the level of a telephone ringing). Noise impacts are expected to be greatest during the nine-week period in which the trailing booster would move in a zone from 3,000 feet upstream to 2,000 feet downstream of any given receptor. Noise levels would increase from 57 dBA (the level of sound generated by an electronic toothbrush) to the 79-dBA maximum, and then decrease to 59 dBA.
• Mechanical dredging (short-term). With mechanical dredging, noise levels would be
lower than during hydraulic dredging. Noise impacts from mechanical dredging are expected to be greatest during the ten-week period in which the mechanical dredge would move in a zone from 1,000 feet upstream to 1,000 feet downstream of any given receptor. Noise levels would range between 57 and 70 dBA (similar to the audio level of a television).
• Transfer facilities (long-term). Noise levels would be below 65 dBA (a typical urban
office area background level of noise) at the closest receptor (house or club) to each transfer facility. However, noise levels would be considerably higher at the transfer facility boundary.
The white paper evaluates the potential impacts from example facilities located in Port of Albany (southern transfer facility) and near the Moreau Landfill (northern transfer facility), and for the dredging. The decibel levels were identified for various major noise sources associated with the proposed short-term or long-term operations, and these decibel levels were then used for estimating noise levels at the representative noise receptor locations. The white paper concluded that:
• The short-term noise associated with construction of the sediment transfer/processing facilities and hydraulic and mechanical dredging operations would not exceed the New York State Department of Transportation (NYSDOT)-established short-term construction impact guideline.
• The long-term noise associated with sediment processing operations would not exceed
Federal Highway Administration (FHWA) Noise Abatement Criteria (NAC) or the US Department of Housing and Urban Development (USHUD) housing guideline.
Responsiveness Summary Hudson River PCBs Site Record of Decision
8-12
• The long-term noise associated with stationary booster pump operations, under the
hydraulic dredging scenario, would exceed FHWA NAC in areas within an 800-ft radius of the booster and USHUD housing guideline in areas within a 1,000-ft radius of the booster. However, in this case, a series of mitigation measures (such as use of electric pumps) can be implemented to mitigate this situation.
EPA will consider pertinent local regulations concerning noise (if such regulations exist) during the design of the sediment processing/transfer facility(ies). Prior remediation and major construction projects in the Upper Hudson River area also provide qualitative indications that potential noise impacts, particularly from short-term construction operations, are not likely to unreasonably disrupt the affected communities. Although smaller in scope, these projects have been significant, and include:
• Remedial work by General Electric for the Hudson River PCBs Site Remnant Deposits during the early 1990s.
• Reconstruction of the Bakers Falls hydroelectric facility by Niagara Mohawk Power Corp. during the early 1990s.
• Past and ongoing remedial work by General Electric at the Hudson Falls plant, including construction and operation of a water treatment facility, all in proximity to residential areas.
It is important to note that EPA will not determine the actual facility location(s) until after EPA performs additional analyses and holds a public comment period on proposed location(s) and considers public input in the final siting decision during remedial design. Thus, all information provided in this response relative to noise impacts of the sediment processing/transfer facilities should be considered representative and illustrative. During design, as part of the siting process for the sediment processing/transfer facilities, an on-site noise monitoring study will be performed to determine potential long-term noise impacts (based on net change in operational noise compared to the background). Appropriate mitigation of potential noise impacts will also be addressed during remedial design. Possible noise mitigation, if needed, may involve alteration or modification of the source noise output or interception/deflection of the noise to avoid impacts to the community. The following are examples (but not an exhaustive list) of possible noise mitigation measures:
• Requiring the use of newer models of machinery that are quieter, and maintaining equipment so that noise-related performance is also optimal throughout the remedial program;
• Substituting electric drives for diesel engines where practicable; • Using electric conveyor belts for material handling where practicable; • Enclosing noise producing equipment and areas where possible; • Reducing vehicle running speed (locomotives, trucks, etc.); • Avoiding excessive gear shifting and throttling; • Isolating and damping vibrating elements;
Responsiveness Summary Hudson River PCBs Site Record of Decision
8-13
• Performing routine maintenance; • Using high performance mufflers for dredges and other diesel-driven equipment; • Placing operating restrictions on equipment where engineered approaches are not
otherwise available; and • Installing portable noise barriers where necessary.
Master Comment 767 Noise from dredging operations is described as having an especially negative effect on dairy cattle operations. Commenters say that noise causes adverse stress on dairy herds. Some other commenters suggested that noise might affect milk production in dairy cows and sheep. Response to Master Comment 767 As already discussed in the foregoing Response to Master Comment 699 (Section 8.2), White Paper – Evaluation of Noise provides estimates of noise levels associated with the proposed dredging and transfer facility operations. Kovalcik and Sottnik (1971) found that a noise level of 80 dB (unspecified scale) increased feed intake and the rate of milk-releasing indices, but did not affect the milk yield of dairy cows, and presumed that this noise level was within the limits of the normal tolerance of the animal. A noise level of 80 dB is comparable to the estimated maximum noise level for hydraulic dredging, but well above the estimated noise levels associated with mechanical dredging. Domestic animals appear to acclimate to some sound disturbances (Manci et al., 1988) and will readily adapt to reasonable levels of continuous sound such as white noise, instrumental music, and miscellaneous sounds (Grandin, 1997). For example, milk production was not lowered when a jackhammer was used in the barn of dairy cows that had become accustomed to a variety of sounds and activity (e.g., children playing in the barn aisle [Grandin, 1997]). As the dredge will not be in any fixed location for an extended period of time, the exposure of penned domestic animals to dredging noise will be limited. Depending on the location of the transfer facilities relative to existing farms, exposure of livestock to the noise from sediment processing operations may be more prolonged. It is important to note, therefore, that the sediment processing/transfer facilities are expected to be situated in industrial or other non-agricultural locations. In addition, due to the apparent tolerance of livestock to continuous noise and to their ability to acclimate to such disturbances, it is not anticipated that this disturbance will be significant. References Bond, J., T. S. Rumsey, J. R. Meaear, L. I. Colber, D. Kern, and B. T. Weinland. 1974. Effects of simulated sonic booms on eating patterns, feed intake, and behavioral activity of ponies and beef cattle. Proc. Int. Livest. Environ. Symp., University of Nebraska, Lincoln. Am. Soc. Agric. Eng., St. Joseph, MI. As cited in: Manci, K. M., D. N. Gladwin, R. Villella, and M. G. Cavendish. 1988. Effects of Aircraft Noise and Sonic Booms on Domestic Animals and Wildlife: a
Responsiveness Summary Hudson River PCBs Site Record of Decision
8-14
Literature Synthesis. US Fish and Wildlife Service (USFWS), National Ecology Research Center (NERC), Fort Collins, CO. NERC-88/29. Casady, R. B., and R. P. Lehmann. 1967. Response of Farm Animals to Sonic Booms, Studies at Edwards Air Force Base, June 6-30, 1966. Interim Report, US Department of Agriculture, Agricultural Research Division, Beltsville, MD. As cited in: Manci, K. M., D. N. Gladwin, R. Villella, and M. G. Cavendish. 1988. Effects of Aircraft Noise and Sonic Booms on Domestic Animals and Wildlife: a Literature Synthesis. USFWS, NERC, Fort Collins, CO. NERC-88/29. Espmark, Y., L. Falt, and B. Falt. 1974. Behavioral responses in cattle and sheep exposed to sonic booms and low-altitude subsonic flight noise. Vet. Rec. 94(6):106-113. As cited in: Manci, K. M., D. N. Gladwin, R. Villella, and M. G. Cavendish. 1988. Effects of Aircraft Noise and Sonic Booms on Domestic Animals and Wildlife: a Literature Synthesis. USFWS, NERC, Fort Collins, CO. NERC-88/29. Grandin, T. 1997. Adapting Bovine Behavior to Improve Performance. Website accessed June 28, 2001 at http://www.afns.ualberta.ca/wcds/wcd97/ch29-97.htm. Kovalcik, K., and J. Sottnik. 1971. The effect of noise on the milk efficiency of cows. Zivocisna Vyroba 16:795-804. As cited in: Manci, K. M., D. N. Gladwin, R. Villella, and M. G. Cavendish. 1988. Effects of Aircraft Noise and Sonic Booms on Domestic Animals and Wildlife: a Literature Synthesis. USFWS, NERC, Fort Collins, CO. NERC-88/29. Manci, K. M., D. N. Gladwin, R. Villella, and M. G. Cavendish. 1988. Effects of Aircraft Noise and Sonic Booms on Domestic Animals and Wildlife: a Literature Synthesis. US Fish and Wildlife Service, National Ecology Research Center, Fort Collins, CO. NERC-88/29. Available at http://www.nonoise.org/library/animals/litsyn.htm. Nixon, C. W., H. K. Hille, H. C. Sommer, and E. Guild. 1968. Sonic booms resulting from extremely low-altitude supersonic flight: measurements and observations on houses, livestock, and people. Defense Documentation Cent., Alexandria, VA, Aerospace Med. Res. Lab. Rep. No. TR-68-52. As cited in: Manci, K. M., D. N. Gladwin, R. Villella, and M. G. Cavendish. 1988. Effects of Aircraft Noise and Sonic Booms on Domestic Animals and Wildlife: a Literature Synthesis. USFWS, NERC, Fort Collins, CO. NERC-88/29. Parker, J. B., and N. D. Bayley. 1960. Investigation of Effects of Aircraft Sound Milk Production Of Dairy Cattle 1957-1958. Us Department of Agriculture, Washington, DC. As cited in: Manci, K. M., D. N. Gladwin, R. Villella, and M. G. Cavendish. 1988. Effects of Aircraft Noise and Sonic Booms on Domestic Animals and Wildlife: a Literature Synthesis. USFWS, NERC, Fort Collins, CO. NERC-88/29. Master Comment 358188 Commenters worried that noise associated with dredging and operation of the transfer facilities could be disruptive to local wildlife, particularly territorial species.
Responsiveness Summary Hudson River PCBs Site Record of Decision
8-15
Response to Master Comment 358188 White Paper – Evaluation of Noise provides the following estimates of noise levels associated with the proposed dredging and transfer facility operations: • Hydraulic dredging (short-term). At a location 50 feet landward of the shoreline, noise
from hydraulic dredging operations could reach levels as high as 79 dBA (the level of a telephone ringing). Noise impacts are expected to be greatest during the nine week period in which the trailing booster would move in a zone from 3,000 feet upstream to 2,000 feet downstream of any given receptor. Noise levels would increase from 57 dBA (the level of sound generated by an electronic toothbrush) to the 79-dBA maximum, and then decrease to 59 dBA.
• Mechanical dredging (short-term). With mechanical dredging, noise levels would be
lower than for hydraulic dredging. Noise impacts from mechanical dredging are expected to be greatest during the ten-week period in which the mechanical dredge would move in a zone from 1,000 feet upstream to 1,000 feet downstream of any given receptor. Noise levels would range between 57 and 70 dBA (similar to the audio level of a television).
• Transfer facilities (long-term). Noise levels would be below 65 dBA (a typical urban
office area background level of noise) at the closest receptor (house or club) to each transfer facility. However, noise levels would be considerably higher at the transfer facility boundary.
The operation of heavy machinery and equipment, as well as aircraft overflights, recreational activities such as the use of snowmobiles and motorboats, and automobile traffic, are among the sources of noise that have the potential to affect wildlife (Noise Pollution Clearinghouse, undated). The effects of aircraft noise have been studied intensively. Physiological responses to aircraft noise range from mild, such as an increase in heart rate, to more damaging effects on metabolism and hormone balance (Noise Pollution Clearinghouse, undated). Long-term exposure to noise can cause excessive stimulation to the nervous system and chronic stress that is harmful to the health of wildlife species and their reproductive fitness (Fletcher, 1980; 1990). Behavioral responses range from head raising and body shifting to panic and escape behavior (National Park Service, 1994). Physiological and behavioral responses have the potential to cause injury, energy loss, decrease in food intake, habitat avoidance and abandonment, and reproductive losses (National Park Service, 1994). Sound levels that result in adverse physiological and behavior responses, however, are relatively high. Sound levels above about 90 dB are likely to adversely affect mammals and are associated with several behaviors, such as retreat from the sound source, freezing, or a strong startle response (Manci et al., 1988). Sound below about 90 dB usually causes much less adverse behavior (Manci et al., 1988). Dredging and dredged material processing operations would result in increased noise levels that could disturb wildlife in the area. However, because the estimates of the noise levels associated with the proposed operations are below 90 dB, it is not anticipated that this disturbance would be
Responsiveness Summary Hudson River PCBs Site Record of Decision
8-16
significant. The dredge will advance on the river, and will not occupy the same space on the river on a constant basis. Therefore, the dredge will not be in any fixed location for an extended period of time and the noise impacts to territorial wildlife will be limited. Some wildlife will temporarily leave areas affected by higher noise levels, but are expected to return when the dredge moves downstream. However, wildlife occupying habitats close to the transfer facilities may abandon these areas for several years, although it is noted that wildlife's abandoning habitat during construction occurs at essentially any significant construction project. In addition, mitigative measures can be taken to reduce overall noise levels; such measures will be considered in the design phase. References Fletcher, J. L. 1980. Effects of noise on wildlife: a review of relevant literature 1971-1978. In: Tobias, J. V., G. Jansen, and W. D. Ward, eds. Proceedings of the Third International Congress on Noise as a Public Health Problem. Am. Speech-Language-Hearing Assoc., Rockville, MD. As cited in: Noise Pollution Clearinghouse. Undated. Fact Sheet: Noise Effects on Wildlife. Fletcher, J. L. 1990. review of noise and terrestrial species: 1983-1988. In: Berglund, B., and T. Lindvall, eds. Noise as a Public Health Problem, Vol. 5: New Advances in Noise Research Part II. Swedish Council for Building Research, Stockholm. As cited in: Noise Pollution Clearinghouse. Undated. Fact Sheet: Noise Effects on Wildlife. Manci, K. M., D. N. Gladwin, R. Villella, and M. G. Cavendish. 1988. Effects of Aircraft Noise and Sonic Booms on Domestic Animals and Wildlife: a Literature Synthesis. USFWS, NERC, Fort Collins, CO. NERC-88/29. Available at http://www.nonoise.org/library/animals/litsyn.htm. National Park Service. September 12, 1994. Report to Congress: Report on Effects of Aircraft Overflights on the National Park System. Available at http://www.nonoise.org/library/npreport/intro.htm. Noise Pollution Clearinghouse. Undated. Fact Sheet: Noise Effects on Wildlife. Website accessed June 11, 2001 at http://www.nonoise.org/library/fctsheet/wildlife.htm. 8.3 Lighting
8.3.1 Impact of Lighting on Livestock Master Comment 645 Some commenters observed that in order to meet the project schedule, there may be a need for nighttime activities, in which case artificial lighting will be necessary. It may be needed in backfill, processing and/or dredging activities. Concern was expressed that continuous lighting could be disruptive to dairy cattle.
Responsiveness Summary Hudson River PCBs Site Record of Decision
8-17
Response to Master Comment 645 EPA has examined the types of artificial lighting that will likely be used in support of the project. Artificial lighting systems will be used as necessary to illuminate nighttime operations. Positioning of lights, as well as their brightness and direction, are key factors that create the opportunities to minimize potential for off-site impacts. In the initial construction and mobilization phase, work is scheduled only for daylight hours. Lighting is not required for removal of Site sediments by mechanical or hydraulic dredging. Instead, sediment removal is monitored by on-board instrumentation, limiting the amount of lighting necessary to support the dredging operation to safety lighting in areas with active personnel. It should also be noted that the dredge will not occupy the same position for extended periods of time. Nighttime lighting requirements for the proposed work will conform to established industry safety standards. The lighting required for in-river transport will conform to the Coast Guard standards for commercial towboats and barges and New York State navigation law requirements, and is not expected to be disruptive. Lighting at the land-based processing facilities will meet OSHA standards for construction. Appropriate intensity can be accomplished without the use of high-mast or stadium-type lighting. In fact, it will not be necessary to use high-mast or stadium-type lighting systems at either dredging sites or at the sediment processing facilities. Lighting at the land-based facilities will be directed toward work areas and away from neighboring properties. In addition, the use of low-mast lights will limit off-site glare. Photoperiod manipulation is a management technique used by some dairy farmers to improve production efficiency and cash flow by increasing feeding activity and milk production (Dahl, 2000). Daily milk production has been shown to increase in lactating cows exposed to long days, i.e., between 16 and 18 hours of light and between 6 and 8 hours of darkness (Kearnan, 1998; Janni, 1999; Tucker, 2000). Continuous (24-hour) light does not provide additional milk yield response (Dahl et al., 1998; Erickson, 2001; Reid, 2001). Further, according to Tucker (2000), six to eight hours of darkness are required to achieve the optimal increase in milk production. Conversely, a short period of light and a long period of dark is required by dry cows to optimize production increases in the subsequent lactation (Dahl, 2000; Tucker, 2000). Researchers recommend providing cows with 8 hours of light and 16 hours of dark during the dry period (Shoemaker, 2000). Dry period exposure to long-day photoperiods reduces milk production in the subsequent lactation in comparison exposure to the recommended short-day photoperiods (Tucker, 2000). Activities that decrease the period of darkness to which lactating or dry dairy cows are exposed could eliminate the response of cows to photoperiod manipulation (Dahl, 2001) and result in milk yields below optimum. However, factors other than photoperiod are critical to realizing optimum production increases, including lighting location and intensity (Reid, 2001). During the light period, light should target the eye level of the cows (Tucker, 2000; Erickson, 2001; Reid, 2001). Research has set the desired light-period light intensity between 10 and 30 foot-candles (Kearnan, 1998; Tucker, 2000; Erickson, 2001; Reid, 2001). Illumination at 10 to
Responsiveness Summary Hudson River PCBs Site Record of Decision
8-18
30 foot-candles is typical of auditoriums, banks, hotel corridors and lobbies, hospital corridors during the day, conference rooms, offices, and factories (Hoke, 1988). During the dark period, light levels should be maintained at two to three foot-candles, according to Janni (1999), or, according to Shoemaker (2000), five foot-candles or less, the illumination typical of hospital corridors at night (Hoke, 1988). How much artificial light enters the barns occupied by the cows and for how long will determine the extent to which project nighttime lighting will impact dairy cattle and milk production (Shoemaker, 2001). Given that lighting will be directed away from neighboring properties, and that the sediment processing facilities are expected to be located on industrial or other non-agricultural land and in as remote an area as possible, project nighttime activities are not expected to increase illumination inside area dairy barns to levels exceeding the two or three foot-candle maximum required during the dark period. This is particularly true in the case of photoperiod manipulation for dry cows, as to achieve the required 16 hours of darkness the cows already would be confined for extended periods in darkened barn areas to exclude daylight. Therefore, nighttime lighting for the proposed work will not reduce milk production by dairy cattle. References Dahl, G. E. 2000. Photoperiod Management of Dairy Cattle. Website accessed June 26, 2001 at http://www.gov.on.ca/OMAFRA/english/livestock/dairy/facts/info_photoperiod.htm. Dahl, G. E. June 29, 2001. Associate Professor. Department of Animal Sciences, University of Illinois. Personal communication by e-mail. Dahl, G. E., J. P. Chastain, and R. R. Peters. 1998. Manipulation of photoperiod to increase milk production in cattle: biological, economical and practical considerations. In: Proc. fourth Int. Dairy Housing conf., ASAE, St. Joseph, MI. As cited in: Janni, K. Summer 1999. Lighting Dairy Facilities. Minnesota/Wisconsin Engineering Notes. Erickson, P. June 27, 2001. Assistant Professor of Dairy Management and Extension Dairy Specialist. University of New Hampshire. Personal communication by e-mail. Hoke, J. R. (editor in chief). 1988. Architectural Graphic Standards, Eighth Edition. John Wiley & Sons, Inc., New York. Janni, K. Summer 1999. Lighting Dairy Facilities. MN/WI Engineering Notes. Website accessed June 26, 2001: http://www.bae.umn.edu/extens/ennotes/ensum99/lighting.html. Kearnan, J. March 1998. Supplemental lighting for dairy cattle. Dairy Biz. Website accessed June 28, 2001 at http://www.dairybiz.com/archive/prod-18.htm. Reid, J. 2001. More Milk with Extended Light. Website accessed June 26, 2001 at http://www.cce.cornell.edu/yates/AgCorner12.13.00.htm.
Responsiveness Summary Hudson River PCBs Site Record of Decision
8-19
Shoemaker, D. February 10, 2000. Light Improves Milk Production. Farm and Dairy. Available at http://www.ag.ohio-state.edu/~bediabr/nedairy/excel/articles/light.htm. Shoemaker, D. June 27, 2001. District specialist - Dairy, Ohio State University Extension. Personal communication by e-mail. Tucker, H. A. January 2000. Light-up in the new millennium. Michigan Dairy Review 5(1):7-8.
8.3.2 Impact of Lighting on Community Master Comment 358825 Various comments were offered relative to potential impacts of lighting related to the proposed remedy on area residents and communities, highlighted as follows: In order to meet the project schedule there may be a need for nighttime activities. If this is the case, artificial lighting will be necessary. It may be needed in backfill, processing and/or dredging activities. Project lighting may be disruptive to local communities and, depending on the duration of the project, it may have potential to devalue property. Response to Master Comment 358825 EPA has examined the types of artificial lighting that will likely be used in support of the project. Artificial lighting systems will be used as necessary to illuminate nighttime operations. Positioning of the lighting systems, as well as their brightness and direction, are the key variables that can be controlled to limit potential off-site impacts. These factors are considered in the following text for each component of the selected remedy. Mobilization phase work, i.e., construction of sediment processing/transfer facilities and backfill operations, are expected to occur during daylight hours and, therefore, will not generate nuisance impacts from lighting. It should also be noted that the dredge will not occupy the same position on the river for extended periods of time, further minimizing potential impacts. During nighttime dredging operations, lighting would be needed for vessel navigation, illuminating decks and railings of work equipment, and interior lighting for operating instrumentation spaces. Lighting is not required for removal of Site sediments by mechanical or hydraulic dredging. Sediment removal is monitored by on-board instrumentation. Lighting necessary to support the dredging operation is limited to safety lighting in areas with active personnel, to a specifically directed light to illuminate the cutterhead area on hydraulic dredges, and to other occasional lights. Nighttime lighting requirements for the proposed work will conform to established industry safety standards. Hydraulic Dredging The type of lighting necessary for implementation of the selected remedy is that which is standard for safe operations. It is very similar to night illumination used on tugboats. The dredge includes a directed light for illuminating the cutterhead area; however, it is anticipated that this directed light would only be used occasionally, as most dredging occurs without a need for
Responsiveness Summary Hudson River PCBs Site Record of Decision
8-20
illumination. This light may sometimes be used to observe the dredge head or to check ongoing operations, but on most occasions it will be in the ‘off’ mode so that operating personnel need not adjust their vision to varying light conditions. Mechanical Dredging The types of lighting used for mechanical dredging operations will be similar to those for hydraulic dredging, with the exception of some low-intensity lights needed to illuminate the storage barge. It is expected that the levels of lighting needed to delimit the storage barge will not create a nuisance, as the lights will be relatively close to the water and only intended to provide direction to the dredge operator. Also, changeover of storage barges at night will be avoided as much as possible to further limit lighting impacts. In-River Transport The lighting required for in-river transport will conform to the Coast Guard standards for commercial towboats and barges, and is not expected to be disruptive. The US Coast Guard requires the use of nighttime running lights to ensure safe passage of vessels underway. Running lights include a masthead forward light, sidelights, a stern light, and a towing light (US Coast Guard Navigational Rules International – Inland, 33 USCG § 2001). Section 43 of the New York State Navigation Law also contains lighting requirements for vessels, depending on the size of the craft. Unlike a car, a barge does not light its own path, but rather is guided by channel markers in the canal. Therefore, in-river transport activities will not create a lighting nuisance. Land-Based Operations It is important to note that EPA has not yet determined the locations of sediment processing/transfer facilities necessary to implement the selected remedy. For purposes of the Feasibility Study, example locations were identified from an initial list of candidate sites based on screening-level field observations which considered potential facility locations from an engineering perspective. In the FS, it was necessary to assume the locations of sediment processing/transfer facilities in order to develop conceptual engineering plans, analyze equipment requirements, and develop cost estimates for the remedial alternatives. For this purpose, two example locations were identified: one at the northern end of the project area in the vicinity of the Old Moreau Dredge Spoils Area, and one at the southern end of the project area near the Port of Albany. Each of these example locations fulfills many of the desired engineering characteristics for such a facility to support the remedial work, and is representative of reasonable assumptions with regard to distance from the dredging work and cost. Other locations, both within the upper Hudson River valley and farther downstream, are possible. The example facility locations presented in the FS have also been used in this Responsiveness Summary in order to clarify material presented in the FS and Proposed Plan, and in connection with additional noise, odor and other analyses that were performed in order to respond to public comments. EPA will not determine the actual facility location(s) until after the Agency holds a public comment period on proposed locations and considers public input in the final siting decision. Thus, all information provided in this Responsiveness Summary relative to potential impacts of the sediment processing/transfer facilities on communities, residents, agriculture, the
Responsiveness Summary Hudson River PCBs Site Record of Decision
8-21
environment, and businesses should likewise be considered representative and illustrative. Further specific assessment of and, as necessary, mitigation of, potential impacts will be addressed during design. Since there is a low population density at the northern end of the project area, careful layout of a northern processing/transfer facility should effectively eliminate any lighting nuisance to the local community. Given the nature of the remedial work and the fact that the sediment processing/transfer facilities are expected to be located in industrial or other non-residential areas, it is not expected that actual installed lighting will create a nuisance for nearby residents. Since the example STF location is near the Port of Albany, in an industrial area, no significant lighting impacts on the community are expected. Potential impacts to property values are addressed in White Paper – Socioeconomics. For properties along the river proximate to dredging, the brief duration of operations and the limited impacts as described are not anticipated to have any effect on property values. For properties in proximity to the processing/transfer facilities, the controlled emission of lighting is not anticipated to create significant or discernable impacts on property values. Lighting requirements for the sediment transfer and processing facilities, including the wharf area, rail yards, staging areas, administrative buildings, parking lots, and roads, have been estimated based on approximate square footage necessary for a typical materials-processing facility. For safety reasons, heavy work zones require an intensity of five foot-candles per square foot for operating areas (OSHA Regulations 29 CFR 1926.56; US Coast Guard 33 CFR 154.70). Less active zones, such as parking lots, are normally provided with illumination intensities approaching three foot-candles per square foot. The intensity levels required for safety can be provided without the use of high-mast or stadium-type lighting (In fact, it will not be necessary to use high-mast or stadium-type lighting systems at either dredging sites or at the sediment processing facilities.). It is expected that nuisance light glare can be minimized by careful layout of the processing operation; mounting fixtures closer to grade levels and directing the beam onto working areas and away from off-site land uses can minimize off-site glare. Reference US Coast Guard Navigational Rules International – Inland. Rule 22, Rule 23, and Rule 24. Website accessed June 8, 2001 at: www.uscg.mil/vtm/navrules/navrules.pdf. 8.3.3 Impact of Lighting on Agriculture and Ecological Resources Master Comment 805 Concerns were expressed that impacts associated with the use of lighting during dredging and processing could adversely affect local wildlife. Commenters worried that lights will disrupt the migration patterns and diminish the day/night discerning ability of birds, and that exposure to artificial light for prolonged periods may also affect insects.
Responsiveness Summary Hudson River PCBs Site Record of Decision
8-22
Response to Master Comment 805 Comments pertaining to the artificial lighting effects on wildlife do not cite any pertinent references to this project. For example, one commenter cited the Fatal Light Awareness Program (FLAP) to show that the artificial lighting planned for the remediation would adversely affect the local wildlife. However, FLAP’s mission is to “preserve the lives of migratory birds in urban areas” (FLAP, 2001) and concentrates its efforts on structures such as towers/skyscrapers and windows that cause bird deaths. This focus has little relevance to the planned lighting on the dredging barges and processing facilities. Other organizations, such as the New England Light Pollution Advisory Group (NELPAG), also concentrate their efforts on urban areas with constant light. In a phenomenon that is not fully understood, migratory birds become confused by building lights, particularly on cloudy or misty nights. They circle around the light until they are exhausted, or crash into windows that either appear transparent or reflect the surrounding terrain or sky (NY Times, 2001). The Hudson River remediation will not take place in an urban area and will not involve tall towers, buildings, or high mast stadium-type lighting. Therefore, it is not anticipated that project-related lighting will cause difficulties for migrating birds. Another comment proposed a study “examining the likely disruption of bird migration and disruption over the term of the five-year construction and operation period” (GE, 2001) to comply with Executive Order 13186 (Responsibilities of Federal Agencies To Protect Migratory Birds). However, there is no reason to conduct such a study, as there was not a single study cited showing any adverse impacts associated with a dredging, processing, or remediation project such as the Hudson River remediation program. The Hudson River Valley serves as a flyway, a route followed by birds as they migrate north in spring and south in the fall. During these travels, many species settle on the river and its wetlands to rest and feed (Stanne et al., 1986). The overall long-term benefits of reduced contaminant concentrations in fish outweigh any temporary loss of feeding area due to artificial lighting or other remediation-related activities. Artificial lighting can have implications for other wildlife, in particular for insect populations and nocturnal mammal species (Outen, 2001). Moths navigate by the moon but they are easily fooled such that they and other night-flying insects may be attracted to light, sometimes from considerable distances. Continuous usage of bright light sources could cause congregation of these insects in the vicinity where they can be an easy prey for bats, or, the following morning, for birds. Protective measures, such as careful selection of the type of lighting used, will limit the potential affect of artificial lighting. Sodium lights do not attract insects to the same extent as mercury vapor lights (Rydell and Baagoe, 1996). Low-pressure sodium lamps are less likely than other lamps to elicit flight-to-light behavior and to shift circadian rhythms and can be used to reduce adverse effects of lighting (Frank, 1988). Reducing exposure to lighting may help protect moths in small, endangered habitats (Frank, 1988); however, in a large area such as the Hudson River, the reduced lighting is not expected to significantly affect insects, including moths. Impacts to moth populations cited by the commenter (e.g., Frank, 1996) refer to moth populations in urban areas, such as Washington, D.C., Philadelphia, and Boston, which have little in common with the upper Hudson River valley. One commenter also stated that nighttime lighting was of such concern that the National Parks Service implemented a nighttime light monitoring program. In reality, however, the monitoring program in five National Parks was implemented to protect stargazing, not wildlife (National
Responsiveness Summary Hudson River PCBs Site Record of Decision
8-23
Parks Conservation Association, 2000). The negligible effect of lights used for the project on stargazing is not considered to be an issue of concern for local residents. Nighttime lighting requirements for the proposed work will conform to established industry safety standards, which do not require the use of intrusive lighting systems such as high mast, stadium-type lighting systems. Smaller, more directed artificial lighting systems will be used as necessary to illuminate nighttime dredging and in-river transport operations, as well as land-based facility processing operations (Response to Master Comment 358825, above). Positioning of the lighting systems, as well as their brightness and direction, are the key variables that can be controlled to limit potential impacts to local wildlife. Mobilization phase work, i.e., construction of processing/transfer facilities, as well as backfill operations, are expected to occur during daylight hours; therefore, such activities will not generate nuisance lighting impacts on biota. Lighting requirements for in-river transportation activities will be typical of commercial vessels. The US Coast Guard requires the use of nighttime running light to ensure safe passage of vessels underway. The lights include a masthead forward light, sidelights, a stern light, and a towing light. Section 43 of the New York Navigation Law also contains lighting requirements for vessels, depending on the size of the craft. Unlike a car, a barge does not light its own path; rather, a barge is guided by channel markers in the canal. It should be noted that the dredge will not constantly occupy the same space on the river. Rather, it will move downstream with production. Consequently, the dredge should not be in the same place for extended periods of time. This facet of the removal operations will reduce the potential for lighting-related impacts on wildlife. References Bower, J. 2000. The Dark Side of Light. Audubon Magazine. March/April. http://magazine.audubon.org/darksideoflight.html Fatal Light Awareness Program (FLAP). http://www.flap.org/home2.htm Federal Register. 2001. Executive Order 13186 of January 10, 2001, Responsibilities of Federal Agencies To Protect Migratory Birds. Vol. 66, no. 11, pp. 3853-3856. Wednesday, January 17, 2001. http://www.epa.gov/owow/wetlands/regs/eo13186.pdf Frank, K. D. 1996. Impact of outdoor lighting on moths: In Information Sheet 109, July 1996. International Dark-Sky Association, Tucson, AZ. http://www.darksky.org/ida/info109.html. Frank, K. D. 1988. Impact of outdoor lighting on moths: An assessment. Journal of the Lepidopterists' Society 42(2): 63-93. General Electric (GE). 2001. Comments of the General Electric Company on the Feasibility Study and the Proposed Plan for the Hudson River PCBs Superfund Site (December 2000). Appendix C Environmental Impacts Analysis for the Hudson River. April 17, 2001. Outen, A. 2001. The Problem for Ecology. Hertfordshire Biological Records Centre. http://enquire.hertscc.gov.uk/hbrc/currentprojects/lep.htm. Accessed 28 June 2001.
Responsiveness Summary Hudson River PCBs Site Record of Decision
8-24
National Parks Conservation Association. 2000. National Parks, September/October. http:7/208.226.12.12/magazine. New England Light Pollution Advisory Group (NELPAG. 2001). http://cfa-www.harvard.edu/cfa/ps/nelpag.html New York Times (NY Times). 2001. Skyscrapers Turn Out Lights to Save Migrating Birds. May 31. Rydell, J. and H. J. Baagoe (1996). Street lamps increase bat predation on moths. Entomologisk Tidskrift 117(part 4): 129135, as summarized in Effects of lighting of wildlife flora and fauna. http://www.geocities.com/maltastro/1pag/enviroimpact.htm. Stanne, S.P., R.G. Panetta, and B.E. Forist. 1996. The Hudson an Illustrated Guide to the Living River. Rutgers University Press. New Brunswick, NJ.
8.4 Air Emissions Master Comment 423734 Commenters voiced concern that the dredging is likely to cause airborne diseases. Response to Master Comment 423734 The impacts of dredging PCB-contaminated sediment have been evaluated in this RS. (White Paper – Air Quality Evaluation, White Paper – Odor Evaluation, and White Paper – PCB Releases to Air). The risk associated with these contaminants was found to be much below the allowable risk. Moreover, EPA is not aware of any particular disease associated with dredging a river. EPA therefore believes that implementation of the project will be safe and will not cause spread of any diseases to the surrounding communities.
8.4.1 Odor Master Comment 647 Commenters were concerned about the fact that this project will involve the removal of sediments with organic matter and the subsequent processing and transport of these sediments. Some worried that project activities, including dredging and treatment, may generate nuisance odors. Others said that backfill, dredging, and transport operations have the potential to negatively impact air quality. Comments asserted that odors and/or degraded air quality may be disruptive to local communities, industries such as tourism, and area wildlife, and that prolonged activity could negatively impact property values. It has been proposed that potential amounts of H2S generated be defined, areas of exposure be determined, and ultimately, that steps should be taken to avoid or mitigate any adverse impacts.
Responsiveness Summary Hudson River PCBs Site Record of Decision
8-25
In addition, commenters requested information on what measures will be employed to monitor and mitigate nuisance odors generated from project activities. Response to Master Comment 647 Several potential sources of nuisance odor, associated with EPA's selected remedy, have been evaluated. These include construction of processing facilities, dredging, in-river sediment transport and handling, and sediment processing. Construction Activities Developing two processing/transfer facilities could involve construction of rail spurs, water treatment plants, wharfs, and temporary staging areas. Additional activities would include grading, drainage, and construction of on-site roadways. EPA has not yet determined the locations of sediment processing/transfer facilities necessary to implement the selected remedy. For purposes of the Feasibility Study, example locations were identified from an initial list of candidates based on screening-level field observations which considered potential facility locations from an engineering perspective. In the FS, it was necessary to assume the locations of sediment processing/transfer facilities in order to develop conceptual engineering plans, analyze equipment requirements, and develop cost estimates for the remedial alternatives. For this purpose, two example locations were identified: one at the northern end of the project area in the vicinity of the Old Moreau Dredge Spoils Area, and one at the southern end of the project area near the Port of Albany. Each of these example locations fulfills many of the desired engineering characteristics for such a facility to support the remedial work, and is representative of reasonable assumptions with regard to distance from the dredging work and cost. Other locations, both within the upper Hudson River valley and farther downstream, are possible. In any event, given the nature of the construction activities that would be involved at any location, nuisance-level odor is not expected to be associated with these activities. Dredging and Processing Activities Some commenters argue that hydrogen sulfide, ammonia, and diesel-fume odors may be generated by dredging and sediment processing. Since sufficient relevant data are not available for Hudson River sediments, data from Mississippi River sediments were used to evaluate the odor generation potential of the selected remedy. Hydrogen Sulfide Gas As detailed in the White Paper - Odor Evaluation, one-hour and annual maximum H2S concentrations at the receptor locations outside the beyond the processing/transfer facility boundary and at various dredging locations were calculated using the ISCST3 model. The predicted airborne H2S concentrations were found to be lower than the corresponding applicable State or OSHA standards; therefore, the release of H2S is not expected to cause regulatory exceedances or adverse health effects.
Responsiveness Summary Hudson River PCBs Site Record of Decision
8-26
The H2S recognition threshold level is the minimum concentration at which a typical person can perceive and recognize H2S odor. Based on porewater data from other riverine sites (i.e., Mississippi), the predicted short-term airborne H2S concentrations beyond the transfer/processing facility boundary and near dredging locations indicates the hypothetical possibility of brief episodes of H2S odor if no mitigation measures are taken. During remedial design, site-specific porewater H2S data will be collected and the odor generation potential of the selected remedy will be evaluated in greater detail. A number of mitigation measures may be employed to address potential H2S odor generation, if necessary. The predicted H2S concentrations within and beyond the processing/transfer facility boundaries as well as at dredging locations, were projected to comply with applicable ambient and workplace standards. It should be emphasized that the evaluation described above is hypothetical as no Site-specific data are currently available. The likelihood of nuisance odors occurring is low based on experience at other sites. Ammonia Ammonia may be released during dredging if porewater pH is high (above 8) and there is sufficient ammonia present in the porewater. Since aqueous phase un-ionized ammonia concentration data is unavailable for the Upper Hudson River sediments, porewater data from the Mississippi River was employed to assess the ammonia odor generation potential of EPA's selected remedy. One-hour, 8-hour and annual maximum NH3 concentrations were calculated using the ISCST3 results and the values were compared with the New York State and OSHA standards and the recognition threshold value. The predicted airborne NH3 concentration values were found to be several orders of magnitude lower than the corresponding applicable standards or threshold value; therefore, the air phase NH3 release is not expected to cause odor problems or adverse health effects. Other Dredging Projects Other remedial projects were reviewed to determine if community odor impacts had occurred. Personnel associated with the Fox River project and the New Bedford Harbor dredging project indicated that odor was not noticed during dredging operations at those sites. White Paper – Odor Evaluation contains details from several other remedial projects. In addition, previous dredging completed around Rogers Island in the mid-1970s did not generate noticeable odor. Similarly, it is not expected that dredging of the Hudson River's targeted sediments will generate a nuisance odor impact. Nevertheless, measures to address odor (in the highly unlikely event that such impacts occur) will be considered during remedial design. White Paper – Odor Evaluation contains a more detailed analysis of the odor producing potential of EPA's selected remedy.
Responsiveness Summary Hudson River PCBs Site Record of Decision
8-27
8.4.2 Diesel Master Comment 729 Commenters claimed that the dredging project will produce elevated levels of diesel fumes and exhaust; possibly release contaminants to the ambient air; and will produce dust and other particles. Comments said that this would result in localized air pollution, inconvenience, and human health risk to area residents. Suggestions were made that air monitoring in the vicinity of the dredging areas and ex situ treatment facilities should be conducted to assure the community that human health impacts are minimized. Response to Master Comment 729 An air quality impact analysis (for NOx, CO, PM10, and SO2) was conducted and the details are presented in White Paper – Air Quality Evaluation. The analysis consisted of: • Potential long-term air quality effects from the proposed continuous operations were
considered. • A broad variety of emission sources (including exhaust emissions from diesel equipment,
trucks, locomotives, tugboats, and boosters, as well as roadway dust emissions) were considered and modeled.
• The worst-case concentrations for the Clean Air Act's criteria pollutants were predicted for the above-listed emission sources.
• Conservative assumptions and dispersion-modeling approaches were utilized in order to predict reasonably conservative concentration levels.
It is concluded that the total concentration of pollutants (including the background monitored levels) from the processing facility operations, the stationary booster pump operation, and dredging activities would be within the National Ambient Air Quality Standards (NAAQS) established by USEPA to protect public health. Based on the results, it is unlikely that the project would result in a significant air quality impact. However, EPA will implement an air monitoring program to address any community concerns. The details of this monitoring program will be developed during remedial design.
8.4.3 PCB Transport (Particulates; Volatilization) Master Comment 253186 It was suggested that volatilization of PCBs should be included among the factors to be considered when determining what remedial technologies are going to be used. Necessary steps need to be taken to minimize exposure to workers and local communities to airborne PCBs.
Response to Master Comment 253186 A number of laboratory field studies have documented the volatilization of PCBs from contaminated water, sediment, and soil. It is one of the significant transport routes controlling the
Responsiveness Summary Hudson River PCBs Site Record of Decision
8-28
fate and transport of PCBs in the environment. The mechanism of PCB volatilization from dredging and subsequent dewatering processes may be described as a two-step process. It involves desorption of PCBs from the solid into the liquid phase, followed by volatilization of the solubilized PCBs from the liquid to the air phase. The resulting PCB emission rate from the dredging or the sediment processing facilities, the air-water PCB transfer area, and weather data were used as input to an air dispersion model for estimating the air phase PCB concentration at a sediment processing/transfer facility and at a specific receptor location outside a facility boundary. The resulting PCB concentrations were used to quantify the risk associated with the dredging or the operation of sediment processing/transfer facilities. The PCB flux from liquid to air and the resulting air phase concentration and the associated risks are presented in White Paper – PCB Releases to Air. The calculated cancer risks and non-cancer hazards for sediment processing facility workers and outside facility boundary adult, adolescent, and child residents were de minimis (i.e., below a cancer risk of 10-6 and a hazard index of 1.0). It should be noted that the calculated PCB flux associated with the total suspended particles (TSP) are about three orders of magnitude lower than the calculated PCB flux due to volatilization; therefore, exposure from TSP is not included in the risk calculations. A detailed air phase risk characterization due to the volatilization of PCBs from the Hudson River is presented in the Revised Baseline Human Health Risk Assessment. Air monitoring, engineering controls, and standard safety procedures will be used to protect the processing facility workers and the nearby community. In addition, facility workers will wear appropriate personal protection equipment. EPA will also conduct a detailed analysis to quantify the exposure potential of PCBs from the dredging and the sediment processing/transfer facilities during design, and will implement a comprehensive air monitoring and health and safety program to address community concerns. Master Comment 253191 Several comments argue that EPA's apparent dismissal of volatilization as insignificant needs to be revisited. Some commenters contend that volatilization of PCBs from the Hudson River may be a significant source of PCBs to the ecosystem. It was stated that the FS pays little attention to the potential for redistribution via atmospheric transport to upland areas, including crops, all forms of habitat, and inland waters both near and far. Other commenters said that dredging PCB-contaminated sediments substantially lowers the release of PCBs to the ecosystem from volatilization. Response to Master Comment 253191 EPA disagrees that it "dismissed" the issue of PCB volatilization at the Site. EPA's Revised Baseline Human Health Risk Assessment (Revised HHRA, November 2000) included an evaluation of cancer risks from inhalation of PCBs in air. In the Revised HHRA, EPA
Responsiveness Summary Hudson River PCBs Site Record of Decision
8-29
determined that such cancer risks are below EPA's levels of concern. EPA stated that it was not possible to quantify non-cancer health hazards from inhalation of volatilized PCBs due to the lack of non-cancer toxicity values for this pathway. An analysis of the cancer risks associated with the release of PCBs to the surrounding air due to dredging and sediment processing/transfer facilities is presented in White Paper – PCB Releases to Air. The discussion of terrestrial exposure pathways in the Revised Baseline Ecological Risk Assessment includes exposure to PCBs by inhalation of air; however, this pathway was not evaluated because PCBs enter the terrestrial food chain primarily via food uptake (Revised Baseline Ecological Risk Assessment, November 2000). An analysis of whether PCBs volatilizing from the Hudson River are a significant source of PCBs to the ecosystem beyond the Site is outside the scope of the Reassessment RI/FS. The release of PCBs in the surrounding air (amount) and the resulting impact (risks) due to dredging and sediment transfer/processing facilities is presented in detail in White Paper – PCB Releases to Air.
8.5 Socioeconomic Issues 8.5.1 Aesthetics and Tourism Master Comment 505 Commenters asserted that disruption from the planned project would adversely affect the region in terms of aesthetics, recreational and scenic use of the river, and tourism. Some particular comments are highlighted as follows: • For area residents, outdoor activities on the Hudson, including swimming, wading,
boating, and catch and release fishing are an integral benefit of residing in the upper Hudson valley; some feel that the proposed project threatens to deny them this critical benefit of living in this region.
• In the short term there may be a significant loss of tourism in the area. One of the primary
reasons the Upper Hudson River region is visited by so many tourists each year is because of the peaceful pastoral setting it provides; concern is that this would be diminished by the proposed dredging project.
• In the past, tourism in the region has suffered from the stigma of the Hudson’s being a
toxic waste site/dumping ground. Some groups think the remedial activities may reinforce that stigma and drive tourists to other areas; others think it will restore the image of the Hudson.
• Some feel that the proposed project would result in disruption of recreational uses and
boating access to the river. For example, increased turbidity may inhibit recreational uses such as swimming in the river.
Responsiveness Summary Hudson River PCBs Site Record of Decision
8-30
• It was suggested that the dredging project is likely to deplete the fish populations for many years in the areas being dredged, and would devalue substantially the pleasure and attraction of catch and release fishing in those areas.
• Some say the proposed project would curtail New York State plans to transform the canal
system into a historic tourist destination. Potential projects related to this plan include the expansion and development of parks, walking or biking paths, and other waterfront revitalization projects along the Hudson.
• There are many parks along the river, many of which host festivals. It was suggested that
the nuisance conditions created by project activities could preclude such uses. Response to Master Comment 505 The comments on the proposed remediation's impacts on aesthetics, scenic or visual impacts, recreation, fishing, parks and festivals relate substantially to the larger concept of tourism and impacts on this important economic activity. White Paper – Socioeconomics provides a discussion of existing and potential tourism-related economics in the region, as well as a review of economic and property value impacts; the Responses to Master Comments 499 (economic benefits), 717 (agricultural impacts), and 689 (regional stigma) are also relevant. The conclusions of the white paper discussion are that the limited duration, limited scale, and limited areas targeted for dredging are unlikely to generate other than some limited short-term impacts on tourism that are confined to very specific areas and situations. Further, there is a major potential for growth of recreational tourism with a cleaned-up river. A summary of relevant sections of the white paper is included in the discussion below. Aesthetics Aesthetic issues typically relate to visual intrusions into the existing landscape and, in this case, may be generated both by the dredging along the river and the presence of transfer and processing facilities at the northern and southern ends of the project area. The dredging operations will be conducted in a six-year phased approach over the 30-week annual season, with dredges on average operating up to 14 to 16 hours per day, six days a week. However, it is important to understand that the dredging will apply to limited sections of the river. The most northern section (River Section 1, about 6.3 miles between Fort Edward and the Thompson Island Dam) would experience the most concentrated dredging activity, with most of this six-mile section subject to dredging activity. Along River Section 2 (about 5.1 miles between Thompson Island Dam and the Northumberland Dam), about two miles would be subject to dredging, typically near only one bank. Of River Section 3’s 29.5-mile length, a total of only 1.75 miles comprising three locations on one bank of the river is subject to PCB dredging, although additional isolated areas (total of about one mile) would be dredged for navigational purposes. Thus, in linear terms, only eleven of the 40 miles of the river would experience any dredging activity; the remaining 73 percent of the upper river would not be subject to dredging. In surface area terms, only 13 percent of the upper river is targeted for dredging. Moreover, less than one percent of the Upper Hudson River would be involved with dredging operations at any particular time. In any event, navigational dredging will have to be carried out.
Responsiveness Summary Hudson River PCBs Site Record of Decision
8-31
Although low density residences are scattered along both river banks, the great majority of residences of the study area would not be near the dredging operation. In terms of the major urban centers along the river (Fort Edward, Stillwater, Mechanicville, Pleasantdale, Waterford, Lansingburgh, and Troy), dredging would be adjacent only at Fort Edward and Stillwater. At Mechanicville, there would be some navigational dredging on the other side of the island separating the navigational channel from this town. Proximity effects of dredging, including visual impacts, would be limited by the geography of the targeted dredging, as well as by the relatively brief duration when dredging activity would be proximate. Dredging is expected to occur directly in front of a particular location in a targeted area for about one week, and within view for only a few weeks longer. Thus, potential visual impacts from the dredging would apply to only a small portion of the 40 miles of river, and would be very temporary where they would occur. Once the dredging and backfill operations have passed by, the only remediation-associated activity would be ongoing monitoring activities in the river. It should also be recognized that navigational dredging activities were commonplace on this section of the river (prior to its designation as a Superfund site), as they continue to be on other sections of the Hudson River and the NYS Canal System. Operations at the processing facilities would be continuous over the planned six-year period. These facilities are assumed to operate 24-hour days during the 30-week annual operating season. However, the processing facility locations will be carefully sited and designed to minimize potential impacts. They are likely to be in areas with an industrial or commercial land use and have access to rail and water transportation for the movement of materials. Potential impacts from the processing plants would thus be relatively limited and would apply only to areas of close proximity. Aesthetic and visual impacts would be minimized or mitigated to the extent practicable. The aesthetic, visual, and scenic significance of the river particularly relates to important recreational uses, including boating, fishing, visiting waterfront parks, and various water-oriented festivals, much of which can be considered under the heading of tourism. Tourism Section 3 of White Paper – Socioeconomics provides a discussion of existing and potential tourism-related economics in the region, with additional discussion (Section 4) on recreational fishing. With respect to recreational boating, the dredging would be organized so that river navigation would continue to function during the day, with the possible exception of short-term restrictions when maneuvering barges/pipelines in limited areas is required. As noted above, actual dredging would be limited to less than one percent of the upper river at any time. The dredging operation’s potential impacts on navigation would be primarily limited to traversing the section of the river where dredging would be in operation or sharing the locks with barges hauling the dredged material. Because of the relatively small area of the river affected at
Responsiveness Summary Hudson River PCBs Site Record of Decision
8-32
any particular time, the recreational experience on the river would remain substantially unaffected in those areas away from the dredging operation. Travelers on the river or moving along adjacent roadways would pass through areas where dredging was in progress in a matter of minutes. For these individuals, project-generated noise, odor, and visual intrusion will be of little consequence once they are beyond the immediate work area by only several hundred feet. In these situations the impacts would be quite minimal and the river travelers, in particular, would have 99 percent of the Upper Hudson River unaffected by the physical presence of the dredging barges. Noise impacts and concerns about potential for odor generation are detailed in other white papers. Noise levels are expected to be below NYSDOT construction impact guidelines a relatively short distance from the dredging equipment and odor is not expected to be an issue at all. With respect to the potential congestion of the river and canal locks, the operational demands and lock capacities are discussed in White Paper – River Traffic. The conclusions of the analysis are that, based on 1999 use patterns by pleasure vessels and projections of dredging operations, there would continue to be excess lock capacity with generally no congestion for pleasure vessels at locks under all reasonable scenarios. There is a potential for congestion to occur at Locks 5 and 6 during the peak canal season. However, if project-related vessels utilize the locks after hours, lock congestion as a result of the remedy is reduced, if not eliminated altogether. Consequently, few adverse impacts are anticipated for recreational boaters during the remediation. Moreover, a significant portion of the dredging is oriented to navigational dredging that, when completed, would provide an expanded and safer capacity for recreational and commercial use of the river, and would likely enhance the area's economy through increased tourism. For those tourists that would be non-mobile (e.g., staying at an inn on the river), the dredging operations would be slowly moving into proximity and then receding. The rate of movement would depend on the amount of dredging targeted at that location; however, on average, the dredging operation would be adjacent to a particular location for about one week. Assuming the river has no bends, islands, or other obstructions close to the hypothetical inn, the operation would be audible for only about two to six weeks. It is true that during this relatively brief period, the river may lose some of its aesthetic attraction for tourists staying at such an inn. However, there is also a possibility that the dredging work will engender some interest for tourists since it will be viewed as a temporary activity with a unique environmental objective. Public information on the schedule and location of the dredging activities during particular weeks/months would help mitigate any unexpected disappointments for tourists. It is also appropriate to consider that such impacts would be far less severe than if, for example, another hotel were to be built near to our hypothetical inn. Building construction impacts of any kind would likely to be of much longer duration and would involve far more landside impacts from trucks and workers than a river-based dredging barge. Much of the Hudson River along the 40 miles from Troy to Fort Edward is rural, with relatively few built tourist amenities. Washington County, as a whole, is more representative of this stretch of the river than would be, for example, Saratoga County, which has numerous tourist attractions although mostly oriented to Saratoga Springs, the Saratoga Spa State Park, to I-87, and to other attractions away from the river. The 1999 data from County Business Patterns cites 52 accommodation establishments in Saratoga County and 62 amusement and recreation
Responsiveness Summary Hudson River PCBs Site Record of Decision
8-33
establishments; equivalent data for Washington County show no accommodation establishments and 15 amusement and recreation establishments reported (US Census Bureau, 1999). The discussion on river-oriented accommodations in White Paper – Socioeconomics does identify one motel in Fort Edward, Washington County that was open in 1999, implying that the County Business Patterns data source may not be completely inclusive. White Paper – Socioeconomics also examines tourism and recreation-oriented activities in each of the affected counties along the river and compares these with other counties in upstate New York that have freshwater recreation resources but are outside the region, i.e., Herkimer, Cayuga, and Seneca Counties. The data reveal that Washington County’s small tourist-oriented employment has declined since 1988, whereas Cayuga County’s has grown 63 percent over the period 1988-99. If Washington County had increased this sector at the same rate as Herkimer County (23 percent) it would have added 500 tourism-oriented jobs or, similarly, Albany County would have added 3,266. With Washington County so far behind the tourism growth of other counties, both in the upper Hudson region and elsewhere in the State, it is quite apparent that the county that typifies the target area for dredging has not shared in this important growth industry. The presence of PCB contamination in the Hudson River, its key tourist amenity, may well have contributed to this poor performance. Scenic Hudson’s consultant, KLIOS, Inc. noted in Appendix A of its comments, for example, that the value of recreational boating in Maryland exceeded $1 billion in 1993, that Lake Michigan festivals in 1992 grossed revenues of $51 million, and that recreational boating on the Ottawa River added $14 million in sales to the local economy. The authors note that specific studies on the value of tourism in the Hudson Valley are not available. Tourism involves a wide variety of recreational activities. Among those most relevant for the upper Hudson valley would be outdoor recreation, as compared to visiting museums or movie theaters. Data from the National Survey of Recreation and the Environment conducted in 1994 and 1995 (Outdoor Coalition of America, 1997) show high annual participation rates in the US for activities relevant to the upper Hudson River valley: • Viewing/studying (76.2 percent or 152.6 million persons). • Visiting beach/waterside (62.1 percent or 124.4 million persons). • Sightseeing (56.6 percent or 113.4 million persons). • Freshwater fishing (24.4 percent or 48.8 million persons). • Boating (29 percent or 58.1 million persons). Major increases in participation over the previous decade were recorded for bird watching (an increase from 21.2 million to 54.1 million persons) and hiking and backpacking (an increase from 33.5 million to 63 million persons). Another key database on this type of tourist activity is the National Survey of Fishing, Hunting and Wildlife Associated Recreation (USFWS, 1998). This source reported 3.3 million wildlife-watching participants in New York State, of whom 1.173 million were nonresidential (i.e., away from home). Total expenditures for wildlife watching in New York were almost $1.3 billion, of which trip-related expenditures were $139.7 million and $1.1 billion was for equipment and other expenditures. It is clear that the Upper Hudson River ought to be a major participant in these outdoor, nature-oriented modes of recreation. The available data on the economic significance of these activities
Responsiveness Summary Hudson River PCBs Site Record of Decision
8-34
points to their substantial scale; however, the riverside communities of the four counties adjacent to the PCB dredging appear to participate much less than would be expected, especially given the world class resource that the river provides in its own right along this reach of the river, and as a connector to other magnificent resources, such as Lake Champlain to the St Lawrence River, and the Mohawk River/Erie Canal to the Great Lakes. With the remediation of the PCB contamination, the river would have a much greater likelihood of securing and expanding its fair share of these tourism and recreational benefits. Recreational Fishing After the 1976 ban, catch-and-release sport fishing alone has been permitted in the Upper Hudson River, and only since 1995. Consumption advisories remain in effect and it is illegal to possess fish from a large portion of the upper river. It is interesting to note that the NY Canal Corporation, responsible for the entire New York canal system including the Erie Canal and the Champlain Canal (of which the Upper Hudson River is part), markets the waterways as a major tourist/recreational resource, with fishing as one of the key activities (NY Canal Corporation, Recreationway Plan, 1995). It is the PCB contamination that prevents the Champlain Canal south of Fort Edward from joining with this world class recreation resource. If the proposed remediation operations were to inhibit the presently limited fishing, it would be from one or more of the following: • The proximity of the dredging barges. • The resuspension of PCBs. • The destruction of fish habitat. In the case of proximity to the dredging, such operations would occupy less than one percent of the 40 mile reach of the upper river such that, at any particular time, anglers would be able to find alternate sites to fish where the dredging and backfill operations are not proximate. Moreover, only 13 percent of the upper river bottom area will be dredged. In the case of the resuspension of PCBs, the threat of contamination would be only marginally greater than at present and would be closely monitored to assure that this remains so; resuspension should not affect catch-and-release fishing. The impacts to habitat would be temporary and affect only certain species over the short term. Some species of fish are likely to return sooner than others, but within several years the waterway is expected to return to conditions that would support a major recreational fishery. Effective removal of PCBs in the Upper Hudson River should result in considerable reductions in PCB levels in fish taken downstream; thus, remediation will also help restore the value of potential recreational and commercial fishing downstream of Troy. Recreational fishing along this section of the river is likely to be a much more significant economic activity than its commercial counterpart. An estimated 78,000 fishing licenses were issued in 1998-1999 fishing season to anglers in the five counties surrounding the Upper Hudson. The 1996 National Survey of Fishing, Hunting, and Wildlife-Associated Recreation indicates that in New York State there are 1,493,000 NY resident anglers (over age 16) who spend an average of 18 days at this activity, with average annual expenditures of $942 each, and $1.3 billion spent in New York. Of New York’s resident anglers, 996,000 (or 67 percent) fished in freshwater (excluding the Great Lakes), making 13.5 million trips covering 16.2 million days.
Responsiveness Summary Hudson River PCBs Site Record of Decision
8-35
In 1996, of the $1.3 billion fishing expenditures in New York, trip-related expenditures, including food, lodging, and transportation and boat rentals, came to $601 million, and each angler spent an average of $353 on trip-related costs. In addition to these direct expenditures by anglers, there are secondary economic benefits as these dollars circulate in the local economy generating additional indirect jobs and earnings. Employment multipliers from service activities, such as hotels and eating/drinking places in the upper Hudson region, are on the order of 18 to 28 jobs per million dollars expended (US Bureau of Economic Analysis, 2001b). Thus if, for example, the Upper Hudson were to generate a direct increment of $100 million of expenditures in these service industries important to anglers, another 1,800 to 2,800 new jobs would be created. It is important to recognize that with the bans and advisories in effect, the communities along the Hudson River south of Fort Edward have barely participated in these huge recreational expenditures, despite some of the most magnificent scenery and fishing opportunities in the State. It is also appropriate to note that the benefits of recreational fishing are hardly limited to economics. The social, physical, psychological, and educational benefits of intimate contact with nature, while intangible, provide significant opportunities for personal renewal and reflection, accounting for much of fishing’s broad popularity. The PCB remediation offers the long-term prospects of a renewed and enhanced recreational fishing-associated industry. This would generate a range of positive benefits that include a substantial boost to local economies and, indirectly, a greater sensitivity to preservation of the natural environment, an intrinsic quality of recreational fishing. Parks and Festivals A number of parks and other recreational attractions are located on or near the 40 miles between Fort Edward and the Troy Dam. Many of these are considerable distances from the proposed dredging sites and potential transfer and processing facility locations. Depending upon the distance of each facility from proposed dredging or processing, the type of dredging (hydraulic or mechanical), and whether or not the public facility is available for use at night, there could be short-term impacts at some locations that EPA would seek to mitigate to the extent practicable. A few of the 22 public venues discussed in detail in White Paper – Socioeconomics are close enough to project activities to have the potential for short-term impacts. Among these are: • Sites along the Champlain Canal Scenic Byway, stretching for 64 miles from Waterford to
Whitehall. • Rogers Island Visitors Center, a historical attraction on Rogers Island in Fort Edward. • Fort Edward Yacht Basin, a public marina located in downtown Fort Edward. • Fort Miller recreation area alongside the Hudson River in Fort Miller. • A golf course in Mechanicville whose river border is about 2,000 feet from proposed
dredging sites. A series of events and festivals are associated with the parks and/or the waterway. Of the 16 annual events identified from the 2001 calendar, it is anticipated that only four events would
Responsiveness Summary Hudson River PCBs Site Record of Decision
8-36
have the potential to be affected by the dredging activity, based on the proximity of these activities and potential scheduling conflicts: • Annual Canal Cruise and Trek – boating and cycling along the canal system that occurs in
July. • Antique Auction and Country Fair, Fort Edward – arts and crafts vendors, also in July. • Summer Concerts at the Yacht Basin, Fort Edward, one night per week in August. • Fort Edward Heritage Days, occurring in July of 2001. Although the brief duration of the dredging at any particular location minimizes potential conflict with any of these annual events, EPA would work with the community to mitigate impacts to the extent practicable. Marinas Of 11 marinas located between Fort Edward and the Troy Dam, potential short-term impacts are anticipated at only one location, the West River Road Marina in Moreau; however, at the time of this writing, it appears that this marina may no longer be operating. Lodgings and Accommodations Sixteen hotels, motels, and bed and breakfast inns have been identified in the communities along the 40-mile section of the Hudson River from Fort Edward to the Troy Dam. Depending upon the distance from the dredging sites and the type of dredging that occurs there (mechanical or hydraulic), there could be some short-term nighttime noise impacts at some of these locations that would be mitigated as much as practicable. Noise impacts from the processing/transfer facilities would also be mitigated. 8.5.2 Economics Master Comment 499 An economic impact analysis was performed by KLIOS, Inc. and submitted as a comment to the EPA. Response to Master Comment 499 KLIOS, Inc. has prepared a document entitled Hudson River Regional Economic Impact Analysis: Impact of Environmental Remediation (KLIOS, April 12, 2001) that examines: regional economic impacts along the Hudson River; economic benefits and potential of the Hudson River; economic value of Hudson River Fisheries; economic potential of Hudson River Valley tourism; and the impact of environmental remediation on property values. Major issues and conclusions of the KLIOS report are discussed below.
Responsiveness Summary Hudson River PCBs Site Record of Decision
8-37
KLIOS’ report makes a strongly positive case for the economic benefits of the PCB remediation. The report distinguishes near-term benefits from longer-term benefits and includes among the near-term benefits the economic activity associated with expenditures for the remedial dredging in Saratoga and Washington Counties. The report uses an econometric input-output model developed by REMI, Inc., allocating $225 million in direct expenditures to the region. The resulting benefits are 3,543 new direct jobs and 1,028 new indirect jobs, with a total payroll of $141 million, and a regional product of $800 million. Section 2 of White Paper – Socioeconomics discusses the creation of an alternative input-output model by the US Bureau of Economic Analysis (BEA) for a larger (five-county) region of the upper Hudson, but with somewhat different input data that produces rather less in the way of jobs, earnings and output than the REMI model. This BEA model (RIMS II) generates $576.2 million in output; 3,214 new direct and indirect jobs spread over the five (or more) years (i.e., 643 jobs per year if spread over five years); and $126.8 million in earnings. Differences in the models include the counties incorporated, the dollars assigned as inputs, and other proprietary factors internal to the REMI model. The KLIOS/REMI estimates may represent something of an upper boundary of potential near-term benefits from the direct dredging expenditures, while the BEA RIMS II model may represent a more conservative baseline of estimated economic impacts. In another analysis, KLIOS estimates economic benefits from the Hudson River as at least $288 million in 1999, much less than its full potential because of the additional costs of waterfront redevelopment and restoration caused by the PCB pollution. With the remediation of this problem, KLIOS estimates longer-term benefits of 3,700 to 8,900 new jobs, and wages of $144 million to $346 million. While no attempt is made by EPA to validate these inherently difficult-to-predict impacts, the waterfront revitalization potential of the river is presently handicapped by additional costs of dredge disposal for restored piers, unmaintained navigational channels; and public perceptions of a polluted river. With the effective clean-up of one the major sources of contamination, development costs will be lower and the public’s interest in living near the river and enjoying its recreational amenities will be enhanced, logically stimulating economic activity. The KLIOS estimates appear quite conservative in that they focus only on bringing the water-related economic sectors in the Hudson River counties to the average levels for the State. Given the historical significance of this waterway, and its continuing magnificence as a recreational resource, it is not unreasonable to expect that these counties should substantially exceed the Statewide average for water-related industries. Among the economic losses attributable to PCBs is that of commercial fishing in the Hudson, which was suspended in 1976 and remains suspended, except for a brief annual shad run. KLIOS cites the economic value of the commercial and recreational fishing industries at $40 million when they were closed in 1976. Since 1995, catch-and-release recreational fishing has been permitted in the upper Hudson. White Paper – Socioeconomics, Section 4, discusses both commercial and recreational fishing. It notes that in 1999 more fully functioning commercial fisheries, as for example, Cape May County, New Jersey, or Washington County, Rhode Island, directly supported 204 jobs and 65 jobs, respectively, with a substantial multiplier creating additional secondary employment at those locations. Recreational fishing is likely to be a much more significant economic activity, and the white paper cites data from the National Survey of Fishing, Hunting, and Wildlife-Associated Recreation showing expenditures of over $1.3 billion on freshwater fishing (excluding the Great Lakes) in New York, again generating substantial
Responsiveness Summary Hudson River PCBs Site Record of Decision
8-38
multipliers for secondary economic benefits. Unfortunately, the upper Hudson region presently shares a very minor portion of this revenue. As KLIOS notes, recreational fishing along the entire river south of Hudson Falls is likely to experience a major resurgence once the bans on commercial fishing and advisories on recreational fishing are relaxed. KLIOS notes the loss of potential tourism in the Hudson Valley as a result of Superfund site stigma, citing the value of water-oriented tourism in other parts of North America. White Paper – Socioeconomics, Section 3, also examines tourism in relative context, noting that Washington County, as more typical of the upper Hudson waterfront region, has actually declined in its tourist-related employment since 1988, compared to gains in, for example, Herkimer County, which saw gains of 23 percent over 1988-99. The white paper also notes the growing interest in wildlife watching, boating, and other outdoor recreation, activities in which the region is well equipped to participate at much greater than current levels. Finally, KLIOS notes the positive impact that remediation will have on property values on the Hudson River waterfront. Details in White Paper – Socioeconomics, Section 5, address the potential evidence of the PCB contamination’s influence in depressing riverfront prices, citing a 1990 NY Canal Corporation study of property values along the river that shows those properties to be substantially lower than median residential values in the respective counties. The white paper also reviews the literature on the effects of hazardous waste sites on surrounding property values and the typical improvement in property values following remediation. White Paper – Socioeconomics addresses several related topics, as do the Response to Master Comments 505 (scenic and tourism concerns), 689 (regional stigma), 691 (property values) and 717 (agriculture). Master Comment 689 Commenters suggested that the planned project would harm local businesses and the local economy in many ways:
• Dredging will impact businesses along the river (e.g., marinas) because it may curtail access to the river (e.g., erection of silt curtains) as well as prevent use of the navigable channel.
• Businesses may find it difficult to attract new employees from outside the area. A limited labor pool could cause the overall wages to increase and local businesses would suffer.
• A massive dredging project could consume most of the available rail transportation in the region; some businesses may be forced to incur higher operating costs as they switch to truck transportation.
• The region would be unable to attract new businesses because of the stigma that would be attached to the entire region and the increased cost of doing business that would result from the dredging project.
Response to Master Comment 689 Comments on impacts of the proposed remedy on the regional economy and local businesses are substantially addressed in White Paper – Socioeconomics, which discusses the proposed
Responsiveness Summary Hudson River PCBs Site Record of Decision
8-39
dredging and its direct and indirect short-term impacts on the regional economy, existing and potential tourism economics, commercial and recreational fishing, and impacts on property values along the river and near the processing facilities. The conclusions reflected in this white paper are that the limited duration, limited scale, and limited areas targeted for dredging are unlikely to generate a regional stigma or noticeably raise business costs. Further, there is a major potential for growth of recreational tourism, particularly of recreational boating and fishing, once the PCBs in the river are cleaned up. Stigma and the Regional Economy The concerns relative to the remediation program are associated with proximity to dredging operations on sections of the 40.9 miles of the Hudson River/Champlain Canal between the former dam at Fort Edward and the Federal Dam at Troy, and to perhaps two sediment processing/transfer facilities. The dredging operations will be conducted in a six-year phased approach over the 30-week annual season, with dredges on average operating up to 14 to 16 hours per day, six days a week. However, it is important to understand that the dredging will apply to limited sections of the river. The most northern section (River Section 1, the 6.3 miles between Fort Edward and the Thompson Island Dam) would experience the most concentrated dredging activity, with most of this six-mile section subject to dredging activity. Along River Section 2 (the 5.1 miles between Thompson Island Dam and the Northumberland Dam), about two miles would be subject to dredging, typically near only one bank. Of River Section 3’s 29.5-mile length, a total of only 1.75 miles comprising three locations on one bank of the river is subject to PCB dredging, although additional isolated areas (total of about one mile) would be dredged for navigational purposes. Thus, in linear terms, only eleven of the 40.9 miles of the upper river would experience dredging activity; the remaining 73 percent of the upper river would not be subject to dredging. In terms of surface area, only 493 (or 13 percent) of the 3,900 acres of the upper river would be involved in remedial activities. Moreover, less than one percent of the upper river would be involved with dredging operations at any particular time. In any event, navigational dredging will have to be carried out. Although low density residences are scattered along both river banks, the great majority of residences of the study area would not be near the dredging operation. In terms of the major urban centers along the river (Fort Edward, Stillwater, Mechanicville, Pleasantdale, Waterford, Lansingburgh, and Troy), dredging would be adjacent only at Fort Edward and Stillwater. At Mechanicville, there would be some navigational dredging on the other side of the island separating the navigational channel from this town. Proximity effects of dredging, including noise and visual impacts, would be limited by the geography of the targeted dredging, as well as by the relatively brief duration of proximate dredging activity. Dredging is expected to occur directly in front of a particular location in a targeted area for about one week, and within view for only a few weeks longer. Thus, potential visual impacts from the dredging would apply to only a small portion of the 40 miles of river, and would be very temporary where they would occur. Once the dredging and backfill operations have passed by, the only remediation-associated activity would be ongoing monitoring activities in the river. It should also be recognized that navigational dredging activities were commonplace
Responsiveness Summary Hudson River PCBs Site Record of Decision
8-40
on this section of the river (prior to its designation as a Superfund site), as they continue to be on other sections of the Hudson River and the NYS Canal System. Operations at the processing sites would be continuous over the planned six-year period. These facilities are assumed to operate 24-hour days during the 30-week annual operating season. However, the processing facility locations will be carefully selected to minimize potential impacts. They are likely to be areas with an industrial land use history, would likely be substantially screened and buffered from residential and other sensitive land uses, and would have access to and rely on rail and water transportation for the movement of materials. Potential impacts from the processing plants would thus be relatively limited and apply only to areas of close proximity. Aesthetic and visual impacts would be minimized by the fact that these sites would likely be substantially buffered from neighboring properties. Impacts to local highway networks would be minimal. Stabilized or dewatered sediments would be transported by rail or barge. Concerns that the remediation will displace and/or overcrowd other users of the highways, rails, and the river are also unfounded and are addressed elsewhere in detail (White Paper – Project-Related Traffic, White Paper – River Traffic, and White Paper – Rail Operations). However, to summarize these discussions, it is important to note that the processing facilities are likely to generate an estimated nine truck deliveries per day; these will generally not occur during peak commuter hours. There would be an increase in traffic volumes of less than eight percent, which would not disrupt traffic on the local network near the potential northern processing facility. Interstates I-87 and I-787 serve the general area being considered for a southern processing facility, providing easy access to the entire area; thus, local highways will not be significantly affected. On the river, the remedial activity will primarily take place outside the navigational channel, so there will be limited interference with non-project related river traffic. However, when remedial activity is necessary in the navigational channel, the dredge equipment and barges will be positioned to allow clear and safe passage of other vessels. With respect to potential congestion at locks along the river, it has been determined that even at the busiest locks there will be sufficient capacity available to accommodate both project and non-project related traffic. Use of locks out of hours is anticipated to be an option for minimizing congestion at peak season. (White Paper – River Traffic). With respect to rail transportation, the regional rail carrier is the Canadian Pacific Railroad (CPR). Project rail requirements have been discussed with them at length. CPR has stated that there is sufficient available capacity to accommodate project-related rail traffic without effects to current regional freight and passenger train service. Thus, the transportation movements associated with the proposed remediation plan would not impact these transportation networks enough to drive up business costs and thereby create economic hardship for the region. One comment claims that existing businesses would have difficulty in recruiting new employees and, with a limited labor pool, dredging would cause labor costs to rise and local businesses to suffer. It is true that the resurgent regional economy has seen a decline in the number of unemployed. Nonetheless, in April 2001, the numbers of unemployed in the region remain substantial, with 10,500 unemployed in the four-county region, and 11,700 when Warren County
Responsiveness Summary Hudson River PCBs Site Record of Decision
8-41
is added. This is a substantial pool of labor actively seeking work, compared to the 533 direct and indirect jobs to be generated by the dredging for each of the six years of the project’s duration (Section 2 of the White Paper – Socioeconomics discusses these impacts in greater detail). Moreover, to assume that the stigma of dredging would inhibit recruiting new employees to the region is hardly credible given the limits to the affected area (a narrow swath along eleven miles of river in a five-county region of almost 3,700 square miles) and the duration of impacts, which, except for the processing sites, would impact a particular location on the river for only a matter of weeks. White Paper – Socioeconomics presents an input-output model customized for the upper Hudson region indicating the patterns of short-term earnings and employment that would be directly and indirectly generated by the proposed dredging program. The key findings of this model are that of the total of 3,200 jobs generated in the five-county region over the six years, the construction sector would account for 25 percent (almost 800 jobs) of the employment generated by the expenditures on dredging. Construction employment is followed by various business services, with about 670 jobs (21 percent), and transportation 560 jobs (17 percent). A variety of other services account for the bulk of the remaining projected employment, notably in retail, health, and eating and drinking places. Employment in construction in the region has experienced a slower rebound than other economic sectors, with 11.8 percent (or 2,898) fewer employed in 1998 than in 1989 (US Bureau of Economic Analysis, 2001a). It is likely, therefore, that the dredging activity with the greatest demand upon the labor pool would, in fact, be a welcome addition to this economic sector of the region. The combined direct and indirect increase in employment in the region that would be generated from the dredging operation is estimated at 3,200 jobs over the six years or, if the expenditures were evenly distributed over the period, an average of 533 jobs per year. As a percent of current employment, this would represent an increment of 0.16 percent to the April 2001 employed population of 386,000 in the five-county region (NYS Department of Labor, June 2001). Of the presently unemployed population of 11,700, the 640 jobs would represent 5.5 percent; if all the employees were to be drawn from this unemployed pool, it would reduce the unemployment rate from 3 percent to 2.8 percent. Therefore, the expected scale of the dredging employment is not of a scale sufficient to create discernable labor shortages or wage pressures that would adversely impact business. No loss of livelihood as a result of direct or indirect impacts of remedial dredging on any particular business is anticipated. Potential impacts on marina operators, perhaps the most directly affected class of business, is discussed below. Any potential for a regional scale and long-lasting stigma is quite remote under the conditions described of very temporary and limited impacts on particular locations along the 40 miles of river, and the finite operations (approximately six years) of substantially buffered processing/transfer facilities that rely on water and rail transportation. The positive opportunities for businesses presented by project-related activities appear to obviate the concerns of adverse impacts to the cost of doing business in the area or to the availability of labor. Indeed, the selected remedy is expected to help remove the long-standing stigma associated with the PCB contamination in the river.
Responsiveness Summary Hudson River PCBs Site Record of Decision
8-42
Recreational Navigation White Paper – Socioeconomics (Section 3) discusses existing tourism and its potential for growth in the upper Hudson region. Section 4 of the white paper also discusses recreational fishing. With respect to recreational boating, the dredging would be organized so that the river navigation channel would continue to function normally, with the possible exception of short-term restrictions when maneuvering barges/pipelines in limited areas is required. As noted above, actual dredging would be limited to less than one percent of the Upper Hudson River at any time. The dredging operation’s potential impacts on navigation would be primarily limited to traversing the section of the river where dredging would be in operation or sharing the locks with barges hauling the dredged material. Because of the relatively small area of the river affected at any particular time, the recreational experience on the river would remain substantially unaffected in those areas away from the dredging operation. Travelers on the river or moving along adjacent roadways would pass through areas where dredging was in-progress in a matter of minutes. For these individuals project generated noise, odor, and visual intrusion will be of little consequence once they are beyond the immediate work area by only several hundred feet. In these situations the impacts would be quite minimal and the river travelers, in particular, would have 99 percent of the Upper Hudson unaffected by the physical presence of the dredging barges. Noise impacts and the potential for odor generation are detailed in other white papers; noise levels are expected to be below NYSDOT construction impact guidelines a relatively short distance from the dredging equipment and odor is not expected to be an issue at all. There is also a possibility that the dredging work will engender some interest for tourists since it will be viewed as a temporary activity with a unique environmental objective. With respect to the potential congestion of the river and canal locks, the operational demands and lock capacities are discussed at length in the White Paper – River Traffic. The conclusions of the analysis are that, based on 1999 use patterns by pleasure vessels and projections of dredging operations, there would continue to be excess lock capacity generally with no congestion for pleasure vessels at locks under all reasonable scenarios. There is a potential for congestion to occur at Locks 5 and 6 during the peak canal season. However, if project-related vessels utilize the locks after hours, lock congestion as a result of the remedy is reduced, if not eliminated altogether. Consequently, few adverse impacts are anticipated for recreational boaters during the remediation. Moreover, a portion of the dredging is oriented to navigational dredging that, when completed, would provide an expanded and safer capacity for recreational and commercial use of the river, and would likely enhance the area's economy through increased tourism. Marinas along the river are major participants in the recreational boating activity and comprise a class of local business with concerns about remediation -related impacts. Eleven marinas have been identified as being located on the river between Fort Edward and the Troy Dam. White Paper – Socioeconomics identifies each marina, its proximity to any proposed dredging, and likelihood of any adverse impacts.
Responsiveness Summary Hudson River PCBs Site Record of Decision
8-43
Only one marina, the West River Road Marina near Moreau, would be adjacent to any proposed dredging. At the time of this writing, however, it seems that this particular marina may no longer be operating. Longer Term Economic Effects In the post-remediation phase, the upper Hudson region is likely to experience a notable improvement in its economy, particularly in those activities relating to recreation and tourism, expanding employment and earnings in the many sectors of the economy that relate to these activities. This in turn will be likely to improve property values in the region and especially along the river. Much of the Hudson River along the 40 miles from Troy to Fort Edward is rural, with relatively few built tourist amenities. Washington County as a whole is more representative of this stretch of the river than would be, for example, Saratoga County, which has lots of tourist attractions but largely oriented to Saratoga Springs, the Saratoga Spa State Park, to I-87, and other attractions away from the river. The 1999 data from County Business Patterns cites 52 accommodation establishments in Saratoga County and 62 amusement and recreation establishments; equivalent data for Washington County show no accommodation establishments and 15 amusement and recreation establishments reported. (US Census Bureau, 1999). The discussion on river-oriented accommodations in White Paper – Socioeconomics identifies one motel in Fort Edward, Washington County, that was open in 1999, implying that the County Business Patterns data may not be completely inclusive. White Paper – Socioeconomics examines tourism and recreation-oriented activities in each of the affected counties along the river and compares these with other counties in upstate New York that have freshwater recreation resources but are outside the region, i.e., Herkimer, Cayuga, and Seneca Counties. The data reveal that Washington County’s small tourist-oriented employment has declined since 1988, whereas Cayuga County’s has increased 63 percent over the period 1988-99. If, for example, Washington County had increased this sector at the same rate as Herkimer County (23 percent), it would have added 500 tourism-oriented jobs or, similarly, Albany County would have added 3,266. With Washington County so far behind the tourism growth of other counties, both in the upper Hudson region and elsewhere in the State, it is quite apparent that the county that typifies the target area for dredging has not shared in this important growth industry. The image of one of its key tourist amenities, the Hudson River, as being contaminated with PCBs may well have contributed to this poor performance. Scenic Hudson’s consultant, KLIOS, Inc., (in Appendix A of its comments) noted, for example, that the value of recreational boating in Maryland exceeded $1 billion in 1993, that Lake Michigan festivals in 1992 grossed revenues of $51 million, and that recreational boating on the Ottawa River added $14 million in sales to the local economy. The authors note that specific studies on the value of tourism in the Hudson Valley are not available. Tourism involves a wide variety of recreational activities. Among those most relevant for the upper Hudson valley would be outdoor recreation, as compared to visiting museums or movie theaters. Data from the National Survey of Recreation and the Environment conducted in 1994
Responsiveness Summary Hudson River PCBs Site Record of Decision
8-44
and 1995 (Outdoor Coalition of America, 1997) show high annual participation rates in the US for activities relevant to the upper Hudson valley:
• Viewing/studying (76.2 percent or 152.6 million persons). • Visiting beach/waterside (62.1 percent or 124.4 million persons). • Sightseeing (56.6 percent or 113.4 million persons). • Freshwater fishing (24.4 percent or 48.8 million persons). • Boating (29 percent or 58.1 million persons).
Major increases in participation over the previous decade were recorded for bird watching (an increase from 21.2 million to 54.1 million persons) and hiking and backpacking (an increase from 33.5 million to 63 million persons). Another key database on this type of tourist activity is the National Survey of Fishing, Hunting and Wildlife Associated Recreation (USFWS, 1998). This source reported 3.3 million wildlife-watching participants in New York State, of whom 1.173 million were nonresidential (i.e., away from home). Total expenditures for wildlife watching in New York were almost $1.3 billion, of which trip-related expenditures were $139.7 million and $1.1 billion was for equipment and other expenditures. It is clear that the Upper Hudson River ought to be a major participant in these outdoor, nature-oriented modes of recreation. The available data on the economic significance of these activities points to their substantial scale; however, the riverside communities of the four counties adjacent to the PCB dredging appear to participate much less than would be expected, especially given the world class resource that the river provides in its own right along this reach of the river, and as a connector to other magnificent resources, such as Lake Champlain to the St Lawrence River, and the Mohawk River/Erie Canal to the Great Lakes. With the remediation of the PCB contamination, the river would have a much greater likelihood of securing and expanding its fair share of these tourism and recreational benefits. Recreational fishing is another key activity but, following the 1976 fishing ban in a portion of the Upper Hudson River (Hudson Falls to Troy), catch-and-release sport fishing has been allowed only since 1995. Fish consumption advisories remain in effect, and it is illegal to possess fish from this portion of the river. It is interesting to note that the NY Canal Corporation, which is responsible for the entire New York canal system including the Erie Canal and the Champlain Canal (of which the Upper Hudson River is part), markets the waterways as a major tourist/recreational resource, with fishing as one of the key activities (NY Canal Corporation, Recreationway Plan, 1995). It is the PCB contamination that prevents the Champlain Canal south of Fort Edward from joining with this world class recreation resource. Recreational fishing along this section of the river could be a significant economic activity. An estimated 78,000 fishing licenses were issued in 1998-1999 fishing season to anglers in the five counties surrounding the Upper Hudson. The 1996 National Survey of Fishing, Hunting, and Wildlife-Associated Recreation indicates that in New York State, there are 1,493,000 NY resident anglers (over age 16) who spend an average of 18 days at this activity with average annual expenditures of $942 each, with $1.3 billion spent in New York. Of New York’s resident anglers, 996,000 (or 67 percent) fished in freshwater (excluding the Great Lakes), making 13.5 million trips covering 16.2 million days. In 1996, of the $1.3 billion fishing expenditures in New
Responsiveness Summary Hudson River PCBs Site Record of Decision
8-45
York, trip-related expenditures, including food, lodging and transportation, and boat rentals, came to $601 million, and each angler spent an average of $353 on trip-related costs. In addition to these direct expenditures by anglers, there are secondary economic benefits as these dollars circulate in the local economy, generating additional indirect jobs and earnings. Employment multipliers from service activities such as hotels, and eating/drinking places in the upper Hudson region are on the order of 18 to 28 jobs per million dollars expended (US Bureau of Economic Analysis, 2001b). Thus if, for example, the Upper Hudson were to generate a direct increment of $100 million of expenditures in these service industries important to anglers, another 1,800 to 2,800 new jobs would be created. With the bans and advisories in effect, the communities along the Hudson River south of Fort Edward have barely participated in these huge recreational expenditures, despite some of the most magnificent scenery and fishing opportunities in the State. It is also appropriate to note that the benefits of recreational fishing are hardly limited to economics. The social, physical, psychological and educational benefits of intimate contact with nature, while intangible, provide significant opportunities for personal renewal and reflection, accounting for much of fishing’s broad popularity. The PCB remediation offers the long-term prospects of a renewed and enhanced recreational fishing-associated industry. It is expected to generate a range of positive benefits that include a substantial boost to local economies and, indirectly, a greater sensitivity to preservation of the natural environment, an intrinsic quality of recreational fishing. Master Comment 313952 A number of comments said that the Feasibility Study should have considered potential economic impacts of the preferred remedy on the local community, including impacts to local businesses and property values. Response to Master Comment 313952 CERCLA and the NCP establish criteria that EPA must consider when evaluating remedial alternatives for a Superfund site. In accordance with 40 CFR § 300.430(e)(9), these criteria include overall protection of human health and the environment; compliance with ARARs; long-term effectiveness and permanence; reduction of toxicity, mobility, or volume through treatment; short-term effectiveness; implementability; cost; State acceptance; and community acceptance. Potential economic impacts of remedial alternatives is not one of the evaluation criteria established by CERCLA or the NCP, and therefore EPA did not collect data on such issues prior to the Proposed Plan. Nevertheless, EPA can address public comments concerning potential economic impacts of a remedy under the "community acceptance" criterion, although community acceptance cannot be fully assessed until after the public comment period on the draft RI/FS and proposed plan is completed. See 55 Fed. Reg. 8666, 8719 (March 8, 1990). EPA has received a number of comments on potential economic impacts of the selected remedy. These comments are addressed in this RS throughout this chapter, Chapter 8, and in White Paper – Socioeconomics.
Responsiveness Summary Hudson River PCBs Site Record of Decision
8-46
Master Comment 691 Some commenters expressed concern that the planned project would impact local property values and harm the real estate industry due to nuisances caused by the construction, dredging, and processing activities. Response to Master Comment 691 White Paper – Socioeconomics addresses the potential for adverse impacts on property values created by the remediation program. The white paper notes that existing property values along the Upper Hudson River appear to have suffered some depreciation from the presence of PCB contamination in the river, and that the cleanup is likely to substantially enhance their value over the longer term. Further, the limited locations targeted for dredging and their brief duration are unlikely to generate adverse impacts on the values of these waterfront properties. Properties in close proximity to the processing sites may experience some temporary property value impacts but these would be minimized by their careful selection at former industrial sites, with water and rail access for the movement of materials, and their design as substantially indoors and buffered from adjacent properties. Data on property values along the Hudson River and Champlain Canal were studied in detail in the Canal Corporation’s study of Economic Benefits of Operation, Appendix A13, on Flood Damages (Canal Corporation 1990). The Canal Corporation collected and refined data on property values for 1,592 residential properties along the river’s floodplain in the following municipalities: Village of Waterford, Town of Waterford, Mechanicville, Schaghticoke, Village of Stillwater, Town of Stillwater, Schuylerville, Fort Miller, and Fort Edward. While the purpose of the study was to assess potential flood damages on different types of residences (e.g., with and without basements, second floors, trailers, etc.), it also allows an identification of the average values of the residences near the water. For such residences in Saratoga County, the average value in 1990 was $61,218; for those in Rensselaer County it was $68,331; and for those in Washington County it was $50,406. The 1990 Census records median owner-occupied values of $107,600, $92,500, and $69,900, respectively for Saratoga, Rensselaer, and Washington Counties. While average and median values as indicators of centrality may not be identical, the differences between values along the river’s flood plain and the rest of the county are very substantial. In Saratoga County those in the flood plain were 43 percent less than the county as a whole; in Rensselaer County 26 percent less; and in Washington County, 28 percent less. Exactly what specific factors account for this variation in values are uncertain, but the potential that the PCB issue was a contributing factor in lowering these values must be considered. Only if these data were reversed, and property along the river was valued more highly, could proximity to the PCB Superfund site issue be discounted. Property brokers in Saratoga County have noted reluctance of purchasers to look at property near the river. Although, as noted, the existing property values along the river may have already suffered because of their proximity to a designated Superfund site, comments that it is the proposed remedial dredging that would depress property values (ARCC, pp. 23-25) may be discounted once the scale and operational patterns of the dredging are understood. The dredging
Responsiveness Summary Hudson River PCBs Site Record of Decision
8-47
scenario presents a remediation effort that would involve dredge barges and their support vessels steadily moving along the river for six years. The pace of the barges would be such that its adjacency to most locations would be limited to only a few weeks. At other times, loaded and empty barges and supply vessels are likely to pass by a few times a day. These are patterns of operation that are reminiscent of the 1970s and earlier, when numerous commercial barges used the canal and navigational dredging was regularly performed. The operational characteristics of the proposed PCB dredging, the relatively small scale, the brief duration of the dredging at any particular location (less than one percent of the upper river at any one time), and the targeted dredging for only 13 percent of the river’s surface area (affecting 27 percent of the river length) between Fort Edward and the Troy Dam, are highly unlikely to generate any significant or permanent adverse impacts on the adjacent waterfront properties. Over the longer term, after the PCB remediation, owners would likely enjoy the prospect of substantially enhanced property values. Similarly, owners along the entire Hudson River south of Troy would obtain an increased amenity from the cleanup of the river that could translate into substantial gains in aggregate property value. The remediation program also requires sediment processing/transfer sites where the dredged material is dewatered and stabilized (by adding Portland cement or another stabilization agent), and from which the stabilized material would be transported by rail to sites situated well beyond the Hudson Valley. These facilities would operate for approximately six years (i.e., until completion of active remedial activities). The careful selection of these sites at industrial or other appropriate locations with water and rail access for the movement of materials, and their being substantially buffered from adjacent properties, would minimize their potential for adverse impacts on nearby property values. With regard to PCB volatilization and general air quality, no significant off-site hazards are likely to be associated with operations of the transfer and processing sites (see White Paper – PCB Releases to Air). The handling of PCBs at the processing/transfer facilities will not pose an undue risk to nearby communities since EPA will impose strict operating controls on the contractor and will then monitor site operations to confirm adherence to the project’s technical specifications. It is expected that the overall perception of the transfer and processing sites will appropriately be that of modest industrial complexes that operate for several years and are then recycled for other uses. White Paper – Socioeconomics addresses nuisance factors as follows:
• Traffic - The processing/transfer facilities will generate traffic both during the project’s mobilization phase and during the six-year period of dredging operations. However, the anticipated level of vehicular activity is not expected to generate a significant impact on roadways near the transfer and processing facilities.
• Odor - Activities at the transfer/processing facility sites are not expected to be a source of odor to nearby communities.
• Noise - Operations at the processing/transfer facilities will generate low though perceptible levels of noise in their immediate vicinity.
• Lighting - Nighttime operations at the processing/transfer facilities will require lighting for worker safety reasons. It is expected that site lighting can be designed so as to avoid nuisance impacts to nearby residential land uses.
Responsiveness Summary Hudson River PCBs Site Record of Decision
8-48
Despite the foregoing, it is possible that the processing/transfer facilities would have the potential for temporarily impacting property values in close proximity. The literature of empirical studies on the negative effects of Superfund sites on property values is reviewed in White Paper – Socioeconomics. Generally, adverse impacts created by hazardous waste facilities range from two to eight percent, with such negative effects declining with distance from the site. A variety of factors appear to influence the level of effect, among which a powerful influence can be negative publicity by the media, in the mode of a “self-fulfilling prophecy.” In conclusion, the brief operational characteristics and duration of dredging at any particular location (usually only about one week) and the limited geographic targeting of the dredging (13 percent of the river surface or 27 percent of its length between Fort Edward and the Troy Dam) are not sufficient to generate significant or permanent adverse impacts on property values along the river. Effects on adjacent properties, in fact, would be much less than if a landside construction project were to occur. After the cleanup of the river, property values, particularly of waterfront properties, would be expected to substantially improve, overcoming what appears to be a historical depression from their proximity to PCB contamination. Potential impacts on property values adjacent to the processing facilities would be substantially mitigated by the careful siting and design of these facilities. Such conditions, together with their approximate six-year design life, will limit potential adverse property value impacts and offer the prospect of their full recovery once remediation is complete. Thus, over the long term, the remediation program offers a permanent means of overcoming the PCB-contamination stigma and improving property values in the region. EPA has supported a literature review of the effects of Superfund sites on local property values (web site: www.epa.gov/superfund/programs/recycle/stigma.htm). This paper, entitled "Property Values, Stigma and Superfund," is a working document recording current knowledge and understanding of the role of stigma in retarding or limiting the post-remediation recovery in the value of properties on or near hazardous waste sites. 8.5.3 Quality of Life Master Comment 733 Commenters, including individuals and such organizations as Scenic Hudson, NOAA, NYPIRG, NYOAG, NRDC, and USFWS, felt that the remedy was needed despite any temporary inconveniences caused by it. These commenters felt that the improvement reached by the dredging remedy and long-term advantages to the economy more than justified the temporary disruptions. Other commenters expressed concerns that dredging operations would severely compromise their overall quality of life, the bucolic life of the Upper Hudson, and the aesthetic value of living in that area.
Responsiveness Summary Hudson River PCBs Site Record of Decision
8-49
Response to Master Comment 733 A number of the longer term benefits that a number of commenters view as worth the investment of some inconvenience have to do with the economy of the area and the prospect of reduced PCB contamination in fish, which would benefit human health and the environment and contribute to the overall recovery of the river. Such benefits include the following: • The estimated total expenditure for dredging and related disposal and monitoring activities
(in year 2000 dollars) is $461.9 million (US EPA FS Table 8-11b). Of these dollars, $262.2 million, or 38 percent, are conservatively assigned as expenditures within the five-county region (Albany, Rensselaer, Saratoga, Warren, and Washington Counties). This will generate an estimated 3214 jobs.
• The Upper Hudson River region stands to improve its tourist-based economy from the
cleanup of the river, attracting more recreational use of the river and surroundings than it does presently; current data indicate that Washington County, for example, enjoys significantly lower levels of tourism-related activities and associated employment than comparable counties elsewhere in New York State.
• Dredging the sediment-laden navigational channel of the Champlain Canal can only increase
the potential for commercial and recreational navigation, with associated economic benefits to area marinas, lodgings, and restaurants.
• Property values along the river, which today lag behind waterfront property values
elsewhere in the State, are expected to increase as a result of removal of PCBs and diminishing of the "Superfund site" reputation.
White Paper – Socioeconomics and responses to comments in Section 8.5 for more details concerning potential economic benefits of the remedy. The concerns having to do with the bucolic life and aesthetics of the Upper Hudson River region fall largely into the following general areas of disturbance: • Visual intrusion, light, and noise generated by the dredging and transfer/processing facility
operations. • Disruptive increases of traffic on local roadways and in the river.
Several white papers and responses to master comments in this chapter address elements of these concerns, including the following white papers: Socioeconomics; River Traffic; Project-Related Traffic; and Evaluation of Noise. Highlights addressing the foregoing concerns are as follows: • Visual intrusion: The dredging operation is a mobile one, targeted to limited areas of the
river and progressing about 150 feet per day, so that visual impact from dredges will be short-term and limited by the geography of the targeted dredging. The great majority of residences in the study area would not be near the dredging operation, and as to more urban settings, dredging would be adjacent only at Fort Edward and Stillwater. Some navigational dredging would occur at Mechanicville, but on the other side of the island separating the
Responsiveness Summary Hudson River PCBs Site Record of Decision
8-50
navigational channel from this town (Response to Master Comment 505 in Section 8.5.1). Potential visual impact from the processing sites will be longer term, approximately six years, but also ultimately finite. Careful siting and design would minimize these impacts.
• Lighting - Nighttime operations at the transfer and processing facilities will require lighting for worker safety reasons. It is expected that site lighting can be designed so as to avoid nuisance impacts to nearby residential land uses (Response to Master Comment 645, Section 8.3.1).
• Noise - Operations at the processing/transfer facilities will generate low though perceptible levels of noise in their immediate vicinity (Response to Master Comment 699, Section 8.2).
• Traffic - The processing facilities will generate traffic both during the project’s mobilization phase and during the six-year period of dredging operations. However, the anticipated level of vehicular activity is not expected to generate a significant impact on roadways near the transfer and processing facilities. Principal roadways in the vicinity of the example northern processing site that would be used by project employees and for delivery of materials are not operating at capacity and the additional project load will increase vehicular flows by only four to eight percent under peak hour conditions. Further, barges will be used extensively at the northern facility for delivery of mechanically dredged sediments. Project activity in the general area of the example southern facility will not impact traffic congestion because of the assumed industrial nature of the site, the presence of both interstate highways, and anticipated extensive use of rail and barges.
There is a potential for congestion to occur at Locks 5 and 6 during the peak canal season. However, after-hours use of locks by project-related vessels is anticipated to mitigate any congestion problems. Most dredging work will take place outside of the navigation channel, and the width of the river in most targeted areas can accommodate both project equipment and current vessel traffic (Response to Master Comment 312942, Section 8.1.2). Master Comment 422786 Commenters felt that dredging PCBs would improve the quality of life in the Hudson River area by increasing fishing, boating, swimming and other recreational activities and reducing concerns associated with current levels of PCBs (e.g., drinking water, agriculture, effects on fish and wildlife). Response to Master Comment 422786 EPA agrees that active remediation as outlined in the selected remedy would ultimately improve the overall quality of live and the economy in the Hudson River Valley, in addition to being protective of human health and the environment. Response to Master Comment 499 in Section 8.5.2 and Response to Master Comment 505 in Section 8.5.1 contain discussions of the benefits that are anticipated, such as improved fishing and recreational activities and economic advantages.
Responsiveness Summary Hudson River PCBs Site Record of Decision
8-51
8.5.4 Historic and Cultural Resources Master Comment 362961 Several commenters cited the presence of cultural resources (variously described as historic events, historic sites, archaeological treasures, historic and archaeological sites, and landmarks) located within the Upper Hudson River. The commenters said such resources should be identified, or that they would be adversely impacted by the proposed remediation. One particular commenter discussed historic preservation legislation applicable to federal undertakings, National Register-listed resources located within the general project area, and possible impacts to cultural resources from dredging and associated activities. This commenter also suggested that the schedule for the proposed remediation makes it unlikely that cultural resources will be afforded the consideration required by State and federal law. Response to Master Comment 362961 This response provides the following subsections: a brief summary of federal and State regulations that offer protection to cultural resources; a response to significant public comments regarding the impacts of the proposed dredging action upon cultural resources; a summary of EPA’s Stage 1A Cultural Resources Survey (CRS), provided as Appendix B to this Responsiveness Summary; and a general discussion of the National Historic Preservation Act (NHPA) Section 106 process, the most directly relevant legislation concerning the EPA’s obligations to consider cultural resources. National Historic Preservation Act (NHPA) The NHPA of 1966, as amended (16 USC 470 et seq.), was enacted to integrate the consideration of historic preservation issues into the early stages of project planning by a federal agency. Under Section 106 of NHPA, and its implementing regulations (36 CFR Part 800), the head of any federal agency having direct or indirect jurisdiction over a proposed federal or federally financed undertaking is required to take into account its effect on any district, site, building, structure, or object that is included in or eligible for inclusion in the National Register of Historic Places. Effects are evaluated with regard to the Criteria of Adverse Effect set forth in 36 CFR 800.9. The federal Advisory Council on Historic Preservation (ACHP) oversees the NHPA. Response to Comments Concerning Impacts to Cultural Resources Through a survey of the files of the New York State Historic Preservation Office (NYSHPO), EPA has determined that a number of previously identified cultural resources are located within approximately 2,000 feet of the Hudson River coastline between Hudson Falls and the Port of Albany. These resources include over 85 buildings, structures, sites, or historic districts that are listed on the National Register of Historic Places (primarily buildings and districts, although two listed resources include archaeological sites), approximately 300 identified but unevaluated archaeological sites, and an undetermined number of National Register-eligible resources. In addition, through preliminary analysis of the project area, there is the high potential for
Responsiveness Summary Hudson River PCBs Site Record of Decision
8-52
additional historic architectural resources and archaeological sites (located both along the coastline and buried within the river sediments) to be present in the immediate vicinity of the proposed remediation area. Preliminary Section 106 analyses of the impact of the selected remedy on National Register-listed resources and identified archaeological sites appears to indicate that the remedy would have no effect on the resources either because of the nature of the resource or because they are far removed from the remediation area. However, preliminary Section 106 analyses appear to indicate that the selected remedy may have an adverse effect upon three National Register-listed and one known National Register-eligible resource in the project area, as summarized below. It is possible that there may be some impact to Rogers Island, the Mechanicville Hydroelectric Plant, and the Old Champlain Canal (National Register listed), and the Champlain Barge Canal (National Register-eligible) from the selected remedy. If a sediment processing/transfer facility were to be located near the example site proximal to the Old Moreau Dredge Spoils Area, there could be some visual impacts to Rogers Island. Although it is post-World War II sediments that contain targeted PCBs, either mechanical or hydraulic dredging along the channel between the island and the east bank of the Hudson River does have the potential to disturb some older sediments that might have some prehistoric and historic sensitivity. Dredging near the Mechanicville Hydroelectric Plant may have a temporary visual impact on this historic resource but no damage to the facility itself is anticipated as a result of the project. The Champlain Barge Canal route follows the channel of the Upper Hudson for most of its length, beginning at the Federal Dam in Troy, and dredging has occurred in the past both there and in the Old Champlain Canal without damage to historic stone features, locks, and dams; neither is such damage anticipated to be associated with the proposed dredging operation. However, the presence of booster pumps and pipelines associated with hydraulic dredging could temporarily alter the historic character and feeling of the canal area. Potential methods to mitigate adverse effects to Rogers Island, the Old Champlain Canal, the Champlain Barge Canal and the Mechanicville Hydroelectric Plant include devising dredging plans that minimize impacts to elements that qualify these resources for listing in the National Register (i.e., preserve historic character-defining features of the resources while implementing dredging activity). Additionally, there is the potential that the proposed dredging may impact cultural resources that may be present but have not been identified. Such resources could include historic buildings, structures, sites, objects and districts located along the river bank or within the river itself in areas that will be dredged. Comments also identified potential adverse effects to historic properties due to a decline in tourism and the siting of processing/transfer facilities. EPA believes that the selected remedy would result in an expansion, rather than a decline, in tourism in the Hudson River Valley (White Paper – Socioeconomics). Therefore, EPA does not believe that the remedy will adversely affect tourism. With regard to transfer facilities, it is important to note that EPA has not yet determined the locations of sediment processing/transfer facilities necessary to implement the selected remedy. EPA will comply with substantive requirements of the NHPA in connection with the facility siting process. For purposes of the Feasibility Study, example locations were identified

Responsiveness Summary Hudson River PCBs Site Record of Decision
8-53
from an initial list of candidate sites based on screening-level field observations which considered potential facility locations from an engineering perspective. In the Feasibility Study, it was necessary to assume the locations of sediment processing/transfer facilities in order to develop conceptual engineering plans, analyze equipment requirements, and develop cost estimates for the remedial alternatives. For this purpose, two example locations were identified: one at the northern end of the project area in the vicinity of the Old Moreau Dredge Spoils Area, and one at the southern end of the project area near the Port of Albany. Each of these example locations fulfills many of the desired engineering characteristics for such a facility to support the remedial work, and is representative of reasonable bounding assumptions with regard to distance from the dredging work and cost. Other locations, both within the upper Hudson River valley and farther downstream, are possible. The example facility locations presented in the FS have also been used in the Responsiveness Summary in order to clarify material presented in the FS and Proposed Plan, and in connection with additional noise, odor, and other analyses that were performed in order to respond to public comments. EPA will not determine the actual facility location(s) until after the Agency holds a public comment period on proposed locations and considers public input in the final siting decision. Thus, all information provided in this RS relative to potential impacts of the sediment processing/transfer facilities on communities, residents, agriculture, the environment, and businesses should likewise be considered representative and illustrative. Further specific assessment of and, as necessary, mitigation of, potential impacts will be addressed during design. Stage 1A Cultural Resource Survey In compliance with Section 106, EPA has prepared a Stage 1A CRS. EPA has prepared this document as a preliminary step in the identification of cultural resources in the area of potential effect (APE) in order to evaluate the potential impacts of the selected remedy upon such resources. As mentioned earlier, this CRS is provided as Appendix B of this Responsiveness Summary and will also be distributed separately from this document. The CRS provides the following major sections:
• Methodology – a description of the EPA’s APE, goals and research methods, the information repositories visited, and substantive issues regarding limitations of the collected data.
• Selected Remedy – a description of the selected remedy as it applies to potential impacts to cultural resources. This chapter also summarizes the other alternatives considered.
• Environmental Setting – background information on the physiology, glacial history, hydrology, and sediments of the project area to provide an environmental context for subsequent discussions of cultural resources.
• Prehistoric and Historic Background – an overview of the prehistoric and historic development of the upper Hudson River valley. This chapter provides a baseline contextual framework against which to consider the cultural resources of the project area in particular. Given the size of the project area, and its considerably long and complex history, this chapter necessarily focuses on broad themes such as settlement, economic development, transportation innovations, and military conflicts.
• Results of Survey – summary information, as well as lists and tables, regarding the substantive information collected during EPA’s research at the NYSHPO. This chapter
Responsiveness Summary Hudson River PCBs Site Record of Decision
8-54
includes information concerning National Register-listed resources, National Register-eligible resources, unevaluated resources, and relevant compliance and planning surveys.
• Effects of Selected Remedy – a discussion of potential effects to known resources, as summarized earlier in this response.
• Future Steps – an outline of additional steps EPA may take, in compliance with Section 106, to identify National Register-eligible resources.
Section 106 Process of the NHPA With the preparation of the CRS, EPA has completed its first step in compliance with substantive requirements of Section 106. As stated above, the CRS establishes baseline information and provides an overall framework for possible future identification and evaluation efforts. The EPA’s next step will be to initiate consultation with the NYSHPO and identified consulting parties. Consultation will likely be ongoing during this process and could serve to identify additional resources, survey strategies, and to evaluate effects. It is expected that additional surveys may be necessary to complete EPA’s identification of potentially affected cultural resources. Such studies could include additional topic-specific research, walkover surveys, development of an archaeological sensitivity model of the coastline and riverbed, subsurface testing, radiometric dating of riverbed sediments, and intensive-level surveys of historic resources located adjacent to impact areas. If unavoidable impacts are subsequently identified, mitigation strategies would be developed in consultation with the NYSHPO and relevant consulting parties. References New York Canal Corporation. 1995. Recreationway Plan. New York State Department of Labor. 2001. Local Area Unemployment Statistics, June. Outdoor Coalition of America. 1997. Emerging Markets for Outdoor Recreation in the United States: Results of the National Survey of Recreation and the Environment. US Bureau of Economic Analysis, Department of Commerce (US BEA). 2001a. Regional Economic Information System. US BEA. 2001b. Regional Input-Ouput Modeling System II (RIMS II), customized computer model for the five-county upper Hudson region. US Census Bureau, Department of Commerce. 1999. County Business Patterns (Washington County). US Fish and Wildlife Service, Department of the Interior. 1998. National Survey of Fishing, Hunting, and Wildlife-Associated Recreation.
Responsiveness Summary Hudson River PCBs Site Record of Decision
8-55
8.6 Siting of the Facilities
8.6.1 Site Selection Criteria
Master Comment 745 Commenters expressed concern about the lack of detailed information regarding site selection criteria for the sediment processing/transfer facilities. Also of concern is that the facilities could ultimately be in undesirable locations such as near residential areas. A related concern was raised with regard to final disposition of the processing/transfer facilities once the project has been completed. Response to Master Comment 745 EPA has not yet determined the location(s) of sediment processing/transfer facilities necessary to implement the selected remedy. For purposes of the Feasibility Study, example locations were identified from an initial list of candidate sites based on screening-level field observations which considered potential facility location(s) from an engineering perspective. In the Feasibility Study, it was necessary to assume the locations of sediment processing/transfer facilities in order to develop conceptual engineering plans, analyze equipment requirements, and develop cost estimates for the remedial alternatives. For this purpose, two example locations were identified, one at the northern end of the project area in the vicinity of the Old Moreau Dredge Spoils Area, and one at the southern end of the project area near the Port of Albany. Each of these example locations meets many of the desired engineering characteristics for such a facility to support the remedial work, and is representative of reasonable assumptions with regard to distance from the dredging work and cost. Other locations, both within the upper Hudson River valley and farther downstream, are possible. The example facility locations presented in the FS have also been used in the RS in order to clarify material presented in the FS and Proposed Plan and in connection with additional noise, odor, and other analyses that were performed in order to respond to public comments. EPA will not determine the actual facility location(s) until after EPA performs additional analyses and holds a public comment period on proposed locations and considers public input in the final siting decision. Thus, all information provided in this RS relative to potential impacts of the sediment processing/transfer facilities on communities, residents, agriculture, the environment, and businesses should likewise be considered representative and illustrative. Further specific assessment of and, as necessary, mitigation of, potential impacts will be addressed during design. Important characteristics of a potential site are as follows: • Shoreline: The immediate river bank area should have good water access or be easily
dredged to provide good access for barges and other floating equipment. The immediate upland area should not be elevated more than five to 10 feet above water level to facilitate transfer of dredged material and other operations. If a bulkhead does not already exist at a particular location, then subsurface conditions should lend themselves to construction of a bulkhead wall and/or a dock. It would be preferable to find a shoreline reach where a heavy-duty bulkhead already exists.
Responsiveness Summary Hudson River PCBs Site Record of Decision
8-56
• Landside: The property selected for transfer operations should be fairly level so that transfer
operations, material processing, and rail/truck facilities are situated at approximately the same elevation. It would be preferable to select an industrial site so as to avoid impacting residential, recreational, and institutional land uses.
• Roadway Access: Transfer locations should have good roadway access for construction equipment and employees. Roadways that connect the site should optimally avoid densely populated residential communities and should either be two-lane truck routes or should connect directly to such route(s).
• Rail Access: Sites with good rail access are preferable, to facilitate sediment hauling and probably reduce the overall cost of transportation through movement of relatively large loads by rail.
• Site Area: Ideally the site should be an industrial one. In the case of a northern facility, the site, if not completely industrial, should be in as remote an area as possible with regard to residences to minimize any nuisance inconveniences. Further, access to off-site storage of gondolas and other associated equipment should be considered.
It is not anticipated that there will be risks to residences associated with operation of facilities at these sites. Relative location of residences and land use in proximate areas are factors that will be considered as part of the facility siting process. Further, given the result of preliminary assessment, it is unlikely that a residential area would meet the selection criteria as outlined above. A health and safety plan and contingency plan will be in effect during operation of the transfer and processing facilities, as in the case of any similar operation. EPA will solicit public comment on potential facility locations before selecting final locations. White papers containing discussions relevant to facilities include PCB Releases to Air; Example Sediment Processing/Transfer Facilities; and Air Quality. The results indicate that the risks associated with the operation is insignificant compared to the published standards. Finally, facility design and layout, lighting, and screening and buffering of the facility as much as practicable, and minimization of truck traffic, among other considerations, will mitigate potential impacts on surroundings.
With regard to final disposition of the processing/transfer facilities, as indicated in the Proposed Plan (p.24), EPA expects that the sediment processing/transfer facilities will be removed after completion of active remedial activities. In the event any unanticipated contamination on facility property results from remedial activities, the property will be cleaned up in connection with the facility removal process. Though purely speculative at this time, it is conceivable that one or more of the facilities may not be removed if the local municipality or owner of the facility property wishes to keep the facility (or parts of it) in place for another use after the remediation project is complete.
Responsiveness Summary Hudson River PCBs Site Record of Decision
8-57
8.6.2 Implications of the Facilities Master Comment 743 Commenters were concerned that placement of the processing facilities would have a major negative impact on their lives through adverse effects on their financial situation as well as their overall quality of life. Response to Master Comment 743 It is not anticipated that the processing/transfer facilities would have a negative impact on overall quality of life. Ideally the facility(ies) will be located in industrial areas, or in areas that are as remote as possible with regard to residences in order to minimize any nuisance inconveniences. Although some adverse impacts upon proximate property owners are possible, these will be minimized by the careful siting and design of the facilities. A review of the literature on potential property value impacts indicates that while there may be some negative impact, the exact impact is difficult to predict, and property values are likely to rebound upon the cessation of these facilities' operations. Details concerning potential economic and quality of life impacts from the selected remedy are provided in White Paper – Socioeconomics. Further related discussion appears in this chapter appears in Section 8.5. 8.7 Facility Operation
8.7.1 Staging of Dredged Sediments Master Comment 741 Commenters contended that operation of sediment processing/transfer facilities and storage of operating materials and dredged sediments prior to transport could be dangerous and hazardous, and would be disruptive of the neighborhood quality of life. Response to Master Comment 741 Ideally, in order to minimize any nuisance inconveniences, sediment processing/transfer facilities will be located in industrial areas, or in areas that are as remote as possible with regard to residences. Relative location of residences and land use in proximate areas will be factors in consideration of sites for these facilities. It is not anticipated that storage of stabilizing agents (e.g., Portland cement) or other chemicals will impact the communities in the general area of a facility. White Paper – Example Sediment Processing/Transfer Facilities contains a conceptual facility layout for processing the mechanically or hydraulically dredged sediment. For mechanically dredged sediment, processing will include barge unloading, pumping and treatment of excess
Responsiveness Summary Hudson River PCBs Site Record of Decision
8-58
water, removal of large debris, chemical stabilization, transfer to rail car loading area, and rail load-out. The water treatment would consist of coagulation/flocculation, filtration, and granular activated carbon treatment. For hydraulically dredged sediment, the slurry flow and its solids content would be equalized before the dewatering process. The vibrating screen and the Hydrocyclone would remove the debris and large sandy particles. The coagulation/flocculation process would remove the fine particle from the slurry stream. The settled solids would be dewatered using belt filter presses and the supernatant would be treated in a water treatment unit. The processed sediment will be classified as TSCA and non-TSCA material based on PCB content for off-site disposal. It should be noted that the selection of disposal facilities has not been made yet. The disposal facilities located in western New York and Texas are example sites and were used for preliminary conceptual design and cost analysis and comparison purposes. The disposal site selection will be finalized just prior to construction phase of the project. The selected disposal sites will have State and federal permits and prior EPA approval. The processing facilities will be designed to handle and stabilize the dredged material on a continuous basis. For the mechanical dredging option, a temporary staging area will be used to handle the stabilized dredged material (e.g., mixed with Portland cement) prior to sending it to a railcar loading area. For the hydraulic dredging option, a covered surge tank will be provided for flow and concentration equalization. There will be no short-term or long-term storage facility at either of the proposed processing facilities, as indicated in White Paper – Example Sediment Processing/Transfer Facilities. The discharge of water from the facilities will comply with all substantive State and federal requirements. The release of PCBs in the surrounding air and other air pollutants from the processing/transfer facility and the resulting impact is variously discussed in: White Paper –PCB Releases to Air, White Paper – Example Sediment Processing/Transfer Facilities, and White Paper – Air Quality Evaluation. The results indicate that the risks associated with the operation are insignificant compared to the published standards. After issuance of the ROD, EPA will perform additional analyses and seek public comment on a possible location(s) for the sediment processing/transfer facility(ies) before selecting a final location(s). EPA also intends, as a matter of policy, to provide the public with opportunities to provide input regarding design aspects of the remedy so that community concerns and suggestions can be considered by EPA during remedial design. 8.7.2 Processing Master Comment 717 Several commenters argued that the FS does not address potential impacts to the agricultural community due to the dredging project and in particular, the processing facilities. Among potential impacts to the agricultural community raised by commenters are: • Changes to the drainage dynamics of farmland directly adjacent to and near the river. • The possibility of adverse effects on floodplain farmland during spring flooding. • Impacts on wells that are hydrologically influenced by the river.
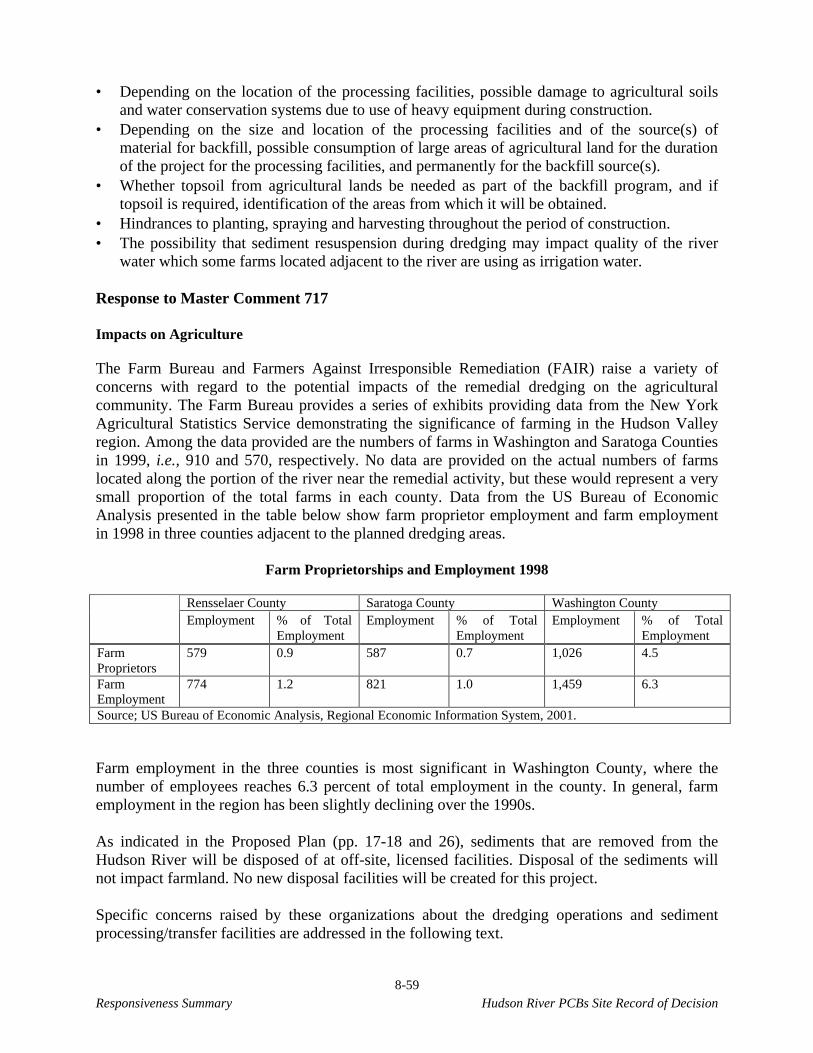
Responsiveness Summary Hudson River PCBs Site Record of Decision
8-59
• Depending on the location of the processing facilities, possible damage to agricultural soils and water conservation systems due to use of heavy equipment during construction.
• Depending on the size and location of the processing facilities and of the source(s) of material for backfill, possible consumption of large areas of agricultural land for the duration of the project for the processing facilities, and permanently for the backfill source(s).
• Whether topsoil from agricultural lands be needed as part of the backfill program, and if topsoil is required, identification of the areas from which it will be obtained.
• Hindrances to planting, spraying and harvesting throughout the period of construction. • The possibility that sediment resuspension during dredging may impact quality of the river
water which some farms located adjacent to the river are using as irrigation water. Response to Master Comment 717 Impacts on Agriculture The Farm Bureau and Farmers Against Irresponsible Remediation (FAIR) raise a variety of concerns with regard to the potential impacts of the remedial dredging on the agricultural community. The Farm Bureau provides a series of exhibits providing data from the New York Agricultural Statistics Service demonstrating the significance of farming in the Hudson Valley region. Among the data provided are the numbers of farms in Washington and Saratoga Counties in 1999, i.e., 910 and 570, respectively. No data are provided on the actual numbers of farms located along the portion of the river near the remedial activity, but these would represent a very small proportion of the total farms in each county. Data from the US Bureau of Economic Analysis presented in the table below show farm proprietor employment and farm employment in 1998 in three counties adjacent to the planned dredging areas.
Farm Proprietorships and Employment 1998
Rensselaer County Saratoga County Washington County Employment % of Total
Employment Employment % of Total
Employment Employment % of Total
Employment Farm Proprietors
579 0.9 587 0.7 1,026 4.5
Farm Employment
774 1.2 821 1.0 1,459 6.3
Source; US Bureau of Economic Analysis, Regional Economic Information System, 2001. Farm employment in the three counties is most significant in Washington County, where the number of employees reaches 6.3 percent of total employment in the county. In general, farm employment in the region has been slightly declining over the 1990s. As indicated in the Proposed Plan (pp. 17-18 and 26), sediments that are removed from the Hudson River will be disposed of at off-site, licensed facilities. Disposal of the sediments will not impact farmland. No new disposal facilities will be created for this project. Specific concerns raised by these organizations about the dredging operations and sediment processing/transfer facilities are addressed in the following text.

Responsiveness Summary Hudson River PCBs Site Record of Decision
8-60
Drainage Dynamics of Farmland Adjacent to the River The dredging will have no effect on the drainage characteristics of farmland adjacent to the river. At some locations the dredging may disturb riverbanks, but this would not affect drainage patterns and these areas would be restored after the few weeks involved in removing any contaminated materials near these locations. Effects on Floodplain Farmland during Spring Flooding Dredging cannot be conducted during spring floods. Work in the river will commence after spring runoff has abated each year. Thus there is not likely to be any additional PCB input to floodplain farmland as a direct result of sediment resuspension during dredging. During typical spring floods the solids dynamics are dominated by external solids input, and the DOSM modeling indicates that only minimal scour of cohesive sediment hot spots is expected during such events. Much of the current spring pulse of PCB load appears to be due to mobilization of PCB-contaminated oil seeps in the vicinity of the GE Hudson Falls plant, which should be addressed by GE’s source control activities. In the longer term, dredging will remove PCBs from the system, and thus actually reduce the potential for contamination of farmland. Impact on Wells The dredging will not affect the water levels of the river and hence will not affect the hydrology of any nearby wells. The potential for contamination of wells is addressed under Response to Master Comment 253421 in Chapter 9. Processing Facilities’ Impacts on Farms The processing/transfer facilities will be carefully sited to minimize any potential for adverse impacts on surrounding properties. Among the key criteria considered will be:
• Access to water and rail transportation, thereby eliminating almost all reliance on local roadways for the movement of materials.
• Preference for sites with prior industrial use as opposed to other sites with other land uses.
• Buffering of operations within the sites (substantially within structures, screened, and as far away from property boundaries as feasible).
These criteria will eliminate almost any potential for adverse impacts on existing farms, including any potential hindrance to planting, spraying, and harvesting. Backfill Backfill in dredged areas will involve sand and gravel to be obtained from existing industrial operations within reasonable distance of the project. Such sand and gravel mines are constantly being opened and closed in response to demand, and the availability of supply at existing
Responsiveness Summary Hudson River PCBs Site Record of Decision
8-61
facilities. Such material may be brought by barge carrying from as far north as Lake Champlain. Obtaining backfill for the project is not expected to have an impact on farmland. Irrigation Water Concern is raised that any resuspension of PCBs could contaminate farmlands that are irrigated by river water. Based on the analyses presented in White Paper – Resuspension of PCBs during Dredging, PCB releases during dredging are not expected to result in the contamination of farms that use Hudson River water for irrigation. As indicated in the FS, increases in PCB concentration associated with the dredging are expected to be well below the year-to-year and season-to-season variations regularly observed in the Upper Hudson River. Releases of other contaminants during dredging are likewise not expected to significantly impact Hudson River water quality (White Paper – Potential Impacts to Water Resources). In fact, the overall water quality in the Hudson River will improve following implementation of the selected remedy. Master Comment 364871 It was asserted that only one water treatment facility is needed. The suggestion was made that dredged sediment can be barged or piped to one location, rather than building a second dewatering facility in the Albany area. It was suggested that the facility can offer a win-win solution to the host community and the project if it is sited in exchange for full remediation of existing upland hazardous waste sites containing PCB-laden dredged sediments. Response to Master Comment 364871 From a strictly operational standpoint, it is conceivable that the full amount of (mechanically or hydraulically) dredged sediment could be processed at a single location somewhere along the Upper Hudson River. However, constraints on rail capacity in the Old Moreau Dredge Spoil area, used as an example for the purpose of engineering analysis conducted for the FS and the Proposed Plan, would prohibit transporting all material from that location. The number of processing/transfer facilities, as well as their location(s), will be determined during remedial design, as part of the public participation process outlined in the ROD. 8.8 Remedy Health and Safety Issues Master Comment 555 Several commenters asserted that EPA has not adequately quantified the risks of performing the remedy, contending that a dredging project would threaten the health and well-being of the local communities and workers. It was suggested that the risk of accidents, injury, and remedy-related fatalities would outweigh the benefits of reducing human health risks due to consumption of fish.
Responsiveness Summary Hudson River PCBs Site Record of Decision
8-62
Response to Master Comment 555 All operations associated with the selected remedy will be conducted in accordance with OSHA rules and regulations. EPA recognizes that there are inevitable risks of accidents associated with the selected remedy. By the same token, workers would face a similar possibility of occupational accidents in the normal course of their work regardless of whether they are working on the Hudson River remediation or at some other job location. That is, the workers are not facing an increased risk because of the selected remedy. In addition, a site-specific health and safety plan will be developed for this project by the contractor and reviewed by EPA to ensure that all operations are conducted as safely as possible to protect workers and minimize accidents. Railroad Traffic Injuries In one set of comments, GE has submitted specific claims as to the estimate of the number of fatalities (from 0.06 to 1.6) and injuries (up to 56) that could result from the project. While accidents may occur, EPA believes the implication raised by GE’s quantitative estimates skews the conclusion that the project would be unduly dangerous. In GE’s analysis, the only fatality estimate that exceeds 1.0 is based on fatal accidents occurring during rail transport. The estimate of fatalities for other remediation-related activities range from 0.06 to 0.092 fatalities. In addition, the statement that the total number of train derailments and accidents have risen from 1997 to 2000 by somewhat over 20 percent (GE, p. 104) gives the impression that rail transport is becoming more dangerous. Without normalizing the accident rates to the total number of rail-miles or another normalizing factor, the absolute value of the total accidents in itself is not meaningful. In addition, the narrow window of time examined by GE also skews the trend within the rail industry. For example, the train accident rate fell 67 percent from 1980 to 1998, and 20 percent since 1990. Furthermore, while the number of accidents may have risen from 1997 to 2000, the number of fatalities has actually fallen by 41 percent during the same time-period. Thus, GE’s estimate of train-related fatalities is likely to be high based on the industry trend indicating reduced numbers of fatal accidents. While it is impossible to estimate with certainty whether fatalities may occur as a result of the Hudson River remediation project, the amount of rail traffic that would be required for the project is small relative to nationwide rail traffic. For example, in 1997 freight rail-miles totaled 475 million miles (AAR, 1998), of which approximately 170 million miles occurred in the eastern United States. (GE, Appendix E, Table 1). Less than 2 million rail-miles are anticipated in the FS for hauling sediment to disposal facilities. Thus, the rail traffic related to the proposed remedy represents less than 0.4 percent of the national class I traffic, and approximately one percent of the rail traffic in the eastern United States. Finally, as discussed in White Paper – Rail Operations, approximately 20 trains per day (passenger plus freight combined) run along the local rail line, and the rail operator indicates the lines can readily handle greater capacity. It is anticipated that rail traffic to and from the dewatering transfer facilities and local switching yards will account for two trips per day (e.g., one round-trip per day). It is also expected that between one and two train trips to the out of State disposal facility will occur per week. Thus, compared to the 140 weekly trains (20 per day x 7 days per week) serving the region, the proposed remedy would add approximately 16 trips per week, or an increase of approximately 11 percent.
Responsiveness Summary Hudson River PCBs Site Record of Decision
8-63
Other comments questioned the safety at rail crossings. As discussed in White Paper – Rail Operations, one comment states that there are 26 at-grade crossings between Saratoga and Ft. Edward, and that 19 of these crossings have no electronic controls or signals. The contention is that this circumstance poses safety issues and has even dictated Amtrak’s mode of operation along the line. However, Canadian Pacific Railroad (CPR), which is the principal rail system that serves the upper Hudson valley, has indicated that the 19 uncontrolled crossings are all private roads (e.g., on farm property). Furthermore, with regard to public crossings between Ft. Edward and Saratoga, all are equipped with Automatic Highway Warning devices consisting of gates, flashers, and bells. Thus, the attempt to characterize road crossing conditions along the Ft. Edward/Albany corridor as unsafe is without merit. In terms of safety around the transfer/facility, the entire area in which processing and rail activities are planned to occur will be fenced off from the public and the surrounding areas. Warning signs will be posted stating that trespassing is not allowed. The fence will essentially form the exclusion zone. All visitors to the site will have to sign in upon entering. This area will be inaccessible to the public for the entire project duration. All personnel within the exclusion zone will wear proper clothing and be advised of the health and safety plan to be followed while on the premises. Boating Injuries Several commenters have suggested that implementation of the selected remedy will create untenable vessel traffic congestion on the Upper Hudson. In particular, they are concerned that congestion would take the form of bottlenecks at various locks along the Champlain Canal and interference with routine passage of vessels along the canal’s navigational channel. GE stated that while it is not possible to estimate quantitatively the fatality and injury rates for collisions in the water, it is believed that increased recreational boating accidents will occur because of the dredging project in the river. As discussed in White Paper – River Traffic, an estimated total of 39 vessels and other in-river equipment will be required to support the project. It is important to note that these vessels will be dispersed over 40 miles of river. There will be barges located at the dredge site, barges and towboats in transit, barges secured at transfer facilities, and other supporting equipment in various river sections conducting surveys and other work. It is expected that the worst-case situation for in-river congestion would occur when 4 dredges and required supporting equipment are located in the TI Pool (River Section 1). In the worst case scenarios, 24 and 18 of the 39 project vessels are likely to be actively involved at TI Pool work sites at any one time for mechanical and hydraulic dredging, respectively, (i.e., dredging, restoring shorelines, backfilling, planting). Given that the length of the TI Pool (River Section 1) is approximately 6.3 miles, it is not expected that this number of vessels actively involved in remedial work will generate either an actual or perceived congestion problem. Several factors warrant this conclusion:
• Much of the work will occur off-channel in shallower sections of the river. Thus, the working equipment will not unduly inconvenience movements of pleasure craft and tour boats in the channel.
Responsiveness Summary Hudson River PCBs Site Record of Decision
8-64
• Some of the working vessels are not significantly different in scale than tour boats and pleasure craft already using the river. This is particularly the case for various survey vessels and also possibly vessels engaged in restoration activities.
• Major pieces of equipment will tend to work in clusters and, therefore, the number of possible interactions between working vessels and other river traffic will be fewer than otherwise expected. The equipment clusters will include dredges and associated barges, debris collector and associated barge, and backfill system and barge.
Most importantly in this regard, the remedial contractor will be required to develop a work plan that limits the potential for interference with other river traffic. The contractor will be required to maintain sufficient clearance in the navigation channel for other river users to move past work zones, and while dredging in the channel, to avoid delays to other river users to the extent possible. In addition, movements through the locks associated with the remedial work will be directed to favor off-peak hours as necessary to avoid potential inconveniences to other canal users, and will be coordinated with the Canal Corporation. Finally, EPA expects that the contractor will be required to position both the working equipment and the equipment movements so as to reduce the potential for project caused congestion. Overall, the analyses presented in White Paper – River Traffic conclude that there may be some interference with other vessels passing through the canal; however, it is expected that impacts can be controlled with proper management of remedial work and that, overall, project-related interference will not be significant. As a result, increased recreational boating accidents are not expected to occur because of the dredging project in the river. Road Traffic Injuries GE has stated that road traffic fatalities and injuries would increase as a result of transporting material via truck to and from the river. Implementation of the selected remedy would generate additional truck and auto trips principally in the vicinity of the transfer and processing facilities. It has been suggested that project-related traffic will create congestion on adjoining roadways at these locations increasing the need for road maintenance and resulting in a higher occurrence of accidents. As discussed in White Paper – Project-Related Traffic, the accident rate associated with project-related movements will be no different than that associated with any other operation of a comparable size. According to an analysis that was conducted using available traffic data for select roadways in the vicinity of a potential northern transfer/processing facility, minimal increase in traffic volume is projected (i.e., the additional project load will increase vehicular flows by four to eight percent under peak hour conditions). The principal roadways that would be used by project employees and for delivery of materials are not operating at capacity, so there is sufficient available capacity to handle project-related traffic. Truck deliveries will occur mainly during non-peak commuter hours. In addition, the entrance area to the processing facilities will be clearly marked with proper traffic control devices to minimize any potential effects in the immediate vicinity of the processing site.
Responsiveness Summary Hudson River PCBs Site Record of Decision
8-65
Occupational Injuries GE estimates 42 to 56 project-related injuries for all aspects of the project (GE, p. 106). The implication is that the remediation project is unnecessarily endangering the health and safety of the workers, or that the injuries would somehow not occur if the project is not adopted. This is not the case. The statistics relied upon by GE for its analysis merely indicate the normal risk of injury faced by workers in the respective industry sector analyzed. Workers within their respective professions will face no more risk of injury on the Hudson River remediation project than they would on other work-related projects in which they would otherwise be engaged. Furthermore, the accident rates for workers on the project are comparable to, and in many cases lower than, other common activities, as shown in the table on the following page. As the information in the following table indicates, the injury incidence rates for the types of work categories used by GE in its analysis range from 1.6 to 9.5 work-related injuries per 100 full time workers per year, or equivalently 1.6 to 9.5 injuries per 200,000 hours (BLS, 2000a). These injury rates are comparable to workers involved in auto repair, carpentry, dairy farming, plumbing and heating, and fishing, hunting, and trapping activities. The table below also indicates the seriousness of the injuries incurred by indicating the incidence rate involving workdays lost due to the injury. Again, workers involved in the Hudson River remediation project face no greater risk of serious injury than that associated with other common activities. Finally, EPA was unable to confirm the accuracy of the non-train related injury claims by GE (p. 106), and has reason to believe the estimates are incorrect. In GE Appendix E, Table 4, it is reported that the estimated number of fatalities for “people working on the project” is 0.092 and the injury estimate range is from 42 to 56. The ratio of injury to fatality is thus 456 to 619 (42/0.092 to 56/0.092). Yet, according to Bureau of Labor Statistics (BLS, 1999; 2000b), the ratio of deaths to total accidents is 136 for sand and gravel mining (SIC 144), and the ratio is 218 for heavy construction excluding highways (SIC 162). Both SIC 144 and 162 were primary occupational categories adopted as a surrogate for dredging activities by GE in its analysis. (BLS, 2000). Thus, the ratio of injuries to fatalities calculated by GE is in disagreement with underlying data from which the fatality and injury estimates were calculated, and calls into question the validity of the GE fatality and injury claims.
Responsiveness Summary Hudson River PCBs Site Record of Decision
8-66
Comparison of Incidence Rates for Different Occupations/Activities
Injury Incidence Rates* Industry (SIC Codes)
Total Total With Lost Plumbing, heating and air conditioning (171) 10 3.5 Auto repair, services, and parking (75) 5.9 2.3 Dairy Farming (024) 8.2 3.7 Fishing, hunting, trapping (09) 6.3 2.9 Carpentry (175) 10.8 4.2
Example Categories Used in GE Analysis Heavy construction, except highway (162) 7.1 2.7 Sand and gravel mining (144) 3.8 1.9 Sanitary services (495) 9.5 3.4 Engineering and Architectural Services (871) 1.6 0.4 Water transportation of freight (444) 7.5 4.3 Trucking and courier services, except air (421) 8.6 3.6 *Incidence per 100 full time workers per year. Source: US Department of Labor, Bureau of Labor Statistics (BLS, 2000a)
Occupational Injury Risks are not Comparable to PCB Chemical Risks As stated earlier, workers within their respective professions will face no more risk of injury on the Hudson River remediation project than they would on other work-related projects in which they would otherwise be engaged. Because workers are aware of the inherent risks involved in their line of work, while anglers and individuals along the Hudson River may not be aware of the risks involved with exposure to PCBs, it is not appropriate to compare the two types of risk to each other. In effect, risks involved in remediation work can be viewed as voluntary, while risks due to PCB exposure from recreating and living along the Hudson River can be viewed as involuntary. It is important that EPA protect those that are involuntarily put at risk by their surrounding environment when those risks exceed guidelines set to protect public health. References Association of American Railroads (AAR). 1998. Railroad Facts 1997. Hoskin, A. F., Leigh, J.P., and Planek, T.W. 1994. Estimated Risk of Occupational Fatalities Associated with Hazardous Waste Site Remediation. Risk Analysis, 14(6): p.1011-1017 US Department of Labor (USDOL), Bureau of Labor Statistics (BLS). 1999. Census of Fatal Occupational Injuries. Fatal occupational injuries by industry and event or exposure, 1999. USDOL, Bureau of Labor Statistics (BLS). 2000a. Incidence rates of nonfatal occupational injuries and illnesses by industry and selected case types, 1999. December, 2000. USDOL, Bureau of Labor Statistics (BLS). 2000b. Number of nonfatal occupational injuries and illnesses by industry and selected case types, 1999. December, 2000.
Responsiveness Summary Hudson River PCBs Site Record of Decision
8-67
US Department of Transportation (USDOT), National Transportation Statistics (NTS). 1999 USDOT, Federal Railroad Administration (FRA). August, 1996. Accident/Incident Bulletin, No. 164 Calendar year 1995. USDOT, Federal Railroad Administration (FRA). 2001. Total Accidents/Incidents, JA – DEC (Final). http://safetydata.fra.dot.gov/Prelim/2000/r01.htm.
Responsiveness Summary Hudson River PCBs Site Record of Decision
9-1
9. IN-RIVER IMPACTS (SHORT- AND LONG-TERM) 9.1 Issues Related to SAV and other Ecological Resources Master Comment 366264 Some commenters stated that hydraulic dredging will destroy the river bottom by "sucking up everything in its path." Response to Master Comment 366264 Dredging is intended to completely remove the targeted sediments. In this process, benthic organisms and vegetation in the path of the dredging operation will also be removed, although mobile species will most likely move away from the dredge. As discussed in the Responses to Master Comments 253458 and 807, recovery of benthic invertebrates in an area of previous disturbance generally commences soon after the disturbance, if suitable habitat conditions exist. As noted in the Response to Master Comment 537, SAV does not cover the entire river or, more specifically, even all the areas targeted for dredging. A program for SAV replacement has been included in the selected remedy and is intended to offset the impacts of dredging. Habitat replacement monitoring, implemented as an essential and integrated component of the overall program, will help to ensure the successful reestablishment of SAV and its associated fauna. Moreover, the selected remedy includes targeted dredging which will affect just 13 percent of the bottom of the Upper Hudson River. Master Comment 507
Some commenters suggested that no detailed data collection or analysis on existing habitats has been conducted. Some commenters said that EPA's Proposed Plan lacks detail on existing habitats and potential impacts from the proposed remedy. Others stated that the status of the existing SAV populations has not been evaluated, no wetland functional assessment has been performed, and that a biotic inventory should be undertaken to establish pre-remediation conditions.
Response to Master Comment 507
EPA has studied the various habitats of the Upper Hudson River (e.g., main channel stream, palustrine systems, deep emergent marsh, shallow emergent marsh, and forest) and has characterized these habitats in the Ecological Risk Assessment (USEPA, 2000). A preliminary assessment of wetlands has been performed and is attached as Appendix A. A detailed delineation of the Upper Hudson River habitats (including SAV), collection of baseline habitat data, and a wetland functional assessment will be conducted during remedial design. All available information, including the GE SAV report (Exponent, 1998), will be used in the delineation of Upper Hudson River habitats and collection of baseline habitat data. The detailed delineation of habitats and collection of baseline data will be used to formulate the habitat replacement program.
Responsiveness Summary Hudson River PCBs Site Record of Decision
9-2
The habitat replacement program description in the FS, Appendix F, p. 1, identifies the potential habitat impacts that may result from implementation of a remedial alternative (i.e., removal or capping of substrate used as spawning and foraging habitat by fish and benthic invertebrate species; displacement of benthic organisms; loss of vegetation communities; loss of freshwater wetlands acreage and wetlands functional values; and disturbance of riparian habitat and shoreline stability). The habitat replacement program will be implemented to mitigate these potential disturbances to aquatic and wildlife habitat. Response to Master Comment 422647 in Section 9.4 contains more detailed information on habitat replacement.
References
Exponent. 1998. Data Documentation and Interpretation Report: Submerged Aquatic Vegetation and Fish Community Analysis. Prepared for General Electric Company.
US Environmental Protection Agency (USEPA). 2000. Phase 2 Report, Further Site Characterization and Analysis. Volume 2E - Revised Baseline Ecological Risk Assessment, Hudson River PCBs Reassessment RI/FS. Prepared for USEPA Region 2 and the US Army Corps of Engineers (USACE), Kansas City District by TAMS/MCA. November.
Master Comment 509
A number of comments suggest that additional areas of critical habitat should be remediated. They pointed out that extensive areas characterized by SAV are excluded from remediation under the REM-3/10/Select alternative. These SAV areas, which serve as important habitat for certain fish and invertebrate species, will continue to act as a source of localized contamination to biota if left unremediated.
Other commenters viewing the same areas of SAV felt that dredging activities would endanger nursery and spawning habitats, remove habitat for benthic organisms, and cause bank erosion, which could in turn smother benthic organisms and fish eggs and cause oxygen depletion.
Response to Master Comment 509
This comment illustrates the different lines of thinking regarding areas of SAV. The federal Trustees have stated that important habitat areas that are prime habitat for juvenile fish should be remediated. They have urged EPA to select a remedy that to the maximum extent practicable improves the environmental quality of the Hudson River by removing PCBs. Given what is now known regarding recovery of riverine ecosystems following dredging, advances in dredging technology, and EPA’s proposed habitat replacement programs, the Trustees do not believe that such a dredging program would cause long-term environmental damage. The Trustees concur with EPA's conclusion that the adverse impacts of targeted dredging on river habitat will be temporary and this temporary loss will be offset by the accelerated recovery of the entire river. Any short-term impacts from dredging can be minimized through appropriate habitat replacement activities. EPA believes that the selected remedy minimizes adverse impacts, while also achieving protection of human health and the environment. EPA will consult with appropriate federal and State agencies in determining whether any especially sensitive or unique habitats exist in the Upper Hudson River that warrant special consideration during remedial design.
Responsiveness Summary Hudson River PCBs Site Record of Decision
9-3
Master Comment 537 Commenters expressed concern that substantial amounts of submerged aquatic vegetation (SAV) and their associated fauna will be adversely impacted by dredging, thereby seriously jeopardizing the recovery of the river after dredging. Meadows of SAV create essential habitat and form a basis of primary production that supports ecologically and economically important species. Some commenters argued that once SAV has been destroyed, there may be significant effects to fisheries, not only for the reach of river from which SAV is removed, but for adjacent areas of the river as well. It was suggested that ecological risks be weighed against anticipated benefits from contaminant removal. Another comment suggested that targeted dredging would allow recolonization from undisturbed areas and that removal of PCBs would benefit the ecosystem. New York State, federal Natural Resource Trustees, and various environmental organizations have expressed support for removal of PCB-contaminated sediment, as it will improve the environmental quality of the river and reduce injury to environmental resources. Response to Master Comment 537 The Trustees have stated that important habitat areas for Trust resources, such as near shore areas, quiescent areas, and those containing SAV beds, which are prime habitat for juvenile fish, should be remediated. Given what is now known regarding recovery of riverine ecosystems following dredging, advances in dredging technology, and EPA’s proposed habitat replacement program, the Trustees do not believe that a dredging program that is more aggressive than the selected remedy would be environmentally damaging. It should be noted that SAV is present in observable, discrete areas in the river. SAV does not cover the entire river or, more specifically, even all the areas targeted for dredging. SAV replacement, therefore, would only be needed in a portion of the dredged area. Nonetheless, during the design phase a habitat replacement program, with SAV replacement as an integral component, will be formulated. The SAV replacement program is intended to offset the impacts of dredging. Habitat replacement monitoring, implemented as an essential and integrated component of the overall program, will help to ensure the successful reestablishment of SAV and its associated fauna. Adaptive management will enhance the capacity of the habitat replacement program to achieve its objectives by integrating the following elements:
• Articulation of existing interdisciplinary experience and scientific information. • Delineation of Upper Hudson River habitats and collection of baseline habitat data. • Formulation of a dynamic Upper Hudson River habitat replacement model. • Formulation of specific habitat replacement goals and objectives, evaluation criteria,
and an unambiguous definition of replacement success. • Formulation of a monitoring, appraisal, and feedback program. • Design, prioritization, scheduling, and implementation of habitat replacement actions. • Monitoring of habitat variables and of the ecosystem's response to the replacement
actions.
Responsiveness Summary Hudson River PCBs Site Record of Decision
9-4
• Periodic evaluation of the dynamic model, the effectiveness of replacement actions undertaken, and progress toward the replacement objectives. Periodic revision of the dynamic model.
Under this management program, successful habitat replacement can be achieved such that there will be no long-term impacts to the Upper Hudson ecosystem. There will be some unavoidable short-term impacts, such as displacement of the benthic community, but the benefits of long-term PCB removal are expected to outweigh temporary impacts. With successful habitat replacement, ecological risks associated with the proposed action will be minimized and there will be ecosystem improvements through contamination removal. Targeted dredging will allow for benthic recolonization from undisturbed areas, and the resulting removal of PCBs will benefit the entire ecosystem. Master Comment 253458 Commenters contend that, of the nine orders of insects that reside at the bottom of most rivers, the two most important in the Hudson River are caddisflies (trichopterans) and mayflies (emphemeropterans), saying that these two orders supply 75 percent of the fish food. Commenters expressed concern that if the river is dredged as proposed, these two orders along with the other seven will be removed from the bottom of the river and the fish will have no food. These insects have a one-year life cycle. When they hatch from a larva or nymph stage once per year they fly upstream to mate and lay their eggs. The distance they fly will typically be one quarter to one-half a mile. Commenters worry that it will take 80 to 160 years to regain the fish food supply. Response to Master Comment 253458 EPA conducted a survey of benthic fauna (i.e., bottom-dwelling invertebrates that include insects) in the Upper Hudson River in 1993. The five most abundant types of organisms collected were sowbugs (isopods), midge larvae (chironomids), earthworms (oligochaetes), freshwater shrimp or "scuds" (amphipods), and small clams (pelecypods). No mayflies were observed. While caddisflies were collected, their abundance was relatively low as compared to the five most abundant taxa collected. These findings were corroborated by studies by Exponent (1998). Thus, it is unlikely that caddisflies and mayflies serve as the principal food source for fish in the Upper Hudson. The comment that it will take 80 to 160 years for fish to regain their food supply is not correct. First, since dredging will occur in targeted areas, there will be portions of the river bottom where bottom-dwelling invertebrates will be undisturbed and will always be available as food to fish. Secondly, even in those targeted areas that are dredged, the recolonization of benthic invertebrates will begin soon after the dredging is complete. With respect specifically to recolonization, there are four principal mechanisms for benthic dispersal: downstream drift, upstream migration, vertical migration from within the substrate, and aerial sources (i.e., flying adults depositing eggs upstream). For certain major disturbances (e.g., elimination of fauna along an entire channel without upstream sources of drift), aerial colonization represents the major, if not only, source for recovery. However, where present, as in
Responsiveness Summary Hudson River PCBs Site Record of Decision
9-5
the case of the Hudson River, downstream drift, a continuous stream of benthic organisms (larval and adult) that is generally represented in the currents of streams and rivers, is the most important recovery mechanism of the benthos (Petts, and Calow, 1996). Given this continual source of benthic invertebrates, recovery of benthic invertebrates in an area of previous disturbance generally commences soon after the disturbance, if suitable habitat conditions exist. In a study of the recovery rates of macroinvertebrate communities following disturbance, Niemi, et al. (1990) found that 90 percent of the cases reviewed indicated recovery times within one year. Channel relocation and reconstruction projects provide an indication of recovery times where a major physical modification of the river channel occurs. In a colonization study of a newly formed channel in the Tongue River, Wyoming, maximum densities of macroinvertebrates were obtained in less than 90 days, with equilibrium levels reached in about 200 days (Gore 1979, 1982). For a new stream channel in Scotland, Doughty and Turner (1991) reported maximum diversity and similarity to a reference site 80 to100 days after invertebrate recolonization began. Malmqvist et al. (1991) found that invertebrate diversity in a man-made channel was similar to that in reference streams within one year. References Doughty, C. R., and M. J. Turner. 1991. The Ponesk Burn Diversion: Colonization of Benthic Invertebrates and Fish. Technical Report No. 98. Clyde River Purification Board, East Kilbride, Scotland. As reported in: Petts, G., and C. Calow. 1996. River Restoration. Blackwell Science, Inc., Malden, MA. Exponent. 1998. Data Documentation and Interpretation Report: Submerged Aquatic Vegetation and Fish Community Analysis. Prepared for General Electric Company. Gore, J. A. 1979. Patterns of initial benthic recolonization of a reclaimed coal strip-mined river channel. Canadian Journal of Zoology 57:2429-39. As reported in: Petts, G., and C. Calow. 1996. River Restoration. Blackwell Science, Inc., Malden, MA. Gore, J. A. 1982. Benthic invertebrate colonization: source distance effects on community composition. Hydrobiologia 94:183-93. As reported in: Petts, G., and C. Calow. 1996. River Restoration. Blackwell Science, Inc., Malden, MA. Malmqvist, B., S. Rundle, C. Bronmark, and A. Erlandson. 1991. Invertebrate colonization of a new, man-made stream in Sweden. Freshwater Biology 26:307-24. As reported in: Petts, G., and C. Calow. 1996. River Restoration. Blackwell Science, Inc., Malden, MA. Niemi, G. J., P. DeVore, N. Detenbeck, D. Taylor, J. D. Yount, A. Lima, J. Pastor, and R. J. Naiman. 1990. Overview of case studies on recovery of aquatic systems from disturbance. Environmental Management 14: 571-88. As reported in: Petts, G., and C. Calow. 1996. River Restoration. Blackwell Science, Inc., Malden, MA. Petts, G., and C. Calow. 1996. River Restoration. Blackwell Science, Inc., Malden, MA.
Responsiveness Summary Hudson River PCBs Site Record of Decision
9-6
Master Comment 359545 Some commenters expressed concern that construction and operation of the northern and southern sediment processing facilities along the river may have both short- and long-term effects on freshwater wetlands and resident wildlife (including threatened and endangered species). Response to Master Comment 359545 This response is broken into two parts: 1) potential impacts to wetlands; and 2) potential impacts to wildlife habitat and threatened and endangered species. First, it is important to note that EPA has not yet determined the location(s) of sediment processing/transfer facilities necessary to implement the selected remedy. For purposes of the Feasibility Study, example locations were identified from an initial list of candidate sites based on screening-level field observations which considered potential facility locations from an engineering perspective. In the Feasibility Study, it was necessary to assume the locations of sediment processing/transfer facilities in order to develop conceptual engineering plans, analyze equipment requirements, and develop cost estimates for the remedial alternatives. For this purpose, two example locations were identified: one at the northern end of the project area in the vicinity of the Old Moreau Dredge Spoils Area, and one at the southern end of the project area near the Port of Albany. Each of these example locations fulfills many of the desired engineering characteristics for such a facility to support the remedial work, and is representative of reasonable assumptions with regard to distance from the dredging work and cost. Other locations, both within the Upper Hudson River valley and farther downstream, are possible. The example facility locations presented in the Feasibility Study have also been used in the Responsiveness Summary in order to clarify material presented in the Feasibility Study and Proposed Plan and in connection with additional noise, odor and other analyses that were performed in order to respond to public comments. EPA will not determine the actual facility location(s) until after EPA performs additional analyses and holds a public comment period on proposed locations and considers public input in the final siting decision. Thus, all information provided in this Responsiveness Summary relative to potential impacts of the sediment processing/transfer facilities on communities, residents, agriculture, the environment and businesses should likewise be considered representative and illustrative. Further specific assessment of and, as necessary, mitigation of, potential impacts will be addressed during design. Wetlands There are known freshwater wetlands in the general vicinity of the example locations of the northern and southern sediment processing/transfer facilities. Under the Office of Solid Waste and Emergency Response August 1985 Directive 9280.0-02, Policy on Floodplain and Wetland Assessments for Comprehensive Environmental Response, Compensation, and Liability Act (CERCLA) Actions, Superfund actions must meet the substantive requirements of Executive Order 11990, Protection of Wetlands (USEPA, May 1994, Considering Wetlands at [CERCLA]
Responsiveness Summary Hudson River PCBs Site Record of Decision
9-7
Sites). Executive Order 11990 directs all federal agencies to avoid, if possible, adverse impacts to wetlands, and to preserve and enhance the natural and beneficial values of wetlands. During remedial design, when final facility location(s) are identified, a wetland delineation will be conducted to determine the extent of wetlands that occur at those location(s). Wetlands will be delineated consistent with the USACE 1987 Wetland Delineation Manual, which utilizes the “three-parameter approach” (i.e., the presence of wetland hydrology, hydric soils, and hydrophytic vegetation). The wetland boundaries will be flagged and surveyed. Wetland boundaries will be determined so that during the actual siting of the sediment processing/transfer facilities, wetland impacts can be avoided or minimized. EPA will confer with USACE, the federal Trustees, and NYSDEC in order to determine what resources will be delineated as wetlands and to discuss options for avoidance, minimization, and mitigation. The general hierarchy with respect to potential wetlands impacts will be as follows:
• Avoidance: Avoid potential impacts to the maximum extent practicable. • Minimization: Take appropriate and practicable steps to minimize the adverse
impacts (e.g., limit the anticipated impact to an area of the wetland with lesser value than other areas, or reduce the actual size of the impacted area).
• Compensatory Mitigation: Take appropriate and practicable compensatory mitigation action for unavoidable adverse impacts that remain after all appropriate and practicable minimization has been performed (create a new wetland area, restore existing degraded wetland, or enhance low-value wetland into improved wetland).
If it is determined that there would be wetland impacts resulting from the construction and operation of the sediment processing facilities that cannot be avoided or further minimized, compensatory wetland mitigation will be implemented. The goal of any compensatory mitigation will be to fully compensate for (replace) wetland acreage and all functions and benefits lost as a result of the construction and operation of the proposed northern and southern sediment processing facilities. Additional measures to avoid or minimize impacts to wetlands and associated habitats, habitat loss, habitat fragmentation, and human disturbance will be formulated and integrated into site development design and operations planning during the design phase. These are discussed in the following section. Wildlife Habitat and Threatened and Endangered Species The construction and operation of the proposed sediment processing facilities may result in impacts to wildlife due to potential habitat loss or fragmentation and/or human disturbance. These potential impacts will be analyzed during the design phase, as will the possibility of impacts to threatened and endangered species. Wildlife/Wildlife Habitat In the design phase, when final sites are identified, wildlife habitats (i.e., cover types) will be investigated, surveyed, and mapped. A cover type map will be drawn for the affected sites and the area within 0.5 miles from the perimeter of those sites that will show major vegetative
Responsiveness Summary Hudson River PCBs Site Record of Decision
9-8
communities, including wetlands, aquatic habitats, and NYSDEC significant habitats. The NYSDEC Natural Heritage Program descriptions and classifications of natural communities (Ecological Communities of New York State, NYSDEC, 1990) and the New York GAP project database (http://www.dnr.cornell.edu/gap) will be utilized to identify the cover types. Fish and wildlife species will be described for each cover type. An assessment will be made of the general ability of the areas within 0.5 miles of the affected sites to support fish and wildlife. The degree to which the habitats meet the requirements for food, cover, breeding areas, and roosting sites will be determined. Potential impacts to wildlife and wildlife habitat will be evaluated requisite to site selection for the sediment processing facilities. Once the final sites have been identified, an ecological impact analysis will be prepared to determine potential impacts of the proposed action to wildlife. Potential impacts resulting from habitat loss will be documented, as will potential impacts resulting from habitat fragmentation and human disturbance (i.e., increased traffic, noise, and lighting). The findings of the ecological impact analysis will be used to guide the planning, design, and operation of the sediment processing facilities so as to avoid or minimize habitat loss, habitat fragmentation, human disturbance, and impacts to wetlands and associated habitats. Among the methods that, as appropriate, will be formulated and integrated into project design and operations planning during the design phase are:
• Facility Siting and Layout: Siting and layout of project elements so as to avoid habitat fragmentation and direct or indirect impacts to wetlands, associated habitats, and other sensitive habitats.
• Facility Design: Incorporation of vegetative buffers, screens, barriers, and other site
and project elements to avoid or minimize impacts to wetlands, associated habitats, and other sensitive habitats. Such elements will address, for example, physiological and behavioral impacts to wildlife of construction- and operation-phase increases in noise and nighttime lighting, soil erosion and sedimentation control, and water quality protection.
• Construction Controls: Specification in construction documents of required
procedures for protecting fish and wildlife resources (e.g., prohibitions against unnecessary removal of vegetation or disturbance of waterways, soil erosion and sediment control plans, and seasonal limitations on certain construction activities in specific areas).
• Operation Controls: Wildlife and habitat protection restrictions for sediment
processing facility operations that would, as necessary, specify acceptable procedures, limits, and controls for certain operations.
• Habitat Restoration/Replacement: Habitat restoration and replacement (as
determined by the appropriate resource agencies) will be designed during the design phase and implemented after completion of sediment processing operations.
Responsiveness Summary Hudson River PCBs Site Record of Decision
9-9
Threatened and Endangered Species Consultation will occur with the appropriate federal and State agencies (USFWS, National Marine Fisheries Service [NMFS], and NYSDEC) to identify sensitive and unique habitats, as well as areas known to be utilized by threatened and endangered species. USFWS has identified the bald eagle as a federally-listed threatened species that is known to occur in the area of the selected remedy for the Hudson River, and the Karner blue butterfly and Indiana bat as federally-listed endangered species that may be found within or adjacent to the project area. The NMFS has indicated that the range of the shortnose sturgeon includes the Hudson River PCBs Site. EPA will conduct biological assessments (BAs) for the bald eagle and shortnose sturgeon, as they have been identified as being in the project area. Since the sediment processing/transfer-facilities have not been sited or designed, it cannot be determined at this time if the Karner blue butterfly or Indiana bat, or potential suitable habitat for either species, may be affected by the selected remedy. Nevertheless, once the locations for the transfer facilities and other necessary land-based infrastructure have been established, EPA will evaluate the habitat that will be affected to determine if it is suitable to support either species. If suitable habitat is found, additional biological assessment work will be conducted for these species. Any completed BAs will include an effects determination, which will state what conclusions regarding potential impacts to the local population of the species discussed can be supported from the information presented in the BAs. The BAs will be submitted to the FWS or NMFS for review and a final determination of effect. The BAs will be completed before remedial construction, and the remedial design will reflect appropriate measures to protect these species that result from the consultation process. References New York State Department of Environmental Conservation. March 1990. Ecological Communities in New York State. New York Natural Heritage Program. US Army Corps of Engineers. 1987. Corps of Engineers Wetlands Delineation Manual. Environmental Laboratory, Technical Report Y-87-1. January. US Environmental Protection Agency. 1994. Considering Wetlands at CERCLA Sites. Office of Solid Waste and Emergency Response, EPA/540/R-94/019. May. Master Comment 313331 Commenters recommended that ecosystem impacts should specifically include SAV as being impacted by remedial activities (as discussed in section 5.6.2 of the FS report). Response to Master Comment 313331 EPA concurs that SAV would be impacted by dredging activities. The generic term "vegetation" was intended to include SAV, but it is acknowledged that SAV is part of the impacted vegetation.
Responsiveness Summary Hudson River PCBs Site Record of Decision
9-10
Master Comment 807 A number of commenters contend that dredging is required to preserve critical habitats. Some, however, expressed concern that dredging may result in habitat loss and displacement of wildlife. Some felt that remedial activities will result in impacts to aquatic and wildlife habitat of the Upper Hudson River, including removal of substrate for spawning and foraging habitat by fish; displacement of benthic organisms; reduction of food sources; loss of vegetation; loss of freshwater acreage; and disturbance of riparian and shoreline stability. It was suggested that the potential (even if temporary) loss of parts of the river ecosystem due to dredging should be evaluated for the mink and river otter. Response to Master Comment 807 Concerns associated with dredging result from the physical disturbance involved in removing sediment and relate to increases in turbidity, nutrients, and contaminants in the short-term and loss of habitat in the long-term. To minimize short- and long-term impacts, a habitat restoration program will be implemented (Section 9.3). Prior to the start of remediation of the Upper Hudson River, habitats will be delineated and baseline habitat data will be collected. Replacement of submerged aquatic vegetation (SAV) will be one of the prime objectives of the revegetation plan. Replacement will depend on the actual extent of dredging and backfilling, the geomorphical response of the river in redistributing sediments, the habitat replacement goals formulated during the design phase, and navigational requirements. SAV replacement may not be desirable or feasible in certain situations (e.g., to enable recreational use of the river or accommodate gravel substrate for fish spawning). Riparian and shoreline stability will be maintained through determining the hydrology, sediment texture, and sediment stability of an area prior to initiating work. Biologically based state-of-the-art methods will be used to enhance the environment and accomplish engineering requirements. Parameters will be verified through monitoring, which will also be used to identify needed mid-course corrective actions, such as adjustments to the Site hydrology, replanting/reseeding, and routine maintenance. Monitoring for natural recovery will help to reduce the need for artificial reestablishment. Such an activity recognizes that the river has historically been and still is impacted by agricultural runoff and other land use practices resulting in increased siltation and enrichment, to the extent that the remedial activities may benefit the system in removing excess build-up of sediments and nuisance vegetation. Benthic organisms will be disturbed during environmental dredging operations. However, recovery is expected to be quick because the majority of the benthic species present have life-history characteristics that make them resilient to disturbance (Response to Master Comment 253458, Section 9.1). These characteristics include high productivity and turnover rates, high dispersal ability, planktonic larvae, and most importantly a source of benthic invertebrate recovery (downstream drift, aerial dispersal, etc.). In a study of the recovery rates of macroinvertebrate communities following disturbance, Niemi et al. (1990) found that 90 percent of the cases reviewed indicated recovery times within one year.
Responsiveness Summary Hudson River PCBs Site Record of Decision
9-11
Impacts of environmental dredging on fish vary to some degree with life stage. Potential short-term effects result from increases in turbidity, temporary loss of a benthic food source, and increases in contaminant concentrations. Early life stages are more sensitive than adults to increases in turbidity. Although turbidity is transient in nature, increases in turbidity can affect the survival of fish eggs that are attached to underwater surfaces. Adult fish would be mobile enough to avoid areas of environmental dredging activity and will leave an affected area while environmental dredging is being undertaken, thereby avoiding direct impacts. Recolonization of remediated areas by benthic invertebrates will lead to recolonization by fish and wildlife that feed on these organisms. Fish spawning habitat will be replaced with suitable substrata, and SAV used for foraging will be replaced. There may be temporary loss of parts of the Hudson River habitat for wildlife receptors such as the mink and river otter during remediation. These receptors can move to other areas of their home range during environmental dredging activities and return once environmental dredging is completed. Due to the rate of advancement of the dredge (approximately 400 feet per day), the dredge will not be in any fixed location for an extended period of time, so any individual den would only be directly impacted by environmental dredging for a short period. Individual mink may use several denning areas within their home range (Birks and Linn, 1982) and are expected to move temporarily from dens close to remedial activities. As the home range of river otters is larger than that of mink, it is anticipated that otters will move to areas within their range, but away from remedial activities. Mink are opportunistic piscivores/carnivores and during remediation may utilize a larger component than usual of terrestrial prey such as birds, reptiles, and insects in their diet. (Note: mink PCB exposure was modeled based on consumption of 50.5 percent river-related food sources). Although river otters have a larger component of fish in their diet, they are also opportunistic feeders (USEPA, 1993) and are likely to feed upon other prey such as birds and small mammals if fish are temporarily unavailable or difficult to capture. The Natural Resource Trustees, i.e., NYSDEC, NOAA, and USFW, and various environmental organizations have expressed support for active sediment remediation, as it will improve the environmental quality of the river and reduce injury to environmental resources (Response to Master Comment 801, Chapter 3). In fact, the federal Trustees have indicated support for an even more extensive dredging program (i.e., the REM-0/0/3 alternative). The Trustees have stated that important habitat areas for Trust resources, such as near shore areas, quiescent areas and those containing vegetative beds, which are prime habitat for juvenile fish, should be remediated. Further, the Trustees believe that as currently proposed, the selected remedy would leave unacceptable residual injury to river ecosystems in the form of PCBs left behind, and have urged EPA to select a remedy that to the maximum extent practicable improves the environmental quality of the Hudson River by removing as much of the resident PCBs as possible. Given what is now known regarding recovery of riverine ecosystems following dredging, advances in dredging technology, and EPA’s proposed habitat replacement programs, the Trustees do not believe that a more aggressive dredging program such as the REM-0/0/3 alternative would be environmentally damaging.
Responsiveness Summary Hudson River PCBs Site Record of Decision
9-12
References Birk, J.D. and I.J. Linn. 1982. Studies of home range of the feral mink, Mustela vison. Symp. Zool. Soc. Lond. 49:231-257 as cited in: United States Environmental Protection Agency (USEPA). 1993. Wildlife Exposure Factors Handbook. Office of Research and Development, Washington, DC. EPA/600/R-93/187a. December. Niemi, G. J., P. DeVore, N. Detenbeck, D. Taylor, J. D. Yount, A. Lima, J. Pastor, and R. J. Naiman. 1990. Overview of case studies on recovery of aquatic systems from disturbance. Environmental Management 14: 571-88. As reported in: Petts, G., and C. Calow. 1996. River Restoration. Blackwell Science, Inc., Malden, MA. USEPA. 1993. Wildlife Exposure Factors Handbook. Office of Research and Development, Washington, DC. EPA/600/R-93/187a. December. 9.2 Effect on Water Quality Master Comment 587 It has been suggested in comments that dredging will remobilize sediments and PCBs into the water column. Undisturbed hot spot sediments in the TI Pool have also been cited as a passive source of PCBs in the water column, possibly declining in concentration through historical mass removal. Some commenters contend that remobilized PCBs in the water column will increase exposure to the food chain and impact irrigation users, and that increased turbidity will impact aquatic organisms. Comments also reflect the belief that burial of exposed hot spot sediments through natural and artificial mechanisms reduces PCB resuspension. While some commenters suggest that PCBs are being buried through natural sedimentation processes, others indicate that the DEIR, Low Resolution Coring Report and high concentrations observed in surface sediments at Hot Spot 14 disprove this. Some commenters contend that the selected remedy may leave PCB reservoirs in place, and increase PCB concentrations in areas like River Section 3 where little backfilling is proposed. Response to Master Comment 587 Resuspension of PCBs and sediments due to dredging is addressed in the Response to Master Comment 365942 later in this section as well in the Response to Master Comment 583 in Chapter 10. It is concluded in these responses that water-column PCB levels as a result of downstream transport of dredging-induced resuspension will be a minor fraction of currently existing levels. The increased loads will also be small relative to current conditions. Therefore, dredging-induced releases, which are short-term in nature, will not result in significant impacts to the river nor significantly affect the ensuing decline of PCB concentrations in sediments and water resulting from sediment removal. Model forecasts documenting the rate of river recovery including dredging-induced resuspension are described in White Paper – Model Forecasts for Additional Simulations in the Upper Hudson.
Responsiveness Summary Hudson River PCBs Site Record of Decision
9-13
Water column parameters will be monitored during dredge operations in order to ensure that a minimal amount of PCBs will be transported downstream. Because PCB levels naturally fluctuate within the water column due to seasonal variables, EPA will, during remedial design, determine a threshold level for a PCB concentration increase as a result of dredge operations. If the water samples during dredge operations indicate that the downstream PCBs transport is within the natural variation, then there will be no impact of dredging downstream. On the other hand, if sampling finds levels of PCBs above the variation in “naturally” occurring concentrations, then further preventative measures will be employed in order to minimize the downstream impact. Related issues are discussed in Response to Master Comment 583 in Chapter 10 (the mechanism of PCB resuspension). With regard to impacts to conventional water quality parameters, an assessment is provided later in this chapter in the Response to Master Comment 735; further discussion can be found in White Paper – Potential Impacts to Water Resources. Based on the analyses described in these discussions, it is concluded that NYS water quality standards will either not be contravened or the increases will not be significant where those standards are already being exceeded. The concern over impacts of resuspended solids and their impacts to water clarity and municipal use is discussed in Response to Master Comment 362637 below. This response concludes that the suspended solids increases due to dredging will be largely local (within a few hundred meters of the dredging operation) and not detectable above natural variation beyond this distance. Additionally, typical spring suspended solids levels are well above those predicted within the dredging plume. With regard to impacts to the biota, EPA is aware that there may be an increase in fish and animal body burdens during or shortly after the dredging program. Over the long-term, body burdens will decrease because exposure concentrations in sediment and water will have been greatly reduced. Model forecasts of fish body burdens are presented in White Paper – Model Forecasts for Additional Simulations in the Upper Hudson. Long-term, secure storage of PCBs in the sediments of the Hudson is not guaranteed, as demonstrated by several observations made during the Phase 2 investigation. There is a statistically significant loss of PCB inventory from highly contaminated sediments in the TI Pool between 1984 and 1994. A number of GE's 1998-99 sediment samples were co-located with the EPA 1994 samples and the NYSDEC 1984 samples. Both the 1994 and 1998 samples indicate a large decrease in sediment PCB inventory relative to 1984; however, no consistent decrease in surface concentrations between 1994 and 1998-99 is evident. Actually, slightly more than half of the 25 co-located samples showed an increase in concentration, suggesting that surface concentrations remain largely unchanged in those areas. These results support the conclusion that significant concentrations of PCBs remain near the surface in the Upper Hudson, at depths where they impact biota. The occurrence of high PCB concentrations in the surface sediments (0-5cm) of Hot Spot 14 as documented by GE in 1999 (QEA, 2001) also supports this conclusion. See also the Responses to Master Comments 619 and 577 in Chapter 2. Having identified the sediments of the Upper Hudson as the primary source of PCBs (USEPA, 1997, 1998, and 1999), it was then necessary to identify those sediments whose remediation would have the greatest impact in reducing fish body burdens and PCB transport. Also, it was
Responsiveness Summary Hudson River PCBs Site Record of Decision
9-14
important to identify those sediments with the greatest potential for subsequent PCB release, considering PCB concentration and inventory as well as susceptibility to remobilization. The selection of sediment areas for remediation was based mostly on geochemical and statistical interpretations of the data, including observations concerning PCB transport, changes in sediment inventory, sediment PCB distribution, and biological impacts. PCB inventory, PCB surface concentration, sediment texture, and proximity to shore must all be considered in the selection of sediment remedial areas. With regard to the removal of PCB reservoirs, the purpose of the selected remedy is not to remove all PCB-contaminated sediments exceeding some specified threshold or to target every isolated contaminated area. Rather, the goal is to achieve the remedial action objectives through sufficient reduction of PCB mass and concentration. Engineering considerations determined that the minimum unit of area selected for remediation should be 50,000 sq ft. Nonetheless, as noted in Response to Master Comment 597 in Chapter 4, the selected remedy removes more than 85 percent of historical locations with concentrations or MPA values above the selection criteria. Additionally, future plans call for extensive additional sampling and collection of geophysical data to further discern and refine the target areas. Thus, it is unlikely that significant regions of PCB contamination will be left unremediated (see also Response to Master Comment 362631 in Chapter 10). References Quantitative Environmental Analysis, LLC. (QEA). 2001. General Electric Database Transmittal from Michael Werth (QEA) to Doug Tomchuk (USEPA). June 1, 2001. USEPA. 1997. Phase 2 Report, Further Site Characterization and Analysis, Volume 2C - Data Evaluation and Interpretation Report (DEIR), Hudson River PCBs Reassessment RI/FS. Prepared for USEPA Region 2 and the USACE, Kansas City District by TAMS Consultants, Inc., the Cadmus Group, Inc., and Gradient Corporation. February. USEPA. 1998. Further Site Characterization and Analysis. Volume 2C-A Low Resolution Sediment Coring Report (LRC), Addendum to the Data Evaluation and Interpretation Report, Hudson River PCBs Reassessment RI/FS. Prepared for USEPA Region 2 and the USACE, Kansas City District by TAMS Consultants, Inc., Gradient Corporation, and TetraTech, Inc. July. USEPA. 1999. Responsiveness Summary for Volume 2C-A Low Resolution Sediment Coring Report, Addendum to the Data Evaluation and Interpretation Report, Hudson River PCBs Reassessment RI/FS. Prepared for USEPA Region 2 and the USACE, Kansas City District by TAMS and TetraTech, Inc. February. USEPA. 2000. Response to Peer Review Comments on Volume 2C-(DEIR) and 2C-A-(LRC), Hudson River PCBs Reassessment RI/FS. Prepared for USEPA Region 2 and USACE by TAMS Consultants, Inc. and TetraTech, Inc. November.
Responsiveness Summary Hudson River PCBs Site Record of Decision
9-15
Master Comment 365942 Commenters were concerned that PCB release to the water column due to resuspension will increase the PCB water column concentration significantly and result in the transport of PCBs downstream, even to the Lower Hudson River. It was suggested that the increased PCB concentration in the water column will pose a threat to water intakes from the Hudson and could generate the need for changes to or addition of extra steps to the water treatment procedure. Response to Master Comment 365942 Downstream transport of PCBs as a result of dredging-induced resuspension (in grams per day) has been estimated for each river section and dredge type. The complete analysis is presented in White Paper – Resuspension of PCBs during Dredging, and in FS Appendix E.6. The FS and white paper evaluate the two dredging technologies considered applicable to the Hudson River (mechanical and hydraulic). Based on data from numerous other remedial sites, an estimate of the resuspension rate for each dredge type has been formulated. Thus, knowing the resuspension rate, the sediment PCB concentration, and the dredging production rate, it was possible to estimate the PCB flux 10 meters downstream of the dredge head by application of a basic gaussian dispersion model that accounts for some sediment settling between the dredge and the ten-meter point. Results of the analysis are shown below in the table entitled Estimated PCB Flux at 10 Meters Downstream of Dredge Head. Given the fluxes presented in this table, it is possible to estimate dredging season PCB loads generated by dredging operations and, as well, induced water column PCB concentrations (table entitled Estimated Additional PCB Load and Concentration Compared to the Background Level, below). As shown, the estimated dredging-induced seasonal increase in water column PCB load is 5 percent for River Section 1 and 39 percent for River Section 2, compared to the average load experienced in the past 5 years. These are relatively modest increases that are well within the range of natural variation: the seasonal load over the past 5 years, 1996 to 2000, ranged from 158 kg to 278 kg. Moreover, PCB concentrations in the early 1990’s frequently fell within the range of 300 to 1000 ng/L, but there were no reported exceedances at the Waterford Water Works. The water column PCB concentrations presented in the table Estimated Additional PCB Load and Concentration Compared to the Background Level have been generated using a flowrate of 2,300 cfs, representing the minimum 30 day flow for a 10-year period (30Q10) as specified by NYSDEC. This is a conservatively low flowrate that would not be expected to persist. For River Section 1, the dredging-induced water column PCB concentrations have been estimated to be about 11 percent of the average background level (Table entitled Estimated Additional PCB Load and Concentration Compared to the Background Level, below). For River Sections 2 and 3, the increase was about 77 and 31 percent of the average background level, respectively. However, these increases are well below water column concentrations often experienced during the dredging season (May through November), as noted in this same table. Several commenters expressed concern over uptake of dredging induced PCBs by the Waterford water supply system. Based on the analysis presented in the FS and in White Paper – Resuspension of PCBs during Dredging, it can be concluded that dredging-related water column PCB increases are only a fraction of the typical water column levels routinely experienced
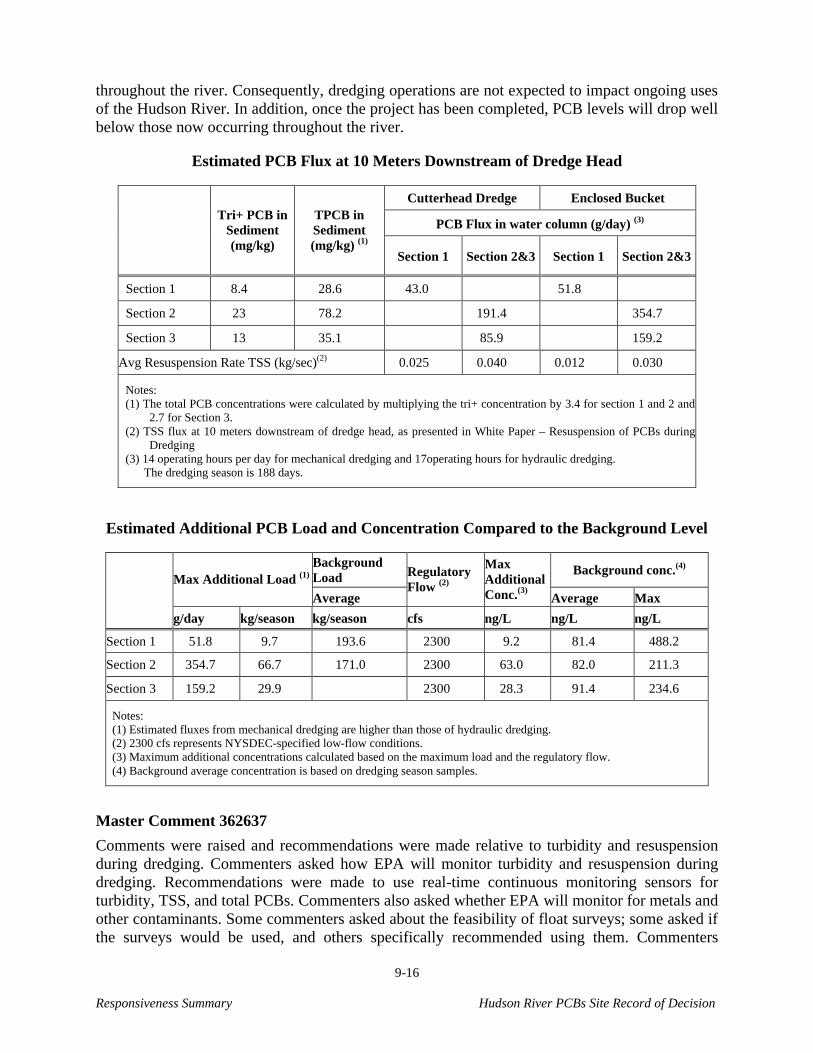
Responsiveness Summary Hudson River PCBs Site Record of Decision
9-16
throughout the river. Consequently, dredging operations are not expected to impact ongoing uses of the Hudson River. In addition, once the project has been completed, PCB levels will drop well below those now occurring throughout the river.
Estimated PCB Flux at 10 Meters Downstream of Dredge Head
Cutterhead Dredge Enclosed Bucket
PCB Flux in water column (g/day) (3) Tri+ PCB in
Sediment (mg/kg)
TPCB in Sediment (mg/kg) (1)
Section 1 Section 2&3 Section 1 Section 2&3
Section 1 8.4 28.6 43.0 51.8
Section 2 23 78.2 191.4 354.7
Section 3 13 35.1 85.9 159.2
Avg Resuspension Rate TSS (kg/sec)(2) 0.025 0.040 0.012 0.030
Notes: (1) The total PCB concentrations were calculated by multiplying the tri+ concentration by 3.4 for section 1 and 2 and
2.7 for Section 3. (2) TSS flux at 10 meters downstream of dredge head, as presented in White Paper – Resuspension of PCBs during
Dredging (3) 14 operating hours per day for mechanical dredging and 17operating hours for hydraulic dredging.
The dredging season is 188 days.
Estimated Additional PCB Load and Concentration Compared to the Background Level
Background Load
Background conc.(4) Max Additional Load (1)
Average
Regulatory Flow (2)
Max Additional Conc.(3) Average Max
g/day kg/season kg/season cfs ng/L ng/L ng/L
Section 1 51.8 9.7 193.6 2300 9.2 81.4 488.2
Section 2 354.7 66.7 171.0 2300 63.0 82.0 211.3
Section 3 159.2 29.9 2300 28.3 91.4 234.6
Notes: (1) Estimated fluxes from mechanical dredging are higher than those of hydraulic dredging. (2) 2300 cfs represents NYSDEC-specified low-flow conditions. (3) Maximum additional concentrations calculated based on the maximum load and the regulatory flow. (4) Background average concentration is based on dredging season samples.
Master Comment 362637
Comments were raised and recommendations were made relative to turbidity and resuspension during dredging. Commenters asked how EPA will monitor turbidity and resuspension during dredging. Recommendations were made to use real-time continuous monitoring sensors for turbidity, TSS, and total PCBs. Commenters also asked whether EPA will monitor for metals and other contaminants. Some commenters asked about the feasibility of float surveys; some asked if the surveys would be used, and others specifically recommended using them. Commenters
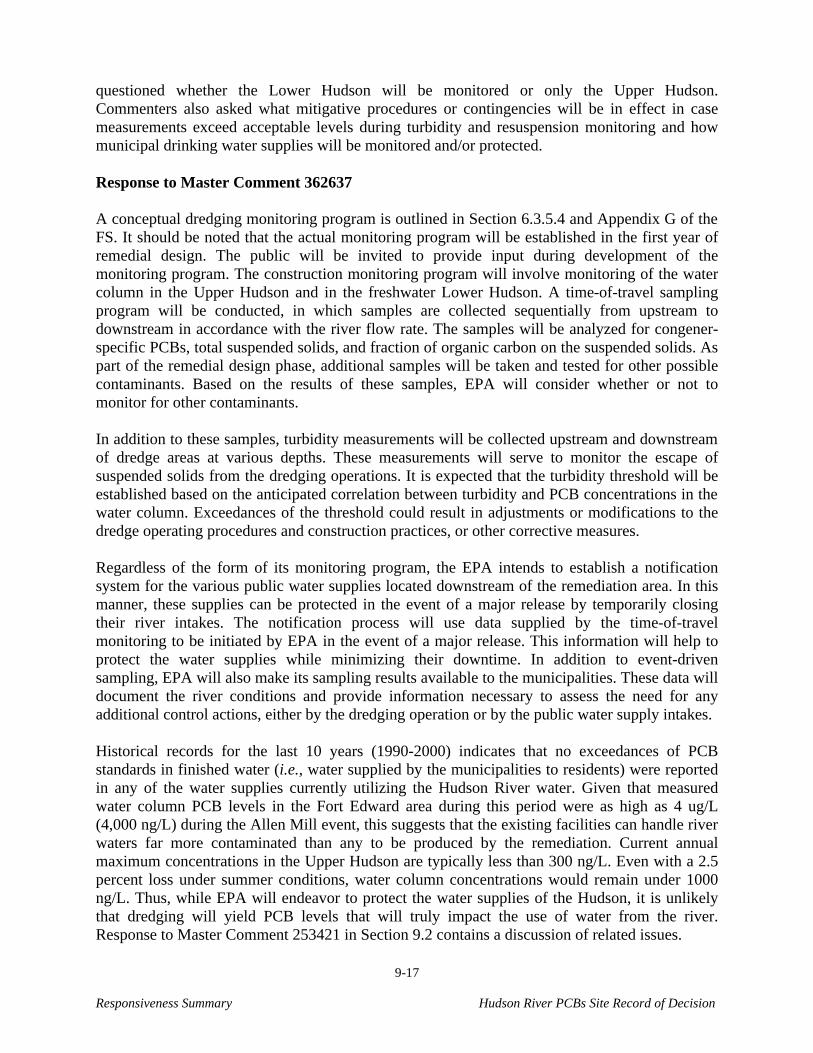
Responsiveness Summary Hudson River PCBs Site Record of Decision
9-17
questioned whether the Lower Hudson will be monitored or only the Upper Hudson. Commenters also asked what mitigative procedures or contingencies will be in effect in case measurements exceed acceptable levels during turbidity and resuspension monitoring and how municipal drinking water supplies will be monitored and/or protected. Response to Master Comment 362637 A conceptual dredging monitoring program is outlined in Section 6.3.5.4 and Appendix G of the FS. It should be noted that the actual monitoring program will be established in the first year of remedial design. The public will be invited to provide input during development of the monitoring program. The construction monitoring program will involve monitoring of the water column in the Upper Hudson and in the freshwater Lower Hudson. A time-of-travel sampling program will be conducted, in which samples are collected sequentially from upstream to downstream in accordance with the river flow rate. The samples will be analyzed for congener-specific PCBs, total suspended solids, and fraction of organic carbon on the suspended solids. As part of the remedial design phase, additional samples will be taken and tested for other possible contaminants. Based on the results of these samples, EPA will consider whether or not to monitor for other contaminants. In addition to these samples, turbidity measurements will be collected upstream and downstream of dredge areas at various depths. These measurements will serve to monitor the escape of suspended solids from the dredging operations. It is expected that the turbidity threshold will be established based on the anticipated correlation between turbidity and PCB concentrations in the water column. Exceedances of the threshold could result in adjustments or modifications to the dredge operating procedures and construction practices, or other corrective measures. Regardless of the form of its monitoring program, the EPA intends to establish a notification system for the various public water supplies located downstream of the remediation area. In this manner, these supplies can be protected in the event of a major release by temporarily closing their river intakes. The notification process will use data supplied by the time-of-travel monitoring to be initiated by EPA in the event of a major release. This information will help to protect the water supplies while minimizing their downtime. In addition to event-driven sampling, EPA will also make its sampling results available to the municipalities. These data will document the river conditions and provide information necessary to assess the need for any additional control actions, either by the dredging operation or by the public water supply intakes. Historical records for the last 10 years (1990-2000) indicates that no exceedances of PCB standards in finished water (i.e., water supplied by the municipalities to residents) were reported in any of the water supplies currently utilizing the Hudson River water. Given that measured water column PCB levels in the Fort Edward area during this period were as high as 4 ug/L (4,000 ng/L) during the Allen Mill event, this suggests that the existing facilities can handle river waters far more contaminated than any to be produced by the remediation. Current annual maximum concentrations in the Upper Hudson are typically less than 300 ng/L. Even with a 2.5 percent loss under summer conditions, water column concentrations would remain under 1000 ng/L. Thus, while EPA will endeavor to protect the water supplies of the Hudson, it is unlikely that dredging will yield PCB levels that will truly impact the use of water from the river. Response to Master Comment 253421 in Section 9.2 contains a discussion of related issues.
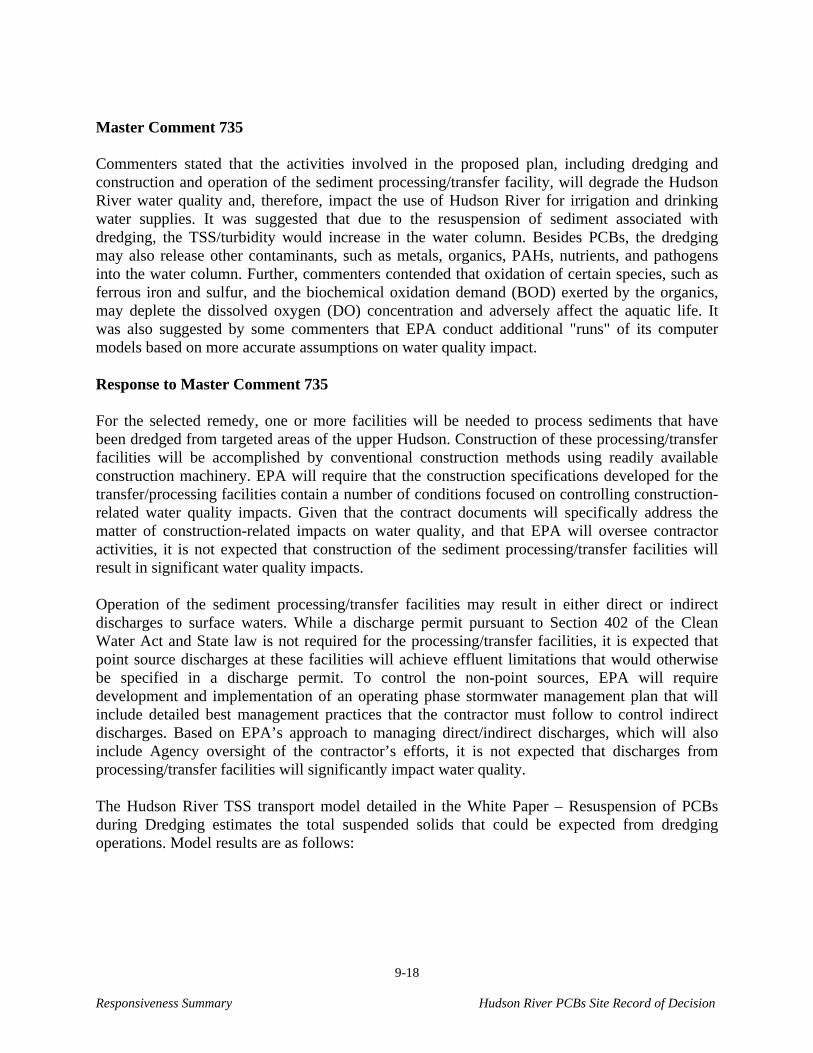
Responsiveness Summary Hudson River PCBs Site Record of Decision
9-18
Master Comment 735 Commenters stated that the activities involved in the proposed plan, including dredging and construction and operation of the sediment processing/transfer facility, will degrade the Hudson River water quality and, therefore, impact the use of Hudson River for irrigation and drinking water supplies. It was suggested that due to the resuspension of sediment associated with dredging, the TSS/turbidity would increase in the water column. Besides PCBs, the dredging may also release other contaminants, such as metals, organics, PAHs, nutrients, and pathogens into the water column. Further, commenters contended that oxidation of certain species, such as ferrous iron and sulfur, and the biochemical oxidation demand (BOD) exerted by the organics, may deplete the dissolved oxygen (DO) concentration and adversely affect the aquatic life. It was also suggested by some commenters that EPA conduct additional "runs" of its computer models based on more accurate assumptions on water quality impact. Response to Master Comment 735 For the selected remedy, one or more facilities will be needed to process sediments that have been dredged from targeted areas of the upper Hudson. Construction of these processing/transfer facilities will be accomplished by conventional construction methods using readily available construction machinery. EPA will require that the construction specifications developed for the transfer/processing facilities contain a number of conditions focused on controlling construction-related water quality impacts. Given that the contract documents will specifically address the matter of construction-related impacts on water quality, and that EPA will oversee contractor activities, it is not expected that construction of the sediment processing/transfer facilities will result in significant water quality impacts. Operation of the sediment processing/transfer facilities may result in either direct or indirect discharges to surface waters. While a discharge permit pursuant to Section 402 of the Clean Water Act and State law is not required for the processing/transfer facilities, it is expected that point source discharges at these facilities will achieve effluent limitations that would otherwise be specified in a discharge permit. To control the non-point sources, EPA will require development and implementation of an operating phase stormwater management plan that will include detailed best management practices that the contractor must follow to control indirect discharges. Based on EPA’s approach to managing direct/indirect discharges, which will also include Agency oversight of the contractor’s efforts, it is not expected that discharges from processing/transfer facilities will significantly impact water quality. The Hudson River TSS transport model detailed in the White Paper – Resuspension of PCBs during Dredging estimates the total suspended solids that could be expected from dredging operations. Model results are as follows:
Responsiveness Summary Hudson River PCBs Site Record of Decision
9-19
TSS model results for Hudson River
TSS Concentration (mg/L) 1 Type of Dredge
River Section 1 River Section 2 River Section
Hydraulic 1.1 / 0.3 1.4 / 0.5 1.4 / 0.5
Mechanical 1.0 / 0.4 1.2 / 1.1 1.2 / 1.1
Note: 1. First value in each box represents the TSS concentration increase at a distance of
10m downstream of the dredge head. The second value represents the TSS concentration increase in the river when the TSS release has been fully mixed into the river, assuming no further settling beyond 10m of the dredge head. Both estimates are calculated for a flow of 3,000 cfs.
For comparison, spring runoff produces increased flows and increased TSS concentrations throughout the entire river. USGS data for Fort Edward show average levels of 13 mg/L in April over the period 1978-1995; Schuylerville averaged 21 mg/L in April from 1977-1989; Stillwater averaged 27 mg/L in April from 1977-1996, and Waterford averaged 40 mg/L in April from 1976-1996. Thus, normal spring run-off produces far greater TSS levels than any increase estimated from dredging operations. Additionally, spring TSS loads encompass the entire river while dredging operations are projected to increase levels by less than 1.5 mg/L within 10 meters of the dredge. TSS increases associated with dredging are not likely to impact the use of Hudson River. As detailed in the White Paper – Potential Impacts to Water Resources, concentrations of other contaminants that could be released into the water column during dredging were calculated based on the estimated TSS release. The results are presented below in the table entitled Estimated Release Into Water Column Due to Dredging for Conventional and Trace Compounds. For all trace contaminants and nutrients evaluated, except mercury, the estimated water column increases due to dredging are relatively minor and do not represent a significant concern relative to New York State ambient water quality standards. Mercury is estimated to approach the NYSDEC standard for consumption of fish based on the conservative analysis conducted for this Responsiveness Summary. Given the transient nature of dredging operations and the low flowrate used for this analysis, it is not expected that temporary project-induced mercury level increases will generate significant impact. The possible consumption of oxygen by resuspended sediment was estimated based on the TOC, iron, and sulfur concentration in sediment. As shown in the table, the post-dredging dissolved oxygen concentration in the Upper Hudson River will remain above 5 mg/L, which is the level set by NYSDEC. Therefore, there should be no concern in this regard.
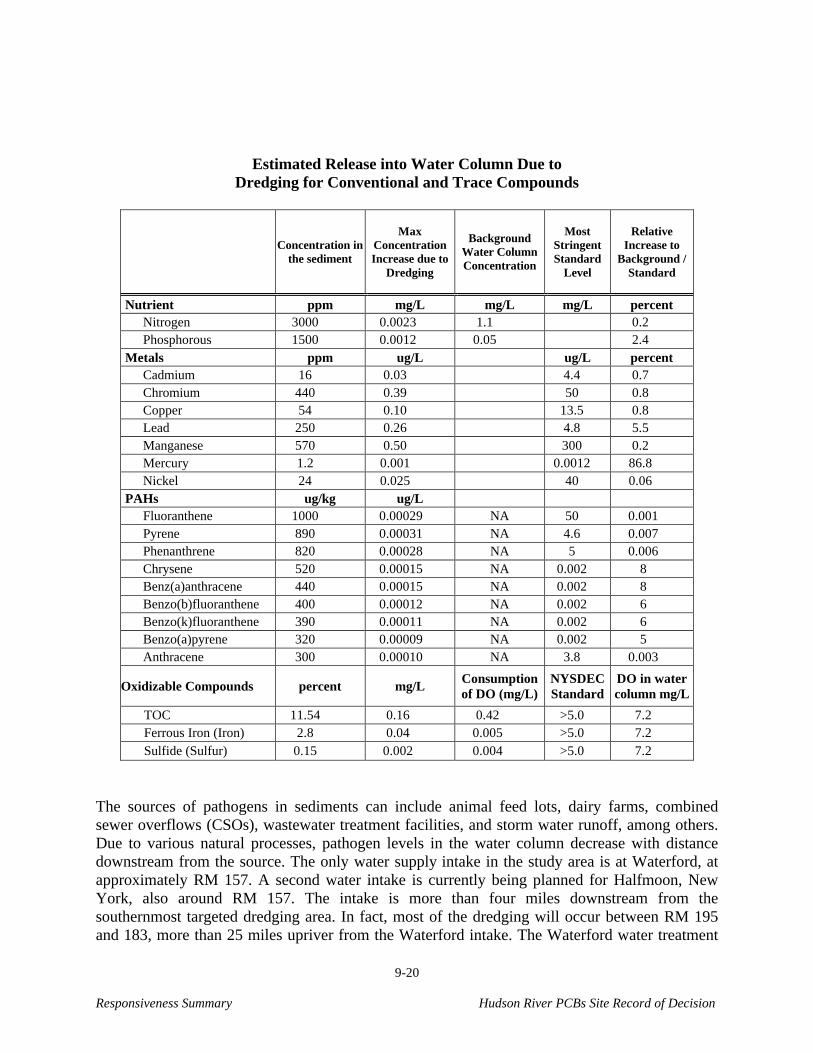
Responsiveness Summary Hudson River PCBs Site Record of Decision
9-20
Estimated Release into Water Column Due to Dredging for Conventional and Trace Compounds
Concentration in the sediment
Max Concentration Increase due to
Dredging
Background Water Column Concentration
Most Stringent Standard
Level
Relative Increase to
Background / Standard
Nutrient ppm mg/L mg/L mg/L percent Nitrogen 3000 0.0023 1.1 0.2 Phosphorous 1500 0.0012 0.05 2.4
Metals ppm ug/L ug/L percent Cadmium 16 0.03 4.4 0.7 Chromium 440 0.39 50 0.8 Copper 54 0.10 13.5 0.8 Lead 250 0.26 4.8 5.5 Manganese 570 0.50 300 0.2 Mercury 1.2 0.001 0.0012 86.8 Nickel 24 0.025 40 0.06
PAHs ug/kg ug/L Fluoranthene 1000 0.00029 NA 50 0.001 Pyrene 890 0.00031 NA 4.6 0.007 Phenanthrene 820 0.00028 NA 5 0.006 Chrysene 520 0.00015 NA 0.002 8 Benz(a)anthracene 440 0.00015 NA 0.002 8 Benzo(b)fluoranthene 400 0.00012 NA 0.002 6 Benzo(k)fluoranthene 390 0.00011 NA 0.002 6 Benzo(a)pyrene 320 0.00009 NA 0.002 5 Anthracene 300 0.00010 NA 3.8 0.003
Oxidizable Compounds percent mg/L Consumption of DO (mg/L)
NYSDEC Standard
DO in water column mg/L
TOC 11.54 0.16 0.42 >5.0 7.2 Ferrous Iron (Iron) 2.8 0.04 0.005 >5.0 7.2 Sulfide (Sulfur) 0.15 0.002 0.004 >5.0 7.2
The sources of pathogens in sediments can include animal feed lots, dairy farms, combined sewer overflows (CSOs), wastewater treatment facilities, and storm water runoff, among others. Due to various natural processes, pathogen levels in the water column decrease with distance downstream from the source. The only water supply intake in the study area is at Waterford, at approximately RM 157. A second water intake is currently being planned for Halfmoon, New York, also around RM 157. The intake is more than four miles downstream from the southernmost targeted dredging area. In fact, most of the dredging will occur between RM 195 and 183, more than 25 miles upriver from the Waterford intake. The Waterford water treatment
Responsiveness Summary Hudson River PCBs Site Record of Decision
9-21
facility includes a full treatment train (coagulation, prechlorination, flocculation, two-stage settling, filtration and post-chlorination) that effectively removes pathogenic organisms routinely present in river water. Given the distance from dredging areas to the Waterford intake, and the treatment facility, no impact to the water supply is expected from dredging operations. White Paper – Potential Impacts to Water Resources contains additional information related to water quality impacts. Master Comment 253421 Commenters were concerned that there may be adverse impacts on drinking water supplies due to resuspension of PCBs. Commenters were also concerned that wells are hydrologically connected with the Upper Hudson and may become contaminated with PCBs. One comment stated that dredging operations at New Bedford Harbor lowered the water table and caused all the water to flow out of the wells in the vicinity. Response to Master Comment 253421 This comment is answered in two parts, concerns about the effects on drinking water supplies and about effects on groundwater and drinking wells. It is important to note that in neither case is the dredging operation anticipated to cause PCB contamination of drinking water. EPA recognizes the concern over the possible impacts to drinking water supplies downstream of the dredging operations. For this reason, EPA will implement both a monitoring program and a notification network to reassure the public about protection of surface water supply intakes along the river (Response to Master Comment 362637, Section 9.2). However, as discussed in detail in White Paper – Potential Impacts to Water Resources and White Paper – Resuspension of PCBs during Dredging, the anticipated impacts to water quality within the Hudson due to dredging operations will be very minor, at most, and probably not detectable beyond a few hundred yards downstream from dredging operations. The impacts to water quality from resuspension of PCBs are discussed in Chapter 10 (Response to Master Comment 365942), and for potential impacts from other contaminants in Section 9.2 (Response to Master Comment 735). Generally the treatment train at drinking water supply facilities such as Waterford, which utilizes a surface water source for water, involves filtration. Even in the early 1990s when total PCB levels in the Upper Hudson River were five to 10 times greater than current levels, the filtration process was able to remove the PCBs effectively. Evidence for this comes from the fact that during this period (1991-1993) there were no violations with regard to total PCB levels in the drinking water. As mentioned previously, the impacts to the water quality are anticipated to be minor and total PCB levels will not approach the historically high levels. Since the treatment train at the water supply facility has been shown to be able to deal with PCBs in general and has been shown to effectively remove them in the past despite significantly higher levels at the time, no adverse effects on drinking water due to dredging are expected. From this analysis, it also can be concluded that impacts to groundwater from resuspension are also likely to be imperceptible. This can be concluded based on the following:
Responsiveness Summary Hudson River PCBs Site Record of Decision
9-22
• The Hudson is a river of great age in a region of moderate rainfall. Rivers in this part of the country in general represent areas where groundwater contributes to the base flow of the river rather than the river recharging a groundwater system. Thus the Upper Hudson is expected to be the receptor for groundwater flow from unconsolidated and/or bedrock aquifers throughout the region. Given its great age, it is highly likely that the freshwater river has eroded its bed such that extensive areas of groundwater discharge exist along its length to Troy. Groundwater supplies in these areas would be completely unaffected by any dredging operation in the river since the dominant flow direction is from surficial aquifers into the river, rather than the river contributing to the groundwater system.
• Man-made alterations to water surface elevations caused by the construction of dams
in the river may have changed the nature of recharge in some areas. In some areas upstream of the dams, the increased hydraulic head may cause some water to flow from the river into the surficial aquifer. In a TI Pool study (HSI GeoTrans, 1997 for GE) which characterized groundwater and river water fluxes across the sediment-water interface, it was determined that the measurements were generally positive, i.e., flow was in the direction from groundwater into the Hudson River. This study found only one location (at site S5 from that report), about one mile upstream of the TI Dam, where groundwater flow was consistently negative. In these isolated areas where river water may be flowing into the groundwater system, however, the low permeability and low hydraulic conductivity of these aquifers will prevent significant infiltration of river water into the overall groundwater system. This is due to the glacial tills and weathered bedrock (saprolite) which generally comprise the aquifers in the region. Most water supply wells in this area are completed within fractured bedrock and do not withdraw water directly from the unconsolidated aquifer. Regardless of whether the well is completed into the bedrock or into the unconsolidated material, the travel time of the groundwater is so slow that any infiltrated PCB contamination will either be sorbed to the clays and tills which comprise the aquifer matrix, or be discharged back into the river slightly downstream, where the regional flow into the river is once again the dominant direction of flow. The anticipated change in water column PCB concentrations within the river will not have a measurable impact on local groundwater supplies, since the concentration change within the river itself is expected to be small and within the natural variability that occurs annually.
Lastly, the EPA is unaware of the New Bedford Harbor dredging project's having lowered the water table and caused wells to dry. It seems unlikely that this would have occurred, as the water table in the area is approximately at sea level. In addition, the area is highly industrialized and the majority of residences in the area would receive drinking water from municipally provided public water. Master Comment 803 Commenters had a number of concerns about resuspended sediment: 1) biota downstream of dredging operations may be impaired by resuspended sediment; 2) resuspension of sediments
Responsiveness Summary Hudson River PCBs Site Record of Decision
9-23
during dredging may affect fish and filter feeding bivalves, due to physical impairment of feeding processes and from toxicity caused by mobilization and downstream transport of contaminated sediment; and 3) sediment resuspension may also interfere with light penetration and feeding of benthic organisms. Concerns were raised that effects on lower trophic levels would impact higher trophic level animals. Response to Master Comment 803 Suspended sediments may adversely affect aquatic habitat by accumulating in the interstices of coarse substrata, thereby limiting habitat for aquatic invertebrates. Fine sediments can also settle on coarser sediments, smothering the eggs of fish and other aquatic animals and covering filter feeding animals, such as bivalves, so that they have difficulty obtaining adequate food. Under extreme conditions, fish and aquatic invertebrates that feed by sight may have difficulty in finding prey, gills may become clogged (killing fish or reducing their growth rate), and disease may occur. Increased sediment can also alter aquatic communities. For example, agricultural sites that received a four- to five-times greater suspended load than forested sites had fish communities dominated by disturbance-tolerant fish (Sutherland et al., 2001). Suspended sediments may also adversely affect plant communities by reducing light penetration into the water column. This reduces the ability of algae to produce food and oxygen and affects animals that feed on algae. As suspended sediment settles out and drops to the bottom, it may smother plants, thereby reducing the extent of submerged aquatic vegetation (SAV). Water column TSS levels (mg/L) for the hydraulic and mechanical dredging technologies have been estimated in White Paper – Resuspension of PCBs during Dredging. The impact of increased TSS due to dredging on water quality is discussed in the Response to Master Comment 735 (Section 9.2). The table below, TSS Model Results for the Hudson River, presents the results of plume TSS concentrations estimated to occur 10 meters downstream of the dredging work. These concentrations do not reflect complete mixing of resuspended sediment within the Upper Hudson, which can be expected to occur at some point further downstream of the dredging operations. For the purpose of comparison, the impact of complete mixing on TSS concentrations is also presented for the case where one hydraulic dredge is used to remove targeted sediments. These minimal increases in TSS concentrations incorporate several conservative assumptions including:
• No further removal of PCBs by settling beyond 10 meters downstream of the dredge head.
• No adjustment made for the silt curtains, which serve to reduce downstream movement of sediment.
• A low flow rate (3,000 cfs) that serves to maximize PCB concentrations in the water column.
A further discussion can be found in Appendix E.6 of the FS.
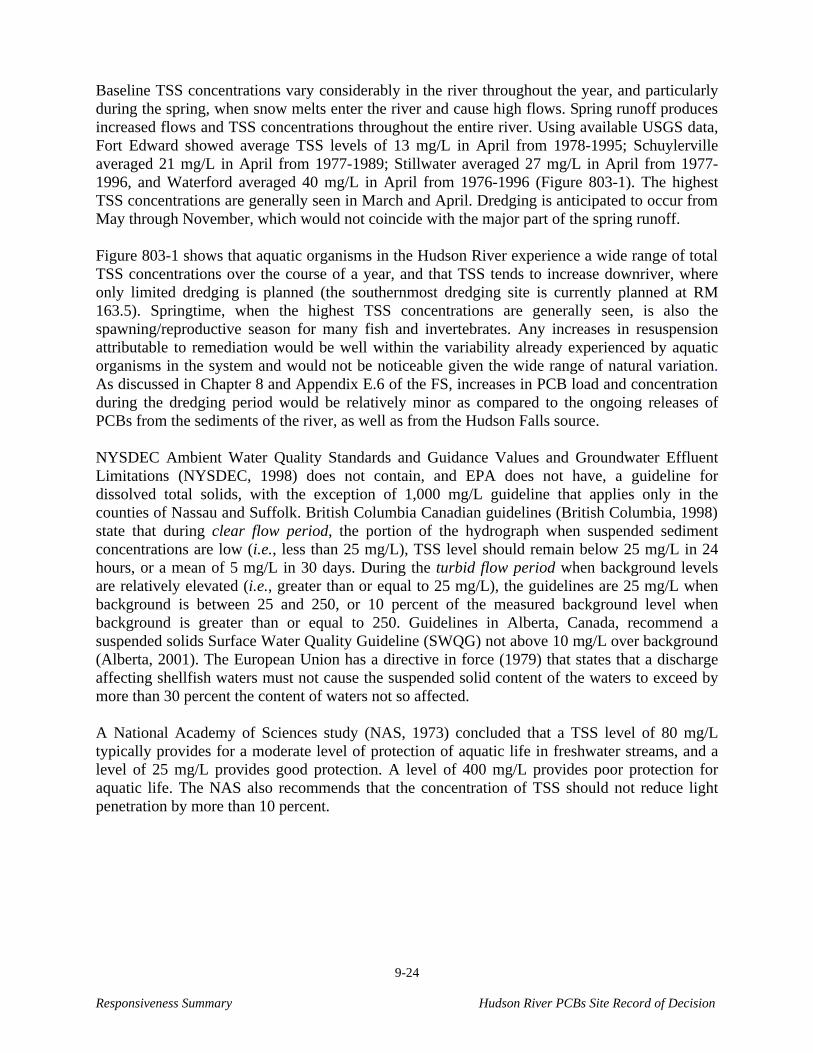
Responsiveness Summary Hudson River PCBs Site Record of Decision
9-24
Baseline TSS concentrations vary considerably in the river throughout the year, and particularly during the spring, when snow melts enter the river and cause high flows. Spring runoff produces increased flows and TSS concentrations throughout the entire river. Using available USGS data, Fort Edward showed average TSS levels of 13 mg/L in April from 1978-1995; Schuylerville averaged 21 mg/L in April from 1977-1989; Stillwater averaged 27 mg/L in April from 1977-1996, and Waterford averaged 40 mg/L in April from 1976-1996 (Figure 803-1). The highest TSS concentrations are generally seen in March and April. Dredging is anticipated to occur from May through November, which would not coincide with the major part of the spring runoff. Figure 803-1 shows that aquatic organisms in the Hudson River experience a wide range of total TSS concentrations over the course of a year, and that TSS tends to increase downriver, where only limited dredging is planned (the southernmost dredging site is currently planned at RM 163.5). Springtime, when the highest TSS concentrations are generally seen, is also the spawning/reproductive season for many fish and invertebrates. Any increases in resuspension attributable to remediation would be well within the variability already experienced by aquatic organisms in the system and would not be noticeable given the wide range of natural variation. As discussed in Chapter 8 and Appendix E.6 of the FS, increases in PCB load and concentration during the dredging period would be relatively minor as compared to the ongoing releases of PCBs from the sediments of the river, as well as from the Hudson Falls source. NYSDEC Ambient Water Quality Standards and Guidance Values and Groundwater Effluent Limitations (NYSDEC, 1998) does not contain, and EPA does not have, a guideline for dissolved total solids, with the exception of 1,000 mg/L guideline that applies only in the counties of Nassau and Suffolk. British Columbia Canadian guidelines (British Columbia, 1998) state that during clear flow period, the portion of the hydrograph when suspended sediment concentrations are low (i.e., less than 25 mg/L), TSS level should remain below 25 mg/L in 24 hours, or a mean of 5 mg/L in 30 days. During the turbid flow period when background levels are relatively elevated (i.e., greater than or equal to 25 mg/L), the guidelines are 25 mg/L when background is between 25 and 250, or 10 percent of the measured background level when background is greater than or equal to 250. Guidelines in Alberta, Canada, recommend a suspended solids Surface Water Quality Guideline (SWQG) not above 10 mg/L over background (Alberta, 2001). The European Union has a directive in force (1979) that states that a discharge affecting shellfish waters must not cause the suspended solid content of the waters to exceed by more than 30 percent the content of waters not so affected. A National Academy of Sciences study (NAS, 1973) concluded that a TSS level of 80 mg/L typically provides for a moderate level of protection of aquatic life in freshwater streams, and a level of 25 mg/L provides good protection. A level of 400 mg/L provides poor protection for aquatic life. The NAS also recommends that the concentration of TSS should not reduce light penetration by more than 10 percent.
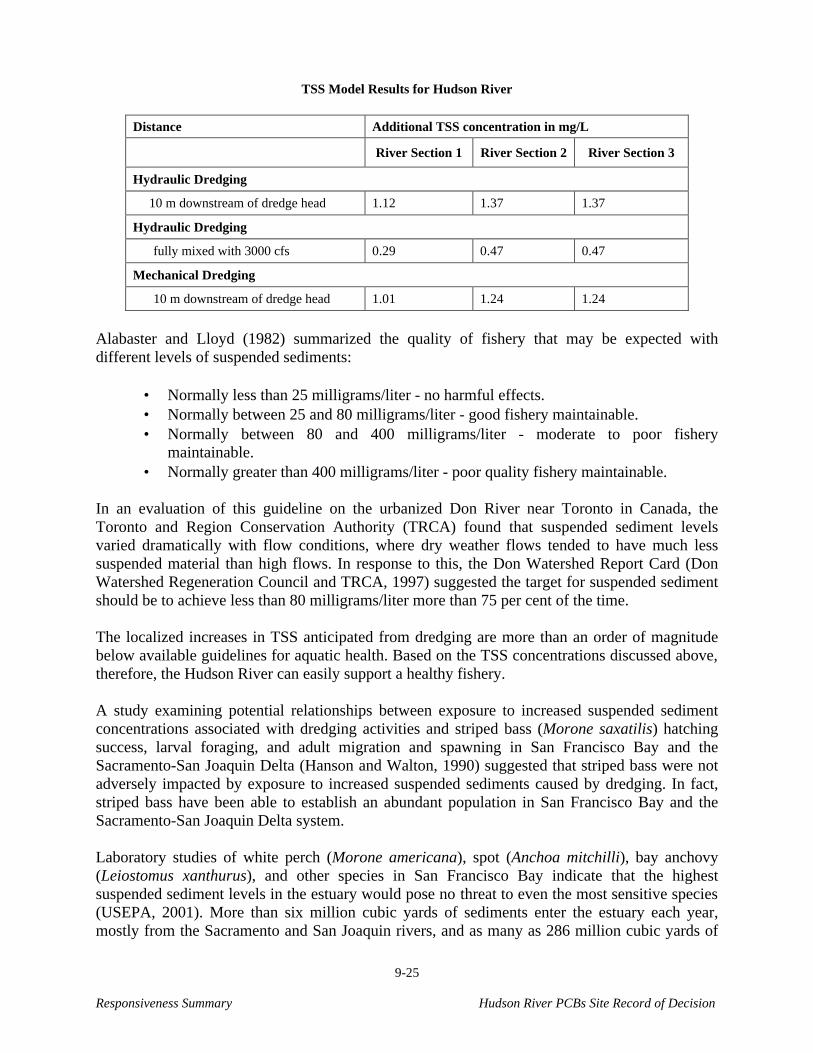
Responsiveness Summary Hudson River PCBs Site Record of Decision
9-25
TSS Model Results for Hudson River
Distance Additional TSS concentration in mg/L
River Section 1 River Section 2 River Section 3
Hydraulic Dredging
10 m downstream of dredge head 1.12 1.37 1.37
Hydraulic Dredging
fully mixed with 3000 cfs 0.29 0.47 0.47
Mechanical Dredging
10 m downstream of dredge head 1.01 1.24 1.24
Alabaster and Lloyd (1982) summarized the quality of fishery that may be expected with different levels of suspended sediments:
• Normally less than 25 milligrams/liter - no harmful effects. • Normally between 25 and 80 milligrams/liter - good fishery maintainable. • Normally between 80 and 400 milligrams/liter - moderate to poor fishery
maintainable. • Normally greater than 400 milligrams/liter - poor quality fishery maintainable.
In an evaluation of this guideline on the urbanized Don River near Toronto in Canada, the Toronto and Region Conservation Authority (TRCA) found that suspended sediment levels varied dramatically with flow conditions, where dry weather flows tended to have much less suspended material than high flows. In response to this, the Don Watershed Report Card (Don Watershed Regeneration Council and TRCA, 1997) suggested the target for suspended sediment should be to achieve less than 80 milligrams/liter more than 75 per cent of the time. The localized increases in TSS anticipated from dredging are more than an order of magnitude below available guidelines for aquatic health. Based on the TSS concentrations discussed above, therefore, the Hudson River can easily support a healthy fishery. A study examining potential relationships between exposure to increased suspended sediment concentrations associated with dredging activities and striped bass (Morone saxatilis) hatching success, larval foraging, and adult migration and spawning in San Francisco Bay and the Sacramento-San Joaquin Delta (Hanson and Walton, 1990) suggested that striped bass were not adversely impacted by exposure to increased suspended sediments caused by dredging. In fact, striped bass have been able to establish an abundant population in San Francisco Bay and the Sacramento-San Joaquin Delta system. Laboratory studies of white perch (Morone americana), spot (Anchoa mitchilli), bay anchovy (Leiostomus xanthurus), and other species in San Francisco Bay indicate that the highest suspended sediment levels in the estuary would pose no threat to even the most sensitive species (USEPA, 2001). More than six million cubic yards of sediments enter the estuary each year, mostly from the Sacramento and San Joaquin rivers, and as many as 286 million cubic yards of
Responsiveness Summary Hudson River PCBs Site Record of Decision
9-26
existing sediments in the shallows of San Francisco Bay are resuspended by currents and wind-driven waves. Even at suspended sediment concentrations adjacent to disposal barges or in the water column immediately following disposal, fish would have to be exposed for several hours in order for death to occur, while plumes of highly concentrated suspended solids last only for minutes. In summary, normal spring run-off produces far greater TSS variation than the minimal increases estimated from dredging operations. Spring TSS loads encompass the entire river, while dredging operations are projected to increase levels by less than 1.5 mg/L within 10 meters of the dredge. These increases are well below the levels where aquatic life may be impacted based on available guidelines. Beyond 10 meters, the incremental TSS levels would be further reduced as water column mixing continues. Given the low resuspension levels anticipated, the relatively modest area which dredging influences, and the fact that further mixing will quickly reduce dredging-induced increases, aquatic life in the river and the organisms that feed upon them will not experience any adverse effects caused by sediment resuspension during dredging. References Alabaster, J.S. and R. Lloyd. 1982. Water quality criteria for freshwater fish. Alabaster, J.S. Butterworths, London. 361 pp. Alberta Ambient Surface Water Quality Interim Guidelines. 2001. http://www.biology.ualberta.ca/alms/Parameter.htm. Accessed August 13, 2001. British Columbia, Canada, Water Management Branch, Environment and Resource Division, Ministry of Environment, Lands, and Parks. 1998. Ambient Water Quality Criteria for Turbidity, Suspended and Benthic Sediments. Accessed from website http://www.env.gov.bc.ca/wat/wq/BCguidelines/turbidity.html August 9, 2001. Don Watershed Regeneration Council and the Toronto and Region Conservation Authority (TRCA). 1997. Turning the Corner: the Don Watershed Report Card. The Toronto and Region Conservation Authority. 35pp. European Union (EU). 1979. Community legislation in force. Council Directive 79/923/EEC of 30 October 1979 on the quality required of shellfish waters. http://europa.eu.int/eur-lex/en/lif/dat/1979/en_379L0923.html. Accessed August 13, 2001. Hanson, C.H., and C.P. Walton. 1990. Potential effects of dredging on early life stages of striped bass (Morone saxatilis) in the San Francisco Bay area: An overview. Effects of Dredging on Anadromous Pacific Fishes: Workshop Proceedings, Seattle, WA (USA), 8-9 September 1988, pp. 38-56. National Academy of Sciences (NAS), National Academy of Engineering. 1973. Water Quality Criteria 1972. EPA Ecol. Res. Series. EPA-R3-73-033, USEPA, Washington, D.C. 594 p.
Responsiveness Summary Hudson River PCBs Site Record of Decision
9-27
New York State Department of Environmental Conservation (NYSDEC). 1998. Ambient Water Quality Standards and Guidance Values and Groundwater Effluent Limitations. Division of Water Technical and Operational Guidance Series (1.1.1). Reissued June 1998. Sutherland A., J. Meyer, and N. Gardiner. 2001. Effects of Land-Use on Sediment Regime and Fish Assemblage Structure in the Southern Appalachians. http://coweeta.ecology.uga.edu/webdocs/meta/html/str/ronstr-andsediment-doc.html. Accessed August 13, 2001. USEPA, Office of Water. National Estuary Project (NEP). San Francisco Estuary Project. 2001. State of the Estuary Report 8a Dredging and Waterway Modification (Part A) http://www.abag.ca.gov/bayarea/sfep/reports/soe/soe8a.htm#10
9.3 Habitat Replacement
Master Comment 511
A number of commenters stated that the adverse impacts of targeted dredging on river habitat will be temporary and this temporary loss will be offset by the accelerated recovery of the entire river. They contend that any short-term impacts from dredging can be minimized through appropriate habitat replacement activities.
Response to Master Comment 511
EPA agrees. Potential adverse impacts resulting from dredging activities will be temporary and will be offset by implementation of the habitat replacement program. Page 1 of the habitat replacement program description (Appendix F of the FS) identifies the potential habitat impacts that may result from implementation of a remedial alternative (i.e., removal or capping of substrate used as spawning and foraging habitat by fish and benthic invertebrate species; displacement of benthic organisms; loss of vegetation communities; loss of freshwater wetlands acreage and wetlands functional values; and disturbance of riparian habitat and shoreline stability). The habitat replacement program will be implemented to mitigate these disturbances to aquatic and wildlife habitat. Master Comment 513 Commenters suggested that the thickness and type of backfill material to be placed should depend on the type of restoration to be achieved. In some instances, no fill may be required and in others, more than one foot may be required. Also, commenters said that details of recolonization of backfill should be provided. Response to Master Comment 513 Details regarding backfill type and thickness in specific locations will be determined during remedial design. These details, along with other decisions that pertain to the habitat replacement
Responsiveness Summary Hudson River PCBs Site Record of Decision
9-28
program, will be formulated in consultation with the federal Trustees and NYSDEC. The need to place backfill and backfill specifications will be determined in accordance with the habitat replacement objectives, but within the context of the more fundamental objectives and requirements of the proposed remediation. Backfilling is proposed to isolate residual contaminants that remain after dredging and is critical to attaining the modeled decreases in PCB concentrations sediment. Backfilling could be omitted in specific locations only if such action would not compromise attainment of the target PCB concentrations. With respect to recolonization of backfill, the intent of the habitat replacement program is to return the river bottom to a stable, well-sorted substrate with a complex mixture of sediment sizes that provides suitable habitat diversity to enable the recolonization of a variety of benthic invertebrates. As such, remediated areas in the deep river and shallow river habitat zones would be backfilled with gravel and sand and, over time, some silt and other fines would be transported by the river into these backfilled areas. This varied substrate would provide habitat for the recolonization of a variety of epifaunal (attached to the sediment surface, such as snails) and infaunal (occurring within the sediment, such as oligochaete worms) invertebrates. The reestablishment of SAV beds would provide habitat for benthic species that thrive in areas of submerged aquatic vegetation, such as freshwater scuds (amphipods). Master Comment 517 Some commenters expressed concern that several of the suggested plant species are not appropriate for revegetating areas impacted by remedial actions. Commenters recommended that only species native to the Upper Hudson River should be replanted or reseeded. For example, at least one species of Ruppia (Ruppia maritima) is characteristic of brackish marshes and should be deleted from the target list. Pistia stratiotes is a pantropic species and should not be introduced to the Hudson River. The web site mentioned was http://florawww.eeb.uconn.edu.acc_num/199600001.html. Zenobia pulverulenta is native to the coastal plain ranging between North Carolina and Florida and is not a suitable candidate for mitigation along the Upper Hudson. Response to Master Comment 517 A final list of SAV and wetland vegetation species to be planted will be detailed during remedial design, although it is anticipated that the list of species will be modified at times during the implementation of the habitat replacement program as experience with the conditions on the Upper Hudson River is accumulated. This list, along with all other aspects of the habitat replacement program, will be formulated in consultation with the federal Trustees and NYSDEC. Only vegetation species native to the Upper Hudson River will be planted or seeded. As addressed in Response to Master Comment 529, sequencing and scheduling of habitat replacement actions will be analyzed for opportunities to preclude or minimize establishment of invasive, exotic species, notably Eurasian water milfoil (Myriophyllum spicatum), curly pondweed (Potamogeton crispus), and water chestnut (Trapa natans) in the river, and purple loosestrife (Lythrum salicaria) and common reed (Phragmites australis) in the emergent wetlands.
Responsiveness Summary Hudson River PCBs Site Record of Decision
9-29
Master Comment 313373 Commenters recommended that the plan to backfill dredged non-capped non-channel areas be further discussed with the State and federal Trustees. Some contended that backfilling may not be warranted in all circumstances and may lead to re-colonization by nuisance species. Further, some suggested that decreasing the amount of backfill required will decrease mitigation cost estimates. Response to Master Comment 313373 It is agreed that from a habitat replacement perspective, backfilling may not be warranted in all circumstances and could increase the potential for invasion by nuisance species, and that decreasing the amount of backfill could decrease remediation cost estimates. Further, the need to consult the federal and State Trustees is acknowledged. Details regarding backfill type and thickness in specific locations will be determined during remedial design. These details, along with other decisions that pertain to the habitat replacement program, will be formulated in consultation with the federal Trustees and NYSDEC. The need to place backfill and backfill specifications will be determined in accordance with the habitat replacement objectives, but within the context of the more fundamental objectives and requirements of the proposed remediation. Backfilling is proposed to isolate residual contaminants that remain after dredging and is important in attaining the modeled decreases in PCB concentrations. Backfilling could be omitted in specific locations only if such action would not compromise attainment of the target PCB concentrations. Master Comment 313365 Some commenters pointed out that backfill material can provide appropriate elevations and substrate for emergent and submerged aquatic vegetation. Response to Master Comment 313365 EPA concurs that backfill material can provide appropriate elevations and substrate for emergent and submerged aquatic vegetation. Details regarding backfill type and thickness in actual specific locations will be determined during remedial design. These details, along with all other aspects of the habitat replacement program, will be formulated in consultation with the federal Trustees and NYSDEC. EPA's backfill placement strategy will consider both the need to immobilize residual contamination and the substrate type most suitable for aquatic vegetation. Master Comment 313336 Commenters suggested that for shallow wetland areas, backfilled sediment should contain sufficient organic matter and approximate pH to support the desired vegetative community.
Responsiveness Summary Hudson River PCBs Site Record of Decision
9-30
Response to Master Comment 313336 It is expected that fines and other organic material will be deposited naturally. However, during remedial design, methods for augmenting the amount of organic material in the restored wetland will be reviewed. With respect to pH, while the placement of extremely alkaline or acidic sediments will be avoided, it is the pH of the river water that is most critical to plant survival. Master Comment 313194 Several comments were submitted relative to reestablishment of the SAV beds: 1) Reestablishment of SAV beds is likely to extend beyond five years. 2) Given the scale and complexity of the proposed action, it seems likely that the reestablishment of functioning SAV beds and the recovery of fish populations dependent on those beds will require far longer than the five-year remediation period discussed in the FS. 3) Even if the vegetation is successfully reestablished, there will likely be a lag of several years following replanting before biotic communities are restored. Response to Master Comment 313194 Reestablishment of SAV (and, in fact, much of the habitat replacement work, including wetland restoration) will extend beyond the current six-year time frame of the remediation. The actual duration of implementation of the habitat replacement program in general and SAV replacement in particular will depend on the following:
• Extent of the habitats (e.g., SAV is not continuous throughout the river bottom, but occurs in discontinuous beds) and the extent of direct and indirect habitat disturbance.
• Geomorphological response of the river to the remediation activities. • Precision and accuracy of the Upper Hudson River habitat replacement model. • Response of the ecosystem to the disturbance of riverine habitats and to habitat
replacement actions, particularly those undertaken early in the program. • Responsiveness of the adaptive management framework. • Other factors that may hasten or prolong reestablishment, such as the weather, river
discharges, competition from invasive exotic species, predation, and the occurrence of pests.
River modification by dredging and backfilling will result in changes to the sediment supply and channel morphology, which in turn may lead to riverbed and bank erosion and sedimentation. If significant river bottom and bank instability were to occur during and following remediation, such effects would be temporary and localized, although the actual duration and extent of those effects cannot be predicted accurately. Such instability, documented through monitoring, may require substantial delays in the implementation of some components of the habitat replacement program, at least in some locations along the river. Further, various difficulties may be encountered during the implementation of the habitat replacement actions; e.g., problems in developing the dynamic habitat replacement model, high failure rates in SAV bed establishment, low rates of colonization by native SAV species, or, conversely, high rates of invasion by exotic SAV species.
Responsiveness Summary Hudson River PCBs Site Record of Decision
9-31
Although adaptive management is intended to identify such problems early in the habitat replacement program and provide an effective framework for the rapid development of appropriate solutions, e.g., implementation of an aggressive program to control invasive vegetation and limit SAV predation, such difficulties could prolong the program, potentially over many years. The active habitat replacement program will be undertaken until the levels of ecosystem recovery, health, and stability defined during the design phase have been reached and sustained. Master Comment 313187 Some commenters stated that the EPA has failed to consider how predation will be controlled. Concern was expressed that wildlife predation of both naturally colonizing and planted/seeded vegetation will be widespread. Response to Master Comment 313187 The nature and extent of herbivory will be defined through monitoring, as will the species requiring control, e.g., invertebrates, turtles, common carp (Cyprinus carpio), waterfowl, beaver (Castor canadensis), and muskrat (Ondatra zibethicus). The predation control element of the program, in concert with other elements, will aim to maintain predation at acceptable levels. Specification for predation control techniques such as herbivore enclosures, trapping, chemical control, and biocontrol will be detailed during remedial design, and opportunities to integrate predation control with wildlife reestablishment and management will be analyzed. Master Comment 759 Commenters were skeptical that the river and affected environs could be returned to a beneficial state after dredging. There were questions surrounding the plans for backfill material - what it would be and what its source would be. There were some concerns that the habitat restoration process was not well defined and might cause more harm than good. Response to Master Comment 759 A habitat replacement program will be formulated during the design phase of the project. This program will be implemented as an essential component of the overall remedy. With successful habitat replacement, ecological risk associated with the proposed action will be minimized and there will be ecosystem improvements through contamination removal. Further details on the proposed habitat replacement are addressed in Response to Master Comment 537 in Section 9.1. Backfill material will be obtained from commercial suppliers/distributors and may originate from a number of locations ranging from Lake Champlain to coastal New Jersey. Further discussion is provided in the Response to Master Comment 653.
Responsiveness Summary Hudson River PCBs Site Record of Decision
9-32
Master Comment 523 Some commenters suggested that EPA's proposed monitoring program is inadequate, saying that the plan fails to address both the monitoring of the success of the restoration effort and time-of-year limitations related to sampling locations, frequencies, and parameters. It has been suggested that there is no conceptual model for SAV habitat interactions that is specific to the Upper Hudson. Other comments say that there is no evidence that adaptive management is being integrated into the early planning phases of the restoration process. It was recommended that the monitoring plan should be fleshed out during the design stage, and that photo-documentation should be a required component of the monitoring plan. Response to Master Comment 523 Habitat replacement monitoring will be implemented as an essential, integrated component of the overall program and, as such, will comprise systematic data collection and documentation before habitat replacement implementation, during implementation, and after implementation. A monitoring plan that will include photo-documentation will be formulated during the design phase of the project and will specify sampling locations, frequencies, and parameters. Per the guidelines established by the Federal Interagency Stream Restoration Working Group (1998), the following steps will be undertaken requisite to formulation of the monitoring plan:
• Define the restoration vision, goals, and objectives. • Develop the dynamic model. • Choose performance criteria. • Choose monitoring parameters and methods. • Estimate costs. • Categorize the types of data. • Determine the level of effort and duration.
With respect specifically to SAV, as stated by Stevenson and Davis (2001), a conceptual model for SAV habitat interactions exists and has been revised based on extensive scientific research. EPA would use this model – Chesapeake Bay Submerged Aquatic Vegetation Water Quality and Habitat-Based Requirements and Restoration Targets: A Second Technical Synthesis (Batiuk, et al., 2000), or similar – as a basis for constructing a dynamic model specific to the Upper Hudson River and the replacement of the SAV habitats. References Batiuk, R. A., P. Bergstrom, M. Kemp, E. Koch, L. Murray, J. C. Stevenson, R. Bartleson, V. Carter, N. B. Rybicki, J. M. Landwehr, C. Gallegos, L. Karrh, M. Naylor, D. Wilcox, K. A. Moore, S. Ailstock, and M. Techberg. August 2000. Chesapeake Bay Submerged Aquatic Vegetation Water Quality and Habitat-Based Requirements and Restoration Targets: A Second Technical Synthesis. US Environmental Protection Agency/Chesapeake Bay Program, Annapolis, MD. Federal Interagency Stream Restoration Working Group. October 1998. Stream Corridor Restoration: Principles, Processes, and Practices.
Responsiveness Summary Hudson River PCBs Site Record of Decision
9-33
Stevenson, J. C., and R. C. Davis. April 2001. Assessment of EPA’s Habitat Replacement Program for the Hudson River Proposed Remedial Plan (REM 3/10/Select). In: Comments of the General Electric Company on U.S. EPA’s Hudson River PCB Feasibility Study and Proposed Remedial Action Plan, Volume 4, Appendix D-1. Master Comment 525 Commenters stated that EPA's description of benthic community restoration is overly simplistic. Some commenters said that the Proposed Plan does not adequately differentiate between epifaunal and benthic invertebrate communities and potential differences in the feasibility of their restoration, and that EPA has not evaluated potential effects on the benthic community (and concomitant fisheries resources) from change of substrate type. Response to Master Comment 525 The intent of the habitat replacement program is to return the river bottom to a stable, well-sorted substrate with a complex mixture of sediment sizes that provides benthic habitat diversity and a productive benthic community as a source of food for fish. As such, remediated areas in the deep river and shallow river habitat zones would be backfilled with gravel and sand and, over time, some silt and other fines would be transported into these backfilled areas. This varied substrate would provide habitat for a variety of epifaunal (attached to the sediment surface, such as snails) and infaunal (occurring within the sediment, such as oligochaete worms) invertebrates. The reestablishment of SAV beds would provide habitat for benthic species that thrive in areas of submerged aquatic vegetation, such as freshwater scuds (amphipods). As benthic invertebrates will readily reestablish in the remediated areas, fish and wildlife that depend on those resources for food are expected to experience, at most, temporary food shortages in localized areas. Downstream migration or drift is typically the most important mechanism of benthos dispersal (Petts and Calow, 1996). There is generally a continuous stream of benthic organisms (larval and adult) represented in the currents of streams and rivers. As there is a continual source of benthic invertebrates in the downstream drift, the recovery of benthic invertebrates in an area of previous disturbance generally commences soon after the disturbance, if suitable habitat conditions exist. In a study of the recovery rates of macroinvertebrate communities following disturbance, Niemi, et al. (1990) found that 90 percent of the cases reviewed indicated recovery times within one year. Channel relocation and reconstruction projects provide an indication of recovery times where a major physical modification of the river channel occurs. In a colonization study of a newly formed channel in the Tongue River, Wyoming, maximum densities of macroinvertebrates were obtained in less than 90 days, with equilibrium levels reached in about 200 days (Gore 1979, 1982). For a new stream channel in Scotland, Doughty and Turner (1991) reported maximum diversity and similarity to a reference site 80 to100 days after invertebrate recolonization began. Malmqvist et al. (1991) found that invertebrate diversity in a man-made channel was similar to that in reference streams within one year.
Responsiveness Summary Hudson River PCBs Site Record of Decision
9-34
References Doughty, C. R., and M. J. Turner. 1991. The Ponesk Burn Diversion: Colonization of Benthic Invertebrates and Fish. Technical Report No. 98. Clyde River Purification Board, East Kilbride, Scotland. As reported in: Petts, G., and C. Calow. 1996. River Restoration. Blackwell Science, Inc., Malden, MA. Gore, J. A. 1979. Patterns of initial benthic recolonization of a reclaimed coal strip-mined river channel. Canadian Journal of Zoology 57:2429-39. As reported in: Petts, G., and C. Calow. 1996. River Restoration. Blackwell Science, Inc., Malden, MA. Gore, J. A. 1982. Benthic invertebrate colonization: source distance effects on community composition. Hydrobiologia 94:183-93. As reported in: Petts, G., and C. Calow. 1996. River Restoration. Blackwell Science, Inc., Malden, MA. Malmqvist, B., S. Rundle, C. Bronmark, and A. Erlandson. 1991. Invertebrate colonization of a new, man-made stream in Sweden. Freshwater Biology 26:307-24. As reported in: Petts, G., and C. Calow. 1996. River Restoration. Blackwell Science, Inc., Malden, MA. Niemi, G. J., P. DeVore, N. Detenbeck, D. Taylor, J. D. Yount, A. Lima, J. Pastor, and R. J. Naiman. 1990. Overview of case studies on recovery of aquatic systems from disturbance. Environmental Management 14: 571-88. As reported in: Petts, G., and C. Calow. 1996. River Restoration. Blackwell Science, Inc., Malden, MA. Petts, G., and C. Calow. 1996. River Restoration. Blackwell Science, Inc., Malden, MA. Master Comment 527 Commenters stated that EPA has failed to adequately evaluate the challenges of replacing and protecting the emergent wetlands. Some say there is no mention as to whether monitoring will be used to ensure appropriate hydrology before planting occurs. Others expressed concern that the current plan does not consider the potential for water quality degradation. Concerns were expressed that there is no mention of how invasive species such as common reed (Phragmites australis) and purple loosestrife (Lythrum salicaria) would be controlled and prevented from colonizing the disturbed areas. Some contend that the replacement of wetlands disturbed by dredging should consist of regrading to appropriate elevations for desirable hydrophytic species. Recommendations were made that other habitat replacement objectives specific to wetlands should include replacement of bird and mammal habitat. Response to Master Comment 527 The goal of the wetland replacement actions generally will be to replace the wetland functions and values that existed before remediation. This will include the replacement of bird and mammal habitat.
Responsiveness Summary Hudson River PCBs Site Record of Decision
9-35
This effort will require the collection and documentation of extensive hydrology, soil, and biological data on the pre-remediation conditions of the wetlands. In some cases, a return to pre-remediation conditions may not be feasible; e.g., in situations where the post-remediation hydrology does not permit restoration to pre-remediation conditions. In such cases, hydrology, soil, and biological data will be collected and documented for both the original pre-remediation wetland and local reference sites. Reference sites are nearby wetlands with physical characteristics (e.g., elevation, hydrology, and soil texture) that closely match those of the subject replacement wetland after remediation. Wetlands disturbed by remediation activities will be regraded to elevations suitable for supporting target hydrophytic vegetation. Elevation requirements will be detailed initially during remedial design, but will be modified during program implementation in response to knowledge gained through monitoring, evaluation, and feedback. Replacement design plans for each wetland will specify all elevation requirements. After initial grading, resulting elevations will be surveyed and the wetland hydrology will be monitored, at a minimum throughout one year but potentially through several consecutive years. Some wetland replacement sites and all of the wetland reference sites will be monitored throughout the habitat replacement program. If appropriate, the wetlands will be regraded to establish the required hydrology. Requisite to wetland replacement, specific objectives will be designated for each wetland for all stages of the replacement process. Monitoring before, during, and after implementation will be used to ensure that the objectives for each stage are achieved prior to progressing to the next stage. As examples, appropriate hydrology, sediment texture, and sediment stability, verified through monitoring, will be required before planting or seeding is initiated; and monitoring will be used to identify needed mid-course corrective actions, such as adjustments to the site hydrology, replanting/reseeding, and routine maintenance. Of paramount importance will be establishing the required hydrology, as hydrology typically is the most critical factor affecting the success of wetland restoration projects (Lowry, 1989). Monitoring, performed at a frequency that allows for intervention, will also be critical to the early identification of colonization by invasive wetland vegetation, e.g., common reed (Phragmites australis) and purple loosestrife (Lythrum salicaria), and the extent of their spread, as well as to the assessment of the effectiveness of measures undertaken to control invasive vegetation. The invasive vegetation control element of the program, in concert with other elements of the program, will seek to minimize the spread and prevalence of exotic species. The invasive vegetation control element will be formulated during remedial design. References Interagency Workgroup on Wetland Restoration. May 2001. An Introduction to Wetland Restoration, Creation, and Enhancement – Review Draft. USEPA, NOAA, USACE, USFWS, and Natural Resources Conservation Service. Lowry, D. J. October 1989. Restoration and creation of palustrine wetlands associated with riverine systems of the glaciated Northeast. In: Kusler, Jon A., and Mary E. Kentula (eds.). Wetland Creation and Restoration: The Status of the Science, Volume I: Regional Reviews. USEPA, Environmental Research Laboratory, Corvallis, OR, document EPA/600/3-89/038.
Responsiveness Summary Hudson River PCBs Site Record of Decision
9-36
Master Comment 529 Commenters stated that EPA has not considered how it will control/prevent exotic species from colonizing disturbed areas; only species native to the Upper Hudson should be replanted or reseeded. Some commenters said that if the river were dredged, in the absence of native plant communities, the aquatic ecosystem would likely be recolonized by nuisance exotic species that can tolerate disturbed conditions. Commenters recommended that every effort should be made to avoid creating conditions that optimize recolonization of the invasive exotic, water chestnut (Trapa natans). While Trapa inhabits slower, more depositional areas of the river, wild celery (Vallisneria) and pondweed (Potamogeton) dominate in faster-moving water where sediments are characteristically non-cohesive. Response to Master Comment 529 The habitat replacement program to be formulated during remedial design will integrate invasive vegetation control, predation control, and reseeding/replanting program elements with implementation of habitat replacement actions. Only vegetation species native to the Upper Hudson River will be planted or seeded. Sequencing and scheduling of habitat replacement actions will be analyzed for opportunities to preclude or minimize establishment of invasive, exotic species, notably Eurasian water milfoil (Myriophyllum spicatum), curly pondweed (Potamogeton crispus), and water chestnut (Trapa natans) in the river, and purple loosestrife (Lythrum salicaria) and common reed (Phragmites australis) in the emergent wetlands. Despite efforts to preclude or minimize their establishment, colonization by invasive, exotic species will occur. The monitoring element of the habitat restoration program coupled with the dynamic model will be used to predict the location and extent of invasive species problems, potentially using predictive approaches currently being developed, such as that reported by Madsen (1999). The invasive vegetation control element of the program, in concert with other elements of the program, will seek to minimize the spread and prevalence of exotic species. Species-specific candidate control techniques – mechanical, chemical, and biological – will be evaluated, selected, and integrated into both the invasive vegetation control element and the overall habitat replacement program. Integration will strive to resolve management conflicts (e.g., incidental harm to non-target, native species resulting from the control of invasive, exotic species) and exploit synergies (e.g., opportunities to control more than one species with a technology, or manage a desirable, native herbivore to control an invasive, exotic plant). Reference Madsen, J. D. Fall/Winter 1999. A quantitative approach to predict potential nonindigenous aquatic plant species problems. ANS Update 5(4):1.
Responsiveness Summary Hudson River PCBs Site Record of Decision
9-37
Master Comment 531 Some commenters stated that EPA has not considered the source and availability of plant material and transplanting requirements, and worry that the large number of plants required for restoration may not be readily available. Others say that the proposed plan also lacks information on sequencing and prioritization. Response to Master Comment 531 Natural seeding/relocation of SAV will be the central component of SAV replacement. Only if the monitored rates of natural seeding/recolonization do not satisfy the evaluation criteria will extensive SAV propagation and planting be initiated. Natural seeding/recolonization of SAV will be a central component of the SAV replacement. SAV reproduce sexually through flower and seed production. Acre-for-acre replacement of SAV beds may not be desirable or feasible. This will depend on the actual extent of dredging and backfilling; the geomorphological response of the river in redistributing sediments; and the habitat replacement goals formulated during remedial design, particularly in terms of competing uses of the river (e.g., recreational use and navigation, and fish spawning by species requiring unvegetated gravel substrate). If it is determined that acre-for-acre replacement is either not desirable or not feasible, the number of plants required could be reduced substantially. A final list of SAV and wetland vegetation species to be planted will be detailed in the remedial design phase. This list, along with all other aspects of the habitat replacement program, will be formulated in consultation with the federal Trustees and NYSDEC. The list of species will be modified at times during the implementation of the habitat replacement program based on accumulation of experience with the conditions on the Upper Hudson River and the findings of other habitat replacement projects. Likewise, planting requirements and the sources and availability of plant materials will be detailed initially in the design phase, but as knowledge is gained, these, too, will be modified during program implementation. SAV will be reestablished in locations where the post-remediation physical conditions, specifically sediment substrate, water quality, water circulation and mixing, and light regimes (Batiuk, et al., 2000; Cerco and Moore, 2000; Korschgen and Green, 1988; Sager, et al., 1998; Sheriden, et al., 1998; Smart and Dick, 1999), would support the community and where its presence would not conflict with other objectives. It is expected that the source of plant materials will include wild collection, purchase from existing nurseries, and transplanting from nurseries established specifically for the program. (Several nurseries in the region currently supply plant material for restoration projects and will be candidates for supplying this project.) Prioritization, sequencing, and scheduling will be addressed during remedial design. Scheduling of habitat replacement actions can be accomplished only after the dynamic model has been formulated and in concert with scheduling of the remediation actions, both of which will be addressed during the remedial design phase as well. The integration of the habitat replacement program schedule with the schedule for the remediation activities will be important to the
Responsiveness Summary Hudson River PCBs Site Record of Decision
9-38
success of the program, particularly in terms of preventing the loss of unprotected backfill, fully utilizing opportunities to establish restoration plantings, precluding damage to restoration plantings through sediment re-suspension, and control of invasive vegetation. References Batiuk, R. A., P. Bergstrom, M. Kemp, E. Koch, L. Murray, J. C. Stevenson, R. Bartleson, V. Carter, N. B. Rybicki, J. M. Landwehr, C. Gallegos, L. Karrh, M. Naylor, D. Wilcox, K. A. Moore, S. Ailstock, and M. Techberg. August 2000. Chesapeake Bay Submerged Aquatic Vegetation Water Quality and Habitat-Based Requirements and Restoration Targets: A Second Technical Synthesis. US Environmental Protection Agency/Chesapeake Bay Program, Annapolis, MD. Cerco, C. F., and K. Moore. January 1, 2000. System-Wide Submerged Aquatic Vegetation Model for Chesapeake Bay. Korschgen, C. E., and W. L. Green. 1988. American Wildcelery (Vallisneria americana): Ecological Considerations for Restoration. US Fish and Wildlfie Service Report 19, Northern Prairie Wildlife Research Center. Sager, E. P. S., T. H. Whillans, and M. G. Fox. June 1998. Factors influencing the recovery of submersed macrophytes in four coastal marshes of Lake Ontario. Wetlands 18(2):256-265. Sheridan, P., G. McMahan, K. Hammerstrom, and W. Pulich, Jr. June 1998. Factors affecting restoration of Halodule wrightii to Galveston Bay, Texas. Restoration Ecology 6(2):144-158. Smart, R. M., and G. O. Dick. February 1999. Propagation and Establishment of Aquatic Plants: A Handbook for Ecosystem Restoration Projects. USACE, Waterways Experiment Station, Vicksburg, MS, Technical Report A-99-4. Master Comment 533 Several comments were received relative to restoration of SAV: 1) Natural seeding/recolonization of SAV should be used. 2) Restoration of desirable SAV lost because of dredging activities should factor in optimal light attenuation, nutrient levels, flows, and sediment type for their survival and growth. 3) Planting of SAV is not recommended unless pilot studies demonstrate success and at a much faster rate of restoration compared to natural reseeding/recolonization. 4) Relying on natural recolonization processes should also decrease costs of habitat replacement. Response to Master Comment 533 Natural seeding/recolonization of SAV will be a central component of the SAV replacement. SAV reproduce sexually through flower and seed production. Redhead grass or clasping leaved pondweed (Potamogeton perfoliatus) reproduces primarily by seed, and the seeds are dispersed readily by currents to new locations. Wild celery (Vallisneria americana) produce fruit capsules,
Responsiveness Summary Hudson River PCBs Site Record of Decision
9-39
some of which rupture and release a gelatinous matrix containing seeds (Korschgen and Green, 1988). Often, the seed-containing matrix settles to the bottom in close proximity to the parent plant (Kaul, 1978). Otherwise, if the fruits do not rupture until the plants have broken free of the substrate and floated away to a suitable location, dispersal of the wild celery can occur (Korschgen and Green, 1988). The monitoring and evaluation elements of the habitat replacement program will be used to gauge the effectiveness of natural seeding/recolonization of establishing SAV on suitable, post-remediation substrates. Establishment of SAV communities by natural seeding/recolonization will be measured against evaluation criteria to be formulated during remedial design. The evaluation criteria would specify percent cover thresholds for native SAV species for several years following remediation, as well as percent cover limits for exotic species. References Kaul, R. B. 1978. Morphology of germination and establishment of aquatic seedlings in Alismataceae and Hydrocharitaceae. Aquatic Botany 5:139-147. As reported in: Korschgen, Carl E., and William L. Green. 1988. American Wildcelery (Vallisneria americana): Ecological Considerations for Restoration. US Fish and Wildlife Service Report 19, Northern Prairie Wildlife Research Center. Korschgen, C. E., and W. L. Green. 1988. American Wildcelery (Vallisneria americana): Ecological Considerations for Restoration. US Fish and Wildlfie Service Report 19, Northern Prairie Wildlife Research Center. Master Comment 535 Commenters stated that EPA collected no data and conducted no pilot project that could serve as a basis to evaluate the likelihood of success or the time necessary for ecological restoration after dredging. Some said that there is no information on the substrate necessary for the growth and sustenance of aquatic vegetation or the problems of reestablishing native vegetation. Others assert that the status of the science does not support EPA's conclusion that the habitat replacement effort, in particular the SAV habitat restoration, will be successful. It was suggested that if restoration efforts are unsuccessful, the Natural Resource Trustees claim should seek compensation for such losses as part of the NRD. It was said that in defending its proposal publicly, EPA has claimed that independent groups believe restoration is likely. The Biological Technical Assistance Group (BTAG) November 3, 2000 letter offered as an example does not report successful restoration at sites analogous to the Upper Hudson. Commenters say that no hard evidence has been presented to indicate that impacts would be short-term and transient. Numerous commenters stated that the short-term disturbance of the local ecosystem is justified by the medium and long-term benefits of PCB removal. Response to Master Comment 535 During remedial design, a habitat replacement program, with SAV replacement as an integral component, will be formulated in an adaptive management framework, as the most appropriate management framework for implementing as large a scale habitat replacement program as is
Responsiveness Summary Hudson River PCBs Site Record of Decision
9-40
envisioned for the Hudson River PCBs Superfund Site. The decision to employ an adaptive management framework is founded on the conclusion that, although gaps currently exist and will continue to exist in our understanding of the Upper Hudson River ecosystem, a comprehensive and responsive science-based program will be required to replace and restore the habitats disturbed by remediation. Adaptive management would facilitate going forward with habitat replacement activities despite uncertainties regarding the specific responses of the ecosystem to the replacement actions to be undertaken. Although the specific outcomes of the habitat replacement program cannot be predicted, adaptive management will enhance the capacity of the program to achieve the habitat replacement objectives by integrating the following elements into the habitat replacement program, as appropriate:
• Articulation of existing interdisciplinary experience and scientific information. • Delineation of Upper Hudson River habitats and collection of baseline habitat data. • Formulation of a dynamic Upper Hudson River habitat replacement model. • Formulation of specific habitat replacement goals and objectives, evaluation criteria,
and definition of replacement success. • Formulation of a monitoring, appraisal, and feedback program. • Design, prioritization, scheduling, and implementation of habitat replacement actions. • Monitoring of habitat variables and the response of the ecosystem to replacement
actions. • Periodic evaluation of the dynamic model, the effectiveness of replacement actions
undertaken, and progress toward the replacement objectives. • Periodic revision of the dynamic model.
The proposed SAV replacement program would be implemented based, in part, on experience gained in SAV restoration projects in brackish and marine environments and in smaller-scale SAV restoration projects. The SAV replacement program will also rely on available guidance, mostly for SAV restoration in marine environments (e.g., Fonseca et al., 1998). As stated by Stevenson and Davis (2001), a conceptual model for SAV habitat interactions exists and has been revised based on extensive scientific research. EPA would use this model – Chesapeake Bay Submerged Aquatic Vegetation Water Quality and Habitat-Based Requirements and Restoration Targets: A Second Technical Synthesis (Batiuk, et al., 2000), or similar – as a basis for constructing a dynamic model specific to the Upper Hudson River and the replacement of the SAV habitats. The habitat replacement model would be developed during remedial design. References Batiuk, R. A., P. Bergstrom, M. Kemp, E. Koch, L. Murray, J. C. Stevenson, R. Bartleson, V. Carter, N. B. Rybicki, J. M. Landwehr, C. Gallegos, L. Karrh, M. Naylor, D. Wilcox, K. A. Moore, S. Ailstock, and M. Techberg. August 2000. Chesapeake Bay Submerged Aquatic Vegetation Water Quality and Habitat-Based Requirements and Restoration Targets: A Second Technical Synthesis. US Environmental Protection Agency/Chesapeake Bay Program, Annapolis, MD.
Responsiveness Summary Hudson River PCBs Site Record of Decision
9-41
Fonseca, M. S., W. J. Kenworthy, and G. W. Thayer. November 1998. Guidelines for the Conservation and Restoration of Seagrasses in the United States and Adjacent Waters. NOAA Coastal Ocean Program Decision Analysis Series No. 12. National Oceanic and Atmospheric Administration, Coastal Ocean Office, Silver Spring, MD. Stevenson, J. C., and R. C. Davis. April 2001. Assessment of EPA’s Habitat Replacement Program for the Hudson River Proposed Remedial Plan (REM 3/10/Select). In: Comments of the General Electric Company on U.S. EPA’s Hudson River PCB Feasibility Study and Proposed Remedial Action Plan, Volume 4, Appendix D-1.
9.4 Time to Recovery Master Comment 422647 Several commenters have asked how long it would take for the river to recover following implementation of REM-3/10/Select. Response to Master Comment 422647 Implementation of the selected remedy may result in the following riverine impacts:
• Removal and/or backfilling of substrate used as spawning and foraging habitat by fish and benthic invertebrate species.
• Displacement of benthic organisms. • Loss of submerged aquatic vegetation. • Loss of freshwater wetlands acreage and wetlands functional values. • Disturbance of riverbank. • Resuspension.
A habitat replacement program will be implemented to mitigate these disturbances. The habitat replacement program will be formulated in an adaptive management framework. Adaptive management is intended to identify problems early in the habitat replacement program and provide an effective framework for the rapid development of appropriate solutions (e.g., implementation of an aggressive program to control invasive species and predation on newly established vegetation communities). The active habitat replacement program will be undertaken until levels of ecosystem recovery, health, and stability defined during the design phase have been reached and sustained. Following is a general discussion of riverine recovery following implementation of the selected remedy. Substrate Removal and Replacement of Benthic Organisms Since dredging will occur in targeted areas and will not be bank-to-bank, there will always be portions of the river bottom where bottom-dwelling invertebrates will be undisturbed and will be available as a food resource to fish. Further, even in those targeted areas that are dredged and/or
Responsiveness Summary Hudson River PCBs Site Record of Decision
9-42
backfilled, the recolonization of benthic invertebrates will begin in a given area soon after remediation activities are complete. The intent of the habitat replacement program is to return the river bottom to a stable, well-sorted substrate with a complex mixture of sediment sizes that provides benthic habitat diversity and a productive benthic community as a source of food for fish. With respect to benthic invertebrate recovery following remediation and habitat replacement activities, the most important recovery mechanism is downstream drift dispersal. There is generally a continuous stream of benthic organisms (larval and adult) represented in the currents of streams and rivers. As there is a continual source of benthic invertebrates in the downstream drift, the recovery of benthic invertebrates in an area of previous disturbance generally commences soon after the disturbance, if suitable habitat conditions exist. In a study of the recovery rates of macroinvertebrate communities following disturbance, Niemi, et al. (1990) found that 90 percent of the cases reviewed indicated recovery times within one year. Channel relocation and reconstruction projects provide an indication of recovery times where a major physical modification of the river channel occurs. In a colonization study of a newly formed channel in the Tongue River, Wyoming, maximum densities of macroinvertebrates were obtained in less than 90 days with equilibrium levels reached in about 200 days (Gore 1979, 1982). For a new stream channel in Scotland, Doughty and Turner (1991) reported maximum diversity and similarity to a reference site 80 to100 days after invertebrate recolonization began. Malmqvist et al., (1991) found that invertebrate diversity in a man-made channel was similar to that in reference streams within one year. Thus, it is anticipated that recolonization of benthic invertebrates in a given remediated area of the Hudson River would commence soon after remediation activities were complete, and that recovery of benthic communities could occur within one year of implementation of the selected remedy at the area. As it is expected that benthic invertebrates will readily reestablish in the remediated areas, fish and wildlife that depend on those resources for food are expected to experience, at most, temporary food shortages in localized areas. Submerged Aquatic Vegetation (SAV) Reestablishment of SAV (and, in fact, much of the habitat replacement work, including wetland restoration) will extend beyond the current six-year time frame of the remediation. The actual duration of implementation of the habitat replacement program in general, and SAV replacement in particular, will depend on the following:
• Extent of the habitats (e.g., SAV is not continuous throughout the river bottom, but occurs in discontinuous beds) and the extent of direct and indirect habitat disturbance.
• Geomorphological response of the river to the remediation activities. • Precision and accuracy of the Upper Hudson River habitat replacement model. • Response of the ecosystem to the disturbance of riverine habitats and to habitat
replacement actions, particularly those undertaken early in the program. • Responsiveness of the adaptive management framework. • Other factors that could also hasten or prolong reestablishment, such as the weather,
river discharges, competition from invasive exotic species, predation, and the occurrence of pests.
Responsiveness Summary Hudson River PCBs Site Record of Decision
9-43
As mentioned above, the active habitat replacement program will be undertaken until levels of ecosystem recovery, health, and stability defined during remedial design have been reached and sustained. Wetlands The goal of the wetland restoration actions generally will be to restore the wetland conditions that existed before remediation. Wetlands disturbed by remediation activities will be regraded to elevations suitable for supporting target hydrophytic vegetation. Elevation requirements will be detailed initially during the design phase, but during program implementation will be modified in response to knowledge gained through monitoring, evaluation, and feedback. Restoration design plans for each wetland will specify elevation requirements. After initial grading, resulting elevations will be surveyed and the wetland hydrology will be monitored, at minimum throughout one year, but potentially through several consecutive years. Riverbank Rehabilitation Riverbanks immediately adjacent to sediment removal locations may require stabilization to control bank erosion, slumping, and sloughing. Restoration objectives for the riverbank zone are to replace vegetation communities and to stabilize shorelines. Banks with well-developed riparian vegetation are protected from erosion and provide a source of food for small fish. The actual riverbank stabilization method to be employed along a given shoreline segment will be specified during remedial design. Vegetative and structural-vegetative methods will be employed, the choice being dependent on the extent of bottom sediment removal in the adjacent river and the magnitude of erosive forces. Riverbank restoration measures would commence soon after remediation activities along a given shoreline segment are completed. Resuspension As described in the Response to Master Comment 735, Section 9.2, total suspended solids (TSS) modeling indicates that the Hudson River will be minimally impacted by resuspension. The model indicates that normal spring runoff produces far greater TSS variations than those predicted as a result of dredging. The relatively small TSS increase and the small area affected by dredging indicate that the river will be minimally impacted by resuspension. Further, as also described in the Response to Master Comment 735, resuspension will not release significant amounts of contaminants into the water column compared to the background level. Thus, recovery time is not an issue with respect to water quality. References Doughty, C. R., and M. J. Turner. 1991. The Ponesk Burn Diversion: Colonization of Benthic Invertebrates and Fish. Technical Report No. 98. Clyde River Purification Board, East Kilbride, Scotland. As reported in: Petts, G., and C. Calow. 1996. River Restoration. Blackwell Science, Inc., Malden, MA.
Responsiveness Summary Hudson River PCBs Site Record of Decision
9-44
Gore, J. A. 1979. Patterns of initial benthic recolonization of a reclaimed coal strip-mined river channel. Canadian Journal of Zoology 57:2429-39. As reported in: Petts, G., and C. Calow. 1996. River Restoration. Blackwell Science, Inc., Malden, MA. Gore, J. A. 1982. Benthic invertebrate colonization: source distance effects on community composition. Hydrobiologia 94:183-93. As reported in: Petts, G., and C. Calow. 1996. River Restoration. Blackwell Science, Inc., Malden, MA. Malmqvist, B., S. Rundle, C. Bronmark, and A. Erlandson. 1991. Invertebrate colonization of a new, man-made stream in Sweden. Freshwater Biology 26:307-24. As reported in: Petts, G., and C. Calow. 1996. River Restoration. Blackwell Science, Inc., Malden, MA. Niemi, G. J., P. DeVore, N. Detenbeck, D. Taylor, J. D. Yount, A. Lima, J. Pastor, and R. J. Naiman. 1990. Overview of case studies on recovery of aquatic systems from disturbance. Environmental Management 14: 571-88. As reported in: Petts, G., and C. Calow. 1996. River Restoration. Blackwell Science, Inc., Malden, MA. Petts, G., and C. Calow. 1996. River Restoration. Blackwell Science, Inc., Malden, MA. 9.5 Effect on Navigation Channel/Bathymetry Master Comment 757 The New York State Office of the Attorney General and, at a number of public meetings, representatives of boating concerns operating on the Hudson River, stated that environmental dredging would facilitate navigational dredging, thereby improving access to and the economy related to the waterway. Some commenters stated that dredging operations would have an adverse effect on navigation in the Upper Hudson River. Response to Master Comment 757 The selected remedy includes navigational dredging as necessary for implementation. It is anticipated that dredging and associated supporting activities will have a positive impact on Hudson River navigation. Analysis presented in White Paper – River Traffic suggests that mechanical dredging will result in an additional 18 lockages per 24-hour day at Lock 6 and an additional six lockages per 24-hour day at Lock 5. A lockage represents a vessel passage – either pleasure craft or commercial craft – in one direction through the locks. Therefore, the additional 18 lockages per 24-hour day at Lock 6 are actually nine lockages heading downstream and nine lockages heading upstream. The same logic applies to the six lockages at Lock 5: three lockages heading downstream and three lockages heading upstream. It is important to note that Locks 5 and 6 are not currently used to full capacity, and that the lock-operating schedule has available capacity for project-related barge and associated towboat traffic. In addition, the Proposed Plan suggests the use of locks on a 24-hour-per-day basis. Off-hours will be available for project vessel passage. During busy days and weekends, it is anticipated that
Responsiveness Summary Hudson River PCBs Site Record of Decision
9-45
a majority of project traffic can pass through the locks in the off hours, thus mitigating excessive lock congestion or interference with either recreational or commercial boaters. As a rule, hydraulic dredging requires fewer barge and towboat movements through the locks compared to the mechanical dredging alternative. This is largely due to the fact that hydraulic dredging uses extended pipelines instead of barges to transport much of the dredged material. Hydraulic dredging would have dredged sediments pumped to a northern transfer facility for processing and final disposal1. Therefore, fewer disposal barges are needed in the hydraulic dredging scenario. In total, an additional six lockages per 24-hour day are anticipated from the hydraulic dredging alternative at Locks 6 and 5. Due to the current available capacity at Locks 5 and 6, hydraulic dredging is not expected to interfere with traffic at the locks. In addition, off-hours will be available each day for project vessel passage. Also see the White Paper – River Traffic for details and specific information regarding the complete analysis of navigation on affected areas of the Hudson River. It is anticipated that debris removal will occur throughout the entire project area prior to dredging in any particular target area. Overall navigation in the river will be improved through the removal of underwater obstructions and debris, and the process slightly deepens the river in multiple locations. This debris removal is also beneficial to the overall health of the river system, greatly reducing potential obstructions, choking debris, and excessive organic matter that can strain a river's biological systems. It is important to note that removal operations associated with the remediation include both environmental dredging and navigational dredging. Historically, the Canal Corporation routinely dredged the canal to maintain a water depth of 12 feet. Dredging in the project area has not occurred since 1979, with the exception of the area where the Hoosic River discharges into the Hudson River between Locks 3 and 4. Since that time, the Canal Corporation has completed annual canal sweeps to determine areas of increased sedimentation and decreased water depth in the navigation channel. The most recent sweep data, collected during the 2000 river season, 1 It is important to note that EPA has not yet determined the location(s) of sediment processing/transfer facilities necessary to implement the selected remedy. For purposes of the Feasibility Study, example locations were identified from an initial list of candidate sites based on screening-level field observations which considered potential facility locations from an engineering perspective. In the Feasibility Study, it was necessary to assume the locations of sediment processing/transfer facilities in order to develop conceptual engineering plans, analyze equipment requirements, and develop cost estimates for the remedial alternatives. For this purpose, two example locations were identified: one at the northern end of the project area in the vicinity of the Old Moreau Dredge Spoils Area, and one at the southern end of the project area near the Port of Albany. Each of these example locations fulfills many of the desired engineering characteristics for such a facility to support the remedial work, and is representative of reasonable assumptions with regard to distance from the dredging work and cost. Other locations, both within the Upper Hudson River valley and farther downstream, are possible. The example facility locations presented in the Feasibility Study have also been used in the Responsiveness Summary in order to clarify material presented in the Feasibility Study and Proposed Plan and in connection with additional noise, odor and other analyses that were performed in order to respond to public comments. EPA will not determine the actual facility location(s) until after EPA performs additional analyses and holds a public comment period on proposed locations and considers public input in the final siting decision. Thus, all information provided in this Responsiveness Summary relative to potential impacts of the sediment processing/transfer facilities on communities, residents, agriculture, the environment and businesses should likewise be considered representative and illustrative. Further specific assessment of and, as necessary, mitigation of, potential impacts will be addressed during remedial design.
Responsiveness Summary Hudson River PCBs Site Record of Decision
9-46
determined that the area near Buoy R160, located north of Lock 5 and south of the Route 4 Bridge, contains only seven feet of water. This suggests that the navigation of vessels from the north or from the south of this area is significantly impeded by the current conditions. This area of passage is very narrow and presently prohibits safe and adequate passage. The selected remedy includes removal of sediments to depths of six and eight feet to open up this area and return it to a depth of 12 feet. This will facilitate navigation of the river both north and south of this location. Similar sedimentation has occurred in other river sections as well, and removal of these sediments would allow commercial traffic to pass from Lake Champlain down to Albany with no significant limitations, which is expected to have a beneficial impact on the region’s economy. Economic impacts of the project are discussed in greater detail in White Paper – Socioeconomics.
Responsiveness Summary Hudson River PCBs Site Record of Decision
10-1
10. IMPLEMENTABILITY OF REMEDIAL ALTERNATIVES 10.1 Dredging Schedule and Production Rates Master Comment 659 Several commenters advocate environmental dredging as the preferred remedy, while others consider the technology to be unreliable and costly. Commenters have raised questions concerning which dredging method will be used, and presented their own analysis of hydraulic versus mechanical dredging. Some suggest particular dredging systems while others specify performance criteria for either hydraulic or mechanical dredging technologies. Some commenters have asked for additional clarification as to how particular equipment will operate and suggested that further evaluation of specific innovative technologies should be done. It has also been recommended that information on past navigational dredging in the Hudson River be gathered in order to understand the environmental impacts of dredging in the area. Response to Master Comment 659 As presented in Chapters 4 and 5 of the FS, both mechanical and hydraulic dredging technologies are considered to be applicable to dredging upper Hudson River PCB-contaminated sediments. Within the mechanical dredging category, the Horizontal Profiler bucket mounted on a hydraulic excavator is the preferred system. In the hydraulic equipment category, the cutterhead suction dredge is preferred. See the Response to Master Comment 671 for additional information on the engineering reliability of dredging systems and White Paper – Post-Dredging PCB Residuals on effectiveness of dredging systems. EPA has determined the selected remedy is cost-effective. The final selection of dredging equipment will occur during the project's design stage. Numerous factors will influence the selection, including data obtained from the pre-construction sediment sampling program; the results of more detailed engineering planning and analysis required during the design phase of the project; and information obtained from potential contractors. It should be noted, however, that River Section 3, the reach south of Lock 5, would be dredged using mechanical methods in any event, as discussed in the FS. The reason is that there are practical limitations to the distance that a sediment slurry (discharged by a hydraulic dredge) can be reliably pumped. Thus, it is expected that some mechanical dredging will occur irrespective of which technology is selected for the bulk of removal work. Beyond the two principal dredging technologies identified in the FS, it may be necessary for the contractor to use any one of several specialty dredges to conduct removal operations in particularly shallow river sections. EPA will review the contractor's recommendations concerning specialty dredging equipment before it is actually employed on the river. Finally, while there has been historical navigational dredging activity on the Upper Hudson River, the equipment was different from that which will be used to implement the selected remedy. Therefore, evaluation of historical dredging work is not relevant in evaluating environmental impacts of the selected remedy. Environmental impacts of the selected remedy are discussed at length in Chapters 8 and 9.
Responsiveness Summary Hudson River PCBs Site Record of Decision
10-2
Master Comment 669 Commenters have raised questions as to the order in which the sections of the river will be dredged. Response to Master Comment 669 The precise sequence of dredging work has not yet been determined. There will be a general preference to dredge the river in the upstream-to-downstream direction to limit recontamination of completed target areas. As discussed later in this chapter, there will be exceptions to this approach, irrespective of which dredging technology is selected for the bulk of removal operations. However, as also will be discussed, it is not expected that recontamination of completed work areas will be significant. It is likely that initial dredging work will be focused on improving navigation along the Hudson River/Champlain Canal between Locks 1 and 6. One reason for this is to enable project-related equipment to navigate the Champlain Canal system with minimal interference from in-river obstructions. Another reason is to limit, as much as possible, interference between project-generated river traffic and traffic otherwise occurring on the river. One way to reduce such in-river interference is to clear out shoal areas and thereby restore the navigation channel to its designated width. In addition to the aforementioned navigational dredging considerations, logistical planning relative to use of equipment may preclude achieving a completely upstream-to-downstream work plan. Under both the mechanical and hydraulic dredging scenarios, multiple dredges will be working at the same time. It can be expected that this equipment would be distributed to a number of upstream and downstream locations so that the appropriate piece of equipment is being used to remove material in each targeted area. While a strict north to south approach may, therefore, not be possible, several factors mitigate concern over this circumstance. As presented in White Paper – Resuspension of PCBs during Dredging, both the mass of sediment and of PCBs re-mobilized during dredging operations is estimated to be minimal. In addition, most remobilized sediment will be deposited within the immediate vicinity of the ongoing work and will be captured as dredging progresses downstream within a work area. Thus, it is not expected that dredging work in an upstream area will have significant potential to impact completed downstream target areas. Also, modern positioning systems on dredges enable removal of minimum amounts of material from very specific areas. Should post-remedial sampling reveal the presence of a veneer of material that needs to be removed, this could be readily accomplished by modern dredging systems. If river dynamics result in significant recontamination under a particular sequence of dredging work, it may be necessary to develop an approach that involves some redredging. An example may be the vicinity of Hot Spot 34, where navigational dredging is required in order to move equipment through the area for work to be performed upstream. At this location, the targeted area may be dredged and backfilled initially, and then at some future date the surface materials
Responsiveness Summary Hudson River PCBs Site Record of Decision
10-3
would be tested to determine if a veneer of newly deposited sediment would still need to be removed. This strategy could be cost-effective if it enabled the work to be expedited. Master Comment 671 Questions have been raised with regard to the EPA's ability to achieve the proposed project schedule during both the design and construction phases. The Hudson River remedy has been compared to other Superfund projects and, based on experiences at those sites, it has been stated that EPA's proposed production rates are unrealistic and that the EPA will not complete all construction work in a five-year period. Commenters have stated that dredging will take twice as long or longer to accomplish, depending on the technology selected. Finally, concern has been expressed that various factors will lead to delays and downtime and frustrate timely completion of the program. Response to Master Comment 671 In addition to the following response, White Paper – Dredging Productivity and Schedule and White Paper – Delays and Downtime contain additional information relevant to these questions. Remedial Design Period EPA has developed a conceptual approach to implementing the selected remedy under the assumption that the government will perform the remedial work. The project's remedial design period will entail sediment sampling to finalize dredge cut lines, selection of a contractor, selection of dredging technology, construction of sediment processing/transfer facilities, and finalization of agreements with landfills, rail companies, backfill material suppliers, and energy providers. It is expected that many of these tasks will occur in parallel. EPA will begin sediment sampling and analysis subsequent to issuance of a ROD, and will also initiate contractor selection. Contractor selection involves preparation of requests for qualifications followed by review of contractor submittals and then release of bid packages to qualified contracting teams. It is currently anticipated that there will be approximately 30 months available to accomplish remedial design; this is considered adequate time to complete the associated tasks. Remediation Phasing As indicated in the ROD, EPA will conduct a phased remedial program, with dredging commencing in 2005 and continuing for six construction seasons. In the first phase, the first construction season of remedial dredging will be implemented initially at less than full-scale, during which extensive monitoring of operations will be performed. The second phase will be the remainder of the dredging operation, which will be conducted at full-scale and is expected to last five years.
Responsiveness Summary Hudson River PCBs Site Record of Decision
10-4
Mechanical Dredging One commenter focused largely on Saginaw River removal work conducted during calendar year 2000, where removal rates approached only 50 percent of rates planned for the Hudson. However, the comparison is inappropriate, as discussed in the White Paper – Dredging Productivity and Schedule. For example, the Saginaw River project employed one mechanical dredge to accomplish all work, whereas the Hudson River analysis is based on four mechanical dredges operating simultaneously. Thus, there is little relevance to comparing outcomes at Saginaw to results expected on the Hudson River. Commenters also compared removal rates attained at New Bedford Harbor to those proposed for the Hudson River. Prior to calendar year 2000, all dredging programs conducted at New Bedford used hydraulic equipment. During calendar year 2000, mechanical equipment, similar in capacity and design to that proposed in the FS, was demonstrated. During that New Bedford demonstration, sediment removal rates between 50 and 60 cubic yards per hour (cy/hr) were achieved. In addition, program participants concluded that the mechanical dredge could have achieved production levels greater than 75 cy/hr with further pre-planning of the work (White Paper – Dredging Productivity and Schedule). This compares favorably with the production goals set for the Hudson River, which are 82 cy/hr for the large dredge (4 cu yd) and 27 cy/hr for the small dredge (2 cu yd). Hydraulic Dredging Estimated production rates for the selected hydraulic dredging system were presented in the FS (Appendix H) and are discussed further in White Paper – Dredging Productivity and Schedule. The hydraulic cutterhead dredge system that is proposed for use in the Upper Hudson will be specifically designed to reflect the physical and environmental constraints imposed by the river. EPA is aware that at many other remedial locations there has been a tendency to apply off-the-shelf equipment simply to avoid devoting time and resources to developing focused and tailored solutions. As described in the White Paper – Dredging Productivity and Schedule, commenters attempting to compare the Hudson River to other Superfund sites did not present sufficient information to generate a truly valid comparison for hydraulic dredging systems. Factors such as the type of dredge (auger, cutterhead, etc.), type of sediment, depth of cut, presence of debris, horsepower of pump, size of cutterhead, dimensions of ladder, etc., all have a bearing on the results obtained. For instance, comparing the performance of auger dredges (designed for work in sludge ponds and industrial lagoons) to the 12-inch cutterhead proposed for use on the upper Hudson, has little technical merit and would not produce a valid conclusion. Delays and Downtime Factors that could create delays and downtime such as river congestion, weather, and equipment problems have been reviewed (see White Paper – Delays and Downtime). Since productivity estimates applied in the FS were based on dredging equipment operating between 48 percent (mechanical) and 61 percent (hydraulic) of the week, considerable margin has been left to manage potential delaying factors such as those mentioned herein.
Responsiveness Summary Hudson River PCBs Site Record of Decision
10-5
Additionally, an analysis of current canal traffic and usage indicates that river congestion can potentially occur during the months of July and August. EPA believes that congestion problems can be avoided if project equipment movements are scheduled, as much as possible, for off-peak periods (White Paper – River Traffic). Weather-related downtime includes delays from high flows, low temperatures, and high winds. After reviewing meteorological data, the potential for weather-related delays has been accounted for in the calculation of downtime (see White Paper –Delays and Downtime), and does not appear to be significant. Finally, delays from equipment malfunctions and equipment unavailability need not represent major difficulties because extensive planning will occur at the outset of work and attention will be given to management of the overall remedial program. Master Comment 422186 There are two categories of comments concerning dredging and floods:
• Concern about how implementing the remedy would affect flooding. • Concern about how flooding would affect dredging operations.
Response to Master Comment 422186 This response is in two parts as per the comment. Potential impacts of EPA's selected remedy on flooding are evaluated first and then a discussion follows addressing the impacts of flooding on dredging operations. Impacts of Selected Remedy on Upper Hudson Valley Flooding Implementation of the selected remedy is not expected to influence flooding in the Upper Hudson valley since the volume of active storage of the river will not be changed substantially. EPA will place considerable fill in the river's floodway as a follow-up activity to dredging operations. However, the volume of fill material will only be a fraction of the sediments removed by the dredging operations. The selected remedy entails removal of approximately 2.65 million cubic yards of sediment. Upon completion of the remedy, about 0.8 million cubic yards of fill material will have been placed. Thus, EPA will remove considerably more material from the river bottom than it will place as fill. Furthermore, in the context of the Hudson River's being a series of impounded pools, backfilling will not utilize the river's active storage capacity. For both of these reasons backfilling, as per EPA's selected remedy, is not expected to exacerbate flooding effects. Another aspect of the selected remedy that potentially involves placement of fill in the river's floodway and flood fringe is construction of sediment processing/transfer facilities, particularly a new wharf or dock to facilitate unloading sediment-laden barges. EPA would prefer to construct the sediment processing/transfer facility at locations where wharf facilities already exist. However, in the event that in not possible, then a wharf would need to constructed at the river's edge to receive loaded barges. The type of structure likely to be used is an open lattice pile supported deck that would involve placement of little fill material. However, the final selection
Responsiveness Summary Hudson River PCBs Site Record of Decision
10-6
of wharf structure will depend on subsurface conditions at the transfer site as well as on the loads the structure will need to carry. Since the processing/transfer site has not been selected at this stage, it would be speculative to proceed further with a flooding assessment. EPA is aware of the need to minimize encroachments within floodplains and will consider the matter in detail during the project's design stage. As stated elsewhere in this Responsiveness Summary, the principal benefit of EPA's selected remedy is removal of a considerable sediment-bound contaminant mass from the river's floodway. As removal work proceeds, the mass of PCBs available to be carried over onto residential and farm land during flood events will diminish. In this context, the selected remedy will have a significant positive impact during flood events when the potential for sediment resuspension is greatest. Impacts of Flooding on Dredging Operations It is expected that weather will have some impact on dredging operations each construction season. For instance, it is expected that in-river operations, particularly dredging, will be temporarily halted when river discharges approach levels in the 10,000 to 15,000 cfs range to avoid worker injuries and property damage. These discharge rates are relatively modest flows, well below the peak levels that occur during storm events with only a five- or 10-year return frequency. In addition, it may be counter-productive to work with sophisticated positioning and materials management systems under conditions where sediment targeting accuracy is likely to be impaired. The important consideration here is that EPA will require control of dredging operations at all times. At times when environmental conditions impede maintenance of adequate control, work will be temporarily halted until the river returns to more typical discharge levels. Should it prove necessary to halt work because of high river flows, the dredges, barges, and other in-river equipment will be secured either at processing/transfer facilities or at mooring points constructed at suitable locations within the river. As discussed in the White Paper – Delays and Downtime, impacts of weather and other factors that may reduce project throughput have been taken into consideration in determining dredging productivity. Thus, since operations will not be conducted under such conditions, it is not expected that river discharges associated with severe storm events, such as storms with a return frequency of 50 or 100 years, will delay dredging operations beyond the downtime already incorporated in productivity calculations. Master Comment 362590 One commenter asked, will the suction of the hydraulic dredge capture the high (especially > 1000 ppm) oily NAPL better than a mechanical dredge?
Responsiveness Summary Hudson River PCBs Site Record of Decision
10-7
Response to Master Comment 362590 Considerable sediment sampling has been conducted over the last decade within sections of the Hudson River that are now targeted for remediation. Investigators of conditions within the upper Hudson have included both GE and EPA. Results of the various sediment sampling programs show the river bottom continuing to be PCB contaminated but do not indicate the presence of PCBs, or other organic contaminants, in quantities that constitute oily free product or NAPL (non-aqueous phase liquid) as it is sometimes called. Consequently, it is neither expected nor likely that dredging operations will encounter contaminants that have the physical characteristics of an oily waste. Therefore, selection of a dredging technology, either hydraulic or mechanical, will not be based on the presence of such materials since none are expected within targeted areas.
10.2 Monitoring Master Comment 313970 With regard to implementability, a commenter questioned how EPA could conduct a five-year review under a No Action scenario since no task is designated to monitor sediment, water, and biota. Response to Master Comment 313970 In accordance with CERCLA Section 121(c), for any remedial action that results in any hazardous substances, pollutants, or contaminants remaining at a Superfund site, EPA “shall review such remedial action no less often than each 5 years...to assure that human health and the environment are being protected” by that remedial action. A “no action” remedy is, for this purpose, a remedial action under CERCLA. See, e.g., 40 CFR § 300.430(e)(iii)(7) (evaluation of remedial alternatives for a Superfund site shall include an assessment of the “no-action alternative”). EPA can provide for monitoring and other studies required for a five-year review independently of whether the required monitoring and studies are included in a remedial decision. Master Comment 362634 Commenters raised these two questions: How will EPA's monitoring/sampling plan be conducted to attain a residual cleanup goal of 1 ppm in dredged areas? Will cores or samples be collected from non-dredged areas to determine whether PCB concentrations have changed due to remedial activities? Response to Master Comment 362634 As part of the construction monitoring program, an example of which is outlined in Section 6.3.5.4 and Appendix G of the FS, confirmational sediment sampling will be designed to document the degree of PCB mass and concentration reduction in remediation areas. The post-construction monitoring program, (an example which is outlined in the FS, Section 6.3.5.4 and
Responsiveness Summary Hudson River PCBs Site Record of Decision
10-8
Appendix G) will require two separate core collection efforts, one high resolution dated core collection to monitor transport and thus to document the long-term recovery of the river, and one essentially low resolution coring effort to monitor sediment inventory, particularly in remediated areas. Both of the monitoring programs will be developed during the design phase with public input. The following discussion illustrates how these programs could address the commenter’s questions. As part of the construction monitoring program, sediment cores will be collected in remediation areas to document the removal of the PCB inventory and the attainment of acceptable PCB concentrations. Sampling in dredged areas will be fairly dense. Each sample would be tested via a field laboratory, presumably using an immunoassay technique. A fourth of the samples would be sent to a conventional laboratory for PCB, organic carbon, and radionuclide (Cs-137) analyses. An area would be certified as acceptable when a preset number of cores falls below the desired threshold value based on the immunoassay tests. Alternately, an area may be certified as acceptable when the mean value falls below a specific threshold. In this case, the threshold is expected to be 1 ppm for Tri+ PCBs and 2ppm for total PCBs. White Paper – Post-Dredging PCB Residuals and White Paper – Relationship between Tri+ and Total PCBs contain discussions of the relationship among cleanup levels. Sampling in remediation areas after backfilling would also be implemented as part of the construction monitoring program to document that acceptable PCB levels have been achieved and that the thickness of the backfill material is sufficient. Since the backfill material will be essentially pristine prior to its placement on the river bottom, a lower rate of sampling is likely needed than noted above. Sampling in remediation areas would also be included in the post-construction monitoring program. This sampling will document changes, if any, in the thickness of backfill material and levels of contamination, and would reveal any recontamination of the surface sediments. As part of the Phase 2 investigation, EPA made extensive use of dated high resolution sediment cores collected from the Hudson River. Dateable cores were collected in 14 areas. They provided an integrative perspective of long-term PCB transport in the river. The cores documented both the principal source of PCBs as well as the long-term fate of PCBs within the sediments in the absence of resuspension. Dated sediments cores would be sampled as part of the post-construction monitoring program. The cores would be divided into 2- to 4-cm intervals and analyzed for both congener-specific PCBs and radionuclides. The radionuclides would provide the information to establish depositional history, and the congener-specific data could be used to identify the source of contamination. High-resolution cores partially address the issue of sediment release during dredging and subsequent accumulation in non-dredge areas by examining the long-range PCB transport. These cores would exhibit the response of the river to remedial activities. Also, as outlined in Section 8 and Appendix G of the FS, additional shallow cores and grab samples will be collected and analyzed for total PCBs on an Aroclor basis.
Responsiveness Summary Hudson River PCBs Site Record of Decision
10-9
Master Comment 405943 Concerns have been raised regarding resuspension of PCB-laden sediments during the debris removal process. Response to Master Comment 405943 Results of an in-river debris survey are presented in Appendix H.2 of the FS. The goal of the survey was to obtain a general assessment of the quantity of bottom debris (cobbles, logs, manmade materials, etc.) that would be encountered during dredging operations. It is concluded, and reflected in Appendix H.2, that instrumentation is available to detect most near-surface material that would interfere with dredging operations, and that the extent of observed debris is not sufficient to cause a significant removal problem. Knowing that debris is present on the river bottom, it will be possible to develop a program to retrieve much of that material prior to initiating sediment removal operations in a particular area. The survey reported in Appendix H.2 further confirmed the presence of near-surface consolidated rock within the Upper Hudson River channel. Rocky outcrops were rather extensively documented by side-scan sonar surveys during the remedial investigation. Where pockets of contaminated sediments are present in the vicinity of rocky outcrops, it may not be possible to remove these sediments by conventional dredging methods. An allowance was made for the inability to capture contaminated sediment pockets in the FS risk analysis. During design, sonar methods will once again be employed to further refine the spatial extent of rock at targeted dredging locations. Because contaminated sediments are primarily found in depositional areas of the Upper Hudson River, the presence of debris and rocky outcrops represent manageable problems for implementation of the selected remedy, as explained in the FS. Depositional areas are areas where fine materials accumulate and where consolidated materials, if present, are being buried. The process of sedimentation has been occurring over a much more extensive period than has the discharge of PCBs, which largely occurred in the decades following World War II. In this context, it would be expected that the contaminated sediments now overlay cleaner, historic deposits, thereby reducing the probability of interference that consolidated or rocky materials might otherwise exert during dredging operations. As noted above, the amount of debris encountered during dredging is expected to be small and target areas will generally avoid areas of rock outcropping. Also, EPA will use silt curtains or other containment measures to the extent practicable during both debris removal and dredging. Therefore, debris removal should not have a major impact on sediment resuspension. Master Comment 253427 Comments include a question as to why Aroclor and not congener-specific analysis will be performed on sediments under the post-construction monitoring program. This is claimed to be inconsistent with the proposal to conduct congener-specific analysis on water and fish under the MNA scenario.
Responsiveness Summary Hudson River PCBs Site Record of Decision
10-10
Response to Master Comment 253427 Congener-specific analysis on sediments is, in fact, planned as part of the post-construction monitoring program for the selected remedy, as is radionuclide dating and Aroclor analysis, as outlined in Section 5.2.7.4 of the FS and discussed in the foregoing Response to Master Comment 362634. Post-construction monitoring of fish and water will also be conducted on a congener-specific basis since monitored natural attenuation is a component of the selected remedy following active remediation. The post-construction monitoring program that would have been implemented under the MNA alternative, had EPA selected that as the remedy, would have been designed to track changes or lack of changes in several media. Because of their dynamic and short-term nature, water and biota are generally monitored on a congener-specific basis to examine how changes in concentration are reflected in the congener pattern. These media are the recipients of contamination, and not the sources of it. Thus, their PCB inventories are relatively small and dynamic. The analytical plan under MNA would have been designed to capture these variations. A congener-specific analysis involving collection of sediment cores for dating and testing would also have been implemented as part of a post-construction monitoring program for MNA, similar to the program to be implemented for the selected remedy but with a different start date and duration. Master Comment 362631 Some commenters asserted that additional samples/cores should be taken before proposing a final remedy. Commenters wondered whether sediment samples will be collected in areas where there is little historical data, particularly in River Sections 2 and 3 (below the TID), to better determine PCB inventories. It was suggested that documented locations of cores should be very precise so that future cores can be collected at exactly the same location, and that in addition to contaminant concentrations, physical characteristics of core sediments should be analyzed and documented. Commenters also asked whether new bathymetry data of the Upper Hudson will be obtained prior to remedial activities, and whether bathymetric data will be used to determine the new geometry of the river bottom, as well as the quantity of sediments removed, during post-dredge assessments. Response to Master Comment 362631 EPA recognizes the need to document the current spatial extent of PCB contamination (both vertically and horizontally) prior to beginning any remedial action. As discussed in Appendix G of the FS, an extensive sediment coring program is planned as part of the remedial design. In addition to sampling the areas already targeted, the program calls for an extensive core collection effort in areas not previously identified for removal. This portion of the program is intended to examine the areas of the Upper Hudson that have not been extensively sampled to ascertain the PCB concentrations and inventories of these areas. Those areas meeting the contamination criteria would be included in the remediation.
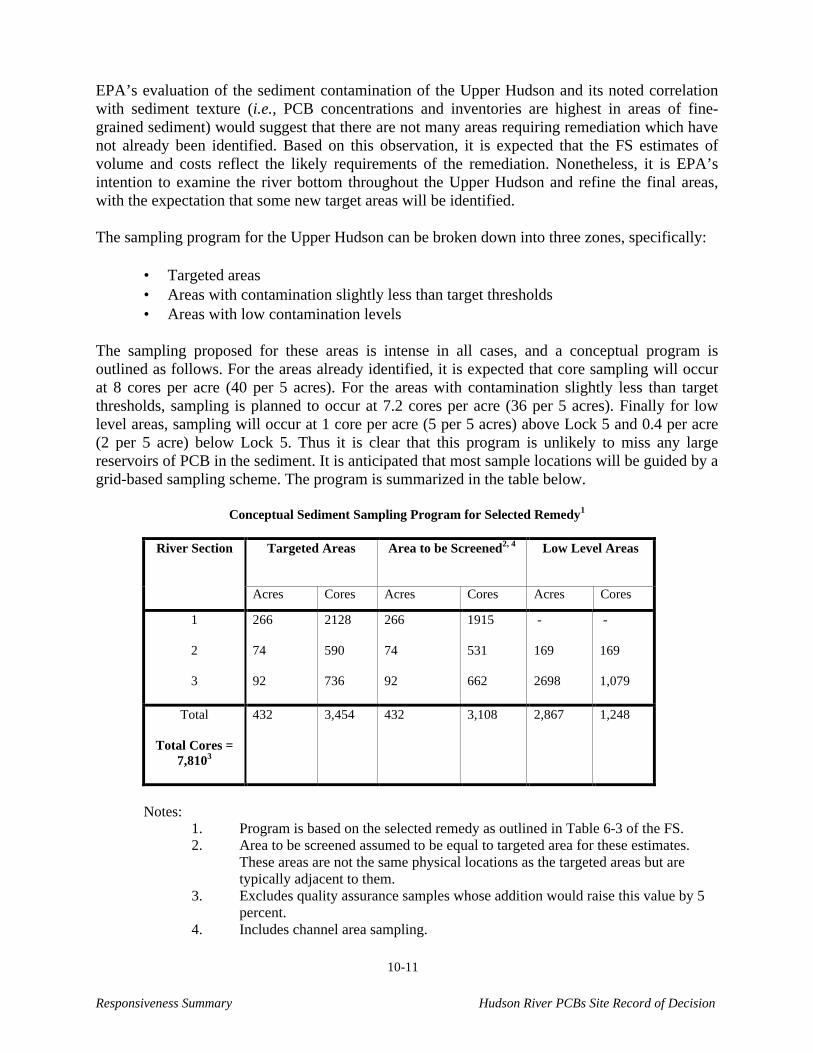
Responsiveness Summary Hudson River PCBs Site Record of Decision
10-11
EPA’s evaluation of the sediment contamination of the Upper Hudson and its noted correlation with sediment texture (i.e., PCB concentrations and inventories are highest in areas of fine-grained sediment) would suggest that there are not many areas requiring remediation which have not already been identified. Based on this observation, it is expected that the FS estimates of volume and costs reflect the likely requirements of the remediation. Nonetheless, it is EPA’s intention to examine the river bottom throughout the Upper Hudson and refine the final areas, with the expectation that some new target areas will be identified. The sampling program for the Upper Hudson can be broken down into three zones, specifically:
• Targeted areas • Areas with contamination slightly less than target thresholds • Areas with low contamination levels
The sampling proposed for these areas is intense in all cases, and a conceptual program is outlined as follows. For the areas already identified, it is expected that core sampling will occur at 8 cores per acre (40 per 5 acres). For the areas with contamination slightly less than target thresholds, sampling is planned to occur at 7.2 cores per acre (36 per 5 acres). Finally for low level areas, sampling will occur at 1 core per acre (5 per 5 acres) above Lock 5 and 0.4 per acre (2 per 5 acre) below Lock 5. Thus it is clear that this program is unlikely to miss any large reservoirs of PCB in the sediment. It is anticipated that most sample locations will be guided by a grid-based sampling scheme. The program is summarized in the table below.
Conceptual Sediment Sampling Program for Selected Remedy1
Targeted Areas
Area to be Screened2, 4 Low Level Areas River Section
Acres Cores Acres Cores Acres Cores
1
2
3
266 74 92
2128 590 736
266 74 92
1915 531 662
- 169 2698
- 169 1,079
Total
Total Cores = 7,8103
432
3,454
432 3,108 2,867
1,248
Notes:
1. Program is based on the selected remedy as outlined in Table 6-3 of the FS. 2. Area to be screened assumed to be equal to targeted area for these estimates.
These areas are not the same physical locations as the targeted areas but are typically adjacent to them.
3. Excludes quality assurance samples whose addition would raise this value by 5 percent.
4. Includes channel area sampling.
Responsiveness Summary Hudson River PCBs Site Record of Decision
10-12
Although the EPA has planned a large sediment sampling program for the purposes of the remedial design, it should not be inferred that the existing data are insufficient to support the selected remedy. Rather, the data to be collected are almost exclusively for the purpose of refining boundaries of the target areas and volumes of sediments to be dredged. The existing data set is quite sufficient to identify the contaminated sediments of the Upper Hudson as the current source of PCBs to the biota and to the regions downstream. It is also a sufficient basis for the engineering estimates prepared in the FS. In addition to the planned sediment coring effort, geophysical investigations will also play an important part in the design, removal and monitoring of the sediments under the selected remedy. The geophysical investigations will be used for the following:
• establish river bathymetry and sediment type prior to the onset of remediation, • re-examine the river bottom in conjunction with the sediment sampling program
discussed above as an aid to the final delineation of remediation areas. • examine the river bathymetry during and after dredging to assure that the appropriate
volume of sediment has been removed and that the backfill material has been properly placed, and
• monitor river bathymetry and sediment texture so as to monitor any substantive changes in the backfill material over time.
For both the geophysical work as well as the sediment core collection, the EPA intends to employ accurate measures of location at a precision appropriate to the use of the data. Sediment physical characteristics will be included with the analytical data to be obtained.
10.3 Resuspension and Residual PCB Concentration Master Comment 667 Commenters have raised questions with regard to the effectiveness of turbidity barriers (in particular silt curtains) due to their failure at other sites, and the effects of water level fluctuations on their performance, and concerns associated with their use and purpose. Commenters were skeptical with regard to the effectiveness of silt curtains due to resuspension that occurred at the Fox River (SMU-56/57) dredging project despite the use of turbidity barriers. One commenter questioned the effectiveness of silt curtains in regard to water height fluctuations associated with the operation of hydroelectric facilities. Response to Master Comment 667 In general, EPA has determined that the level of resuspension associated with remedial activities will be relatively low, regardless of whether turbidity barriers are used. The reader is referred to the White Paper – Resuspension of PCBs during Dredging. The FS report (Appendix E) presented a technical memorandum discussing the applicability of turbidity barriers in the Upper Hudson River. EPA proposes the use of turbidity barriers in the Upper Hudson River for removal work that is being conducted in relatively shallow areas to
Responsiveness Summary Hudson River PCBs Site Record of Decision
10-13
reduce downstream suspended sediment load. Estimation (modeling) of downstream TSS and PCB loads from dredging did not assume the use of turbidity barriers, so those estimates would be conservative in light of the fact that barriers will be used where applicable. While problems with turbidity barriers were noted at sites such as the Grasse River, GM Central Foundry, and the Outboard Marine site, it is important to note that the difficulties encountered at these sites were due to variable winds and current speeds in excess of those at which the barriers are effective. Conversations with various silt curtain manufacturers and users have indicated that silt curtains will work effectively in rivers with currents equal to or less than 2 feet per second (fps). River currents in the Hudson River center channel are in the range of 1.5 fps, and turbidity barriers are proposed for use in shallower river areas where river velocities are even lower. Review of available Fox River data indicates little difference between upstream and downstream total suspended solids (TSS) concentrations (USGS, 2000) when averaged over the length of the project. The goal of turbidity barriers is to control TSS; thus, it cannot be concluded from the Fox River experience that the turbidity barriers failed to achieve the project objectives since the TSS concentrations upstream and downstream of the dredging operation were essentially the same. Also, during the project's design phase, plans will be developed for optimal deployment and anchoring of silt curtains. Prior to deployment of a system, an analysis will be conducted to define the position of the anchor line and evaluate the forces expected to occur at each location. If this analysis determines that high currents may be encountered, causing extreme forces on a planned silt curtain, an upstream barrier such as a deflective curtain may be installed to help reduce water pressure. Additional flow-velocity data will be collected during the project's design phase for purposes of this analysis. Analysis of these data will identify specific zones where silt curtains are likely to be effective. With regard to water level variations, it is not expected that fluctuations due to operation of upstream hydroelectric facilities will impact the effectiveness of silt curtains or other turbidity barriers. Reference USGS. 2000. “A Mass-Balance Approach for Assessing PCB Movement during Remediation of a PCB-Contaminated Deposit on the Fox River, Wisconsin,” USGS Water-Resources Investigations Report 00-4245, December. Master Comment 583 Commenters contended that resuspension caused by dredging will remobilize and increase concentrations of PCBs in the water column and surficial sediments, possibly causing higher levels in surface sediments than were present before dredging. Many believe that resuspension caused by the various dredging operations cannot be fully controlled and suggest that projects such as the Fox River demonstration dredging projects support that position. According to some commenters, data collected during the Fox River demonstration projects resulted in estimates of 2.2 to 10 percent releases of dissolved PCBs to the water column. One commenter contends that
Responsiveness Summary Hudson River PCBs Site Record of Decision
10-14
EPA has assumed an unrealistically low rate of resuspension during dredging, observing that EPA did not include a resuspension input in its model forecast simulations. GE provided comments and calculations assuming that 2.5 percent of the PCB mass in dredged material will be mobilized and transported downstream, stating that a higher assumed rate of resuspension will have a much greater effect in River Sections 2 and 3, relative to River Section 1. Concern was expressed relative to such possible negative impacts resulting from resuspension as degraded water quality, impact on downstream water uses (e.g., agricultural, municipal, and industrial water supply), an increase in the bioavailable PCBs, and contamination of additional areas. Others expressed the belief that continuous, long-term resuspension occurs naturally, and that resuspension may be less of a threat than portrayed by some, since many of the hot spots occur in relatively quiet water. Response to Master Comment 583 The issue of resuspension is discussed in some detail in White Paper – Resuspension of PCBs during Dredging. Other potential impacts of the project are addressed in White Paper – Potential Impacts to Water Resources, White Paper – PCB Releases to Air, White Paper – Air Quality Evaluation, and White Paper – Post-Dredging PCB Residuals, in addition to responses to master comments in Chapters 8 and 9. These concerns must be balanced with impacts associated with ongoing PCB releases to the water column and existing impacts to the aquatic biota. Much depends upon the extent to which (if at all) remedial operations increase the health and ecological risk. Thus, estimates of sediment resuspension and subsequent PCB releases to the water column in Appendix E.6 have generated considerable discussion and debate since the release of the FS. Considerable opinion has been offered and information proposed that seem contrary to the estimates provided in Appendix E.6. However, EPA, upon close evaluation, finds no information upon which to base changes to the original FS suspended sediment loss estimates of 0.35 percent for a conventional cutterhead dredge and 0.3 percent for an “environmental bucket” working in the Hudson River. This response summarizes the issues raised and addresses them and their pertinence to the project. Before beginning the discussion on resuspension in general, it is important to note the following conventions. Resuspension of sediments occurs as a result of the movements of the dredge head and its appendages along the river bottom (and in the case of the mechanical dredge, upward through the water column). These disturbances serve to suspend a portion of the sediment in the water column in the immediate vicinity of the dredge head. Materials such as sands and gravels quickly fall right back down to the bottom under the river velocities typical of the Upper Hudson. Silts and clays require more time to settle and may remain in the water column for some time after resuspension. Materials that immediately fall to the river bottom after being disturbed (i.e., sands and gravels) do not constitute a release of sediment (or associated PCBs) to the water column. These materials will be picked up on a second pass if needed based on tests of the residual surface concentration. Only those materials that remain in the water column for a longer period of time represent potentially important releases to the water column and downstream areas. In the discussion of resuspension, the values of 0.3 and 0.35 percent (for mechanical and hydraulic dredges, respectively) resuspension mentioned above refer to the mass of silts and clays released at the dredge head relative to the entire mass of sediment removed. As discussed in Appendix E6 of the FS, these materials are then transported away from the dredgehead to varying degrees by river currents. EPA has estimated the net escape of sediment and associated
Responsiveness Summary Hudson River PCBs Site Record of Decision
10-15
PCBs as the amount of silt and clay remaining in the water column 30 feet downstream of the dredgehead. This value, estimated for mechanical dredging to be approximately 0.13 percent of the material removed, represents the fraction of sediment and PCBs available for downstream transport. Thus for a mechanical bucket dredge, a resuspension rate of 0.3 percent yields a downstream release of 0.13 percent (for the hydraulic dredge the resuspension rate of 0.35 percent yields a downstream release rate of 0.065 percent). It is the downstream release rate value that is used for estimating downstream impacts of dredging to downstream areas via the use of EPA’s HUDTOX and FISHRAND models. In the remainder of this response, the term “resuspension” is used to refer to the process of resuspension at the dredge head itself and not the downstream transport. Elsewhere in the report, the term is used interchangably for both the process of resuspension as well as the fraction of material that becomes available for downstream transport. It is ultimately the control of the latter value that will determine the degree of impact, if any, of the dredging process on downstream areas. Importance of Dredge Type Comments on the FS reveal confusion over dredging equipment and the role equipment characteristics play in sediment resuspension. This confusion at least partially results from the fact that specifics relative to equipment to be used will be determined during the design phase. Project reports to date, therefore, have described equipment options available, but have appropriately not specifically stated which individual types and specifications of dredging equipment are definitely to be used. Further confusion results from some parties misrepresenting to the public that equipment used for other, non-remedial, purposes, such as earthmoving, are intended for use in the Hudson River. Confusing data from the Fox River dredging demonstration projects exacerbate the situation. USGS (2000) summarizes water quality data collected during the SMU 56/57 demonstration project, but does not acknowledge until the final paragraph that the data were associated with a hydraulic dredge with a horizontal auger cutter. Their report on the Deposit N, FRRAT (2000) entirely fails to describe the dredging equipment used. Only in the conclusions does the report refer to a “cutter-head.” Nowhere do they mention that the dredge used was the Moray Ultra dredge. Although the Moray Ultra dredge does have a “basket-type” cutterhead, it is strikingly different from a conventional cutterhead dredge and its resuspension characteristics would be expected to be quite different from those of a conventional hydraulic cutterhead dredge. Fortunately, reports by BBL (2000) and Foth & Van Dyke (2000) do describe the dredges used on these projects. Many environmental dredging projects utilize smaller dredges, such as the horizontal auger and Moray Ultra dredges used in the Fox River demonstration dredging studies. However, the extent and nature of the selected remedy for the Hudson River presents challenges not easily overcome by these types of dredges. In contrast, larger, more powerful dredges operate routinely under conditions similar to the selected remedy. Such dredges have a much higher likelihood of success and will reduce water quality impacts since they are operating under relatively normal conditions for their equipment. Thus, the FS considered only the application of hydraulic
Responsiveness Summary Hudson River PCBs Site Record of Decision
10-16
cutterhead dredges and environmental bucket dredges in the implementation of the proposed remedy. Site Conditions Effective removal requires a dredge matched to site conditions. For many projects, several dredge types can usually effectively remove sediments. In those cases, dredge selection depends on cost-effectiveness and compatibility with sediment management alternatives. However, some site conditions can impede dredging operations and have marked impacts on dredging effectiveness, especially in terms of sediment removal and sediment resuspension rates. Site conditions substantially complicated removal efforts at some of the projects commenters used as examples to dispute sediment resuspension estimates for the selected remedy as outlined in the FS. For example, in the Grasse River, the rocky nature of the river bottom significantly interfered with and reduced the efficiency of removal operations (Thibodeaux, 2000; Alcoa, 1995). Manistique Harbor is the primary bucket-dredging operation mentioned in disputing the loss rate used in the FS. Dredging at Manistique was primarily accomplished with a bucket dredge, although other dredges were used as well. Ray Bergeron of CableArm Clamshell (personal communication, 2001) indicated that extensive areas of dense, coarse sediments and debris inhibited the effectiveness of the dredge bucket. The Cable Arm bucket is designed to dredge soft sediments and does not perform as well where either consolidated materials or debris are present. In fact EPA has documented several remedial dredging operations where resuspension during dredging was not significant, e.g., New Bedford Harbor and GE Hudson Falls. These are further described in the White Paper – Resuspension of PCBs during Dredging. Summary Data from several other dredging projects were pointed to by commenters as representative of sediment resuspension rates that should be expected from the selected remedy (Hayes and Wu 2001). However, the projects from which these data are derived have site conditions different from the Hudson River, which render comparisons inappropriate. Thus, the original sediment resuspension rates estimated in Appendix E.6 still represent the best estimates that can be developed from currently available data. References Alcoa, Inc. 1995. Non-Time Critical Removal Action Documentation Report, Volumes I and II, Grasse River Study Area, Massena, NY. Prepared for Alcoa, Inc. by Blasland, Bouck & Lee, Inc December. Hayes, Donald F. and Wu, Pei-Yao, “Simple Approach to TSS Source Strength Estimates,” Proceedings of the WEDA XXI and TAMU 33 Annual Conference, Houston, TX, June 25-27, 2001.
Responsiveness Summary Hudson River PCBs Site Record of Decision
10-17
Blasland Bouck and Lee (BBL). 2000. Fox River SMU 56/57 Dredging Demonstration Project, June. Foth & Van Dyke. 2000. “Summary Report: Fox River Deposit N,” Wisconsin Department of Natural Resources, April. Fox River Remediation Advisory Team (FRRAT). 2000. “Evaluation of the Effectiveness of Remediation Dredging: The Fox River Deposit N Demonstration Project; November 1998 – January 1999,” Special Report WRI SR 00-01, Water Resources Institute, University of Wisconsin-Madison, Madison, WI. Thibodeaux L.J. 2000. The Effectiveness of Environmental Dredging: A Study of Three Sites. Final Report. South and Southwest, Center for Hazardous Waste Research, Louisiana State University at Baton Rouge, LA. Submitted to: Environmental Science and Technology Development Environmental Health Sciences Services, North American, ALCOA. USGS. 2000. “A Mass-Balance Approach for Assessing PCB Movement during Remediation of a PCB-Contaminated Deposit on the Fox River, Wisconsin,” USGS Water-Resources Investigations Report 00-4245, December. Master Comment 424977 GE comments (Appendix A) stated that the EPA estimate of PCB resuspension rates during dredging was too low and hence overestimated the remedial benefit to the Hudson River. GE asserted that a more reasonable estimate of the PCB resuspension rate is on the order of one to five percent based on the studies conducted on the Fox River dredging project. Response to Master Comment 424977 EPA analyses show that a conservative estimate for mass-weighted average PCB loss rates for conventional closed bucket dredges, based on the specific characteristics of Upper Hudson River sections, is 0.13 percent. The description of this analysis can be found in White Paper – Resuspension of PCBs during Dredging. The effects of including Tri+ PCBs resuspension in the Hudson River fate and transport modeling simulations can also be found in that white paper. EPA believes that the Fox River results are not applicable to the Hudson River. The dredging technology that will be used for the Hudson River is different from that used in the Fox River and will achieve lower loss rates, and EPA has serious concerns about the downstream PCB release sampling approach conducted in the Fox River project. EPA also ran its model using the 2.5 percent PCB loss rate in view of, among other things, the large number of public comments received on the dredging resuspension issue. This run was conducted for comparative purposes, even though the Agency believes that 2.5 percent resuspension is unrealistically high for the dredging equipment and methods that are expected to be used at the Site. The estimated total amount of Tri+ PCBs being remediated in the Upper Hudson River is 21,700 kg (see White Paper − Sediment PCB Inventory Estimates). The total
Responsiveness Summary Hudson River PCBs Site Record of Decision
10-18
mass of Tri+ PCBs lost to the water column at a 0.13 percent resuspension rate1 is about 28 kg over the entire dredging period. EPA calculations indicate that the 2.5 percent resuspension rate postulated by GE would result in about 500 kg of Tri+ PCBs being released during the whole dredging period. GE’s comments (Appendix A) present estimates of the impact of PCB resuspension using their PCB fate model. Specifically, GE reports results for PCB dredging loss rates of 1, 2.5, and 10 percent applied to the REM-3/10/Select alternative. GE did not, however, describe how these loss rates were incorporated into their PCB fate model. Results reported by GE for the cumulative increase in Tri+ PCB load to the lower river by the end of the dredging period in 2008 were about 350, 800, and 3500 kg for the 1, 2.5, and 10 percent resuspension rates, respectively. The higher predicted load might be due to GE’s assumption of higher PCB residuals in the sediment. Nevertheless, GE's reported increase in load to the lower river for a 2.5 percent loss rate is approximately 60 percent greater than the total release to the water column estimated by EPA for that loss rate.2 EPA concludes that GE has over-estimated the amount of downstream transport of PCBs associated with a given resuspension loss rate. As described in White Paper − Model Forecasts for Additional Simulations in the Upper Hudson River, the impacts associated with resuspension loss will be minor and transient, largely confined to the time period of active dredging. Accordingly, the substantial benefits associated with the selected remedy outweigh the reasonably expected impacts of dredging resuspension. Master Comment 579 Commenters stated that evidence regarding previous environmental dredging projects indicates that EPA's anticipated residual sediment PCB concentration of 1 ppm is unachievable. They contend that the lowest average residual PCB levels achieved for the 10 dredging projects completed to date range from 2.2 to 5.9 ppm. Response to Master Comment 579 As discussed in White Paper – Post-Dredging PCB Residuals, residual contamination depends upon a number of factors. Among these are:
• Type and depth of materials that underlie the dredging horizon. • Average level of contamination above the dredging horizon prior to dredging. • Depth of sediment to be removed. • Ultimate cleanup goal of the project.
1 Monitoring distance from the dredge head makes a difference in the calculated resuspension rate, due to sediment settling in the immediate vicinity of the operation. This value represents the net release via resuspension at a distance of 10 meters downstream of the mechanical dredge head. The resuspension due to the hydraulic dredge would be less. 2 GE has since submitted corrections to their calculations with a smaller PCB load to the Lower Hudson River.
Responsiveness Summary Hudson River PCBs Site Record of Decision
10-19
Several of the remedial dredging projects described by the commenters involved sites where contaminated sediments were underlain by hard substrate. This site-specific condition prevented overcutting of contaminated materials, a strategy that could have led to significantly lower PCB residuals. A comparable condition is not expected to be encountered in most areas being targeted under EPA’s selected remedy. Within the Hudson, the targeted fine-grained sediments are generally underlain by older fine-grained sediments, thus permitting an overcut to be taken with the goal of leaving relatively clean sediments exposed. Also, based on EPA's review of the sediment residuals, it is apparent that sites with higher initial PCB concentrations yielded higher PCB residuals after dredging than did sites with relatively lower PCB levels. In this regard the Hudson is at the lower end of the PCB contamination spectrum (in terms of sediment PCB concentration). For the Hudson River, a targeted residual of 1 mg/kg Tri+ PCBs represents a reduction of 96 to 98 percent from pre-dredging sediment concentrations (see White Paper – Post-Dredging PCB Residuals). Several dredging operations, including the GM Massena and the Cumberland Bay site on Lake Champlain, achieved PCB residuals comparable to those expected under EPA’s selected remedy. At the GM Massena site, the mean residual concentrations in two subsections represented 98.6 percent and 98.8 percent reductions from the initial mean concentrations, respectively. At Cumberland Bay, the average PCB concentration was estimated to be 135 mg/kg in the dredged sediment and the average post-dredging residual was about 2.5 mg/kg, which results in a 98.1 percent reduction. Further discussion of these results can be found in White Paper – Post-Dredging PCB Residuals. Thus, the targeted Hudson River residuals of 1 mg/kg Tri+ PCBs is comparable to that achieved at these two locations. In reviewing outcomes at other Superfund sites, it should be noted that the PCB residual concentration actually attained at these other locations was dependent, in part, on the cleanup goal set there. For example, at the Manistique River site, the cleanup goal was to remove 95 percent of PCB mass and achieve an overall average residual concentration of less than 10 mg/kg after dredging. Therefore, the residual PCB concentration, at this location, should not be expected to be 1 mg/kg since the targeted level was actually higher. Beyond these considerations, the conservative approach taken by EPA to estimate dredging depth and volumes for the selected remedy should also be noted:
• The depth to 1 mg/kg PCBs in sediment samples was determined either directly or by estimation from the Hudson River database.
• Reasonable work areas were identified and then the dredging depth was set equal to the greatest depth of contamination found in the work area samples; and
• Minimum dredging depths were assigned to areas designated as > 3 g/m2 and > 10 g/m2.
Based on this conservative strategy for selecting dredging depths and estimating dredging volumes, EPA expects to attain post-dredging residuals at or below 1 mg/kg Tri+ PCBs.
Responsiveness Summary Hudson River PCBs Site Record of Decision
10-20
In applying these above considerations to the fate and transport and bioaccumulation modeling, it was assumed that the dredging operation would achieve, on average, a 1 mg/kg Tri + PCBs residual for the reasons stated in the foregoing text. It was further assumed that the PCB residual level would be considerably reduced after backfilling due to the presence of the backfill cap. While the result of backfilling is expected to be a near zero residual, the modeling assumed a conservative Tri+ PCBs residual of 0.25 mg/kg. In summary, EPA’s assessment of PCB residuals is reasonable. Dredging depths and volumes were estimated in a highly conservative manner. In fact, one commenter who was not analyzing removal requirements as conservatively as EPA estimated that the Agency would need to remove about 500,000 fewer cubic yards of sediment than stated in the FS. Finally, comparing conditions and results at other sites lends support to EPA’s assessment; in some cases, however, comparisons to other projects is complicated by site-specific circumstances that render those comparisons either difficult or inappropriate. 10.4 Backfilling and Shoreline Restoration Master Comment 653 Commenters stated concerns including: a) the overall volume of backfill material and the impact of the remedy on the local supply of material; b) the source, the means of transport, and the location of the handling facilities; c) the duration of the backfill operation, the rate of placement and the hours of operation per day; d) the type of equipment used for the placement; and e) the type of material. With regard to source of materials, some commenters expressed the fear that EPA was planning to take soil from private property proximal to the river for use as backfill. Response to Master Comment 653 Overall Volume and Availability of Backfill Required Based on refined computation, the overall quantity of fill material has been revised for the selected remedy (REM-3/10/Select) from 851,600 cubic yards to 756,000 cubic yards, including 15 percent for bank reconstruction and habitat restoration. Approximately 322 acres of riverbed will be backfilled. The breakdown of quantities by type of material consistent with the backfill criteria stated in the Feasibility Study is as follows:
• Gravel: 112,000 cubic yards. • Sand: 447,000 cubic yards. • Fine material: 197,000 cubic yards.
The selected remedy is scheduled to take six years, which includes a less than full-scale first year phase-in. Calculations performed in the FS assumed a five-year construction period. Since the annual requirements calculated under this assumption represent a maximum for the phased implementation, the figures used in the FS are conservative for this presentation. Therefore,
Responsiveness Summary Hudson River PCBs Site Record of Decision
10-21
implementation of the selected remedy will require, as a maximum, approximately 151,200 cubic yards of fill per year. According to the USGS report (1999) titled "The Mineral Industry of New York," the total annual production of sand and gravel in the eastern part of New York State north of Ulster and Duchess Counties is approximately 7,500,000 metric tons. The project backfill requirement represents only on the order of three percent of the regional production and therefore will not affect either the cost or the availability of material in the project area. Source, Means of Transport, and Staging Areas Backfill material will be obtained from commercial suppliers/distributors, and will not be excavated from land, agricultural or otherwise, in the vicinity of the project. In general, material to be used as backfill under water on the bed of the river will not be topsoil. A six-inch layer of topsoil may be used above the shoreline for shoreline stabilization and to promote the restoration of vegetation. This relatively minor volume of topsoil will also be obtained from commercial suppliers. At least five large suppliers/distributors of sand and gravel were identified and contacted at various times during the course of the studies. It was determined that backfill materials may originate anywhere from Ft. Anne near Lake Champlain to coastal New Jersey. One of the suppliers indicated that his planned operation at Ft. Anne will be rail-accessible and material could be shipped to an appropriate off-loading point near a docking facility. Another supplier suggested that sand and gravel could be obtained in the coastal New Jersey area and delivered in canal-compatible barges (up to 2,500 tons per load) or by rail. There will be several sources of material, with appropriate means of transport to temporary stockpile areas. The technical specifications for the backfill material, to be determined during the design phase of the project, will dictate to a great extent the location of the borrow areas. At the present time, two backfill staging areas are considered to be appropriate for this project. The temporary staging of material is necessary to assure the continuity of the backfill operation. It can be either a land-based stockpile near the barge docking facility, or a set of loaded barges docked at convenient locations between the sources and the project area. EPA will ensure that the operation meets the requirements to be established during the design phase of the project. These requirements may include restriction on the hours of operation, traffic routes, etc. Transportation of the backfill material between the temporary staging areas and the project area will be via barges. EPA has stated that backfill will not be transported by truck within the Upper Hudson River area, so as to avoid roadway congestion and other disturbances that could potentially be generated by truck delivery. As stated above, the requirements and parameters of the operation will be finalized during the design period, to include any guidelines or restriction on the staging areas for backfill material. At this time, it is assumed that two backfill staging areas will be operated, co-located with the sediment processing/transfer facilities.
Responsiveness Summary Hudson River PCBs Site Record of Decision
10-22
Duration of Backfill Operation, Rate of Placement, and Hours of Operation The backfill operation will follow the dredging and progress at a similar rate. It is anticipated that both operations will take place at the same time in different locations. As the dredging operation is scheduled to last for six years, so is the backfilling. As indicated above, the average annual volume of backfill material to be placed is conservatively estimated at approximately 151,200 cubic yards. For planning purposes, it is assumed that backfilling will be done 25 weeks out of the 30 weeks of the navigation season, which would equate to an average placement rate of between approximately 5,040 and 6,050 cubic yards per week. Because this productivity rate is an average rate over a six-year period, it is anticipated that an experienced contractor will have equipment capable of handling a production rate approximately 50 percent larger so as to maintain the schedule even in areas where the operation will be more difficult. The placement of backfill material will be essentially done during daylight hours. As the construction season may be limited to 25 to 30 weeks per year, i.e., the navigation season, it is anticipated the contractor will operate six days per week. Type of Equipment Required It is anticipated that the equipment used for the placement of the backfill will be specifically designed and built for this project. The design will be based on contractor experience and the specific requirements of the task. Different techniques may be used for placement in the deeper portion of the river (6 to 12 feet) than would be used for the shallower areas. The applicable techniques include:
• Hydraulic washing - the material (sand and gravel) is transported to the Site in a flattop barge and washed overboard with high-pressure hoses. This technique is particularly well adapted to the gradual buildup of a thin uniform layer of backfill for the depths of water considered for this project.
• Pipeline with baffle-plate or sand-box - placement is accomplished with surface
discharge from a pipeline equipped with a deflecting plate or a sand-box attached at the end. For this technique the backfill material is mixed with water and pumped through the pipeline. This technique may not be applicable to the coarser material such as gravel.
• Telescoping conveyor - for shallower areas, the unloading of material from the barge
can be done using front-end loaders and telescoping conveyors.
Placement of backfill materials will be monitored to assess compliance with project requirements for turbidity control and for minimum thickness of backfill layer.
Responsiveness Summary Hudson River PCBs Site Record of Decision
10-23
Type of Material Backfill material characteristics were specified in general terms; a primary objective was habitat replacement. In order to create a varied habitat, both sandy and gravel bottom conditions were identified as being desirable. In addition, where wetlands would be impacted by the dredging operation, a sandy-silt type soil was identified as suitable replacement substrate for replanting emergent or rooted woody vegetation. Master Comment 655 Some commenters questioned the length of shoreline reconstruction to be undertaken. Some commenters stated that the shoreline should not be protected with rip-rap. Others suggested that the shoreline reconstruction should not be done until data has been collected for the adjacent floodplain. Response to Master Comment 655 The following information can be found in the FS, Section 8.5.1.6, and Tables 8-10a and 8-10b. The disturbed portions of the river shoreline will have to be restored and stabilized. The stabilization measures envisioned consist of hydro-seeding where the disturbance is minimal, and the placement of vegetative mattress where two to three feet of sediment have been removed. Where shoreline disturbance will exceed three feet of sediment removal, the stabilization will include log or wood crib revetment in addition to the vegetative mattress. Where shoreline wetlands may be affected by the dredging work, the original bottom elevation will be restored with an upper layer of silty material. Based on the area determined to require remediation, the length of shoreline restoration is currently estimated to be approximately 17 miles. For the selected remedy it is anticipated that approximately 20 percent of the shoreline stabilization will consist of hydro-seeding, 50 percent include the placement of vegetative mattress, and the remaining 30 percent would require a log or wood crib revetment in addition to the vegetative mattress. In very limited areas where significant erosion has been observed, structural measures such as rip-rap may be required to prevent further degradation of the shoreline. EPA will work with New York State with regard to investigation of PCB contamination in the floodplain concurrent with the remedial design. 10.5 Dredged Materials Disposal Master Comment 665 Commenters raised questions about the lack of identification of potential landfill sites. Some commenters questioned why EPA has not released the location of disposal facilities. Commenters believe that a remedy cannot be selected until the destination of the dredged sediments is publicly known.
Responsiveness Summary Hudson River PCBs Site Record of Decision
10-24
Cost-effectiveness of disposing of sediments outside the Hudson Valley versus the possibility of using a regional or local landfill has been questioned. One commenter suggested that, as transportation and disposal in non-regional landfills is a significant part of the remediation project's cost, disposal in a local or regional facility could potentially reduce costs if a suitable facility(ies) could be identified. The commenter stated that the decision not to landfill non-TSCA wastes locally should therefore be reconsidered. The FS conceptually evaluated disposal of TSCA-regulated material at a facility located in Texas but commenters have questioned the cost-effectiveness of doing so when compared to using the TSCA facility in Model City, New York. Numerous commenters, on the other hand, opposed disposal anywhere in western New York. Commenters also inquired if landfills exist in Canada, and if so, would this be a cost-effective alternative? It has been suggested that EPA has proposed a solution with high disposal and transportation costs when compared to other dredging projects. Also, commenters questioned whether TSCA- and non-TSCA dredged material mass has been estimated on a spatial basis. Spatial distribution may impact rail operations and landfilling. Response to Master Comment 665 Identification of Disposal Facilities EPA has determined that dredged sediments, after dewatering and/or stabilization, will be transported out of the Hudson Valley to approved landfills for final disposal. An initial search was conducted during preparation of the FS to identify landfills that have both the capacity and rail access to manage and handle Hudson River sediments. The search focused on two categories of landfill:
• Non-TSCA landfills approved pursuant to RCRA Subtitle D and capable of accepting sediments with PCB concentrations less than 50 ppm.
• TSCA landfills regulated by the USEPA and capable of accepting sediments with PCB concentrations greater than 50 ppm.
Results were presented in Table 4-14 of the FS report for non-TSCA landfills and Table 4-15 of the FS report for TSCA landfills. It would be ideal to identify and secure one TSCA facility and one non-TSCA facility to handle the Hudson River sediments over the proposed six construction seasons; however, landfill availability and current and projected landfill capacities during the project design phase will dictate the number of commercial facilities required to support the selected remedy. Currently viable landfills and their capacity limitations, in relation to the demand generated by the selected remedy for the Hudson River, were presented in Appendix E of the FS report As described in the FS report, (Appendix E and Table 4-14), the only likely landfill within New York State that could receive non-TSCA material is BFI Waste Systems of North America, Inc.’s Niagara Falls Landfill (formerly CECOS landfill). The other non-TSCA landfill located in New York State is only permitted to receive PCB-contaminated soil with less than 1 ppm PCB; this level is too low for the Hudson River sediments, which typically contain significantly higher levels of PCB. The search was, therefore, expanded outside New York State in an attempt to locate additional non-TSCA disposal alternatives. Results of the search were presented in the FS
Responsiveness Summary Hudson River PCBs Site Record of Decision
10-25
report (Appendix E) and are summarized in White Paper – Off-Site Disposal of Processed Sediments. With regard to TSCA landfills, EPA's search within New York State identified one such facility but that operation does not have direct rail access. Thus, it proved necessary to evaluate the few nationally available rail-capable, TSCA facilities, all of which are located a considerable distance from New York State. A rail-capable, TSCA landfill in Texas was selected for purposes of generating the FS cost estimate. However, the final selection of landfills will be made during the project's design phase and cannot be presented at this time, as requested by the commenter. Cost Effectiveness Associated with Location of Landfill Selected for Disposal Typically, disposal costs identified during the landfill search (including tipping fee and associated state taxes) were within the range of $40-$60 per ton for non-TSCA facilities and $50-$80 per ton for TSCA facilities. These disposal costs were presented in Tables 4-14 and 4-15 of the FS. Although disposal costs vary somewhat between in-state facilities and out-of-state facilities, the cost for transportation was also evaluated to determine the cost-effectiveness of the available disposal options. Given the limited number of large capacity TSCA landfills with rail access, cost variations between candidate sites proved minor. Appendix E of the FS presented a cost analysis between trucking to a landfill located within New York State and rail transport to a landfill located outside New York State. Comparison of total unit costs (disposal plus transportation) showed the in-state option to cost about $107 per ton while the out-of-state alternative cost $102 per ton. These results suggest that disposal outside New York State is potentially as viable as in-state disposal. Similarly, disposal at Canadian facilities could be cost-effective. Disposal costs presented in Table 4-14 of the FS report indicated that disposal costs at Canadian facilities are comparable to disposal costs within the Unites States. It may be necessary for EPA to enter into an agreement with a Canadian provincial government before a Canadian site is used for disposal. Beneficial Use In addition to landfilling, EPA considered the possibility of beneficially using some portion of the dredged sediment. Chapters 5 and 8 of the FS describe the scenarios EPA considered with regard to beneficial use. EPA will continue to evaluate beneficial use of Hudson River sediments during the project's design phase as a means to improve the overall cost-effectiveness of the selected remedy. However, since the engineering and cost parameters for landfill disposal are relatively well known compared to possible beneficial use alternatives, EPA continues to view landfill disposal as a likely management option for the dredged sediments. TSCA vs. Non-TSCA Volumes Commenters have raised questions concerning characterization of Hudson River sediments for disposal purposes. In the FS, estimated volumes of TSCA and non-TSCA material requiring removal were indicated. This estimate assumed all material greater than 32 ppm PCBs would be disposed of at a TSCA-permitted facility. Appendix E of the FS presents the calculation of these
Responsiveness Summary Hudson River PCBs Site Record of Decision
10-26
volumes. Logistical aspects of the remedy will be complicated by the presence of two different commodities (TSCA sediments, greater than 32 ppm, and non-TSCA sediments, less than 32 ppm); however, these difficulties can be overcome in several ways, including close coordination between the dredging operation and the transportation component of the selected remedy. This matter is also discussed in White Paper – Rail Operations. Master Comment 405890 Commenters questioned the value of moving PCB contamination from one area to another by dredging the river and then disposing contaminated sediments in landfills; everyone would be better off if PCBs were left buried in river sediments instead of landfilled where they could leak back into the earth. Landfilling may result in contamination of groundwater, air, and land at the selected landfill location. Many commenters were concerned that EPA would locate the landfills within the vicinity of the Hudson Valley or more specifically, "in their backyard." Others opined that the placement of over two million cubic yards of sediment in a landfill is a waste of space. Additionally, commenters expressed concerns that PCB-contaminated sediment could be spilled during transportation or other operations. Several commenters supported landfilling, stating that it is better to remove the PCBs from the river and immobilize them in a landfill specifically designed to contain them. Some commenters emphasized the need to safely treat and dispose of the sediments to achieve the benefits of protection of human health and the environment through implementation of EPA's plan. Response to Master Comment 405890 EPA has determined that dredged sediments will be stabilized as necessary, or dewatered, and then hauled by rail (or possibly barges) to permitted landfills located well beyond the Hudson Valley. The more highly contaminated sediment would be disposed in a TSCA-permitted landfill specifically designed for and in business to safely handle hazardous and toxic waste, while the less highly contaminated sediments would be disposed in a sanitary-type landfill approved to handle such materials. EPA does not plan to use existing landfills within the Hudson Valley or to establish a new Hudson Valley facility for landfilling the dredged sediments. Disposal of dredged sediments in permitted facilities is not simply moving contamination from one place to another, as has been suggested. Removing PCBs from the sediments of the Hudson River removes a toxic threat to human and ecological receptors that is continually entering the environment. Removal of PCBs is therefore protective of human health and the environment, which is EPA's mandate. Sequestering processed sediments in permitted landfills isolates the contamination from the environment, contrary to the current situation, and is therefore desirable. Such landfills, as has been said, are specifically designed to manage these materials and are thus protective of the environment. Permitted landfills so designed will avoid the very concerns raised by several commenters regarding spreading contamination. Disposal facilities will be selected based on their permit status, available capacity, availability of rail access, and disposal costs. EPA conducted a comprehensive landfill search, described in the FS report. That search identified landfills that have both the required capacity and rail access to
Responsiveness Summary Hudson River PCBs Site Record of Decision
10-27
manage Hudson River sediments. Results of the search were presented in Table 4-14 and Table 4-15 of the FS report. There are, in fact, alternatives to landfilling, which have been described in Chapter 4 of the FS. In addition, Chapters 5 and 8 of the FS evaluate beneficial use of non-TSCA sediments in one of several ways. Viability of some of these alternatives depends upon the PCB concentrations in the processed sediments. EPA will continue to review non-landfilling options during remedial design. However, at this time, it appears that the material will be disposed of in appropriate approved landfills, an option with relatively well-known engineering and cost parameters. 10.6 Safety Concerns Master Comment 661 Some commenters have raised concerns about discharges and spills of hazardous materials resulting from project related activities. These activities include transport of sediments as well as spillage resulting from pipeline or other equipment failures. Concerns about accidental releases of fuel have also been raised. Response to Master Comment 661 Transport of Sediments After dewatering or stabilization, the contaminated sediment will be hauled to landfills in covered rail cars. Use of covered gondolas will limit the loss of contaminants in the form of fugitive dust. While it is possible that some stabilized sediment may be discharged as a result of an unexpected transportation incident, it is likely that any discharged sediment can be quickly recovered since it is in the form of a readily manageable soil. Given that transportation incidents that may result in a spill of processed sediments are relatively infrequent and that released sediment will be in an easily recoverable form, it is highly unlikely that contaminants will be spread during transport of Hudson River sediments to final disposal facilities. Spills EPA will require a spill control, response, and counter measures plan. That plan will require measures that limit the potential for accidental releases while at the same time requiring full preparation with equipment and trained personnel available to respond to spill contingencies should they occur. Such requirements are routine and EPA will ensure conformance to these requirements throughout the term of the project. Traffic Safety Estimates of increased road and rail traffic demonstrate that project-related movements are within the capacity of existing upper Hudson road and rail networks, so unusual increases in the risk of accidents are not anticipated from increases in these two modes of transportation. Issues of safety are addressed further in Response to Master Comment 555 in Chapter 8.
Responsiveness Summary Hudson River PCBs Site Record of Decision
10-28
EPA will pay particular attention to the points of access and egress to and from sediment processing/transfer sites. The truck/auto entry points to these facilities will have appropriate traffic control devices so that vehicles moving on and off the sites can merge smoothly with other traffic flows. Project-related traffic problems, including both congestion and accident risks, have been substantially mitigated as a result of EPA's commitment not to ship dredged sediment by truck. Also, EPA has determined that backfill will not be transported by truck within the Upper Hudson River area, so as to further reduce traffic-related impacts. An increase in accident rates for project vessels (barges and towboats) is also not expected to occur. In-river work areas will be clearly delineated so as to avoid conflicts between project vessels and other craft using the Champlain Canal. EPA will ensure conformance with all US Coast Guard safety regulations over the course of the project. These regulations apply to all the vessels that will participate in the project, including sediment storage barges and barges and vessels that may bring fuels and other commodities to the work area. A detailed discussion of project-generated road, river, and rail activity can be found in White Paper – Project-Related Traffic, White Paper – River Traffic, and White Paper – Rail Operations. Equipment With regard to the matter of slurry pipeline failure, the slurry pipeline will be equipped with sensors that react to a drop in system pressure. When the pressure transducers sense a loss of pressure they will transmit a signal to shut down dredging and pumping operations. Thus, the slurry system will have the capability to terminate discharges should a pipeline failure occur. Moreover, the piping system will be routinely inspected, and portions of the system will be replaced on a regular basis to be determined during design. In this manner, impacts from the slurry conveyance system will be minimized or eliminated. Area Municipal Water Supplies EPA intends to establish a notification system for municipal water suppliers located downstream of the active remedial areas. In the highly unlikely event of an observed release of sediments, municipal water suppliers will be alerted so they can take action with regard to their river intakes. In addition, ongoing sampling results will be made available to municipalities and to reassure them the EPA is maintaining the dredging operation at predicted levels of efficiency and safety.
Responsiveness Summary Hudson River PCBs Site Record of Decision
11-1
11. SELECTION OF THE PREFERRED REMEDY 11.1 Overall Protection of Human Health and Environment Master Comment 313320 The Revised Baseline Human Health Risk Assessment (Revised HHRA) and Revised Baseline Ecological Risk Assessment (RBERA) showed risks to humans and wildlife consuming fish from the Hudson River to be above acceptable levels. Human health non-cancer hazards and cancer risks from fish ingestion were both calculated to be above acceptable ranges. Risks to wildlife were greatest for piscivorous species, such as the river otter and mink. A number of commenters contended that institutional controls (e.g., fishing advisories and bans) will not protect wildlife exposed to the high levels of PCB in sediment, water, and fish or adequately protect human health. Response to Master Comment 313320 EPA concurs that institutional controls are ineffective for protection of the environment (e.g., ecological receptors), since environmental receptors such as the bald eagle, otter, and mink obviously do not adhere to the consumption advisories and are exposed to high levels of PCBs in sediment, water, and fish (FS, Section 8.3.2.3). The existing fish consumption advisories and fishing bans are also not completely protective of Hudson River anglers, as discussed in the Revised BHHRA and in Response to Master Comment 543 in Chapter 3 of this Responsiveness Summary. The consumption advisories have not eliminated all fish consumption at the Site, as evidenced by a 1996 NYSDOH survey that found that eighteen percent of Upper Hudson River respondents had fish in their possession when interviewed, and eleven percent had more than one fish (NYSDOH 1999). The selected remedy will enable cancer risks and non-cancer hazards from fish consumption to reach acceptable levels more quickly than if no action is taken to remediate the PCB-contaminated sediments. Reference New York State Department of Health (NYSDOH). 1999. Health Consultation: 1996 Survey of Hudson River Anglers, Hudson Falls to Tappan Zee Bridge at Tarrytown, New York. February. Master Comment 337854 The Trustees support EPA's rejection of the No Action (no Upstream Source Control) alternative (Alternative 1) and the Monitored Natural Attenuation (MNA) with Upstream Source Control alternative (Alternative 2), because selection of either of these alternatives would allow residual contaminants in sediments to be redistributed and transported throughout the ecosystem for decades into the future, thereby continuing to cause residual injury and delaying restoration of Trust resources. From the Trustees' perspective, the extent of ongoing natural resource injuries and the threat of other potential injuries caused by PCB contamination warrant immediate action.
Responsiveness Summary Hudson River PCBs Site Record of Decision
11-2
Response to Master Comment 337854 EPA acknowledges the support of the Trustees of this valuable natural resource. As stated in the Proposed Plan (e.g., pp. 27-29) and the ROD, EPA's selected remedy was chosen because EPA recognizes the continued harm to human health and the environment posed by leaving large quantities of PCBs indefinitely in this sensitive ecosystem, as would be the case under the No Action and MNA alternatives. Master Comment 337860 Scenic Hudson asserted that the results of its recent analysis provide specific evidence that contaminated sediment cleanups can reduce contamination in sediment and fish. Table 1 in Appendix F of Scenic Hudson's comments, Contaminant Concentrations in Sediment Before and After Remediation and Contaminant Mass Removal, shows PCB sediment reductions for seven sites, ranging from 13 to greater than 99 percent following remediation. Table 2, Appendix F, Contaminant Concentrations in Fish Before and After Remediation, shows reductions in PCB concentrations in fish ranging from approximately 56 to greater than 99 percent following remediation. Four successful removal actions are summarized in Appendix G. Scenic Hudson's October 2000 Report, Results of Contaminated Sediment Cleanups Relevant to the Hudson River, contains additional information. Results vary from site to site, and some studies are subject to research limitations (e.g., small sample sizes). Viewed collectively, however, the studies show consistently that dredging has beneficial results and does not make matters worse. In general, contaminant reductions at the study sites exceed reductions at control sites, and the greatest contaminant reductions are seen at monitoring locations closest to the cleanup areas. Short-term (i.e., three-year) adverse impacts on fish contamination were suggested for only two sites that were looked at, the Black and Grasse Rivers, where mechanical dredges were used and where challenges were posed by bedrock and/or debris. Clear benefits were observed at these sites by the fourth year after the cleanups. Response to Master Comment 337860 EPA recognizes that studies have consistently shown that dredging has beneficial results and does not make matters worse. When environmental dredging is conducted under properly controlled conditions, a large mass of PCBs is permanently removed. Such actions have definite benefits that, for this Site, are described in Chapters 8 and 9 of the FS Report, in the Proposed Plan and ROD, and in this Responsiveness Summary (e.g., Responses to Master Comments 485 and 601, Chapter 11). EPA is also aware that there may be a relatively short-term increase in fish body burdens during and immediately after dredging (e.g., Oliver and Hulberg, 1977). However, within approximately two to three years after construction is completed, EPA expects that significant reductions in fish body burdens will be observed both within the areas that are remediated as well as in downstream areas (see White Paper – Model Forecasts for Additional Simulations in the Upper Hudson River). These reductions and subsequent further reductions in PCB fish tissue concentrations are in turn expected to continue to reduce the risks posed by PCBs to human health and the environment.
Responsiveness Summary Hudson River PCBs Site Record of Decision
11-3
Reference Oliver, J.S. and L.W. Hulberg. 1977. Patterns of Succession in Benthic Infaunal Communities Following Dredging and Dredged Material Disposal in Monterey Bay. Dredged Material Research Program. Technical Report D-77-27. US Army Corps of Engineers (USACE), Waterways Experiment Station, Vicksburg, MS. Master Comment 337788 Commenters said that the No Action, MNA, or capping alternative do not adequately address reduction of the significant ecological health risks. Commenters asserted that capping at best represents an expensive Band-AidTM that leaves a significant reservoir of PCBs in place. Further, the capping alternative would require some removal and does not adequately address the need to clear and maintain navigable channels on the upper Hudson. In addition, commenters said, the permanence of these caps is not adequate. Sooner or later PCBs will again become available as the cap is breached under the dynamic conditions that affect the river bottom. Commenters stated that removal alternatives provide a more comprehensive, protective, long-term cost-effective solution. Response to Master Comment 337788 EPA concurs. EPA has determined that the No Action and MNA alternatives are not sufficiently protective of human health and the environment because neither of those alternatives reduces fish PCB concentrations to target levels within an acceptable time frame. EPA also believes that removal alternatives are more protective of human health and the environment because of the long-term uncertainties associated with leaving PCB-contaminated sediments in place under the No Action, MNA, and capping alternatives. An additional reason for supporting a removal alternative over a capping alternative is that exposure of deeper contaminated sediments during the interval between dredging and capping can increase exposure to ecological receptors utilizing these habitats, as discussed in Section 9.5.3 of the FS. The Proposed Plan and the ROD contain additional details on the rationale for remedy selection. 11.2 Cost Master Comment 483 A number of commenters asserted that the remedy must be cost-effective. Commenters said that the most important mandate of CERCLA is that the remedy protects human health and the environment (per NCP 300.430(f)(1)(A) and (B)), but that EPA should choose a cost-effective remedy from among those that achieve that goal. Some commenters observed that cost-effectiveness supports a comprehensive dredging remedy: actual removal of sediment, as opposed to the hoped-for burial of PCBs by cleaner sediments, will reduce overall costs and limit the likelihood of additional dredging in the future.
Responsiveness Summary Hudson River PCBs Site Record of Decision
11-4
Response to Master Comment 483 EPA agrees that the most important mandate of the CERCLA remedy selection provisions is that a remedy be protective of human health and the environment. EPA's selected remedy was chosen because it will reduce to acceptable levels the risks to human health and the environment from the consumption of PCB-contaminated fish within an acceptable time frame. These risk reductions are presented in Chapter 7 of the FS. Chapters 8 and 9 of the FS contain EPA's detailed analysis for all the alternatives that passed the initial screening (for effectiveness, implementability, and cost) using seven of the nine NCP criteria (the two threshold criteria and the five balancing criteria). EPA has determined that the selected remedy is cost-effective (Declaration and Section 14.3 of the ROD). EPA believes that the selected remedy is more cost-effective than REM-0/0/3 because the incremental improvements in risk reduction under the more aggressive remedy do not justify its additional $110 million in projected costs. Master Comment 365920 Commenters indicated that the fact that the cost of the proposed dredging remedy will be relatively large and could be imposed upon a single private party does not support selection of a less expensive remedy. Moreover, it was stated, General Electric has forfeited the right to any leniency with regard to consideration of clean-up costs in choosing a remedy. While cost is one of the nine evaluation criteria that the EPA must consider in selecting its remedy, one comment asserted that the additional cost of Alternative 5 is not an acceptable reason to go with a less comprehensive alternative. Rather than coming to the table and working with EPA to develop a clean-up plan for the Hudson River PCBs, GE has waged an aggressive public relations campaign attacking the EPA's proposal, at an estimated cost of $1-3 million per week. GE may well have already spent the $110 million cost difference for its ad campaign, lobbying activities, and federal lawsuit. Further, it was said, GE has taken an expensive gamble that aggressively fighting the cleanup will save them money in the long run. By rewarding this approach with a weaker cleanup alternative, EPA would in effect be punishing other companies that have complied to their best ability with the federal Superfund cleanup program. The opinion was also expressed that GE can afford to finance the preferred remedy without financial hardship. Response to Master Comment 365920 EPA has determined that the selected remedy is more cost-effective than the remedial alternative REM-0/0/3. EPA is not "reward[ing]" GE by not selecting the more aggressive remedial alternative, as claimed by one commenter. As indicated in the Proposed Plan (page 27), REM-0/0/3 would cost $110 million more than the selected remedy, without substantial improvements in the amount of ecological or human health risk reduction. The ability of a potentially responsible party to pay for or perform a cleanup is not one of the remedy selection criteria established by CERCLA or the NCP, and GE's ability to pay the costs of a remedy was not a factor that was considered by EPA in making a remedy selection decision for the Site.
Responsiveness Summary Hudson River PCBs Site Record of Decision
11-5
Master Comment 364022 A commenter contends that, pound-for-pound, EPA's proposal is projected to cost nearly three times more than the Cumberland Bay project, which, the commenter says is relatively close geographically, and therefore should have similar unit costs. Response to Master Comment 364022 The costs of environmental dredging at a particular site depend on many factors, including the areas and volumes to be dredged, the number and location of the sediment transfer/processing facilities, the type of transportation used, and the requirements for disposal of the dredged sediments, among others. A very significant portion of the costs for EPA's selected remedy for the Upper Hudson River can be attributed to transportation and disposal costs. The estimated cost for EPA's remedy is based on transportation via rail to various disposal facilities in different parts of the country, including, for cost-estimating purposes, a licensed facility in Texas. At Cumberland Bay, the dredging was limited to a small area, whereas, for the Upper Hudson River, the dredging will be performed along miles of the river. There are many other site-specific differences that also affect the costs. Therefore, EPA believes that it is not valid to make a pound-for-pound cost comparison without considering pertinent details. Master Comment 493 Commenters have asserted that the proposed remedy violates CERCLA Section 121(b)(1), as encapsulation with Portland cement (EPC) is more expensive and creates a larger volume of toxic materials than vitrification. Response to Master Comment 493 EPA's remedy does not utilize "encapsulation with Portland cement" as presumed by the commenter. EPA's remedy considers the option of using Portland cement (or another stabilizing agent) for stabilizing and improving the handling properties of the mechanically dredged sediments. Although addition of a stabilizing agent will generate a somewhat larger volume for disposal, stabilization is necessary to prepare mechanically dredged sediments for transportation and acceptance at the disposal facility. Contrary to the statements made in the comment, EPA's FS Report also considered plasma-arc vitrification (developed by Westinghouse) as an option for the potential higher-value beneficial use (FS Report, Section 4.2.8.2 and Table 4-13). Final decisions regarding the use of particular stabilization agents and processes will be made during remedial design.
Responsiveness Summary Hudson River PCBs Site Record of Decision
11-6
11.3 Long-term Effectiveness and Permanence Master Comment 601 Several comments claim that EPA failed to consider smaller, more focused projects to examine whether they would provide comparable benefits to the EPA dredging proposal. A demonstration dredging project should be performed and utilized in the decision to implement the Proposed Plan. Response to Master Comment 601 EPA has considered both the possibility of a short-duration demonstration project as well as smaller scale remedial efforts in the Upper Hudson River. The latter topic is discussed at length in Chapter 6 of the FS, where the initial model screening runs are described. Several model runs involving lesser areas (such as the REM-10/MNA/MNA and REM-0/MNA/MNA scenarios) were simulated and presented. These model runs failed to show a substantive improvement over the MNA scenario below the Thompson Island Dam and were dropped from further consideration. Thus, it is EPA's conclusion that smaller efforts will not achieve the desired goals in a sufficiently short period of time. The discussion of the model screening process in Chapter 6 of the FS contains further details. A demonstration project suffers from several limitations involving the scale of the operation, the equipment involved, the added time to the overall project's duration, and a basis by which to establish success. The two last issues are particularly difficult ones. Because it would be at least several years after any removal operation before the full impact of the remediation would be seen in decreased fish-body burdens, the success of a demonstration project could not be measured on the basis of a reduction in fish tissue concentrations until at least four to five years after completion of the project. Additionally, the effort would have to be quite large in scale (perhaps one-tenth to one-fifth of the removal under the selected remedy) in order to modify an area of sufficient size so that a local population of fish might be affected. If no further remedial operations were performed in the interim while awaiting the outcome of the demonstration project, an additional ton of PCBs would be released from the sediments of the Upper Hudson and transported to the lower river, given the current rate of release. (This estimate of a one-ton release of PCBs is based on the current rate of release of approximately 200 kg/year of total PCBs and the assumption of a five-year waiting period after completion of the demonstration project to observe improved fish body burdens.) Thus, a demonstration project could not be performed and evaluated on the basis of the improvement in fish body burdens without an unacceptable impact on downstream regions and an unacceptable expansion in the length of the overall project. Many projects involving far larger volumes of sediment have been completed to date. For example, maintenance of the New York, Delaware River, and Chesapeake Bay harbors involves the removal of millions of cubic yards of sediment each year (e.g., USACE, 1996 and 1999). Maintenance of the Mississippi River also involves the removal of similar quantities of sediment. While these projects do not involve highly contaminated sediments such as those in the Hudson, they still require land-based disposal, involving truck or rail transport. The ongoing remediation
Responsiveness Summary Hudson River PCBs Site Record of Decision
11-7
of the Ketelmeer (Lake Kettel) in the Netherlands involves the removal of a volume of contaminated sediments much greater than that planned for the selected alternative (Ministerie van Verkeer en Waterstaat, 2001). Thus, while the design requirements for the Hudson may be challenging to the engineers and scientists involved, the effort does not represent an extraordinarily larger effort compared to other ongoing and completed efforts. Further, evidence of the efficacy of dredging to reduce fish body burdens already exists, so there is no need to conduct a demonstration for this purpose. For example, two recent sites, the Niagara-Mohawk site at Queensbury, New York and the Steele Bayou site (part of the Big Sunflower River Maintenance Project) in Vicksburg, Mississippi have demonstrated a clear improvement of fish body burdens after sediment remediation. At Queensbury, the chief contaminant was PCBs. Data from the NYSDEC clearly document a five-fold decline in fish body burdens after partial sediment removal. (R. Sloan, Pers. Comm., 2001). The reduction in fish PCB concentrations occurred even though it was only a partial sediment removal. (A smaller source condition is still present and further remediation steps for the Queensbury site are under consideration by NYSDEC.) In the Steele Bayou, fish body burdens of DDT declined 85 percent (more than six-fold) after dredging (USACE, 2001). DDT is a pesticide with bioaccumulative properties similar to those of PCBs. While a demonstration project might confirm the effectiveness of the engineering controls in preventing downstream transport of contamination, a better test than a demonstration project is already available. The 1996-1997 dredging program at New Bedford Harbor collected a large suite of data documenting the effectiveness of the controls implemented during the remediation. As discussed in White Paper – Resuspension of PCBs during Dredging, this project was successful with respect to a number of engineering issues, including the minimization of downstream transport. Thus, rather than relying on a small-scale demonstration effort, it is EPA's intention to employ the techniques and lessons learned at New Bedford Harbor in the remedial design phase of the remedy to minimize downstream transport. Such transport has already been evaluated as part of the FS and found to be negligible in comparison to the annual PCB loads. The original analysis was updated for this responsiveness summary and is included in White Paper – Resuspension of PCBs during Dredging. Although the EPA does not believe a demonstration project would be useful given the above issues, the selected remedy will be conducted in two phases. The first phase will be the first construction season of remedial dredging. The dredging during that year will be implemented initially at less than full-scale operation. It will include an extensive monitoring program of all operations. These monitoring data will be compared to performance standards identified in the ROD or developed during the remedial design with input from the public and in consultation with the State and federal natural resource trustees. In the ROD, EPA has identified performance standards that address air and noise emissions from the dredging operations and the sediment processing/transfer facilities. Performance standards that will be developed during the remedial design phase will address (but may not be limited to) dredging resuspension, production rates, PCB residuals after dredging (or dredging with backfill, as appropriate), PCB air emissions, and community impacts (e.g., odor). The information and experience gained during the first phase of dredging will be used to evaluate and determine compliance with the performance standards. Further, the data gathered will enable EPA to determine if adjustments are needed to operations in the succeeding phase of dredging or if performance standards need to be reevaluated.
Responsiveness Summary Hudson River PCBs Site Record of Decision
11-8
References
Ministerie van Verkeer en Waterstaat, 2001. Information Centre Ketelmeer 2001 at http://www.waterland.net/rdij/ketel/exploitatie/indexe.htm accessed on November 1, 2001.
R. Sloan, Pers. Comm., 2001, NYSDEC database release.
USACE, New York Division, 1996. Dredged Materials Management Plan for the Port of New York and New Jersey. Interim report. September 1996.
USACE, New York Division, 1999. Final Feasibility Report for the New York and New Jersey Navigation Study. December.
USACE, 2001. Official News Release, Vicksburg District. "Corps Test Results: Dredging Decreases DDT in Fish Tissue." June 26, 2001.
11.4 Comparison Issues Master Comment 491 Commenters contended that both source control and the preferred remedy achieve the same degree of compliance with chemical-specific ARARs for surface water concentration. Neither is expected to achieve the more stringent ARARs for surface water and a waiver will be required. Some comments said that the proposed remedy would not comply with location-specific ARARs relating to wetlands, submerged aquatic vegetation, and endangered species. Response to Master Comment 491 The chemical-specific ARARs for PCBs in the water column are • 0.5 µg/L (500 ng/L) federal MCL. • 0.09 µg/L (90 ng/L) NYS standard for protection of human health and drinking water
sources. • 0.014 µg/L (14 ng/L) criteria continuous concentration (CCC) Federal Water Quality
Criterion (FWQC) for freshwater. • 0.03 µg/L (30 ng/L) CCC FWQC for saltwater. • 1 ng/L federal ambient water criterion for navigable waters. • 0.12 ng/L NYS standard for protection of piscivorous wildlife. • 0.001 ng/L NYS standard for protection of human consumers of fish. It is true that the first four chemical-specific ARARs for surface water listed above are met by all five remedial alternatives, while the other three chemical-specific ARARs for the surface water are not met by any of the five alternatives for the 70-year model forecast period. That these three ARARs apparently cannot be achieved does not mean that there is no difference between remedial alternatives. In fact, the selected remedy achieves a much greater reduction in PCB load to the water column than source control alone.
Responsiveness Summary Hudson River PCBs Site Record of Decision
11-9
EPA's analysis of the ability of the different remedial alternatives to approach the lowest chemical-specific ARARs for water column concentrations is provided on page 9-14 of the FS, which is recapped here: "The benefits of active remediation of the sediments are readily apparent in the differences in the trajectories for the MNA alternative and those for the active remediation alternatives…. These differences are most apparent for the first 20 years of the forecast period, between 2005 and 2024." In other words, PCB concentrations in river water are significantly lower under the active remedial alternatives, including the selected remedy, than under MNA during this period. (Note: EPA now expects dredging to commence in 2005. Initiating dredging in 2005 would not be expected to significantly affect modeling projections or the comparative analysis of alternatives.) EPA agrees that upstream source control alone is predicted by the model to result in reach-averaged water column concentrations that are approximately equivalent to active remediation after approximately 50 years (e.g., by 2045). This convergence, however, will not occur if, as may be the case, the model provides overly optimistic projections of rates of natural recovery under source control. Further, reach-averaged model predictions may not be representative of water column concentrations in the vicinity of sediment hot spots under MNA. In contrast, active remediation removes PCBs from the river, and thus has a lower risk of failing to achieve the long-term predictions of water column concentrations. Location-specific ARARs relating to wetlands (e.g., Executive Order 11990 - Protection of Wetlands, Section 404 of the Clean Water Act and substantive requirements of the New York State Freshwater Wetlands Act) will be satisfied. Section 9.3 of this Responsiveness Summary provides further information on approaches to minimize long-term and short-term impacts associated with the modification or destruction of submerged aquatic vegetation (SAV) and wetlands. The selected remedy will comply with substantive requirements of the Endangered Species Act (Response to Master Comment 358464, Chapter 1). EPA will conduct biological assessments for the bald eagle (Haliaeetus leucocephalus) and shortnose sturgeon (Acipenser brevirostrum), which are endangered or threatened species that have been identified as being in the project area. The Karner blue butterfly (Lycaeides melissa samuelis) and Indiana bat (Myotis sodalis) are also federally listed endangered species that may be found within or adjacent to the project area. Once the locations for the processing/transfer facilities and other necessary land-based infrastructure have been established, EPA will evaluate the habitat that will be affected to determine whether it is suitable to support the Karner blue butterfly or the Indiana bat. If suitable habitat is found, additional assessment work will be conducted for these species. Long-term benefits to the Hudson River ecosystem overall as a result of PCB reduction outweigh the short-term impacts associated with dredging. With respect to individual ecosystem components (such as wetlands), SAV, and endangered species, implementation of the habitat replacement program would offset impacts associated with dredging. This is addressed extensively in Chapter 9 of this RS. The selected remedy results in greater risk reduction than source control, and in fact the federal Trustees recommend a more aggressive removal alternative than the selected remedy to further reduce risks to the biological community.
Responsiveness Summary Hudson River PCBs Site Record of Decision
11-10
Master Comment 405926 Commenters stated their confidence in the capacity of the Hudson River to ‘clean itself,’ and that it will continue to improve, citing as evidence observed improvements to the health of the river during the last few decades without human intervention. Some commenters indicated that the PCBs are safely buried in the river sediments. Many of these commenters expressed their opposition to dredging and concern with the short- and long-term impacts of dredging on the environment. They stated their preference for reliance on natural attenuation combined with source control. Other commenters felt that the river is not cleaning itself. Response to Master Comment 405926 Some commenters refer to visual improvements to the river as well as species abundance as a key indicator in their observations of improvement. While these improvements are real, they are not related to the level of PCBs within the river and its biota. Further, while substantial improvements in PCB levels have occurred since the 1970s, many of the observed improvements relate to nutrients, biological oxygen demand (BOD), coliform, etc., as a result of improvements in sewage treatment under the Clean Water Act. EPA believes that the rate of improvement has slowed markedly in recent years, that further improvement is not guaranteed to occur in the short term, and that an active remedy is required (see Response to Master Comment 635, Chapter 2). EPA has found through its analysis that there is no widespread burial of PCBs in the Upper Hudson River. In addition, PCBs stored in sediment in the river cannot be assured to remain stable, and risk recontaminating both the Upper and Lower Hudson (Response to Master Comment 619, Chapter 2). As stated in the Proposed Plan (e.g., pages 27-29), EPA identified its selected remedy because the agency recognizes the continued harm to human health and the environment posed by the PCBs remaining indefinitely in this sensitive ecosystem under the No Action and MNA alternatives. Those remedial alternatives that do not include active remediation of the sediments are not sufficiently protective of human health and the environment. Relying on the natural attenuation of PCBs in the sediments, either alone or in combination with upstream source control, would result in fish PCB levels remaining above target concentrations for an unacceptably long period of time. With respect to potential environmental impacts, the FS included an assessment of potential impacts to the environment of the selected remedy, including impacts associated with PCB resuspension (FS, Section 8.5.2.5.), in which EPA concluded that it is unlikely that removal of PCB-contaminated sediments would yield substantively higher PCB concentrations in Upper Hudson River fish during remedial construction. Anticipated PCB resuspension during dredging operations was discussed in greater detail in Appendix E.6 of the FS (Semi-Quantitative Assessment of Water Quality Impacts Associated with Dredging Activities). The FS also included discussions of post-dredging Site reconstruction and habitat replacement (FS, Section 5.2.6), and provided a proposed Habitat Replacement/River Bank Restoration Concept (Appendix E.8) and Habitat Replacement Program Description (Appendix 9) for restoration of dredged areas following remediation. With respect to the "overall protection of human health and the environment" criterion in the NCP, EPA concluded that the overall protection of human health and the environment afforded
Responsiveness Summary Hudson River PCBs Site Record of Decision
11-11
by remedial alternatives that include active remediation of contaminated sediments, including the selected remedy, is "considerably more than that achieved by the No Action and MNA alternatives." (FS, Section 9.1.1.1) For example, the fish PCB target concentration of 0.2 mg/kg (1 meal/month) averaged over the entire Upper Hudson River is expected to be achieved at least 25 years more quickly under REM-3/10/Select than under MNA, while the 0.2 mg/kg target concentration is not met within the 70-year modeling time period under the No Action alternative. (FS, Section 9.1.1.1.) EPA’s model also predicts that the 0.4 mg/kg PCB target fish concentration averaged over the entire Upper Hudson River is achieved at least 14 years, and possibly more than 47 years, sooner under REM-3/10/Select than under MNA. EPA also determined that remedies involving active remediation of contaminated sediments show greater reductions in risks to piscivorous mammals (river otter and mink) than either MNA or No Action. (FS, Section 9.1.2) Based on the comparative analysis of alternatives, EPA determined that active remediation of contaminated sediments is necessary in order to significantly reduce the human health and environmental risks at the Site. Unlike the selected remedial alternative, the alternatives which do not require removal of PCB-contaminated sediments are not sufficiently protective of human health and the environment (FS, Section 9.1.1.1). Further, the potential transportation, noise, odor and lighting impacts, as well as impacts from construction and operation of the processing/transfer facility(ies) are not expected to be significant, or can be minimized through appropriate controls. Chapter 8 of this Responsiveness Summary and several white papers (e.g., Project-Related Traffic; Noise Evaluation; Odor Evaluation; Example Sediment Processing/Transfer Facilities, etc.) contain additional relevant discussion. Master Comment 337780 A commenter suggested that the FS (p. 9-13) was incorrect in stating that loads over the Federal Dam are similar by the year 2035 for the various remedial alternatives. The commenter pointed out that the modeled Tri+ PCB loads over the Federal Dam in 2035 are respectively about 16 percent, 17 percent, and 25 percent lower than MNA under CAP-3/10/Select, REM-3/10/Select, and REM-0/0/3. The commenter also stated that at the more upstream TID and Northumberland Dams the active remedies achieve a reduction in loads of greater than 30 percent relative to MNA by 2035. Response to Master Comment 337780
The commenter is correct: The three remedial options all result in lower Tri+ PCB loads over Federal Dam in 2035 than does MNA, with the smallest predicted loads to the lower river resulting from REM-0/0/3. As noted in the comment, the 2035 annual load across Federal Dam under REM-0/0/3 is 25 percent less than the load associated with MNA, while the 2035 annual load across Thompson Island and Northumberland Dams under REM-0/0/3 is about 30 and 40 percent less than the load predicted for MNA, respectively.
The sentence on page 9-13 was intended to note that both the absolute and relative predicted differences between the remedial options and MNA, in terms of annual load across Federal Dam,
Responsiveness Summary Hudson River PCBs Site Record of Decision
11-12
decline over time. This occurs because the predicted PCB load becomes increasingly controlled over time by the value assumed for the upstream PCB load.
The EPA recently revised the Tri+ to Total PCB ratio for various regions of the river based on the available data obtained by the EPA and GE. The description of this analysis can be found in the White Paper - Relationship Between Tri+ and Total PCBs. Due to this revision, the Total PCB transport by the river required an adjustment. The predicted annual Tri+ and Total PCB loads transported downriver for several representative years are summarized in Table 337780-1.
For comparing loads to the lower river, it is probably more informative to examine cumulative loads than loads from a single year. Table 337780-2 compares cumulative Tri+ (extracted from Table 8-3 in the FS) and Total PCB loads over Thompson Island, Northumberland, and Federal Dams from 2004 (assumed start of remediation in modeling) to 2067. (Note: EPA now expects dredging to commence in 2005. Initiating dredging in 2005 would not be expected to significantly affect modeling projections or the comparative analysis of alternatives.) As shown in the table, the three active remedial options reduce the total PCB loading to the lower river (at Federal Dam) by from 23 to 32 percent. The table also contains the estimate for the cumulative load delivered to the Lower Hudson with the assumption of 2.5 percent loss due to resuspension. Although the EPA does not consider this rate of loss to be realistic, the scenario still yields a small (2 percent) net reduction of Total PCB and Tri+ delivered to the Lower Hudson relative to the MNA alternative. Reference USEPA, 2000. Response to Peer Review Comments on the Data Evaluation and Interpretation Report (DEIR) and the Low Resolution Sediment Coring Report (LRC). Prepared for USEPA Region 2 and US Army Corps of Engineers, Kansas City District by TAMS Consultants, Inc. and TetraTech, Inc. November. 11.5 Benefits vs. Risks Master Comment 421 A number of commenters contend that the potential short-term impacts of EPA's preferred remedy outweigh the benefits. Others say that EPA's failure to consider adverse impacts is arbitrary, capricious, and an abuse of discretion. Response to Master Comment 421 EPA disagrees that the Agency failed to consider adverse short-term impacts of the selected remedy. The Feasibility Study provides information concerning potential short-term risks associated with remedial alternatives for the Site that is "sufficient to support an informed risk management decision regarding which remedy appears to be most appropriate" for the Site (USEPA, RI/FS Guidance, 1988, Section 1.1). In accordance with the NCP (40 CFR
Responsiveness Summary Hudson River PCBs Site Record of Decision
11-13
300.430(e)(9)), the FS includes a detailed analysis of remedial alternatives that evaluated, among other things, the overall protection of human health and the environment afforded by each alternative, and an assessment of the potential short-term risks associated with each alternative (FS Chapters 8 and 9). Under the "overall protection of human health and the environment" criterion (40 CFR § 300.430(e)(9)(iii)(A)), EPA evaluated the degree to which the remedial alternatives provide adequate protection of human health and the environment from unacceptable risks posed by PCBs at the Site, and compared the relative protection afforded by each alternative. Under the short-term effectiveness criterion, EPA evaluated and compared the potential short-term impacts of the remedial alternatives, including:
i. Short-term risks that might be posed to the community during implementation. ii. Potential impacts on workers during implementation, including protective measures. iii. Potential adverse environmental impacts resulting from construction and implementation,
and the effectiveness of mitigative measures. iv. Time until remedial response objectives are achieved.
The assessment of short-term effectiveness included general discussions of how certain short-term risks would be minimized during implementation (FS, Section 8.5.2.5). The FS indicated that potential short-term impacts of remedial alternatives could be sufficiently mitigated during implementation of the remedy. For example, monitoring and engineering controls will be employed to minimize short-term effects due to material processing activities at the dewatering/transfer facility(ies); access to these facilities will be restricted to authorized personnel; and potential occupational risks to workers would be addressed through a Site-specific health and safety plan, compliance with OSHA health and safety procedures, and use of appropriate personal protection equipment (FS, Sections 8.5.2.5 [Short-Term Effectiveness evaluation of REM-3/10/Select] and 9.5.1 [Comparative Analysis of Alternatives, Short-Term Effectiveness]). Potential impacts associated with additional truck traffic are expected to be minimal because transportation of sediments for off-site disposal would be accomplished via rail. Further, potential impacts of in-river work would be minimized by restricting access to work zones, and by creating an adequate buffer zone to allow commercial and pleasure craft to avoid such zones (FS, Sections 8.5.2.5 and 9.5). It should be noted that, if a beneficial use of some portion of the dredged materials is arranged, then an appropriate transportation method will be determined (e.g., rail, truck, or barge) (ROD, Section 13.1). Under a beneficial use scenario, there will be a preference for modes of transportation other than trucking. With respect to potential environmental impacts, the FS included an assessment of potential impacts of the selected remedy to the environment, including impacts associated with PCB resuspension (FS, Section 8.5.2.5), in which EPA concluded that it is not expected that removal of PCB-contaminated sediments would yield substantively higher PCB concentrations in Upper Hudson River fish during remedial construction. Anticipated PCB resuspension during dredging operations was discussed in greater detail in Appendix E.6 of the FS (Semi-Quantitative Assessment of Water Quality Impacts Associated with Dredging Activities). The FS also included discussions of post-dredging site reconstruction and habitat replacement (FS, Section 5.2.6), and provided a proposed Habitat Replacement/River Bank Restoration Concept
Responsiveness Summary Hudson River PCBs Site Record of Decision
11-14
(Appendix E.8) and Habitat Replacement Program Description (Appendix 9) for restoration of dredged areas following remediation. With respect to the "overall protection of human health and the environment" criterion in the NCP, EPA concluded in the FS that the overall protection of human health and the environment afforded by remedial alternatives that include active remediation of contaminated sediments, including the selected remedy, is "considerably more than that achieved by the No Action and MNA alternatives" (FS, Section 9.1.1.1). For example, the fish PCB target concentration of 0.2 mg/kg (one meal/month) averaged over the entire Upper Hudson River is expected to be achieved at least 25 years more quickly under REM-3/10/Select than under MNA, while the 0.2 mg/kg target concentration is not met within the 70-year modeling time period under the No Action alternative (FS, Section 9.1.1.1). In the FS, EPA’s model also predicts that the 0.4 mg/kg PCB target fish concentration averaged over the entire Upper Hudson River is achieved at least 14 years, and possibly more than 47 years, sooner under REM-3/10/Select than under MNA. EPA also determined that remedies involving active remediation of contaminated sediments show significantly greater reductions in risks to piscivorous mammals (river otter and mink) than either MNA or No Action (FS, Section 9.1.2). It should be noted that the comparisons of remedial alternatives presented above are based on model runs that were performed for the Feasibility Study. In White Paper – Model Forecasts for Additional Simulation in the Upper Hudson River and White Paper – Human Health and Ecological Risk Reduction under Phased Implementation, EPA presents the results of additional model runs that were performed after issuance of the Proposed Plan. These model runs reflect the revised remediation schedule of six years (versus five years in the Feasibility Study and Proposed Plan) and possible impacts of PCBs' being remobilized during dredging. No significant differences in human health or ecological risk reduction were seen between the original five-year and new extended phasing time frames. The new model runs are consistent with EPA's determination, discussed in the Feasibility Study and the Proposed Plan, that active remediation will reduce risks to humans and wildlife, and allow fish target concentrations to be met more quickly than without active sediment remediation. Based on the comparative analysis of alternatives, EPA determined that active remediation of contaminated sediments is necessary in order to significantly reduce the human health and environmental risks at the Site. Unlike the selected remedial alternative, the alternatives which do not require removal of PCB-contaminated sediments and the use of dewatering/transfer facility(ies) are not sufficiently protective of human health and the environment (FS, Section 9.1.1.1). Further, the potential transportation, noise, odor, and lighting impacts, as well as impacts from construction and operation of the processing/transfer facility(ies), are not expected to be significant, or can be minimized through appropriate controls (Chapter 8 of this Responsiveness Summary and associated white papers). Consequently, EPA has determined that the potential short-term impacts of the selected remedy, which can be minimized, are substantially outweighed by the remedy’s benefits to human health and the environment over the long term. These potential and controllable short-term impacts do not justify the selection of a remedy such as MNA that provides substantially less protection of human health and the environment.
Responsiveness Summary Hudson River PCBs Site Record of Decision
11-15
Response to Master Comment 313728 in Chapter 1 of this Responsiveness Summary addresses similar issues to those raised by Master Comment 421. Reference USEPA. 1988. Guidance for Conducting Remedial Investigations and Feasibility Studies under CERCLA (OSWER Directive 9355.3-01 [1988]). Master Comment 485 Commenters contend that the proposed plan would be an environmental disaster and provides no obvious benefit to the environment, the citizens, or to the development, peace, and harmony of communities. Several commenters believe the river is cleaning itself naturally and will continue to improve. Some contend that the proposed remedy would do more harm than good, and cited risks associated with the remedy. Other comments expressed doubt that the selected remedy would be able to achieve the proposed degree of removal. Response to Master Comment 485 EPA believes that the selected remedial action is necessary in order to remove the continued unacceptable threat to human health and the environment posed by the PCBs and to restore this beautiful natural resource for the use and enjoyment of all citizens in the region, including those who live near the river as well as those who live downstream. The federal Natural Resource Trustees and the State of New York also are supportive of EPA's decision to dredge and remove contaminated sediment from the Hudson River environment, although the federal Trustees believe that further natural resource benefits would accrue from additional environmental dredging. With regard to the river's cleaning itself, while substantial improvements in river conditions have occurred since the 1970s, EPA notes that the rate of improvement has slowed markedly in recent years, that further improvement is not guaranteed to occur in the short term, and that an active remedy is required to assure continued recovery (Responses to Master Comments 405926, Chapter 4, and 635 in Chapter 2). In addition, PCBs buried in sediment in the river cannot be assured to remain stable, and present an ongoing risk of recontaminating both the Upper and Lower Hudson (Response to Master Comment 619, Chapter 2). EPA agrees that there may be risks associated with the selected remedy, although the Agency believes that such risks, which can be minimized, are substantially outweighed by the remedy's benefits to human health and the environment. The potential risks associated with the selected remedy fall into two classes: the potential short-term risks associated with performing the remedy, and the potential long-term risk that the selected remedy will not improve conditions. These are discussed further below. Short-term Risks Potential short-term risks of performing the selected remedy are discussed in a number of responses to comments in this document, including particularly Responses to Master Comments
Responsiveness Summary Hudson River PCBs Site Record of Decision
11-16
421, Section 11.4 (whether the short-term risks outweigh benefits) and 705, Chapter 8 (addressing concerns about potential disruption associated with the project). Other specific references that contain relevant detail include Responses to Master Comments 553, Chapter 7 (human health and ecological risks of performing the remedy); 505, 555, and 733, in Chapter 8 (impacts on scenic, recreational, and economic uses of the river, risks, and quality of life, respectively); 807, Chapter 3 (impacts on wildlife); 583, Chapter 10 (resuspension and downstream transport during dredging); and 313723, Chapter 1 (risks to workers). As outlined in those responses, EPA has determined that the short-term risks are both limited and manageable, and are far outweighed by the benefits of the selected remedy. Many of the comments on short-term risks were concerned with the ability of dredging technology to achieve the projected results. There have been significant advances in dredging technology over the last decade (Response to Master Comment 657, Chapter 5), and modern hydraulic and mechanical dredging are capable of achieving low residual contamination without significant resuspension of contaminants (Response to Master Comment 583, Chapter 10 and White Paper - Resuspension of PCBs during Dredging). EPA recognizes that there may be some short-term impacts to the local communities while the remedy is being implemented, but the Agency believes that these impact(s) will be minor, temporary, and very localized. During the design phase of the project, additional analyses of such potential impacts will be performed. EPA anticipates that its monitoring program will enable the Agency to effectively monitor and mitigate short-term adverse impacts, if any, during implementation of the remedy. In addition, as a matter of policy, EPA will seek public comment on potential locations for the sediment processing facility (or facilities) before making a final decision about facility location(s), and will also accept public input on design aspects of the facility(ies) related to potential noise, lighting and other impacts, as described in the ROD. Long-term Risks EPA believes that concerns that the selected remedy will fail to improve conditions or make conditions worse are not well founded. As described in the FS, EPA’s simulation modeling indicates that the selected remedy will result in a substantial reduction in risks to both human and ecological health in the Upper Hudson River (FS, Chapter 9; Response to Master Comment 565, Chapter 7). The selected remedy is also expected to result in reduced risk in the Lower Hudson River (Response to Master Comment 413, Chapter 1). The benefits of EPA’s selected remedy include, among others, the following:
• Permanent remedy that reduces inventory (mass) of PCBs that are or may be bioavailable.
• Significant reduction in risks to human health. • Reduction in time required to reach target concentrations in fish tissue. • Decreased time to reopening of all fisheries with attendant long-term economic benefits. • Reduced risks to ecological health. • Ability to resume navigational dredging and maintain navigation in the Champlain Canal,
New York harbor, and other areas.
Responsiveness Summary Hudson River PCBs Site Record of Decision
11-17
• Subsequent improvements to tourism and the area's economy as a result of the improved navigability.
EPA believes that the assumptions used in GE’s modeling that shows little or no benefit associated with the selected remedy relative to source control alone are inappropriate, do not reflect the abilities of current dredging technology, and are not supported by evidence from other sites. The predictions presented by GE are the result of a set of assumptions regarding production rate of dredging, releases during dredging, and residual left after dredging that differ from those developed by EPA and collectively reduce the apparent benefit of dredging. GE’s alternative modeling predictions are discussed in greater detail in Response to Master Comment 823, Chapter 6. EPA believes that concerns that the selected remedy will not achieve the projected degree of removal are misplaced. Modern dredging technology is fully capable of achieving the PCB mass removal and residual concentration targets set out in the FS (Response to Master Comment 366358, Chapter 5, and White Paper - Post-Dredging PCB Residuals). Finally, a substantial body of evidence from other sites indicates that dredging projects can indeed produce significant reductions in PCB concentrations in the environment and in biota. Response to Master Comment 337860, Section 11.4 in this chapter contains further details. In sum, EPA has determined that the selected remedy is feasible and will provide significant long-term benefits for the Hudson River. The benefits of remediation fare outweigh potential short-term impacts, which can be minimized. 11.6 Other Master Comment 487 Commenters asked why EPA believes it is administratively feasible to locate a sediment processing facility along the Hudson, but not a disposal facility. They noted that past experience at this Site suggests that neither can be sited, and asked whether EPA will submit itself to and abide by State and local requirements for waste storage and treatment facilities. Response to Master Comment 487 EPA has determined that it is administratively feasible to locate a sediment processing/transfer facility(ies) close enough to the river to be considered "on site" for purposes of CERCLA Section 121(e)(1), and therefore no federal, State, or local permits would be required for such facility(ies). In accordance with CERCLA Section 121(d), such facility(ies) will comply with substantive federal or State requirements that are applicable or relevant and appropriate (ARAR). Local regulations are not ARARs under CERCLA, although EPA will consider pertinent local regulations regarding sediment processing/transfer facility(ies) (if such local regulations exist) during the design phase for the facility(ies). EPA notes that such sediment processing/transfer facilities have been used at other locations with no significant adverse or long-term impacts. Such locations include the Marathon Battery Superfund site, the Niagara Mohawk Queensbury site, and Wilcox Dock at the Cumberland Bay site on Lake Champlain.
Responsiveness Summary Hudson River PCBs Site Record of Decision
11-18
While EPA recognizes that there may be some short-term impacts to the local communities during implementation of the remedy, the Agency believes that these impact(s) will be minor, temporary, and very localized. During the design phase of the project, additional analyses of such potential impacts will be performed. EPA anticipates that its monitoring program will enable the Agency to effectively monitor and mitigate short-term adverse impacts, if any, during implementation of the remedy. In addition, as a matter of policy, EPA will seek public comment on potential locations for the sediment processing facility(ies) before making a final decision about facility location(s) and will also accept public input on design aspects of the facility(ies) related to potential noise, lighting, and other impacts, as described in the ROD. Master Comment 364004 One commenter states that the copy of the administrative record file for the Site located in the Crandall Library in Glens Falls, New York, is not properly maintained. According to the comment, non-privileged and privileged documents are not promptly added to the administrative record file. Further, the administrative record file index is incomplete because it does not include a list of documents considered by EPA to be privileged or confidential, or a list of administrative record documents that are not maintained at the repository. The commenter also argues that EPA has not assessed or supported the ability of the Crandall Library to maintain the administrative record file, that the library does not maintain a sign-in book to minimize document loss or damage, and that documents in the Crandall Library administrative record file are maintained in a "highly chaotic fashion" and are interspersed with documents concerning unrelated manners. The commenter further argues that by not updating the administrative record file in a timely manner, and by not assessing and supporting "the Crandall Library’s ability to maintain this enormous and highly controversial record, USEPA has prevented effective public participation by the communities who will be most affected by USEPA’s remedial determinations." Response to Master Comment 364004 EPA disagrees that the administrative record file for this Site has been maintained in such a way as to "prevent effective public participation" with respect to the Site. The administrative record file has been established and maintained in accordance with CERCLA and the NCP, and has been updated a number of times during the course of the study (February 1998, December 2000, June 2001). During the public comment period on the Proposed Plan, the publicly available administrative record file for the Site contained sufficient information regarding the basis for EPA’s proposed remedy for the public to provide meaningful comments on the Agency’s proposal. In accordance with CERCLA and the NCP, EPA maintains the central Hudson River PCBs Superfund Site administrative record file at EPA’s Region 2 offices in New York. Copies of the administrative record are also maintained at or near the Site at the Crandall Library in Glens Falls, New York and the Adriance Memorial Library in Poughkeepsie, New York. At the Crandall and Adriance Memorial Libraries, the administrative record is maintained in binders that include an index of the original administrative record file and all updates. EPA periodically inspects each of the administrative record repositories to ensure that the administrative record file is intact and available to the public, and has generally found the administrative record file at
Responsiveness Summary Hudson River PCBs Site Record of Decision
11-19
the Crandall Library to be in good condition. EPA is aware of no complaints from a member of the public stating that a specific document listed in the administrative record file index at the Crandall Library could not be located. Since the administrative record file documents are kept in binders, it is unclear as to how "portions of the record" are "mixed in with public documents on unrelated topics," as claimed by the commenter. In any event, all records added to the administrative record file since June 2001 are on CD-ROM, which will minimize the likelihood of administrative record documents being separated or disorganized. Each transmittal of administrative record documents to the Crandall and Adriance Memorial Libraries includes a letter from EPA stating that the record should be made available to the public as non-circulating reference material that should not be removed from the facility. While EPA maintains a sign-in book at the central administrative file location in New York, the library repositories are not required to maintain a sign-in book. The fact that the Crandall Library may not require members of the public to sign their names before reviewing the administrative record in no way diminishes the public’s access to documents in the record. During the public comment period for the Proposed Plan, the administrative record file index did not identify any privileged documents that were included in the administrative record file because EPA had not identified any privileged documents for inclusion in the record at that time. The administrative record file index also did not include a list of documents included in the record but not maintained at the Crandall Library repository because no such documents had been formally added to the record as of December 2000. In addition to the administrative record files in New York, Glens Falls, and Poughkeepsie, EPA also has established sixteen information repositories throughout the Hudson River valley, including the Crandall Library and Adriance Memorial Library, in which Site-related documents, including the major Reassessment RI/FS reports, are available to the public. The information in the repositories has been regularly updated throughout the Reassessment RI/FS. The major Reassessment reports as well as other information concerning the Site are also available on EPA’s website for the Hudson River PCBs Site, http://www.epa.gov/hudson. These repositories and the website provided additional opportunities for the public to obtain information concerning the Site and the basis for EPA’s proposed remedy. In sum, the Administrative Record for the Site has been established and maintained in accordance with CERCLA and the NCP, and EPA disagrees that the issues raised by the commenter "prevent[ed] effective public participation" with respect to the Site. Master Comment 362628 Comments argue that there is a contradiction in the duration (10 years or 25 years?) of the long-term monitoring of remedial actions proposed in the FS. Commenters suggest that a 30-year monitoring program be implemented in the Upper and Lower Hudson (the entire Hudson River Superfund Site) in order to evaluate the ongoing potential risks to human health and the environment, and to verify that the final results have complied with the ARARs and RAOs.
Responsiveness Summary Hudson River PCBs Site Record of Decision
11-20
Response to Master Comment 362628 In the FS, EPA developed conceptual monitoring programs for each alternative evaluated in detail. The costs associated with these conceptual monitoring programs were estimated up to 30 years; monitoring costs were not considered beyond 30 years because such costs do not add appreciably to the present-worth costs of the remedial alternatives (year 2000 dollars). The 10-year and 25-year monitoring durations are for different components of the conceptual monitoring programs in the FS. For the removal alternatives, the scope and frequency of water column monitoring was assumed to decrease after 10 years. For all active alternatives (capping and removal), the fish monitoring program was assumed to continue for 25 years in the Upper and Lower Hudson River. The monitoring program for the selected remedy will be established during the design period. This monitoring program will continue, modified as appropriate, until the RAOs are achieved and the ARARs that are not waived are attained. Master Comment 481 One comment said that there is no imminent and substantial endangerment, so EPA is precluded from issuing a unilateral order implementing its plan. Response to Master Comment 481 EPA disagrees. The release and threatened release of PCBs to the Hudson River constitutes an imminent and substantial endangerment to the public health or welfare or the environment within the meaning of CERCLA Section 106(a), 42 U.S.C. § 9606(a). The administrative record amply supports this position. Master Comment 359565 A commenter contends that the discussion on page ES-25 of the FS concerning the adequacy of controls again illustrates EPA's desire to cast actions contrary to its desired action in a bad light. The commenter asked why institutional controls are "inadequate" when considered with MNA but simply are "provided" when discussing the REM-3/10/Select and REM-0/0/3 alternatives. However, the commenter adds, it "is refreshing to see EPA admit institutional controls are effective and also on page 1-34 to see EPA recognize the problems introduced by the high degree of heterogeneity in the PCB distribution in the Thompson Island Pool." Response to Master Comment 359565 EPA has provided an objective analysis of the adequacy of controls under the Long-term Effectiveness and Permanence primary balancing criterion, consistent with the requirements stated in the NCP and the 1988 RI/FS Guidance document. EPA has stated that the No Action and the MNA alternatives do not provide for engineering controls on the river sediments. This is an accurate statement based on the factual description of these two alternatives and does not
Responsiveness Summary Hudson River PCBs Site Record of Decision
11-21
represent "EPA's desire to cast actions contrary to its desired action in a bad light" as indicated in the comment. EPA has also explained that institutional controls such as the fish consumption advisories, which rely on voluntary compliance, have not eliminated all fish consumption (and related cancer risks and non-cancer hazards) at the Site. Further, institutional controls like "posting of warnings and advisories" do not serve to protect piscivorous ecological receptors like the otter, the mink, and the bald eagle, among others. When discussing REM-3/10/Select and REM-0/0/3, EPA has stated that institutional controls will be used in conjunction with implementation of the engineering controls (i.e., removal of the sediments, backfilling, restoration, and monitoring). No Action and MNA necessarily rely much more heavily on institutional controls than the active alternatives because of the significantly longer time periods required to reach PCB target levels in fish under MNA and No Action. EPA does not believe that institutional controls alone are fully effective in preventing exposure to PCBs via consumption of contaminated fish. That is why EPA has proposed dredging of the sediments and restoring this valuable resource in New York State. EPA has recognized the existence of a high degree of heterogeneity in the PCB distribution in the sediments of the Thompson Island Pool since the 1984 NYSDEC survey and reiterated this in several of the Reassessment Remedial Investigation reports.
RESPONSIVENESS SUMMARY HUDSON RIVER PCBs SITE RECORD OF DECISION
INDEX
Index-1
Responsiveness Summary Hudson River PCBs Site Record of Decision
Keywords Master Comment (Report Section) Adverse Impacts.....................................................................421 (11.5), 505 (8.5.1), 713 (1.3) Energy Use.................................................................649 (8) Equipment Failure......................................................661 (10.6) Agriculture .............................................................................717 (8.7.2), 729 (8.4.2) Air Quality Impacts ...............................................................423734 (8.4) Processing and Transfer Facility................................313846 (w.p.) Alternative Technologies .......................................................253189 (5.1.2) ARARs ..................................................................................381 (1.1), 387 (1.1), 395 (1.1), 399 (1.1), 401 (1.1), 407 (1.1), 447 (3.3), 503 (1.1), 313682 (1.1), 365240 (1.2.1), 407625 (1.1) CERCLA....................................................................397 (1.1) Coastal Zone Management (CZM) ............................358807 (1.1) Fish and Wildlife Coordination Act (FWCA) ...........358802 (1.1) Fish Population ..........................................................403 (1.1) Legal Issues................................................................383 (1.1) Lighting......................................................................391 (1.1) Odor ...........................................................................393 (1.1) Source Control Water Quality Wetlands ............................................491 (11.4) Wetlands ....................................................................365246 (1.1) Assumptions Resuspension Residual Concentrations PCB Transport to Lower Hudson River .....................................591 (6.1.4) Backfill ..................................................................................653 (10.4) Dredging Habitat Replacement ......................................313373 (9.3) Habitat Replacement ..................................................313336 (9.3) Submerged Aquatic Vegetation (SAV) Wetlands ........................................................313365 (9.3) Barge Operations Canal Corporation Navigation Socioeconomic Impacts .....................337804 (w.p.) Baseline Ecological Risk Assessment (BERA) Assumptions Risk Benefit PCB Exposure....................................793 (3.2.3) Ecological Risk Assessment (ERA)-analysis Peer Review ...................................................811 (3.2)
RESPONSIVENESS SUMMARY HUDSON RIVER PCBs SITE RECORD OF DECISION
INDEX
Index-2
Responsiveness Summary Hudson River PCBs Site Record of Decision
Human Health Risk Assessment (HHRA) Support of Dredging Source Control ...................................813 (3.2.1) Remedial Alternatives Wetlands Biota...................................................815 (3.2.2) Benthic Habitat Epifaunal ....................................................................525 (9.3) Bioaccumulation Recovery Time Ecological Risk Assessment (ERA)-analysis FISHRAND........................................785 (6.2) Bioavailability PCB Concentrations in Sediment PCB Burial Benthic Habitat ..................................637 (2.3) Biodegradation Bioaccumulation PCB Toxicity .................................................253430 (2.3) Dechlorination Bioremediation...............................................255314 (w.p.) Biota Hydraulic Dredging Submerged Aquatic Vegetation (SAV) Water Quality.....................................366264 (9.1) Bioturbation Fate and Transport PCB Burial .....................................................253424 (2.3) Canal System Socioeconomic Impacts Transportation ................................................312942 (8.1.2) Capping .................................................................................423258 (5.1.1) Long Term Effectiveness and Permanence................337788 (11.1) Natural Attenuation Erosion ...........................................................651 (5.1.1) Remedial Alternatives................................................313835 (5.2) CERCLA National Contingency Plan (NCP).............................475 (1.2.1) Remedy Selection ......................................................493 (11.2) Coastal Zone Management (CZM) .......................................253238 (w.p.) Lower Hudson............................................................413 (1.2.1) Community Acceptance Public Participation Record of Decision (2001 ROD) ...................423154 (1.2.1) Support of Dredging...................................................445 (1.3)
RESPONSIVENESS SUMMARY HUDSON RIVER PCBs SITE RECORD OF DECISION
INDEX
Index-3
Responsiveness Summary Hudson River PCBs Site Record of Decision
Consensus Based Guidelines Adverse Impacts.........................................................795 (3.3) Cost Effective ........................................................................483 (11.2) Disposal......................................................................253477 (w.p.) Effectiveness of Implementability Cost .....................369325 (5.3) Other Sites......................................................364022 (11.2) Legal Issues................................................................365920 (11.2) Definition of Onsite CERCLA....................................................................721 (1.2.1) Dioxins and Furans ................................................................860 (w.p.) Disposal..................................................................................405890 (10.5), 424851 (w.p.) Dredging.................................................................................511 (9.3), 733 (8.5.3), 743 (8.6.2) Adverse Impacts.........................................................709 (8.1) Dredging Technology.................................................405943 (10.2) Remedy Selection ..........................................657 (5.1.3) Habitat Replacement Backfill...........................................................513 (9.3) Processing and Transfer Facility Treatment .......................................................745 (8.6.1) Residual Concentrations ............................................579 (10.3) Dredging Technology Alternative Technologies ...........................................423845 (5.1.3) Hydraulic Dredging Resuspension Sedimentation ....................................366262 (5.1.3) Manufacture of Commercial Products Remedial Alternatives....................................364760 (5.1.3) Drinking Water Supply .........................................................253421 (9.2) PCB Concentrations in Water PCB Transport to Lower Hudson River.........365942 (9.2) PCB Discharge...........................................................422386 (2.1) Ecological Risk Assessment (ERA)-analysis Human Health Risk Assessment (HHRA) Risk Benefit Remedial Alternatives........................363176 (w.p.) Peer Review ...............................................................465 (1.3.1) Risk Benefit Biota...............................................................817 (7.2) Ecological Risk Assessment (ERA)-impacts Ecological Risk Assessment (ERA)-analysis Flood ..............................................................809 (3.2.2) Effectiveness of Implementability Cost Remedial Alternatives................................................313983 (5.2) Endangered Species Act (ESA) ARARs.......................................................................358464 (1.1)
RESPONSIVENESS SUMMARY HUDSON RIVER PCBs SITE RECORD OF DECISION
INDEX
Index-4
Responsiveness Summary Hudson River PCBs Site Record of Decision
EPA's Contaminated Sediment Management Strategy Remedial Alternatives................................................313990 (6.4.1) Safety Impacts ............................................................555 (8.8) Equipment Selection Dredging Technology.................................................659 (10.1) Fate and Transport Phase 1 Phase 2 ...........................................................575 (2.3) Fate and Transport (Models) PCB Concentrations in Water PCB Concentrations in Sediment PCB Concentrations in Fish...............363150 (w.p.) Field Studies Biota Animal Studies (ecological) Fish Population ..................................819 (3.2.2) Fish Concentration Trend Analysis PCB Concentrations in Fish.......................................312627 (w.p.) Fish Consumption Human Health Risk Assessment (HHRA) Ecological Risk Assessment (ERA)-analysis Support of Dredging...........................313320 (11.1) Risk Benefit ...............................................................553 (7.1) Fish Habitat Benthic Habitat ..........................................................253458 (9.1) Flood ......................................................................................422186 (10.1) Sediment Transport Model Erosion PCB Release.......................................364582 (6.1), 407426 (w.p.) Fort Edward PCB Discharge Hudson Falls Remnant Deposits ..............................617 (2.1) GE's Model HUDTOX FISHRAND Peer Review .......................................843 (6.4.3) Sub-Reach Scale Remedial Alternatives....................................847 (6.1.2) Habitat Replacement .............................................................313187 (9.3), 517 (9.3), 529 (9.3) Dredging.....................................................................759 (9.3) Submerged Aquatic Vegetation (SAV)......................535 (9.3) Historic Sites..........................................................................362961 (8.5.4) Hot Spot ................................................................................359303 (4.4) Habitat
RESPONSIVENESS SUMMARY HUDSON RIVER PCBs SITE RECORD OF DECISION
INDEX
Index-5
Responsiveness Summary Hudson River PCBs Site Record of Decision
Submerged Aquatic Vegetation (SAV) Fish Habitat ........................................593 (4.5) HUDTOX Non Cohesive Sediment Cohesive Sediment.........................................833 (2.4.1) Sediment Transport Model Erosion ...........................................................363193 (2.4) Human Health Risk Assessment (HHRA) Fish Consumption Institutional Controls Fishing................................................543 (3.1.3) Connelly Study...............................................569 (3.1.2) PCB Concentrations in Fish.......................................549 (7.1) PCB Exposure PCB Concentrations in Water........................567 (3.1.4) PCB Toxicity Animal Studies (toxicity) Weight-of-Evidence ...........................362704 (w.p.), 541 (3.1.1.2), 571 (3.1.1.1) Sediment Removal .....................................................313280 (4.2) Hydraulic Dredging Mechanical Dredging.................................................362590 (10.1) Legal Issues............................................................................362908 (1.2.1), 364004 (11.6), 423426 (1.2), 424247 (1.2.1) ARARs.......................................................................385 (1.1) Disposal......................................................................665 (10.5), 424920 (1.2.1), 424926 (1.2.1) Processing and Transfer Facility................................424915 (1.2.1) Lighting Adverse Impacts.........................................................358825 (8.3.2) Biota Animal Studies (ecological) Dredging.............................................805 (8.3.3) Dredging Adverse Impacts.............................................645 (8.3.1) Long Term Effectiveness and Permanence Institutional Controls .................................................359565 (11.6) Long Term Monitoring ..........................................................362628 (11.6) Long Term Trends Mathematical Model PCB Concentrations in Fish Bounding Calculation ........................609 (6.4.2) Low Resolution Coring Report (LRCR)
RESPONSIVENESS SUMMARY HUDSON RIVER PCBs SITE RECORD OF DECISION
INDEX
Index-6
Responsiveness Summary Hudson River PCBs Site Record of Decision
PCB Burial Data Evaluation and Interpretation Report (DEIR) Bed Stability (Instability) ...................577 (2.2) PCB Concentrations in Sediment Fate and Transport PCB Burial .........................................607 (6.4.3) Lower Hudson .......................................................................405965 (5.2), 423847 (2.5) Fate and Transport (Models) PCB Concentrations in Fish FISHRAND........................................313699 (w.p.) PCB Concentrations in Water PCB Concentrations in Fish PCB Transport to Lower Hudson River .....................................313787 (2.4.3) Preliminary Remedial Goal (PRG) Recovery Time...............................................313765 (1.1) Risk Benefit Remedial Alternatives Natural Resource................................799 (6.3) Superfund (NPL) site .................................................415 (1.2.1) Mass Removal of PCBs .........................................................313214 (4.2.1) Mass-Per-Unit-Area (MPA) PCB Concentrations in Sediment...............................597 (4.3) Mathematical Model Recovery Time...........................................................589 (6.4) Metals Dioxins and Furans ....................................................407876 (6.1.3) Disposal......................................................................253002 (w.p.) Monitored Natural Attenuation Monitoring Program...................................................253427 (10.2) Monitoring Program PCB Concentrations in Fish Long Term Monitoring Field Studies.......................................313297 (3.3) Resuspension Drinking Water Supply ..................................362637 (9.2) More Harm Than Good Long Term Effectiveness and Permanence Short Term Risks and Impacts .......................485 (11.5) National Academy of Sciences (NAS) ..................................411 (1.2.2) Record of Decision (2001 ROD) ...............................409 (1.2.2) Natural Attenuation Biodegradation ...........................................................313261 (7.2) PCB Concentrations in Fish
RESPONSIVENESS SUMMARY HUDSON RIVER PCBs SITE RECORD OF DECISION
INDEX
Index-7
Responsiveness Summary Hudson River PCBs Site Record of Decision
Ecological Risk Assessment (ERA)-analysis.629 (2.6) PCB Concentrations in Sediment PCB Mass Sedimentation ....................................633 (2.6) PCB Toxicity Dechlorination....................................639 (2.3) Source Control Recovery Time Risk Benefit .......................................405926 (11.4) Navigation Canal System..............................................................705 (8.1) Downtime...................................................................313398 (w.p.) Navigational Dredging Dredging.........................................................757 (9.5) New York State......................................................................459 (2) No Action Effectiveness of Implementability Cost .....................313970 (10.2) Noise Adverse Impacts Dredging.........................................................767 (8.2) Dredging Adverse Impacts.............................................358188 (8.2) Environmental Impact Study (EIS)............................312685 (w.p.) Regulatory Analysis ...................................................699 (8.2) Non Cohesive Sediment PCB Concentrations in Sediment PCB Inventory Backfill...............................................313266 (4.2.2) Odor Natural Resource Air Quality Impacts........................................255361 (w.p.) Opposition to Dredging..........................................................313388 (1.3) PCB Burial PCB Concentrations in Sediment Sedimentation Thompson Island Pool (TIP)..............619 (2.1) PCB Concentrations in Fish Assumptions PCB Transport to Lower Hudson River Source Control ...................................823 (6.1) Remedial Goals (Fish) Preliminary Remedial Goal (PRG) ................547 (7.1) PCB Concentrations in Sediment PCB Burial Low Resolution Coring Report (LRCR)
RESPONSIVENESS SUMMARY HUDSON RIVER PCBs SITE RECORD OF DECISION
INDEX
Index-8
Responsiveness Summary Hudson River PCBs Site Record of Decision
PCB Loss ...........................................641 (2.2) Tri+ PCBs ..................................................................424694 (w.p.) PCB Concentrations in Water Natural Attenuation....................................................631 (2.6) PCB Concentrations in Fish Natural Attenuation........................................635 (2.6) PCB Concentrations in Sediment...............................255353 (w.p.) PCB Inventory........................................................................363334 (w.p.) PCB Loss Sediment Sampling Thompson Island Pool (TIP) PCB Inventory....................................625 (2.2) PCB Mass PCB Inventory............................................................369451 (4.2) PCB Source Flood HUDTOX.......................................................821 (6.1.1) Historic Sites..............................................................313444 (2.1) Hudson Falls Source Control Remnant Deposits ..............................573 (2.1) HUDTOX...................................................................825 (6.1.1) PCB Transport to Lower Hudson River.........835 (6.1.1) PCB Release Phase 1 ...........................................................643 (2.1) PCB Toxicity Animal Studies (toxicity) Biota...............................................................359281 (3.2.1) Human Health Risk Assessment (HHRA) Animal Studies (toxicity) Weight-of-Evidence ...........................362702 (w.p.) PCB Transport to Lower Hudson River.................................337780 (11.4) Peer Review Scientific Method.......................................................467 (1.3.1) Preliminary Remediation Goal (PRG) Biota PCB Concentrations in Fish...........................313300 (3.3) PCB Transport to Lower Hudson River Ecological Risk Assessment (ERA)-analysis Lower Hudson....................................831 (7.1) Remedial Alternatives................................................362555 (3.3) Remedial Goals (Fish) ..............................................551 (7.1), 561 (7.1) FDA Standard Human Health Risk Assessment (HHRA)..........................545 (3.3)
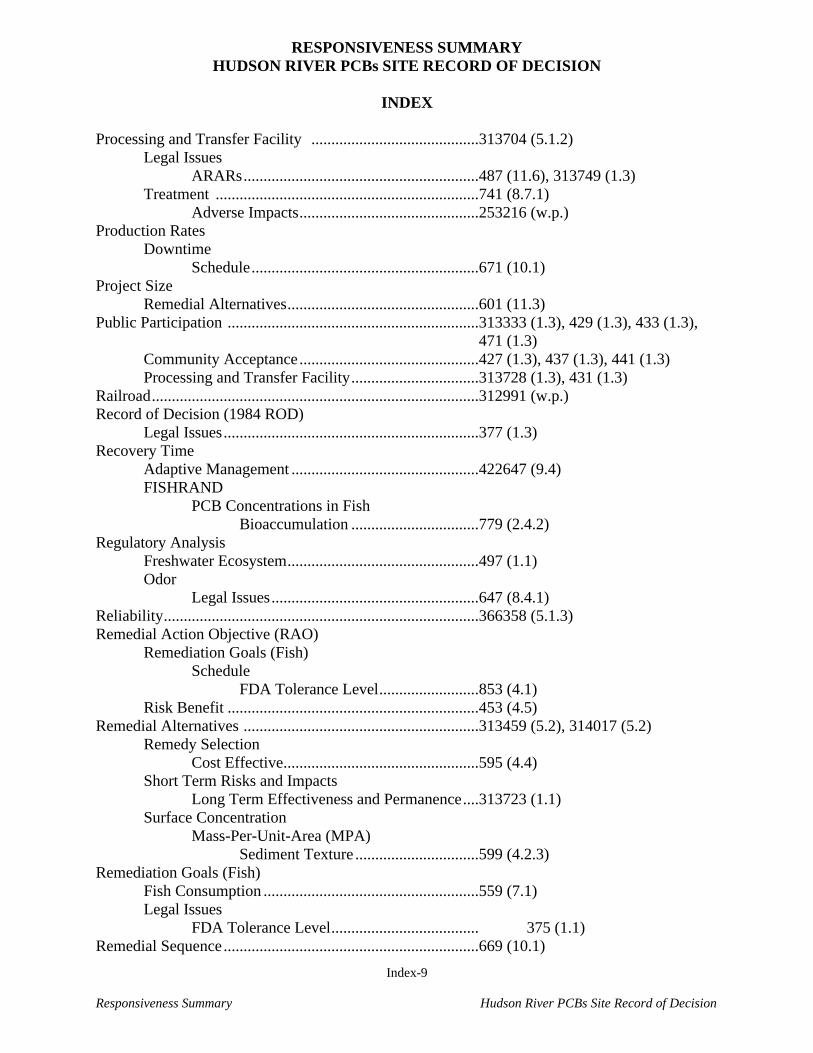
RESPONSIVENESS SUMMARY HUDSON RIVER PCBs SITE RECORD OF DECISION
INDEX
Index-9
Responsiveness Summary Hudson River PCBs Site Record of Decision
Processing and Transfer Facility ..........................................313704 (5.1.2) Legal Issues ARARs...........................................................487 (11.6), 313749 (1.3) Treatment ..................................................................741 (8.7.1) Adverse Impacts.............................................253216 (w.p.) Production Rates Downtime Schedule.........................................................671 (10.1) Project Size Remedial Alternatives................................................601 (11.3) Public Participation ...............................................................313333 (1.3), 429 (1.3), 433 (1.3), 471 (1.3) Community Acceptance.............................................427 (1.3), 437 (1.3), 441 (1.3) Processing and Transfer Facility................................313728 (1.3), 431 (1.3) Railroad..................................................................................312991 (w.p.) Record of Decision (1984 ROD) Legal Issues................................................................377 (1.3) Recovery Time Adaptive Management ...............................................422647 (9.4) FISHRAND PCB Concentrations in Fish Bioaccumulation ................................779 (2.4.2) Regulatory Analysis Freshwater Ecosystem................................................497 (1.1) Odor Legal Issues....................................................647 (8.4.1) Reliability...............................................................................366358 (5.1.3) Remedial Action Objective (RAO) Remediation Goals (Fish) Schedule FDA Tolerance Level.........................853 (4.1) Risk Benefit ...............................................................453 (4.5) Remedial Alternatives ...........................................................313459 (5.2), 314017 (5.2) Remedy Selection Cost Effective.................................................595 (4.4) Short Term Risks and Impacts Long Term Effectiveness and Permanence....313723 (1.1) Surface Concentration Mass-Per-Unit-Area (MPA) Sediment Texture ...............................599 (4.2.3) Remediation Goals (Fish) Fish Consumption ......................................................559 (7.1) Legal Issues FDA Tolerance Level..................................... 375 (1.1) Remedial Sequence................................................................669 (10.1)
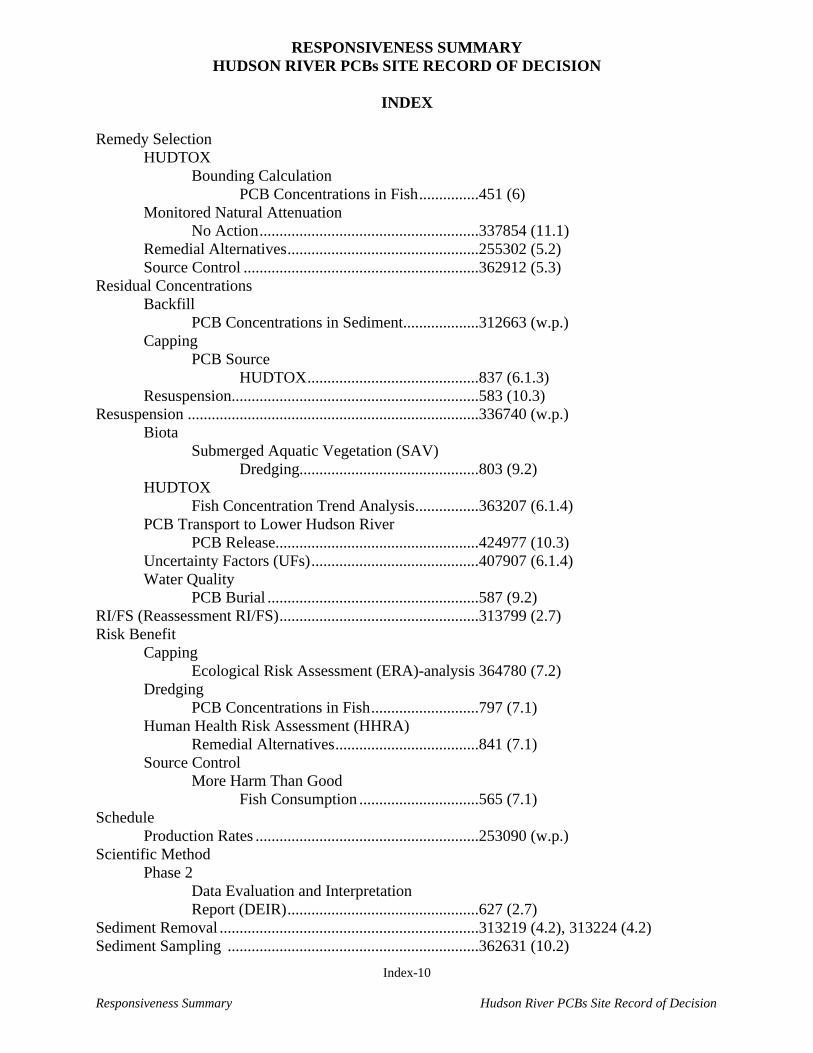
RESPONSIVENESS SUMMARY HUDSON RIVER PCBs SITE RECORD OF DECISION
INDEX
Index-10
Responsiveness Summary Hudson River PCBs Site Record of Decision
Remedy Selection HUDTOX Bounding Calculation PCB Concentrations in Fish...............451 (6) Monitored Natural Attenuation No Action.......................................................337854 (11.1) Remedial Alternatives................................................255302 (5.2) Source Control ...........................................................362912 (5.3) Residual Concentrations Backfill PCB Concentrations in Sediment...................312663 (w.p.) Capping PCB Source HUDTOX...........................................837 (6.1.3) Resuspension..............................................................583 (10.3) Resuspension .........................................................................336740 (w.p.) Biota Submerged Aquatic Vegetation (SAV) Dredging.............................................803 (9.2) HUDTOX Fish Concentration Trend Analysis................363207 (6.1.4) PCB Transport to Lower Hudson River PCB Release...................................................424977 (10.3) Uncertainty Factors (UFs)..........................................407907 (6.1.4) Water Quality PCB Burial .....................................................587 (9.2) RI/FS (Reassessment RI/FS)..................................................313799 (2.7) Risk Benefit Capping Ecological Risk Assessment (ERA)-analysis 364780 (7.2) Dredging PCB Concentrations in Fish...........................797 (7.1) Human Health Risk Assessment (HHRA) Remedial Alternatives....................................841 (7.1) Source Control More Harm Than Good Fish Consumption ..............................565 (7.1) Schedule Production Rates ........................................................253090 (w.p.) Scientific Method Phase 2 Data Evaluation and Interpretation Report (DEIR)................................................627 (2.7) Sediment Removal .................................................................313219 (4.2), 313224 (4.2) Sediment Sampling ...............................................................362631 (10.2)
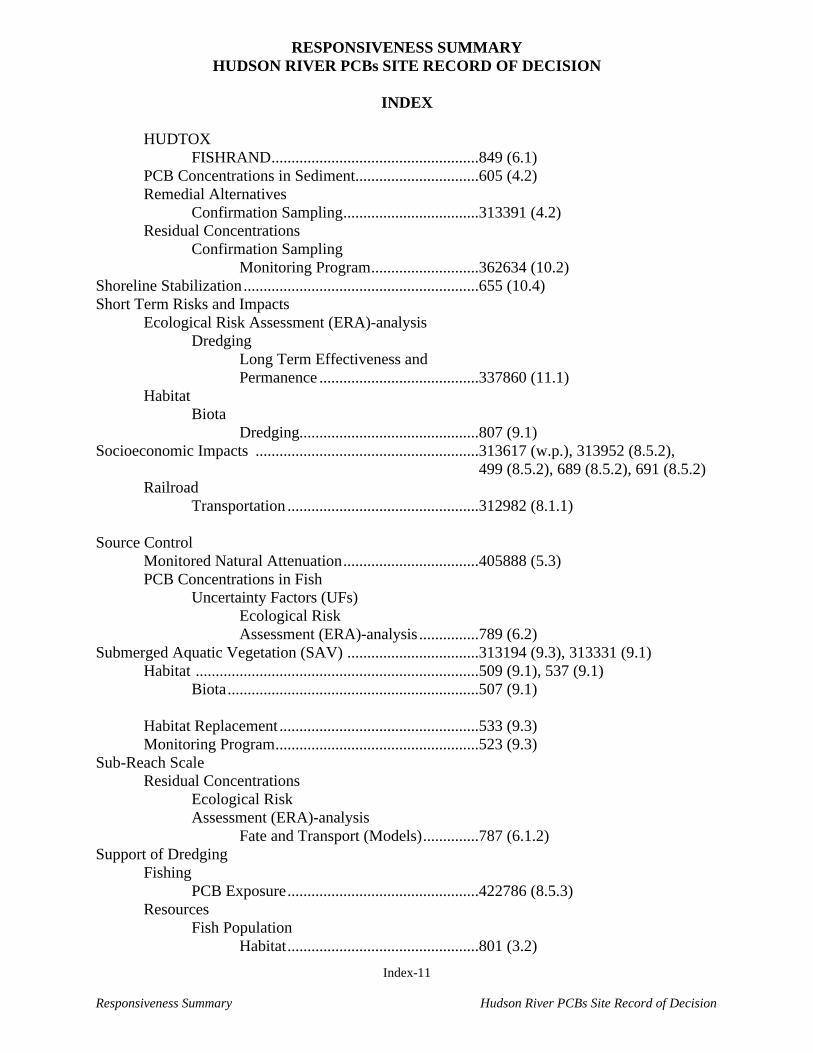
RESPONSIVENESS SUMMARY HUDSON RIVER PCBs SITE RECORD OF DECISION
INDEX
Index-11
Responsiveness Summary Hudson River PCBs Site Record of Decision
HUDTOX FISHRAND....................................................849 (6.1) PCB Concentrations in Sediment...............................605 (4.2) Remedial Alternatives Confirmation Sampling..................................313391 (4.2) Residual Concentrations Confirmation Sampling Monitoring Program...........................362634 (10.2) Shoreline Stabilization...........................................................655 (10.4) Short Term Risks and Impacts Ecological Risk Assessment (ERA)-analysis Dredging Long Term Effectiveness and Permanence ........................................337860 (11.1) Habitat Biota Dredging.............................................807 (9.1) Socioeconomic Impacts ........................................................313617 (w.p.), 313952 (8.5.2), 499 (8.5.2), 689 (8.5.2), 691 (8.5.2) Railroad Transportation ................................................312982 (8.1.1) Source Control Monitored Natural Attenuation..................................405888 (5.3) PCB Concentrations in Fish Uncertainty Factors (UFs) Ecological Risk Assessment (ERA)-analysis ...............789 (6.2) Submerged Aquatic Vegetation (SAV) .................................313194 (9.3), 313331 (9.1) Habitat .......................................................................509 (9.1), 537 (9.1) Biota...............................................................507 (9.1) Habitat Replacement ..................................................533 (9.3) Monitoring Program...................................................523 (9.3) Sub-Reach Scale Residual Concentrations Ecological Risk Assessment (ERA)-analysis Fate and Transport (Models)..............787 (6.1.2) Support of Dredging Fishing PCB Exposure................................................422786 (8.5.3) Resources Fish Population Habitat................................................801 (3.2)
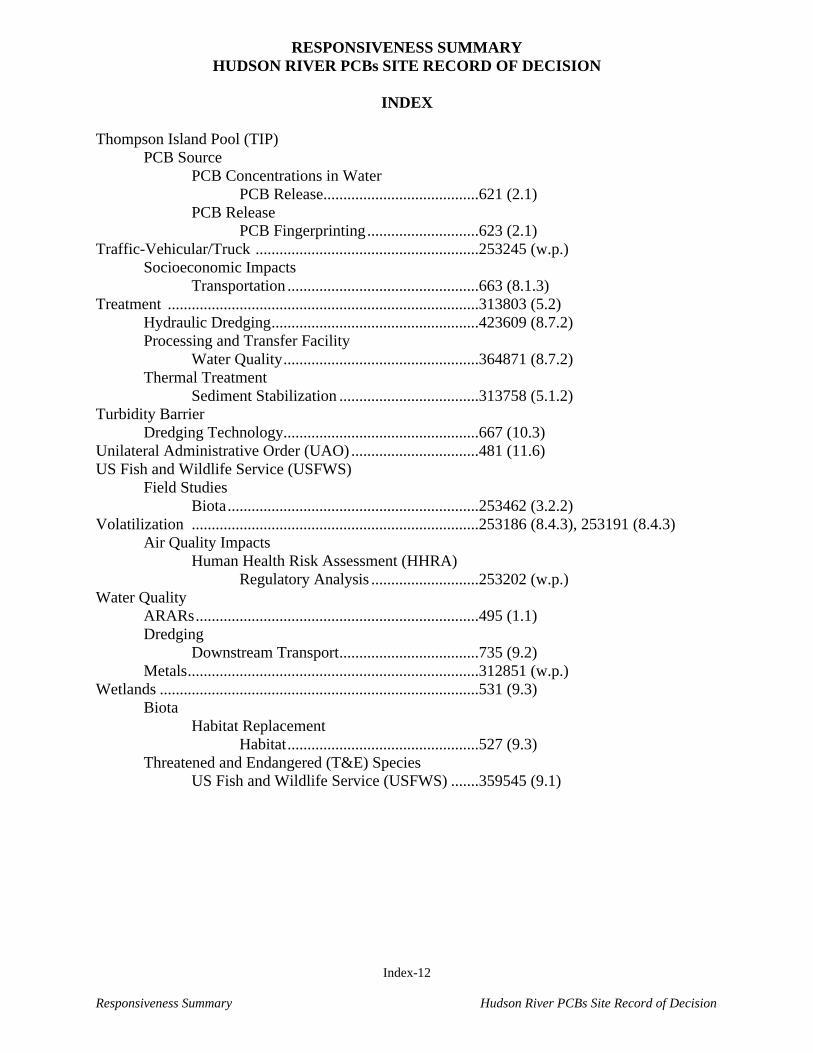
RESPONSIVENESS SUMMARY HUDSON RIVER PCBs SITE RECORD OF DECISION
INDEX
Index-12
Responsiveness Summary Hudson River PCBs Site Record of Decision
Thompson Island Pool (TIP) PCB Source PCB Concentrations in Water PCB Release.......................................621 (2.1) PCB Release PCB Fingerprinting............................623 (2.1) Traffic-Vehicular/Truck ........................................................253245 (w.p.) Socioeconomic Impacts Transportation ................................................663 (8.1.3) Treatment ..............................................................................313803 (5.2) Hydraulic Dredging....................................................423609 (8.7.2) Processing and Transfer Facility Water Quality.................................................364871 (8.7.2) Thermal Treatment Sediment Stabilization ...................................313758 (5.1.2) Turbidity Barrier Dredging Technology.................................................667 (10.3) Unilateral Administrative Order (UAO) ................................481 (11.6) US Fish and Wildlife Service (USFWS) Field Studies Biota...............................................................253462 (3.2.2) Volatilization ........................................................................253186 (8.4.3), 253191 (8.4.3) Air Quality Impacts Human Health Risk Assessment (HHRA) Regulatory Analysis ...........................253202 (w.p.) Water Quality ARARs.......................................................................495 (1.1) Dredging Downstream Transport...................................735 (9.2) Metals.........................................................................312851 (w.p.) Wetlands ................................................................................531 (9.3) Biota Habitat Replacement Habitat................................................527 (9.3) Threatened and Endangered (T&E) Species US Fish and Wildlife Service (USFWS) .......359545 (9.1)


