Embed Size (px)
Citation preview
University of Northern ColoradoScholarship & Creative Works @ Digital UNC
Dissertations Student Research
5-1-2012
Response of riparian areas of the shortgrass steppeto anthropogenic disturbance and assessment ofstudents' changed understanding of ecosystemreclamation through experienceMichael Henry Schiebout
Follow this and additional works at: http://digscholarship.unco.edu/dissertations
This Text is brought to you for free and open access by the Student Research at Scholarship & Creative Works @ Digital UNC. It has been accepted forinclusion in Dissertations by an authorized administrator of Scholarship & Creative Works @ Digital UNC. For more information, please [email protected].
Recommended CitationSchiebout, Michael Henry, "Response of riparian areas of the shortgrass steppe to anthropogenic disturbance and assessment ofstudents' changed understanding of ecosystem reclamation through experience" (2012). Dissertations. Paper 247.
UNIVERSITY OF NORTHERN COLORADO
Greeley, Colorado
The Graduate School
RESPONSE OF RIPARIAN AREAS OF THE SHORTGRASS STEPPE
TO ANTHROPOGENIC DISTURBANCE AND ASSESSMENT
OF STUDENTS’ CHANGED UNDERSTANDING
OF ECOSYSTEM RECLAMATION
THROUGH EXPERIENCE
A Dissertation Submitted in Partial Fulfillment
of the Requirements for the Degree of
Doctor of Philosophy
Michael Henry Schiebout
College of Natural Health Sciences
School of Biological Sciences
Biological Education
May 2012

ii
This Dissertation by: Michael Henry Schiebout
Entitled: Response of riparian areas of the shortgrass steppe to anthropogenic disturbance
and assessment of students’ changed understanding of ecosystem reclamation through
experience
has been approved as meeting the requirement for the Degree of Doctor of Philosophy in
College of Natural Health Sciences, in School of Biological Sciences, Program of
Biological Education
Accepted by the Doctoral Committee
______________________________________________________
Scott Franklin, Ph.D., Chair
______________________________________________________
Mitchell McGlaughlin, Ph.D., Committee Member
_______________________________________________________
Robert Reinsvold, Ph.D., Committee Member
_______________________________________________________
William Hoyt, Ph.D., Faculty Representative
Date of Dissertation Defense: _______________________________
Accepted by the Graduate School
_________________________________________________
Linda L. Black, Ed.D., LPC
Acting Dean of the Graduate School and International Admissions
iii
ABSTRACT
Schiebout, Michael Henry Response of riparian areas of the shortgrass steppe to
anthropogenic disturbance and assessment of students’ changed understanding of
ecosystem reclamation through experience. Published Doctor of Philosophy
dissertation, University of Northern Colorado, 2012.
Most vegetation communities are in some way impacted by humans. This
dissertation is composed of a series of studies aimed at understanding how the shortgrass
steppe in northeastern Colorado responds to human disturbance. Specifically, it
addresses the impact of gravel mining on a riparian area of the shortgrass steppe and its
response to reclamation efforts. In addition, the impact of cattle grazing on the shortgrass
steppe was investigated using exclosures. Studies concerning competition of noxious
weeds present at the reclamation site were also conducted, both in the field and
greenhouse. Finally, a qualitative study was completed addressing how student
understanding and perception of gravel mine reclamation changed after visiting a mine
reclamation site.
The reclamation study evaluated plant and soil composition of an aggregate mine
site on the shortgrass steppe of northeastern Colorado to determine its status five years
following active mining. This assessment was made by comparing the gravel mine site to
minimally-impacted reference sites on the Pawnee National Grasslands. Community
composition, soil characteristics and productivity were all significantly different for the
mined site. In particular, soil phosphorus and soil potassium levels were lower. In
addition, the gravel mine site had lower levels of below-ground biomass. The results
iv
indicate that reclamation efforts on the mined site have been successful in establishing
ground cover composed of native grasses and establishing functionally similar species to
the references sites. Planting more native forbs and adding phosphorus and potassium to
the soil is recommended to bring the experimental site closer to the reference site
conditions. Grazing effects on riparian areas of the shortgrass steppe were tested using a
seasonal and a multi-year study. Species composition and functional composition were
compared for areas exposed to grazing and areas released from grazing. Soil nutrient
levels and biomass levels were also compared but only over one grazing season. Results
from the single grazing season study showed areas exposed to grazing had less above-
ground biomass and greater heterogeneity than non-grazed areas. The multi-year study
showed that species composition differed between grazed and un-grazed areas from the
onset but demonstrated similar dynamics for diversity and species composition. The data
suggested other environmental factors, perhaps hail, had a greater impact on the system
than grazing. Release from grazing caused the system to change more than continual
grazing and resulted in increased species evenness. This study demonstrated variability
of species composition from year to year on the shortgrass steppe and supported the
concept that grazing has minimal impact in regions adapted to low levels of precipitation.
The competition studies investigated the possibility of utilizing native functionally
equivalent plants as a means to control the spread and dominance of noxious weeds.
Greenhouse and field studies were conducted to investigate the impact plant functionality
and nativeness have on competitive ability of the ubiquitous noxious species Bromus
tectorum and Cirsium arvense. Results indicate that Vulpia octoflora may inhibit the
growth of Bromus tectorum but has little impact on Cirsium arvense, and that Achillea
v
millifolium var. lanulosa does not significantly impact the growth of these noxious
weeds. In the field, increased graminoid cover predicted decreased performance of
Cirsium arvense. Data support the current practice of planting native perennial grasses in
reclamation sites is an effective control measure for containing Cirsium arvense on the
shortgrass steppe and suggest that planting Vulpia octoflora may be useful in controlling
Bromus tectorum. A case study utilizing interviews, drawings, and observations was
conducted. The goal of this case study was to investigate understanding and perceptions
of high school geology students toward aggregate mining prior to and after a visit to a
gravel mine reclamation site. Five underlying themes emerged from the data: increased
knowledge of the gravel mining and reclamation processes, vocalization of the
importance of reclamation, increased understanding of the structural composition of a
gravel mine reclamation site on the shortgrass steppe, decreased emphasis of an
anthropocentric purpose of mine reclamation, and identification of the location of a
specific reclamation site. These results elucidate the importance in place-based education
for developing student understanding of science concepts and stewardship perspectives.

vi
ACKNOWLEDGEMENTS
No one starts on an endeavor such as a Ph.D. and sees it to completion without the
guidance, encouragement and support of a great team of individuals.
I am grateful for Scott Franklin for accepting me as a Doctoral student. I
appreciate the many hours of work both in the field, greenhouse and in mentoring me
through the design and writing process. Many stories can be told of these experiences.
He was always helpful, cheerful, and willing to answer any of my questions. I am also
thankful for the other members of my committee; Rob Reinsvold, Mitt McGlaughlin and
Bill Hoyt. Each of these individuals made significant (p<0.0001) contributions to the
quality of my dissertation.
I would like to thank the many other faculty members at UNC who through this
process were willing to give their time and effort in mentoring me. These individual
include my Master’s advisor Neil Snow and cell and molecular biology mentors Susan
Keenan and Patrick Burns. Both persevered with me as I worked to gain knowledge,
training and understanding in the field of molecular biology.
Thanks goes out to the Poudre Learning Center staff and in particular to the
director, Ray Tschillard, who enabled me to conduct research at the PLC. He is also a
good friend who made the work at the PLC enjoyable with tasks including movement of
road base by hand, putting in the dock, and hand planting the very first shrubs now
composing the wind break.

vii
Don Hazlett deserves much credit for my training as a field biologist. I am
thankful for his friendship, advice, botanical experience and of course the many lunches.
I have enjoyed every field endeavor we have done together, starting with the collecting in
Mills Canyon and continuing with the work on Eagle Rock Ranch.
I would like to thank Mary Ashby for allowing me to conduct research on the
CPER and for always being willing to help with supplies such as exclosure cages and
questions. I thank Judy Firestein for her permission to conduct research on her property
and for always having a cheerful attitude.
I am grateful for Gary Frasier who allowed me to work with data that was initially
collected under his supervision and also Mary Ann Murphy for her willingness to help
out whenever I asked.
I am thankful for help in the field and lab from a number of teachers, graduate
students, and undergraduate students including: Robert Frederick, Amber Brant, Morgan
Hockley, and Isaiah Runyan.
I am very appreciative for the support my wife Jodi has given me - for always
believing in me and finding ways to enjoy the journey with me through this process. She
is the best partner anyone could ask for. I would like to thank my children; Allison,
Monique, Henry, and Grant. For three of them, this life is the only one they have known
and I appreciate their love. I would like to thank my extended family as well. In
particular, I am thankful for my sister Valerie and my in-laws who were willing to
provide childcare at times. Both sets of our parents have been great encouragers and
have come along side us in many tangible, generous and supportive ways.

viii
I would like to acknowledge the funding I have received to conduct my research
and to support my graduate education; the Flood and Peterson scholarship, the GAANN
Fellowship, NSF GK-12 Fellowship, NSF-MSP Grant, the Robert Sund Scholarship, the
School of Biological Sciences and the Winchester Graduate Fellowship.
ix
TABLE OF CONTENTS
CHAPTER I. INTRODUCTION AND OVERVIEW………………………………….... 1
Need for Reclamation Evaluation of the Shortgrass Steppe……….……….…….. 2
Description of the Shortgrass Steppe….………………… ………………………..3
Disturbance and the Community.………………………..……………………...... 4
Hypotheses for Invasive Plant Success………………………………..…………. 5
Linking the Science to Education…………………………………..…………….. 7
Characteristics of the Research Sites…………………………………………….. 9
Summary of Dissertation..………………………………………………………. 11
CHAPTER II. SHORTGRASS STEPPE RESPONSE TO GRAVEL MINING WITH
ACTIVE RECLAMATION INTERVENTION………….…….……………….. 13
Abstract…………………………………………………………………….……. 13
Introduction………………………………………………………………..…….. 14
Methods………………………………………………….……………………….17
Characteristics of the Sites………………………………………………. 17
Procedures………………………………………………………..……… 23
Results…………………..………………………………………………..……... 26
Discussion……………………………………………………………..………… 48
Assessment of Restoration Success….………………………………..………… 54
Future Studies………………………..………………………………………….. 56
Management Recommendations……..………………………………..………… 57
CHAPTER III. RESPONSE OF RIPARIAN/LOWLAND AREAS OF THE
SHORTGRASS STEPPE TO THE RELEASE FROM CATTLE GRAZING
USING EXCLOSURES: COMPARISON OF DIFFERENT SPATIAL AND
TEMPORAL SCALES…………………….………………………………….… 59
.
Abstract……………………………………………………….…………………. 59
Introduction……………………………………………………………………… 60
Methods………………………………………………………………………..…63
Site locations………………..…………………………………………… 63
Study 1: One Year Cessation From Grazing Study….….………………. 65
Study 2: Five Year Transect Study..…………………….…………….… 69
Results…………………………………………………………………………… 75
One Year Cessation From Grazing Study………………………….….… 75
Five Year Transect Study………………………………………………...80
x
Discussion……………………………………………………………………..… 94
CHAPTER IV. ASSESSMENT OF COMPETITION BETWEEN NOXIOUS WEEDS
AND FUNCTIONALLY EQUIVALENT NATIVES UTILIZING FIELD AND
GREENHOUSE STUDIES……………………………………………………. 103
Abstract………………………………………………………………………… 103
Introduction………………………………………..…..……………………….. 104
Methods……………………………………………..…………………………..109
Site Locations and Characteristics……………………………………... 109
Research Species…………..………………………………………….... 110
Green House Study: Density- Functionality – Intraspecific for
Noxious………………………………………………………………… 112
Green House Study: Nativness –Functionality – Intraspecific ……….. 114 Field Study: Determination of Cirsium arvense competition in situ…..118
Results………………………………………………………………….………. 119
Green House Study: Density- Functionality – Intraspecific for
Noxious………………………………………………………………… 119
Green House Study: Nativness –Functionality - Intraspecific…………. 119
Field Study: Determination of Cirsium arvense Competition in Situ…. 132
Disscusion……………………………………………………………………… 137
Management Recommendations……………………………………………….. 142
CHAPTER V. ASSESSING CHANGES IN PERCPTION AND UNDERSTANDING
OF STUDENTS TOWARD MINE RECLAMATION SITES THROUGH
AN EXPERIENTIAL PROCESS……………………………………………… 143
Abstract………………………………………………………………………… 143
Introduction………………………………………………………………….… .144
Methodology………..…………………………………………………………. .147
Theoretical Perspective………………………………………………... .147
Researchers Personal Stance………………………………………….... 148
IRB Procedure …………………………………………………………. 148
Participants..…………………………………………………………….148
Setting…………………………………………………………………. .149
Findings………………………………………………………..………………..155
Discussion – Recommendations………………………………………….…… .160
Conclusion…………………………………………………………………..…..162
Future Directions………………………………………………………………. 163
CHAPTER VI. CONCLUSION/ OVERALL SUMMARY OF RESULTS……………165
REFERENCES………….……………………………………………………………... 174
xi
APPENDIX A. CUMULATIVE SPECIES LIST FROM PLC, PAWNEE 17,
AND PAWNEE 27 …………………………………………….………….…. .193
APPENDIX B. CUMULATIVE SPECIES LIST FROM PAWNEE 17,
AND PAWNEE 27 ………………………………..…………………………...196
APPENDIX C. CUMULATIVE SPECIES RECORDED BY CPER
CREW FROM PAWNEE 17 (1995-1999)………….…………….……….….. .199
APPENDIX D. SPECIES RECORDED AT PLC IN NON-FLOODED
COMPETITION PLOTS …………….…………………………...…………… 204
APPENDIX E. STUDENT PRE-SITE VISIT INTERVIEW
QUESTIONS…………….…………………………………….……..…………206
APPENDIX F. STUDENT PRE-SITE VISIT INTERVIEW
QUESTIONS …………………………………………………..……………… 208
APPENDIX G. IRB APPROVAL….………………………………………………….. 210
xii
LIST OF TABLES
1. Average ground cover measurements for three sites in Colorado; two are
reference sites (Pawnee 17 & 27) and one is a mine reclamation site (PLC)……28
2. Indicator species analysis of three sites on the shortgrass steppe in Colorado… ..30
3. Results of an ANOVA of soil characteristics from three sites on the shortgrass
steppe in Colorado………………………………………………………………..32
4. ANOVA Results for biomass from three sites on the shortgrass steppe in
Colorado…………………………………………………………………………. 34
5. Indicator values (% of perfect indication, based on combining the values for
relative abundance and relative frequency) from three sites on the shortgrass
steppe in Colorado…………………………………………………………….….38
6. ANOVA output comparing coeficient of variation utilizing within plot
variability for above and below ground biomass and litter from three sites on the
shortgrass steppe in Colorado…………………………………………………… 39
7. ANOVA results comparing the biomass of plots located at the mine reclamation
Site (PLC)…………………………………………………………………….…..44
8. ANOVA results comparing soil nutrients for plots located at the PLC……….....45
9. Nine parameters recommended by the society of ecological restoration….……. 55
10. Indicator species analysis of caged (non-grazed) and un-caged (grazed) sites on
the shortgrass steppe……………………………………………………….……..77
11. ANOVA results for biomass, rocks, and shoot-root ratio from grazed and
un-grazed plots on the shortgrass steppe…………………………………………77
12. Indicator species analysis of 1995 exclosure (in) and grazed (out)
transects on the shortgrass steppe…………..………………………………….... 84
13. Indicator species analysis of 1999 exclosure (in) and grazed (out) transects on the
shortgrass steppe………………………………………………………………… 84
xiii
14. Indicator species analysis comparing 1995 to 1999 for exclosure transect data
on the shortgrass steppe………………………………………………………… .85
15. Indicator species analysis comparing 1995 to 1999 for grazed transect data on the
shortgrass steppe………………………………………………………………… 85
16. Indicator species analysis comparing 1995 to 1997 for exclosure transect data on
the shortgrass steppe…………………………………………………………….. 86
17. Indicator species analysis comparing 1995 to 1997 for grazed transect data on the
shortgrass steppe………………………………………………………………… 86
18. Indicator functional analysis comparing 1995 to 1999 for exclosures on the
shortgrass steppe………………………………………………………………… 92
19. Indicator functional analysis comparing 1995 to 1997 exclosure on the shortgrass
steppe……………………………………………………………………………. 92
20. Density levels utilized in the experiment and functional relationships between the
noxious species……………………………………………………………..….. 114
21. Two-way ANOVA setup comparing the relationship functionality and nativeness
have on competition of the noxious species………………………………….... 115
22. Contrasts set up to investigate intraspecific and interspecific competition of the
experimental species…………………………………………………………… 115
23. Global ANOVA results for Achillea millifolium var. lanulosa, Bromus tectorum,
Cirsium arvense, and Vulpia octoflora investigating the impact density and
functionality have on growth………..…………………………………………. 120
24. Two-way ANOVA analysis investigating the significance of plant density,
competition and density competition interaction…………………………….… 121
25. Global ANOVA results for Achillea millifolium var. lanulosa, Bromus tectorum,
Cirsium arvense, and Vulpia octoflora investigating the impact nativeness and
competition has on growth………………………..……………………….…… 123
26. Two-way ANOVA analysis investigating the significance of plant nativeness,
functionality and nativeness functionality interaction………………………..... 123
27. Paired-T test results comparing Cirsium plants grown alone (control) and Cirsium
plants grown with competition………………………………………………….134
xiv
LIST OF FIGURES
1. Location of the research sites: Poudre Learning Center and two reference
sites…….………………………………………………………………………... 21
2. Locations of 1 m2
plots at the Poudre Learning Center, CO…………..………….22
3. Location of the 1 m2
plots at site 17 on the Pawnee Grassland, CO…….............22
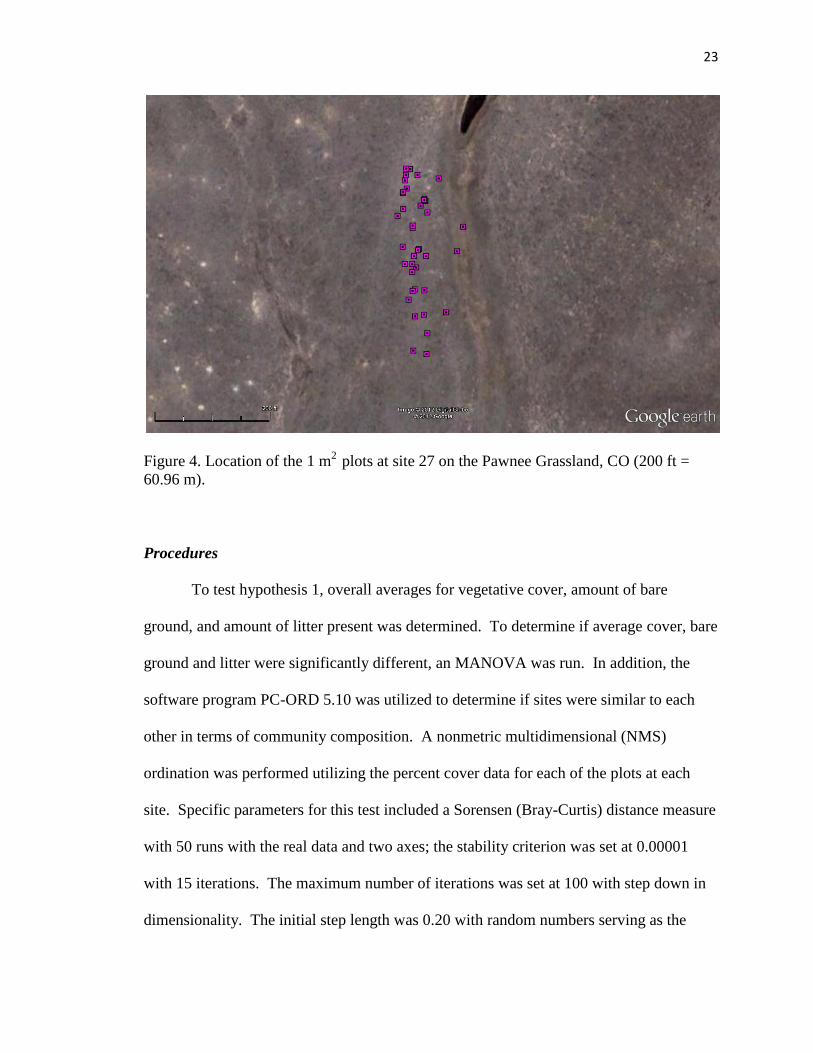
4. Location of the 1 m2
plots at site 27 on the Pawnee Grassland, CO…………… 23
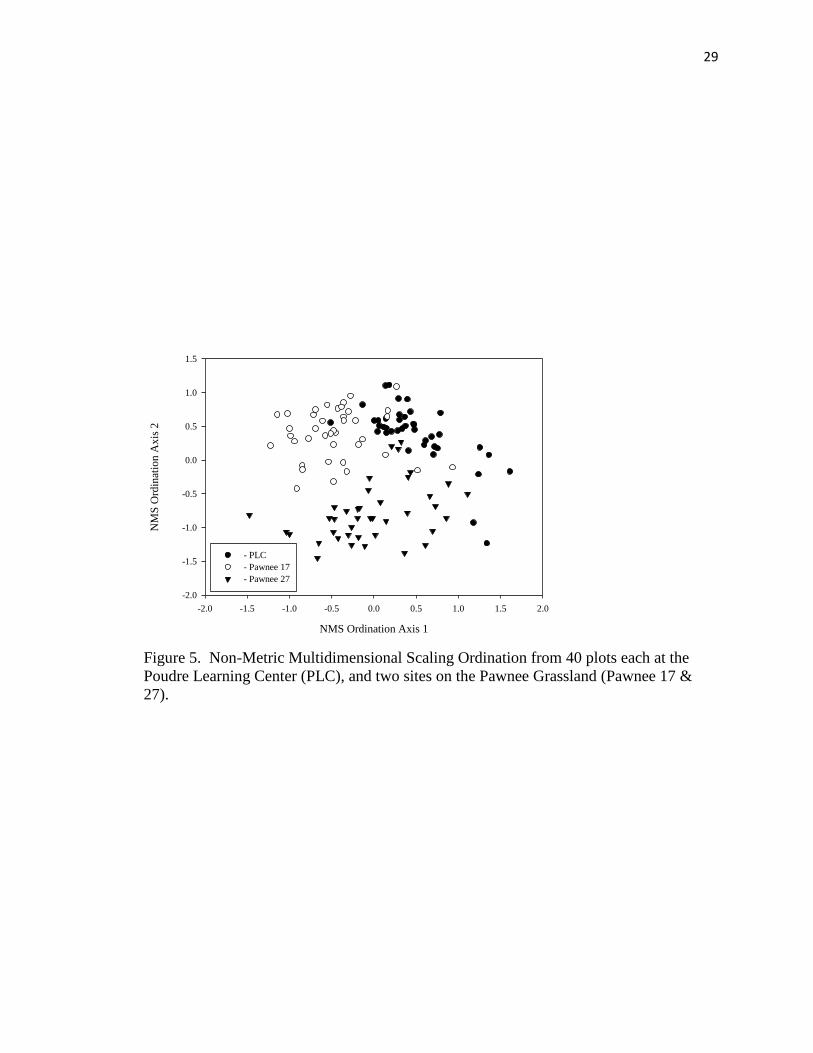
5. Non-Metric Multidimensional Scaling Ordination from 40 plots each at the
Poudre Learning Center (PLC) and two sites on the Pawnee Grassland
(Pawnee 17 & 27)……………………………………………………………….. 29
6. Percentage of invasive (non-native) species at the mine reclamation site Poudre
Learning Center (PLC) and two reference sites on the Pawnee Grassland
(Pawnee 17 & 27)……………………………………………….………………..31
7. A comparison of the means for richness, evenness, Shannon’s Diversity Index,
and Simpson’s Diversity Index from three sites on the shortgrass steppe……… 31
8. Nutrient loads from three sites on the shortgrass steppe…………………………32
9. Soil nutrient characteristics at three sites………………………………………... 33
10. Biomass means……………………………………….……………………….….35
11. Comparison of rock mass and shoot to root ratios………………………..……. ..35
12. NMS comparison of functional similarity for the mine reclamation site Poudre
Learning Center (PLC) and two reference sites…………………………………. 36
.
13. Comparison of abundance of functional groups from three sites on the shortgrass
steppe……………………………………………………………………………. 37
14. Mean coefficient of variation for above and below ground biomass……………. 39
15. Maximum, minimum and mean measurements of diversity for from three sites on
the shortgrass steppe………………………………………………………..…… 40
xv
16. Maximum, minimum and mean measurement of soil minerals from three sites on
the shortgrass steppe………………………………………………………….…. 41
17. Maximum, minimum and mean measurements for soil characteristics from three
sites on the shortgrass steppe……………………………………………………. 42
18. Maximum, minimum and mean measurements of biomass from three sites on the
shortgrass steppe………………………………………………………………… 43
19. Rock composition and Shoot/root ratios of the mine reclamation site PLC north
and PLC south……………………………………………………………….….. .45
20. Biomass characteristics for research site PLC north and PLC south………….... .46
21. Soil characteristic comparing mine reclamation site PLC north to PLC south…. 47
22. Location of shortgrass steppe riparian research sites on the Pawnee National
Grassland………………………………………………………………………....65
23. Exclosure cage used to cover m2 plots…………………………………………... 66
24. Arrangement of cages in Section 27, shortgrass steppe ………………………… 67
25. Orientation of the transect perpendicular to the lowland area from upland to
upland……………………………………………………………………………. 70
26. Location of six transects in exclosure (un-grazed; red circle) and six transects
exposed to continuous grazing (blue circles)…………………………………… 71
27. Point drop method for determining species composition for the five-year transect
study………………………………………………………………….…………. 72
28. Average composition of cover including bare, litter and cow patty for areas
excluded from grazing (cage) and areas exposed to grazing (no cage)……....…. 75
29. NMS ordination comparing caged (un-grazed) m2 plots to uncaged (grazed) m
2
plots……………………………………………………………………….….….. 76
30. Biomass of caged (un-grazed) compared to un-caged (grazed) m2
plots.……..… 78
31. Rock mass and shoot-to-root ratio in caged (un-grazed) compared to un-caged
(grazed) m2
plots …………………………………………………………………79
32 . Average height of the tallest plant species located in either caged or un-caged
plots……………………………………………………………………………… 79
33. Frequency of tallest plants in un-grazed (caged) and grazed (un-caged) plots...... 80
xvi
34. NMS Ordination of average coordinates for each year for the exclosure transects
(black) and the grazed transects (clear)…………………………………...…….. 83
35. NMS Ordination of average coordinates for each year for the exclosure transects
(black) and the grazed transect (clear)………………………………………….. 83
36. Percent composition of the most abundant species along with litter and bare cover
for transects located in the exclosure and grazed areas………………………..... 87
37. Average evenness, richness and diversity indices (Shannon’s and Simpson’s) for
the exclosure and grazed transects……………………………………………… 90
38. NMS coordinates averaged for functional groupings by treatment and year
comparing change through time………………………………………………….91
39 NMS with species organized into functional groupings comparing the exclosure
to the grazed areas in 1995 and 1999………………………………………….... 91
40. Percentage of functional composition for the grazed transects in 1995 and 1999
and the exclosure transects in 1995 and 1999………………………………..…. 93
41. Percentage of functional composition for the grazed transects in 1995 and 1997
and the exclosure transects in 1995 and 1997…………………………………… 93
42. Weather data from the CPER site…………………………………………..…. 102
43. Research locations of paired plots investigating Cirsium arvense competition
occurring naturally………………………………………………………..……. 110
44. Paired plot design and photographs of a paired plot in the field………………. 117
45. Evidence of flooding in the research area……………………………………… 118
46. Growth variable average number of leaves for Achillea millifolium var. lanulosa
in response to density levels…………………………………………………… 121
47. Growth variable average number of leaves for Vulpia octoflora in response to
density levels…………………………………………………………..……….. 122
48. Growth variable average number of leaves for Cirsium arvense……..……….. 122
49. Interaction graphs for the effects of nativeness and functional equivalence on the
means of a number of growth parameters for Achillea millifolium
var. lanulosa……………………………………………………………………. 125
xvii
50. Interaction graphs for the effects of nativeness and functional equivalence on the
means of a number of growth parameters for Bromus tectorum………………. 126
51. Interaction graphs for the effects of nativeness and functional equivalence on the
means of a number of growth parameters for Cirsium arvense……………….. 127
52. Interaction graphs for the effects of nativeness and functional equivalence on the
means of a number of growth parameters for Vulpia octoflora……………..…. 128
53. Control compared to intraspecific competition and interspecific competition for
Achillea millifolium var. lanulosa……………………………………………... .130
54. Control compared to intraspecific competition and interspecific competition for
Bromus tectorum………………………………………………………..……… 130
55. Control compared to intraspecific competition and interspecific competition for
Cirsium arvense………………………………………………………………... 131
56. Control compared to intraspecific competition and interspecific competition for
Vulpia octoflora………………………………………………………………... 131
57. Ordination of species percent ground cover of each plot……………………… 133
58. Growth parameters of Cirsium arvense grown with competition and without
competition…………………………………………………………………….. 134
59. Change in the average measurements of the growth variables longest leaf length,
height, number of leaves, and flower structures for Cirsium arvense in the
field………………………………………………………………………….… 135
60. Significant variables identified through regression analysis predicting Cirsium
arvense growth and flower production……………………………..…………. .136
61. Composite calculations percent species cover for competitive plots used in the
regression analysis………………………………………………………..……. 137
62. Photo used as a prompt for participants to complete reclamation drawing.…… 149
63. Composition of ground vegetation at the Poudre Learning Center……..….….. 153

1
CHAPTER I
INTRODUCTION AND OVERVIEW
The shortgrass steppe region of northeastern Colorado has been impacted by
human and naturally-caused disturbances. Some of the disturbances impacting this
region are intense such as mining and construction. Others are more subtle such as
drought, grazing and the impact of prairie dogs (Peters et al., 2008). These more
consistent disturbances have shaped the vegetation patterns observed on the shortgrass
steppe. As humans continue to encroach on natural areas, it is important to understand
how systems respond to this pressure and equally important to understand how citizens
view these disturbances. Without community support, conservation and stewardship
activities are constrained. One of the goals of environmental education is to develop in
students an understanding of the natural world, the impact humans have on the natural
world, and the processes such as land reclamation and restoration that mitigate human
impacts (Davis, 1998; Thomson & Hoffman, 2004). Through ecological and
environmental science education utilizing experiences with nature, students gain an eco-
consciousness and desire to minimally impact the natural world (Knapp, 1999). To make
a successful transition toward eco-consciousness, students must understand human
impacts on the natural world and perceive the need for intervening through the process of
restoration and reclamation. This dissertation investigated the response of the shortgrass
steppe to gravel mine reclamation and release from cattle grazing as well as high school
2
students’ changed perceptions after visiting a gravel mine reclamation site. Included in
the dissertation is a study which investigated noxious weed interactions with native
vegetation in an attempt to understand mechanistic controls of community assemblage
that may be used for restoration.
The following introduces the main purpose and research topics of the dissertation,
beginning with the need for assessing restoration of the shortgrass steppe. Brief
introductions to disturbance theory, invasion biology, and ecological education (major
drivers of restoration success) give the background information to understand the studies
in the following chapters. This chapter concludes with specific characteristics of the
study sites and description of remaining chapters.
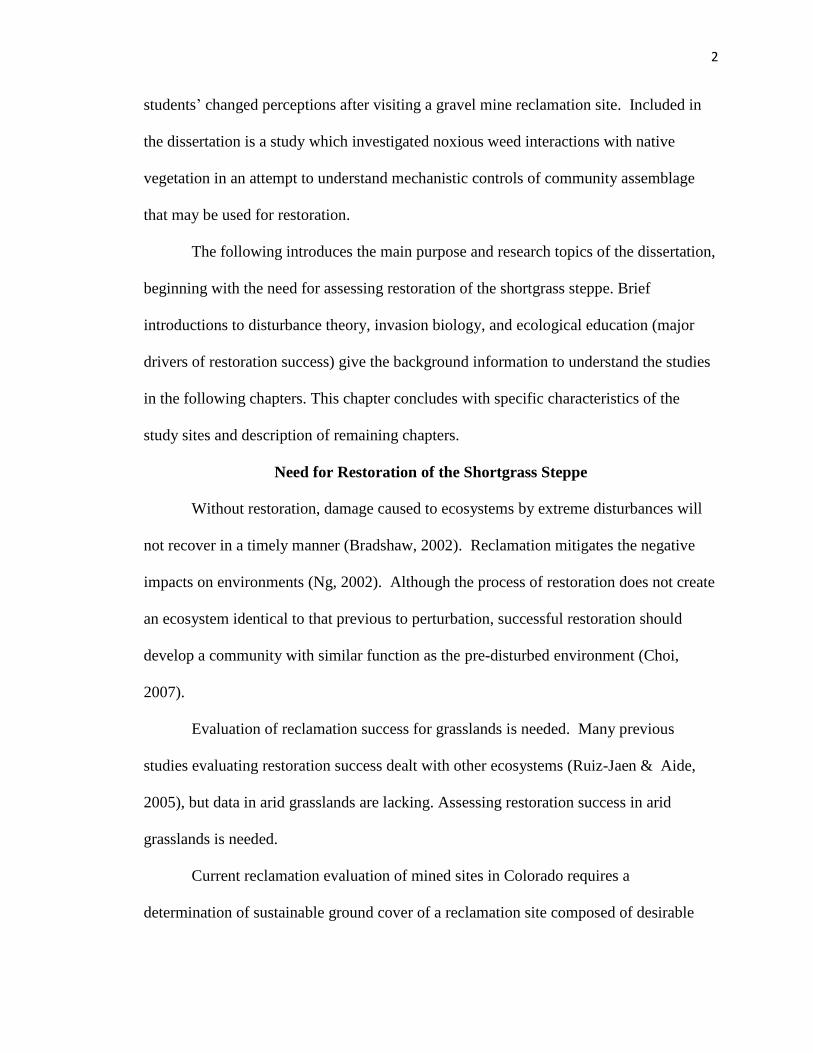
Need for Restoration of the Shortgrass Steppe
Without restoration, damage caused to ecosystems by extreme disturbances will
not recover in a timely manner (Bradshaw, 2002). Reclamation mitigates the negative
impacts on environments (Ng, 2002). Although the process of restoration does not create
an ecosystem identical to that previous to perturbation, successful restoration should
develop a community with similar function as the pre-disturbed environment (Choi,
2007).
Evaluation of reclamation success for grasslands is needed. Many previous
studies evaluating restoration success dealt with other ecosystems (Ruiz-Jaen & Aide,
2005), but data in arid grasslands are lacking. Assessing restoration success in arid
grasslands is needed.
Current reclamation evaluation of mined sites in Colorado requires a
determination of sustainable ground cover of a reclamation site composed of desirable
3
plant species (Assembly, 2008). These parameters are important, but they do not require
an assessment of community function or compare a reclaimed site to an intact functional
reference ecosystem. One of my studies did that and can now serve as a template for
determining the level of restoration success in other regions.
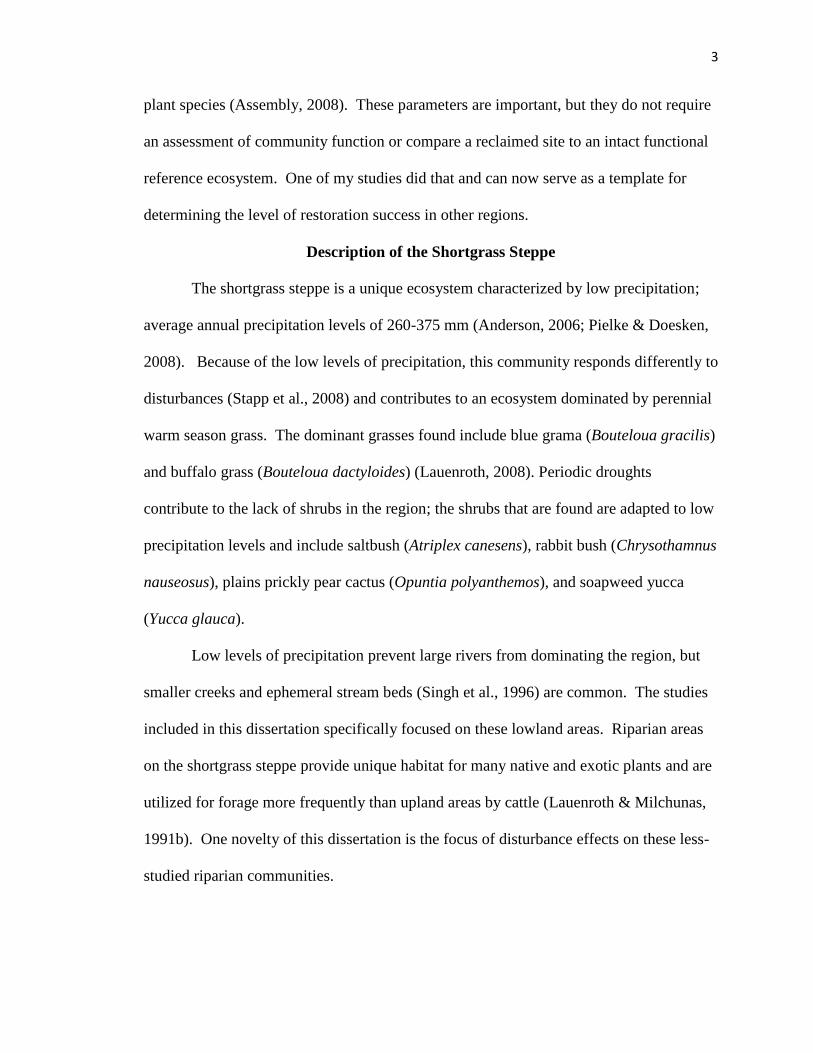
Description of the Shortgrass Steppe
The shortgrass steppe is a unique ecosystem characterized by low precipitation;
average annual precipitation levels of 260-375 mm (Anderson, 2006; Pielke & Doesken,
2008). Because of the low levels of precipitation, this community responds differently to
disturbances (Stapp et al., 2008) and contributes to an ecosystem dominated by perennial
warm season grass. The dominant grasses found include blue grama (Bouteloua gracilis)
and buffalo grass (Bouteloua dactyloides) (Lauenroth, 2008). Periodic droughts
contribute to the lack of shrubs in the region; the shrubs that are found are adapted to low
precipitation levels and include saltbush (Atriplex canesens), rabbit bush (Chrysothamnus
nauseosus), plains prickly pear cactus (Opuntia polyanthemos), and soapweed yucca
(Yucca glauca).
Low levels of precipitation prevent large rivers from dominating the region, but
smaller creeks and ephemeral stream beds (Singh et al., 1996) are common. The studies
included in this dissertation specifically focused on these lowland areas. Riparian areas
on the shortgrass steppe provide unique habitat for many native and exotic plants and are
utilized for forage more frequently than upland areas by cattle (Lauenroth & Milchunas,
1991b). One novelty of this dissertation is the focus of disturbance effects on these less-
studied riparian communities.
4
Disturbance and the Community
For this dissertation, a disturbance will be defined as an event in time and place
that alters the structure of populations, communities, and ecosystems. The structural
changes modify resource availability of the physical environment (White & Pickett,
1985). Disturbances could be a chronic long term event such as cattle grazing or climate
change –or a more immediate event such as drought, mining, oil drilling or fire.
Disturbances frequently precipitate a cascade effect elevating the impact of other stresses
in the environment (Sousa, 1984).
Change in community structure is a key effect of a disturbance. Vegetation
present prior to the disturbance will be changed and the level of change is contingent on
the magnitude and severity of the disturbance. This structural change will contribute to
changes in resource and substrate availability.
Disturbances interact with the landscape. The location, structure, elevation, and
species composition of the landscape all determine the impact a disturbance will have on
an ecosystem. In addition, the disturbance often dictates the type of plants capable of
living in an area, either by the selective stress of the disturbance or the post-disturbance
environment (Grime, 1977). Mining may elicit particularly strong stressors and filters.
Resources that were used by one plant destroyed by mining become available for other
plants. Plants able to gain a hold quickly, utilize the available resources, and reproduce
abundantly dominate (Denslow, 1980). For aggregate mining, not only have the existing
native plants been removed, but the seed bank may also have been removed opening up
the site to species that have long distance dispersal methods and thrive in dry conditions
on the shortgrass steppe.
5
A novel disturbance such as gravel mining will have a greater impact on the
shortgrass steppe verses a long-term chronic disturbance because the system likely has
not adapted to the novel experience. For example, much of the overburden used in
surface mine reclamation is deficient in both nitrogen and phosphorus (Sengupta, 1993).
Sunlight availability also increases in mined areas previously occupied by standing
vegetation, and increased light availability contributes to the increase in invasive weeds
following disturbance (Tilman, 1986).
An example of a long term chronic disturbance is grazing. Ungulate grazing has
had and continues to have a profound influence on plant structure of the shortgrass steppe
(Milchunas et al., 1988b). Because cattle spend more time during the summer months in
lowland/riparian areas of the shortgrass steppe, these areas are grazed more frequently
than corresponding upland areas (Lauenroth & Milchunas, 1991b). This increased
grazing pressure increases the negative impacts of heavy grazing. In addition, grazed
riparian areas are more susceptible to trampling and elimination of vegetation (Clary &
Webster, 1989). From the results of this dissertation, resource managers will be better
able to make land use decisions with knowledge of how riparian areas of the shortgrass
steppe respond to reduced grazing or cessation of grazing.
Hypotheses for Invasive Plant Success
A number of hypotheses have been postulated to predict invasiveness of a species
into a community and the invasibility of the community itself. The hypotheses predict
invasion based on: similarity to native species, species intrinsic evolution rate, ability to
utilize resources not currently being utilized in a community, possession of novel traits
6
with which to interact with the environment, adaption to disturbance, species richness of
the invaded community, and level of propagule pressure (Hierro et al., 2005).
Darwin’s naturalization hypothesis predicts that similar taxa (taxonomically or
functionally) are prevented from invading because they encounter similar functional
competitors (Wolfe, 2002; Thuiller et al., 2010). Therefore exotics that are different are
more likely to successfully invade communities (Diez et al., 2008). These unique species
can utilize resources not being used in an ecosystem and will fill a void not occupied by
current vegetation (Elton, 1958; Macarthur, 1972; Tilman, 1997). For example, a species
that has deeper roots than the native vegetation would have an advantage in sequestering
water and would have the ability to grow without direct competition for the resource.
With an increased intrinsic evolutionary rate, an invasive species will be
successful if the species has the ability to change rapidly in a new environment. This
ability to rapidly change is an adaptive trait which enables the species to take advantage
of available resources and resist predators (Lee, 2002; Stockwell et al., 2003).
Some species have novel traits that enable them to inhibit the growth of natives.
These novel traits often include allopathic chemicals, which may have coevolved in the
original environment to confer resistance against plants and predators (Thorpe et al.,
2009). In the invaded community, little resistance has been built up by native plants or
predators (Callaway & Aschehoug, 2000; Thorpe et al., 2009; Wilsey et al., 2009).
Plants adapted to disturbance will successfully invade disturbed environments
(Gray, 1879; Burke & Grime, 1996; Yurkonis et al., 2012). These plants will likely be r-
strategists able to respond quickly to disturbance and typically have short lives, rapid
development, many offspring and excellent dispersal ability. Some of these colonizers

7
need disturbance to exist because of their poor competition ability (Sousa, 1984). As
such, invasive species that need disturbances to thrive should not dominate a community
moving toward stability.
Increased species richness is predicted to prevent species invasion because more
of the available space and resources are being allocated to the current species.
Communities with low levels of diversity will afford opportunities for invaders (Elton,
1958; Tilman, 1997; Kreyling et al., 2008).
Some ecologists have proposed that invasive success is due primarily to
propagule pressure (Williamson & Fitter, 1996; Lonsdale, 1999; Kolar & Lodge, 2001;
Eschtruth & Battles, 2009). If a large number of seeds are continually brought into a
community, it is likely they will invade, assuming they have the genetic plasticity to grow
and reproduce in the new environment.
Linking the Science to Education
Mining, construction and agriculture are important and needed components of our
society and yet they negatively impact the natural world. This impact is seen through
removed topsoil, chemical leaching, soil erosion, and loss of habitat (Sengupta, 1993).
As urbanization continues to encroach and degrade intact, self supporting, and resilient
land, more areas will be in need of and benefit from restoration and reclamation. Yet
many people do not have an understanding of the reclamation process or its importance,
nor do we know its efficacy. As part of this project, a study was developed to
specifically investigate students’ perception of an aggregate mined site after visiting a
reclamation site. Individuals generally are unsure of or have negative ideas about the
impact of mining on natural environments (Bloodworth et al., 2009). They have even

8
less understanding of the importance and process of reclamation and how an environment
changes through the reclamation process. Gaining an understanding of students’
perceptions will allow teachers in the future to develop methods that more effectively
communicate how reclamation benefits a disturbed environment. In addition, students
themselves will apply direct experiences to develop an understanding of the importance
of reclamation in their communities. This information can then be applied as students
make future ecological decisions (NAAEE, 2004).
This study aimed to investigate student understanding of the impacts and
mitigation involved in gravel mining and was the first study describing how students’
perceptions change in response to a direct experience with an aggregate mine reclamation
site. Although students have a general idea of how human impacts affect a natural site
(Yow, 2008), they do not have clear understanding about specific processes. One way to
change these misconceptions is through experiential activities that modify an individual’s
perspective and understanding (Dewey, 1938; NAAEE, 2004). These types of
experiences can also give students a sense of place and an appreciation for nature (Louv,
2005) which enhances their knowledge of natural processes.
As environmental educators work to help their students develop an understanding
of the natural world, there is also a hope that students will gain a desire to positively
impact the natural world. To make successful transitions toward eco-consciousness,
students must understand destructive human impact on the natural world and perceive the
need for intervening through the process of restoration and reclamation to improve the
9
condition of an impacted area. It is expected that direct experience will enhance their
understanding and heighten their perception of the importance of these intervention
processes.
Characteristics of the Research Sites
Two locations on the shortgrass steppe in northeastern Colorado were used for
this research. These locations were the Poudre Learning Center (PLC) including a
contiguous area north of the center and the Shortgrass Steppe Long-Term Ecological
Research Site (SGS LTER) located on the Pawnee National Grasslands.
The PLC located in Weld County, Colorado along the Cache la Poudre River
(40°26'35" N latitude, 104 °48'55" W longitude) with an average elevation of 1437
meters. The site was actively mined for sand and gravel from 1986-2003. Prior to
mining, this area showed a heterogeneous landscape consisting of 26.3 hectares of
shortgrass steppe, wetland, and riparian/terrace habitat (Resh & Chimmer, 2005). The
influence of the Poudre River has provided some complexity to the site, allowing patches
of taller grasses to occur in the year-round moister conditions of the associated riparian
areas. As is the case with many degraded landscapes, the PLC has more noxious invasive
weeds than undisturbed landscapes.
Active gravel mining was terminated on the site in 2003 and the removal of
overburden was completed in 2006. An augmented lake was created on the site and the
topography was returned to a state similar to that of pre-mining. In 2006, the site was
tilled and seeded with a native grass seed mix. The seeds were covered with weed-free
straw mulch to prevent soil erosion and maintain soil moisture. No native forbs were
included in the replanting efforts. The site has also been managed to control the invasion
10
of noxious weeds through a combination of methods such as manual removal, localized
herbicide use, and mowing. In addition, bindweed mite has been utilized in areas as a
biological control against Convolvulus arvensis.
The PLC is also impacted by disturbances other than mining. Prior to gravel
mining the area had been utilized for agriculture and adjacent land areas are still being
utilized for grazing and crop farming. In addition, by being located adjacent to the Cache
la Poudre River the center has been impacted directly by flooding. The more periodic
flooding can be seen on the sand bars and dirt bars located along the river. More extreme
flooding has occurred in the site as well and water has covered most of the site at times
within the last 30 years. Flooding also affects the plants located at the site, in particular
the plains cottonwoods, the sand bar willows, and the peach leaf willows found along the
Poudre river corridor. This flooding and movement of the river over time has also
contributed to soil diversity on the site.
The other research area was located at the Shortgrass Steppe Long-Term
Ecological Research (SGS LTER) located approximately 40 km north of Greeley,
Colorado. The SGS LTER is composed of the USDA ARS Central Plains Experimental
Range (CPER) forming the western boundary and is part of the larger USDA Forest
Service Pawnee National Grassland (PNG) extending east of the site (Lauenroth et al.,
2008). The CPER is a continuous 6280 ha block of land (40°49' N latitude, 104 °47" W
longitude) and was established by purchasing the land from farmers and ranchers unable
to keep their land following the dust storms and drought of the 1930’s. Cattle grazing has
occurred on the CPER since 1939 (Lauenroth & Milchunas, 1991a). The Pawnee
11
National Grassland is composed of 78,100 ha of public land that lies within a patchwork
of private land. Average yearly precipitation for this site is 321 mm (Lauenroth et al.,
2008).
Summary of Dissertation
The first aim of this dissertation, Chapter II, was to assess the response of the
shortgrass steppe to gravel mining after five years of active reclamation. Determining
reclamation success is imperative to evaluate current reclamation practices. This study
evaluated the plant and soil reclamation of an aggregate mine site at the PLC by
comparing the gravel mine site to minimally impacted reference sites on the shortgrass
steppe. Community composition, soil characteristics and productivity were measured and
compared.
The second aim, Chapter III, was to investigate the response of riparian/lowland
areas of the shortgrass steppe to release from cattle grazing using exclosures. Human
impact on grassland areas through cattle grazing has had a profound influence on plant
structure and composition in these areas. The investigation was conducted at two
different spatial and temporal scales. Specifically, one study was conducted over one
grazing season utilizing 1 m2
plots and the other was conducted over a five year period
utilizing twelve 50 meter transects. Species composition and functional composition
were compared for areas exposed to grazing and areas released from grazing. In addition,
soil nutrient levels and biomass levels were compared over one grazing season.
The third aim, Chapter IV, was an assessment of competition between noxious
weeds and functionally equivalent natives utilizing field and greenhouse studies. A goal
of restoration is to develop an ecosystem which is functioning similar to the one prior to

12
the disturbance event. Studies investigated the possibility of utilizing native functionally
equivalent plants as a means to control the spread and dominance of noxious weeds.
Greenhouse and field studies were conducted to investigate the impact that plant
functionality and nativeness have on competitive ability of the ubiquitous noxious species
Bromus tectorum and Cirsium arvense. In the greenhouse, these species were grown
with each other and with the native species Vulpia octoflora and Achillea millifolium var.
lanulosa. Growth parameters including height, number of leaves and above and
belowground biomass were recorded and compared. In the field, growth of Cirsium
arvense was investigated with ground cover vegetation (competiton) and without ground
cover vegetation to determine the effect ground cover composition has on growth and
fecundity of the species.
The fourth and final aim, Chapter V, was to assess changes in perception and
understanding of high school students toward a gravel mine reclamation site. One of the
goals of environmental education is to develop in students an understanding of the natural
world and through this learning process to develop in students an eco-consciousness.
This perspective translates into a desire to impact the natural world in a positive way.
The study was a qualitative case study that investigated understanding and perceptions of
high school geology students toward aggregate mining prior to and after a visit to a
gravel mine reclamation site through interviews, drawings, and observations.
13
CHAPTER II
SHORTGRASS STEPPE RESPONSE TO GRAVEL
MINING WITH ACTIVE RECLAMATION
INTERVENTION
Abstract
Reclamation is needed to restore areas damaged by human activities to a level of
ecological sustainability and functional diversity. Determining reclamation success is
imperative to evaluate current reclamation practices. This study evaluated the plant and
soil reclamation of an aggregate mine site on the shortgrass steppe of northeastern
Colorado to determine its status five years after mining activity was terminated. This
assessment was made by comparing the gravel mine site to minimally impacted reference
sites on the shortgrass steppe. Community composition, soil characteristics and
productivity were all significantly different for the research site. In particular, soil
phosphorus and soil potassium levels were lower for the mined site. In addition, the
gravel mine site had lower levels of belowground biomass. The results of this study
indicate that reclamation efforts on the gravel mine site have been successful in
establishing ground cover composed of native grasses and establishing functionally
similar species to the references sites. Planting more native forbs and adding phosphorus
and potassium to the soil is recommended to bring the experimental site closer to the
reference site conditions.
14
Introduction
Restoration is a practical means of mitigating the impact humans have had on
many natural environments. The shortgrass steppe region of Colorado is no exception,
although some of the disturbances impacting this region are more destructive than others;
e.g., mining and construction. Others are more subtle, such as drought, cattle grazing and
the impact of prairie dogs (Peters et al., 2008). The more consistent disturbances have
shaped the vegetation patterns observed on the shorgrass steppe. Grasslands in general
lack studies to assess restoration success (Ruiz-Jaen & Aide, 2005), and, considering the
unique structural composition and climate variables of the shortgrass steppe (Munson &
Lauenroth, 2011), assessment of restoration projects of degraded areas is especially
needed. The aim of this study was to assess the status of a gravel mine reclamation site
on the shortgrass steppe five years after mining was terminated by comparing it to two
intact reference sites. Comparisons included community composition, soil
characteristics, and productivity.
The shortgrass steppe is a unique ecosystem characterized by low levels of
precipitation (260-375 mm; (Anderson, 2006)) and large and rapid temperature changes
(Pielke & Doesken, 2008). The shortgrass steppe is impacted by the low level of
precipitation in general and periodic drought more directly. This semiarid environment is
unique compared to other grasslands and shows different responses to disturbances
(Stapp et al., 2008). The ecosystem is dominated by grasses; specifically, it’s
characterized by short monostructure grasses composed of blue grama (Bouteloua
gracilis) and buffalo grass (Bouteloua dactyloides) (Lauenroth, 2008). Both are
perennial warm season (C4) grasses. Another impact of periodic droughts is the low
15
number of shrubs present in this environment, which include saltbush (Atriplex
canesens), rabbit bush (Chrysothamnus nauseosus), plains prickly pear cactus (Opuntia
polyanthemos), and soapweed yucca (Yucca glauca). Low precipitation levels make the
shortgrass steppe less resilient (measure of the amount of time needed to return a system
to the equilibrium before the disturbance (Ives, 1995)) and resistant (ability to absorb
changes through time (Sutherland, 1974)) to disturbances such as gravel mining than
systems that receive more water.
Gravel mining causes environmental disturbance by changing the landscape from
undeveloped agricultural land into a hole in the ground, and this process destroys habitat
(Langer & Arbogast, 2002). The vegetation structural changes could be as simple as
plants no longer standing upright due to compaction of mine vehicles or as drastic as
plants being completely removed with the removal of soil at the mine extraction site.
Structural changes contribute to changes in resource and substrate availability. For
example, much of the overburden used in surface mine reclamation is deficient in both
nitrogen and phosphorus (Sengupta, 1993). Sunlight availability also increases in mined
areas previously occupied by standing vegetation, and increased light availability is one
reason invasive weeds become so abundant in disturbed areas (Tilman, 1986).
Restoration of degraded landscapes is an important process of returning – in a
timely manner – ecosystems disturbed by human caused activities such as agriculture, oil
extraction, and aggregate mining (Drew et al., 2002) back to a condition of functioning
within normal ranges of its reference ecosystem (SER, 2004). Without restoration,
damage caused to the ecosystem by erosion, decreased productivity, invasion of exotic
species and loss of biodiversity will have long term negative impacts (Bradshaw, 2002).
16
In the absence of intervention, impacted ecosystems could cause pollution and risk to
human health (Ng, 2002). Restoration will not create an ecosystem identical to the one
prior to the disturbance, but it should rehabilitate the environment by rebuilding or
replacing ecological structures that will function in a manner similar to the previous
environment (Choi, 2007).
Great need exists to evaluate reclamation success for grasslands. Ruiz-Jean and
Aide (2005) examined 68 restoration studies published between 1996 and 2003. Many of
these studies dealt with restoration projects of wetland or forested areas. Only 13 of these
studies examined grassland or prairie restoration, and of these 13, only four studied
reclamation from mining disturbance (Cullen & Wheater, 1993; Chapman & Younger,
1995; Corbett et al., 1996; Bisevac & Majer, 1999). None of the grassland studies were
conducted on the shortgrass steppe but instead were conducted in U.S. tall grass prairie,
Australian grassland, or European grassland. The results from these reclamation studies
generally showed that such efforts are effective in increasing species diversity and
biomass (Bisevac & Majer, 1999).
The Society for Ecological Restoration (SER) recommends nine ecosystem
attributes to be used as guidelines for assessing restoration success (SER, 2004). These
nine attributes include: similar species in the restored ecosystem compared to a reference
site, abundance of native species, correct functional groups for continued ecosystem
development, physical environment capable of providing needs for continued
development, community showing function for a its stage of succession, community
integrated into the broader ecological matrix, elimination of threats from surrounding
degraded landscapes, community resilient to normal stresses, and self-sustainable
17
community (SER, 2004). Because assessing all nine attributes is difficult due to financial
and time constraints, it has been recommended that at least three areas be measured to
assess ecosystem function: species diversity, vegetation structure, and ecological
processes (Ruiz-Jaen & Aide, 2005). These functional parameters were investigated in
the study using the following hypotheses: (1) Vegetation composition of reference sites is
significantly different from the PLC (a reclamation site); (2) Species diversity of
reference sites is greater than the PLC; (3) Biomass of reference sites is significantly
greater than the PLC; (4) Soil characteristics of reference sites are significantly different
from the PLC; (5): Functional group composition of reference sites are significantly
different from the PLC; (6) Heterogeneity of reference sites are significantly less than
the PLC.
Methods
Characteristics of the Sites
Three locations on the shortgrass steppe in northeastern Colorado were chosen for
this study: a gravel mine reclamation site located on the PLC and two reference sites
located on the Shortgrass Steppe Long-Term Ecological Research Site (SGS LTER) of
the Pawnee National Grasslands.
The PLC located in Weld County, Colorado adjacent to the Cache la Poudre River
(40°26'35" N latitude, 104 °48'55" W longitude) with an average elevation of 1437
meters and annual precipitation of 34.5 cm. The PLC soil is characterized by Ascalon
Loam, Aquolls and Aquents Gravelly Substratum and Columbo Clay Loam (USDA
NRCS 1980). It was actively mined for sand and gravel from 1986-2003. Prior to
mining, this area showed a heterogeneous landscape consisting of 26.3 hectares of
18
shortgrass steppe, wetland, and riparian/terrace habitat (Resh & Chimmer, 2005). The
influence of the Cache la Poudre River has provided some complexity to the site,
allowing patches of taller grasses to occur in the year-round moister conditions of
riparian areas. This site was chosen because of specific knowledge of the active
reclamation plan (Tschillard et al., 2006). In addition, the site offers research
opportunities as part of their focus of offering active inquiry-based education to K- 16
students.
Active gravel mining was terminated on the site in 2003 and the removal of
overburden was completed in 2006. A 7.3 hectare augmented lake was created on the
site and the topography was returned to a state similar to that of pre-mining. In 2006, the
site was tilled and seeded with a twelve-seed grass mix containing the following species:
sideoats grama (Bouteloua curtipendula), blue grama (Bouteloua gracilis), alkaligrass
(Puccinellia nuttalliana), alkali sacaton (Sporobolus airoides), little bluestem
(Schizachyrium scoparium), needle and thread (Hesperostipa comata), switchgrass
(Panicum virgatum), western wheatgrass (Agropyron smithii), Indian ricegrass
(Achnatherum hymenoides), yellow Indiangrass (Sorghastrum nutans), prairie junegrass
(Koeleria macrantha) and sand dropseed (Sporobolus cryptandrus) at a density of 20.3
kg/hectare. The seeds were then covered with weed-free straw mulch to prevent soil
erosion. No native forbs were included in the replanting efforts. The site has also been
managed to control the invasion of noxious weeds through a combination of methods
such as manual removal, herbicide, and mowing. In addition, a localized biological
control, Aceria malherbae (bindweed mite), has been utilized to control Convolvulus
arvensis. Although at this stage of reclamation noxious weeds are being targeted, they
19
are advantageous in the initial establishment of groundcover which helps to mitigate the
impact of erosion.
The other research locations are at the Shortgrass Steppe Long-Term Ecological
Research (SGS LTER) located approximately 40 km north of Greeley, Colorado. The
SGS LTER is composed of the USDA ARS Central Plains Experimental Range (CPER)
forming the western boundary and the adjacent USDA Forest Service Pawnee National
Grassland (PNG) forming the eastern region of the site. (Lauenroth et al., 2008). The
CPER is a continuous 6280 ha block of land (40°49' N latitude, 104 °47" W longitude)
and was established by purchasing the land from farmers and ranchers unable to keep
their land following the dust storms and drought of the 1930’s. Cattle grazing has
occurred on the CPER since 1939 (Lauenroth & Milchunas, 1991a). The Pawnee
National Grassland is composed of 78,100 ha of public land that lies within a patchwork
of private land. Average yearly precipitation for this site is 32.1 cm (Lauenroth et al.,
2008). Blue grama (Bouteloua gracilis) with buffalo grass (Buchloe dactyloides)
dominate plant communities of the SGS LTER (Singh et al., 1996).
Two sites located on the CPER served as reference sites. Specifically, one of the
reference sites was located in Colorado Township 10N, Range 65W, Section 17 (40˚50’7
N latitude, 104˚41’19” W longitude) and the other was located in Colorado Township
10N, Range 65W, Section 27 (40˚48’32” N latitude, 104˚45’36” W longitude). The site
located in Section 17 is referred to as Pawnee 17 or Pawnee site 17 throughout this
document and the site located in Section 27 is referred to as Pawnee site 27 or Pawnee
27. These areas were chosen as reference sites because they were similarly located in
close proximity to a stream; Little Owl Creek for Pawnee 27 and Eastman Creek for
20
Pawnee 17. Loamy soils were identified at these locations similar to the soil type located
at the PLC. Specifically, site 27 was characterized by Nunn Clay Loam surrounded by
Ascalon Fine Sandy Loam, site 17 was characterized by Avar Fine Sandy Loam, (Crabb,
1982). In addition, from initial observations these sites appeared to have similar plant
composition to the PLC. Another possible reference site located on the Pawnee Grassland
was explored but not selected because of greater distance from the selected reference
sites. One difference of the selected reference sites from the PLC is that both of these
sites have been exposed to moderate cattle grazing (Ashby personal communication
2010). Although it is difficult to find areas on the shortgrass steppe that have not been
impacted by humans, these selected sites represent areas that could be considered mature
in terms of shortgrass steppe structure and will function as possible endpoints in
considering the PLC being restored to a functional equilibrium.
Forty random 1 m2 plots were permanently marked at the PLC as well as from
two locations (Pawnee 17 and 27) on the shorgrass steppe LTER site (n=40; N=120)
(Figure 1, 2, 3, and 4). Plots were placed at least 2 m apart to maintain independence.
Percent species cover was determined for each plot during peak biomass from July 20 –
24, 2010 (a species list is in Appendix A; nomenclature follows Snow, 2007). In addition
to recording percent cover, above ground and below ground biomass data were collected
utilizing a 8 cm diameter, 18 cm tall (0.9 liter) soil sampling auger with three collection
locations per plot. Any plant material located above the cylinder was collected as above
ground biomass, while below ground biomass was collected from root structure located
in the soil collected in the auger. Root structure and litter were separated from soil using
a 2mm sieve in the lab. Above and below ground biomass and litter samples were dried
21
at 75 °C in a drying oven for 48 hours prior to being massed. After the belowground
biomass, litter and rocks were removed from the soil, the three soil samples from each
plot were combined. Ten plots from each site were randomly chosen and soils from these
plots were sent to A & L Laboratories Inc. for analysis of estimated nitrogen release
(ENR), pH, Ca, Mg, K, P and soil organic matter (SOM).
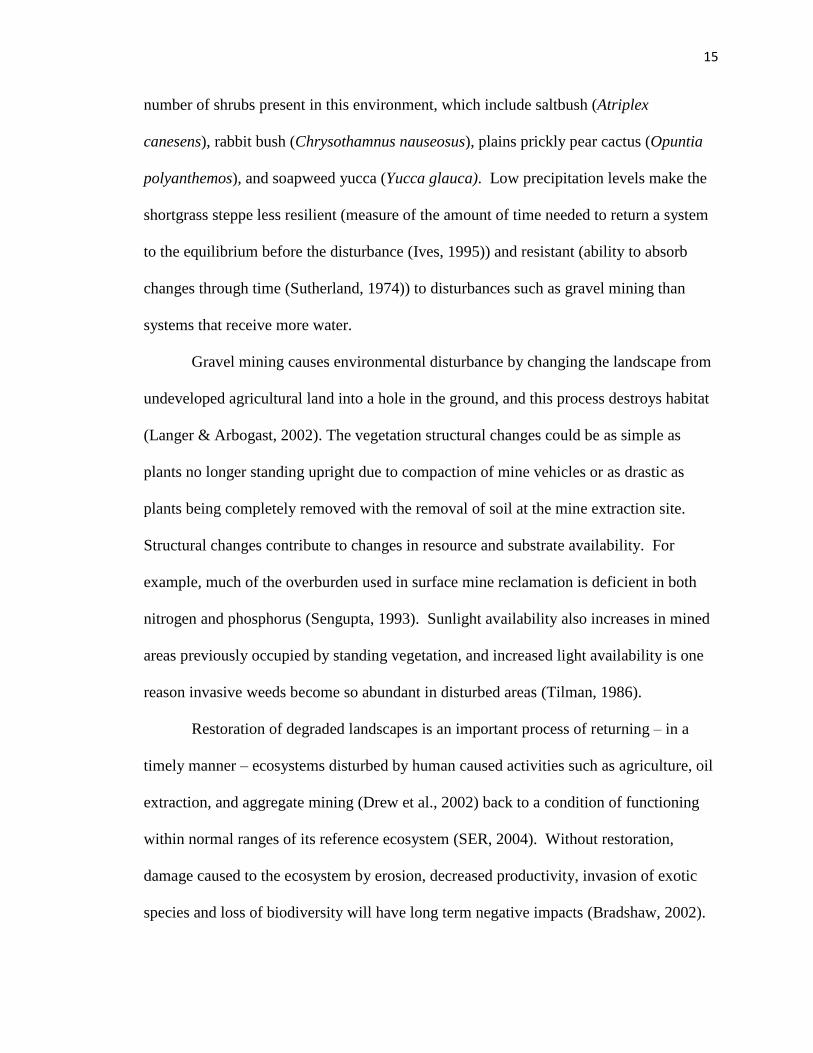
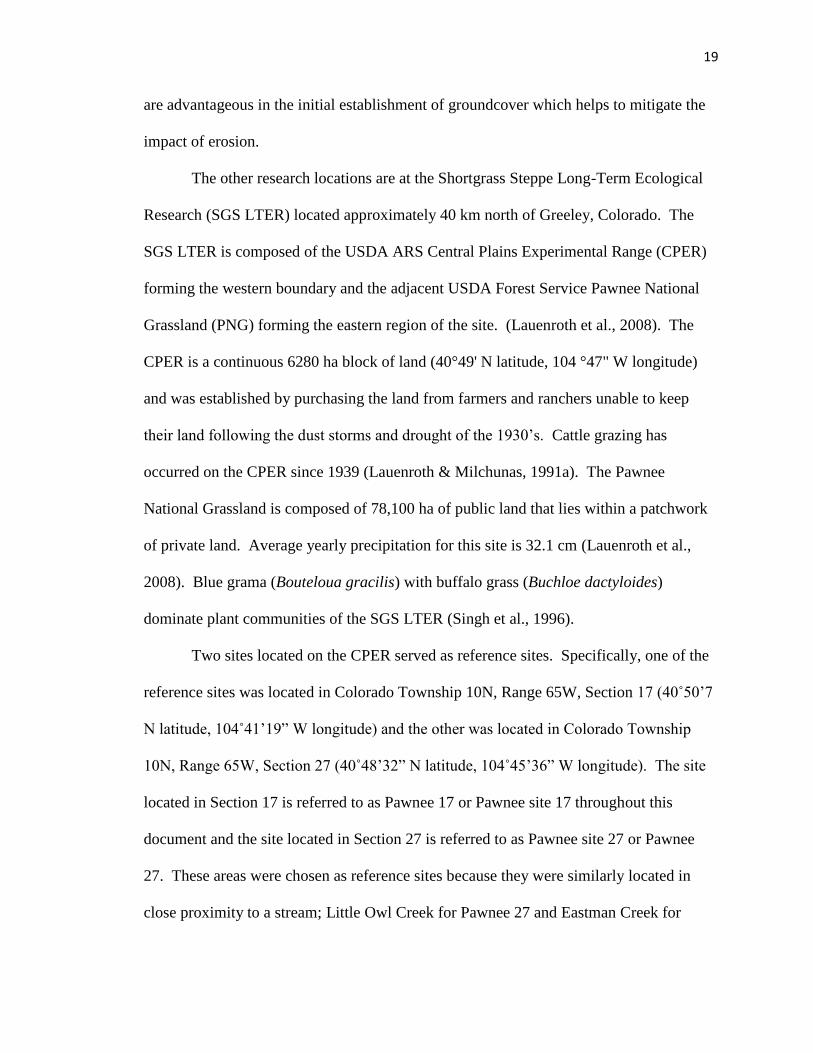
Figure 1. Location of the research sites: Poudre Learning Center and two reference sites.
The south reference site is Pawnee Grassland Site 27 (SGS27) and the north reference
site is Pawnee Grassland Site 17 (SGS17).
Pawnee National Grassland
´1:400,000
Legend
#* Reference Site SGS17
") Reference Site SGS27
!( Research Site PLC
!(!(!(!(!(!(!(!(!(!(!(!(!(!(!(!(!(!(!(!(!(!(!(!(!(!(!(!(!(!(!(!(!(!(!(!(!(!(!(!(
")")")")")")")")")")")")")")")")")")")")")")")")")")")")")")")")")")")")")")")")
#*#*#*#*#*#*#*#*#*#*#*#*#*#*#*#*#*#*#*#*#*#*#*#*#*#*#*#*#*#*#*#*#*#*#*#*#*#*#*#*
GREELEY
WINDSOR
NUNN
EATONSEVERANCE
AULT
PIERCE
WINDSOR
GARDEN CITY
PAWNEE NATIONAL GRASSLAND
22
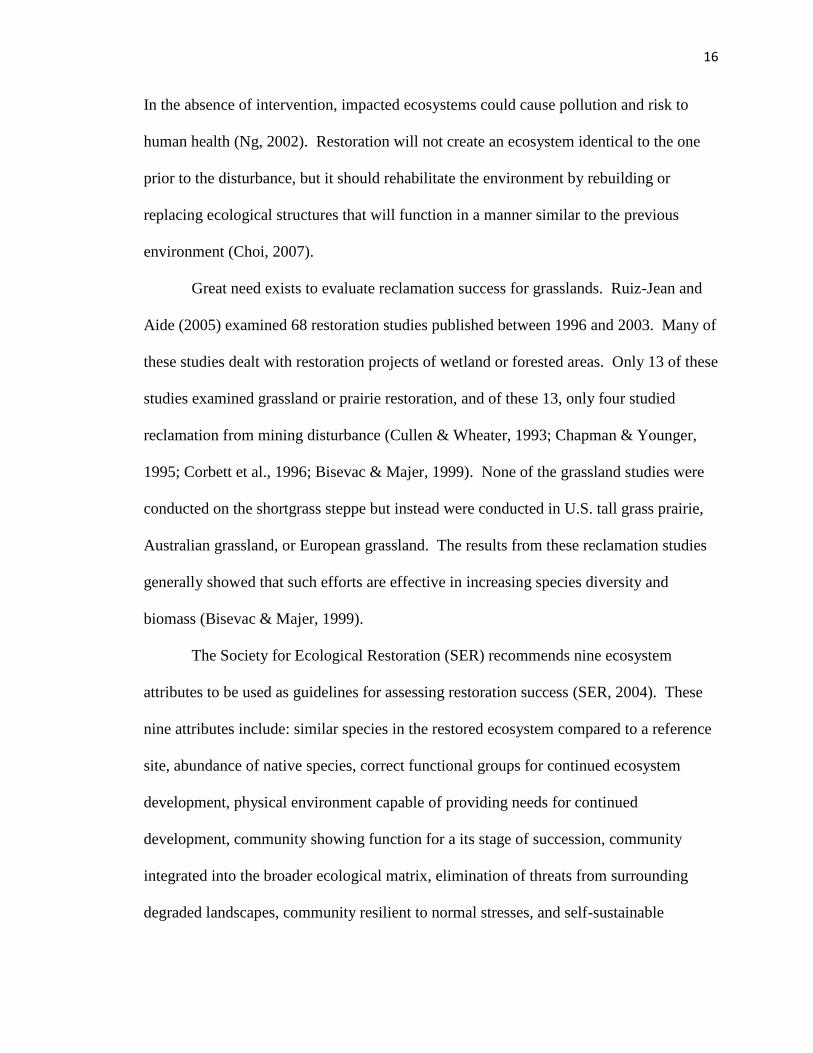
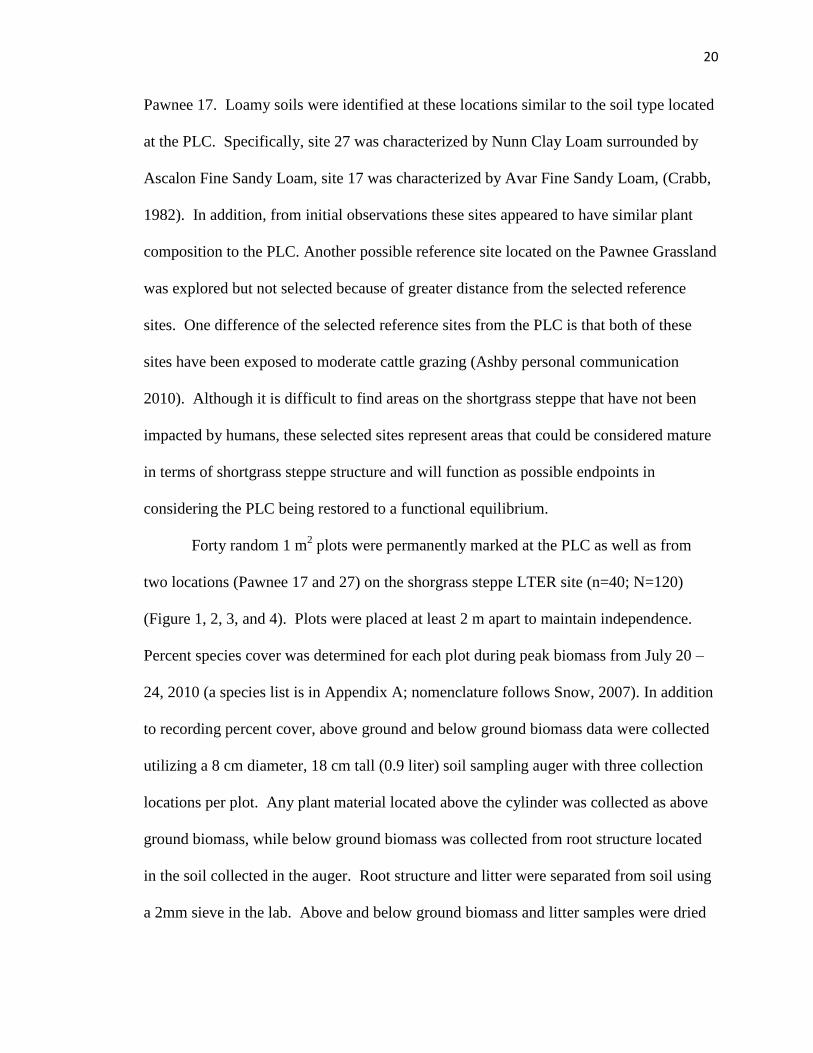
Figure 2. Locations of the 1 m2
plots at the Poudre Learning Center. Plots were located
in two distinct regions of the Poudre learning Center, CO (306 ft = 93.27 m).
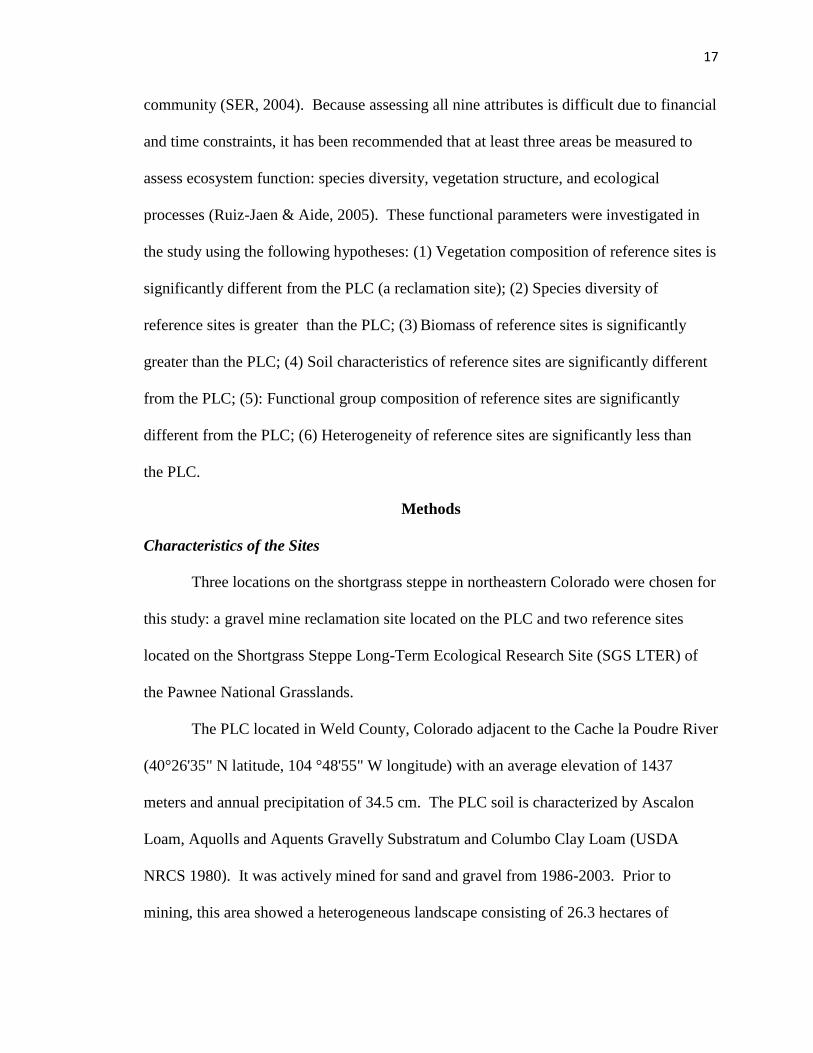
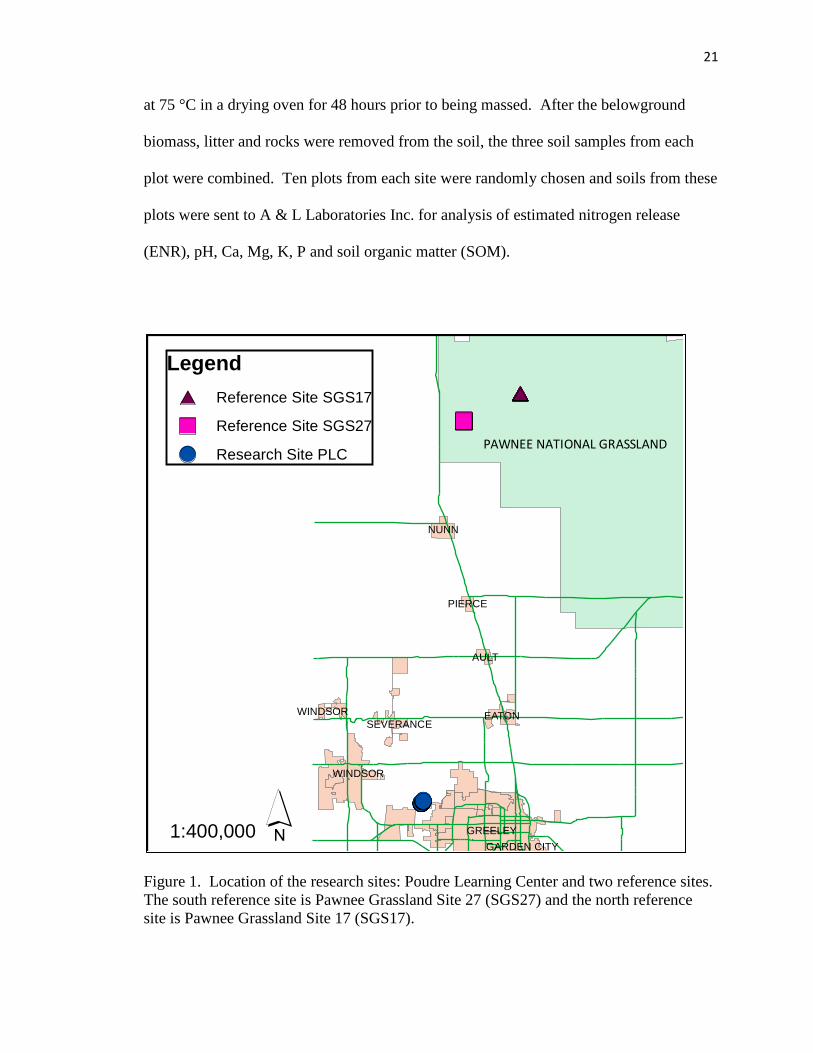
Figure 3. Location of the 1 m2
plots at site 17 on the Pawnee Grassland, CO (200 ft =
60.96 m).
23
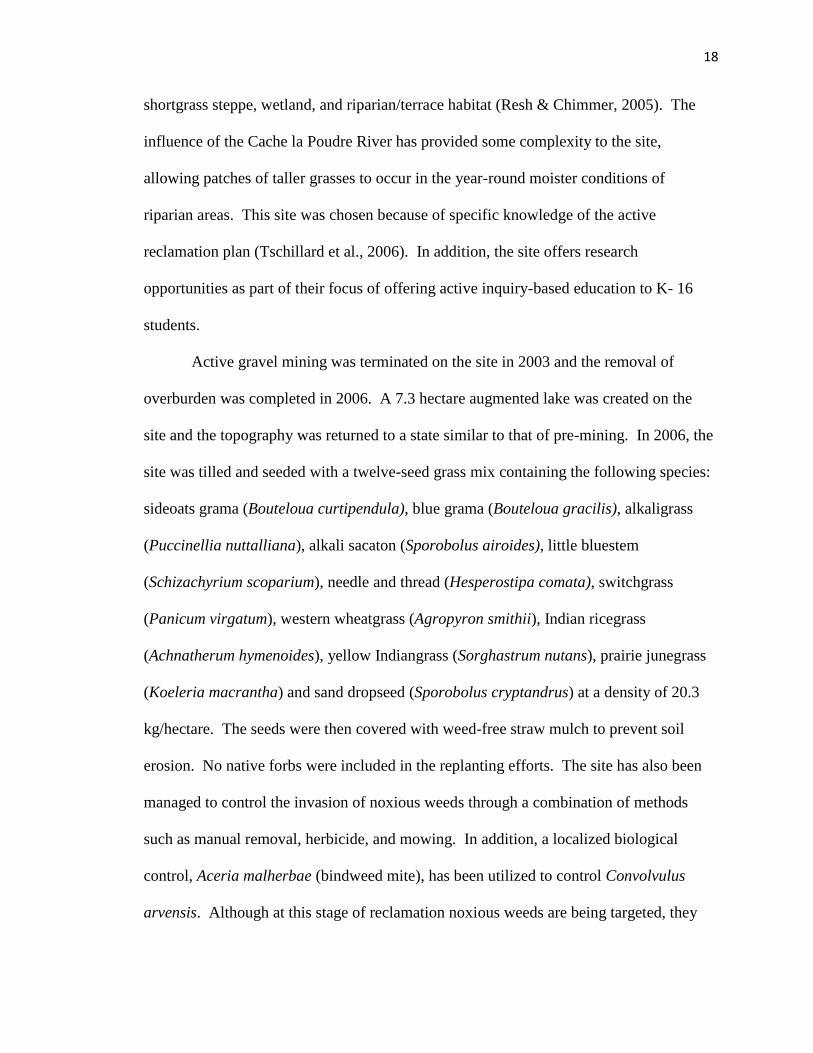
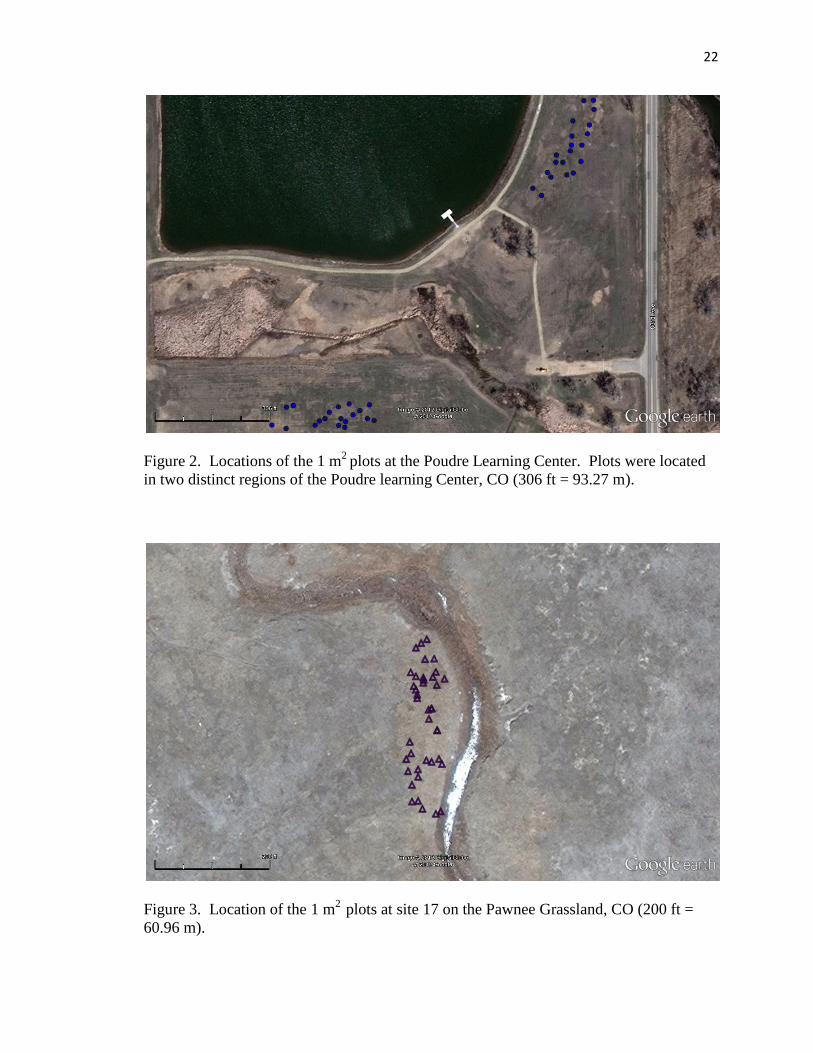
Figure 4. Location of the 1 m2
plots at site 27 on the Pawnee Grassland, CO (200 ft =
60.96 m).
Procedures
To test hypothesis 1, overall averages for vegetative cover, amount of bare
ground, and amount of litter present was determined. To determine if average cover, bare
ground and litter were significantly different, an MANOVA was run. In addition, the
software program PC-ORD 5.10 was utilized to determine if sites were similar to each
other in terms of community composition. A nonmetric multidimensional (NMS)
ordination was performed utilizing the percent cover data for each of the plots at each
site. Specific parameters for this test included a Sorensen (Bray-Curtis) distance measure
with 50 runs with the real data and two axes; the stability criterion was set at 0.00001
with 15 iterations. The maximum number of iterations was set at 100 with step down in
dimensionality. The initial step length was 0.20 with random numbers serving as the
24
source (100 randomizations). To statistically verify the visual differences observed from
the ordination, a multi-response permutation procedure (MRPP) analysis was performed
using the same distance measure.
Species composition was also investigated utilizing abundance and frequency
(Bonham, 1989) measurements calculated from percent cover data in each plot. From
these measurements, an indicator species analysis (McCune & Metford, 2006) was
performed to determine which species were characteristic of the three sites.
Interpretation of the analysis was based on a strong, moderate and weak indicator
criterion with strong indicators having a value > 50%, moderate species having values
between 25-50% and weak species having a value of < 25% with a cutoff at 5%. A
Monte Carlo test of significance was run to determine if the observed indicator value was
significant.
To compare sites in terms of species diversity (hypothesis 2), richness (number of
different species per plot), evenness (Shannon’s diversity index/ ln (richness), diversity I
(Shannon’s diversity index = - sum (Pi*ln(Pi)) where Pi = importance probability in
element I relativized by row total), and diversity II (D = Simpson`s diversity index for
infinite population = 1 - sum (Pi*Pi) where Pi = importance probability in element i
relativized by row total) were determined for each plot. This data were compared across
sites. Richness and diversity II where determined not to be evenly distributed so these
data were log transformed, analyzed with a MANOVA and if significant, an ANOVA
was run with a post hoc Student Newman Keuls test conducted to determine significant
differences between the sites.
25
To address the question of how similar the research site biomass was to the
biomass in reference sites (hypothesis 3), measurements of above ground biomass, below
ground biomass, litter mass and rock mass were used from 20 randomly selected plots
from each site. Determination of normality using Wilks-Shapiro test in SAS 9.2 showed
the data were not evenly distributed for all variables except below ground biomass, so
data were log transformed and analyzed using MANOVA, followed again by ANOVA
and the post hoc Student Newman Keuls test.
Using SAS 9.2, a determination of normality was conducted for soil nutrients.
The soils data were not normally distributed (Wilks-Shapiro test p<0.0001); therefore, the
data were transformed. Organic matter was first sine arc transformed because it was
recorded as a percent and then log transformed. All other data for the variables were log
transformed. Analysis was the same as with biomass.
To test hypothesis five, investigating the question of how similar ecosystem
function was between the research site and the reference sites, plant species were
categorized into different functional groups. Sites were compared based on functional
group composition of plots located at each site. These functional group classifications
included annual cold season (C3) graminoids, annual warm season (C4) graminoids (C3),
perennial cold season graminoids (C3), perennial warm season graminoids (C4), annual
forbs, perennial forbs, and perennial shrubs (see Appendix A). The dominance of these
functional groups was compared between sites using NMS ordination. A MRPP analysis
was used to determined if sites where significantly different from each other in terms of
functional groupings. Characteristic functional groups were also examined by an
indicator species analysis (McCune & Metford, 2006). Interpretation of the analysis was
26
as above. A Monte Carlo test of significance was run to determine if the observed
maximum indicator value for each indicator was significant.
Because there were three data points from each plot, an examination of variability
as a proxy for heterogeneity was possible. To test for such heterogeneity of the sites, a
coefficient of variation (standard deviation/mean) was calculated for each plot for above
ground biomass, belowground biomass, and litter. The calculated values were then
analyzed using an ANOVA after the data were log transformed; the data were not
normally distributed.
In addition to comparing among sites, the two locations (north and south) at the
PLC were analyzed to determine if differences existed within the PLC. These sites had
slightly different gravel mine impacts, with the northern site being churned and dug up
through the mining process, while the southern site was adjacent to a mining road and
had overburden placed over it. Soil data and biomass data from these locations were
compared to each other using an ANOVA test and again a student Newman Keuls post
hoc analysis.
Results
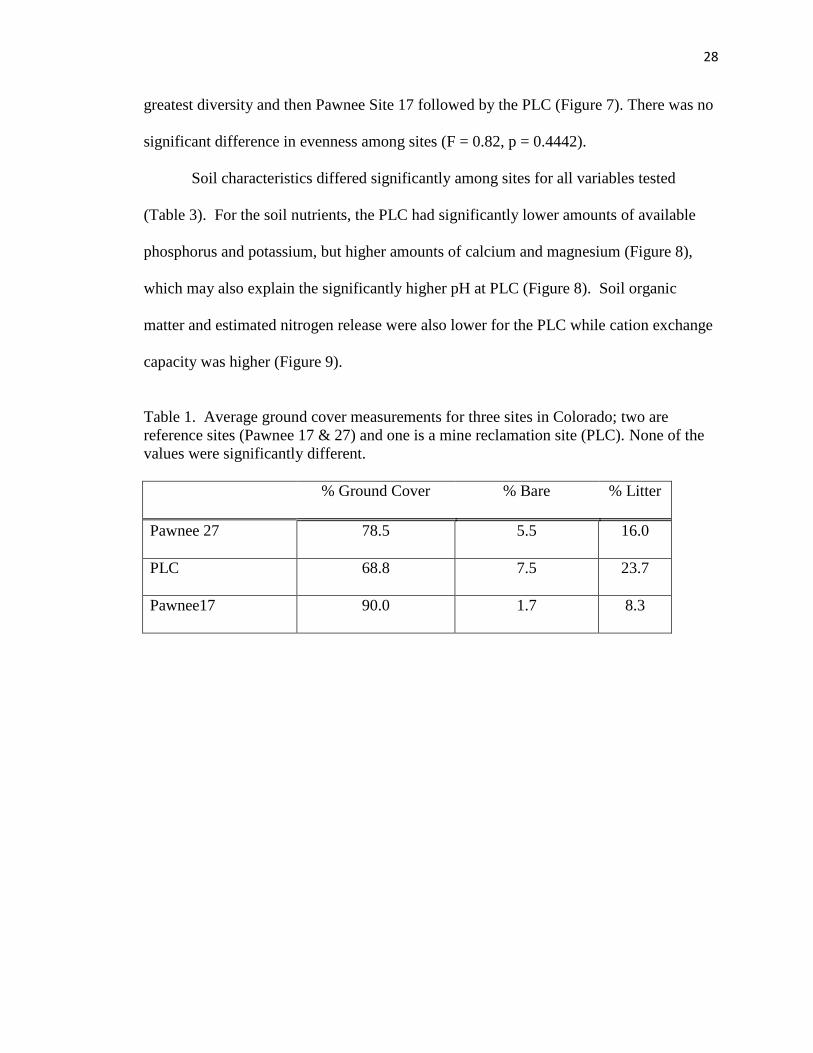
Vegetation composition was different at the PLC compared to the two reference
sites on the Pawnee Grassland. The PLC had more bare ground than the reference sites,
more litter, and less ground cover (Table 1), but these differences were not significantly
different. Non-Metric Multidimensional Scaling Ordination, based on percent cover for
species present at each plot, showed distinct groupings (Figure 5). Some of these areas
do overlap, indicating some similarity among these groups; the PLC site and Pawnee
Grassland site 17 showed the greatest overlap (Figure 5). However, an MRPP (T-test =
27
-44.61, p < 0.001, observed delta = 0.597, expected delta = 0.724) test determined the
three sites to be significantly different. A community similarity analysis was conducted
to determine the percent similarity for species groundcover for the sites. The PLC was
18.5% similar to Pawnee 27 and 42.6% similar to Pawnee 17. When compared to each
other the Pawnee sites were 34.9% similar. In terms of difference of average cover, litter
and bare, no significant difference were seen among site (F-test = 1.96, p = 0.1613).
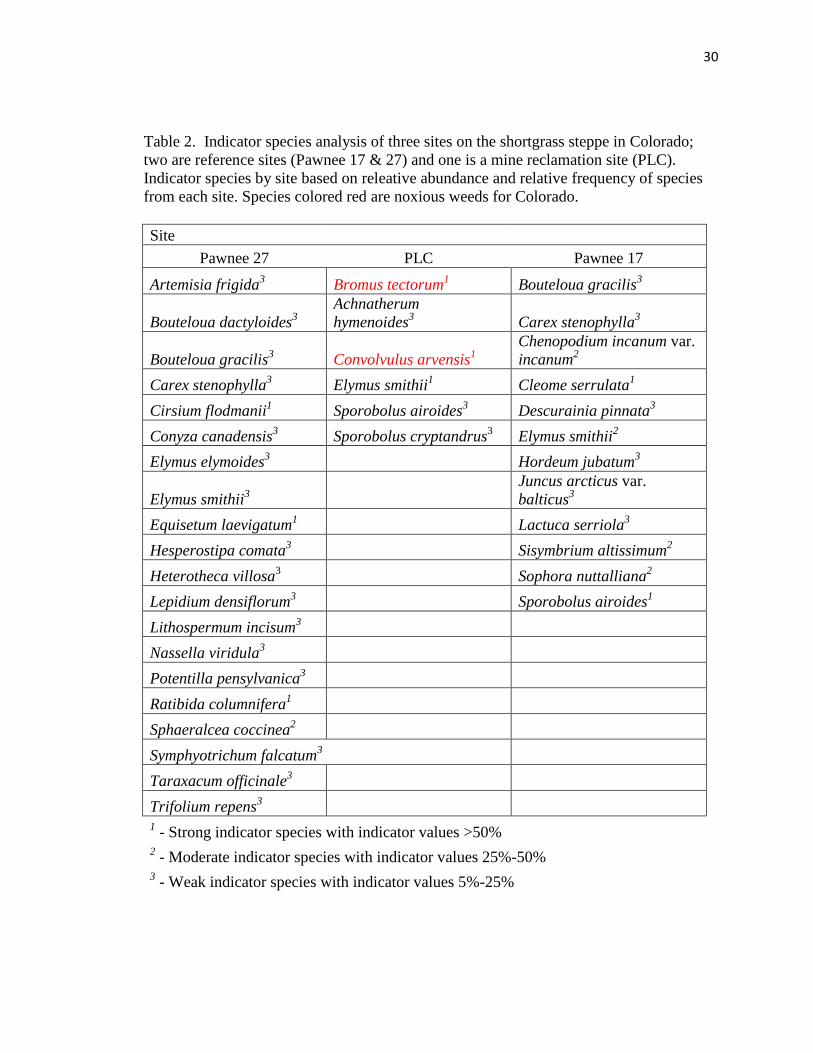
Indicator species analysis showed marked differences between the two references
sites and the research site. The PLC was characterized by the strong indicator species
Bromus tectorum, Convolvulus arvensis, and Elymus smithii. Both Bromus tectorum and
Convolvulus arvensis are classified as noxious weeds in Colorado. Pawnee 27 was
characterized by strong indicator species of Cirsium flodmanii, Equisetum laevigatum,
and Ratibida columnifera along with moderate indicator species Sphaeralcea coccinea.
Pawnee 17 was characterized by strong indicator species, Cleome serrulata and
Sporobolus airoides, along with moderate indicator species, Chenopodium incanum var.
incanum, Elymus smithii, Sisymbrium altissimum, and Sophora nuttalliana (Table 2). In
addition, the PLC showed greater amounts of invasive species than either of the Pawnee
sites (Figure 6).
Richness (F = 85.4, p < 0.001) and diversity (Shannon F = 20.5, p < 0.0001;
Simpson F = 7.7, p = 0.0007) values were also significantly different between sites.
Pawnee site 27 had the greatest number of species (richness) and was significantly higher
than both Pawnee site 17 and the PLC. Pawnee site 17 also had significantly more
species than the PLC. Using Shannon’s diversity index, all three sites showed significant
differences from each other (F = 20.53, p < 0.0001) with Pawnee site 27 showing the
28
greatest diversity and then Pawnee Site 17 followed by the PLC (Figure 7). There was no
significant difference in evenness among sites (F = 0.82, p = 0.4442).
Soil characteristics differed significantly among sites for all variables tested
(Table 3). For the soil nutrients, the PLC had significantly lower amounts of available
phosphorus and potassium, but higher amounts of calcium and magnesium (Figure 8),
which may also explain the significantly higher pH at PLC (Figure 8). Soil organic
matter and estimated nitrogen release were also lower for the PLC while cation exchange
capacity was higher (Figure 9).
Table 1. Average ground cover measurements for three sites in Colorado; two are
reference sites (Pawnee 17 & 27) and one is a mine reclamation site (PLC). None of the
values were significantly different.
% Ground Cover % Bare % Litter
Pawnee 27 78.5 5.5 16.0
PLC 68.8 7.5 23.7
Pawnee17 90.0 1.7 8.3
29
Figure 5. Non-Metric Multidimensional Scaling Ordination from 40 plots each at the
Poudre Learning Center (PLC), and two sites on the Pawnee Grassland (Pawnee 17 &
27).
NMS Ordination Axis 1
-2.0 -1.5 -1.0 -0.5 0.0 0.5 1.0 1.5 2.0
NM
S O
rdin
atio
n A
xis
2
-2.0
-1.5
-1.0
-0.5
0.0
0.5
1.0
1.5
- PLC
- Pawnee 17
- Pawnee 27
30
Table 2. Indicator species analysis of three sites on the shortgrass steppe in Colorado;
two are reference sites (Pawnee 17 & 27) and one is a mine reclamation site (PLC).
Indicator species by site based on releative abundance and relative frequency of species
from each site. Species colored red are noxious weeds for Colorado.
Site
Pawnee 27 PLC Pawnee 17
Artemisia frigida3 Bromus tectorum
1 Bouteloua gracilis
3
Bouteloua dactyloides3
Achnatherum
hymenoides3 Carex stenophylla
3
Bouteloua gracilis3 Convolvulus arvensis
1
Chenopodium incanum var.
incanum2
Carex stenophylla3 Elymus smithii
1 Cleome serrulata
1
Cirsium flodmanii1 Sporobolus airoides
3 Descurainia pinnata
3
Conyza canadensis3 Sporobolus cryptandrus
3 Elymus smithii
2
Elymus elymoides3
Hordeum jubatum3
Elymus smithii3
Juncus arcticus var.
balticus3
Equisetum laevigatum1
Lactuca serriola3
Hesperostipa comata3
Sisymbrium altissimum2
Heterotheca villosa3
Sophora nuttalliana2
Lepidium densiflorum3
Sporobolus airoides1
Lithospermum incisum3
Nassella viridula3
Potentilla pensylvanica3
Ratibida columnifera
1
Sphaeralcea coccinea2
Symphyotrichum falcatum
3
Taraxacum officinale3
Trifolium repens
3
1 - Strong indicator species with indicator values >50%
2 - Moderate indicator species with indicator values 25%-50%
3 - Weak indicator species with indicator values 5%-25%
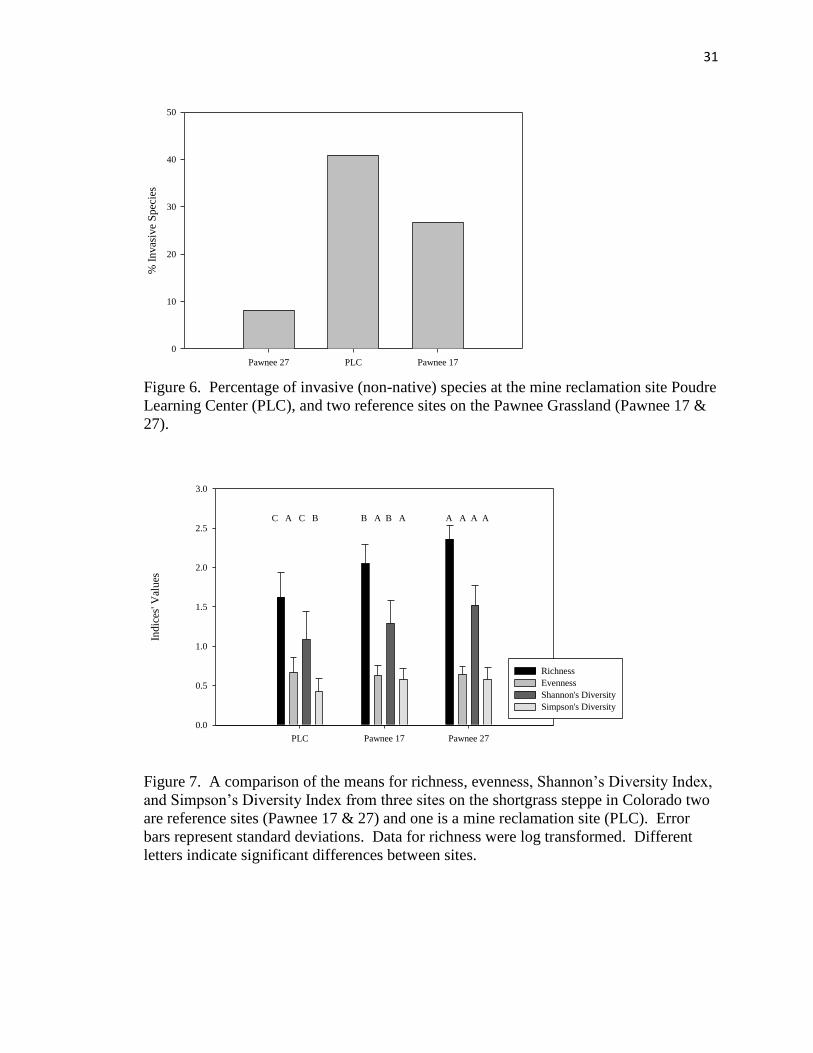
31
Figure 6. Percentage of invasive (non-native) species at the mine reclamation site Poudre
Learning Center (PLC), and two reference sites on the Pawnee Grassland (Pawnee 17 &
27).
Figure 7. A comparison of the means for richness, evenness, Shannon’s Diversity Index,
and Simpson’s Diversity Index from three sites on the shortgrass steppe in Colorado two
are reference sites (Pawnee 17 & 27) and one is a mine reclamation site (PLC). Error
bars represent standard deviations. Data for richness were log transformed. Different
letters indicate significant differences between sites.
Pawnee 27 PLC Pawnee 17
% I
nvas
ive
Spec
ies
0
10
20
30
40
50
PLC Pawnee 17 Pawnee 27
Indic
es' V
alu
es
0.0
0.5
1.0
1.5
2.0
2.5
3.0
Richness
Evenness
Shannon's Diversity
Simpson's Diversity
C A C B B A B A A A A A
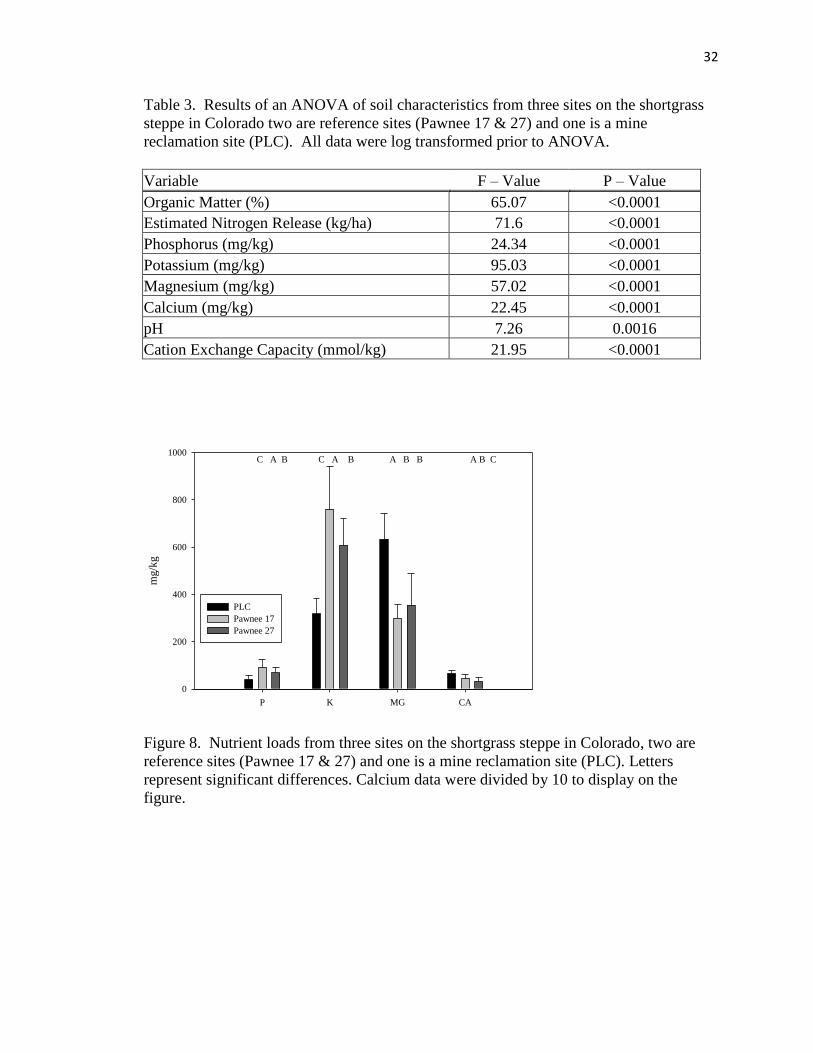
32
Table 3. Results of an ANOVA of soil characteristics from three sites on the shortgrass
steppe in Colorado two are reference sites (Pawnee 17 & 27) and one is a mine
reclamation site (PLC). All data were log transformed prior to ANOVA.
Variable F – Value P – Value
Organic Matter (%) 65.07 <0.0001
Estimated Nitrogen Release (kg/ha) 71.6 <0.0001
Phosphorus (mg/kg) 24.34 <0.0001
Potassium (mg/kg) 95.03 <0.0001
Magnesium (mg/kg) 57.02 <0.0001
Calcium (mg/kg) 22.45 <0.0001
pH 7.26 0.0016
Cation Exchange Capacity (mmol/kg) 21.95 <0.0001
Figure 8. Nutrient loads from three sites on the shortgrass steppe in Colorado, two are
reference sites (Pawnee 17 & 27) and one is a mine reclamation site (PLC). Letters
represent significant differences. Calcium data were divided by 10 to display on the
figure.
P K MG CA
mg/k
g
0
200
400
600
800
1000
PLC
Pawnee 17
Pawnee 27
C A B C A B A B B A B C
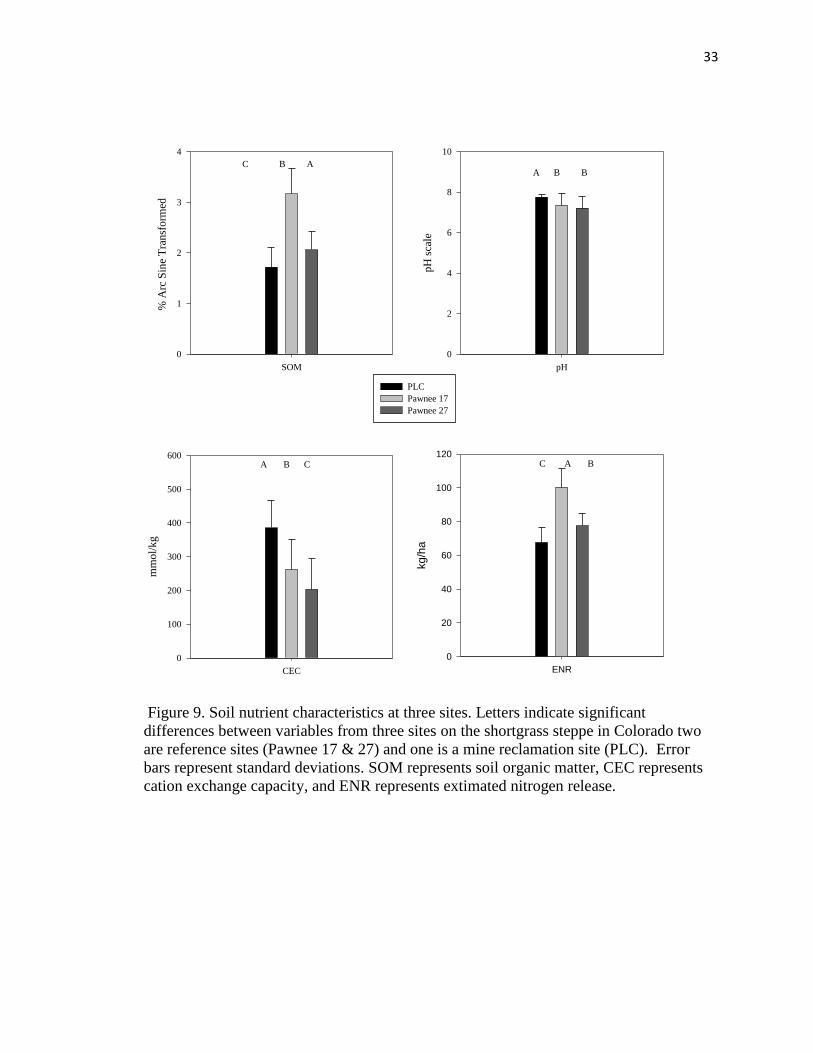
33
Figure 9. Soil nutrient characteristics at three sites. Letters indicate significant
differences between variables from three sites on the shortgrass steppe in Colorado two
are reference sites (Pawnee 17 & 27) and one is a mine reclamation site (PLC). Error
bars represent standard deviations. SOM represents soil organic matter, CEC represents
cation exchange capacity, and ENR represents extimated nitrogen release.
SOM
% A
rc S
ine
Tra
nsf
orm
ed
0
1
2
3
4
C B A
pH
pH
sca
le
0
2
4
6
8
10
PLC
Pawnee 17
Pawnee 27
A B B
CEC
mm
ol/
kg
0
100
200
300
400
500
600 A B C
ENR
kg/h
a
0
20
40
60
80
100
120 C A B
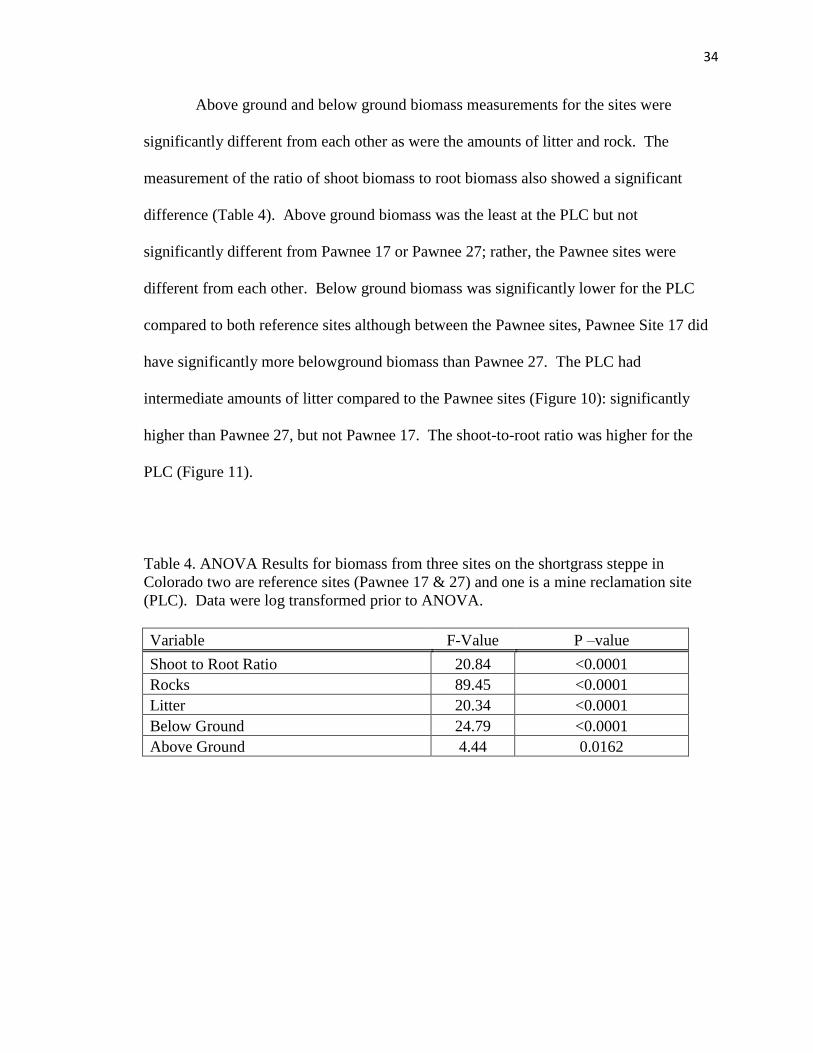
34
Above ground and below ground biomass measurements for the sites were
significantly different from each other as were the amounts of litter and rock. The
measurement of the ratio of shoot biomass to root biomass also showed a significant
difference (Table 4). Above ground biomass was the least at the PLC but not
significantly different from Pawnee 17 or Pawnee 27; rather, the Pawnee sites were
different from each other. Below ground biomass was significantly lower for the PLC
compared to both reference sites although between the Pawnee sites, Pawnee Site 17 did
have significantly more belowground biomass than Pawnee 27. The PLC had
intermediate amounts of litter compared to the Pawnee sites (Figure 10): significantly
higher than Pawnee 27, but not Pawnee 17. The shoot-to-root ratio was higher for the
PLC (Figure 11).
Table 4. ANOVA Results for biomass from three sites on the shortgrass steppe in
Colorado two are reference sites (Pawnee 17 & 27) and one is a mine reclamation site
(PLC). Data were log transformed prior to ANOVA.
Variable F-Value P –value
Shoot to Root Ratio 20.84 <0.0001
Rocks 89.45 <0.0001
Litter 20.34 <0.0001
Below Ground 24.79 <0.0001
Above Ground 4.44 0.0162
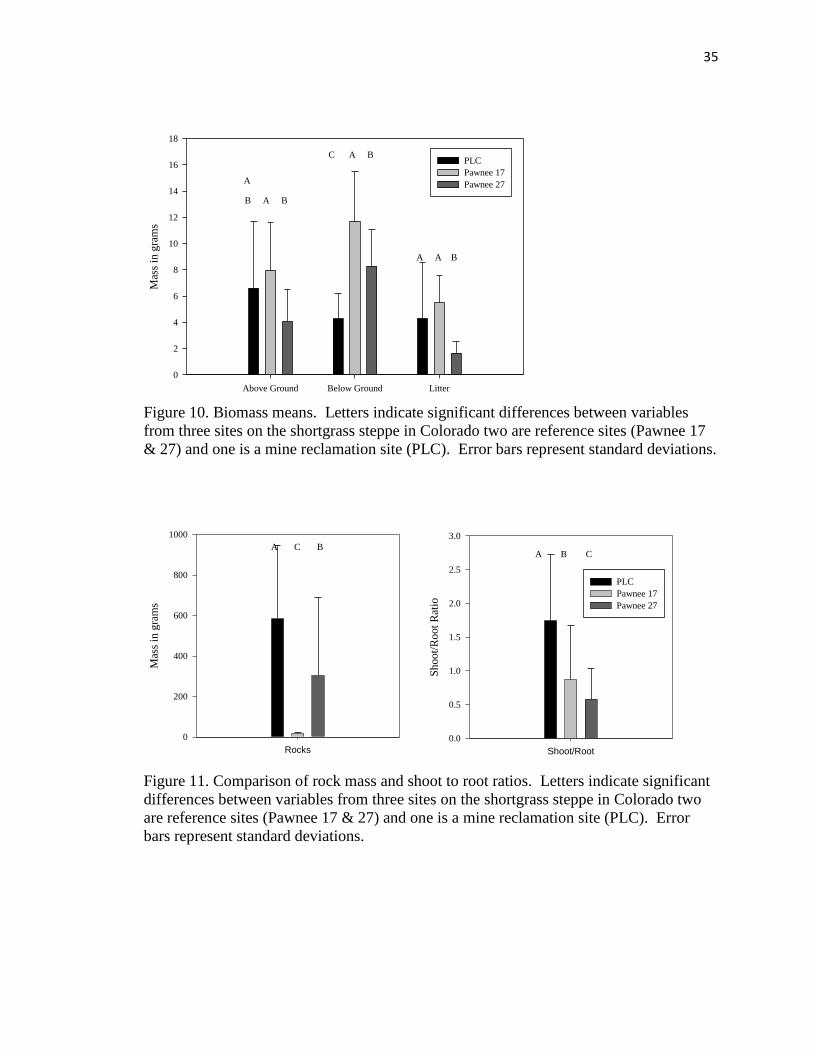
35
Figure 10. Biomass means. Letters indicate significant differences between variables
from three sites on the shortgrass steppe in Colorado two are reference sites (Pawnee 17
& 27) and one is a mine reclamation site (PLC). Error bars represent standard deviations.
Figure 11. Comparison of rock mass and shoot to root ratios. Letters indicate significant
differences between variables from three sites on the shortgrass steppe in Colorado two
are reference sites (Pawnee 17 & 27) and one is a mine reclamation site (PLC). Error
bars represent standard deviations.
Above Ground Below Ground Litter
Mas
s in
gra
ms
0
2
4
6
8
10
12
14
16
18
PLC
Pawnee 17
Pawnee 27
B A B
C A B
A A B
A
Rocks
Mas
s in
gra
ms
0
200
400
600
800
1000
A C B
Shoot/Root
Sh
oo
t/R
oot
Rat
io
0.0
0.5
1.0
1.5
2.0
2.5
3.0
PLC
Pawnee 17
Pawnee 27
A B C
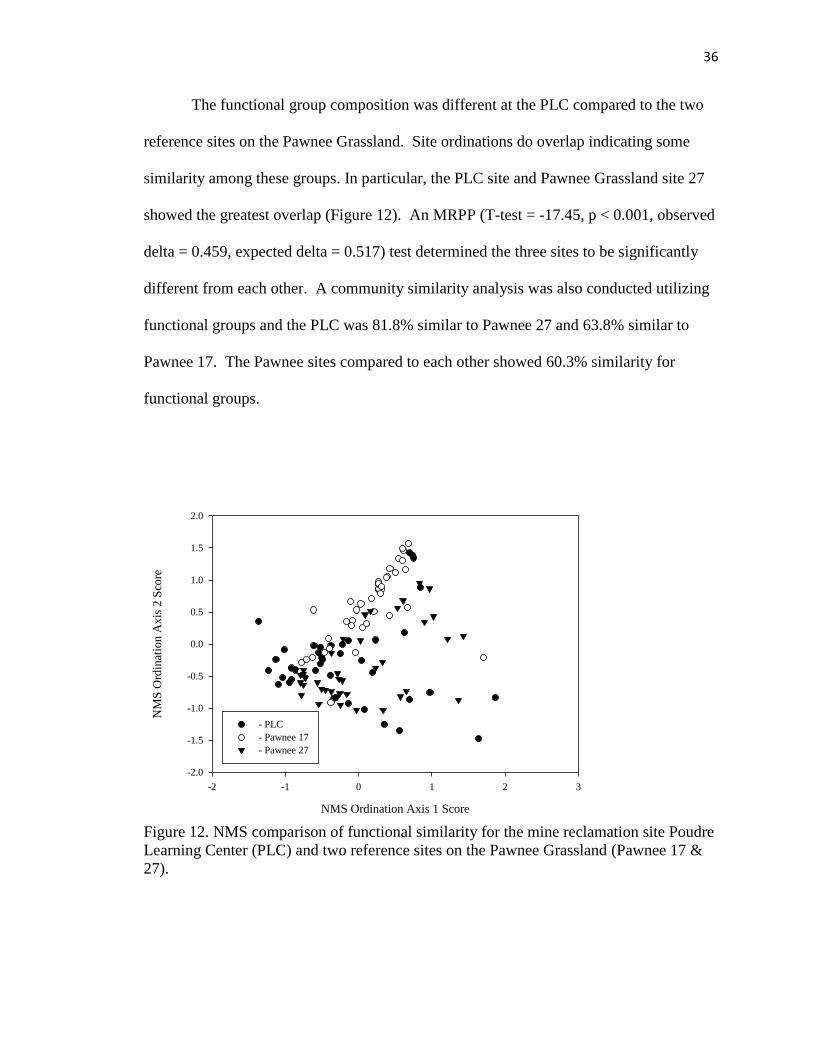
36
The functional group composition was different at the PLC compared to the two
reference sites on the Pawnee Grassland. Site ordinations do overlap indicating some
similarity among these groups. In particular, the PLC site and Pawnee Grassland site 27
showed the greatest overlap (Figure 12). An MRPP (T-test = -17.45, p < 0.001, observed
delta = 0.459, expected delta = 0.517) test determined the three sites to be significantly
different from each other. A community similarity analysis was also conducted utilizing
functional groups and the PLC was 81.8% similar to Pawnee 27 and 63.8% similar to
Pawnee 17. The Pawnee sites compared to each other showed 60.3% similarity for
functional groups.
Figure 12. NMS comparison of functional similarity for the mine reclamation site Poudre
Learning Center (PLC) and two reference sites on the Pawnee Grassland (Pawnee 17 &
27).
NMS Ordination Axis 1 Score
-2 -1 0 1 2 3
NM
S O
rdin
atio
n A
xis
2 S
core
-2.0
-1.5
-1.0
-0.5
0.0
0.5
1.0
1.5
2.0
- PLC
- Pawnee 17
- Pawnee 27
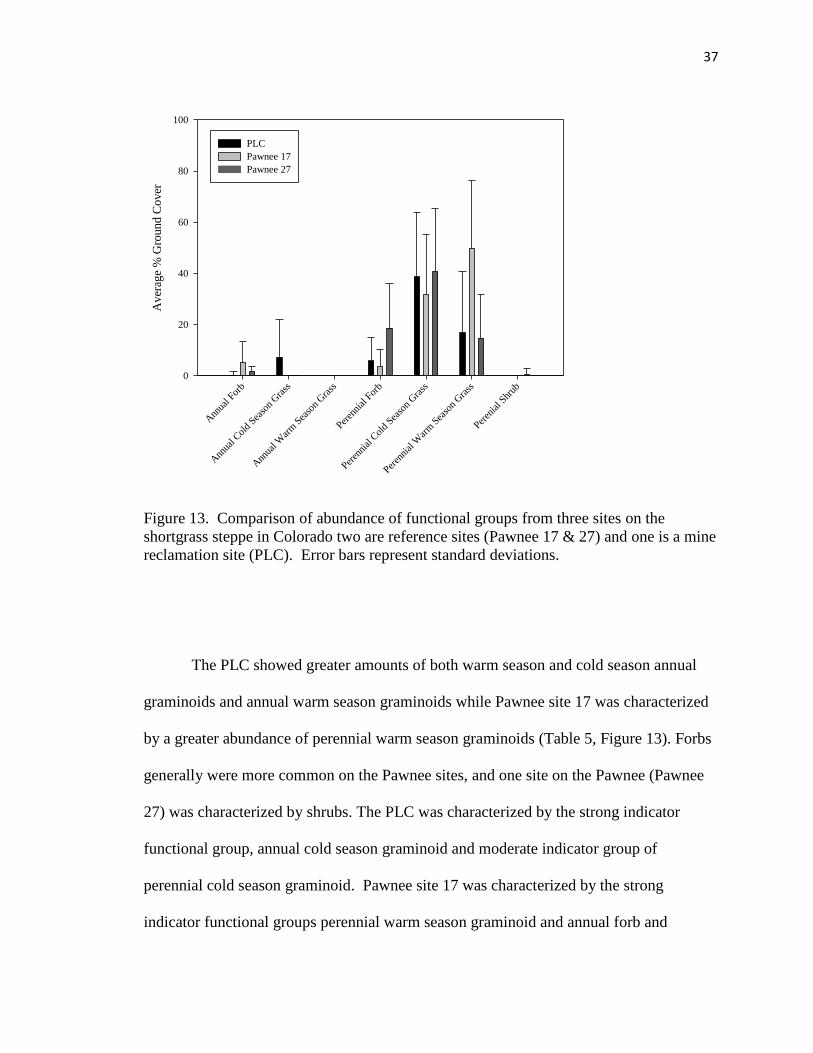
37
Figure 13. Comparison of abundance of functional groups from three sites on the
shortgrass steppe in Colorado two are reference sites (Pawnee 17 & 27) and one is a mine
reclamation site (PLC). Error bars represent standard deviations.
The PLC showed greater amounts of both warm season and cold season annual
graminoids and annual warm season graminoids while Pawnee site 17 was characterized
by a greater abundance of perennial warm season graminoids (Table 5, Figure 13). Forbs
generally were more common on the Pawnee sites, and one site on the Pawnee (Pawnee
27) was characterized by shrubs. The PLC was characterized by the strong indicator
functional group, annual cold season graminoid and moderate indicator group of
perennial cold season graminoid. Pawnee site 17 was characterized by the strong
indicator functional groups perennial warm season graminoid and annual forb and
Ann
ual F
orb
Ann
ual C
old
Seaso
n G
rass
Ann
ual W
arm
Sea
son
Gra
ss
Peren
nial
For
b
Peren
nial
Col
d Sea
son
Gra
ss
Peren
nial
War
m S
easo
n G
rass
Peren
ial S
hrub
Aver
age
% G
round C
over
0
20
40
60
80
100
PLC
Pawnee 17
Pawnee 27
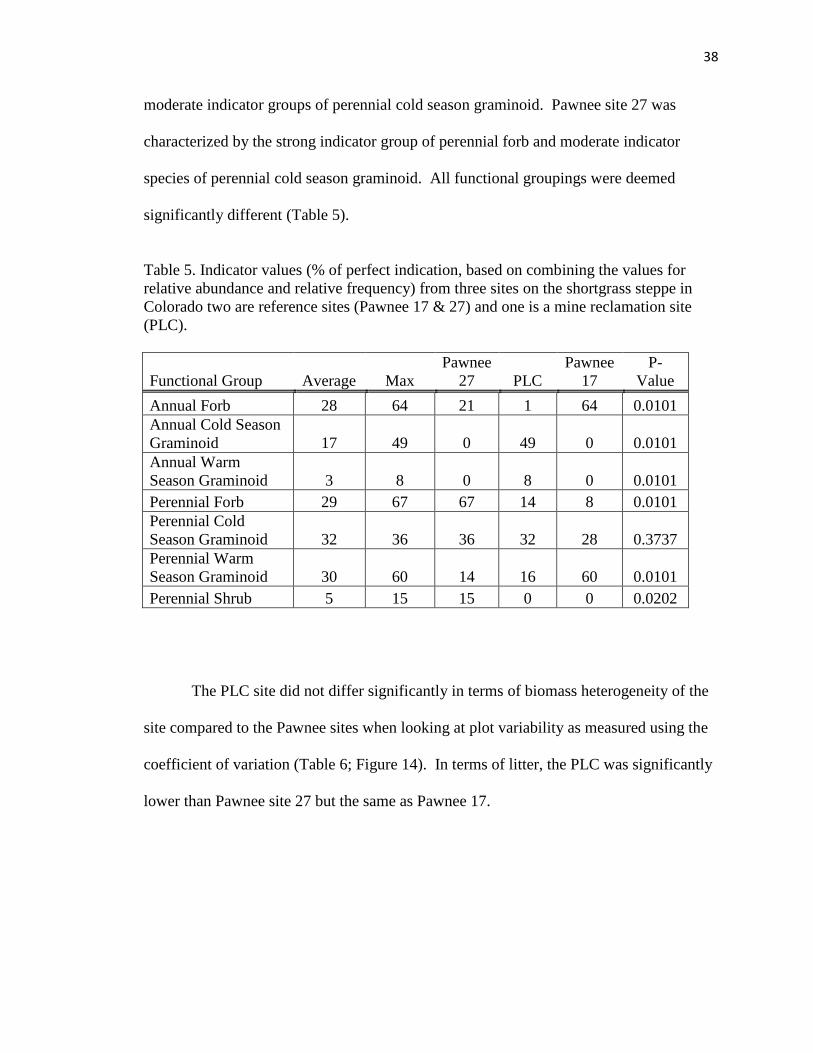
38
moderate indicator groups of perennial cold season graminoid. Pawnee site 27 was
characterized by the strong indicator group of perennial forb and moderate indicator
species of perennial cold season graminoid. All functional groupings were deemed
significantly different (Table 5).
Table 5. Indicator values (% of perfect indication, based on combining the values for
relative abundance and relative frequency) from three sites on the shortgrass steppe in
Colorado two are reference sites (Pawnee 17 & 27) and one is a mine reclamation site
(PLC).
Functional Group Average Max
Pawnee
27 PLC
Pawnee
17
P-
Value
Annual Forb 28 64 21 1 64 0.0101
Annual Cold Season
Graminoid 17 49 0 49 0 0.0101
Annual Warm
Season Graminoid 3 8 0 8 0 0.0101
Perennial Forb 29 67 67 14 8 0.0101
Perennial Cold
Season Graminoid 32 36 36 32 28 0.3737
Perennial Warm
Season Graminoid 30 60 14 16 60 0.0101
Perennial Shrub 5 15 15 0 0 0.0202
The PLC site did not differ significantly in terms of biomass heterogeneity of the
site compared to the Pawnee sites when looking at plot variability as measured using the
coefficient of variation (Table 6; Figure 14). In terms of litter, the PLC was significantly
lower than Pawnee site 27 but the same as Pawnee 17.
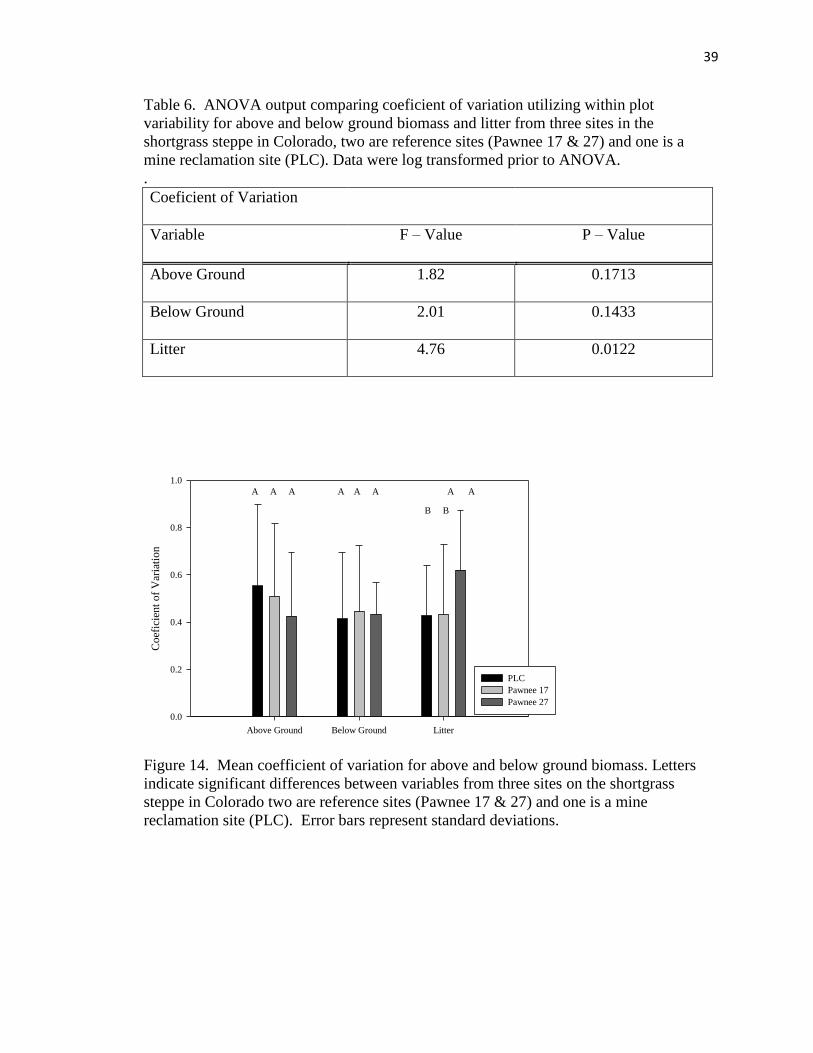
39
Table 6. ANOVA output comparing coeficient of variation utilizing within plot
variability for above and below ground biomass and litter from three sites in the
shortgrass steppe in Colorado, two are reference sites (Pawnee 17 & 27) and one is a
mine reclamation site (PLC). Data were log transformed prior to ANOVA.
.
Coeficient of Variation
Variable F – Value P – Value
Above Ground 1.82 0.1713
Below Ground 2.01 0.1433
Litter 4.76 0.0122
Figure 14. Mean coefficient of variation for above and below ground biomass. Letters
indicate significant differences between variables from three sites on the shortgrass
steppe in Colorado two are reference sites (Pawnee 17 & 27) and one is a mine
reclamation site (PLC). Error bars represent standard deviations.
Above Ground Below Ground Litter
Coef
icie
nt
of
Var
iati
on
0.0
0.2
0.4
0.6
0.8
1.0
PLC
Pawnee 17
Pawnee 27
A A A A A A A A
B B
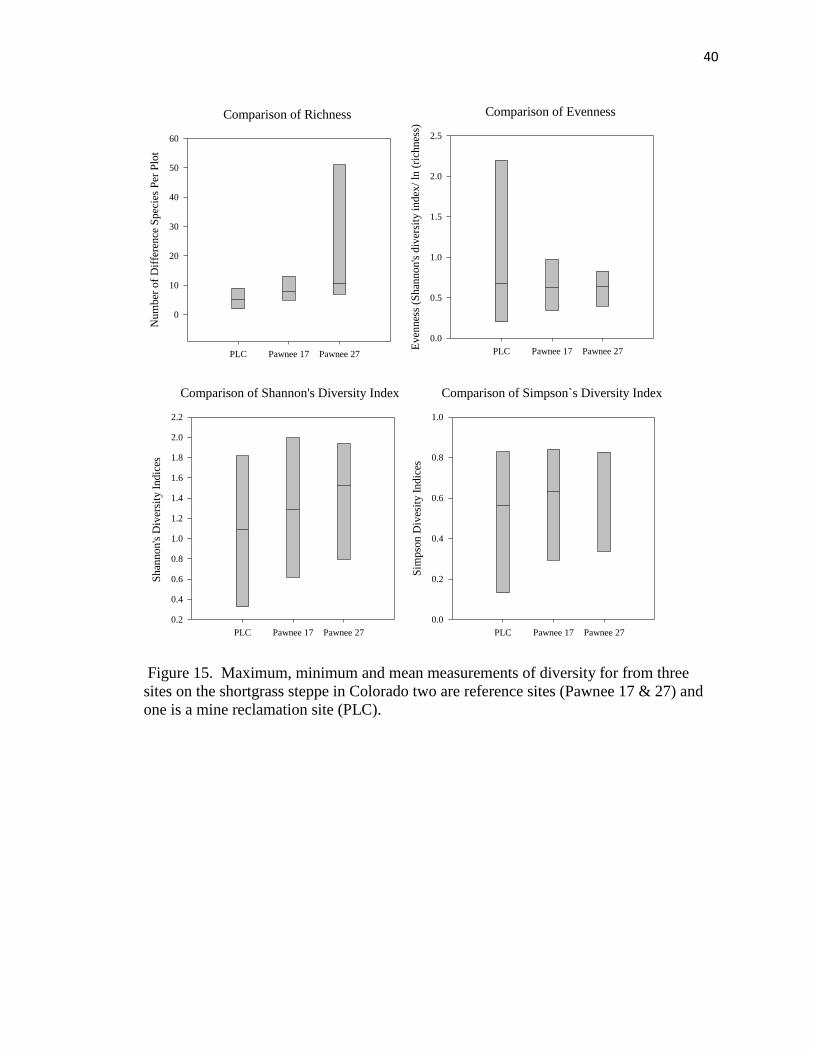
40
Figure 15. Maximum, minimum and mean measurements of diversity for from three
sites on the shortgrass steppe in Colorado two are reference sites (Pawnee 17 & 27) and
one is a mine reclamation site (PLC).
Comparison of Shannon's Diversity Index
PLC Pawnee 17 Pawnee 27
Shan
non's
Div
ersi
ty I
ndic
es
0.2
0.4
0.6
0.8
1.0
1.2
1.4
1.6
1.8
2.0
2.2
Comparison of Evenness
PLC Pawnee 17 Pawnee 27Even
nes
s (S
han
non's
div
ersi
ty i
ndex
/ ln
(ri
chnes
s)
0.0
0.5
1.0
1.5
2.0
2.5
Comparison of Richness
PLC Pawnee 17 Pawnee 27
Num
ber
of
Dif
fere
nce
Spec
ies
Per
Plo
t
0
10
20
30
40
50
60
Comparison of Simpson`s Diversity Index
PLC Pawnee 17 Pawnee 27
Sim
pso
n D
ives
ity I
ndic
es
0.0
0.2
0.4
0.6
0.8
1.0
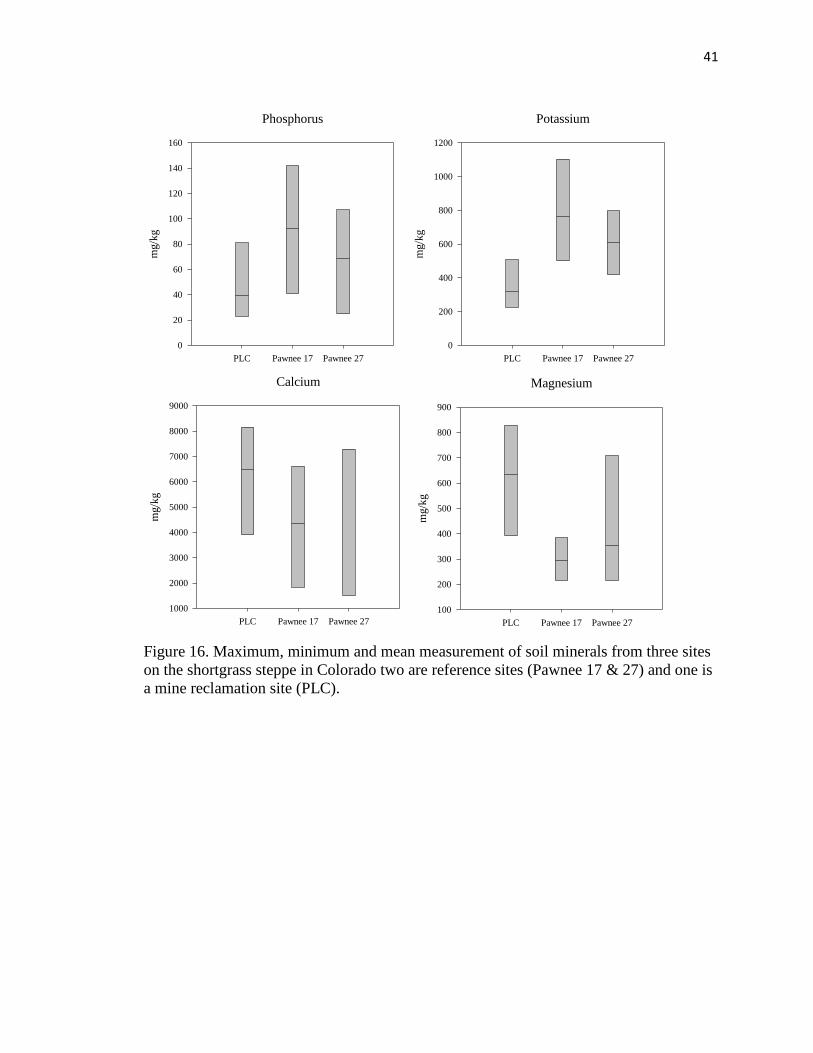
41
Figure 16. Maximum, minimum and mean measurement of soil minerals from three sites
on the shortgrass steppe in Colorado two are reference sites (Pawnee 17 & 27) and one is
a mine reclamation site (PLC).
Phosphorus
PLC Pawnee 17 Pawnee 27
mg/k
g
0
20
40
60
80
100
120
140
160
Potassium
PLC Pawnee 17 Pawnee 27
mg/k
g
0
200
400
600
800
1000
1200
Magnesium
PLC Pawnee 17 Pawnee 27
mg/k
g
100
200
300
400
500
600
700
800
900
Calcium
PLC Pawnee 17 Pawnee 27
mg/k
g
1000
2000
3000
4000
5000
6000
7000
8000
9000
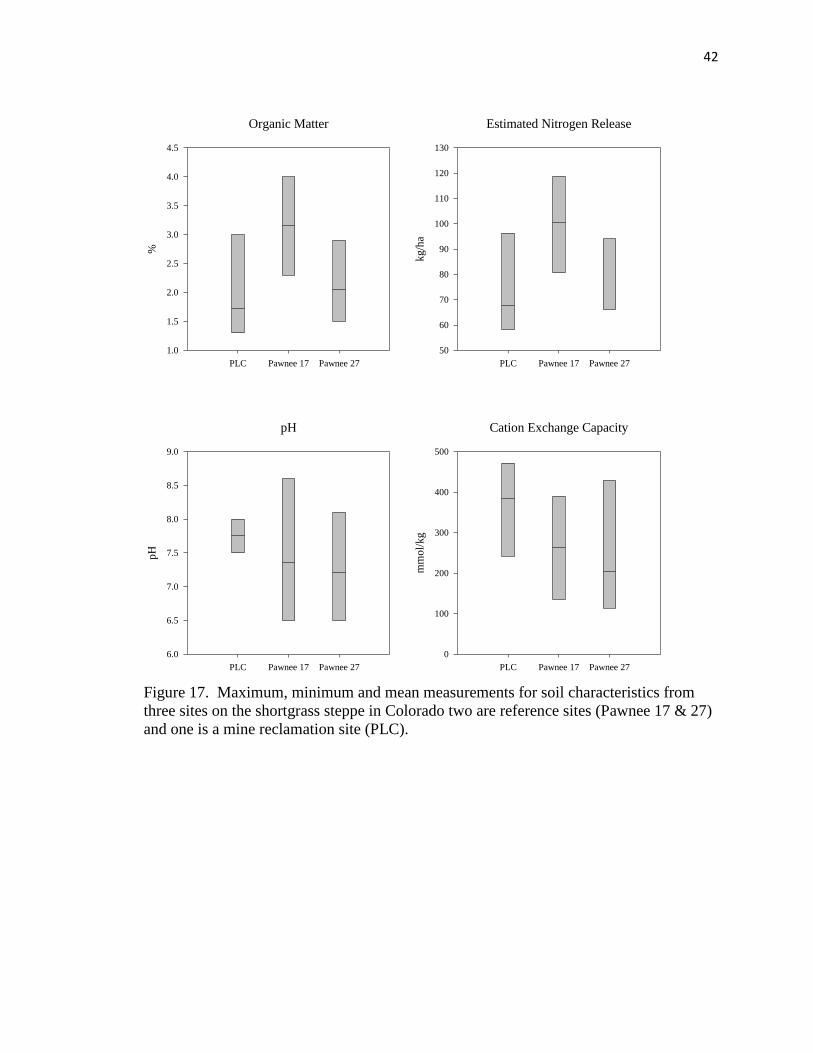
42
Figure 17. Maximum, minimum and mean measurements for soil characteristics from
three sites on the shortgrass steppe in Colorado two are reference sites (Pawnee 17 & 27)
and one is a mine reclamation site (PLC).
Organic Matter
PLC Pawnee 17 Pawnee 27
%
1.0
1.5
2.0
2.5
3.0
3.5
4.0
4.5
Cation Exchange Capacity
PLC Pawnee 17 Pawnee 27
mm
ol/
kg
0
100
200
300
400
500
pH
PLC Pawnee 17 Pawnee 27
pH
6.0
6.5
7.0
7.5
8.0
8.5
9.0
Estimated Nitrogen Release
PLC Pawnee 17 Pawnee 27
kg/h
a
50
60
70
80
90
100
110
120
130
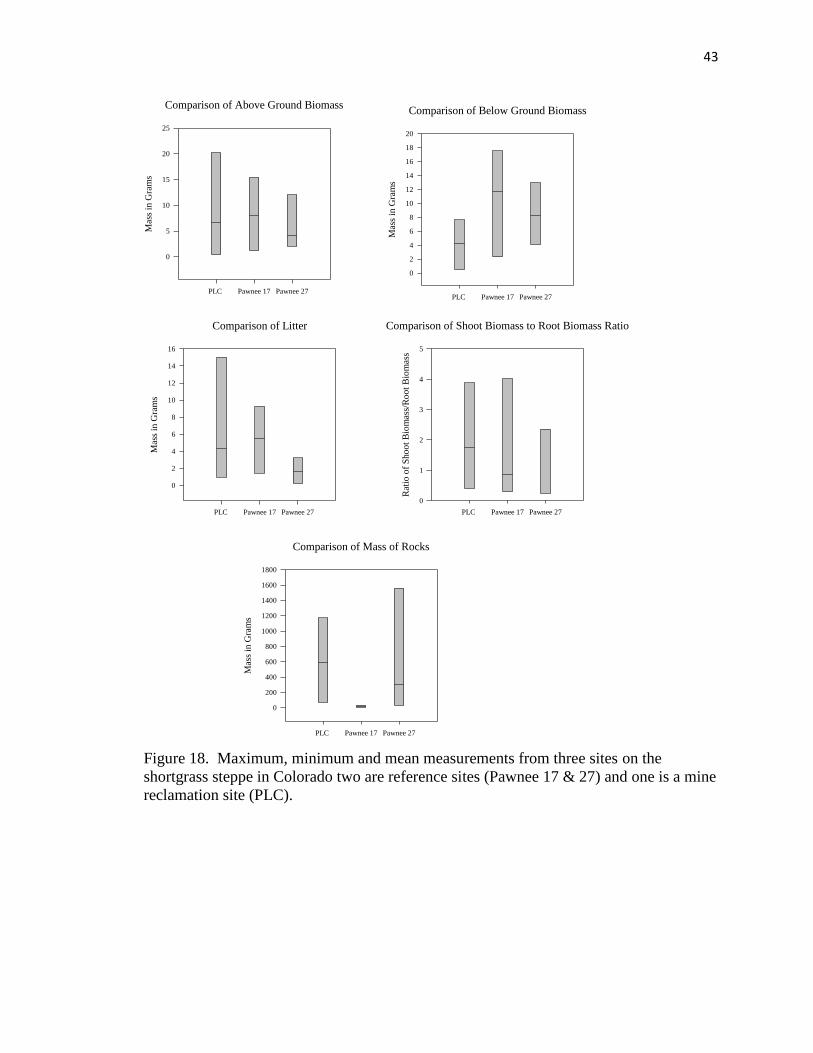
43
Figure 18. Maximum, minimum and mean measurements from three sites on the
shortgrass steppe in Colorado two are reference sites (Pawnee 17 & 27) and one is a mine
reclamation site (PLC).
Comparison of Above Ground Biomass
PLC Pawnee 17 Pawnee 27
Mas
s in
Gra
ms
0
5
10
15
20
25
Comparison of Below Ground Biomass
PLC Pawnee 17 Pawnee 27
Mas
s in
Gra
ms
0
2
4
6
8
10
12
14
16
18
20
Comparison of Litter
PLC Pawnee 17 Pawnee 27
Mas
s in
Gra
ms
0
2
4
6
8
10
12
14
16
Comparison of Mass of Rocks
PLC Pawnee 17 Pawnee 27
Mas
s in
Gra
ms
0
200
400
600
800
1000
1200
1400
1600
1800
Comparison of Shoot Biomass to Root Biomass Ratio
PLC Pawnee 17 Pawnee 27
Rat
io o
f S
ho
ot
Bio
mas
s/R
oo
t B
iom
ass
0
1
2
3
4
5
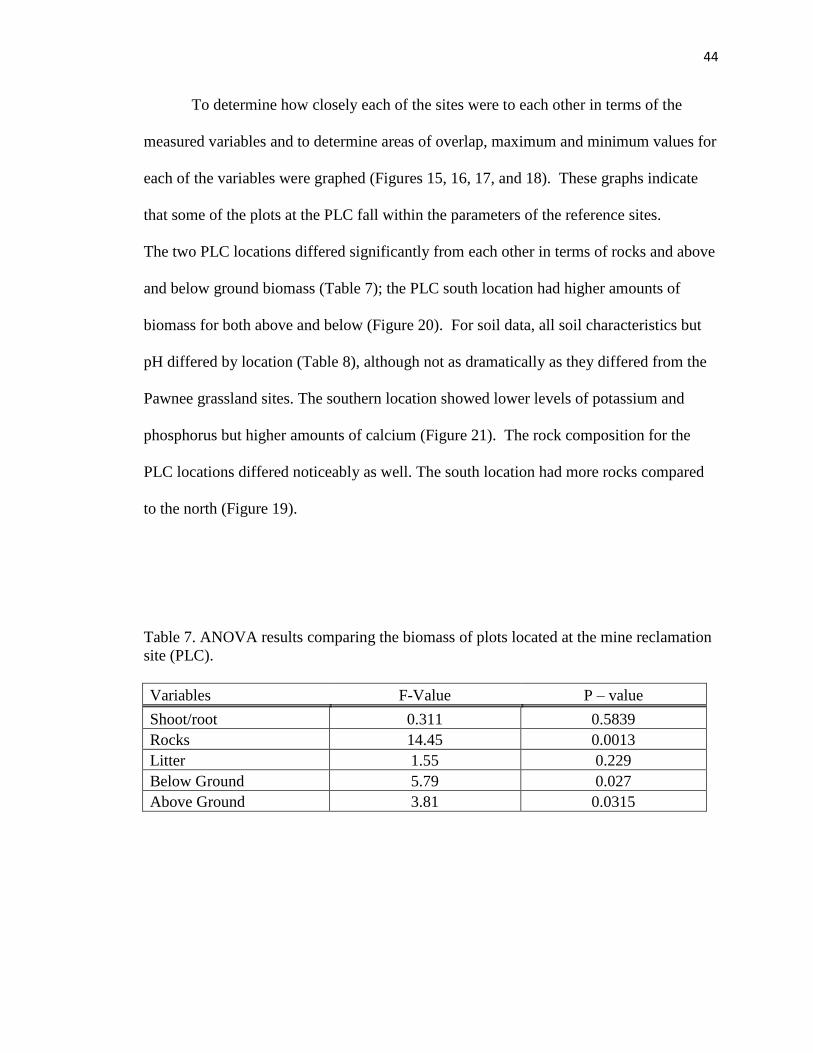
44
To determine how closely each of the sites were to each other in terms of the
measured variables and to determine areas of overlap, maximum and minimum values for
each of the variables were graphed (Figures 15, 16, 17, and 18). These graphs indicate
that some of the plots at the PLC fall within the parameters of the reference sites.
The two PLC locations differed significantly from each other in terms of rocks and above
and below ground biomass (Table 7); the PLC south location had higher amounts of
biomass for both above and below (Figure 20). For soil data, all soil characteristics but
pH differed by location (Table 8), although not as dramatically as they differed from the
Pawnee grassland sites. The southern location showed lower levels of potassium and
phosphorus but higher amounts of calcium (Figure 21). The rock composition for the
PLC locations differed noticeably as well. The south location had more rocks compared
to the north (Figure 19).
Table 7. ANOVA results comparing the biomass of plots located at the mine reclamation
site (PLC).
Variables F-Value P – value
Shoot/root 0.311 0.5839
Rocks 14.45 0.0013
Litter 1.55 0.229
Below Ground 5.79 0.027
Above Ground 3.81 0.0315
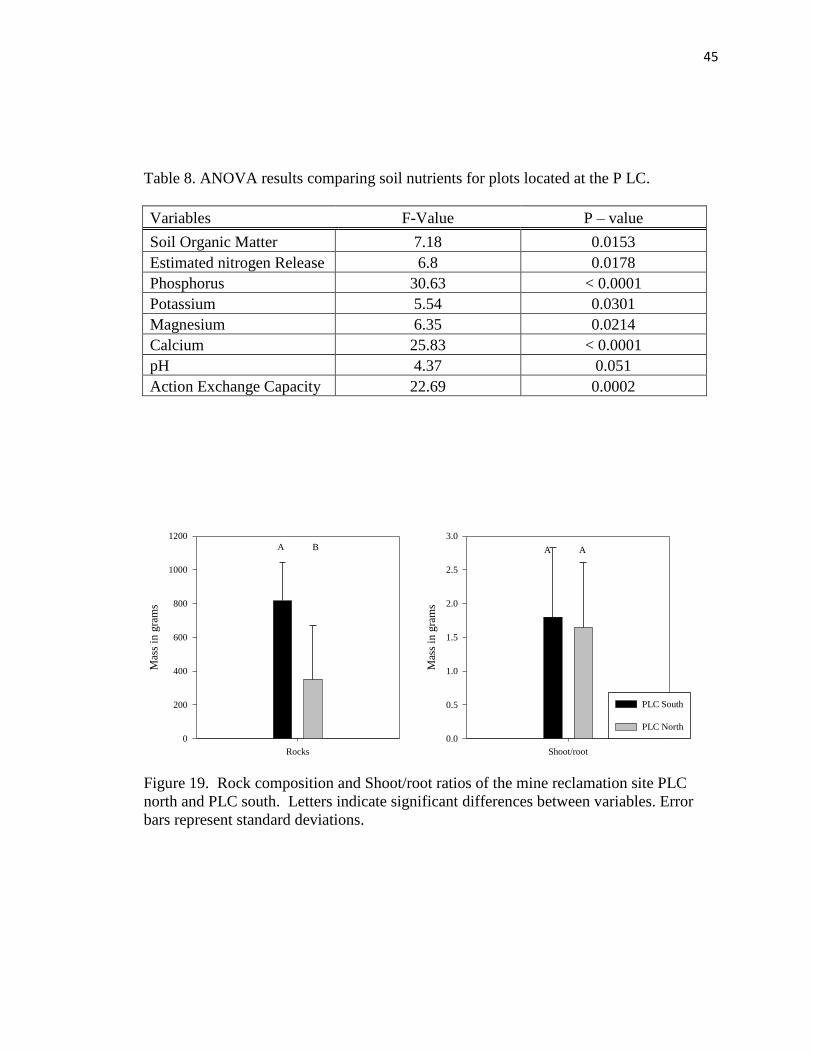
45
Table 8. ANOVA results comparing soil nutrients for plots located at the P LC.
Variables F-Value P – value
Soil Organic Matter 7.18 0.0153
Estimated nitrogen Release 6.8 0.0178
Phosphorus 30.63 < 0.0001
Potassium 5.54 0.0301
Magnesium 6.35 0.0214
Calcium 25.83 < 0.0001
pH 4.37 0.051
Action Exchange Capacity 22.69 0.0002
Figure 19. Rock composition and Shoot/root ratios of the mine reclamation site PLC
north and PLC south. Letters indicate significant differences between variables. Error
bars represent standard deviations.
Rocks
Mas
s in
gra
ms
0
200
400
600
800
1000
1200
A B
Shoot/root
Mas
s in
gra
ms
0.0
0.5
1.0
1.5
2.0
2.5
3.0
PLC South
PLC North
A A
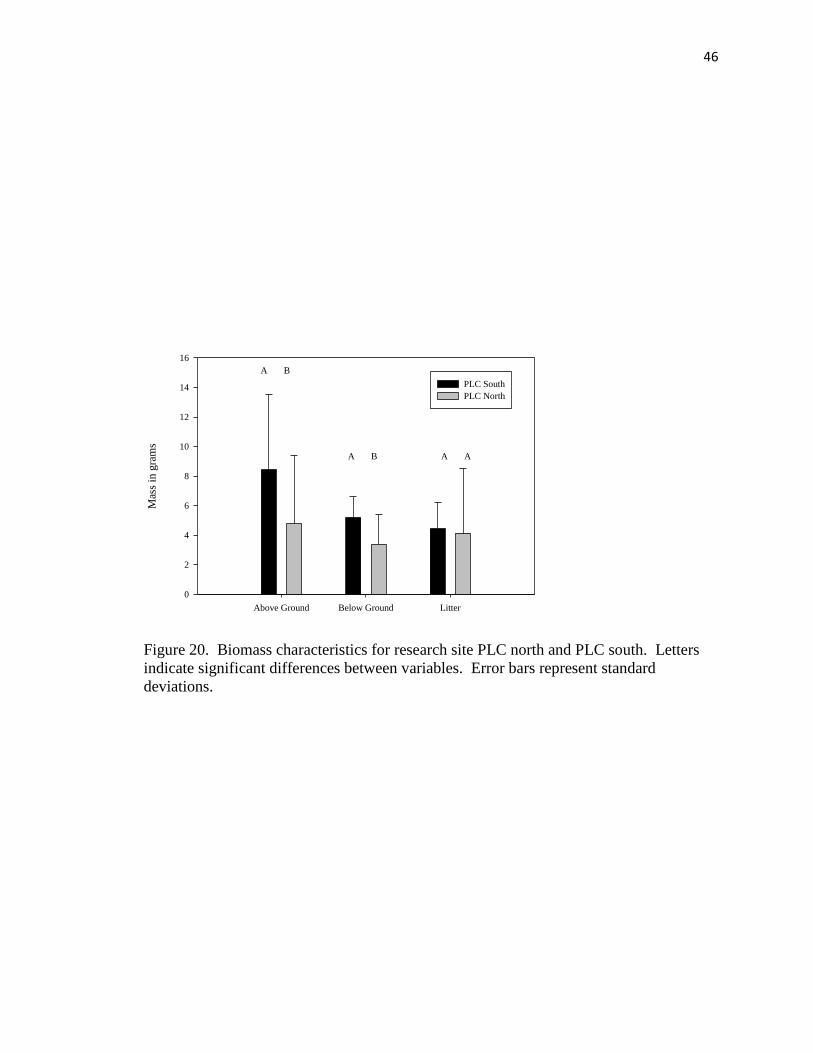
46
Figure 20. Biomass characteristics for research site PLC north and PLC south. Letters
indicate significant differences between variables. Error bars represent standard
deviations.
Above Ground Below Ground Litter
Mas
s in
gra
ms
0
2
4
6
8
10
12
14
16
PLC South
PLC North
A B
A B A A
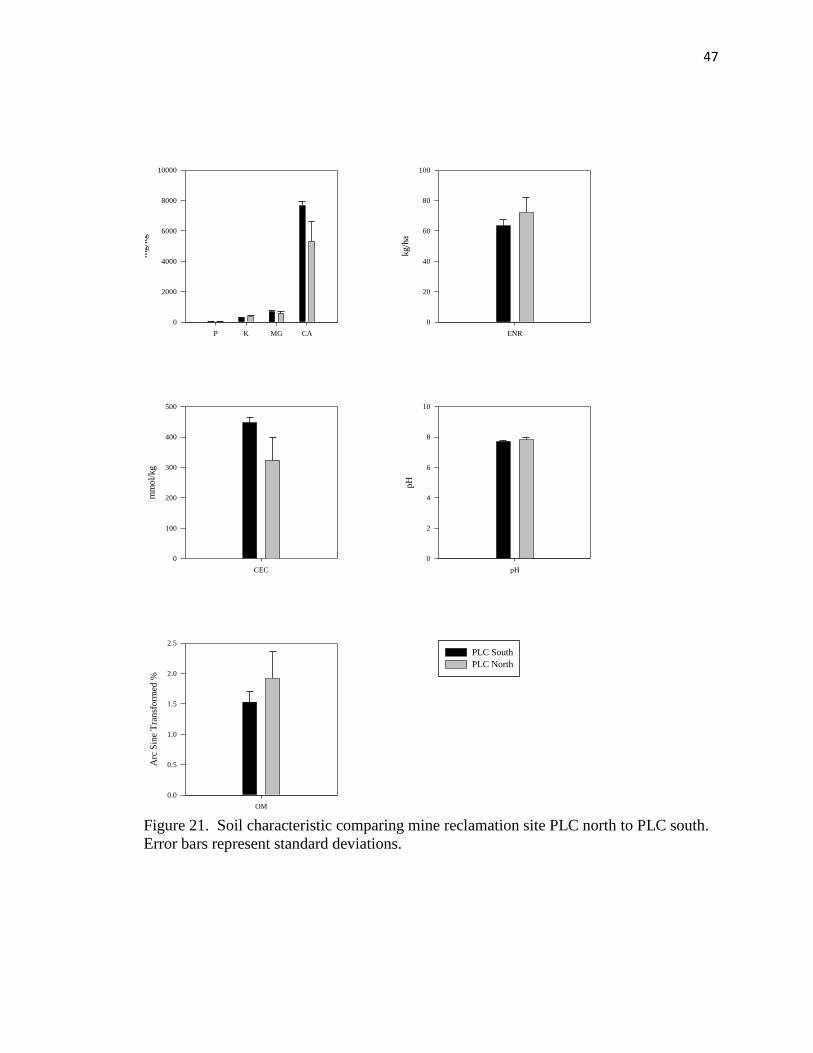
47
Figure 21. Soil characteristic comparing mine reclamation site PLC north to PLC south.
Error bars represent standard deviations.
P K MG CA
mg/k
g
0
2000
4000
6000
8000
10000
OM
Arc
Sin
e T
ransf
orm
ed %
0.0
0.5
1.0
1.5
2.0
2.5
pH
pH
0
2
4
6
8
10
PLC South
PLC North
ENR
kg/h
a
0
20
40
60
80
100
CEC
mm
ol/
kg
0
100
200
300
400
500
48
Discussion
Based on the nine restoration attributes the Society for Ecological Restoration
recommends for assessing reclamation success (SER, 2004), the PLC is moving in the
direction of full restoration but not yet completely reclaimed. The PLC has less
vegetative cover than the reference sites, but does show 69% ground cover overall
indicating the success of revegetation efforts.
Hypothesis1, “Vegetation composition of reference sites is significantly different
from the PLC,” was supported. While some differences are expected due to the
heterogeneity of the region (Fuhlendorf & Engle, 2001), significant differences also
indicate that the propagule pressure may be different at the PLC than on the Pawnee
Grassland with some of the plants located on the Pawnee Grassland sites either not being
dispersed to the PLC (Bradshaw, 2000) because intact shortgrass steppe grasslands are
about 40 km away or because local plants are failing to successfully colonize. This lack
of establishment is evidenced by the lack of dominant species from the planted seed mix.
Of the vegetation mixture planted in 2006, only one fourth of species, including Elymus
smithii, Achnatherum hymenoides, Panicum virgatum and Sporobolus cryptandrus, were
found in research plots. Other grasses planted, including, Bouteloua curtipendula,
Hesperostipa comata, and Sporobolus ariodes, were present on the site (personal
observations) but not in abundance. In the future, these plants may become better
established as succession continues and the dominance of some of the cool season grasses
decreases (Munson & Lauenroth, 2011). Reseeding should not be needed.
Although many of the species located on the PLC were different from the Pawnee
sites, there were a number of species that did overlap. Nine species were shared by the
49
PLC and by one or both of the Pawnee sites: Chamaesyce fendleri, Cirsium arvense,
Descrania pinnata, Elymus smithii, Panicum virgatum, Sporobolus cryptandrus,
Sporobolus ariodes, Tragopogon dubius, and Verbenea bracteata. The presence of the
ubiquitous noxious weed Cirsium arvense is not encouraging for reclamation progress,
but the similarity of the warm season grasses (Elymus smithii, Panicum virgatum,
Sporobolus cryptandrus, and Sporobolus ariodes) does indicate that progress is being
made and that native grasses found on the Pawnee are becoming established at the PLC.
The community similarity analysis utilizing species composition showed the PLC being
more similar to Pawnee 17 than Pawnee 17 was to Pawnee 27. The similarity between
the PLC and Pawnee 17 may be due to the two sites having similar soil texture. Fine
sandy loam located at the PLC and Pawnee 17 retains water better than other soils found
on the Pawnee Grasslands (Dodd & Lauenroth, 1997). Greater ground cover at Pawnee
17 than Pawnee 27 (which had a fine clay loam soil) also supports the notion of greater
water availability.
As is common for most disturbed areas (Langer & Arbogast, 2002), the PLC site
contained higher amounts of invasive weeds than the Pawnee Grassland sites. In
particular, high levels of Convolvulus arvensis and Bromus tectorum contributed to the
decreased quality of the site. Noxious invasive plants such as these grow well in harsh
abiotic conditions such as poor nutrient soils and low soil moisture, and can propagate
rapidly to take advantage of disturbed areas (Grime, 1977). In a gravel mined site, many
of the native seeds in the seed bank are removed or buried under overburden. This
creates an opportunity for prolific seed producing noxious weeds, such as Convolvulus
arvensis and Bromus tectorum, to colonize. Greater densities of noxious weeds render an
50
increase in propagule pressure which ensures continued presence of these noxious weeds.
Noxious weeds may also compete effectively against native plants, preventing them from
becoming established. Prior studies predict that functionally similar natives will compete
more effectively than plants that are functionally dissimilar (Pokorny et al., 2005; Emery,
2007), although it is unknown how functionally equivalent native plants extirpated from
the PLC would compete with the invading noxious weeds. From a management
perspective, some of the native functionally equivalent plants may require the direct input
of seeds. In addition, in an arid environment such as the shortgrass steppe, once
established, perennial warm season grasses are expected to compete effectively against
invasive weeds as demonstrated in a previous study (Ang et al., 1995).
Many measures of restoration success compare the diversity of the restoration site
to a reference site (Martin et al., 2005; Ruiz-Jaen & Aide, 2005). It is a generally
accepted concept that the greater the diversity of a site, the greater the resilience and
stability of an ecosystem (Tilman, 1996). Hypothesis 2, “Species diversity of reference
sites is greater than the PLC,” was accepted. The lower level of diversity at the PLC
compared to the Pawnee sites could be due to the relatively short period of time since the
termination of mining or due to constraints placed on plant growth because of the residual
abiotic conditions caused by gravel mining. Studies have shown plants colonizing mine
sites from distances greater than 10 km but this colonization process takes time (Kirmer
et al., 2008) and as decades pass after the termination of mining, species diversity
increases (Rehounkova & Prach, 2010). If the lack of diversity was caused by the short
recovery period, diversity may increase naturally over time as succession continues and
more species colonize the site. If the decreased diversity was caused by the abiotic
51
conditions of the site, altering soil phosphorus and potassium levels should equalize PLC
soil conditions and reference conditions.
Hypothesis 3, “ Biomass of reference sites is significantly greater than the PLC,”
was accepted. The reference sites exhibited greater biomass than the PLC. The lower
levels of above-ground and below-ground biomass observed at the PLC are likely due to
the recent establishment of plants after the gravel mining and the types of plants
becoming established. One of the dominant plants identified at the PLC is the grass
Bromus tectorum. Because of the annual growth habit of this plant, little above-ground
or below-ground biomass is developed. The higher shoot-to-root ratio at the PLC can also
be attributed to the presence of more annuals similar to a previous study (Schenk &
Jackson, 2002). Perennial warm season grasses often have well established root systems
that exceed their above-ground structure (Weaver, 1968). This growth strategy,
characterized by many of the native plants of the shortgrass steppe, allows them to store
vast quantities of energy in their root systems that can be utilized when conditions
become favorable. Grazing may also shift the ratio of shoot biomass to root biomass
(Christiansen & Svejcar, 1988). Above ground biomass was less at the PLC and
significantly different from Pawnee 27, although the amount of above ground biomass at
the PLC was not significantly different from Pawnee 17. It is likely that Pawnee 27 was
different from the PLC because of the noticeable impact grazing had on this site (personal
observation) heavy grazing has been shown to decrease above ground biomass (Van Der
Maarel & Titlyanova, 1989). For the soil litter measurements, the PLC generally showed
greater amounts of litter compared to Pawnee Grassland sites. Again, this is probably due
to the increased impact of grazing on both Pawnee sites.
52
The PLC sites themselves differed significantly from each other in terms of
rockiness and both above and below ground biomass. The higher amounts of biomass for
the southern area could be partially due to the recent impacts the site has experienced
through flooding. The northern plots were under water in the spring of the 2010
contributing to their decreased aboveground biomass, flooding has been shown to
decrease biomass (Van Eck et al., 2004). Another possibility explaining the differences
is that the north plots appeared to have been more dramatically impacted by mining and
therefore has taken longer to become established. As disturbance intensity increases,
time to recovery becomes longer as demonstrated previously (Coffin et al., 1998).
Hypothesis 4, “Soil characteristics of reference sites are significantly different
from the PLC,” was accepted. Soil characteristics were different between the PLC and
reference sites. The higher calcium levels at the PLC may explain the significantly
higher pH of the PLC site. Higher calcium levels contribute to increases in pH
(Bradshaw et al., 1960). The lower amount of soil organic matter and estimated nitrogen
release for the PLC could be because of the recent exposure of subsurface soil to the
surface through the gravel mine process. A decrease in these variables at mine sites was
noted from previous studies (Indorante et al., 1981; Banning et al., 2008). The lower
amount of phosphorus and potassium at the PLC could be acting as a limiting factor for
plant growth, as both phosphorus and potassium are critical plant nutrients (Donahue et
al., 1977). The higher calcium and magnesium levels at the PLC also contribute to the
increased alkalinity of this site and make the site more conducive to plants tolerating high
alkalinity; e.g., Sporobolus airoides. The increased pH impacts nutrient availability for
plants; in particular the macronutrient phosphorus and the micronutrient iron are
53
decreased as noted from prior research (Brown 1978, Hinsinger 2001). The amount of
organic matter will increase as the soil matures and more surface litter gets incorporated
into the soil (Frouz et al., 2008).
Hypothesis 5, “Functional group composition of reference sites are significantly
different from the PLC,” was accepted. MRPP results showed the PLC being different
from reference sites. Although, a community similarity analysis utilizing functional
groupings showed greater site similarity functionally than when looking at species
composition. The PLC has greater amounts of annual grasses and lacks many of the
forbs found on the Pawnee sites. Since no forbs were included in the re-vegetation effort,
this could explain the lower number of forbs present on the site. Including forbs in future
replanting efforts could shift the forb composition toward greater abundance (Martin &
Wilsey, 2006). In particular, including a nitrogen fixing plant such as Sophora
nuttalliana, which was found at both Pawnee sites, could increase the availablility of
nitrogen in the soil (Bradshaw, 1997). This increase in forbs would also increase the
diversity of the PLC site.
Hypothesis 6, “Heterogeneity of reference sites are significantly less than the
PLC,” was rejected. The structure of the PLC is similar to the reference sites based on the
coefficient of variation for biomass, indicating the heterogeneous distribution of
vegetation is similar.
There were a few limitations to the study. One of the limitations is in the
selection of the references sites. As noted previously these sites were selected based on
soil characteristics and location within riparian areas but, it is possible that they do not
correctly represent functionally intact areas of the shortgrass steppe. The sites selected
54
may themselves degraded due to cattle grazing. Another limitation to the study was lack
of replicates of the experimental sites. This limitation was intentiaonal as the study was
assessing specific reclamation procedures utilized at the site, but does limit the
transferability of the results to other gravel mine sites on the shortgrass steppe. In
addition, taking ground cover measurements during peak biomass likely excluded some
of the early spring species.
Assessment of Restoration Success
Of the nine recommended restoration attributes (SER 2004; Table 9), three of the
attributes at the PLC showed significant differences compared to Pawnee reference sites:
species composition, functional group dominance, and the physical environment.
Completely reclaimed sites should have similar species as reference sites. In addition,
they should be composed of similar functional groups which will enable continued
ecosystem progress toward a restored end point. Further, the restored site should have a
physical environment capable of providing required resources for continued development
(SER 2004).
Restored sites should also show a high percentage of native species, but this study
found lower amounts of native species (59.1%) at the PLC than the Pawnees sites.
Pawnee site 27 had 91.8% of the species being native and Pawnee site 17 had 73.3%.
The community similarity analysis showed that species composition was more varied
than functional groups, indicating that functionally the PLC is similar to the Pawnee
grasslands; indeed, functional composition of the PLC was more similar to the reference
sites than the two reference sites were to each other.
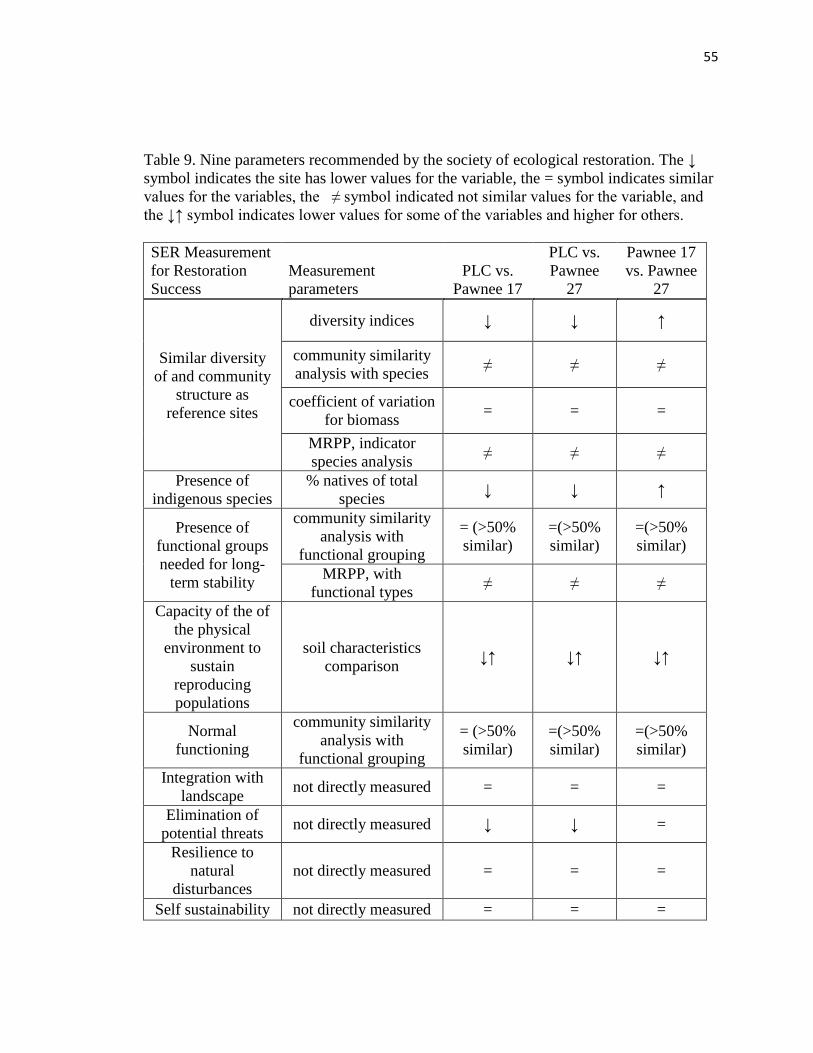
55
Table 9. Nine parameters recommended by the society of ecological restoration. The ↓
symbol indicates the site has lower values for the variable, the = symbol indicates similar
values for the variables, the ≠ symbol indicated not similar values for the variable, and
the ↓↑ symbol indicates lower values for some of the variables and higher for others.
SER Measurement
for Restoration
Success
Measurement
parameters
PLC vs.
Pawnee 17
PLC vs.
Pawnee
27
Pawnee 17
vs. Pawnee
27
Similar diversity
of and community
structure as
reference sites
diversity indices ↓ ↓ ↑
community similarity
analysis with species ≠ ≠ ≠
coefficient of variation
for biomass = = =
MRPP, indicator
species analysis ≠ ≠ ≠
Presence of
indigenous species
% natives of total
species ↓ ↓ ↑
Presence of
functional groups
needed for long-
term stability
community similarity
analysis with
functional grouping
= (>50%
similar)
=(>50%
similar)
=(>50%
similar)
MRPP, with
functional types ≠ ≠ ≠
Capacity of the of
the physical
environment to
sustain
reproducing
populations
soil characteristics
comparison ↓↑ ↓↑ ↓↑
Normal
functioning
community similarity
analysis with
functional grouping
= (>50%
similar)
=(>50%
similar)
=(>50%
similar)
Integration with
landscape not directly measured = = =
Elimination of
potential threats not directly measured ↓ ↓ =
Resilience to
natural
disturbances
not directly measured = = =
Self sustainability not directly measured = = =
56
The following attributes appear to be met with the PLC but were either not
directly measured in this study or lacked baseline studies to assess the attributes. The
function of the PLC appears to be at the level for a community at its stage of
development (Munson & Lauenroth, 2011) and has also been integrated into the broader
ecological matrix. Evidence of this claim comes from the fact that replanting efforts have
not been required at the PLC. The PLC likely continues to be impacted via threats from
surrounding degraded landscapes as gravel mining continues in close proximity to the
site. In addition, it is expected the direction of ground water flow has changed due to the
bentonite slurry wall lining the lake created from the gravel extraction (unpublished data
from the PLC corroborate the altered ground flow). It appears that the PLC is self
sustainable and also has built up a level of resilience to normal stresses. This self
sustainability can be seen by the continued increase in ground cover on the site (personal
observations) and resiliency has been demonstrated by the fairly rapid response and
resiliency of regions of the PLC to flooding in 2009 and 2010 (personal observations).
Future Studies
It is recommended that continual monitoring be conducted on the PLC site to gain
an understanding of how a gravel mine site on the shortgrass steppe progress in response
to reclamation. This monitoring could help verify successional models (Munson &
Lauenroth, 2011).
A study establishing research sites with input of potassium and phosphorus could
determine how limiting these variables are in plant growth and species composition of the
site. Although, a previous study showed that the noxious weed Bromus tectorum
increased with this treatment in the foothills of Colorado (Cherwin et al., 2009). In

57
addition, active planting of native forbs including legumes could change the structural
composition of the vegetation of the PLC and the mineral composition of the soil.
Another question is the impact grazing has on vegetation patterns on the
shortgrass steppe. Are the differences in shoot to root ratios and species composition due
to cattle grazing? A grazing study could be set up at the PLC or similar site. Increased
grazing could shift the vegetation at the PLC more toward perennial warm season grasses
and increase the amount of root biomass compared to the aboveground biomass (Van Der
Maarel & Titlyanova, 1989).
Management Recommendations
Although the PLC cannot be considered completely reclaimed compared to the
Pawnee reference sites, much progress has been made toward a sustainable functioning
ecosystem. The management procedures, including planting of the native seed mix and
control of noxious weeds, appear to have been successful in restoring the PLC toward the
reference sites on the shortgrass steppe.
It is likely that the end point of reclamation of the PLC will be slightly different
from the reference sites based on current species composition and soil characteristics, but
the results of this study are encouraging. Dramatic progress can be seen based on the
high percentage of ground cover at the PLC and a species composition consisting of
native perennial grasses.
Increasing the nutrients by adding phosphorus and potassium to the PLC site
would be possible, but because much of the calcium is present in the form of free lime
(personal observation), little can be done to lower the pH. Rather, plants being utilized
for reclamation should be tolerant of the increased pH of the site. Planting more native

58
forbs should increase species diversity, and it is also recommended that measures to
control noxious weeds are continued. Incorporating these management suggestions
should bring the PLC closer to the biotic and abiotic conditions of the reference sites.
59
CHAPTER III
RESPONSE OF RIPARIAN/LOWLAND AREAS OF
THE SHORTGRASS STEPPE TO THE RELEASE
FROM CATTLE GRAZING USING
EXCLOSURES: COMPARISON
OF DIFFERENT SPATIAL
AND TEMPORAL
SCALES
Abstract
Human impact on grassland areas through cattle grazing has had a profound
influence on plant structure and composition in these areas, but little research has been
conducted investigating grazing impact on riparian areas of the shortgrass steppe. A one
grazing season and a multi-year study were conducted to address this issue. Species
composition and functional composition were compared for areas exposed to grazing and
areas released from grazing. In addition, soil nutrient levels and biomass levels were
compared over one grazing season. Results from the single grazing season study showed
areas exposed to grazing had less aboveground biomass and greater heterogeneity than
non-grazed areas. The multi-year study showed that species composition varied
comparing grazed to un-grazed areas from the onset, but demonstrated similar decreases
and increases for diversity and species composition. This suggested other environmental
factors, perhaps hail, had a greater impact on the system than grazing. Release from
grazing caused the system to change more than continual grazing and resulted in
increased species evenness. Functional composition started and remained different for
60
the treatments but within treatments did not change significantly. This study
demonstrates variability of species composition from year to year on the shortgrass
steppe and supports the concept that grazing has minimal impact in regions adapted to
low levels of precipitation.
Introduction
Understanding the impact of grazing on different grassland communities has
contributed to our knowledge of ecosystem dynamics under this selective pressure
(Milchunas et al., 1988b; Anderson & Briske, 1995; Olff & Ritchiee, 1998; Adler et al.,
2004; Derner & Whitman, 2009) and has ensured continued sustainable cattle production.
Studies have been conducted on the shortgrass steppe investigating the impact of grazing
(Milchunas & Lauenroth, 1989; Hazlett, 1992 ; Milchunas et al., 1994; Hart & Ashby,
1998; Hart, 2001; LeCain et al., 2002) but none of these studies investigated specifically
the impact of release from grazing on community structure and dynamics in riparian
areas. Considering the uniqueness of riparian areas on the shortgrass steppe (e.g., greater
diversity, (Stohlgren et al., 1998)), grazing response in riparian communities may be
different than upland communities.
The shortgrass steppe is a unique ecosystem characterized by low levels of
precipitation (260-375 mm; Anderson, 2006) and large and rapid temperature changes
(Pielke & Doesken, 2008). It is impacted by the low level of precipitation in general and
periodic drought more directly. This semiarid environment is unique compared to other
grasslands and shows different responses to disturbances (Stapp et al., 2008). The low
levels of precipitation contribute to an ecosystem dominated by grasses; specifically,
shortgrass steppe in Colorado is characterized by short monostructure grasses composed
61
of blue grama (Bouteloua gracilis) and buffalo grass (Bouteloua dactyloides) (Lauenroth,
2008). Both are perennial warm season (C4) grasses. Another impact of periodic
droughts is the small number of shrubs present in this environment, which include
saltbush (Atriplex canesens), rabbit bush (Chrysothamnus nauseosus), plains prickly pear
cactus (Opuntia polyanthemos), and soapweed yucca (Yucca glauca). Low precipitation
levels make the shortgrass steppe less resilient (the amount of time needed to return a
system to pre-disturbance levels; Ives, 1995) and resistant (ability to absorb changes
through time; Sutherland, 1974) to intense anthropogenic disturbances. Because the
shortgrass steppe is characterized by low levels of precipitation, large rivers are
uncommon, but there are creeks and ephemeral stream beds (Singh et al., 1996) which
occur more frequently. These riparian areas were important to early settlers and are
important for native wildlife (Hazlett, 1998). On the shortgrass steppe, riparian areas also
provide unique habitat for many native and exotic plants (Stohlgren et al., 1998;
Schiebout et al., 2008).
Ungulate grazing historically had a profound influence on shortgrass steppe
vegetative structure (Larson, 1940; Milchunas et al., 1988a) and continues to impact plant
structure and function through domestic cattle grazing (Milchunas & Lauenroth, 1993).
Some studies suggest that moderate levels of cattle grazing can have beneficial effects on
many grass species through the promotion of an increase in productivity (McNaughton,
1993); other studies highlight the negative impacts of ungulate herbivores on arid
ecosystems including the removal of certain plants, redistribution of seeds and nitrogen,
and compaction of soil (Blensky & Blumenthal, 1997). Studies looking at heavy cattle
grazing have shown that grazing increases basal cover of grasses and decreases basal
62
cover of forbs (Milchunas et al., 1988a). In addition, heavy grazing on restored mixed
grass prairie soils has been shown to reduce the rate of soil nutrient and organic matter
accumulation as well as increase the amount of bare ground (Fuhlendorf et al., 2002).
In upland grazed pastures of the shortgrass steppe, areas released from grazing
after 56 years showed an increase in cool season grasses and forbs compared to an
increased amount of warm season grasses (LeCain et al., 2002). Species richness was
higher in moderately grazed pastures compared to ungrazed pastures but no different in
lightly grazed pastures (Hart, 2001). Productivity was found to decrease following heavy
grazing in years of increased and average precipitation (Milchunas et al., 1994). Biomass
(Hart & Ashby, 1998; Hart, 2001) and bare ground were greater in grazed areas and
grazed areas accumulated less litter (Hazlett, 1992 ).
In general, riparian areas throughout the U.S. are negatively impacted by grazing
(Hoorman & McCutcheon, 2005). These grazed riparian areas are susceptible to
trampling and elimination of vegetation through uprooting (Clary & Webster, 1989). In
riparian areas, grazing also decreases vegetative biomass and litter (Kauffmann &
Krueger, 1984; Schultz & Leininger, 1990; Giuliano & Homyack, 2004) and contributes
to a decrease in species diversity (Lucas et al., 2004). Because of the increased grazing
occurring in riparian areas of the shortgrass steppe (Schwartz & Ellis, 1981; Senft et al.,
1985), impacts on above-ground vegetation in these areas may be greater than in upland
regions. Cattle congregate in lowland areas during the growing season, which amplifies
the negative impacts of trampling from heavy grazing (Senft et al., 1985). Although,
increased grazing intensities for short periods of time did not significantly alter plant
composition in upland areas (Derner & Hart, 2007). Here we investigate the response of
63
riparian areas on the shortgrass steppe after they are released from grazing. This
knowledge will enable resource managers to make land use decisions with knowledge of
how vegetation patterns in riparian areas of the shortgrass steppe respond to reduced
grazing or cessation of grazing.
Specifically, we examined a five-year study of a large cattle exclosure and a one-
year study of several meter square cattle exclosures in the Pawnee Grasslands of
Colorado. We hypothesized that: (1) vegetation composition and functional group
composition of excluded areas will significantly differ from grazed areas, (2) diversity
will be greater in exclosures, (3) biomass and maximum height of plants will be greater in
the excluded plots following one grazing season, (4) heterogeneity measured by
coefficient of variation will be greater in grazed areas, and (5) soil nutrient composition
will be significantly different for un-grazed compared to grazed plots.
Methods
Site locations
Research was conducted at the Shortgrass Steppe Long-Term Ecological
Research (SGS LTER) site located approximately 40 km north of Greeley, Colorado.
The SGS LTER is composed of the USDA ARS Central Plains Experimental Range
(CPER) and is part of the larger USDA Forest Service Pawnee National Grassland (PNG)
(Lauenroth et al., 2008). The CPER is a continuous 6280 ha block of land (40°49' N
latitude, 104 °47" W longitude) and was established by purchasing land from farmers and
ranchers unable to keep their land following the dust storms and drought of the 1930’s.
Cattle grazing has occurred on the CPER since 1939 (Coffin et al., 1998). The Pawnee
National Grassland is composed of 78,100 ha of fragmented public land in a matrix
64
private land holdings. Average yearly precipitation is 321 mm (Lauenroth et al., 2008).
Blue grama (Bouteloua gracilis) with Buffalo grass (Buchloe dactyloides) dominate plant
communities of the SGS LTER (Singh et al., 1996).
The two research sites were located in Colorado Township 10N, Range 65W,
Section 17 (40˚50’7 N latitude, 104˚41’19” W longitude) and Colorado Township 10N,
Range 65W, Section 27 (40˚48’32” N latitude, 104˚45’36” W longitude). These areas
were chosen because they represented riparian areas on the shortgrass steppe, being
located next to Eastman Creek and Little Owl Creek, respectively (Figure 22).
Ephemeral streams like these are located in many arid environments and result in a
unique plant structure and composition (Shaw & Cooper, 2008). In addition, both sites
have been moderately grazed with section 17 having a grazing density of 0.150 cattle ha-1
and section 27 having a grazing density of 0.155 cattle ha-1
for the duration. Loamy soils
characterize these sites generally and specifically Nunn Clay Loan dominates site located
in Section 27 and Avar Fine Clay Loam dominates the site located in Section17 (Crabb,
1982).
Two different studies were conducted to investigate how cessation of grazing
impacts riparian areas on the shortgrass steppe. One study investigated impacts over one
growing season and utilized ground cover, biomass and soil data as well as tallest species
per 1 m2
plots to compare plots that were grazed vs. plots that were not grazed. The other
study, initiated by Gary Fraiser with data collection conducted by the CPER crew,
utilized transect data from section 17 to determine shifts in vegetation patterns over a
period of five years for areas exclosed from cattle grazing compared to areas exposed to
grazing pressure.
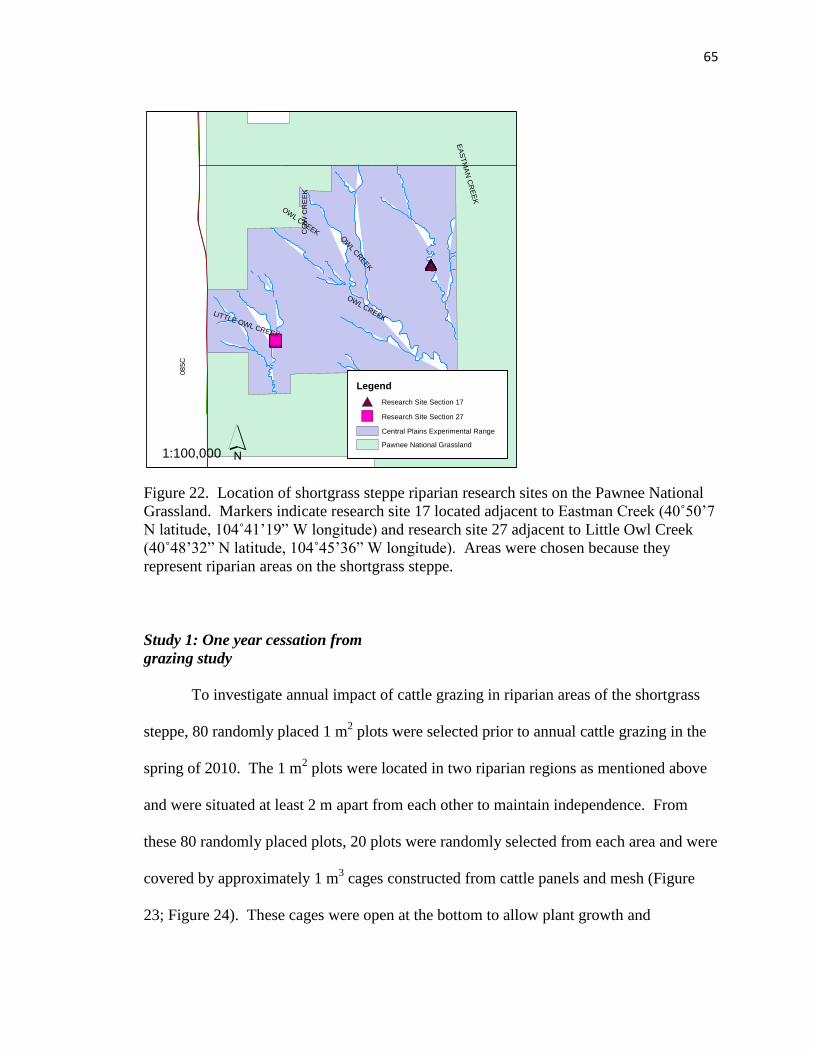
65
Figure 22. Location of shortgrass steppe riparian research sites on the Pawnee National
Grassland. Markers indicate research site 17 located adjacent to Eastman Creek (40˚50’7
N latitude, 104˚41’19” W longitude) and research site 27 adjacent to Little Owl Creek
(40˚48’32” N latitude, 104˚45’36” W longitude). Areas were chosen because they
represent riparian areas on the shortgrass steppe.
Study 1: One year cessation from
grazing study
To investigate annual impact of cattle grazing in riparian areas of the shortgrass
steppe, 80 randomly placed 1 m2 plots were selected prior to annual cattle grazing in the
spring of 2010. The 1 m2 plots were located in two riparian regions as mentioned above
and were situated at least 2 m apart from each other to maintain independence. From
these 80 randomly placed plots, 20 plots were randomly selected from each area and were
covered by approximately 1 m3 cages constructed from cattle panels and mesh (Figure
23; Figure 24). These cages were open at the bottom to allow plant growth and
")")")")")")")")")")")")")")")")")")")")")")")")")")")")")")")")")")")")")")")")
#*#*#*#*#*#*#*#*#*#*#*#*#*#*#*#*#*#*#*#*#*#*#*#*#*#*#*#*#*#*#*#*#*#*#*#*#*#*#*#*
OWL CREEK
CO
W C
RE
EK
EA
ST
MA
N C
RE
EK
LITTLE OWL CREEK
OWL CREEK
OWL CREEK
OW
L CREEK
08
5C
1:100,000 ´
Legend
#* Research Site Section 17
") Research Site Section 27
Central Plains Experimental Range
Pawnee National Grassland
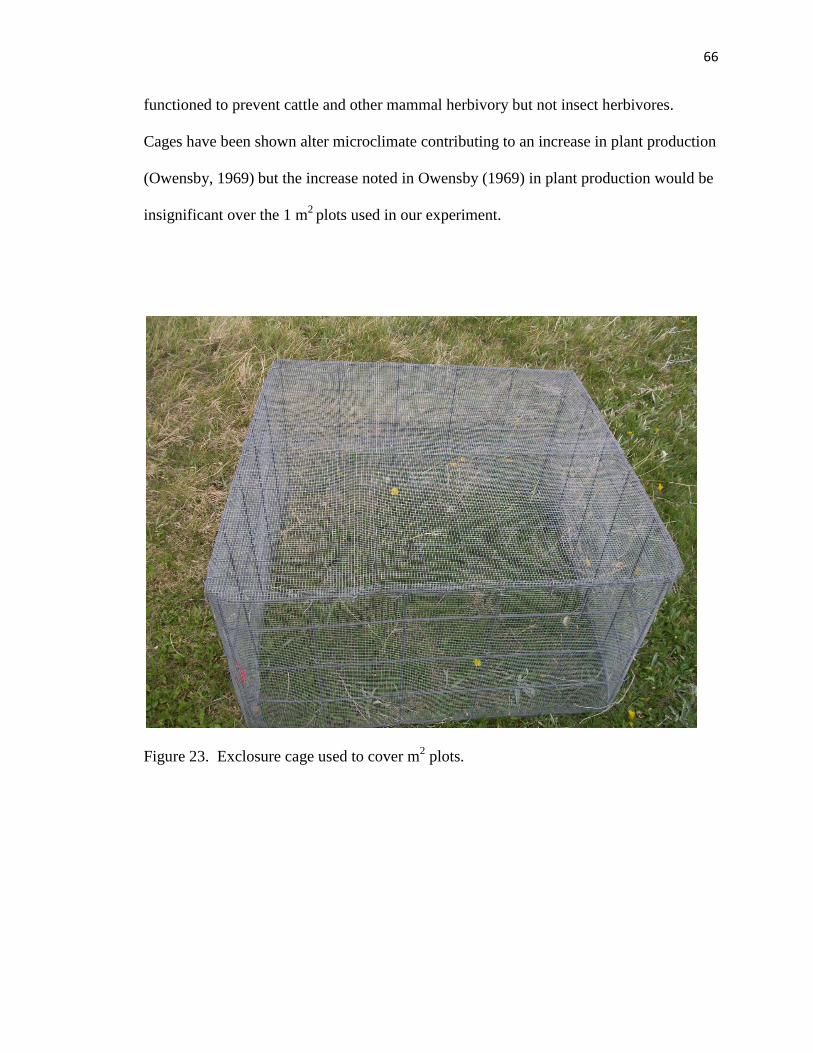
66
functioned to prevent cattle and other mammal herbivory but not insect herbivores.
Cages have been shown alter microclimate contributing to an increase in plant production
(Owensby, 1969) but the increase noted in Owensby (1969) in plant production would be
insignificant over the 1 m2
plots used in our experiment.
Figure 23. Exclosure cage used to cover m2 plots.
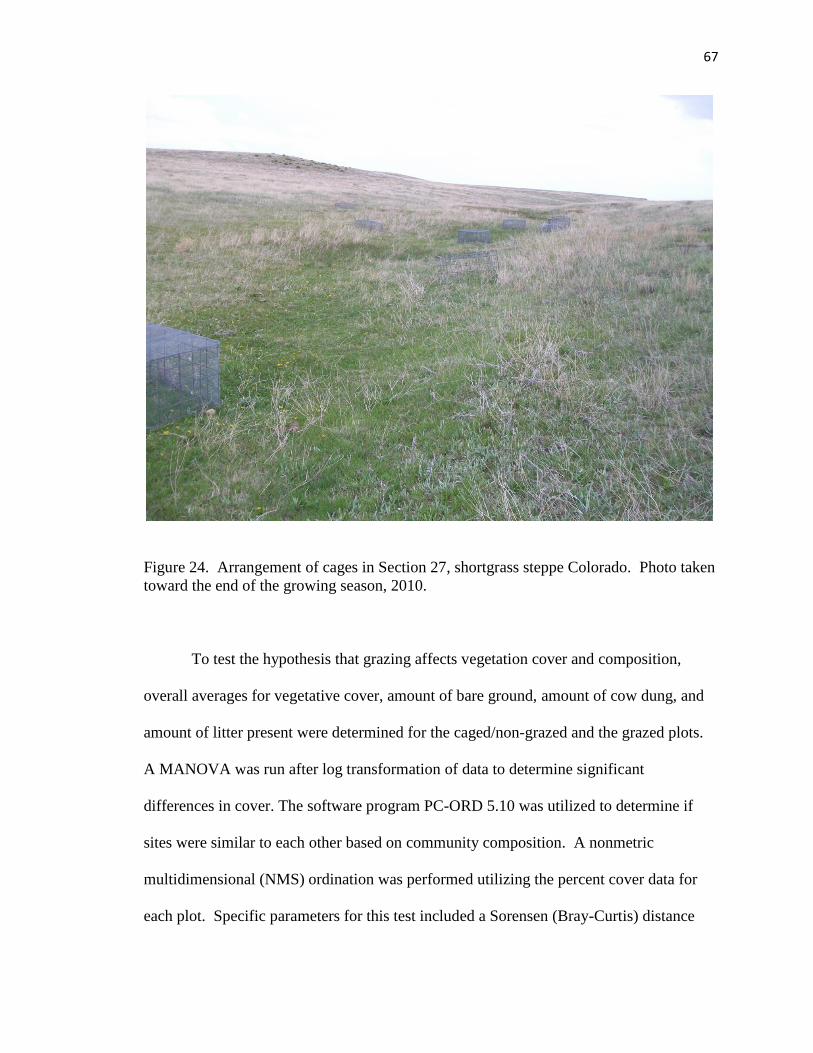
67
Figure 24. Arrangement of cages in Section 27, shortgrass steppe Colorado. Photo taken
toward the end of the growing season, 2010.
To test the hypothesis that grazing affects vegetation cover and composition,
overall averages for vegetative cover, amount of bare ground, amount of cow dung, and
amount of litter present were determined for the caged/non-grazed and the grazed plots.
A MANOVA was run after log transformation of data to determine significant
differences in cover. The software program PC-ORD 5.10 was utilized to determine if
sites were similar to each other based on community composition. A nonmetric
multidimensional (NMS) ordination was performed utilizing the percent cover data for
each plot. Specific parameters for this test included a Sorensen (Bray-Curtis) distance
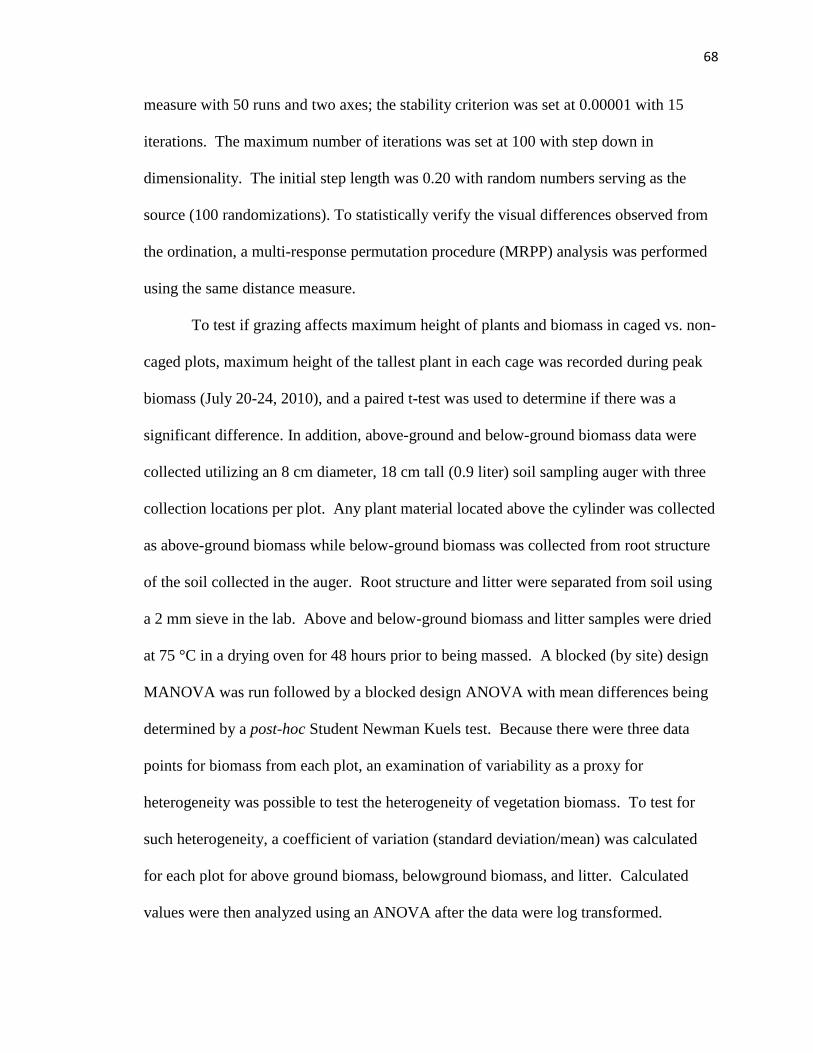
68
measure with 50 runs and two axes; the stability criterion was set at 0.00001 with 15
iterations. The maximum number of iterations was set at 100 with step down in
dimensionality. The initial step length was 0.20 with random numbers serving as the
source (100 randomizations). To statistically verify the visual differences observed from
the ordination, a multi-response permutation procedure (MRPP) analysis was performed
using the same distance measure.
To test if grazing affects maximum height of plants and biomass in caged vs. non-
caged plots, maximum height of the tallest plant in each cage was recorded during peak
biomass (July 20-24, 2010), and a paired t-test was used to determine if there was a
significant difference. In addition, above-ground and below-ground biomass data were
collected utilizing an 8 cm diameter, 18 cm tall (0.9 liter) soil sampling auger with three
collection locations per plot. Any plant material located above the cylinder was collected
as above-ground biomass while below-ground biomass was collected from root structure
of the soil collected in the auger. Root structure and litter were separated from soil using
a 2 mm sieve in the lab. Above and below-ground biomass and litter samples were dried
at 75 °C in a drying oven for 48 hours prior to being massed. A blocked (by site) design
MANOVA was run followed by a blocked design ANOVA with mean differences being
determined by a post-hoc Student Newman Kuels test. Because there were three data
points for biomass from each plot, an examination of variability as a proxy for
heterogeneity was possible to test the heterogeneity of vegetation biomass. To test for
such heterogeneity, a coefficient of variation (standard deviation/mean) was calculated
for each plot for above ground biomass, belowground biomass, and litter. Calculated
values were then analyzed using an ANOVA after the data were log transformed.
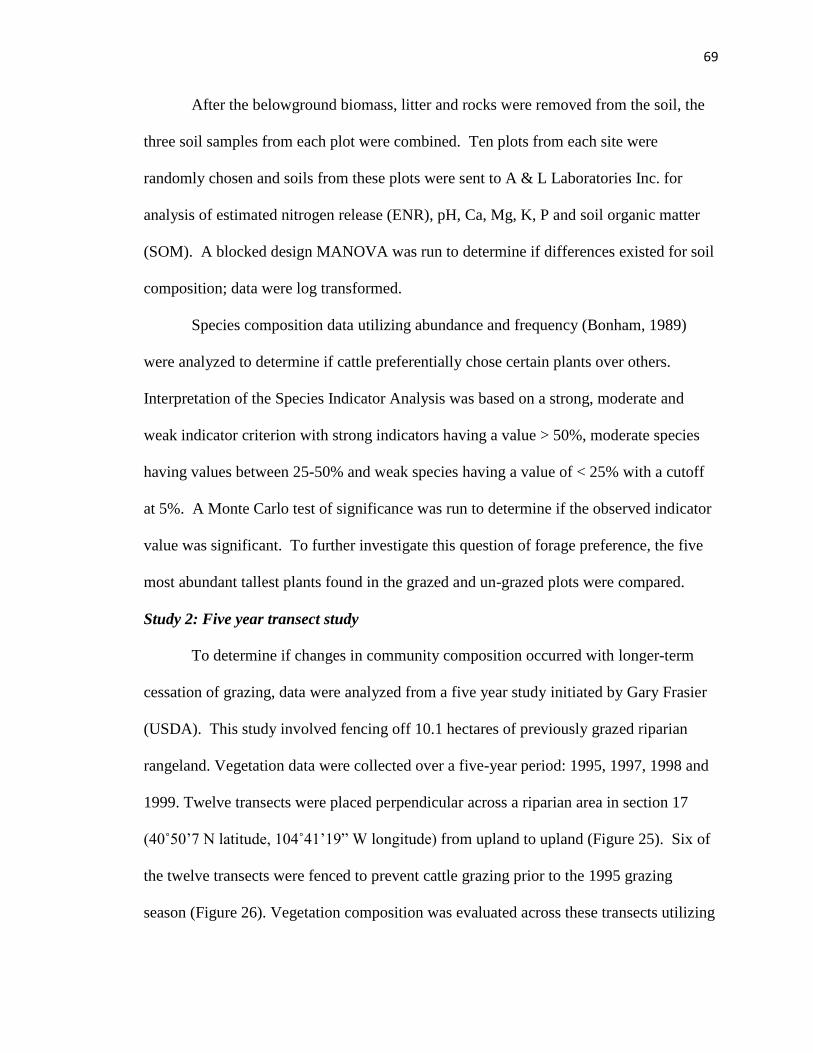
69
After the belowground biomass, litter and rocks were removed from the soil, the
three soil samples from each plot were combined. Ten plots from each site were
randomly chosen and soils from these plots were sent to A & L Laboratories Inc. for
analysis of estimated nitrogen release (ENR), pH, Ca, Mg, K, P and soil organic matter
(SOM). A blocked design MANOVA was run to determine if differences existed for soil
composition; data were log transformed.
Species composition data utilizing abundance and frequency (Bonham, 1989)
were analyzed to determine if cattle preferentially chose certain plants over others.
Interpretation of the Species Indicator Analysis was based on a strong, moderate and
weak indicator criterion with strong indicators having a value > 50%, moderate species
having values between 25-50% and weak species having a value of < 25% with a cutoff
at 5%. A Monte Carlo test of significance was run to determine if the observed indicator
value was significant. To further investigate this question of forage preference, the five
most abundant tallest plants found in the grazed and un-grazed plots were compared.
Study 2: Five year transect study
To determine if changes in community composition occurred with longer-term
cessation of grazing, data were analyzed from a five year study initiated by Gary Frasier
(USDA). This study involved fencing off 10.1 hectares of previously grazed riparian
rangeland. Vegetation data were collected over a five-year period: 1995, 1997, 1998 and
1999. Twelve transects were placed perpendicular across a riparian area in section 17
(40˚50’7 N latitude, 104˚41’19” W longitude) from upland to upland (Figure 25). Six of
the twelve transects were fenced to prevent cattle grazing prior to the 1995 grazing
season (Figure 26). Vegetation composition was evaluated across these transects utilizing
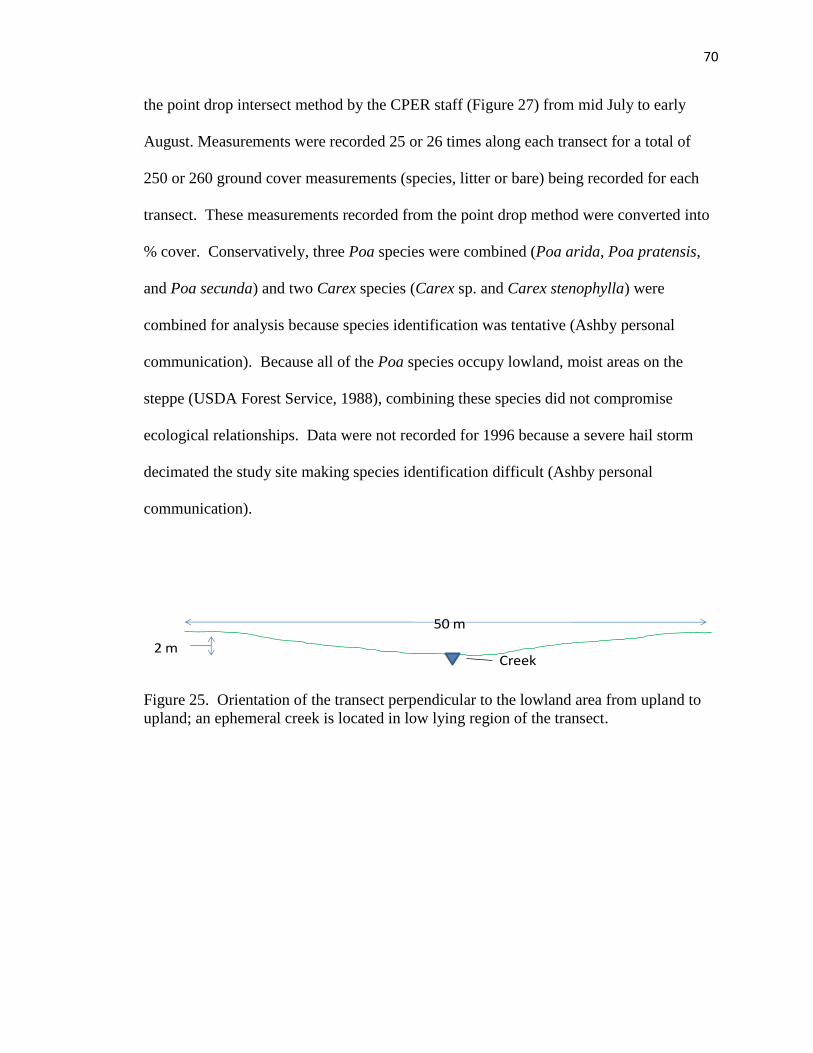
70
the point drop intersect method by the CPER staff (Figure 27) from mid July to early
August. Measurements were recorded 25 or 26 times along each transect for a total of
250 or 260 ground cover measurements (species, litter or bare) being recorded for each
transect. These measurements recorded from the point drop method were converted into
% cover. Conservatively, three Poa species were combined (Poa arida, Poa pratensis,
and Poa secunda) and two Carex species (Carex sp. and Carex stenophylla) were
combined for analysis because species identification was tentative (Ashby personal
communication). Because all of the Poa species occupy lowland, moist areas on the
steppe (USDA Forest Service, 1988), combining these species did not compromise
ecological relationships. Data were not recorded for 1996 because a severe hail storm
decimated the study site making species identification difficult (Ashby personal
communication).
Figure 25. Orientation of the transect perpendicular to the lowland area from upland to
upland; an ephemeral creek is located in low lying region of the transect.
2 m
50 m
Creek
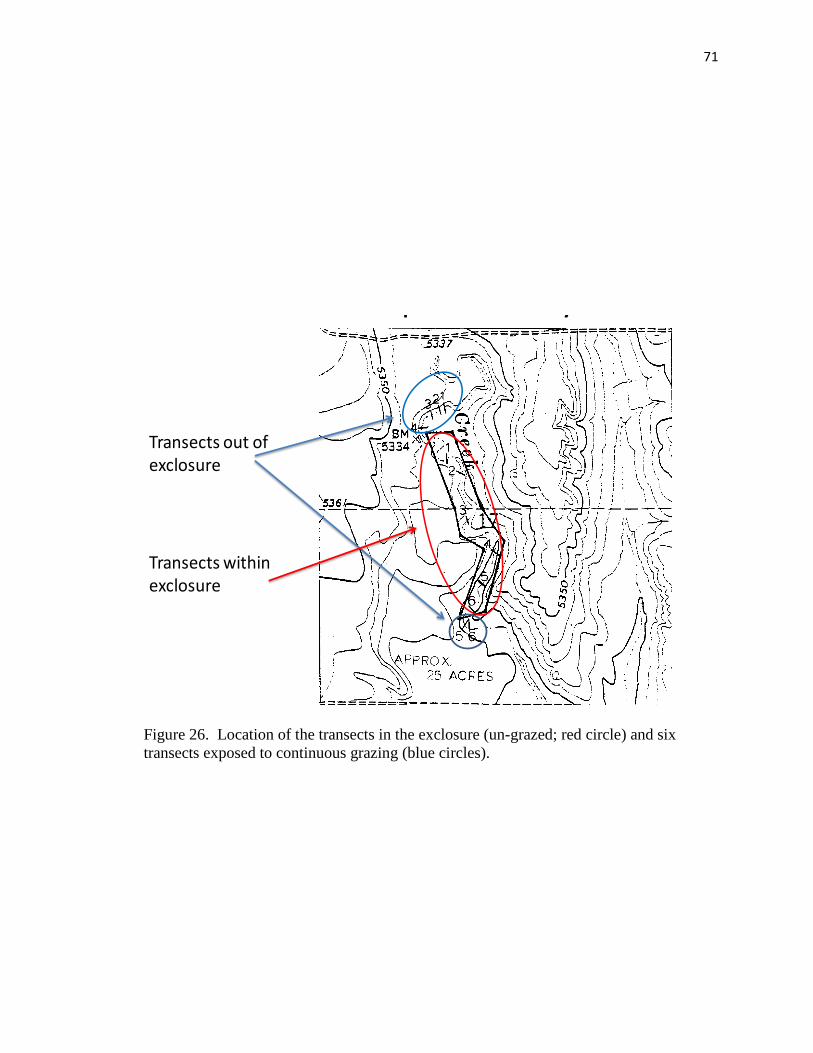
71
Figure 26. Location of the transects in the exclosure (un-grazed; red circle) and six
transects exposed to continuous grazing (blue circles).
Riparian Study Site
Transects out of exclosure
Transects within exclosure
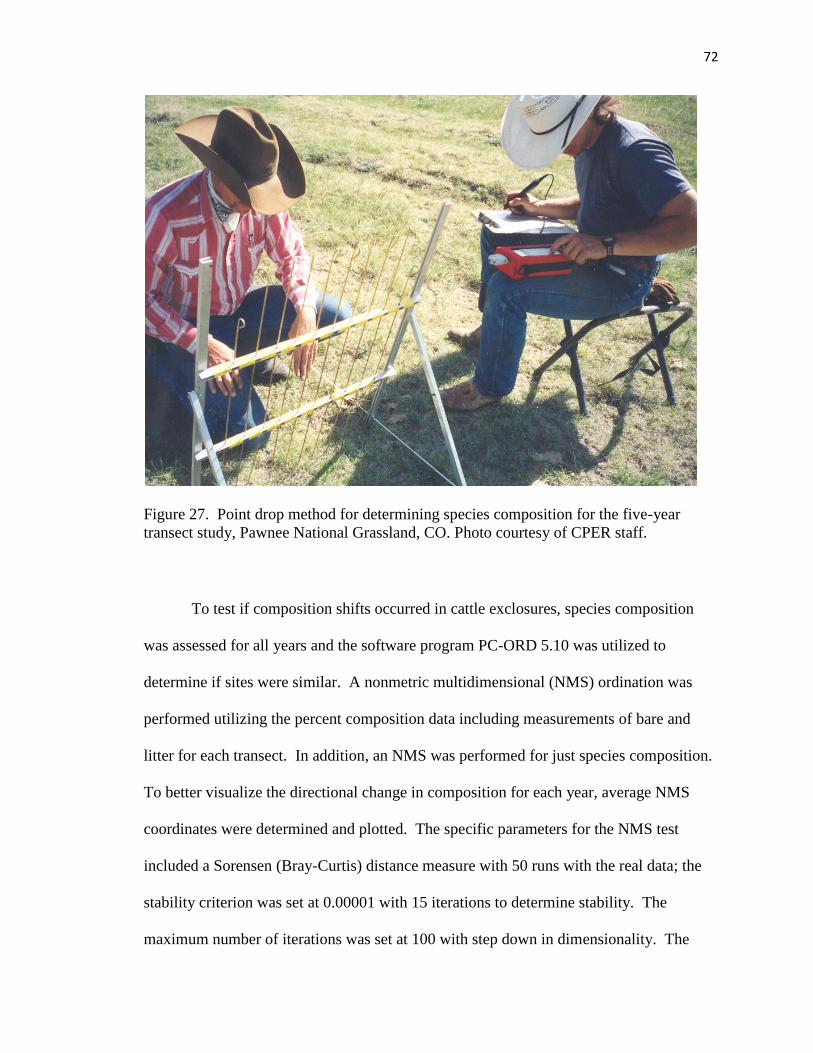
72
Figure 27. Point drop method for determining species composition for the five-year
transect study, Pawnee National Grassland, CO. Photo courtesy of CPER staff.
To test if composition shifts occurred in cattle exclosures, species composition
was assessed for all years and the software program PC-ORD 5.10 was utilized to
determine if sites were similar. A nonmetric multidimensional (NMS) ordination was
performed utilizing the percent composition data including measurements of bare and
litter for each transect. In addition, an NMS was performed for just species composition.
To better visualize the directional change in composition for each year, average NMS
coordinates were determined and plotted. The specific parameters for the NMS test
included a Sorensen (Bray-Curtis) distance measure with 50 runs with the real data; the
stability criterion was set at 0.00001 with 15 iterations to determine stability. The
maximum number of iterations was set at 100 with step down in dimensionality. The
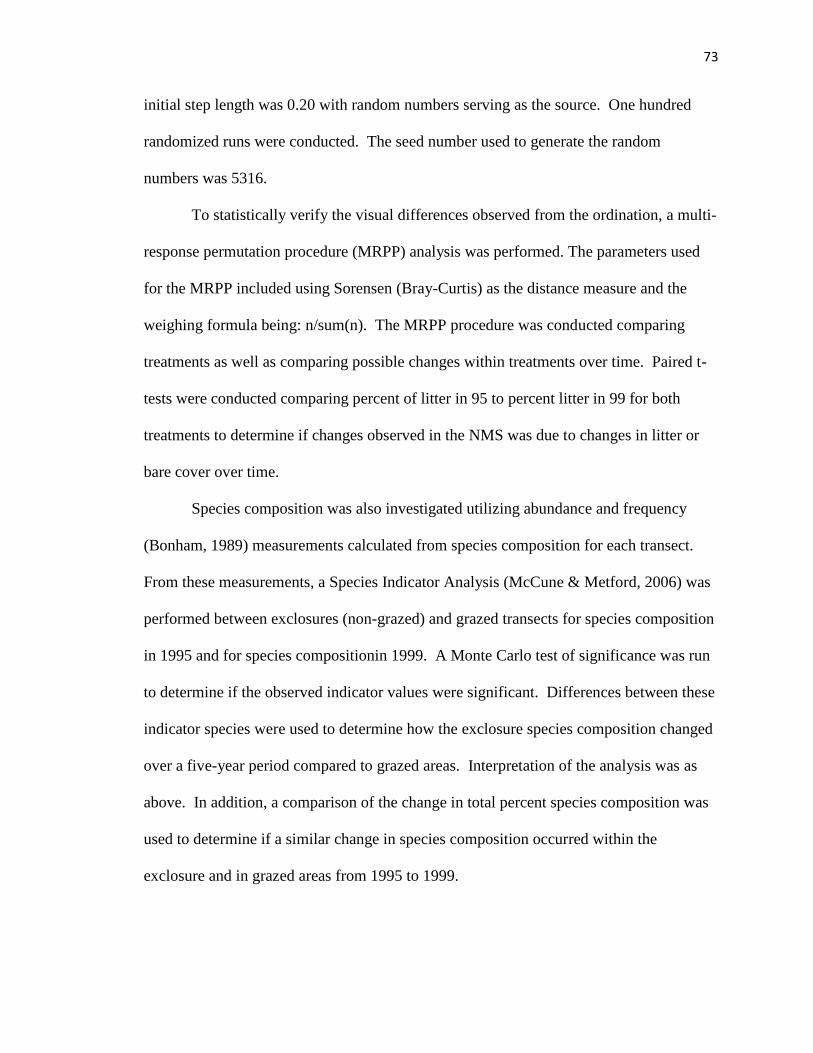
73
initial step length was 0.20 with random numbers serving as the source. One hundred
randomized runs were conducted. The seed number used to generate the random
numbers was 5316.
To statistically verify the visual differences observed from the ordination, a multi-
response permutation procedure (MRPP) analysis was performed. The parameters used
for the MRPP included using Sorensen (Bray-Curtis) as the distance measure and the
weighing formula being: n/sum(n). The MRPP procedure was conducted comparing
treatments as well as comparing possible changes within treatments over time. Paired t-
tests were conducted comparing percent of litter in 95 to percent litter in 99 for both
treatments to determine if changes observed in the NMS was due to changes in litter or
bare cover over time.
Species composition was also investigated utilizing abundance and frequency
(Bonham, 1989) measurements calculated from species composition for each transect.
From these measurements, a Species Indicator Analysis (McCune & Metford, 2006) was
performed between exclosures (non-grazed) and grazed transects for species composition
in 1995 and for species compositionin 1999. A Monte Carlo test of significance was run
to determine if the observed indicator values were significant. Differences between these
indicator species were used to determine how the exclosure species composition changed
over a five-year period compared to grazed areas. Interpretation of the analysis was as
above. In addition, a comparison of the change in total percent species composition was
used to determine if a similar change in species composition occurred within the
exclosure and in grazed areas from 1995 to 1999.
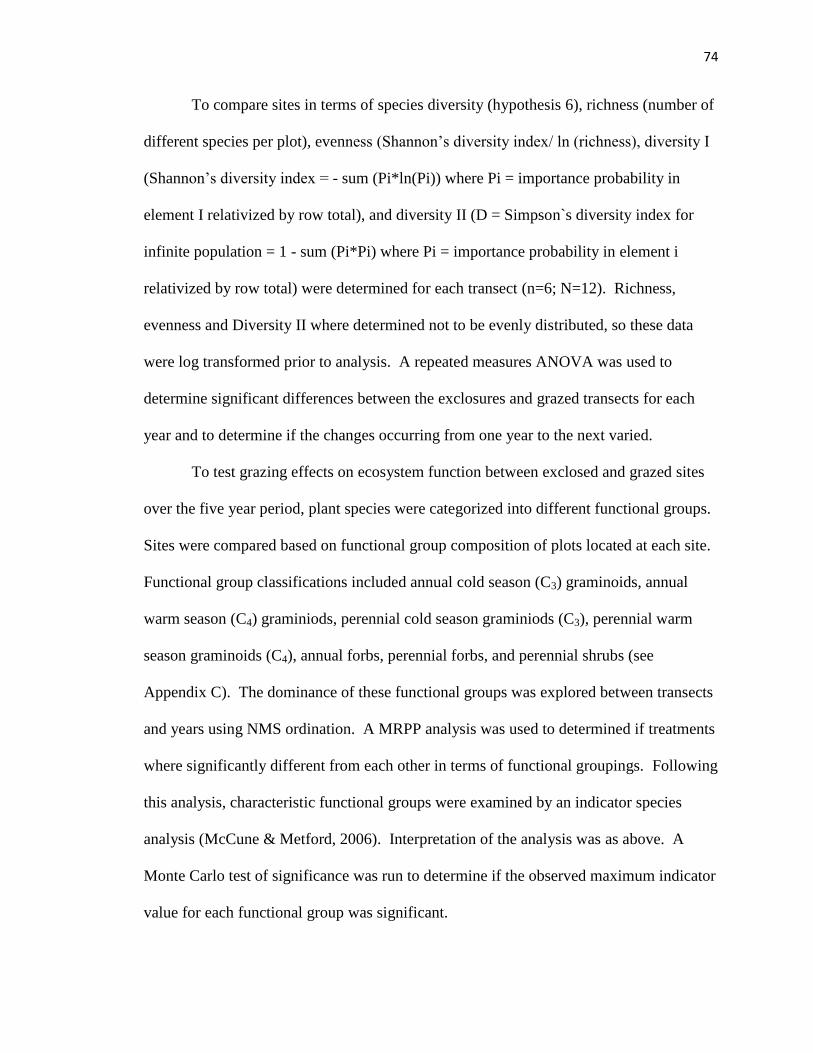
74
To compare sites in terms of species diversity (hypothesis 6), richness (number of
different species per plot), evenness (Shannon’s diversity index/ ln (richness), diversity I
(Shannon’s diversity index = - sum (Pi*ln(Pi)) where Pi = importance probability in
element I relativized by row total), and diversity II (D = Simpson`s diversity index for
infinite population = 1 - sum (Pi*Pi) where Pi = importance probability in element i
relativized by row total) were determined for each transect (n=6; N=12). Richness,
evenness and Diversity II where determined not to be evenly distributed, so these data
were log transformed prior to analysis. A repeated measures ANOVA was used to
determine significant differences between the exclosures and grazed transects for each
year and to determine if the changes occurring from one year to the next varied.
To test grazing effects on ecosystem function between exclosed and grazed sites
over the five year period, plant species were categorized into different functional groups.
Sites were compared based on functional group composition of plots located at each site.
Functional group classifications included annual cold season (C3) graminoids, annual
warm season (C4) graminiods, perennial cold season graminiods (C3), perennial warm
season graminoids (C4), annual forbs, perennial forbs, and perennial shrubs (see
Appendix C). The dominance of these functional groups was explored between transects
and years using NMS ordination. A MRPP analysis was used to determined if treatments
where significantly different from each other in terms of functional groupings. Following
this analysis, characteristic functional groups were examined by an indicator species
analysis (McCune & Metford, 2006). Interpretation of the analysis was as above. A
Monte Carlo test of significance was run to determine if the observed maximum indicator
value for each functional group was significant.
75
Results
One year cessation from
grazing study
Caged vs. grazed plots did not significantly differ from each other in terms of
cover, litter, bare ground or cow dung (Figure 28; MANOVA: F-value = 1.10, p = 0.425).
A Nonmetric multidimensional (NMS) ordination elucidated no species composition
differences between the caged and un-caged plots (Figure 29), and that was support by
the MRPP (T-value = -0.30, p = 0.29, observed delta = 0.722, expected delta = 0.722).
Species diversity, richness and evenness were not significantly different (MANOVA: F-
value = 0.93, p = 0.496).
Figure 28. Average composition of cover including bare, litter and cow dung for areas
excluded from grazing (cage) and areas exposed to grazing (no cage).
76
Figure 29. NMS ordination comparing caged (un-grazed) m
2 plots to uncaged (grazed)
m2
plots, Pawnee National Grassland, CO.
Indicator species analysis only showed one species to be significantly different;
Poa segunda was more prominent in areas excluded from grazing. A few other species
were found either in grazed or non-grazed plots. Grazed plots were characterized by
Bouteloua gracilis, while non-grazed plots were characterized by Equisetum laevigatum
and Kochia scoparia (Table 10).
Significant differences between biomass measurements were identified from the
MANOVA (F = 5.09 p = 0.0014). Specifically, both above ground biomass and
shoot/root ratio were significantly greater (Table 11) in the grazed plots (Figure 30;
Figure 31). Belowground biomass, litter and amount of rocks did not differ between
treatments.
Maximum plant height was significantly greater in the caged plots (T-value = -5.42, p <
0.0001) (Figure 32). Equisetum laevigatum, Hesperostipa comata and Nessella viridula
NMS Ordination Axis 1
-1.5 -1.0 -0.5 0.0 0.5 1.0 1.5 2.0
NM
S O
rdin
atio
n A
xis
2
-1.5
-1.0
-0.5
0.0
0.5
1.0
1.5
Caged
Uncaged
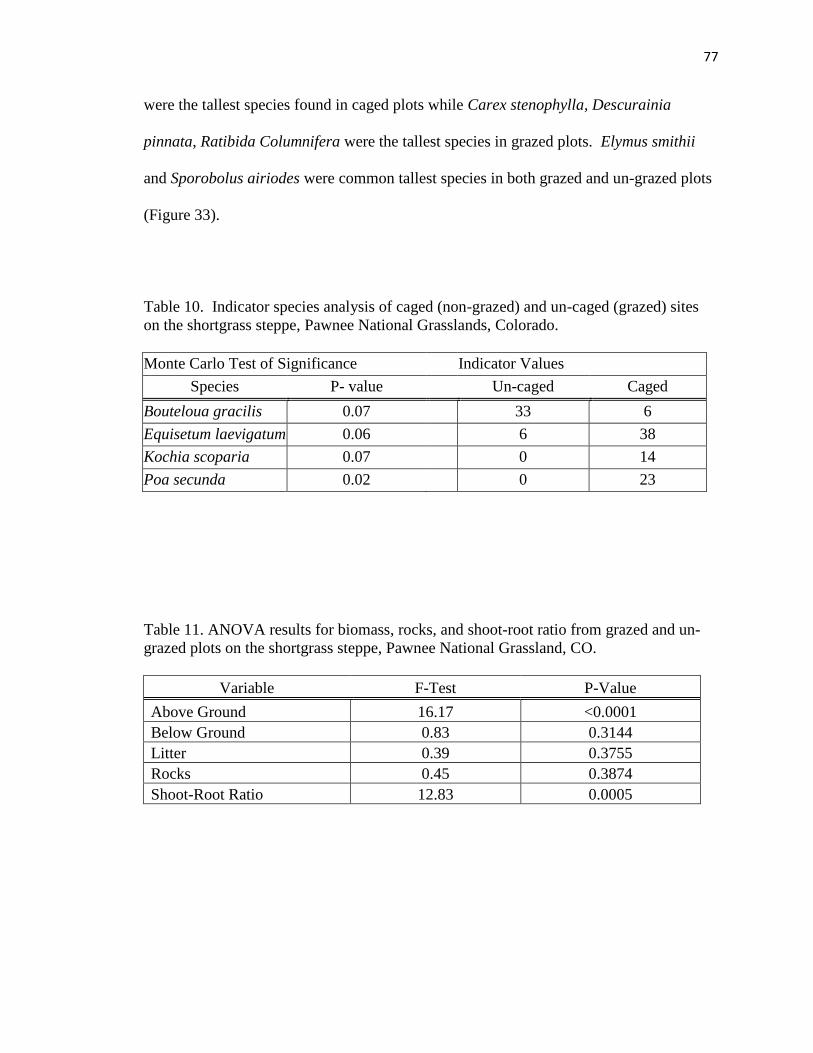
77
were the tallest species found in caged plots while Carex stenophylla, Descurainia
pinnata, Ratibida Columnifera were the tallest species in grazed plots. Elymus smithii
and Sporobolus airiodes were common tallest species in both grazed and un-grazed plots
(Figure 33).
Table 10. Indicator species analysis of caged (non-grazed) and un-caged (grazed) sites
on the shortgrass steppe, Pawnee National Grasslands, Colorado.
Monte Carlo Test of Significance
Indicator Values
Species P- value Un-caged Caged
Bouteloua gracilis 0.07
33 6
Equisetum laevigatum 0.06
6 38
Kochia scoparia 0.07
0 14
Poa secunda 0.02
0 23
Table 11. ANOVA results for biomass, rocks, and shoot-root ratio from grazed and un-
grazed plots on the shortgrass steppe, Pawnee National Grassland, CO.
Variable F-Test P-Value
Above Ground 16.17 <0.0001
Below Ground 0.83 0.3144
Litter 0.39 0.3755
Rocks 0.45 0.3874
Shoot-Root Ratio 12.83 0.0005
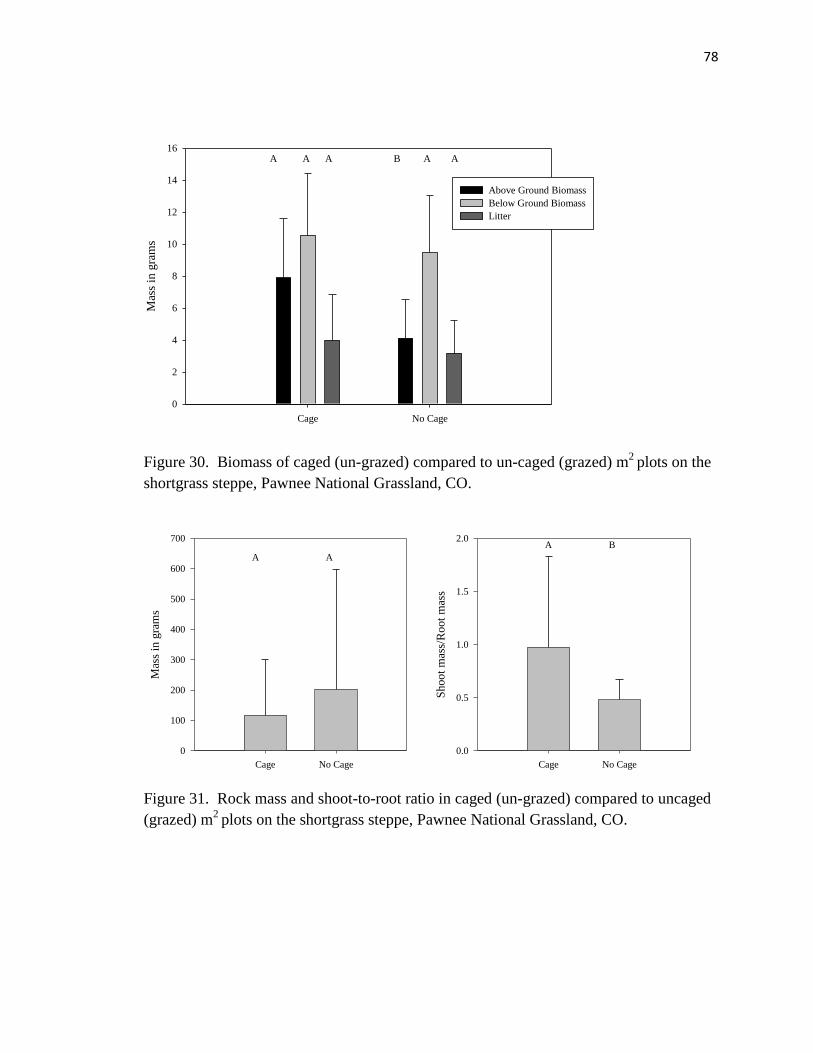
78
Figure 30. Biomass of caged (un-grazed) compared to un-caged (grazed) m
2 plots on the
shortgrass steppe, Pawnee National Grassland, CO.
Figure 31. Rock mass and shoot-to-root ratio in caged (un-grazed) compared to uncaged
(grazed) m2
plots on the shortgrass steppe, Pawnee National Grassland, CO.
Cage No Cage
Mas
s in
gra
ms
0
2
4
6
8
10
12
14
16
Above Ground Biomass
Below Ground Biomass
Litter
A A A B A A
Cage No Cage
Mas
s in
gra
ms
0
100
200
300
400
500
600
700
Cage No Cage
Shoot
mas
s/R
oot
mas
s
0.0
0.5
1.0
1.5
2.0
A A
A B
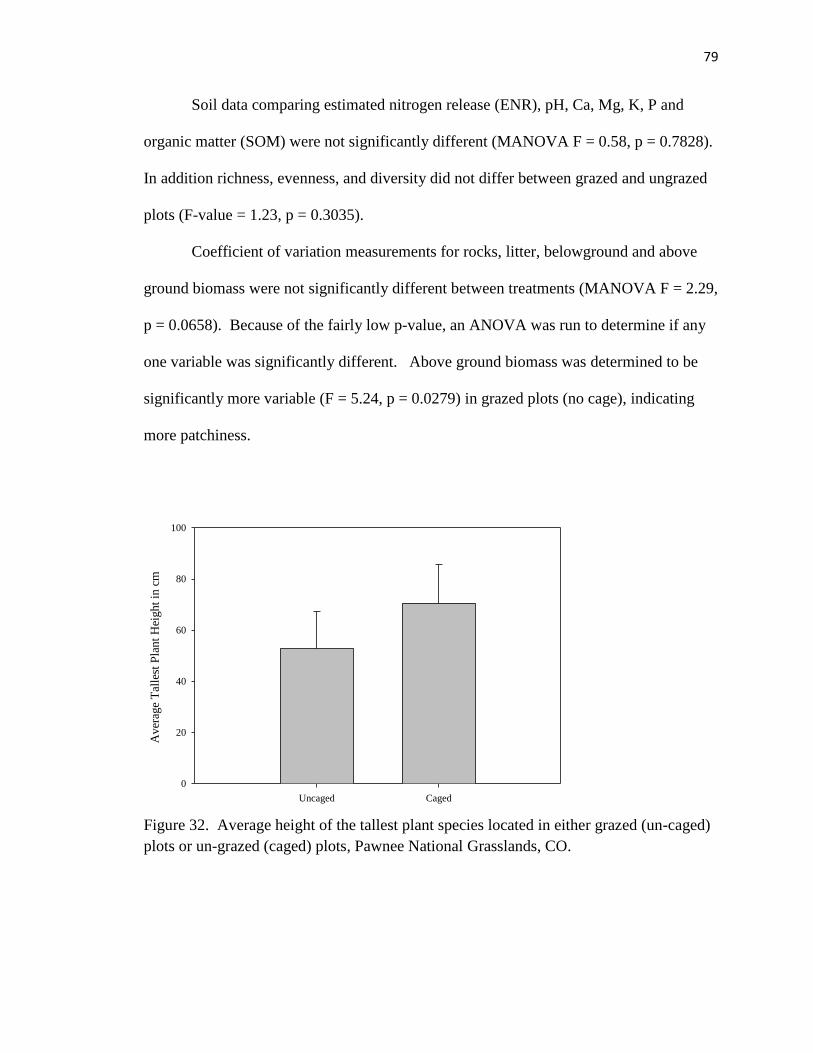
79
Soil data comparing estimated nitrogen release (ENR), pH, Ca, Mg, K, P and
organic matter (SOM) were not significantly different (MANOVA F = 0.58, p = 0.7828).
In addition richness, evenness, and diversity did not differ between grazed and ungrazed
plots (F-value = 1.23, p = 0.3035).
Coefficient of variation measurements for rocks, litter, belowground and above
ground biomass were not significantly different between treatments (MANOVA F = 2.29,
p = 0.0658). Because of the fairly low p-value, an ANOVA was run to determine if any
one variable was significantly different. Above ground biomass was determined to be
significantly more variable (F = 5.24, p = 0.0279) in grazed plots (no cage), indicating
more patchiness.
Figure 32. Average height of the tallest plant species located in either grazed (un-caged)
plots or un-grazed (caged) plots, Pawnee National Grasslands, CO.
Uncaged Caged
Aver
age
Tal
lest
Pla
nt
Hei
ght
in c
m
0
20
40
60
80
100
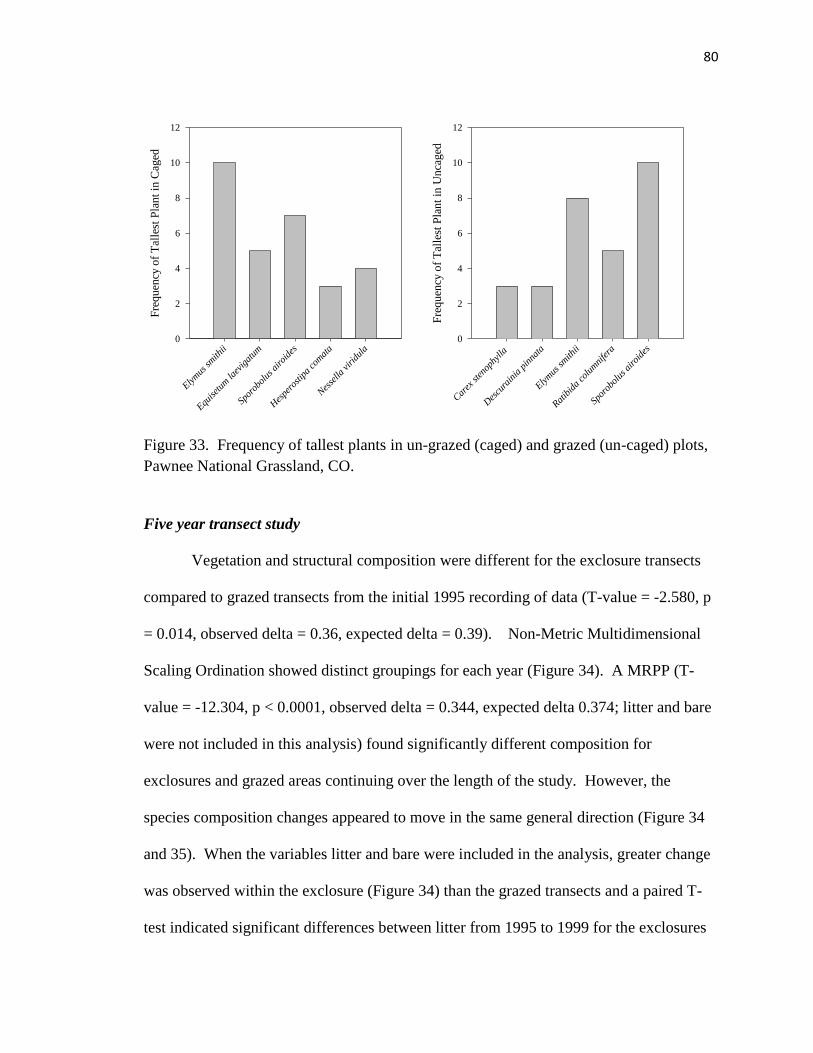
80
Figure 33. Frequency of tallest plants in un-grazed (caged) and grazed (un-caged) plots,
Pawnee National Grassland, CO.
Five year transect study
Vegetation and structural composition were different for the exclosure transects
compared to grazed transects from the initial 1995 recording of data (T-value = -2.580, p
= 0.014, observed delta = 0.36, expected delta = 0.39). Non-Metric Multidimensional
Scaling Ordination showed distinct groupings for each year (Figure 34). A MRPP (T-
value = -12.304, p < 0.0001, observed delta = 0.344, expected delta 0.374; litter and bare
were not included in this analysis) found significantly different composition for
exclosures and grazed areas continuing over the length of the study. However, the
species composition changes appeared to move in the same general direction (Figure 34
and 35). When the variables litter and bare were included in the analysis, greater change
was observed within the exclosure (Figure 34) than the grazed transects and a paired T-
test indicated significant differences between litter from 1995 to 1999 for the exclosures
Elym
us sm
ithii
Equiset
um la
evig
atum
Spor
obol
us a
iroi
des
Hes
pero
stip
a co
mat
a
Nes
sella
virid
ula
Fre
quen
cy o
f T
alle
st P
lant
in C
aged
0
2
4
6
8
10
12
Car
ex st
enop
hylla
Des
cura
inia
pin
nata
Elym
us sm
ithii
Ratib
ida
colu
mni
fera
Spor
obol
us a
iroi
des
Fre
quen
cy o
f T
alle
st P
lant
in U
nca
ged
0
2
4
6
8
10
12
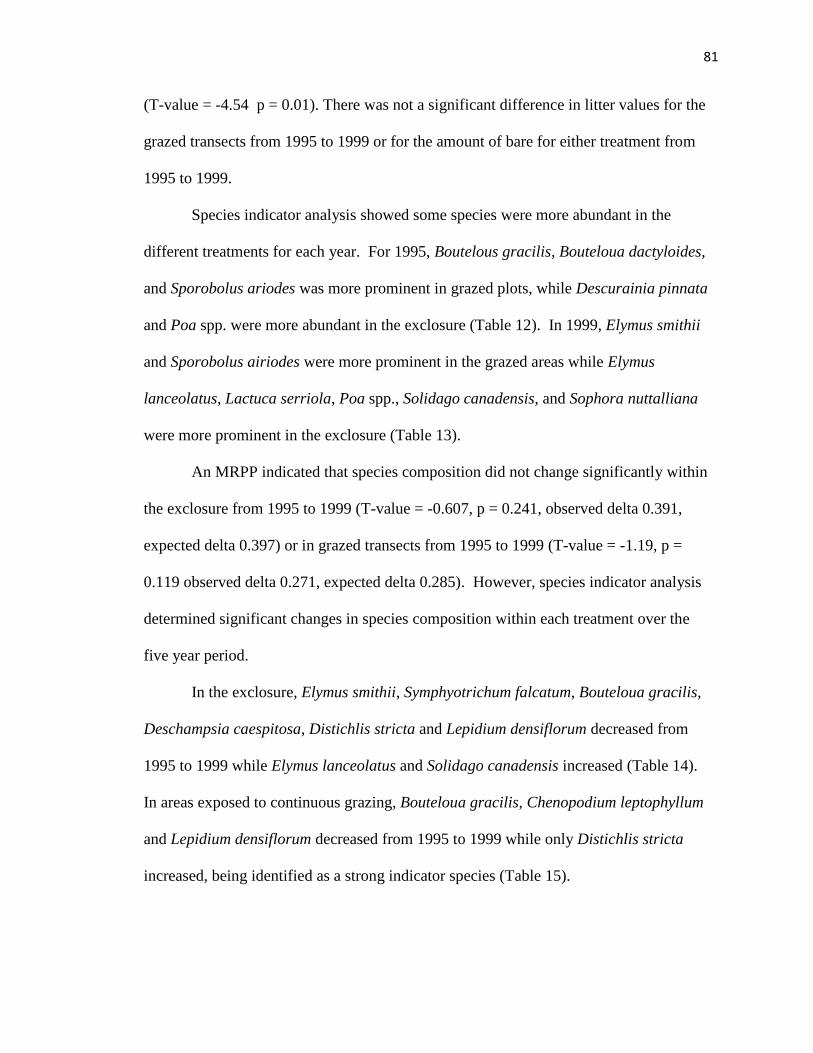
81
(T-value = -4.54 p = 0.01). There was not a significant difference in litter values for the
grazed transects from 1995 to 1999 or for the amount of bare for either treatment from
1995 to 1999.
Species indicator analysis showed some species were more abundant in the
different treatments for each year. For 1995, Boutelous gracilis, Bouteloua dactyloides,
and Sporobolus ariodes was more prominent in grazed plots, while Descurainia pinnata
and Poa spp. were more abundant in the exclosure (Table 12). In 1999, Elymus smithii
and Sporobolus airiodes were more prominent in the grazed areas while Elymus
lanceolatus, Lactuca serriola, Poa spp., Solidago canadensis, and Sophora nuttalliana
were more prominent in the exclosure (Table 13).
An MRPP indicated that species composition did not change significantly within
the exclosure from 1995 to 1999 (T-value = -0.607, p = 0.241, observed delta 0.391,
expected delta 0.397) or in grazed transects from 1995 to 1999 (T-value = -1.19, p =
0.119 observed delta 0.271, expected delta 0.285). However, species indicator analysis
determined significant changes in species composition within each treatment over the
five year period.
In the exclosure, Elymus smithii, Symphyotrichum falcatum, Bouteloua gracilis,
Deschampsia caespitosa, Distichlis stricta and Lepidium densiflorum decreased from
1995 to 1999 while Elymus lanceolatus and Solidago canadensis increased (Table 14).
In areas exposed to continuous grazing, Bouteloua gracilis, Chenopodium leptophyllum
and Lepidium densiflorum decreased from 1995 to 1999 while only Distichlis stricta
increased, being identified as a strong indicator species (Table 15).
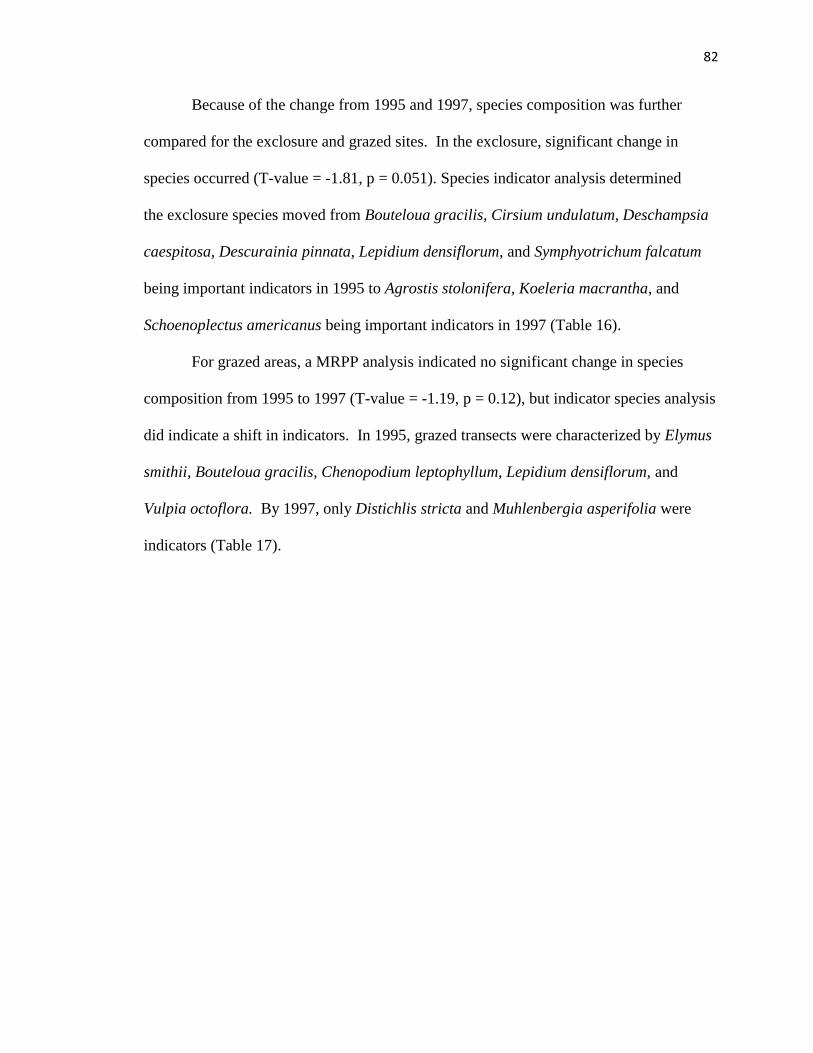
82
Because of the change from 1995 and 1997, species composition was further
compared for the exclosure and grazed sites. In the exclosure, significant change in
species occurred (T-value = -1.81, p = 0.051). Species indicator analysis determined
the exclosure species moved from Bouteloua gracilis, Cirsium undulatum, Deschampsia
caespitosa, Descurainia pinnata, Lepidium densiflorum, and Symphyotrichum falcatum
being important indicators in 1995 to Agrostis stolonifera, Koeleria macrantha, and
Schoenoplectus americanus being important indicators in 1997 (Table 16).
For grazed areas, a MRPP analysis indicated no significant change in species
composition from 1995 to 1997 (T-value = -1.19, p = 0.12), but indicator species analysis
did indicate a shift in indicators. In 1995, grazed transects were characterized by Elymus
smithii, Bouteloua gracilis, Chenopodium leptophyllum, Lepidium densiflorum, and
Vulpia octoflora. By 1997, only Distichlis stricta and Muhlenbergia asperifolia were
indicators (Table 17).
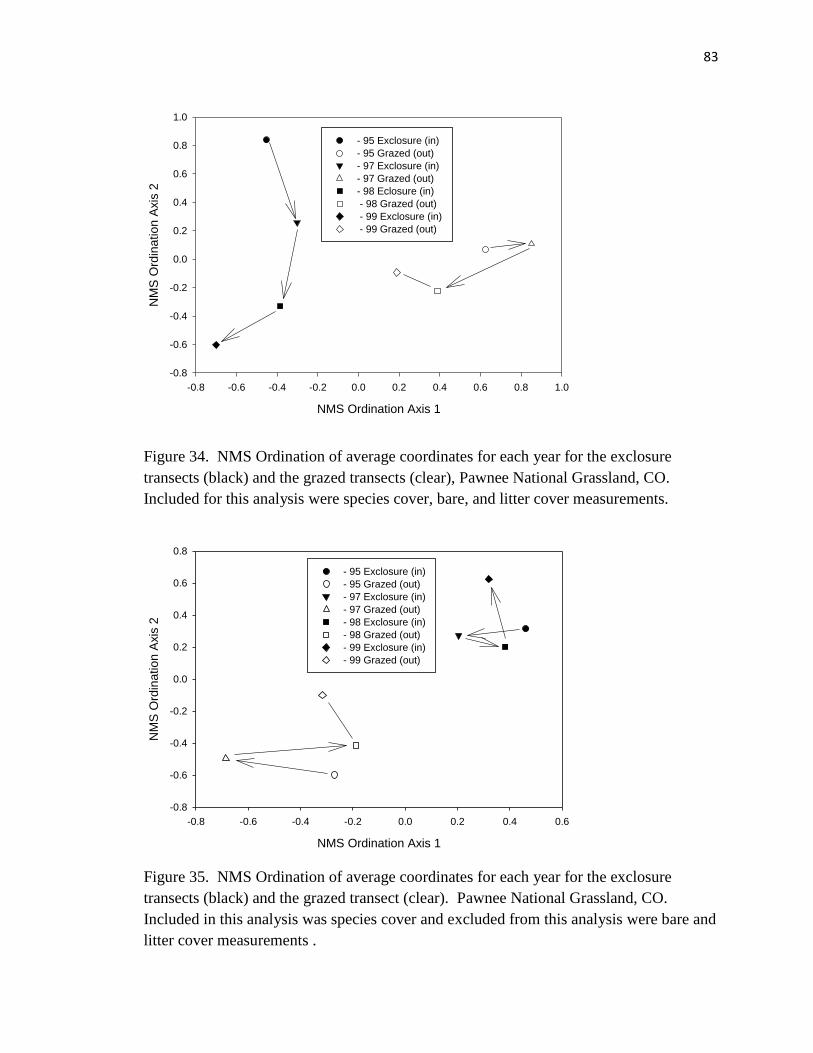
83
Figure 34. NMS Ordination of average coordinates for each year for the exclosure
transects (black) and the grazed transects (clear), Pawnee National Grassland, CO.
Included for this analysis were species cover, bare, and litter cover measurements.
Figure 35. NMS Ordination of average coordinates for each year for the exclosure
transects (black) and the grazed transect (clear). Pawnee National Grassland, CO.
Included in this analysis was species cover and excluded from this analysis were bare and
litter cover measurements .
NMS Ordination Axis 1
-0.8 -0.6 -0.4 -0.2 0.0 0.2 0.4 0.6 0.8 1.0
NM
S O
rdin
atio
n A
xis
2
-0.8
-0.6
-0.4
-0.2
0.0
0.2
0.4
0.6
0.8
1.0
- 95 Exclosure (in)
- 95 Grazed (out)
- 97 Exclosure (in)
- 97 Grazed (out)
- 98 Eclosure (in)
- 98 Grazed (out)
- 99 Exclosure (in)
- 99 Grazed (out)
NMS Ordination Axis 1
-0.8 -0.6 -0.4 -0.2 0.0 0.2 0.4 0.6
NM
S O
rdin
atio
n A
xis
2
-0.8
-0.6
-0.4
-0.2
0.0
0.2
0.4
0.6
0.8
- 95 Exclosure (in)
- 95 Grazed (out)
- 97 Exclosure (in)
- 97 Grazed (out)
- 98 Exclosure (in)
- 98 Grazed (out)
- 99 Exclosure (in)
- 99 Grazed (out)
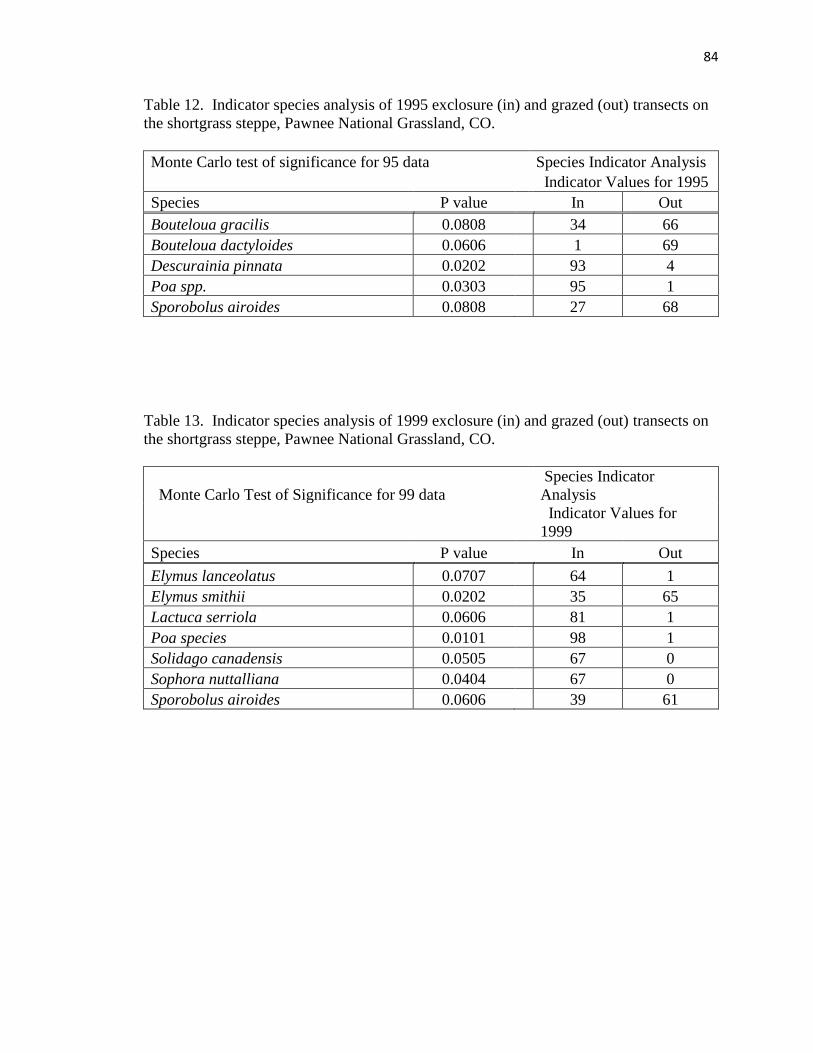
84
Table 12. Indicator species analysis of 1995 exclosure (in) and grazed (out) transects on
the shortgrass steppe, Pawnee National Grassland, CO.
Monte Carlo test of significance for 95 data Species Indicator Analysis
Indicator Values for 1995
Species P value In Out
Bouteloua gracilis 0.0808
34 66
Bouteloua dactyloides 0.0606
1 69
Descurainia pinnata 0.0202
93 4
Poa spp. 0.0303
95 1
Sporobolus airoides 0.0808
27 68
Table 13. Indicator species analysis of 1999 exclosure (in) and grazed (out) transects on
the shortgrass steppe, Pawnee National Grassland, CO.
Monte Carlo Test of Significance for 99 data
Species Indicator
Analysis
Indicator Values for
1999
Species P value In Out
Elymus lanceolatus 0.0707
64 1
Elymus smithii 0.0202
35 65
Lactuca serriola 0.0606
81 1
Poa species 0.0101
98 1
Solidago canadensis 0.0505
67 0
Sophora nuttalliana 0.0404
67 0
Sporobolus airoides 0.0606
39 61
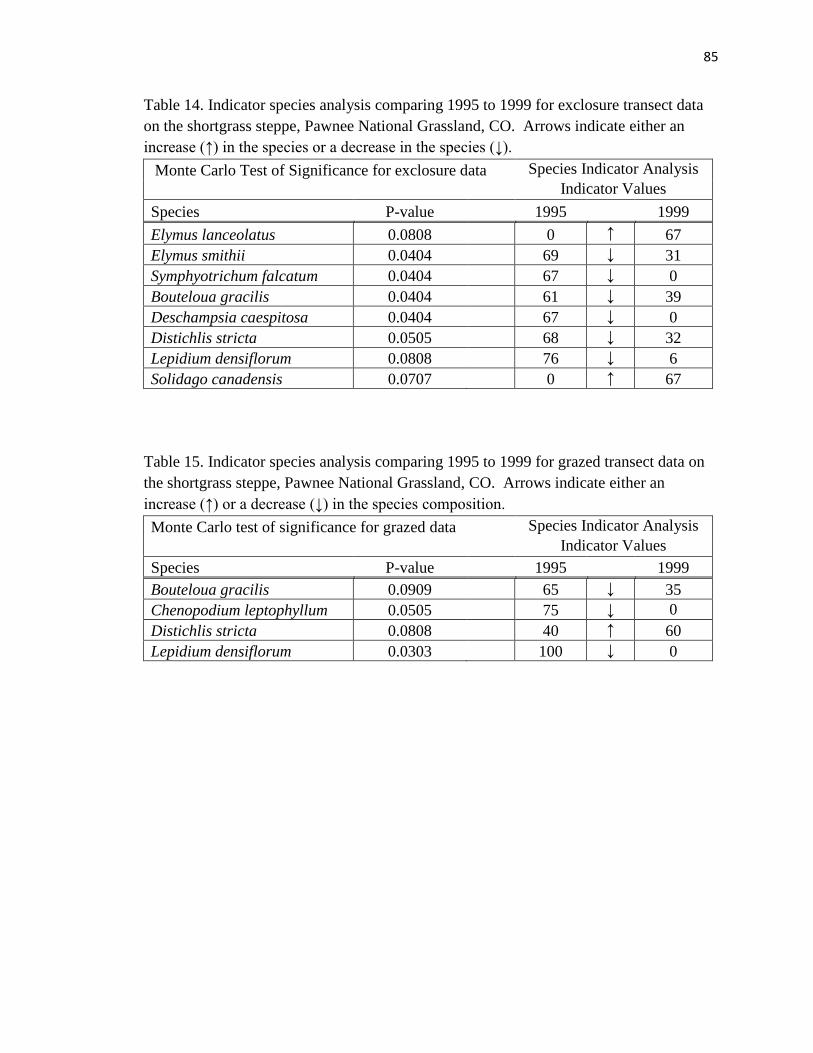
85
Table 14. Indicator species analysis comparing 1995 to 1999 for exclosure transect data
on the shortgrass steppe, Pawnee National Grassland, CO. Arrows indicate either an
increase (↑) in the species or a decrease in the species (↓).
Monte Carlo Test of Significance for exclosure data Species Indicator Analysis
Indicator Values
Species P-value 1995 1999
Elymus lanceolatus 0.0808
0 ↑ 67
Elymus smithii 0.0404
69 ↓ 31
Symphyotrichum falcatum 0.0404
67 ↓ 0
Bouteloua gracilis 0.0404
61 ↓ 39
Deschampsia caespitosa 0.0404
67 ↓ 0
Distichlis stricta 0.0505
68 ↓ 32
Lepidium densiflorum 0.0808
76 ↓ 6
Solidago canadensis 0.0707
0 ↑ 67
Table 15. Indicator species analysis comparing 1995 to 1999 for grazed transect data on
the shortgrass steppe, Pawnee National Grassland, CO. Arrows indicate either an
increase (↑) or a decrease (↓) in the species composition.
Monte Carlo test of significance for grazed data Species Indicator Analysis
Indicator Values
Species P-value 1995 1999
Bouteloua gracilis 0.0909
65 ↓ 35
Chenopodium leptophyllum 0.0505
75 ↓ 0
Distichlis stricta 0.0808
40 ↑ 60
Lepidium densiflorum 0.0303
100 ↓ 0
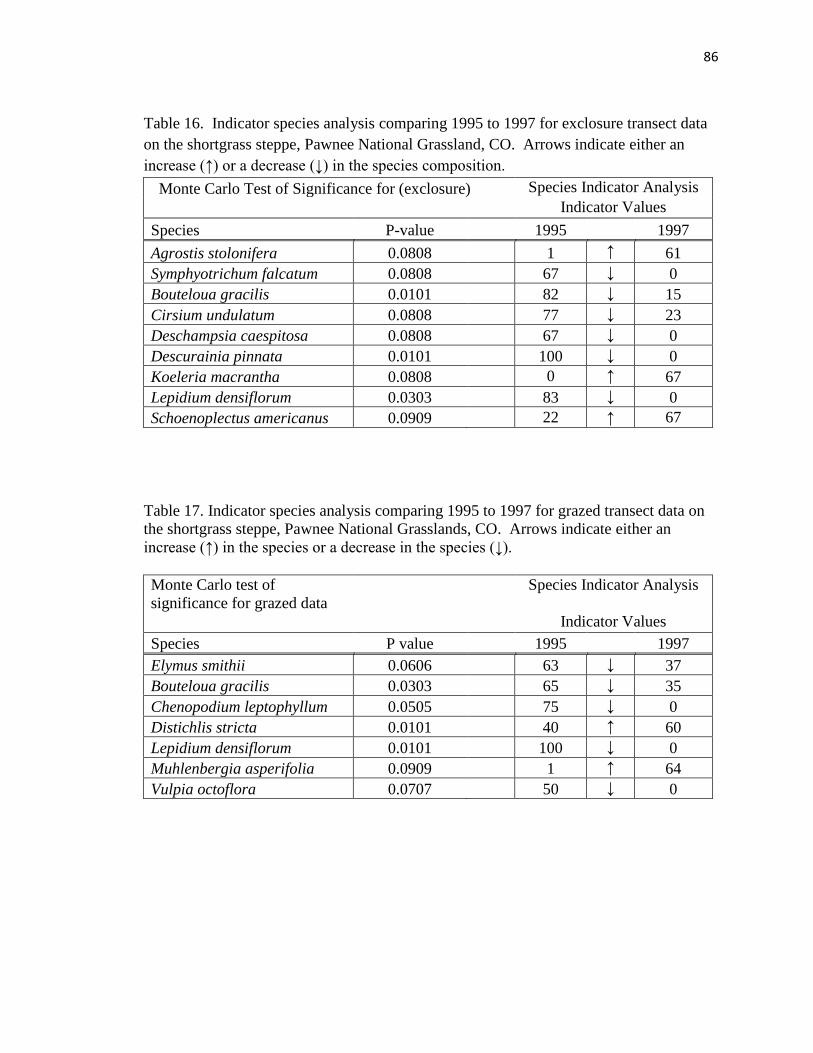
86
Table 16. Indicator species analysis comparing 1995 to 1997 for exclosure transect data
on the shortgrass steppe, Pawnee National Grassland, CO. Arrows indicate either an
increase (↑) or a decrease (↓) in the species composition.
Monte Carlo Test of Significance for (exclosure) Species Indicator Analysis
Indicator Values
Species P-value 1995 1997
Agrostis stolonifera 0.0808
1 ↑ 61
Symphyotrichum falcatum 0.0808
67 ↓ 0
Bouteloua gracilis 0.0101
82 ↓ 15
Cirsium undulatum 0.0808
77 ↓ 23
Deschampsia caespitosa 0.0808
67 ↓ 0
Descurainia pinnata 0.0101
100 ↓ 0
Koeleria macrantha 0.0808
0 ↑ 67
Lepidium densiflorum 0.0303
83 ↓ 0
Schoenoplectus americanus 0.0909
22 ↑ 67
Table 17. Indicator species analysis comparing 1995 to 1997 for grazed transect data on
the shortgrass steppe, Pawnee National Grasslands, CO. Arrows indicate either an
increase (↑) in the species or a decrease in the species (↓).
Monte Carlo test of
significance for grazed data
Species Indicator Analysis
Indicator Values
Species P value 1995 1997
Elymus smithii 0.0606
63 ↓ 37
Bouteloua gracilis 0.0303
65 ↓ 35
Chenopodium leptophyllum 0.0505
75 ↓ 0
Distichlis stricta 0.0101
40 ↑ 60
Lepidium densiflorum 0.0101
100 ↓ 0
Muhlenbergia asperifolia 0.0909
1 ↑ 64
Vulpia octoflora 0.0707
50 ↓ 0
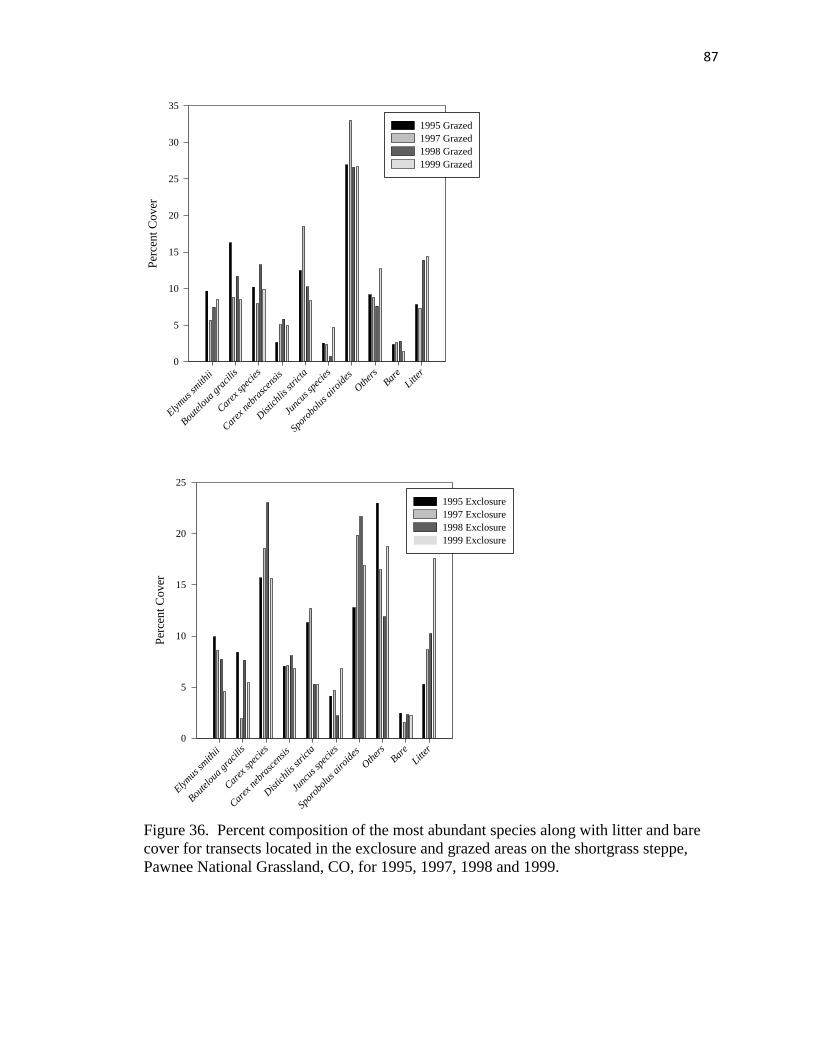
87
Figure 36. Percent composition of the most abundant species along with litter and bare
cover for transects located in the exclosure and grazed areas on the shortgrass steppe,
Pawnee National Grassland, CO, for 1995, 1997, 1998 and 1999.
Elym
us sm
ithii
Boute
loua
gra
cilis
Car
ex sp
ecie
s
Car
ex n
ebra
scen
sis
Distic
hlis st
rict
a
Junc
us sp
ecie
s
Spor
obol
us a
iroi
des
Oth
ers
Bare
Litter
Per
cent
Cover
0
5
10
15
20
25
30
35
1995 Grazed
1997 Grazed
1998 Grazed
1999 Grazed
Elym
us sm
ithii
Boute
loua
gra
cilis
Car
ex sp
ecie
s
Car
ex n
ebra
scen
sis
Distic
hlis st
rict
a
Junc
us sp
ecie
s
Spor
obol
us a
iroi
des
Oth
ers
Bare
Litter
Per
cent
Cover
0
5
10
15
20
25
1995 Exclosure
1997 Exclosure
1998 Exclosure
1999 Exclosure
88
In the exclosure, a continuous increase in litter and a decrease in Elymus smithii
were observed from 1995 to 1999. For the grazed trasects, an increase in Elymus smithii
was observed after 1997 as well as a decrease in Distichilis stricta (Figure 36).
No significant difference was observed in richness between the exclosures and the
grazed areas for any of the years but change from year to year was significant for both
treatments (F-value = 67.72, p < 0.0001) with a general decreasing trend over the first
four years of the study and a significant increase occurring from 1998 to 1999 (F-value =
38.73, p = 0.0003). Evenness was only significantly different in 1995 with the exclosure
having greater evenness (F-value = 7.55, p = 0.025), but it did not significantly change
from one year to the next (F-value = 3.47, p = 0.091), although a general trend of
decreased evenness occurred in the exclosure and an increase in evenness occurred in the
grazed transects. Both the Simpson’s diversity index (F-value = 6.82, p = 0.031) and
Shannon’s diversity index (F-value = -6.25, p = 0.037) showed a significance difference
for 1995; the exclosure had greater diversity. Diversity did change significantly over
time for both indices (Shannon’s, F-value = 24.78, p = 0.0009; Simpson’s, F-value =
16.89, p = 0.0025) with a gradual decline in diversity for the first four years and a
significant increase in diversity from 1998 to 1999 within both treatments (Shannon’s, F-
value = 49.06, p < 0.0001; Simpson’s, F-value = 21.72, p = 0.0016)(Figure 37).
No divergences between the exclosure and grazed areas were seen for richness,
evenness, Shannon’s diversity index or Simpson’s diversity index over time. The
changes observed followed similar patterns for grazed and non-grazed transects.
NMS ordination showed functional composition changes over time (Figure 38).
Generally, from 1997 on this change was in the same direction for both grazed and
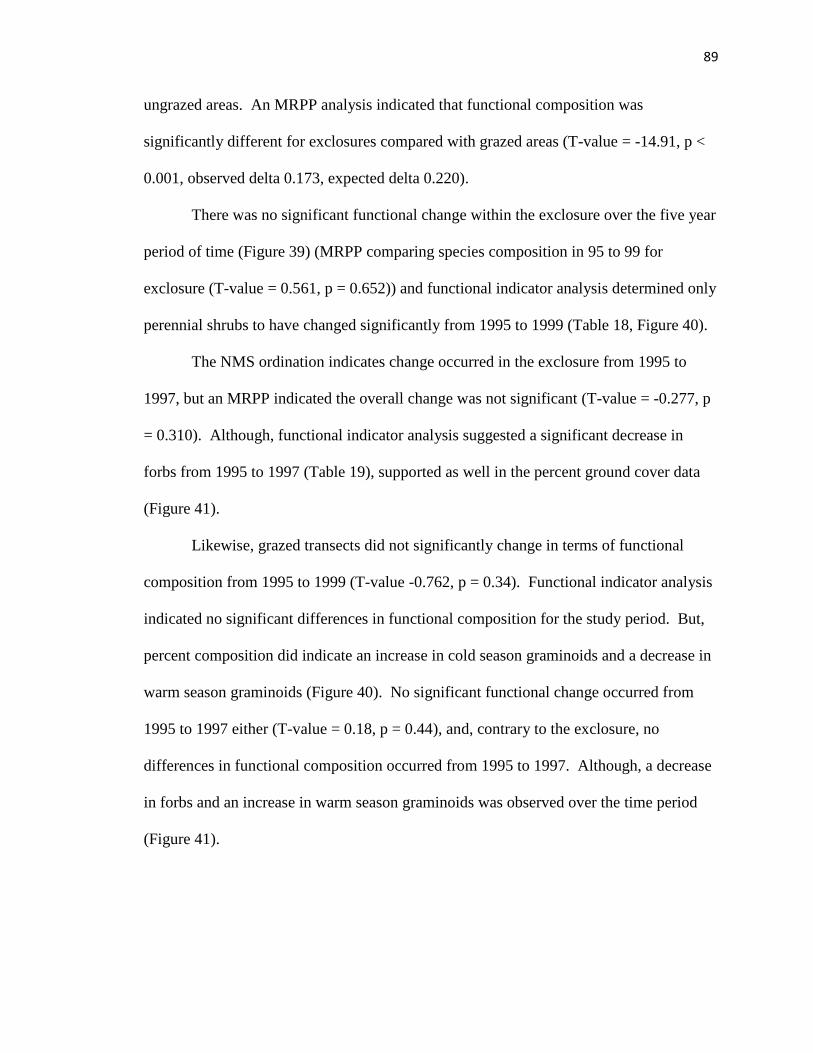
89
ungrazed areas. An MRPP analysis indicated that functional composition was
significantly different for exclosures compared with grazed areas (T-value = -14.91, p <
0.001, observed delta 0.173, expected delta 0.220).
There was no significant functional change within the exclosure over the five year
period of time (Figure 39) (MRPP comparing species composition in 95 to 99 for
exclosure (T-value = 0.561, p = 0.652)) and functional indicator analysis determined only
perennial shrubs to have changed significantly from 1995 to 1999 (Table 18, Figure 40).
The NMS ordination indicates change occurred in the exclosure from 1995 to
1997, but an MRPP indicated the overall change was not significant (T-value = -0.277, p
= 0.310). Although, functional indicator analysis suggested a significant decrease in
forbs from 1995 to 1997 (Table 19), supported as well in the percent ground cover data
(Figure 41).
Likewise, grazed transects did not significantly change in terms of functional
composition from 1995 to 1999 (T-value -0.762, p = 0.34). Functional indicator analysis
indicated no significant differences in functional composition for the study period. But,
percent composition did indicate an increase in cold season graminoids and a decrease in
warm season graminoids (Figure 40). No significant functional change occurred from
1995 to 1997 either (T-value = 0.18, p = 0.44), and, contrary to the exclosure, no
differences in functional composition occurred from 1995 to 1997. Although, a decrease
in forbs and an increase in warm season graminoids was observed over the time period
(Figure 41).
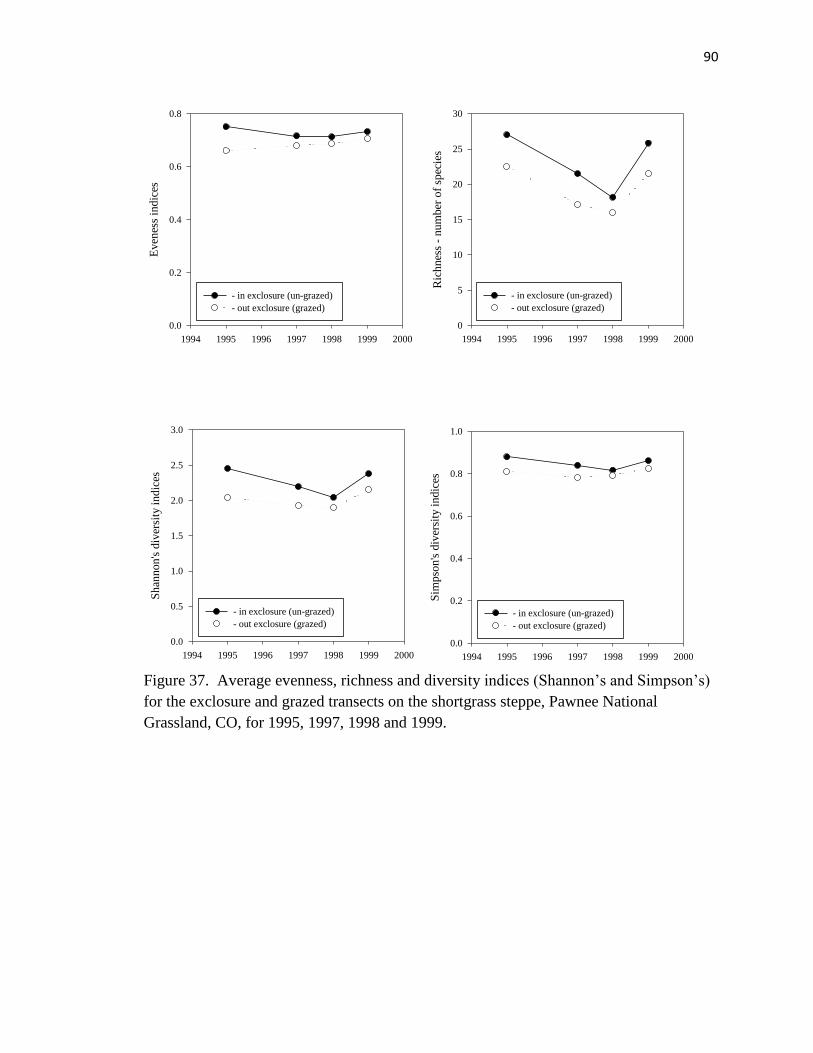
90
Figure 37. Average evenness, richness and diversity indices (Shannon’s and Simpson’s)
for the exclosure and grazed transects on the shortgrass steppe, Pawnee National
Grassland, CO, for 1995, 1997, 1998 and 1999.
1994 1995 1996 1997 1998 1999 2000
Shan
non's
div
ersi
ty i
ndic
es
0.0
0.5
1.0
1.5
2.0
2.5
3.0
- in exclosure (un-grazed)
- out exclosure (grazed)
1994 1995 1996 1997 1998 1999 2000
Ric
hnes
s -
num
ber
of
spec
ies
0
5
10
15
20
25
30
- in exclosure (un-grazed)
- out exclosure (grazed)
1994 1995 1996 1997 1998 1999 2000
Sim
pso
n's
div
ersi
ty i
ndic
es
0.0
0.2
0.4
0.6
0.8
1.0
- in exclosure (un-grazed)
- out exclosure (grazed)
1994 1995 1996 1997 1998 1999 2000
Even
ess
indic
es
0.0
0.2
0.4
0.6
0.8
- in exclosure (un-grazed)
- out exclosure (grazed)
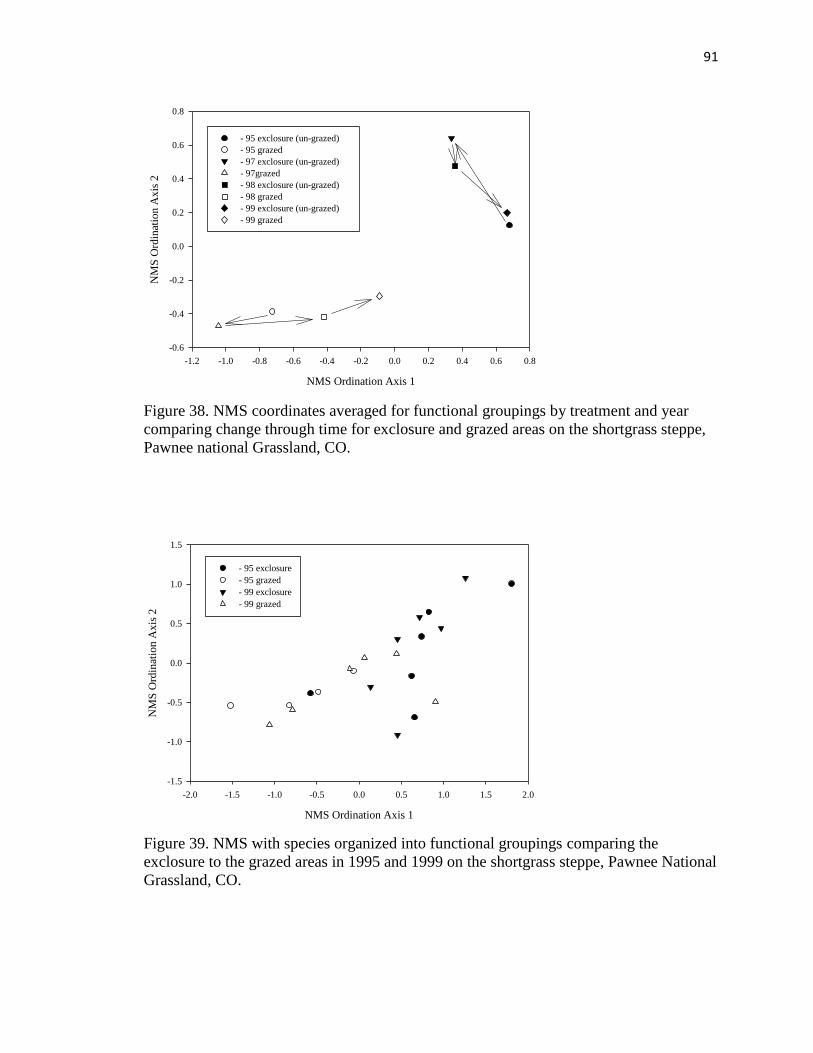
91
Figure 38. NMS coordinates averaged for functional groupings by treatment and year
comparing change through time for exclosure and grazed areas on the shortgrass steppe,
Pawnee national Grassland, CO.
Figure 39. NMS with species organized into functional groupings comparing the
exclosure to the grazed areas in 1995 and 1999 on the shortgrass steppe, Pawnee National
Grassland, CO.
NMS Ordination Axis 1
-1.2 -1.0 -0.8 -0.6 -0.4 -0.2 0.0 0.2 0.4 0.6 0.8
NM
S O
rdin
atio
n A
xis
2
-0.6
-0.4
-0.2
0.0
0.2
0.4
0.6
0.8
- 95 exclosure (un-grazed)
- 95 grazed
- 97 exclosure (un-grazed)
- 97grazed
- 98 exclosure (un-grazed)
- 98 grazed
- 99 exclosure (un-grazed)
- 99 grazed
NMS Ordination Axis 1
-2.0 -1.5 -1.0 -0.5 0.0 0.5 1.0 1.5 2.0
NM
S O
rdin
atio
n A
xis
2
-1.5
-1.0
-0.5
0.0
0.5
1.0
1.5
- 95 exclosure
- 95 grazed
- 99 exclosure
- 99 grazed
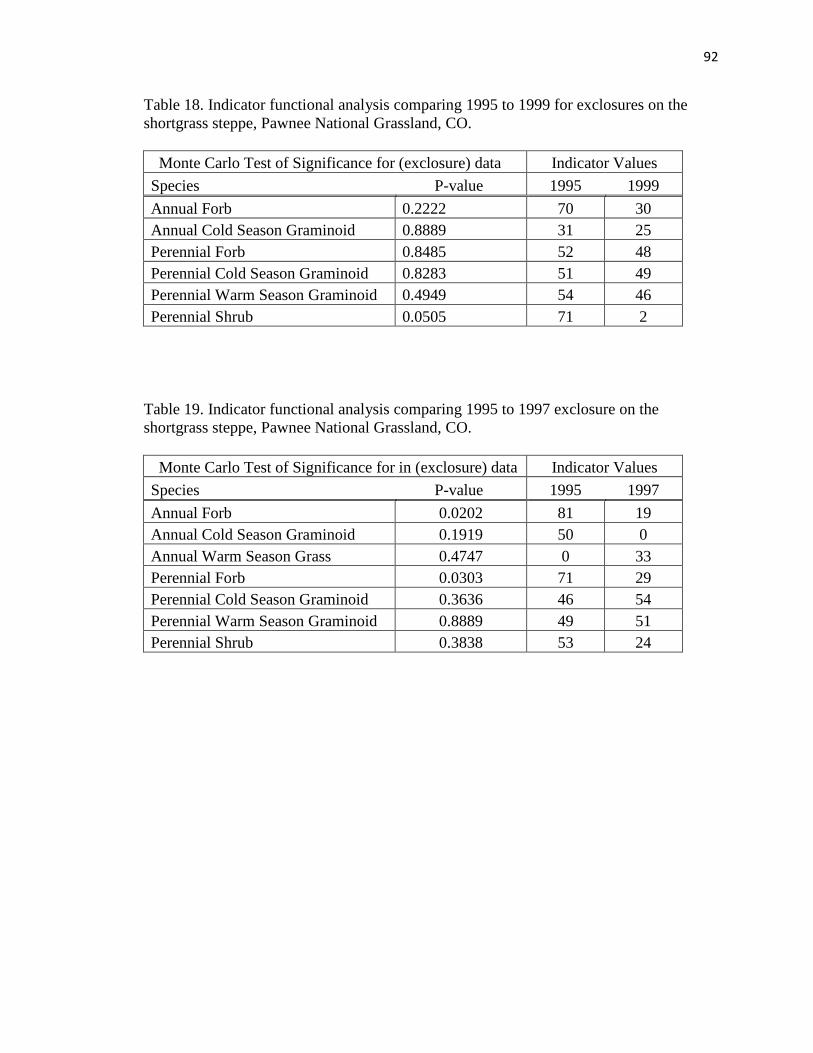
92
Table 18. Indicator functional analysis comparing 1995 to 1999 for exclosures on the
shortgrass steppe, Pawnee National Grassland, CO.
Monte Carlo Test of Significance for (exclosure) data Indicator Values
Species P-value 1995 1999
Annual Forb 0.2222 70 30
Annual Cold Season Graminoid 0.8889 31 25
Perennial Forb 0.8485 52 48
Perennial Cold Season Graminoid 0.8283 51 49
Perennial Warm Season Graminoid 0.4949 54 46
Perennial Shrub 0.0505 71 2
Table 19. Indicator functional analysis comparing 1995 to 1997 exclosure on the
shortgrass steppe, Pawnee National Grassland, CO.
Monte Carlo Test of Significance for in (exclosure) data Indicator Values
Species P-value 1995 1997
Annual Forb 0.0202 81 19
Annual Cold Season Graminoid 0.1919 50 0
Annual Warm Season Grass 0.4747 0 33
Perennial Forb 0.0303 71 29
Perennial Cold Season Graminoid 0.3636 46 54
Perennial Warm Season Graminoid 0.8889 49 51
Perennial Shrub 0.3838 53 24
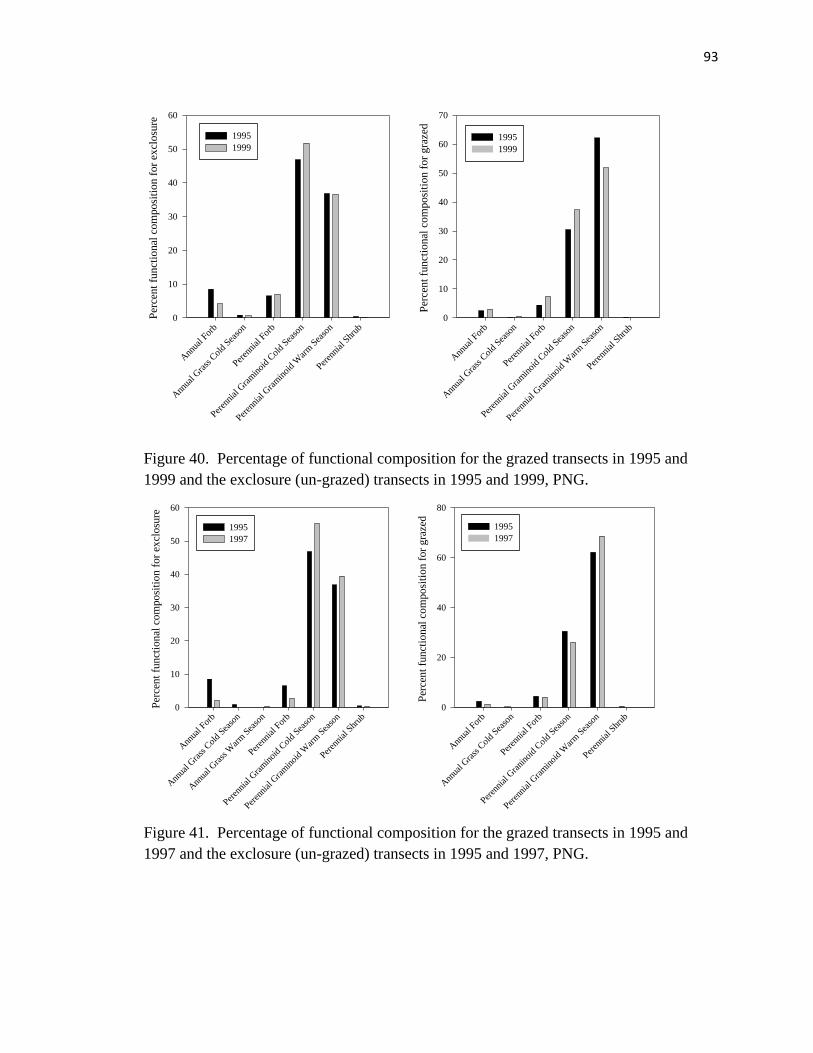
93
Figure 40. Percentage of functional composition for the grazed transects in 1995 and
1999 and the exclosure (un-grazed) transects in 1995 and 1999, PNG.
Figure 41. Percentage of functional composition for the grazed transects in 1995 and
1997 and the exclosure (un-grazed) transects in 1995 and 1997, PNG.
Ann
ual F
orb
Ann
ual G
rass
Col
d Sea
son
Peren
nial
For
b
Peren
nial
Gra
min
oid
Col
d Sea
son
Peren
nial
Gra
min
oid
War
m S
easo
n
Peren
nial
Shr
ub
Per
cent
funct
ional
com
posi
tion f
or
excl
osu
re
0
10
20
30
40
50
60
1995
1999
Ann
ual F
orb
Ann
ual G
rass
Col
d Sea
son
Peren
nial
For
b
Peren
nial
Gra
min
oid
Col
d Sea
son
Peren
nial
Gra
min
oid
War
m S
easo
n
Peren
nial
Shr
ub
Per
cent
funct
ional
com
posi
tion f
or
gra
zed
0
10
20
30
40
50
60
70
1995
1999
Ann
ual F
orb
Ann
ual G
rass
Col
d Sea
son
Ann
ual G
rass
War
m S
easo
n
Peren
nial
For
b
Peren
nial
Gra
min
oid
Col
d Sea
son
Peren
nial
Gra
min
oid
War
m S
easo
n
Peren
nial
Shr
ub
Per
cent
funct
ional
com
posi
tion f
or
excl
osu
re
0
10
20
30
40
50
60
1995
1997
Ann
ual F
orb
Ann
ual G
rass
Col
d Sea
son
Peren
nial
For
b
Peren
nial
Gra
nino
id C
old
Seaso
n
Peren
nial
Gra
min
oid
War
m S
easo
n
Peren
nial
Shr
ub
Per
cent
funct
ional
com
posi
tion f
or
gra
zed
0
20
40
60
80
1995
1997
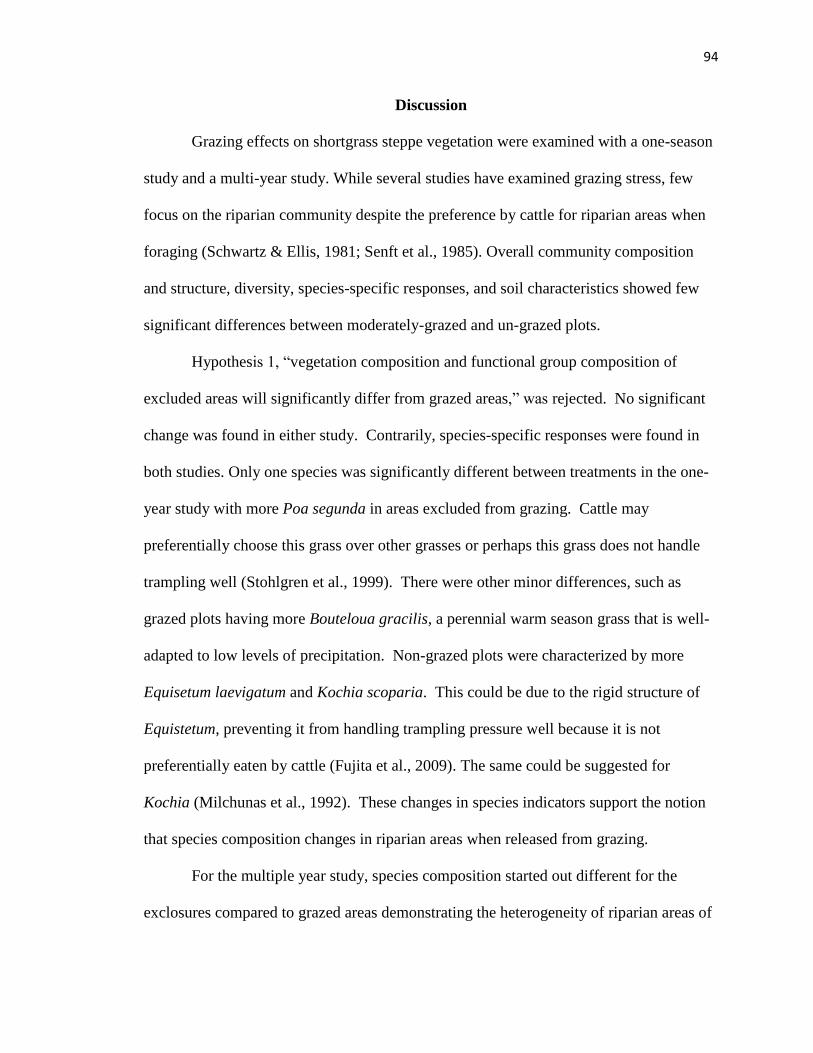
94
Discussion
Grazing effects on shortgrass steppe vegetation were examined with a one-season
study and a multi-year study. While several studies have examined grazing stress, few
focus on the riparian community despite the preference by cattle for riparian areas when
foraging (Schwartz & Ellis, 1981; Senft et al., 1985). Overall community composition
and structure, diversity, species-specific responses, and soil characteristics showed few
significant differences between moderately-grazed and un-grazed plots.
Hypothesis 1, “vegetation composition and functional group composition of
excluded areas will significantly differ from grazed areas,” was rejected. No significant
change was found in either study. Contrarily, species-specific responses were found in
both studies. Only one species was significantly different between treatments in the one-
year study with more Poa segunda in areas excluded from grazing. Cattle may
preferentially choose this grass over other grasses or perhaps this grass does not handle
trampling well (Stohlgren et al., 1999). There were other minor differences, such as
grazed plots having more Bouteloua gracilis, a perennial warm season grass that is well-
adapted to low levels of precipitation. Non-grazed plots were characterized by more
Equisetum laevigatum and Kochia scoparia. This could be due to the rigid structure of
Equistetum, preventing it from handling trampling pressure well because it is not
preferentially eaten by cattle (Fujita et al., 2009). The same could be suggested for
Kochia (Milchunas et al., 1992). These changes in species indicators support the notion
that species composition changes in riparian areas when released from grazing.
For the multiple year study, species composition started out different for the
exclosures compared to grazed areas demonstrating the heterogeneity of riparian areas of
95
the shortgrass steppe or indicating a rapid change in vegetation composition from one
growing season at this site as measurements were not recorded prior to the first season of
release from grazing. The lack of significant changed based on the one-year study
supports a heterogeneity explanation. Within the five year period, change in vegetation
composition occurred both in areas released from grazing and areas exposed to
continuous grazing; with more compositional change occurring within the exclosure.
In terms of structure, an increase in litter was observed every year in the exclosure
and was consistent with other studies (Hazlett, 1992). This build-up of litter over time
could impact which species germinate and will likely change soil composition, but such
changes were not evidenced in this study.
Species-specific responses were seen in the multi-year study as well. When
comparing the exclosure to grazed transects in 1995, grazed transects were characterized
by dominant grasses of the steppe: Bouteloua gracilis and Bouteloua dactyloides and
Sporobolus airoides, a grass species adapted to alkali soils. In 1999 grazed transects
remained characterized by grasses, but both Bouteloua gracilis and Bouteloua
dactyloides decreased while Elymus smithii increased and Sporobolus ariodes remained
about the same. The exclosures showed a decrease in the grass Elymus smithii and the
forb Descurainia pinnata, an increase in the warm season grass Elymus lanceolatus, and
a minor increase for forb species in general. Elymus smithii decreased in percent cover
every year of the study. This decrease was expected in grazed areas where it is a
preferred grass but not expected in the un-grazed transects and was contrary to a previous
study conducted in upland pastures (Hart, 2001). Perhaps the higher moister content in
the riparian area enabled other species to compete with Elymus smithii.
96
The cool season grass taxa Poa species remained an indicator species of the
exclosures for both years. The abundance of this species in un-grazed areas was
consistent for both our studies and may indicate a preference for this species by cattle
(Stohlgren et al., 1999; Fujita et al., 2009). The data suggest mild grazing effects with
perennial grasses being better adapted to grazing than forbs as supported by previous
studies (Amiri et al., 2008). In the absence of grazing, forbs generally become more
prominent (Hazlett, 1992; LeCain et al., 2002).
Functional group composition between treatments, like overall species
composition, was different throughout the multi-year study. After 1997, the general
dynamics of functional types for the exclosure and the grazed areas followed the same
pattern. In fact, and contrary to what was hypothesized, the ending points were even
more functionally similar than the starting points. Both sites saw a decrease in forbs and
an increase in perennial warm-season grasses from 1995 to 1997 that was likely due to
the hail storm and early season drought conditions of 1996 (LeCain et al., 2002). By
1999, functional composition in the exclosure was similar to its starting point, but the
grazed transects showed movement away from the starting point. Functional group
percentages showed an increase in the perennial forbs and perennial cool-season
graminoids from 1995 to 1999, potentially due to increased moisture in 1999 that allowed
cool season graminoids to out-compete perennial warm season grasses in the grazed
environment.
Contrary to expectations, hypothesis 2, “diversity will be greater in exclosures,”
was rejected. Grazing had no significant impact on species richness or diversity in either
study. Richness and diversity measurements followed the same general patterns for both
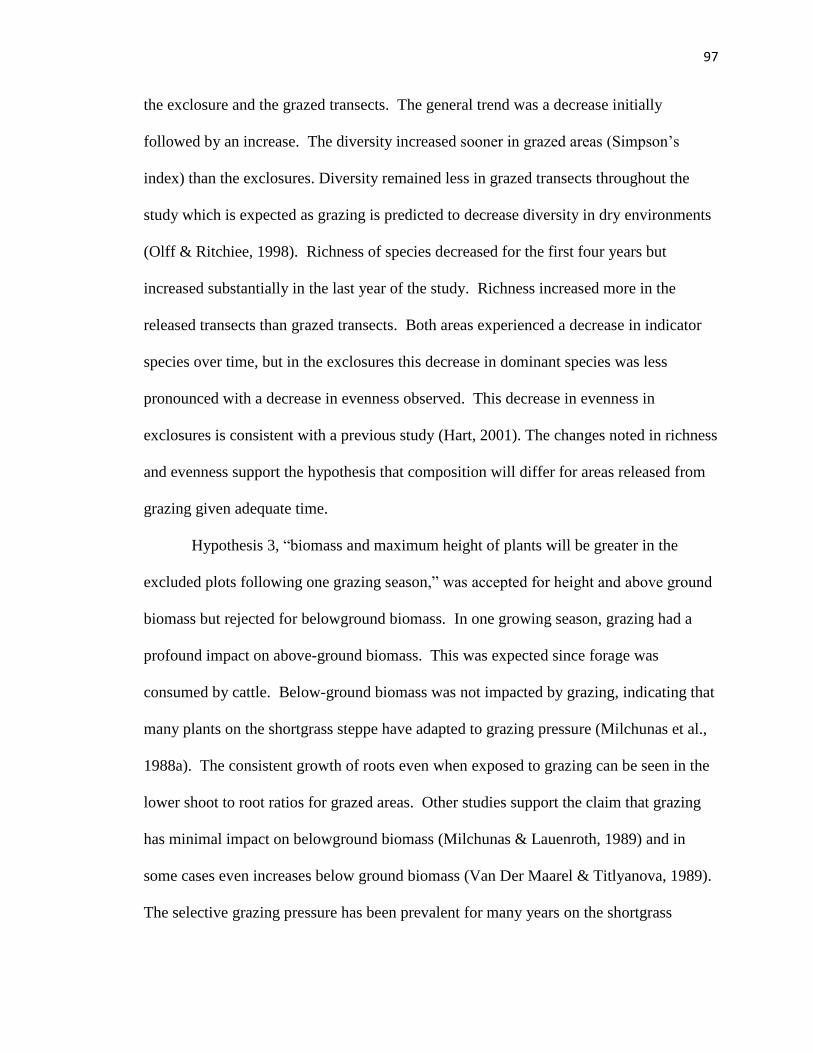
97
the exclosure and the grazed transects. The general trend was a decrease initially
followed by an increase. The diversity increased sooner in grazed areas (Simpson’s
index) than the exclosures. Diversity remained less in grazed transects throughout the
study which is expected as grazing is predicted to decrease diversity in dry environments
(Olff & Ritchiee, 1998). Richness of species decreased for the first four years but
increased substantially in the last year of the study. Richness increased more in the
released transects than grazed transects. Both areas experienced a decrease in indicator
species over time, but in the exclosures this decrease in dominant species was less
pronounced with a decrease in evenness observed. This decrease in evenness in
exclosures is consistent with a previous study (Hart, 2001). The changes noted in richness
and evenness support the hypothesis that composition will differ for areas released from
grazing given adequate time.
Hypothesis 3, “biomass and maximum height of plants will be greater in the
excluded plots following one grazing season,” was accepted for height and above ground
biomass but rejected for belowground biomass. In one growing season, grazing had a
profound impact on above-ground biomass. This was expected since forage was
consumed by cattle. Below-ground biomass was not impacted by grazing, indicating that
many plants on the shortgrass steppe have adapted to grazing pressure (Milchunas et al.,
1988a). The consistent growth of roots even when exposed to grazing can be seen in the
lower shoot to root ratios for grazed areas. Other studies support the claim that grazing
has minimal impact on belowground biomass (Milchunas & Lauenroth, 1989) and in
some cases even increases below ground biomass (Van Der Maarel & Titlyanova, 1989).
The selective grazing pressure has been prevalent for many years on the shortgrass
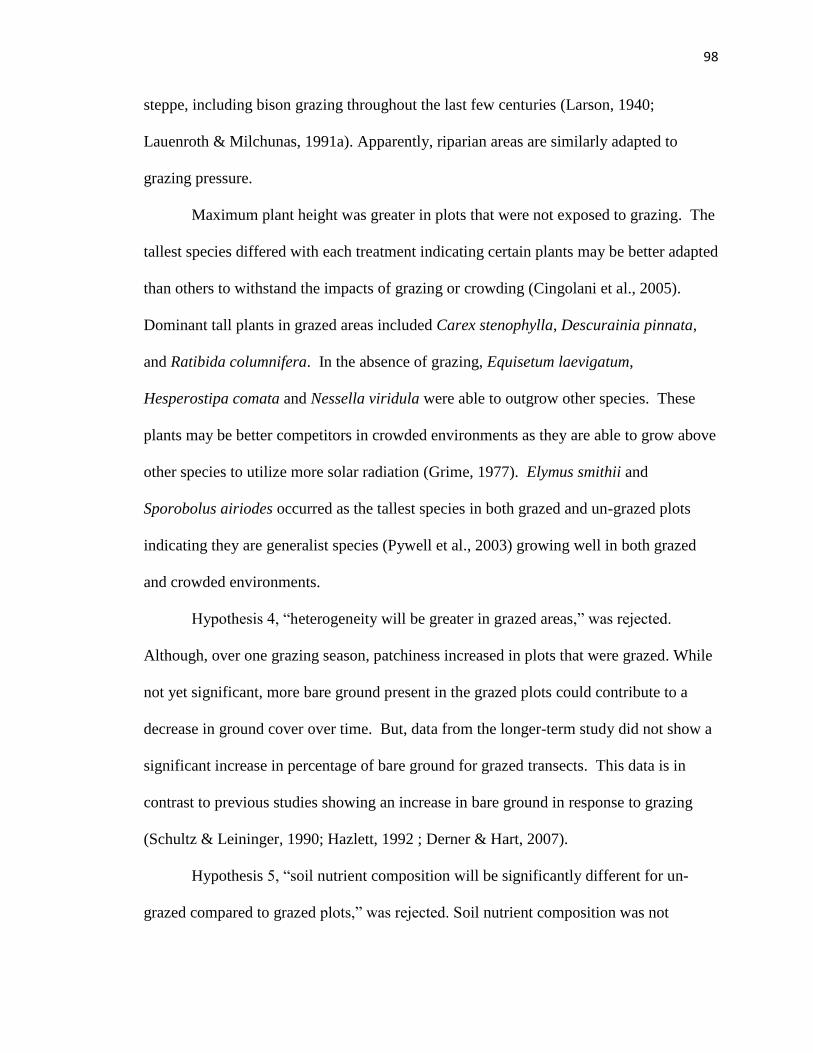
98
steppe, including bison grazing throughout the last few centuries (Larson, 1940;
Lauenroth & Milchunas, 1991a). Apparently, riparian areas are similarly adapted to
grazing pressure.
Maximum plant height was greater in plots that were not exposed to grazing. The
tallest species differed with each treatment indicating certain plants may be better adapted
than others to withstand the impacts of grazing or crowding (Cingolani et al., 2005).
Dominant tall plants in grazed areas included Carex stenophylla, Descurainia pinnata,
and Ratibida columnifera. In the absence of grazing, Equisetum laevigatum,
Hesperostipa comata and Nessella viridula were able to outgrow other species. These
plants may be better competitors in crowded environments as they are able to grow above
other species to utilize more solar radiation (Grime, 1977). Elymus smithii and
Sporobolus airiodes occurred as the tallest species in both grazed and un-grazed plots
indicating they are generalist species (Pywell et al., 2003) growing well in both grazed
and crowded environments.
Hypothesis 4, “heterogeneity will be greater in grazed areas,” was rejected.
Although, over one grazing season, patchiness increased in plots that were grazed. While
not yet significant, more bare ground present in the grazed plots could contribute to a
decrease in ground cover over time. But, data from the longer-term study did not show a
significant increase in percentage of bare ground for grazed transects. This data is in
contrast to previous studies showing an increase in bare ground in response to grazing
(Schultz & Leininger, 1990; Hazlett, 1992 ; Derner & Hart, 2007).
Hypothesis 5, “soil nutrient composition will be significantly different for un-
grazed compared to grazed plots,” was rejected. Soil nutrient composition was not
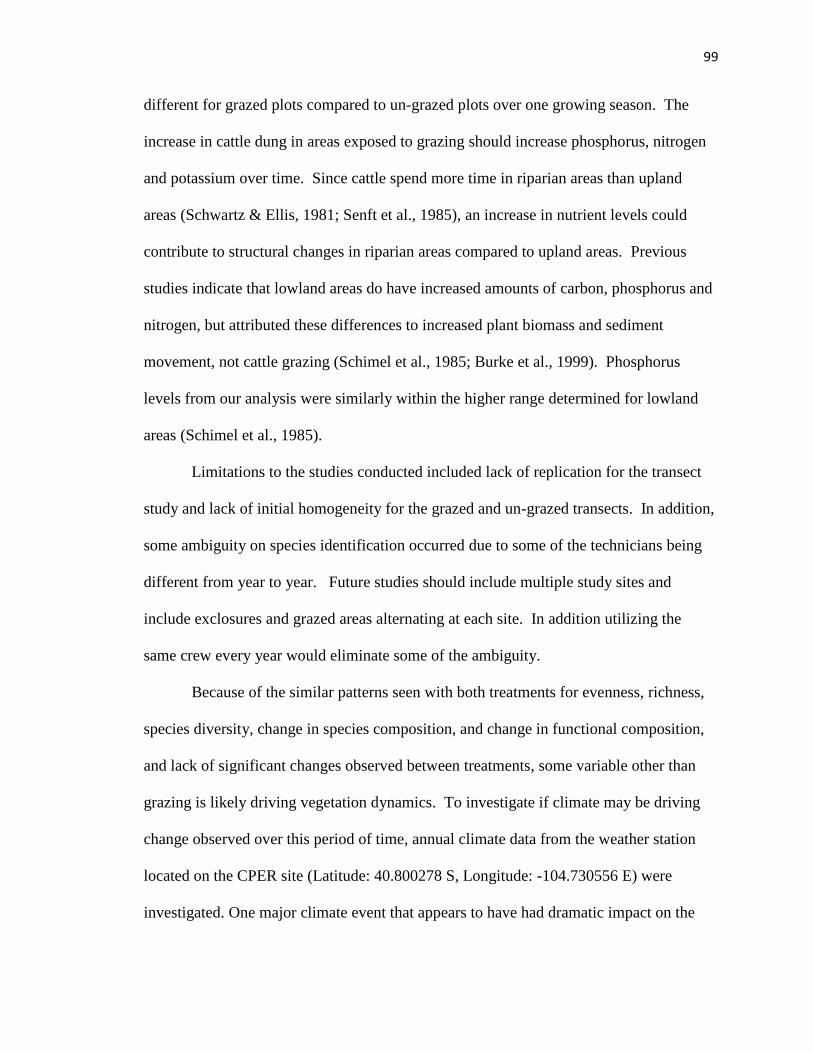
99
different for grazed plots compared to un-grazed plots over one growing season. The
increase in cattle dung in areas exposed to grazing should increase phosphorus, nitrogen
and potassium over time. Since cattle spend more time in riparian areas than upland
areas (Schwartz & Ellis, 1981; Senft et al., 1985), an increase in nutrient levels could
contribute to structural changes in riparian areas compared to upland areas. Previous
studies indicate that lowland areas do have increased amounts of carbon, phosphorus and
nitrogen, but attributed these differences to increased plant biomass and sediment
movement, not cattle grazing (Schimel et al., 1985; Burke et al., 1999). Phosphorus
levels from our analysis were similarly within the higher range determined for lowland
areas (Schimel et al., 1985).
Limitations to the studies conducted included lack of replication for the transect
study and lack of initial homogeneity for the grazed and un-grazed transects. In addition,
some ambiguity on species identification occurred due to some of the technicians being
different from year to year. Future studies should include multiple study sites and
include exclosures and grazed areas alternating at each site. In addition utilizing the
same crew every year would eliminate some of the ambiguity.
Because of the similar patterns seen with both treatments for evenness, richness,
species diversity, change in species composition, and change in functional composition,
and lack of significant changes observed between treatments, some variable other than
grazing is likely driving vegetation dynamics. To investigate if climate may be driving
change observed over this period of time, annual climate data from the weather station
located on the CPER site (Latitude: 40.800278 S, Longitude: -104.730556 E) were
investigated. One major climate event that appears to have had dramatic impact on the
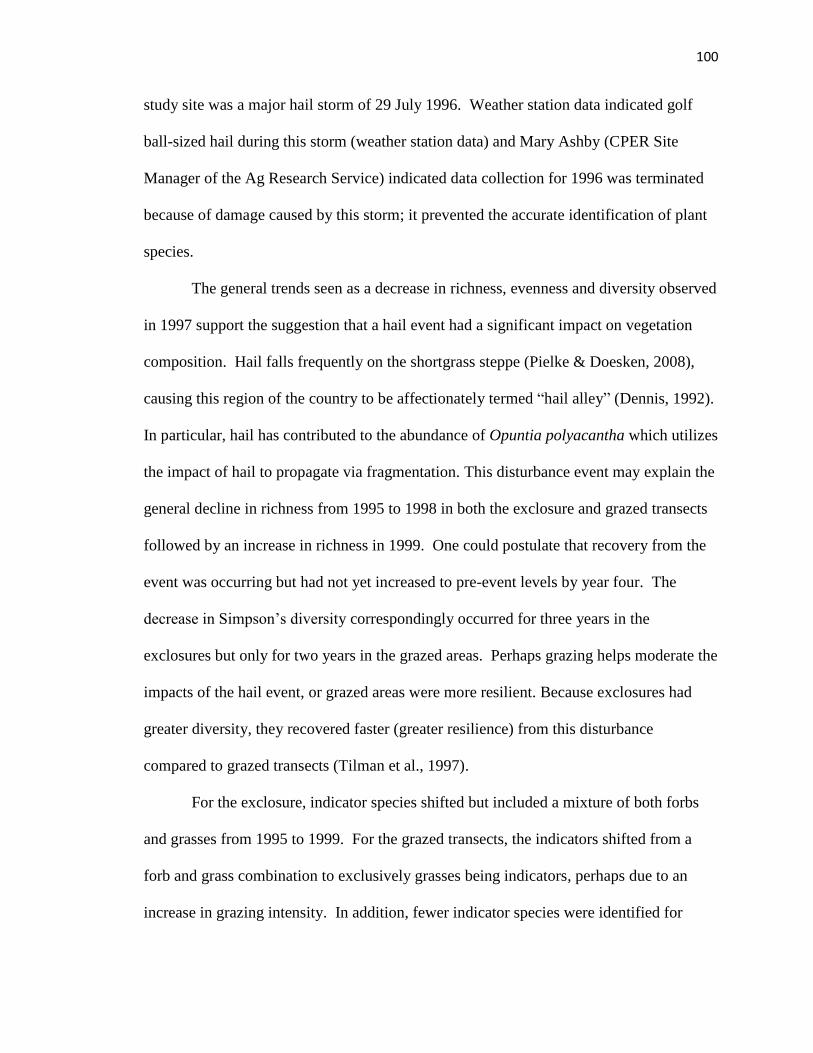
100
study site was a major hail storm of 29 July 1996. Weather station data indicated golf
ball-sized hail during this storm (weather station data) and Mary Ashby (CPER Site
Manager of the Ag Research Service) indicated data collection for 1996 was terminated
because of damage caused by this storm; it prevented the accurate identification of plant
species.
The general trends seen as a decrease in richness, evenness and diversity observed
in 1997 support the suggestion that a hail event had a significant impact on vegetation
composition. Hail falls frequently on the shortgrass steppe (Pielke & Doesken, 2008),
causing this region of the country to be affectionately termed “hail alley” (Dennis, 1992).
In particular, hail has contributed to the abundance of Opuntia polyacantha which utilizes
the impact of hail to propagate via fragmentation. This disturbance event may explain the
general decline in richness from 1995 to 1998 in both the exclosure and grazed transects
followed by an increase in richness in 1999. One could postulate that recovery from the
event was occurring but had not yet increased to pre-event levels by year four. The
decrease in Simpson’s diversity correspondingly occurred for three years in the
exclosures but only for two years in the grazed areas. Perhaps grazing helps moderate the
impacts of the hail event, or grazed areas were more resilient. Because exclosures had
greater diversity, they recovered faster (greater resilience) from this disturbance
compared to grazed transects (Tilman et al., 1997).
For the exclosure, indicator species shifted but included a mixture of both forbs
and grasses from 1995 to 1999. For the grazed transects, the indicators shifted from a
forb and grass combination to exclusively grasses being indicators, perhaps due to an
increase in grazing intensity. In addition, fewer indicator species were identified for
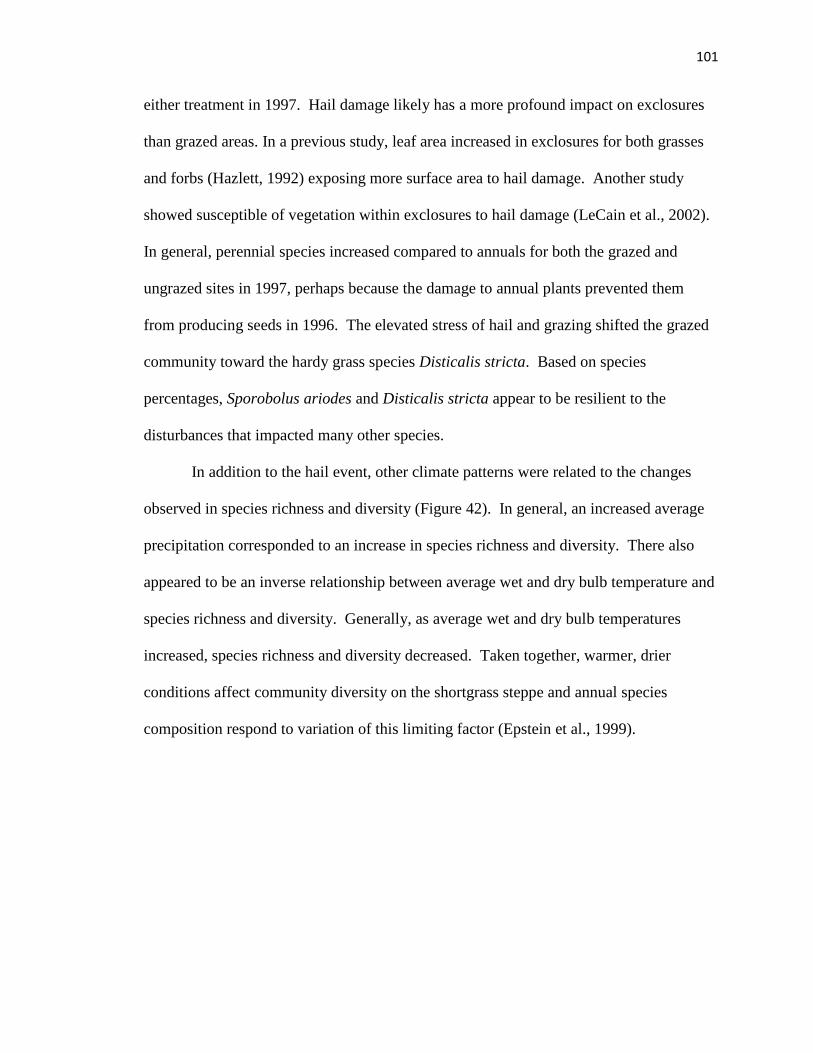
101
either treatment in 1997. Hail damage likely has a more profound impact on exclosures
than grazed areas. In a previous study, leaf area increased in exclosures for both grasses
and forbs (Hazlett, 1992) exposing more surface area to hail damage. Another study
showed susceptible of vegetation within exclosures to hail damage (LeCain et al., 2002).
In general, perennial species increased compared to annuals for both the grazed and
ungrazed sites in 1997, perhaps because the damage to annual plants prevented them
from producing seeds in 1996. The elevated stress of hail and grazing shifted the grazed
community toward the hardy grass species Disticalis stricta. Based on species
percentages, Sporobolus ariodes and Disticalis stricta appear to be resilient to the
disturbances that impacted many other species.
In addition to the hail event, other climate patterns were related to the changes
observed in species richness and diversity (Figure 42). In general, an increased average
precipitation corresponded to an increase in species richness and diversity. There also
appeared to be an inverse relationship between average wet and dry bulb temperature and
species richness and diversity. Generally, as average wet and dry bulb temperatures
increased, species richness and diversity decreased. Taken together, warmer, drier
conditions affect community diversity on the shortgrass steppe and annual species
composition respond to variation of this limiting factor (Epstein et al., 1999).
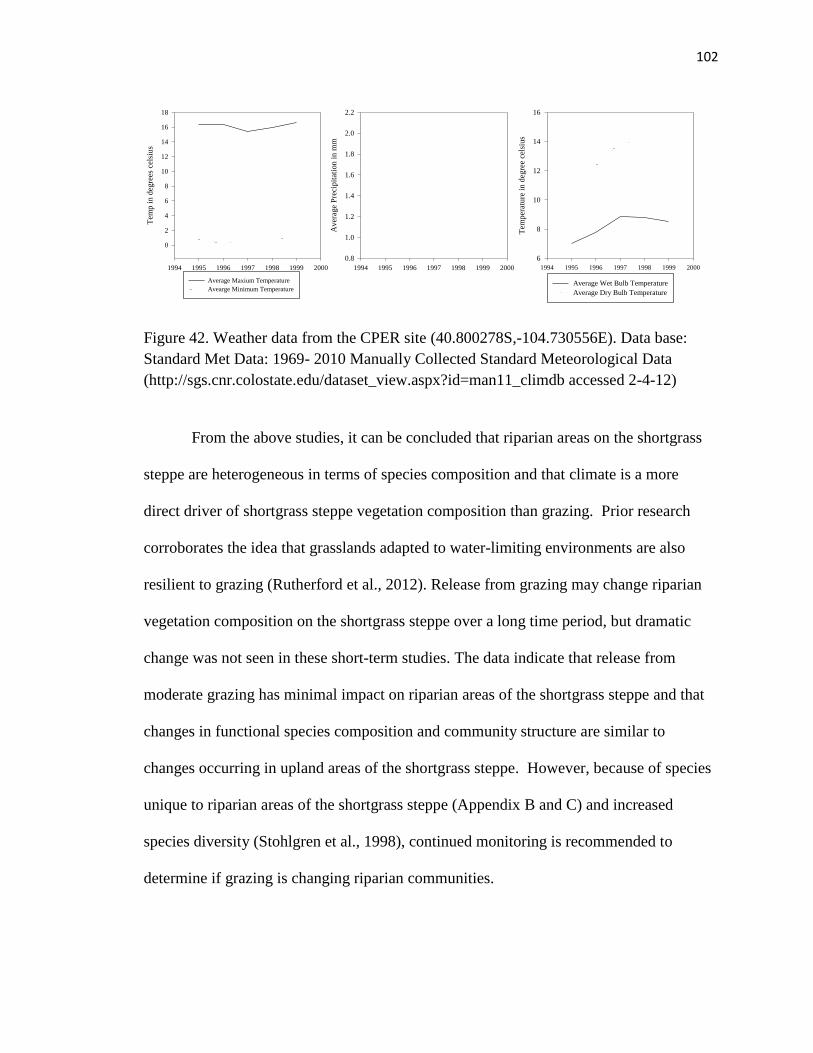
102
Figure 42. Weather data from the CPER site (40.800278S,-104.730556E). Data base:
Standard Met Data: 1969- 2010 Manually Collected Standard Meteorological Data
(http://sgs.cnr.colostate.edu/dataset_view.aspx?id=man11_climdb accessed 2-4-12)
From the above studies, it can be concluded that riparian areas on the shortgrass
steppe are heterogeneous in terms of species composition and that climate is a more
direct driver of shortgrass steppe vegetation composition than grazing. Prior research
corroborates the idea that grasslands adapted to water-limiting environments are also
resilient to grazing (Rutherford et al., 2012). Release from grazing may change riparian
vegetation composition on the shortgrass steppe over a long time period, but dramatic
change was not seen in these short-term studies. The data indicate that release from
moderate grazing has minimal impact on riparian areas of the shortgrass steppe and that
changes in functional species composition and community structure are similar to
changes occurring in upland areas of the shortgrass steppe. However, because of species
unique to riparian areas of the shortgrass steppe (Appendix B and C) and increased
species diversity (Stohlgren et al., 1998), continued monitoring is recommended to
determine if grazing is changing riparian communities.
1994 1995 1996 1997 1998 1999 2000
Tem
p i
n d
egre
es c
elsi
us
0
2
4
6
8
10
12
14
16
18
Average Maxium Temperature
Avearge Minimum Temperature
1994 1995 1996 1997 1998 1999 2000
Tem
per
atu
re i
n d
egre
e ce
lsiu
s
6
8
10
12
14
16
Average Wet Bulb Temperature
Average Dry Bulb Temperature
1994 1995 1996 1997 1998 1999 2000
Aver
age
Pre
cip
itat
ion
in
mm
0.8
1.0
1.2
1.4
1.6
1.8
2.0
2.2
103
CHAPTER IV
ASSESSMENT OF COMPETITION BETWEEN
NOXIOUS WEEDS AND FUNCTIONALLY
EQUIVALENT NATIVES UTILIZING
FIELD AND GREENHOUSE
STUDIES
Abstract
Community composition is determined to a large extent by the interactions among
plants. Large scale disturbances such as mining decrease the diversity of plant
communities and cause a shift from native plants to ruderal invasive plants. A goal of
restoration is to develop an ecosystem functioning similar to that prior to the disturbance.
Such mitigation can be accomplished through soil augmentation, re-vegetation and weed
control. This study investigates the possibility of utilizing native functionally equivalent
plants as a means to control the spread and dominance of noxious weeds. Greenhouse
and field studies were conducted to investigate the impact plant functionality and
nativeness has on competitive ability of the ubiquitous noxious species Bromus tectorum
and Cirsium arvense. Results indicate that Vulpia octoflora may inhibit the growth of
Bromus tectorum but has little impact on Cirsium arvense and that Achillea millifolium
var. lanulosa does not significantly impact the growth of these noxious weeds. In the
field, increased graminoid cover predicted decreased performance of Cirsium arvense.
Our results indicated that the current practice of planting native perennial grasses in
104
reclamation sites is an effective control measure for containing Cirsium arvense on the
shortgrass steppe and that planting Vulpia octoflora may be useful in controlling Bromus
tectorum.
Introduction
A goal of ecological restoration is to facilitate the recovery of degraded
landscapes to a previous level of biodiversity and ecological function (SER, 2004). In
many severely disturbed areas, plant diversity decreases (Collins & Barber, 1985; Hobbs
& Huenneke, 1992) and species that do thrive are often introduced noxious plants (Hobbs
& Harold, 1991; Larson, 2003). This increase in noxious invasive plants is due to their
ability to disperse to disturbed areas and utilize resources (Marvier et al., 2004).
The threat of noxious invasive weeds in natural landscapes is a major concern due
to the functional degradation they cause to a community (Vitousek et al., 1996). In
disturbed areas such as roadsides, mined sites, and construction sites, invasive species
often dominate. Invasive plants have characteristics that enable them to rapidly colonize
areas vacated by native plants following a disturbance. Reasons for their success include
the ability to grow well in harsh abiotic conditions such as poor soils and low moisture
levels (Daehler, 2003) and to propagate rapidly (Grime, 1977). These characteristics
coupled with limited natural predators (Wolfe, 2002) and allopathic characteristics
(Thorpe et al., 2009) ensure – once established – invasive weeds perpetuate in degraded
environments. This persistence hinders native plant re-establishment (Eliason & Allen,
1997) and creates challenges for humans with decreased cattle and crop production,
decreased ecosystem function and degradation of recreational areas (DiTommaso, 2000;
Pimentel et al., 2000).
105
In the case of some disturbances such as aggregate mining, not only have the
existing native plants been removed, but the seed bank has also been removed preventing
the rapid reestablishment of plants that do not have long-distance dispersal methods
(Kirmer et al., 2008). Thus, restoration of communities may require direct impute of
seeds (Seabloom et al., 2003).
A number of management techniques have been developed to control the
introduction and spread of noxious invasive weeds including herbicide treatment, manual
removal, mowing and prescribed burning (DiTommaso & Johnson, 2006). Of these
techniques, herbicide use predominates (Haggar et al., 1986; DiTommaso, 2000).
Herbicide use has been shown to have negative impacts on the environment and
particularly people in the environment as herbicide can contribute to cancer (Hoar et al.,
1986; Orsi et al., 2009). Herbicide use also has collateral effect on native plant species
(Carlson & Gorchov, 2004), residual effects in the soil (Felixa et al., 2007), and impacts
aquatic ecosystems (Fairchild et al., 1997). A need exists for utilizing ecological
principles in restoring invasive-infested landscapes (Sheley & Krueger-Mangold, 2003),
such as biotic controls (McEvoy & Coombs, 1999) and the use of functionally equivalent
native plants as alternate means of controlling noxious weeds.
Plants are often classified based on their family groupings, but can also be
classified based on their functional groupings (Gitay & Noble, 1997). Plant functional
diversity appears to be equally import to ecosystem processes as species diversity and
predicts dynamics within a community (Diaz & Cabido, 2001). Two broad categories are
generally employed in determining functional classification; species utilizing the same
resources or species responding similarly to disturbances (Gitay & Noble, 1997). To
106
determine these characteristics, plants are often classified based on their growth form
(graminoid, forb, sub shrub, shrub, tree), growth characteristic (annual, biennial, or
perennial), metabolic pathway (C3, C4, CAM), or their interaction with soil nutrient pools
(nitrogen fixers and selenium indicator species) (Paruelo & Lauenroth, 1996; Lavorel et
al., 1997).
Plants in the same functional grouping utilizing similar resources will compete
with each other. Competition is the process through which plants vie for limited
resources such as light, water, or nutrients (Darwin, 1859). Successful competitors will
be plants that are able to grow larger faster, or more efficiently use resources, and
ultimately produce the most viable seeds. Competitive ability can therefore be measured
by growth parameters and fecundity. Correctly identified functionally equivalent plants
should prevent each other from coexisting in the same location (micro-scale) in an
ecosystem (Gause, 1934; Hardin, 1960). For this reason, many competition hypotheses
predicted that intraspecifc competition would be greater than interspecific competition
(Tilman, 1988). Current research, however, is inconclusive (Bengtsson et al., 1994;
Thacher et al., 2009a). In some situations, species seem to facilitate the growth of other
plants (Callaway & Walker, 1997). In addition, because of limited resources, plants are
negatively impacted by increased plant density (White & Harper, 1970), but this negative
impact becomes less apparent in species demonstrating high levels of physiological
plasticity (Harper & Gajic, 1961).
At the local level, competition excludes similar plant species, but at the landscape
level, functionally similar plant species are expected to coexist because they thrive in
similar biotic and abiotic environments (Aarssen, 1989; Bengtsson et al., 1994). Darwin
107
recognized this paradox and predicted similar exotic species should invade communities
because of phylogenetic relatedness, but his naturalization hypothesis contrarily predicted
that similar taxa are prevented from invading because they encounter similar functional
species that results in a strong competitive relationship (Wolfe, 2002; Thuiller et al.,
2010). Therefore, exotics that are functionally different are more likely to successfully
invade communities (Diez et al., 2008) because they can utilize resources differently and
fill a void not occupied by current vegetation (Elton 1958, MacArthur 1970, Tilman
1997). For example, a species that has deeper roots than the native vegetation would
have an advantage in sequestering water and would have the ability to grow without
strong competition for resources. It logically follows that increased species and
functional richness prevents species invasion because more of the available space and
resources are being used by the current species. Communities with low levels of
diversity will afford opportunities for invaders (Elton 1958, MacArthur 1970, Tillman
1997, Kreyling et al. 2008). The concept holds for small-scale plots in some cases
(Maron & Marbler, 2007) but not in others (Davies et al., 2007) and also does not appear
to hold at the regional scale (Stohlgren et al., 1999).
Previous studies have investigated the influence of plant functionality on invasive
species (Vila & Weiner, 2004). At the community level, results indicate that increased
functional diversity either hindered invasion (Symstad, 2000; Carpinalli et al., 2004;
Hooper & Dukes, 2010) or had no effect on invasive plant growth (Carpinelli et al.,
2004). At the species level, perennial grasses increased resistance to invasion by the
annual noxious grass Medusahead (Taeniatherum caput-medusae) (Sheley & James,
2010). Likewise, the density of the perennial rhizomatous forb Russian knapweed
108
(Acroptilon repens) decreased at one research site when planted with a forb but not at all
sites (Mangold et al., 2007). Functionally equivalent annual forbs decreased the impact
of the noxious annual forb Centaurea solstitalis (Dukes, 2000), and competition from
native perennial grasses resulted in decreased biomass of the invasive forb Cirsium
arvense (Ang et al., 1995) These studies lend support to the idea that functionally
equivalent natives effectively control noxious weeds. However, a specific need exists for
investigating this question on more species and in more regions, particularly in the short
grass steppe where no such studies exist.
Species adapted to the shortgrass steppe must have the ability to deal with
periodic water limitations. This filter of invasion has resulted in relatively low levels of
exotic species on the shortgrass steppe (Mack & Thompson, 1982). However, in lowland
and riparian areas where water becomes less limiting and sites are generally more
productive, exotic species become more abundant (Kotanen et al., 1998). Many
restoration efforts on the shortgrass steppe involve planting native grasses but not forbs.
However, some of these excluded native forbs may successfully compete with invasive
plants, especially in riparian areas.
This study focuses on utilizing native functionally equivalent plants to control the
abundance and spread of noxious weeds. Of particular interest is the efficacy of utilizing
native forbs to control exotics in reclamation efforts in more mesic areas of arid
grasslands. Our overarching hypothesis is than native species will inhibit the growth of
functionally equivalent noxious weeds. If correct, native plant restoration techniques
could decrease the dependency on herbicide in managing noxious invasive weeds.
Specifically, we set up two greenhouse experiments to investigate the competitive
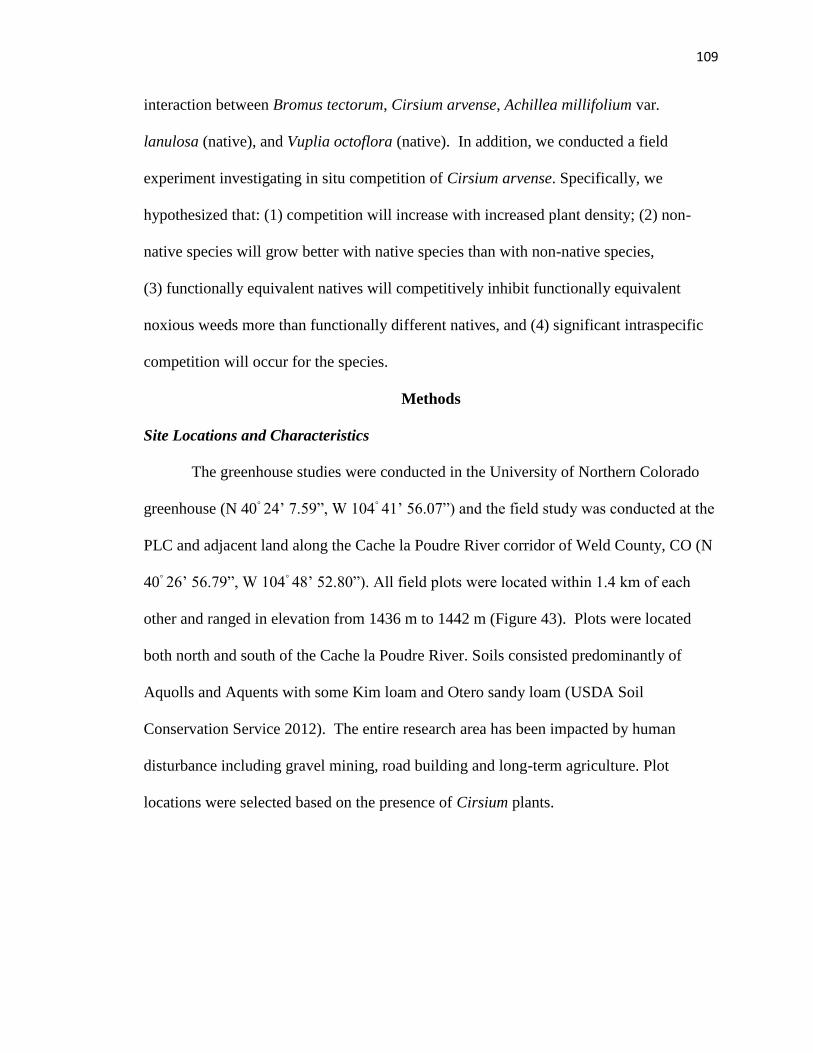
109
interaction between Bromus tectorum, Cirsium arvense, Achillea millifolium var.
lanulosa (native), and Vuplia octoflora (native). In addition, we conducted a field
experiment investigating in situ competition of Cirsium arvense. Specifically, we
hypothesized that: (1) competition will increase with increased plant density; (2) non-
native species will grow better with native species than with non-native species,
(3) functionally equivalent natives will competitively inhibit functionally equivalent
noxious weeds more than functionally different natives, and (4) significant intraspecific
competition will occur for the species.
Methods
Site Locations and Characteristics
The greenhouse studies were conducted in the University of Northern Colorado
greenhouse (N 40◦ 24’ 7.59”, W 104
◦ 41’ 56.07”) and the field study was conducted at the
PLC and adjacent land along the Cache la Poudre River corridor of Weld County, CO (N
40◦ 26’ 56.79”, W 104
◦ 48’ 52.80”). All field plots were located within 1.4 km of each
other and ranged in elevation from 1436 m to 1442 m (Figure 43). Plots were located
both north and south of the Cache la Poudre River. Soils consisted predominantly of
Aquolls and Aquents with some Kim loam and Otero sandy loam (USDA Soil
Conservation Service 2012). The entire research area has been impacted by human
disturbance including gravel mining, road building and long-term agriculture. Plot
locations were selected based on the presence of Cirsium plants.
110
Figure 43. Research locations of paired plots investigating Cirsium arvense competition
occurring naturally, Weld County, Colorado.
Research Species
Cirsium arvense
Canada thistle, Cirsium arvense, a noxious perennial forb from the Asteraceae
family, grows by underground rhizomes with a root structure that commonly grow at 2 -
3 m depths in the soil. It is ubiquitous across Colorado and is common in moist habitats
(Moore, 1975). In addition to asexual reproduction, it also reproduces from seed. Plants
produce both male and female flowers with up to 100 seed heads per plant producing up
to 1,500 seeds per plant which stay viable in the soil for up to 20 years (Moore, 1975;
Beck, 2008). Once it becomes established, roots play an important role in maintaining
GREELEY
EVANS
WINDSOR
MILLIKEN
EATON
SEVERANCE
AULT
LA SALLE
JOHNSTOWN
BERTHOUD
WINDSOR
JOHNSTOWNJOHNSTOWN
GARDEN CITY
64
27
27
6225 83
RD
AV
Cache La Poudre River
98
765 3 2 1
28 27
2625
2423
22
21
1110

111
the species. As little as 1.25 cm of root stock is needed to develop vegetative structure
(Hayden, 1934).
Achillea millefolium var. lanulosa
The perennial aromatic forb Achillea millefolium var. lanulosa (western yarrow)
is a polyploid (Ehrendorfer, 1973) that has a wide distribution in the United States
(Pollard 1899) including riparian zones in Colorado (Baker, 1989). The species is
rhizomatous and adapted to a wide variety of soil types, including dry sandy soils, and is
able to tolerate periodic drought. It can reproduce both sexually and asexually (Warwick
& Black, 1982). Similar to Cirsium, Achillea is in the family Asteraceae and a functional
equivalent of Cirsium.
Bromus tectorum
Cheat grass B. tectorm), classified as a noxious weed, is a short-rooted annual C3
grass in the family Poaceae. It germinates either in the fall or early spring (Skinner,
2008) and greens up quickly before other plants are able to compete for resources. It is
the most abundant invasive species in the shortgrass steppe and has been in Colorado
since before 1900 (Mack, 1981). It has prolific seed production and dispersal ability with
seeds remaining viable for up to 11.5 years (Hulbert, 1955). Seeds are produced by
individuals less than 45 days old (Mack & Pyke, 1983). It has fibrous roots that extend
into the soil up to 1.4 m (Hulbert, 1955) and has the ability to exude phenolic compounds
that create an environment inhospitable to competing plants: although, Bromus tectorum
exudes less of these allopathic compounds than other Bromus species (Holzsapfel et al.,
2010).
112
Vulpia octoflora
Vulpia octoflora (six week fescue) is a widely distributed short-lived annual
native C3 grass adapted to dry climate (Shaw, 2008) and is widely distributed across
western rangelands. The species is not preferred by cattle and produces more seed in
response to increased precipitation. It is classified as a winter grass and is one of the first
plants to grow in the spring (Houston & Hyden, 1976), typically completing its life cycle
prior to other plants. Vulpia is like Bromus in the Poaceae family and they are functional
equivalents.
Greenhouse Study: Density –
Functionality – Intraspecific
for Noxious
Seeds of Bromus tectorum (collected in the field around Greeley, CO), Cirsium
arvense (collected in the field around Greeley, CO), Vulpia octoflora, (purchased from
Pawnee Buttes Seeds Inc., Greeley, CO), and Achillea millefolium var. lanulosa
(purchased from Pawnee Buttes Seeds Inc., Greeley CO) were planted in trays in the
University of Northern Colorado greenhouse. After germination, plants were grown for
two weeks and subsequently transplanted into 25.4 cm diameter pots containing 70%
sand (Quickrete Playsand) and 30% potting soil (Miracle Grow potting mix) and
fertilized (fertilome geranium and hanging basket soluble plant food; N 20% (5.0%
Ammoniacal Nitrogen, 5.9% Nitrate Nitrogen, 9.1% Urea Nitrogen), P2O5 20%, K2O
20%; 5 ml per 3.8 L of H2O). The noxious plants were grown with functionally
equivalent native plants, with functionally different native plants, and with themselves at
three density levels (1x1, 2x2, 3x3). For example, Cirsium arvense was grown with
Achillea millefolium var. lanulosa, with Vulpia octoflora and with itself. Likewise
113
Bromus tectorum was grown with Vulpia octoflora, with Achillea millefolium var.
lanulosa and with itself (Table 20). Native plants were not grown with each other. Ten
pots for each treatment were used and these pots were randomly placed on greenhouse
benches (N=180, n=10). For each plant, initial measurements of height and number of
leaves were recorded. Each pot was watered for one minute daily using an automated
sprinkling system. Following eight weeks growth, final heights and number of leaves
were recorded for each plant. Growth gain was determined by subtracting the initial
measurements from the final. In addition, for Vulpia octoflora number of spikelets per
plant was recorded. Plants were harvested to obtain oven dry weight (ODW) of above
ground and below ground biomass after being dried for 48 hours at 75˚C. Following
drying, each sample was massed to determine above and belowground biomass. All
measurements were standardized to one plant by averaging variable measurements in
pots with multiple plants.
A two-way ANOVA with density level and functional similarity was conducted
both for the noxious weeds and for the native species. For the noxious weeds, functional
types included equivalent, different, and same species (intraspecific); for the native
plants, functional types included equivalent and different species (Table 20).
Intraspecific competition was not investigated for the native plants in this experiment. If
treatments were not normally distributed, data were log transformed prior to conducting
the analysis.
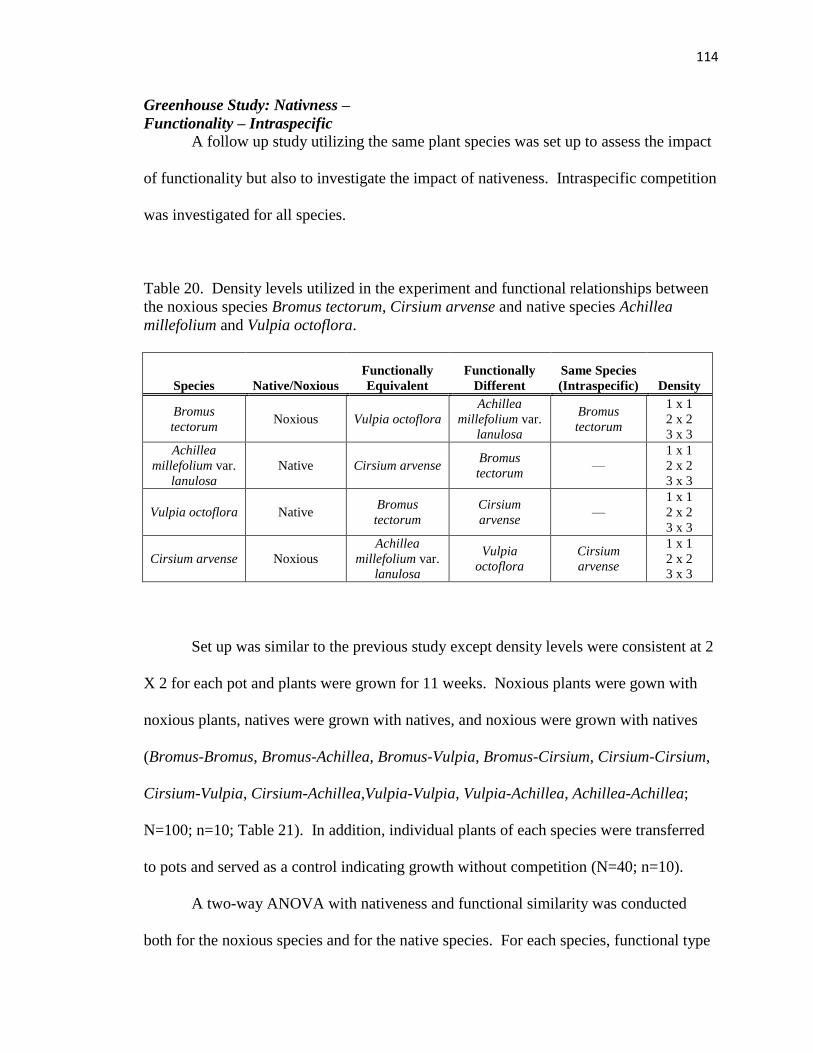
114
Greenhouse Study: Nativness –
Functionality – Intraspecific
A follow up study utilizing the same plant species was set up to assess the impact
of functionality but also to investigate the impact of nativeness. Intraspecific competition
was investigated for all species.
Table 20. Density levels utilized in the experiment and functional relationships between
the noxious species Bromus tectorum, Cirsium arvense and native species Achillea
millefolium and Vulpia octoflora.
Species Native/Noxious
Functionally
Equivalent
Functionally
Different
Same Species
(Intraspecific) Density
Bromus
tectorum Noxious Vulpia octoflora
Achillea
millefolium var.
lanulosa
Bromus
tectorum
1 x 1
2 x 2
3 x 3
Achillea
millefolium var.
lanulosa
Native Cirsium arvense Bromus
tectorum —
1 x 1
2 x 2
3 x 3
Vulpia octoflora Native Bromus
tectorum
Cirsium
arvense —
1 x 1
2 x 2
3 x 3
Cirsium arvense Noxious
Achillea
millefolium var.
lanulosa
Vulpia
octoflora
Cirsium
arvense
1 x 1
2 x 2
3 x 3
Set up was similar to the previous study except density levels were consistent at 2
X 2 for each pot and plants were grown for 11 weeks. Noxious plants were gown with
noxious plants, natives were grown with natives, and noxious were grown with natives
(Bromus-Bromus, Bromus-Achillea, Bromus-Vulpia, Bromus-Cirsium, Cirsium-Cirsium,
Cirsium-Vulpia, Cirsium-Achillea,Vulpia-Vulpia, Vulpia-Achillea, Achillea-Achillea;
N=100; n=10; Table 21). In addition, individual plants of each species were transferred
to pots and served as a control indicating growth without competition (N=40; n=10).
A two-way ANOVA with nativeness and functional similarity was conducted
both for the noxious species and for the native species. For each species, functional type
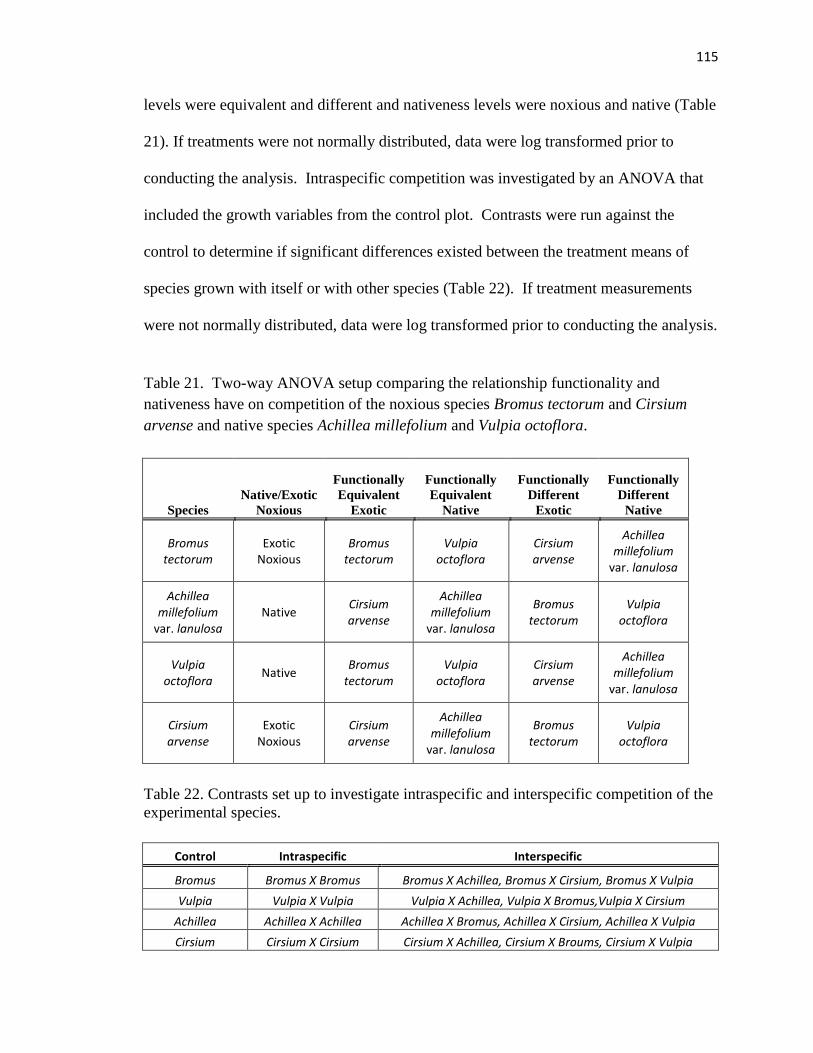
115
levels were equivalent and different and nativeness levels were noxious and native (Table
21). If treatments were not normally distributed, data were log transformed prior to
conducting the analysis. Intraspecific competition was investigated by an ANOVA that
included the growth variables from the control plot. Contrasts were run against the
control to determine if significant differences existed between the treatment means of
species grown with itself or with other species (Table 22). If treatment measurements
were not normally distributed, data were log transformed prior to conducting the analysis.
Table 21. Two-way ANOVA setup comparing the relationship functionality and
nativeness have on competition of the noxious species Bromus tectorum and Cirsium
arvense and native species Achillea millefolium and Vulpia octoflora.
Species
Native/Exotic
Noxious
Functionally
Equivalent
Exotic
Functionally
Equivalent
Native
Functionally
Different
Exotic
Functionally
Different
Native
Bromus tectorum
Exotic Noxious
Bromus tectorum
Vulpia octoflora
Cirsium arvense
Achillea millefolium
var. lanulosa
Achillea millefolium
var. lanulosa Native
Cirsium arvense
Achillea millefolium
var. lanulosa
Bromus tectorum
Vulpia octoflora
Vulpia octoflora
Native Bromus
tectorum Vulpia
octoflora Cirsium arvense
Achillea millefolium
var. lanulosa
Cirsium arvense
Exotic Noxious
Cirsium arvense
Achillea millefolium
var. lanulosa
Bromus tectorum
Vulpia octoflora
Table 22. Contrasts set up to investigate intraspecific and interspecific competition of the
experimental species.
Control Intraspecific Interspecific
Bromus Bromus X Bromus Bromus X Achillea, Bromus X Cirsium, Bromus X Vulpia
Vulpia Vulpia X Vulpia Vulpia X Achillea, Vulpia X Bromus,Vulpia X Cirsium
Achillea Achillea X Achillea Achillea X Bromus, Achillea X Cirsium, Achillea X Vulpia
Cirsium Cirsium X Cirsium Cirsium X Achillea, Cirsium X Broums, Cirsium X Vulpia
116
Field Study: Determination of
Cirsium arvense competition
in situ
Greenhouse studies have advantages (Gibson et al., 1999) but do not adequately
account for all of the biotic and abiotic variables impacting plants in their natural
environments (Tilman, 1988; Goldberg & Barton, 1992; Grime, 2001). To determine
competition of Cirsium arvense in its natural environment, a field study was conducted.
Nineteen paired plots (n=38) each containing a centrally located Cirsium arvense
were selected (Figure 44). Each plot pair was separated by ≤ 3 m. Initial ground cover
vegetation was recorded for each plot on May 19, 2011. Sites were selected that had
similar initial starting Cirsium characteristics (height, number of leaves, and longest leaf)
and similar ground cover. An NMS Ordination using the cover values was conducted to
visually determine if starting pairs had similar vegetation. Specific parameters for this
test included a Sorensen (Bray-Curtis) distance measure with 50 runs and two axes; the
stability criterion was set at 0.00001 with 15 iterations. The maximum number of
iterations was set at 100 with step down in dimensionality. The initial step length was
0.20 with random numbers serving as the source (100 randomizations). To statistically
verify the results of the NMS, MRPP analysis was conducted.
Following the initial recording of ground cover, one of the paired plots was
randomly selected and served as a control. Within the control plots, all of the vegetation
but the centrally located Cirsium was removed. Continued removal of vegetation in these
plots was conducted weekly throughout the length of the experiment. In the competition
plots, vegetation was not removed. Weekly measurements of growth parameters (height,
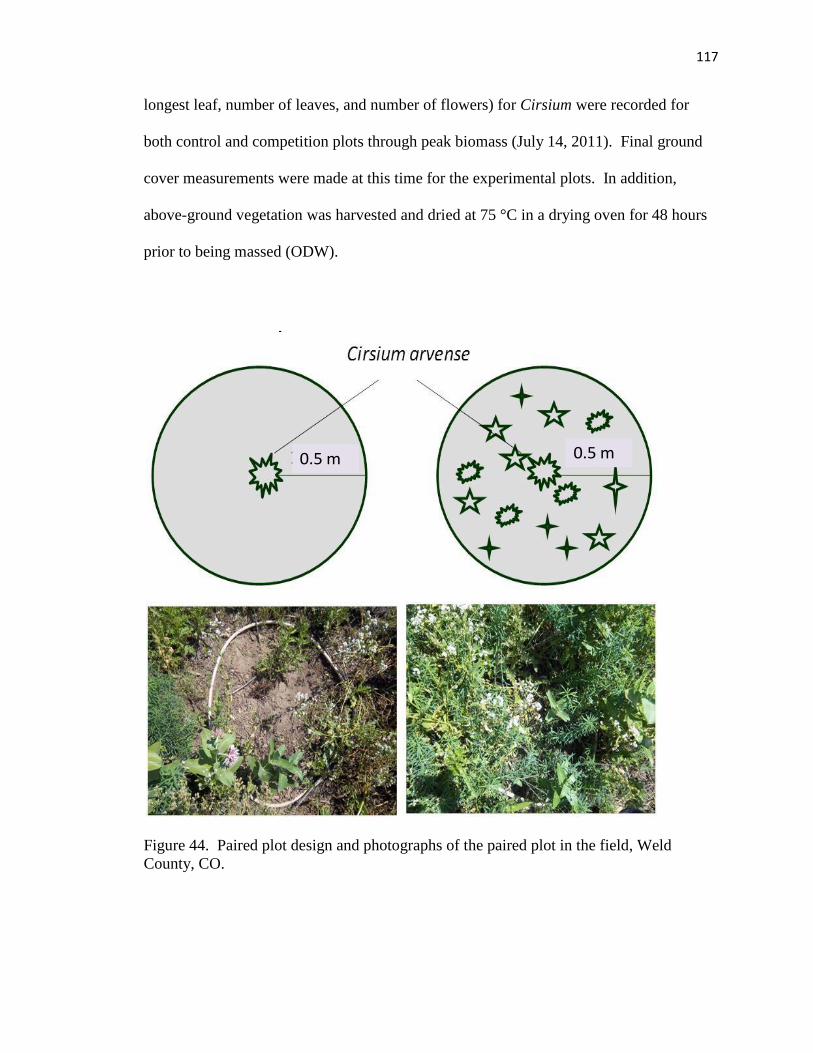
117
longest leaf, number of leaves, and number of flowers) for Cirsium were recorded for
both control and competition plots through peak biomass (July 14, 2011). Final ground
cover measurements were made at this time for the experimental plots. In addition,
above-ground vegetation was harvested and dried at 75 °C in a drying oven for 48 hours
prior to being massed (ODW).
Figure 44. Paired plot design and photographs of the paired plot in the field, Weld
County, CO.
• Results: In Situ CirsiumCompetition
0.5 m0.5 m
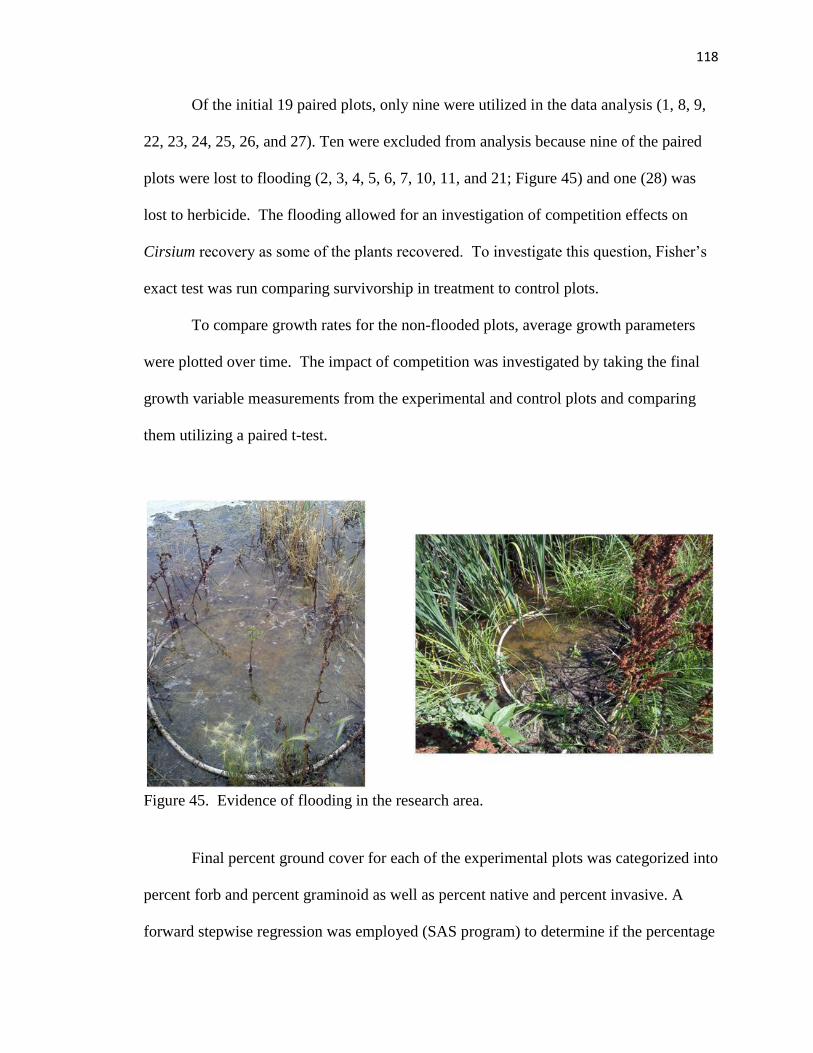
118
Of the initial 19 paired plots, only nine were utilized in the data analysis (1, 8, 9,
22, 23, 24, 25, 26, and 27). Ten were excluded from analysis because nine of the paired
plots were lost to flooding (2, 3, 4, 5, 6, 7, 10, 11, and 21; Figure 45) and one (28) was
lost to herbicide. The flooding allowed for an investigation of competition effects on
Cirsium recovery as some of the plants recovered. To investigate this question, Fisher’s
exact test was run comparing survivorship in treatment to control plots.
To compare growth rates for the non-flooded plots, average growth parameters
were plotted over time. The impact of competition was investigated by taking the final
growth variable measurements from the experimental and control plots and comparing
them utilizing a paired t-test.
Figure 45. Evidence of flooding in the research area.
Final percent ground cover for each of the experimental plots was categorized into
percent forb and percent graminoid as well as percent native and percent invasive. A
forward stepwise regression was employed (SAS program) to determine if the percentage
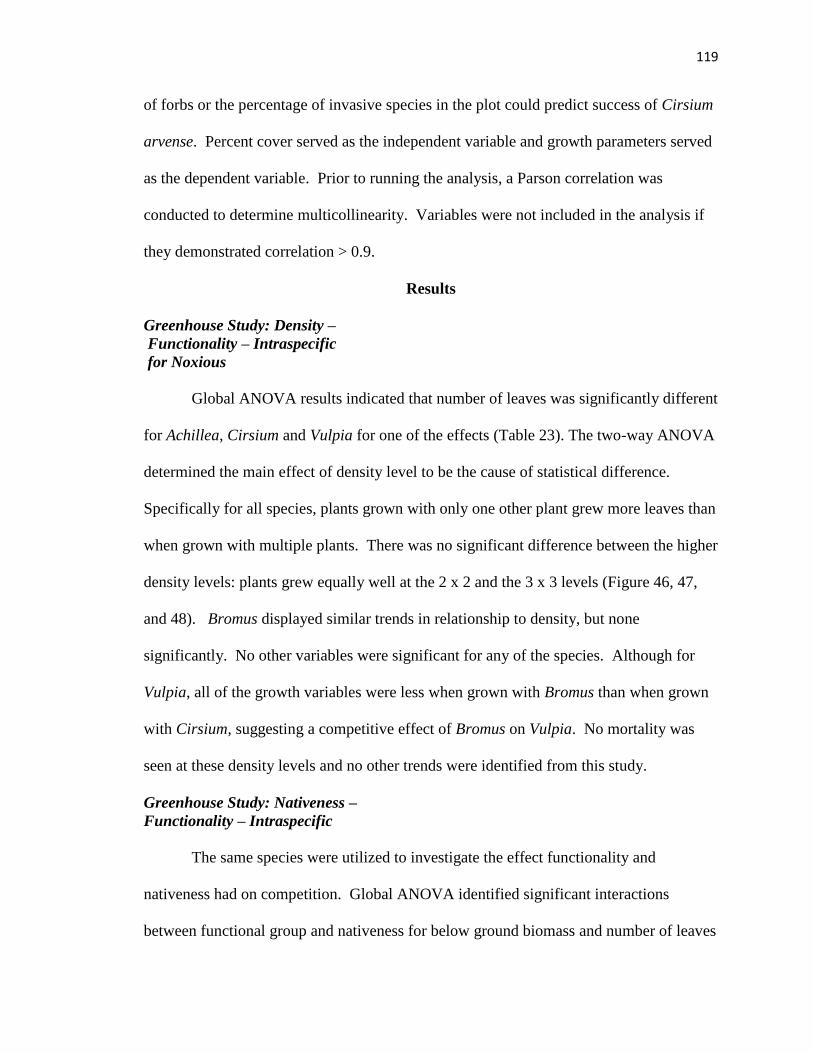
119
of forbs or the percentage of invasive species in the plot could predict success of Cirsium
arvense. Percent cover served as the independent variable and growth parameters served
as the dependent variable. Prior to running the analysis, a Parson correlation was
conducted to determine multicollinearity. Variables were not included in the analysis if
they demonstrated correlation > 0.9.
Results
Greenhouse Study: Density –
Functionality – Intraspecific
for Noxious
Global ANOVA results indicated that number of leaves was significantly different
for Achillea, Cirsium and Vulpia for one of the effects (Table 23). The two-way ANOVA
determined the main effect of density level to be the cause of statistical difference.
Specifically for all species, plants grown with only one other plant grew more leaves than
when grown with multiple plants. There was no significant difference between the higher
density levels: plants grew equally well at the 2 x 2 and the 3 x 3 levels (Figure 46, 47,
and 48). Bromus displayed similar trends in relationship to density, but none
significantly. No other variables were significant for any of the species. Although for
Vulpia, all of the growth variables were less when grown with Bromus than when grown
with Cirsium, suggesting a competitive effect of Bromus on Vulpia. No mortality was
seen at these density levels and no other trends were identified from this study.
Greenhouse Study: Nativeness –
Functionality – Intraspecific
The same species were utilized to investigate the effect functionality and
nativeness had on competition. Global ANOVA identified significant interactions
between functional group and nativeness for below ground biomass and number of leaves
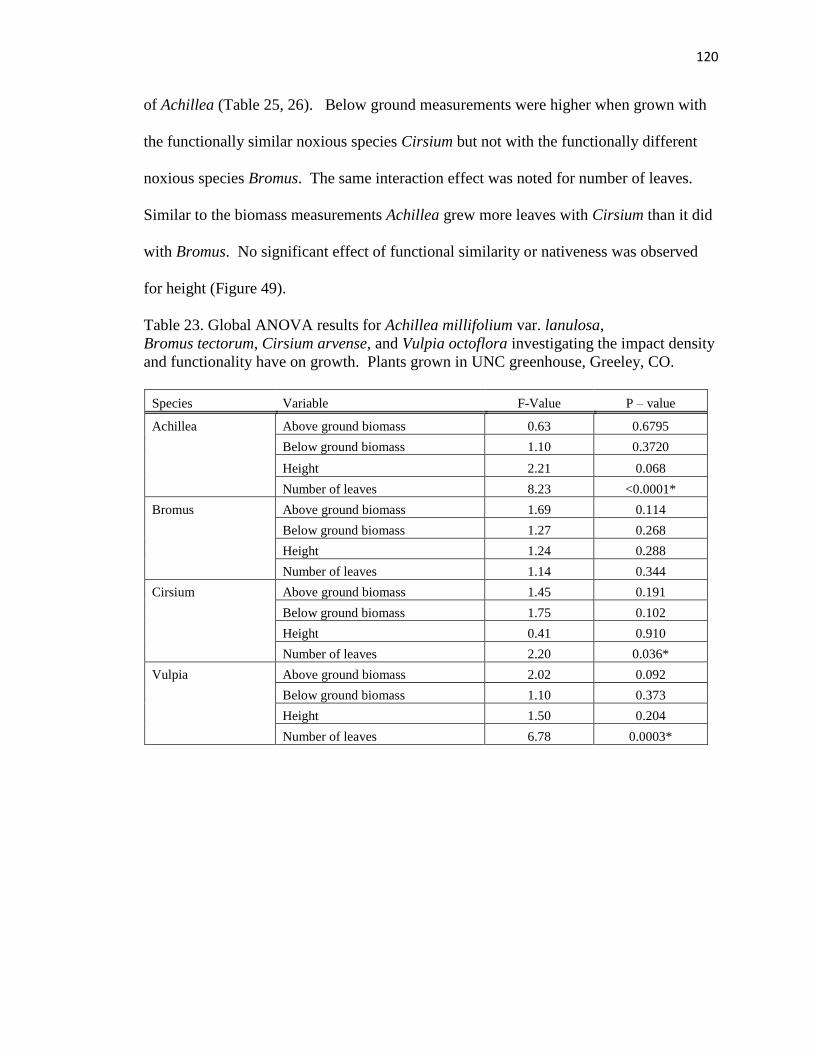
120
of Achillea (Table 25, 26). Below ground measurements were higher when grown with
the functionally similar noxious species Cirsium but not with the functionally different
noxious species Bromus. The same interaction effect was noted for number of leaves.
Similar to the biomass measurements Achillea grew more leaves with Cirsium than it did
with Bromus. No significant effect of functional similarity or nativeness was observed
for height (Figure 49).
Table 23. Global ANOVA results for Achillea millifolium var. lanulosa,
Bromus tectorum, Cirsium arvense, and Vulpia octoflora investigating the impact density
and functionality have on growth. Plants grown in UNC greenhouse, Greeley, CO.
Species Variable F-Value P – value
Achillea Above ground biomass 0.63 0.6795
Below ground biomass 1.10 0.3720
Height 2.21 0.068
Number of leaves 8.23 <0.0001*
Bromus Above ground biomass 1.69 0.114
Below ground biomass 1.27 0.268
Height 1.24 0.288
Number of leaves 1.14 0.344
Cirsium Above ground biomass 1.45 0.191
Below ground biomass 1.75 0.102
Height 0.41 0.910
Number of leaves 2.20 0.036*
Vulpia Above ground biomass 2.02 0.092
Below ground biomass 1.10 0.373
Height 1.50 0.204
Number of leaves 6.78 0.0003*
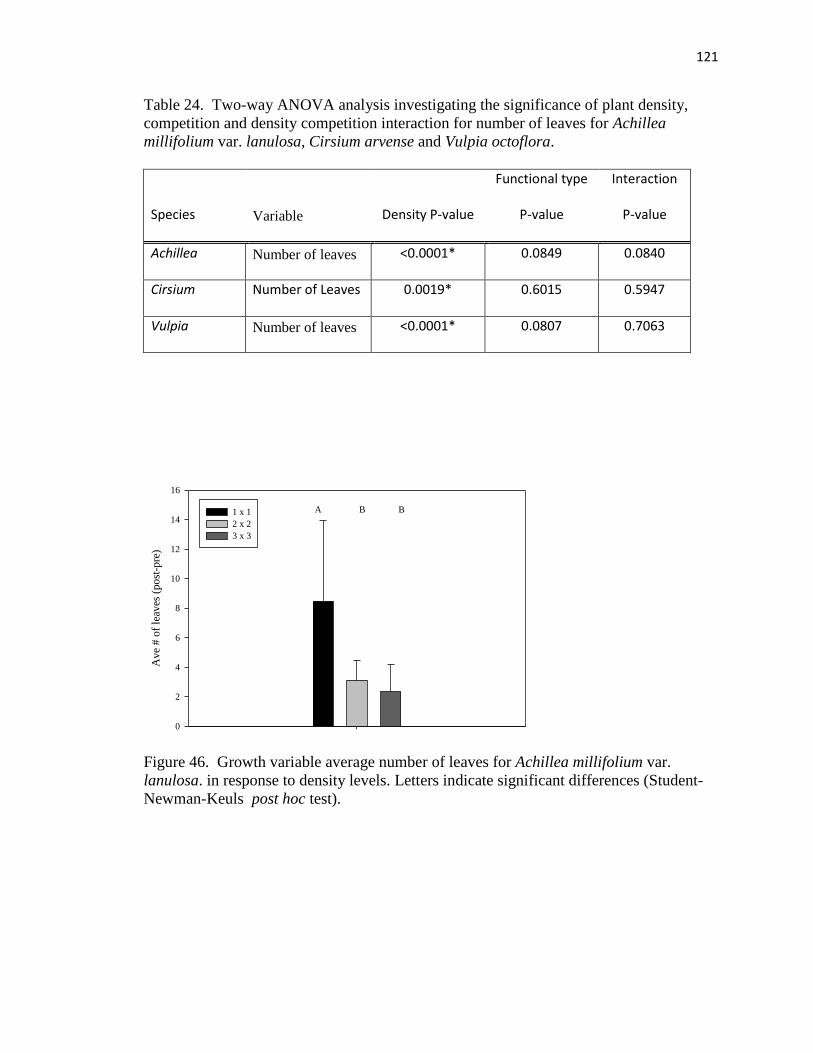
121
Table 24. Two-way ANOVA analysis investigating the significance of plant density,
competition and density competition interaction for number of leaves for Achillea
millifolium var. lanulosa, Cirsium arvense and Vulpia octoflora.
Species Variable Density P-value
Functional type
P-value
Interaction
P-value
Achillea Number of leaves <0.0001* 0.0849 0.0840
Cirsium Number of Leaves 0.0019* 0.6015 0.5947
Vulpia Number of leaves <0.0001* 0.0807 0.7063
Figure 46. Growth variable average number of leaves for Achillea millifolium var.
lanulosa. in response to density levels. Letters indicate significant differences (Student-
Newman-Keuls post hoc test).
Ave
# o
f le
aves
(post
-pre
)
0
2
4
6
8
10
12
14
16
1 x 1
2 x 2
3 x 3
A B B
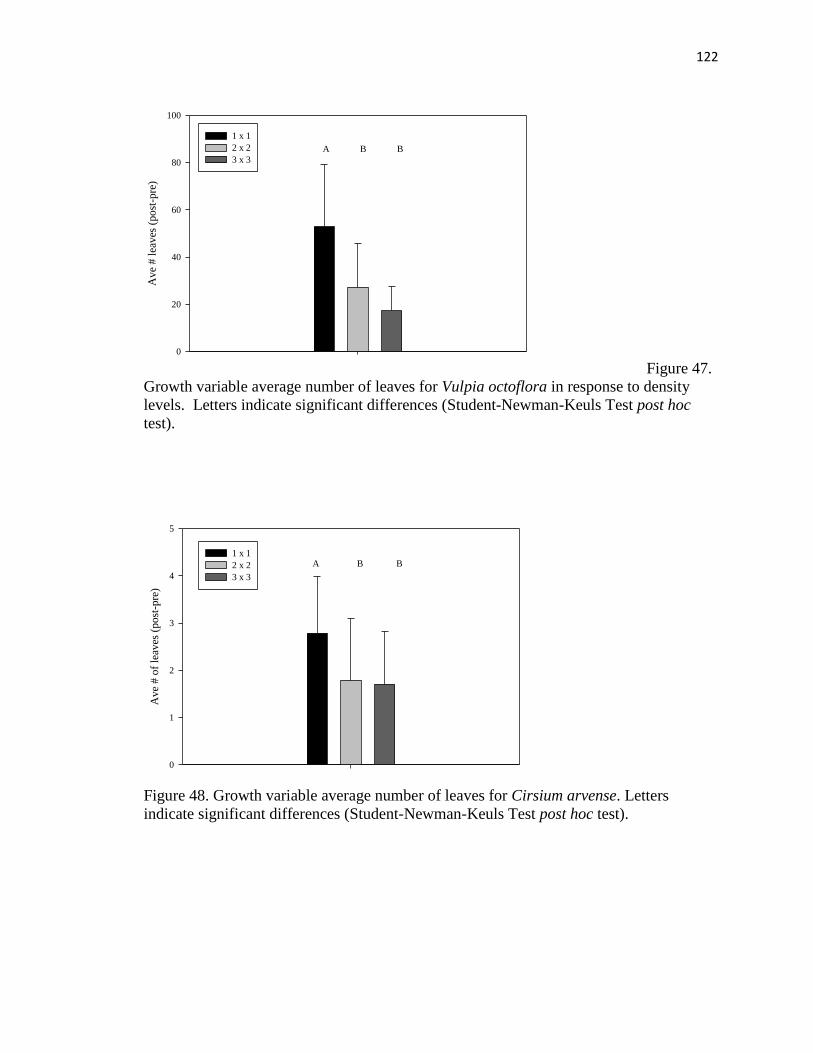
122
Figure 47.
Growth variable average number of leaves for Vulpia octoflora in response to density
levels. Letters indicate significant differences (Student-Newman-Keuls Test post hoc
test).
Figure 48. Growth variable average number of leaves for Cirsium arvense. Letters
indicate significant differences (Student-Newman-Keuls Test post hoc test).
Ave
# l
eaves
(post
-pre
)
0
20
40
60
80
100
1 x 1
2 x 2
3 x 3
A B BA
ve
# o
f le
aves
(post
-pre
)
0
1
2
3
4
5
1 x 1
2 x 2
3 x 3
A B B
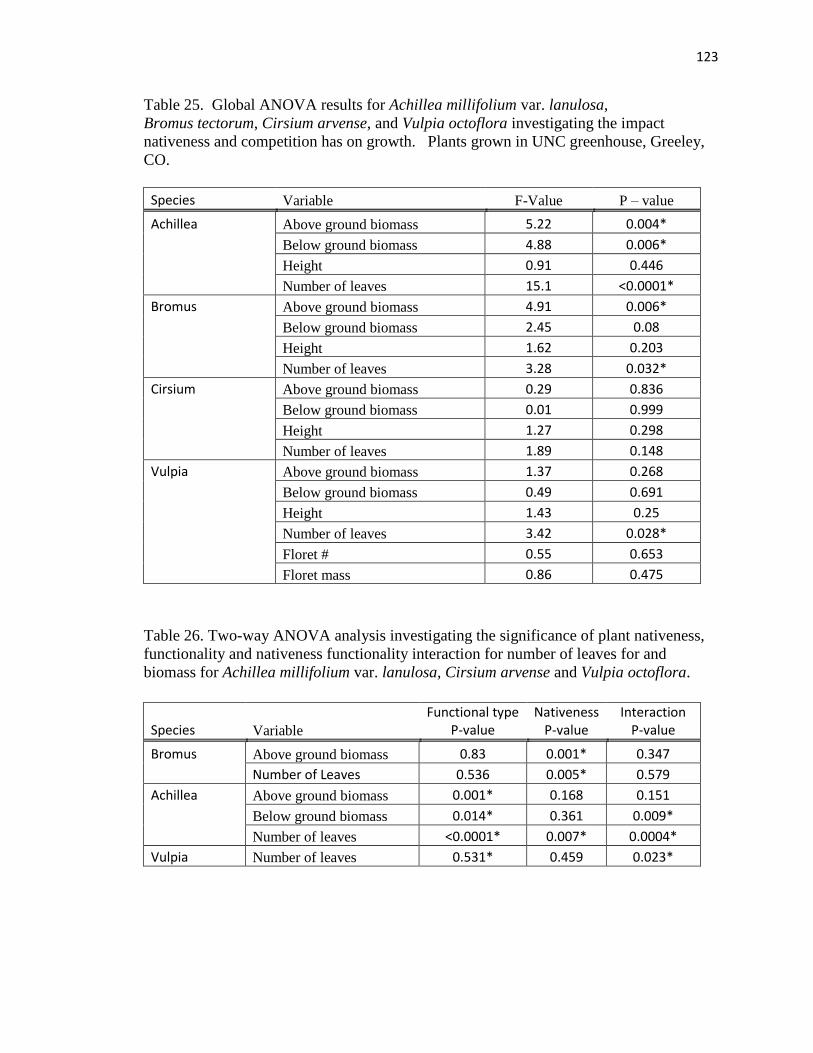
123
Table 25. Global ANOVA results for Achillea millifolium var. lanulosa,
Bromus tectorum, Cirsium arvense, and Vulpia octoflora investigating the impact
nativeness and competition has on growth. Plants grown in UNC greenhouse, Greeley,
CO.
Species Variable F-Value P – value
Achillea Above ground biomass 5.22 0.004*
Below ground biomass 4.88 0.006*
Height 0.91 0.446
Number of leaves 15.1 <0.0001*
Bromus Above ground biomass 4.91 0.006*
Below ground biomass 2.45 0.08
Height 1.62 0.203
Number of leaves 3.28 0.032*
Cirsium Above ground biomass 0.29 0.836
Below ground biomass 0.01 0.999
Height 1.27 0.298
Number of leaves 1.89 0.148
Vulpia Above ground biomass 1.37 0.268
Below ground biomass 0.49 0.691
Height 1.43 0.25
Number of leaves 3.42 0.028*
Floret # 0.55 0.653
Floret mass 0.86 0.475
Table 26. Two-way ANOVA analysis investigating the significance of plant nativeness,
functionality and nativeness functionality interaction for number of leaves for and
biomass for Achillea millifolium var. lanulosa, Cirsium arvense and Vulpia octoflora.
Species Variable
Functional type P-value
Nativeness P-value
Interaction P-value
Bromus Above ground biomass 0.83 0.001* 0.347
Number of Leaves 0.536 0.005* 0.579
Achillea Above ground biomass 0.001* 0.168 0.151
Below ground biomass 0.014* 0.361 0.009*
Number of leaves <0.0001* 0.007* 0.0004*
Vulpia Number of leaves 0.531* 0.459 0.023*
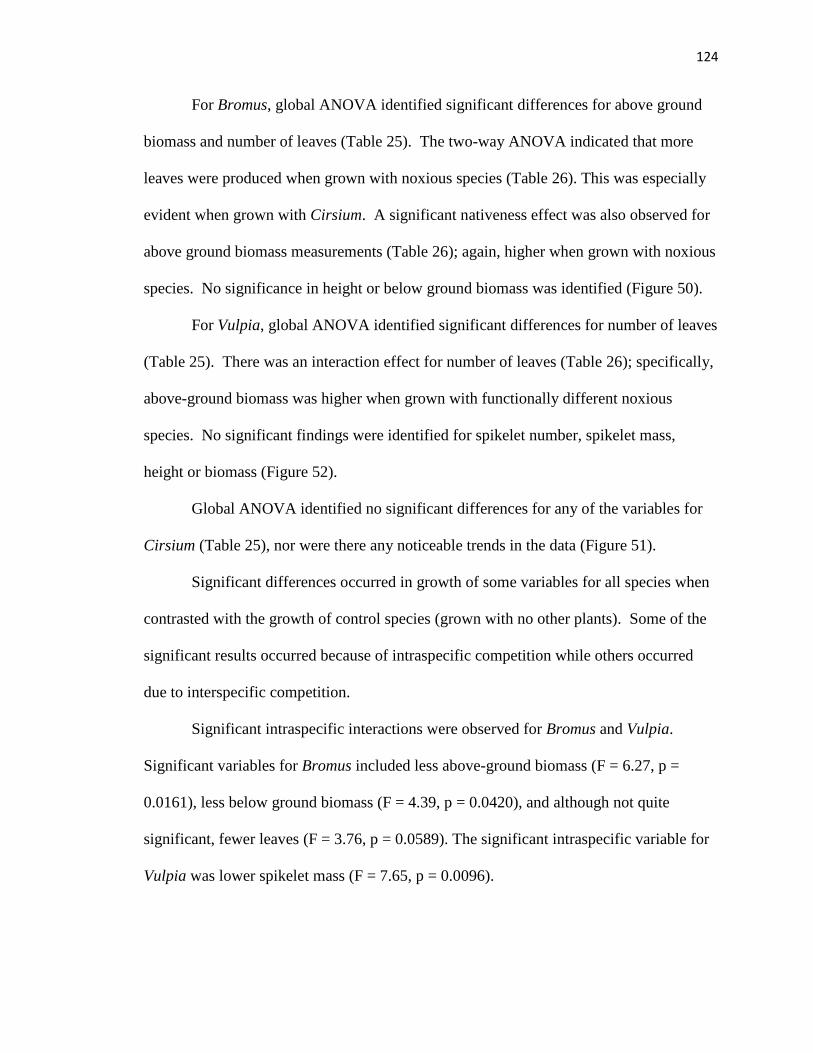
124
For Bromus, global ANOVA identified significant differences for above ground
biomass and number of leaves (Table 25). The two-way ANOVA indicated that more
leaves were produced when grown with noxious species (Table 26). This was especially
evident when grown with Cirsium. A significant nativeness effect was also observed for
above ground biomass measurements (Table 26); again, higher when grown with noxious
species. No significance in height or below ground biomass was identified (Figure 50).
For Vulpia, global ANOVA identified significant differences for number of leaves
(Table 25). There was an interaction effect for number of leaves (Table 26); specifically,
above-ground biomass was higher when grown with functionally different noxious
species. No significant findings were identified for spikelet number, spikelet mass,
height or biomass (Figure 52).
Global ANOVA identified no significant differences for any of the variables for
Cirsium (Table 25), nor were there any noticeable trends in the data (Figure 51).
Significant differences occurred in growth of some variables for all species when
contrasted with the growth of control species (grown with no other plants). Some of the
significant results occurred because of intraspecific competition while others occurred
due to interspecific competition.
Significant intraspecific interactions were observed for Bromus and Vulpia.
Significant variables for Bromus included less above-ground biomass (F = 6.27, p =
0.0161), less below ground biomass (F = 4.39, p = 0.0420), and although not quite
significant, fewer leaves (F = 3.76, p = 0.0589). The significant intraspecific variable for
Vulpia was lower spikelet mass (F = 7.65, p = 0.0096).
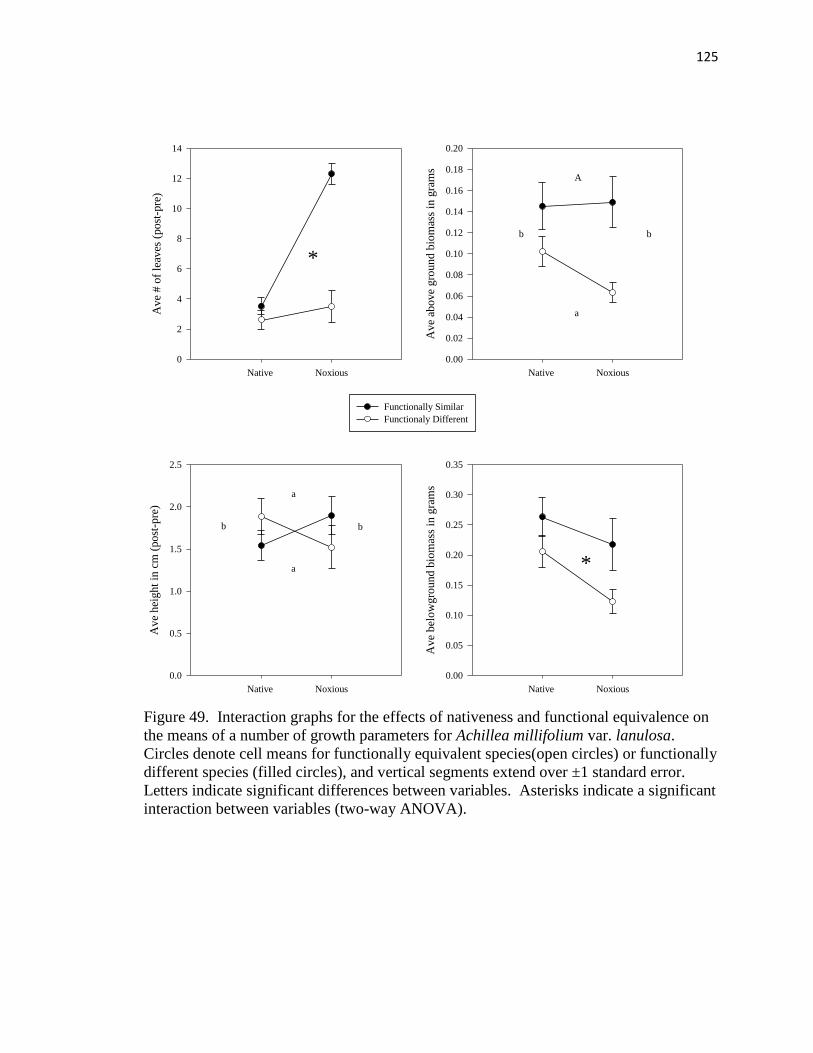
125
Figure 49. Interaction graphs for the effects of nativeness and functional equivalence on
the means of a number of growth parameters for Achillea millifolium var. lanulosa.
Circles denote cell means for functionally equivalent species(open circles) or functionally
different species (filled circles), and vertical segments extend over ±1 standard error.
Letters indicate significant differences between variables. Asterisks indicate a significant
interaction between variables (two-way ANOVA).
Native Noxious
Ave
above
gro
und b
iom
ass
in g
ram
s
0.00
0.02
0.04
0.06
0.08
0.10
0.12
0.14
0.16
0.18
0.20
Functionally Similar
Functionaly Different
Native Noxious
Ave
bel
ow
gro
und b
iom
ass
in g
ram
s
0.00
0.05
0.10
0.15
0.20
0.25
0.30
0.35
b b
A
a
A
a
b b
Native Noxious
Ave
# o
f le
aves
(post
-pre
)
0
2
4
6
8
10
12
14
*
Native Noxious
Ave
hei
ght
in c
m (
post
-pre
)
0.0
0.5
1.0
1.5
2.0
2.5
a
a
b b
*
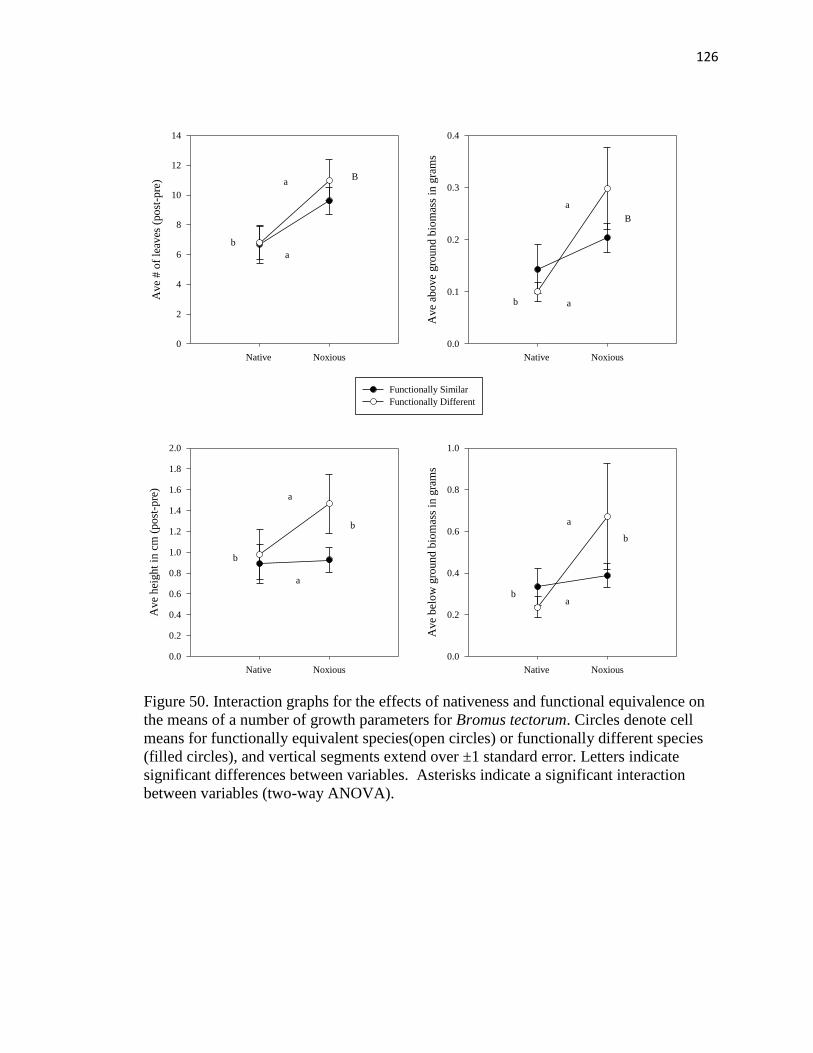
126
Figure 50. Interaction graphs for the effects of nativeness and functional equivalence on
the means of a number of growth parameters for Bromus tectorum. Circles denote cell
means for functionally equivalent species(open circles) or functionally different species
(filled circles), and vertical segments extend over ±1 standard error. Letters indicate
significant differences between variables. Asterisks indicate a significant interaction
between variables (two-way ANOVA).
Native Noxious
Ave
# o
f le
aves
(post
-pre
)
0
2
4
6
8
10
12
14
Native Noxious
Ave
hei
ght
in c
m (
post
-pre
)
0.0
0.2
0.4
0.6
0.8
1.0
1.2
1.4
1.6
1.8
2.0
Native Noxious
Ave
above
gro
und b
iom
ass
in g
ram
s
0.0
0.1
0.2
0.3
0.4
Functionally Similar
Functionally Different
Native Noxious
Ave
bel
ow
gro
und b
iom
ass
in g
ram
s
0.0
0.2
0.4
0.6
0.8
1.0
a
a
B
b
a
ab
b
b
Ba
a
a
a
b
b
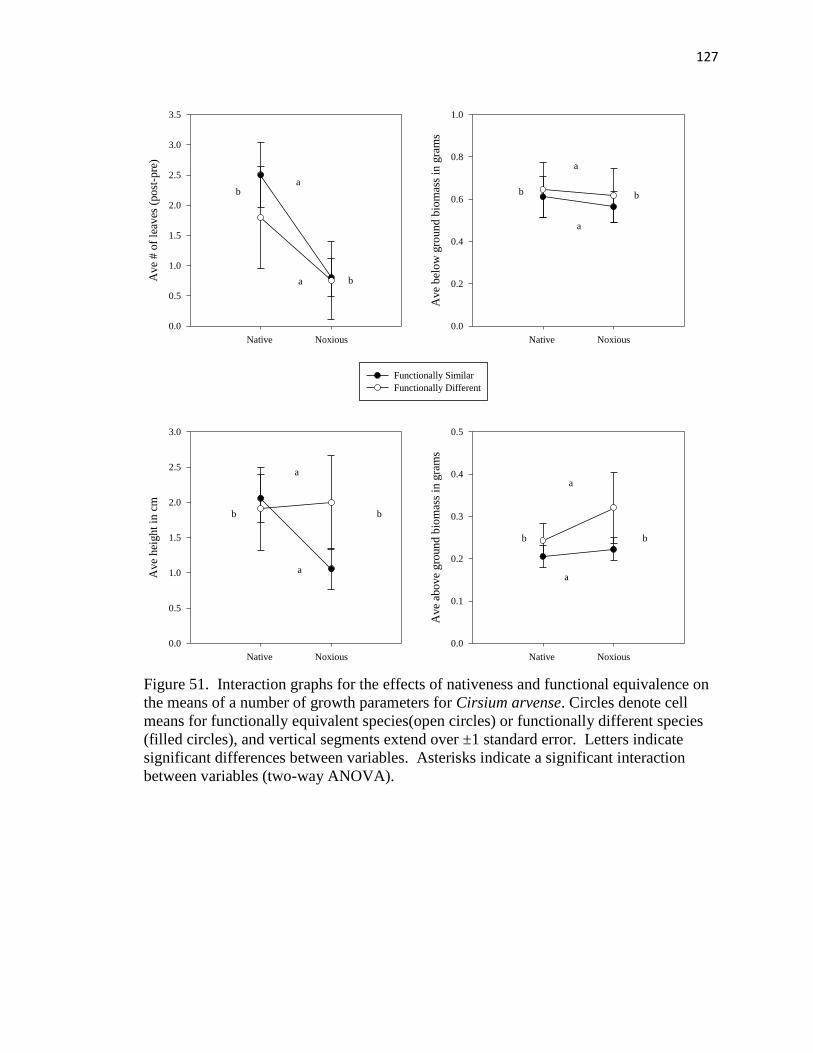
127
Figure 51. Interaction graphs for the effects of nativeness and functional equivalence on
the means of a number of growth parameters for Cirsium arvense. Circles denote cell
means for functionally equivalent species(open circles) or functionally different species
(filled circles), and vertical segments extend over ±1 standard error. Letters indicate
significant differences between variables. Asterisks indicate a significant interaction
between variables (two-way ANOVA).
Native Noxious
Av
e #
of
leav
es (
po
st-p
re)
0.0
0.5
1.0
1.5
2.0
2.5
3.0
3.5
Functionally Similar
Functionally Different
Native Noxious
Av
e h
eigh
t in
cm
0.0
0.5
1.0
1.5
2.0
2.5
3.0
Native Noxious
Av
e b
elo
w g
roun
d b
iom
ass
in g
ram
s
0.0
0.2
0.4
0.6
0.8
1.0
Native Noxious
Av
e ab
ov
e gro
un
d b
iom
ass
in g
ram
s
0.0
0.1
0.2
0.3
0.4
0.5
a
a
b
b
b b
a
a
a
a
b b
b b
a
a
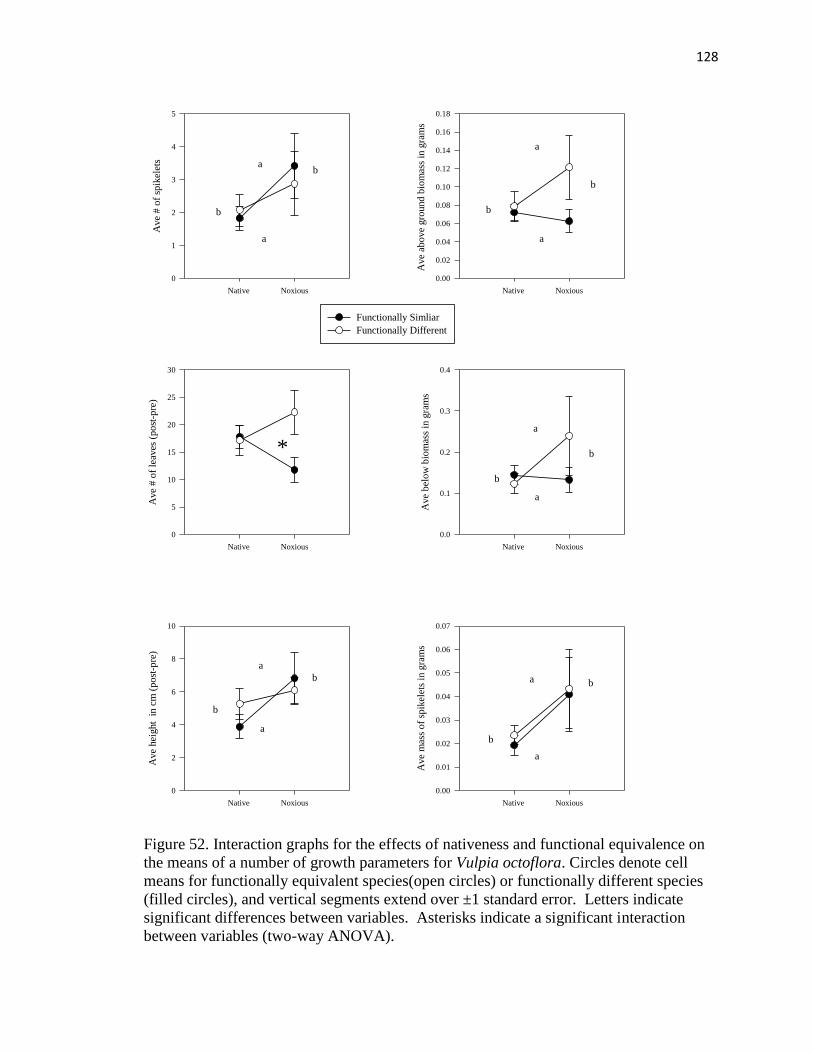
128
Figure 52. Interaction graphs for the effects of nativeness and functional equivalence on
the means of a number of growth parameters for Vulpia octoflora. Circles denote cell
means for functionally equivalent species(open circles) or functionally different species
(filled circles), and vertical segments extend over ±1 standard error. Letters indicate
significant differences between variables. Asterisks indicate a significant interaction
between variables (two-way ANOVA).
Native Noxious
Ave
# o
f le
aves
(p
ost
-pre
)
0
5
10
15
20
25
30
Native Noxious
Ave
hei
ght
in c
m (
po
st-p
re)
0
2
4
6
8
10
Native Noxious
Ave
abo
ve
gro
und
bio
mas
s in
gra
ms
0.00
0.02
0.04
0.06
0.08
0.10
0.12
0.14
0.16
0.18
Functionally Simliar
Functionally Different
Native Noxious
Ave
bel
ow
bio
mas
s in
gra
ms
0.0
0.1
0.2
0.3
0.4
Native Noxious
Ave
# o
f sp
ikel
ets
0
1
2
3
4
5
Native Noxious
Ave
mas
s o
f sp
ikel
ets
in g
ram
s
0.00
0.01
0.02
0.03
0.04
0.05
0.06
0.07
a
a a
a
b
b
a
a
*
b
b
b
b
b
b
a
a
a
a
b
b
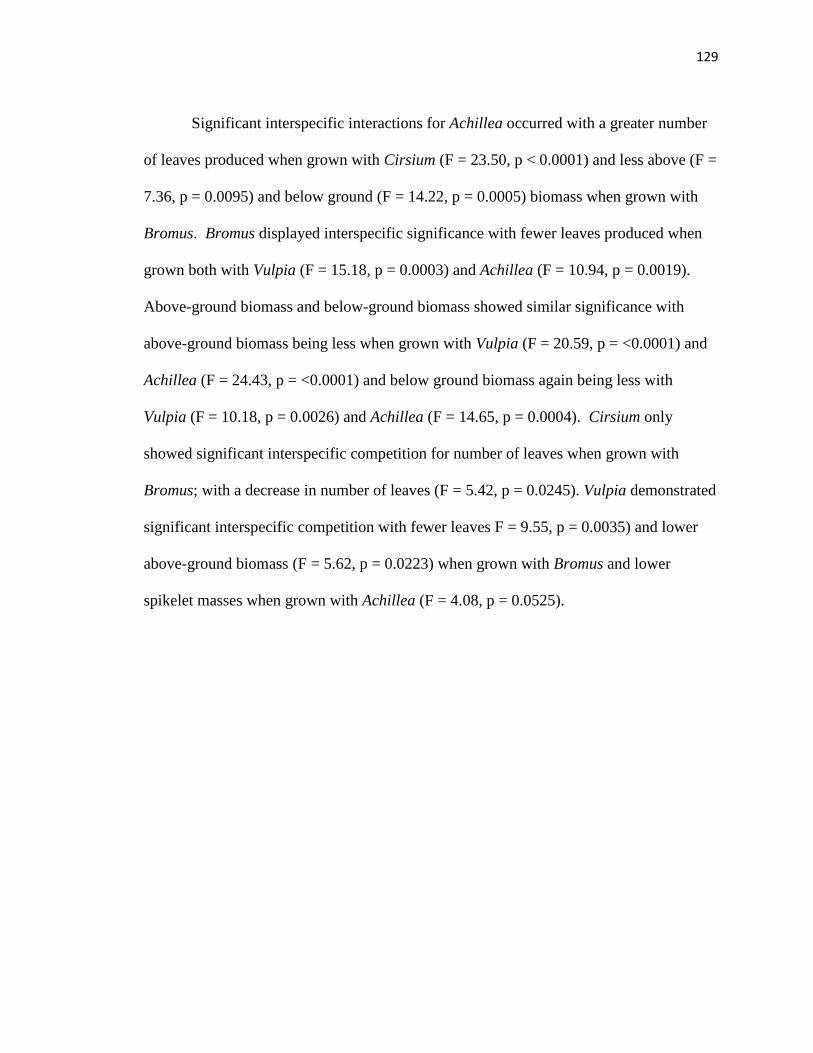
129
Significant interspecific interactions for Achillea occurred with a greater number
of leaves produced when grown with Cirsium (F = 23.50, p < 0.0001) and less above (F =
7.36, p = 0.0095) and below ground (F = 14.22, p = 0.0005) biomass when grown with
Bromus. Bromus displayed interspecific significance with fewer leaves produced when
grown both with Vulpia (F = 15.18, p = 0.0003) and Achillea (F = 10.94, p = 0.0019).
Above-ground biomass and below-ground biomass showed similar significance with
above-ground biomass being less when grown with Vulpia (F = 20.59, p = <0.0001) and
Achillea (F = 24.43, p = <0.0001) and below ground biomass again being less with
Vulpia (F = 10.18, p = 0.0026) and Achillea (F = 14.65, p = 0.0004). Cirsium only
showed significant interspecific competition for number of leaves when grown with
Bromus; with a decrease in number of leaves (F = 5.42, p = 0.0245). Vulpia demonstrated
significant interspecific competition with fewer leaves F = 9.55, p = 0.0035) and lower
above-ground biomass (F = 5.62, p = 0.0223) when grown with Bromus and lower
spikelet masses when grown with Achillea (F = 4.08, p = 0.0525).
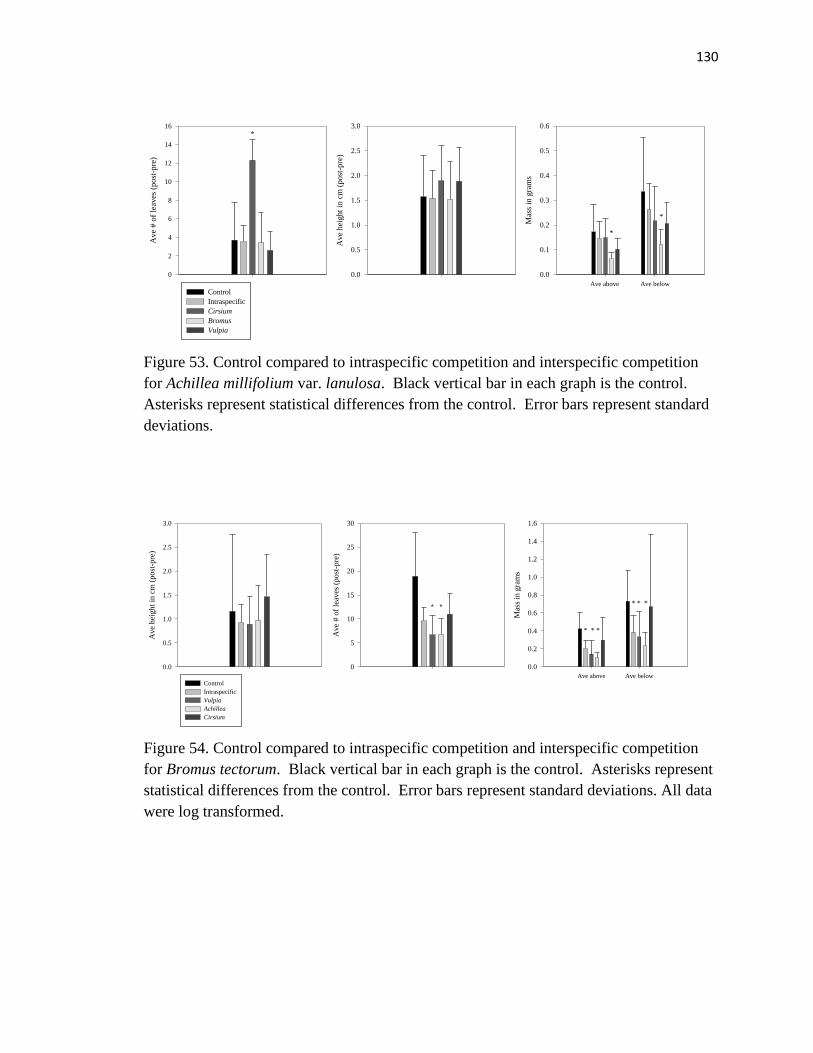
130
Figure 53. Control compared to intraspecific competition and interspecific competition
for Achillea millifolium var. lanulosa. Black vertical bar in each graph is the control.
Asterisks represent statistical differences from the control. Error bars represent standard
deviations.
Figure 54. Control compared to intraspecific competition and interspecific competition
for Bromus tectorum. Black vertical bar in each graph is the control. Asterisks represent
statistical differences from the control. Error bars represent standard deviations. All data
were log transformed.
Ave
# o
f le
aves
(p
ost
-pre
)
0
2
4
6
8
10
12
14
16
Ave above Ave below
Mas
s in
gra
ms
0.0
0.1
0.2
0.3
0.4
0.5
0.6
Control
Intraspecific
Cirsium
Bromus
Vulpia
Ave
hei
gh
t in
cm
(p
ost
-pre
)
0.0
0.5
1.0
1.5
2.0
2.5
3.0*
*
*
Ave
# o
f le
aves
(p
ost
-pre
)
0
5
10
15
20
25
30
Control
Intraspecific
Vulpia
Achillea
Cirsium
Ave
hei
gh
t in
cm
(p
ost
-pre
)
0.0
0.5
1.0
1.5
2.0
2.5
3.0
Ave above Ave below
Mas
s in
gra
ms
0.0
0.2
0.4
0.6
0.8
1.0
1.2
1.4
1.6
* * *
* * ** *
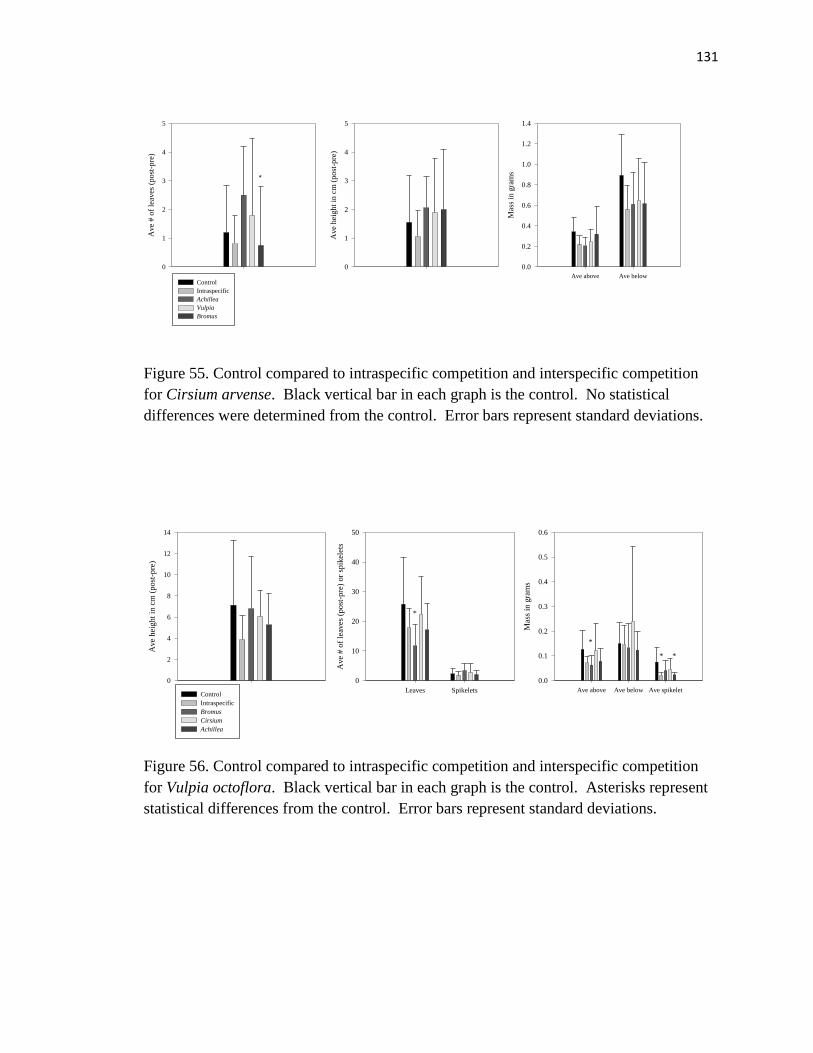
131
Figure 55. Control compared to intraspecific competition and interspecific competition
for Cirsium arvense. Black vertical bar in each graph is the control. No statistical
differences were determined from the control. Error bars represent standard deviations.
Figure 56. Control compared to intraspecific competition and interspecific competition
for Vulpia octoflora. Black vertical bar in each graph is the control. Asterisks represent
statistical differences from the control. Error bars represent standard deviations.
Ave
hei
gh
t in
cm
(p
ost
-pre
)
0
1
2
3
4
5
Control
Intraspecific
Achillea
Vulpia
Bromus
Ave
# o
f le
aves
(p
ost
-pre
)
0
1
2
3
4
5
Ave above Ave below
Mas
s in
gra
ms
0.0
0.2
0.4
0.6
0.8
1.0
1.2
1.4
*
Leaves Spikelets
Ave
# o
f le
aves
(p
ost
-pre
) or
spik
elet
s
0
10
20
30
40
50
Control
Intraspecific
Bromus
Cirsium
Achillea
Ave
hei
gh
t in
cm
(p
ost
-pre
)
0
2
4
6
8
10
12
14
Ave above Ave below Ave spikelet
Mas
s in
gra
ms
0.0
0.1
0.2
0.3
0.4
0.5
0.6
*
*
* *
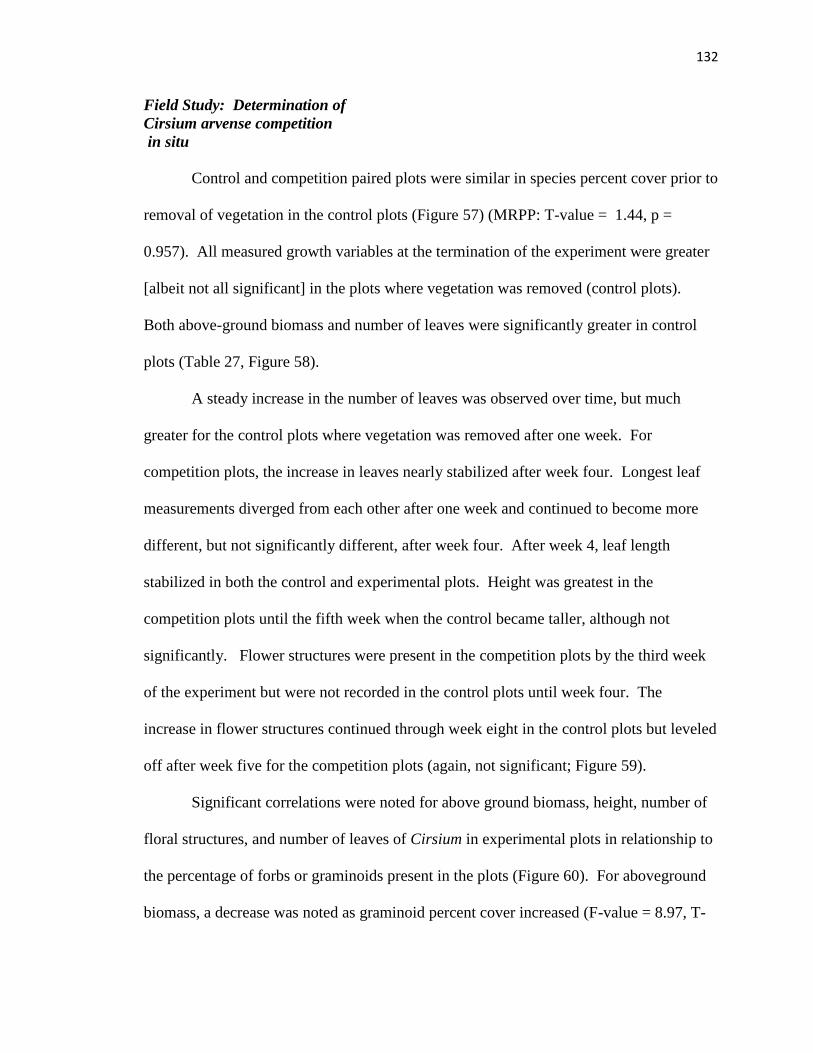
132
Field Study: Determination of
Cirsium arvense competition
in situ
Control and competition paired plots were similar in species percent cover prior to
removal of vegetation in the control plots (Figure 57) (MRPP: T-value = 1.44, p =
0.957). All measured growth variables at the termination of the experiment were greater
[albeit not all significant] in the plots where vegetation was removed (control plots).
Both above-ground biomass and number of leaves were significantly greater in control
plots (Table 27, Figure 58).
A steady increase in the number of leaves was observed over time, but much
greater for the control plots where vegetation was removed after one week. For
competition plots, the increase in leaves nearly stabilized after week four. Longest leaf
measurements diverged from each other after one week and continued to become more
different, but not significantly different, after week four. After week 4, leaf length
stabilized in both the control and experimental plots. Height was greatest in the
competition plots until the fifth week when the control became taller, although not
significantly. Flower structures were present in the competition plots by the third week
of the experiment but were not recorded in the control plots until week four. The
increase in flower structures continued through week eight in the control plots but leveled
off after week five for the competition plots (again, not significant; Figure 59).
Significant correlations were noted for above ground biomass, height, number of
floral structures, and number of leaves of Cirsium in experimental plots in relationship to
the percentage of forbs or graminoids present in the plots (Figure 60). For aboveground
biomass, a decrease was noted as graminoid percent cover increased (F-value = 8.97, T-
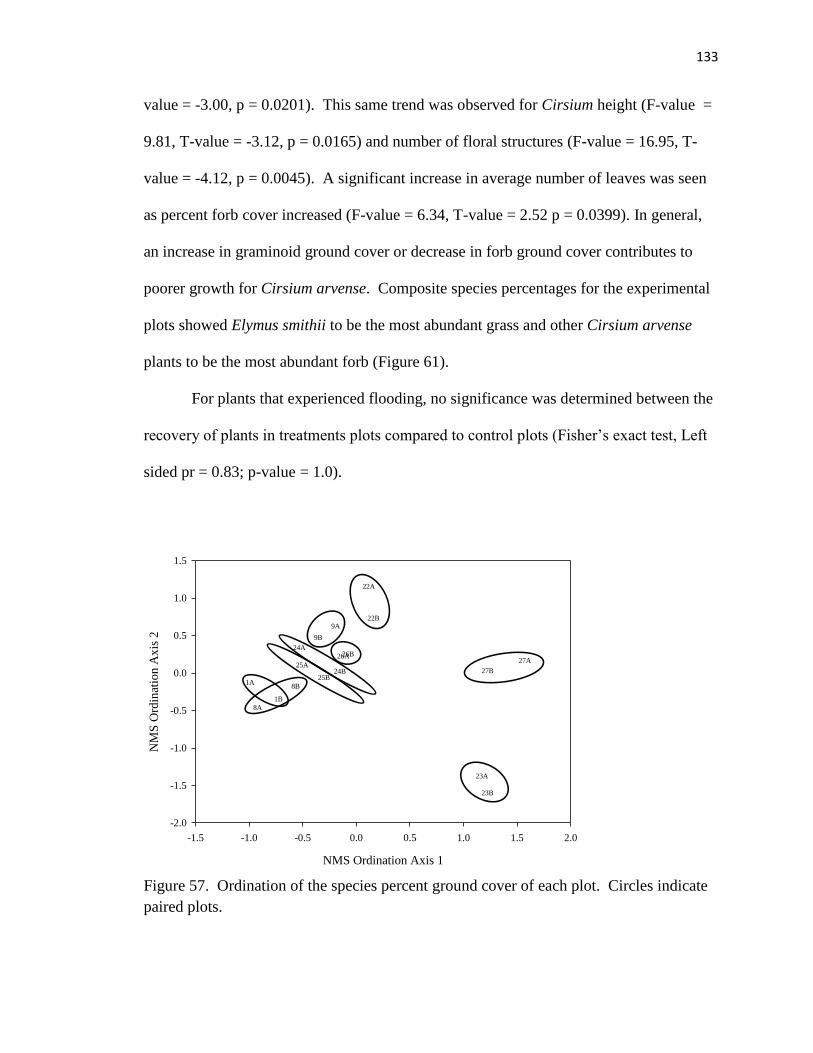
133
value = -3.00, p = 0.0201). This same trend was observed for Cirsium height (F-value =
9.81, T-value = -3.12, p = 0.0165) and number of floral structures (F-value = 16.95, T-
value = -4.12, p = 0.0045). A significant increase in average number of leaves was seen
as percent forb cover increased (F-value = 6.34, T-value = 2.52 p = 0.0399). In general,
an increase in graminoid ground cover or decrease in forb ground cover contributes to
poorer growth for Cirsium arvense. Composite species percentages for the experimental
plots showed Elymus smithii to be the most abundant grass and other Cirsium arvense
plants to be the most abundant forb (Figure 61).
For plants that experienced flooding, no significance was determined between the
recovery of plants in treatments plots compared to control plots (Fisher’s exact test, Left
sided pr = 0.83; p-value = 1.0).
Figure 57. Ordination of the species percent ground cover of each plot. Circles indicate
paired plots.
NMS Ordination Axis 1
-1.5 -1.0 -0.5 0.0 0.5 1.0 1.5 2.0
NM
S O
rdin
atio
n A
xis
2
-2.0
-1.5
-1.0
-0.5
0.0
0.5
1.0
1.5
1A
1B
22A
22B
23A
23B
24A
24B25A
25B
26A26B27A
27B
8A
8B
9A
9B
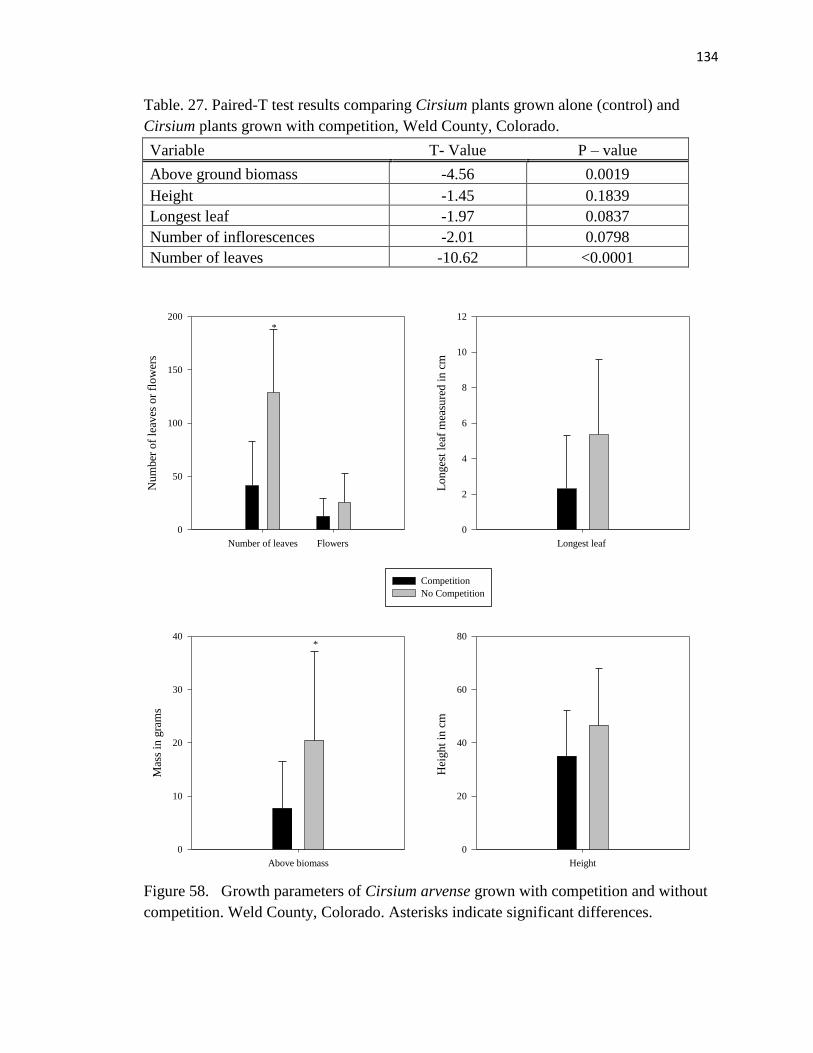
134
Table. 27. Paired-T test results comparing Cirsium plants grown alone (control) and
Cirsium plants grown with competition, Weld County, Colorado.
Variable T- Value P – value
Above ground biomass -4.56 0.0019
Height -1.45 0.1839
Longest leaf -1.97 0.0837
Number of inflorescences -2.01 0.0798
Number of leaves -10.62 <0.0001
Figure 58. Growth parameters of Cirsium arvense grown with competition and without
competition. Weld County, Colorado. Asterisks indicate significant differences.
Number of leaves Flowers
Nu
mber
of
leav
es o
r fl
ow
ers
0
50
100
150
200
Competition
No Competition
Longest leaf
Lo
nges
t le
af m
easu
red
in
cm
0
2
4
6
8
10
12
Height
Hei
gh
t in
cm
0
20
40
60
80
Above biomass
Mas
s in
gra
ms
0
10
20
30
40
*
*
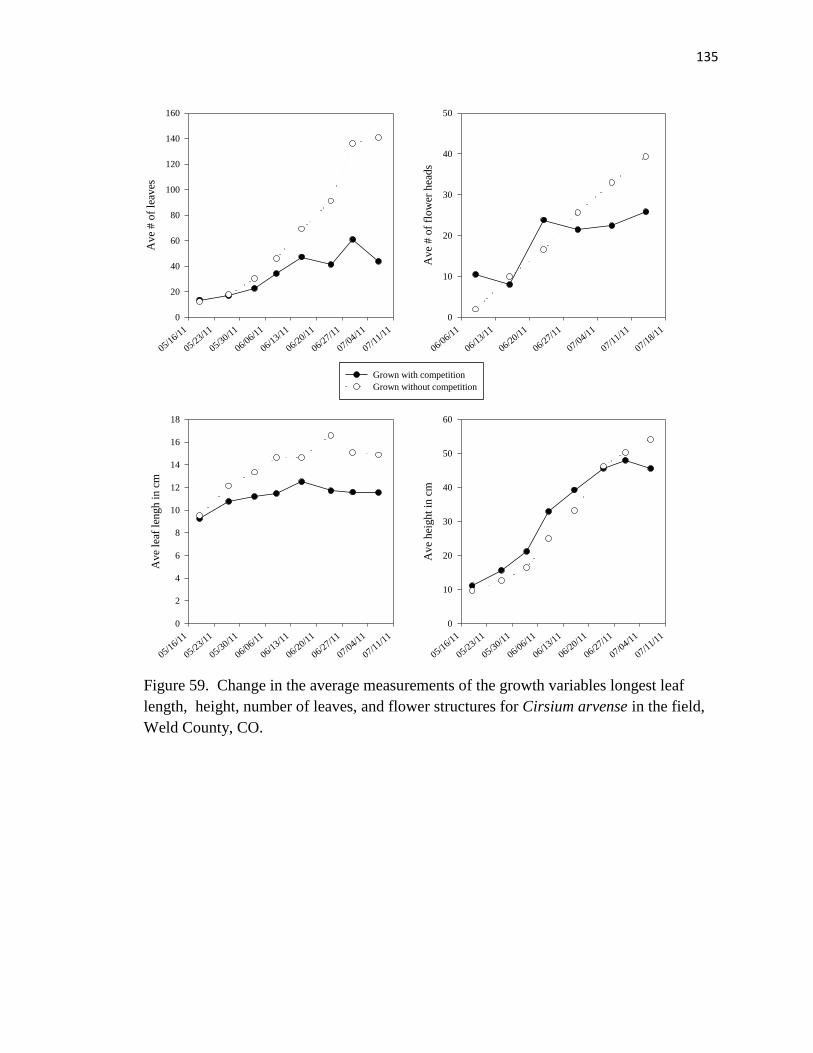
135
Figure 59. Change in the average measurements of the growth variables longest leaf
length, height, number of leaves, and flower structures for Cirsium arvense in the field,
Weld County, CO.
05/16/1
1
05/23/1
1
05/30/1
1
06/06/1
1
06/13/1
1
06/20/1
1
06/27/1
1
07/04/1
1
07/11/1
1
Av
e #
of
leav
es
0
20
40
60
80
100
120
140
160
Grown with competition
Grown without competition
06/06/1
1
06/13/1
1
06/20/1
1
06/27/1
1
07/04/1
1
07/11/1
1
07/18/1
1
Av
e #
of
flo
wer
hea
ds
0
10
20
30
40
50
05/16/1
1
05/23/1
1
05/30/1
1
06/06/1
1
06/13/1
1
06/20/1
1
06/27/1
1
07/04/1
1
07/11/1
1
Av
e le
af l
engh
in
cm
0
2
4
6
8
10
12
14
16
18
05/16/1
1
05/23/1
1
05/30/1
1
06/06/1
1
06/13/1
1
06/20/1
1
06/27/1
1
07/04/1
1
07/11/1
1
Av
e h
eigh
t in
cm
0
10
20
30
40
50
60
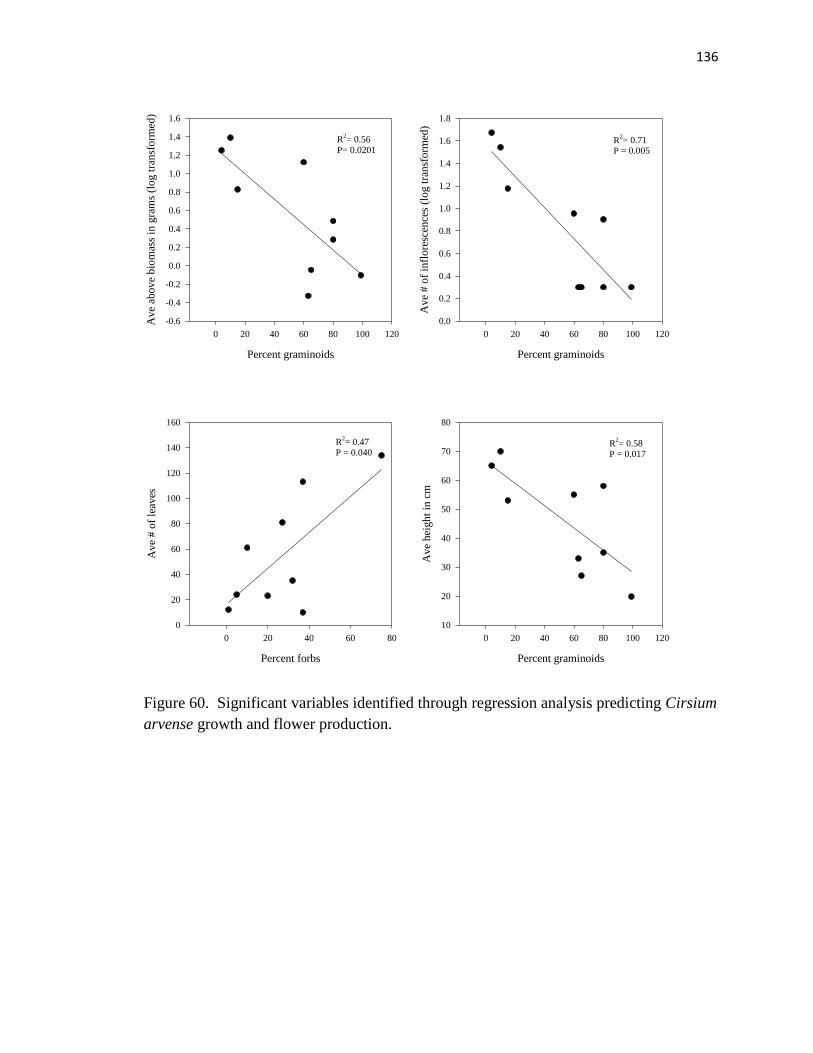
136
Figure 60. Significant variables identified through regression analysis predicting Cirsium
arvense growth and flower production.
Percent graminoids
0 20 40 60 80 100 120
Ave
above
bio
mas
s in
gra
ms
(log t
ransf
orm
ed)
-0.6
-0.4
-0.2
0.0
0.2
0.4
0.6
0.8
1.0
1.2
1.4
1.6
Percent graminoids
0 20 40 60 80 100 120
Ave
# o
f in
flore
scen
ces
(log t
ransf
orm
ed)
0.0
0.2
0.4
0.6
0.8
1.0
1.2
1.4
1.6
1.8
Percent graminoids
0 20 40 60 80 100 120
Ave
hei
ght
in c
m
10
20
30
40
50
60
70
80
Percent forbs
0 20 40 60 80
Ave
# o
f le
aves
0
20
40
60
80
100
120
140
160
R2= 0.56
P= 0.0201 R
2= 0.71
P = 0.005
R2= 0.47
P = 0.040 R
2= 0.58
P = 0.017
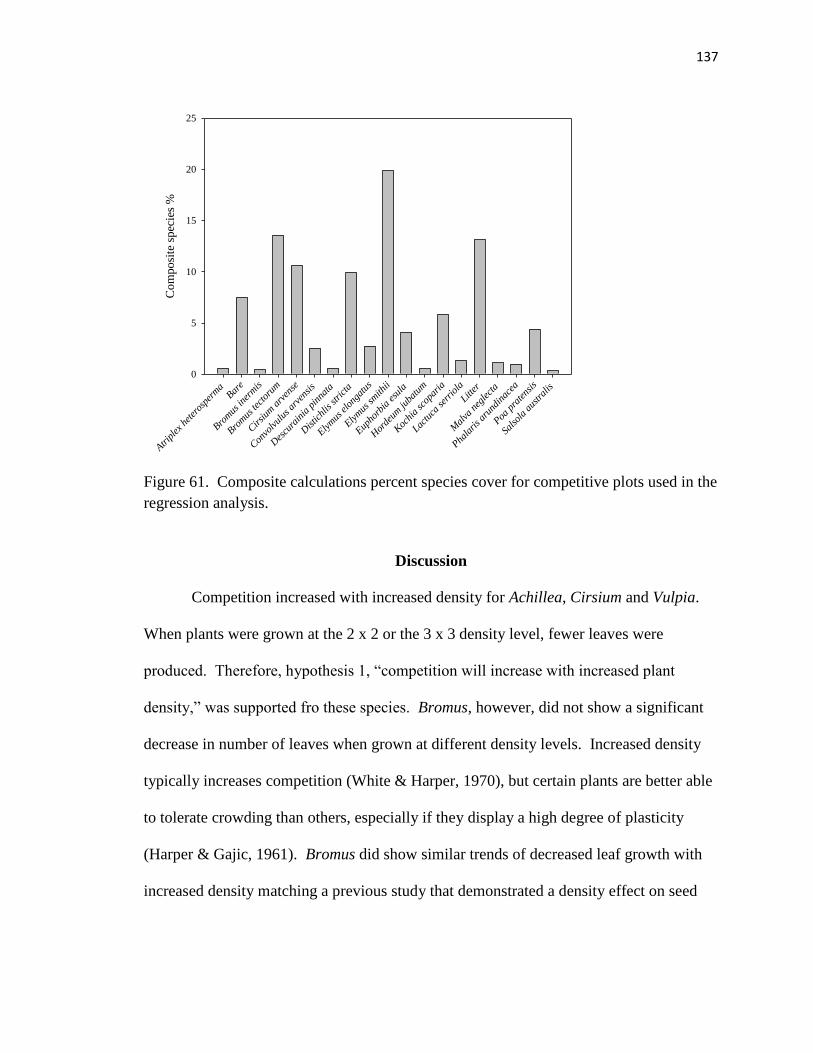
137
Figure 61. Composite calculations percent species cover for competitive plots used in the
regression analysis.
Discussion
Competition increased with increased density for Achillea, Cirsium and Vulpia.
When plants were grown at the 2 x 2 or the 3 x 3 density level, fewer leaves were
produced. Therefore, hypothesis 1, “competition will increase with increased plant
density,” was supported fro these species. Bromus, however, did not show a significant
decrease in number of leaves when grown at different density levels. Increased density
typically increases competition (White & Harper, 1970), but certain plants are better able
to tolerate crowding than others, especially if they display a high degree of plasticity
(Harper & Gajic, 1961). Bromus did show similar trends of decreased leaf growth with
increased density matching a previous study that demonstrated a density effect on seed
Atrip
lex he
tero
sper
ma
Bare
Brom
us in
erm
is
Brom
us te
ctor
um
Cirsium
arv
ense
Con
volv
ulus
arv
ensis
Des
cura
inia
pin
nata
Distic
hlis st
rict
a
Elym
us elo
ngat
us
Elym
us sm
ithii
Eupho
rbia
esu
la
Hor
deum
juba
tum
Koc
hia
scop
aria
Lactu
ca se
rrio
la
Litter
Mal
va n
egle
cta
Phala
ris a
rund
inac
ea
Poa p
rate
nsis
Salsol
a au
stra
lis
Com
posi
te s
pec
ies
%
0
5
10
15
20
25
138
mass for Bromus; the previous study suggested that its plasticity predicted its competitive
success (Palmblad, 1968).
Hypothesis 2, “non-native species will grow better with native species than with
non-native species,” was rejected for Bromus. In fact, Bromus grew significantly better
when grown with noxious plants. Cirsium demonstrated a competitive response to
natives although not siginifcant. For example, it grew more leaves when grown with
natives indicating a positive growth response but also grew taller and had less biomass
indicating more resources were being utilized to grow above the natives (see below).
Some of the growth parameters seemed better indicators of competition than
others. An increase in height did not seem to be an indication of less competition.
Studies have shown that an increase in height is a response to increased levels of
competition especially if the plants are competing for sunlight (Aphalo et al., 1999;
Weinig, 2000). This is apparently what was observed in the Cirsium arvense grown in the
field with competition. The competition group remained taller than the control for most
of the experiment. Longest leaf was not a good indicator of competition for Cirsium, as
the leaves did not continue to grow markedly in length over the course of the experiment;
rather, leaf growth stalled out after week four. Above and below ground biomass,
number of leaves, and number of floral structures all seemed to be better indicators of
competition for the species we were investigating.
Hypothesis 3, “functionally equivalent natives will competitively inhibit
functionally equivalent noxious weeds more than functionally different natives,” was
rejected for Cirsium. No significant decrease in growth was observed for any of the
measured variables when grown with Achillea. Cirsium grew about the same in the
139
greenhouse regardless of its neighbor. In the field, the hypothesis was also rejected;
Cirsium showed a positive correlation when grown with other forbs. However, these
forbs were typically not native. In fact, the most common forb associated with Cirsium in
the field was other Cirsium plants and as noted in the greenhouse study, intraspecific
competition was minor. Results from Bezemer et al. (2004) indicate that a seeded aster,
Tanacetum vulgare, limited percent cover of Cirsium in research plots ; thus, it could be
that Achillea is a poor competitor of Cirsium (see below), and examination of other forbs
is warranted.
A negative correlation was demonstrated when Cirsium was grown with
functionally different grasses. The decrease in number of flowers as the percent of grass
increased showed a direct impact on fecundity. In some plots, these were perennial
warm season grasses (Elymus smithii and Disticalis stricta), while other plots had a
perennial cold season grass (Poa pratensis) or an annual cold season grass (Bromus
tectorum). Future studies could elicit which of these species most effectively hinders
Cirsium growth and fecundity. Our greenhouse study using biomass data indicates it is
not Bromus tectorum. All of the perennial grasses in the field were rhizomatous, and
perhaps in terms of functional classification, below ground structure of these rhizomatous
grasses is more similar to Cirsium than Achillea’s root structure. Much plant competition
occurs underground (Casper & Jackson, 1997). Other studies have shown similar
inhibitory effects of rhizomatous grasses on Cirsium (Ang et al., 1995). Correctly
identified functionally equivalent plants may also inhibit Cirsium growth as demostrated
by a 1% decrease in growth when grown with the forb Medicago sativa (alfalfa) in an
agricultural setting (Hodgson, 1968).
140
Noxious weeds had no impact on Achillea. In fact, it grew better when it was
grown with its functionally equivalent supporting the notion above that Achillea and
Cirsium may not be a functionally equivalent. As well as refuting our hypothesis that
functionally similar species would inhibit growth more than functionally different
species. For the grasses there appeared to be trends supporting this hypothesis, but none
were significant.
For Bromus, the native species Vulpia did inhibit growth in support of our
hypothesis but this inhibition was also noted for Achillea. The decrease was noted for
three different variables including number of leaves, aboveground biomass, and
belowground biomass. A previous field study found a decrease in Bromus when grown
with a perennial grass (Thacher et al., 2009b), suggesting both perennial and annual
native grasses compete with Bromus. It should be noted that Vulpia also showed
decreased growth when grown with Bromus.
Hypothesis 4, “significant intraspecific competition will occur,” was accepted for
Bromus and Vulpia. For Bromus, a decrease in biomass was noted which supports results
from a previous study (Blank, 2010). Other variables for these species did not indicate
intraspecifc competition. Neither Cirsium nor Achillea demonstrated intraspecific
competition. Perhaps because perennials grow slower than annuals (Pitelka, 1977;
Garnier, 1992), the greenhouse study did not offer enough time for the competitive effect
to be observed.
It appears a number of different invasive strategies are being demonstrated by
Cirsium on the shortgrass steppe: ability to utilize resources not currently being utilized
in a community, adaption to disturbance, low species richness of the invaded community,
141
and high level of propagule pressure, but none of these strategies were directly tested in
our study. Its extensive root system which can extend 2-3 m is likely obtaining resources
not utilized by local plants. In the field, Circium took advantage of the disturbance caused
by gravel mining and agriculture. Results from plot data indicate low diversity of species
surrounding Cirsium; this coupled with high propagule pressure (average of 30
inflorescences/plant from our study) predicts continued presence of the species. These
factors support both the propagule pressure and species diversity hypotheses. Cirsium
does not appear to be well-adapted to all areas on the steppe; rather, it is predominantly
restricted to riparian and roadsides (Kotanen et al., 1998) indicting it is not drought
tolerant.
For Bromus, invasive strategies, although not directly tested, likely include the
ability to utilize resources not currently being utilized in a community, possession of
novel traits with which to interact with the environment, adaption to disturbance, species
richness of the invaded community, and level of propagule pressure. Being allelopathic
may give Bromus a competitive advantage (Holzsapfel et al., 2010), but this was not
observed in the greenhouse. In addition, it exhibits characteristics typical of an r-
strategists which allows it to thrive in disturbed areas although it also is prevalent in
relatively intact regions on the shortgrass steppe (personal observation). Its plasticity
(Rice & Mack, 1991), drought tolerance, and early season growth (Chambers et al., 2007)
allow Bromus to take advantage of spring precipitation and snowmelt common in eastern
Colorado to ensure its continued presence.
The growth conditions in the greenhouse with daily watering, was atypical for
upland conditions on the shortgrass steppe. Riparian areas will have more soil moisture
142
than the uplands but not the regularity of water prescribed in our experiment. A future
study should be conducted that investigates competition of these species under varying
water levels to determine if any of them would have competitive advantages under
greater moisture stress. Other limitations to the study included small sample size. For
both the greenhouse studies increasing the sample size is recommended. In addition
including competition between more than two species would better replicate the
complexity of plant interaction in the field.
Management Recommendations
Overall, more research should be conducted to determine other native species
competitive potential against these noxious weeds. Perhaps native forbs other than
Achillea would inhibit the growth of Cirsium. Revegetation in general should be
encouraged in disturbed areas and areas infested with noxious weeds, as vegetation cover
was shown to decrease the prevalence of Cirsium. In particular, continued planting of
perennial grasses is a good strategy on the shortgrass steppe for mitigating the negative
effects of Cirsium arvense. Our results indicate Vuplia and Achillea could be used to
lessen the impact of Bromus. We recommend experimenting with seeding these species
in areas invaded with Bromus to determine there effectiveness in the field.

143
CHAPTER V
ASSESSING CHANGES IN PERCPTION AND
UNDERSTANDING OF STUDENTS
TOWARD MINE RECLAMATION
SITES THROUGH AN
EXPERIENTIAL
PROCESS
Abstract
One of the goals of environmental education is to develop in students an
understanding of the natural world, the impact humans have on the natural world, and the
processes to mitigate human impact. Through this learning process it is desired that
students gain an eco-consciousness that develops into a desire to impact the natural world
in a positive way. To make a successful transition toward eco-consciousness students
must understand destructive human impacts on the natural world and perceive the need
for intervening through the process of restoration and reclamation to improve the
condition of an impacted area. It is expected that direct experience will enhance the
understanding and heighten the perception of the importance of these intervention
processes. Through a case study I investigated understanding and perceptions of high
school geology students toward aggregate mining prior to and after a visit to a gravel
mine reclamation site. Fifteen high school geology students were involved in this study
and participated in pre and post reclamation site drawings taking about ten minutes each.
They also participated in pre and post site visit interviews lasting about seven minutes.
Through this process misperceptions about mine reclamation were determined and the

144
impact of experientially visiting a mine reclamation site was evaluated. Six underlying
themes were found: increased interest in the issue of reclamation, increased knowledge
of the mining process, sense of connection to site, articulation of the importance of
reclamation, decreased emphasis of an anthropocentric purpose of mine reclamation and
increased understanding of the structural composition of a gravel mine reclamation site.
These results indicate the importance in place-based education for developing student
understanding of science concepts and stewardship perspectives.
Introduction
It used to be a tranquil meadow covered with waving grasses and flowers, a gentle
warm breeze could be felt and the smell of the clover drifted in the air. Now shrill
grating sounds pierce the air, large earth moving vehicles gouge the soil; crunching rock
dust and the nauseating smell of exhaust is in the air. The above describes the change
that occurs to a natural environment through the process of gravel mining in Colorado.
What will this area be like in the future? How does the environment respond to the
impact of aggregate mining, and what is the process of returning it back to a functioning
ecosystem through reclamation? In this study I evaluated understanding and perception
changes occurring in high school students. The purpose of this case study was to
discover the change in perception of high school students prior to and after to being
exposed to a reclaimed gravel mine on the shortgrass steppe. Through this process
potential student misperceptions about mine reclamation were determined and the impact
of experientially visiting and interacting with a mine reclamation site was evaluated. A
goal of the study was to evaluate interventions used at the reclamation site to enhance
student understanding of the process and importance of gravel mine reclamation. The
145
research question was, “How does a student’s interaction with a gravel mine reclamation
site impact their perceptions and ideas of mine reclamation?”
As urbanization continues to encroach on natural land, more and more areas will
be in need of, and benefit from reclamation. Individuals generally are unsure of or have
negative ideas about the impact of mining on natural environments (Bloodworth et al.,
2009). They have even less understanding of the importance and process of reclamation
and how an environment changes through reclamation. Gaining an understanding of
students’ perceptions will allow teachers in the future to develop teaching methods to
more effectively communicate how reclamation benefits a disturbed environment. In
addition, students themselves will apply direct experiences to develop an understanding
of the importance of reclamation in their communities. This information can then be
applied as students make decisions in the future (NAAEE, 2004).
Mining and construction are important and needed components to our industrial
society and yet have great negative impacts on the natural world. This impact is seen
through removed topsoil, chemical leaching, soil erosion, and loss of habitat. Many
states including Colorado have requirements to mitigate the destructive impact of mining.
The importance of reclamation from aggregate mining is taken seriously in Colorado and
certain legal requirements must be met as noted in the Colorado Land Reclamation Act
for the Extraction of Construction Materials, article 32.5, 2008 (Assembly, 2008). In this
document, reclamation was defined as,
the employment, during and after an operation, of procedures reasonably
designed to minimize as much as practicable the disruption from an
operation and provide for the establishment of plant cover, stabilization of
soil, protection of water resources, or other measures appropriate to the
subsequent beneficial use of the affected lands (p. 4).

146
The Act further clarifies the requirement of vegetation reclamation,
In those areas where revegetation is part of the reclamation plan, land shall
be revegetated so that a diverse, effective, and long-lasting vegetative
cover is established that is capable of self-regeneration and is at least
equal, with respect to the extent of cover, to the natural vegetation of the
surrounding area. Species chosen for revegetation shall be compatible
for the proposed post-extraction land use and shall be of adequate
diversity to establish successful reclamation (p. 16).
Ecosystems impacted by these processes will not return to a natural state in a timely
manner without reclamation (Langer & Arbogast, 2002).
Although students have been found to have a general idea of how human impact
affects a natural site (Yow, 2008) this is the first study describing how students’
perceptions change in response to experiencing an aggregate mine reclamation site. In a
previous study, students have demonstrated misconceptions toward natural objects (Dove
et al., 1997). One way to mitigate these misconceptions is through experiential activities,
which have been shown to change an individual’s perspective and understanding (Dewey,
1938; NAAEE, 2004). Lack of outdoor experience has contributed to some of the
challenges facing youth today (Louv, 2005), and for that reason, there has been a push to
involve students in outdoor activities to give them a sense of place and appreciation for
nature. As environmental educators develop in students an understanding of the natural
world there is also a hope that students will gain a desire to positively impact the natural
world. To make successful transitions toward eco-consciousness, students must
understand destructive human impact on the natural world and perceive the need for
intervening through the process of restoration and reclamation to improve the condition
of an impacted area. It is expected that direct experience will enhance the understanding
and heighten the perception of the importance of these intervention processes. Generally,
147
students are receptive to outdoor education and have a positive attitude toward it (Smeds
et al., 2011). Through this study I assessed perceptions of students toward mine
reclamation before an intentional experience with a mine reclamation site and evaluated
potential changes in perception and understanding of aggregate mine reclamation after
involving students in the experience of a mine reclamation site.
Methodology
Theoretical Perspective
The type of research I conducted was a case study (Merriam, 1998) in which I
sought to understand perspectives and ideas students had toward reclamation. The case is
bounded (Merriam, 1998) around the student’s field trip to a gravel mine reclamation
site, the PLC, and experiences occurring during this visit.
The epistemological perspective I approached this research from is one of
constructivism (Cakir, 2008). Individuals develop meaning and understanding of their
world and experiences through the building and creation of connections within their mind
(Crotty, 1998). In the context of mine reclamation, students must put their experiences in
the context of prior knowledge and experiences. When students are exposed to new ideas
and activities that they have not experienced before, they must place these experiences in
an already established frame work within their minds. The resulting new experiences
will be constructed from the prior experiences. Students in this study showed a prior
framework of perceptions and understanding of mine reclamation and after visiting a
mine reclamation site, they constructed new ideas upon this prior framework. In some
cases, misperceptions were changed and understanding reconstructed.

148
Researchers Personal Stance
Personally, I came into the study with certain perspectives and experiences. I
have been trained as a biologist thus I have the perspective that a functioning ecosystem
is one in which biodiversity and interactions are great within a biological community. I
have also taught and interacted with high school students for over eight years and
therefore have an opinion on their perspectives and prior knowledge. In addition I have
been involved as an educator and researcher at the gravel mine reclamation site the PLC
and most importantly have been involved directly with the reclamation occurring at this
site and have a personal bias of the importance of reclamation.
IRB Procedure
An expedited IRB application was submitted and approved fall semester 2010.
Data including both drawings and audio recordings are stored in a locked file cabinet in
my office or on a password protected computer with only me having access to the data.
Students’ identities remained confidential. Consent forms will be stored for three years
and then destroyed.
Participants
Fifteen high school students participated in this study. The high school is located
in a moderately-sized city in the Front Range of Colorado. The students were typical of
students enrolled in the geology class. Ten of the students were male and five of the
students were female. Seven of the participants identified themselves as being Hispanic,
three as Mexican, four as white and one identified themselves as being Latin. The age of
the students ranged from 15 through 19 with the median age being 17. All of the
participants lived either in town or in both town and the country. None of the participants
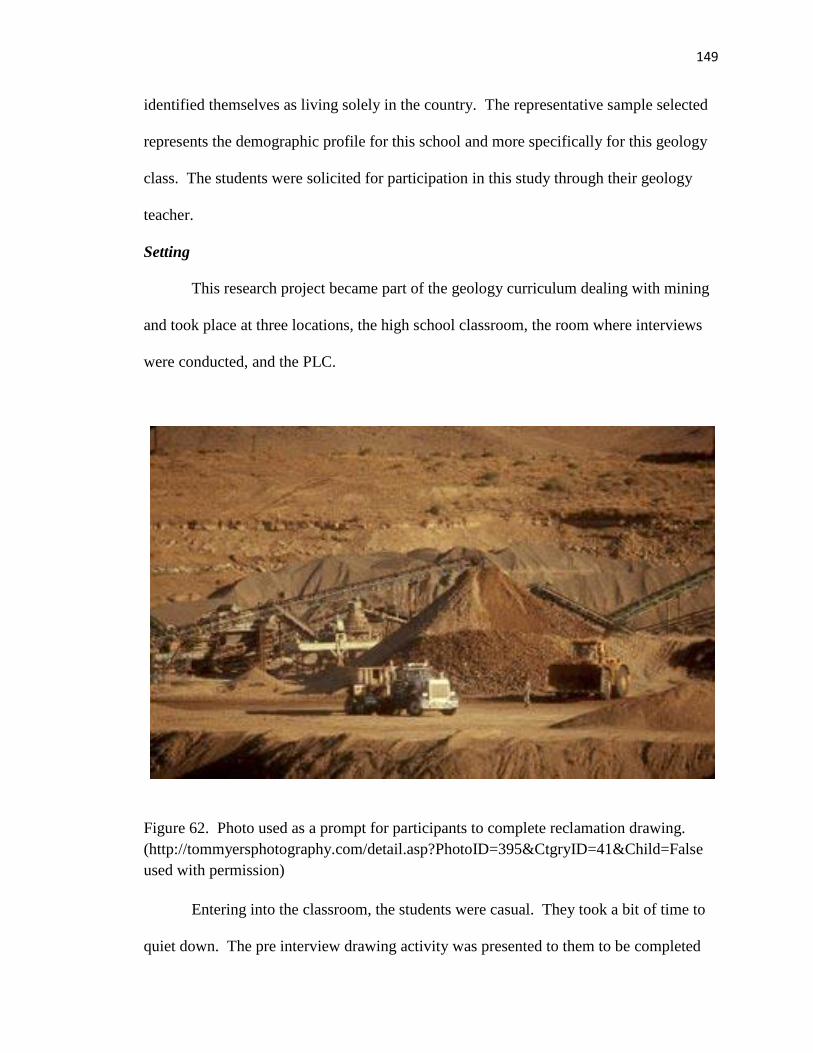
149
identified themselves as living solely in the country. The representative sample selected
represents the demographic profile for this school and more specifically for this geology
class. The students were solicited for participation in this study through their geology
teacher.
Setting
This research project became part of the geology curriculum dealing with mining
and took place at three locations, the high school classroom, the room where interviews
were conducted, and the PLC.
Figure 62. Photo used as a prompt for participants to complete reclamation drawing.
(http://tommyersphotography.com/detail.asp?PhotoID=395&CtgryID=41&Child=False
used with permission)
Entering into the classroom, the students were casual. They took a bit of time to
quiet down. The pre interview drawing activity was presented to them to be completed
150
based on a picture of an active gravel mine site (Figure 62) that was projected on a
screen. The pre-interview drawing instructions were the following, “Draw a picture of
what this area would look like after mine reclamation. Include as much detail as possible
and fill as much of the paper as possible.” Students were given about five minutes to
complete this task. Some of them started immediately, others took longer to get started.
After completion of this activity students who had agreed to participate in the
study where then asked to go to one of two areas where the semi structured research
questions were being asked (Pihlainen-Bednarik & Keinonen, 2011). The room I
conducted interviews in was a conference-prep room with a table in the center as well as
book cases and a copier located around the periphery of the room. Participants sat across
the table from me and were asked a series of questions which were recorded utilizing the
audio recording device on my computer. Alternately a research assistant conducted
interviews in a prep/storage room, also sitting across from the participant, but in contrast
to my interview room, it did not have a table separating the interviewer from the
participant.
Two days after the pre-site visit interviews, on a mild October day with
temperatures in the mid 60’s, the participants along with the rest of their class were
brought to the mine reclamation site, the PLC. The PLC is located in Weld County, CO
adjacent to the Cache la Poudre River (40°26'35" N latitude, 104 °48'55" W longitude)
with an average elevation of 1437 meters. This site falls within the zone of prairie known
as the shortgrass steppe and is typified by drought tolerant plants such as Blue grama
(Bouteloua gracilis), Buffalo grass (Bouteloua dactyloides) and Prickly pear (Opuntia
polyacantha); adapted to an average annual precipitation level of 260-375 mm
151
(Anderson, 2006). The site has experienced much degradation through agriculture,
aggregate mining, and urbanization; gravel mining occurred from 1986-2003. Prior to
mining, this area was a heterogeneous landscape consisting of 65 acres of shortgrass
steppe, wetland, and riparian/terrace habitat (Resh & Chimmer, 2005). The influence of
the Poudre River has provided some complexity to the site, allowing patches of taller
grasses to occur in the year-round mesic conditions of the associated riparian areas. As is
the case with many degraded landscapes, the PLC has experienced a greater abundance of
noxious invasive weeds than undisturbed landscapes. Some of the more abundant
invasive weeds found on site include cheat grass B. tectorm), Canada thistle (Cirsium
arvense), white top (Cardaria draba), field bindweed (Convolvulus arvesis), leafy spurge
(Euphorbia esula), smooth brome (Bromus inermis) and sweet clover (Melilotus albus).
Active gravel mining was terminated on the site in 2004. The removal of
overburden (topsoil obtained from the mining site) which had been placed on the site was
completed in 2006. An 18-acre augmented lake was created on the site and the
topography was returned to a state similar to pre-mining. In 2006, the site was tilled and
seeded with a twelve seed grass mix containing the following species: sideoats grama
(Bouteloua curtipendula), blue grama (Bouteloua gracilis), alkaligrass (Puccinellia
nuttalliana), alkali sacaton (Sporobolus airoides), little bluestem (Schizachyrium
scoparium), needle and thread (Hesperostipa comata), switchgrass (Panicum virgatum),
western wheatgrass (Agropyron smithii), Indian ricegrass (Achnatherum hymenoides),
yellow Indiangrass (Sorghastrum nutans), prairie junegrass (Koeleria macrantha) and
sand dropseed (Sporobolus cryptandrus) at a density of 8.2 kg/acre. The seeds were then
covered with weed-free straw mulch to prevent soil erosion. No native forbs or annual
152
species were included in the replanting efforts. The site has also been managed to control
the invasion of noxious weeds through a combination of methods such as manual
removal, mowing, and localized biological controls.
Prior to arriving at the PLC, students stopped at an active gravel mine and made
observations about what the active gravel mine looked like. Once arriving at the PLC,
students were brought into the classroom and asked to simulate the process of gravel
mining and reclamation. Each group of students was given a tray containing three plant
types (western yarrow (Achillea millifolium var. lanulosa, six week fescue (Vulpia
octoflora), and cheat grass (Bromus tectorum)) growing in potting soil above a gravel and
sand substrate. They were instructed to remove as much of the gravel resource as
possible. After the removal of the resource they were then asked to reclaim their site by
putting the vegetation back into the planting tray. Students appeared to be engaged in
this activity and were actively participating with other members of their group. They
approached the process of removing the gravel and in a number of ways. Some of them
carefully removed the vegetation in large chunks and then proceeded to move the gravel
and sand out of the trays. Another group removed plants individually, then removed the
potting soil, followed by removal of the gravel and sand. One group left the vegetation
intact and removed the sand and gravel by digging under the plants and potting soil.
Students were asked to reflect on and determine plant composition before and
after this simulated activity. The intention of this reflection was to get students to
visualize how the process of mining could impact vegetation structure and distribution.
Following the reclamation activity, a power point presentation was shown in
which the word reclamation was defined. In addition, the history of reclamation of the
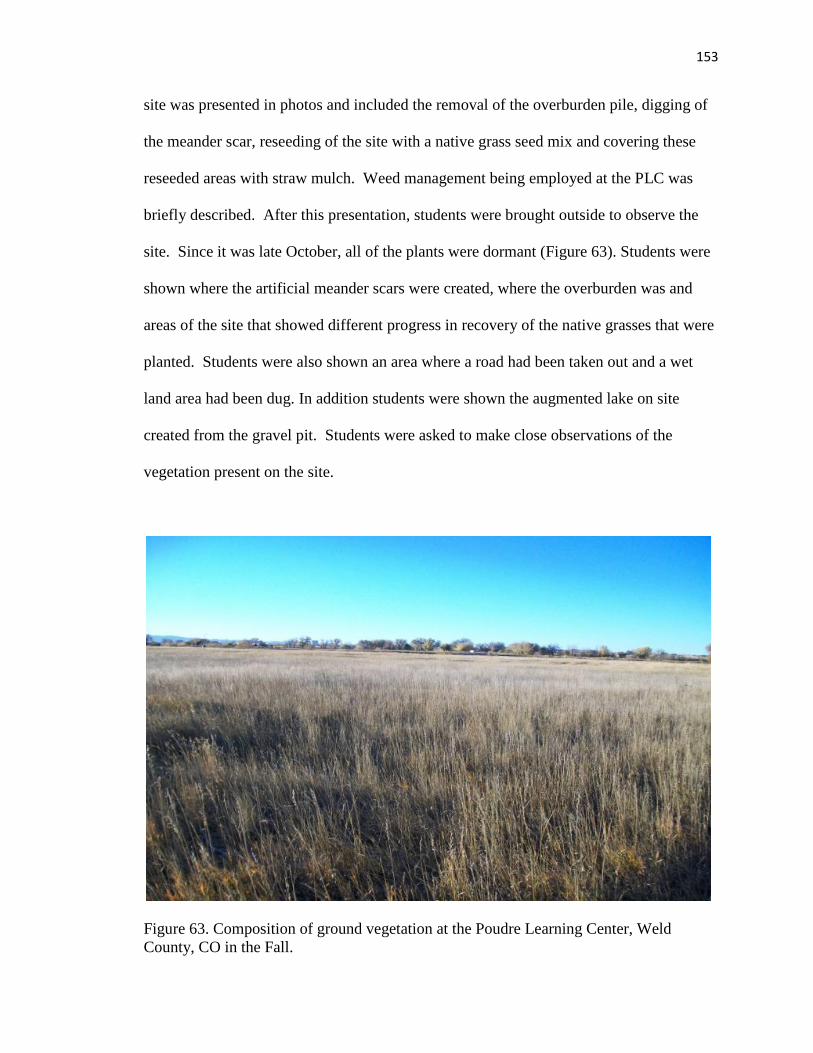
153
site was presented in photos and included the removal of the overburden pile, digging of
the meander scar, reseeding of the site with a native grass seed mix and covering these
reseeded areas with straw mulch. Weed management being employed at the PLC was
briefly described. After this presentation, students were brought outside to observe the
site. Since it was late October, all of the plants were dormant (Figure 63). Students were
shown where the artificial meander scars were created, where the overburden was and
areas of the site that showed different progress in recovery of the native grasses that were
planted. Students were also shown an area where a road had been taken out and a wet
land area had been dug. In addition students were shown the augmented lake on site
created from the gravel pit. Students were asked to make close observations of the
vegetation present on the site.
Figure 63. Composition of ground vegetation at the Poudre Learning Center, Weld
County, CO in the Fall.
154
Six days following their site visit, students were again asked to respond to the
photo of a gravel mine site (Figure 62). They were given five minutes to complete their
drawings and were again interviewed following the semi-structured script from before.
In addition to the pre questions, near the end of the interview after students were asked if
they knew of any local mine reclamation sites, students where asked how the trip to the
PLC impacted their ideas about mine reclamation.
Analysis of Data
Following basic qualitative research methods (Merriam, 1998), the interviews
were audio recorded, and transcribed. After transcribing the quotes, organizing
observational notes and student drawings, formal analysis was initiated. The data were
analyzed in an effort to identify major themes and salient quotes. Perception of change
was evaluated by determining how the participants’ answers and drawings changed from
the initial visit to after the students experienced the reclaimed site (Shepardson et al.,
2007). Five of the major themes are presented in this chapter. These themes included:
increased interest in the issue of reclamation, increased knowledge of the mining process,
sense of connection to site, articulation of the importance of reclamation, decreased
emphasis of an anthropocentric purpose of mine reclamation and increased understanding
of the structural composition of a gravel mine reclamation site.
Analyzing different data sources (interviews, observations and drawings) allowed
triangulation to occur (Jick, 1979). In addition an independent researcher listened to all
of the transcripts to verify its correctness. Through these processes the findings were
corroborated. The above procedures ensured the study was valid and reliable.
155
Findings
Increased knowledge of the gravel
mining and reclamation processes
From the pre interviews and pre site drawings, it was apparent that many of the
participants did not have a good understanding about gravel mine reclamation. This
misunderstanding was articulated through the following quote, “I don’t know exactly
what they do in mine reclamation.” Others had a basic understanding of what
reclamation was, but applied the process to subsurface mining such as copper mining.
This was seen from a pre site visit picture where the participant drew a hole in the side of
a mountain.
In response to the process of reclamation for pre site visit responses, many
students included some of the processes involved in reclamation, but did not have a
complete understanding of the process. Others felt reclamation involved the process of
replacing animals with a correct balance of predator and prey species. “First turn over
the soil making it fertile so grass and trees can grow maybe throw in some rabbits, we
would need some wolves as well rabbits and trees.”
After visiting the site, a more complete understanding of the reclamation process
was articulated. Including the steps involved.
First I would put in seed try to put everything back the way it was, maybe
put in a lake. Or put in some trees. Maybe some grasses I’ll try to find the
same grasses that were there but in seed form and like plant them, replant
them and then start moving out the equipment like the trucks and
everything so that theywouldn’t bother anything.
The above response was typical of the increased understanding of the multiple steps
involved in reclamation.
156
Students included a lake in most of the post visit drawings and interviews. A lake
would form from the hole created from removal of the gravel as articulated by one of the
participants, “I like the lake, I put a lake there, like if there was a hole where we were
digging and went lower I guess we could make it lower make a lake there.” Some of the
pre site visit pictures showed water in the form of a river, which would not be the result
of mining.
Vocalization of the importance
of reclamation
Students gained the perspective of reclamation being an important process to
occur and for a number of different reasons including preservation, use-ability, and
recreation. From the pre visit questions and drawings it is apparent that some of the
students felt that mining was beneficial. Others did not think it was beneficial or needed.
For example participant three responded, “No because you own the land” to the question
of if land should be reclaimed.
After the site visit, most students responded that reclamation would be helpful and
felt it important to put the mined site back the way it was before. The following quote
was a typical response, “Yes cause then you don’t have the whole chunk of land that’s
not being used, you could use it for walking trails or something”. Although most
participants felt mined sites should be reclaimed, there was one individual who felt
reclamation should not occur and that a mined site should be fenced off for safety
reasons. Interestingly, no students mentioned the need to maintain natural areas for
future generations. Perhaps students of this age group have a difficult time thinking of
future generations because they do not have children themselves.
157
Increased understanding of the
structure of a gravel mine
reclamation site on the
shortgrass steppe
From the pre-field trip drawings, a number of objects were included in the
drawings that would not be found on the shortgrass steppe. Most noticeably students
included trees. These trees were both deciduous and coniferous and often dominated the
landscape in these drawings. The ideas of trees being found in reclamation areas also
came through in the interviews as noted from the quote that follows describing what a
reclaimed area would look like, “Maybe like trees like more trees.” Trees would not
typically be located in the shortgrass steppe because of low levels of precipitation but are
more common in urban areas. The only places deciduous trees would be found
historically on the short grass steppe would be in riparian areas and although the PLC
does have a few deciduous trees they are restricted naturally to areas around the wetland,
lake, and river.
In the post site visit grasses became more dominant in their drawings and
interviews. One participant described their drawing the following way,
We could put grass or like weeds, these are like plants and there are like
planted grass and these are rocks and little things there are rocks in there,
this is overburden then there would be like some dirt over there and these
are high grasses.
They were clearly describing the structural composition of the site being composed of a
variety of grasses. It is also interesting to note that after the site visit, participants
mentioned weeds being present on the mine reclamation site. Weeds are typical in areas
of disturbance on the shortgrass steppe as in other disturbed areas (Vitousek et al., 1996).
158
In general, more non-tree plants were included in the post pictures including grasses,
weeds, flowers and aquatic plants.
Participants correctly included in pre-site drawings animals that would be found
on the shortgrass steppe including birds, deer, a snake, a fox, a fish and a rabbit. Some of
the pictures included mountains. Different animals were included in the drawings after
the visit, but would also be found on the shortgrass steppe or in water habitats including:
birds, ducks, a butterfly, an owl, a mouse, fish and a snake.
Decreased emphasis of an
anthropocentric purpose
of mine reclamation
Many of the participants drew people and human built structures including
houses, skyscrapers, playgrounds, roads, vehicles and a restroom in their pre-visit
drawings. It is interesting to note that humans were also included in many of the pictures.
The humans in these drawings were actively involved in some activity. For example, a
human was hunting in one picture. In another picture humans were climbing a tree.
Students had an anthropocentric view of the reclamation process prior to visiting a
reclamation site. The following quote in response to the question of if reclamation is
needed, articulates this human-centered perspective, “Yes I do because it is the ecosystem
and it’s important for our environment and if we are going to do anything like for our
use.” Clearly the focus is on how humans will benefit from the reclamation process.
Following the site visit, people were present in only one of the drawings. In
addition, there was a noticeable decrease in human buildings when participants redrew
what a reclamation site would look like. There was a shift toward reclamation being done
to help nature. This idea can be seen from the following quote, “I think it is beneficial,
159
not for us really, I guess it’s good to live in a healthy environment but really it’s just for
the plants and animals”.
Identification of a specific
reclamation site location
Probably the most interesting piece of information to be gained from the pre
interviews was the lack of knowledge about local reclamation sites. Some identified oil
fields as going through the process of reclamation while most could not identify a gravel
mine reclamation site nearby.
Following the site visit, students could define reclamation and also were aware of
a mine reclamation site location. The following quote demonstrates this understand of
place.
we went and we go there cause the Poudre Learning Center before was a
gravel mining place, but now there is a lake theres grasses and theres
meander scar where the river used to run through now runs through a
different place and they took moved it around and they planted new
grasses in there still native grasses there but they planted new ones and
they couldn’t bring in dirt, more dirt in but they used the meander scar to
take dirt over there and put it so that could like level it our or something
The above quote also demonstrates how participants included both in their drawings and
interviews some site specific components of the reclamation occurring at the PLC. These
site specific responses included the creation of artificial meander scares and removal of
the overburden pile.
Increased interest to the issue of
reclamation
This theme was determined by looking at the length and depth of the post
interviews. In the post interviews, the participants had more elaborate answers and were
able to describe the issue in more detail and also were able to connect restoration more to

160
their experience. In describing if the site visit impacted his ideas about reclamation the
participant replied, “yea cause we actually got to see it and see how it looks now that its
been replanted and we saw some of the overburden and stuff.” Without a site visit, this
participant would not have connected as much to the topic of mine reclamation.
Discussion - Recommendations
From this case study more specific understanding of gravel mining occurred.
Participants saw the need and also were able to connect and use the experience to
formulate a more complete understanding about gravel mine reclamation. High school
students in general typically show a disinterest in learning about things that are not
related directly to their lives. It was apparent for the pre interviews that the students did
not have an interest and understanding about mine reclamation. They were not connected
to the process and often had misconceptions about the process of mine reclamation and
specifically about gravel mine reclamation. Much of their knowledge appears to have
initially come from textbooks or videos. This perspective is intuitive from a
constructivist perspective. Students can only build information upon prior knowledge
and experience (Crotty, 1998).
The trip to the mine reclamation site had an impact on student understanding and
knowledge of mine reclamation. Students where including specific reclamation
procedures in their responses to questions after the site visit. They were talking
specifically about the overburden removal and planting of grasses. Almost all of the
individuals mentioned or included a lake in their post interviews and reclamation
drawings.
161
A challenge still lies in the ability to get students to care and develop an
environmental ethic (Mueller, 2011). There was a shift toward more ownership and
involvement of the process of reclamation, but most students did not articulate a
connection or passion for the process of restoration and reclamation. Developing a sense
of connection and place is important to developing this environmental ethic, but
somehow the curriculum must connect with students and their current interests. The
process of visiting the mine reclamation site moved students in this direction, but did not
completely motivate students to change their perceptions.
Not understanding the terminology appears to be a hindrance of building the
connections needed to really grasp the process of mine reclamation. Even though most
students could define the process of reclamation after visiting the reclamation site, they
appeared to have stumbled with this word initially and seemed to understand it after it
was defined, but many did not recognize the word even though it had been brought up in
class on different occasions.
Four activities were conducted during the students visit to the PLC, they included,
the gravel mine simulation, the power point presentation and the walk about the mine
reclamation site. Other educators may want to utilize some of these activities in their
classrooms. The power point presentation and the walk about appeared to have the most
impact on students as material covered during these processes were brought up by the
participants in both their interviews and drawings. None of the students brought up the
mine reclamation simulation in their post interviews. One can conclude from this that
that activity had little impact on their understanding of the process or that the interview

162
questions did not address the learning that may have occurred through this particular
activity.
The time of the year the study was conducted may have an impact on student’s
perception of mine reclamation. In October, the site does not appear as a green verdant
meadow, rather it is composed of shades of brown and red (Figure 63 ), the taller grasses
including western wheat grass, smooth brome and alkali sacaton are interspersed with
some of the shorter grasses such as side outs grama and switch grass. Many of the forbs
are difficult to identify this late in the season. Perhaps visiting the site in the summer
during peak biomass would have given students a different perspective of the process of
reclamation. Another limitation of the the study was the small sample size. Increasing
the sample size beyond 15 students may have generated different themes. In addition,
because the case study is bounded by the specific school, specific reclamations site and
specific students, transferability of the results should not extend beyond this case.
Conclusion
From the above data, one can conclude that after the site visit participants had
gained a more complete picture of the process of reclamation although some
misperceptions still persist. Many students did not go into much detail concerning the
benefits and purpose of reclamation. Students were able to gain a sense of place from
this experience and that certainly contributed to their perceptions about the process.
Students also shifted away from a human centered purpose for mine reclamation and
included more broadly the natural world including plants and animals.
As human impact on the environment continues to increase, understanding how
students think about these modified environments becomes critical in connecting with

163
students and developing responsible stewards of the environment (Tsurusaki 2010).
Some general recommendations concerning this topic include being explicit in teaching
reclamation, giving students specific experiences at reclamation sites and relating directly
to these sites when discussing the process of reclamation. To develop a sense of eco-
consciousness it is necessary to talk about the importance of reclamation. Encouraging
students to think about what would happen if mine reclamation did not occur may give
them a perspective to consider the importance of the process. Give students an
opportunity to experience a mine site as well as site going through the process of
reclamation. The experience appeared to really solidify the connection to the topic.
Identify themes related to reclamation that students can connect with. Maybe it will be
anthropocentric, such as the importance mineral resources have for our society, or it
could be to increase recreational activities and locales, or maybe connecting to the idea of
the damage un-reclaimed sites confer to the environment.
This study indicates the importance of place based education in enabling students
to make appropriate connections about mine reclamation. Development of other activities
could be incorporated at the mine site which would broaden the understanding of the
process and connect the students to specific plants being selected at the site and including
these plants in the mining simulation would enable appreciation and care for nature to
develop.
Future Directions
This research has opened up other questions that would be interesting to answer.
For example, assessing long term participant understanding on this topic would be
helpful in developing effective curriculum. Determining what is retained after 6 or 7

164
months would allow one to evaluate what parts of the activities really impacted the
participants, subsequent activities could be developed to scaffold upon these themes.
Since all of the participants were from urban areas, determination if different
background or experiences contributes to understanding of mine reclamation would be
helpful. Maybe connections can be found that a different group of students might make
that could be generally transferred to other learners.
It would also be interesting to delve deeper into how the participants formulated
their knowledge and perceptions about gravel mine reclamation and to determine what
contributes to their perceptions
165
CHAPTER VI
CONCLUSION AND SUMMARY OF RESULTS
Humans continue to have a profound impact on our natural world. This impact
will increase as the population continues to increase. We are called as individuals and a
society to make a difference and to minimize our impact so that future generations have
the ability to enjoy a quality of life that is equal to that of previous generations.
Conservation, restoration and education are important components to the process of
ensuring that we leave planet earth better than how it was found. As Aldo Leopold said
so eloquently,
One of the penalties of an ecological education is that one lives alone in a
world of wounds. Much of the damage inflicted on land is quite invisible
to laymen. An ecologist must either harden his shell and make believe that
the consequences of science are none of his business, or he must be the
doctor who sees the marks of death in a community that believes itself
well and does not want to be told otherwise (Leopold, 1949).
This concluding chapter will describe the main findings of this dissertation which may be
used to mitigate the impacts of anthropogenic disturbances and serve as a conversation
point for ways to engage individuals and students in the process of stewardship. From
these studies, it is clear that the process of restoration can and does contribute to
improving the quality of disturbed environments and that there are certain mechanistic
controls for community response to disturbance. The studies examined the success of
gravel mine reclamation, the response of vegetation to gazing and competition
(mechanistic responses), and the efficacy of experiential environmental education.
166
Evidence of Restoration Success
Based on the nine restoration attributes the Society for Ecological Restoration
recommends for assessing reclamation success (SER, 2004), the PLC is moving in the
direction of full restoration. The PLC has less vegetative cover than the reference sites
but does show 69% ground cover overall indicating that re-vegetation efforts have been
successful (Ruiz-Jaen & Aide, 2005). Many of the species located on the PLC were
different from the Pawnee sites, but there were several species which occurred in both
sites. Nine species were shared by the PLC and by one or both of the Pawnee sites.
Many of the native grasses planted during the reclamation process are established at the
PLC. The community similarity analysis showed the PLC being more similar to one of
the Pawnee sites than the Pawnee sites were to each other; and when the analysis was
conducted based on functional types, the PLC was more similar to both reference sites
than the reference sites were to each other. Thus, the PLC site falls within the range of
variation for vegetation composition on the shortgrass steppe (Smith & Smith, 2001).
When comparing the maximum and minimum ranges of the PLC plots to the Pawnee
plots, the PLC plots are within the range of at least one of the Pawnee sites for the
following characteristics: evenness, richness, diversity, soil nutrients, biomass
measurements and amount of litter. Again this indicates that some of the plots at the PLC
are within the reference conditions of plots on the Pawnee Grassland. A similar type of
approach has been used in aquatic systems to determine health of the system (Bailey et
al., 2004).
Although similarities point to restoration success, differences were also apparent.
For example, in terms of functional group similarity, the PLC was significantly different
167
from reference sites. The PLC has greater cover of annual grasses and lacked many of
the forbs found on the Pawnee sites. Since no forbs were included in the re-vegetation
effort, this could explain the lower number of forbs present on the site. In addition, the
PLC had significantly lower levels of phosphorus, potassium and estimated nitrogen
release. Because of some of the different species at the PLC and different soil conditions,
the established vegetation following reclamation will be slightly different than reference
sites as in expected in any restoration site (Choi, 2004). But, the high percentage of
ground cover and established native perennials indicate continued sustainability of this
site as seen for other degraded sites in arid regions (Aronson et al., 1993).
Recommendations for continued progression of the reclamation process include
planting more native forbs, which should increase species diversity, and continued weed
control. Increasing nitrogen and phosphorus levels should bring the soil closer to
reference site conditions but should be used with caution because of the possible increase
in noxious annual grasses through this treatment (Cherwin et al., 2009). While the above
study suggests restoration success, many land stewards lack an understanding of
mechanistic controls which could be used to alter restoration procedures for increased
efficacy.
Mechanistic Community Response to Disturbance
Greenhouse and field studies were used to assess the importance of competition
and grazing on shortgrass steppe communities. These studies were focused on riparian
zones that have lacked adequate study and noxious weeds that decrease the effectiveness
of restoration efforts (Sheley & Krueger-Mangold, 2003). Precipitation levels, flood
tolerance, ability to tolerate soil nutrient levels, grazing tolerance and propagule
168
pressure/availability all appeared to be major drivers of shortgrass steppe vegetation and
determine vegetation response to disturbance. Riparian areas of the shortgrass steppe
appeared resilient to release from cattle grazing. Overall community composition and
structure, diversity, species-specific responses, and soil characteristics showed few
significant differences between moderately-grazed and un-grazed plots. In terms of
structure, an increase in litter was observed every year in the exclosure. This build-up of
litter over time could impact which species germinate and will likely change soil
composition (Xiong & Nilsson, 1999), but such changes were not evidenced in the
release from grazing study. Further, grazing had a minimal impact on horizontal
vegetation structure but a significant impact on vertical vegetation structure. Over one
grazing season, patchiness increased in plots that were grazed with more bare ground
present in the grazed plots.
Composition started out different for the exclosures compared to grazed areas.
Within the five year period of time, change in vegetation composition occurred both in
areas released from grazing and in areas exposed to continuous grazing, although more
compositional change occurred in areas excluded from grazing. Mild grazing effects
were indicated with perennial grasses being better adapted to grazing than forbs (Amiri et
al., 2008). In the absence of grazing, forbs generally become more prominent (Hazlett
1992).
Contrary to expectations, grazing had no significant impact on species richness or
diversity in either release-from-grazing study. Richness and diversity measurements
followed the same general patterns for both exclosure and grazed transects. The general
trend was a decrease initially followed by an increase. The diversity increased sooner in
169
grazed areas (Simpson’s index) than exclosures. Diversity remained less in grazed
transects throughout the study which is expected as grazing is predicted to decrease
diversity in dry environments (Olff & Ritchiee, 1998). Richness of species decreased for
the first four years but increased substantially in the last year of the study. Richness
increased more in the released transects than grazed transects, but contributed to a
decrease in species evenness.
Because of the similar patterns seen with grazing for evenness, richness, species
diversity, change in species composition, and change in functional composition, some
variable other than grazing is likely driving vegetation dynamics. Such drivers could
include historical effects (Quetier et al., 2007), propagule pressure (Davis et al., 2000),
community resiliency (Briske et al., 2006), and climate change (Lauenroth & Sala, 1992).
The Pawnee National Grasslands have been under the influence of widespread
grazing for years (Larson, 1940). Because of this historical effect, potential riparian
species susceptible to grazing have likely been removed from the system. The isolation of
site locations from riparian areas unaffected by grazing likely resulted in a lack of
propagule pressure. After only five years, it is unlikely many new seeds had been
brought into the system. A longer period of time may allow for dispersal of some of
these species into areas protected from grazing and enable a better conclusion to be
drawn on the impact of grazing (Levin et al., 2003). Conversely, studying a
complimentary riparian site not exposed to grazing may give a better indication of the
impact of grazing in these areas.
Another component of propagule pressure is noxious weeds. Impacts on the PLC
were likely greater because of increased propagule pressure and available space created
170
through the mining process. Species present at the PLC have the ability to produce many
seeds and have excellent dispersal characteristics. However, such noxious species must
have the adaptive means to withstand the water limiting environment of the shortgrass
steppe and the ability to invade shortgrass communities. Competition studies indicated
that as space becomes less available through the growth of native vegetation, the impact
of noxious weeds will likely decrease (Sheley & Carpinelli, 2005). In other words,
shortgrass steppe communities have some resiliency to exotic species invasion.
An increase in competition was noted for Achillea, Cirsium and Vulpia as plant
density levels increased from 2 to 4 and 6 plants per pot. For Bromus, the native species
Vulpia inhibited growth and suggests a biological control for the exotic (Dukes, 2000).
This decrease was noted for three different variables including number of leaves,
aboveground biomass, and belowground biomass. Vulpia similarly showed a decrease in
growth when grown with Bromus. Intraspecific competition was also demonstrated in
both Bromus and Vulpia. The combination of intraspecific and interspecific competition
may explain the coexistence of these species in the field as hypothesized by Tilman &
Pacala (1993).
In the field, Cirsium showed a positive correlation when grown with other forbs
and a negative correlation when grown with clonal grasses. Decreased growth was
determined for above ground biomass, height and number of flower structures. The
decrease in number of flowers as grass percentage increased showed a direct decrease in
fecundity and may suggest stronger competition with perennial grasses than forbs:
perennial grasses may be more functionally equivalent to the clonal Cirsium than other
forbs. Further, the greatest cover of forbs in the study was actually additional Cirsium, so
171
intraspecific competition may be notably less than interspecific and partially explain the
invasiveness of Cirsium (Bossdorf et al., 2004).
Overall, more research should be conducted to determine other native species’
competitive potential against noxious weeds on the shortgrass steppe. Perhaps native
forbs other than Achillea would inhibit the growth of Cirsium. Revegetation in general
should be encouraged in disturbed areas and areas infested with noxious weeds, as
vegetation cover was shown to decrease the prevalence of Cirsium. In particular,
continued planting of perennial grasses is a good strategy on the short grass steppe for
mitigating the invasion of Cirsium arvense. Results indicate Vuplia could be used to
lessen the impact of Bromus. Experimenting with seeding this species in areas invaded
with Bromus to determine its effectiveness in the field is recommended.
The PLC being impacted both by flooding and gravel mining has plants on site
(some planted) that respond well to residual site conditions of both of these assaults. In
addition, the PLC soil is alkaline. Sporobolus airoides and Distichlis stricta are alkali-
tolerant species that appear to be flood tolerant; for these reasons, these species were
prevalent at the PLC. These plants are also common at Pawnee site 17 indicating similar
factors shaping this community. As the PLC continues to move through the process of
succession, such factors will continue to shape which plants become dominant in the
community. Although restoration appears to have some efficacy, and that efficacy can be
explained by mechanistic processes, restoration efforts will be limited without public
support and understanding.

172
The Necessity for Experiential
Environmental Education
Developing public support and understanding begins with education and the
qualitative study conducted was aimed at evaluating how students were impacted by
visiting a gravel mine reclamation site to determine if this activity would heighten
students awareness of and need for reclamation. Students benefitted from the site visit by
gaining a more complete picture of the process of reclamation. Some misperceptions still
persisted and many students did not go into much detail concerning the benefits and
purpose of reclamation, but students were able to gain a sense of place from this
experience and that increased their perceptions about the process. Students also shifted
away from a human-centered purpose for mine reclamation and included more broadly
the plant and animals of the natural world.
As human impact on the environment continues to increase, understanding how
students think about these modified environments becomes critical in connecting with
students and helping them develop responsible stewardship toward the environment
(NAAEE, 2004). This study showed that being explicit in teaching reclamation, giving
students specific experiences at reclamation sites, and relating directly to these sites when
discussing the process of reclamation improved student understanding and attitudes
toward reclamation. To develop a sense of eco-consciousness, it is necessary to talk
about the importance of reclamation. By encouraging students to think about what would
happen if mine reclamation did not occur, students were able to gain a perspective on the
importance of the process. The experience of visiting the mine site appeared to solidify
the connection to the topic. Connection of the topic for students can be further enhanced
by having them identify themes related to reclamation. These themes may be
173
anthropocentric, such as the importance mineral resources have for our society, may
increase recreational activities and locales, or may connect to the idea of the damage un-
reclaimed sites confer to the environment.
This study indicated the importance of place-based education in enabling students
to make appropriate connections about mine reclamation. Development of other activities
could be incorporated at the mine site which would broaden the understanding of the
process and connect the students to specific plants being selected at the site for
reclamation. Including these plants in the mining simulation could further enhance
appreciation and care for nature.
Conclusion
In conclusion, these studies investigating disturbance ecology and restoration
increase our knowledge of how the shortgrass steppe responds to disturbance. These
results will contribute to the management of natural areas in the region degraded by
human impact. For example, invasive species clearly compete with natives but native
shortgrass steppe communities dominated by perennial grasses offer some resilience to
invasion, and environmental controls such as climate and soil nutrient levels provide
strong filters of community assembly. Additionally, the qualitative study contributed to a
greater understanding of the impact visiting a reclamation site had on students and can be
used to facilitate a successful transition toward eco-consciousness in students.
Collectively, the information can be used to minimize anthropogenic impact and ensure
individual connection with the environment so that future generations have the ability to
enjoy a quality of life that is equal to that of the current generation.
174
REFERENCES
Aarssen, L. W. 1989. Competitive ability and species coexistence: a 'plant's-eye' view.
Oikos 56:386-401.
Adler, P. B., D. G. Milchunas, W. K. Lauenroth, and I. C. Burke 2004. Functional traits
of graminoids in semi-arid steppes: a test of grazing histories. Journal of Applied
Ecology 41:653–663.
Anderson, R. C. 2006. Evolution and origin of the Central Grassland of North America:
climate, fire, and mammalian grazers. Journal of the Torrey Botanical Society
133:626-647.
Anderson, V. J., and D. D. Briske 1995. Herbivore-induced species replacement in
grasslands: is it driven herbivory tollerance or avoidance? Ecological
Applications 5:1014-1024.
Ang, B. N., L. T. Kok, G. I. Holtzman, and D. D. Wolf 1995. Canada thistle (Cirsium
arvense) response to density of Cassida rubiginosa (Coleoptera: Chrysomelidae)
and plant competition. Biological Control 5:31-38
Aphalo, P. J., C. L. Ballaré, and A. L. Scopel 1999. Plant-plant signalling, the shade-
avoidance response and competition. Journal of Experimental Botany 50:1629-
1634.
Amiri, F., A. Ariapour, and S. Fadai 2008 Effects of livestock grazing on vegetation
composition and soil moisture properties in grazed and non-grazed range site.
Journal of Biological Sciences 8:1289-1297.
Aronson, J., C. Fled, E. Le Floc’hl, C. Ode, and R. R Pontanier 1993. Restoration and
Rehabilitation of Degraded Ecosystems in Arid and Semi-Arid Lands. Restoration
Ecology 1:8-17.
Ashby M. CPER Site Manager for the Ag Research Service 2010. Personal
communication.
Assembly, C. G. 2008. Colorado Land Reclamation Act for the Extraction of
Construction Materials.
175
Bailey, R. C., R. H. Norris, and T. B. Reynoldson. 2004. Bioassessment of freshwater
ecosystems using the reference condition approach. Kluwer Academic Publishers,
Norwell, MA.
Baker, W. B. 1989. Classification of the riparian vegetation of the montane and subalpine
zones in western Colorado. Western North American Naturalist 49:214-228.
Banning, N. C., C. D. Grant, D. L. Jones, and D. V. Murphy 2008. Recovery of soil
organic matter, organic matter turnover and nitrogen cycling in a post-mining
forest rehabilitation chronosequence. Soil Biology & Biochemistry 40:2021-2031.
Beck, K. G. 2008. Canada thistle. Colorado State University Extension, Ft. Collins.
Bengtsson, J., T. Fagerstrom, and H. Rydin 1994. Competition and coexistence in plant
communities. Trends in Ecology & Evolution 9:246-250.
Bezemer, T. M., O. Graca, P. Rousseau, and W. H. Van Der Putten 2004. Above and
belowground trophic interactions on creeping thistle (Cirsium arvense) in high
and low diversity plant communities: potential for biotic resistance? Plant Biology
6:231-238.
Bisevac, L., and J. D. Majer 1999. Comparative study of ant communities of rehabilitated
mineral sand mines and heathland, western Australia. Restoration Ecology 7:117-
126.
Blank, R. R. 2010. Inraspecific and interspecific pair-wise seedling competition between
exotic annual grasses and native perennials: plant - soil relationships. Plant Soil
326:331-343.
Blensky, J. A., and D. M. Blumenthal 1997. Effects of livestock grazing on stand
dynamics and soils in upland forests of the interior west. Conservation Biology
11:315-327.
Bloodworth, A. J., P. W. Scott, and M. F. M. 2009. Digging the backyard: Mining and
quarrying in the UK and their impact on future land use. Land Use Policy 26:317-
325.
Bonham, C. D. 1989. Measurements for terrestrial vegetation. John Wiley & Sons, New
York.
Bossdorf, O., D. Prati, H. Auge, and B. Schmid 2004. Reduced competitive ability in an
invasive plant. Ecology Letters 7:346-353.
Bradshaw, A. 1997. Restoration of mined lands - using natural processes. Ecological
Engineering 8:255-269.
176
Bradshaw, A. 2000. The use of natural processes in reclamation - advantages and
difficulties. Landscape and Urban Planning 51:89-100.
Bradshaw, A. 2002. Introduction and philosophy. Pages 3-9 in M. R. Perrow and A. J.
Davy, editors. Handbook on ecological restoration: Volume 1. Principals of
restoration. Cambridge University Press, Cambridge, United Kingdom.
Bradshaw, A. D., R. W. Lodge, J. D., and C. M. J. 1960. Experimental investigations into
the mineral nutrition of several grass species: part II. pH and calcium level.
Journal of Ecology 48:143-150.
Briske, D. D., S. D. Fuhlendorf, and F. E. Smeins 2006. A unified framework for
assessment and application of ecological thresholds. Rangeland Ecology &
Management 59:225-236.
Brown, J. C. 1978. Mechanism of iron uptake by plants. Plant, Cell & Environment
1:249-257.
Burke, I. C., W. K. Lauenroth, R. Riggle, P. Brannen, B. Madigan, and S. Beard 1999.
Spacial variability of soil properties in the shortgrass steppe: the relative
importance of topography, grazing, microsite, and plant species in controlling
spacial patterns. Ecosystems 2:422-438.
Burke, M. J. W., and J. P. Grime 1996. An experimental study of plant community
invasibility. Ecology 77:776-790.
Cakir, M. 2008. Constructivist approaches to learning in science and their implications
for science pedagogy: a literature review. Internarnational Journal of
Environmental & Science Education 3:193-206.
Callaway, R. M., and E. T. Aschehoug 2000. Invasive plants versus their new and old
neighbors: a mechanism for exotic invasion. Science 290:521-523.
Callaway, R. M., and L. R. Walker 1997. Competition and facilitation: a synthetic
approach to interactions in plant communities. Ecology 78:1958-1965.
Carlson, A. M., and D. L. Gorchov 2004. Effects of herbicide on the invasive biennial
Alliaria petiolata (Garlic Mustard) and initial responses of native plants in a
southwestern Ohio forest. Restoration Ecology 12:559-567.
Carpinalli, M. F., R. L. Sheley, and B. D. Maxwell 2004. Revegetating weedinfested
rangeland with niche-differentiated desirable species. Journal of Range
Management 57:97-105.
177
Casper, B. B., and R. B. Jackson 1997. Plant competition underground. Annual Review
of Ecology, Evolution, and Systematics 28:545-570.
Chambers, J. C., B. A. Roundy, R. R. Blank, S. Meyer, and W. A 2007. What makes
great basin sagebrush ecosystems invasible by Bromus tectorum? Ecological
Monographs 77:117–145.
Chapman, R., and A. Younger 1995. The establishment and maintenance of a species-
rich grassland on a reclaimed opencast coal site. Restoration Ecology 3:39-50.
Cherwin, K. L., T. R. Seastedt, and K. N. Suding 2009. Effects of nutrients manipulations
and grass removal on cover species composition, and invasibility of a novel
grassland in Colorado Restoration Ecology 17:818-826.
Choi, Y. D. I. 2004. Theories for ecological restoration in changing environment: Toward
‘futuristic’ restoration. Ecological Research 19:75–81.
Choi, Y. D. 2007. Restoration ecology to the future: a call for new paradigm. Restoration
Ecology 15:351-353.
Christiansen, S., and T. Svejcar 1988. Grazing effects on shoot and root dynamics and
above- and below-ground non-structural carbohydrate in Caucasian bluestem.
Grass and Forage Science 43:111-119.
Cingolani, A. M., I. Noy-Meir, and S. Diaz 2005. Grazing effects on rangeland
diversity: a synthesis of contemporary models. Ecological Applications 15:757-
773.
Clary, W. P., and B. F. Webster 1989. Managing grazing of riparian areas in
intermountain region. Pages 1-11. USDA Forest Service.
Coffin, D. P., W. A. Laycock, and W. K. Lauenroth 1998. Disturbance intensity and
above- and belowground herbivory effects on long-term (14 y) recovery of a
semiarid grassland. Plant Ecology 139:221-233.
Collins, S. L., and S. C. Barber 1985. Effects of disturbance on diversity in mixed-grass
prairie. Plant Ecology 64:87-94.
Corbett, E. A., R. C. Anderson, and C. S. Rogers 1996. Prairie revegetation of a stripmine
in Illinois: fifteen years after establishment. Restoration Ecology 4:346-354.
Crabb, J. A. 1982. Soil survey of Weld County, Colorado northern part Pages 157
in United States Department of Agriculture Soil Conservation Service with
Colorado Agricultural Experiment Station. Station, editor.
Crotty, M. 1998. The Foundations of social research. Sage Publications London, UK.
178
Cullen, W. R., and C. P. Wheater 1993. The flora and invertebrate fauna of a relocated
grassland at Thrislington Plantation, County Durham, England. Restoration
Ecology 1:130-137.
Daehler, C. C. 2003. Performance comparisons of co-occurring native and alien invasive
plants: Implications for conservation and restoration. Annual Review of Ecology,
Evolution, and Systematics 34:183-211
Darwin, C. 1859. The origin of species. J. Murray, London.
Davies, K. F., S. Harrison, H. D. Safford, and J. H. Viers 2007. Productivity alter the
scale dependence of the diversity- invasibility relationship. Ecology 88:1940-
1947.
Davis, J. 1998. Young children, environmental education, and the future Early Childhood
Education Journal 26:117-123.
Dennis, J. 1992. It's raining frogs and fishes - four seasons of natural phenomena and
oddities of the sky. HarperCollins Publishers Inc, New York NY.
Denslow, J. S. 1980. Patterns of plant species diversity during succession under different
disturbance regimes. Oecologia 46:18-21.
Derner, J. D., and R. H. Hart 2007. Livestock and vegetation responses to rotational
grazing in short-grass steppe. Western North American Naturalist 67:359-367.
Derner, J. D., and A. J. Whitman 2009. Plant interspaces resulting from contrasting
grazing management in northern mixed-grass prairie: implications for ecosystem
function. Rangeland Ecology & Management 62:83-88.
Dewey, J. 1938. Experience and education. The Macmillan Company, New York.
Diaz, S., and M. Cabido 2001. Vive la difference: plant functional diversity matters to
ecosystem processes. Trends in Ecology and Evolution 16:646-655.
Diez, J. M., J. J. Sullivan, P. E. Hulme, G. Edwards, and R. P. Duncan 2008. Darwin's
naturalization conundrum: dissecting taxonomic patterns of species invasions.
Ecology Letters 11:674–681.
Ditommaso, J. M. 2000. Invasive weeds in rangelands: species, impacts, and
management. Weed Science 48:255-265.
Ditommaso, J. M., and D. W. Johnson 2006. The use of fire as a tool for controlling
invasive plants Pages 56. Cal-IPC Publication 2006-01. California Invasive Plant
Council, Berkeley, CA.
179
Dodd, M. B., and W. K. Lauenroth 1997. The influence of soil texture on the soil water
dynamics and vegetation structure of a shortgrass steppe ecosystem. Plant
Ecology 133:13-28.
Donahue, R. L., R. W. Miller, and J. C. Shickluna. 1977. Soils and introduction to soils
and plant growth 4th ed. Prentice-Hall, Englewood Cliffs.
Dove, J., L. Everett, and P. Preece 1997. The urban child's concentration of a river.
Landscape Research 22:52-56.
Drew, L. J., W. H. Langer, and J. S. Sachs 2002. Environmentalism and natural
aggregate mining. Natural Resources Research 11:19-28.
Dukes, J. 2000. Biodiversity and invasibility in grassland microcosms. Oecologia
126:563-568.
Ehrendorfer, F. 1973. New chromosome numbers and remarks on theAchillea
millefolium polyploid complex in North America. Plant Systematics and
Evolution 122 133-143.
Eliason, S. A., and E. B. Allen 1997. Exotic grass competition in suppressing native
shrubland re-establishment. Restoration Ecology 5:245-255.
Elton, C. S. 1958. The ecology of invasions by animals and plants. Methuen, London.
Emery, S. M. 2007. Limiting similarity between invaders and dominant species in
herbaceous plant communities? Journal or Ecology 95:1027-1035.
Epstein, H. E., I. C. Burke, and W. K. Lauenroth 1999. Response of the shortgrass steppe
to changes in rainfall seasonality. Ecosystems 2:139-150.
Eschtruth, A. K., and J. J. Battles 2009. Assessing the relative importance of disturbance,
herbivory, diversity, and propagule pressure in exotic plant invasion Ecological
Monographs 79:265-280.
Fairchild, J. F., D. S. Ruessler, P. S. Haverland, and A. R. Carlson 1997. Comparative
sensitivity of Selenastrum capricornutum and Lemna minor to sixteen herbicides.
Environmental Contamination and Toxicology 32:353-357.
Felixa, J., D. J. Doohana, and D. Bruins 2007. Differential vegetable crop responses to
mesotrione soil residues a year after application. Crop protection 26 1395–1403.
180
Frouz, J., K. Prach, V. Pizl, L. Hanel, J. Stary, K. Tajovsky, J. Materna, V. Balik, J.
Kalcik, K. Rehounkova 2008. Interactions between soil development, vegetation
and soil fauna during spontaneous succession in post mining sites. European
Journal of Soil Biology 44:109-121.
Fuhlendorf, S. D., and D. M. Engle 2001. Restoring heterogeneity on rangelands:
ecosystem management based on evolutionary grazing patterns. BioScience
51:625-632.
Fuhlendorf, S. D., H. Zhang, T. R. Tunnell, D. M. Engle, and A. F. Cross 2002. Effects of
grazing on restoration of southern mixed prairie soils. Restoration Ecology
10:401-407.
Fujita, N., N. Amartuvshin, Y. Yamada, K. Matsui, S. Sakai, and N. Yamamura 2009.
Positive and negative effects of livestock grazing on plant diversity of Mongolian
nomadic pasturelands along a slope with soil moisture gradient. Grassland
Science 55:126–134.
Garnier, E. 1992. Growth analysis of congeneric annual and perennial grass species.
Journal of Ecology 80:665-675.
Gause, G. F. 1934. The struggle for existance. Williams and Wilkins, Baltimore, MA.
Gibson, D. J., B. A. Middleton, G. W. Saunders, M. Mathis, W. T. Weaver, J. Neely, J.
Rivera, and M. Oyler 1999. Learning ecology by doing ecology: long-term field
experiments in succession. The American Biology Teacher 61:217-222.
Gitay, H., and I. R. Noble 1997. What are functional types and how should we seek
them? Pages 3-19 in T. M. Smith, H. H. Shugart and F. I. Woodward, editors.
Plant Functional Types. Cambrige University Press, New York, NY.
Giuliano, W. M., and J. D. Homyack 2004. Short-term grazing exclusion effects on
riparian small mammal communities. Journa of Range Management 57:346-350.
Goldberg, D. E., and A. M. Barton 1992. Patterns and consequences of interspecific
competition in natural communities: A review of field experiments with plants.
The American Naturalist 139:771-801.
Gray, A. 1879. The predominance and pertinacity of weeds. Journal of Science and Arts
118:161-167.
Grime, J. P. 1977. Evidence for the existence of three primary strategies in plants and its
relavance to ecological and evolutionary theory. The American Naturalist
111:1169-1194.
181
Grime, J. P. 2001. Plant strategies, vegetation processes, and ecosystem properties. John
Wiley & Sons New York, NY
Haggar, R. J., A. K. Oswald, and W. G. Richardson 1986. A review of the impact and
control of creeping thistle (Cirsium arvense L.) in grassland. Crop Protection
5:73-76.
Hardin, G. 1960. The competitive exclusion principle. Science 131:1292-1297.
Harper, J., and D. Gajic 1961. Experimental studies of the mortality and plasticity of a
weed. Weed Research 1:91–104
Hart, R. H. 2001. Plant biodiversity on shortgrass steppe after 55 years of zero, light, or
heavy cattle grazzing. Plant Ecology 155:111-118.
Hart, R. H., and M. M. Ashby 1998. Grazing intensities, vegetation and heifer gains: 55
years on shortgrass. Journal of Range Management 51:392-398.
Hayden, A. 1934. Distribution and reproduction of Canada thistle in Iowa. American
Journal of Botany 21:355-373.
Hazlett 1998. Vascular Plant Species of the Pawnee National Grassland. Pages 1-32.
USDA, Forest Service, Rocky Mountain Research Station.
Hazlett, D. H. 1992 Leaf area development of four plant communities on the Colorado
steppe. American Midland Naturalist 127:276-289.
Hierro, J. L., J. L. Maron, and R.M. Callaway 2005. A biogeographical approach to
plant invasions: the importance of studying exotics in their introduced and native
range. Journal of Ecology 93:5-15.
Hinsinger, P. 2001. Bioavailablility of soil inorganic P in the rhizosphere as affected by
root-induced chemical changes: a review. Plant and Soil 237:173-195.
Hoar, S. K., A. Blair, F. F. Holmes, C. D. Boysen, R. J. Robel, R. Hoover, and J. F.
Fraumeni 1986. Agricultural herbicide use and risk of lymphoma and soft-tissue
sarcoma. JAMA 256:1141-1147.
Hobbs, R. J., and A. M. Harold 1991. Effects of rainfall variability and gopher
disturbance on serpentine annual grassland dynamics. Ecology 72:59–68.
Hobbs, R. J., and L. F. Huenneke 1992. Disturbance, diversity, and Invasion: Iplication
for conservation. Conservation Biology 6:324-337
Hodgson, J. M. 1968. The nature, ecology, and control of Canada thistle. U.S.
Department of Agriculture Technical Bulletin
182
Holzsapfel, C., P. Shahrokh, and D. Kafkewitz 2010. Polyphenol oxidase avctivity in the
roots of seedlings of Bromus (Poaceae) and other grass genera American Journal
of Botany 97:1195-1199.
Hooper, D. U., and J. S. Dukes 2010. Functional composition controls invasion success in
a California serpentine grassland. Journal of Ecology 98:764-777.
Hoorman, J. J., and J. Mccutcheon 2005. Best management practices to control the
effects of livestock grazing on riparian areas. Pages 1-6 in L. Owens, S. Loerch
and R. Hendershott, editors. Ohio State University Extension Fact Sheet
Ohio State University Extension, Columbus, Ohio.
Houston, W. R., and D. N. Hyden 1976. Controlling sixweek fescue on shortgrass range.
Journal of Range Management 29:151-153.
Hulbert, L. C. 1955. Ecological studies of Bromus tectorum and other annual
bromegrasses. Ecological Monographs 25:181-213.
Indorante, S. J., I. J. Jansen, and C. W. Boast 1981. Surface mining and reclamation:
initial changes in soil character Journal of Soil and Water Conservation 36:347-
351.
Ives, A. R. 1995. Measuring resilience in sochastic systems. Ecological Monographs
65:217-233.
Jick, T. D. 1979. Mixing qualitative and quantitative methods: triangulation in action.
Administrative Science Quarterly 24:602-611.
Kauffmann, B. J., and W. C. Krueger 1984. Livestock impacts on riparian ecosystems
and streamside management implications a review. Journal of Range
Management 37:430-438.
Kirmer, A., S. Tischew, W. A. Ozinga, M. Von Lampe, A. Baasch, and J. M. Van
Groenendael 2008. Importance of regional species pools and functional traits in
colonization processes: predicting re-colonization after large-scale destruction of
ecosystems. Journal of Applied Ecology 45:1523-1530.
Knapp, C. E. 1999. In accord with nature: helping students form an environmental
ethic using outdoor experience and reflection. ERIC/CRESS, Appalachia
Educational Laboratory, Chareston, WV.
Kolar, C. S., and D. M. Lodge 2001. Progress in invasive biology: predicting invaders.
Trends in Ecology & Evolution 16:199-204.
183
Kotanen, P. M., J. Bergelson, and D. L. Hazlett 1998. Habitats of native and exotic plants
in Colorado shortgrass steppe: a comparative approach. Canadian Journal of
Botany 76:664-672.
Kreyling, J., L. E. Beierkuhnlein, and A. Jentsch 2008. Invasibility of grassland and heath
communities exposed to extreme weather events - additive effects of diversity
resistance and fluctuating physical environment. Oikos 117:1542-1554.
Langer, W. H., and B. F. Arbogast 2002. Environmental impacts of mining natural
aggregate Pages 151-169 in A. G. Fabbri, G. Gaal and R. B. Mccammon, editors.
Deposit and Geoenvironmental Models for Resource Exploitation and
Environmental Security. Kluwer Academic Publishers, Boston.
Larson, D. L. 2003. Native weeds and exotic plants: relationships to disturbance in
mixed-grass prairie. Plant Ecology 169:317–333.
Larson, F. 1940. The role of bison in maintaining the shortgrass plains. Ecology 21:113-
121.
Lauenroth, W. K. 2008. Vegetation of the shortgrass steppe. Pages 70-83 in W. H.
Langer and I. C. Burke, editors. Ecology of the shortgrass steppe a long-term
perspective Oxford University Press, New York.
Lauenroth, W. K., I. C. Burke, and J. A. Morgan 2008. The shortgrass steppe the region
and research sites Pages 3-13 in W. K. Lauenroth and I. C. Burke, editors.
Ecology of the shortgrass steppe. Oxford University Press, New York.
Lauenroth, W. K., and D. G. Milchunas 1991a. The shortgrass steppe. Pages 183-226 in
Coupland, editor. Ecosystems of the World. Elsevier, New York.
Lauenroth, W. K., and D. G. Milchunas 1991b. The shortgrasse steppe. Pages 183-226 in
R. T. Coupland, editor. Ecosystems of the World. Elsevier, New York.
Lauenroth, W. K., and O. E. Sala 1992. Long-term forage production of North American
shortgrass steppe Ecological Applications 2:397-403.
Lavorel, S., S. Mcintyre, J. Landsberg, and T. D. A. Forbes 1997. Plant functional
classifications: from general groups to specific groups based on response to
disturbance. Trends in Ecology & Evolution 12:474-478.
LeCain, D. R., J. A. Morgan, G. E. Schumann, D. Reeder Jean, and R. H. Hart 2002.
Carbon exchange and species composition of grazed pastures and exclosures in
the shortgrass steppe of Colorado. Agriculture Ecosystem & Environment 93:421-
435.
184
Lee, C. E. 2002. Evolutionary genetics of invasive species. TRENDS in Ecology &
Evolution Vol.17 No.8 August 2002 17:386-391.
Levin, S. A., H. C. Muller-Landau, R. Nathan, and J. Chave 2003. The ecology and
evolution of seed dispersal: a theoretical perspective. Annu. Rev. Ecol. Syst.
34:575-604.
Leopold, A. 1949. A Sand County almanac and sketches here and there Oxford
University Press, New York, NY.
Lonsdale, W. M. 1999. Global patterns of plant invasions and the concept of invasibility.
Ecology 80:1522-1536.
Louv, R. 2005. Last child in the woods. Algonquin, Chapel Hill, North Carolina.
Lucas, R. W., T. T. Baker, K. M. Wood, C. D. Allison, and D. M. Vanleeuwn 2004.
Riparian vegetation response to different intensities and seasons of grazing.
Journal of Range Management 57:466-474.
Macarthur, R. H. 1972. Geographical ecology : patterns in the distribution of species.
Harper & Row, New York.
Mack, R. N. 1981. Invasion of Bromus tectorum L. into western North America: an
ecological chronicle. Agr-Ecosystems 7:145-165.
Mack, R. N., and D. A. Pyke 1983. The domography of Bromus Tectorum variation in
time and space. Journal of Ecology 71:69-93.
Mack, R. N., and J. N. Thompson 1982. Evolution in steppe with few large, hooved
mammals. The American Naturalist 119:757-773.
Mangold, J. M., C. L. Poulsen, and M. F. Carpinelli 2007. Revegetating Russian
knapweed (Acroptilon repens) infestations using morphologically diverse species
and seedbed preparation. Rangeland Ecology & Management 60:378-385.
Maron, M., and M. Marbler 2007. Native plant diversity resists invasion at both low and
high resource levels. Ecology 88:2651-2661.
Martin, L. M., K. A. Moloney, and B. J. Wilsey 2005. An assessment of grassland
restoration success using species diversity components. Journal of Applied
Ecology 42:327-336.
Martin, L. M., and B. J. Wilsey 2006. Assessing grassland restoration success: relative
roles of seed additions and native ungulate activities. Jornal of Applied Ecology
43:1098-1109.
185
Marvier, M., P. Peter Kareiva, and M. G. Neubert 2004. Habitat destruction,
fragmentation, and disturbance promote invasion by habitat generalists in a
multispecies metapopulation. Risk Analysis 24:869–878.
Mccune, B., and M. J. Metford 2006. PC-ORD. Multivariate analysis of ecological data.
version 5. MjM Software, Gleneden Beach, Oregon, U.S.A.
Mcevoy, P. B., and E. M. Coombs 1999. Biological control of plant invaders: regional
patterns, field experiments, and structured population models Ecological
Applications 9:387-401.
Mcnaughton, S. J. 1993. Grasses and grazers, science and management. Ecological
Applications 3:17-20.
Merriam, S. B. 1998. Qualitative Research and case study applications in education.
John Wiley & Sons, San Francisco, CA.
Milchunas, D. G., J. R. Forwood, and W. K. Lauenroth 1994. Productivity of long-term
grazing treatment response to seasonal precipitation. Journal of Range
Management 47:133-139.
Milchunas, D. G., and W. K. Lauenroth 1993. Quantitative effects of grazing on
vegetation and soils over a global range of environments. Ecological
Monographs 63:327-366.
Milchunas, D. G., W. K. Lauenroth, and I. C. Burke 1988a. Livestock grazing: animal
and plant biodiversity of shortgrass steppe and the relationship to ecosystem
function. Oikos 83:65-74.
Milchunas, D. G., W. K. Lauenroth, and P. L. Chapman 1992. Plant competition, abiotic,
and long- and short-term effects of large herbivores on demography of
opportunistic species in a semiarid grassland. Oecologia 92:520-531.
Milchunas, D. G., O. E. Sala, and W. K. Lauenroth 1988b. A generalized model of the
effects of grazing by large herbivores on grassland community. The American
Naturalist 132:87-106.
Milchunas, G. D., and W. K. Lauenroth 1989. Three-dimensional distribution of plant
biomass in relation to grazing and topography in the shortgrass steppe. Oikos
55:82-86.
Moore, R. J. 1975. The biology of Canadian weeds: Cirsium arvense (L.) Scop. Canadian
Journal of Plant Science 55:1033-1048.
Mueller, M. P. 2011. Lessons from the tree that owns itself: implications for education.
Internarnational Journal of Environmental & Science Education 6:293-314.
186
Munson, S. M., and W. K. Lauenroth 2011. Plant community recovery following
restoration in semiarid grasslands. Restoration Ecology. DOI: 10.1111/j.1526-
100x.2011.00808.x
NAAEE 2004. Excellence in environmental education: guidelines for learning (K-12)
2nd Edition, Rock Spring, GA
Ng, J. C. 2002. Degradation of land and its relation to public health Pages 7-18 in M. H.
Wong and B. A. D., editors. The Restoration and Management of Derelict Land.
World Scientific Publishing Co. Pte. Ltd. , River Edge.
Olff, H., and M. Ritchiee 1998. Effects of herbivores on grassland plant diversity. Trends
in Ecology and Evolution 13:261-265.
Orsi, L., L. Delabre, A. Monnereau, P. Delval, C. Berthou, P. Fenaux, G. Marit, P.
Soubeyran, F. Huguet, N. Milpied, M. Leporrier, D. Hemon, Troussard, and J.
Clavel 2009. Occupational exposure to pesticides and lymphoid neoplasms among
men: results of a French case-control study. Occup Environ Med 66:291-298.
Owensby, C. E. 1969. Effect of cages on herbage yield in true prairie vegetation. Journal
of Range Management 22:131-132.
Palmblad, I. G. 1968. Experimantal populations of weeds with emphasis on the regulation
of population size. Ecology 49:26-34.
Paruelo, J. M., and W. K. Lauenroth 1996. Relative abundance of plant functional types
in grasslands and shrublands of North America 4:1212-1224
Peters, D. P. C., W. K. Laurenroth, and I. C. Burke 2008. Ecology of the shortgrass
steppe. Pages 84-118 in W. H. Langer and I. C. Burke, editors. Ecology of the
Shortgrass Steppe. Oxford University Press, New York.
Pielke, R. A. S., and N. J. Doesken 2008. Climate of the shortgrass steppe. Pages 14-29
in W. K. Lauenroth and I. C. Burke, editors. Ecology of the shortgrass steppe a
long-term perspective. Oxford University Press, New York.
Pihlainen-Bednarik, K., and T. Keinonen 2011. Six graders understanding of their own
learning: A case study in environmental education course. Internarnational
Journal of Environmental & Science Education 6:59-78.
Pimentel, D., L. Lach, R. Zuniga, and D. Morrison 2000. Environmental and economic
costs of nonindigenous species in the United States BioScience 50:53-65.
Pitelka, L. F. 1977. Energy allocation in annual and perennial lupines (Lupinus:
Leguminosae). Ecology 58:1055-1065.
187
Pokorny, M. L., R. L. Sheley, C. A. Zabinski, R. E. Engel, T. J. Svejcar, and J. J.
Borkowski 2005. Plant functional group diversity as a mechanism for invasion
resistance. Restoration Ecology 13:448-459.
Pollard, C. L. 1899. The genus Achillea in North America. Bulletin of the Torrey
Botanical Club 26:365-372.
Pywell, R. F., J. M. Bullock, D. B. Roy, L. Warman, K. J. Walker, and P. Rothery 2003.
Plant traits as predictors of performance in ecological restoration. Journal of
Applied Ecology 40:65-77.
Quetier, F., A. Thebault, and S. Lavorel 2007. Plant traits in a state and transition
framework as markers of ecosystem response to land-use change. Ecological
Monographs 77:33-52.
Rehounkova, K., and K. Prach 2010. Life-history traits and habitat preferences of
colonizing plant species in long-term spontaneous succession in abandoned
gravel-sand pits. Basic and Applied Ecology 11:45-53.
Resh, S. C., and R. A. Chimmer. 2005. Restoration plan for the Poudre Learning Center.
Poudre Learning Center, Greeley, CO.
Rice, K. J., and R. N. Mack 1991. Ecological genetics of Bromus tectorum. II.
intraspecific variation in phenotypic plasticity. Oecologia 88:84-90.
Ruiz-Jaen, M. C., and M. T. Aide 2005. Restoration success: How it is being measured.
Restoration Ecology 13:569-577.
Rutherford, M. C., L. W. Powrie, and L. B. Husted 2012. Plant diversity consequences of
a herbivore-driven biome switch from grassland to nama-karoo shrub steppe in
South Africa. Applied Vegetation Science 15:14-25.
Schenk, J. H., and R. B. Jackson 2002. Rooting depths, lateral root spreads and below-
ground/above-ground allometries of plants in water-limited ecosystems. Journal
of Ecology 90:480-493.
Schiebout, M. H., D. L. Hazlett, N. Snow, and 2008. A floristic survey of vascular plants
over parts of northeastern New Mexico. Jornal of Bot. Res. Inst. of Texas
2:1407-1448
Schimel, D., M. A. Stillwell, and R. G. Woodmansee 1985. Biochemistry of C, N, and P
in a soil catena of the shortgrass steppe. Ecology 66:276-282.
Schultz, T. T., and W. C. Leininger 1990. Differences in riparian structure between
grazed areas and exclosures. Journal of Range Management 43:295-299.
188
Schwartz, C. C., and J. E. Ellis 1981. Feeding ecology and niche separation in some
native and domestic ungulates on the shortgrass prairie. Journal of Applied
Ecology 18:343-353.
Seabloom, E. W., E. T. Borer, V. L. Boucher, Burton, Rebecca S., K. L. Cottingham, L.
Goldwasser, W. K. Gram, B. E. Kendall, and F. Micheli 2003. Competition, seed
limitation, disturbance, and reestablishment of California native annual forbs
13:575-592.
Senft, R. L., L. R. Rittenhouse, and R. G. Woodmansee 1985. Factors influencing
patterns of cattle grazing behavior on shortgrass steppe. Journal of Range
Management 38:82-87.
Sengupta, M. 1993. Reclamation and revegetation of mined land. Pages 103-119 in M.
Sengupta, editor. Environmental impacts of Mining Monitoring, Restoration and
Control. CRC Press, Inc., Boca Raton.
SER, Society for Ecological Restoration International Science & Policy Working Group
2004. The SER International Primer on Ecological Restoration. Tucson, Arizona
Shaw, J. R., and D. J. Cooper 2008. Linkages among watersheds, stream reaches, and
riparian vegetation in dryland ephemeral stream networks. Journal of Hydrology
350:68-82.
Shaw, R. B. 2008. Grasses of Colorado. University Press of Colorado, Boulder,
Colorado.
Sheley, R. L., and M. F. Carpinelli 2005. Creating weed-resistant plant communities
using niche-differentiated nonnative species. Rangeland Ecology & Management
58:480-488.
Sheley, R. L., and J. James 2010. Resistance of native plant functional groups to invasion
by medusahead (Taeniatherum caput-medusae) Invasive Plant Science and
Manegement 3:294-300.
Sheley, R. L., and J. Krueger-Mangold 2003. Principles for restoring invasive plant-
infested rangeland. Weed Science 51:260-265.
Shepardson, D. P., B. Wee, M. Priddy, and J. Harbor 2007. Students mental mModels of
the Environment. Journal of Research in Science Teaching 44:327-348.
Singh, J. S., P. Bourgeron, and W. K. Lauenroth 1996. Plant species richness and species-
area relations in a shortgrass steppe in Colorado. Journal of Vegetation Science
7:645-650.
189
Skinner, M. 2008. Plant Guide: Cheat grass, Bromus tectorum in USDA, National Plant
Data Center, Baton Rouge, Louisiana.
Smeds, P., E. Jeronen, S. Kurppa, and M.-L. Vieraankivi 2011. Rural camp school eco
learn - outdoor education in rural settings. Internarnational Journal of
Environmental & Science Education 6:267-291.
Smith, R. L., and T. M. Smith. 2001. Ecology and Field Biology 6th Ed. Benjamin-
Cumming Pub Co.
Snow, N. 2007. Checklist of Vascular Plants of the Southern Rocky Mountain Region
(Version 2):308 pp
Sousa, W. 1984. The role of disturbance in natural communities. Annu. Rev. Ecol. Syst.
15:353-391.
Stapp, P., B. Vanhorn, and M. D. Lindquist. 2008. Ecology of mammals of the shortgrass
steppe. Oxford University Press, New York.
Stockwell, C. A., A. P. Hendry, and M. T. Kinnison 2003. Contemporary evolution meets
conservation biology. Trends in Ecology & Evolution 18 94–101.
Stohlgren, T., J., K. A. Bull, Y. Otsuki, C. A. Villa, and M. Lee 1998. Riparian zones as
havens for exotic plant species in the central grasslands. Plant Ecology 138:113-
125.
Stohlgren, T., J., L. D. Schell, and B. Vanden Heuvel 1999. How grazing and soil quality
affect native and exotic plant diversity in Rocky Mountain grasslands. Ecological
Applications 9:45-64.
Sutherland, J. P. 1974. Multiple stable points in natural communities. The American
Naturalist 108:859-873.
Symstad, A. J. 2000. A test of the effects of functional group richness and composition
on grassland invasibility. Ecology 81:99-109.
Thacher, E., M. H. Ralphs, and T. A. Monaco 2009a. A comparison of inter- and
intraspecific interference on broom snakeweed (Gutierrezia sarothrae) seedling
growth. Invasive Plant Science and Manegement 2:36-44.
Thacher, E., M. H. Ralphs, and T. A. Monaco 2009b. Seeding cool-season grasses to
suppress broom snakeweed (Gutierrezia sarothrae), downy brome (Bromus
tectorum), and weedy forbs. Invasive Plant Science and Manegement 2:237-246.
Thomson, G., and J. Hoffman 2004. Measuring the success of environmental education
programs. Canadian Parks and Wilderness Society.
190
Thorpe, A. S., G. C. Thelen, A. Diaconu, and R. M. Callaway 2009. Root exudate is
alleopathic in invaded community but not in native community: field evidence for
the novel weapons hypothesis. Journal of Ecology 97:641-645.
Thuiller, W., L. Gallien, I. Boulangeat, F. De Bello, T. Munkemuller, C. Roquet, and S.
Lavergne 2010. Resolving Darwin’s naturization conundrum: a quest fro
evidence. Diversity and Distributions 16:461-475.
Tilman, D. 1986. Resources, Competition and the Dynamics of Plant Communities.
Pages 51-75 in M. Crawley, editor. Plant Ecology. Blackwell Scientific
Publications, Oxford.
Tilman, D. 1988. Synamics and structure of plant communities. Princeton Universty
Press, Princeton, NJ.
Tilman, D. 1996. Biodiversity: population vs. ecosystem stability. Ecology 77:350-363.
Tilman, D. 1997. Community invasibility, recruitment limitation, and grassland
biodiversity Ecology 78:81-92.
Tilman, D., J. Knops, D. Wedin, P. Reich, M. Ritchie, and Siemann 1997. The influence
of functional diversity and composition on ecosystem processes Science
277:1300-1302.
Tilman, D., and S. Pacala 1993. The maintenance of species richness in plant
communities. Pages 13-25 in R. E. Ricklefs and S. D., editors. Species Diversity
in Ecological Communities. University of Chicago, Chicago.
Tschillard, R., T. Booton, R. Reinsvold, L. Rogstad, G. Philp, N. Hoban, D. Hazlett, R.
Simpson, and M. Urban. 2006. Poudre Learning Center reclamation plan,
Greeley, CO.
USDA Forest Service. 1988. Range plant handbook. Dover Publications, Inc., New
York, NY.
USDA NRCS, 2012. URL http ://websoilsurvey.nrcs.usda.gov/app/WebSoilSurvey.aspx
[accessed on 2/29/12 2012].
USDA Soil Conservation Service 1980. Soil survey of Weld County, Colorado southern
part Pages 147 in USDA Soil Conservation Service with Colorado Agricultural
Experiment Station. Station, editor.
Van Der Maarel, E., and A. Titlyanova 1989. Above-ground and below-ground biomass
relations in steppes under different grazing conditions. Oikos 56:364-370.
191
Van Eck, W. H. J. M., H. M. Van De Steeg, C. W. P. M. Blom, and H. De Kroon 2004. Is
tolerance to summer flooding correlated with distribution patterns in river
floodplains? A camparative study of 20 terrestrial grassland species. Oikos
107:393-405.
Vila, M., and J. Weiner 2004. Are invasive plant species better competitors than native
plant species? - evidence from pair-wise experiments. Oikos
105:229-238.
Vitousek, P. M., C. M. D'antonio, L. L. Loope, and R. Westbrooks 1996. Biological
invasions as global environmental change. American Scientist 84:468-478.
Warwick, S. I., and L. Black 1982. The biology of canadian weeds: 52. Achillea
millefolium L. Canadian Journal of Plant Science, 62:163-182.
Weaver, J. E. 1968. Prairie plants and their environment. University of Nebraska Press,
Lincon.
Weinig, C. 2000. Plasticity versus canalization: population differences in the timing of
shade aviodance responses. Evolution 54:441-451.
White, J., and J. L. Harper 1970. Correlated changes in plant size and number in plant
populations. Journal of Ecology 58:467-485.
White, P. S., and S. T. A. Pickett 1985. Natural disturbance and patch dynamics: an
introduction. Pages 3-13 in S. T. A. Pickett and P. S. White, editors. The Ecology
of Natural Disturbance and Patch Dynamics. Academic Press, Inc., San Diego.
Williamson, M., and A. Fitter 1996. The varying success of invaders. Ecology 77:1661-
1666.
Wilsey, B. J., T. B. Teaschner, P. P. Daneshgar, I. I. Forest, and W. H. Polley 2009.
Biodiversity maintenance mechanisms differ between native and novel exotic-
dominated communities. Ecology Letters 12:432-442.
Wolfe, L. M. 2002. Why alien invaders succeed: Support for the escape "from" enemy
hypothesis. American Naturalist 160:705-711.
Xiong, S., and C. Nilsson 1999. The effects of plant litter on vegetation: a meta-analysis
Journal of Ecology 87:984-994.
Yow, S. H. 2008. Making Sense of human/environmental interaction: student dialogue
focused on visual representations of environmental change over time. PhD
Dissertation. University of Kentucky

192
Yurkonis, K. A., B. J. Wilsey, and K. A. Moloney 2012. Initial species pattern affects
invasion resistance in experimental grassland plots. Journal of Vegetation Science
23:4–12.

193
APPENDIX A
CUMULATIVE SPECIES LIST FROM PLC, PAWNEE 17, AND PAWNEE 27
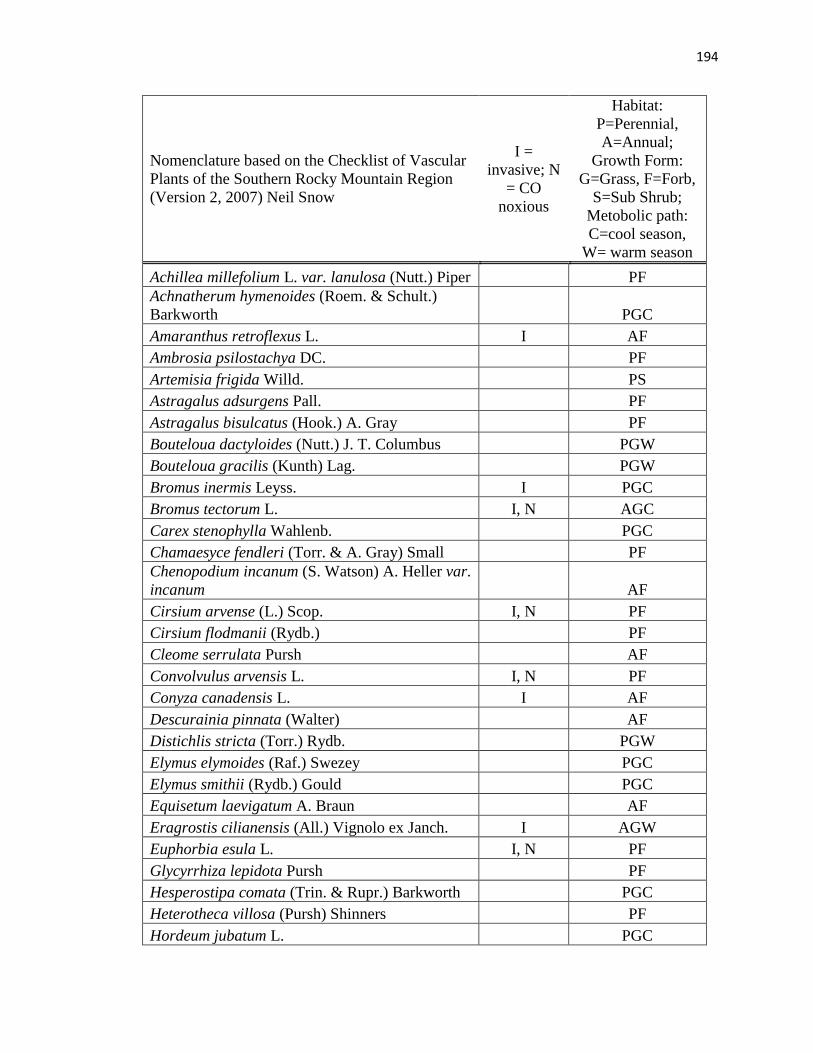
194
Nomenclature based on the Checklist of Vascular
Plants of the Southern Rocky Mountain Region
(Version 2, 2007) Neil Snow
I =
invasive; N
= CO
noxious
Habitat:
P=Perennial,
A=Annual;
Growth Form:
G=Grass, F=Forb,
S=Sub Shrub;
Metobolic path:
C=cool season,
W= warm season
Achillea millefolium L. var. lanulosa (Nutt.) Piper PF
Achnatherum hymenoides (Roem. & Schult.)
Barkworth PGC
Amaranthus retroflexus L. I AF
Ambrosia psilostachya DC. PF
Artemisia frigida Willd. PS
Astragalus adsurgens Pall. PF
Astragalus bisulcatus (Hook.) A. Gray PF
Bouteloua dactyloides (Nutt.) J. T. Columbus PGW
Bouteloua gracilis (Kunth) Lag. PGW
Bromus inermis Leyss. I PGC
Bromus tectorum L. I, N AGC
Carex stenophylla Wahlenb. PGC
Chamaesyce fendleri (Torr. & A. Gray) Small PF
Chenopodium incanum (S. Watson) A. Heller var.
incanum AF
Cirsium arvense (L.) Scop. I, N PF
Cirsium flodmanii (Rydb.) PF
Cleome serrulata Pursh AF
Convolvulus arvensis L. I, N PF
Conyza canadensis L. I AF
Descurainia pinnata (Walter) AF
Distichlis stricta (Torr.) Rydb. PGW
Elymus elymoides (Raf.) Swezey PGC
Elymus smithii (Rydb.) Gould PGC
Equisetum laevigatum A. Braun AF
Eragrostis cilianensis (All.) Vignolo ex Janch. I AGW
Euphorbia esula L. I, N PF
Glycyrrhiza lepidota Pursh PF
Hesperostipa comata (Trin. & Rupr.) Barkworth PGC
Heterotheca villosa (Pursh) Shinners PF
Hordeum jubatum L. PGC
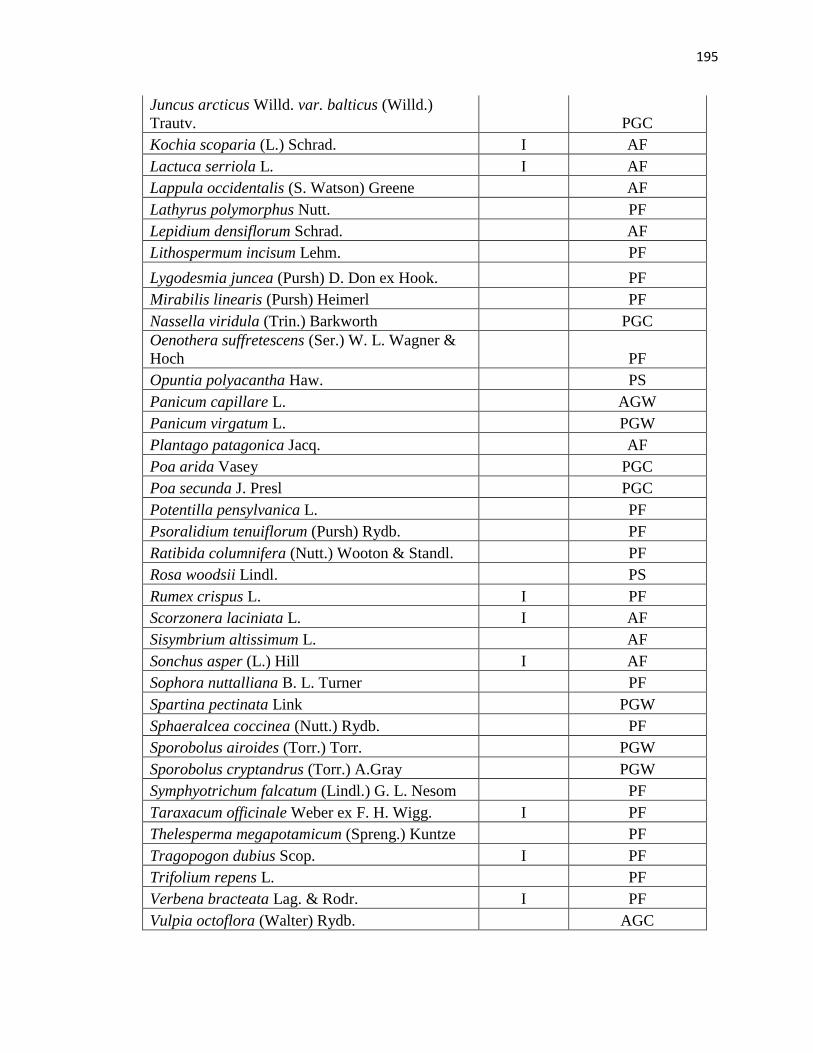
195
Juncus arcticus Willd. var. balticus (Willd.)
Trautv. PGC
Kochia scoparia (L.) Schrad. I AF
Lactuca serriola L. I AF
Lappula occidentalis (S. Watson) Greene AF
Lathyrus polymorphus Nutt. PF
Lepidium densiflorum Schrad. AF
Lithospermum incisum Lehm. PF
Lygodesmia juncea (Pursh) D. Don ex Hook. PF
Mirabilis linearis (Pursh) Heimerl PF
Nassella viridula (Trin.) Barkworth PGC
Oenothera suffretescens (Ser.) W. L. Wagner &
Hoch PF
Opuntia polyacantha Haw. PS
Panicum capillare L. AGW
Panicum virgatum L. PGW
Plantago patagonica Jacq. AF
Poa arida Vasey PGC
Poa secunda J. Presl PGC
Potentilla pensylvanica L. PF
Psoralidium tenuiflorum (Pursh) Rydb. PF
Ratibida columnifera (Nutt.) Wooton & Standl. PF
Rosa woodsii Lindl. PS
Rumex crispus L. I PF
Scorzonera laciniata L. I AF
Sisymbrium altissimum L. AF
Sonchus asper (L.) Hill I AF
Sophora nuttalliana B. L. Turner PF
Spartina pectinata Link PGW
Sphaeralcea coccinea (Nutt.) Rydb. PF
Sporobolus airoides (Torr.) Torr. PGW
Sporobolus cryptandrus (Torr.) A.Gray PGW
Symphyotrichum falcatum (Lindl.) G. L. Nesom PF
Taraxacum officinale Weber ex F. H. Wigg. I PF
Thelesperma megapotamicum (Spreng.) Kuntze PF
Tragopogon dubius Scop. I PF
Trifolium repens L. PF
Verbena bracteata Lag. & Rodr. I PF
Vulpia octoflora (Walter) Rydb. AGC

196
APPENDIX B
CUMULATIVE SPECIES LIST FROM PAWNEE 17, AND PAWNEE 27
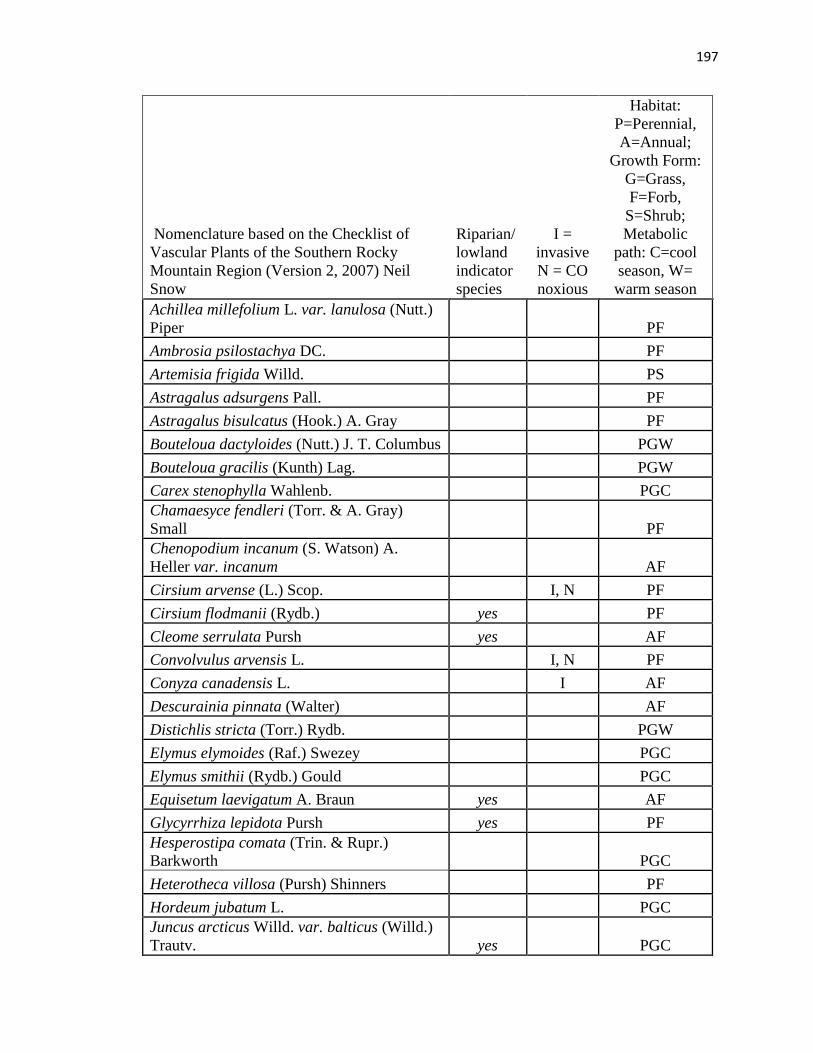
197
Nomenclature based on the Checklist of
Vascular Plants of the Southern Rocky
Mountain Region (Version 2, 2007) Neil
Snow
Riparian/
lowland
indicator
species
I =
invasive
N = CO
noxious
Habitat:
P=Perennial,
A=Annual;
Growth Form:
G=Grass,
F=Forb,
S=Shrub;
Metabolic
path: C=cool
season, W=
warm season
Achillea millefolium L. var. lanulosa (Nutt.)
Piper PF
Ambrosia psilostachya DC. PF
Artemisia frigida Willd. PS
Astragalus adsurgens Pall. PF
Astragalus bisulcatus (Hook.) A. Gray PF
Bouteloua dactyloides (Nutt.) J. T. Columbus PGW
Bouteloua gracilis (Kunth) Lag. PGW
Carex stenophylla Wahlenb. PGC
Chamaesyce fendleri (Torr. & A. Gray)
Small PF
Chenopodium incanum (S. Watson) A.
Heller var. incanum AF
Cirsium arvense (L.) Scop. I, N PF
Cirsium flodmanii (Rydb.) yes PF
Cleome serrulata Pursh yes AF
Convolvulus arvensis L. I, N PF
Conyza canadensis L. I AF
Descurainia pinnata (Walter) AF
Distichlis stricta (Torr.) Rydb. PGW
Elymus elymoides (Raf.) Swezey PGC
Elymus smithii (Rydb.) Gould PGC
Equisetum laevigatum A. Braun yes AF
Glycyrrhiza lepidota Pursh yes PF
Hesperostipa comata (Trin. & Rupr.)
Barkworth PGC
Heterotheca villosa (Pursh) Shinners PF
Hordeum jubatum L. PGC
Juncus arcticus Willd. var. balticus (Willd.)
Trautv. yes PGC
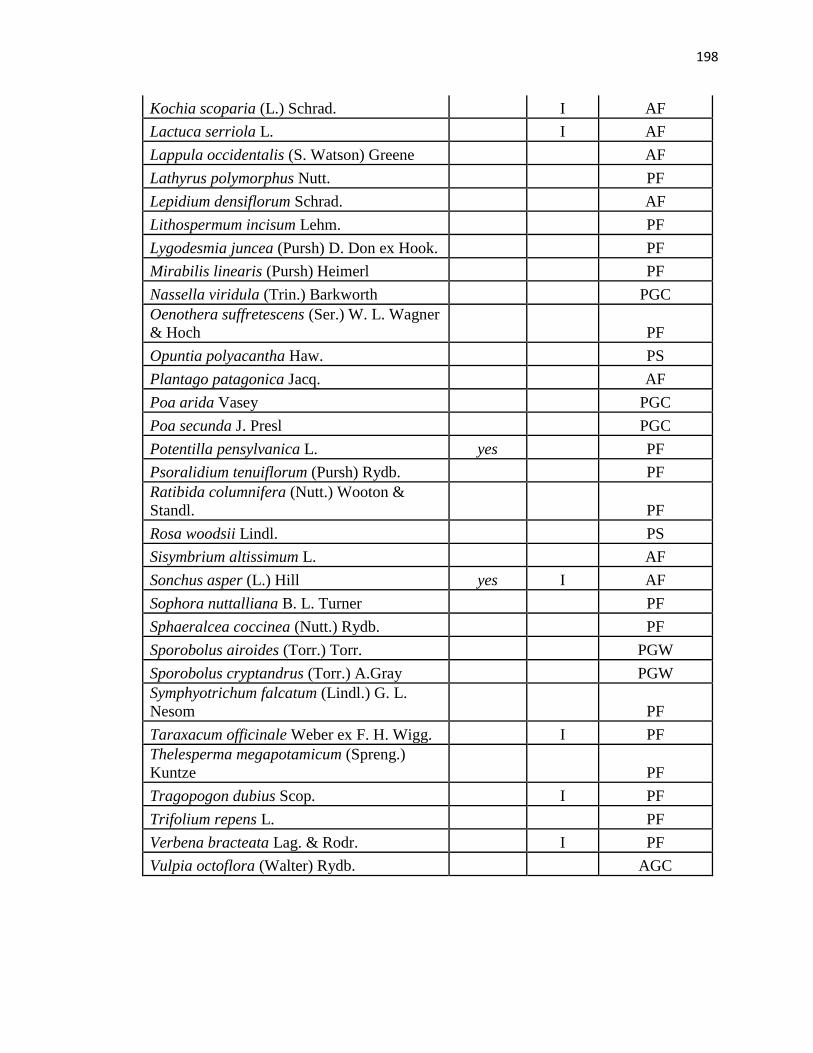
198
Kochia scoparia (L.) Schrad. I AF
Lactuca serriola L. I AF
Lappula occidentalis (S. Watson) Greene AF
Lathyrus polymorphus Nutt. PF
Lepidium densiflorum Schrad. AF
Lithospermum incisum Lehm. PF
Lygodesmia juncea (Pursh) D. Don ex Hook. PF
Mirabilis linearis (Pursh) Heimerl PF
Nassella viridula (Trin.) Barkworth PGC
Oenothera suffretescens (Ser.) W. L. Wagner
& Hoch PF
Opuntia polyacantha Haw. PS
Plantago patagonica Jacq. AF
Poa arida Vasey PGC
Poa secunda J. Presl PGC
Potentilla pensylvanica L. yes PF
Psoralidium tenuiflorum (Pursh) Rydb. PF
Ratibida columnifera (Nutt.) Wooton &
Standl. PF
Rosa woodsii Lindl. PS
Sisymbrium altissimum L. AF
Sonchus asper (L.) Hill yes I AF
Sophora nuttalliana B. L. Turner PF
Sphaeralcea coccinea (Nutt.) Rydb. PF
Sporobolus airoides (Torr.) Torr. PGW
Sporobolus cryptandrus (Torr.) A.Gray PGW
Symphyotrichum falcatum (Lindl.) G. L.
Nesom PF
Taraxacum officinale Weber ex F. H. Wigg. I PF
Thelesperma megapotamicum (Spreng.)
Kuntze PF
Tragopogon dubius Scop. I PF
Trifolium repens L. PF
Verbena bracteata Lag. & Rodr. I PF
Vulpia octoflora (Walter) Rydb. AGC

199
APPENDIX C
CUMULATIVE SPECIES RECORDED BY CPER CREW
FROM PAWNEE 17 (1995-1999)
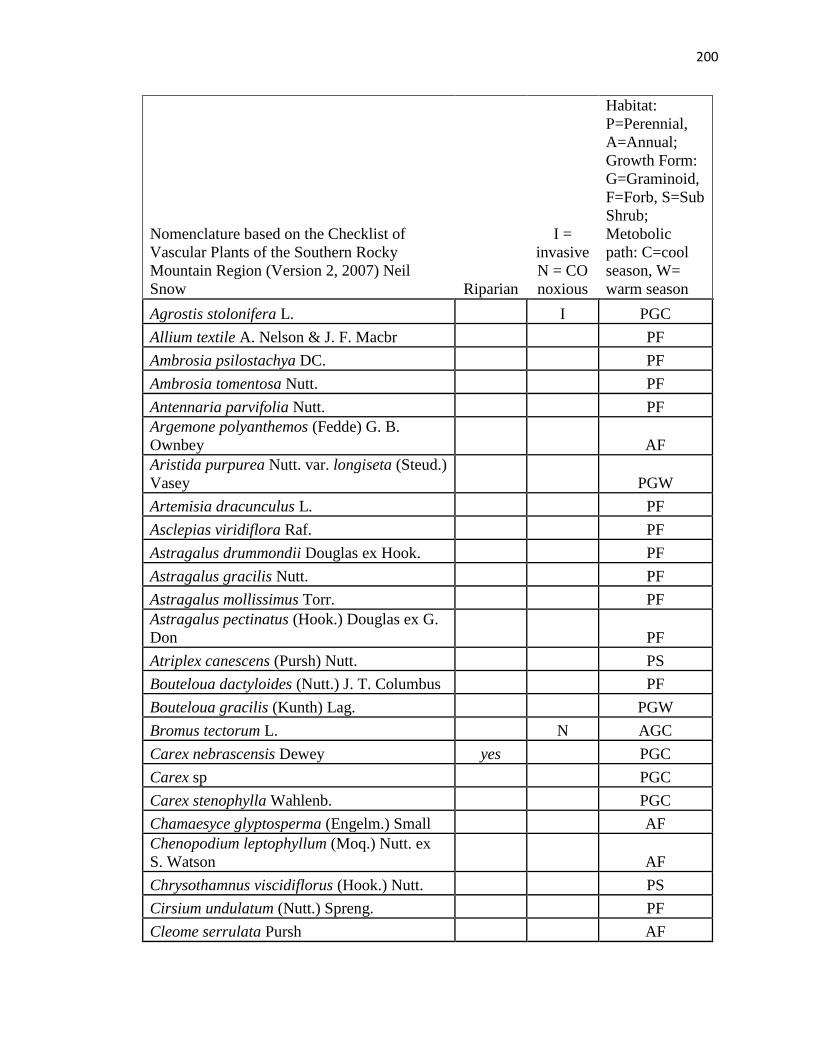
200
Nomenclature based on the Checklist of
Vascular Plants of the Southern Rocky
Mountain Region (Version 2, 2007) Neil
Snow Riparian
I =
invasive
N = CO
noxious
Habitat:
P=Perennial,
A=Annual;
Growth Form:
G=Graminoid,
F=Forb, S=Sub
Shrub;
Metobolic
path: C=cool
season, W=
warm season
Agrostis stolonifera L. I PGC
Allium textile A. Nelson & J. F. Macbr PF
Ambrosia psilostachya DC. PF
Ambrosia tomentosa Nutt. PF
Antennaria parvifolia Nutt. PF
Argemone polyanthemos (Fedde) G. B.
Ownbey AF
Aristida purpurea Nutt. var. longiseta (Steud.)
Vasey PGW
Artemisia dracunculus L. PF
Asclepias viridiflora Raf. PF
Astragalus drummondii Douglas ex Hook. PF
Astragalus gracilis Nutt. PF
Astragalus mollissimus Torr. PF
Astragalus pectinatus (Hook.) Douglas ex G.
Don PF
Atriplex canescens (Pursh) Nutt. PS
Bouteloua dactyloides (Nutt.) J. T. Columbus PF
Bouteloua gracilis (Kunth) Lag. PGW
Bromus tectorum L. N AGC
Carex nebrascensis Dewey yes PGC
Carex sp PGC
Carex stenophylla Wahlenb. PGC
Chamaesyce glyptosperma (Engelm.) Small AF
Chenopodium leptophyllum (Moq.) Nutt. ex
S. Watson AF
Chrysothamnus viscidiflorus (Hook.) Nutt. PS
Cirsium undulatum (Nutt.) Spreng. PF
Cleome serrulata Pursh AF
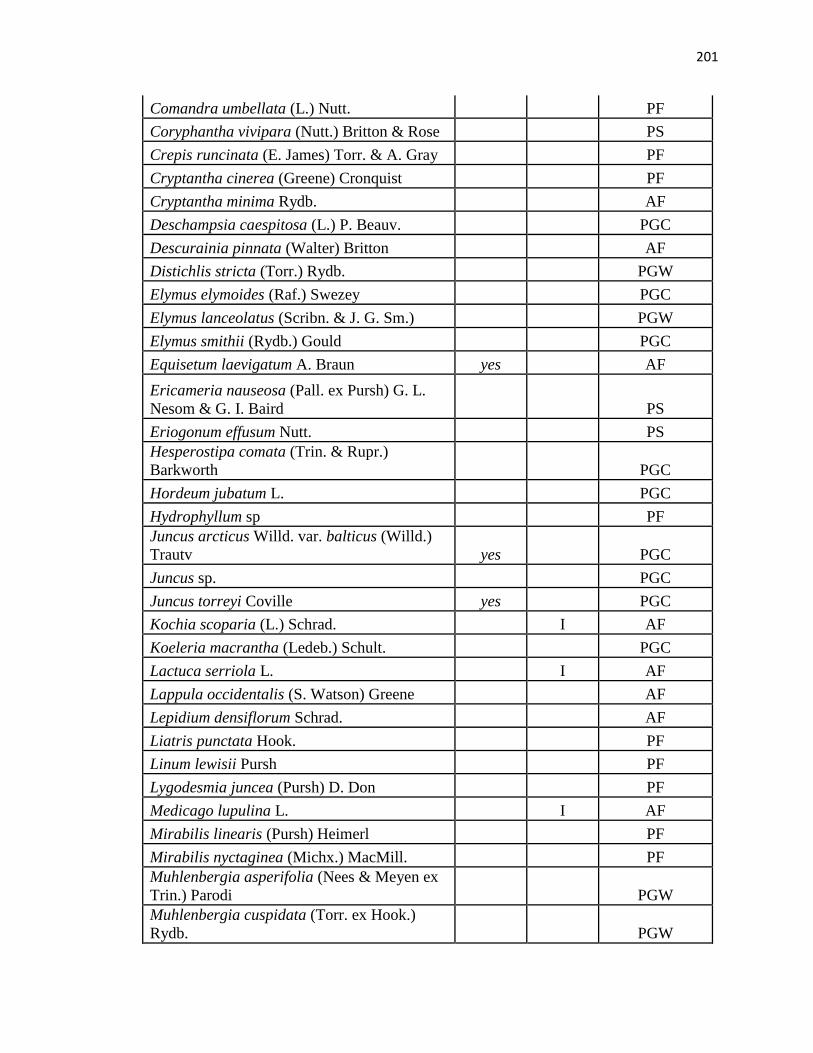
201
Comandra umbellata (L.) Nutt. PF
Coryphantha vivipara (Nutt.) Britton & Rose PS
Crepis runcinata (E. James) Torr. & A. Gray PF
Cryptantha cinerea (Greene) Cronquist PF
Cryptantha minima Rydb. AF
Deschampsia caespitosa (L.) P. Beauv. PGC
Descurainia pinnata (Walter) Britton AF
Distichlis stricta (Torr.) Rydb. PGW
Elymus elymoides (Raf.) Swezey PGC
Elymus lanceolatus (Scribn. & J. G. Sm.) PGW
Elymus smithii (Rydb.) Gould PGC
Equisetum laevigatum A. Braun yes AF
Ericameria nauseosa (Pall. ex Pursh) G. L.
Nesom & G. I. Baird PS
Eriogonum effusum Nutt. PS
Hesperostipa comata (Trin. & Rupr.)
Barkworth PGC
Hordeum jubatum L. PGC
Hydrophyllum sp PF
Juncus arcticus Willd. var. balticus (Willd.)
Trautv yes PGC
Juncus sp. PGC
Juncus torreyi Coville yes PGC
Kochia scoparia (L.) Schrad. I AF
Koeleria macrantha (Ledeb.) Schult. PGC
Lactuca serriola L. I AF
Lappula occidentalis (S. Watson) Greene AF
Lepidium densiflorum Schrad. AF
Liatris punctata Hook. PF
Linum lewisii Pursh PF
Lygodesmia juncea (Pursh) D. Don PF
Medicago lupulina L. I AF
Mirabilis linearis (Pursh) Heimerl PF
Mirabilis nyctaginea (Michx.) MacMill. PF
Muhlenbergia asperifolia (Nees & Meyen ex
Trin.) Parodi PGW
Muhlenbergia cuspidata (Torr. ex Hook.)
Rydb. PGW
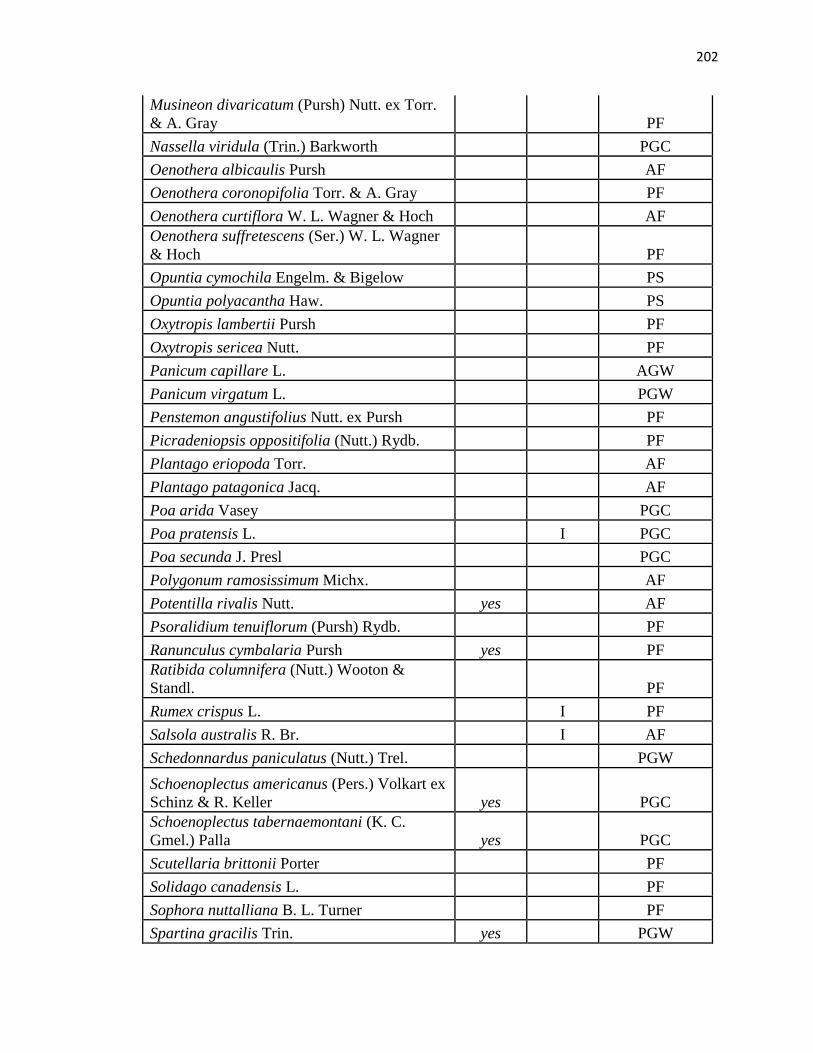
202
Musineon divaricatum (Pursh) Nutt. ex Torr.
& A. Gray PF
Nassella viridula (Trin.) Barkworth PGC
Oenothera albicaulis Pursh AF
Oenothera coronopifolia Torr. & A. Gray PF
Oenothera curtiflora W. L. Wagner & Hoch AF
Oenothera suffretescens (Ser.) W. L. Wagner
& Hoch PF
Opuntia cymochila Engelm. & Bigelow PS
Opuntia polyacantha Haw. PS
Oxytropis lambertii Pursh PF
Oxytropis sericea Nutt. PF
Panicum capillare L. AGW
Panicum virgatum L. PGW
Penstemon angustifolius Nutt. ex Pursh PF
Picradeniopsis oppositifolia (Nutt.) Rydb. PF
Plantago eriopoda Torr. AF
Plantago patagonica Jacq. AF
Poa arida Vasey PGC
Poa pratensis L. I PGC
Poa secunda J. Presl PGC
Polygonum ramosissimum Michx. AF
Potentilla rivalis Nutt. yes AF
Psoralidium tenuiflorum (Pursh) Rydb. PF
Ranunculus cymbalaria Pursh yes PF
Ratibida columnifera (Nutt.) Wooton &
Standl. PF
Rumex crispus L. I PF
Salsola australis R. Br. I AF
Schedonnardus paniculatus (Nutt.) Trel. PGW
Schoenoplectus americanus (Pers.) Volkart ex
Schinz & R. Keller yes PGC
Schoenoplectus tabernaemontani (K. C.
Gmel.) Palla yes PGC
Scutellaria brittonii Porter PF
Solidago canadensis L. PF
Sophora nuttalliana B. L. Turner PF
Spartina gracilis Trin. yes PGW
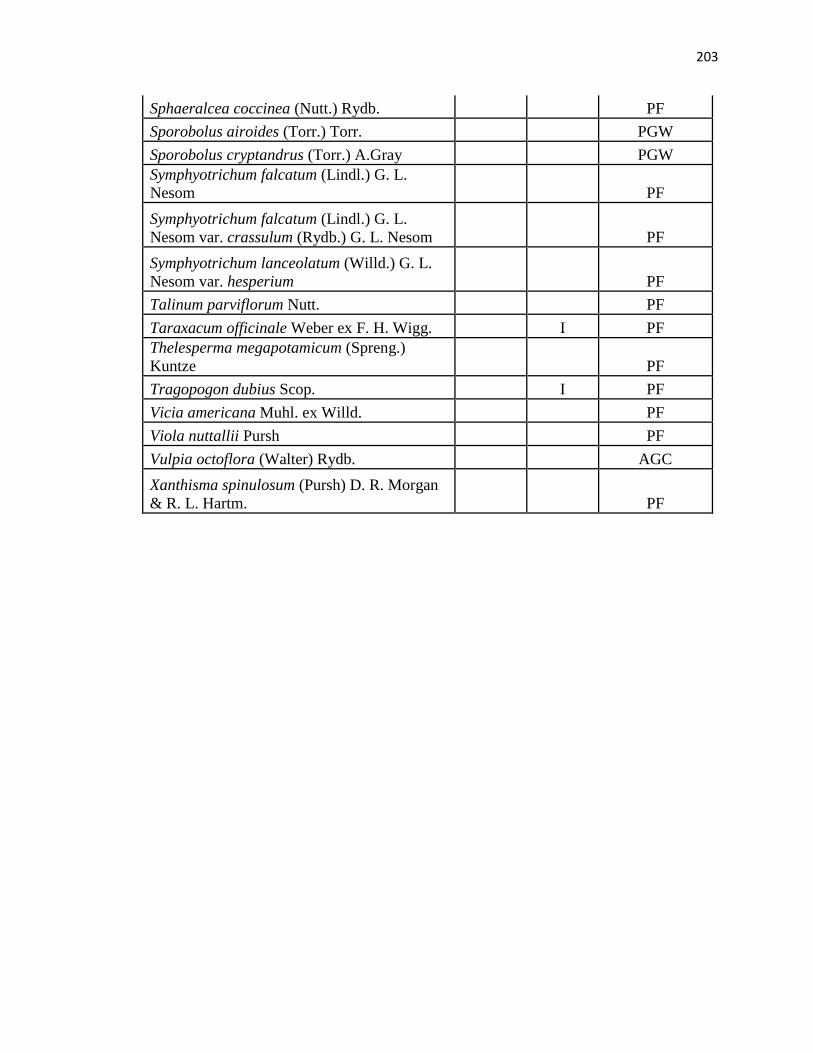
203
Sphaeralcea coccinea (Nutt.) Rydb. PF
Sporobolus airoides (Torr.) Torr. PGW
Sporobolus cryptandrus (Torr.) A.Gray PGW
Symphyotrichum falcatum (Lindl.) G. L.
Nesom PF
Symphyotrichum falcatum (Lindl.) G. L.
Nesom var. crassulum (Rydb.) G. L. Nesom PF
Symphyotrichum lanceolatum (Willd.) G. L.
Nesom var. hesperium PF
Talinum parviflorum Nutt. PF
Taraxacum officinale Weber ex F. H. Wigg. I PF
Thelesperma megapotamicum (Spreng.)
Kuntze PF
Tragopogon dubius Scop. I PF
Vicia americana Muhl. ex Willd. PF
Viola nuttallii Pursh PF
Vulpia octoflora (Walter) Rydb. AGC
Xanthisma spinulosum (Pursh) D. R. Morgan
& R. L. Hartm. PF

204
APPENDIX D
SPECIES RECORDED AT PLC IN NON-FLOODED COMPETITION PLOTS
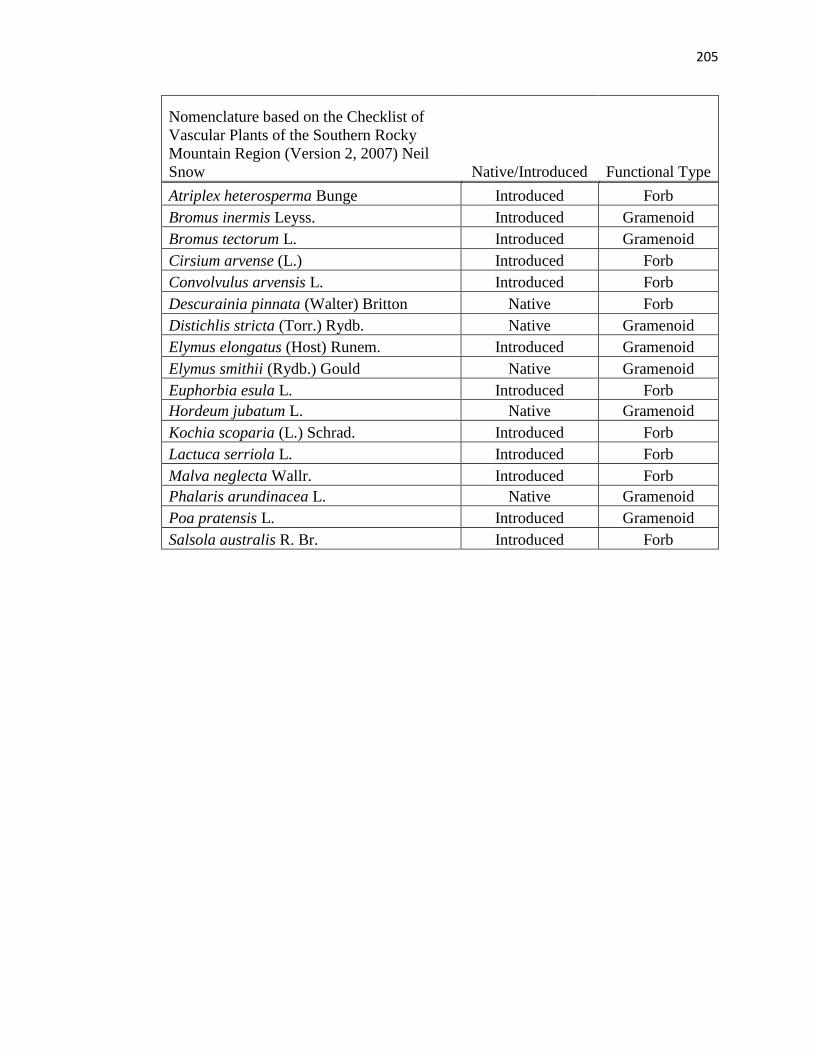
205
Nomenclature based on the Checklist of
Vascular Plants of the Southern Rocky
Mountain Region (Version 2, 2007) Neil
Snow Native/Introduced Functional Type
Atriplex heterosperma Bunge Introduced Forb
Bromus inermis Leyss. Introduced Gramenoid
Bromus tectorum L. Introduced Gramenoid
Cirsium arvense (L.) Introduced Forb
Convolvulus arvensis L. Introduced Forb
Descurainia pinnata (Walter) Britton Native Forb
Distichlis stricta (Torr.) Rydb. Native Gramenoid
Elymus elongatus (Host) Runem. Introduced Gramenoid
Elymus smithii (Rydb.) Gould Native Gramenoid
Euphorbia esula L. Introduced Forb
Hordeum jubatum L. Native Gramenoid
Kochia scoparia (L.) Schrad. Introduced Forb
Lactuca serriola L. Introduced Forb
Malva neglecta Wallr. Introduced Forb
Phalaris arundinacea L. Native Gramenoid
Poa pratensis L. Introduced Gramenoid
Salsola australis R. Br. Introduced Forb

206
APPENDIX E
STUDENT PRE-SITE VISIT INTERVIEW QUESTIONS

207
Date:
Time:
Interviewer:
Interviewee:
Intro script: I am a researcher from UNC and will be asking you a few questions about
mine reclamation to determine your perceptions and understanding about reclamation.
Thank you for being willing to participate in this study. If you do not want to participate
in the study you can choose to quit. You may also skip any questions you are not
comfortable answering.
1. Do you know what the word reclamation means? If so, could you define it for me?
(If the student does not know, define reclamation: The act or process of reclaiming - a
restoration, as to productivity, usefulness, or health; the process of returning a
disturbed site back to a functioning ecosystem through re-vegetation and soil
conditioning.)
2. Tell me what you know about mine reclamation.
3. Do you think a damaged by mining area should be reclaimed?
4. What damage would an area mined for gravel experience?
5. Describe a healthy ecosystem in terms of plants, animals and soil characteristics.
6. What steps would you take to turn a mined site into a functional or healthy ecosystem?
7. How many years do you think it would take to turn a mined area into a healthy
evironment?
8. Go ahead and bring out your picture you drew in class. Explain your drawing.
9. Why did you draw what you did?
10. Do you think the process of reclamation is beneficial?
11. Do you think the process of reclamation could be harmful?
12. What would happen if reclamation did not occur?
13. Are you aware of any areas near where you live where gravel mine reclamation is
occurring?
14. Is there anything else you would like to add or questions you have for me?
Closure: Thank you, I appreciate your participating in this study. Would you fill out a
short questionnaire on some general information about yourself? Thanks!

208
APPENDIX F
STUDENT POST-SITE VISIT INTERVIEW QUESTIONS

209
Date:
Time:
Interviewer:
Interviewee:
Intro script: I am a researcher from UNC and will be asking you a few questions about
mine reclamation to determine your perceptions and understanding about reclamation.
Thank you for being willing to participate in this study. If you do not want to participate
in the study you can choose to quit. You may also skip any questions you are not
comfortable answering.
1. Do you know what the word reclamation means? If so, could you define it for me?
(If the student does not know, define reclamation: The act or process of reclaiming - a
restoration, as to productivity, usefulness, or health; the process of returning a
disturbed site back to a functioning ecosystem through re-vegetation and soil
conditioning.)
2. Tell me what you know about mine reclamation.
3. Do you think a damaged by mining area should be reclaimed?
4. What damage would an area mined for gravel experience?
5. Describe a healthy ecosystem in terms of plants, animals and soil characteristics.
6. What steps would you take to turn a mined site into a functional or healthy ecosystem?
7. How many years do you think it would take to turn a mined area into a healthy
environment?
8. Go ahead and bring out your picture you drew in class. Explain your drawing.
9. Why did you draw what you did?
10. Do you think the process of reclamation is beneficial?
11. Do you think the process of reclamation could be harmful?
12. What would happen if reclamation did not occur?
13. Are you aware of any areas near where you live where gravel mine reclamation is
occurring?
14. Describe your trip to the Poudre Learning Center.
15. How did this trip affect your ideas about reclamation?
16. Is there anything else you would like to add or questions you have for me?
Closure: Thank you, I appreciate you participating in this study. Thanks!

210
APPENDIX G
IRB APPROVAL

211


