Embed Size (px)
Citation preview
761 © IWA Publishing 2012 Journal of Hydroinformatics | 14.3 | 2012
Resilience and entropy as indices of robustness of water
distribution networks
R. Greco, A. Di Nardo and G. Santonastaso
ABSTRACT
The use of entropy and resilience indices for measuring robustness of water distribution networks
has been investigated. The effects on network performance, caused by the failure of one or two
links, have been evaluated by means of several indices for two existing medium sized water
distribution networks serving two towns in southern Italy. All the possible network configurations
obtained by suppressing one or two links have been studied, excluding only the cases in which
disconnection of some nodes from the remaining part of the network occurred. The hydraulic
simulations, carried out with a demand-driven approach by means of the EPANET2 software, have
shown that, unlike entropy, resilience may represent a useful index of network robustness with
regard to link failures.
doi: 10.2166/hydro.2012.037
R. Greco (corresponding author)A. Di NardoG. SantonastasoDipartimento di Ingegneria Civile,Seconda Università di Napoli,via Roma 29,81031 Aversa (CE),ItalyE-mail: [email protected]
Key words | entropy, performance indices, resilience, robustness, water supply network
INTRODUCTION
The design of water distribution networks has been carried
out for decades by a priori assigning network topology,
under the assumption that a densely looped layout allows
overcoming of local pipe failures and peaks in the water
demand spatial and temporal pattern. Pipe diameters are
then assigned aimed at the minimization of the overall net-
work cost (capital cost plus operating cost), usually
assumed to depend on pipe diameter by means of a simplified
relationship (Shamir ; Alperovits & Shamir ). Such
optimal design is usually carried out for the conventional
case of peak hour demand, considered to be the most fre-
quent among the possible critical operating conditions. Due
to computational difficulties, even for medium sized net-
works, such a task is usually accomplished for a simplified
scheme of network layout in which only some of the pipes,
arbitrarily considered as ‘main pipes’, are retained. The
remaining pipes are then added in a second phase, assigning
them the minimum pipe size (usually 100 mm), without any
further consideration of their cost (Todini ). The hydrau-
lic performance of the obtained network is then tested for
several conventional loading scenarios (i.e., peak hour, fire
extinguishment, local pipe failures, and so on).
The advent of low-cost computing has more recently
made it possible to define more sophisticated network
design procedures, explicitly taking into account water dis-
tribution system performance requirements under various
network operating conditions.
In this respect, the concept of system reliability, usually
defined as its ability of performing its required functions
under stated conditions for a specified period of time, has
been introduced in water distribution networks design.
However, such definition is hardly applicable to the case
of water distribution systems, due to their inherent complex-
ity and to the uncertainty about possible operating
conditions. Indeed, early studies, which considered among
the possible operating scenarios only the case of failure of
some of network mechanical components (i.e., pipes,
pumps, tanks, valves, etc.), mistook network mechanical
reliability for network connectivity, thereby neglecting the
effects of failures upon hydraulic head losses (Goulter &
Coals ; Wagner et al. ). More recently, general defi-
nitions of network hydraulic reliability have been proposed,
directly related to the probability that the network is able to
deliver the required demand at nodes under the required
762 R. Greco et al. | Resilience and entropy as indices of robustness of water distribution networks Journal of Hydroinformatics | 14.3 | 2012
pressure heads (Su et al. ; Bao & Mays ; Fujiwara &
De Silva ; Cullinane et al. ; Tanyimboh & Temple-
man ; Setiadi et al. ; Martínez-Rodríguez ,
; Martínez-Rodríguez et al. ). Only in a few cases has
the uncertainty about water demand also been taken into
account (Gargano & Pianese ; Babayan et al. ;
Surendran et al. ). An overview about reliability applied
to water distribution systems can be found in Ostfeld ().
A common shortcoming of most of the proposed
reliability-based hydraulic network design procedures, besides
the computational burden, is that they rely upon the knowl-
edge of the probability of the considered unfavourable
events, such as pipe failures or critical demand distributions.
Indeed, few data sets exist allowing either to calculate the
probability of mechanical components unavailability (Walski
& Pelliccia ; Su et al. ; Cullinane et al. ; Tabesh
et al. ) or to calibrate the probability distribution of
water demand (Khomsi et al. ; Babayan et al. ;
Surendran et al. ). The extrapolation of the obtained prob-
abilities to networks others than those to which the available
data originally referred seems questionable.
Therefore, in this paper the deterministic concept of
robustness, e.g., the capability of a system of maintaining
given performance levels in the presence of unfavourable vari-
ations of operating conditions, is investigated and applied to
real water distribution systems. To such an aim, network be-
haviour will be modelled only under a critical condition,
namely after the failure of one or more pipes, irrespective of
its probability of occurrence. The scope of the study is to
define indices that, evaluated for the network under normal
operating conditions, allow measuring of to what extent it
will be capable of retaining its performance level after the fail-
ure of some pipes. The definition of such indices would help
prioritizing rehabilitation interventions on water distribution
systems at a regional decision-making level.
In particular, the potential use of network entropy
(Tanyimboh & Templeman ) and resilience index
(Todini ) as synthetic indices of network robustness is
investigated.
Network entropy, which has been proposed by several
authors as a surrogate for network reliability (Tanyimboh
& Templeman ; Tanyimboh & Sheahan ; Setiadi
et al. ), is related to looped network redundancy, thus
inherently prone to measure network robustness (Ang &
Jowitt ). Several examples can be found in the literature
in which entropy is included within the objectives of optimiz-
ation procedures for water distribution network design (i.e.,
Sousa et al. ; Geem ; Tanyimboh & Kalungi ).
Resilience indexes have been introduced in order to
evaluate the usefulness of pressure head surplus in normal
operating conditions to allow the network to overcome criti-
cal operating conditions (Todini ; Prasad & Park ;
Jayaram & Srinivasan ), and have been recently tested
by several authors in cost-based multi-objective optimal net-
work design procedures (i.e., Farmani et al. ;
Saldarriaga et al. ; Vasan & Simonovic ; Baños
et al. ).
To test the usefulness for evaluating network robustness of
the above-mentioned indices, two existing medium sized net-
works serving two towns close to the city of Naples, southern
Italy, namely Villaricca (NA), with 30,000 inhabitants, and
Parete (CE), with 11,000 inhabitants, have been studied.
The performance of the two networks has been evaluated
by means of a demand-driven hydraulic model, with reference
to all the possible combinations of simultaneous failures of
some pipes, simulated as closures of links in the model. For
all the obtained network configurations, the hydraulic simu-
lation has been carried out and the proposed robustness
indices have been calculated. The relationships between the
two indices, as well as with other commonly used indices of
network hydraulic performance, are discussed.
MATERIALS AND METHODS
Demand-driven hydraulic simulations of the network under
peak conditions, by considering all the possible combi-
nations of simultaneous failure of one or more links, have
been carried out by running EPANET2 software (Rossman
) in the MATLAB® environment. In particular, the fol-
lowed procedure consists of four steps:
1. Hydraulic simulation of the network;
2. Evaluation of entropy and resilience indices;
3. Hydraulic simulation of all the possible network con-
figurations obtained by suppressing one link;
4. For each of the obtained configurations, evaluation of
hydraulic performance indices.
763 R. Greco et al. | Resilience and entropy as indices of robustness of water distribution networks Journal of Hydroinformatics | 14.3 | 2012
Steps 2 to 4 can be repeated by suppressing more links
until the number of considered network configurations
becomes so large to make the calculations infeasible. Such a
limit depends on the initial number of links in the considered
network: as will be shown in this paper, for medium sized net-
works (between 100 and 200 links), more than two
simultaneous failures can be hardly considered.
The relationship between the values of resilience and
entropy indices for all the considered network configur-
ations has been studied, in order to get more insight about
the information carried by each of the proposed robustness
indices. Furthermore, the suitability of such indices to quan-
tify network robustness has been investigated by evaluating
the relationship between each of the proposed robustness
indices, calculated for a given network configuration, and
the values of hydraulic performance indices for all the poss-
ible configurations obtainable by depriving such a network
of one link. In the following sections all of the adopted indi-
ces are briefly defined.
Network entropy
The concept of entropy of a water supply network has been
derived from Shannon’s information entropy (Shannon
), by considering all the possible Np flow paths of
water through the network, from source nodes to delivery
nodes, and assuming that the probability Pk of water flowing
through a pipe belongs to k-th path might be expressed as
the ratio between path flow Qk and total flow delivered by
the network through demand nodes, Q. In such a way, the
Np flow paths constitute a set of mutually exclusive and
completely exhaustive events, for which the entropy func-
tion may be written as:
S ¼ �XNp
k¼1
Pk lnPk ð1Þ
It is worth noting that, for a given network topology, the
set of possible paths connecting all the source nodes to all
the delivery nodes is unequivocally defined, as well as the
flow belonging to each of them, for a given operating scen-
ario, by means of an hydraulic model of the network.
Thus, once network topology, diameters and roughness
parameters of pipes, and a set of demands at delivery
nodes have been assigned, a value of entropy S is unequivo-
cally associated to the network.
For the sake of automating the computational pro-
cedure, in this study, the calculation of S has been carried
out making use of the equivalent recursive expression,
based on multiple probability space formulation, proposed
by Tanyimboh & Templeman () and applicable to gen-
eral network layouts.
For any given network topology, the above defined
entropy is a measurement of the redundancy of the paths
available for water flow in the network, and becomes maxi-
mum when all the possible paths carry the same flow
Qk ¼ Q=N, say when there are no ‘main’ paths in the net-
work. Such a feature explains why entropy has been
proposed as a surrogate for network reliability, assuming
that the more a network is redundant, the more it is reliable
(Tanyimboh & Templeman ; Tanyimboh & Sheahan
; Setiadi et al. ).
However, such an assumption should be handled with
care, since it has been already argued that entropy is more
related to connectivity than to hydraulic reliability (Ostfeld
), while there is no direct relation between entropy
and energy losses: paradoxically, two topologically identical
networks, with diameters and roughness coefficients chan-
ged in such a way that energy losses along all the links
maintain their mutual ratios, would share the same pipe
flows, and thus the same entropy, in a demand-driven analy-
sis, even in the case of an increase in energy losses causing
pressure deficit at some nodes. In the same case, a pressure-
driven analysis would predict a reduction of delivered flows
at some nodes, and thus a change of calculated flows
through pipes, which would not necessarily produce a
reduction of network entropy, because both Qk and Q
could decrease, unpredictably affecting the values of Pk in
Equation (1).
Network resilience
The concept of resilience introduced by Todini ()
immediately resembles the above definition of network
robustness. The proposed resilience index represents the
fraction of the total available power which is not dissipated
in the network for delivering the design demands Q�D;j at
764 R. Greco et al. | Resilience and entropy as indices of robustness of water distribution networks Journal of Hydroinformatics | 14.3 | 2012
nodes:
Ir ¼ P�OUT � PMIN
OUT
PIN � PMINOUT
¼PN
j¼1 Q�D;jHj �
PNj¼1 Q
�D;jH
�D;jPNR
i¼1 QR;iHR;i �PN
j¼1 Q�D;jH
�D;j
ð2Þ
In Equation (2), P�OUT represents the power associated
with the delivery of the design demands at the N nodes of
the network under the actual heads, Hj; PMINOUT is the value
assumed by the same quantity whereas the design demands
are delivered exactly under the minimum design heads,H�D;j;
PIN is the total power carried by the flows QR;i entering the
network through the NR nodes connected to reservoirs with
head HR;i.
The resilience index is in the range [0, 1] if the design
requirements are fulfilled and represents the residual
amount of available power which may allow the network
to properly operate under stress conditions, such as the fail-
ure of one or more links, and/or unpredicted demand
concentrated peaks at some nodes.
In this paper, the resilience index, which is tested as the
network robustness index, has also been calculated for situ-
ations in which design requirements are not fulfilled. In
these cases, the resilience index may assume negative
values.
Hydraulic performance indices
The test of the capability of the proposed indices to syn-
thesize network robustness is carried out by means of
some indices commonly used to evaluate the hydraulic per-
formance of water supply networks. In particular, the
following indices are calculated:
• mean hydraulic head at network nodes,
Hmed ¼PN
j¼1 Hj
Nð3Þ
• hydraulic head standard deviation,
σH ¼
ffiffiffiffiffiffiffiffiffiffiffiffiffiffiffiffiffiffiffiffiffiffiffiffiffiffiffiffiffiffiffiffiffiffiffiffiffiffiffiffiffiPNj¼1 Hj �Hmed� �2N � 1
sð4Þ
mean head deficit,
•HD ¼PN
j¼1 HD;jQ�D;j
Qwith
HD;j ¼ 0 ∀j : Hj ≥ H�j
HD;j ¼ H�j �Hj ∀j : Hj <H�
j
( ð5Þ
• mean head surplus,
HS ¼PN
j¼1 HS;jQ�D;j
Qwith
HS;j ¼ Hj �H�j ∀j : Hj >H�
j
HS;j ¼ 0 ∀j : Hj ≤ H�j
( ð6Þ
• hydraulic performance index,
HPI ¼PN
j¼1 αjQ�D;j
Qwith
αj ¼ 0 ∀j : Hj < zj
αj ¼Hj � zjH�
j � zj
!1=2
∀j : zj <Hj <H�j
αj ¼ 1 ∀j : Hj >H�j
8>>>><>>>>:
ð7Þ
In the above equations, zj represents the ground elevation
at network nodes; HPI is a simplified version of the
hydraulic performance index proposed by Gargano &
Pianese ().
Case studies
The suitability of entropy and resilience as robustness indi-
ces has been tested for two medium sized hydraulic
networks, serving two towns near Naples (Italy): Villaricca,
with 30,000 inhabitants (Di Nardo & Di Natale ) and
Parete, with 11,000 inhabitants (Di Nardo & Di Natale
). Figure 1 shows a sketch of the layout of the two net-
works. The main characteristics of the studied networks
are summarized in Table 1.
Amongst all the network layouts obtained by consider-
ing all the possible combinations of simultaneous failure
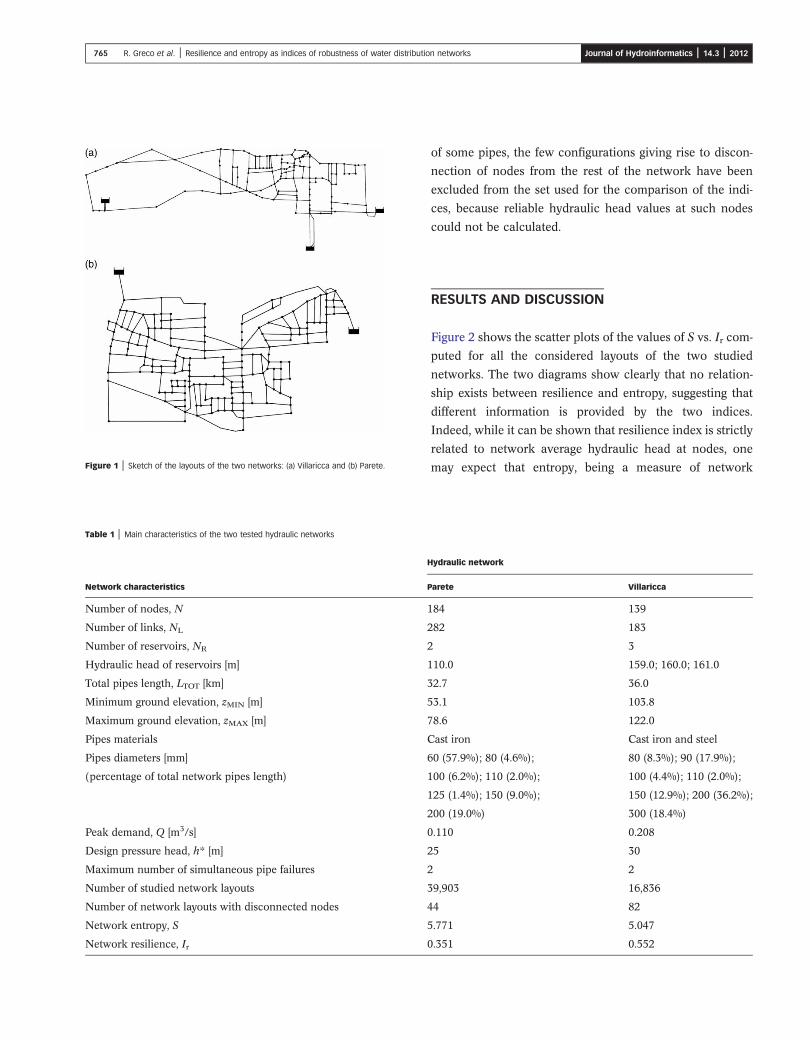
Figure 1 | Sketch of the layouts of the two networks: (a) Villaricca and (b) Parete.
Table 1 | Main characteristics of the two tested hydraulic networks
Network characteristics
Number of nodes, N
Number of links, NL
Number of reservoirs, NR
Hydraulic head of reservoirs [m]
Total pipes length, LTOT [km]
Minimum ground elevation, zMIN [m]
Maximum ground elevation, zMAX [m]
Pipes materials
Pipes diameters [mm]
(percentage of total network pipes length)
Peak demand, Q [m3/s]
Design pressure head, h* [m]
Maximum number of simultaneous pipe failures
Number of studied network layouts
Number of network layouts with disconnected nodes
Network entropy, S
Network resilience, Ir
765 R. Greco et al. | Resilience and entropy as indices of robustness of water distribution networks Journal of Hydroinformatics | 14.3 | 2012
of some pipes, the few configurations giving rise to discon-
nection of nodes from the rest of the network have been
excluded from the set used for the comparison of the indi-
ces, because reliable hydraulic head values at such nodes
could not be calculated.
RESULTS AND DISCUSSION
Figure 2 shows the scatter plots of the values of S vs. Ir com-
puted for all the considered layouts of the two studied
networks. The two diagrams show clearly that no relation-
ship exists between resilience and entropy, suggesting that
different information is provided by the two indices.
Indeed, while it can be shown that resilience index is strictly
related to network average hydraulic head at nodes, one
may expect that entropy, being a measure of network
Hydraulic network
Parete Villaricca
184 139
282 183
2 3
110.0 159.0; 160.0; 161.0
32.7 36.0
53.1 103.8
78.6 122.0
Cast iron Cast iron and steel
60 (57.9%); 80 (4.6%); 80 (8.3%); 90 (17.9%);
100 (6.2%); 110 (2.0%); 100 (4.4%); 110 (2.0%);
125 (1.4%); 150 (9.0%); 150 (12.9%); 200 (36.2%);
200 (19.0%) 300 (18.4%)
0.110 0.208
25 30
2 2
39,903 16,836
44 82
5.771 5.047
0.351 0.552
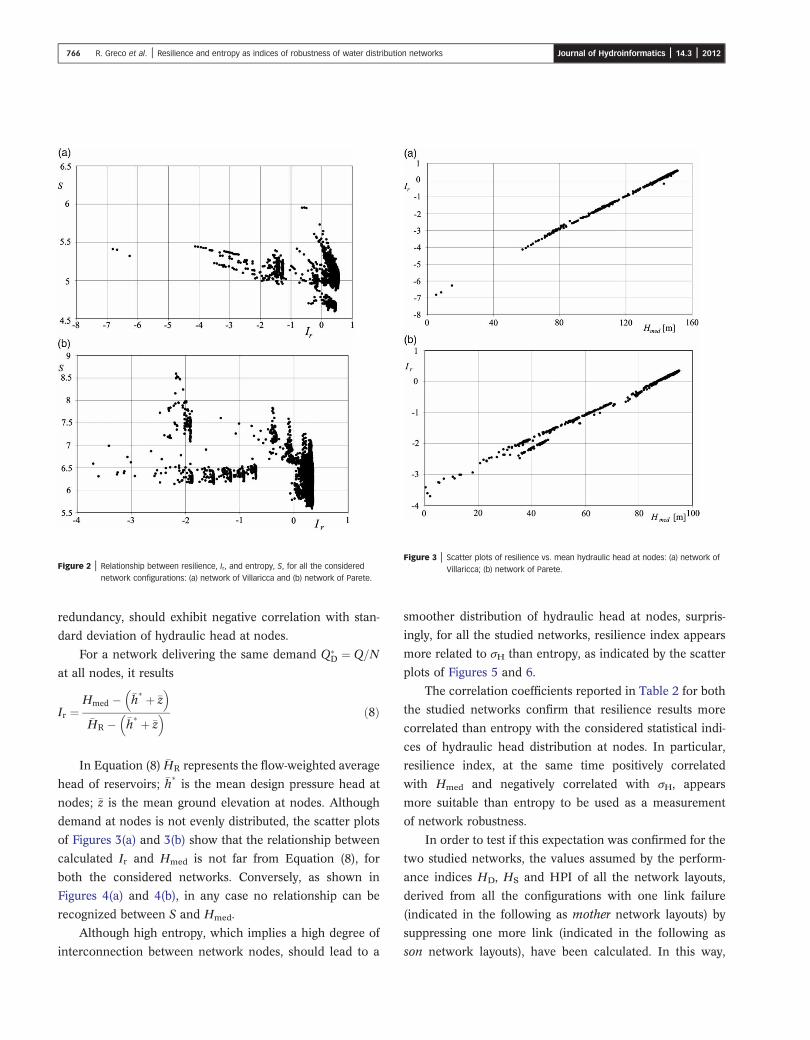
Figure 2 | Relationship between resilience, Ir, and entropy, S, for all the considered
network configurations: (a) network of Villaricca and (b) network of Parete.
Figure 3 | Scatter plots of resilience vs. mean hydraulic head at nodes: (a) network of
Villaricca; (b) network of Parete.
766 R. Greco et al. | Resilience and entropy as indices of robustness of water distribution networks Journal of Hydroinformatics | 14.3 | 2012
redundancy, should exhibit negative correlation with stan-
dard deviation of hydraulic head at nodes.
For a network delivering the same demand Q�D ¼ Q=N
at all nodes, it results
Ir ¼Hmed � �h
� þ �z� �
�HR � �h� þ �z
� � ð8Þ
In Equation (8) �HR represents the flow-weighted average
head of reservoirs; �h�is the mean design pressure head at
nodes; �z is the mean ground elevation at nodes. Although
demand at nodes is not evenly distributed, the scatter plots
of Figures 3(a) and 3(b) show that the relationship between
calculated Ir and Hmed is not far from Equation (8), for
both the considered networks. Conversely, as shown in
Figures 4(a) and 4(b), in any case no relationship can be
recognized between S and Hmed.
Although high entropy, which implies a high degree of
interconnection between network nodes, should lead to a
smoother distribution of hydraulic head at nodes, surpris-
ingly, for all the studied networks, resilience index appears
more related to σH than entropy, as indicated by the scatter
plots of Figures 5 and 6.
The correlation coefficients reported in Table 2 for both
the studied networks confirm that resilience results more
correlated than entropy with the considered statistical indi-
ces of hydraulic head distribution at nodes. In particular,
resilience index, at the same time positively correlated
with Hmed and negatively correlated with σH, appears
more suitable than entropy to be used as a measurement
of network robustness.
In order to test if this expectation was confirmed for the
two studied networks, the values assumed by the perform-
ance indices HD, HS and HPI of all the network layouts,
derived from all the configurations with one link failure
(indicated in the following as mother network layouts) by
suppressing one more link (indicated in the following as
son network layouts), have been calculated. In this way,

Figure 4 | Scatter plots of entropy vs. mean hydraulic head at nodes: (a) network of
Villaricca; (b) network of Parete.Figure 5 | Scatter plots of resilience vs. standard deviation of hydraulic head at nodes:
(a) network of Villaricca; (b) network of Parete.
767 R. Greco et al. | Resilience and entropy as indices of robustness of water distribution networks Journal of Hydroinformatics | 14.3 | 2012
for each of the studied networks, it was possible to investi-
gate N different mother layouts, and to evaluate at what
extent hydraulic performance was retained after the failure
of one more link.
For the hydraulic network of Parete, the distribution of
the values of the performance indices HD, HS and HPI of
all the son network layouts, are plotted in Figures 7 and 8,
in the form of box and whiskers plots (Tukey ), against
resilience and entropy, respectively, of the mother network
layout. The subscript of the indices indicates the number
of simultaneous link failures of the considered network lay-
outs. The five lines of the box and whiskers plots represent
the 10, 25, 50, 75 and 90% quantiles. Figures 9 and 10
show the same diagrams for the network of Villaricca.
In all cases the distributions of the values of the various
indices are such that the 50, 75 and 90% quantiles are nearly
identical, so that the relevant lines in box plots collapse
into each other; in most cases, the same also happens
for the 25% quantile, so that the only whisker clearly
distinguishable from the others is the 10% quantile. These
features indicate that most of the network configurations
deriving from a common mother layout assume the highest
values of all the considered performance indices, while the
few cases for which the indices indicate lower performances
correspond to configurations in which the failure of links
that are particularly crucial due to network topology has
been considered.
The diagrams show that the entropy of the mother net-
work does not allow predicting the performance of the
son networks, whatever performance index is used. High
values of HPI2 and HD2 are achieved regardless the entropy
S1 of the mother network, while the values of HS2 are chao-
tically spread.
Conversely, all the considered performance indices of
the son network layouts show a strong dependence on the
resilience of the mother layout, indicating bad performances
of the son networks when the resilience of themother layout
is negative.
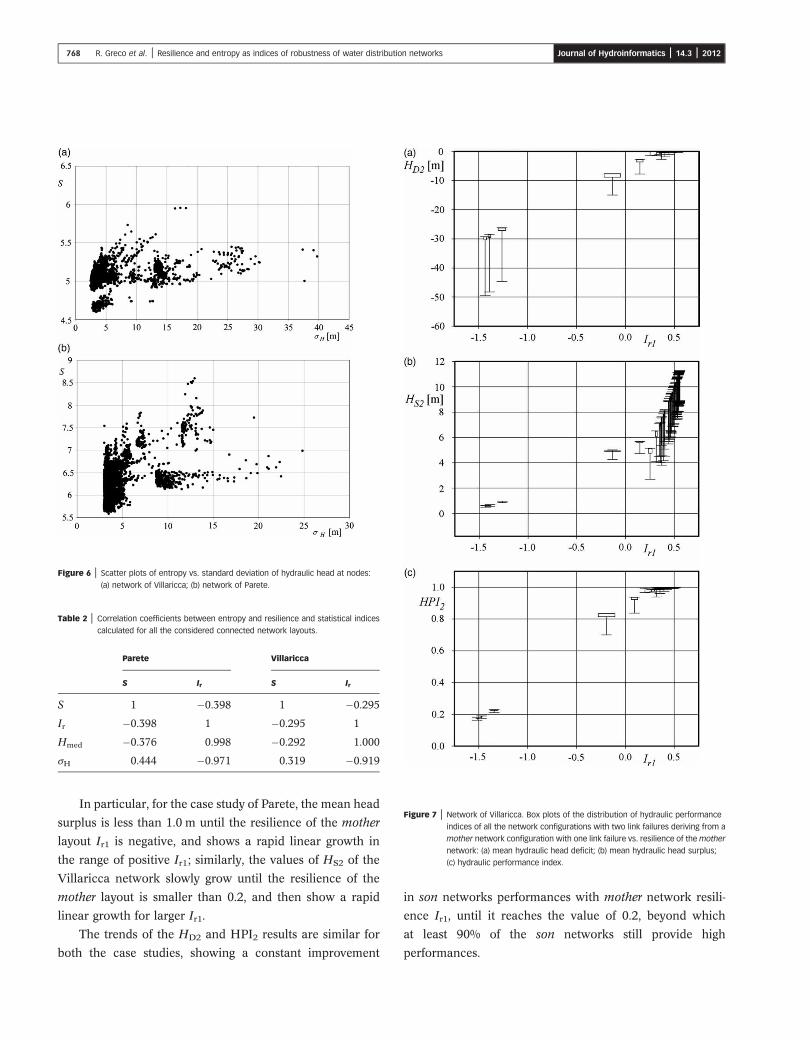
Table 2 | Correlation coefficients between entropy and resilience and statistical indices
calculated for all the considered connected network layouts.
Parete Villaricca
S Ir S Ir
S 1 �0.398 1 �0.295
Ir �0.398 1 �0.295 1
Hmed �0.376 0.998 �0.292 1.000
σH 0.444 �0.971 0.319 �0.919
Figure 6 | Scatter plots of entropy vs. standard deviation of hydraulic head at nodes:
(a) network of Villaricca; (b) network of Parete.
Figure 7 | Network of Villaricca. Box plots of the distribution of hydraulic performance
indices of all the network configurations with two link failures deriving from a
mother network configuration with one link failure vs. resilience of the mother
network: (a) mean hydraulic head deficit; (b) mean hydraulic head surplus;
(c) hydraulic performance index.
768 R. Greco et al. | Resilience and entropy as indices of robustness of water distribution networks Journal of Hydroinformatics | 14.3 | 2012
In particular, for the case study of Parete, the mean head
surplus is less than 1.0 m until the resilience of the mother
layout Ir1 is negative, and shows a rapid linear growth in
the range of positive Ir1; similarly, the values of HS2 of the
Villaricca network slowly grow until the resilience of the
mother layout is smaller than 0.2, and then show a rapid
linear growth for larger Ir1.
The trends of the HD2 and HPI2 results are similar for
both the case studies, showing a constant improvement
in son networks performances with mother network resili-
ence Ir1, until it reaches the value of 0.2, beyond which
at least 90% of the son networks still provide high
performances.
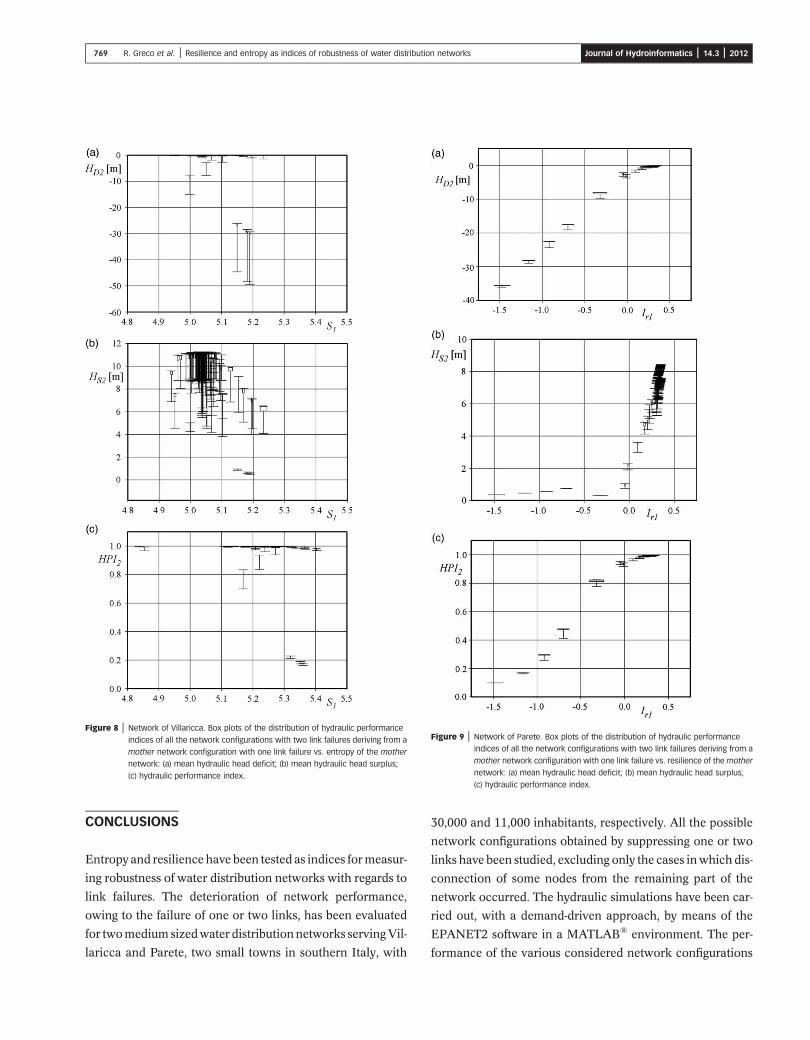
Figure 8 | Network of Villaricca. Box plots of the distribution of hydraulic performance
indices of all the network configurations with two link failures deriving from a
mother network configuration with one link failure vs. entropy of the mother
network: (a) mean hydraulic head deficit; (b) mean hydraulic head surplus;
(c) hydraulic performance index.
Figure 9 | Network of Parete. Box plots of the distribution of hydraulic performance
indices of all the network configurations with two link failures deriving from a
mother network configuration with one link failure vs. resilience of the mother
network: (a) mean hydraulic head deficit; (b) mean hydraulic head surplus;
(c) hydraulic performance index.
769 R. Greco et al. | Resilience and entropy as indices of robustness of water distribution networks Journal of Hydroinformatics | 14.3 | 2012
CONCLUSIONS
Entropy and resilience have been tested as indices formeasur-
ing robustness of water distribution networks with regards to
link failures. The deterioration of network performance,
owing to the failure of one or two links, has been evaluated
for twomediumsizedwater distributionnetworks servingVil-
laricca and Parete, two small towns in southern Italy, with
30,000 and 11,000 inhabitants, respectively. All the possible
network configurations obtained by suppressing one or two
links have been studied, excluding only the cases inwhich dis-
connection of some nodes from the remaining part of the
network occurred. The hydraulic simulations have been car-
ried out, with a demand-driven approach, by means of the
EPANET2 software in a MATLAB® environment. The per-
formance of the various considered network configurations

Figure 10 | Network of Parete. Box plots of the distribution of hydraulic performance
indices of all the network configurations with two link failures deriving from a
mother network configuration with one link failure vs. entropy of the mother
network: (a) mean hydraulic head deficit; (b) mean hydraulic head surplus;
(c) hydraulic performance index.
770 R. Greco et al. | Resilience and entropy as indices of robustness of water distribution networks Journal of Hydroinformatics | 14.3 | 2012
has been synthesized by evaluating the mean hydraulic head
at nodes, the standard deviation of hydraulic head, the
demand-weighted mean head deficit and surplus, and a
hydraulic performance index expressing the degree of fulfil-
ment of the design pressures and demands at nodes.
From the obtained results, two main conclusions can be
drawn. First, that entropy and resilience indices provide
different information about network characteristics:
indeed, for both the case studies, no relationship exists
between the values assumed by the two indices for all the
considered network configurations. Furthermore, resilience
shows strong positive correlation with mean hydraulic
head at nodes and, to a lesser degree, negative correlation
with hydraulic head standard deviation. Conversely, no
relationship between such indices of hydraulic head dis-
tribution and entropy has been found, although a
correspondence between smoothness of hydraulic head dis-
tribution and entropy was expected, since the latter is
usually interpreted as a measurement of the redundancy of
looped networks.
Second, network configurations with high resilience are
more robust with respect to link failures: indeed, the distri-
butions of the values assumed by the performance indices,
for all the possible network configurations obtained by sup-
pressing one link starting from a network configuration,
indicate that the higher the resilience, the more the perform-
ance level is maintained in the case of link failures.
Conversely, no relationship has been found between the
entropy of a network configuration and the values assumed
by the performance indices for the configurations obtained
by depriving the starting configuration of one link.
Therefore, for the two studied networks, it was shown that
high values of resilience indicate high robustness of the net-
work with regards to link failures; conversely, network
entropy, although it represents a surrogate of topological
reliability useful in network design procedures, does not
provide information about the capability of the network to
assure good performances after the occurrence of link failures.
REFERENCES
Alperovits, E. & Shamir, U. Design of optimal waterdistribution systems. Water Resour. Res. 13, 885–900.
Ang, W. K. & Jowitt, P. W. Some observations on energy lossand network entropy in water distribution networks. Eng.Opt. 35, 375–389.
Babayan, A., Kapelan, Z., Savic, D. & Walters, G. Least-cost design of water distribution networks under demanduncertainty. J. Water Resour. Plan. Manage. 131,375–382.
Baños, R., Reca, J., Martínez, J., Gil, C. & Márquezet, A. L. Resilience indexes for water distribution network design: a

771 R. Greco et al. | Resilience and entropy as indices of robustness of water distribution networks Journal of Hydroinformatics | 14.3 | 2012
performance analysis under demand uncertainty. WaterResour. Manage. 25, 2351–2366.
Bao, Y. & Mays, L. W. Model for water distribution systemreliability. J. Hydr. Eng. 116, 1119–1137.
Cullinane, M. J., Lansey, K. E. & Mays, L. W. Optimization-availability-based design of water-distribution networks.J. Hydr. Eng. 118, 420–441.
Di Nardo, A. & Di Natale, M. A design support methodologyfor district metering of water supply networks. In Proceedingsof WDSA (Water Distribution Systems Analysis), 12–15September 2010, Tucson, Arizona, USA.
Di Nardo, A. & Di Natale, M. A heuristic Design SupportMethodology based on graph theory for district metering ofwater supply networks. Eng. Opt. 43, 193–211.
Farmani, R., Walters, G. & Savic, D. Evolutionary multi-objective optimization of the design and operation of waterdistribution network: total cost vs. reliability vs. waterquality. J. Hydroinform. 8, 165–169.
Fujiwara, O. & De Silva, A. U. Algorithm for reliability-basedoptimal design of water networks. J. Envir. Eng. 116,575–587.
Gargano, R. & Pianese, D. Reliability as tool for hydraulicnetwork planning. J. Hydr. Eng. 126, 354–364.
Geem, Z. W. Particle-swarm harmony search for waternetwork design. Eng. Opt. 41, 297–311.
Goulter, C.&Coals, A. V. Quantitative approaches to reliabilityassessment in pipe networks. J. Transp. Eng. 112, 287–301.
Jayaram, N. & Srinivasan, K. Performance-based optimaldesign and rehabilitation of water distribution networksusing life cycle costing. Water Resour. Res. 44, W01417.
Khomsi, D., Walters, G. A., Thorley, A. R. D. & Ouazar, D. Reliability tester for water-distribution networks. J. Comp.Civil Eng. 10, 10–19.
Martínez-Rodríguez, J. B. Cost and reliability comparisonbetween branched and looped water supply networks.J. Hydroinform. 12, 150–160.
Martínez-Rodríguez, J. B. Quantifying the economy of flowdistribution in water supply looped networks. J. Hydroinform.13, 687–698.
Martínez-Rodríguez, J. B., Montalvo, I., Izquierdo, J. & Pérez-García, R. Reliability and tolerance comparison inwater supply networks. Water Resour. Manage. 25,1437–1448.
Ostfeld, A. Reliability analysis of water distribution systems.J. Hydroinform. 6, 281–294.
Prasad, T. D. & Park, N.-S. Multiobjective genetic algorithmsfor design of water distribution networks. J. Water Resour.Plan. Manage. 130, 73–82.
Rossman, L. A. EPANET 2 User Manual. U.S. EnvironmentalProtection Agency, Cincinnati, OH, pp. 200. Available from:http://www.epa.gov/nrmrl/wswrd/dw/epanet/EN2manual.PDF.
Saldarriaga, J. G., Ochoa, S., Moreno, M. E., Romero, N. & Cortès,O. J. Prioritised rehabilitation of water distributionnetworks using dissipated power concept to reduce non-revenue water. Urban Water J. 7, 121–140.
Setiadi, Y., Tanyimboh, T. T. & Templeman, A. B. Modelling errors, entropy and the hydraulic reliabilityof water distribution systems. Adv. Eng. Softw. 36,780–788.
Shamir, U. Optimal design and operation of waterdistribution systems. Water Resour. Res. 10, 27–36.
Shannon, C. E. A mathematical theory of communication.Bell Syst. Tech. J. 27, 379–423, 623–656.
Sousa, J. J. O., Cunha, M. C. & Sá Marques, J. A. Entropy-based reliable design of water distribution networks. WITTrans. Ecol. Environ. 103, 615–624.
Su, Y. C., Mays, L. W., Duan, N. & Lansey, K. E. Reliability-based optimization model for water distribution systems.J. Hydr. Eng. 113, 1539–1556.
Surendran, S., Tanyimboh, T. T. & Tabesh, M. Peakingdemand factor-based reliability analysis of water distributionsystems. Adv. Eng. Softw. 36, 789–796.
Tabesh, M., Soltani, J., Farmani, R. & Savic, D. A. Assessingpipe failure rate and mechanical reliability of waterdistribution networks using data driven modelling.J. Hydroinform. 11, 1–17.
Tanyimboh, T. T. & Kalungi, P. Multicriteria assessmentof optimal design, rehabilitation and upgrading schemes forwater distribution networks. Civ. Eng. Environ. Syst. 26,117–140.
Tanyimboh, T. T. & Sheahan, C. A maximum entropybased approach to the layout optimization ofwater distribution systems. Civ. Eng. Environ. Syst. 19,223–253.
Tanyimboh, T. T. & Templeman, A. B. Calculating maximumentropy flows in networks. J. Oper. Res. Soc. 44, 383–396.
Tanyimboh, T. T. & Templeman, A. B. A quantifiedassessment of the relationship between the reliabilityand entropy of water distribution systems. Eng. Opt. 33,179–199.
Todini, E. Looped water distribution networks design using aresilience index based heuristic approach. Urban Water 2,115–122.
Tukey, J. W. Exploratory Data Analysis. Addison-Wesley,Reading, MA, 688 pp.
Vasan, A. & Simonovic, S. P. Optimization of waterdistribution network design using Differential Evolution.J. Water Resour. Plan. Manage. 136, 279–287.
Wagner, J. M., Shamir, U. & Marks, D. H. Water distributionreliability: analytical methods. J. Water Resour. Plan.Manage. 114, 253–274.
Walski, T. M. & Pelliccia, A. Economic analysis of watermain breaks. J. AWWA 74, 140–147.
First received 28 March 2011; accepted in revised form 19 October 2011. Available online 2 March 2012
![Indices de sitio preliminares para eucalipto [Preliminary site indices for eucalypts]](https://img.dokumen.tips/doc/110x75/6344cc97596bdb97a908a0b5/indices-de-sitio-preliminares-para-eucalipto-preliminary-site-indices-for-eucalypts.jpg)


