Embed Size (px)
Citation preview
e-planet
Journalof
Organisation for Protection of Ecosystem, Environment and Endangered Species
Volume - 6 (2) July- 2008 Issue No. - 2

Managing EditorsDr. Basant Kumar Das, Senior Scientist, C.I.F.A., Bhubaneswar
Dr. M. Brahmam, Former Senior Scientist, R.R.L., Bhubaneswar
Executive EditorMr. Sangram Keshari Nayak, Former Principal Scientist & Head, CRRI, Cuttack
Editors (Technical)Dr. Hemant Kumar Patra, Prof of Environ. Sc., Utkal UniversityDr. J K. Panigrahi, HOD of Zoology, Choudwar CollegeDr. Pradeep K. Satapathy, AGM (Operation), EHPL, V. H. Group
Editors (Circulation)Dr. Kalandi Mohanty,Senior Manager, IOB, Brahmapur
Dr. Pranab Mohanty, Senior Manager, IOB, Paradeep
Associate EditorsDr. Priyabrat Swain, Senior Scientist, C.I.F.A., BhubaneswarMr. Arun Kumar Mishra, Assistant Director , NandankananMr. S. S. Jiban Dash, Aquaculture Researcher, BhubaneswarMr. Suvakanta Padhy, Social Activist, OPES, BhubaneswarMs. Sthitaprajna, Lecturer, ITER, Bhubaneswar
Legal AdvisorMr. P. K. Dhal, Sr. Inspector, Customs, Excise & S. Tax; Former Advocate, H.C.
Chief - PatronMr. Ramesh Ch. Parida, Chairman; NM Institute of Engineering andTechnology, Sijua, Patrapara, Bhubaneswar
PatronsMr. Kamini Kanta Patnaik, President , G.B; Orissa Engineering College
Ms. Geetanjali Mohanty, Prop; Gitanjali Herbal Garden
Dr. Mukti Kanta Bhuyan, Vety. Officer; Rourkela Vety. Hospital
AdvisorsMr. Jatin Das, World Famed Artist, New Delhi
Mr. U.N. Dev, Noted Ornithologist, Orissa
Dr. J. V. Cheeran, Former Profossor & Member to IUCN, Thrissur, Keral
Dr. S. K. Ray, Former Director, Animal Husbandry, Department, Orissa
Mr. Vinod Kumar, Managing Director, Orissa Forest Development Corporation
Mr. Sabir Baux, Noted International diver and Environment Activist
Dr. S. K. Samantarai, Professor , OUAT, Bhubaneswar
Dr. S. B. Mishra, Geneticist and former President, OVA, Bhubaneswar
Mr. Stephan Maasberg, Executive, MTS, AG Company, Switzerland
Financial AdvisorsMd. M.A. Baig, Chartered Accountant, Satya nagar, Bhubaneswar
Rtn. Bhagaban Mahapatra,M.D;B.M. Constr & Engg (P)Ltd; Paradeep
Editorial BoardEditor-in-Chief
Rtn (Dr) R. K. Samantaray
SUBSCRIPTION
Annual Subscription (Individual) –– Rs. 150/-Annual subscription (Institutional) — Rs. 300/-Life Member (Individual) 15yrs — Rs. 1500/-Life Member (Institutional) 15 yrs — Rs. 5000/-Patron (Individual) — Rs. 10000/-Patron (Institutional) — Rs. 20000/-
* Please send payment to : OPES, Bhubaneswarin shape of D.D.
ADDRESS FOR CORRESPONDENCEDr. R. K. Samantaray
Editor-in-Chief1(A), Nandankanan Zoo Campus, P.O. Barang,
Dist-Khurda, Orissa, India, Pin - 754005Tel. 9437090017/ 9337102457 (Mob.)e-mail - [email protected] and
[email protected] ( Managing Editor )[email protected] ( Managing Editor )
Printed, publised & edited by Dr. R.K. Samantaray, 1(A), Nandankanan Zoo, P.O. Barang, Dist- Khurda, Orissa, India,Pin - 754005. Owned by the Organisation for Protection of Ecosystem, Environment and Endangered Species (OPES), Plot No.- 20/ A, Ashok Nagar, Bhubaneswar- 751 009, Orissa, India: Published from Naba Gouranga Press, c/o BBT, ISKCON, B/ 48,Chandaka Industrial Estate, Patia, Bhubaneswar, Printed at Naba Gouranga Press, c/o BBT, ISKCON, B/ 48, ChandakaIndustrial Estate, Patia, Bhubaneswar.
Logo Description : It symbolizes an elephant within an ecological frame of peace and harmony moving towards prosperityand posterity.Cover photo description (Anticlockwise from top) : 1. A group of magnificient melon barbs (Puntius fasciatus), 2. Handrearing of orphaned elephant calf ‘Anant’ at Nandankanan ( Rescued from Joda, Keonjhar Forest Division in the aftermathof a train accident where the calf lost his parents). 3. Giant squirrel of Satkosia Gorge Sanctuary 4. Derivation anddifferentiation of Catla ES cells; Developing embryo at mid-blastula stage, stem cell patches 5. World Wetland Day 2008Celebration at Nandankanan near Kanjia lake. 7. A red line turpido fish (Puntius denisonii), an endangered fish displayed ina recreated aquatic ecosystem.
Zoo & Wild Life Vet, Nandankanan and Head, Anti Depredation Squad, OrissaCharter President, Rotary Club of Bhubaneswar Centennial, RID - 3260
Regional Secretary, Association of Indian Zoos & Wildlife Veterinarians( 2000 - 2007)

RESEARCHBIO-TECHNOLOGY Genetic fingerprinting of Aeromonas Anil. T, B. K. Das, 01-06
hydrophila isolated from diseased H. K. Barman andfreshwater fishes of eastern India S. K. Samal
AQUA WORLD Existence and derivation of embryonic C. Dash, S. Tripathy, 07-11stem cell like cells in Indian major D. K. Verma, P. K. Meher,carp, Catla catla (Ham.) S. K. Swain, P. Routray
and B.C.Guru
MICRO-BIOLOGY A survey of some major bacterial S. Dash , P. Swain, 12-17diseases In key freshwater S. K. Nayak, P. K. Nanda,aquaculture zones of India: P. V. Rangacharyulu,Andhra Pradesh, West Bengal B. K. Mishra andand Orissa S. K. Swain
MEDICINE Antibacterial studies of Alstonia A. K. Swain, R. Mahapatra 18-19scholaris R. Br. against and M. K. Panigrahidermatologial pathogens.
REVIEWORNAMENTAL FISHES Indigenous ornamental fishes: S. K. Swain, S. K. Singh, 20-26
status, issues and strategies P. Routray and N. K. Barikfor propagation and conservation
GENERAL SCIENCEWILD ANIMAL RESCUE Rescue of a gun shot injured sloth R.K. Samantaray, P. K. Roy, 27-31AND REHABILITATION bear (Melursus ursinus) from Nuapada, A. Das, A.K.Mishra, S.N.
Orissa, its successful treatment, Mahapatra and A. K. Pattanaiktranslocation and rehabilitation GENERAL SCIENCE
ACID RAIN Effect of acid rain on wildlife K. K. Sardar and N. Sahoo 32-34health and ecosystem
MEDICINAL PLANT Bael cultivation in dry areas S. C. Mohapatra and D. Sahoo 35-36to fight malnutrition
REMOTE SENSING Application of remote sensing and S. S. Jiban Dash 37-41GIS in agriculture management
AGRO-ECOMONY Role of Krishi Vigyan Kendra in B. R. Samantaray and 42-44changing the profile of rural S. C. Mohapatrafolks of Subarnapur district, Orissa
GLOBAL WARMING Impact of global warming B. K. Das, S. Ghosh, 45-48upon aquatic resources - an over view K. K. Nayak, P. Patnaik,
D. K. Swain and A. MallickGREEN BUILDING Green Buildings in Indian A. K. Sabat and S. Nayak 49-51
perspective and its potentialities SHORTSOLID WASTE MANAGEMENT Management of muncipal solid wastes - A. K.Sabat, S. Nayak, 52-56
A case study N. C. Moharana & T. MohantyBIO-CONSERVATION Gola-the semi nomadic bio-conservationist B. Sahu 57-59
of Orissa
SHORT COMMUNICATIONELEPHANT BREEDING Breeding behaviour of a wild tusker R. K. Samantaray 60-60VULTURE REPORTING Rescue and rehabilitation of a Cinereous A. K. Mishra, R.K. Samantaray, 61-61
vulture (Aegypius monachus) in Orissa P. K. Roy, P.K.Ray & A.K.PattnaikINTERNATIONAL CONGRESS Inauguration of e-planet in International Reitz, S. Padhi and T. Samantaray 62-62
Congress at Jammu on 26th April 2008ENVIRON-BALANCE Environmental balance and its sustainability R.S. Rohella and P. Biswal 63-64
CONTENTS
bodies have taken several initiatives time and againtowards preservation of the same. Most of the creatureslive in the world’s oceans and rivers. Crocodiles, turtles,sharks, dolphins, whales, shell fish, eels, octopus,shrimps, salmon, tilapias, oysters, trouts,herrings,clams and thousand other species make the seas thehottest biological spots less undiscovered. But peopleround the globe in the name of sailing, fishing, sports,establishing ports and industries in the sea coast poseinnumerable threats to the abundant marine species.Damage of huge marine species might result in longterm harm to the viability of the coast to the species.Infrastructural projects such as large ports and off-shoreoil explorations would certainly raise a big concern tothe marine environment. Sometimes there are naturalcalamities like Tsunami, Rita, Hurricane that causemassive damage to the marine eco-system. Someother times, seismic waves disturb and displace manyspecies out of their original abode. Tsunami caused adrastic decrease in the number of dolphins in the Indiansea coast. There’s a wonderful world exists under water.Considering the immense biological wealth that is atstake, it is vital and urgent to restore the seas theworld over. Internationally many voluntary organizationsand forest wings of many state administrations shouldaddress urgently for restoration of different aquatichabitat for future generations. E-planet ever since itspublication has always tried to give a better coverageto aquatic species but in vein. Thanks to the dedicatedefforts of some of our scientists who could finally makeit possible to address the issues in the ensuingpublication in a manner never before.
(R. K. Samantaray) Editor-in-chief
INSTRUCTIONS FOR PREPARTION OF THE MANUSCRIPTS
1. Manuscripts should be in MS Word, 10th Arial font, on one side only,double-spaced with 30mm margin on all sides, on A-4 sized paper. Hardcopy should be submitted along with soft copy to Editor -In- Chief.
2. Title page should have:i) Title in capital letters, ii) Abstract, iii) Keywords, iv) Atuthor(s) name,v) Address of the institution where the work was carried out below theline, (vi) Telephone,e-mail,fax etc including address for communication.
3. The manuscripts should be organized in the following manner:A) Abstract: All manuscripts must carry a brief abstract of not more than200 words, in single space (font - 9)B) Keywords : 3-5 keywords having relevance to the topic (font - 10)C) Text :
The manuscripts should be devided into the following sections —i. Introduction ii.Materials and Methodsiii. Results / Observationsiv. Discussion/inferencev. Acknowledgementvi. References
Tables, Figures caption / legends, should be typed on separate pages.All measurements should be given in standard international units.Scientific names of genus and species should be in italics and it
should not be underlined.Words and phrases of origin other than English and not in common
use (eg.in vitro, in vivo, in situ ) should be in italic.4. Tables: All tables should be numbered consecutively in Arabic numerals
in order of their appearance in the text and should have a descriptive title.Experimental details (not mentioned in the text) may be given below thetable as a legend.
5. Figures and Photographs:(i) Figures should be numbered consecutively in Arabic numerals inorder of appearance in the text. Original figures should be drawn withIndian ink on tracing paper of A-4 size. Photographs of line drawings arenot acceptable.(ii) Photographs if any, should be numbered along with figures in Arabicnumerals in the order of appearance. Please see that all the photographsare in one plate. Photographs should be sharp, of high contrast and onglossy paper.
6. References :i) References in the text should be cited as author (Brahmam andSamantaray, 1998) or (Samantray et al, 2003)ii) References at the end should be arranged alphabetically and shouldhave author’s name(s) followed by initial(s),year of publication, full title of thepaper, name of the journal (abbreviated according to the World list of scientificperiodicals),volume number first and last page number. Example : It has beensimplified as per the following.Samantaray R K, Roy P K and Mishra B (2003) Artificial insemination inbig cats of Nandankanan zoological Prak, Bhubaneswar - An attempttowards conservation. e-planet 1(2) : 4 - 14
7. General Science Section : The contributors should note that the referencesare also desired in this section
EDITORIAL
Wildlives have always becomeimportant components of theenvironment. But there is ageneral lack of knowledge in thefield of conservation of nature andvalues and benefits of wild livesaround the globe even thoughdifferent nations and international
1
July 2008 e-planet 6 (2): 1-6
GENETIC FINGERPRINTING OF Aeromonas hydrophila ISOLATED
FROM DISEASED FRESHWATER FISHES OF EASTERN INDIA
A. Thankappan1, B. K. Das2*, H. K. Barman3 and S. K. Samal4
ABSTRACTAeromonas hydrophila strains isolated from diseased fishes exhibiting different symptoms like haemorrhagic
septicaemia, abdominal dropsy, exopthalmia, ulcerations and abdominal distensions were studied for their DNAfingerprinting patterns. The diseased fishes were collected from Central Institute of Freshwater Aquaculture farmcomplex, commercial farms of Puri, Orissa and Andhra Pradesh. Out of the twenty random decamer primers ofOPC series screened against genomic DNA of A. hydrophila, five primers amplified and produced good, consistentand reproducible fingerprints. The greatest number of amplified fragments (8 bands) was found with the use ofprimers OPC 13 in Ah1; OPC 20 in Ah2, Ah3, Ah5, Ah7, Ah8 and Ah10. The minimum numbers of amplified bandswere observed in Ah2, Ah5, Ah6, Ah7, and Ah9 with use of primer OPC 14 (3 bands). The molecular weight of theamplified fragments of different strains of A. hydrophila against all the primers ranged from 0.35-2.70 kb. Theamplified bands with molecular weights 1.10, 1.40 and 1.95 kb were common in all the strains of A. hydrophilawith primer OPC 13; 1.0 and 1.50 kb; with primer OPC 19; 0.90, 1.40 and 1.70 kb; with primer OPC 20; 0.98 and1.23 kb; in Ah2 and Ah3 using OPC 19 and 1.35, 2.20 kb; using primer OPC 11 respectively. The genetic similarityamong all the strains of A. hydrophila varied from 0.134-0.436. The clear, distinct and reproducible DNA fragmentsgenerated by selected primers can be used as standard for identifying new strains of A. hydrophila.
Keywords : Aeromonas hydrophila, RAPD-PCR, genomic DNA, primer, epidemiological study
INTRODUCTIONAeromonas hydrophila, a member of the family
Aeromonadaceae, is a Gram negative motile rod-shapedbacterium having the capacity to infect cold bloodedvertebrates, mammals and exist freely in water (Ho et al.,1990; Joseph and Carnahan, 2000; Ko et al., 2000). It isconsidered to be the principal cause of bacterialhaemorrhagic septicemia in freshwater fish (Frerichs, 1989;Austin and Austin, 1993; Angra et al., 1995) and has beenreported in association with various ulcerative conditionsincluding epizootic ulcerative syndrome (EUS) in Thailand,Philippines and India (Laobrera and Gacutan, 1987; Lio-poet al., 1992; Das and Mukherjee, 1997; Nayak et al., 1999)and red spot disease in Australia (Cahill, 1987). Fishdiseases caused by A. hydrophila is considered to be amajor economic problem, but it is difficult to distinguishdirect losses from those caused by secondary infections(Amin et al., 1985; Aguilera-Arreola et al., 2005).Amplification of specific segment of DNA by means ofpolymerase chain reaction (PCR) provides a highly sensitiveand specific tool for detection of microorganisms fromdifferent sources. Discrimination methods based ongenotypic differences are not affected by the physiological
state of bacterium and can be easily standardized.Randomly amplified polymorphic DNA (RAPD) patterns havebeen successfully employed for discriminating strains of anumber of finfish and shellfish bacterial pathogens (Aznaret al., 1993) and they have potential use in epidemiologicalstudies. A. hydrophila isolates are phenotypically,serologically and genetically quite diverse due to itsheterogeneous nature. Methods like phenotyping, proteinanalysis and serotyping show contradictory results, in sucha situation strain characterization by genetic and molecularmethods like Randomly Amplified Polymorphic DNA inassociation with PCR (RAPD-PCR), Restriction FragmentLength Polymorphism (RFLP), Ribotyping and Pulse fieldgel electrophoresis (PFGE) were done, as these methodsare simple, rapid and specific. Szczuka and Kaznowski(2004) evaluated random amplified polymorphic DNA PCR,repetitive extragenic palindromic sequence PCR andenterobacterial repetitive intergenic consensus sequencePCR methods for fingerprinting of Aeromonas sp. isolates.The cytolytic enterotoxin aerolysin and virulent genes inAeromonas sp. was detected (Kingombe et al., 1999; Albertet al., 2000; Watanabe et al., 2004)
1. Ex MFSc student, Central Institute of Fisheries Education (Deemed University ICAR), Andheri West, Mumbai-400061, India2*. Senior Scientist, Fish Health Management Division, Central Institute of Freshwater Aquaculture (ICAR), Kausalyaganga, Bhubaneswar-751
002, India *Corresponding author, Ph. +91-9437080411. e-mail: [email protected]. Scientist (Senior Scale), Fish Genetics and Biotechnology Division, Central Institute of Freshwater Aquaculture (ICAR), Kausalyaganga,
Bhubaneswar-751 002, India4. Senior Research Fellow, Regional Medical Research Centre (ICMR), Bhubaneswar, India
2
July 2008 e-planet 6 (2): 1-6
In this study, we have demonstrated that both rapidand clear differentiation of A. hydrophila from related bacterialspecies, as well as an efficient intraspecific-typing of A.hydrophila strains can be achieved by using RAPDfingerprinting technique (Williams et al., 1990), dependingon the primers used. This method can be useful foridentification of unknown A. hydrophila strains inepidemiological studies.
MATERIALS AND METHODSIsolation of bacteria
The bacterial isolates obtained from diseased fisheswere identified as Aeromonas hydrophila based on thephenotypic and biochemical characters as described in the
Bergey’s Manual of Systematic Bacteriology (Krieg andHolt, 1984) and using microbial identification kit (MicrosoftCorporation, Redmons, WA 98073) and Multiscan (340/MMC). Pure cultures of A. hydrophila strains were furtherstreaked on Rimler Shott’s medium (HiMedia, India) to studythe colony morphology. Out of the twenty five isolatesscreened, only twelve were selected based on the variabilityin reaction to different substrates. The sources of isolatesused in this study are listed in Table-1.Reference strain ofAeromonas hydrophila (MTCC 646) was procured fromInstitute of Microbial Technology, Chandigarh, India. Pureisolates of two Pseudomonas sp. used in the present studywere obtained from Aquatic Animal Health Division, CentralInstitute of Freshwater Aquaculture, Orissa, India.
Tab - 1 : Isolation of Aeromonas hydrophila from different sourcesSl. Isolate Source of Organs Area ofNo. code isolation collection1. Ah1 Cirrhinus mrigala Skin lesion CIFA* Pond2. Ah2 Channa punctatus Skin lesion Commercial fish farm, Puri District, India3. Ah3 Channa punctatus Skin lesion Commercial fish farm, Puri District, India4. Ah4 Channa punctatus Liver CIFA wet laboratory5. Ah5 Channa punctatus Skin lesion CIFA wet laboratory6. Ah6 Clarias batrachus Skin lesion CIFA catfish unit7. Ah7 Carassius auratus Kidney CIFA aquarium unit8. Ah8 Carassius auratus Intestine CIFA aquarium unit9. Ah9 Channa punctatus Kidney CIFA wet laboratory10. Ah10 Channa marulius Skin lesion Andhra Pradesh11. Ah11 Channa species Skin lesion CIFA wet laboratory12. Ah12 Channa marulius Skin lesion Andhra Pradesh
Genomic DNA preparation Chromosomal DNA of bacteria was isolated followingthe procedure described by Sambrook et al., (1989) withsome modifications. The bacterial cultures were grown in5 ml Brain heart infusion (BHI, HiMedia, India) broth at 37°Cfor 18-24 h with periodic shaking in a shaker waterbath.Bacterial cells were separated by centrifugation at 10,000xgat 4°C for 10 min. The pellet obtained was resuspended in467ml of TE buffer (10m mol Tris Cl (pH 8.0), 1 m molEDTA (pH 8.0). Then 30 ml of 10% SDS and 3ml proteinaseK (20mg ml-1, BDH) were added and incubated at 37°C for1h. After incubation, the samples were mixed with an equalvolume of phenol: chloroform: isoamylalcohol (25:24:1) andcentrifuged at 10,000xg for 15 min at room temperature.The top aqueous phase was collected in a microcentrifugetube (Eppendorf) and 1/10 volume of 3M sodium acetate(pH 5.2, Merck; Germany) was added followed by exactlytwo volumes of isopropanol (BDH) to precipitate the DNA.The precipitate was recovered by centrifuging at 10,000xgfor 10 min, washed with 70% alcohol and air dried. Then 50ml of TE buffer was added and RNAase treatment was given.
The samples were incubated at 37°C for 1 h. Subsequentlyphenol: chloroform method as described above was followedto isolate pure DNA. The DNA samples were quantified byspectrophotometric method by measuring optical densityat 260 nm. Finally DNA of each isolate was dissolved andfinal concentration was adjusted to 25 ng/ml for amplificationreactions.RAPD assay Randomly Amplified Polymorphic DNA analysis wasperformed according to Williams et al., (1990). Amplificationwas done in a thermal cycler (Gene Amp. PCR system2400, Perkin, USA) with programme being set as: Onecycle of initial denaturation at 94°C for 4 minutes followedby amplification for 45 cycles; each cycle taking 45s at94°C, 45s at 36°C and 1 min 30 sec at 72°C (fordenaturation, annealing and extension respectively) forcompletion. Amplification was conducted by an additionalfinal extension at 72°C for 7 minutes. The PCR reactionwas carried out in a final volume of 25ml containing 25 ngof purified template DNA, 2.5 ml of 10X PCR buffer, 100mmeach dNTPs, 5 pmol primer and 1 U Taq DNA polymerase.
*CIFA –Central Institute of Freshwater Aquaculture.
3
July 2008 e-planet 6 (2): 1-6
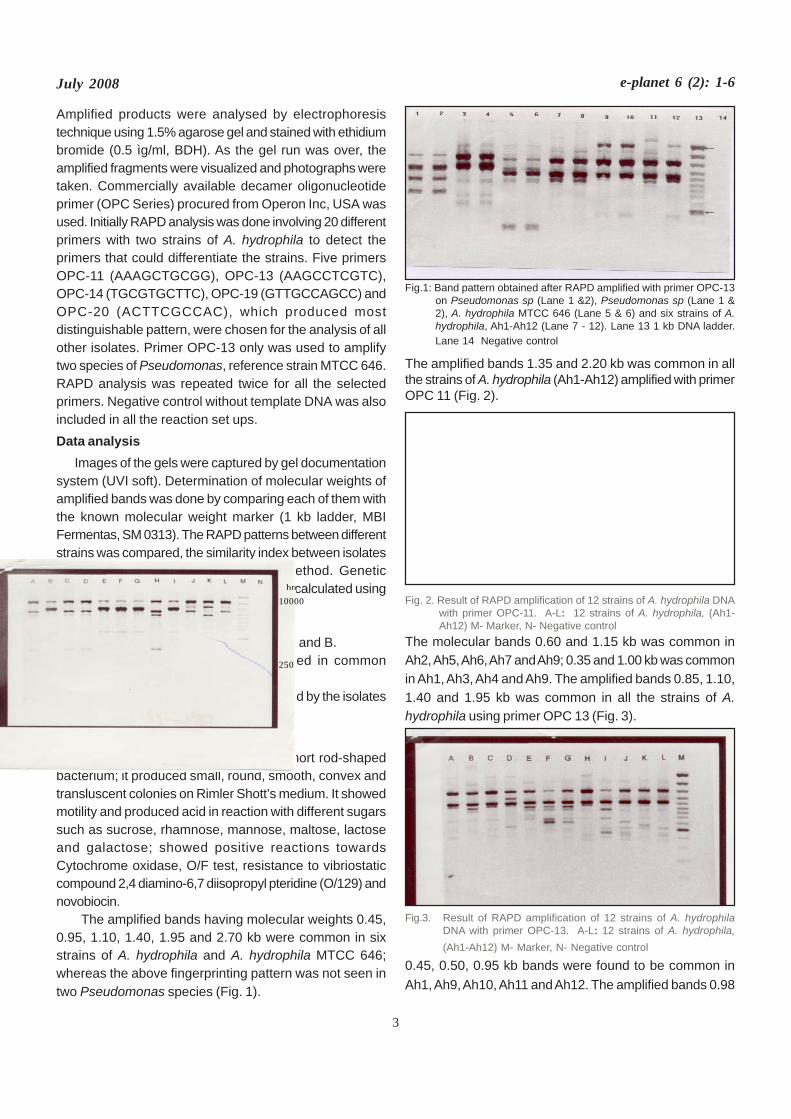
Amplified products were analysed by electrophoresistechnique using 1.5% agarose gel and stained with ethidiumbromide (0.5 ìg/ml, BDH). As the gel run was over, theamplified fragments were visualized and photographs weretaken. Commercially available decamer oligonucleotideprimer (OPC Series) procured from Operon Inc, USA wasused. Initially RAPD analysis was done involving 20 differentprimers with two strains of A. hydrophila to detect theprimers that could differentiate the strains. Five primersOPC-11 (AAAGCTGCGG), OPC-13 (AAGCCTCGTC),OPC-14 (TGCGTGCTTC), OPC-19 (GTTGCCAGCC) andOPC-20 (ACTTCGCCAC), which produced mostdistinguishable pattern, were chosen for the analysis of allother isolates. Primer OPC-13 only was used to amplifytwo species of Pseudomonas, reference strain MTCC 646.RAPD analysis was repeated twice for all the selectedprimers. Negative control without template DNA was alsoincluded in all the reaction set ups.Data analysis Images of the gels were captured by gel documentationsystem (UVI soft). Determination of molecular weights ofamplified bands was done by comparing each of them withthe known molecular weight marker (1 kb ladder, MBIFermentas, SM 0313). The RAPD patterns between differentstrains was compared, the similarity index between isolateswas calculated as per the following method. Geneticsimilarity between isolates A & B (SAB) was calculated usingthe formula:-SAB = 2 NAB/ (NA + NB)Where SAB = Genetic similarity between A and B.NAB = Number of amplified bands shared in commonbetween isolates A and B.NA and NB = Total number of bands produced by the isolatesA and B respectively.RESULTS AND DISCUSSION A. hydrophila is a Gram negative, short rod-shapedbacterium; it produced small, round, smooth, convex andtransluscent colonies on Rimler Shott’s medium. It showedmotility and produced acid in reaction with different sugarssuch as sucrose, rhamnose, mannose, maltose, lactoseand galactose; showed positive reactions towardsCytochrome oxidase, O/F test, resistance to vibriostaticcompound 2,4 diamino-6,7 diisopropyl pteridine (O/129) andnovobiocin. The amplified bands having molecular weights 0.45,0.95, 1.10, 1.40, 1.95 and 2.70 kb were common in sixstrains of A. hydrophila and A. hydrophila MTCC 646;whereas the above fingerprinting pattern was not seen intwo Pseudomonas species (Fig. 1).
Fig.1: Band pattern obtained after RAPD amplified with primer OPC-13on Pseudomonas sp (Lane 1 &2), Pseudomonas sp (Lane 1 &2), A. hydrophila MTCC 646 (Lane 5 & 6) and six strains of A.hydrophila, Ah1-Ah12 (Lane 7 - 12). Lane 13 1 kb DNA ladder.Lane 14 Negative control
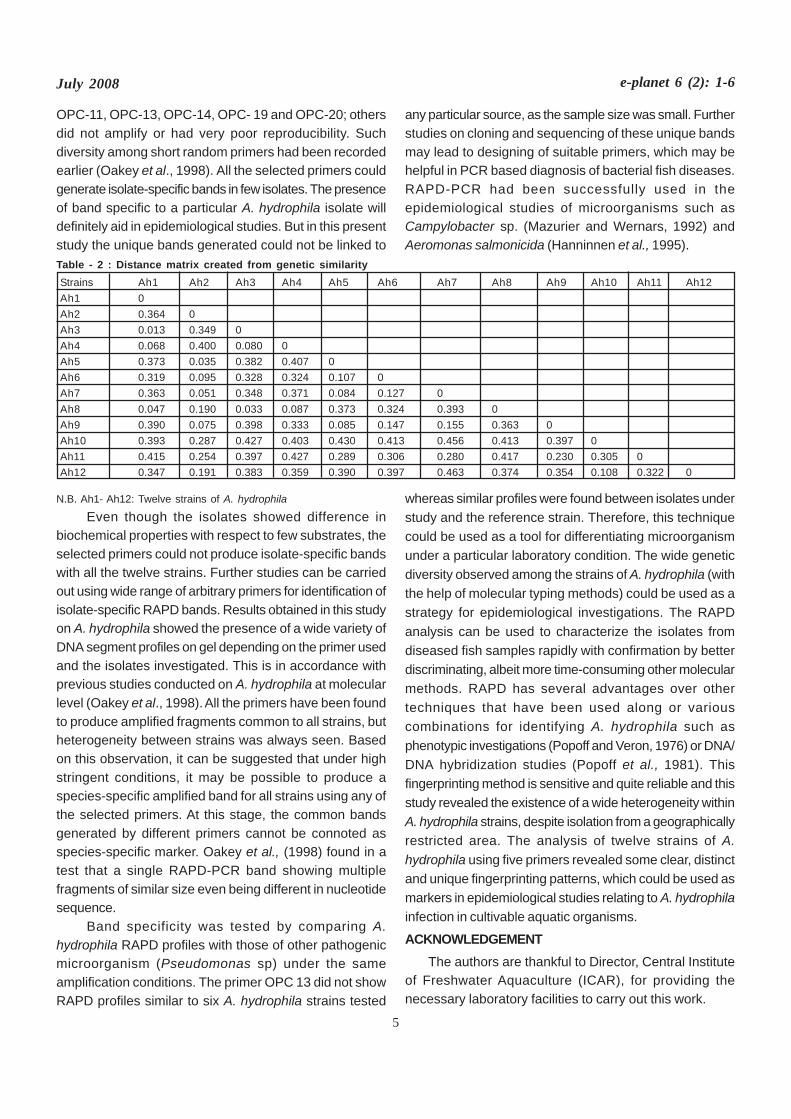
The amplified bands 1.35 and 2.20 kb was common in allthe strains of A. hydrophila (Ah1-Ah12) amplified with primerOPC 11 (Fig. 2).
Fig. 2. Result of RAPD amplification of 12 strains of A. hydrophila DNAwith primer OPC-11. A-L: 12 strains of A. hydrophila, (Ah1-Ah12) M- Marker, N- Negative control
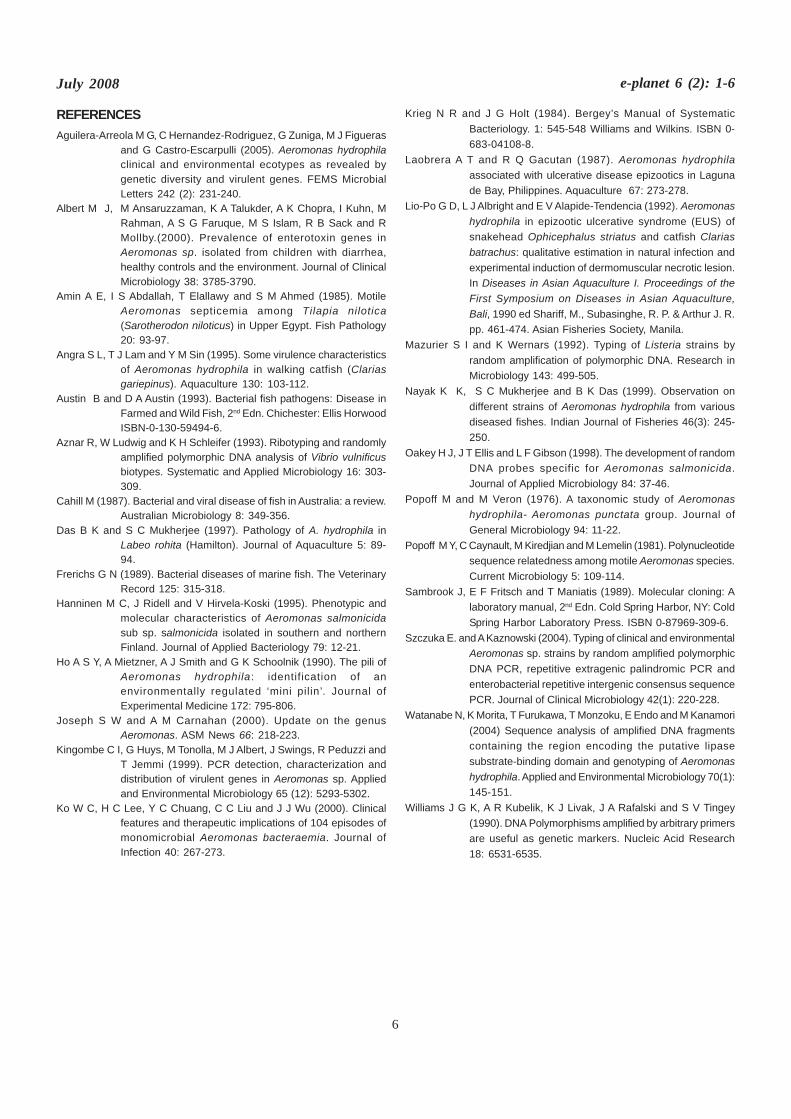
The molecular bands 0.60 and 1.15 kb was common inAh2, Ah5, Ah6, Ah7 and Ah9; 0.35 and 1.00 kb was commonin Ah1, Ah3, Ah4 and Ah9. The amplified bands 0.85, 1.10,1.40 and 1.95 kb was common in all the strains of A.hydrophila using primer OPC 13 (Fig. 3).
Fig.3. Result of RAPD amplification of 12 strains of A. hydrophilaDNA with primer OPC-13. A-L: 12 strains of A. hydrophila,(Ah1-Ah12) M- Marker, N- Negative control
0.45, 0.50, 0.95 kb bands were found to be common inAh1, Ah9, Ah10, Ah11 and Ah12. The amplified bands 0.98
bp 10000 250

4
July 2008 e-planet 6 (2): 1-6
and 1.23 kb was common in all the strains of A. hydrophila(Fig. 4).
Fig.4: Result of RAPD amplification of 12 strains of A. hydrophilaDNA with primer OPC-14. A-L: 12 strains of A. hydrophila,(Ah1-Ah12) M- Marker, N- Negative control
Fig.5. Result of RAPD amplification of 12 strains of A. hydrophilaDNA with primer OPC-19. A-L: 12 strains of A. hydrophila,(Ah1-Ah12) M- Marker, N- Negative control
primer OPC 14 produced the common bands 0.76, 1.85and 2.50 kb in Ah1, Ah3, Ah4 and Ah8. The amplified bands0.95, 1.00 and 1.50 kb were common in all the strains of A.hydrophila (Fig. 5)
Fig.6. Result of RAPD amplification of 12 strains of A. hydrophila DNAwith primer OPC-20. A-L: 12 strains of A. hydrophila, (Ah1-Ah12) M- Marker, N- Negative control
using primer OPC 19; the bands 0.65, 0.85 and 2.70 kbwas common in Ah2, Ah4, Ah5, Ah6, Ah7 and Ah9. Theamplified fragments 0.90, 1.40, 1.70 and 1.95 kb werecommon in all the strains of A. hydrophila using primerOPC 20 as observed in (Fig. 6); The fragments 0.55, 0.60,0.85 and 2.16 kb amplified fragments were common in Ah2,Ah4, Ah5, Ah6, Ah7 and Ah8.
In the RAPD-PCR analysis, out of the 20 primersscreened, only 5 primers were selected based on their abilityto produce consistent and distinguishable fingerprintpatterns. The selected primers were OPC-11, OPC-13,OPC-14, OPC-19 and OPC-20. While OPC-05 and OPC-07 did not amplify at all, other primers produced only oneor two bands. The genomic DNA of reference strain A.hydrophila MTCC 646, two Pseudomonas species and sixstrains of A. hydrophila were amplified with the primer OPC-13, so as to compare the RAPD profiles of few A. hydrophilaisolates with the reference strain and the unrelatedPseudomonas sp. Similar DNA fragment profiles wereobtained for the six strains of A. hydrophila and for thereference strain. With each primer, the number of amplifiedbands varied from a minimum of 3 to a maximum of 8 andthe molecular weight of the fragments ranged from 0.35kbto 2.70kb. All the tested primers could produce 2-3 amplifiedbands common to all isolates. In some cases, isolate-specific unique bands were seen. A minimum of one uniqueband for the isolate Ah5 and Ah8 was observed with primerOPC-19 whereas primers OPC-11, OPC-13, OPC-14 andOPC-20 produced one unique bands for the strains Ah8,Ah1, Ah10 and Ah11 respectively. The average number ofamplified bands per primer varied from 5.2-6.4. One-way ANOVA analysis of banding patterns oftwelve strains of A. hydrophila using five primers showedsignificant difference from each other at 0.01% level. Thedistance matrix created from genetic similarity using twelvestrains of A. hydrophila is shown in Table - 2. The geneticsimilarity value among the strains varied from 0.134-0.436.From the distance matrix, it can be concluded that Ah1,Ah3, Ah4 and Ah8 were clearly related, though the abovestrains were isolated from three different sources i.e.Cirrhinus mrigala, Channa punctatus and Carassiusauratus. Strains Ah2, Ah5, Ah6, Ah7, Ah9 and Ah11 wereclosely related, though these belonged to different sourcesof isolation i.e. Channa punctatus, Carassius auratus,Clarius batrachus and Channa species. Strains Ah10 andAh12 were closely related as the two belonged to samesource of isolation i.e. Channa marulius. Strains Ah4, Ah9,Ah10 and Ah11 were distancely related, though these strainsbelonged to same source of isolation i.e. Channa species. RAPD assay has mostly been used for intra species(among bacterium) determination in epidemiological studiesand is one of the promising methods for distinguishingindividual bacterial strain. In the present study, RAPD assaywas chosen to type twelve strains of A. hydrophila isolatedfrom diseased fishes. All the strains could be typed usingthe selected primers. But out of 20 primers screened, except
5
July 2008 e-planet 6 (2): 1-6
OPC-11, OPC-13, OPC-14, OPC- 19 and OPC-20; othersdid not amplify or had very poor reproducibility. Suchdiversity among short random primers had been recordedearlier (Oakey et al., 1998). All the selected primers couldgenerate isolate-specific bands in few isolates. The presenceof band specific to a particular A. hydrophila isolate willdefinitely aid in epidemiological studies. But in this presentstudy the unique bands generated could not be linked to
any particular source, as the sample size was small. Furtherstudies on cloning and sequencing of these unique bandsmay lead to designing of suitable primers, which may behelpful in PCR based diagnosis of bacterial fish diseases.RAPD-PCR had been successfully used in theepidemiological studies of microorganisms such asCampylobacter sp. (Mazurier and Wernars, 1992) andAeromonas salmonicida (Hanninnen et al., 1995).
Table - 2 : Distance matrix created from genetic similarityStrains Ah1 Ah2 Ah3 Ah4 Ah5 Ah6 Ah7 Ah8 Ah9 Ah10 Ah11 Ah12Ah1 0Ah2 0.364 0Ah3 0.013 0.349 0Ah4 0.068 0.400 0.080 0Ah5 0.373 0.035 0.382 0.407 0Ah6 0.319 0.095 0.328 0.324 0.107 0Ah7 0.363 0.051 0.348 0.371 0.084 0.127 0Ah8 0.047 0.190 0.033 0.087 0.373 0.324 0.393 0Ah9 0.390 0.075 0.398 0.333 0.085 0.147 0.155 0.363 0Ah10 0.393 0.287 0.427 0.403 0.430 0.413 0.456 0.413 0.397 0Ah11 0.415 0.254 0.397 0.427 0.289 0.306 0.280 0.417 0.230 0.305 0Ah12 0.347 0.191 0.383 0.359 0.390 0.397 0.463 0.374 0.354 0.108 0.322 0
N.B. Ah1- Ah12: Twelve strains of A. hydrophila
Even though the isolates showed difference inbiochemical properties with respect to few substrates, theselected primers could not produce isolate-specific bandswith all the twelve strains. Further studies can be carriedout using wide range of arbitrary primers for identification ofisolate-specific RAPD bands. Results obtained in this studyon A. hydrophila showed the presence of a wide variety ofDNA segment profiles on gel depending on the primer usedand the isolates investigated. This is in accordance withprevious studies conducted on A. hydrophila at molecularlevel (Oakey et al., 1998). All the primers have been foundto produce amplified fragments common to all strains, butheterogeneity between strains was always seen. Basedon this observation, it can be suggested that under highstringent conditions, it may be possible to produce aspecies-specific amplified band for all strains using any ofthe selected primers. At this stage, the common bandsgenerated by different primers cannot be connoted asspecies-specific marker. Oakey et al., (1998) found in atest that a single RAPD-PCR band showing multiplefragments of similar size even being different in nucleotidesequence.
Band specificity was tested by comparing A.hydrophila RAPD profiles with those of other pathogenicmicroorganism (Pseudomonas sp) under the sameamplification conditions. The primer OPC 13 did not showRAPD profiles similar to six A. hydrophila strains tested
whereas similar profiles were found between isolates understudy and the reference strain. Therefore, this techniquecould be used as a tool for differentiating microorganismunder a particular laboratory condition. The wide geneticdiversity observed among the strains of A. hydrophila (withthe help of molecular typing methods) could be used as astrategy for epidemiological investigations. The RAPDanalysis can be used to characterize the isolates fromdiseased fish samples rapidly with confirmation by betterdiscriminating, albeit more time-consuming other molecularmethods. RAPD has several advantages over othertechniques that have been used along or variouscombinations for identifying A. hydrophila such asphenotypic investigations (Popoff and Veron, 1976) or DNA/DNA hybridization studies (Popoff et al., 1981). Thisfingerprinting method is sensitive and quite reliable and thisstudy revealed the existence of a wide heterogeneity withinA. hydrophila strains, despite isolation from a geographicallyrestricted area. The analysis of twelve strains of A.hydrophila using five primers revealed some clear, distinctand unique fingerprinting patterns, which could be used asmarkers in epidemiological studies relating to A. hydrophilainfection in cultivable aquatic organisms.
ACKNOWLEDGEMENT The authors are thankful to Director, Central Instituteof Freshwater Aquaculture (ICAR), for providing thenecessary laboratory facilities to carry out this work.
6
July 2008 e-planet 6 (2): 1-6
REFERENCESAguilera-Arreola M G, C Hernandez-Rodriguez, G Zuniga, M J Figueras
and G Castro-Escarpulli (2005). Aeromonas hydrophilaclinical and environmental ecotypes as revealed bygenetic diversity and virulent genes. FEMS MicrobialLetters 242 (2): 231-240.
Albert M J, M Ansaruzzaman, K A Talukder, A K Chopra, I Kuhn, MRahman, A S G Faruque, M S Islam, R B Sack and RMollby.(2000). Prevalence of enterotoxin genes inAeromonas sp. isolated from children with diarrhea,healthy controls and the environment. Journal of ClinicalMicrobiology 38: 3785-3790.
Amin A E, I S Abdallah, T Elallawy and S M Ahmed (1985). MotileAeromonas septicemia among Tilapia nilotica(Sarotherodon niloticus) in Upper Egypt. Fish Pathology20: 93-97.
Angra S L, T J Lam and Y M Sin (1995). Some virulence characteristicsof Aeromonas hydrophila in walking catfish (Clariasgariepinus). Aquaculture 130: 103-112.
Austin B and D A Austin (1993). Bacterial fish pathogens: Disease inFarmed and Wild Fish, 2nd Edn. Chichester: Ellis HorwoodISBN-0-130-59494-6.
Aznar R, W Ludwig and K H Schleifer (1993). Ribotyping and randomlyamplified polymorphic DNA analysis of Vibrio vulnificusbiotypes. Systematic and Applied Microbiology 16: 303-309.
Cahill M (1987). Bacterial and viral disease of fish in Australia: a review.Australian Microbiology 8: 349-356.
Das B K and S C Mukherjee (1997). Pathology of A. hydrophila inLabeo rohita (Hamilton). Journal of Aquaculture 5: 89-94.
Frerichs G N (1989). Bacterial diseases of marine fish. The VeterinaryRecord 125: 315-318.
Hanninen M C, J Ridell and V Hirvela-Koski (1995). Phenotypic andmolecular characteristics of Aeromonas salmonicidasub sp. salmonicida isolated in southern and northernFinland. Journal of Applied Bacteriology 79: 12-21.
Ho A S Y, A Mietzner, A J Smith and G K Schoolnik (1990). The pili ofAeromonas hydrophila: identification of anenvironmentally regulated ‘mini pilin’. Journal ofExperimental Medicine 172: 795-806.
Joseph S W and A M Carnahan (2000). Update on the genusAeromonas. ASM News 66: 218-223.
Kingombe C I, G Huys, M Tonolla, M J Albert, J Swings, R Peduzzi andT Jemmi (1999). PCR detection, characterization anddistribution of virulent genes in Aeromonas sp. Appliedand Environmental Microbiology 65 (12): 5293-5302.
Ko W C, H C Lee, Y C Chuang, C C Liu and J J Wu (2000). Clinicalfeatures and therapeutic implications of 104 episodes ofmonomicrobial Aeromonas bacteraemia. Journal ofInfection 40: 267-273.
Krieg N R and J G Holt (1984). Bergey’s Manual of SystematicBacteriology. 1: 545-548 Williams and Wilkins. ISBN 0-683-04108-8.
Laobrera A T and R Q Gacutan (1987). Aeromonas hydrophilaassociated with ulcerative disease epizootics in Lagunade Bay, Philippines. Aquaculture 67: 273-278.
Lio-Po G D, L J Albright and E V Alapide-Tendencia (1992). Aeromonashydrophila in epizootic ulcerative syndrome (EUS) ofsnakehead Ophicephalus striatus and catfish Clariasbatrachus: qualitative estimation in natural infection andexperimental induction of dermomuscular necrotic lesion.In Diseases in Asian Aquaculture I. Proceedings of theFirst Symposium on Diseases in Asian Aquaculture,Bali, 1990 ed Shariff, M., Subasinghe, R. P. & Arthur J. R.pp. 461-474. Asian Fisheries Society, Manila.
Mazurier S I and K Wernars (1992). Typing of Listeria strains byrandom amplification of polymorphic DNA. Research inMicrobiology 143: 499-505.
Nayak K K, S C Mukherjee and B K Das (1999). Observation ondifferent strains of Aeromonas hydrophila from variousdiseased fishes. Indian Journal of Fisheries 46(3): 245-250.
Oakey H J, J T Ellis and L F Gibson (1998). The development of randomDNA probes specific for Aeromonas salmonicida.Journal of Applied Microbiology 84: 37-46.
Popoff M and M Veron (1976). A taxonomic study of Aeromonashydrophila- Aeromonas punctata group. Journal ofGeneral Microbiology 94: 11-22.
Popoff M Y, C Caynault, M Kiredjian and M Lemelin (1981). Polynucleotidesequence relatedness among motile Aeromonas species.Current Microbiology 5: 109-114.
Sambrook J, E F Fritsch and T Maniatis (1989). Molecular cloning: Alaboratory manual, 2nd Edn. Cold Spring Harbor, NY: ColdSpring Harbor Laboratory Press. ISBN 0-87969-309-6.
Szczuka E. and A Kaznowski (2004). Typing of clinical and environmentalAeromonas sp. strains by random amplified polymorphicDNA PCR, repetitive extragenic palindromic PCR andenterobacterial repetitive intergenic consensus sequencePCR. Journal of Clinical Microbiology 42(1): 220-228.
Watanabe N, K Morita, T Furukawa, T Monzoku, E Endo and M Kanamori(2004) Sequence analysis of amplified DNA fragmentscontaining the region encoding the putative lipasesubstrate-binding domain and genotyping of Aeromonashydrophila. Applied and Environmental Microbiology 70(1):145-151.
Williams J G K, A R Kubelik, K J Livak, J A Rafalski and S V Tingey(1990). DNA Polymorphisms amplified by arbitrary primersare useful as genetic markers. Nucleic Acid Research18: 6531-6535.
7
July 2008 e-planet 6 (2): 7-11
EXISTENCE AND DERIVATION OF EMBRYONIC STEM CELL LIKE
CELL IN INDIAN MAJOR CARP Catla catla (HAM)
C. Dash1, S. Tripathy2, D. K. Verma3, P.K. Meher4,
S. K. Swain5, P. Routray6* and B.C. Guru7
ABSTRACT
The unique feature of embryonic stem (ES) cells to become any type of cells makes them a favourable toolfor basic and applied research. ES cells were shown to be valuable in development of knock out animals. So farthe identification and complete characterization of ES cells have been limited to few animals such as mice,primates and humans. But it has been elusive in various other vertebrates. The existence of ES like cells in fishhas been reported in some fishes. Here we derived ES-like cells from a commercially important fish Catla, Catlacatla. An optimum in vitro culture condition for derivation of these cells has been tried with different combinationsof media and other additives. Finally, a novel cellular environment has been created for Catla catla ES like cells(CCES) and they were characterized with various tools viz. alkaline phosphatase activity, immunocytochemistryand differentiation ability. The present study will have direct applications in production of transgenic and otherdesired aquatic animals.
Key words : Catla, ES cells, in vitro culture, derivation, AP activity
1, 2 Senior Research Fellows, Cryopreservation laboratory, Central Institute of Freshwater Aquaculture (ICAR), Bhubaneswar-7510023. Technical Officer, Aquaculture Production and Environment Division, Central Institute of Freshwater Aquaculture (ICAR), Bhubaneswar-0024. Scientist (Senior Scale), Fish Genetics and Biotechnology Division, Central Institute of Freshwater Aquaculture (ICAR), Bhubaneswar-0025, 6*.Senior Scientists, Aquaculture Production and Environment Division, Central Institute of Freshwater Aquaculture (ICAR), Bhubaneswar-002
corresponding author: Ph. + 91-9861196248,e- mail: [email protected]. Professor (Zoology), Department of Zoology, Utkal University, Bhubaneswar-751013.
INTRODUCTIONThe history of stem cell research had a benign
beginning in the mid 1800’s with the discovery that somecells could generate other cells. Embryonic stem (ES) cellsare undifferentiated cells derived from early embryonic cellsof a developing embryo. They provide an efficient tool forgenome manipulation with many applications inbiotechnology and a virtual cell factory for other studies.When ES cells colonize germ cells in chimeras, transgenicanimals with modified phenotypes are generated and usedeither for functional genomic studies or for improvingproductivity in commercial settings (Alvarez et al., 2006).ES cells represent a bridge between in vitro and in vivomanipulations of animal genomes and have enormouspotential for basic biomedical research, speciesconservation and genetic engineering of livestock (Hong etal., 2000). This ES cell technology has currently becomean invaluable tool for discovering the biological function ofgenes by developing knock out models that are relevant tohumans (Muller, 1999). ES cell technology can be analternative approach to preserve biodiversity where gametecryopreservation is not possible.
The first ES cell lines were derived from the innercell mass of preimplantation mouse embryos and cultured
on either a feeder layer (Evans and Kauffman, 1981) or inembryonic carcinoma (EC) cell-conditioned medium (Martin,1981). Later on ES cell technology has been extended toother vertebrate species. Among them fish are attractivemodel organisms due to external fertilization, high fecundity,large transparent embryos and rapid development. ES celllines have been developed in many fish like zebrafish (Collodiet al., 1992), medaka (Wakamatsu et al., 1994), sea perch(Chen et al., 2003), sea bream (Chen et al., 2003), seabass and flounder (Chen et al., 2004). ES cells in fish arecharacterized in a similar pattern to mammalian ES cellsby their proliferation, chromosome complement, AP staining,telomerase activity, specific gene expression,immunocytochemistry of cell surface antigens and inductionof cell differentiation. Hence fish ES cells can act asmammalian complements. Again it appears that ES cellsupto 10 days in culture are efficient for contribution to manycell lineages including the germ line (Hong et al., 2004). Inmany aspects fish ES cells are similar to mammalian EScells e.g., ubiquitous expression of oct-4 promoter (Honget al., 2004). ES cell technology; especially in commerciallyimportant fish is to improve the productivity by targetinggenes related to commercial traits, such as growth anddisease resistance. Here, we report the existence of ES
8
July 2008 e-planet 6 (2): 7-11
like cells and its in vitro culture system in a commerciallyimportant carp, Catla catla that is cultured extensively inthe Indian sub-continent.MATERIALS AND METHODSInduced Breeding and Artificial Fertilization
The brood fish of Indian major carp, Catla catla usedin this study was reared in earthen ponds (0.2 ha) of theCentral Institute of Freshwater Aquaculture, Bhubaneswar,India. In the monsoon season brood fishes are selected bychecking the maturity status of the brood males (free oozingcondition of semen) and females (swollen abdomen). Eachtime 2-4 males and females were brought to the hatcheryand administered intra-peritoneal with ovaprim (SalmonGnRH + Domperidone, Syndel Laboratories, Canada) at arate of 0.25 ml / kg and 0.5 ml / kg body weight to malesand females respectively. After 5-6 h of hormone injection,the semen and egg was collected on a dry sterilizedpetridish. Fertilization was done by mixing the milt andeggs of catla with a bird feather while slowly adding waterto it and washed with sterile Dulbecco’s phosphate bufferedsaline (DPBS pH -7.4, Sigma, USA).Media conditions and supplements
For embryonic cell culture different media,supplemented with fetal bovine serum, growth factors, fishserum and fish embryo extract were tested for theirefficiency with all components of Collodi et al., 1992 , usedfor zebrafish ES cells. In this experiment differentcombinations of L-15, DMEM, Ham’s F12 (LDF) (1:1:1,2:1:1, 1:2:1 & 1:1:2) were tested. With these combinationsof media different concentration of FBS (5 %, 10 % & 15%) have been tried. The detail composition of conditionmedia is shown below.Conditioned media used for CCES cellsBasic medium,L-15: 2, DMEM: 1, Ham’s F12: 1ProteinsFBS: 10%, LIF: 10ng/ml, bFGF: 10ng/ml, Fish Serum: 1%,Fish Embryo Extract: 1mg/mlAntibioticsPenicillin/Streptomycin: 100IU/100µg/ml, Amphotericin B:Other ComponentsSodium pyruvate: 1mM, Sodium Selenite: 2 to 8 nM,HEPES: 15 mM, L-Glutamine:2mM, Non essential aminoacid: 1mM, ß-mercaptoethanol: 1mM
Primary culture of embryonic cells and itsmaintenance
Approximately 100 to 200 embryos (at 256 cell stage)of 2 h post fertilization were taken for cell culture. Forcollection of blastomeres, the embryos were disinfected
with 70 % ethanol, washed 7-8 times with D-PBS andpipetted with a wide mouth sterilized pipette to rupture thechorion and release the blastomeres. To get single cellsgentle pipetting was done one or two times. Now cells wereseeded on a 0.1 % gelatin coated six well plate (Nunc)with the complete growth medium comprising of L-15,DMEM with high glucose and Ham’s F-12 in different ratios,different % of FBS, 15 mM Hepes, 100 IU/ml penicillin,0.1mg/ml streptomycin, 1 % catla embryo extract, 8 nMsodium selenite, 10 ng/ml basic human fibroblast growthfactor (bFGF), 10 ng/ml human leukemia inhibitory factor(hLIF), 1mM ß-mercaptoethanol, 1mM sodium pyruvate,1mM non-essential amino acid (All from Sigma, USA). Themethods followed were modified from Collodi et al., (1992)to suit our conditions after preliminary studies. The cellsuspension was incubated at 28 °C. The medium waschanged on every third day and passaging of cells doneafter reaching 95 % confluence.
Preparation of embryo extractApproximately 300 embryos were washed with 70%
isopropanol to avoid contamination and washed repeatedlyin PBS (pH 7.2), homogenized in a 2ml eppendorf andcentrifuged at 20,000×g for 10 min. the debris was removedand supernatant was filtered by 0.4µm and then 0.2µm.Protein concentrations were determined by the method ofBradford. The final solution was made to a concentration of10mg/ml and stored at -20 º C following a standard protocol(Fan et al., 2004).
Growth StudiesThe effect of different media combinations and FBS
concentration on cell growth and pluripotency was testedupto 10th passage. Cells were seeded on a 24 well plate ata density of 1X10⁵ no. of cells/ml with different combinationsand incubated for 48 hours for cell attachment. Thereafter,on every passage the cell density was measured in ahemocytometer under a microscope after addition of 0.1mlof 0.25 % trypsin and 0.2 % of EDTA to each well.
Alkaline Phosphatase ActivityCultured cells were washed twice with PBS, fixed in
1 % glutaraldehyde solution for 10 min, washed again withPBS and then stained in dark with 0.38mM 5-bromo-4-chloro-3-indolyphosphate p-toluidine salt and 0.4mM Nitroblue tetrazolium (BCIP/NBT, Roche Molecular Biochemical)in 100mM Tris-HCl buffer at pH 9.5, 100 mM NaCl and 5mM MgCl2. Cells were observed under an invertedmicroscope.
9
July 2008 e-planet 6 (2): 7-11
Immunocytochemical AnalysisCell surface markers like SSEA-1, SSEA-3, TRA1-
60 and TRA1-81 (Chemicon International, Inc. USA) wereanalyzed for pluripotency by immunofluorescent method.Cells from culture dish were fixed in 4 % paraformaldehydefor 15 min at 4 ºC, washed with 1X rinse buffer (20mM TrisHCl, pH 7.4, 0.15g NaCl, 0.05 % Tween-20), permeabilisedwith Triton X-100 for 10 min at room temperature as ablocking solution. The primary antibodies were diluted at aworking concentration, incubated for 1h at roomtemperature, washed 3 to 4 times with rinse buffer.Fluorescence Isothyocyanite (FITC) labeled goat anti-mouse IgG was used as a secondary antibody, appropriateto the isotype of primary antibody. Stained cells wereobserved under an inverted microscope attached withfluorescent light at excitation wave length of 490nm (FITC).200 colonies were observed at each experimental groupwith different markers.Cell Differentiation
To induce differentiation of ES like cells, the cells wereseeded with low density (105) or high density (5 x 10⁷) andthen cultured for 3 weeks with regular change of media.After 2 days of culture 2 µM all-trans retinoic acid (Sigma)and observed under microscope. Control cultures wereseeded on gelatin coated 6 well plates without retinoic acid.RESULTSGrowth Kinetic Studies
With different combinations of LDF and FBS, LDF in2:1:1 and 10% FBS showed maximum proliferation of 4.5 x10⁵ cells/ml in comparison to other combinations are shownin Table - 1. Although with increasing FBS concentrationproliferation was more, but cell were more differentiated. Here,higher percentage of L-15 medium suited the proliferationrate compared to DMEM and Ham’s F12.Table - 1 : Concentration and media conditions used for invitro culture of catla ES cells, different concentration ofmedia and FBS
Sl.No LDF (ratio) FBS (%) Number of Cells1 1:1:1 5 2,30,0002 10 3220003 15 3450004 2:1:1 5 250,0005 10 420,0006 15 401,0007 1:2:1 5 2,450008 10 2900009 15 31000010 1:1:2 5 18900011 10 24600012 15 278000
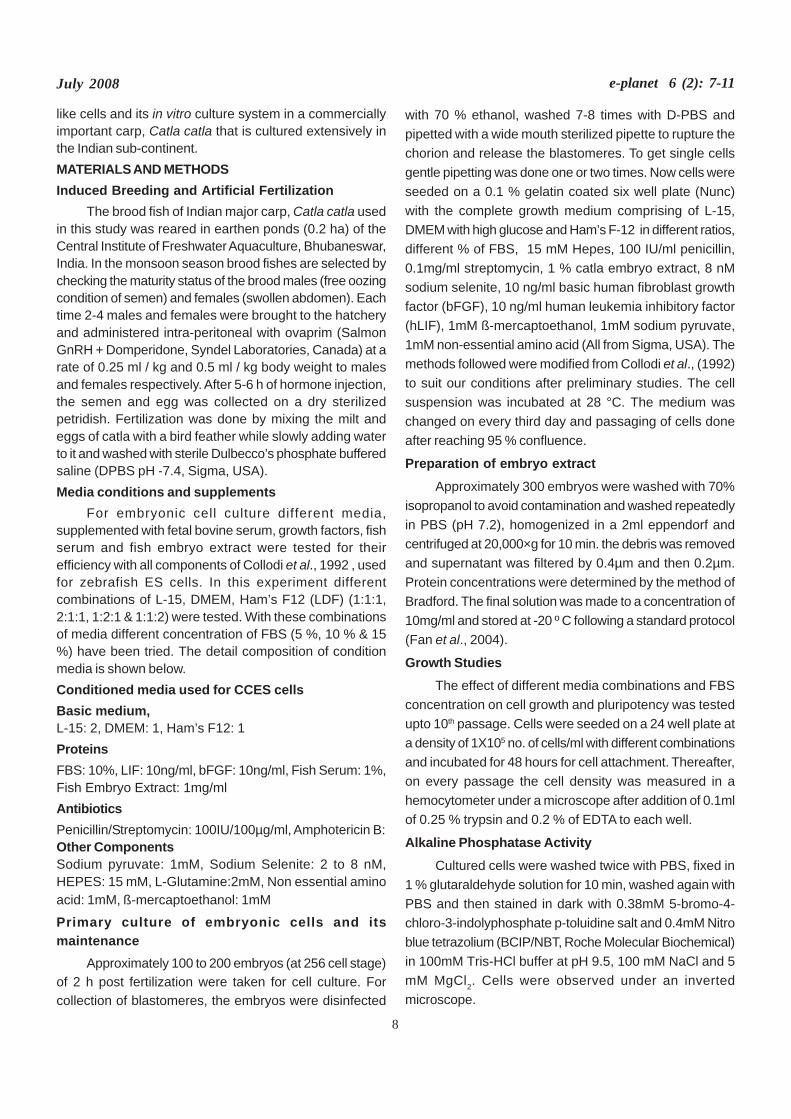
Derivation of ES like cellsTo develop ES like cells mid-blastula stage embryos
(Fig. 1a) were used. Approximately 100 embryos wereinoculated into the well of 6 well plates. Cells in appropriateconditions with 10 % FBS and LDF in 2:1:1 ratio showedbetter proliferation than all other combinations with all growthfactors as shown in the Table-1.
Fig. 1 (a): Derivation and differentiation of catla ES cells. Developing
embryo at mid-blastula stage, Stem cell patches
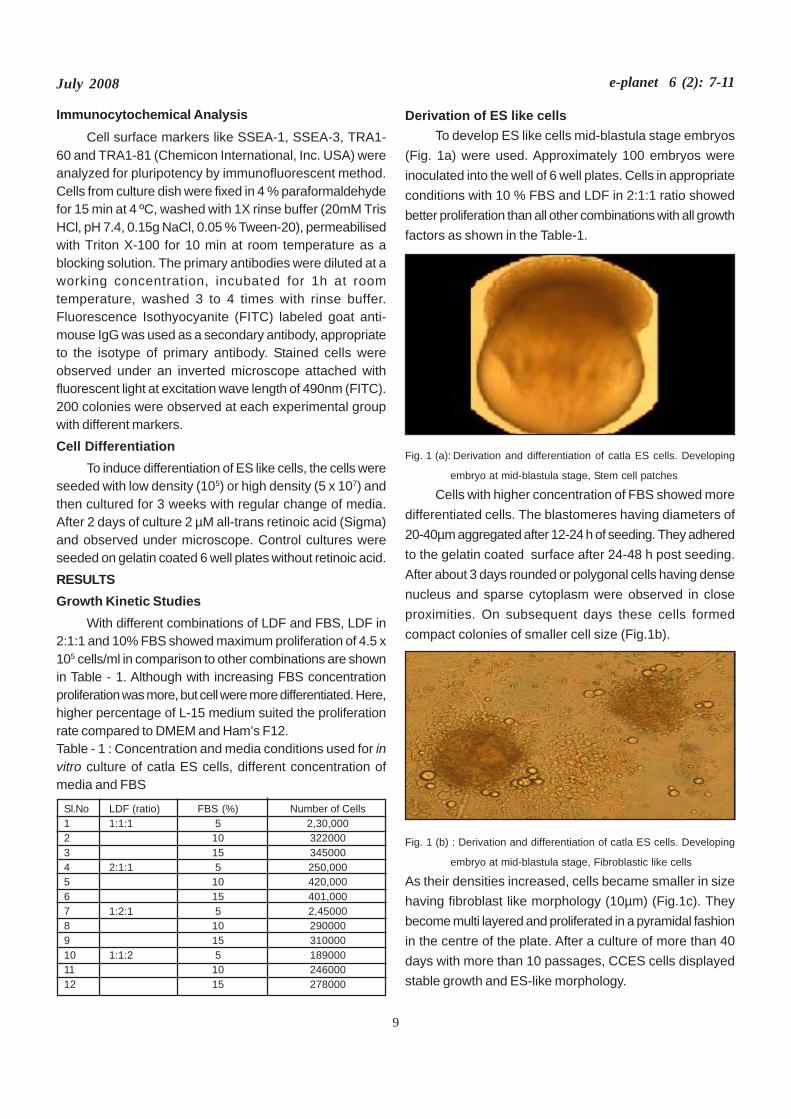
Cells with higher concentration of FBS showed moredifferentiated cells. The blastomeres having diameters of20-40µm aggregated after 12-24 h of seeding. They adheredto the gelatin coated surface after 24-48 h post seeding.After about 3 days rounded or polygonal cells having densenucleus and sparse cytoplasm were observed in closeproximities. On subsequent days these cells formedcompact colonies of smaller cell size (Fig.1b).
Fig. 1 (b) : Derivation and differentiation of catla ES cells. Developing
embryo at mid-blastula stage, Fibroblastic like cells
As their densities increased, cells became smaller in sizehaving fibroblast like morphology (10µm) (Fig.1c). Theybecome multi layered and proliferated in a pyramidal fashionin the centre of the plate. After a culture of more than 40days with more than 10 passages, CCES cells displayedstable growth and ES-like morphology.
10
July 2008 e-planet 6 (2): 7-11
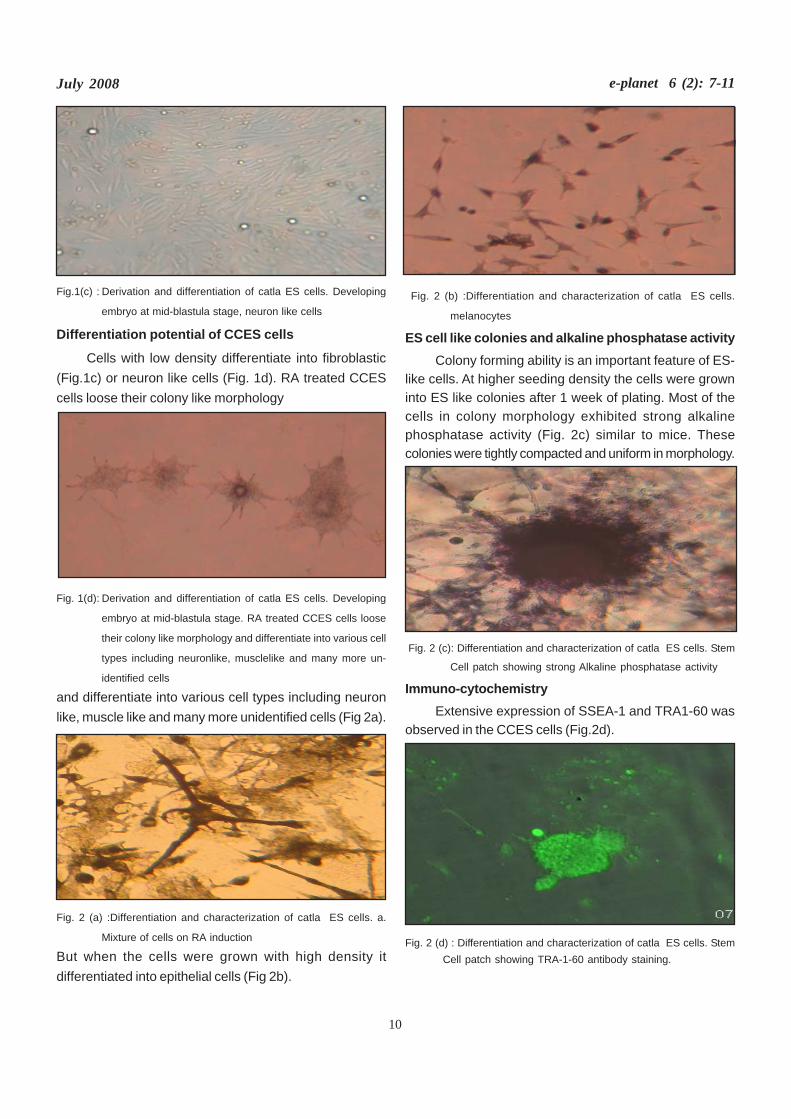
Fig.1(c) : Derivation and differentiation of catla ES cells. Developing
embryo at mid-blastula stage, neuron like cells
Differentiation potential of CCES cells
Cells with low density differentiate into fibroblastic(Fig.1c) or neuron like cells (Fig. 1d). RA treated CCEScells loose their colony like morphology
Fig. 1(d): Derivation and differentiation of catla ES cells. Developing
embryo at mid-blastula stage. RA treated CCES cells loose
their colony like morphology and differentiate into various cell
types including neuronlike, musclelike and many more un-
identified cells
and differentiate into various cell types including neuronlike, muscle like and many more unidentified cells (Fig 2a).
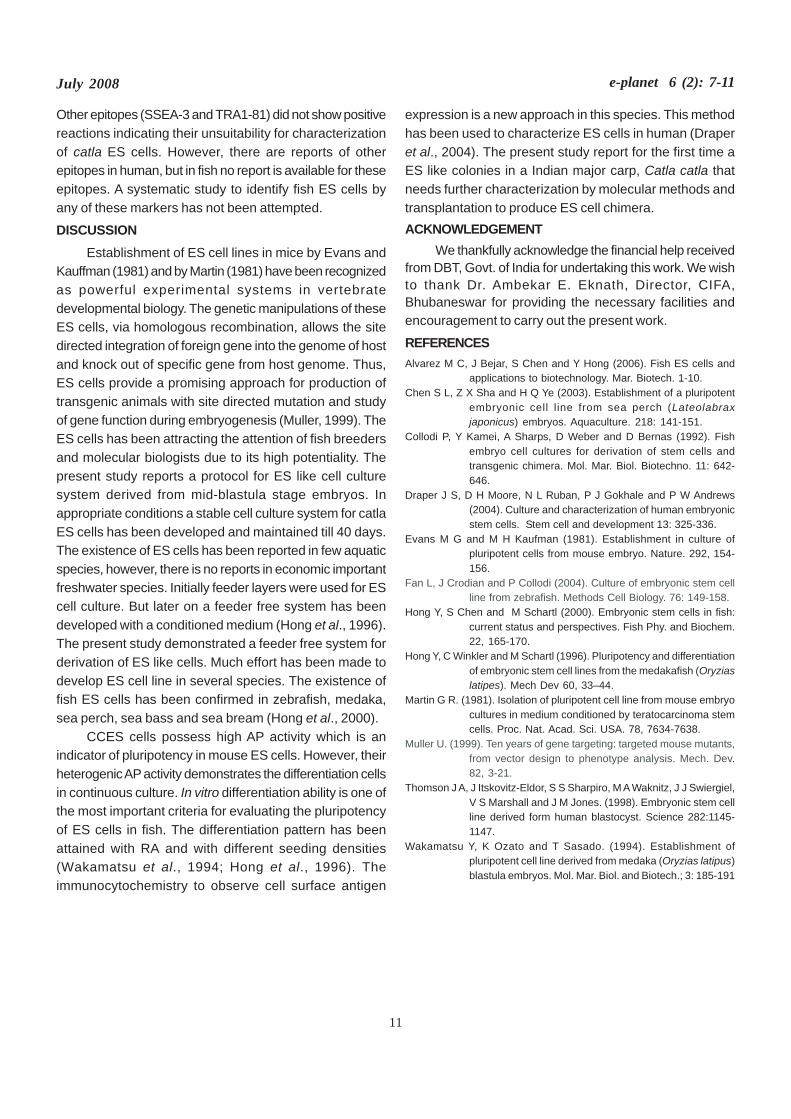
Fig. 2 (a) :Differentiation and characterization of catla ES cells. a.
Mixture of cells on RA induction
But when the cells were grown with high density itdifferentiated into epithelial cells (Fig 2b).
Fig. 2 (b) :Differentiation and characterization of catla ES cells.
melanocytes
ES cell like colonies and alkaline phosphatase activityColony forming ability is an important feature of ES-
like cells. At higher seeding density the cells were growninto ES like colonies after 1 week of plating. Most of thecells in colony morphology exhibited strong alkalinephosphatase activity (Fig. 2c) similar to mice. Thesecolonies were tightly compacted and uniform in morphology.
Fig. 2 (c): Differentiation and characterization of catla ES cells. Stem
Cell patch showing strong Alkaline phosphatase activity
Immuno-cytochemistryExtensive expression of SSEA-1 and TRA1-60 was
observed in the CCES cells (Fig.2d).
Fig. 2 (d) : Differentiation and characterization of catla ES cells. StemCell patch showing TRA-1-60 antibody staining.
11
July 2008 e-planet 6 (2): 7-11
Other epitopes (SSEA-3 and TRA1-81) did not show positivereactions indicating their unsuitability for characterizationof catla ES cells. However, there are reports of otherepitopes in human, but in fish no report is available for theseepitopes. A systematic study to identify fish ES cells byany of these markers has not been attempted.
DISCUSSIONEstablishment of ES cell lines in mice by Evans and
Kauffman (1981) and by Martin (1981) have been recognizedas powerful experimental systems in vertebratedevelopmental biology. The genetic manipulations of theseES cells, via homologous recombination, allows the sitedirected integration of foreign gene into the genome of hostand knock out of specific gene from host genome. Thus,ES cells provide a promising approach for production oftransgenic animals with site directed mutation and studyof gene function during embryogenesis (Muller, 1999). TheES cells has been attracting the attention of fish breedersand molecular biologists due to its high potentiality. Thepresent study reports a protocol for ES like cell culturesystem derived from mid-blastula stage embryos. Inappropriate conditions a stable cell culture system for catlaES cells has been developed and maintained till 40 days.The existence of ES cells has been reported in few aquaticspecies, however, there is no reports in economic importantfreshwater species. Initially feeder layers were used for EScell culture. But later on a feeder free system has beendeveloped with a conditioned medium (Hong et al., 1996).The present study demonstrated a feeder free system forderivation of ES like cells. Much effort has been made todevelop ES cell line in several species. The existence offish ES cells has been confirmed in zebrafish, medaka,sea perch, sea bass and sea bream (Hong et al., 2000).
CCES cells possess high AP activity which is anindicator of pluripotency in mouse ES cells. However, theirheterogenic AP activity demonstrates the differentiation cellsin continuous culture. In vitro differentiation ability is one ofthe most important criteria for evaluating the pluripotencyof ES cells in fish. The differentiation pattern has beenattained with RA and with different seeding densities(Wakamatsu et al., 1994; Hong et al., 1996). Theimmunocytochemistry to observe cell surface antigen
expression is a new approach in this species. This methodhas been used to characterize ES cells in human (Draperet al., 2004). The present study report for the first time aES like colonies in a Indian major carp, Catla catla thatneeds further characterization by molecular methods andtransplantation to produce ES cell chimera.ACKNOWLEDGEMENT
We thankfully acknowledge the financial help receivedfrom DBT, Govt. of India for undertaking this work. We wishto thank Dr. Ambekar E. Eknath, Director, CIFA,Bhubaneswar for providing the necessary facilities andencouragement to carry out the present work.
REFERENCESAlvarez M C, J Bejar, S Chen and Y Hong (2006). Fish ES cells and
applications to biotechnology. Mar. Biotech. 1-10.Chen S L, Z X Sha and H Q Ye (2003). Establishment of a pluripotent
embryonic cell line from sea perch (Lateolabraxjaponicus) embryos. Aquaculture. 218: 141-151.
Collodi P, Y Kamei, A Sharps, D Weber and D Bernas (1992). Fishembryo cell cultures for derivation of stem cells andtransgenic chimera. Mol. Mar. Biol. Biotechno. 11: 642-646.
Draper J S, D H Moore, N L Ruban, P J Gokhale and P W Andrews(2004). Culture and characterization of human embryonicstem cells. Stem cell and development 13: 325-336.
Evans M G and M H Kaufman (1981). Establishment in culture ofpluripotent cells from mouse embryo. Nature. 292, 154-156.
Fan L, J Crodian and P Collodi (2004). Culture of embryonic stem cellline from zebrafish. Methods Cell Biology. 76: 149-158.
Hong Y, S Chen and M Schartl (2000). Embryonic stem cells in fish:current status and perspectives. Fish Phy. and Biochem.22, 165-170.
Hong Y, C Winkler and M Schartl (1996). Pluripotency and differentiationof embryonic stem cell lines from the medakafish (Oryziaslatipes). Mech Dev 60, 33–44.
Martin G R. (1981). Isolation of pluripotent cell line from mouse embryocultures in medium conditioned by teratocarcinoma stemcells. Proc. Nat. Acad. Sci. USA. 78, 7634-7638.
Muller U. (1999). Ten years of gene targeting: targeted mouse mutants,from vector design to phenotype analysis. Mech. Dev.82, 3-21.
Thomson J A, J Itskovitz-Eldor, S S Sharpiro, M A Waknitz, J J Swiergiel,V S Marshall and J M Jones. (1998). Embryonic stem cellline derived form human blastocyst. Science 282:1145-1147.
Wakamatsu Y, K Ozato and T Sasado. (1994). Establishment ofpluripotent cell line derived from medaka (Oryzias latipus)blastula embryos. Mol. Mar. Biol. and Biotech.; 3: 185-191
12
July 2008 e-planet 6 (2): 12-17
A SURVEY OF SOME MAJOR BACTERIAL DISEASES IN KEY FRESHWATER AQUACUL-TURE ZONES OF INDIA: ANDHRA PRADESH, WEST BENGAL AND ORISSA.
S. Dash1, P. Swain2*,S. K. Nayak3, P. K. Nanda4,
P.V. Rangacharyulu5, B. K. Mishra6 and S. K. Swain7
ABSTRACT
Indian major carps constitute prime component of Indian freshwater aquaculture system. Due to rapidintensification they suffer from many disease problems among which bacterial diseases cause enormous eco-nomic loss in terms of morbidity and mortality. Investigations on incidences of some important bacterial diseasesin three major aquaculture zones of India i.e. states of Orissa (zone-I), Andhra Pradesh (zone-II) and West Bengal(zone-III) over last seven years, revealed 21±2.7% to be bacterial gill disease followed by columnaris (13.8±0.88%),ulcerative conditions (12.5±1.21%), fin rot/tail rot (11.9±1.18%), dropsy (11.4±1.18%) and septicemia conditions(8.14±0.79%). Diseases either due to mixed bacterial infections or other causes were restricted to 6.57±2.71%and 14.1±2.46%, respectively. Aeromonas hydrophila and Edwardisiella tarda isolates of both virulent andnonvirulent types were frequently isolated from the diseased fishes affected with dropsy, ulcerative, fin rot/tail rotand septicaemic conditions, respectively in all the three species of Indian major carps. Flavobacteriumbranchiophilum and Flavobacterium columnarae were isolated from cases with bacterial gill disease andcolumnaris, respectively. The serosurveillance study against specific pathogen by competitive ELISA showed75% of the test sera positive for A. hydrophila antibodies followed by F. branchiophilum (74.04%), and positiveantibodies for E tarda, (58.3%) and Pseudomonas fluorescens (46.6%), respectively. The percentage of occur-rence of different diseases in three different zones over the years did not vary significantly (p<0.01) except bacterialgill disease. Zone-wise, there was also no significant variation in incidence of each disease (p<0.01).
Keywords: Bacterial diseases, freshwater Aquaculture, Indian major carps, Seroincidence
1 Senior Research Fellow, Immunodiagnostic Laboratory, Central Institute of Freshwater Aquaculture, Bhubaneswar- 751002, India2*,7Senior Scientists, Central Institute of Freshwater Aquaculture, Bhubaneswar- 751002, India. Corresponding author: Ph. + 91-9437231099;
e-mail: [email protected] Scientist, DST Fast Track Scheme, Central Institute of Freshwater Aquaculture, Bhubaneswar- 751002, India4 Scientist (Senior Scale), Eastern Regional Station, Indian Veterinary Research Institute, Kolkata – 700037, India5 Senior Scientist, Regional Research Centre of CIFA, Vijayawada6 Principal Scientist, Fish Health Management Division, Central Institute of Freshwater Aquaculture, Bhubaneswar - 751002, India.
INTRODUCTION Aquaculture has developed from an extensively low
capital practice to large intensive culture with a wide rangeof cultured species. However, one deterrent to successfulaquaculture is the occurrence of infectious diseases amongcultured fish species, which lead to poor economic viabilityof the aquaculture industry ( Snieszko, 1974).
In India, aquaculture has grown considerably in thepast few years with culture of Indian major carps as theimportant component species. These include Catla catla,Labeo rohita and Cirrhinus mrigala. Diseases are the majorconstraints for aquaculture loss in India (Otta et al., 2003).Bacterial diseases are also considered to be major causeof mortality in fish (Grisez and Ollevier, 1995). Differentreported diseases of Indian major carps include ulcer(Manohar et al., 1976), Dropsy (Kumar et al., 1986a),bacterial gill disease (Swain et al., 2003a), hemorrhagicsepticemia (Sahoo et al., 1998), Columnaris (Kumar et al.,
1986b) etc. Also a wide range of bacteria belonging to thegenus such as Aeromonas, Pseudomonas, Flavobacterium,Enterobacter, Staphylococcus, Streptococcus,Edwardsiella, Moraxella, Myxobacter and Escherichia havebeen found to be isolated form different fish diseaseconditions. Among them Aeromonas, Flavobacterium andEdwardsiella are found to cause severe morbidity andmortality and are associated with many disease conditions(Swain and Nayak, 2003). In aquaculture, the etiology ofany disease condition is many times very complex. A singlebacterium is often reported to cause different types ofinfection and lesions. A. hydrophila, a freshwater fishpathogen, is found to be primarily associated with or is asecondary invader of various disease conditions such ashemorrhagic septicemia, dropsy, ulcers and ulcerativesyndrome, etc (Aoki, 1974; Egusa, 1978). Moreover, theinfection by a particular organism may be affected by somany factors including water quality parameters. Therefore,
13
July 2008 e-planet 6 (2): 12-17
both conventional and serological studies are oftennecessary for confirmational identification of a disease.Inspite of wide occurrence of diseases in these speciesand their association with production loss, no informationis available to date on their incidence pattern. Moreover,no systemic approach has been made earlier in this regard.The present investigation was therefore, carried out withthe following objectives, such as; (i) Rate of occurrenceand distribution of different bacterial diseases of fish, (ii)Zone-wise and time-wise occurrence of each disease and(iii)Seroincidence of some of these bacterial infections inIndian major carps.
MATERIALS AND METHODSCollection of data through farmer’s participatoryapproach
The study was conducted in three major aquaculturezones of India viz. coastal areas of Orissa (Zone I), 925sqkilometer area of Kolleru lake of Andhra Pradesh (Zone II),freshwater and wastewater aquaculture areas of WestBengal (Zone III) from the year 1999 to 2005. Informationregarding the different culture practices was collected fromprogressive fish farmers and state fisheries departmentofficials in a prescribed format.
Sample collectionSamples for bacteriological isolation and serological
studies were collected from the outbreaks and sporadicincidences of diseases in all the three species Indian majorcarps i.e., rohu (L. rohita), catla (C. catla), and mrigal (C.mrigala). Blood was collected randomly from 300 fishes /year (average body weight ranging from 250gm to 1kg) forscreening of antibodies against the different pathogens.
Isolation, identification and characterization ofbacteria
Tissue samples such as gill, kidney, heart, tail, fin,muscle and septicaemic blood as well as peritoneal fluidwere collected from diseased fishes in brain heart infusionbroth (Hi- media, India). Bacterial species associated withdiseased conditions were isolated, identified andcharacterized through standard microbiological methods(Collins and Lyne, 1970; Cruickshank et al., 1975).
Bacteria:One virulent strain each of A. hydrophila, E. tarda, F.
branchiophilum, F. columnare and P. fluorescens obtainedfrom the Fish Health Management Division, Central Instituteof Freshwater Aquaculture, Bhubaneswar, Orissa, India wereused in the present investigation as reference stains.
Bacterial antigens:
The reference strains of A. hydrophila, E. tarda, P.fluorescens, F. columnarae and F. branchiophilum wereused for preparation of whole cell antigens. Bacteria wasgrown separately in BHI broth for 24 h and centrifuged at10,000 X g for 10 min. The bacterial pellet was washedtwice in phosphate buffer saline (PBS, pH 7.2) and finallysuspended in PBS. They were inactivated with 1% (v/v)formalin at 4°C for 18 h and the viability was checked innutrient agar plates.
ELISA antigen:The formalin killed bacterin prepared as above was
sonicated at 30 Hz for 10 min and the supernatant wascollected after centrifuging at 10,000 X g for 10 min andpassed through the cellulose triacetate ultra filter of 20 kD(Sartorius, Germany).The filtrate obtained was used asELISA antigen. This procedure was used in order to avoidthe cross-reactive antigen evident among most of the Gram–ve bacteria (Swain et al, 2003b) and stored at –200C tillfurther use. The protein content was estimated by thestandard method of Lowry et al, (1951).
Antisera:Antisera against bacterial whole cells for each
bacterial species was raised in rabbit and rohu as per themethods of Chen et al, (1997) and Lund et al., (1991),respectively. Briefly, rabbits (6-8 months old) wereseparately injected intramuscularly with 0.5 ml of bacterialwhole cell (109 CFU/ml) antigen emulsified with equal volumeof Freund’s complete adjuvant followed by two boosterswith Freund’s incomplete adjuvant at fortnight intervals. Therabbits were bled for serum through ear veins 15 days aftersecond booster. Similarly in 10 rohu fingerlings (Avg. wt.100-150 gm), maintained in 1000l plastic pools, with constantaeration and artificial diet, were immunized intraperitoneallywith 0.1ml of adjuvated antigen as used in rabbit. Theimmunization schedule was same as for rabbit. The pHand temperature of the rearing pools varied from 7.4-7.8and 26-290 C, respectively. After immunization serum wascollected through cardiac puncture. Antibody titre in theblood sera was checked by agglutination and ELISA test.Antisera raised against whole cells were mixed with anequal volume of packed heterologous bacterial cells,incubated at 37°C for 1h with constant stirring, centrifugedat 10,000 X g for 10 min and the supernatant was used asadsorbed sera for use in serological tests such ascompetitive ELISA and agglutination test.
14
July 2008 e-planet 6 (2): 12-17
Detection of antibodies by Competitive ELISACompetitive ELISA was done as per the method of
Swain and Nayak (2003). The microtitre plates (Nunc,Denmark) were coated overnight with antigen (1ìg/ml) andblocked with 1% bovine serum albumin dissolved in PBS(pH-7.2) for 2 h at 37°C. After washing in PBS- T, 50mleach of test fish sera and rabbit sera (1:200 dilution) wereadded, simultaneously in duplicate wells of microtitre platesand incubated for 45 min at 37°C. A 0% competition testwas done with only rabbit sera where five wells were addedwith 50ml of rabbit sera (1:200 dilution) for 45 min. at 37°C.In another set a 100% competition test was done in fivewells where 50ml each of hyperimmune antisera raised inboth fish and rabbit were added simultaneously as above.The plates were washed in PBS-T and 50 ml of anti-rabbitconjugate (1:500 dilution) was added. They were incubatedfurther for 45 min at 37°C washed thoroughly and 50 ml ofsubstrate solution (5mg of O-phenylenediaminedihydrochloride and 10 ml of H2O2 (38%V/V) in 5 ml ofacetate buffer, pH 5.0) was added. The plates wereincubated at 37°C for 5 min in the dark and the opticaldensity (OD) was recorded at 450/655 nm in a micro platereader (BIORAD, USA). The results of test sera werecalculated by expressing the percentage of inhibition (P.I)as follows.P.I.= 100- [(mean O.D of test sera/mean O.D.of 0%competition) x100]. The results were interpreted as positiveif the values were higher than 50 & negative if less than 50.Statistical analysisThe zone-wise incidence of different diseases during theentire observation period were analysed and means werecompared using one-way analysis of variance (ANOVA) andDuncan’s multiple range test (DMRT) using the statisticalanalysis system (SAS) software (Version 6.12) (SAS, 1991)
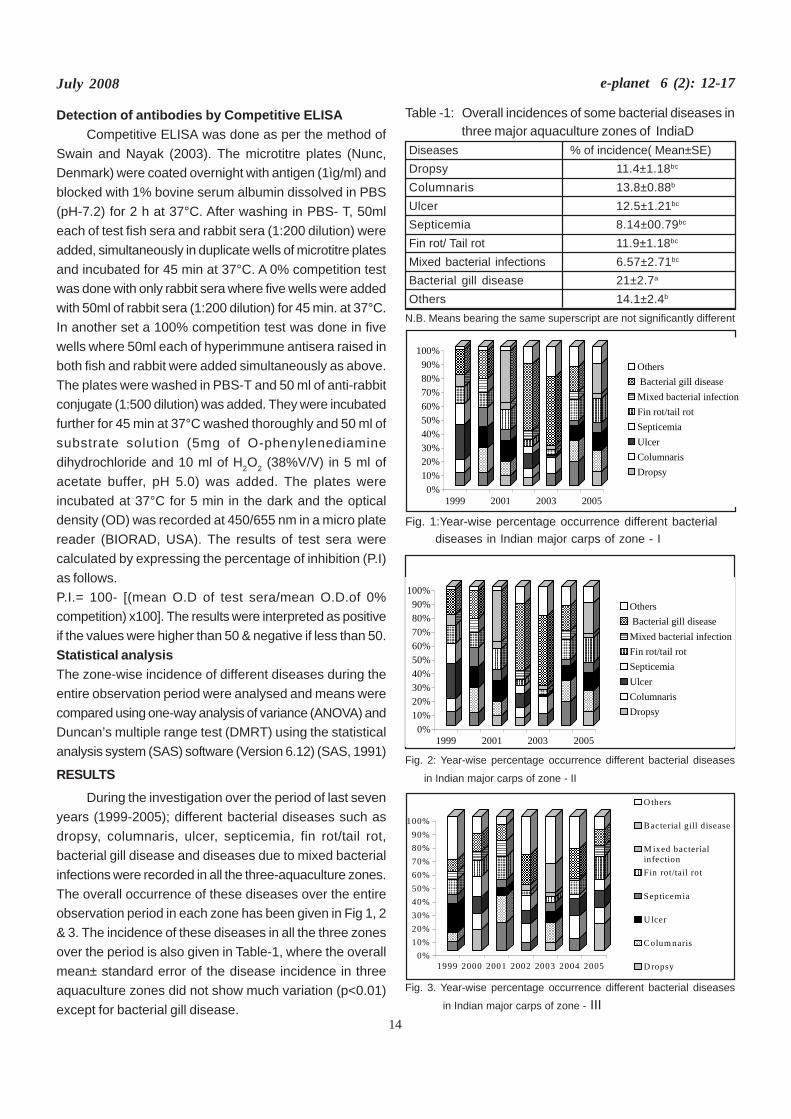
RESULTSDuring the investigation over the period of last seven
years (1999-2005); different bacterial diseases such asdropsy, columnaris, ulcer, septicemia, fin rot/tail rot,bacterial gill disease and diseases due to mixed bacterialinfections were recorded in all the three-aquaculture zones.The overall occurrence of these diseases over the entireobservation period in each zone has been given in Fig 1, 2& 3. The incidence of these diseases in all the three zonesover the period is also given in Table-1, where the overallmean± standard error of the disease incidence in threeaquaculture zones did not show much variation (p<0.01)except for bacterial gill disease.
Table -1: Overall incidences of some bacterial diseases inthree major aquaculture zones of IndiaD
Diseases % of incidence( Mean±SE)Dropsy 11.4±1.18bc
Columnaris 13.8±0.88b
Ulcer 12.5±1.21bc
Septicemia 8.14±00.79bc
Fin rot/ Tail rot 11.9±1.18bc
Mixed bacterial infections 6.57±2.71bc
Bacterial gill disease 21±2.7a
Others 14.1±2.4b
N.B. Means bearing the same superscript are not significantly different
Fig. 1:Year-wise percentage occurrence different bacterialdiseases in Indian major carps of zone - I
Fig. 2: Year-wise percentage occurrence different bacterial diseases
in Indian major carps of zone - II
Fig. 3. Year-wise percentage occurrence different bacterial diseases
in Indian major carps of zone - III
0%10%20%30%40%50%60%70%80%90%
100%
1999 2001 2003 2005
Others Bacterial gill diseaseMixed bacterial infectionFin rot/tail rotSepticemiaUlcerColumnarisDropsy
0%10%20%30%40%50%60%70%80%90%
100%
1999 2000 2001 2002 2003 2004 2005
O thers
Bacterial gill disease
M ixed bacterialinfectionFin rot/tail rot
Septicemia
U lcer
Colum naris
D ropsy
0%10%20%30%40%50%60%70%80%90%
100%
1999 2001 2003 2005
Others Bacterial gill diseaseMixed bacterial infectionFin rot/tail rotSepticemiaUlcerColumnarisDropsy
15
July 2008 e-planet 6 (2): 12-17
Zone-wise incidence of these diseases over the entireobservation period is given in the Table 3. Among the threezones there was no variation in the incidence of eachdisease. Therefore, superscript has not been assigned tomean of the incidence of disease in Table - 2.Table - 2 : Zone-wise incidence of different bacterial
diseases
Diseases Zone-I Zone-II Zone-IIIDropsy 12.7±2.21a 9.4±1.36b 12.1±2.52 abc
Columnaris 15.4±1.52 a 12.1±1.48 b 13.8±1.56 abc
Ulcer 12.8±2.13 a 12.8±2.58 b 11.8±1.81 abc
Septicemia 8.57±0.86 a 7.71±1.83 b 8.14±1.45 bc
Fin rot/ Tail rot 13.8±2.17 a 11.28±2.07 b 10.7±2.02 bc
Mixed bacterial 7.71±4.51 a 6.0±0.97 b 6.0±1.29 c
infectionsBacterial 16.8±4.22 a 30.2±5.46 a 16.14±2.24 ab
gill diseaseOthers 11.71±4.5 a 9.57±2.62 b 21.14±4.32 a
N. B. Means bearing the same superscript are not significantly differentcolumn- wise (p<0.01). Means in a row did not differ significantly(p<0.01), therefore, superscript has not been assigned.
Zone-wise analysis revealed that the diseaseincidence in zone-1 did not differ significantly (p<0.01). Inzone-II, only bacterial gill disease showed higher incidencethan rest of the diseases. However, in zone-III, the incidenceof diseases showed a little variation among themselves.On bacteriological study, A. hydrophila was isolated fromthe diseased fishes affected with dropsy, ulcerative,septicaemia, and fin rot/tail rot diseases from all the fishspecies of Indian major carps, whereas bacteria like F.branchiophilum and F. columnarae isolated from fishesaffected with gill disease and columnaris cases, respectively.Bacteria like P. aeruginosa, P. fluorescens, E. tarda, E.coli and F. columnarae were routinely isolated fromulcerative and septicaemic conditions of fishes. (Table - 3)
Table -3: Different bacteria isolated from disease-affectedIndian major carps
SI Disease Organs of fish BacteriaNo. from where isolated
bacteriaisolated
1. Bacterial Gill F. branchiophilumgill disease
2. Dropsy Peritoneal fluid Kidney, A. hydrophilaLiver, Blood P. sorbia
P.aeruginosa3. Ulcerative and Deep skin P.aeruginosa
Septicemia lesion, Blood P. fluorescens,conditions E. tarda,
A hydrophila,E.coli,F. columnare
4. Columnaris Kidney F. columnarae5. Tail rot/fin rot Tail/Fin lesions A. hydrophila
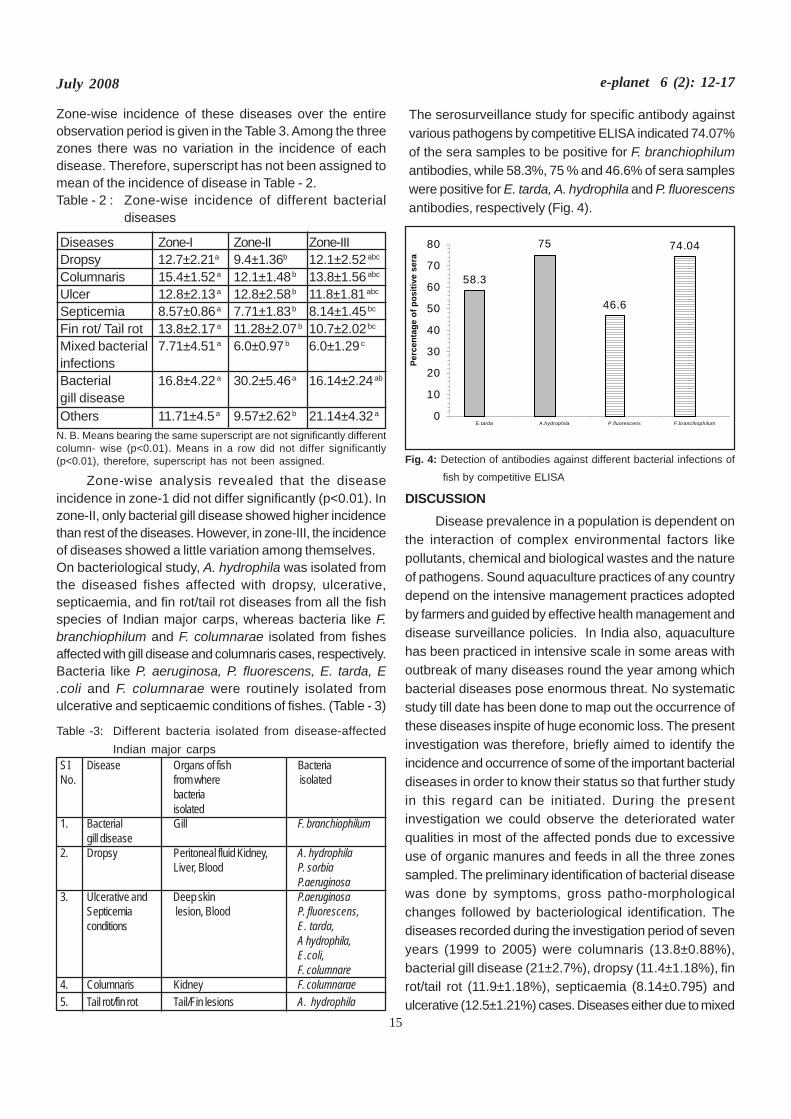
The serosurveillance study for specific antibody againstvarious pathogens by competitive ELISA indicated 74.07%of the sera samples to be positive for F. branchiophilumantibodies, while 58.3%, 75 % and 46.6% of sera sampleswere positive for E. tarda, A. hydrophila and P. fluorescensantibodies, respectively (Fig. 4).
58.3
75
46.6
74.04
0
10
20
30
40
50
60
70
80
E.tarda A.hydrophila P.fluorescens F.branchiophilum
Perc
enta
ge o
f pos
itive
ser
a
Fig. 4: Detection of antibodies against different bacterial infections of
fish by competitive ELISA
DISCUSSIONDisease prevalence in a population is dependent on
the interaction of complex environmental factors likepollutants, chemical and biological wastes and the natureof pathogens. Sound aquaculture practices of any countrydepend on the intensive management practices adoptedby farmers and guided by effective health management anddisease surveillance policies. In India also, aquaculturehas been practiced in intensive scale in some areas withoutbreak of many diseases round the year among whichbacterial diseases pose enormous threat. No systematicstudy till date has been done to map out the occurrence ofthese diseases inspite of huge economic loss. The presentinvestigation was therefore, briefly aimed to identify theincidence and occurrence of some of the important bacterialdiseases in order to know their status so that further studyin this regard can be initiated. During the presentinvestigation we could observe the deteriorated waterqualities in most of the affected ponds due to excessiveuse of organic manures and feeds in all the three zonessampled. The preliminary identification of bacterial diseasewas done by symptoms, gross patho-morphologicalchanges followed by bacteriological identification. Thediseases recorded during the investigation period of sevenyears (1999 to 2005) were columnaris (13.8±0.88%),bacterial gill disease (21±2.7%), dropsy (11.4±1.18%), finrot/tail rot (11.9±1.18%), septicaemia (8.14±0.795) andulcerative (12.5±1.21%) cases. Diseases either due to mixed
16
July 2008 e-planet 6 (2): 12-17
bacterial infection or other causes were restricted to6.57±2.71% and 14.1±2.46%, respectively. The incidenceof acute abdominal dropsy as recorded earlier (Shome etal., 1996; Shome et al., 1999 and Gopalkrishna, 1961) inIndian major carps was observed in zone I II& III. Zone-wise, there was no variation in occurrence of each disease.Moreover, incidence of all the bacterial diseases over theyears did not show much variation (p<0.01). During theinvestigation the highest percentage of diseased sampleswere found to be affected with gill diseases and amongdifferent zones, zone-II had quite high incidence of bacterialgill disease particularly during the year 2002 and 2003. Onbacteriological study of gill diseases, a Gram negative,yellow-pigmented filamentous F. branchiophilum was foundto be responsible for the onset of this disease. Thebacterium is one of the causative agents of this economicallyimportant disease, responsible for high mortalities in a widerange of fishes (Bernardet and Grimont, 1989; Bullock,1990). The serosurveillance study showed 74.04% fishesto be positive for F. branchiophilum antibodies.
A number of factors are responsible for theestablishment of bacterial gill disease including bacterialload, environmental condition, high organic load, and watertemperature (Arp, 1988; Huh and Wakabayashi, 1989;Toranzo and Barja, 1993).
A wide range of bacteria A. hydrophila, E. tarda,P.fluorescens were frequently isolated from fin rot/tail rot,ulcerative and septicemic conditions of the fishes. Besidesthis, A. hydrophila isolates were frequently isolated fromsepticemic blood and body fluids of dropsy-affected fishes,irrespective of fish species. Moreover, all the sera collectedfrom fishes with dropsy were positive for A. hydrophilaantibodies, A. hydrophila, a ubiquitous freshwater bacterium,might be primarily or secondarily associated with infectionleading to ulceration in skin, tail and fin and was found tobe seropositive in 75% of the tested samples.
Serological tests are very popular in screening diseaseincidence/diagnosis of disease in veterinary and medicalpractices, but limited in aquaculture practices. The serosurveillance study using a competitive ELISA found out theincidence and occurrence of some of these bacterialinfections. From the above study it is concluded that Indianmajor carps were affected by a wide range of bacterialpathogens and disease due to the bacteria are very welloccurring in these species over the years in all theaquaculture regions of India The poor environment andmanagement practices are the main predisposing factorsfor these diseases. Hence, proper care has to be taken inorder to avoid the losses due to these bacterial diseases.
ACKNOWLEDGEMENTThe authors thank the Indian Council of Agricultural
Research, New Delhi, India for financial support in form ofresearch grant.
REFERENCESAoki T (1974). Studies of drug resistant bacteria isolated from water of
carp ponds and intestinal tracts of carp (in Japanese).
Bulletin of Japanese Society of Science and Fisheries
40: 247-254.
Arp L H (1988). Bacterial infections of mucosal surfaces: An overview
of cellular and molecular mechanisms. In: Virulence
mechanisms of bacterial pathogens (Ed. by J.A. Roth) pp
3-27. American Society of Microbiology. Washinton, DC.
Bernardet J F and P A T Grimont (1989). Deoxyriboneucleic acid
relatedness and phenotypic characterization of
Flexibacter columnaris sp. nov. Rev. wakabayashi,
Hikida and Masumatic 1986. International Journal of
Bacteriology 39:346-354.
Bullock G L (1990). Bacterial gill disease of freshwater fishes. U.S.
fish and wildlife service fish disease leaflet 19, Washington
DC.
Chen S C, A Adams, K D Thompson and H D Richards (1997). A
comparison of the antigenicity of the extra cellular products
(ECP) and whole cell sonicates (WCS) from
Mycobacterium sp. in rabbits, mice and fish by
immunoblotting and enzyme-linked immunosorbent assay
(ELISA). Journal of Fish Disease 20:427-442.
Collins C H and P M Lyne (1970). Microbial Methods. Butterworths.
London.
Cruickshank R, T P Duguid, B P Marrimon and R H H Swain (1975).
Medical microbiology 12th edition. The English Language
Book Society, Churchil Livingstone, London, 806-821.
Egusa S (1978). Infectious diseases of fish. [In Japanese]. Kouseisha
Kouseikaku, Tokyo, 554.
Gopalkrishan V (1961). Observations on infectious dropsy of Indian
major carps and its experimental induction. Journal of
Scientific and Industrial Research. 20: 357-358.
Grisez L and F Ollevier (1995). Vibrio (Listonella anguillarum) infections
in marine fish Larviculture. In: Larvi 91-fish and crustacean
larviculture symposium (eds Lavens, P., Jaspers, E. and
Roelands, I.), European Aquaculture Society, Gent. pp.
497. Special publication no. 24.
Huh G J and H Wakabayashi (1989). Serological characteristics of
Flavobacterium branchiophilum isolated from gill
diseases of freshwater fishes in Japan, USA,and
Hungary. Journal of Aquatic Animal Health 1: 142-147.
Kumar D, B Mishra and R K Dey (1986a). Dropsy of Catla catla (Ham.)
caused by a mixed infection of Aeromonas hydrophila

17
July 2008 e-planet 6 (2): 12-17
and myxospordian sp. Aquaculture Hungarica (Szarvas)
5: 107-112
Kumar D, K Suresh, R K Dey and B K Mishra (1986b). Stress mediated
columnaris disease in rohu, Labeo rohita (Hamilton).
Journal of Fish Diseases 9: 87-89.
Lowry O H, N J Rosebrough, A L Farr and R J Randall (1951). Protein
measurement with the Folin phenol reagent. Journal
Biological Chemistry 193: 265-275.
Lund V, T Jorgensen, K O Holm and G Eggset (1991). Humoral immune
response in Atlantic salmon, Salmo salar L.,to cellular
and extra cellular antigens of Aeromonas salmonicida.
Journal of Fish Disease. 14: 443-452.
Manohar L, M G Shenoy, K C Chandramohon and T K K Reddy (1976).
A new bacterial fish pathogen causing skin disease in
catfish, Clarias batrachus Lim. Current Research. 5: 76-
77.
Otta S K, I Karunasagar and I Karunasagar (2003). Disease problems
affecting fish in tropical environments.Journal of Applied
Aquaculture 13:1045-4438.
Sahoo P K, S C Mukherjee, S K Nayak and S Dey (1998). Pathology of
Dropsy in Indian major carp. Journal of Aquaculture.
6:93-96.
Shome R, B R Shome and N Ram (1999). Study of virulence factors of
Aeromonas hydrophila isolates causing acute abdominal
dropsy and ulcerative diseases in Indian major carps.
Indian Journal of Fisheries. 46: 133-140.
Shome R, B R Shome, N Sarangi and A K Bandyopadhyay. (1996).
Etiological characterization of acute infectious abdominal
dropsy outbreak affecting Indian major carp Cirrhinus
mrigala in South Andaman. Current Science. 70:744-747.
Snieszko S F (1974). The effects of environmental stress on outbreaks
of infectious diseases of Fishes. Journal of Fish Biology
6: 197-208.
Swain P and S K Nayak (2003). Comparative sensitivity of different
serological tests for seromonitoring and surveillance of
Edwardsiella tarda infection of Indian major carps. Fish
and Shellfish Immunology. 15: 333-340.
Swain P, S Mishra and S K Nayak (2003a). Bacterial gill disease in
Indian major carps. Indian Council of Agriculture Research
News.9 (July-September). 16-17.
Swain P, S K Nayak, A Sahu, P K Meher and B K Mishra (2006). High
antigenic cross-reaction among the bacterial species
responsible for diseases of cultured freshwater fishes
and strategies to overcome it for specific sero diagnosis.
Comparative Immunology and Microbiology 26: 129-211.
Toranzo A E and J L Barja (1993). Virulence of coldwater fish
pathogens. Annual Review of Fish Disease 199:127-144.
18
July 2008 e-planet 6 (2): 18-19
ANTIBACTERIAL STUDIES OF Alstonia scholaris R. BR.AGAINST DERMATOLOGICAL PATHOGENS
A. K. Swain1, R. Mahapatra 2 and M. K. Panigrahi 3
ABSTRACT
Extracts [petroleum ether (PE), benzene (BN), chloroform (CL), ethanol 95% (ET) and Purified water(AQ)] of stem bark of Alstonia scholaris R. Br. (Family: Apocynaceae) were investigated for antibacterial activityagainst Staphylococcus aureus, Streptococcus pyrogenes, Enterococcus faecalis, Propionibacterium acnes,Klebsiella pneumoniae and Pseudomonas aeruginosa by determining minimum inhibitory concentration (MIC)by macrodilution method. The MIC of extracts for antibacterial activity was PE (500 to 1000), BN (62.5-250), CL(125-1000), ET (250-1000) mcg/ml and much higher for aqueous extract. Benzene extract exhibited significantinhibition against most of the tested bacteria in comparison to other extracts. An attempt has been made tocompare the activity with that of standards in terms of zone of inhibition by disc diffusion method.
Keywords : antibacterial activity, stem bark extracts, zone of inhibition, Alstonia scholaris
1. Asst. Prof. Hi-Tech Medical College and Hospital, Bhubaneswar2. UDPS, Utkal University3. Kanakmajuri Institute of Pharmaceutical Sciences, Rourkela
INTRODUCTIONAlstonia scholaris R. Br. (Family apocynaceae) is an
evergreen tree, 40-60 ft. tall, branched, leaves are in wholeand bark grey and rough, found throughout India in forestsand plains and also in many other countries (Kirtikar andBasu, 1976).
Bark and leaves are used to treat headache, influenza,bronchitis, pneumonia, and fresh latex is applied locally onboils for suppuration (Maheswari, 2000). The plant is aconstituent of Ayush-64 effective in micro-filaraemia (Pandey,1991). The bark has been reported to have antileishmanial(Singha, 1992), anticancer and hypoglycemic activity(Akhtar and Bano, 2002). The present study is intended todetermine the antibacterial activity of the stem bark againstselected dermatological pathogens and compare it with thestandards. The stem bark of Alstonia scholaris was cutand removed from a fully grown plant during the month ofFebruary from Bhubaneswar. The tree along with bark wasauthenticated in Central Research Institute (Ayurveda),Bhubaneswar.
MATERIAL AND METHODS
Experimental Design
The bark was collected in bulk, washed with tap waterfor proper cleaning and dried under shade. The dried barkwas powdered with the help of a mechanical grinder. Thecoarse powder was then extracted successively in Soxhletapparatus using petroleum ether (PE), benzene (BN),chloroform(CL), ethanol 95%(ET) and purified water(AQ).The extracts were filtered and concentrated to dryness undervacuum. The in-vitro antibacterial screening was carried out
using selected superficial dermatological pathogensincluding bacteria such as Staphylococcus aureus (Sa),Streptococcus pyogenes (Sp), Enterococcus faecalis (Ef),Propionibacterium acnes (Pacnes), Klebsiella pneumoniae(Kp) and Pseudomonas aeruginosa (Pa) obtained fromM.T.C.C. Institute of Microbial Technology, Chandigarh, andfrom standard laboratory maintained in the Dept. ofMicrobiology , Utkal University, Bhubaneswar
Macrodilution technique for MIC determination
One thousand mcg/mL solution of each extract wasprepared by dissolving in 6% DMSO solution and by twofold serial dilution method a range of 8 solutions from 7.8 to1000 mcg/mL were prepared using same solvent. 0.5 mleach of above solutions was taken in test tubes. 0.5 ml ofrespective sterile broth was added to each followed byinoculation using 50 mcL of overnight respective brothculture of bacteria. One test tube containing the inoculatedbroth with solvent as positive control and one withoutinoculation as negative control were used. All tubes wereincubated at 370C for 24 hours. The test tubes were observedfor appearance of turbidity in comparison to both positiveand negative controls. The minimum concentration showingno turbidity (no growth of microorganism) was consideredas MIC. For confirmation, respective solutions of each tubewere subcultured on respective sterile agar plates andincubated as mentioned above (Janssen et al., 1986).Plates showing no growth with respect to lowestconcentration confirm the MIC value and are given in Table 1.
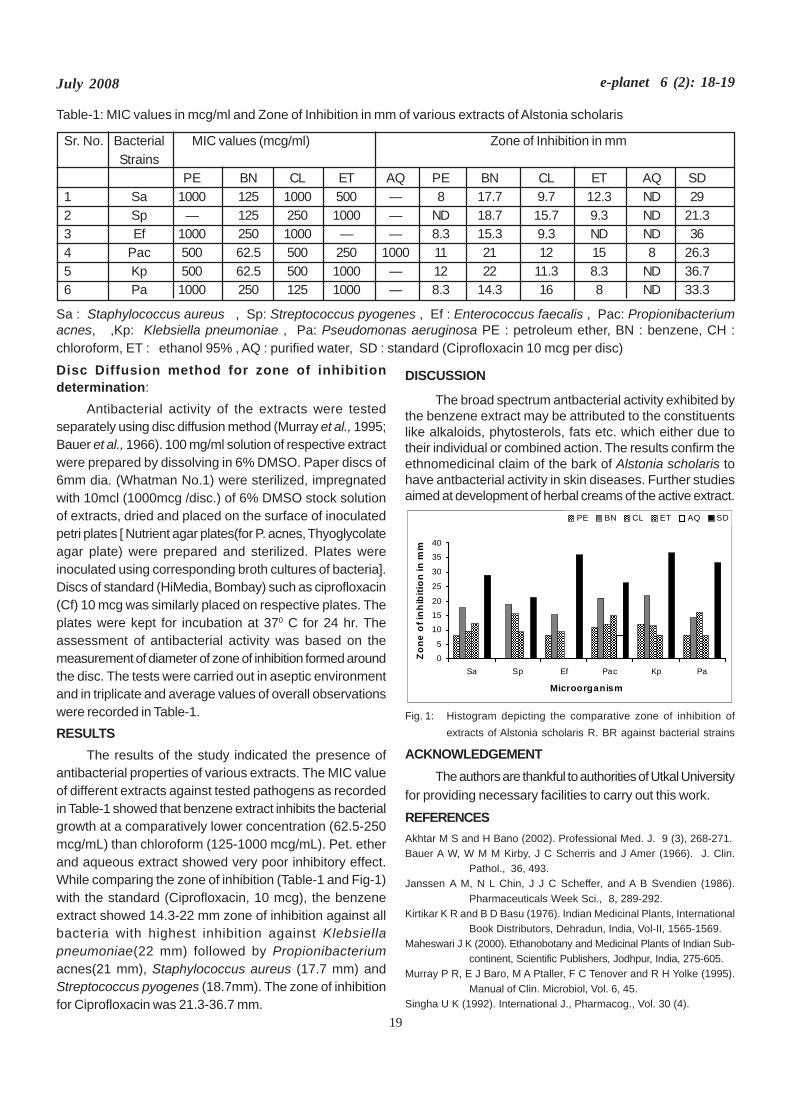
19
July 2008 e-planet 6 (2): 18-19
Table-1: MIC values in mcg/ml and Zone of Inhibition in mm of various extracts of Alstonia scholaris
Sr. No. Bacterial MIC values (mcg/ml) Zone of Inhibition in mmStrains
PE BN CL ET AQ PE BN CL ET AQ SD1 Sa 1000 125 1000 500 — 8 17.7 9.7 12.3 ND 292 Sp — 125 250 1000 — ND 18.7 15.7 9.3 ND 21.33 Ef 1000 250 1000 — — 8.3 15.3 9.3 ND ND 364 Pac 500 62.5 500 250 1000 11 21 12 15 8 26.35 Kp 500 62.5 500 1000 — 12 22 11.3 8.3 ND 36.76 Pa 1000 250 125 1000 — 8.3 14.3 16 8 ND 33.3
Sa : Staphylococcus aureus , Sp: Streptococcus pyogenes , Ef : Enterococcus faecalis , Pac: Propionibacteriumacnes, ,Kp: Klebsiella pneumoniae , Pa: Pseudomonas aeruginosa PE : petroleum ether, BN : benzene, CH :chloroform, ET : ethanol 95% , AQ : purified water, SD : standard (Ciprofloxacin 10 mcg per disc)Disc Diffusion method for zone of inhibitiondetermination:
Antibacterial activity of the extracts were testedseparately using disc diffusion method (Murray et al., 1995;Bauer et al., 1966). 100 mg/ml solution of respective extractwere prepared by dissolving in 6% DMSO. Paper discs of6mm dia. (Whatman No.1) were sterilized, impregnatedwith 10mcl (1000mcg /disc.) of 6% DMSO stock solutionof extracts, dried and placed on the surface of inoculatedpetri plates [ Nutrient agar plates(for P. acnes, Thyoglycolateagar plate) were prepared and sterilized. Plates wereinoculated using corresponding broth cultures of bacteria].Discs of standard (HiMedia, Bombay) such as ciprofloxacin(Cf) 10 mcg was similarly placed on respective plates. Theplates were kept for incubation at 370 C for 24 hr. Theassessment of antibacterial activity was based on themeasurement of diameter of zone of inhibition formed aroundthe disc. The tests were carried out in aseptic environmentand in triplicate and average values of overall observationswere recorded in Table-1.RESULTS
The results of the study indicated the presence ofantibacterial properties of various extracts. The MIC valueof different extracts against tested pathogens as recordedin Table-1 showed that benzene extract inhibits the bacterialgrowth at a comparatively lower concentration (62.5-250mcg/mL) than chloroform (125-1000 mcg/mL). Pet. etherand aqueous extract showed very poor inhibitory effect.While comparing the zone of inhibition (Table-1 and Fig-1)with the standard (Ciprofloxacin, 10 mcg), the benzeneextract showed 14.3-22 mm zone of inhibition against allbacteria with highest inhibition against Klebsiellapneumoniae(22 mm) followed by Propionibacteriumacnes(21 mm), Staphylococcus aureus (17.7 mm) andStreptococcus pyogenes (18.7mm). The zone of inhibitionfor Ciprofloxacin was 21.3-36.7 mm.
DISCUSSION
The broad spectrum antbacterial activity exhibited bythe benzene extract may be attributed to the constituentslike alkaloids, phytosterols, fats etc. which either due totheir individual or combined action. The results confirm theethnomedicinal claim of the bark of Alstonia scholaris tohave antbacterial activity in skin diseases. Further studiesaimed at development of herbal creams of the active extract.
Fig. 1: Histogram depicting the comparative zone of inhibition ofextracts of Alstonia scholaris R. BR against bacterial strains
ACKNOWLEDGEMENTThe authors are thankful to authorities of Utkal University
for providing necessary facilities to carry out this work.
REFERENCESAkhtar M S and H Bano (2002). Professional Med. J. 9 (3), 268-271.Bauer A W, W M M Kirby, J C Scherris and J Amer (1966). J. Clin.
Pathol., 36, 493.Janssen A M, N L Chin, J J C Scheffer, and A B Svendien (1986).
Pharmaceuticals Week Sci., 8, 289-292.Kirtikar K R and B D Basu (1976). Indian Medicinal Plants, International
Book Distributors, Dehradun, India, Vol-II, 1565-1569.Maheswari J K (2000). Ethanobotany and Medicinal Plants of Indian Sub-
continent, Scientific Publishers, Jodhpur, India, 275-605.Murray P R, E J Baro, M A Ptaller, F C Tenover and R H Yolke (1995).
Manual of Clin. Microbiol, Vol. 6, 45.Singha U K (1992). International J., Pharmacog., Vol. 30 (4).
0
5
10
15
20
25
30
35
40
Sa Sp Ef Pac Kp Pa
Microorganism
Zon
e o
f in
hib
itio
n in
mm
PE BN CL ET AQ SD
20
July 2008 e-planet 6 (2): 20 -26
INDIGENOUS ORNAMENTAL FISHES: STATUS, ISSUES ANDSTRATEGIES FOR PROPAGATION AND CONSERVATION
S. K. Swain1 , S. K. Singh2, P. Routray3 and N. K. Barik4
ABSTRACT
The ornamental fish is an emerging area of research and development owing to its growing popularity in thecountry. Entrepreneurs in the country have shown interest in the utilization of the indigenous ornamental fishes foreconomic development of the country. But, there are many areas of concern in the conservation and utilization ofindigenous fishes as irrational exploitation of it may lead to the depletion of these vital resources. There are twostreams of strategies for the conservation of the resource, i.e through in-situ and in-vivo conservation anddevelopment of breeding technology. This paper reviews the status and issues involved in the propagation andconservation of the indigenous ornamental fishes in India.
Key words : ornamental fish, biodiversity, conservation, breeding technology
1,3 Senior Scientists, Aquaculture Production and Environment Division, Central Institute of Freshwater Aquaculture, Kausalyaganga,Bhubaneswar-751002 *Corresponding author: Ph. +91-9437268341. e-mail: [email protected].
2. Technical Officer, Central Institute of Freshwater Aquaculture, Kausalyaganga, Bhubaneswar-7510024. Scientist, Agricultural Economics, Central Institute of Freshwater Aquaculture, Kausalyaganga, Bhubaneswar-751002
INTRODUCTIONOrnamental fishes form an important commercial
component of aquaculture, providing for aestheticrequirements and upkeep of the environment. Nowadayskeeping ornamental fish in aquarium and garden pool is afashion. New varieties of fish are brought in the purview ofornamental fishes over the period of time. Out of this, onlyfew species are bred in captive conditions and rest aretraded after collection from natural water bodies like lakes,wetlands, rivers, stream, flooded lowlands etc. The tradersand exporters of the indigenous ornamental fishes arebanking upon rampant exploitation of these fishes from thenatural ecosystem. If this continues, there is a seriousapprehension that we may loose our indigenous stocks.Therefore, conservation of the indigenous ornamental fishesis a key to sustain the ornamental fish industry both withinand outside the country. Two basic strategies are adoptedfor the conservation and propagation of these vital resourcesi.e in-situ and in-vivo conservation and development of thebreeding technology. Many initiatives are taken by thenational and international research and developmentalagencies on various strategies to conserve the indigenousornamental fishery resources. The present paper reviewsthe issues, strategies and initiatives in the conservationand propagation of the indigenous ornamental fishes in India.India possesses a rich fish biodiversity of about 2118species, out of which more than 600 species are distributedin freshwater lotic and lentic systems . The country furtherpossesses a rich diversity of non-food colourful fish asprospective candidate species for ornamental purposes,
with over 100 varieties of indigenous species and similarnumber of exotic species that can be bred in captivity. Sucha large fish biodiversity in the country is supported by thepresence of vast natural freshwater resources comprising2.36 million ha ponds and tanks, 1.3 million ha beels, jheelsand derelict waters in addition to 0.12 million canals, 2.05million ha reservoirs and 75,000 km stretch of rivers (FAO,2000). It offers a greater scope for utilization and commercialproduction of the fishes in comparison to those of otherpotential countries like Singapore, Sri Lanka, Malaysia,Indonesia and many African countries.
BIODIVERSITY OF INDIGENOUS SPECIES OF INDIAThe indigenous fishes are distributed across all parts
of the country but few regions are considered to be hotspotof these resources. It is estimated that about 33% areavailable in North-Eastern region, 24% in Southern region,23% in Eastern region, 6% in Western region, 3% Northernregion, 2% in Central region and 10% throughout India(Swain, 2006). The two pockets of North-Eastern Hill regionand the Western Ghats remained unexplored to a largeextent and still many fishes are untapped. Out of 806 fishspecies inhabiting in freshwaters of India, the total fishspecies reported from North Eastern States consist of 114genera belonging to 38 families and 10 orders; the numberof fishes include 217 in Assam, 167 in Arunachal pradesh,165 in Meghalaya, 134 in Tripura, 121 in Manipur, 68 inNagaland, 48 in Mizoram and 29 in Sikkim, some of thembeing commonly found at more than one places (Pers.comm. NERC, CIFRI, Guwahati, Assam). Out of the totalnumber, 196 species are considered as ornamental. Sinha
21
July 2008 e-planet 6 (2): 20 -26
(1994) in his comprehensive review gave a list of 230 fishesavailable from North Eastern region. Recently Nath and Dey(1989) recorded a total of 131 species from the drainagesof Arunachal Pradesh. Mahanta et. al (1998) recordedaltogether 187 fish species from Assam and neighbouringNEH regions of India. Department of Fisheries, Governmentof Nagaland has identified 90 endemic fishes in the Stateof which many are very colourful and can be considered asornamental fishes (Senli, 2005). Vishwanath, (2003) hasrecorded 200 species of fishes available in Manipur out ofwhich majority are small sized and colourful hill streamfishes. At present, 58 species of indigenous ornamentalfishes occurring in the North East are being exported asreported by MPEDA, India. Similarly, in Western Ghats,out of 287 species, 192 species are demarcated as endemic.Of the 153 fishes listed from Western Ghats, 106 speciesendemic to peninsular India (with reference to WesternGhats) are ornamental in nature. College of Fisheries,Pasangad, Kerala have collected 57 species of freshwaterfishes from the Western Ghats and studied their behaviourand feeding habits in captive conditions. Forty-seven of themwere recommended as ideal for ornamental fish industry(Gopalakrishnan and Ponniah, 2000, Mercy et. al. 2001).
Ornamental fish breeding centers and the related tradehas been confined in and around the metropolitan citieslike Kolkata, Chennai and Mumbai obviously due to readyurban market and availability of international airports forboth import and export business. Kolkata has been thegateway of import of popular aquarium fishes from differentcountries, from where they are distributed to other places.
It has also been noticed that Indian ornamental fisheshaving aesthetic values are of greater demand in internationalmarket for aquarium keeping. The main markets are theUnited States of America, the United Kingdom, Belgium,Italy, Japan, China, Australia and South Africa. Many Indianspecies like catfish, dwarf gouramis, and barbs are popularabroad and fetch good price.
PROSPECTS OF COMMERCIAL PRODUCTION IN INDIAExport of ornamental fishes from the country presently
is mainly confined to freshwater varieties and the export islimited to the fishes inhabiting in freshwaters in the North-Eastern states (85%) and a few bred varieties of exoticspecies (15%). As the country possesses vast resourcesin terms of natural water bodies and species diversity, wehave a great potential to increase the level of export of aboutUS $ 30 million, i.e. about Rs. 110 crore every year (Swainet. al 2006). Systematic studies on the biology of most ofthe varieties of ornamental fish are yet to be made. It is
imperative to adopt a rational exploitation strategy fromnatural freshwater resources where the indigenous varietiesare available. The strategy should be made on propagationof some of the colourful varieties of ornamental fishes inthe captivity after knowing their exact feeding habit andbiology. Through this measure, we may proceed towardsconservation of the resources.
ECONOMIC PROSPECTS OF ORNAMENTAL FISHOff late ornamental fishes have been recognized as
the important avenue for the income and employmentgeneration in the country. The economic activities ofornamental fish culture involve a complete chain of theentrepreneurs and enterprises i.e. fish collectors from naturalwater bodies, local traders, exporters, manufacturers of theaquarium, fish breeders, ornamental fish farmers, vendorsetc. With the increase in income and urbanization, the habitof keeping ornamental fishes has been increasing at rapidpace. The sector has a lot of potential in terms of wealthgeneration as economic activities can be widened withinthe scope of limited volume of water. The price fetched byornamental fishes is much more than the food fishesindicating high degree of economic efficiency vis-à-visresource consumption in the sector. Till today, a very limitedstudy has been conducted on economics and economicprospects of ornamental fishes.
According to John Dawes, Secretary-General of thenon-profit organization Ornamental Fish International basedin Singapore, the common thinking of general mass is thatthe aquarium industry depletes and destroys marine lifewhereas in fact, it has far less impact than commercialfishing. The average retail price for food fish was betweenUS$ 14,500-16,500/t, but ornamental fish typically is tradedat US$ 1.8 million/t. Lack of information plays a major partin misconceptions about the trade, spurring global effortsfor more accurate data.
TENETS OF SUSTAINABLE HARVEST OF WILDSPECIES
There are many issues involved in the sustainableharvest of wild species. Few principles and practices of theeco-friendly utilization of fish biodiversity are as follows:(i) Freshwater fishes can be sustainably harvested as longas natural habitats (including the breeding grounds) areconserved. Therefore, knowledge about the habitat, ecology,food and feeding habits and feeding behaviour, breedingseason and size at maturity stage, reproductive physiology(including fecundity) etc. of important species need to begathered first.(ii) The fishes pass through two phases in terms of thepopulation dynamics, i.e growing and collapse phases.
22
July 2008 e-planet 6 (2): 20 -26
Typically, the growing phase is just after spawning duringthe monsoon season and young ones are seen in the nature.This phase is vulnerable to both inter- and intra-specificcompetition and predation. Growing phase is the phase inwhich certain species can be harvested with less immediateand direct impact to the long-term survival of the population.During the collapse phase many individuals die due to lackof water and other resources. This is a particularlyappropriate juncture to harvest, not only because many ofthe fishes will die, but also it is relatively easier for fishermento catch them since the water table is low.(iii) Most species of tropical freshwater fishes are not annualfish, and the typical lifespan of smaller fishes is anywherebetween two to five years. Therefore, fish collected duringthe collapse phase may not have much impact on thepopulation size of the species. Its effect on the ecosystemmay be minimal due to small size of the fish. Properharvesting techniques will certainly reduce high mortalityrates and the threat to survivability of the species can beavoided.(iv) Care should be taken to minimize the mortality in wild-caught fishes. The actual harvesting process has to beimproved. The nature of the aquarium market today is thathigh quality fish are in demand, even if prices lie somewhatin higher side.(v) Improved technology of harvest and proper acclimatizationof the fishes are necessary before export to ensure a highpercentage of survival on arrival at the destination.(vi) Improvement in packing technology allows highlystocked fishes to remain alive for longer periods. Thisinvolves not only the technology concerned and waterquality but also more appropriate use of anesthetics andchemicals during transportation.(vii) Freshwater fishes in general are relatively easy toacclimatize if critical detail of its natural habitat type isknown.
DEVELOPMENT OF BREEDING TECHNOLOGY OFINDIGENOUS SPECIES
Central Institute of Freshwater Aquaculture (CIFA) isa premier research Institute in the country working inresearch and development of different aspects of freshwateraquaculture and ornamental fish breeding and its nutrition-related research since last two decades. The role playedby the ornamental fish unit of this institute ensurespromotion of hobby of fish keeping, entrepreneurialdevelopment through conducting many national andinternational training programmes, development of policy
by interacting with various state agencies for popularizingthe ornamental fish sector in the country. Special effortsare being made to breed some of the indigenous varietiesin captive condition. Success in breeding and larval rearinghas been achieved in a dozen of ornamental fishes endemicof North Eastern India (Table-1). Successful breeding andlarval rearing of the spiny eel Mastacembelus armatus havebeen achieved by the Institute. Some success on broodstock development of Y-loach (Botia lohachata), YellowtailScissortail (Rasbora rasbora) and many indigenousornamental fishes of commercial importance has beenmade but breeding experiments are yet to be conducted. Ahybridization programme was successfully taken upbetween two indigenous barbs to observe any change ofbody colour or fin pattern. In F1 generation, it has beenobserved that the spot in caudal peduncle region in thehybrids was more prominent and surrounded by goldencolour ring. The species are kept in a controlled conditionfor further research. The indigenous fish species(s) thatcould be successfully bred and reared at CIFA areBrachydanio rerio (Zebra fish), Puntius conchonius (Rosybarb), Colisa fasciata (Banded gourami), Colisa lalia (Dwarfgourami), Parlucioma daniconius (Black line rasbora),Esomus barbatus (Flying barb), Danio aequipinnatus (Giantdanio), Danio devario (Torquoise danio), Puntius sophore(Sophore barb), Puntius ticto (Two spot barb), Badis badis(Chameleon fish) and Puntius fasciatus (Melon barb).. Larvalrearing of Ompak pabda is successfully done by the Kalyanicentre of CIFA leading towards commercialization. Effortsare being made in the Institute to standardize the breedingexperiments of the important indigenous varieties likePuntius denisonii and Puntius filamentosus (Swain et. al.,2008).
Besides CIFA, other institutions like College ofFisheries, Raha, Assam has been able to breed fewornamental fish species including Peacock eel of NorthEastern India (Das and Kalita 2003). Some indigenousornamental fish species like Chaca chaca (Sane and Bhide,1992) and Colisa chuna (Sane, 1962) are also bred by theNGO ”Sanjeevan” at Mumbai leading to theircommercialization in small scale. It is high time to developbreeding technology of many indigenous varieties whichare depleting from nature. Unless the technology ofcommercial breeding of an Indian species is made, it isdifficult to conserve our indigenous fish biodiversity as wellas adoption of programmes on entrepreneurial scale forexport.

23
July 2008 e-planet 6 (2): 20 -26
Table: 1 Distribution of Indian freshwater ornamental fishes (Swain, et.al, 2008)Common name Scientific name DistributionBlack knife fish Notopterus notopterus All over IndiaScaly barb Gonoproktopterus lithopidos South KarnatakaRed tailed silver shark Gonoproktopterus curmuca Western GhatRed gilled violet shark Labeo boga Ganga riverAll black shark Labeo calbasu Northern IndiaPencil gold labeo Labeo nandina AssamHi fin barb Oreichthys cosuatis Eastern IndiaBlack border tail Osteochilichthys nashii Western Ghats oforange cap KarnatakaFour spot barb Puntius arulius tambraparnei Rivers of TamilnaduIndian rosy barb Puntius conchonius Eastern IndiaRed line torpedo fish Puntius denisoni KeralaLong snouted barb Puntius dorsalis Krishna River SystemGreen swamp barb Puntius chola North Eastern IndiaMelon barb Puntius faciatus faciatus Nilgiri hill, streams in
Kerala and KarnatakaBlack spot barb Puntius filamentosus Karnataka
madraspatensisFilament barb Puntius filamentosus assimillisSouth KeralaMalini’s barb Puntius mahecola Annamalai hillsNeon hatchet Chela cachius AssamChaguni Chagunius chagunio NagalandGangetic mud eel Monopterus cuchia North eastern IndiaBurjors brilliance Chela dadiburjori Kerala, GoaBlue dot hill trout Barilius bakeri Western Ghat, KeralaSilver trout Barilius barna NagalandShacra baril Barilius scacra NagalandSpotted trout Barilius tileo Nagaland and Ar.
PradeshHalf banded Barilius vagra NagalandZebra danio Brachydanio rerio All over IndiaGiant danio Danio aequipinnatus North eastern IndiaMoustached danio Danio dangila Bihar , AssamTorquoise danio Danio devario Eastern IndiaNaga danio Danio nagaensis NagalandMalabar danio Danio malabaricus Wetern GhatsSouth Indian flying barb Esomus barbatus Tamilnadu, KarnatakaMustached rasbora Esomus daniconius AssamSlender rasbora Parluciosoma daniconius Throughout IndiaBlack line rasbora Parluciosoma labiosa Nasik dist of
MaharastraRhinocerous algaeater Garra bicornuta Thunga river ,
KarnatakaCauvery gara Garra mcclellandi North Eastern IndiaNaga gara Garra naganensis NagalandGotyla gara Garra gotyla North eastern IndiaKhasi gara Garra lissorhynchus Meghalaya and
NagalandSidewinder loach Aborichthys bijulensis Garo hills, MeghalayaPuma loach Acanthocobitis rubidipinnis Upper AssamLeopard loach Acanthocobitis botia North eastern IndiaBlack line loach Nemachelius anguilla Krishna river,
South India
Common name Scientific name DistributionBurmese stone loach Balitora burmanica NagalandGrey’s stone loach Balitora brucei NagalandJayantia loach Nemacheilus reticulofasciatus Meghalaya and
NagalandCorica loach Nemacheilus corica Assam, Arunachal
Pradesh andMeghalaya
Penguin loach Nemacheilus penguensis ManipurManipur loach Nemacheilus manipurensis Manipur and NagalandBanded loach Shistura beavani North BengalPolka dotted loach Schistura corica North BengalRing loach Shistura denisoni dayi BiharOlivaceous loach Schistura devdevi Teesta river drainageMany banded loach Schistura multifaciatus Eastern HimalayasVictory loach Shistura scaturigina Eastern sub HimalayasFascinating loach Schistura semiarmatus Cauvery river in
South IndiaSavanna loach Shistura savana Assam, Arunachal
Pradesh, Meghalayaand Manipur
Long snouted loach Nemachilichthys ruppelli KarnatakaBlack panther loach Shistura yenjitee BhutanGrizzled loach Shistura sikmaiensis Manipur ValleyZodiac loach Mesonoemacheilus triangularisWestern Ghats, KeralaTail spot loach Lepidocephalus annandalei Upper AssamGoalpara loach Lepidocephalus goalparensis Goalpara Assam,
OrissaPanther loach Lepidocephalus gunthea Northern and
Eastern IndiaIndian coolie loach Pangio pangia North-East Bengal,
Eastern MadhyaPradesh
Jaguar loach Somileptes gongota North Bengal ,AssamTwin banded loach Botia rostrata AssamY-loach Botia lohachata Indus and Ganga
drainageTiger loach Botia birdi Punjab, North IndiaGolden banded loach Botia dario Assam,Bengal,
Bihar,OrissaStriped loach Botia striata Tunga river, Kolhapur,
MaharastraBlyth’s loach Botia berdmorei NagalandVelvet catfish Rita pavimentatus Andhra PradeshButter catfish Ompok bimaculatus Throughout IndiaGulper catfish Ompak pabda North east IndiaIndian tiger shark Pangasius pangasius Large rivers of IndiaGiant river catfish Bagarius yarelli Throughout IndiaThread tail catfish Conta conta Upper AssamClown catfish Gagata cenia North and North
east IndiaBlack line catfish Glyptothorax anamaliensis Anamalai hills, KeralaCopper catfish Glyptothorax telchitta Northern India, OrissaButterfly catfish Hara hara Northern IndiaElongated mouth catfish Hara horai North Bengal
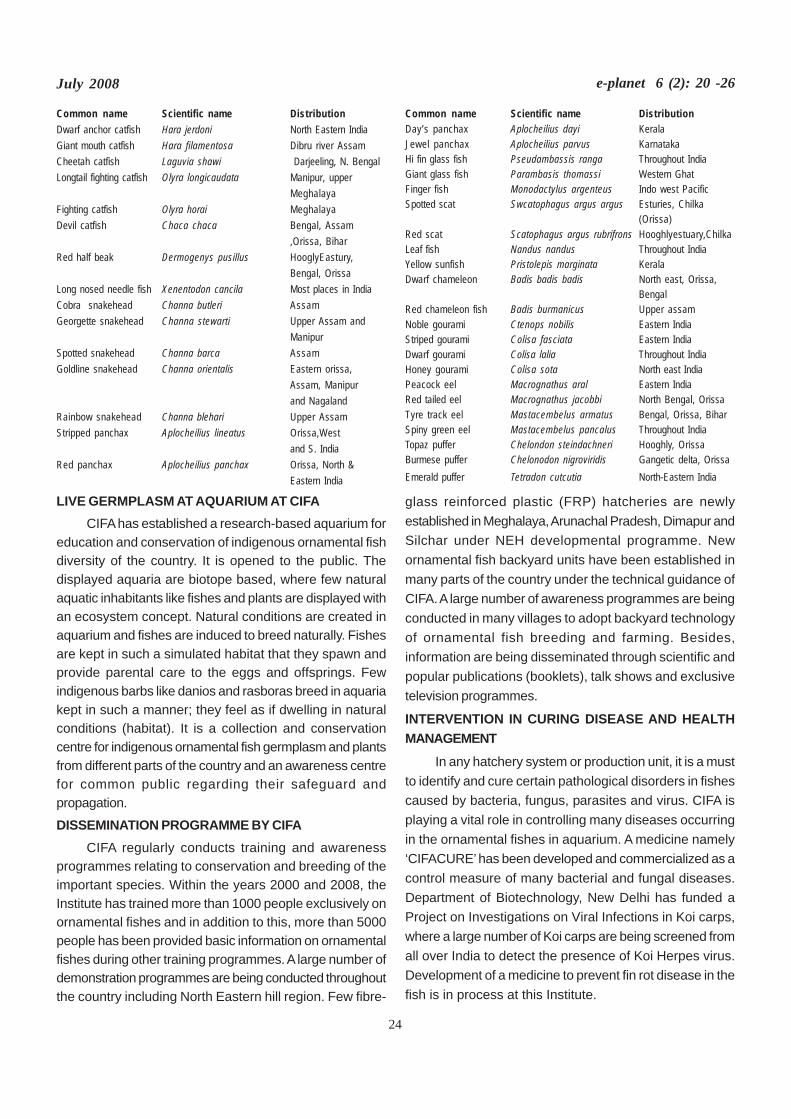
24
July 2008 e-planet 6 (2): 20 -26
Common name Scientific name DistributionDwarf anchor catfish Hara jerdoni North Eastern IndiaGiant mouth catfish Hara filamentosa Dibru river AssamCheetah catfish Laguvia shawi Darjeeling, N. BengalLongtail fighting catfish Olyra longicaudata Manipur, upper
MeghalayaFighting catfish Olyra horai MeghalayaDevil catfish Chaca chaca Bengal, Assam
,Orissa, BiharRed half beak Dermogenys pusillus HooglyEastury,
Bengal, OrissaLong nosed needle fish Xenentodon cancila Most places in IndiaCobra snakehead Channa butleri AssamGeorgette snakehead Channa stewarti Upper Assam and
ManipurSpotted snakehead Channa barca AssamGoldline snakehead Channa orientalis Eastern orissa,
Assam, Manipurand Nagaland
Rainbow snakehead Channa blehari Upper AssamStripped panchax Aplocheilius lineatus Orissa,West
and S. IndiaRed panchax Aplocheilius panchax Orissa, North &
Eastern India
Common name Scientific name DistributionDay’s panchax Aplocheilius dayi KeralaJewel panchax Aplocheilius parvus KarnatakaHi fin glass fish Pseudambassis ranga Throughout IndiaGiant glass fish Parambasis thomassi Western GhatFinger fish Monodactylus argenteus Indo west PacificSpotted scat Swcatophagus argus argus Esturies, Chilka
(Orissa)Red scat Scatophagus argus rubrifrons Hooghlyestuary,ChilkaLeaf fish Nandus nandus Throughout IndiaYellow sunfish Pristolepis marginata KeralaDwarf chameleon Badis badis badis North east, Orissa,
BengalRed chameleon fish Badis burmanicus Upper assamNoble gourami Ctenops nobilis Eastern IndiaStriped gourami Colisa fasciata Eastern IndiaDwarf gourami Colisa lalia Throughout IndiaHoney gourami Colisa sota North east IndiaPeacock eel Macrognathus aral Eastern IndiaRed tailed eel Macrognathus jacobbi North Bengal, OrissaTyre track eel Mastacembelus armatus Bengal, Orissa, BiharSpiny green eel Mastacembelus pancalus Throughout IndiaTopaz puffer Chelondon steindachneri Hooghly, OrissaBurmese puffer Chelonodon nigroviridis Gangetic delta, OrissaEmerald puffer Tetradon cutcutia North-Eastern India
LIVE GERMPLASM AT AQUARIUM AT CIFACIFA has established a research-based aquarium for
education and conservation of indigenous ornamental fishdiversity of the country. It is opened to the public. Thedisplayed aquaria are biotope based, where few naturalaquatic inhabitants like fishes and plants are displayed withan ecosystem concept. Natural conditions are created inaquarium and fishes are induced to breed naturally. Fishesare kept in such a simulated habitat that they spawn andprovide parental care to the eggs and offsprings. Fewindigenous barbs like danios and rasboras breed in aquariakept in such a manner; they feel as if dwelling in naturalconditions (habitat). It is a collection and conservationcentre for indigenous ornamental fish germplasm and plantsfrom different parts of the country and an awareness centrefor common public regarding their safeguard andpropagation.
DISSEMINATION PROGRAMME BY CIFACIFA regularly conducts training and awareness
programmes relating to conservation and breeding of theimportant species. Within the years 2000 and 2008, theInstitute has trained more than 1000 people exclusively onornamental fishes and in addition to this, more than 5000people has been provided basic information on ornamentalfishes during other training programmes. A large number ofdemonstration programmes are being conducted throughoutthe country including North Eastern hill region. Few fibre-
glass reinforced plastic (FRP) hatcheries are newlyestablished in Meghalaya, Arunachal Pradesh, Dimapur andSilchar under NEH developmental programme. Newornamental fish backyard units have been established inmany parts of the country under the technical guidance ofCIFA. A large number of awareness programmes are beingconducted in many villages to adopt backyard technologyof ornamental fish breeding and farming. Besides,information are being disseminated through scientific andpopular publications (booklets), talk shows and exclusivetelevision programmes.
INTERVENTION IN CURING DISEASE AND HEALTHMANAGEMENT
In any hatchery system or production unit, it is a mustto identify and cure certain pathological disorders in fishescaused by bacteria, fungus, parasites and virus. CIFA isplaying a vital role in controlling many diseases occurringin the ornamental fishes in aquarium. A medicine namely‘CIFACURE’ has been developed and commercialized as acontrol measure of many bacterial and fungal diseases.Department of Biotechnology, New Delhi has funded aProject on Investigations on Viral Infections in Koi carps,where a large number of Koi carps are being screened fromall over India to detect the presence of Koi Herpes virus.Development of a medicine to prevent fin rot disease in thefish is in process at this Institute.
25
July 2008 e-planet 6 (2): 20 -26
SUGGESTIONS FOR CONSERVATION OF WILD FISHSPECIES
Of all the live fish species that have ever existed onearth, some are found in plenty, some are endangered andsome others have got extinct. Conservation of neither theformer nor the latter is an issue but it is important to focuson conservation of the endangered fishes. When theendangered species are considered, it can again becategorized into three groups i.e. species approachingendangerment, species typically endangered and specieson the verge of extinction.
When the issue of conservation is addressed, it ismore or less directed towards the species that are ‘typicallyendangered’. However, in the context of the indigenous self-recruiting ornamental fish species, conservation of all thethree categories of endangered species needs to beaddressed. Some suggestions for scientifically tacklingthese issues are as follows:(i) After gathering adequate information on the habitat,biology, feeding and reproductive behaviour of the targetfish species, their captive breeding strategies could bescientifically thought of; methods can be devised andprocesses standardized.(ii) Successful rearing of larvae, young ones and juvenilesof ornamental fishes in captivity needs to be taken up. Thefood and feeding behaviour of each developmental stage ofthe target fish must be studied and food and feed preferencemust be recorded.(iii) After conducting successful breeding trials andcompletely studying the species’ attributes, the speciescan be ranched in suitable locations in open water systemsto allow multiplication of the endangered species in naturalenvironment.(iv) During rainy (fish breeding) season, harvest of wildspecies for commercial purpose must be strictly regulatedand legislated. This will ensure a steady and sustainablesupply of the species from natural environment.(v) In line with the concept of social forestry, socialfisheries (participatory natural resource conservationstrategy) needs to be devised by the Research Institutesin collaboration with the State Fisheries departments, Forestdepartments and the State & Central Ministries of WaterResources. This would provide legal power to the localcommunities for the protection of natural water bodies andthe inhabiting natural resource from being subjected toexcessive exploitation.(vi) Indiscriminate mine explosions, poisoning of naturalwater bodies, viz., hill streams (natural flowing waters) etc.
for easy harvest of food fish in the ecologically vulnerableareas are potential precursors for the extinction or at leastendangerment of valuable self-recruiting indigenousornamental fish.(vii) Knowledge dissemination is one of the importantaspects for successful ornamental fishery. Therefore areasare to be sorted out, where such ornamental fishes areavailable and continuous training and motivation programmesare to be conducted for knowledge on conservation andoptimum level of harvest of such fishes.
Sustainable harvest of wild fish populations ispossible, if the managers and government officers havesufficient knowledge and foresight of the future disasters.There are certain fish dealers who only collect a limitednumber of species and fully acclimatize them before saleto customers overseas. But still there are some, whooverexploit the natural resource whereupon the issue ofendangerment looms large. To understand the fact that thenatural resource is ours, the environment that we live in isours and we being the caretakers, the safeguard of natureand its resources should be our concern. The most plausiblesolution to the issue of ornamental fish biodiversityconservation is collection of a limited number from thenature, feed and culture them in captivity, study theirbehaviour and life cycle, breed them and further utilise themfor trade and other economic activities or let them to remainsafe in the wild nature. Therefore our slogan is always forthe nature and environment and we say…. “Nature’swonderful creation, ornamental fish; let’s save andpropagate them”.
REFERENCESBhattacharya B K and M Choudhury (2004). Ornamental fish culture
and trade in North Eastern India, Bhattacharya andChoudhury Eds.CIFRI (NERC), Assam, 97 p.
Das S K and N Kalita (2003). Captive breeding of peacock eel,Macrognathus aculeatus, Aquaculture Asia, July-Sept.Vol. VII, No. 3, 17-21p.
FAO. 2000. Yearbook, 2000 Vol.90/2FAO.1999. Ornamental aquatic life: What’s FAO got to do with it? FAO
News & Highlights (1 September) Food and AgricultureOrganization, Rome.
Gopalakrishnan A and A G Ponniah (2000). Cultivable, ornamental,sport and food fishes endemic to Peninsular India withspecial reference to Western Ghats. p. 13-32. In A.G.Ponniah and A. Gopalakrishnan (eds.) Endemic FishDiversity of Western Ghats. NBFGR-NATP Publication.National Bureau of Fish Genetic Resources, Lucknow,U.P., India. 1, 347 p.
Mahanta P C, S M Srivastava and S K Paul (1998). Preliminaryassessment of fish germplasm resources of North EastRegion to evolve strategy for conservation. NewAgriculturist, 8(1).

26
July 2008 e-planet 6 (2): 20 -26
Mercy Anna T V, R Thomas and E Jacob (2001). Riverine and ReservoirFisheries of India (Ed. Boopendranath M. R. et al.), Societyof Fisheries Technologists, India, 2001, 151–161 p.
Nath P and S C Dey (1989). Fish and Fisheries of North East India, Vol.I , 1-143 p
Sane S R and L R Bhide (1992).The successful spawning of Chacachaca, Tropical Fish hobbyist, March 196-199 p.
Sane S R (1962).Colisa chuna. A rare and exciting subset gourami,The aquarium, 93-96 p.
Sen N (2000). Occurrence, distribution and status of diversified fishfauna of North East India. In: Fish germplasm inventoryand conservation in North East India ( Eds. A.G.Ponniahand U.K.Sarkar, NBFGR, Lucknow.
Senli A (2005). A glimpse of the endemic fishes of Nagaland, Governmentof Nagaland, Department of fisheries, Nagaland, Kohima,30 p.
Singh T (2005). Emerging trends in world ornamental fish trade, InfofishInternational, Number, 3, May/June,16 p.
Sinha M (1994). Fish genetic resources of the North Eastern region ofIndia. J. Inland Fish. Soc. India, 26 (1); 1-19 p.
Swain S K and R K Jana (2005). Freshwater ornamental fish farmingin India: present status, prospects and constraints,BIOVED, 16(1,2),139-146 p.
Swain S K, D Mallik, S Mishra, B Sarkar and P Routray (2007). Ornamentalfish-as model animals for biotechnological research. InEnvironmental Biotechnology (Ed. Mishra and Juwarkar)APH publ. corp. Delhi.293-328 p.
Swain S K and B K Das (2001). Captive mass breeding of dwarfgourami Colisa lalia in the cement cisterns, NBFGR-NATPPublication No. 3, Paper No. 10.
Swain S K (2005). Breeding of ornamental fish species andentrepreneurship development. In training cum workshopon ornamental fish culture and trade, edited by Das, S.K., College of Fisheries, AAU, Raha, Nawgaon,Assam,32-38p.
Swain S K (2004). Training manual on ornamental fish breeding andculture for entrepreneurship development. CIFA (TTC)Publ, 84 p.
Swain S K, K Kumar and G S Saha (2006). Training manual on“ornamental fish farming for entrepreneurshipdevelopment”. Sponsored by NFDB, Hyderabad,Organized by CIFA, Kausalyaganga, CIFA Publ. 102 p.
Swain. S K (2006). Ornamental fish breeding and culture, In Hand bookof Fisheries and Aquaculture, ICAR, New Delhi, DIPA Publ,354-377 p
Swain S K, P P Chakrabarty and N Sarangi (2008). Export and breedingprotocols developed for the indigenous fishes of Northeast India, In Book on Ornamental fish breeding, farmingand trade (Kurup, B.M., Boopendranath,M.R., Ravindran,K.,Saira Banu and Nair,A.G., eds).Department of Fisheries,Govt. Of Kerala, India: 114-134 p.
Vishwanath W (2003). Ornamental fisheries, potential of Manipur,MASS Ecoline, August-September, 10-12 p.
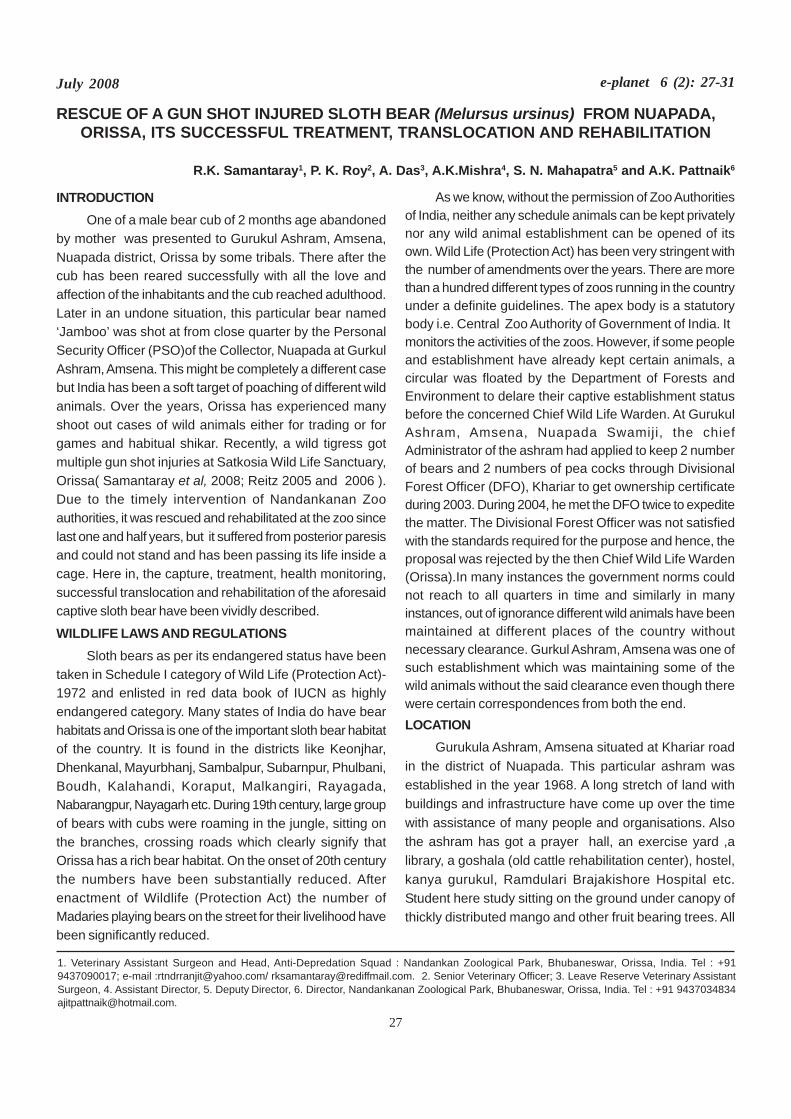
27
July 2008 e-planet 6 (2): 27-31
RESCUE OF A GUN SHOT INJURED SLOTH BEAR (Melursus ursinus) FROM NUAPADA,ORISSA, ITS SUCCESSFUL TREATMENT, TRANSLOCATION AND REHABILITATION
R.K. Samantaray1, P. K. Roy2, A. Das3, A.K.Mishra4, S. N. Mahapatra5 and A.K. Pattnaik6
INTRODUCTIONOne of a male bear cub of 2 months age abandoned
by mother was presented to Gurukul Ashram, Amsena,Nuapada district, Orissa by some tribals. There after thecub has been reared successfully with all the love andaffection of the inhabitants and the cub reached adulthood.Later in an undone situation, this particular bear named‘Jamboo’ was shot at from close quarter by the PersonalSecurity Officer (PSO)of the Collector, Nuapada at GurkulAshram, Amsena. This might be completely a different casebut India has been a soft target of poaching of different wildanimals. Over the years, Orissa has experienced manyshoot out cases of wild animals either for trading or forgames and habitual shikar. Recently, a wild tigress gotmultiple gun shot injuries at Satkosia Wild Life Sanctuary,Orissa( Samantaray et al, 2008; Reitz 2005 and 2006 ).Due to the timely intervention of Nandankanan Zooauthorities, it was rescued and rehabilitated at the zoo sincelast one and half years, but it suffered from posterior paresisand could not stand and has been passing its life inside acage. Here in, the capture, treatment, health monitoring,successful translocation and rehabilitation of the aforesaidcaptive sloth bear have been vividly described.
WILDLIFE LAWS AND REGULATIONSSloth bears as per its endangered status have been
taken in Schedule I category of Wild Life (Protection Act)-1972 and enlisted in red data book of IUCN as highlyendangered category. Many states of India do have bearhabitats and Orissa is one of the important sloth bear habitatof the country. It is found in the districts like Keonjhar,Dhenkanal, Mayurbhanj, Sambalpur, Subarnpur, Phulbani,Boudh, Kalahandi, Koraput, Malkangiri, Rayagada,Nabarangpur, Nayagarh etc. During 19th century, large groupof bears with cubs were roaming in the jungle, sitting onthe branches, crossing roads which clearly signify thatOrissa has a rich bear habitat. On the onset of 20th centurythe numbers have been substantially reduced. Afterenactment of Wildlife (Protection Act) the number ofMadaries playing bears on the street for their livelihood havebeen significantly reduced.
As we know, without the permission of Zoo Authoritiesof India, neither any schedule animals can be kept privatelynor any wild animal establishment can be opened of itsown. Wild Life (Protection Act) has been very stringent withthe number of amendments over the years. There are morethan a hundred different types of zoos running in the countryunder a definite guidelines. The apex body is a statutorybody i.e. Central Zoo Authority of Government of India. Itmonitors the activities of the zoos. However, if some peopleand establishment have already kept certain animals, acircular was floated by the Department of Forests andEnvironment to delare their captive establishment statusbefore the concerned Chief Wild Life Warden. At GurukulAshram, Amsena, Nuapada Swamiji, the chiefAdministrator of the ashram had applied to keep 2 numberof bears and 2 numbers of pea cocks through DivisionalForest Officer (DFO), Khariar to get ownership certificateduring 2003. During 2004, he met the DFO twice to expeditethe matter. The Divisional Forest Officer was not satisfiedwith the standards required for the purpose and hence, theproposal was rejected by the then Chief Wild Life Warden(Orissa).In many instances the government norms couldnot reach to all quarters in time and similarly in manyinstances, out of ignorance different wild animals have beenmaintained at different places of the country withoutnecessary clearance. Gurkul Ashram, Amsena was one ofsuch establishment which was maintaining some of thewild animals without the said clearance even though therewere certain correspondences from both the end.LOCATION
Gurukula Ashram, Amsena situated at Khariar roadin the district of Nuapada. This particular ashram wasestablished in the year 1968. A long stretch of land withbuildings and infrastructure have come up over the timewith assistance of many people and organisations. Alsothe ashram has got a prayer hall, an exercise yard ,alibrary, a goshala (old cattle rehabilitation center), hostel,kanya gurukul, Ramdulari Brajakishore Hospital etc.Student here study sitting on the ground under canopy ofthickly distributed mango and other fruit bearing trees. All
1. Veterinary Assistant Surgeon and Head, Anti-Depredation Squad : Nandankan Zoological Park, Bhubaneswar, Orissa, India. Tel : +919437090017; e-mail :[email protected]/ [email protected]. 2. Senior Veterinary Officer; 3. Leave Reserve Veterinary AssistantSurgeon, 4. Assistant Director, 5. Deputy Director, 6. Director, Nandankanan Zoological Park, Bhubaneswar, Orissa, India. Tel : +91 [email protected].
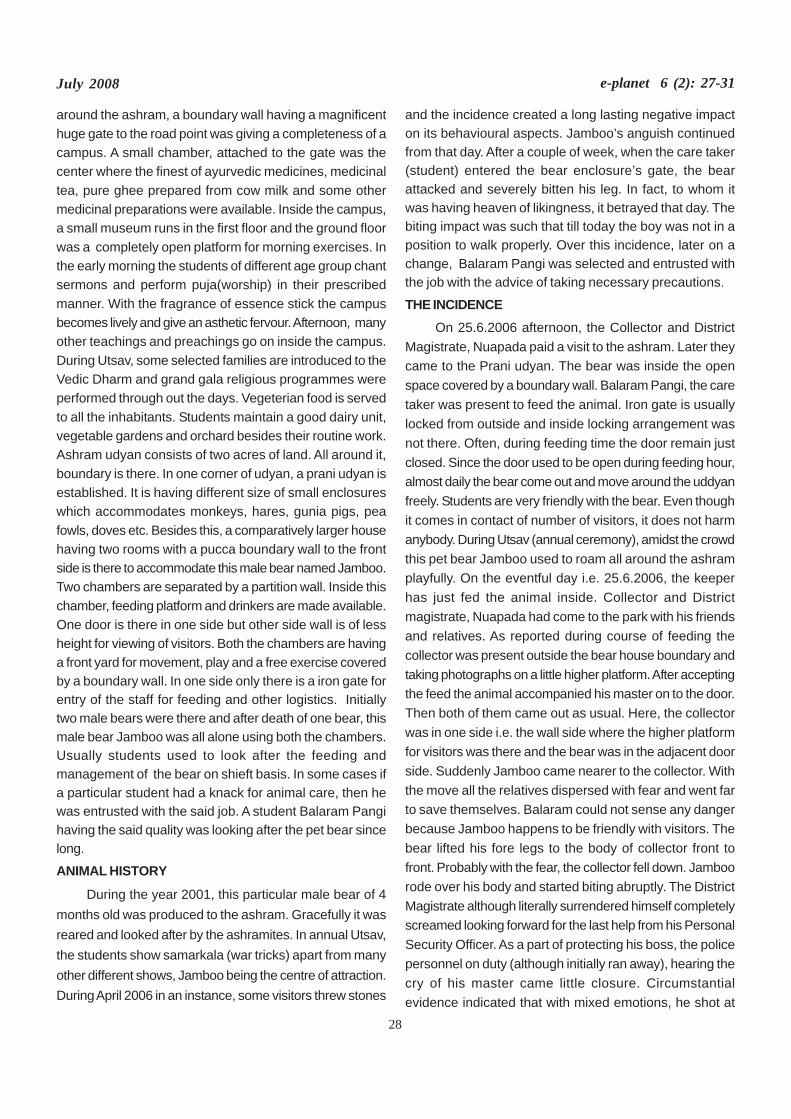
28
July 2008 e-planet 6 (2): 27-31
around the ashram, a boundary wall having a magnificenthuge gate to the road point was giving a completeness of acampus. A small chamber, attached to the gate was thecenter where the finest of ayurvedic medicines, medicinaltea, pure ghee prepared from cow milk and some othermedicinal preparations were available. Inside the campus,a small museum runs in the first floor and the ground floorwas a completely open platform for morning exercises. Inthe early morning the students of different age group chantsermons and perform puja(worship) in their prescribedmanner. With the fragrance of essence stick the campusbecomes lively and give an asthetic fervour. Afternoon, manyother teachings and preachings go on inside the campus.During Utsav, some selected families are introduced to theVedic Dharm and grand gala religious programmes wereperformed through out the days. Vegeterian food is servedto all the inhabitants. Students maintain a good dairy unit,vegetable gardens and orchard besides their routine work.Ashram udyan consists of two acres of land. All around it,boundary is there. In one corner of udyan, a prani udyan isestablished. It is having different size of small enclosureswhich accommodates monkeys, hares, gunia pigs, peafowls, doves etc. Besides this, a comparatively larger househaving two rooms with a pucca boundary wall to the frontside is there to accommodate this male bear named Jamboo.Two chambers are separated by a partition wall. Inside thischamber, feeding platform and drinkers are made available.One door is there in one side but other side wall is of lessheight for viewing of visitors. Both the chambers are havinga front yard for movement, play and a free exercise coveredby a boundary wall. In one side only there is a iron gate forentry of the staff for feeding and other logistics. Initiallytwo male bears were there and after death of one bear, thismale bear Jamboo was all alone using both the chambers.Usually students used to look after the feeding andmanagement of the bear on shieft basis. In some cases ifa particular student had a knack for animal care, then hewas entrusted with the said job. A student Balaram Pangihaving the said quality was looking after the pet bear sincelong.
ANIMAL HISTORY
During the year 2001, this particular male bear of 4months old was produced to the ashram. Gracefully it wasreared and looked after by the ashramites. In annual Utsav,the students show samarkala (war tricks) apart from manyother different shows, Jamboo being the centre of attraction.During April 2006 in an instance, some visitors threw stones
and the incidence created a long lasting negative impacton its behavioural aspects. Jamboo’s anguish continuedfrom that day. After a couple of week, when the care taker(student) entered the bear enclosure’s gate, the bearattacked and severely bitten his leg. In fact, to whom itwas having heaven of likingness, it betrayed that day. Thebiting impact was such that till today the boy was not in aposition to walk properly. Over this incidence, later on achange, Balaram Pangi was selected and entrusted withthe job with the advice of taking necessary precautions.
THE INCIDENCEOn 25.6.2006 afternoon, the Collector and District
Magistrate, Nuapada paid a visit to the ashram. Later theycame to the Prani udyan. The bear was inside the openspace covered by a boundary wall. Balaram Pangi, the caretaker was present to feed the animal. Iron gate is usuallylocked from outside and inside locking arrangement wasnot there. Often, during feeding time the door remain justclosed. Since the door used to be open during feeding hour,almost daily the bear come out and move around the uddyanfreely. Students are very friendly with the bear. Even thoughit comes in contact of number of visitors, it does not harmanybody. During Utsav (annual ceremony), amidst the crowdthis pet bear Jamboo used to roam all around the ashramplayfully. On the eventful day i.e. 25.6.2006, the keeperhas just fed the animal inside. Collector and Districtmagistrate, Nuapada had come to the park with his friendsand relatives. As reported during course of feeding thecollector was present outside the bear house boundary andtaking photographs on a little higher platform. After acceptingthe feed the animal accompanied his master on to the door.Then both of them came out as usual. Here, the collectorwas in one side i.e. the wall side where the higher platformfor visitors was there and the bear was in the adjacent doorside. Suddenly Jamboo came nearer to the collector. Withthe move all the relatives dispersed with fear and went farto save themselves. Balaram could not sense any dangerbecause Jamboo happens to be friendly with visitors. Thebear lifted his fore legs to the body of collector front tofront. Probably with the fear, the collector fell down. Jamboorode over his body and started biting abruptly. The DistrictMagistrate although literally surrendered himself completelyscreamed looking forward for the last help from his PersonalSecurity Officer. As a part of protecting his boss, the policepersonnel on duty (although initially ran away), hearing thecry of his master came little closure. Circumstantialevidence indicated that with mixed emotions, he shot at
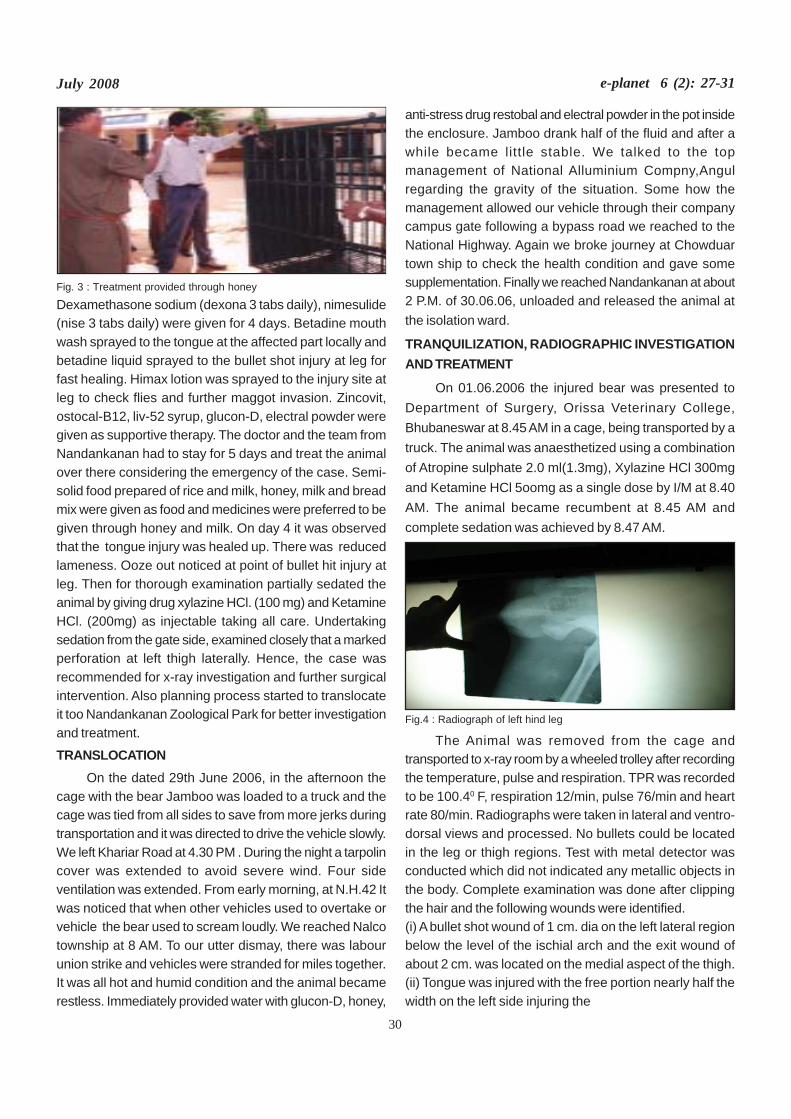
30
July 2008 e-planet 6 (2): 27-31
Fig. 3 : Treatment provided through honey
Dexamethasone sodium (dexona 3 tabs daily), nimesulide(nise 3 tabs daily) were given for 4 days. Betadine mouthwash sprayed to the tongue at the affected part locally andbetadine liquid sprayed to the bullet shot injury at leg forfast healing. Himax lotion was sprayed to the injury site atleg to check flies and further maggot invasion. Zincovit,ostocal-B12, liv-52 syrup, glucon-D, electral powder weregiven as supportive therapy. The doctor and the team fromNandankanan had to stay for 5 days and treat the animalover there considering the emergency of the case. Semi-solid food prepared of rice and milk, honey, milk and breadmix were given as food and medicines were preferred to begiven through honey and milk. On day 4 it was observedthat the tongue injury was healed up. There was reducedlameness. Ooze out noticed at point of bullet hit injury atleg. Then for thorough examination partially sedated theanimal by giving drug xylazine HCl. (100 mg) and KetamineHCl. (200mg) as injectable taking all care. Undertakingsedation from the gate side, examined closely that a markedperforation at left thigh laterally. Hence, the case wasrecommended for x-ray investigation and further surgicalintervention. Also planning process started to translocateit too Nandankanan Zoological Park for better investigationand treatment.
TRANSLOCATIONOn the dated 29th June 2006, in the afternoon the
cage with the bear Jamboo was loaded to a truck and thecage was tied from all sides to save from more jerks duringtransportation and it was directed to drive the vehicle slowly.We left Khariar Road at 4.30 PM . During the night a tarpolincover was extended to avoid severe wind. Four sideventilation was extended. From early morning, at N.H.42 Itwas noticed that when other vehicles used to overtake orvehicle the bear used to scream loudly. We reached Nalcotownship at 8 AM. To our utter dismay, there was labourunion strike and vehicles were stranded for miles together.It was all hot and humid condition and the animal becamerestless. Immediately provided water with glucon-D, honey,
anti-stress drug restobal and electral powder in the pot insidethe enclosure. Jamboo drank half of the fluid and after awhile became little stable. We talked to the topmanagement of National Alluminium Compny,Angulregarding the gravity of the situation. Some how themanagement allowed our vehicle through their companycampus gate following a bypass road we reached to theNational Highway. Again we broke journey at Chowduartown ship to check the health condition and gave somesupplementation. Finally we reached Nandankanan at about2 P.M. of 30.06.06, unloaded and released the animal atthe isolation ward.
TRANQUILIZATION, RADIOGRAPHIC INVESTIGATIONAND TREATMENT
On 01.06.2006 the injured bear was presented toDepartment of Surgery, Orissa Veterinary College,Bhubaneswar at 8.45 AM in a cage, being transported by atruck. The animal was anaesthetized using a combinationof Atropine sulphate 2.0 ml(1.3mg), Xylazine HCl 300mgand Ketamine HCl 5oomg as a single dose by I/M at 8.40AM. The animal became recumbent at 8.45 AM andcomplete sedation was achieved by 8.47 AM.
Fig.4 : Radiograph of left hind leg
The Animal was removed from the cage andtransported to x-ray room by a wheeled trolley after recordingthe temperature, pulse and respiration. TPR was recordedto be 100.40 F, respiration 12/min, pulse 76/min and heartrate 80/min. Radiographs were taken in lateral and ventro-dorsal views and processed. No bullets could be locatedin the leg or thigh regions. Test with metal detector wasconducted which did not indicated any metallic objects inthe body. Complete examination was done after clippingthe hair and the following wounds were identified.(i) A bullet shot wound of 1 cm. dia on the left lateral regionbelow the level of the ischial arch and the exit wound ofabout 2 cm. was located on the medial aspect of the thigh.(ii) Tongue was injured with the free portion nearly half thewidth on the left side injuring the
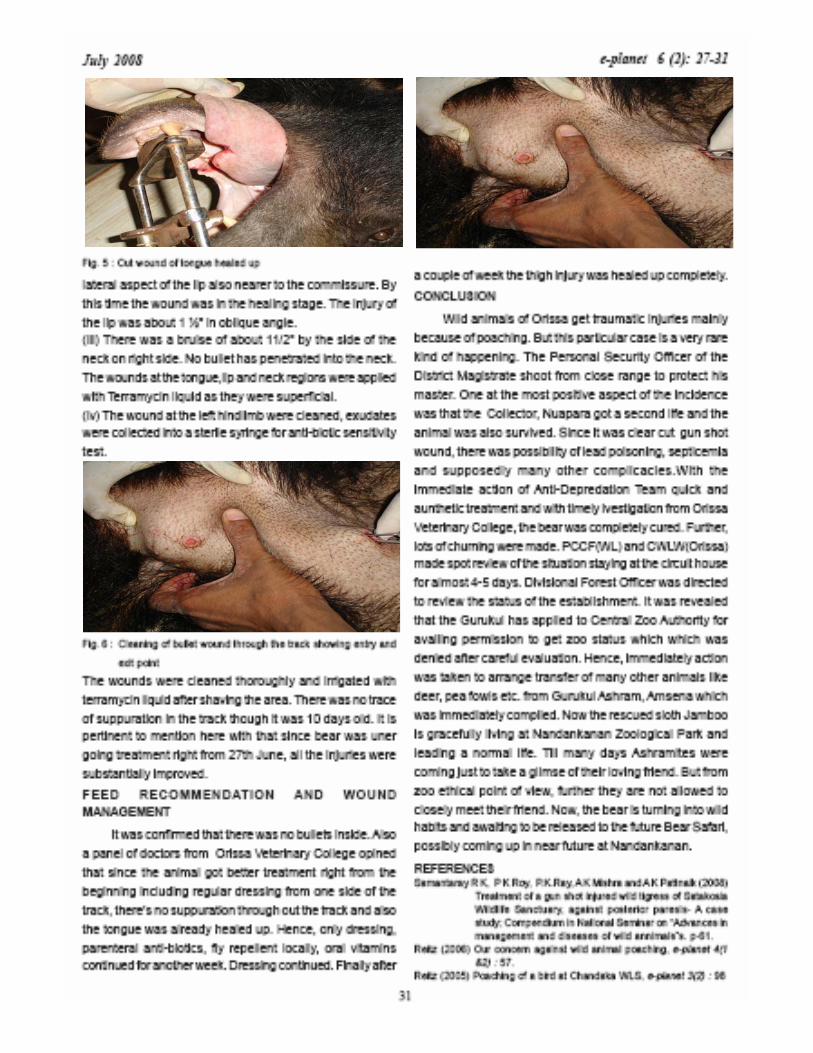
32
July 2008 e-planet 6 (2): 32-34
EFFECT OF ACID RAIN ON WILDLIFE AND THE ECOSYSTEM
K. K. Sardar1 and N. Sahoo2
INTRODUCTION Acid rain, a high content of sulphuric acid, is produced
when sulphur dioxide combines with hydrogen. Sulphurdioxide is released from natural sources, such asvolcanoes, sea spray and rotting vegetation. Burning fossilfuels such as coal and oil also produce it. Once released,sulphuric acid mixes with hydrogen, a gas that is alreadyin the atmosphere. The resulting sulphuric acid falls backdown to the earth as a pollutant, acid rain. Rain is acidic innature because carbon dioxide, found normally in the earth’satmosphere, reacts with water to form carbonic acid. While“pure” rain’s acidity is pH 5.6-5.7, actual pH readings varyfrom place to place depending upon the type and amountof other gases present in the air, such as sulphur oxideand nitrogen oxides. The acid in acid rain comes from twokinds of air pollutants namely sulphur dioxide and nitrogenoxides (Economopoulos, 1993 ).
Acid-rain does not affect one place in the environmentbut it causes widespread problems. Damage by acid-rainis most likely seen in water environments such as smallponds, streams and lakes. When acid-rain falls it flowsthrough small ponds, streams and lakes right after it hitsthe fields, roads and buildings. But sometimes acid-raincan fall directly in the water. When acid-rain falls more andmore, it affects wildlife significantly. Because acid-raincauses the loss of acid-sensitive organisms, food may alsobe affected. The soil will dry up and stay hard until it iswatered. If this continues then there will be no more plantson earth and no more plants would invite a serious fall on ofother living beings on earth.
One of the serious side effects of acid rain on humanis “respiratory” problems such as affection of nose, throatirritation, dry coughs, headaches and asthma governed byemission of the dioxide and nitrogen oxide. Polluted rainfallis especially harmful to those who suffer from asthma orthose who have a hard time breathing. But even healthypeople can have their lungs damaged by acid air and rain.Acid rain can aggravate a person’s ability to breathe whichcould lead to death. The only cost-effective solution to theproblem, according to the environmentalists, is to reduceemissions at their point of origin (Postel, 1984).
FORMATION OF ACID-RAIN AND KIND OFDESTRUCTION CAUSED
Acid rain is formed from pollution that has risen intothe atmosphere and reach cloud, hence forming acid rain.When the rain falls it contains acid in it. The sulphur andnitrogen that mainly contribute to the acid rain enter theatmosphere. This pollution mainly comes from the burningof fossil fuels such as coal, gas and oil and from vehicleswell. For example the exhausts of different vehicles riseinto the atmosphere which then reacts with the water inthe clouds to create the acid rain. The demand for electricityand huge number of vehicles on road lead to lot of polutingsubstances that are going into our atmosphere and this isa major contributing factor of acid rain. The areas worstaffected by acid rain are North America and Europe. This isbecause the developed countries use more for electricityand vehicles but generally the third world counties are worstaffected viz. the rivers, lakes, tropical forests and wildlifehabitation. Acid rain is quickening up the process of erosionwhich means that wildlife habitation, ecosystem and greenenvironment may wear away a lot sooner than expected.
The worst measurement of acid rain has been recordedto be pH 2. The more sulphuric and nitric acids present,the higher the acidity of the rain. Battery acid is about 1acidity and lemon juice is around 2 acidity. Regular rain isbetween 5 and 6 acidity. Acid rain is somewhere between2 and 5.5. The worst case of acid rain ever recorded was inWheeling, West Virginia where the rain had an acidity of2.2. These levels of acidity seriously harm plants, treesand all other life. The interactions between living organismsand the chemistry of their aquatic habitats are extremelycomplex. If the number of one species or group of specieschanges in response to acidification, then the ecosystemof the entire water and land body is likely to be affectedthrough the predator-prey relationships of the food web(Bourodimos E L, 1974). At first, the effects of aciddeposition may be almost imperceptible, but as acidityincreases, more and more wildlife habitation, differentspecies and the green environment as a whole may declineor disappear.
Acid rain forms when molecules of oxidized sulphurand/or nitrogen in the atmosphere combine with water,forming acidic compounds that dissolve in the water andbecomes rain. Typical sulphur compounds (SO2 and SO3)
1. Pharmacology and Toxicology Department, Faculty of Veterinary Sciences, Orissa University of Agriculture and Technology, Bhubaneswar-751 003, India
2. Project co-ordinater, Centre for Wildlife Health,Orissa Veterinary college, Bhubaneswar-751 003, India
33
July 2008 e-planet 6 (2): 32-34
get into the atmosphere from both natural (i.e., volcanoes,windblown dust containing gypsum which has SO4 ions init, etc..) and non-natural (i.e., burning of coal, refining ofmetal ores) sources. Nitrogen compounds also get intothe atmosphere and form acids, although the natural sourcesare much more limited. The biggest non-natural source isburning fossil fuels, especially gasoline.
Acid rain or more precisely acid precipitation, is theword used to describe rainfall that has a pH level of lessthan 5.6. This form of air pollution is currently a subject ofgreat concern and controversy because of its worldwideenvironmental implication. Acid rain poses health risks topeople and nature. Danger of acid rain is that it containsthe remains of toxic metals. When there is acid rain, toxicremains are absorbed by fruits, vegetables, and livestockand passed on to human consumers. Consumption of thesetoxic metals, such as mercury, for example, can lead tobrain damage, kidney problems, and even death. Whenacid rain occurs, it does not immediately effect acidity inlakes and streams. The water dilutes the acid; so only overa long period of time can the water become too acidic. Inthe spring, something called acid shock can happen. Snow,that contains acid, can build up and when it melts all theacid runs into the streams and lakes at one time. Whenacid levels are too high it can kill small organisms likealgae. When the algae dies, the animals that live on algaedie of starvation.
Health damage to animal kingdom, vegetation andcrops have prompted concern about the health effects ofcontaminants in humans. While there are approximatelytwo million chemicals being used worldwide, there are veryfew studies undertaken in their long-term effects on humanhealth, particularly concerning the effects of pesticides,polychlorinated biphenyls, dioxins and lead in combinationwith each other or how they interact with other factors inhuman health. The contaminant safety guidelines are basedon animal studies and it is further difficult to state the levelof human affection.
The short-term danger from acid rain happen mostlyto forest and lake ecosystems. With the loss of theseecosystems that effectively moderate the pH of surfacerun-off water in many areas, the effect of acid rain on localwater supplies could become more pronounced infuture. Another problem encountered in human and animalkingdom is to breathe in smog, acid rain in one of its manyforms. Acid rain can also harm people indirectly and thishappens when people eat fish caught in affected lakes orrivers. Also, if the water source is acidic enough, it woulddamage the copper or lead pipes to harm human usage. Italso washes aluminum into the water supply. Birds can beharmed if they live in affected waters or feed on fish living inaffected waters. A significant proportion of eastern Canada’s forestshas been affected; and considerable damage to buildings
and monuments has been documented. The CanadianCouncil of Resource and Environment Ministers hasestablished 20 kg/hectare per year as the target forCanadian sulphur dioxide loading. In eastern Canada, 96% of the land with high capability for forestry is subject toacidic deposition in excess of 20 kg/ha per year. In recentyears, important instances of dieback and declines in growthrate have been noted in sugar maple groves in parts ofCanada that receive high levels of these and other airpollutants, such as ozone. Significant growth declines innorthern Ontario forests, most notable over the past 30years, coincide with a period of rapidly increasingindustrialization and urbanization across many provinces.
The effects of acid rain have been encountered in partsof the United States, Germany, Czechoslovakia,Netherlands, Switzerland, Australia, Yugoslavia andelsewhere. It is also becoming a significant problem in Japanand China and in southeast Asia. Rain with a pH of 4.5 andbelow has been reported in Chinese cities. Sulphur dioxideemissions were reported in 1979 to have nearly tripled inIndia since the early 1960s, making them only slightly lessthan the then-current emissions from the Federal Republicof Germany.EFFECTS OF ACID RAIN ON WILD LIFE AND HUMANHEALTH
Acid rain affects the wildlife health in many ways. Theterm acid rain does not convey the true nature of the problemand therefore scientists use the term “acid depositions”.This is because the acid which has formed due to pollutionmay return to the earth as a solid or a gas and not just asrain. Depending upon the climatic conditions it could alsocome down as rain, fog, or snow, and in the wet form it isknown as “acid precipitation”. All living organisms areinterdependent on each other. If a lower life form is killed,other species that depend on it will also be affected. Everyanimal up the food chain will be affected. Due to the effectsof acid rain, animals which depend on plants for their foodalso begin to suffer. Tree dwelling birds and animals alsobegin to languish due to loss of habitat.
Mankind depends upon plants and animals for food.Due to acid rain the entire fish stocks in certain lakes havebeen wiped out. The economic livelihood of people whodepended on fish and other aquatic life suffers as a result.Eating fish which may have been contaminated by mercurycan cause serious health problems. Apart from the loss ofplant and animal life as food sources, acid rain gets intothe food we eat, the water we drink, as well as the air webreathe. Huma being suffer from asthma because of theacid contamination. Aluminum which dissolves more easilyin acid rain as compared to pure rainfall, has been linked toAlzheimer’s disease. The treatment of urban water suppliesmay not include removal of elements like aluminum, andso is a serious problem in cities too. The long term effects
34
July 2008 e-planet 6 (2): 32-34
from the damage of acid rain are that we can loose ourtropical rainforests and our wildlife too. Whenever any acidrain is getting into our rivers, streams and lakes, some ofthe fish may be killed or harmed which means that thebirds will be affected because they have no fish to eat. Inthe long run some of fish and birds species could be extinctfrom earth.OTHER EFFECTS
All living being whether living or non living on earth areaffected either directly or indirectly by acid rain. Evenbuildings, bridges and other structures are affected. In cities,paint from buildings have peeled off and colours of carshave faded due to the effects of acid rain. From the TajMahal to the empire state building the acid rain causescorrosion, fracturing, and discoloration in the structures.Temples, murals, and ancient inscriptions which hadpreviously survived for centuries are now showing severesigns of corrosion. In some parts of Poland, trains arerequired to run slowly, as the tracks are badly damageddue to corrosion caused by acid rain.POSSIBLE MEASURES TO BE TAKEN TO PREVENTACID RAIN
The bottom line is that all things on earth are beingaffected by this problem. There is a consensus amongestthe environmental groups, and public on the increasedeffects of the havoc caused by acid rain. Many countiesthe world over have drawn up certain plans to tackle thisproblem. Lakes that have become highly acidic, can betreated by adding large quantities of alkaline substanceslike quicklime, in a process called liming. It has not beensuccessful where the lake is very large, making thisprocedure economically unfeasible. In many other lakeswhere the flushing rate of the lake waters is too large resultin the lake becoming acidic again.
Acid rain is mainly a result of air pollution and this isall caused by humans. Certain measures have been carriedout by the government and the environment agencies toprevent the damage of acid rain. Some of the nations aretrying to invest in different ways of producing energyalternatives. These include electric cars and producingelectricity through different methods other than by burningfossil fuels.
If attempts to clean our air continue, rain may returnto normal and acidic lakes over a period of time would returnto normal. But if our attempts to clean up contaminantsare failed, we may loose our natural resources. A reductionin use of vehicles will reduce the amount of emission causedby our vehicles. Ensure that your vehicle is properly tuned,and fitted with a catalytic converter, to reduce the emissions.
We have to reduce the use of electric power byswitching off lights, and other electrical appliances when
not required. We must not leave your televisions, VCRs,microwave ovens or music systems on stand-by when notrequired. Reducing power consumption will reduce theamount of coal burnt to produce electricity and thus reducethe amount of pollution. The more environmentally friendlyway. Electricity we have saved can be used elsewhere thusbenefiting nature. Increasing awareness would slove thisglobal problem in some extent. Suitable legislation toensure that industries keep their emissions within limits.
Several industries have added scrubbers to their smokestacks to reduce the amount of sulphur dioxide dumped inthe atmosphere. Specially designed catalytic convertersare used to ensure that the gases coming out from exhaustpipes of automobiles are rendered harmless. Severalindustries which use coal as fuel have begun to wash thecoal before using it thereby reducing the amount of sulphurpresent in it and consequently the amount of emissions.Usage of coal with a low sulphur content also reduces theproblem.CONCLUSION
Attempt was taken to provide a primer on acid rain forthe ecologists, zoo and wildlife veterinarians, environmentalbiologists to act upon on war footing. There are severalways to reduce acid deposition, starting from societalchanges to individual action. Scientific studies are invitedto asses the level of acid deposition. National seminars,symposia, conferences, might draw some conclusion inthis score for energy efficiency and alternative energysources should be intervened. The cutting edge of protectingthe environment from acid deposition will continue to developand implement cost-effective mechanisms to cut emissionsand reduce their impact on the environment. One of thefirst steps is to understand the problem and its solutions.However, like many environmental problems, acid depositionis caused by the cumulative actions of millions of individualhuman beings. Therefore, each individual should enrich theirknowledge and aware themselves to become a part of thesolution.
REFERENCESBourodimos E L ( 1974 ). “Thermopollution in the aquatic environment,”
in Against Pollution and Hunger .John Wiley and Sons.New York.
Economopoulos A P (1993 ). Assessment of source of air, water andland pollution : a guide to rapid source inventory techniquesand their use in formulating environmental controlstrategies. Part 1: rapid inventory techniques inenvironmental pollution. WHO / PEP / GETNET.
Postel S (1984). “Air pollution, acid rain, and the future of forests,Worldwatch Paper 58, Worldwatch Institute, Washington,DC.
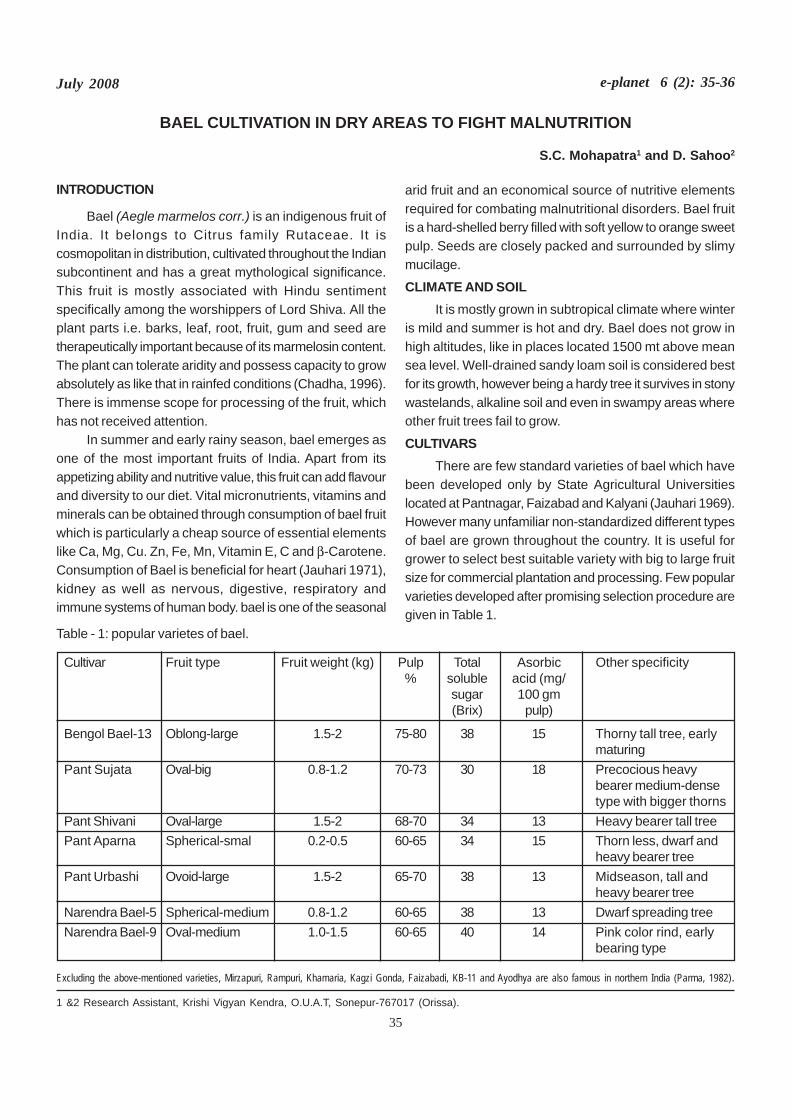
35
July 2008 e-planet 6 (2): 35-36
BAEL CULTIVATION IN DRY AREAS TO FIGHT MALNUTRITION
S.C. Mohapatra1 and D. Sahoo2
INTRODUCTION
Bael (Aegle marmelos corr.) is an indigenous fruit ofIndia. It belongs to Citrus family Rutaceae. It iscosmopolitan in distribution, cultivated throughout the Indiansubcontinent and has a great mythological significance.This fruit is mostly associated with Hindu sentimentspecifically among the worshippers of Lord Shiva. All theplant parts i.e. barks, leaf, root, fruit, gum and seed aretherapeutically important because of its marmelosin content.The plant can tolerate aridity and possess capacity to growabsolutely as like that in rainfed conditions (Chadha, 1996).There is immense scope for processing of the fruit, whichhas not received attention.
In summer and early rainy season, bael emerges asone of the most important fruits of India. Apart from itsappetizing ability and nutritive value, this fruit can add flavourand diversity to our diet. Vital micronutrients, vitamins andminerals can be obtained through consumption of bael fruitwhich is particularly a cheap source of essential elementslike Ca, Mg, Cu. Zn, Fe, Mn, Vitamin E, C and β-Carotene.Consumption of Bael is beneficial for heart (Jauhari 1971),kidney as well as nervous, digestive, respiratory andimmune systems of human body. bael is one of the seasonal
arid fruit and an economical source of nutritive elementsrequired for combating malnutritional disorders. Bael fruitis a hard-shelled berry filled with soft yellow to orange sweetpulp. Seeds are closely packed and surrounded by slimymucilage.
CLIMATE AND SOILIt is mostly grown in subtropical climate where winter
is mild and summer is hot and dry. Bael does not grow inhigh altitudes, like in places located 1500 mt above meansea level. Well-drained sandy loam soil is considered bestfor its growth, however being a hardy tree it survives in stonywastelands, alkaline soil and even in swampy areas whereother fruit trees fail to grow.
CULTIVARSThere are few standard varieties of bael which have
been developed only by State Agricultural Universitieslocated at Pantnagar, Faizabad and Kalyani (Jauhari 1969).However many unfamiliar non-standardized different typesof bael are grown throughout the country. It is useful forgrower to select best suitable variety with big to large fruitsize for commercial plantation and processing. Few popularvarieties developed after promising selection procedure aregiven in Table 1.
1 &2 Research Assistant, Krishi Vigyan Kendra, O.U.A.T, Sonepur-767017 (Orissa).
Cultivar Fruit type Fruit weight (kg) Pulp Total Asorbic Other specificity% soluble acid (mg/
sugar 100 gm(Brix) pulp)
Bengol Bael-13 Oblong-large 1.5-2 75-80 38 15 Thorny tall tree, earlymaturing
Pant Sujata Oval-big 0.8-1.2 70-73 30 18 Precocious heavybearer medium-densetype with bigger thorns
Pant Shivani Oval-large 1.5-2 68-70 34 13 Heavy bearer tall treePant Aparna Spherical-smal 0.2-0.5 60-65 34 15 Thorn less, dwarf and
heavy bearer treePant Urbashi Ovoid-large 1.5-2 65-70 38 13 Midseason, tall and
heavy bearer treeNarendra Bael-5 Spherical-medium 0.8-1.2 60-65 38 13 Dwarf spreading treeNarendra Bael-9 Oval-medium 1.0-1.5 60-65 40 14 Pink color rind, early
bearing type
Excluding the above-mentioned varieties, Mirzapuri, Rampuri, Khamaria, Kagzi Gonda, Faizabadi, KB-11 and Ayodhya are also famous in northern India (Parma, 1982).
Table - 1: popular varietes of bael.
36
July 2008 e-planet 6 (2): 35-36
PROPAGATION AND PLANTINGBael is generally raised from seed. Fungicide-treated
freshly extracted seeds are sown in nursery bed. Seedshave no dormancy and germinate in hypogeal way within3-4 weeks after sowing. In the second month, strong andstout seedlings are selected and planted in polybags filledwith normal pot mix soil; after 8-10 months, vigorous growingseedlings are ready for transplanting in the main field. Rootsuckers of bael tree can be separated during rainy seasonand planted in pits. One day patch budding has provedbest. Grafting of bael can be successful when grafted overAegle fraeglegabonesis and Aeglopsis chevalieri. Plantingis done in pits of 45-50 cm depth at 8-10 m spacing duringthe onset of monsoon. Life saving irrigation may benecessary till the establishment of seedlings during longdry spell and hot summer months (Singh 2003).
CULTURAL AND NUTRITIONAL PRACTICESBael plants have enough capacity to tolerate arid
conditions, however in order to achieve good yield, rainwatercollection is usually practiced by creating micro- catchmentarea around the tree. Young plantations should remain freefrom weeds. Commonly the interspace areas are coveredwith legume crops, green manure crops or forage crops.Farmers can get additional income from this practice andalso young plants will be saved from weeds. To give erectshape to the plant, lateral branches on trunk of each plantwithin one metre height from the ground are removed.Pruning is not a general practice in seed plants, but it isneeded to avoid cross branching and to discard dead,diseased, weak and broken branches. Lateral vegetativegrowths from root stocks of grafted plants are regularlypruned.
Being a hardy plant, farmers normally do not opt forfertilization to bael plants, however it would definitelyrespond to good fertilization practice. At the time of planting,each pit should be filled with 15-20 kg well rotten compostor farmyard manure (FYM) and 200-300gm phosphorousfor better establishment. Cultivation in shallow conditionsand application of 20-30kg FYM or compost per annum perplant during the onset of rainy season will be beneficial.
FRUITING BEHAVIOUR AND PRODUCTIONBael tree blooms in summer in between May and June
and fruit takes a long time (10-11 months) to mature andripe. Fruit has three distinct growth stages. In the initial
two months, growth is slow; then the fruit picks up fastgrowth in the next 4-5 months, in the rest 4-5 months growthremains stationary. A seedling tree required 7-8 years tobear fruits while root sucker, budded and grafted plantscan bear fruits 2-3 years earlier. It takes about 12 years fora bael tree to reach its maximum size. Plant of small-fruittype bears more number of fruits than large-fruit type. In agood monsoon year, a grown-up tree in well-maturedcondition can produce 300-500 fruits, which can weigharound 150-200kg.
Grading of bael fruits are commonly made on the basisof organoleptic characters, viz. general appearance, skincolour and texture, taste and flavour of pulp (Singh 1992).Ripe fruits are harvested and transported with care so thatcracks do not develop on its pericarp. However bael fruitscan be kept for a long period in store, they are known towithstand transport and marketing hazards.
DISEASE AND PEST PROBLEMThough disease and pests do not severely affect hardy
bael trees, but sometimes leaves, fruits, twinges, thornshas been reported to be infested by bacteria belonging togenus Xanthomonas. It can be easily controlled by sprayingrecommended antibiotics during pre- and post-monsoontime after removing severely affected plant parts.Occasionally leaf eating caterpillars, leaf rollers can affectthe plants during rainy season. Insect pests infest the baeltrees more in humid than and arid regions. ‘Fruit drop’ is acommon problem in bael but there is no perfect remedy forit. Fruit splitting is another problem which occurs just beforeharvesting. It can be tackled by early harvesting of fruits orby spraying potassium sulphate and potassium borate twicein a year.
REFERENCESChadha K L (1996). Handbook of Horticulture, Published by ICAR, New
DelhiJauhari O S and R.D Singh (1971). Bael, a valuable fruit. Indian Hort. 16
(1): 9-10.Jauhari O S, R.D Singh and R K Awasthi (1969). Survey of five important
varieties of bael (Aegle mormelos corr.). Punjab Hort. J.9 : 18-53.
Parma C, and M K Kavshal (1982). Aegle mormelos p. 1-5. Wild fruits.Kalyani Publishers, New Delhi
Singh H K, A K Srivastava and J Prasad (2003). The catalogue on bael(Aegle mormelos corr.) published from NDUAT,Kumarganj, Faridabad
Singh I S and W Ali (1992). Bael: Panacea Indian Horticulture 37: 55.
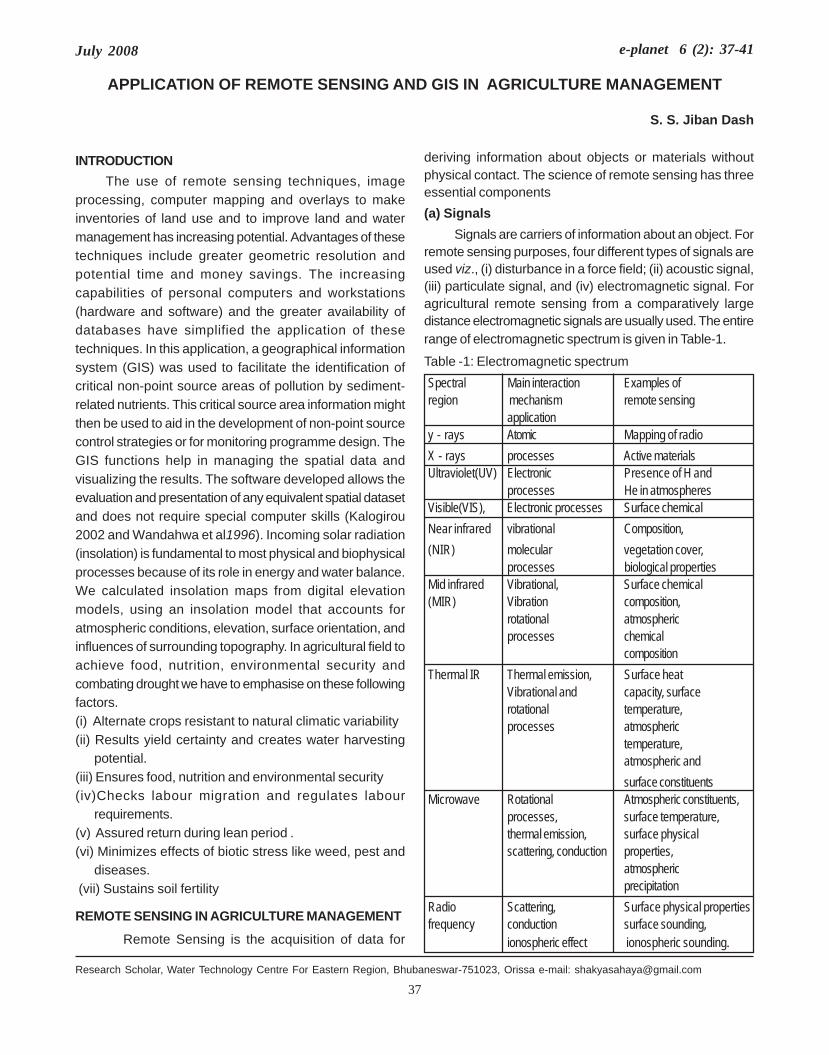
37
July 2008 e-planet 6 (2): 37-41
APPLICATION OF REMOTE SENSING AND GIS IN AGRICULTURE MANAGEMENT
S. S. Jiban Dash
INTRODUCTIONThe use of remote sensing techniques, image
processing, computer mapping and overlays to makeinventories of land use and to improve land and watermanagement has increasing potential. Advantages of thesetechniques include greater geometric resolution andpotential time and money savings. The increasingcapabilities of personal computers and workstations(hardware and software) and the greater availability ofdatabases have simplified the application of thesetechniques. In this application, a geographical informationsystem (GIS) was used to facilitate the identification ofcritical non-point source areas of pollution by sediment-related nutrients. This critical source area information mightthen be used to aid in the development of non-point sourcecontrol strategies or for monitoring programme design. TheGIS functions help in managing the spatial data andvisualizing the results. The software developed allows theevaluation and presentation of any equivalent spatial datasetand does not require special computer skills (Kalogirou2002 and Wandahwa et al1996). Incoming solar radiation(insolation) is fundamental to most physical and biophysicalprocesses because of its role in energy and water balance.We calculated insolation maps from digital elevationmodels, using an insolation model that accounts foratmospheric conditions, elevation, surface orientation, andinfluences of surrounding topography. In agricultural field toachieve food, nutrition, environmental security andcombating drought we have to emphasise on these followingfactors.(i) Alternate crops resistant to natural climatic variability(ii) Results yield certainty and creates water harvesting
potential.(iii) Ensures food, nutrition and environmental security(iv)Checks labour migration and regulates labour
requirements.(v) Assured return during lean period .(vi) Minimizes effects of biotic stress like weed, pest and
diseases. (vii) Sustains soil fertility
REMOTE SENSING IN AGRICULTURE MANAGEMENT
Remote Sensing is the acquisition of data for
deriving information about objects or materials withoutphysical contact. The science of remote sensing has threeessential components(a) Signals
Signals are carriers of information about an object. Forremote sensing purposes, four different types of signals areused viz., (i) disturbance in a force field; (ii) acoustic signal,(iii) particulate signal, and (iv) electromagnetic signal. Foragricultural remote sensing from a comparatively largedistance electromagnetic signals are usually used. The entirerange of electromagnetic spectrum is given in Table-1.
Table -1: Electromagnetic spectrumSpectral Main interaction Examples ofregion mechanism remote sensing
applicationy - rays Atomic Mapping of radioX - rays processes Active materialsUltraviolet(UV) Electronic Presence of H and
processes He in atmospheresVisible(VIS), Electronic processes Surface chemicalNear infrared vibrational Composition,(NIR) molecular vegetation cover,
processes biological propertiesMid infrared Vibrational, Surface chemical(MIR) Vibration composition,
rotational atmosphericprocesses chemical
compositionThermal IR Thermal emission, Surface heat
Vibrational and capacity, surfacerotational temperature,processes atmospheric
temperature,atmospheric andsurface constituents
Microwave Rotational Atmospheric constituents,processes, surface temperature,thermal emission, surface physicalscattering, conduction properties,
atmosphericprecipitation
Radio Scattering, Surface physical propertiesfrequency conduction surface sounding,
ionospheric effect ionospheric sounding.
Research Scholar, Water Technology Centre For Eastern Region, Bhubaneswar-751023, Orissa e-mail: [email protected]
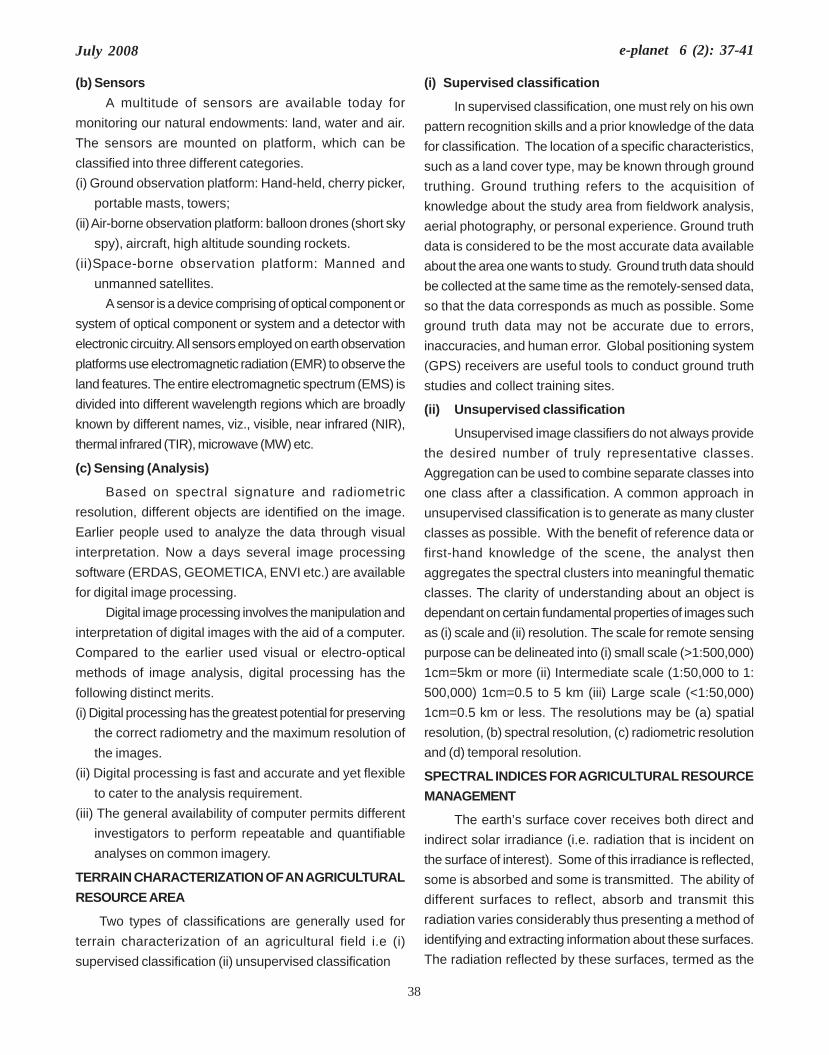
38
July 2008 e-planet 6 (2): 37-41
(b) SensorsA multitude of sensors are available today for
monitoring our natural endowments: land, water and air.The sensors are mounted on platform, which can beclassified into three different categories.(i) Ground observation platform: Hand-held, cherry picker,
portable masts, towers;(ii) Air-borne observation platform: balloon drones (short sky
spy), aircraft, high altitude sounding rockets.(ii)Space-borne observation platform: Manned and
unmanned satellites.A sensor is a device comprising of optical component or
system of optical component or system and a detector withelectronic circuitry. All sensors employed on earth observationplatforms use electromagnetic radiation (EMR) to observe theland features. The entire electromagnetic spectrum (EMS) isdivided into different wavelength regions which are broadlyknown by different names, viz., visible, near infrared (NIR),thermal infrared (TIR), microwave (MW) etc.
(c) Sensing (Analysis)
Based on spectral signature and radiometricresolution, different objects are identified on the image.Earlier people used to analyze the data through visualinterpretation. Now a days several image processingsoftware (ERDAS, GEOMETICA, ENVI etc.) are availablefor digital image processing.
Digital image processing involves the manipulation andinterpretation of digital images with the aid of a computer.Compared to the earlier used visual or electro-opticalmethods of image analysis, digital processing has thefollowing distinct merits.(i) Digital processing has the greatest potential for preserving
the correct radiometry and the maximum resolution ofthe images.
(ii) Digital processing is fast and accurate and yet flexibleto cater to the analysis requirement.
(iii) The general availability of computer permits differentinvestigators to perform repeatable and quantifiableanalyses on common imagery.
TERRAIN CHARACTERIZATION OF AN AGRICULTURALRESOURCE AREA
Two types of classifications are generally used forterrain characterization of an agricultural field i.e (i)supervised classification (ii) unsupervised classification
(i) Supervised classification
In supervised classification, one must rely on his ownpattern recognition skills and a prior knowledge of the datafor classification. The location of a specific characteristics,such as a land cover type, may be known through groundtruthing. Ground truthing refers to the acquisition ofknowledge about the study area from fieldwork analysis,aerial photography, or personal experience. Ground truthdata is considered to be the most accurate data availableabout the area one wants to study. Ground truth data shouldbe collected at the same time as the remotely-sensed data,so that the data corresponds as much as possible. Someground truth data may not be accurate due to errors,inaccuracies, and human error. Global positioning system(GPS) receivers are useful tools to conduct ground truthstudies and collect training sites.
(ii) Unsupervised classification
Unsupervised image classifiers do not always providethe desired number of truly representative classes.Aggregation can be used to combine separate classes intoone class after a classification. A common approach inunsupervised classification is to generate as many clusterclasses as possible. With the benefit of reference data orfirst-hand knowledge of the scene, the analyst thenaggregates the spectral clusters into meaningful thematicclasses. The clarity of understanding about an object isdependant on certain fundamental properties of images suchas (i) scale and (ii) resolution. The scale for remote sensingpurpose can be delineated into (i) small scale (>1:500,000)1cm=5km or more (ii) Intermediate scale (1:50,000 to 1:500,000) 1cm=0.5 to 5 km (iii) Large scale (<1:50,000)1cm=0.5 km or less. The resolutions may be (a) spatialresolution, (b) spectral resolution, (c) radiometric resolutionand (d) temporal resolution.
SPECTRAL INDICES FOR AGRICULTURAL RESOURCEMANAGEMENT
The earth’s surface cover receives both direct andindirect solar irradiance (i.e. radiation that is incident onthe surface of interest). Some of this irradiance is reflected,some is absorbed and some is transmitted. The ability ofdifferent surfaces to reflect, absorb and transmit thisradiation varies considerably thus presenting a method ofidentifying and extracting information about these surfaces.The radiation reflected by these surfaces, termed as the
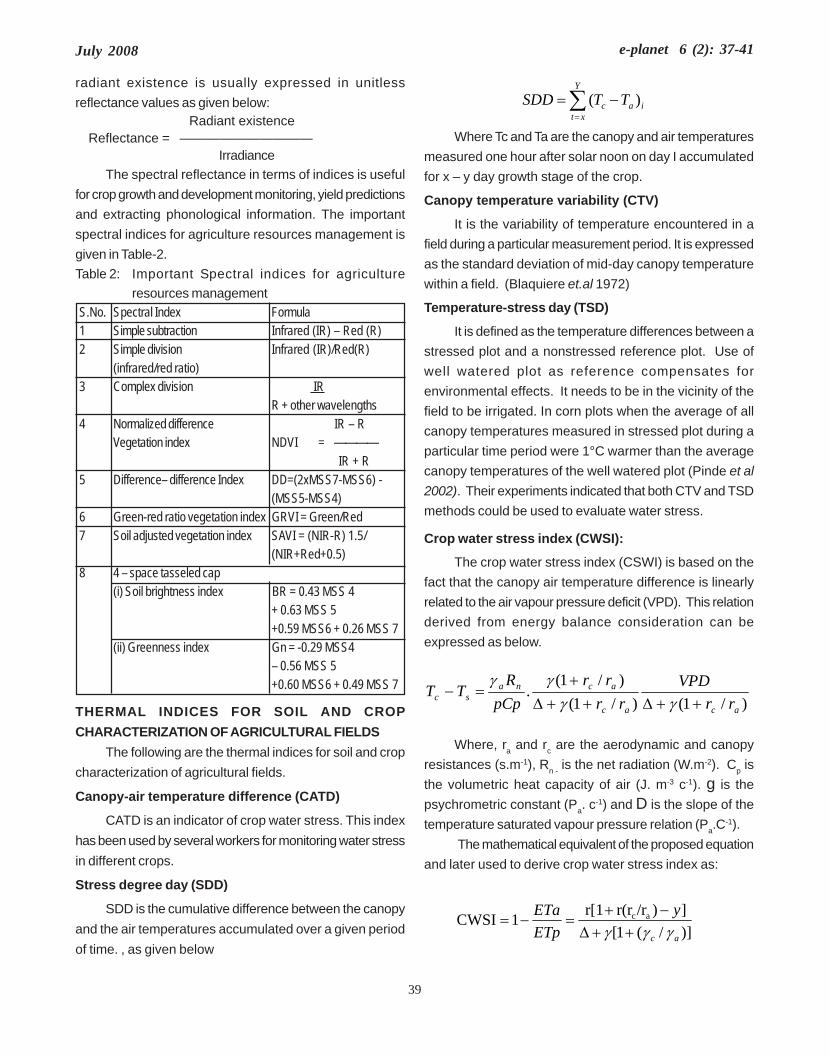
39
July 2008 e-planet 6 (2): 37-41
radiant existence is usually expressed in unitlessreflectance values as given below: Radiant existence Reflectance = ——————————
IrradianceThe spectral reflectance in terms of indices is useful
for crop growth and development monitoring, yield predictionsand extracting phonological information. The importantspectral indices for agriculture resources management isgiven in Table-2.Table 2: Important Spectral indices for agriculture
resources managementS.No. Spectral Index Formula1 Simple subtraction Infrared (IR) – Red (R)2 Simple division Infrared (IR)/Red(R)
(infrared/red ratio)3 Complex division IR
R + other wavelengths4 Normalized difference IR – R
Vegetation index NDVI = ———— IR + R
5 Difference– difference Index DD=(2xMSS7-MSS6) -(MSS5-MSS4)
6 Green-red ratio vegetation index GRVI = Green/Red7 Soil adjusted vegetation index SAVI = (NIR-R) 1.5/
(NIR+Red+0.5)8 4 – space tasseled cap
(i) Soil brightness index BR = 0.43 MSS 4+ 0.63 MSS 5+0.59 MSS6 + 0.26 MSS 7
(ii) Greenness index Gn = -0.29 MSS4– 0.56 MSS 5+0.60 MSS6 + 0.49 MSS 7
THERMAL INDICES FOR SOIL AND CROPCHARACTERIZATION OF AGRICULTURAL FIELDS
The following are the thermal indices for soil and cropcharacterization of agricultural fields.
Canopy-air temperature difference (CATD)
CATD is an indicator of crop water stress. This indexhas been used by several workers for monitoring water stressin different crops.
Stress degree day (SDD)
SDD is the cumulative difference between the canopyand the air temperatures accumulated over a given periodof time. , as given below
∑=
−=Y
xtiac TTSDD )(
Where Tc and Ta are the canopy and air temperaturesmeasured one hour after solar noon on day I accumulatedfor x – y day growth stage of the crop.
Canopy temperature variability (CTV)
It is the variability of temperature encountered in afield during a particular measurement period. It is expressedas the standard deviation of mid-day canopy temperaturewithin a field. (Blaquiere et.al 1972)
Temperature-stress day (TSD)
It is defined as the temperature differences between astressed plot and a nonstressed reference plot. Use ofwell watered plot as reference compensates forenvironmental effects. It needs to be in the vicinity of thefield to be irrigated. In corn plots when the average of allcanopy temperatures measured in stressed plot during aparticular time period were 1°C warmer than the averagecanopy temperatures of the well watered plot (Pinde et al2002). Their experiments indicated that both CTV and TSDmethods could be used to evaluate water stress.
Crop water stress index (CWSI):
The crop water stress index (CSWI) is based on thefact that the canopy air temperature difference is linearlyrelated to the air vapour pressure deficit (VPD). This relationderived from energy balance consideration can beexpressed as below.
Where, ra and rc are the aerodynamic and canopyresistances (s.m-1), Rn - is the net radiation (W.m-2). Cp isthe volumetric heat capacity of air (J. m-3 c-1). g is thepsychrometric constant (Pa. c
-1) and D is the slope of thetemperature saturated vapour pressure relation (Pa.C
-1). The mathematical equivalent of the proposed equation
and later used to derive crop water stress index as:
)]/(1[])/rr(rr[11CWSI ac
ac
yETpETa
γγγ ++∆−+
=−=
)/1()/1()/1(
.acac
acnasc rr
VPDrr
rrpCp
RTT
++∆++∆+
=−γγ
γγ
40
July 2008 e-planet 6 (2): 37-41
Where ETa is actual evapo-transpiration. ETp ispotential evapo-transpiration, is psychro metric constant(paC-1, rc is the canopy resistance (sec m-1)., ra is theaerodynamic resistance (sec m-1) and is the slope ofsaturated vapour pressure temperature relation (Pa°C-1).
MORPHOMETRIC ANALYIS USING REMOTE SENSINGAND GIS
The mapping of drainage pattern of watershed formorphometric analysis can be done by using satellite dataor from topographical map. Earlier many researchersperformed quantitative analysis of drainage network usingmanual methods like area measurement using grid methodor using planimeter and length measurement using threadlength, Opsiometer, Ruler and Digital Curvimeter etc. Butthese methods are very tedious and time consuming(Usery et al 1995). It is more difficult if the map is onhigher scale like 1:50,000 0r 1:25,000. To overcome theproblem, GIS technique is used for agriculture landmorphometric analysis.
ESTIMATION OF SOIL LOSS USING REMOTE SENSINGAND GIS
Estimation of soil loss from the watershed to identifypriority area for establishment of soil and water conservationmeasures for agricultural proposes. The widely adoptedUSLE model (RKLSCP) is used to estimate soil erosion.From the average annual rainfall and maximum 30-miniuteintensity of rainfall, the R is calculated. The erodibility factor(K), topographic factor (LS), and cover management factor(C) are extracted form different sources.
ESTIMATION OF SEDIMENT YIELD INDEX USINGREMOTE SENSING AND GIS
Quantitative estimate of sediment yield index (SYI) iscarried out after computing two derived parameters; firstlythe erosivity (measure of erosion intensity units) andsecondly a delivery ratio indicating transportability ofsediment to the dam reservoir. Area weightage value of eacherosion intensity unit and sediment yield index of thewatersheds are calculated using the following formulae; SYI = E ´ Dr ´ 100where, E = the erosivity of mapping unit, Aei = the area ifthe ith erosion mapping unit, Wei = the weightage assignedto ith mapping unit, Aw = the area of the watershed, SYI =the sediment yield index, and Dr = the delivery ratio.
LAND USE PLANNING IN AGRICULTURAL LAND USINGREMOTE SENSING AND GIS TOOLS
Proper inventory of natural resources data like landuse, soil, slope hydrogeomorphology, groundwaterresources, climate, etc. can be made using GIS in theform of separate layers. With the help of integrated GIScoverage of different thematic maps and based on somedecision rules, alternative site specific land and waterresources development can be suggested on watershed orblock basis. Keeping existing land use and land cover asa base and considering the limitation and potential of otherfactors for development, alternative site-specific land usesystem like agro-forestry, silvipasture, multiple cropping,agro-horticulture, plantation crops, fodder plantation etc.may be recommended (Messing et al 2003). Waterharvesting and soil-water conservation measures can alsobe suggested on the basis of soil, slope,hydrogeomorphological information.
REMOTE SENSING APPLICATION IN WATERRESOURCES PLANNING IN AGRICULTURE LOCATION
Remote sensing techniques, complementing theground based data collection methods, can provideadequate, reliable and time effective information on waterresources, which includes inventory of surface and groundwater resources (Kontoes 1993). High altitude aerialphotography and satellite remote sensing have been usedfor mapping surface water bodies such as reservoirs, lakesand tanks over large areas. Investigation for ground waterrequires comprehensive information on soil, vegetation,geology etc. On the other hand, the hydrological applicationof Remote Sensing can be divided into two groups:
Direct indicator
Refer to the detection of physical properties directlyassociated with ground water or the ground waterenvironment. Persistence of green vegetation during thedry season may indicate shallow water table conditions.The excessive soil moisture in a given region could be anindicator of shallow aquifers. The detection of rechargesand discharge zones is also directly linked with themovement of the ground water.
Indirect indicator
Other than the climatological factors the movementof surface and subsurface water is controlled by thegeomorphology (landforms) and geology (lithology and
41
July 2008 e-planet 6 (2): 37-41
structures) of the region. The indirect indicators essentiallyrefer to the interpretation of these hydrogeological factors.
REMOTE SENSING APPLICATIONS IN AQUIFERCHARACTERIZATION
The presence of broad shallow valleys, alluvial cores,alluvial fans etc. suggest the availability of fluvial deposits,which form good shallow aquifers. The information extractedabout the lineaments, the dykes, outcrop pattern like circularwill be of great hydro-geological significance and will helpin locating deep aquifers.
MICROWAVE REMOTE SENSING FOR SOIL MOISTUREDETERMINATION
The dielectric properties of a medium determine thepropagation characteristics for electromagnetic waves inthe medium, and as a result they affect the emissive andreflective properties at the surface. Thus these latter twoquantities for a soil will depend on its moisture content,and they can be measured in the microwave region of thespectrum by radiometric (passive) and radar (active)techniques. This physical relationship between microwaveresponse and soil moisture plus the ability of the microwavesensors to penetrate clouds, make them very attractive foruse as soil moisture sensors (Cools et al 2003).
GENERATION OF DIGITAL ELEVATION MODEL
The Digital Elevation Model (DEM) represents a database from which various secondary products are derivede.g., contours profiles, volumes, slope, hill shading, 3Dscenes, perspective view, etc. A special class of applicationrelates to the intersection of DEMs with other spatial orplaniertric data like cadastral properties, land use, vegetationcover, traffic lines, etc. DEM also forms a base of technicalmodelling for many natural and induced processes of ourenvironment such as climate, water, flood, disastermonitoring, etc. DEM data can be extracted from terraindirectly or from images of the terrain (photographs or remotesensing). There are mainly three techniques for acquiringDEM data.
CONCLUSION
Remote sensing and GIS technique provides aneffective means of handling spatial and non-spatial data. Itcan be effectively used for; terrain characterization of anagricultural resource areas; agriculture resourcesmanagement; soil and crop characterization of agriculturefields; Morphometric analysis of agricultural areas;
estimation of soil loss; estimation of sediment yield index;aquifer characterization; soil moisture determination inagriculture fields; generation of digital elevation model; landuse planning in agriculture areas and resources planningin asgriculture location. Today many research organizationsare moving agricultural land information into remote sensingand GIS. Land information is an integral part of government,non-profit, and private sector activities. Adopting remetesensing and GIS techniques can advance broader socialpurposes by making more effective public decisions. Theremote sensing and GIS techniques are helpful for ouragriculture engineers of natural resource development andmanagement and protection of environment.
REFERENCES
Blaquiere A, L Juricek and K E Wiese (1972). Geometry of Pareto
equilibria and a maximum principle in N-person differen-
tial games, Journal of Mathematical Analysis and Appli-
cations, 38(1): 223-243.
Cools N, E De Pauw and J Deckers (2003). Towards an integration of
conventional land evaluation methods and farmers’ soil
suitability assessment: a case study in northwestern
Syria Agriculture, Ecosystems & Environment, 95 (1):
327-342.
Fu Pinde and M. Paul Rich (2002). A geometric solar radiation model
with applications in agriculture and forestry Computers
and Electronics in Agriculture, 37(1-3): 25-35.
JKalogirou S (2002). Expert systems and GIS: an application of land
suitability evaluation Computers, Environment and Urban
Systems, 26(2-3): 89-112.
Kontoes C, G G Wilkinson, A Burrill, S Goffredo and J M Gier (1993).
An experimental system for the integration of GIS data in
knowledge-based image analysis for remote sensing of
agriculture International Journal of Geographical Infor-
mation Science, 7 (3): 247 - 262
Messing I, Minh-Ha, H Fagerström, L Chen and B Fu (2003). Criteria for
land suitability evaluation in a small catchment on the
Loess Plateau in China CATENA, 54(1-2) : 215-234.
Usery E L, S Pocknee and B Boydell (1995). Precision Farming Data
Management Using Geographic Information Systems,
Journal Of Photogrammetric Engineering And Remote
Sensing, 61(11): 1345-1404.
Wandahwa P and E van Ranst (1996). Qualitative land suitability
assessment for pyrethrum cultivation in west Kenya
based upon computer-captured expert knowledge and
GIS, Agriculture, Ecosystems & Environment, 56 (3):
187-202
42
July 2008 e-planet 6 (2): 42-44
ROLE OF KRISHI VIGYAN KENDRA IN CHANGING THE PROFILE OF RURAL FOLKS OFSUBARNAPUR DISTRICT, ORISSA
B. R. Samantaray1 and S. C. Mohapatra2
INTRODUCTIONAgricultural extension has long been recognized as
an arm of agricultural research that facilitates the transferof technology from laboratories and experimental stationsto farmers and also bridging the gap between scientistsand farmers in the larger interest of improving the standardof living of a vast majority of rural people. The village basedscientific agricultural institution called as farm science cen-ter is popularly known as KVK which plays the role modelin the transfer of technology from laboratory to farmer’sfield with respect to agriculture and allied disciplines like,Horticulture, Fishery, Animal Husbandary etc. Krishi VigyanKendra, Sonepur was established on 1st July 2005 atBadajhinki, Sonepur, Subarnapur under the administrativecontrol of Orissa University of Agriculture and Technology(O.U.A.T.), Bhubaneswar, with cent percent financial sup-port of staff salary, infrastructure and contingency by Min-istry of Agriculture, Government of India through IndianCouncil of Agricultural Research (ICAR), New Delhi andthe land of the institute is given by Government of Orissa(Department of Agriculture) with an aim to fulfill the follow-ing objectives to empower the rural people.MODUS OPERANDI
Programme coordinator is the head of K. V .K. familyand coordinates work of all the scientists for smoothfunctioning of K.V.K. as well as for the benefit of rural peopleof that particular area. He takes the leading role in keepingliaison with other line departments for coordination andeffective implementation of different programmes of K.V.K.in the adopted village. The work of KVK is based on adoptedvillage concept, each adopted village represents oneparticular agro-eco situation of the district. As per theguidelines, KVK Sonepur has selected 5 (Chasagotha,Panisiali, Arjunpur, Lakarma and Ichhapur) economically,culturally and technologically backward villages situatedwithin 20 km radius of K.V.K. Before the selection of adoptedvillage, detailed survey of the villages was carried out tostudy the socio-economic, cultural status and resourcepotential of these villages using Participatory Rural Appraisal(PRA) tool through active participation of the villagers likethe drawing of village map population, animal resources,school, colleges etc. which in turn helped the scientists toprioritize the problems, prepare the projects according totheir need and solve their farm problems through differenton farm testing (OFT), front line demonstration(FLD) andtraining programs. Besides the adopted villages, KVKSonepur has also intervened in the villages like Jhinki,
Phulmuthi, Haladipalli, Banka Bija, Aiganjori, Anandapur,Singhari, Sasamura, Sahajbahal, Nandanmal, Gadia,Karlakhaman, Laturpet, Kirtipur, Marichpur. As there is noKVK in Bolangir district, KVK Sonepur is also assigned tolook after the sub division of Bolangir district till theestablishment of KVK there.MAIN OBJECTIVES OF KRISHI VIGYAN KENDRA,SONEPUR(i) To keep intact the research extension linkages and toprovide new and important information to the extensionagencies and NGOs for wider circulation in that locality forthe betterment of rural people.(ii) To identify important problems of the locality as per theneed of farmers and prioritization of the identified problemsas per their importance based on the agro climatic zoneand agro ecological situation.(iii) To act as an intermediary organization in farmers’ ca-pacity building by imparting need based training programon agriculture and allied sectors for the refinement of knowl-edge and well to develop eagerness to adopt new tech-nologies.(iv) To prepare different extension models and verify thesemodels in the farmers’ field with their participation to cre-ate confidence among them.(v) To demonstrate new improved technology to the farm-ers as well as to the extension agencies directly in thefarmers’ field with their active participation and also withthe involvement of block level extension workers.(vi) To collect feedback from the farmers and extension agen-cies and to communicate these message to research sci-entists for modification of technology and to keep goodrelation with all the line departments for better transfer oftechnology and minimization of the gap.
Apart from the mandatory works the other works whichhave been performed by KVK without hampering the rou-tine work are:(vii)To produce quality seeds and planting materials in KVKfarm by utilizing ICAR revolving fund.(viii)To provide technical support to line departments as andwhen necessary.(ix)To conduct sponsored training (short and long duration)programmes on agriculture and allied field with direct finan-cial support of government and some cases non-governmentorganisations, self help group and individuals.(x)To provide consultancy service to individual farmer, group
1. Subject Matter Specialist (Fishery), Krishi Vigyan Kendra, Orissa University of Agriculture and Technology (O.U.A.T), Sonepur– 767017,Orissa, India; E-mail: [email protected];
2. Programme Coordinator, Krishi Vigyan Kendra, Sonepur– 767017, Orissa, India
43
July 2008 e-planet 6 (2): 42-44
of farmers and private companies on different income genera-tion activities and innovative technologies on farm sectors.(xi)To be part of the executive body of all central govern-ment funded schemes / projects, operated by the line de-partments like -(ATMA), NFSM, NHM, RKVY, Cotton minimission, Pani Panchayat, Water shed, NFDP, ICDP etc.(xii)To document and survey different activities going on inagricultural and allied disciplines in the district.TRAINNING THROUGH FIELD DEMONSTRATION
“Seeing is believing” is the basic philosophy of fielddemonstrations. Only proven technologies are thereforeselected for field demonstrations. Field demonstrationseducate farmers through results obtained in terms of cropvarieties resistant to disease and pest, quality of the grainsand overall higher yields. In addition, it also educate thefarmers in term of input-output ratio and economic gains interms of net returns. Basically, there are two types of fielddemonstrations.STEPS IN CONDUCTING FIELD DEMONSTRATION
Apart from the special learning session inside class,distribution of land layout, fild demonstration is taken up.Since field demonstration is often used as an extensionmethod, it is sometimes laid out in a routine manner. A wellconducted demonstration should help the scientists to givefinishing touch to changing attitude of farmers and extensionworkers and improve their knowledge, understanding andskills. The following steps need to be followed in conductingfield demonstration.A. PLANNING PHASE
Know the vicinity:The scientists develop an understanding of the
farmers, their farming systems, resources and establishrapport with them which is essential to gather informationon cropping system, present level of use of inputs andproductivity of major crops of the area. There are differentways of knowing vicinity, such as; (i) Visiting villages andfarmers, (ii) Collection of information using PRA tools, (iii)Meeting people individually and in groups, (iv) Meetingopinion leaders, (v) Exchanging information with localextension workers and (vi) Consulting office records ofpopulation and basic agriculture.Selection of technologies
Only proven technologies that have higherpotentialities in terms of yield, disease resistance, qualityand can fit in the existing farming systems and situationsof the area should be taken into account. The technologyshould be frontier ones i.e. recently released technologiesor such which are at advance stage of release and muchsuperior than the technology being already in use.Select demonstration site
Demonstration sites which are selected are easilyaccessible for the farmers and extension workers. Place of
demonstration site should have a all around good numberof farmers of all categories of land holding and status. Dem-onstration must never be conducted in a single farmer’splot. Attention should be given to farm size, layout of thefield, soil type, fertility status, irrigation facilities and drain-age system.Select Demonstration Farmers
A group of farmers’ land holdings in the selecteddemonstration block and those who are willing to cooperatein conduct of demonstration should be selected.Demonstration farmers should be selected finally by holdinga meeting in the village where the purpose of demonstrationshould be clearly stated and suggestion sought fromfarmers.Finalise package of practices
This is an important step in planning the fielddemonstrations in which new technologies from the ICARInstitute/ State Agricultural Universities (SAUs) are collectedand ensure these technologies are frontier ones showingsubstantial increase in yields. Involve as many scientistsof the research station in the discussion as possible. Thiswill help in working out minute details of sequences ofmethod demonstration required, identification of importanttasks/practices in which presence of scientists should benecessary and critical input for demonstration.Prepare for demonstration
Critical inputs are those agricultural inputs which arevital to help the selected technologies to exhibit itsproduction potentialities on farmer’s field and not earlierbeing used by the farmers. Only critical inputs are suppliedby the scientists. The farmers themselves arrange otherinputs.B. CONDUCTING PHASELayout of Demonstration
Special training programme are arranged for all farmersin whose plots demonstrations are to be laid.Harvesting
The farmers are asked to estimate the yield and tosay in what way the demonstrated technologies are superiorthan the earlier ones. Are they satisfied with the performanceof the technologies? What lessons they have learned fromthe demonstration? Will they advice other fellow farmers toadopt this practice? Will they exchange the seed materialsof new variety with other fellow farmers? What are theexpected profits? Will it be more than what they used toget from their own practices? What are the difficulties infollowing the demonstrated practices? Idea is to ascertainas to what extent farmers are satisfied with thedemonstrated technology and what is the possibility of theircontinued adoption. Generally farmers may revert to oldpractices in the absence of follow-up. They need informationreinforcement, timely supply of inputs or on-the-spotguidance. So group approach in follow-up is always carriedout to give better results.
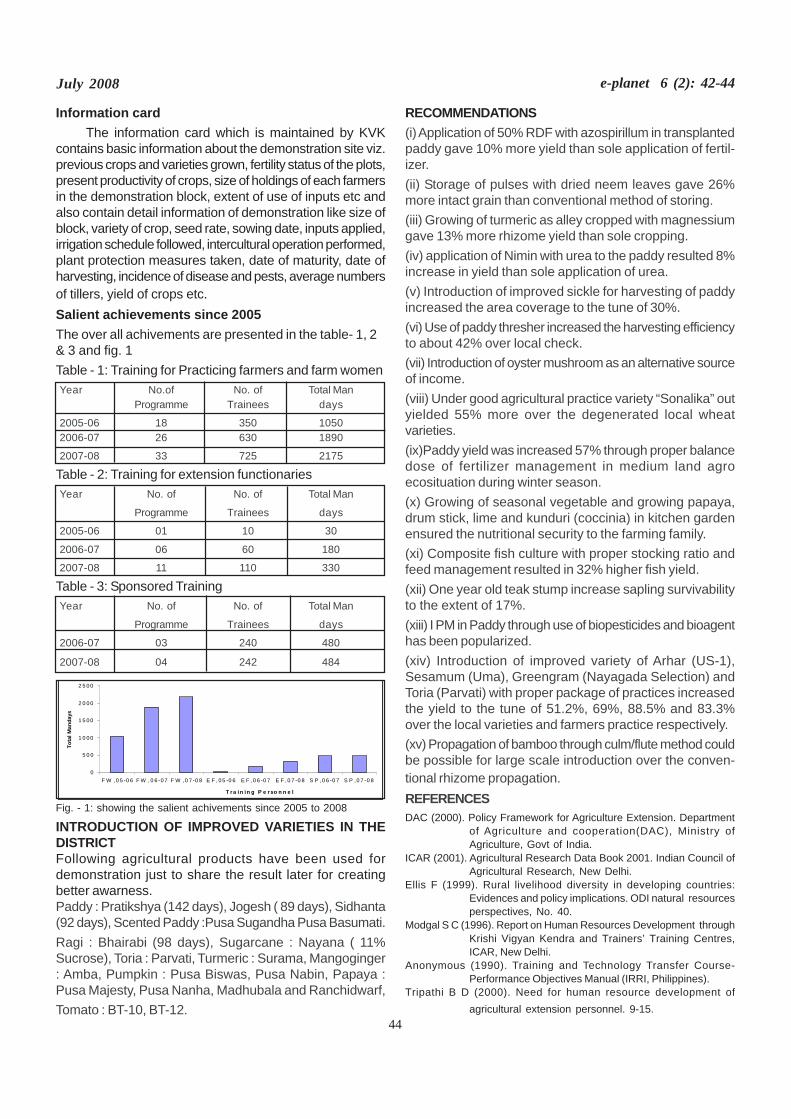
44
July 2008 e-planet 6 (2): 42-44
Information cardThe information card which is maintained by KVK
contains basic information about the demonstration site viz.previous crops and varieties grown, fertility status of the plots,present productivity of crops, size of holdings of each farmersin the demonstration block, extent of use of inputs etc andalso contain detail information of demonstration like size ofblock, variety of crop, seed rate, sowing date, inputs applied,irrigation schedule followed, intercultural operation performed,plant protection measures taken, date of maturity, date ofharvesting, incidence of disease and pests, average numbersof tillers, yield of crops etc.Salient achievements since 2005The over all achivements are presented in the table- 1, 2& 3 and fig. 1Table - 1: Training for Practicing farmers and farm womenYear No.of No. of Total Man
Programme Trainees days
2005-06 18 350 10502006-07 26 630 1890
2007-08 33 725 2175
Table - 2: Training for extension functionariesYear No. of No. of Total Man
Programme Trainees days
2005-06 01 10 30
2006-07 06 60 180
2007-08 11 110 330
Table - 3: Sponsored TrainingYear No. of No. of Total Man
Programme Trainees days
2006-07 03 240 480
2007-08 04 242 484
Fig. - 1: showing the salient achivements since 2005 to 2008
INTRODUCTION OF IMPROVED VARIETIES IN THEDISTRICTFollowing agricultural products have been used fordemonstration just to share the result later for creatingbetter awarness.Paddy : Pratikshya (142 days), Jogesh ( 89 days), Sidhanta(92 days), Scented Paddy :Pusa Sugandha Pusa Basumati.Ragi : Bhairabi (98 days), Sugarcane : Nayana ( 11%Sucrose), Toria : Parvati, Turmeric : Surama, Mangoginger: Amba, Pumpkin : Pusa Biswas, Pusa Nabin, Papaya :Pusa Majesty, Pusa Nanha, Madhubala and Ranchidwarf,Tomato : BT-10, BT-12.
RECOMMENDATIONS(i) Application of 50% RDF with azospirillum in transplantedpaddy gave 10% more yield than sole application of fertil-izer.(ii) Storage of pulses with dried neem leaves gave 26%more intact grain than conventional method of storing.(iii) Growing of turmeric as alley cropped with magnessiumgave 13% more rhizome yield than sole cropping.(iv) application of Nimin with urea to the paddy resulted 8%increase in yield than sole application of urea.(v) Introduction of improved sickle for harvesting of paddyincreased the area coverage to the tune of 30%.(vi) Use of paddy thresher increased the harvesting efficiencyto about 42% over local check.(vii) Introduction of oyster mushroom as an alternative sourceof income.(viii) Under good agricultural practice variety “Sonalika” outyielded 55% more over the degenerated local wheatvarieties.(ix)Paddy yield was increased 57% through proper balancedose of fertilizer management in medium land agroecosituation during winter season.(x) Growing of seasonal vegetable and growing papaya,drum stick, lime and kunduri (coccinia) in kitchen gardenensured the nutritional security to the farming family.(xi) Composite fish culture with proper stocking ratio andfeed management resulted in 32% higher fish yield.(xii) One year old teak stump increase sapling survivabilityto the extent of 17%.(xiii) I PM in Paddy through use of biopesticides and bioagenthas been popularized.(xiv) Introduction of improved variety of Arhar (US-1),Sesamum (Uma), Greengram (Nayagada Selection) andToria (Parvati) with proper package of practices increasedthe yield to the tune of 51.2%, 69%, 88.5% and 83.3%over the local varieties and farmers practice respectively.(xv) Propagation of bamboo through culm/flute method couldbe possible for large scale introduction over the conven-tional rhizome propagation.REFERENCESDAC (2000). Policy Framework for Agriculture Extension. Department
of Agriculture and cooperation(DAC), Ministry ofAgriculture, Govt of India.
ICAR (2001). Agricultural Research Data Book 2001. Indian Council ofAgricultural Research, New Delhi.
Ellis F (1999). Rural livelihood diversity in developing countries:Evidences and policy implications. ODI natural resourcesperspectives, No. 40.
Modgal S C (1996). Report on Human Resources Development throughKrishi Vigyan Kendra and Trainers’ Training Centres,ICAR, New Delhi.
Anonymous (1990). Training and Technology Transfer Course-Performance Objectives Manual (IRRI, Philippines).
Tripathi B D (2000). Need for human resource development ofagricultural extension personnel. 9-15.
0
5 0 0
1 0 0 0
1 5 0 0
2 0 0 0
2 5 0 0
F W ,0 5 -0 6 F W , 0 6 -0 7 F W ,0 7 -0 8 E F , 0 5 -0 6 E F ,0 6 -0 7 E F ,0 7 -0 8 S P ,0 6 -0 7 S P ,0 7 -0 8
T r a in in g P e r so n n e l
Tota
l Man
days
45
July 2008 e-planet 6 (2): 45-48
IMPACT OF GLOBAL WARMING UPON AQUATIC RESOURCES - AN OVERVIEW
B. K. Das1, S. Ghosh2, K. K. Nayak3, P. Patnaik4,
D. K. Swain5 and A. Mallick6
INTRODUCTION In recent years in media, prediction and consensusof global warming, i.e. the greenhouse effect has supercededall other concerns relating to changing environment. Minorconstituents of the atmosphere, like carbon dioxide,methane and water vapour allow solar radiation to come inbut trap the longer wavelengths of the sun and resultingthermal re-radiation from the earth to a considerable extent.Ozone depletion in the stratosphere caused a significantincrease in ultraviolet radiation reaching earth’s surface(Brahmam, 2008). It is a well-established fact that industrialactivities over the past century have resulted in increasingatmospheric concentrations of greenhouse gases, whichhas further led to a sharp rise in mean global temperaturesover the last fifty years. The increase in greenhouse gaseslike carbon dioxide has been implicated to the burning ofnatural gas and fossil fuels such as oil and coal, andchanges in land use, such as cutting down forests to makeway for agriculture and other developmental activitiesincluding housing. Carbon-dioxide emissions from developingcountries have increased by 32% during 1990 and 1998.Agriculture is said to be primarily responsible for increasesin methane and nitrous oxide gases. Methane, volume pervolume is considered to be far more harmful than Carbondioxide. Increasing abundance of these gases affect theradiation balance at the earth’s surface (Mitchell, 1989).The other human-influenced greenhouse gases includehydrofluorocarbons, perfluorocarbons and sulphurhexafluoride.
The average global temperature has increased by 0.3to 0.60 C between 1890-1990. Global temperatures areexpected to increase 2.1 to 4.8 degrees C by the year2050. The consequential results can be massive. Risingtemperatures will change global weather patterns, whichare having a direct control and effect on water supplies,agriculture and life forms. The General Circulation Modelsof the atmosphere indicates that increase in Carbon dioxidelevel can effect a greater frequency of heavy rainfall orextreme precipitation. It may also effect an increased rateof evaporation in many parts of the world. If the latterexceeds the former, soil will become drier, water level in
lakes will drop and river will carry less water. Lakes andopen water ponds may turn into damp land. In a drierclimate, agrofarmers will be forced to increase the rate ofirrigation. This process will further lower the water table inlakes and rivers. Once the river flow decreases,concentration of pollutants in it will rise. All such processeswill definitely worsen the natural habitat of fishes.Desertification, frequency and severity of droughts andharmful heat waves will increase. Snow and glacier melt inthe Himalayas-Karakoram range may also result in changesin the flows of the Indus, Brahmaputra, Ganges andMekong, which sustain major riverine and floodplainfisheries. The harmful impacts of greenhouse-gas pollutantscan have its influence on the whole world.
GENERAL IMPACT ON MANKINDIncreasing global temperatures causes the thermal
expansion of seawater and the melting of icecaps, whichwill result in rising sea level. Effects of global warming onsea levels are clearly accelerating, as is evidenced by thefact that global sea levels rose 6 to 9 inches in the 20thcentury. A doubling of pre-industrial CO2 concentration (550ppm) is predicted to result in a sea level rise of greater than40 inches. Sea levels worldwide have been predicted torise between 7 and 23 inches by the year 2100 and willcontinue to rise. Consequently, fierce storms will becomemore frequent and river flooding will increase in some areas.Rising sea levels will cause millions of people in coastalareas to leave their homes. It will cause land to be lost dueto erosion. Many small island nations lack the coastaldefense systems to cope with higher water levels. Thusrising waters might force the occupants of such islands tomigrate (as refugees) elsewhere. There are currently 46million people around the world who are at risk due toflooding from storm surges. With a sea level rise by oneand a half feet, about 92 million people will be at risk.Flooding will contaminate water supplies in some areasand give rise to infectious water-borne diseases in humans.Rising temperatures will increase the congeniality ofbreeding environment of mosquitoes and other disease-
1 Senior Scientist, Fish Health Management Division, Central Institute of Freshwater Aquaculture (ICAR), Bhubaneswar – 7510022,4,5,6 Research Fellows (DBT-funded Project), Central Institute of Freshwater Aquaculture (ICAR), Bhubaneswar – 7510023 Lecturer in Zoology, KVDAV College, Nirakarpur, Khurda * Corresponding author. Email: [email protected]
46
July 2008 e-planet 6 (2): 45-48
bearing insects; more people are likely to be exposed todiseases like malaria, dengue fever and encephalitis.
In tropical and subtropical regions, food production isexpected to change substantially as a result of climatechange. The variety of crops that can be grown in a particularregion is predicted to decline. Developing countries thatcurrently struggle with issues of global warming will not beable to adapt to these circumstances. Global warming islikely to exacerbate inadequate access to food, water, healthcare and income in continent like Africa and other developingcountries.
IMPACT UPON LAND AND AQUATIC LIFE FORMS
Increased levels of carbon dioxide in the atmospherewill change the pH balance of seawater, making it slightlymore acidic. According to marine biologists, a shift towardgreater acidity can threaten the survival of coral reefs andplankton. Due to global warming, ideal temperature andprecipitation ranges that are suitable for survival of presentlife forms is expected to shift rapidly. It may result in declinein biodiversity and in the goods and services provided bymost ecosystems. Most plants, birds and fishes will rarelyfind a favourable temperature for their survival (Das et al.,2007). Climate change will definitely have impact upon thebehaviour and biological traits of animals and plants. Coralreefs support huge diversity of marine fish world over. Climatewarming has been reported to cause coral bleaching. Inthis process, a decline in the abundance of symbioticbacteria occurs upon which the corals depend for theirgrowth. A significant change in the abundance of some fisheshas been observed in locations where intense coralbleaching has occurred. On account of warm weather, anincreased number of female hatchlings of turtles have beenfound to be produced. Thus turtles can be considered to beat risk of global warming.
IMPACT UPON SHELL FISHESThe world’s fisheries generate over US $ 130 billion
annually and contribute significantly to the economies ofmany developing countries. Following the acid rain issue,a new acid environmental problem has arisen which means:the oceans are turning sourer. Because of the increasinganthropogenic release of carbon dioxide, more than one-third of this greenhouse gas is finding its way into the ocean.The resulting carbonic acid gas is acidifying the surfacewater. The past two centuries of industrialization showed adecrease of 0.1 unit of pH of sea water. The average acidityof the ocean level is presently above 8. It has beenestimated that the sea absorbs 25 million tons of Carbon
dioxide every day. If this continues at the same rate, theIntergovernmental Panel on Climate Change has predicteda further decline of pH value of upto 0.35 by the end of thecentury. In such water, calcification of sea life that needscalcium carbonate to strengthen their shell (like mussels)or skeleton (like corals) have been found to be hinderedand get slower. The additional Carbon dioxide makes thewater more acidic, decreases the carbonate (CO3
2-)concentration in the water, which in turn impedes thedeposition of calcium carbonate on the animals. If this shellor in other words, their armour does not get strengthened,they will not be able to escape from the grasp of predators(Combes et al., 2005). By the year 2100, mussels andoysters are expected to calcify their shells 25% and 10%respectively slower than the current rate. An experimentalexposure of edible mussels and Pacific oysters to moreacid conditions for a few hours have resulted in immediatediminishing of shell calcification. A diminished yield of thesespecies from natural waters will have a large financialimpact as these are considered as economically importantfood commodity. Besides that, these vulnerable speciesare important components of biodiversity along theshorelines. As a long-term impact of global warming andsea temperature rise on reef coral and fish communities,species diversity of the fish community has been found todecrease by 50 per cent in the heavily impacted locations.Smaller fishes have been observed to reduce in numbermore quickly than larger species; their decreased availabilityhas started to have a negative effect on the food chain.
IMPACT UPON FIN FISHESThe white fish trawlersmen on Yorkshire coast, United
Kingdom have opined that sea temperatures in the Northsea are rising and this has led to increase in warm waterfish such as red mullet, specially in the southern section ofthe North sea. On account of warm weather, changingnatural food production in oceans can restrict the foodsupply of many aquatic species and threaten theirexistence. Global warming is reported to have a significantimpact on Australian marine life. The warmer oceans,changes in currents, disruption of reproductive cycles andmass migration of species are capable of affecting marinefaunal diversity in southeast Australia. The nesting seaturtles, yellow-fin tuna, dugongs and stinging jellyfish aresome of the marine species which have started movingsouthwards as seas are getting warmer. In Tasmania,salmon farming in commercial terms has been reported tobecome largely unviable as the ocean will get warmed, thepredicted one to two degrees over the next thirty years. Ifglobal warming continues, the threat on those finfish
47
July 2008 e-planet 6 (2): 45-48
population will increase which are already stressed onaccount of overfishing, pollution and loss of natural habitat.Adding to the cause, there will be changes in rainfall andcurrent pattern. The effect of slightly warmer water on fishand aquatic ecosystems can prove severe, which in turnwill affect the global food supply and economic stability ofmany developing countries.
INSUFFICIENCY OF FOOD AND OXYGENFishes are sensitive to water temperature. It has been
described that when fish comes in contact with water thatproves too cold for them, their metabolism slows down andthey become sluggish. As the surrounding water warmsup, their metabolism and appetite speeds up, they intakeand digest food more rapidly and grow at a faster rate. Butincidentally, fishes need a great amount of food and oxygento support this higher metabolism. Marine fishes likesalmon, whitefish and perch are all expected to grow muchslowly if natural food supply does not increase with rise inwater temperature (McGregor, 2007). Fish filter oxygen fromthe water they are swimming in, but the dissolved oxygenconcentration in water decreases with rise in temperature.Thus there will be inadequacy of oxygen in warmed-upwater, hindering natural breathing process of fishes. CSIROrecords have indicated the declining oxygen content inocean depths of 500-1500 mts. An observed decrease inherbivorous fishes controlling algal over-abundance hasbecome a subject of concern. Global warming has beenreported to diminish natural productivity in Lake Tanganyika,East Africa. Since the beginning of the twentieth century, arise in surface-water temperature in the lake has increasedthe stability of the water column. A regional decrease inwind velocity has contributed to reduced mixing anddecreasing deep-water nutrient upwelling. Carbon isotoperecords in sediment cores have suggested that primaryproductivity may have decreased by about 20%, implyinga roughly 30% decrease in fish yields (O’ Reilley et al,2003). Reports have described that an increase of watertemperature by 1-2 0C is capable of causing fish kills ingreat numbers, especially in shallow aquaculture pondsand shallow confined systems of the Amazon and Mekongrivers. Due to respiration of aquatic plants and algae, suchlentic aquatic ecosystems experience low levels of oxygenovernight, and when these waters get warm, combinationof increased metabolic (food) demand for fishes andreduced dissolved oxygen concentration can lead todeficiency of oxygen, dropping below the minimum desirablelevel. Inadequacy of food matter and dissolved oxygen inwarmed-up water obstructs the normal reproductive abilityof fishes. Many fishes will produce only less offspring astemperature rises and some may not be able to reproduceat all. Fishes like salmon, catfish and sturgeon cannot
spawn at all if water temperatures in winter do not dropbelow a certain level. Under uncongenial conditions, tropicalfish like guppies have been found to produce smaller broodsand frequency of ovulation in female grass carps decrease.Imbalance of water temperatures is stressful to fishes, whichare likely to cause inhibition of reproductive function,cessation of ovulation, depression of reproductive hormonesin blood stream and ovarian failure (Dr Praveen Maurye, Sr.Scientist, CIFRI, Barrackpore; Personal communication).FORCED MIGRATION FOR FISHES
Climate change is forecasted to cause a substantialshift in fish habitats and disruption of the current pattern ofaquatic plant and fish distribution. With rise in globaltemperature, some fishes may be able to shift locally insearch of a comfortable environment, either by moving todeeper zones or by heading upriver towards cool upstreamwaters. Capelin, a coldwater fish will swim long distancesto remain in water that is between minus 1 - 2 0 C, which istheir suitable state of survival. Even a slight increase inglobal temperature is expected to shift the habitat rangesof many economically important valuable marine fishes.Highly warmed-up waters have caused Pacific salmonharvests in much less amount in the southern part of theirrange. Fishes like cod, plaice and halibut are expected tobecome scarce in ocean waters of United States andSouthern Canada in near future, and cods will probably nomore be found in the southern north sea, which is known tobe one of their main spawning areas. Suitable habitats forthe trouts, whitefish and seabass in the United States areexpected to decline by as much as 50% due to the effectsof global warming (NRDC, 2008). The Cape anchovy hasbeen one of the prominent items in fish catches off of theSouth Africa Cape since mid 1960’s, but this fishery isexpected to be affected as climate change will causealteration in wind patterns in this region. Climate changehas been reported to be responsible for the less survivabilityof North-Western Mediterranean fisheries as watertemperature and sea level is on rise and water flow gettingreduced. Warmer temperature is likely to causeeconomically important coldwater fishes such as hake andcod to migrate and shift their natural location range. Theymay be unable to survive in North-Western Mediterraneanwaters. Catfish and trout are the two most importantcommercially cultured freshwater fishes in the UnitedStates. High water temperatures in culture systems duringsummer months may lead to shortage in their productionin this region.
INFECTION CAUSED TO FIN FISHESIncidentally when water temperature begins to climb,
many parasites and microbes capable of causing fishdiseases grow at a fast rate, become numerous and more
48
July 2008 e-planet 6 (2): 45-48
virulent. In such a condition, fishes whose immune systemshave got already stressed by warmed-up water, low oxygenavailability and crowding become more susceptible toinfections and diseases. There may occur fish mortalitydue to consumption of toxic blue-green algae; such nuisancealgae will increase in amount in warmer waters and willresult in dissolved oxygen depletion. Human health maydeteriorate from eating poisoned fish unknowingly. It hasbeen found that in muscle of Arctic char, concentration ofcadmium and lead remain higher when maintained in waterwith high temperatures. Fishes in warmer water has beenreported to become more capable of accumulating mercuryin their body. Toxicity of natural foreign chemicals orxenobiotics to fish has been reported to alter with changesin water temperature. In higher temperature, uptake ofxenobiotics increases through increased metabolic rate anddecrease in oxygen solubility. Fish species in polar regionare very sensitive; they are uniquely adapted to narrow coldtemperature ranges and well-oxygenated water, they maybecome vulnerable to even slight increases in watertemperature. Species like emerald rockcod and strippedrockcod cannot survive when temperatures climb only afew degrees above 00 C. With rise in temperature, freshwaterspecies that are incapable of migrating to cooler waterswill have to remain in hot water. Fish migration may not bepossible from many isolated freshwater lakes and wetlands.A CASE STUDY AT KENDRAPARA
In village ponds, water temperature value was foundto be an unusual 34.50 C in the first week of August, thattoo in late evening time. The large water bodies were havingonly one meter water depth during this time. Small waterbodies of around 0.3-0.4 acre in area were found to liealmost in a dewatered state. We have experienced in carpbreeding experiments that when pond water having 340 Ctemperature is intaken into indoor circular fish breeding andincubation chambers, male and female fishes could bemade to mate safely, fertilized eggs could be obtained, butthe eggs were found to hatch much before the normal timeinterval (incubation time) and the hatched out larvae couldonly survive for the next four to five hours. It is no doubt thatthe high water temperature and partially turbid water areresponsible for the mortality of entire mass of carp larvae(Sarangi et al., 2008). This may be an indication that earthis getting warmer slowly but surely.OTHER ISSUES
Temperature dependant sex determination has beenobserved in fishes, a rise in water temperature of just above1.50 C can change the male to female ratio from 1: 1 to 3:1.
In the sensitive fish like South American pejerrey, anincrease of 40 C can result in a population that is 98% male(Alvarez et al., 2008).Based on the impacts of temperature rise,(i) it seems likely that many finfishes in natural waters willbecome harder to find; (ii) the valuable and commerciallyimportant coldwater species will begin to be replaced bymore adaptable and less valuable warmwater fishes; (iii)With a 10 C rise in water temperature, the marine catfishesmay permanently shift their natural habitat zone and moveabout 240 km northwards from southern part of UnitedStates of America, much far away from the original locationwhere infrastructure for fish harvest have been established.This can largely cause harm to the fish industry in thesouthern United States of America (100 million $ catfishturnover). A 10 C increase in water temperature has led topolarward distributional shift for the coldwater migratoryfishes Atlantic herring and Atlantic mackerel by about 110km. With a water temperature rise by 10 C, seven importantinland warm water fishes in USA have been reported toface temperature above their survival limits. It has led todecline in inland fisheries.REFERENCESAlvarez O, P Piferer and L Abend (2008). Global warming’s fish-sex
effect. Health and Science, July 30, 2008.Brahmam M (2008). Global warming – Role of green fuels to pacify the
fury. E-Planet, Vol. 5 No. 2 and Vol. 6 No. 1. 24-27pp.Combes S, C Myrick, J Cech, M Case and L Hansen (2005). Are we
putting our fishes in hot water? WWF News Centre onClimate Change Programme, WWF Publication,Switzerland. 1-9pp.
Das M K, P Maurye, M P Brahmane, M K Mukhopadhaya and P K Saha(2007). Impact, adaptation and vulnerability of inlandfisheries to climate change. Journal of Indian Associationfor Environmental Management, Vol. 34 No. 2. 68-76pp.
McGregor H V (2007). Global warming puts fish stock at risk; rapid20th century increase in coastal upwelling off NorthwestAfrica. Science, Vol. 315 No. 5812. 637-639pp.
Mitchell J F B (1989). The greenhouse effect and climate change. Rev.Geophysics Vol. 27. 115-139pp.
Natural Resource Defense Council (NRDC) News Media Centre (2008).Global warming threatens coldwater fish. July 22, 2008.
O’ Reilley C M, R Simone, A Alini, P D Plisnier, S Andrew and A Brent(2003). Climate change decreases aquatic ecosystemproductivity of Lake Tanganyika, Africa.Nature, Vol. 424, 766 – 768pp.
Sarangi N, B K Das, B C Mohapatra, P Patnaik, S Ghosh, D K Swain andA Mallick (2008). Carp seed production under extremetemperatures: an experience at Tanar village, Orissa,
India. Fishing Chimes, Vol. 28 No. 2. 42-44pp.
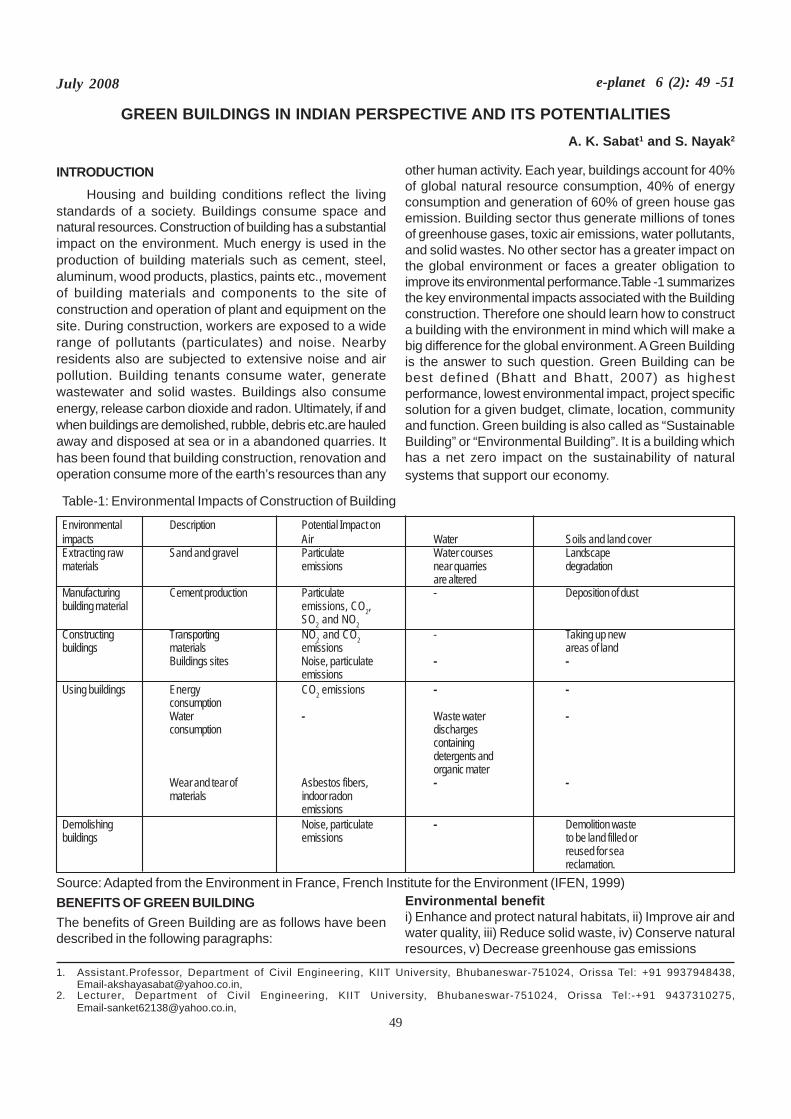
49
July 2008 e-planet 6 (2): 49 -51
GREEN BUILDINGS IN INDIAN PERSPECTIVE AND ITS POTENTIALITIES A. K. Sabat1 and S. Nayak2
1. Assistant.Professor, Department of Civil Engineering, KIIT University, Bhubaneswar-751024, Orissa Tel: +91 9937948438,[email protected],
2. Lecturer, Department of Civil Engineering, KIIT University, Bhubaneswar-751024, Orissa Tel:-+91 9437310275,[email protected],
INTRODUCTIONHousing and building conditions reflect the living
standards of a society. Buildings consume space andnatural resources. Construction of building has a substantialimpact on the environment. Much energy is used in theproduction of building materials such as cement, steel,aluminum, wood products, plastics, paints etc., movementof building materials and components to the site ofconstruction and operation of plant and equipment on thesite. During construction, workers are exposed to a widerange of pollutants (particulates) and noise. Nearbyresidents also are subjected to extensive noise and airpollution. Building tenants consume water, generatewastewater and solid wastes. Buildings also consumeenergy, release carbon dioxide and radon. Ultimately, if andwhen buildings are demolished, rubble, debris etc.are hauledaway and disposed at sea or in a abandoned quarries. Ithas been found that building construction, renovation andoperation consume more of the earth’s resources than any
other human activity. Each year, buildings account for 40%of global natural resource consumption, 40% of energyconsumption and generation of 60% of green house gasemission. Building sector thus generate millions of tonesof greenhouse gases, toxic air emissions, water pollutants,and solid wastes. No other sector has a greater impact onthe global environment or faces a greater obligation toimprove its environmental performance.Table -1 summarizesthe key environmental impacts associated with the Buildingconstruction. Therefore one should learn how to constructa building with the environment in mind which will make abig difference for the global environment. A Green Buildingis the answer to such question. Green Building can bebest defined (Bhatt and Bhatt, 2007) as highestperformance, lowest environmental impact, project specificsolution for a given budget, climate, location, communityand function. Green building is also called as “SustainableBuilding” or “Environmental Building”. It is a building whichhas a net zero impact on the sustainability of naturalsystems that support our economy.
Table-1: Environmental Impacts of Construction of Building
Environmental Description Potential Impact onimpacts Air Water Soils and land coverExtracting raw Sand and gravel Particulate Water courses Landscapematerials emissions near quarries degradation
are alteredManufacturing Cement production Particulate - Deposition of dustbuilding material emissions, CO2,
SO2 and NO2Constructing Transporting NO2 and CO2 - Taking up newbuildings materials emissions areas of land
Buildings sites Noise, particulate - -emissions
Using buildings Energy CO2 emissions - -consumptionWater - Waste water -consumption discharges
containingdetergents andorganic mater
Wear and tear of Asbestos fibers, - -materials indoor radon
emissionsDemolishing Noise, particulate - Demolition wastebuildings emissions to be land filled or
reused for seareclamation.
Source: Adapted from the Environment in France, French Institute for the Environment (IFEN, 1999)BENEFITS OF GREEN BUILDINGThe benefits of Green Building are as follows have beendescribed in the following paragraphs:
Environmental benefiti) Enhance and protect natural habitats, ii) Improve air andwater quality, iii) Reduce solid waste, iv) Conserve naturalresources, v) Decrease greenhouse gas emissions
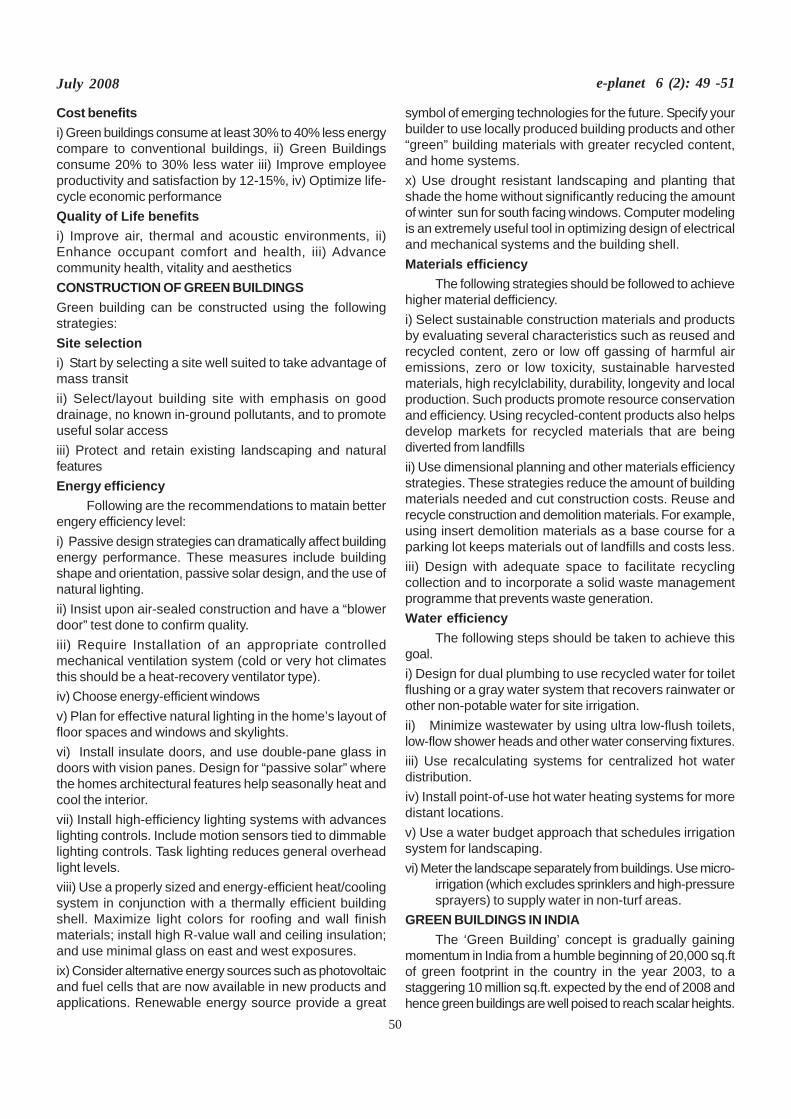
50
July 2008 e-planet 6 (2): 49 -51
Cost benefitsi) Green buildings consume at least 30% to 40% less energycompare to conventional buildings, ii) Green Buildingsconsume 20% to 30% less water iii) Improve employeeproductivity and satisfaction by 12-15%, iv) Optimize life-cycle economic performanceQuality of Life benefitsi) Improve air, thermal and acoustic environments, ii)Enhance occupant comfort and health, iii) Advancecommunity health, vitality and aestheticsCONSTRUCTION OF GREEN BUILDINGSGreen building can be constructed using the followingstrategies:Site selectioni) Start by selecting a site well suited to take advantage ofmass transitii) Select/layout building site with emphasis on gooddrainage, no known in-ground pollutants, and to promoteuseful solar accessiii) Protect and retain existing landscaping and naturalfeaturesEnergy efficiency
Following are the recommendations to matain betterengery efficiency level:i) Passive design strategies can dramatically affect buildingenergy performance. These measures include buildingshape and orientation, passive solar design, and the use ofnatural lighting.ii) Insist upon air-sealed construction and have a “blowerdoor” test done to confirm quality.iii) Require Installation of an appropriate controlledmechanical ventilation system (cold or very hot climatesthis should be a heat-recovery ventilator type).iv) Choose energy-efficient windowsv) Plan for effective natural lighting in the home’s layout offloor spaces and windows and skylights.vi) Install insulate doors, and use double-pane glass indoors with vision panes. Design for “passive solar” wherethe homes architectural features help seasonally heat andcool the interior.vii) Install high-efficiency lighting systems with advanceslighting controls. Include motion sensors tied to dimmablelighting controls. Task lighting reduces general overheadlight levels.viii) Use a properly sized and energy-efficient heat/coolingsystem in conjunction with a thermally efficient buildingshell. Maximize light colors for roofing and wall finishmaterials; install high R-value wall and ceiling insulation;and use minimal glass on east and west exposures.ix) Consider alternative energy sources such as photovoltaicand fuel cells that are now available in new products andapplications. Renewable energy source provide a great
symbol of emerging technologies for the future. Specify yourbuilder to use locally produced building products and other“green” building materials with greater recycled content,and home systems.x) Use drought resistant landscaping and planting thatshade the home without significantly reducing the amountof winter sun for south facing windows. Computer modelingis an extremely useful tool in optimizing design of electricaland mechanical systems and the building shell.Materials efficiency
The following strategies should be followed to achievehigher material defficiency.i) Select sustainable construction materials and productsby evaluating several characteristics such as reused andrecycled content, zero or low off gassing of harmful airemissions, zero or low toxicity, sustainable harvestedmaterials, high recylclability, durability, longevity and localproduction. Such products promote resource conservationand efficiency. Using recycled-content products also helpsdevelop markets for recycled materials that are beingdiverted from landfillsii) Use dimensional planning and other materials efficiencystrategies. These strategies reduce the amount of buildingmaterials needed and cut construction costs. Reuse andrecycle construction and demolition materials. For example,using insert demolition materials as a base course for aparking lot keeps materials out of landfills and costs less.iii) Design with adequate space to facilitate recyclingcollection and to incorporate a solid waste managementprogramme that prevents waste generation.Water efficiency
The following steps should be taken to achieve thisgoal.i) Design for dual plumbing to use recycled water for toiletflushing or a gray water system that recovers rainwater orother non-potable water for site irrigation.ii) Minimize wastewater by using ultra low-flush toilets,low-flow shower heads and other water conserving fixtures.iii) Use recalculating systems for centralized hot waterdistribution.iv) Install point-of-use hot water heating systems for moredistant locations.v) Use a water budget approach that schedules irrigationsystem for landscaping.vi) Meter the landscape separately from buildings. Use micro-
irrigation (which excludes sprinklers and high-pressuresprayers) to supply water in non-turf areas.
GREEN BUILDINGS IN INDIAThe ‘Green Building’ concept is gradually gaining
momentum in India from a humble beginning of 20,000 sq.ftof green footprint in the country in the year 2003, to astaggering 10 million sq.ft. expected by the end of 2008 andhence green buildings are well poised to reach scalar heights.
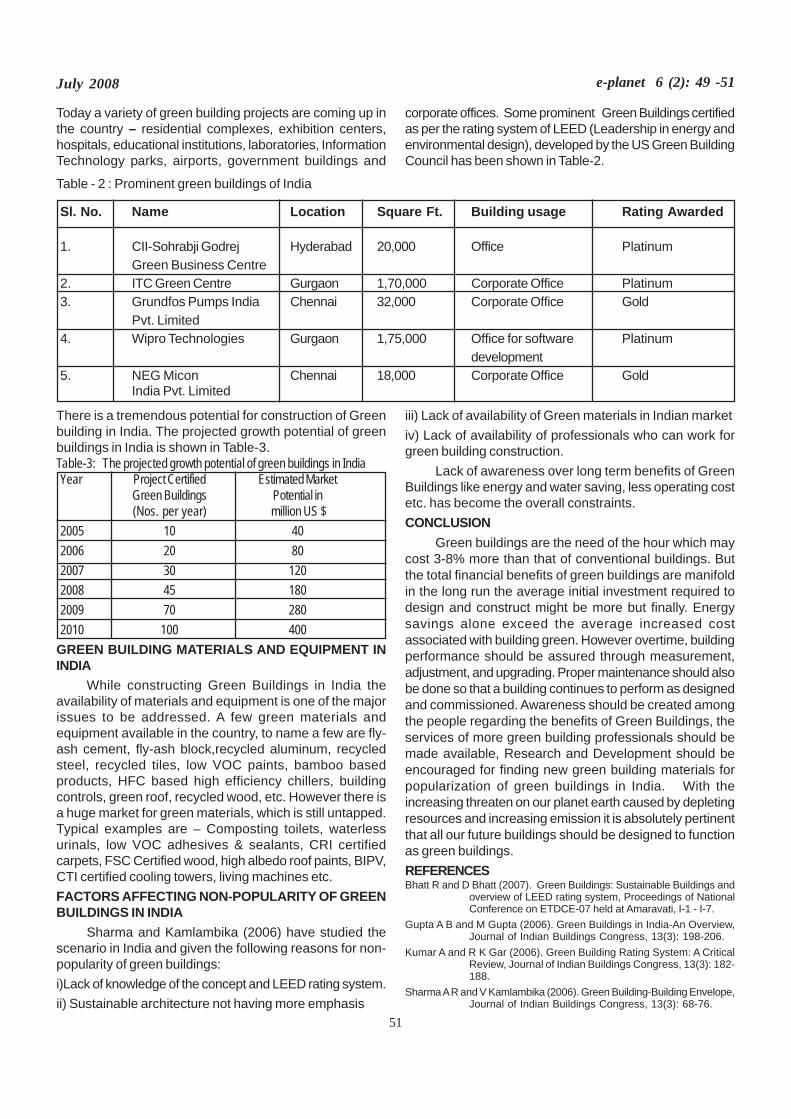
51
July 2008 e-planet 6 (2): 49 -51
Today a variety of green building projects are coming up inthe country – residential complexes, exhibition centers,hospitals, educational institutions, laboratories, InformationTechnology parks, airports, government buildings and
Sl. No. Name Location Square Ft. Building usage Rating Awarded
1. CII-Sohrabji Godrej Hyderabad 20,000 Office PlatinumGreen Business Centre
2. ITC Green Centre Gurgaon 1,70,000 Corporate Office Platinum3. Grundfos Pumps India Chennai 32,000 Corporate Office Gold
Pvt. Limited4. Wipro Technologies Gurgaon 1,75,000 Office for software Platinum
development5. NEG Micon Chennai 18,000 Corporate Office Gold
India Pvt. Limited
There is a tremendous potential for construction of Greenbuilding in India. The projected growth potential of greenbuildings in India is shown in Table-3.Table-3: The projected growth potential of green buildings in IndiaYear Project Certified Estimated Market
Green Buildings Potential in(Nos. per year) million US $
2005 10 402006 20 802007 30 1202008 45 1802009 70 2802010 100 400
GREEN BUILDING MATERIALS AND EQUIPMENT ININDIA
While constructing Green Buildings in India theavailability of materials and equipment is one of the majorissues to be addressed. A few green materials andequipment available in the country, to name a few are fly-ash cement, fly-ash block,recycled aluminum, recycledsteel, recycled tiles, low VOC paints, bamboo basedproducts, HFC based high efficiency chillers, buildingcontrols, green roof, recycled wood, etc. However there isa huge market for green materials, which is still untapped.Typical examples are – Composting toilets, waterlessurinals, low VOC adhesives & sealants, CRI certifiedcarpets, FSC Certified wood, high albedo roof paints, BIPV,CTI certified cooling towers, living machines etc.FACTORS AFFECTING NON-POPULARITY OF GREENBUILDINGS IN INDIA
Sharma and Kamlambika (2006) have studied thescenario in India and given the following reasons for non-popularity of green buildings:i)Lack of knowledge of the concept and LEED rating system.ii) Sustainable architecture not having more emphasis
iii) Lack of availability of Green materials in Indian marketiv) Lack of availability of professionals who can work forgreen building construction.
Lack of awareness over long term benefits of GreenBuildings like energy and water saving, less operating costetc. has become the overall constraints.CONCLUSION
Green buildings are the need of the hour which maycost 3-8% more than that of conventional buildings. Butthe total financial benefits of green buildings are manifoldin the long run the average initial investment required todesign and construct might be more but finally. Energysavings alone exceed the average increased costassociated with building green. However overtime, buildingperformance should be assured through measurement,adjustment, and upgrading. Proper maintenance should alsobe done so that a building continues to perform as designedand commissioned. Awareness should be created amongthe people regarding the benefits of Green Buildings, theservices of more green building professionals should bemade available, Research and Development should beencouraged for finding new green building materials forpopularization of green buildings in India. With theincreasing threaten on our planet earth caused by depletingresources and increasing emission it is absolutely pertinentthat all our future buildings should be designed to functionas green buildings.REFERENCESBhatt R and D Bhatt (2007). Green Buildings: Sustainable Buildings and
overview of LEED rating system, Proceedings of NationalConference on ETDCE-07 held at Amaravati, I-1 - I-7.
Gupta A B and M Gupta (2006). Green Buildings in India-An Overview,Journal of Indian Buildings Congress, 13(3): 198-206.
Kumar A and R K Gar (2006). Green Building Rating System: A CriticalReview, Journal of Indian Buildings Congress, 13(3): 182-188.
Sharma A R and V Kamlambika (2006). Green Building-Building Envelope,Journal of Indian Buildings Congress, 13(3): 68-76.
corporate offices. Some prominent Green Buildings certifiedas per the rating system of LEED (Leadership in energy andenvironmental design), developed by the US Green BuildingCouncil has been shown in Table-2.
Table - 2 : Prominent green buildings of India
52
July 2008 e-planet 6 (2): 52 -56
MANAGEMENT OF MUNICIPAL SOLID WASTES – A CASE STUDY
A. K. Sabat1, S. Nayak2, N. C. Moharana3,T. Mohanty4
1. Assistant Professor, Department of Civil Engineering , Kalinga Institue of Industrial Technology (KIIT) University Bhubaneswar-751024,E-mail:- [email protected],Tel : 09937948438
2. Lecturer, Department of Civil Engineering KIITUniversity Bhubaneswar-751024, E-Mail:[email protected]. Sr. Lecturer Department of Civil Engineering KIIT University Bhubaneswar-751024, E Mail:- [email protected]. Lecturer, Department of Civil Engineering KIIT University Bhubaneswar-751024, E-Mail:[email protected]
INTRODUCTIONMunicipal solid waste (MSW) is defined as the solid
wastes generated in a community except industrial andagricultural waste. Though waste from hospitals and nursinghomes are required to be collected and treated separately,in most cities and towns, such waste continue to form apart of MSW. Generation of these waste is directly relatedto variation in per capita income and the size of thepopulation. Improper management of solid waste hasserious environmental and health consequences. Suchpractices contribute to widespread environmental pollutionas well as the spread of diseases. Health deterioration,accidents, flood occurrences, and environmental pressuresare just a few of the negative effects. Other environmentaleffects include pollution of surface and subsurface waters,unpleasant odours, and gas explosions. The hazardsassociated with inappropriate solid waste disposal and theassociated environmental health impacts should thereforebe of utmost concern to waste management experts.However environmentally acceptable management of MSWhas become a global challenge due to limited resources,an exponentially increasing population, rapid urbanizationand worldwide industrialization. In developing Asiancountries, these factors are further exacerbated byinadequate financial resources, and inadequatemanagement and technical skills within municipalities andgovernment authorities(Hazra et al. 2008).
Improper management of solid waste has been reportedby several researchers in different cities of developingcountries (Turan et al.2008, Chung et al., 2008; Agdag2008).
Bhubaneswar is the capital city of Orissa .It is locatedin the eastern part of India. Bhubaneswar MunicipalCorporation (BMC) is responsible for the management ofthe solid wastes generated in the city. BhubaneswarMunicipal Corporation spreads over 135 sq.Km of areawith approximately 2400 Kms of roads. During the last 55years, the population of the city has increased from 16,521in 1951 to approximately 8.0 lakh population in 2006,(6.48
lakh vide census-2001) with a floating population of morethan 1 lakh.
This paper presents an overview of current municipalsolid waste (MSW) management practices in Bhubaneswarcity, and provides several recommendations for systemimprovement. This study may be beneficial for authoritiesand researchers to work towards improving their presentmunicipal solid waste management system
COLLECTION OF DATA ON WASTE MANAGEMENTPRACTICES
To investigate the present situation of solid wastemanagement of BMC, several questionnaires were preparedand distributed among various people of the city from differentwalks of life. The collected data for different MSW functionalelements were based on the data collected from the above-mentioned questionnaires, available records fromgovernment and non-government organizations. Data wasalso collected from several persons, including engineersand scientists working in the Bhubaneswar MunicipalCorporation and the Orissa State Pollution Control Board.
CURRENT STATE OF SOLID WASTE MANAGEMENTPRACTICES IN BHUBANESWAR MUNICIPALCORPORATION
Solid waste management has several functionalelements, including waste generation, waste handling andseparation, storage and processing, collection, transfer andtransport, and final disposal (Tchobanoglous et al., 1993).For Bhubaneswar Municipal Corporation the existing solidwaste management system is being managed by the healthofficer, who is assisted by several sanitary inspectors andzamadars, who look after the work of collection,transportation and disposal of solid wastes by the field staffand transport operators. There are 47no of wards out ofwhich 14 no of wards have been privatized. In this section,the current state of municipal solid waste management inBhubaneswar Municipal Corporation has been discussed.
Solid waste generation and characteristics
Waste production and composition depend on many
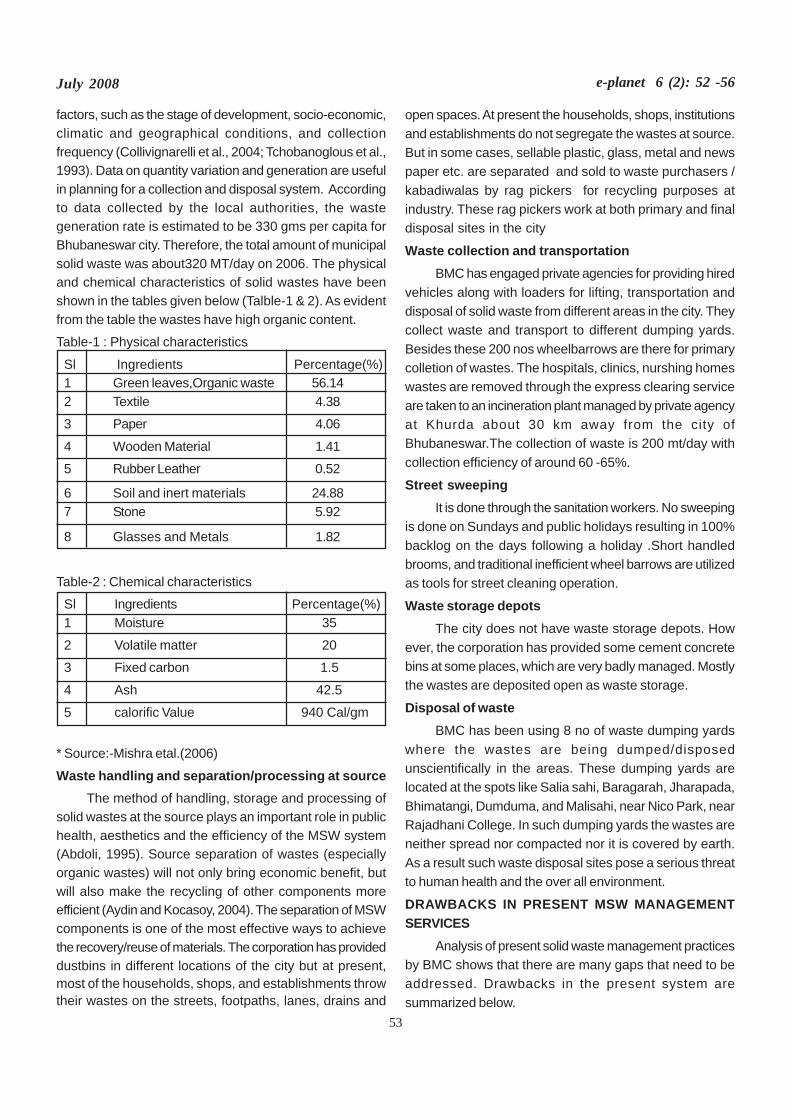
53
July 2008 e-planet 6 (2): 52 -56
factors, such as the stage of development, socio-economic,climatic and geographical conditions, and collectionfrequency (Collivignarelli et al., 2004; Tchobanoglous et al.,1993). Data on quantity variation and generation are usefulin planning for a collection and disposal system. Accordingto data collected by the local authorities, the wastegeneration rate is estimated to be 330 gms per capita forBhubaneswar city. Therefore, the total amount of municipalsolid waste was about320 MT/day on 2006. The physicaland chemical characteristics of solid wastes have beenshown in the tables given below (Talble-1 & 2). As evidentfrom the table the wastes have high organic content.
Table-1 : Physical characteristics
Sl Ingredients Percentage(%)1 Green leaves,Organic waste 56.142 Textile 4.38
3 Paper 4.06
4 Wooden Material 1.41
5 Rubber Leather 0.52
6 Soil and inert materials 24.887 Stone 5.92
8 Glasses and Metals 1.82
Table-2 : Chemical characteristics
Sl Ingredients Percentage(%)1 Moisture 35
2 Volatile matter 20
3 Fixed carbon 1.5
4 Ash 42.5
5 calorific Value 940 Cal/gm
* Source:-Mishra etal.(2006)
Waste handling and separation/processing at sourceThe method of handling, storage and processing of
solid wastes at the source plays an important role in publichealth, aesthetics and the efficiency of the MSW system(Abdoli, 1995). Source separation of wastes (especiallyorganic wastes) will not only bring economic benefit, butwill also make the recycling of other components moreefficient (Aydin and Kocasoy, 2004). The separation of MSWcomponents is one of the most effective ways to achievethe recovery/reuse of materials. The corporation has provideddustbins in different locations of the city but at present,most of the households, shops, and establishments throwtheir wastes on the streets, footpaths, lanes, drains and
open spaces. At present the households, shops, institutionsand establishments do not segregate the wastes at source.But in some cases, sellable plastic, glass, metal and newspaper etc. are separated and sold to waste purchasers /kabadiwalas by rag pickers for recycling purposes atindustry. These rag pickers work at both primary and finaldisposal sites in the city
Waste collection and transportationBMC has engaged private agencies for providing hired
vehicles along with loaders for lifting, transportation anddisposal of solid waste from different areas in the city. Theycollect waste and transport to different dumping yards.Besides these 200 nos wheelbarrows are there for primarycolletion of wastes. The hospitals, clinics, nurshing homeswastes are removed through the express clearing serviceare taken to an incineration plant managed by private agencyat Khurda about 30 km away from the city ofBhubaneswar.The collection of waste is 200 mt/day withcollection efficiency of around 60 -65%.
Street sweepingIt is done through the sanitation workers. No sweeping
is done on Sundays and public holidays resulting in 100%backlog on the days following a holiday .Short handledbrooms, and traditional inefficient wheel barrows are utilizedas tools for street cleaning operation.
Waste storage depotsThe city does not have waste storage depots. How
ever, the corporation has provided some cement concretebins at some places, which are very badly managed. Mostlythe wastes are deposited open as waste storage.
Disposal of wasteBMC has been using 8 no of waste dumping yards
where the wastes are being dumped/disposedunscientifically in the areas. These dumping yards arelocated at the spots like Salia sahi, Baragarah, Jharapada,Bhimatangi, Dumduma, and Malisahi, near Nico Park, nearRajadhani College. In such dumping yards the wastes areneither spread nor compacted nor it is covered by earth.As a result such waste disposal sites pose a serious threatto human health and the over all environment.
DRAWBACKS IN PRESENT MSW MANAGEMENTSERVICES
Analysis of present solid waste management practicesby BMC shows that there are many gaps that need to beaddressed. Drawbacks in the present system aresummarized below.
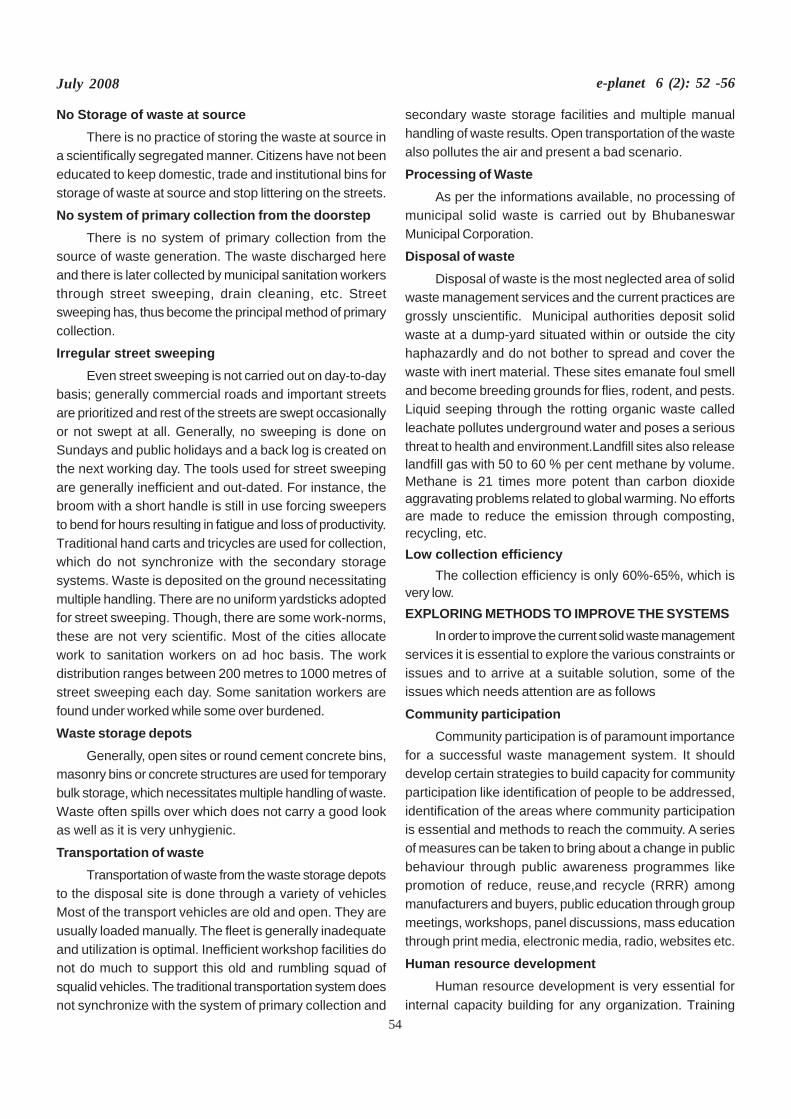
54
July 2008 e-planet 6 (2): 52 -56
No Storage of waste at sourceThere is no practice of storing the waste at source in
a scientifically segregated manner. Citizens have not beeneducated to keep domestic, trade and institutional bins forstorage of waste at source and stop littering on the streets.
No system of primary collection from the doorstepThere is no system of primary collection from the
source of waste generation. The waste discharged hereand there is later collected by municipal sanitation workersthrough street sweeping, drain cleaning, etc. Streetsweeping has, thus become the principal method of primarycollection.
Irregular street sweepingEven street sweeping is not carried out on day-to-day
basis; generally commercial roads and important streetsare prioritized and rest of the streets are swept occasionallyor not swept at all. Generally, no sweeping is done onSundays and public holidays and a back log is created onthe next working day. The tools used for street sweepingare generally inefficient and out-dated. For instance, thebroom with a short handle is still in use forcing sweepersto bend for hours resulting in fatigue and loss of productivity.Traditional hand carts and tricycles are used for collection,which do not synchronize with the secondary storagesystems. Waste is deposited on the ground necessitatingmultiple handling. There are no uniform yardsticks adoptedfor street sweeping. Though, there are some work-norms,these are not very scientific. Most of the cities allocatework to sanitation workers on ad hoc basis. The workdistribution ranges between 200 metres to 1000 metres ofstreet sweeping each day. Some sanitation workers arefound under worked while some over burdened.
Waste storage depotsGenerally, open sites or round cement concrete bins,
masonry bins or concrete structures are used for temporarybulk storage, which necessitates multiple handling of waste.Waste often spills over which does not carry a good lookas well as it is very unhygienic.
Transportation of wasteTransportation of waste from the waste storage depots
to the disposal site is done through a variety of vehiclesMost of the transport vehicles are old and open. They areusually loaded manually. The fleet is generally inadequateand utilization is optimal. Inefficient workshop facilities donot do much to support this old and rumbling squad ofsqualid vehicles. The traditional transportation system doesnot synchronize with the system of primary collection and
secondary waste storage facilities and multiple manualhandling of waste results. Open transportation of the wastealso pollutes the air and present a bad scenario.
Processing of WasteAs per the informations available, no processing of
municipal solid waste is carried out by BhubaneswarMunicipal Corporation.
Disposal of wasteDisposal of waste is the most neglected area of solid
waste management services and the current practices aregrossly unscientific. Municipal authorities deposit solidwaste at a dump-yard situated within or outside the cityhaphazardly and do not bother to spread and cover thewaste with inert material. These sites emanate foul smelland become breeding grounds for flies, rodent, and pests.Liquid seeping through the rotting organic waste calledleachate pollutes underground water and poses a seriousthreat to health and environment.Landfill sites also releaselandfill gas with 50 to 60 % per cent methane by volume.Methane is 21 times more potent than carbon dioxideaggravating problems related to global warming. No effortsare made to reduce the emission through composting,recycling, etc.Low collection efficiency
The collection efficiency is only 60%-65%, which isvery low.EXPLORING METHODS TO IMPROVE THE SYSTEMS
In order to improve the current solid waste managementservices it is essential to explore the various constraints orissues and to arrive at a suitable solution, some of theissues which needs attention are as follows
Community participationCommunity participation is of paramount importance
for a successful waste management system. It shoulddevelop certain strategies to build capacity for communityparticipation like identification of people to be addressed,identification of the areas where community participationis essential and methods to reach the commuity. A seriesof measures can be taken to bring about a change in publicbehaviour through public awareness programmes likepromotion of reduce, reuse,and recycle (RRR) amongmanufacturers and buyers, public education through groupmeetings, workshops, panel discussions, mass educationthrough print media, electronic media, radio, websites etc.
Human resource developmentHuman resource development is very essential for
internal capacity building for any organization. Training
55
July 2008 e-planet 6 (2): 52 -56
motivation, incentives for outstanding services, disincentivesfor those who fail to perform are essential. Application ofnew technology and methods coupled with training atdifferent level is highly necessary. The corporators shouldbe given appropriate know how towards modernization ofsolid waste management system. Rag pickers around hecity should be identified and encouraged to participate inwaste collection at different points. They should also begiven some designation badges and uniform so as to givesome dignity to this much neglected class. They shouldbe given some training by non governmental organizationsfor door to door collection and segregation of waste. Byimposing some monthly fee on local residents, there mightbe some income generation. They should be promoted togenerate income by selling the recyclable wastes separatedfrom garbage.Promoting GIS-GPS system to obtain reliable data onwaste
A management information system is required tomanage large amount of spatial attribute data required tothe 47 wards and generate reports (daily, weekly etc.)atvarious levels with details of the waste, types of vehicleetc.Training should be imparted to personnel in handlingand updating the data.Legal Mandate
Solid waste management practices can never reachthe desire level of efficiency until the Municipal Solid waste(Management and Handling) Rules, 2005 is implementedproperly.Planning an Intregrated Solid Waste ManagementSystems for BMC
The objectives of this Municipal Solid WasteManagement Plan are: ( i ) Providing directions for carryingout the waste management activities (collection,transportation, treatment and disposal) in a manner, whichis not just environmentally, socially and financiallysustainable but is also economically viable. ( ii ) Establishingan integrated and self-contained operating framework forMSW,which would include the development of appropriatemeans and technologies to handle various wastemanagement activities. ( iii ) Enhancing the ability of BMCto provide effective waste management services to theircitizens.RECOMMENDATIONS
After careful analysis following recommendations havebeen drawn for Bhubaneswar Municipal Corporation.
Encourage source reductionA reduction in the amount of wastes could be achieved
by change of consumption pattern and lifestyle, use of more
recyclable materials, practice of waste segregation, changeof manufacturing, design packaging, simple house keepingmeasures etc.
Storage of waste at sourceIt is essential that the wastes should be segregated
at household level into recyclable/reusable and nonrecyclables. Source stored at source of generation can beput to two types bins/bags; one for bio-degradable wasteand the other one for recyclable waste such as plastics,metals, glass, rags, etc. No wastes should be thrown onstreets, footpaths, open spaces, drains or water bodies,nallahs etc. However, toxic wastes should be separatedfrom the above two types of waste.Rag pickers may beorganized through NGOs to collect recyclable materialsfrom door steps. Community bins may be provided in slumareas.
Maximize waste collectionUtilize the service of rag-pickers and use more
vehicles including collection from congested areas and makeoptimum utilization of available vehicles.
Maximize waste recycling and reusesource separation and recycling of waste reduces the
volume of waste to be disposed. The authority may gainnet cost savings biodegradable part should go to themunicipal system and recyclable part should be handedover to waste collectors (rag pickers). At the door steps,door to door collection should be encouraged.
Encourage waste processingEncourage the people to go for vermi composting in
their houses and the compost found there may be utilizedin their gardens for soil conditioning. Aerobic microbialcomposting is suggested for processing of bio-degradablepart of MSW. Care should be taken to keep the level ofmechanization and the production cost to the minimumand to produce a good quality of compost free from heavymetals, sharp object, glass etc. so that it finds a goodmarket. Considering 50% of the total quantity of MSWgenerated daily to be bio-degradable, a 160 MT per/ daycompost plant may be set up and subsequently it may beupgraded.
Promote safe disposal of soild wasteFor eliminating the negative aspect of open dumping
and to facilitate the city with an effective solid waste disposalsystem a proper scientific sanitary landfill is proposed anddesigned .The primary objective of designing a sanitarylandfill is to dispose of the discarded materials in a manner
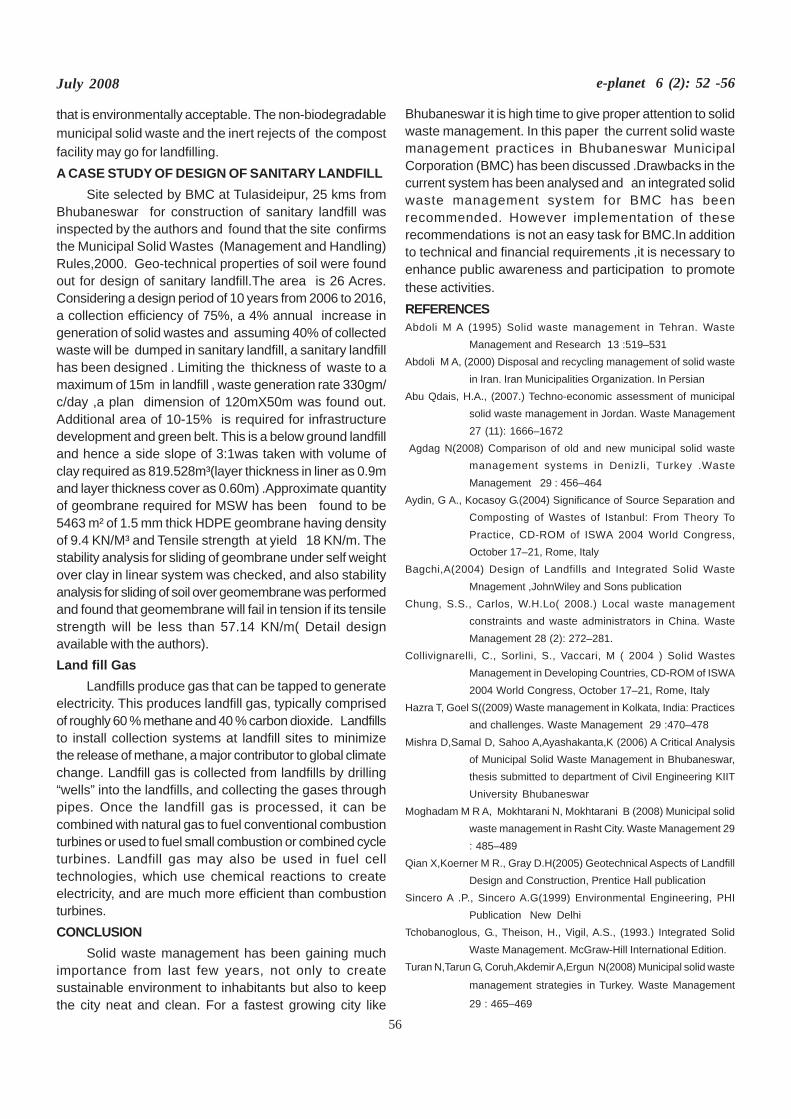
56
July 2008 e-planet 6 (2): 52 -56
that is environmentally acceptable. The non-biodegradablemunicipal solid waste and the inert rejects of the compostfacility may go for landfilling.A CASE STUDY OF DESIGN OF SANITARY LANDFILL
Site selected by BMC at Tulasideipur, 25 kms fromBhubaneswar for construction of sanitary landfill wasinspected by the authors and found that the site confirmsthe Municipal Solid Wastes (Management and Handling)Rules,2000. Geo-technical properties of soil were foundout for design of sanitary landfill.The area is 26 Acres.Considering a design period of 10 years from 2006 to 2016,a collection efficiency of 75%, a 4% annual increase ingeneration of solid wastes and assuming 40% of collectedwaste will be dumped in sanitary landfill, a sanitary landfillhas been designed . Limiting the thickness of waste to amaximum of 15m in landfill , waste generation rate 330gm/c/day ,a plan dimension of 120mX50m was found out.Additional area of 10-15% is required for infrastructuredevelopment and green belt. This is a below ground landfilland hence a side slope of 3:1was taken with volume ofclay required as 819.528m³(layer thickness in liner as 0.9mand layer thickness cover as 0.60m) .Approximate quantityof geombrane required for MSW has been found to be5463 m² of 1.5 mm thick HDPE geombrane having densityof 9.4 KN/M³ and Tensile strength at yield 18 KN/m. Thestability analysis for sliding of geombrane under self weightover clay in linear system was checked, and also stabilityanalysis for sliding of soil over geomembrane was performedand found that geomembrane will fail in tension if its tensilestrength will be less than 57.14 KN/m( Detail designavailable with the authors).Land fill Gas
Landfills produce gas that can be tapped to generateelectricity. This produces landfill gas, typically comprisedof roughly 60 % methane and 40 % carbon dioxide. Landfillsto install collection systems at landfill sites to minimizethe release of methane, a major contributor to global climatechange. Landfill gas is collected from landfills by drilling“wells” into the landfills, and collecting the gases throughpipes. Once the landfill gas is processed, it can becombined with natural gas to fuel conventional combustionturbines or used to fuel small combustion or combined cycleturbines. Landfill gas may also be used in fuel celltechnologies, which use chemical reactions to createelectricity, and are much more efficient than combustionturbines.CONCLUSION
Solid waste management has been gaining muchimportance from last few years, not only to createsustainable environment to inhabitants but also to keepthe city neat and clean. For a fastest growing city like
Bhubaneswar it is high time to give proper attention to solidwaste management. In this paper the current solid wastemanagement practices in Bhubaneswar MunicipalCorporation (BMC) has been discussed .Drawbacks in thecurrent system has been analysed and an integrated solidwaste management system for BMC has beenrecommended. However implementation of theserecommendations is not an easy task for BMC.In additionto technical and financial requirements ,it is necessary toenhance public awareness and participation to promotethese activities.REFERENCESAbdoli M A (1995) Solid waste management in Tehran. Waste
Management and Research 13 :519–531Abdoli M A, (2000) Disposal and recycling management of solid waste
in Iran. Iran Municipalities Organization. In PersianAbu Qdais, H.A., (2007.) Techno-economic assessment of municipal
solid waste management in Jordan. Waste Management27 (11): 1666–1672
Agdag N(2008) Comparison of old and new municipal solid wastemanagement systems in Denizli, Turkey .WasteManagement 29 : 456–464
Aydin, G A., Kocasoy G.(2004) Significance of Source Separation andComposting of Wastes of Istanbul: From Theory ToPractice, CD-ROM of ISWA 2004 World Congress,October 17–21, Rome, Italy
Bagchi,A(2004) Design of Landfills and Integrated Solid WasteMnagement ,JohnWiley and Sons publication
Chung, S.S., Carlos, W.H.Lo( 2008.) Local waste managementconstraints and waste administrators in China. WasteManagement 28 (2): 272–281.
Collivignarelli, C., Sorlini, S., Vaccari, M ( 2004 ) Solid WastesManagement in Developing Countries, CD-ROM of ISWA2004 World Congress, October 17–21, Rome, Italy
Hazra T, Goel S((2009) Waste management in Kolkata, India: Practicesand challenges. Waste Management 29 :470–478
Mishra D,Samal D, Sahoo A,Ayashakanta,K (2006) A Critical Analysisof Municipal Solid Waste Management in Bhubaneswar,thesis submitted to department of Civil Engineering KIITUniversity Bhubaneswar
Moghadam M R A, Mokhtarani N, Mokhtarani B (2008) Municipal solidwaste management in Rasht City. Waste Management 29: 485–489
Qian X,Koerner M R., Gray D.H(2005) Geotechnical Aspects of LandfillDesign and Construction, Prentice Hall publication
Sincero A .P., Sincero A.G(1999) Environmental Engineering, PHIPublication New Delhi
Tchobanoglous, G., Theison, H., Vigil, A.S., (1993.) Integrated SolidWaste Management. McGraw-Hill International Edition.
Turan N,Tarun G, Coruh,Akdemir A,Ergun N(2008) Municipal solid waste
management strategies in Turkey. Waste Management
29 : 465–469
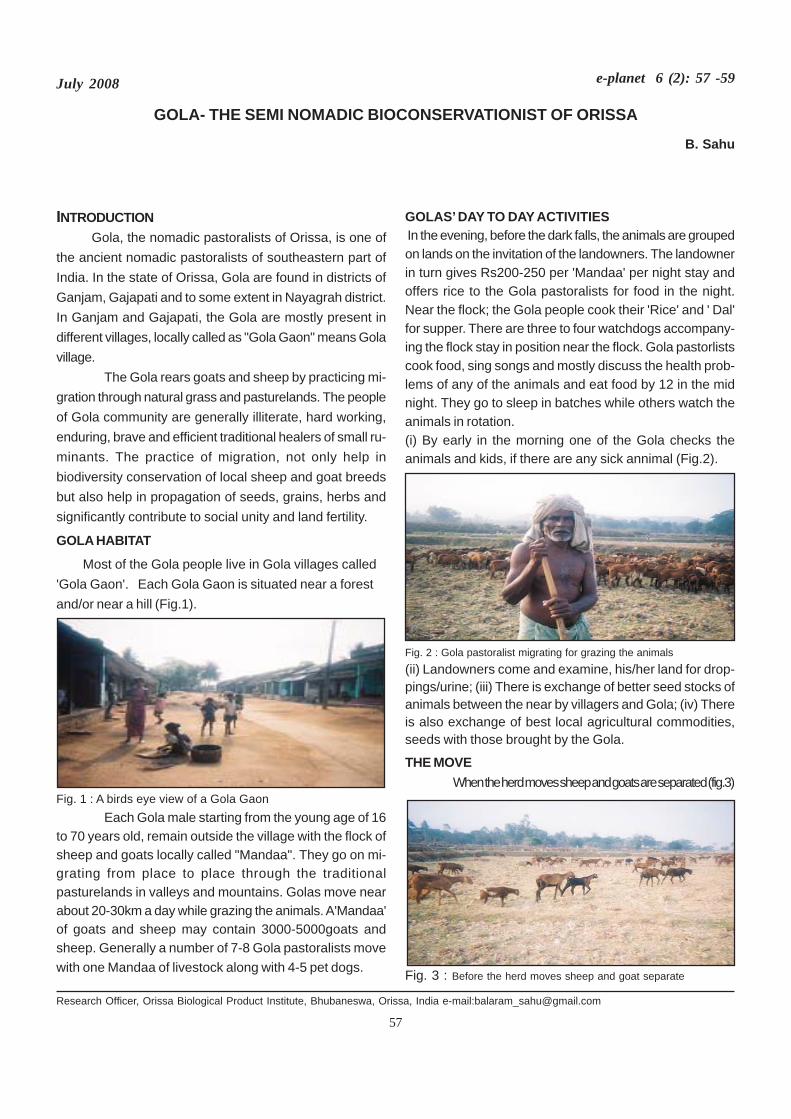
57
July 2008
GOLA- THE SEMI NOMADIC BIOCONSERVATIONIST OF ORISSA
INTRODUCTION Gola, the nomadic pastoralists of Orissa, is one ofthe ancient nomadic pastoralists of southeastern part ofIndia. In the state of Orissa, Gola are found in districts ofGanjam, Gajapati and to some extent in Nayagrah district.In Ganjam and Gajapati, the Gola are mostly present indifferent villages, locally called as "Gola Gaon" means Golavillage.
The Gola rears goats and sheep by practicing mi-gration through natural grass and pasturelands. The peopleof Gola community are generally illiterate, hard working,enduring, brave and efficient traditional healers of small ru-minants. The practice of migration, not only help inbiodiversity conservation of local sheep and goat breedsbut also help in propagation of seeds, grains, herbs andsignificantly contribute to social unity and land fertility.
GOLA HABITAT
Most of the Gola people live in Gola villages called'Gola Gaon'. Each Gola Gaon is situated near a forestand/or near a hill (Fig.1).
GOLAS’ DAY TO DAY ACTIVITIES In the evening, before the dark falls, the animals are groupedon lands on the invitation of the landowners. The landownerin turn gives Rs200-250 per 'Mandaa' per night stay andoffers rice to the Gola pastoralists for food in the night.Near the flock; the Gola people cook their 'Rice' and ' Dal'for supper. There are three to four watchdogs accompany-ing the flock stay in position near the flock. Gola pastorlistscook food, sing songs and mostly discuss the health prob-lems of any of the animals and eat food by 12 in the midnight. They go to sleep in batches while others watch theanimals in rotation.(i) By early in the morning one of the Gola checks theanimals and kids, if there are any sick annimal (Fig.2).
Fig. 2 : Gola pastoralist migrating for grazing the animals(ii) Landowners come and examine, his/her land for drop-pings/urine; (iii) There is exchange of better seed stocks ofanimals between the near by villagers and Gola; (iv) Thereis also exchange of best local agricultural commodities,seeds with those brought by the Gola.
THE MOVEWhen the herd moves sheep and goats are separated (fig.3)
B. Sahu
Research Officer, Orissa Biological Product Institute, Bhubaneswa, Orissa, India e-mail:[email protected]
Fig. 1 : A birds eye view of a Gola GaonEach Gola male starting from the young age of 16
to 70 years old, remain outside the village with the flock ofsheep and goats locally called "Mandaa". They go on mi-grating from place to place through the traditionalpasturelands in valleys and mountains. Golas move nearabout 20-30km a day while grazing the animals. A'Mandaa'of goats and sheep may contain 3000-5000goats andsheep. Generally a number of 7-8 Gola pastoralists movewith one Mandaa of livestock along with 4-5 pet dogs. Fig. 3 : Before the herd moves sheep and goat separate
e-planet 6 (2): 57 -59
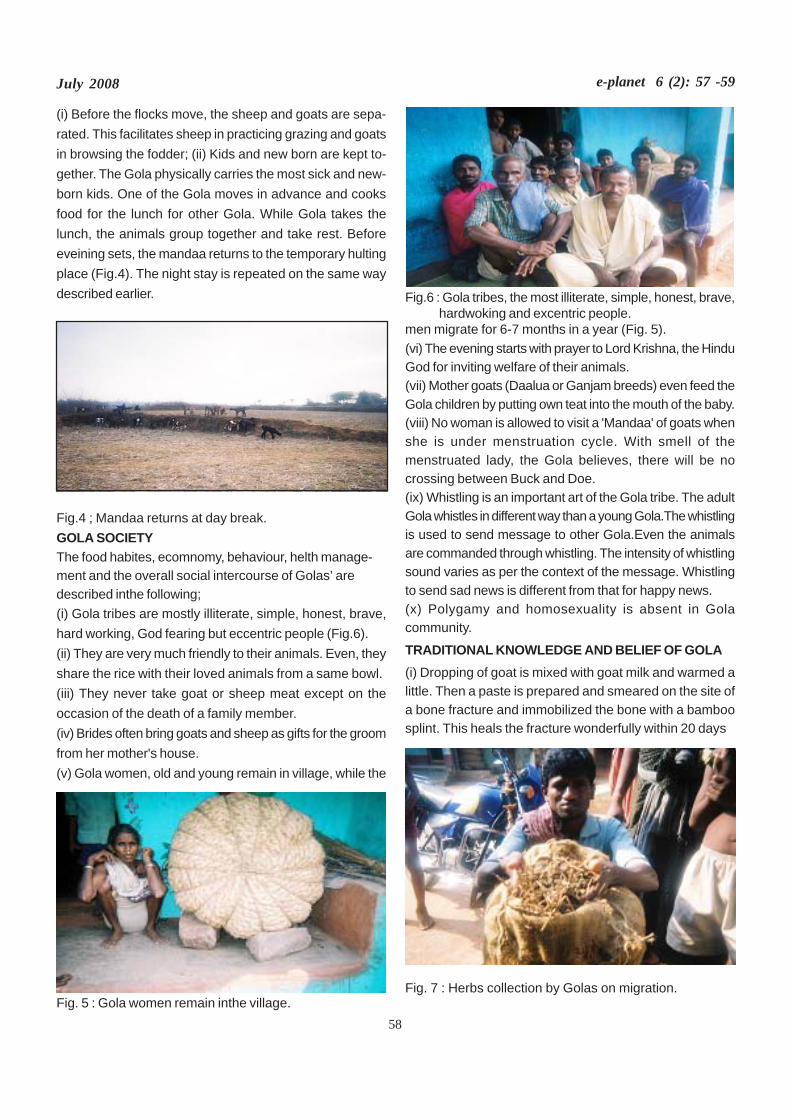
58
July 2008
(i) Before the flocks move, the sheep and goats are sepa-rated. This facilitates sheep in practicing grazing and goatsin browsing the fodder; (ii) Kids and new born are kept to-gether. The Gola physically carries the most sick and new-born kids. One of the Gola moves in advance and cooksfood for the lunch for other Gola. While Gola takes thelunch, the animals group together and take rest. Beforeeveining sets, the mandaa returns to the temporary hultingplace (Fig.4). The night stay is repeated on the same waydescribed earlier.
Fig.4 ; Mandaa returns at day break.GOLA SOCIETYThe food habites, ecomnomy, behaviour, helth manage-ment and the overall social intercourse of Golas’ aredescribed inthe following;(i) Gola tribes are mostly illiterate, simple, honest, brave,hard working, God fearing but eccentric people (Fig.6).(ii) They are very much friendly to their animals. Even, theyshare the rice with their loved animals from a same bowl.(iii) They never take goat or sheep meat except on theoccasion of the death of a family member.(iv) Brides often bring goats and sheep as gifts for the groomfrom her mother's house.(v) Gola women, old and young remain in village, while the
men migrate for 6-7 months in a year (Fig. 5).(vi) The evening starts with prayer to Lord Krishna, the HinduGod for inviting welfare of their animals.(vii) Mother goats (Daalua or Ganjam breeds) even feed theGola children by putting own teat into the mouth of the baby.(viii) No woman is allowed to visit a 'Mandaa' of goats whenshe is under menstruation cycle. With smell of themenstruated lady, the Gola believes, there will be nocrossing between Buck and Doe.(ix) Whistling is an important art of the Gola tribe. The adultGola whistles in different way than a young Gola.The whistlingis used to send message to other Gola.Even the animalsare commanded through whistling. The intensity of whistlingsound varies as per the context of the message. Whistlingto send sad news is different from that for happy news.(x) Polygamy and homosexuality is absent in Golacommunity.
TRADITIONAL KNOWLEDGE AND BELIEF OF GOLA(i) Dropping of goat is mixed with goat milk and warmed alittle. Then a paste is prepared and smeared on the site ofa bone fracture and immobilized the bone with a bamboosplint. This heals the fracture wonderfully within 20 days
e-planet 6 (2): 57 -59
Fig. 5 : Gola women remain inthe village.
Fig.6 : Gola tribes, the most illiterate, simple, honest, brave,hardwoking and excentric people.
Fig. 7 : Herbs collection by Golas on migration.
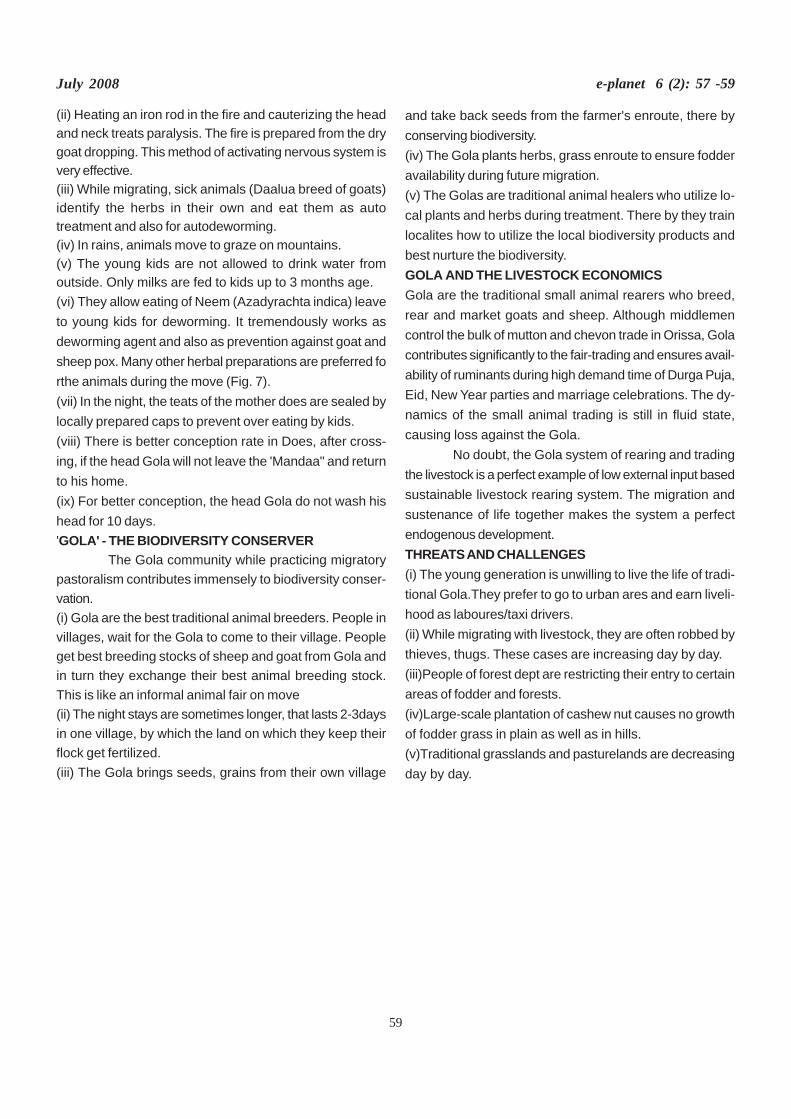
59
July 2008 e-planet 6 (2): 57 -59
(ii) Heating an iron rod in the fire and cauterizing the headand neck treats paralysis. The fire is prepared from the drygoat dropping. This method of activating nervous system isvery effective.(iii) While migrating, sick animals (Daalua breed of goats)identify the herbs in their own and eat them as autotreatment and also for autodeworming.(iv) In rains, animals move to graze on mountains.(v) The young kids are not allowed to drink water fromoutside. Only milks are fed to kids up to 3 months age.(vi) They allow eating of Neem (Azadyrachta indica) leaveto young kids for deworming. It tremendously works asdeworming agent and also as prevention against goat andsheep pox. Many other herbal preparations are preferred forthe animals during the move (Fig. 7).(vii) In the night, the teats of the mother does are sealed bylocally prepared caps to prevent over eating by kids.(viii) There is better conception rate in Does, after cross-ing, if the head Gola will not leave the 'Mandaa" and returnto his home.(ix) For better conception, the head Gola do not wash hishead for 10 days.'GOLA' - THE BIODIVERSITY CONSERVER
The Gola community while practicing migratorypastoralism contributes immensely to biodiversity conser-vation.(i) Gola are the best traditional animal breeders. People invillages, wait for the Gola to come to their village. Peopleget best breeding stocks of sheep and goat from Gola andin turn they exchange their best animal breeding stock.This is like an informal animal fair on move(ii) The night stays are sometimes longer, that lasts 2-3daysin one village, by which the land on which they keep theirflock get fertilized.(iii) The Gola brings seeds, grains from their own village
and take back seeds from the farmer's enroute, there byconserving biodiversity.(iv) The Gola plants herbs, grass enroute to ensure fodderavailability during future migration.(v) The Golas are traditional animal healers who utilize lo-cal plants and herbs during treatment. There by they trainlocalites how to utilize the local biodiversity products andbest nurture the biodiversity.GOLA AND THE LIVESTOCK ECONOMICSGola are the traditional small animal rearers who breed,rear and market goats and sheep. Although middlemencontrol the bulk of mutton and chevon trade in Orissa, Golacontributes significantly to the fair-trading and ensures avail-ability of ruminants during high demand time of Durga Puja,Eid, New Year parties and marriage celebrations. The dy-namics of the small animal trading is still in fluid state,causing loss against the Gola.
No doubt, the Gola system of rearing and tradingthe livestock is a perfect example of low external input basedsustainable livestock rearing system. The migration andsustenance of life together makes the system a perfectendogenous development.THREATS AND CHALLENGES(i) The young generation is unwilling to live the life of tradi-tional Gola.They prefer to go to urban ares and earn liveli-hood as laboures/taxi drivers.(ii) While migrating with livestock, they are often robbed bythieves, thugs. These cases are increasing day by day.(iii)People of forest dept are restricting their entry to certainareas of fodder and forests.(iv)Large-scale plantation of cashew nut causes no growthof fodder grass in plain as well as in hills.(v)Traditional grasslands and pasturelands are decreasingday by day.
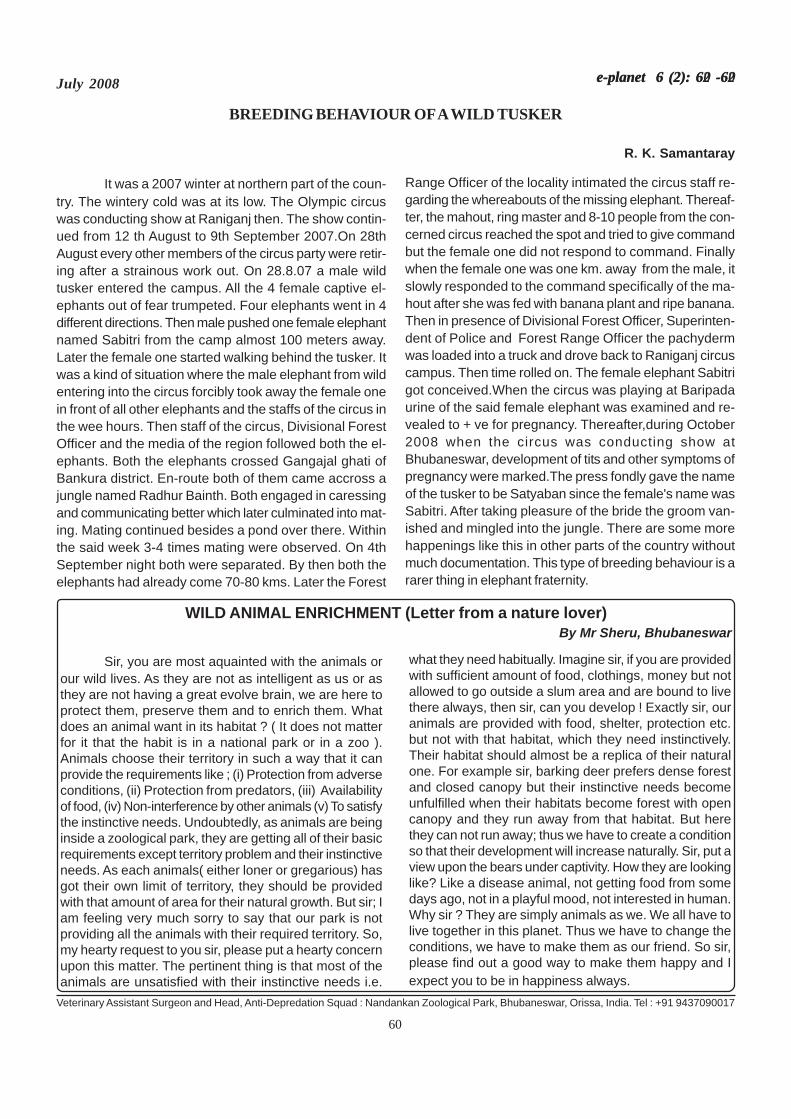
60
July 2008 e-planet 6 (2): 60 -60e-planet 6 (2): 62 -62
BREEDING BEHAVIOUR OF A WILD TUSKER
R. K. Samantaray
It was a 2007 winter at northern part of the coun-try. The wintery cold was at its low. The Olympic circuswas conducting show at Raniganj then. The show contin-ued from 12 th August to 9th September 2007.On 28thAugust every other members of the circus party were retir-ing after a strainous work out. On 28.8.07 a male wildtusker entered the campus. All the 4 female captive el-ephants out of fear trumpeted. Four elephants went in 4different directions. Then male pushed one female elephantnamed Sabitri from the camp almost 100 meters away.Later the female one started walking behind the tusker. Itwas a kind of situation where the male elephant from wildentering into the circus forcibly took away the female onein front of all other elephants and the staffs of the circus inthe wee hours. Then staff of the circus, Divisional ForestOfficer and the media of the region followed both the el-ephants. Both the elephants crossed Gangajal ghati ofBankura district. En-route both of them came accross ajungle named Radhur Bainth. Both engaged in caressingand communicating better which later culminated into mat-ing. Mating continued besides a pond over there. Withinthe said week 3-4 times mating were observed. On 4thSeptember night both were separated. By then both theelephants had already come 70-80 kms. Later the Forest
Range Officer of the locality intimated the circus staff re-garding the whereabouts of the missing elephant. Thereaf-ter, the mahout, ring master and 8-10 people from the con-cerned circus reached the spot and tried to give commandbut the female one did not respond to command. Finallywhen the female one was one km. away from the male, itslowly responded to the command specifically of the ma-hout after she was fed with banana plant and ripe banana.Then in presence of Divisional Forest Officer, Superinten-dent of Police and Forest Range Officer the pachydermwas loaded into a truck and drove back to Raniganj circuscampus. Then time rolled on. The female elephant Sabitrigot conceived.When the circus was playing at Baripadaurine of the said female elephant was examined and re-vealed to + ve for pregnancy. Thereafter,during October2008 when the circus was conducting show atBhubaneswar, development of tits and other symptoms ofpregnancy were marked.The press fondly gave the nameof the tusker to be Satyaban since the female's name wasSabitri. After taking pleasure of the bride the groom van-ished and mingled into the jungle. There are some morehappenings like this in other parts of the country withoutmuch documentation. This type of breeding behaviour is ararer thing in elephant fraternity.
Veterinary Assistant Surgeon and Head, Anti-Depredation Squad : Nandankan Zoological Park, Bhubaneswar, Orissa, India. Tel : +91 9437090017
WILD ANIMAL ENRICHMENT (Letter from a nature lover) By Mr Sheru, Bhubaneswar
Sir, you are most aquainted with the animals orour wild lives. As they are not as intelligent as us or asthey are not having a great evolve brain, we are here toprotect them, preserve them and to enrich them. Whatdoes an animal want in its habitat ? ( It does not matterfor it that the habit is in a national park or in a zoo ).Animals choose their territory in such a way that it canprovide the requirements like ; (i) Protection from adverseconditions, (ii) Protection from predators, (iii) Availabilityof food, (iv) Non-interference by other animals (v) To satisfythe instinctive needs. Undoubtedly, as animals are beinginside a zoological park, they are getting all of their basicrequirements except territory problem and their instinctiveneeds. As each animals( either loner or gregarious) hasgot their own limit of territory, they should be providedwith that amount of area for their natural growth. But sir; Iam feeling very much sorry to say that our park is notproviding all the animals with their required territory. So,my hearty request to you sir, please put a hearty concernupon this matter. The pertinent thing is that most of theanimals are unsatisfied with their instinctive needs i.e.
what they need habitually. Imagine sir, if you are providedwith sufficient amount of food, clothings, money but notallowed to go outside a slum area and are bound to livethere always, then sir, can you develop ! Exactly sir, ouranimals are provided with food, shelter, protection etc.but not with that habitat, which they need instinctively.Their habitat should almost be a replica of their naturalone. For example sir, barking deer prefers dense forestand closed canopy but their instinctive needs becomeunfulfilled when their habitats become forest with opencanopy and they run away from that habitat. But herethey can not run away; thus we have to create a conditionso that their development will increase naturally. Sir, put aview upon the bears under captivity. How they are lookinglike? Like a disease animal, not getting food from somedays ago, not in a playful mood, not interested in human.Why sir ? They are simply animals as we. We all have tolive together in this planet. Thus we have to change theconditions, we have to make them as our friend. So sir,please find out a good way to make them happy and Iexpect you to be in happiness always.
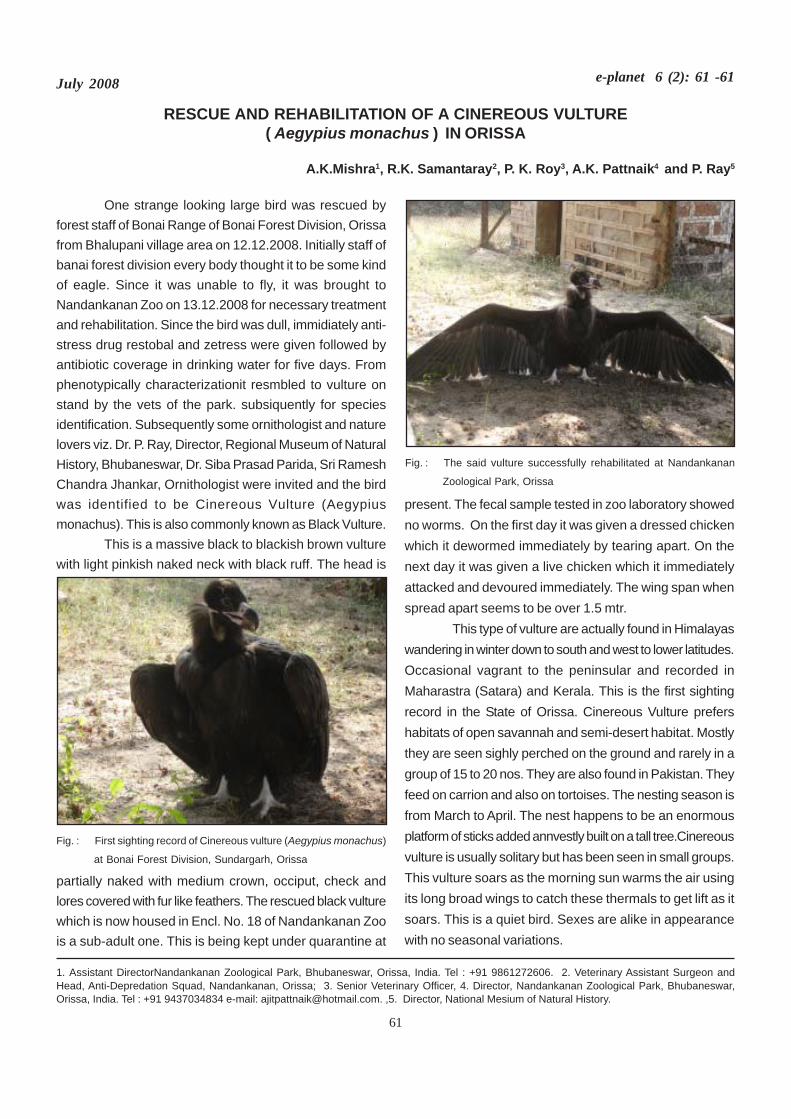
61
July 2008 e-planet 6 (2): 61 -61
RESCUE AND REHABILITATION OF A CINEREOUS VULTURE( Aegypius monachus ) IN ORISSA
A.K.Mishra1, R.K. Samantaray2, P. K. Roy3, A.K. Pattnaik4 and P. Ray5
One strange looking large bird was rescued byforest staff of Bonai Range of Bonai Forest Division, Orissafrom Bhalupani village area on 12.12.2008. Initially staff ofbanai forest division every body thought it to be some kindof eagle. Since it was unable to fly, it was brought toNandankanan Zoo on 13.12.2008 for necessary treatmentand rehabilitation. Since the bird was dull, immidiately anti-stress drug restobal and zetress were given followed byantibiotic coverage in drinking water for five days. Fromphenotypically characterizationit resmbled to vulture onstand by the vets of the park. subsiquently for speciesidentification. Subsequently some ornithologist and naturelovers viz. Dr. P. Ray, Director, Regional Museum of NaturalHistory, Bhubaneswar, Dr. Siba Prasad Parida, Sri RameshChandra Jhankar, Ornithologist were invited and the birdwas identified to be Cinereous Vulture (Aegypiusmonachus). This is also commonly known as Black Vulture.
This is a massive black to blackish brown vulturewith light pinkish naked neck with black ruff. The head is
present. The fecal sample tested in zoo laboratory showedno worms. On the first day it was given a dressed chickenwhich it dewormed immediately by tearing apart. On thenext day it was given a live chicken which it immediatelyattacked and devoured immediately. The wing span whenspread apart seems to be over 1.5 mtr.
This type of vulture are actually found in Himalayaswandering in winter down to south and west to lower latitudes.Occasional vagrant to the peninsular and recorded inMaharastra (Satara) and Kerala. This is the first sightingrecord in the State of Orissa. Cinereous Vulture prefershabitats of open savannah and semi-desert habitat. Mostlythey are seen sighly perched on the ground and rarely in agroup of 15 to 20 nos. They are also found in Pakistan. Theyfeed on carrion and also on tortoises. The nesting season isfrom March to April. The nest happens to be an enormousplatform of sticks added annvestly built on a tall tree.Cinereousvulture is usually solitary but has been seen in small groups.This vulture soars as the morning sun warms the air usingits long broad wings to catch these thermals to get lift as itsoars. This is a quiet bird. Sexes are alike in appearancewith no seasonal variations.
Fig. : First sighting record of Cinereous vulture (Aegypius monachus)
at Bonai Forest Division, Sundargarh, Orissa
Fig. : The said vulture successfully rehabilitated at Nandankanan
Zoological Park, Orissa
1. Assistant DirectorNandankanan Zoological Park, Bhubaneswar, Orissa, India. Tel : +91 9861272606. 2. Veterinary Assistant Surgeon andHead, Anti-Depredation Squad, Nandankanan, Orissa; 3. Senior Veterinary Officer, 4. Director, Nandankanan Zoological Park, Bhubaneswar,Orissa, India. Tel : +91 9437034834 e-mail: [email protected]. ,5. Director, National Mesium of Natural History.
partially naked with medium crown, occiput, check andlores covered with fur like feathers. The rescued black vulturewhich is now housed in Encl. No. 18 of Nandankanan Zoois a sub-adult one. This is being kept under quarantine at
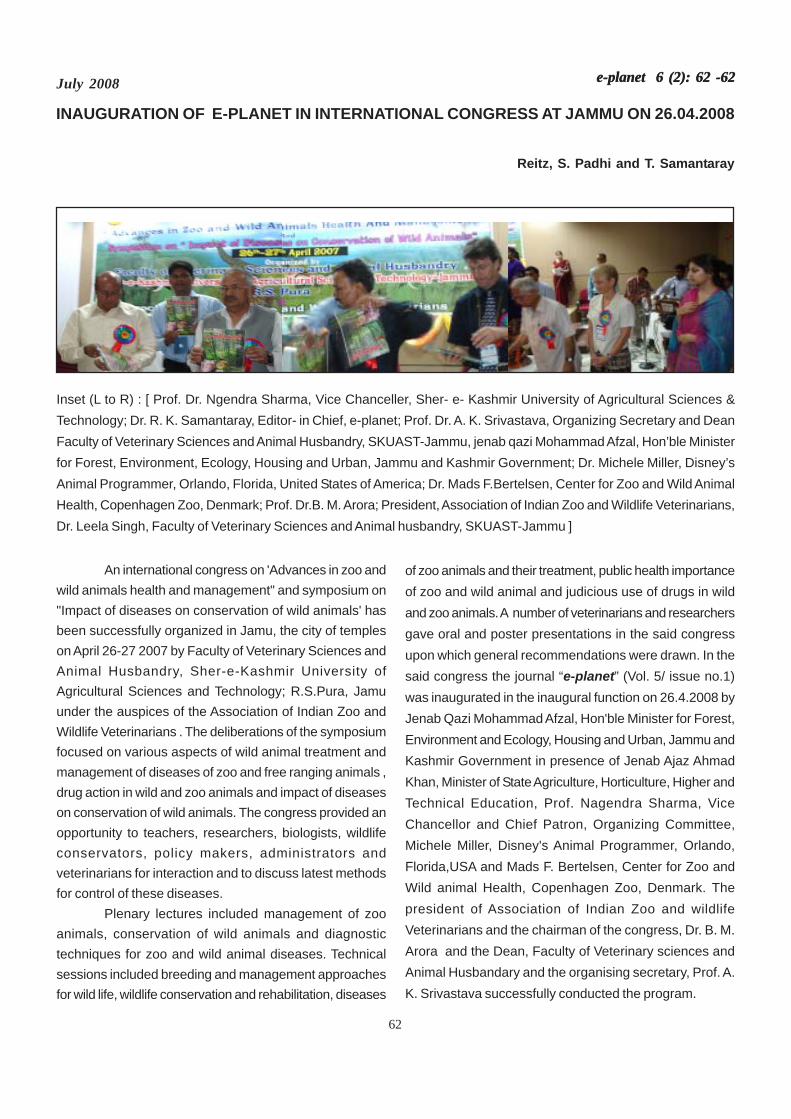
62
July 2008 e-planet 6 (2): 62 -62e-planet 6 (2): 62 -62
An international congress on 'Advances in zoo andwild animals health and management" and symposium on"Impact of diseases on conservation of wild animals' hasbeen successfully organized in Jamu, the city of templeson April 26-27 2007 by Faculty of Veterinary Sciences andAnimal Husbandry, Sher-e-Kashmir University ofAgricultural Sciences and Technology; R.S.Pura, Jamuunder the auspices of the Association of Indian Zoo andWildlife Veterinarians . The deliberations of the symposiumfocused on various aspects of wild animal treatment andmanagement of diseases of zoo and free ranging animals ,drug action in wild and zoo animals and impact of diseaseson conservation of wild animals. The congress provided anopportunity to teachers, researchers, biologists, wildlifeconservators, policy makers, administrators andveterinarians for interaction and to discuss latest methodsfor control of these diseases.
Plenary lectures included management of zooanimals, conservation of wild animals and diagnostictechniques for zoo and wild animal diseases. Technicalsessions included breeding and management approachesfor wild life, wildlife conservation and rehabilitation, diseases
of zoo animals and their treatment, public health importanceof zoo and wild animal and judicious use of drugs in wildand zoo animals. A number of veterinarians and researchersgave oral and poster presentations in the said congressupon which general recommendations were drawn. In thesaid congress the journal “e-planet” (Vol. 5/ issue no.1)was inaugurated in the inaugural function on 26.4.2008 byJenab Qazi Mohammad Afzal, Hon'ble Minister for Forest,Environment and Ecology, Housing and Urban, Jammu andKashmir Government in presence of Jenab Ajaz AhmadKhan, Minister of State Agriculture, Horticulture, Higher andTechnical Education, Prof. Nagendra Sharma, ViceChancellor and Chief Patron, Organizing Committee,Michele Miller, Disney's Animal Programmer, Orlando,Florida,USA and Mads F. Bertelsen, Center for Zoo andWild animal Health, Copenhagen Zoo, Denmark. Thepresident of Association of Indian Zoo and wildlifeVeterinarians and the chairman of the congress, Dr. B. M.Arora and the Dean, Faculty of Veterinary sciences andAnimal Husbandary and the organising secretary, Prof. A.K. Srivastava successfully conducted the program.
INAUGURATION OF E-PLANET IN INTERNATIONAL CONGRESS AT JAMMU ON 26.04.2008
Reitz, S. Padhi and T. Samantaray
Inset (L to R) : [ Prof. Dr. Ngendra Sharma, Vice Chanceller, Sher- e- Kashmir University of Agricultural Sciences &Technology; Dr. R. K. Samantaray, Editor- in Chief, e-planet; Prof. Dr. A. K. Srivastava, Organizing Secretary and DeanFaculty of Veterinary Sciences and Animal Husbandry, SKUAST-Jammu, jenab qazi Mohammad Afzal, Hon’ble Ministerfor Forest, Environment, Ecology, Housing and Urban, Jammu and Kashmir Government; Dr. Michele Miller, Disney’sAnimal Programmer, Orlando, Florida, United States of America; Dr. Mads F.Bertelsen, Center for Zoo and Wild AnimalHealth, Copenhagen Zoo, Denmark; Prof. Dr.B. M. Arora; President, Association of Indian Zoo and Wildlife Veterinarians,Dr. Leela Singh, Faculty of Veterinary Sciences and Animal husbandry, SKUAST-Jammu ]
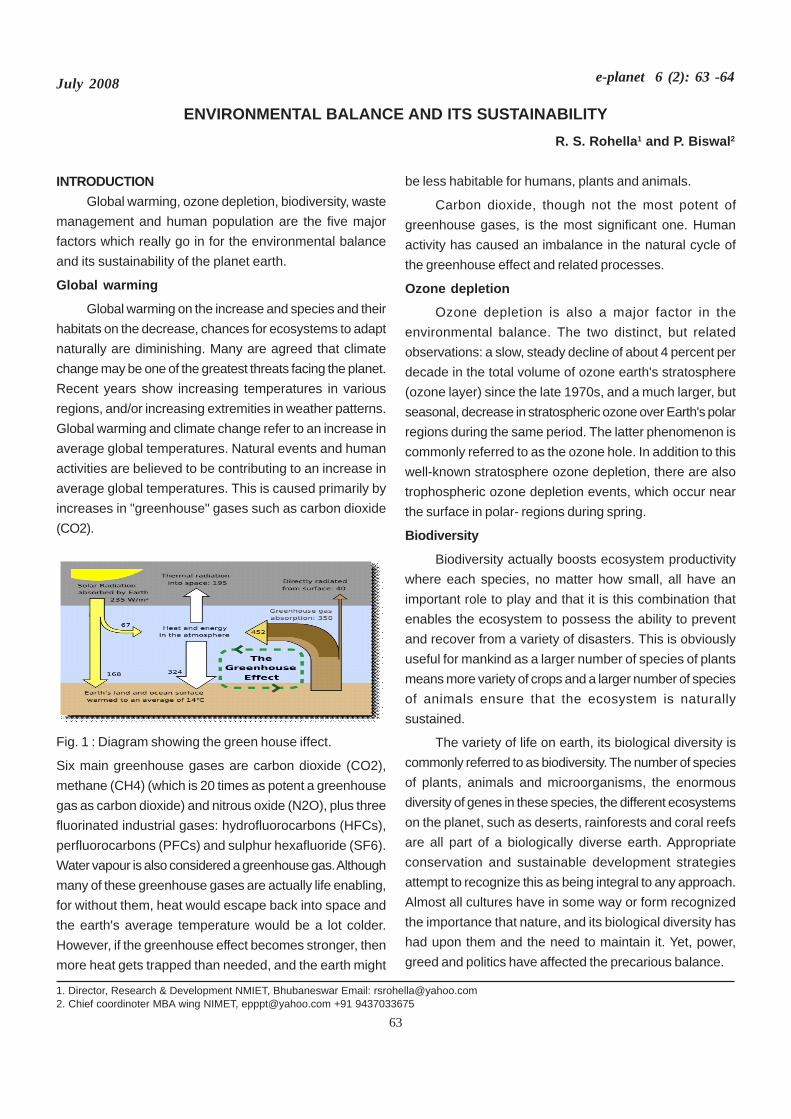
63
July 2008 e-planet 6 (2): 63 -64
ENVIRONMENTAL BALANCE AND ITS SUSTAINABILITYR. S. Rohella1 and P. Biswal2
1. Director, Research & Development NMIET, Bhubaneswar Email: [email protected]. Chief coordinoter MBA wing NIMET, [email protected] +91 9437033675
INTRODUCTIONGlobal warming, ozone depletion, biodiversity, waste
management and human population are the five majorfactors which really go in for the environmental balanceand its sustainability of the planet earth.
Global warming
Global warming on the increase and species and theirhabitats on the decrease, chances for ecosystems to adaptnaturally are diminishing. Many are agreed that climatechange may be one of the greatest threats facing the planet.Recent years show increasing temperatures in variousregions, and/or increasing extremities in weather patterns.Global warming and climate change refer to an increase inaverage global temperatures. Natural events and humanactivities are believed to be contributing to an increase inaverage global temperatures. This is caused primarily byincreases in "greenhouse" gases such as carbon dioxide(CO2).
Fig. 1 : Diagram showing the green house iffect.
Six main greenhouse gases are carbon dioxide (CO2),methane (CH4) (which is 20 times as potent a greenhousegas as carbon dioxide) and nitrous oxide (N2O), plus threefluorinated industrial gases: hydrofluorocarbons (HFCs),perfluorocarbons (PFCs) and sulphur hexafluoride (SF6).Water vapour is also considered a greenhouse gas. Althoughmany of these greenhouse gases are actually life enabling,for without them, heat would escape back into space andthe earth's average temperature would be a lot colder.However, if the greenhouse effect becomes stronger, thenmore heat gets trapped than needed, and the earth might
be less habitable for humans, plants and animals.
Carbon dioxide, though not the most potent ofgreenhouse gases, is the most significant one. Humanactivity has caused an imbalance in the natural cycle ofthe greenhouse effect and related processes.
Ozone depletion
Ozone depletion is also a major factor in theenvironmental balance. The two distinct, but relatedobservations: a slow, steady decline of about 4 percent perdecade in the total volume of ozone earth's stratosphere(ozone layer) since the late 1970s, and a much larger, butseasonal, decrease in stratospheric ozone over Earth's polarregions during the same period. The latter phenomenon iscommonly referred to as the ozone hole. In addition to thiswell-known stratosphere ozone depletion, there are alsotrophospheric ozone depletion events, which occur nearthe surface in polar- regions during spring.
Biodiversity
Biodiversity actually boosts ecosystem productivitywhere each species, no matter how small, all have animportant role to play and that it is this combination thatenables the ecosystem to possess the ability to preventand recover from a variety of disasters. This is obviouslyuseful for mankind as a larger number of species of plantsmeans more variety of crops and a larger number of speciesof animals ensure that the ecosystem is naturallysustained.
The variety of life on earth, its biological diversity iscommonly referred to as biodiversity. The number of speciesof plants, animals and microorganisms, the enormousdiversity of genes in these species, the different ecosystemson the planet, such as deserts, rainforests and coral reefsare all part of a biologically diverse earth. Appropriateconservation and sustainable development strategiesattempt to recognize this as being integral to any approach.Almost all cultures have in some way or form recognizedthe importance that nature, and its biological diversity hashad upon them and the need to maintain it. Yet, power,greed and politics have affected the precarious balance.
64
July 2008 e-planet 6 (2): 63 -64
Waste management
Waste Management is the human control of thecollection, treatment and disposal of different wastes.Waste is an unwanted or undesired material or substance.It is also referred to as rubbish, trash, garbage, or junkdepending upon the type of material and the regionalterminology. In living organisms, waste relates to unwantedsubstances or toxins that are expelled from them.
This is in order to reduce the negative impacts wastehas on environment and society. Waste is directly linkedto the human development, both technologically andsocially. The composition of different wastes have variedover time and location, with industrial development andinnovation being directly linked to waste materials.Examples of this include plastics and nuclear technology.Some components of waste have economical value andcan be recycledonce correctly recovered.
Biodegradable waste such as food waste or sewage,is broken down naturally by microorganisms eitheraerobically or anaerobically. If the disposal of biodegradablewaste is not controlled it can cause a number of widerproblems including contributing to the release of greenhousegases and can impact upon human health viaencouragement of pathogens.
Human population growth
5. Human population growth is the number one threat tothe world's environment. Each person requires energy,space and resources to survive, which results inenvironmental losses. If the human population weremaintained at sustainable levels, it would be possible tobalance these environmental losses with renewableresources and regeneration. But our population is rapidlyrising beyond the earth's ability to regenerate and sustain
us with a reasonable quality of life. We are exceeding thecarrying capacity of our planet.
We need to limit our growth voluntarily, and promotecontraceptive use, before nature controls our population forus with famines, drought and plagues. Our children's futuredepends on us. The population reached 6.1 billion in 2000.The United Nation projects that world population for theyear 2050 could range from 7.9 billion to 10.9 billion,depending on the actions we take today.
India as a country of vast resources and variedbiodiversity is on rapid economic growth and certainly hasto face the threat of climate change. The utilization of theunique natural resources depends on the judicious and itsfood and energy needs vis-à-vis social development andobligations are the overriding priorities before India and thesehave to be met without compromising and sacrificing theglobal environmental balance and sustainability. Furthermaintaining high growth rate is also a necessity for India.So it is the responsibility of every citizen of country tocontribute to minimize and control environmentaldegradation any further by adopting the energy efficientmeans and devices in their daily routine.
ROLE OF NM GROUP OF INSTITUTIONS
NM Group while spreading the message on use ofrenewable energy through its Renewable Energy Club (REC)set up at NMIET Bhubaneswar in Oct. 2006 under aegis ofMinistry of New and Renewable Energy (MNRE),Government of India is doing a very good job and is alsoplaying a critical role in disseminating information regardingthe renewable energy generation, efficient energy devices,optimum utilization and energy conservation in our day today life there by contributing in global environmental balanceand ssustainability
NATIONAL SEMINAR ON
CLIMATE CHANGE ISSUES & MITIGATION PRIORITIES28TH FEBRUARY – 2ND MARCH 2009
VenueNM INSTITUTE OF ENGINEERING AND TECHNOLOGY, BHUBANESWAR
LAST DATE FOR REGISTRATION & SUBMISSION OF ABSTRACTS:15TH JANUARY 2009CONTACT:[email protected] & [email protected]