Embed Size (px)
Citation preview

MARINE MAMMAL SCIENCE, 23(3): 553–573 (July 2007)C© 2007 by the Society for Marine MammalogyDOI: 10.1111/j.1748-7692.2007.00136.x
REPRODUCTIVE PATTERNS OFTHE HAWAIIAN MONK SEAL
ALBERT L. HARTING
Harting Biological Consulting,8898 Sandy Creek Lane,
Bozeman, Montana 59715, U.S.A.E-mail: [email protected]
JASON D. BAKER
THEA C. JOHANOS
Pacific Islands Fisheries Science Center,National Marine Fisheries Service, NOAA,
2570 Dole Street,Honolulu, Hawaii 96822-2396, U.S.A.
ABSTRACT
We evaluated reproductive patterns of the Hawaiian monk seal (Monachus schauins-landi) using a combination of fitted age-specific reproductive curves and analysis ofreproductive patterns of individual females. We review the difficulties inherent inthe acquisition and modeling of reproductive data with emphasis on the signifi-cance of reproductive senescence to populations with dissimilar age/sex composi-tions. Validation of the fitted reproductive parameters was accomplished by MonteCarlo sampling of parameter distributions to compare the expected number of pupswith the observed production. Although the fitted reproductive functions appearto provide an acceptable fit to the raw reproductive data, we found that the fittedcurves did a poor job of predicting the actual pup production in individual yearsbecause of high variability among years. To further verify, and elaborate on, thepatterns in the pooled (multi-seal, and multi-year) rates, we examined attributesof the reproductive performance of individual seals. The attributes included age ofprimiparity, reproductive rates computed over several age ranges, and the relation-ship between reproductive performance and seal longevity. Analysis of individualseal patterns reinforced the conclusion that reproductive senescence is operative inmonk seal populations.
Key words: Monachus schauinslandi, monk seal, Northwestern Hawaiian Islands,reproduction, fecundity, reproductive senescence, population modeling, sensitivityanalysis.
For many marine mammal species, acquiring data on age-specific reproductive rates(number of pups per female) is more challenging than gathering data for age-specificsurvival. The fact that an animal has survived can be ascertained by a single sightingat any time during the current or subsequent years, whereas in phocids, reproduction
553

554 MARINE MAMMAL SCIENCE, VOL. 23, NO. 3, 2007
can be established only during the relatively brief, nursing-period interval (about 40d in the monk seal; Johanos et al. 1994). In addition, to confirm that a female didnot reproduce, it is necessary to either observe her at regular intervals throughout thebreeding season or else ascertain that all possible parturition sites are visited on afrequent basis so that all births will be witnessed. Even with an intensive monitoringprogram, some uncertainty may remain because parturition events that culminate ina neonatal death (or an otherwise truncated nursing interval) may escape detection.
There are several approaches for coping with sparse reproductive data. The simplestbut least informative approach is to pool all mature females and calculate an averagereproductive rate applicable to all adult ages. This strategy may be sufficient for somepurposes, but it dismisses any demographic consequences that might accompany age-specific differences in reproductive output. Also, this strategy may be biased if somereproductive events remain undetected. Another common practice is to assume thatreproductive rates remain relatively static and to pool data over all available years soas to boost age-specific samples.
These approximations to a full set of reproductive rates are generally deemedacceptable because small errors in estimating reproductive rates (especially withinthe oldest age classes) are viewed as less critical than other aspects of the life tablein determining population trajectories. This assumption is predicated on the factthat few females survive to the older age classes where senescence is likely to play arole, and hence, the diminished reproductive output of those few females that survivedoes not exert much influence on the population trend. In certain cases, however,the reproductive performance of older animals is influential. This is particularlytrue in populations where age-structure perturbations cause much of the currentreproductive potential to be loaded into older age classes. For example, an extendedperiod of poor pup production can result in a string of depleted cohorts with fewyoung females recruiting to reproductive age. Until such time as the age-structureeffects have dampened (a process that may require several generations to be resolved),the bulk of the reproduction will be limited to older-aged females.
The functional form of the reproductive curve is of interest not only because it en-ables a better estimate of the population growth rate, but also for theoretical reasons.The manner in which reproductive rates change can provide some clues regardingdensity-dependent pressures affecting the population. Eberhardt (1977) proposed aparadigm for the sequence of demographic adjustments that accompany density-dependent regulation in large mammals. According to this theory, juvenile survivalwill be the first rate affected, followed by early reproduction (age of first birth), maturereproduction, and finally mature survival. If we accept this paradigm, then detectingchanges in either early or mature reproduction provides clues as to the population’sposition on the density-dependence track. Furthermore, understanding how repro-ductive rates vary among sites and years can help elucidate possible mechanisms thatdrive those rates up or down.
Monk seals are critically endangered, and are listed in both the Endangered SpeciesAct (status: endangered) and the Marine Mammal Protection Act (status: depleted).They reside exclusively in the Hawaiian archipelago, with most breeding occurringat six sites (four atolls and two single islands) in the remote Northwestern Hawai-ian Islands (NWHI). The National Marine Fisheries Service has conducted detailedpopulation assessments of monk seals in the NWHI since the early 1980s, includingannual mark and resighting studies, with tagging of most pups soon after wean-ing. These studies have provided an exceptional foundation for detailed demographicanalysis. However, until recently, age-specific reproductive rates for older monk seals

HARTING ET AL.: MONK SEAL REPRODUCTION 555
Figure 1. Current (2004) female age structure for French Frigate Shoals, Laysan, and Lisian-ski. The theoretical stable age structure is shown as a dashed line.
were largely unknown because most older seals were of indefinite age. For modelingpurposes, this uncertainty was not a great concern for those subpopulations withfavorable age structures. However, at some sites, an extended period of poor juvenilesurvival has given rise to age structures biased toward older females. The situationis most egregious at French Frigate Shoals (FFS), where very low pup survival from1990 to 2004 has led to a skewed age distribution in which females aged 1–14 areunder represented and females aged 15 and older are over represented (Fig. 1). Here,the reproductive performance of older females may be critical to arresting the declinenow underway at this atoll, and errors in estimating reproductive rates for olderfemales can lead to inaccurate assessments regarding the long-term prospects for thepopulation.
In this paper we present an overview of monk seal reproductive patterns as viewedfrom two complementary perspectives. First, we examine age-specific reproductiverates for separate subpopulations, with an emphasis on fitting an appropriate modelto the raw data. Next, we analyze the reproductive performance of individual seals.

556 MARINE MAMMAL SCIENCE, VOL. 23, NO. 3, 2007
We look for contrasting reproductive patterns among individual seals as revealed byinter relationships in age of primiparity, early and late reproductive rates, and seallongevity. Throughout the paper we pay particular attention to the evidence for, andimportance of, reproductive senescence.
METHODS
Field Data Collection
Research teams are deployed seasonally at each of the six primary breeding sitesfor periods ranging from 3 to 5 mo. At each site, most young-of-the-year were de-tected, usually in the season of their birth, but sometimes (for late-born births) inthe following year. Neonatal deaths may remain undetected if the birth and mor-tality occurred outside the field season. Determining age-specific reproduction wasonly possible if the nursing interval coincides with the period when field teams arepresent. At some sites (those with abbreviated field seasons), a high proportion of theannual births occurred prior to the team’s arrival, and therefore, maternity could notbe determined for those weaned pups. Age-specific reproductive data were availablefor the three subpopulations having field seasons of sufficient duration to ensure that alarge majority of the births were detected each year and the maternal female was iden-tified: Laysan Island (LAY), Lisianski Island (LIS), and FFS. Confidence that nearlyall births were detected at these sites was derived from the observation that veryfew unmarked juveniles were observed in subsequent years. As a result of intensivemonitoring at these three sites, we believe that observational bias in the reproductivehistories was minimal.
As an additional complication, even if a pup is still nursing, it is not certain thatthe nursing female is the same as the pup’s birth mother because of the high degree ofpup switching that occurs in the monk seal (Boness 1990, Boness et al. 1998). For thisreason, assigning maternity to an individual female is relatively conservative: lackingdirect evidence of recent parturition (fresh placenta, bloody genitalia, or other), afemale is credited with reproduction, but not maternity, for the pup observed inassociation with her.
We limited our analyses to those females whose exact age was known or estimated,with a maximum error of 2 yr (those first tagged as juveniles). The oldest sealscurrently in the population are now 20–28 yr old, but the sample sizes for >15-yr-old females are small. We chose to analyze each site separately, rather than combiningthem, as the subpopulations are not homogenous in their habitat, population trends,or management histories (Ragen and Lavigne 1999, Schmelzer 2000, Antonelis et al.2006).
Fitting a Model to Observed Reproductive Rates
For some purposes, it may be adequate to use the raw (observed) reproductiverates for life-table analysis and modeling. However, because of a small sample size,stochastic variability in these raw rates may appear as an irregular scatter unaccountedfor by any aspect of the species life history. It is therefore beneficial to smooth theobserved points using an appropriate model.
Unlike survival rates, in which a number of suitable models have gained broadacceptance (e.g., Siler 1979, Barlow and Boveng 1991), no single model has been

HARTING ET AL.: MONK SEAL REPRODUCTION 557
widely used to represent reproductive curves. For modeling purposes, it is usefulto partition reproductive rates into three separate components that correspond todistinct life stages: early age (prematurity), prime reproductive age, and late-matureage (Eberhardt 1985, Lunn et al. 1994). The reproductive curve associated with thesestages typically reflects a rise in fecundity as animals attain reproductive maturity,an asymptotic maximum fecundity for prime-age adults, and a decline in fecundityas a result of senescent factors.
Identifying models or functions to describe the first two phases of the reproductivecurve presents no great difficulties. Depending on the functions used, these twophases may be collapsed into a single function that captures both the ascending andasymptotic segments of the curve. Among the options for representing the early andmature phases are the three-parameter (a, b, x0) growth curve described by Brody(1945) and used by Eberhardt (1985):1
m x = a[1 − e −b (x−x0
]; (1)
and the three-parameter logistic equation used by Harting (2002) for monk seals:
m x = a
1 + e b−c x. (2)
Parameters for these functions, or a number of other candidate models, can usuallybe fit to the observed data using nonlinear least squares methods.
Finding a function to represent the senescent part of the reproductive curve is moreproblematic. Part of the difficulty stems from the fact that the biology governing thesenescent phase is not fixed in the same way as early reproduction. We are confidentthat the left portion of the reproductive curve lies on the x-axis (reproductive rate of0.0 for the youngest ages); however, less is known about the form of the right portionof that curve. Also, in most studies, far fewer animals are available in the older ageclasses to observe reproductive performance, so that the observed rates may containa number of outliers and a scatter that does not suggest a true underlying pattern.
Candidate functions for modeling senescence include the model used by Lunn et al.(1994) for Antarctic fur seals:
b (x ) = x − 2[a + b (x − 2) + c (x − 2)2
] ; (3)
or that of Eberhardt (1985), who proposed a Gompertz model similar to that usedby Siler (1979) to represent senescent decline in survival:
m x = e a (1−e b x ). (4)
In Eberhardt’s model, the “total” age-specific reproductive rate was derived by mul-tiplying the results of Equations 1 and 4. For modeling reproduction in the monkseal, we incorporated a second term to Equation 2 to represent the senescent phase:
1 For all equations, mx is the age-specific reproductive rate at age x.

558 MARINE MAMMAL SCIENCE, VOL. 23, NO. 3, 2007
m x = ae d∗[1−exp( f x )]
1 + exp(b − c x ). (5)
This is a flexible function adaptable to a variety of patterns in the observed data,but it is prone to nonconvergence problems with all but the most accommodatingof data sets. To alleviate this problem, the two terms were first fitted separately tofind suitable parameter initialization values. The full function was then refitted withsimultaneous fitting of all five parameters. The fitting was performed using nonlinear,least-squares regression (modified Levenberg-Marquardt method: Levenberg 1944,Marquardt 1963), using IMSL numeric routines (Visual Numerics, Inc) within ded-icated FORTRAN software developed for the monk seal project. Observations wereweighted by sample size, with normally distributed error terms.
The predictive power of the fitted model was tested by comparing the numberof pups expected from the fitted parameters with the number observed born inindividual years. Random parameter values were Monte Carlo sampled from theirfitted distributions, consistent with the associated variance/covariance matrix fromthe fitting. Each unique parameter set was then used to generate a set of age-specificrates that were applied to the known female age structure at a given site and yearto obtain an “expected” number of pups for that year. Iteratively, resampling inthis fashion provided a distribution of expected pup numbers for that year, and thisdistribution was compared to the observed number of pups to assess its correspondencewith the fitted function.
Reproductive Histories of Individual Females
We examined reproductive histories of individual females to better understand theorigins of the patterns observed in the age-specific rates and also to determine theextent to which individual females departed from the norm prescribed by the gen-eral reproductive curve. Among the measures we examined were age of primiparity,reproductive rate calculated over different phases of a seal’s reproductive life (early,late, and total), interval between pups, cohort differences, and the inter relationshipsamong these measures. Of particular interest in understanding reproductive senes-cence was the relationship among age of primiparity, reproductive rate, and survival.Because many of the older seals in our sample were still alive, for some analyses lastobserved age was used rather than age-at-death as a measure of seal longevity, or thedata were censored according to whether each seal was still alive in the most recentdata.
Other Analyses
The importance of reproductive senescence to the monk seal population was testedin multiple ways. Life-table sensitivity analysis (Caswell 2001) was used to deter-mine how changes in age-specific reproduction influenced lambda (�), the annualfactor of population increase. Age-specific reproductive value, Vx (the expected re-production of an individual from the current age onward; Fisher 1930, Goodman1984) was computed for each subpopulation to determine how that measure variedwith age and among sites. Finally, short-term Leslie matrix population projectionswere performed to examine how the realized growth rate varied with and withoutreproductive senescence.
HARTING ET AL.: MONK SEAL REPRODUCTION 559
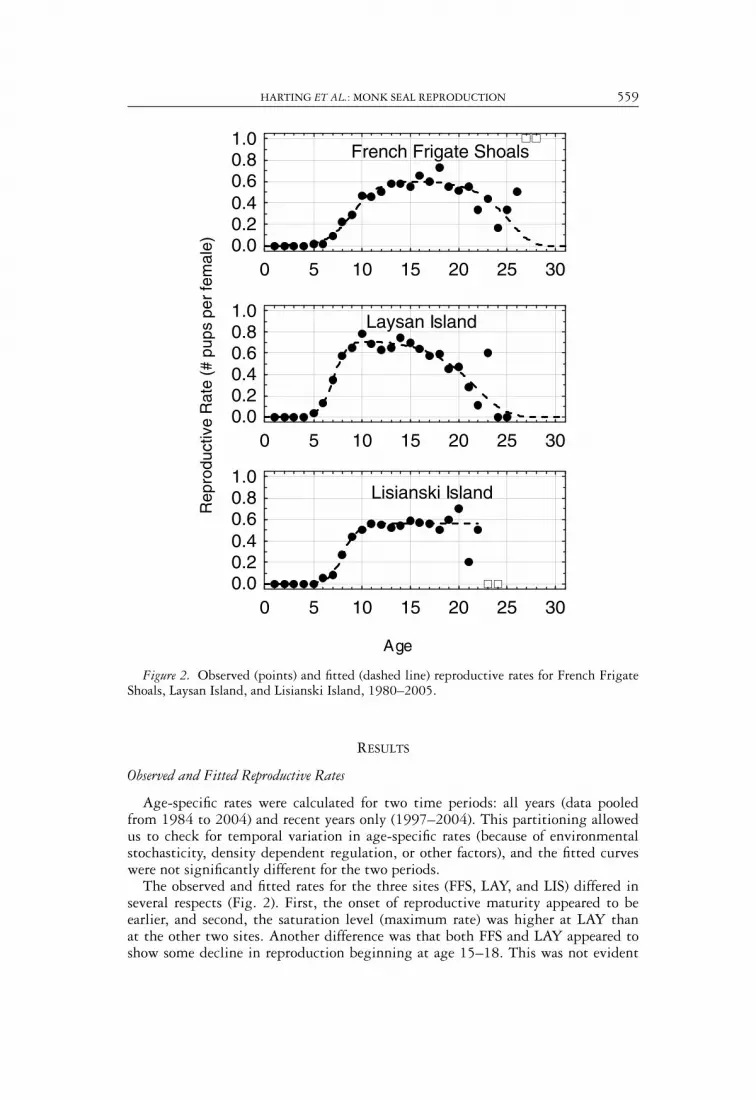
Figure 2. Observed (points) and fitted (dashed line) reproductive rates for French FrigateShoals, Laysan Island, and Lisianski Island, 1980–2005.
RESULTS
Observed and Fitted Reproductive Rates
Age-specific rates were calculated for two time periods: all years (data pooledfrom 1984 to 2004) and recent years only (1997–2004). This partitioning allowedus to check for temporal variation in age-specific rates (because of environmentalstochasticity, density dependent regulation, or other factors), and the fitted curveswere not significantly different for the two periods.
The observed and fitted rates for the three sites (FFS, LAY, and LIS) differed inseveral respects (Fig. 2). First, the onset of reproductive maturity appeared to beearlier, and second, the saturation level (maximum rate) was higher at LAY thanat the other two sites. Another difference was that both FFS and LAY appeared toshow some decline in reproduction beginning at age 15–18. This was not evident

560 MARINE MAMMAL SCIENCE, VOL. 23, NO. 3, 2007
0 2 4 6 8 10 12 14 16
Age
0.0
0.2
0.4
0.6
0.8
1.0
Pro
port
ion
of F
emal
es A
dult
Siz
ed
FFS LAY LIS
Figure 3. Proportion of seals of each age classified as adult sized at FFS, LAY, and LIS.
in the pattern for LIS, but the diffuse scatter seen in the rates for the last fourages at LIS suggested that additional data will be necessary before the actual trendis discernible. At FFS, total sample size for ages 26–28 was only four, with threeof those data points contributed by a single female that reproduced at all threeages. Parameter convergence was attained only when those three observations wereexcluded. Although the resultant curve appeared very consistent with the observedpoints through age 25, the curve should be reevaluated as soon as additional data areacquired.
Intuitively, differences among sites in the ascending portions of the reproductivecurves might be expected to correspond to differences in seal growth rates. Thelimited data available support this hypothesis, as seen in the proportion of females ofeach age classified as adult sized (Fig. 3). LAY females grew most rapidly, followedby LIS and FFS—reflecting the same order as seen in the fitted reproductive curves.
Recalling that the observed data used for fitting the five model parameters (Eq. 5;Fig. 2; Tables 1,2) were pooled from multiple years, it is reasonable to ask how wellthe fitted reproductive curves were able to predict the number of pups in a given year.Monte Carlo parameter sampling from the fitted distributions indicated that althoughthe fitted curves provided an acceptably tight fit to the pooled data (Fig. 2; Table 2),they did not perform well for predicting the number of pups born in individual years(Fig. 4). In some years, the observed number of pups was markedly higher than thenumber predicted by the pooled data curve, and in other years the observed numberlay below most predictions. The primary factor underlying this result is that theannual variation in reproductive performance is masked when samples from multipleyears are pooled. Sample sizes were not sufficient to reliably fit the reproductivecurve on an annual basis, but the magnitude of inter-year variability was evident in

HARTING ET AL.: MONK SEAL REPRODUCTION 561
Table 1. Observed number of adult females, number of pups, and reproductive rate(pups/female) for French Frigate Shoals, Laysan Island, and Lisianski Island (data pooledover all years, 1980–2005).
French Frigate Shoals Laysan Island Lisianski Island
Age Females Pups Rate Females Pups Rate Females Pups Rate
1 439 0 0 274 0 0 146 0 02 294 0 0 223 0 0 109 0 03 229 0 0 203 0 0 109 0 04 202 0 0 178 0 0 95 0 05 172 3 0.017 144 5 0.035 72 0 06 155 2 0.013 127 16 0.126 57 3 0.0537 157 14 0.089 102 36 0.353 59 5 0.0858 155 35 0.226 83 48 0.578 56 15 0.2689 147 42 0.286 78 51 0.654 48 21 0.438
10 137 64 0.467 65 51 0.785 46 23 0.511 125 57 0.456 55 38 0.691 41 23 0.56112 112 57 0.509 49 31 0.633 40 22 0.5513 100 58 0.58 46 30 0.652 36 19 0.52814 95 55 0.579 43 32 0.744 35 19 0.54315 83 46 0.554 37 26 0.703 29 17 0.58616 73 48 0.658 34 22 0.647 30 17 0.56717 63 38 0.603 33 19 0.576 25 14 0.5618 56 41 0.732 27 16 0.593 16 8 0.519 45 25 0.556 22 10 0.455 15 9 0.620 29 15 0.517 19 9 0.474 10 7 0.721 20 11 0.55 14 4 0.286 10 2 0.222 9 3 0.333 9 1 0.111 8 4 0.523 9 4 0.444 5 3 0.6 1 0 024 6 1 0.167 4 0 0 1 0 025 6 2 0.333 3 0 0 0 0 026 2 1 0.5 0 0 0 0 0 027 1 1 1 0 0 0 0 0 028 1 1 1 0 0 0 0 0 029 0 0 0 0 0 0 0 0 030 0 0 0 0 0 0 0 0 0
the ratio of pups to adult females (defined as all females aged 5 and older) each year,termed the gross birth rate. The data indicated considerable annual variation in grossbirth rates (Fig. 5) at all three sites. The high degree of variation was also evidentwhen age-specific reproductive rates for the prime breeding ages (ages 10–20) werecomputed on an annual basis (Fig. 6).
Life-Table Analysis and Population Projections
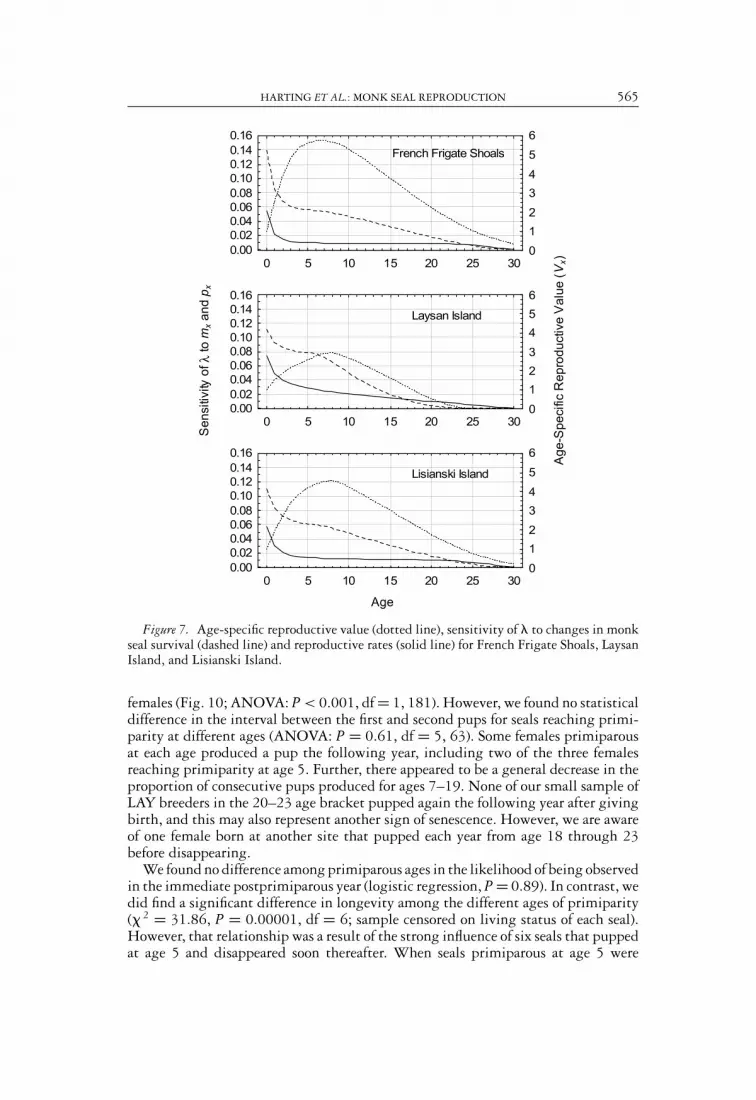
Sensitivity analysis of monk seal life tables indicated that age-specific survival hadmore influence on population growth rate than did age-specific reproduction untilage 17 at LAY and to age 25 at FFS (Fig. 7). At all three subpopulations, age-specificreproductive value, a measure that incorporates information on the probabilities ofboth future survival and reproduction, attained a maximum at age 7–8.

562 MARINE MAMMAL SCIENCE, VOL. 23, NO. 3, 2007
Table 2. Fitted reproductive parameters (Eq. 5) for FFS, LAY, and LIS using data pooledduring 1980–2005.a
FFSb LAY LISc
Parametersa 0.608 0.731 0.560
(0.603, 0.613) (0.724, 0.739) (0.557, 0.562)b 7.063 10.328 10.976
(6.909, 7.216) (10.046, 10.609) (10.697, 11.255)c 0.784 1.463 1.355
(0.765, 0.802) (1.422, 1.505) (1.320, 1.390)d 0.000007 0.001 Not fit
(0.000007, 0.000007) (0.00041, 0.00095)f 0.467 0.333 Not fit
(0.423, 0.511) (0.314, 0.352)Final loss 3.814 2.403 0.428r2 0.979 0.985 0.994ANOVA P < 0.01, P < 0.01, P < 0.01,
df = (5, 2.915) df = (5, 1.872) df = (3, 1.071)
aUpper and lower 95% confidence intervals for each parameter are indicated in parentheses.Final loss (weighted by sample size) and ANOVA results for nonlinear regression areprovided.
bFFS function fit using points with n > 2 only.cSenescent parameters not estimated for Lisianski Island.
Sensitivity analysis does not, however, reference the current age/sex structure of apopulation, and therefore conclusions derived from sensitivity analysis are primar-ily applicable to populations at or near stable age distribution. The implications ofsenescence to the actual subpopulation (not at stable age distribution) were examinedfrom population projections initialized at the current age/sex structure, comparing
Figure 4. Results of Monte Carlo parameter sampling to evaluate accuracy of annual pre-dictions (1997–2004) using the fitted reproductive parameters (parameters fit to pooled re-productive data over the same years).

HARTING ET AL.: MONK SEAL REPRODUCTION 563
Figure 5. Gross birth rate (#pups per adult female) for the three eastern atolls.
outcomes with and without senescent decline in reproductive rates. Using this ap-proach, the difference in the mean final abundance at FFS with reproductive senescencevs. without reproductive senescence after 5 yr was 115 and 123 females, respectively(Fig. 8). Although eighteen additional pups were born in the 5-yr projection withno reproductive senescence, high early mortality cropped most of those pups fromthe population before they could mature. In contrast, eliminating senescence at LAYincreased the final abundance from 137 to 157 seals. When the same set of nonsenes-cence reproductive rates was used at FFS, but the site was also assigned the highersurvival rates observed at LAY, the increase in final abundance was greater (157 vs. 115seals, an increase of 36%). And finally, when FFS was granted the full complementof demographic rates from LAY (i.e., both survival and reproductive rates), with nosenescent decline in the reproductive rate of older females, final abundance increasedto 175 seals, an increase of 52% over the baseline scenario.
Measures of Reproductive Performance
Age of primiparity—Examining only parous females born at LAY during 1984–2004 (n = 84), the mean age of primiparity was found to be 7.4 yr (range 5–10).All females that survived to age 10 were parous: that is, there were no females aged11 or older in the population that had failed to produce at least one prior pup (Fig.9). This fact was used to partition reproductive performance into “early” (ages 5–10)and “late” (age 11 and older) reproductive phases for some subsequent analyses.
There was no evidence of a trend in the mean age of primiparity over time amongdifferent cohorts (linear regression r2 = 0.001, F1,82 = 0.0617, P = 0.80). However,a number of females born into the 1980–1986 cohorts were primiparous at age 5, and

564 MARINE MAMMAL SCIENCE, VOL. 23, NO. 3, 2007
Figure 6. Observed age-specific birth rate (#pups produced per female in each age class) forindividual years, 1997–2004.
no females from later cohorts attained primiparity at that age. Similarly, there didnot appear to be any temporal trend in the early reproductive rate among differentcohorts (ANOVA P = 0.27, df = 1, 56), but that analysis was necessarily limitedto those cohorts old enough to have reached age 10 at the time of the analysis (1994and earlier cohorts).
We looked for evidence of a “penalty” (either reduced reproduction or survival)associated with early primiparity or high, early reproductive output. The evidencewas mixed, but most indices were not consistent with such effects. It might be hy-pothesized that an early primiparous female (age 5–6) would be more physiologicallydepleted than a female reaching primiparity at an older age, leading to either a longerinterval prior to producing a second pup or possibly a reduced likelihood of survival tothe following age. We tested this hypothesis by calculating the proportion of breedersthat were present and produced a pup the following year, and found that seals of thefirst two primiparous ages (age 5–6) were significantly less likely to produce a pupthe following year (i.e., at ages 6 and 7, respectively) than were prime age (age 10–15)
HARTING ET AL.: MONK SEAL REPRODUCTION 565
Figure 7. Age-specific reproductive value (dotted line), sensitivity of � to changes in monkseal survival (dashed line) and reproductive rates (solid line) for French Frigate Shoals, LaysanIsland, and Lisianski Island.
females (Fig. 10; ANOVA: P < 0.001, df = 1, 181). However, we found no statisticaldifference in the interval between the first and second pups for seals reaching primi-parity at different ages (ANOVA: P = 0.61, df = 5, 63). Some females primiparousat each age produced a pup the following year, including two of the three femalesreaching primiparity at age 5. Further, there appeared to be a general decrease in theproportion of consecutive pups produced for ages 7–19. None of our small sample ofLAY breeders in the 20–23 age bracket pupped again the following year after givingbirth, and this may also represent another sign of senescence. However, we are awareof one female born at another site that pupped each year from age 18 through 23before disappearing.
We found no difference among primiparous ages in the likelihood of being observedin the immediate postprimiparous year (logistic regression, P = 0.89). In contrast, wedid find a significant difference in longevity among the different ages of primiparity(� 2 = 31.86, P = 0.00001, df = 6; sample censored on living status of each seal).However, that relationship was a result of the strong influence of six seals that puppedat age 5 and disappeared soon thereafter. When seals primiparous at age 5 were

566 MARINE MAMMAL SCIENCE, VOL. 23, NO. 3, 2007
0 1 2 3 4 5
Year
110
120
130
140
150
160
170
180#
Fe
mal
es
Baseline (FFS rates) No repro. senescence Use Lay repro rates Use Lay survival rates Use Lay repro and survival rates
Figure 8. Results of population projections for French Frigate Shoals (FFS) demonstratingthe relative importance of different demographic rates in altering the population trajectory.
omitted from the analysis, there was no clear relationship between age of primiparityand survival (� 2 = 2.10, P = 0.718, df = 5).
Among parous females living at least three years after reaching primiparity, thereappeared to be an inverse relationship between the age of primiparity and the life-time reproductive rate, with early breeders faring better than late-maturing females(multiple regression r2 = 0.296; F1,36 = 16.565; P < 0.00025).
0 2 4 6 8 10 12 14 16 18 20 22 24 26
Age
0.0
0.2
0.4
0.6
0.8
1.0
Pro
porti
on o
f Fem
ales
Par
ous
Figure 9. Proportion of Laysan females that are parous at each age (produced a pup at orprior to that age).

HARTING ET AL.: MONK SEAL REPRODUCTION 567
4 6 8 10 12 14 16 18 20 22 24
First Age
0.0
0.2
0.4
0.6
0.8
1.0
Pro
porti
on P
uppi
ng a
tC
onse
cutiv
e A
ges
Figure 10. Proportion of females that pupped consecutively at each age (x-axis) and againat the following age.
Reproductive rate— As expected, the total number of pups produced was directlyrelated to the number of years a female was alive and of breeding age (Fig. 11). Therewere, however, a number of noteworthy exceptions to this general rule, includingone female, currently aged 21, that produced her only pup at age 8. Another femaleof the same age was primiparous at age 9, did not produce a pup until six years later,and has pupped only once since then. It is unlikely that these exceptions arise fromfailure to detect a birth because LAY has extended field seasons, very high resightingprobabilities, and the two females were observed in all years, and in all but one year,respectively.
Some females pupped in consecutive years over surprisingly long periods. Theseincluded one female (currently aged 20) that pupped consecutively every year from
0 2 4 6 8 10 12 14 16 18 20 22
Reproductive Lifespan (# yrs age 5 and older)
0
2
4
6
8
10
12
14
# P
ups
Pro
duce
d
Figure 11. Total number of pups vs. the number of years a female is alive at age 5 and older(larger circles denote multiple data points at a loci).

568 MARINE MAMMAL SCIENCE, VOL. 23, NO. 3, 2007
age 9 to 18, failed to pup at age 19, and pupped again at age 20. Six other femalespupped consecutively for 6–7 yr.
We found a positive relationship between early (age 5–10) and late (age ≥11)reproductive performance, suggesting that seals with higher rates tended to maintaintheir higher productivity throughout their lifespan (linear regression: r2 = 0.19, F1,82= 19.261, P < 0.005). To include cohorts of all ages in this analysis, the late ratewas computed over the time period in which the seal was alive after age 10.
Additional lines of evidence were consistent with reproductive senescence in themonk seal. The data suggested an inverse, but nonsignificant, relationship betweenthe overall reproductive rate and the last observed age for parous females of the pre-1995 cohorts (linear regression: r2 = 0.029, F1,70 = 2.069, P = 0.15). In pooleddata, that relationship could reflect either reproductive senescence (reproductive out-put of individual seals declines with age), or a reproductive-survival tradeoff (higherproductivity females die earlier). We believe that senescence is the most likely expla-nation because plots of the reproductive histories for many individual females roughlymirrored the age-specific pattern obtained by pooling all females. Also, evidence of astrong relationship between reproductive investment and survival was lacking whenthe age-specific reproductive rates of seals surviving to a given age (e.g., age 12 or 15)were contrasted with the rates for seals failing to survive to that same age (logisticregression: P = 0.31 for survival to age 12, and P = 0.78 for survival to age 15).
DISCUSSION
Estimating age-specific reproductive rates has received less attention than esti-mating age-specific survival because of the difficulties in obtaining sufficient samplesizes and the belief that errors in estimating reproductive rates, especially for olderfemales, were of less demographic consequence than errors in estimating survival.The monk seal data set provided an ideal context for exploring age-specific repro-ductive patterns because it provides a continuous record of annual reproduction forindividuals of known age, spread across multiple subpopulations.
The function we selected for modeling monk seal reproduction was sufficientlyflexible to realistically represent all three of the major phases in the reproductivelifespan of the monk seal, and when properly initialized, the model parameters con-verged to provide a satisfactory fit to the pooled data. When viewed in this fashion, theobserved data for all three sites revealed a clear pattern for the early and mature phasesof reproduction, with a well-defined ascending segment and a discernible asymptotefor the maximum reproductive rate. As expected, the pattern for the late-mature andolder ages was less obvious, and the acquisition of additional data may lead to revisedestimates for the two parameters (d and f ) that govern the behavior of the functionfor the older ages.
Because the rates used herein were derived from a “longitudinal” study (trackingobserved reproductive performance of the same individuals throughout their life),rather than a “vertical” or “transverse” sample (e.g., harvest data from one or severalyears), many of the potential biases inherent to the latter type of data (Caughley1966, 1977; Seber 1982) were circumvented. However, pooling data from multipleyears to estimate age-specific rates, a common practice, can be misleading if the ratesfluctuate over that time. All three of the subpopulations we examined underwentmajor declines over the last 50 yr (based on mean beach counts), but LAY and LIShave remained relatively stable since 1990, in contrast to FFS that has undergone

HARTING ET AL.: MONK SEAL REPRODUCTION 569
a major decline over the last 15 yr (Antonelis et al. 2006). Because the pooled datafor FFS were collected over a period of fluctuating growth rate, the pooled data maynot properly represent the reproductive rate at any given time. However, given thedistinctive patterns observed at the three sites, it would be equally questionable tosimply apply the rates from another site to FFS.
Although our fitted model appeared to provide a satisfactory fit to the pooleddata, it obscured the rather marked annual variation, as was evident in the lack ofconcordance between observed pup production and the predictions of the randomlydrawn parameter sets in the Monte Carlo model validation exercise. This findingrevealed that the fitted model should not be regarded as a reliable predictor of actualpup production in an individual year but rather as the best available representationof the mean reproductive performance over many years. We experimented with alterna-tive model fitting procedures that operated on annual observed rates separately, butfrequent nonconvergence of the nonlinear algorithms made that approach intractable.
One of our key objectives was to investigate the existence, rate, and significance ofsenescent decline in the reproductive rate of monk seals. Multiple lines of evidenceindicated that reproductive senescence was operative in monk seal populations. First,the age-specific reproductive curves showed clear patterns of senescence at two of thethree sites (FFS and LAY), with no clear pattern discernible from the limited data atthe third (LIS). However, a number of different factors could give rise to a similarpattern in pooled data, including:
1. True senescence: A tendency for monk seal productivity to decline with age.2. Cohort effects: Cohorts now occupying the oldest ages have intrinsically lower
reproductive rates than do the younger cohorts.3. Observation bias: Older females may tend to pup later so that their reproduction
is less likely to be observed during the normal field season.4. Contrasting reproductive patterns: Specifically, seals that reproduce at higher
rates might die at younger ages, leaving only those females that reproduce atlower rates to dominate the sample of old age females.
Expanding on the last possibility, the most disparate patterns could consist of earlyprimiparity coupled with high output and early death vs. delayed primiparity withlower productivity and greater longevity. Other patterns are possible, including atendency for seals with early primiparity to be penalized for their premature repro-ductive investment via a reduction in subsequent fecundity, either in the years justfollowing their first parturition or possibly throughout their lifespan.
We evaluated the support for these four alternative explanations by examiningthe relationships between age of primiparity, birth rate (over the entire reproductivelifespan and chosen age ranges), and survival. We detected no significant differencesamong cohorts in age of primiparity or reproductive rate. Observational bias did notappear likely because most analyses relied on data from LAY where field seasons arelongest, and few untagged yearlings were discovered each year.
We also found little support for the “live fast, die young” strategy in either thelongevity of early primiparous seals or in the relationship between lifetime repro-ductive rate and survival. The lack of evidence for a penalty associated with earlyreproduction accords with the findings of Lunn et al. (1994) for female Antarctic furseals, but differs from those of Huber (1987) who reported that the survivorship,natality, and weaning success of northern elephant seals were all related to age ofprimiparity. In the latter case, it appeared that the observed relationship was largely

570 MARINE MAMMAL SCIENCE, VOL. 23, NO. 3, 2007
a function of seal size, with larger females better able to absorb the energetic costsof rearing young. As noted by Lunn et al. (1994), the absence of a similar pattern inAntarctic fur seals may result from their ability to feed throughout the pup-rearingperiod so that larger size may be less critical to reproductive success. Because monkseals fast during lactation, they might be expected to be more closely aligned withthe elephant seals, but we found no evidence that early breeding impairs long-termreproductive performance in monk seals.
Many reproductive histories of individual females displayed a pattern consistentwith true senescence (rather than the alternative explanation that females with lowerproductivity had longer life spans), reinforcing the conclusion that the patterns vis-ible in the pooled data arise from true senescence. Among pinnipeds, reproductivesenescence is not unique to monk seals and has been observed in northern and Antarc-tic fur seals (York and Hartley 1981, Trites 1991, Lunn et al. 1994). An analysis ofmonk seal survival rates detected a senescent drop in survival at four of six sites,beginning at approximately the same age as the onset of reproductive senescence atFFS and LAY (Baker and Thompson 2007).
Although we accept that reproductive senescence is operative in monk seal pop-ulations, its significance is less clear. Sensitivity analysis generally reinforced thetraditional view that deterioration in reproductive output with advanced age wasunlikely to be a major factor in limiting population growth or recovery. However, allsix of the main breeding populations have been influenced by human occupation, pe-riodic catastrophes, intermittent periods of low survival, and other unknown factors(Ragen and Lavigne 1999), and show varying degrees of departure from the stableage distribution at which sensitivity analysis is most informative. These perturba-tions are reflected as imbalances in the current age/sex structure (or departure fromthe theoretical stable age distribution) at FFS and to a lesser extent at LAY and LIS(Fig. 1).
Results of short-term population projections largely affirmed conclusions fromsensitivity analysis, but varied between subpopulations. The weak response to the re-moval of reproductive senescence at FFS was attributable to two factors: low juvenilesurvival and a dearth of prime age reproductive females available to take advantage ofthe improved fecundity. With so few reproductive-aged females remaining in the FFSpopulation, changes in their reproductive performance did not translate into appre-ciable changes in the population trajectory. In fact, this subpopulation is so severelyconstrained by its poor juvenile survival rates that there is little likelihood of recoveryuntil such time as those rates improve. However, the projections showed that evenwith the paucity of adult females now in the population, there appeared to be enoughindividuals remaining to seed the population’s recovery, providing that both theirreproductive output and the survival of their pups were sufficiently high. Further,should juvenile survival rates improve at FFS so that significant recruitment becomespossible, virtually all of the reproductive potential will lie with older females—thefew remaining representatives of the last cohorts to evade the intense mortality ofthe last 10 yr.
Among the more intriguing questions to emerge from this investigation are thesources of the variability, both spatial and temporal, in the observed reproductive rates.The three different subpopulations we examined had unique reproductive curves (atleast, when the data were pooled over multiple years). Spatial variation was alsodetected in monk seal survival rates, but unlike for reproductive rates, the pattern ofthe variation was consistent with the geographic distribution of the sites (Baker andThompson 2007). The adjacent sites of LAY and LIS had similar survival patterns

HARTING ET AL.: MONK SEAL REPRODUCTION 571
for seals aged 3 and older, but differed from the more isolated FFS, which had lowersurvival for most age-year combinations. It is not clear why this spatial linking wouldbe manifest in survival but less so in reproduction, unless some of the key, yet tobe identified, drivers for reproductive rates operate at a more local scale than thosedetermining survival.
The interannual variation in reproductive rates within a site (Figs. 5, 6) was greaterthan expected from demographic stochasticity alone, suggesting that a fluctuatingenvironment (and, presumably, forage base) was instrumental in affecting reproduc-tive rates. This inference is consistent with the observations of Lunn et al. (1994)that resource availability in both the current and previous years influenced severalmeasures of reproductive performance in Antarctic fur seals. Evidence of a link be-tween oceanographic conditions and reproductive performance in the monk seal wasdescribed by Antonelis et al. (2003), who found that pup girths were greater dur-ing El Nino years at FFS and LAY. Our limited analysis to date does not rule outdensity-dependent regulation as an additional driver of interannual variability, butit is notoriously difficult to quantify the influence of density-dependent regulationwithin the context of a fluctuating environment (Harting 2002).
Lunn et al. (1994) found that the mean duration of fur seal foraging trips signif-icantly improved models of pupping and weaning success. This is not surprising asthe close relationship between nutrition and reproduction is well established (Follett1985, Flowerdew 1987, Bronson 1989). Consistent with that relationship, we sus-pect that certain monk seal females possess a suite of characteristics that include notonly larger size but also superior foraging skill that enables these females to attainprimiparity earlier, produce pups more frequently, and recover the energetic costs ofreproduction in less time, as compared to other females.
Our exploration of reproductive senescence in the monk seal was limited to therelationship between age and reproductive rate. Boyd (2000) pointed out that it maybe a fallacy to approach life-history analyses from such a purely age-based perspectivebecause age may be less important in determining performance (reproduction orsurvival) than certain state-based variables, most notably mass. Boyd focused onthe difference between capital breeders (species that rely on stored body reserves torear young) and income breeders (species that rely on food intake to sustain youngduring gestation and lactation), and found that in capital breeders the occurrenceof pregnancy was more sensitive to body reserves (as indicated by body mass) thanwas the case for income breeders. Monk seals are clearly capital breeders and itwould be illuminating to determine whether the senescence we observed is strictlya function of age or perhaps linked more directly to declining body mass that mightbe associated with advanced age. Because we do not have a large sample of size datafor adult female monk seals, a detailed analysis of the relationship between femalesize and reproductive performance was not possible. However, it is noteworthy thatthe rate of ascent of the three reproductive curves corresponded with the rate ofattainment of adult size for the three subpopulations (LAY > LIS > FFS), providingstrong evidence for the belief that the different reproductive curves reflect differentnutritional regimes at the three sites.
CONCLUSIONS
Because reproduction, unlike survival, is not directly accessible for managementintervention (barring more invasive procedures, such as artificial insemination), the

572 MARINE MAMMAL SCIENCE, VOL. 23, NO. 3, 2007
management significance of the reproductive patterns we described, particularlysenescence vs. nonsenescence, is largely heuristic but not entirely so. Because allof the monk seal subpopulations in the Northwest Hawaiian Islands are hovering ator below � = 1.0 (Harting 2002), small differences in vital rates determine whetheror not a population lies above or below that critical breakpoint. Although our resultswere limited to only three sites for fitting reproductive rates and one site for inten-sive analysis of individual female reproductive patterns, they provide a baseline forinvestigating reproductive performance at the other major breeding sites. Where wedetect major differences in reproductive patterns among sites, it would be instructiveto understand what environmental drivers account for the observed differences.
Our results have direct implications for further research and management. Giventhe endangered and declining status of the monk seal, small differences in the re-productive performance of individual seals assume greater importance. In this light,it would be beneficial to know what traits distinguish the superior breeders fromtheir less fecund counterparts. The disparity among females in the number of pupsproduced tends to increase with age, with some females pupping at more regularintervals than others (Fig. 10). The distinguishing characteristics of more successfulmothers might be morphological (mass), behavioral (higher foraging success), ge-netic, or possibly epidemiological. Each of these is a measurable attribute, with someof the data for preliminary analyses already in hand. The results of the present studywill aid in identifying individual females for epidemiological sampling and analysisof foraging behavior.
ACKNOWLEDGMENTS
Special thanks are extended to D. Alcorn, B. Becker, S. Canja, M. Craig, and other fieldstaff who endured long months under isolated conditions. We also thank D. Goodman forhis encouragement and valuable input on modeling approaches and interpretation, and G.Antonelis for his support during all phases of this study. The U.S. Fish and Wildlife ServiceHawaiian Islands National Wildlife Refuge and the captain and crew of the NOAA shipsTownsend Cromwell and Oscar Sette provided important logistical support. Melissa Snoverand Dave Johnston (Pacific Island Fisheries Science Center: NMFS) and Peter Boveng (NationalMarine Mammal Laboratory: NOAA) also provided helpful reviews.
LITERATURE CITED
ANTONELIS, G. A., J. D. BAKER AND J. J. POLOVINA. 2003. Improved body condition ofweaned Hawaiian monk seal pups associated with El Nino events: Potential benefits toan endangered species. Marine Mammal Science 19:590–598.
ANTONELIS, G. A., J. D. BAKER, T. Johanos, A. Harting AND R. Braun. 2006. Hawaiianmonk seal (Monachus schauinslandi): Status and conservation issues. Smithsonian AtollResearch Bulletin 543:75–101.
BAKER, J. D., AND P. D. THOMPSON. 2007. Temporal and spatial variation in age-specificsurvival rates of a long-lived animal, the Hawaiian monk seal. Proceedings of the RoyalSociety B 274:407–415.
BARLOW, J., AND P. BOVENG. 1991. Modeling age-specific mortality for marine mammalpopulations. Marine Mammal Science 7:50–65.
BONESS, D. J. 1990. Fostering behavior in Hawaiian monk seals: Is there a reproductive cost?Behavior, Ecology, and Sociobiology 27:113–122.
BONESS, D. J., M. P. CRAIG, L. HONIGMAN AND S. AUSTIN. 1998. Fostering behavior andthe effect of female density in Hawaiian monk seals, Monachus schauinslandi. Journal ofMammalogy 79:1060–1069.

HARTING ET AL.: MONK SEAL REPRODUCTION 573
BOYD, I. L. 2000. State-dependent fertility in pinnipeds: Contrasting capital and incomebreeders. Functional Ecology 14:623–630.
BRODY, S. A. 1945. Bioenergetics and growth. Reinhold, New York, NY.BRONSON, F. H. 1989. Mammalian reproductive biology. University of Chicago Press,
Chicago, IL.CASWELL, H. 2001. Matrix population models: Construction, analysis, and interpretation.
Sinauer Associates, Inc., Sunderland, MA.CAUGHLEY, G. 1966. Mortality patterns in mammals. Ecology 47:906–918.CAUGHLEY, G. 1977. Analysis of vertebrate populations. Wiley, New York, NY.EBERHARDT, L. L. 1977. Optimal policies for conservation of large mammals, with special
reference to marine ecosystems. Environmental Conservation 4:205–212.EBERHARDT, L. L. 1985. Assessing the dynamics of wild populations. Journal of Wildlife
Management 49:997–1012.FISHER, R. A. 1930. The genetical theory of natural selection. Oxford University Press, Oxford,
UK.FLOWERDEW, J. R. 1987. Mammals: Their reproductive biology and population ecology.
Edward Arnold, London, UK.FOLLETT, B. K. 1985. The environment and reproduction. Pages 103–132 in E. R. Austin and
R. V. Short, eds. Reproductive fitness. Cambridge University Press, Cambridge, UK.GOODMAN, D. 1984. The value of reproductive value. American Naturalist 119:803–823.HARTING, A. L. 2002. Stochastic simulation model for the Hawaiian monk seal. Ph.D. thesis,
Montana State University, Bozeman, MT. 328 pp.HUBER, H. R. 1987. Natality and weaning success in relation to age of first reproduction in
northern elephant seals. Canadian Journal of Zoology 65:1311–1316.JOHANOS, T., B. L. BECKER AND T. J. RAGEN. 1994. Annual reproductive cycle of the female
Hawaiian monk seal, Monachus schauinslandi. Marine Mammal Science 10:13–30.LEVENBERG, K. 1944. A method for the solution of certain problems in least squares. Quarterly
of Applied Mathematics 2:164–168.LUNN, N. J., I. L. BOYD AND J. P. CROXALL. 1994. Reproductive performance of female
Antarctic fur seals: The influence of age, breeding experience, environmental variationand individual quality. Journal of Animal Ecology 63:827–840.
MARQUARDT, D. 1963. An algorithm for least-squares estimation of non-linear parameters.SIAM Journal on Applied Mathematics 11:431–441.
RAGEN, T. J., AND D. M. LAVIGNE. 1999. The Hawaiian monk seal: Biology of an endan-gered species. Pages 224–245 in J. R. Twiss and R. R. Reeves, eds. Conservation andmanagement of marine mammals. Smithsonian Institution Press, Washington, DC.
SCHMELZER, I. 2000. Seals and seascapes: Covariation in Hawaiian monk seal subpopulationsand the oceanic landscape of the Hawaiian archipelago. Journal of Biogeography 27:901–914.
SEBER, G. A. F. 1982. The estimation of animal abundance and related parameters. 2ndedition. MacMillan, New York, NY.
SILER, W. 1979. A competing-risk model for animal mortality. Ecology 60:750–757.TRITES, A. W. 1991. Fetal growth of northern fur seals: Life history strategy and sources of
variation. Canadian Journal of Zoology 69:2608–2617.YORK, A. E., AND J. R. HARTLEY. 1981. Pup production following harvest of females northern
fur seals. Canadian Journal of Fisheries and Aquatic Sciences 38:84–90.
Received: 4 April 2006Accepted: 26 January 2007


