Embed Size (px)
Citation preview

Representative Farm Analysis of the H.R. 2646 Farm Bill Proposal
Briefing Paper 01-10
James W. RichardsonEdward G. Smith
Abner W. WomackDavid P. Anderson
Joe L. OutlawSteven L. Klose
Keith D. SchumannPaul A. Feldman
Agricultural and Food Policy CenterDepartment of Agricultural EconomicsTexas Agricultural Experiment StationTexas Agricultural Extension Service
Texas A&M University
August 2001
College Station, TX 77843-2124Telephone: (979) 845-5913
Fax: (979) 845-3140Web Site: http://www.afpc.tamu.edu

1
Representative Farm Analysis of the H.R. 2646 Farm Bill Proposal
Farm Level Analytical Overview
• 31 of the 44 (70 percent) representative crop farms analyzed would update their baseacres using the 1998-2001 plantings.
• Of the 13 operations (30 percent) that did not update base, their planted acreages eitherremained in line with their base or the shifts in crop production over the 1998-2001period would not compensate for losing 1996 base acreage.
• The 31 operations (70 percent) that did update base, were either expanding AMTA basecrops such as cotton or the additional soybean acreage available would more than offsetlosses in AMTA base crops such as wheat and corn.
• Under House Bill H.R. 2646 all 44 farms increased net cash farm income relative to thecurrent farm bill. These increases ranged from $11,000 on the moderate North Dakotawheat, feed grain-oilseed operation to $294,000 on the large California cotton farm.
• 37 of the 44 farms saw the probability of a cash flow deficit decline from 1 percent pointfor the Tennessee 1675 acre cotton farm to 44 percentage points for the Texas 1400 acre Blackland cotton farm. No farm increased their probability of a cash flow deficit underH.R. 2646.
• 41 farms improve their ability to retain net worth under H.R. 2646, ranging from 1percentage point on the Tennessee 900 acre grain farm to 90 percentage point for theTexas 1400 acre cotton farm.

2
Analysis Assumptions
• Forty-four representative crop farms simulated from 2000-2006 with prices and inputinflation rates (including land) projected by FAPRI.
• Sector and farm level analysis include estimated price and yield risk based on historicalfarm experiences.
• Farms assumed to have 20% term debt to assets on January 1, 2000. Operating expensesfully financed with borrowed capital.
• Farms choose base structure to maximize government benefits. The choice being eitherto keep original 1996 FAIR Act base acreages or update to the average 1998-2001 plantedacreages.
• MPCI coverage maintained at 50/100 across all farms.
• Baseline assumes all farms operate under the provisions of the 1996 FAIR Act withAMTA payments extended at 2002 levels through 2006. Includes market loss assistancepayments and disaster package for 2000, but does not include market loss assistance for2001 crops.
• The H.R. 2646 proposal includes the crop provisions as interpreted by FAPRI/AFPC inconsultation with House Ag Committee staff for 2002-2006. The House passed marketloss provisions for 2001 have also been incorporated into the concept scenario.
• Payment limits are assumed to be nonrestrictive in the analysis.
• Analysis of only the AMTA, and target price, and conservation reserve changes; does notinclude other aspects of the bill such as peanuts, wool and mohair, etc.
Definition of Terms
• Net Cash Farm Income = Total Receipts including Government Payments minus all CashExpenses
• Probability of a Cash Flow Deficit = Chance that net cash farm income is less than cashrequired for family living, taxes, principal payments and capital replacement
• Probability of Losing Real Net Worth = Chance that real net worth Dec. 31, 2006 is lessthan beginning net worth Jan. 1, 2000

3
Table 1. Summary of How the Representative Crop Farms Would Elect to Change Base Acres Under the H.R.2646 Farm Bill Proposal
Retained 1996 Base Updated Base to 98-01 Planted Acres
Feed Grain FarmsTXNP1600 XTXNP6700 XMOCG3300 XMOCG1700 XMONG1400 XIAG950 XIAG2400 XNEG900 XNEG1300 XTNG900 XTNG2400 XSCG1500 XSCG3500 X
WheatCOW5440 XCOW2700 XKSNW4300 XKSNW2325 XKSSW1385 XKSSW3180 XNDW4850 XNDW1760 XWAW1500 XWAW4250 X
CottonTXSP3697 XTXSP1682 XTXRP2500 XTXBC1400 XTXCB1720 XCAC2000 XCAC6000 XTNC1675 XTNC3800 XALC3000 XLAC2640 X
RiceCAR424 XCAR2365 XTXR1553 XTXR3774 XLANR2500 XLAR1200 XMOWR4000 XMOER4000 XMSR4735 XARR3640 X

4
Table 2. Comparison of the H.R. 2646 Farm Bill Proposal to a Continuation of the 1996 Farm Bill forRepresentative Crop Farms, 2001-2006.
Change in % Change in Change in Change inNet Cash Farm Net Cash Farm Probability Probability of
Income Income of a Deficit Decreasing Net Worth($1,000) (% Points) (% Points)
Feed Grain FarmsTXNP1600 44 80.6% -25 -40TXNP6700 156 127.2% -22 -57MOCG3300 44 23.8% -21 -35MOCG1700 32 29.7% -18 -32MONG1400 21 169.4% 0 -13IAG950 21 34.7% -20 -55IAG2400 46 43.4% -36 -33NEG900 35 35.7% -31 -17NEG1300 42 31.7% -21 -27TNG900 16 252.0% 0 -1TNG2400 41 80.1% -8 0SCG1500 39 255.0% -7 -49SCG3500 131 67.8% -35 -28
WheatCOW5440 36 22.0% -12 -4COW2700 20 28.0% -21 -2KSNW4300 57 1623.6% -1 0KSNW2325 26 255.5% 0 -2KSSW1385 21 56.7% -11 -67KSSW3180 41 33.7% -22 -18NDW4850 62 39.1% -27 -30NDW1760 11 29.9% -10 -21WAW1500 35 598.6% 0 -6WAW4250 98 109.1% -11 -83
CottonTXSP3697 93 44.7% -19 -5TXSP1682 40 46.0% -30 -26TXRP2500 48 434.2% -8 -32TXBC1400 30 79.8% -44 -90TXCB1720 50 94.8% -22 -46CAC2000 160 226.5% -6 -72CAC6000 294 29.5% -2 -14TNC1675 52 1185.5% -1 -29TNC3800 173 242.8% -39 -79ALC3000 143 81.5% -19 -47LAC2640 96 940.5% -42 -53
RiceCAR424 43 1475.3% -3 -20CAR2365 235 1020.0% -19 -32TXR1553 52 569.1% 0 0TXR3774 105 109.0% -16 -59LANR2500 101 405.6% 0 -5LAR1200 44 744.7% -2 -10MOWR4000 178 93.0% -11 -54MOER4000 147 52.3% -37 -78MSR4735 164 407.4% 0 -14ARR3640 131 42.5% -26 -41
* Change in net cash farm income is the average annual increase over the 2001-2006 period while the percentage pointchange is the probabbility of a deficit and the probability of decreasing real net worth as measured in 2006.
5
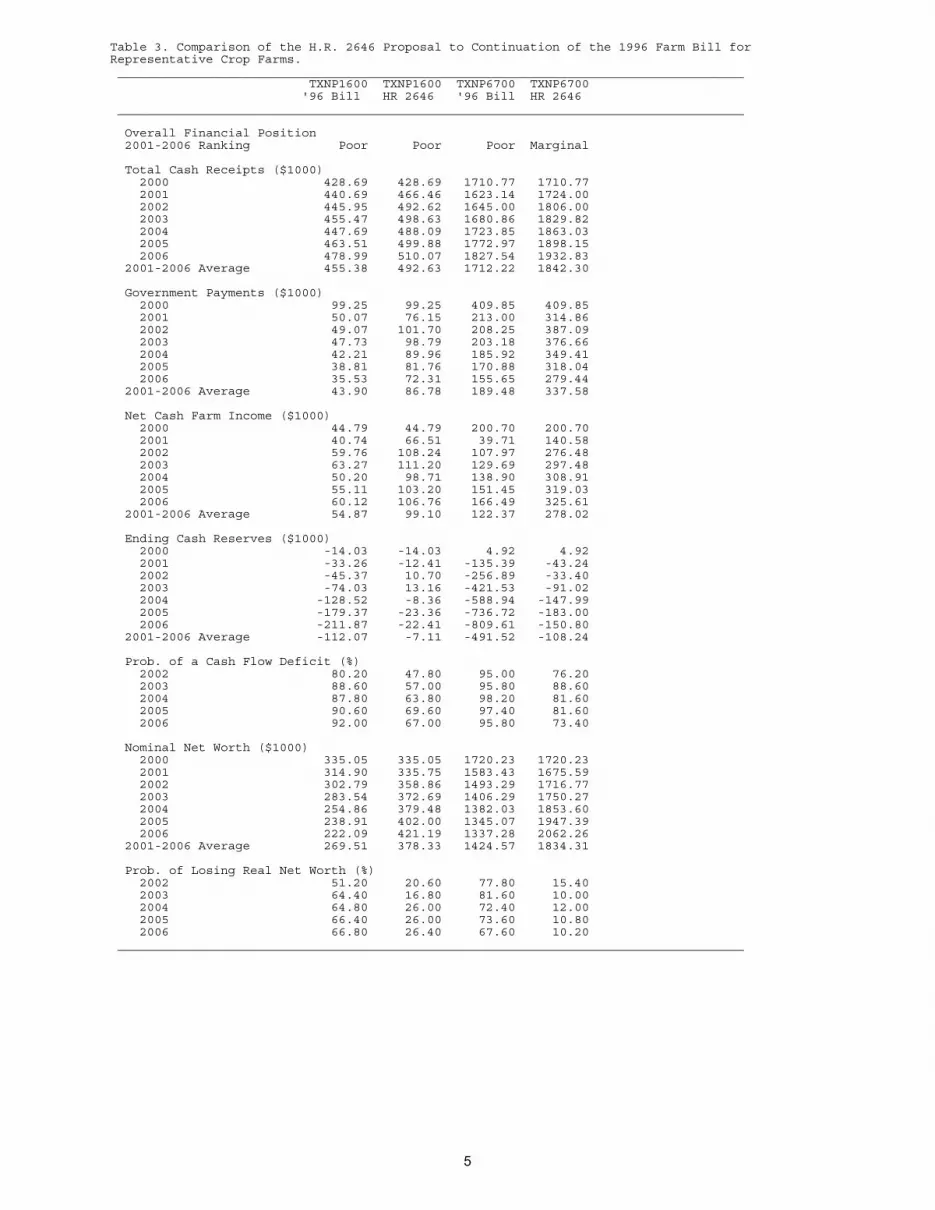
Table 3. Comparison of the H.R. 2646 Proposal to Continuation of the 1996 Farm Bill forRepresentative Crop Farms._____________________________________________________________________________________
TXNP1600 TXNP1600 TXNP6700 TXNP6700'96 Bill HR 2646 '96 Bill HR 2646
_____________________________________________________________________________________
Overall Financial Position2001-2006 Ranking Poor Poor Poor Marginal
Total Cash Receipts ($1000)2000 428.69 428.69 1710.77 1710.772001 440.69 466.46 1623.14 1724.002002 445.95 492.62 1645.00 1806.002003 455.47 498.63 1680.86 1829.822004 447.69 488.09 1723.85 1863.032005 463.51 499.88 1772.97 1898.152006 478.99 510.07 1827.54 1932.83
2001-2006 Average 455.38 492.63 1712.22 1842.30
Government Payments ($1000)2000 99.25 99.25 409.85 409.852001 50.07 76.15 213.00 314.862002 49.07 101.70 208.25 387.092003 47.73 98.79 203.18 376.662004 42.21 89.96 185.92 349.412005 38.81 81.76 170.88 318.042006 35.53 72.31 155.65 279.44
2001-2006 Average 43.90 86.78 189.48 337.58
Net Cash Farm Income ($1000)2000 44.79 44.79 200.70 200.702001 40.74 66.51 39.71 140.582002 59.76 108.24 107.97 276.482003 63.27 111.20 129.69 297.482004 50.20 98.71 138.90 308.912005 55.11 103.20 151.45 319.032006 60.12 106.76 166.49 325.61
2001-2006 Average 54.87 99.10 122.37 278.02
Ending Cash Reserves ($1000)2000 -14.03 -14.03 4.92 4.922001 -33.26 -12.41 -135.39 -43.242002 -45.37 10.70 -256.89 -33.402003 -74.03 13.16 -421.53 -91.022004 -128.52 -8.36 -588.94 -147.992005 -179.37 -23.36 -736.72 -183.002006 -211.87 -22.41 -809.61 -150.80
2001-2006 Average -112.07 -7.11 -491.52 -108.24
Prob. of a Cash Flow Deficit (%)2002 80.20 47.80 95.00 76.202003 88.60 57.00 95.80 88.602004 87.80 63.80 98.20 81.602005 90.60 69.60 97.40 81.602006 92.00 67.00 95.80 73.40
Nominal Net Worth ($1000)2000 335.05 335.05 1720.23 1720.232001 314.90 335.75 1583.43 1675.592002 302.79 358.86 1493.29 1716.772003 283.54 372.69 1406.29 1750.272004 254.86 379.48 1382.03 1853.602005 238.91 402.00 1345.07 1947.392006 222.09 421.19 1337.28 2062.26
2001-2006 Average 269.51 378.33 1424.57 1834.31
Prob. of Losing Real Net Worth (%)2002 51.20 20.60 77.80 15.402003 64.40 16.80 81.60 10.002004 64.80 26.00 72.40 12.002005 66.40 26.00 73.60 10.802006 66.80 26.40 67.60 10.20
_____________________________________________________________________________________

6
Table 4. Comparison of the H.R. 2646 Proposal to Continuation of the 1996 Farm Billfor Representative Crop Farms._____________________________________________________________________________________
MOCG3300 MOCG3300 MOCG1700 MOCG1700 MONG1400 MONG1400'96 Bill HR 2646 '96 Bill HR 2646 '96 Bill HR 2646
_____________________________________________________________________________________
Overall Financial Position2001-2006 Ranking Poor Marginal Marginal Good Poor Poor
Total Cash Receipts ($1000)2000 709.51 709.51 364.97 364.97 384.82 384.822001 676.48 710.60 348.84 363.04 416.11 424.502002 682.82 730.84 352.63 388.27 421.69 443.242003 694.00 738.91 359.08 392.87 427.87 448.172004 713.01 756.03 373.83 406.25 404.59 424.452005 729.57 768.49 382.92 412.80 400.15 418.382006 747.04 779.44 393.43 419.31 400.55 416.53
2001-2006 Average 707.16 747.38 368.46 397.09 411.83 429.21
Government Payments ($1000)2000 187.79 187.79 86.59 86.59 59.27 59.272001 139.37 173.64 63.12 77.43 47.69 56.192002 135.77 183.40 61.53 97.90 46.36 69.012003 127.10 173.57 57.86 93.50 43.80 66.232004 110.87 156.83 50.70 85.64 35.62 57.502005 102.56 144.32 46.38 78.59 32.41 52.582006 93.44 128.16 41.82 69.67 29.11 46.68
2001-2006 Average 118.19 159.99 53.57 83.79 39.16 58.03
Net Cash Farm Income ($1000)2000 216.09 216.09 105.46 105.46 19.26 19.262001 158.14 192.27 81.84 96.04 30.71 39.102002 177.48 226.57 96.56 132.95 43.62 65.862003 186.79 234.42 105.31 140.99 45.33 67.992004 190.19 237.79 113.56 149.29 9.42 33.372005 199.24 245.18 116.24 151.32 -16.84 7.442006 205.67 247.28 125.31 157.96 -37.93 -13.62
2001-2006 Average 186.25 230.58 106.47 138.09 12.38 33.36
Ending Cash Reserves ($1000)2000 57.12 57.12 17.37 17.37 -55.62 -55.622001 59.99 83.05 23.51 36.64 -89.07 -80.702002 63.33 115.80 36.72 69.62 -116.52 -87.792003 58.42 137.12 47.37 100.27 -150.79 -105.482004 23.69 130.75 47.88 124.76 -237.43 -173.272005 -4.44 129.05 55.48 154.31 -383.02 -295.332006 3.33 160.46 77.49 195.05 -521.17 -408.88
2001-2006 Average 34.05 126.04 48.08 113.44 -249.67 -191.91
Prob. of a Cash Flow Deficit (%)2002 58.60 5.60 14.60 4.80 99.60 99.402003 68.20 12.80 30.40 3.80 99.00 99.802004 64.60 52.00 47.40 30.80 99.00 99.002005 72.00 52.40 51.40 29.20 99.00 99.002006 61.40 40.40 42.60 24.40 99.00 99.00
Nominal Net Worth ($1000)2000 3203.73 3203.73 1847.00 1847.00 1537.88 1537.882001 3266.55 3289.62 1881.67 1894.81 1544.87 1553.242002 3246.15 3298.56 1873.44 1906.31 1511.76 1540.452003 3227.54 3356.62 1866.05 1945.72 1474.31 1541.412004 3237.21 3458.84 1884.81 2022.55 1403.13 1516.832005 3267.69 3582.99 1908.23 2103.65 1295.88 1462.182006 3339.74 3744.48 1938.23 2187.33 1175.63 1394.99
2001-2006 Average 3264.15 3455.19 1892.07 2010.06 1400.93 1501.52
Prob. of Losing Real Net Worth (%)2002 47.00 18.60 39.60 10.80 66.00 46.602003 65.60 10.60 58.40 4.60 83.80 48.802004 56.40 8.20 45.60 3.40 94.60 59.602005 50.20 2.40 39.60 1.00 98.40 76.402006 36.00 0.80 32.60 1.00 99.80 87.00
_____________________________________________________________________________________

7
Table 5. Comparison of the H.R. 2646 Proposal to Continuation of the 1996 Farm Billfor Representative Crop Farms._____________________________________________________________________________________
IAG950 IAG950 IAG2400 IAG2400'96 Bill HR 2646 '96 Bill HR 2646
_____________________________________________________________________________________
Overall Financial Position2001-2006 Ranking Poor Marginal Poor Marginal
Total Cash Receipts ($1000)2000 279.16 279.16 609.66 609.662001 267.41 280.33 579.17 610.402002 270.19 292.99 585.13 632.532003 274.80 296.34 595.12 639.802004 278.90 299.40 604.21 646.592005 286.65 305.33 620.94 659.362006 291.67 307.56 631.82 664.12
2001-2006 Average 278.27 296.99 602.73 642.13
Government Payments ($1000)2000 69.43 69.43 157.18 157.182001 48.83 61.83 107.94 139.352002 47.53 70.90 105.06 153.682003 44.93 67.88 99.48 147.182004 39.74 61.96 88.34 134.442005 36.41 56.81 81.19 123.312006 33.18 50.46 74.26 109.53
2001-2006 Average 41.77 61.64 92.71 134.58
Net Cash Farm Income ($1000)2000 69.71 69.71 140.24 140.242001 51.21 64.13 83.70 114.932002 60.29 83.61 101.06 150.462003 62.09 84.93 108.97 158.232004 59.08 81.73 107.15 157.162005 62.73 85.09 115.51 164.552006 65.82 87.11 116.29 162.15
2001-2006 Average 60.20 81.10 105.45 151.25
Ending Cash Reserves ($1000)2000 24.20 24.20 -0.70 -0.702001 25.24 34.53 -33.47 -10.032002 17.81 39.22 -56.89 -7.042003 7.53 39.20 -90.84 -15.322004 -15.63 31.14 -120.06 -13.282005 -50.05 12.48 -140.83 -5.092006 -70.11 4.82 -137.69 23.26
2001-2006 Average -14.20 26.90 -96.63 -4.58
Prob. of a Cash Flow Deficit (%)2002 85.80 12.60 95.20 68.602003 87.80 50.40 98.40 86.402004 77.80 65.40 92.40 58.202005 90.00 75.60 90.60 60.602006 90.60 70.80 87.80 51.60
Nominal Net Worth ($1000)2000 915.54 915.54 1480.34 1480.342001 931.57 940.85 1487.33 1510.762002 925.32 946.72 1473.71 1523.542003 913.83 958.25 1459.89 1554.862004 909.34 985.11 1480.45 1631.452005 908.21 1016.76 1502.92 1708.832006 913.33 1050.94 1518.71 1775.23
2001-2006 Average 916.93 983.11 1487.17 1617.44
Prob. of Losing Real Net Worth (%)2002 41.60 9.40 53.00 7.402003 77.20 12.00 71.40 6.402004 67.80 11.40 46.60 7.202005 62.40 6.60 39.60 4.002006 60.00 4.60 36.20 3.20
_____________________________________________________________________________________

8
Table 6. Comparison of the H.R. 2646 Proposal to Continuation of the 1996 Farm Billfor Representative Crop Farms._____________________________________________________________________________________
NEG900 NEG900 NEG1300 NEG1300'96 Bill HR 2646 '96 Bill HR 2646
_____________________________________________________________________________________
Overall Financial Position2001-2006 Ranking Marginal Marginal Marginal Good
Total Cash Receipts ($1000)2000 343.92 343.92 482.63 482.632001 303.89 328.44 458.36 488.002002 307.53 345.33 464.21 509.042003 313.57 349.58 473.51 516.032004 332.89 366.77 472.83 512.962005 341.12 372.01 487.83 524.322006 350.03 376.20 498.86 529.62
2001-2006 Average 324.84 356.39 475.93 513.33
Government Payments ($1000)2000 95.50 95.50 123.52 123.522001 52.61 77.30 72.22 102.082002 51.47 91.25 70.55 118.402003 49.64 88.74 68.02 115.222004 46.02 83.33 61.41 106.142005 42.68 76.77 56.40 97.242006 39.44 68.24 51.95 86.29
2001-2006 Average 46.98 80.94 63.42 104.23
Net Cash Farm Income ($1000)2000 122.58 122.58 138.55 138.552001 77.64 102.19 110.77 140.422002 87.99 126.52 129.83 175.802003 89.11 127.10 138.35 183.752004 103.39 140.70 129.78 174.792005 108.11 144.37 136.38 179.942006 117.07 150.60 141.45 181.47
2001-2006 Average 97.22 131.91 131.09 172.70
Ending Cash Reserves ($1000)2000 40.06 40.06 31.83 31.832001 25.64 40.04 45.79 65.382002 33.97 70.07 63.15 109.572003 26.14 82.11 83.30 154.812004 12.24 92.32 78.50 175.662005 -0.78 102.89 74.78 196.572006 -1.78 122.43 83.98 228.70
2001-2006 Average 15.90 84.98 71.58 155.12
Prob. of a Cash Flow Deficit (%)2002 9.20 2.80 12.20 3.802003 81.00 5.80 11.80 3.602004 67.40 44.80 52.00 27.802005 71.80 48.40 56.60 30.402006 68.60 37.80 43.20 21.80
Nominal Net Worth ($1000)2000 830.88 830.88 1100.13 1100.132001 838.14 852.54 1113.46 1133.052002 844.77 880.86 1116.27 1162.692003 844.21 908.07 1127.39 1209.152004 856.14 954.15 1131.03 1251.492005 876.37 1008.49 1150.43 1309.212006 919.15 1082.09 1170.69 1365.78
2001-2006 Average 863.13 947.70 1134.88 1238.56
Prob. of Losing Real Net Worth (%)2002 6.40 2.60 23.00 4.002003 20.00 1.40 22.20 1.202004 34.00 0.80 36.20 2.802005 29.40 0.40 31.60 1.602006 16.80 0.20 27.20 0.60
_____________________________________________________________________________________

9
Table 7. Comparison of the H.R. 2646 Proposal to Continuation of the 1996 Farm Billfor Representative Crop Farms._____________________________________________________________________________________
TNG900 TNG900 TNG2400 TNG2400'96 Bill HR 2646 '96 Bill HR 2646
_____________________________________________________________________________________
Overall Financial Position2001-2006 Ranking Poor Poor Poor Poor
Total Cash Receipts ($1000)2000 266.94 266.94 692.78 692.782001 281.28 287.20 693.67 722.362002 284.15 300.81 704.26 745.582003 290.87 306.29 720.28 757.822004 285.02 299.82 710.31 745.812005 290.64 304.18 729.24 760.922006 295.13 306.82 748.77 774.97
2001-2006 Average 287.85 300.85 717.76 751.24
Government Payments ($1000)2000 46.62 46.62 155.95 155.952001 37.49 43.47 108.71 137.602002 36.78 53.71 106.44 149.982003 34.33 50.71 100.41 142.272004 29.50 45.40 87.94 127.992005 26.79 41.44 80.21 116.252006 24.06 36.60 72.84 102.51
2001-2006 Average 31.49 45.22 92.76 129.43
Net Cash Farm Income ($1000)2000 13.32 13.32 93.52 93.522001 14.23 20.15 43.56 72.242002 18.52 35.71 69.54 112.892003 16.87 34.40 71.22 113.602004 2.35 21.00 41.10 85.382005 -5.08 14.17 43.69 88.292006 -8.05 11.31 38.99 82.38
2001-2006 Average 6.47 22.79 51.35 92.46
Ending Cash Reserves ($1000)2000 -37.38 -37.38 11.09 11.092001 -68.10 -62.10 -17.84 10.842002 -104.72 -81.59 -29.59 37.292003 -160.83 -121.73 -82.05 19.532004 -240.73 -183.80 -187.78 -49.342005 -338.13 -262.36 -312.51 -135.252006 -424.04 -329.41 -433.35 -218.94
2001-2006 Average -222.76 -173.50 -177.19 -55.98
Prob. of a Cash Flow Deficit (%)2002 99.00 99.00 80.80 9.802003 99.00 99.00 92.00 83.202004 99.00 99.00 93.40 76.002005 99.00 99.00 96.00 86.202006 99.00 99.00 97.60 89.60
Nominal Net Worth ($1000)2000 547.08 547.08 510.02 510.022001 524.91 530.92 469.12 497.802002 484.82 507.95 450.29 517.172003 438.67 483.96 407.04 508.622004 379.13 450.13 333.61 472.062005 316.81 414.92 275.22 452.472006 245.61 370.68 193.04 407.46
2001-2006 Average 398.32 459.76 354.72 475.93
Prob. of Losing Real Net Worth (%)2002 95.20 87.20 74.60 6.602003 98.80 97.60 81.80 19.202004 99.80 97.40 84.40 50.802005 99.60 97.20 84.00 56.202006 99.00 98.00 87.20 64.60
_____________________________________________________________________________________

10
Table 8. Comparison of the H.R. 2646 Proposal to Continuation of the 1996 Farm Billfor Representative Crop Farms._____________________________________________________________________________________
SCG1500 SCG1500 SCG3500 SCG3500'96 Bill HR 2646 '96 Bill HR 2646
_____________________________________________________________________________________
Overall Financial Position2001-2006 Ranking Poor Poor Poor Marginal
Total Cash Receipts ($1000)2000 485.11 485.11 1539.63 1539.632001 441.77 464.56 1407.46 1469.422002 447.67 487.76 1421.39 1562.832003 457.43 494.43 1448.45 1582.712004 483.39 517.77 1514.62 1642.142005 495.48 526.61 1551.71 1671.152006 507.17 533.60 1586.19 1694.62
2001-2006 Average 472.15 504.12 1488.30 1603.81
Government Payments ($1000)2000 105.93 105.93 239.43 239.432001 64.17 87.08 131.76 194.042002 62.71 104.38 128.40 275.392003 59.50 99.29 122.32 265.032004 54.50 91.99 114.07 250.422005 50.57 84.65 107.01 234.852006 46.39 75.22 99.64 215.04
2001-2006 Average 56.31 90.44 117.20 239.13
Net Cash Farm Income ($1000)2000 59.51 59.51 327.20 327.202001 -1.88 20.91 112.61 174.572002 9.64 51.64 151.83 296.982003 13.80 56.00 180.86 326.692004 23.98 67.09 222.11 369.052005 25.00 67.93 240.68 387.022006 21.34 62.57 254.91 397.63
2001-2006 Average 15.31 54.36 193.83 325.32
Ending Cash Reserves ($1000)2000 -28.46 -28.46 113.62 113.622001 -98.10 -75.72 39.22 89.252002 -156.05 -95.40 3.26 162.352003 -214.96 -120.60 -22.99 218.632004 -272.44 -146.83 -50.24 273.132005 -306.70 -150.44 -74.36 332.302006 -343.89 -155.83 -24.47 461.23
2001-2006 Average -232.02 -124.14 -21.59 256.15
Prob. of a Cash Flow Deficit (%)2002 99.00 99.00 63.60 34.602003 99.00 99.00 66.20 37.202004 99.00 98.60 68.20 39.202005 99.40 96.40 70.60 38.802006 99.40 92.80 62.80 27.40
Nominal Net Worth ($1000)2000 804.52 804.52 2763.96 2763.962001 751.91 774.29 2739.98 2790.012002 691.88 752.51 2697.55 2856.592003 636.57 742.08 2683.03 2964.812004 596.93 747.89 2715.43 3130.122005 585.75 782.25 2775.03 3326.612006 542.71 785.56 2894.73 3577.79
2001-2006 Average 634.29 764.10 2750.96 3107.65
Prob. of Losing Real Net Worth (%)2002 93.80 64.80 52.60 26.002003 97.40 73.40 56.00 8.002004 95.00 62.00 49.40 5.202005 91.40 42.40 41.20 2.002006 91.80 43.00 29.00 1.00
_____________________________________________________________________________________

11
Table 9. Comparison of the H.R. 2646 Proposal to Continuation of the 1996 Farm Billfor Representative Crop Farms._____________________________________________________________________________________
COW2700 COW2700 COW5440 COW5440'96 Bill HR 2646 '96 Bill HR 2646
_____________________________________________________________________________________
Overall Financial Position2001-2006 Ranking Marginal Good Marginal Good
Total Cash Receipts ($1000)2000 220.42 220.42 483.08 483.082001 211.66 225.49 458.26 491.512002 213.82 236.82 462.03 504.882003 219.60 239.95 473.96 510.182004 217.23 235.95 466.42 498.812005 223.06 239.71 476.61 504.682006 228.24 242.49 486.97 510.61
2001-2006 Average 218.94 236.73 470.71 503.44
Government Payments ($1000)2000 46.40 46.40 102.53 102.532001 20.47 34.36 43.75 77.062002 19.82 43.88 42.19 86.412003 18.74 40.77 39.82 78.502004 17.31 37.69 37.13 72.052005 16.19 34.36 35.28 65.672006 15.27 30.79 33.87 59.40
2001-2006 Average 17.97 36.97 38.67 73.18
Net Cash Farm Income ($1000)2000 75.33 75.33 184.30 184.302001 60.65 74.48 145.36 178.612002 69.92 93.57 160.24 204.252003 78.04 100.15 171.46 210.472004 69.72 91.36 160.17 197.712005 75.21 96.19 168.92 202.082006 81.11 100.72 176.56 205.78
2001-2006 Average 72.44 92.75 163.79 199.82
Ending Cash Reserves ($1000)2000 8.19 8.19 89.18 89.182001 16.77 25.59 128.98 151.152002 27.17 51.49 172.33 221.012003 40.53 79.26 208.61 279.802004 20.35 74.64 215.34 309.412005 37.26 104.94 214.74 329.272006 58.56 139.19 243.59 377.06
2001-2006 Average 33.44 79.19 197.27 277.95
Prob. of a Cash Flow Deficit (%)2002 11.60 3.40 3.80 3.002003 10.40 3.00 4.60 4.002004 84.40 64.60 46.00 24.202005 28.20 6.60 54.20 35.602006 25.60 4.40 30.80 18.80
Nominal Net Worth ($1000)2000 527.00 527.00 1858.06 1858.062001 546.27 555.09 1917.89 1940.052002 555.03 579.35 1941.42 1990.072003 569.84 615.16 1964.40 2059.362004 585.32 654.60 1990.17 2138.312005 618.09 709.55 2023.04 2223.372006 639.80 752.81 2083.26 2333.57
2001-2006 Average 585.73 644.42 1986.70 2114.12
Prob. of Losing Real Net Worth (%)2002 6.40 2.40 4.40 2.802003 7.40 0.20 7.20 0.602004 10.20 0.20 10.60 1.002005 5.40 1.00 8.60 1.002006 3.20 1.00 4.60 1.00
_____________________________________________________________________________________

12
Table 10. Comparison of the H.R. 2646 Proposal to Continuation of the 1996 Farm Billfor Representative Crop Farms._____________________________________________________________________________________
KSNW2325 KSNW2325 KSNW4300 KSNW4300'96 Bill HR 2646 '96 Bill HR 2646
_____________________________________________________________________________________
Overall Financial Position2001-2006 Ranking Poor Poor Poor Poor
Total Cash Receipts ($1000)2000 227.77 227.77 482.03 482.032001 207.06 224.14 446.78 483.972002 208.93 234.12 450.62 508.282003 213.38 235.94 461.05 512.472004 218.60 239.52 467.35 514.982005 224.91 243.49 476.47 518.902006 231.07 246.82 484.78 521.25
2001-2006 Average 217.32 237.34 464.51 509.98
Government Payments ($1000)2000 57.51 57.51 118.77 118.772001 25.88 43.07 53.30 90.692002 25.20 52.70 51.61 113.532003 24.26 49.89 49.24 106.422004 22.89 46.83 46.14 99.352005 21.18 42.48 43.10 90.562006 19.63 37.70 40.34 81.01
2001-2006 Average 23.17 45.45 47.29 96.93
Net Cash Farm Income ($1000)2000 30.09 30.09 45.90 45.902001 -3.84 13.24 -4.38 32.812002 0.73 27.51 5.44 66.482003 -5.62 21.03 8.30 68.372004 -11.77 16.06 -1.71 60.312005 -17.45 10.83 -9.87 52.452006 -22.68 5.58 -19.01 43.01
2001-2006 Average -10.11 15.71 -3.54 53.90
Ending Cash Reserves ($1000)2000 -36.50 -36.50 -30.73 -30.732001 -104.49 -87.38 -93.26 -56.072002 -176.23 -132.79 -152.63 -56.362003 -276.34 -207.01 -209.95 -60.972004 -387.74 -291.14 -291.74 -89.722005 -497.16 -373.13 -391.99 -136.022006 -602.04 -450.39 -492.96 -180.95
2001-2006 Average -340.67 -256.97 -272.09 -96.68
Prob. of a Cash Flow Deficit (%)2002 99.00 99.00 99.60 98.202003 99.00 99.00 99.00 96.802004 99.00 99.00 99.80 89.602005 99.00 99.00 99.00 95.402006 99.00 99.00 99.00 98.00
Nominal Net Worth ($1000)2000 261.16 261.16 500.55 500.552001 198.05 215.17 434.43 471.622002 137.71 181.15 374.55 470.812003 61.29 132.91 317.09 468.452004 -15.50 86.32 239.18 446.622005 -79.81 52.51 151.84 416.432006 -158.72 4.22 45.67 369.42
2001-2006 Average 23.84 112.04 260.46 440.56
Prob. of Losing Real Net Worth (%)2002 99.60 98.20 95.40 40.002003 99.00 99.00 98.00 48.002004 99.80 97.80 97.60 63.202005 99.60 97.60 98.00 70.802006 99.80 97.60 99.00 81.00
_____________________________________________________________________________________

13
Table 11. Comparison of the H.R. 2646 Proposal to Continuation of the 1996 Farm Billfor Representative Crop Farms._____________________________________________________________________________________
KSSW1385 KSSW1385 KSSW3180 KSSW3180'96 Bill HR 2646 '96 Bill HR 2646
_____________________________________________________________________________________
Overall Financial Position2001-2006 Ranking Poor Poor Marginal Good
Total Cash Receipts ($1000)2000 157.55 157.55 405.08 405.082001 134.93 152.73 356.53 391.522002 135.31 158.82 357.23 405.572003 138.04 158.32 365.19 406.562004 141.99 160.34 380.26 417.222005 144.53 160.47 384.39 416.382006 147.44 160.83 390.78 417.69
2001-2006 Average 140.37 158.59 372.40 409.16
Government Payments ($1000)2000 52.90 52.90 106.49 106.492001 25.48 43.33 47.71 82.822002 24.66 49.33 45.97 97.602003 23.32 45.18 43.32 89.032004 21.72 41.64 41.08 82.272005 20.74 38.07 38.88 74.592006 19.69 34.23 36.63 66.67
2001-2006 Average 22.60 41.96 42.26 82.16
Net Cash Farm Income ($1000)2000 63.67 63.67 163.13 163.132001 37.38 55.18 98.75 133.742002 41.24 65.57 112.36 162.012003 44.76 66.93 119.13 163.752004 40.97 62.42 133.76 176.062005 35.72 56.84 131.35 170.742006 25.52 46.59 136.95 172.96
2001-2006 Average 37.60 58.92 122.05 163.21
Ending Cash Reserves ($1000)2000 11.44 11.44 57.74 57.742001 8.96 20.01 63.12 85.262002 5.54 31.04 73.30 124.132003 -0.76 38.44 76.21 151.632004 -26.17 31.60 74.79 174.982005 -72.46 4.21 58.03 182.172006 -126.12 -28.88 89.14 235.38
2001-2006 Average -35.17 16.07 72.43 158.93
Prob. of a Cash Flow Deficit (%)2002 70.60 8.00 33.80 0.402003 84.20 21.00 51.20 7.402004 89.80 67.20 59.60 35.402005 99.00 88.60 71.40 57.202006 99.80 89.00 31.80 9.40
Nominal Net Worth ($1000)2000 380.58 380.58 882.27 882.272001 380.64 391.69 880.34 902.492002 371.90 397.39 885.53 936.362003 362.26 405.99 892.30 971.492004 353.49 421.57 910.02 1018.772005 336.53 429.56 925.86 1063.602006 303.47 422.99 959.82 1124.57
2001-2006 Average 351.38 411.53 908.98 1002.88
Prob. of Losing Real Net Worth (%)2002 77.40 13.80 31.60 2.202003 89.40 9.80 32.80 1.002004 85.60 8.40 30.00 0.202005 89.00 13.00 27.60 1.002006 94.60 27.20 19.40 1.00
_____________________________________________________________________________________

14
Table 12. Comparison of the H.R. 2646 Proposal to Continuation of the 1996 Farm Billfor Representative Crop Farms._____________________________________________________________________________________
NDW1760 NDW1760 NDW4850 NDW4850'96 Bill HR 2646 '96 Bill HR 2646
_____________________________________________________________________________________
Overall Financial Position2001-2006 Ranking Poor Poor Poor Marginal
Total Cash Receipts ($1000)2000 235.81 235.81 751.53 751.532001 230.70 245.29 713.34 761.782002 233.99 244.52 722.56 792.172003 240.33 248.71 742.64 803.242004 239.89 247.03 745.83 800.482005 246.68 252.61 765.46 815.002006 252.90 257.37 785.06 828.28
2001-2006 Average 240.75 249.26 745.81 800.16
Government Payments ($1000)2000 52.87 52.87 157.32 157.322001 30.27 44.88 80.37 128.852002 29.61 40.15 78.31 147.612003 27.82 36.76 72.79 134.532004 25.19 32.92 66.57 122.532005 23.76 30.30 62.86 113.862006 22.34 27.32 59.58 103.96
2001-2006 Average 26.50 35.39 70.08 125.22
Net Cash Farm Income ($1000)2000 47.04 47.04 185.74 185.742001 34.85 49.44 119.74 168.182002 38.46 49.66 138.97 210.992003 41.57 51.76 161.51 227.902004 37.23 47.47 160.45 223.722005 34.41 44.40 177.04 238.572006 33.42 43.07 188.22 246.15
2001-2006 Average 36.66 47.63 157.66 219.25
Ending Cash Reserves ($1000)2000 5.33 5.33 81.31 81.312001 0.68 8.91 76.45 122.552002 -9.34 10.41 73.44 173.132003 -22.43 8.15 72.74 202.982004 -43.04 -3.94 36.44 198.422005 -72.95 -24.35 7.34 200.672006 -105.32 -47.31 23.69 246.08
2001-2006 Average -42.07 -8.02 48.35 190.64
Prob. of a Cash Flow Deficit (%)2002 78.20 36.00 56.00 5.202003 85.60 60.00 54.20 7.802004 86.60 67.80 63.80 50.602005 92.40 78.60 72.00 51.602006 95.00 85.40 56.80 30.00
Nominal Net Worth ($1000)2000 318.71 318.71 1617.74 1617.742001 309.15 317.38 1609.09 1655.202002 297.10 316.85 1595.76 1695.432003 286.59 318.72 1604.07 1749.382004 268.76 311.41 1603.03 1799.262005 244.49 298.72 1631.16 1878.842006 219.15 284.81 1681.75 1978.17
2001-2006 Average 270.87 307.98 1620.81 1792.71
Prob. of Losing Real Net Worth (%)2002 76.00 34.00 51.60 4.802003 81.60 38.40 46.20 3.602004 81.60 50.20 47.80 8.802005 85.00 60.60 43.20 3.202006 89.40 68.20 31.40 1.80
_____________________________________________________________________________________

15
Table 13. Comparison of the H.R. 2646 Proposal to Continuation of the 1996 Farm Billfor Representative Crop Farms._____________________________________________________________________________________
WAW1500 WAW1500 WAW4250 WAW4250'96 Bill HR 2646 '96 Bill HR 2646
_____________________________________________________________________________________
Overall Financial Position2001-2006 Ranking Poor Poor Poor Marginal
Total Cash Receipts ($1000)2000 351.02 351.02 937.14 937.142001 346.73 365.89 946.43 1000.262002 333.76 371.52 886.09 998.662003 334.94 367.81 878.03 976.162004 346.96 377.06 915.07 1005.082005 353.58 380.94 931.39 1012.552006 361.84 385.88 953.37 1024.65
2001-2006 Average 346.30 374.85 918.40 1002.89
Government Payments ($1000)2000 61.56 61.56 172.61 172.612001 25.61 44.83 71.74 125.692002 24.71 64.76 68.64 186.382003 22.71 58.60 62.63 167.662004 21.26 54.22 58.43 155.082005 19.89 49.81 55.28 142.212006 18.99 45.23 52.93 129.13
2001-2006 Average 22.20 52.91 61.61 151.03
Net Cash Farm Income ($1000)2000 46.05 46.05 162.26 162.262001 21.80 40.96 134.36 188.192002 11.05 50.27 84.72 199.902003 7.44 44.81 64.31 171.282004 3.02 40.97 81.51 187.772005 -2.21 36.48 84.44 188.222006 -5.81 33.06 87.69 187.81
2001-2006 Average 5.88 41.09 89.51 187.19
Ending Cash Reserves ($1000)2000 -16.80 -16.80 -43.52 -43.522001 -60.77 -43.27 -46.79 -3.552002 -118.43 -65.97 -170.22 -40.012003 -189.33 -105.07 -272.97 -61.432004 -304.95 -185.61 -362.24 -77.332005 -396.65 -242.01 -471.18 -116.532006 -493.29 -301.96 -567.32 -146.85
2001-2006 Average -260.57 -157.32 -315.12 -74.28
Prob. of a Cash Flow Deficit (%)2002 99.00 98.20 99.80 79.602003 99.00 99.00 99.40 81.402004 99.00 99.00 99.60 75.802005 99.00 99.00 99.60 87.002006 99.00 99.00 99.80 88.60
Nominal Net Worth ($1000)2000 1170.23 1170.23 3349.60 3349.602001 1143.24 1160.74 3406.17 3449.412002 1071.08 1123.52 3299.82 3429.972003 997.22 1096.90 3181.45 3443.172004 924.44 1078.85 3123.45 3522.472005 844.21 1054.50 3058.70 3594.452006 768.40 1035.53 3022.04 3689.15
2001-2006 Average 958.10 1091.67 3181.94 3521.44
Prob. of Losing Real Net Worth (%)2002 97.60 82.80 83.60 45.802003 99.00 93.80 96.80 43.402004 99.00 91.40 95.80 27.602005 99.00 92.80 94.80 16.402006 99.00 93.00 93.80 10.60
_____________________________________________________________________________________

16
Table 14. Comparison of the H.R. 2646 Proposal to Continuation of the 1996 Farm Billfor Representative Crop Farms._____________________________________________________________________________________
TXSP1682 TXSP1682 TXSP3697 TXSP3697 TXRP2500 TXRP2500'96 Bill HR 2646 '96 Bill HR 2646 '96 Bill HR 2646
_____________________________________________________________________________________
Overall Financial Position2001-2006 Ranking Poor Marginal Marginal Good Poor Poor
Total Cash Receipts ($1000)2000 513.70 513.70 1035.73 1035.73 246.17 246.172001 512.57 528.88 1007.03 1057.73 190.51 213.642002 509.83 552.70 1005.42 1102.03 191.16 236.812003 515.00 557.12 1014.63 1109.37 194.55 238.592004 518.48 559.19 1026.75 1118.05 224.84 266.922005 522.82 562.09 1034.58 1122.33 228.43 268.532006 529.75 567.26 1045.68 1129.11 229.90 267.65
2001-2006 Average 518.07 554.54 1022.35 1106.44 209.90 248.69
Government Payments ($1000)2000 39.78 39.78 122.62 122.62 58.16 58.162001 27.30 43.69 75.71 126.57 27.96 51.132002 28.69 73.08 78.76 179.03 28.04 74.712003 28.17 72.25 77.41 176.90 27.41 72.772004 26.83 69.37 74.17 169.90 27.57 71.082005 25.48 66.51 71.14 163.15 26.68 68.122006 23.97 62.99 67.52 154.57 25.90 64.76
2001-2006 Average 26.74 64.65 74.12 161.69 27.26 67.10
Net Cash Farm Income ($1000)2000 98.45 98.45 243.20 243.20 49.90 49.902001 83.96 100.28 183.45 234.15 -7.54 15.602002 94.10 137.83 207.81 306.61 -9.69 37.972003 94.62 139.19 210.89 311.65 -14.75 35.322004 89.32 134.42 217.32 319.09 -0.51 52.292005 82.97 128.95 214.28 317.04 -9.82 45.312006 82.76 129.59 213.93 317.10 -23.71 34.15
2001-2006 Average 87.96 128.37 207.95 300.94 -11.00 36.77
Ending Cash Reserves ($1000)2000 33.90 33.90 99.74 99.74 5.01 5.012001 43.36 57.42 153.56 190.33 -41.24 -19.322002 66.04 105.87 221.41 318.74 -98.69 -32.612003 79.40 143.94 256.33 410.59 -159.76 -48.812004 49.77 143.31 265.37 478.05 -224.14 -67.092005 31.09 154.67 286.37 558.50 -314.14 -106.492006 25.16 177.20 341.80 673.29 -408.47 -145.60
2001-2006 Average 49.14 130.40 254.14 438.25 -207.74 -69.99
Prob. of a Cash Flow Deficit (%)2002 9.80 1.00 1.80 1.00 99.80 93.002003 24.00 2.00 22.40 2.00 99.00 97.002004 73.40 54.60 51.00 30.40 99.60 84.202005 66.20 43.60 45.40 27.20 99.40 92.402006 63.60 33.20 35.20 16.60 99.80 92.20
Nominal Net Worth ($1000)2000 564.36 564.36 1391.31 1391.31 310.17 310.172001 584.17 598.23 1458.24 1495.02 261.72 283.642002 601.07 640.89 1522.89 1620.20 207.97 274.052003 613.12 682.94 1568.89 1738.77 149.85 263.432004 615.92 721.48 1621.88 1870.09 96.86 259.882005 618.56 761.20 1694.31 2022.83 26.58 243.722006 626.04 804.05 1773.69 2181.97 -47.35 228.44
2001-2006 Average 609.81 701.46 1606.65 1821.48 115.94 258.86
Prob. of Losing Real Net Worth (%)2002 12.00 0.20 1.60 1.00 98.40 74.402003 9.00 0.40 0.80 1.00 99.00 75.202004 26.40 0.60 7.60 1.00 94.60 67.802005 28.00 0.60 8.00 1.00 97.60 68.802006 26.80 1.00 5.60 1.00 98.00 66.20
_____________________________________________________________________________________

17
Table 15. Comparison of the H.R. 2646 Proposal to Continuation of the 1996 Farm Billfor Representative Crop Farms._____________________________________________________________________________________
TXBC1400 TXBC1400 TXCB1720 TXCB1720'96 Bill HR 2646 '96 Bill HR 2646
_____________________________________________________________________________________
Overall Financial Position2001-2006 Ranking Poor Marginal Poor Marginal
Total Cash Receipts ($1000)2000 252.85 252.85 339.78 339.782001 232.79 250.90 319.94 347.382002 235.18 265.19 320.70 371.932003 238.04 266.82 323.79 373.262004 240.95 268.24 318.51 365.802005 245.12 270.61 322.74 367.112006 247.80 271.05 327.24 367.87
2001-2006 Average 239.98 265.47 322.15 365.56
Government Payments ($1000)2000 54.97 54.97 75.67 75.672001 27.86 46.11 43.89 71.542002 27.59 60.04 44.22 99.902003 27.21 59.18 43.26 98.242004 25.67 56.01 40.58 92.882005 24.14 52.40 38.84 87.622006 22.45 48.03 35.85 80.28
2001-2006 Average 25.82 53.63 41.11 88.41
Net Cash Farm Income ($1000)2000 63.57 63.57 79.34 79.342001 40.05 58.17 48.08 75.522002 39.38 70.27 60.14 112.992003 43.01 74.62 60.52 113.872004 40.99 73.28 51.20 105.192005 31.74 64.61 50.68 106.382006 30.47 64.84 44.60 99.97
2001-2006 Average 37.61 67.63 52.54 102.32
Ending Cash Reserves ($1000)2000 11.36 11.36 39.86 39.862001 9.37 20.70 34.18 60.372002 -3.37 30.55 38.96 96.812003 -11.57 44.21 34.91 125.322004 -29.50 49.09 2.86 132.822005 -68.82 40.63 -35.17 136.512006 -104.85 37.11 -63.76 151.20
2001-2006 Average -34.79 37.05 2.00 117.17
Prob. of a Cash Flow Deficit (%)2002 83.60 7.00 36.80 5.002003 80.20 5.80 54.00 6.202004 94.40 34.60 57.80 46.802005 98.60 81.40 70.00 49.802006 98.40 54.80 70.40 48.40
Nominal Net Worth ($1000)2000 470.87 470.87 813.16 813.162001 468.46 479.79 821.98 848.182002 453.96 487.88 816.84 875.412003 443.48 503.73 806.41 905.072004 431.70 520.49 780.76 928.562005 399.92 525.53 753.88 953.462006 372.95 536.92 695.71 948.57
2001-2006 Average 428.41 509.06 779.26 909.88
Prob. of Losing Real Net Worth (%)2002 77.00 10.00 48.20 3.802003 82.40 4.80 55.20 4.802004 87.40 3.60 55.40 31.002005 94.60 3.80 62.80 25.402006 95.20 4.80 71.80 26.00
_____________________________________________________________________________________

18
Table 16. Comparison of the H.R. 2646 Proposal to Continuation of the 1996 Farm Billfor Representative Crop Farms._____________________________________________________________________________________
CAC2000 CAC2000 CAC6000 CAC6000'96 Bill HR 2646 '96 Bill HR 2646
_____________________________________________________________________________________
Overall Financial Position2001-2006 Ranking Poor Poor Poor Poor
Total Cash Receipts ($1000)2000 1511.00 1511.00 7726.88 7726.882001 1423.94 1507.13 7456.82 7618.412002 1429.38 1583.52 7454.52 7731.202003 1446.35 1596.46 7580.85 7845.232004 1438.06 1582.39 7741.63 7994.632005 1466.94 1605.08 7984.39 8224.412006 1496.57 1627.07 8222.43 8446.87
2001-2006 Average 1450.21 1583.61 7740.11 7976.79
Government Payments ($1000)2000 219.01 219.01 393.88 393.882001 103.99 187.43 193.05 355.262002 103.88 262.34 194.61 484.862003 102.16 258.28 192.59 474.812004 98.06 248.15 186.54 456.072005 95.50 239.10 183.88 439.732006 91.99 227.16 178.60 416.59
2001-2006 Average 99.26 237.08 188.21 437.89
Net Cash Farm Income ($1000)2000 44.72 44.72 -527.85 -527.852001 -84.54 -1.35 -940.84 -779.252002 -34.15 126.47 -855.59 -565.182003 -34.87 133.29 -917.97 -615.292004 -71.63 104.20 -1035.45 -714.622005 -89.62 93.50 -1065.12 -728.442006 -109.52 80.71 -1155.71 -804.40
2001-2006 Average -70.72 89.47 -995.12 -701.20
Ending Cash Reserves ($1000)2000 -55.11 -55.11 -731.78 -731.782001 -220.48 -137.53 -1789.83 -1633.572002 -341.80 -103.47 -2791.92 -2359.022003 -479.79 -96.59 -3859.05 -3141.232004 -666.41 -135.47 -5054.72 -4040.732005 -942.66 -252.68 -6310.44 -4987.022006 -1171.58 -312.61 -7661.65 -6013.67
2001-2006 Average -637.12 -173.06 -4577.94 -3695.88
Prob. of a Cash Flow Deficit (%)2002 98.20 81.40 97.40 95.402003 98.20 78.20 98.20 96.802004 99.80 83.00 98.00 95.802005 99.00 95.60 98.20 95.602006 99.00 93.40 98.00 96.20
Nominal Net Worth ($1000)2000 3064.76 3064.76 11653.59 11653.592001 2963.64 3046.59 10946.09 11102.362002 2808.42 3046.69 9794.33 10226.972003 2640.98 3076.06 8561.05 9517.962004 2478.67 3127.58 7391.29 8948.982005 2275.61 3152.79 6150.74 8336.962006 2095.88 3209.81 4951.45 7774.48
2001-2006 Average 2543.86 3109.92 7965.83 9317.95
Prob. of Losing Real Net Worth (%)2002 92.60 35.00 85.20 79.402003 97.40 33.60 91.00 83.402004 98.20 29.80 91.40 81.002005 98.40 29.20 93.80 80.202006 99.00 26.80 94.20 79.80
_____________________________________________________________________________________

19
Table 17. Comparison of the H.R. 2646 Proposal to Continuation of the 1996 Farm Billfor Representative Crop Farms._____________________________________________________________________________________
TNC1675 TNC1675 TNC3800 TNC3800'96 Bill HR 2646 '96 Bill HR 2646
_____________________________________________________________________________________
Overall Financial Position2001-2006 Ranking Poor Poor Poor Marginal
Total Cash Receipts ($1000)2000 563.76 563.76 1349.66 1349.662001 537.29 560.55 1321.61 1382.942002 545.09 594.03 1339.04 1511.532003 554.67 602.23 1364.07 1532.072004 564.56 610.21 1407.90 1569.772005 578.84 622.48 1442.26 1597.412006 589.30 630.34 1475.78 1622.17
2001-2006 Average 561.62 603.30 1391.78 1535.98
Government Payments ($1000)2000 83.08 83.08 185.23 185.232001 64.12 87.46 129.38 191.022002 64.73 114.54 132.92 311.442003 62.37 111.68 129.55 305.992004 57.94 105.43 122.68 292.752005 54.94 100.54 114.19 277.172006 51.23 93.89 107.44 260.61
2001-2006 Average 59.22 102.26 122.69 273.16
Net Cash Farm Income ($1000)2000 39.49 39.49 89.58 89.582001 -28.79 -5.53 -14.72 46.622002 -15.14 35.92 20.28 198.262003 13.93 68.17 99.02 287.162004 7.67 65.08 100.20 297.692005 4.44 64.79 111.46 316.632006 -8.20 54.81 112.57 323.38
2001-2006 Average -4.35 47.21 71.47 244.96
Ending Cash Reserves ($1000)2000 -22.93 -22.93 -43.09 -43.092001 -128.30 -105.30 -186.58 -125.242002 -214.72 -142.19 -307.87 -73.222003 -284.67 -164.01 -386.85 6.282004 -373.35 -205.46 -522.71 27.462005 -468.01 -249.10 -656.45 42.392006 -564.01 -289.90 -754.51 93.46
2001-2006 Average -338.84 -192.66 -469.16 -4.81
Prob. of a Cash Flow Deficit (%)2002 99.00 99.00 99.80 81.402003 99.00 99.60 99.00 43.402004 99.00 98.40 94.40 53.402005 99.00 97.60 93.80 58.402006 99.00 97.80 93.40 54.20
Nominal Net Worth ($1000)2000 855.65 855.65 7614.38 7614.382001 771.36 794.35 7583.80 7645.132002 678.45 750.98 7346.63 7581.162003 611.37 739.45 7163.90 7670.702004 542.76 727.51 7045.04 7853.712005 478.21 723.88 6962.99 8072.042006 399.53 710.09 6913.77 8320.40
2001-2006 Average 580.28 741.04 7169.35 7857.19
Prob. of Losing Real Net Worth (%)2002 95.60 70.20 95.20 54.202003 97.80 78.20 99.00 29.402004 97.40 71.60 95.00 19.802005 97.00 67.80 90.80 17.602006 97.80 68.40 89.00 10.20
_____________________________________________________________________________________

20
Table 18. Comparison of the H.R. 2646 Proposal to Continuation of the 1996 Farm Billfor Representative Crop Farms._____________________________________________________________________________________
ALC3000 ALC3000 LAC2640 LAC2640'96 Bill HR 2646 '96 Bill HR 2646
_____________________________________________________________________________________
Overall Financial Position2001-2006 Ranking Poor Marginal Poor Poor
Total Cash Receipts ($1000)2000 1262.67 1262.67 907.94 907.942001 1108.07 1181.76 823.73 864.162002 1120.50 1275.25 834.42 932.712003 1141.61 1293.23 848.85 944.402004 1176.13 1322.55 868.74 960.752005 1197.51 1337.96 886.00 974.242006 1228.23 1360.99 910.17 992.99
2001-2006 Average 1162.01 1295.29 861.99 944.88
Government Payments ($1000)2000 251.58 251.58 185.26 185.262001 109.75 183.74 92.06 132.752002 113.06 274.35 93.64 197.182003 112.08 272.20 91.02 193.622004 108.35 262.75 84.38 183.282005 104.74 252.88 79.14 173.832006 99.64 238.97 73.81 162.16
2001-2006 Average 107.94 247.48 85.67 173.80
Net Cash Farm Income ($1000)2000 346.55 346.55 92.80 92.802001 156.65 230.36 -21.71 18.722002 174.09 330.89 -3.03 97.902003 181.04 338.95 -3.30 101.122004 186.90 344.63 -5.67 102.482005 179.35 337.04 -12.04 98.972006 177.39 333.40 -15.60 96.50
2001-2006 Average 175.90 319.21 -10.23 85.95
Ending Cash Reserves ($1000)2000 210.78 210.78 12.15 12.152001 178.89 244.43 -82.88 -42.452002 184.51 379.87 -152.66 -13.542003 162.34 468.67 -236.39 -5.382004 118.44 526.01 -323.44 3.322005 42.38 559.69 -380.07 46.422006 -22.61 598.35 -451.77 74.37
2001-2006 Average 110.66 462.84 -271.20 10.46
Prob. of a Cash Flow Deficit (%)2002 52.80 18.20 97.80 61.402003 61.80 30.80 99.60 63.002004 60.00 46.40 97.20 57.802005 69.60 49.40 96.60 51.602006 68.40 49.00 96.80 55.00
Nominal Net Worth ($1000)2000 1173.38 1173.38 869.97 869.972001 1118.08 1183.62 750.25 790.682002 1109.89 1305.26 661.01 800.132003 1104.35 1410.68 568.17 799.182004 1080.36 1487.93 477.83 804.592005 1050.19 1567.50 425.10 851.602006 1002.46 1623.42 325.09 851.23
2001-2006 Average 1077.56 1429.74 534.57 816.23
Prob. of Losing Real Net Worth (%)2002 52.40 16.60 93.20 39.402003 53.20 8.60 97.20 39.802004 50.40 11.80 95.40 45.202005 57.20 10.80 94.20 36.002006 57.60 10.60 94.40 41.00
_____________________________________________________________________________________

21
Table 19. Comparison of the H.R. 2646 Proposal to Continuation of the 1996 Farm Billfor Representative Crop Farms._____________________________________________________________________________________
CAR424 CAR424 CAR2365 CAR2365'96 Bill HR 2646 '96 Bill HR 2646
_____________________________________________________________________________________
Overall Financial Position2001-2006 Ranking Poor Poor Poor Poor
Total Cash Receipts ($1000)2000 347.80 347.80 2038.08 2038.082001 313.53 361.30 1847.25 2121.732002 315.73 354.39 1860.57 2082.512003 320.25 353.57 1887.42 2078.692004 300.87 333.65 1771.87 1960.062005 302.67 331.63 1782.79 1949.062006 299.07 326.17 1805.94 1961.50
2001-2006 Average 308.69 343.45 1825.97 2025.59
Government Payments ($1000)2000 194.30 194.30 1132.01 1132.012001 121.54 169.28 713.02 987.362002 115.15 156.93 675.35 915.832003 106.84 143.14 626.03 834.992004 99.08 134.44 580.02 783.532005 94.70 126.05 554.04 734.442006 91.90 121.22 537.45 706.15
2001-2006 Average 104.87 141.84 614.32 827.05
Net Cash Farm Income ($1000)2000 64.84 64.84 318.96 318.962001 14.77 62.53 35.16 309.642002 21.39 63.16 70.52 305.682003 17.12 56.58 65.13 282.092004 -8.49 34.23 -53.23 175.592005 -20.85 22.27 -102.67 120.732006 -41.60 4.07 -153.09 77.61
2001-2006 Average -2.94 40.47 -23.03 211.89
Ending Cash Reserves ($1000)2000 20.77 20.77 126.19 126.192001 -22.58 19.35 -43.25 157.572002 -61.74 10.51 -181.43 166.872003 -112.98 -8.50 -355.30 133.602004 -206.78 -65.19 -678.54 -36.342005 -319.81 -138.36 -1058.34 -243.752006 -438.51 -212.76 -1425.17 -422.54
2001-2006 Average -193.73 -65.83 -623.67 -40.77
Prob. of a Cash Flow Deficit (%)2002 92.80 57.00 80.60 39.002003 99.00 73.00 90.40 52.202004 99.40 85.00 90.00 60.202005 99.00 95.00 95.20 72.202006 99.00 96.20 96.20 77.40
Nominal Net Worth ($1000)2000 667.57 667.57 2622.12 2622.122001 632.97 674.91 2478.82 2679.642002 589.32 661.56 2312.09 2660.362003 534.20 647.31 2130.85 2654.922004 457.01 618.23 1855.52 2577.672005 369.05 581.66 1541.03 2482.492006 269.18 537.37 1207.51 2382.93
2001-2006 Average 475.29 620.17 1920.97 2573.00
Prob. of Losing Real Net Worth (%)2002 84.40 47.40 71.20 35.602003 97.60 59.40 87.60 39.002004 97.60 66.80 87.40 50.802005 98.60 72.80 90.00 57.602006 99.60 80.00 92.80 61.20
_____________________________________________________________________________________

22
Table 20. Comparison of the H.R. 2646 Proposal to Continuation of the 1996 Farm Billfor Representative Crop Farms._____________________________________________________________________________________
TXR1553 TXR1553 TXR3774 TXR3774'96 Bill HR 2646 '96 Bill HR 2646
_____________________________________________________________________________________
Overall Financial Position2001-2006 Ranking Poor Poor Poor Poor
Total Cash Receipts ($1000)2000 429.58 429.58 1082.57 1082.572001 350.90 408.53 908.91 1036.772002 352.89 399.78 914.96 1018.472003 357.89 398.32 928.51 1017.732004 356.65 396.42 925.28 1013.042005 360.31 395.47 935.23 1012.802006 361.24 394.14 937.83 1010.43
2001-2006 Average 356.65 398.78 925.12 1018.21
Government Payments ($1000)2000 225.08 225.08 541.93 541.932001 130.01 187.61 325.06 452.862002 123.28 173.27 307.68 419.522003 115.05 158.44 285.55 382.722004 113.31 155.84 280.88 376.072005 109.37 147.04 270.29 354.622006 106.54 141.79 262.70 341.59
2001-2006 Average 116.26 160.66 288.69 387.89
Net Cash Farm Income ($1000)2000 100.26 100.26 290.13 290.132001 17.29 74.91 88.01 215.882002 23.87 73.86 117.13 224.962003 21.58 68.75 124.70 222.042004 8.66 59.44 97.54 198.172005 -0.63 49.89 91.05 188.242006 -16.49 36.44 58.32 156.22
2001-2006 Average 9.05 60.55 96.13 200.92
Ending Cash Reserves ($1000)2000 18.60 18.60 92.66 92.662001 -28.45 11.81 -17.19 78.602002 -78.83 1.47 -59.01 94.512003 -139.87 -19.60 -109.68 99.072004 -230.32 -64.64 -234.00 46.732005 -328.40 -113.65 -332.47 14.282006 -439.95 -171.36 -467.76 -49.69
2001-2006 Average -207.64 -59.33 -203.35 47.25
Prob. of a Cash Flow Deficit (%)2002 99.00 83.40 95.00 24.002003 99.00 99.00 98.60 37.202004 99.00 99.20 98.80 70.202005 99.00 99.00 99.60 66.602006 99.00 99.00 99.00 82.60
Nominal Net Worth ($1000)2000 375.19 375.19 599.75 599.752001 322.23 362.49 506.43 602.222002 266.40 346.70 473.03 626.552003 207.71 329.44 441.26 650.012004 132.86 301.84 362.39 643.122005 54.86 274.86 315.76 662.512006 -52.15 223.59 225.07 643.13
2001-2006 Average 155.32 306.49 387.32 637.92
Prob. of Losing Real Net Worth (%)2002 99.00 91.20 73.00 11.802003 99.00 99.00 87.80 6.802004 99.00 97.40 87.20 28.002005 99.00 97.40 89.80 26.402006 99.00 99.00 94.40 35.00
_____________________________________________________________________________________

23
Table 21. Comparison of the H.R. 2646 Proposal to Continuation of the 1996 Farm Billfor Representative Crop Farms._____________________________________________________________________________________
LAR1200 LAR1200 LANR2500 LANR2500'96 Bill HR 2646 '96 Bill HR 2646
_____________________________________________________________________________________
Overall Financial Position2001-2006 Ranking Poor Poor Poor Poor
Total Cash Receipts ($1000)2000 387.61 387.61 1060.71 1060.712001 337.06 371.35 932.05 1017.192002 341.69 382.61 944.72 1039.562003 348.72 384.95 963.62 1049.402004 349.24 384.90 968.04 1051.682005 355.90 388.23 985.56 1061.892006 360.43 391.02 1001.55 1073.09
2001-2006 Average 348.84 383.84 965.92 1048.80
Government Payments ($1000)2000 174.12 174.12 424.10 424.102001 109.44 143.70 257.10 342.272002 104.13 147.28 246.82 347.892003 96.28 134.66 229.55 322.132004 93.91 131.64 222.83 313.122005 89.80 124.09 212.86 295.452006 86.93 119.35 203.98 281.16
2001-2006 Average 96.75 133.45 228.86 317.00
Net Cash Farm Income ($1000)2000 72.27 72.27 140.23 140.232001 13.76 48.04 -8.85 76.282002 17.72 60.97 -1.36 99.102003 17.52 59.69 -3.76 95.542004 1.61 47.58 -31.18 74.062005 -3.14 43.59 -43.50 62.572006 -12.38 36.46 -60.76 48.97
2001-2006 Average 5.85 49.39 -24.90 76.09
Ending Cash Reserves ($1000)2000 21.53 21.53 43.50 43.502001 -14.36 21.35 -75.19 9.952002 -61.38 18.72 -226.56 -51.382003 -116.94 6.89 -371.05 -111.342004 -200.72 -33.56 -560.30 -209.292005 -289.28 -81.16 -773.33 -326.122006 -386.81 -132.71 -969.07 -420.37
2001-2006 Average -178.25 -33.41 -495.92 -184.76
Prob. of a Cash Flow Deficit (%)2002 99.00 49.80 99.00 99.002003 99.00 81.60 99.00 99.002004 99.00 83.40 99.00 99.002005 99.00 93.80 99.00 99.002006 99.00 97.00 99.00 99.00
Nominal Net Worth ($1000)2000 260.50 260.50 1777.09 1777.092001 219.97 255.68 1671.85 1756.992002 168.57 248.67 1535.82 1710.982003 120.57 245.31 1402.88 1681.302004 48.17 217.41 1255.46 1649.002005 -19.41 192.02 1102.90 1617.612006 -101.64 156.96 952.02 1592.64
2001-2006 Average 72.71 219.34 1320.16 1668.09
Prob. of Losing Real Net Worth (%)2002 99.00 57.00 99.00 94.202003 99.00 57.20 99.00 98.002004 99.00 72.00 99.00 94.602005 99.80 80.40 99.00 94.802006 99.00 88.60 99.00 94.40
_____________________________________________________________________________________

24
Table 22. Comparison of the H.R. 2646 Proposal to Continuation of the 1996 Farm Billfor Representative Crop Farms._____________________________________________________________________________________
MOWR4000 MOWR4000 MOER4000 MOER4000'96 Bill HR 2646 '96 Bill HR 2646
_____________________________________________________________________________________
Overall Financial Position2001-2006 Ranking Poor Poor Poor Marginal
Total Cash Receipts ($1000)2000 1780.49 1780.49 1514.48 1514.482001 1534.91 1678.18 1384.60 1478.522002 1552.19 1735.84 1400.74 1569.082003 1574.92 1737.61 1427.57 1581.662004 1587.57 1747.48 1448.16 1598.172005 1605.58 1751.17 1473.32 1611.202006 1615.91 1753.85 1496.30 1623.26
2001-2006 Average 1578.51 1734.02 1438.45 1576.98
Government Payments ($1000)2000 757.38 757.38 525.70 525.702001 472.46 615.57 329.22 423.352002 449.19 638.79 313.87 491.792003 410.35 578.93 290.82 456.442004 400.32 566.28 279.52 441.032005 377.57 529.15 261.29 409.962006 362.04 505.62 247.06 383.54
2001-2006 Average 411.99 572.39 286.96 434.35
Net Cash Farm Income ($1000)2000 487.70 487.70 407.96 407.962001 203.74 347.02 243.05 336.962002 231.19 420.62 283.35 453.712003 228.10 404.71 293.51 452.912004 186.41 371.16 290.53 449.722005 169.72 353.30 287.33 438.782006 129.45 319.61 283.33 428.88
2001-2006 Average 191.44 369.40 280.18 426.83
Ending Cash Reserves ($1000)2000 224.74 224.74 166.02 166.022001 85.54 207.42 153.12 218.822002 -27.84 238.14 170.21 327.282003 -182.47 216.38 163.08 402.052004 -432.64 105.83 124.10 450.342005 -744.41 -66.61 39.40 446.682006 -1075.65 -250.00 -9.52 478.12
2001-2006 Average -396.24 75.19 106.73 387.22
Prob. of a Cash Flow Deficit (%)2002 73.00 40.80 45.20 0.202003 82.00 55.40 54.00 10.402004 94.40 70.40 64.20 34.602005 98.60 82.20 82.80 55.802006 99.20 88.20 78.40 41.40
Nominal Net Worth ($1000)2000 4510.01 4510.01 3585.43 3585.432001 4433.91 4555.78 3603.15 3668.852002 4281.98 4547.89 3569.19 3726.212003 4113.73 4570.77 3523.20 3808.722004 3926.56 4597.35 3505.08 3937.182005 3722.73 4610.52 3464.19 4039.462006 3494.14 4605.77 3442.94 4159.36
2001-2006 Average 3995.51 4581.35 3517.96 3889.96
Prob. of Losing Real Net Worth (%)2002 64.20 40.00 53.00 6.802003 81.00 41.60 75.60 3.602004 89.20 42.40 71.80 1.402005 92.80 41.20 76.60 0.602006 96.20 42.20 78.40 0.40
_____________________________________________________________________________________

25
Table 23. Comparison of the H.R. 2646 Proposal to Continuation of the 1996 Farm Billfor Representative Crop Farms._____________________________________________________________________________________
ARR3640 ARR3640 MSR4735 MSR4735'96 Bill HR 2646 '96 Bill HR 2646
_____________________________________________________________________________________
Overall Financial Position2001-2006 Ranking Poor Marginal Poor Poor
Total Cash Receipts ($1000)2000 1333.45 1333.45 1768.77 1768.772001 1183.36 1302.75 1618.56 1738.072002 1200.38 1343.75 1641.29 1796.602003 1227.00 1352.95 1673.47 1813.042004 1236.26 1359.30 1695.23 1830.122005 1257.12 1368.16 1720.69 1844.332006 1277.23 1381.52 1748.54 1864.80
2001-2006 Average 1230.22 1351.41 1682.96 1814.50
Government Payments ($1000)2000 588.33 588.33 633.71 633.712001 385.51 504.79 437.30 556.692002 368.16 517.39 420.68 579.252003 340.80 472.80 390.46 533.782004 330.24 459.36 374.19 513.212005 314.55 431.45 355.97 484.032006 303.75 413.40 341.89 462.23
2001-2006 Average 340.50 466.53 386.75 521.53
Net Cash Farm Income ($1000)2000 431.43 431.43 156.01 156.012001 252.26 371.66 -20.77 98.742002 300.80 447.77 7.99 172.912003 324.65 457.89 -1.13 161.142004 317.51 451.54 -39.62 133.002005 326.56 453.15 -69.12 107.542006 324.40 448.86 -118.19 67.11
2001-2006 Average 307.70 438.48 -40.14 123.41
Ending Cash Reserves ($1000)2000 189.25 189.25 27.91 27.912001 165.43 242.99 -153.71 -34.202002 207.82 354.84 -313.98 -42.742003 236.05 430.73 -513.50 -105.112004 225.36 474.65 -793.49 -235.502005 194.57 505.09 -1134.20 -418.412006 191.12 562.64 -1505.50 -621.38
2001-2006 Average 203.39 428.49 -735.73 -242.89
Prob. of a Cash Flow Deficit (%)2002 7.00 2.00 99.00 75.002003 12.80 2.20 99.00 92.402004 51.40 31.20 99.00 92.402005 60.40 36.40 99.00 98.002006 53.00 26.80 99.00 99.80
Nominal Net Worth ($1000)2000 3630.30 3630.30 709.76 709.762001 3644.39 3721.94 522.21 641.722002 3634.33 3781.31 379.95 651.202003 3625.30 3862.97 213.03 621.452004 3626.72 3973.75 0.13 558.192005 3629.16 4094.80 -232.05 483.862006 3667.08 4249.83 -533.32 350.94
2001-2006 Average 3637.83 3947.43 58.33 551.23
Prob. of Losing Real Net Worth (%)2002 23.80 2.60 98.00 45.402003 43.60 3.20 99.00 56.602004 49.80 2.60 99.80 67.802005 49.20 1.80 99.80 74.002006 41.80 0.40 99.00 84.60
_____________________________________________________________________________________

26
Table 24. Summary of Base Acres for the AFPC Representative Crop FarmsCurrent
Base AcresProposed Gain or Loss
Farm and Crop Base Acres in Base AcresTXNP1600WHEAT 642 528 -114SORGHUM 280 240 -40CORN 470 800 330Sum 1392 1568 176
TXNP6700WHEAT 2010 1173 -837SORGHUM 335 335 0CORN 2680 3350 670WHEAT 0 670 670SOYBEAN 0 503 503Sum 5025 6031 1006
TXBG2000SORGHUM 750 750 0COTTON 400 400 0SEED 400 400 0WHEAT 250 250 0CORN 600 600 0Sum 2400 2400 0
MOCG3300 CORN 1170 1319 149WHEAT 625 100 -525SOYBEAN 0 1881 1881Sum 1795 3300 1505
MOCG1700 CORN 476 807.5 331.5WHEAT 255 84 -171SOYBEAN 0 807.5 807.5Sum 731 1699 968
MONG1400CORN 460 600 140SOYBEAN 0 600 600Sum 460 1200 740
IAG950 CORN 475 475 0SOYBEAN 0 475 475Sum 475 950 475
IAG2400 CORN 1320 1200 -120SOYBEAN 0 1200 1200Sum 1320 2400 1080
NEG900 IRRIGATED CORN 427.5 300 -127.5DRY CORN 427.5 300 -127.5SOYBEANS 0 300 300Sum 855 900 45
NEG1300IRRIGATED CORN 706 537 -169WHITE CORN 160 160 0IRRIGATED SOYBEAN 0 343 343YELLOW CORN 134 134 0WHITE CORN 40 40 0SOYBEANS 0 86 86Sum 1040 1300 260
TNG2400 CORN 1200 1200 0WHEAT 600 600 0SOYBEAN 0 1200 1200Sum 1800 3000 1200

27
Table 24. ContinuedCurrent Proposed Gain or Loss
Farm and Crop Base Acres Base Acres in Base AcresSCG1500 CORN 846 846 0WHEAT 300 454 154DOUBLE CROP SOYBEAN 0 454 454FULL CROP SOYBEAN 0 212 212Sum 1146 1966 820
SCG3500 CORN 1450 1400 -50FULL CROP SOYBEAN 0 360 360DOUBLE CROP SOYBEAN 0 948 948WHEAT 1100 948 -152COTTON 300 793 493Sum 2850 4449 1599
COW5440 WHEAT 2920 1750 -1170CORN 0 508 508Sum 2920 2258 -662
COW2700 WHEAT 1343 1120 -223CORN 0 421 421Sum 1343 1541 198
KSNW4300DRY WHEAT 2000 1948 -52SORGHUM 250 465 215DRY CORN 250 308 58IRRIGATED CORN 240 241 1SUNFLOWER 0 262 262Sum 2740 3224 484
KSNW2325DRY WHEAT 900 769 -131SORGHUM 250 154 -96DRY CORN 225 615 390Sum 1375 1538 163
KSSW1385WHEAT 1370 956 -414SORGHUM 140 313 173SOYBEAN 0 90 90Sum 1510 1359 -151
KSSW3180WHEAT 3180 2243 -937SORGHUM 0 664 664SOYBEAN 0 89 89CORN 0 57 57Sum 3180 3053 -127
NDW4850WHEAT 2450 2585 135BARLEY 1225 529 -696BARLEY 0 0SUNFLOWER 0 940 940SOYBEAN 0 646 646Sum 3675 4700 1025
NDW1760 WHEAT 920 704 -216BARLEY 400 176 -224BARLEY 0 0SUNFLOWER 0 352 352CORN 0 176 176SOYBEAN 0 352 352Sum 1320 1760 440
WAW1500WHEAT 675 600 -75BARLEY 225 300 75WHEAT 0 300 300Sum 900 1200 300
WAW4250 WINTER WHEAT 1690 1700 10BARLEY 420 200 -220SPRING WHEAT 200 1062.5 862.5Sum 2310 2962.5 652.5

28
Table 24. ContinuedCurrent Proposed Gain or Loss
Farm and Crop Base Acres Base Acres in Base AcresTXSP3697DRY COTTON 2095 2095 0IRRIGATED COTTON 727 570 -157Sum 2822 2665 -157
TXSP1682DRY COTTON 866 866 0IRRIGATED COTTON 75 258 183Sum 941 1124 183
TXRP2500COTTON 1143 1240 97WHEAT 790 825 35Sum 1933 2065 132
TXBC1400SORGHUM 450 400 -50COTTON 500 350 -150WHEAT 100 100 0CORN 350 550 200Sum 1400 1400 0
TXCB1720SORGHUM 946.7 870 -76.7COTTON 623.3 700 76.7WHEAT 50 0 -50CORN 100 150 50Sum 1720 1720 0
CAC2000 COTTON 1400 600 -800WHEAT 150 400 250FIELD CORN 75 200 125Sum 1625 1200 -425
CAC6000 COTTON 2000 1200 -800CORN 272 300 28WHEAT 720 300 -420Sum 2992 1800 -1192
TNC1675 COTTON 750 837.5 87.5SOYBEAN 0 670 670CORN 250 167.5 -82.5Sum 1000 1675 675
TNC3800 COTTON 2000 2508 508SOYBEAN 0 760 760CORN 250 532 282WHEAT 150 300 150Sum 2400 4100 1700
ALC3000IRRIGATED COTTON 173 175 2DRY COTTON 2057 2075 18CORN 107 750 643Sum 2337 3000 663
LAC2640 IRRIGATED COTTON 456 456 0DRY COTTON 684 684 0IRRIGATED SOYBEAN 0 814 814CORN 0 686 686Sum 1140 2640 1500
CAR424 RICE 400 400 0
CAR2365 RICE 2240 2240 0
TXR1553 RICE 517.5 450 -67.5
TXR3774 RICE 1611 1589.1 -21.9

29
Table 24. ContinuedCurrent Proposed Gain or Loss
Farm and Crop Base Acres Base Acres in Base AcresLANR2500RICE 950 1000 50DRY SOYBEAN 0 250 250IRRIGATED SOYBEAN 0 500 500IRRIGATED COTTON 182 162.5 -19.5DRY COTTON 182 162.5 -19.5GRAIN SORGHUM 100 100 0CORN 200 200 0Sum 1614 2375 761
LAR1200RICE 550 660 110SOYBEAN 0 324 324Sum 550 984 434
MOWR4000RICE 1200 2000 800SOYBEAN 0 2000 2000CORN 800 0 -800COTTON 400 0 -400Sum 2400 4000 1600
MOER4000RICE 750 1334 584SOYBEAN 0 1333 1333CORN 1500 1333 -167COTTON 0 0Sum 2250 4000 1750
MSR4735RICE 1202 1335 133DRY SOYBEAN 0 700 700IRRIGATED SOYBEAN 0 2000 2000IRRIGATED COTTON 338 375 37DRY COTTON 113 125 12WHEAT 350 0 -350Sum 2003 4535 2532
ARR3640RICE 325 122 -203RICE 1055 1620 565WHEAT 1080 615 -465FIELD SOYBEAN 0 883 883DRY SOYBEAN 0 615 615Sum 2460 3855 1395

30
2000 CHARACTERISTICS OF PANEL FARMS PRODUCING FEED GRAIN AND OILSEEDS
IAG950 A 950-acre Northwestern Iowa (Webster County) moderate size grain farm that plants 475acres of corn, and 475 acres of soybeans. The farm receives 57 percent of its receipts fromcorn.
IAG2400 A 2,400-acre Northwestern Iowa (Webster County) large grain farm that plants 1,200 acresof corn, and 1,200 acres of soybeans. The farm generates 59 percent of its receipts fromcorn.
NEG900 A 900-acre South Central Nebraska (York County) grain farm that plants 600 acres ofcorn, and 300 acres of soybeans. The farm generates 75 percent of its receipts from corn.
NEG1300 A 1,300 South Central Nebraska (Hamilton County) grain farm that plants 871 acres ofcorn and 429 acres of soybeans. The farm generates about 74 percent of its receipts fromcorn.
MOCG1700 A 1,700-acre Central Missouri (Carroll County) moderate size grain farm with 85 acres ofwheat, 808 acres of corn, and 808 acres of soybeans. This farm is located in the Missouririver bottom and supplies feed to the livestock producers in the region at a premium toother areas of Missouri. Corn generates 56 percent of the farm's receipts and soybeansaccount for 39 percent of receipts.
MOCG3300 A 3,300-acre Central Missouri (Carroll County) large grain farm with 100 acres of wheat,1,319 acres of corn, and 1,881 acres of soybeans. This farm is located in the Missouri riverbottom-and supplies feed to the livestock producers in the region at a premium to otherareas of Missouri. The farm generates about 48 percent of its total revenue from corn and48 percent from soybeans.
MONG1400 A 1,400-acre Northern Missouri (Nodaway County) diversified grain farm with 600 acresof corn, 600 acres of soybeans, and 200 acres of hay. The farm also has 200 breeding cowsand in 1996 sold its 80 breeding sows. The farm generates about 40 percent of its totalrevenue from corn, 27 percent from soybeans, and 30 percent from cattle.

31
Appendix Table A1. Characteristics of Panel Farms Producing Feed Grains for 2000.
IAG950 IAG2400 NEG900 NEG1300 MOCG1700 MOCG3300 MONG1400
County Webster Webster York Hamilton Carroll Carroll Nodaway
Total Cropland 950 2,400 900 1,300 1,700 3,300 1,400Acres Owned 240 380 180 260 850 1,600 700Acres Leased 710 2,020 720 1,040 850 1,700 700
PasturelandAcres Owned 0 0 0 0 0 0 400Acres Leased 0 0 0 0 0 0 400
Assets ($1000)Total 1,209 2,109 1,336 1,576 2,527 4,349 2,107Real Estate 905 1,358 714 809 1,744 3,198 1,502Machinery 213 445 397 434 439 652 441Other & Livestock 91 307 225 333 345 499 164
Debt/Asset RatiosTotal 0.14 0.15 0.19 0.12 0.13 0.14 0.30Intermediate 0.12 0.16 0.23 0.10 0.12 0.16 0.66Long Run 0.14 0.14 0.16 0.15 0.14 0.14 0.15
Number of LivestockBeef Cows 0 0 0 0 0 0 200
2000 Gross Receipts ($1,000)*Total 282.9 624.6 343.8 482.5 362.2 718.3 386.9
Cattle 0.0 0.0 0.0 0.0 0.0 0.0 117.70.00% 0.00% 0.00% 0.00% 0.00% 0.00% 30.40%
Corn 161.2 367.9 259.0 356.5 201.8 343.4 156.157.00% 58.90% 75.30% 73.90% 55.70% 47.80% 40.30%
Wheat 0.0 0.0 0.0 0.0 16.0 30.0 0.00.00% 0.00% 0.00% 0.00% 4.40% 4.20% 0.00%
Soybeans 119.7 256.7 84.8 125.9 139.4 344.9 105.842.30% 41.10% 24.70% 26.10% 38.50% 48.00% 27.40%
Hay 0.0 0.0 0.0 0.0 0.0 0.0 3.50.00% 0.00% 0.00% 0.00% 0.00% 0.00% 0.90%
Other Receipts 2.0 0.0 0.0 0.0 5.0 0.0 3.80.70% 0.00% 0.00% 0.00% 1.40% 0.00% 1.00%
2000 Planted Acres**Total 950.0 2,400.0 900.0 1,300.0 1,700.0 3,300.0 1,450.0
Corn 475.0 1,200.0 600.0 871.0 807.5 1,319.0 600.050.00% 50.00% 66.70% 67.00% 47.50% 40.00% 41.40%
Wheat 0.0 0.0 0.0 0.0 85.0 100.0 0.00.00% 0.00% 0.00% 0.00% 5.00% 3.00% 0.00%
Soybeans 475.0 1,200.0 300.0 429.0 807.5 1,881.0 600.050.00% 50.00% 33.30% 33.00% 47.50% 57.00% 41.40%
Hay 0.0 0.0 0.0 0.0 0.0 0.0 200.00.00% 0.00% 0.00% 0.00% 0.00% 0.00% 13.80%
CRP 0.0 0.0 0.0 0.0 0.0 0.0 50.00.00% 0.00% 0.00% 0.00% 0.00% 0.00% 3.40%
* Receipts for 2000 are included to indicate the relative importance of each enterprise to the farm. Percents indicate the percentage of the total receipts accounted for bythe livestock categories and the crops.
** Acreages for 2000 are included to indicate the relative importance of each enterprise to the farm. Total planted acreage may exceed total cropland available due to doublecropping. Percents indicate the percentage of total planted acreage accounted for by the crop.

32
PANEL FARMS PRODUCING FEED GRAIN AND OILSEEDS (CONTINUED)
TXNP1600 A 1,600-acre Northern High Plains of Texas (Moore County) moderate size, 100 percentirrigated, grain farm with 528 acres of wheat, 240 acres of sorghum, 800 acres of corn, and32 acres fallow. The farm generates 82 percent of its total receipts from feed grains.
TXNP6700 A 6,700-acre Northern High Plains of Texas (Moore County) large, 80 percent irrigated,grain farm with 1,675 acres of irrigated wheat (670 acres of the wheat is in the drylandcorners of all pivot irrigated fields), 335 acres of irrigated sorghum, 3,350 acres of irrigatedcorn, 670 acres of irrigated soybeans, and 670 acres fallow. The farm generates about 80percent of its receipts from feed grains.
TXBG2000 A 2,000 acre Texas Blacklands (Hill County) grain farm with 600 acres of corn, 750 acresof sorghum, 250 acres of wheat, 400 acres of cotton and 150 acres of pasture. About 66percent of the receipts are from feedgrains. The farm has 20 cows and receives only 3percent of its receipts from cattle.
TXBG2500 A 2,500 acre Texas Blacklands (Falls County) grain farm with 750 acres of corn, 250 acresof sorghum, 250 acres of wheat, and 625 acres of oats. The feedgrains account for 62percent of the receipts on the farm.
TNG900 A 900-acre Western Tennessee (Henry County) grain and soybean farm with 400 acres ofcorn, 500 acres of soybeans, 200 acres of wheat, and 250 acres of hay. The farm generatesabout 78 percent of its receipts from corn and soybeans. Fifty head of beef cattle accountfor 8 percent of receipts.
TNG2400 A 2,400-acre Western Tennessee (Henry County) grain and soybean farm with 1,200 acresof corn, 1,200 acres of soybeans, and 600 acres of wheat. The farm generates about 87percent of its receipts from corn and soybeans.
SCG1500 A 1,500-acre South Carolina (Clarendon County) moderate size grain farm with 454 acresof double cropped wheat and soybeans, 846 acres of corn, and 654 acres of soybeans. Thefarm generates about 84 percent of its total receipts from corn and soybeans. This farmenjoys high returns on double-cropped acreage but timing does not allow more than 454acres.
SCG3500 A 3,500-acre South Carolina (Clarendon County) large grain farm with 900 acres of doublecrop wheat and soybeans, 1260 acres of soybeans, 840 acres of cotton, and 1,400 acres ofcorn. This farm enjoys high returns on double-cropped acreage but timing is a limitingfactor. The farm generates 48 percent of its receipts from corn and soybeans.

33
Appendix Table A2. Characteristics of Panel Farms Producing Feed Grains for 2000.
TXNP1600 TXNP6700 TXBG2000 TXBG2500 TNG900 TNG2400 SCG1500 SCG3500
County Moore Moore Hill Falls Henry Henry Clarendon Clarendon
Total Cropland 1,600 6,700 2,000 1,250 900 2,400 1,500 3,500Acres Owned 160 1,100 200 312 207 482 500 1,400Acres Leased 1,440 5,600 1,800 938 693 1,918 1,000 2,100
PasturelandAcres Owned 0 0 15 312 57 0 300 1,400Acres Leased 0 0 135 700 190 0 0 0
Assets ($1000)Total 522 2,914 567 1,152 700 1,103 1,063 3,923Real Estate 128 896 324 804 409 138 717 2,551Machinery 290 1,366 231 132 219 686 311 919Other & Livestock 104 651 13 216 72 279 35 454
Debt/Asset RatiosTotal 0.17 0.15 0.31 0.10 0.28 0.37 0.14 0.17Intermediate 0.18 0.16 0.60 0.03 0.52 0.30 0.13 0.20Long Run 0.15 0.12 0.09 0.13 0.14 0.66 0.15 0.15
Number of LivestockBeef Cows 0 0 20 20 50 0 0 0
2000 Gross Receipts ($1,000)*Total 428.6 1,737.8 309.5 307.1 278.2 704.8 490.2 1,550.5
Cattle 0.0 0.0 8.4 7.0 22.7 0.0 0.0 0.00.00% 0.00% 2.70% 2.30% 8.20% 0.00% 0.00% 0.00%
Corn 292.5 1,299.9 104.7 151.6 100.5 344.1 270.5 518.268.30% 74.80% 33.80% 49.40% 36.10% 48.80% 55.20% 33.40%
Sorghum 56.7 78.6 98.4 38.5 0.0 0.0 0.0 0.013.20% 4.50% 31.80% 12.50% 0.00% 0.00% 0.00% 0.00%
Wheat 79.4 205.5 26.1 36.9 24.2 90.7 81.0 236.418.50% 11.80% 8.40% 12.00% 8.70% 12.90% 16.50% 15.20%
Soybeans 0.0 138.7 0.0 0.0 115.4 270.0 138.7 224.20.00% 8.00% 0.00% 0.00% 41.50% 38.30% 28.30% 14.50%
Cotton 0.0 0.0 72.0 0.0 0.0 0.0 0.0 571.70.00% 0.00% 23.30% 0.00% 0.00% 0.00% 0.00% 36.90%
Hay 0.0 0.0 0.0 0.0 8.3 0.0 0.0 0.00.00% 0.00% 0.00% 0.00% 3.00% 0.00% 0.00% 0.00%
Oats 0.0 0.0 0.0 24.4 0.0 0.0 0.0 0.00.00% 0.00% 0.00% 8.00% 0.00% 0.00% 0.00% 0.00%
Other Receipts 0.0 15.0 0.0 48.7 9.7 6.2 2.0 5.80.00% 0.90% 0.00% 15.90% 3.50% 0.90% 0.40% 0.40%
2000 Planted Acres**Total 1,568.0 6,030.0 2,150.0 1,875.0 1,350.0 3,000.0 1,954.0 4,400.0
Corn 800.0 3,350.0 600.0 750.0 400.0 1,200.0 846.0 1,400.051.00% 55.60% 27.90% 40.00% 29.60% 40.00% 43.30% 31.80%
Sorghum 240.0 335.0 750.0 250.0 0.0 0.0 0.0 0.015.30% 5.60% 34.90% 13.30% 0.00% 0.00% 0.00% 0.00%
Wheat 528.0 1,675.0 250.0 250.0 200.0 600.0 454.0 900.033.70% 27.80% 11.60% 13.30% 14.80% 20.00% 23.20% 20.50%
Soybeans 0.0 670.0 0.0 0.0 500.0 1,200.0 654.0 1,260.00.00% 11.10% 0.00% 0.00% 37.00% 40.00% 33.50% 28.60%
Cotton 0.0 0.0 400.0 0.0 0.0 0.0 0.0 840.00.00% 0.00% 18.60% 0.00% 0.00% 0.00% 0.00% 19.10%
Hay 0.0 0.0 0.0 0.0 250.0 0.0 0.0 0.00.00% 0.00% 0.00% 0.00% 18.50% 0.00% 0.00% 0.00%
Oats 0.0 0.0 0.0 625.0 0.0 0.0 0.0 0.00.00% 0.00% 0.00% 33.30% 0.00% 0.00% 0.00% 0.00%
Improved Pasture 0.0 0.0 150.0 0.0 0.0 0.0 0.0 0.00.00% 0.00% 7.00% 0.00% 0.00% 0.00% 0.00% 0.00%
*Receipts for 2000 are included to indicate the relative importance of each enterprise to the farm. Percents indicate the percentage of the total receipts accounted for by the livestock categories and the crops. **Acreages for 2000 are included to indicate the relative importance of each enterprise to the farm. Total planted acreage may exceed total cropland available due to double cropping. Percents indicate the percentage of total planted acreage accounted for by the crop.

34
2000 CHARACTERISTICS OF PANEL FARMS PRODUCING WHEAT
WAW1500 A 1,500-acre Southeastern Washington (Whitman County) moderate size grain farm thatplants 900 acres of wheat, 300 acres of barley, and 300 acres of dry peas. Diseaseproblems require a rotation that includes a minimum amount of barley and peas to maintainwheat yields. The farm generates 74 percent of its receipts from wheat.
WAW4250 A 4,250-acre Southeastern Washington (Whitman County) large size grain farm that isharvesting 2,763 acres of wheat, 200 acres of barley, and 1,282 acres of peas. Diseaseproblems require a rotation that includes a minimum amount of barley and peas in order tomaintain wheat yields. Winter and spring wheat account for 78 percent of receipts.
NDW1760 A 1,760-acre South Central North Dakota (Barnes County) moderate size grain farm thathas 704 acres of wheat, 176 acres of barley, 176 acres of corn, 352 acres of soybeans, and352 acres of sunflowers. The farm receives about 49 percent of receipts from small grainsof wheat and barley and about 20 percent from sunflowers.
NDW4850 A 4,850-acre South Central North Dakota (Barnes County) large grain farm that plants2,585 acres of wheat, 470 acres of barley, 705 acres of soybeans, 940 acres of sunflowers,and 150 acres of CRP. Wheat accounts for about 50 percent of the farms total grossreceipts with soybeans contributing 38 percent.
KSSW1385 A 1,385-acre South Central Kansas (Sumner County) moderate size grain farm that plants928 acres of wheat, 138 acres of soybeans, and 319 acres of grain-sorghum. The farmgenerates about 67 percent of its receipts from wheat and 22 percent from sorghum.
KSSW3180 A 3,180-acre South Central Kansas (Sumner County) large grain farm harvesting 2,258acres of wheat, 652 acres of grain sorghum, 56 acres of corn, 87 acres of soybeans, and 127acres of hay. The farm also has 67 mother cows. The farm generates 69 percent of itsreceipts from wheat.
KSNW2325 A 2,325-acre North Western Kansas (Thomas County) moderate size grain farm that plants775 acres of wheat, 155 acres of grain sorghum, 620 acres of corn, and has 775 acres offallow. The farm generates 40 percent of its receipts from wheat and 41 percent from corn.
KSNW4300 A 4,300-acre North Western Kansas (Thomas County) large grain farm harvesting 1,948acres of wheat, 465 acres of sorghum, 549 acres of corn, 262 acres of sunflowers, 75 acresof hay, and 1,001 acres of fallow. The farm also has 100 breeding cows. The farmgenerates about 45 percent of its receipts from wheat and 28 percent from corn.
COW2700 A 2,700-acre Northeast Colorado (Washington County) moderate size grain farm thatplants 1,127 acres of wheat, 608 acres of millet, and 446 acres of corn, and will leave 519acres fallow. The farm generates 43 percent of its receipts from wheat and 38 percent frommillet.
COW5440 A 5,440-acre Northeast Colorado (Washington County) large size grain farm that plants1,900 acres of wheat, 500 acres of corn, 1,300 acres of millet, 640 acres of CRP, and 1,100acres in fallow. Wheat produces 44 percent of the farms gross revenue while milletproduces 40 percent.

35
Appendix Table A3. Characteristics of Panel Farms Producing Wheat for 2000.
WAW1500 WAW4250 NDW1760 NDW4850 KSSW1385 KSSW3180 KSNW2325 KSNW4300 COW2700 COW5440
County Whitman Whitman Barnes Barnes Sumner Sumner Thomas Thomas Washington Washington
Total Cropland 1,500 4,250 1,760 4,850 1,385 3,180 2,325 4,300 2,700 5,440Acres Owned 750 2,125 176 1,701 485 330 930 1,147 837 3,020Acres Leased 750 2,125 1,584 3,149 900 2,850 1,395 3,153 1,863 2,420
PasturelandAcres Owned 0 0 0 0 0 25 500 500 0 0Acres Leased 0 0 0 0 0 775 500 500 0 0
Assets ($1000)Total 1,544 4,431 399 2,237 601 1,381 586 901 767 2,282Real Estate 1,063 3,253 132 1,029 311 405 181 187 444 1,578Machinery 476 982 201 882 202 465 326 465 223 500Other & Livestock 6 196 66 326 88 511 79 250 100 204
Debt/Asset RatiosTotal 0.24 0.15 0.11 0.15 0.22 0.09 0.36 0.24 0.17 0.14Intermediate 0.46 0.24 0.09 0.15 0.24 0.06 0.26 0.11 0.23 0.15Long Run 0.15 0.12 0.15 0.15 0.20 0.18 0.57 0.69 0.14 0.13
Number of LivestockBeef Cows 0 0 0 0 0 67 0 100 0 0
2000 Gross Receipts ($1,000)* Total 351.1 937.4 253.5 778.4 157.8 406.2 227.8 490.1 174.1 395.9
Cattle 0.0 0.0 0.0 0.0 0.0 33.4 0.0 43.2 0.0 0.00.00% 0.00% 0.00% 0.00% 0.00% 8.20% 0.00% 8.80% 0.00% 0.00%
Wheat 258.6 728.7 97.7 385.4 105.7 278.7 91.4 220.6 77.7 181.273.70% 77.70% 38.50% 49.50% 67.00% 68.60% 40.10% 45.00% 44.60% 45.80%
Sorghum 0.0 0.0 0.0 0.0 35.2 65.3 24.4 56.9 0.0 0.00.00% 0.00% 0.00% 0.00% 22.30% 16.10% 10.70% 11.60% 0.00% 0.00%
Barley 53.3 42.7 27.6 85.8 0.0 0.0 0.0 0.0 0.0 0.015.20% 4.60% 10.90% 11.00% 0.00% 0.00% 0.00% 0.00% 0.00% 0.00%
Corn 0.0 0.0 22.4 0.0 0.0 6.2 94.0 138.8 28.2 34.00.00% 0.00% 8.80% 0.00% 0.00% 1.50% 41.30% 28.30% 16.20% 8.60%
Soybeans 0.0 0.0 55.9 297.9 16.9 11.2 0.0 0.0 0.0 0.00.00% 0.00% 22.00% 38.30% 10.70% 2.80% 0.00% 0.00% 0.00% 0.00%
Dry Peas 39.1 166.1 0.0 0.0 0.0 0.0 0.0 0.0 0.0 0.011.10% 17.70% 0.00% 0.00% 0.00% 0.00% 0.00% 0.00% 0.00% 0.00%
Sunflowers 0.0 0.0 50.0 0.0 0.0 0.0 0.0 29.1 0.0 0.00.00% 0.00% 19.70% 0.00% 0.00% 0.00% 0.00% 5.90% 0.00% 0.00%
Millet 0.0 0.0 0.0 0.0 0.0 0.0 0.0 0.0 64.0 157.40.00% 0.00% 0.00% 0.00% 0.00% 0.00% 0.00% 0.00% 36.70% 39.80%
Hay 0.0 0.0 0.0 0.0 0.0 11.4 0.0 0.0 0.0 0.00.00% 0.00% 0.00% 0.00% 0.00% 2.80% 0.00% 0.00% 0.00% 0.00%
Other Receipts 0.0 0.0 0.0 6.6 0.0 0.0 18.0 1.5 4.3 23.40.00% 0.00% 0.00% 0.90% 0.00% 0.00% 7.90% 0.30% 2.40% 5.90%
2000 Panted Acres**Total 1,500.0 4,244.0 1,760.0 4,700.0 1,385.0 3,180.0 2,325.0 4,300.0 2,181.0 4,340.0
Wheat 900.0 2,762.5 704.0 2,585.0 928.0 2,258.0 775.0 1,948.0 1,127.0 1,900.060.00% 65.10% 40.00% 55.00% 67.00% 71.00% 33.30% 45.30% 51.70% 43.80%
Sorghum 0.0 0.0 0.0 0.0 319.0 652.0 155.0 465.0 0.0 0.00.00% 0.00% 0.00% 0.00% 23.00% 20.50% 6.70% 10.80% 0.00% 0.00%
Barley 300.0 200.0 176.0 470.0 0.0 0.0 0.0 0.0 0.0 0.020.00% 4.70% 10.00% 10.00% 0.00% 0.00% 0.00% 0.00% 0.00% 0.00%
Corn 0.0 0.0 176.0 0.0 0.0 56.0 620.0 549.0 446.0 500.00.00% 0.00% 10.00% 0.00% 0.00% 1.80% 26.70% 12.80% 20.40% 11.50%
Soybeans 0.0 0.0 352.0 1,645.0 138.0 87.0 0.0 0.0 0.0 0.00.00% 0.00% 20.00% 35.00% 10.00% 2.70% 0.00% 0.00% 0.00% 0.00%
Dry Peas 300.0 1,281.5 0.0 0.0 0.0 0.0 0.0 0.0 0.0 0.020.00% 30.20% 0.00% 0.00% 0.00% 0.00% 0.00% 0.00% 0.00% 0.00%
Sunflowers 0.0 0.0 352.0 0.0 0.0 0.0 0.0 262.0 0.0 0.00.00% 0.00% 20.00% 0.00% 0.00% 0.00% 0.00% 6.10% 0.00% 0.00%
Millet 0.0 0.0 0.0 0.0 0.0 0.0 0.0 0.0 608.0 1,300.00.00% 0.00% 0.00% 0.00% 0.00% 0.00% 0.00% 0.00% 27.90% 30.00%
Hay 0.0 0.0 0.0 0.0 0.0 127.0 0.0 75.0 0.0 0.00.00% 0.00% 0.00% 0.00% 0.00% 4.00% 0.00% 1.70% 0.00% 0.00%
Fallow 0.0 0.0 0.0 0.0 0.0 0.0 775.0 1,001.0 0.0 0.00.00% 0.00% 0.00% 0.00% 0.00% 0.00% 33.30% 23.30% 0.00% 0.00%
CRP 0.0 0.0 0.0 0.0 0.0 0.0 0.0 0.0 0.0 640.00.00% 0.00% 0.00% 0.00% 0.00% 0.00% 0.00% 0.00% 0.00% 14.70%
C Receipts for 2000 are included to indicate the relative importance of each enterprise to the farm. Percents indicate the percentage of the total receipts accounted for by thelivestock categories and the crops.
** Acreages for 2000 are included to indicate the relative importance of each enterprise to the farm. Total planted acreage may exceed total cropland available due to doublecropping. Percents indicate the percentage of total planted acreage accounted for by the crop.

36
2000 CHARACTERISTICS OF PANEL FARMS PRODUCING COTTON
CAC2000 A 2,000-acre Central San Joaquin Valley California (Kings County) moderate size cottonfarm that plants 600 acres of cotton, 600 acres of wheat, 400 acres of corn, and 600 acresof hay. The farm generates 45 percent of its gross income from cotton and 36 percent fromhay.
CAC6000 A 6,000-acre Central San Joaquin Valley California (Kings County) large cotton farmharvesting 2,400 acres of cotton, 2,100 acres of vegetables and almonds, 600 acres ofwheat, 300 acres of corn, and 600 acres of hay. Vegetables on this farm vary from year toyear depending on the price of the various vegetables, however, the returns to this 2,100acres remain relatively stable over time. Cotton generates about 36 percent of this farm'sreceipts while the vegetables generate about 53 percent.
TXSP1682 A 1,682-acre Texas Southern High Plains (Dawson County) moderate size cotton farmplants 1,185 acres of cotton (866 dryland and 319 irrigated), 196 acres of peanuts, and has183 acres in CRP. The farm generates 54 percent of its receipts from cotton and 42 percentfrom peanuts.
TXSP3697 A 3,697-acre Texas Southern High Plains (Dawson County) large cotton farm plants 2,665acres of cotton (2,095 dryland and 570 irrigated), 285 acres of peanuts, and has 214 acresin CRP. Cotton generates 65 percent of this farm’s receipts while peanuts generate about34 percent.
TXRP2500 A 2,500-acre Texas Rolling Plains (Jones County) cotton farm that plants 1,240 acres ofcotton, and 825 acres of wheat. About 80 percent of this farm’s receipts are derived fromcotton.
TXBC1400 A 1,400-acre Texas Blacklands (Williamson County) moderate size cotton and grain farmhas 350 acres of cotton, 400 acres of sorghum, 550 acres of corn, and 100 acres of wheat. This farm also has 50 breeding cows that are pastured on rented land that cannot becropped. Cotton generates 39 percent of the farm's receipts and corn generates 30 percent.
TXCB1720 A 1,720-acre Texas Coastal Bend (San Patricio County) cotton farm has 700 acres ofcotton, 870 acres of grain sorghum and 150 acres of corn. About 61 percent of the receiptsare cotton receipts.
TNC1675 A 1,675-acre Southwest Tennessee (Fayette County) cotton farm has 838 acres of cotton,670 acres of soybeans, and 168 acres of corn. The farm generates about 70 percent of itscash receipts from cotton.
TNC3800 A 3,800-acre Southwest Tennessee (Haywood County) cotton farm has 2,508 acres ofcotton, 760 acres of soybeans, 300 acres of wheat, and 532 acres of corn. The farmgenerates about 79 percent of its cash receipts from cotton.

37
Appendix Table A4. Characteristics of Panel Farms Producing Cotton for 2000.
CAC2000 CAC6000 TXSP1682 TXSP3697 TXRP2500 TXBC1400 TXCB1720 TNC1675 TNC3800
County Kings Kings Dawson Dawson Jones Williamson San Patricio Fayette Haywood
Total Cropland 2,000 6,000 1,682 3,697 2,500 1,400 1,720 1,675 3,800Acres Owned 1,000 4,800 606 1,627 400 150 360 225 1,520Acres Leased 1,000 1,200 1,076 2,070 2,100 1,250 1,360 1,450 2,280
PasturelandAcres Owned 0 0 0 0 0 30 50 0 0Acres Leased 0 0 0 0 500 210 0 0 0
Assets ($1000)Total 4,123 14,623 737 1,664 333 569 922 1,030 8,432Real Estate 3,397 14,616 333 969 176 279 460 527 6,929Machinery 468 7 404 696 141 195 280 317 1,287Other & Livestock 258 0 0 0 16 96 182 185 216
Debt/Asset RatiosTotal 0.16 0.17 0.51 0.25 0.36 0.11 0.07 0.31 0.10Intermediate 0.18 80.32 0.81 0.46 0.60 0.04 0.04 0.73 0.31Long Run 0.16 0.13 0.14 0.11 0.15 0.18 0.10 0.12 0.06
Number of LivestockBeef Cows 0 0 0 0 12 50 0 0 0
2000 Gross Receipts ($1,000)*Total 1,510.9 7,712.1 410.5 630.3 246.2 252.8 344.9 581.7 1,355.6
Cattle 0.0 0.0 0.0 0.0 4.3 19.8 0.0 0.0 0.00.00% 0.00% 0.00% 0.00% 1.70% 7.80% 0.00% 0.00% 0.00%
Cotton 679.8 2,791.5 221.3 411.6 194.7 98.1 208.7 407.7 1,066.745.00% 36.20% 53.90% 65.30% 79.10% 38.80% 60.50% 70.10% 78.70%
Sorghum 0.0 0.0 0.0 0.0 0.0 47.4 118.5 0.0 0.00.00% 0.00% 0.00% 0.00% 0.00% 18.70% 34.40% 0.00% 0.00%
Wheat 160.3 293.4 0.0 0.0 47.2 8.7 1.2 0.0 50.510.60% 3.80% 0.00% 0.00% 19.20% 3.40% 0.30% 0.00% 3.70%
Soybeans 0.0 0.0 0.0 0.0 0.0 0.0 0.0 127.6 112.20.00% 0.00% 0.00% 0.00% 0.00% 0.00% 0.00% 21.90% 8.30%
Corn 122.6 96.1 0.0 0.0 0.0 76.8 16.6 46.4 119.28.10% 1.20% 0.00% 0.00% 0.00% 30.40% 4.80% 8.00% 8.80%
Hay 548.2 477.8 0.0 0.0 0.0 0.0 0.0 0.0 0.036.30% 6.20% 0.00% 0.00% 0.00% 0.00% 0.00% 0.00% 0.00%
Quota Peanuts 0.0 0.0 68.4 0.0 0.0 0.0 0.0 0.0 0.00.00% 0.00% 16.70% 0.00% 0.00% 0.00% 0.00% 0.00% 0.00%
Additional Peanuts 0.0 0.0 105.2 211.7 0.0 0.0 0.0 0.0 0.00.00% 0.00% 25.60% 33.60% 0.00% 0.00% 0.00% 0.00% 0.00%
Other Receipts 0.0 4,053.2 15.6 7.1 0.0 2.0 0.0 15.2 10.60.00% 52.60% 3.80% 1.10% 0.00% 0.80% 0.00% 2.60% 0.80%
2000 Planted Acres**Total 2,200.0 6,000.0 1,564.0 3,164.0 2,065.0 1,400.0 1,720.0 1,675.0 4,100.0
Cotton 600.0 2,400.0 1,185.0 2,665.0 1,240.0 350.0 700.0 837.5 2,508.027.30% 40.00% 75.80% 84.20% 60.00% 25.00% 40.70% 50.00% 61.20%
Sorghum 0.0 0.0 0.0 0.0 0.0 400.0 870.0 0.0 0.00.00% 0.00% 0.00% 0.00% 0.00% 28.60% 50.60% 0.00% 0.00%
Wheat 400.0 600.0 0.0 0.0 825.0 100.0 0.0 0.0 300.018.20% 10.00% 0.00% 0.00% 40.00% 7.10% 0.00% 0.00% 7.30%
Soybeans 0.0 0.0 0.0 0.0 0.0 0.0 0.0 670.0 760.00.00% 0.00% 0.00% 0.00% 0.00% 0.00% 0.00% 40.00% 18.50%
Corn 200.0 300.0 0.0 0.0 0.0 550.0 150.0 167.5 532.09.10% 5.00% 0.00% 0.00% 0.00% 39.30% 8.70% 10.00% 13.00%
Hay 1,000.0 600.0 0.0 0.0 0.0 0.0 0.0 0.0 0.045.50% 10.00% 0.00% 0.00% 0.00% 0.00% 0.00% 0.00% 0.00%
Quota Peanuts 0.0 0.0 65.0 0.0 0.0 0.0 0.0 0.0 0.00.00% 0.00% 4.20% 0.00% 0.00% 0.00% 0.00% 0.00% 0.00%
Additional Peanuts 0.0 0.0 131.0 285.0 0.0 0.0 0.0 0.0 0.00.00% 0.00% 8.40% 9.00% 0.00% 0.00% 0.00% 0.00% 0.00%
Vegetables 0.0 2,100.0 0.0 0.0 0.0 0.0 0.0 0.0 0.00.00% 35.00% 0.00% 0.00% 0.00% 0.00% 0.00% 0.00% 0.00%
CRP 0.0 0.0 183.0 214.0 0.0 0.0 0.0 0.0 0.00.00% 0.00% 11.70% 6.80% 0.00% 0.00% 0.00% 0.00% 0.00%
* Receipts for 2000 are included to indicate the relative importance of each enterprise to the farm. Percents indicate the percentage of the total receipts accounted for by the livestock categories and the crops.
** Acreages for 2000 are included to indicate the relative importance of each enterprise to the farm. Total planted acreage may exceed total cropland available due to double cropping. Percents indicate the percentage of total planted acreage accounted for by the crop.

38
2000 CHARACTERISTICS OF PANEL FARMS PRODUCING RICE
CAR424 A 424-acre Sacramento Valley California (Sutter and Yuba Counties) moderate size ricefarm that plants 400 acres of rice. The farm generates 95 percent of its gross income fromrice.
CAR1365 A 1,365-acre Sacramento Valley California (Sutter and Yuba Counties) large rice farm thatplants 1,265 acres of rice. The farm generates about 98 percent of its gross income fromrice.
TXR2118 A 2,118-acre West of Houston, Texas (Wharton County) moderate size rice farm thatharvests 600 acres of first crop rice, and 510 acres of ratoon rice. The farm receives 99percent of its gross receipts from rice.
TXR3750 A 3,750-acre West of Houston, Texas (Wharton County) large rice farm that harvests1,500 acres of first-crop rice, 1,275 acres of ratoon rice, and 200 acres of hay. The farmalso has 200 breeding cows. About 95 percent of the farm's gross receipts are from rice.
MOER4000 A 4,000-acre Southeastern Missouri (Stoddard County) large size rice farm with 1,334acres of rice, 1,333 acres of soybeans and 1,333 acres of corn. This farm lies on theSouthern bootheel of Missouri. Rice accounts for 46 percent of this farm’s receipts whilecorn accounts for about 33 percent.
MOWR4000 A 4,000-acre Southeastern Missouri (Butler County) large rice farm with 2,000 acres ofrice and 2,000 acres soybeans. This farm lies on the Southern bootheel of Missouri. About76 percent of this farm’s receipts are generated from rice and 24 percent are generatedfrom soybeans.
ARR3640 A 3,640-acre Arkansas (Arkansas County) large size rice farm with 122 acres of mediumgrain rice, 1620 acres of long grain rice, 883 acres of soybeans, and 615 acres of doublecropped wheat and soybeans. About 72 percent of the farm’s receipts come from rice.
LASR1100 A 1,100-acre Southwest Louisiana (Jefferson Davis, Acadia, and Vermilion Parishes)moderate size rice farm harvesting 189 acres of medium grain rice, 351 acres of long grainrice, 362 acres of soybeans, and 198 acres of fallow. About 85 percent of this farm'sreceipts are generated by rice.
LANR2500 A 2,500 acre Northeast Louisiana (Richland Parish) moderate size rice farm harvesting1,000 acres of long-grain rice with 700 acres of soybeans, 325 acres of cotton, 100 acres ofsorghum, and 200 acres of corn. About 62 percent of this farm’s receipts come from rice.
MSR4735 A 4,735 acre Mississippi (Tunica County) rice farm with 1,335 acres of rice, 2,700 acres ofsoybeans, and 500 acres of cotton. The farm generates about 52 percent of receipts fromrice.

39
Appendix Table A5. Characteristics of Panel Farms Producing Rice for 2000.
CAR424 CAR1365 TXR2118 TXR3750 MOER4000 MOWR4000 ARR3640 LAR1100
County Sutter Sutter Wharton Wharton Stoddard Butler Arkansas Acadia
Total Cropland 424 1,365 2,118 3,750 4,000 4,000 3,640 1,100Acres Owned 212 515 318 1,688 1,400 2,000 1,456 50Acres Leased 212 850 1,800 2,062 2,600 2,000 2,184 1,050
PasturelandAcres Owned 0 0 0 200 0 0 0 0
Assets ($1000)Total 847 2,156 790 2,715 5,434 7,497 5,393 416Real Estate 522 1,559 230 1,327 3,034 3,985 2,816 87Machinery 298 485 262 653 1,099 1,434 1,000 329Other & Livestock 27 112 299 735 1,301 2,079 1,577 0
Debt/Asset RatiosTotal 0.24 0.15 0.10 0.14 0.14 0.14 0.08 0.55Intermediate 0.39 0.14 0.09 0.14 0.06 0.13 0.05 0.66Long Run 0.15 0.15 0.14 0.14 0.21 0.16 0.10 0.14
Number of LivestockBeef Cows 0 0 0 200 0 0 0 0
2000 Gross Receipts ($1,000)*Total 358.7 1,103.8 510.4 1,454.8 1,494.0 1,959.7 1,565.3 305.3
Cattle 0.0 0.0 0.0 58.3 0.0 0.0 0.0 0.00.00% 0.00% 0.00% 4.00% 0.00% 0.00% 0.00% 0.00%
Rice 340.4 1,084.2 503.4 1,376.4 692.1 1,493.1 1,118.4 258.994.90% 98.20% 98.60% 94.60% 46.30% 76.20% 71.50% 84.80%
Soybeans 0.0 0.0 0.0 0.0 305.4 466.6 320.1 43.40.00% 0.00% 0.00% 0.00% 20.40% 23.80% 20.40% 14.20%
Corn 0.0 0.0 0.0 0.0 496.5 0.0 0.0 0.00.00% 0.00% 0.00% 0.00% 33.20% 0.00% 0.00% 0.00%
Wheat 0.0 0.0 0.0 0.0 0.0 0.0 126.8 0.00.00% 0.00% 0.00% 0.00% 0.00% 0.00% 8.10% 0.00%
Cotton 0.0 0.0 0.0 0.0 0.0 0.0 0.0 0.00.00% 0.00% 0.00% 0.00% 0.00% 0.00% 0.00% 0.00%
Other Receipts 18.3 19.6 7.0 20.0 0.0 0.0 0.0 3.05.10% 1.80% 1.40% 1.40% 0.00% 0.00% 0.00% 1.00%
2000 Planted Acres**Total 400.0 1,265.0 1,110.2 2,975.0 4,000.0 4,000.0 3,855.0 901.9
Rice 400.0 1,265.0 1,110.2 2,775.0 1,334.0 2,000.0 1,742.0 540.0100.00% 100.00% 100.00% 93.30% 33.30% 50.00% 45.20% 59.90%
Soybeans 0.0 0.0 0.0 0.0 1,333.0 2,000.0 1,498.0 361.90.00% 0.00% 0.00% 0.00% 33.30% 50.00% 38.90% 40.10%
Corn 0.0 0.0 0.0 0.0 1,333.0 0.0 0.0 0.00.00% 0.00% 0.00% 0.00% 33.30% 0.00% 0.00% 0.00%
Wheat 0.0 0.0 0.0 0.0 0.0 0.0 615.0 0.00.00% 0.00% 0.00% 0.00% 0.00% 0.00% 16.00% 0.00%
Cotton 0.0 0.0 0.0 0.0 0.0 0.0 0.0 0.00.00% 0.00% 0.00% 0.00% 0.00% 0.00% 0.00% 0.00%
Hay 0.0 0.0 0.0 200.0 0.0 0.0 0.0 0.00.00% 0.00% 0.00% 6.70% 0.00% 0.00% 0.00% 0.00%
* Receipts for 2000 are included to indicate the relative importance of each enterprise to the farm. Percents indicate the percentage of the total receipts accounted for by thelivestock categories and the crops.
** Acreages for 2000 are included to indicate the relative importance of each enterprise to the farm. Total planted acreage may exceed total cropland available due to doublecropping. Percents indicate the percentage


