Embed Size (px)
Citation preview
Remaining Ore Reserve Estimation and
Feasibility Study of Padcal Operations
Tuba and Itogon, Benguet, Philippines
By: Eulalio B. Austin Jr.,
P. Mining Engineer
April 30, 2013
Remaining Ore Reserve Estimation and
Feasibility Study of Padcal Operations
Main Report
By: Eulalio B. Austin Jr.,
P. Mining Engineer
April 30, 2013

PADCAL Operations
ApriI 2013
Chapter 2.0

PADCAL Operations
April 2013
Chapter 2 Page 1
2.0 CERTIFICATES AND CONSENTS OF CPs FOR TECHNICAL REPORTS
2.1 Certificates and Consents of CPs for Technical Reports
- Left Intentionally Blank -
Chapter 2 Page 2
PADCAL Operations
April 2013
I, Eulalio B. Austin Jr., Bachelor of Science, and Professional Mining Engineer, of 2509 Lee
Gardens Condominium Mandaluyong City do hereby certify that:
• I am President, Chief Operating Officer and a Director of Philex Mining Corporation.
• The title of this report is “Remaining Ore Reserve Estimation and Feasibility Study of
Padcal Operations” dated April 30th, 2013.
• I graduated with a Bachelor of Science degree in Mining Engineering on March 1982
from Saint Louis University, Baguio City, Philippines.
• I have practiced my profession as a mining engineer continually for the last 30 years as
an employee of Philex Mining Corporation.
• I am a designated Competent Person (CP) as defined by the Philippine Society of Mining
Engineers with CP reference number EM 01814-01810. I have spent 30 years working
in various capacities in the Padcal Mine.
• I am responsible for all technical, operational and exploration activities at Padcal Mine
have been since 2004 up to October 2010.
• The Technical Report has been prepared in compliance with Philippine Mineral
Reporting Code (PMRC).
• I own and control securities in Philex Mining Corporation and I am not independent of the
issuer (Philex Mining Corporation).
• I consent to the use of this Technical Report as a filing with the Philippine Stock
Exchange or Regulatory Authority.
2.2 Scope of Work of each CP involved
PADCAL Operations
April 2013
Mr. Eulalio B. Austin Jr., a CP Mining Engineer, has the primary role in this Technical
Report. He managed the process of estimating the remaining ore reserve of the mine based
on the mineral resource provided by the CP Geologist.
He has verified the capital costs used in the financial analysis using his 25 years of
experience in the Padcal mine.
2.3 Reliance on Other Experts indicating therein objective, nature and coverage
A number of senior engineers and scientists employed in the Padcal mine have contributed
in this Technical Report and to this effect the term Experts apply. These Experts and their
coverage are identified below.
Mr. Roger G. Laraya, a Professional Geologist, is the company’s senior adviser. He heads
the hedging and metal market group in the corporate office before he resigned on April 1,
2013. He wrote the section on the behavior of copper and gold in the global market as part
of the economic assessment of the mining operation. Similar market analyses were used for
the company’s Silangan Project technical report for its Declaration of Mining Project
Feasibility (DMPF) submitted to the Mines and Geosciences Bureau (MGB).
Mr. Libby R. Ricafort, a Professional Metallurgical Engineer, is currently the Vice President
and Resident Manager of Padcal. Prior to this, he was the Mill Division Manager for 16
years. His functions include overseeing the short and long term operation of the 25,000 tons
per day mill plant as well as the concentrate shipment to the smelters. Throughout his
career, he has been employed in 3 more gold and copper recovery operations. He once
held the vice president and board of director positions of the Society of Metallurgical
Engineers of the Philippines (SMEP).
His expertise was used to validate the efficiency of the current mill plant to produce a
realistic and sustainable projection of metal recovery and production. He also verified the
operating and capital costs estimated for the milling operation in the financial assessment of
the mining operation.
Mr. Ricardo S. Dolipas II, a Professional Mining Engineer, is currently the Mine Division
Manager whose functions includes the short and long term planning of the underground
operations and the mining engineering aspects.
Chapter 2 Page 4


PADCAL Operations
ApriI 2013
Chapter 3.0
PADCAL Operations
ApriI 2013
Chapter 3 Page 1
3.0 EXECUTIVE SUMMARY
Philex Mining Corporation has prepared this Philippine Mineral Reporting Code (PMRC)
compliant technical report on the remaining mineral reserve estimates and feasibility of its
Padcal Copper-Gold Operations in Tuba and Itogon, Benguet, Philippines. The report was
prepared by the management of Philex under the supervision of Eulalio B. Austin Jr.,
Professional Mining Engineer, President and Chief Operating Officer of Philex Mining
Corporation acting as the Competent Person for this report. Padcal is an operating mine.
The Company intends to offer shares in its capital stock for subscription by certain eligible
shareholders as determined by the board of directors in accordance with the Company’s
amended articles of incorporation. The offering will be registered with the SEC and the new
shares will be listed on the PSE. As provided under the PSE Memo on “Documentary
Requirements for Mining Companies” issued on October 2, 2007, mining companies applying
for initial or additional listings are required to submit a Competent Person’s Report that is
compliant with the requirements of the PMRC on public reporting in the country of exploration
results, mineral resources and ore reserves, including the economic viability, of the relevant
mineral properties.
Padcal operation is located thirty kilometers of Baguio City, in the northern part of the Luzon
region in the Philippines. It is hundred percent owned and operated by Philex Mining
corporation. Benguet has since been known as a mining province, hosting a number of mining
operations throughout its history. Adequate infrastructures are in place including grid power,
paved roads, educated labor force and readily accessible technical support.
The Padcal mine has operated continuously for more than 50 years of mining the ore
underground through block caving using Load-Haul-Dump (LHD) units as the mode of ore
extraction and recovering copper and gold through flotation. Three Tailings Storage Facilities
(TSF) have been built to manage the waste from the operations, the first two has already been
decommissioned. The design and construction of an additional TSF is already moving forward.
Since start, Padcal has already produced and sold 201 billion pounds of copper, 6 million
ounces of gold and 6 million ounces of silver. The current ore production rate is 9.4 million
metric tons per annum and the mine produced 38 million pounds of copper, 140 thousand
ounces of gold and 130 thousand ounces of silver in 2011 calendar year.
PADCAL Operations
ApriI 2013
Chapter 3 Page 2
Operations were suspended in August 2012, due to a sediment spillage incident on its TSF 3.
Sediments flowed through one of the penstocks after a series of storm events. The main
embankment remains intact. Its stability has been validated by both local and international TSF
experts. Remediation and rehabilitation activities are underway not only to the facility but to the
affected areas as well. As part of the remediation measure, the void created must be filled up
before the onset of the next rainy season and fresh tailings from the operation is the fastest
means to get it done. In March 8, 2013, temporary operations have been allowed by the Mines
and Geosciences Bureau (MGB) and Environment Management Bureau (EMB), which will last
four months.
The orebody is located in the prolific Baguio mineral district, which is underlain by Cretaceous-
Paleogene metamorphosed sediments and volcanic locally known as the Zig-zag-Pugo
Formation. The volcanic units consist of spilitic basalt, andesite flows, green tuffs, tuff breccias
and volcanoclastics overlain by sediments consisting of sandstones and red and green
tuffaceous shales. All metamorphosed in varying degrees.
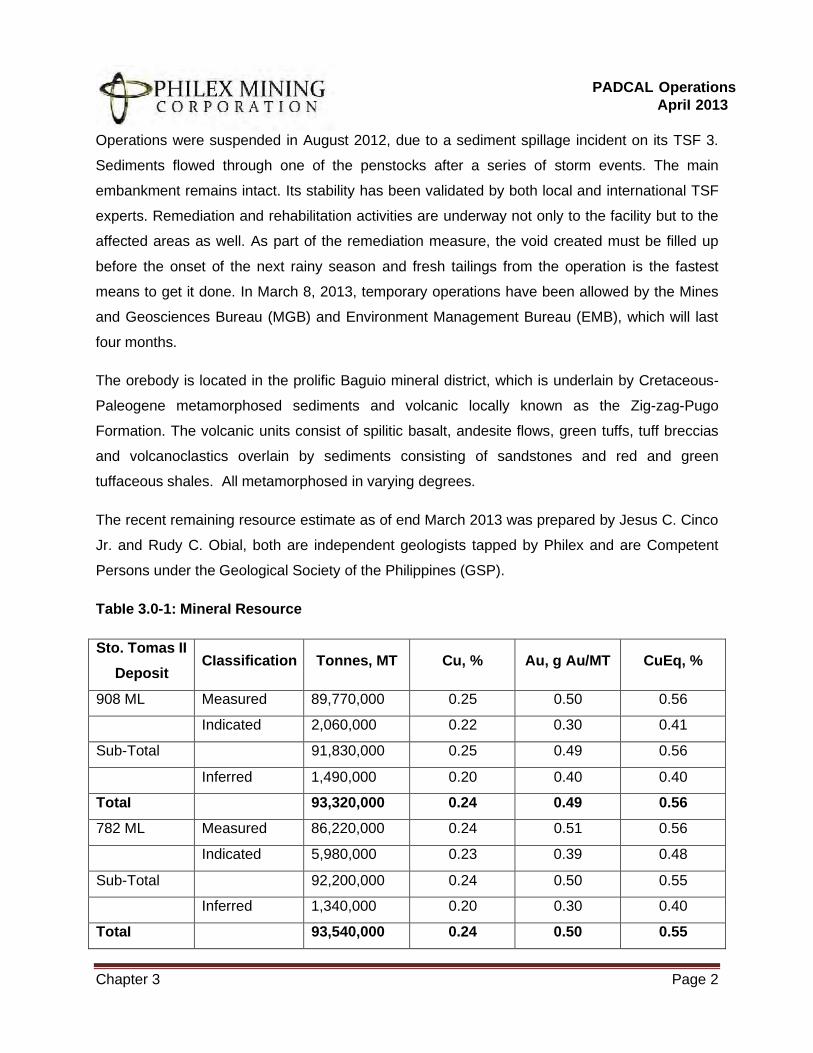
The recent remaining resource estimate as of end March 2013 was prepared by Jesus C. Cinco
Jr. and Rudy C. Obial, both are independent geologists tapped by Philex and are Competent
Persons under the Geological Society of the Philippines (GSP).
TabIe 3.0-1: MineraI Resource
Sto. Tomas II
Deposit CIassification Tonnes, MT Cu, % Au, g Au/MT CuEq, %
908 ML Measured 89,770,000 0.25 0.50 0.56
Indicated 2,060,000 0.22 0.30 0.41
Sub-Total 91,830,000 0.25 0.49 0.56
Inferred 1,490,000 0.20 0.40 0.40
TotaI 93,320,000 0.24 0.49 0.56
782 ML Measured 86,220,000 0.24 0.51 0.56
Indicated 5,980,000 0.23 0.39 0.48
Sub-Total 92,200,000 0.24 0.50 0.55
Inferred 1,340,000 0.20 0.30 0.40
TotaI 93,540,000 0.24 0.50 0.55
PADCAL Operations
ApriI 2013
Chapter 3 Page 3
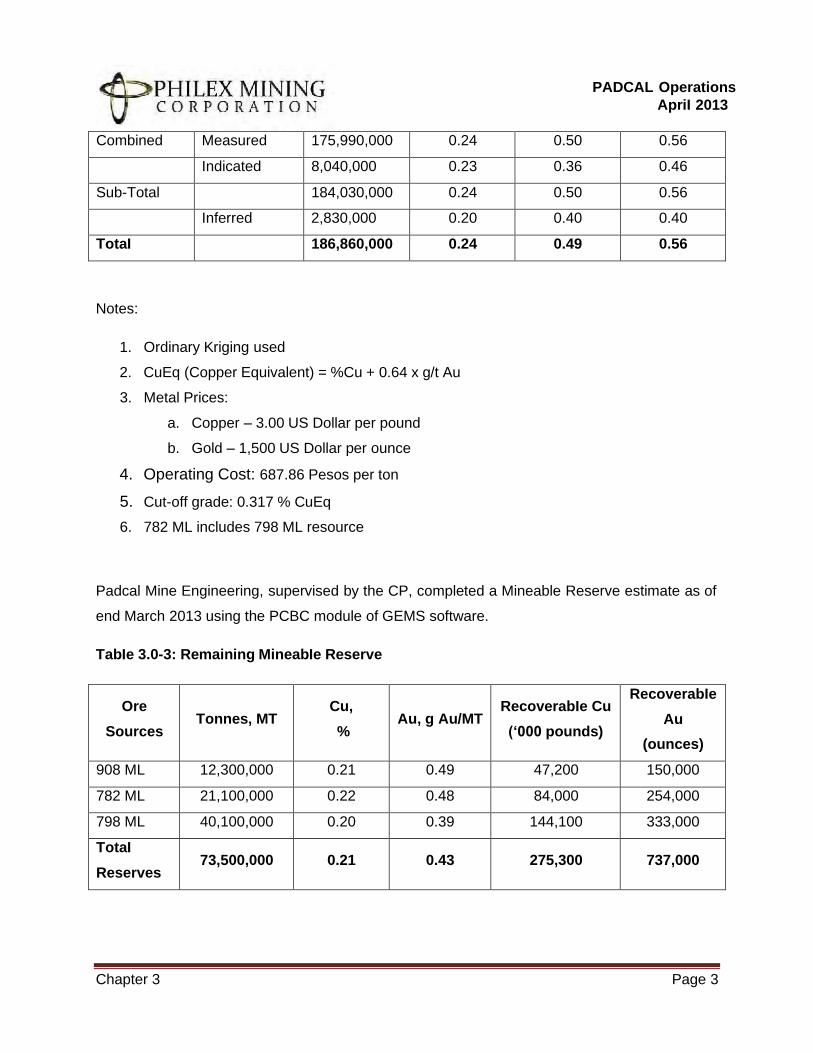
Combined Measured 175,990,000 0.24 0.50 0.56
Indicated 8,040,000 0.23 0.36 0.46
Sub-Total 184,030,000 0.24 0.50 0.56
Inferred 2,830,000 0.20 0.40 0.40
TotaI 186,860,000 0.24 0.49 0.56
Notes:
1. Ordinary Kriging used
2. CuEq (Copper Equivalent) = %Cu + 0.64 x g/t Au
3. Metal Prices:
a. Copper – 3.00 US Dollar per pound
b. Gold – 1,500 US Dollar per ounce
4. Operating Cost: 687.86 Pesos per ton
5. Cut-off grade: 0.317 % CuEq
6. 782 ML includes 798 ML resource
Padcal Mine Engineering, supervised by the CP, completed a Mineable Reserve estimate as of
end March 2013 using the PCBC module of GEMS software.
TabIe 3.0-3: Remaining MineabIe Reserve
Ore
Sources
Tonnes, MT
Cu,
%
Au, g Au/MT
RecoverabIe Cu
(‘000 pounds)
RecoverabIe
Au
(ounces)
908 ML 12,300,000 0.21 0.49 47,200 150,000
782 ML 21,100,000 0.22 0.48 84,000 254,000
798 ML 40,100,000 0.20 0.39 144,100 333,000
TotaI
Reserves 73,500,000 0.21 0.43 275,300 737,000
PADCAL Operations
ApriI 2013
Chapter 3 Page 4
Notes:
1. Metal Prices:
a. Copper – 3.00 US Dollar per pound
b. Gold – 1,500 US Dollar per ounce
2. Metal Recoveries:
a. Copper – 82 percent
b. Gold – 72 percent
3. Forex: 40 Philippine Peso to 1 US Dollar
4. Cash operating Cost per Metric Ton: 687.86 Pesos
5. Conversion Factor for Gold to Copper Equivalent: 0.481
6. Cut-off Grade (percent Copper Equivalent): 0.317
7. Category: Proved
Sustaining the 8-year mine life, inclusive of all underground and surface ancillary structures, will
entail a total capital outlay of 8.96 Billion Pesos. Majority is allotted for mine development and
the design and construction of an additional TSF.
Based on metal prices of 3.00 US Dollar per pound of copper and 1,500 US Dollar per ounce of
gold, this project is expected to realize an average of about 1.28 Billion Pesos annually in net
income after taxes over Padcal’s remaining mine life.
At the same levels of metal prices, this Project is expected to produce a positive cumulative
undiscounted net cashflow of 12.74 Billion Pesos over its project life. With this stream of
cashflows, it is expected to provide an internal rate of return on investment of 27 percent per
annum.

PADCAL Operations
ApriI 2013
Chapter 4.0
PADCAL Operations
April 2013
Table of Contents
Chapter 1
1.0 Title Page
Chapter 2
2.0 Certificates and Consents of CP’s for Technical Reports
2.1 Certificates and Consents of CP’s for Technical Reports 1
2.2 Scope of Work of each CP involved 4
2.3 Reliance on Other Experts indicating therein objective, nature and coverage 4
2.4 Signatures of CP 5
Chapter 3
3.0 Executive Summary 1
Chapter 4
4.0 Table of Contents
Chapter 5
5.0 Introduction
5.1 Who commissioned the report preparation and to whom it should be submitted 1
5.2 Purpose for which the report was prepared 1
5.3 Scope of Work or Terms of Reference 1
5.4 Duration of the preparation, including field visits and verification 1
5.5 Members of the technical report preparation team 2
5.6 Host company representative 2
5.7 Compliance of report with PMRC 2
Chapter 6
6.0 Reliance on the other Expert or CP’s 1
Chapter 7
7.0 Tenements and Mineral Rights
7.1 Description of mineral rights 1
7.1.1 Location of area, Barangay, Municipality, Province 1
7.1.2 Coordinate locations as per MGB 4
7.1.3 Number of claims and hectares covered by EP/MPSA/FTAA mode of agreement 5
7.1.4 Type of permit or agreement with government 6
7.2 History of mineral rights 7
7.3 Current owners of mineral rights 8
7.4 Validity of current mineral rights (state date of validity of rights at the date of reporting) 8
7.5 Agreements with respect to mineral rights 8
7.6 In order to make clear the net revenue that may be derived from the project, include the following
7.6.1 Royalties, Taxes, advances and similar payments paid or to be paid by the company
to the mineral rights holder, joint venture partner(s), government, Indigenous People,
local government, and others 11
7.6.2 Receivables and payable sums to the company and mineral rights holder 13
PADCAL Operations
April 2013
Chapter 8
8.0 Geographic Features
8.1 Location and accessibility 1
8.2 Topography, physiography, drainage and vegetation 2
8.3 Climate, population 3
8.4 Land Use 7
8.5 Socio Economic Environment 9
8.6 Environmental features 9
Chapter 9
9.0 Previous Work 1
9.1 History of previous work
9.2 Briefly describe essential work done by previous workers
9.3 Conclusions of each of the previous workers
Chapter 10
10.0 History of Production
10.1 Production history of district and area, if any 1
10.2 Previous Mining Areas 4
10.3 General description of mining, ore beneficiation, concentrate, mineral product market 5
10.4 Tonnage mined and sold 5
Chapter 11
11.0 Regional and Distrinct Geology
11.1 Regional and Local Geology 1
11.2 Local Lithology 2
11.3 Alteration 3
11.4 Structural Geology 3
11.5 Mineralization location(s) and general description 8
Chapter 12
12.0 Mineral Property Geology
12.1 Geological work undertaken by the company in the property, to include scale of mapping and
laboratory tests undertaken for the samples 1
Chapter 13
13.0 Mineralization 1
Chapter 14 - Found in Geology CP Report
14.0 Exploration
14.1 Geological work
14.1.1 Geological data generated from mapping and surface sampling
14.1.2 Geological map and sections
14.2 Sample location map
14.2.1 Outcrop sampling
14.2.2 Trench sampling
14.2.3 Test pit sampling
14.3 Drilling and Sampling
14.3.1 Describe type of drilling program
PADCAL Operations
April 2013
14.3.2 Drillhole location and surveying
14.3.3 Drillhole orientation and depth
14.3.4 Describe core logging
14.3.5 Drill core/chip sampling procedure and sampling interval
14.3.6 Representative/Drill core photographs
14.3.7 Petrography and Ore microscopy studies
14.4 Exploration Geochemistry
14.4.1 Describe geochemical survey type: drainage, soil, rock, vegetation, bogs, etc.
14.4.2 Describe sampling and analytic methods employed
14.4.3 Define background, threshold and anomaly levels for the elements determined
14.4.4 Apply synthesis and interpretive techniques (for single multi-element) to bring our
significant geochemical features related to mineralization
14.4.5 Describe geochemical anomalies detected
14.4.6 Relate geochemical findings to geology and mineralization
14.5 Applied Geophysics
14.5.1 Describe geophysical method used and objectives of the survey
14.5.2 Describe whether a geophysical contractor, independent consultant or an in-house
staff was engaged in the conduct of the geophysical survey
14.5.3 Describe equipment used, its limitations and the survey parameters adopted
14.5.4 Describe how it was carried out (design of stations with respect to mineralization trends)
14.5.5 Describe interpretive tools used
14.5.6 Discuss essential results with respect to the objective
Chapter 15 - Found in Geology CP Report
15.0 QA/QC of Data Used
Chapter 16 - Found in Geology CP Report
16.0 Declared Mineral Resources
Chapter 17
17.0 Economic Assessment of the Mining Project
17.1 Description of Mineral Resources estimates used as basis for conversation to Ore Reserves 1
17.2 Type and Level of Feasibility Study 1
17.3 Brief Description of the Project
17.3.1 Mining and processing operations 2
17.3.2 Mining Method and capacity 2
17.3.3 Processing Method and capacity 2
17.3.4 Ore to be Mined / Product to be produced 2
17.3.5 Prospective Markets or Buyers 2
17.3.6 Estimated Mine Life 3
17.3.7 Total Project Cost/Financing 3
17.3.8 Production Cost / Production Schedule 3
17.4 Marketing Aspects
17.4.1 World Supply and Demand Situation 4
17.4.1.1 Gold 4
17.4.1.1.1 Central Bank 6
17.4.1.1.2 Copper 7
17.4.2 Prospective Markets or Buyers 10
17.4.2.1 Gold 10
PADCAL Operations
April 2013
17.4.2.2 Copper 10
17.4.3 Product Specification 11
17.4.4 Price and Volume Forecasts 11
17.4.4.1 Gold 11
17.4.4.1.1 Fundamental Analysis 11
17.4.4.1.1.1 Easy Monetary Policies 11
17.4.4.1.1.2 Rising Central Bank Buying 13
17.4.4.1.1.3 Basel III Implentation 14
17.4.4.1.1.4 Yuan’s Potential to be a Global Reserve Currency 14
17.4.4.1.2 Technical Analysis 15
17.4.4.1.3 Bank Forecast 16
17.4.4.2 Copper 17
17.4.4.2.1 Fundamental Analysis 17
17.4.4.2.1.1 Supply Demand Outlook 17
17.4.4.2.1.2 Decelerating China 19
17.4.4.2.1.3 Complexities, Declining Ore Grade and Rising Mining Costs 19
17.4.4.2.2 Technical Analysis 20
17.4.4.2.3 Bank Forecast 21
17.4.5 Sales Contract
17.4.5.1 Market 22
17.4.5.1.1 Copper Concentrates Offtakers 22
17.5 Technical Aspects
17.5.1 Mining Plans 23
17.5.1.1 Mining Method 23
17.5.1.2 Mine Design/Mining Parameters/Geotechnical Parameters 25
17.5.1.2.1 Mine Design 25
17.5.1.2.2 Mining Parameters 28
17.5.1.2.2.1 Ore Extraction 28
17.5.1.2.2.2 Ore Transport 32
17.5.1.2.2.3 Ventilation 35
17.5.1.2.2.4 Dewatering 37
17.5.1.2.2.5 Subsidence 39
17.5.1.2.3 Geotechnical Parameters 41
17.5.1.3 Mining Recovery, Dilution and Losses 44
17.5.1.4 Planned Capacity/Production Schedule/Estimated Life of Mine 44
17.5.1.5 Working Schedule 45
17.5.1.6 List of Mining Equipment and Auxiliary Machinery/Mine Infrastructure 48
17.5.1.7 Mine Development Plans and Schedule 54
17.5.2 Processing Plans 66
17.5.2.1 Metallurgical Process Flowsheet/Process Plant Design 66
17.5.2.2 Metallurgical Test Works Result 75
17.5.2.3 Material Balance 78
17.5.2.4 Plant Capacity/Production schedule 80
17.5.2.5 Plant Working Schedule 82
17.5.2.6 Product Specification 82
17.5.2.7 Tailings Specification 84
PADCAL Operations
April 2013
17.5.2.8 Tailings Dam Siting 84
17.5.2.9 List of Mill Machineries and Auxiliary Equipment 86
17.5.2.10 Mill Plant Layout 89
17.5.3 Mine Support Services
17.5.3.1 Power Source / Power Generation Plant 89
17.5.3.2 Industrial / Domestic Water Supply 93
17.5.3.3 Assay Laboratory 95
17.5.3.3.1 Sample Preparation 95
17.5.3.3.2 Assay Protocols 95
17.5.3.3.2.1 Analytical Procedures 95
17.5.3.3.2.1.1 Copper 96
17.5.3.3.2.1.2 Gold 96
17.5.3.3.2.2 Plant Laboratory Protocol 97
17.5.3.3.3 Quality Assurance – Quality Control Procedures 97
17.5.4 Environmental Protection and Management Plan 98
17.5.4.1 Environmental Impacts 98
17.5.4.2 Environmental Mitigating Measures 99
17.5.4.3 Environmental Infrastructures 100
17.5.4.4 Mine Closure Plan 101
17.5.5 Mine Safety and Health Plan 106
17.6 Financial Aspects
17.6.1 Total Project Cost Estimate and Assumptions 108
17.6.1.1 Engineering Study 109
17.6.1.2 Exploration / Development Cost 109
17.6.1.3 Pre-Operating Overhead 113
17.6.1.4 Capital Equipment and Machinery 113
17.6.1.5 Allied Mine Facilities and Infrastructures 116
17.6.1.5.1 Tailings Storage Facilities (TSF) 118
17.6.1.5.2 Mill Improvements Including Concentrate Shipping Facility 131
17.6.1.5.3 Electrical Facilities and Mechanical Equipment 131
17.6.1.6 Environmental Equipment and Facilities 131
17.6.2 List of Capital Equipment and Works 132
17.6.3 Financial Plans / Sources of Funds 133
17.6.4 Production Cost Estimates and Assumptions 133
17.6.4.1 Mining Cost 133
17.6.4.2 Milling Cost 133
17.6.4.3 Mine Overhead Cost 133
17.6.4.4 Assumptions on Mining, Milling and Overhead Costs 134
17.6.4.5 Marketing Cost 137
17.6.4.6 Mine Overhead Cost 137
17.6.4.7 Environment Cost 137
17.6.4.8 Community Development Cost 137
17.6.4.9 Excise Tax 138
17.6.4.10 Head Office Overhead Cost 138
17.6.4.11 Royalty 138
17.6.4.12 Penalties 138
PADCAL Operations
April 2013
17.6.5 Government Financial Incentives 139
17.6.6 Basis of Revenue Calculation 139
17.6.7 Pro-forma Financial Statements 140
17.6.7.1 Profit and Loss 140
17.6.7.2 Cash Flow 144
17.6.8 Financial Analyses 145
17.6.8.1 Break even Analysis 145
17.6.8.2 Sensitivity Analyses 146
17.6.8.3 Profitability Analysis 146
17.7 Economic Aspects
17.7.1 Employment / Management 147
17.7.1.1 Number, Nationality, Position and Annual Payroll 147
17.7.1.2 List of Key Personnel and Qualifications 148
17.7.1.3 Personnel Pay Scale 148
17.7.1.4 Table of Organization 148
17.7.1.5 Availability of Technical and Skilled Worker 149
17.7.1.6 Township/Housing 149
17.7.2 Community Development Plan 149
17.7.3 Socio-economic contributions 149
Chapter 18
18.0 ORE Reserve Estimates
18.1 Database Used 1
18.2 Integrity of Database 1
18.3 Data Verification and Validation (Limitations) 1
18.4 Ore Reserve Estimation Method Used 1
18.5 Ore Reserve Estimations 9
18.5.1 Ore Specific Gravity / Density 9
18.5.2 Mining Plans / Mining Recovery / Dilution Factor / Mining Losses 9
18.5.3 Relevant Production Costs considered 12
18.5.4 Basis of Revenue Calculation 12
18.5.5 Cut-off Grade Determination 13
18.6 Ore Reserve Classification Used 13
18.7 Ore Reserve Estimates 13
Chapter 19
19.0 Interpretation and Conclusions
Chapter 20
20.0 Recommendations
Chapter 21
21.0 References
PADCAL Operations
April 2013
Listing of Tables
Table 3.0-1: Mineral Resources CH3 - 2
Table 3.0-2: Contained Metal CH3 - 3
Table 3.0-3: Remaining Mineable Reserve CH3 - 3
Table 5.5-1: List of Technical Preparation Team CH5 - 2
Table 7.1.2-1: List of Tenements CH7 - 4
Table 7.1.3-1: Number of Claims and Hectares CH7 - 5
Table 7.5-1: Head Grade CH7 - 9
Table 7.6-1: Claims Owned and Maintained by Philex Mining Corporation CH7 - 12
Table 8.4-1: List of Land Use CH3 - 8
Table 11.5-1: Baguio Gold Distrinct – Principal Deposits CH11 - 8
Table 17.2-1: Mine Parameters CH17 - 1
Table 17.3-1: Total Project Cost CH17 - 3
Table 17.3-2: Production Schedule CH17 - 4
Table 17.3-3: Total Production Cost CH17 - 4
Table 17.4.4.1.3-1: Bank Forecast CH17 - 17
Table 17.4.4.2.3-1: Bank Forecast CH17 - 21
Table 17.5.1.2.1-1: Area of Influence of a Drawpoint CH17 - 28
Table 17.5.1.2.2.3-1: Tabulation of Ventilation Parameters CH17 - 35
Table 17.5.1.2.3-1: Summary of Geotechnical Parameters CH17 - 41
Table 17.5.1.2.3-2: Laubscher Rock support Matrix CH17 - 42
Table 17.5.1.2.3-3: Laubscher Rock Support Matrix CH17 - 42
Table 17.5.1.6-1: Tabulation of the Major Mine Equipment CH17 - 48
Table 17.5.1.6-2: Facilities Service Bay Capacities CH17 - 50
Table 17.5.1.6-3: Location of Magazines and Capacity CH17 - 52
Table 17.5.1.6-4: Locations Substations CH17 - 53
Table 17.5.1.7-1: Rate of Advances CH17 - 54
Table 17.5.1.7-2: Activities at three (3) Production Level CH17 - 66
Table 17.5.2.2-1: Mill and Metallurgical Parameters CH17 - 75
Table 17.5.2.3-1: Material Balance CH17 - 78
Table 17.5.2.4-1: Plant Capacity/Production Schedule CH17 - 80
Table 17.5.2.4-2: Plant Production Schedule CH17 - 81
Table 17.5.2.5-1: Plant Working Schedule CH17 - 82
Table 17.5.2.6-1: Typical Analysis of Concentrate CH17 - 83
Table 17.5.2.7-1: Typical Analysis of Final Flotation Tails CH17 - 84
Table 17.5.2.9-1: List of Mill Machineries and Auxiliary CH17 - 86
Table 17.5.4.4-1: Summary of Financial Plan for Decommissioning and Rehabilitation CH17 - 105
Table 17.6.1-1: Nominal Cash Flow of Direct and Indirect Costs CH17 - 108
Table 17.6.1.2-1: Schedule of Development Activity CH17 - 110
Table 17.6.1.2-2: Development Works Cost Indices CH17 - 111
Table 17.6.1.2-3: Mine Development CH17 - 112
Table 17.6.1.4-1: 2007 to 2011 Capital Expenditures CH17 - 114
Table 17.6.1.4-2: 2013 to 2020 Capital Expenditure Summary CH17 - 114
Table 17.6.1.4-3: Machinery and Equipment CH17 - 115
PADCAL Operations
April 2013
Table 17.6.1.5-1: Capital Projects CH17 - 117
Table 17.6.1.5.1-1: Tabulation of Impounding Capacity for the Centerline Construction Method
CH17 - 121
Table 17.6.1.5.1-2: Tabulation of Embankment Material Requirement for the Centerline
Construction Method
CH17 - 121
Table 17.6.2-1: Major Capital Equipment and Works CH17 - 131
Table 17.6.2-2: Major Capital Equipment and Works CH17 - 131
Table 17.6.6-1: Revenue Calculation CH17 - 138
Table 17.6.7.1-1: Padcal Profit and Loss for 2013 to 2020 CH17 - 140
Table 17.6.7.2-1: Cash Flow CH17 - 144
Table 17.6.8.1-1: Summary of Production Cost CH17 - 145
Table 17.6.8.2-1: Sensitivity Analyses CH17 - 145
Table 17.7.1.1-1: Position, Number and Annual Payroll CH17 - 146
Table 18.5.2-1: Grade reconciliation for active 908 ML South Blocks CH18 - 11
Table 18.7-1: Mineable Reserve Estimate CH18 - 13
PADCAL Operations
April 2013
Listing of Figures
Figure 7.1.1-1: Location Map of the Padcal Project, Luzon, Philippines CH7 - 2
Figure 7.1.1-2: Location Map of MPSA and APSA under Control by Philex CH7 - 3
Figure 8-1: Type of Climate According to Area CH8 - 4
Figure 10.1-1: Vertical Section of Philex Mine CH10 - 2
Figure 10.4-2: Tonnage Mined and Sold CH10 - 6
Figure 11.4-1: Map Showing Fold Patterns CH11 - 6
Figure 11.4-2: Map Showing Crustal Fractures CH11 - 7
Figure 17.4.1.1-1: India and China’s Gold Demand in Tonnes CH17 – 5
Figure 17.4.1.1-2: India and China’s Gold Demand in Tonnes CH17 - 6
Figure 17.4.1.1.1-1: Historical Gold Prices CH17 - 7
Figure 17.4.1.2-1: China’s significant contribution to copper demand in past 10 years CH17 - 8
Figure 17.4.1.2-2: Copper Price for the last 10 Years CH17 - 9
Figure 17.4.1.2-3: Copper Price for the last 10 Years CH17 - 9
Figure 17.4.4.1.1.1-1: Gold Price and Monetary Base CH17 - 12
Figure 17.4.4.1.1.1-2: Gold Rises on Low Interest Rates CH17 - 13
Figure 17.4.4.1.1.2-1: Official Gold Reserves CH17 - 14
Figure 17.4.4.1.1.4-1: Increasing Gold Demand CH17 - 15
Figure 17.4.4.1.2-1: Gold Technical Analysis CH17 - 16
Figure 17.4.4.2.1.1-1: Copper Supply-Demand Balance (2012) CH17 - 18
Figure 17.4.4.2.1.1-2: Copper Supply-Demand Balance (2011) CH17 - 18
Figure 17.4.4.2.1.2-1: Decelerating China CH17 - 19
Figure 17.4.4.2.1.2-2: Declining Ore Grades CH17 - 20
Figure 17.4.4.2.2-1: Historical Copper Price CH17 - 21
Figure 17.5.1.1-1: Mining Method CH17 - 24
Figure 17.5.1.2.1-1: Details of Production Lines and Draw Crosscut Spacing
and Sizes of Openings
CH17 - 26
Figure 17.5.1.2.1-2: Development Layout of Fanholes at Undercutlines CH17 - 27
Figure 17.5.1.2.1-3: Typical UndercutLine Fanhole Section CH17 - 27
Figure 17.5.1.2.1-4: Details of Trench Fanholes CH17 - 29
Figure 17.5.1.2.2.1-1: 908 Production Level in Plan CH17 - 30
Figure 17.5.1.2.2.1-2: 782ML Production Level in Plan CH17 - 31
Figure 17.5.1.2.2.1-3: 798ML Production Level in Plan CH17 - 32
Figure 17.5.1.2.2.2-1: 908ML Central-East Block Showing Dumping Points CH17 - 33
Figure 17.5.1.2.2.2-2: Feeder Belt Conveyors configuration CH17 - 34
Figure 17.5.1.2.2.3-1: 782ML Showing Ventilation CH17 - 36
Figure 17.5.1.2.2.4-1: Water Sumps at 1020ML and 1015ML and the Supplied Areas CH17 - 38
Figure 17.5.1.2.2.2-2: Schematic Diagram of Pump system from 745 ML to Mill CH17 - 39
Figure 17.5.1.2.2.5-1: Subsidence Area CH17 - 40
Figure 17.5.1.4-1: Production Performance CH17 - 47
Figure 17.5.1.6-1: 908ML Centralized Mechanical Shop CH17 - 51
Figure 17.5.1.7-1: 908ML Production Line Development Layout CH17 – 55
Figure 17.5.1.7-2: 908 Undercut Line Development Layout CH17 - 56
Figure 17.5.1.7-3: 908ML Drawpoint Commissioning Schedule CH17 – 57
PADCAL Operations
April 2013
Figure 17.5.1.7-4: 782 ML Production Line Development Layout CH17 - 59
Figure 17.5.1.7-5: 782ML Undercut Line Development Layout CH17 - 60
Figure 17.5.1.7-6: 782ML Drawpoint Commissioning Schedule CH17 - 61
Figure 17.5.1.7-7: 798ML Production Line Development Layout CH17 - 63
Figure 17.5.1.7-8: 798ML Undercut Line Development Layout CH17 - 64
Figure 17.5.1.7-9: 798ML Drawpoints Development Schedule CH17 - 65
Figure 17.5.2.1-1: Run-of-Mine (CHC Discharge) CH17 – 67
Figure 17.5.2.1-2: Priamary Crushing – Jaw Crusher CH17 - 67
Figure 17.5.2.1-3: Secondary-tertiary Crushing Plant (Tertiary Crusher Top View) CH17 - 69
Figure 17.5.2.1-4: Grinding Plant CH17 - 70
Figure 17.5.2.1-5: Flotation Section CH17 - 71
Figure 17.5.2.1-6: Concentrate Filtering – Drum Filter CH17 - 71
Figure 17.5.2.1-7: Concentrate Shipping Port – Poro, La Union CH17 - 72
Figure 17.5.2.1-8: Tailings Thickening CH17 - 72
Figure 17.5.2.1-9: Process Flowchart CH17 - 73
Figure 17.5.2.1-10 Evolution of Banget Mill Plant CH17 - 74
Figure 17.5.2.8-1: Tailings Dam Siting CH17 - 85
Figure 17.5.2.10-1: Over-all Banget Plant Layout CH17 -89
Figure 17.5.3.1-1: Schematic Diagram Electric Power Facility CH17 - 91
Figure 17.5.3.3.2.2-1: Plant Laboratory CH17 - 97
Figure 17.5.4.3-1: TSF 3 CH17 - 101
Figure 17.5.5-1: Central Safety and Health Plan CH17 - 106
Figure 17.5.5-2: Safety Statistics CH17 - 107
Figure 17.6.1.5.1-1: Plan of Embankment using Downstream Method CH17 - 131
Figure 17.6.1.5.1-2: Sections A and C of Centerline Construction Method of Embankment CH17 - 123
Figure 17.6.1.5.1-3: Sections B and 1 Centerline Construction Method of Embankment CH17 - 124
Figure 17.6.1.5.1-4: Typical Section of Centerline Construction Method of Embankment CH17 - 125
Figure 17.6.1.5.1-5: Preliminary Tailings Conveyance route CH17 - 128
Figure 17.6.1.5.1-6: Schedule of Works CH17 - 129
Figure 17.6.4.4-1: Assumptions on Mining, Milling Overhead Costs CH17 - 133
Figure 17.6.4.4-2: Type of Expense (Average) CH17 - 134
Figure 17.6.4.4-3: Major Materials and supplies CH17 - 135
Figure 18.4-1: Outline of 0.317 % CuEq at 908 ML CH18 - 2
Figure 18.4-2: Outline of 0.317 % CuEq at 798 ML CH18 - 3
Figure 18.4-3: Outline of 0.317 % CuEq at 783 ML CH18 - 4
Figure 18.4-4: Economic and Operational footprints at 908 CH18 - 6
Figure 18.4-5: Economic and Operational footprints at 798 CH18 – 7
Figure 18.4-6: Economic and operational footprints at 782 CH18 - 8
Figure 18.5.2-1: Representative drawpoints for discount factor at 908 CH18 - 10
Figure 18.5.2-2: Discounted blocks at 798 ML using factor from 908 ML CH18 - 11
PADCAL Operations
April 2013
ANNEX A. Mine
ANNEX A-1. List of existing machineries and equipment
ANNEX A-2 Development cost indices details ANNEX A-3 Basis of Dilution Grade Factor
ANNEX B. Mill
ANNEX B-2 List of existing machineries and equipment
ANNEX C. Tailings Storage Facility
ANNEX C-1 Philex Padcal Mine TSF 3 Rehabilitation and Clean-up Plan
ANNEX C-2 Integrated Environmental Management Program
ANNEX D. Environment and Community
ANNEX D-1 Environment Compliance Certificate
ANNEX D-2 Key Personnel and Qualifications
ANNEX D-3 Padcal Table of Organization
ANNEX D-4 Community Development Program

PADCAL Operations
ApriI 2013
Chapter 5.0
PADCAL Operations
ApriI 2013
Chapter 5 Page 1
5.0 INTRODUCTION
5.1 Who commissioned the report preparation and to whom it shouId be submitted
This Technical Report was commissioned by Philex Mining Corporation for submission to the
Securities and Exchange Commission (SEC) and the Philippine Stock Exchange (PSE).
5.2 Purpose for which the report was prepared
The Company intends to offer shares in its capital stock for subscription by certain eligible
shareholders as determined by the board of directors in accordance with the Company’s
amended articles of incorporation. The offering will be registered with the SEC and the new
shares will be listed on the PSE. As provided under the PSE Memo on “Documentary
Requirements for Mining Companies” issued on October 2, 2007, mining companies applying
for initial or additional listing are required to submit a Competent Person’s Report that is
compliant with the requirements of the Philippine Mineral Reporting Code on public reporting in
the country of exploration results, mineral resources and ore reserves, including the economic
viability, of the relevant mineral properties.
5.3 Scope of Work or Terms of Reference
This report was developed internally and did not employ any third party.
5.4 Duration of the preparation, incIuding fieId visits and verification
The preparation of the report took two months from February to April 2013. The preparers are
all personnel of Philex and are assigned in the mine site. They regularly verify information used
in this report as part of their job functions.
PADCAL Operations
ApriI 2013
Chapter 5 Page 2
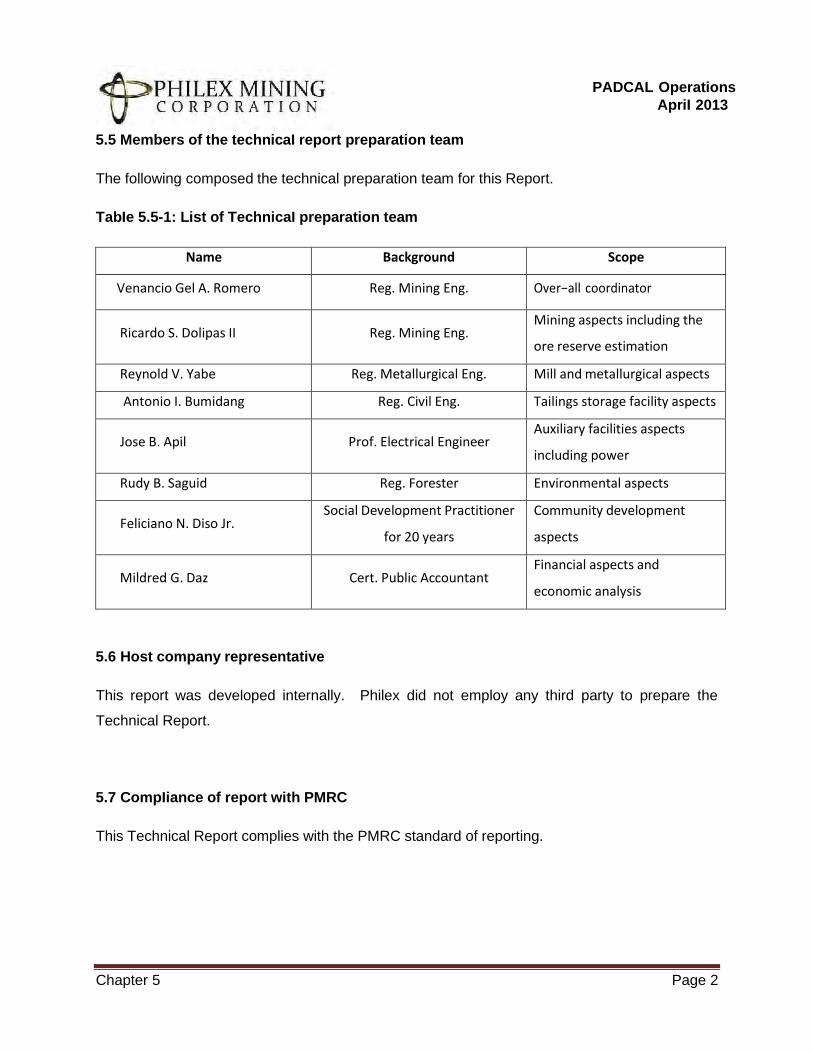
5.5 Members of the technicaI report preparation team
The following composed the technical preparation team for this Report.
TabIe 5.5-1: List of TechnicaI preparation team
Name Background Scope
Venancio Gel A. Romero Reg. Mining Eng. Over−all coordinator
Ricardo S. Dolipas II
Reg. Mining Eng. Mining aspects including the
ore reserve estimation
Reynold V. Yabe Reg. Metallurgical Eng. Mill and metallurgical aspects
Antonio I. Bumidang Reg. Civil Eng. Tailings storage facility aspects
Jose B. Apil
Prof. Electrical Engineer Auxiliary facilities aspects
including power
Rudy B. Saguid Reg. Forester Environmental aspects
Feliciano N. Diso Jr. Social Development Practitioner
for 20 years
Community development
aspects
Mildred G. Daz
Cert. Public Accountant Financial aspects and
economic analysis
5.6 Host company representative
This report was developed internally. Philex did not employ any third party to prepare the
Technical Report.
5.7 CompIiance of report with PMRC
This Technical Report complies with the PMRC standard of reporting.

PADCAL Operations
ApriI 2013
Chapter 6.0
PADCAL Operations
ApriI 2013
Chapter 6 Page 1
6.0 RELIANCE ON OTHER EXPERTS OR CPs
The main CP for the report has relied on Experts to prepare the report. Except the mineral
resource estimation, all are under his direct guidance. He is responsible for the correctness and
truthfulness of this report with the aforementioned exception.
The resource estimate is contained in a separate CP report done by geologists. The resource
model is the basis in mine planning to estimate the remaining mineable reserve.
− Left IntentionaIIy BIank -

PADCAL Operations
ApriI 2013
Chapter 7.0
PADCAL Operations April 2013
Chapter 7 Page 1
7.0 TENEMENT AND MINERAL RIGHTS
7.1 Description of mineral rights
Philex Mining Corporation’s mineral property occupies an area of 14,752 hectares.
7.1.1 Location of area, Barangay, Municipality, Province
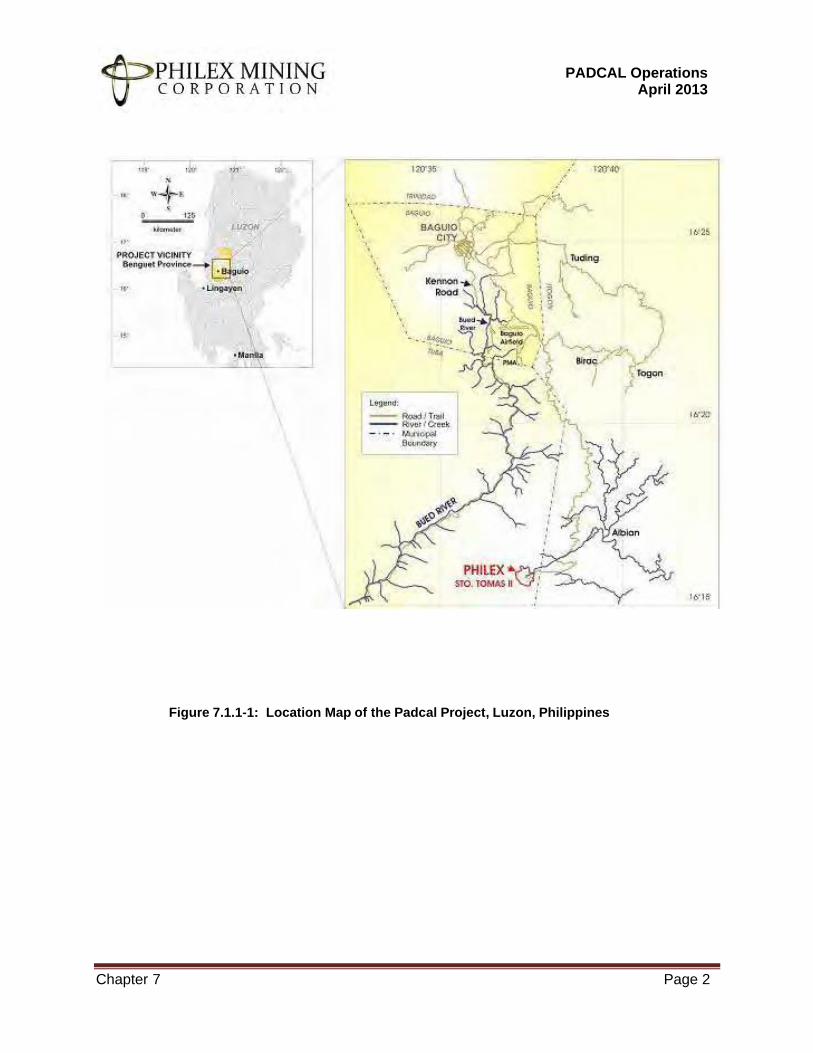
Philex Mining’s Padcal Mine is located at the southern tip of the Baguio Mineral District, about
17 aerial kilometers southeast of Baguio City. The mine straddles the municipalities of Tuba
and Itogon, Province of Benguet, Cordillera Administrative Region. The ore body is situated in
Sitio Padcal, Barangay Camp 3 of Tuba centered at latitude 16°15’50” and longitude
120°37’16”. The Mill and Tailings Storage Facility Nos. 1, 2 and 3 are within the sitios of
Banget, Sal-angan, Talnag and Balog, Barangay Ampucao of Itogon, Province of Benguet.
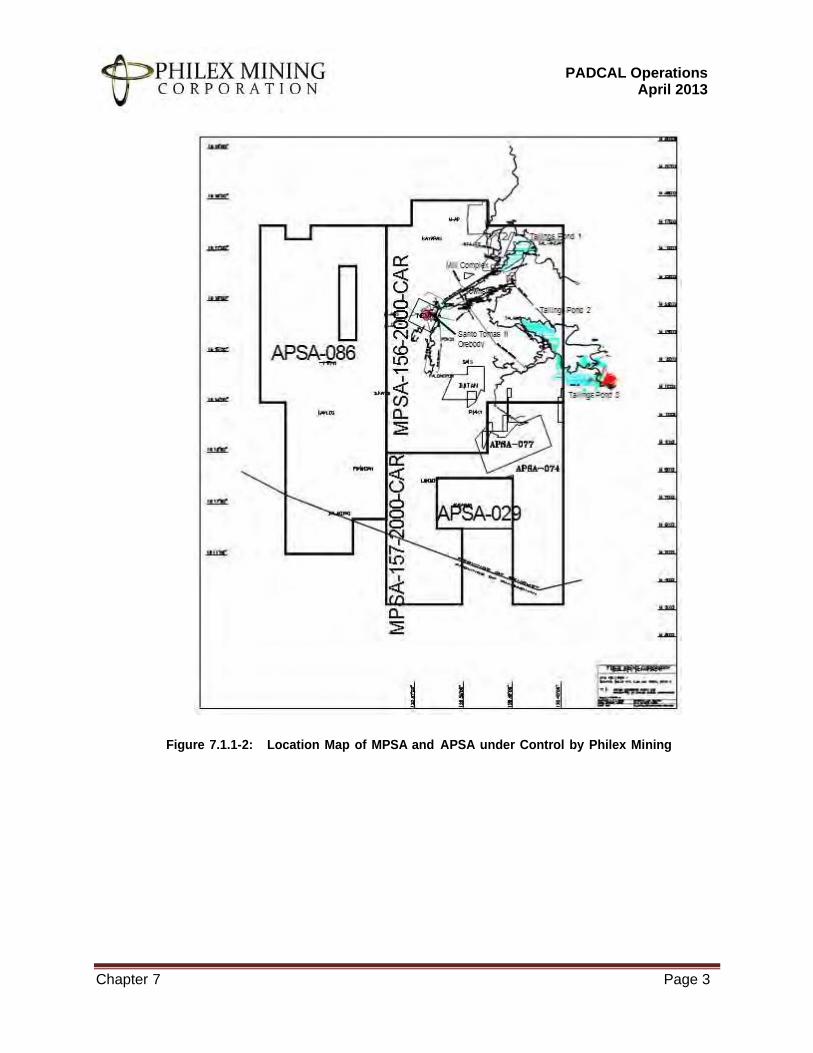
Philex Mining Corporation have three Mineral Production Sharing Agreements (MPSA)
denominated as MPSA-156-2000-CAR, MPSA-157-2000-CAR and MPSA-276-2009-CAR. Two
applications for Exploration Permits (ExPA) and one application for MPSA are still pending at
the office of MGB, Central Office. These tenements cover the Barangays of Camp1, Camp3 and
Ansagan in the Municipality of Tuba and Barangay Ampucao, Municipality of Itogon, all in the
Province of Benguet.
PADCAL Operations April 2013
Chapter 7 Page 2
Figure 7.1.1-1: Location Map of the Padcal Project, Luzon, Philippines
PADCAL Operations April 2013
Chapter 7 Page 3
Figure 7.1.1-2: Location Map of MPSA and APSA under Control by Philex Mining
PADCAL Operations April 2013
Chapter 7 Page 4
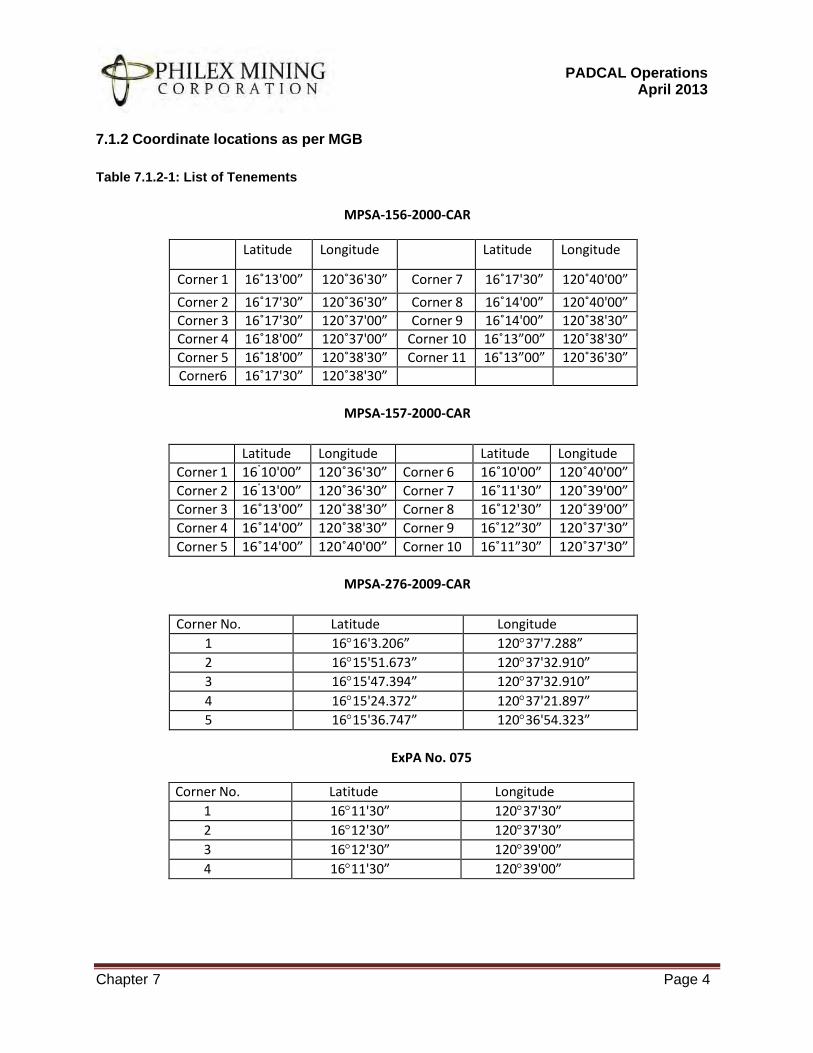
7.1.2 Coordinate locations as per MGB
Table 7.1.2-1: List of Tenements
MPSA-156-2000-CAR
Latitude Longitude Latitude Longitude
Corner 1 16˚13'00” 120˚36'30” Corner 7 16˚17'30” 120˚40'00”
Corner 2 16˚17'30” 120˚36'30” Corner 8 16˚14'00” 120˚40'00” Corner 3 16˚17'30” 120˚37'00” Corner 9 16˚14'00” 120˚38'30” Corner 4 16˚18'00” 120˚37'00” Corner 10 16˚13”00” 120˚38'30”
Corner 5 16˚18'00” 120˚38'30” Corner 11 16˚13”00” 120˚36'30” Corner6 16˚17'30” 120˚38'30”
MPSA-157-2000-CAR
Latitude Longitude Latitude Longitude
Corner 1 16˚10'00” 120˚36'30” Corner 6 16˚10'00” 120˚40'00”
Corner 2 16˚13'00” 120˚36'30” Corner 7 16˚11'30” 120˚39'00”
Corner 3 16˚13'00” 120˚38'30” Corner 8 16˚12'30” 120˚39'00”
Corner 4 16˚14'00” 120˚38'30” Corner 9 16˚12”30” 120˚37'30”
Corner 5 16˚14'00” 120˚40'00” Corner 10 16˚11”30” 120˚37'30”
MPSA-276-2009-CAR
Corner No. Latitude Longitude
1 1616'3.206” 12037'7.288”
2 1615'51.673” 12037'32.910”
3 1615'47.394” 12037'32.910”
4 1615'24.372” 12037'21.897”
5 1615'36.747” 12036'54.323”
ExPA No. 075
Corner No. Latitude Longitude
1 1611'30” 12037'30”
2 1612'30” 12037'30”
3 1612'30” 12039'00”
4 1611'30” 12039'00”
PADCAL Operations April 2013
Chapter 7 Page 5
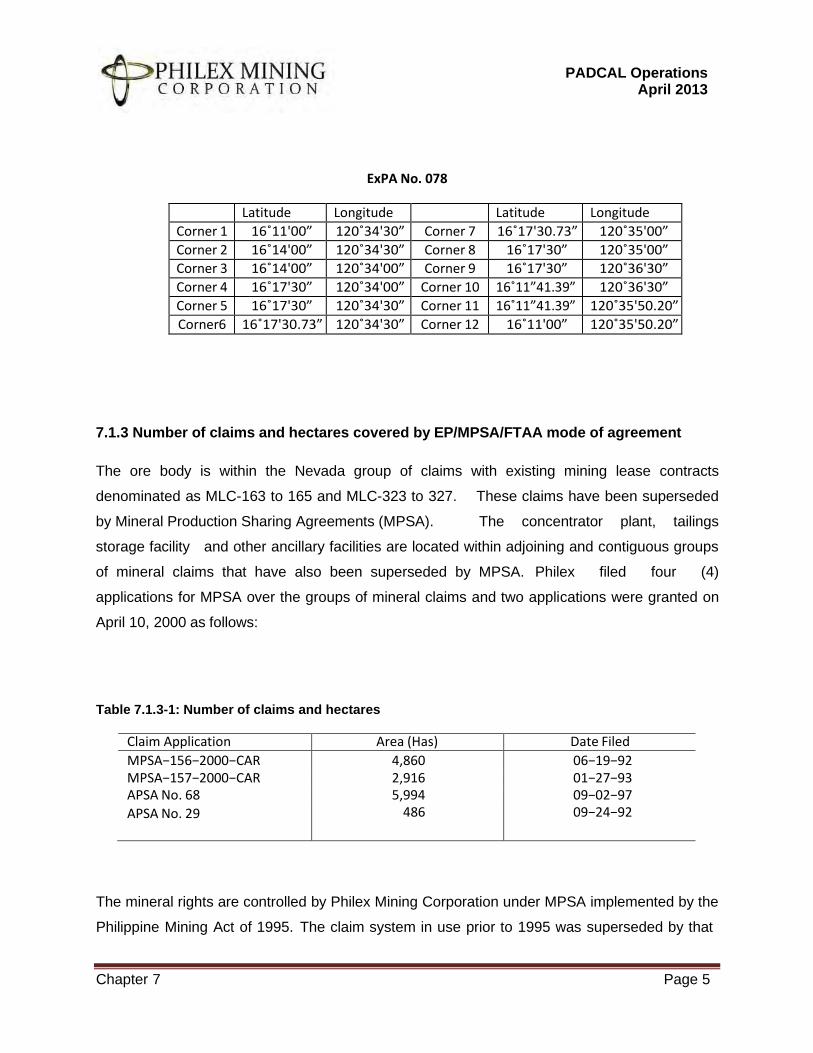
ExPA No. 078
Latitude Longitude Latitude Longitude
Corner 1 16˚11'00” 120˚34'30” Corner 7 16˚17'30.73” 120˚35'00”
Corner 2 16˚14'00” 120˚34'30” Corner 8 16˚17'30” 120˚35'00”
Corner 3 16˚14'00” 120˚34'00” Corner 9 16˚17'30” 120˚36'30”
Corner 4 16˚17'30” 120˚34'00” Corner 10 16˚11”41.39” 120˚36'30”
Corner 5 16˚17'30” 120˚34'30” Corner 11 16˚11”41.39” 120˚35'50.20”
Corner6 16˚17'30.73” 120˚34'30” Corner 12 16˚11'00” 120˚35'50.20”
7.1.3 Number of claims and hectares covered by EP/MPSA/FTAA mode of agreement
The ore body is within the Nevada group of claims with existing mining lease contracts
denominated as MLC-163 to 165 and MLC-323 to 327. These claims have been superseded
by Mineral Production Sharing Agreements (MPSA). The concentrator plant, tailings
storage facility and other ancillary facilities are located within adjoining and contiguous groups
of mineral claims that have also been superseded by MPSA. Philex filed four (4)
applications for MPSA over the groups of mineral claims and two applications were granted on
April 10, 2000 as follows:
Table 7.1.3-1: Number of claims and hectares
Claim Application Area (Has) Date Filed
MPSA−156−2000−CAR 4,860 06−19−92 MPSA−157−2000−CAR 2,916 01−27−93 APSA No. 68 5,994 09−02−97
APSA No. 29 486 09−24−92
The mineral rights are controlled by Philex Mining Corporation under MPSA implemented by the
Philippine Mining Act of 1995. The claim system in use prior to 1995 was superseded by that
PADCAL Operations April 2013
Chapter 7 Page 6
law. Applications for Production Sharing Agreements (APSA) covering all existing claims were
filed in the years following implementation of the 1995 Mining Act. Under the current system,
Philex has entered into a mineral agreement with the Philippine government wherein the
Government grants to the company the exclusive rights to conduct mining operations within the
contract area for a term of 25 years that is renewable for another 25 years, but does not transfer
title to the minerals or surface to the company. Mining operations allowed include
exploration, development and utilization of mineral resources. Under an MPSA, the
government shares in the production of the contractor, in kind or in value, as owner of the
minerals. The company provides the necessary financing, technology, management and
personnel for the mining project. At Padcal, the government’s share is in the form of a 2%
excise tax on gross value (net refining costs) of the mineral produced.
At present time, Philex has two completed MPSA and two APSA (applications for MPSA) The
completed MPSA (MPSA-156-2000-CAR and MPSA-157-2000-CAR) cover the mine and mill
area, Tailings Storage Facility (TSF) 1 and 2 and a portion of TSF 3. The APSA cover areas
that are outside the mine area, but are currently being explored. The MPSA and APSA are
contiguous. Several claim blocks within the area covered by Philex’ MPSA and APSA leased
by Philex. Each of these claim blocks has active APSA that are being handled by Philex Mining
for the underlying owners.
7.1.4 Type of permit or agreement with the government
MPSA confer the exclusive right to mine and use the surface for mining activities and facilities,
but do not transfer title of the surface to the mining company. Annual payments of 50 Philippine
pesos per hectare are required to retain the property. An MPSA confers exclusive mining rights
for 25 years, renewable for an additional 25 years provided the annual payments have been
made. The current MPSA will expire in 2025 and are renewable to 2050.
PADCAL Operations April 2013
Chapter 7 Page 7
7.2 History of mineral rights
From the record, it appears that copper and gold were discovered on the property prior to 1933
when some of the early claims in the area were staked. This and other properties in the area
may have been first discovered during the Spanish colonial era. There is none that can discern,
a definitive record of exploration prior to 1956.After that time, exploration was conducted
exclusively by drilling and tunneling.
Ownership of the claims prior to 1955 is largely irrelevant to the current operation. The following
is a brief history of Padcal and Philex as described in Anonymous (2004).
“The Santo Tomas II deposit was acquired by Philex Mining Corporation, incorporated in July
1955 in Manila, Philippines and was one of its principal properties. The company’s main
proponents were Henry A. Brimo, a Philippine national who became its first President, Paul A.
Schafer, an American geologist and George T. Scholey, an American mining engineer. Capital
was raised by a listing of shares in the Manila Stock Exchange. The Santo Tomas II deposit
(Padcal Mine) was a low-grade disseminated copper ore body with gold as by-product. Philex
started immediate exploration works in the area and by the end of 1956, an initial reserve of 18
million tonnes of 0.90% copper and 0.977 grams gold per tonne was blocked after drilling 2,703
meters of diamond drill holes and driving 463 meters of crosscuts and drifts. When Philex first
entered the area, it was completely logged out with very few people found. In fact, the Padcal
Mine, as it is known today, used to be an old saw mill and access to the area was through a 20-
kilometre logging trail.”
”In spite of the difficulties the mining industry faced at that time, primarily a depressed copper
price, the lowest at that time since 1949, development of the mine by open pit and later by
underground and construction of mill facilities at 2,000 tonnes per day ensued. Production
started in the middle of 1958 with a small tonnage of 800 tonnes per day at 0.79% Cu and 1.030
g/t Au. The mine was operated for the first two years by small open pit and shifted ever since to
block caving method using slusher system until 1994. Ore at the lower levels is harder which
necessitated a shift from the traditional slushing method of mining to a more mechanized
method using Load-Haul- Dump (LHD) units. Mechanized mining commenced at the end of
1995. Philex- Padcal was the first mine in the Far East to employ block caving method of
mining.“
PADCAL Operations April 2013
Chapter 7 Page 8
“Concurrent with the mine and mill development, the Philex started improvement of the logging
trail into a dirt road and later a hard-surfaced road, construction of houses, a hospital, school,
chapel, and recreational facilities for its workers.“
“Philex Mining Corporation is listed in the Philippine Stock Exchange under SEC registration no.
10044-Vol. 4. The company is currently owned by about 50,000 stockholders and 38 percent of
its outstanding shares are owned by foreign nationals and institutions.“
7.3 Current owners of mineral rights
Section 7.6 describes the ownership of the mineral rights.
7.4 Validity of current mineral rights
Under the Mining Act of 1995 or R.A. No. 7942, all the three MPSA’s of Philex have each a 25
year term and renewable for another 25 years. Both MPSA-156-2000-CAR and MPSA-157-
2000-CAR will expire on 2025 and MPSA-276-2009-CAR will expire on 2034.
7.5 Agreements with respect to mineral rights.
At the present time, Philex has five (5) existing royalty agreements within the area of its
properties. Only one, Nevada claims, is related to current production. The other four are on
adjacent exploration properties.
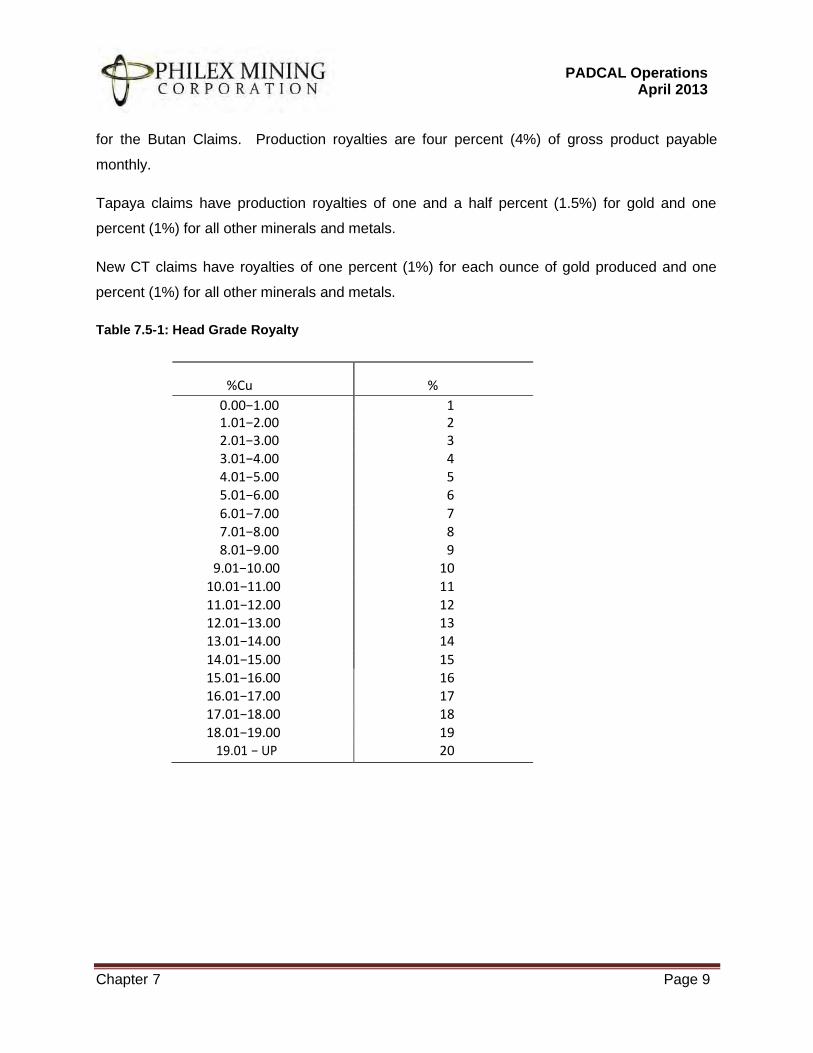
Nevada has a sliding royalty schedule based on copper head grade during production as
shown. A straight royalty of four percent (4%) of the gross is paid on all other mineral and
mineral products.
Clifton has a royalty of four percent (4%) on gold and one percent (1%) on copper and all other
minerals and metals based on gross monthly production. Clifton has a 4,000 peso per month
advance royalty payment chargeable against future production.
The Butan claims have advance royalty payments of 40,000 pesos per month chargeable
against future production. The table below summarizes the advance royalty payments to date
PADCAL Operations April 2013
Chapter 7 Page 9
for the Butan Claims. Production royalties are four percent (4%) of gross product payable
monthly.
Tapaya claims have production royalties of one and a half percent (1.5%) for gold and one
percent (1%) for all other minerals and metals.
New CT claims have royalties of one percent (1%) for each ounce of gold produced and one
percent (1%) for all other minerals and metals.
Table 7.5-1: Head Grade Royalty
%Cu
%
0.00−1.00 1 1.01−2.00 2 2.01−3.00 3 3.01−4.00 4 4.01−5.00 5 5.01−6.00 6
6.01−7.00 7 7.01−8.00 8 8.01−9.00 9
9.01−10.00 10
10.01−11.00 11 11.01−12.00 12 12.01−13.00 13 13.01−14.00 14
14.01−15.00 15 15.01−16.00 16 16.01−17.00 17 17.01−18.00 18 18.01−19.00 19
19.01 − UP 20

PADCAL Operations April 2013
Chapter 7 Page 10
7.6 Royalties, taxes, advances and similar payments paid or to be paid by the company
to the mineral rights holder, joint venture partner(s), government, Indigenous People,
local government, and others
- Left Intentionally Blank -
Chapter 7 Page 11
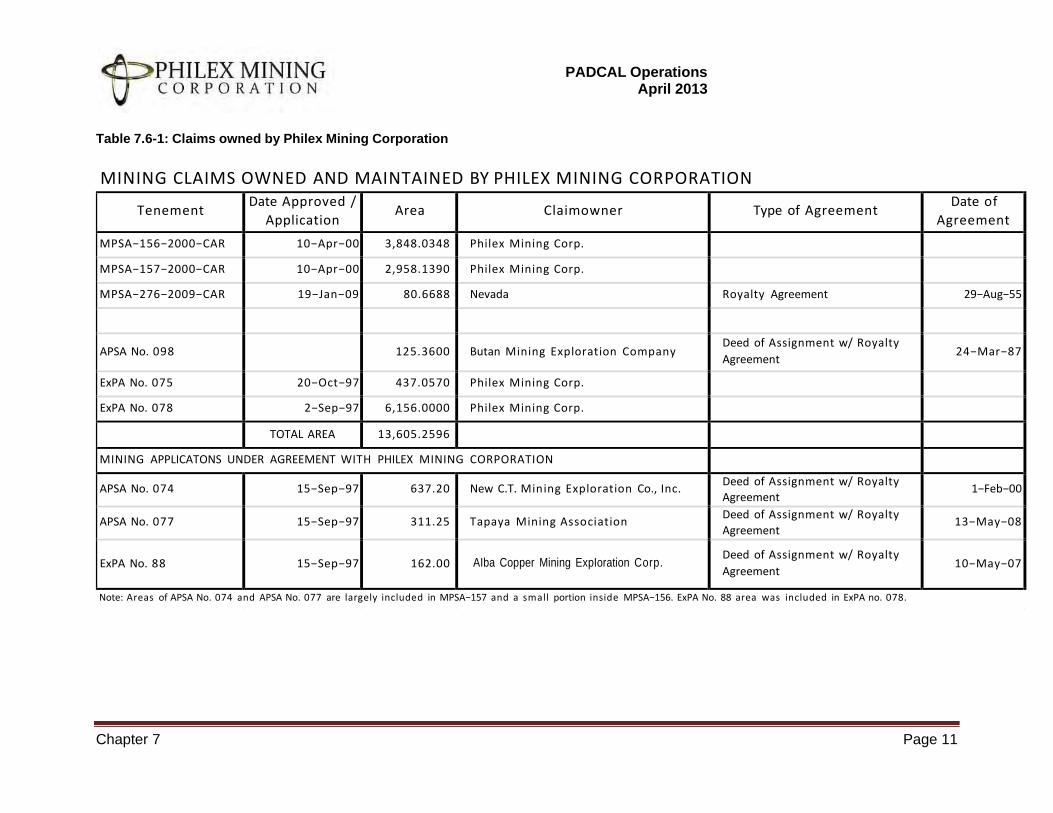
Table 7.6-1: Claims owned by Philex Mining Corporation
PADCAL Operations April 2013
MINING CLAIMS OWNED AND MAINTAINED BY PHILEX MINING CORPORATION
Tenement Date Approved /
Application Area Claimowner Type of Agreement
Date of
Agreement
MPSA−156−2000−CAR 10−Apr−00 3,848.0348 Philex Mining Corp.
MPSA−157−2000−CAR 10−Apr−00 2,958.1390 Philex Mining Corp.
MPSA−276−2009−CAR 19−Jan−09 80.6688 Nevada Royalty Agreement 29−Aug−55
APSA No. 098
125.3600 Butan Mining Exploration Company Deed of Assignment w/ Royalty
Agreement 24−Mar−87
ExPA No. 075 20−Oct−97 437.0570 Philex Mining Corp.
ExPA No. 078 2−Sep−97 6,156.0000 Philex Mining Corp.
TOTAL AREA 13,605.2596
MINING APPLICATONS UNDER AGREEMENT WITH PHILEX MINING CORPORATION
APSA No. 074 15−Sep−97 637.20 New C.T. Mining Exploration Co., Inc. Deed of Assignment w/ Royalty
Agreement 1−Feb−00
APSA No. 077 15−Sep−97 311.25 Tapaya Mining Association Deed of Assignment w/ Royalty
Agreement 13−May−08
ExPA No. 88
15−Sep−97
162.00
AIba Copper Mining ExpIoration Corp. Deed of Assignment w/ Royalty
Agreement
10−May−07
Note: Areas of APSA No. 074 and APSA No. 077 are largely included in MPSA−157 and a small portion inside MPSA−156. ExPA No. 88 area was included in ExPA no. 078.
Chapter 7 Page 12
PADCAL Operations
April 2013
7.6.2 Receivables and payable sums to the company and mineral rights holder
Financial obligations to claim owners and Indigenous People are governed by the following.
• In the case of Nevada, based on copper head grades as outlined in Table 7.5-1;
• For Butan Mining Exploration, Camp 3 Mining Association, Tapaya Lodestar Inc, New
C.T. Mining Exploration, Co. Inc. and Alba Copper Mining Exploration Corporation: various percentage of gold and copper credits ranging from one to four 1 percent; and
• For Indigenous People Organization of Alang, Pokis, Sabian, Sta. Fe, Obial and Loakan (IPO APSSOL) 1.25 percentage of gross output.

PADCAL Operations
ApriI 2013
Chapter 8.0
PADCAL Operations
April 2013
Chapter 8 Page 1
8.0 GEOGRAPHIC FEATURES
8.1 Location and accessibility
The company maintains a shipping facility at Poro Installation Port in San Fernando, La
Union. From the minesite, the port can be reached in about 2.5 hours via Naguilian Road.
The group of Philex Mining Tenements (MPSA-276, MPSA-156, MPSA-157, ExPA-075,
ExPA-078) is located in the Baguio Mineral District at the southern end of the Central
Cordillera Mountain Range and within the Municipalities of Tuba and Itogon, Province of
Benguet, in the Cordillera Administrative Region (CAR), Philippines. It is 17 aerial
kilometers or (±28) road kilometers south-southeast of Baguio City. The tenement group is
enclosed within geographic coordinates North latitudes 16010’00” to 16018’00” and East
longitudes 120034’00” to 120040’00” and encompasses a land area of approximately
13,317.8990 hectares.
On a provincial scale, Benguet is bounded on the north by Mountain Province, on the south
by Pangasinan, on the east by Ifugao and Nueva Vizcaya, and on the west by La Union and
Ilocos Sur.
The Philex area is conveniently accessible from Baguio City through the 28km well-paved
Kias-Philex Provincial Road (estimated 45-minute drive at an average speed of 50kph).
Baguio City is the chartered city and the only city in Benguet Province. Baguio City from
Manila is easily accessible by land transport cruising via the North Luzon Expressway
(NLEx) and Subic-Clark-Tarlac Expressway (SCTEx), then through the national highway.
This route (about 250km, approximately 4-5 hours) passes through the provinces of
Bulacan, Pampanga, Tarlac, Pangasinan, La Union and Benguet.
The southernmost part of the Philex mining property can be reached from Manila via
Binalonan, Pangasinan. From Binalonan proper, the road takes off from the national
highway thence to San Manuel passing through the San Manuel-Ansagan municipal road.
This route is seasonal in nature, accessible only during the dry season, since a long portion
of the road traverses the Toboy River.
PADCAL Operations
April 2013
Chapter 8 Page 2
8.2 Topography, physiography, drainage and vegetation
The Luzon Central Cordillera, belongs within the Central Physiographic Province, and
stretches from Ilocos Highlands in the north to the northern flank of Caraballo Mountains in
the south. It is 320km long and 85 km wide with rugged topography. The highest peak, Mt.
Pulag (2929m), also the highest in Luzon forms the common boundary of Benguet, Ifugao,
and Nueva Vizcaya. The eastern slopes of Mt. Data have been terraced into the famous
Banaue Rice Terraces. The southern part of the Cordillera is rugged; the northern has flat
areas along the east. Four (4) main rivers, Agno, Magat, Chico and Abra, drain the
Cordillera. Cascades, ravines, and waterfalls are common.
The Baguio Mineral District at the southern end of the Central Cordillera Mountain Range
exhibits similar mountainous and rugged topography with reliefs ranging from 300 to 1800
meters above sea level. The slopes are generally steep with variable range of greater than
45°. The project area is prone to massive mass wasting due to the presence of steep
slopes. Landslides, as a result of heavy downpour, and rock falls are common in the area.
Five (5) major rivers that flow perennially in the Province of Benguet are the Agno River,
Amburayan River, Abra River, Naguilian River, and the Aringay River.
Drainage pattern is mainly controlled by geological structures and rock types. Most of these
are drainages that display dendritic and occasionally rectangular patterns. Major structures
found in the project area such as Sta. Fe Fault, Albian Fault, and Paday Fault manifest as
deeply-incised streams or drainages. The project area is drained to the south by the Toboy-
Ansagan River towards Tagamusing River in Binalonan town in Pangasinan (Philex internal
report). The Albian Creek drains the eastern part of the mine towards Sal-angan River
which eventually converges with the Agno River. To the southeast, water flows through the
Balog Creek which also drains toward the southward Agno River. Located at the northeast
of the site is the southwest-flowing Bued River that runs through the town of Tuba, Benguet
leading to La Union and Pangasinan.
PADCAL Operations
April 2013
Chapter 8 Page 3
Pine forest type and secondary growth type and grassland type are generally found in the
project area. Between 800 to 2,000 meters above sea level, the area is dominated by pines,
grasslands and secondary growth. Pine stands are generally abundant in the upper part of
the range and grassland in the lower part. There are two strata of pine forest:
a) Pine layer – mostly consisting of pine trees dominated by Benguet Pine scientifically
known as Pinus Kesiya Royle ex-Gordon.
b) Herbaceous layer - which varies according to altitude. At higher altitude, blacken ferns
are common. Rono grass (Miscanthus sinensis), the Eulalia trispicata and Themeda triandra
occurs at higher and lower elevations, respectively.
In the grassland type, the Themeda triandra, Eulalia trispicata and Imperata cylindrica
(cogon grass) predominate, including the basic unity of pine forest and grassland vegetation.
8.3 Climate, population
The climate of the Philippines is either tropical rainforest, tropical savanna or tropical
monsoon, or humid subtropical (in higher-altitude areas) characterized by relatively high
temperature, oppressive humidity and plenty of rainfall. There are two seasons in the
country, the wet season and the dry season, based upon the amount of rainfall. This is
dependent as well on the location in the country as some areas experience rain all
throughout the year. Based on temperature, the seven warmest months of the year are from
April to October while the winter monsoon brings cooler air from November to March. May is
the warmest month, and January, the coolest.
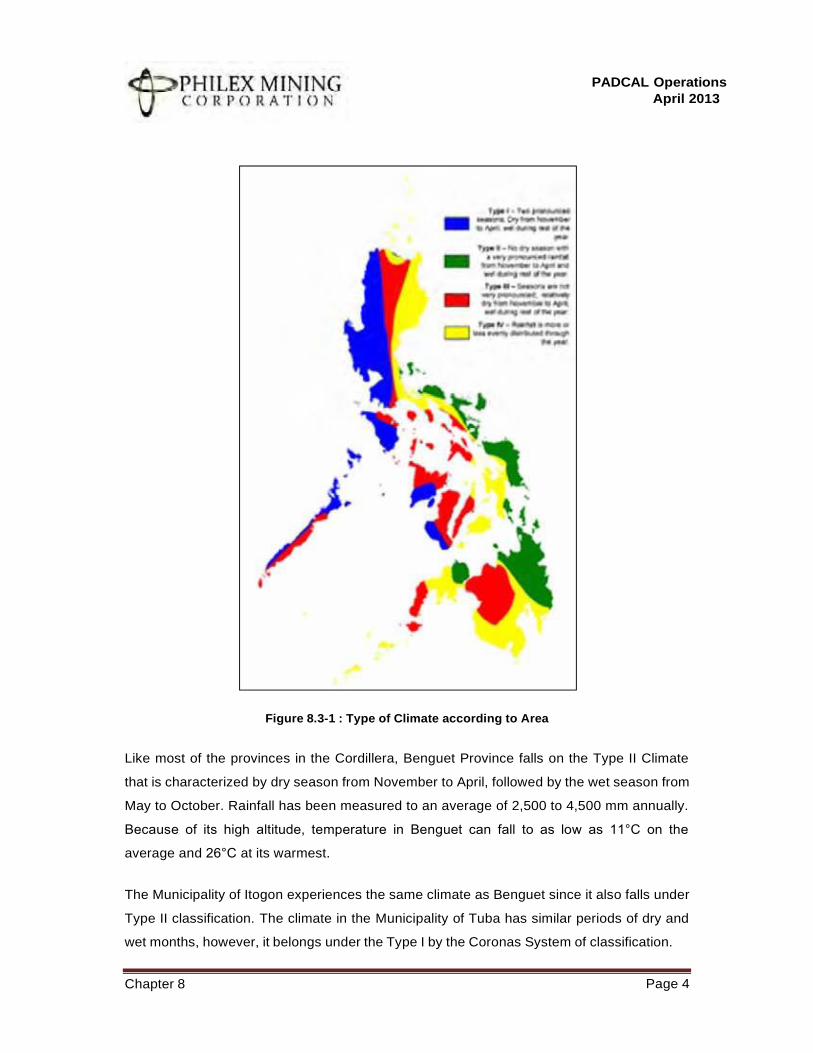
There are four recognized climate types in the Philippines, and they are based on the
distribution of rainfall. They are described as follows:
• Type I. Two pronounced season: dry from November to April and wet during the rest of
the year.
• Type II. No dry season with a pronounced rainfall from November to January.
• Type III. Seasons are not very pronounced, relatively dry from November to April, and
wet during the rest of the year.
• Type IV. Rainfall is more or less evenly distributed throughout the year.
PADCAL Operations
April 2013
Chapter 8 Page 4
Figure 8.3-1 : Type of Climate according to Area
Like most of the provinces in the Cordillera, Benguet Province falls on the Type II Climate
that is characterized by dry season from November to April, followed by the wet season from
May to October. Rainfall has been measured to an average of 2,500 to 4,500 mm annually.
Because of its high altitude, temperature in Benguet can fall to as low as 11°C on the
average and 26°C at its warmest.
The Municipality of Itogon experiences the same climate as Benguet since it also falls under
Type II classification. The climate in the Municipality of Tuba has similar periods of dry and
wet months, however, it belongs under the Type I by the Coronas System of classification.
PADCAL Operations
April 2013
Chapter 8 Page 5
Generally Tuba has a foggy and cold temperature during the coldest months of December,
January and has the warmest temperatures during the months of March to May.
Baguio City features a subtropical highland climate under the Köppen climate classification.
The city is known for its mild climate. Owing to its high elevation, the temperature in the city
is eight degrees Celsius lower compared to the average temperature of the rest of the
country. Average temperature ranges from fifteen to twenty three degrees Celsius. It is
usually lower during the late and early months of the year. The climate follows the typical
Philippine seasons: Dry Season from October to May and the Wet Season from June to
September.
Like many other cities with a subtropical highland climate, Baguio sees noticeably less
precipitation during its dry season. However, the city has an extraordinary amount of
precipitation during the rainy season, with the months of July and August having on average
more than 1,000 mm of rain. Baguio averages over 4500 mm of precipitation annually.
The Province of Benguet lies atop the southern end of the Cordillera Mountains and consists
a total land area of 2,833km², thirteen (13) municipalities, and 140 barangays. It has a
population of about 403,494 and a density of 142.4/km² (as of 2010).
The two (2) municipalities of Benguet which host Philex Mine, namely Tuba and Itogon have
a population of 42,874 (as of 2010) and 55,960 (as of 2010) respectively. Population density
in Tuba is 140/km² (as of 2010) while in Itogon is 120/km² (as of 2010).
Baguio City, the nearest and only city north of Philex minesite has a population of 318,676
and a population density of 5,500/km² (as of 2010).
PADCAL Operations
April 2013
Chapter 8 Page 6
NATURAL RESOURCES
• Water Resources
Benguet is the source of five (5) major river basins that are harnessed for energy
development and irrigation: Agno River, Amburayan River, Abra River, Naguilian River,
Aringay River.
• Mineral Resources
Benguet is rich in mineral resources, both metallic and non-metallic. There are three large-
scale mining companies still operating in the province.
Lepanto Mine Division Lepanto, Mankayan
Philex Mining Corporation Padcal, Tuba
Benguet Corporation Balatoc, Itogon
PADCAL Operations
April 2013
Chapter 8 Page 7
8.4 Land Use
As of 2010, Benguet has a total land area of 2,833.0 square kilometers with most of it falling
within the Cordillera Forest Reserve.
A major portion of the land area of Benguet is devoted to agriculture and is planted with rice,
corn, highland vegetables, root crops, and cutflowers.
Within the Philex tenements, the areas are habitated but not densely populated. Residents
are generally scattered. Some of the residents in the area are engaged in farming, cattle-
raising, small-scale mining. The flat and moderately sloping areas are utilized for agricultural
purposes and the rest covered by vegetation. Some of the areas are as pasture lands.
PADCAL Operations
April 2013
Chapter 8 Page 8
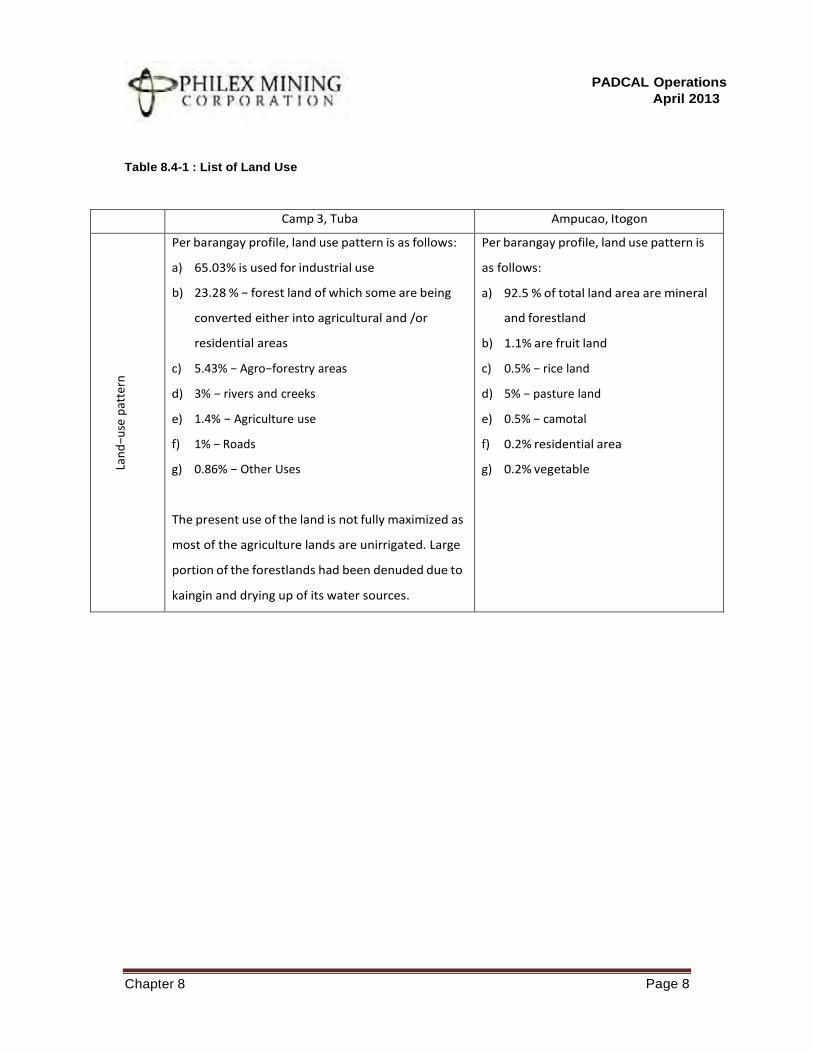
Table 8.4-1 : List of Land Use
Camp 3, Tuba Ampucao, Itogon
La
nd
−use
pat
tern
Per barangay profile, land use pattern is as follows:
a) 65.03% is used for industrial use
b) 23.28 % − forest land of which some are being
converted either into agricultural and /or
residential areas
c) 5.43% − Agro−forestry areas
d) 3% − rivers and creeks
e) 1.4% − Agriculture use
f) 1% − Roads
g) 0.86% − Other Uses
The present use of the land is not fully maximized as
most of the agriculture lands are unirrigated. Large
portion of the forestlands had been denuded due to
kaingin and drying up of its water sources.
Per barangay profile, land use pattern is
as follows:
a) 92.5 % of total land area are mineral
and forestland
b) 1.1% are fruit land
c) 0.5% − rice land
d) 5% − pasture land
e) 0.5% − camotal
f) 0.2% residential area
g) 0.2% vegetable
PADCAL Operations
April 2013
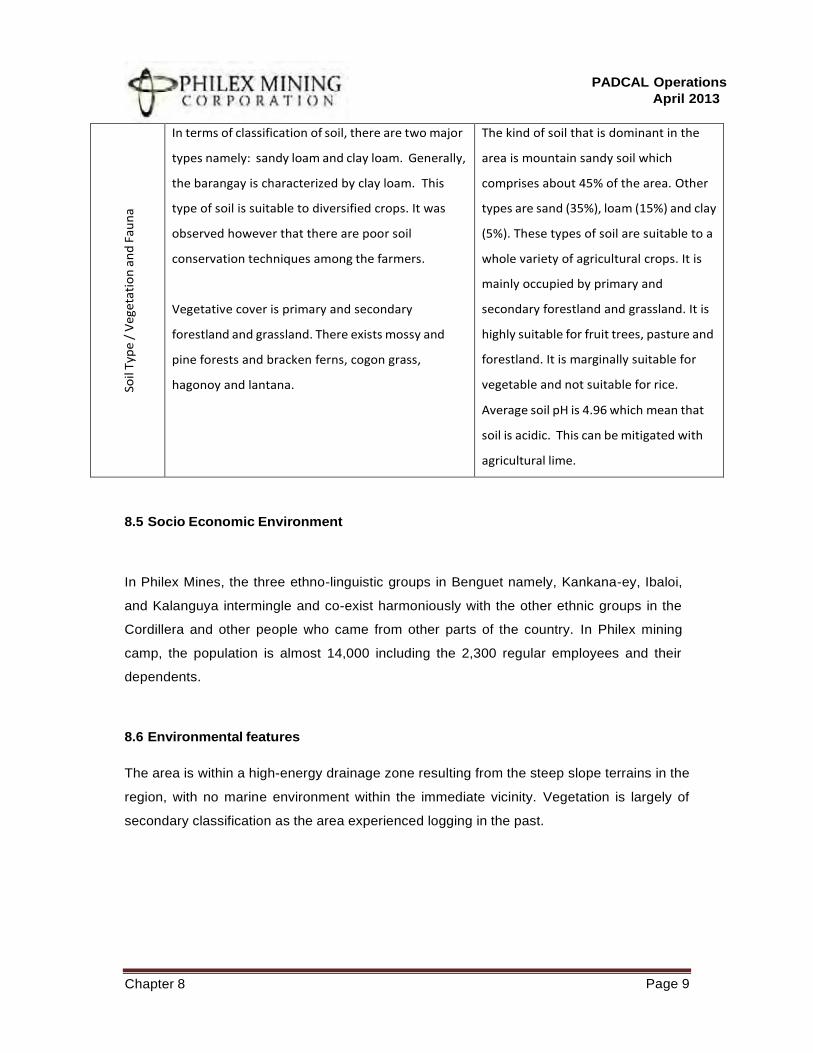
Chapter 8 Page 9
Soil
Typ
e /
Ve
ge
tati
on
an
d F
au
na
In terms of classification of soil, there are two major
types namely: sandy loam and clay loam. Generally,
the barangay is characterized by clay loam. This
type of soil is suitable to diversified crops. It was
observed however that there are poor soil
conservation techniques among the farmers.
Vegetative cover is primary and secondary
forestland and grassland. There exists mossy and
pine forests and bracken ferns, cogon grass,
hagonoy and lantana.
The kind of soil that is dominant in the
area is mountain sandy soil which
comprises about 45% of the area. Other
types are sand (35%), loam (15%) and clay
(5%). These types of soil are suitable to a
whole variety of agricultural crops. It is
mainly occupied by primary and
secondary forestland and grassland. It is
highly suitable for fruit trees, pasture and
forestland. It is marginally suitable for
vegetable and not suitable for rice.
Average soil pH is 4.96 which mean that
soil is acidic. This can be mitigated with
agricultural lime.
8.5 Socio Economic Environment
In Philex Mines, the three ethno-linguistic groups in Benguet namely, Kankana-ey, Ibaloi,
and Kalanguya intermingle and co-exist harmoniously with the other ethnic groups in the
Cordillera and other people who came from other parts of the country. In Philex mining
camp, the population is almost 14,000 including the 2,300 regular employees and their
dependents.
8.6 Environmental features
The area is within a high-energy drainage zone resulting from the steep slope terrains in the
region, with no marine environment within the immediate vicinity. Vegetation is largely of
secondary classification as the area experienced logging in the past.

PADCAL Operations
ApriI 2013
Chapter 9.0
PADCAL Operations
ApriI 2013
Chapter 9 Page 1
9.0 PREVIOUS WORK
Previous technical works, which makes Padcal as it is now, are integrated to the milestones
the operations have achieved in its 50 plus years of existence.
Philex was incorporated on July 19, 1955 to primarily engage in consultancy services,
mineral exploration, and mining among others. With Mr. Henry A. Brimo, as the first
President, he together with six (6) others formed Philex Mining Corporation. Exploration
program was immediately undertaken, and many mining projects were examined in the
entire Philippines which resulted to the Sto. Tomas I, Sto. Tomas II, and Sto. Tomas III
copper-gold projects, two (2) oil concessions, and other mineral properties on chromite,
mercury, iron, and nickel. The most promising was the Sto. Tomas II referred now to the
Padcal Mine operations.
The 50's…
The company’s income for the first two years was derived from consulting and management
fees. Philex then had a ten-year contract to manage Benguet Exploration, Inc. in Camp 6,
Kennon Road. By April 1957, 18 Million Tonnes of ore was block by diamond drilling in the
Sto. Tomas II property. Development of the mine followed and by June of the same year,
the construction of a 2,000 tonnes per day (tpd) Mill Plant and ancillary buildings were
started. On June 23, 1958, the Mill Plant was inaugurated.
Actual production commenced in August 1958, with a tonnage of 800 tpd. Towards the last
quarter of the year, the first shipment of 860 dry metric tonnes (DMT) of copper concentrate
was realized. A contract with Nippon Mining Company, Unlimited for the sale of the copper
concentrate was signed as early as October 1957.
Mining for the first two years was through an open pit. 1959 marked the Padcal Mine’s first
full year of operation and the start of underground mining using the block caving-slusher
method combined with open pit mining.
PADCAL Operations
ApriI 2013
Chapter 9 Page 2
The 60's…
Growth becomes steady through the 60’s due to improved copper prices and substantial
income from gold recovery. The Padcal Mine was indeed a profitable operation, with 20%
stock dividend and first cash dividend of 5% or half centavo per share was given in October
1960 to stockholders. In 1961, the Philex Mines Workers Union, an affiliate of the National
Mines and Allied Workers Union (NAMAWU) was formed. The first 3-year Collective
Bargaining Agreement (CBA) was signed in August 1961. In 1964, the company also signed
a 3-year CBA with then Philex Supervisors and Classified Employees Union. The first
elementary school in the mine site was established in 1961 at Banget with 90 pupils and 3
teachers. A chapel was also inaugurated.
In 1963, Philex shifted to full underground mining at 1414-ML. In the late 60’s, expansion
projects was planned. The new mill site at Banget was constructed. Level 4300 was
developed. The magnetite plant was also inaugurated. The Poro Point Conveyor Loading
pier in San Fernando City, La Union was completed.
In 1967, the employees established the first credit and consumer cooperatives with the
company providing Php 5,000 loan for their capitalization.
As part of the pollution control program, the construction of Tailings Dam No. 1 was the
major project in 1968.
The year 1968 marked several outstanding achievements in the various operations and
growth of Philex. The mine fully recovered from the ravages of the June 28, 1967 incident
(mud rush at underground) where production, development, and installations rose to
accomplishments above any previous annual period in Philex’s history. Also in 1968, Philex
entered into an operating agreement with Baguio Gold to explore, develop, and operate the
Sto. Niño Copper Project in Tublay, Benguet. In 1969, Philex filed applications for twelve
(12) offshore petroleum concessions and signed an agreement with the Philippine Overseas
Drilling and Oil Development Corporation (PHILODRILL). PHILODRILL was to operate the
concessions and pay to Philex a gross royalty. Philex also made a modest investment in
PHILODRILL.
After 15 years of existence, Philex had 10,000 stockholders and 2,200 employees.
PADCAL Operations
ApriI 2013
Chapter 9 Page 3
The 70's…
Tailings Pond No. 1 became operational in February 1972. Project 21,000 or increasing the
mill capacity to 21,000 tpd was undertaken in 1972-1973 and project 24,000 in 1974-1975.
1974 was the most unusual year for copper producers and Philex in particular. In almost all
respects, records were set by the company. The mine’s products, prices paid for its output,
gross and net income, foreign exchange generated and taxes, as well as cash dividends to
shareholders, were all at historic highs. Not to be outdone, nature contributed the most
severe late season typhoon yet experienced, causing heavy damage to camp facilities,
moderate damage to roads and bridges, and to a lesser degree to equipment.
The construction of the George C. Henry Shaft (GCH) was started in 1975. The shaft, at
depth of 405 meters, initially served the 1020-ML with fresh air, supplies, and access to
personnel. Later, the shaft was connected to 745-ML for a total distance of 618 meters.
In 1975, the first gold bullion was smelted. Also, in this year, Saint Louis High School –
Philex was established.
In 1976, Philex produced a total of 5,397 kgs or 173,517 ounces of gold, making it the
largest gold producer in the Philippines. In this year, Philex net Php 120 Million and
another Php 152 Million in 1979, two of the golden years of the company.
The 80's…
1980 marked the 25th year of Philex as a corporation and 23rd year of continuous operation.
Gold price at USD 850/oz was at all time high. While the Sto. Niño Mine was about to close,
a management agreement for the operation of the Batong Buhay Mine in Nueva Viscaya
was signed. Investment opportunities were made outside the mining venture – Firestone,
Armco Steel, and Citi Trust Bank among others.
The second Tailings Pond (Tailings Pond No.2) was completed in 1981.
1982, economically, was the most difficult year specially for the mining industry since the
great depression due to destabilizing elements such as inflation, deflation, bank failures,
interest rates, oil prices, and others. Construction of the New Mill at 745-ML was pursued in
PADCAL Operations
ApriI 2013
Chapter 9 Page 4
1982 but eventually deferred in 1984 on account of unfavorable economic situation. With
this deferment, the Cable Belt Conveyor (CBC) System was pursued in 1985 to continue the
delivery of the ore to the existing Banget Mill. Development of blocks below 1020-ML
ensued. The GCH shaft was connected to the 745-ML and became fully operational to the
lowest level.
Driving of the CBC tunnel was completed on October 13, 1987 and was commissioned in
April 1989.
Philex started to supply copper concentrate to PASAR in Isabela, Leyte in 1983.
Mr. Gerard H. Brimo, son of the founder Mr. Henry A. Brimo, joined Philex as Vice President
for Finance in 1985. He became Executive Vice President in 1986 and as President and
Chief Operating Officer in 1989.
The late 80’s was also marked by two occasions of labor strike, the first time in the history of
the company, 4 days in August 1986 and 13 days in December 1989. The Philex Mines
Supervisory Union was organized in 1989 and the first set of officers was inducted in
February 1990.
The 90's…
1990 was the most trying time in the 33 years of mining operations in Padcal due series of
natural calamities – the July 16 earthquake and the succeeding typhoons. It was also a year
of heroism. Philex miners risked their lives to help in the rescue operations at Hyatt Hotel in
Baguio City. Even if Philex is suffering from its own operational problems and difficulties, it
still went out of its way to help victims when Mt. Pinatubo erupted in 1991.
The development of first blocks at 908-ML and its subsequent operation in driving the
Bumolo Ramp were the major events in the early 90’s. The mine and mill operation
underwent re-engineering and marked the mechanization of the mine with the shift from
slusher method to LHD mining. The rehabilitation of the 22-km Philex-Kias provincial road
commenced in 1991 and became an all-weather concrete road when it was fully completed
in February 1994.
Tailings Pond No. 3 was operational in 1992.
PADCAL Operations
ApriI 2013
Chapter 9 Page 5
For the first time in the history of Philex, manpower downsizing by 20% was implemented
through early voluntary retirement and redundancy, reducing the manpower to 1,010
employees in 1993. The company further reduced manpower by more than 500 in 1996 and
another 124 employees in 1999.
Mr. Gerard H. Brimo became the new chairman of the board when Mr. Henry A. Brimo
retired in 1994 after 39 years with the company. The son took over the helm and led the
mining industry for the passage of the New Philippine Mining Act in 1995. RA 7942 gave the
industry the much needed shot to its revitalization.
In 1997, Philex became the largest copper and gold producer in the Philippines. Gold
production reached 9.4 Million grams, including that of Bulawan. 5.9 Million grams was
produced by Padcal, more than double of its production in 1996 at 2.8 Million grams. It was
the highest in the mine’s 39 years of operation. Bulawan accounts for 3.5 Million grams. It
was ironic that these milestones were achieved at a time of cyclically low metal prices.
The locomotive system of ore delivery was fully phased out in 1997, and the CBC became
the sole ore transport to the Banget Concentrator.
2000 and beyond…
Year 2000 came in with lots of challenges and opportunities for Philex. In Padcal Mine, two
underground crushers were installed in 2000 and became operational in 2001 to provide a
uniform feed to the feeder belts and the Cable Belt to improve productivity.
Philex Padcal’s Environmental Management System earned its ISO 14001 certification in
September 2002.
2003 is another significant year as it marked another transition for Philex. First, Dr. Walter
W. Brown joined Philex as President and Chief Operating Officer and later became the
chairman when Mr. Gerard H. Brimo retired in December 2003. Second, the development of
the 782-ML, the lowest and the last mining level also started in 2003. The first mining block
will be commissioned into production by latter part of 2005. This additional source is
expected to offset very low copper and gold grades of the ore sources from the fringes of
908-ML.
PADCAL Operations
ApriI 2013
Chapter 9 Page 6
In 2005, Philex celebrated its 50th year of incorporation. Overall, the company continues to
make progress. On the operational side, continuous programs were undertaken of
upgrading the Padcal mine and mill equipment in order to stabilize operations and increase
operating efficiencies. The 782-ML was inaugurated in November 2005 but was officially
commissioned in January 2006. Declared mine life of the Padcal mine is until 2011.
2006, the 51st year of the company’s existence was again marked by another milestone,
having had the highest earnings in the history of Philex so far. The rise in production levels
as a result of increased production from the 782-ML of the Padcal mine, significant increase
in metals prices, as well as higher ore grades, resulted in record revenues of Php 9.960
Billion. Net income was Php 3.087 Billion, or Php 1.044 per share. As result of careful
review of the ore reserves, anticipated production capability and attendant costs, and after
considering conservative projections of metal prices, the programmed economic life of
Padcal Mine has been extended by three years from the previous plan of closing by year
2011 to 2014.
The favorable trend continued in 2007. The continued rise in both gold and copper prices
coupled with significant increase in the quantity of metals produced, led to another landmark
year. Revenues of Php 12.2 Billion and net income of Php 5.0 billion surpassed 2006
records by 23% and 62%, respectively. Philex continued to focus on stabilizing and
improving operational capability.
After a few years of rising and historical record high for both copper and gold, in 2008, Philex
and the rest of the mining industry were again reminded of the certainty that commodity
prices are cyclical. From its high of around USD 4.00 per pound in April 2008, copper prices
dropped to as low as USD 1.26 per pound in December 2008. There was less severe
correction in the prices of gold, from near USD 1,000 per ounce to USD 712 per ounce in
December 2008. This negative effect of the decline in prices aggravated by lower
production volume and ore grade in both copper and gold, all contributed to the 19%
decrease in operating revenue net of marketing charges from Php 11.2 Billion to Php 9.0
Billion.
In 2008, the First Pacific Group of Hong Kong entered at Philex as a major shareholder.
Their entry, together with the continued involvement of other long-term investment groups,
not only strengthened the financial capability of the company but likewise increased its
capability to expand activities locally and abroad.
PADCAL Operations
ApriI 2013
Chapter 9 Page 7
2009 was another year of challenges and transition for the company. Manuel V. Pangilinan,
Managing Director and Chief Executive Officer of First Pacific seated as Chairman of the
Board of the company. First Pacific has chosen Philex to be the key company in its entry to
mineral and natural resource development. This is because of Philex’s reputation of being
responsible and profitable operator with mature mining assets.
Also, in 2009, the company benefitted from the rise in metal prices from the lows seen the
previous year. During the year, gold price reached as high as USD 1,214 per ounce in
December 2009 while copper price rallied towards the latter half of the year, reaching a high
of USD 3.33 per pound in December 2009.
The Padcal mine, however, had unusually high rate of operating setbacks during the year,
such as the entry of watery and clayey material that not only diluted ore grades but also
caused problems in the conveyor belt, frequently interrupting the 2.3 kilometer-long conveyor
that feeds the mill. Consequently, milling tonnage decline to 8.2 Million tonnes from the 8.9
Million tonnes of 2008.
Development works for the year were concentrated in the 908-ML and 782-ML, including the
advance development activities in preparation for the scheduled commissioning of
drawpoints for 2010, undertaken during the later part of the year. During the last quarter of
the year, the Sublevel Mining Project at 867-ML and 840-ML commenced in order to recover
the uncaved portion of the high grade ore source at 782-ML Cental Block.
A new twin-shaft sizer was also installed at 745-ML Feeder Belt Conveyor no. 1, the first of
its kind in the Philippines, which allow the ore to undergo comminution before reporting to
the conveyors. During the year, the installation of the 35 meters Sacrificial Belt between the
loading chutes and the Cable Hauled Conveyor (CHC, formerly termed as CBC) was also
completed. The installation of which is another milestone for the operations that eventually
prolonged belt life and drastically reduced delays.
Along with the improvements in the mine, the mill plant completed the installation of six (6)
units of 50 cum WEMCO Smart flotation cells to replace the old Agitair flotation machines.
This new equipment resulted in an additional flotation volume of about 180 cubic meters to
the rougher flotation circuit which is expected to improve overall metal recovery.
In 2009, Padcal mine life was officially declared to be up to 2017.
PADCAL Operations
ApriI 2013
Chapter 9 Page 8
The second half of 2010 saw the Padcal Mine’s full recovery from the operating setbacks
that started in 2008. The 867-ML and 840-ML Sublevel Mining Project were in full
production by July as source of high grade ores in addition to the 66 drawpoints
commissioned at 908-ML South Block. Along with the addition and improvement of ore
sources, the operation has sustained to keep ore handling and conveyance delays to the
minimum and propelled equipment availability with the six brand new LHD units added to the
fleet underground. The mill operations also reaped the benefits of the installation of
WEMCO Smart Cell as it increased the flotation capacity and retention time, thus
contributing to the increased metal recovery by lowering the tails grade. Another
improvement in the Mill is the installation of one (1) unit Metso C100 Jaw Crusher to replace
the old Pioneer Oro Jaw Crusher, increasing mechanical availability and efficiency in the
primary crushing operation.
The outcome of Padcal’s perseverance and creativity was the highest annual tonnage of 9.4
Million tonnes since 1987.
2010 was also a buoyant year for the Philippine mining industry, as gold and copper prices
reached all-time highs. During the year, the price of gold reached a high of USD 1,421 per
ounce and averaged USD 1,224 for the year. The price of copper went as high as high as
USD 4.41 per pound and averaged USD 3.42 per pound. With this favorable trend, re-
evaluation of Padcal’s present mineral resources was undertaken during the year to see if
more of it could be classified as ore reserves, and justify the investment in the development
works needed to extend the mine life beyond 2017.
2011 is another record year for Padcal surpassing its 2010 records in terms of tonnage,
grade and metals production. Tonnage for the year is 9.49 million tonnes, higher by 1%
compared to 2010. Copper grade of 0.221 %Cu and Gold grade of 0.564 g/t were both
higher by 5% and 2% than in 2010, respectively. Copper production of 37.9 Million pounds
is higher by 7% and gold production of 140,113 ounces is higher by 5%, both compared to
last year.
Major improvements in the mine for the year include the modification of Feeder Belt
Conveyor No.17 and installation of Feeder Belt Conveyor No. 19 at 773-ML which resulted
to the flexibility of the conveying system. A total of 100 drawpoints has been commissioned
for the year, 85 drawpoints at 908-ML South Block and 15 drawpoints at 782-ML North
Block. Development works during the last quarter of the year were also focused on the
PADCAL Operations
ApriI 2013
Chapter 9 Page 9
driving of extension of drilling drifts at 867-ML and 840-ML as source for 2012, including the
preparation of PL 8,9,10,12, and 13 at 908-ML North Block for the scheduled pillar robbing
by 2012.
In August 2011, Padcal’s mine life was extended further to 3 more years from its previous
declared mine life of up to 2017 to be extended until year 2020. This is the result of the re-
evaluation of its mineral resource, converting a portion of which into reserves based on
better metal prices projections and its mineability. The additional reserves will be coming
from the 798-ML, a new mining level scheduled to be developed by 2012 and will be in
production by 2015.

PADCAL Operations
ApriI 2013
Chapter 10.0
PADCAL Operations
ApriI 2013
Chapter 10 Page 1
10.0 HISTORY OF PRODUCTION
10.1 Production history of district and area
Philex Mining Corporation has been mining the Sto. Tomas II orebody within MPSA 156 as
early as 1958 using surface ore extraction method. Coinciding with the construction of a mill
plant, the operation started at a meager rate of 800 tons per day. The rate gradually
increased as the mill was continuously improved. Three years after the operation grew to
1.2 million tons per annum.
The year 1959 marks the era of first underground production in PHILEX when the first stope
at 1440 meter level was brought into production. A total of 11 million tons was extracted at
this level which sustained the operation for 13 years.
With the need to increase production and waning of better grade ore source at 1440 ML,
1320 meter production level was commissioned in 1967. Mining ore below the existing
haulage level called for the construction of a production shaft that will allow ore from 1320
ML to be hoisted to the 1425 haulage level. Level 1320 contributed 18 million tons of ore
and at some point was producing at the same time with another mining level, the 1190 meter
level to produce 24,000 tons of ore per day.
The 1190 ML was commissioned in 1972 as part of the “Project 24,000” which allowed the
mine to deliver the same amount of ore daily. The mill has undergone major improvements
prior to this, with the construction of Banget Copper Concentrator. This level was able to
contribute 54 million tons of ore. The next mining level by far produced the most tonnage for
the Padcal operations, the 1060/1020 ML, contributing a total of 134 million tons of ore. This
level also was characterized as the first “high-lift” mining level that was mined. 1015 and
975 mining levels were mined because of its high metal grade contents. These levels were
commissioned in 1995 and 1994 respectively.
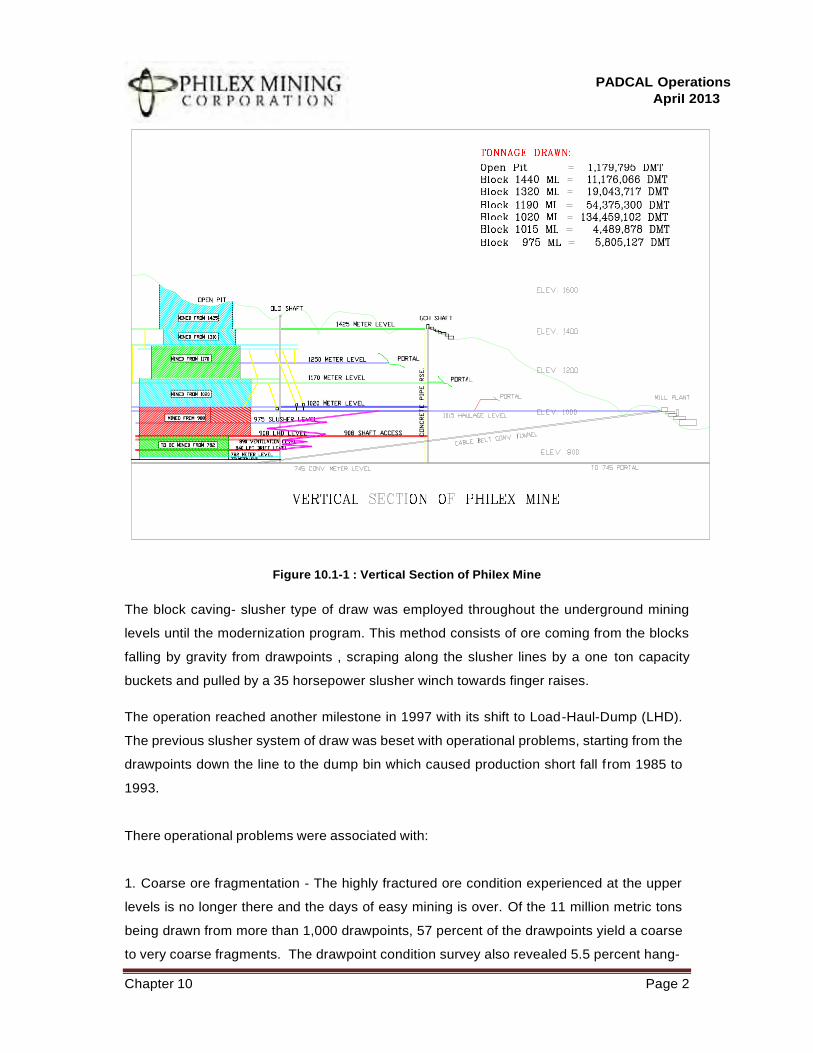
PADCAL Operations
ApriI 2013
Chapter 10 Page 2
Figure 10.1-1 : VerticaI Section of PhiIex Mine
The block caving- slusher type of draw was employed throughout the underground mining
levels until the modernization program. This method consists of ore coming from the blocks
falling by gravity from drawpoints , scraping along the slusher lines by a one ton capacity
buckets and pulled by a 35 horsepower slusher winch towards finger raises.
The operation reached another milestone in 1997 with its shift to Load-Haul-Dump (LHD).
The previous slusher system of draw was beset with operational problems, starting from the
drawpoints down the line to the dump bin which caused production short fall from 1985 to
1993.
There operational problems were associated with:
1. Coarse ore fragmentation - The highly fractured ore condition experienced at the upper
levels is no longer there and the days of easy mining is over. Of the 11 million metric tons
being drawn from more than 1,000 drawpoints, 57 percent of the drawpoints yield a coarse
to very coarse fragments. The drawpoint condition survey also revealed 5.5 percent hang-
PADCAL Operations
ApriI 2013
Chapter 10 Page 3
ups above the drawpoint brow. At the 908 meter level, where the rock mass is considered
very competent. All joints and fractures are totally yield with gypsum and anhydrite veins
making the fracture frequency per meter less than 2. Likewise the matrix or ground mass
of the rock is strongly silicified giving an intact rock mass strength of 140 megapascal. The
rock mass rating based on Laubscher’s classification is 60.
At the upper levels, specifically at 1020 meter level there are at least three prominent joint
sets that compose the rock mass. The rock mass rating at this level is 43. Considering
that most of joints are open with in-fillings of gypsum.
The coarse ore fragmentations results to hang-ups at the finger raises, clogged boulders
are brought down by high packing.
2. Excessive water inflow in the caved mass - About 4 million metric tons of ore or 20
percent of the drawpoints are infiltrated with water. Water in the mine generally enters from
the periphery of the cave domain through the failure zone and open structures, only 10
percent of the volume of water is attributed to the direct penetration of rain water at the
subsidence area. The water table is measured at elevation 1100 meters. Water inflow
has increased by 400 percent after the 1990 earthquake. The horse tailing end of the
Albian fault is the main passage of water into the mine. Measurements from all our drain
tunnels indicate an annual average of a little less than 4,000 gallons per minute during the
rainy months of August to November from 1990 to 1994. Approximately 10 percent of this
figure report to our ore passes and into the ore haulage system. The Sta. Fe fault at the
northeast of the orebody is impermeable but the area beyond the foot wall side is watery.
At the drawpoints, the water renders the ore sticky and fluidized. Drawing of stick ore
requires frequent secondary blasting. The fluidized ore result to mudrush which poses
hazards to men. At the slusher lines and transfer raises, the water and ore are scraped at
the transfer raises. When pulled out, this results to blow outs at the loading chutes.
Derailment of mine cars and damage to conveyor structures will result. There is also a
severe siltation at the haulage drift which requires additional equipment to clear the
spillages. In order to control water underground various dewatering measures were
undertaken.
At the underground, dewatering dogholes and drain raises were driven below the slusher
lines in a direction across the orientation of the slusher lines. Closely spaced grizzlies are
PADCAL Operations
ApriI 2013
Chapter 10 Page 4
provided to drain the silt and water. At the long transfer raises, at the footwall above the
loading chutes: grizzly, vibrating screen and spiral classifier are installed to dewater the silt
and water from the long transfer raises.
3. Early entry of dilution and weight problems - The uneven drawing of ore from the
drawpoints attributed from hang ups, sticky ore and fluidized ore have resulted to some
extent to an early entry of dilution and pressure.
Comprehensive researches and studies including actual observation from mines abroad
employing LHD mining coupled from the ideas culled from these trips and inputs from foreign
consultants have convinced PHILEX to shift to LHD extraction method. The LHD drawpoint
is capable of handling coarser ore than the drawpoint in the slusher method. It can address
water related problems since the water coming from the drawpoints can be diverted to the
drain level. In the slusher method water from the drawpoint report at the transfer raises.
Early dilution and pressure can significantly be reduced since the coarser ore can be drawn
easily and regularly. The pillars in the LHD method are thicker thus stronger and more
resistant to weight pressure.
The succeeding production levels at 975 ML, 908 ML and 782 ML were mined using this
method that allowed Philex to sustain 9 million tons per annum operation.
In 2005, the Padcal mine commissioned its lowest mining lift, the 782 ML, aimed to replace
better grade ore sources mined out in 908 ML.
10.2 Previous mining areas
The location of the mining activities is within the coordinates of MPSA 156 defined in
Chapter 7.
PADCAL Operations
ApriI 2013
Chapter 10 Page 5
10.3 GeneraI description of mining, ore beneficiation, concentrate, mineraI product
market
Extraction was done initially using surface mining method called open pit at a rate of 800
tons per day. Shortly, this shifted to underground mining employing block caving with
slusher as type of draw then later on advanced to a more mechanized Load-Haul-Dump
(LHD) units which ramped up the production rate to 25,000 tons per day. Caved ore were
extracted at slusher drifts (during the slusher era) and drawpoints (LHD mining) of the
production level. The ore underwent size reduction techniques through either manual or
mechanized rock breaking techniques. Recently, underground crushers were installed to
ensure that the biggest size of the run of mine is six inches. Ore was transported to the mill
at the surface using diesel locomotives and presently using cable hauled conveyor.
The flotation method was used to recover the minerals from the ore. First ore undergoes to
a process of communition or the process of further breaking the ore to the mineral’s
liberation size through stages of crushing and grinding. The grinded ore, then is introduced
to reagents which separates the valuable minerals containing copper, gold and silver, to the
gangue. The final product of the milling and metallurgical process is copper concentrate
which are shipped to the smelters.
Philex Mining Corporation has been for decades, one of the largest producer of copper and
gold in the Philippines.
10.4 Tonnage mined and soId
The Padcal operations since start has already mined and processed 362 Million tons of ore
and produced and sold 201 billion pounds of copper, 6 million ounces of gold and 6 million
ounces of silver as of July 2012.
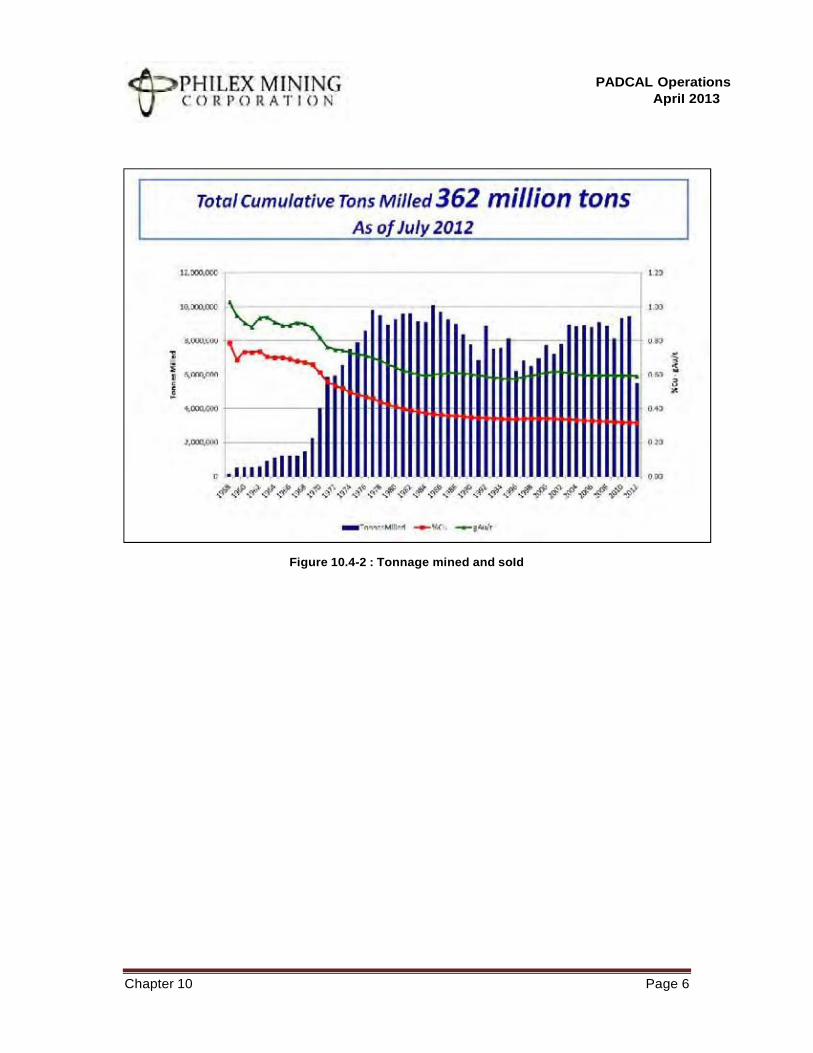
PADCAL Operations
ApriI 2013
Chapter 10 Page 6
Figure 10.4-2 : Tonnage mined and soId

PADCAL Operations
ApriI 2013
Chapter 11.0
PADCAL Operations
ApriI 2013
Chapter 11 Page 1
11.0 GEOLOGY
11.1 Regional and Local Geology
The Philippine Archipelago lies in the West Pacific Ocean, just north of the junction of three (3)
great tectonic plates of the lithosphere, the Eurasian Plate, the Pacific Plate and the Indo-
Australian Plate. It forms a roughly triangular area bounded by the Bashi Channel on the north,
the North Luzon-Manila-Palawan Trench and the ridge system on the west, the Sulu-Sabah
Ridge Complex and Cotabato Trench on the south and the Philippine-East Luzon Trench on the
East.
Morphologically, the Philippines may be described as a composite of linear, subparallel ridges
alternating with basins and troughs following the trend of bordering trenches. The ridges are
upthrusted and/or uplifted belts of ophiolite and volcano-plutonic complexes. The intervening
lows are sedimentary basins and troughs exposed partly on land areas following uplift of folding.
The archipelago is defined by a main arc of islands facing the Pacific and two (2) narrower arcs
projecting from its southwest flank linking it to Borneo. The main arc may be viewed as made
up of convex arcs, the northern arc convex westward and the southern arc, convex eastward
The Baguio Mineral District, where Philex Mine sits, is underlain by Cretaceous-Paleogene
metamorphosed sediments and volcanics locally known as the Zigzag-Pugo Formation. The
volcanic rock units consist of spilitic basalt, andesite flows, green tuffs, tuff breccias and
volcano-clastics overlain by sediments consisting of sandstones and red and green tuffaceous
shales. These are metamorphosed in varying degrees.
Overlying the basement rocks to the western side of the project area are marine sediments of
the Kennon Limestone, Twin Peaks Formation and the Klondyke Conglomerate. The
hornblende – biotite – quartz diorite intrusive of the Agno Batholith intruded the basement rocks
to the east giving a narrow zone of hornfels associated with pyritization. The age of the
intrusive is Middle Miocene with K-Ar date of 15 Million Years.
Intermediate to felsic intrusives in the form of stocks, dikes and flat bodies were found up to the
lower member of the Klondyke Conglomerate. Porphyry copper deposits are localized within
these felsic intrusive stocks.
PADCAL Operations
April 2013
Chapter 11 Page 2
11.2 Local Lithology
The following lithologies occur within the Padcal deposit:
Andesite Porphyry (Ap): This rock type is located within the center of the Santo Tomas II ore
body and represents the “low grade” core. It is porphyritic in texture with diagnostic sub-
rounded plagioclase phenocrysts, light gray in color and weakly mineralized. It was dated to be
about 1.9 million years (Early Pleistocene age) through K-Ar dating.
Hornblende Andesite (Ha): This lithology is similar to the andesite porphyry, but has somewhat
coarser hornblende phenocrysts and may somewhat postdate the andesite porphyry.
Clear Diorite (Cd): Texture is medium hypidiomorphic granular. The texture, however
is commonly obliterated where high silicification was observed. Subhedral plagioclases of
andesine to labradorite compositions are fresh, but some are partly altered to sericite, calcite
and alkali feldspar. Mafic minerals, hornblende and to a lesser extent biotite are partly or
wholly altered to chlorite, secondary biotite, calcite and magnetite. The dominant alteration
mineral is strong silicification. This rock type was dated through zircon fission track dating at 2.1
Ma (Late Pliocene).
Dark Diorite (Dd): Subhedral to anhedral plagioclase, hornblende and quartz
phenocrysts in seriate series set in an extremely fine grained to aplitic quartz- feldspathic
groundmass. Plagioclase phenocrysts are composed of andesine- labradorite exhibiting
twinning and zoning. Some phenocrysts partly replaced by sericite and calcite, others have
alkali feldspars along cracks and margins of the crystals. Hornblende is fresh to partly to wholly
replaced by secondary biotite and to a lesser extent by chlorite and calcite. It’s dark color is due
to its fine texture and to fine magnetite and secondary biotite disseminations. This rock is the
most mineralized and altered among the intrusive rocks in the area. It was dated at 3.8 Ma (K-
Ar) or Late Miocene.
Metamorphosed Sedimentary and Volcanic Rocks (Ma): This is the country rock unit belonging
to the Zig-Zag-Pugo Formations of the Baguio District and is believed to be of Paleogene age.
It consists of regionally metamorphosed andesite and tuffaceous rocks with intercalated
sedimentary intervals. The texture is variable ranging from aphanitic to porphyritic
and hornfelsic. It is usually dark in color. Mineralization near contact with the diorite
PADCAL Operations
April 2013
Chapter 11 Page 3
intrusive is strong and decreases outward to a maximum radius of about 200 meters from the
contact.
11.3 Alteration
Alteration is typical of porphyry copper deposits. Main alteration assemblage
associated with copper sulfide mineralization is quartz-biotite-chlorite-actinolite-
gypsum/anhydrite that is typical of potassic alteration. Orthoclase, which is characteristic
of alternation in the potassic zone, is absent. Sericite is also weak. Below the 1100ML, or
about 1,100 meters above mean sea level, gypsum fracture fillings give way to anhydrite
fracture fillings. Below 1,100 meters, the anhydrite fracture fillings cause the ore to be
somewhat more competent which causes very coarse in fragmentation when the rock is caved.
Phyllic and argillic alteration with pervasive clay, pyrite and silicification were mapped only near
surface at the subsidence area. A possible pyrite halo is observed underground at the
fringes about 200 meters from the ore boundary. Enveloping these alteration halos is the
propylitic zone with chlorite dominating the fringe ore zone and epidote gradually increasing
outwards.
11.4 Structural Geology
The Archipelago is classified into two major structural units, a mobile belt and a stable region.
The mobile belt is a broad zone of active deformation characterized by pronounced seismicity
and volcanism that runs longitudinally throughout the entire length of the archipelago. Tectonic
activity is defined by active crustal underthrusting or subduction along its bordering trenches.
On the east, the Philippine Sea floor is underthrusted along a west-dipping subduction zone
marked by the Philippine Trench. On the west, the South China Sea bottom is underthrusted
along the east dipping Manila Trench. Active subduction is likewise occurring along the east-
dipping Negros and Cotabato Trenches.
In contrast to the mobile belt, the southwestern part of the archipelago which embraces mainly
Palawan and Sulu Sea is generally considered a stable or aseismic zone. The Sulu and
Palawan trench-arc complexes appear as generally inactive subduction systems which in north
Palawan show a remnant of continental platform developed most probably in the Early Jurassic.
PADCAL Operations
April 2013
Chapter 11 Page 4
Geologic structures of the Archipelago consist fundamentally of folds and faults (crustal
fractures). On the basis of their axial trends, the folds may be classified into three (3) distinct
sets:
1. A NW-SE set which includes folds with axial traces ranging between N45W to N10W;
2. A NE-SW set which includes folds with axial traces ranging between N5E to N45E;
3. A N-S set which includes folds with axial traces ranging between N10W to N5E;
Faults are generally described as transcurrent faults, normal faults and thrust faults. The
Philippine Fault is the greatest transcurrent fault in the Philippines. It is traceable for about
1200km, from Lingayen Gulf on the north, thence along the southern border of the Luzon
Central Cordillera, Polillo Strait, Tayabas Isthmus, Masbate, Leyte, Agusan and into the Davao
Gulf on the south. It is determined by many workers as a strike-slip, left-lateral fault.
Normal faults of varying magnitude are sporadically distributed throughout the archipelago.
Among the prominent ones are faults in Ilocos Norte, Cagayan Valley, Mindoro and Cotabato.
The more important thrust faults generally occur along the borders of the main Philippine arc
and Sulu arc. Examples of the significant ones are those along the western edges of Mindoro,
in Panay, in the Bicol Region, in Surigao del Norte, Surigao del Sur, Central Mindanao, Davao
Oriental and some parts of Lanao and Cotabato.
All significant gold mineralization are localized along fault structures bounded by the splits of the
Philippine Rift. Three (3) sets of faults are prominent in the Philex area:
1. North-South fault – almost parallel to the regional structure of the Central
Cordillera. Most prominent of the North-South is located south of Philex in the
headwaters of Toboy River along which shear zones of tens of meters are
developed. Approaching the orebody, it becomes unclear because of later
disturbances in the ore zones.
2. East-Northeast Fault – most conspicuous in regional topography are shear
zones, veins and dikes of gold-bearing quartz, gouge and andesite. Northeasterly
faults are well defined along the western contact of the Agno Batholith and
PADCAL Operations
April 2013
Chapter 11 Page 5
named from north to south as Sta. Fe Fault, Bumolo Fault, Albian Fault, Wilson
Fault, San Expedito North and South and North Faults. They are recurrent in
nature.
3. Northwesterly fault is complimentary to the above two and the most closely
associated with porphyry copper mineralization.
In the Philex Mine in Benguet, the two (2) major faults considered of importance are the Sta. Fe
Fault and the Albian Fault.
The Sta. Fe Fault is one of the major structures transecting the Sto. Tomas II orebody. It is a
normal strike-slip fault with a right-lateral component. It extends in a northeast-southwest
direction, intercepting the orebody at around 908ML while dipping southeast at 60°, steepening
to an angle of 70° at depth. Exposures of the fault at the mining levels and drillholes
intercepting the fault exhibit 40-60m thick gougy zones with some slickensides showing dextral
movement. The fault is interpreted to be pre- or syn-mineralization in timing, though a syn- to
post-mineralization activation is also possible due to evidences showing a possible truncation of
the orebody at depth towards the northeast.
The Albian Fault is the structure regarded as the primary conduit of mineralized fluids during the
formation of the Sto. Tomas II orebody. It is a northeast trending, southeast dipping fault similar
to the Sta. Fe, and also being located only a few hundred meters south of the latter. The Albian
fault splits into three branches at the orebody with the northern branch dipping 80° southeast
and the southern branch dipping 50°. Towards the northeast away from the orebody, it is
manifested by the steeply-walled Albian Creek.
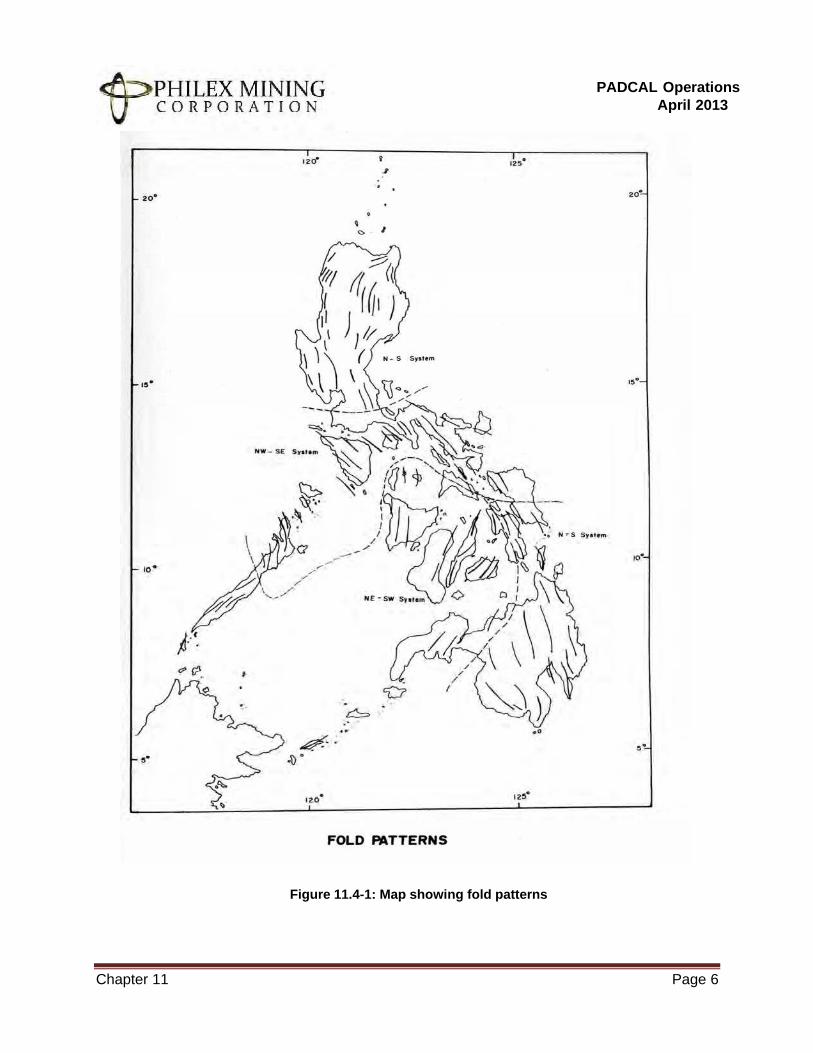
PADCAL Operations
April 2013
Chapter 11 Page 6
Figure 11.4-1: Map showing fold patterns
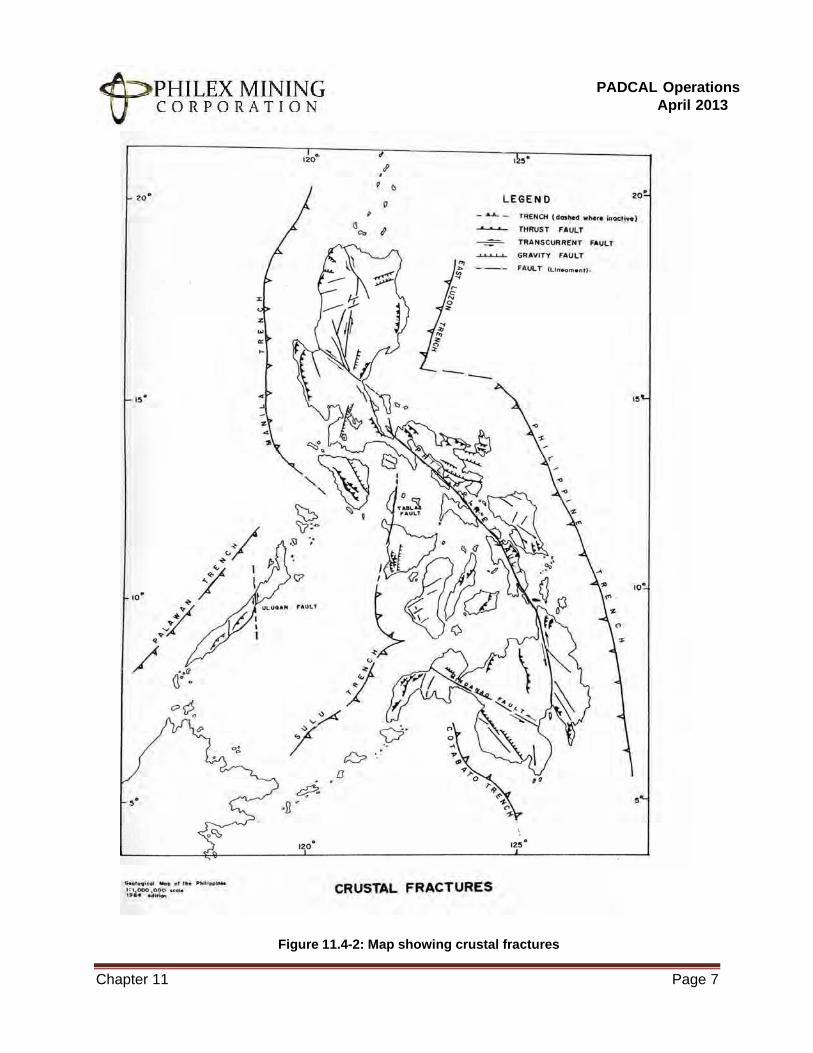
PADCAL Operations
April 2013
Chapter 11 Page 7
Figure 11.4-2: Map showing crustal fractures
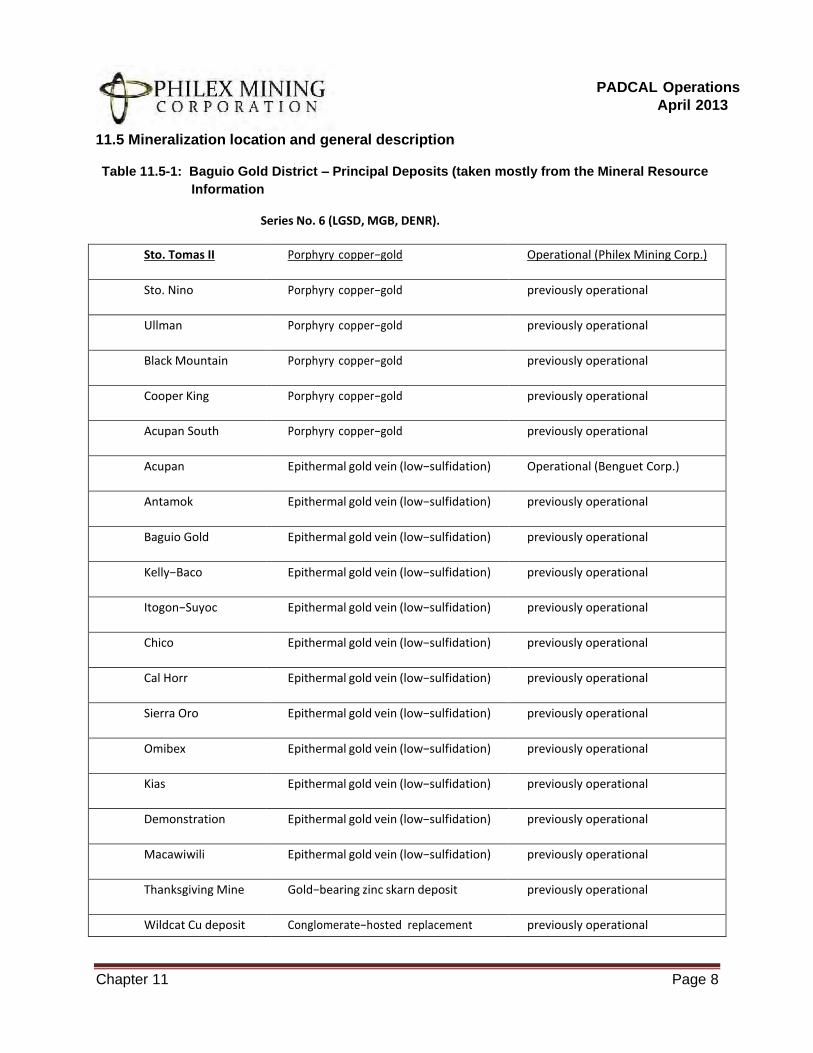
PADCAL Operations
April 2013
Chapter 11 Page 8
11.5 Mineralization location and general description
Table 11.5-1: Baguio Gold District – Principal Deposits (taken mostly from the Mineral Resource
Information
Series No. 6 (LGSD, MGB, DENR).
Sto. Tomas II Porphyry copper−gold Operational (Philex Mining Corp.)
Sto. Nino Porphyry copper−gold previously operational
Ullman Porphyry copper−gold previously operational
Black Mountain Porphyry copper−gold previously operational
Cooper King Porphyry copper−gold previously operational
Acupan South Porphyry copper−gold previously operational
Acupan Epithermal gold vein (low−sulfidation) Operational (Benguet Corp.)
Antamok Epithermal gold vein (low−sulfidation) previously operational
Baguio Gold Epithermal gold vein (low−sulfidation) previously operational
Kelly−Baco Epithermal gold vein (low−sulfidation) previously operational
Itogon−Suyoc Epithermal gold vein (low−sulfidation) previously operational
Chico Epithermal gold vein (low−sulfidation) previously operational
Cal Horr Epithermal gold vein (low−sulfidation) previously operational
Sierra Oro Epithermal gold vein (low−sulfidation) previously operational
Omibex Epithermal gold vein (low−sulfidation) previously operational
Kias Epithermal gold vein (low−sulfidation) previously operational
Demonstration Epithermal gold vein (low−sulfidation) previously operational
Macawiwili Epithermal gold vein (low−sulfidation) previously operational
Thanksgiving Mine Gold−bearing zinc skarn deposit previously operational
Wildcat Cu deposit Conglomerate−hosted replacement previously operational

PADCAL Operations
ApriI 2013
Chapter 12.0
PADCAL Operations
ApriI 2013
Chapter 12 Page 1
12.0 MINERAL PROPERTY GEOLOGY
12.1 GeoIogicaI work undertaken by the company in the property
During the period 2004-2012, the company has undertaken numerous geological work across 8
prospects enclosed in its three tenement claims: Sto. Tomas II in MPSA-276-2009-CAR;
Bumolo, Southwest, Bumolo 2, Butan, Midway and Copper Queen in MPSA-156-2000-CAR;
and Tapaya in MPSA-157-2000-CAR. Focus of the discussion is on the Sto. Tomas II orebody.
MPSA-276-2009-CAR
(Sto. Tomas II)
For MPSA-276-2009-CAR, fifty-three (53) holes were drilled since 2008. The first 3 holes sat at
the NE and SW peripheries of the Sto. Tomas II Orebody at 908ML. They were aimed to find
lateral extensions of the orebody. An aggregate meterage of 1,868.60m was drilled, and it
intersected a discontinuous zone of marginal Cu and Au grades.
Meanwhile, of the 53 holes, 36 were aimed to find vertical ore extensions of the Sto. Tomas II
Porphyry Cu-Au Mine below the current lowest mining level, which is 745ML. This endeavor,
which commenced on October 2008 and ended on September 2011 sunk a total meterage of
18,505.30m of scout and definition drillholes stationed at 5 diamond drilling stations (DDS).
These stations were constructed at accessible drifts at the peripheries of the mineralized
porphyry stocks at 773ML.
Furthermore, 14 of the remaining holes were placed at 840ML. 11 of these holes were
confirmatory, which summed 796.60m. The last three were exploratory, probing through the
northern periphery of the orebody. A total meterage of 1,373.90m were drilled for these holes.

PADCAL Operations
ApriI 2013
Chapter 13.0
PADCAL Operations
ApriI 2013
Chapter 13 Page 1
13.0 MINERALIZATION
The different prospects within the vicinity of Padcal can be generally divided into copper-gold
porphyry prospects and the gold vein prospects. Sto. Tomas II, Bumolo, Bumolo 2/Sta. Fe,
Southwest, Southwest Breccia and Tapaya fall under the copper-gold porphyry prospects while
Butan, Midway and Copper Queen are classified within the gold vein prospects. Discussed
below are the different mineralization characteristics of these areas.
Sto. Tomas II (Below 773ML)
Mineralization Overview
Mineralization within the Sto. Tomas II orebody is associated with the various diorite porphyry
stocks (Dark diorite, Clear diorite, Andesite porphyry, and Quartz diorite/Tonalite) which have
intruded the basement meta-andesite wallrocks of the Pugo-Zigzag Formation. These intrusive
stocks are said to be related to the diorite and dacite porphyries of the Black Mountain Quartz
Diorite. Among the porphyry stocks in the area, the dark diorite (DD) is the principal ore bearing
rock. The inter-mineral clear diorite on the other hand is less mineralized than DD. The andesite
porphyry (AP) is characteristically low in copper but high in gold while the post-mineral quartz
diorite (QD/tonalite) is almost devoid of both copper and gold. Subsequent exploration drilling
activities discovered a structurally controlled gold-rich, copper-poor zone at 400-500 meter level
was also discovered at the northeast fringe of the orebody. It has an apparent thickness of 117
meters along drillhole intercepts and is noted to occur in CD and some meta-andesite. Likewise
a deeper gold-rich interval of post-porphyry copper-gold mineralization was also intersected in
one of the holes collared at the northeast, hosted in a sericitized quartz-gypsum vein in meta-
andesite and located at approximately -150 meter level.
Style and Type of Mineralization
The Sto. Tomas II prospect resembles a typical porphyry style of mineralization. It is a copper-
gold deposit, with rare molybdenite as well as traces of palladium-bearing minerals. Within the
main orebody, chalcopyrite and bornite are the most common copper minerals occurring as
PADCAL Operations
April 2013
Chapter 13 Page 2
stringers, veinlets, and disseminations. Covellite and chalcocite are also noted as replacements
of bornite and some chalcopyrite, albeit only partially. Other sulfides noted include galena and
sphalerite.
Occurrence of gold is revealed to be along grain boundaries with some interstitially to quartz.
Observations from microscopy determined them to be either attached or locked in bornite and
chalcopyrite, with more preference for bornite; this shows a 60 percent preference of native gold
as attachments to copper minerals. Other occurrences observed are also in fine pyrite, and
within quartz veins/veinlets.
Four distinct ore zones within the Sto. Tomas II deposit were identified; these are namely the
high bornite zone, low bornite zone, low copper-high gold zone, and the fringe/low copper-gold
zone. The high bornite or high gold zone is regarded as the main ore zone, with bornite to
chalcopyrite ratio from 1:1 to 1:4 and concentrate grade of >27 percent Cu and 40 to 50g Au/t.
Rock types within this zone consist of the dark diorite, clear diorite, and some meta-andesite
portions. The low bornite zone on the other hand envelops the main ore zone, with bornite to
chalcopyrite ratio from 1:3 to 1:8 and concentrate grade of 24 to 25 percent Cu and 30 to 40g
Au/t. Rock types in this zone includes clear diorite and meta-andesite with less quartz
stockworkings than those from the high bornite zone. The low copper-high gold zone is also
known as the barren core zone. This is mainly composed of the andesite porphyry which is
characteristically high only in gold content. Bornite-copper ratios are from 1:3 to 1:4 while the
concentrate grade is 20 to 22 percent Cu and >40g Au/t. The fourth ore zone is the fringe ore
zone, which is generally low in both copper and gold and envelops mainly the low bornite zone.
Bornite-copper ratios are from 1:3 to 1:4 with concentrate grade of 20 to 23 percent Cu and
<30g Au/t.
Subsequent drilling activities were also conducted to characterize the orebody at depth. At 773
meter level and below, copper and gold occurrence is generally related to the persistence of
chalcopyrite along wallrock-intrusive contacts; specks of bornite are also encountered but are
mostly confined in fractures and veinlets. Sphalerite and galena are also present but usually
related to post porphyry copper mineralization. Within the wallrock, chalcopyrite and pyrite
generally occur as fine disseminations, stringers and fracture fills. Short intercepted intervals of
dark diorite exhibited decreased values of chalcopyrite, pyrite, and bornite mineralization, with
strong propylitic alteration. In clear diorite, chalcopyrite and pyrite occur as specks and
PADCAL Operations
April 2013
Chapter 13 Page 3
disseminations in fractures and veinlet fills while bornite is rarely seen. For andesite porphyry,
pyrite is dominant with traces of chalcopyrite. The quartz diorite or tonalite body is almost barren
of mineralization, owing to its post-mineral timing. The hydrothermal breccias encountered at
the northwest and southeast peripheries of the main orebody also contained disseminations of
sulfides in matrix and clasts as well as stringers and fracture fills.
An occurrence of a high gold zone at depth was also discovered. This zone at 400 to 500 meter
level is concluded to be a younger structurally-controlled pulse of mineralization unrelated from
the main stage porphyry while a deeper gold rich zone at -150 meter level is likely a bonanza
vein type of mineralization. Within the deep gold zone, mineralization is mostly pyrite occurring
as coarse aggregations, with some occurrences of chalcopyrite, galena, and sphalerite. Copper
content is negligible while gold grade ranges from 0.10 to 9.18g Au/t, correlating with gougy and
sheared zones. Unlike the preference of gold to copper sulfides particularly bornite at upper
levels, gold in lower elevations shows preference for pyrite.
Alteration
Alteration in the Sto. Tomas II orebody is mainly potassic and propylitic. The potassic alteration
is comprised of a quartz-secondary biotite-magnetite-chlorite-actinolite assemblage and is
situated on the north and west zones of the orebody coinciding with the high bornite-high gold
zone. Biotite occurrences, often in association with chlorite, are common as quartz vein/veinlet
infills, stringers, with some stockworks. Propylitic alteration on the other hand is composed of a
chlorite-clay-epidote-calcite-magnetite-pyrite-zeolite assemblage, with the notable chlorite as
replacement and groundmass and epidote mostly as vein infills. Limited phyllic altered zones
are noted, mostly along fractures. Alteration at levels below 773 meter level is also dominantly
potassic (biotite-magnetite-quartz-chlorite±chalcopyrite±pyrite) with minor propylitic (quartz-
chlorite-pyrite-epidote-calcite) assemblages. Furthermore, the major potassic alteration grades
to propylitic with increasing distance from the intrusive complex and eventually grades into
regional metamorphism both laterally and vertically. Strong propylitic altered intervals together
with potassic alteration assemblages are also noted on the dark diorites below 773 meter level.
Sericitic alteration, on the other hand, is exhibited mostly at intercepts where fault planes are
intersected. Gypsum-anhydrite veins are also present and are probably introduced from a later
hydrothermal event. Within the gold rich zone, alteration is strongly propylitic, with chlorite-
epidote-calcite±quartz alteration assemblage. Calcite occurs as open space fillings while
PADCAL Operations
April 2013
Chapter 13 Page 4
chlorite grains were observed as complete alteration of primary mafic minerals. Clay-altered
plagioclase grains were also noted.
Geological Structures
Two major north-northeast striking, southeast dipping structures played an important role in the
formation of the Sto. Tomas II orebody; these are namely the Sta. Fe Fault and the Albian Fault.
The latter is considered to be the conduit of mineralization, with the fault splitting into three
branches at the orebody. However, no prominent exposure of the fault was observed at the
mining levels. The Sta. Fe Fault on the other hand is the main structure affecting the behavior of
the intrusive complex at depth, intercepting the orebody from 908 meter level downwards.
Mineralization within the Sta. Fe Fault occurs in short intervals related to the gougy and sheared
zones, as intercepted by different drillholes. Sulfides are observed as fracture fills as well as
disseminated grains usually within the gouge material. The fault is interpreted to be pre- to syn-
mineralization in timing, which would place it contemporaneously with the introduction of the
structurally-controlled gold-rich zone.
Grade Levels
Copper and gold values within the main orebody where bornite-chalcopyrite ratios are 1:1 fall
within the range of 0.60 to 1.20 percent for Cu and 0.80 to 1.50g Au/t for gold. With increasing
depth from 773 meter level, copper and gold values are still appreciable (>0.2 percent Cu,
>0.20g Au/t), though it diminishes at depth and lateral distance. The hydrothermal breccias at
the orebody peripheries, also contained disseminations of sulfides; however, only the breccia
body occurring at the northwest periphery exhibited significant copper and gold, with values
reaching ≤0.48 percent Cu and ≤0.36g Au/t in short intervals.
Localization and Continuity of Mineralization
The Sto. Tomas II orebody forms a roughly pipe-like deposit having lateral dimensions of 500
meters by 550 meters and a vertical extent of 730 meters. Copper and gold mineralization at
levels above 745 meter level is generally focused within the main intrusives, with the occurrence
of the quartz diorite body at 600 meter level causing an abrupt drop in both copper and gold
grades. Subsequent mineralization below 745 meter level was observed to be within the
wallrock-intrusive contact zones with extensions into the meta-andesite. Recent drilling from 773
PADCAL Operations
April 2013
Chapter 13 Page 5
meter level has also delineated the extent of the main intrusives up to around 400 meter level,
where the said lithologies seemed to have “floored” into the meta-andesite. Evidences of a post-
mineralization occurrence of the Sta. Fe Fault brought up the possibility of the truncation of the
orebody at depth. Given the fault’s normal sense with a minor right-lateral component, a
possible truncated half of the deposit might be situated to the northeast of the present location
of the orebody.

PADCAL Operations
ApriI 2013
Chapter 14.0

PADCAL Operations
ApriI 2013
Chapter 15.0

PADCAL Operations
ApriI 2013
Chapter 16.0

PADCAL Operations
ApriI 2013
Chapter 17.0
PADCAL Operations
April 2013
Chapter 17 Page 1
17.0 ECONOMIC ASSESSMENT OF THE MINING PROJECT
17.1 Description of Mineral Resources estimates used as basis for conversion to
Ore Reserves
The mineral resource modeling was done by Company geologist under the supervision of a
CP Geologist. It has undergone a number of iterations done with the guidance of the Joint
Ore Reserve Committee (JORC) standard.
The mineral resource estimate used in this Technical Report is done to a definitive feasibility
study level and reported using the PMRC.
17.2 Type and Level of Feasibility Study
In as much as the company has been operating for more than 50 years, the feasibility
evaluation is considered to be definitive. Almost all of the pertinent unknowns compared to
opening a new mine have been identified if not experienced. Some of these parameters are:
Table 17.2-1: Mine Parameters
Parameters Aspect Decision Affected
Caveability of the orebody
Mining
Mining method
Ground conditions
Mine design, Rock supports,
Equipment selection, CAPEX and
OPEX Mineralogy Mill and Metallurgy Mill process and Mill Parameters
Mill process Mill and Tailings handling Material balance and Tailings storage
facility (TSF) construction parameters
Materials, supplies
equipment supply chain
and
Procurement
Pricing and Lead times
Facilities location Legal Permitting
acquisitions
and Surface rights
Environmental regulations
(ECC) and Company’s social
commitment
Environment
Mine, Mill and TSF construction
parameters, Environmental
monitoring activities and audits and
Design of mine closure plan
Social Social impacts and Design of
community development programs
The Padcal mine has established all of these in the course of its operating life and would be
the basis of this technical report.
PADCAL Operations
April 2013
Chapter 17 Page 2
17.3 Brief Description of the Project
17.3.1 Mining and processing operations
Philex employs block caving method of mining to extract ore and utilizes LHDs to draw ore
from drawpoints. Conveyors are used to transport the ore materials to the processing plant.
The processing operations employs flotation process to separate gangue materials from
copper and gold minerals to produce concentrates.
17.3.2 Mining Method and capacity
Block caving being a bulk underground mining method allows high extraction rates. For the
remainder of the operating life of the mine, the average daily throughput is 25,730 Dry Metric
Ton (DMT) or 9.4 million DMT per year.
17.3.3 Processing Method and capacity
Run of mine ore pass through stages of crushing and grinding to a suitable size. Valuable
minerals are recovered using flotation method. The mill, at its present state can process ore
at maximum daily rate of 30,000 DMT.
17.3.4 Ore to be Mined / Product to be produced
The ore being mined contains copper and gold with head grades of 0.21 percent Cu and
0.43 g Au/t, which after going through milling and metallurgical process will be turned to a
copper concentrate containing 25 percent copper and 45.69 grams gold per ton.
17.3.5 Prospective Markets or Buyers
Copper concentrates produced by mining companies in the Philippines are sold to smelters
and refiners (“Offtakers”), either abroad or to Philippine Associated Smelter and Refinery
(“PASAR”) in the Philippines. Sales contracts, either spot or long-term, with Offtakers are
typically denominated in US dollars following the global prices of metals, which are also
denominated in US dollars, as in the London Metal Exchange which is usually the basis of
pricing contracts. The final value of metals from concentrates sold is determined following
PADCAL Operations
April 2013
Chapter 17 Page 3
agreed quotational period, typically one to three months from the delivery of concentrates to
Offtakers.
Offtakers who treat the ore and refine the copper, collect treatment charges (TCs) in US$
per dry metric ton and refining charges (RCs) in cents per pound. Additional charges are
also collected for other metals refined such as gold or silver. These treatment and refining
charges are usually negotiated but generally are based on the benchmark rates arrived at
annually by major Japanese smelters with their suppliers of concentrates.
Philex has two current Offtakers for its copper concentrates, namely Pan Pacific Copper Co.
Ltd. and Louis Dreyfus Commodities Metals Suisse SA.
17.3.6 Estimated Mine Life
The technical report illustrates an economic mine life of eight years including 2013 for the
Padcal operations.
17.3.7 Total Project Cost/Financing
The project is in operational state, thus do not require an initial capital cost. However, it will
need a capital investment to sustain its economic viability. In summary, the following costs
will be incurred throughout its 8 year life.
Table 17.3-1: Total Project Cost
Component In Philippine Pesos
Mine Development 4.45 Billion
Tailings Storage Facility 3.57 Billion
Other Capital Expenses 0.45 Billion
Machinery and Equipment 0.49 Billion
Total 8.96 Billion
17.3.8 Production Cost / Production Schedule
The result of the production scheduling software, PCBC is tabulated and shows that the ore
sources are sufficient to sustain 9.4 million tons per year. The production of 2013 takes off in
March 8 on the order of the Mines and Geosciences Bureau (MGB) and Environmental
Management Bureau (EMB), temporarily lifting the suspension order of the Padcal
PADCAL Operations
April 2013
Chapter 17 Page 4
operations. The suspension is a result of the sediment spill in the Tailings Storage Facility
(TSF) 3. The order allows operation for four months from March 8, 2013 as part of the
remediation activities.
In conjunction with the remediation activities in TSF 3, the construction of the operational
spillway will be completed before July 2013 which will replace the penstock system as an
outlet for effluents. Upon completion of the remediation works, international TSF consultants
would have certified the reusability of the facility, thus covering all technical bases to
continue the operations using the restored TSF 3.
Table 17.3-2: Production Schedule
2013 2014 2015 2016 2017 2018 2019 2020 Total
Metric Tons
Ore, Millions 7.7 9.4 9.4 9.40 9.40 9.4 9.40 9.40 73.50
Copper, % Cu 0.22 0.22 0.21 0.21 0.21 0.20 0.19 0.19 0.21
Gold, g Au / t 0.50 0.52 0.47 0.44 0.42 0.38 0.37 0.37 0.43
To mine and process a sustained rate of 9.4 million tons per annum for the majority of the
operating life, the Padcal mine will spend 43.33 Billion Pesos as outlined below.
Table 17.3-3: Total Production Cost
Component In Philippine Pesos
Mining 16.14 Billion
Milling 17.70 Billion
Maintenance 0.98 Billion
Tailings Management 1.83 Billion
General Overhead 6.16 Billion
Trucking of Concentrate 0.32 Billion
Drying and Loading of Concentrate 0.20 Billion
Total 43.33 Billion
17.4 Marketing Aspects
17.4.1 World Supply and Demand Situation
17.4.1.1 Gold
India, China and recently, global central banks, have been the major sources of gold
demand for the last ten years. China and India, because of their special affinity and cultural
connections with gold, contribute about 50 percent of global gold consumption, according to
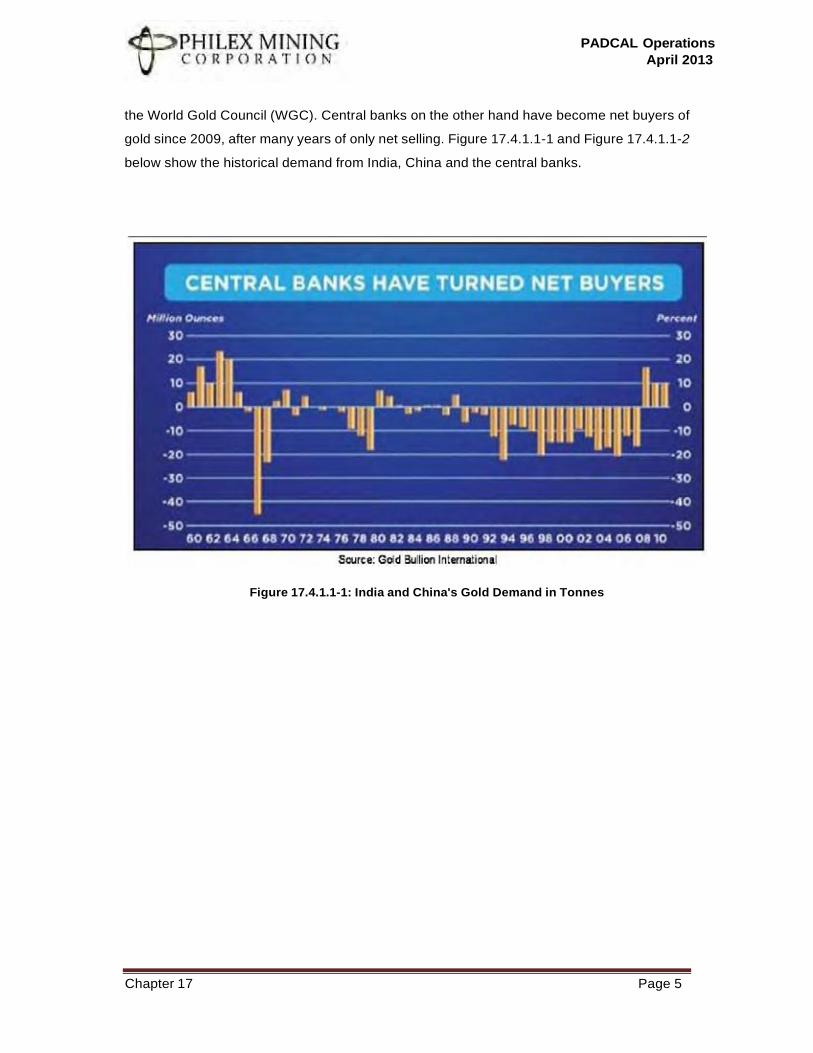
PADCAL Operations
April 2013
Chapter 17 Page 5
the World Gold Council (WGC). Central banks on the other hand have become net buyers of
gold since 2009, after many years of only net selling. Figure 17.4.1.1-1 and Figure 17.4.1.1-2
below show the historical demand from India, China and the central banks.
Figure 17.4.1.1-1: India and China's Gold Demand in Tonnes
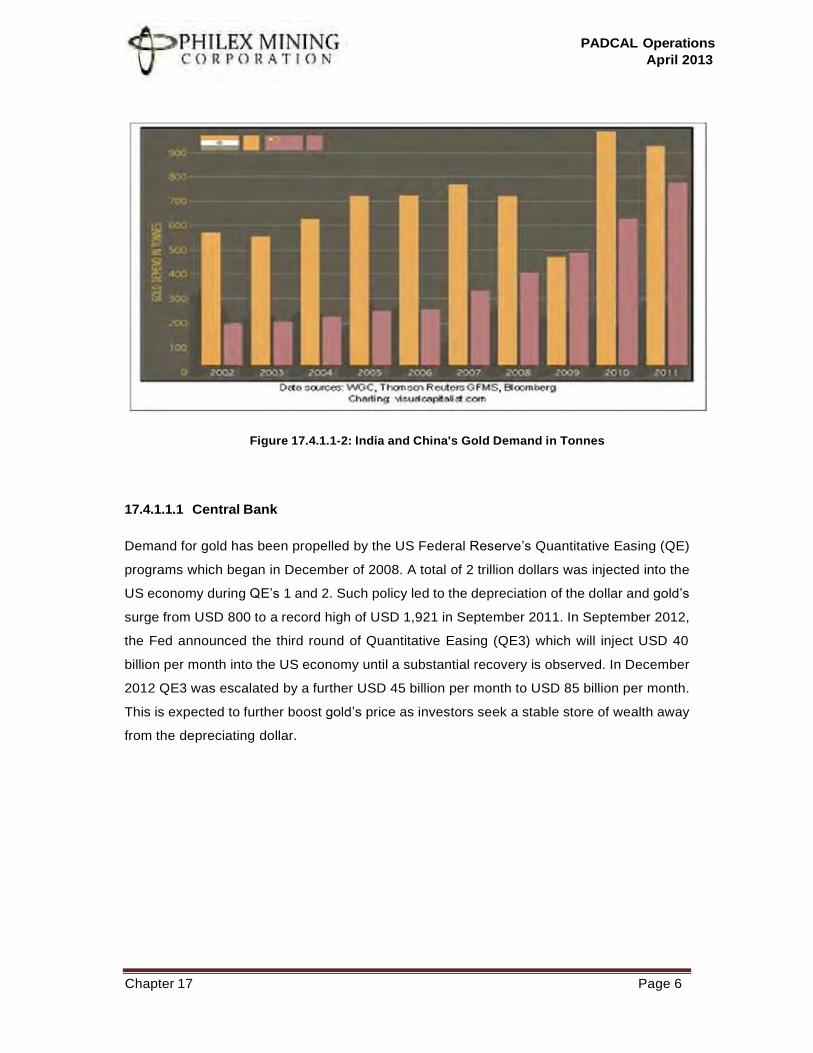
PADCAL Operations
April 2013
Chapter 17 Page 6
Figure 17.4.1.1-2: India and China's Gold Demand in Tonnes
17.4.1.1.1 Central Bank
Demand for gold has been propelled by the US Federal Reserve’s Quantitative Easing (QE)
programs which began in December of 2008. A total of 2 trillion dollars was injected into the
US economy during QE’s 1 and 2. Such policy led to the depreciation of the dollar and gold’s
surge from USD 800 to a record high of USD 1,921 in September 2011. In September 2012,
the Fed announced the third round of Quantitative Easing (QE3) which will inject USD 40
billion per month into the US economy until a substantial recovery is observed. In December
2012 QE3 was escalated by a further USD 45 billion per month to USD 85 billion per month.
This is expected to further boost gold’s price as investors seek a stable store of wealth away
from the depreciating dollar.
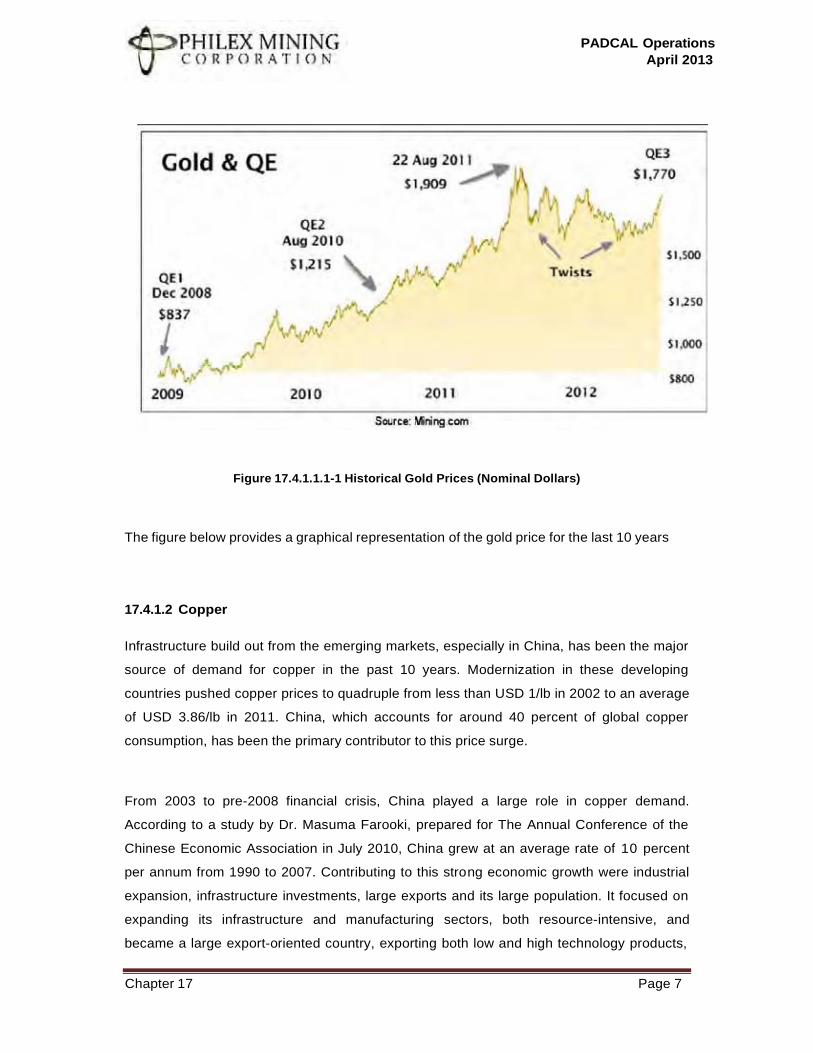
PADCAL Operations
April 2013
Chapter 17 Page 7
Figure 17.4.1.1.1-1 Historical Gold Prices (Nominal Dollars)
The figure below provides a graphical representation of the gold price for the last 10 years
17.4.1.2 Copper
Infrastructure build out from the emerging markets, especially in China, has been the major
source of demand for copper in the past 10 years. Modernization in these developing
countries pushed copper prices to quadruple from less than USD 1/lb in 2002 to an average
of USD 3.86/lb in 2011. China, which accounts for around 40 percent of global copper
consumption, has been the primary contributor to this price surge.
From 2003 to pre-2008 financial crisis, China played a large role in copper demand.
According to a study by Dr. Masuma Farooki, prepared for The Annual Conference of the
Chinese Economic Association in July 2010, China grew at an average rate of 10 percent
per annum from 1990 to 2007. Contributing to this strong economic growth were industrial
expansion, infrastructure investments, large exports and its large population. It focused on
expanding its infrastructure and manufacturing sectors, both resource-intensive, and
became a large export-oriented country, exporting both low and high technology products,
Figure 17.4-3: Gold and QE
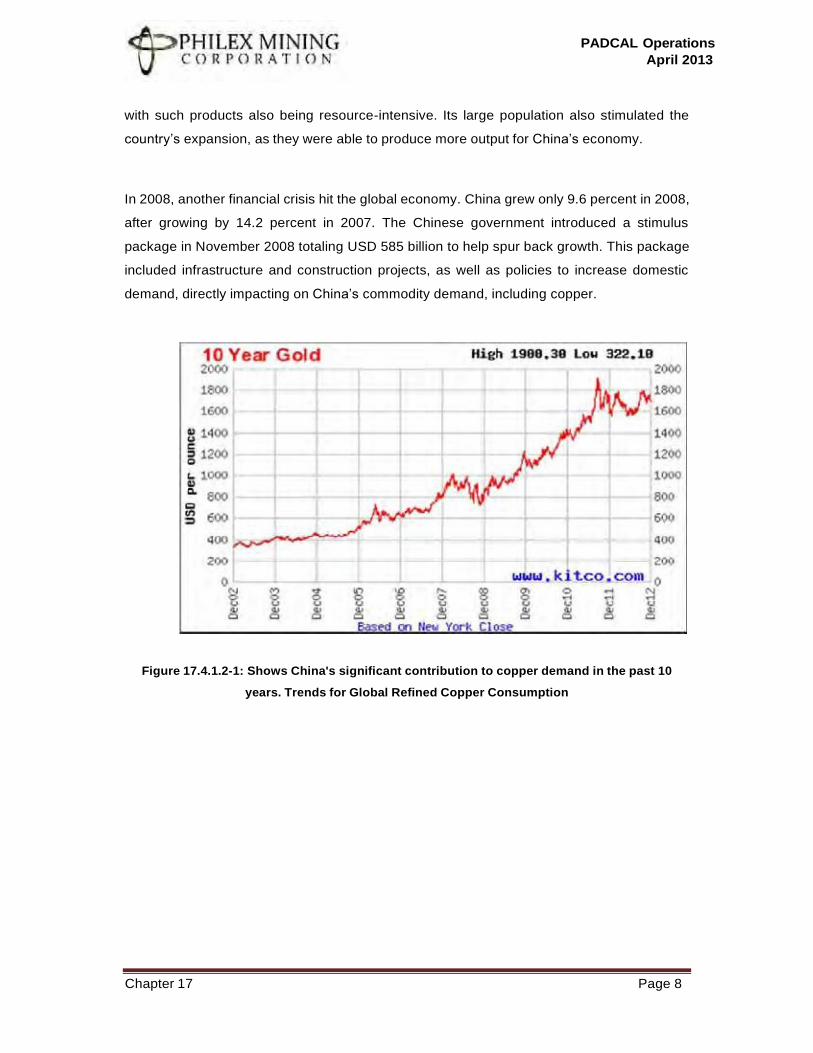
PADCAL Operations
April 2013
Chapter 17 Page 8
with such products also being resource-intensive. Its large population also stimulated the
country’s expansion, as they were able to produce more output for China’s economy.
In 2008, another financial crisis hit the global economy. China grew only 9.6 percent in 2008,
after growing by 14.2 percent in 2007. The Chinese government introduced a stimulus
package in November 2008 totaling USD 585 billion to help spur back growth. This package
included infrastructure and construction projects, as well as policies to increase domestic
demand, directly impacting on China’s commodity demand, including copper.
Figure 17.4.1.2-1: Shows China's significant contribution to copper demand in the past 10
years. Trends for Global Refined Copper Consumption
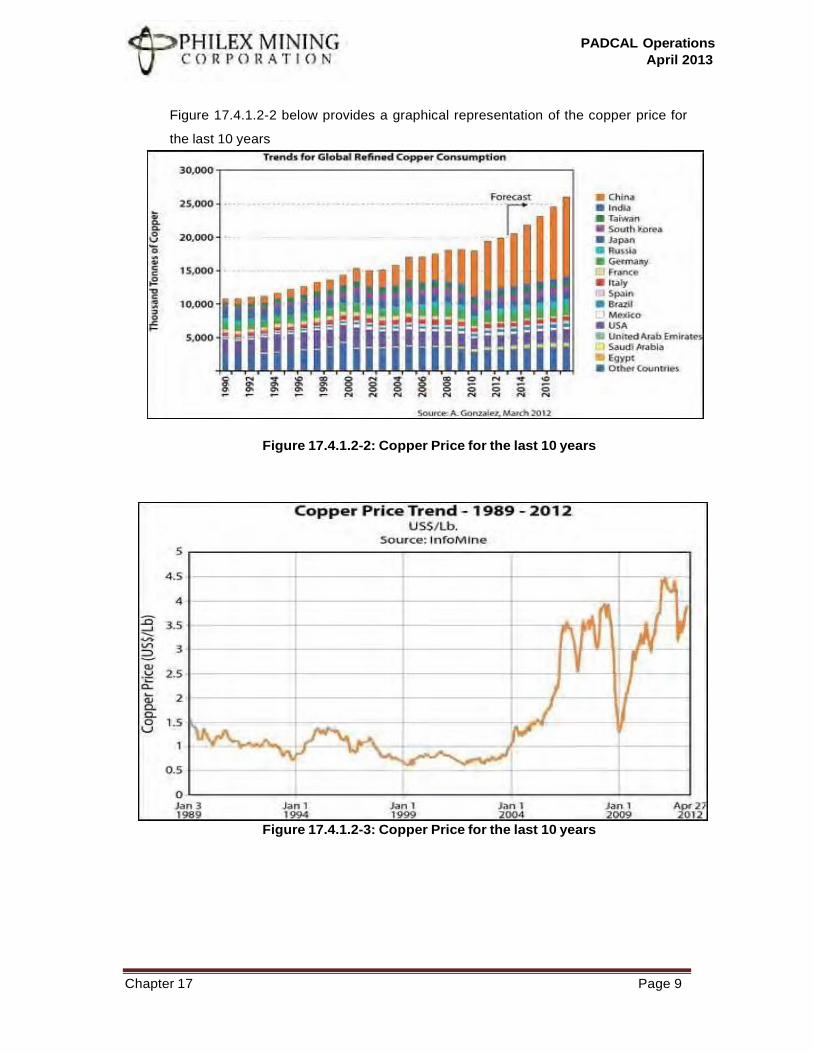
PADCAL Operations
April 2013
Chapter 17 Page 9
Figure 17.4-6: Historical Copper Prices (Nominal Dollars)
Figure 17.4.1.2-2 below provides a graphical representation of the copper price for
the last 10 years
Figure 17.4.1.2-2: Copper Price for the last 10 years
Figure 17.4.1.2-3: Copper Price for the last 10 years
PADCAL Operations
April 2013
Chapter 17 Page 10
17.4.2 Prospective Markets or Buyers
17.4.2.1 Gold
According to BDO Capital & Investment Corp. President Eduardo Francisco, investors in the
Philippines do not have access to gold bars and coins, consequently Filipinos wanting to
invest in gold choose alternatively to invest in stocks of gold mining companies. Local
demand in the Philippines comes from the Bangko Sentral ng Pilipinas (BSP), which
purchases from small-scale miners in the country. In accordance with Republic Act No. 7076
(People's Small Scale Mining Act of 1991), all gold and silver produced by small-scale
miners must be sold to the BSP.
According to the Department of Environment and Natural Resources (DENR), gold sold to
the BSP declined 95 percent in the first 6 months of 2012 (786 kilograms) from levels seen
in the same period of 2011 (15,000 kilograms). DENR said such a decrease indicates that
the gold from small-scale miners is largely going to the black market and related activities.
Global gold demand in 2011 amounted to 4,067 tonnes, according to the World Gold
Council, equivalent to 4.067 million kilograms. Considering the Philippines’ 17,389 kilograms
of gold purchases in 2011, gold demand from the Philippines as a percentage of global gold
demand is just a mere 0.4 percent and is therefore considered insignificant on a global
perspective.
17.4.2.2 Copper
In 2011, the Philippines imported a total of 56,500 tonnes of refined copper products
(Source: National Statistics Office). During this period, global refined copper consumption
amounted to 19.7 million tonnes (Source: Wood Mackenzie). This means that copper
demand from the Philippines represents only 0.3 percent of copper consumption worldwide,
which makes Philippine consumption irrelevant on a global scale.
On copper concentrates, there is still no demand from the local market according to the
Philippine Industry Roadmap for Copper published by the Board of Investments. Apparently,
the source of demand of copper concentrates from PASAR is being filled by foreign
companies from Papua New Guinea, Peru, Indonesia, Australia, Canada and Chile. This has
PADCAL Operations
April 2013
Chapter 17 Page 11
been the case since the late 1990s when Philex Mining Corporation (PMC) and Atlas ceased
to be members of the stockholders of PASAR.
On wires and cables, the same study mentions that 90 to 95 percent of local production is
sold to the local market while the remainder is sold abroad, mostly to Taiwan and Korea. The
domestic market is 60 percent supplied by local producers while 40 percent comes from
imports including possibly smuggled products. Smuggling of rods, bars and profiles is
estimated by the study to have a 1:1 ratio with imports while smuggled wires and cables
were estimated to be 15 to 20 percent of the local market. The study estimated production of
wire rods at about 30,000 MT per year, and is projected to grow by 2 to 3 percent annually.
According to some manufacturers, wire and cable demand grew by an average of 10 percent
recently due to the surge in private sector construction.
17.4.3 Product Specifications
The final product is in the form of copper concentrates with a copper grade of 24 to 26
percent and gold grade of 50 to 60 grams per ton.
17.4.4 Price and Volume Forecasts
17.4.4.1 Gold
The gold price assumption adopted for the financial evaluation of the remaining Life of Mine
of Padcal in this report is USD 1,500 per oz, based upon the fundamental and technical
analysis presented below.
17.4.4.1.1 Fundamental Analysis
17.4.4.1.1.1 Easy Monetary Policies
Global central banks have again embarked on quantitative easing policies in order to
stimulate their ailing economies. The US Federal Reserve has implemented QE3, wherein
the Fed will buy USD 40 billion worth of mortgage-backed securities monthly until their weak
jobs market improves significantly. The European Central Bank (ECB) also announced its
own version of QE, Outright Monetary Transactions (OMT), wherein the ECB will buy
sovereign bonds of nations requesting aid subject to certain conditions. This bond-buying
program is likewise unlimited in nature. The Bank of Japan also announced it will increase its
asset purchasing program by 10 trillion yen (USD 126 billion) to boost its slowing economy.
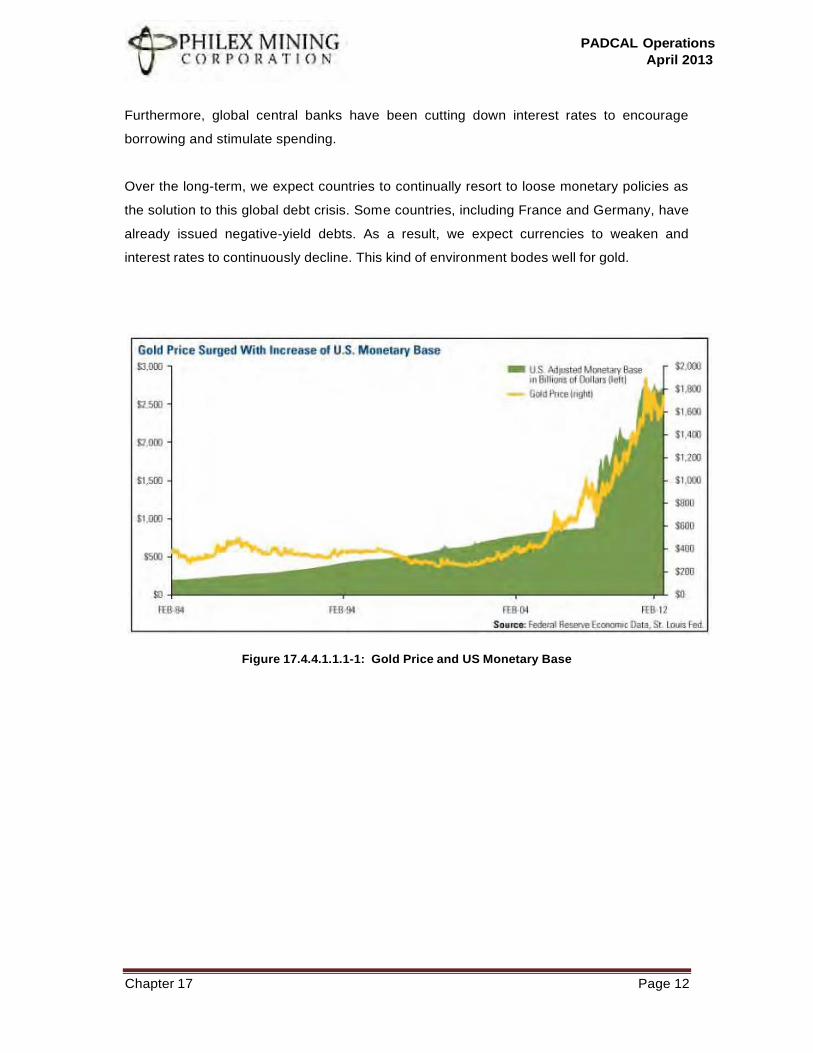
PADCAL Operations
April 2013
Chapter 17 Page 12
Furthermore, global central banks have been cutting down interest rates to encourage
borrowing and stimulate spending.
Over the long-term, we expect countries to continually resort to loose monetary policies as
the solution to this global debt crisis. Some countries, including France and Germany, have
already issued negative-yield debts. As a result, we expect currencies to weaken and
interest rates to continuously decline. This kind of environment bodes well for gold.
Figure 17.4.4.1.1.1-1: Gold Price and US Monetary Base
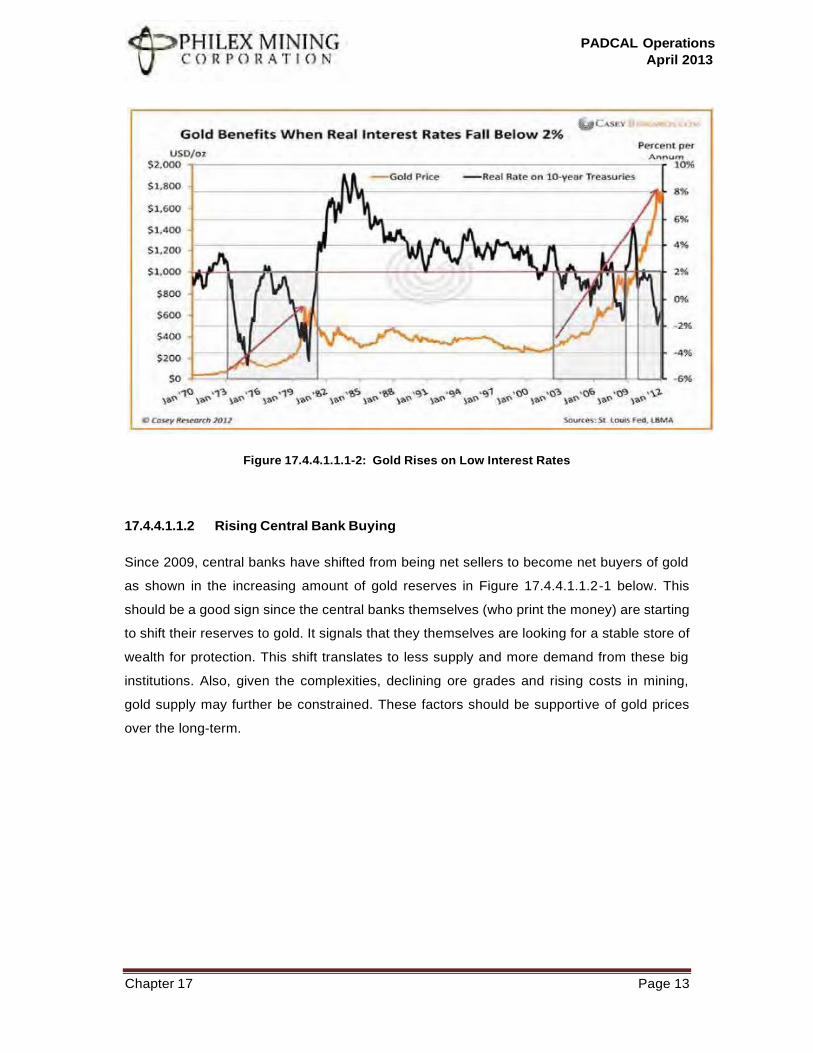
PADCAL Operations
April 2013
Chapter 17 Page 13
Figure 17.4.4.1.1.1-2: Gold Rises on Low Interest Rates
17.4.4.1.1.2 Rising Central Bank Buying
Since 2009, central banks have shifted from being net sellers to become net buyers of gold
as shown in the increasing amount of gold reserves in Figure 17.4.4.1.1.2-1 below. This
should be a good sign since the central banks themselves (who print the money) are starting
to shift their reserves to gold. It signals that they themselves are looking for a stable store of
wealth for protection. This shift translates to less supply and more demand from these big
institutions. Also, given the complexities, declining ore grades and rising costs in mining,
gold supply may further be constrained. These factors should be supportive of gold prices
over the long-term.
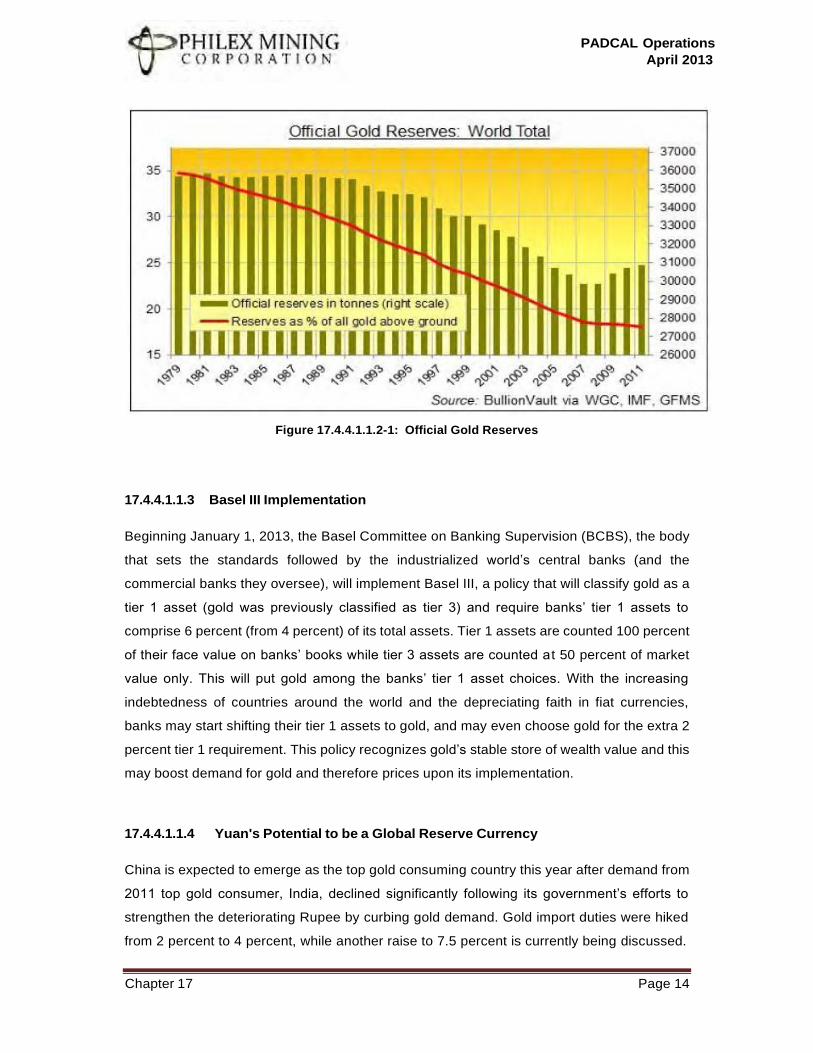
PADCAL Operations
April 2013
Chapter 17 Page 14
Figure 17.4.4.1.1.2-1: Official Gold Reserves
17.4.4.1.1.3 Basel III Implementation
Beginning January 1, 2013, the Basel Committee on Banking Supervision (BCBS), the body
that sets the standards followed by the industrialized world’s central banks (and the
commercial banks they oversee), will implement Basel III, a policy that will classify gold as a
tier 1 asset (gold was previously classified as tier 3) and require banks’ tier 1 assets to
comprise 6 percent (from 4 percent) of its total assets. Tier 1 assets are counted 100 percent
of their face value on banks’ books while tier 3 assets are counted at 50 percent of market
value only. This will put gold among the banks’ tier 1 asset choices. With the increasing
indebtedness of countries around the world and the depreciating faith in fiat currencies,
banks may start shifting their tier 1 assets to gold, and may even choose gold for the extra 2
percent tier 1 requirement. This policy recognizes gold’s stable store of wealth value and this
may boost demand for gold and therefore prices upon its implementation.
17.4.4.1.1.4 Yuan's Potential to be a Global Reserve Currency
China is expected to emerge as the top gold consuming country this year after demand from
2011 top gold consumer, India, declined significantly following its government’s efforts to
strengthen the deteriorating Rupee by curbing gold demand. Gold import duties were hiked
from 2 percent to 4 percent, while another raise to 7.5 percent is currently being discussed.
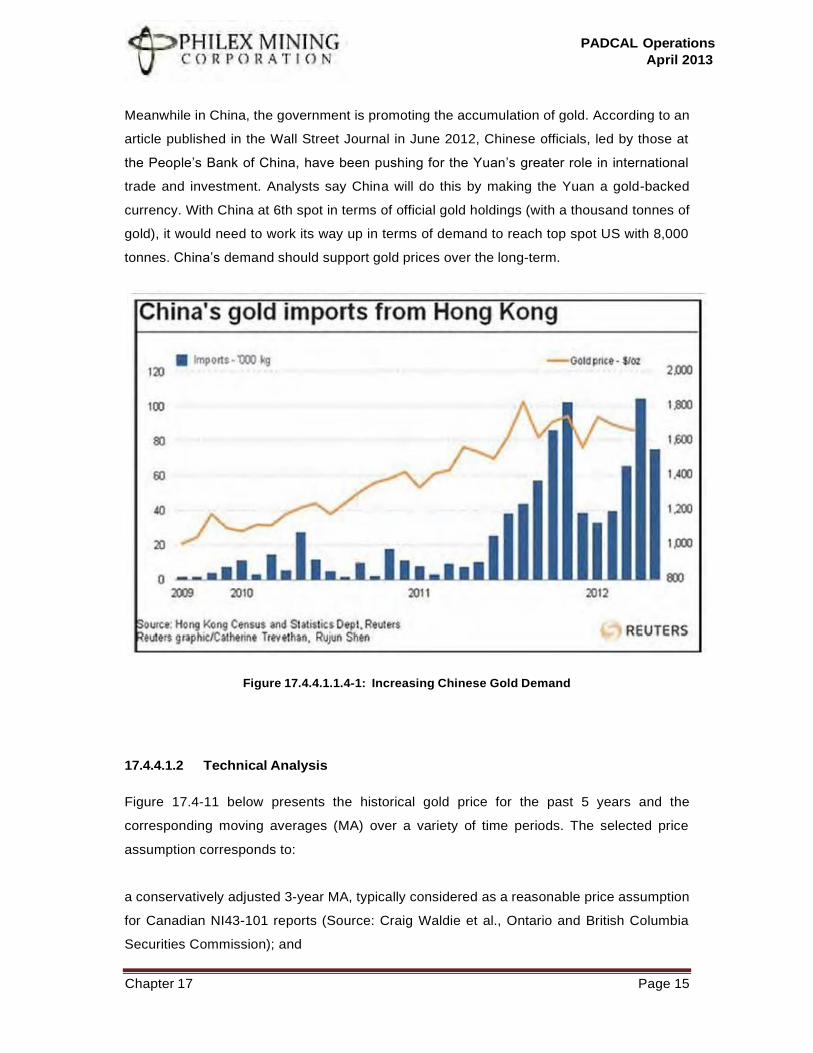
PADCAL Operations
April 2013
Chapter 17 Page 15
Meanwhile in China, the government is promoting the accumulation of gold. According to an
article published in the Wall Street Journal in June 2012, Chinese officials, led by those at
the People’s Bank of China, have been pushing for the Yuan’s greater role in international
trade and investment. Analysts say China will do this by making the Yuan a gold-backed
currency. With China at 6th spot in terms of official gold holdings (with a thousand tonnes of
gold), it would need to work its way up in terms of demand to reach top spot US with 8,000
tonnes. China’s demand should support gold prices over the long-term.
Figure 17.4.4.1.1.4-1: Increasing Chinese Gold Demand
17.4.4.1.2 Technical Analysis
Figure 17.4-11 below presents the historical gold price for the past 5 years and the
corresponding moving averages (MA) over a variety of time periods. The selected price
assumption corresponds to:
a conservatively adjusted 3-year MA, typically considered as a reasonable price assumption
for Canadian NI43-101 reports (Source: Craig Waldie et al., Ontario and British Columbia
Securities Commission); and
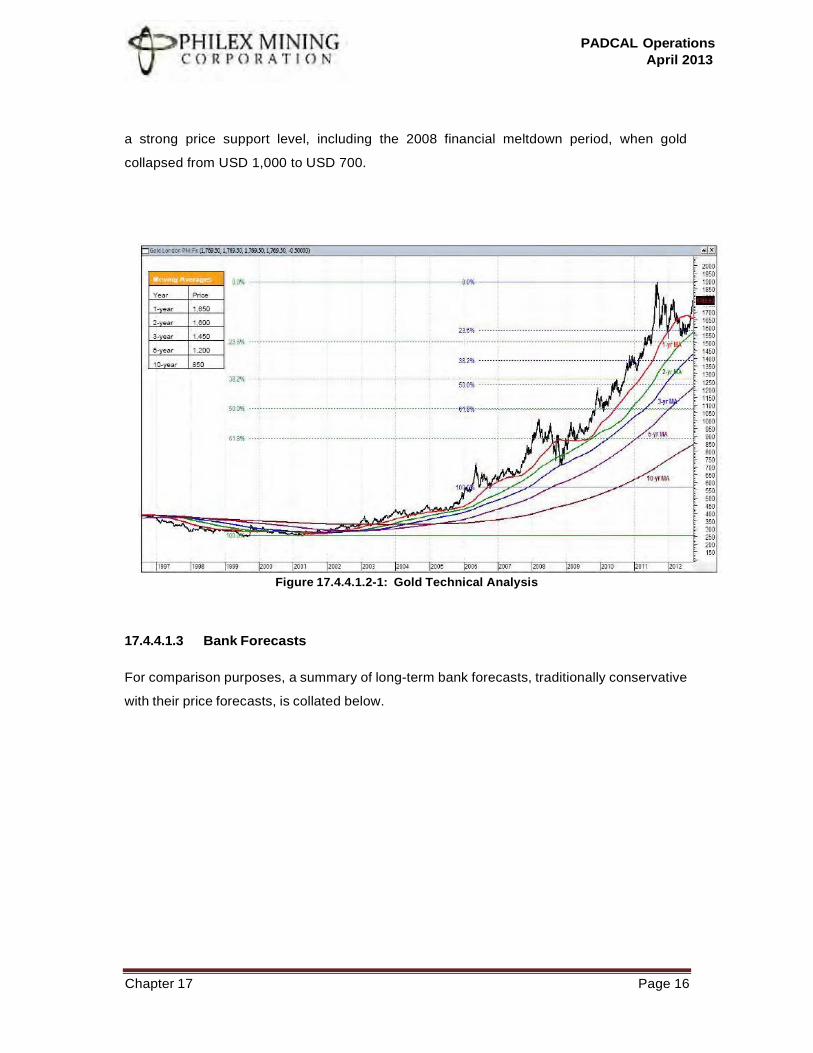
PADCAL Operations
April 2013
Chapter 17 Page 16
a strong price support level, including the 2008 financial meltdown period, when gold
collapsed from USD 1,000 to USD 700.
Figure 17.4.4.1.2-1: Gold Technical Analysis
17.4.4.1.3 Bank Forecasts
For comparison purposes, a summary of long-term bank forecasts, traditionally conservative
with their price forecasts, is collated below.
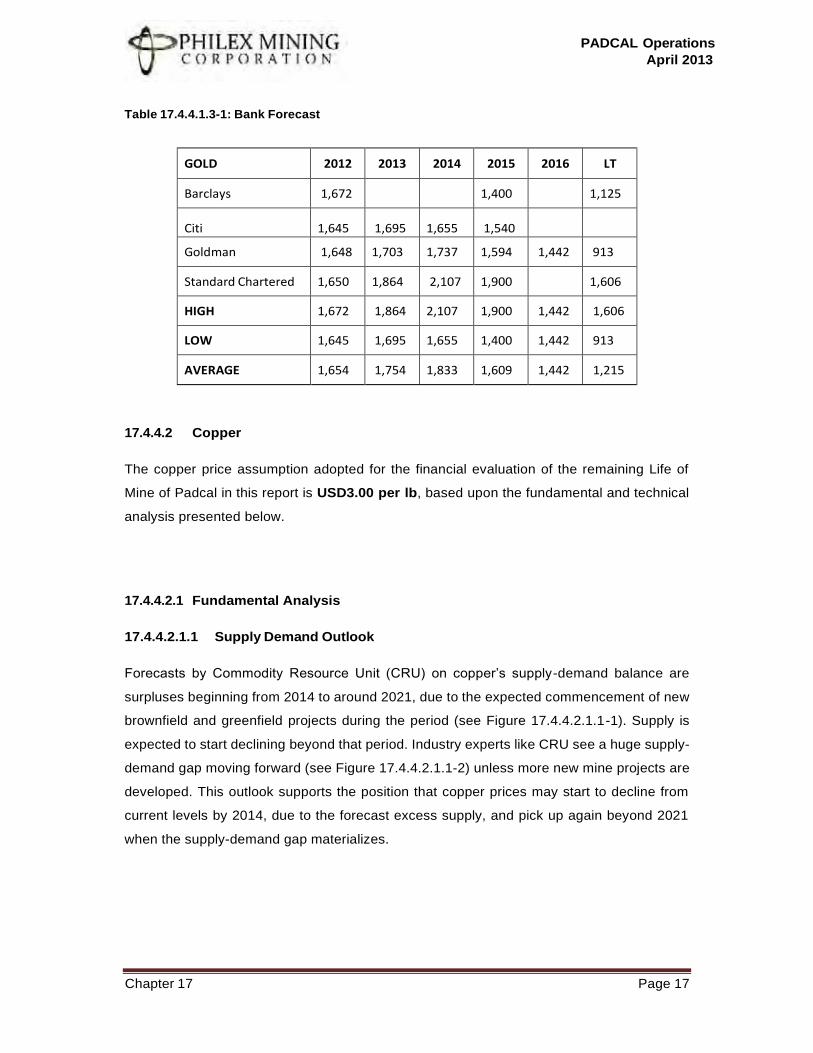
PADCAL Operations
April 2013
Chapter 17 Page 17
Table 17.4.4.1.3-1: Bank Forecast
GOLD 2012 2013 2014 2015 2016 LT
Barclays 1,672 1,400 1,125
Citi 1,645 1,695 1,655 1,540
Goldman 1,648 1,703 1,737 1,594 1,442 913
Standard Chartered 1,650 1,864 2,107 1,900
1,606
HIGH 1,672 1,864 2,107 1,900 1,442 1,606
LOW 1,645 1,695 1,655 1,400 1,442 913
AVERAGE 1,654 1,754 1,833 1,609 1,442 1,215
17.4.4.2 Copper
The copper price assumption adopted for the financial evaluation of the remaining Life of
Mine of Padcal in this report is USD3.00 per lb, based upon the fundamental and technical
analysis presented below.
17.4.4.2.1 Fundamental Analysis
17.4.4.2.1.1 Supply Demand Outlook
Forecasts by Commodity Resource Unit (CRU) on copper’s supply-demand balance are
surpluses beginning from 2014 to around 2021, due to the expected commencement of new
brownfield and greenfield projects during the period (see Figure 17.4.4.2.1.1-1). Supply is
expected to start declining beyond that period. Industry experts like CRU see a huge supply-
demand gap moving forward (see Figure 17.4.4.2.1.1-2) unless more new mine projects are
developed. This outlook supports the position that copper prices may start to decline from
current levels by 2014, due to the forecast excess supply, and pick up again beyond 2021
when the supply-demand gap materializes.
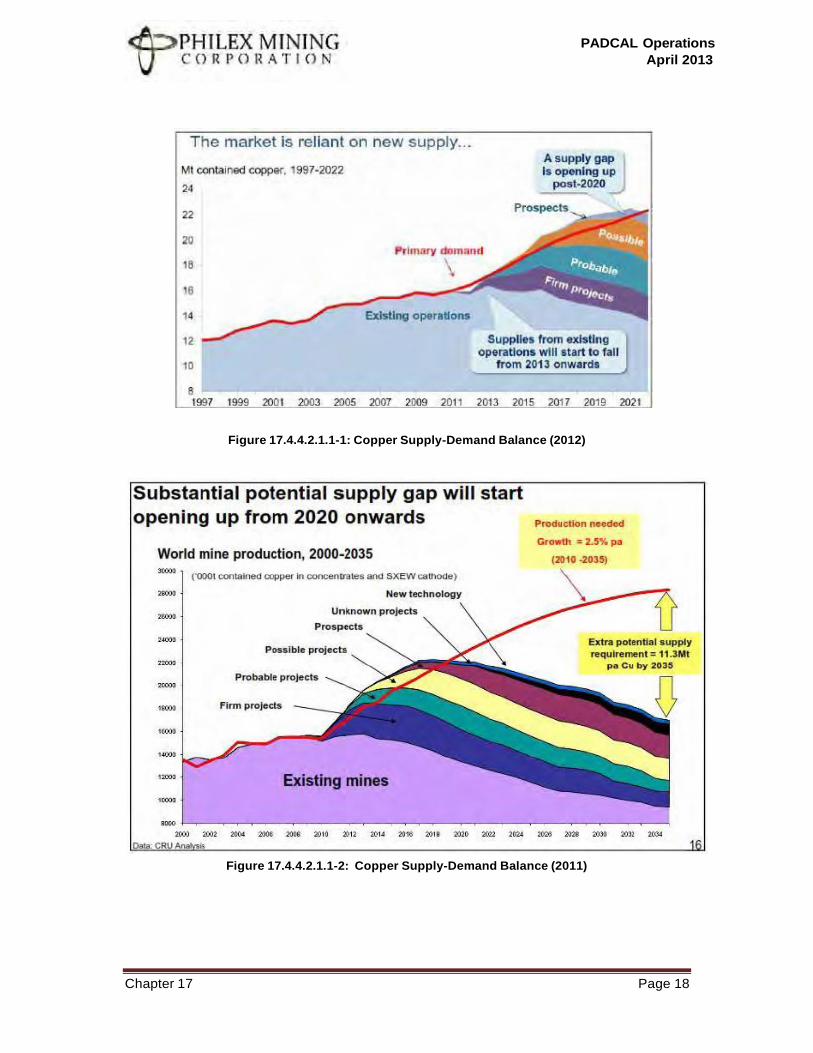
PADCAL Operations
April 2013
Chapter 17 Page 18
Figure 17.4.4.2.1.1-1: Copper Supply-Demand Balance (2012)
Figure 17.4.4.2.1.1-2: Copper Supply-Demand Balance (2011)
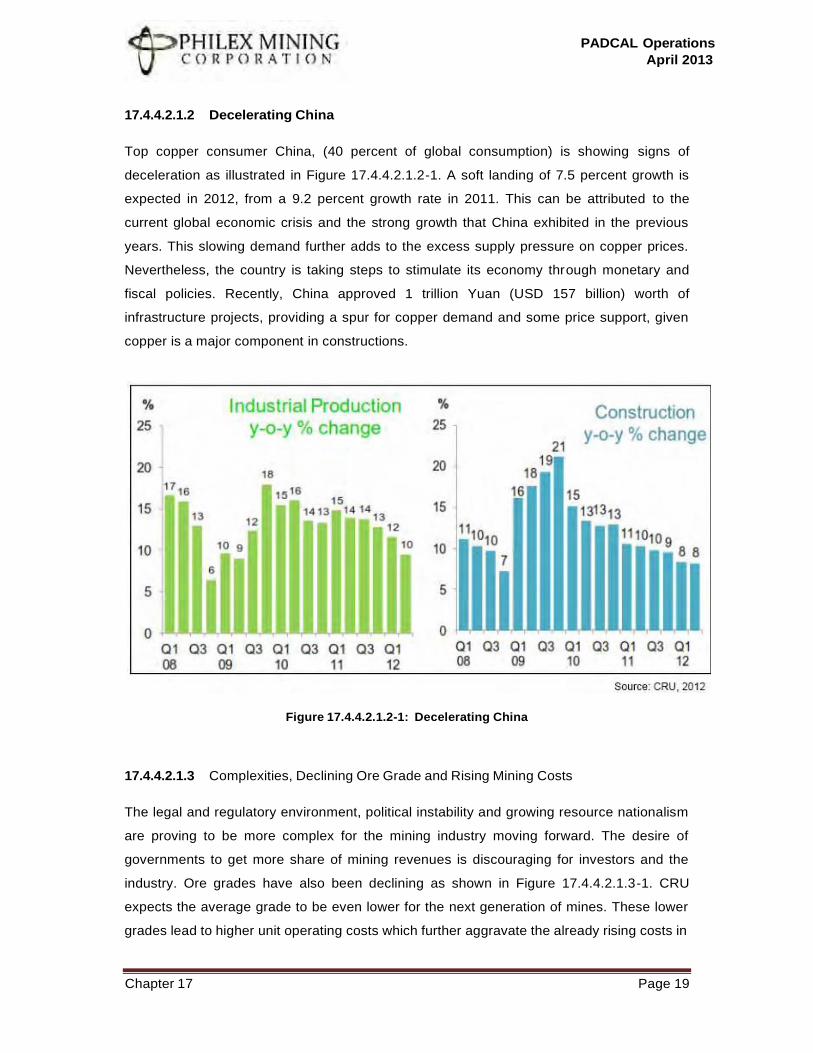
PADCAL Operations
April 2013
Chapter 17 Page 19
17.4.4.2.1.2 Decelerating China
Top copper consumer China, (40 percent of global consumption) is showing signs of
deceleration as illustrated in Figure 17.4.4.2.1.2-1. A soft landing of 7.5 percent growth is
expected in 2012, from a 9.2 percent growth rate in 2011. This can be attributed to the
current global economic crisis and the strong growth that China exhibited in the previous
years. This slowing demand further adds to the excess supply pressure on copper prices.
Nevertheless, the country is taking steps to stimulate its economy through monetary and
fiscal policies. Recently, China approved 1 trillion Yuan (USD 157 billion) worth of
infrastructure projects, providing a spur for copper demand and some price support, given
copper is a major component in constructions.
Figure 17.4.4.2.1.2-1: Decelerating China
17.4.4.2.1.3 Complexities, Declining Ore Grade and Rising Mining Costs
The legal and regulatory environment, political instability and growing resource nationalism
are proving to be more complex for the mining industry moving forward. The desire of
governments to get more share of mining revenues is discouraging for investors and the
industry. Ore grades have also been declining as shown in Figure 17.4.4.2.1.3-1. CRU
expects the average grade to be even lower for the next generation of mines. These lower
grades lead to higher unit operating costs which further aggravate the already rising costs in
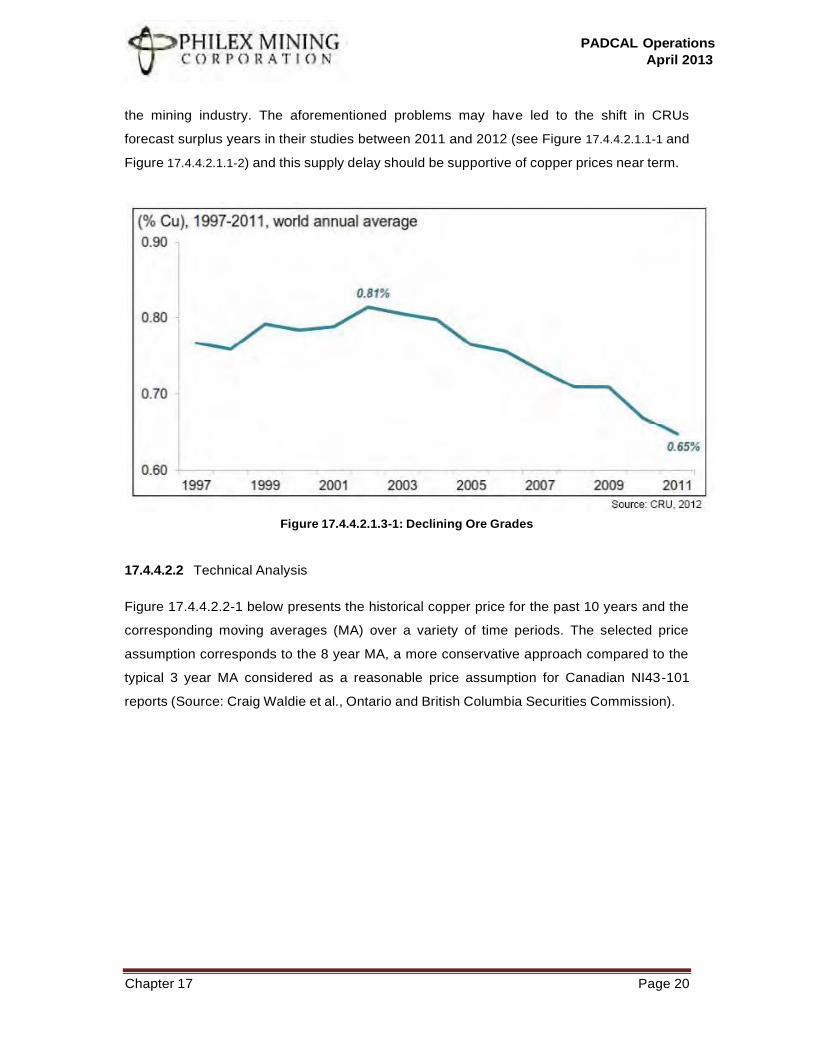
PADCAL Operations
April 2013
Chapter 17 Page 20
the mining industry. The aforementioned problems may have led to the shift in CRUs
forecast surplus years in their studies between 2011 and 2012 (see Figure 17.4.4.2.1.1-1 and
Figure 17.4.4.2.1.1-2) and this supply delay should be supportive of copper prices near term.
Figure 17.4.4.2.1.3-1: Declining Ore Grades
17.4.4.2.2 Technical Analysis
Figure 17.4.4.2.2-1 below presents the historical copper price for the past 10 years and the
corresponding moving averages (MA) over a variety of time periods. The selected price
assumption corresponds to the 8 year MA, a more conservative approach compared to the
typical 3 year MA considered as a reasonable price assumption for Canadian NI43-101
reports (Source: Craig Waldie et al., Ontario and British Columbia Securities Commission).
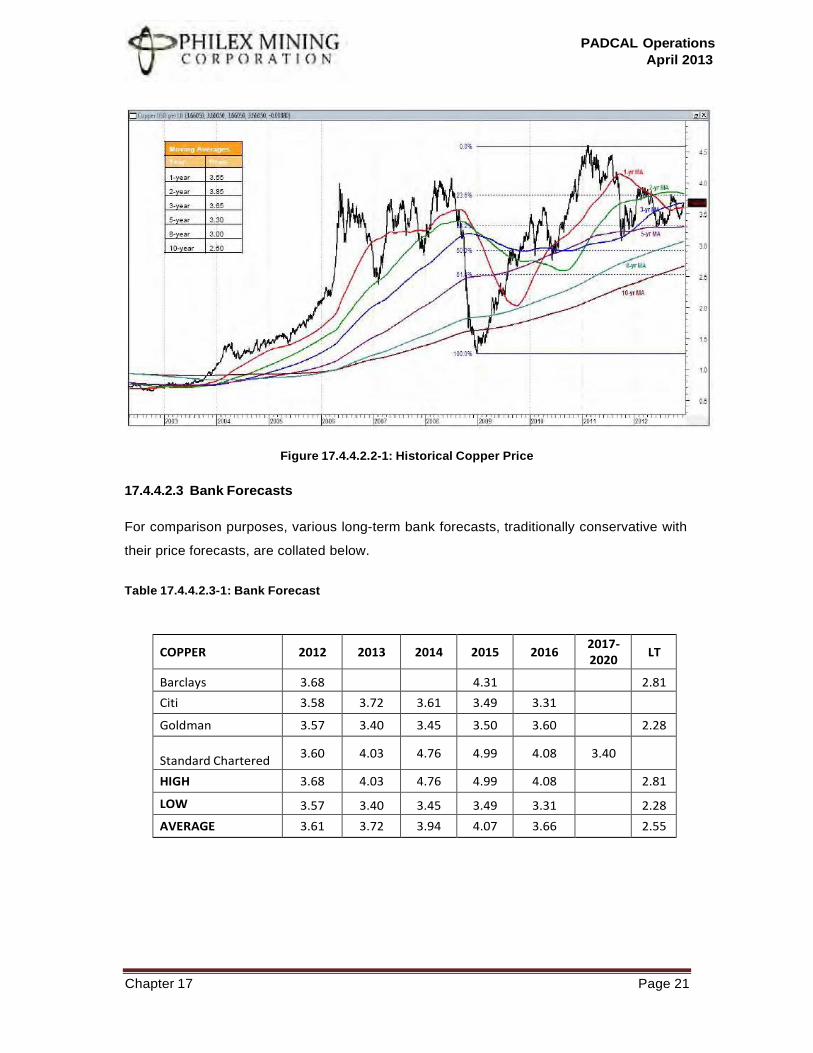
PADCAL Operations
April 2013
Chapter 17 Page 21
Figure 17.4.4.2.2-1: Historical Copper Price
17.4.4.2.3 Bank Forecasts
For comparison purposes, various long-term bank forecasts, traditionally conservative with
their price forecasts, are collated below.
Table 17.4.4.2.3-1: Bank Forecast
COPPER 2012 2013 2014 2015 2016 2017- 2020
LT
Barclays 3.68 4.31 2.81
Citi 3.58 3.72 3.61 3.49 3.31
Goldman 3.57 3.40 3.45 3.50 3.60 2.28
Standard Chartered
3.60 4.03 4.76 4.99 4.08 3.40
HIGH 3.68 4.03 4.76 4.99 4.08 2.81
LOW 3.57 3.40 3.45 3.49 3.31 2.28
AVERAGE 3.61 3.72 3.94 4.07 3.66 2.55
PADCAL Operations
April 2013
Chapter 17 Page 22
17.4.5 Sales Contract
17.4.5.1 MARKET
17.4.5.1.1 COPPER CONCENTRATES OFFTAKERS
Philex Mining Corporation has existing engagement to two off takers for Padcal’s copper
concentrate.
Pan Pacific Copper Co., Ltd (Pan Pacific)
Pan Pacific, a joint venture company between Nippon Mining Co. Ltd. and Mitsui Mining and
Smelting Co., Ltd., is the largest buyer of copper concentrate in the world, procuring
approximately 1.7 million tonnes of concentrate . Its principal sources of concentrates
include the Los Pelambres mine, Collahuasi mine and Escondida mine, the world’s largest,
all in Chile, and Cadia Hill & Ridgeway Mines in Australia. The Padcal mine of Philex Mining
Corporation also sells copper concentrate to Pan Pacific under a long-term gold and copper
concentrates sales agreement whereby Philex Mining is committed to sell to Pan Pacific the
concentrates produced from the Padcal Mine now at 60 percent of annual production up to
end of mine life.
Copper concentrates are delivered to Pan Pacific’s Saganoseki smelter and refinery in
Kyushu Island and Hitachi Works, and just recently to the Tamano smelter of Hibi Kyodo
Smelting Co., Ltd., a subsidiary of Pan Pacific, to produce electrolytic copper. The aggregate
production capacity of refined copper totals 710 thousand tons per year (Saganoseki and
Hitachi for 450 thousand tons, and Tamano for 260 thousand tons), which is the largest in
Japan and also one of the largest in the world.
Louise Dreyfus Commodities Metals Suisse SA (LDM)
Louis Dreyfus Commodities Metals Suisse SA (“LDM”) is part of the Louis Dreyfus Group,
which is a French global conglomerate company involved in agriculture, oil, energy and
commodities (global processing, trading and merchandising), as well as international
shipping. It also owns and manages ocean vessels, develops and operates
telecommunications infrastructures and is involved in real estate (development,
management and ownership). The company was founded in 1851, in Alsace, by Leopold
Louis-Dreyfus, who developed a fortune through cross-border cereal trading.
PADCAL Operations
April 2013
Chapter 17 Page 23
The Metals Platform began trading non-ferrous metals and raw materials in 2006. LD now
originates, consolidates, exports and transports different metals, including copper, zinc, and
lead concentrates, copper blister and refined base metals. As sales volumes have
quadrupled since the inception of the Metals Platform, LD is now among the top 3 global
merchandisers of Copper, Zinc and Lead Concentrates.
LDM also sends the copper concentrates to the Saganoseki smelting plant.
17.5 Technical Aspects
17.5.1 Mining Plans
17.5.1.1 Mining method
LHD Block Caving will be continually employed in the remainder of the operating life of
Padcal. The method has been used successfully for 50 years now and has undergone
modernization from its roots of slusher machines.
Load-Haul-Dump (LHD) mining is a system of ore extraction in block caving using the Low
Profile Loaders. It was introduced at 908 ML on May 1996 after a series of consultation with
block caving experts and by 1999, Philex became a full LHD block caving operation.
Block caving, in principle, is a method that is suitable to moderately fractured ore bodies,
which when undercut, will collapse by its own weight thereby creating fragments of rocks
that are subsequently extracted.
The process consists of driving a series of evenly spaced openings called drifts in an east-
west direction below the ore column on the production level and simultaneously on the
undercut level. On the production level, openings called crosscuts are driven obliquely
following a northwest-southeast trend at about 60° relative to the production drifts.
The pillars supporting the block at the undercut level are then blasted or undercut which
causes the ore column to cave and thus crushed into fragments due to its own weight and
the weight of the overlying materials.
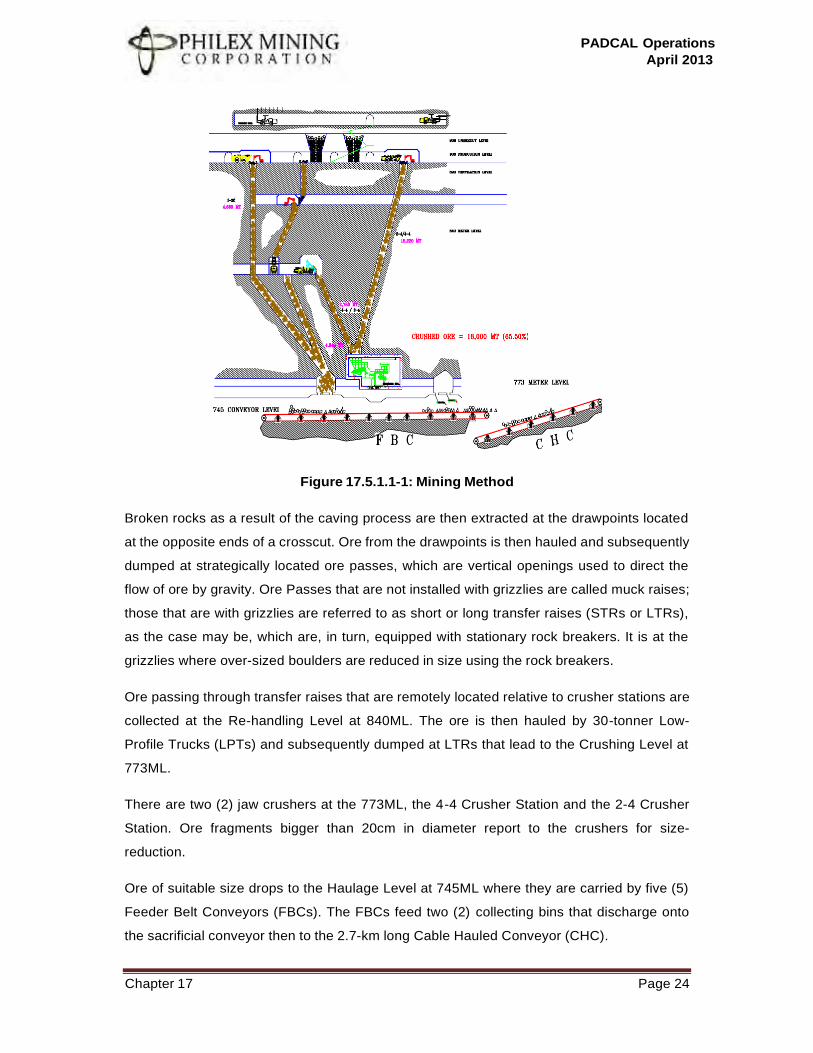
PADCAL Operations
April 2013
Chapter 17 Page 24
Figure 17.5.1.1-1: Mining Method
Broken rocks as a result of the caving process are then extracted at the drawpoints located
at the opposite ends of a crosscut. Ore from the drawpoints is then hauled and subsequently
dumped at strategically located ore passes, which are vertical openings used to direct the
flow of ore by gravity. Ore Passes that are not installed with grizzlies are called muck raises;
those that are with grizzlies are referred to as short or long transfer raises (STRs or LTRs),
as the case may be, which are, in turn, equipped with stationary rock breakers. It is at the
grizzlies where over-sized boulders are reduced in size using the rock breakers.
Ore passing through transfer raises that are remotely located relative to crusher stations are
collected at the Re-handling Level at 840ML. The ore is then hauled by 30-tonner Low-
Profile Trucks (LPTs) and subsequently dumped at LTRs that lead to the Crushing Level at
773ML.
There are two (2) jaw crushers at the 773ML, the 4-4 Crusher Station and the 2-4 Crusher
Station. Ore fragments bigger than 20cm in diameter report to the crushers for size-
reduction.
Ore of suitable size drops to the Haulage Level at 745ML where they are carried by five (5)
Feeder Belt Conveyors (FBCs). The FBCs feed two (2) collecting bins that discharge onto
the sacrificial conveyor then to the 2.7-km long Cable Hauled Conveyor (CHC).
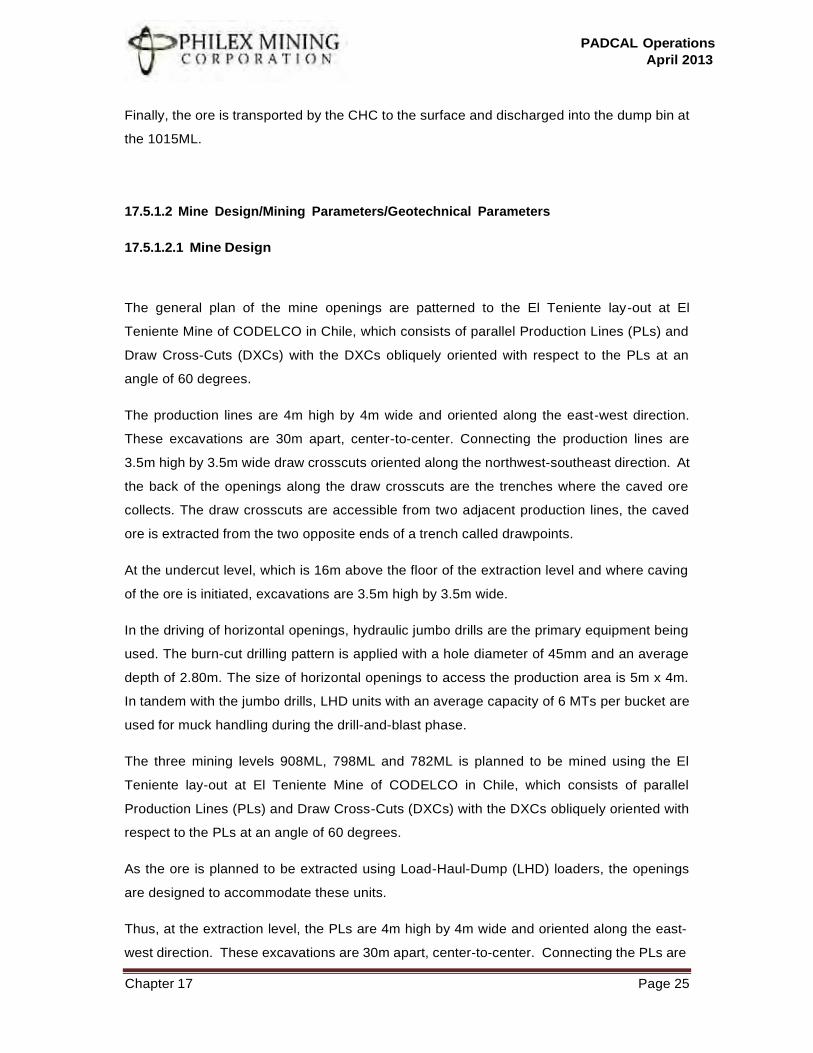
PADCAL Operations
April 2013
Chapter 17 Page 25
Finally, the ore is transported by the CHC to the surface and discharged into the dump bin at
the 1015ML.
17.5.1.2 Mine Design/Mining Parameters/Geotechnical Parameters
17.5.1.2.1 Mine Design
The general plan of the mine openings are patterned to the El Teniente lay-out at El
Teniente Mine of CODELCO in Chile, which consists of parallel Production Lines (PLs) and
Draw Cross-Cuts (DXCs) with the DXCs obliquely oriented with respect to the PLs at an
angle of 60 degrees.
The production lines are 4m high by 4m wide and oriented along the east-west direction.
These excavations are 30m apart, center-to-center. Connecting the production lines are
3.5m high by 3.5m wide draw crosscuts oriented along the northwest-southeast direction. At
the back of the openings along the draw crosscuts are the trenches where the caved ore
collects. The draw crosscuts are accessible from two adjacent production lines, the caved
ore is extracted from the two opposite ends of a trench called drawpoints.
At the undercut level, which is 16m above the floor of the extraction level and where caving
of the ore is initiated, excavations are 3.5m high by 3.5m wide.
In the driving of horizontal openings, hydraulic jumbo drills are the primary equipment being
used. The burn-cut drilling pattern is applied with a hole diameter of 45mm and an average
depth of 2.80m. The size of horizontal openings to access the production area is 5m x 4m.
In tandem with the jumbo drills, LHD units with an average capacity of 6 MTs per bucket are
used for muck handling during the drill-and-blast phase.
The three mining levels 908ML, 798ML and 782ML is planned to be mined using the El
Teniente lay-out at El Teniente Mine of CODELCO in Chile, which consists of parallel
Production Lines (PLs) and Draw Cross-Cuts (DXCs) with the DXCs obliquely oriented with
respect to the PLs at an angle of 60 degrees.
As the ore is planned to be extracted using Load-Haul-Dump (LHD) loaders, the openings
are designed to accommodate these units.
Thus, at the extraction level, the PLs are 4m high by 4m wide and oriented along the east-
west direction. These excavations are 30m apart, center-to-center. Connecting the PLs are
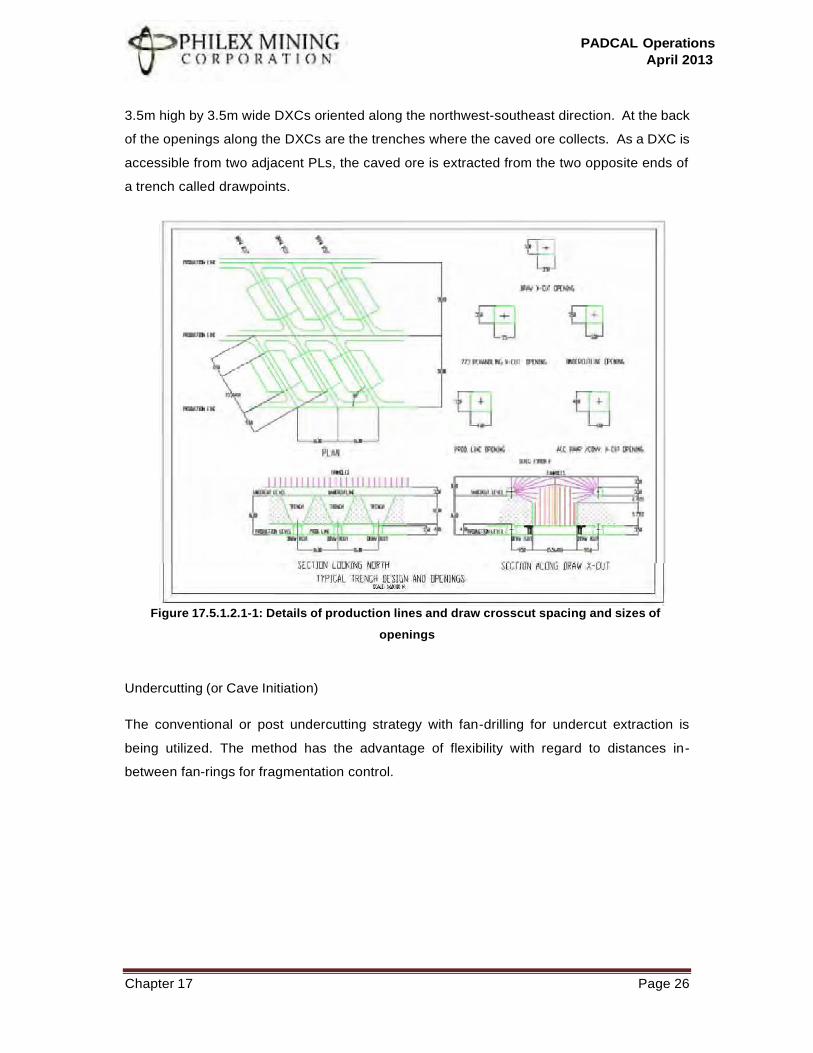
PADCAL Operations
April 2013
Chapter 17 Page 26
3.5m high by 3.5m wide DXCs oriented along the northwest-southeast direction. At the back
of the openings along the DXCs are the trenches where the caved ore collects. As a DXC is
accessible from two adjacent PLs, the caved ore is extracted from the two opposite ends of
a trench called drawpoints.
Figure 17.5.1.2.1-1: Details of production lines and draw crosscut spacing and sizes of
openings
Undercutting (or Cave Initiation)
The conventional or post undercutting strategy with fan-drilling for undercut extraction is
being utilized. The method has the advantage of flexibility with regard to distances in-
between fan-rings for fragmentation control.
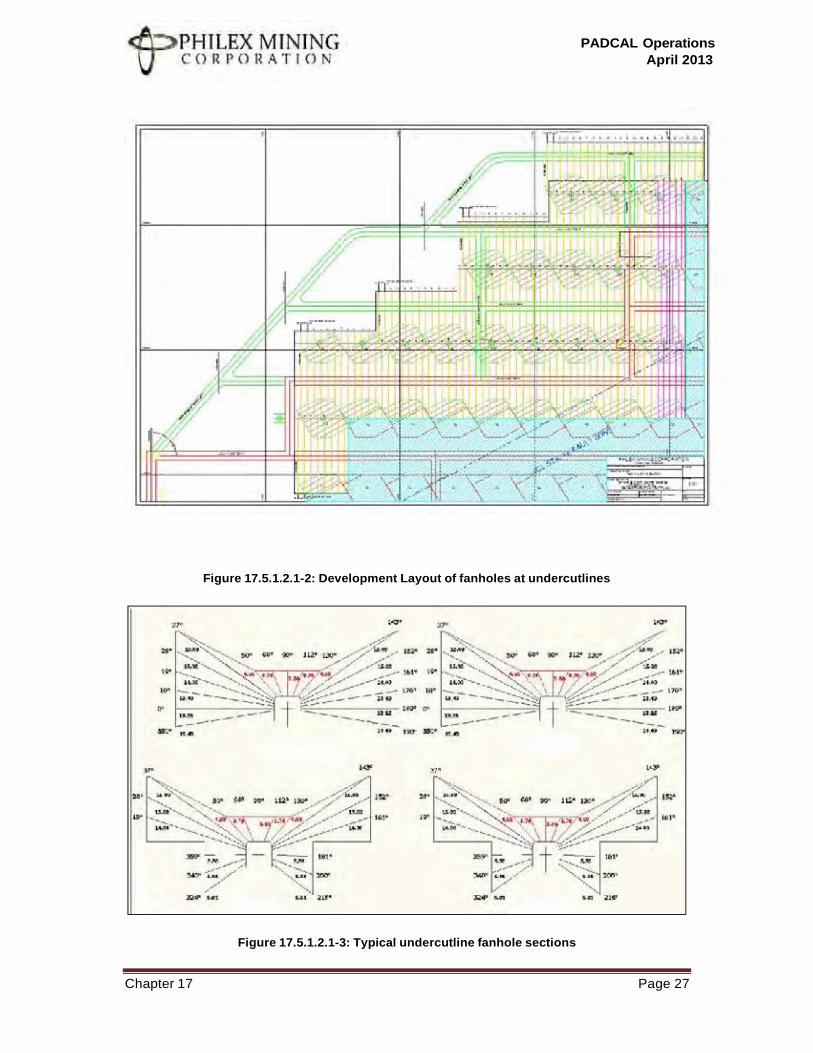
PADCAL Operations
April 2013
Chapter 17 Page 27
Figure 17.5.1.2.1-2: Development Layout of fanholes at undercutlines
Figure 17.5.1.2.1-3: Typical undercutline fanhole sections
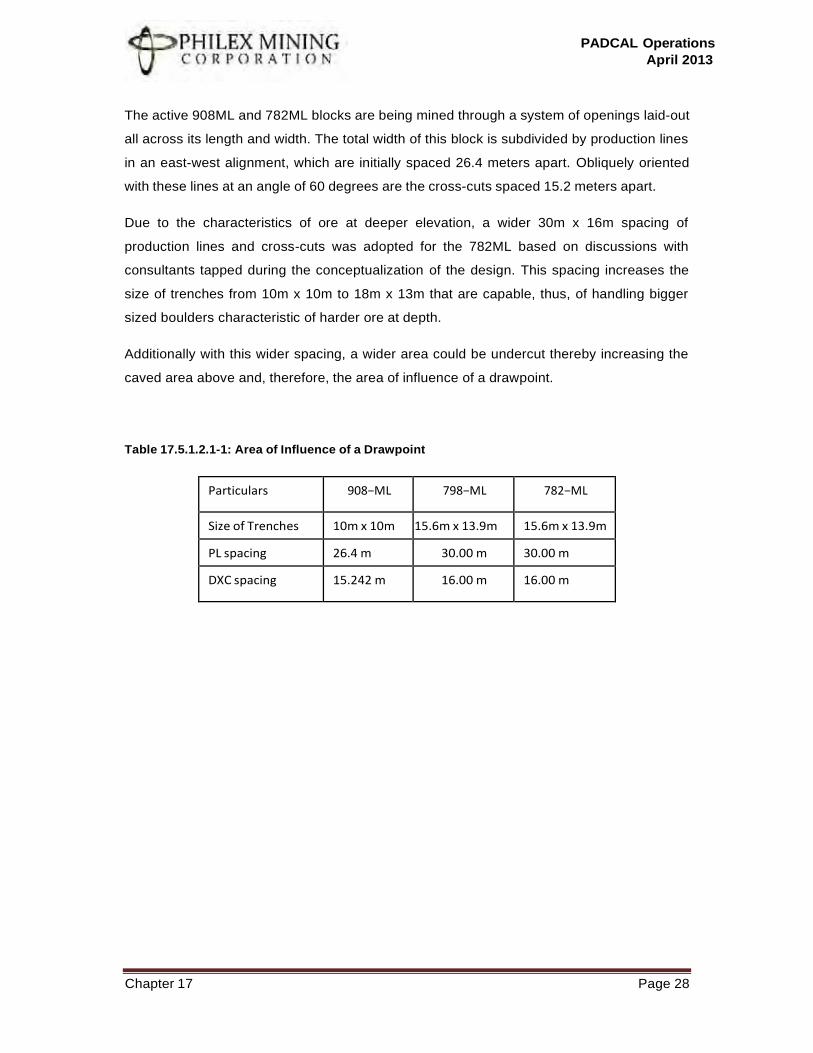
PADCAL Operations
April 2013
Chapter 17 Page 28
The active 908ML and 782ML blocks are being mined through a system of openings laid-out
all across its length and width. The total width of this block is subdivided by production lines
in an east-west alignment, which are initially spaced 26.4 meters apart. Obliquely oriented
with these lines at an angle of 60 degrees are the cross-cuts spaced 15.2 meters apart.
Due to the characteristics of ore at deeper elevation, a wider 30m x 16m spacing of
production lines and cross-cuts was adopted for the 782ML based on discussions with
consultants tapped during the conceptualization of the design. This spacing increases the
size of trenches from 10m x 10m to 18m x 13m that are capable, thus, of handling bigger
sized boulders characteristic of harder ore at depth.
Additionally with this wider spacing, a wider area could be undercut thereby increasing the
caved area above and, therefore, the area of influence of a drawpoint.
Table 17.5.1.2.1-1: Area of Influence of a Drawpoint
Particulars 908−ML 798−ML 782−ML
Size of Trenches 10m x 10m 15.6m x 13.9m 15.6m x 13.9m
PL spacing 26.4 m 30.00 m 30.00 m
DXC spacing 15.242 m 16.00 m 16.00 m
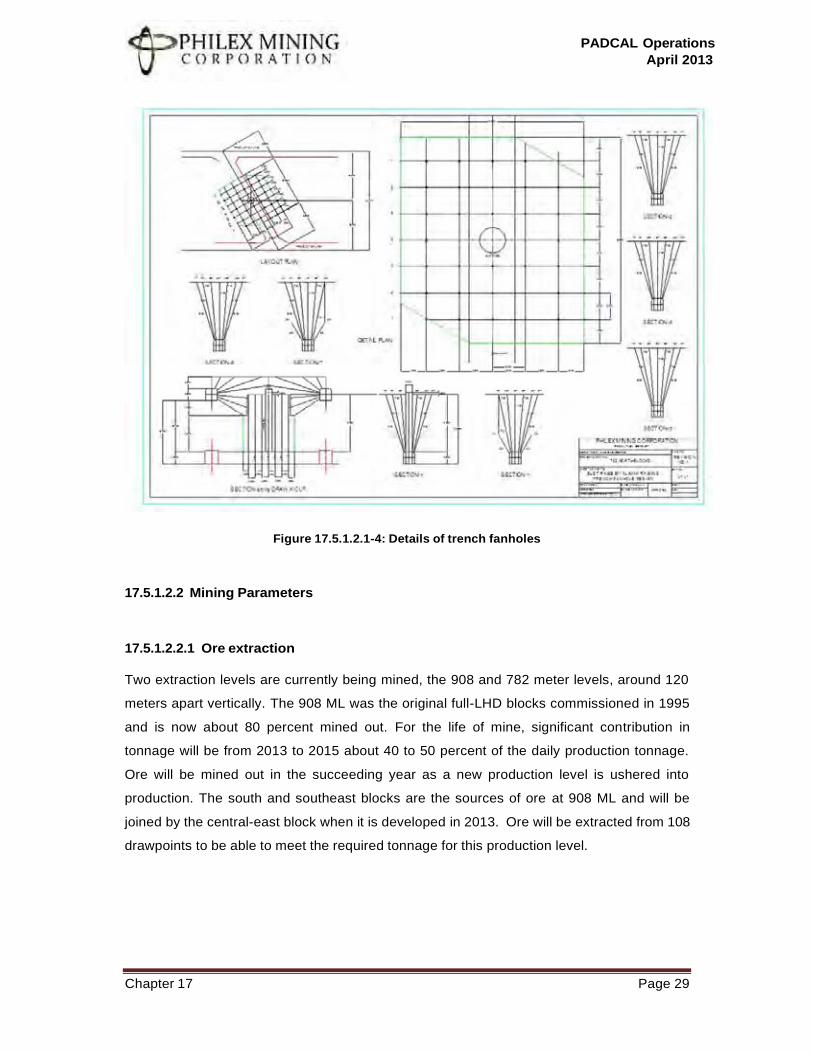
PADCAL Operations
April 2013
Chapter 17 Page 29
Figure 17.5.1.2.1-4: Details of trench fanholes
17.5.1.2.2 Mining Parameters
17.5.1.2.2.1 Ore extraction
Two extraction levels are currently being mined, the 908 and 782 meter levels, around 120
meters apart vertically. The 908 ML was the original full-LHD blocks commissioned in 1995
and is now about 80 percent mined out. For the life of mine, significant contribution in
tonnage will be from 2013 to 2015 about 40 to 50 percent of the daily production tonnage.
Ore will be mined out in the succeeding year as a new production level is ushered into
production. The south and southeast blocks are the sources of ore at 908 ML and will be
joined by the central-east block when it is developed in 2013. Ore will be extracted from 108
drawpoints to be able to meet the required tonnage for this production level.
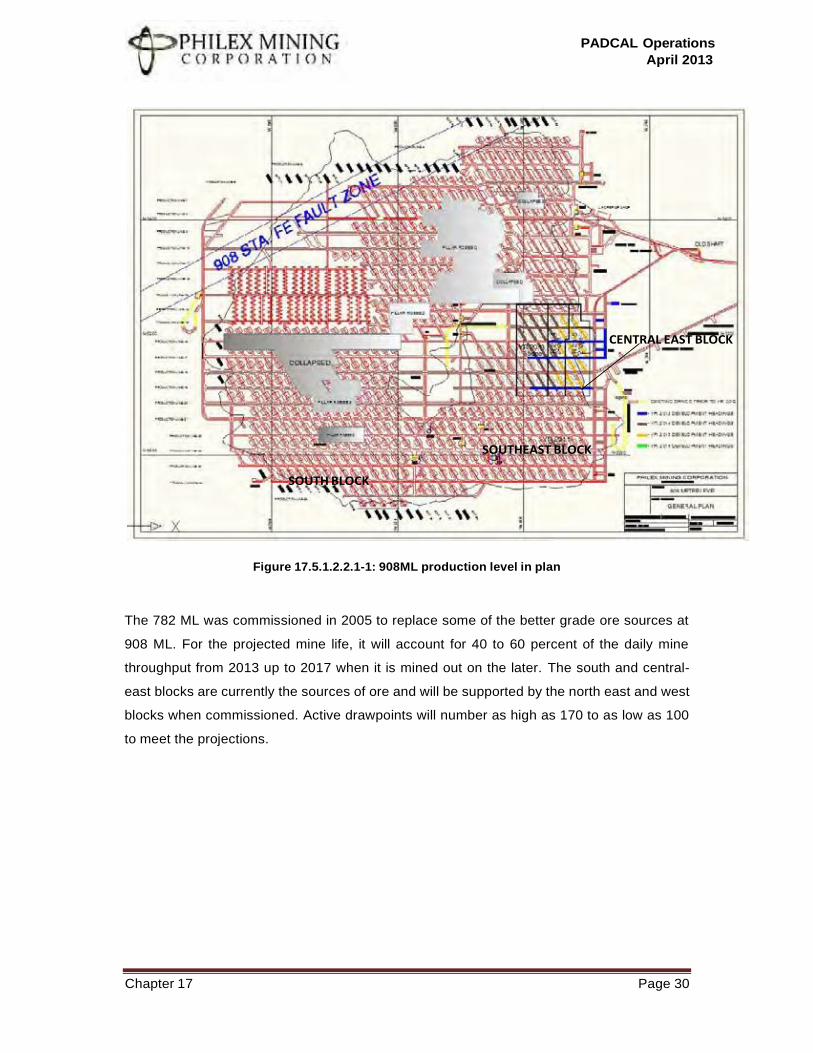
PADCAL Operations
April 2013
Chapter 17 Page 30
Figure 17.5.1.2.2.1-1: 908ML production level in plan
The 782 ML was commissioned in 2005 to replace some of the better grade ore sources at
908 ML. For the projected mine life, it will account for 40 to 60 percent of the daily mine
throughput from 2013 up to 2017 when it is mined out on the later. The south and central-
east blocks are currently the sources of ore and will be supported by the north east and west
blocks when commissioned. Active drawpoints will number as high as 170 to as low as 100
to meet the projections.
CENTRAL EAST BLOCK
SOUTHEAST BLOCK
SOUTH BLOCK
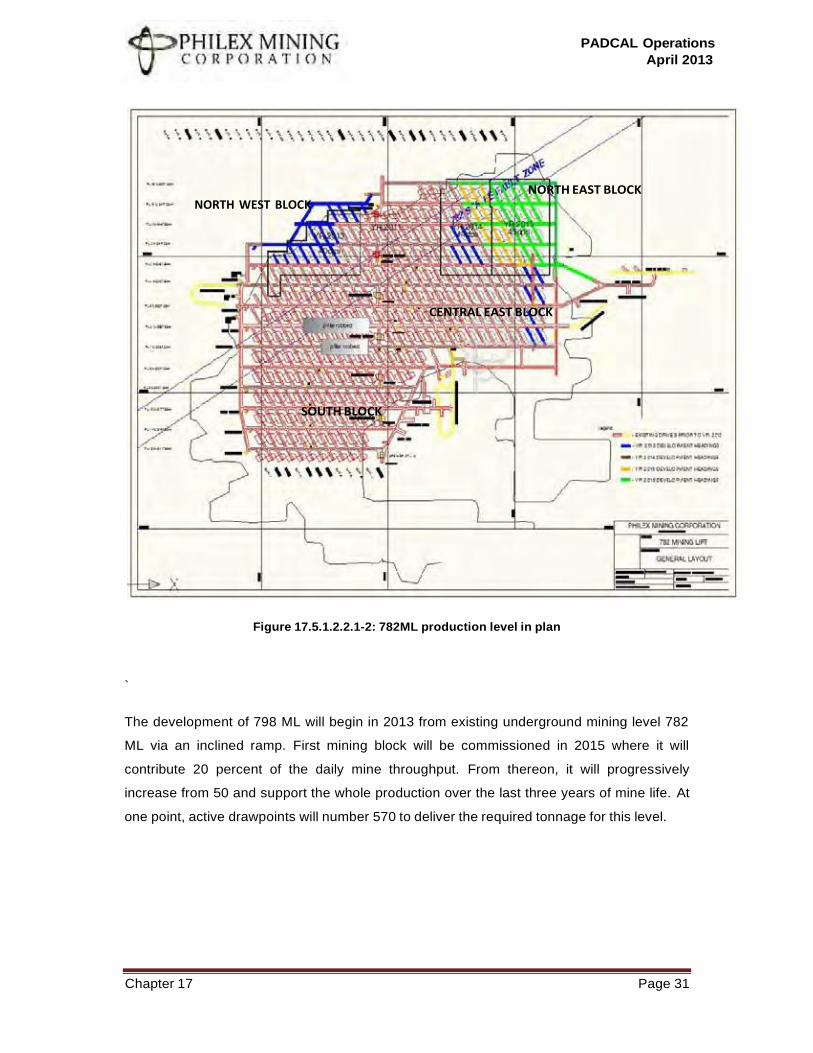
PADCAL Operations
April 2013
Chapter 17 Page 31
Figure 17.5.1.2.2.1-2: 782ML production level in plan
`
The development of 798 ML will begin in 2013 from existing underground mining level 782
ML via an inclined ramp. First mining block will be commissioned in 2015 where it will
contribute 20 percent of the daily mine throughput. From thereon, it will progressively
increase from 50 and support the whole production over the last three years of mine life. At
one point, active drawpoints will number 570 to deliver the required tonnage for this level.
NORTH EAST BLOCK NORTH WEST BLOCK
CENTRAL EAST BLOCK
SOUTH BLOCK
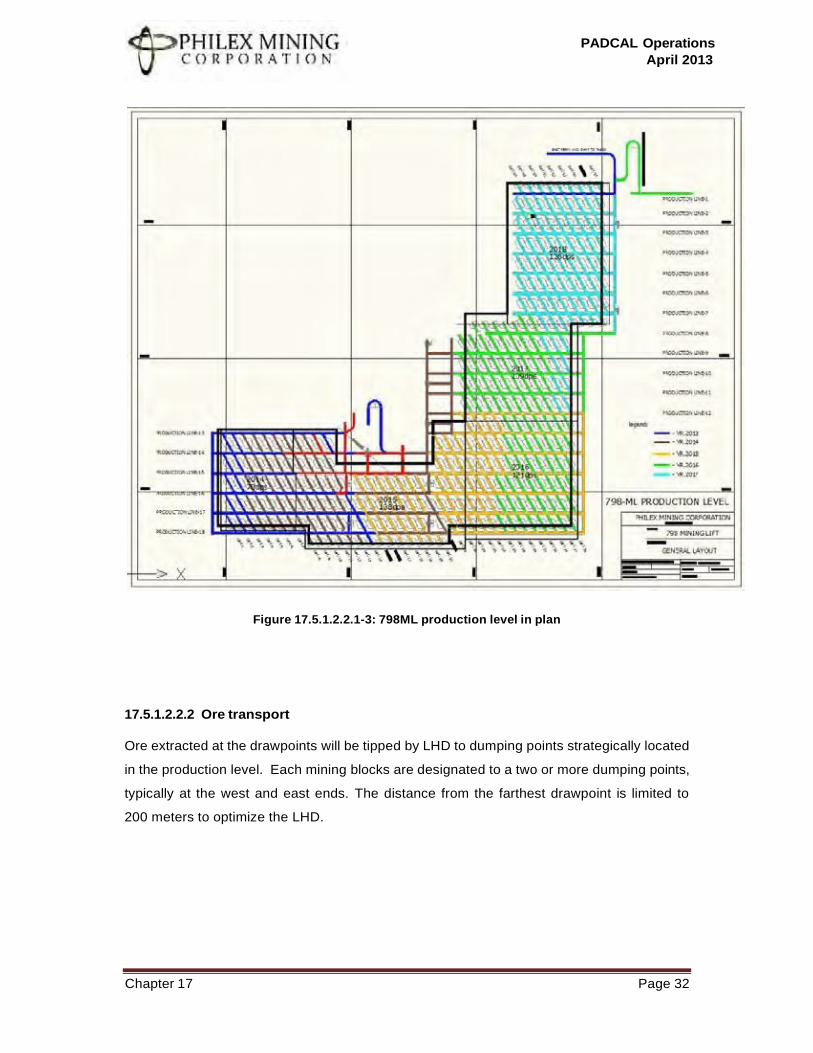
PADCAL Operations
April 2013
Chapter 17 Page 32
Figure 17.5.1.2.2.1-3: 798ML production level in plan
17.5.1.2.2.2 Ore transport
Ore extracted at the drawpoints will be tipped by LHD to dumping points strategically located
in the production level. Each mining blocks are designated to a two or more dumping points,
typically at the west and east ends. The distance from the farthest drawpoint is limited to
200 meters to optimize the LHD.
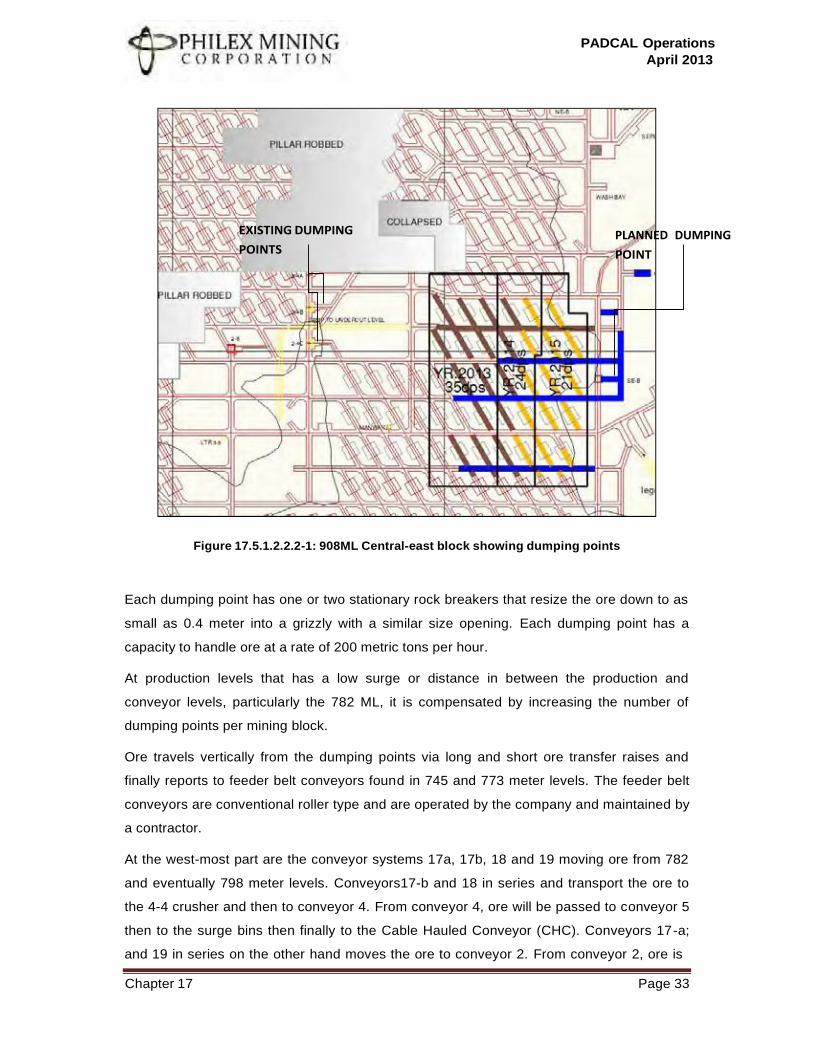
PADCAL Operations
April 2013
Chapter 17 Page 33
EXISTING DUMPING
POINTS PLANNED DUMPING
POINT
Figure 17.5.1.2.2.2-1: 908ML Central-east block showing dumping points
Each dumping point has one or two stationary rock breakers that resize the ore down to as
small as 0.4 meter into a grizzly with a similar size opening. Each dumping point has a
capacity to handle ore at a rate of 200 metric tons per hour.
At production levels that has a low surge or distance in between the production and
conveyor levels, particularly the 782 ML, it is compensated by increasing the number of
dumping points per mining block.
Ore travels vertically from the dumping points via long and short ore transfer raises and
finally reports to feeder belt conveyors found in 745 and 773 meter levels. The feeder belt
conveyors are conventional roller type and are operated by the company and maintained by
a contractor.
At the west-most part are the conveyor systems 17a, 17b, 18 and 19 moving ore from 782
and eventually 798 meter levels. Conveyors17-b and 18 in series and transport the ore to
the 4-4 crusher and then to conveyor 4. From conveyor 4, ore will be passed to conveyor 5
then to the surge bins then finally to the Cable Hauled Conveyor (CHC). Conveyors 17-a;
and 19 in series on the other hand moves the ore to conveyor 2. From conveyor 2, ore is
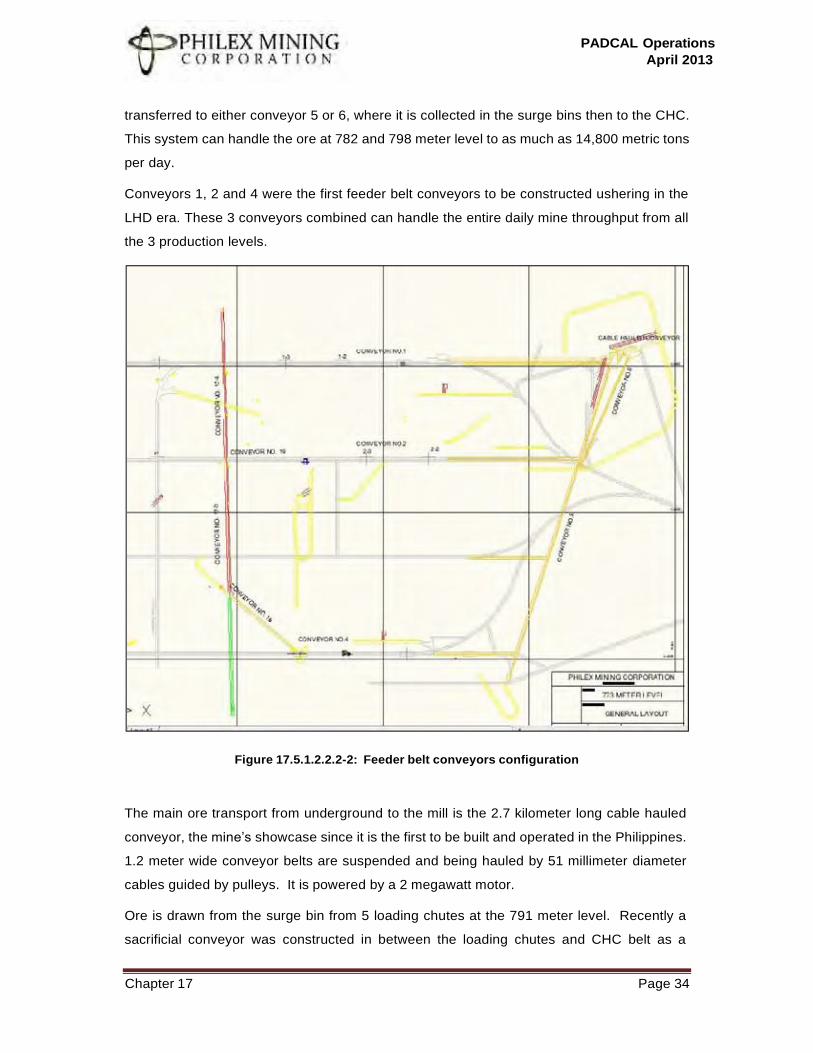
PADCAL Operations
April 2013
Chapter 17 Page 34
transferred to either conveyor 5 or 6, where it is collected in the surge bins then to the CHC.
This system can handle the ore at 782 and 798 meter level to as much as 14,800 metric tons
per day.
Conveyors 1, 2 and 4 were the first feeder belt conveyors to be constructed ushering in the
LHD era. These 3 conveyors combined can handle the entire daily mine throughput from all
the 3 production levels.
Figure 17.5.1.2.2.2-2: Feeder belt conveyors configuration
The main ore transport from underground to the mill is the 2.7 kilometer long cable hauled
conveyor, the mine’s showcase since it is the first to be built and operated in the Philippines.
1.2 meter wide conveyor belts are suspended and being hauled by 51 millimeter diameter
cables guided by pulleys. It is powered by a 2 megawatt motor.
Ore is drawn from the surge bin from 5 loading chutes at the 791 meter level. Recently a
sacrificial conveyor was constructed in between the loading chutes and CHC belt as a
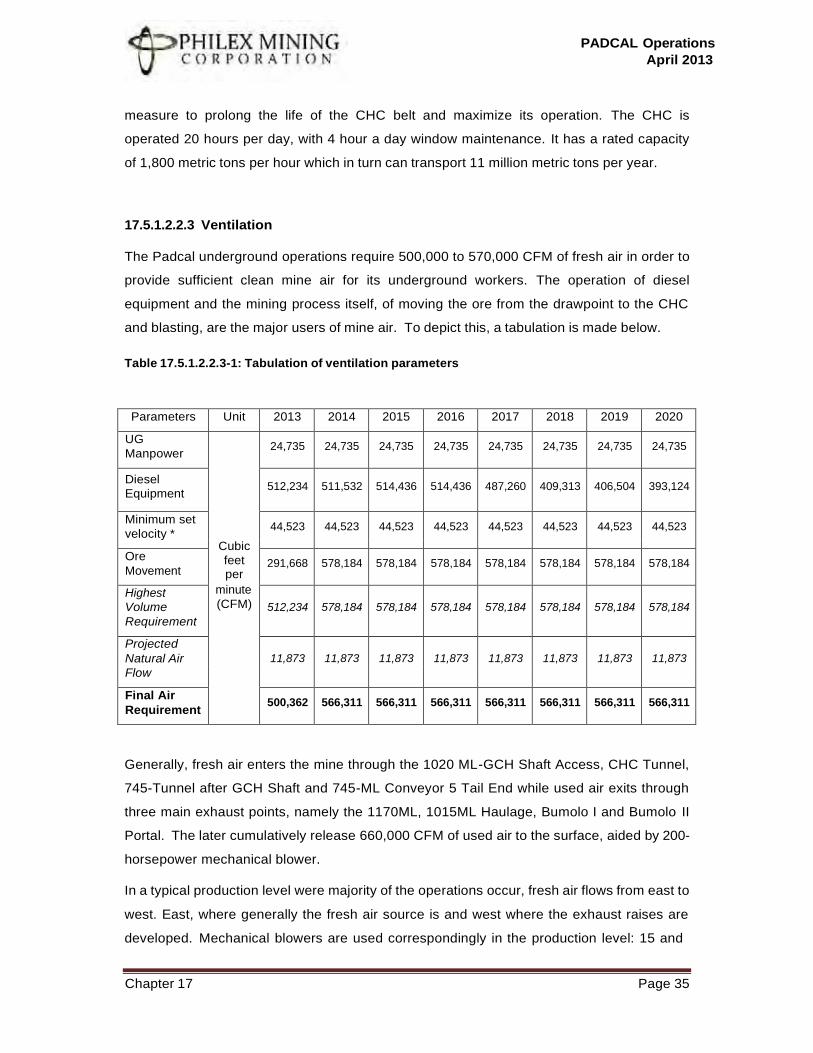
PADCAL Operations
April 2013
Chapter 17 Page 35
measure to prolong the life of the CHC belt and maximize its operation. The CHC is
operated 20 hours per day, with 4 hour a day window maintenance. It has a rated capacity
of 1,800 metric tons per hour which in turn can transport 11 million metric tons per year.
17.5.1.2.2.3 Ventilation
The Padcal underground operations require 500,000 to 570,000 CFM of fresh air in order to
provide sufficient clean mine air for its underground workers. The operation of diesel
equipment and the mining process itself, of moving the ore from the drawpoint to the CHC
and blasting, are the major users of mine air. To depict this, a tabulation is made below.
Table 17.5.1.2.2.3-1: Tabulation of ventilation parameters
Parameters Unit 2013 2014 2015 2016 2017 2018 2019 2020
UG
Manpower
24,735 24,735 24,735 24,735 24,735 24,735 24,735 24,735
Diesel
Equipment
512,234
511,532
514,436
514,436
487,260
409,313
406,504
393,124
Minimum set
velocity *
44,523 44,523 44,523 44,523 44,523 44,523 44,523 44,523
Cubic
feet per
Ore
Movement 291,668 578,184 578,184 578,184 578,184 578,184 578,184 578,184
minute
(CFM) Highest
Volume
512,234
578,184
578,184
578,184
578,184
578,184
578,184
578,184
Requirement
Projected
Natural Air 11,873 11,873 11,873 11,873 11,873 11,873 11,873 11,873
Flow
Final Air
Requirement
500,362 566,311 566,311 566,311 566,311 566,311 566,311 566,311
Generally, fresh air enters the mine through the 1020 ML-GCH Shaft Access, CHC Tunnel,
745-Tunnel after GCH Shaft and 745-ML Conveyor 5 Tail End while used air exits through
three main exhaust points, namely the 1170ML, 1015ML Haulage, Bumolo I and Bumolo II
Portal. The later cumulatively release 660,000 CFM of used air to the surface, aided by 200-
horsepower mechanical blower.
In a typical production level were majority of the operations occur, fresh air flows from east to
west. East, where generally the fresh air source is and west where the exhaust raises are
developed. Mechanical blowers are used correspondingly in the production level: 15 and
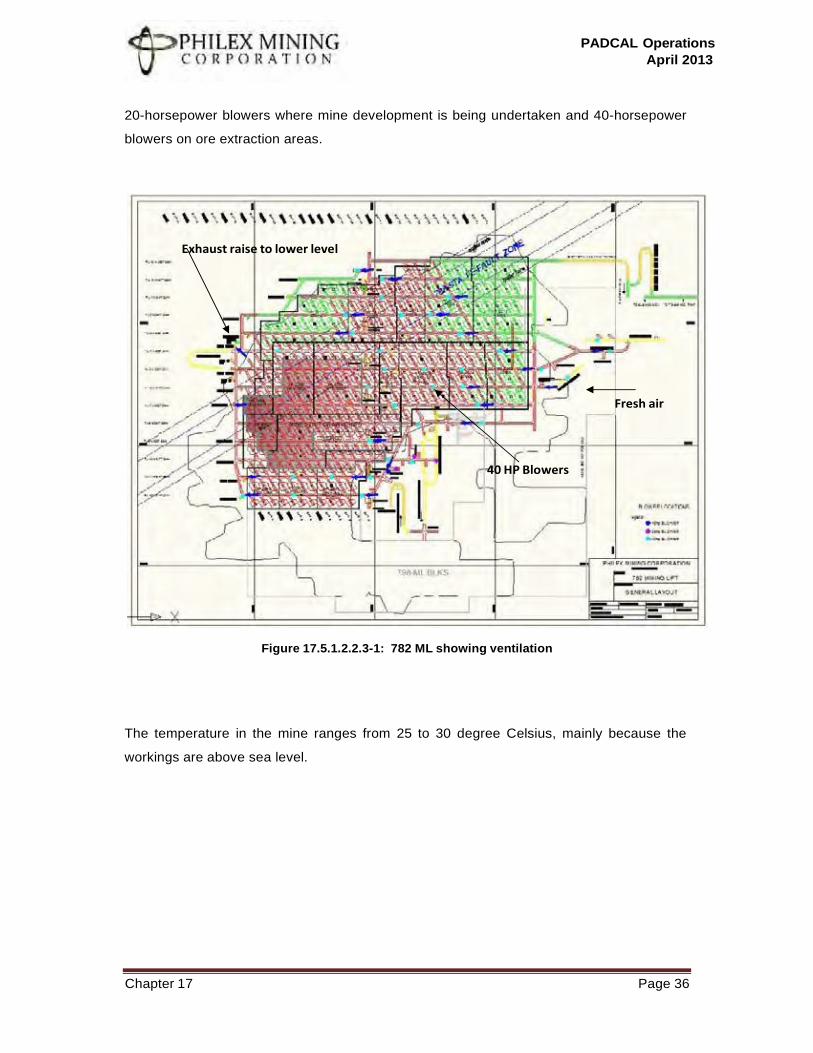
PADCAL Operations
April 2013
Chapter 17 Page 36
Exhaust raise to lower level
Fresh air
40 HP Blowers
20-horsepower blowers where mine development is being undertaken and 40-horsepower
blowers on ore extraction areas.
Figure 17.5.1.2.2.3-1: 782 ML showing ventilation
The temperature in the mine ranges from 25 to 30 degree Celsius, mainly because the
workings are above sea level.
PADCAL Operations
April 2013
Chapter 17 Page 37
17.5.1.2.2.4 Dewatering
Surface water at the subsidence area is drained by two canals namely north and central
canals which are directed towards the Albian Canal or the Albian Creek. The Albian Canal
is being deepened yearly to maintain a -4 to -7 percent gradient of backfill materials. With
this system of draining surface run off at the subsidence area, still unquantifiable seepage at
the subsidence area still reports to the underground workings.
At the underground workings, every opening is dug with ditch at one side to manage the flow
of water. For concrete roadways at 782ML canals are provided at the center. Drain holes
with 0.15 meter diameter are drilled using Cubex Machine from upper level to lower level. A
total of 11 drain holes were drilled from 908ML to 890ML to dewater the 908ML mine
workings. The Bumolo Ramp was also provided with ditch to drain water from 908 control
room going to 890ML. From 890 ML three(3) drain holes were driven to 840ML and
subsequently drained by five (5) drain holes to 745 ML. At 798 and 782 ML at total of 29
drain holes were driven to either 745 ML / 773 ML. The drainage system of the Cable Haul
Conveyor is also directed to 745 ML. The 745 ML tunnel serves as the main dewatering
channel of underground openings.
While water supply is needed in the underground for drilling and washing, the old workings
at 1020ML/1015ML were provided with water sumps to contain water. These sumps are
installed with 150mm diameter pipes going to the old shaft 1020/1015 ML and it supplies all
working levels from 908ML down to 745ML.
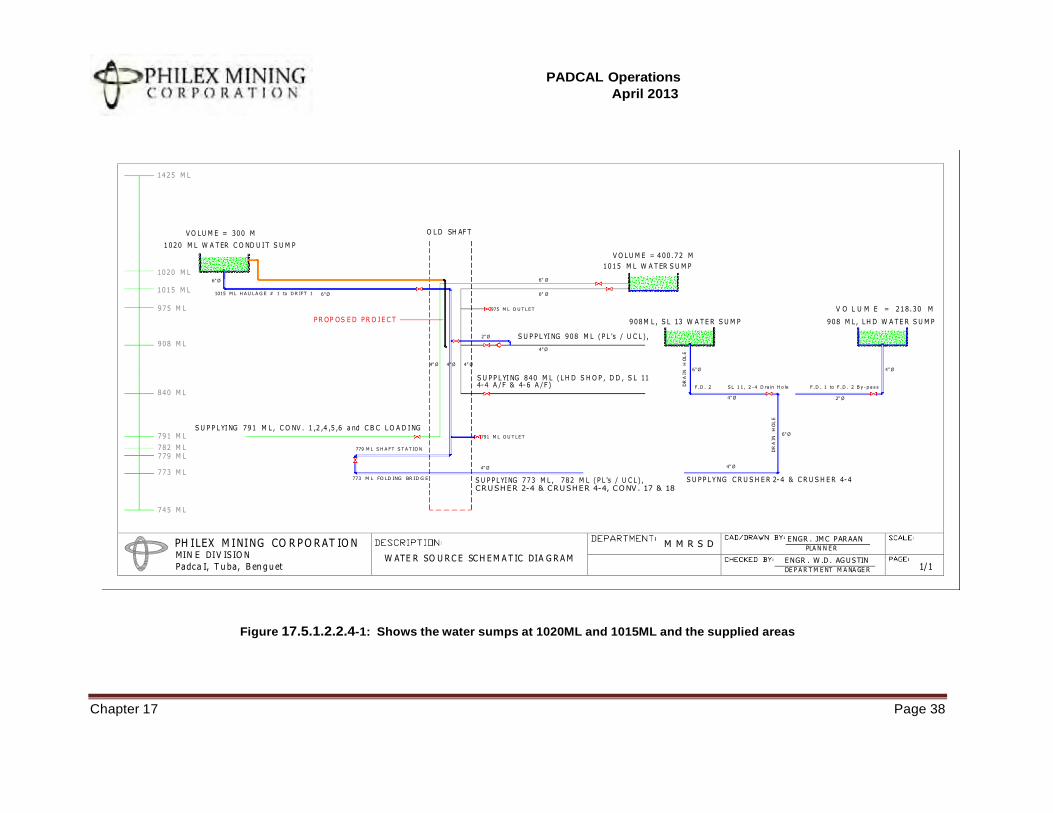
PADCAL Operations
April 2013
Chapter 17 Page 38
DR A
IN
H O
L E
DR A
IN
H O
L E
1425 M L
V O L U M E = 300 M O L D SH AF T
1020 M L W A T ER C O ND U I T S U M P
V O L U M E = 400.72 M
1015 M L W A T ER S U M P 1020 M L
6" Ø 6" Ø
1015 M L 1015 M L H A U L A G E # 1 to D R IF T 1 6" Ø 6" Ø
975 M L 975 M L O U T L E T V O L U M E = 218.30 M
P R OP OS E D P R O J E C T 908M L , S L 13 W A T E R S U M P 908 M L , L H D W A T E R S U M P
2" Ø S U P P L YI NG 908 M L ( P L 's / U C L ) , 908 M L
4" Ø
4" Ø 4" Ø 4" Ø 6" Ø 4" Ø
S U P P L YI NG 840 M L ( L H D S H O P , D D , S L 11 4- 4 A / F & 4- 6 A / F ) F . D . 2 S L 1 1 , 2 - 4 D ra in H o le F . D . 1 to F . D . 2 B y - p a s s
840 M L 4" Ø 2" Ø
S U P P L YI NG 791 M L , C O NV . 1 ,2 ,4 ,5 ,6 a nd C B C L O A D I NG 791 M L 791 M L O U T L E T
6" Ø
782 M L 779 M L S H A F T S T A T IO N
779 M L
4" Ø 4" Ø
773 M L 773 M L FO LD ING BR ID G E S U P P L YI NG 773 M L , 782 M L ( P L 's / U C L ) , S U P P L YNG C R U S H E R 2- 4 & C R U S H E R 4- 4
C R U S H E R 2- 4 & C R U S H E R 4- 4, C O NV . 17 & 18
745 M L
PH ILEX M INING CO R P O R AT IO N MIN E DIV IS IO N
Padca I, T u ba, B en g u et
W ATE R SO U R C E SC H E M A T IC DIA G R A M
M M R S D E NGR . JM C P AR AAN
PLA N N E R
E NGR . W .D . AG U S TIN
DE P A R T M E NT M A NA GE R 1/ 1
Figure 17.5.1.2.2.4-1: Shows the water sumps at 1020ML and 1015ML and the supplied areas
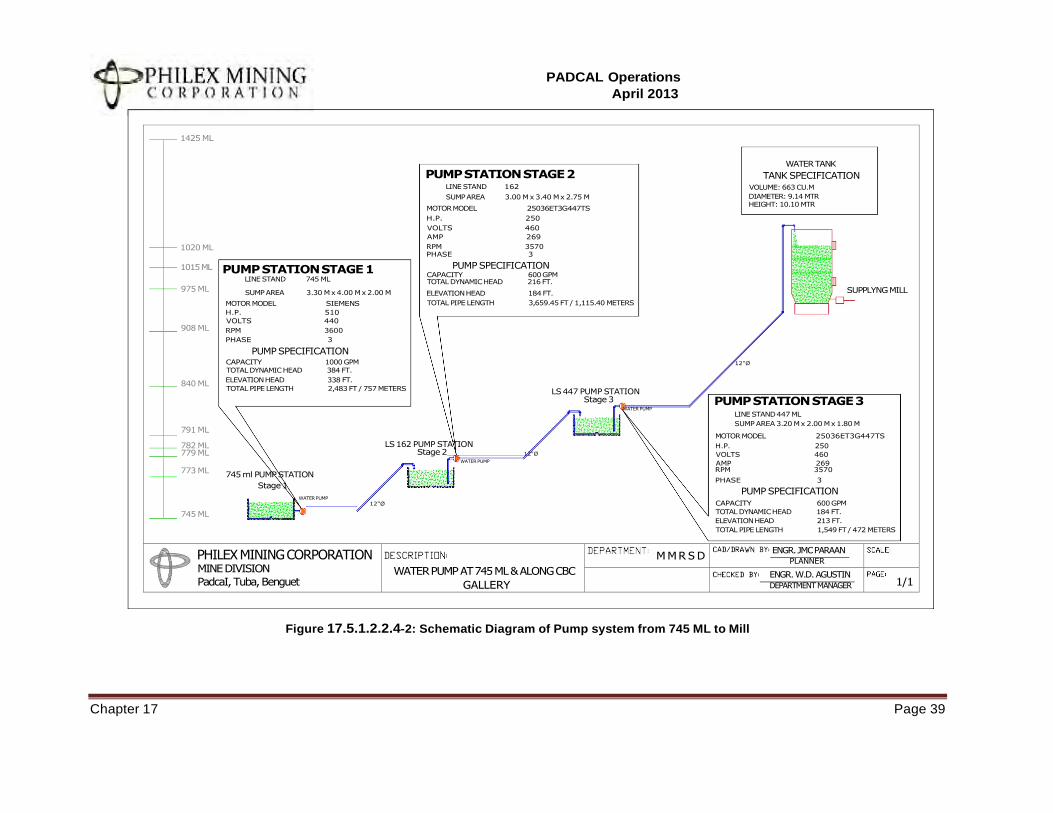
PADCAL Operations
April 2013
Chapter 17 Page 39
1425 ML
WATER TANK
PUMP STATION STAGE 2 TANK SPECIFICATION LINE STAND 162 VOLUME: 663 CU.M
SUMP AREA 3.00 M x 3.40 M x 2.75 M DIAMETER: 9.14 MTR
MOTOR MODEL 25036ET3G447TS HEIGHT: 10.10 MTR
H.P. 250
VOLTS 460
AMP 269
1020 ML RPM 3570 PHASE 3
1015 ML PUMP STATION STAGE 1 PUMP SPECIFICATION CAPACITY 600 GPM
LINE STAND 745 ML TOTAL DYNAMIC HEAD 216 FT. 975 ML
SUMP AREA 3.30 M x 4.00 M x 2.00 M ELEVATION HEAD 184 FT. SUPPLYNG MILL
MOTOR MODEL SIEMENS TOTAL PIPE LENGTH 3,659.45 FT / 1,115.40 METERS
H.P. 510
VOLTS 440 908 ML RPM 3600
PHASE 3
PUMP SPECIFICATION CAPACITY 1000 GPM 12"Ø
TOTAL DYNAMIC HEAD 384 FT.
840 ML ELEVATION HEAD 338 FT.
TOTAL PIPE LENGTH 2,483 FT / 757 METERS LS 447 PUMP STATION
Stage 3 PUMP STATION STAGE 3 WATER PUMP
LINE STAND 447 ML
SUMP AREA 3.20 M x 2.00 M x 1.80 M 791 ML
MOTOR MODEL 25036ET3G447TS
782 ML LS 162 PUMP STATION H.P. 250
779 ML Stage 2 12"Ø VOLTS 460 WATER PUMP AMP 269
773 ML 745 ml PUMP STATION
RPM 3570
PHASE 3 Stage 1
PUMP SPECIFICATION WATER PUMP
12"Ø CAPACITY 600 GPM
745 ML TOTAL DYNAMIC HEAD 184 FT.
ELEVATION HEAD 213 FT.
TOTAL PIPE LENGTH 1,549 FT / 472 METERS
PHILEX MINING CORPORATION MINE DIVISION
PadcaI, Tuba, Benguet
WATER PUMP AT 745 ML & ALONG CBC
GALLERY
M M R S D ENGR. JMC PARAAN
PLANNER
ENGR. W.D. AGUSTIN
DEPARTMENT MANAGER 1/1
Figure 17.5.1.2.2.4-2: Schematic Diagram of Pump system from 745 ML to Mill
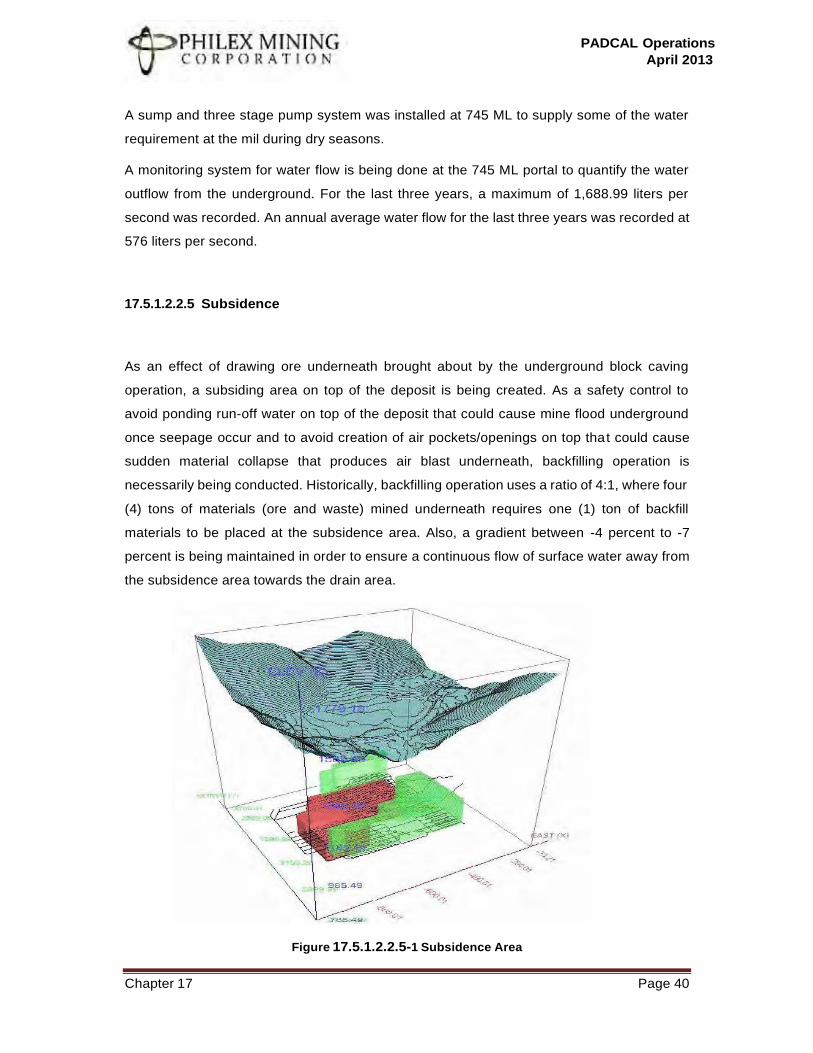
PADCAL Operations
April 2013
Chapter 17 Page 40
A sump and three stage pump system was installed at 745 ML to supply some of the water
requirement at the mil during dry seasons.
A monitoring system for water flow is being done at the 745 ML portal to quantify the water
outflow from the underground. For the last three years, a maximum of 1,688.99 liters per
second was recorded. An annual average water flow for the last three years was recorded at
576 liters per second.
17.5.1.2.2.5 Subsidence
As an effect of drawing ore underneath brought about by the underground block caving
operation, a subsiding area on top of the deposit is being created. As a safety control to
avoid ponding run-off water on top of the deposit that could cause mine flood underground
once seepage occur and to avoid creation of air pockets/openings on top that could cause
sudden material collapse that produces air blast underneath, backfilling operation is
necessarily being conducted. Historically, backfilling operation uses a ratio of 4:1, where four
(4) tons of materials (ore and waste) mined underneath requires one (1) ton of backfill
materials to be placed at the subsidence area. Also, a gradient between -4 percent to -7
percent is being maintained in order to ensure a continuous flow of surface water away from
the subsidence area towards the drain area.
Figure 17.5.1.2.2.5-1 Subsidence Area
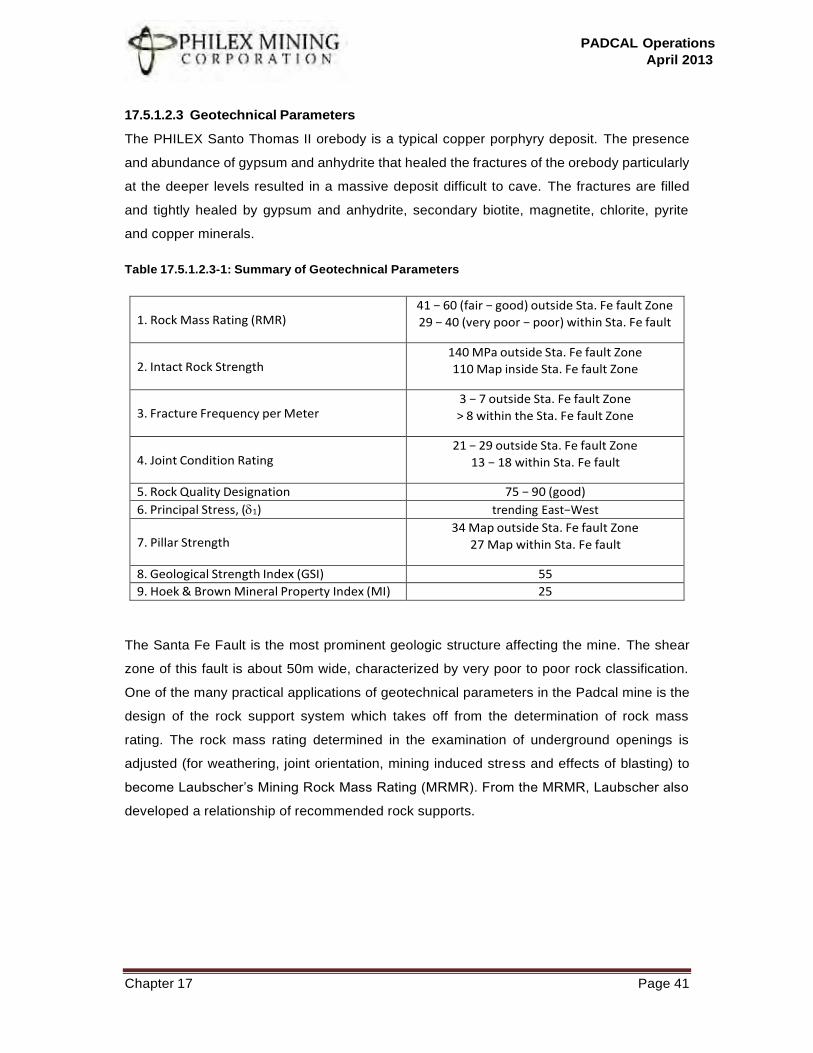
PADCAL Operations
April 2013
Chapter 17 Page 41
17.5.1.2.3 Geotechnical Parameters
The PHILEX Santo Thomas II orebody is a typical copper porphyry deposit. The presence
and abundance of gypsum and anhydrite that healed the fractures of the orebody particularly
at the deeper levels resulted in a massive deposit difficult to cave. The fractures are filled
and tightly healed by gypsum and anhydrite, secondary biotite, magnetite, chlorite, pyrite
and copper minerals.
Table 17.5.1.2.3-1: Summary of Geotechnical Parameters
1. Rock Mass Rating (RMR) 41 − 60 (fair − good) outside Sta. Fe fault Zone
29 − 40 (very poor − poor) within Sta. Fe fault
2. Intact Rock Strength 140 MPa outside Sta. Fe fault Zone
110 Map inside Sta. Fe fault Zone
3. Fracture Frequency per Meter 3 − 7 outside Sta. Fe fault Zone
> 8 within the Sta. Fe fault Zone
4. Joint Condition Rating 21 − 29 outside Sta. Fe fault Zone
13 − 18 within Sta. Fe fault
5. Rock Quality Designation 75 − 90 (good)
6. Principal Stress, (1) trending East−West
7. Pillar Strength 34 Map outside Sta. Fe fault Zone
27 Map within Sta. Fe fault
8. Geological Strength Index (GSI) 55
9. Hoek & Brown Mineral Property Index (MI) 25
The Santa Fe Fault is the most prominent geologic structure affecting the mine. The shear
zone of this fault is about 50m wide, characterized by very poor to poor rock classification.
One of the many practical applications of geotechnical parameters in the Padcal mine is the
design of the rock support system which takes off from the determination of rock mass
rating. The rock mass rating determined in the examination of underground openings is
adjusted (for weathering, joint orientation, mining induced stress and effects of blasting) to
become Laubscher’s Mining Rock Mass Rating (MRMR). From the MRMR, Laubscher also
developed a relationship of recommended rock supports.
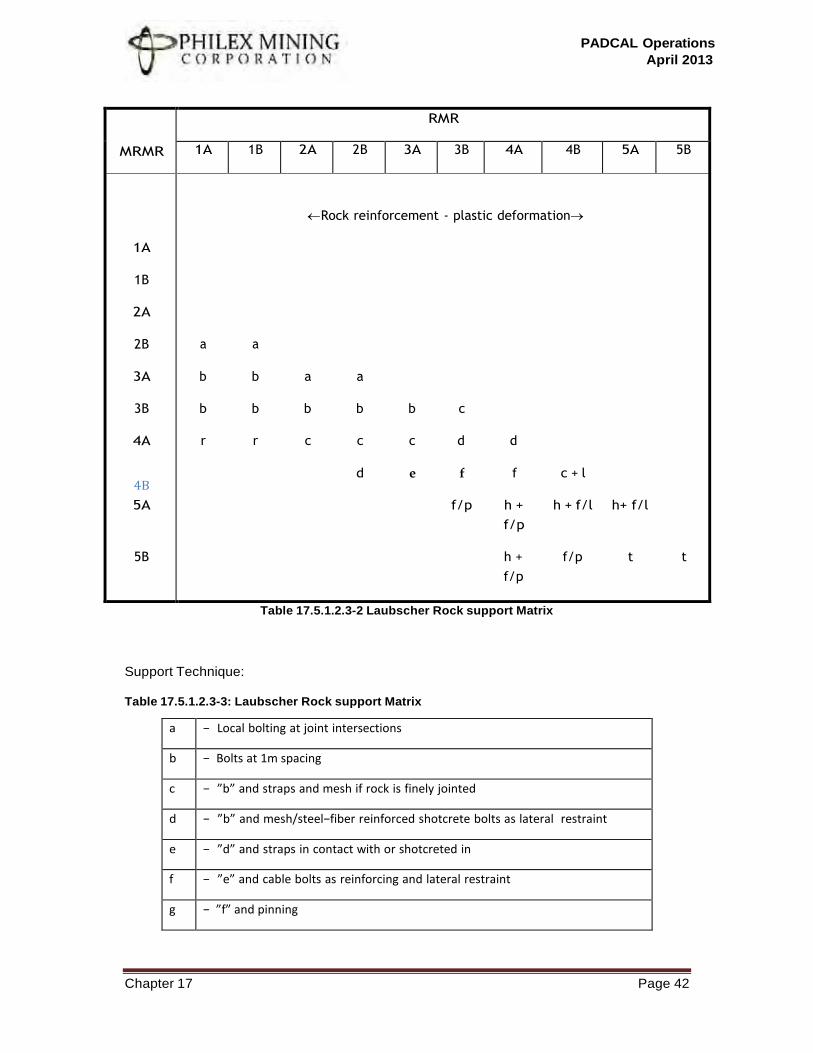
PADCAL Operations
April 2013
Chapter 17 Page 42
MRMR
RMR
1A 1B 2A 2B 3A 3B 4A 4B 5A 5B
1A
1B
2A
2B
3A
3B
4A
4B
5A
5B
Rock reinforcement - plastic deformation→
a a
b b a a
b b b b b c
r r c c c d d
d e f f c + l
f/p h + h + f/l h+ f/l
f/p
h + f/p t t
f/p
Table 17.5.1.2.3-2 Laubscher Rock support Matrix
Support Technique:
Table 17.5.1.2.3-3: Laubscher Rock support Matrix
a − Local bolting at joint intersections
b − Bolts at 1m spacing
c − ”b” and straps and mesh if rock is finely jointed
d − ”b” and mesh/steel−fiber reinforced shotcrete bolts as lateral restraint
e − ”d” and straps in contact with or shotcreted in
f − ”e” and cable bolts as reinforcing and lateral restraint
g − ”f” and pinning
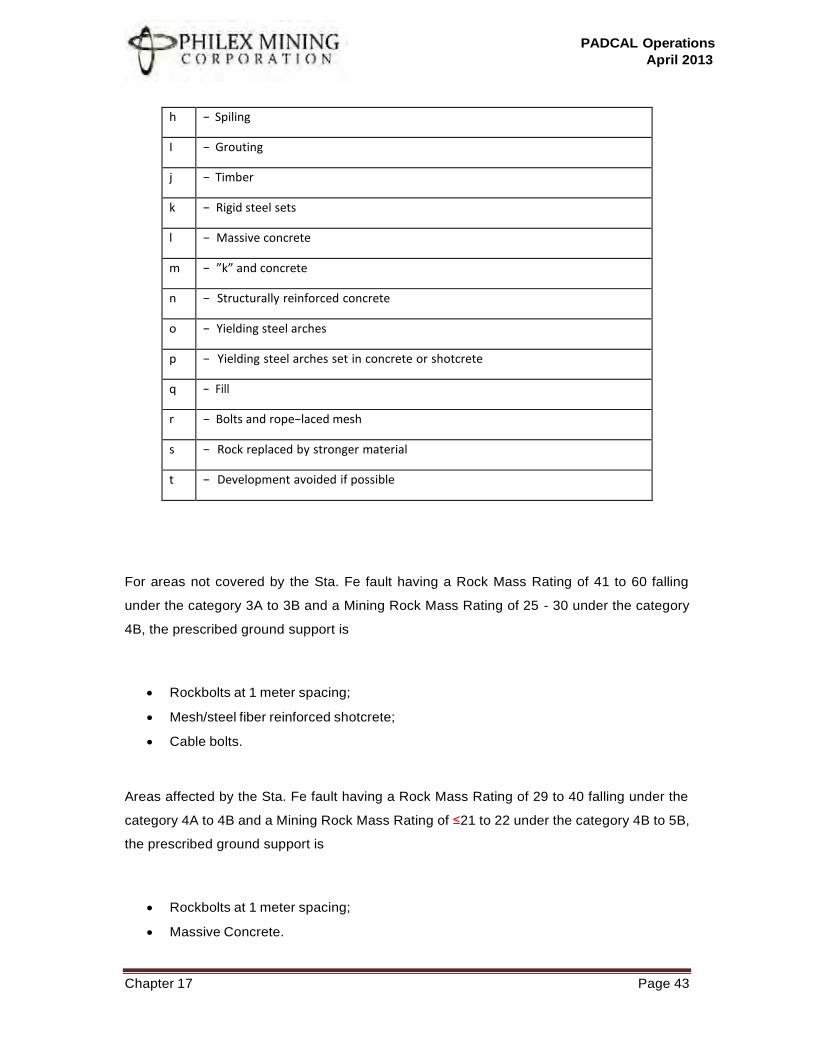
PADCAL Operations
April 2013
Chapter 17 Page 43
h − Spiling
I − Grouting
j − Timber
k − Rigid steel sets
l − Massive concrete
m − ”k” and concrete
n − Structurally reinforced concrete
o − Yielding steel arches
p − Yielding steel arches set in concrete or shotcrete
q − Fill
r − Bolts and rope−laced mesh
s − Rock replaced by stronger material
t − Development avoided if possible
For areas not covered by the Sta. Fe fault having a Rock Mass Rating of 41 to 60 falling
under the category 3A to 3B and a Mining Rock Mass Rating of 25 - 30 under the category
4B, the prescribed ground support is
• Rockbolts at 1 meter spacing;
• Mesh/steel fiber reinforced shotcrete;
• Cable bolts.
Areas affected by the Sta. Fe fault having a Rock Mass Rating of 29 to 40 falling under the
category 4A to 4B and a Mining Rock Mass Rating of ≤21 to 22 under the category 4B to 5B,
the prescribed ground support is
• Rockbolts at 1 meter spacing;
• Massive Concrete.
PADCAL Operations
April 2013
Chapter 17 Page 44
• Steel sets
• Massive reinforced concrete
17.5.1.3 Mining Recovery, Dilution and Losses
Block caving typically exhibits high if not 100 percent mining recovery. Same can be said in
Padcal, which historically show the recovery to average 100 percent, with the exception of
cases wherein block failure occur which stops ore extraction to proceed in that particular
level. When this happens, the lost ore is almost always recovered when the next production
level (lower than the previous) is commissioned into production.
For production planning and ore reserve estimation purposes, wherein the specialized PCBC
software is used, it is assumed that a 100 percent recovery of the broken ore reserve is met.
Padcal, from its experience modeled dilution as: for blocks that are below a previously mined
out area, dilution begins to set in after extracting 20 percent of the mining column and for
virgin blocks, dilutions sets in after extracting 70 percent of the mining column. These
parameters are input to the PCBC software before running a production schedule.
Losses in the form of dilution factor in the metal grades were historically used since 2010
which basically discounts the copper grade by 0.03 percent and gold by 0.10 gram per ton,
based on the assay grades of backfill materials placed in the subsidence are and traces of
previously mined out areas. The factors are applied in the resulting production schedule from
the PCBC software. The factors were derived by constructing a block model of the historical
mined out blocks and depleting it up the current status then.
17.5.1.4 Planned Capacity/Production Schedule/Estimated Life of mine
Mining capacity is dictated by the availability of ore sources at the production levels and the
ability to move the tonnages to the mill. In this technical report, the planned mine throughput
is 9.4 million metric tons per annum or 25,750 metric tons per calendar day. The graph
below shows that Padcal has practically achieved this feat in 2010 and 2011 and was
enroute again in 2012, if not for the suspension of operations.
The improved production is attributed to the improvement in manpower productivity and the
mechanical availabilites of the production equipment including the CHC.
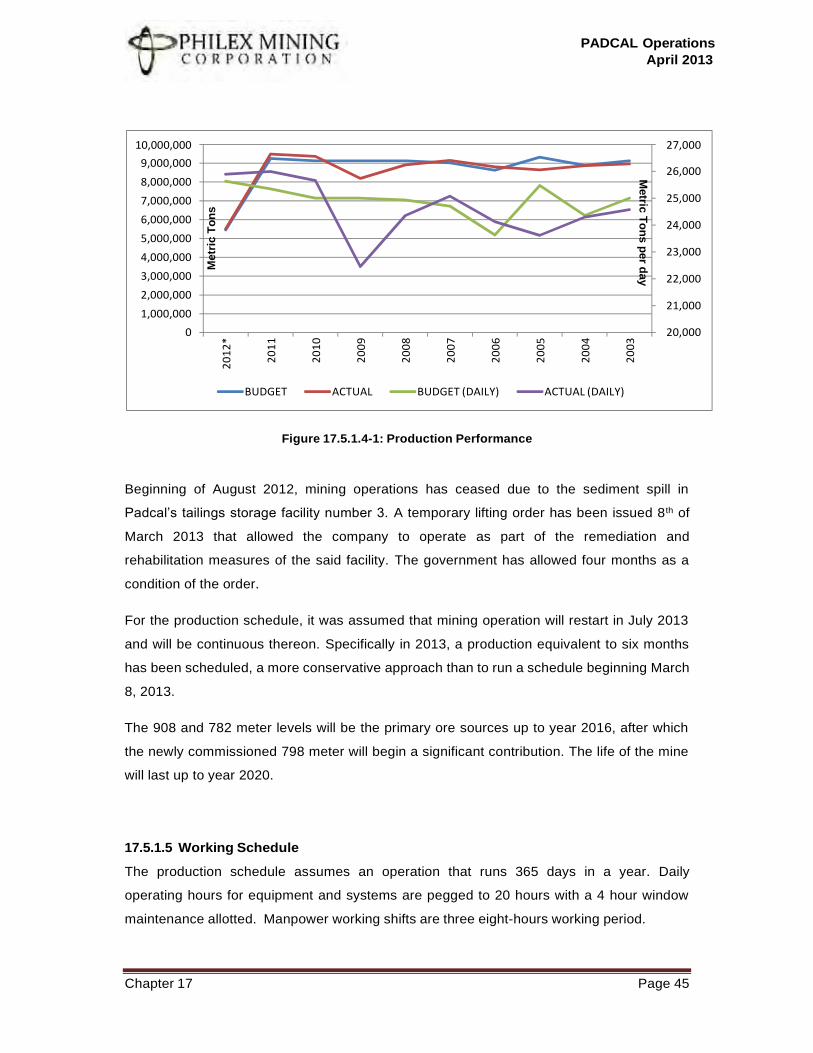
PADCAL Operations
April 2013
Chapter 17 Page 45
Figure 17.5.1.4-1: Production Performance
Beginning of August 2012, mining operations has ceased due to the sediment spill in
Padcal’s tailings storage facility number 3. A temporary lifting order has been issued 8th of
March 2013 that allowed the company to operate as part of the remediation and
rehabilitation measures of the said facility. The government has allowed four months as a
condition of the order.
For the production schedule, it was assumed that mining operation will restart in July 2013
and will be continuous thereon. Specifically in 2013, a production equivalent to six months
has been scheduled, a more conservative approach than to run a schedule beginning March
8, 2013.
The 908 and 782 meter levels will be the primary ore sources up to year 2016, after which
the newly commissioned 798 meter will begin a significant contribution. The life of the mine
will last up to year 2020.
17.5.1.5 Working Schedule
The production schedule assumes an operation that runs 365 days in a year. Daily
operating hours for equipment and systems are pegged to 20 hours with a 4 hour window
maintenance allotted. Manpower working shifts are three eight-hours working period.
10,000,000
9,000,000
8,000,000
7,000,000
6,000,000
5,000,000
4,000,000
3,000,000
2,000,000
1,000,000
0
27,000
26,000
25,000
24,000
23,000
22,000
21,000
20,000
BUDGET ACTUAL BUDGET (DAILY) ACTUAL (DAILY)
Metric
To
ns p
er d
ay
Metr
ic T
on
s
20
12
*
20
11
20
10
20
09
20
08
20
07
20
06
20
05
20
04
20
03
PADCAL Operations
April 2013
Chapter 17 Page 46
The rationale behind using the calendar days as against projected working days is that the
mine has always been capable of delivering up to 27,000 tons per day. If an operational
shutdown happens the operations compensates by delivering at a higher product ion rate,
thus rendering the days immaterial.
Major preventive maintenance schedules and or major systems repair such as cable and
belt replacements for the CHC are usually jibed with National Power Corporation shutdown
schedules which Padcal usually receives ahead of its intended schedule.
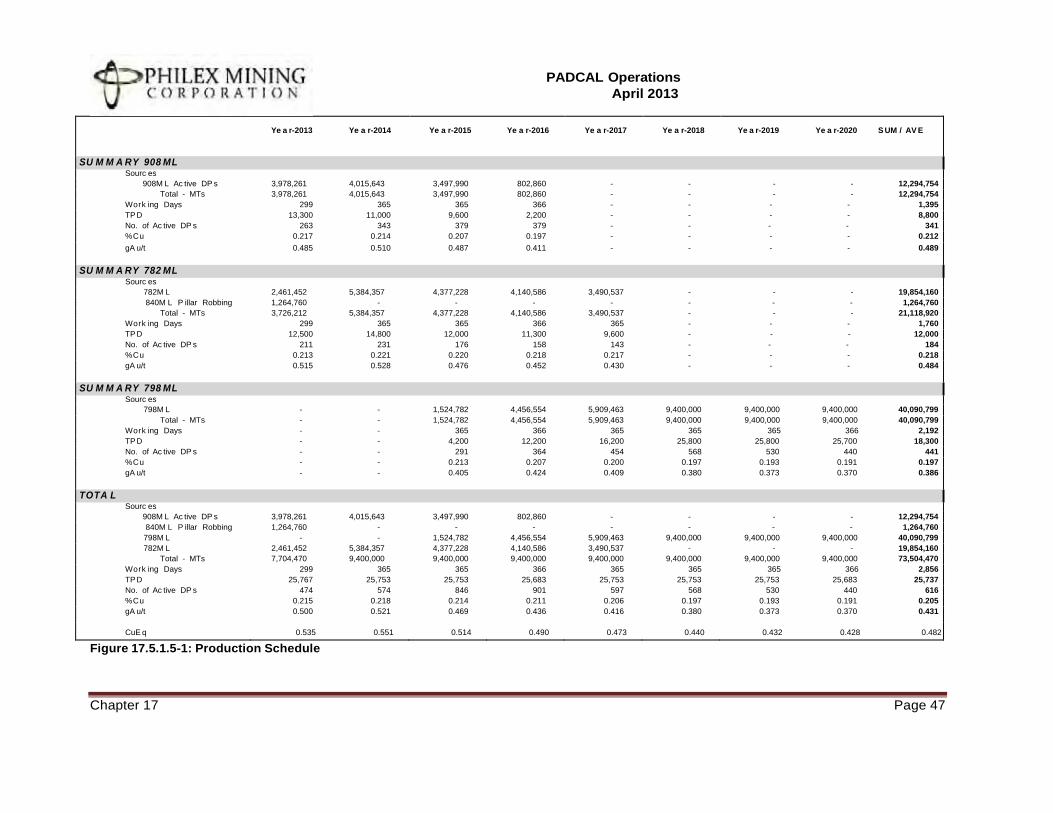
PADCAL Operations
April 2013
Ye a r-2013 Ye a r-2014
Ye a r-2015
Ye a r-2016
Ye a r-2017
Ye a r-2018
Ye a r-2019 Ye a r-2020 S UM / AV E
SU M M A RY 908 ML Sourc es
908M L Ac tive DP s 3,978,261 4,015,643 3,497,990 802,860 - - - - 12,294,754
Total - MTs 3,978,261 4,015,643 3,497,990 802,860 - - - - 12,294,754
Work ing Days 299 365 365 366 - - - - 1,395
TP D 13,300 11,000 9,600 2,200 - - - - 8,800
No. of Ac tive DP s 263 343 379 379 - - - - 341
%Cu 0.217 0.214 0.207 0.197 - - - - 0.212
gA u/t 0.485 0.510 0.487 0.411 - - - - 0.489
SU M M A RY 782 ML Sourc es
782M L 2,461,452 5,384,357 4,377,228 4,140,586 3,490,537 - - - 19,854,160
840M L P illar Robbing 1,264,760 - - - - - - - 1,264,760
Total - MTs 3,726,212 5,384,357 4,377,228 4,140,586 3,490,537 - - - 21,118,920
Work ing Days 299 365 365 366 365 - - - 1,760
TP D 12,500 14,800 12,000 11,300 9,600 - - - 12,000
No. of Ac tive DP s 211 231 176 158 143 - - - 184
%Cu 0.213 0.221 0.220 0.218 0.217 - - - 0.218
gA u/t 0.515 0.528 0.476 0.452 0.430 - - - 0.484
SU M M A RY 798 ML Sourc es
798M L - - 1,524,782 4,456,554 5,909,463 9,400,000 9,400,000 9,400,000 40,090,799
Total - MTs - - 1,524,782 4,456,554 5,909,463 9,400,000 9,400,000 9,400,000 40,090,799
Work ing Days - - 365 366 365 365 365 366 2,192
TP D - - 4,200 12,200 16,200 25,800 25,800 25,700 18,300
No. of Ac tive DP s - - 291 364 454 568 530 440 441
%Cu - - 0.213 0.207 0.200 0.197 0.193 0.191 0.197
gA u/t - - 0.405 0.424 0.409 0.380 0.373 0.370 0.386
TOTA L Sourc es
908M L Ac tive DP s 3,978,261 4,015,643 3,497,990 802,860 - - - - 12,294,754
840M L P illar Robbing 1,264,760 - - - - - - - 1,264,760
798M L - - 1,524,782 4,456,554 5,909,463 9,400,000 9,400,000 9,400,000 40,090,799
782M L 2,461,452 5,384,357 4,377,228 4,140,586 3,490,537 - - - 19,854,160
Total - MTs 7,704,470 9,400,000 9,400,000 9,400,000 9,400,000 9,400,000 9,400,000 9,400,000 73,504,470
Work ing Days 299 365 365 366 365 365 365 366 2,856
TP D 25,767 25,753 25,753 25,683 25,753 25,753 25,753 25,683 25,737
No. of Ac tive DP s 474 574 846 901 597 568 530 440 616
%Cu 0.215 0.218 0.214 0.211 0.206 0.197 0.193 0.191 0.205
gA u/t 0.500 0.521 0.469 0.436 0.416 0.380 0.373 0.370 0.431
CuE q 0.535 0.551 0.514 0.490 0.473 0.440 0.432 0.428 0.482
Figure 17.5.1.5-1: Production Schedule
Chapter 17 Page 47
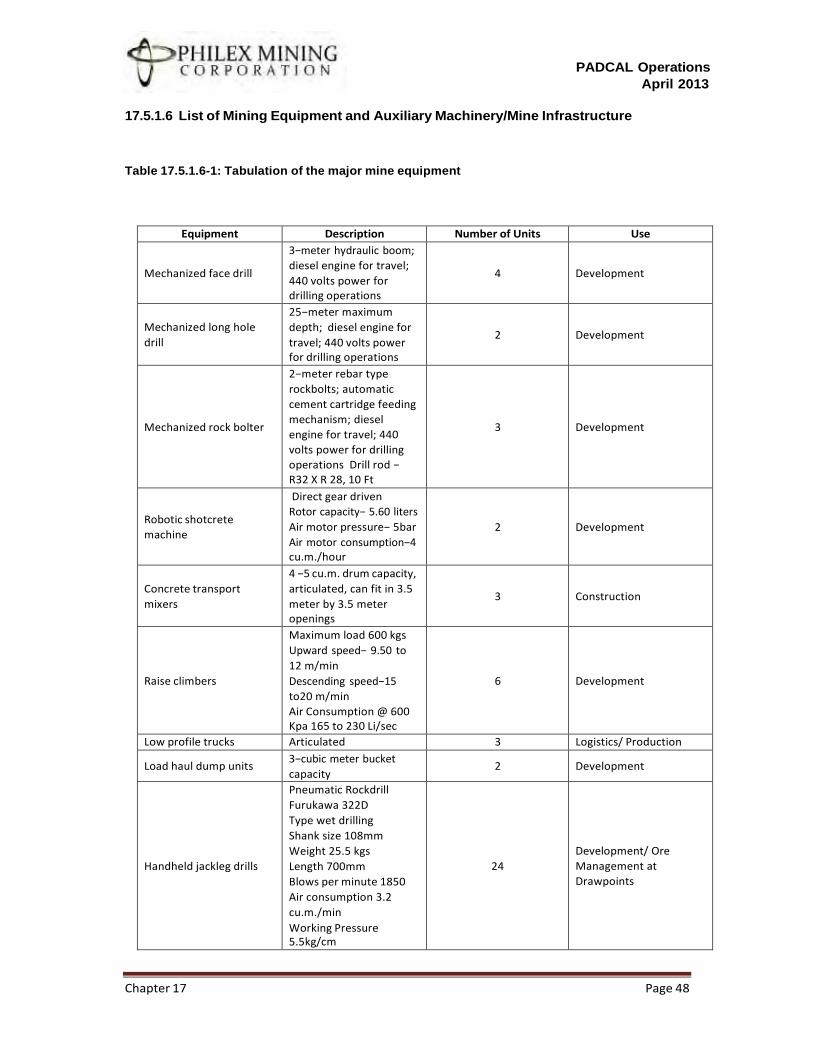
PADCAL Operations
April 2013
Chapter 17 Page 48
17.5.1.6 List of Mining Equipment and Auxiliary Machinery/Mine Infrastructure
Table 17.5.1.6-1: Tabulation of the major mine equipment
Equipment Description Number of Units Use
Mechanized face drill
3−meter hydraulic boom;
diesel engine for travel;
440 volts power for drilling operations
4
Development
Mechanized long hole
drill
25−meter maximum
depth; diesel engine for
travel; 440 volts power for drilling operations
2
Development
Mechanized rock bolter
2−meter rebar type
rockbolts; automatic
cement cartridge feeding
mechanism; diesel
engine for travel; 440
volts power for drilling
operations Drill rod − R32 X R 28, 10 Ft
3
Development
Robotic shotcrete
machine
Direct gear driven
Rotor capacity− 5.60 liters
Air motor pressure− 5bar
Air motor consumption−4 cu.m./hour
2
Development
Concrete transport
mixers
4 −5 cu.m. drum capacity,
articulated, can fit in 3.5
meter by 3.5 meter openings
3
Construction
Raise climbers
Maximum load 600 kgs
Upward speed− 9.50 to
12 m/min
Descending speed−15
to20 m/min
Air Consumption @ 600 Kpa 165 to 230 Li/sec
6
Development
Low profile trucks Articulated 3 Logistics/ Production
Load haul dump units 3−cubic meter bucket
capacity 2 Development
Handheld jackleg drills
Pneumatic Rockdrill
Furukawa 322D
Type wet drilling
Shank size 108mm
Weight 25.5 kgs
Length 700mm
Blows per minute 1850
Air consumption 3.2
cu.m./min
Working Pressure 5.5kg/cm
24
Development/ Ore
Management at
Drawpoints
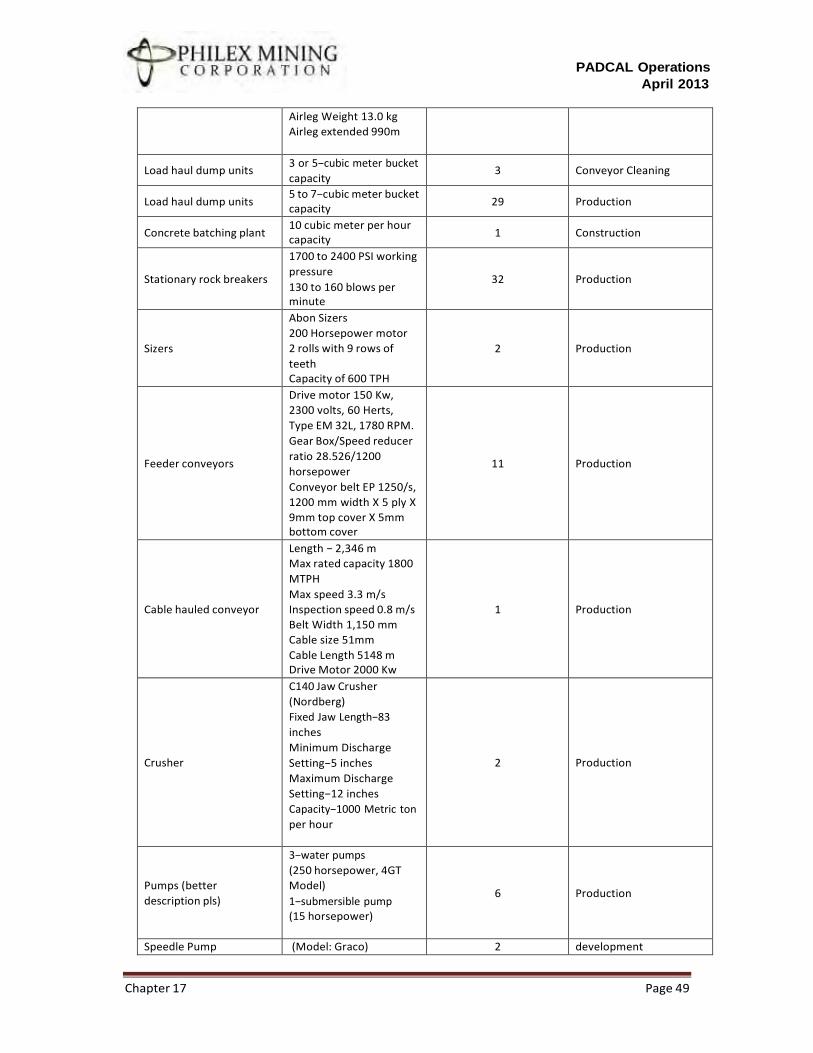
PADCAL Operations
April 2013
Chapter 17 Page 49
Airleg Weight 13.0 kg
Airleg extended 990m
Load haul dump units 3 or 5−cubic meter bucket
capacity 3 Conveyor Cleaning
Load haul dump units 5 to 7−cubic meter bucket capacity
29 Production
Concrete batching plant 10 cubic meter per hour capacity
1 Construction
Stationary rock breakers
1700 to 2400 PSI working
pressure
130 to 160 blows per minute
32
Production
Sizers
Abon Sizers
200 Horsepower motor
2 rolls with 9 rows of
teeth Capacity of 600 TPH
2
Production
Feeder conveyors
Drive motor 150 Kw,
2300 volts, 60 Herts,
Type EM 32L, 1780 RPM.
Gear Box/Speed reducer
ratio 28.526/1200
horsepower
Conveyor belt EP 1250/s,
1200 mm width X 5 ply X
9mm top cover X 5mm bottom cover
11
Production
Cable hauled conveyor
Length − 2,346 m
Max rated capacity 1800
MTPH
Max speed 3.3 m/s
Inspection speed 0.8 m/s
Belt Width 1,150 mm
Cable size 51mm
Cable Length 5148 m Drive Motor 2000 Kw
1
Production
Crusher
C140 Jaw Crusher
(Nordberg)
Fixed Jaw Length−83
inches
Minimum Discharge
Setting−5 inches
Maximum Discharge
Setting−12 inches
Capacity−1000 Metric ton
per hour
2
Production
Pumps (better
description pls)
3−water pumps
(250 horsepower, 4GT
Model)
1−submersible pump (15 horsepower)
6
Production
Speedle Pump (Model: Graco) 2 development
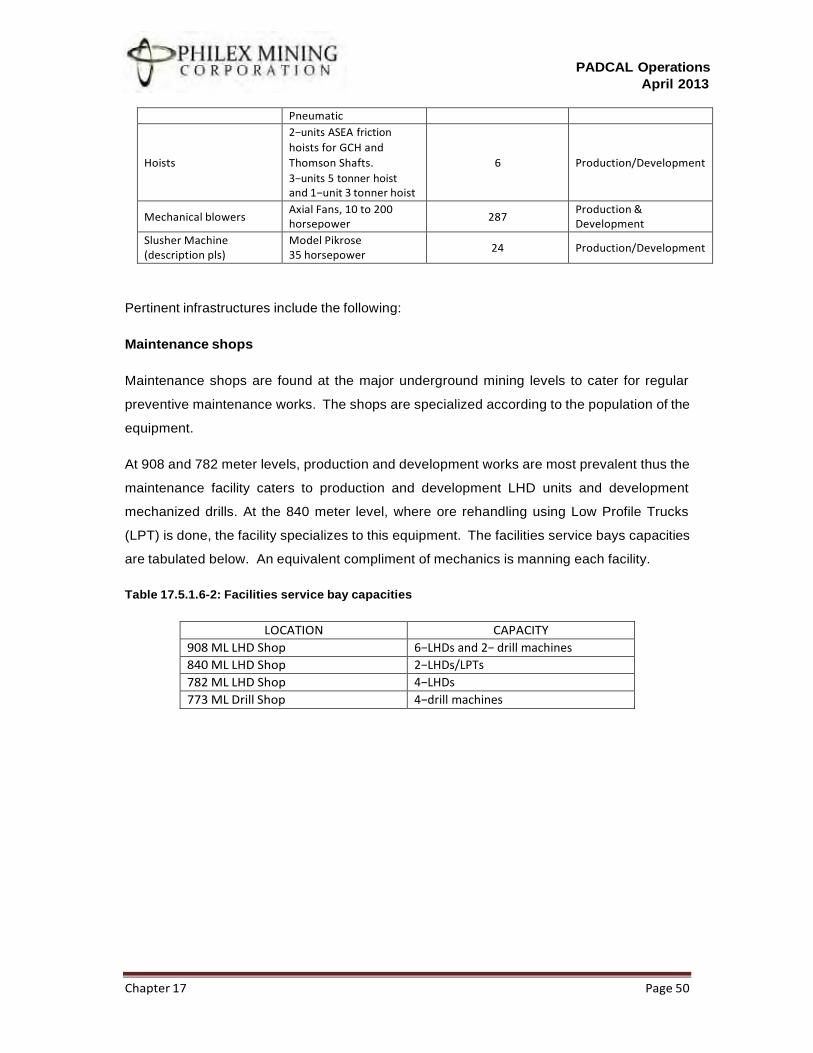
PADCAL Operations
April 2013
Chapter 17 Page 50
Pneumatic
Hoists
2−units ASEA friction
hoists for GCH and
Thomson Shafts.
3−units 5 tonner hoist and 1−unit 3 tonner hoist
6
Production/Development
Mechanical blowers Axial Fans, 10 to 200 horsepower
287 Production & Development
Slusher Machine (description pls)
Model Pikrose 35 horsepower
24 Production/Development
Pertinent infrastructures include the following:
Maintenance shops
Maintenance shops are found at the major underground mining levels to cater for regular
preventive maintenance works. The shops are specialized according to the population of the
equipment.
At 908 and 782 meter levels, production and development works are most prevalent thus the
maintenance facility caters to production and development LHD units and development
mechanized drills. At the 840 meter level, where ore rehandling using Low Profile Trucks
(LPT) is done, the facility specializes to this equipment. The facilities service bays capacities
are tabulated below. An equivalent compliment of mechanics is manning each facility.
Table 17.5.1.6-2: Facilities service bay capacities
LOCATION CAPACITY
908 ML LHD Shop 6−LHDs and 2− drill machines
840 ML LHD Shop 2−LHDs/LPTs
782 ML LHD Shop 4−LHDs
773 ML Drill Shop 4−drill machines
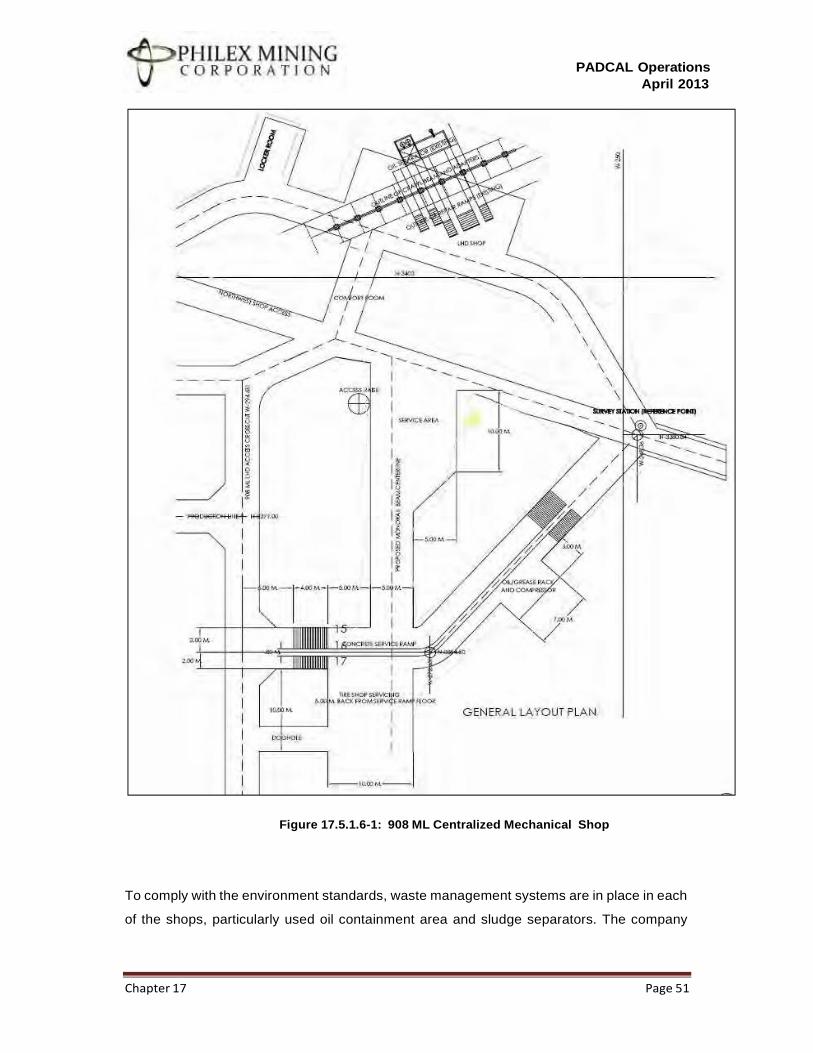
PADCAL Operations
April 2013
Chapter 17 Page 51
Figure 17.5.1.6-1: 908 ML Centralized Mechanical Shop
To comply with the environment standards, waste management systems are in place in each
of the shops, particularly used oil containment area and sludge separators. The company
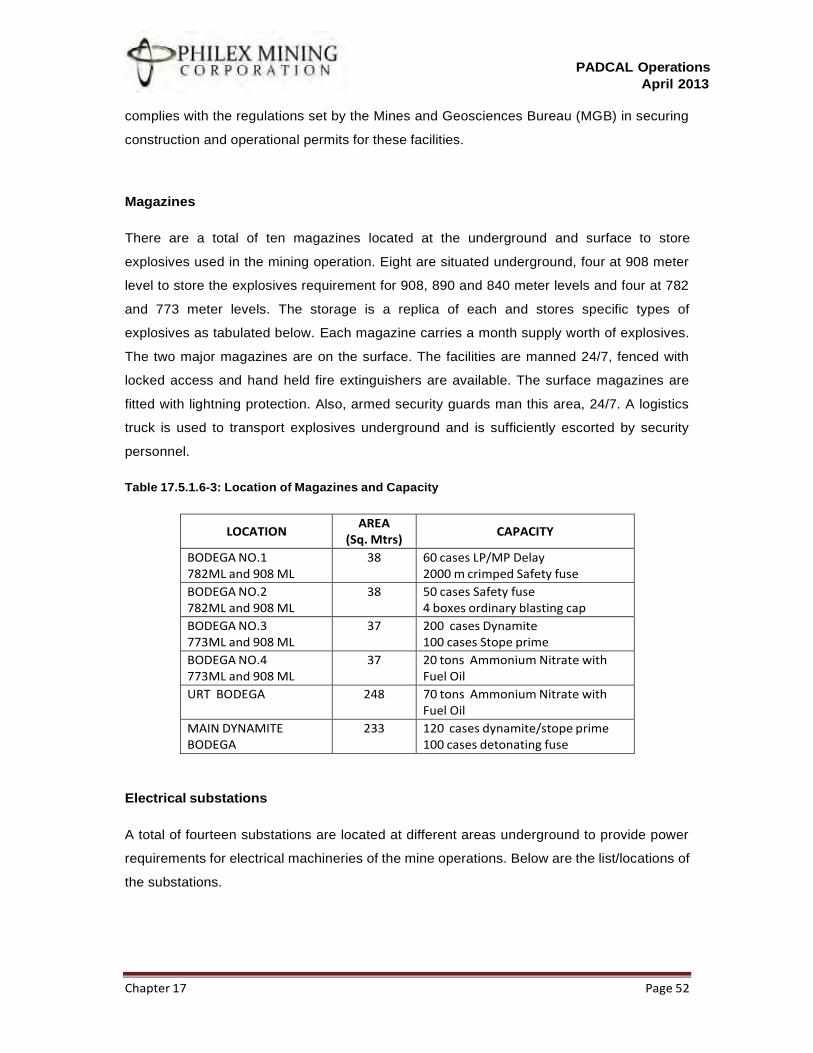
PADCAL Operations
April 2013
Chapter 17 Page 52
complies with the regulations set by the Mines and Geosciences Bureau (MGB) in securing
construction and operational permits for these facilities.
Magazines
There are a total of ten magazines located at the underground and surface to store
explosives used in the mining operation. Eight are situated underground, four at 908 meter
level to store the explosives requirement for 908, 890 and 840 meter levels and four at 782
and 773 meter levels. The storage is a replica of each and stores specific types of
explosives as tabulated below. Each magazine carries a month supply worth of explosives.
The two major magazines are on the surface. The facilities are manned 24/7, fenced with
locked access and hand held fire extinguishers are available. The surface magazines are
fitted with lightning protection. Also, armed security guards man this area, 24/7. A logistics
truck is used to transport explosives underground and is sufficiently escorted by security
personnel.
Table 17.5.1.6-3: Location of Magazines and Capacity
LOCATION AREA
(Sq. Mtrs) CAPACITY
BODEGA NO.1 782ML and 908 ML
38 60 cases LP/MP Delay 2000 m crimped Safety fuse
BODEGA NO.2 782ML and 908 ML
38 50 cases Safety fuse 4 boxes ordinary blasting cap
BODEGA NO.3 773ML and 908 ML
37 200 cases Dynamite 100 cases Stope prime
BODEGA NO.4 773ML and 908 ML
37 20 tons Ammonium Nitrate with Fuel Oil
URT BODEGA 248 70 tons Ammonium Nitrate with Fuel Oil
MAIN DYNAMITE BODEGA
233 120 cases dynamite/stope prime 100 cases detonating fuse
Electrical substations
A total of fourteen substations are located at different areas underground to provide power
requirements for electrical machineries of the mine operations. Below are the list/locations of
the substations.
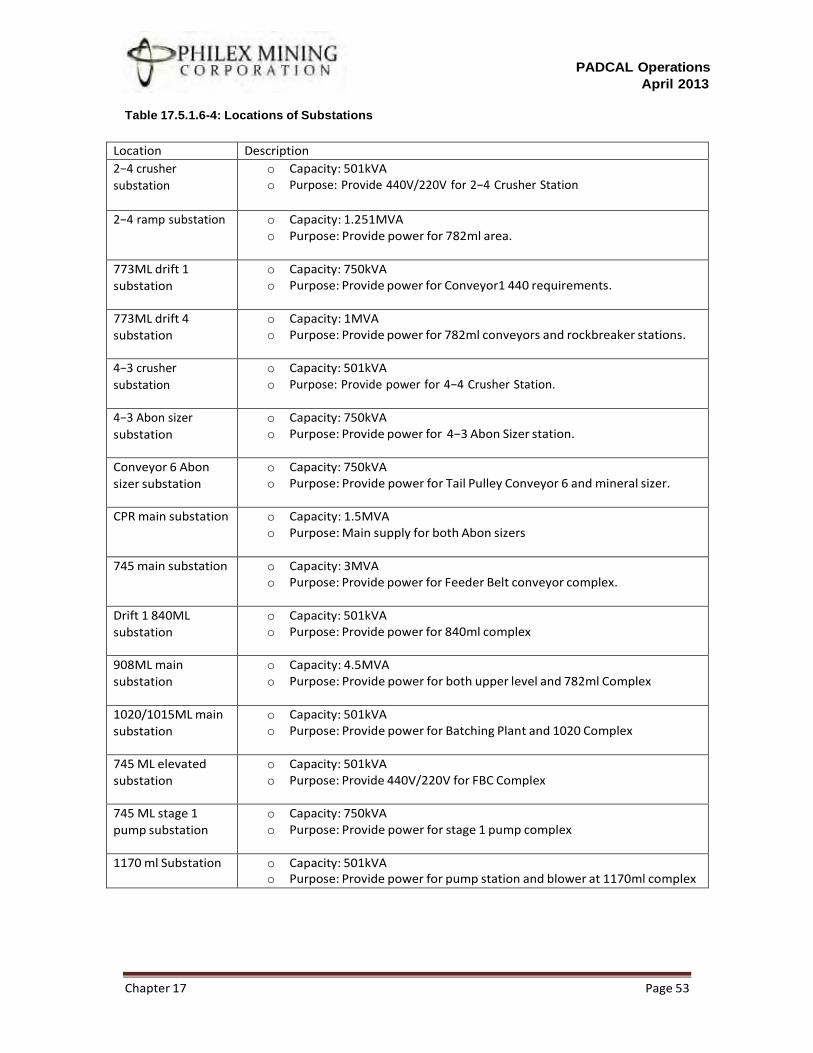
PADCAL Operations
April 2013
Chapter 17 Page 53
Table 17.5.1.6-4: Locations of Substations
Location Description
2−4 crusher
substation
o Capacity: 501kVA o Purpose: Provide 440V/220V for 2−4 Crusher Station
2−4 ramp substation o Capacity: 1.251MVA o Purpose: Provide power for 782ml area.
773ML drift 1
substation
o Capacity: 750kVA o Purpose: Provide power for Conveyor1 440 requirements.
773ML drift 4
substation
o Capacity: 1MVA o Purpose: Provide power for 782ml conveyors and rockbreaker stations.
4−3 crusher
substation
o Capacity: 501kVA o Purpose: Provide power for 4−4 Crusher Station.
4−3 Abon sizer
substation
o Capacity: 750kVA o Purpose: Provide power for 4−3 Abon Sizer station.
Conveyor 6 Abon
sizer substation
o Capacity: 750kVA o Purpose: Provide power for Tail Pulley Conveyor 6 and mineral sizer.
CPR main substation o Capacity: 1.5MVA o Purpose: Main supply for both Abon sizers
745 main substation o Capacity: 3MVA o Purpose: Provide power for Feeder Belt conveyor complex.
Drift 1 840ML
substation
o Capacity: 501kVA o Purpose: Provide power for 840ml complex
908ML main
substation
o Capacity: 4.5MVA o Purpose: Provide power for both upper level and 782ml Complex
1020/1015ML main
substation
o Capacity: 501kVA o Purpose: Provide power for Batching Plant and 1020 Complex
745 ML elevated
substation
o Capacity: 501kVA o Purpose: Provide 440V/220V for FBC Complex
745 ML stage 1
pump substation
o Capacity: 750kVA o Purpose: Provide power for stage 1 pump complex
1170 ml Substation o Capacity: 501kVA o Purpose: Provide power for pump station and blower at 1170ml complex
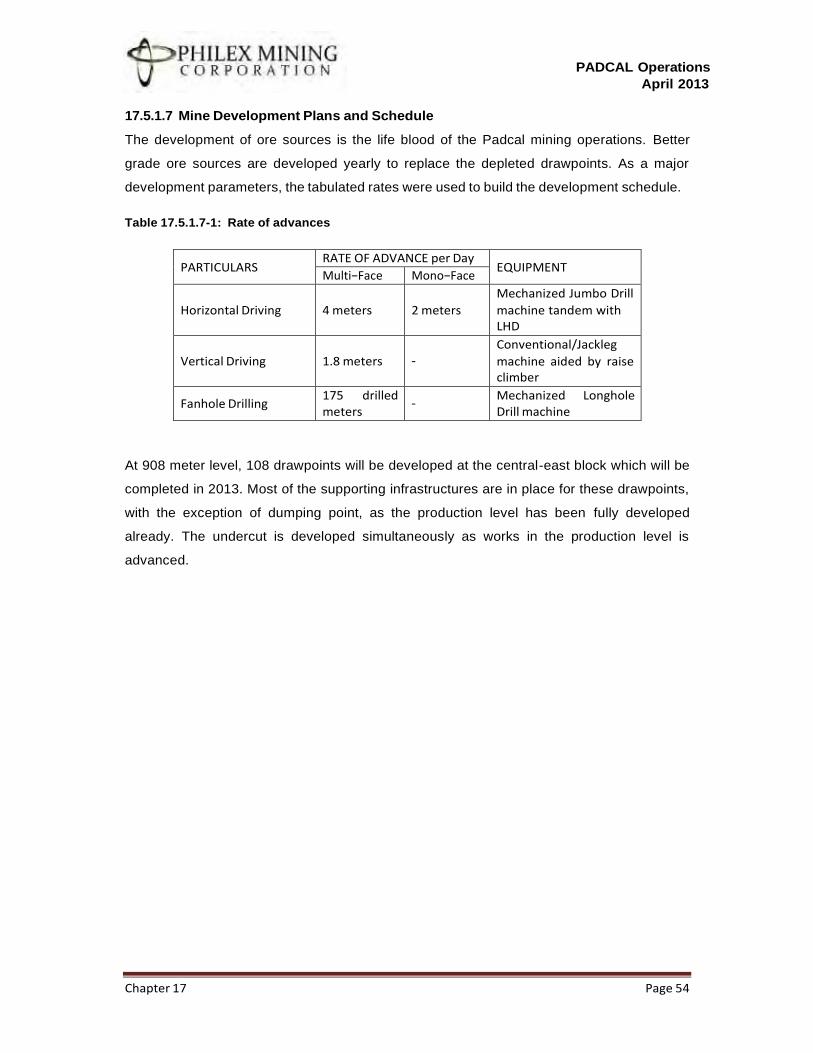
PADCAL Operations
April 2013
Chapter 17 Page 54
17.5.1.7 Mine Development Plans and Schedule
The development of ore sources is the life blood of the Padcal mining operations. Better
grade ore sources are developed yearly to replace the depleted drawpoints. As a major
development parameters, the tabulated rates were used to build the development schedule.
Table 17.5.1.7-1: Rate of advances
PARTICULARS RATE OF ADVANCE per Day
EQUIPMENT Multi−Face Mono−Face
Horizontal Driving
4 meters
2 meters
Mechanized Jumbo Drill
machine tandem with LHD
Vertical Driving
1.8 meters
−
Conventional/Jackleg
machine aided by raise climber
Fanhole Drilling 175 drilled meters
− Mechanized Longhole Drill machine
At 908 meter level, 108 drawpoints will be developed at the central-east block which will be
completed in 2013. Most of the supporting infrastructures are in place for these drawpoints,
with the exception of dumping point, as the production level has been fully developed
already. The undercut is developed simultaneously as works in the production level is
advanced.
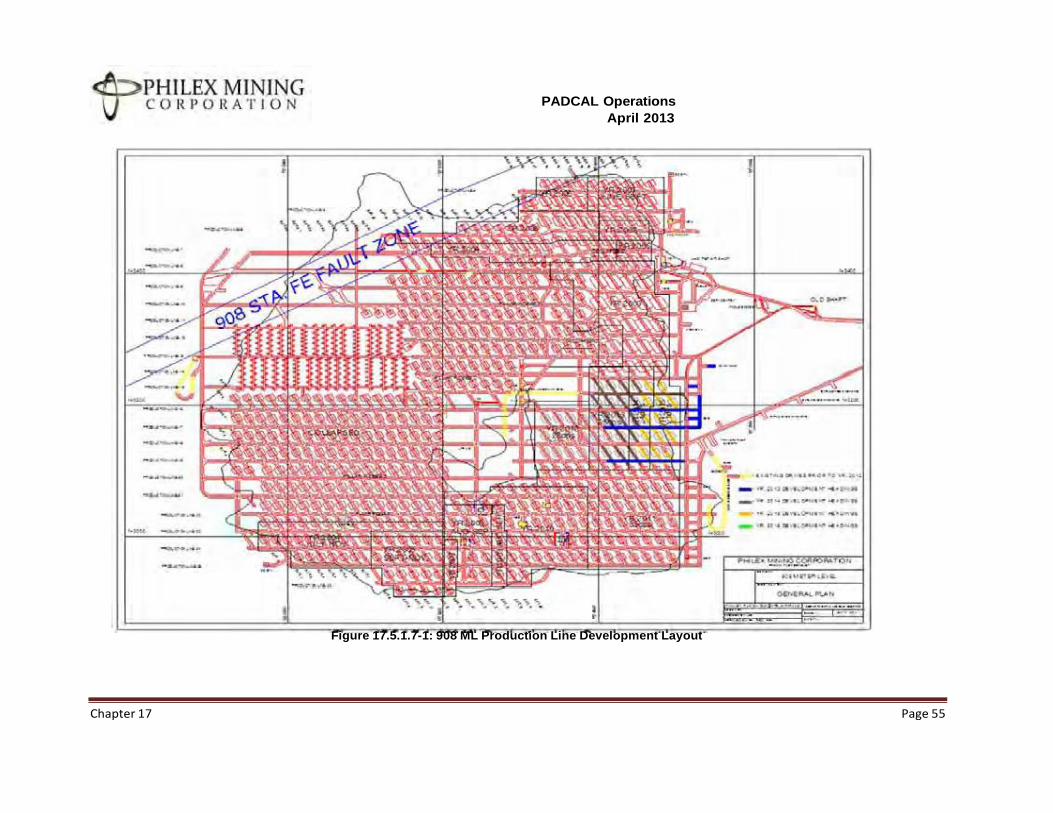
PADCAL Operations
April 2013
Chapter 17 Page 55
Figure 17.5.1.7-1: 908 ML Production Line Development Layout
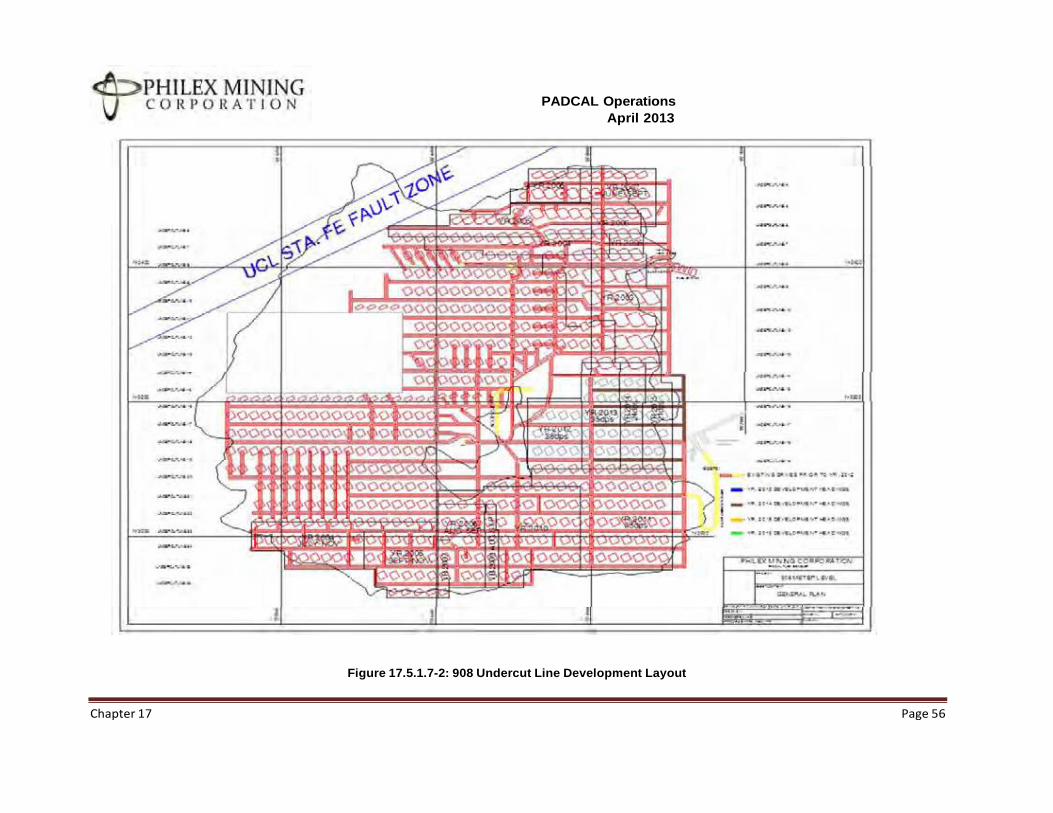
PADCAL Operations
April 2013
Chapter 17 Page 56
Figure 17.5.1.7-2: 908 Undercut Line Development Layout
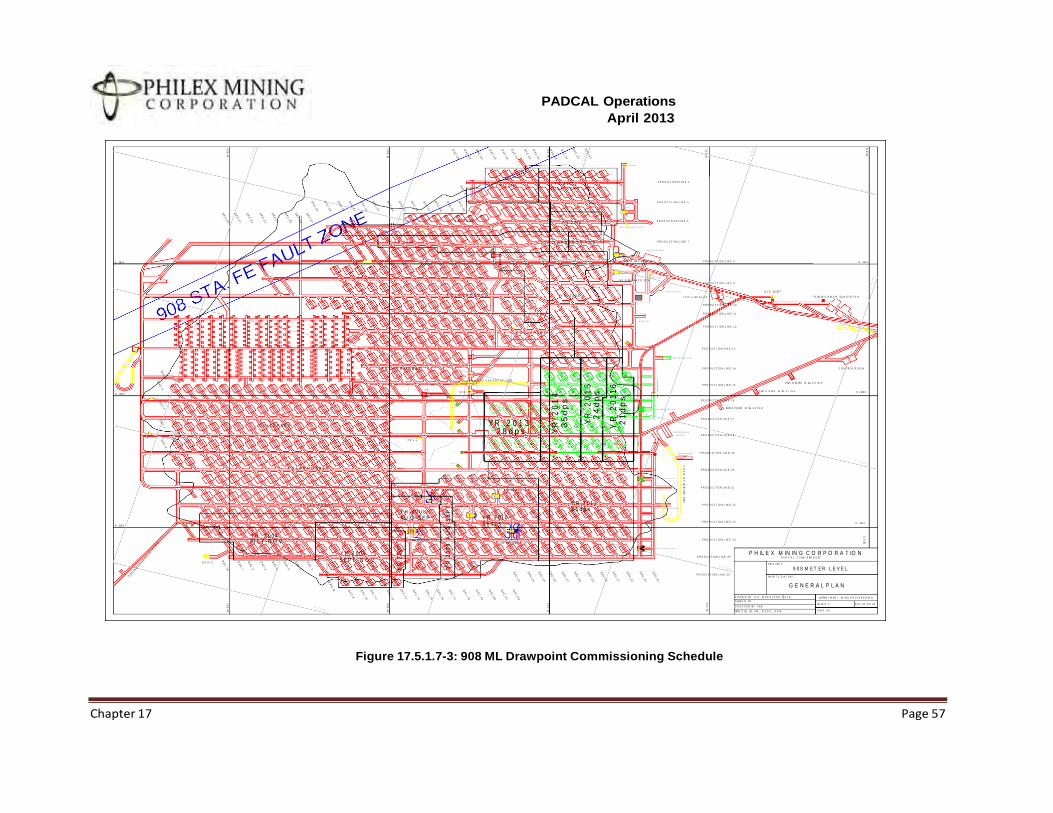
PADCAL Operations
April 2013
Chapter 17 Page 57
D D S T A .
P R O D U C T I O N L I N E - 4
Y R . 2 0 0 6 Y R . 2 0 0 7
J U N E - S E P T
P R O D U C T I O N L I N E - 5
N E - C
Y R . 2 0 0 5 Y R . 2 0 0 6
P R O D U C T I O N L I N E - 6
A C C . M A N W A Y T O U C L - 6
Y R . 2 0 0 4 C O L L A P S E D Y R . 2 0 0 5 P R O D U C T I O N L I N E - 7
L H D R E P A I R S H O P
N - 340 0 N E - A BR E A KER ST A. P R O D U C T I O N L I N E - 8 N - 340 0
F U E L S T A .
N E - B BR E A K E R S T A . P R O D U C T I O N L I N E - 9
S E R V I C E A R E A O L D SH AF T
P IL L A R R O B B E D Y R . 2 0 0 3 T O O L S BO D E G A T R AN SF O R M E R SU B- ST AT I O N
P R O D U C T I O N L I N E - 1 0
P R O D U C T I O N L I N E - 1 1
W A S H B A Y
P R O D U C T I O N L I N E - 1 2
C O L L A P S E D
P R O D U C T I O N L I N E - 1 3
2- 4 A B B F R E P A I R S H O P
38 39 40 41 42
P IL L A R R O B B E D P R O D U C T I O N L I N E - 1 4 C O N T R O L R O O M
2- 4 B 37 38 39 40 41 42 43
R A M P T O U N D E R C U T L EVEL
P R O D U C T I O N L I N E - 1 5 EXPL O SI VES M AG A Z I N E
2- 5 EXPL O SI VES M AG A Z I N E
N - 320 0 2- 4 C 36 37 38
39 40 41 42 N - 320 0
P R O D U C T I O N L I N E - 1 6
V E N T . R S E .- 1 6 31 32 33 34 35 37 38 39 40
36 41 1 6 / 1 7 B R E A K E R S T A .
EXPL O SI VES M AG A Z I N E
C O L L A P S E D V E N T . R
S E .- 1 7 Y R . 2 0 1 3
P R O D U C T I O N L I N E - 1 7
30 31 32 V E N T . R
S E .- 1 8 2 8 d p s 33 34 35 36 37 38 39 40
T R A N S F O R M E R
S U B - S T A . P R O D U C T I O N L I N E - 1 8 M A N W A Y
LT R 3 - 5
29 30 31 32 33 34 35 36 37 38 39
V E N T . R S E .- 1 9
P R O D U C T IO N P R O D U C T I O N L I N E - 1 9 L O C K E R S
V E N T . R S E .- 2 0
28 29 30 31 32 33 34 35 36 37 38
P IL L A R R O B B E D P R O D U C T I O N L I N E - 2 0
31 32 33 34 35 36 37 2 0 / 2 1 B R E A K E R S T A .
23 24 25 26 27 28 29 30
P R O D U C T I O N L I N E - 2 1 4 - 4 AA BR EAKE R S T A . 4 - 3 BR EAKER S T A . B O D E G A - 1
18 19 21 22 23 24 25 27 28 29 30 31 32 33 34 35 36
P I L L A R R O BBE D 4 - 4 BB BR EAKE R S T A .
21 22
Y R . 2 0 1 1 8 5 d p s
29 30 31 32 33 34 35
P R O D U C T I O N L I N E - 2 2 S A T T E L I T E B O D E G A
2 3 4 5 6 7 8 9 1 0 1 1 1 2 1 3 1 4 1 5 1 6 1 7Y R . 128 0 0 8 1 9
A U G - S E P 4- 6 R S E . - 8
24 25 26 27 28
Y R . 2 0 1 0 6 6 d p s P R O D U C T I O N L I N E - 2 3
N - 300 0 N - 300 0
1A 1 2 3 4 5 6 7
Y R . 2 0 0 4 JU L Y - N O V
2 3 4 5 6
9 16
10 11 12 13 14 15 18 19 20 21 22 23 24 26 27 28 29 30 31 32 33 34
4 - 4 A BR EAKER S T A . P R O D U C T I O N L I N E - 2 4
4 - 4 B BR EAKER S T A .
7 9 10 11 12 13 1 4
Y R . 2 0 0 5 S E P T - N O V .
9 10 11 12 13
15 17 18 19 20 21 22 23 24 25 26 27 28 29 30 31 32 33 2 4 / 2 5 B R E A K E R S T A .
P R O D U C T I O N L I N E - 2 5 P H IL E X M IN IN G C O R P O R A T IO N
P A D C A L , T U BA, B EN G U ET
D D S T A . PR O J EC T :
14 16 17 18 19 20
P R O D U C T I O N L I N E - 2 6
9 0 8 M E T E R L E V E L
SH EE T C O N T EN T :
9 10 11 12 13
G E N E R A L P L A N
D R A W N BY : R .O . M A M A Y S O N D A T E :
D ESI G N BY :
C H E C K E D BY : J A B
APPR O VE BY: PPL , R S D I I , R P M
D EPAR T M EN T : M I N E E N G I N E E R I N G
SC AL E 1 : S H T . 01 O F 0 1
D W G . N 0 .
Figure 17.5.1.7-3: 908 ML Drawpoint Commissioning Schedule
W -
8 0
0
W -
8 0
0
W -
6 0
0
W -
6 0
0
Y R
. 2
00
7
Y R
. 2
00
9
A U
G -
SE
PT
W -
4 0
0
W -
4 0
0
YR
. 2
0 1
4
35
dp
s
YR
. 2
0 1
5
24
dp
s
Y R
. 2
01
16
2
1d
ps
E A
S T
P
E R
I M
. N
O R
T H
EA
ST
PE
R I
M
ET
E R
R A
M
P
W -
2 0
0
W -
2 0
0
ZE
R O
Z
E R
O
PADCAL Operations
April 2013
The 782 meter level has 157 drawpoints that will be developed in the next three years at the
east and west corners of the mining level. As with the 908 ML most of the supporting
infrastructures are in place for these drawpoints. The undercut is developed simultaneously
as works in the production level is advanced.
- Left Intentionally Blank –
Chapter 17 Page 58
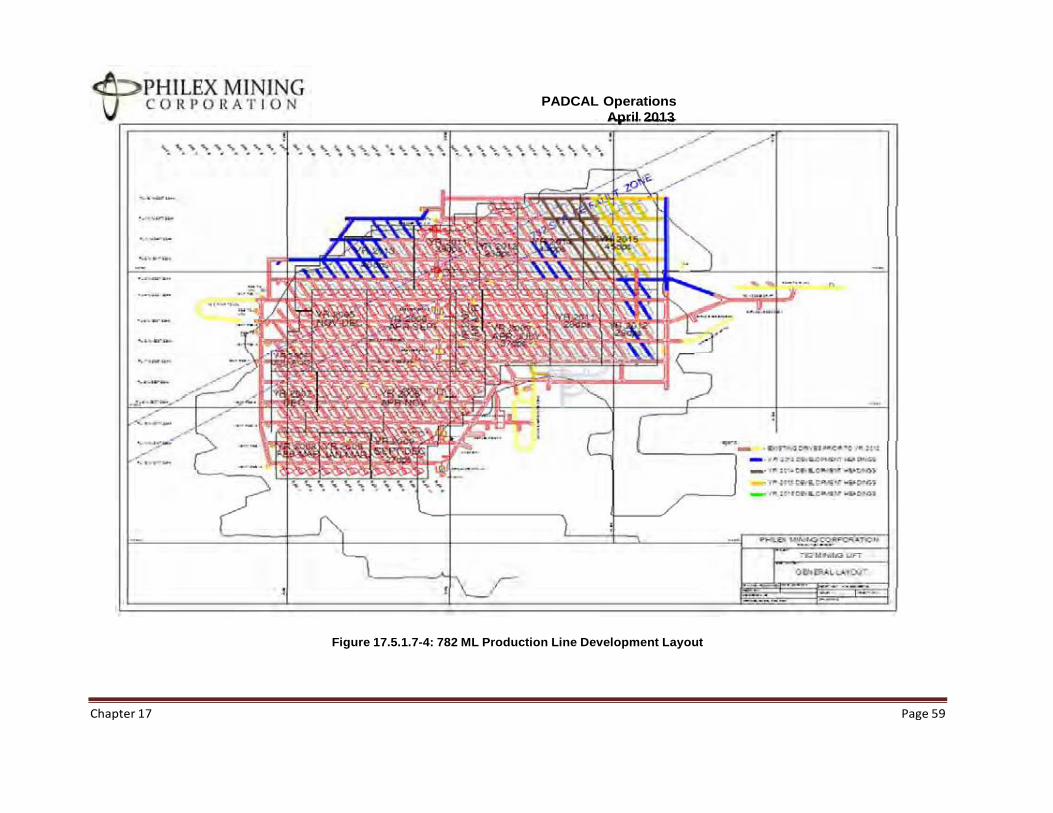
PADCAL Operations
Chapter 17 Page 59
April 2013
Figure 17.5.1.7-4: 782 ML Production Line Development Layout
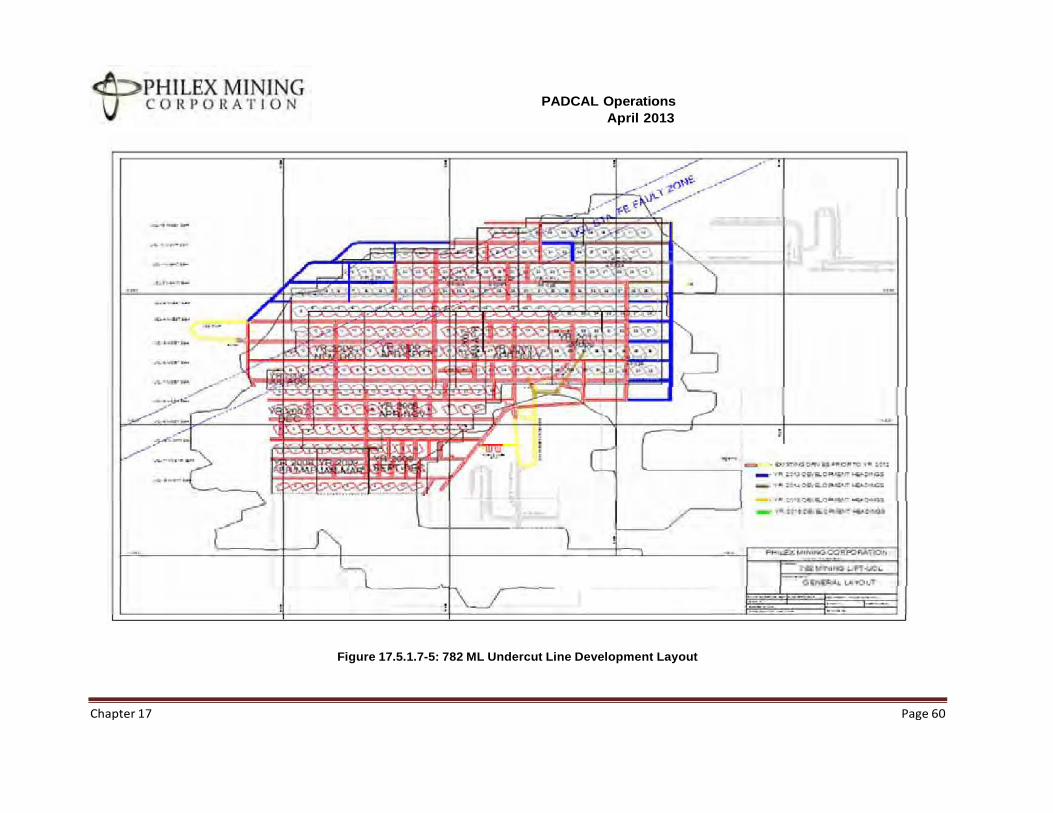
PADCAL Operations
April 2013
Chapter 17 Page 60
Figure 17.5.1.7-5: 782 ML Undercut Line Development Layout
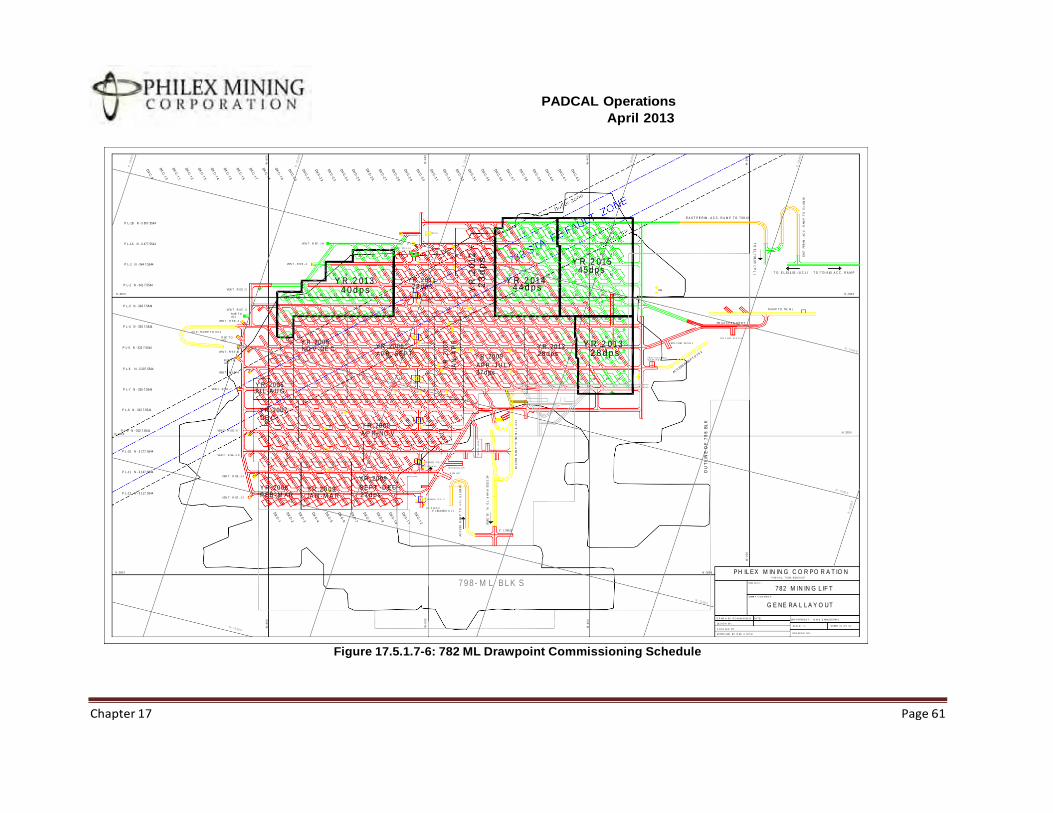
PADCAL Operations
April 2013
Chapter 17 Page 61
Figure 17.5.1.7-6: 782 ML Drawpoint Commissioning Schedule
E A S T P E R IM . A C C . R A M P T O 7 9 8 .0 0
P L- 1B N - 3 507. 5544
DD H- H 31 32 33 34 35 36 37 38 39 40 41 42
P L- 1A N - 3 477. 5544 VEN T . R SE .- 1 A G T U
B R EA K E R ST A .1 - 1 A
21 22 23 2 4 26 27 28 29 30 31 32 33 34 35 36 37 38 39 40 41
A C C . M A N W A Y
P L- 1 N - 344 7.5544 VEN T . R S E .- 1 Y R .2 015
18 19 20 21 22 23 24 25 26 27 28 29 30 31 32 33 34 35 36 3 7 3 8 3 9 40 4 5 d p s T O E L.81 4.00 ( U C L ) T O 7 73 - 8 40 A C C . R A M P
P L- 2 N - 341 7.5544 Y R .2 013
VEN T . R S E .- 2 4 0 d p s Y R . 2011
28dps Y R .2 014
4 4 d p s NE
N - 340 0 15 16 17 18 19 20 21 22 N - 340 0
13 14 24 25 26 27 28 29 30 31 32 33 34 35 36 37 38 39
B R E AK E R S T A .2 - 3 A C C . M A N W A Y
P L- 3 N - 338 7.5544 VEN T . R S E .- 3
R SE. T O UC L
VEN T . R S E .- 4
DP R A M P T O 791 M L
13 14 15 16 17 18 19 20 21 22 23 24 25 26 27 28 29 30 12
31 32 33 34 35 36 37 38
DP 782 A C C E S S D R IF T
P L- 4 N - 335 7.5544
A C C . R A M P T O U C L
R SE. T O UC L
12 13 14 15 16 17 18 19 20
22 23 24 25 26 27 28 29 11
30 31 32 33 34 35 36 37
P L- 5 N - 332 7.5544
Y R . 2005 NO V - DE C
EX P L O SIV ES B O D E G A B R EA K E R S T A .4 - 5
Y R . 2006 A C C . M A N W A Y Y R .2 013 EX P L O SIV ES B O D E G A
DP DP Y R . 2012
VEN T . R S E .- 5
A P R - S E P T R SE. T O UC L
9 10 11 12 13 14 15 16 17 18 19 20 21 22
DP
23 24 Y R . 2009 28dps 2 8 d p s 25 26 27
30 29 30 31 32 33 34 35 36 P R O P . E L E C T RICA L S U B- S T A T IO N
P L- 6 N - 3 297. 5544 VEN T . R S E .- 6
A C C . M A N W A Y
A P R - J U L Y 37 d ps DP
8 9 1 0 11 12 13 14 15 16 17 18
P L- 7 N - 326 7.5544 VEN T . R S E .- 7 Y R . 2006 JU L - A U G
6 7 8
Y R . 2007
7 20 21 22 23 24 25 26 27 28 29 30 31 32 33 34 35
B R EA K E R S T A .6 - 7
DP 2- 5 D P 2- 4 D P
9 1 0 11 12 13 14 15 16 17 18 19 20 21 22
P L- 8 N - 323 7.5544 DP
DE C 5 6
7 8 9 1 0 1 1 12 13 14 15
DP Y R . 2008 A P R- NO V
16 18 19 20 B R EA K E R S T A .8 - 9
A C C . M A N W A Y
P L- 9 N - 320 7.5544 N - 320 0
VEN T . R S E .- 9 N - 320 0
4 5 18
6 7 8 9
DP
1 0 1 1 12 13 14 15 16 17
P L- 10 N - 3 177. 5544 VEN T . R SE .- 1 0
3 4 5 6 7 8
DP
9 1 0 11 12 13 B R EA K E R S T A.1 0 - 1 1
A C C . M A N W A Y RE F U E L IN G S T A .
P L- 11 N - 3 147. 5544 W AS H B A Y
VEN T . R SE .- 1 1
2 3 4 5 6 7 8 Y R . 2009
P L- 12 N - 3 117. 5544
VEN T . R SE .- 1 2
Y R . 2008 F EB - M AR
1 2 3
Y R .2 0 0D P9 JA N - M A R
4 5 6 7
9 10 11 12
S E P T - D EC 27dps
8 9 1 0 1 1 B R EA K E R S T A .- 1 2
A C C . M A N W A Y
E L.814.00( U C L )
E L.798.00
N - 300 0 N - 300 0
798 - M L B LK S
PH IL EX M IN IN G C O R PO R A T IO N P AD C A L , T U BA, B EN G U ET
PRO J E C T :
782 M IN IN G L IF T SHEE T C O N T E N T :
G E NE RA L L A Y O UT
D R AW N BY: R O M AM AYSO N DA T E :
DE S IG N BY :
DE P A RT M E N T : M IN E E NGIN E E RIN G
SC AL E : 1 : SH EET 0 1 O F 0 1
C H EC KED BY:
AP PRO V ED BY: R SD II, R P M DR A W IN G N O .
T O
E
L.7 98. 0
0 (
P L
)
AC
C E
SS
R
AM
P
T O
P
L
E
L .7
98.0
0
W -
8 0
0
W -
8 0
0
W -
6 0
0
W -
6 0
0
Y R
.2
00
7
JA N
- A
P R
A
C C
ES
S
R A
M P
T
O
U C
L
E L
.814.0
0
Y R
.2
01
2
23
dp
s
SER
VIC
E
A R
E A
AC
C E
SS
R
AM
P
T 0
782
M L
&
U
C L
W -
4 0
0
W -
4 0
0
O U
T L
IN E
O F
7
9 8
B
L K
W -
2 0
0
W -
2 0
0
EA
ST
PE
R I
M .
A
C C
.
R A
M P
T
O
E L
.814.0
0
PADCAL Operations
April 2013
The 798 meter level will be a new production level spinning off from the 782 meter level.
The production level aims to mine the south and east boundaries of the 782 production level.
An initial evaluation carried out finds that mining these at an elevation 16 meters higher will
be more economic than at the 782 meter level.
The development of 798 meter level will be from the undercut of 782 meter level which is
about the same elevation. Around 564 drawpoints will be developed in this mining level from
2014 to 2018. Ventilation drives at the perimeters as well as short ore transfer raises to
support the ore extraction.
Access and block development must commence in 2013 to be able to commission the first
block in 2014.
- Left Intentionally Blank -
Chapter 17 Page 62
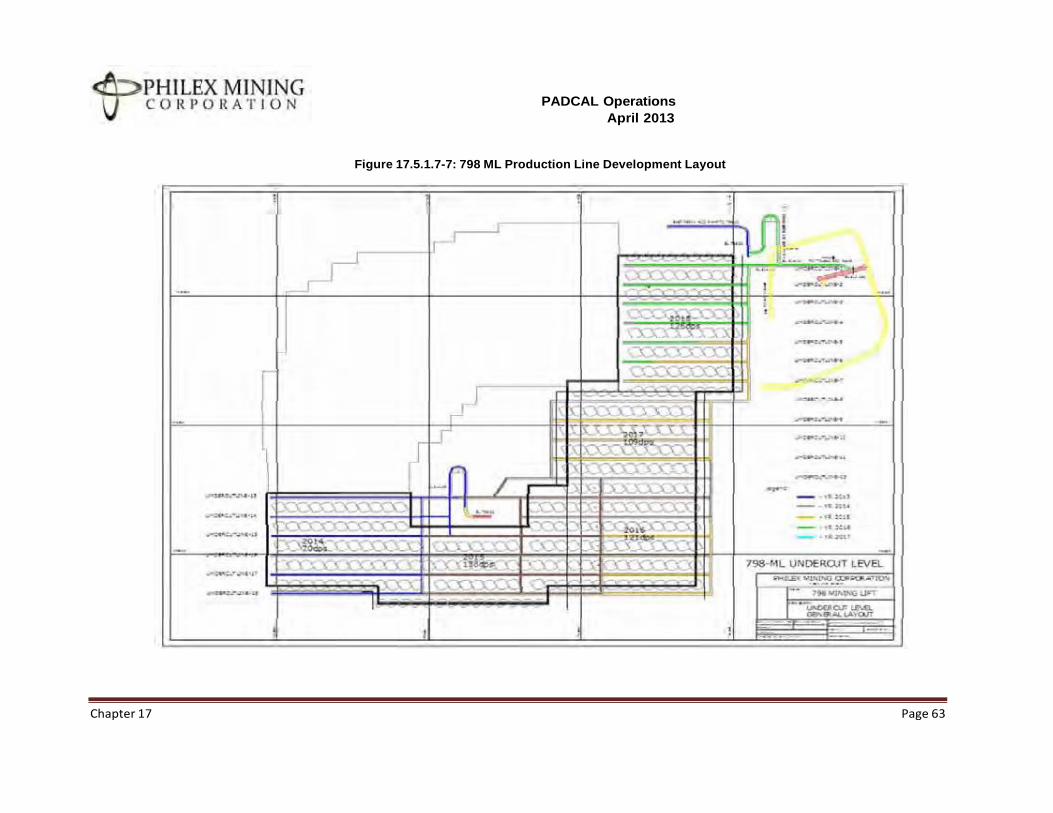
PADCAL Operations
April 2013
Chapter 17 Page 63
Figure 17.5.1.7-7: 798 ML Production Line Development Layout
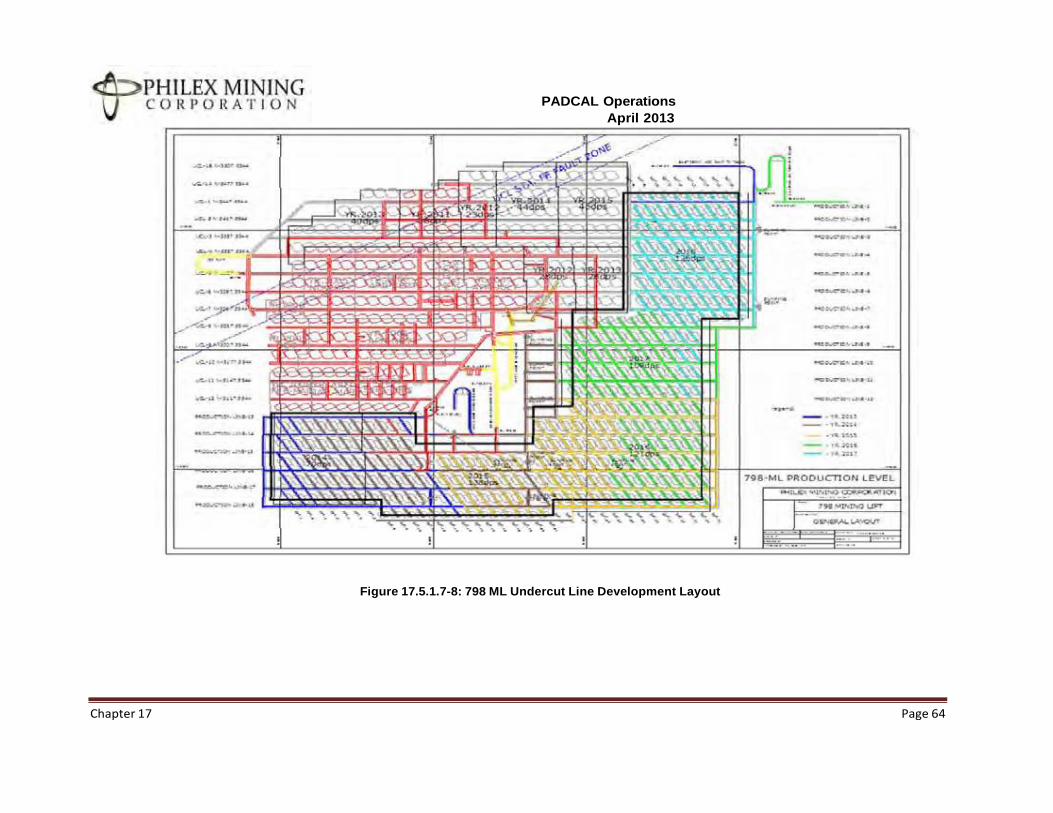
PADCAL Operations
April 2013
Chapter 17 Page 64
Figure 17.5.1.7-8: 798 ML Undercut Line Development Layout
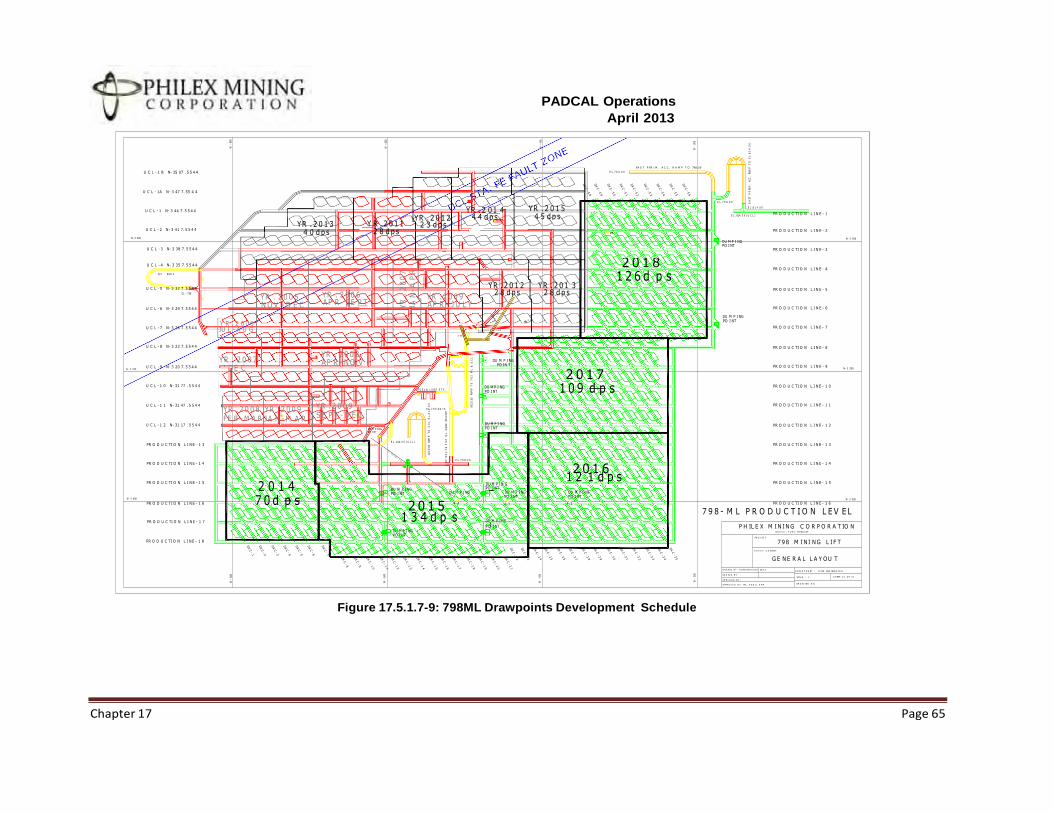
PADCAL Operations
April 2013
Chapter 17 Page 65
EA S T P ER I M . A C C . R A M P T O 798. 00
U C L - 1 B N- 35 07 . 5 5 4 4 E L .7 8 2 .0 0
U C L - 1A N- 3 47 7. 55 4 4
E L .7 9 8 .0 0
YR . 2 01 4 YR . 2 0 1 5 4 5 d p s
E L .8 1 4 .0 0
U C L - 1 N- 3 44 7. 5 5 4 4
YR . 2 0 1 2 4 4 d p s E L . 814. 0 0 ( U C L ) PR O D U C TI O N L I N E - 1
U C L - 2 N- 3 41 7. 5 5 4 4 YR . 2 0 1 3
4 0 d p s Y R . 2 0 1 1
2 8 d p s 2 3 d p s
U C L 1 - 2 NW
NE PR O D U C TI O N L I N E - 2
N- 3 400 N- 3 400
U C L - 3 N- 3 38 7. 5 5 4 4
DU M P I NG PO I NT
PR O D U C TI O N L I N E - 3
U C L - 4 N- 3 35 7. 5 5 4 4 2 0 1 8 1 2 6 d p s
PR O D U C TI O N L I N E - 4
ACC . RAM P
U C L - 5 N- 3 32 7. 5 5 4 4
EL - 798
YR . 2 0 1 2 YR . 2 0 1 3 PR O D U C TI O N L I N E - 5
U C L - 6 N- 3 29 7. 5 5 4 4
YR . 2 0 0 5 N O V - D E C
YR . 2 0 0 6 AP R- SE P T
YR . 2 0 0 9 2 8 d p s 2 8 d p s
AP R - J U L Y PR O D U C TI O N L I N E - 6
Y R . 2 0 0 6 JU L - A U G
2- 3
DU M P I NG PO I NT
U C L - 7 N- 3 26 7. 5 5 4 4 PR O D U C TI O N L I N E - 7 2- 4 O B S E R VAT I O N RAI S E
2- 4D P
U C L - 8 N- 3 23 7. 5 5 4 4 PR O D U C TI O N L I N E - 8
N- 3 200 U C L - 9 N- 3 20 7. 5 5 4 4
YR . 2 0 0 7 DE C
YR . 2 0 0 8 AP R- N O V DU M P I NG
PO I N T PR O D U C TI O N L I N E - 9 N- 3 200
U C L - 1 0 N- 31 77 . 5 5 4 4
2 0 1 7 1 0 9 d p s PR O D U C TI O N L I N E - 1 0
F U E L & L U B E S T A . DU M P I NG PO I NT
U C L - 1 1 N- 31 47 . 5 5 4 4 YR . 2 0 0 9 SE P T - D E C
PR O D U C TI O N L I N E - 1 1
YR . 2 0 0 8 YR . 2 0 0 9 FE B - M A R JA N -M A R
E L .7 9 0 .8 4 7 6
U C L - 1 2 N- 31 17 . 5 5 4 4 DU M P I NG PO I NT
DU M P I NG PO I NT
PR O D U C TI O N L I N E - 1 2
PR O D U C TI O N L I N E - 1 3 E L . 814. 0 0 ( U C L )
PR O D U C TI O N L I N E - 1 3
E L .7 9 8 .0 0
PR O D U C TI O N L I N E - 1 4
2 0 1 6 PR O D U C TI O N L I N E - 1 4
PR O D U C TI O N L I N E - 1 5
2 0 1 4 7 0 d p s
DU M P I NG PO I NT
1 2 1 d p s DU M P I N G
PO I NT
PR O D U C TI O N L I N E - 1 5
DU M P I NG
N- 3 000
2 0 1 5 4- 4
DU M P I NG PO I NT
4- 3
DU M P I NG PO I NT
4- 2
N- 3 000
PR O D U C TI O N L I N E - 1 6
PR O D U C TI O N L I N E - 1 7 1 3 4 d p s DU M P I NG
PO I NT DU M P I NG PO I NT
PR O D U C TI O N L I N E - 1 6
7 9 8 - M L P R O D U C T I O N L E V E L
P H IL E X M IN IN G C O R P O R A T IO N PA D C A L , T U B A , B E NG U ET
PR O J EC T:
PR O D U C TI O N L I N E - 1 8 7 9 8 M I N I NG L I F T S H E E T C O NTENT:
GE NE R A L L A Y OU T
D R A W N B Y : R O M A M A Y S O N DA T E : D E PA R T M E NT : M I NE ENG I NEE R I N G
DE S I G N B Y : SCAL E : 1 : S H EET 0 1 O F 0 1
CH E C K E D B Y :
A PPR O V E D B Y : PPL , R S D I I , R P M DR A W I NG N O.
Figure 17.5.1.7-9: 798ML Drawpoints Development Schedule ACC E S
S
RAM
P T O
U
C L
E L . 7 9 8 . 0 0
W -
800
W
-
800
W -
600
W
-
600
YR
. 2
00
7
JA N
-A
P R
ACC E
SS
RAM
P
T O
U C
L
E L
. 8 1
4 .
0 0
ACC E
SS
RAM
P
T 0
7 8
2 M
L
&
U C
L
W -
400
W
-
400
W -
200
W
-
200
E A S
T P
E RI M
.
ACC .
RAM
P
T O
E L
. 8 1
4 .
0 0
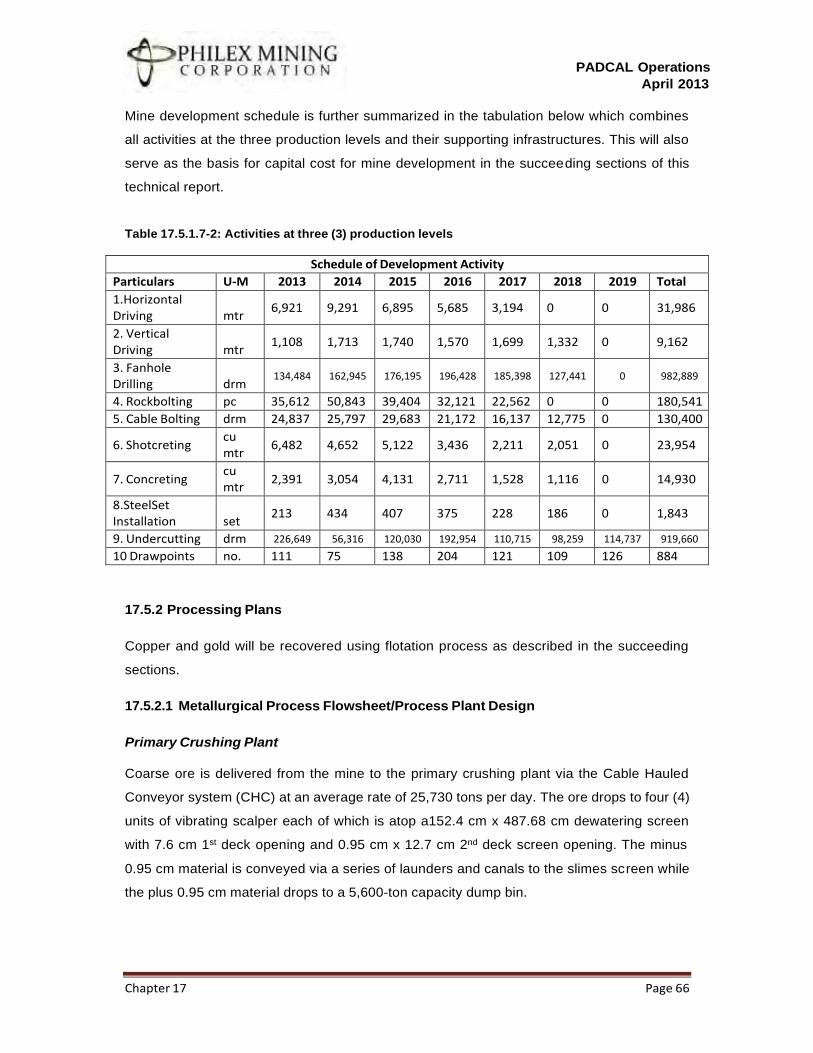
PADCAL Operations
April 2013
Chapter 17 Page 66
Mine development schedule is further summarized in the tabulation below which combines
all activities at the three production levels and their supporting infrastructures. This will also
serve as the basis for capital cost for mine development in the succeeding sections of this
technical report.
Table 17.5.1.7-2: Activities at three (3) production levels
Schedule of Development Activity
Particulars U-M 2013 2014 2015 2016 2017 2018 2019 Total
1.Horizontal Driving
mtr
6,921 9,291 6,895 5,685 3,194 0 0 31,986
2. Vertical Driving
mtr
1,108 1,713 1,740 1,570 1,699 1,332 0 9,162
3. Fanhole Drilling
drm
134,484
162,945
176,195
196,428
185,398
127,441
0
982,889
4. Rockbolting pc 35,612 50,843 39,404 32,121 22,562 0 0 180,541
5. Cable Bolting drm 24,837 25,797 29,683 21,172 16,137 12,775 0 130,400
6. Shotcreting cu mtr
6,482 4,652 5,122 3,436 2,211 2,051 0 23,954
7. Concreting cu mtr
2,391 3,054 4,131 2,711 1,528 1,116 0 14,930
8.SteelSet Installation
set
213 434 407 375 228 186 0 1,843
9. Undercutting drm 226,649 56,316 120,030 192,954 110,715 98,259 114,737 919,660
10 Drawpoints no. 111 75 138 204 121 109 126 884
17.5.2 Processing Plans
Copper and gold will be recovered using flotation process as described in the succeeding
sections.
17.5.2.1 Metallurgical Process Flowsheet/Process Plant Design
Primary Crushing Plant
Coarse ore is delivered from the mine to the primary crushing plant via the Cable Hauled
Conveyor system (CHC) at an average rate of 25,730 tons per day. The ore drops to four (4)
units of vibrating scalper each of which is atop a152.4 cm x 487.68 cm dewatering screen
with 7.6 cm 1st deck opening and 0.95 cm x 12.7 cm 2nd deck screen opening. The minus
0.95 cm material is conveyed via a series of launders and canals to the slimes screen while
the plus 0.95 cm material drops to a 5,600-ton capacity dump bin.
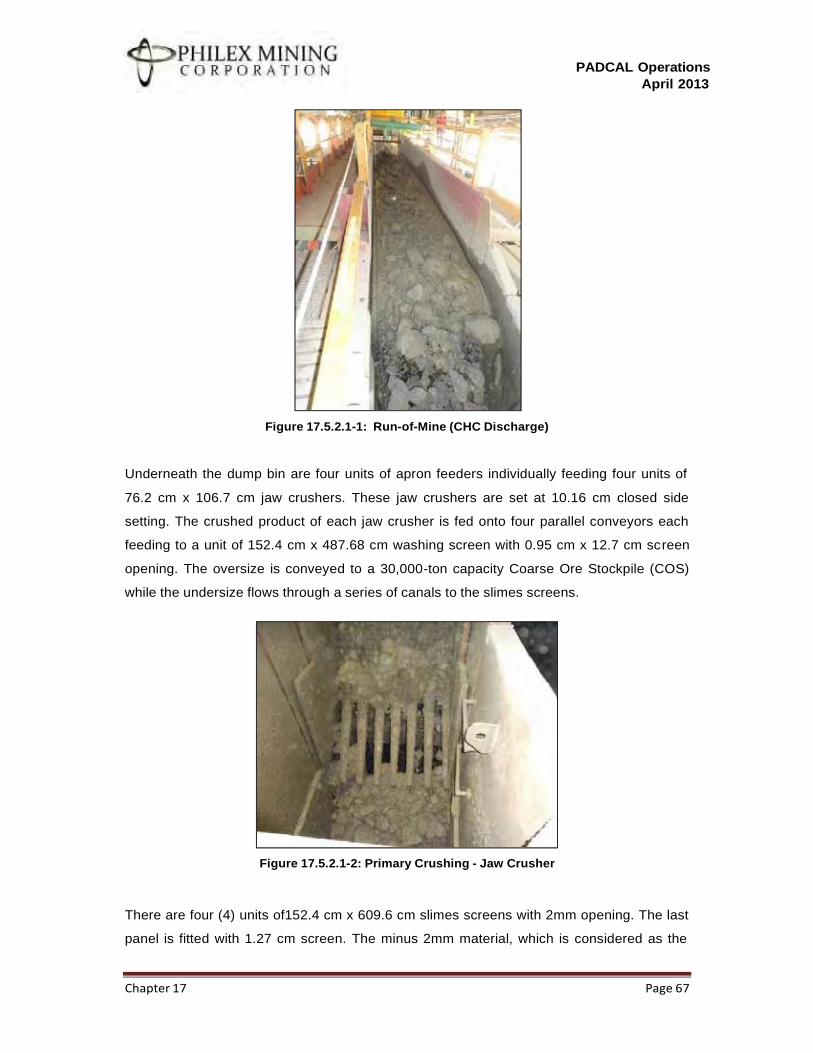
PADCAL Operations
April 2013
Chapter 17 Page 67
Figure 17.5.2.1-1: Run-of-Mine (CHC Discharge)
Underneath the dump bin are four units of apron feeders individually feeding four units of
76.2 cm x 106.7 cm jaw crushers. These jaw crushers are set at 10.16 cm closed side
setting. The crushed product of each jaw crusher is fed onto four parallel conveyors each
feeding to a unit of 152.4 cm x 487.68 cm washing screen with 0.95 cm x 12.7 cm screen
opening. The oversize is conveyed to a 30,000-ton capacity Coarse Ore Stockpile (COS)
while the undersize flows through a series of canals to the slimes screens.
Figure 17.5.2.1-2: Primary Crushing - Jaw Crusher
There are four (4) units of152.4 cm x 609.6 cm slimes screens with 2mm opening. The last
panel is fitted with 1.27 cm screen. The minus 2mm material, which is considered as the
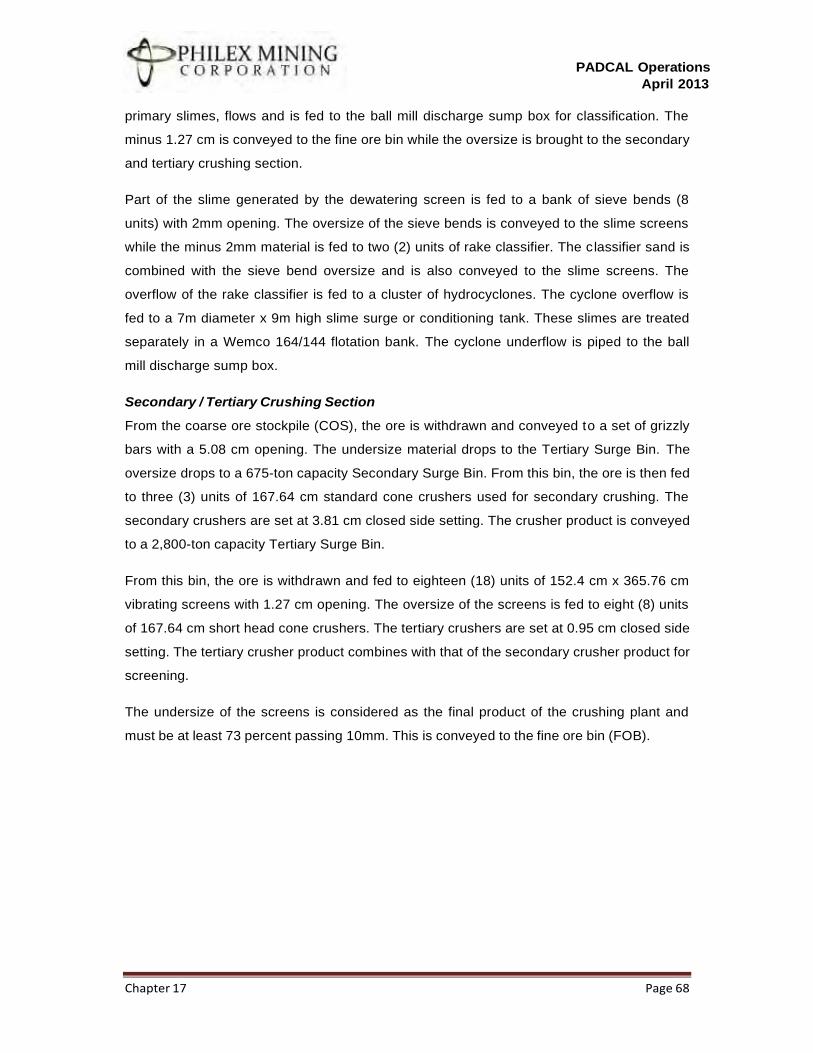
PADCAL Operations
April 2013
Chapter 17 Page 68
primary slimes, flows and is fed to the ball mill discharge sump box for classification. The
minus 1.27 cm is conveyed to the fine ore bin while the oversize is brought to the secondary
and tertiary crushing section.
Part of the slime generated by the dewatering screen is fed to a bank of sieve bends (8
units) with 2mm opening. The oversize of the sieve bends is conveyed to the slime screens
while the minus 2mm material is fed to two (2) units of rake classifier. The classifier sand is
combined with the sieve bend oversize and is also conveyed to the slime screens. The
overflow of the rake classifier is fed to a cluster of hydrocyclones. The cyclone overflow is
fed to a 7m diameter x 9m high slime surge or conditioning tank. These slimes are treated
separately in a Wemco 164/144 flotation bank. The cyclone underflow is piped to the ball
mill discharge sump box.
Secondary / Tertiary Crushing Section
From the coarse ore stockpile (COS), the ore is withdrawn and conveyed to a set of grizzly
bars with a 5.08 cm opening. The undersize material drops to the Tertiary Surge Bin. The
oversize drops to a 675-ton capacity Secondary Surge Bin. From this bin, the ore is then fed
to three (3) units of 167.64 cm standard cone crushers used for secondary crushing. The
secondary crushers are set at 3.81 cm closed side setting. The crusher product is conveyed
to a 2,800-ton capacity Tertiary Surge Bin.
From this bin, the ore is withdrawn and fed to eighteen (18) units of 152.4 cm x 365.76 cm
vibrating screens with 1.27 cm opening. The oversize of the screens is fed to eight (8) units
of 167.64 cm short head cone crushers. The tertiary crushers are set at 0.95 cm closed side
setting. The tertiary crusher product combines with that of the secondary crusher product for
screening.
The undersize of the screens is considered as the final product of the crushing plant and
must be at least 73 percent passing 10mm. This is conveyed to the fine ore bin (FOB).
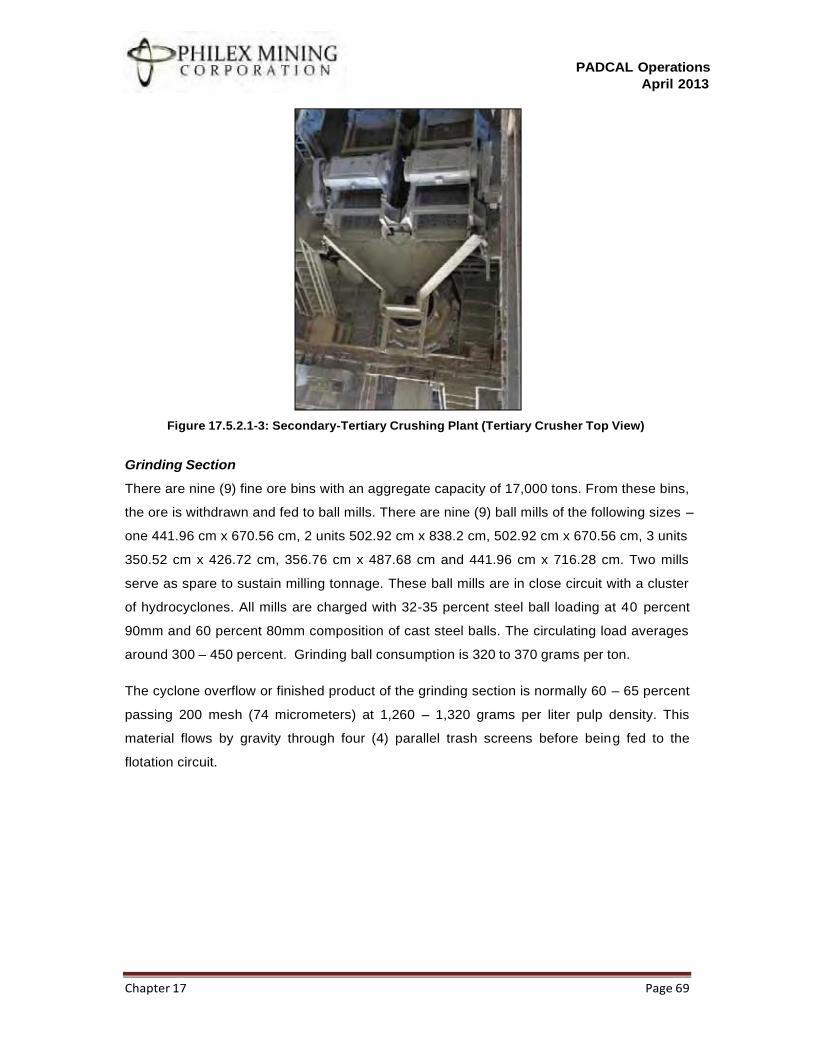
PADCAL Operations
April 2013
Chapter 17 Page 69
Figure 17.5.2.1-3: Secondary-Tertiary Crushing Plant (Tertiary Crusher Top View)
Grinding Section
There are nine (9) fine ore bins with an aggregate capacity of 17,000 tons. From these bins,
the ore is withdrawn and fed to ball mills. There are nine (9) ball mills of the following sizes –
one 441.96 cm x 670.56 cm, 2 units 502.92 cm x 838.2 cm, 502.92 cm x 670.56 cm, 3 units
350.52 cm x 426.72 cm, 356.76 cm x 487.68 cm and 441.96 cm x 716.28 cm. Two mills
serve as spare to sustain milling tonnage. These ball mills are in close circuit with a cluster
of hydrocyclones. All mills are charged with 32-35 percent steel ball loading at 40 percent
90mm and 60 percent 80mm composition of cast steel balls. The circulating load averages
around 300 – 450 percent. Grinding ball consumption is 320 to 370 grams per ton.
The cyclone overflow or finished product of the grinding section is normally 60 – 65 percent
passing 200 mesh (74 micrometers) at 1,260 – 1,320 grams per liter pulp density. This
material flows by gravity through four (4) parallel trash screens before being fed to the
flotation circuit.
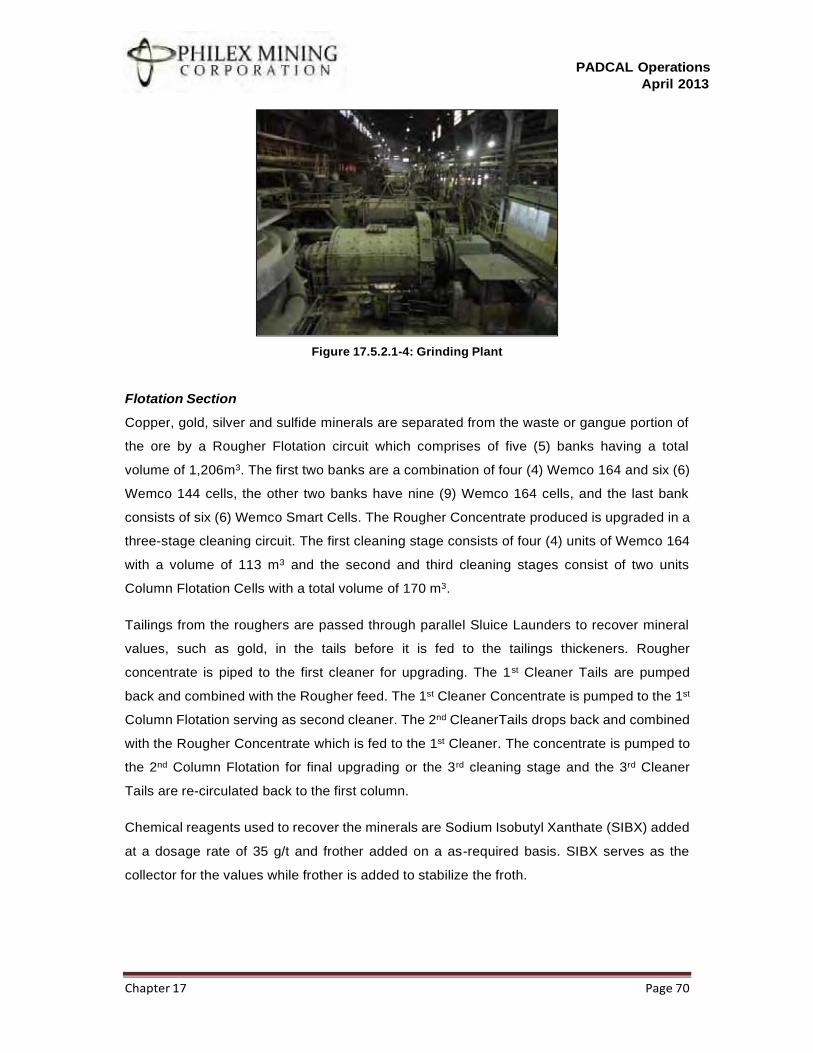
PADCAL Operations
April 2013
Chapter 17 Page 70
Figure 17.5.2.1-4: Grinding Plant
Flotation Section
Copper, gold, silver and sulfide minerals are separated from the waste or gangue portion of
the ore by a Rougher Flotation circuit which comprises of five (5) banks having a total
volume of 1,206m3. The first two banks are a combination of four (4) Wemco 164 and six (6)
Wemco 144 cells, the other two banks have nine (9) Wemco 164 cells, and the last bank
consists of six (6) Wemco Smart Cells. The Rougher Concentrate produced is upgraded in a
three-stage cleaning circuit. The first cleaning stage consists of four (4) units of Wemco 164
with a volume of 113 m3 and the second and third cleaning stages consist of two units
Column Flotation Cells with a total volume of 170 m3.
Tailings from the roughers are passed through parallel Sluice Launders to recover mineral
values, such as gold, in the tails before it is fed to the tailings thickeners. Rougher
concentrate is piped to the first cleaner for upgrading. The 1st Cleaner Tails are pumped
back and combined with the Rougher feed. The 1st Cleaner Concentrate is pumped to the 1st
Column Flotation serving as second cleaner. The 2nd CleanerTails drops back and combined
with the Rougher Concentrate which is fed to the 1st Cleaner. The concentrate is pumped to
the 2nd Column Flotation for final upgrading or the 3rd cleaning stage and the 3rd Cleaner
Tails are re-circulated back to the first column.
Chemical reagents used to recover the minerals are Sodium Isobutyl Xanthate (SIBX) added
at a dosage rate of 35 g/t and frother added on a as-required basis. SIBX serves as the
collector for the values while frother is added to stabilize the froth.
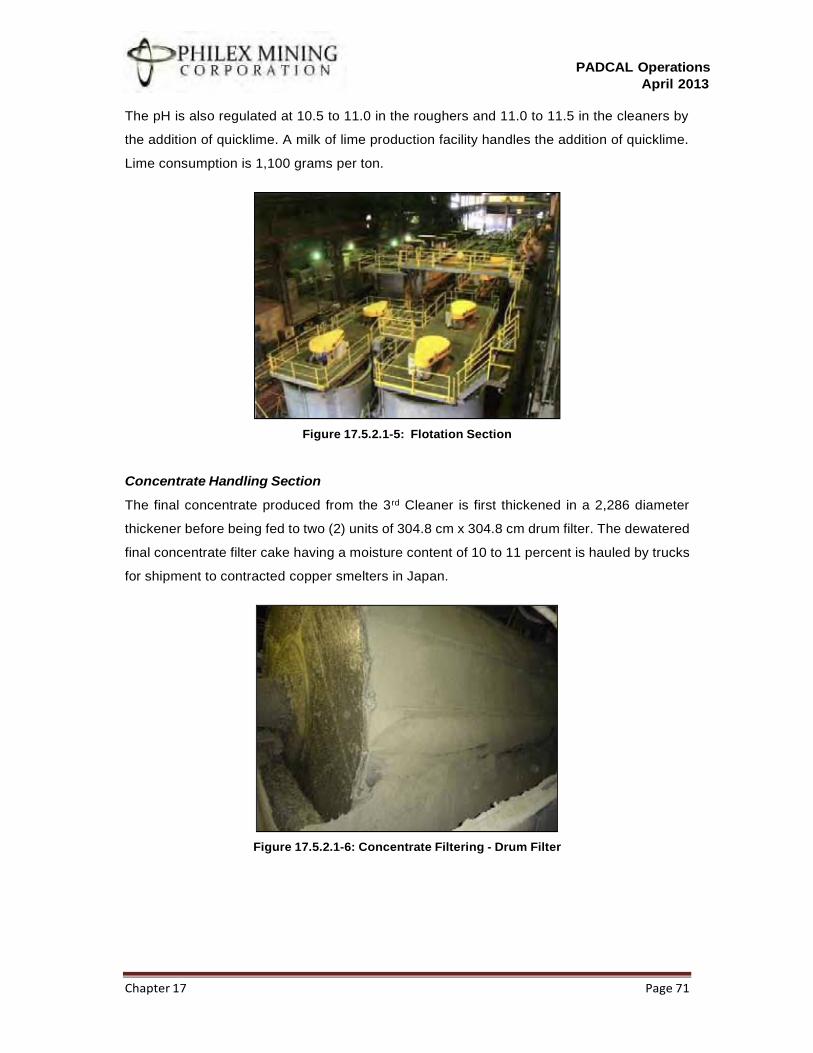
PADCAL Operations
April 2013
Chapter 17 Page 71
The pH is also regulated at 10.5 to 11.0 in the roughers and 11.0 to 11.5 in the cleaners by
the addition of quicklime. A milk of lime production facility handles the addition of quicklime.
Lime consumption is 1,100 grams per ton.
Figure 17.5.2.1-5: Flotation Section
Concentrate Handling Section
The final concentrate produced from the 3rd Cleaner is first thickened in a 2,286 diameter
thickener before being fed to two (2) units of 304.8 cm x 304.8 cm drum filter. The dewatered
final concentrate filter cake having a moisture content of 10 to 11 percent is hauled by trucks
for shipment to contracted copper smelters in Japan.
Figure 17.5.2.1-6: Concentrate Filtering - Drum Filter
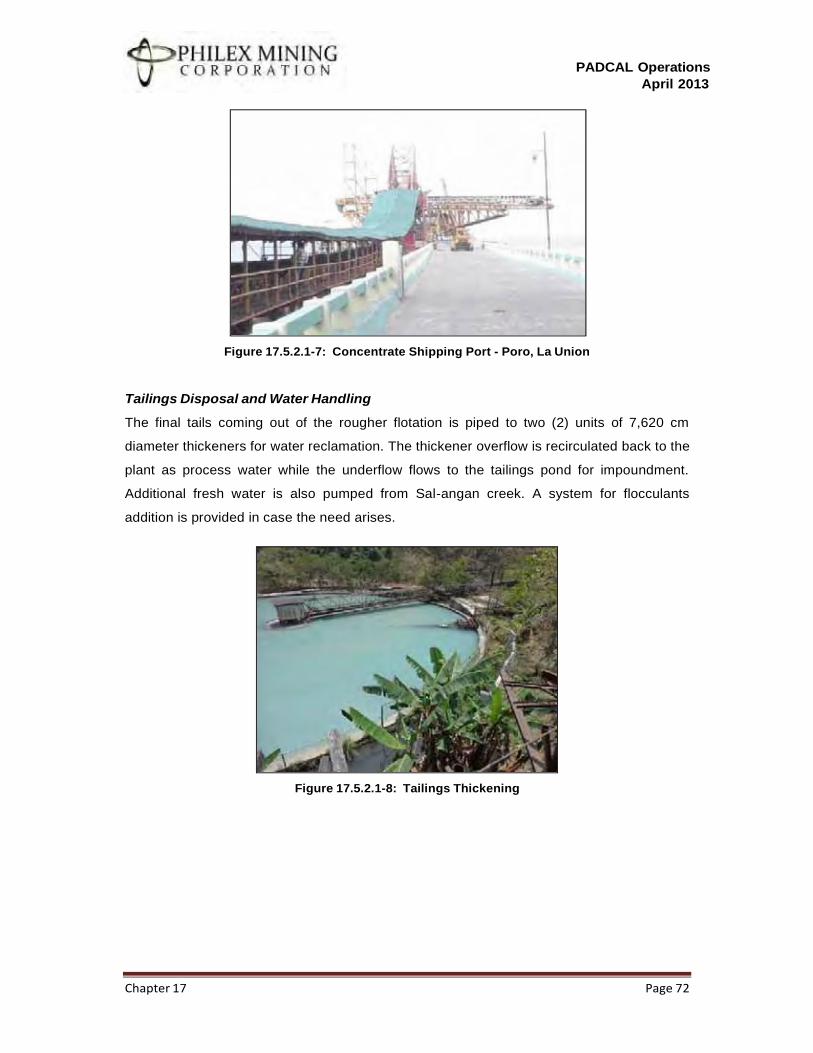
PADCAL Operations
April 2013
Chapter 17 Page 72
Figure 17.5.2.1-7: Concentrate Shipping Port - Poro, La Union
Tailings Disposal and Water Handling
The final tails coming out of the rougher flotation is piped to two (2) units of 7,620 cm
diameter thickeners for water reclamation. The thickener overflow is recirculated back to the
plant as process water while the underflow flows to the tailings pond for impoundment.
Additional fresh water is also pumped from Sal-angan creek. A system for flocculants
addition is provided in case the need arises.
Figure 17.5.2.1-8: Tailings Thickening
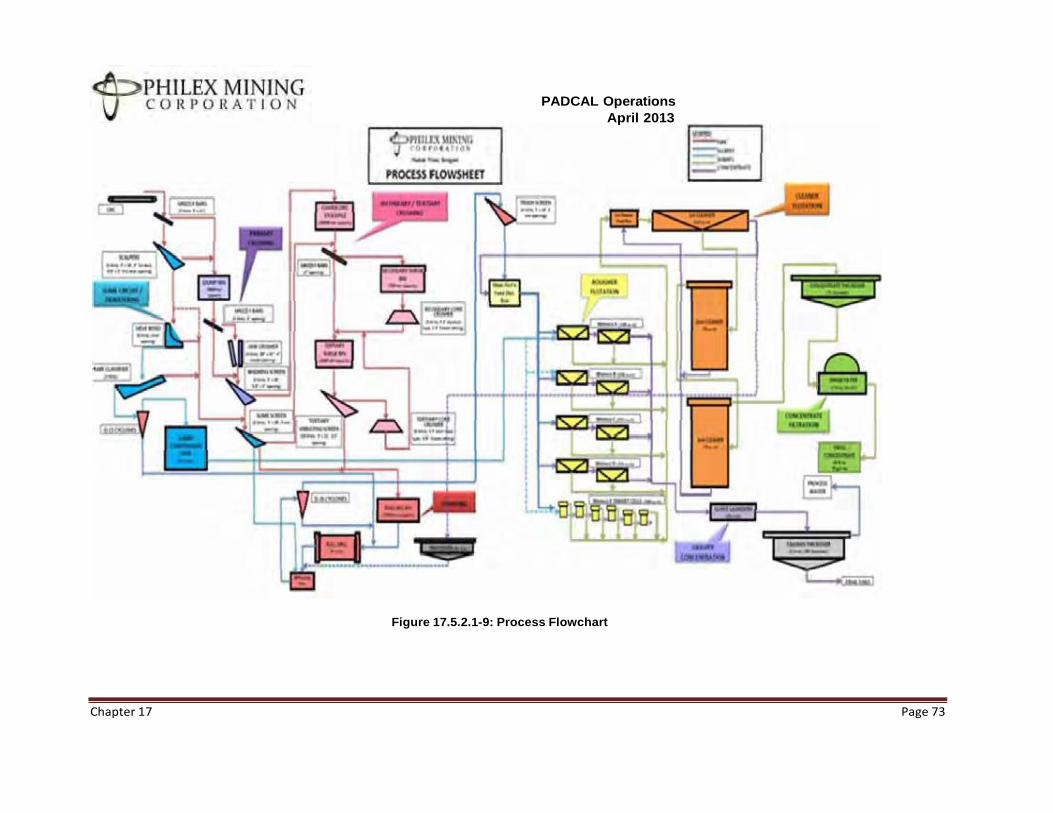
PADCAL Operations
April 2013
Figure 17.5.2.1-9: Process Flowchart
Chapter 17 Page 73
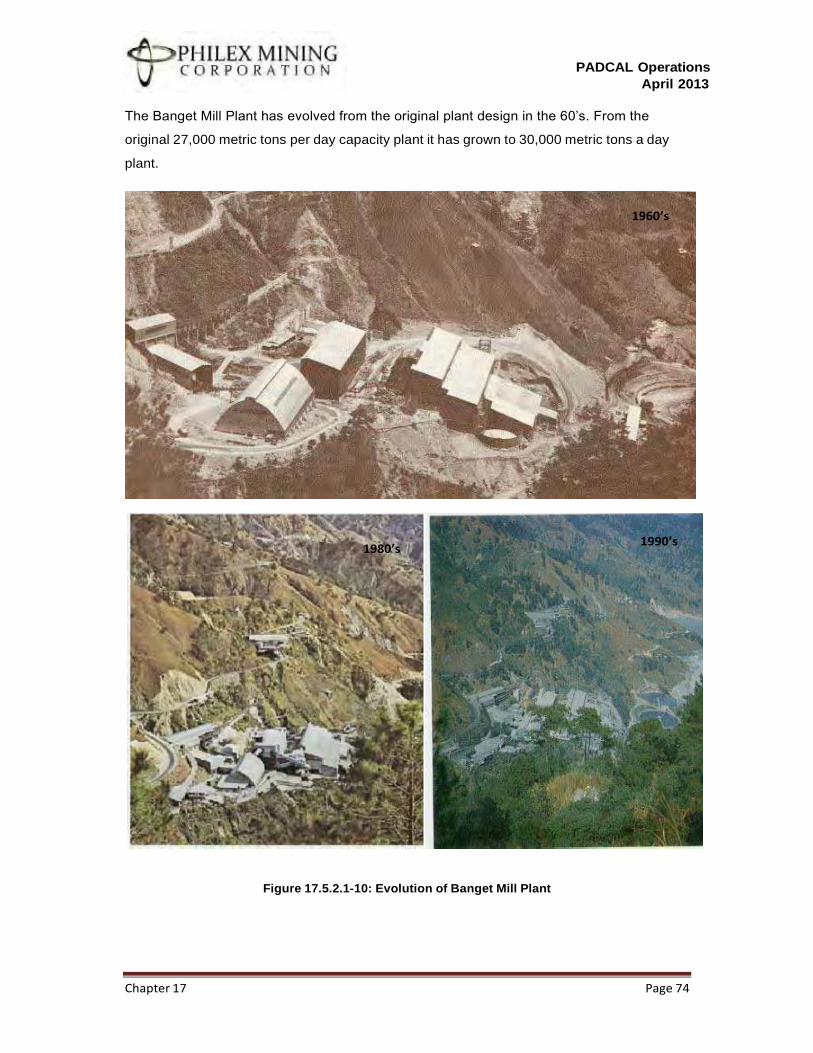
PADCAL Operations
April 2013
Chapter 17 Page 74
1960’s
The Banget Mill Plant has evolved from the original plant design in the 60’s. From the
original 27,000 metric tons per day capacity plant it has grown to 30,000 metric tons a day
plant.
Figure 17.5.2.1-10: Evolution of Banget Mill Plant
1980’s 1990’s
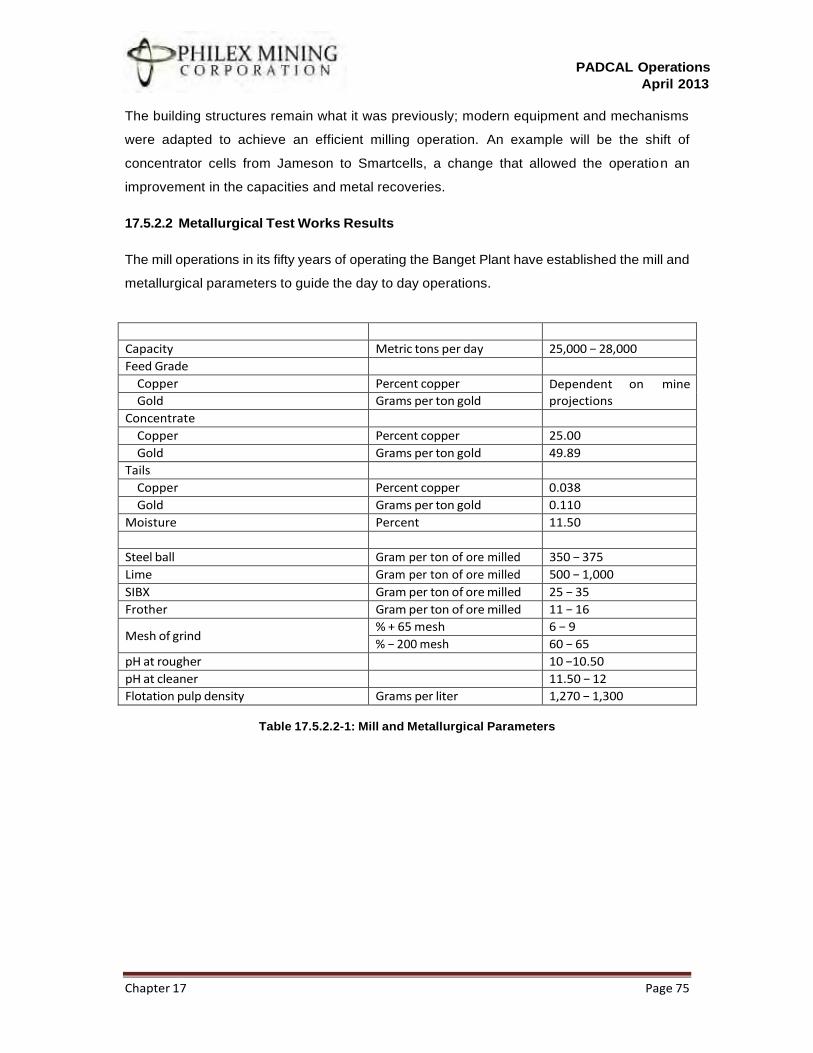
PADCAL Operations
April 2013
Chapter 17 Page 75
The building structures remain what it was previously; modern equipment and mechanisms
were adapted to achieve an efficient milling operation. An example will be the shift of
concentrator cells from Jameson to Smartcells, a change that allowed the operation an
improvement in the capacities and metal recoveries.
17.5.2.2 Metallurgical Test Works Results
The mill operations in its fifty years of operating the Banget Plant have established the mill and
metallurgical parameters to guide the day to day operations.
Capacity Metric tons per day 25,000 − 28,000
Feed Grade
Copper Percent copper Dependent on mine
projections Gold Grams per ton gold
Concentrate
Copper Percent copper 25.00
Gold Grams per ton gold 49.89
Tails
Copper Percent copper 0.038
Gold Grams per ton gold 0.110
Moisture Percent 11.50
Steel ball Gram per ton of ore milled 350 − 375
Lime Gram per ton of ore milled 500 − 1,000
SIBX Gram per ton of ore milled 25 − 35
Frother Gram per ton of ore milled 11 − 16
Mesh of grind % + 65 mesh 6 − 9
% − 200 mesh 60 − 65
pH at rougher 10 −10.50
pH at cleaner 11.50 − 12
Flotation pulp density Grams per liter 1,270 − 1,300
Table 17.5.2.2-1: Mill and Metallurgical Parameters
PADCAL Operations
April 2013
Chapter 17 Page 76
To confirm these parameters, the Mill conduct regular block optimization metallurgical tests
wherein the ore projected to be milled and processed a period ahead will be subjected to
metallurgical simulation in the laboratory.
The Mine operations provide the samples from drawpoints of blocks that are planned to be
mined a month or so ahead. They will assume that ore characteristics will have no significant
change in few regular increments. A monthly period interval is ideally done for this
undertaking. The geologists, in parallel conduct a microscopic mineralogical analysis of the
sample to determine the characteristics. The Mill, upon obtaining the samples, determines the
head grades and work index. A simulation flotation is done using first the current mill and
metallurgical parameters, then varying the following factors:
• Mesh of grind (60, 80, 100 percent passing 200 mesh)
• pH (8, 10 and 12)
• Collector dosage - SIBX (20, 25 to 30 grams per ton)
• Pulp density (35, 45 and 50 percent solids)
The mean metal recoveries and recorded and pitted against the calculated metal recoveries
using the current plant parameters. The results and conclusions are finalized and discussed
with the operations management. A plant wide test is usually done using the optimized mill
and metallurgical parameters from the simulation.
Research and development is a continuing process in the Mill to further enhance the recovery
of copper and gold and efficiently cut the operating cost. The more recent and significant
studies and results are:
• Grinding balls composition. Plant wide tests of both cast and forged steel balls
were made. It was determined that the consumption for the cast steel balls is 370
grams per ton of ore (520 gpt for forged steel ball), which makes it more economical
to use (28.85 percent reduction in consumption).
• Reagents. New reagents are constantly being introduced to the market, promising
higher metal recoveries and cost efficiency. These are being screened in the
laboratory by simulating the Mill flotation process. Reagents with promising results
are subjected to a plant wide test.
• Point of Addition of SIBX. A simulation of flotation varying the point of introduction
PADCAL Operations
April 2013
Chapter 17 Page 77
of SIBX was done. The base case is SIBX was introduced during the start of the
process, while the variation was 50 percent of the volume of SIBX was introduced at
the start of the process and the remaining volume added halfway to the flotation
process. All other parameters remain as is. The later resulted to a possible increase
for up to 2 percent and 8 percent (laboratory figures) in copper and gold recoveries
respectively. The result has been incorporated to the Standard Job Procedure (SJP)
in the Mill.
• New Technology. Equipment manufacturers and distributors regularly give product
presentations to concerned departments. Also, both technical and skilled company
personnel are sent to attend seminars, lectures, or conventions to keep mill
personnel updated. The latest innovations are able to offer higher equipment
efficiency, lower operating costs, and lower maintenance costs, among others.
17.5.2.3 Materials Balance
Several assumptions were made for the presented material balance. The specific
gravity of the ore has an average value of 2.6 and the overall plant throughput rate is
27,000 tons per day (1,125 tons per hour) of ore. Most of the moisture contents of the
streams in the crushing section are only based on visual estimates and only some are
based on actual sampling data. The head grade averages at 0.2 percent copper and the
overall recovery at 83 percent. The grades of the final concentrate and the tailings
grade are 25 percent copper and 0.040 percent copper, respectively.
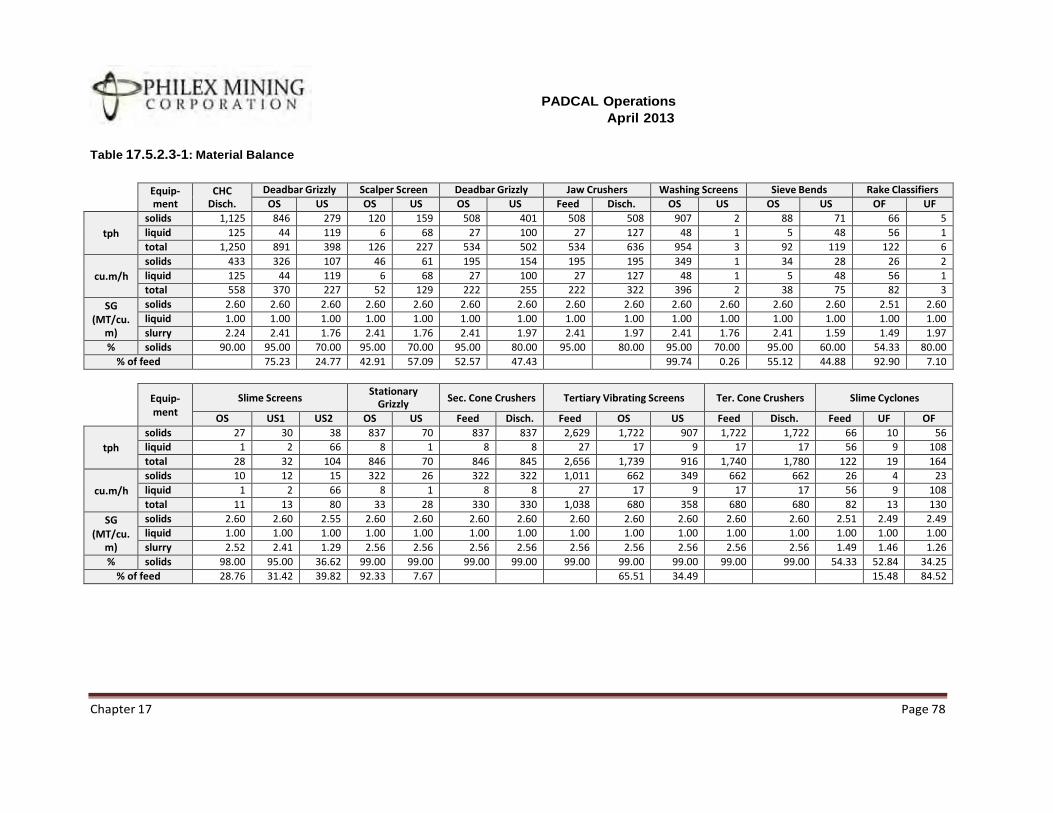
PADCAL Operations
April 2013
Chapter 17 Page 78
Table 17.5.2.3-1: Material Balance
Equip-
ment CHC
Disch.
Deadbar Grizzly Scalper Screen Deadbar Grizzly Jaw Crushers Washing Screens Sieve Bends Rake Classifiers
OS US OS US OS US Feed Disch. OS US OS US OF UF
tph
solids 1,125 846 279 120 159 508 401 508 508 907 2 88 71 66 5
liquid 125 44 119 6 68 27 100 27 127 48 1 5 48 56 1
total 1,250 891 398 126 227 534 502 534 636 954 3 92 119 122 6
cu.m/h
solids 433 326 107 46 61 195 154 195 195 349 1 34 28 26 2
liquid 125 44 119 6 68 27 100 27 127 48 1 5 48 56 1
total 558 370 227 52 129 222 255 222 322 396 2 38 75 82 3
SG (MT/cu.
m)
solids 2.60 2.60 2.60 2.60 2.60 2.60 2.60 2.60 2.60 2.60 2.60 2.60 2.60 2.51 2.60
liquid 1.00 1.00 1.00 1.00 1.00 1.00 1.00 1.00 1.00 1.00 1.00 1.00 1.00 1.00 1.00
slurry 2.24 2.41 1.76 2.41 1.76 2.41 1.97 2.41 1.97 2.41 1.76 2.41 1.59 1.49 1.97
% solids 90.00 95.00 70.00 95.00 70.00 95.00 80.00 95.00 80.00 95.00 70.00 95.00 60.00 54.33 80.00
% of feed 75.23 24.77 42.91 57.09 52.57 47.43 99.74 0.26 55.12 44.88 92.90 7.10
Equip- ment
Slime Screens Stationary
Grizzly Sec. Cone Crushers Tertiary Vibrating Screens Ter. Cone Crushers Slime Cyclones
OS US1 US2 OS US Feed Disch. Feed OS US Feed Disch. Feed UF OF
tph
solids 27 30 38 837 70 837 837 2,629 1,722 907 1,722 1,722 66 10 56
liquid 1 2 66 8 1 8 8 27 17 9 17 17 56 9 108
total 28 32 104 846 70 846 845 2,656 1,739 916 1,740 1,780 122 19 164
cu.m/h
solids 10 12 15 322 26 322 322 1,011 662 349 662 662 26 4 23
liquid 1 2 66 8 1 8 8 27 17 9 17 17 56 9 108
total 11 13 80 33 28 330 330 1,038 680 358 680 680 82 13 130
SG (MT/cu.
m)
solids 2.60 2.60 2.55 2.60 2.60 2.60 2.60 2.60 2.60 2.60 2.60 2.60 2.51 2.49 2.49
liquid 1.00 1.00 1.00 1.00 1.00 1.00 1.00 1.00 1.00 1.00 1.00 1.00 1.00 1.00 1.00
slurry 2.52 2.41 1.29 2.56 2.56 2.56 2.56 2.56 2.56 2.56 2.56 2.56 1.49 1.46 1.26
% solids 98.00 95.00 36.62 99.00 99.00 99.00 99.00 99.00 99.00 99.00 99.00 99.00 54.33 52.84 34.25
% of feed 28.76 31.42 39.82 92.33 7.67 65.51 34.49 15.48 84.52
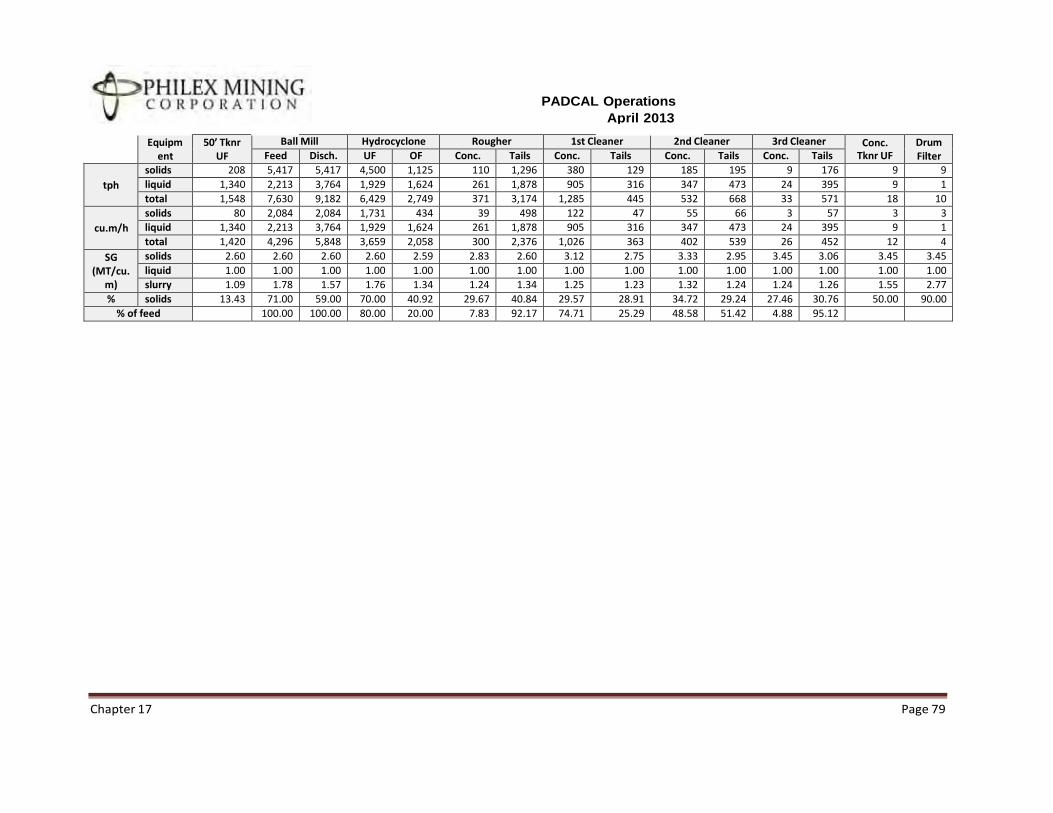
PADCAL Operations
April 2013
Chapter 17 Page 79
Equipm ent
50’ Tknr UF
Ball Mill Hydrocyclone Rougher 1st Cleaner 2nd Cleaner 3rd Cleaner Conc. Tknr UF
Drum Filter Feed Disch. UF OF Conc. Tails Conc. Tails Conc. Tails Conc. Tails
tph
solids 208 5,417 5,417 4,500 1,125 110 1,296 380 129 185 195 9 176 9 9
liquid 1,340 2,213 3,764 1,929 1,624 261 1,878 905 316 347 473 24 395 9 1
total 1,548 7,630 9,182 6,429 2,749 371 3,174 1,285 445 532 668 33 571 18 10
cu.m/h
solids 80 2,084 2,084 1,731 434 39 498 122 47 55 66 3 57 3 3
liquid 1,340 2,213 3,764 1,929 1,624 261 1,878 905 316 347 473 24 395 9 1
total 1,420 4,296 5,848 3,659 2,058 300 2,376 1,026 363 402 539 26 452 12 4
SG (MT/cu.
m)
solids 2.60 2.60 2.60 2.60 2.59 2.83 2.60 3.12 2.75 3.33 2.95 3.45 3.06 3.45 3.45
liquid 1.00 1.00 1.00 1.00 1.00 1.00 1.00 1.00 1.00 1.00 1.00 1.00 1.00 1.00 1.00
slurry 1.09 1.78 1.57 1.76 1.34 1.24 1.34 1.25 1.23 1.32 1.24 1.24 1.26 1.55 2.77
% solids 13.43 71.00 59.00 70.00 40.92 29.67 40.84 29.57 28.91 34.72 29.24 27.46 30.76 50.00 90.00
% of feed 100.00 100.00 80.00 20.00 7.83 92.17 74.71 25.29 48.58 51.42 4.88 95.12
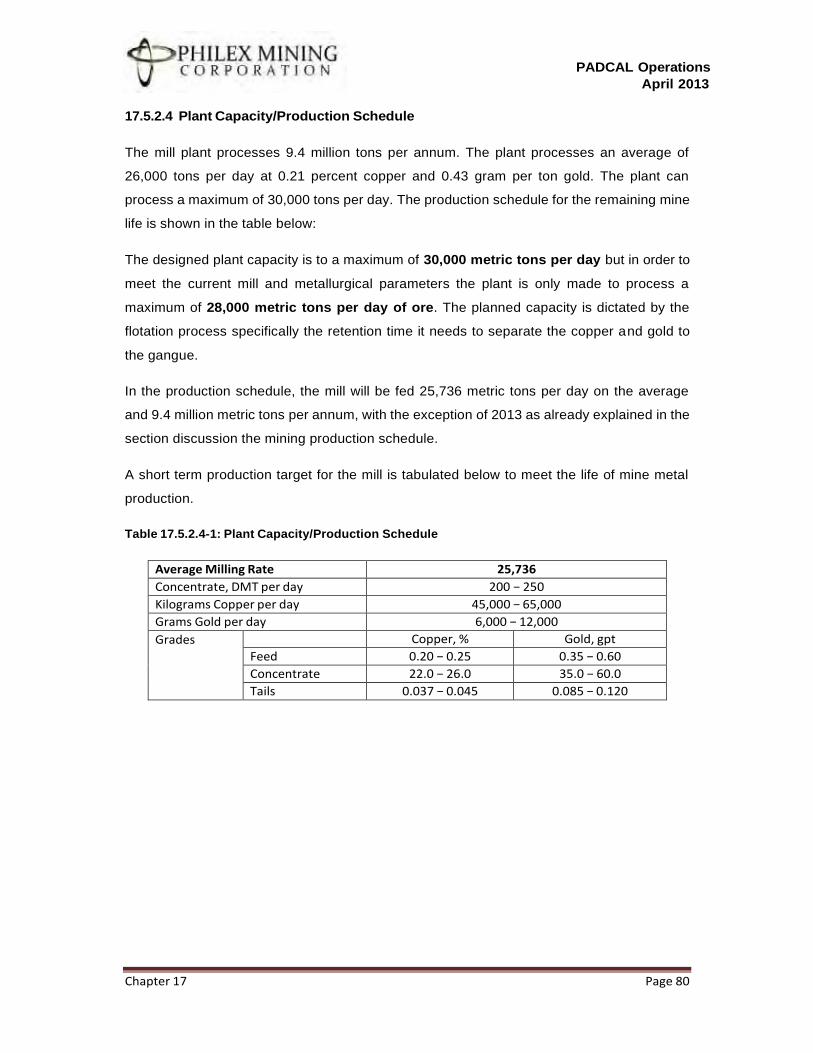
17.5.2.4 Plant Capacity/Production Schedule
PADCAL Operations
April 2013
The mill plant processes 9.4 million tons per annum. The plant processes an average of
26,000 tons per day at 0.21 percent copper and 0.43 gram per ton gold. The plant can
process a maximum of 30,000 tons per day. The production schedule for the remaining mine
life is shown in the table below:
The designed plant capacity is to a maximum of 30,000 metric tons per day but in order to
meet the current mill and metallurgical parameters the plant is only made to process a
maximum of 28,000 metric tons per day of ore. The planned capacity is dictated by the
flotation process specifically the retention time it needs to separate the copper and gold to
the gangue.
In the production schedule, the mill will be fed 25,736 metric tons per day on the average
and 9.4 million metric tons per annum, with the exception of 2013 as already explained in the
section discussion the mining production schedule.
A short term production target for the mill is tabulated below to meet the life of mine metal
production.
Table 17.5.2.4-1: Plant Capacity/Production Schedule
Average Milling Rate 25,736
Concentrate, DMT per day 200 − 250
Kilograms Copper per day 45,000 − 65,000
Grams Gold per day 6,000 − 12,000
Grades Copper, % Gold, gpt
Feed 0.20 − 0.25 0.35 − 0.60
Concentrate 22.0 − 26.0 35.0 − 60.0
Tails 0.037 − 0.045 0.085 − 0.120
Chapter 17 Page 80
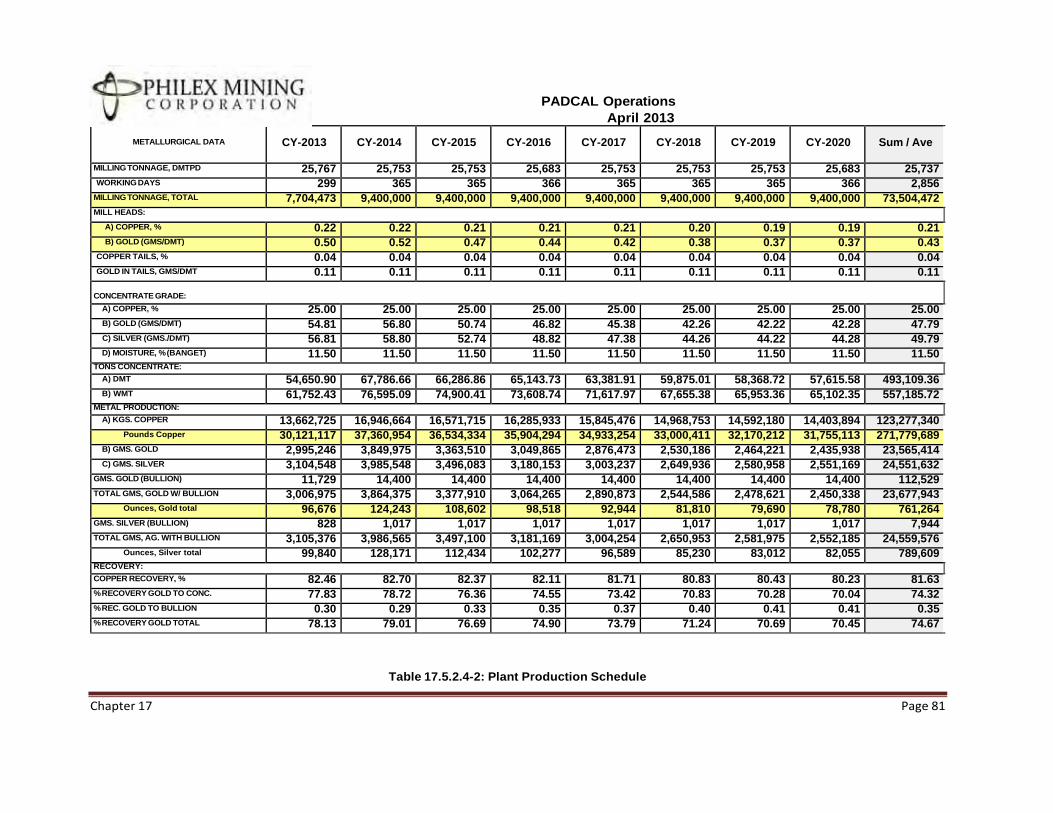
PADCAL Operations
April 2013
METALLURGICAL DATA CY-2013 CY-2014 CY-2015 CY-2016 CY-2017 CY-2018 CY-2019 CY-2020 Sum / Ave
MILLING TONNAGE, DMTPD 25,767 25,753 25,753 25,683 25,753 25,753 25,753 25,683 25,737 WORKING DAYS 299 365 365 366 365 365 365 366 2,856
MILLING TONNAGE, TOTAL 7,704,473 9,400,000 9,400,000 9,400,000 9,400,000 9,400,000 9,400,000 9,400,000 73,504,472 MILL HEADS:
A) COPPER, % 0.22 0.22 0.21 0.21 0.21 0.20 0.19 0.19 0.21 B) GOLD (GMS/DMT) 0.50 0.52 0.47 0.44 0.42 0.38 0.37 0.37 0.43
COPPER TAILS, % 0.04 0.04 0.04 0.04 0.04 0.04 0.04 0.04 0.04 GOLD IN TAILS, GMS/DMT 0.11 0.11 0.11 0.11 0.11 0.11 0.11 0.11 0.11
CONCENTRATE GRADE:
A) COPPER, % 25.00 25.00 25.00 25.00 25.00 25.00 25.00 25.00 25.00 B) GOLD (GMS/DMT) 54.81 56.80 50.74 46.82 45.38 42.26 42.22 42.28 47.79 C) SILVER (GMS./DMT) 56.81 58.80 52.74 48.82 47.38 44.26 44.22 44.28 49.79 D) MOISTURE, % (BANGET) 11.50 11.50 11.50 11.50 11.50 11.50 11.50 11.50 11.50
TONS CONCENTRATE:
A) DMT 54,650.90 67,786.66 66,286.86 65,143.73 63,381.91 59,875.01 58,368.72 57,615.58 493,109.36 B) WMT 61,752.43 76,595.09 74,900.41 73,608.74 71,617.97 67,655.38 65,953.36 65,102.35 557,185.72
METAL PRODUCTION:
A) KGS. COPPER 13,662,725 16,946,664 16,571,715 16,285,933 15,845,476 14,968,753 14,592,180 14,403,894 123,277,340 Pounds Copper 30,121,117 37,360,954 36,534,334 35,904,294 34,933,254 33,000,411 32,170,212 31,755,113 271,779,689
B) GMS. GOLD 2,995,246 3,849,975 3,363,510 3,049,865 2,876,473 2,530,186 2,464,221 2,435,938 23,565,414 C) GMS. SILVER 3,104,548 3,985,548 3,496,083 3,180,153 3,003,237 2,649,936 2,580,958 2,551,169 24,551,632
GMS. GOLD (BULLION) 11,729 14,400 14,400 14,400 14,400 14,400 14,400 14,400 112,529 TOTAL GMS, GOLD W/ BULLION 3,006,975 3,864,375 3,377,910 3,064,265 2,890,873 2,544,586 2,478,621 2,450,338 23,677,943
Ounces, Gold total 96,676 124,243 108,602 98,518 92,944 81,810 79,690 78,780 761,264 GMS. SILVER (BULLION) 828 1,017 1,017 1,017 1,017 1,017 1,017 1,017 7,944 TOTAL GMS, AG. WITH BULLION 3,105,376 3,986,565 3,497,100 3,181,169 3,004,254 2,650,953 2,581,975 2,552,185 24,559,576
Ounces, Silver total 99,840 128,171 112,434 102,277 96,589 85,230 83,012 82,055 789,609 RECOVERY:
COPPER RECOVERY, % 82.46 82.70 82.37 82.11 81.71 80.83 80.43 80.23 81.63 % RECOVERY GOLD TO CONC. 77.83 78.72 76.36 74.55 73.42 70.83 70.28 70.04 74.32 % REC. GOLD TO BULLION 0.30 0.29 0.33 0.35 0.37 0.40 0.41 0.41 0.35 % RECOVERY GOLD TOTAL 78.13 79.01 76.69 74.90 73.79 71.24 70.69 70.45 74.67
Table 17.5.2.4-2: Plant Production Schedule
Chapter 17 Page 81
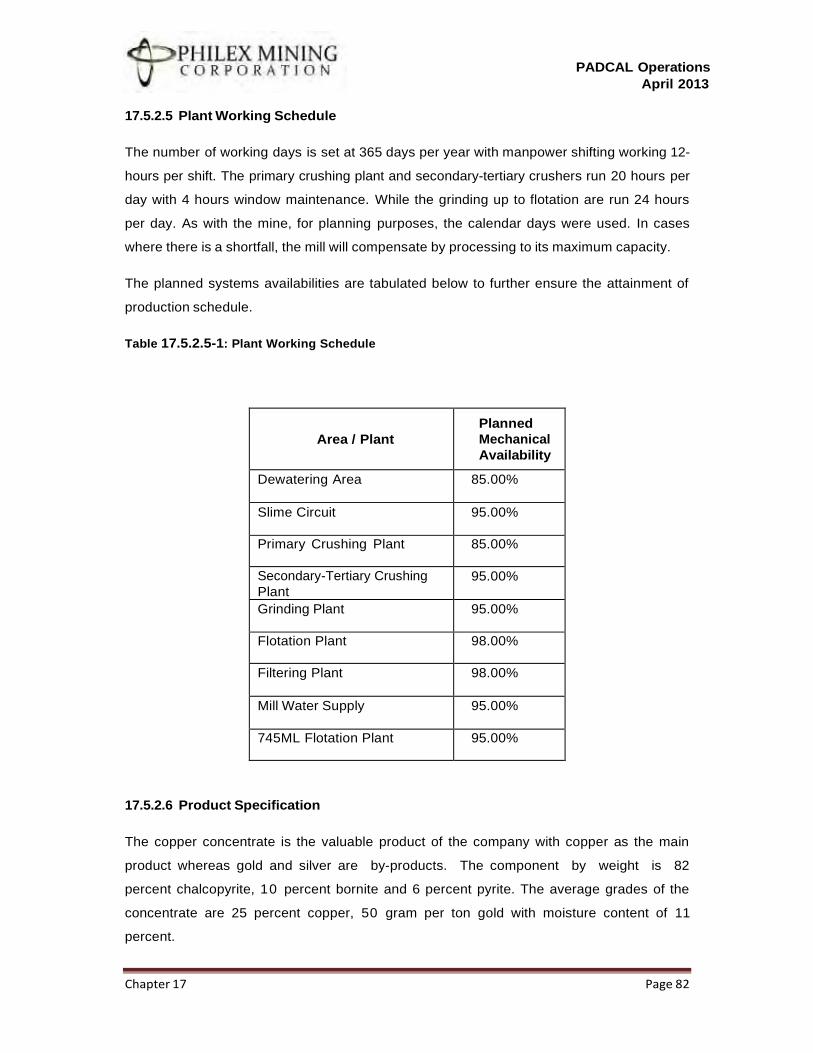
PADCAL Operations
April 2013
Chapter 17 Page 82
17.5.2.5 Plant Working Schedule
The number of working days is set at 365 days per year with manpower shifting working 12-
hours per shift. The primary crushing plant and secondary-tertiary crushers run 20 hours per
day with 4 hours window maintenance. While the grinding up to flotation are run 24 hours
per day. As with the mine, for planning purposes, the calendar days were used. In cases
where there is a shortfall, the mill will compensate by processing to its maximum capacity.
The planned systems availabilities are tabulated below to further ensure the attainment of
production schedule.
Table 17.5.2.5-1: Plant Working Schedule
Area / Plant
Planned
Mechanical
Availability
Dewatering Area 85.00%
Slime Circuit 95.00%
Primary Crushing Plant 85.00%
Secondary-Tertiary Crushing
Plant
95.00%
Grinding Plant 95.00%
Flotation Plant 98.00%
Filtering Plant 98.00%
Mill Water Supply 95.00%
745ML Flotation Plant 95.00%
17.5.2.6 Product Specification
The copper concentrate is the valuable product of the company with copper as the main
product whereas gold and silver are by-products. The component by weight is 82
percent chalcopyrite, 10 percent bornite and 6 percent pyrite. The average grades of the
concentrate are 25 percent copper, 50 gram per ton gold with moisture content of 11
percent.
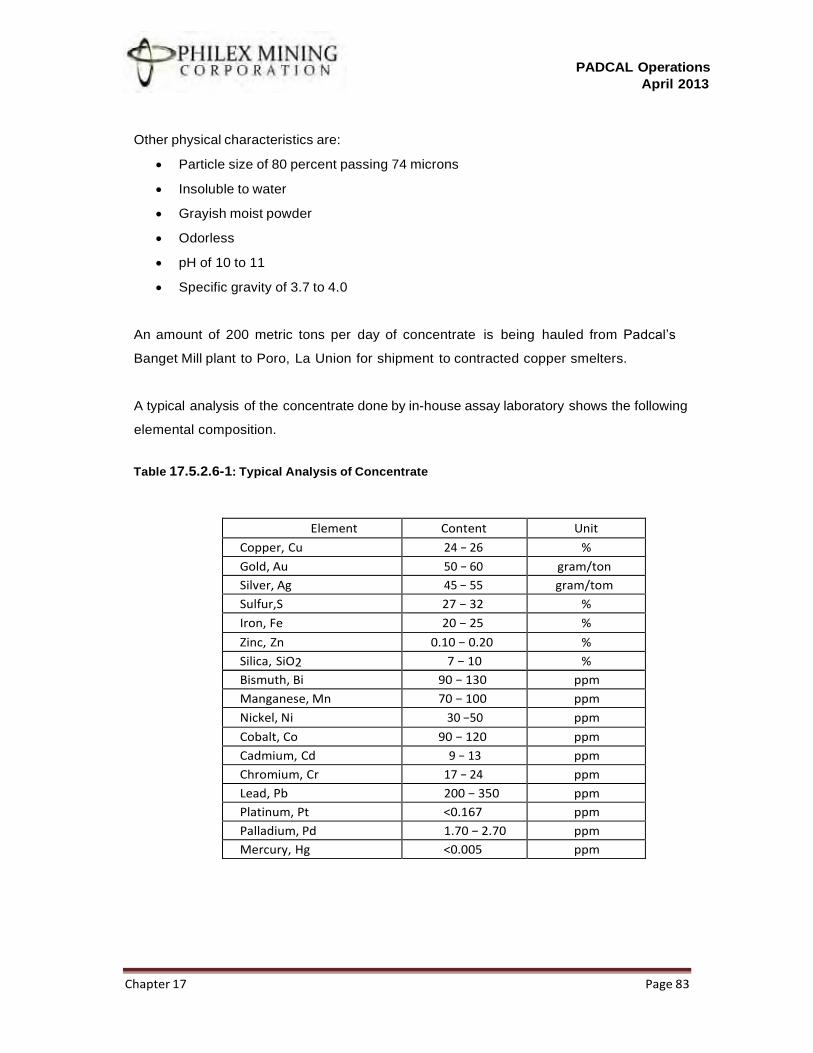
PADCAL Operations
April 2013
Chapter 17 Page 83
Other physical characteristics are:
• Particle size of 80 percent passing 74 microns
• Insoluble to water
• Grayish moist powder
• Odorless
• pH of 10 to 11
• Specific gravity of 3.7 to 4.0
An amount of 200 metric tons per day of concentrate is being hauled from Padcal’s
Banget Mill plant to Poro, La Union for shipment to contracted copper smelters.
A typical analysis of the concentrate done by in-house assay laboratory shows the following
elemental composition.
Table 17.5.2.6-1: Typical Analysis of Concentrate
Element Content Unit
Copper, Cu 24 − 26 %
Gold, Au 50 − 60 gram/ton
Silver, Ag 45 − 55 gram/tom
Sulfur,S 27 − 32 %
Iron, Fe 20 − 25 %
Zinc, Zn 0.10 − 0.20 %
Silica, SiO2 7 − 10 %
Bismuth, Bi 90 − 130 ppm
Manganese, Mn 70 − 100 ppm
Nickel, Ni 30 −50 ppm
Cobalt, Co 90 − 120 ppm
Cadmium, Cd 9 − 13 ppm
Chromium, Cr 17 − 24 ppm
Lead, Pb 200 − 350 ppm
Platinum, Pt <0.167 ppm
Palladium, Pd 1.70 − 2.70 ppm
Mercury, Hg <0.005 ppm
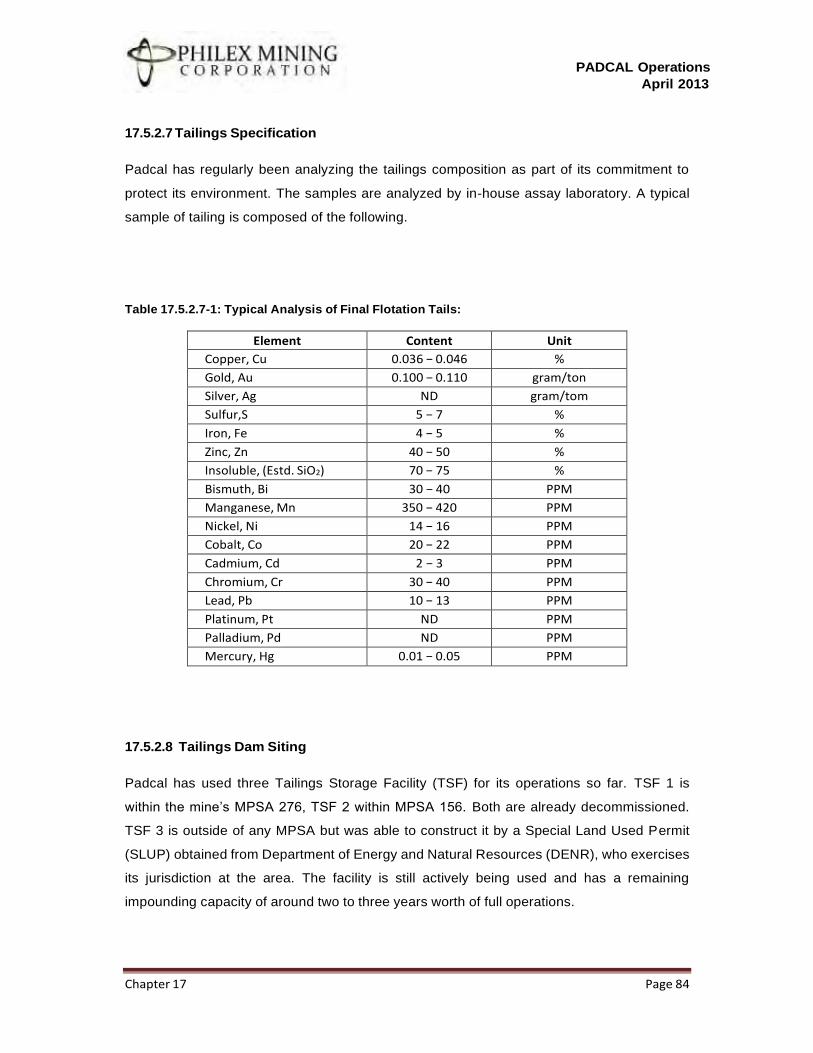
PADCAL Operations
April 2013
Chapter 17 Page 84
17.5.2.7 Tailings Specification
Padcal has regularly been analyzing the tailings composition as part of its commitment to
protect its environment. The samples are analyzed by in-house assay laboratory. A typical
sample of tailing is composed of the following.
Table 17.5.2.7-1: Typical Analysis of Final Flotation Tails:
Element Content Unit
Copper, Cu 0.036 − 0.046 %
Gold, Au 0.100 − 0.110 gram/ton
Silver, Ag ND gram/tom
Sulfur,S 5 − 7 %
Iron, Fe 4 − 5 %
Zinc, Zn 40 − 50 %
Insoluble, (Estd. SiO2) 70 − 75 %
Bismuth, Bi 30 − 40 PPM
Manganese, Mn 350 − 420 PPM
Nickel, Ni 14 − 16 PPM
Cobalt, Co 20 − 22 PPM
Cadmium, Cd 2 − 3 PPM
Chromium, Cr 30 − 40 PPM
Lead, Pb 10 − 13 PPM
Platinum, Pt ND PPM
Palladium, Pd ND PPM
Mercury, Hg 0.01 − 0.05 PPM
17.5.2.8 Tailings Dam Siting
Padcal has used three Tailings Storage Facility (TSF) for its operations so far. TSF 1 is
within the mine’s MPSA 276, TSF 2 within MPSA 156. Both are already decommissioned.
TSF 3 is outside of any MPSA but was able to construct it by a Special Land Used Permit
(SLUP) obtained from Department of Energy and Natural Resources (DENR), who exercises
its jurisdiction at the area. The facility is still actively being used and has a remaining
impounding capacity of around two to three years worth of full operations.
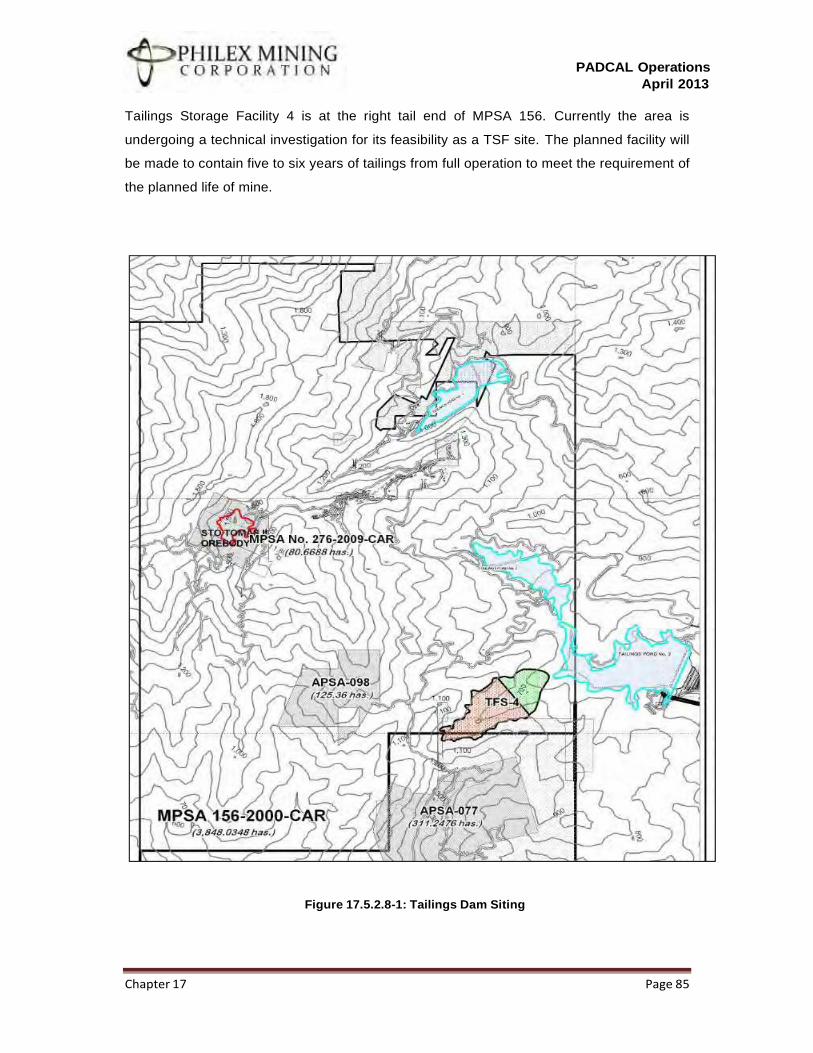
PADCAL Operations
April 2013
Chapter 17 Page 85
Tailings Storage Facility 4 is at the right tail end of MPSA 156. Currently the area is
undergoing a technical investigation for its feasibility as a TSF site. The planned facility will
be made to contain five to six years of tailings from full operation to meet the requirement of
the planned life of mine.
Figure 17.5.2.8-1: Tailings Dam Siting
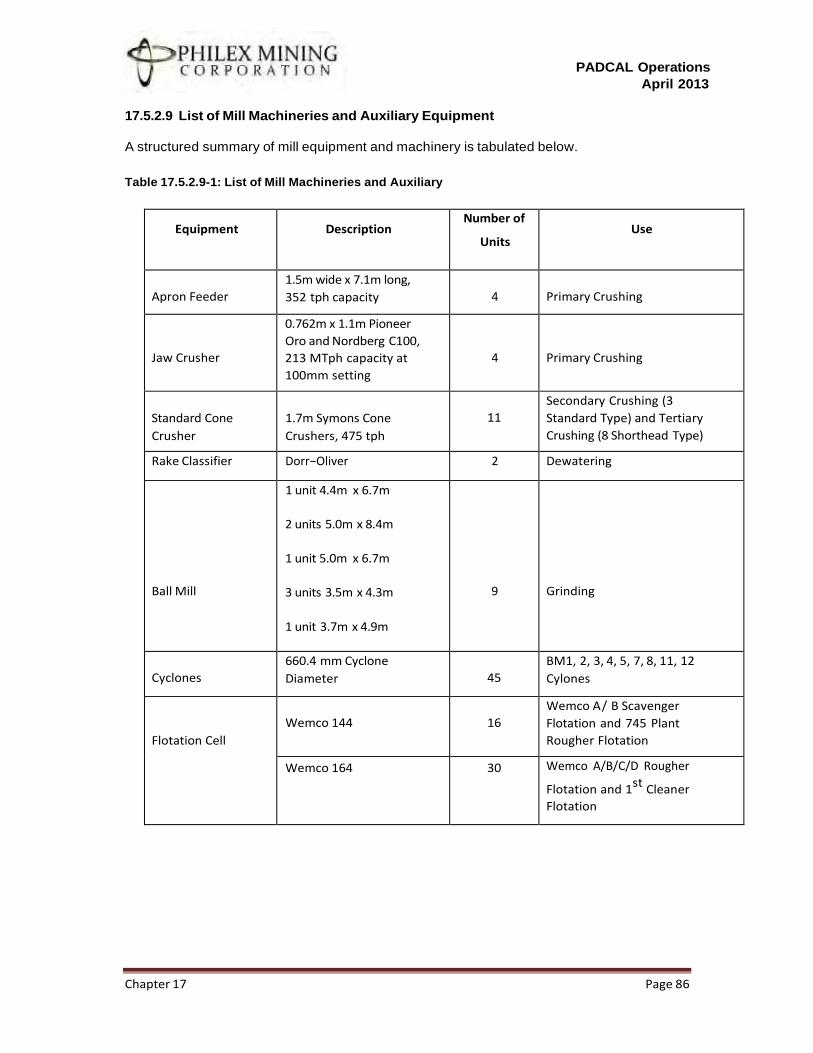
PADCAL Operations
April 2013
Chapter 17 Page 86
17.5.2.9 List of Mill Machineries and Auxiliary Equipment
A structured summary of mill equipment and machinery is tabulated below.
Table 17.5.2.9-1: List of Mill Machineries and Auxiliary
Equipment Description Number of
Units Use
Apron Feeder
1.5m wide x 7.1m long,
352 tph capacity
4
Primary Crushing
Jaw Crusher
0.762m x 1.1m Pioneer
Oro and Nordberg C100,
213 MTph capacity at
100mm setting
4
Primary Crushing
Standard Cone
Crusher
1.7m Symons Cone
Crushers, 475 tph
11
Secondary Crushing (3
Standard Type) and Tertiary
Crushing (8 Shorthead Type)
Rake Classifier Dorr−Oliver 2 Dewatering
Ball Mill
1 unit 4.4m x 6.7m
2 units 5.0m x 8.4m
1 unit 5.0m x 6.7m
3 units 3.5m x 4.3m
1 unit 3.7m x 4.9m
9
Grinding
Cyclones
660.4 mm Cyclone
Diameter
45
BM1, 2, 3, 4, 5, 7, 8, 11, 12
Cylones
Flotation Cell
Wemco 144
16
Wemco A/ B Scavenger
Flotation and 745 Plant
Rougher Flotation
Wemco 164 30 Wemco A/B/C/D Rougher
Flotation and 1st
Cleaner
Flotation
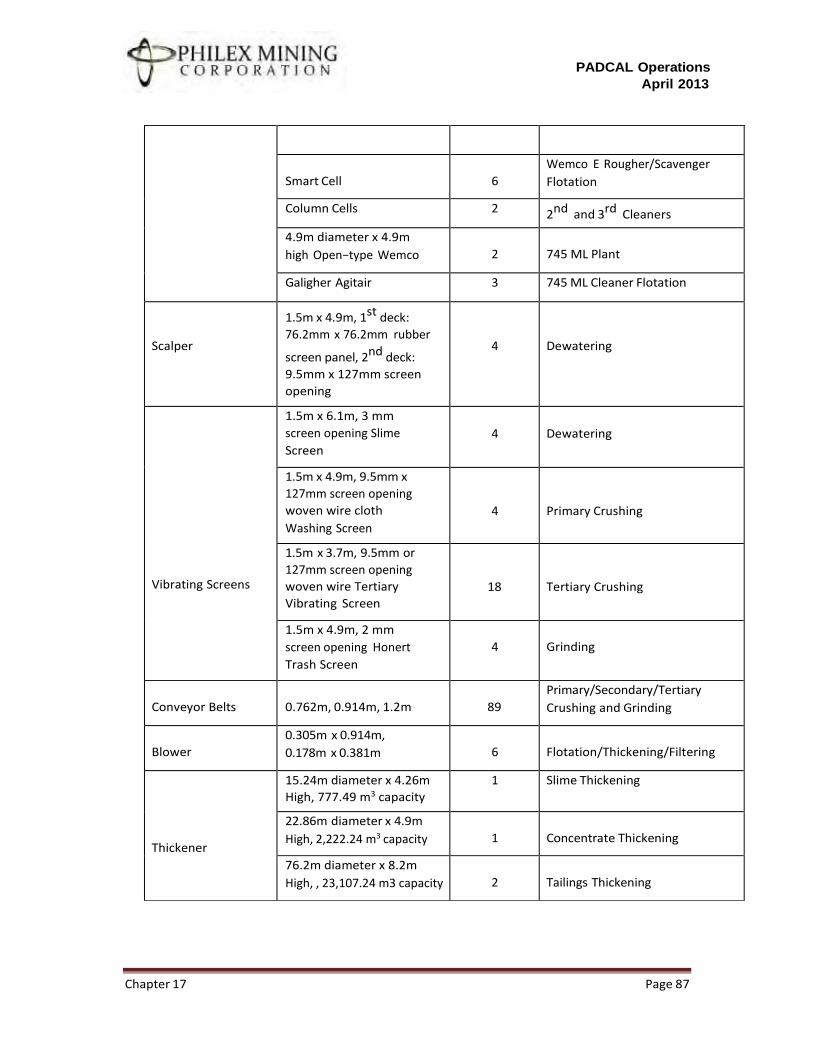
PADCAL Operations
April 2013
Chapter 17 Page 87
Smart Cell
6
Wemco E Rougher/Scavenger
Flotation
Column Cells 2 2nd and 3rd Cleaners
4.9m diameter x 4.9m
high Open−type Wemco
2
745 ML Plant
Galigher Agitair 3 745 ML Cleaner Flotation
Scalper
1.5m x 4.9m, 1st deck:
76.2mm x 76.2mm rubber
screen panel, 2nd deck:
9.5mm x 127mm screen
opening
4
Dewatering
Vibrating Screens
1.5m x 6.1m, 3 mm
screen opening Slime
Screen
4
Dewatering
1.5m x 4.9m, 9.5mm x
127mm screen opening
woven wire cloth
Washing Screen
4
Primary Crushing
1.5m x 3.7m, 9.5mm or
127mm screen opening
woven wire Tertiary
Vibrating Screen
18
Tertiary Crushing
1.5m x 4.9m, 2 mm
screen opening Honert
Trash Screen
4
Grinding
Conveyor Belts
0.762m, 0.914m, 1.2m
89
Primary/Secondary/Tertiary
Crushing and Grinding
Blower
0.305m x 0.914m,
0.178m x 0.381m
6
Flotation/Thickening/Filtering
Thickener
15.24m diameter x 4.26m
High, 777.49 m3 capacity
1 Slime Thickening
22.86m diameter x 4.9m
High, 2,222.24 m3 capacity
1
Concentrate Thickening
76.2m diameter x 8.2m
High, , 23,107.24 m3 capacity
2
Tailings Thickening
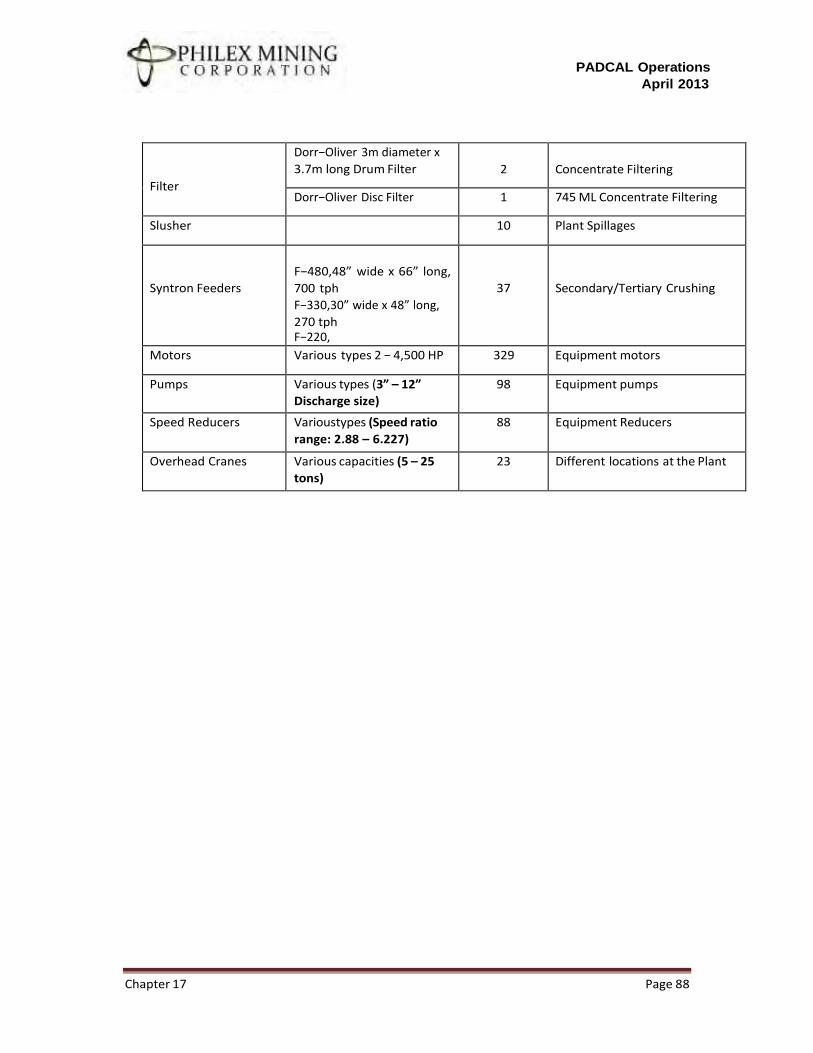
PADCAL Operations
April 2013
Chapter 17 Page 88
Filter
Dorr−Oliver 3m diameter x
3.7m long Drum Filter
2
Concentrate Filtering
Dorr−Oliver Disc Filter 1 745 ML Concentrate Filtering
Slusher 10 Plant Spillages
Syntron Feeders
F−480,48” wide x 66” long,
700 tph
F−330,30” wide x 48” long,
270 tph F−220,
37
Secondary/Tertiary Crushing
Motors Various types 2 − 4,500 HP 329 Equipment motors
Pumps Various types (3” – 12”
Discharge size)
98 Equipment pumps
Speed Reducers Varioustypes (Speed ratio
range: 2.88 – 6.227)
88 Equipment Reducers
Overhead Cranes Various capacities (5 – 25
tons)
23 Different locations at the Plant
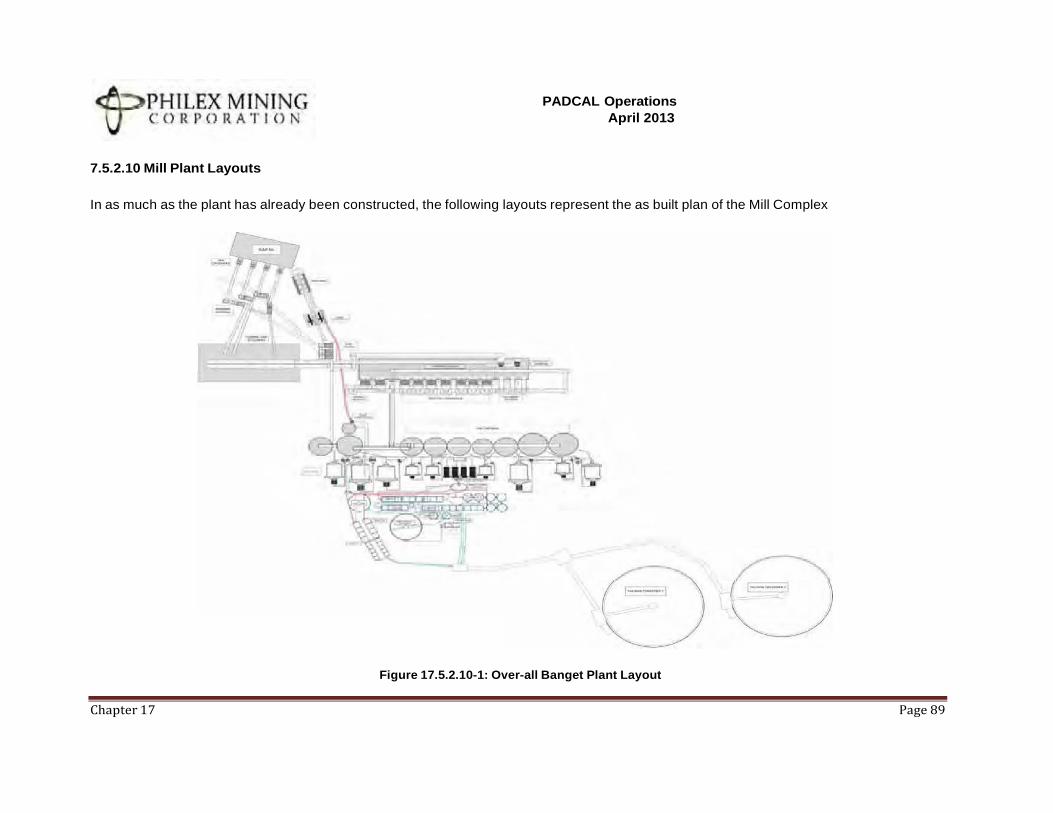
7.5.2.10 Mill Plant Layouts
PADCAL Operations
April 2013
In as much as the plant has already been constructed, the following layouts represent the as built plan of the Mill Complex
Figure 17.5.2.10-1: Over-all Banget Plant Layout
Chapter 17 Page 89
PADCAL Operations
April 2013
Chapter 17 Page 90
17.5.3 Mine Support Services
17.5.3.1 Power Source / Power Generation Plant
Facility Electric Power Distribution Systems
The Primary Power supply on site is fed at 69 Kilovolts from the La Trinidad Substation
owned by the National Grid Corporation of the Phil. (NGCP). The La Trinidad Substation
feeds power through a 69 Kilovolts, 336.4MCM overhead lines on wood and steel poles to
NGCP’s Itogon substation then a dedicated line to the Philex Substation#69 at sitio Banget.
From the Itogon SS a 23 Kilovolts, American Wire Gauge #4/0 overhead power line feeds
the mine camp site community.
- Left Intentionally Blank -
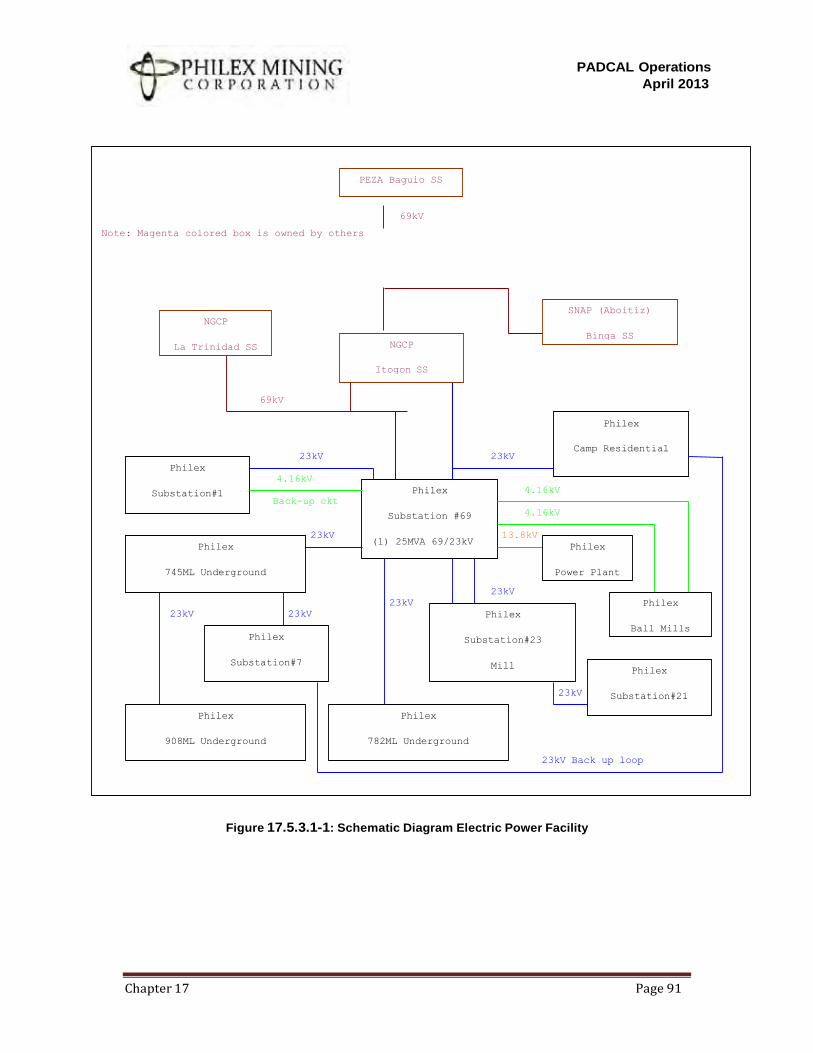
PADCAL Operations
April 2013
Chapter 17 Page 91
69kV
Note: Magenta colored box is owned by others
SNAP (Aboitiz)
NGCP
Binga SS
La Trinidad SS NGCP
Itogon SS
69kV
Philex
Camp Residential 23kV 23kV
Philex
4.16kV
Substation#1 Philex 4.16kV
Back-up ckt
Substation #69 4.16kV
23kV
Philex (1) 25MVA 69/23kV
13.8kV
Philex
745ML Underground Power Plant
23kV
23kV Philex
23kV 23kV Philex
Ball Mills Philex Substation#23
Substation#7 Mill Philex
23kV Substation#21
Philex Philex
908ML Underground 782ML Underground
23kV Back up loop
Figure 17.5.3.1-1: Schematic Diagram Electric Power Facility
PEZA Baguio SS
PADCAL Operations
April 2013
Chapter 17 Page 92
Primary Power Supply Substation
The 69kV is received at Substation No. 69 by four (4) main power transformers namely:
1. MT01 - 25MVA, 69/23kV, Westinghouse Brand, Mfg. 1973.
2. MT02 - 10MVA, 69kV / 2,300V, Westinghouse Brand, Mfg. 1972.
3. MT26 - 10MVA, 69000/4160V, Philec Brand, Mfg. 2007
4. MT27 - 10MVA, 69000/4160V, Philec Brand, Mfg. 2007
An expansion project to install another 25MVA was planned to be implemented this 2013
and expected to be completed first quarter of 2014. This project is mainly for an N-1
capability of the main substation thus an assurance of very minimal business interruption in
case of shutdown of any of the main transformers.
Electric energy is supplied through a 3 years (2011- 2014) bilateral contract with TEAM
(Philippines) Energy Corporation from their SUAL Power Station, the largest coal-fired power
plant in the Philippines. The contract is fixed energy rate to protect the mine against the
volatility of power rates in the market.
Contracted Minimum Energy Off-take = 15,000,000 kWh
Contract Demand = 36,000kW
Estimated Annual Energy = 250,000,000 kWh
Underground Power Supply
Underground power is fed by two (2) 23kV feeders through the conveyor (CHC) gallery. The
power cables are installed on cable trays and hangers. First, the underground loop feeder
uses a power cable, OKOGUARDR brand, AWG#1/0, 3core, 36kV rated, EPR 133 percent
insulation, with corrugated aluminum guard. This is a reliable, rugged, and durable power
cable which is a product of OKONITE company USA. This power supply feeder has a back-
up loop that enters the underground via the GCH shaft hoist column and meets at the
underground substation at 745ML (substation no.38). Second, the underground feeder #72
uses a power cable GT Kabel brand, 50mm2, 3core, 36kV rated, XLPE 133 percent
insulation, with lead sheathed guard, indent from Indonesia. This provides power to 782ML
underground and other FBC process equipment.
There are four (4) 23kV power distribution feeder circuit breakers that feeds the mine’s 5
main substations (SS). Two feeders for the underground OCB#06 supplies SS#37 and
PADCAL Operations
April 2013
Chapter 17 Page 93
SS#38, Feeder OCB#05 supplies SS#01, Feeder OCB#04 supplies SS#09 that has loop
interconnection with OCB#06, and Feeder VCB#08 supplies SS#72.
The five (5) main distribution substations that serve the power requirement of the mine
facilities and the underground are:
1. SS#01, Located at the CHC portal (surface)– supply power to the CHC
conveyor and dump bin.
2. SS#37, Located at 745ML UG – supply power to FBC
3. SS#38, Located at 908ML UG – supply power to 908ML, 840ML, part of
782ML.
4. SS#09, Located at 1425ML surface – supply power to GCH & Thompson
Hoists, 975ML, 1020ML, Bumolo Ventilation, 1425ML repair shops, subsidence
area.
5. SS#72, Located at 782ML CPR UG – supply power to some FBC process
equipment and 782ML UG.
Mill Power Supply
MT01, the 25MVA feeds 23kV to the mill by two feeder Oil Circuit breakers, one duty and the
other as back-up loop. Six power transformers 5x5MVA, and 12.5MVA receives the 23kV
from the 25MVA and three 3x10MVA from 69kV supplies power to the mill. The electrical
network is wired so that each transformer loads can be supplied by other transformers in the
event of shutdown of one.
Camp and Domestic Power Supply
Camp residential area is supplied by a dedicated 2.5MVA power transformer with a demand
of 3MW. Average energy usage is estimated at 1,200,000kWh.
17.5.3.2 Industrial/Domestic Water Supply
The Mill operations consume the biggest volume of water in Padcal. To process 25,730
metric tons per day of ore, around 820 cubic meter per hour of fresh water is required which
in most of the time can be supplied by running two 3,000 gallons per minute pumps from the
Sal-angan river just below the mill complex.
PADCAL Operations
April 2013
Chapter 17 Page 94
The mill is also equipped with two thickener cells, 19 and 23 meters in diameter, when
combined has a capacity of 2,000 cubic meters of water storage. These cells are often used
during the dry seasons when the water supply at Sal-angan river diminishes.
The supply for domestic water is sourced from Smith Tunnel and Shimada crosscut
contributing 70 percent and 30 percent of the supply, respectively. The water from these
sources is conveyed by gravity through 25.4 centimeters and 15.2 centimeter diameter
pipes.
a. Minimum monthly requirement : 77,000 cubic meters
b. Maximum monthly requirement : 82,000 cubic meters
c. Minimum annual requirement : 924,000 cubic meters
d. Maximum annual requirement : 984,000 cubic meters
e. Point of delivery : Stage I Pump house and
Chlorination Station located at Banget, Itogon,
Benguet
Supply Alternatives
There are two (2) additional domestic water sources during the first semester of each year to
augment the water requirement.
a. C.Y.M. Tunnel – the water from this source is conveyed through a 25.4 centimeter
diameter pipeline to a cylindrical tank used as reservoir. From the tank, the water is
pumped to Smith line at a higher elevation around 20 meters high.
b. Banawel Tunnel water source
c. Water from the underground mine’s drainage level at 745 ML is also pumped out to a
tank located at the dump bin area of the mill. This serves an additional supply during
summer in milling operations.
PADCAL Operations
April 2013
Chapter 17 Page 95
17.5.3.3 Assay Laboratory
The Assay Laboratory is located in the minesite and conducts analysis of ore (core/pulp),
water and wastewater, and oil and used oil samples. Two sites of laboratory in the minesite
are located at Padcal (Main Lab) and Banget (Plant Lab.) The Main Lab caters to all analysis
of different sources and type of samples while the Plant Lab is only for the Mill Plant
products for process control purposes.
For ore samples from exploration, development, production and shipment were prepared
and assayed in the laboratory at the mine site. Wastewater were prepared and analyzed for
self monitoring purposes and used oil is for preventive maintenance. A limited number of
these samples were sent to outside laboratories for check assays.
17.5.3.3.1 Sample Preparation
Samples received are prepared at the laboratory as follows:
• The core sample is dried at 105 degree C and crushed to a -10 mesh
• An approximately 20 percent split until about 150 g representative sample is taken from
the crushed material by setting the Rotary Sample Divider (RSD)
• The 150 g representative sample is pulverized for 5 minutes to get a 95 percent -200
mesh
The sample is then rolled and quartered to obtain approximately 20 grams for copper
analytical sample. The remaining pulp is for the gold analytical sample.
These sample preparation procedures with manual intervention using Jones Splitter have
not changed in at least several years except with the upgrading of equipment like the
integration of RSD with the crusher.
17.5.3.3.2 Assay Protocols
17.5.3.3.2.1 Analytical Procedures
The following assay procedures have been established and documented for the mine
laboratory use. Two sites of laboratory are maintained, the Padcal (Main) laboratory and the
Banget (Plant) laboratory. The Padcal laboratory caters to the analysis for ore, water and oil
PADCAL Operations
April 2013
Chapter 17 Page 96
samples while the Plant laboratory caters the samples from the Mill Plant products for
process control purposes.
17.5.3.3.2.1.1 Copper
Total copper is determined by different methods developed as the standard procedures:
Low grade samples: 2-acid digestion & AAS Method. Digest 0.5 g sample in a mixture of
3ml of concentrated HCl and 1 ml of concentrated HNO3. The sample is digested for 30
minutes and then diluted to 50 ml with water without filtration of the sample. The resulting
solution is then read on an AA. Samples containing more than 0.6 percent Cu are diluted by
50 percent and re-read. Some samples are treated with 3-acid digestion namely hydrochloric
acid, nitric acid and perchloric acid.
Soluble copper is determined by leaching 2.5 g of sample in 50 ml of 3 percent H2SO4 for 30
minutes at 60 degree C temperature. The sample is then filtered and read on an AAS.
High grade samples with >1 percent Cu: Acidimetry Titrimetry Method. Digest 0.50/1.0 g
sample with 10 ml Nitric and 20 ml HCl, volume with 100 ml distilled water, boil and add
ammonium hydroxide to precipitate the iron content, acidify with acetic acid and cool. Add
sodium fluoride, potassium iodide and starch as indicator. Titrate with sodium thiosulfate
until the end-point is reached with creamy white solution. Calculate result.
17.5.3.3.2.1.2 Gold
Gold is determined by fire assay with 10/30/60 grams of sample on concentrate, feed and
tails sample, respectively and followed by gravimetric finished. The bead is parted prior to
final weighing of the dore, but silver is not determined on the parting solution. Silver is
analyzed separately. Pre-mixed flux is used.
Results are captured from AAS and microbalance by computer station and automatically
transcribed into the Excel spreadsheets and printed for the appropriate departments.
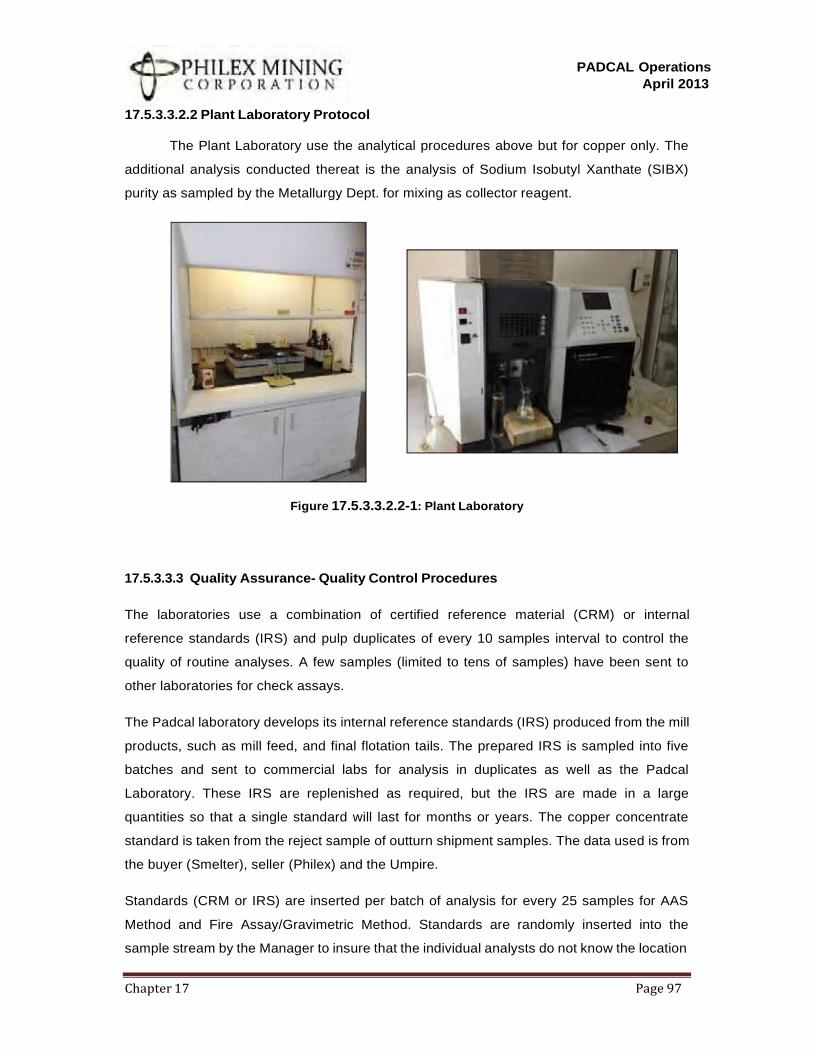
PADCAL Operations
April 2013
Chapter 17 Page 97
17.5.3.3.2.2 Plant Laboratory Protocol
The Plant Laboratory use the analytical procedures above but for copper only. The
additional analysis conducted thereat is the analysis of Sodium Isobutyl Xanthate (SIBX)
purity as sampled by the Metallurgy Dept. for mixing as collector reagent.
Figure 17.5.3.3.2.2-1: Plant Laboratory
17.5.3.3.3 Quality Assurance- Quality Control Procedures
The laboratories use a combination of certified reference material (CRM) or internal
reference standards (IRS) and pulp duplicates of every 10 samples interval to control the
quality of routine analyses. A few samples (limited to tens of samples) have been sent to
other laboratories for check assays.
The Padcal laboratory develops its internal reference standards (IRS) produced from the mill
products, such as mill feed, and final flotation tails. The prepared IRS is sampled into five
batches and sent to commercial labs for analysis in duplicates as well as the Padcal
Laboratory. These IRS are replenished as required, but the IRS are made in a large
quantities so that a single standard will last for months or years. The copper concentrate
standard is taken from the reject sample of outturn shipment samples. The data used is from
the buyer (Smelter), seller (Philex) and the Umpire.
Standards (CRM or IRS) are inserted per batch of analysis for every 25 samples for AAS
Method and Fire Assay/Gravimetric Method. Standards are randomly inserted into the
sample stream by the Manager to insure that the individual analysts do not know the location
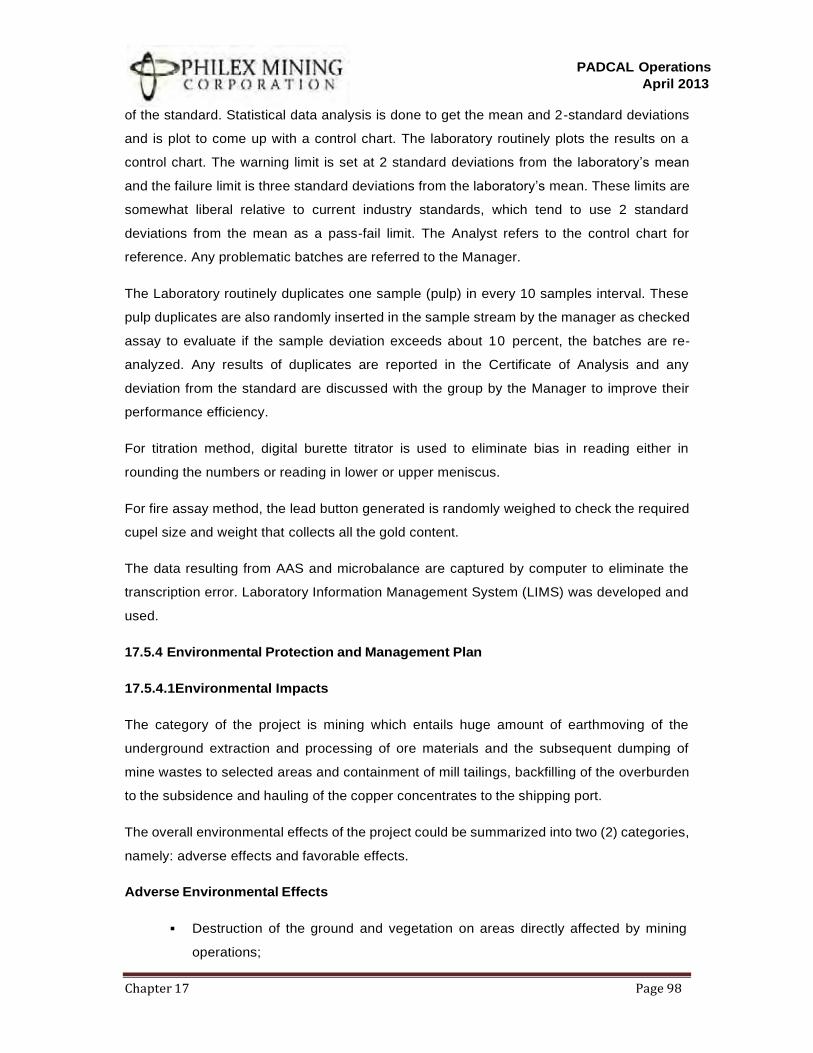
PADCAL Operations
April 2013
Chapter 17 Page 98
of the standard. Statistical data analysis is done to get the mean and 2-standard deviations
and is plot to come up with a control chart. The laboratory routinely plots the results on a
control chart. The warning limit is set at 2 standard deviations from the laboratory’s mean
and the failure limit is three standard deviations from the laboratory’s mean. These limits are
somewhat liberal relative to current industry standards, which tend to use 2 standard
deviations from the mean as a pass-fail limit. The Analyst refers to the control chart for
reference. Any problematic batches are referred to the Manager.
The Laboratory routinely duplicates one sample (pulp) in every 10 samples interval. These
pulp duplicates are also randomly inserted in the sample stream by the manager as checked
assay to evaluate if the sample deviation exceeds about 10 percent, the batches are re-
analyzed. Any results of duplicates are reported in the Certificate of Analysis and any
deviation from the standard are discussed with the group by the Manager to improve their
performance efficiency.
For titration method, digital burette titrator is used to eliminate bias in reading either in
rounding the numbers or reading in lower or upper meniscus.
For fire assay method, the lead button generated is randomly weighed to check the required
cupel size and weight that collects all the gold content.
The data resulting from AAS and microbalance are captured by computer to eliminate the
transcription error. Laboratory Information Management System (LIMS) was developed and
used.
17.5.4 Environmental Protection and Management Plan
17.5.4.1Environmental Impacts
The category of the project is mining which entails huge amount of earthmoving of the
underground extraction and processing of ore materials and the subsequent dumping of
mine wastes to selected areas and containment of mill tailings, backfilling of the overburden
to the subsidence and hauling of the copper concentrates to the shipping port.
The overall environmental effects of the project could be summarized into two (2) categories,
namely: adverse effects and favorable effects.
Adverse Environmental Effects
▪ Destruction of the ground and vegetation on areas directly affected by mining
operations;
PADCAL Operations
April 2013
Chapter 17 Page 99
▪ Alteration of original land configuration;
▪ Change of atmosphere and air quality in the immediate vicinities;
▪ Exploration of natural resources;
▪ Destruction and alteration of the habitats of wildlife;
▪ Reduction of water resources; and
▪ Displacement of some families living within the project area
Favorable Environmental Effects
• Increased dollar reserves and/or income of both the national and local
governments derived from taxes;
• Improvement and addition of roads, bridges, power lines, communication and
transport systems and other infrastructures;
• Increased and/or generation of employment;
• Improvement of lifestyles and standard of living of people in the communities;
• Increased literacy rate due to establishment of educational facilities;
• Promotion of small business and medium scale industries that usually co-exist
with mining operation of the project component;
• Improvement of water supply system sewerage facilities;
• Improvement of the health condition of the community and development of social
services like family planning, housing, education and recreational facilities; and
• Introduction and promotion of Company-assisted income generating projects to
help residents near the mining area to be self-reliant and self-manageable
communities.
17.5.4.2 Environmental Mitigating Measures
A summarized mitigating measures is outlined below. A more detailed discussion is found in
the Environmental Impact Statement in Annex D-1.
• The company continues to implement its reforestation and afforestation projects to
the areas affected by its mining operation. Slopes, roads and embankments will be
designed to minimize erosion and maintain aesthetic appeal of the mines.
• For the original program of Life of Mine (LOM) of until 2017, three (3) tailings
disposal system were originally built where affluent resulting from the processing of
copper ore were stored and being stored. Tailings Ponds No. 1 in Sitio Banget,
Barangay Ampucao, Itogon and Tailings Pond No 2 in Barangay Talnag, Itogon
PADCAL Operations
April 2013
Chapter 17 Page 100
were decommissioned on 1981 and 1992, respectively. Tailings Pond No. 3 started
impounding operation in 1992 in Barangay Balog, Itogon, some fifteen (15)
kilometers by road way from the community. However, due to the tail leakage
incident happened last August 1, 2012 at the latter Tailings Pond and in
consideration to the expanded mineable reserve of the project, Tailings Pond No. 4
is currently on its planning and design stage.
• The reforestation is thru Man and the Biosphere (MAB) tree planting program. The
company started implementation of the program since 1976 and more than million
trees in different varieties have been planted and thoroughly scattered within the
mine property.
• Mined-out areas will be backfilled and covered with top soil and shall be reforested
with fast growing trees before being abandoned.
• Adequate drainage network will be maintained to prevent water run-off from tailings
and positively control soil erosion.
17.5.4.3 Environmental Infrastructures
The following infrastructures are maintained and operated by Padcal to address some of the
environmental effects of its operations.
Tailings Storage Facilities (TSF)
These facilities are the most elaborate structures in any mining operation to contain the
waste minerals after milling and processing. Padcal has successfully operated and
decommissioned two TSF and now maintaining and operating its third. The facility contains
the tailings from the mill plant. Tailings are the byproduct of the milling process after the
valuable metals have been recovered. It is 35 percent solids and the rest water. In the
facilities’ containment area, the sediments settle while the water in the tailings along with
water flowing along the catchment area flows out of the penstocks or spillway. The
sediments remain and fill up the TSF.
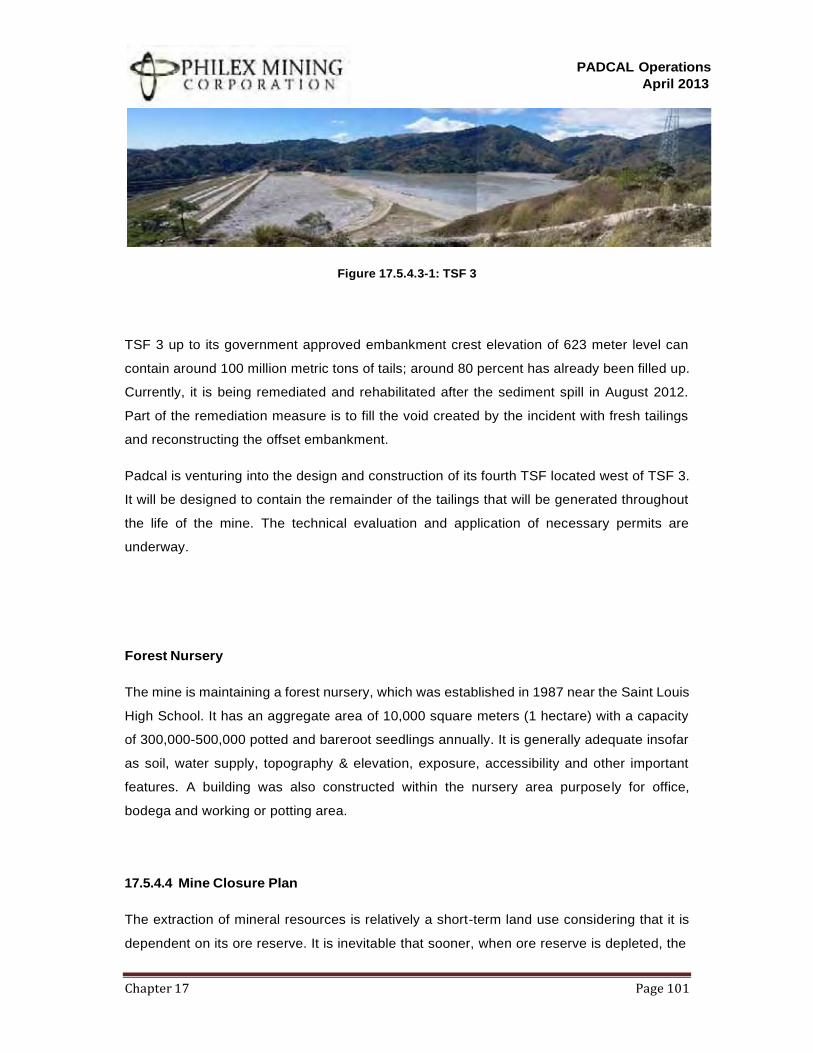
PADCAL Operations
April 2013
Chapter 17 Page 101
Figure 17.5.4.3-1: TSF 3
TSF 3 up to its government approved embankment crest elevation of 623 meter level can
contain around 100 million metric tons of tails; around 80 percent has already been filled up.
Currently, it is being remediated and rehabilitated after the sediment spill in August 2012.
Part of the remediation measure is to fill the void created by the incident with fresh tailings
and reconstructing the offset embankment.
Padcal is venturing into the design and construction of its fourth TSF located west of TSF 3.
It will be designed to contain the remainder of the tailings that will be generated throughout
the life of the mine. The technical evaluation and application of necessary permits are
underway.
Forest Nursery
The mine is maintaining a forest nursery, which was established in 1987 near the Saint Louis
High School. It has an aggregate area of 10,000 square meters (1 hectare) with a capacity
of 300,000-500,000 potted and bareroot seedlings annually. It is generally adequate insofar
as soil, water supply, topography & elevation, exposure, accessibility and other important
features. A building was also constructed within the nursery area purposely for office,
bodega and working or potting area.
17.5.4.4 Mine Closure Plan
The extraction of mineral resources is relatively a short-term land use considering that it is
dependent on its ore reserve. It is inevitable that sooner, when ore reserve is depleted, the

PADCAL Operations
April 2013
Chapter 17 Page 102
mine will definitely decommission. Philex Mining Corporation – Padcal Operations in Tuba,
Benguet, which remains one of the surviving mines in the country today, is no exception.
Philex – Padcal Operations is projected to be decommissioned originally by 2017 and for the
next ten years, rehabilitation of the mine shall be a prime activity.
Biophysical Closure Issues:
Public Safety and Human Health
The various phases of mine closure will carry different types and levels of risks to different
groups of people, which include the workers, contractors and community. From
decommissioning to post closure period, public safety and human health within the
community becomes the prime concern. The public should be protected from possible risks
and unsafe conditions.
Philex Mine’s vision is to develop and enhance the area in a manner that leaves all sites as
safe as possible. Part of the activities to be undertaken is to educate the community to
understand the safety hazards and potential environmental impacts of mine closure.
Philex will continue to commit to implement best management practices to identify,
communicate and minimize potential health and safety risks.
Environmental Impacts
Mining is an extractive industry which entails earthmoving consisting of underground
extraction and processing of ore materials and the subsequent containment of mine wastes
in designated tailings ponds, and backfilling of the overburden to the subsidence area.
Negative environmental effects include the disturbance of the ground and vegetation on
areas directly affected by the mining operations; alteration of original land configuration and
alteration of the wildlife habitats; and reduction of water resources.
Socio-Economic Closure Issues:
For the last five decades, Philex continues to contribute to the social and economic life not
only within the workers community but also for its host communities of Camp 3, Tuba and
Ampucao, Itogon. Local industries as well as folks from nearby barangays, trade their farm
products within the mine site and enjoy other benefits that flow from the mine such as for
social services, health and education.
PADCAL Operations
April 2013
Chapter 17 Page 103
It remains to be one of the main providers of direct and indirect employment in the area. As
the mine will start decommissioning, many sectors will be affected. Foremost are the
workforce, which will be reduced as production tapers down and consequently community
population follows. Residents from the host and neighboring communities relying on the
services and livelihood provided by the mine will also be affected. Thus, sustaining a
community after mine life shall be a major issue and will be part of the mine transition plan.
Philex is a major contributor of revenue to the Local Government Units from the barangay
level to the national level. Government revenues will be reduced, thus affecting its delivery of
services to its constituents.
Closure of the mine will also have an effect to industries relying on the existence of the mine
such as contractors, suppliers, shareholders and entrepreneurs.
Specific Implication for Mine Closure and Final Land Use per Component of Padcal
Projects
o Mine Component – Underground
Implication for Mine Closure (Situation at Closure)
• After the mine production ceases its operation, the ore resources will be sealed at the
surface and underground portals to prevent unauthorized access.
• After sealing the portals, the vertical shafts, Bumolo 2 and CHC tunnel will also be
sealed. The drainage tunnel at 745ML will be sealed last.
Final Land Use (Stakeholders Aspirations/Options for Closure)
Based on social audit conducted, majority of the stakeholders suggested that the portion of
the underground facilities be preserved and developed as a tourism destination.
o Mill Plant
Implications for Mine Closure (Situation at Closure)
When the processing of ore ceases, it is expected that decommissioning of the mill facilities
and equipment will commence. Part of the activities is to salvage its assets and this could be
PADCAL Operations
April 2013
Chapter 17 Page 104
through selling, dismantling and removing it. After decommissioning, rehabilitation follows to
make the area safe.
Final Land Use (Stakeholders Aspirations/Options for Closure)
The Local Government Units expects that some facilities will be donated to the municipality
for their projects. Other suggestions are to develop it into a commercial center such as
crushing plant for aggregates, tourism site and as a museum.
On the part of the community, majority suggested to use it as a commercial area to support
their livelihood undertaking. Suggestions to develop it as a tourism, education and training
center were noted.
o Tailings Pond 1
Implication for Mine Closure (Situation at Closure)
Progressive rehabilitation is on-going. The area is already covered with vegetation primarily
cogon grass and has been a productive grazing land. The five hectare bamboo plantation is
being maintained together with alnus trees. Revegetation of the area at the downstream of
the Mill Plant shall also commence.
Final Land Use (Stakeholders Aspirations/Options for Closure)
The LGU of Itogon suggested that the area be converted to agricultural land or pasture land
if its suitable. They also suggested to maintain the bamboo research as well as the mini-golf
area and continue reforesting it.
The community suggested to utilize the area for agricultural purposes, farming, pasture land
and for livestock raising.
o Tailings Pond 2
Implication for Mine Closure (Situation at Closure)
Revegetation is currently started. At mine closure, revegetation shall be sustained. Patches
not yet revegetated shall be planted with cogon and nitrogen fixing plant species.
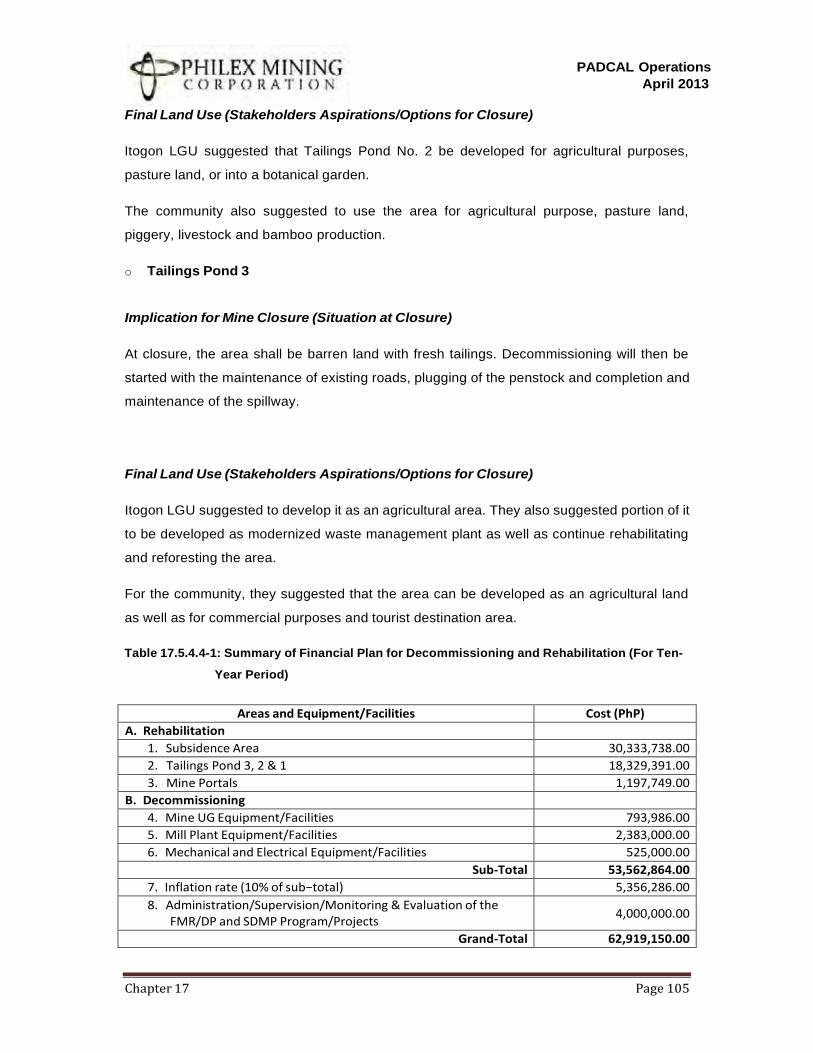
PADCAL Operations
April 2013
Chapter 17 Page 105
Final Land Use (Stakeholders Aspirations/Options for Closure)
Itogon LGU suggested that Tailings Pond No. 2 be developed for agricultural purposes,
pasture land, or into a botanical garden.
The community also suggested to use the area for agricultural purpose, pasture land,
piggery, livestock and bamboo production.
o Tailings Pond 3
Implication for Mine Closure (Situation at Closure)
At closure, the area shall be barren land with fresh tailings. Decommissioning will then be
started with the maintenance of existing roads, plugging of the penstock and completion and
maintenance of the spillway.
Final Land Use (Stakeholders Aspirations/Options for Closure)
Itogon LGU suggested to develop it as an agricultural area. They also suggested portion of it
to be developed as modernized waste management plant as well as continue rehabilitating
and reforesting the area.
For the community, they suggested that the area can be developed as an agricultural land
as well as for commercial purposes and tourist destination area.
Table 17.5.4.4-1: Summary of Financial Plan for Decommissioning and Rehabilitation (For Ten-
Year Period)
Areas and Equipment/Facilities Cost (PhP)
A. Rehabilitation
1. Subsidence Area 30,333,738.00
2. Tailings Pond 3, 2 & 1 18,329,391.00
3. Mine Portals 1,197,749.00
B. Decommissioning
4. Mine UG Equipment/Facilities 793,986.00
5. Mill Plant Equipment/Facilities 2,383,000.00
6. Mechanical and Electrical Equipment/Facilities 525,000.00
Sub-Total 53,562,864.00
7. Inflation rate (10% of sub−total) 5,356,286.00
8. Administration/Supervision/Monitoring & Evaluation of the FMR/DP and SDMP Program/Projects
4,000,000.00
Grand-Total 62,919,150.00
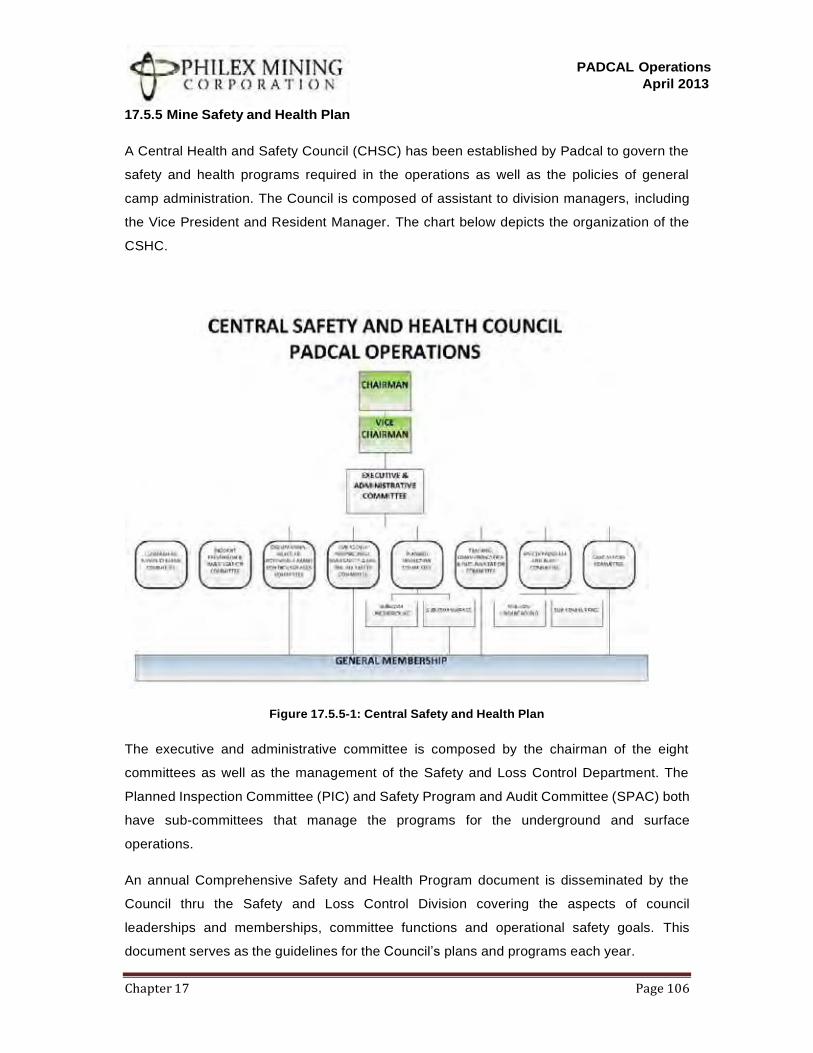
PADCAL Operations
April 2013
Chapter 17 Page 106
17.5.5 Mine Safety and Health Plan
A Central Health and Safety Council (CHSC) has been established by Padcal to govern the
safety and health programs required in the operations as well as the policies of general
camp administration. The Council is composed of assistant to division managers, including
the Vice President and Resident Manager. The chart below depicts the organization of the
CSHC.
Figure 17.5.5-1: Central Safety and Health Plan
The executive and administrative committee is composed by the chairman of the eight
committees as well as the management of the Safety and Loss Control Department. The
Planned Inspection Committee (PIC) and Safety Program and Audit Committee (SPAC) both
have sub-committees that manage the programs for the underground and surface
operations.
An annual Comprehensive Safety and Health Program document is disseminated by the
Council thru the Safety and Loss Control Division covering the aspects of council
leaderships and memberships, committee functions and operational safety goals. This
document serves as the guidelines for the Council’s plans and programs each year.
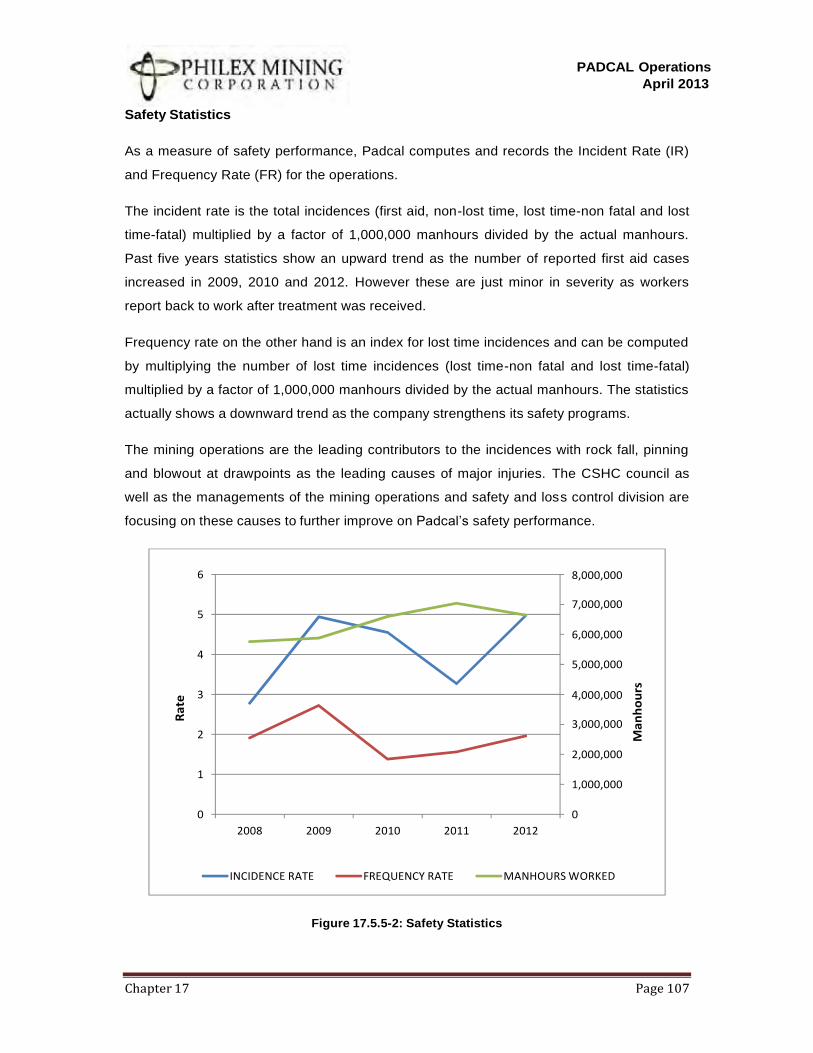
PADCAL Operations
April 2013
Chapter 17 Page 107
Safety Statistics
As a measure of safety performance, Padcal computes and records the Incident Rate (IR)
and Frequency Rate (FR) for the operations.
The incident rate is the total incidences (first aid, non-lost time, lost time-non fatal and lost
time-fatal) multiplied by a factor of 1,000,000 manhours divided by the actual manhours.
Past five years statistics show an upward trend as the number of reported first aid cases
increased in 2009, 2010 and 2012. However these are just minor in severity as workers
report back to work after treatment was received.
Frequency rate on the other hand is an index for lost time incidences and can be computed
by multiplying the number of lost time incidences (lost time-non fatal and lost time-fatal)
multiplied by a factor of 1,000,000 manhours divided by the actual manhours. The statistics
actually shows a downward trend as the company strengthens its safety programs.
The mining operations are the leading contributors to the incidences with rock fall, pinning
and blowout at drawpoints as the leading causes of major injuries. The CSHC council as
well as the managements of the mining operations and safety and loss control division are
focusing on these causes to further improve on Padcal’s safety performance.
Figure 17.5.5-2: Safety Statistics
6 8,000,000 7,000,000
5
6,000,000
4 5,000,000
3 4,000,000 3,000,000
2
2,000,000
1 1,000,000
0 0
2008 2009 2010 2011 2012
INCIDENCE RATE FREQUENCY RATE MANHOURS WORKED
Ra
te
Ma
nh
ou
rs
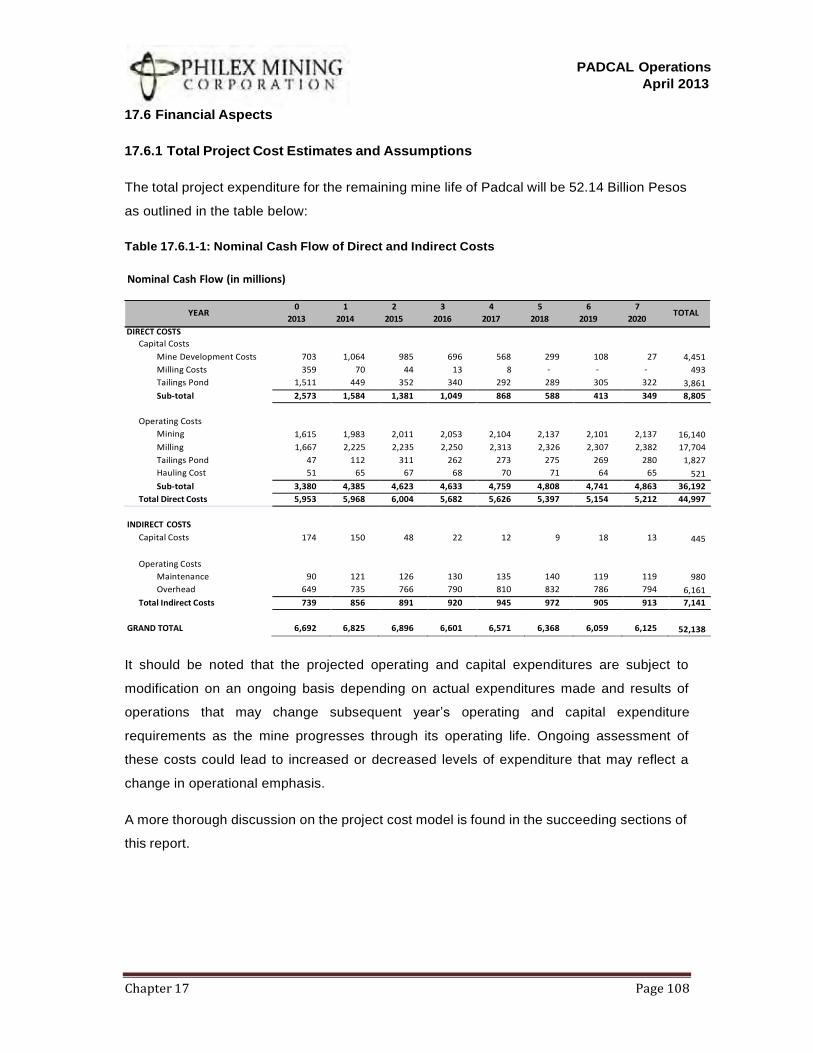
PADCAL Operations
April 2013
Chapter 17 Page 108
YEAR 0
2013
1
2014
2
2015
3
2016
4
2017
5
2018
6
2019
7
2020 TOTAL
17.6 Financial Aspects
17.6.1 Total Project Cost Estimates and Assumptions
The total project expenditure for the remaining mine life of Padcal will be 52.14 Billion Pesos
as outlined in the table below:
Table 17.6.1-1: Nominal Cash Flow of Direct and Indirect Costs
Nominal Cash Flow (in millions)
DIRECT COSTS
Capital Costs
Mine Development Costs
703
1,064
985
696
568
299
108
27
4,451
Milling Costs 359 70 44 13 8 − − −
493
Tailings Pond 1,511 449 352 340 292 289 305 322
3,861
Sub-total 2,573 1,584 1,381 1,049 868 588 413 349 8,805
Operating Costs
Mining
1,615
1,983
2,011
2,053
2,104
2,137
2,101
2,137
16,140
Milling 1,667 2,225 2,235 2,250 2,313 2,326 2,307 2,382
17,704
Tailings Pond 47 112 311 262 273 275 269 280
1,827
Hauling Cost 51 65 67 68 70 71 64 65
521
Sub-total 3,380 4,385 4,623 4,633 4,759 4,808 4,741 4,863 36,192
Total Direct Costs 5,953 5,968 6,004 5,682 5,626 5,397 5,154 5,212 44,997
INDIRECT COSTS
Capital Costs
174
150
48
22
12
9
18
13
445
Operating Costs
Maintenance
90
121
126
130
135
140
119
119
980
Overhead 649 735 766 790 810 832 786 794
6,161
Total Indirect Costs 739 856 891 920 945 972 905 913 7,141
GRAND TOTAL
6,692
6,825
6,896
6,601
6,571
6,368
6,059
6,125
52,138
It should be noted that the projected operating and capital expenditures are subject to
modification on an ongoing basis depending on actual expenditures made and results of
operations that may change subsequent year’s operating and capital expenditure
requirements as the mine progresses through its operating life. Ongoing assessment of
these costs could lead to increased or decreased levels of expenditure that may reflect a
change in operational emphasis.
A more thorough discussion on the project cost model is found in the succeeding sections of
this report.
PADCAL Operations
April 2013
Chapter 17 Page 109
17.6.1.1 Engineering Study Cost
Padcal operations do not require any further engineering studies to determine its feasibility.
Engineering aspects of the operations, mostly done by company personnel, are included in
the operating cost expenses.
Project engineering costs on the other hand are included in the project cost estimate which
is grouped under the capital costs. Major project of Padcal in the remaining mine life will be
the design and construction of Tailings Storage Facility 4.
17.6.1.2 Exploration/Development Cost
Exploration works are programmed annually to progress on the investigation of a number of
prospects in the vicinity of the operations site. Capitalizable exploration costs are reflected
under the account of the Corporate expenditure but the general and administrative expenses
on exploration related to Padcal are included in the general overhead of Padcal.
Development Cost Estimate
The continuing development of ore sources underground comprises 39 percent of the total
capital cost. Total amount of 3.51 Billion Pesos will be spent to commission 884 drawpoints
and to construct ventilation, dewatering and ore handling facilities to support the extraction of
ore in the span of 8 years.
Classification of Costs
The tabulation of development cost consists of the following details.
• Capital Project Costs are costs related to development related activities such as
major overhaul or refurbishment of equipment and systems used in mine
development as well as installation of service lines, particularly power from the
nearest existing source to the work area to be developed.
• Block Development Costs are costs of activities resulting to the commissioning of
drawpoints mostly done in the undercut and production levels. Activities include,
development of production, cross-cut and undercut lines, development of trench or
draw bells, installation of initial and final supports to openings and construction of ore
handling, ventilation and dewatering schemes at the production level.
• Level Development Costs are costs to develop the support facilities to be able to
extract and deliver the ore to the mill. Such facilities may include a breaker station
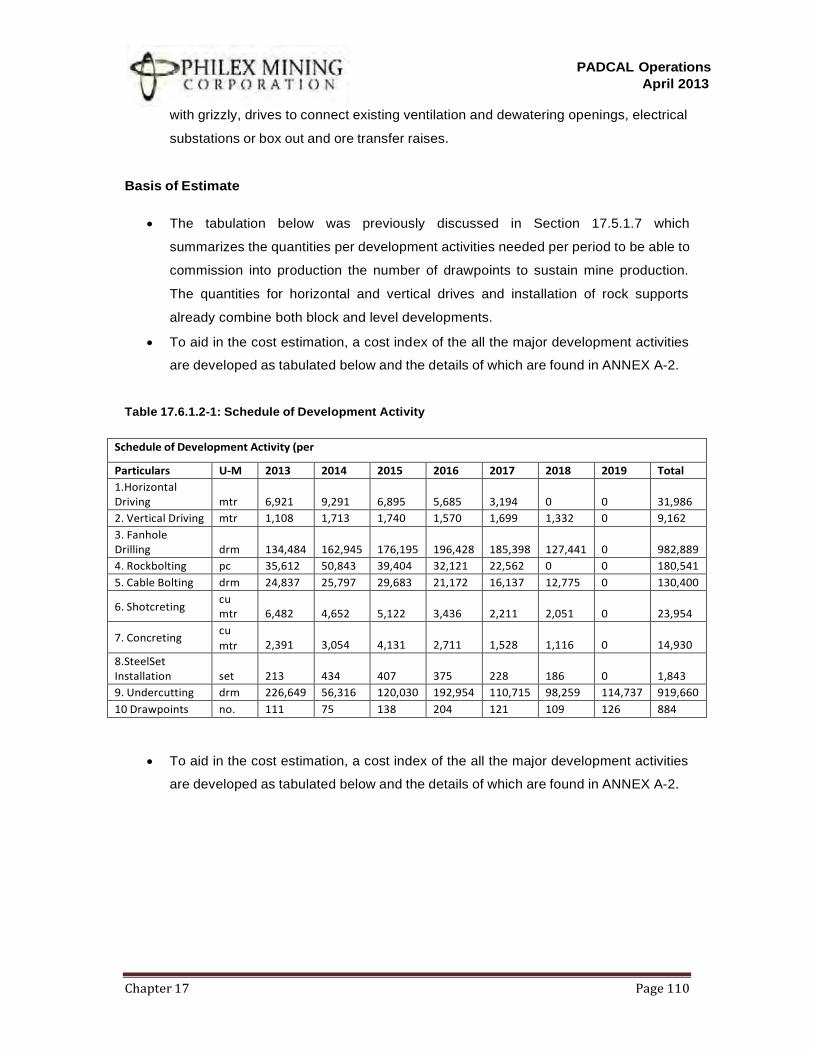
PADCAL Operations
April 2013
Chapter 17 Page 110
with grizzly, drives to connect existing ventilation and dewatering openings, electrical
substations or box out and ore transfer raises.
Basis of Estimate
• The tabulation below was previously discussed in Section 17.5.1.7 which
summarizes the quantities per development activities needed per period to be able to
commission into production the number of drawpoints to sustain mine production.
The quantities for horizontal and vertical drives and installation of rock supports
already combine both block and level developments.
• To aid in the cost estimation, a cost index of the all the major development activities
are developed as tabulated below and the details of which are found in ANNEX A-2.
Table 17.6.1.2-1: Schedule of Development Activity
Schedule of Development Activity (per
Particulars U-M 2013 2014 2015 2016 2017 2018 2019 Total
1.Horizontal Driving
mtr
6,921
9,291
6,895
5,685
3,194
0
0
31,986
2. Vertical Driving mtr 1,108 1,713 1,740 1,570 1,699 1,332 0 9,162
3. Fanhole Drilling
drm
134,484
162,945
176,195
196,428
185,398
127,441
0
982,889
4. Rockbolting pc 35,612 50,843 39,404 32,121 22,562 0 0 180,541
5. Cable Bolting drm 24,837 25,797 29,683 21,172 16,137 12,775 0 130,400
6. Shotcreting cu mtr
6,482
4,652
5,122
3,436
2,211
2,051
0
23,954
7. Concreting cu
mtr
2,391
3,054
4,131
2,711
1,528
1,116
0
14,930
8.SteelSet Installation
set
213
434
407
375
228
186
0
1,843
9. Undercutting drm 226,649 56,316 120,030 192,954 110,715 98,259 114,737 919,660
10 Drawpoints no. 111 75 138 204 121 109 126 884
• To aid in the cost estimation, a cost index of the all the major development activities
are developed as tabulated below and the details of which are found in ANNEX A-2.
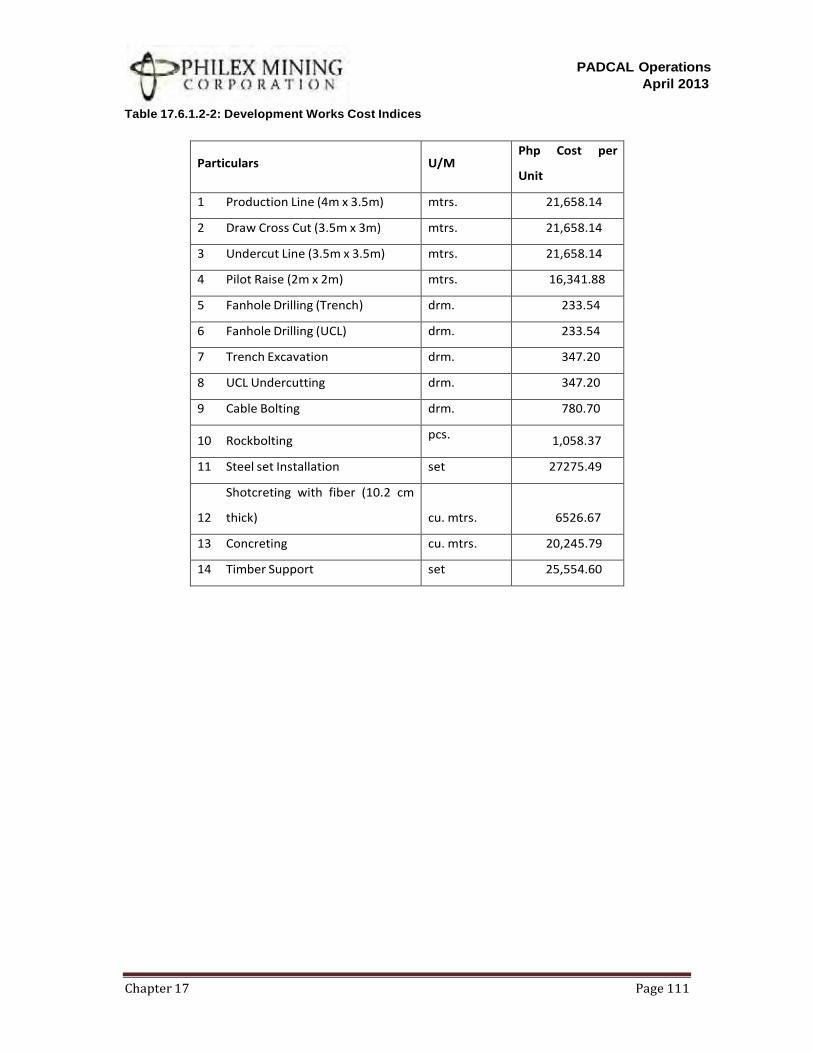
PADCAL Operations
April 2013
Chapter 17 Page 111
Table 17.6.1.2-2: Development Works Cost Indices
Particulars
U/M Php Cost per
Unit
1 Production Line (4m x 3.5m) mtrs. 21,658.14
2 Draw Cross Cut (3.5m x 3m) mtrs. 21,658.14
3 Undercut Line (3.5m x 3.5m) mtrs. 21,658.14
4 Pilot Raise (2m x 2m) mtrs. 16,341.88
5 Fanhole Drilling (Trench) drm. 233.54
6 Fanhole Drilling (UCL) drm. 233.54
7 Trench Excavation drm. 347.20
8 UCL Undercutting drm. 347.20
9 Cable Bolting drm. 780.70
10 Rockbolting pcs. 1,058.37
11 Steel set Installation set 27275.49
Shotcreting with fiber (10.2 cm
12 thick)
cu. mtrs.
6526.67
13 Concreting cu. mtrs. 20,245.79
14 Timber Support set 25,554.60
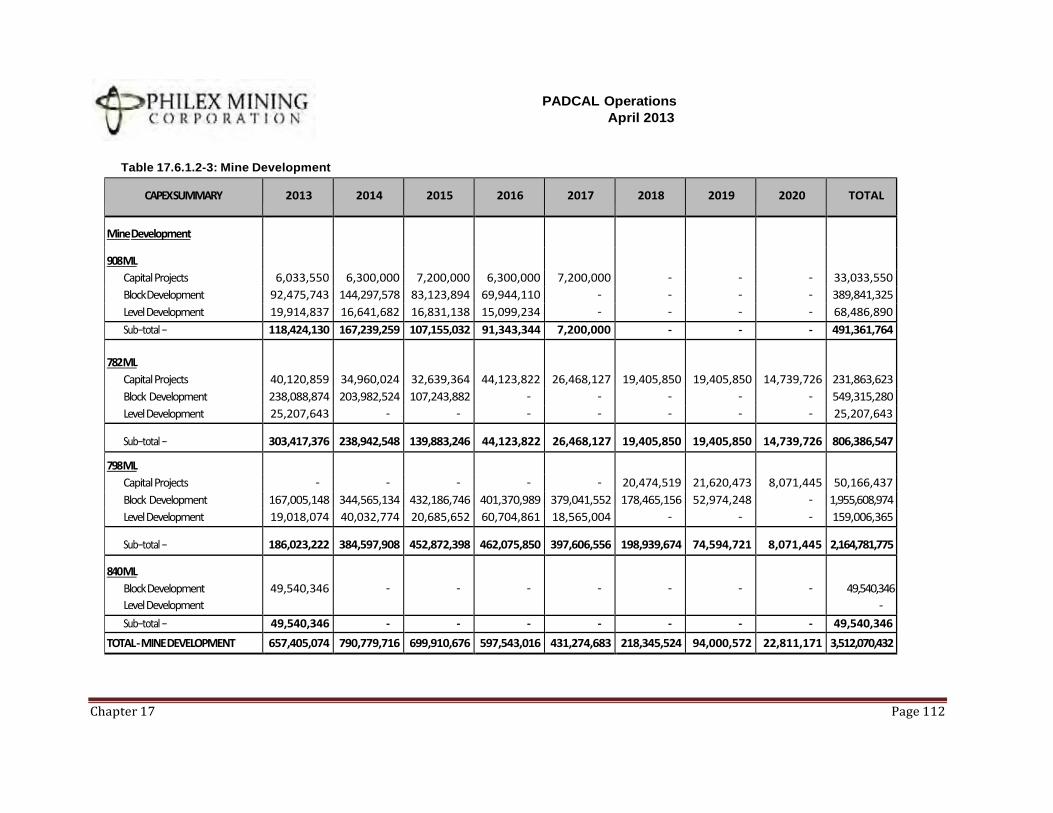
Table 17.6.1.2-3: Mine Development
PADCAL Operations
April 2013
CAPEX SUMMARY 2013 2014 2015 2016 2017 2018 2019 2020 TOTAL
Mine Development
908 ML
Capital Projects 6,033,550 6,300,000 7,200,000 6,300,000 7,200,000 − − − 33,033,550
Block Development 92,475,743 144,297,578 83,123,894 69,944,110 − − − − 389,841,325
Level Development 19,914,837 16,641,682 16,831,138 15,099,234 − − − − 68,486,890
Sub−total − 118,424,130 167,239,259 107,155,032 91,343,344 7,200,000 - - - 491,361,764
782 ML
Capital Projects 40,120,859 34,960,024 32,639,364 44,123,822 26,468,127 19,405,850 19,405,850 14,739,726 231,863,623
Block Development 238,088,874 203,982,524 107,243,882 − − − − − 549,315,280
Level Development 25,207,643 − − − − − − − 25,207,643
Sub−total − 303,417,376 238,942,548 139,883,246 44,123,822 26,468,127 19,405,850 19,405,850 14,739,726 806,386,547
798 ML
Capital Projects − − − − − 20,474,519 21,620,473 8,071,445 50,166,437
Block Development 167,005,148 344,565,134 432,186,746 401,370,989 379,041,552 178,465,156 52,974,248 − 1,955,608,974
Level Development 19,018,074 40,032,774 20,685,652 60,704,861 18,565,004 − − − 159,006,365
Sub−total − 186,023,222 384,597,908 452,872,398 462,075,850 397,606,556 198,939,674 74,594,721 8,071,445 2,164,781,775
840 ML
Block Development
Level Development
49,540,346
−
−
−
−
−
−
−
49,540,346
−
Sub−total − 49,540,346 - - - - - - - 49,540,346
TOTAL - MINE DEVELOPMENT 657,405,074 790,779,716 699,910,676 597,543,016 431,274,683 218,345,524 94,000,572 22,811,171 3,512,070,432
Chapter 17 Page 112
PADCAL Operations
April 2013
Chapter 17 Page 113
Basis of Cost Index
• Labor Cost This comprises the latest 2012 basic pay rates and the equivalent cash
and non-cash fringe benefits of all personnel in the roster of the mine development
from the miners (rank and files) up to supervisors. The number of men and their
respective rates were provided by the Human Resource Department.
• Contract Rates Two major development contractors are currently employed in the
mine. BB Fischer and Co. Inc (BBF) and Consolidated Explosives Group
Corporation (Conex) perform the horizontal development drives and fan hole drilling
using their own equipment and manpower. A fixed rate contract governs the
engagement between the contractors and Padcal,
• Materials and Supplies All materials and supplies costs are based on year 2012
price levels as recorded in Padcal’s purchasing system. Major supplies such as
explosives, diesel and major equipment parts are on consignment basis to Orica,
Petron and Sandvik respectively.
• Power The existing power rate of 6.78 Pesos per Kilowatt-hour was the basis for
power cost estimation. This contracted out yearly. For 2012, power supply is by
Tokyo Electric and Marubeni (TEAM) Energy Corporation.
• Productivity Equipment and manpower productivity are based on actual monitored
productivity for each development works as generated by the General Equipment
Advisory System (GEARS) and as monitored by mine engineering and mine
mechanical personnel.
17.6.1.3 Pre-Operating Overhead
The pre-operating overhead cost is not applicable in this technical report as the status of
Padcal is already operational.
17.6.1.4 Capital Equipment and Machinery
The Padcal mine capitalizes expenditures incurred that will benefit its operations for more
than one year. These assets are classified by the mine under the following categories: Land
and Land Improvements, Mine and Mining Properties (Mine and Mining Properties, Mine
Development and Tailings Pond Structures), Roads and Bridges, Buildings, Structures or
Facilities, Machinery and Equipment, Transportation Equipment, Tools, Office Equipment
and Furniture and Fixtures.
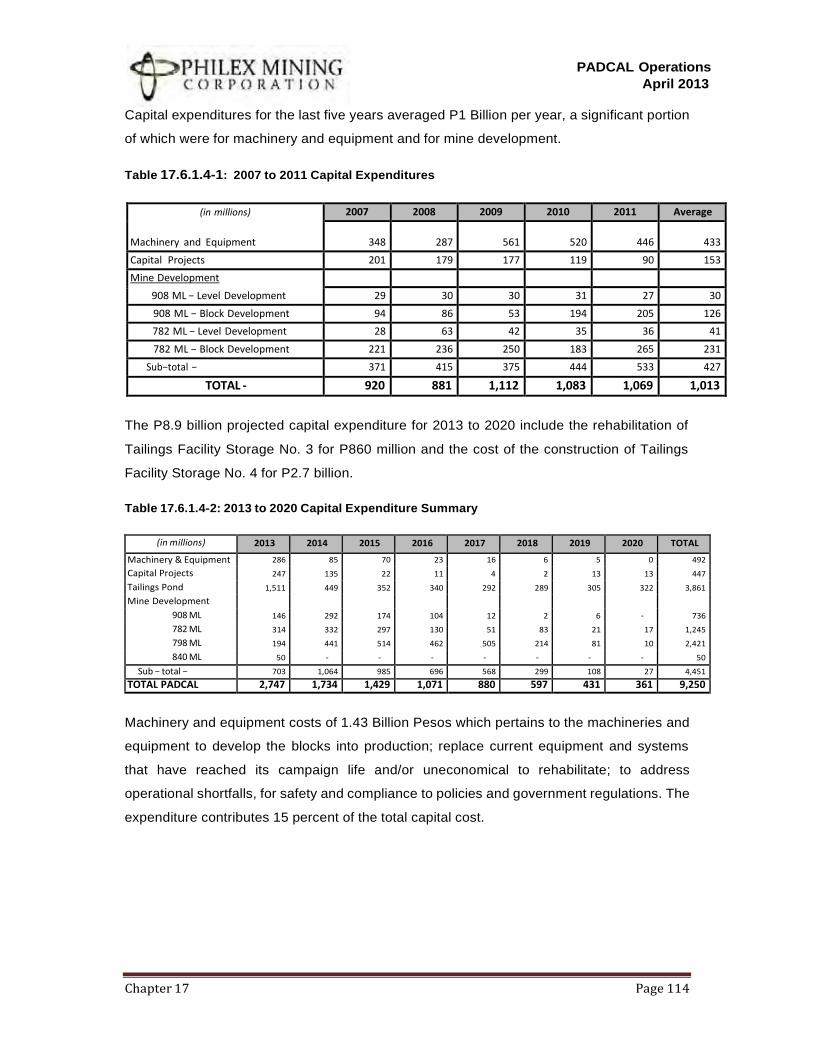
PADCAL Operations
April 2013
Chapter 17 Page 114
Capital expenditures for the last five years averaged P1 Billion per year, a significant portion
of which were for machinery and equipment and for mine development.
Table 17.6.1.4-1: 2007 to 2011 Capital Expenditures
(in millions)
Machinery and Equipment
2007 2008 2009 2010 2011 Average
348
287
561
520
446
433
Capital Projects 201 179 177 119 90 153
Mine Development
908 ML − Level Development
29 30 30 31 27 30
908 ML − Block Development 94 86 53 194 205 126
782 ML − Level Development 28 63 42 35 36 41
782 ML − Block Development 221 236 250 183 265 231
Sub−total − 371 415 375 444 533 427
TOTAL - 920 881 1,112 1,083 1,069 1,013
The P8.9 billion projected capital expenditure for 2013 to 2020 include the rehabilitation of
Tailings Facility Storage No. 3 for P860 million and the cost of the construction of Tailings
Facility Storage No. 4 for P2.7 billion.
Table 17.6.1.4-2: 2013 to 2020 Capital Expenditure Summary
(in millions) 2013 2014 2015 2016 2017 2018 2019 2020 TOTAL
Machinery & Equipment 286 85 70 23 16 6 5 0 492
Capital Projects 247 135 22 11 4 2 13 13 447
Tailings Pond 1,511 449 352 340 292 289 305 322 3,861
Mine Development
908 ML 146 292 174 104 12 2 6 − 736
782 ML 314 332 297 130 51 83 21 17 1,245
798 ML 194 441 514 462 505 214 81 10 2,421
840 ML 50 − − − − − − − 50
Sub − total − 703 1,064 985 696 568 299 108 27 4,451
TOTAL PADCAL 2,747 1,734 1,429 1,071 880 597 431 361 9,250
Machinery and equipment costs of 1.43 Billion Pesos which pertains to the machineries and
equipment to develop the blocks into production; replace current equipment and systems
that have reached its campaign life and/or uneconomical to rehabilitate; to address
operational shortfalls, for safety and compliance to policies and government regulations. The
expenditure contributes 15 percent of the total capital cost.
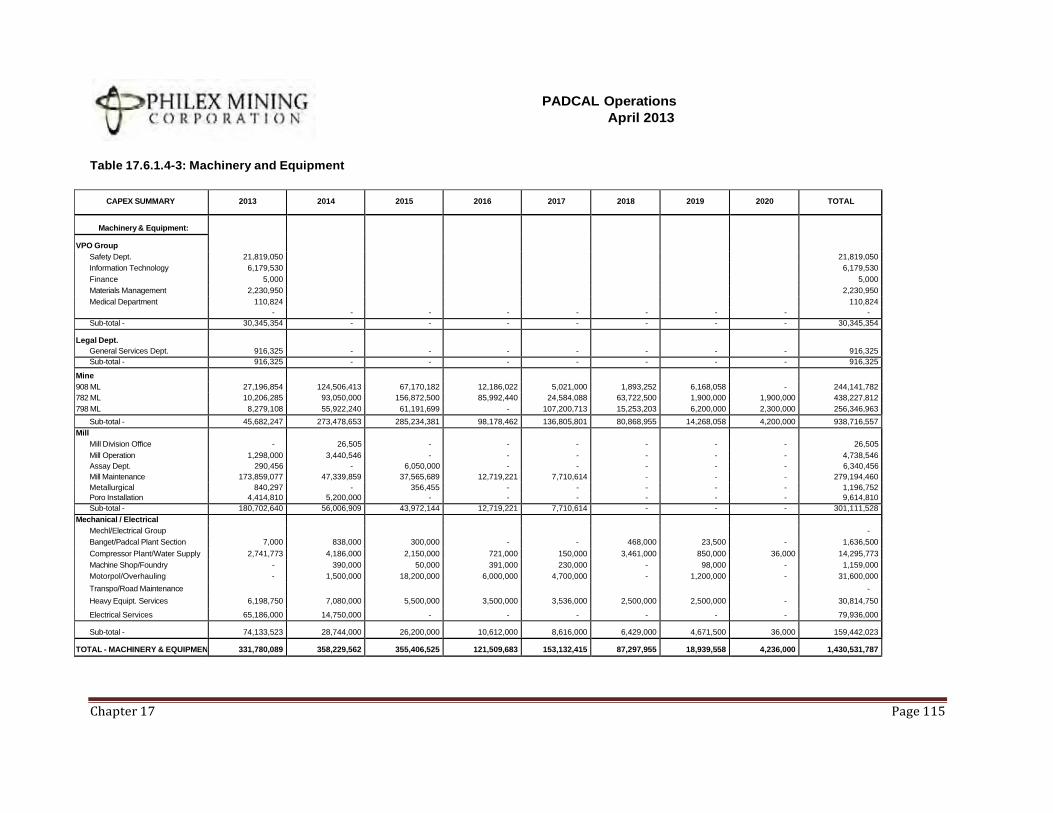
Table 17.6.1.4-3: Machinery and Equipment
PADCAL Operations
April 2013
CAPEX SUMMARY 2013 2014 2015 2016 2017 2018 2019 2020 TOTAL
Machinery & Equipment:
VPO Group
Safety Dept. 21,819,050 21,819,050
Information Technology 6,179,530 6,179,530
Finance 5,000 5,000
Materials Management 2,230,950 2,230,950
Medical Department 110,824 110,824
- - - - - - - - -
Sub-total - 30,345,354 - - - - - - - 30,345,354
Legal Dept.
General Services Dept.
916,325
-
-
-
-
-
-
-
916,325
Sub-total - 916,325 - - - - - - - 916,325
Mine
908 ML 27,196,854 124,506,413 67,170,182 12,186,022 5,021,000 1,893,252 6,168,058 - 244,141,782
782 ML 10,206,285 93,050,000 156,872,500 85,992,440 24,584,088 63,722,500 1,900,000 1,900,000 438,227,812
798 ML 8,279,108 55,922,240 61,191,699 - 107,200,713 15,253,203 6,200,000 2,300,000 256,346,963
Sub-total - 45,682,247 273,478,653 285,234,381 98,178,462 136,805,801 80,868,955 14,268,058 4,200,000 938,716,557
Mill
Mill Division Office - 26,505 - - - - - - 26,505
Mill Operation 1,298,000 3,440,546 - - - - - - 4,738,546
Assay Dept. 290,456 - 6,050,000 - - - - - 6,340,456
Mill Maintenance 173,859,077 47,339,859 37,565,689 12,719,221 7,710,614 - - - 279,194,460
Metallurgical 840,297 - 356,455 - - - - - 1,196,752
Poro Installation 4,414,810 5,200,000 - - - - - - 9,614,810
Sub-total - 180,702,640 56,006,909 43,972,144 12,719,221 7,710,614 - - - 301,111,528
Mechanical / Electrical
Mechl/Electrical Group -
Banget/Padcal Plant Section 7,000 838,000 300,000 - - 468,000 23,500 - 1,636,500
Compressor Plant/Water Supply 2,741,773 4,186,000 2,150,000 721,000 150,000 3,461,000 850,000 36,000 14,295,773
Machine Shop/Foundry - 390,000 50,000 391,000 230,000 - 98,000 - 1,159,000
Motorpol/Overhauling - 1,500,000 18,200,000 6,000,000 4,700,000 - 1,200,000 - 31,600,000
Transpo/Road Maintenance -
Heavy Equipt. Services 6,198,750 7,080,000 5,500,000 3,500,000 3,536,000 2,500,000 2,500,000 - 30,814,750
Electrical Services 65,186,000 14,750,000 - - - - - - 79,936,000
Sub-total - 74,133,523 28,744,000 26,200,000 10,612,000 8,616,000 6,429,000 4,671,500 36,000 159,442,023
TOTAL - MACHINERY & EQUIPMEN 331,780,089 358,229,562 355,406,525 121,509,683 153,132,415 87,297,955 18,939,558 4,236,000 1,430,531,787
Chapter 17 Page 115
Basis of Estimate - Quantity
PADCAL Operations
April 2013
• Mining machineries and equipment, which comprises majority of the cost, generally
assumed a 5 year or 10,000 running hours campaign life period. An allowance for
overhaul of the equipment’s major parts was considered also to extend the life for
another 2 years.
• Additional work loads, such as the development of the new 798 meter level would
require a dedicated development fleet compliment to drive accesses and the
production and undercut lines without disrupting ongoing development activities at
908 and 782 production levels.
• With the scheduled commissioning of 798 meter level, new dumping points would be
constructed thus requiring new stationary rock breakers.
• The mill would replace one of its flotation cells and two of its primary crushers to
further increase the efficiency of the recovery of metals and address the expected
coarser fragmentation of the new mining level that will be commission, respectively.
• All other machinery and equipment is changed based on the anticipated replacement
schedule.
Basis of Estimate - Price
• The operations have established the machineries and equipment specifications
preferred through the experience it acquired throughout its operating life.
• Padcal has established a good partnership with leading machineries and equipment
suppliers and would likely choose the existing brands and models that best fit its
existing fleet.
• Padcal constantly bench marks in terms of cost and efficiency with other peer
industry on the best machinery and equipment available in the market.
• Projected prices are based on most recent price levels which are at most 12 months
old before the onset of the annual budget.
17.6.1.5 Allied Mine Facilities and Infrastructures
Capital projects are works pertaining to construction, replacement or improvement of support
facilities and infrastructures for other departments not belonging to the mine and mill
operations. The total cost for the remaining life of mine for capital projects is 4.31 Billion
Pesos.
Chapter 17 Page 116
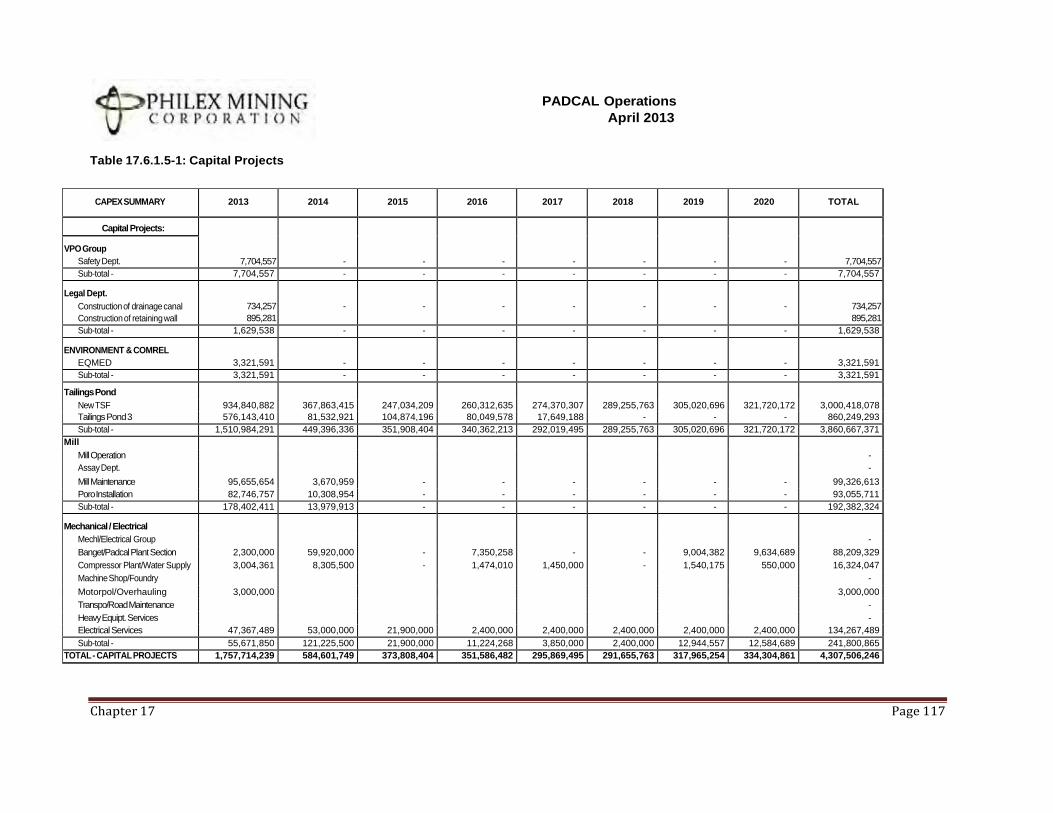
Table 17.6.1.5-1: Capital Projects
PADCAL Operations
April 2013
CAPEX SUMMARY 2013 2014 2015 2016 2017 2018 2019 2020 TOTAL
Capital Projects:
7,704,557
-
-
-
-
-
-
-
7,704,557
VPO Group
Safety Dept.
Sub-total - 7,704,557 - - - - - - - 7,704,557
Legal Dept.
Construction of drainage canal
Construction of retaining wall
734,257
895,281
-
-
-
-
-
-
-
734,257
895,281
Sub-total - 1,629,538 - - - - - - - 1,629,538
ENVIRONMENT & COMREL
EQMED
3,321,591
-
-
-
-
-
-
-
3,321,591
Sub-total - 3,321,591 - - - - - - - 3,321,591
Tailings Pond
New TSF 934,840,882 367,863,415 247,034,209 260,312,635 274,370,307 289,255,763 305,020,696 321,720,172 3,000,418,078
Tailings Pond 3 576,143,410 81,532,921 104,874,196 80,049,578 17,649,188 - - - 860,249,293
Sub-total - 1,510,984,291 449,396,336 351,908,404 340,362,213 292,019,495 289,255,763 305,020,696 321,720,172 3,860,667,371
Mill
Mill Operation -
Assay Dept. -
Mill Maintenance 95,655,654 3,670,959 - - - - - - 99,326,613
Poro Installation 82,746,757 10,308,954 - - - - - - 93,055,711
Sub-total - 178,402,411 13,979,913 - - - - - - 192,382,324
Mechanical / Electrical
Mechl/Electrical Group -
Banget/Padcal Plant Section 2,300,000 59,920,000 - 7,350,258 - - 9,004,382 9,634,689 88,209,329
Compressor Plant/Water Supply 3,004,361 8,305,500 - 1,474,010 1,450,000 - 1,540,175 550,000 16,324,047
Machine Shop/Foundry -
Motorpol/Overhauling 3,000,000 3,000,000
Transpo/Road Maintenance -
Heavy Equipt. Services -
Electrical Services 47,367,489 53,000,000 21,900,000 2,400,000 2,400,000 2,400,000 2,400,000 2,400,000 134,267,489
Sub-total - 55,671,850 121,225,500 21,900,000 11,224,268 3,850,000 2,400,000 12,944,557 12,584,689 241,800,865
TOTAL - CAPITAL PROJECTS 1,757,714,239 584,601,749 373,808,404 351,586,482 295,869,495 291,655,763 317,965,254 334,304,861 4,307,506,246
Chapter 17 Page 117
PADCAL Operations
April 2013
Chapter 17 Page 118
17.6.1.5.1 Tailings Storage Facilities (TSF)
The remediation and rehabilitation of TSF 3 and the design and construction of TSF 4 entails
a capital cost of 3.86 Billion Pesos which is 42 percent of the entire capital cost.
Tailings Storage Facility 3
Padcal began construction of TSF 3 in the 80’s after receipt of a construction permit from
National Pollution Control Commission (NPCC). It is composed initially of a 160 meter high
embankment, two three-compartment penstocks that drain into two decant tunnels,
construction culvert, tailings line and cyclone. Tailing deposition started early 90’s and up to
recently was the operational TSF for Padcal.
In August 1, 2012, during an unprecedented heavy storm event, TSF 3 discharged
sediments to the Balog Creek and Agno River. It was suspected that the discharge was
caused by an opening created in between the stop logs in one of its penstock. MGB
reported that around 20 million tons of sediments were released downstream right after the
incident.
Immediately, Philex, in its own accord stopped operation and began remediating the
situation. It took a number of attempts to stop the discharge and finally around the third
week of September 2012, it was confirmed that penstock was plugged by a nine-meter
diameter concrete sphere. Right then, the connecting tunnel to the penstock was closed by
constructing a 60 meter concrete bulkhead.
Up to now, remediation is still underway and the costs of the remediation and rehabilitation
programs are reflected in this technical and financial analysis. The total cost of the
programs amounts to 0.86 Billion Pesos which are composed of the following major
activities.
• Construction of an operating spillway to replace the penstock system to discharge
decant water amounting to 446 Million Pesos. The spillway has a final width of 32
meters and divided into three chutes. The ready mixed concrete provided by Holcim
Philippines Inc. is the biggest cost for this activity.
• Reinstating the offset dike up to the approved crest elevation of 623 meter level will
involve backfilling and compacting 400,000 cubic meters of materials. The activity is
currently being contracted out to a local contractor. The cost upon completion is
estimated to be 155 Million Pesos.
PADCAL Operations
April 2013
Chapter 17 Page 119
• During the early remediation works, Padcal has tapped several consultants to stop
further discharges. International experts in TSF were brought to the site to
recommend action plans. After the incident has been addressed, consultancy works
were moved forward in aspects of spillway design, embankment stability analysis and
an overall independent assessment of the reusability of the TSF. Golder Associates
in various Australian offices and Snowy Mountain Engineering Company (SMEC)
were engaged by Padcal. The cost of all consultancy works will amount to 81 Million
Pesos.
• The concrete block that finally sealed the tunnel connecting to the failed penstock
cost 70 Million PHP. Concrete was introduced from a hole drilled from the surface to
create an initial plug of 15 meters. Thereafter concrete was pumped from the portal
around 600 meters away to the pour site using a long distance capacity concrete
pump. Materials and supply costs and logistics were big cost items.
• The geotechnical investigation to confirm that the embankment is stable cost 36
Million Pesos. This entailed purchasing of stability systems and installing them in the
embankment using a highly specialized drilling methodology that does not use water.
Quest Exploration Drilling Company (QED) was tapped to undertake the drilling.
• Lastly, filling the void with fresh tailings will require additional pipelines to be able to
discharge directly to the void. The piping system cost 22 Million Pesos.
Upon completion of all these programs, Padcal is confident that all technical risks are
mitigated and that the TSF 3 is safe to be used again up to its permitted elevation.
Tailings Storage Facility 4
TSF 3 cannot contain all the tailings from the remaining 8 years of operation, thus a
requirement for another TSF to be constructed. A probable location is found west of TSF 3,
along the Sidweng valley. It is currently being investigated by Padcal thru its consultant
Coffey Mining Pty Ltd. under an Engineering and Construction Management (ECM)
agreement. The following works has been completed as part of the site investigation
• Field geotechnical and hydrological testing
• Seismic study by Geotecnica Philippines Inc.
• Aerial photograph and raw topographic map at 1 meter interval
PADCAL Operations
April 2013
Chapter 17 Page 120
Centerline Construction Method of Embankment
The tails from mill will be conveyed down to 745ML plant and is pump up to the proposed
TSF area. From the pump station, the tails will pass thru a cyclone process. The underflow
of which will be conveyed
to the downstream of the starter embankment and will be allowed to consolidate and will
soon serve as foundation of the subsequent offset dikes starting from the rock toe wall up to
its designed final crest elevation. At same time, the overflow will be deposited through
movable spigots to provide even deposition of tails along the embankment onwards.
A 6.0 meter by 3.0 meter size diversion channel is proposed to be constructed at the upper
slope of the proposed TSF area to handle run-off water from the watershed catchment’s
area along 920 ML. A coffer dam would be built to handle silt from the tributaries. A 2.0
meter by 1.5 meter size of runoff drain conduit will be constructed to handle the stream and
allow dry surface for the construction of the starter dam. The drain conduit will be plugged
before the start of tails deposition.
The starter dam shall be constructed simultaneously and be raised from 640 up to 840ML.
The starter dam is estimated to handle a year life. Embankment material is proposed to be
partly sourced out at the side slope within the reservoir which will result a wider containment
and minimizing hauling cost. The embankment will continually be raised up to 900ML as the
final crest elevation by centerline construction method. Tail water shall be stored at the
reservoir at a longer time to allow settlements before discharging to the environment through
siphon and or will be pump out through a pump installed to a floating pontoon that will
discharge to the environment.
The tabulation below shows the estimated tails to be impounded at the TSF is around 27.32
million cubic meters. The TSF embankment’s crest is at 900 ML and a 5-meter free board
will be maintained. A tails specific gravity of 1.5 will result to a 40.97 M tons holding capacity
which can contain 5-years worth of tailings for the 9 million tons per annum milling
operations.
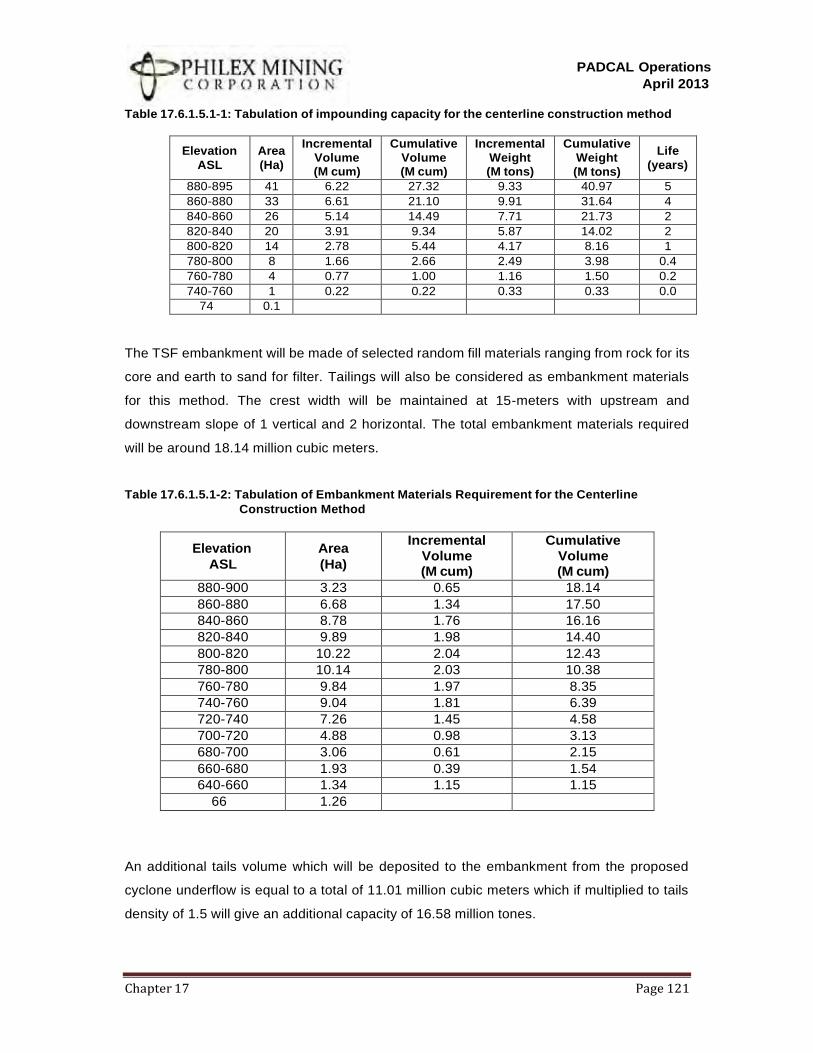
PADCAL Operations
April 2013
Chapter 17 Page 121
Table 17.6.1.5.1-1: Tabulation of impounding capacity for the centerline construction method
Elevation
ASL
Area
(Ha)
Incremental
Volume (M cum)
Cumulative
Volume (M cum)
Incremental
Weight (M tons)
Cumulative
Weight
(M tons)
Life
(years)
880-895 41 6.22 27.32 9.33 40.97 5
860-880 33 6.61 21.10 9.91 31.64 4
840-860 26 5.14 14.49 7.71 21.73 2
820-840 20 3.91 9.34 5.87 14.02 2
800-820 14 2.78 5.44 4.17 8.16 1
780-800 8 1.66 2.66 2.49 3.98 0.4
760-780 4 0.77 1.00 1.16 1.50 0.2
740-760 1 0.22 0.22 0.33 0.33 0.0
74 0.1
The TSF embankment will be made of selected random fill materials ranging from rock for its
core and earth to sand for filter. Tailings will also be considered as embankment materials
for this method. The crest width will be maintained at 15-meters with upstream and
downstream slope of 1 vertical and 2 horizontal. The total embankment materials required
will be around 18.14 million cubic meters.
Table 17.6.1.5.1-2: Tabulation of Embankment Materials Requirement for the Centerline
Construction Method
Elevation
ASL
Area
(Ha)
Incremental
Volume (M cum)
Cumulative
Volume (M cum)
880-900 3.23 0.65 18.14
860-880 6.68 1.34 17.50
840-860 8.78 1.76 16.16
820-840 9.89 1.98 14.40
800-820 10.22 2.04 12.43
780-800 10.14 2.03 10.38
760-780 9.84 1.97 8.35
740-760 9.04 1.81 6.39
720-740 7.26 1.45 4.58
700-720 4.88 0.98 3.13
680-700 3.06 0.61 2.15
660-680 1.93 0.39 1.54
640-660 1.34 1.15 1.15
66 1.26
An additional tails volume which will be deposited to the embankment from the proposed
cyclone underflow is equal to a total of 11.01 million cubic meters which if multiplied to tails
density of 1.5 will give an additional capacity of 16.58 million tones.
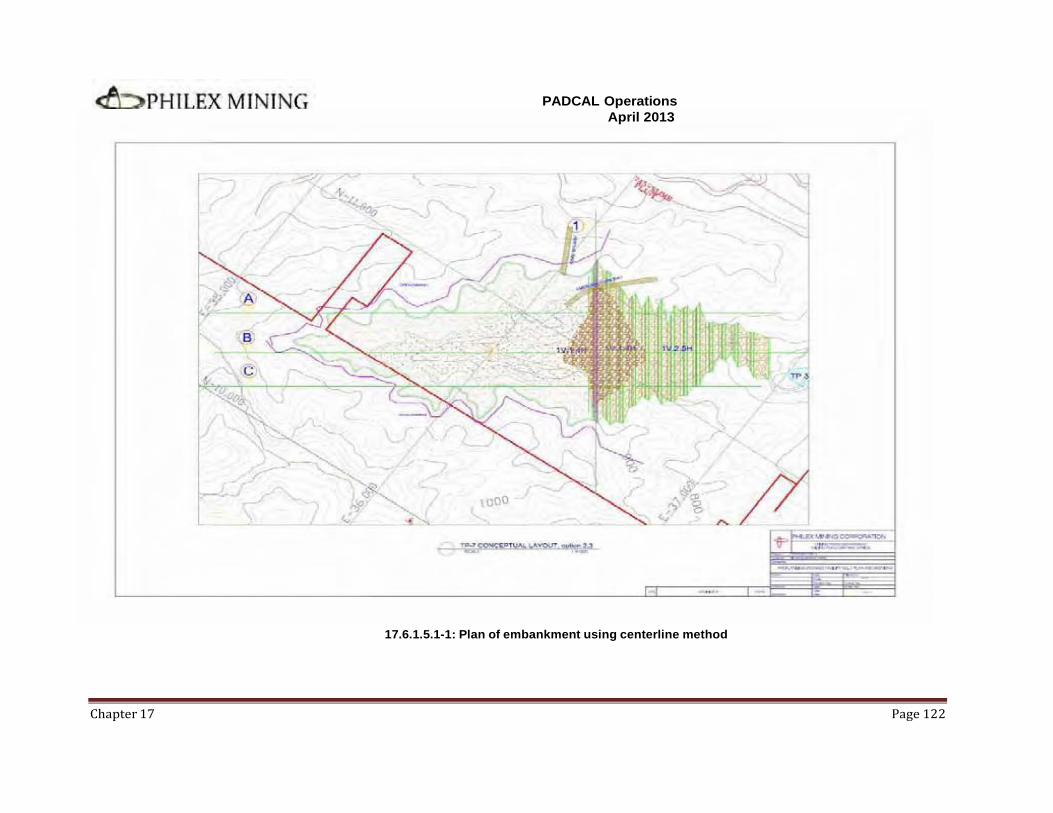
PADCAL Operations
Chapter 17 Page 122
April 2013
17.6.1.5.1-1: Plan of embankment using centerline method
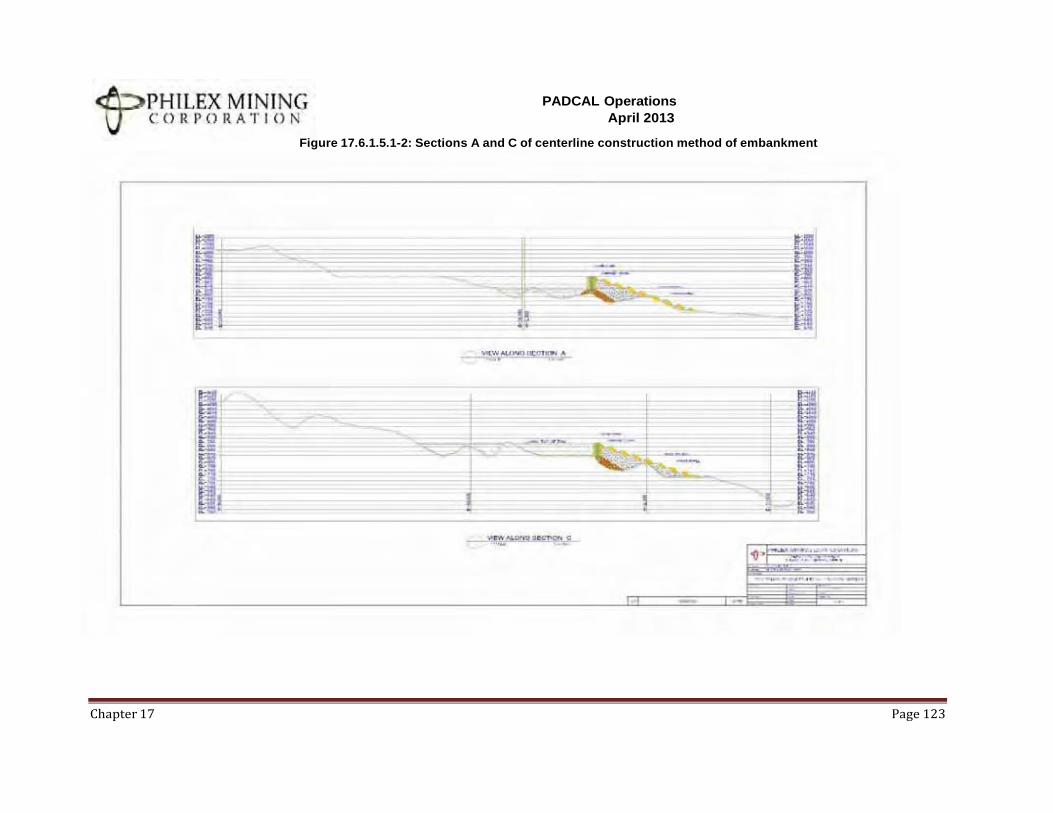
PADCAL Operations
April 2013
Chapter 17 Page 123
Figure 17.6.1.5.1-2: Sections A and C of centerline construction method of embankment
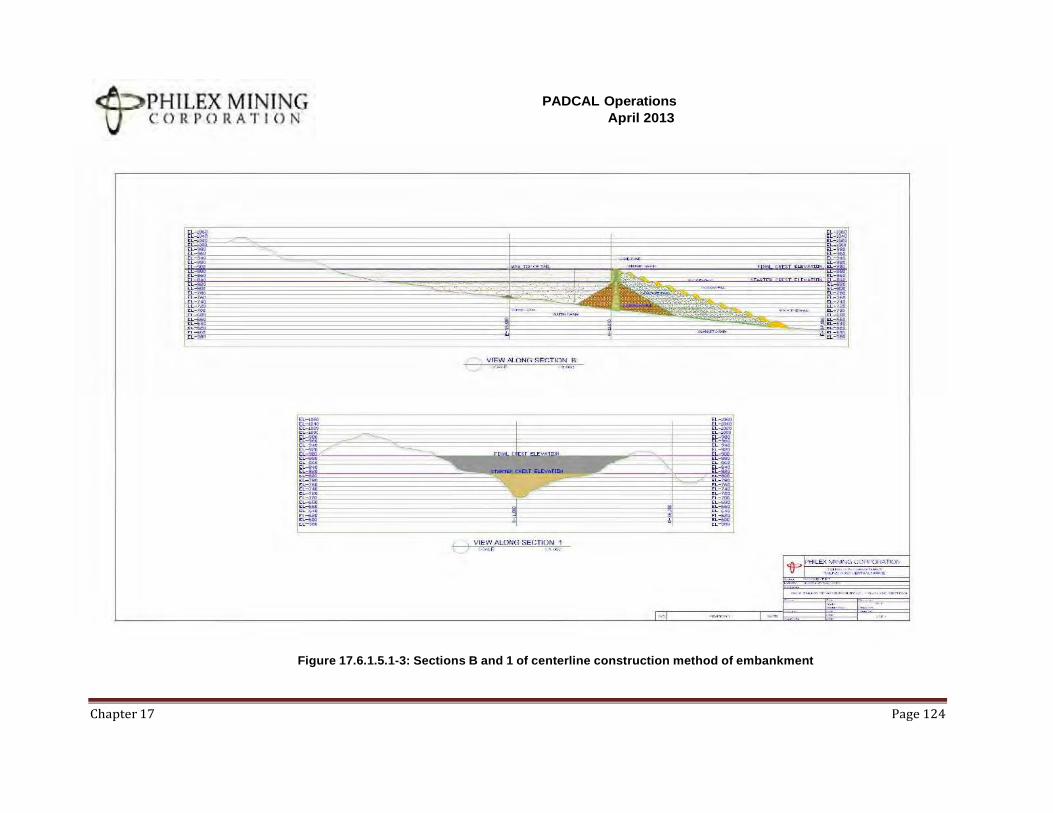
PADCAL Operations
April 2013
Chapter 17 Page 124
Figure 17.6.1.5.1-3: Sections B and 1 of centerline construction method of embankment
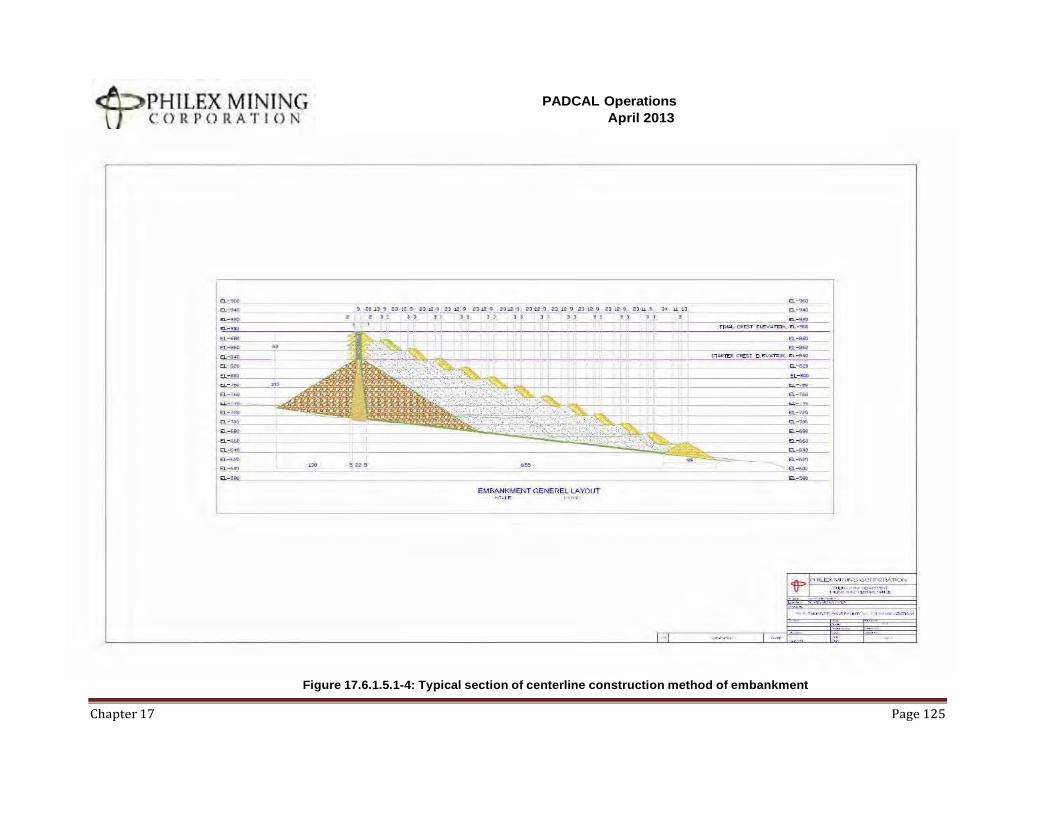
PADCAL Operations
April 2013
Chapter 17 Page 125
Figure 17.6.1.5.1-4: Typical section of centerline construction method of embankment
PADCAL Operations
April 2013
Chapter 17 Page 126
Hydrologic Considerations
The proposed TSF is located at the Sidweng/Banao area with watershed area of
approximately 1.69 square kilometers. The reservoir is mostly within the tenement area and
generally covered with forest growth. In the absence of a formal hydrologic report,
conceptual design of drainage structures are based on assumed parameters, rule of thumb
and manipulation using empirical formulas.
• Crest design: W = 1.1 H ½
o W is the crest width of dam, in meters
o H is the height of the dam in meters
• Inflow design flood for water drainage structures
o Return period = y in years, evaluated using the range of 5 to 1,000
o Meyers constants
▪ a = 143.38 y 0.2864
▪ b = 19.772 y 0.2249
• Time of concentration using Kraven’s Formula: TK = LH/W
o TK is the time of concentration in seconds
o LH is the horizontal distance from remote point in the watershed in meters
o W is a coefficient = 3.5 for I = or > 0.1
o I = H/LH
o H is the difference in elevation between remote point and the spillway
intake in meters
• Time of concentration using Nakayasu’s Formula: TN = 0.27LS0.7
o TN is the time of concentration in hours
o LS is the inclined distance from remote point in the watershed to the
spillway intake in kilometers
o LS = (LH2 + H2)1/2
o The values of LH and H are the same in Kraven’s formula
• Rainfall intensity: i =a / (T +b)
o i is the rainfall intensity in inches per hour
o a and b are Meyer’s constants
o T is the time of concentration
• Runoff [Q] for various flood returns: Q = 0.278 CiA
o Q is the peak flow rate in cubic meter per second
PADCAL Operations
April 2013
Chapter 17 Page 127
o C is a coefficient = 1
o i is the rainfall intensity in inches per hour
o A is the drainage or catchment area in square kilometers
o Plus Q of tail water =0.38 cum/sec
• Diversion channel discharge capacity using Manning’s formula:
Q = 4.43 a [{(H+L sin A)/{(19.58n2L)/(1+Kc+r4/3)}]1/2
o Q is the discharge rate in cubic meter per second
o a is the cross sectional area of the conduit in square meters
o H is the head measured from the water surface to the bottom of the
opening in meters
o L is the length of the channel in meters
o sin A is the difference in elevation between tunnel inlet floor and outlet
floor divided by length of the tunnel in meters
o D is the height of the tunnel in meters
o Kc is the entrance loss coefficient = 0.70
o n is Manning’s friction factor = 0.013
o r =a/p is the hydraulic radius in meter
o p is the wetted perimeter in meters
o d is the difference in elevation between channel inlet and channel outlet
floor
o W is the width of the tunnel in meters
Using the relationships above, a diversion channel with dimensions 6 meters wide and 3
meters high is proposed to be constructed to handle the water discharges during the TSF’s
construction period.
An emergency spillway will also be provided for the starter dam to handle excess water that
the pump on pontoon inadequately handles and to take care of excess run-off. A final
spillway will be designed to handle runoff after the TSF life.
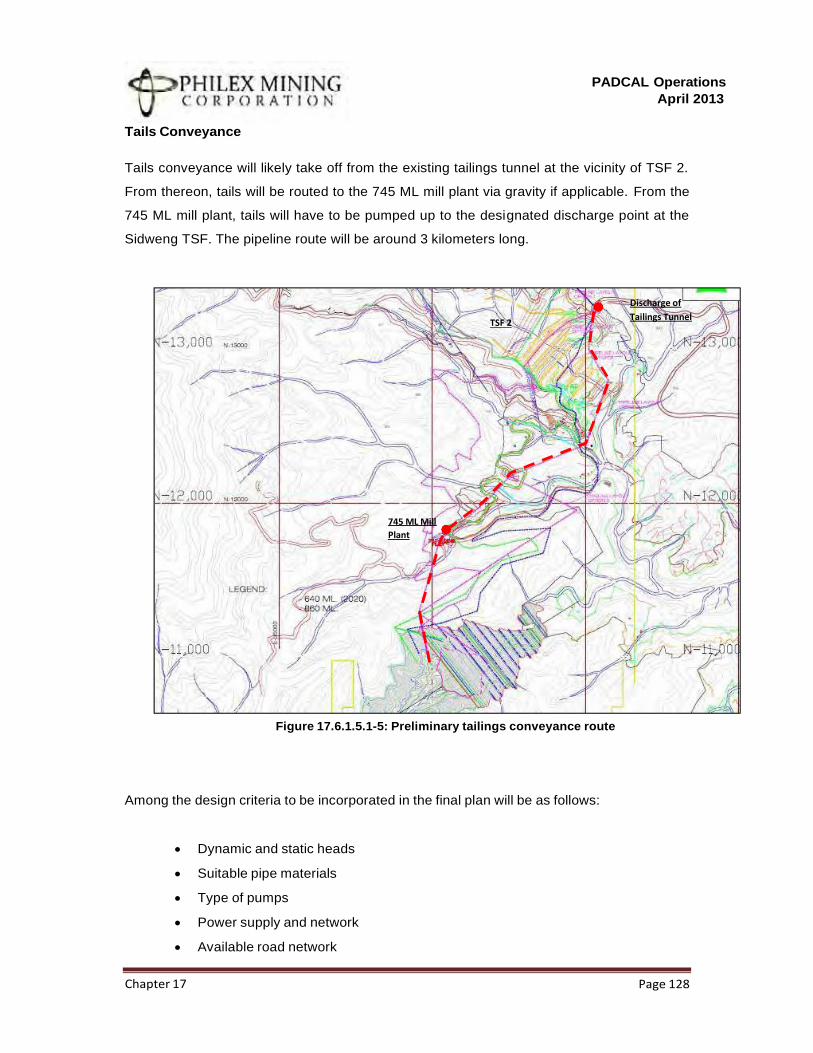
PADCAL Operations
April 2013
Chapter 17 Page 128
Discharge of
TSF 2 Tailings Tunnel
745 ML Mill
Plant
Tails Conveyance
Tails conveyance will likely take off from the existing tailings tunnel at the vicinity of TSF 2.
From thereon, tails will be routed to the 745 ML mill plant via gravity if applicable. From the
745 ML mill plant, tails will have to be pumped up to the designated discharge point at the
Sidweng TSF. The pipeline route will be around 3 kilometers long.
Figure 17.6.1.5.1-5: Preliminary tailings conveyance route
Among the design criteria to be incorporated in the final plan will be as follows:
• Dynamic and static heads
• Suitable pipe materials
• Type of pumps
• Power supply and network
• Available road network
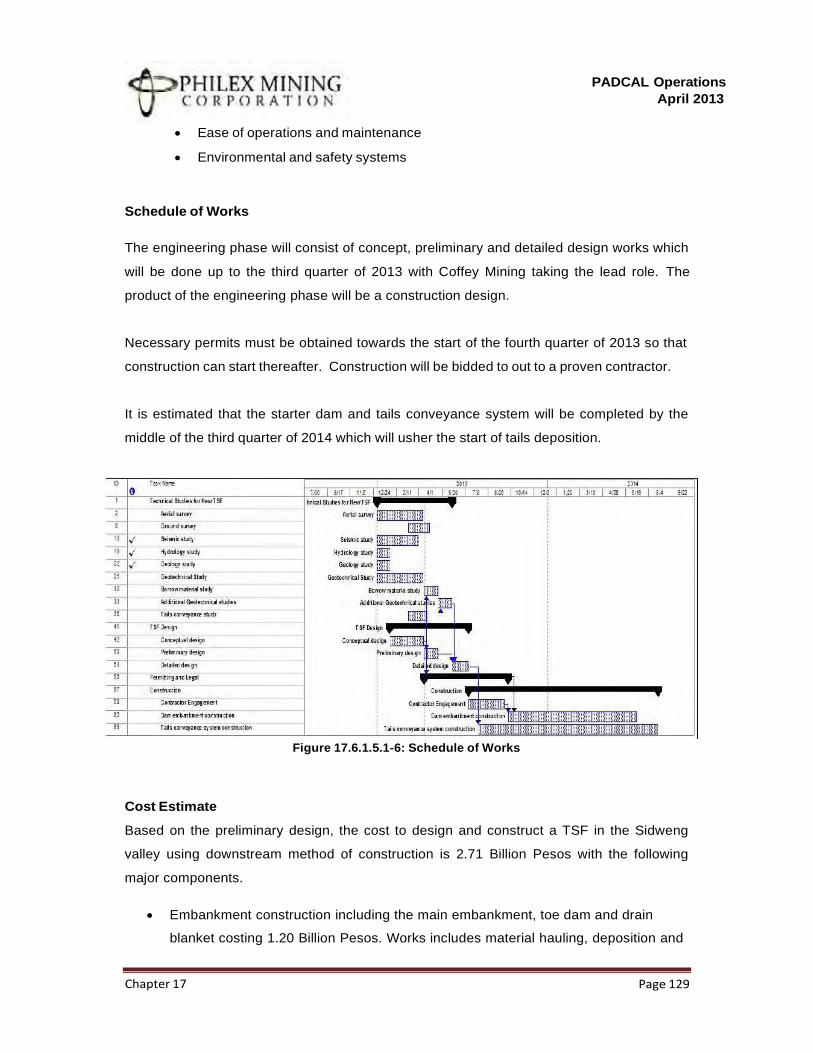
PADCAL Operations
April 2013
Chapter 17 Page 129
• Ease of operations and maintenance
• Environmental and safety systems
Schedule of Works
The engineering phase will consist of concept, preliminary and detailed design works which
will be done up to the third quarter of 2013 with Coffey Mining taking the lead role. The
product of the engineering phase will be a construction design.
Necessary permits must be obtained towards the start of the fourth quarter of 2013 so that
construction can start thereafter. Construction will be bidded to out to a proven contractor.
It is estimated that the starter dam and tails conveyance system will be completed by the
middle of the third quarter of 2014 which will usher the start of tails deposition.
Figure 17.6.1.5.1-6: Schedule of Works
Cost Estimate
Based on the preliminary design, the cost to design and construct a TSF in the Sidweng
valley using downstream method of construction is 2.71 Billion Pesos with the following
major components.
• Embankment construction including the main embankment, toe dam and drain
blanket costing 1.20 Billion Pesos. Works includes material hauling, deposition and
PADCAL Operations
April 2013
Chapter 17 Page 130
compaction an estimated volume of 6.57 Bank Cubic Meters (BCM) and 513,200
cubic meters for the main embankment and drain blanket respectively. The existing
contract rates of RU Aquino in the works performed in the subsidence backfilling
operations were used.
• Construction and operation of tailings conveyance system which is seen to utilize
mechanical pumps costing 1.20 Billion Pesos. The cost consists largely of the power
to operate the pumping system with a total power rating of 3,573 Kilowatt to hurdle a
300 meters total dynamic head. Purchase and installation of slurry pumps, electrical
systems and pipes round off the remainder of the cost.
• Pre-construction works such as engineering and design and permits application and
processing entails a cost of 300 Million Pesos.
• The cost of a decant facility is estimated to be 44 Million Pesos. Initially, pontoon
pumps are being considered in this report. A provision for an eight-meter wide
spillway is included.
17.6.1.5.2 Mill Improvements Including Concentrate Shipping Facility
The Mill operations has included in its capital costs, a budget for the following improvements
worth 192 Million Pesos
• Various programs to improve the efficiency of its grinding and flotation processes
worth 99 Million Pesos particularly the construction of the foundation for the new
flotation cell and refurbishment of existing flotation cells and ball mills to improve
concentrate recovery.
• Structural improvements at the shipping facility in Poro, La Union including the ship
loading system, swivel boom and loading and drying conveyors amounting to 93
Million Pesos.
17.6.1.5.3 Electrical Facilities and Mechanical Equipment
New purchases and upgrades of existing mechanical and electrical facilities, such as a
number of transformer stations, equipment related to power and water supply and
refurbishment of surface heavy and transportation equipment like concentrate hauling trucks,
those assigned to the tailings facility operations and Philex road maintenance.
17.6.1.6 Environmental Equipment and Facilities
PADCAL Operations
April 2013
Chapter 17 Page 131
Padcal has included environmental equipment facilities like the dust suppression system in
the Mill plant but most of its environmental related expenditures were incorporated in the
mine closure plan.
17.6.2 List of Capital Equipment and Works
Table 17.6.2-1: Major capital equipment and works
Capital Works
Description Cost (Pesos)
Mine
Development of 908 meter level 458 Million
Development of 782 meter level 575 Million
Development of 798 meter level 2,115 Million
Development of 840 meter level 50 Million
Overhaul and refurbishments of development equipment 315 Million
Mill
Construction of foundation for new flotation cell 63 Million
Various refurbishments of ball mills 36 Million
Improvements at the shipping facility in Poro La Union 93 Million
Other Facilities
Remediation and rehabilitation of TSF 3 860 Million
Design and construction of TSF 4 2,710 Million
Repair and maintenance of various electrical sub-stations and transformers
143 Million
Table 17.6.2-2: Major capital equipment and works
Capital Equipment
Equipment Quantity Cost (Pesos)
Mine
Production LHD unit, 10 metric tons capacity 17 477 Million
Stationary rock breaker with power pack 15 202 Million
Development LHD, 6 to 8 metric tons capacity 1 30 Million
Jumbo drill, 3 meter feed, 45 millimeter bit 3 78 Million
Mill
Flotation cell, WEMCO 1 125 Million
Jaw crusher, C-100 2 18 Million
Surface Operations
Fire truck 1 18 Million
PADCAL Operations
April 2013
Chapter 17 Page 132
17.6.3 Financial Plans/Sources of Funds
The Company’s financial plan for the Padcal mine is premised on the achievement of its
production program discussed in the relevant sections of this report. The revenue generated
from operations minus the operating costs and expenses and the capital expenditure
requirements derives the funds that could be provided by or would be needed for the mine’s
continued operations.
The cash flow projections show that the mine could generate sufficient cash flows to support
its operations. Proceeds from the sale of its production can fully cover operating costs and
capital expenditures. Gross proceeds of 74.92 Billion Pesos will be raised, with 42.96 Billion
to be spent for operating costs and 8.96 billion for capital expenditures. The 23 Billion Pesos
remaining cash could provide the necessary funds not only for the mine’s working capital but
also for the exploration activities within the Padcal vicinity with the goal of further extending
the Padcal mine life. With sufficient internally-generated funds, third party funding would not
be necessary.
17.6.4 Production Cost Estimates and Assumptions
17.6.4.1 Mining Cost
Mining cost averages 207.40 Pesos or USD 5.18 per metric ton of ore milled for the eight
year mine life. Mining Cost applies to the operating cost directly attributable to the mining,
crushing and conveying of ore, including costs for labor, supervision, engineering, power,
fuel, supplies, equipment replacement and maintenance
17.6.4.2 Milling Cost
Milling cost averages 215.73 Pesos or USD 5.39 per metric ton of ore milled for the eight
year mine life. Milling Cost applies to the operating costs directly attributable to the
processing of ores or other feed materials to produce copper concentrate, including labor,
supervision, engineering(operations, assaying and metallurgical reviews), power, fuel,
supplies, reagents, and maintenance (including tailing pond maintenance)
17.6.4.3 Mine Overhead Cost
Mine overhead cost averages 83.35 Pesos or USD 2.08 per metric ton of ore milled for the
eight year mine life. Mine General Overhead refers to an ongoing expense of operating
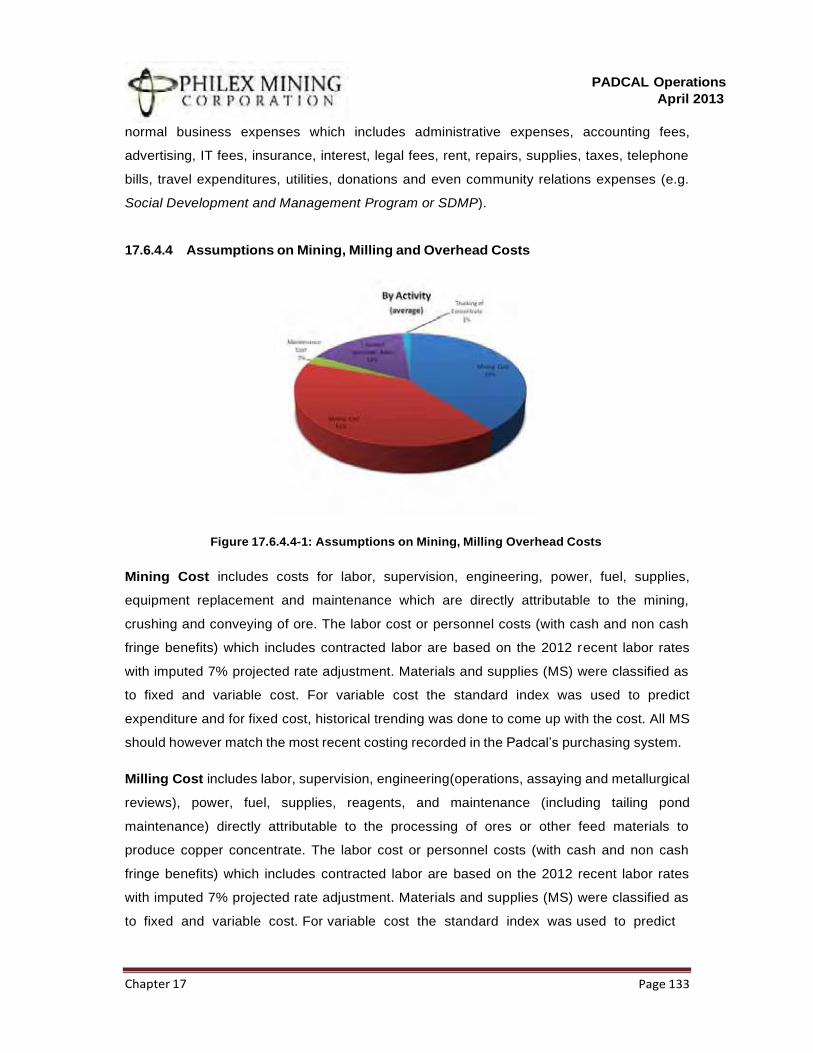
PADCAL Operations
April 2013
Chapter 17 Page 133
normal business expenses which includes administrative expenses, accounting fees,
advertising, IT fees, insurance, interest, legal fees, rent, repairs, supplies, taxes, telephone
bills, travel expenditures, utilities, donations and even community relations expenses (e.g.
Social Development and Management Program or SDMP).
17.6.4.4 Assumptions on Mining, Milling and Overhead Costs
Figure 17.6.4.4-1: Assumptions on Mining, Milling Overhead Costs
Mining Cost includes costs for labor, supervision, engineering, power, fuel, supplies,
equipment replacement and maintenance which are directly attributable to the mining,
crushing and conveying of ore. The labor cost or personnel costs (with cash and non cash
fringe benefits) which includes contracted labor are based on the 2012 recent labor rates
with imputed 7% projected rate adjustment. Materials and supplies (MS) were classified as
to fixed and variable cost. For variable cost the standard index was used to predict
expenditure and for fixed cost, historical trending was done to come up with the cost. All MS
should however match the most recent costing recorded in the Padcal’s purchasing system.
Milling Cost includes labor, supervision, engineering(operations, assaying and metallurgical
reviews), power, fuel, supplies, reagents, and maintenance (including tailing pond
maintenance) directly attributable to the processing of ores or other feed materials to
produce copper concentrate. The labor cost or personnel costs (with cash and non cash
fringe benefits) which includes contracted labor are based on the 2012 recent labor rates
with imputed 7% projected rate adjustment. Materials and supplies (MS) were classified as
to fixed and variable cost. For variable cost the standard index was used to predict
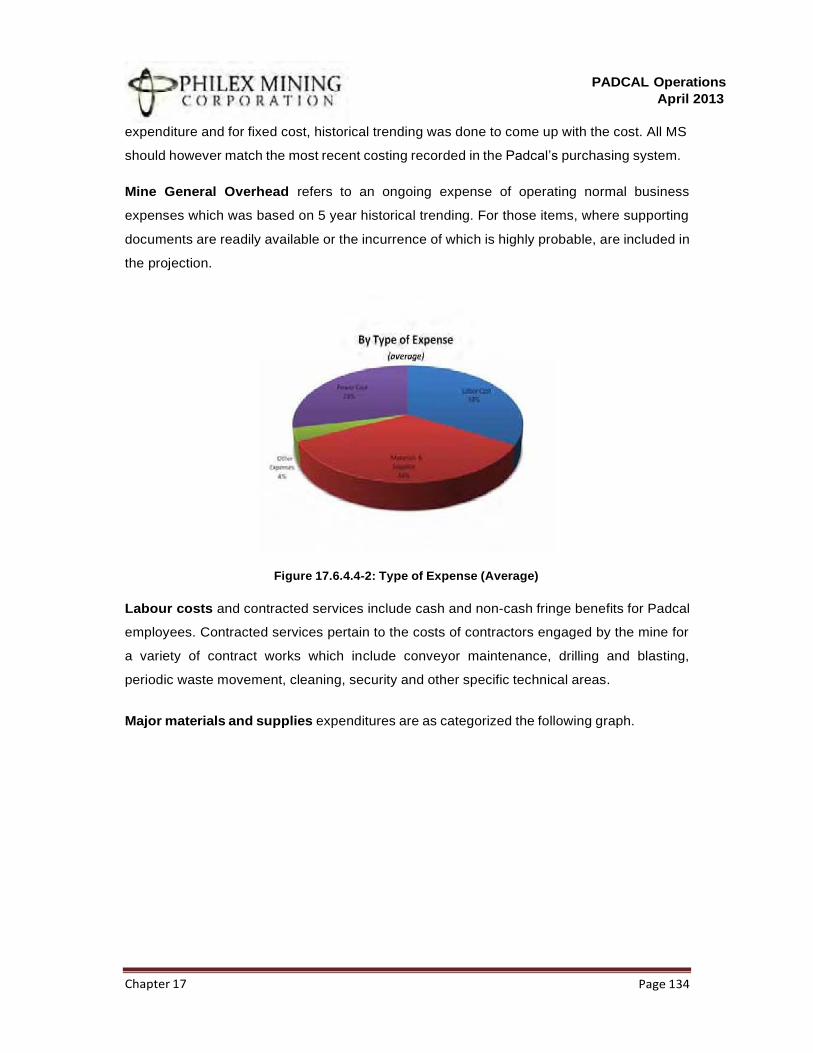
PADCAL Operations
April 2013
Chapter 17 Page 134
expenditure and for fixed cost, historical trending was done to come up with the cost. All MS
should however match the most recent costing recorded in the Padcal’s purchasing system.
Mine General Overhead refers to an ongoing expense of operating normal business
expenses which was based on 5 year historical trending. For those items, where supporting
documents are readily available or the incurrence of which is highly probable, are included in
the projection.
Figure 17.6.4.4-2: Type of Expense (Average)
Labour costs and contracted services include cash and non-cash fringe benefits for Padcal
employees. Contracted services pertain to the costs of contractors engaged by the mine for
a variety of contract works which include conveyor maintenance, drilling and blasting,
periodic waste movement, cleaning, security and other specific technical areas.
Major materials and supplies expenditures are as categorized the following graph.
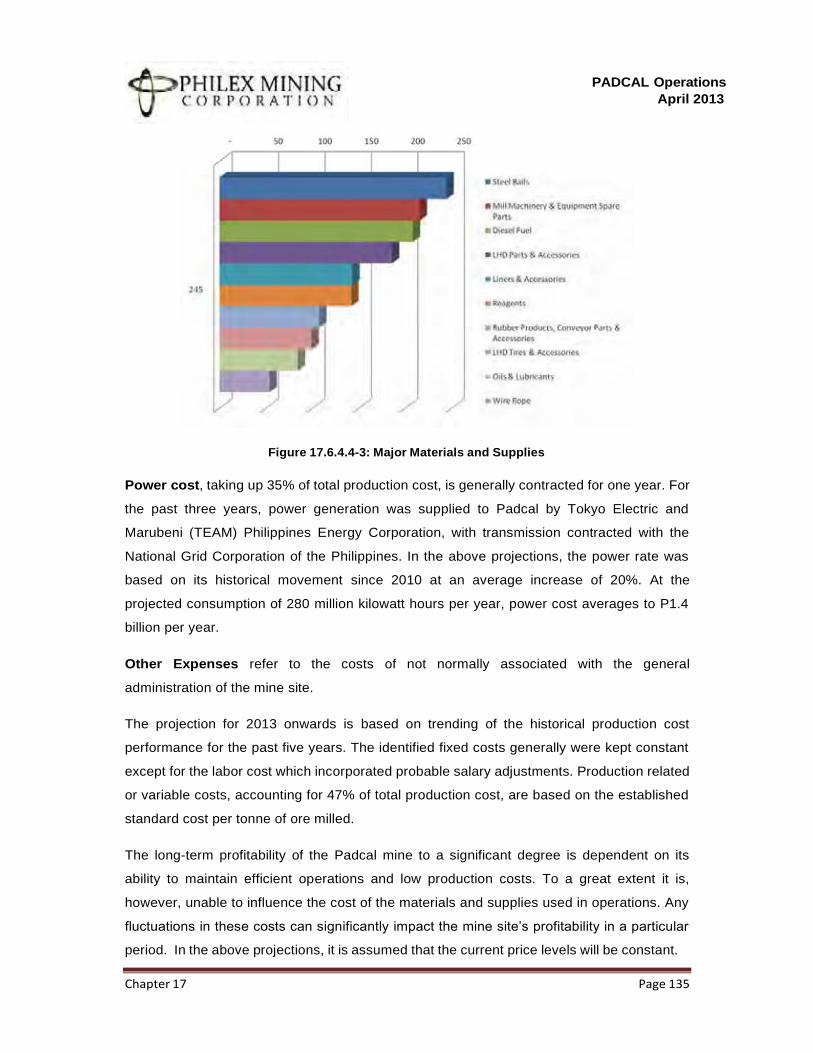
PADCAL Operations
April 2013
Chapter 17 Page 135
Figure 17.6.4.4-3: Major Materials and Supplies
Power cost, taking up 35% of total production cost, is generally contracted for one year. For
the past three years, power generation was supplied to Padcal by Tokyo Electric and
Marubeni (TEAM) Philippines Energy Corporation, with transmission contracted with the
National Grid Corporation of the Philippines. In the above projections, the power rate was
based on its historical movement since 2010 at an average increase of 20%. At the
projected consumption of 280 million kilowatt hours per year, power cost averages to P1.4
billion per year.
Other Expenses refer to the costs of not normally associated with the general
administration of the mine site.
The projection for 2013 onwards is based on trending of the historical production cost
performance for the past five years. The identified fixed costs generally were kept constant
except for the labor cost which incorporated probable salary adjustments. Production related
or variable costs, accounting for 47% of total production cost, are based on the established
standard cost per tonne of ore milled.
The long-term profitability of the Padcal mine to a significant degree is dependent on its
ability to maintain efficient operations and low production costs. To a great extent it is,
however, unable to influence the cost of the materials and supplies used in operations. Any
fluctuations in these costs can significantly impact the mine site’s profitability in a particular
period. In the above projections, it is assumed that the current price levels will be constant.

PADCAL Operations
April 2013
Chapter 17 Page 136
17.6.4.5 Marketing Cost
Marketing charges comprise of ocean freight and insurance in shipping the Padcal mine’s
copper concentrate production, and the treatment and refining costs charged by smelters to
extract the gold, copper and silver from the concentrates. Currently, 60% of Padcal’s
production is shipped to Pan Pacific Copper Co., Ltd and 40% to Louis Dreyfus Commodities
Metals Suisse SA. The smelter charges used in the projections are based on the latest
prevailing terms with these smelters. Ocean freight and insurance are likewise based on the
latest rates. Actual rates, however, are negotiated year-to-year and could significantly vary
from the rates assumed in the projections.
17.6.4.6 Mine Overhead Cost
Mine overhead includes activities related to administration, security, internal audit, safety,
finance, information system, purchasing, medical, community relations, environment and
legal.
17.6.4.7 Environment Cost
As an effect of the sediment spill in its TSF 3, the remediation cost is reflected in the
analysis. The company has completed its clean-up drive in Balog creek and is moving
programs in motion to do the same in parts of Agno River. A document entitled, Integrated
Environment Management Program, containing the technical evaluations done by various
experts and resulting action plans were submitted to the PAB last March 2013. The
environment cost amounts 316 Million Pesos, majority will be spent in 2013.
17.6.4.8 Community Development Cost
Social Development Management Plan (SDMP) is in pursuant to Section 8 of Republic Act
No. 7492 of the Philippine Mining Act of 1995 with revised implementing rules and
regulations under Administrative Order No. 2010-13 requiring operating mines to allot 1.5%
of the total operating cost for the implementation of program for the Development of Mining
Technology and Geosciences; Information, education and communication program; and
PADCAL Operations
April 2013
Chapter 17 Page 137
programs of development and to promote general welfare of host and neighboring
communities where the mining area is located.
17.6.4.9 Excise Tax
The excise tax is 2 percent of the net revenue from the value of the copper, gold and silver in
the concentrates. Net revenue is defined as the gross revenue less smelting, refining and
other charges incurred in the process of converting the mineral concentrates into refined
metal, ocean freight and insurance. Gross revenue is the actual market value of minerals or
mineral products or bullion. The government’s intent to change the current fiscal regime on
mining could, however, result to a higher excise tax rate or its equivalent tax structure that
the government may impose in the future.
17.6.4.10 Head Office Overhead Cost
This technical report will not include overhead cost from Philex head office to maintain the
independence of Padcal operations in this evaluation.
17.6.4.11 Royalty
The royalty rates at the current ore grade level of the Padcal mine are 4 percent and 1
percent of the net revenue from gold and silver, and copper, respectively. The royalty rate for
the indigenous cultural community of Padcal is at 1.25 percent of gross sales.
17.6.4.12 Mine Waste Tailings (MWT) Fees
The MGB, in its decision on the sediment spill of TSF 3, found Padcal in violation of the
Mining Act when it discharged tailings to Balog creek and Agno River and has assessed
Padcal 1.03 Billion Pesos. Around 20 Million metric tons of sediments were released to the
two bodies of water. The fee, as stipulated in the MGB decision will be used to rehabilitate
the affected areas of the incident. Philex has paid the amount in full early this year and is
reflected as cost in this evaluation.
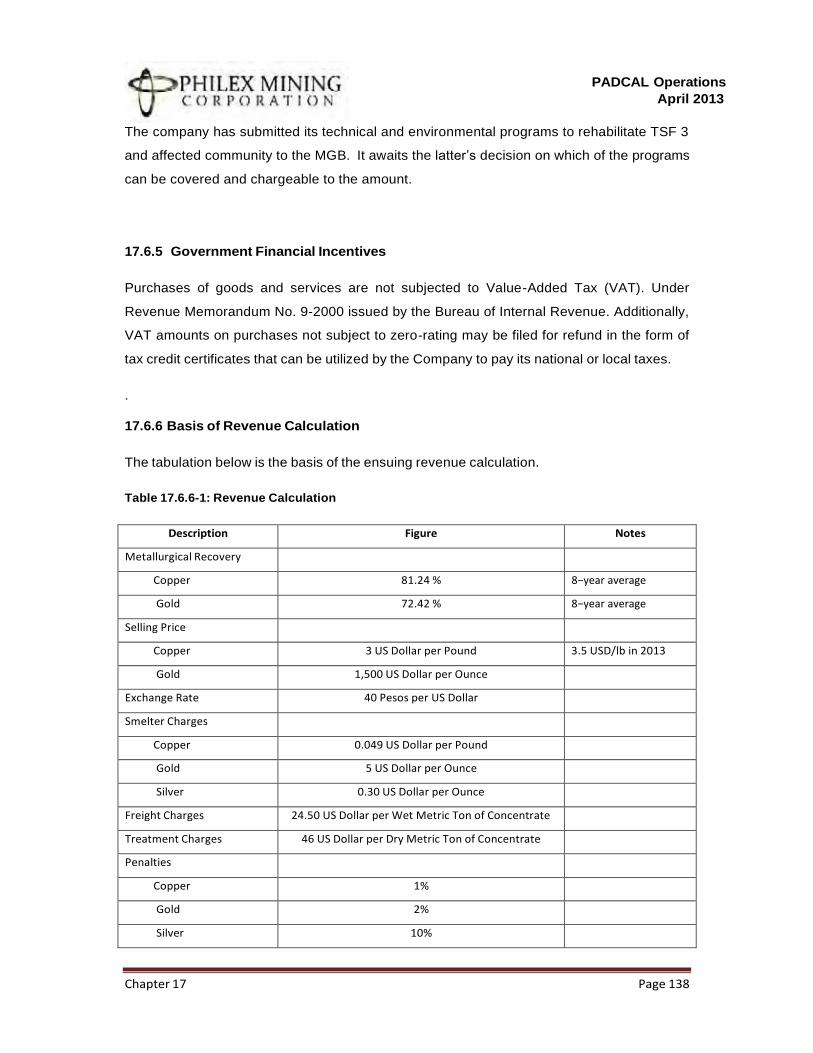
PADCAL Operations
April 2013
Chapter 17 Page 138
The company has submitted its technical and environmental programs to rehabilitate TSF 3
and affected community to the MGB. It awaits the latter’s decision on which of the programs
can be covered and chargeable to the amount.
17.6.5 Government Financial Incentives
Purchases of goods and services are not subjected to Value-Added Tax (VAT). Under
Revenue Memorandum No. 9-2000 issued by the Bureau of Internal Revenue. Additionally,
VAT amounts on purchases not subject to zero-rating may be filed for refund in the form of
tax credit certificates that can be utilized by the Company to pay its national or local taxes.
.
17.6.6 Basis of Revenue Calculation
The tabulation below is the basis of the ensuing revenue calculation.
Table 17.6.6-1: Revenue Calculation
Description Figure Notes
Metallurgical Recovery
Copper 81.24 % 8−year average
Gold 72.42 % 8−year average
Selling Price
Copper 3 US Dollar per Pound 3.5 USD/lb in 2013
Gold 1,500 US Dollar per Ounce
Exchange Rate 40 Pesos per US Dollar
Smelter Charges
Copper 0.049 US Dollar per Pound
Gold 5 US Dollar per Ounce
Silver 0.30 US Dollar per Ounce
Freight Charges 24.50 US Dollar per Wet Metric Ton of Concentrate
Treatment Charges 46 US Dollar per Dry Metric Ton of Concentrate
Penalties
Copper 1%
Gold 2%
Silver 10%
PADCAL Operations
April 2013
Chapter 17 Page 139
Excise Tax
Copper & Ag/Ag−1 2%
Au/Au Bullion 2%
Insurance 0.04%
Royalties
Copper 1%
Gold 4%
Silver 4%
17.6.7 Pro-forma Financial Statements
17.6.7.1 Profit and Loss
The following table reflects the projected results of operation during the anticipated
remaining mine life of Padcal and were provided by the Company based on the operating
parameters discussed in the following sections of this report. These projections were
reviewed and are deemed reasonable as calculated based on the parameters assumed for
this purpose. Nevertheless, these projections, being mere forward-looking statements
reflect management’s current outlook of future operating results.
Profit and Loss projections show that Padcal will have a total after tax net earnings of Php
10.2 billion at the end of its life in operations on 2020 as shown on the following schedule
above.
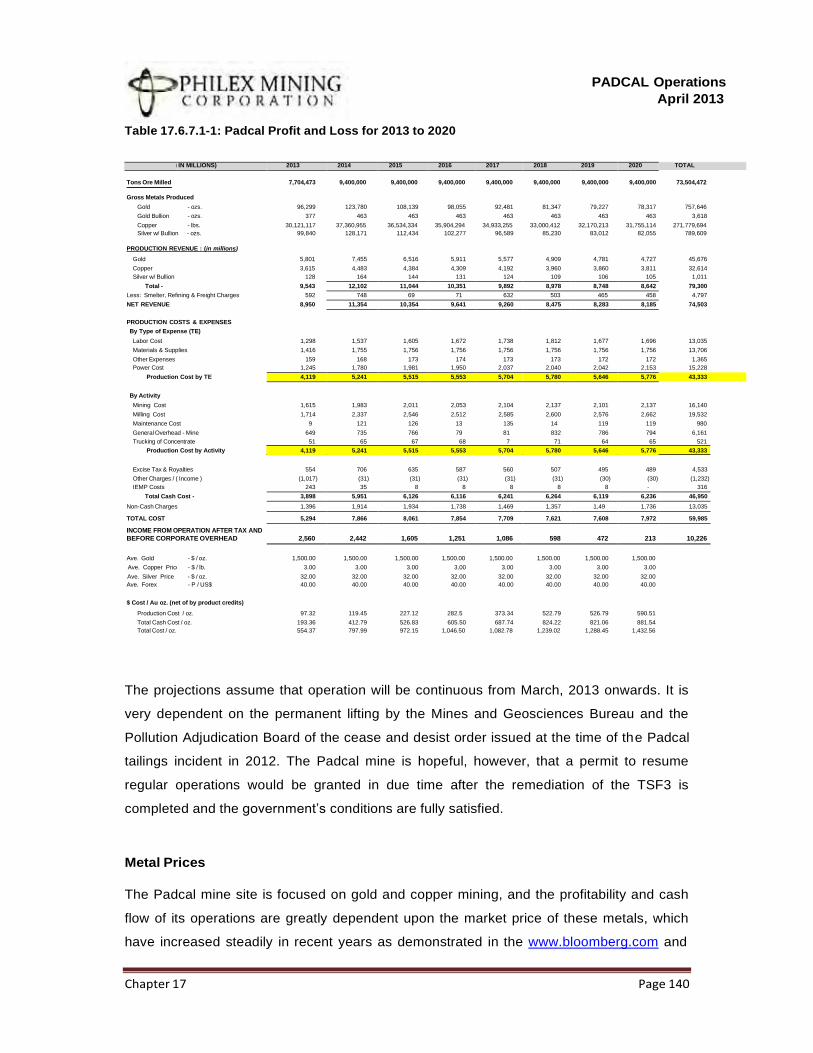
PADCAL Operations
April 2013
Chapter 17 Page 140
Table 17.6.7.1-1: Padcal Profit and Loss for 2013 to 2020
( IN MILLIONS) 2013 2014 2015 2016 2017 2018 2019 2020 TOTAL
Tons Ore Milled
7,704,473
9,400,000
9,400,000
9,400,000
9,400,000
9,400,000
9,400,000
9,400,000
73,504,472
Gross Metals Produced
Gold - ozs. 96,299 123,780 108,139 98,055 92,481 81,347 79,227 78,317 757,646
Gold Bullion - ozs. 377 463 463 463 463 463 463 463 3,618
Copper - lbs. 30,121,117 37,360,955 36,534,334 35,904,294 34,933,255 33,000,412 32,170,213 31,755,114 271,779,694
Silver w/ Bullion - ozs. 99,840 128,171 112,434 102,277 96,589 85,230 83,012 82,055 789,609
PRODUCTION REVENUE : (in millions)
Gold 5,801 7,455 6,516 5,911 5,577 4,909 4,781 4,727 45,676
Copper 3,615 4,483 4,384 4,309 4,192 3,960 3,860 3,811 32,614
Silver w/ Bullion 128 164 144 131 124 109 106 105 1,011
Total - 9,543 12,102 11,044 10,351 9,892 8,978 8,748 8,642 79,300
Less: Smelter, Refining & Freight Charges 592 748 69 71 632 503 465 458 4,797
NET REVENUE 8,950 11,354 10,354 9,641 9,260 8,475 8,283 8,185 74,503
PRODUCTION COSTS & EXPENSES
By Type of Expense (TE)
Labor Cost 1,298 1,537 1,605 1,672 1,738 1,812 1,677 1,696 13,035
Materials & Supplies 1,416 1,755 1,756 1,756 1,756 1,756 1,756 1,756 13,706
Other Expenses 159 168 173 174 173 173 172 172 1,365
Power Cost 1,245 1,780 1,981 1,950 2,037 2,040 2,042 2,153 15,228
Production Cost by TE 4,119 5,241 5,515 5,553 5,704 5,780 5,646 5,776 43,333
By Activity
Mining Cost 1,615 1,983 2,011 2,053 2,104 2,137 2,101 2,137 16,140
Milling Cost 1,714 2,337 2,546 2,512 2,585 2,600 2,576 2,662 19,532
Maintenance Cost 9 121 126 13 135 14 119 119 980
General Overhead - Mine 649 735 766 79 81 832 786 794 6,161
Trucking of Concentrate 51 65 67 68 7 71 64 65 521
Production Cost by Activity 4,119 5,241 5,515 5,553 5,704 5,780 5,646 5,776 43,333
Excise Tax & Royalties
554
706
635
587
560
507
495
489
4,533
Other Charges / ( Income ) (1,017) (31) (31) (31) (31) (31) (30) (30) (1,232)
IEMP Costs 243 35 8 8 8 8 8 - 316
Total Cash Cost - 3,898 5,951 6,126 6,116 6,241 6,264 6,119 6,236 46,950
Non-Cash Charges 1,396 1,914 1,934 1,738 1,469 1,357 1,49 1,736 13,035
TOTAL COST 5,294 7,866 8,061 7,854 7,709 7,621 7,608 7,972 59,985
INCOME FROM OPERATION AFTER TAX AND
BEFORE CORPORATE OVERHEAD
2,560
2,442
1,605
1,251
1,086
598
472
213
10,226
Ave. Gold
- $ / oz.
1,500.00
1,500.00
1,500.00
1,500.00
1,500.00
1,500.00
1,500.00
1,500.00
Ave. Copper Price - $ / lb. 3.00 3.00 3.00 3.00 3.00 3.00 3.00 3.00
Ave. Silver Price - $ / oz. 32.00 32.00 32.00 32.00 32.00 32.00 32.00 32.00
Ave. Forex - P / US$ 40.00 40.00 40.00 40.00 40.00 40.00 40.00 40.00
$ Cost / Au oz. (net of by product credits)
Production Cost / oz. 97.32 119.45 227.12 282.5 373.34 522.79 526.79 590.51
Total Cash Cost / oz. 193.36 412.79 526.83 605.50 687.74 824.22 821.06 881.54
Total Cost / oz. 554.37 797.99 972.15 1,046.50 1,082.78 1,239.02 1,288.45 1,432.56
The projections assume that operation will be continuous from March, 2013 onwards. It is
very dependent on the permanent lifting by the Mines and Geosciences Bureau and the
Pollution Adjudication Board of the cease and desist order issued at the time of the Padcal
tailings incident in 2012. The Padcal mine is hopeful, however, that a permit to resume
regular operations would be granted in due time after the remediation of the TSF3 is
completed and the government’s conditions are fully satisfied.
Metal Prices
The Padcal mine site is focused on gold and copper mining, and the profitability and cash
flow of its operations are greatly dependent upon the market price of these metals, which
have increased steadily in recent years as demonstrated in the www.bloomberg.com and
PADCAL Operations
April 2013
Chapter 17 Page 141
www.lme.com. These prices, however, are affected by numerous factors including global
economic conditions as well as consumption patterns of industries that utilize these metals.
The effect of these factors on the price of gold and copper, and correspondingly the future
economic viability of the Padcal Mine cannot be accurately predicted. For purposes of the
foregoing projection for 2013, the current prices of gold and copper at US$ 1,500.00 per
ounce and US$ 3.00 per pound, respectively, were assumed. Subsequent years’ average
metal prices were assumed at the constant level of US$ 1,500.00 per ounce gold and US$
3.00 per pound copper.
For every US$10 change in gold price per ounce, Padcal net revenue would change by 277
million Pesos. For every US$0.10 change in copper per pound, Padcal net revenue would
change by 111 million Pesos.
Exchange rates
Padcal’s functional currency is the Philippine Peso, being the applicable currency where the
Mine operates and which comprise the greater portion of the Company’s operating costs.
But because the Company receives its production revenue in US dollars and sourcing of
equipment, materials and supplies could come from different countries, the exchange rates
of different currencies into Philippine peso bear on the mine operating costs and capital
expenditures. Thus, fluctuations in exchange rates can have an impact on the Padcal mine
operating results. To mitigate the impact of exchange rate’s volatility on the peso cost
component, the Company in the past have entered into currency hedging arrangements to
set the average peso to dollar exchange rate. There is a natural hedge on the dollar cost
component as the mine’s revenues are in US dollars.
Mineral Resources and Ore Reserves
Ore reserves provide the basis for the estimates of the volume of gold, copper and silver that
can be produced by the Padcal mine. As additional geological data is obtained during the
course of operations and as the economic assumptions used to estimate ore reserves may
change, estimates of ore reserves may vary from period to period and actual production may
not necessarily reconcile with estimates. Padcal’s current practice is to use the latest
disclosure being made under PSE Circular No. 1850-2013 dated February 28, 2013.
PADCAL Operations
April 2013
Chapter 17 Page 142
Depletion and amortization are calculated based on ore reserves and thus are affected by
changes in ore reserves estimates, which could impact total production costs and operating
income of the Padcal mine.
Marketing Charges, Excise Taxes & Royalties, Other Charges/Income and IRBM Costs
Marketing charges comprise of ocean freight and insurance in shipping the Padcal mine’s
copper concentrate production, and the treatment and refining costs charged by smelters to
extract the gold, copper and silver from the concentrates. Currently, 60% of Padcal’s
production is shipped to Pan Pacific Copper Co., Ltd and 40% to Louis Dreyfus Commodities
Metals Suisse SA. The smelter charges used in the projections are based on the latest
prevailing terms with these smelters. Ocean freight and insurance are likewise based on the
latest rates. Actual rates, however, are negotiated year-to-year and could significantly vary
from the rates assumed in the projections.
Other Charges/Income is expenditures or income items not normally incurred or are non-
recurring. In the above projections, other income of P 1.02 billion for business interruption
insurance claim and interest income from Mine Rehabilitation fund were provided. An
annual estimated income of P30 million from scrap sales have also been assumed.
Expenditures amounting to P 345 million for the Integrated River Basin Management (IRBM)
relates to the rehabilitation of the Balog Creek and Agno River Convergence following the
2012 tailings spillage.
Production costs
Padcal production costs by type of expenses consist of labor, materials and supplies, power
and other expenses. Production costs classified by activity comprise of mining cost, milling
cost, maintenance cost, trucking of concentrate and general overhead. For purposes of
break-even volume analysis, production costs are classified as to fixed and variable in
relation to production output.
The projection for 2013 onwards was based on trending of the historical production cost
performance for the past five years. The identified fixed costs generally remained constant
except for the labor cost which incorporated probable labor costs adjustments. Production
related or variable costs were based on the established standard cost of consumables used
in the operation.
PADCAL Operations
April 2013
Chapter 17 Page 143
In the projection, the variable costs account for 47% of total production cost and the
remaining are all considered non-production related or fixed costs.
Any fluctuations in these costs can significantly impact the mine site’s profitability in a
particular period.
Cash Costs (Unaudited)
Cash costs are measure of the cash cost of production of a particular metal or commodity.
Padcal’s cash costs for gold include royalties and selling expenses, less proceeds from the
sale of copper and silver, which is a by-product found within the ore body. They exclude
capitalized production, depreciation and amortization, movement in inventory, and other
costs of sales which do not relate directly to production, such as exploration expenditure
expensed in the income statement. They also exclude head office costs, such as
Administrative Expenses, that are unrelated to production. Total cash costs and cash costs
per ounce are key performance indicators that allow management to monitor costs and to
evaluate operating efficiency while managing those factors that impact production costs on a
monthly basis. Cash costs per ounce are calculated as total cash costs divided by total
ounces of gold produced within a period.
Investors should not consider total cash costs or total cash costs per ounce in isolation. Total
cash costs and total cash costs per ounce as calculated for the mine site in this Prospectus
may not be comparable with other similarly titled measures of performance for other peer
companies.
On the other hand, total cost include non cash charges which is the write down or expense
against profit that does not involve actual cash outflow. This typically includes depreciation,
amortization and depletion. By 2020, unamortized costs of major projects and equipment will
be maintained in the books because of the probability of extension of the life of mine.
17.6.7.2 Cash Flow
The following cash flow projections show that the Padcal mine could generate possible cash
flows throughout its entire eight years declared mine life. It should be noted that while the
cashflow for 2013 will be a deficit of 26 million Pesos, the net cash flow until 2020 will,
however, be a positive of 12.7 Billion Pesos, which justifies maintaining the declared mine
life of up to 2020, this after a total capital expenditure 9.25 Billion Pesos for the entire period,
including a provision of 62 million Pesos for the mine closure plan.
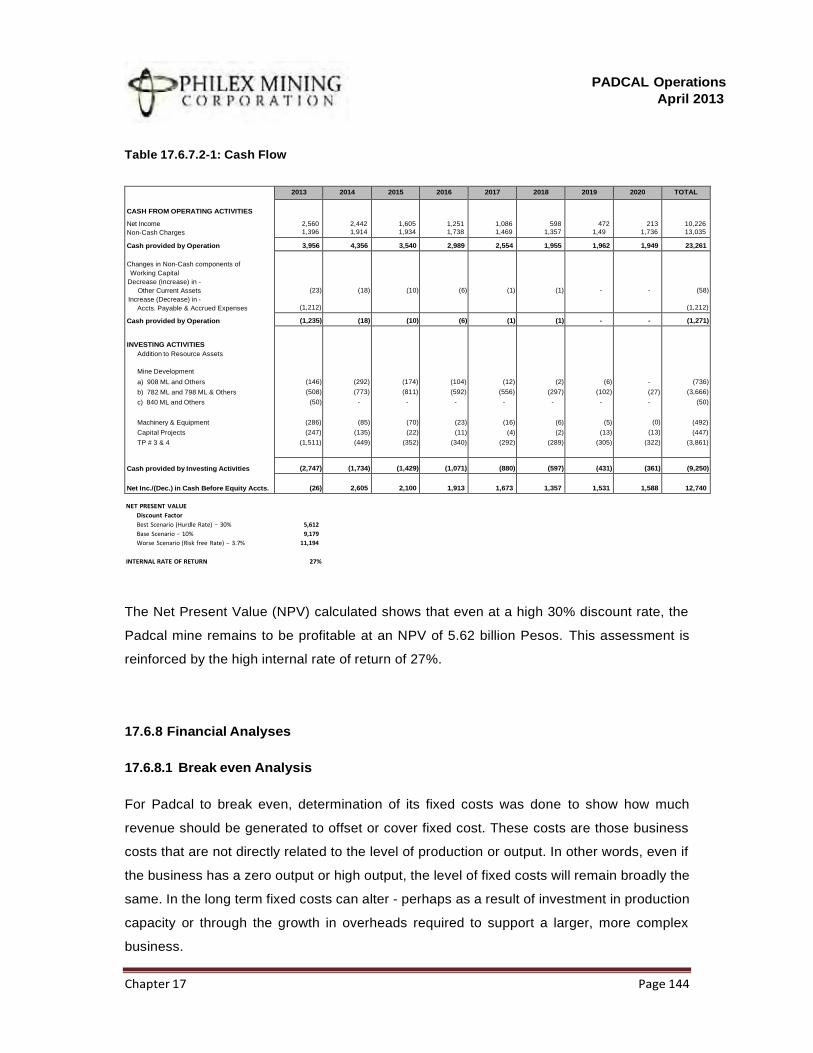
PADCAL Operations
April 2013
Chapter 17 Page 144
Table 17.6.7.2-1: Cash Flow
CASH FROM OPERATING ACTIVITIES
Net Income
Non-Cash Charges
Cash provided by Operation
Changes in Non-Cash components of
Working Capital
Decrease (Increase) in -
Other Current Assets
Increase (Decrease) in -
Accts. Payable & Accrued Expenses
Cash provided by Operation
INVESTING ACTIVITIES
Addition to Resource Assets
Mine Development
a) 908 ML and Others
b) 782 ML and 798 ML & Others
c) 840 ML and Others
Machinery & Equipment
Capital Projects
TP # 3 & 4
Cash provided by Investing Activities
Net Inc./(Dec.) in Cash Before Equity Accts.
2013 2014 2015 2016 2017 2018 2019 2020 TOTAL
2,560
1,396
2,442
1,914
1,605
1,934
1,251
1,738
1,086
1,469
598
1,357
472
1,49
213
1,736
10,226
13,035
3,956 4,356 3,540 2,989 2,554 1,955 1,962 1,949 23,261
(23)
(1,212)
(18)
(10)
(6)
(1)
(1)
-
-
(58)
(1,212)
(1,235) (18) (10) (6) (1) (1) - - (1,271)
(146)
(508)
(50)
(286)
(247)
(1,511)
(292)
(773)
-
(85)
(135)
(449)
(174)
(811)
-
(70)
(22)
(352)
(104)
(592)
-
(23)
(11)
(340)
(12)
(556)
-
(16)
(4)
(292)
(2)
(297)
-
(6)
(2)
(289)
(6)
(102)
-
(5)
(13)
(305)
-
(27)
-
(0)
(13)
(322)
(736)
(3,666)
(50)
(492)
(447)
(3,861)
(2,747)
(1,734)
(1,429)
(1,071)
(880)
(597)
(431)
(361)
(9,250)
(26)
2,605
2,100
1,913
1,673
1,357
1,531
1,588
12,740
NET PRESENT VALUE
Discount Factor
Best Scenario (Hurdle Rate) − 30% 5,612
Base Scenario − 10% 9,179
Worse Scenario (Risk free Rate) − 3.7% 11,194
INTERNAL RATE OF RETURN 27%
The Net Present Value (NPV) calculated shows that even at a high 30% discount rate, the
Padcal mine remains to be profitable at an NPV of 5.62 billion Pesos. This assessment is
reinforced by the high internal rate of return of 27%.
17.6.8 Financial Analyses
17.6.8.1 Break even Analysis
For Padcal to break even, determination of its fixed costs was done to show how much
revenue should be generated to offset or cover fixed cost. These costs are those business
costs that are not directly related to the level of production or output. In other words, even if
the business has a zero output or high output, the level of fixed costs will remain broadly the
same. In the long term fixed costs can alter - perhaps as a result of investment in production
capacity or through the growth in overheads required to support a larger, more complex
business.
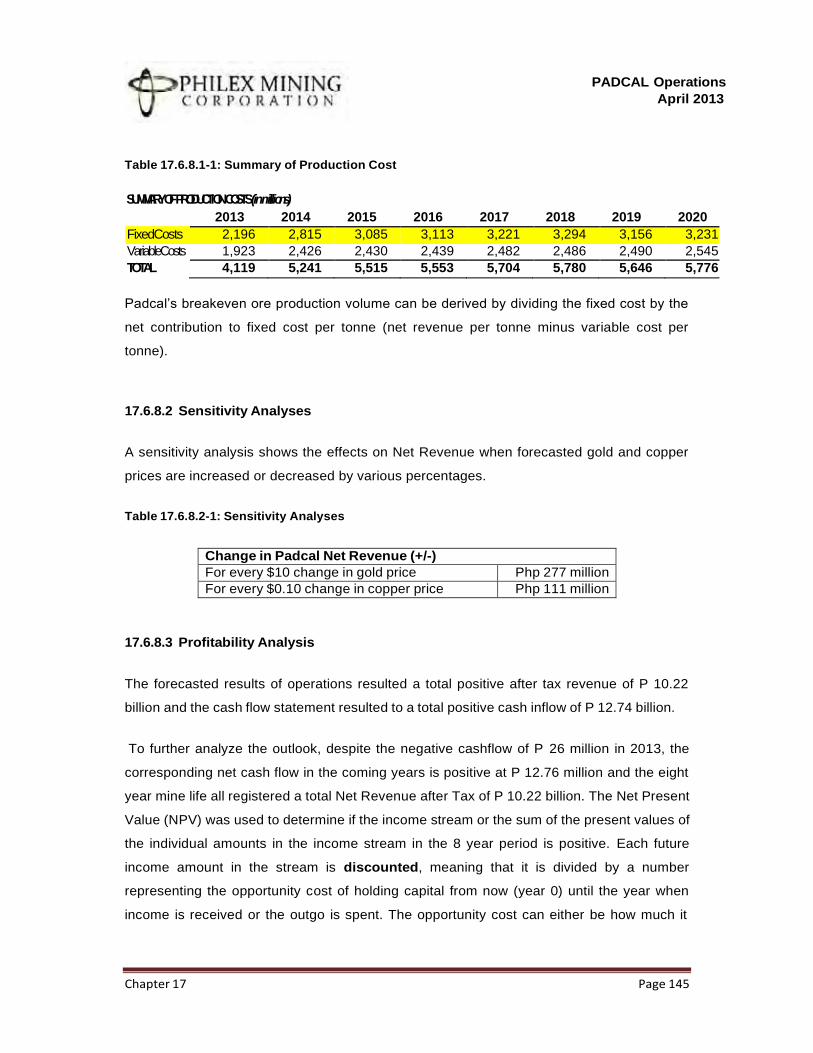
PADCAL Operations
April 2013
Chapter 17 Page 145
Table 17.6.8.1-1: Summary of Production Cost
SUMMARYOFPRODUCTIONCOSTS(inmillions)
2013 2014 2015 2016 2017 2018 2019 2020
FixedCosts 2,196 2,815 3,085 3,113 3,221 3,294 3,156 3,231
VariableCosts 1,923 2,426 2,430 2,439 2,482 2,486 2,490 2,545
TOTAL 4,119 5,241 5,515 5,553 5,704 5,780 5,646 5,776
Padcal’s breakeven ore production volume can be derived by dividing the fixed cost by the
net contribution to fixed cost per tonne (net revenue per tonne minus variable cost per
tonne).
17.6.8.2 Sensitivity Analyses
A sensitivity analysis shows the effects on Net Revenue when forecasted gold and copper
prices are increased or decreased by various percentages.
Table 17.6.8.2-1: Sensitivity Analyses
Change in Padcal Net Revenue (+/-)
For every $10 change in gold price Php 277 million
For every $0.10 change in copper price Php 111 million
17.6.8.3 Profitability Analysis
The forecasted results of operations resulted a total positive after tax revenue of P 10.22
billion and the cash flow statement resulted to a total positive cash inflow of P 12.74 billion.
To further analyze the outlook, despite the negative cashflow of P 26 million in 2013, the
corresponding net cash flow in the coming years is positive at P 12.76 million and the eight
year mine life all registered a total Net Revenue after Tax of P 10.22 billion. The Net Present
Value (NPV) was used to determine if the income stream or the sum of the present values of
the individual amounts in the income stream in the 8 year period is positive. Each future
income amount in the stream is discounted, meaning that it is divided by a number
representing the opportunity cost of holding capital from now (year 0) until the year when
income is received or the outgo is spent. The opportunity cost can either be how much it
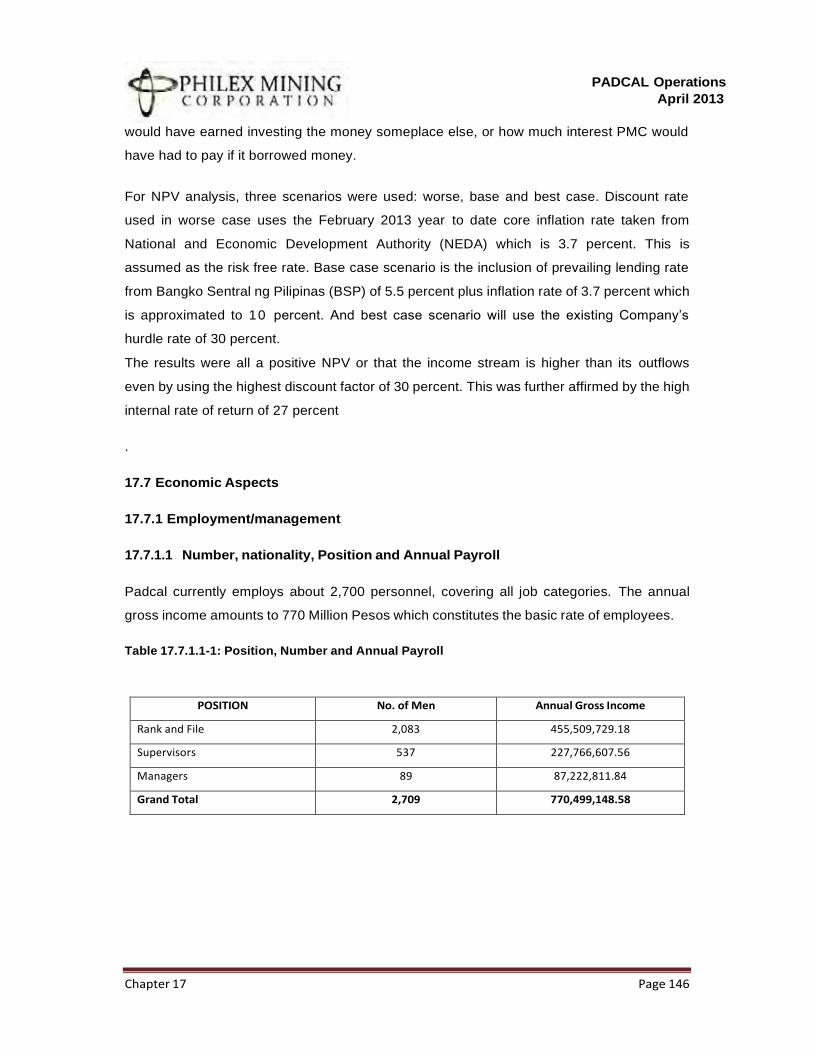
PADCAL Operations
April 2013
Chapter 17 Page 146
would have earned investing the money someplace else, or how much interest PMC would
have had to pay if it borrowed money.
For NPV analysis, three scenarios were used: worse, base and best case. Discount rate
used in worse case uses the February 2013 year to date core inflation rate taken from
National and Economic Development Authority (NEDA) which is 3.7 percent. This is
assumed as the risk free rate. Base case scenario is the inclusion of prevailing lending rate
from Bangko Sentral ng Pilipinas (BSP) of 5.5 percent plus inflation rate of 3.7 percent which
is approximated to 10 percent. And best case scenario will use the existing Company’s
hurdle rate of 30 percent.
The results were all a positive NPV or that the income stream is higher than its outflows
even by using the highest discount factor of 30 percent. This was further affirmed by the high
internal rate of return of 27 percent
.
17.7 Economic Aspects
17.7.1 Employment/management
17.7.1.1 Number, nationality, Position and Annual Payroll
Padcal currently employs about 2,700 personnel, covering all job categories. The annual
gross income amounts to 770 Million Pesos which constitutes the basic rate of employees.
Table 17.7.1.1-1: Position, Number and Annual Payroll
POSITION No. of Men Annual Gross Income
Rank and File 2,083 455,509,729.18
Supervisors 537 227,766,607.56
Managers 89 87,222,811.84
Grand Total 2,709 770,499,148.58
PADCAL Operations
April 2013
Chapter 17 Page 147
17.7.1.2 List of Key Personnel and Qualifications
The details required in this section are found in Annex D-2.
17.7.1.3 Personnel Pay Scale
The personnel pay scale is defined by the following aspects.
Definition of Job Grades
• Skilled/Semi-Skilled/Unskilled (SSU) is Padcal’s equivalent to a rank and file. Most
are miners and equipment operators in the mill.
• Office Administrative Clerk (OAC) is an unskilled office worker whose primary
functions are clerical in nature.
• Professional Technician (PT) is a semi-skilled office worker.
• Supervisory Technical Staff (STS) may be working underground or surface and
possess high level of skills pertinent to his function.
Unions
Padcal nurtures a good relationship with the two unions of both the rank and file and
supervisory employees. The Philex Rank-and-File Employees Union-Associated Labor
Unions-Trade Union Congress of the Philippines (PRFEU-ALU-TUCP) and Philex Mining
Supervisory Employees Union (PMSEU) governs the labor relations of their members to the
Padcal management. Every five years, the Collective Bargaining Agreement (CBA) are
renegotiated and renewed. The stipulations of the CBA have an increasing effect
(historically) to the employees pay rates.
17.7.1.4 Table of Organization
The details required in this section are found in Annex D-3.
PADCAL Operations
April 2013
Chapter 17 Page 148
17.7.1.5 Availability of Technical and Skilled Worker
In the nearest city from the minesite, Baguio City, are several Colleges and Universities that
can offer a wide array of skilled labor. A particular University offers the BS Mining
Engineering program that is very relevant to Padcal.
The industries within Baguio Export Processing Zone are also a good sources of engineers
as well. The mine of Lepanto is the most proximate mining operations that has similar skills
requirement of Padcal.
In Padcal, training and development of high school graduates, who can’t afford college
education are being undertaken. Trainings are specialized in technical skills that can be
utilized in the operations.
17.7.1.6 Township/Housing
Housing and basic amenities (water and electricity) are provided to regular Padcal
employees within the mine site. The Padcal community’s population has already grown to
around 10,000 and is turning to be one of the highly urbanized communities around the area.
With the proximity of Baguio City, some employees choose to commute daily to and from
work. Public Utility Jeeps (PUJ) are the most accessible mode of transport.
17.7.2 Community Development Plan
The details required in this section are found in Annex D-4.
17.7.3 Socio-economic Contributions
Philex Mining Corporation, has committed to the development of its mining community as
well as its host and neighboring communities. The company has provided stable
employment to about 2,852 (as of Feb 28, 2013). Basic Social services such as education,
medical, water and power utilities were likewise implemented in support to the workers and
their dependents.
The company has adopted the Social Development and Management Program (SDMP) as
its core program in the poverty alleviation of its host and neighboring communities. Through
its SDMP, it aims to uplift the quality of life of the marginalized members of the community
through its livelihood and social services on health and education and establishment of
PADCAL Operations
April 2013
Chapter 17 Page 149
social and physical infrastructures to promote economic and social opportunities.
The SDMP is focused on four components dubbed as H.E.L.P., which stands for Health
Care, Education, Livelihood and Employment Enhancement and Public Infrastructure.
For the last ten (10) years from 2003 to 2012, the following were the socio-economic
contribution of the company to its host and neighboring communities.
HEALTH CARE PROGRAM: Provision of health services by medical/dental missions and
free hospitalization at Sto. Nino Hospital; improvement of facilities/equipment on water and
sanitation; provision of assistance to Rural Health Units; nutrition programs; and training of
health workers and families on disease prevention
EDUCATION PROGRAM: To address the poor quality of education, the company has
focused on the School Improvement Projects of partner schools/LGUs and Department of
Education. Schools/classrooms, clinics and teachers quarters were constructed; providing
students opportunities to finish school under the College and Technical Vocation
Scholarship; Employment opportunity for students to earn for their education and projects for
the out of school youth under the Alternative Learning System
LIVELIHOOD PROGRAM: In order to provide employment opportunities for its
communities, the company has instituted a Livelihood and Employment Enhancement
Program. This included strengthening and empowering cooperatives and livelihood
associations. Continuous capability building trainings were conducted. Financial and
technical assistance are regularly extended to ensure the sustainability of the projects.
PUBLIC INFRASTRUCTURE PROGRAM: In support to the Health, Education and
Livelihood Programs is the Infrastructure Development. Over ten years, the company has
constructed an aggregate of 28 kilometers of concrete pavement/farm to market road. 85
units water system projects; 99 units of multi-purpose buildings/schools/clinics were
constructed and improved.
For this period, the company has spent about P255 million as its contribution to the poverty
alleviation in its host and neighboring communities.
PADCAL Operations
April 2013
Chapter 17 Page 150
17.8 Project Schedule
The production and development schedules discussed in Section 17.5.1 will be the project
schedule.
17.8.1 EPCM Contract
All operational activities are done by Padcal manpower with the exception of the following
major works.
• Subsidence backfilling
• Construction of tailings storage facility 4
• Maintenance of cable-hauled and feeder belt conveyors
To these, a Department within the Padcal organization still manages the operations.

PADCAL Operations
April 2013
Chapter 18.0
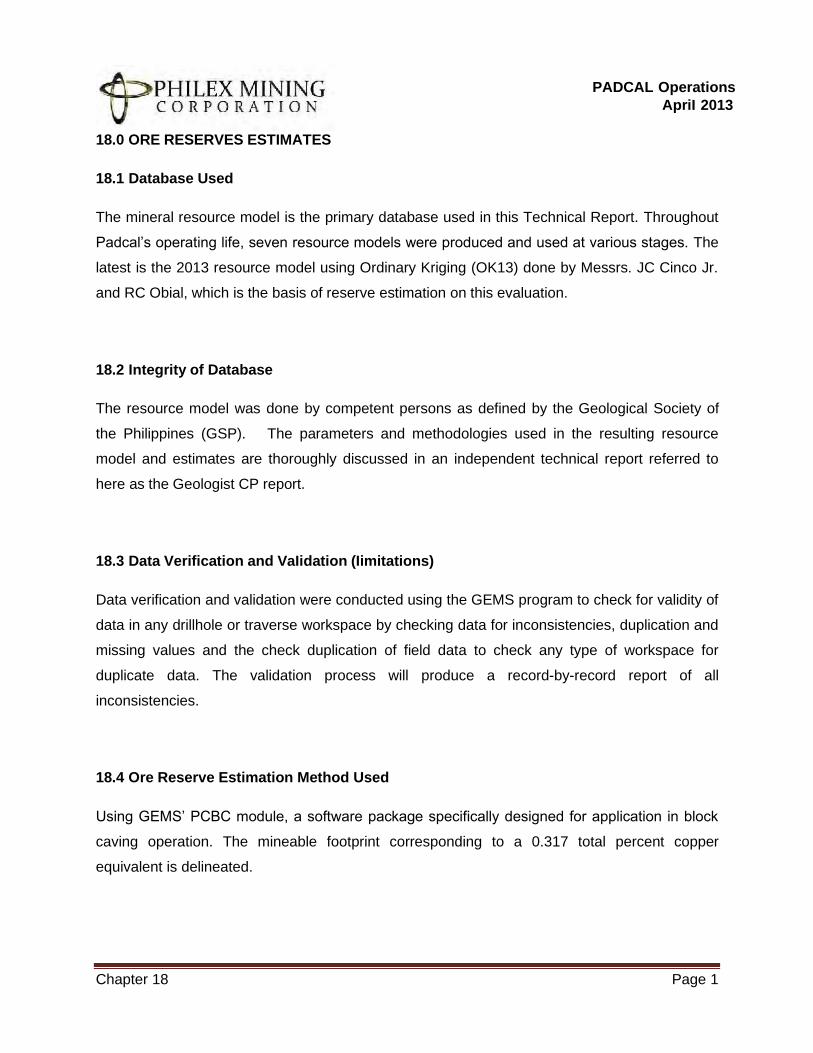
PADCAL Operations
ApriI 2013
Chapter 18 Page 1
18.0 ORE RESERVES ESTIMATES
18.1 Database Used
The mineral resource model is the primary database used in this Technical Report. Throughout
Padcal’s operating life, seven resource models were produced and used at various stages. The
latest is the 2013 resource model using Ordinary Kriging (OK13) done by Messrs. JC Cinco Jr.
and RC Obial, which is the basis of reserve estimation on this evaluation.
18.2 Integrity of Database
The resource model was done by competent persons as defined by the Geological Society of
the Philippines (GSP). The parameters and methodologies used in the resulting resource
model and estimates are thoroughly discussed in an independent technical report referred to
here as the Geologist CP report.
18.3 Data Verification and VaIidation (Iimitations)
Data verification and validation were conducted using the GEMS program to check for validity of
data in any drillhole or traverse workspace by checking data for inconsistencies, duplication and
missing values and the check duplication of field data to check any type of workspace for
duplicate data. The validation process will produce a record-by-record report of all
inconsistencies.
18.4 Ore Reserve Estimation Method Used
Using GEMS’ PCBC module, a software package specifically designed for application in block
caving operation. The mineable footprint corresponding to a 0.317 total percent copper
equivalent is delineated.
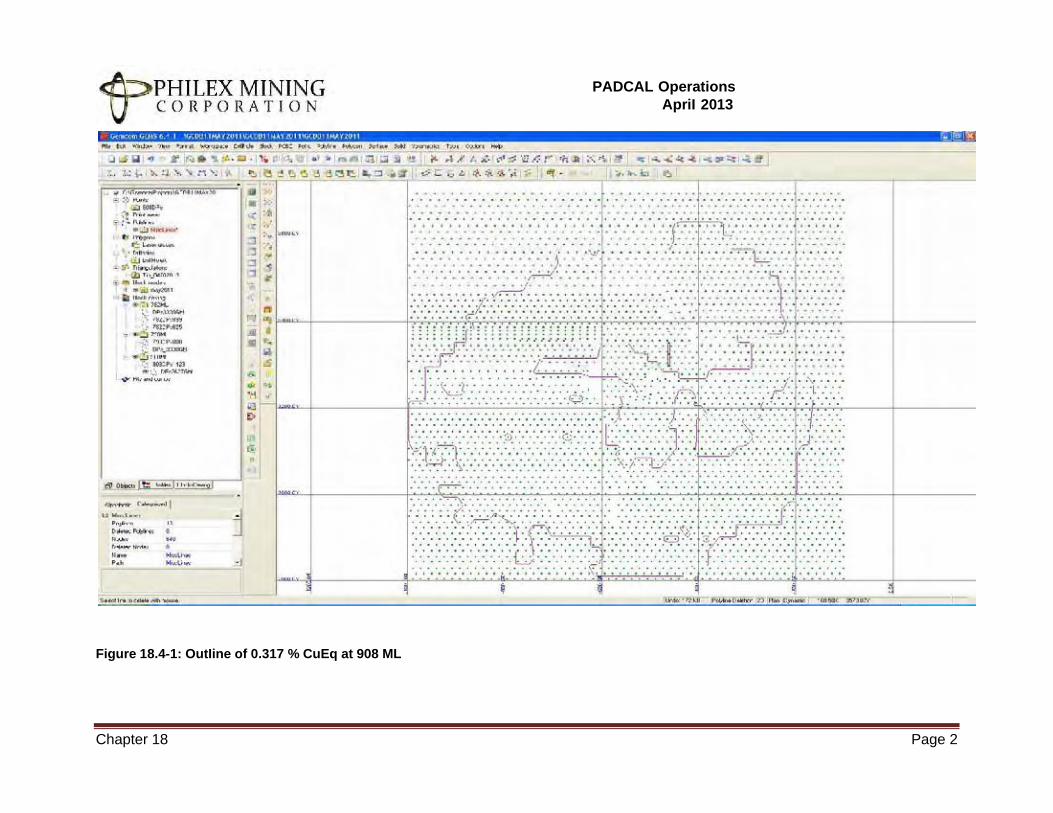
PADCAL Operations
ApriI 2013
Chapter 18 Page 2
Figure 18.4-1: OutIine of 0.317 % CuEq at 908 ML
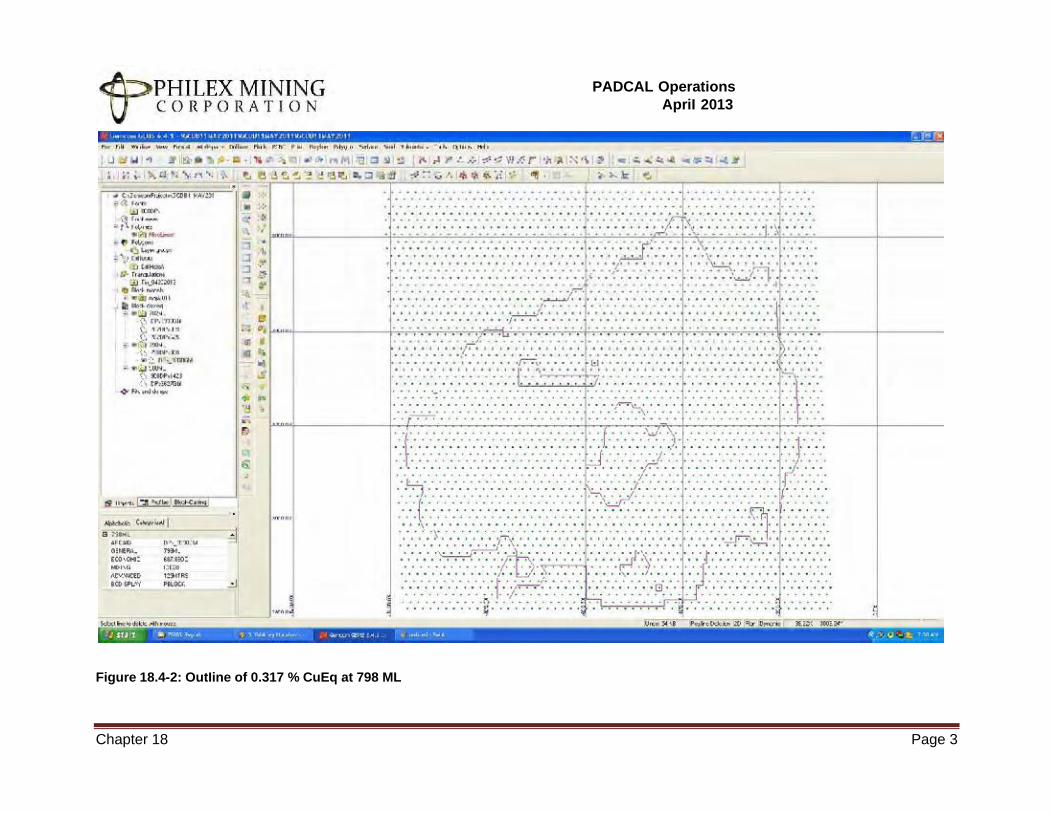
PADCAL Operations
ApriI 2013
Chapter 18 Page 3
Figure 18.4-2: OutIine of 0.317 % CuEq at 798 ML
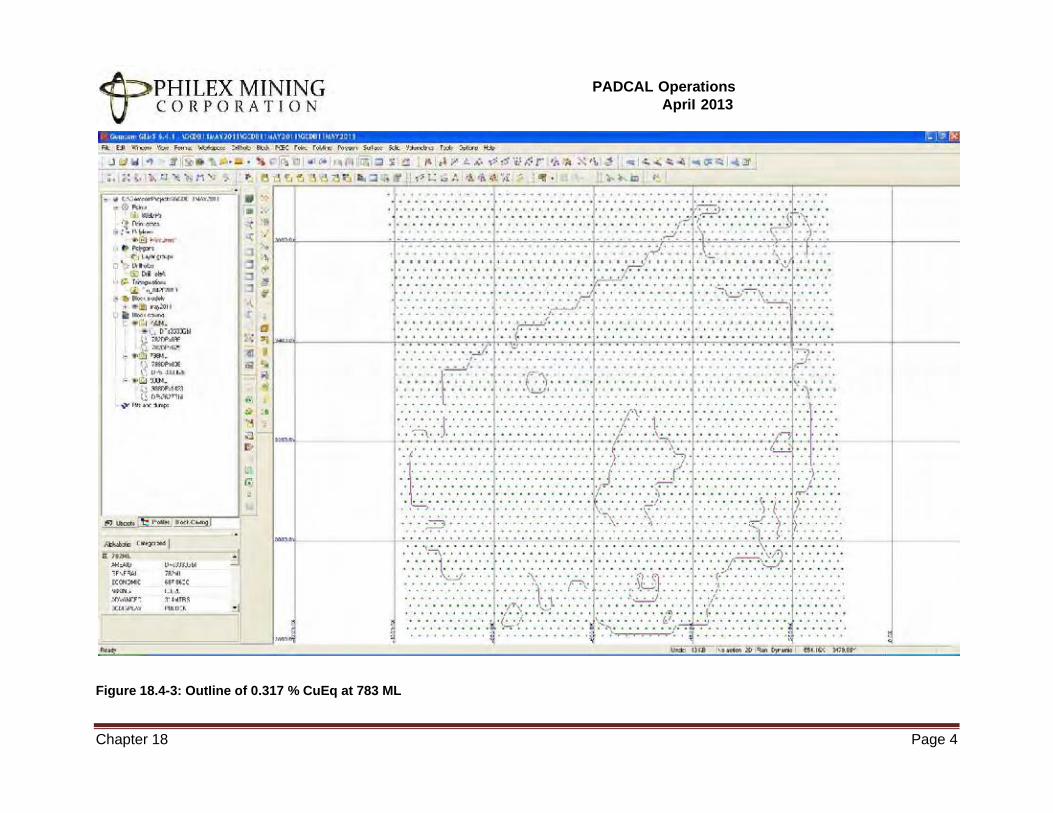
PADCAL Operations
ApriI 2013
Chapter 18 Page 4
Figure 18.4-3: OutIine of 0.317 % CuEq at 783 ML
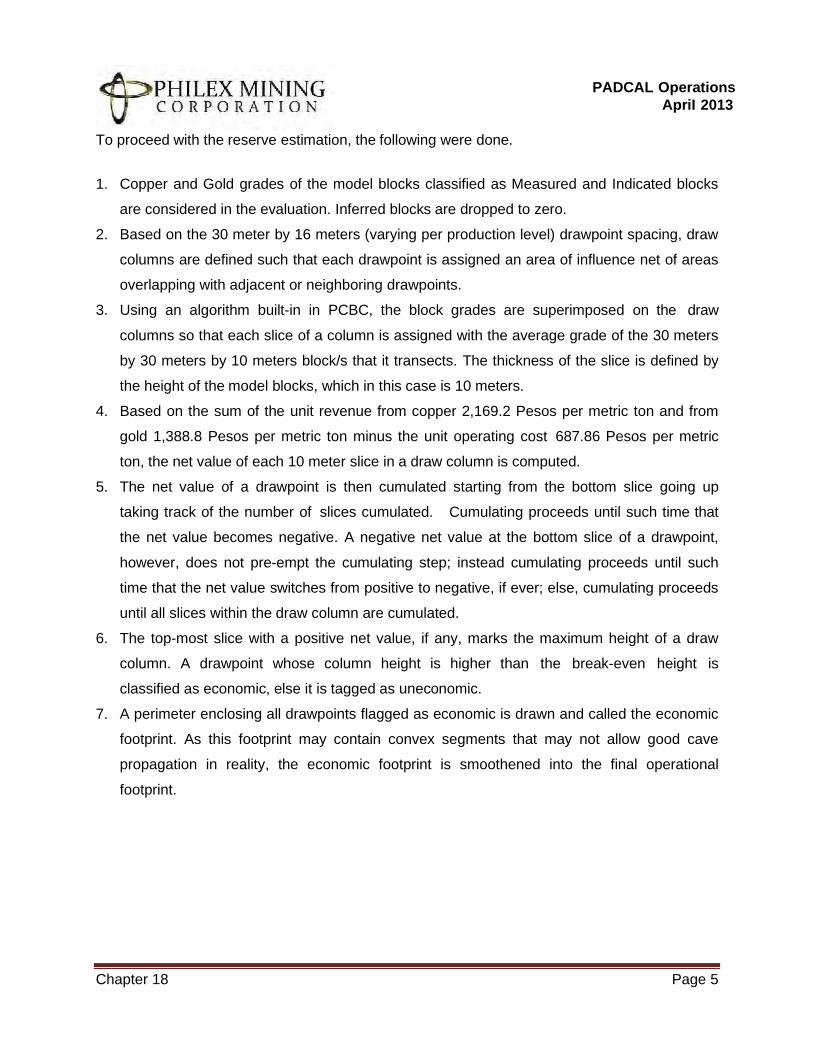
Chapter 18 Page 5
To proceed with the reserve estimation, the following were done.
PADCAL Operations
ApriI 2013
1. Copper and Gold grades of the model blocks classified as Measured and Indicated blocks
are considered in the evaluation. Inferred blocks are dropped to zero.
2. Based on the 30 meter by 16 meters (varying per production level) drawpoint spacing, draw
columns are defined such that each drawpoint is assigned an area of influence net of areas
overlapping with adjacent or neighboring drawpoints.
3. Using an algorithm built-in in PCBC, the block grades are superimposed on the draw
columns so that each slice of a column is assigned with the average grade of the 30 meters
by 30 meters by 10 meters block/s that it transects. The thickness of the slice is defined by
the height of the model blocks, which in this case is 10 meters.
4. Based on the sum of the unit revenue from copper 2,169.2 Pesos per metric ton and from
gold 1,388.8 Pesos per metric ton minus the unit operating cost 687.86 Pesos per metric
ton, the net value of each 10 meter slice in a draw column is computed.
5. The net value of a drawpoint is then cumulated starting from the bottom slice going up
taking track of the number of slices cumulated. Cumulating proceeds until such time that
the net value becomes negative. A negative net value at the bottom slice of a drawpoint,
however, does not pre-empt the cumulating step; instead cumulating proceeds until such
time that the net value switches from positive to negative, if ever; else, cumulating proceeds
until all slices within the draw column are cumulated.
6. The top-most slice with a positive net value, if any, marks the maximum height of a draw
column. A drawpoint whose column height is higher than the break-even height is
classified as economic, else it is tagged as uneconomic.
7. A perimeter enclosing all drawpoints flagged as economic is drawn and called the economic
footprint. As this footprint may contain convex segments that may not allow good cave
propagation in reality, the economic footprint is smoothened into the final operational
footprint.
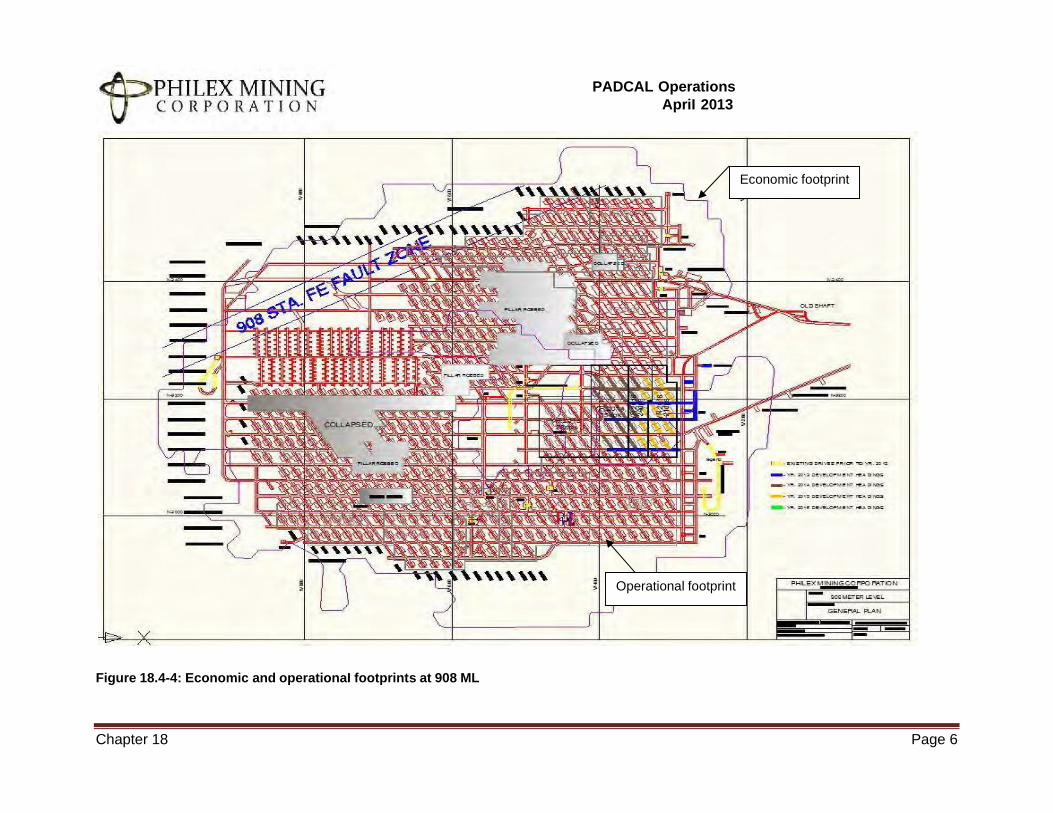
PADCAL Operations
ApriI 2013
Chapter 18 Page 6
Operational footprint
Figure 18.4-4: Economic and operationaI footprints at 908 ML
Economic footprint
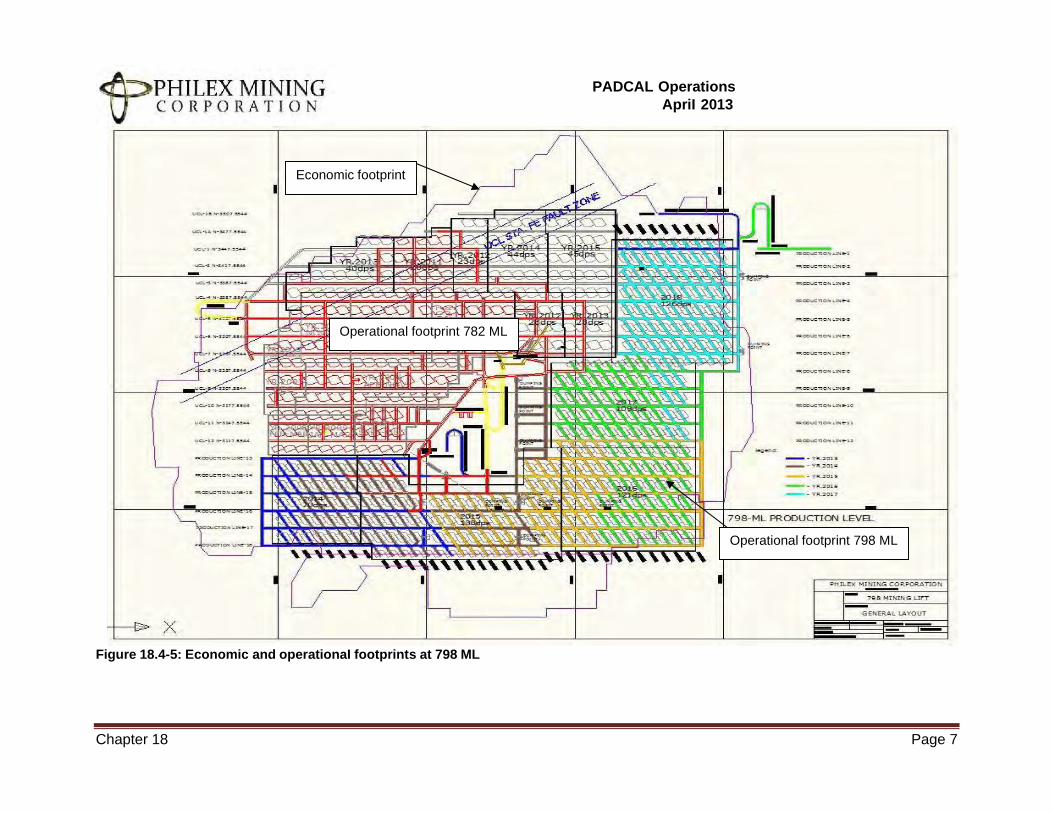
PADCAL Operations
ApriI 2013
Chapter 18 Page 7
Operational footprint 782 ML
Operational footprint 798 ML
Figure 18.4-5: Economic and operationaI footprints at 798 ML
Economic footprint
PADCAL Operations
ApriI 2013
Chapter 18 Page 8
Figure 18.4-6: Economic and operationaI footprints at 782 ML
Economic footprint
Operational footprint
PADCAL Operations
ApriI 2013
Chapter 18 Page 9
8. The maximum height of those drawpoints within the operational footprint is then multiplied
by the area of influence of each particular drawpoint and by the specific gravity of caved ore
in order to arrive at the maximum ore theoretically drawable from each drawpoint. The
summation of these tonnages then serves as the basis of the mineable reserve.
9. This reserve, however, is further trimmed to allow for ore loss due to early entry of dilution
and premature collapse of drawpoints. A dilution factor of 0.03 percent for copper and 0.10
gram gold per metric ton for gold is being applied.
18.5 Ore Reserve Estimations
18.5.1 Ore Specific Gravity / Density
Based on tests, the specific gravity of caved ore in Padcal Mine is 2.7.
18.5.2 Mining PIans / Mining Recovery / DiIution Factor / Mining Losses
The discussion for this section has been tackled in Section 17.5.1.
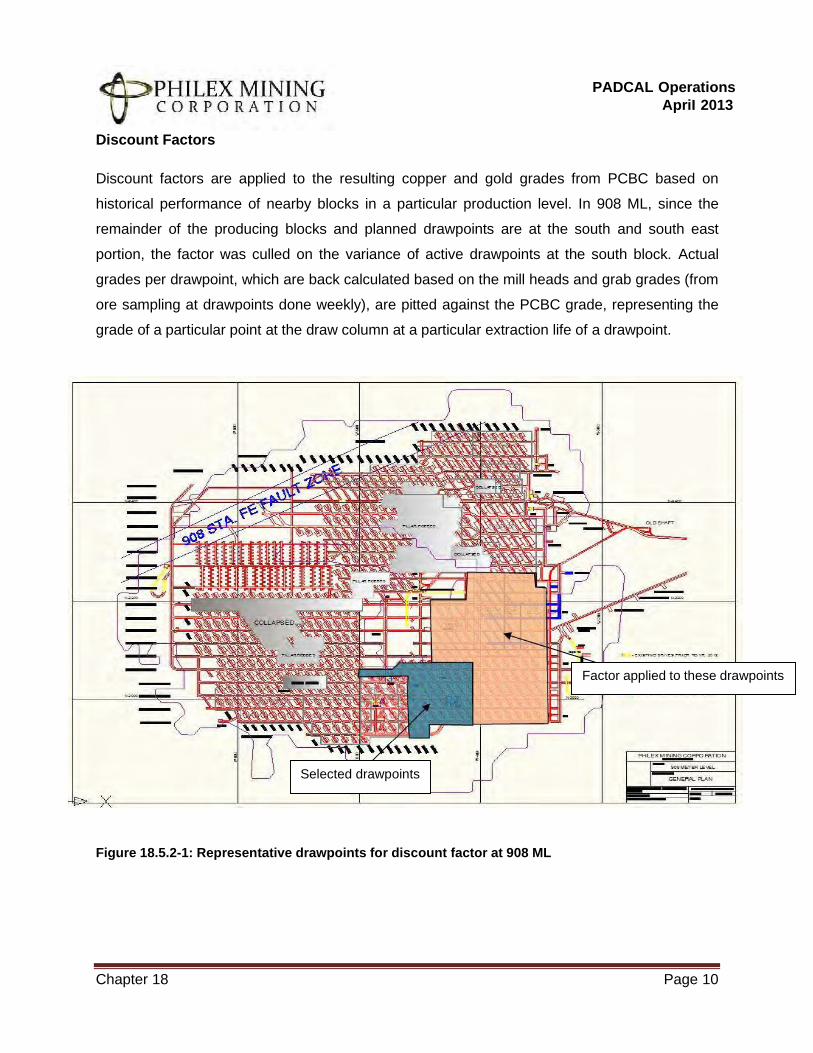
PADCAL Operations
ApriI 2013
Chapter 18 Page 10
Selected drawpoints
Factor applied to these drawpoints
Discount Factors
Discount factors are applied to the resulting copper and gold grades from PCBC based on
historical performance of nearby blocks in a particular production level. In 908 ML, since the
remainder of the producing blocks and planned drawpoints are at the south and south east
portion, the factor was culled on the variance of active drawpoints at the south block. Actual
grades per drawpoint, which are back calculated based on the mill heads and grab grades (from
ore sampling at drawpoints done weekly), are pitted against the PCBC grade, representing the
grade of a particular point at the draw column at a particular extraction life of a drawpoint.
Figure 18.5.2-1: Representative drawpoints for discount factor at 908 ML
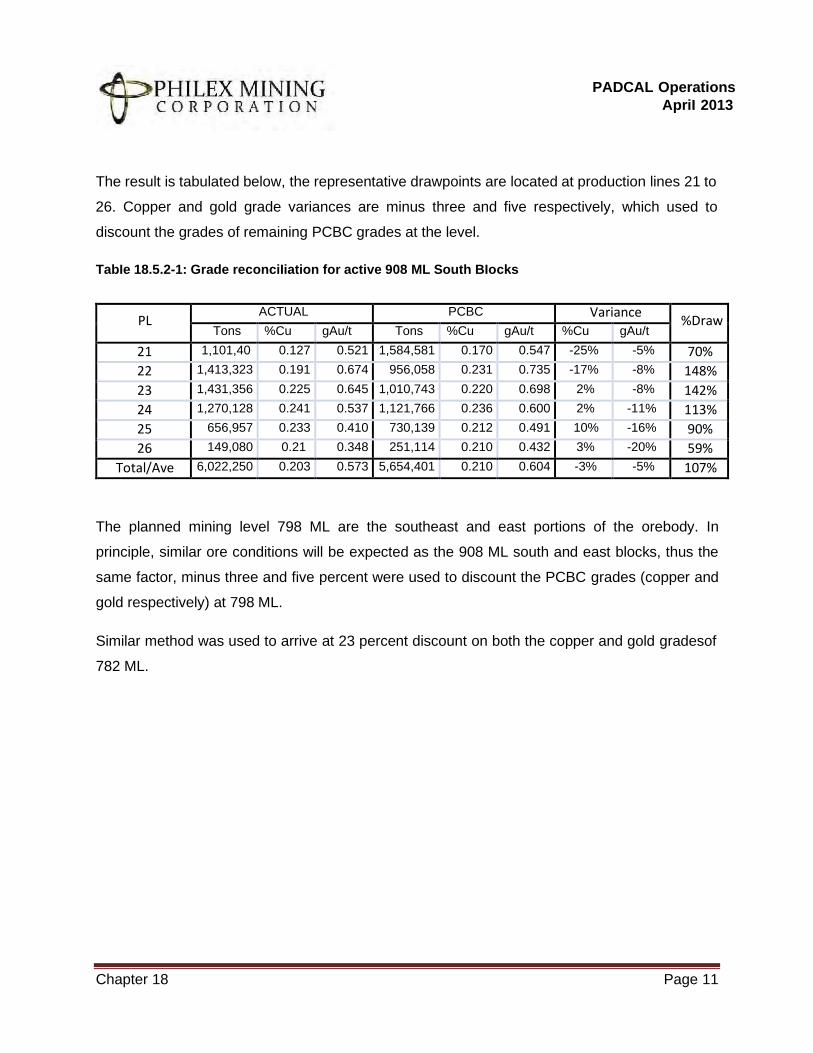
PADCAL Operations
ApriI 2013
Chapter 18 Page 11
The result is tabulated below, the representative drawpoints are located at production lines 21 to
26. Copper and gold grade variances are minus three and five respectively, which used to
discount the grades of remaining PCBC grades at the level.
TabIe 18.5.2-1: Grade reconciIiation for active 908 ML South BIocks
PL ACTUAL PCBC Variance
%Draw Tons %Cu gAu/t Tons %Cu gAu/t %Cu gAu/t
21 1,101,40 0.127 0.521 1,584,581 0.170 0.547 -25% -5% 70%
22 1,413,323 0.191 0.674 956,058 0.231 0.735 -17% -8% 148%
23 1,431,356 0.225 0.645 1,010,743 0.220 0.698 2% -8% 142%
24 1,270,128 0.241 0.537 1,121,766 0.236 0.600 2% -11% 113%
25 656,957 0.233 0.410 730,139 0.212 0.491 10% -16% 90%
26 149,080 0.21 0.348 251,114 0.210 0.432 3% -20% 59%
Total/Ave 6,022,250 0.203 0.573 5,654,401 0.210 0.604 -3% -5% 107%
The planned mining level 798 ML are the southeast and east portions of the orebody. In
principle, similar ore conditions will be expected as the 908 ML south and east blocks, thus the
same factor, minus three and five percent were used to discount the PCBC grades (copper and
gold respectively) at 798 ML.
Similar method was used to arrive at 23 percent discount on both the copper and gold gradesof
782 ML.
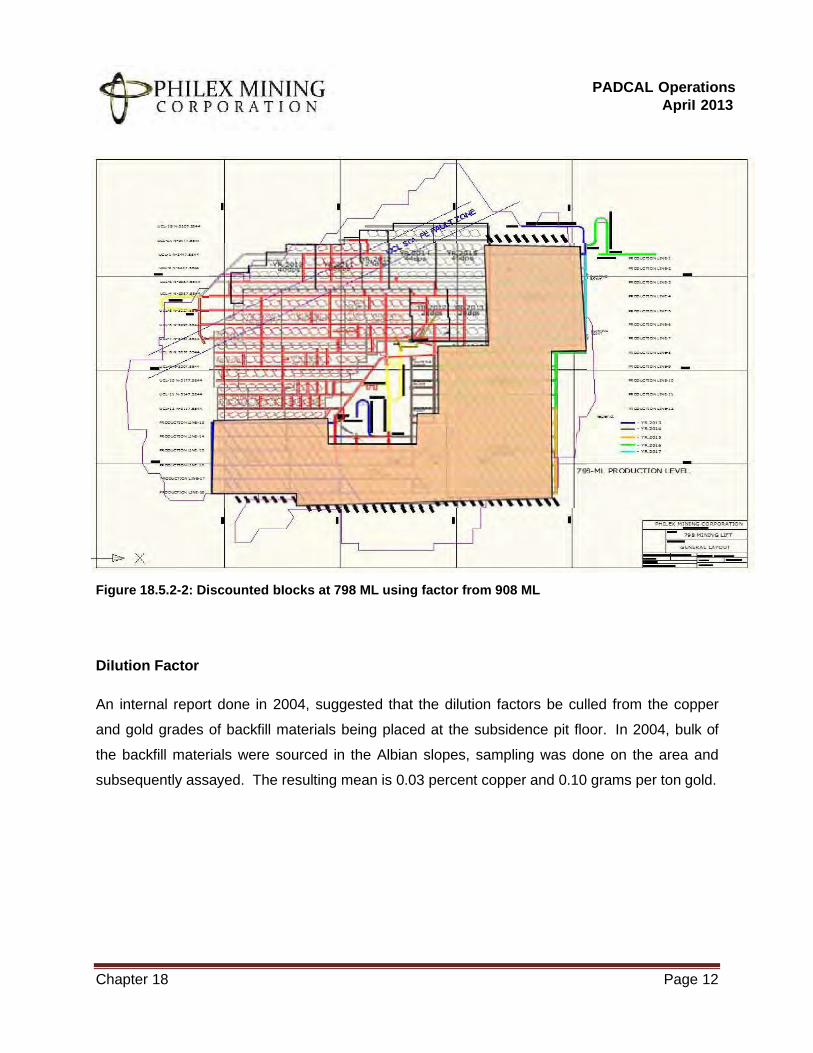
PADCAL Operations
ApriI 2013
Chapter 18 Page 12
Figure 18.5.2-2: Discounted bIocks at 798 ML using factor from 908 ML
DiIution Factor
An internal report done in 2004, suggested that the dilution factors be culled from the copper
and gold grades of backfill materials being placed at the subsidence pit floor. In 2004, bulk of
the backfill materials were sourced in the Albian slopes, sampling was done on the area and
subsequently assayed. The resulting mean is 0.03 percent copper and 0.10 grams per ton gold.
PADCAL Operations
ApriI 2013
Chapter 18 Page 13
18.5.3 ReIevant Production Costs considered
An average operating cost of 687.86 Pesos per metric ton of ore milled for the first semester of
year 2012 was considered in the parameter. This cost is inclusive of all variable costs and
minesite overhead cost.
18.5.4 Basis of Revenue CaIcuIation
MetaI Price
Metal prices are assumed to be 3.00 US Dollar per pound of copper and 1,500 US Dollar per
ounce of gold.
MetaI Recovery
Metal recovery is set at 82 percent and 72 percent for copper and gold, respectively.
Unit Revenues
Based on these prices and recoveries, the unit revenues per metric ton per unit grade of each
metal are calculated as 2,169.20 Pesos per metric ton for every percent copper grade and
1,388.80 Pesos per metric ton for every gram per ton gold grade
Copper EquivaIent of GoId
As the cut-off grade is normally expressed only in terms of copper, the revenue contribution of
the gold metal has to be expressed in terms of its equivalent in copper. Taking the ratio of the
unit revenue from copper and the unit revenue from gold gives the copper equivalent of each
gram of gold per metric ton of ore. Thus, by adding the copper grade and the copper equivalent
of the gold grade, the total percent copper equivalent (Total %CuEq) grade of a material is
assessed. The copper equivalent of 1 gram gold per ton of material is 0.481 percent copper.
Currency Exchange Rate
The currency exchange rate is pegged at 40 Pesos to a US Dollar over the life of the project.
Cut-Off Grades
A cut-off grade of 0.317 Total %CuEq is applied in the estimation of ore reserve.
18.5.5 Cut-off Grade Determination
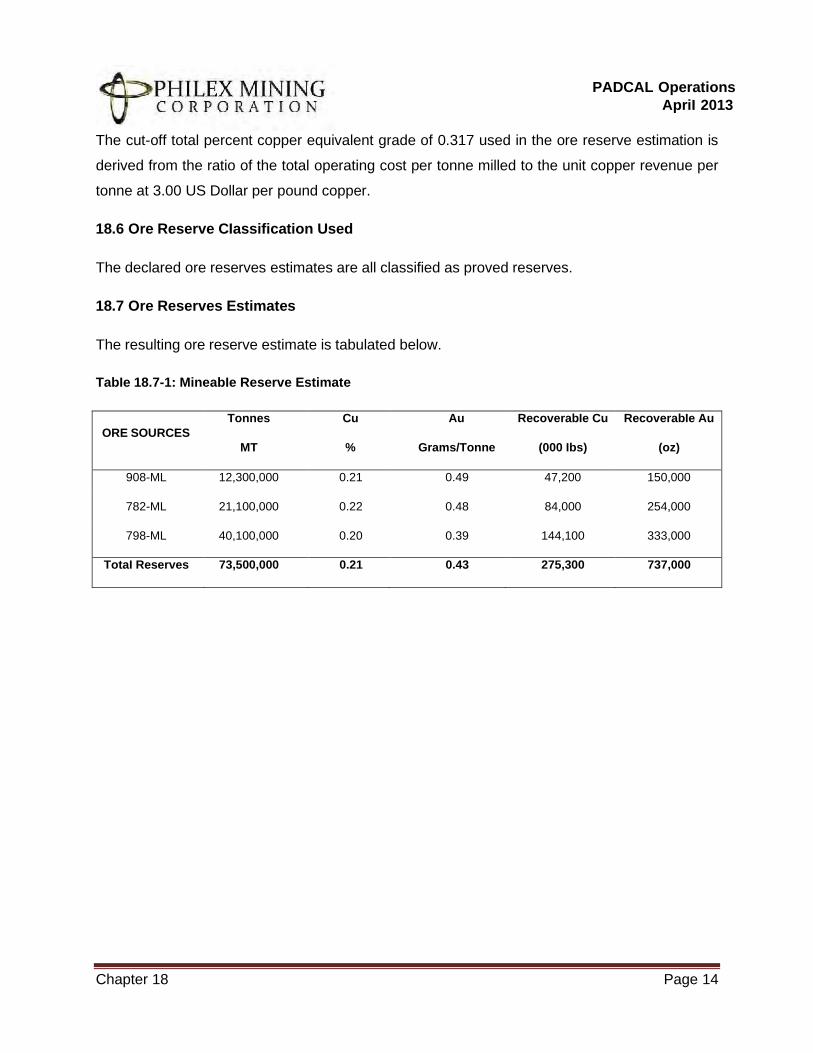
PADCAL Operations
ApriI 2013
Chapter 18 Page 14
The cut-off total percent copper equivalent grade of 0.317 used in the ore reserve estimation is
derived from the ratio of the total operating cost per tonne milled to the unit copper revenue per
tonne at 3.00 US Dollar per pound copper.
18.6 Ore Reserve CIassification Used
The declared ore reserves estimates are all classified as proved reserves.
18.7 Ore Reserves Estimates
The resulting ore reserve estimate is tabulated below.
TabIe 18.7-1: MineabIe Reserve Estimate
ORE SOURCES
Tonnes
MT
Cu
%
Au
Grams/Tonne
RecoverabIe Cu
(000 Ibs)
RecoverabIe Au
(oz)
908-ML 12,300,000 0.21 0.49 47,200 150,000
782-ML 21,100,000 0.22 0.48 84,000 254,000
798-ML 40,100,000 0.20 0.39 144,100 333,000
TotaI Reserves 73,500,000 0.21 0.43 275,300 737,000

PADCAL Operations
April 2013
Chapter 19.0
PADCAL Operations
ApriI 2013
Chapter 19 Page 1
19.0 INTERPRETATION AND CONCLUSIONS
19.1 Synthesis of aII the data
Philex owns and operate the Padcal mine in Tuba, Benguet, Philippines which lies in an
approved Mineral Processing Sharing Agreement (MPSA) mining tenement. The ore is mined
through an underground mining method called block caving at a rate close to 26,000 metric tons
per day. The mine transports the ore through an underground to surface conveyor which
operates all year round to deliver 9.4 million tons of ore per year to the mill.
Copper and gold is recovered using flotation process after crushing and grinding stages. The
final product of the whole operation is copper concentrates which are trucked to a concentrate
facility in Poro, La Union and shipped to smelters in Japan. In a year Padcal can produce 33
Million pounds of copper and 80 thousand ounces of gold.
Operations have been sustained for more than fifty years.
A new mineable reserve estimate was completed in February 2013 using a base case copper
price of 3 US Dollar per pound, gold price of 1,500 US Dollar per ounce and operating cost of
688 Pesos per ton of ore milled. Current copper has a wider positive margin to the base case
while the current gold price is closer.
The proven reserve estimate for Padcal at the end of 2012 is 73.5 million metric tonnes of ore
with grades of 0.21 percent copper and 0.43 gram gold per ton which when recovered will
equate to 275 Million pounds copper and 737 thousand ounces of gold. At a planned
production rate of 9.4 million metric tons per annum, the mine life will be 8 years.
Sustaining the mine life will require a capital cost of 8.94 Billion Pesos and when
analysed using a profit and loss projection would yield positive cashflow throughout the
mine life. Using Net Present Value (NPV) analysis with varying discount factors
representing worst, base and best cases, as all are positive, tells of the project’s
viability. The project also resulted to an acceptable Internal Rate of Return of 27
percent
PADCAL Operations
ApriI 2013
Chapter 19 Page 2
19.2 Discuss the adequacy of data, overaII data integrity and areas of uncertainty.
All information leading to the mineable reserve estimation was deemed adequate. Padcal has
been regularly updating the remaining reserves based on the actual mined in the previous year
which keeps the recorded information current.
Some uncertainties lie in these major aspects of the technical evaluation.
• The engineering works done to date in the design of TSF 4 are conceptual and would
require further studies to be made. Therefore the cost estimate for the facility is at least
plus or minus 25% off.
• Continuation of operation after the 4 month period granted by the Department of
Environment and Natural Resources (DENR)
• The volatility of metal prices in the market
19.3 OveraII concIusions by the CP
Overall, given the historical success of Padcal and the results of this evaluation, the
project is viable; hence the objectives set for this technical report have been met

PADCAL Operations
April 2013
Chapter 20.0
PADCAL Operations
ApriI 2013
Chapter 20 Page 1
20.0 RECOMMENDATIONS
The following recommendations are offered as a result of the evaluation.
• Continue the technical investigation of the proposed site for the Tailings Storage Facility
4 to arrive at a detailed design and a more robust estimate of the facility.
• Rehabilitate Tailings Storage Facility 3 as it is the only means to sustain operation,
particularly because TSF 4 is still currently in the engineering phase.
• Vicinity exploration must be pursued to take advantage of the current infrastructures as
well as the available skilled and technical manpower

PADCAL Operations
April 2013
Chapter 21.0
PADCAL Operations
ApriI 2013
Chapter 21 Page 1
21.0 REFERENCES
Amec, 2004, Draft Technical Report Padcal Mines, Philippines
Anonymous, 2005, Transcriptions from the Philex 50th Year Commemorative Video
Anonymous, 2010, Final Mine Decommissioning and Rehabilitation Plan
Anonymous, 2013, Philex Padcal Mine TSF 3 Rehabilitation and Clean-up Plan
Anonymous, 2013, Integrated Environmental Management Program
Anonymous, Annual Reports
Anonymous, Various Internal Reports
Austin, E.B. Jr., Dolipas, R.S. II, Nakihid, J.W. and Romero, V.G.A., 2009, Ore Hauling
Improvement in Philex Mining Corporation – Padcal Operations
Austin, E.B. Jr., Dolipas, R.S. II, Lumpias, J.W. and Romero, V.G.A., 2010, Philex Padcal Mine
– Highlights of Operation
Baluda, R.P. and Galapon, J.B., 2005, Geology of Sto. Tomas II Porphyry Copper Deposit-
Internal Report Philex Mining Corporation
Carandang, F.E.P., 2004, Average Grade of Backfilling Material at Subsidence Pit – Internal
Report
Cinco J.C. Jr., and Obial R.C., 2013, Technical Report Exploration Results and Mineral
Resources of the Sto. Tomas II Copper-Gold Deposit Located in Padcal, Tuba, Benguet
Province, Philippines
Dolipas, R.S. II, Romero, V.G.A. and Sta. Ana, AV, 2005, Ground Support System of Philex –
Padcal Block Cave Operations
Dolipas II, RS, 2000, Rock Mechanics as Applied in Philex Block Cave Operations
Pena, R.A., 1975, Brief Geology of a Portion of the Baguio Mineral District. Journal of the
Geological Society of the Philippines, Volume 24 Number 4
PADCAL Operations
ApriI 2013
Chapter 21 Page 2
Prangan, EL, et.al., 1995, Philex Mine Modernization Program: A Shift from Slushing to LHD
Block Cave Mining
Prangan, EL, Ricafort, LR, Son, JS+, 2013, Comprehensive Safety Program – Padcal
Operations
Victorino, R.S., 1999, Modified Geologic Model of the Sto. Thomas II Deposit, Philex Mining
Corporation Internal Report
Wikepedia, Wikepedia.org
Remaining Ore Reserve Estimation and
Feasibility Study of Padcal Operations
Annexes
By: Eulalio B. Austin Jr.,
P. Mining Engineer
April 30, 2013
PADCAL Operations
April 2013
Annex A: Mine
Annex A-1: List of Existing Machineries
and Equipment
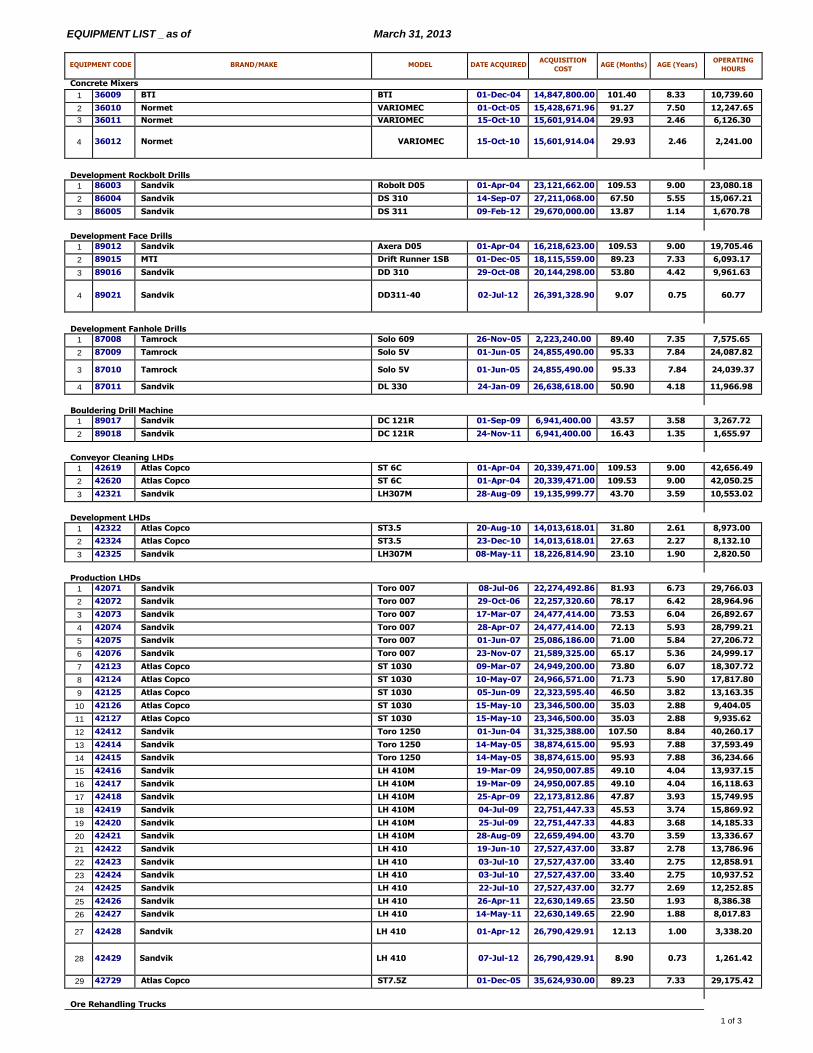
EQUIPMENT LIST _ as of March 31, 2013
1 of 3
EQUIPMENT CODE
BRAND/MAKE
MODEL
DATE ACQUIRED ACQUISITION
COST
AGE (Months)
AGE (Years) OPERATING
HOURS
Concrete Mixers
1 36009 BTI BTI 01-Dec-04 14,847,800.00 101.40 8.33 10,739.60
2 36010 Normet VARIOMEC 01-Oct-05 15,428,671.96 91.27 7.50 12,247.65
3 36011 Normet VARIOMEC 15-Oct-10 15,601,914.04 29.93 2.46 6,126.30
4
36012
Normet
VARIOMEC
15-Oct-10
15,601,914.04
29.93
2.46
2,241.00
Development Rockbolt Drills
1 86003 Sandvik Robolt D05 01-Apr-04 23,121,662.00 109.53 9.00 23,080.18
2 86004 Sandvik DS 310 14-Sep-07 27,211,068.00 67.50 5.55 15,067.21
3 86005 Sandvik DS 311 09-Feb-12 29,670,000.00 13.87 1.14 1,670.78
Development Face Drills
1 89012 Sandvik Axera D05 01-Apr-04 16,218,623.00 109.53 9.00 19,705.46
2 89015 MTI Drift Runner 1SB 01-Dec-05 18,115,559.00 89.23 7.33 6,093.17
3 89016 Sandvik DD 310 29-Oct-08 20,144,298.00 53.80 4.42 9,961.63
4
89021
Sandvik
DD311-40
02-Jul-12
26,391,328.90
9.07
0.75
60.77
Development Fanhole Drills
1 87008 Tamrock Solo 609 26-Nov-05 2,223,240.00 89.40 7.35 7,575.65
2 87009 Tamrock Solo 5V 01-Jun-05 24,855,490.00 95.33 7.84 24,087.82
3 87010 Tamrock Solo 5V 01-Jun-05 24,855,490.00 95.33 7.84 24,039.37
4 87011 Sandvik DL 330 24-Jan-09 26,638,618.00 50.90 4.18 11,966.98
Bouldering Drill Machine
1 89017 Sandvik DC 121R 01-Sep-09 6,941,400.00 43.57 3.58 3,267.72
2 89018 Sandvik DC 121R 24-Nov-11 6,941,400.00 16.43 1.35 1,655.97
Conveyor Cleaning LHDs
1 42619 Atlas Copco ST 6C 01-Apr-04 20,339,471.00 109.53 9.00 42,656.49
2 42620 Atlas Copco ST 6C 01-Apr-04 20,339,471.00 109.53 9.00 42,050.25
3 42321 Sandvik LH307M 28-Aug-09 19,135,999.77 43.70 3.59 10,553.02
Development LHDs
1 42322 Atlas Copco ST3.5 20-Aug-10 14,013,618.01 31.80 2.61 8,973.00
2 42324 Atlas Copco ST3.5 23-Dec-10 14,013,618.01 27.63 2.27 8,132.10
3 42325 Sandvik LH307M 08-May-11 18,226,814.90 23.10 1.90 2,820.50
Production LHDs
1 42071 Sandvik Toro 007 08-Jul-06 22,274,492.86 81.93 6.73 29,766.03
2 42072 Sandvik Toro 007 29-Oct-06 22,257,320.60 78.17 6.42 28,964.96
3 42073 Sandvik Toro 007 17-Mar-07 24,477,414.00 73.53 6.04 26,892.67
4 42074 Sandvik Toro 007 28-Apr-07 24,477,414.00 72.13 5.93 28,799.21
5 42075 Sandvik Toro 007 01-Jun-07 25,086,186.00 71.00 5.84 27,206.72
6 42076 Sandvik Toro 007 23-Nov-07 21,589,325.00 65.17 5.36 24,999.17
7 42123 Atlas Copco ST 1030 09-Mar-07 24,949,200.00 73.80 6.07 18,307.72
8 42124 Atlas Copco ST 1030 10-May-07 24,966,571.00 71.73 5.90 17,817.80
9 42125 Atlas Copco ST 1030 05-Jun-09 22,323,595.40 46.50 3.82 13,163.35
10 42126 Atlas Copco ST 1030 15-May-10 23,346,500.00 35.03 2.88 9,404.05
11 42127 Atlas Copco ST 1030 15-May-10 23,346,500.00 35.03 2.88 9,935.62
12 42412 Sandvik Toro 1250 01-Jun-04 31,325,388.00 107.50 8.84 40,260.17
13 42414 Sandvik Toro 1250 14-May-05 38,874,615.00 95.93 7.88 37,593.49
14 42415 Sandvik Toro 1250 14-May-05 38,874,615.00 95.93 7.88 36,234.66
15 42416 Sandvik LH 410M 19-Mar-09 24,950,007.85 49.10 4.04 13,937.15
16 42417 Sandvik LH 410M 19-Mar-09 24,950,007.85 49.10 4.04 16,118.63
17 42418 Sandvik LH 410M 25-Apr-09 22,173,812.86 47.87 3.93 15,749.95
18 42419 Sandvik LH 410M 04-Jul-09 22,751,447.33 45.53 3.74 15,869.92
19 42420 Sandvik LH 410M 25-Jul-09 22,751,447.33 44.83 3.68 14,185.33
20 42421 Sandvik LH 410M 28-Aug-09 22,659,494.00 43.70 3.59 13,336.67
21 42422 Sandvik LH 410 19-Jun-10 27,527,437.00 33.87 2.78 13,786.96
22 42423 Sandvik LH 410 03-Jul-10 27,527,437.00 33.40 2.75 12,858.91
23 42424 Sandvik LH 410 03-Jul-10 27,527,437.00 33.40 2.75 10,937.52
24 42425 Sandvik LH 410 22-Jul-10 27,527,437.00 32.77 2.69 12,252.85
25 42426 Sandvik LH 410 26-Apr-11 22,630,149.65 23.50 1.93 8,386.38
26 42427 Sandvik LH 410 14-May-11 22,630,149.65 22.90 1.88 8,017.83
27 42428 Sandvik LH 410 01-Apr-12 26,790,429.91 12.13 1.00 3,338.20
28
42429
Sandvik
LH 410
07-Jul-12
26,790,429.91
8.90
0.73
1,261.42
29 42729 Atlas Copco ST7.5Z 01-Dec-05 35,624,930.00 89.23 7.33 29,175.42
Ore Rehandling Trucks
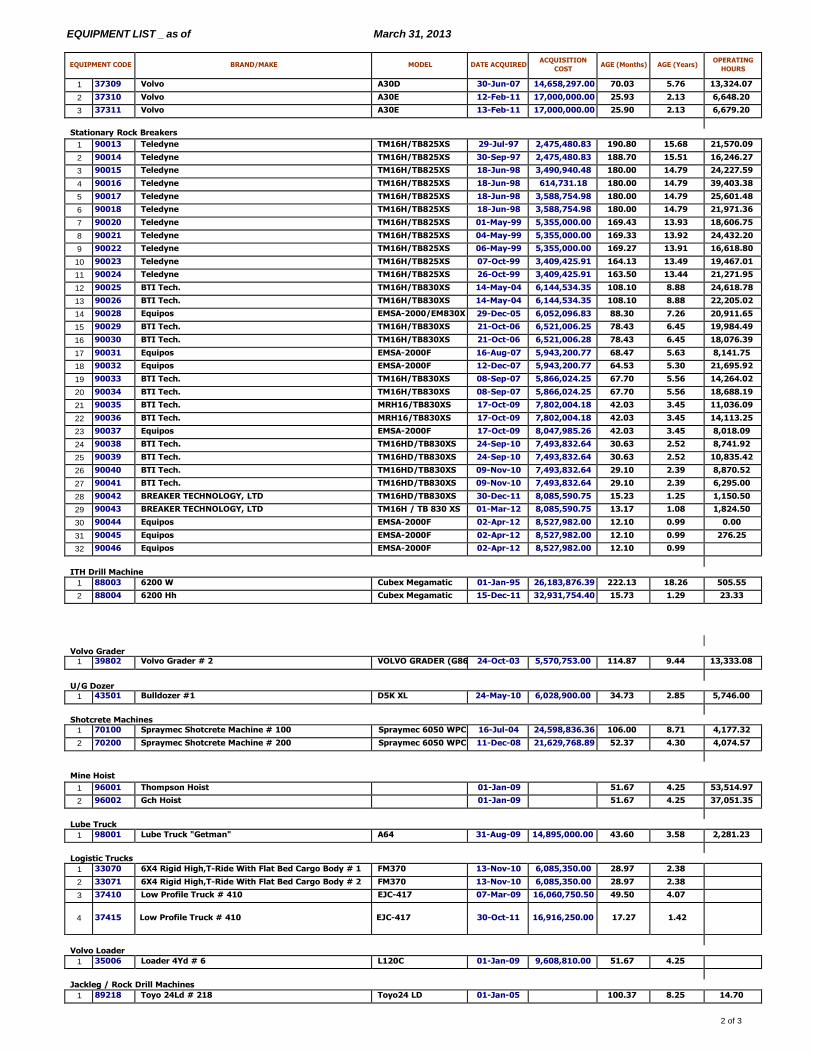
EQUIPMENT LIST _ as of March 31, 2013
2 of 3
EQUIPMENT CODE
BRAND/MAKE
MODEL
DATE ACQUIRED ACQUISITION
COST
AGE (Months)
AGE (Years) OPERATING
HOURS
1 37309 Volvo A30D 30-Jun-07 14,658,297.00 70.03 5.76 13,324.07
2 37310 Volvo A30E 12-Feb-11 17,000,000.00 25.93 2.13 6,648.20
3 37311 Volvo A30E 13-Feb-11 17,000,000.00 25.90 2.13 6,679.20
Stationary Rock Breakers
1 90013 Teledyne TM16H/TB825XS 29-Jul-97 2,475,480.83 190.80 15.68 21,570.09
2 90014 Teledyne TM16H/TB825XS 30-Sep-97 2,475,480.83 188.70 15.51 16,246.27
3 90015 Teledyne TM16H/TB825XS 18-Jun-98 3,490,940.48 180.00 14.79 24,227.59
4 90016 Teledyne TM16H/TB825XS 18-Jun-98 614,731.18 180.00 14.79 39,403.38
5 90017 Teledyne TM16H/TB825XS 18-Jun-98 3,588,754.98 180.00 14.79 25,601.48
6 90018 Teledyne TM16H/TB825XS 18-Jun-98 3,588,754.98 180.00 14.79 21,971.36
7 90020 Teledyne TM16H/TB825XS 01-May-99 5,355,000.00 169.43 13.93 18,606.75
8 90021 Teledyne TM16H/TB825XS 04-May-99 5,355,000.00 169.33 13.92 24,432.20
9 90022 Teledyne TM16H/TB825XS 06-May-99 5,355,000.00 169.27 13.91 16,618.80
10 90023 Teledyne TM16H/TB825XS 07-Oct-99 3,409,425.91 164.13 13.49 19,467.01
11 90024 Teledyne TM16H/TB825XS 26-Oct-99 3,409,425.91 163.50 13.44 21,271.95
12 90025 BTI Tech. TM16H/TB830XS 14-May-04 6,144,534.35 108.10 8.88 24,618.78
13 90026 BTI Tech. TM16H/TB830XS 14-May-04 6,144,534.35 108.10 8.88 22,205.02
14 90028 Equipos EMSA-2000/EM830X 29-Dec-05 6,052,096.83 88.30 7.26 20,911.65
15 90029 BTI Tech. TM16H/TB830XS 21-Oct-06 6,521,006.25 78.43 6.45 19,984.49
16 90030 BTI Tech. TM16H/TB830XS 21-Oct-06 6,521,006.28 78.43 6.45 18,076.39
17 90031 Equipos EMSA-2000F 16-Aug-07 5,943,200.77 68.47 5.63 8,141.75
18 90032 Equipos EMSA-2000F 12-Dec-07 5,943,200.77 64.53 5.30 21,695.92
19 90033 BTI Tech. TM16H/TB830XS 08-Sep-07 5,866,024.25 67.70 5.56 14,264.02
20 90034 BTI Tech. TM16H/TB830XS 08-Sep-07 5,866,024.25 67.70 5.56 18,688.19
21 90035 BTI Tech. MRH16/TB830XS 17-Oct-09 7,802,004.18 42.03 3.45 11,036.09
22 90036 BTI Tech. MRH16/TB830XS 17-Oct-09 7,802,004.18 42.03 3.45 14,113.25
23 90037 Equipos EMSA-2000F 17-Oct-09 8,047,985.26 42.03 3.45 8,018.09
24 90038 BTI Tech. TM16HD/TB830XS 24-Sep-10 7,493,832.64 30.63 2.52 8,741.92
25 90039 BTI Tech. TM16HD/TB830XS 24-Sep-10 7,493,832.64 30.63 2.52 10,835.42
26 90040 BTI Tech. TM16HD/TB830XS 09-Nov-10 7,493,832.64 29.10 2.39 8,870.52
27 90041 BTI Tech. TM16HD/TB830XS 09-Nov-10 7,493,832.64 29.10 2.39 6,295.00
28 90042 BREAKER TECHNOLOGY, LTD TM16HD/TB830XS 30-Dec-11 8,085,590.75 15.23 1.25 1,150.50
29 90043 BREAKER TECHNOLOGY, LTD TM16H / TB 830 XS 01-Mar-12 8,085,590.75 13.17 1.08 1,824.50
30 90044 Equipos EMSA-2000F 02-Apr-12 8,527,982.00 12.10 0.99 0.00
31 90045 Equipos EMSA-2000F 02-Apr-12 8,527,982.00 12.10 0.99 276.25
32 90046 Equipos EMSA-2000F 02-Apr-12 8,527,982.00 12.10 0.99
ITH Drill Machine
1 88003 6200 W Cubex Megamatic 01-Jan-95 26,183,876.39 222.13 18.26 505.55
2 88004 6200 Hh Cubex Megamatic 15-Dec-11 32,931,754.40 15.73 1.29 23.33
Volvo Grader
1 39802 Volvo Grader # 2 VOLVO GRADER (G86 24-Oct-03 5,570,753.00 114.87 9.44 13,333.08
U/G Dozer
1 43501 Bulldozer #1 D5K XL 24-May-10 6,028,900.00 34.73 2.85 5,746.00
Shotcrete Machines
1 70100 Spraymec Shotcrete Machine # 100 Spraymec 6050 WPC 16-Jul-04 24,598,836.36 106.00 8.71 4,177.32
2 70200 Spraymec Shotcrete Machine # 200 Spraymec 6050 WPC 11-Dec-08 21,629,768.89 52.37 4.30 4,074.57
Mine Hoist
1 96001 Thompson Hoist 01-Jan-09 51.67 4.25 53,514.97
2 96002 Gch Hoist 01-Jan-09 51.67 4.25 37,051.35
Lube Truck
1 98001 Lube Truck "Getman" A64 31-Aug-09 14,895,000.00 43.60 3.58 2,281.23
Logistic Trucks
1 33070 6X4 Rigid High,T-Ride With Flat Bed Cargo Body # 1 FM370 13-Nov-10 6,085,350.00 28.97 2.38
2 33071 6X4 Rigid High,T-Ride With Flat Bed Cargo Body # 2 FM370 13-Nov-10 6,085,350.00 28.97 2.38
3 37410 Low Profile Truck # 410 EJC-417 07-Mar-09 16,060,750.50 49.50 4.07
4
37415
Low Profile Truck # 410
EJC-417
30-Oct-11
16,916,250.00
17.27
1.42
Volvo Loader
1 35006 Loader 4Yd # 6 L120C 01-Jan-09 9,608,810.00 51.67 4.25
Jackleg / Rock Drill Machines
1 89218 Toyo 24Ld # 218 Toyo24 LD 01-Jan-05 100.37 8.25 14.70
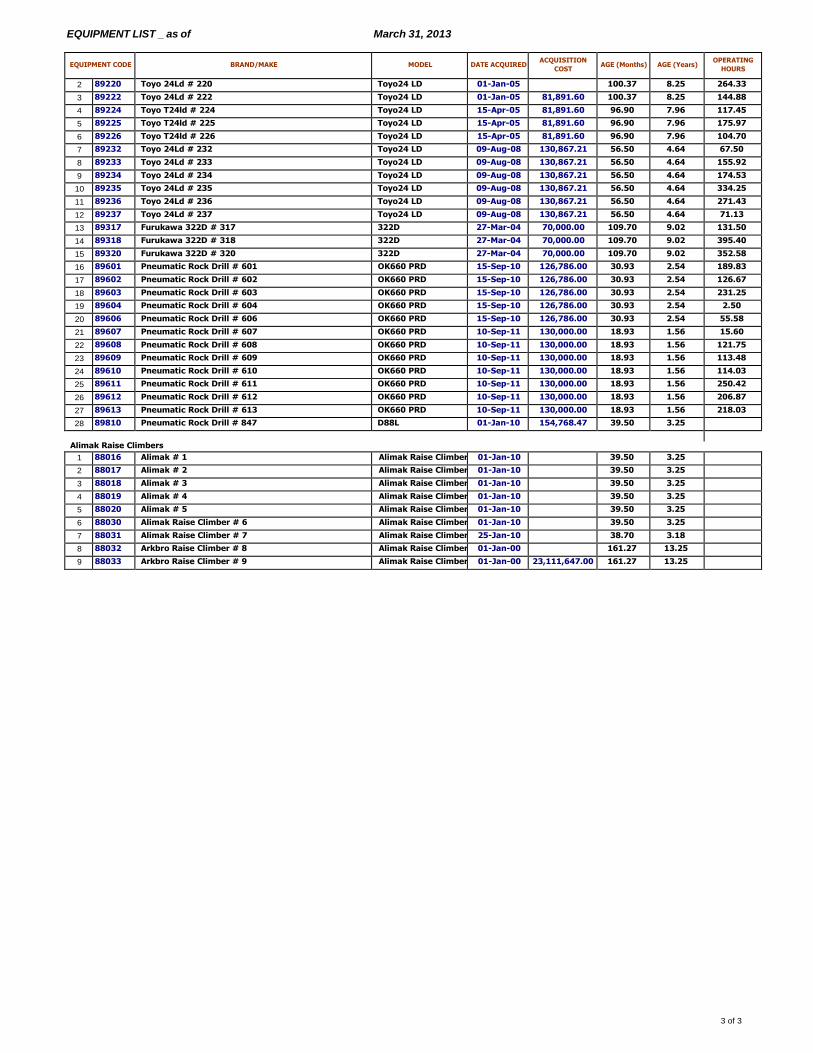
EQUIPMENT LIST _ as of March 31, 2013
3 of 3
EQUIPMENT CODE
BRAND/MAKE
MODEL
DATE ACQUIRED ACQUISITION
COST
AGE (Months)
AGE (Years) OPERATING
HOURS
2 89220 Toyo 24Ld # 220 Toyo24 LD 01-Jan-05 100.37 8.25 264.33
3 89222 Toyo 24Ld # 222 Toyo24 LD 01-Jan-05 81,891.60 100.37 8.25 144.88
4 89224 Toyo T24ld # 224 Toyo24 LD 15-Apr-05 81,891.60 96.90 7.96 117.45
5 89225 Toyo T24ld # 225 Toyo24 LD 15-Apr-05 81,891.60 96.90 7.96 175.97
6 89226 Toyo T24ld # 226 Toyo24 LD 15-Apr-05 81,891.60 96.90 7.96 104.70
7 89232 Toyo 24Ld # 232 Toyo24 LD 09-Aug-08 130,867.21 56.50 4.64 67.50
8 89233 Toyo 24Ld # 233 Toyo24 LD 09-Aug-08 130,867.21 56.50 4.64 155.92
9 89234 Toyo 24Ld # 234 Toyo24 LD 09-Aug-08 130,867.21 56.50 4.64 174.53
10 89235 Toyo 24Ld # 235 Toyo24 LD 09-Aug-08 130,867.21 56.50 4.64 334.25
11 89236 Toyo 24Ld # 236 Toyo24 LD 09-Aug-08 130,867.21 56.50 4.64 271.43
12 89237 Toyo 24Ld # 237 Toyo24 LD 09-Aug-08 130,867.21 56.50 4.64 71.13
13 89317 Furukawa 322D # 317 322D 27-Mar-04 70,000.00 109.70 9.02 131.50
14 89318 Furukawa 322D # 318 322D 27-Mar-04 70,000.00 109.70 9.02 395.40
15 89320 Furukawa 322D # 320 322D 27-Mar-04 70,000.00 109.70 9.02 352.58
16 89601 Pneumatic Rock Drill # 601 OK660 PRD 15-Sep-10 126,786.00 30.93 2.54 189.83
17 89602 Pneumatic Rock Drill # 602 OK660 PRD 15-Sep-10 126,786.00 30.93 2.54 126.67
18 89603 Pneumatic Rock Drill # 603 OK660 PRD 15-Sep-10 126,786.00 30.93 2.54 231.25
19 89604 Pneumatic Rock Drill # 604 OK660 PRD 15-Sep-10 126,786.00 30.93 2.54 2.50
20 89606 Pneumatic Rock Drill # 606 OK660 PRD 15-Sep-10 126,786.00 30.93 2.54 55.58
21 89607 Pneumatic Rock Drill # 607 OK660 PRD 10-Sep-11 130,000.00 18.93 1.56 15.60
22 89608 Pneumatic Rock Drill # 608 OK660 PRD 10-Sep-11 130,000.00 18.93 1.56 121.75
23 89609 Pneumatic Rock Drill # 609 OK660 PRD 10-Sep-11 130,000.00 18.93 1.56 113.48
24 89610 Pneumatic Rock Drill # 610 OK660 PRD 10-Sep-11 130,000.00 18.93 1.56 114.03
25 89611 Pneumatic Rock Drill # 611 OK660 PRD 10-Sep-11 130,000.00 18.93 1.56 250.42
26 89612 Pneumatic Rock Drill # 612 OK660 PRD 10-Sep-11 130,000.00 18.93 1.56 206.87
27 89613 Pneumatic Rock Drill # 613 OK660 PRD 10-Sep-11 130,000.00 18.93 1.56 218.03
28 89810 Pneumatic Rock Drill # 847 D88L 01-Jan-10 154,768.47 39.50 3.25
Alimak Raise Climbers
1 88016 Alimak # 1 Alimak Raise Climber 01-Jan-10 39.50 3.25
2 88017 Alimak # 2 Alimak Raise Climber 01-Jan-10 39.50 3.25
3 88018 Alimak # 3 Alimak Raise Climber 01-Jan-10 39.50 3.25
4 88019 Alimak # 4 Alimak Raise Climber 01-Jan-10 39.50 3.25
5 88020 Alimak # 5 Alimak Raise Climber 01-Jan-10 39.50 3.25
6 88030 Alimak Raise Climber # 6 Alimak Raise Climber 01-Jan-10 39.50 3.25
7 88031 Alimak Raise Climber # 7 Alimak Raise Climber 25-Jan-10 38.70 3.18
8 88032 Arkbro Raise Climber # 8 Alimak Raise Climber 01-Jan-00 161.27 13.25
9 88033 Arkbro Raise Climber # 9 Alimak Raise Climber 01-Jan-00 23,111,647.00 161.27 13.25
PADCAL Operations
April 2013
Annex A: Mine
Annex A-2: Development Cost Indices
Details
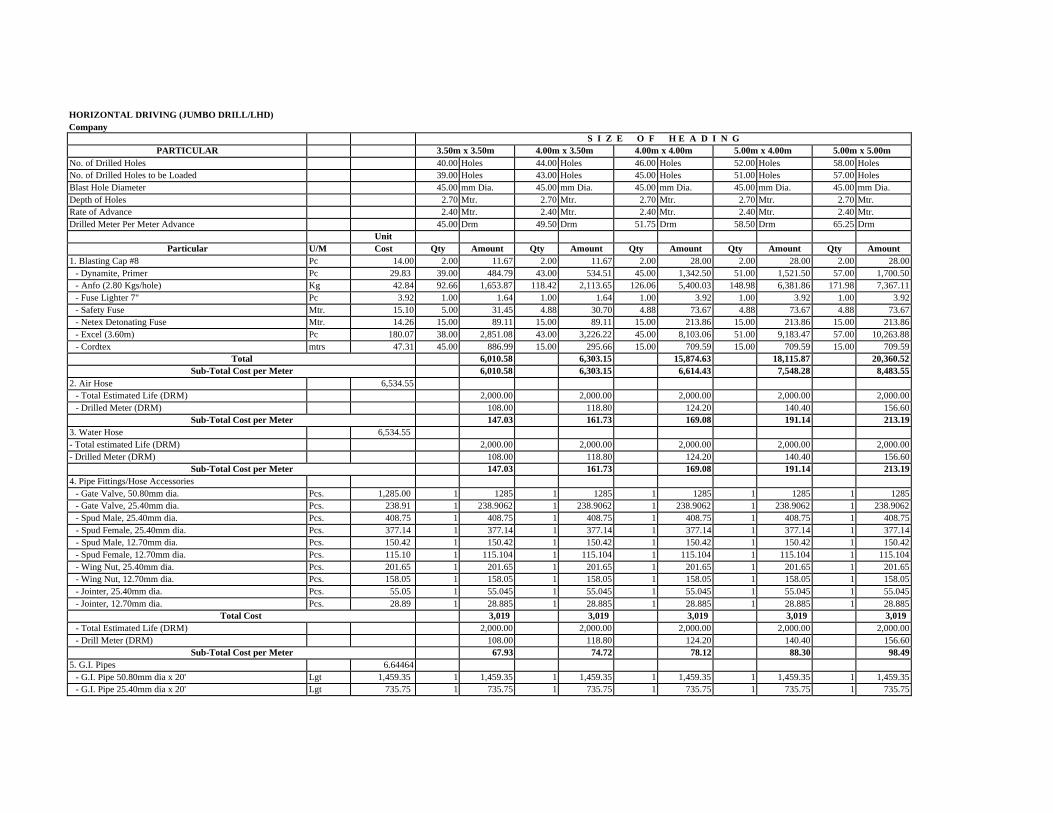
HORIZONTAL DRIVING (JUMBO DRILL/LHD)
Company S I Z E O F H E A D I N G
PARTICULAR 3.50m x 3.50m 4.00m x 3.50m 4.00m x 4.00m 5.00m x 4.00m 5.00m x 5.00m
No. of Drilled Holes 40.00 Holes 44.00 Holes 46.00 Holes 52.00 Holes 58.00 Holes
No. of Drilled Holes to be Loaded 39.00 Holes 43.00 Holes 45.00 Holes 51.00 Holes 57.00 Holes
Blast Hole Diameter 45.00 mm Dia. 45.00 mm Dia. 45.00 mm Dia. 45.00 mm Dia. 45.00 mm Dia.
Depth of Holes 2.70 Mtr. 2.70 Mtr. 2.70 Mtr. 2.70 Mtr. 2.70 Mtr.
Rate of Advance 2.40 Mtr. 2.40 Mtr. 2.40 Mtr. 2.40 Mtr. 2.40 Mtr.
Drilled Meter Per Meter Advance 45.00 Drm 49.50 Drm 51.75 Drm 58.50 Drm 65.25 Drm Unit
Particular U/M Cost Qty Amount Qty Amount Qty Amount Qty Amount Qty Amount
1. Blasting Cap #8 Pc 14.00 2.00 11.67 2.00 11.67 2.00 28.00 2.00 28.00 2.00 28.00
- Dynamite, Primer Pc 29.83 39.00 484.79 43.00 534.51 45.00 1,342.50 51.00 1,521.50 57.00 1,700.50
- Anfo (2.80 Kgs/hole) Kg 42.84 92.66 1,653.87 118.42 2,113.65 126.06 5,400.03 148.98 6,381.86 171.98 7,367.11
- Fuse Lighter 7" Pc 3.92 1.00 1.64 1.00 1.64 1.00 3.92 1.00 3.92 1.00 3.92
- Safety Fuse Mtr. 15.10 5.00 31.45 4.88 30.70 4.88 73.67 4.88 73.67 4.88 73.67
- Netex Detonating Fuse Mtr. 14.26 15.00 89.11 15.00 89.11 15.00 213.86 15.00 213.86 15.00 213.86
- Excel (3.60m) Pc 180.07 38.00 2,851.08 43.00 3,226.22 45.00 8,103.06 51.00 9,183.47 57.00 10,263.88
- Cordtex mtrs 47.31 45.00 886.99 15.00 295.66 15.00 709.59 15.00 709.59 15.00 709.59
Total 6,010.58 6,303.15 15,874.63 18,115.87 20,360.52
Sub-Total Cost per Meter 6,010.58 6,303.15 6,614.43 7,548.28 8,483.55
2. Air Hose 6,534.55
- Total Estimated Life (DRM) 2,000.00 2,000.00 2,000.00 2,000.00 2,000.00
- Drilled Meter (DRM) 108.00 118.80 124.20 140.40 156.60
Sub-Total Cost per Meter 147.03 161.73 169.08 191.14 213.19
3. Water Hose 6,534.55
- Total estimated Life (DRM) 2,000.00 2,000.00 2,000.00 2,000.00 2,000.00
- Drilled Meter (DRM) 108.00 118.80 124.20 140.40 156.60
Sub-Total Cost per Meter 147.03 161.73 169.08 191.14 213.19
4. Pipe Fittings/Hose Accessories
- Gate Valve, 50.80mm dia. Pcs. 1,285.00 1 1285 1 1285 1 1285 1 1285 1 1285
- Gate Valve, 25.40mm dia. Pcs. 238.91 1 238.9062 1 238.9062 1 238.9062 1 238.9062 1 238.9062
- Spud Male, 25.40mm dia. Pcs. 408.75 1 408.75 1 408.75 1 408.75 1 408.75 1 408.75
- Spud Female, 25.40mm dia. Pcs. 377.14 1 377.14 1 377.14 1 377.14 1 377.14 1 377.14
- Spud Male, 12.70mm dia. Pcs. 150.42 1 150.42 1 150.42 1 150.42 1 150.42 1 150.42
- Spud Female, 12.70mm dia. Pcs. 115.10 1 115.104 1 115.104 1 115.104 1 115.104 1 115.104
- Wing Nut, 25.40mm dia. Pcs. 201.65 1 201.65 1 201.65 1 201.65 1 201.65 1 201.65
- Wing Nut, 12.70mm dia. Pcs. 158.05 1 158.05 1 158.05 1 158.05 1 158.05 1 158.05
- Jointer, 25.40mm dia. Pcs. 55.05 1 55.045 1 55.045 1 55.045 1 55.045 1 55.045
- Jointer, 12.70mm dia. Pcs. 28.89 1 28.885 1 28.885 1 28.885 1 28.885 1 28.885
Total Cost 3,019 3,019 3,019 3,019 3,019
- Total Estimated Life (DRM) 2,000.00 2,000.00 2,000.00 2,000.00 2,000.00
- Drill Meter (DRM) 108.00 118.80 124.20 140.40 156.60
Sub-Total Cost per Meter 67.93 74.72 78.12 88.30 98.49
5. G.I. Pipes 6.64464
- G.I. Pipe 50.80mm dia x 20' Lgt 1,459.35 1 1,459.35 1 1,459.35 1 1,459.35 1 1,459.35 1 1,459.35
- G.I. Pipe 25.40mm dia x 20' Lgt 735.75 1 735.75 1 735.75 1 735.75 1 735.75 1 735.75
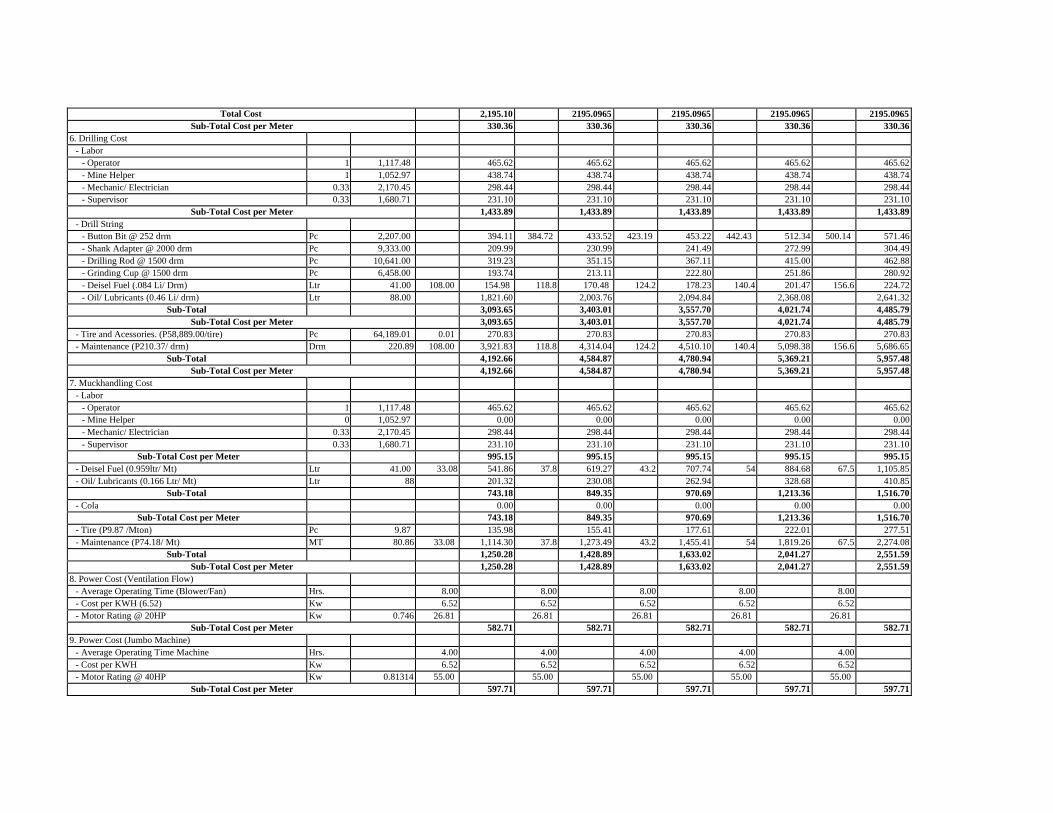
Total Cost 2,195.10 2195.0965 2195.0965 2195.0965 2195.0965
Sub-Total Cost per Meter 330.36 330.36 330.36 330.36 330.36
6. Drilling Cost
- Labor
- Operator 1 1,117.48 465.62 465.62 465.62 465.62 465.62
- Mine Helper 1 1,052.97 438.74 438.74 438.74 438.74 438.74
- Mechanic/ Electrician 0.33 2,170.45 298.44 298.44 298.44 298.44 298.44
- Supervisor 0.33 1,680.71 231.10 231.10 231.10 231.10 231.10
Sub-Total Cost per Meter 1,433.89 1,433.89 1,433.89 1,433.89 1,433.89
- Drill String
- Button Bit @ 252 drm Pc 2,207.00 394.11 384.72 433.52 423.19 453.22 442.43 512.34 500.14 571.46
- Shank Adapter @ 2000 drm Pc 9,333.00 209.99 230.99 241.49 272.99 304.49
- Drilling Rod @ 1500 drm Pc 10,641.00 319.23 351.15 367.11 415.00 462.88
- Grinding Cup @ 1500 drm Pc 6,458.00 193.74 213.11 222.80 251.86 280.92
- Deisel Fuel (.084 Li/ Drm) Ltr 41.00 108.00 154.98 118.8 170.48 124.2 178.23 140.4 201.47 156.6 224.72
- Oil/ Lubricants (0.46 Li/ drm) Ltr 88.00 1,821.60 2,003.76 2,094.84 2,368.08 2,641.32
Sub-Total 3,093.65 3,403.01 3,557.70 4,021.74 4,485.79
Sub-Total Cost per Meter 3,093.65 3,403.01 3,557.70 4,021.74 4,485.79
- Tire and Acessories. (P58,889.00/tire) Pc 64,189.01 0.01 270.83 270.83 270.83 270.83 270.83
- Maintenance (P210.37/ drm) Drm 220.89 108.00 3,921.83 118.8 4,314.04 124.2 4,510.10 140.4 5,098.38 156.6 5,686.65
Sub-Total 4,192.66 4,584.87 4,780.94 5,369.21 5,957.48
Sub-Total Cost per Meter 4,192.66 4,584.87 4,780.94 5,369.21 5,957.48
7. Muckhandling Cost
- Labor
- Operator 1 1,117.48 465.62 465.62 465.62 465.62 465.62
- Mine Helper 0 1,052.97 0.00 0.00 0.00 0.00 0.00
- Mechanic/ Electrician 0.33 2,170.45 298.44 298.44 298.44 298.44 298.44
- Supervisor 0.33 1,680.71 231.10 231.10 231.10 231.10 231.10
Sub-Total Cost per Meter 995.15 995.15 995.15 995.15 995.15
- Deisel Fuel (0.959ltr/ Mt) Ltr 41.00 33.08 541.86 37.8 619.27 43.2 707.74 54 884.68 67.5 1,105.85
- Oil/ Lubricants (0.166 Ltr/ Mt) Ltr 88 201.32 230.08 262.94 328.68 410.85
Sub-Total 743.18 849.35 970.69 1,213.36 1,516.70
- Cola 0.00 0.00 0.00 0.00 0.00
Sub-Total Cost per Meter 743.18 849.35 970.69 1,213.36 1,516.70
- Tire (P9.87 /Mton) Pc 9.87 135.98 155.41 177.61 222.01 277.51
- Maintenance (P74.18/ Mt) MT 80.86 33.08 1,114.30 37.8 1,273.49 43.2 1,455.41 54 1,819.26 67.5 2,274.08
Sub-Total 1,250.28 1,428.89 1,633.02 2,041.27 2,551.59
Sub-Total Cost per Meter 1,250.28 1,428.89 1,633.02 2,041.27 2,551.59
8. Power Cost (Ventilation Flow)
- Average Operating Time (Blower/Fan) Hrs. 8.00 8.00 8.00 8.00 8.00
- Cost per KWH (6.52) Kw 6.52 6.52 6.52 6.52 6.52
- Motor Rating @ 20HP Kw 0.746 26.81 26.81 26.81 26.81 26.81
Sub-Total Cost per Meter 582.71 582.71 582.71 582.71 582.71
9. Power Cost (Jumbo Machine)
- Average Operating Time Machine Hrs. 4.00 4.00 4.00 4.00 4.00
- Cost per KWH Kw 6.52 6.52 6.52 6.52 6.52
- Motor Rating @ 40HP Kw 0.81314 55.00 55.00 55.00 55.00 55.00
Sub-Total Cost per Meter 597.71 597.71 597.71 597.71 597.71
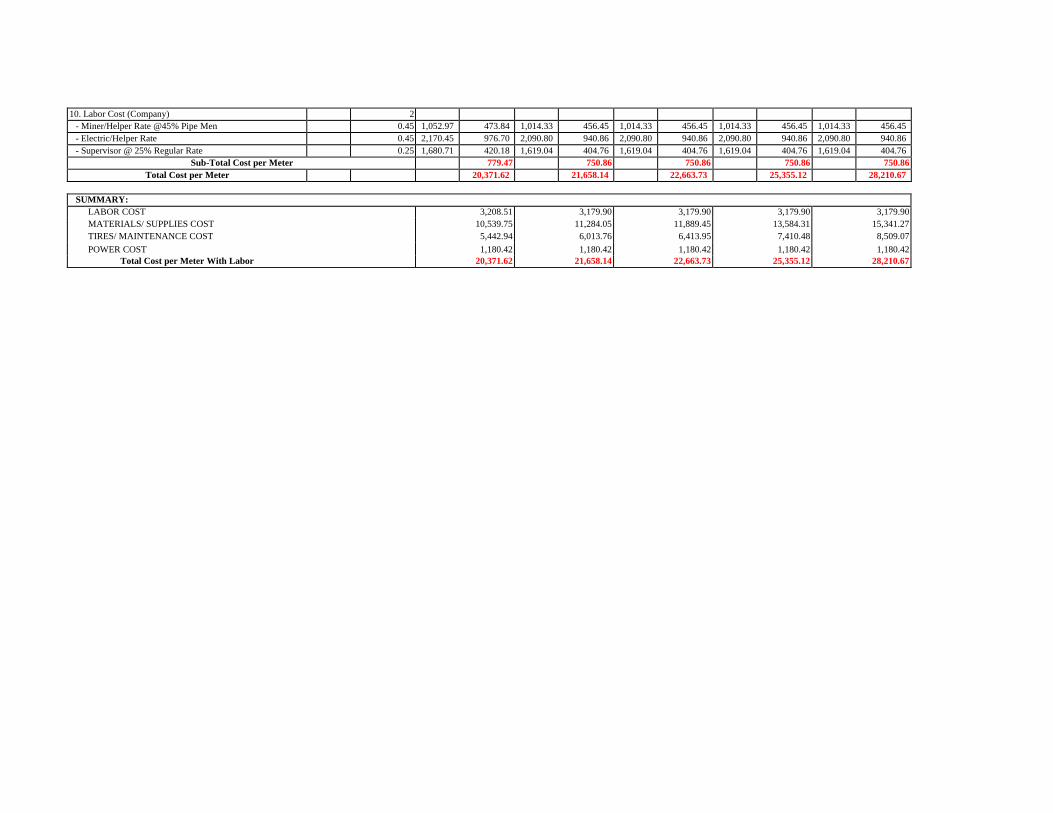
10. Labor Cost (Company) 2
- Miner/Helper Rate @45% Pipe Men 0.45 1,052.97 473.84 1,014.33 456.45 1,014.33 456.45 1,014.33 456.45 1,014.33 456.45
- Electric/Helper Rate 0.45 2,170.45 976.70 2,090.80 940.86 2,090.80 940.86 2,090.80 940.86 2,090.80 940.86
- Supervisor @ 25% Regular Rate 0.25 1,680.71 420.18 1,619.04 404.76 1,619.04 404.76 1,619.04 404.76 1,619.04 404.76
Sub-Total Cost per Meter 779.47 750.86 750.86 750.86 750.86
Total Cost per Meter 20,371.62 21,658.14 22,663.73 25,355.12 28,210.67
SUMMARY:
LABOR COST 3,208.51 3,179.90 3,179.90 3,179.90 3,179.90
MATERIALS/ SUPPLIES COST 10,539.75 11,284.05 11,889.45 13,584.31 15,341.27
TIRES/ MAINTENANCE COST 5,442.94 6,013.76 6,413.95 7,410.48 8,509.07
POWER COST 1,180.42 1,180.42 1,180.42 1,180.42 1,180.42
Total Cost per Meter With Labor 20,371.62 21,658.14 22,663.73 25,355.12 28,210.67
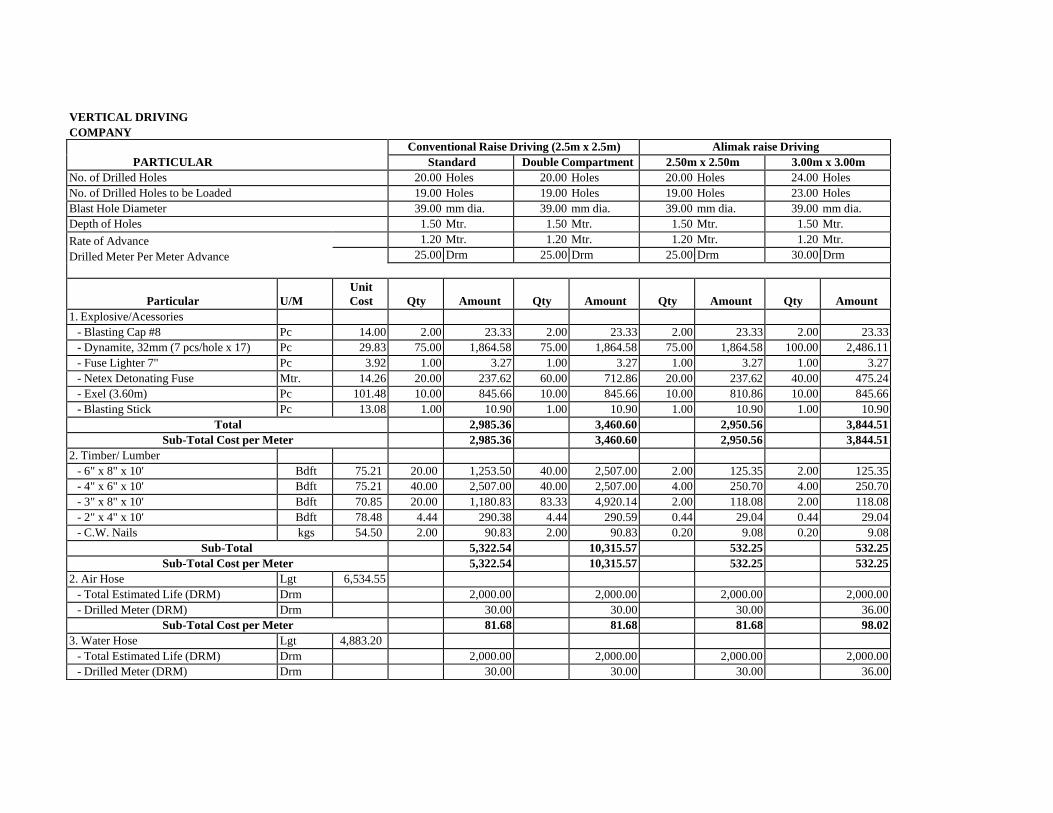
VERTICAL DRIVING
COMPANY
PARTICULAR
Conventional Raise Driving (2.5m x 2.5m) Alimak raise Driving
Standard Double Compartment 2.50m x 2.50m 3.00m x 3.00m
No. of Drilled Holes 20.00 Holes 20.00 Holes 20.00 Holes 24.00 Holes
No. of Drilled Holes to be Loaded 19.00 Holes 19.00 Holes 19.00 Holes 23.00 Holes
Blast Hole Diameter 39.00 mm dia. 39.00 mm dia. 39.00 mm dia. 39.00 mm dia.
Depth of Holes 1.50 Mtr. 1.50 Mtr. 1.50 Mtr. 1.50 Mtr.
Rate of Advance
Drilled Meter Per Meter Advance
1.20 Mtr. 1.20 Mtr. 1.20 Mtr. 1.20 Mtr. 25.00 Drm 25.00 Drm 25.00 Drm 30.00 Drm
Particular
U/M
Unit
Cost
Qty
Amount
Qty
Amount
Qty
Amount
Qty
Amount
1. Explosive/Acessories
- Blasting Cap #8 Pc 14.00 2.00 23.33 2.00 23.33 2.00 23.33 2.00 23.33
- Dynamite, 32mm (7 pcs/hole x 17) Pc 29.83 75.00 1,864.58 75.00 1,864.58 75.00 1,864.58 100.00 2,486.11
- Fuse Lighter 7" Pc 3.92 1.00 3.27 1.00 3.27 1.00 3.27 1.00 3.27
- Netex Detonating Fuse Mtr. 14.26 20.00 237.62 60.00 712.86 20.00 237.62 40.00 475.24
- Exel (3.60m) Pc 101.48 10.00 845.66 10.00 845.66 10.00 810.86 10.00 845.66
- Blasting Stick Pc 13.08 1.00 10.90 1.00 10.90 1.00 10.90 1.00 10.90
Total 2,985.36 3,460.60 2,950.56 3,844.51
Sub-Total Cost per Meter 2,985.36 3,460.60 2,950.56 3,844.51
2. Timber/ Lumber
- 6" x 8" x 10' Bdft 75.21 20.00 1,253.50 40.00 2,507.00 2.00 125.35 2.00 125.35
- 4" x 6" x 10' Bdft 75.21 40.00 2,507.00 40.00 2,507.00 4.00 250.70 4.00 250.70
- 3" x 8" x 10' Bdft 70.85 20.00 1,180.83 83.33 4,920.14 2.00 118.08 2.00 118.08
- 2" x 4" x 10' Bdft 78.48 4.44 290.38 4.44 290.59 0.44 29.04 0.44 29.04
- C.W. Nails kgs 54.50 2.00 90.83 2.00 90.83 0.20 9.08 0.20 9.08
Sub-Total 5,322.54 10,315.57 532.25 532.25
Sub-Total Cost per Meter 5,322.54 10,315.57 532.25 532.25
2. Air Hose Lgt 6,534.55
- Total Estimated Life (DRM) Drm 2,000.00 2,000.00 2,000.00 2,000.00
- Drilled Meter (DRM) Drm 30.00 30.00 30.00 36.00
Sub-Total Cost per Meter 81.68 81.68 81.68 98.02
3. Water Hose Lgt 4,883.20
- Total Estimated Life (DRM) Drm 2,000.00 2,000.00 2,000.00 2,000.00
- Drilled Meter (DRM) Drm 30.00 30.00 30.00 36.00
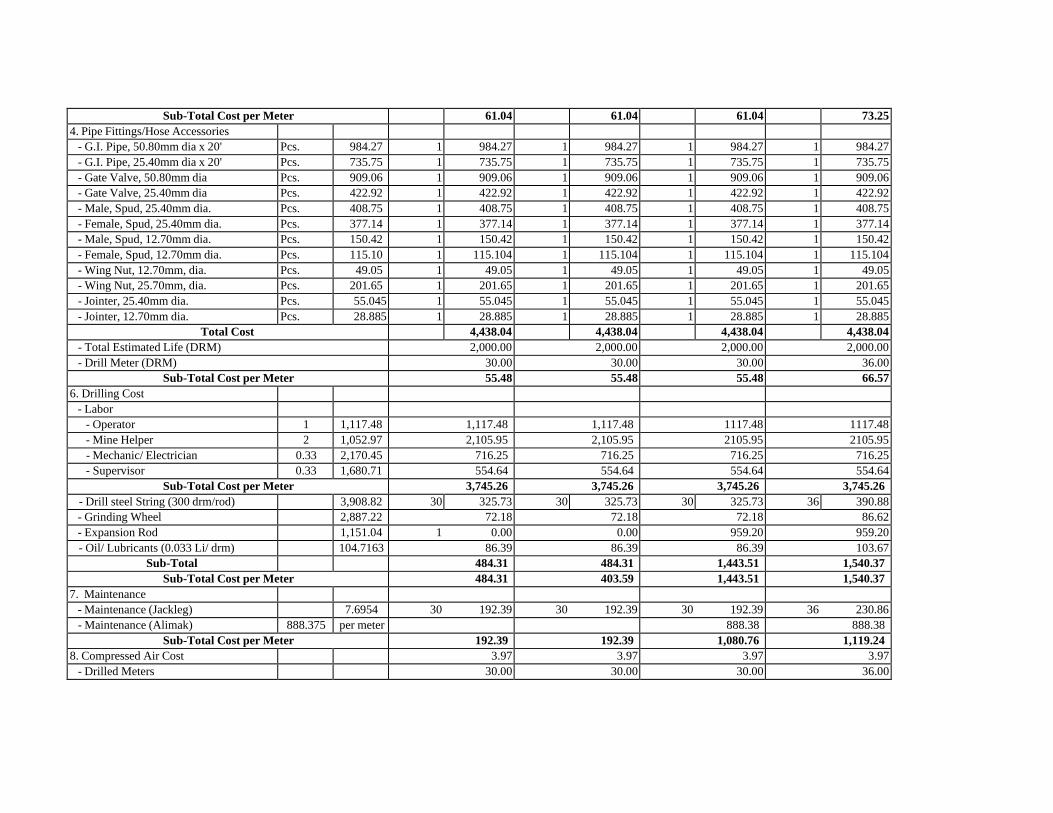
Sub-Total Cost per Meter 61.04 61.04 61.04 73.25
4. Pipe Fittings/Hose Accessories
- G.I. Pipe, 50.80mm dia x 20' Pcs. 984.27 1 984.27 1 984.27 1 984.27 1 984.27
- G.I. Pipe, 25.40mm dia x 20' Pcs. 735.75 1 735.75 1 735.75 1 735.75 1 735.75
- Gate Valve, 50.80mm dia Pcs. 909.06 1 909.06 1 909.06 1 909.06 1 909.06
- Gate Valve, 25.40mm dia Pcs. 422.92 1 422.92 1 422.92 1 422.92 1 422.92
- Male, Spud, 25.40mm dia. Pcs. 408.75 1 408.75 1 408.75 1 408.75 1 408.75
- Female, Spud, 25.40mm dia. Pcs. 377.14 1 377.14 1 377.14 1 377.14 1 377.14
- Male, Spud, 12.70mm dia. Pcs. 150.42 1 150.42 1 150.42 1 150.42 1 150.42
- Female, Spud, 12.70mm dia. Pcs. 115.10 1 115.104 1 115.104 1 115.104 1 115.104
- Wing Nut, 12.70mm, dia. Pcs. 49.05 1 49.05 1 49.05 1 49.05 1 49.05
- Wing Nut, 25.70mm, dia. Pcs. 201.65 1 201.65 1 201.65 1 201.65 1 201.65
- Jointer, 25.40mm dia. Pcs. 55.045 1 55.045 1 55.045 1 55.045 1 55.045
- Jointer, 12.70mm dia. Pcs. 28.885 1 28.885 1 28.885 1 28.885 1 28.885
Total Cost 4,438.04 4,438.04 4,438.04 4,438.04
- Total Estimated Life (DRM) 2,000.00 2,000.00 2,000.00 2,000.00
- Drill Meter (DRM) 30.00 30.00 30.00 36.00
Sub-Total Cost per Meter 55.48 55.48 55.48 66.57
6. Drilling Cost
- Labor
- Operator 1 1,117.48 1,117.48 1,117.48 1117.48 1117.48
- Mine Helper 2 1,052.97 2,105.95 2,105.95 2105.95 2105.95
- Mechanic/ Electrician 0.33 2,170.45 716.25 716.25 716.25 716.25
- Supervisor 0.33 1,680.71 554.64 554.64 554.64 554.64
Sub-Total Cost per Meter 3,745.26 3,745.26 3,745.26 3,745.26
- Drill steel String (300 drm/rod) 3,908.82 30 325.73 30 325.73 30 325.73 36 390.88
- Grinding Wheel 2,887.22 72.18 72.18 72.18 86.62
- Expansion Rod 1,151.04 1 0.00 0.00 959.20 959.20
- Oil/ Lubricants (0.033 Li/ drm) 104.7163 86.39 86.39 86.39 103.67
Sub-Total 484.31 484.31 1,443.51 1,540.37
Sub-Total Cost per Meter 484.31 403.59 1,443.51 1,540.37
7. Maintenance
- Maintenance (Jackleg) 7.6954 30 192.39 30 192.39 30 192.39 36 230.86
- Maintenance (Alimak) 888.375 per meter 888.38 888.38
Sub-Total Cost per Meter 192.39 192.39 1,080.76 1,119.24
8. Compressed Air Cost 3.97 3.97 3.97 3.97
- Drilled Meters 30.00 30.00 30.00 36.00
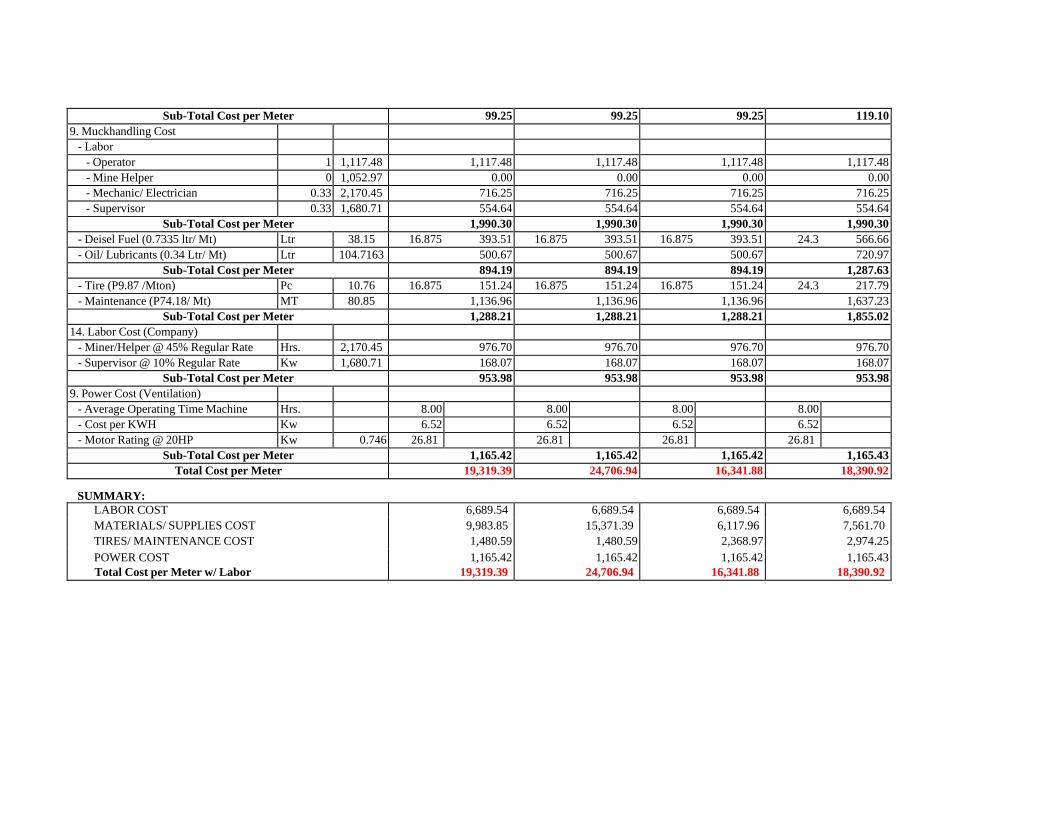
Sub-Total Cost per Meter 99.25 99.25 99.25 119.10
9. Muckhandling Cost
- Labor
- Operator 1 1,117.48 1,117.48 1,117.48 1,117.48 1,117.48
- Mine Helper 0 1,052.97 0.00 0.00 0.00 0.00
- Mechanic/ Electrician 0.33 2,170.45 716.25 716.25 716.25 716.25
- Supervisor 0.33 1,680.71 554.64 554.64 554.64 554.64
Sub-Total Cost per Meter 1,990.30 1,990.30 1,990.30 1,990.30
- Deisel Fuel (0.7335 ltr/ Mt) Ltr 38.15 16.875 393.51 16.875 393.51 16.875 393.51 24.3 566.66
- Oil/ Lubricants (0.34 Ltr/ Mt) Ltr 104.7163 500.67 500.67 500.67 720.97
Sub-Total Cost per Meter 894.19 894.19 894.19 1,287.63
- Tire (P9.87 /Mton) Pc 10.76 16.875 151.24 16.875 151.24 16.875 151.24 24.3 217.79
- Maintenance (P74.18/ Mt) MT 80.85 1,136.96 1,136.96 1,136.96 1,637.23
Sub-Total Cost per Meter 1,288.21 1,288.21 1,288.21 1,855.02
14. Labor Cost (Company)
- Miner/Helper @ 45% Regular Rate Hrs. 2,170.45 976.70 976.70 976.70 976.70
- Supervisor @ 10% Regular Rate Kw 1,680.71 168.07 168.07 168.07 168.07
Sub-Total Cost per Meter 953.98 953.98 953.98 953.98
9. Power Cost (Ventilation)
- Average Operating Time Machine Hrs. 8.00 8.00 8.00 8.00
- Cost per KWH Kw 6.52 6.52 6.52 6.52
- Motor Rating @ 20HP Kw 0.746 26.81 26.81 26.81 26.81
Sub-Total Cost per Meter 1,165.42 1,165.42 1,165.42 1,165.43
Total Cost per Meter 19,319.39 24,706.94 16,341.88 18,390.92
SUMMARY:
LABOR COST 6,689.54 6,689.54 6,689.54 6,689.54
MATERIALS/ SUPPLIES COST 9,983.85 15,371.39 6,117.96 7,561.70
TIRES/ MAINTENANCE COST 1,480.59 1,480.59 2,368.97 2,974.25
POWER COST 1,165.42 1,165.42 1,165.42 1,165.43
Total Cost per Meter w/ Labor 19,319.39 24,706.94 16,341.88 18,390.92
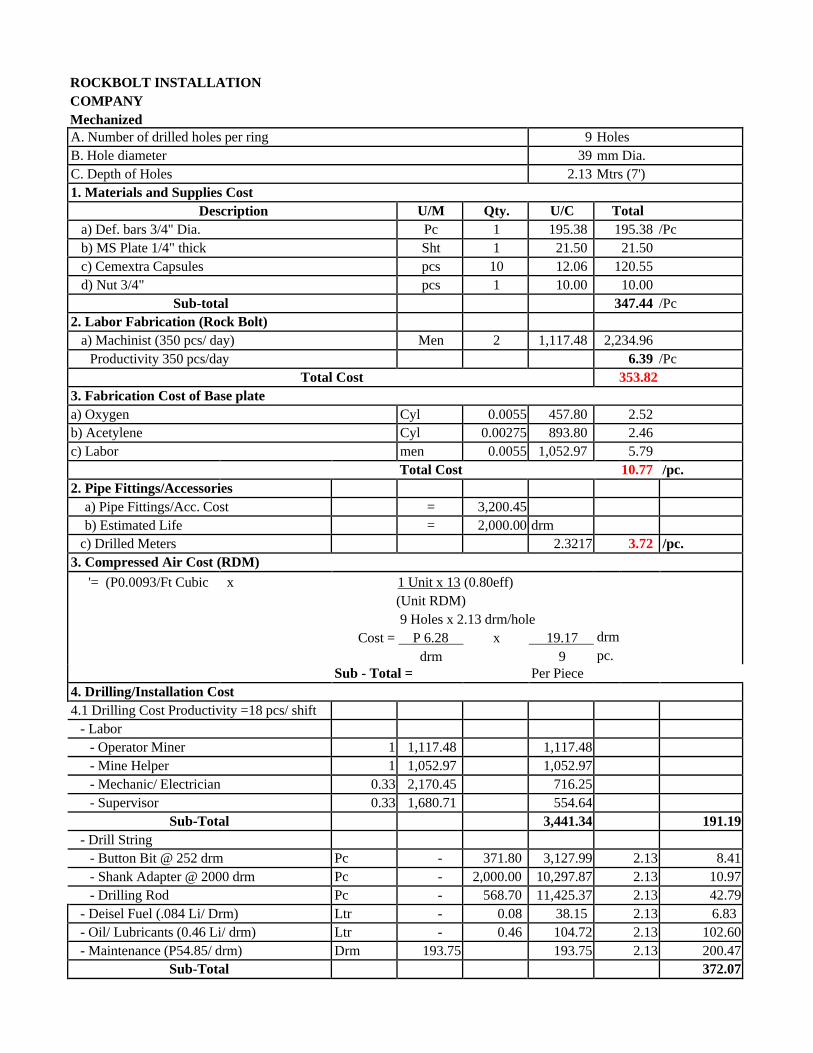
ROCKBOLT INSTALLATION
COMPANY
Mechanized
A. Number of drilled holes per ring 9 Holes
B. Hole diameter 39 mm Dia.
C. Depth of Holes 2.13 Mtrs (7')
1. Materials and Supplies Cost
Description U/M Qty. U/C Total
a) Def. bars 3/4" Dia. Pc 1 195.38 195.38 /Pc
b) MS Plate 1/4" thick Sht 1 21.50 21.50
c) Cemextra Capsules pcs 10 12.06 120.55
d) Nut 3/4" pcs 1 10.00 10.00
Sub-total 347.44 /Pc
2. Labor Fabrication (Rock Bolt)
a) Machinist (350 pcs/ day) Men 2 1,117.48 2,234.96
Productivity 350 pcs/day 6.39 /Pc
Total Cost 353.82
3. Fabrication Cost of Base plate
a) Oxygen Cyl 0.0055 457.80 2.52
b) Acetylene Cyl 0.00275 893.80 2.46
c) Labor men 0.0055 1,052.97 5.79
Total Cost 10.77 /pc.
2. Pipe Fittings/Accessories
a) Pipe Fittings/Acc. Cost = 3,200.45
b) Estimated Life = 2,000.00 drm
c) Drilled Meters 2.3217 3.72 /pc.
3. Compressed Air Cost (RDM)
'= (P0.0093/Ft Cubic x 1 Unit x 13 (0.80eff)
(Unit RDM)
9 Holes x 2.13 drm/hole
Cost = P 6.28 x 19.17
drm 9
drm
pc.
Sub - Total = Per Piece
4. Drilling/Installation Cost
4.1 Drilling Cost Productivity =18 pcs/ shift
- Labor
- Operator Miner 1 1,117.48 1,117.48
- Mine Helper 1 1,052.97 1,052.97
- Mechanic/ Electrician 0.33 2,170.45 716.25
- Supervisor 0.33 1,680.71 554.64
Sub-Total 3,441.34 191.19
- Drill String
- Button Bit @ 252 drm Pc - 371.80 3,127.99 2.13 8.41
- Shank Adapter @ 2000 drm Pc - 2,000.00 10,297.87 2.13 10.97
- Drilling Rod Pc - 568.70 11,425.37 2.13 42.79
- Deisel Fuel (.084 Li/ Drm) Ltr - 0.08 38.15 2.13 6.83
- Oil/ Lubricants (0.46 Li/ drm) Ltr - 0.46 104.72 2.13 102.60
- Maintenance (P54.85/ drm) Drm 193.75 193.75 2.13 200.47
Sub-Total 372.07
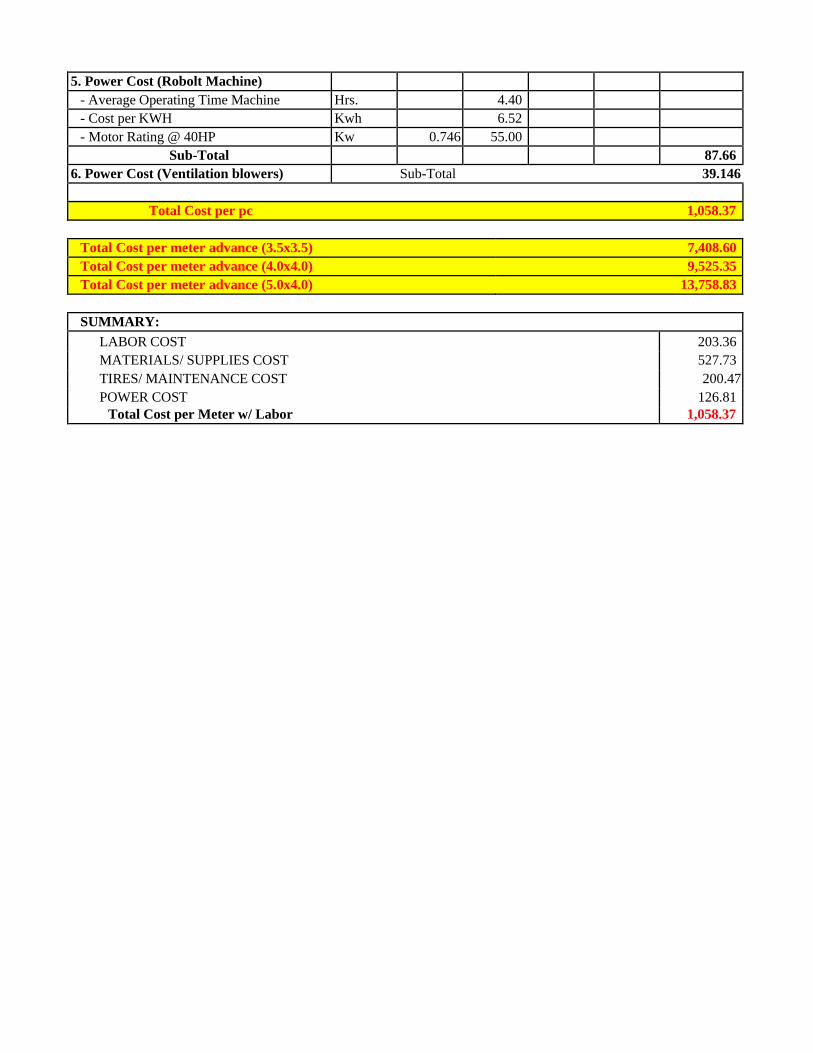
5. Power Cost (Robolt Machine)
- Average Operating Time Machine Hrs. 4.40
- Cost per KWH Kwh 6.52
- Motor Rating @ 40HP Kw 0.746 55.00
Sub-Total 87.66
6. Power Cost (Ventilation blowers) Sub-Total 39.146
Total Cost per pc 1,058.37
Total Cost per meter advance (3.5x3.5) 7,408.60
Total Cost per meter advance (4.0x4.0) 9,525.35
Total Cost per meter advance (5.0x4.0) 13,758.83
SUMMARY:
LABOR COST 203.36
MATERIALS/ SUPPLIES COST 527.73
TIRES/ MAINTENANCE COST 200.47
POWER COST 126.81
Total Cost per Meter w/ Labor 1,058.37
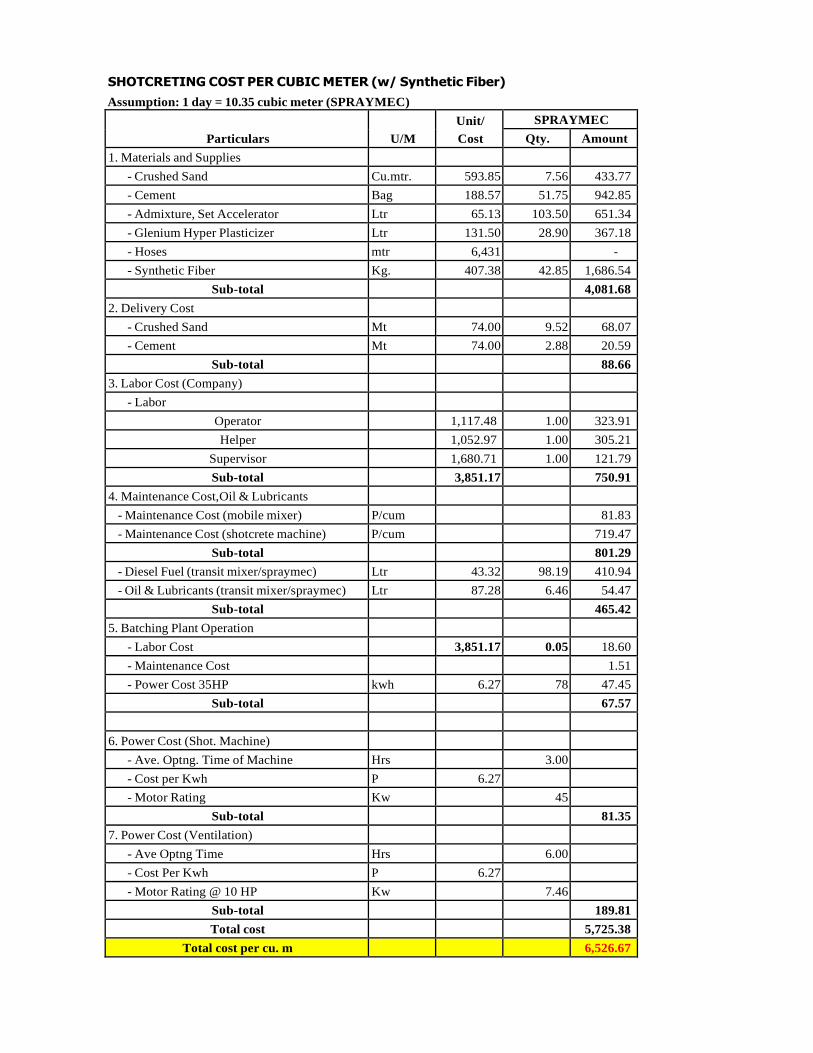
SHOTCRETING COST PER CUBIC METER (w/ Synthetic Fiber)
Assumption: 1 day = 10.35 cubic meter (SPRAYMEC)
Particulars
U/M
Unit/
Cost
SPRAYMEC
Qty. Amount
1. Materials and Supplies
- Crushed Sand Cu.mtr. 593.85 7.56 433.77
- Cement Bag 188.57 51.75 942.85
- Admixture, Set Accelerator Ltr 65.13 103.50 651.34
- Glenium Hyper Plasticizer Ltr 131.50 28.90 367.18
- Hoses mtr 6,431 -
- Synthetic Fiber Kg. 407.38 42.85 1,686.54
Sub-total 4,081.68
2. Delivery Cost
- Crushed Sand Mt 74.00 9.52 68.07
- Cement Mt 74.00 2.88 20.59
Sub-total 88.66
3. Labor Cost (Company)
- Labor
Operator 1,117.48 1.00 323.91
Helper 1,052.97 1.00 305.21
Supervisor 1,680.71 1.00 121.79
Sub-total 3,851.17 750.91
4. Maintenance Cost,Oil & Lubricants
- Maintenance Cost (mobile mixer) P/cum 81.83
- Maintenance Cost (shotcrete machine) P/cum 719.47
Sub-total 801.29
- Diesel Fuel (transit mixer/spraymec) Ltr 43.32 98.19 410.94
- Oil & Lubricants (transit mixer/spraymec) Ltr 87.28 6.46 54.47
Sub-total 465.42
5. Batching Plant Operation
- Labor Cost 3,851.17 0.05 18.60
- Maintenance Cost 1.51
- Power Cost 35HP kwh 6.27 78 47.45
Sub-total 67.57
6. Power Cost (Shot. Machine)
- Ave. Optng. Time of Machine Hrs 3.00
- Cost per Kwh P 6.27
- Motor Rating Kw 45
Sub-total 81.35
7. Power Cost (Ventilation)
- Ave Optng Time Hrs 6.00
- Cost Per Kwh P 6.27
- Motor Rating @ 10 HP Kw 7.46
Sub-total 189.81
Total cost 5,725.38
Total cost per cu. m 6,526.67

SUMMARY:
LABOR COST 769.51
PURCHASED COST 88.66
MATERIALS/ SUPPLIES COST 4,547.09
TIRES/ MAINTENANCE COST 802.80
POWER COST 318.61
Total Cost per Meter w/ Labor 6,526.67
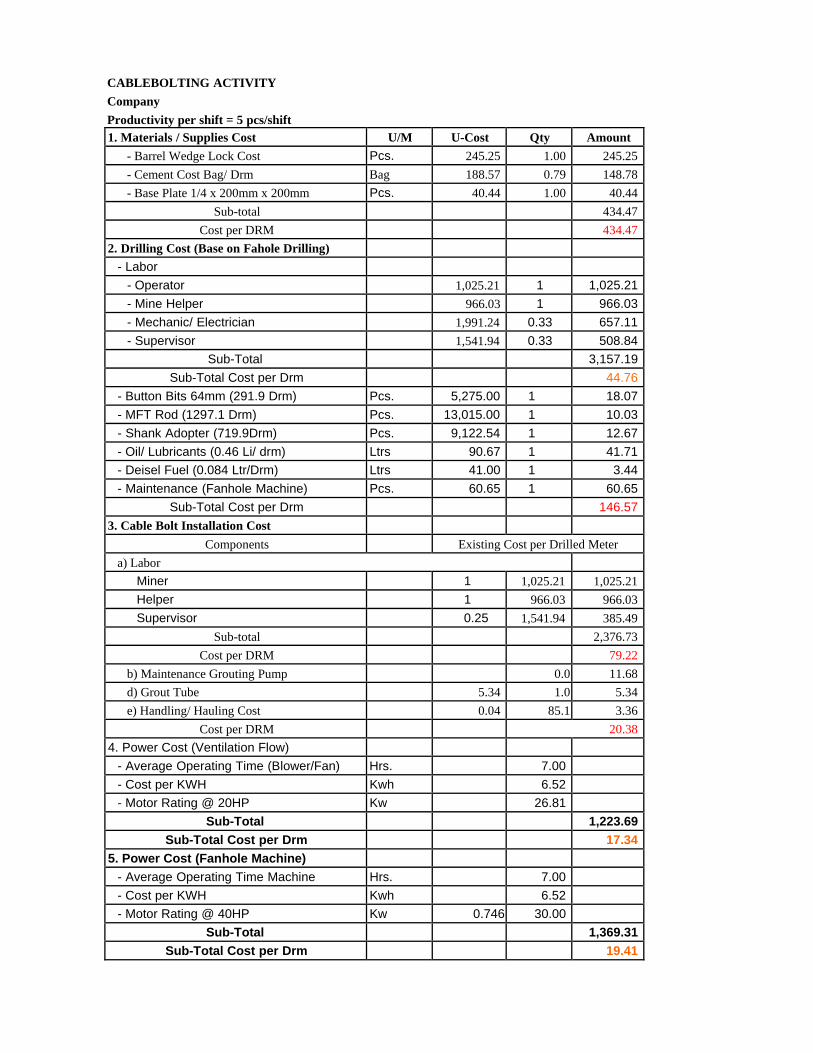
CABLEBOLTING ACTIVITY
Company
Productivity per shift = 5 pcs/shift
1. Materials / Supplies Cost U/M U-Cost Qty Amount
- Barrel Wedge Lock Cost Pcs. 245.25 1.00 245.25
- Cement Cost Bag/ Drm Bag 188.57 0.79 148.78
- Base Plate 1/4 x 200mm x 200mm Pcs. 40.44 1.00 40.44
Sub-total 434.47
Cost per DRM 434.47
2. Drilling Cost (Base on Fahole Drilling)
- Labor
- Operator 1,025.21 1 1,025.21
- Mine Helper 966.03 1 966.03
- Mechanic/ Electrician 1,991.24 0.33 657.11
- Supervisor 1,541.94 0.33 508.84
Sub-Total 3,157.19
Sub-Total Cost per Drm 44.76
- Button Bits 64mm (291.9 Drm) Pcs. 5,275.00 1 18.07
- MFT Rod (1297.1 Drm) Pcs. 13,015.00 1 10.03
- Shank Adopter (719.9Drm) Pcs. 9,122.54 1 12.67
- Oil/ Lubricants (0.46 Li/ drm) Ltrs 90.67 1 41.71
- Deisel Fuel (0.084 Ltr/Drm) Ltrs 41.00 1 3.44
- Maintenance (Fanhole Machine) Pcs. 60.65 1 60.65
Sub-Total Cost per Drm 146.57
3. Cable Bolt Installation Cost
Components Existing Cost per Drilled Meter
a) Labor
Miner 1 1,025.21 1,025.21
Helper 1 966.03 966.03
Supervisor 0.25 1,541.94 385.49
Sub-total 2,376.73
Cost per DRM 79.22
b) Maintenance Grouting Pump 0.0 11.68
d) Grout Tube 5.34 1.0 5.34
e) Handling/ Hauling Cost 0.04 85.1 3.36
Cost per DRM 20.38
4. Power Cost (Ventilation Flow)
- Average Operating Time (Blower/Fan) Hrs. 7.00
- Cost per KWH Kwh 6.52
- Motor Rating @ 20HP Kw 26.81
Sub-Total 1,223.69
Sub-Total Cost per Drm 17.34
5. Power Cost (Fanhole Machine)
- Average Operating Time Machine Hrs. 7.00
- Cost per KWH Kwh 6.52
- Motor Rating @ 40HP Kw 0.746 30.00
Sub-Total 1,369.31
Sub-Total Cost per Drm 19.41
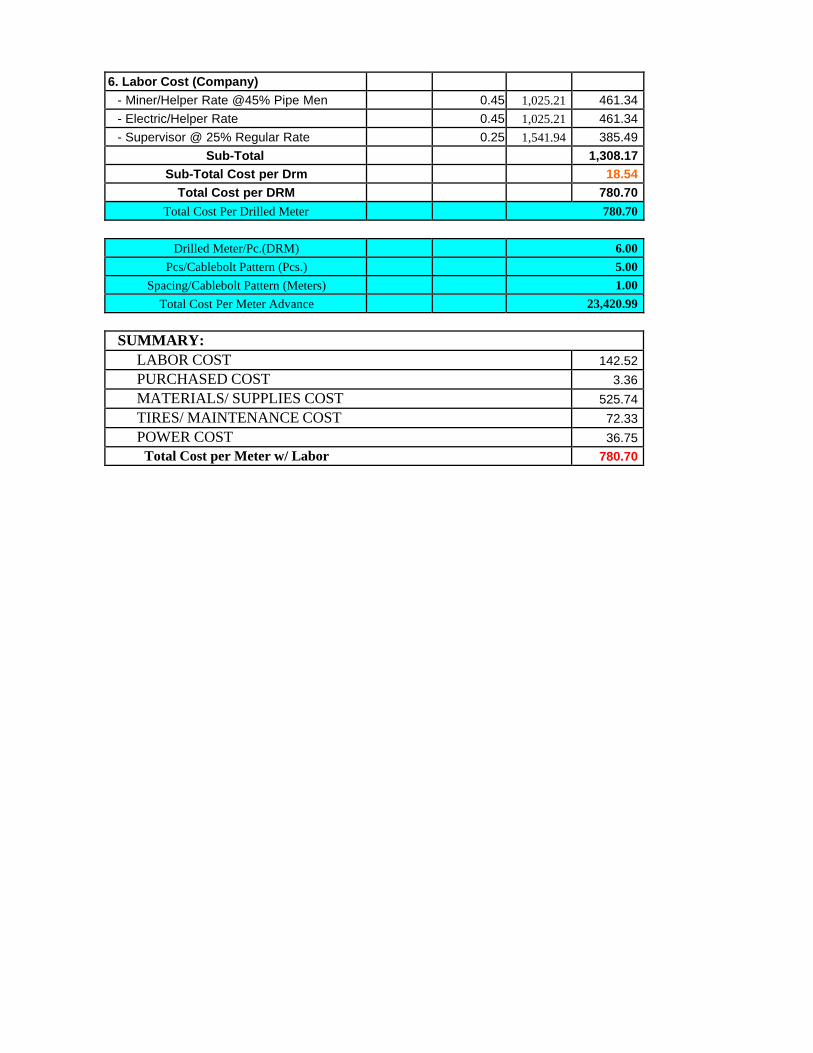
6. Labor Cost (Company)
- Miner/Helper Rate @45% Pipe Men 0.45 1,025.21 461.34
- Electric/Helper Rate 0.45 1,025.21 461.34
- Supervisor @ 25% Regular Rate 0.25 1,541.94 385.49
Sub-Total 1,308.17
Sub-Total Cost per Drm 18.54
Total Cost per DRM 780.70
Total Cost Per Drilled Meter 780.70
Drilled Meter/Pc.(DRM) 6.00
Pcs/Cablebolt Pattern (Pcs.) 5.00
Spacing/Cablebolt Pattern (Meters) 1.00
Total Cost Per Meter Advance 23,420.99
SUMMARY:
LABOR COST 142.52
PURCHASED COST 3.36
MATERIALS/ SUPPLIES COST 525.74
TIRES/ MAINTENANCE COST 72.33
POWER COST 36.75
Total Cost per Meter w/ Labor 780.70
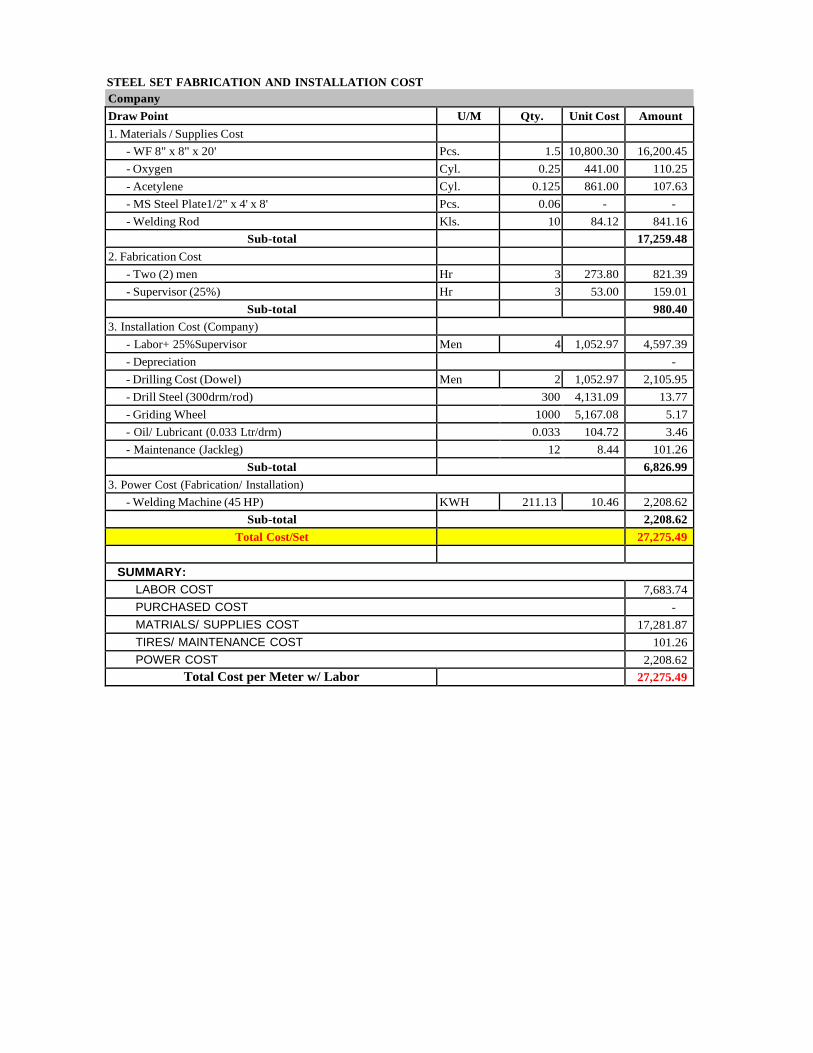
STEEL SET FABRICATION AND INSTALLATION COST
Company
Draw Point U/M Qty. Unit Cost Amount
1. Materials / Supplies Cost
- WF 8" x 8" x 20' Pcs. 1.5 10,800.30 16,200.45
- Oxygen Cyl. 0.25 441.00 110.25
- Acetylene Cyl. 0.125 861.00 107.63
- MS Steel Plate1/2" x 4' x 8' Pcs. 0.06 - -
- Welding Rod Kls. 10 84.12 841.16
Sub-total 17,259.48
2. Fabrication Cost
- Two (2) men Hr 3 273.80 821.39
- Supervisor (25%) Hr 3 53.00 159.01
Sub-total 980.40
3. Installation Cost (Company)
- Labor+ 25%Supervisor Men 4 1,052.97 4,597.39
- Depreciation -
- Drilling Cost (Dowel) Men 2 1,052.97 2,105.95
- Drill Steel (300drm/rod) 300 4,131.09 13.77
- Griding Wheel 1000 5,167.08 5.17
- Oil/ Lubricant (0.033 Ltr/drm) 0.033 104.72 3.46
- Maintenance (Jackleg) 12 8.44 101.26
Sub-total 6,826.99
3. Power Cost (Fabrication/ Installation)
- Welding Machine (45 HP) KWH 211.13 10.46 2,208.62
Sub-total 2,208.62
Total Cost/Set 27,275.49
SUMMARY:
LABOR COST 7,683.74
PURCHASED COST -
MATRIALS/ SUPPLIES COST 17,281.87
TIRES/ MAINTENANCE COST 101.26
POWER COST 2,208.62
Total Cost per Meter w/ Labor 27,275.49
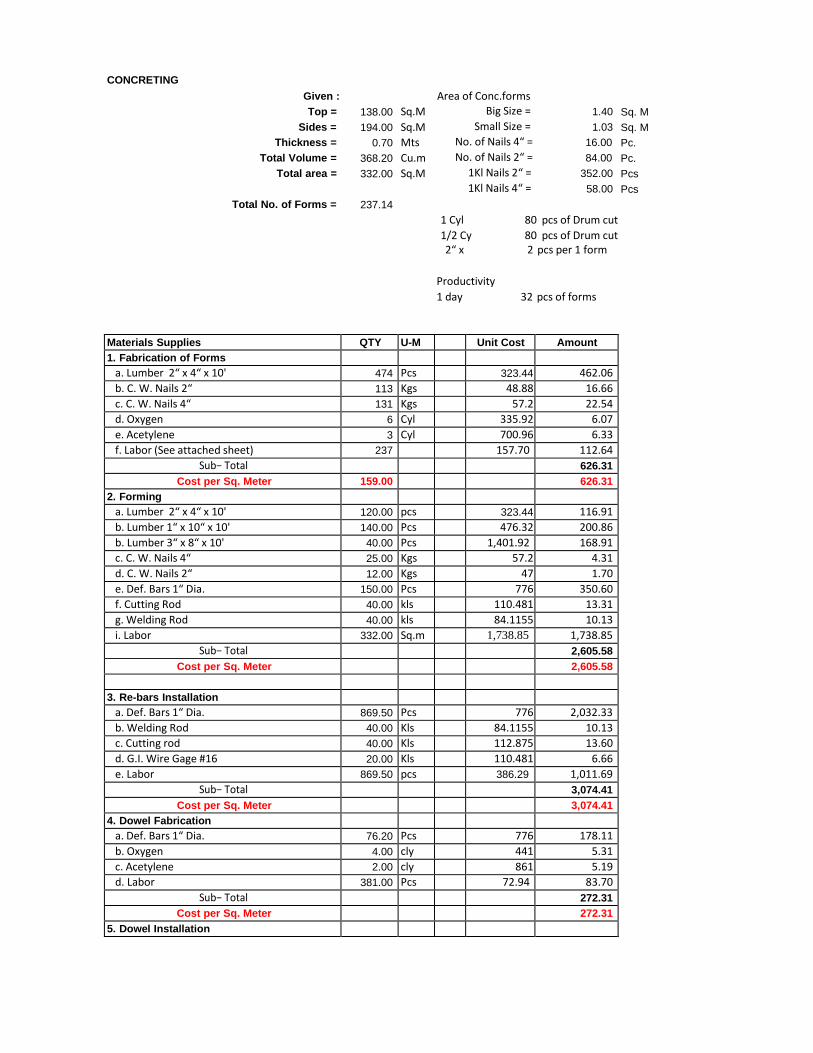
CONCRETING
Given : Area of Conc.forms
Top = 138.00 Sq.M Big Size = 1.40 Sq. M
Sides = 194.00 Sq.M Small Size = 1.03 Sq. M
Thickness = 0.70 Mts No. of Nails 4“ = 16.00 Pc.
Total Volume = 368.20 Cu.m No. of Nails 2“ = 84.00 Pc.
Total area = 332.00 Sq.M 1Kl Nails 2“ = 352.00 Pcs
Total No. of Forms =
237.14
1Kl Nails 4“ = 58.00 Pcs
1 Cyl 80 pcs of Drum cut
1/2 Cy 80 pcs of Drum cut 2“ x 2 pcs per 1 form
Productivity
1 day 32 pcs of forms
Materials Supplies QTY U-M Unit Cost Amount
1. Fabrication of Forms
a. Lumber 2“ x 4“ x 10' 474 Pcs 323.44 462.06
b. C. W. Nails 2“ 113 Kgs 48.88 16.66
c. C. W. Nails 4“ 131 Kgs 57.2 22.54
d. Oxygen 6 Cyl 335.92 6.07
e. Acetylene 3 Cyl 700.96 6.33
f. Labor (See attached sheet) 237 157.70 112.64
Sub− Total 626.31
Cost per Sq. Meter 159.00 626.31
2. Forming
a. Lumber 2“ x 4“ x 10' 120.00 pcs 323.44 116.91
b. Lumber 1“ x 10“ x 10' 140.00 Pcs 476.32 200.86
b. Lumber 3“ x 8“ x 10' 40.00 Pcs 1,401.92 168.91
c. C. W. Nails 4“ 25.00 Kgs 57.2 4.31
d. C. W. Nails 2“ 12.00 Kgs 47 1.70
e. Def. Bars 1“ Dia. 150.00 Pcs 776 350.60
f. Cutting Rod 40.00 kls 110.481 13.31
g. Welding Rod 40.00 kls 84.1155 10.13
i. Labor 332.00 Sq.m 1,738.85 1,738.85
Sub− Total 2,605.58
Cost per Sq. Meter 2,605.58
3. Re-bars Installation
a. Def. Bars 1“ Dia. 869.50 Pcs 776 2,032.33
b. Welding Rod 40.00 Kls 84.1155 10.13
c. Cutting rod 40.00 Kls 112.875 13.60
d. G.I. Wire Gage #16 20.00 Kls 110.481 6.66
e. Labor 869.50 pcs 386.29 1,011.69
Sub− Total 3,074.41
Cost per Sq. Meter 3,074.41
4. Dowel Fabrication
a. Def. Bars 1“ Dia. 76.20 Pcs 776 178.11
b. Oxygen 4.00 cly 441 5.31
c. Acetylene 2.00 cly 861 5.19
d. Labor 381.00 Pcs 72.94 83.70
Sub− Total 272.31
Cost per Sq. Meter 272.31
5. Dowel Installation
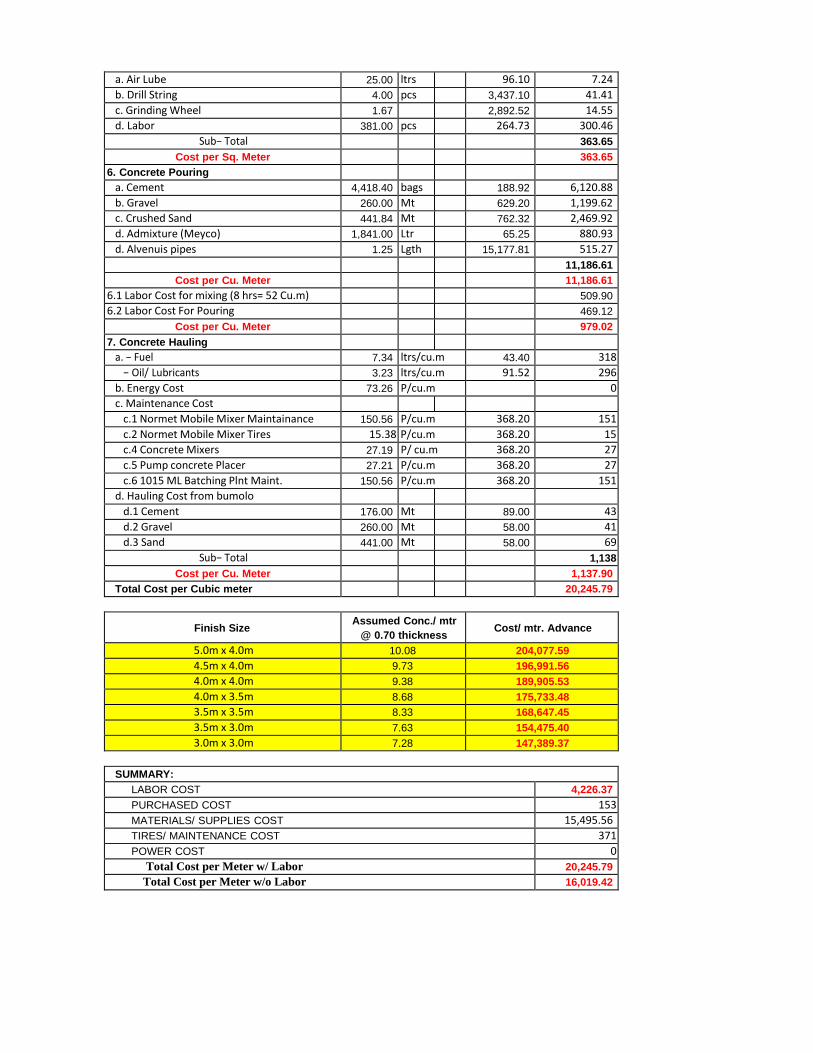
a. Air Lube 25.00 ltrs 96.10 7.24
b. Drill String 4.00 pcs 3,437.10 41.41
c. Grinding Wheel 1.67 2,892.52 14.55
d. Labor 381.00 pcs 264.73 300.46
Sub− Total 363.65
Cost per Sq. Meter 363.65
6. Concrete Pouring
a. Cement 4,418.40 bags 188.92 6,120.88
b. Gravel 260.00 Mt 629.20 1,199.62
c. Crushed Sand 441.84 Mt 762.32 2,469.92
d. Admixture (Meyco) 1,841.00 Ltr 65.25 880.93
d. Alvenuis pipes 1.25 Lgth 15,177.81 515.27 11,186.61
Cost per Cu. Meter 11,186.61
6.1 Labor Cost for mixing (8 hrs= 52 Cu.m) 509.90
6.2 Labor Cost For Pouring 469.12
Cost per Cu. Meter 979.02
7. Concrete Hauling
a. − Fuel 7.34 ltrs/cu.m 43.40 318
− Oil/ Lubricants 3.23 ltrs/cu.m 91.52 296
b. Energy Cost 73.26 P/cu.m 0
c. Maintenance Cost
c.1 Normet Mobile Mixer Maintainance 150.56 P/cu.m 368.20 151
c.2 Normet Mobile Mixer Tires 15.38 P/cu.m 368.20 15
c.4 Concrete Mixers 27.19 P/ cu.m 368.20 27
c.5 Pump concrete Placer 27.21 P/cu.m 368.20 27
c.6 1015 ML Batching Plnt Maint. 150.56 P/cu.m 368.20 151
d. Hauling Cost from bumolo
d.1 Cement 176.00 Mt 89.00 43
d.2 Gravel 260.00 Mt 58.00 41
d.3 Sand 441.00 Mt 58.00 69
Sub− Total 1,138
Cost per Cu. Meter 1,137.90
Total Cost per Cubic meter 20,245.79
Finish Size Assumed Conc./ mtr
@ 0.70 thickness Cost/ mtr. Advance
5.0m x 4.0m 10.08 204,077.59
4.5m x 4.0m 9.73 196,991.56
4.0m x 4.0m 9.38 189,905.53
4.0m x 3.5m 8.68 175,733.48
3.5m x 3.5m 8.33 168,647.45
3.5m x 3.0m 7.63 154,475.40
3.0m x 3.0m 7.28 147,389.37
SUMMARY:
LABOR COST 4,226.37
PURCHASED COST 153
MATERIALS/ SUPPLIES COST 15,495.56
TIRES/ MAINTENANCE COST 371
POWER COST 0
Total Cost per Meter w/ Labor 20,245.79
Total Cost per Meter w/o Labor 16,019.42
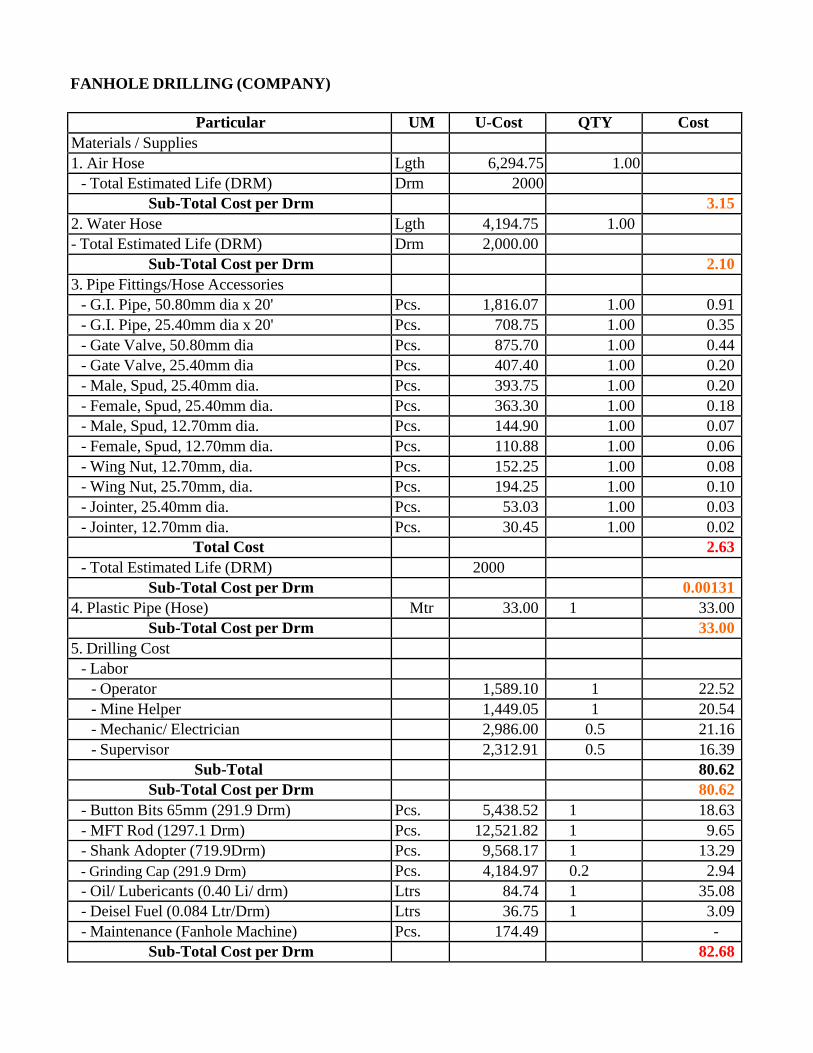
FANHOLE DRILLING (COMPANY)
Particular UM U-Cost QTY Cost
Materials / Supplies
1. Air Hose Lgth 6,294.75 1.00
- Total Estimated Life (DRM) Drm 2000
Sub-Total Cost per Drm 3.15
2. Water Hose Lgth 4,194.75 1.00
- Total Estimated Life (DRM) Drm 2,000.00
Sub-Total Cost per Drm 2.10
3. Pipe Fittings/Hose Accessories
- G.I. Pipe, 50.80mm dia x 20' Pcs. 1,816.07 1.00 0.91
- G.I. Pipe, 25.40mm dia x 20' Pcs. 708.75 1.00 0.35
- Gate Valve, 50.80mm dia Pcs. 875.70 1.00 0.44
- Gate Valve, 25.40mm dia Pcs. 407.40 1.00 0.20
- Male, Spud, 25.40mm dia. Pcs. 393.75 1.00 0.20
- Female, Spud, 25.40mm dia. Pcs. 363.30 1.00 0.18
- Male, Spud, 12.70mm dia. Pcs. 144.90 1.00 0.07
- Female, Spud, 12.70mm dia. Pcs. 110.88 1.00 0.06
- Wing Nut, 12.70mm, dia. Pcs. 152.25 1.00 0.08
- Wing Nut, 25.70mm, dia. Pcs. 194.25 1.00 0.10
- Jointer, 25.40mm dia. Pcs. 53.03 1.00 0.03
- Jointer, 12.70mm dia. Pcs. 30.45 1.00 0.02
Total Cost 2.63
- Total Estimated Life (DRM) 2000
Sub-Total Cost per Drm 0.00131
4. Plastic Pipe (Hose) Mtr 33.00 1 33.00
Sub-Total Cost per Drm 33.00
5. Drilling Cost
- Labor
- Operator 1,589.10 1 22.52
- Mine Helper 1,449.05 1 20.54
- Mechanic/ Electrician 2,986.00 0.5 21.16
- Supervisor 2,312.91 0.5 16.39
Sub-Total 80.62
Sub-Total Cost per Drm 80.62
- Button Bits 65mm (291.9 Drm) Pcs. 5,438.52 1 18.63
- MFT Rod (1297.1 Drm) Pcs. 12,521.82 1 9.65
- Shank Adopter (719.9Drm) Pcs. 9,568.17 1 13.29
- Grinding Cap (291.9 Drm) Pcs. 4,184.97 0.2 2.94
- Oil/ Lubericants (0.40 Li/ drm) Ltrs 84.74 1 35.08
- Deisel Fuel (0.084 Ltr/Drm) Ltrs 36.75 1 3.09
- Maintenance (Fanhole Machine) Pcs. 174.49 -
Sub-Total Cost per Drm 82.68
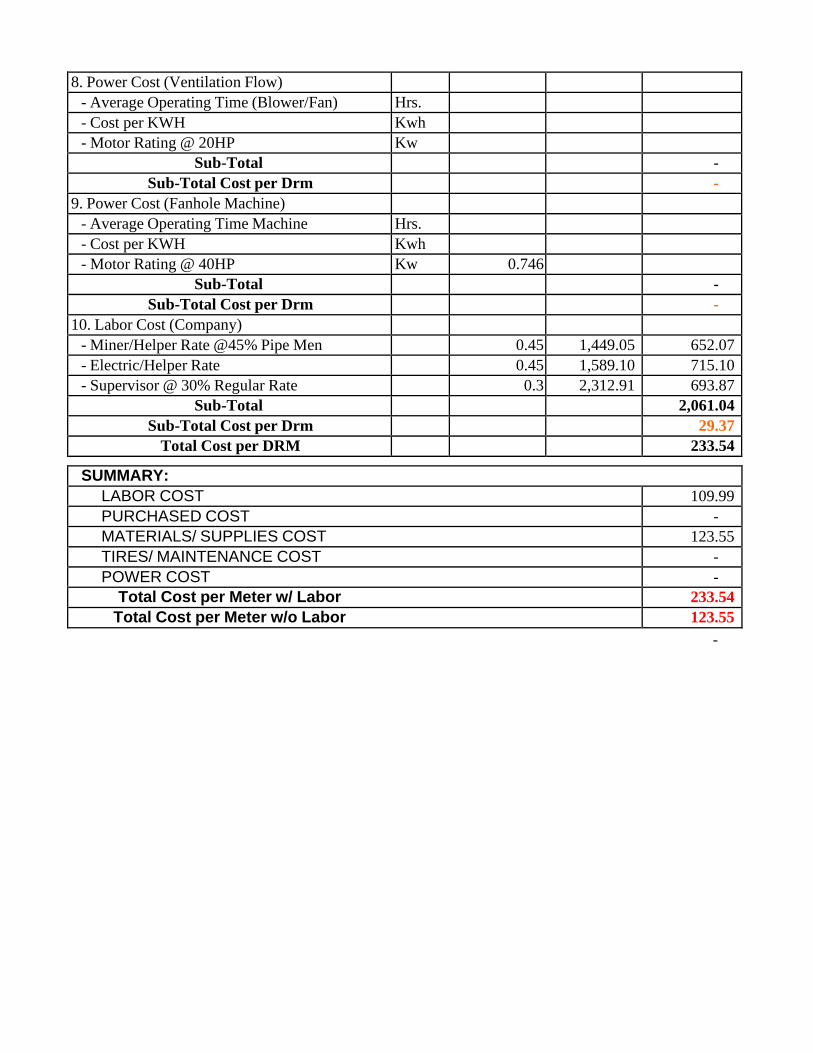
8. Power Cost (Ventilation Flow)
- Average Operating Time (Blower/Fan) Hrs.
- Cost per KWH Kwh
- Motor Rating @ 20HP Kw
Sub-Total -
Sub-Total Cost per Drm -
9. Power Cost (Fanhole Machine)
- Average Operating Time Machine Hrs.
- Cost per KWH Kwh
- Motor Rating @ 40HP Kw 0.746
Sub-Total -
Sub-Total Cost per Drm -
10. Labor Cost (Company)
- Miner/Helper Rate @45% Pipe Men 0.45 1,449.05 652.07
- Electric/Helper Rate 0.45 1,589.10 715.10
- Supervisor @ 30% Regular Rate 0.3 2,312.91 693.87
Sub-Total 2,061.04
Sub-Total Cost per Drm 29.37
Total Cost per DRM 233.54
SUMMARY:
LABOR COST 109.99
PURCHASED COST -
MATERIALS/ SUPPLIES COST 123.55
TIRES/ MAINTENANCE COST -
POWER COST -
Total Cost per Meter w/ Labor 233.54
Total Cost per Meter w/o Labor 123.55
-
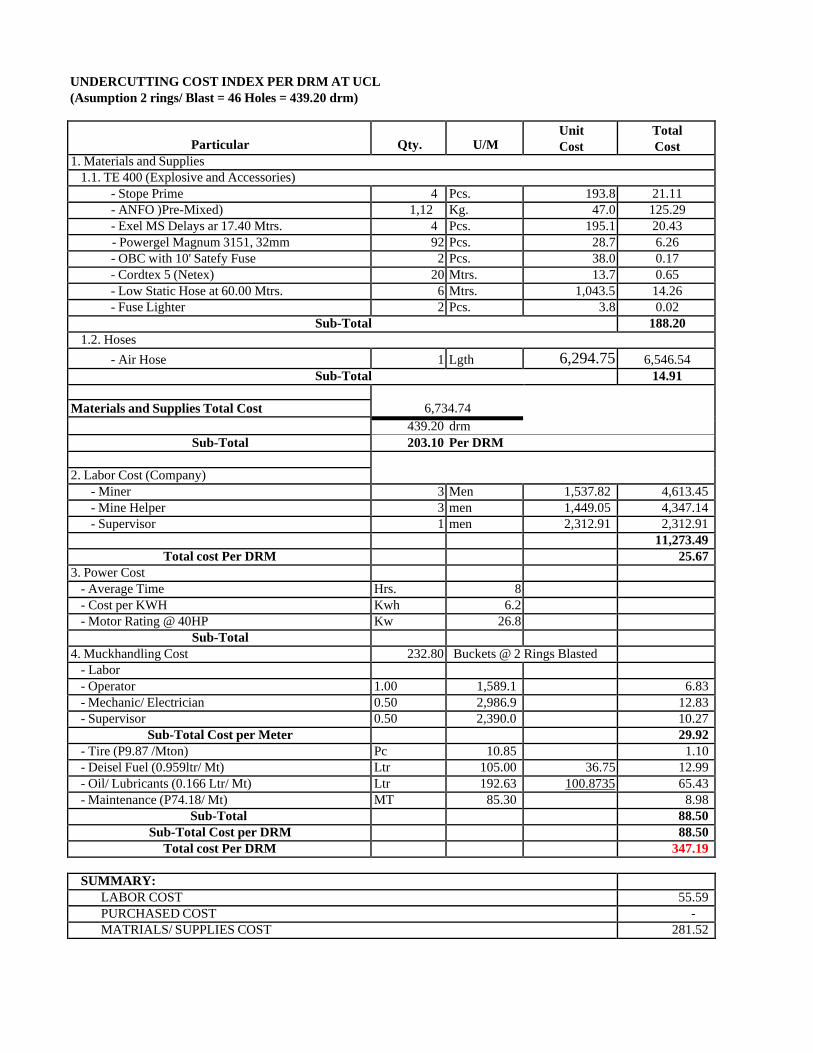
UNDERCUTTING COST INDEX PER DRM AT UCL
(Asumption 2 rings/ Blast = 46 Holes = 439.20 drm)
Particular
Qty.
U/M
Unit
Cost
Total
Cost 1. Materials and Supplies
1.1. TE 400 (Explosive and Accessories)
- Stope Prime 4 Pcs. 193.8 21.11
- ANFO )Pre-Mixed) 1,12 Kg. 47.0 125.29
- Exel MS Delays ar 17.40 Mtrs. 4 Pcs. 195.1 20.43
- Powergel Magnum 3151, 32mm 92 Pcs. 28.7 6.26
- OBC with 10' Satefy Fuse 2 Pcs. 38.0 0.17
- Cordtex 5 (Netex) 20 Mtrs. 13.7 0.65
- Low Static Hose at 60.00 Mtrs. 6 Mtrs. 1,043.5 14.26
- Fuse Lighter 2 Pcs. 3.8 0.02
Sub-Total 188.20
1.2. Hoses
- Air Hose 1 Lgth 6,294.75 6,546.54
Sub-Total 14.91
6,734.74
Materials and Supplies Total Cost
439.20 drm
Sub-Total 203.10 Per DRM
2. Labor Cost (Company)
- Miner 3 Men 1,537.82 4,613.45
- Mine Helper 3 men 1,449.05 4,347.14
- Supervisor 1 men 2,312.91 2,312.91
11,273.49
Total cost Per DRM 25.67
3. Power Cost
- Average Time Hrs. 8
- Cost per KWH Kwh 6.2
- Motor Rating @ 40HP Kw 26.8
Sub-Total
4. Muckhandling Cost 232.80 Buckets @ 2 Rings Blasted
- Labor
- Operator 1.00 1,589.1 6.83
- Mechanic/ Electrician 0.50 2,986.9 12.83
- Supervisor 0.50 2,390.0 10.27
Sub-Total Cost per Meter 29.92
- Tire (P9.87 /Mton) Pc 10.85 1.10
- Deisel Fuel (0.959ltr/ Mt) Ltr 105.00 36.75 12.99
- Oil/ Lubricants (0.166 Ltr/ Mt) Ltr 192.63 100.8735 65.43
- Maintenance (P74.18/ Mt) MT 85.30 8.98
Sub-Total 88.50
Sub-Total Cost per DRM 88.50
Total cost Per DRM 347.19
SUMMARY:
LABOR COST 55.59
PURCHASED COST -
MATRIALS/ SUPPLIES COST 281.52
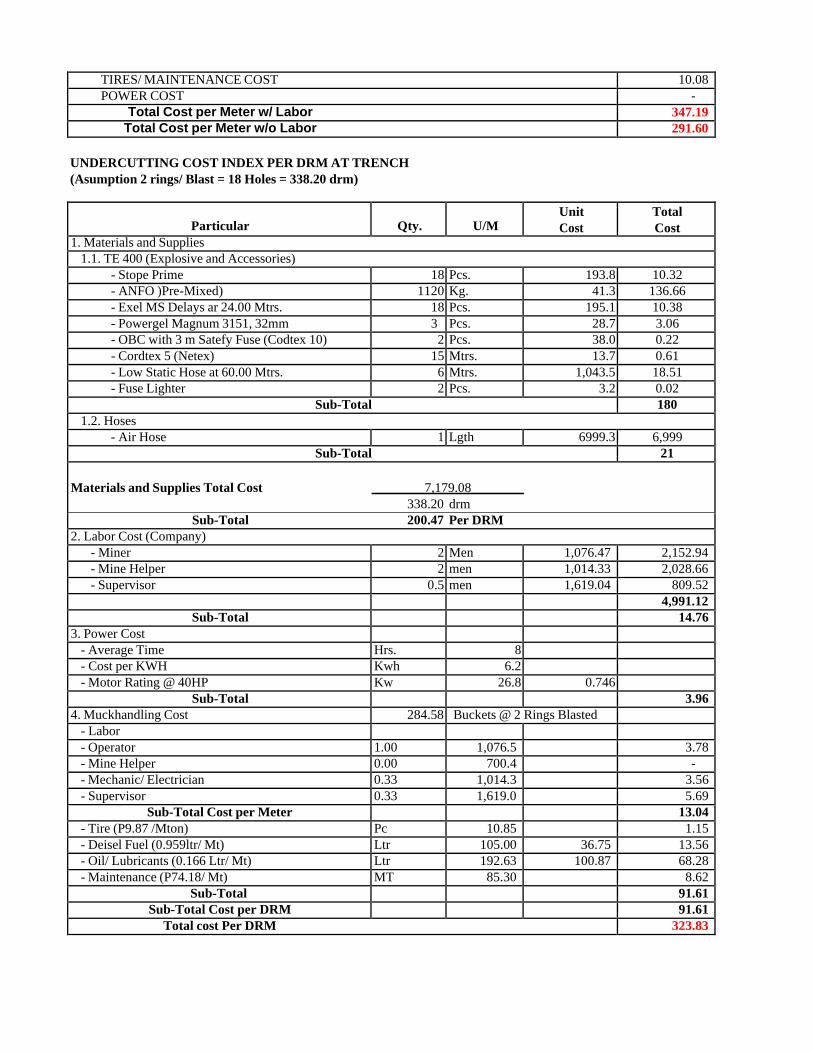
TIRES/ MAINTENANCE COST 10.08
POWER COST -
Total Cost per Meter w/ Labor 347.19
Total Cost per Meter w/o Labor 291.60
UNDERCUTTING COST INDEX PER DRM AT TRENCH
(Asumption 2 rings/ Blast = 18 Holes = 338.20 drm)
Particular
Qty.
U/M
Unit
Cost
Total
Cost 1. Materials and Supplies
1.1. TE 400 (Explosive and Accessories)
- Stope Prime 18 Pcs. 193.8 10.32
- ANFO )Pre-Mixed) 1120 Kg. 41.3 136.66
- Exel MS Delays ar 24.00 Mtrs. 18 Pcs. 195.1 10.38
- Powergel Magnum 3151, 32mm 3 Pcs. 28.7 3.06
- OBC with 3 m Satefy Fuse (Codtex 10) 2 Pcs. 38.0 0.22
- Cordtex 5 (Netex) 15 Mtrs. 13.7 0.61
- Low Static Hose at 60.00 Mtrs. 6 Mtrs. 1,043.5 18.51
- Fuse Lighter 2 Pcs. 3.2 0.02
Sub-Total 180
1.2. Hoses
- Air Hose 1 Lgth 6999.3 6,999
Sub-Total 21
Materials and Supplies Total Cost 7,179.08
338.20 drm
Sub-Total 200.47 Per DRM
2. Labor Cost (Company)
- Miner 2 Men 1,076.47 2,152.94
- Mine Helper 2 men 1,014.33 2,028.66
- Supervisor 0.5 men 1,619.04 809.52
4,991.12
Sub-Total 14.76
3. Power Cost
- Average Time Hrs. 8
- Cost per KWH Kwh 6.2
- Motor Rating @ 40HP Kw 26.8 0.746
Sub-Total 3.96
4. Muckhandling Cost 284.58 Buckets @ 2 Rings Blasted
- Labor
- Operator 1.00 1,076.5 3.78
- Mine Helper 0.00 700.4 -
- Mechanic/ Electrician 0.33 1,014.3 3.56
- Supervisor 0.33 1,619.0 5.69
Sub-Total Cost per Meter 13.04
- Tire (P9.87 /Mton) Pc 10.85 1.15
- Deisel Fuel (0.959ltr/ Mt) Ltr 105.00 36.75 13.56
- Oil/ Lubricants (0.166 Ltr/ Mt) Ltr 192.63 100.87 68.28
- Maintenance (P74.18/ Mt) MT 85.30 8.62
Sub-Total 91.61
Sub-Total Cost per DRM 91.61
Total cost Per DRM 323.83

SUMMARY:
LABOR COST 27.79
PURCHASED COST -
MATRIALS/ SUPPLIES COST 282.32
TIRES/ MAINTENANCE COST 9.77
POWER COST 3.96
Total Cost per Meter w/ Labor 323.83
Total Cost per Meter w/o Labor 296.04
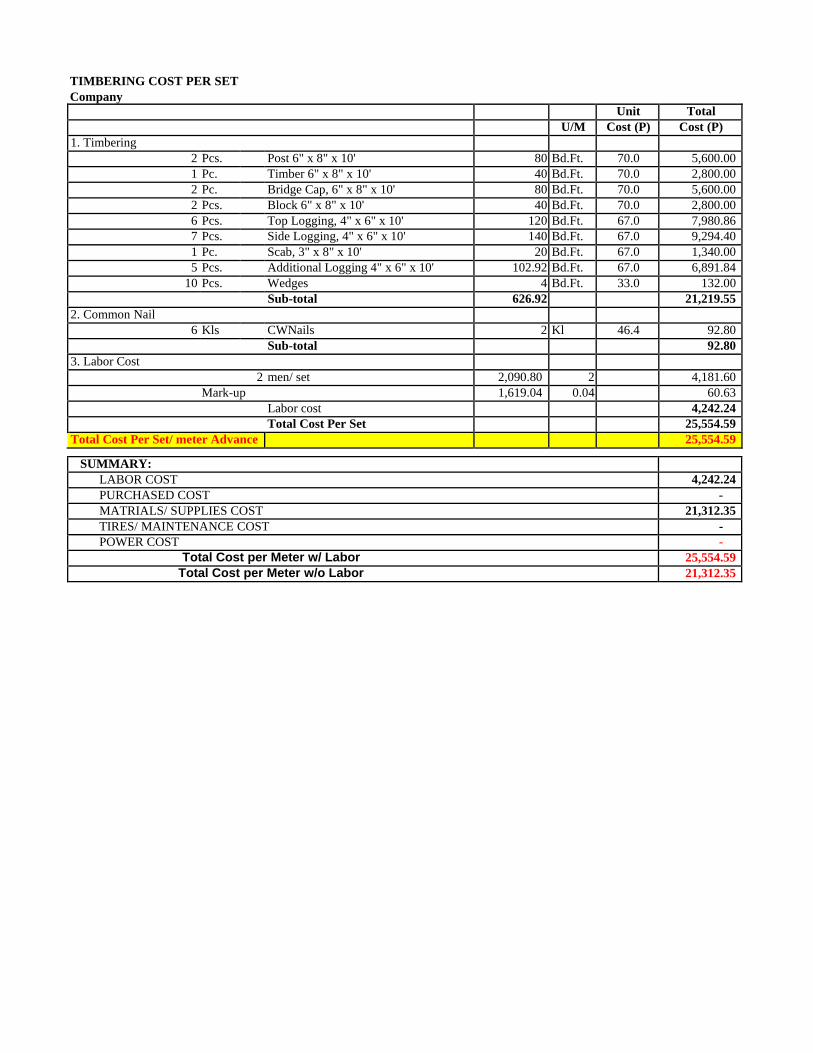
TIMBERING COST PER SET
Company Unit Total U/M Cost (P) Cost (P)
1. Timbering
2 Pcs. Post 6" x 8" x 10' 80 Bd.Ft. 70.0 5,600.00
1 Pc. Timber 6" x 8" x 10' 40 Bd.Ft. 70.0 2,800.00
2 Pc. Bridge Cap, 6" x 8" x 10' 80 Bd.Ft. 70.0 5,600.00
2 Pcs. Block 6" x 8" x 10' 40 Bd.Ft. 70.0 2,800.00
6 Pcs. Top Logging, 4" x 6" x 10' 120 Bd.Ft. 67.0 7,980.86
7 Pcs. Side Logging, 4" x 6" x 10' 140 Bd.Ft. 67.0 9,294.40
1 Pc. Scab, 3" x 8" x 10' 20 Bd.Ft. 67.0 1,340.00
5 Pcs. Additional Logging 4" x 6" x 10' 102.92 Bd.Ft. 67.0 6,891.84
10 Pcs. Wedges 4 Bd.Ft. 33.0 132.00
Sub-total 626.92 21,219.55
2. Common Nail
6 Kls CWNails 2 Kl 46.4 92.80
Sub-total 92.80
3. Labor Cost
2 men/ set 2,090.80 2 4,181.60
Mark-up 1,619.04 0.04 60.63
Labor cost 4,242.24
Total Cost Per Set 25,554.59
Total Cost Per Set/ meter Advance 25,554.59
SUMMARY:
LABOR COST 4,242.24
PURCHASED COST -
MATRIALS/ SUPPLIES COST 21,312.35
TIRES/ MAINTENANCE COST -
POWER COST -
Total Cost per Meter w/ Labor 25,554.59
Total Cost per Meter w/o Labor 21,312.35
Annex A: Mine
Annex A-3: Basis of Dilution Grade
Factor
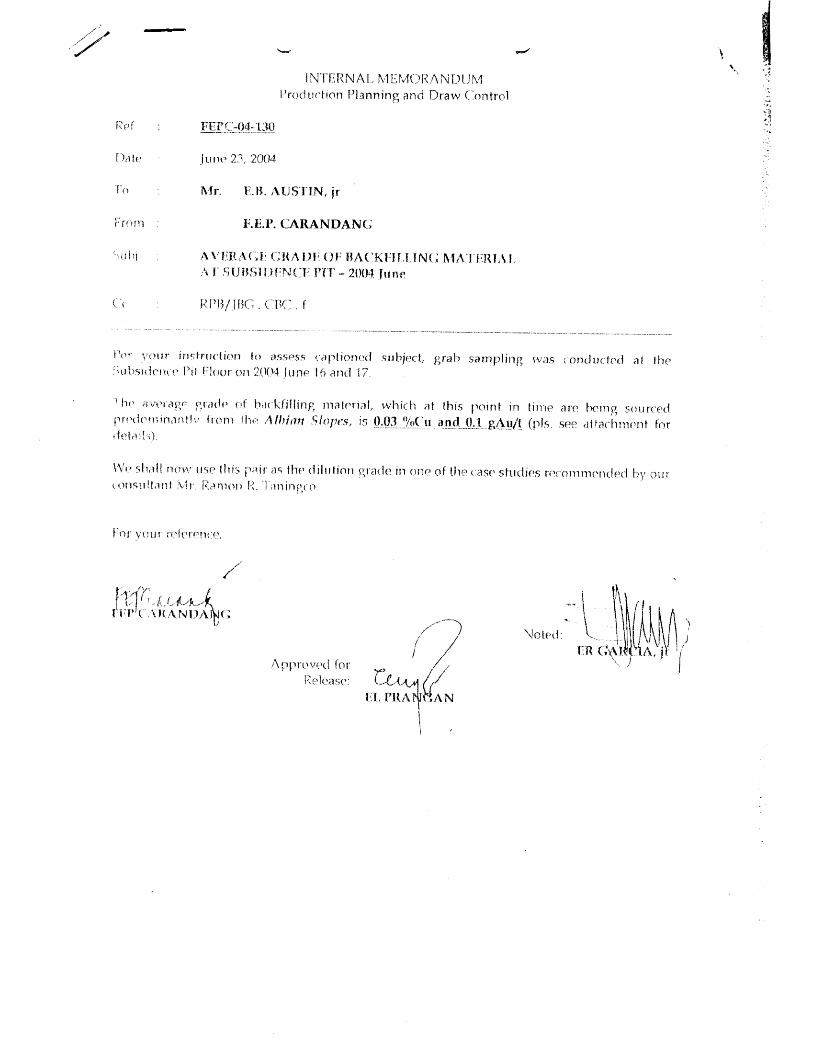
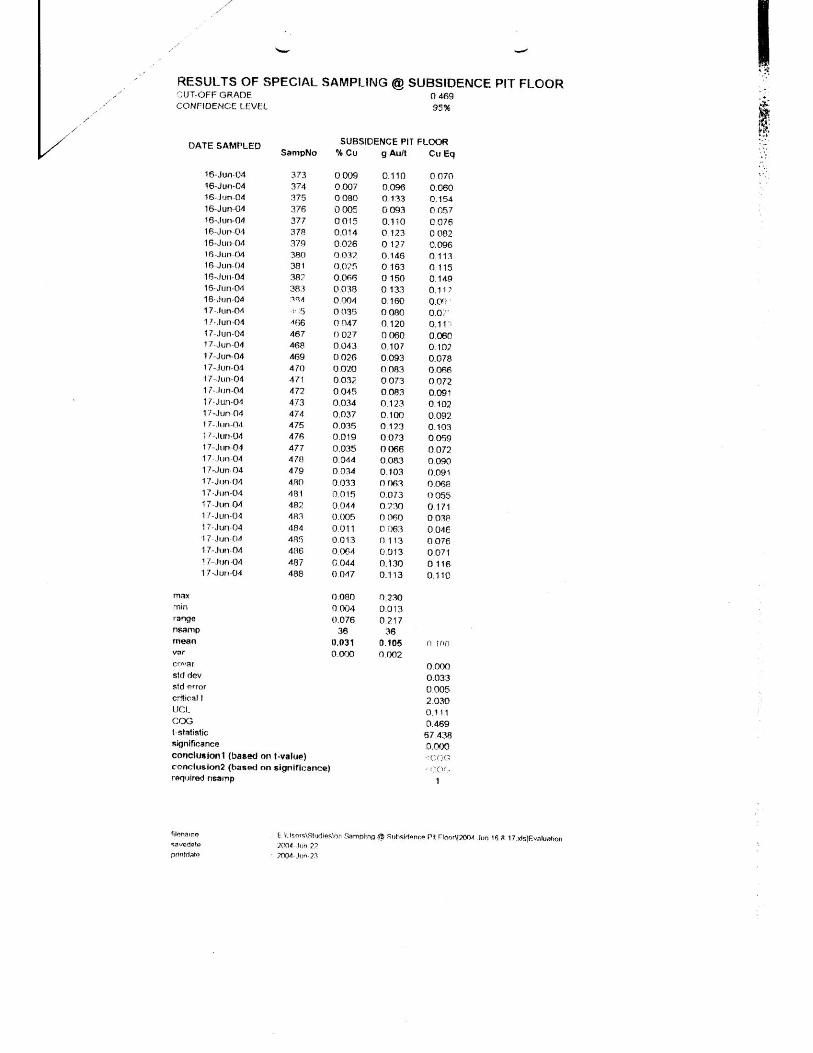
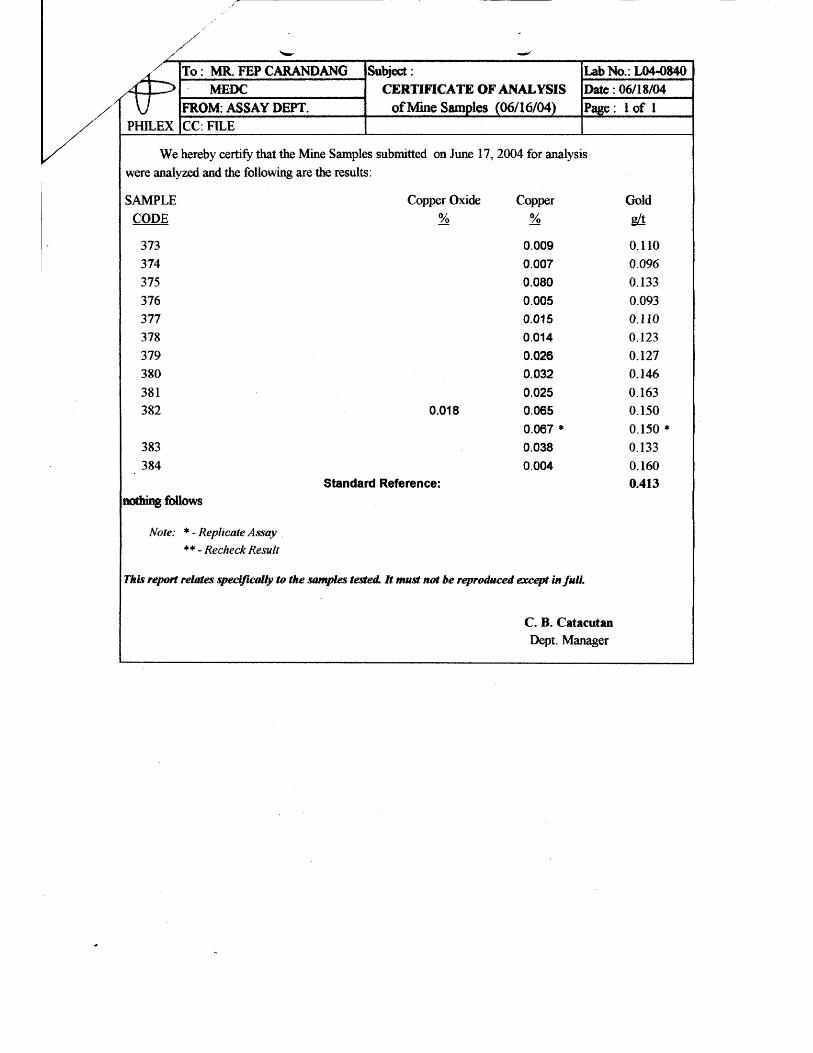
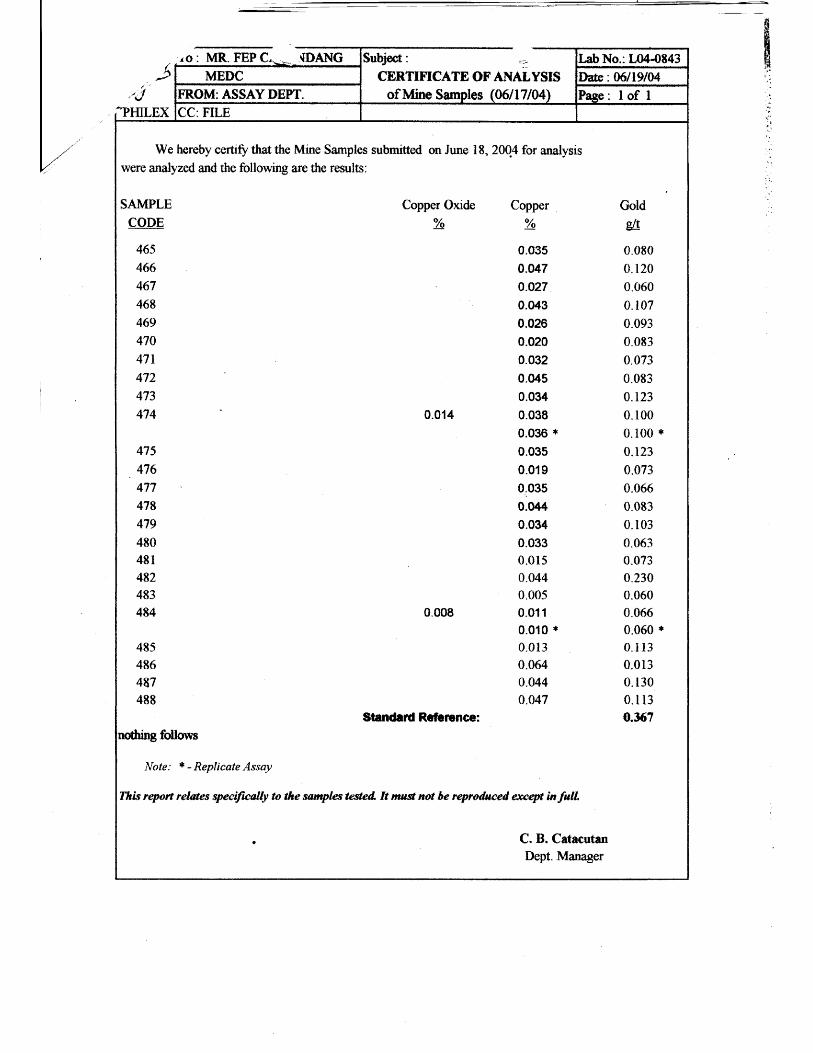
PADCAL Operations
April 2013
Annex B: Mill
Annex B-1: List of Existing Machineries
and Equipment
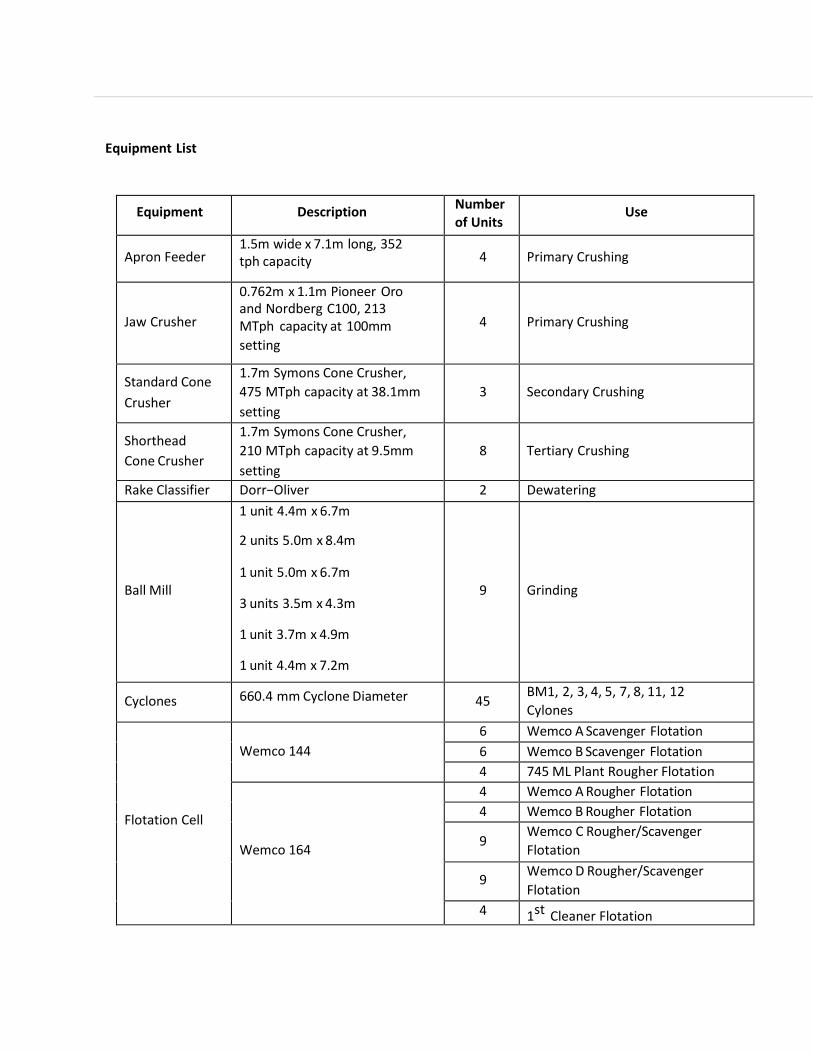
Equipment List
Equipment Description Number of Units
Use
Apron Feeder 1.5m wide x 7.1m long, 352 tph capacity 4 Primary Crushing
Jaw Crusher
0.762m x 1.1m Pioneer Oro and Nordberg C100, 213 MTph capacity at 100mm
setting
4
Primary Crushing
Standard Cone
Crusher
1.7m Symons Cone Crusher,
475 MTph capacity at 38.1mm
setting
3
Secondary Crushing
Shorthead
Cone Crusher
1.7m Symons Cone Crusher,
210 MTph capacity at 9.5mm
setting
8
Tertiary Crushing
Rake Classifier Dorr−Oliver 2 Dewatering
Ball Mill
1 unit 4.4m x 6.7m
2 units 5.0m x 8.4m
1 unit 5.0m x 6.7m
3 units 3.5m x 4.3m
1 unit 3.7m x 4.9m
1 unit 4.4m x 7.2m
9
Grinding
Cyclones 660.4 mm Cyclone Diameter 45 BM1, 2, 3, 4, 5, 7, 8, 11, 12
Cylones
Flotation Cell
Wemco 144
6 Wemco A Scavenger Flotation
6 Wemco B Scavenger Flotation
4 745 ML Plant Rougher Flotation
Wemco 164
4 Wemco A Rougher Flotation
4 Wemco B Rougher Flotation
9 Wemco C Rougher/Scavenger
Flotation
9 Wemco D Rougher/Scavenger
Flotation
4 1st Cleaner Flotation
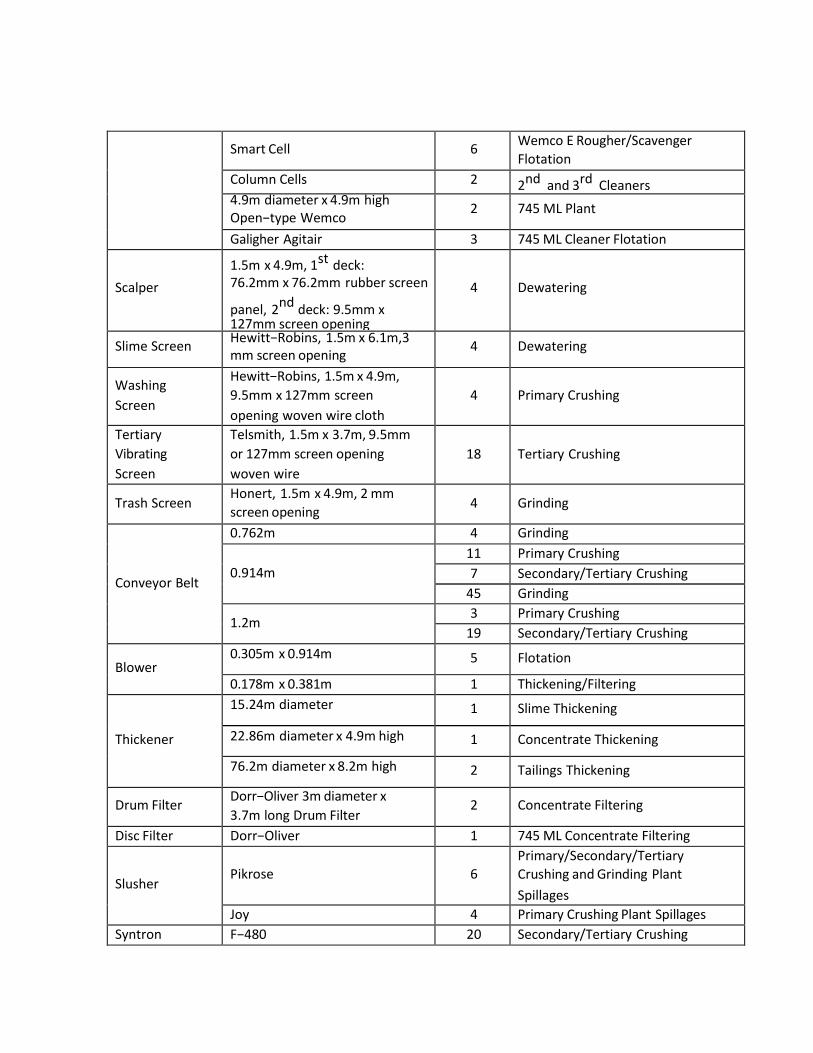
Smart Cell 6
Wemco E Rougher/Scavenger
Flotation
Column Cells 2 2nd and 3rd Cleaners 4.9m diameter x 4.9m high Open−type Wemco
2 745 ML Plant
Galigher Agitair 3 745 ML Cleaner Flotation
Scalper
1.5m x 4.9m, 1st deck: 76.2mm x 76.2mm rubber screen
panel, 2nd deck: 9.5mm x 127mm screen opening
4
Dewatering
Slime Screen Hewitt−Robins, 1.5m x 6.1m,3 mm screen opening
4 Dewatering
Washing
Screen
Hewitt−Robins, 1.5m x 4.9m,
9.5mm x 127mm screen
opening woven wire cloth
4
Primary Crushing
Tertiary
Vibrating
Screen
Telsmith, 1.5m x 3.7m, 9.5mm
or 127mm screen opening
woven wire
18
Tertiary Crushing
Trash Screen Honert, 1.5m x 4.9m, 2 mm
screen opening 4 Grinding
Conveyor Belt
0.762m 4 Grinding
0.914m
11 Primary Crushing
7 Secondary/Tertiary Crushing
45 Grinding
1.2m 3 Primary Crushing
19 Secondary/Tertiary Crushing
Blower 0.305m x 0.914m 5 Flotation
0.178m x 0.381m 1 Thickening/Filtering
Thickener
15.24m diameter 1 Slime Thickening
22.86m diameter x 4.9m high 1 Concentrate Thickening
76.2m diameter x 8.2m high 2 Tailings Thickening
Drum Filter Dorr−Oliver 3m diameter x
3.7m long Drum Filter 2 Concentrate Filtering
Disc Filter Dorr−Oliver 1 745 ML Concentrate Filtering
Slusher
Pikrose
6
Primary/Secondary/Tertiary
Crushing and Grinding Plant
Spillages
Joy 4 Primary Crushing Plant Spillages
Syntron F−480 20 Secondary/Tertiary Crushing
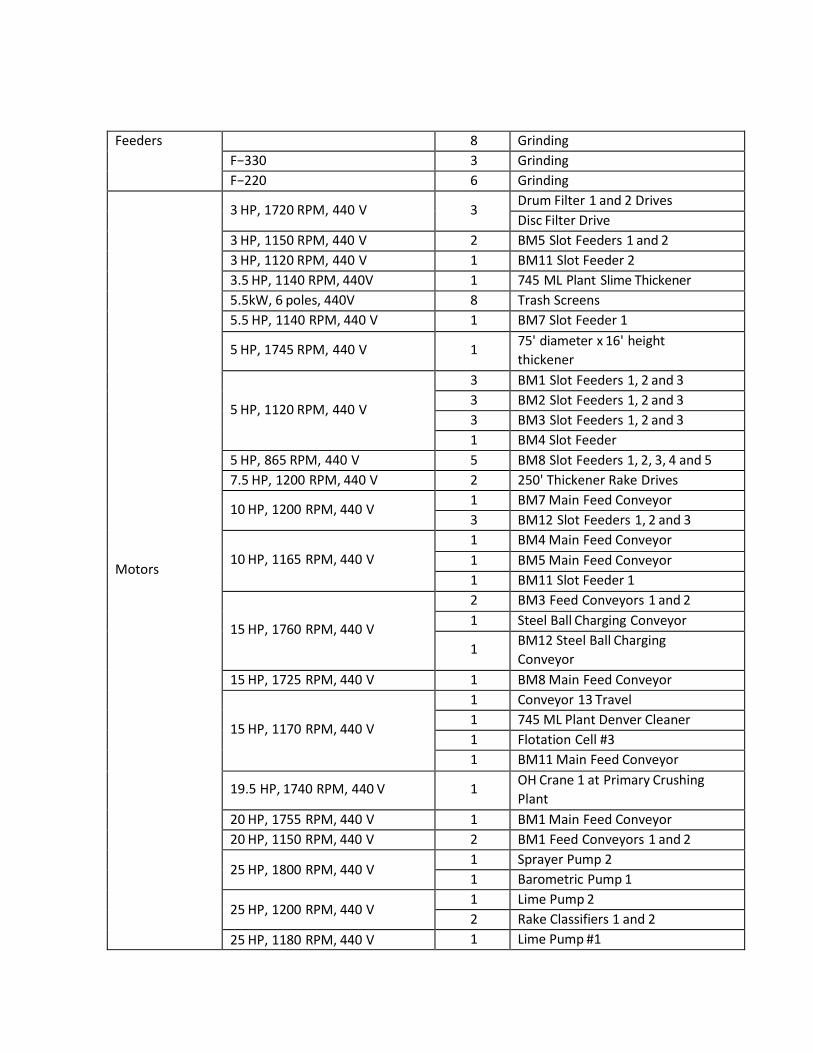
Feeders 8 Grinding
F−330 3 Grinding
F−220 6 Grinding
Motors
3 HP, 1720 RPM, 440 V 3 Drum Filter 1 and 2 Drives
Disc Filter Drive
3 HP, 1150 RPM, 440 V 2 BM5 Slot Feeders 1 and 2
3 HP, 1120 RPM, 440 V 1 BM11 Slot Feeder 2
3.5 HP, 1140 RPM, 440V 1 745 ML Plant Slime Thickener
5.5kW, 6 poles, 440V 8 Trash Screens
5.5 HP, 1140 RPM, 440 V 1 BM7 Slot Feeder 1
5 HP, 1745 RPM, 440 V 1 75' diameter x 16' height
thickener
5 HP, 1120 RPM, 440 V
3 BM1 Slot Feeders 1, 2 and 3
3 BM2 Slot Feeders 1, 2 and 3
3 BM3 Slot Feeders 1, 2 and 3
1 BM4 Slot Feeder
5 HP, 865 RPM, 440 V 5 BM8 Slot Feeders 1, 2, 3, 4 and 5
7.5 HP, 1200 RPM, 440 V 2 250' Thickener Rake Drives
10 HP, 1200 RPM, 440 V 1 BM7 Main Feed Conveyor
3 BM12 Slot Feeders 1, 2 and 3
10 HP, 1165 RPM, 440 V
1 BM4 Main Feed Conveyor
1 BM5 Main Feed Conveyor
1 BM11 Slot Feeder 1
15 HP, 1760 RPM, 440 V
2 BM3 Feed Conveyors 1 and 2
1 Steel Ball Charging Conveyor
1 BM12 Steel Ball Charging
Conveyor
15 HP, 1725 RPM, 440 V 1 BM8 Main Feed Conveyor
15 HP, 1170 RPM, 440 V
1 Conveyor 13 Travel
1 745 ML Plant Denver Cleaner
1 Flotation Cell #3
1 BM11 Main Feed Conveyor
19.5 HP, 1740 RPM, 440 V 1 OH Crane 1 at Primary Crushing
Plant
20 HP, 1755 RPM, 440 V 1 BM1 Main Feed Conveyor
20 HP, 1150 RPM, 440 V 2 BM1 Feed Conveyors 1 and 2
25 HP, 1800 RPM, 440 V 1 Sprayer Pump 2
1 Barometric Pump 1
25 HP, 1200 RPM, 440 V 1 Lime Pump 2
2 Rake Classifiers 1 and 2
25 HP, 1180 RPM, 440 V 1 Lime Pump #1
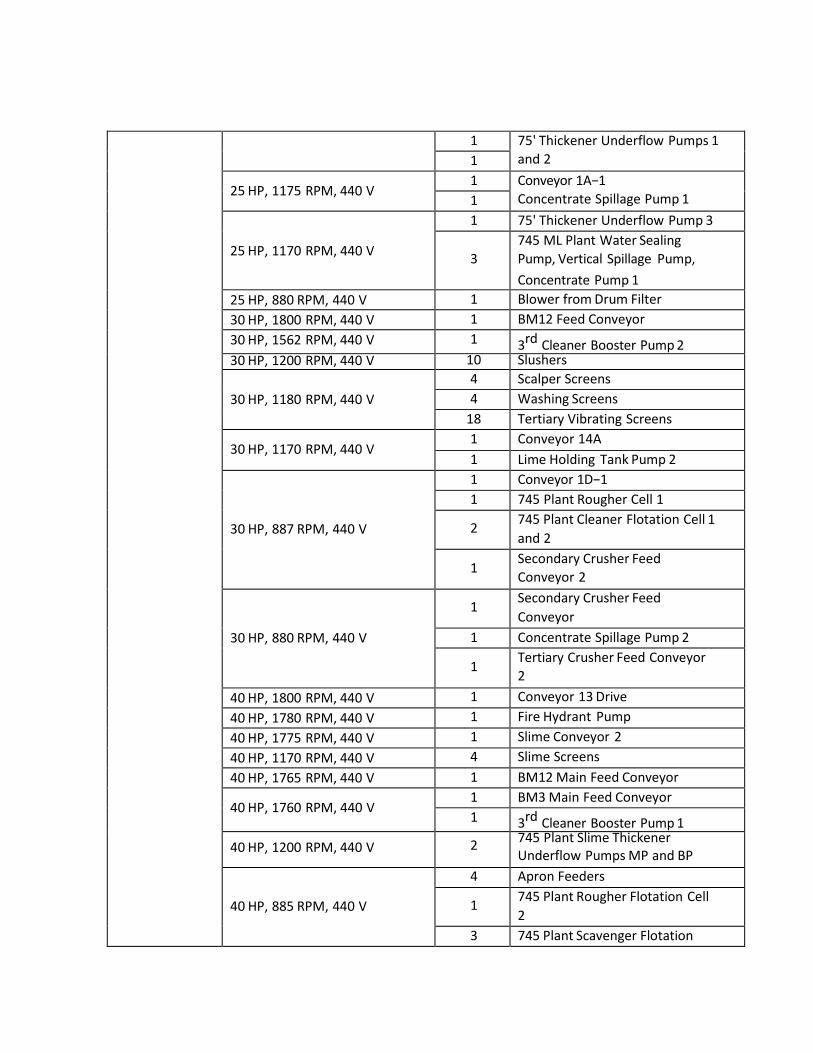
1 75' Thickener Underflow Pumps 1
and 2 1
25 HP, 1175 RPM, 440 V 1 Conveyor 1A−1
Concentrate Spillage Pump 1 1
25 HP, 1170 RPM, 440 V
1 75' Thickener Underflow Pump 3
3
745 ML Plant Water Sealing
Pump, Vertical Spillage Pump,
Concentrate Pump 1
25 HP, 880 RPM, 440 V 1 Blower from Drum Filter
30 HP, 1800 RPM, 440 V 1 BM12 Feed Conveyor
30 HP, 1562 RPM, 440 V 1 3rd Cleaner Booster Pump 2 30 HP, 1200 RPM, 440 V 10 Slushers
30 HP, 1180 RPM, 440 V
4 Scalper Screens
4 Washing Screens
18 Tertiary Vibrating Screens
30 HP, 1170 RPM, 440 V 1 Conveyor 14A
1 Lime Holding Tank Pump 2
30 HP, 887 RPM, 440 V
1 Conveyor 1D−1
1 745 Plant Rougher Cell 1
2 745 Plant Cleaner Flotation Cell 1
and 2
1 Secondary Crusher Feed
Conveyor 2
30 HP, 880 RPM, 440 V
1 Secondary Crusher Feed
Conveyor
1 Concentrate Spillage Pump 2
1 Tertiary Crusher Feed Conveyor
2
40 HP, 1800 RPM, 440 V 1 Conveyor 13 Drive
40 HP, 1780 RPM, 440 V 1 Fire Hydrant Pump
40 HP, 1775 RPM, 440 V 1 Slime Conveyor 2
40 HP, 1170 RPM, 440 V 4 Slime Screens
40 HP, 1765 RPM, 440 V 1 BM12 Main Feed Conveyor
40 HP, 1760 RPM, 440 V 1 BM3 Main Feed Conveyor
1 3rd Cleaner Booster Pump 1
40 HP, 1200 RPM, 440 V 2 745 Plant Slime Thickener Underflow Pumps MP and BP
40 HP, 885 RPM, 440 V
4 Apron Feeders
1 745 Plant Rougher Flotation Cell
2
3 745 Plant Scavenger Flotation
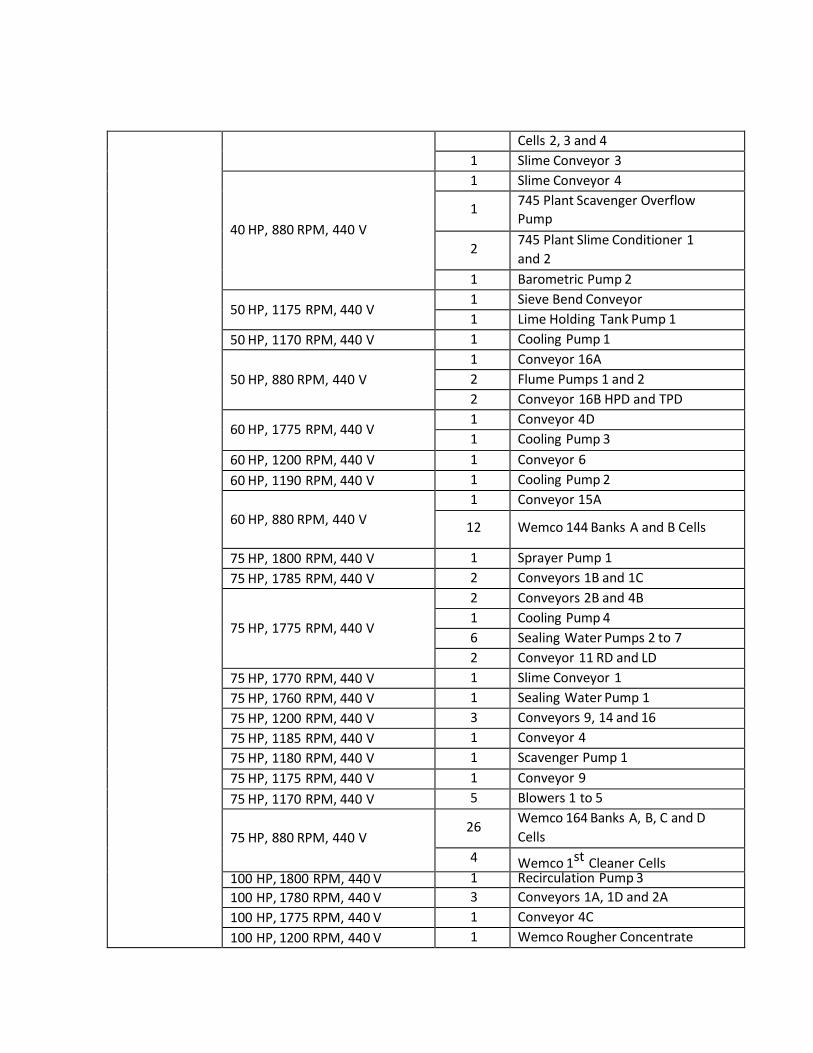
Cells 2, 3 and 4
1 Slime Conveyor 3
40 HP, 880 RPM, 440 V
1 Slime Conveyor 4
1 745 Plant Scavenger Overflow
Pump
2 745 Plant Slime Conditioner 1
and 2
1 Barometric Pump 2
50 HP, 1175 RPM, 440 V 1 Sieve Bend Conveyor
1 Lime Holding Tank Pump 1
50 HP, 1170 RPM, 440 V 1 Cooling Pump 1
50 HP, 880 RPM, 440 V
1 Conveyor 16A
2 Flume Pumps 1 and 2
2 Conveyor 16B HPD and TPD
60 HP, 1775 RPM, 440 V 1 Conveyor 4D
1 Cooling Pump 3
60 HP, 1200 RPM, 440 V 1 Conveyor 6
60 HP, 1190 RPM, 440 V 1 Cooling Pump 2
60 HP, 880 RPM, 440 V
1 Conveyor 15A
12 Wemco 144 Banks A and B Cells
75 HP, 1800 RPM, 440 V 1 Sprayer Pump 1
75 HP, 1785 RPM, 440 V 2 Conveyors 1B and 1C
75 HP, 1775 RPM, 440 V
2 Conveyors 2B and 4B
1 Cooling Pump 4
6 Sealing Water Pumps 2 to 7
2 Conveyor 11 RD and LD
75 HP, 1770 RPM, 440 V 1 Slime Conveyor 1
75 HP, 1760 RPM, 440 V 1 Sealing Water Pump 1
75 HP, 1200 RPM, 440 V 3 Conveyors 9, 14 and 16
75 HP, 1185 RPM, 440 V 1 Conveyor 4
75 HP, 1180 RPM, 440 V 1 Scavenger Pump 1
75 HP, 1175 RPM, 440 V 1 Conveyor 9
75 HP, 1170 RPM, 440 V 5 Blowers 1 to 5
75 HP, 880 RPM, 440 V
26 Wemco 164 Banks A, B, C and D
Cells
4 Wemco 1st Cleaner Cells 100 HP, 1800 RPM, 440 V 1 Recirculation Pump 3
100 HP, 1780 RPM, 440 V 3 Conveyors 1A, 1D and 2A
100 HP, 1775 RPM, 440 V 1 Conveyor 4C
100 HP, 1200 RPM, 440 V 1 Wemco Rougher Concentrate
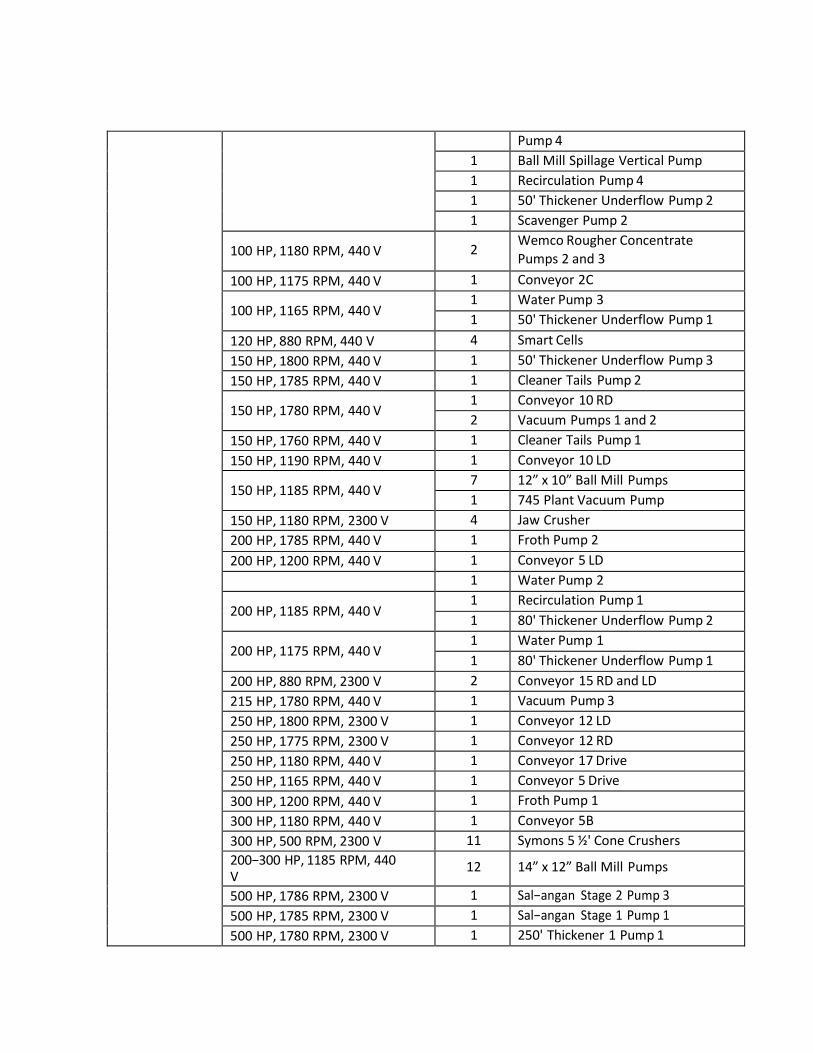
Pump 4
1 Ball Mill Spillage Vertical Pump
1 Recirculation Pump 4
1 50' Thickener Underflow Pump 2
1 Scavenger Pump 2
100 HP, 1180 RPM, 440 V 2 Wemco Rougher Concentrate
Pumps 2 and 3
100 HP, 1175 RPM, 440 V 1 Conveyor 2C
100 HP, 1165 RPM, 440 V 1 Water Pump 3
1 50' Thickener Underflow Pump 1
120 HP, 880 RPM, 440 V 4 Smart Cells
150 HP, 1800 RPM, 440 V 1 50' Thickener Underflow Pump 3
150 HP, 1785 RPM, 440 V 1 Cleaner Tails Pump 2
150 HP, 1780 RPM, 440 V 1 Conveyor 10 RD
2 Vacuum Pumps 1 and 2
150 HP, 1760 RPM, 440 V 1 Cleaner Tails Pump 1
150 HP, 1190 RPM, 440 V 1 Conveyor 10 LD
150 HP, 1185 RPM, 440 V 7 12” x 10” Ball Mill Pumps
1 745 Plant Vacuum Pump
150 HP, 1180 RPM, 2300 V 4 Jaw Crusher
200 HP, 1785 RPM, 440 V 1 Froth Pump 2
200 HP, 1200 RPM, 440 V 1 Conveyor 5 LD
1 Water Pump 2
200 HP, 1185 RPM, 440 V 1 Recirculation Pump 1
1 80' Thickener Underflow Pump 2
200 HP, 1175 RPM, 440 V 1 Water Pump 1
1 80' Thickener Underflow Pump 1
200 HP, 880 RPM, 2300 V 2 Conveyor 15 RD and LD
215 HP, 1780 RPM, 440 V 1 Vacuum Pump 3
250 HP, 1800 RPM, 2300 V 1 Conveyor 12 LD
250 HP, 1775 RPM, 2300 V 1 Conveyor 12 RD
250 HP, 1180 RPM, 440 V 1 Conveyor 17 Drive
250 HP, 1165 RPM, 440 V 1 Conveyor 5 Drive
300 HP, 1200 RPM, 440 V 1 Froth Pump 1
300 HP, 1180 RPM, 440 V 1 Conveyor 5B
300 HP, 500 RPM, 2300 V 11 Symons 5 ½' Cone Crushers
200−300 HP, 1185 RPM, 440 V
12 14” x 12” Ball Mill Pumps
500 HP, 1786 RPM, 2300 V 1 Sal−angan Stage 2 Pump 3
500 HP, 1785 RPM, 2300 V 1 Sal−angan Stage 1 Pump 1
500 HP, 1780 RPM, 2300 V 1 250' Thickener 1 Pump 1
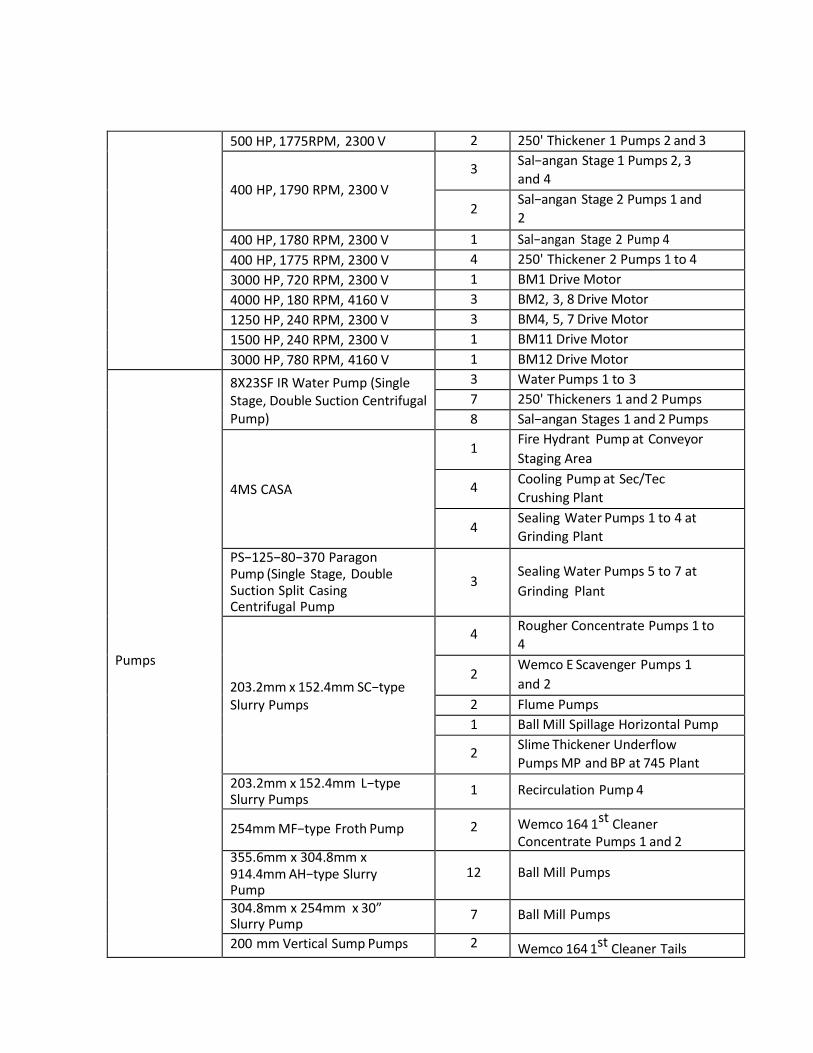
500 HP, 1775RPM, 2300 V 2 250' Thickener 1 Pumps 2 and 3
400 HP, 1790 RPM, 2300 V
3 Sal−angan Stage 1 Pumps 2, 3
and 4
2 Sal−angan Stage 2 Pumps 1 and
2
400 HP, 1780 RPM, 2300 V 1 Sal−angan Stage 2 Pump 4
400 HP, 1775 RPM, 2300 V 4 250' Thickener 2 Pumps 1 to 4
3000 HP, 720 RPM, 2300 V 1 BM1 Drive Motor
4000 HP, 180 RPM, 4160 V 3 BM2, 3, 8 Drive Motor
1250 HP, 240 RPM, 2300 V 3 BM4, 5, 7 Drive Motor
1500 HP, 240 RPM, 2300 V 1 BM11 Drive Motor
3000 HP, 780 RPM, 4160 V 1 BM12 Drive Motor
Pumps
8X23SF IR Water Pump (Single Stage, Double Suction Centrifugal Pump)
3 Water Pumps 1 to 3
7 250' Thickeners 1 and 2 Pumps
8 Sal−angan Stages 1 and 2 Pumps
4MS CASA
1 Fire Hydrant Pump at Conveyor
Staging Area
4 Cooling Pump at Sec/Tec
Crushing Plant
4 Sealing Water Pumps 1 to 4 at
Grinding Plant
PS−125−80−370 Paragon Pump (Single Stage, Double Suction Split Casing Centrifugal Pump
3
Sealing Water Pumps 5 to 7 at
Grinding Plant
203.2mm x 152.4mm SC−type Slurry Pumps
4 Rougher Concentrate Pumps 1 to
4
2 Wemco E Scavenger Pumps 1
and 2
2 Flume Pumps
1 Ball Mill Spillage Horizontal Pump
2 Slime Thickener Underflow
Pumps MP and BP at 745 Plant
203.2mm x 152.4mm L−type Slurry Pumps
1 Recirculation Pump 4
254mm MF−type Froth Pump 2 Wemco 164 1st Cleaner Concentrate Pumps 1 and 2
355.6mm x 304.8mm x 914.4mm AH−type Slurry Pump
12 Ball Mill Pumps
304.8mm x 254mm x 30” Slurry Pump
7 Ball Mill Pumps
200 mm Vertical Sump Pumps 2 Wemco 164 1st Cleaner Tails
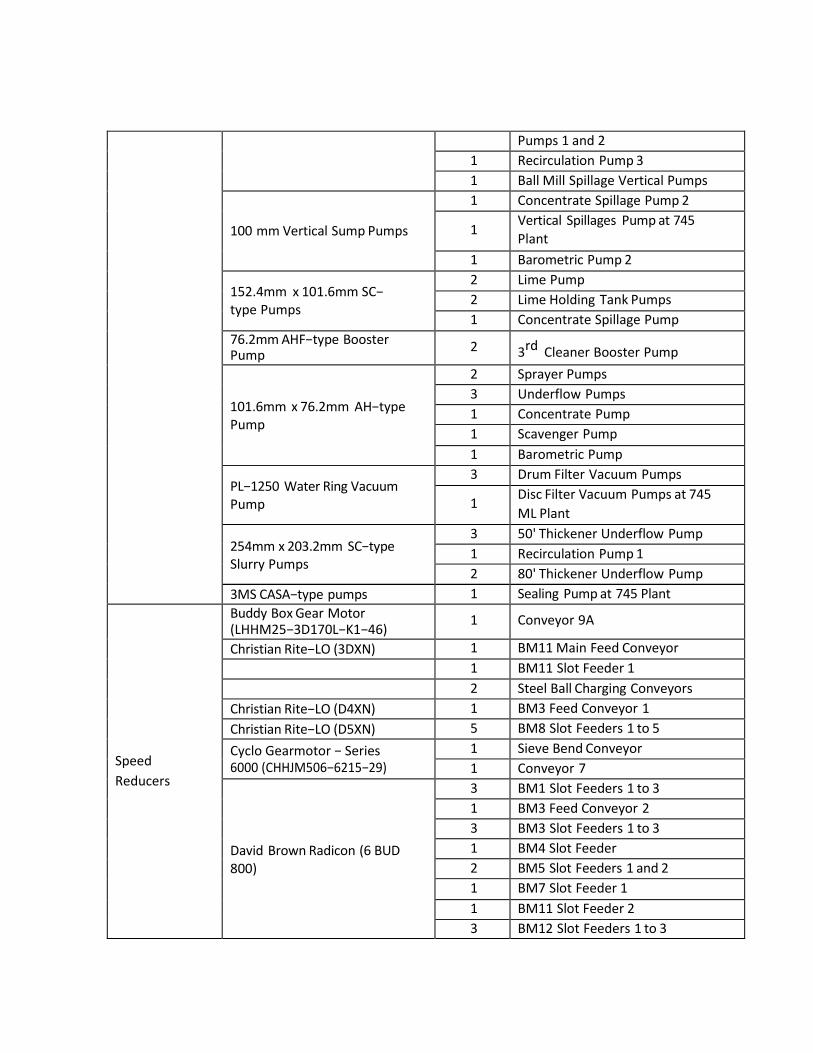
Pumps 1 and 2
1 Recirculation Pump 3
1 Ball Mill Spillage Vertical Pumps
100 mm Vertical Sump Pumps
1 Concentrate Spillage Pump 2
1 Vertical Spillages Pump at 745
Plant
1 Barometric Pump 2
152.4mm x 101.6mm SC− type Pumps
2 Lime Pump
2 Lime Holding Tank Pumps
1 Concentrate Spillage Pump
76.2mm AHF−type Booster Pump
2 3rd Cleaner Booster Pump
101.6mm x 76.2mm AH−type Pump
2 Sprayer Pumps
3 Underflow Pumps
1 Concentrate Pump
1 Scavenger Pump
1 Barometric Pump
PL−1250 Water Ring Vacuum Pump
3 Drum Filter Vacuum Pumps
1 Disc Filter Vacuum Pumps at 745
ML Plant
254mm x 203.2mm SC−type Slurry Pumps
3 50' Thickener Underflow Pump
1 Recirculation Pump 1
2 80' Thickener Underflow Pump
3MS CASA−type pumps 1 Sealing Pump at 745 Plant
Speed
Reducers
Buddy Box Gear Motor (LHHM25−3D170L−K1−46)
1 Conveyor 9A
Christian Rite−LO (3DXN) 1 BM11 Main Feed Conveyor
1 BM11 Slot Feeder 1
2 Steel Ball Charging Conveyors
Christian Rite−LO (D4XN) 1 BM3 Feed Conveyor 1
Christian Rite−LO (D5XN) 5 BM8 Slot Feeders 1 to 5
Cyclo Gearmotor − Series 6000 (CHHJM506−6215−29)
1 Sieve Bend Conveyor
1 Conveyor 7
David Brown Radicon (6 BUD 800)
3 BM1 Slot Feeders 1 to 3
1 BM3 Feed Conveyor 2
3 BM3 Slot Feeders 1 to 3
1 BM4 Slot Feeder
2 BM5 Slot Feeders 1 and 2
1 BM7 Slot Feeder 1
1 BM11 Slot Feeder 2
3 BM12 Slot Feeders 1 to 3
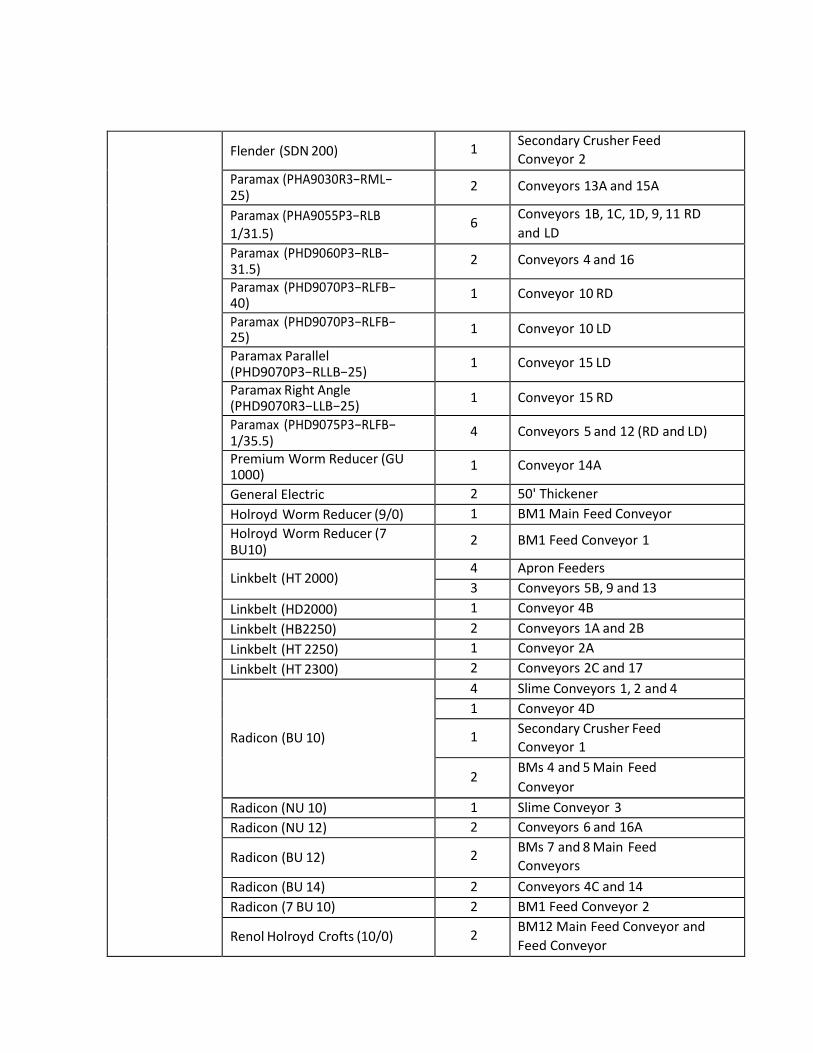
Flender (SDN 200) 1
Secondary Crusher Feed
Conveyor 2
Paramax (PHA9030R3−RML− 25)
2 Conveyors 13A and 15A
Paramax (PHA9055P3−RLB 1/31.5)
6 Conveyors 1B, 1C, 1D, 9, 11 RD
and LD
Paramax (PHD9060P3−RLB− 31.5)
2 Conveyors 4 and 16
Paramax (PHD9070P3−RLFB− 40)
1 Conveyor 10 RD
Paramax (PHD9070P3−RLFB− 25)
1 Conveyor 10 LD
Paramax Parallel (PHD9070P3−RLLB−25)
1 Conveyor 15 LD
Paramax Right Angle (PHD9070R3−LLB−25)
1 Conveyor 15 RD
Paramax (PHD9075P3−RLFB− 1/35.5)
4 Conveyors 5 and 12 (RD and LD)
Premium Worm Reducer (GU 1000)
1 Conveyor 14A
General Electric 2 50' Thickener
Holroyd Worm Reducer (9/0) 1 BM1 Main Feed Conveyor
Holroyd Worm Reducer (7 BU10)
2 BM1 Feed Conveyor 1
Linkbelt (HT 2000) 4 Apron Feeders
3 Conveyors 5B, 9 and 13
Linkbelt (HD2000) 1 Conveyor 4B
Linkbelt (HB2250) 2 Conveyors 1A and 2B
Linkbelt (HT 2250) 1 Conveyor 2A
Linkbelt (HT 2300) 2 Conveyors 2C and 17
Radicon (BU 10)
4 Slime Conveyors 1, 2 and 4
1 Conveyor 4D
1 Secondary Crusher Feed
Conveyor 1
2 BMs 4 and 5 Main Feed
Conveyor
Radicon (NU 10) 1 Slime Conveyor 3
Radicon (NU 12) 2 Conveyors 6 and 16A
Radicon (BU 12) 2 BMs 7 and 8 Main Feed
Conveyors
Radicon (BU 14) 2 Conveyors 4C and 14
Radicon (7 BU 10) 2 BM1 Feed Conveyor 2
Renol Holroyd Crofts (10/0) 2 BM12 Main Feed Conveyor and
Feed Conveyor
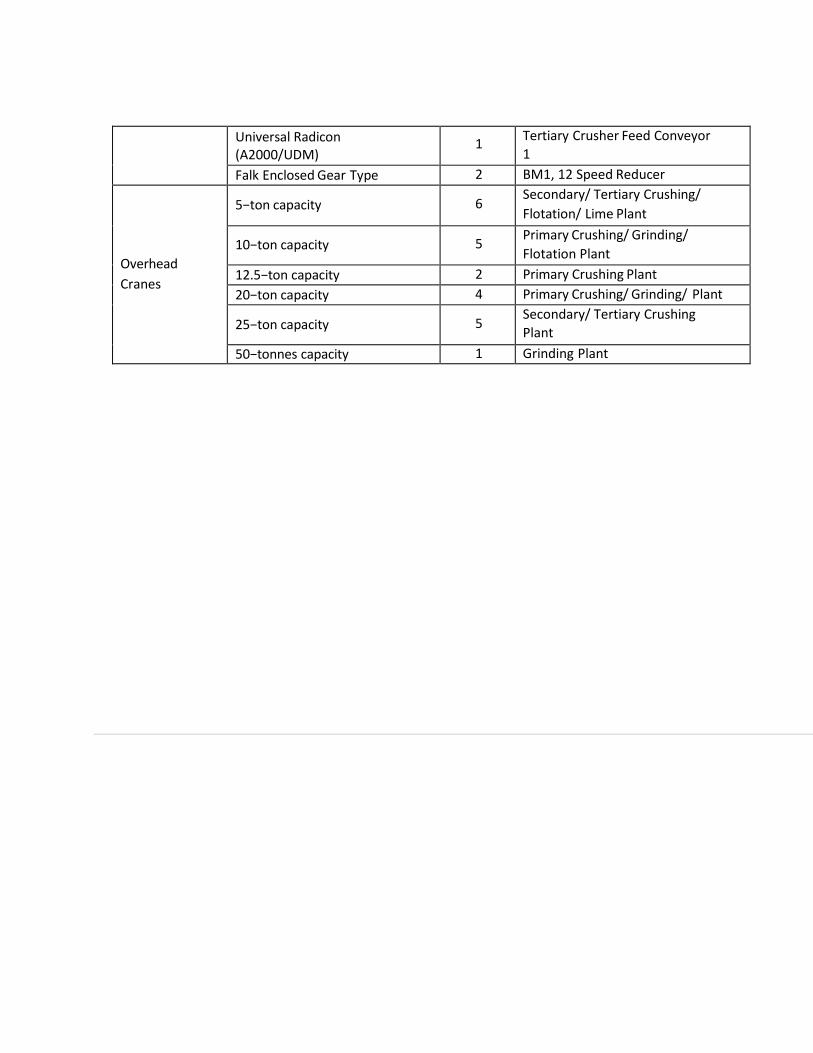
Universal Radicon (A2000/UDM)
1 Tertiary Crusher Feed Conveyor
1
Falk Enclosed Gear Type 2 BM1, 12 Speed Reducer
Overhead
Cranes
5−ton capacity 6 Secondary/ Tertiary Crushing/
Flotation/ Lime Plant
10−ton capacity 5 Primary Crushing/ Grinding/
Flotation Plant
12.5−ton capacity 2 Primary Crushing Plant
20−ton capacity 4 Primary Crushing/ Grinding/ Plant
25−ton capacity 5 Secondary/ Tertiary Crushing
Plant
50−tonnes capacity 1 Grinding Plant
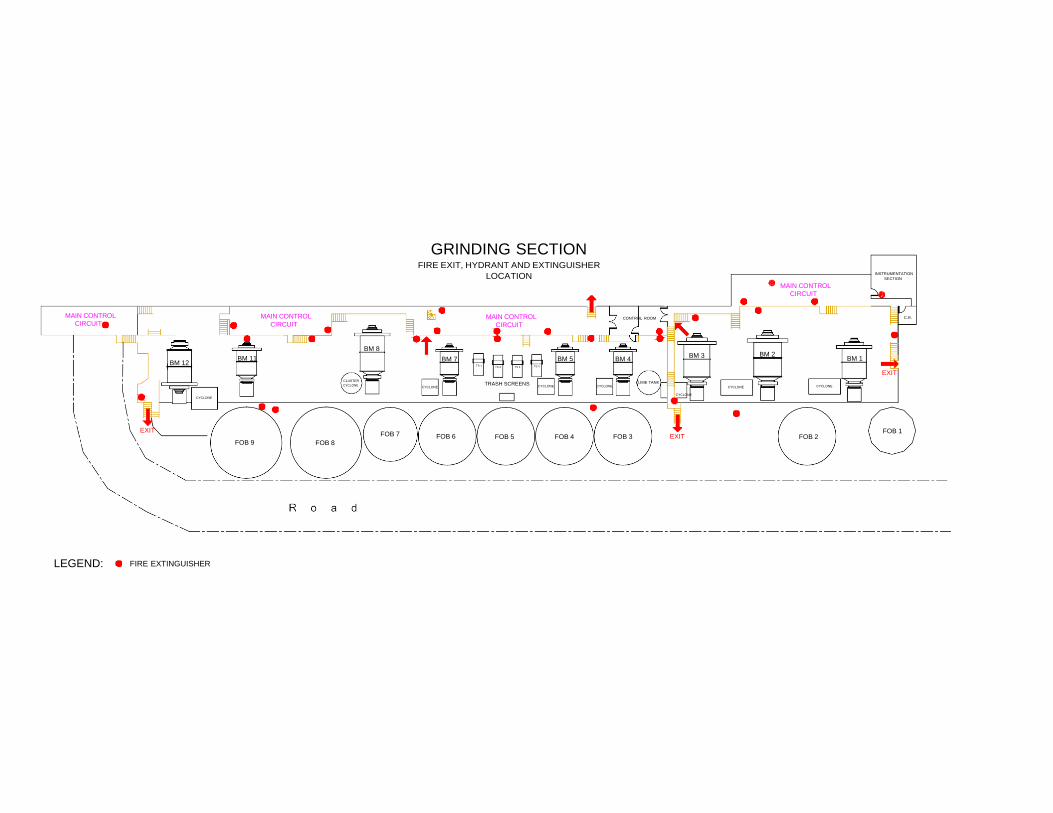
GRINDING SECTION FIRE EXIT, HYDRANT AND EXTINGUISHER
LOCATION INSTRUMENTATION
SECTION
MAIN CONTROL
CIRCUIT
MAIN CONTROL
CIRCUIT MAIN CONTROL
CIRCUIT MAIN CONTROL
CIRCUIT CONTROL ROOM C.R.
BM 8
BM 12 BM 11 BM 7 BM 5 BM 4
BM 3 BM 2 BM 1
TS 1 TS 2 TS 3 TS 4
EXIT CLUSTER
CYCLONE CYCLONE
TRASH SCREENS LIME TANK CYCLONE CYCLONE CYCLONE CYCLONE
CYCLONE CYCLONE
EXIT FOB 7 FOB 1
FOB 9 FOB 8 FOB 6 FOB 5 FOB 4 FOB 3 EXIT FOB 2
LEGEND: FIRE EXTINGUISHER
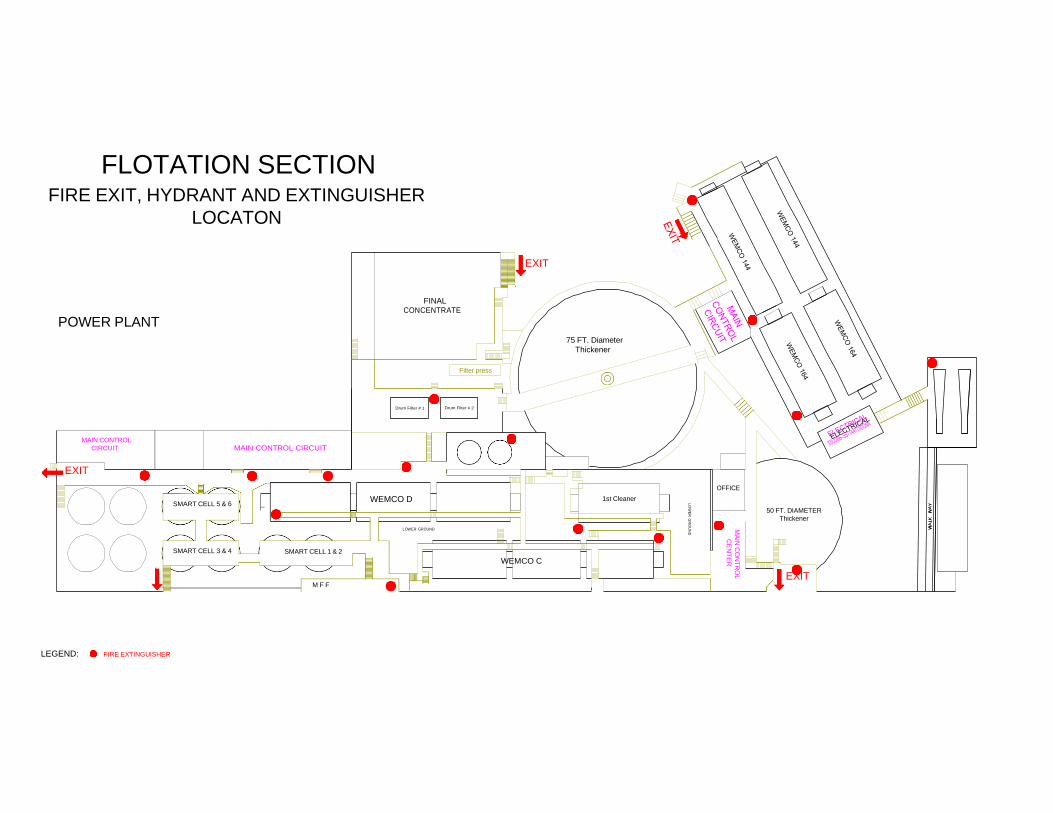
Drum Filter # 1
Drum Filter # 2
FLOTATION SECTION FIRE EXIT, HYDRANT AND EXTINGUISHER
LOCATON
EXIT
POWER PLANT
FINAL
CONCENTRATE
75 FT. Diameter
Thickener
MAIN CONTROL
CIRCUIT
MAIN CONTROL CIRCUIT
EXIT
SMART CELL 5 & 6
SMART CELL 3 & 4 SMART CELL 1 & 2
M F F
WEMCO D
LOWER GROUND
WEMCO C
1st Cleaner
OFFICE
50 FT. DIAMETER
Thickener
EXIT
LEGEND: FIRE EXTINGUISHER
Filter press
MA
IN C
ON
TR
OL
CE
NT
ER
LO
WE
R G
RO
UN
D
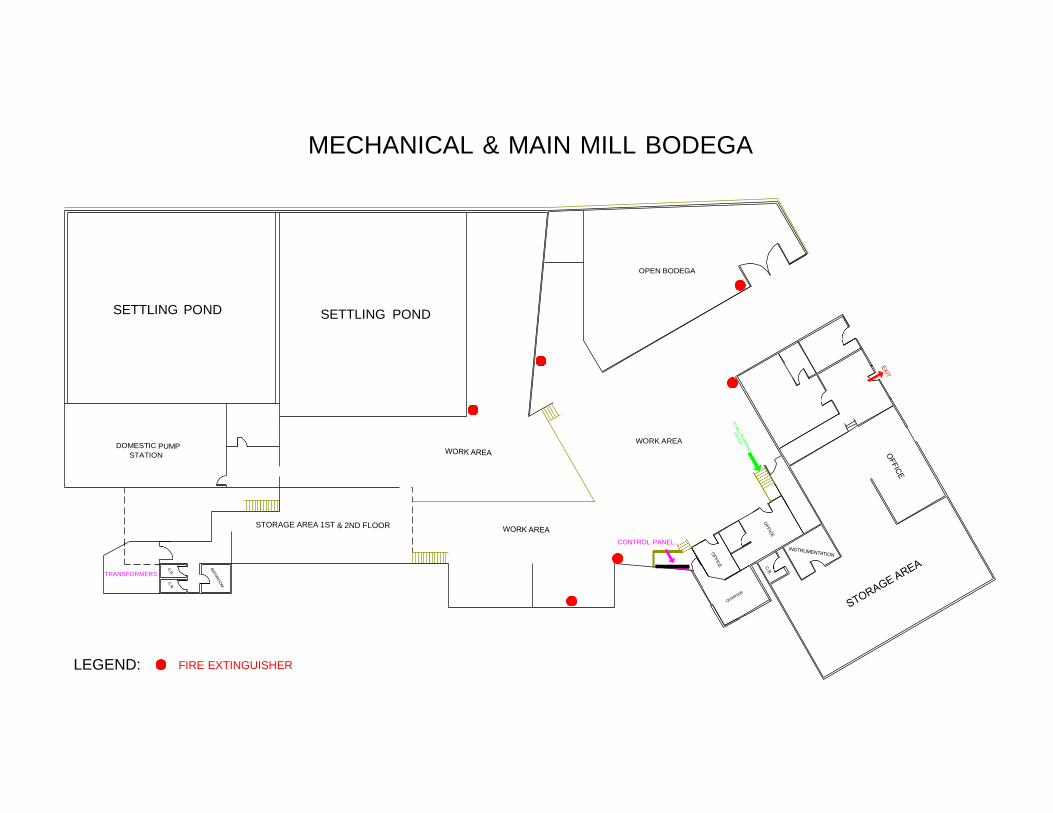
MECHANICAL & MAIN MILL BODEGA
OPEN BODEGA
SETTLING POND SETTLING POND
DOMESTIC PUMP
STATION
WORK AREA
STORAGE AREA 1ST & 2ND FLOOR
CONTROL PANEL
LEGEND: FIRE EXTINGUISHER
TRANSFORMERS
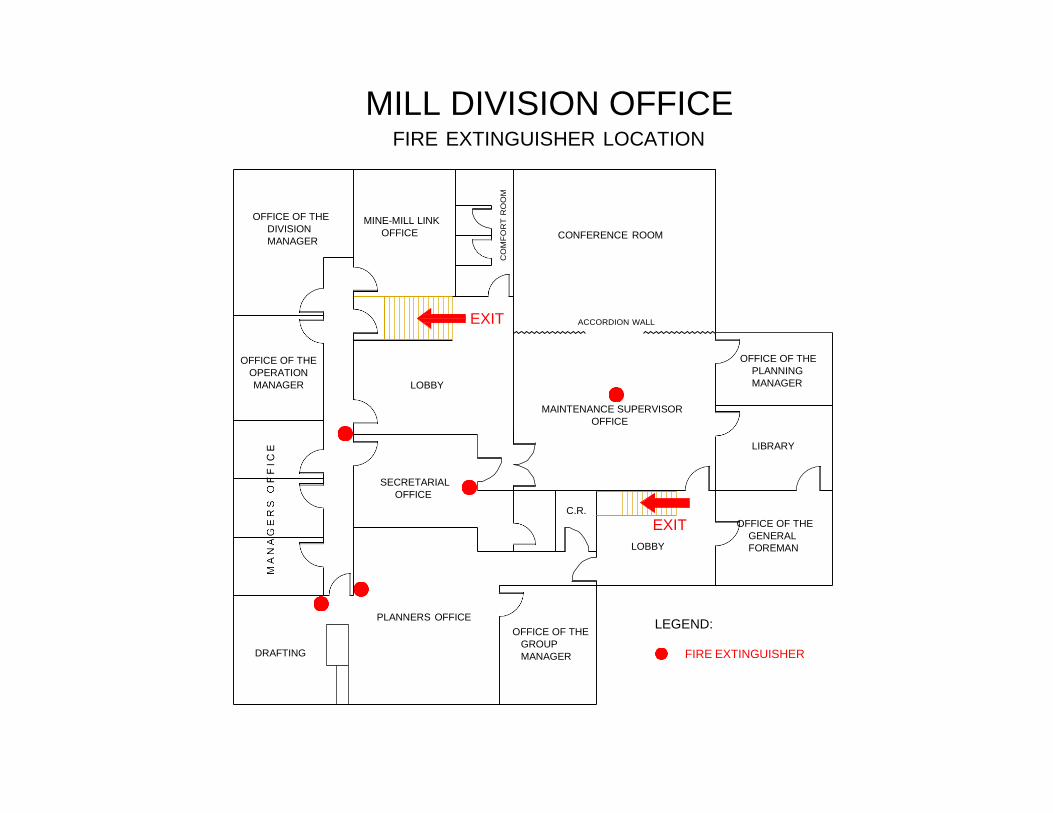
MILL DIVISION OFFICE FIRE EXTINGUISHER LOCATION
OFFICE OF THE
DIVISION
MANAGER
MINE-MILL LINK
OFFICE CONFERENCE ROOM
EXIT ACCORDION WALL
OFFICE OF THE
OPERATION
MANAGER LOBBY
OFFICE OF THE
PLANNING
MANAGER
MAINTENANCE SUPERVISOR
OFFICE
LIBRARY
SECRETARIAL
OFFICE
C.R.
EXIT
LOBBY
OFFICE OF THE
GENERAL
FOREMAN
PLANNERS OFFICE
DRAFTING
OFFICE OF THE
GROUP
MANAGER
LEGEND:
FIRE EXTINGUISHER
CO
MF
OR
T R
OO
M
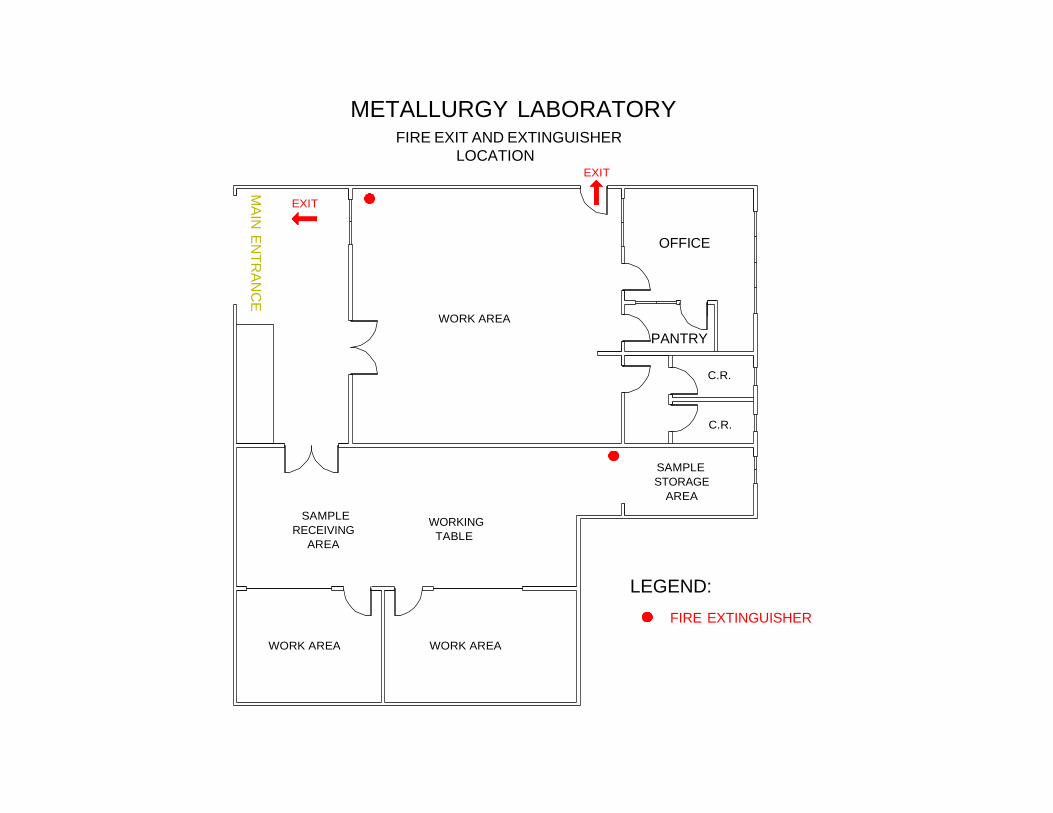
METALLURGY LABORATORY FIRE EXIT AND EXTINGUISHER
LOCATION EXIT
EXIT
OFFICE
WORK AREA PANTRY
C.R.
C.R.
SAMPLE
RECEIVING
AREA
WORKING
TABLE
SAMPLE
STORAGE
AREA
LEGEND:
FIRE EXTINGUISHER
WORK AREA WORK AREA
MA
IN E
NT
RA
NC
E
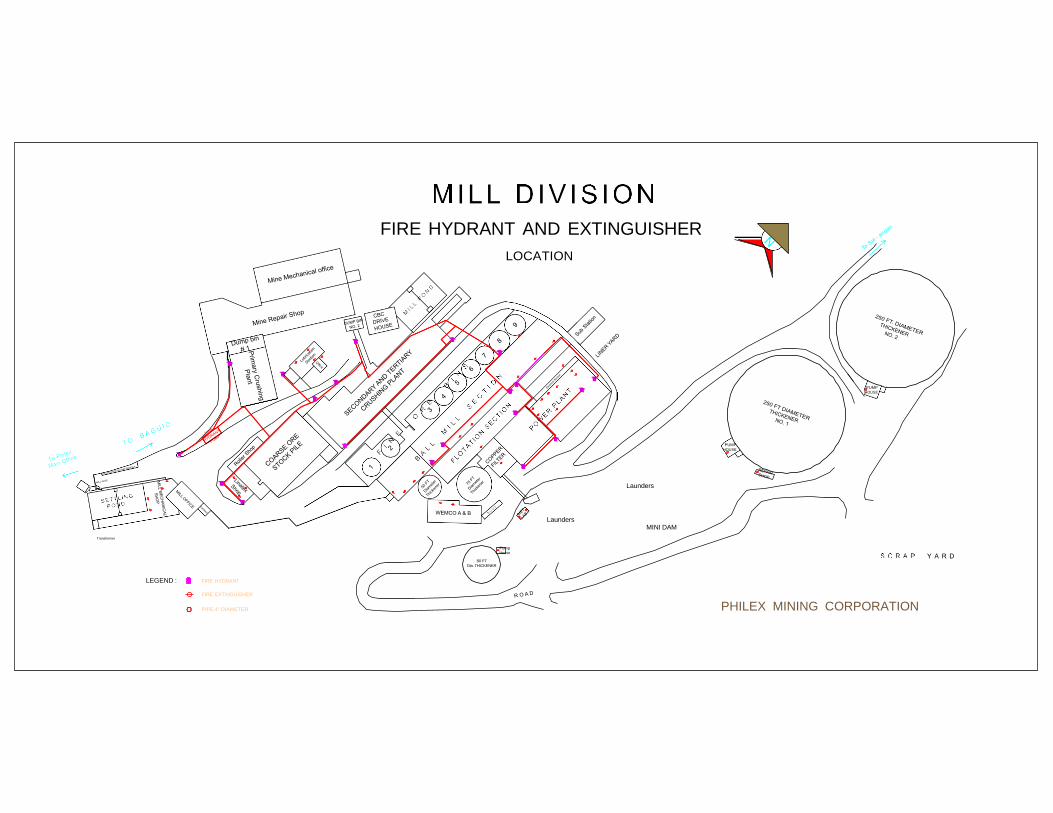
FIRE HYDRANT AND EXTINGUISHER
LOCATION
PUMP
HOUSE
PUMP
HOUSE
Launders
Launders
MINI DAM
Transformer
LEGEND : FIRE HYDRANT
FIRE EXTINGUISHER
80 FT
Dia. THICKENER
Pump House
PIPE 4" DIAMETER PHILEX MINING CORPORATION
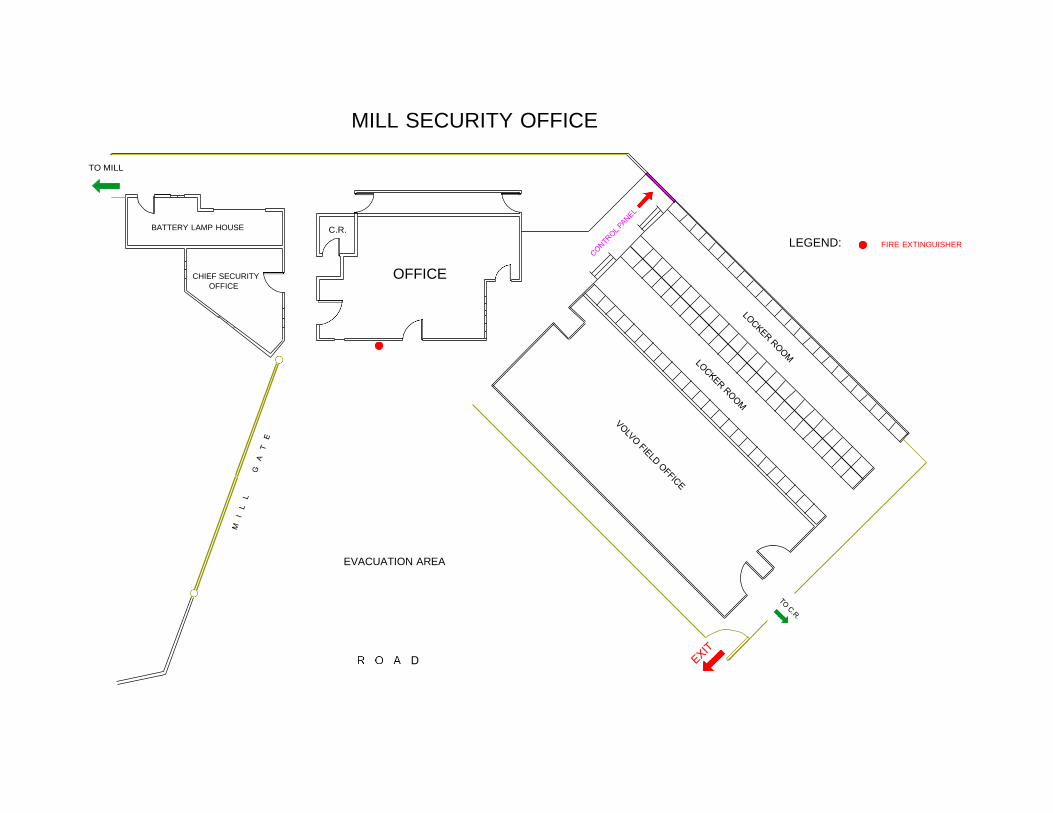
MILL SECURITY OFFICE
TO MILL
BATTERY LAMP HOUSE
CHIEF SECURITY
OFFICE
C.R.
OFFICE
LEGEND: FIRE EXTINGUISHER
EVACUATION AREA
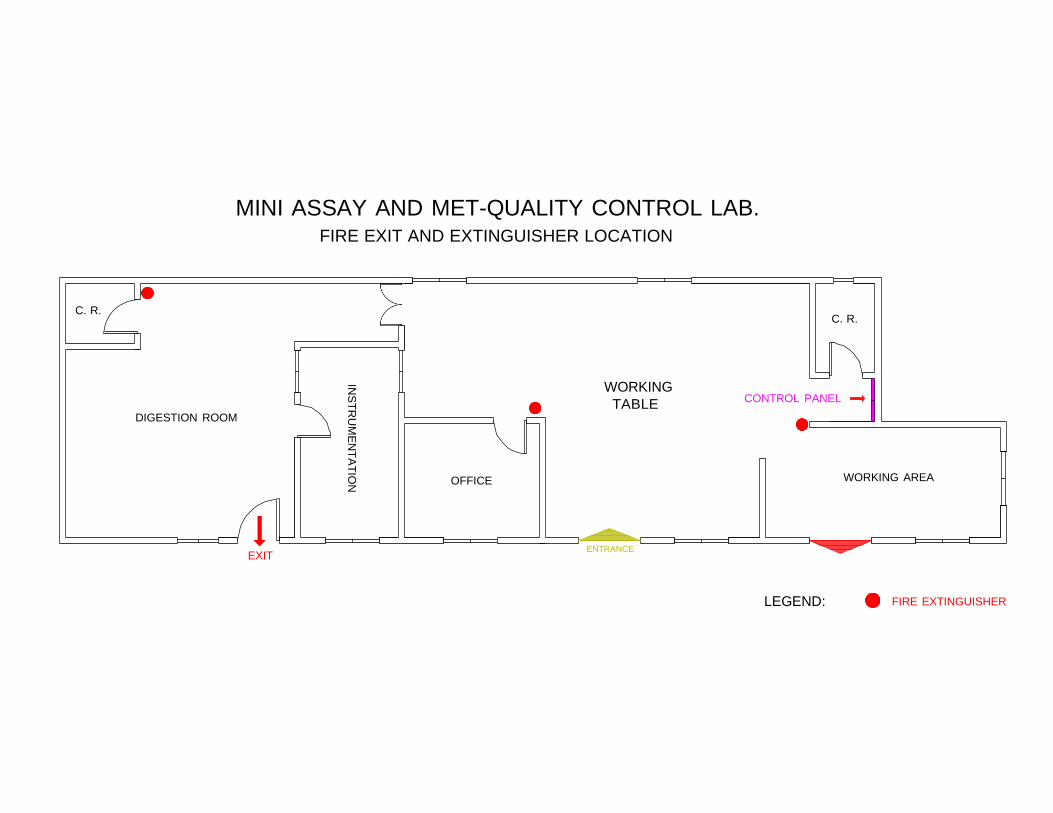
MINI ASSAY AND MET-QUALITY CONTROL LAB. FIRE EXIT AND EXTINGUISHER LOCATION
LEGEND: FIRE EXTINGUISHER
C. R. C. R.
DIGESTION ROOM
WORKING
TABLE CONTROL PANEL
OFFICE WORKING AREA
EXIT ENTRANCE
INS
TR
UM
EN
TA
TIO
N
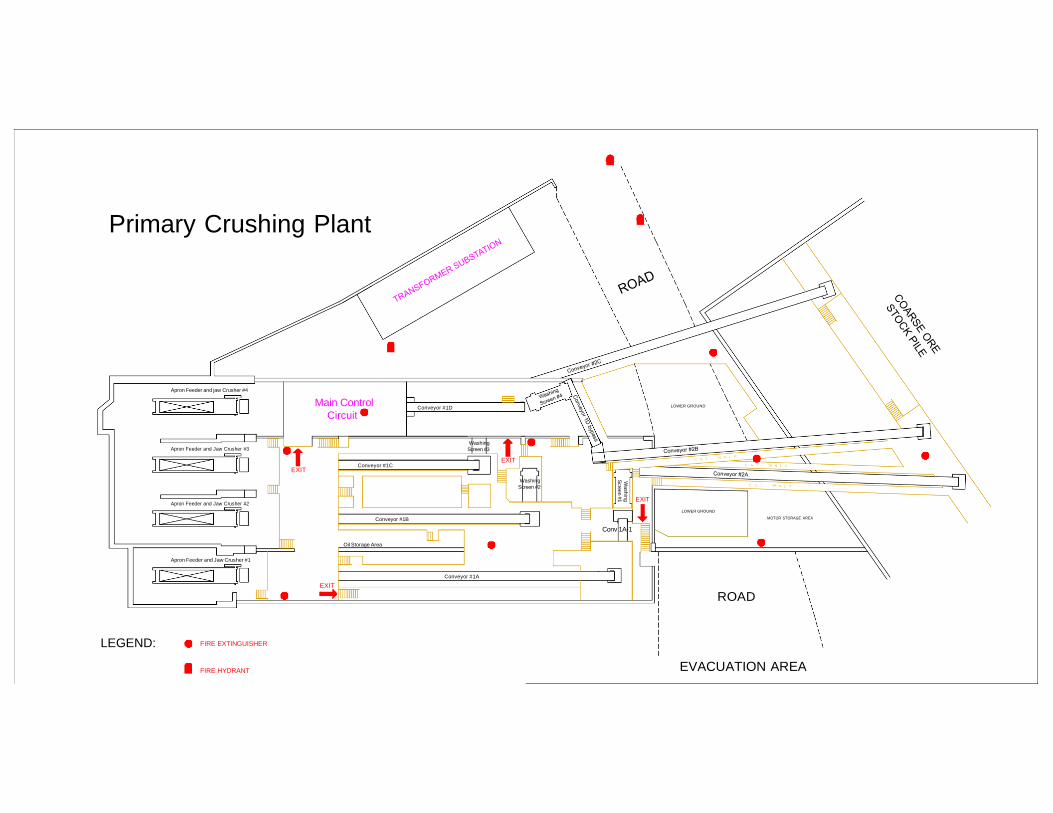
Primary Crushing Plant
Apron Feeder and jaw Crusher #4 Main Control
Circuit
Conveyor #1D
LOWER GROUND
Apron Feeder and Jaw Crusher #3
Apron Feeder and Jaw Crusher #2
EXIT
Conveyor #1C
Conveyor #1B
Washing
Screen #3
EXIT
Washing
Screen #2
Conv 1A-1
EXIT
LOWER GROUND
MOTOR STORAGE AREA
Oil Storage Area
Apron Feeder and Jaw Crusher #1
EXIT
Conveyor #1A
ROAD
LEGEND: FIRE EXTINGUISHER
FIRE HYDRANT
EVACUATION AREA
Wash
ing
Scre
en #
1
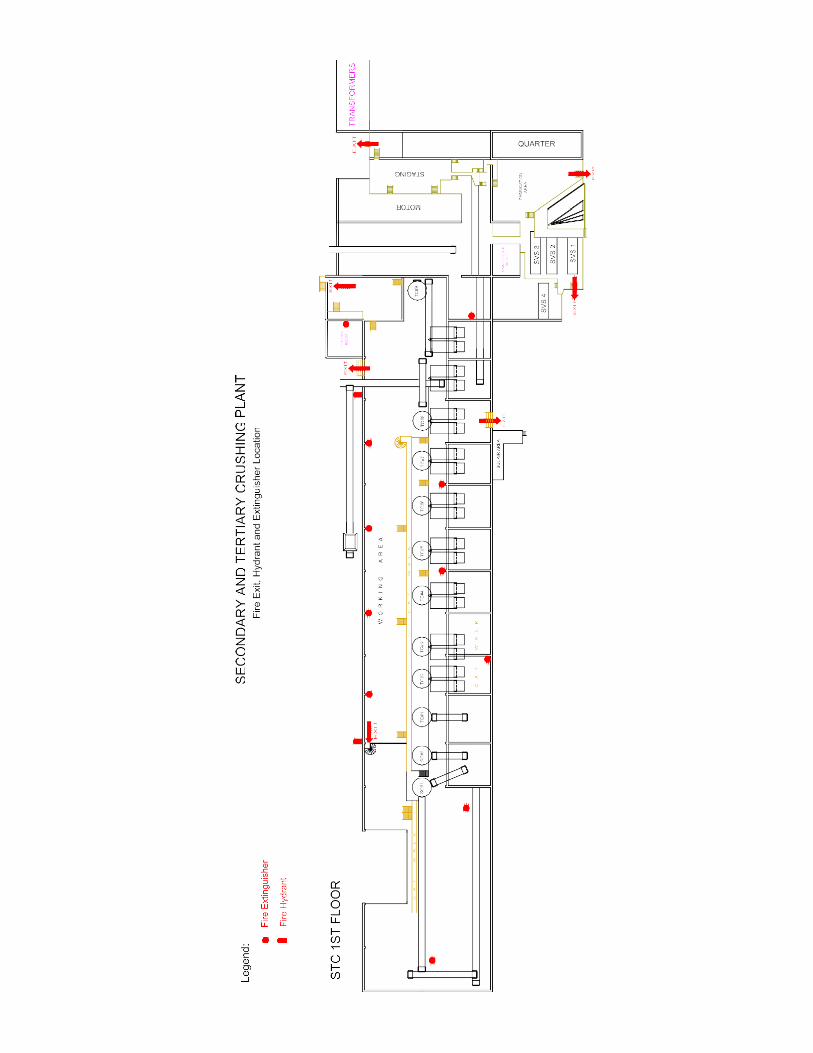
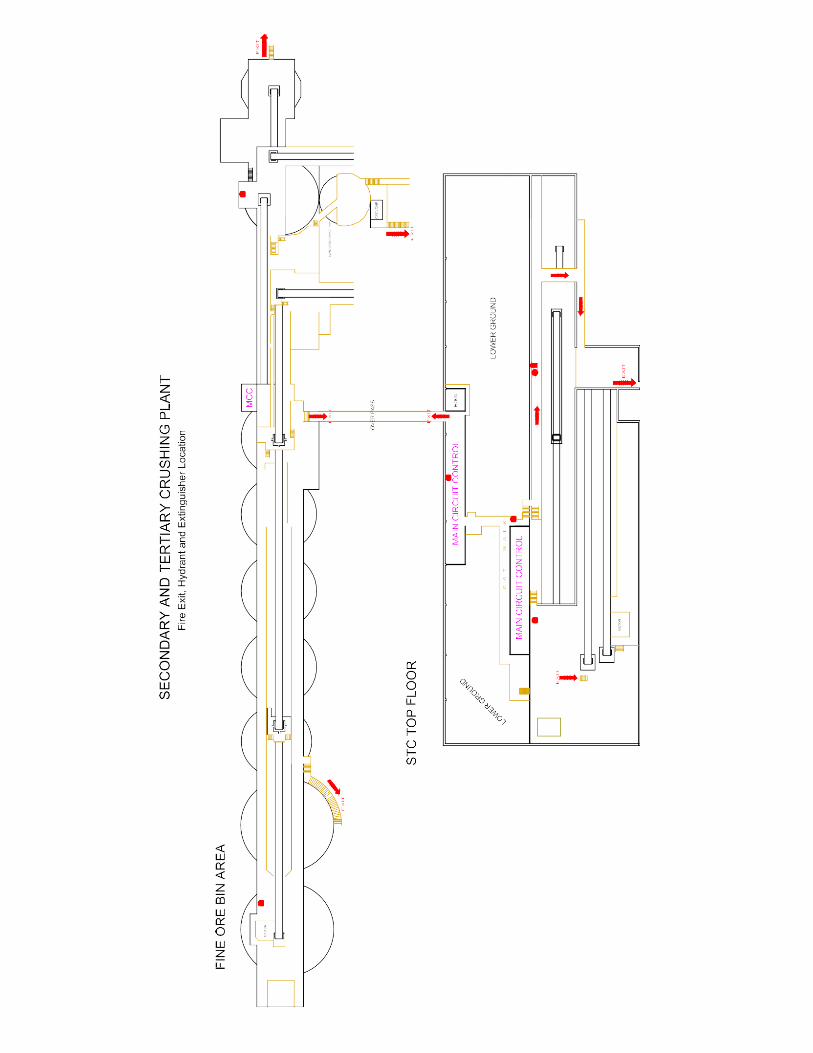
PADCAL Operations
April 2013
Annex C: Tailings Storage Facility
Annex C-1: Philex Padcal Mine TSF 3
Rehabilitation and Clean-up Plan
PHILEX MINING CORPORATION PADCAL MINE
PPHHIILLEEXX PPAADDCCAALL MMIINNEE TTSSFF33
RREEHHAABBIILLIITTAATTIIOONN && CCLLEEAANN--UUPP PPLLAANN
22 November 2012 Benguet
2
I
PREFACE
Philex Mining Corporation (Philex) owns and operates the Padcal Mine (copper and gold), known as Sto. Tomas II Ore body, in Benguet Province, Cordillera Administrative Region, Philippines. The mine has been in operation for the last 54 years.
Tailings Storage Facility No. 3 (TSF3) is the active tailings storage facility for the Padcal Mine which has been maintained and in operation since 1992. It is located in Sitio Catcatbal, Barangay Ampucao, Municipality of Itogon, Province of Benguet.
It has been established that TSF3 was compromised by the intense rainfall which has been recorded during the month of July 2012 and which continued until the month of August. The heavy rainfall was exacerbated by Typhoons Ferdie and Gener which built up in the Luzon region, and even further worsened by the southwest monsoon (habagat). Indeed, the amount of rainfall which fell in the region on August 1, 2012 was completely unprecedented and unexpectedly severe and so had caused TSF3 to discharge water and sediments into the Balog Creek exceeding regulatory standards. Some of these materials found their way into the convergence of the Balog Creek and the Agno River.
This Report contains the Philex’s proposed rehabilitation and remediation plan for TSF3 and the affected environment and communities (the”Plan”). The Plan includes restoration activities to address the environmental effect of the incident and pave the way for the resumption of the Padcal Mine operations. Competent foreign and domestic consultants in the field of mining and environment have been engaged to help in the planning and implementation of the rehabilitation Plan.
Remediation measures undertaken by Philex Padcal Mine
3
Immediately after the occurrence of the incident, Philex undertook the following measures:
(a) Plug the sinkhole. – Various materials were dropped into the sinkhole for the purpose of plugging the leak that created the sinkhole. A land bridge was constructed using borrow materials from available areas to get as close as possible to the location of the sinkhole. A surveying team monitored closely the activities at the pond to approximate the location of the sink hole. The leak was finally plugged by a 9- meter diameter concrete sphere designed and fabricated by Philex. Additional spheres of smaller and various sizes were dropped to form a strata or layer and reinforce the plug created by the 9-meter diameter concrete sphere. To fortify the layer and to construct a filtering medium, sand bags, gabions and concrete using half drums as forms were also dropped using improvised barges powered with 200-HP, 75-HP, and 25-HP motors.
(b) Emergency spillway. – The emergency spillway was originally intended to be used when the Padcal Mine closes and thus, was provisionally cut to 620ML. At the height of the TSF3 incident, it was further excavated down to 600ML from 620ML. It was done to protect the dam (TSF3) in case of strong rains. At that time, slimes elevation infront of the main dike was 605ML.
(c) Removal of concrete shutter boards of penstock B. – Parallel to the cutting of the level of emergency spillway is the removal of concrete shutter boards of Penstock B to a level where the water in the pond could be discharged into Penstock B. Similar to the emergency spillway, this was done to protect the dam (TSF3) in case of strong rains. The pond water was managed mainly by either the addition or removal of concrete shutter boards to avoid the discharge of sediments. At one point, the shutter board elevation was as high as 598ML and was brought down to as low as 585ML.
(d) Water Diversion. – Water diversion activities were undertaken to further manage the water entering TSF3. First, was the diversion of water from the Benguet Creek. Pipes and pumps were immediately laid and installed to allow the pumping of water into the Banawel tunnel and further to the Sal-angan River using a 3,000-gpm pump. At one stage, the Benguet Creek contributed 6,000-gpm of water into TSF3. Second, another 3,000-gpm pump was commissioned at the tailings conveying area so that water will directly go to Sal-angan River. Lastly, water coming from the northwest area of the main embankment of TSF3, particularly along the pipeline coming from the Pusposok Creek was diverted towards Wagis Creek using gravity piping systems.
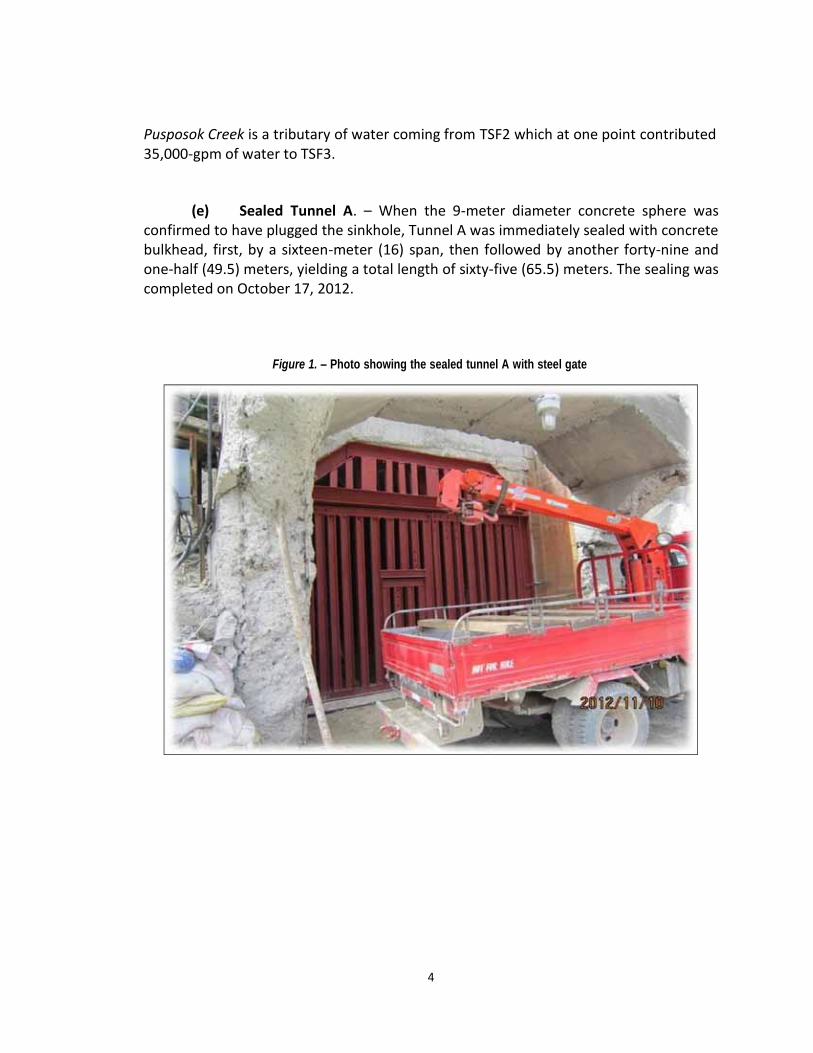
4
Pusposok Creek is a tributary of water coming from TSF2 which at one point contributed 35,000-gpm of water to TSF3.
(e) Sealed Tunnel A. – When the 9-meter diameter concrete sphere was confirmed to have plugged the sinkhole, Tunnel A was immediately sealed with concrete bulkhead, first, by a sixteen-meter (16) span, then followed by another forty-nine and one-half (49.5) meters, yielding a total length of sixty-five (65.5) meters. The sealing was completed on October 17, 2012.
Figure 1. – Photo showing the sealed tunnel A with steel gate
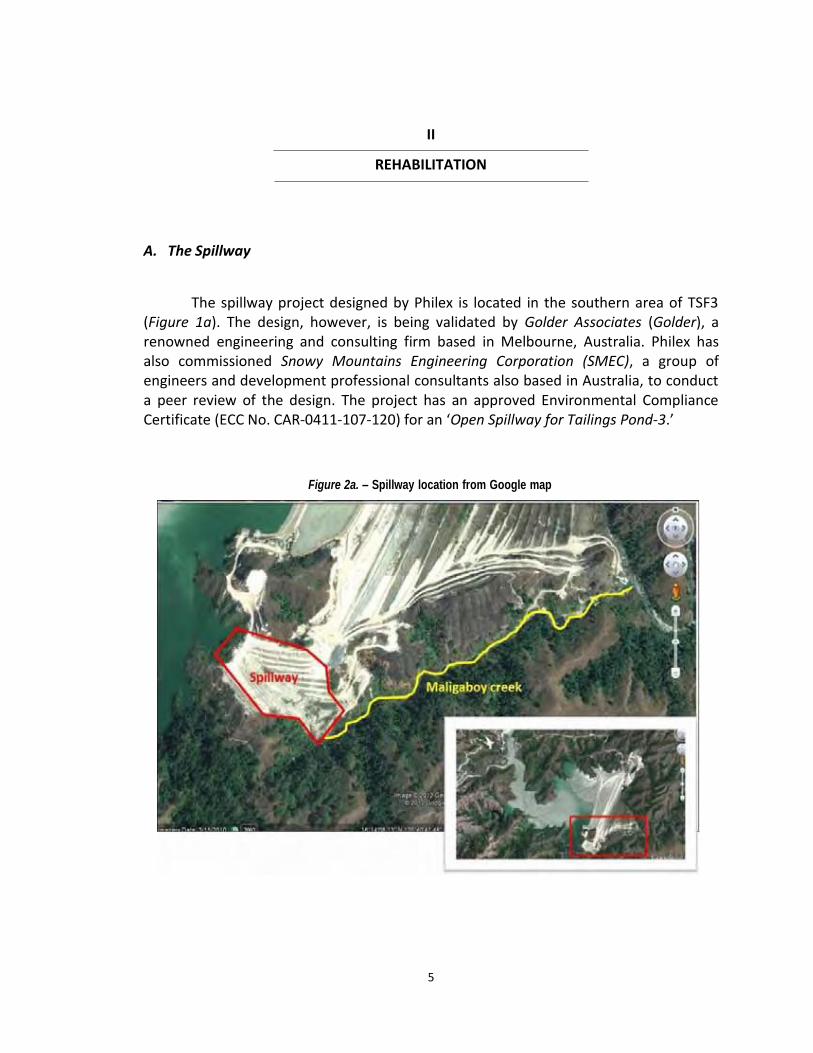
5
II
REHABILITATION
A. The Spillway
The spillway project designed by Philex is located in the southern area of TSF3
(Figure 1a). The design, however, is being validated by Golder Associates (Golder), a renowned engineering and consulting firm based in Melbourne, Australia. Philex has also commissioned Snowy Mountains Engineering Corporation (SMEC), a group of engineers and development professional consultants also based in Australia, to conduct a peer review of the design. The project has an approved Environmental Compliance Certificate (ECC No. CAR-0411-107-120) for an ‘Open Spillway for Tailings Pond-3.’
Figure 2a. – Spillway location from Google map
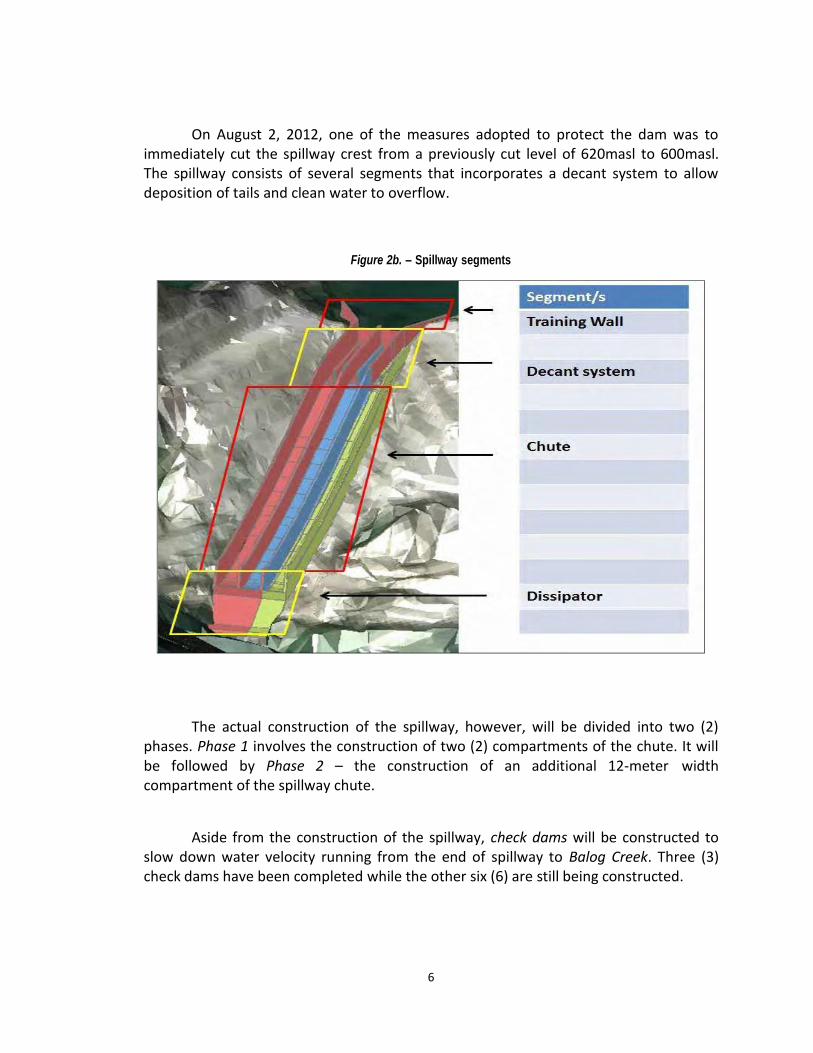
6
On August 2, 2012, one of the measures adopted to protect the dam was to immediately cut the spillway crest from a previously cut level of 620masl to 600masl. The spillway consists of several segments that incorporates a decant system to allow deposition of tails and clean water to overflow.
Figure 2b. – Spillway segments
The actual construction of the spillway, however, will be divided into two (2) phases. Phase 1 involves the construction of two (2) compartments of the chute. It will be followed by Phase 2 – the construction of an additional 12-meter width compartment of the spillway chute.
Aside from the construction of the spillway, check dams will be constructed to slow down water velocity running from the end of spillway to Balog Creek. Three (3) check dams have been completed while the other six (6) are still being constructed.
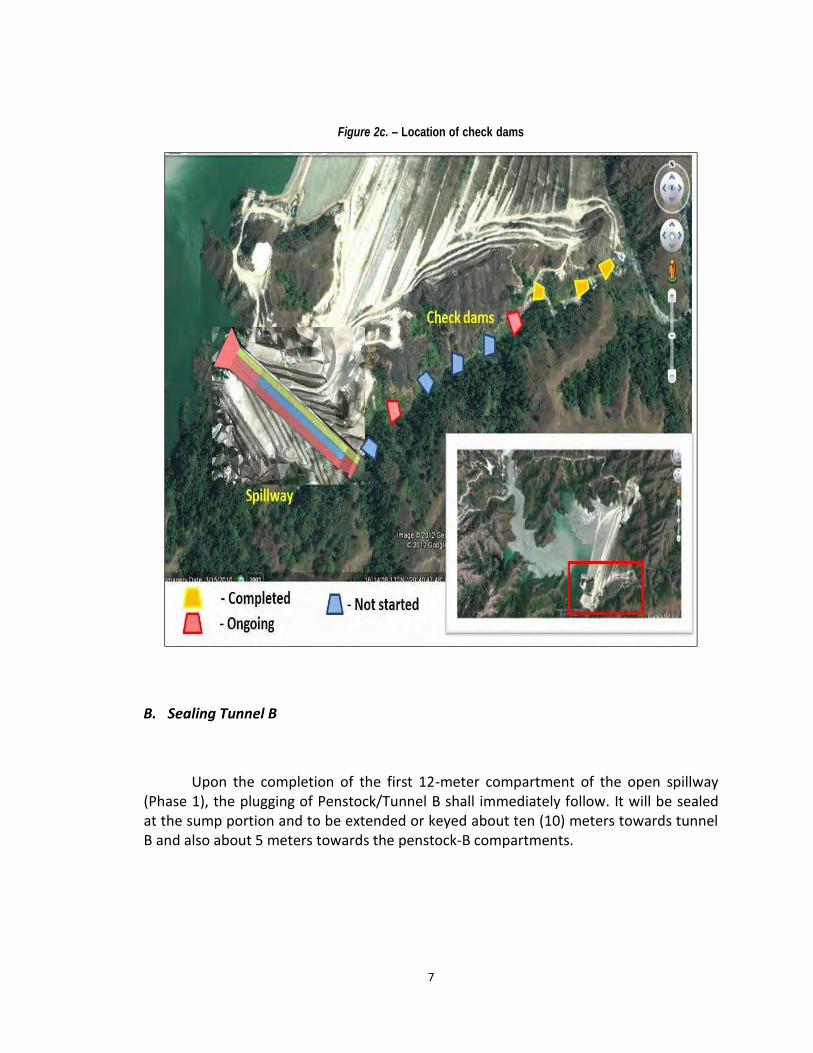
7
Figure 2c. – Location of check dams
B. Sealing Tunnel B
Upon the completion of the first 12-meter compartment of the open spillway (Phase 1), the plugging of Penstock/Tunnel B shall immediately follow. It will be sealed at the sump portion and to be extended or keyed about ten (10) meters towards tunnel B and also about 5 meters towards the penstock-B compartments.
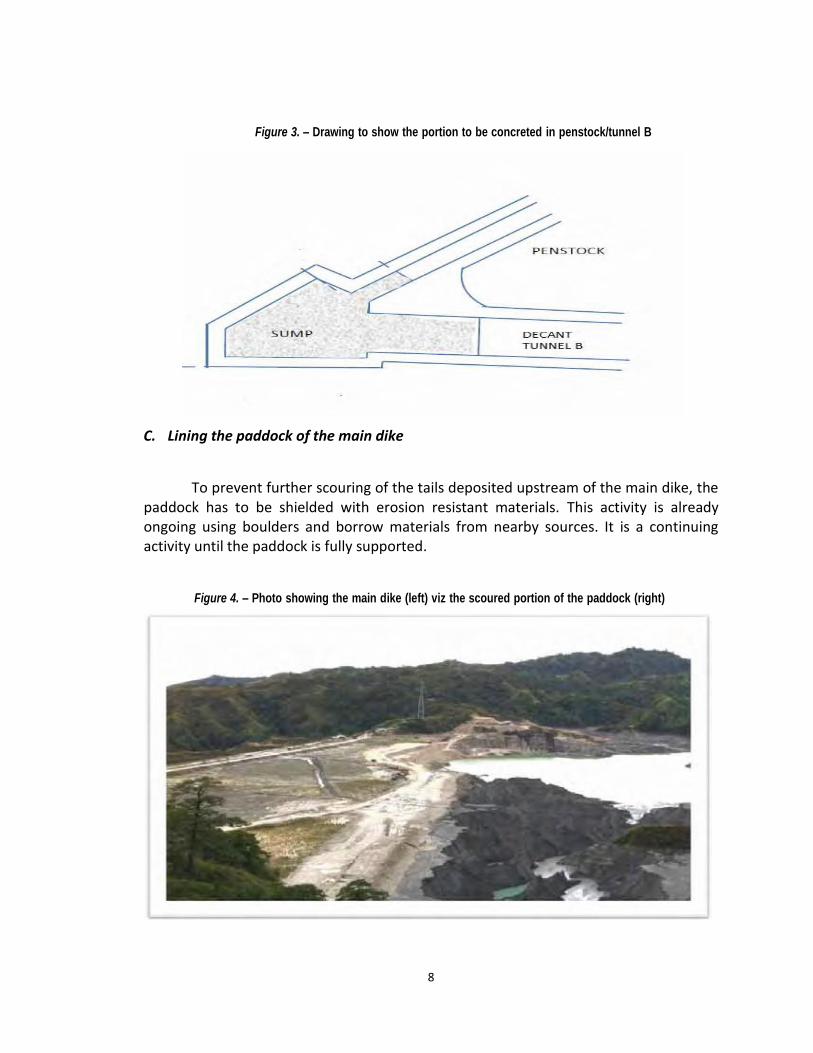
8
Figure 3. – Drawing to show the portion to be concreted in penstock/tunnel B
C. Lining the paddock of the main dike
To prevent further scouring of the tails deposited upstream of the main dike, the
paddock has to be shielded with erosion resistant materials. This activity is already ongoing using boulders and borrow materials from nearby sources. It is a continuing activity until the paddock is fully supported.
Figure 4. – Photo showing the main dike (left) viz the scoured portion of the paddock (right)
9
D. Construction of dike upstream of penstocks
A dike will be constructed across the narrow part of the existing beach and upstream of decants (penstock) A and B. It would be constructed using rock fill and will isolate the tailings beach, void and embankment from the valley which will drain over the spillway. The dike will also help to protect the void area from flooding during the high rainfall season when most of the flood runoff will be discharged over the spillway.
E. Beach Formation
It is necessary and very important that a beach should be formed upstream of
the main dike and fill the void created by the discharge of water and sediments through the sinkhole. The water should be pushed or driven further away from the main embankment and the decommissioned penstock structures. This activity should take undertaken immediately to take advantage of the dry season and to prevent excessive ponding that might be brought by the rainy season. Moreover, the formed beach will also complete the decommissioning of the penstock system and the adoption of the spillway system as the new water management system for TSF3.
The beach formation will reduce the exposure of the main embankment to water. Less water decreases the phreatic level inside the dam that results to the increase of the factor of safety of the dam. An embankment with low phreatic level will hold its ground even during a slightest seismic activity.
Beach formation can best be achieved by using fresh tailings from operation to be deposited evenly and systematically to strategic locations inside the pond. It is best to use fresh tails to fill up the void because of its faster settling rate and quicker consolidation. Aside from its higher specific gravity compared to borrow materials (i.e., weathered diorite), it also contains complete strings of particle sizes essential to its proper consolidation or cohesiveness that will create an impermeable protection against seepage to the main embankment.
For its urgency and importance in the whole remediation process of TSF3, Philex will request the government through the Mines and Geosciences Bureau to allow the Padcal Mine to operate, even at a limited capacity (dry metric tons per day or DMTPD)
10
only, to start filling up the void created by the sinkhole with fresh tailing during the dry season.
F. Consultants engaged
(a) Golder Associates. – The TSF3 Stability Study is being undertaken by
Golder. The engagement started following the site visit of one of its principals, Mr. Brian Wrench on October 26, 2012. Aside from validating the spillway design, Golder is further tasked to assess the stability of the main embankment as well as to make an independent recommendation on the remediation and rehabilitation measures done by Philex, and where possible, to recommend or certify the recommissioning of TSF3.
The assessment of the main embankment’s stability will involve: (a) monitoring and interpretation of information gathered from the existing and additional piezometers and inclinometers strategically placed within the area; (b) gathering and interpretation of hydrology and seismic data from accredited government agencies; (c) geotechnical tests; and (d) extensive stability analysis; while the evaluation of the remediation and rehabilitation measures will involve: (a) the review of as built plans of concrete bulkheads at Tunnel A; (b) review of proposed bulkhead at Tunnel B; and (c) generation of monitoring plans. The timelines and possible costs will depend on the consultant’s review and peer evaluation.
Golder Associates is a global company providing consulting, designing and construction services in the specialists’ area for earth, the environment and the related area of energy. Recently, Golder’s success was recognized at Australia’s leading client service awards, winning in five categories, including Best Professional Services Firm, at the 2012 BW/Beaton Client Choice Awards.
The company had designed and has ongoing involvement with the construction and operation of many of the world’s largest copper/gold TSF including: Antamina TSF (Peru) 570 M MT tailings; PT Freeport Grasberg TSF (Indonesia); Collahuasi TSF (Chile) 700 M MT tailings; Bata Hijua TSF (Indonesia) 1.3 B MT tailings; Kabanga TSF (Tanzania); KCGM TSF (Australia) +500 M MT tailings; and El Pachon TSF (Argentina) 500 M MT tailings, to name a few.
11
Golder staffs have also authored international tailings guidelines for the Mining Association of Canada and the Western Australian government and the GARD acid rock drainage guideline of INAP.
(b) Snowy Mountains Engineering Corporation (SMEC). – It is a professional services firm with Australian origin and a global footprint that provides high-quality consultancy services on major infrastructure projects. SMEC has over 5,000 employees and an established network of more than 70 offices spread in Australia, Asia, the Middle East, Africa and North and South America.
SMEC provides consultancy services for the lifecycle of a project, to a broad range of sectors. These are: Transport, Water, Environment, Geotechnics and Tunnels, Urban Development, Hydropower and Energy, Government and Advisory Services and Social Development. SMEC has been ranked in the Top 100 of Engineering News- Record’s (ENR) Top 200 International Design Firms for the past 14 years. In 2012, SMEC was ranked at Number 58 in the Top 200 International Design Firms and Number 74 in the Top Global Design Firms. In ENR's 2012 'Top Ten by Market' for Water, SMEC ranked at number nine. SMEC was also awarded the 2010 BRW ANZ Private Business Award for ‘Most Successful Private Business Trading Overseas – Asia.’
SMEC was involved in the engineering and construction of many major water and hydropower dams in Asia and Australia the likes of: Bakun hydroelectric power
plant in Malaysia; Son La Hydroelectric project in Vietnam; Hume dam in Australia;
Kohala hydropower project in Pakistan; Taishir hydropower project in Mongolia.
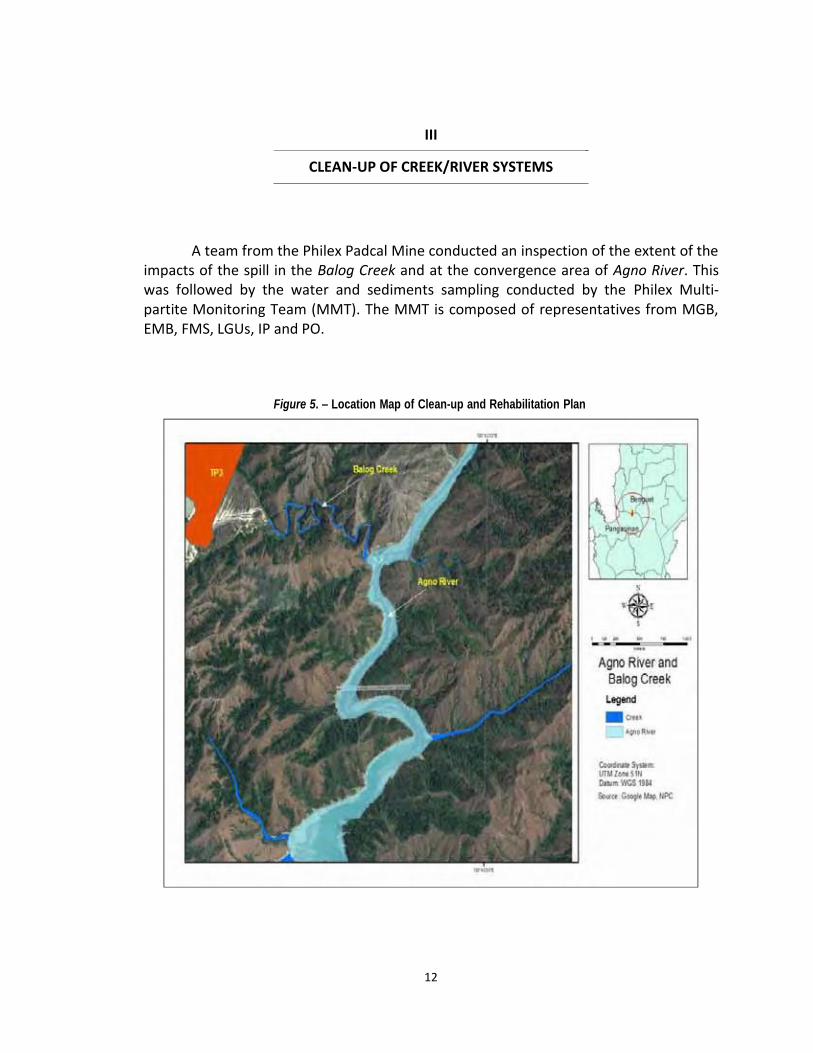
12
III _
CLEAN-UP OF CREEK/RIVER SYSTEMS
A team from the Philex Padcal Mine conducted an inspection of the extent of the impacts of the spill in the Balog Creek and at the convergence area of Agno River. This was followed by the water and sediments sampling conducted by the Philex Multi- partite Monitoring Team (MMT). The MMT is composed of representatives from MGB, EMB, FMS, LGUs, IP and PO.
Figure 5. – Location Map of Clean-up and Rehabilitation Plan
13
Likewise, an inter-disciplinary team of Environmental Specialists from various fields of expertise has been engaged by Philex to help prepare and implement the clean up and rehabilitation program. The team is composed of:
Nicomedes Briones, Ph.D. (Team Leader) – Environmental & Natural Resources Management Planning/Resource Economist
Emmanuel LLeva, Ph.D. ( Asst.Team Leader) – River Basin Planning/Forester
Macrina A. Zafaralla, Ph.D. / Bonifacio Labatos M.Sc., – Limnology/Water Biology
Federico O. Perez, Ph.D., – Soils Management & Upland Agriculture
Armando Espino, Ph.D. – Groundwater Flow & Mass Transport/Hydrologist
Eliseo Ana, Jr., Ph.D. – Water Resources Engineering
Alma Lorelei De Jesus, M.Sc. – Environmental Chemistry
Russel Son Cosico, M. Sc. – Mammalian Conservation/Environmental Science
Alvin Nacu – Aquatic Specialist
Peter McLatchie – Manager Studies, Harmony Gold PTY Limited
Carlos P. David, Ph.D. – Environment & Geology
A. Environmental and Social Rehabilitation Framework
The program for rehabilitation will be undertaken as follows:
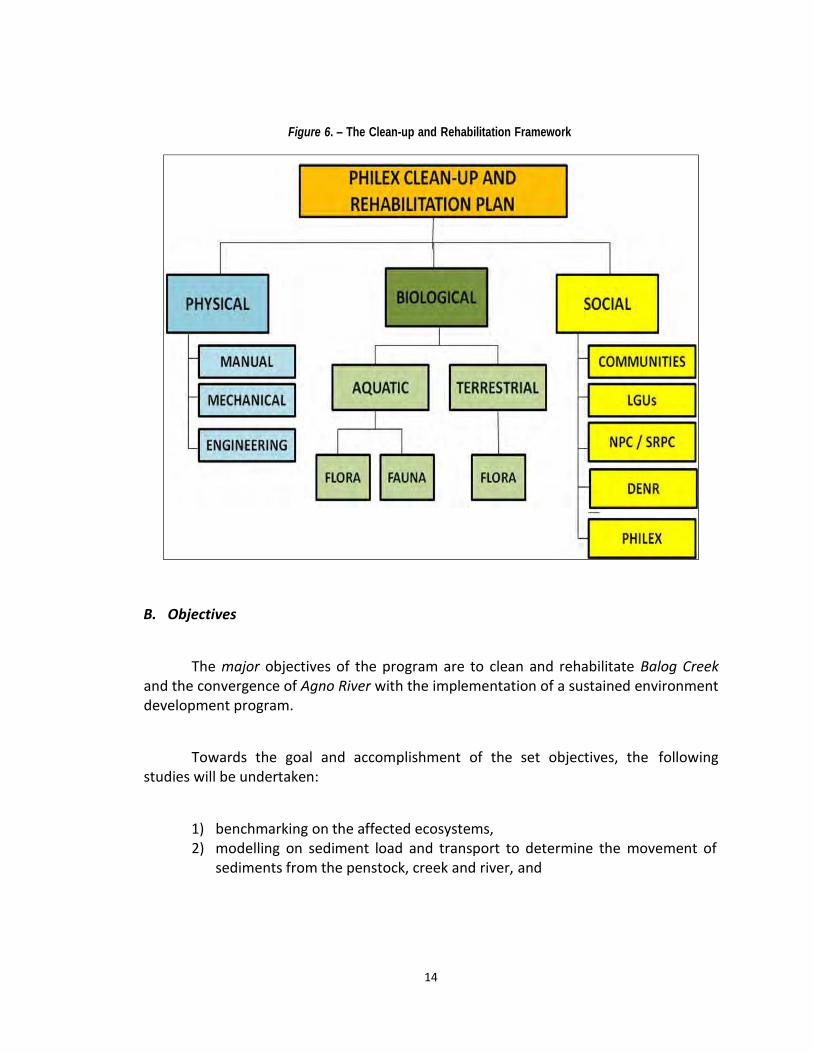
14
Figure 6. – The Clean-up and Rehabilitation Framework
B. Objectives
The major objectives of the program are to clean and rehabilitate Balog Creek
and the convergence of Agno River with the implementation of a sustained environment development program.
Towards the goal and accomplishment of the set objectives, the following studies will be undertaken:
1) benchmarking on the affected ecosystems, 2) modelling on sediment load and transport to determine the movement of
sediments from the penstock, creek and river, and
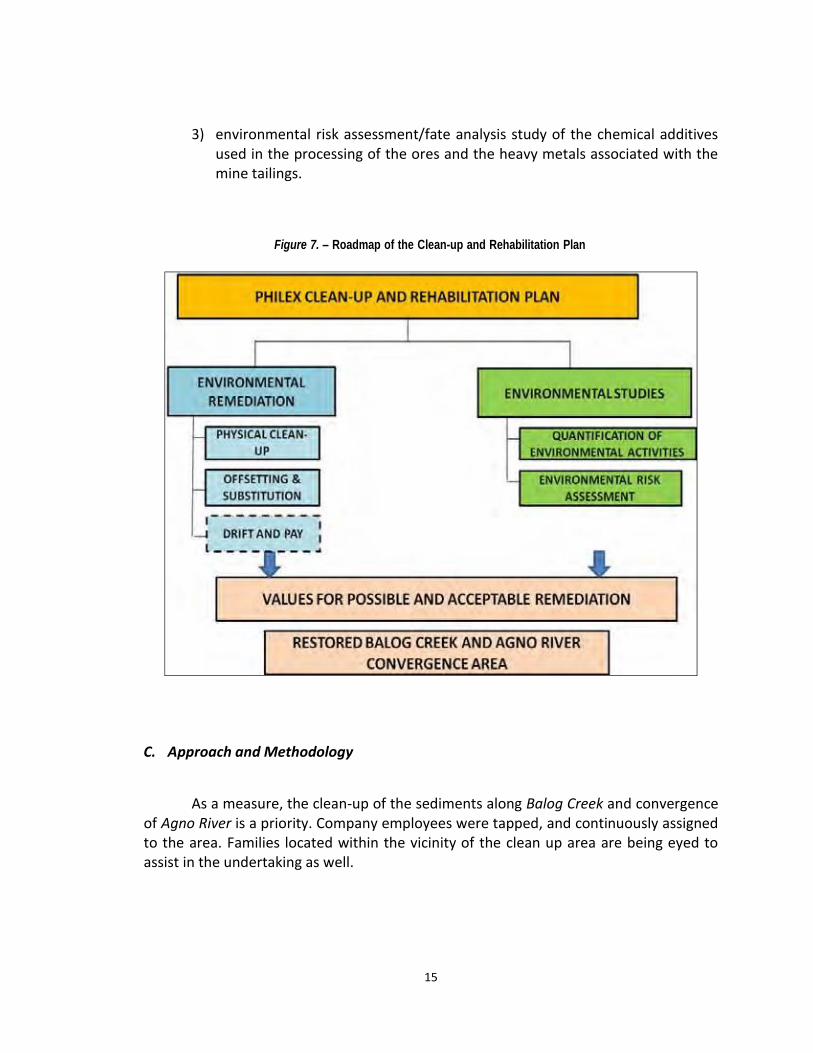
15
3) environmental risk assessment/fate analysis study of the chemical additives used in the processing of the ores and the heavy metals associated with the mine tailings.
Figure 7. – Roadmap of the Clean-up and Rehabilitation Plan
C. Approach and Methodology
As a measure, the clean-up of the sediments along Balog Creek and convergence
of Agno River is a priority. Company employees were tapped, and continuously assigned to the area. Families located within the vicinity of the clean up area are being eyed to assist in the undertaking as well.
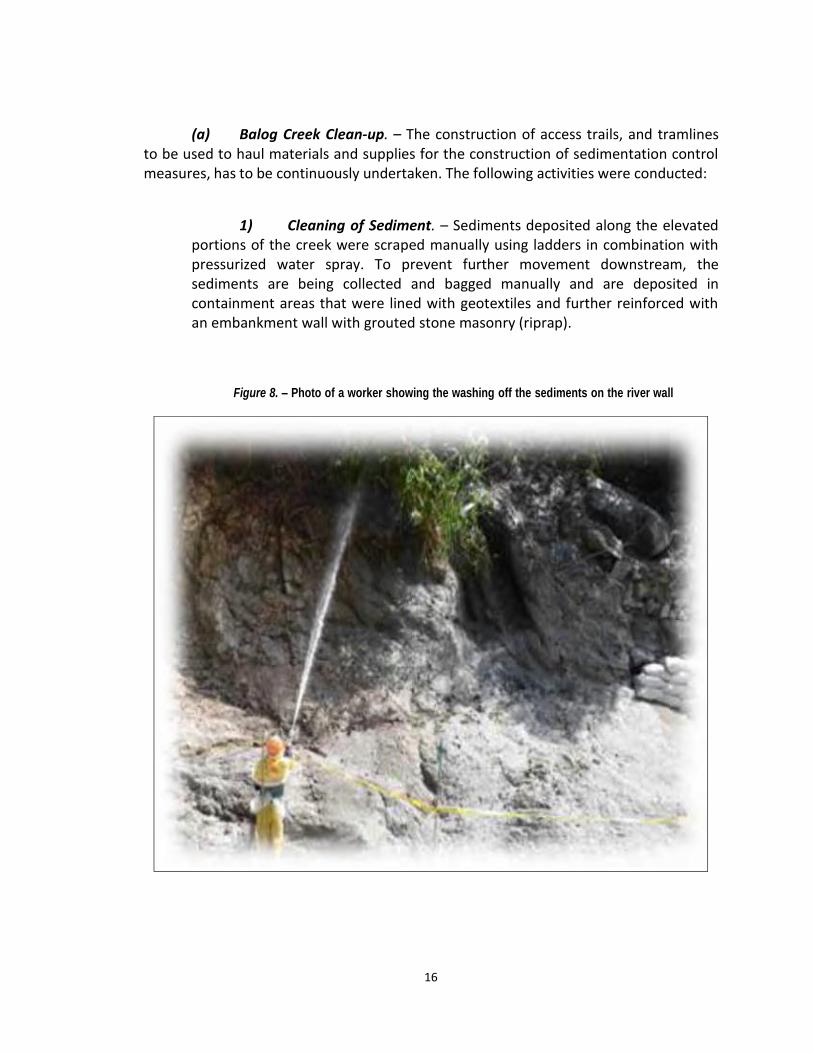
16
(a) Balog Creek Clean-up. – The construction of access trails, and tramlines to be used to haul materials and supplies for the construction of sedimentation control measures, has to be continuously undertaken. The following activities were conducted:
1) Cleaning of Sediment. – Sediments deposited along the elevated portions of the creek were scraped manually using ladders in combination with pressurized water spray. To prevent further movement downstream, the sediments are being collected and bagged manually and are deposited in containment areas that were lined with geotextiles and further reinforced with an embankment wall with grouted stone masonry (riprap).
Figure 8. – Photo of a worker showing the washing off the sediments on the river wall
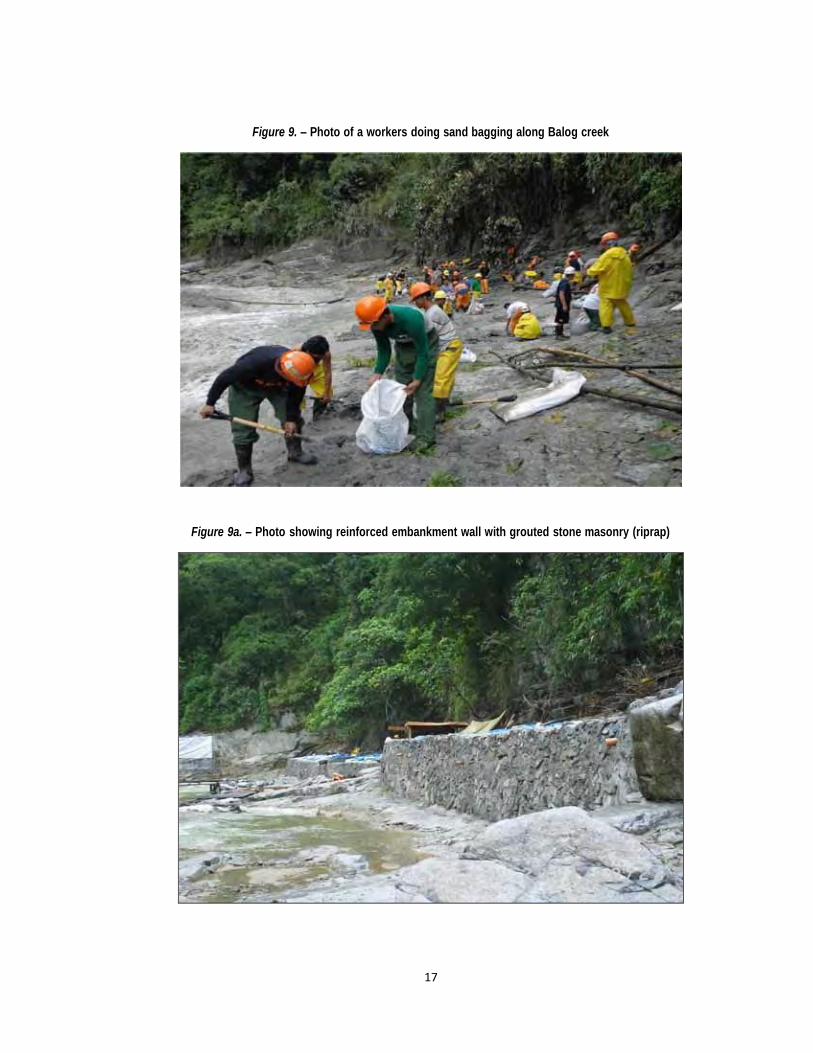
17
Figure 9. – Photo of a workers doing sand bagging along Balog creek
Figure 9a. – Photo showing reinforced embankment wall with grouted stone masonry (riprap)
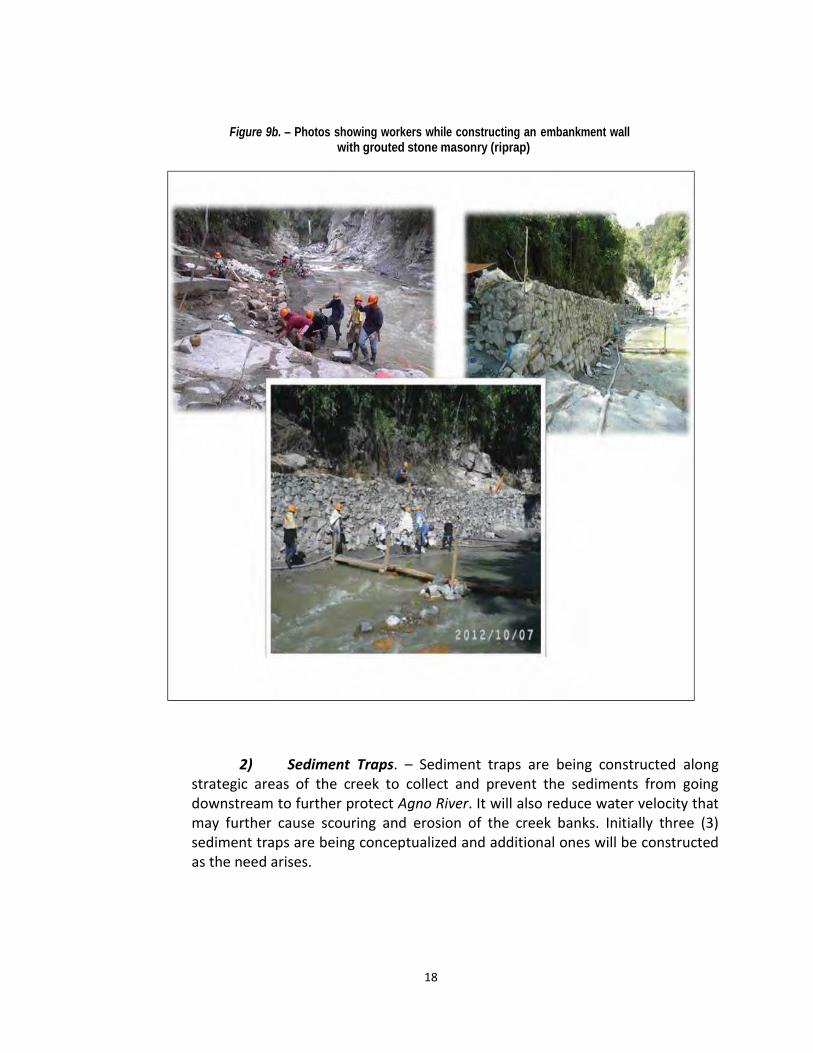
18
Figure 9b. – Photos showing workers while constructing an embankment wall with grouted stone masonry (riprap)
2) Sediment Traps. – Sediment traps are being constructed along strategic areas of the creek to collect and prevent the sediments from going downstream to further protect Agno River. It will also reduce water velocity that may further cause scouring and erosion of the creek banks. Initially three (3) sediment traps are being conceptualized and additional ones will be constructed as the need arises.
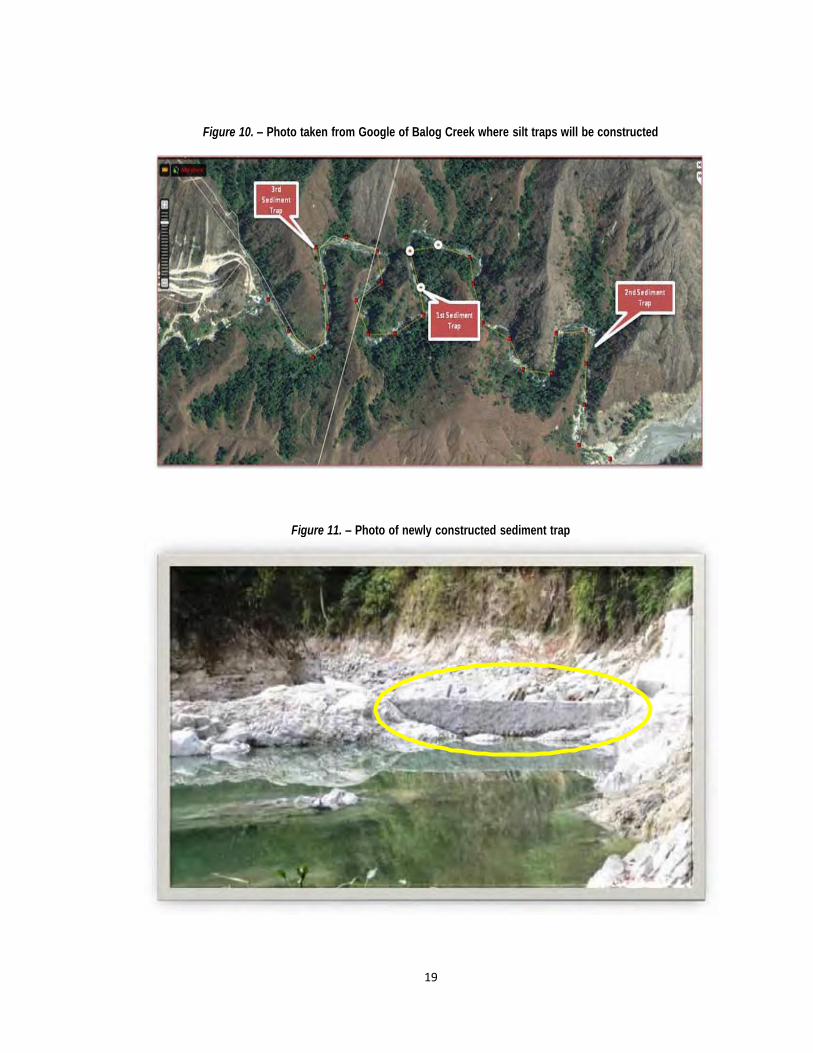
19
Figure 10. – Photo taken from Google of Balog Creek where silt traps will be constructed
Figure 11. – Photo of newly constructed sediment trap
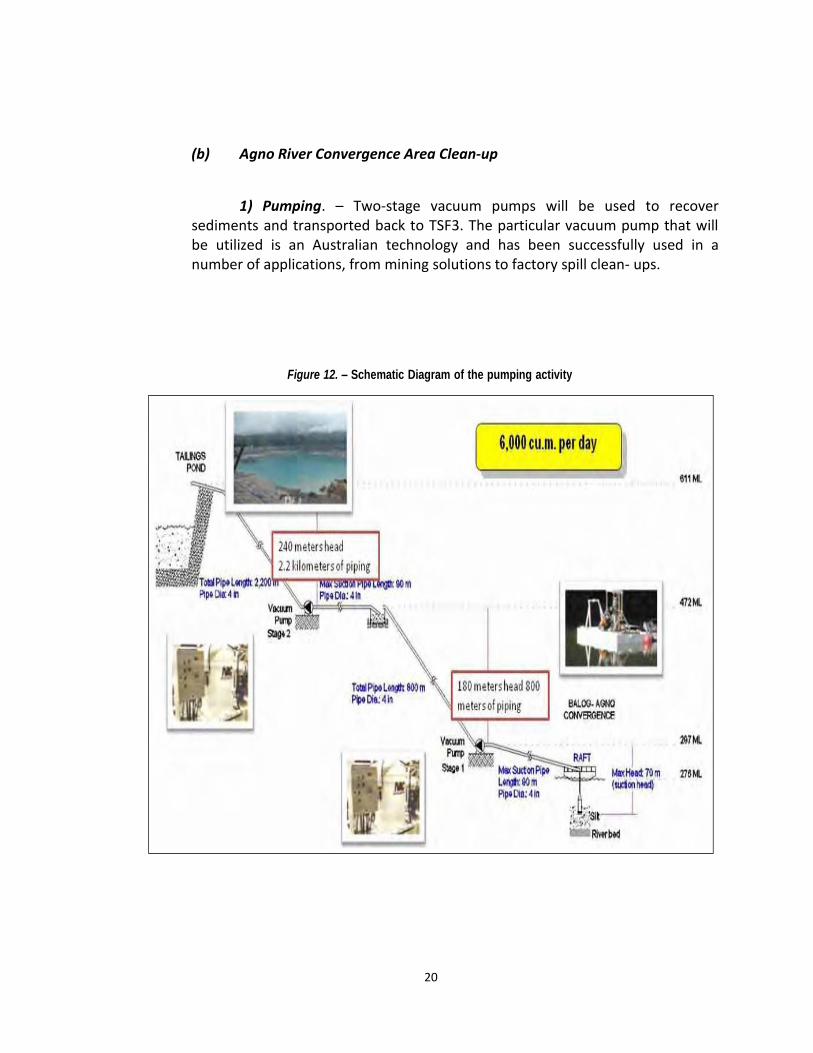
20
(b) Agno River Convergence Area Clean-up
1) Pumping. – Two-stage vacuum pumps will be used to recover
sediments and transported back to TSF3. The particular vacuum pump that will be utilized is an Australian technology and has been successfully used in a number of applications, from mining solutions to factory spill clean- ups.
Figure 12. – Schematic Diagram of the pumping activity
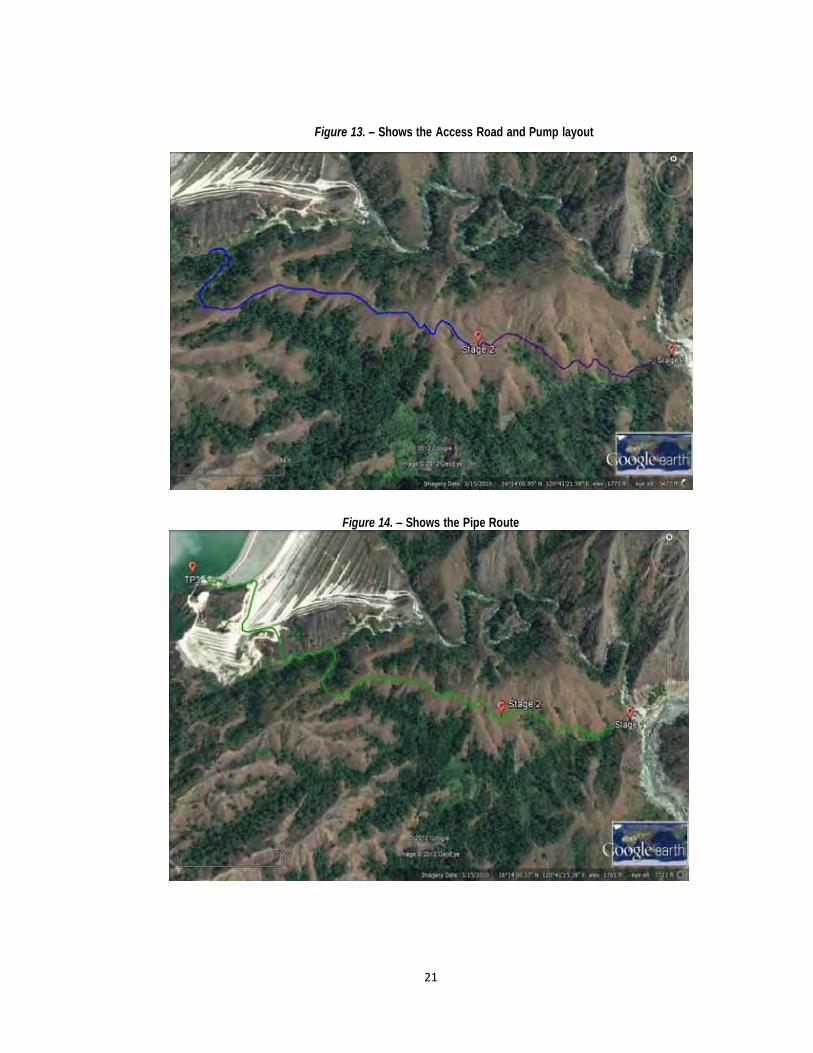
21
Figure 13. – Shows the Access Road and Pump layout
Figure 14. – Shows the Pipe Route
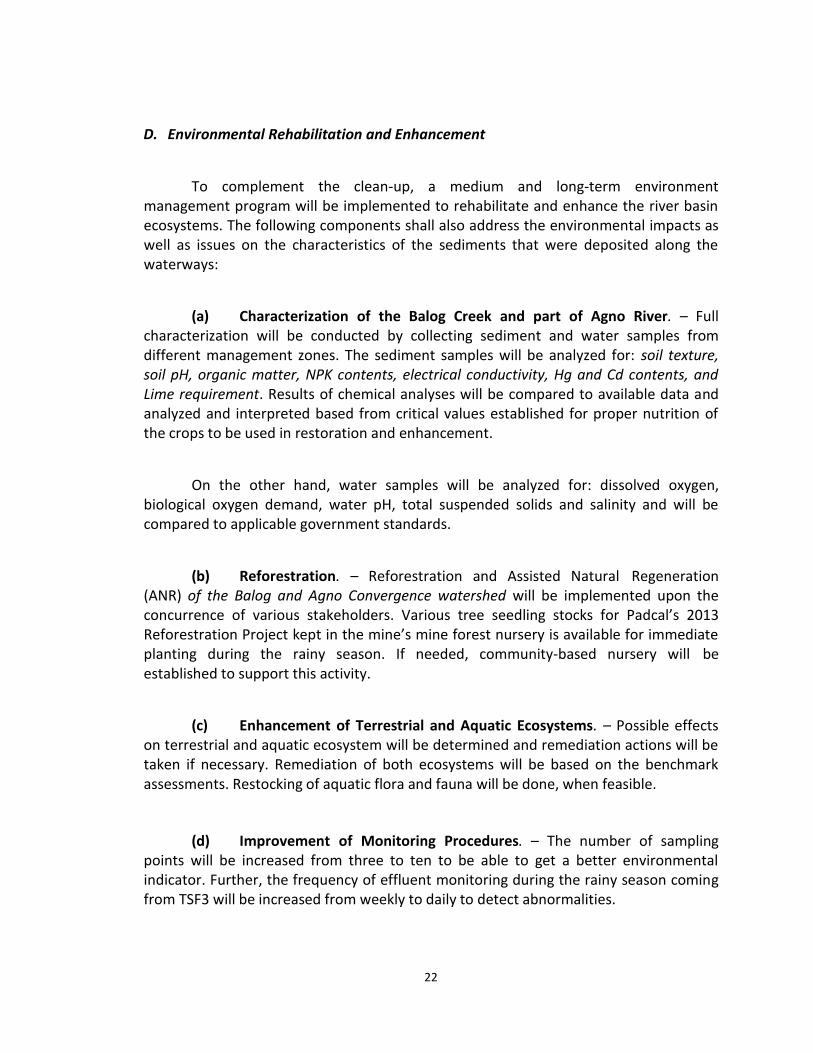
22
D. Environmental Rehabilitation and Enhancement
To complement the clean-up, a medium and long-term environment
management program will be implemented to rehabilitate and enhance the river basin ecosystems. The following components shall also address the environmental impacts as well as issues on the characteristics of the sediments that were deposited along the waterways:
(a) Characterization of the Balog Creek and part of Agno River. – Full characterization will be conducted by collecting sediment and water samples from different management zones. The sediment samples will be analyzed for: soil texture, soil pH, organic matter, NPK contents, electrical conductivity, Hg and Cd contents, and Lime requirement. Results of chemical analyses will be compared to available data and analyzed and interpreted based from critical values established for proper nutrition of the crops to be used in restoration and enhancement.
On the other hand, water samples will be analyzed for: dissolved oxygen, biological oxygen demand, water pH, total suspended solids and salinity and will be compared to applicable government standards.
(b) Reforestration. – Reforestration and Assisted Natural Regeneration (ANR) of the Balog and Agno Convergence watershed will be implemented upon the concurrence of various stakeholders. Various tree seedling stocks for Padcal’s 2013 Reforestration Project kept in the mine’s mine forest nursery is available for immediate planting during the rainy season. If needed, community-based nursery will be established to support this activity.
(c) Enhancement of Terrestrial and Aquatic Ecosystems. – Possible effects on terrestrial and aquatic ecosystem will be determined and remediation actions will be taken if necessary. Remediation of both ecosystems will be based on the benchmark assessments. Restocking of aquatic flora and fauna will be done, when feasible.
(d) Improvement of Monitoring Procedures. – The number of sampling points will be increased from three to ten to be able to get a better environmental indicator. Further, the frequency of effluent monitoring during the rainy season coming from TSF3 will be increased from weekly to daily to detect abnormalities.
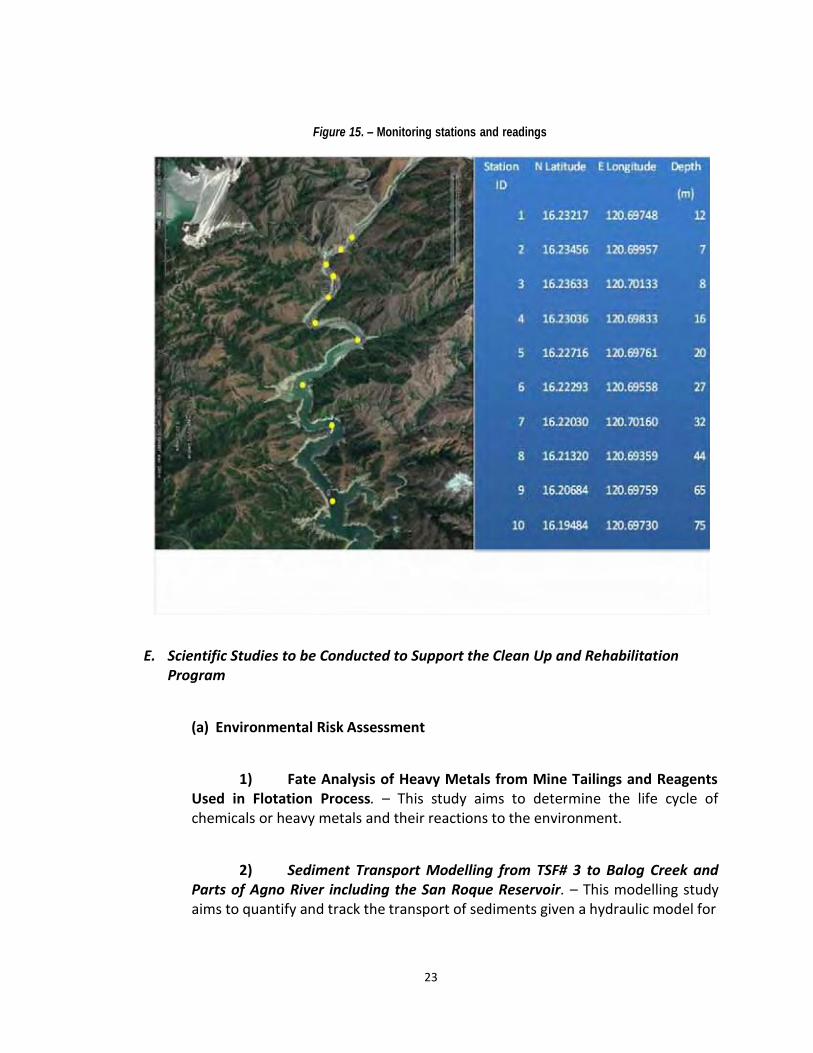
23
Figure 15. – Monitoring stations and readings
E. Scientific Studies to be Conducted to Support the Clean Up and Rehabilitation
Program
(a) Environmental Risk Assessment
1) Fate Analysis of Heavy Metals from Mine Tailings and Reagents Used in Flotation Process. – This study aims to determine the life cycle of chemicals or heavy metals and their reactions to the environment.
2) Sediment Transport Modelling from TSF# 3 to Balog Creek and Parts of Agno River including the San Roque Reservoir. – This modelling study aims to quantify and track the transport of sediments given a hydraulic model for
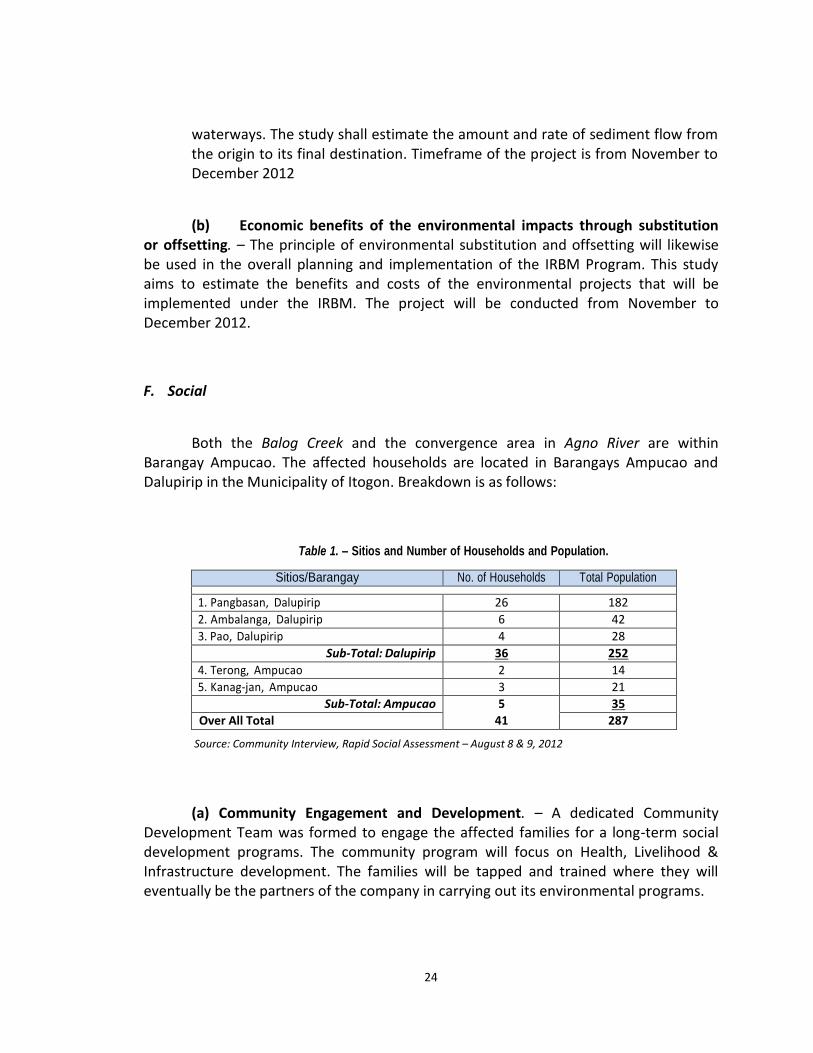
24
waterways. The study shall estimate the amount and rate of sediment flow from the origin to its final destination. Timeframe of the project is from November to December 2012
(b) Economic benefits of the environmental impacts through substitution or offsetting. – The principle of environmental substitution and offsetting will likewise be used in the overall planning and implementation of the IRBM Program. This study aims to estimate the benefits and costs of the environmental projects that will be implemented under the IRBM. The project will be conducted from November to December 2012.
F. Social
Both the Balog Creek and the convergence area in Agno River are within
Barangay Ampucao. The affected households are located in Barangays Ampucao and Dalupirip in the Municipality of Itogon. Breakdown is as follows:
Table 1. – Sitios and Number of Households and Population.
Sitios/Barangay No. of Households Total Population
1. Pangbasan, Dalupirip 26 182
2. Ambalanga, Dalupirip 6 42
3. Pao, Dalupirip 4 28
Sub-Total: Dalupirip 36 252
4. Terong, Ampucao 2 14
5. Kanag-jan, Ampucao 3 21
Sub-Total: Ampucao 5 35
Over All Total 41 287
Source: Community Interview, Rapid Social Assessment – August 8 & 9, 2012
(a) Community Engagement and Development. – A dedicated Community Development Team was formed to engage the affected families for a long-term social development programs. The community program will focus on Health, Livelihood & Infrastructure development. The families will be tapped and trained where they will eventually be the partners of the company in carrying out its environmental programs.
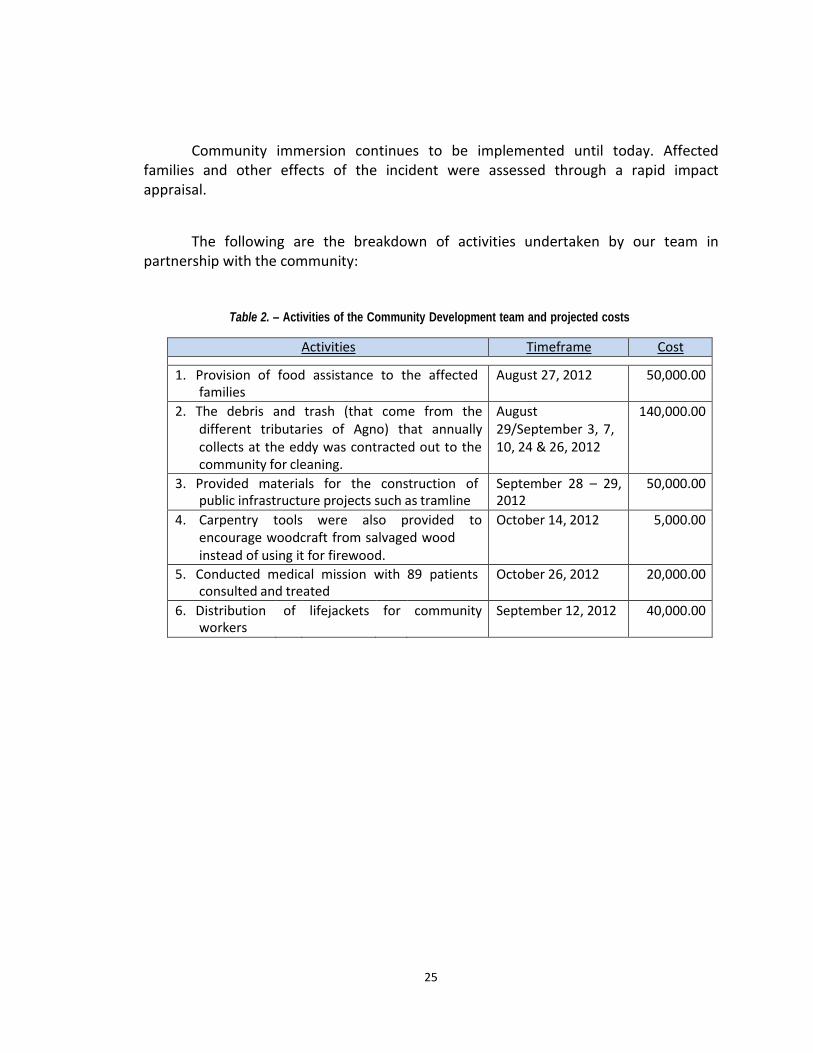
25
Community immersion continues to be implemented until today. Affected families and other effects of the incident were assessed through a rapid impact appraisal.
The following are the breakdown of activities undertaken by our team in partnership with the community:
Table 2. – Activities of the Community Development team and projected costs
Activities Timeframe Cost
1. Provision of food assistance to the affected families
August 27, 2012 50,000.00
2. The debris and trash (that come from the different tributaries of Agno) that annually collects at the eddy was contracted out to the community for cleaning.
August 29/September 3, 7, 10, 24 & 26, 2012
140,000.00
3. Provided materials for the construction of public infrastructure projects such as tramline
September 28 – 29, 2012
50,000.00
4. Carpentry tools were also provided to encourage woodcraft from salvaged wood instead of using it for firewood.
October 14, 2012 5,000.00
5. Conducted medical mission with 89 patients consulted and treated
October 26, 2012 20,000.00
6. Distribution workers
of lifejackets for community September 12, 2012 40,000.00
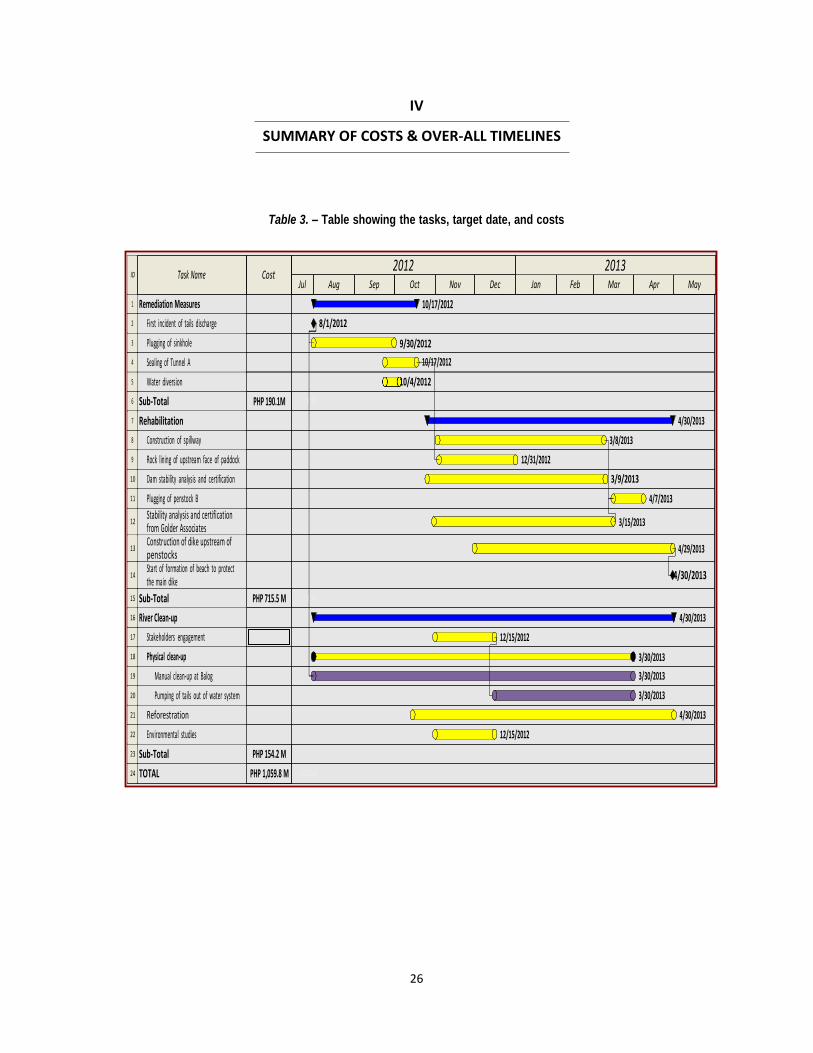
26
10/17/2012
9/30/2012
10/17/2012
4/30/2013
3/8/2013
12/31/2012
4/7/2013
3/15/2013
4/29/2013
4/30/2013
12/15/2012
3/30/2013
3/30/2013
3/30/2013
4/30/2013
12/15/2012
7/15/2012 PHP 1,059.8 M TOTAL 24
PHP 154.2 M Sub-Total 23
Environmental studies 22
Reforestration 21
Pumping of tails out of water system 20
Manual clean-up at Balog 19
Physical clean-up 18
Stakeholders engagement 17
River Clean-up 16
PHP 715.5 M Sub-Total 15
4/30/2013 Start of formation of beach to protect the main dike
14
Construction of dike upstream of penstocks
13
Stability analysis and certification from Golder Associates
12
Plugging of penstock B 11
3/9/2013 Dam stability analysis and certification 10
Rock lining of upstream face of paddock 9
Construction of spillway 8
Rehabilitation 7
PHP 190.1M Sub-Total 6
10/4/2012 Water diversion 5
Sealing of Tunnel A 4
Plugging of sinkhole 3
8/1/2012 First incident of tails discharge 2
Remediation Measures 1
May Apr Mar Feb Jan Dec Nov Oct Sep Aug Jul
2013 2012 Cost Task Name
ID
IV
SUMMARY OF COSTS & OVER-ALL TIMELINES
Table 3. – Table showing the tasks, target date, and costs
PADCAL Operations
April 2013
Annex C: Tailings Storage Facility
Annex C-2: Integrated Environmental
Management Program

[Type text]
1
3/9/2013
PHILEX MINING
CORPORATION
INTEGRATED ENVIRONMENTAL MANAGEMENT PROGRAM
i
Integrated Environmental Management Program
Contents 1.0 INTRODUCTION ....................................................................................................................................... 1
1.1 Background .......................................................................................................................................... 1
1.2 Goal ..................................................................................................................................................... 1
1.3 Objectives ............................................................................................................................................ 1
1.4 Methodologies .................................................................................................................................... 1
1.5 Components ........................................................................................................................................ 3
1.5.1 Social Component ......................................................................................................................... 3
1.5.2 Physical Component ..................................................................................................................... 3
1.5.3 Biological Component .................................................................................................................. 3
1.5.3.1 Aquatic Ecosystem. .................................................................................................................... 4
1.5.3.2 Terrestrial Ecosystem ................................................................................................................ 4
2.0 BASELINE DATA ........................................................................................................................................ 4
2.1 Physical Environment ........................................................................................................................... 4
2.1.1 Location ........................................................................................................................................ 4
2.1.1.1 Balog Creek ................................................................................................................................ 4
2.1.1.2 Agno River ................................................................................................................................. 4
2.1.2 Meteorology ................................................................................................................................. 5
2.1.2.1 Rainfall ....................................................................................................................................... 5
2.1.2.2 Temperature and Relative Humidity ......................................................................................... 5
2.1.3 Topography, Geology and Seismicity ........................................................................................... 5
2.1.3.1 Topography................................................................................................................................ 5
2.1.3.2 Geology ...................................................................................................................................... 6
2.1.3.3 Seismicity ................................................................................................................................... 6
2.1.4 Hydrology and River Sub-basin ..................................................................................................... 6
2.1.4.1 Hydrology .................................................................................................................................. 6
ii
2.1.4.2 Streamflow and Sedimentation ................................................................................................. 6
2.1.5 Waterbodies .................................................................................................................................. 6
2.1.5.1 Balog Creek ................................................................................................................................ 7
2.1.5.2 Agno River ................................................................................................................................. 7
2.1.5.3 Maligaboy Stream...................................................................................................................... 9
2.2 Biological Environment ...................................................................................................................... 10
2.2.1 Terrestrial ...................................................................................................................................10
2.2.1.1 Flora ......................................................................................................................................... 10
2.2.1.2 Fauna ....................................................................................................................................... 10
2.2. 2 Aquatic Ecosystem ..................................................................................................................... 10
2.3 Socio-economic Profile ...................................................................................................................... 11
2.3.1 Local Government Units ............................................................................................................. 11
2.3.2 Area Characteristics .................................................................................................................... 12
3.0 ENVIRONMENTAL IMPACT ASSESSMENT .............................................................................................. 15
3.1 Physical Assessment ........................................................................................................................... 15
3.1.1 Sediment Deposition .................................................................................................................. 15
3.1.2 Sediment Analysis ....................................................................................................................... 16
3.1.3 Water Analysis ............................................................................................................................ 17
3.2 Biological Assessment ........................................................................................................................ 20
3.2.1 Aquatic Ecosystem. ..................................................................................................................... 20
3.2.2 Terrestrial Ecosystem ................................................................................................................. 26
3.3. Socio-economic Assessment ............................................................................................................ 28
3.3.1 Property Damage ........................................................................................................................ 28
3.3.2 Opportunity Costs....................................................................................................................... 28
4.0 ENVIRONMENTAL AND SOCIAL MANAGEMENT PROGRAM .................................................................28
4.1 Physical Cleanup ................................................................................................................................ 28
4.1.1 Balog Creek .................................................................................................................................29
4.1.2 Agno River Confluence Area ....................................................................................................... 31
4.2. Environmental Enhancement ........................................................................................................... 36
4.2.1 Enhancement of the Watershed ................................................................................................ 36
4.2.2 Biodiversity Enhancement .......................................................................................................... 38
iii
4.3 Participatory Approaches and Community Development Strategies ................................................ 40
4.3.1 Community Engagement ............................................................................................................ 40
4.3.2 Socio-economic Development Programs ................................................................................... 40
4.3.2 Information and Education Campaign. ....................................................................................... 47
4.3.3 Cost Estimates and Schedule ......................................................................................................48
4.4. On-going Scientific Studies to Support the Cleanup and Environment Rehabilitation and
Enhancement Programs .......................................................................................................................... 49
4.4.1 Environmental Risk Assessment .................................................................................................50
4.4.2 Economic Pricing ......................................................................................................................... 50
4.4.3 Budget and Schedule ..................................................................................................................51
5.0 MONITORING AND EVALUATION .......................................................................................................... 51
5.1 Coverage ............................................................................................................................................ 52
5.2 Objectives .......................................................................................................................................... 52
5.3 Composition ......................................................................................................................................52
5.4 Roles and Responsibilities ................................................................................................................. 52
5.5 Operationalization ............................................................................................................................. 53
5.5.1 Location and Number of Sampling Points: .................................................................................. 53
5.5.2 Frequency of Monitoring ............................................................................................................ 55
5.6 Budget ............................................................................................................................................... 55
6.0 SUMMARY OF THE PROGRAM ............................................................................................................... 56
7.0 REFERENCES .......................................................................................................................................... 64
[INTEGRATED ENVIRONMENTAL MANAGEMENT PROGRAM] The Integrated Environmental Management Program (IEMP) discusses the environmental rehabilitation and
enhancement program of the Balog Creek and parts of the Agno River
iv
List of Figures
Figure 1 Integrated components of the environmental rehabilitation of Balog Creek and parts of Agno River.
Figure 2 Components of the social, physical, and biological rehabilitation of Balog Creek and parts of Agno River.
Figure 3 Location of Balog Creek and Maligaboy Stream
Figure 4 Geographic Distribution of the Affected Households
Figure 5 Species Composition of Phytoplanktons at the 12 Sampling Stations along the Lower Agno River.
Figure 6 Relative Mean Density of the Different Phytoplankton Division/Phyla in Lower Agno River
Figure 7 Average Densities of Phytoplankton Communities at the12Sampling Stations Along Lower Agno River.
Figure 8 Cluster Analysis of the Phytoplankton Phyla in 12 Sampling Stations along Lower Agno River.
Figure 9 Segmented Balog Creek Figure 10 Access Road Layout from TSF3 to Agno River Figure 11 Vacuum Pump Diagram
Figure 12 Pipeline Route Figure 13 Indicative of Proposed Reforestation / Agroforestry Project Figure 14 Time dimension of the socio-economic development program. Figure 15 Monitoring area Balog Creek Figure 16 Monitoring Area Agno River
v
List of Tables
Table 1 Water Quality, Physical Parameters, of Balog Creek, October 1999 – December 1999
Table 2 Levels of Heavy Metals in the Agno River Basin (NACIAD et al., 1981) Table 3 Water Quality, Physical Parameters ,of Agno River, Balog Downstream,
Convergence Area, May 27, 2008 Table 4 Presence of Heavy Metals in Water Samples from Agno River,Balog Downstream,
Convergence Area, May 27, 2008 Table 5 Water Quality, Physical Parameters of Agno River and San Roque Dam Inflow,
March 2012 Table 6 Water Quality, Physical Parameters of Maligaboy Creek, February 2013 Table 7 Water Quality, Presence of Heavy Metals, in Maligaboy Creek, February 2013
Data Comparison of Heavy Metals from Tilapia Samples in San Roque Dam, Table 8 October 2011 and January, April and May 2012
Table 9 Relevant Households
Table 10: Tilapia and Eel Production in the San Roque Dam Reservoir Table 11 Heavy Metal Analysis of Sediments at Agno River, Downsteam of Balog Creek,
Convergence of Agno and Balog Creek Table 12 Water Quality, Physical Parameters of Water from Agno River,Balog Downstream,
Convergence Area, San Roque Dam Outlet and NIA Weir, December 18, 2012 Table 13 Monthly Water Analysis for Presence of Heavy metal, September 2012 to
December 2012 Table 14 Water Analysis for Heavy Metals: Agno River,Balog Downstream, Convergence
Area, December 12, 2012 Table 15 Water Analysis for Presence of Milling Reagents, November 2012 Table 16 Heavy Metal Analysis of Different Fish Species in the Agno River Table 17 List of Phytoplankton Species found at the 12 Sampling stations along the Lower
Agno River Table 18 Diversity Indices of Phytoplankton Communities at the 12 Sampling Stations along
Lower Agno River Table 19 Projected Cost and Schedule of Activities for Balog Creek Cleanup Table 20 Projected Cost and Schedule of Activities for Agno River Convergence Area
Cleanup Table 21 Projected Cost and Schedule of Activities for Reforestation Table 22 Projected Cost and Schedule of Activities for Biodiversity Enhancement Table 23 Summary of Settlement of Damages Table 24 Completed Income Generating Projects Table 25 List of SDP Projects and Activities, Budget and Schedule
Table 26 Ongoing Environmental Studies, Budget and Schedule
Table 27 Annual Monitoring Budget (2013-2014)
Table 28 IEMP Budget and Schedule of Implementation
vi
List of Technical Nomenclature and Acronyms
As As- Arsenic
ANR Assisted Natural Regeneration (ANR
BDL BDL – Below Detection Limit
BFAR Bureau of Fisheries and Aquatic Resources
BSWM Bureau of Soils and Water Management (BSWM)
CAR Cordillera Administrative Region
Cd Cadmium
Cr Chromium
CITES Convention on International Trade in Endangered Species (CITES)
CR critically endangered
Cu Copper
DENR Department of Health (DOH), Department of Education (DepEd),
Department of Environment and Natural Resources
EU European Unio
FAO Fisheries Administrave Order
ft Feet
GIS Geographical Information System
Hg Mercury
HEC-HMS Hydrologic Engineering Centers Hydrologic Modeling System
HEC-RAS Hydrologic Engineering Centers River Analysis System
IEMP Integrated Environmental Management Program
IEC Information, Education and Communication
JICA Japan International Cooperation Agency
km Kilometer
LGU Local Government Unit
m Meter
MSDS Materials Safety Data Sheet
MRL Maximum Residue Limit
mg/L milligram/Liter
MGB-CAR Mines and Geosciences Bureau-Cordillera Administrative Region
mm millimeter
NPCC National Pollution Control Commission
NSO National Statistics Office
ND Not Detected
NPC National Power Corporation
NS not supplied
NSO National Statistics Office
vii
oC degrees Celsius
PAGASA PAGASA
PAIC Pleistocene Aggregate Island Complex
PAGOPAFLA Pangbasan Goldpanners amd Fisherfold Livelihood Association
Pb Lead
pH hydrogen ion concentration
PHP Phillippine Peso
PMC Philex Mining Corporation
ppm parts per million
PSS PSS - sampling point
RBW Receiving Body of Water
SRPC San Roque Power Corporation
TBD to be determined
TESDA Technical Education and Skills Development Administration
TDS total dissolved solids
TSS total suspended solids
TSF3 tailings storage facility number 3
UN United Nations
US-FDA United States-Food and Drug Administration
List of Photos
Photo 1 Hydropower through Dynamos
Photo 2 Spraying of Rock face
Photo 3 Sediment Bagging
Photo 4 Stocking with BFAR, Barangay Dalupirip
and Municipality of Itogon
Photo 5 Agno River Stocked with 60,000 fingerlings
Photo 6 Appraisal of Claims
Photo 7 Validation of Claims
Photo 8 Replacement of Damaged Items
Photo 9 Settlement participated by LGU Official
Photo 10 Food Distribution to the affected Households
Photo 11 Medical Mission in Pangbasan
Photo 12 Dental Mission in Pangbasan
Photo 13 Debris Cleaning
Photo 14 Hanging bridge 140 m
Photo 15 Constructed Sediment Trap at Km 0.8 Balog
viii
Photo 16 Grass matting for Dust Suppression
Photo 17 Visit of Residents to Organic Farm in La Trinidad
Photo 18 Organic Farming Training of Pangbasan Residents
Photo 19 Organic Chicken Raising in Pangbasan
Photo 20 Organic Backyard Gardening in Pangbasan
List of Annexes
ANNEX A Protocol for Analysis of Milling Additives by Impact Analytical Laboratory, US
ANNEX B Protocol for Analysis of Milling Analysis by Materials Safety Data Sheet (MSDS)
ANNEX C Protocols for Aquatic Biota including Planktons, Macroinvertebrates, Macrophytes
and Fishes
ANNEX D Methodology for Vegetation Survey
ANNEX E Methodology for Fauna Survey
ANNEX F Steps in Collecting Soil Samples for Analysis
ANNEX G Hydrologic Engineering Centers River Analysis System (HEC-RAS)
ANNEX H The Hydrologic Engineering Center Hydrologic Modeling System (HEC-HMS)
ANNEX I Rainfall Data August 1 to 15, 2012
ANNEX J PMC’s Water Quality Monitoring Report of Balog Creek prior to TSF 3 Incident (October -December 1999)
ANNEX K PMC’s Water Quality Monitoring Report of Balog Downstream, Convergence Area
and Agno River prior to TSF 3 Incident ( May 2008)
ANNEX L San Roque Power Corporation’s Water Monitoring Report of Agno River ( March – May 2012)
ANNEX M PMC’s Water Quality Monitoring Report of Maligaboy Stream (February 2013)
ANNEX N BFAR-R1’s Fish Tissue Analysis prior to TSF3 Incident
ANNEX O DENR-MGB Letter, dated Sept 26, 2012
ix
ANNEX P Heavy Metal Analysis of Sediments at the identified sampling stations after the TSF3 Incident
ANNEX Q Heavy Metal Analysis of water at the identified sampling stations after the TSF3 Incident, December 2012
ANNEX R Heavy Metal Analysis of different fish species in the Agno River
ANNEX S Plant Diversity Assessment of Quadrats and Transects
ANNEX T List of Amphibians and Reptiles (Convention on International Trade in Endangered Species) recorded during the rapid terrestrial vertebrae survey conducted within the Watersheds of San Roque Power Corporation (SRPC) – (Annex F)
ANNEX U List of Claims Settled
ANNEX V BFAR’s Advisory on the Lifting of Fishing Ban
ANENX W National Power Corporation’s Reforestation Cost
ANNEC X List of Environment Consultants
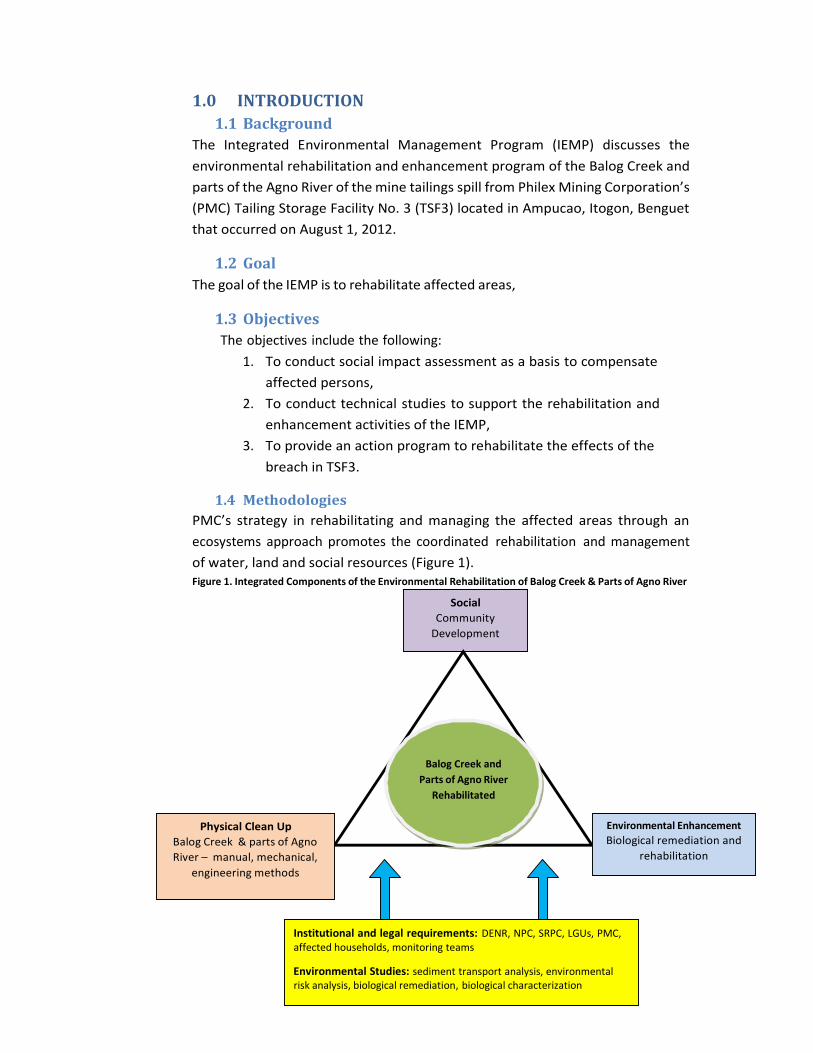
1
Balog Creek and
Parts of Agno River
Rehabilitated
Institutional and legal requirements: DENR, NPC, SRPC, LGUs, PMC, affected households, monitoring teams
Environmental Studies: sediment transport analysis, environmental risk analysis, biological remediation, biological characterization
Environmental Enhancement
Biological remediation and
rehabilitation
Physical Clean Up
Balog Creek & parts of Agno
River – manual, mechanical,
engineering methods
Social
Community
Development
1.0 INTRODUCTION
1.1 Background
The Integrated Environmental Management Program (IEMP) discusses the
environmental rehabilitation and enhancement program of the Balog Creek and
parts of the Agno River of the mine tailings spill from Philex Mining Corporation’s
(PMC) Tailing Storage Facility No. 3 (TSF3) located in Ampucao, Itogon, Benguet
that occurred on August 1, 2012.
1.2 Goal
The goal of the IEMP is to rehabilitate affected areas,
1.3 Objectives
The objectives include the following:
1. To conduct social impact assessment as a basis to compensate
affected persons,
2. To conduct technical studies to support the rehabilitation and
enhancement activities of the IEMP,
3. To provide an action program to rehabilitate the effects of the
breach in TSF3.
1.4 Methodologies
PMC’s strategy in rehabilitating and managing the affected areas through an
ecosystems approach promotes the coordinated rehabilitation and management
of water, land and social resources (Figure 1). Figure 1. Integrated Components of the Environmental Rehabilitation of Balog Creek & Parts of Agno River
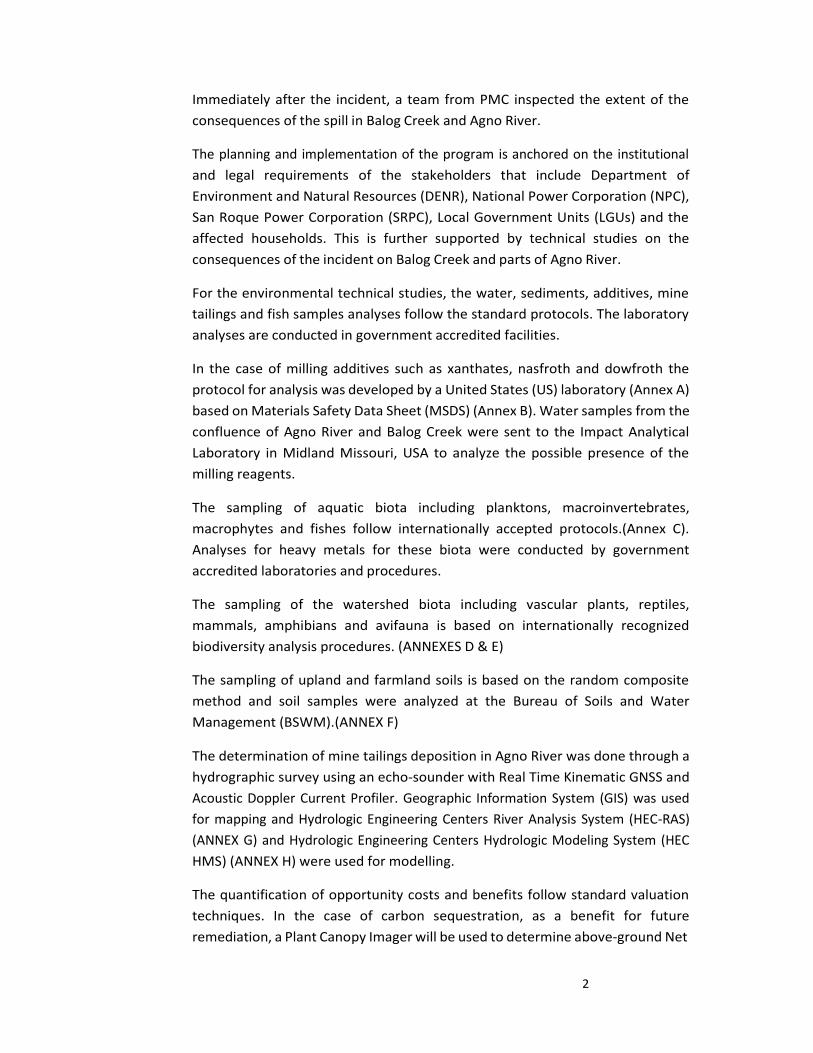
2
Immediately after the incident, a team from PMC inspected the extent of the
consequences of the spill in Balog Creek and Agno River.
The planning and implementation of the program is anchored on the institutional
and legal requirements of the stakeholders that include Department of
Environment and Natural Resources (DENR), National Power Corporation (NPC),
San Roque Power Corporation (SRPC), Local Government Units (LGUs) and the
affected households. This is further supported by technical studies on the
consequences of the incident on Balog Creek and parts of Agno River.
For the environmental technical studies, the water, sediments, additives, mine
tailings and fish samples analyses follow the standard protocols. The laboratory
analyses are conducted in government accredited facilities.
In the case of milling additives such as xanthates, nasfroth and dowfroth the
protocol for analysis was developed by a United States (US) laboratory (Annex A)
based on Materials Safety Data Sheet (MSDS) (Annex B). Water samples from the
confluence of Agno River and Balog Creek were sent to the Impact Analytical
Laboratory in Midland Missouri, USA to analyze the possible presence of the
milling reagents.
The sampling of aquatic biota including planktons, macroinvertebrates,
macrophytes and fishes follow internationally accepted protocols.(Annex C).
Analyses for heavy metals for these biota were conducted by government
accredited laboratories and procedures.
The sampling of the watershed biota including vascular plants, reptiles,
mammals, amphibians and avifauna is based on internationally recognized
biodiversity analysis procedures. (ANNEXES D & E)
The sampling of upland and farmland soils is based on the random composite
method and soil samples were analyzed at the Bureau of Soils and Water
Management (BSWM).(ANNEX F)
The determination of mine tailings deposition in Agno River was done through a
hydrographic survey using an echo-sounder with Real Time Kinematic GNSS and
Acoustic Doppler Current Profiler. Geographic Information System (GIS) was used
for mapping and Hydrologic Engineering Centers River Analysis System (HEC-RAS)
(ANNEX G) and Hydrologic Engineering Centers Hydrologic Modeling System (HEC
HMS) (ANNEX H) were used for modelling.
The quantification of opportunity costs and benefits follow standard valuation
techniques. In the case of carbon sequestration, as a benefit for future
remediation, a Plant Canopy Imager will be used to determine above-ground Net
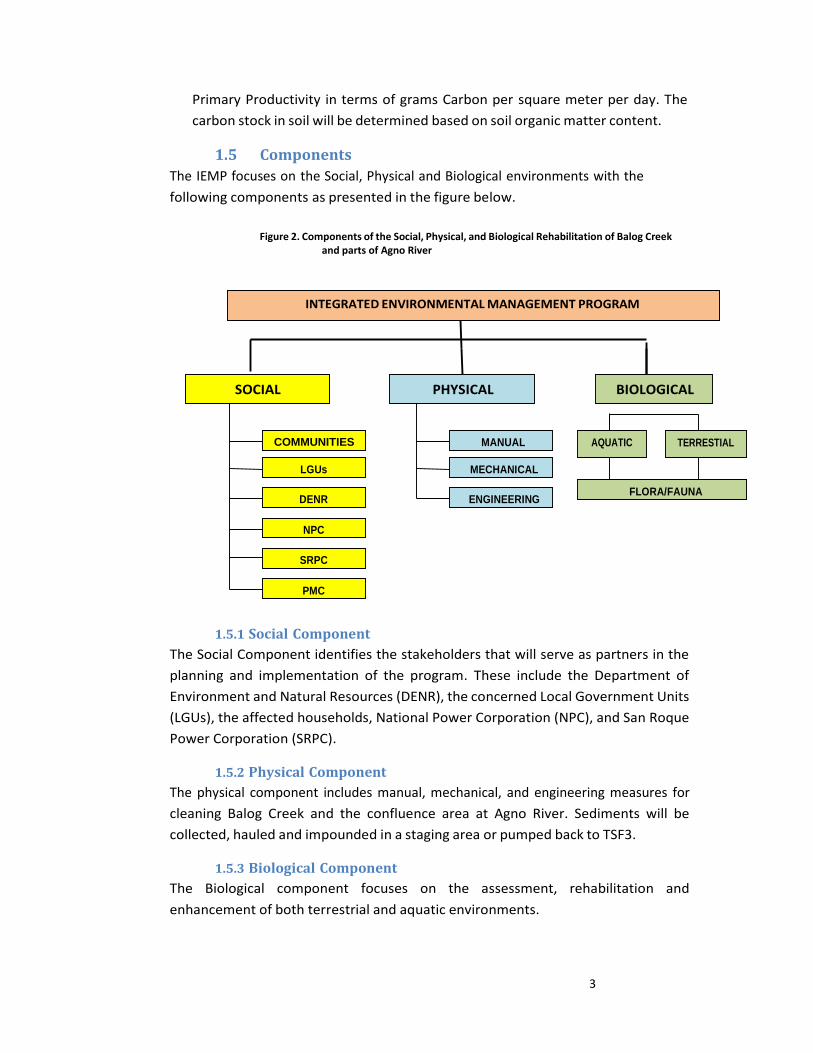
3
BIOLOGICAL
INTEGRATED ENVIRONMENTAL MANAGEMENT PROGRAM
AQUATIC TERRESTIAL
FLORA/FAUNA
Primary Productivity in terms of grams Carbon per square meter per day. The
carbon stock in soil will be determined based on soil organic matter content.
1.5 Components
The IEMP focuses on the Social, Physical and Biological environments with the
following components as presented in the figure below.
Figure 2. Components of the Social, Physical, and Biological Rehabilitation of Balog Creek
and parts of Agno River
1.5.1 Social Component
The Social Component identifies the stakeholders that will serve as partners in the
planning and implementation of the program. These include the Department of
Environment and Natural Resources (DENR), the concerned Local Government Units
(LGUs), the affected households, National Power Corporation (NPC), and San Roque
Power Corporation (SRPC).
1.5.2 Physical Component
The physical component includes manual, mechanical, and engineering measures for
cleaning Balog Creek and the confluence area at Agno River. Sediments will be
collected, hauled and impounded in a staging area or pumped back to TSF3.
1.5.3 Biological Component
The Biological component focuses on the assessment, rehabilitation and
enhancement of both terrestrial and aquatic environments.
PMC
SRPC
NPC
DENR
LGUs
COMMUNITIES
SOCIAL
ENGINEERING
MECHANICAL
MANUAL
PHYSICAL
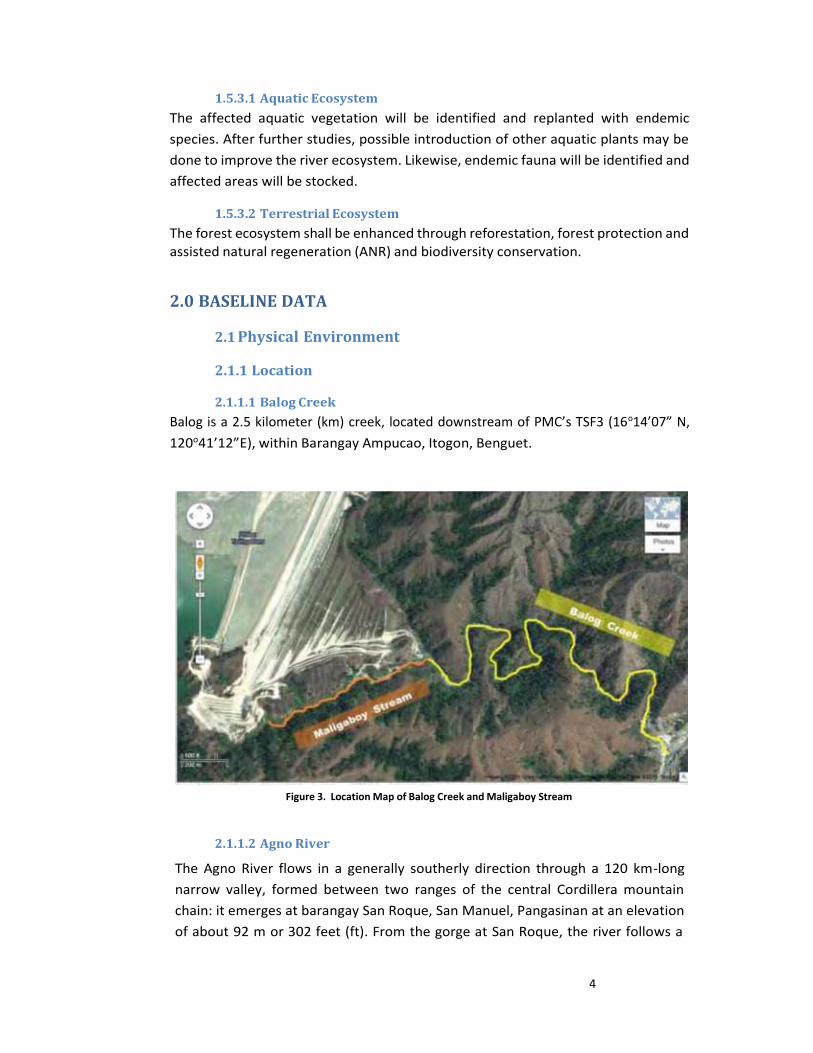
4
1.5.3.1 Aquatic Ecosystem
The affected aquatic vegetation will be identified and replanted with endemic
species. After further studies, possible introduction of other aquatic plants may be
done to improve the river ecosystem. Likewise, endemic fauna will be identified and
affected areas will be stocked.
1.5.3.2 Terrestrial Ecosystem
The forest ecosystem shall be enhanced through reforestation, forest protection and assisted natural regeneration (ANR) and biodiversity conservation.
2.0 BASELINE DATA
2.1 Physical Environment
2.1.1 Location
2.1.1.1 Balog Creek
Balog is a 2.5 kilometer (km) creek, located downstream of PMC’s TSF3 (16o14’07” N,
120o41’12”E), within Barangay Ampucao, Itogon, Benguet.
Figure 3. Location Map of Balog Creek and Maligaboy Stream
2.1.1.2 Agno River
The Agno River flows in a generally southerly direction through a 120 km-long
narrow valley, formed between two ranges of the central Cordillera mountain
chain: it emerges at barangay San Roque, San Manuel, Pangasinan at an elevation
of about 92 m or 302 feet (ft). From the gorge at San Roque, the river follows a
5
semi-circular route to the west and transverses an additional 150 km. across the
relatively flat plains, gradually changing its course northward into the Lingayen
Gulf. (NPC Website Profile; Lower Agno)
2.1.2 Meteorology
2.1.2.1 Rainfall
The San Roque watershed is considered a Type I classification with two pronounced
seasons: the dry season from November to April and the rainy season from May to
October.
Precipitation throughout the year varies sharply between the dry season when little
or to no rainfall can occur over two or more consecutive months and the wet
period, when practically 90% of the annual precipitation in the watershed occurs.
This results in rainfall accumulation from about 2,000 mm per year in the
southeastern portion of the basin to over 4,000 mm per year in the northern
mountainous region and upper Agno River Basin.
It is notable however, that during the month of August 2012, rainfall was relatively
high specially in the Philex mining area. Data indicates that rainfall at the PMC
Corehouse reached 355.6 on August 1 or the highest rainfall event recorded in the
area which triggered the spill incident. (ANNEX I)
2.1.2.2 Temperature and Relative Humidity
Based on data from the Philippine Atmospheric, Geophysical and Astronomical
Services Administration (PAGASA) station in Baguio City, April is the warmest month
with a mean temperature of 23.3oC and January is the coldest with an average of
12.8oC. Usually the temperature varies with elevation, i.e. lower elevation has higher
temperature readings.
The relative humidity is higher at higher elevations, which are subject to cloud and
mist for most part of the year, than the lower elevations. The average relative
humidity is 84% with a maximum of 91% during the month of August and a minimum
of 78% in January.
2.1.3 Topography, Geology and Seismicity
2.1.3.1 Topography
The area is generally rugged, characterized by narrow ridges, steep slopes and deep
creek channels. The highest elevation located at about one (1) km north of TSF3 is at
963m above sea level sloping downwards to 510 m. The west-northwest (almost
east-west) draining Balog Creek, is the principal drainage in the area and directly
drains towards the Agno River. The creek cuts steeply forming V-shaped valleys with
6
isolated plateaus. Floodplains are limited to several meters across the banks of Agno
River.
2.1.3.2 Geology
The area is within the southern foothills of the Cordillera Mountain Range. It is
underlain by Agno batholiths, a medium grained biotite-hornblende quartz diorite,
which easily crumbles when weathered. Weathering within the diorite can go as
deep as 50 m.
In some areas, malachite staining was observed on outcrops of the quartz diorite
indicating mineralization in the area. Pyrite is also ubiquitous.
2.1.3.3 Seismicity
Major fault structures within the vicinity are north-east trending believed to be an
echelon of the splays of the main Philippine fault located 23 km from the site of the
TSF3.
2.1.4 Hydrology and River Sub-basin
2.1.4.1 Hydrology
The Balog Creek is one of the tributaries of Agno River.
Maligaboy is an intermittent stream that recharges only during the rainy season and
discharges to Balog Creek.
2.1.4.2 Streamflow and Sedimentation
A Japan International Cooperation Agency (JICA) study in 1991 showed that the
Upper Agno River has the highest sediment yield to the Lower Agno River. Despite
the large percentage trapped by the Ambuklao and Binga reservoirs, it is the most
significant source of sediments to the Lower Agno River.
In a 1994 NPC Feasibility Study, the best estimation of the annual sedimentation in
the reservoir was based on Ambuklao and Binga reservoirs. A sediment yield of
7,000m3/km2/yr or annual rate of erosion of 7mm has been identified.
2.1.5Waterbodies
As per DENR Memorandum Circular No.7, February 22, 1993, Agno – Lower located
in Pangasinan (Region 1) was classified in 1976 as Class “C” while Agno-Upper
located in Benguet (CAR) was classified also in 1976 as Class “A”. For Balog Creek,
EMB-CAR has classified this as a Class A Body of Water.
Department of Environment and Natural Resources Administrative Order (DAO) 34,
series of 1990 states that significant parameters for mineral ore processing (mining
industry) are Suspended Solids and Heavy metals(Hg, Cn, Cd, etc), Arsenic.
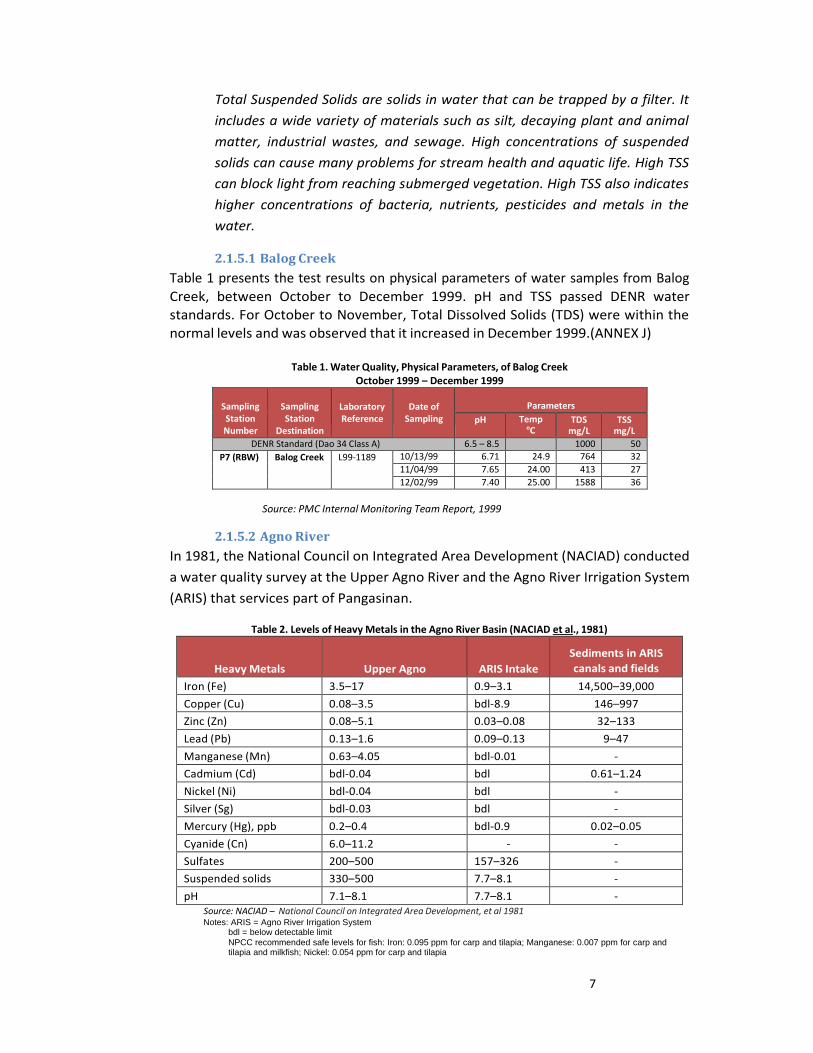
7
Total Suspended Solids are solids in water that can be trapped by a filter. It
includes a wide variety of materials such as silt, decaying plant and animal
matter, industrial wastes, and sewage. High concentrations of suspended
solids can cause many problems for stream health and aquatic life. High TSS
can block light from reaching submerged vegetation. High TSS also indicates
higher concentrations of bacteria, nutrients, pesticides and metals in the
water.
2.1.5.1 Balog Creek
Table 1 presents the test results on physical parameters of water samples from Balog
Creek, between October to December 1999. pH and TSS passed DENR water standards. For October to November, Total Dissolved Solids (TDS) were within the normal levels and was observed that it increased in December 1999.(ANNEX J)
Table 1. Water Quality, Physical Parameters, of Balog Creek
October 1999 – December 1999
Sampling Station Number
Sampling Station
Destination
Laboratory Reference
Date of
Sampling
Parameters
pH Temp oC
TDS mg/L
TSS mg/L
DENR Standard (Dao 34 Class A) 6.5 – 8.5 1000 50
P7 (RBW) Balog Creek L99-1189 10/13/99 6.71 24.9 764 32
11/04/99 7.65 24.00 413 27
12/02/99 7.40 25.00 1588 36
Source: PMC Internal Monitoring Team Report, 1999
2.1.5.2 Agno River
In 1981, the National Council on Integrated Area Development (NACIAD) conducted
a water quality survey at the Upper Agno River and the Agno River Irrigation System
(ARIS) that services part of Pangasinan.
Table 2. Levels of Heavy Metals in the Agno River Basin (NACIAD et al., 1981)
Heavy Metals
Upper Agno
ARIS Intake
Sediments in ARIS
canals and fields
Iron (Fe) 3.5–17 0.9–3.1 14,500–39,000
Copper (Cu) 0.08–3.5 bdl-8.9 146–997
Zinc (Zn) 0.08–5.1 0.03–0.08 32–133
Lead (Pb) 0.13–1.6 0.09–0.13 9–47
Manganese (Mn) 0.63–4.05 bdl-0.01 -
Cadmium (Cd) bdl-0.04 bdl 0.61–1.24
Nickel (Ni) bdl-0.04 bdl -
Silver (Sg) bdl-0.03 bdl -
Mercury (Hg), ppb 0.2–0.4 bdl-0.9 0.02–0.05
Cyanide (Cn) 6.0–11.2 - -
Sulfates 200–500 157–326 -
Suspended solids 330–500 7.7–8.1 -
pH 7.1–8.1 7.7–8.1 - Source: NACIAD – National Council on Integrated Area Development, et al 1981 Notes: ARIS = Agno River Irrigation System
bdl = below detectable limit
NPCC recommended safe levels for fish: Iron: 0.095 ppm for carp and tilapia; Manganese: 0.007 ppm for carp and tilapia and milkfish; Nickel: 0.054 ppm for carp and tilapia
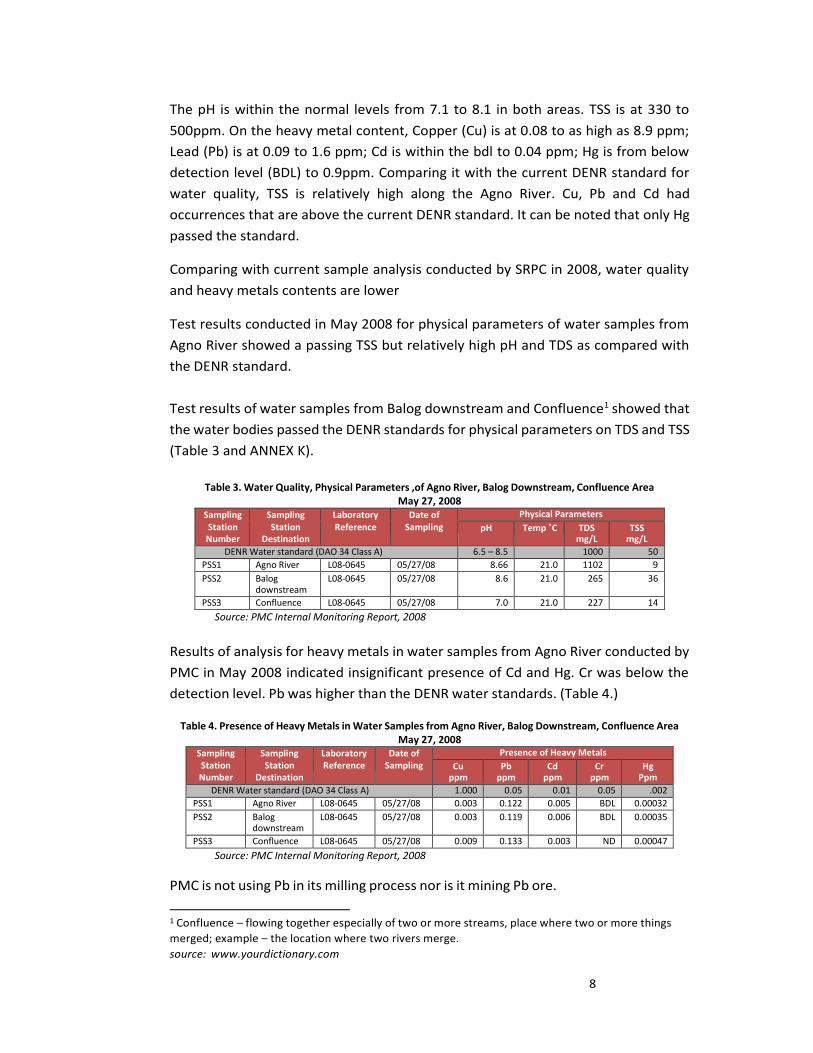
8
The pH is within the normal levels from 7.1 to 8.1 in both areas. TSS is at 330 to
500ppm. On the heavy metal content, Copper (Cu) is at 0.08 to as high as 8.9 ppm;
Lead (Pb) is at 0.09 to 1.6 ppm; Cd is within the bdl to 0.04 ppm; Hg is from below
detection level (BDL) to 0.9ppm. Comparing it with the current DENR standard for
water quality, TSS is relatively high along the Agno River. Cu, Pb and Cd had
occurrences that are above the current DENR standard. It can be noted that only Hg
passed the standard.
Comparing with current sample analysis conducted by SRPC in 2008, water quality
and heavy metals contents are lower
Test results conducted in May 2008 for physical parameters of water samples from
Agno River showed a passing TSS but relatively high pH and TDS as compared with
the DENR standard.
Test results of water samples from Balog downstream and Confluence1 showed that
the water bodies passed the DENR standards for physical parameters on TDS and TSS
(Table 3 and ANNEX K).
Table 3. Water Quality, Physical Parameters ,of Agno River, Balog Downstream, Confluence Area
May 27, 2008 Sampling Station Number
Sampling Station
Destination
Laboratory Reference
Date of Sampling
Physical Parameters
pH Temp ˚C TDS mg/L
TSS mg/L
DENR Water standard (DAO 34 Class A) 6.5 – 8.5 1000 50
PSS1 Agno River L08-0645 05/27/08 8.66 21.0 1102 9
PSS2 Balog downstream
L08-0645 05/27/08 8.6 21.0 265 36
PSS3 Confluence L08-0645 05/27/08 7.0 21.0 227 14
Source: PMC Internal Monitoring Report, 2008
Results of analysis for heavy metals in water samples from Agno River conducted by
PMC in May 2008 indicated insignificant presence of Cd and Hg. Cr was below the
detection level. Pb was higher than the DENR water standards. (Table 4.)
Table 4. Presence of Heavy Metals in Water Samples from Agno River, Balog Downstream, Confluence Area May 27, 2008
Sampling Station Number
Sampling Station
Destination
Laboratory Reference
Date of Sampling
Presence of Heavy Metals
Cu ppm
Pb ppm
Cd ppm
Cr ppm
Hg Ppm
DENR Water standard (DAO 34 Class A) 1.000 0.05 0.01 0.05 .002
PSS1 Agno River L08-0645 05/27/08 0.003 0.122 0.005 BDL 0.00032
PSS2 Balog downstream
L08-0645 05/27/08 0.003 0.119 0.006 BDL 0.00035
PSS3 Confluence L08-0645 05/27/08 0.009 0.133 0.003 ND 0.00047
Source: PMC Internal Monitoring Report, 2008
PMC is not using Pb in its milling process nor is it mining Pb ore.
1 Confluence – flowing together especially of two or more streams, place where two or more things
merged; example – the location where two rivers merge.
source: www.yourdictionary.com
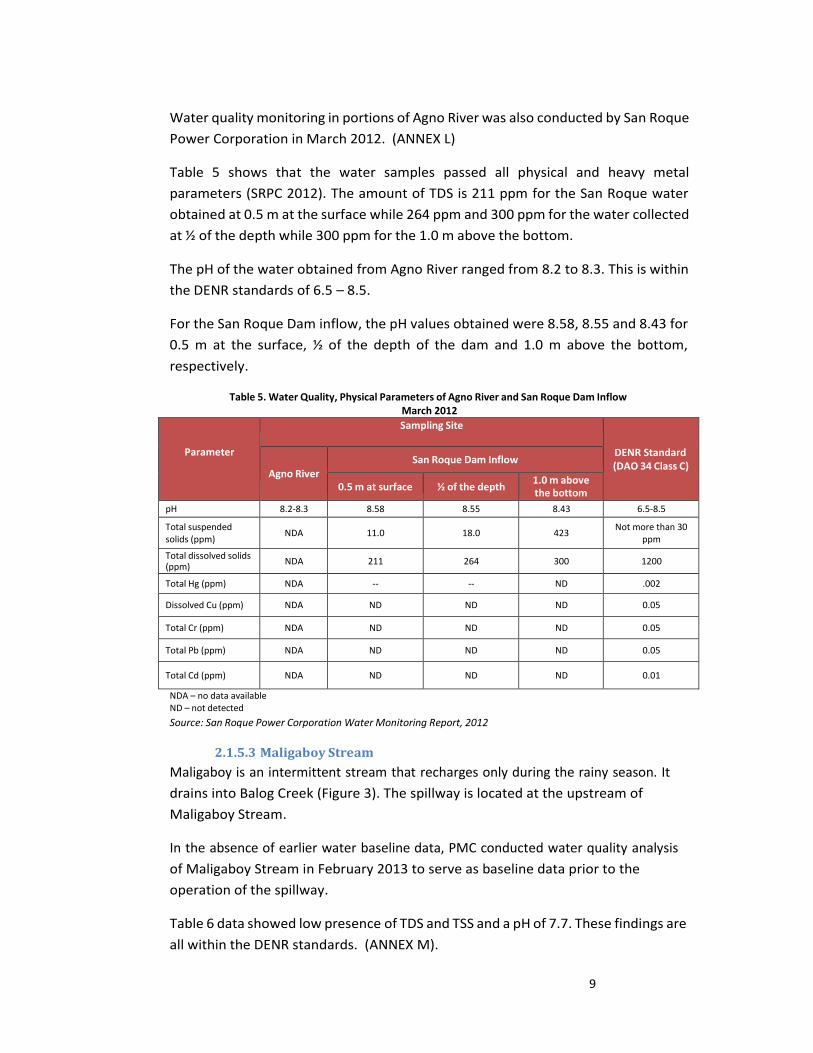
9
Water quality monitoring in portions of Agno River was also conducted by San Roque
Power Corporation in March 2012. (ANNEX L)
Table 5 shows that the water samples passed all physical and heavy metal
parameters (SRPC 2012). The amount of TDS is 211 ppm for the San Roque water
obtained at 0.5 m at the surface while 264 ppm and 300 ppm for the water collected
at ½ of the depth while 300 ppm for the 1.0 m above the bottom.
The pH of the water obtained from Agno River ranged from 8.2 to 8.3. This is within
the DENR standards of 6.5 – 8.5.
For the San Roque Dam inflow, the pH values obtained were 8.58, 8.55 and 8.43 for
0.5 m at the surface, ½ of the depth of the dam and 1.0 m above the bottom,
respectively.
Table 5. Water Quality, Physical Parameters of Agno River and San Roque Dam Inflow March 2012
Parameter
Sampling Site
DENR Standard (DAO 34 Class C)
Agno River San Roque Dam Inflow
0.5 m at surface ½ of the depth 1.0 m above the bottom
pH 8.2-8.3 8.58 8.55 8.43 6.5-8.5
Total suspended solids (ppm)
NDA
11.0
18.0
423 Not more than 30
ppm
Total dissolved solids (ppm)
NDA 211 264 300 1200
Total Hg (ppm) NDA -- -- ND .002
Dissolved Cu (ppm) NDA ND ND ND 0.05
Total Cr (ppm) NDA ND ND ND 0.05
Total Pb (ppm) NDA ND ND ND 0.05
Total Cd (ppm) NDA ND ND ND 0.01
NDA – no data available ND – not detected
Source: San Roque Power Corporation Water Monitoring Report, 2012
2.1.5.3 Maligaboy Stream
Maligaboy is an intermittent stream that recharges only during the rainy season. It
drains into Balog Creek (Figure 3). The spillway is located at the upstream of
Maligaboy Stream.
In the absence of earlier water baseline data, PMC conducted water quality analysis
of Maligaboy Stream in February 2013 to serve as baseline data prior to the
operation of the spillway.
Table 6 data showed low presence of TDS and TSS and a pH of 7.7. These findings are
all within the DENR standards. (ANNEX M).
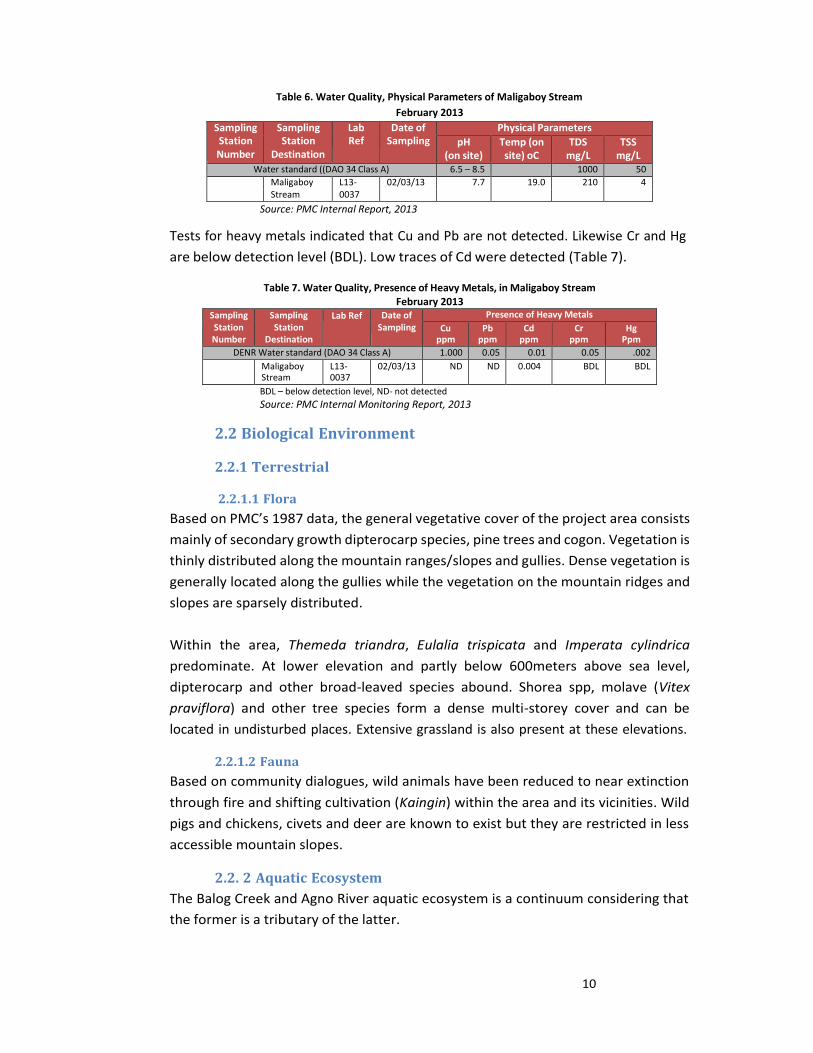
10
Table 6. Water Quality, Physical Parameters of Maligaboy Stream
February 2013
Sampling Station Number
Sampling Station
Destination
Lab Ref
Date of Sampling
Physical Parameters
pH (on site)
Temp (on site) oC
TDS mg/L
TSS mg/L
Water standard ((DAO 34 Class A) 6.5 – 8.5 1000 50
Maligaboy L13- 02/03/13 7.7 19.0 210 4 Stream 0037
Source: PMC Internal Report, 2013
Tests for heavy metals indicated that Cu and Pb are not detected. Likewise Cr and Hg
are below detection level (BDL). Low traces of Cd were detected (Table 7).
Table 7. Water Quality, Presence of Heavy Metals, in Maligaboy Stream February 2013
Sampling Station Number
Sampling Station
Destination
Lab Ref Date of Sampling
Presence of Heavy Metals
Cu ppm
Pb ppm
Cd ppm
Cr ppm
Hg Ppm
DENR Water standard (DAO 34 Class A) 1.000 0.05 0.01 0.05 .002
Maligaboy Stream
L13- 0037
02/03/13 ND ND 0.004 BDL BDL
BDL – below detection level, ND- not detected
Source: PMC Internal Monitoring Report, 2013
2.2 Biological Environment
2.2.1 Terrestrial
2.2.1.1 Flora
Based on PMC’s 1987 data, the general vegetative cover of the project area consists
mainly of secondary growth dipterocarp species, pine trees and cogon. Vegetation is
thinly distributed along the mountain ranges/slopes and gullies. Dense vegetation is
generally located along the gullies while the vegetation on the mountain ridges and
slopes are sparsely distributed.
Within the area, Themeda triandra, Eulalia trispicata and Imperata cylindrica
predominate. At lower elevation and partly below 600meters above sea level,
dipterocarp and other broad-leaved species abound. Shorea spp, molave (Vitex
praviflora) and other tree species form a dense multi-storey cover and can be
located in undisturbed places. Extensive grassland is also present at these elevations.
2.2.1.2 Fauna
Based on community dialogues, wild animals have been reduced to near extinction
through fire and shifting cultivation (Kaingin) within the area and its vicinities. Wild
pigs and chickens, civets and deer are known to exist but they are restricted in less
accessible mountain slopes.
2.2. 2 Aquatic Ecosystem
The Balog Creek and Agno River aquatic ecosystem is a continuum considering that
the former is a tributary of the latter.
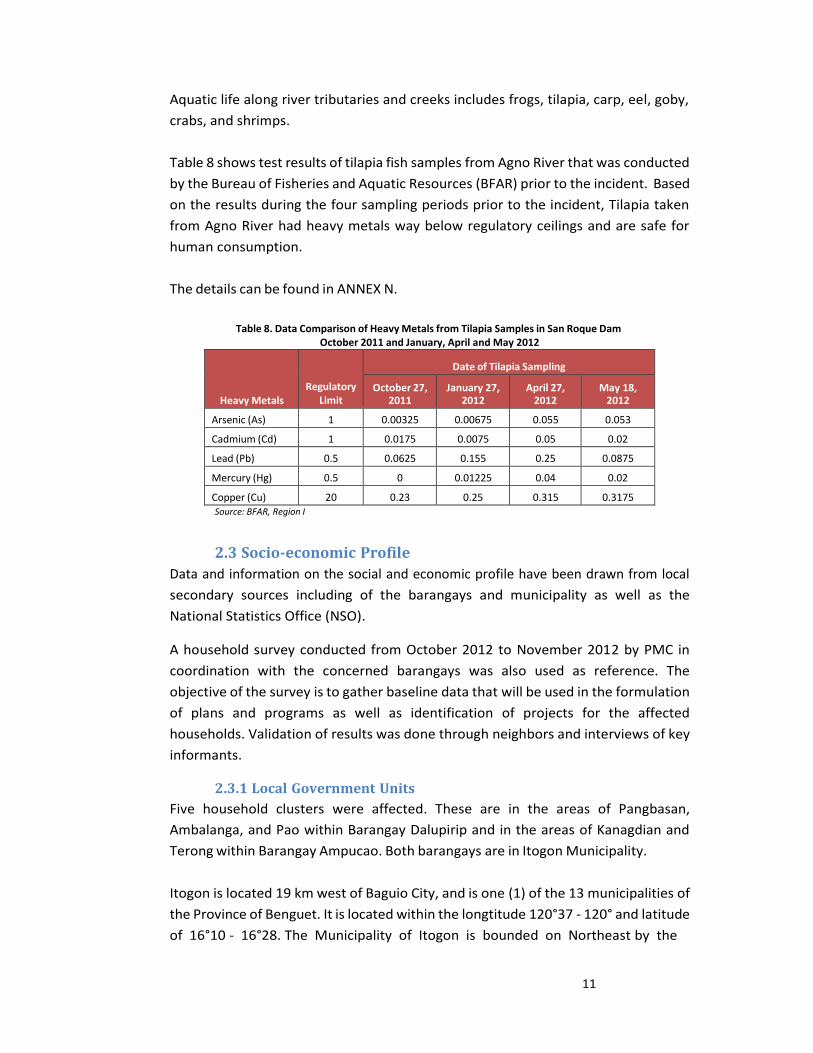
11
Aquatic life along river tributaries and creeks includes frogs, tilapia, carp, eel, goby,
crabs, and shrimps.
Table 8 shows test results of tilapia fish samples from Agno River that was conducted
by the Bureau of Fisheries and Aquatic Resources (BFAR) prior to the incident. Based
on the results during the four sampling periods prior to the incident, Tilapia taken
from Agno River had heavy metals way below regulatory ceilings and are safe for
human consumption.
The details can be found in ANNEX N.
Table 8. Data Comparison of Heavy Metals from Tilapia Samples in San Roque Dam
October 2011 and January, April and May 2012
Heavy Metals
Regulatory
Limit
Date of Tilapia Sampling
October 27, 2011
January 27, 2012
April 27, 2012
May 18, 2012
Arsenic (As) 1 0.00325 0.00675 0.055 0.053
Cadmium (Cd) 1 0.0175 0.0075 0.05 0.02
Lead (Pb) 0.5 0.0625 0.155 0.25 0.0875
Mercury (Hg) 0.5 0 0.01225 0.04 0.02
Copper (Cu) 20 0.23 0.25 0.315 0.3175 Source: BFAR, Region I
2.3 Socio-economic Profile
Data and information on the social and economic profile have been drawn from local
secondary sources including of the barangays and municipality as well as the
National Statistics Office (NSO).
A household survey conducted from October 2012 to November 2012 by PMC in
coordination with the concerned barangays was also used as reference. The
objective of the survey is to gather baseline data that will be used in the formulation
of plans and programs as well as identification of projects for the affected
households. Validation of results was done through neighbors and interviews of key
informants.
2.3.1 Local Government Units
Five household clusters were affected. These are in the areas of Pangbasan,
Ambalanga, and Pao within Barangay Dalupirip and in the areas of Kanagdian and
Terong within Barangay Ampucao. Both barangays are in Itogon Municipality.
Itogon is located 19 km west of Baguio City, and is one (1) of the 13 municipalities of
the Province of Benguet. It is located within the longtitude 120°37 - 120° and latitude
of 16°10 - 16°28. The Municipality of Itogon is bounded on Northeast by the
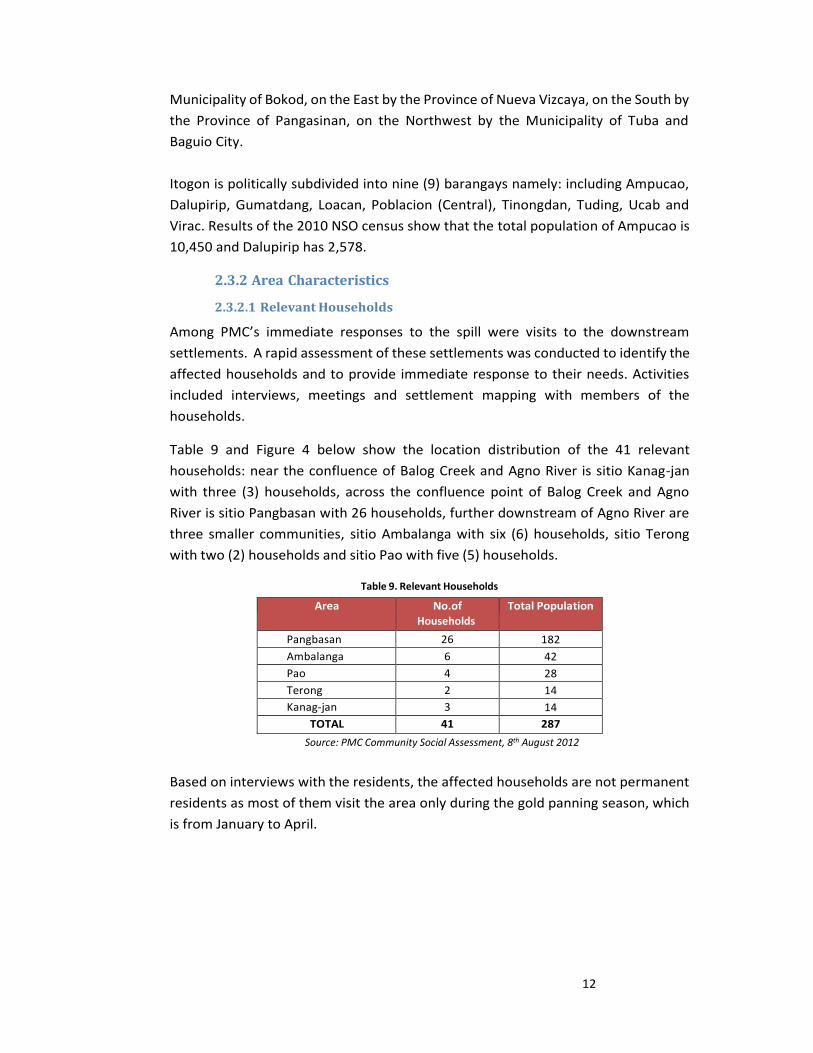
12
Municipality of Bokod, on the East by the Province of Nueva Vizcaya, on the South by
the Province of Pangasinan, on the Northwest by the Municipality of Tuba and
Baguio City.
Itogon is politically subdivided into nine (9) barangays namely: including Ampucao,
Dalupirip, Gumatdang, Loacan, Poblacion (Central), Tinongdan, Tuding, Ucab and
Virac. Results of the 2010 NSO census show that the total population of Ampucao is
10,450 and Dalupirip has 2,578.
2.3.2 Area Characteristics
2.3.2.1 Relevant Households
Among PMC’s immediate responses to the spill were visits to the downstream
settlements. A rapid assessment of these settlements was conducted to identify the
affected households and to provide immediate response to their needs. Activities
included interviews, meetings and settlement mapping with members of the
households.
Table 9 and Figure 4 below show the location distribution of the 41 relevant
households: near the confluence of Balog Creek and Agno River is sitio Kanag-jan
with three (3) households, across the confluence point of Balog Creek and Agno
River is sitio Pangbasan with 26 households, further downstream of Agno River are
three smaller communities, sitio Ambalanga with six (6) households, sitio Terong
with two (2) households and sitio Pao with five (5) households.
Table 9. Relevant Households
Area No.of
Households
Total Population
Pangbasan 26 182
Ambalanga 6 42
Pao 4 28
Terong 2 14
Kanag-jan 3 14
TOTAL 41 287
Source: PMC Community Social Assessment, 8th August 2012
Based on interviews with the residents, the affected households are not permanent
residents as most of them visit the area only during the gold panning season, which
is from January to April.
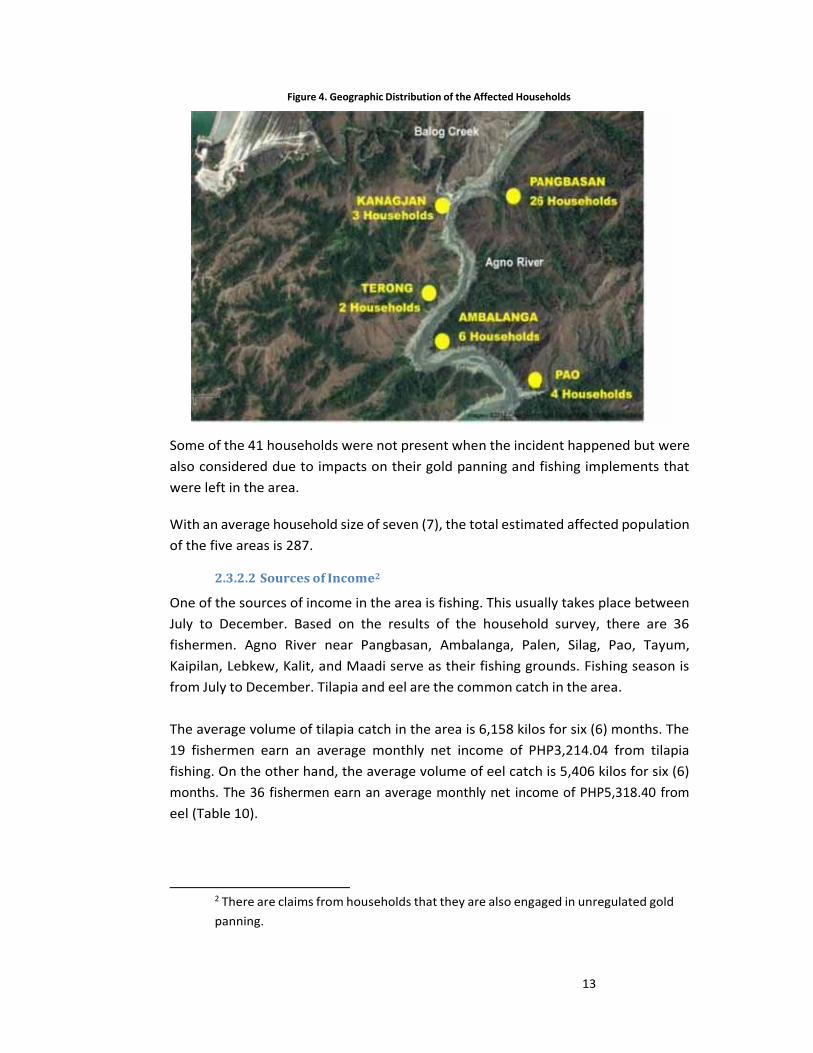
13
Figure 4. Geographic Distribution of the Affected Households
Some of the 41 households were not present when the incident happened but were
also considered due to impacts on their gold panning and fishing implements that
were left in the area.
With an average household size of seven (7), the total estimated affected population
of the five areas is 287.
2.3.2.2 Sources of Income2
One of the sources of income in the area is fishing. This usually takes place between
July to December. Based on the results of the household survey, there are 36
fishermen. Agno River near Pangbasan, Ambalanga, Palen, Silag, Pao, Tayum,
Kaipilan, Lebkew, Kalit, and Maadi serve as their fishing grounds. Fishing season is
from July to December. Tilapia and eel are the common catch in the area.
The average volume of tilapia catch in the area is 6,158 kilos for six (6) months. The
19 fishermen earn an average monthly net income of PHP3,214.04 from tilapia
fishing. On the other hand, the average volume of eel catch is 5,406 kilos for six (6)
months. The 36 fishermen earn an average monthly net income of PHP5,318.40 from
eel (Table 10).
2 There are claims from households that they are also engaged in unregulated gold
panning.
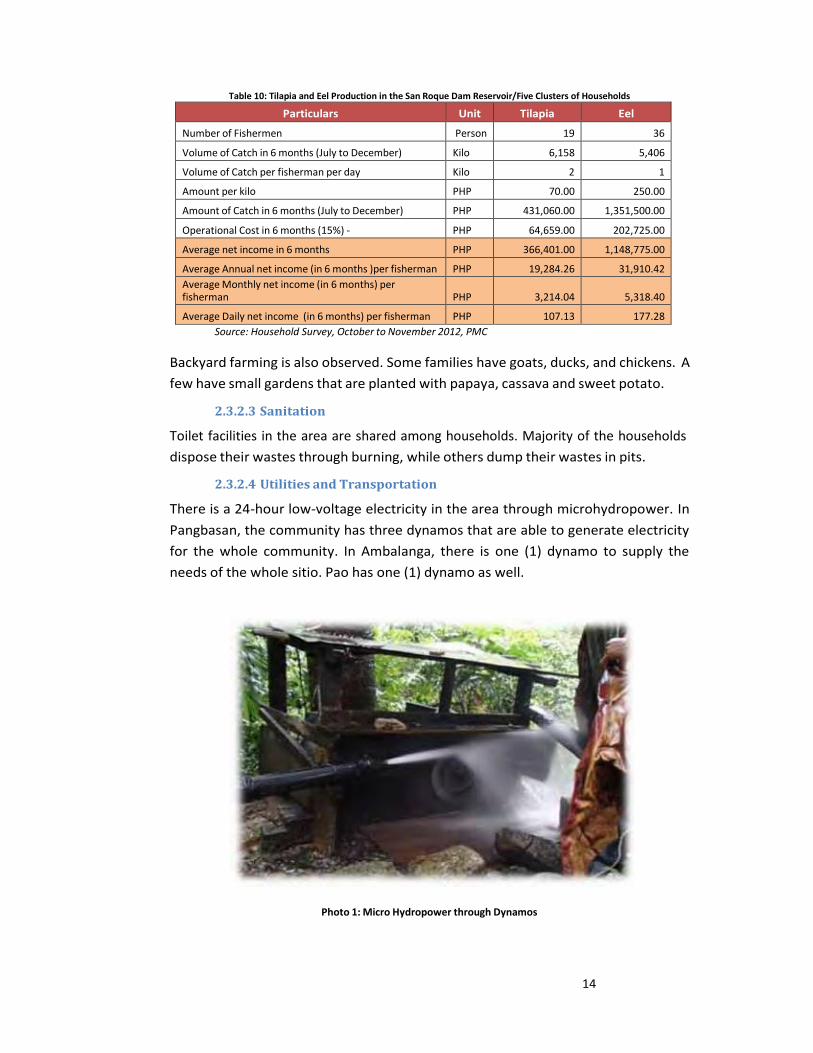
14
Table 10: Tilapia and Eel Production in the San Roque Dam Reservoir/Five Clusters of Households
Particulars Unit Tilapia Eel
Number of Fishermen Person 19 36
Volume of Catch in 6 months (July to December) Kilo 6,158 5,406
Volume of Catch per fisherman per day Kilo 2 1
Amount per kilo PHP 70.00 250.00
Amount of Catch in 6 months (July to December) PHP 431,060.00 1,351,500.00
Operational Cost in 6 months (15%) - PHP 64,659.00 202,725.00
Average net income in 6 months PHP 366,401.00 1,148,775.00
Average Annual net income (in 6 months )per fisherman PHP 19,284.26 31,910.42
Average Monthly net income (in 6 months) per fisherman
PHP
3,214.04
5,318.40
Average Daily net income (in 6 months) per fisherman PHP 107.13 177.28
Source: Household Survey, October to November 2012, PMC
Backyard farming is also observed. Some families have goats, ducks, and chickens. A
few have small gardens that are planted with papaya, cassava and sweet potato.
2.3.2.3 Sanitation
Toilet facilities in the area are shared among households. Majority of the households
dispose their wastes through burning, while others dump their wastes in pits.
2.3.2.4 Utilities and Transportation
There is a 24-hour low-voltage electricity in the area through microhydropower. In
Pangbasan, the community has three dynamos that are able to generate electricity
for the whole community. In Ambalanga, there is one (1) dynamo to supply the
needs of the whole sitio. Pao has one (1) dynamo as well.
Photo 1: Micro Hydropower through Dynamos
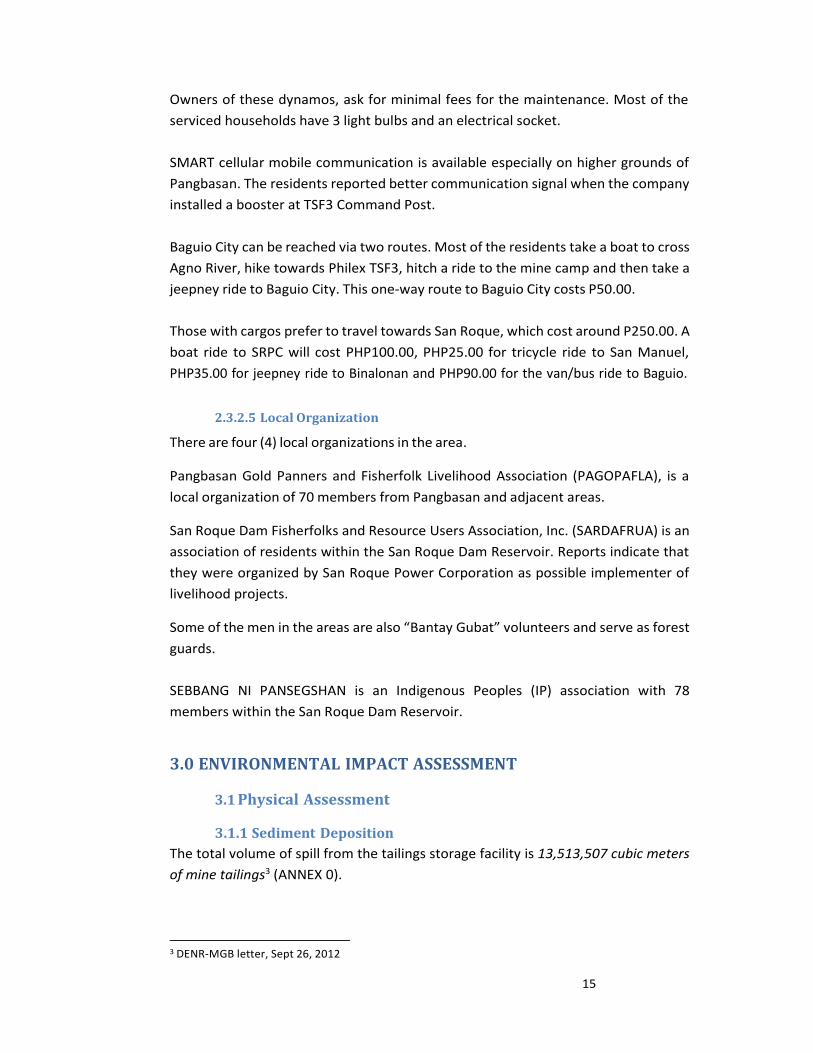
15
Owners of these dynamos, ask for minimal fees for the maintenance. Most of the
serviced households have 3 light bulbs and an electrical socket.
SMART cellular mobile communication is available especially on higher grounds of
Pangbasan. The residents reported better communication signal when the company
installed a booster at TSF3 Command Post.
Baguio City can be reached via two routes. Most of the residents take a boat to cross
Agno River, hike towards Philex TSF3, hitch a ride to the mine camp and then take a
jeepney ride to Baguio City. This one-way route to Baguio City costs P50.00.
Those with cargos prefer to travel towards San Roque, which cost around P250.00. A
boat ride to SRPC will cost PHP100.00, PHP25.00 for tricycle ride to San Manuel,
PHP35.00 for jeepney ride to Binalonan and PHP90.00 for the van/bus ride to Baguio.
2.3.2.5 Local Organization
There are four (4) local organizations in the area.
Pangbasan Gold Panners and Fisherfolk Livelihood Association (PAGOPAFLA), is a
local organization of 70 members from Pangbasan and adjacent areas.
San Roque Dam Fisherfolks and Resource Users Association, Inc. (SARDAFRUA) is an
association of residents within the San Roque Dam Reservoir. Reports indicate that
they were organized by San Roque Power Corporation as possible implementer of
livelihood projects.
Some of the men in the areas are also “Bantay Gubat” volunteers and serve as forest
guards.
SEBBANG NI PANSEGSHAN is an Indigenous Peoples (IP) association with 78
members within the San Roque Dam Reservoir.
3.0 ENVIRONMENTAL IMPACT ASSESSMENT
3.1 Physical Assessment
3.1.1 Sediment Deposition
The total volume of spill from the tailings storage facility is 13,513,507 cubic meters
of mine tailings3 (ANNEX 0).
3 DENR-MGB letter, Sept 26, 2012
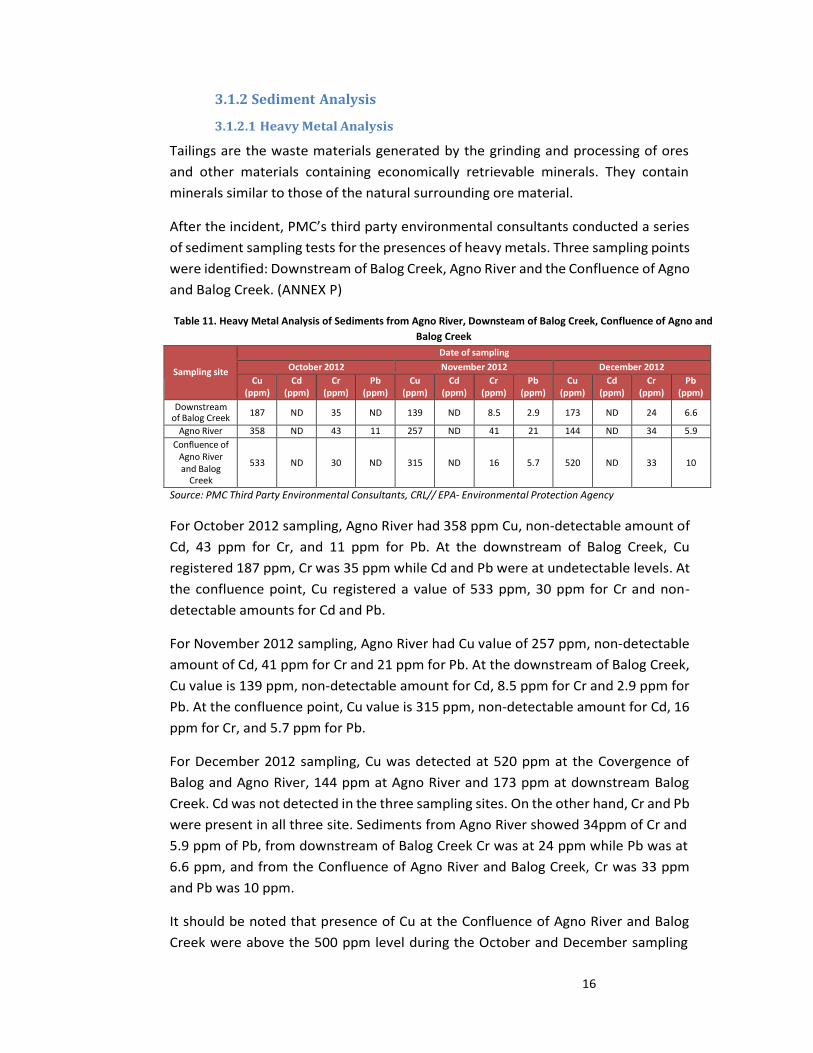
16
3.1.2 Sediment Analysis
3.1.2.1 Heavy Metal Analysis
Tailings are the waste materials generated by the grinding and processing of ores
and other materials containing economically retrievable minerals. They contain
minerals similar to those of the natural surrounding ore material.
After the incident, PMC’s third party environmental consultants conducted a series
of sediment sampling tests for the presences of heavy metals. Three sampling points
were identified: Downstream of Balog Creek, Agno River and the Confluence of Agno
and Balog Creek. (ANNEX P)
Table 11. Heavy Metal Analysis of Sediments from Agno River, Downsteam of Balog Creek, Confluence of Agno and
Balog Creek
Sampling site
Date of sampling
October 2012 November 2012 December 2012
Cu (ppm)
Cd (ppm)
Cr (ppm)
Pb (ppm)
Cu (ppm)
Cd (ppm)
Cr (ppm)
Pb (ppm)
Cu (ppm)
Cd (ppm)
Cr (ppm)
Pb (ppm)
Downstream of Balog Creek
187 ND 35 ND 139 ND 8.5 2.9 173 ND 24 6.6
Agno River 358 ND 43 11 257 ND 41 21 144 ND 34 5.9
Confluence of Agno River and Balog
Creek
533
ND
30
ND
315
ND
16
5.7
520
ND
33
10
Source: PMC Third Party Environmental Consultants, CRL// EPA- Environmental Protection Agency
For October 2012 sampling, Agno River had 358 ppm Cu, non-detectable amount of
Cd, 43 ppm for Cr, and 11 ppm for Pb. At the downstream of Balog Creek, Cu
registered 187 ppm, Cr was 35 ppm while Cd and Pb were at undetectable levels. At
the confluence point, Cu registered a value of 533 ppm, 30 ppm for Cr and non-
detectable amounts for Cd and Pb.
For November 2012 sampling, Agno River had Cu value of 257 ppm, non-detectable
amount of Cd, 41 ppm for Cr and 21 ppm for Pb. At the downstream of Balog Creek,
Cu value is 139 ppm, non-detectable amount for Cd, 8.5 ppm for Cr and 2.9 ppm for
Pb. At the confluence point, Cu value is 315 ppm, non-detectable amount for Cd, 16
ppm for Cr, and 5.7 ppm for Pb.
For December 2012 sampling, Cu was detected at 520 ppm at the Covergence of
Balog and Agno River, 144 ppm at Agno River and 173 ppm at downstream Balog
Creek. Cd was not detected in the three sampling sites. On the other hand, Cr and Pb
were present in all three site. Sediments from Agno River showed 34ppm of Cr and
5.9 ppm of Pb, from downstream of Balog Creek Cr was at 24 ppm while Pb was at
6.6 ppm, and from the Confluence of Agno River and Balog Creek, Cr was 33 ppm
and Pb was 10 ppm.
It should be noted that presence of Cu at the Confluence of Agno River and Balog
Creek were above the 500 ppm level during the October and December sampling
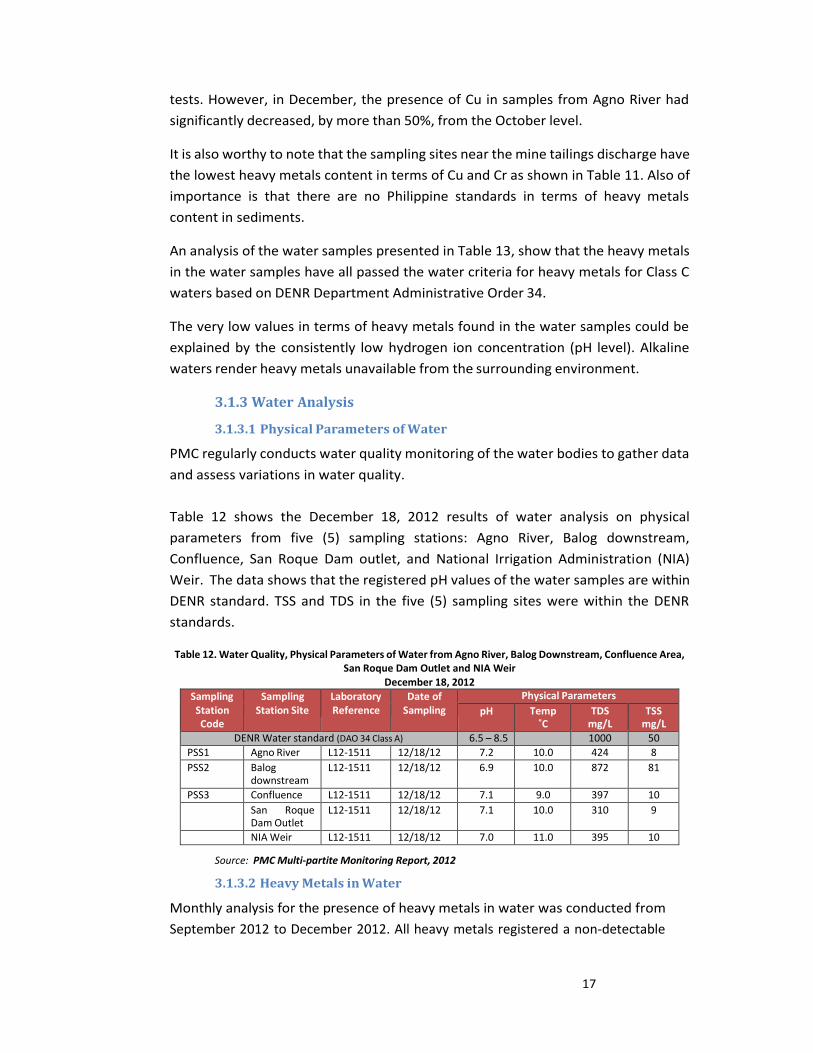
17
tests. However, in December, the presence of Cu in samples from Agno River had
significantly decreased, by more than 50%, from the October level.
It is also worthy to note that the sampling sites near the mine tailings discharge have
the lowest heavy metals content in terms of Cu and Cr as shown in Table 11. Also of
importance is that there are no Philippine standards in terms of heavy metals
content in sediments.
An analysis of the water samples presented in Table 13, show that the heavy metals
in the water samples have all passed the water criteria for heavy metals for Class C
waters based on DENR Department Administrative Order 34.
The very low values in terms of heavy metals found in the water samples could be
explained by the consistently low hydrogen ion concentration (pH level). Alkaline
waters render heavy metals unavailable from the surrounding environment.
3.1.3 Water Analysis
3.1.3.1 Physical Parameters of Water
PMC regularly conducts water quality monitoring of the water bodies to gather data
and assess variations in water quality.
Table 12 shows the December 18, 2012 results of water analysis on physical
parameters from five (5) sampling stations: Agno River, Balog downstream,
Confluence, San Roque Dam outlet, and National Irrigation Administration (NIA)
Weir. The data shows that the registered pH values of the water samples are within
DENR standard. TSS and TDS in the five (5) sampling sites were within the DENR
standards.
Table 12. Water Quality, Physical Parameters of Water from Agno River, Balog Downstream, Confluence Area, San Roque Dam Outlet and NIA Weir
December 18, 2012
Sampling Station Code
Sampling Station Site
Laboratory Reference
Date of Sampling
Physical Parameters
pH Temp ˚C
TDS mg/L
TSS mg/L
DENR Water standard (DAO 34 Class A) 6.5 – 8.5 1000 50
PSS1 Agno River L12-1511 12/18/12 7.2 10.0 424 8
PSS2 Balog downstream
L12-1511 12/18/12 6.9 10.0 872 81
PSS3 Confluence L12-1511 12/18/12 7.1 9.0 397 10
San Roque Dam Outlet
L12-1511 12/18/12 7.1 10.0 310 9
NIA Weir L12-1511 12/18/12 7.0 11.0 395 10
Source: PMC Multi-partite Monitoring Report, 2012
3.1.3.2 Heavy Metals in Water
Monthly analysis for the presence of heavy metals in water was conducted from
September 2012 to December 2012. All heavy metals registered a non-detectable
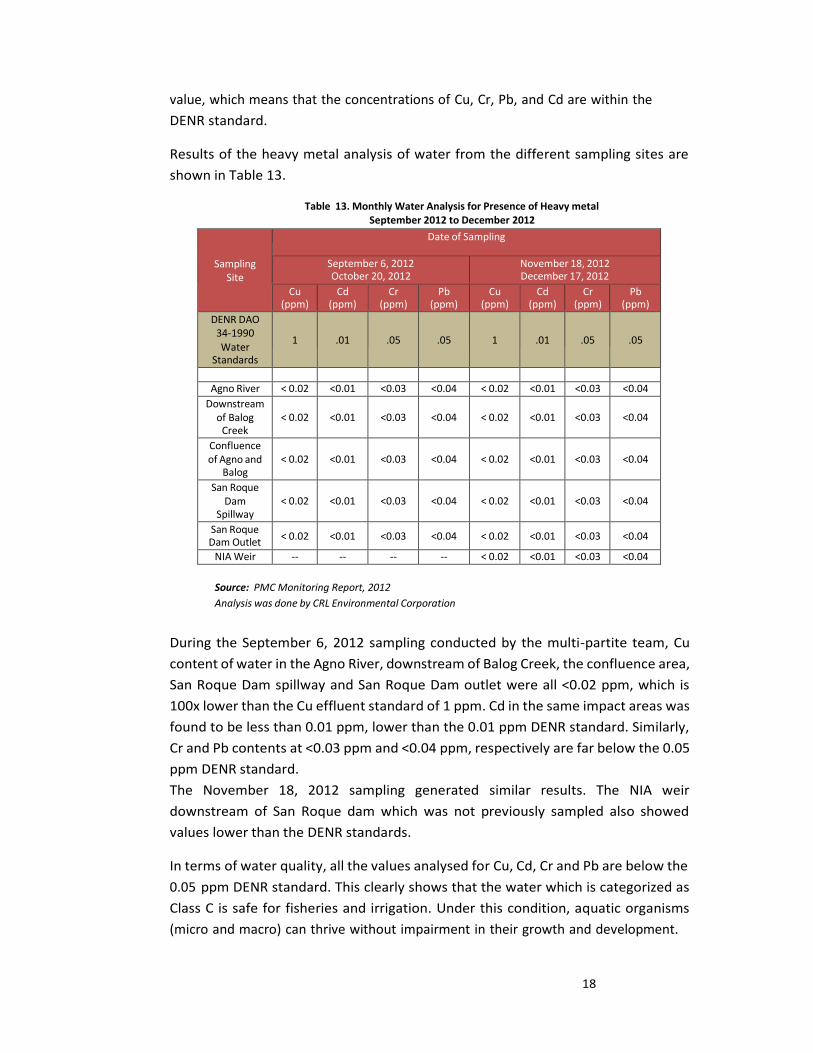
18
value, which means that the concentrations of Cu, Cr, Pb, and Cd are within the
DENR standard.
Results of the heavy metal analysis of water from the different sampling sites are
shown in Table 13.
Table 13. Monthly Water Analysis for Presence of Heavy metal September 2012 to December 2012
Sampling
Site
Date of Sampling
September 6, 2012 October 20, 2012
November 18, 2012 December 17, 2012
Cu (ppm)
Cd (ppm)
Cr (ppm)
Pb (ppm)
Cu (ppm)
Cd (ppm)
Cr (ppm)
Pb (ppm)
DENR DAO 34-1990 Water
Standards
1
.01
.05
.05
1
.01
.05
.05
Agno River < 0.02 <0.01 <0.03 <0.04 < 0.02 <0.01 <0.03 <0.04
Downstream of Balog
Creek
< 0.02
<0.01
<0.03
<0.04
< 0.02
<0.01
<0.03
<0.04
Confluence of Agno and
Balog
< 0.02
<0.01
<0.03
<0.04
< 0.02
<0.01
<0.03
<0.04
San Roque Dam
Spillway
< 0.02
<0.01
<0.03
<0.04
< 0.02
<0.01
<0.03
<0.04
San Roque Dam Outlet
< 0.02 <0.01 <0.03 <0.04 < 0.02 <0.01 <0.03 <0.04
NIA Weir -- -- -- -- < 0.02 <0.01 <0.03 <0.04
Source: PMC Monitoring Report, 2012
Analysis was done by CRL Environmental Corporation
During the September 6, 2012 sampling conducted by the multi-partite team, Cu
content of water in the Agno River, downstream of Balog Creek, the confluence area,
San Roque Dam spillway and San Roque Dam outlet were all <0.02 ppm, which is
100x lower than the Cu effluent standard of 1 ppm. Cd in the same impact areas was
found to be less than 0.01 ppm, lower than the 0.01 ppm DENR standard. Similarly,
Cr and Pb contents at <0.03 ppm and <0.04 ppm, respectively are far below the 0.05
ppm DENR standard.
The November 18, 2012 sampling generated similar results. The NIA weir
downstream of San Roque dam which was not previously sampled also showed
values lower than the DENR standards.
In terms of water quality, all the values analysed for Cu, Cd, Cr and Pb are below the
0.05 ppm DENR standard. This clearly shows that the water which is categorized as
Class C is safe for fisheries and irrigation. Under this condition, aquatic organisms
(micro and macro) can thrive without impairment in their growth and development.
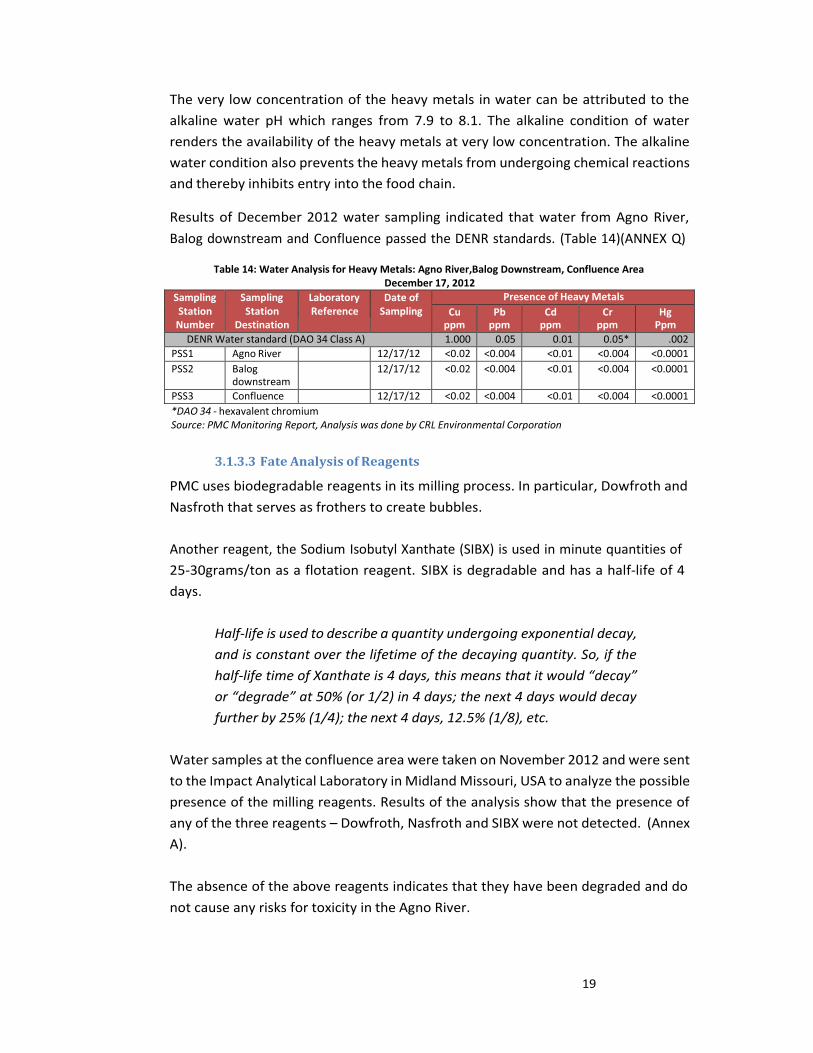
19
The very low concentration of the heavy metals in water can be attributed to the
alkaline water pH which ranges from 7.9 to 8.1. The alkaline condition of water
renders the availability of the heavy metals at very low concentration. The alkaline
water condition also prevents the heavy metals from undergoing chemical reactions
and thereby inhibits entry into the food chain.
Results of December 2012 water sampling indicated that water from Agno River,
Balog downstream and Confluence passed the DENR standards. (Table 14)(ANNEX Q)
Table 14: Water Analysis for Heavy Metals: Agno River,Balog Downstream, Confluence Area December 17, 2012
Sampling Station Number
Sampling Station
Destination
Laboratory Reference
Date of Sampling
Presence of Heavy Metals
Cu ppm
Pb ppm
Cd ppm
Cr ppm
Hg Ppm
DENR Water standard (DAO 34 Class A) 1.000 0.05 0.01 0.05* .002
PSS1 Agno River 12/17/12 <0.02 <0.004 <0.01 <0.004 <0.0001
PSS2 Balog downstream
12/17/12 <0.02 <0.004 <0.01 <0.004 <0.0001
PSS3 Confluence 12/17/12 <0.02 <0.004 <0.01 <0.004 <0.0001
*DAO 34 - hexavalent chromium Source: PMC Monitoring Report, Analysis was done by CRL Environmental Corporation
3.1.3.3 Fate Analysis of Reagents
PMC uses biodegradable reagents in its milling process. In particular, Dowfroth and
Nasfroth that serves as frothers to create bubbles.
Another reagent, the Sodium Isobutyl Xanthate (SIBX) is used in minute quantities of
25-30grams/ton as a flotation reagent. SIBX is degradable and has a half-life of 4
days.
Half-life is used to describe a quantity undergoing exponential decay,
and is constant over the lifetime of the decaying quantity. So, if the
half-life time of Xanthate is 4 days, this means that it would “decay”
or “degrade” at 50% (or 1/2) in 4 days; the next 4 days would decay
further by 25% (1/4); the next 4 days, 12.5% (1/8), etc.
Water samples at the confluence area were taken on November 2012 and were sent
to the Impact Analytical Laboratory in Midland Missouri, USA to analyze the possible
presence of the milling reagents. Results of the analysis show that the presence of
any of the three reagents – Dowfroth, Nasfroth and SIBX were not detected. (Annex
A).
The absence of the above reagents indicates that they have been degraded and do
not cause any risks for toxicity in the Agno River.
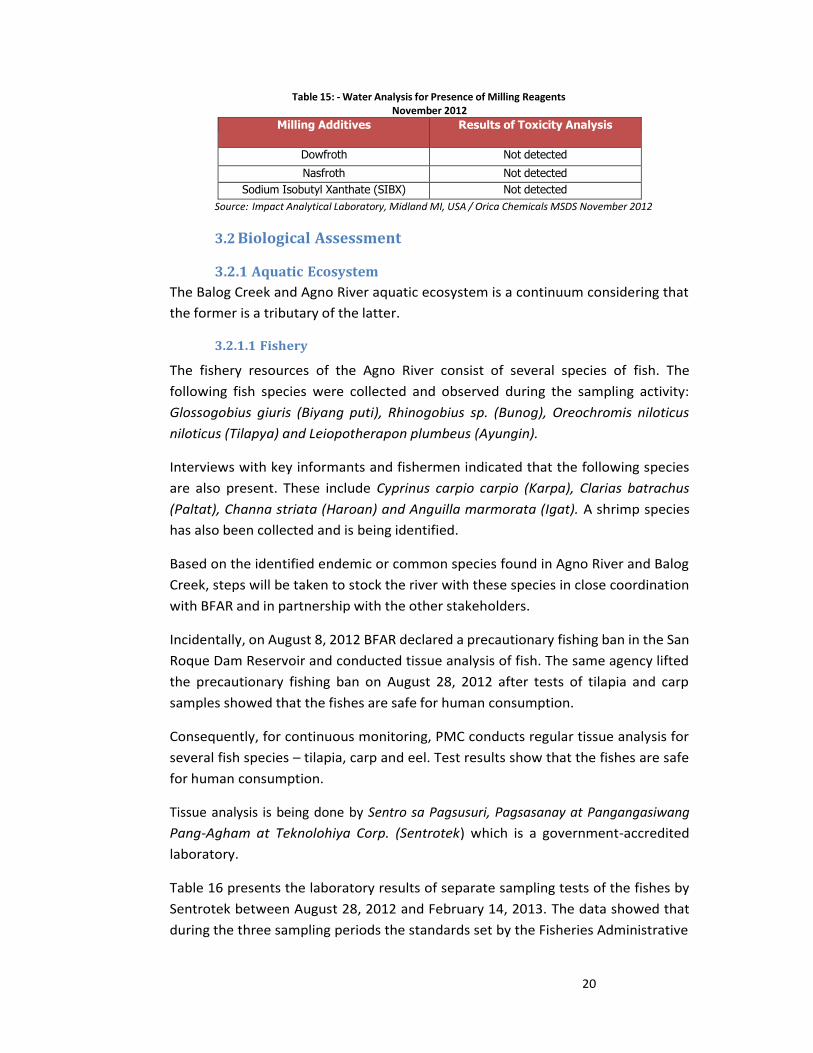
20
Table 15: - Water Analysis for Presence of Milling Reagents November 2012
Milling Additives Results of Toxicity Analysis
Dowfroth Not detected
Nasfroth Not detected
Sodium Isobutyl Xanthate (SIBX) Not detected
Source: Impact Analytical Laboratory, Midland MI, USA / Orica Chemicals MSDS November 2012
3.2 Biological Assessment
3.2.1 Aquatic Ecosystem
The Balog Creek and Agno River aquatic ecosystem is a continuum considering that
the former is a tributary of the latter.
3.2.1.1 Fishery
The fishery resources of the Agno River consist of several species of fish. The
following fish species were collected and observed during the sampling activity:
Glossogobius giuris (Biyang puti), Rhinogobius sp. (Bunog), Oreochromis niloticus
niloticus (Tilapya) and Leiopotherapon plumbeus (Ayungin).
Interviews with key informants and fishermen indicated that the following species
are also present. These include Cyprinus carpio carpio (Karpa), Clarias batrachus
(Paltat), Channa striata (Haroan) and Anguilla marmorata (Igat). A shrimp species
has also been collected and is being identified.
Based on the identified endemic or common species found in Agno River and Balog
Creek, steps will be taken to stock the river with these species in close coordination
with BFAR and in partnership with the other stakeholders.
Incidentally, on August 8, 2012 BFAR declared a precautionary fishing ban in the San
Roque Dam Reservoir and conducted tissue analysis of fish. The same agency lifted
the precautionary fishing ban on August 28, 2012 after tests of tilapia and carp
samples showed that the fishes are safe for human consumption.
Consequently, for continuous monitoring, PMC conducts regular tissue analysis for
several fish species – tilapia, carp and eel. Test results show that the fishes are safe
for human consumption.
Tissue analysis is being done by Sentro sa Pagsusuri, Pagsasanay at Pangangasiwang
Pang-Agham at Teknolohiya Corp. (Sentrotek) which is a government-accredited
laboratory.
Table 16 presents the laboratory results of separate sampling tests of the fishes by
Sentrotek between August 28, 2012 and February 14, 2013. The data showed that
during the three sampling periods the standards set by the Fisheries Administrative
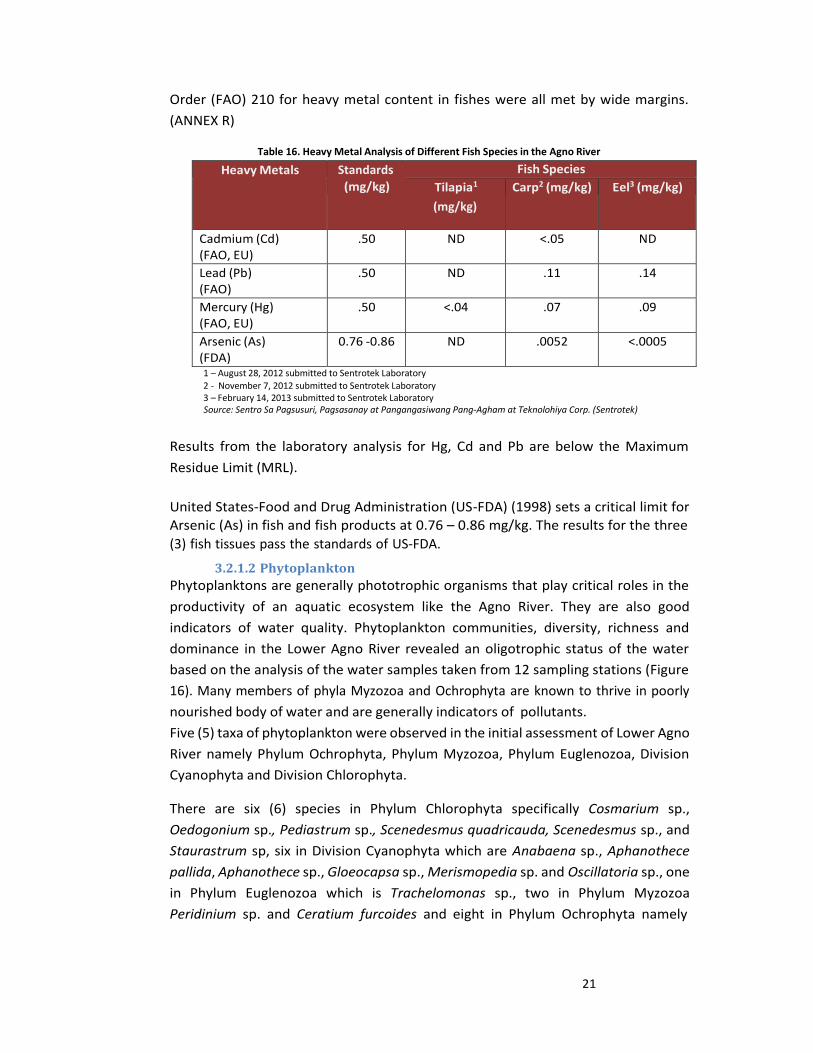
21
Order (FAO) 210 for heavy metal content in fishes were all met by wide margins.
(ANNEX R)
Table 16. Heavy Metal Analysis of Different Fish Species in the Agno River
Heavy Metals Standards
(mg/kg)
Fish Species
Tilapia1
(mg/kg)
Carp2 (mg/kg) Eel3 (mg/kg)
Cadmium (Cd) (FAO, EU)
.50 ND <.05 ND
Lead (Pb) (FAO)
.50 ND .11 .14
Mercury (Hg) (FAO, EU)
.50 <.04 .07 .09
Arsenic (As) (FDA)
0.76 -0.86 ND .0052 <.0005
1 – August 28, 2012 submitted to Sentrotek Laboratory
2 - November 7, 2012 submitted to Sentrotek Laboratory 3 – February 14, 2013 submitted to Sentrotek Laboratory Source: Sentro Sa Pagsusuri, Pagsasanay at Pangangasiwang Pang-Agham at Teknolohiya Corp. (Sentrotek)
Results from the laboratory analysis for Hg, Cd and Pb are below the Maximum
Residue Limit (MRL).
United States-Food and Drug Administration (US-FDA) (1998) sets a critical limit for
Arsenic (As) in fish and fish products at 0.76 – 0.86 mg/kg. The results for the three
(3) fish tissues pass the standards of US-FDA.
3.2.1.2 Phytoplankton
Phytoplanktons are generally phototrophic organisms that play critical roles in the
productivity of an aquatic ecosystem like the Agno River. They are also good
indicators of water quality. Phytoplankton communities, diversity, richness and
dominance in the Lower Agno River revealed an oligotrophic status of the water
based on the analysis of the water samples taken from 12 sampling stations (Figure
16). Many members of phyla Myzozoa and Ochrophyta are known to thrive in poorly
nourished body of water and are generally indicators of pollutants.
Five (5) taxa of phytoplankton were observed in the initial assessment of Lower Agno
River namely Phylum Ochrophyta, Phylum Myzozoa, Phylum Euglenozoa, Division
Cyanophyta and Division Chlorophyta.
There are six (6) species in Phylum Chlorophyta specifically Cosmarium sp.,
Oedogonium sp., Pediastrum sp., Scenedesmus quadricauda, Scenedesmus sp., and
Staurastrum sp, six in Division Cyanophyta which are Anabaena sp., Aphanothece
pallida, Aphanothece sp., Gloeocapsa sp., Merismopedia sp. and Oscillatoria sp., one
in Phylum Euglenozoa which is Trachelomonas sp., two in Phylum Myzozoa
Peridinium sp. and Ceratium furcoides and eight in Phylum Ochrophyta namely

22
Aulacoseira sp., Cyclotella sp., Guinardia sp., Nitzschia sp., Pinnularia sp.,
Pleurosigma sp., Surirella sp. and Synedra sp (Table 17 and Figure 5).
Table 17. List of Phytoplankton Species Found at the Sampling Stations Along the Lower Agno River
Division Chlorophyta
Division Cyanophyta
Phylum Euglenozoa Phylum Myzozoa Phylum Ochrophyta
Cosmarium sp. Anabaena sp. Trachelomonas sp. Peridinium sp. Aulacoseira sp.
Oedogonium sp. Aphanothece pallida
Ceratium furcoides
Cyclotella sp.
Pediastrum sp. Aphanothece sp. Guinardia sp.
Scenedesmus quadricauda
Gloeocapsa sp. Nitzschia sp.
Scenedesmus sp. Merismopedia sp. Pinnularia sp.
Staurastrum sp. Oscillatoria sp. Pleurosigma sp. Surirella sp. Synedra sp.
Source: PMC Third Party Consultants, 2012
Figure 5. Species Composition of Phytoplanktons at the 12 Sampling Stations along the Lower Agno River
Source: PMC Third Party Consultants, 2012
Among the phytoplanktons, Phylum Myzozoa showed the highest relative mean
density with 41% followed by Phylum Ochrophyta, Division Chlorophyta, Phylum
Euglenozoa, and Division Cyanophyta with values 30%, 25%, 3%, and 1% respectively
(Figure 6).
100%
90%
80%
70%
60%
50%
40%
PHYLUM OCHROPHYTA
PHYLUM MYZOZOA
PHYLUM EUGLENOZOA
DIVISION CYANOPHYTA
DIVISION CHLOROPHYTA
30%
20%
10%
0%
1 2 3 4 5 6 7 8 9 10 11 12
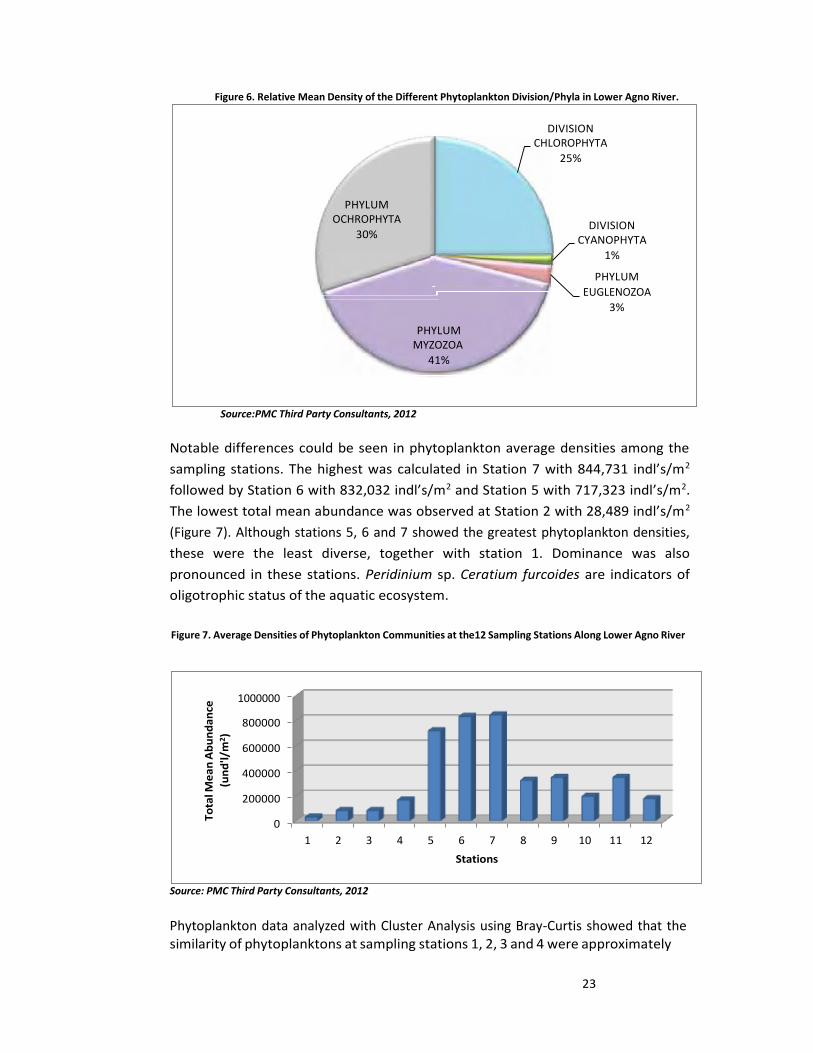
23
Figure 6. Relative Mean Density of the Different Phytoplankton Division/Phyla in Lower Agno River.
Source:PMC Third Party Consultants, 2012
Notable differences could be seen in phytoplankton average densities among the
sampling stations. The highest was calculated in Station 7 with 844,731 indl’s/m2
followed by Station 6 with 832,032 indl’s/m2 and Station 5 with 717,323 indl’s/m2.
The lowest total mean abundance was observed at Station 2 with 28,489 indl’s/m2
(Figure 7). Although stations 5, 6 and 7 showed the greatest phytoplankton densities,
these were the least diverse, together with station 1. Dominance was also
pronounced in these stations. Peridinium sp. Ceratium furcoides are indicators of
oligotrophic status of the aquatic ecosystem.
Figure 7. Average Densities of Phytoplankton Communities at the12 Sampling Stations Along Lower Agno River
Source: PMC Third Party Consultants, 2012
Phytoplankton data analyzed with Cluster Analysis using Bray-Curtis showed that the similarity of phytoplanktons at sampling stations 1, 2, 3 and 4 were approximately
DIVISION CHLOROPHYTA
25%
PHYLUM OCHROPHYTA
30% DIVISION
CYANOPHYTA
1%
PHYLUM
EUGLENOZOA
3%
PHYLUM MYZOZOA
41%
1000000
800000
600000
400000
200000
0
1 2 3 4 5 6 7 8 9 10 11 12
Stations
To
tal M
ea
n A
bu
nd
an
ce
(un
d'l/
m2)
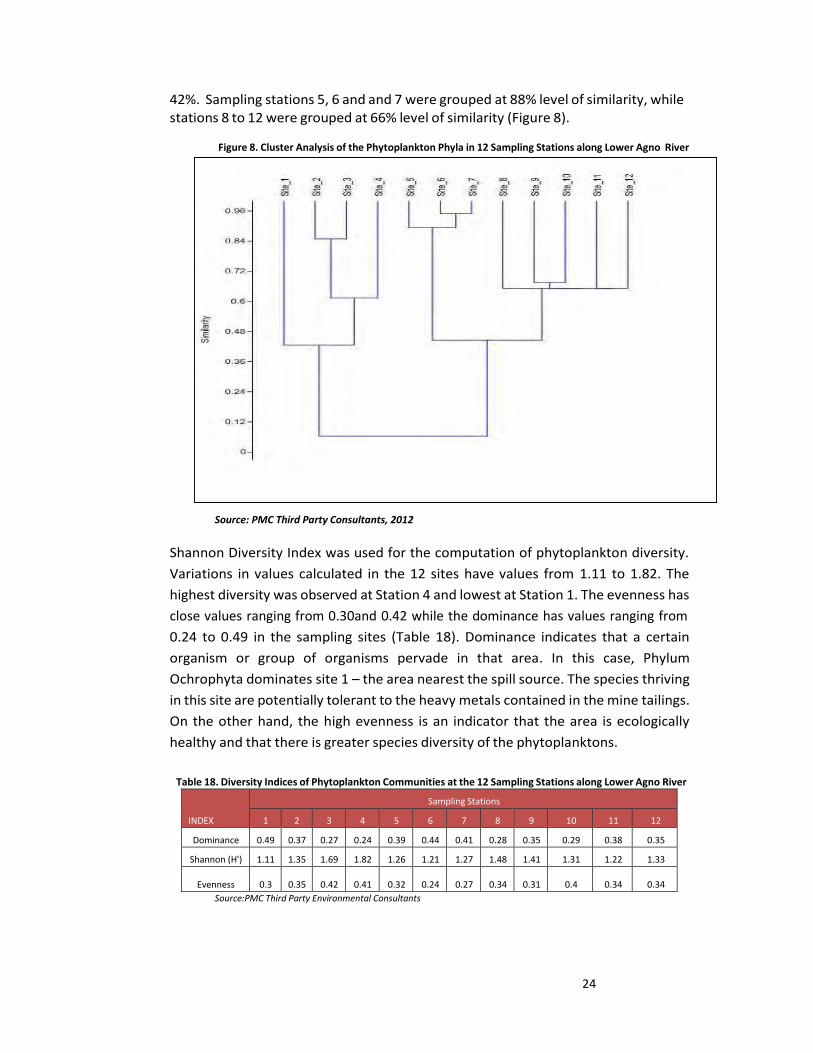
24
42%. Sampling stations 5, 6 and and 7 were grouped at 88% level of similarity, while stations 8 to 12 were grouped at 66% level of similarity (Figure 8).
Figure 8. Cluster Analysis of the Phytoplankton Phyla in 12 Sampling Stations along Lower Agno River
Source: PMC Third Party Consultants, 2012
Shannon Diversity Index was used for the computation of phytoplankton diversity.
Variations in values calculated in the 12 sites have values from 1.11 to 1.82. The
highest diversity was observed at Station 4 and lowest at Station 1. The evenness has
close values ranging from 0.30and 0.42 while the dominance has values ranging from
0.24 to 0.49 in the sampling sites (Table 18). Dominance indicates that a certain
organism or group of organisms pervade in that area. In this case, Phylum
Ochrophyta dominates site 1 – the area nearest the spill source. The species thriving
in this site are potentially tolerant to the heavy metals contained in the mine tailings.
On the other hand, the high evenness is an indicator that the area is ecologically
healthy and that there is greater species diversity of the phytoplanktons.
Table 18. Diversity Indices of Phytoplankton Communities at the 12 Sampling Stations along Lower Agno River
INDEX
Sampling Stations
1 2 3 4 5 6 7 8 9 10 11 12
Dominance 0.49 0.37 0.27 0.24 0.39 0.44 0.41 0.28 0.35 0.29 0.38 0.35
Shannon (H') 1.11 1.35 1.69 1.82 1.26 1.21 1.27 1.48 1.41 1.31 1.22 1.33
Evenness
0.3
0.35
0.42
0.41
0.32
0.24
0.27
0.34
0.31
0.4
0.34
0.34
Source:PMC Third Party Environmental Consultants
25
3.2.1.3 Macroinvertibrates
A study of macroinvertebrates in the Mananga River in Cebu, citing various other
studiesconcluded that biological communities can serve as integrators of the
dynamic physicochemical relations in a river. Their ability to do so can be determined
through a study of community structure and functional rates. Aquatic
macroinvertebrates have been found sensitive to changes in their environment, a
feature that has been proven useful in the quest to find indicators of environmental
conditions. The community characteristics of macro invertebrates, such as diversity
and richness, are often used as indicators of the degree of pollution of bodies of
water to supplement and deepen the meanings of physicochemical information.
(Abel 1989, Arimoro et al. 2007, Barton 1996, Hellawell 1978, Plafkin et al. 1989,
Silva et al. 2009, Wright et al. 1984).
Three field investigations were conducted to collect macroinvertebrates. However,
the sampling protocol was not able to collect any species. The limitation is the length
of time needed for the collection and the rapid subsidence of the Agno River. Efforts
however, will be made to review other sampling protocols. It is expected that
macroinvertebrates despite their fragile nature would be able to recolonize the river
systems when provided with the optimum conditions. In Balog Creek, the presence
of butterflies, dragonflies and damsel flies indicate their resilience in recolonization
as assisted by PMC’s rehabilitation efforts.
3.2.1.4 Macrophytes
A macrophyte is an aquatic plant that grows in or near water and is emergent,
submergent, or floating. In rivers, this consists of large algae, flowering plants, ferns
and other plants. Macrophytes provide cover for fish and substrate for aquatic
invertebrates, produce oxygen, and act as food for some fish and wildlife. A decline
in a macrophyte population may indicate water quality problems. Such problems
may be the result of excessive turbidity, herbicides, or salinization.
The mine tailings from TSF3 have also affected the macrophytes in Balog Creek and
part of Agno River. Efforts to do sampling indicate that these plants are not readily
present.
Efforts will be made to do quarterly sampling as an indicator of the river’s
rehabilitation. The affected aquatic vegetation will be identified and after further
studies, possible introduction of other indigenous aquatic plants may be done to
improve the river ecosystem.
26
3.2.2 Terrestrial Ecosystem
3.2.2.1 The Forest Ecosystem
Results of the plant diversity assessment showed that the remnant forests along the
Agno River are still home to tremendous plant diversity. A total of 316 morpho-
species belonging to the seed plants and Pteridophytes were recorded from the
study area. The computed Shannon index (H’) from the different sampling quadrats
vary from a low of 0.808 to a high of 2.936. Cluster analysis based on species
diversity and abundance revealed very small similarity among quadrats. It implies
that in terms of species composition, each quadrat has their unique floral
characteristics.
A matrix to obtain the true biodiversity value of each quadrat was developed taking
into consideration not only the number of species (richness), but also the number of
threatened species and endemic species. Quadrat from Tapwak creek1 (Q15)
emerged as the most important quadrat because it obtained the highest value in
terms of number of threatened and endemic species.
In terms of forest structure, the average number of trees per plot is only 12
individuals or an average density of only 0.03 tree/m2. The low tree density of the
quadrats can be attributed to the relatively young forest in the area. Based on the
computed importance value, the three most important species are Tan-ag, Kamuling,
and Pagsahingin. These are all pioneer species and their dominance demonstrates
the early succession stage of the forest. Since the survey area is generally a young
secondary forest, smaller trees are more abundant than larger trees. The average
density is significantly higher than that of trees at 1.10 individual/m2. The most
frequently occurring understorey species are Buho, Pagsahingin, Alahan and Takulao.
There are 24 ground cover species, mostly weeds and grasses. The high diversity of
lowland grass and weed species is understandable because the area where the
survey was conducted is low-density, open canopy forest stand.
A total of 309 species were recorded from the transect survey. This is far higher than
those recorded from the quadrat (133). In fact, only seven (7) species recorded from
the quadrat survey were not encountered from the transect survey. The list of
species identified is found in (ANNEX S)
The study also recorded a number of noteworthy species including endemics,
threatened, and important reforestation species. Two (2) species have been
recognized as island endemics, meaning found only in mainland Luzon namely
Dagwey (Saurauia bontocensis) and Luzon paginga (Discocalyx luzoniensis). On the
other hand, 48 Philippine endemics (including the two-( 2) island endemics) were
encountered in the study area.
27
Twenty-three species recorded from the area are listed under either the Philippine
Red List or the International Union for Conservation of Nature (IUCN) Red List of
Threatened Species. Noteworthy among the list are the critically endangered (CR)
Dipterocarp species namely Almon (Shorea almon), White lauan (Shorea contorta)
and Tangile (Shorea polysperma), and the island endemic Dagwey (Saurauia
bontocensis), locally known as Aragwey.
3.2.2.2 Forest Ecosystem Fauna Biodiversity
A total of 87 terrestrial vertebrae were recorded during the rapid assessment survey
within the watersheds of SRPC (ANNEX T). Total endemic4 species (all terrestrial
vertebrates) amounted to 34 or 39% (34/87) of the total species recorded. The
highest percentage of endemicity was observed in mammals with 50% (3/6 species
recorded) followed by herpetofauna (amphibians and reptiles) with 44% (4/9 species
recorded) and lastly, birds with 37% (27/72 species recorded). Threatened5 and
near-threatened species accounted to five (5) (three threatened which are all
vulnerable to extinction and two near-threatened species). Likewise, Convention on
International Trade in Endangered Species (CITES)listed and uncommon species both
tallied to six (6). In addition, species that are restricted only to Luzon and satellite
islands or Luzon PAIC (Pleistocene Aggregate Island Complex) which includes one (1)
amphibian and at least three (3) birds were also recorded.
From a total of two herp transects with a total of seven (7) man-hours of searching
augmented by opportunistic search during transects and general observations for
birds, a total of nine (9) herpetofauna6 (three frogs, a toad and five lizards) were
recorded in this study. At least one (1) threatened and another near-threatened
species were recorded for this group. Total endemic tallied to four or 44% (4/9)
while uncommon and CITES listed species tallied to one respectively.
From 13 study sites (three transects and ten observation areas), a total of 72 species
belonging to 39 Families and 64 genera were recorded in the study. Sixty-six species
where actually recorded during the survey (transect and general observation
combine) while eight species were recorded from interview. Total endemic
(Philippine and Luzon) and near-endemic species tallied to 27 or 37% (27/72) of the
total species recorded. Threatened species accounted to one (1) vulnerable species.
Similarly, a near-threatened species was also recorded though only from interview.
From a total of three (3) sampling sites with accumulated 20 trap-nights and five (5)
net-nights (one net/trap-night is equal to a trap/net set from 1730hrs and retrieved
4 Endemic - found only in the Philippines 5 Threatened – are species under threat of extinction which are Critically Endangered, Endangered and Vulnerable (see attachment for more details) 6 Herpetofauna or heps – refers to amphibians and reptiles
28
at 0530hrs onwards) augmented by general observations and interview, a total of six
(6) mammal species were recorded at the site. Endemic species accounted to three
(3) or 50% (3/6 species) of the total species recorded. Only one (1) threatened
species (Vulnerable) is recorded. CITES species accounted to two (2).
3.3. Socio-economic Assessment
Safety of our stakeholders is the primary concern of the company. Immediately after
the incident, PMC personnel went to the downstream area of TSF3 to ensure that
the concerns of the residents are immediately addressed.
3.3.1 Property Damage
The August 1 incident damaged some properties of 41 households downstream of
TSF3. Damaged properties included gold panning and fishing implements, a few
boats and a tramline. Local government officials also visited the areas and helped
validate the damages caused by the incident.
The damages identified by the residents were all considered for investigation and
verification. Activities regarding settlement were coordinated with the local
governments of Barangay Dalupirip, Barangay Ampucao, the Municipality of Itogon,
and NPC.
There were 36 validated and settled claims. Total settlement cost for the 36 claims
amounted to PHP896,000.00.(ANNEX U)
3.3.2 Opportunity Costs
There was a fishing disruption due to the declaration of the BFAR of a temporary
fishing ban in San Roque Dam Reservoir. In response, PMC immediately provided
food assistance.
The ban was lifted on August 28, 2012 after fish samples were tested and confirmed
safe for human consumption.(ANNEX V) Tilapia and carp samples were tested for
presence of lead, cadmium, arsenic, copper and mercury and their presence were
found to be below harmful levels
4.0 ENVIRONMENTAL AND SOCIAL MANAGEMENT PROGRAM
4.1 Physical Cleanup
As an urgent measure, physical cleanup of the waterways was immediately started
after considering and ensuring the safety of the workers.
The physical cleanup entails manual, mechanical, and engineering measures in
clearing the sediments from the affected water bodies. Sediments are collected,
hauled and impounded to a staging area or will be pumped back to TSF3.
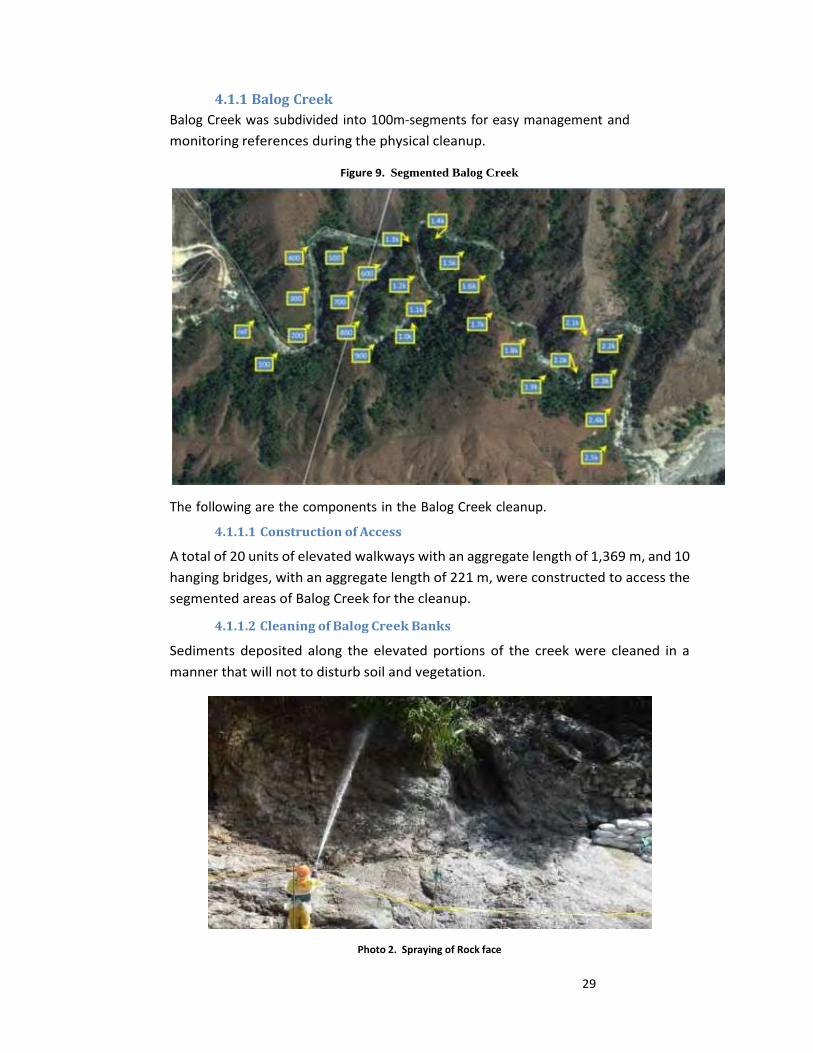
29
4.1.1 Balog Creek
Balog Creek was subdivided into 100m-segments for easy management and
monitoring references during the physical cleanup.
Figure 9. Segmented Balog Creek
The following are the components in the Balog Creek cleanup.
4.1.1.1 Construction of Access
A total of 20 units of elevated walkways with an aggregate length of 1,369 m, and 10
hanging bridges, with an aggregate length of 221 m, were constructed to access the
segmented areas of Balog Creek for the cleanup.
4.1.1.2 Cleaning of Balog Creek Banks
Sediments deposited along the elevated portions of the creek were cleaned in a
manner that will not to disturb soil and vegetation.
Photo 2. Spraying of Rock face
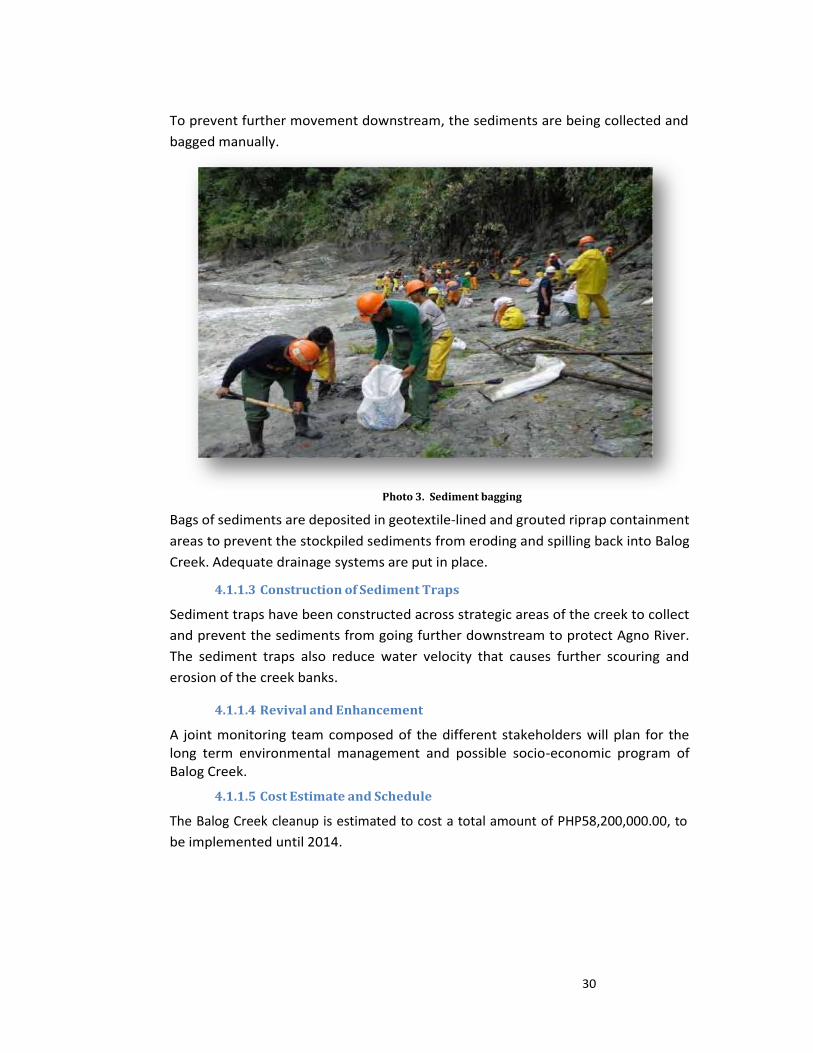
30
To prevent further movement downstream, the sediments are being collected and
bagged manually.
Photo 3. Sediment bagging
Bags of sediments are deposited in geotextile-lined and grouted riprap containment
areas to prevent the stockpiled sediments from eroding and spilling back into Balog
Creek. Adequate drainage systems are put in place.
4.1.1.3 Construction of Sediment Traps
Sediment traps have been constructed across strategic areas of the creek to collect
and prevent the sediments from going further downstream to protect Agno River.
The sediment traps also reduce water velocity that causes further scouring and
erosion of the creek banks.
4.1.1.4 Revival and Enhancement
A joint monitoring team composed of the different stakeholders will plan for the long term environmental management and possible socio-economic program of Balog Creek.
4.1.1.5 Cost Estimate and Schedule
The Balog Creek cleanup is estimated to cost a total amount of PHP58,200,000.00, to
be implemented until 2014.
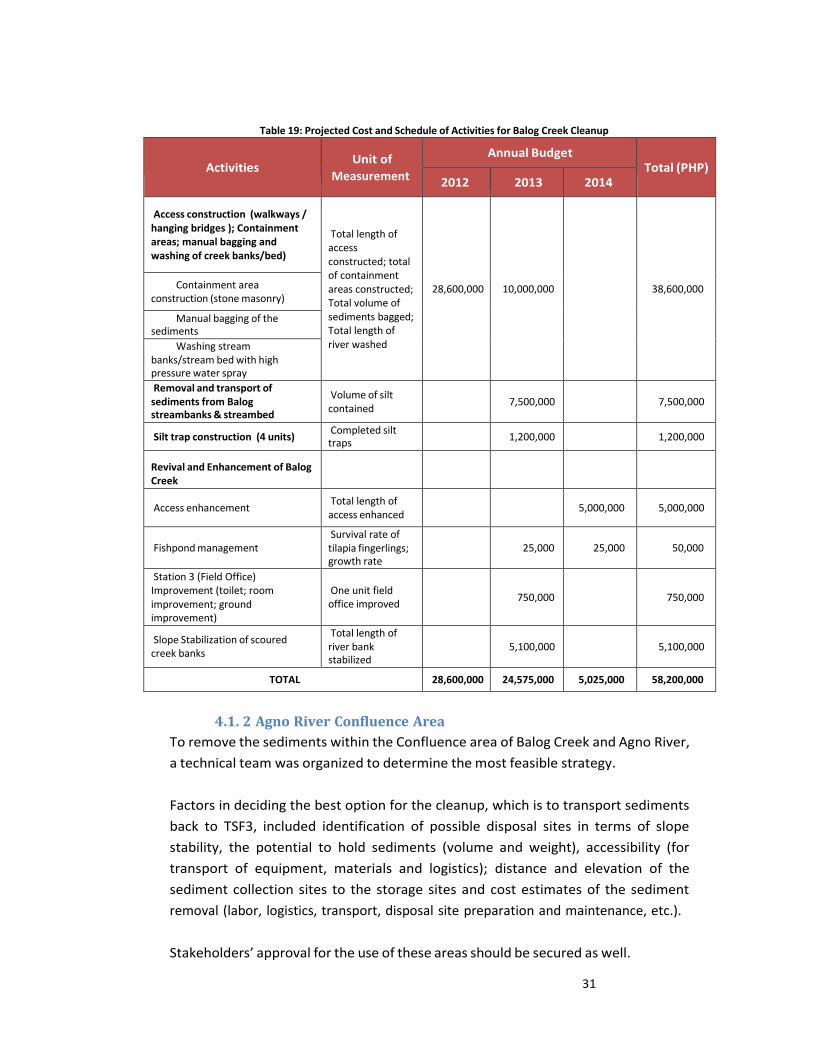
31
Table 19: Projected Cost and Schedule of Activities for Balog Creek Cleanup
Activities
Unit of
Measurement
Annual Budget Total (PHP)
2012 2013 2014
Access construction (walkways / hanging bridges ); Containment areas; manual bagging and washing of creek banks/bed)
Total length of access constructed; total of containment areas constructed; Total volume of sediments bagged; Total length of river washed
28,600,000
10,000,000
38,600,000 Containment area construction (stone masonry)
Manual bagging of the sediments
Washing stream banks/stream bed with high pressure water spray
Removal and transport of sediments from Balog streambanks & streambed
Volume of silt contained
7,500,000
7,500,000
Silt trap construction (4 units) Completed silt traps
1,200,000
1,200,000
Revival and Enhancement of Balog Creek
Access enhancement Total length of access enhanced
5,000,000
5,000,000
Fishpond management Survival rate of tilapia fingerlings; growth rate
25,000
25,000
50,000
Station 3 (Field Office) Improvement (toilet; room improvement; ground improvement)
One unit field office improved
750,000
750,000
Slope Stabilization of scoured creek banks
Total length of river bank stabilized
5,100,000
5,100,000
TOTAL 28,600,000 24,575,000 5,025,000 58,200,000
4.1. 2 Agno River Confluence Area
To remove the sediments within the Confluence area of Balog Creek and Agno River,
a technical team was organized to determine the most feasible strategy.
Factors in deciding the best option for the cleanup, which is to transport sediments
back to TSF3, included identification of possible disposal sites in terms of slope
stability, the potential to hold sediments (volume and weight), accessibility (for
transport of equipment, materials and logistics); distance and elevation of the
sediment collection sites to the storage sites and cost estimates of the sediment
removal (labor, logistics, transport, disposal site preparation and maintenance, etc.).
Stakeholders’ approval for the use of these areas should be secured as well.
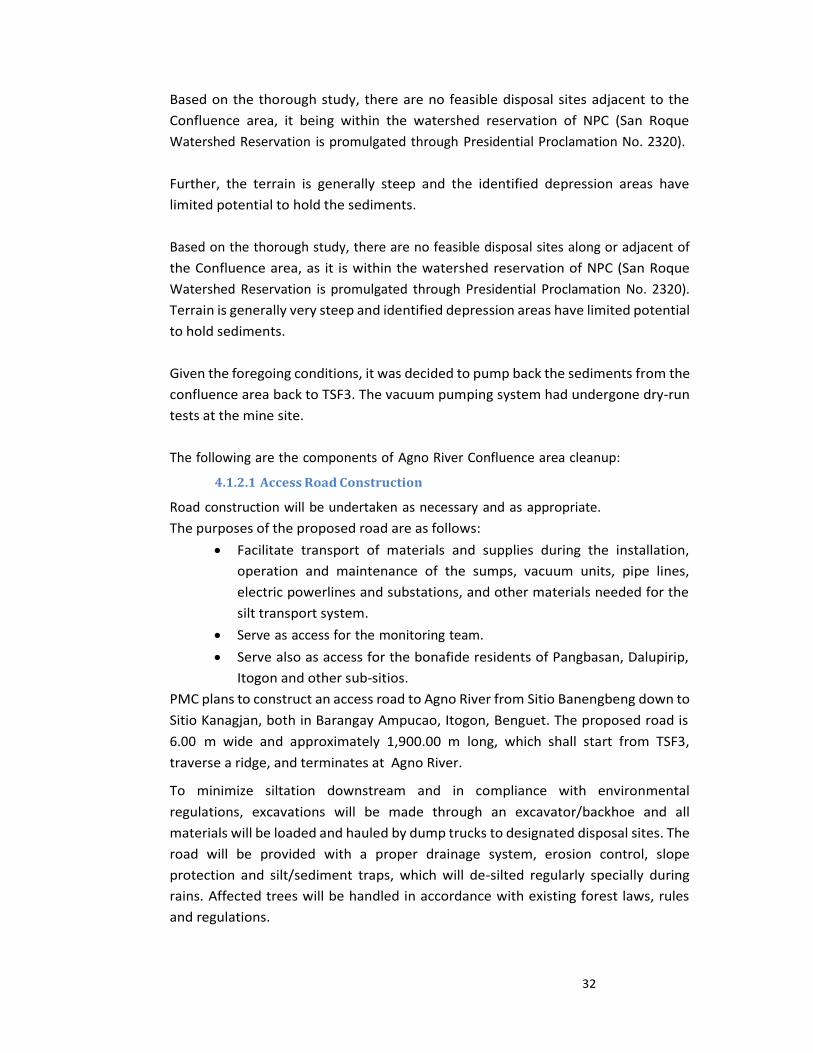
32
Based on the thorough study, there are no feasible disposal sites adjacent to the
Confluence area, it being within the watershed reservation of NPC (San Roque
Watershed Reservation is promulgated through Presidential Proclamation No. 2320).
Further, the terrain is generally steep and the identified depression areas have
limited potential to hold the sediments.
Based on the thorough study, there are no feasible disposal sites along or adjacent of
the Confluence area, as it is within the watershed reservation of NPC (San Roque
Watershed Reservation is promulgated through Presidential Proclamation No. 2320).
Terrain is generally very steep and identified depression areas have limited potential
to hold sediments.
Given the foregoing conditions, it was decided to pump back the sediments from the
confluence area back to TSF3. The vacuum pumping system had undergone dry-run
tests at the mine site.
The following are the components of Agno River Confluence area cleanup:
4.1.2.1 Access Road Construction
Road construction will be undertaken as necessary and as appropriate.
The purposes of the proposed road are as follows:
• Facilitate transport of materials and supplies during the installation,
operation and maintenance of the sumps, vacuum units, pipe lines,
electric powerlines and substations, and other materials needed for the
silt transport system.
• Serve as access for the monitoring team.
• Serve also as access for the bonafide residents of Pangbasan, Dalupirip,
Itogon and other sub-sitios.
PMC plans to construct an access road to Agno River from Sitio Banengbeng down to
Sitio Kanagjan, both in Barangay Ampucao, Itogon, Benguet. The proposed road is
6.00 m wide and approximately 1,900.00 m long, which shall start from TSF3,
traverse a ridge, and terminates at Agno River.
To minimize siltation downstream and in compliance with environmental
regulations, excavations will be made through an excavator/backhoe and all
materials will be loaded and hauled by dump trucks to designated disposal sites. The
road will be provided with a proper drainage system, erosion control, slope
protection and silt/sediment traps, which will de-silted regularly specially during
rains. Affected trees will be handled in accordance with existing forest laws, rules
and regulations.
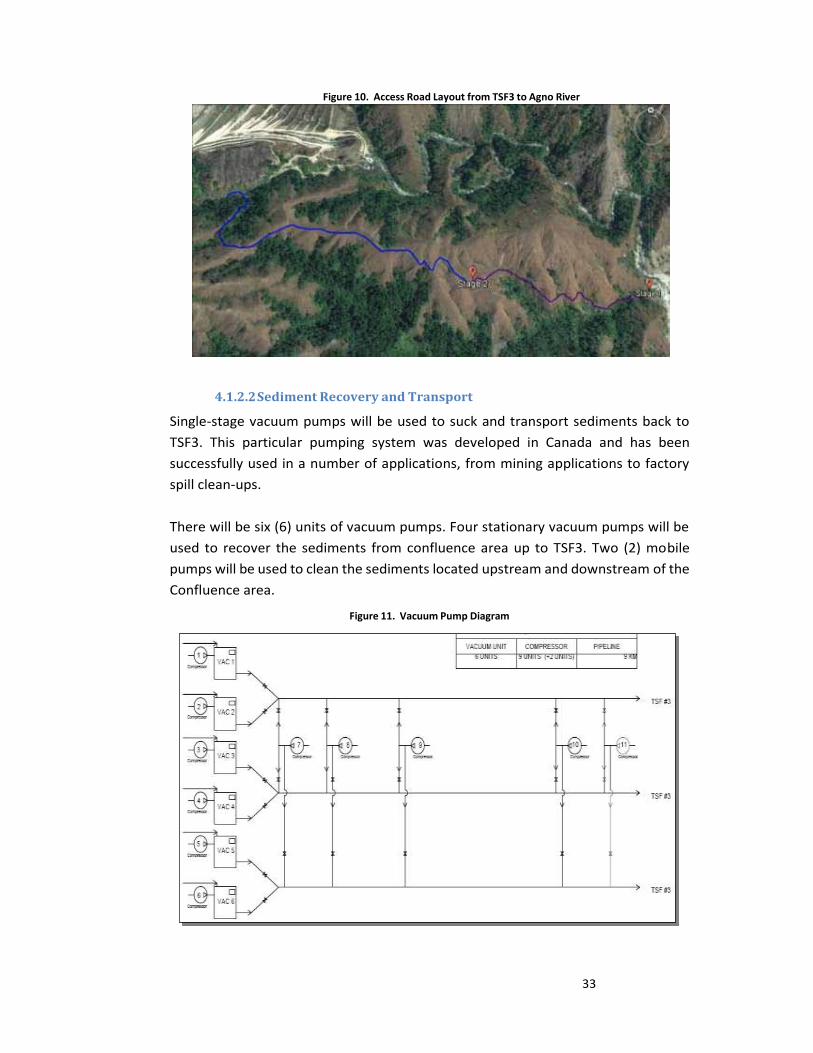
33
Figure 10. Access Road Layout from TSF3 to Agno River
4.1.2.2 Sediment Recovery and Transport
Single-stage vacuum pumps will be used to suck and transport sediments back to
TSF3. This particular pumping system was developed in Canada and has been
successfully used in a number of applications, from mining applications to factory
spill clean-ups.
There will be six (6) units of vacuum pumps. Four stationary vacuum pumps will be
used to recover the sediments from confluence area up to TSF3. Two (2) mobile
pumps will be used to clean the sediments located upstream and downstream of the
Confluence area.
Figure 11. Vacuum Pump Diagram
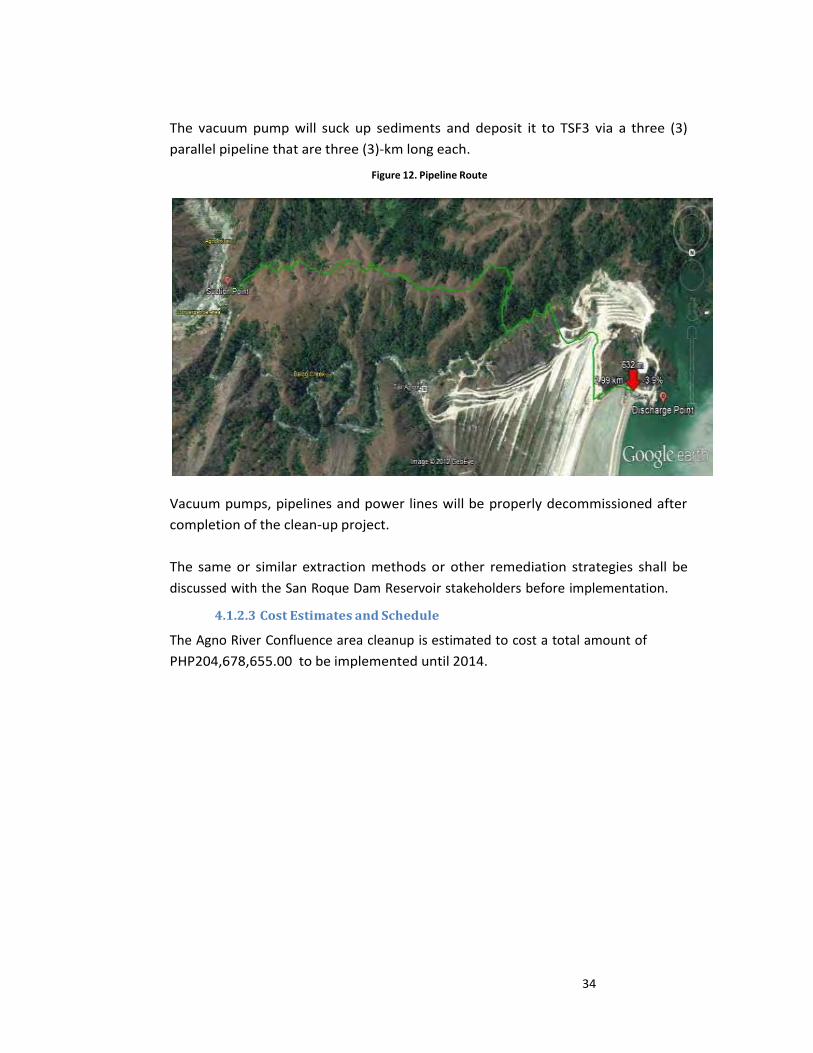
34
The vacuum pump will suck up sediments and deposit it to TSF3 via a three (3)
parallel pipeline that are three (3)-km long each.
Figure 12. Pipeline Route
Vacuum pumps, pipelines and power lines will be properly decommissioned after
completion of the clean-up project.
The same or similar extraction methods or other remediation strategies shall be
discussed with the San Roque Dam Reservoir stakeholders before implementation.
4.1.2.3 Cost Estimates and Schedule
The Agno River Confluence area cleanup is estimated to cost a total amount of
PHP204,678,655.00 to be implemented until 2014.
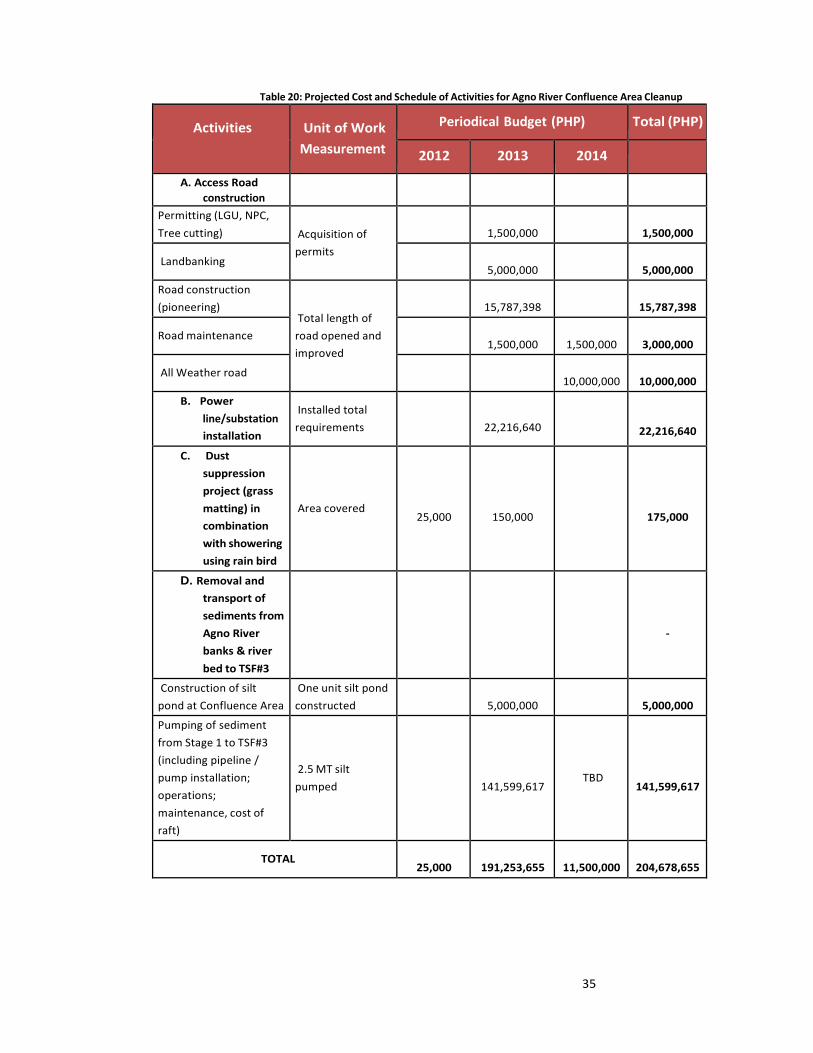
35
Table 20: Projected Cost and Schedule of Activities for Agno River Confluence Area Cleanup
Activities
Unit of Work
Measurement
Periodical Budget (PHP) Total (PHP)
2012 2013 2014
A. Access Road
construction
Permitting (LGU, NPC,
Tree cutting)
Acquisition of
permits
1,500,000
1,500,000
Landbanking
5,000,000
5,000,000
Road construction
(pioneering)
Total length of
road opened and
improved
15,787,398
15,787,398
Road maintenance
1,500,000
1,500,000
3,000,000
All Weather road
10,000,000
10,000,000
B. Power
line/substation
installation
Installed total
requirements
22,216,640
22,216,640
C. Dust
suppression
project (grass
matting) in
combination
with showering
using rain bird
Area covered
25,000
150,000
175,000
D. Removal and
transport of
sediments from
Agno River
banks & river
bed to TSF#3
-
Construction of silt
pond at Confluence Area
One unit silt pond
constructed
5,000,000
5,000,000
Pumping of sediment
from Stage 1 to TSF#3
(including pipeline /
pump installation;
operations;
maintenance, cost of
raft)
2.5 MT silt
pumped
141,599,617
TBD
141,599,617
TOTAL
25,000
191,253,655
11,500,000
204,678,655
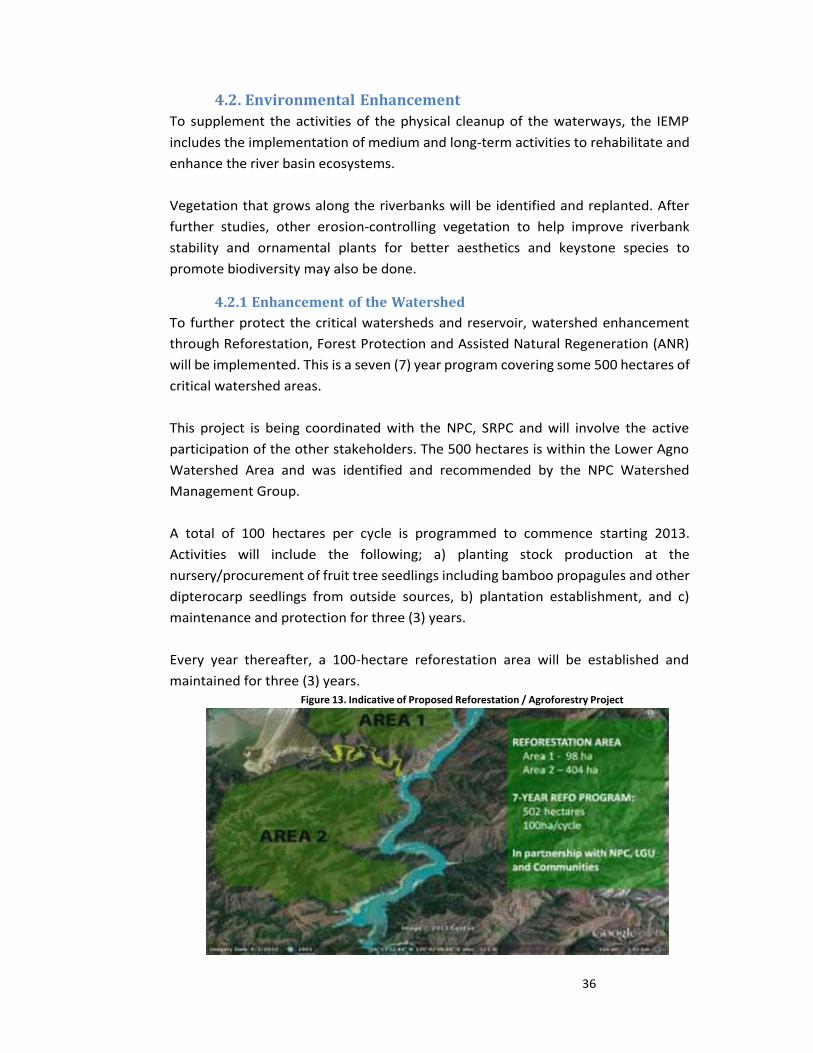
36
4.2. Environmental Enhancement
To supplement the activities of the physical cleanup of the waterways, the IEMP
includes the implementation of medium and long-term activities to rehabilitate and
enhance the river basin ecosystems.
Vegetation that grows along the riverbanks will be identified and replanted. After
further studies, other erosion-controlling vegetation to help improve riverbank
stability and ornamental plants for better aesthetics and keystone species to
promote biodiversity may also be done.
4.2.1 Enhancement of the Watershed
To further protect the critical watersheds and reservoir, watershed enhancement
through Reforestation, Forest Protection and Assisted Natural Regeneration (ANR)
will be implemented. This is a seven (7) year program covering some 500 hectares of
critical watershed areas.
This project is being coordinated with the NPC, SRPC and will involve the active
participation of the other stakeholders. The 500 hectares is within the Lower Agno
Watershed Area and was identified and recommended by the NPC Watershed
Management Group.
A total of 100 hectares per cycle is programmed to commence starting 2013.
Activities will include the following; a) planting stock production at the
nursery/procurement of fruit tree seedlings including bamboo propagules and other
dipterocarp seedlings from outside sources, b) plantation establishment, and c)
maintenance and protection for three (3) years.
Every year thereafter, a 100-hectare reforestation area will be established and
maintained for three (3) years. Figure 13. Indicative of Proposed Reforestation / Agroforestry Project
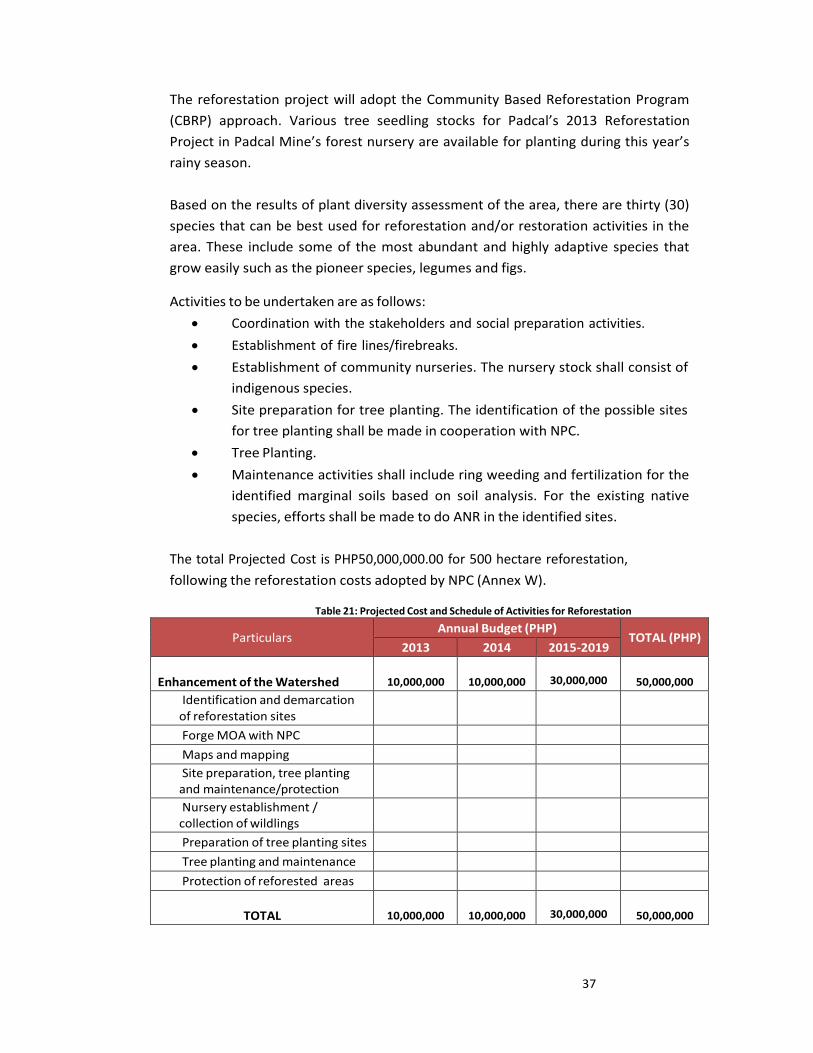
37
The reforestation project will adopt the Community Based Reforestation Program
(CBRP) approach. Various tree seedling stocks for Padcal’s 2013 Reforestation
Project in Padcal Mine’s forest nursery are available for planting during this year’s
rainy season.
Based on the results of plant diversity assessment of the area, there are thirty (30)
species that can be best used for reforestation and/or restoration activities in the
area. These include some of the most abundant and highly adaptive species that
grow easily such as the pioneer species, legumes and figs.
Activities to be undertaken are as follows:
• Coordination with the stakeholders and social preparation activities.
• Establishment of fire lines/firebreaks.
• Establishment of community nurseries. The nursery stock shall consist of
indigenous species.
• Site preparation for tree planting. The identification of the possible sites
for tree planting shall be made in cooperation with NPC.
• Tree Planting.
• Maintenance activities shall include ring weeding and fertilization for the
identified marginal soils based on soil analysis. For the existing native
species, efforts shall be made to do ANR in the identified sites.
The total Projected Cost is PHP50,000,000.00 for 500 hectare reforestation,
following the reforestation costs adopted by NPC (Annex W).
Table 21: Projected Cost and Schedule of Activities for Reforestation
Particulars Annual Budget (PHP)
TOTAL (PHP) 2013 2014 2015-2019
Enhancement of the Watershed
10,000,000
10,000,000
30,000,000
50,000,000
Identification and demarcation of reforestation sites
Forge MOA with NPC
Maps and mapping
Site preparation, tree planting and maintenance/protection
Nursery establishment / collection of wildlings
Preparation of tree planting sites
Tree planting and maintenance
Protection of reforested areas
TOTAL
10,000,000
10,000,000
30,000,000
50,000,000
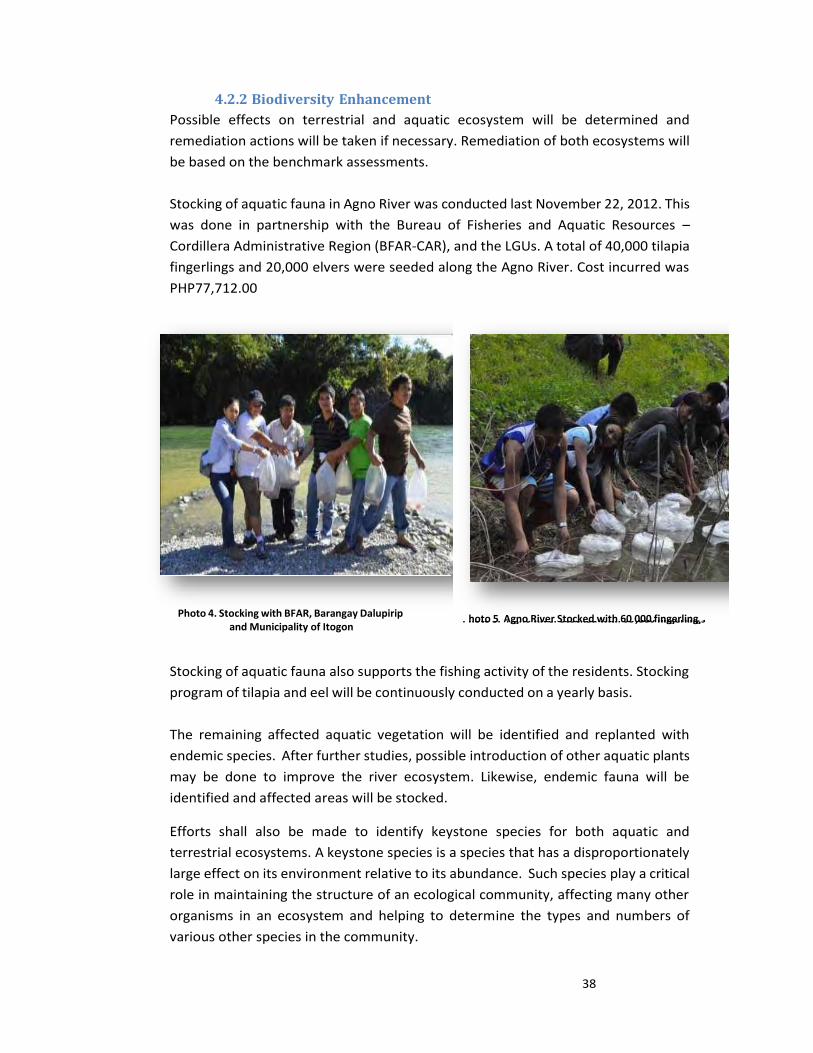
38
Photo 5. Agno River Stocked with 60 ,000 fingerlings
4.2.2 Biodiversity Enhancement
Possible effects on terrestrial and aquatic ecosystem will be determined and
remediation actions will be taken if necessary. Remediation of both ecosystems will
be based on the benchmark assessments.
Stocking of aquatic fauna in Agno River was conducted last November 22, 2012. This
was done in partnership with the Bureau of Fisheries and Aquatic Resources –
Cordillera Administrative Region (BFAR-CAR), and the LGUs. A total of 40,000 tilapia
fingerlings and 20,000 elvers were seeded along the Agno River. Cost incurred was
PHP77,712.00
Photo 4. Stocking with BFAR, Barangay Dalupirip and Municipality of Itogon
hoto 5 Agno River Stocked with 60 000 fingerling
Stocking of aquatic fauna also supports the fishing activity of the residents. Stocking
program of tilapia and eel will be continuously conducted on a yearly basis.
The remaining affected aquatic vegetation will be identified and replanted with
endemic species. After further studies, possible introduction of other aquatic plants
may be done to improve the river ecosystem. Likewise, endemic fauna will be
identified and affected areas will be stocked.
Efforts shall also be made to identify keystone species for both aquatic and
terrestrial ecosystems. A keystone species is a species that has a disproportionately
large effect on its environment relative to its abundance. Such species play a critical
role in maintaining the structure of an ecological community, affecting many other
organisms in an ecosystem and helping to determine the types and numbers of
various other species in the community.
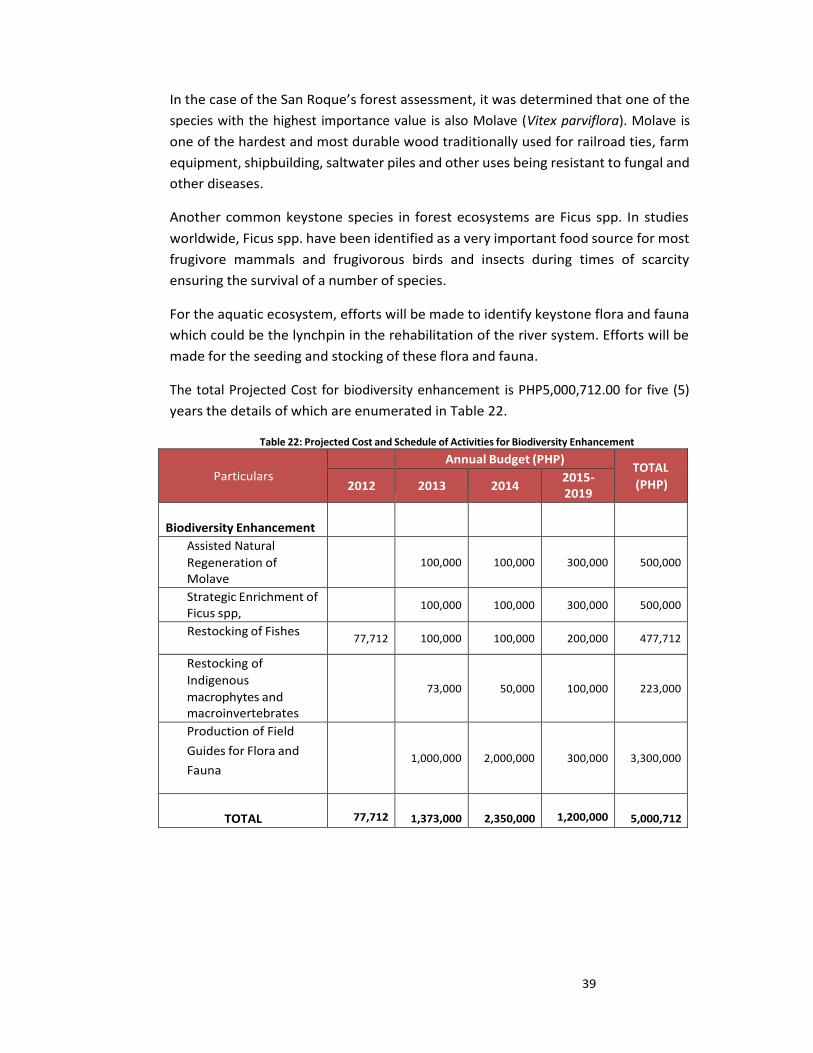
39
In the case of the San Roque’s forest assessment, it was determined that one of the
species with the highest importance value is also Molave (Vitex parviflora). Molave is
one of the hardest and most durable wood traditionally used for railroad ties, farm
equipment, shipbuilding, saltwater piles and other uses being resistant to fungal and
other diseases.
Another common keystone species in forest ecosystems are Ficus spp. In studies
worldwide, Ficus spp. have been identified as a very important food source for most
frugivore mammals and frugivorous birds and insects during times of scarcity
ensuring the survival of a number of species.
For the aquatic ecosystem, efforts will be made to identify keystone flora and fauna
which could be the lynchpin in the rehabilitation of the river system. Efforts will be
made for the seeding and stocking of these flora and fauna.
The total Projected Cost for biodiversity enhancement is PHP5,000,712.00 for five (5)
years the details of which are enumerated in Table 22.
Table 22: Projected Cost and Schedule of Activities for Biodiversity Enhancement
Particulars
Annual Budget (PHP) TOTAL
(PHP) 2012 2013 2014 2015- 2019
Biodiversity Enhancement
Assisted Natural
Regeneration of Molave
100,000
100,000
300,000
500,000
Strategic Enrichment of Ficus spp,
100,000 100,000 300,000 500,000
Restocking of Fishes 77,712 100,000 100,000 200,000 477,712
Restocking of
Indigenous
macrophytes and macroinvertebrates
73,000
50,000
100,000
223,000
Production of Field
Guides for Flora and
Fauna
1,000,000
2,000,000
300,000
3,300,000
TOTAL
77,712
1,373,000
2,350,000
1,200,000
5,000,712
40
4.3 Participatory Approaches and Community Development
Strategies
The IEMP involves a participatory approach in the development and implementation
of socio-economic programs for the identified affected households. This program
aims to bring the affected households to their pre-incident if not better.
4.3.1 Community Engagement
Since August 2012 up to the present, a dedicated Community Relations Team from
the company has been living with the local residents to ensure that concerns are
immediately addressed and also to explore areas for possible partnerships and
community development.
PMC recognizes that the great task of cleanup and rehabilitation of the affected
areas needs the support and cooperation of the different stakeholders including
affected households, local people’s organizations, LGUs, concerned government
agencies and PMC.
Partnership with the non-government sector as well as business entities in the area
will also play a key role in developing a strategic approach to address long term
developmental needs of the community and management of the river basin
ecosystem.
4.3.2 Socio-economic Development Programs
PMC is in constant consultation and continuous to build meaningful partnerships
with the affected families for a possible long-term socio-economic development
program. Identified projects and activities will be prioritized and PMC will tap local
resources including manpower, local organizations and other social structures, and
indigenous materials.
Trainings will be provided so that select members of local organization can become
PMC’s active partners in carrying out its socio-economic development and
environmental programs.
Figure 13 shows the socio-economic development projects and activities in
connection with the time horizons, categorized as short-term (August 2012-
December 2013), medium-term (January 2014- December 2015) and long-term
(2016 and beyond).
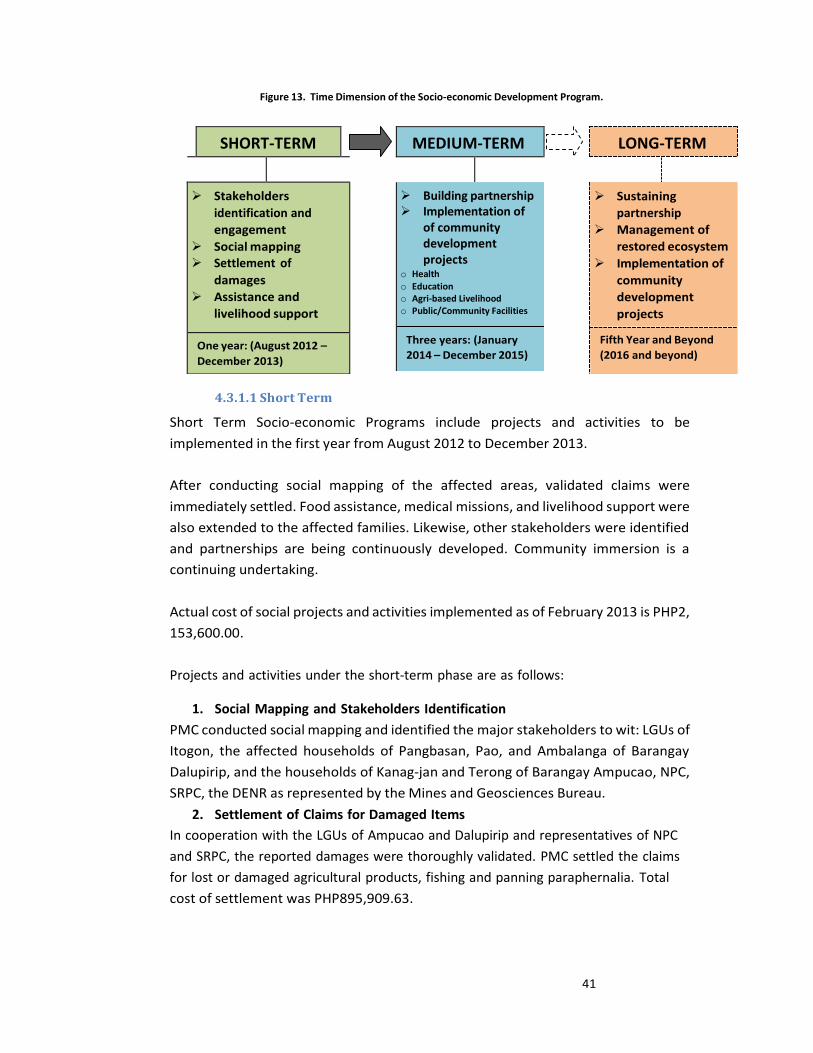
41
SHORT-TERM
➢ Stakeholders
identification and
engagement
➢ Social mapping ➢ Settlement of
damages
➢ Assistance and
livelihood support
One year: (August 2012 –
December 2013)
MEDIUM-TERM
➢ Building partnership ➢ Implementation of
of community development projects
o Health o Education o Agri-based Livelihood o Public/Community Facilities
Three years: (January
2014 – December 2015)
LONG-TERM
➢ Sustaining
partnership
➢ Management of
restored ecosystem
➢ Implementation of
community
development
projects
Fifth Year and Beyond
(2016 and beyond)
Figure 13. Time Dimension of the Socio-economic Development Program.
4.3.1.1 Short Term
Short Term Socio-economic Programs include projects and activities to be
implemented in the first year from August 2012 to December 2013.
After conducting social mapping of the affected areas, validated claims were
immediately settled. Food assistance, medical missions, and livelihood support were
also extended to the affected families. Likewise, other stakeholders were identified
and partnerships are being continuously developed. Community immersion is a
continuing undertaking.
Actual cost of social projects and activities implemented as of February 2013 is PHP2,
153,600.00.
Projects and activities under the short-term phase are as follows:
1. Social Mapping and Stakeholders Identification
PMC conducted social mapping and identified the major stakeholders to wit: LGUs of
Itogon, the affected households of Pangbasan, Pao, and Ambalanga of Barangay
Dalupirip, and the households of Kanag-jan and Terong of Barangay Ampucao, NPC,
SRPC, the DENR as represented by the Mines and Geosciences Bureau.
2. Settlement of Claims for Damaged Items
In cooperation with the LGUs of Ampucao and Dalupirip and representatives of NPC
and SRPC, the reported damages were thoroughly validated. PMC settled the claims
for lost or damaged agricultural products, fishing and panning paraphernalia. Total
cost of settlement was PHP895,909.63.
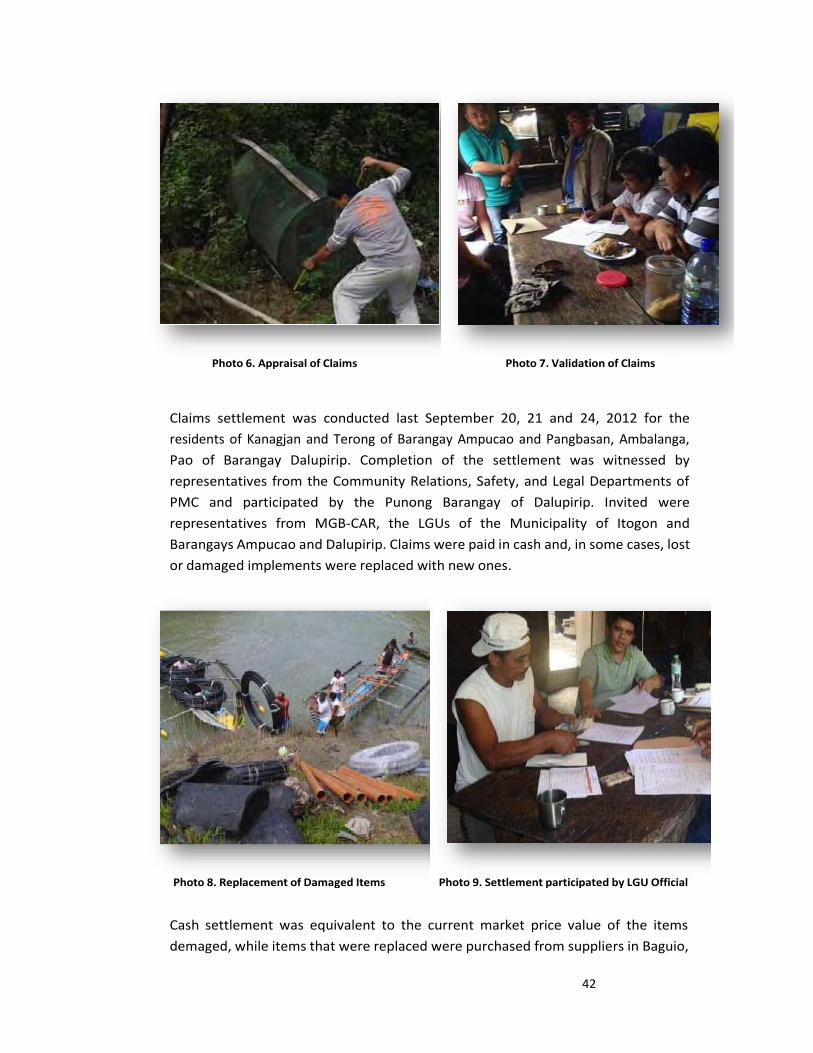
42
Photo 8. Replacement of Damaged Items Photo 9. Settlement participated by LGU Official
Claims settlement was conducted last September 20, 21 and 24, 2012 for the
residents of Kanagjan and Terong of Barangay Ampucao and Pangbasan, Ambalanga,
Pao of Barangay Dalupirip. Completion of the settlement was witnessed by
representatives from the Community Relations, Safety, and Legal Departments of
PMC and participated by the Punong Barangay of Dalupirip. Invited were
representatives from MGB-CAR, the LGUs of the Municipality of Itogon and
Barangays Ampucao and Dalupirip. Claims were paid in cash and, in some cases, lost
or damaged implements were replaced with new ones.
Cash settlement was equivalent to the current market price value of the items
demaged, while items that were replaced were purchased from suppliers in Baguio,
Photo 6. Appraisal of Claims Photo 7. Validation of Claims
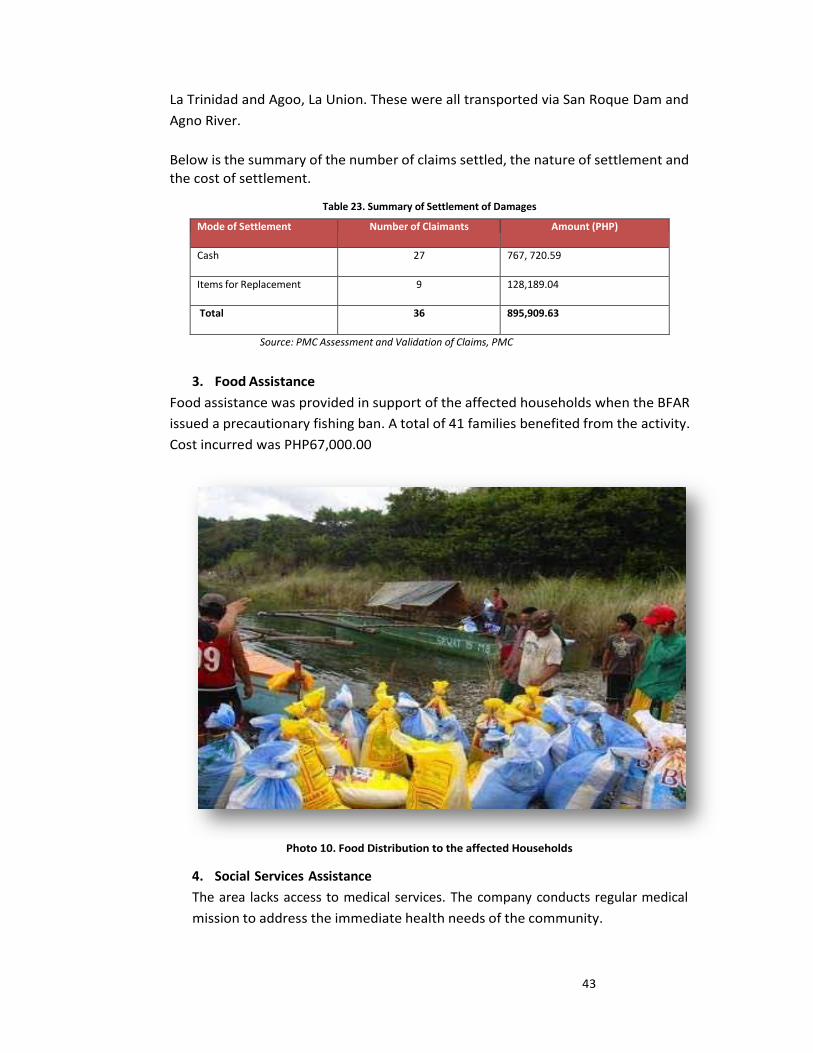
43
La Trinidad and Agoo, La Union. These were all transported via San Roque Dam and
Agno River.
Below is the summary of the number of claims settled, the nature of settlement and
the cost of settlement.
Table 23. Summary of Settlement of Damages
Mode of Settlement Number of Claimants Amount (PHP)
Cash 27 767, 720.59
Items for Replacement 9 128,189.04
Total 36 895,909.63
Source: PMC Assessment and Validation of Claims, PMC
3. Food Assistance
Food assistance was provided in support of the affected households when the BFAR
issued a precautionary fishing ban. A total of 41 families benefited from the activity.
Cost incurred was PHP67,000.00
Photo 10. Food Distribution to the affected Households
4. Social Services Assistance
The area lacks access to medical services. The company conducts regular medical
mission to address the immediate health needs of the community.
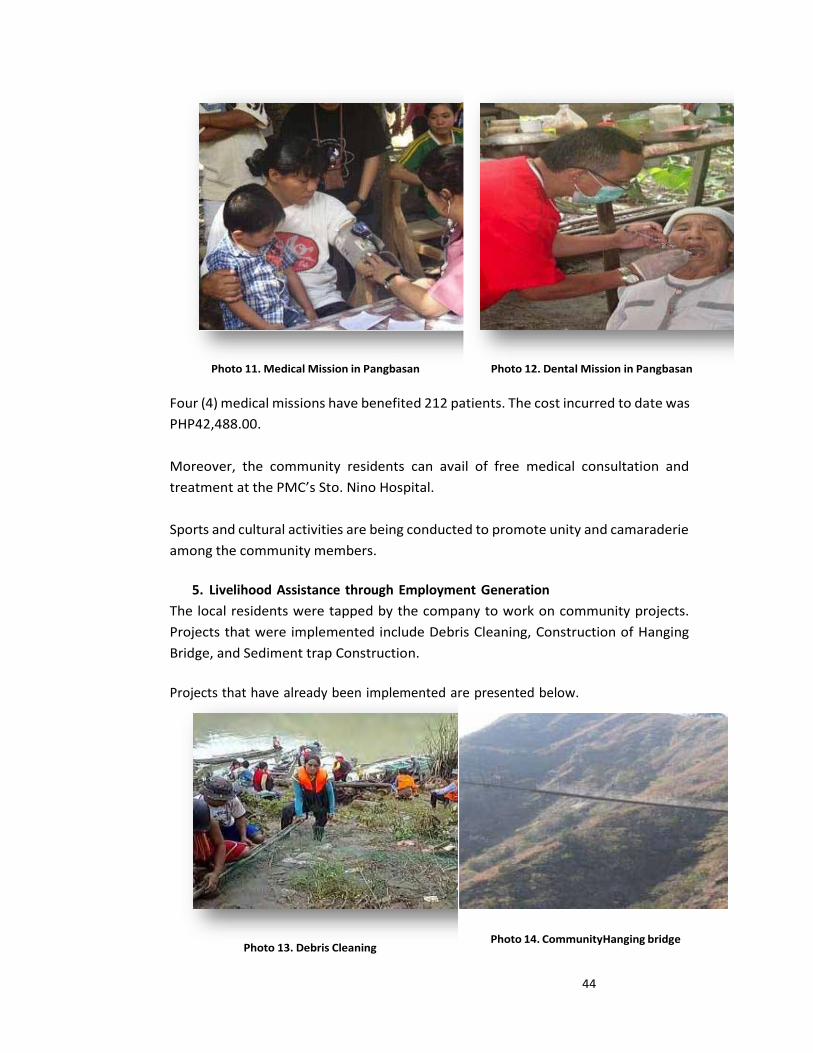
44
Four (4) medical missions have benefited 212 patients. The cost incurred to date was
PHP42,488.00.
Moreover, the community residents can avail of free medical consultation and
treatment at the PMC’s Sto. Nino Hospital.
Sports and cultural activities are being conducted to promote unity and camaraderie
among the community members.
5. Livelihood Assistance through Employment Generation
The local residents were tapped by the company to work on community projects.
Projects that were implemented include Debris Cleaning, Construction of Hanging
Bridge, and Sediment trap Construction.
Projects that have already been implemented are presented below.
Photo 13. Debris Cleaning Photo 14. CommunityHanging bridge
Photo 11. Medical Mission in Pangbasan Photo 12. Dental Mission in Pangbasan
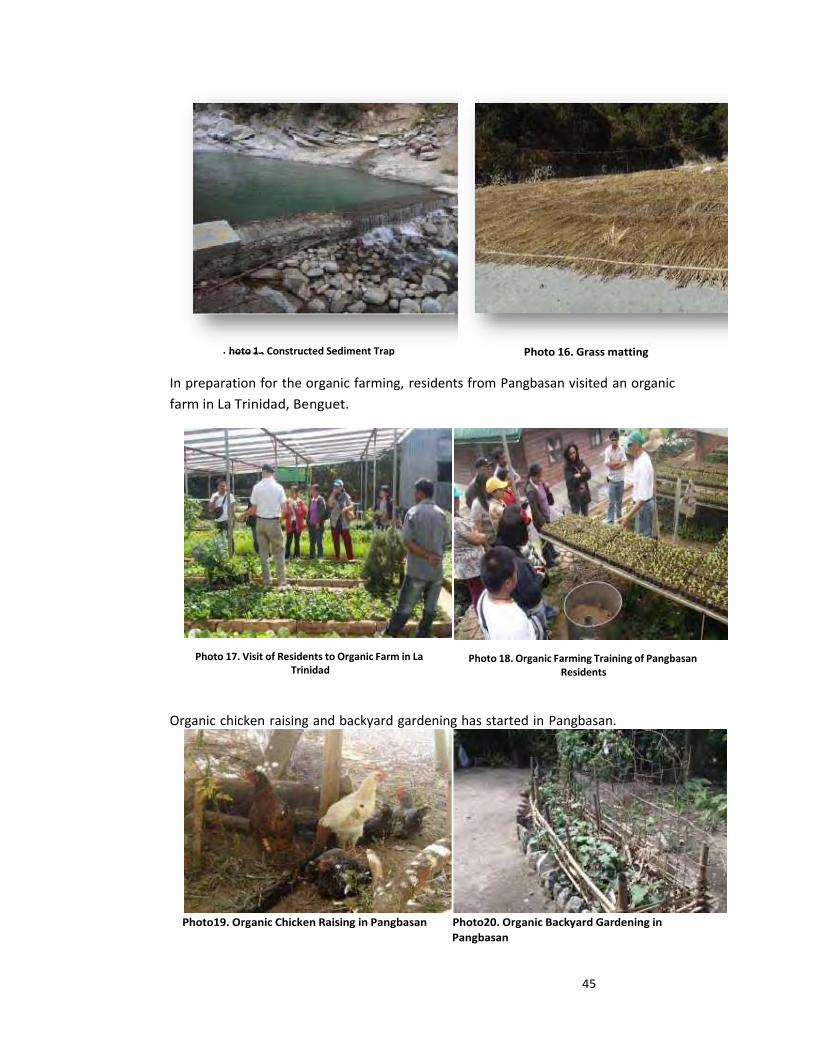
45
Photo 15
In preparation for the organic farming, residents from Pangbasan visited an organic
farm in La Trinidad, Benguet.
Photo 17. Visit of Residents to Organic Farm in La Trinidad
Photo 18. Organic Farming Training of Pangbasan Residents
Organic chicken raising and backyard gardening has started in Pangbasan.
Photo19. Organic Chicken Raising in Pangbasan Photo20. Organic Backyard Gardening in
Pangbasan
hoto 1 . Constructed Sediment Trap Photo 16. Grass matting
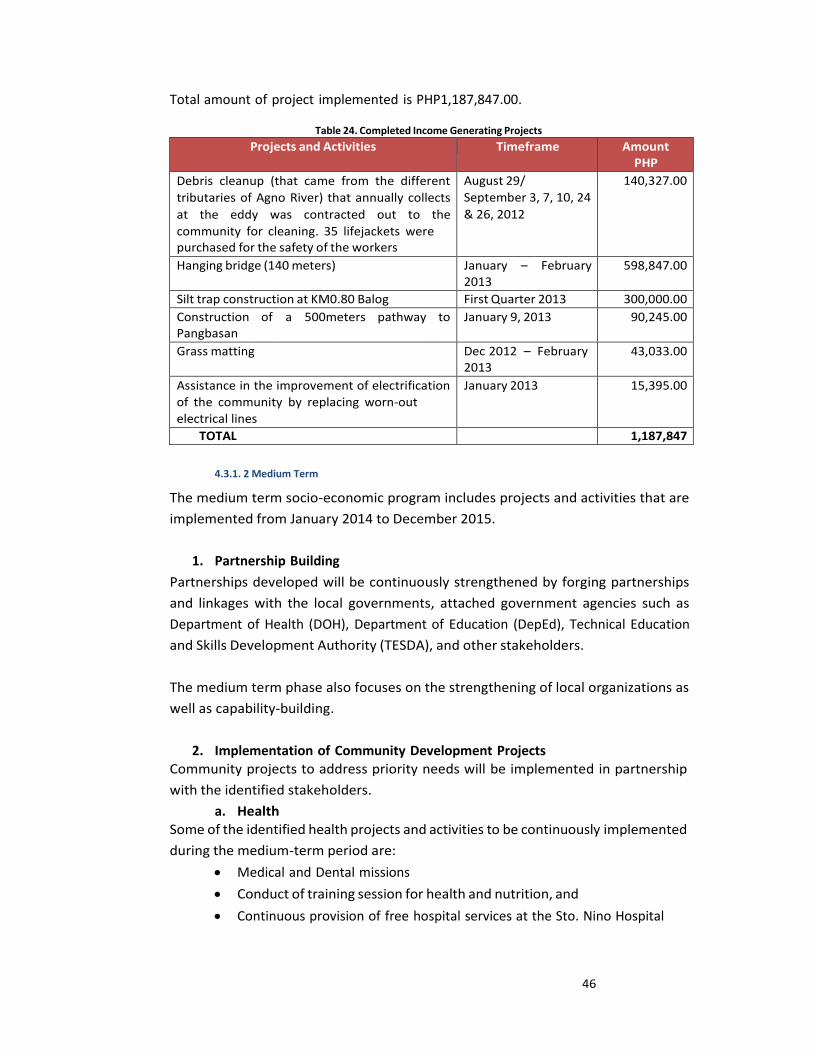
46
Total amount of project implemented is PHP1,187,847.00.
Table 24. Completed Income Generating Projects
Projects and Activities Timeframe Amount PHP
Debris cleanup (that came from the different
tributaries of Agno River) that annually collects
at the eddy was contracted out to the
community for cleaning. 35 lifejackets were purchased for the safety of the workers
August 29/
September 3, 7, 10, 24
& 26, 2012
140,327.00
Hanging bridge (140 meters) January 2013
– February 598,847.00
Silt trap construction at KM0.80 Balog First Quarter 2013 300,000.00
Construction Pangbasan
of a 500meters pathway to January 9, 2013 90,245.00
Grass matting Dec 2012 – February 2013
43,033.00
Assistance in the improvement of electrification
of the community by replacing worn-out
electrical lines
January 2013 15,395.00
TOTAL 1,187,847
4.3.1. 2 Medium Term
The medium term socio-economic program includes projects and activities that are
implemented from January 2014 to December 2015.
1. Partnership Building
Partnerships developed will be continuously strengthened by forging partnerships
and linkages with the local governments, attached government agencies such as
Department of Health (DOH), Department of Education (DepEd), Technical Education
and Skills Development Authority (TESDA), and other stakeholders.
The medium term phase also focuses on the strengthening of local organizations as
well as capability-building.
2. Implementation of Community Development Projects
Community projects to address priority needs will be implemented in partnership
with the identified stakeholders.
a. Health Some of the identified health projects and activities to be continuously implemented
during the medium-term period are:
• Medical and Dental missions
• Conduct of training session for health and nutrition, and
• Continuous provision of free hospital services at the Sto. Nino Hospital
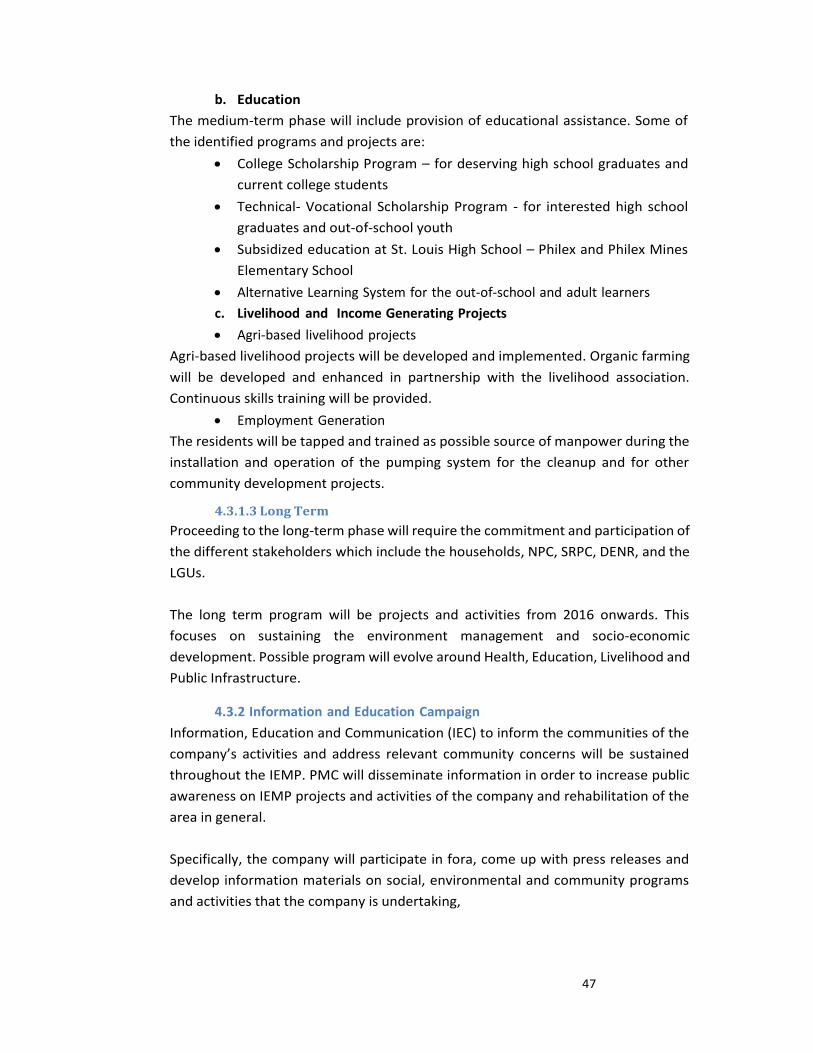
47
b. Education
The medium-term phase will include provision of educational assistance. Some of
the identified programs and projects are:
• College Scholarship Program – for deserving high school graduates and
current college students
• Technical- Vocational Scholarship Program - for interested high school
graduates and out-of-school youth
• Subsidized education at St. Louis High School – Philex and Philex Mines
Elementary School
• Alternative Learning System for the out-of-school and adult learners
c. Livelihood and Income Generating Projects
• Agri-based livelihood projects
Agri-based livelihood projects will be developed and implemented. Organic farming
will be developed and enhanced in partnership with the livelihood association.
Continuous skills training will be provided.
• Employment Generation
The residents will be tapped and trained as possible source of manpower during the
installation and operation of the pumping system for the cleanup and for other
community development projects.
4.3.1.3 Long Term
Proceeding to the long-term phase will require the commitment and participation of
the different stakeholders which include the households, NPC, SRPC, DENR, and the
LGUs.
The long term program will be projects and activities from 2016 onwards. This
focuses on sustaining the environment management and socio-economic
development. Possible program will evolve around Health, Education, Livelihood and
Public Infrastructure.
4.3.2 Information and Education Campaign
Information, Education and Communication (IEC) to inform the communities of the
company’s activities and address relevant community concerns will be sustained
throughout the IEMP. PMC will disseminate information in order to increase public
awareness on IEMP projects and activities of the company and rehabilitation of the
area in general.
Specifically, the company will participate in fora, come up with press releases and
develop information materials on social, environmental and community programs
and activities that the company is undertaking,
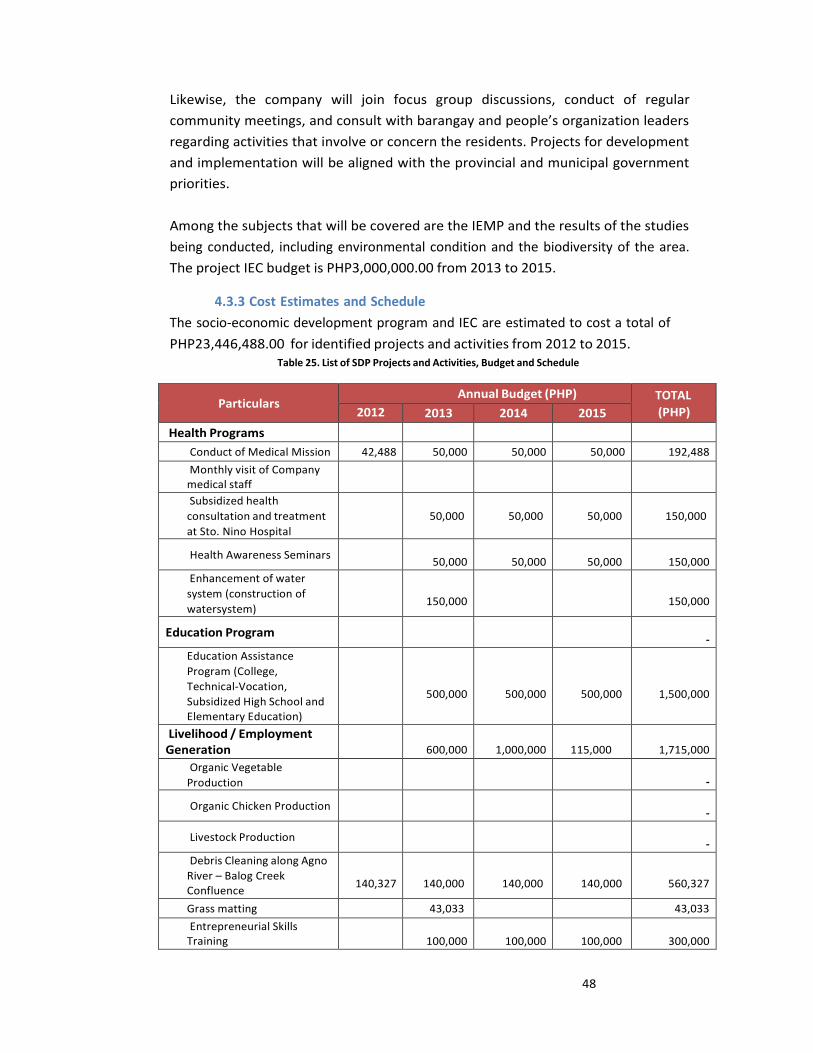
48
Likewise, the company will join focus group discussions, conduct of regular
community meetings, and consult with barangay and people’s organization leaders
regarding activities that involve or concern the residents. Projects for development
and implementation will be aligned with the provincial and municipal government
priorities.
Among the subjects that will be covered are the IEMP and the results of the studies
being conducted, including environmental condition and the biodiversity of the area.
The project IEC budget is PHP3,000,000.00 from 2013 to 2015.
4.3.3 Cost Estimates and Schedule
The socio-economic development program and IEC are estimated to cost a total of
PHP23,446,488.00 for identified projects and activities from 2012 to 2015. Table 25. List of SDP Projects and Activities, Budget and Schedule
Particulars Annual Budget (PHP) TOTAL
(PHP) 2012 2013 2014 2015
Health Programs
Conduct of Medical Mission 42,488 50,000 50,000 50,000 192,488
Monthly visit of Company medical staff
Subsidized health
consultation and treatment
at Sto. Nino Hospital
50,000
50,000
50,000
150,000
Health Awareness Seminars
50,000
50,000
50,000
150,000
Enhancement of water
system (construction of
watersystem)
150,000
150,000
Education Program
-
Education Assistance
Program (College,
Technical-Vocation,
Subsidized High School and Elementary Education)
500,000
500,000
500,000
1,500,000
Livelihood / Employment Generation
600,000
1,000,000
115,000
1,715,000
Organic Vegetable
Production
-
Organic Chicken Production
-
Livestock Production
-
Debris Cleaning along Agno
River – Balog Creek Confluence
140,327
140,000
140,000
140,000
560,327
Grass matting 43,033 43,033
Entrepreneurial Skills Training
100,000
100,000
100,000
300,000
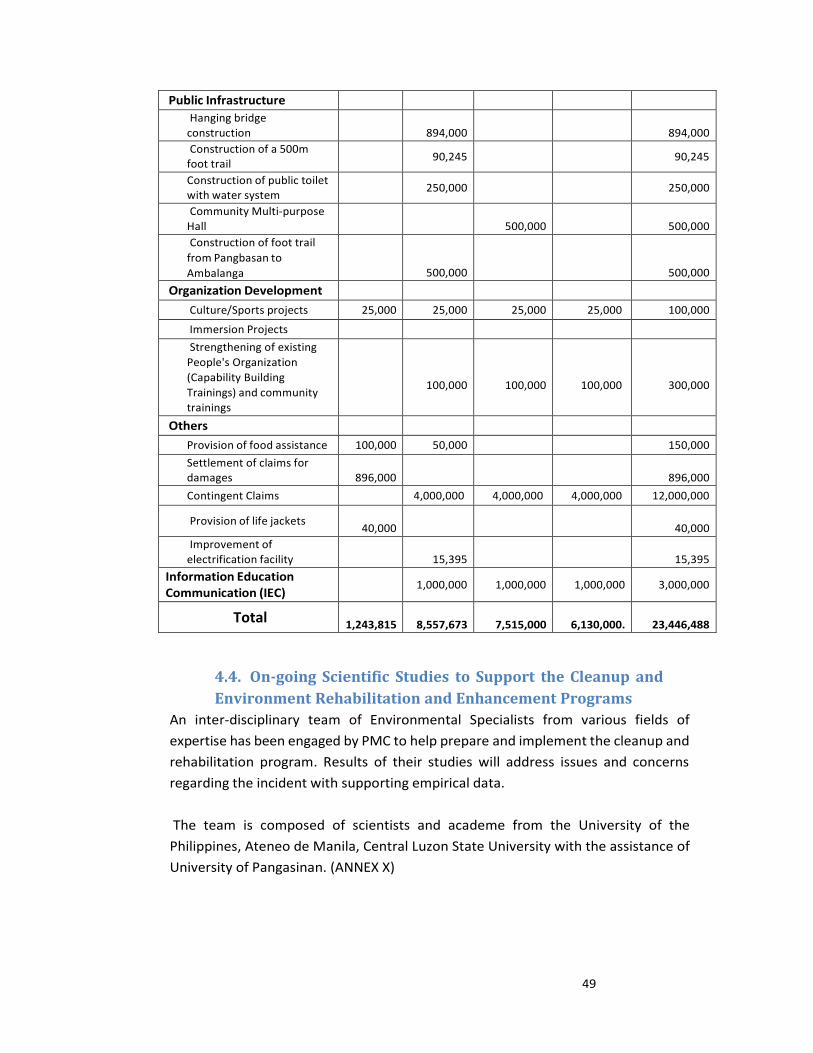
49
Public Infrastructure
Hanging bridge
construction
894,000
894,000
Construction of a 500m foot trail
90,245
90,245
Construction of public toilet with water system
250,000
250,000
Community Multi-purpose
Hall
500,000
500,000
Construction of foot trail
from Pangbasan to
Ambalanga
500,000
500,000
Organization Development
Culture/Sports projects 25,000 25,000 25,000 25,000 100,000
Immersion Projects
Strengthening of existing
People's Organization
(Capability Building
Trainings) and community
trainings
100,000
100,000
100,000
300,000
Others
Provision of food assistance 100,000 50,000 150,000
Settlement of claims for damages
896,000
896,000
Contingent Claims 4,000,000 4,000,000 4,000,000 12,000,000
Provision of life jackets
40,000
40,000
Improvement of
electrification facility
15,395
15,395
Information Education Communication (IEC)
1,000,000 1,000,000 1,000,000 3,000,000
Total
1,243,815
8,557,673
7,515,000
6,130,000.
23,446,488
4.4. On-going Scientific Studies to Support the Cleanup and
Environment Rehabilitation and Enhancement Programs
An inter-disciplinary team of Environmental Specialists from various fields of
expertise has been engaged by PMC to help prepare and implement the cleanup and
rehabilitation program. Results of their studies will address issues and concerns
regarding the incident with supporting empirical data.
The team is composed of scientists and academe from the University of the
Philippines, Ateneo de Manila, Central Luzon State University with the assistance of
University of Pangasinan. (ANNEX X)
50
4.4.1 Environmental Risk Assessment
4.4.1.1 Fate Analysis of Heavy Metals from Mine Tailings and Reagents Used in Flotation
Process
This study will track the pathways and endpoints of the target heavy metals and the
additives used in the mining process. Assessments of the identified heavy metals
and chemicals will be done for water, sediments and biota including macrophytes,
plankton, macroinvertebrates and fishes. This is important to be able to elucidate
the modes by which these elements and compounds can enter the food chain and
pose health risks to human.
4.4.1.2 Sediment Transport Modelling to Determine the Extent and Volume of Sediments
Deposited in Agno River
This study will focus on the estimation of sediments deposited in the Agno River
from the confluence of Balog Creek to San Roque Dam using the Hydrologic
Engineering Centers River Analysis System (HEC- RAS) modeling software. A
bathymetric map (map showing the depth of water bodies) will also be generated to
identify the possible deposition areas. It is intended to provide a reliable assessment
of where the sediments have been deposited along the Agno River’s length. It will
also provide PMC with a better understanding of the river and the kind of
remediation that has to be done.
4.4.1.3 Agno River Characterization Study
This study will focus on the characterization of the Agno River’s macrophyte,
macroinvertebrate and fisheries. The purpose of the characterization will be to
provide PMC with a baseline of the biota in the river system and possibly use it for
the environmental remediation of the affected Balog Creek. This is meant to provide
PMC with sound environmental plans in river and creeks rehabilitation.
4.4.1.4 Revegetation through Natural Reconditioning
This study aims to provide an alternative approach to reforestation/stabilization of
decommissioned tailing pond. The study involves reconditioning of the tailing
nutrient content by propagating pioneer plants with microbiological techniques.
4.4.2 Economic Pricing
4.4.2.1 Estimation of the Economic Impact to SRPC and NPC
This study will provide monetary estimates on the costs associated with the
deposition of sediments in the SRPC reservoir.
4.4.2.2 Estimation of the Environmental Benefits of the Rehabilitation and Enhancement
Program of the Watershed and San Roque Reservoir
This study aims to estimate both the benefits and cost of environmental projects
such as environmental substitution or reforestation that will be implemented under
the Integrated Environmental Management Program.
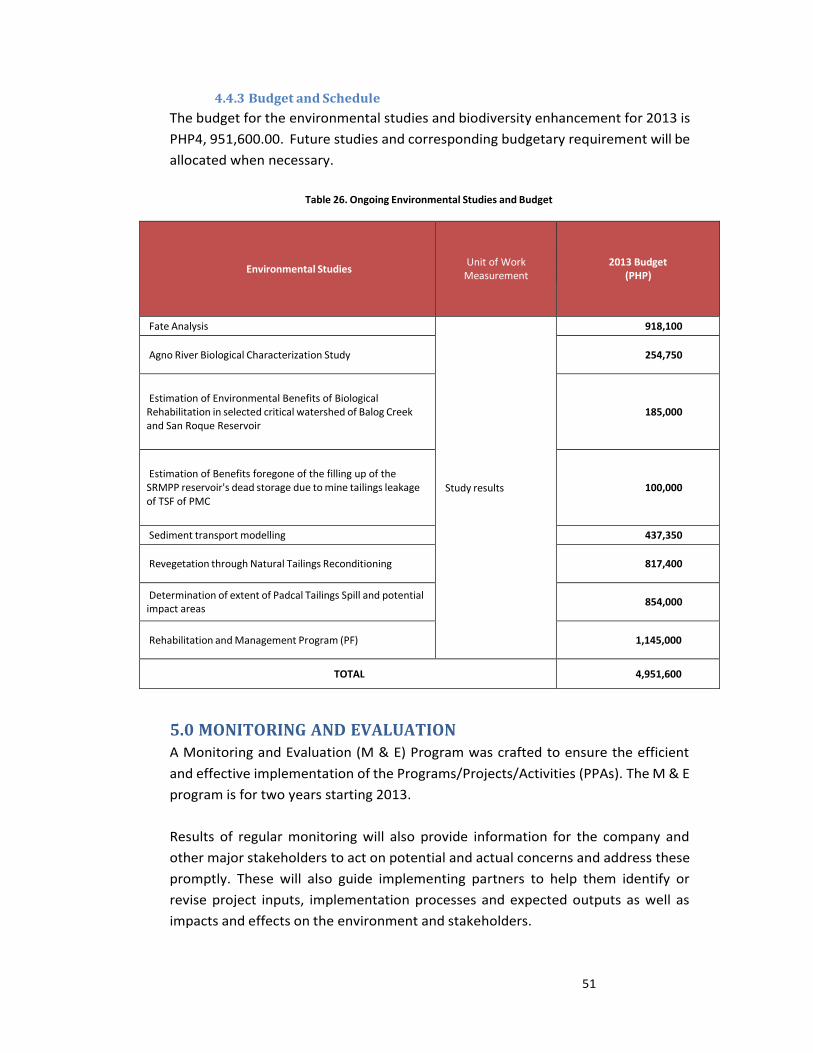
51
4.4.3 Budget and Schedule
The budget for the environmental studies and biodiversity enhancement for 2013 is
PHP4, 951,600.00. Future studies and corresponding budgetary requirement will be
allocated when necessary.
Table 26. Ongoing Environmental Studies and Budget
Environmental Studies
Unit of Work Measurement
2013 Budget (PHP)
Fate Analysis
Study results
918,100
Agno River Biological Characterization Study
254,750
Estimation of Environmental Benefits of Biological Rehabilitation in selected critical watershed of Balog Creek and San Roque Reservoir
185,000
Estimation of Benefits foregone of the filling up of the SRMPP reservoir's dead storage due to mine tailings leakage of TSF of PMC
100,000
Sediment transport modelling 437,350
Revegetation through Natural Tailings Reconditioning
817,400
Determination of extent of Padcal Tailings Spill and potential impact areas
854,000
Rehabilitation and Management Program (PF)
1,145,000
TOTAL 4,951,600
5.0 MONITORING AND EVALUATION A Monitoring and Evaluation (M & E) Program was crafted to ensure the efficient
and effective implementation of the Programs/Projects/Activities (PPAs). The M & E
program is for two years starting 2013.
Results of regular monitoring will also provide information for the company and
other major stakeholders to act on potential and actual concerns and address these
promptly. These will also guide implementing partners to help them identify or
revise project inputs, implementation processes and expected outputs as well as
impacts and effects on the environment and stakeholders.
52
5.1 Coverage
Monitoring activities will focus on the Remediation and Rehabilitation of Balog Creek and the confluence area of the Agno River within Barangays Ampucao and Dalupirip, both in Itogon, Benguet and NIA Weir at San Roque.
5.2 Objectives
The Objectives of monitoring are to:
• Establish monitoring framework and key indicators
• Gather information on the progress of the programmed activities,
timelines and desired objectives as well as problems encountered;
• Recommend appropriate corrective actions; and
• Evaluate stakeholders’ participation
5.3 Composition
A Joint Multi-Partite Monitoring Team (JMMT) will be operationalized consisting of
different stakeholders in the impact area including:
• Philex Multi- partite Monitoring Team
1. Mines and Geosciences Bureau-CAR
2. Environment Management Bureau-CAR
3. LGU-Ampucao
4. LGU - Camp 3
5. Peoples Organization represented by The Indigenouse Host
Communities Association of Philex Outlying Sitios, Inc. (TIHCAPOSI)
6. Indigenous Peoples Representative
7. Forestry Management Services-CAR (RED’s Office)
8. Philex Mining Corporation (5)
• Representatives from the Municipality of Itogon – Municipal Engineer and
Municipal Social Worker (2)
• Representative from Barangay Dalupirip (1)
• Representative from the National Power Corporation (3)
• San Roque Power Corporation (1)
• EMB-R1 (1)
• MGB-R1 (1)
• BFAR-CAR/R1 (2)
5.4 Roles and Responsibilities
• MGB shall chair the JMMT
• Functions of the JMMT
1. Serve as the monitoring arm under this Remediation, Rehabilitation
and Clean-Up Plan
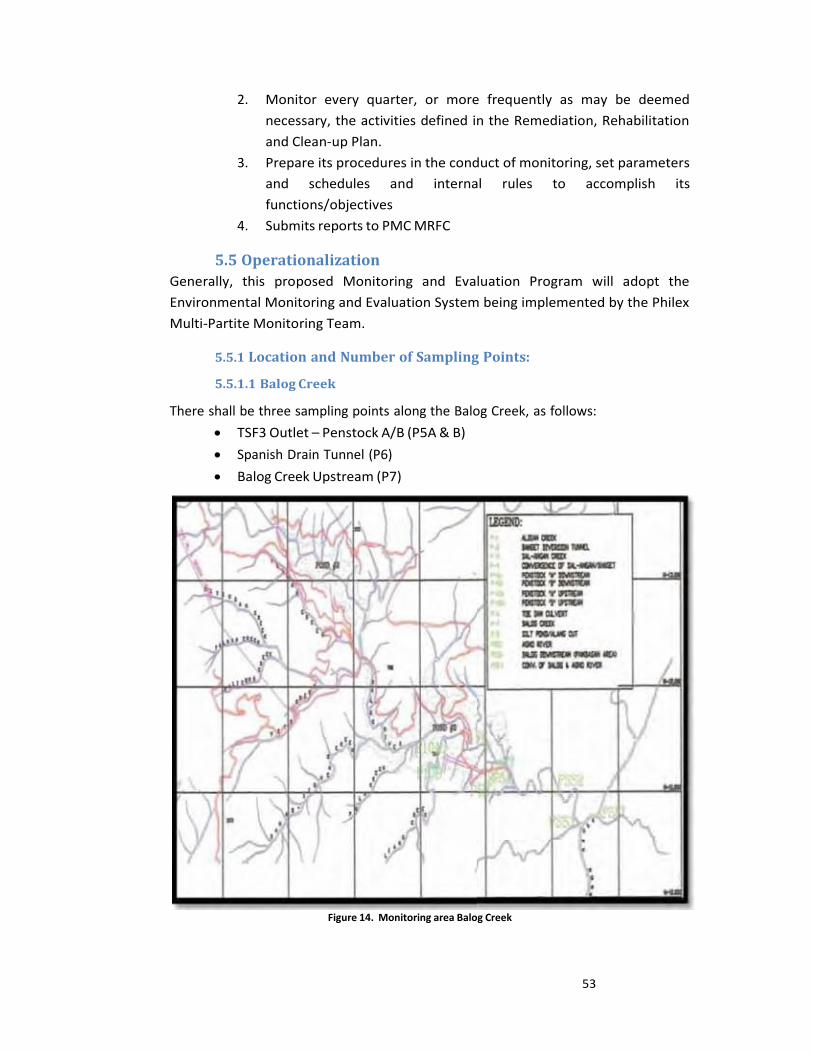
53
2. Monitor every quarter, or more frequently as may be deemed
necessary, the activities defined in the Remediation, Rehabilitation
and Clean-up Plan.
3. Prepare its procedures in the conduct of monitoring, set parameters
and schedules and internal rules to accomplish its
functions/objectives
4. Submits reports to PMC MRFC
5.5 Operationalization
Generally, this proposed Monitoring and Evaluation Program will adopt the
Environmental Monitoring and Evaluation System being implemented by the Philex
Multi-Partite Monitoring Team.
5.5.1 Location and Number of Sampling Points:
5.5.1.1 Balog Creek
There shall be three sampling points along the Balog Creek, as follows:
• TSF3 Outlet – Penstock A/B (P5A & B)
• Spanish Drain Tunnel (P6)
• Balog Creek Upstream (P7)
Figure 14. Monitoring area Balog Creek
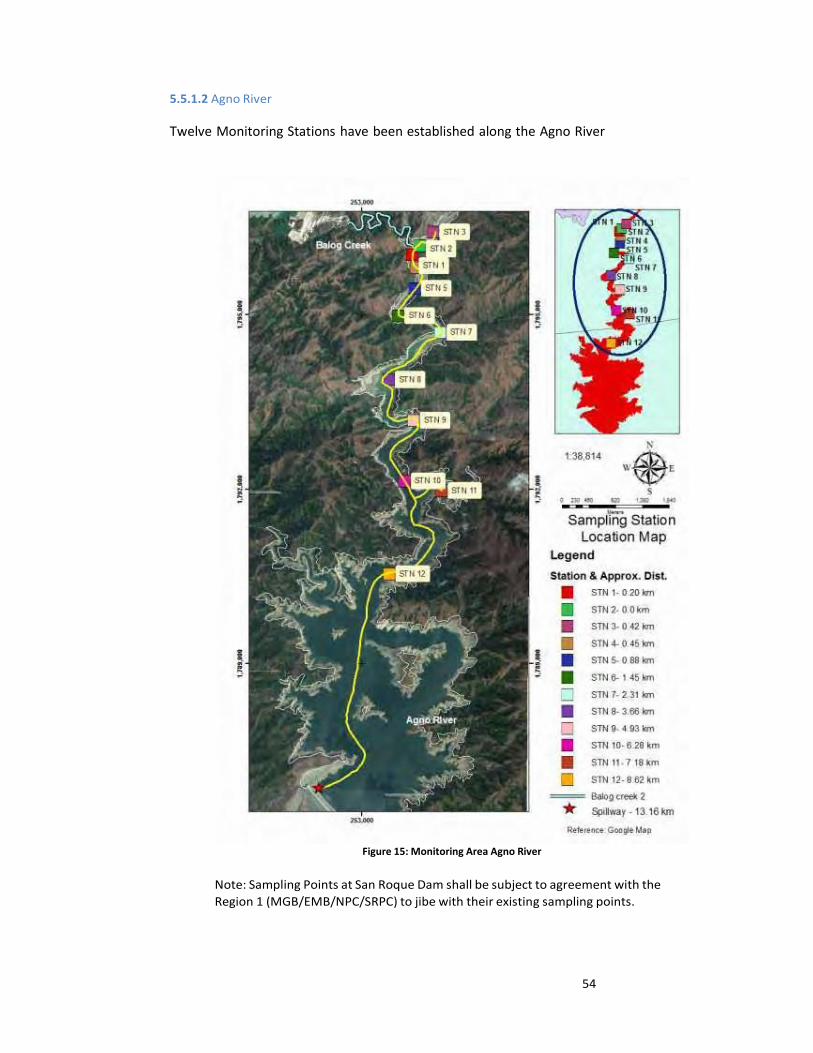
54
5.5.1.2 Agno River
Twelve Monitoring Stations have been established along the Agno River
Figure 15: Monitoring Area Agno River
Note: Sampling Points at San Roque Dam shall be subject to agreement with the
Region 1 (MGB/EMB/NPC/SRPC) to jibe with their existing sampling points.
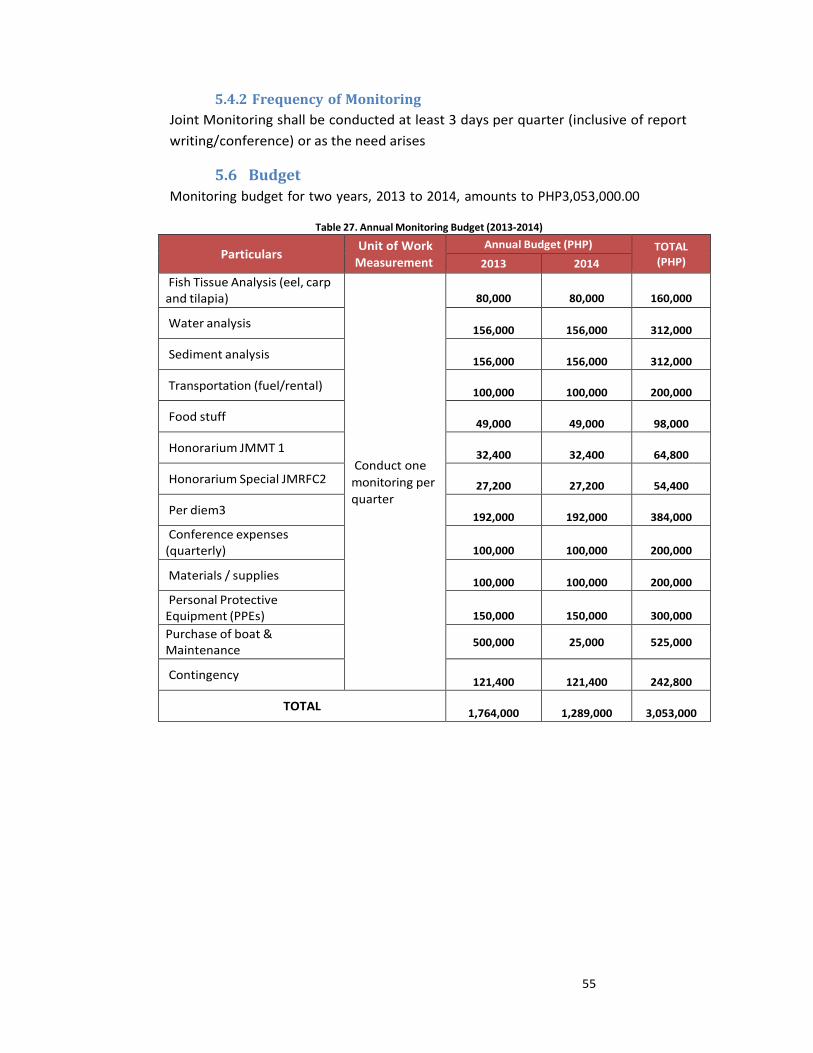
55
5.4.2 Frequency of Monitoring
Joint Monitoring shall be conducted at least 3 days per quarter (inclusive of report
writing/conference) or as the need arises
5.6 Budget
Monitoring budget for two years, 2013 to 2014, amounts to PHP3,053,000.00
Table 27. Annual Monitoring Budget (2013-2014)
Particulars Unit of Work
Measurement
Annual Budget (PHP) TOTAL
(PHP) 2013 2014
Fish Tissue Analysis (eel, carp and tilapia)
Conduct one
monitoring per
quarter
80,000
80,000
160,000
Water analysis
156,000
156,000
312,000
Sediment analysis
156,000
156,000
312,000
Transportation (fuel/rental)
100,000
100,000
200,000
Food stuff
49,000
49,000
98,000
Honorarium JMMT 1
32,400
32,400
64,800
Honorarium Special JMRFC2
27,200
27,200
54,400
Per diem3
192,000
192,000
384,000
Conference expenses (quarterly)
100,000
100,000
200,000
Materials / supplies
100,000
100,000
200,000
Personal Protective Equipment (PPEs)
150,000
150,000
300,000
Purchase of boat & Maintenance
500,000 25,000 525,000
Contingency
121,400
121,400
242,800
TOTAL
1,764,000
1,289,000
3,053,000
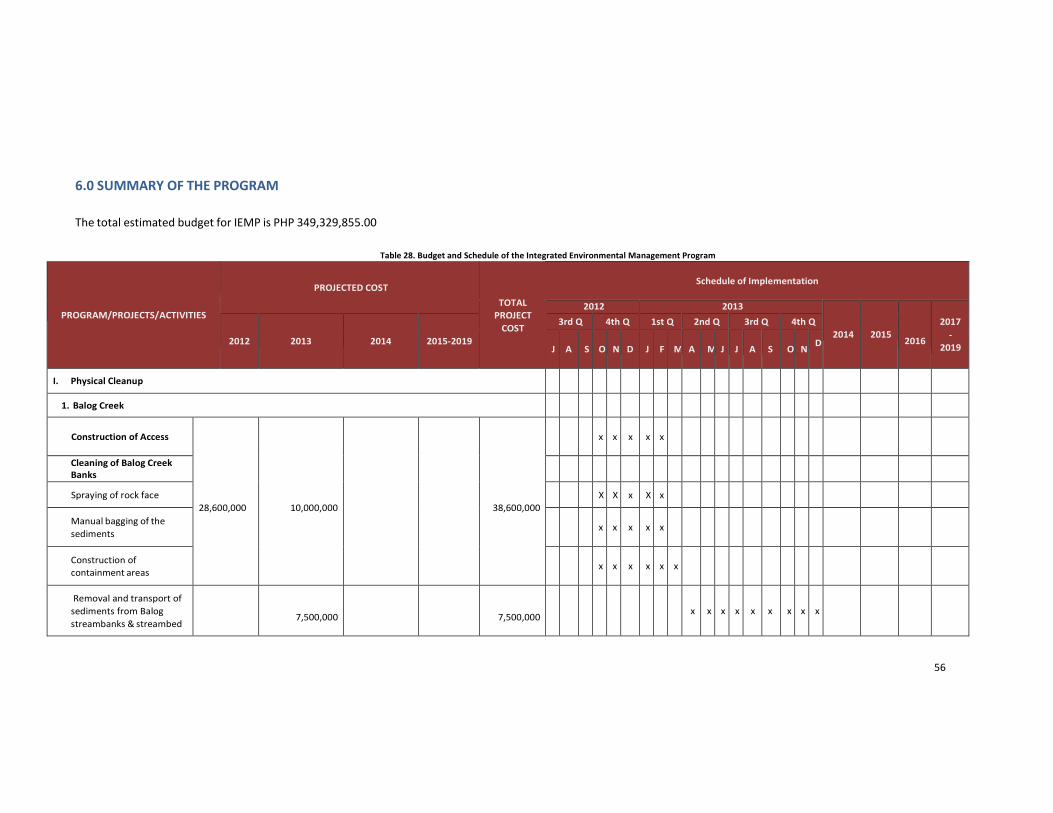
6.0 SUMMARY OF THE PROGRAM
The total estimated budget for IEMP is PHP 349,329,855.00
Table 28. Budget and Schedule of the Integrated Environmental Management Program
PROGRAM/PROJECTS/ACTIVITIES
PROJECTED COST
TOTAL
PROJECT
COST
Schedule of Implementation
2012 2013
2014
2015
2016
2017
-
2019
2012
2013
2014
2015-2019
3rd Q 4th Q 1st Q 2nd Q 3rd Q 4th Q
J
A
S
O
N
D
J
F
M
A
M
J
J
A
S
O
N
D
I. Physical Cleanup
1. Balog Creek
Construction of Access
28,600,000
10,000,000
38,600,000
x
x
x
x
x
Cleaning of Balog Creek Banks
Spraying of rock face
X X x X x
Manual bagging of the
sediments
x
x
x
x
x
Construction of
containment areas
x
x
x
x
x
x
Removal and transport of
sediments from Balog
streambanks & streambed
7,500,000
7,500,000
x
x
x
x
x
x
x
x
x
56
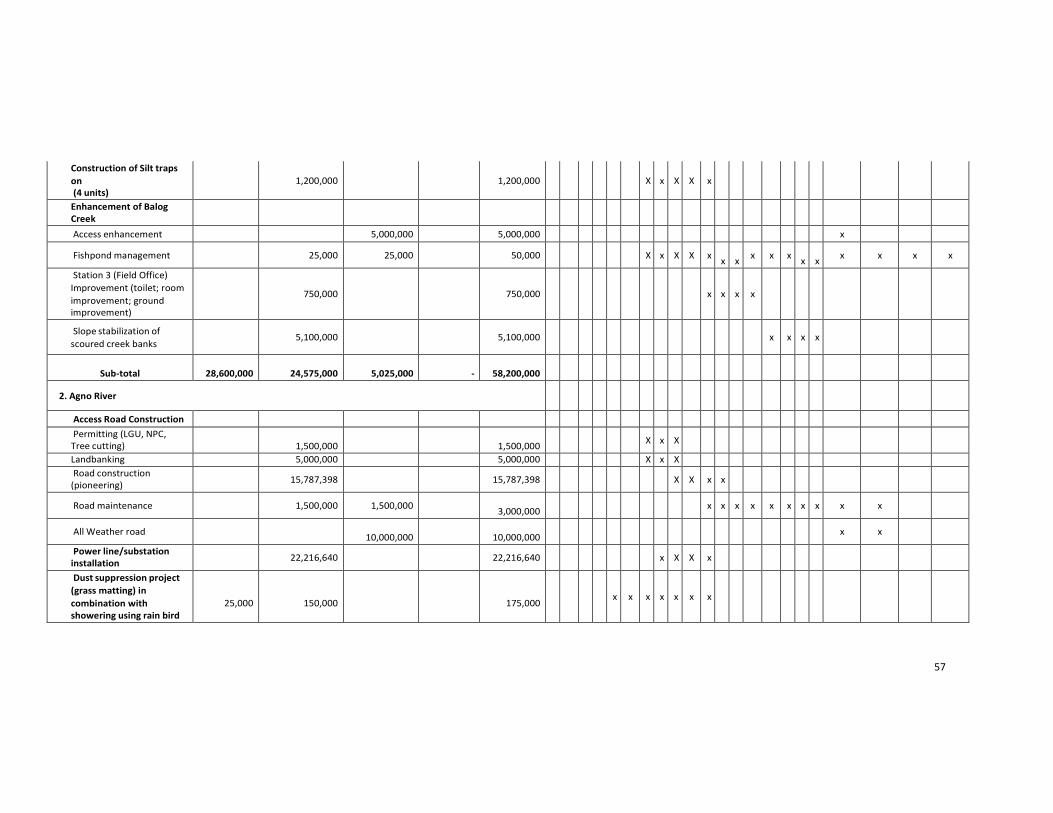
Construction of Silt traps
on (4 units)
1,200,000
1,200,000
X
x
X
X
x
Enhancement of Balog Creek
Access enhancement 5,000,000 5,000,000 x
Fishpond management
25,000 25,000
50,000
X x X X x
x
x x x x
x
x
x x x x
Station 3 (Field Office)
Improvement (toilet; room
improvement; ground improvement)
750,000
750,000
x
x
x
x
Slope stabilization of
scoured creek banks
5,100,000
5,100,000
x
x
x
x
Sub-total
28,600,000
24,575,000
5,025,000
-
58,200,000
2. Agno River
Access Road Construction
Permitting (LGU, NPC, Tree cutting)
1,500,000
1,500,000
X x X
Landbanking 5,000,000 5,000,000 X x X
Road construction (pioneering)
15,787,398
15,787,398
X X x x
Road maintenance
1,500,000 1,500,000
3,000,000
x x x x x x x x x x
All Weather road
10,000,000
10,000,000
x x
Power line/substation installation
22,216,640
22,216,640
x X X x
Dust suppression project
(grass matting) in
combination with showering using rain bird
25,000
150,000
175,000
x
x
x
x
x
x
x
57
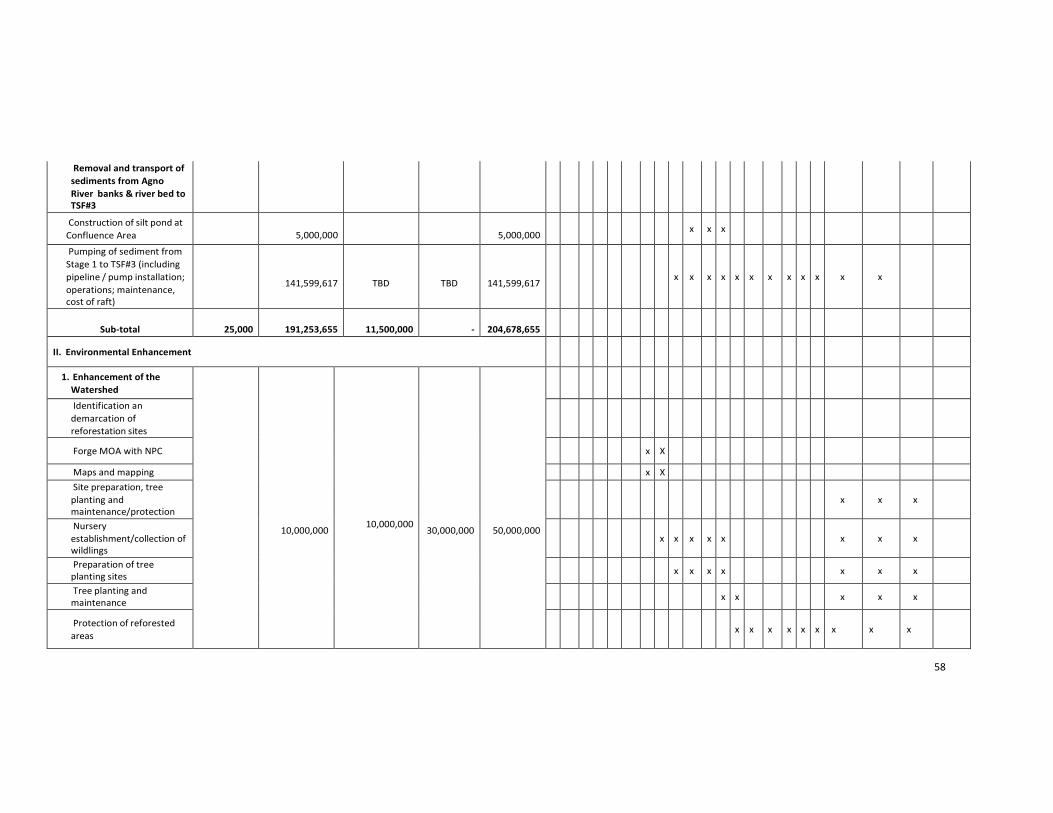
Removal and transport of
sediments from Agno
River banks & river bed to TSF#3
Construction of silt pond at
Confluence Area
5,000,000
5,000,000
x
x
x
Pumping of sediment from
Stage 1 to TSF#3 (including
pipeline / pump installation;
operations; maintenance, cost of raft)
141,599,617
TBD
TBD
141,599,617
x
x
x
x
x
x
x
x
x
x
x
x
Sub-total
25,000
191,253,655
11,500,000
-
204,678,655
II. Environmental Enhancement
1. Enhancement of the
Watershed
10,000,000
10,000,000
30,000,000
50,000,000
Identification an
demarcation of
reforestation sites
Forge MOA with NPC
x X
Maps and mapping x X
Site preparation, tree
planting and maintenance/protection
x
x
x
Nursery
establishment/collection of wildlings
x
x
x
x
x
x
x
x
Preparation of tree planting sites
x x x x
x x x
Tree planting and maintenance
x x
x x x
Protection of reforested
areas
x
x
x
x
x
x
x
x
x
58
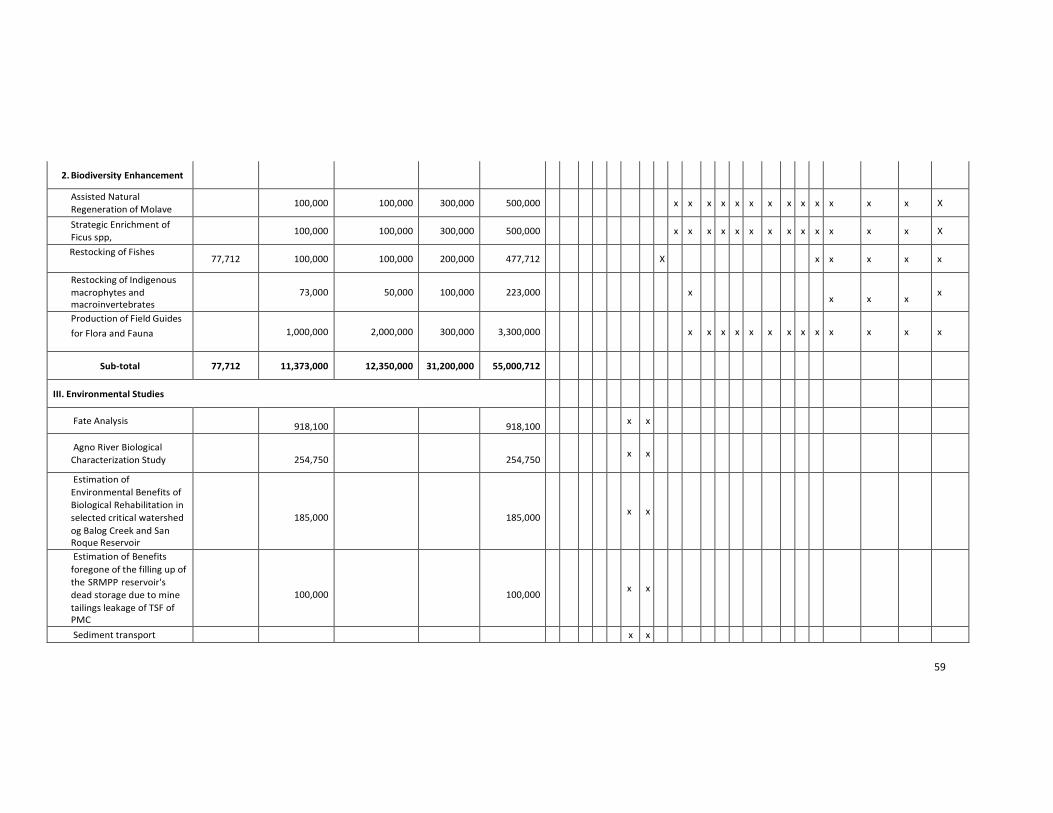
2. Biodiversity Enhancement
Assisted Natural
Regeneration of Molave
100,000 100,000 300,000 500,000
x x x x x x x x x x x x x X
Strategic Enrichment of
Ficus spp,
100,000 100,000 300,000 500,000
x x x x x x x x x x x x x X
Restocking of Fishes 77,712 100,000 100,000 200,000 477,712
X
x x x x x
Restocking of Indigenous
macrophytes and macroinvertebrates
73,000
50,000
100,000
223,000
x
x
x
x
x
Production of Field Guides
for Flora and Fauna
1,000,000
2,000,000
300,000
3,300,000
x
x
x
x
x
x
x
x
x
x
x
x
x
Sub-total 77,712 11,373,000 12,350,000 31,200,000 55,000,712
III. Environmental Studies
Fate Analysis
918,100
918,100
x x
Agno River Biological
Characterization Study
254,750
254,750
x
x
Estimation of
Environmental Benefits of
Biological Rehabilitation in
selected critical watershed
og Balog Creek and San Roque Reservoir
185,000
185,000
x
x
Estimation of Benefits
foregone of the filling up of
the SRMPP reservoir's
dead storage due to mine
tailings leakage of TSF of PMC
100,000
100,000
x
x
Sediment transport x x
59
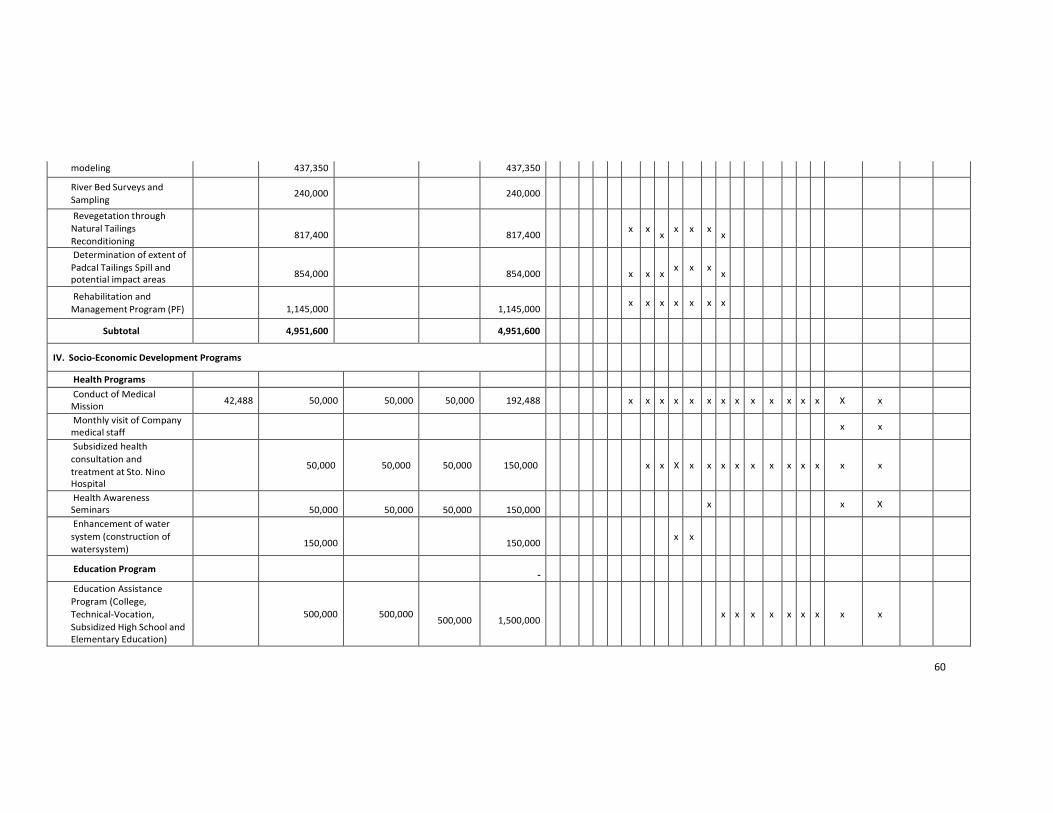
modeling 437,350 437,350
River Bed Surveys and
Sampling
240,000
240,000
Revegetation through
Natural Tailings
Reconditioning
817,400
817,400
x
x
x
x
x
x
x
Determination of extent of
Padcal Tailings Spill and potential impact areas
854,000
854,000
x
x
x
x
x
x
x
Rehabilitation and
Management Program (PF)
1,145,000
1,145,000
x
x
x
x
x
x
x
Subtotal
4,951,600
4,951,600
IV. Socio-Economic Development Programs
Health Programs
Conduct of Medical Mission
42,488 50,000 50,000 50,000 192,488
x x x x x x x x x x x x x X x
Monthly visit of Company medical staff
x x
Subsidized health
consultation and
treatment at Sto. Nino Hospital
50,000
50,000
50,000
150,000
x
x
X
x
x
x
x
x
x
x
x
x
x
x
Health Awareness Seminars
50,000
50,000
50,000
150,000
x
x X
Enhancement of water
system (construction of
watersystem)
150,000
150,000
x
x
Education Program
-
Education Assistance
Program (College,
Technical-Vocation,
Subsidized High School and Elementary Education)
500,000
500,000
500,000
1,500,000
x
x
x
x
x
x
x
x
x
60
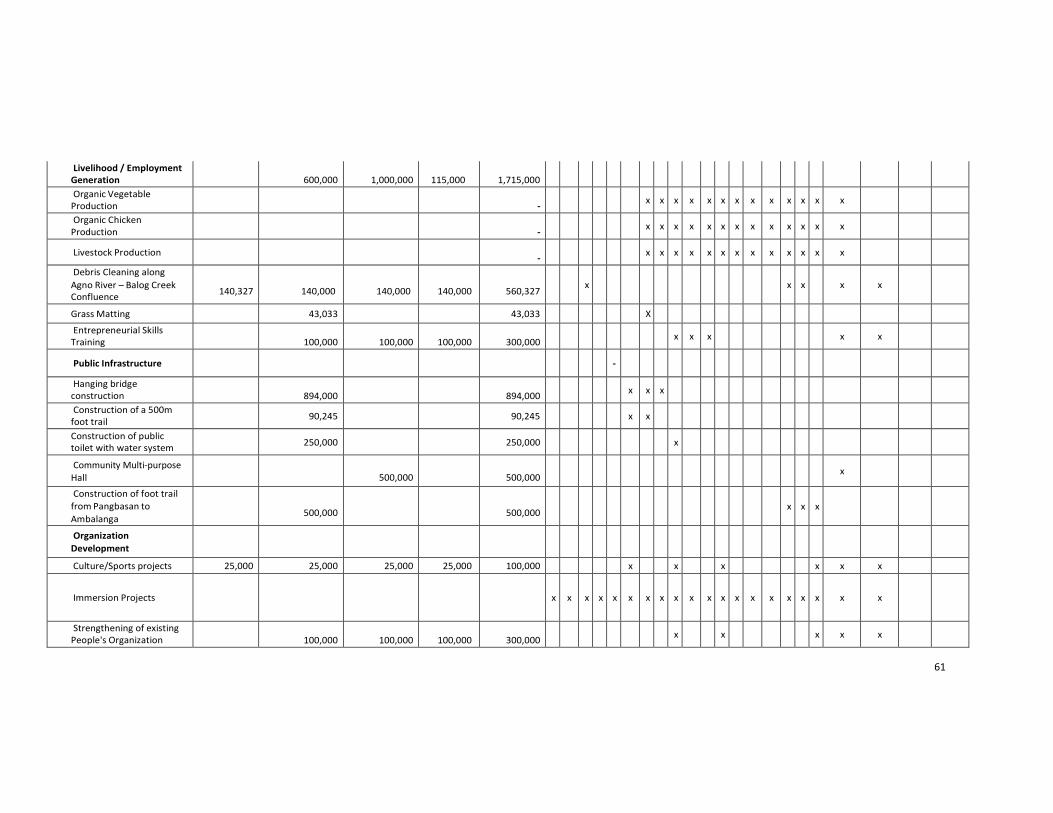
Livelihood / Employment
Generation
600,000
1,000,000
115,000
1,715,000
Organic Vegetable Production
-
x x x x x x x x x x x x x
Organic Chicken Production
-
x x x x x x x x x x x x x
Livestock Production
-
x x x x x x x x x x x x x
Debris Cleaning along
Agno River – Balog Creek Confluence
140,327
140,000
140,000
140,000
560,327
x
x
x
x
x
Grass Matting 43,033 43,033 X
Entrepreneurial Skills Training
100,000
100,000
100,000
300,000
x x x
x x
Public Infrastructure
-
Hanging bridge construction
894,000
894,000
x x x
Construction of a 500m foot trail
90,245
90,245
x x
Construction of public toilet with water system
250,000
250,000
x
Community Multi-purpose
Hall
500,000
500,000
x
Construction of foot trail
from Pangbasan to
Ambalanga
500,000
500,000
x
x
x
Organization
Development
Culture/Sports projects 25,000 25,000 25,000 25,000 100,000 x x x x x x
Immersion Projects
x
x
x
x
x
x
x
x
x
x
x
x
x
x
x
x
x
x
x
x
Strengthening of existing People's Organization
100,000
100,000
100,000
300,000
x
x
x x x
61
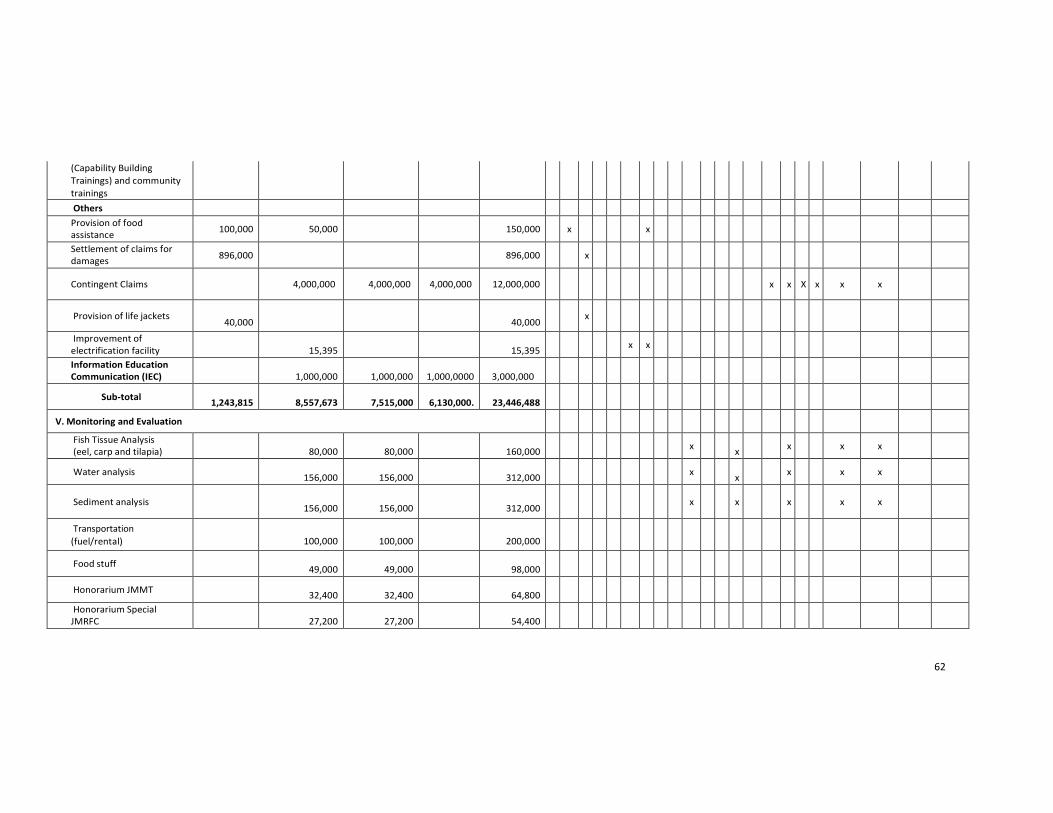
(Capability Building
Trainings) and community
trainings
Others
Provision of food assistance
100,000 50,000
150,000
x
x
Settlement of claims for damages
896,000
896,000
x
Contingent Claims
4,000,000
4,000,000
4,000,000
12,000,000
x
x
X
x
x
x
Provision of life jackets
40,000
40,000
x
Improvement of electrification facility
15,395
15,395
x x
Information Education Communication (IEC)
1,000,000
1,000,000
1,000,0000
3,000,000
Sub-total
1,243,815
8,557,673
7,515,000
6,130,000.
23,446,488
V. Monitoring and Evaluation
Fish Tissue Analysis (eel, carp and tilapia)
80,000
80,000
160,000
x
x
x
x x
Water analysis
156,000
156,000
312,000
x
x
x
x x
Sediment analysis
156,000
156,000
312,000
x
x
x
x
x
Transportation
(fuel/rental)
100,000
100,000
200,000
Food stuff
49,000
49,000
98,000
Honorarium JMMT
32,400
32,400
64,800
Honorarium Special JMRFC
27,200
27,200
54,400
62
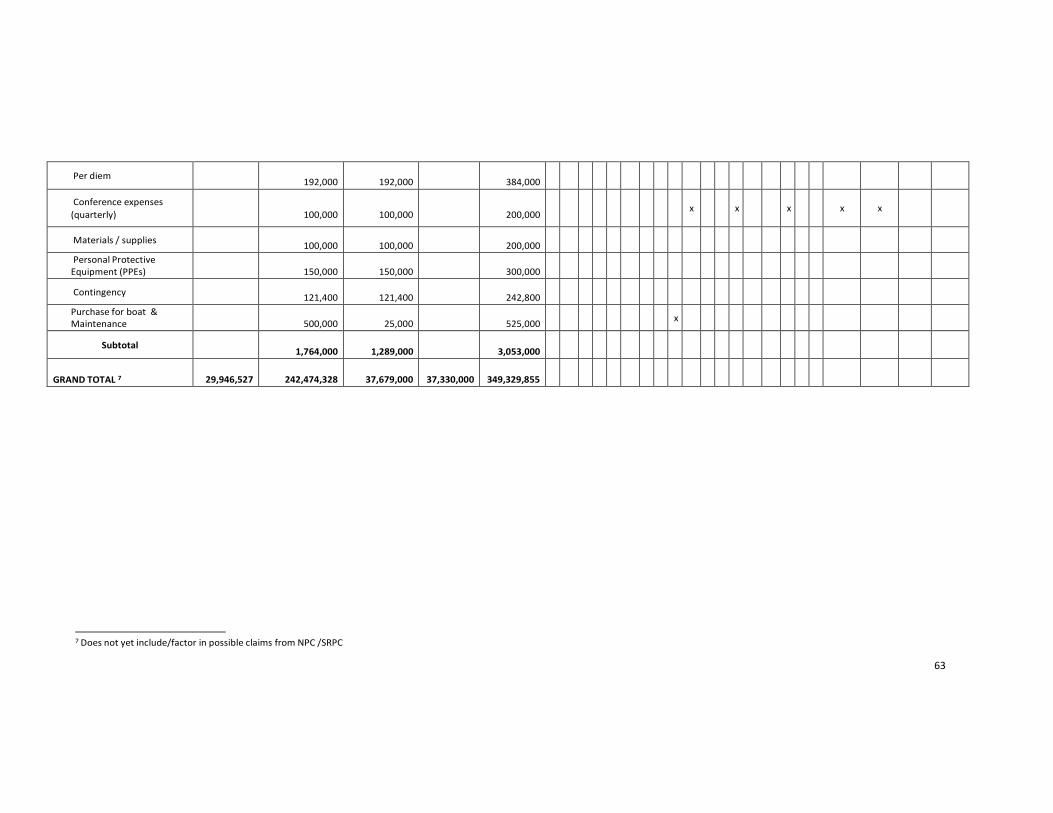
Per diem
192,000
192,000
384,000
Conference expenses
(quarterly)
100,000
100,000
200,000
x
x
x
x
x
Materials / supplies
100,000
100,000
200,000
Personal Protective Equipment (PPEs)
150,000
150,000
300,000
Contingency
121,400
121,400
242,800
Purchase for boat & Maintenance
500,000
25,000
525,000
x
Subtotal
1,764,000
1,289,000
3,053,000
GRAND TOTAL 7
29,946,527
242,474,328
37,679,000
37,330,000
349,329,855
7 Does not yet include/factor in possible claims from NPC /SRPC
63
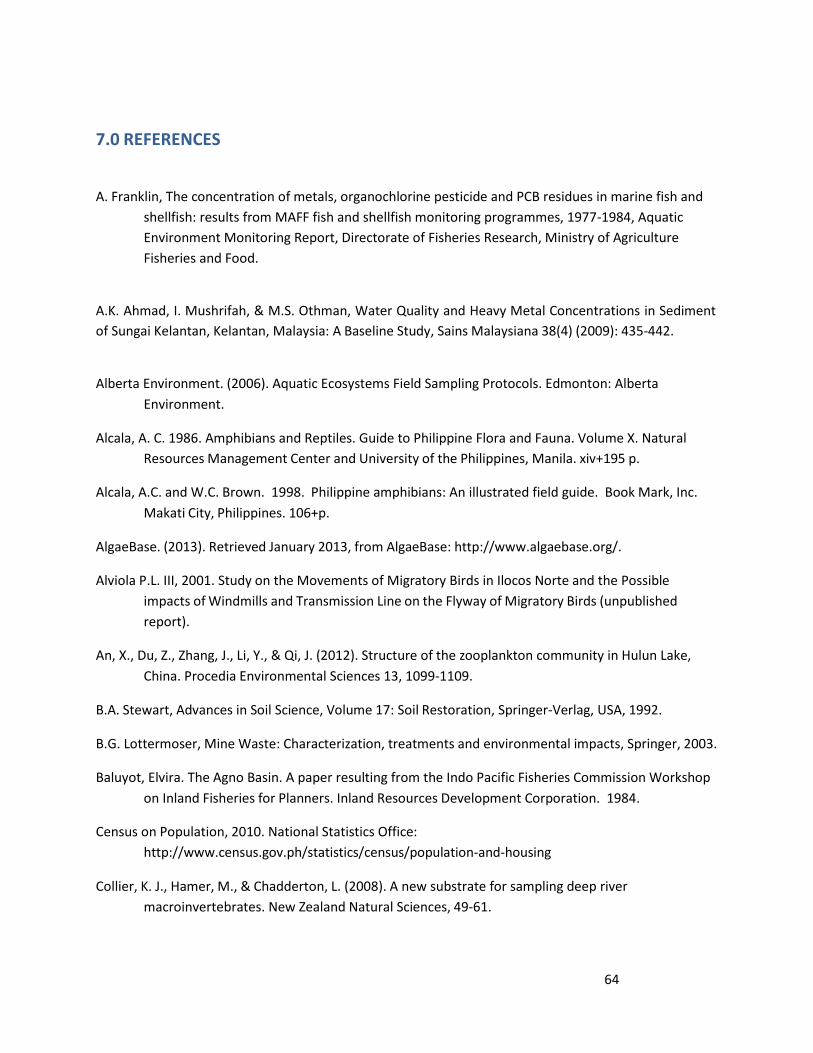
64
7.0 REFERENCES
A. Franklin, The concentration of metals, organochlorine pesticide and PCB residues in marine fish and
shellfish: results from MAFF fish and shellfish monitoring programmes, 1977-1984, Aquatic
Environment Monitoring Report, Directorate of Fisheries Research, Ministry of Agriculture
Fisheries and Food.
A.K. Ahmad, I. Mushrifah, & M.S. Othman, Water Quality and Heavy Metal Concentrations in Sediment
of Sungai Kelantan, Kelantan, Malaysia: A Baseline Study, Sains Malaysiana 38(4) (2009): 435-442.
Alberta Environment. (2006). Aquatic Ecosystems Field Sampling Protocols. Edmonton: Alberta
Environment.
Alcala, A. C. 1986. Amphibians and Reptiles. Guide to Philippine Flora and Fauna. Volume X. Natural
Resources Management Center and University of the Philippines, Manila. xiv+195 p.
Alcala, A.C. and W.C. Brown. 1998. Philippine amphibians: An illustrated field guide. Book Mark, Inc.
Makati City, Philippines. 106+p.
AlgaeBase. (2013). Retrieved January 2013, from AlgaeBase: http://www.algaebase.org/.
Alviola P.L. III, 2001. Study on the Movements of Migratory Birds in Ilocos Norte and the Possible
impacts of Windmills and Transmission Line on the Flyway of Migratory Birds (unpublished
report).
An, X., Du, Z., Zhang, J., Li, Y., & Qi, J. (2012). Structure of the zooplankton community in Hulun Lake,
China. Procedia Environmental Sciences 13, 1099-1109.
B.A. Stewart, Advances in Soil Science, Volume 17: Soil Restoration, Springer-Verlag, USA, 1992.
B.G. Lottermoser, Mine Waste: Characterization, treatments and environmental impacts, Springer, 2003.
Baluyot, Elvira. The Agno Basin. A paper resulting from the Indo Pacific Fisheries Commission Workshop
on Inland Fisheries for Planners. Inland Resources Development Corporation. 1984.
Census on Population, 2010. National Statistics Office:
http://www.census.gov.ph/statistics/census/population-and-housing
Collier, K. J., Hamer, M., & Chadderton, L. (2008). A new substrate for sampling deep river
macroinvertebrates. New Zealand Natural Sciences, 49-61.
65
Cuanp, Rolando.Upstream Sedimentation Study, Itogon Segment Agno River System. Prepared for San
Roque Power Corporation, March 2000
C. Paukert, Effect of Instream Sand Dredging on Fish Communities in the Kansas River USA: Current and
Historical Perspectives, Kansas State University, Kansas 66506 USA.
Diesmos A.C. 2010. Amphibians and Reptiles of Mt. Malarayat, Batangas Biodiversity Survey
(unpublished report).
Duggan, I. C. (2007). An assessment of the water quality of ten Waikato lakes based on zooplankton
community composition. Hamilton: Centre for Biodiversity and Ecology Research Contract
Report 60, The University of Waikato.
Ferdous, Z., & Muktadir, A. (2009). A Review: Potentiality of Zooplankton as Bioindicator. American
Journal of Applied Sciences 6 (10), 1815-1819.
Fernando, E. et al. 1998. Resource inventory and assessment of biodiversity in the Subic Bay
metropolitan authority. Terminal Report. 39p. DOST, PCARRD, SBMP & UPLB.
Forro, L., Korovchinsky, N.M., Kotov, A.A. & Petrusek, A. 2008. Global diversity of cladocerans
(Cladocera; Crustacea) in freshwater. Hydrobiologia 595:177–184.
Fraser River Estuary Management Program, Environmental Management Strategy for Dredging in the
Fraser River Estuary, 2006.
General Information on the Municipality of Itogon: http://itogon.gov.ph/
Ghosh, S., Barinova, S. & Keshri, J.P. (2009). Diversity and seasonal variation of phytoplankton
community in the Santragachi Lake, West Bengal, India, QScience Connect
2012:3http://dx.doi.org/10.5339/connect.2012.3.
G.M. Kondolf, M. Smeltzer, & L. Kimball, Freshwater Gravel Mining and Dredging Issues, University of
California, Berkeley CA 94720, 2002.
Google Earth, Imagery Date 15 March 2010, Satellite Maps of Itogon
Gonzalez JC.T., Afuang L.T. and Dans T.L. 1999. Manual in Wildlife 101 – Introduction to Philippine
Wildlife. Wildlife Biology Laboratory, Institute of Biological Sciences, College of Arts and
Sciences, University of the Philippines Los Banos.
Heaney, L.R., D.S. Balete, M.L. Dolar, A.C. Alcala, A.T.L. Dans, P.C. Gonzales, N.R. Ingle, M.V. Lepiten,
W.L.R. Oliver, P.S. Ong, E.A. Rickart, B.R. Tabaranza and R.C.B. Utzurumm. 1998. A synopsis of
the mammalian fauna of the Philippine Islands. Fieldiana. No. 88 (1493). 61 pp.
Lower Agno Watershed Profile: http://www.napocor.gov.ph/WMD
66
IUCN 2012. IUCN Redlist of Threatened species. Version 2012.2. (www.iucnredlist.org). Downloaded on
14 January 2012.
Japan Internation Cooperation Agency (JICA), JICA Masterplan Study for Agno River Flood Control
Project, 1991.
K. Bhupander & Mukherjee D. P., Assessment of Human Health Risk for Arsenic, Copper, Nickel, Mercury
and Zinc in Fish Collected from Tropical Wetlands in India. In Advances in Life Science and
Technology; Vol. 2, www.iiste.org, 2011.
Kennedy R.S., Gonzales P.C., Dickinson E.C., Miranda H.C. Jr. and Fisher T.H. 2000. A Guide to the
Birds of the Philippines. Oxford University Press. 369p.
Mamaril, A. Sr. 1986. Guide to Philippine Flora and Fauna. Phil:JMC Press Inc.
Marsha Cohen, Dredging: the environmental facts (Where to find what you need to know), 2005.
Marsha Cohen, Dredging: the facts, 2005.
Murphy, Shirley, General Informations on Solids, City of Boulder/USGS Water Quality Monitoring
NACIAD – National Council on Integrated Area Development , under the Office of the Prime Minister is
the national rural development agency which implements Integrated Area Development Area
(IAD) programs and projects), 1981.
Neves, I.F., O. Rocha, K.F. Roche & A.A. Pinto. 2002. Zooplankton Community Structure of two marginal
lakes of the river Cuiaba (Matogrosso, Brazil) with analysis of rotifera and cladocera diversity.
Braz. J. Biol., 63(2): 329-343.
Orica Chemicals, Safety Data Sheet: Sodium Isobutyl Xanthate, Orica Australia Pty. Ltd., Melbourne 3000
Australia.
Papa, R.D., R.C. Pagulayan& A.E. Pagulayan. 2008. Zooplanktivory in the Endemic Freshwater Sardine,
Sardinellatawilis (Herre 1927) of Taal Lake, the Philippines.
Petr, T. (1985). Inland fisheries in multi-purpose river basin planning and development in tropical Asian
countries: three case studies. Rome: FOOD AND AGRICULTURE ORGANIZATION OF THE UNITED
NATIONS.
P. Tucci, & G.E. Hileman, Potential Effects of Dredging the South Fork Obion River on Ground-Water
Levels Near Sidonia, Weakley County, Tennessee, Water-Resources Investigations Report 90-
4041, US Geoogical Survey, 1992.
PMC TSF3 Special Land Use Plan, 2000
67
Sampaio, E.V. Rocha, O. Matsamura-Tundisi& J.G. Tundisi. 2002. Composition and Abundance of
Zooplankton in the Limnetic Zone of Seven Reservoirs of the Paranapanema River, Brazil. Braz. J.
Biol., 62(3): 525-545.
Scottish Environmental Protection Agency, Floods, dredging and river changes.
S.E. Purdy, Analysis of Dredge Tailings Pile Patterns: Applications for Historical Archaeological Research,
Oregon State University, 2007.
Shiel, R.J. 1995. A Guide to Identification of Rotifers, Cladocerans and Copepods from Australian Inland
Waters. Pp. 1-150.
Troubled Waters: How Mine Waste Dumping is Poisoning our Oceans, Rivers, and Lakes. In Earthworks
and MiningWatch Canada, 2012.
United States Environmental Protection Agency. (1994). Standard Operating Procedure for
Phytoplankton Sample Analysis. Retrieved on January 16, 2013 at ttp://www.nemw.org/gsi/GSI-
SOP-LB-RA-SA-2.pdf.
United States Environmental Protection Agency. 2009. Standard Operating Procedure for Zooplankton
Sample Analysis. Retrieved on January 16, 2013 at ttp://www.nemw.org/gsi/GSI-SOP-LB-RA-SA-
2.pdf.
United States Environmental Protection Agency. 1994. Standard Operating Procedure for Phytoplankton
Analysis. Retrieved on January 16, 2013 at http://www.epa.gov/glnpo/lmmb/methods/zoo.pdf
Update to the 1984 EIA for the San Roque Multipurpose Project (SRMP). Volume I-III. Submitted by San
Roque Power Corporation (SRPC). PIRNIE/HEC. Makati City Metro, Manila Philippines. 1997.
USA Environmental Protection Agency. (1999). Rapid Bioassessment Protocols For Use in Streams and
Wadeable Rivers: Periphyton, Benthic Macroinvertebrates, and Fish Second Edition.
Washington: USA Environmental Protection Agency.
USEPA. (1986). Guidelines for the health risk assessment of chemical mixtures. Washington: U.S.
Environmental Protection Agency, Risk Assessment, Forum, Office of Research and
Development.
V.B. Molina, Health Risk Assessment of Heavy Metals Bioaccumulation in Laguna de Bay Fish Products,
Department of Environmental and Occupational Health, College of Public Health, University of
the Philippines Manila.
Wagner, R. (2013). Kleine Lebewesen mit dem Mikroskop betrachtet. Retrieved January 8, 2013, from
http://www.dr-ralf-wagner.de/index.htm.
Witty, L.M. 1994. Practical Guide to Identifying Freshwater Crustacean Zooplankton. Pp. 1-60.

68
Work, K. (2013). Lake Okeechobee Plankton. Retrieved January 9, 2013, from Lake Okeechobee
Plankton: http://www2.stetson.edu/~kwork/lake_okee_plankton.htm.
Y.Y. Choi, International/National Standards for Heavy Metals in Food, 2011.

PADCAL Operations
April 2013
Annex D: Environment and Community
Annex D-1: Environment Compliance
Certificates
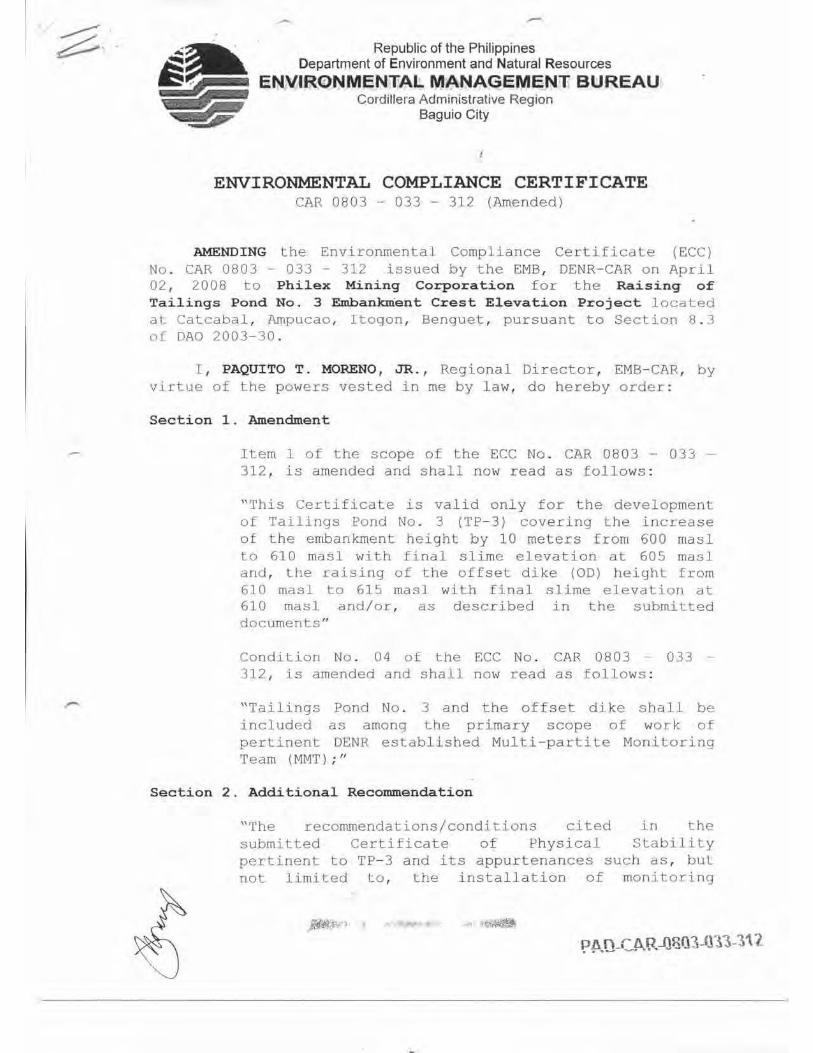
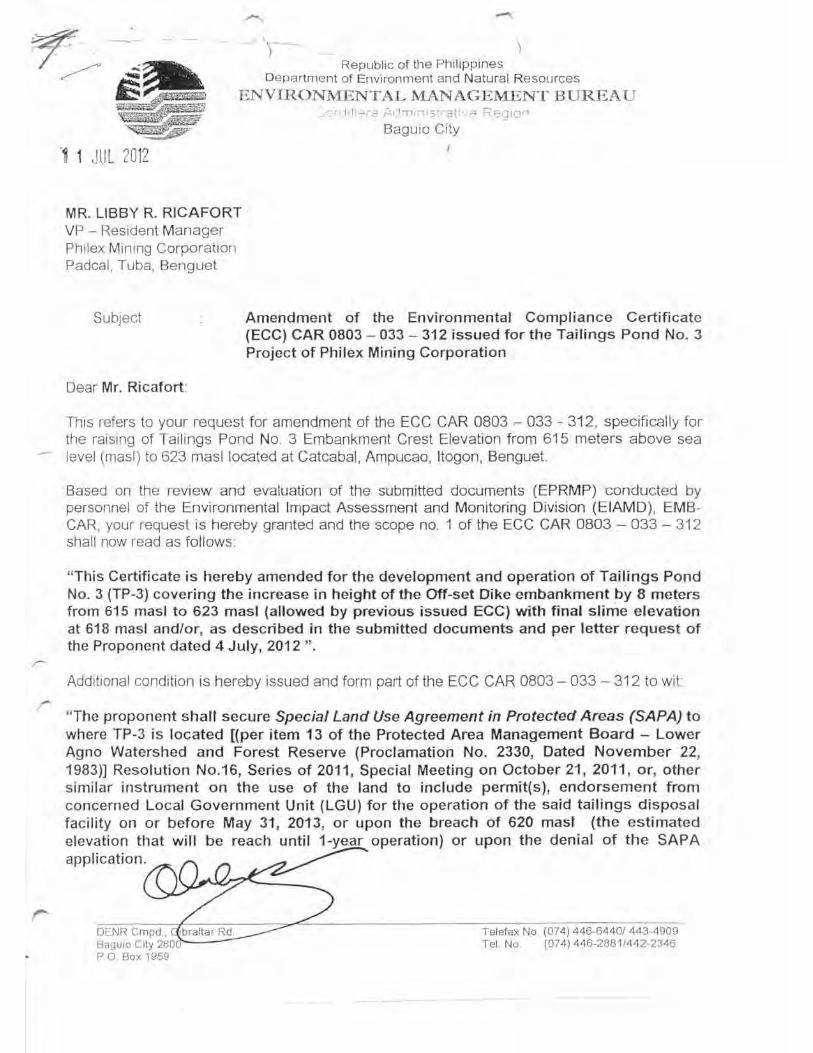
PADCAL Operations
April 2013
Annex D: Environment and Community
Annex D-2: Key Personnel and
Qualifications
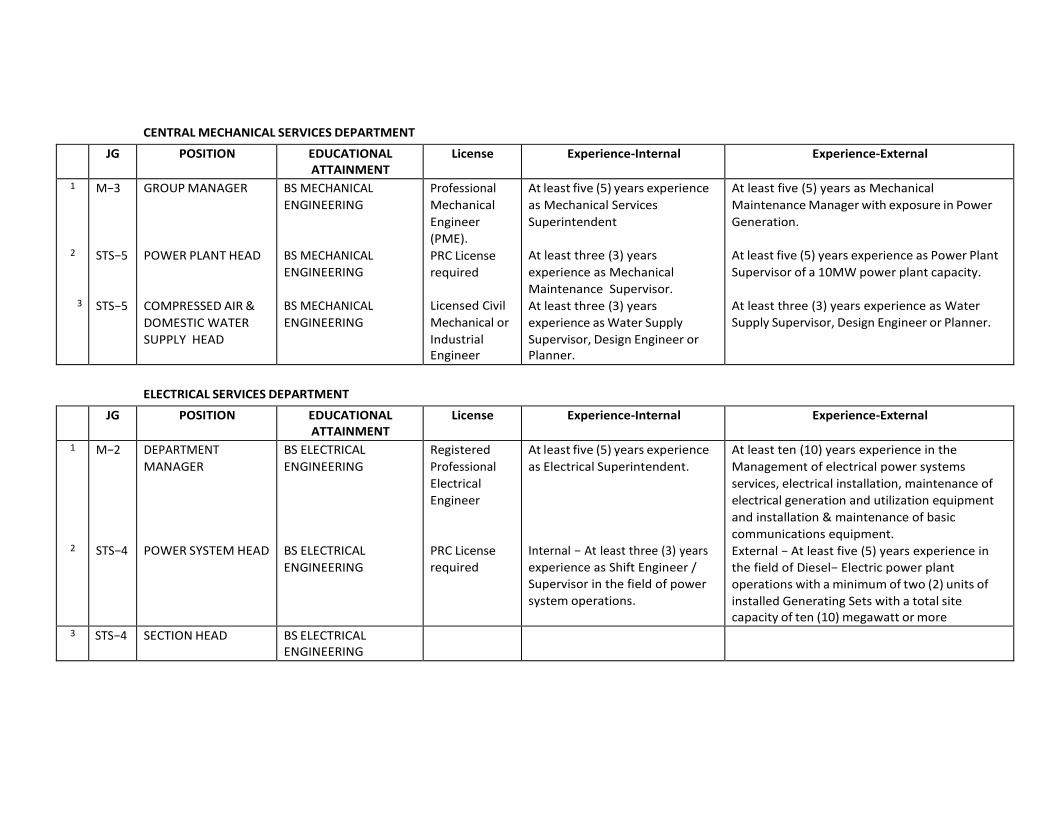
CENTRAL MECHANICAL SERVICES DEPARTMENT
JG POSITION EDUCATIONAL ATTAINMENT
License Experience-Internal Experience-External
1
2
3
M−3
STS−5
STS−5
GROUP MANAGER
POWER PLANT HEAD
COMPRESSED AIR &
DOMESTIC WATER
SUPPLY HEAD
BS MECHANICAL
ENGINEERING
BS MECHANICAL
ENGINEERING
BS MECHANICAL
ENGINEERING
Professional
Mechanical
Engineer
(PME).
PRC License
required
Licensed Civil
Mechanical or
Industrial Engineer
At least five (5) years experience
as Mechanical Services
Superintendent
At least three (3) years
experience as Mechanical
Maintenance Supervisor.
At least three (3) years
experience as Water Supply
Supervisor, Design Engineer or Planner.
At least five (5) years as Mechanical
Maintenance Manager with exposure in Power
Generation.
At least five (5) years experience as Power Plant
Supervisor of a 10MW power plant capacity.
At least three (3) years experience as Water
Supply Supervisor, Design Engineer or Planner.
ELECTRICAL SERVICES DEPARTMENT
JG POSITION EDUCATIONAL ATTAINMENT
License Experience-Internal Experience-External
1
2
M−2
STS−4
DEPARTMENT
MANAGER
POWER SYSTEM HEAD
BS ELECTRICAL
ENGINEERING
BS ELECTRICAL
ENGINEERING
Registered
Professional
Electrical
Engineer
PRC License
required
At least five (5) years experience
as Electrical Superintendent.
Internal − At least three (3) years
experience as Shift Engineer /
Supervisor in the field of power
system operations.
At least ten (10) years experience in the
Management of electrical power systems
services, electrical installation, maintenance of
electrical generation and utilization equipment
and installation & maintenance of basic
communications equipment.
External − At least five (5) years experience in
the field of Diesel− Electric power plant
operations with a minimum of two (2) units of
installed Generating Sets with a total site capacity of ten (10) megawatt or more
3 STS−4 SECTION HEAD BS ELECTRICAL ENGINEERING
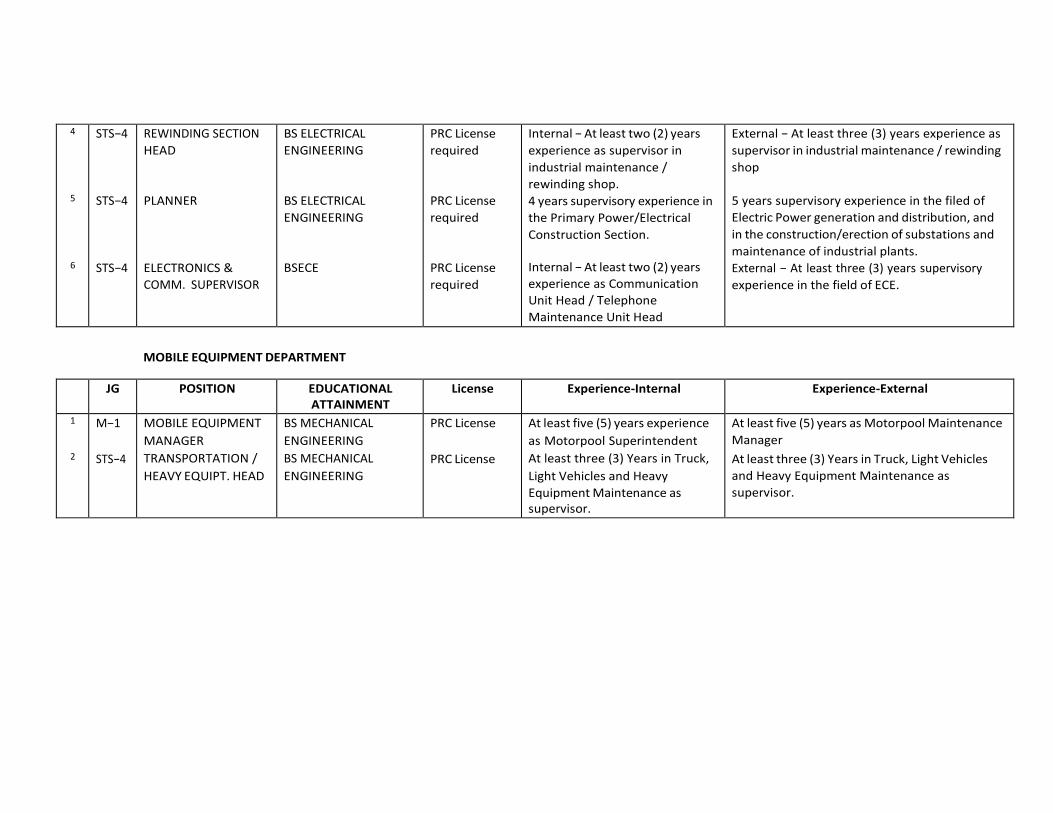
4
5
6
STS−4
STS−4
STS−4
REWINDING SECTION
HEAD
PLANNER
ELECTRONICS &
COMM. SUPERVISOR
BS ELECTRICAL
ENGINEERING
BS ELECTRICAL
ENGINEERING
BSECE
PRC License
required
PRC License
required
PRC License
required
Internal − At least two (2) years
experience as supervisor in
industrial maintenance /
rewinding shop.
4 years supervisory experience in
the Primary Power/Electrical
Construction Section.
Internal − At least two (2) years
experience as Communication
Unit Head / Telephone
Maintenance Unit Head
External − At least three (3) years experience as
supervisor in industrial maintenance / rewinding
shop
5 years supervisory experience in the filed of
Electric Power generation and distribution, and
in the construction/erection of substations and
maintenance of industrial plants.
External − At least three (3) years supervisory
experience in the field of ECE.
MOBILE EQUIPMENT DEPARTMENT
JG POSITION EDUCATIONAL ATTAINMENT
License Experience-Internal Experience-External
1
2
M−1
STS−4
MOBILE EQUIPMENT
MANAGER
TRANSPORTATION /
HEAVY EQUIPT. HEAD
BS MECHANICAL
ENGINEERING
BS MECHANICAL
ENGINEERING
PRC License
PRC License
At least five (5) years experience
as Motorpool Superintendent
At least three (3) Years in Truck,
Light Vehicles and Heavy
Equipment Maintenance as supervisor.
At least five (5) years as Motorpool Maintenance
Manager
At least three (3) Years in Truck, Light Vehicles
and Heavy Equipment Maintenance as
supervisor.
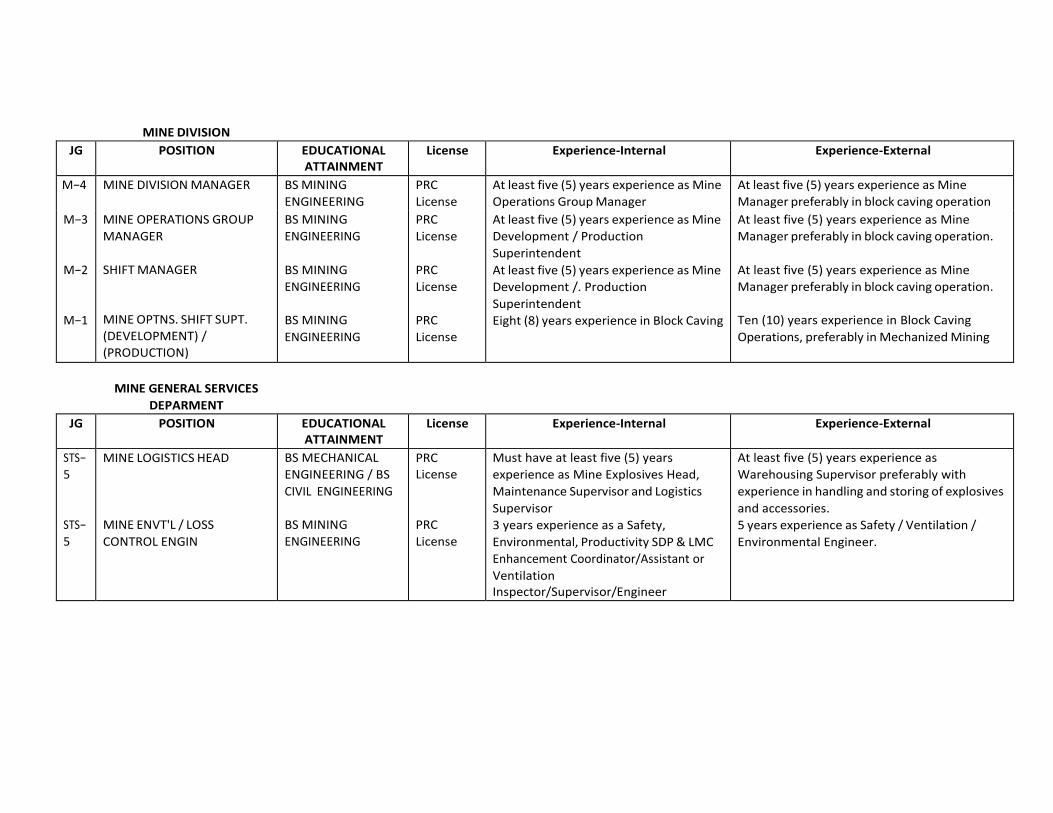
MINE DIVISION
JG POSITION EDUCATIONAL ATTAINMENT
License Experience-Internal Experience-External
M−4 MINE DIVISION MANAGER BS MINING
ENGINEERING
PRC
License
At least five (5) years experience as Mine
Operations Group Manager
At least five (5) years experience as Mine
Manager preferably in block caving operation
M−3
M−2
M−1
MINE OPERATIONS GROUP
MANAGER
SHIFT MANAGER
MINE OPTNS. SHIFT SUPT.
(DEVELOPMENT) /
(PRODUCTION)
BS MINING
ENGINEERING
BS MINING
ENGINEERING
BS MINING
ENGINEERING
PRC
License
PRC
License
PRC
License
At least five (5) years experience as Mine
Development / Production
Superintendent
At least five (5) years experience as Mine
Development /. Production
Superintendent
Eight (8) years experience in Block Caving
At least five (5) years experience as Mine
Manager preferably in block caving operation.
At least five (5) years experience as Mine
Manager preferably in block caving operation.
Ten (10) years experience in Block Caving
Operations, preferably in Mechanized Mining
MINE GENERAL SERVICES
DEPARMENT
JG POSITION EDUCATIONAL ATTAINMENT
License Experience-Internal Experience-External
STS−
5
STS−
5
MINE LOGISTICS HEAD
MINE ENVT'L / LOSS
CONTROL ENGIN
BS MECHANICAL
ENGINEERING / BS
CIVIL ENGINEERING
BS MINING
ENGINEERING
PRC License
PRC
License
Must have at least five (5) years
experience as Mine Explosives Head,
Maintenance Supervisor and Logistics
Supervisor
3 years experience as a Safety,
Environmental, Productivity SDP & LMC
Enhancement Coordinator/Assistant or
Ventilation Inspector/Supervisor/Engineer
At least five (5) years experience as
Warehousing Supervisor preferably with
experience in handling and storing of explosives
and accessories.
5 years experience as Safety / Ventilation /
Environmental Engineer.
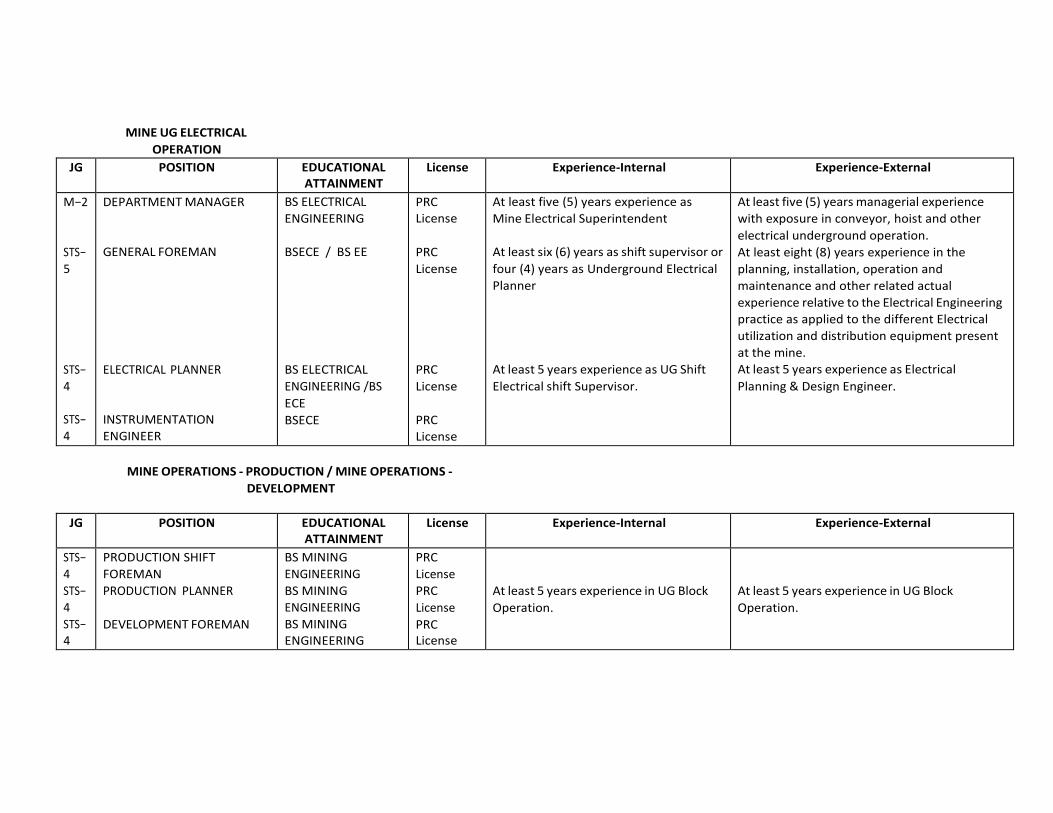
MINE UG ELECTRICAL
OPERATION
JG POSITION EDUCATIONAL ATTAINMENT
License Experience-Internal Experience-External
M−2
STS−
5
STS−
4
STS−
4
DEPARTMENT MANAGER
GENERAL FOREMAN
ELECTRICAL PLANNER
INSTRUMENTATION
ENGINEER
BS ELECTRICAL
ENGINEERING
BSECE / BS EE
BS ELECTRICAL
ENGINEERING /BS
ECE
BSECE
PRC License
PRC
License
PRC
License
PRC License
At least five (5) years experience as
Mine Electrical Superintendent
At least six (6) years as shift supervisor or
four (4) years as Underground Electrical
Planner
At least 5 years experience as UG Shift
Electrical shift Supervisor.
At least five (5) years managerial experience
with exposure in conveyor, hoist and other
electrical underground operation.
At least eight (8) years experience in the
planning, installation, operation and
maintenance and other related actual
experience relative to the Electrical Engineering
practice as applied to the different Electrical
utilization and distribution equipment present
at the mine.
At least 5 years experience as Electrical
Planning & Design Engineer.
MINE OPERATIONS - PRODUCTION / MINE OPERATIONS -
DEVELOPMENT
JG POSITION EDUCATIONAL ATTAINMENT
License Experience-Internal Experience-External
STS−
4
STS−
4
STS− 4
PRODUCTION SHIFT
FOREMAN
PRODUCTION PLANNER
DEVELOPMENT FOREMAN
BS MINING
ENGINEERING
BS MINING
ENGINEERING
BS MINING ENGINEERING
PRC
License
PRC
License
PRC License
At least 5 years experience in UG Block
Operation.
At least 5 years experience in UG Block
Operation.
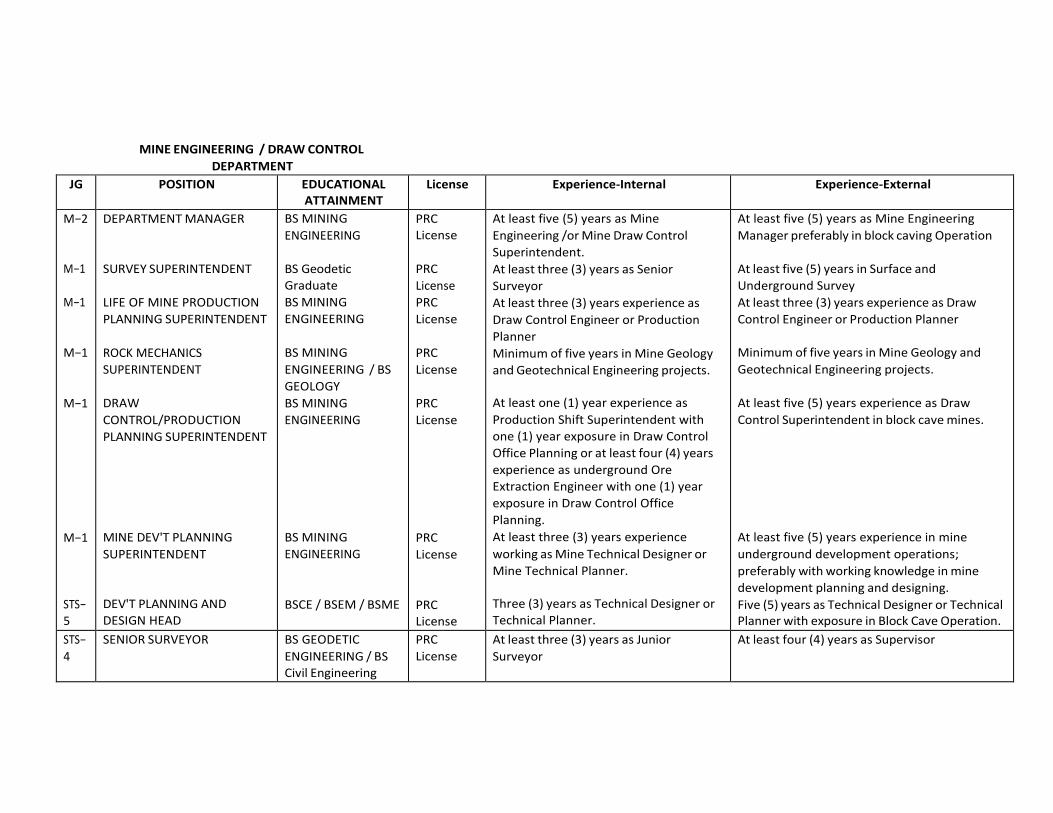
MINE ENGINEERING / DRAW CONTROL
DEPARTMENT
JG POSITION EDUCATIONAL ATTAINMENT
License Experience-Internal Experience-External
M−2
M−1
M−1
M−1
M−1
M−1
STS−
5
DEPARTMENT MANAGER
SURVEY SUPERINTENDENT
LIFE OF MINE PRODUCTION
PLANNING SUPERINTENDENT
ROCK MECHANICS
SUPERINTENDENT
DRAW
CONTROL/PRODUCTION
PLANNING SUPERINTENDENT
MINE DEV'T PLANNING
SUPERINTENDENT
DEV'T PLANNING AND
DESIGN HEAD
BS MINING
ENGINEERING
BS Geodetic
Graduate
BS MINING
ENGINEERING
BS MINING
ENGINEERING / BS
GEOLOGY
BS MINING
ENGINEERING
BS MINING
ENGINEERING
BSCE / BSEM / BSME
PRC License
PRC
License
PRC
License
PRC
License
PRC
License
PRC
License
PRC License
At least five (5) years as Mine
Engineering /or Mine Draw Control
Superintendent.
At least three (3) years as Senior
Surveyor
At least three (3) years experience as
Draw Control Engineer or Production
Planner
Minimum of five years in Mine Geology
and Geotechnical Engineering projects.
At least one (1) year experience as
Production Shift Superintendent with
one (1) year exposure in Draw Control
Office Planning or at least four (4) years
experience as underground Ore
Extraction Engineer with one (1) year
exposure in Draw Control Office
Planning.
At least three (3) years experience
working as Mine Technical Designer or
Mine Technical Planner.
Three (3) years as Technical Designer or
Technical Planner.
At least five (5) years as Mine Engineering
Manager preferably in block caving Operation
At least five (5) years in Surface and
Underground Survey
At least three (3) years experience as Draw
Control Engineer or Production Planner
Minimum of five years in Mine Geology and
Geotechnical Engineering projects.
At least five (5) years experience as Draw
Control Superintendent in block cave mines.
At least five (5) years experience in mine
underground development operations;
preferably with working knowledge in mine
development planning and designing.
Five (5) years as Technical Designer or Technical Planner with exposure in Block Cave Operation.
STS−
4
SENIOR SURVEYOR BS GEODETIC
ENGINEERING / BS Civil Engineering
PRC
License
At least three (3) years as Junior
Surveyor
At least four (4) years as Supervisor
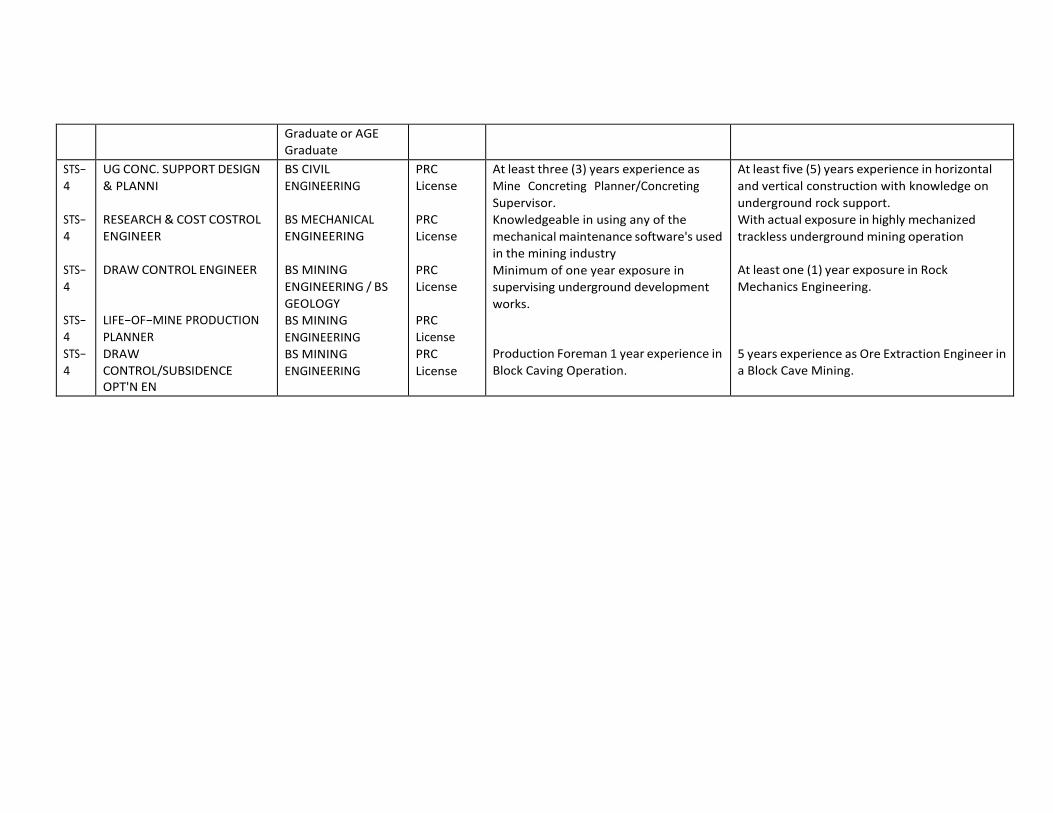
Graduate or AGE
Graduate
STS−
4
STS−
4
STS−
4
STS−
4
STS−
4
UG CONC. SUPPORT DESIGN
& PLANNI
RESEARCH & COST COSTROL
ENGINEER
DRAW CONTROL ENGINEER
LIFE−OF−MINE PRODUCTION
PLANNER
DRAW
CONTROL/SUBSIDENCE OPT'N EN
BS CIVIL
ENGINEERING
BS MECHANICAL
ENGINEERING
BS MINING
ENGINEERING / BS
GEOLOGY
BS MINING
ENGINEERING
BS MINING
ENGINEERING
PRC
License
PRC
License
PRC
License
PRC
License
PRC
License
At least three (3) years experience as
Mine Concreting Planner/Concreting
Supervisor.
Knowledgeable in using any of the
mechanical maintenance software's used
in the mining industry
Minimum of one year exposure in
supervising underground development
works.
Production Foreman 1 year experience in
Block Caving Operation.
At least five (5) years experience in horizontal
and vertical construction with knowledge on
underground rock support.
With actual exposure in highly mechanized
trackless underground mining operation
At least one (1) year exposure in Rock
Mechanics Engineering.
5 years experience as Ore Extraction Engineer in
a Block Cave Mining.
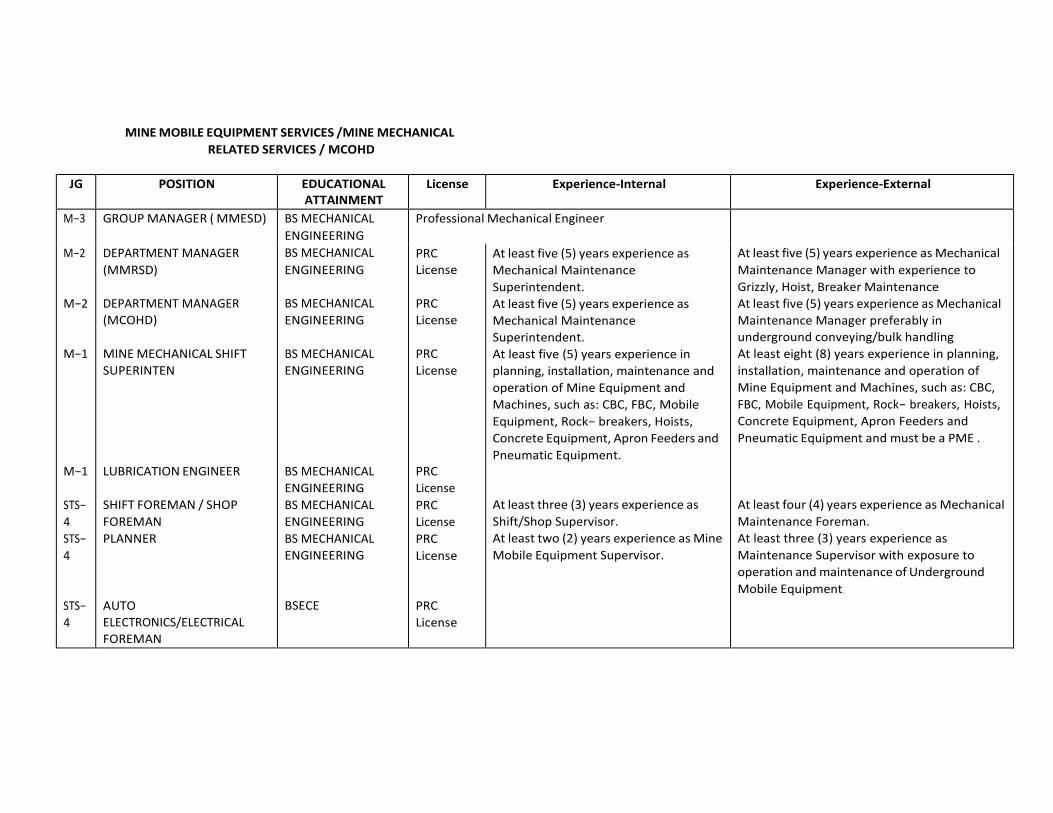
MINE MOBILE EQUIPMENT SERVICES /MINE MECHANICAL
RELATED SERVICES / MCOHD
JG POSITION EDUCATIONAL ATTAINMENT
License Experience-Internal Experience-External
M−3
M−2
M−2
M−1
M−1
STS−
4
STS−
4
STS−
4
GROUP MANAGER ( MMESD)
DEPARTMENT MANAGER
(MMRSD)
DEPARTMENT MANAGER
(MCOHD)
MINE MECHANICAL SHIFT
SUPERINTEN
LUBRICATION ENGINEER
SHIFT FOREMAN / SHOP
FOREMAN
PLANNER
AUTO
ELECTRONICS/ELECTRICAL
FOREMAN
BS MECHANICAL
ENGINEERING
BS MECHANICAL
ENGINEERING
BS MECHANICAL
ENGINEERING
BS MECHANICAL
ENGINEERING
BS MECHANICAL
ENGINEERING
BS MECHANICAL
ENGINEERING
BS MECHANICAL
ENGINEERING
BSECE
Professional Mechanical Engineer
At least five (5) years experience as Mechanical
Maintenance Manager with experience to
Grizzly, Hoist, Breaker Maintenance
At least five (5) years experience as Mechanical
Maintenance Manager preferably in
underground conveying/bulk handling
At least eight (8) years experience in planning,
installation, maintenance and operation of
Mine Equipment and Machines, such as: CBC,
FBC, Mobile Equipment, Rock− breakers, Hoists,
Concrete Equipment, Apron Feeders and
Pneumatic Equipment and must be a PME .
At least four (4) years experience as Mechanical
Maintenance Foreman.
At least three (3) years experience as
Maintenance Supervisor with exposure to
operation and maintenance of Underground
Mobile Equipment.
PRC License
PRC
License
PRC
License
PRC
License
PRC
License
PRC
License
PRC
License
At least five (5) years experience as
Mechanical Maintenance
Superintendent.
At least five (5) years experience as
Mechanical Maintenance
Superintendent.
At least five (5) years experience in
planning, installation, maintenance and
operation of Mine Equipment and
Machines, such as: CBC, FBC, Mobile
Equipment, Rock− breakers, Hoists,
Concrete Equipment, Apron Feeders and
Pneumatic Equipment.
At least three (3) years experience as
Shift/Shop Supervisor.
At least two (2) years experience as Mine
Mobile Equipment Supervisor.
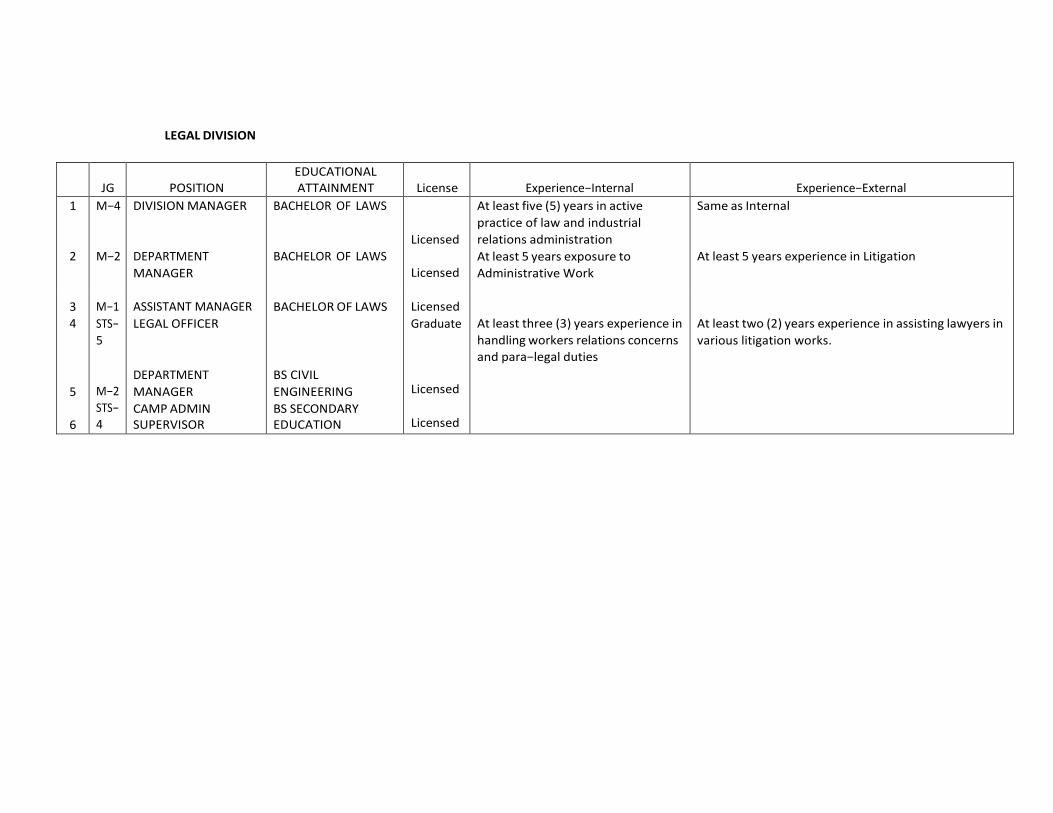
LEGAL DIVISION
JG
POSITION EDUCATIONAL ATTAINMENT
License
Experience−Internal
Experience−External
1
2
M−4
M−2
DIVISION MANAGER
DEPARTMENT
MANAGER
BACHELOR OF LAWS
BACHELOR OF LAWS
Licensed
Licensed
At least five (5) years in active
practice of law and industrial
relations administration
At least 5 years exposure to
Administrative Work
Same as Internal
At least 5 years experience in Litigation
3
4
M−1
STS−
5
ASSISTANT MANAGER
LEGAL OFFICER
BACHELOR OF LAWS Licensed
Graduate
At least three (3) years experience in
handling workers relations concerns
and para−legal duties
At least two (2) years experience in assisting lawyers in
various litigation works.
5
6
M−2
STS−
4
DEPARTMENT
MANAGER
CAMP ADMIN SUPERVISOR
BS CIVIL
ENGINEERING
BS SECONDARY EDUCATION
Licensed
Licensed
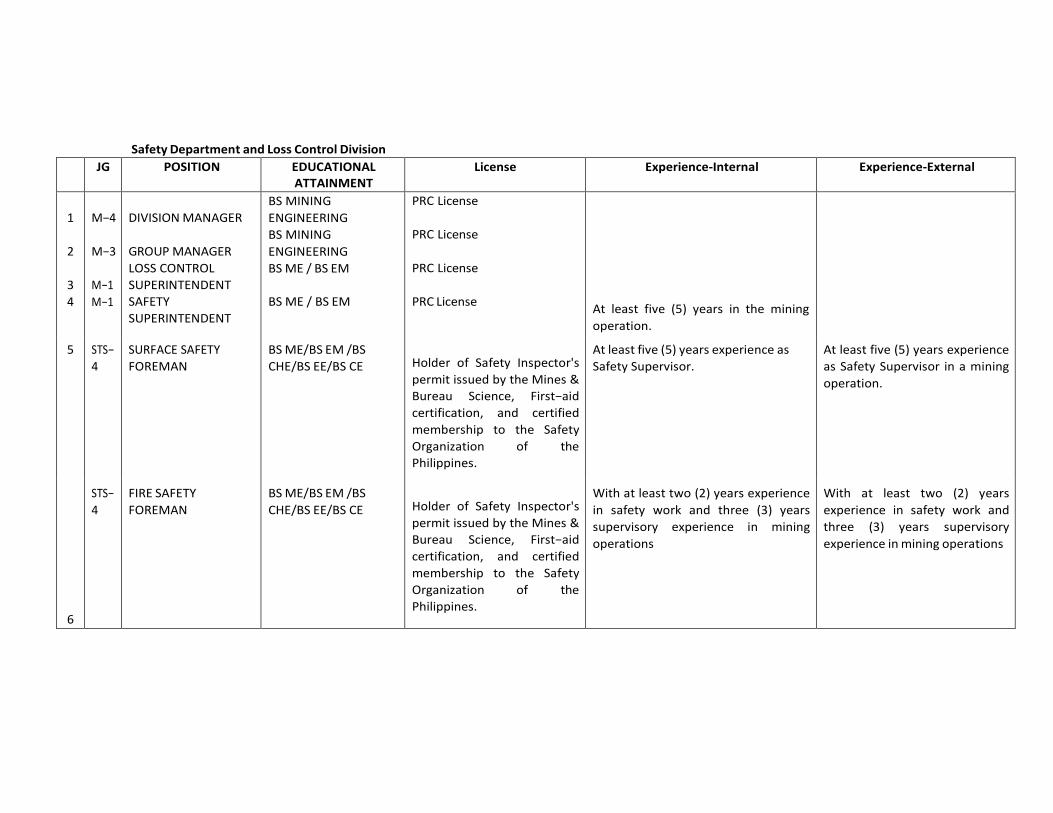
Safety Department and Loss Control Division
JG POSITION EDUCATIONAL ATTAINMENT
License Experience-Internal Experience-External
1
2
3
4
M−4
M−3
M−1
M−1
DIVISION MANAGER
GROUP MANAGER
LOSS CONTROL
SUPERINTENDENT
SAFETY
SUPERINTENDENT
BS MINING
ENGINEERING
BS MINING
ENGINEERING
BS ME / BS EM
BS ME / BS EM
PRC License
PRC License
PRC License
PRC License
At least five (5) years in the mining
operation.
5 STS−
4
SURFACE SAFETY
FOREMAN
BS ME/BS EM /BS
CHE/BS EE/BS CE
Holder of Safety Inspector's
permit issued by the Mines &
Bureau Science, First−aid
certification, and certified
membership to the Safety
Organization of the
Philippines.
At least five (5) years experience as
Safety Supervisor.
At least five (5) years experience
as Safety Supervisor in a mining
operation.
6
STS−
4
FIRE SAFETY
FOREMAN
BS ME/BS EM /BS
CHE/BS EE/BS CE
Holder of Safety Inspector's
permit issued by the Mines &
Bureau Science, First−aid
certification, and certified
membership to the Safety
Organization of the
Philippines.
With at least two (2) years experience
in safety work and three (3) years
supervisory experience in mining
operations
With at least two (2) years
experience in safety work and
three (3) years supervisory
experience in mining operations
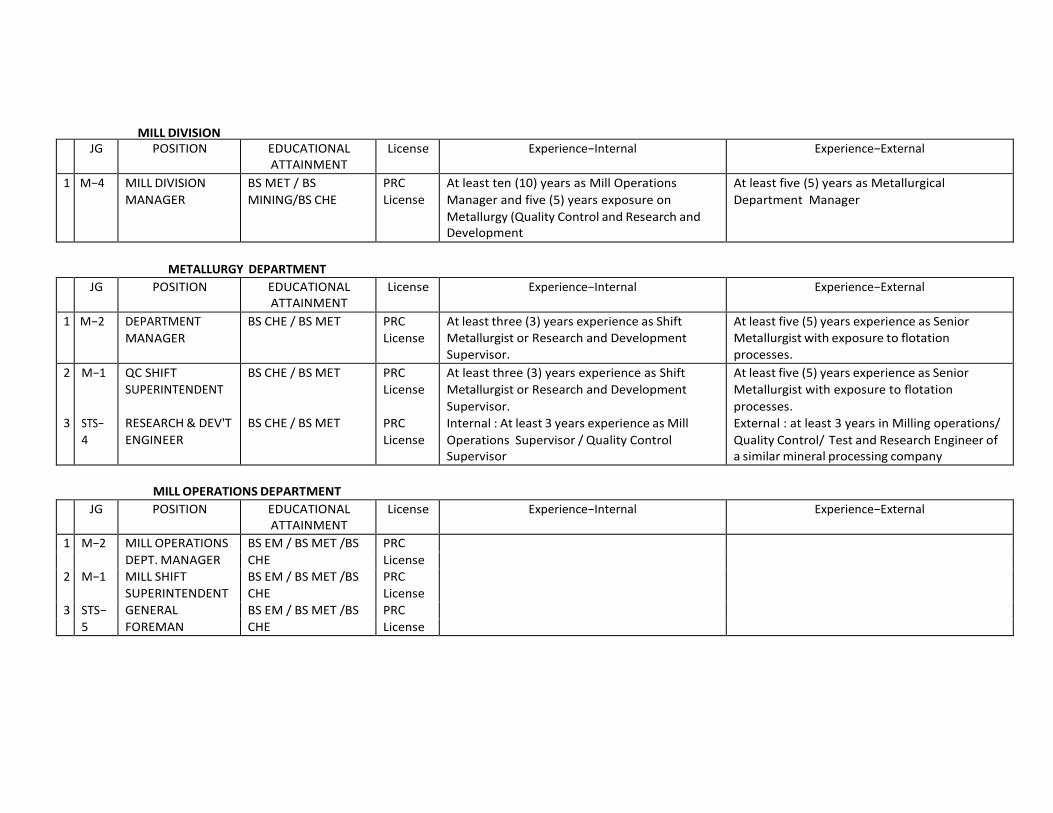
MILL DIVISION
JG POSITION EDUCATIONAL ATTAINMENT
License Experience−Internal Experience−External
1 M−4 MILL DIVISION
MANAGER
BS MET / BS
MINING/BS CHE
PRC
License
At least ten (10) years as Mill Operations
Manager and five (5) years exposure on
Metallurgy (Quality Control and Research and Development
At least five (5) years as Metallurgical
Department Manager
METALLURGY DEPARTMENT
JG POSITION EDUCATIONAL ATTAINMENT
License Experience−Internal Experience−External
1 M−2 DEPARTMENT
MANAGER
BS CHE / BS MET PRC
License
At least three (3) years experience as Shift
Metallurgist or Research and Development
Supervisor.
At least five (5) years experience as Senior
Metallurgist with exposure to flotation
processes.
2
3
M−1
STS−
4
QC SHIFT
SUPERINTENDENT
RESEARCH & DEV'T
ENGINEER
BS CHE / BS MET
BS CHE / BS MET
PRC
License
PRC
License
At least three (3) years experience as Shift
Metallurgist or Research and Development
Supervisor.
Internal : At least 3 years experience as Mill
Operations Supervisor / Quality Control Supervisor
At least five (5) years experience as Senior
Metallurgist with exposure to flotation
processes.
External : at least 3 years in Milling operations/
Quality Control/ Test and Research Engineer of a similar mineral processing company
MILL OPERATIONS DEPARTMENT
JG POSITION EDUCATIONAL ATTAINMENT
License Experience−Internal Experience−External
1 M−2 MILL OPERATIONS BS EM / BS MET /BS PRC
DEPT. MANAGER CHE License
2 M−1 MILL SHIFT BS EM / BS MET /BS PRC SUPERINTENDENT CHE License
3 STS− GENERAL BS EM / BS MET /BS PRC 5 FOREMAN CHE License
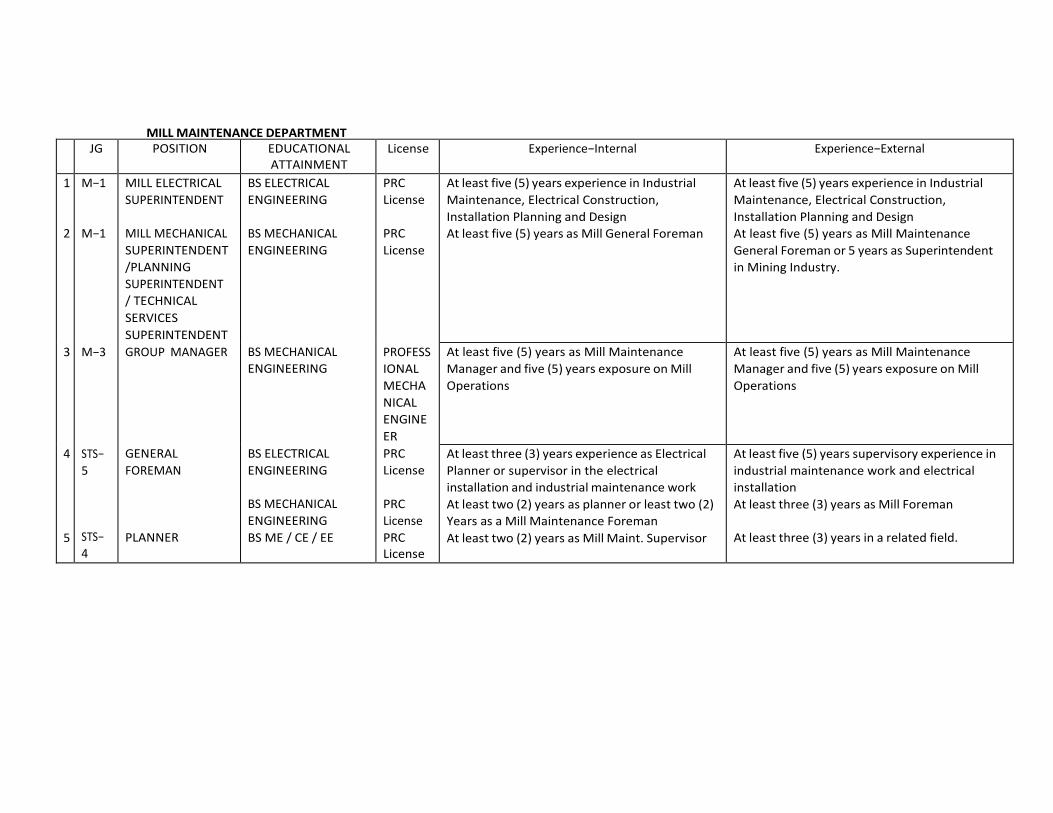
MILL MAINTENANCE DEPARTMENT
JG POSITION EDUCATIONAL ATTAINMENT
License Experience−Internal Experience−External
1
2
3
4
5
M−1
M−1
M−3
STS−
5
STS−
4
MILL ELECTRICAL
SUPERINTENDENT
MILL MECHANICAL
SUPERINTENDENT
/PLANNING
SUPERINTENDENT
/ TECHNICAL
SERVICES
SUPERINTENDENT
GROUP MANAGER
GENERAL
FOREMAN
PLANNER
BS ELECTRICAL
ENGINEERING
BS MECHANICAL
ENGINEERING
BS MECHANICAL
ENGINEERING
BS ELECTRICAL
ENGINEERING
BS MECHANICAL
ENGINEERING
BS ME / CE / EE
PRC
License
PRC
License
PROFESS
IONAL
MECHA
NICAL
ENGINE
ER
PRC
License
PRC
License
PRC License
At least five (5) years experience in Industrial
Maintenance, Electrical Construction,
Installation Planning and Design
At least five (5) years as Mill General Foreman
At least five (5) years experience in Industrial
Maintenance, Electrical Construction,
Installation Planning and Design
At least five (5) years as Mill Maintenance
General Foreman or 5 years as Superintendent
in Mining Industry.
At least five (5) years as Mill Maintenance
Manager and five (5) years exposure on Mill
Operations
At least five (5) years as Mill Maintenance
Manager and five (5) years exposure on Mill
Operations
At least three (3) years experience as Electrical
Planner or supervisor in the electrical
installation and industrial maintenance work
At least two (2) years as planner or least two (2)
Years as a Mill Maintenance Foreman
At least two (2) years as Mill Maint. Supervisor
At least five (5) years supervisory experience in
industrial maintenance work and electrical
installation
At least three (3) years as Mill Foreman
At least three (3) years in a related field.
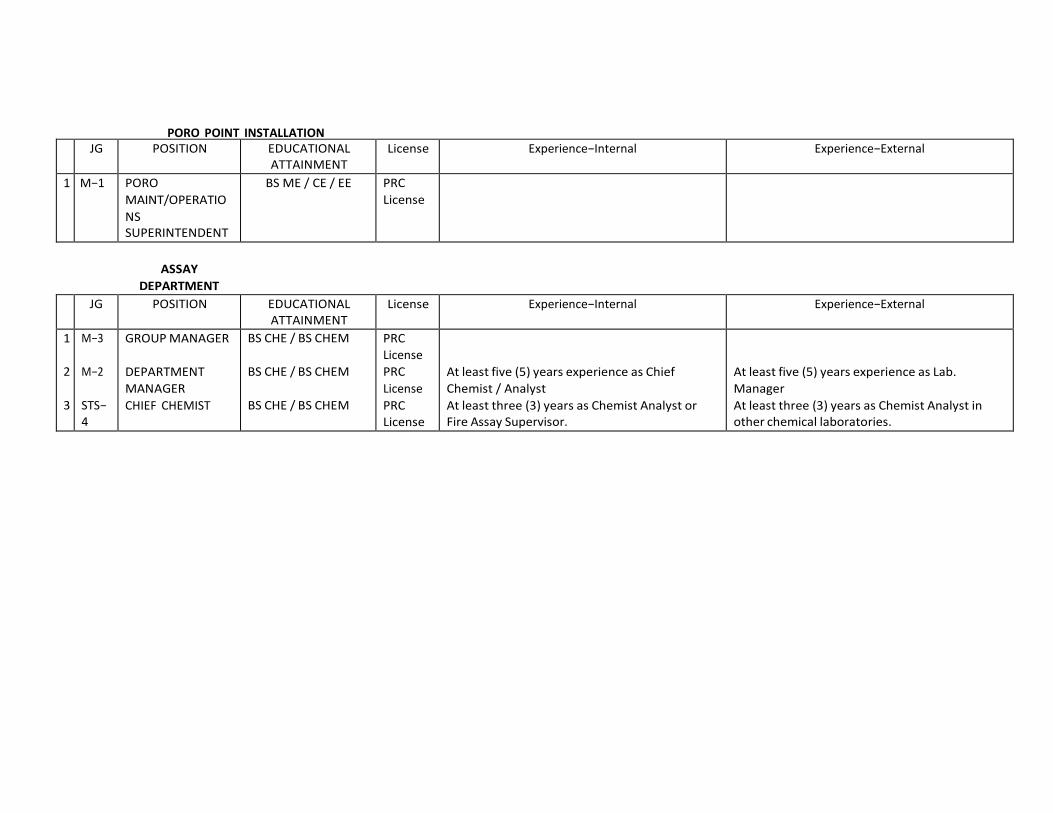
PORO POINT INSTALLATION
JG POSITION EDUCATIONAL ATTAINMENT
License Experience−Internal Experience−External
1 M−1 PORO
MAINT/OPERATIO
NS SUPERINTENDENT
BS ME / CE / EE PRC
License
ASSAY
DEPARTMENT
JG POSITION EDUCATIONAL ATTAINMENT
License Experience−Internal Experience−External
1
2
3
M−3
M−2
STS− 4
GROUP MANAGER
DEPARTMENT
MANAGER
CHIEF CHEMIST
BS CHE / BS CHEM
BS CHE / BS CHEM
BS CHE / BS CHEM
PRC
License
PRC
License
PRC License
At least five (5) years experience as Chief
Chemist / Analyst
At least three (3) years as Chemist Analyst or Fire Assay Supervisor.
At least five (5) years experience as Lab.
Manager
At least three (3) years as Chemist Analyst in other chemical laboratories.
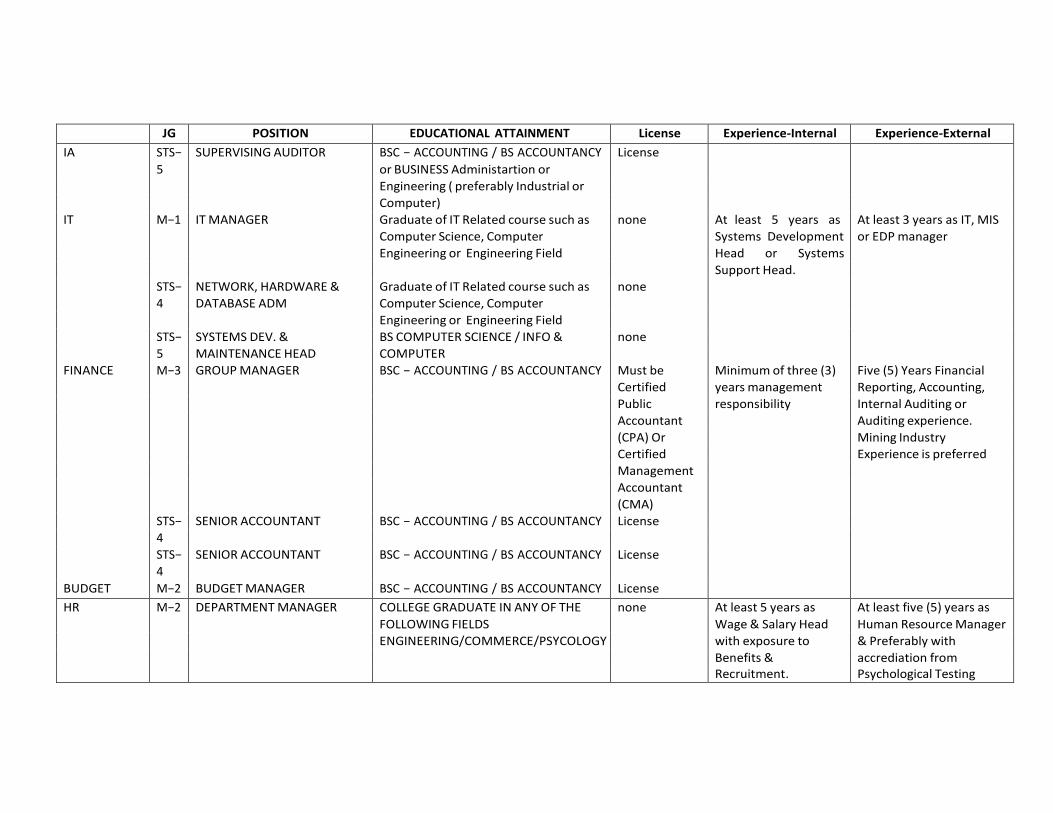
JG POSITION EDUCATIONAL ATTAINMENT License Experience-Internal Experience-External
IA STS− SUPERVISING AUDITOR BSC − ACCOUNTING / BS ACCOUNTANCY License
5 or BUSINESS Administartion or
Engineering ( preferably Industrial or
Computer)
IT M−1 IT MANAGER Graduate of IT Related course such as none At least 5 years as At least 3 years as IT, MIS Computer Science, Computer Systems Development or EDP manager Engineering or Engineering Field Head or Systems
Support Head.
STS− NETWORK, HARDWARE & Graduate of IT Related course such as none
4 DATABASE ADM Computer Science, Computer
Engineering or Engineering Field
STS− SYSTEMS DEV. & BS COMPUTER SCIENCE / INFO & none
5 MAINTENANCE HEAD COMPUTER
FINANCE M−3 GROUP MANAGER BSC − ACCOUNTING / BS ACCOUNTANCY Must be Minimum of three (3) Five (5) Years Financial Certified years management Reporting, Accounting, Public responsibility Internal Auditing or Accountant Auditing experience. (CPA) Or Mining Industry Certified Experience is preferred Management
Accountant
(CMA)
STS− SENIOR ACCOUNTANT BSC − ACCOUNTING / BS ACCOUNTANCY License
4
STS− SENIOR ACCOUNTANT BSC − ACCOUNTING / BS ACCOUNTANCY License
4
BUDGET M−2 BUDGET MANAGER BSC − ACCOUNTING / BS ACCOUNTANCY License
HR M−2 DEPARTMENT MANAGER COLLEGE GRADUATE IN ANY OF THE none At least 5 years as At least five (5) years as FOLLOWING FIELDS Wage & Salary Head Human Resource Manager ENGINEERING/COMMERCE/PSYCOLOGY with exposure to & Preferably with Benefits & accrediation from Recruitment. Psychological Testing
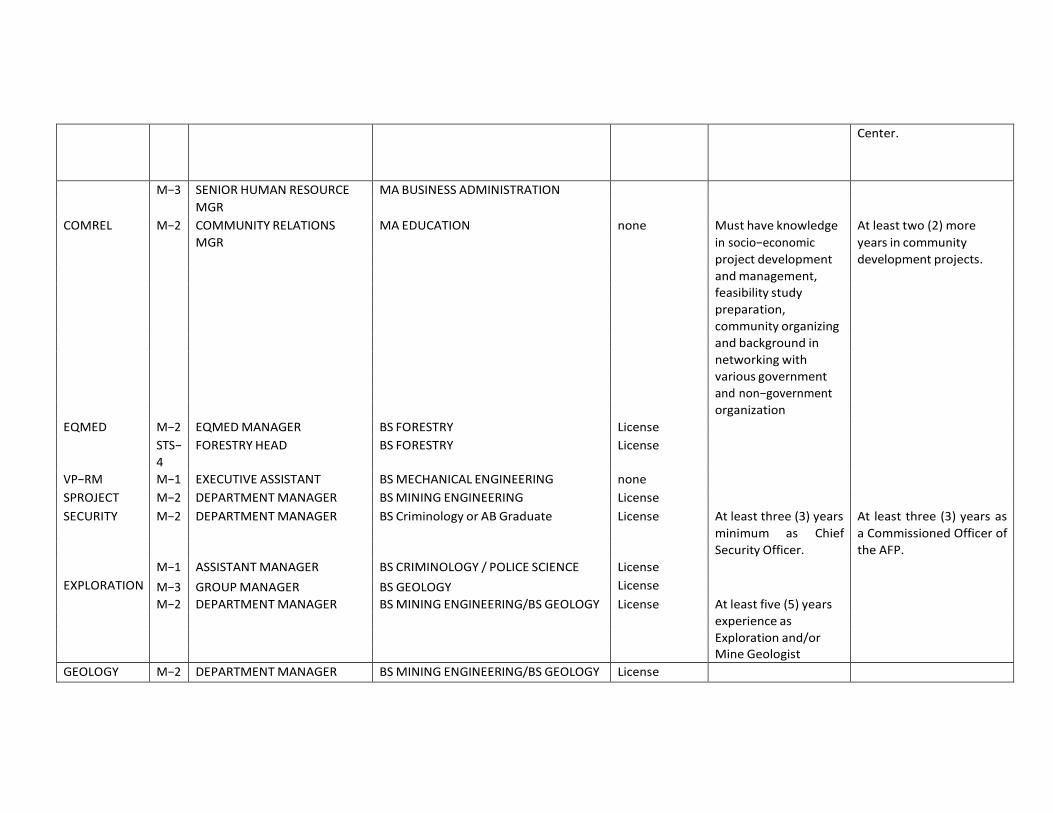
Center.
M−3 SENIOR HUMAN RESOURCE MA BUSINESS ADMINISTRATION
MGR
COMREL M−2 COMMUNITY RELATIONS MA EDUCATION none Must have knowledge At least two (2) more MGR in socio−economic years in community project development development projects. and management,
feasibility study
preparation,
community organizing
and background in
networking with
various government
and non−government
organization
EQMED M−2 EQMED MANAGER BS FORESTRY License
STS− FORESTRY HEAD BS FORESTRY License
4
VP−RM M−1 EXECUTIVE ASSISTANT BS MECHANICAL ENGINEERING none
SPROJECT M−2 DEPARTMENT MANAGER BS MINING ENGINEERING License
SECURITY M−2 DEPARTMENT MANAGER BS Criminology or AB Graduate License At least three (3) years At least three (3) years as minimum as Chief a Commissioned Officer of Security Officer. the AFP. M−1 ASSISTANT MANAGER BS CRIMINOLOGY / POLICE SCIENCE License
EXPLORATION M−3 GROUP MANAGER BS GEOLOGY License
M−2 DEPARTMENT MANAGER BS MINING ENGINEERING/BS GEOLOGY License At least five (5) years
experience as
Exploration and/or
Mine Geologist
GEOLOGY M−2 DEPARTMENT MANAGER BS MINING ENGINEERING/BS GEOLOGY License
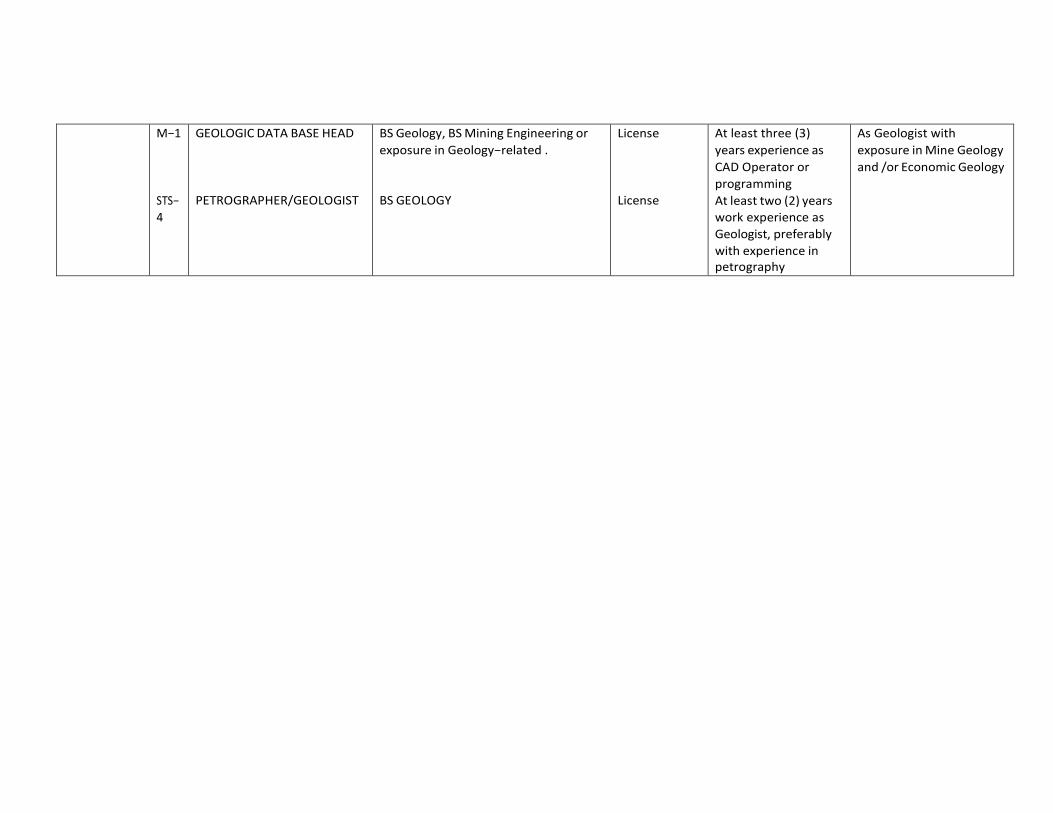
M−1
STS−
4
GEOLOGIC DATA BASE HEAD
PETROGRAPHER/GEOLOGIST
BS Geology, BS Mining Engineering or
exposure in Geology−related .
BS GEOLOGY
License
License
At least three (3)
years experience as
CAD Operator or
programming
At least two (2) years
work experience as
Geologist, preferably
with experience in petrography
As Geologist with
exposure in Mine Geology
and /or Economic Geology
PADCAL Operations
April 2013
Annex D: Environment and Community
Annex D-3: Padcal Table of
Organization
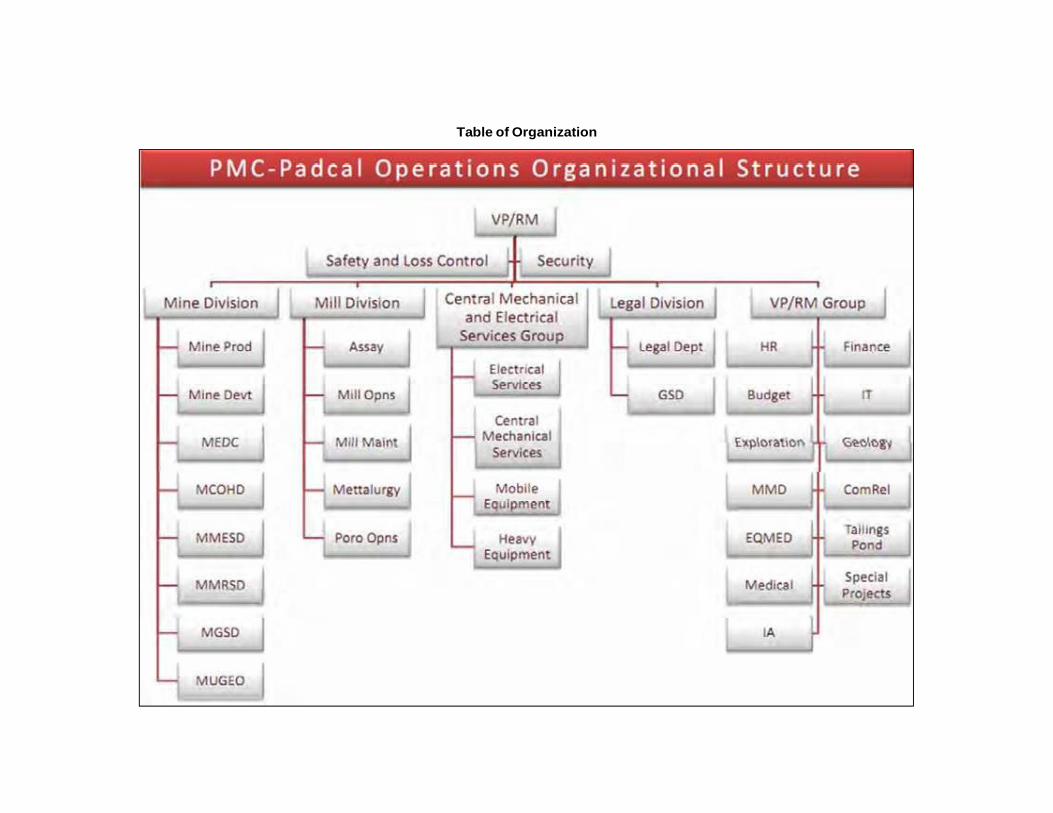
Table of Organization
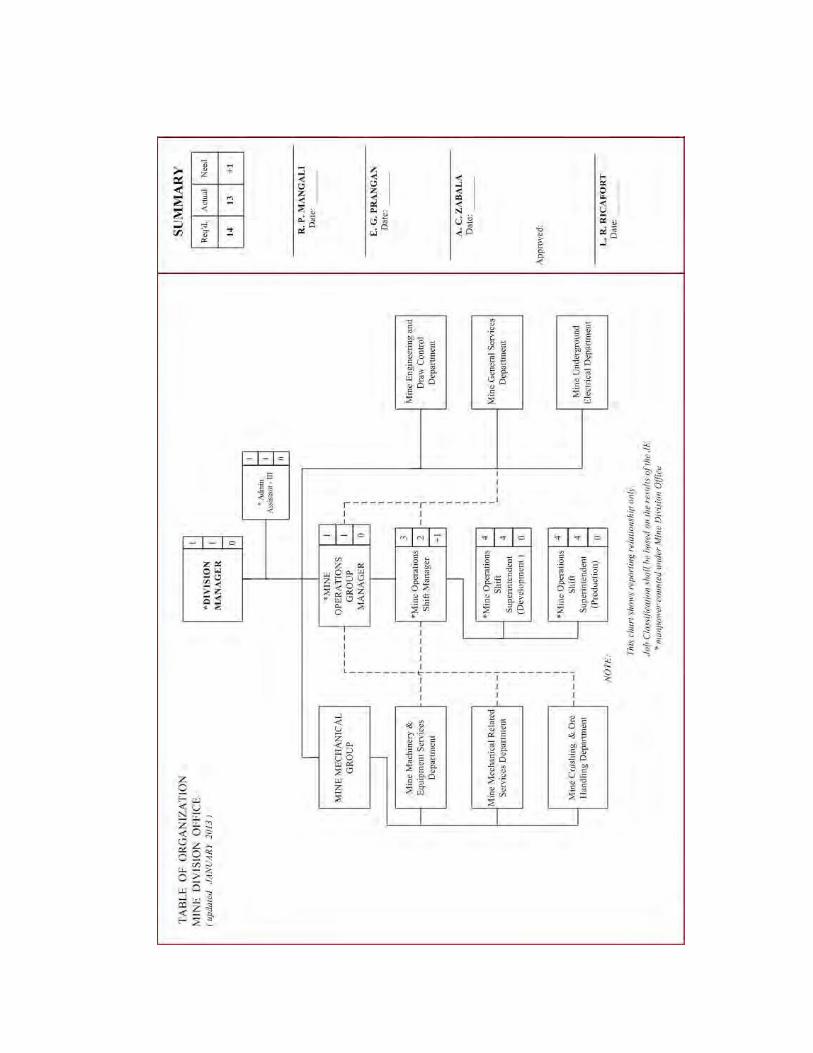
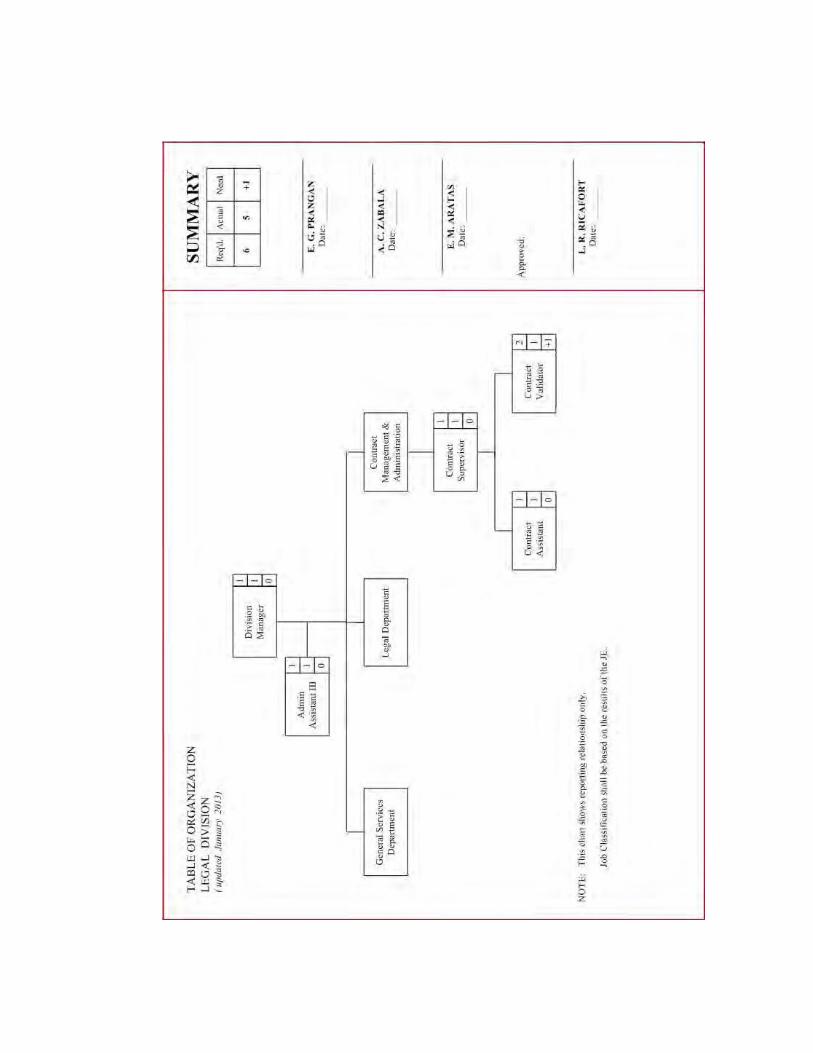
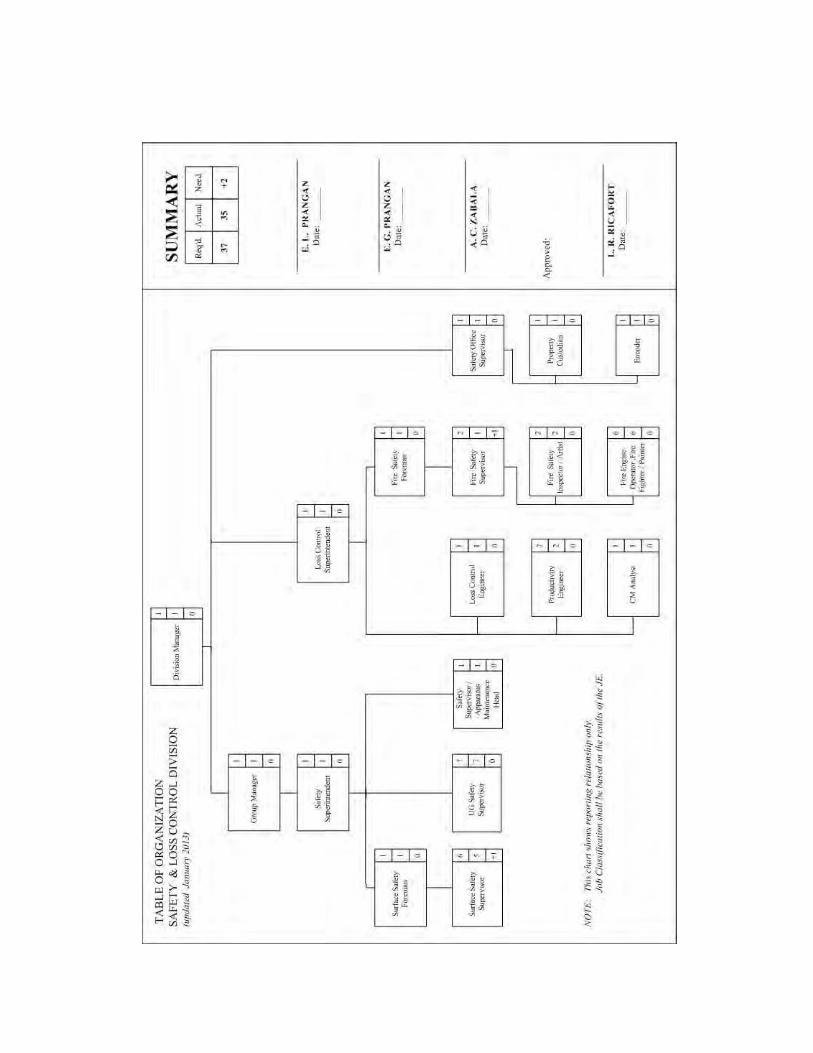
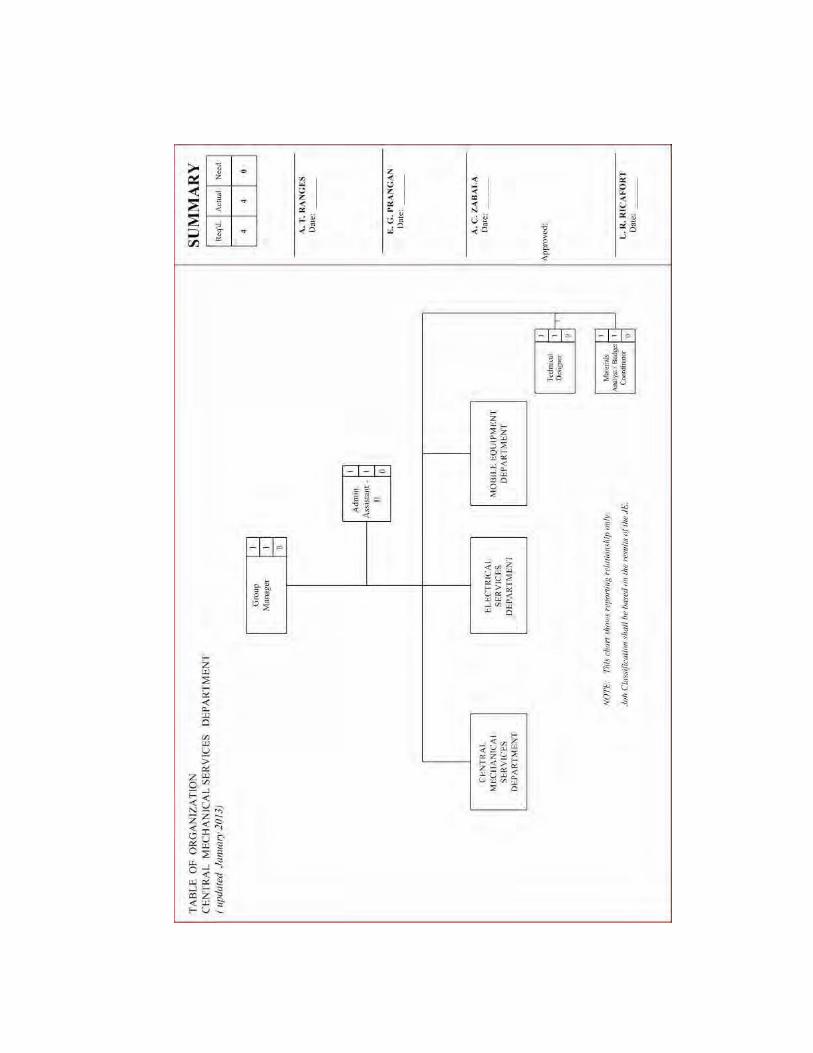
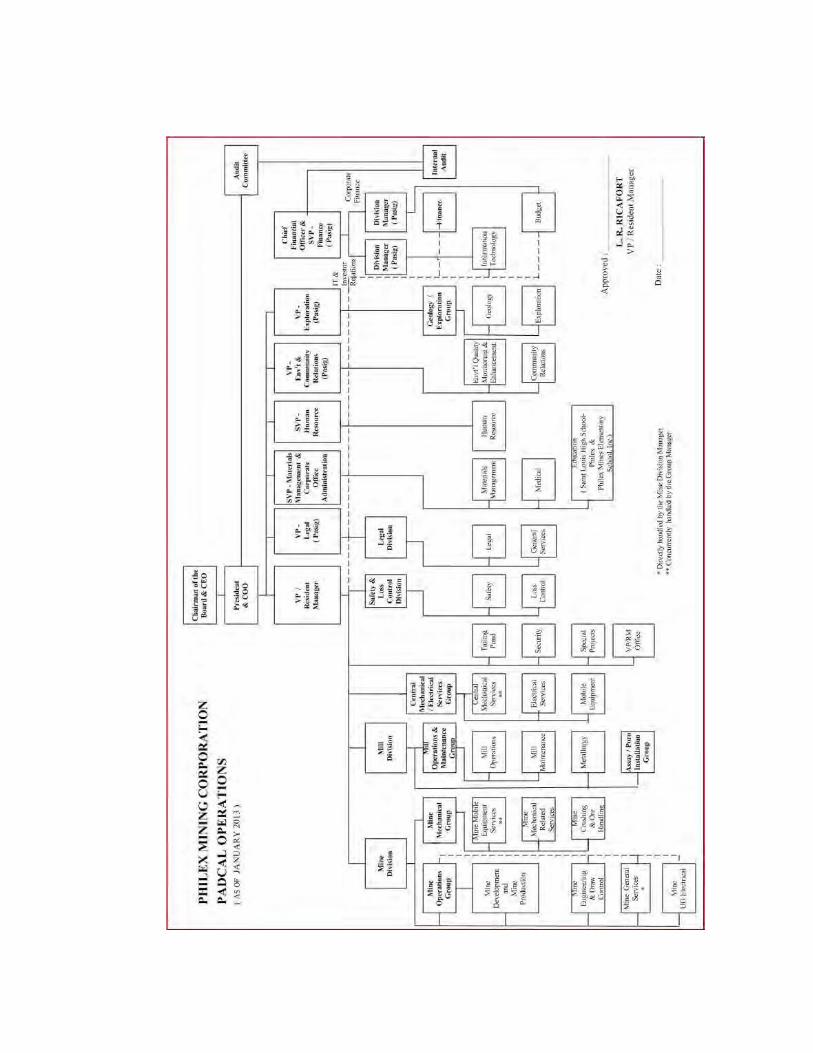
PADCAL Operations
April 2013
Annex D: Environment and Community
Annex D-4: Community Development
Program
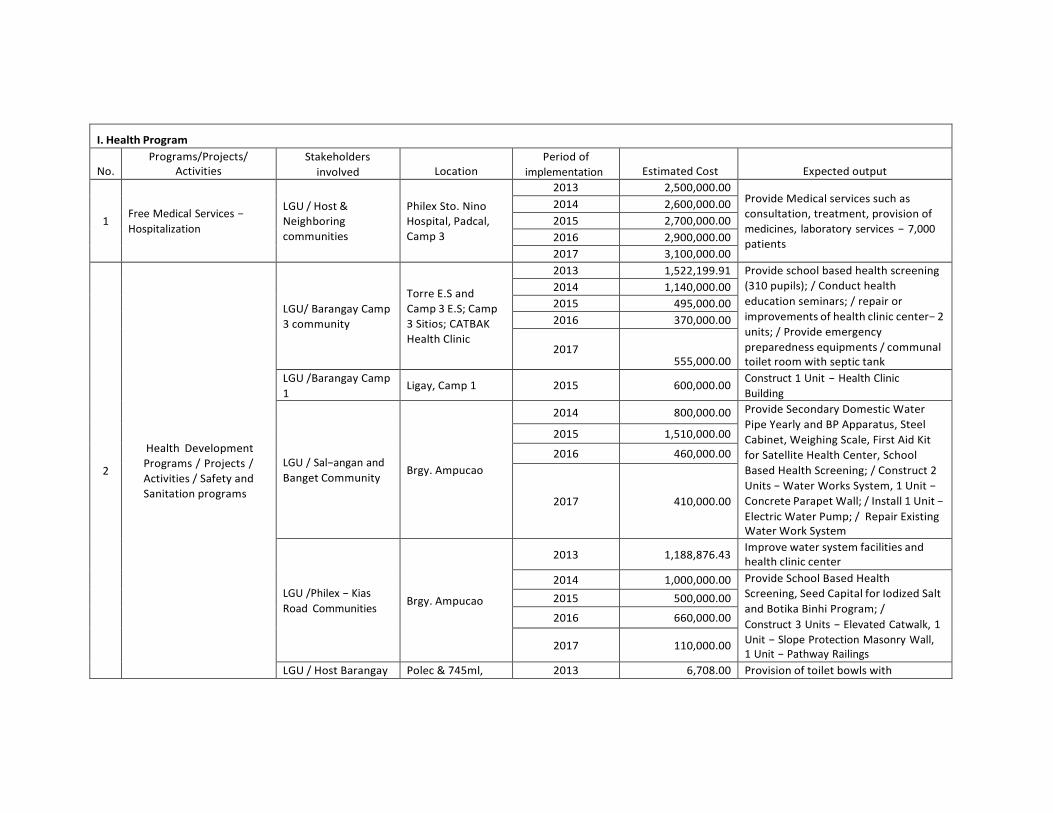
I. Health Program
No.
Programs/Projects/ Activities
Stakeholders
involved
Location Period of
implementation
Estimated Cost
Expected output
1
Free Medical Services −
Hospitalization
LGU / Host &
Neighboring
communities
Philex Sto. Nino
Hospital, Padcal,
Camp 3
2013 2,500,000.00
Provide Medical services such as
consultation, treatment, provision of
medicines, laboratory services − 7,000
patients
2014 2,600,000.00
2015 2,700,000.00
2016 2,900,000.00
2017 3,100,000.00
2
Health Development
Programs / Projects /
Activities / Safety and
Sanitation programs
LGU/ Barangay Camp
3 community
Torre E.S and
Camp 3 E.S; Camp
3 Sitios; CATBAK
Health Clinic
2013 1,522,199.91 Provide school based health screening
(310 pupils); / Conduct health
education seminars; / repair or
improvements of health clinic center− 2
units; / Provide emergency
preparedness equipments / communal toilet room with septic tank
2014 1,140,000.00
2015 495,000.00
2016 370,000.00
2017
555,000.00
LGU /Barangay Camp
1 Ligay, Camp 1 2015 600,000.00
Construct 1 Unit − Health Clinic
Building
LGU / Sal−angan and
Banget Community
Brgy. Ampucao
2014 800,000.00 Provide Secondary Domestic Water
Pipe Yearly and BP Apparatus, Steel
Cabinet, Weighing Scale, First Aid Kit
for Satellite Health Center, School
Based Health Screening; / Construct 2
Units − Water Works System, 1 Unit −
Concrete Parapet Wall; / Install 1 Unit −
Electric Water Pump; / Repair Existing Water Work System
2015 1,510,000.00
2016 460,000.00
2017
410,000.00
LGU /Philex − Kias
Road Communities
Brgy. Ampucao
2013 1,188,876.43 Improve water system facilities and health clinic center
2014 1,000,000.00 Provide School Based Health
Screening, Seed Capital for Iodized Salt
and Botika Binhi Program; /
Construct 3 Units − Elevated Catwalk, 1
Unit − Slope Protection Masonry Wall, 1 Unit − Pathway Railings
2015 500,000.00
2016 660,000.00
2017 110,000.00
LGU / Host Barangay Polec & 745ml, 2013 6,708.00 Provision of toilet bowls with
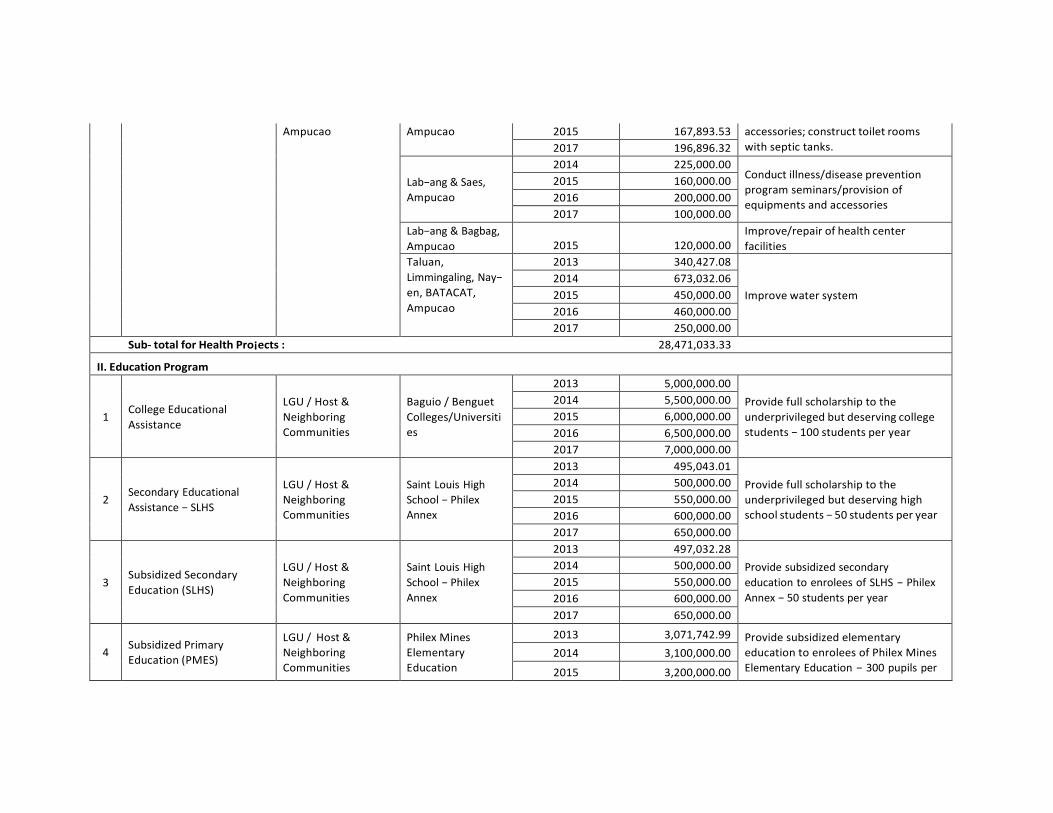
Ampucao Ampucao 2015 167,893.53 accessories; construct toilet rooms
with septic tanks. 2017 196,896.32
Lab−ang & Saes,
Ampucao
2014 225,000.00 Conduct illness/disease prevention
program seminars/provision of
equipments and accessories
2015 160,000.00
2016 200,000.00
2017 100,000.00
Lab−ang & Bagbag,
Ampucao
2015
120,000.00 Improve/repair of health center
facilities
Taluan,
Limmingaling, Nay−
en, BATACAT,
Ampucao
2013 340,427.08
Improve water system
2014 673,032.06
2015 450,000.00
2016 460,000.00
2017 250,000.00
Sub- total for Health Pro¡ects : 28,471,033.33
II. Education Program
1
College Educational
Assistance
LGU / Host &
Neighboring
Communities
Baguio / Benguet
Colleges/Universiti
es
2013 5,000,000.00 Provide full scholarship to the
underprivileged but deserving college
students − 100 students per year
2014 5,500,000.00
2015 6,000,000.00
2016 6,500,000.00
2017 7,000,000.00
2
Secondary Educational
Assistance − SLHS
LGU / Host &
Neighboring
Communities
Saint Louis High
School − Philex
Annex
2013 495,043.01 Provide full scholarship to the
underprivileged but deserving high
school students − 50 students per year
2014 500,000.00
2015 550,000.00
2016 600,000.00
2017 650,000.00
3
Subsidized Secondary
Education (SLHS)
LGU / Host &
Neighboring
Communities
Saint Louis High
School − Philex
Annex
2013 497,032.28 Provide subsidized secondary
education to enrolees of SLHS − Philex
Annex − 50 students per year
2014 500,000.00
2015 550,000.00
2016 600,000.00
2017 650,000.00
4
Subsidized Primary
Education (PMES)
LGU / Host &
Neighboring
Communities
Philex Mines
Elementary
Education
2013 3,071,742.99 Provide subsidized elementary
education to enrolees of Philex Mines
Elementary Education − 300 pupils per 2014 3,100,000.00
2015 3,200,000.00
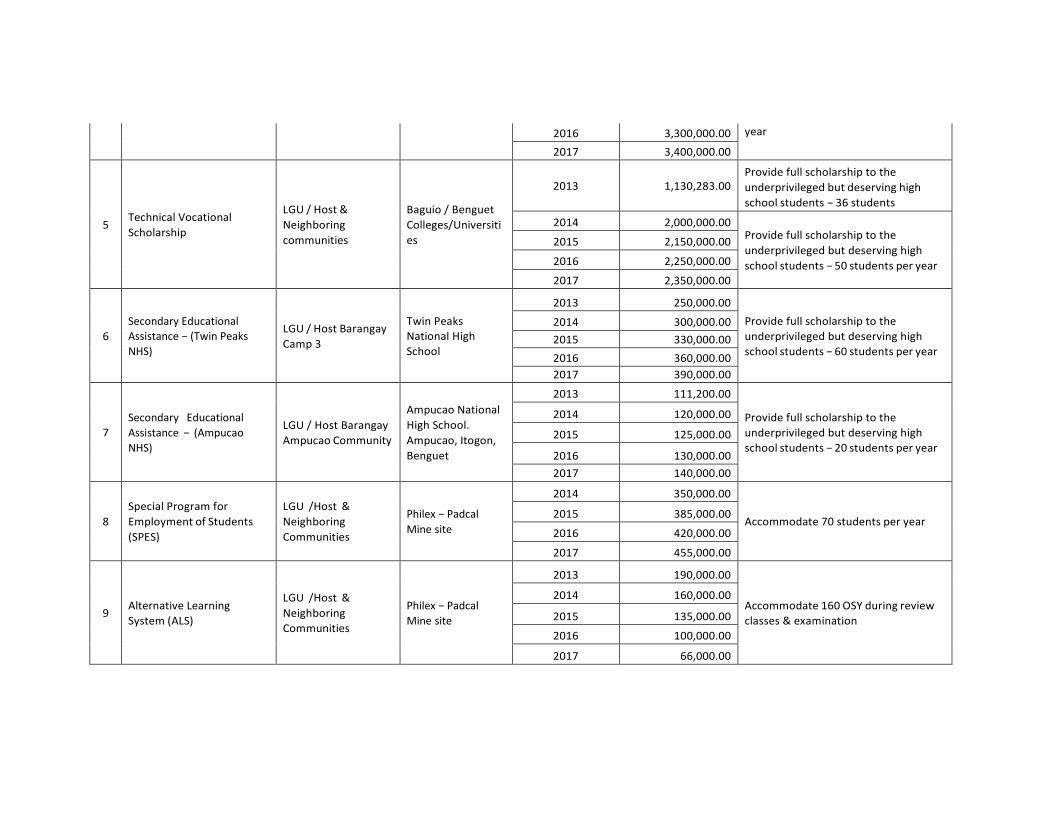
2016 3,300,000.00 year
2017 3,400,000.00
5
Technical Vocational
Scholarship
LGU / Host &
Neighboring
communities
Baguio / Benguet
Colleges/Universiti
es
2013
1,130,283.00
Provide full scholarship to the
underprivileged but deserving high
school students − 36 students
2014 2,000,000.00 Provide full scholarship to the
underprivileged but deserving high
school students − 50 students per year
2015 2,150,000.00
2016 2,250,000.00
2017 2,350,000.00
6
Secondary Educational
Assistance − (Twin Peaks
NHS)
LGU / Host Barangay
Camp 3
Twin Peaks
National High
School
2013 250,000.00
Provide full scholarship to the
underprivileged but deserving high
school students − 60 students per year
2014 300,000.00
2015 330,000.00
2016 360,000.00
2017 390,000.00
7
Secondary Educational
Assistance − (Ampucao
NHS)
LGU / Host Barangay
Ampucao Community
Ampucao National
High School.
Ampucao, Itogon,
Benguet
2013 111,200.00
Provide full scholarship to the
underprivileged but deserving high
school students − 20 students per year
2014 120,000.00
2015 125,000.00
2016 130,000.00
2017 140,000.00
8
Special Program for
Employment of Students
(SPES)
LGU /Host &
Neighboring
Communities
Philex − Padcal
Mine site
2014 350,000.00
Accommodate 70 students per year
2015 385,000.00
2016 420,000.00
2017 455,000.00
9
Alternative Learning
System (ALS)
LGU /Host &
Neighboring
Communities
Philex − Padcal
Mine site
2013 190,000.00
Accommodate 160 OSY during review
classes & examination
2014 160,000.00
2015 135,000.00
2016 100,000.00
2017 66,000.00
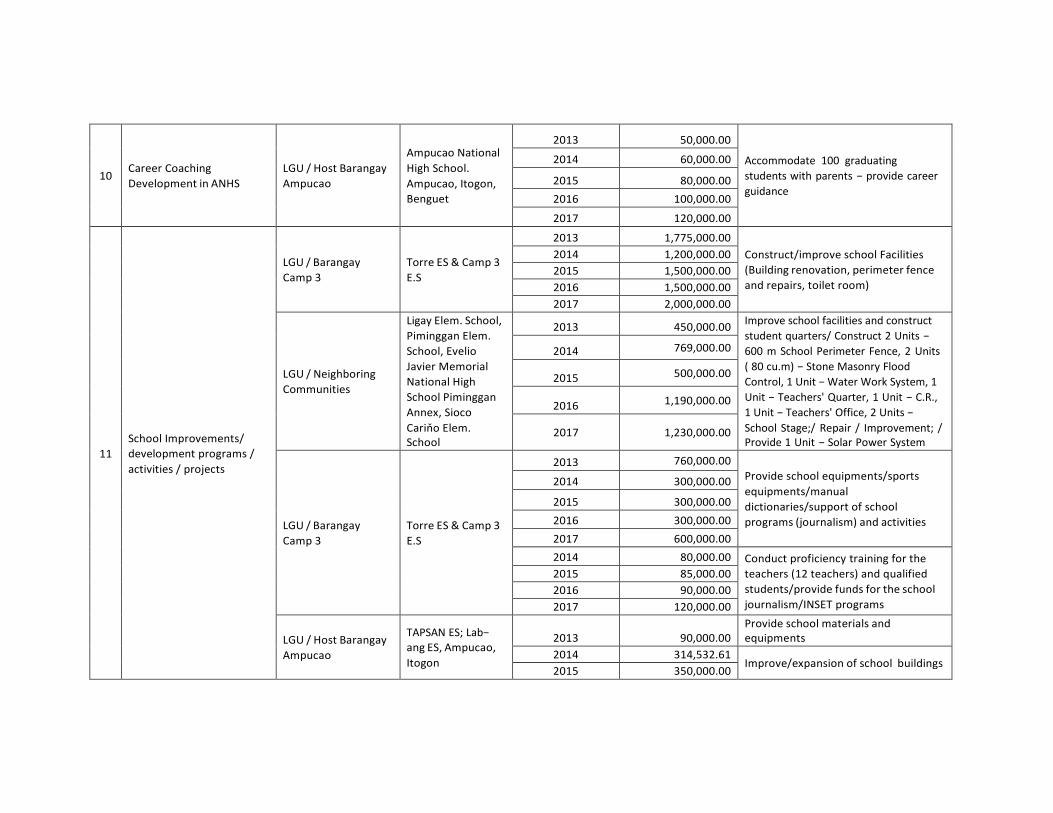
10
Career Coaching
Development in ANHS
LGU / Host Barangay
Ampucao
Ampucao National
High School.
Ampucao, Itogon,
Benguet
2013 50,000.00
Accommodate 100 graduating
students with parents − provide career
guidance
2014 60,000.00
2015 80,000.00
2016 100,000.00
2017 120,000.00
11
School Improvements/
development programs /
activities / projects
LGU / Barangay
Camp 3
Torre ES & Camp 3
E.S
2013 1,775,000.00 Construct/improve school Facilities
(Building renovation, perimeter fence
and repairs, toilet room)
2014 1,200,000.00
2015 1,500,000.00
2016 1,500,000.00
2017 2,000,000.00
LGU / Neighboring
Communities
Ligay Elem. School,
Piminggan Elem.
School, Evelio
Javier Memorial
National High
School Piminggan
Annex, Sioco
Cariňo Elem. School
2013 450,000.00 Improve school facilities and construct
student quarters/ Construct 2 Units −
600 m School Perimeter Fence, 2 Units
( 80 cu.m) − Stone Masonry Flood
Control, 1 Unit − Water Work System, 1
Unit − Teachers' Quarter, 1 Unit − C.R.,
1 Unit − Teachers' Office, 2 Units −
School Stage;/ Repair / Improvement; / Provide 1 Unit − Solar Power System
2014 769,000.00
2015 500,000.00
2016 1,190,000.00
2017 1,230,000.00
LGU / Barangay
Camp 3
Torre ES & Camp 3
E.S
2013 760,000.00 Provide school equipments/sports
equipments/manual
dictionaries/support of school
programs (journalism) and activities
2014 300,000.00
2015 300,000.00
2016 300,000.00
2017 600,000.00
2014 80,000.00 Conduct proficiency training for the
teachers (12 teachers) and qualified
students/provide funds for the school
journalism/INSET programs
2015 85,000.00
2016 90,000.00
2017 120,000.00
LGU / Host Barangay
Ampucao
TAPSAN ES; Lab−
ang ES, Ampucao,
Itogon
2013
90,000.00
Provide school materials and equipments
2014 314,532.61 Improve/expansion of school buildings
2015 350,000.00
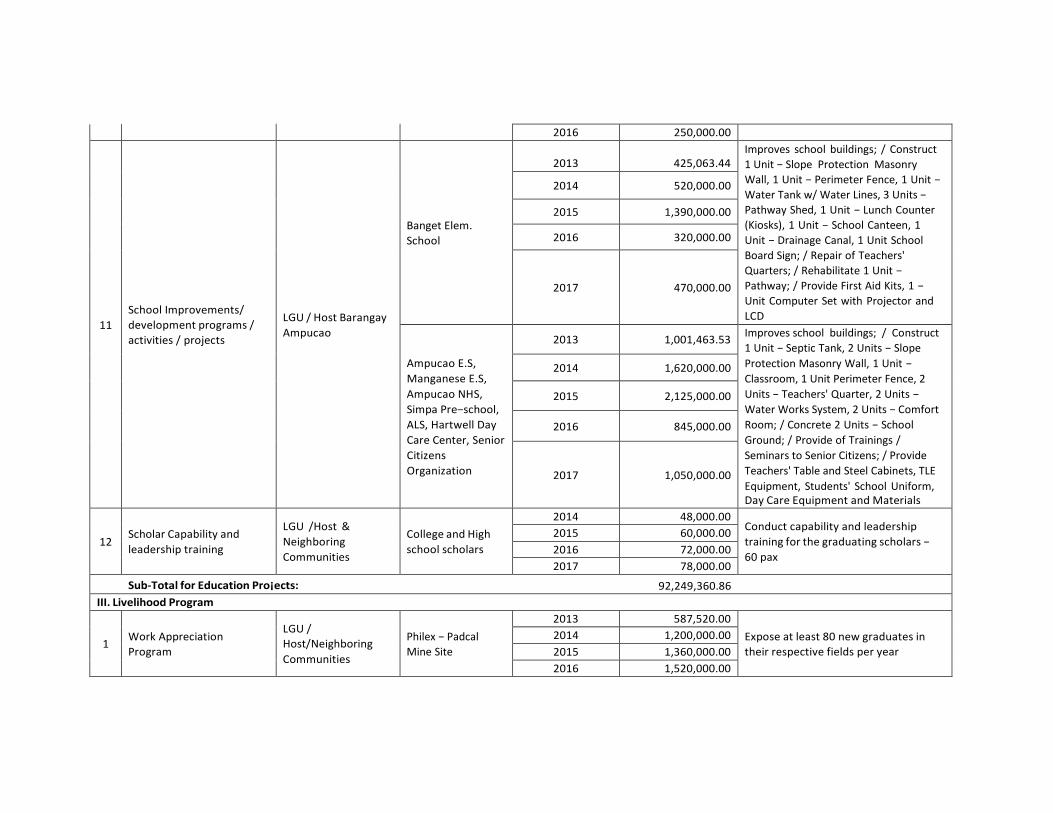
2016 250,000.00
11
School Improvements/
development programs /
activities / projects
LGU / Host Barangay
Ampucao
Banget Elem.
School
2013
425,063.44
Improves school buildings; / Construct
1 Unit − Slope Protection Masonry
Wall, 1 Unit − Perimeter Fence, 1 Unit −
Water Tank w/ Water Lines, 3 Units −
Pathway Shed, 1 Unit − Lunch Counter
(Kiosks), 1 Unit − School Canteen, 1
Unit − Drainage Canal, 1 Unit School
Board Sign; / Repair of Teachers'
Quarters; / Rehabilitate 1 Unit −
Pathway; / Provide First Aid Kits, 1 −
Unit Computer Set with Projector and
LCD
2014 520,000.00
2015 1,390,000.00
2016 320,000.00
2017
470,000.00
Ampucao E.S,
Manganese E.S,
Ampucao NHS,
Simpa Pre−school,
ALS, Hartwell Day
Care Center, Senior
Citizens
Organization
2013 1,001,463.53 Improves school buildings; / Construct
1 Unit − Septic Tank, 2 Units − Slope
Protection Masonry Wall, 1 Unit −
Classroom, 1 Unit Perimeter Fence, 2
Units − Teachers' Quarter, 2 Units −
Water Works System, 2 Units − Comfort
Room; / Concrete 2 Units − School
Ground; / Provide of Trainings /
Seminars to Senior Citizens; / Provide
Teachers' Table and Steel Cabinets, TLE
Equipment, Students' School Uniform, Day Care Equipment and Materials
2014 1,620,000.00
2015 2,125,000.00
2016 845,000.00
2017
1,050,000.00
12
Scholar Capability and
leadership training
LGU /Host &
Neighboring
Communities
College and High
school scholars
2014 48,000.00 Conduct capability and leadership
training for the graduating scholars −
60 pax
2015 60,000.00
2016 72,000.00
2017 78,000.00
Sub-Total for Education Pro¡ects: 92,249,360.86
III. Livelihood Program
1
Work Appreciation
Program
LGU /
Host/Neighboring
Communities
Philex − Padcal
Mine Site
2013 587,520.00 Expose at least 80 new graduates in
their respective fields per year
2014 1,200,000.00
2015 1,360,000.00
2016 1,520,000.00
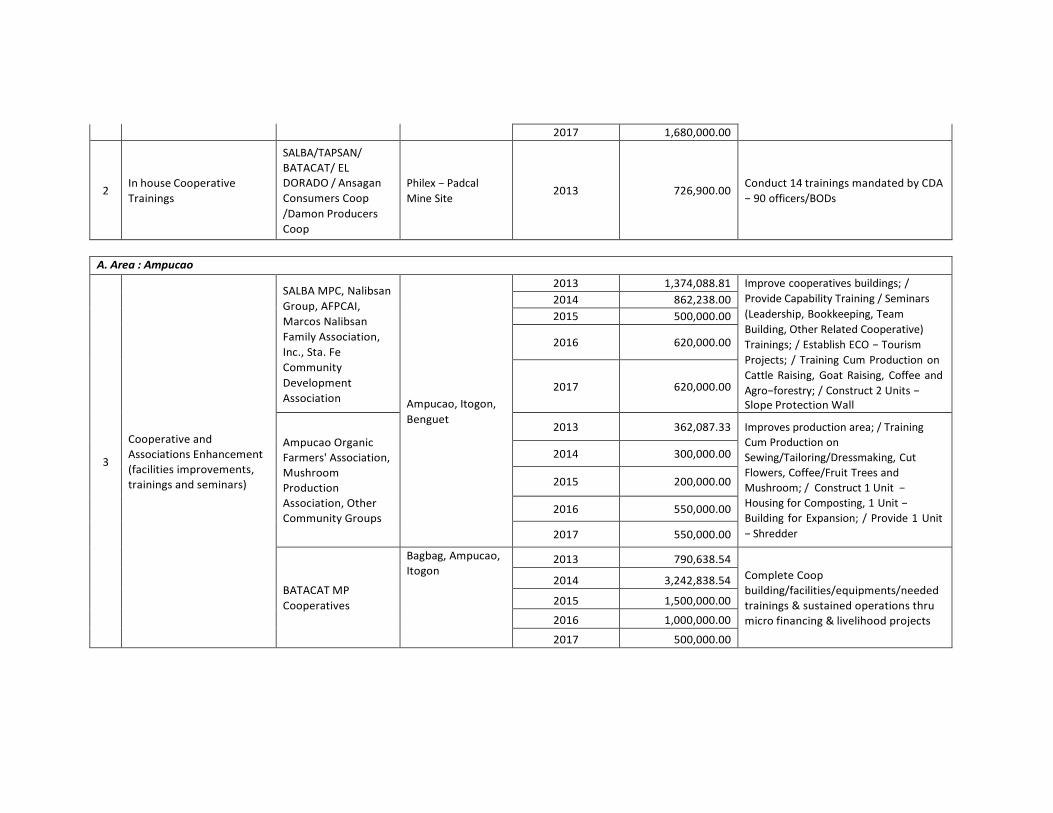
2017 1,680,000.00
2
In house Cooperative
Trainings
SALBA/TAPSAN/
BATACAT/ EL
DORADO / Ansagan
Consumers Coop
/Damon Producers
Coop
Philex − Padcal
Mine Site
2013
726,900.00
Conduct 14 trainings mandated by CDA
− 90 officers/BODs
A. Area : Ampucao
3
Cooperative and
Associations Enhancement
(facilities improvements,
trainings and seminars)
SALBA MPC, Nalibsan
Group, AFPCAI,
Marcos Nalibsan
Family Association,
Inc., Sta. Fe
Community
Development
Association
Ampucao, Itogon,
Benguet
2013 1,374,088.81 Improve cooperatives buildings; /
Provide Capability Training / Seminars
(Leadership, Bookkeeping, Team
Building, Other Related Cooperative)
Trainings; / Establish ECO − Tourism
Projects; / Training Cum Production on
Cattle Raising, Goat Raising, Coffee and
Agro−forestry; / Construct 2 Units − Slope Protection Wall
2014 862,238.00
2015 500,000.00
2016 620,000.00
2017
620,000.00
Ampucao Organic
Farmers' Association,
Mushroom
Production
Association, Other
Community Groups
2013 362,087.33 Improves production area; / Training
Cum Production on
Sewing/Tailoring/Dressmaking, Cut
Flowers, Coffee/Fruit Trees and
Mushroom; / Construct 1 Unit −
Housing for Composting, 1 Unit −
Building for Expansion; / Provide 1 Unit
− Shredder
2014 300,000.00
2015 200,000.00
2016 550,000.00
2017 550,000.00
BATACAT MP
Cooperatives
Bagbag, Ampucao,
Itogon 2013 790,638.54
Complete Coop
building/facilities/equipments/needed
trainings & sustained operations thru
micro financing & livelihood projects
2014 3,242,838.54
2015 1,500,000.00
2016 1,000,000.00
2017 500,000.00
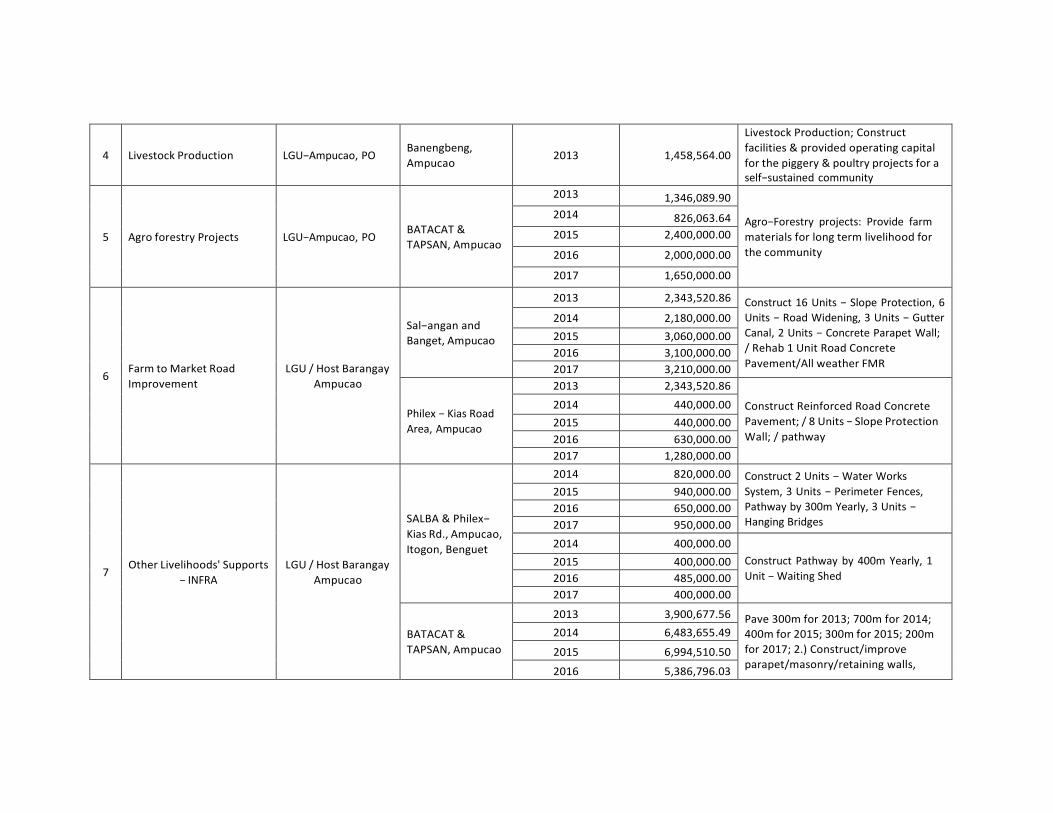
4
Livestock Production
LGU−Ampucao, PO
Banengbeng,
Ampucao
2013
1,458,564.00
Livestock Production; Construct
facilities & provided operating capital
for the piggery & poultry projects for a self−sustained community
5
Agro forestry Projects
LGU−Ampucao, PO
BATACAT &
TAPSAN, Ampucao
2013 1,346,089.90
Agro−Forestry projects: Provide farm
materials for long term livelihood for
the community
2014 826,063.64
2015 2,400,000.00
2016 2,000,000.00
2017 1,650,000.00
6
Farm to Market Road
Improvement
LGU / Host Barangay
Ampucao
Sal−angan and
Banget, Ampucao
2013 2,343,520.86 Construct 16 Units − Slope Protection, 6
Units − Road Widening, 3 Units − Gutter
Canal, 2 Units − Concrete Parapet Wall;
/ Rehab 1 Unit Road Concrete
Pavement/All weather FMR
2014 2,180,000.00
2015 3,060,000.00
2016 3,100,000.00
2017 3,210,000.00
Philex − Kias Road
Area, Ampucao
2013 2,343,520.86 Construct Reinforced Road Concrete
Pavement; / 8 Units − Slope Protection
Wall; / pathway
2014 440,000.00
2015 440,000.00
2016 630,000.00
2017 1,280,000.00
7
Other Livelihoods' Supports
− INFRA
LGU / Host Barangay
Ampucao
SALBA & Philex−
Kias Rd., Ampucao,
Itogon, Benguet
2014 820,000.00 Construct 2 Units − Water Works
System, 3 Units − Perimeter Fences,
Pathway by 300m Yearly, 3 Units −
Hanging Bridges
2015 940,000.00
2016 650,000.00
2017 950,000.00
2014 400,000.00 Construct Pathway by 400m Yearly, 1
Unit − Waiting Shed 2015 400,000.00
2016 485,000.00
2017 400,000.00
BATACAT &
TAPSAN, Ampucao
2013 3,900,677.56 Pave 300m for 2013; 700m for 2014;
400m for 2015; 300m for 2015; 200m
for 2017; 2.) Construct/improve
parapet/masonry/retaining walls,
2014 6,483,655.49
2015 6,994,510.50
2016 5,386,796.03
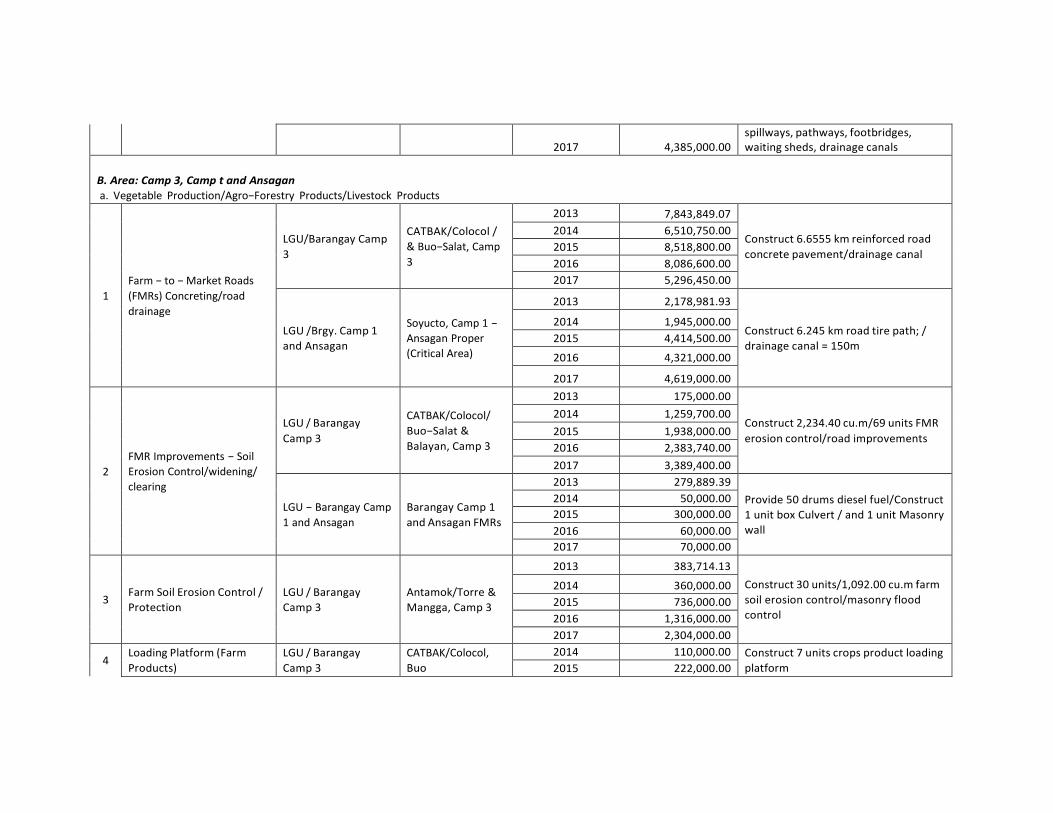
2017
4,385,000.00 spillways, pathways, footbridges, waiting sheds, drainage canals
B. Area: Camp 3, Camp t and Ansagan
a. Vegetable Production/Agro−Forestry Products/Livestock Products
1
Farm − to − Market Roads
(FMRs) Concreting/road
drainage
LGU/Barangay Camp
3
CATBAK/Colocol /
& Buo−Salat, Camp
3
2013 7,843,849.07
Construct 6.6555 km reinforced road
concrete pavement/drainage canal
2014 6,510,750.00
2015 8,518,800.00
2016 8,086,600.00
2017 5,296,450.00
LGU /Brgy. Camp 1
and Ansagan
Soyucto, Camp 1 −
Ansagan Proper
(Critical Area)
2013 2,178,981.93
Construct 6.245 km road tire path; /
drainage canal = 150m
2014 1,945,000.00
2015 4,414,500.00
2016 4,321,000.00
2017 4,619,000.00
2
FMR Improvements − Soil
Erosion Control/widening/
clearing
LGU / Barangay
Camp 3
CATBAK/Colocol/
Buo−Salat &
Balayan, Camp 3
2013 175,000.00
Construct 2,234.40 cu.m/69 units FMR
erosion control/road improvements
2014 1,259,700.00
2015 1,938,000.00
2016 2,383,740.00
2017 3,389,400.00
LGU − Barangay Camp
1 and Ansagan
Barangay Camp 1
and Ansagan FMRs
2013 279,889.39 Provide 50 drums diesel fuel/Construct
1 unit box Culvert / and 1 unit Masonry
wall
2014 50,000.00
2015 300,000.00
2016 60,000.00
2017 70,000.00
3
Farm Soil Erosion Control /
Protection
LGU / Barangay
Camp 3
Antamok/Torre &
Mangga, Camp 3
2013 383,714.13
Construct 30 units/1,092.00 cu.m farm
soil erosion control/masonry flood
control
2014 360,000.00
2015 736,000.00
2016 1,316,000.00
2017 2,304,000.00
4 Loading Platform (Farm
Products)
LGU / Barangay
Camp 3
CATBAK/Colocol,
Buo
2014 110,000.00 Construct 7 units crops product loading
platform 2015 222,000.00
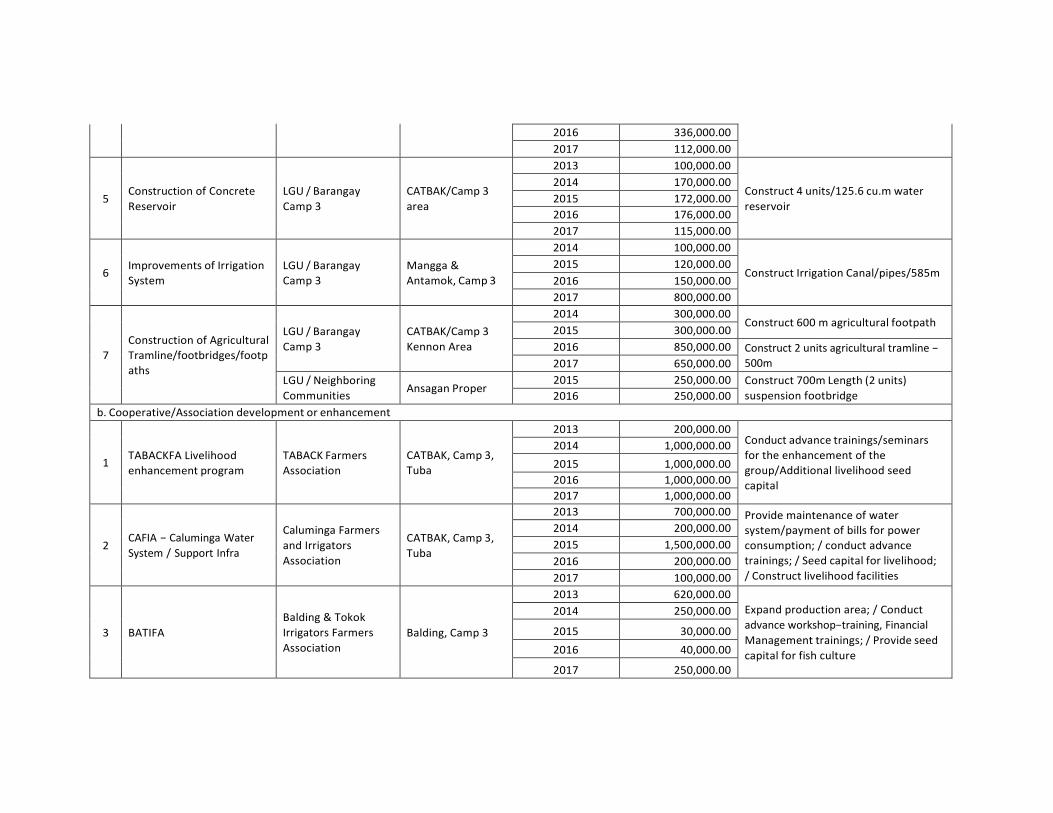
2016 336,000.00
2017 112,000.00
5
Construction of Concrete
Reservoir
LGU / Barangay
Camp 3
CATBAK/Camp 3
area
2013 100,000.00
Construct 4 units/125.6 cu.m water
reservoir
2014 170,000.00
2015 172,000.00
2016 176,000.00
2017 115,000.00
6
Improvements of Irrigation
System
LGU / Barangay
Camp 3
Mangga &
Antamok, Camp 3
2014 100,000.00
Construct Irrigation Canal/pipes/585m 2015 120,000.00
2016 150,000.00
2017 800,000.00
7
Construction of Agricultural
Tramline/footbridges/footp
aths
LGU / Barangay
Camp 3
CATBAK/Camp 3
Kennon Area
2014 300,000.00 Construct 600 m agricultural footpath
2015 300,000.00
2016 850,000.00 Construct 2 units agricultural tramline −
500m 2017 650,000.00
LGU / Neighboring
Communities Ansagan Proper
2015 250,000.00 Construct 700m Length (2 units)
suspension footbridge 2016 250,000.00
b. Cooperative/Association development or enhancement
1
TABACKFA Livelihood
enhancement program
TABACK Farmers
Association
CATBAK, Camp 3,
Tuba
2013 200,000.00
Conduct advance trainings/seminars
for the enhancement of the
group/Additional livelihood seed
capital
2014 1,000,000.00
2015 1,000,000.00
2016 1,000,000.00
2017 1,000,000.00
2
CAFIA − Caluminga Water
System / Support Infra
Caluminga Farmers
and Irrigators
Association
CATBAK, Camp 3,
Tuba
2013 700,000.00 Provide maintenance of water
system/payment of bills for power
consumption; / conduct advance
trainings; / Seed capital for livelihood;
/ Construct livelihood facilities
2014 200,000.00
2015 1,500,000.00
2016 200,000.00
2017 100,000.00
3
BATIFA
Balding & Tokok
Irrigators Farmers
Association
Balding, Camp 3
2013 620,000.00 Expand production area; / Conduct
advance workshop−training, Financial
Management trainings; / Provide seed
capital for fish culture
2014 250,000.00
2015 30,000.00
2016 40,000.00
2017 250,000.00
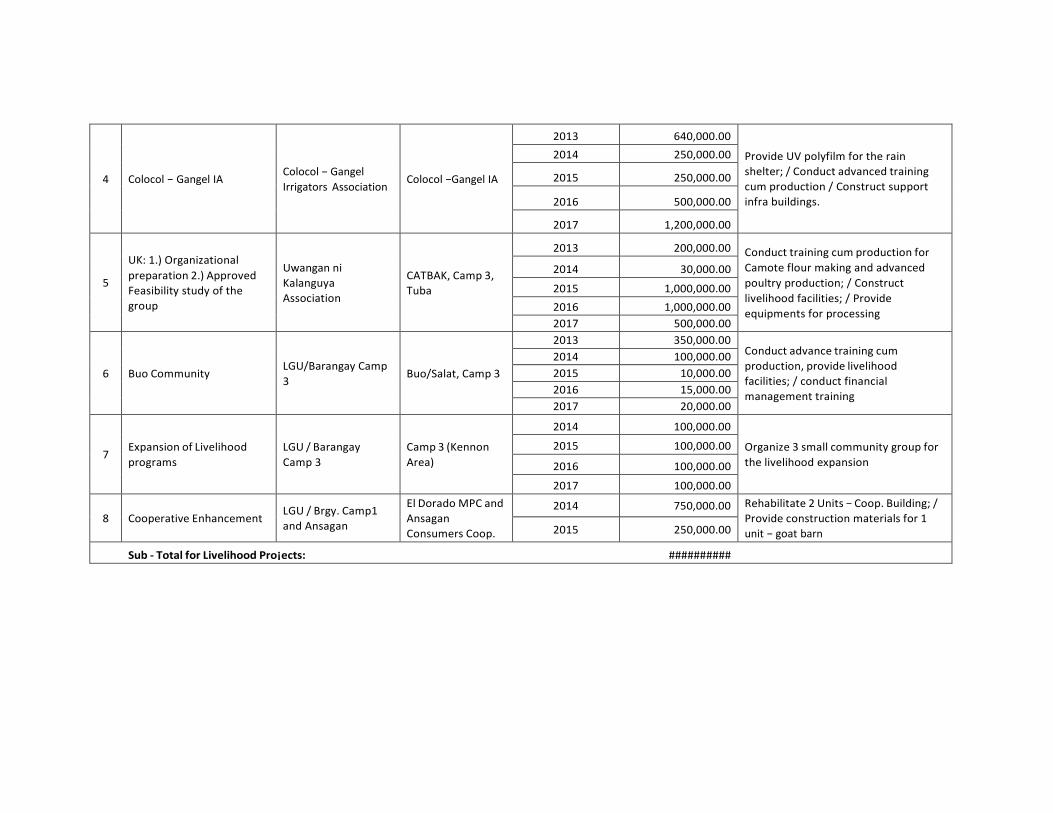
4
Colocol − Gangel IA
Colocol − Gangel
Irrigators Association
Colocol −Gangel IA
2013 640,000.00
Provide UV polyfilm for the rain
shelter; / Conduct advanced training
cum production / Construct support
infra buildings.
2014 250,000.00
2015 250,000.00
2016 500,000.00
2017 1,200,000.00
5
UK: 1.) Organizational
preparation 2.) Approved
Feasibility study of the
group
Uwangan ni
Kalanguya
Association
CATBAK, Camp 3,
Tuba
2013 200,000.00
Conduct training cum production for
Camote flour making and advanced
poultry production; / Construct
livelihood facilities; / Provide
equipments for processing
2014 30,000.00
2015 1,000,000.00
2016 1,000,000.00
2017 500,000.00
6
Buo Community
LGU/Barangay Camp
3
Buo/Salat, Camp 3
2013 350,000.00
Conduct advance training cum
production, provide livelihood
facilities; / conduct financial
management training
2014 100,000.00
2015 10,000.00
2016 15,000.00
2017 20,000.00
7
Expansion of Livelihood
programs
LGU / Barangay
Camp 3
Camp 3 (Kennon
Area)
2014 100,000.00
Organize 3 small community group for
the livelihood expansion
2015 100,000.00
2016 100,000.00
2017 100,000.00
8
Cooperative Enhancement
LGU / Brgy. Camp1
and Ansagan
El Dorado MPC and
Ansagan
Consumers Coop.
2014 750,000.00 Rehabilitate 2 Units − Coop. Building; /
Provide construction materials for 1
unit − goat barn 2015 250,000.00
Sub - Total for Livelihood Pro¡ects: ##########
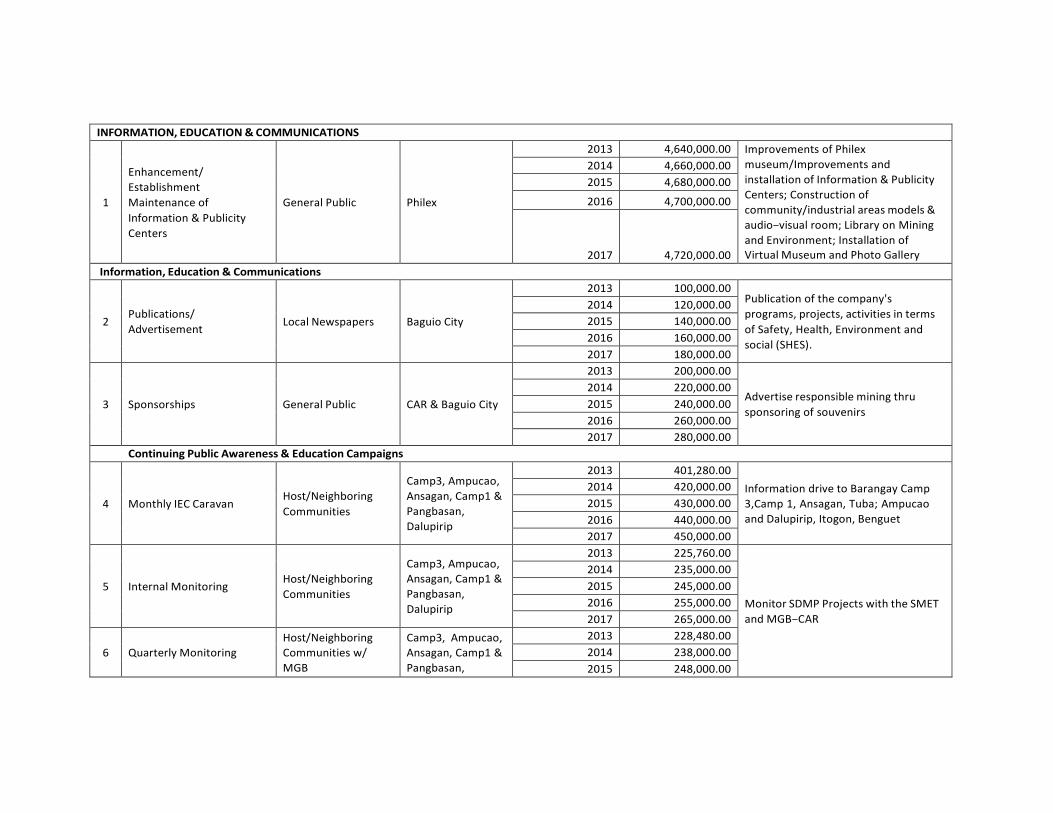
INFORMATION, EDUCATION & COMMUNICATIONS
1
Enhancement/
Establishment
Maintenance of
Information & Publicity
Centers
General Public
Philex
2013 4,640,000.00 Improvements of Philex
museum/Improvements and
installation of Information & Publicity
Centers; Construction of
community/industrial areas models &
audio−visual room; Library on Mining
and Environment; Installation of Virtual Museum and Photo Gallery
2014 4,660,000.00
2015 4,680,000.00
2016 4,700,000.00
2017
4,720,000.00
Information, Education & Communications
2
Publications/
Advertisement
Local Newspapers
Baguio City
2013 100,000.00
Publication of the company's
programs, projects, activities in terms
of Safety, Health, Environment and
social (SHES).
2014 120,000.00
2015 140,000.00
2016 160,000.00
2017 180,000.00
3
Sponsorships
General Public
CAR & Baguio City
2013 200,000.00
Advertise responsible mining thru
sponsoring of souvenirs
2014 220,000.00
2015 240,000.00
2016 260,000.00
2017 280,000.00
Continuing Public Awareness & Education Campaigns
4
Monthly IEC Caravan
Host/Neighboring
Communities
Camp3, Ampucao,
Ansagan, Camp1 &
Pangbasan,
Dalupirip
2013 401,280.00 Information drive to Barangay Camp
3,Camp 1, Ansagan, Tuba; Ampucao
and Dalupirip, Itogon, Benguet
2014 420,000.00
2015 430,000.00
2016 440,000.00
2017 450,000.00
5
Internal Monitoring
Host/Neighboring
Communities
Camp3, Ampucao,
Ansagan, Camp1 &
Pangbasan,
Dalupirip
2013 225,760.00
Monitor SDMP Projects with the SMET
and MGB−CAR
2014 235,000.00
2015 245,000.00
2016 255,000.00
2017 265,000.00
6
Quarterly Monitoring
Host/Neighboring
Communities w/
MGB
Camp3, Ampucao,
Ansagan, Camp1 &
Pangbasan,
2013 228,480.00
2014 238,000.00
2015 248,000.00
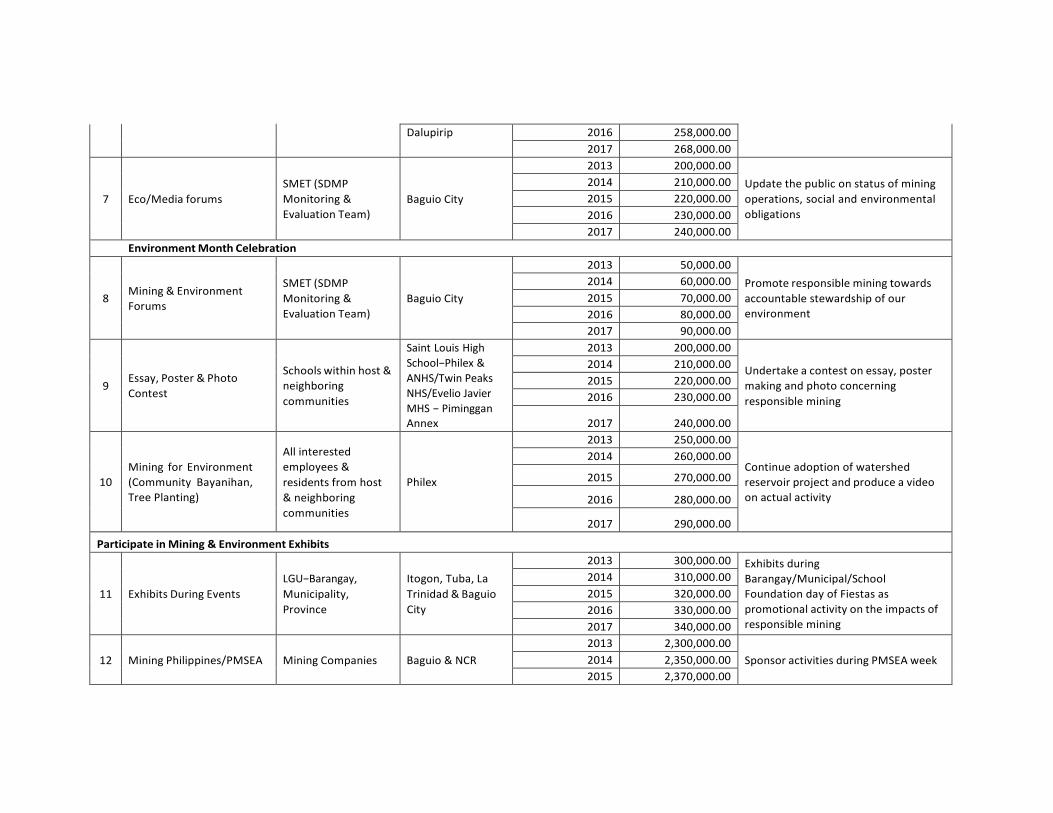
Dalupirip 2016 258,000.00
2017 268,000.00
7
Eco/Media forums
SMET (SDMP
Monitoring &
Evaluation Team)
Baguio City
2013 200,000.00 Update the public on status of mining
operations, social and environmental
obligations
2014 210,000.00
2015 220,000.00
2016 230,000.00
2017 240,000.00
Environment Month Celebration
8
Mining & Environment
Forums
SMET (SDMP
Monitoring &
Evaluation Team)
Baguio City
2013 50,000.00 Promote responsible mining towards
accountable stewardship of our
environment
2014 60,000.00
2015 70,000.00
2016 80,000.00
2017 90,000.00
9
Essay, Poster & Photo
Contest
Schools within host &
neighboring
communities
Saint Louis High
School−Philex &
ANHS/Twin Peaks
NHS/Evelio Javier
MHS − Piminggan Annex
2013 200,000.00
Undertake a contest on essay, poster
making and photo concerning
responsible mining
2014 210,000.00
2015 220,000.00
2016 230,000.00
2017 240,000.00
10
Mining for Environment
(Community Bayanihan,
Tree Planting)
All interested
employees &
residents from host
& neighboring
communities
Philex
2013 250,000.00
Continue adoption of watershed
reservoir project and produce a video
on actual activity
2014 260,000.00
2015 270,000.00
2016 280,000.00
2017 290,000.00
Participate in Mining & Environment Exhibits
11
Exhibits During Events
LGU−Barangay,
Municipality,
Province
Itogon, Tuba, La
Trinidad & Baguio
City
2013 300,000.00 Exhibits during
Barangay/Municipal/School
Foundation day of Fiestas as
promotional activity on the impacts of
responsible mining
2014 310,000.00
2015 320,000.00
2016 330,000.00
2017 340,000.00
12
Mining Philippines/PMSEA
Mining Companies
Baguio & NCR
2013 2,300,000.00 Sponsor activities during PMSEA week 2014 2,350,000.00
2015 2,370,000.00
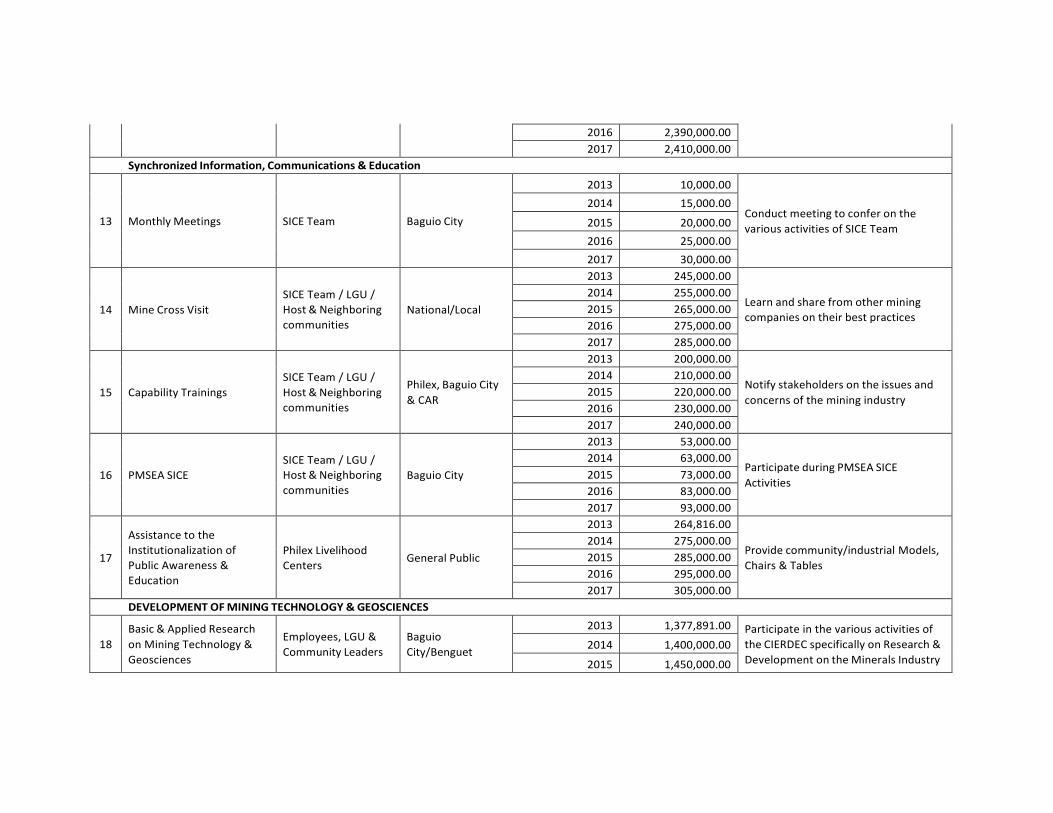
2016 2,390,000.00
2017 2,410,000.00
Synchronized Information, Communications & Education
13
Monthly Meetings
SICE Team
Baguio City
2013 10,000.00
Conduct meeting to confer on the
various activities of SICE Team
2014 15,000.00
2015 20,000.00
2016 25,000.00
2017 30,000.00
14
Mine Cross Visit
SICE Team / LGU /
Host & Neighboring
communities
National/Local
2013 245,000.00
Learn and share from other mining
companies on their best practices
2014 255,000.00
2015 265,000.00
2016 275,000.00
2017 285,000.00
15
Capability Trainings
SICE Team / LGU /
Host & Neighboring
communities
Philex, Baguio City
& CAR
2013 200,000.00
Notify stakeholders on the issues and
concerns of the mining industry
2014 210,000.00
2015 220,000.00
2016 230,000.00
2017 240,000.00
16
PMSEA SICE
SICE Team / LGU /
Host & Neighboring
communities
Baguio City
2013 53,000.00
Participate during PMSEA SICE
Activities
2014 63,000.00
2015 73,000.00
2016 83,000.00
2017 93,000.00
17
Assistance to the
Institutionalization of
Public Awareness &
Education
Philex Livelihood
Centers
General Public
2013 264,816.00
Provide community/industrial Models,
Chairs & Tables
2014 275,000.00
2015 285,000.00
2016 295,000.00
2017 305,000.00
DEVELOPMENT OF MINING TECHNOLOGY & GEOSCIENCES
18
Basic & Applied Research
on Mining Technology &
Geosciences
Employees, LGU &
Community Leaders
Baguio
City/Benguet
2013 1,377,891.00 Participate in the various activities of
the CIERDEC specifically on Research &
Development on the Minerals Industry 2014 1,400,000.00
2015 1,450,000.00
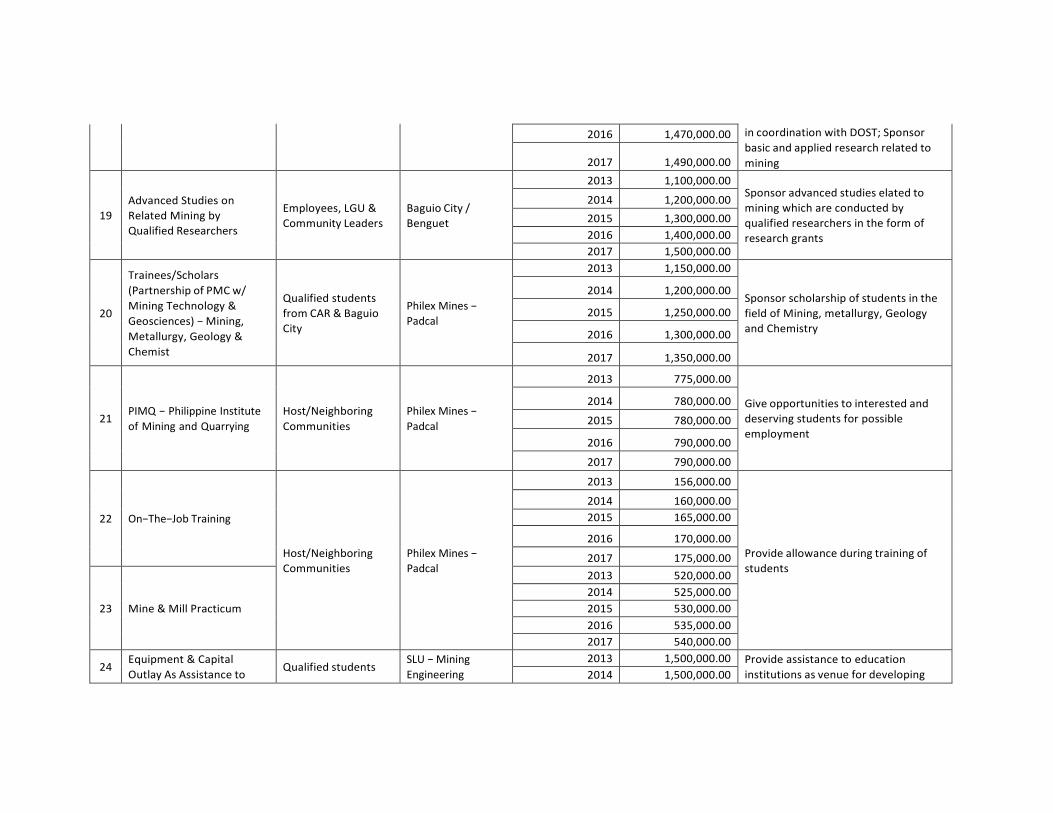
2016 1,470,000.00 in coordination with DOST; Sponsor
basic and applied research related to
mining
2017
1,490,000.00
19
Advanced Studies on
Related Mining by
Qualified Researchers
Employees, LGU &
Community Leaders
Baguio City /
Benguet
2013 1,100,000.00
Sponsor advanced studies elated to
mining which are conducted by
qualified researchers in the form of
research grants
2014 1,200,000.00
2015 1,300,000.00
2016 1,400,000.00
2017 1,500,000.00
20
Trainees/Scholars
(Partnership of PMC w/
Mining Technology &
Geosciences) − Mining,
Metallurgy, Geology &
Chemist
Qualified students
from CAR & Baguio
City
Philex Mines −
Padcal
2013 1,150,000.00
Sponsor scholarship of students in the
field of Mining, metallurgy, Geology
and Chemistry
2014 1,200,000.00
2015 1,250,000.00
2016 1,300,000.00
2017 1,350,000.00
21
PIMQ − Philippine Institute
of Mining and Quarrying
Host/Neighboring
Communities
Philex Mines −
Padcal
2013 775,000.00
Give opportunities to interested and
deserving students for possible
employment
2014 780,000.00
2015 780,000.00
2016 790,000.00
2017 790,000.00
22
On−The−Job Training
Host/Neighboring
Communities
Philex Mines −
Padcal
2013 156,000.00
Provide allowance during training of
students
2014 160,000.00
2015 165,000.00
2016 170,000.00
2017 175,000.00
23
Mine & Mill Practicum
2013 520,000.00
2014 525,000.00
2015 530,000.00
2016 535,000.00
2017 540,000.00
24 Equipment & Capital
Outlay As Assistance to Qualified students
SLU − Mining
Engineering
2013 1,500,000.00 Provide assistance to education
institutions as venue for developing 2014 1,500,000.00
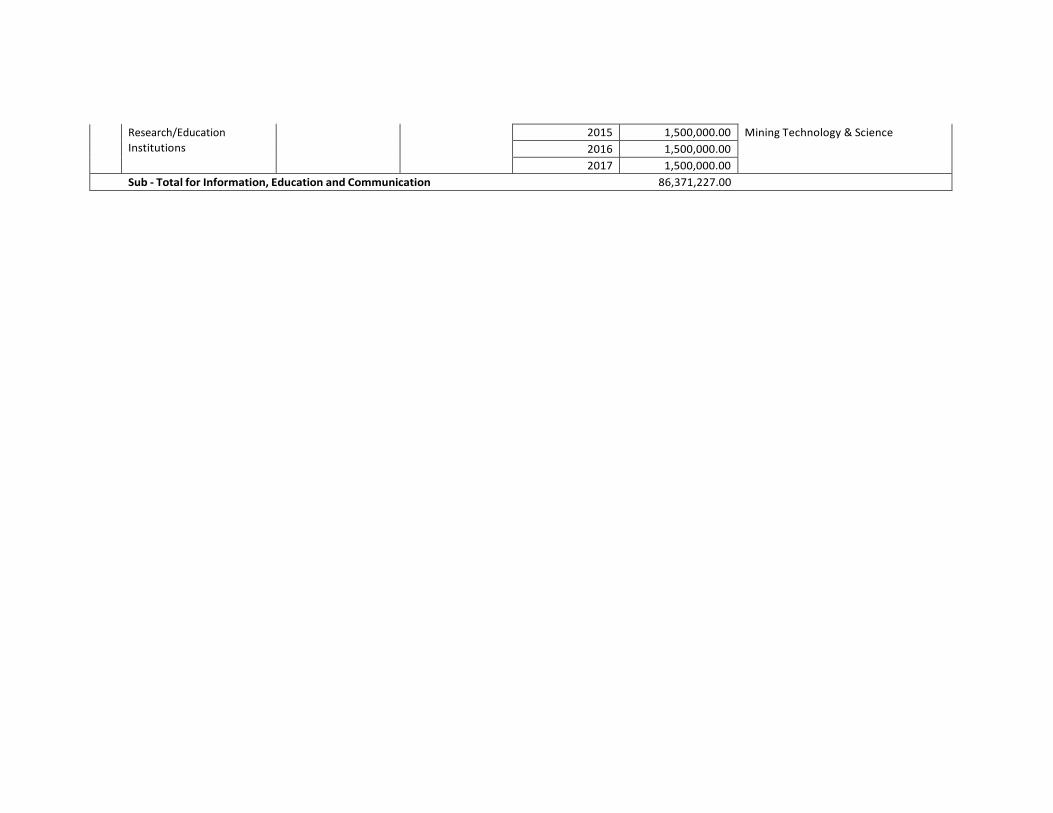
Research/Education
Institutions
2015 1,500,000.00 Mining Technology & Science
2016 1,500,000.00
2017 1,500,000.00
Sub - Total for Information, Education and Communication 86,371,227.00


