Embed Size (px)
Citation preview
Chapter 2
2.1 Introduction
Since time immemorial, humankind has changed land-scapes in attempts to improve the amount, quality, andsecurity of natural resources critical to its well being, suchas food, freshwater, fiber, and medicinal products.Through the increased use of innovation, human popu-lations have, slowly at first, and at increasingly rapid pacelater on, increased its ability to derive resources from theenvironment, and expand its territory. Several authorshave identified three different phases – the control of fire,domestication of biota, and fossil-fuel use – as being piv-otal in enabling increased appropriation of natural re-sources (Goudsblom and De Vries 2004; Turner II andMcCandless 2004).
The first stage in human history, the Paleolithic age, wascharacterized by the use of stone tools and the control offire. The control of fire and its use by paleolithic hunterschanged habitats and was partly responsible for the extinc-tion of megafauna at the beginning of the Holocene (Bar-nosky et al. 2004). This innovation also enabled humansto expand their territory by migrating from their originsin East Africa to Eurasia, Australia and the Americas. Ob-servations of large-scale landscape burning by humans canbe traced to antiquity, as in a Carthaginian reference towestern Africa some 500 years before the birth of Christ:
“By day we saw nothing but woods, but by night we saw manyfires burning … we saw by the night the land full of flame andin the midst of lofty fire … that seemed to touch the stars.” (inStewart 1956, p 119).
The next stage of human history began with the do-mestication of plants and animals, termed the NeolithicRevolution, which began roughly 10 000 years ago in sev-eral places around the world – in Mesopotamia, in China,eastern U.S., New Guinea, and the Sahel, and later on inMesoamerica and the Andes. The advent of sedentaryagriculture matched and exceeded the land changeswrought by fire. Both Plato and Aristotle commented onthe soil erosion and deterioration of the hills and moun-tains of Greece. Plato, wrote in Critias 2 400 years ago, that
“… what now remains … is like the skeleton of a sick man,all the fat and soft earth having wasted away, and only the bareframework of the land being left”.
Agricultural lands today occupy roughly a third of theplanet’s land surface (Ramankutty and Foley 1998; KleinGoldewijk 2001).
The third stage of human history was marked by thehuman appropriation of energy stored in fossil-fuels.This stage began roughly 300 years ago, and was charac-terized by the rise of globalization, the dominance of capi-talism, and the advent of Industrial Revolution technolo-gies. During this period, the world’s human populationexpanded exponentially. While many economically de-veloped nations achieved the demographic transition oflow birth rates and low death rates during the late20th century, this is only just happening in most of thedeveloping world.
The extent and pace of human activities on the landsurface also accelerated during the last 300 years. Moreland was converted for human use than before, and al-ready converted land was managed more intensively toincrease the yields of agricultural and forest products.As early as 1864, George Perkins Marsh, in his book Manand Nature, documented his observations of landscapechanges resulting from human activities. Richards (1990)estimated that more forests were cleared between 1950and 1980 than in the entire 18th and 19th centuries com-bined. Such accelerated changes have been accompaniedby local and global environmental problems, and vari-ous writers such as John Muir, Henry David Thoreau,Rachel Carson, Aldo Leopold, and Paul Ehrlich have con-tributed to the rise of consciousness about environmen-tal issues. In 1956, the book Man’s Role in Changing theFace of the Earth (Thomas Jr. 1956), the outcome of aninternational conference, documented major changes ofthe planet’s landscapes. More recently, books such as TheEarth as Transformed by Human Action (Turner et al.1990), Mappae Mundi (Goudsblom and De Vries 2004),and various reports of the World Resources Institute(e.g., People and Ecosystems: The Fraying Web of Life,http://pubs.wri.org/pubs_pdf.cfm?PubID=3027), theUnited Nations Environment Program (e.g., One Planet,Many People: Atlas of our Changing Environment,http://www.na.unep.net/OnePlanetManyPeople/index.php;Global Environmental Outlook 3, http://www.unep.org/geo/geo3/), the World Watch Institute (e.g., State of theWorld 1996; Brown et al. 1996) and the Millennium Eco-
Global Land-Cover Change: Recent Progress, Remaining Challenges
Navin Ramankutty · Lisa Graumlich · Frédéric Achard · Diogenes Alves · Abha Chhabra · Ruth S. DeFriesJon Foley · Helmut Geist · Richard A. Houghton · Kees Klein Goldewijk · Éric F. Lambin · Andrew MillingtonKjeld Rasmussen · Robin S. Reid · Billie L. Turner II
CHAPTER 2 · Global Land-Cover Change: Recent Progress, Remaining Challenges10
system Assessment (Ecosystems and Human Well-being,Millennium Ecosystem Assessment 2005) have lent fur-ther credence to the notion that one of the most obviousglobal changes in the last three centuries has been thedirect human modification and conversion of land cover.
A recent study by the World Conservation Service es-timated that the “human footprint” covers 83% of the glo-bal land surface (Sanderson et al. 2002). However, thepresence of humans does not necessarily imply that land-scapes are degraded, and that the ecosystem services theyoffer are diminished. Indeed, another study more opti-mistically estimated that roughly half of the world’s landsurface is still covered by “wilderness” areas (Mittermeieret al. 2003). Therefore, it is becoming increasingly obvi-ous that we need to move beyond subjective terms suchas “wilderness” and “human footprint”, and evaluate thetrade-offs between ecosystem goods and services ex-tracted by humans through their land-use practices, andany resulting ecological degradation (see Box 2.1, Millen-nium Ecosystem Assessment 2003, DeFries et al. 2004).
Several estimates have been made of the natural re-sources consumed by humans through their land-usepractices. Several authors (Vitousek et al. 1986; Haberl et al.2004; Imhoff et al. 2004) have estimated that roughly20–40% of global net primary productivity is being co-opted (not available to other species) by humans. How-ever, Rojstaczer et al. (2001) estimated a wider uncer-tainty range of 10% to 55%. Postel et al. (1996) estimatedthat about half of the global renewable freshwater sup-ply was being co-opted. It should be noted that such hu-man use of natural resources is not uniform globally, butvaries spatially depending on the levels of socio-eco-nomic development, lifestyles, and cultures of different
nations of the world. To measure such differences in con-sumption patterns, Wackernagel et al. (1997) developedthe concept of “Ecological Footprint” to denote the amountof land area needed to produce the resources consumedand absorb the waste generated by human societies. Arecent estimate by Venetoulis et al. (2004), indicatesthat while an average Bangladeshi has a footprint of0.5 ha/person, an Italian has a footprint of 3.3 ha/person,and an American of 9.6 ha/person.
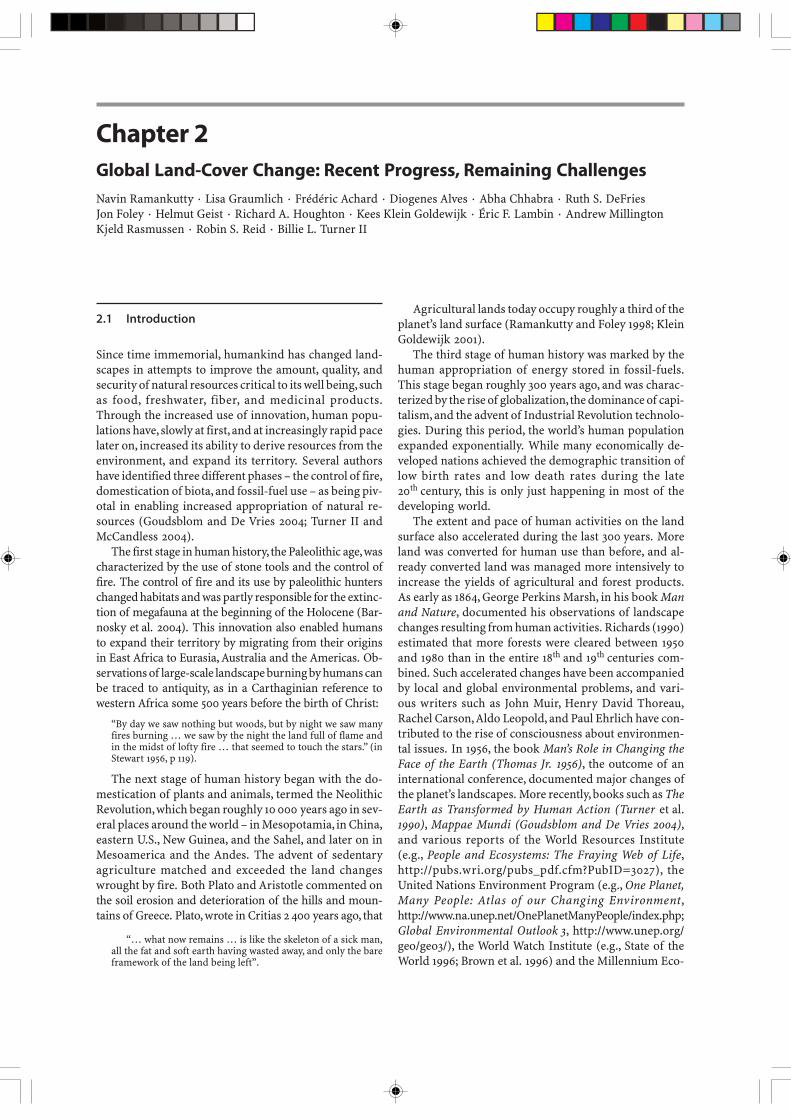
In this chapter, we will review the major landscapechanges resulting from human land-use activities. Wewill initially review, albeit briefly, the millennial timescalechanges covering the first and second phases of humanhistory. However, our major focus in this chapter will beon reviewing the land-use changes that occurred in thelast 300 years; this was one of the major tasks identifiedby the LUCC implementation plan (Lambin et al. 1999).Over the years, environmental historians and historicalecologists have reconstructed fairly accurate depictionsof landscape change around the world; however, theselocal studies did not comprehensively cover the entireglobe and could not be pieced together to get a globalsynoptic view. With the advent of remote sensing, it be-came possible to obtain a consistent, global picture ofthe world’s landscapes. However, global remotely-senseddata are only available for three decades into the past.One of the major tasks facing LUCC was to bridge boththe global synoptic spatial scale, as well as the centennialtime-scale perspective. The BIOME 300 project, a jointLUCC-PAGES initiative oversaw the creation of such aglobal historical land-cover database (Fig. 2.1). Further-more, the Millennium Ecosystem Assessment supporteda LUCC study to map regions of the world undergoing
Box 2.1. The myth of the “natural”
Until recently, many discussions of land-use and land-coverchange have treated it as a dichotomy between the “natural” and“human dominated” portions of the biosphere. However, this isan artificial distinction. There are differing degrees of humanactivity across the landscapes of the globe, ranging from the ex-treme transformation of urban environments, to the intensivemanagement of agricultural areas, or the careful protection of rec-reational areas and parks. And even the most remote and isolatedlandscapes are still affected by human actions; changes in atmo-spheric chemistry (including changes in CO2 concentrations, withtheir effects on plant physiological processes) now mean that thereare no “natural” landscapes left on the planet (McKibben 1989).
Instead of labeling landscapes as “natural” or “human domi-nated”, it might be useful to think of land-use and land-coverchange as a continuum (Theobald 2004). Naturally, we immedi-ately recognize land-use and land-cover change in the most ex-treme cases, such as urban areas and intensively managed crop-lands. But less intensive land-use practices can be subtle or con-fused as “natural”; even the explicit decision to restore “natural”areas is a land-use practice in itself.
While the nature of land-use practices vary greatly across theworld, the ultimate purpose and result of these practices is gen-erally the same: ecosystem goods and services are used in order
to meet immediate human needs, often at the expense of degrad-ing ecosystem conditions in the long term. Land-use practicesthus present us with a tradeoff (Millennium Ecosystem Assess-ment 2003; DeFries et al. 2004; Foley et al. 2005). On one hand,land-use practices are essential for the ongoing success of ourcivilization, as they provide a steady stream of critical naturalresources, such as food, freshwater and fiber. On the other hand,many forms of land use are disrupting environmental systemsand simultaneously diminishing the capacity of ecosystems tosustain the flow of services – such as food production, maintain-ing freshwater and forest resources, regulating climate and airquality, and mediating infectious diseases (DeFries et al. 2004;Foley et al. 2005).
A major challenge to the research community will be to de-velop analytical frameworks for assessing and managing thetradeoffs between meeting immediate human needs and main-taining the capacity of ecosystems to provide goods and servicesin the long term (DeFries et al. 2004). Such assessments of land-use tradeoffs must draw both from social sciences and naturalscience disciplines, and recognize that land use provides crucialsocial and economic benefits even while leading to long-termnegative consequences for ecosystem functioning and humanwelfare (Foley et al. 2005).
11
Fig. 2.1. Spatial and temporal scales addressed by different projectsor fields of study of land-cover change. The BIOME 300 projectuniquely addressed both large spatial scales and long temporalscales in describing changes in agricultural land. The LUCC-MAstudy conducted a detailed global synthesis of areas of major changein forest cover, agricultural land, degraded land, and urban areasover the recent decades
rapid land-cover change today. This chapter will reviewthe historical and contemporary land-cover changes onthe basis of these studies, and the lessons learned fromthem. It will then discuss remaining challenges in quan-tifying and understanding land-cover change.
2.2 Historical Changes in Global Land Cover
The notion that tropical rainforests are being cleared ata rapid pace, with enormous loss of biodiversity is com-mon lore today. Not so well appreciated, however, are twocountervailing observations: (1) large portions of sometropical forests were deforested in ancient times, most ofwhich have reverted back to forest cover; and (2) the cur-rent magnitude and pace of tropical deforestation is arelatively recent phenomenon and apparently unprec-edented in scope. Therefore, to understand the signifi-cance of present-day tropical deforestation, it will be use-ful to develop a “baseline” of historical land-coverchanges. Furthermore, the study of historical land-coverchanges can generate general principles to understandthe conditions under which past land-use systems col-lapsed or sustained. It is in this context that LUCC, incollaboration with PAGES, launched the BIOME 300project (see Box 2.2) to reconstruct historical land coverover the last 300 years. The 300-yr timeframe capturesthe period of greatest and most rapid transformation ofglobal land cover with measurable impacts on today’slandscapes. This section describes historical land-coverchanges as described by the BIOME 300 land-cover dataset. However, in many parts of the world, human impacton the land dates back beyond the last 300 years. There-fore, we first briefly consider land-cover changes thatoccurred in ancient times.
2.2.1 Global Land-Cover Changes over the LastMillennium
Humans have actively managed and transformed theworld’s landscapes for millennia. Students of prehistoryand the paleosciences have discovered and describednumerous examples of rapid or extensive modificationsof the environment by ancient cultures (Redman 1999).In this section we provide a broad overview of the evi-dence of early human modification of land cover, focus-ing on evidence for intensive modification as well as ex-tensive, globally pervasive changes.
In areas where local records are rich with multiplelines of evidence, we catch tantalizing glimpses of hu-man-nature interactions that provide early examples ofhuman dependence on ecosystem services. A classic ex-ample of human alteration of landscapes comes from theNear East – the cradle of civilization. A case study of AinGhazal in southern Jordan suggests that this village andits neighbors were abandoned around 6000 b.c. due todeterioration in the natural vegetation (Redman 1999).Rollefson and Kohler-Rollefson (1992) attribute the land-cover change to a prolonged drought coupled with a changetoward a home construction technique – lime plaster – thatrequired larger quantities of fuel wood than was usedpreviously. In the decades before site abandonment, theevidence for forest-cover change is clear, and is reflectedin the size and quantify of timbers used in buildings atthe site. A decline in the variety of wild animals eatenprovides further evidence of ecological disruption asso-ciated with forest changes. At about 6000 b.c. a slightdeterioration in climate appears to have been the proxi-mate factor for the abandonment of the village. This casestudy portends our current understanding of how cli-mate change interacts with other factors in making alandscape more or less vulnerable to change.
Another particularly rich account of land-use changeand its social precursors and long-term consequencescomes from the Yucatán of Mexico. Sediment recordsfrom lakes in the region provide strong evidence thatmost of the Yucatán forests were altered by human ac-tivities as early as 3 000 to 4 000 years ago (Redman 1999).The lowland Maya cleared substantial portions of thetropical forests of their greater Yucatán Peninsula home-lands between 1 000 to 2 000 years ago. Deforestation andcultivation in the early phases of the growth in the cen-tral and southern heartland of the civilization led to con-siderable erosion and sedimentation of coastal wetlands.Improved land management in their Classic phase sus-tained extremely large populations for hundreds of years,but at the cost of major forest losses and the ecosystemservices they rendered. The famous collapse of the Clas-sic Period Maya at the end of the 10th century apparentlyinvolved synergistic links between severe land stress,
2.2 · Historical Changes in Global Land Cover
CHAPTER 2 · Global Land-Cover Change: Recent Progress, Remaining Challenges12
prolonged climatic desiccation (perhaps amplified byregional forest losses), and socioeconomic disruption.Interestingly, the long-term abandonment of the centraland southern heartlands permitted the return of the for-est, although its species abundance was apparently al-tered by past Mayan activities (Turner II et al. 2003).
Perhaps the largest early transformation of the land-scape occurred in the Indus Valley, where an ancient civi-lization flourished from before 6000 b.c. to at least1500 b.c. in what today is Pakistan and northwest India.The Indus Valley or Harappan Civilization was the larg-est and oldest urban civilization in the world. Archaeo-logical explorations have revealed impressive ruins inparts of Indus River and the extinct Saraswati/GhaggarRiver valleys in the India sub-continent (Thakker 2001).The slow desertification of the region may have led tothe decline of the Harappan civilization after 3500 b.c.,although recent evidence suggests that the decline mayhave been related to the waning of monsoon rainfall(Tripathi et al. 2004).
Numerous other studies document environmentaldeterioration, and associated social disruption, with in-tensification of land use (e.g., Tainter 1990). Examplesinclude the salinization of farmlands due to irrigation insouthern Mesopotamia 4 000 years ago (Jacobsen andAdams 1958; Redman 1999). Another classic example isthe deforestation of the cedar forests of Lebanon around2600 b.c. Cedar wood was highly valued in Mesopota-mia, and the intensity of trade reduced the cedar wood-lands, which once covered 500 000 ha, to the four smallgroves found in Lebanon today (Oedekoven 1963). A par-ticularly intriguing account comes from the now barrenEaster Island. Pollen records from sediment cores docu-ment severe deforestation several hundred years aftercolonization of the island around a.d. 400. Archaeologi-cal accounts reveal that forest cover deteriorated furtheras a consequence of excessive use of forest resources bythe islanders who used them as rollers for transportingheavy statues that they built as part of their ceremonialactivities. When the ~7 000 people were unable to sup-port themselves, the society collapsed quickly arounda.d. 1700 (Diamond 1995).
Despite the richness of local and regional accounts(Redman 1999), a truly global view of early rates of landtransformation has eluded us until recently. Evidence fora global signal of human impacts on ecosystems has beenderived from estimates of atmospheric trace gasestrapped in ice cores extracted from Antarctica (Ruddi-man 2003). Ruddiman’s argument for human impacts isbased on analyzing changes in CO2 and CH4 concentra-tions over the last four glacial-interglacial cycles, as esti-mated from measurements in ice-core records. He findsthat from roughly 5 000 years ago onwards, Holocene CH4atmospheric concentrations diverge from what would beexpected based on the orbital insolation cycle. Similarly,from roughly 8 000 years ago, Holocene CO2 atmospheric
concentrations diverge from the patterns observed in theprevious three interglacials. In both cases, the divergenceis to values higher than those expected. He therefore sug-gests that deforestation 8 000 years ago, and the emer-gence of paddy rice cultivation 5 000 years ago may havebeen responsible for the marked divergence of the CO2and CH4 records from the expected trends. Not all au-thorities accept Ruddiman’s interpretation of these Ho-locene trace gas records (see e.g., Joos et al. 2004). Al-though other modeling studies also suggest that pastland-use/cover changes have impacted global climate(e.g., Bauer et al. 2003) there is, as yet, no clear consen-sus on the extent to which they have been responsiblefor the trends noted by Ruddiman.
2.2.2 Global Land-Cover Changesover the Last 300 Years
Agriculture has been the greatest force of land transfor-mation on this planet. Nearly a third of the Earth’s landsurface is currently being used for growing crops or graz-ing cattle (FAO 2004). Much of this agricultural land hasbeen created at the expense of natural forests, grasslands,and wetlands that provide valuable habitats for speciesand valuable services for humankind (Millennium Eco-system Assessment 2003). It is estimated that roughly halfof the original forests (ca. 8 000 years ago) have been lost(Billington et al. 1996).
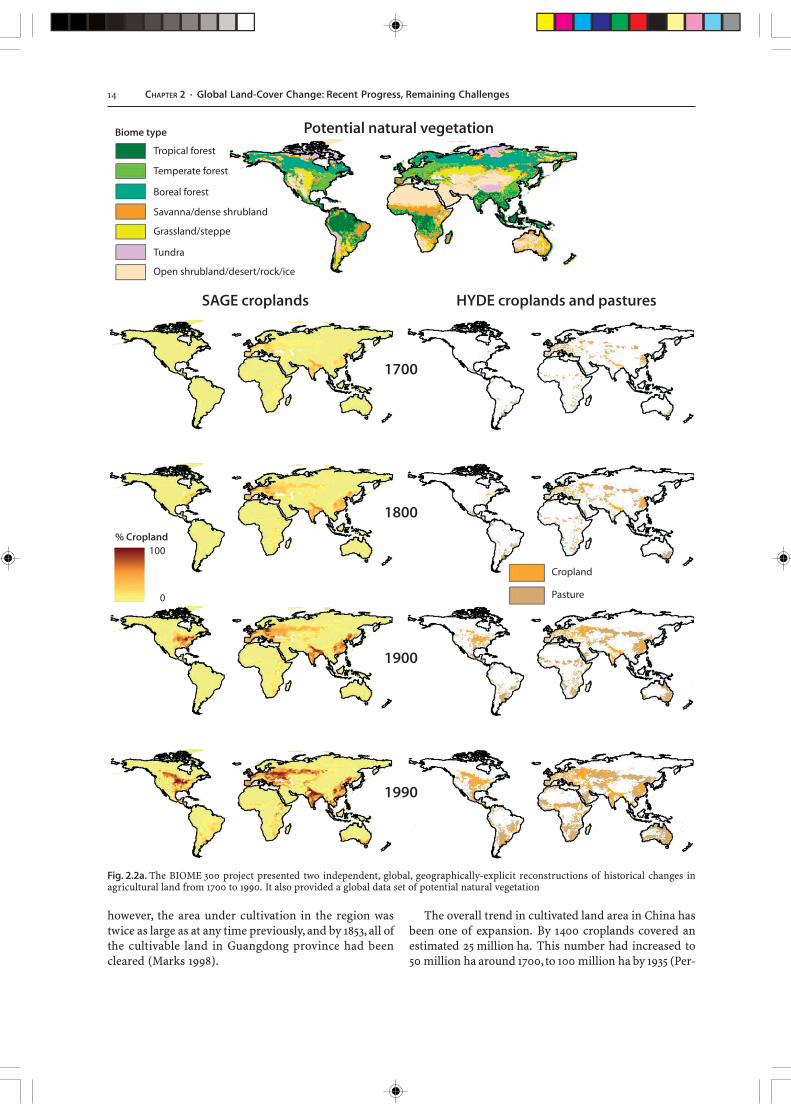
The pace of agricultural land transformation has beenparticularly rapid in the last 300 years. The BIOME 300project (Box 2.2) focussed on describing these histori-cal changes in agricultural land. Results from the pro-ject indicate that global cropland area increased from~3–4 million km2 in 1700 to ~15–18 million km2 in 1990(Fig. 2.2a,b, Ramankutty and Foley 1999; Klein Goldewijk2001). The area of grazing land, around which there isgreater uncertainty, increased from ~500 million km2 in1700 to 3 100 million km2 today. Much of the expansionof croplands came at the expense of forests, while muchof today’s grazing land was formerly grasslands; althoughthere are notable exceptions to these trends – for e.g.,the North American Prairies were lost to croplands, andmany Latin American forests are being cleared for ranch-ing. Subsequently, the forest area globally has decreasedfrom ~53 million km2 in 1700 to ~43–44 million km2 to-day, while the area of savannas and grasslands has de-creased from 30–32 million km2 to 12–23 million km2.
The expansion of agriculture has shifted spatially overtime, following the general development of human settle-ments and the global economic order (Richards 1990).Much of the large-scale cultivation in 1700 was concen-trated in the Old World, specifically in Europe, the Indo-Gangetic Plains, eastern China, and Africa. Roughly2–3% of the global land surface was cultivated at that time.Since then, the rate of cropland expansion increased with
13
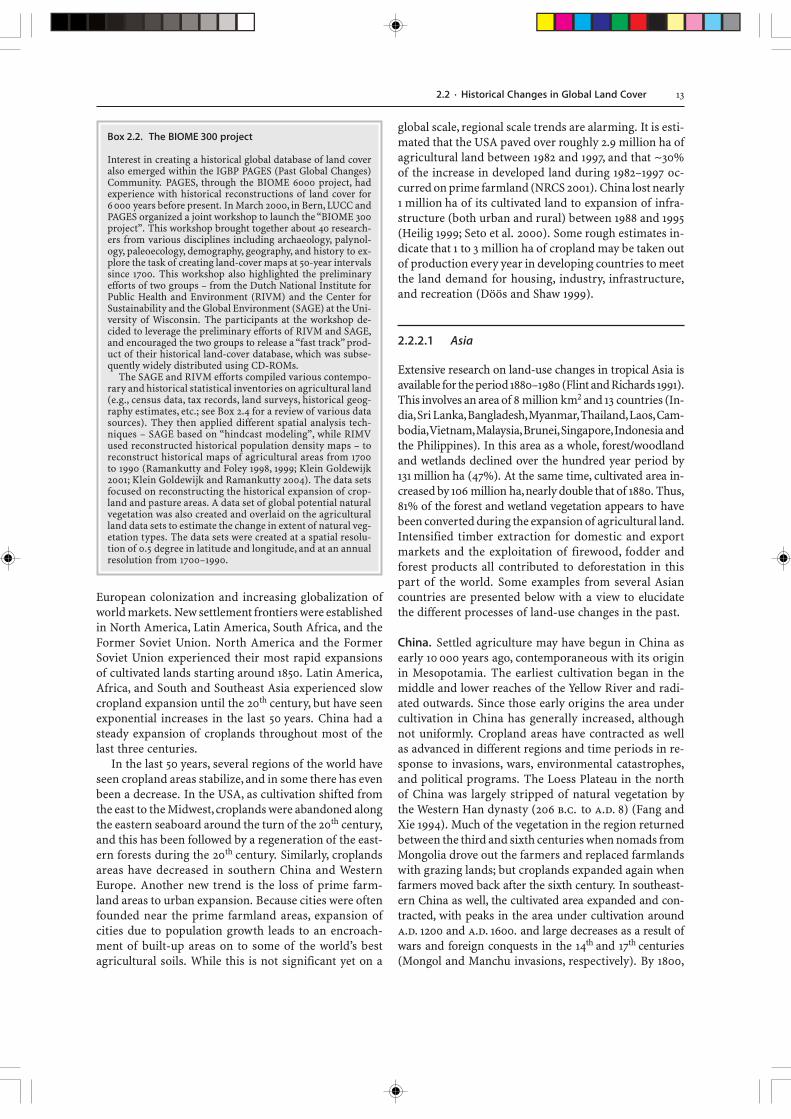
Box 2.2. The BIOME 300 project
Interest in creating a historical global database of land coveralso emerged within the IGBP PAGES (Past Global Changes)Community. PAGES, through the BIOME 6000 project, hadexperience with historical reconstructions of land cover for6000 years before present. In March 2000, in Bern, LUCC andPAGES organized a joint workshop to launch the “BIOME 300project”. This workshop brought together about 40 research-ers from various disciplines including archaeology, palynol-ogy, paleoecology, demography, geography, and history to ex-plore the task of creating land-cover maps at 50-year intervalssince 1700. This workshop also highlighted the preliminaryefforts of two groups – from the Dutch National Institute forPublic Health and Environment (RIVM) and the Center forSustainability and the Global Environment (SAGE) at the Uni-versity of Wisconsin. The participants at the workshop de-cided to leverage the preliminary efforts of RIVM and SAGE,and encouraged the two groups to release a “fast track” prod-uct of their historical land-cover database, which was subse-quently widely distributed using CD-ROMs.
The SAGE and RIVM efforts compiled various contempo-rary and historical statistical inventories on agricultural land(e.g., census data, tax records, land surveys, historical geog-raphy estimates, etc.; see Box 2.4 for a review of various datasources). They then applied different spatial analysis tech-niques – SAGE based on “hindcast modeling”, while RIMVused reconstructed historical population density maps – toreconstruct historical maps of agricultural areas from 1700to 1990 (Ramankutty and Foley 1998, 1999; Klein Goldewijk2001; Klein Goldewijk and Ramankutty 2004). The data setsfocused on reconstructing the historical expansion of crop-land and pasture areas. A data set of global potential naturalvegetation was also created and overlaid on the agriculturalland data sets to estimate the change in extent of natural veg-etation types. The data sets were created at a spatial resolu-tion of 0.5 degree in latitude and longitude, and at an annualresolution from 1700–1990.
European colonization and increasing globalization ofworld markets. New settlement frontiers were establishedin North America, Latin America, South Africa, and theFormer Soviet Union. North America and the FormerSoviet Union experienced their most rapid expansionsof cultivated lands starting around 1850. Latin America,Africa, and South and Southeast Asia experienced slowcropland expansion until the 20th century, but have seenexponential increases in the last 50 years. China had asteady expansion of croplands throughout most of thelast three centuries.
In the last 50 years, several regions of the world haveseen cropland areas stabilize, and in some there has evenbeen a decrease. In the USA, as cultivation shifted fromthe east to the Midwest, croplands were abandoned alongthe eastern seaboard around the turn of the 20th century,and this has been followed by a regeneration of the east-ern forests during the 20th century. Similarly, croplandsareas have decreased in southern China and WesternEurope. Another new trend is the loss of prime farm-land areas to urban expansion. Because cities were oftenfounded near the prime farmland areas, expansion ofcities due to population growth leads to an encroach-ment of built-up areas on to some of the world’s bestagricultural soils. While this is not significant yet on a
global scale, regional scale trends are alarming. It is esti-mated that the USA paved over roughly 2.9 million ha ofagricultural land between 1982 and 1997, and that ~30%of the increase in developed land during 1982–1997 oc-curred on prime farmland (NRCS 2001). China lost nearly1 million ha of its cultivated land to expansion of infra-structure (both urban and rural) between 1988 and 1995(Heilig 1999; Seto et al. 2000). Some rough estimates in-dicate that 1 to 3 million ha of cropland may be taken outof production every year in developing countries to meetthe land demand for housing, industry, infrastructure,and recreation (Döös and Shaw 1999).
2.2.2.1 Asia
Extensive research on land-use changes in tropical Asia isavailable for the period 1880–1980 (Flint and Richards 1991).This involves an area of 8 million km2 and 13 countries (In-dia, Sri Lanka, Bangladesh, Myanmar, Thailand, Laos, Cam-bodia, Vietnam, Malaysia, Brunei, Singapore, Indonesia andthe Philippines). In this area as a whole, forest/woodlandand wetlands declined over the hundred year period by131 million ha (47%). At the same time, cultivated area in-creased by 106 million ha, nearly double that of 1880. Thus,81% of the forest and wetland vegetation appears to havebeen converted during the expansion of agricultural land.Intensified timber extraction for domestic and exportmarkets and the exploitation of firewood, fodder andforest products all contributed to deforestation in thispart of the world. Some examples from several Asiancountries are presented below with a view to elucidatethe different processes of land-use changes in the past.
China. Settled agriculture may have begun in China asearly 10 000 years ago, contemporaneous with its originin Mesopotamia. The earliest cultivation began in themiddle and lower reaches of the Yellow River and radi-ated outwards. Since those early origins the area undercultivation in China has generally increased, althoughnot uniformly. Cropland areas have contracted as wellas advanced in different regions and time periods in re-sponse to invasions, wars, environmental catastrophes,and political programs. The Loess Plateau in the northof China was largely stripped of natural vegetation bythe Western Han dynasty (206 b.c. to a.d. 8) (Fang andXie 1994). Much of the vegetation in the region returnedbetween the third and sixth centuries when nomads fromMongolia drove out the farmers and replaced farmlandswith grazing lands; but croplands expanded again whenfarmers moved back after the sixth century. In southeast-ern China as well, the cultivated area expanded and con-tracted, with peaks in the area under cultivation arounda.d. 1200 and a.d. 1600. and large decreases as a result ofwars and foreign conquests in the 14th and 17th centuries(Mongol and Manchu invasions, respectively). By 1800,
2.2 · Historical Changes in Global Land Cover
CHAPTER 2 · Global Land-Cover Change: Recent Progress, Remaining Challenges14
however, the area under cultivation in the region wastwice as large as at any time previously, and by 1853, all ofthe cultivable land in Guangdong province had beencleared (Marks 1998).
The overall trend in cultivated land area in China hasbeen one of expansion. By 1400 croplands covered anestimated 25 million ha. This number had increased to50 million ha around 1700, to 100 million ha by 1935 (Per-
Fig. 2.2a. The BIOME 300 project presented two independent, global, geographically-explicit reconstructions of historical changes inagricultural land from 1700 to 1990. It also provided a global data set of potential natural vegetation

15
kins 1969), and to 130–140 million ha in the mid-1990s(Yang and Li 2000). The current estimate is 30–40%higher than the officially published value (Heilig 1999).In recent decades, the total area of cropland has declinedby about 4.7 million ha (4.45%), with large losses insoutheastern China being partially offset with increasesin the north and southwest (Yang and Li 2000). In thecontext of land-use change, it is worth pointing out thatthe current area under crops in China accounts for onlyhalf of the long-term loss of forests (Houghton and Hackler2003), suggesting that unsustainable logging practices,burning or other activities have led to a long-term in-crease in lands that are not well defined or quantified.
Malaysia. Southeast Asia has a long human history. Wetrice cultivation was certainly prevalent by the 14th centuryin Malaysia. Early colonial influence was limited, but theneed for control of mineral production (tin in Malaysia)and land for plantations led to spread of colonial admin-istration (Brookfield et al. 1990). In the 19th century, un-der British rule, rubber and oilpalm were introduced toPeninsular Malaysia for commercial purposes. Over thecourse of time, Malaysia became the world’s largest pro-ducer of rubber and oilpalm. As a result, perennial cropsconstituted around 80% of the agricultural land in Ma-laysia by 1961 (FAO 2004). Agricultural land expandedfrom covering 21% of the Malay Peninsula in 1966 to 39%in 1982. Consequently, forest cover in the peninsula wasreduced from around 73% in the early 1950s to ~51% in1982 (Brookfield et al. 1990). Loggers were well estab-
lished in Peninsular Malaysia by 1920 and have now cutover virtually all of the forest/woodland vegetation out-side the limits of protected reserves. Logging has alsobeen the main source of massive deforestation in EastMalaysia, in Sarawak and Sabah. However, with the in-creasing pressure to protect the remaining forests, oil-palm has emerged as a major commercial crop.
Indonesia. Evidence for agriculture in Sumatra goes backto 7 000 years before present. Land-use history in Indo-nesia was influenced by the Dutch colonial influence(Frederick and Worden 1992). In the late 19th century,central and east Java formed the center of Dutch sugarcultivation, supported by labor from the dense popula-tion. Java was the center of paddy rice cultivation (sawah),and while sugar was grown on the most fertile lands, suf-ficient rice was also grown. Not surprisingly, Java hadbeen largely deforested before 1880. In contrast, the is-lands of Sumatra, Kalimantan (Borneo) and Sulawesisupported relatively sparse populations practicing slashand burn agriculture, and were scarcely exploited be-fore 1920 (Richards and Flint 1994). Commercial log-ging started in Kalimantan during the 1960s, and wasboosted in 1967 through huge financial investments byJapanese companies. By 1980, one-fifth of Kalimantan’sforests had been logged. Additional forest losses oc-curred during the droughts of the 1982–1983 El Niño,when almost 3.5 million ha were burnt (Malingreau et al.1985), and again during the 1997–1998 El Niño when al-most 5 million ha of forests and 4 million ha of agricul-
Fig. 2.2b. Intercomparison of the SAGE and HYDE data sets of agricultural land, forest land, and savanna/grassland areas. The forest landarea and savanna/grassland area were inferred by subtracting agricultural land area from the potential natural vegetation data set
2.2 · Historical Changes in Global Land Cover
CHAPTER 2 · Global Land-Cover Change: Recent Progress, Remaining Challenges16
tural lands were damaged (Barber and Schweithelm2000). Studies have concluded that much of the fires wereattributable to side effects of logging (Siegert et al. 2001).
India. Agriculture in the form of settled cultivation be-gan around 7 000 years in the Indo-Gangetic Plain. Therich fertile soil of the Indo-Gangetic alluvium contrib-uted significantly to the growth of the one of the world’soldest civilizations. Records from the Mughal Empire(1526–1857) indicate that much of the land in the Indo-Gangetic Plains was already under use (Abrol et al. 2002).With the establishment of British colonial rule in early19th century, land-use practices became much more ex-tensive and intensified.
Richards and Flint (1994) estimated a forest loss of40% over India during 1880 to 1980. Important drivingforces were an increase in cultivated area by more than42 million ha (40%), a staggering tripling of the popula-tion (increase of half a billion people), and livestock in-crease of 193 million head (105%). Increasing food de-mand was often met through an expansion of cultivatedarea, often at the expense of forests. However, crop pro-duction increased through intensification of productionafter the Green Revolution in 1965, with the introductionof high-yield seed varieties after 1965, the use of irriga-tion and fertilization, and introduction of double crop-ping practices. Indeed, between 1950 and 1997, irrigatedareas tripled, fertilizer consumption increased from66 000 t to 16 million t, and multiple cropping index (ra-tio of gross area sown to net area sown) increased from111% to 134% (DES 2004; FAO 2004).
2.2.2.2 North America
Numerous studies have described historical changes inNorth American agriculture (e.g., Bailey 1909; Helfman1962; Menzies 1973; Schlebecker 1973, 1975; Yates 1981;Richards 1990; Riebsame 1990; Cronon 1991; Sisk 1998;U.S. Department of Agriculture 1998).
In the USA, the Homestead Act of 1862 (wherein160 acres of government land were given free to thosesettling and cultivating it for at least 5 years) led to a rapidsettlement of public lands in the following decades. Thiswas further stimulated by the end of the civil war andthe disbanding of the armies. In particular, the GreatPlains looked promising to people who had lost every-thing in the war. The increasing flow of immigrationadded further to the movement of people into the Mid-west. Furthermore, the building of canals in the early1800s, and subsequent expansion of railroads facilitatedthe rapid transport of goods from the Midwest.
The corn and wheat belts began to develop in the 1850s.Wheat cultivation was constantly forced westward by therising price of land and by corn encroaching from theeast. By 1870, the Corn Belt had moved westward and
stabilized in its present location. Extensive agriculturalsettlement in the Great Plains began in the 1870s and1880s. Dryland farming in the semiarid regions of theMidwest began in the 1880s. In 1902, the governmentpassed the Reclamation Act of 1902 to provide irrigationresources to small farmers, which further encouraged theagricultural development of the Midwest. Since 1900, crop-land area mostly increased in the Great Plains region atthe expensive of grasslands. The period from 1898 to 1914is sometimes known as the Golden Age of American Agri-culture. By 1920, grain production had reached the mostarid regions of the Great Plains and cotton had moved intowestern Texas and Oklahoma. In the 1930s, prolongeddrought combined with poor agricultural soil managementled to the “Dust Bowl” in the southern Great Plains. Foreight years, dust storms blew away topsoil in this regionuntil the drought ended. Between the 1930s and the 1950s,the federal government sponsored large irrigation projectsin the west, which led to subsequent agricultural develop-ment of California and other western states. Around the1940s, crop acreage in the USA began to stabilize. In the1960s, soybean acreage expanded in the Great Plains, as analternative to other crops. The early 20th century also sawthe abandonment of croplands and regrowth of forests inparts of eastern USA, starting in New England, followedby the Mid-Atlantic States, and more recently in the South-east. The abandonment of croplands in the eastern USAwas partly due to competition from more fertile regionsof the Midwest, and also due to competing demands onland within the east from rapid urbanization.
In Canada, railways reached Winnipeg by 1885, pro-viding easy access to the prairies. Roughly a decade later,immigration into the Canadian West reached huge pro-portions. Innis (1935) observed that roughly one millionsettlers came to the Canadian West from the USA, andseveral thousand others from Europe. The Prairie Prov-inces were mostly cultivated by 1930. The expansion ofthis frontier finally ended with settlement in the PeaceRiver Valley in Alberta in the 1930s.
2.2.2.3 Europe and the Former Soviet Union
Land-cover change in Europe and the Former SovietUnion has a long history. The agricultural revolution ofthe Middle East spread into Europe between 7000 b.c.
and 5500 b.c. Extensive forest clearing in the Mediterra-nean Basin has been ascribed to economic and politicalactivities during the Greek and Roman Empires. Defor-estation continued through to the medieval period intemperate western and central Europe, driven by theincrease in population from 18 million ca. a.d. 600, to39 million in a.d. 1000, to 76 million in the early13th century. Forests and swamps decreased from roughly80% of the land area to about half between a.d. 500 anda.d. 1300 (Williams 2002). In Russia, there is some evi-

17
The maps in Fig. 2.3 have been digitized from 1 : 10 000 topo-graphic sheets in the Belgian Ardennes. During the 19th century,heathlands were converted to deciduous forests and arable land.Afterwards, deciduous forests were converted to rapidly grow-ing coniferous plantations. Concurrently, as a result of the in-crease in agricultural yields and the specialization in breedingof dairy and beef cattle, the largest part of arable land was con-verted to grassland. Peatlands as well as wet meadows have ex-perienced a slowly and constant decline. They are often severely
Fig. 2.3. Land-use change history in the Belgian Ardennes (1868to 1973)
Box 2.3. Land-use change history in the Belgian Ardennes
Antoine Stevens · Université catholique de Louvain, Louvain-la-Neuve, Belgium
degraded or threatened and are nowadays subject to conserva-tion and restoration measures. This illustrates that, even in thisrural area considered by many people as ‘natural’, landscape hasbeen strongly modified by human activity. Conversion from natu-ral to managed land is likely to have a large impact on ecosys-tems attributes (e.g. carbon content, biodiversity).
dence for clearing accompanying the eastward movementof Slavs into the mixed-oak forest zone; but the clearingrates were slow and less extensive in comparison to cen-tral and western Europe. The continued deforestation ofEurope was interrupted significantly by the spread of thebubonic plague between 1347 and 1353. The total popula-tion decreased from 76 million in 1340 to around 50 mil-lion in 1450. The effects of the population decline causedby the ‘Black Death’ on land cover was that between one-fifth and one-fourth of all settlements were abandonedacross the continent, and forests regenerated (Williams2002). Forests continued to reestablish themselves dur-ing the following century, as wars ravaged much of thecontinent.
The ‘Renaissance’ of the 16th century was accompaniedby the expansion of commerce. Initially, the sea-based
economies of the Western European nations intensifiedland-use practices – mostly urban – at their cores. Theseinfluences spread to the peripheries in support of the coreeconomies. European overseas expansion, especially theestablishment of trading posts along the coastline of Af-rica and European ‘discovery’ of the Americas in 1492,resulted in the continued exploitation of natural re-sources and corresponding changes on land cover, bothin Europe and abroad. In Europe, the forests that hadregenerated since the ‘Black Death’ were cleared onceagain, partly to build ships but also to provide land foragriculture (Williams 2002). Much of this land was mixedcrop cultivation and animal rearing.
By 1700, croplands and grasslands for grazing werewidespread in Europe and parts of the Former SovietUnion (FSU). The advent of the Industrial Revolution in
2.2 · Historical Changes in Global Land Cover
CHAPTER 2 · Global Land-Cover Change: Recent Progress, Remaining Challenges18
the middle of the 18th century stimulated further land-cover changes. Agriculture continued to expand duringthe late 18th and 19th centuries as the rapidly growing in-dustrial cities created new demands on food supply. Afurther, significant land-use change was that some ruralareas, for example, the west midlands of England – thecradle of the Industrial Revolution, became predomi-nantly urban and industrial. In Russia agricultural ex-pansion occurred at the expense of steppe grasslands andnew frontiers of settlement were also established else-where in Russia and Siberia.
The agricultural revolution that began in Europe inthe 1700s, continued through the 18th and 19th centurieswith the widespread introduction of irrigation, the de-velopment of chemical fertilizers and selective crop andanimal breeding. As a consequence agricultural produc-tion intensified. Cropland expansion had significantlyslowed down in Europe by the second decade of the20th century. However, there were some counter-trendsduring the 20th century. For example, in Britain muchgrassland was brought into cultivation to try and allevi-ate food shortages during the Second World War; andduring the 1950s, the steppes of Russia and Kazakhstanwere extensively cleared for cultivation as a result of the‘Virgin and Idle Lands’ Program of 1954–1960, initiatedby Khrushchev. This plan was designed to increase grainproduction; but by the early 1960s much of the land,which had only been grazed before, had become another‘dust bowl’ and was abandoned. By the 1960s, crop pro-duction increases in the temperate zones of the world camealmost solely from increases in yields. New agriculturalsettlement and expansion had stopped in the former tem-perate forest and steppe zones, which were for all intentsand purposes ‘deforested’ in many western and centralEuropean countries. Since the 1980s agricultural areashave started to contract in Europe and the Former So-viet Union since 1980, in western Europe much of thiscontraction has been driven by EU agricultural and en-vironmental policies (McNeill 2000; Williams 2002).
2.2.2.4 Australia
There is widespread evidence for forest modificationthrough the aboriginal use of fires on the savanna-for-est interface in Australia (Pyne 1991). Landscape modi-fication continued with the first European settlers ar-riving in Australia in 1788. The initial phase of develop-ment was based on commercial cattle ranching, export-ing beef, mutton, and wool to Europe and North America(Richards 1990). Large-scale wheat cultivation began inthe late 19th century, stimulated by the growing urbanfood demand from the eastern USA and Western Europe(Richards 1990). Cultivation was initially based in thesettlements of Victoria, South Australia and WesternAustralia, but expanded later to New South Wales with
the construction of railways. The expansion of cultiva-tion resulted in the modification and loss of the denseeucalyptus forests of southern and eastern Australia. Itis estimated that 69% of the vegetation in Victoria and50% of the vegetation of New South Wales were modi-fied since 1780 (Wells et al. 1984).
2.2.2.5 Africa
Before the 19th century, land in sub-Saharan Africa wasused largely for hunting, gathering, herding, and shift-ing cultivation (Kimble 1962). Some settled agricultureexisted in Africa long before the imposition of colonialrule in the late nineteenth century, but in the pre-colo-nial period, demographic and economic needs allowedfor land cleared for cultivation to be left fallow for longperiods or abandoned as cultivators moved on andcleared new land. Estimates of cropland areas before~1900 are variable, in part because of the lack of dataand in part because ‘croplands’ were part of a shiftingcultivation rotation, where the distinctions betweencropped areas and fallows are unclear (Kimble 1962).Shifting cultivation included annual clearing of 0.5–3.0 haof forest per family creating a mosaic of cropped fieldsintermingled with fields 2–3 years old, fallows, and standsof secondary and mature forest. Clearing of previouslycultivated areas (old fallows of 10–50 years) was gener-ally preferred over clearing old-growth forests. Before~1900, land use had probably been in a “quasi-equilib-rium” for thousands of years (Kimble 1962). Changes in-cluded both increases and decreases as a result of wars,epidemics, famines, and slave trade (both intra-Africanand trans-Atlantic). In fact, populations are thought tohave declined somewhat during the 19th century. Between1850 and 1900 European colonization introduced changes;but with a few exceptions, the most rapid and dramaticchanges occurred after 1930 (Kimble 1962).
Two factors led to the cropland expansion after 1930:population growth and European demand for exportcrops. Populations increased from improved publichealth provision, as well as the absence of the wars, epi-demics, and famines that had characterized the late19th century (Kimble 1962). The area under export cropsexpanded significantly because colonial governmentsneeded the revenues they provided to recover fromworldwide depression of the 1930s. In addition, by the1930s, the railroads and most of the other major trans-port routes were in place in colonial Africa, and it be-came feasible to begin development of areas that hadhitherto been inaccessible. This combination of demo-graphic pressure and economic incentive has continuedto the present. Cropland area in sub-Saharan Africa isestimated to have been 119 million ha in 1961 and163 million ha in 2000 (FAO 2004), an increase of 37% in40 years. The rate of forest clearing for long-term shift-
19
Box 2.4. Review of datasets of historical land cover
Data on land-use and land-cover change can be gleaned fromvarious sources such as tax records, land surveys, periodic cen-suses, forest inventories, paleo records, reconstructions by his-torical geographers, and remote sensing. Using such sources,numerous local-to-continental scale data sets of land-coverchange have been developed (Table 2.1). Here we briefly reviewsome of the major sources of such data.
Ground-based Data
Data on land-use and land-cover change were collected system-atically over the last century through censuses. The first WorldCensus of Agriculture was conducted in 1930, and since then, theFAO has promoted a worldwide census every 10 years. FAO hasalso compiled national-level data on agricultural land use annu-ally since 1961 (the FAOSTAT database), and has also performedperiodic global inventories of forests (Forest Resources Assess-ment). These data are reported to the FAO by the member nations.The quality of data is only as good as the quality of monitoringand reporting by the various countries to FAO. For example, na-tions with poor infrastructure, or that are ravaged by civil wars,are incapable of performing the systematic observations, and there-fore have unreliable data. Data on land use are also available at thesubnational level from various national census organizations atroughly five-to-ten-year intervals (e.g., U.S. Department of Agri-culture; Fundação Instituto Brasileiro de Geografiae e Estatística(IBGE), Brazil; Directorate of Economics and Statistics, India, etc.).A first global synthesis of such subnational agricultural census datais currently being accomplished through the AgroMAPS project(http://www.fao.org/landandwater/agll/agromaps/).
Unfortunately, the quality of census data prior to World War IIis very poor, and other sources of data necessarily need to be used.
The British Colonies kept extensive tax records and conducted fre-quent cadastral and forest surveys. Furthermore, historical maps,aerial photographs, pollen records, and land-use models have beenused to reconstruct historical land-use information. The effort byFlint and Richards (1991) to reconstruct land-cover changes inS.E. Asia from 1880 to 1980 is a good example of this type of work(other examples can be found in Table 2.1). Recently, the Interna-tional Geographical Union Commission on Land Use and LandCover Change (IGU-LUCC) published a two-volume Atlas titled“Land use/cover change in selected regions in the world”, whichpresents regional maps of land cover through the last century(Himiyama et al. 2001, 2002). Another simple proxy often used toreconstruct historical land-cover change is the total human popu-lation numbers. Prior to 19th century, technology played a minorrole in resource extraction, and therefore the extent of human ac-tivities was likely well correlated to human population growth, thenumber of livestock, etc., for which better data are available. Twoexamples of such use of data are Houghton et al. (1983) in theireffort to reconstruct a 300-year global history of land-cover change,and the more recent effort by Stéphenne and Lambin (2001) toreconstruct land-use changes in Sudano-Sahelian Africa.
Remotely-Sensed Data
In the last three decades, the advent of the remote sensing satel-lites has led to the development of instruments to systematicallymonitor land cover from space. While satellite data present auseful baseline for historical reconstructions, they are, by them-selves, not useful to study land-cover change before the 1970s.Therefore, we will not discuss them further in this section. InSect. 2.5.3, we review the development of remotely sensed dataon land-use and land-cover change.
ing cultivation has been even greater than the rate ofclearing for permanent croplands in recent decades(Houghton and Hackler, in press).
Biggs and Scholes (2002) reconstructed land-coverchange for South Africa for the period 1911–1993. The areaunder cultivation more than tripled during the last cen-tury, while the plantation area increased more than ten-fold. They found that expansion of the cultivated areawas highly correlated to total domestic populationgrowth until the 1960s; since then increasing food de-mand has been met through increasing yields from fer-tilizer use and irrigation, and not through continued ex-pansion of the cultivated area.
2.2.2.6 South America
Forest exploitation in Brazil started with Brazil-woodextraction along the Atlantic Coast nearly 500 years agosoon after the first Portuguese arrived. The discovery ofgold in Minas Gerais in 1690 stimulated mining here andin other scattered pockets elsewhere, which led to large-scale destruction of forests (Williams 1990). This wasfollowed by large, export-oriented sugar cane plantations,strengthening Portugal’s supremacy in the world sugartrade. Large-scale forest conversion started with coffeeplantations in the 19th century that resulted in the nearlycomplete loss of the Brazilian Atlantic Forest. The Atlan-
tic forest once stretched all the way from Rio Grande doNorte to Rio Grande do Sul; three million ha had beenconverted into coffee plantations during the nineteenthcentury, and more than 90% had been cleared by the endof the last century.
The first large-scale migration into Amazonia wasmotivated by the rubber boom; the population of Brazil-ian Amazon increased four-fold between 1870 and 1910(Salati et al. 1990). Livestock production accompanied therubber exports, but was not very successful. From 1914 untilWorld War II, little development occurred in the AmazonBasin. During the last decades of the 20th century, massiveconversion of land for large-scale cattle ranching oc-curred. In addition, large-scale infrastructure projectslike the Trans-Amazonian Highway opened-up pristinetropical forest areas, often followed by the influx of set-tlers. Between 1850 and 1985, 370 million ha of forest inLatin America (~28%) was converted into other land uses(Houghton et al. 1991). Most of this deforestation was dueto the expansion of cattle ranching (Lambin and Geist2003). However, in the recent decades, deforestation isbeing increasingly dominated by soybean expansion(Laurance et al. 2004). Soybean areas in Brazil increasedfrom 240 000 ha in 1961 to 8.8 million ha in 1980, to21.5 million ha in 2004 (FAO 2004), and Brazil is on theverge of becoming the largest exporter of soybeans inthe world today. Logging is another major cause of de-forestation in Brazil, the extent of which has been un-
2.2 · Historical Changes in Global Land Cover
CHAPTER 2 · Global Land-Cover Change: Recent Progress, Remaining Challenges20
derestimated until recently as shown by a study by As-ner and colleagues (Asner et al. 2005).
In the mid 19th century, much of Argentina was de-voted to the grazing of sheep and cattle, with very littlearable cultivation (Grigg 1974). Argentina emerged to be-come a major agricultural nation in the late 19th century,with the introduction of agricultural technology and in-tegration into the world economy. Investment, mostly bythe British, as well as migrant workers from Spain andItaly, helped this development. Italian sharecroppersstarted growing wheat, which became the major cropin the humid pampa. Cropland areas increased from0.3 million ha in 1870, to 6 million ha in 1900, 19 million hain 1910, and 24 million ha in 1930 (Grigg 1987). By 1900,Argentina became one of the leading exporters of wheatin the world. In addition, to wheat, maize also began tobe grown in the 1890s, and vegetables, dairying, and otherintensive agricultural practices also took hold after WorldWar I. The 1930s was the peak of Argentinean agriculture.Since 1930, agriculture became stagnant with the great de-pression and cropland areas stabilized. However, in therecent decades, as in Brazil, soybean production has ex-ploded in Argentina, increasing from 26 000 ha in 1970to 14.3 million ha in 2004 (FAO 2004). Soy is expandingnot only at the expense of other crops, but is also causingdeforestation in the foot of the Andes, and in Chaco.
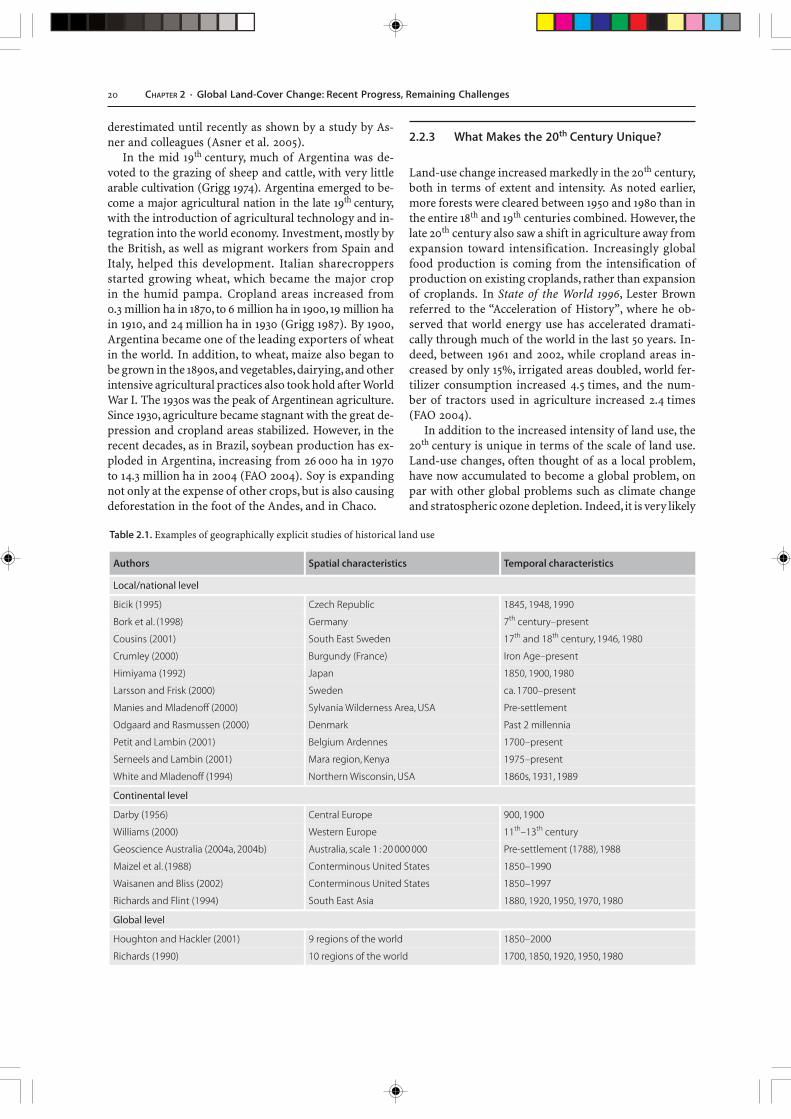
2.2.3 What Makes the 20th Century Unique?
Land-use change increased markedly in the 20th century,both in terms of extent and intensity. As noted earlier,more forests were cleared between 1950 and 1980 than inthe entire 18th and 19th centuries combined. However, thelate 20th century also saw a shift in agriculture away fromexpansion toward intensification. Increasingly globalfood production is coming from the intensification ofproduction on existing croplands, rather than expansionof croplands. In State of the World 1996, Lester Brownreferred to the “Acceleration of History”, where he ob-served that world energy use has accelerated dramati-cally through much of the world in the last 50 years. In-deed, between 1961 and 2002, while cropland areas in-creased by only 15%, irrigated areas doubled, world fer-tilizer consumption increased 4.5 times, and the num-ber of tractors used in agriculture increased 2.4 times(FAO 2004).
In addition to the increased intensity of land use, the20th century is unique in terms of the scale of land use.Land-use changes, often thought of as a local problem,have now accumulated to become a global problem, onpar with other global problems such as climate changeand stratospheric ozone depletion. Indeed, it is very likely

21
that our next major global pollution problem may be re-lated to nitrogen pollution of the world’s waterwaysthrough excess fertilizer application. Therefore, land-usechanges in the 20th century are, unlike any earlier timein history, accelerating in intensity throughout the world.
2.3 Most Rapid Land-Cover Changesof the Last Decades: Rapid and Extensive
With the recognition that land use is an important driverof global environment change, numerous studies in thelast two decades have estimated the rates of tropical de-forestation and other kinds of land-cover change aroundthe world. Remote sensing has played a critical role indocumenting these changes (Mollicone et al. 2003), andthere are multiple examples of studies and resultant da-tabases of rapid land-cover change and ecosystem dis-turbances in important regions of the world: deforesta-tion in the pan-tropical forest belt; snapshots of landcover in European Russia, continental US and Canada;fire frequency globally and regionally in South America,Southern Africa, and parts of Russia; and the influenceof urbanization in selected cities around the world. Whilemost studies were at the local-to-regional scales, globalland-cover data sets were developed, using differentmethodologies, for the early 1990s using AVHRR satel-lite data (Loveland et al. 2000) and 2000–2001 using MO-DIS satellite data (Friedl et al. 2002) and SPOT VGT data.There has also been a profusion of information and stud-ies based on data sources other than remote sensing.
Despite the plethora of land-cover change studies andglobal remote sensing observations, a systematic, globalsynthesis and review of the major trends in land-coverchange was not conducted until recently. The MillenniumEcosystem Assessment (MA), in collaboration with LUCC,recently undertook a synthesis of the regions undergo-ing rapid land-cover change around the world (see Box 2.5,Lepers et al. 2005). Here, on the basis of this synthesis,and other publications, we review the recent changes inland cover around the world, particularly focusing onthe following types of land-cover change: deforestationand forest degradation, changes in croplands and graz-ing lands, urbanization, and changes in drylands.
2.3.1 Recent Forest-Cover Changes
Deforestation, one of the most commonly recognized formsof land-cover change, is nevertheless plagued by inconsis-tencies in definitions (Williams 2002). The Food and Agri-culture Organization (FAO) of the United Nations definesdeforestation as occurring when tree canopy cover falls be-low 10% in natural forests (or when a forest is transformedto other land uses even if tree canopy cover remains higherthan 10% – e.g., shifting cultivation). On the basis of this
definition, and using country forest inventories, expert es-timates, forest-plantation data, and an independent remotesensing survey, the Global Forest Resources Assessment2000 (FAO 2001a) [FRA 2000 hereafter] estimated a netdecrease in forest area of 9.4 million ha yr–1 from 1990 to
Box 2.5. The LUCC-MA rapid land-cover change assessment
Recently, the Millennium Ecosystem Assessment (MA), an in-ternational program designed to assess the status and trendsin the global ecosystem change, also recognized the impor-tance of land-use and land-cover change. The LUCC programwas commissioned by the MA to assess places in the worldundergoing the most rapid land-cover changes. The tremen-dous advance in scientific analysis of land-cover change overthe last decade made such a synthesis both possible and timely.The assessment used both remote sensing information avail-able in widely scattered literature as well as sub-national, na-tional, and regional inventory data on land-cover change.
The rapid land-cover change assessment identified forty-nine data sets at the national and global scale showing eitherrates of land-cover change, or “hot spots” of land-cover changeover the last two decades. The types of change (or proxy vari-ables for change) included in the analysis were: (i) deforesta-tion and forest degradation; (ii) degraded lands in the dry-lands and hyper-arid zones of the world (referred to here asdesertification, even though most definitions of desertifica-tion do not include hyper-arid zones); (iii) cropland expan-sion and abandonment; and (iv) urban settlements. Some im-portant land-cover changes were not included because of ab-sence of reliable data. For instance, no spatially-explicit datasets of reliable quality on afforestation and reforestation oron changes in pastoral lands are available at a regional-to-glo-bal scale. Data limitations also precluded the analysis of ques-tions such as where future land-cover changes are likely tooccur, or where ecosystem impacts are large even though theextent of land-cover change may be small.
The synthesis had to overcome several challenges:
1. Some of the datasets identified “hot spots” of land-coverchange directly while others provided estimates of rates ofchange. For the latter, rapid land-cover change areas wereidentified as those with rates of change above a certainthreshold percentile value. Threshold values were chosenseparately for each of these datasets, and type of land-coverchange.
2. Different data sources are not based on standard definitions,even though some definitions are more commonly accepted.For this synthesis, areas with the highest rates of land-coverchange were determined given the definition adopted for aparticular dataset, rather than attempting to harmonize thedefinitions among all data sets.
3. The different data sets had different spatial resolutions –the finest one being the remote sensing-based data (in theorder of one km2) and the coarsest one being the (sub)-national statistics (in the order of hundreds to thousandskm2). Depending on the scale of the source data sets, thisled to commission and omission errors.
4. Not all data sets covered the 1980–2000 time period chosenfor the synthesis. Therefore, the final maps provide no de-tailed information on the time period during which a par-ticular area experienced rapid land-cover change, nor onthe frequency of disturbances.
5. Some parts of the world were covered by several datasetswhereas, for others, only national statistics were available.Consequently, some areas appear to be more affected byrapid land-cover change simply because they have beenstudied more intensively. To indicate this bias, the map leg-end provides additional information on the number ofdatasets covering an area.
2.3 · Most Rapid Land-Cover Changes of the Last Decades: Rapid and Extensive

CHAPTER 2 · Global Land-Cover Change: Recent Progress, Remaining Challenges22
2000. This change was a result of a 12.5 million ha yr–1 netdecrease in natural forests (comprising deforestation of14.6 million ha yr–1, conversion to forest plantation of1.5 million ha yr–1, and regeneration of 3.6 million ha yr–1),and 3.1 million ha yr–1 net increase in forest plantations(1.5 million ha yr–1 converted from natural forests, and1.6 million ha yr–1 of afforestation). Most of the deforesta-tion occurred in the tropics, while most of the natural for-est regrowth occurred in Western Europe and eastern NorthAmerica; the total net forest change was positive for thetemperate regions and negative for the tropics (Fig. 2.4a).
The overall estimates of forest-cover change from FRA2000, cited above, were a combination of national data ad-justed using information from the FRA remote sensingsurvey, and forest-plantation data (FAO 2001a, see Chap. 1,pages 8–10). One of the major reasons for this adjustmentwas because FAO recognized the unreliability of countrydata, especially in tropical Africa. Indeed, a comparisonbetween the FAO country data and the independent re-mote sensing survey showed reasonably good agreementin Latin America and tropical Asia, but poor agreement intropical Africa (Table 2.2). Two recent studies using remotesensing (Landsat derived estimates from the TREES projectof Achard et al. (Achard et al. 2002), and AVHRR-based
estimates of DeFries et al. (2002) also lend credence to theidea that the FRA 2000 country estimates of deforestationare too high, especially in tropical Africa (see Table 2.2,DeFries and Achard 2002). Achard et al. (Achard et al. 2002)estimated deforestation rates for the humid tropics thatwere 23% lower than FRA while DeFries et al. (2002) es-timated deforestation rates for the entire tropics that were53–62% lower. A simple comparative analysis of these tworemote sensing estimates to the FAO country data un-dertaken by Houghton and Goodale (2004) suggests thatFAO overestimated deforestation rates by roughly 30% ifdry tropical Africa is ignored. In tropical Africa, decreasesin net forest area from the FAO country studies are a lothigher than any of the remote sensing estimates, andmuch of the difference seems to arise in dry tropical for-ests (Table 2.2). Indeed, even the FRA 2000 study sug-gests that the country reports seem too high for certaincountries (e.g., Sudan and Zambia). Another significantdifference between the AVHRR-based estimates and theFAO estimates is that the former suggests that deforesta-tion rates were higher in the 1990s compared to the 1980s(Table 2.2), while FAO found no statistically significanttrends, except for a decreasing rate of deforestation intropical moist deciduous forests (FAO 2001a).
Fig. 2.4a. Results from the LUCC-MA Rapid Land-Cover Change Assessment showing major areas of the forest-cover change in the worldbetween 1980 and 2000

23
While gauging these estimates, a caveat to note is thatchanges in dry tropical forests are difficult to estimatefrom coarse-resolution remote sensing imagery, andwhile country estimates may have overestimated defor-estation, coarse-resolution remote sensing estimates mayunderestimate deforestation (see Sect. 2.5.1.1, FAO 2001a).Indeed for Africa, the AVHRR-based estimate of net for-est change in the 1990s for both humid and dry tropics isless than for the Landsat-based estimate of net forestchange in the humid tropics alone, indicating that theAVHRR data likely underestimates deforestation in Af-rica where size of clearings are relatively small. The esti-mation of deforestation in such situations may requireoptimally chosen Landsat images supplemented withvery-high resolution data such as from the IKONOS sat-ellite, as well as in-situ surveys.
The TREES data is considered more reliable becauseof its high resolution as well as being restricted to moreeasily observed humid tropical forest changes; however,it only covers a statistically-selected subset of the total area(6.5%) based on a stratification determined from expertopinion. According to the TREES data, 5.8 ±1.4 million haof humid tropical forest were lost each year between 1990and 1997 (Achard et al. 2002). Over the same period, for-est regrowth was estimated to be 1.0 ±0.32 million ha yr–1,leading to a net change of 4.9 ±1.3 million ha yr–1 (0.43%per year). An additional 2.3 ±0.7 million ha of forest werevisibly degraded (but this does not include forests af-fected by selective logging). Southeast Asia experiencedthe highest rate of net forest-cover change (0.71% peryear), with the highest rates of deforestation being esti-mated for central Sumatra (3.2–5.9% per year). Africa andLatin America had lower estimates of net forest change(0.36% and 0.33% respectively). However, in terms ofextent, Latin America lost about the same area of forestas Southeast Asia between 1990 and 1997. Forest degra-dation was most extensive in Southeast Asia (0.42% peryear), lowest in Latin America (0.13% per year), and in-
termediate in Africa (0.21% per year). Forest regrowthwas more extensive, both in absolute and relative terms,in Southeast Asia than in the other humid tropical re-gions (0.19% for Southeast Asia, 0.04% for Latin America,and 0.07% for Africa).
Deforestation is not widespread throughout these re-gions, but rather is largely confined to a few areas under-going rapid change, with annual rates of deforestationranging from 2% to 5% (Achard et al. 1998; Lepers et al.2005) (Fig. 2.4a). The largest deforestation front is thewell-known arc of deforestation in the Brazilian Ama-zon (see Box 2.6). Recently, deforestation has extendedoutside Brazil, to the eastern foothills of the Andes whereillegal coca cultivation has promoted deforestation (Stei-ninger 2001; Millington et al. 2003), and along the roadfrom Manaus to Venezuela (Sierra 2000). More scatteredareas of forest loss are detected in the Chaco and Atlan-tic forest areas in South America. Central America hassignificant deforestation fronts in the Yucatán Peninsulaand along the Nicaraguan border with Honduras andCosta Rica. In Africa, forest-cover change is very rapidin small scattered hot spots in Madagascar, Côte d’Ivoire,and the Congo Basin. In Southeast Asia several defores-tation fronts are found around Sumatra, Borneo, Viet-nam, Cambodia, and Myanmar. Relative to the tropics,there are fewer datasets on deforestation covering thetemperate or boreal forests (Wagner et al. 2003; Hansenand DeFries 2004). Less is therefore known about for-est-cover changes in Canada or Siberia. However, forestdegradation in Eurasia, resulting from unsustainable log-ging activities and an increase in fire frequencies, hasbeen growing over the recent years. Fire frequency hasincreased dramatically in Siberia in particular; over7.5 million ha yr–1 of Russian forests were burnt over a6-year period in the late 1990s (Sukhinin et al. 2004). Al-though deforestation is one of the best studied processesof land-cover change, it is clear that regional gaps in spa-tially explicit data persist.
2.3 · Most Rapid Land-Cover Changes of the Last Decades: Rapid and Extensive
CHAPTER 2 · Global Land-Cover Change: Recent Progress, Remaining Challenges24
2.3.2 Recent Changes in Agricultural Areas
Historically, humans have increased agricultural outputmainly by bringing more land into production. The great-est concentration of farmland is found in Eastern Eu-rope, with more than half of its land area under crops(Ramankutty et al. 2002). In the United Kingdom, about70% of its area is classified as agricultural land (crop-land, grassland/rough grazing), with agriculture and ar-eas set aside for conservation or recreation intimatelyintertwined (Hails 2002). Despite claims to the contrary,the amount of suitable land remaining for crops is verylimited in most developing countries where most of thegrowing food demand originates (Döös 2002). Wherethere is a large surplus of cultivable land, land is oftenunder rain forest, permanent pastures, or in ecologicallymarginal areas (Young 1999; Döös 2002).
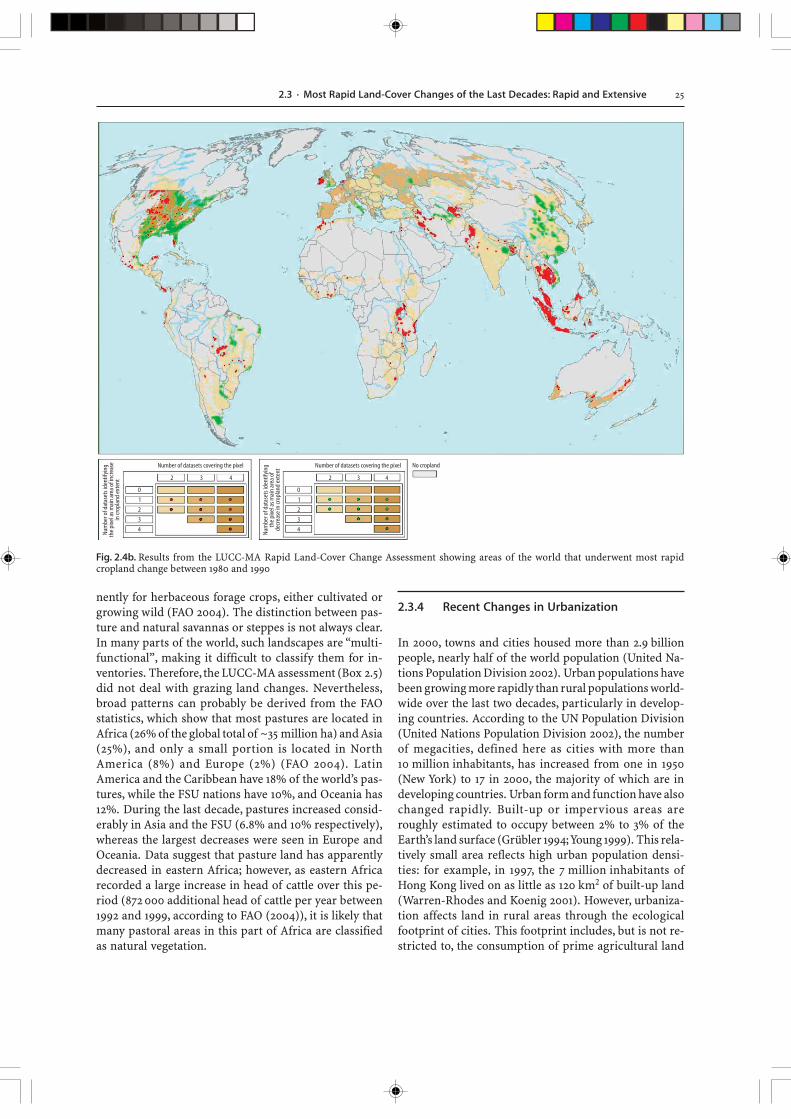
Southeast Asia witnessed the greatest expansion ofcroplands in the past few decades (Fig. 2.4b). The othermain areas of recent cropland expansion have been inBangladesh, along the Indus Valley, in parts of the MiddleEast and Central Asia, in the Great Lakes region of eastAfrica, along the southern border of the Amazon Basin,and in the Great Plains region of the United States (al-though much of what is defined as croplands in the GreatPlains is in a soil conservation program, and is not sown).Extensive abandonment of croplands occurred in NorthAmerica (lowlands of south eastern United States), east-ern China, and parts of Brazil and Argentina.
Since 1960 we have witnessed a decoupling of the in-crease in food production from cropland expansion. The1.97-times increase in world food production from 1961to 1996 was associated with only a 10% increase of landunder cultivation but also with a 1.68-times increase in theamount of irrigated cropland and a 6.87- and 3.48-times
increase in the global annual rate of nitrogen and phos-phorus fertilizer use (Tilman 1999). In 2000, 271 million hawere irrigated (FAO 2004). Globally, the cropland areaper capita decreased by more than half in the twentiethcentury, from around 0.75 ha per person in 1900 to only0.35 ha per person in 1990 (Ramankutty et al. 2002). Note,however, that national statistics in developing countriesoften substantially under-report agricultural land area(Young 1999; Ramankutty et al. 2002), e.g., by as much as50% in parts of China (Seto et al. 2000).
The mix of cropland expansion and agricultural in-tensification has varied geographically (Ramankuttyet al. 2002). Tropical Asia increased its food productionmainly by increasing fertilizer use and irrigation. Mostof Africa and Latin America increased their food pro-duction through both agricultural intensification andextensification. Western Africa is the only part of theworld where, overall, cropland expansion was accom-panied by a decrease in fertilizer use (–1.83% per year)and just a slight increase in irrigation (0.31% per yearcompared to a world average of 1.22% per year). In 1995,the global irrigated areas were distributed as follows:68% in Asia, 16% in the Americas, 10% in Europe, 5% inAfrica, and 1% in Australia (Döll and Siebert 2000). Inwestern Europe and the northeastern United States,cropland decreased during the last decades after aban-donment of agriculture or, in a few cases, following landdegradation mostly on marginal land. Globally, thischange has freed 222 million ha from agricultural usesince 1900 (Ramankutty et al. 2002).
2.3.3 Recent Changes in Pastoral Areas
Natural vegetation covers have given way not only to crop-land but also to pasture – defined as land used perma-
Box 2.6. Deforestation in the Brazilian Amazon
The Brazilian Amazon has experienced some of the highest de-forestation rates in the world. Total deforested area in the re-gion increased from approximately 10 million ha in the 1970sto more than 60 million ha at the turn of the century, after de-velopment policies strongly based on road building and Gov-ernment-directed colonization were put into place. Govern-ment-led projects lead to the concentration of forest clearingin the vicinity of roads and colonization areas. In fact, coloni-zation and forest clearing were sustained mostly in the south-ern and eastern flanks of the Amazon, in regions closely linkedto markets in other parts of Brazil (Pfaff 1996; Alves 2002a,b);90% of all deforestation in the 1991–1997 period was foundwithin 100 km of main roads; at the same time, 87% of this de-forestation was observed within 25 km of areas cleared duringthe 1970s (Alves 2002a,b).
The effects of roads have been the focus of many research ef-forts. Opening a road through an unexplored region attracts newsettlers that initiate deforestation. On a second phase of coloni-zation, concentration of farms and forest clearing lead to increas-ing road density and intensification of land use, while deforesta-
tion expands beyond the limits allowed by the Brazilian ForestCode (Pfaff 1996; Chomitz and Thomas 2001; Alves et al. 2003).
Expansion of deforestation into new areas is frequently linkedto the illegal appropriation of public land in more remote areaswhere roads are often opened by loggers, farmers and unlawfultenants. Sayago and Machado (Sayago and Machado 2004), basedon data from a recent Federal Government Census, reported thathalf of all farm land in the Brazilian Amazon had been illegallyappropriated in Brazilian Amazon, showing the importance ofthis issue to understand the driving forces behind Amazoniandeforestation.
Despite much progress in mapping deforestation in the Ama-zon in the closed forests, rates of forest regeneration followingabandonment, land-cover modification by selective logging andland-cover conversion in the Cerrado areas still lack systematicefforts to a more complete understand of land-cover/use changesin the region (Schimel et al. 1995; Alves 2001). Also, research fo-cused on the role and functioning of institutions, as well as driv-ing forces and actors behind the deforestation process is gener-ally recognized as lacking (Alves 2001; Mahar 2002; Walker 2004).
25
nently for herbaceous forage crops, either cultivated orgrowing wild (FAO 2004). The distinction between pas-ture and natural savannas or steppes is not always clear.In many parts of the world, such landscapes are “multi-functional”, making it difficult to classify them for in-ventories. Therefore, the LUCC-MA assessment (Box 2.5)did not deal with grazing land changes. Nevertheless,broad patterns can probably be derived from the FAOstatistics, which show that most pastures are located inAfrica (26% of the global total of ~35 million ha) and Asia(25%), and only a small portion is located in NorthAmerica (8%) and Europe (2%) (FAO 2004). LatinAmerica and the Caribbean have 18% of the world’s pas-tures, while the FSU nations have 10%, and Oceania has12%. During the last decade, pastures increased consid-erably in Asia and the FSU (6.8% and 10% respectively),whereas the largest decreases were seen in Europe andOceania. Data suggest that pasture land has apparentlydecreased in eastern Africa; however, as eastern Africarecorded a large increase in head of cattle over this pe-riod (872 000 additional head of cattle per year between1992 and 1999, according to FAO (2004)), it is likely thatmany pastoral areas in this part of Africa are classifiedas natural vegetation.
2.3.4 Recent Changes in Urbanization
In 2000, towns and cities housed more than 2.9 billionpeople, nearly half of the world population (United Na-tions Population Division 2002). Urban populations havebeen growing more rapidly than rural populations world-wide over the last two decades, particularly in develop-ing countries. According to the UN Population Division(United Nations Population Division 2002), the numberof megacities, defined here as cities with more than10 million inhabitants, has increased from one in 1950(New York) to 17 in 2000, the majority of which are indeveloping countries. Urban form and function have alsochanged rapidly. Built-up or impervious areas areroughly estimated to occupy between 2% to 3% of theEarth’s land surface (Grübler 1994; Young 1999). This rela-tively small area reflects high urban population densi-ties: for example, in 1997, the 7 million inhabitants ofHong Kong lived on as little as 120 km2 of built-up land(Warren-Rhodes and Koenig 2001). However, urbaniza-tion affects land in rural areas through the ecologicalfootprint of cities. This footprint includes, but is not re-stricted to, the consumption of prime agricultural land
Fig. 2.4b. Results from the LUCC-MA Rapid Land-Cover Change Assessment showing areas of the world that underwent most rapidcropland change between 1980 and 1990
2.3 · Most Rapid Land-Cover Changes of the Last Decades: Rapid and Extensive

CHAPTER 2 · Global Land-Cover Change: Recent Progress, Remaining Challenges26
in peri-urban areas for residential, infrastructure, andamenity uses, which blurs the distinction between citiesand countryside, especially in western developed coun-tries. Urban inhabitants within the Baltic Sea drainage,for example, depend on forest, agriculture, wetland, lake,and marine systems that constitute an area about1 000 times larger than that of the urban area proper(Folke et al. 1997). In 1997, total nonfood material re-sources consumed in Hong Kong (i.e., its urban materialmetabolism) were nearly 25 times larger than the totalmaterial turnover of the natural ecosystem. Fossil fuelenergy consumed in this city (i.e., its urban energy me-tabolism) exceeded photosynthetically fixed solar energyby 17 times (Warren-Rhodes and Koenig 2001). Timeseries of global maps of nighttime lights detected by sat-ellite (Elvidge et al. 2001) illustrate the rapid changes inboth urban extent and electrification of the cities andtheir surroundings. However, the link between thesecoarse scale observations and more detailed character-istics of structural changes in urban environments re-mains challenging (Herold et al. 2003). Another ques-tion still being debated is whether urban land use is moreefficient than rural land use and, therefore, whether ur-banization saves land for nature.
The most densely populated clusters of cities aremainly located along the coasts and major waterways –in India, East Asia, on the east coast of the U.S., and in
Western Europe (Fig. 2.4c). The cities experiencing themost rapid change in urban population between 1990 and2000 are mostly located in developing countries (Deich-mann et al. 2001). It is estimated that 1 to 2 million ha ofcropland are being taken out of production every year indeveloping countries to meet the land demand for hous-ing, industry, infrastructure, and recreation (Döös 2002).This is likely to take place mostly on prime agriculturalland located in coastal plains and in river valleys. Forexample, a recent study in the Pearl River Delta in Chinafound a 364% increase in urban area between 1988 and1996 (Seto et al. 2002). About 70% of this new urban landwas converted from farmland. Another study of the Beijing-Tianjin-Hebei corridor found that urban land had ex-panded by 71% between 1990 and 2000, with about 74%being converted from prime farmland (Tan et al. forth-coming). It should be noted, however, that rural house-holds may consume more land per capita for residentialpurposes than their urban counterparts (Döös 2002).
2.3.5 Recent Changes in Drylands
Desertification is a difficult process to evaluate becauseof its varying definitions and perceptions (see Box 2.7).The United Nation’s Convention to Combat Desertifica-tion (UNCCD) defines desertification as “land degrada-
Fig. 2.4c. Results from the LUCC-MA Rapid Land-Cover Change Assessment showing population density in 1995 and most populated andchanging cities over 750 000 inhabitants between 1980 and 2000
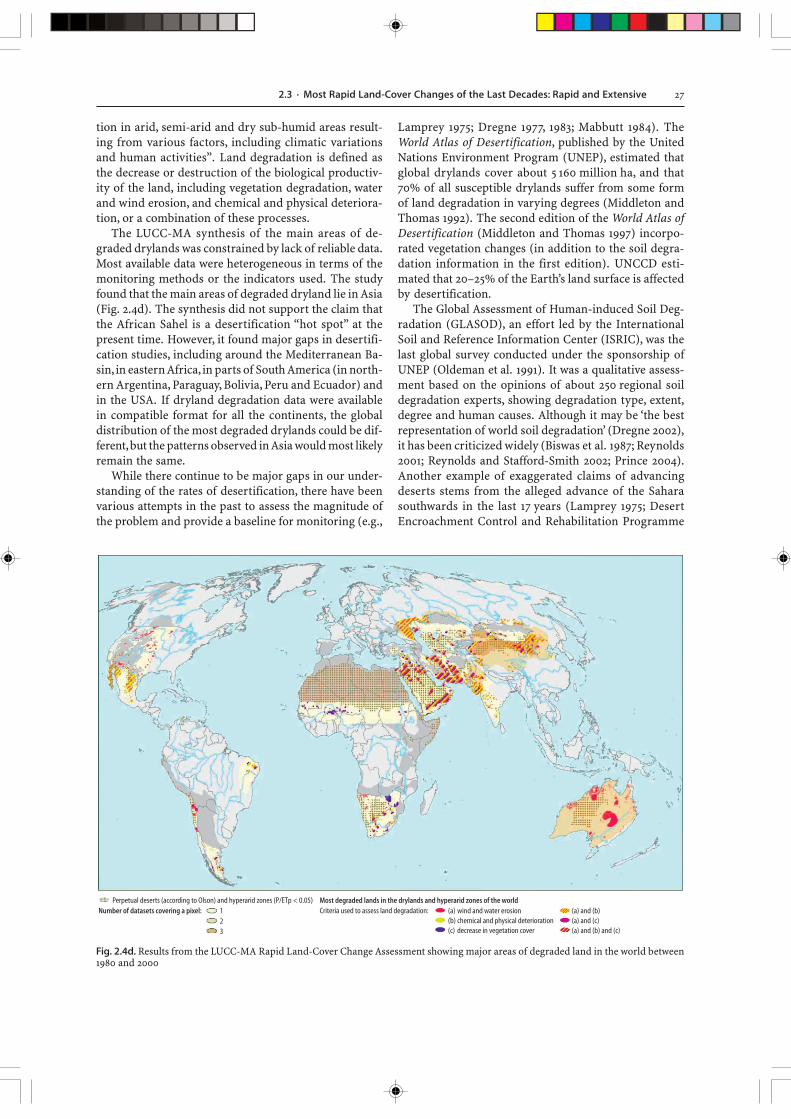
27
tion in arid, semi-arid and dry sub-humid areas result-ing from various factors, including climatic variationsand human activities”. Land degradation is defined asthe decrease or destruction of the biological productiv-ity of the land, including vegetation degradation, waterand wind erosion, and chemical and physical deteriora-tion, or a combination of these processes.
The LUCC-MA synthesis of the main areas of de-graded drylands was constrained by lack of reliable data.Most available data were heterogeneous in terms of themonitoring methods or the indicators used. The studyfound that the main areas of degraded dryland lie in Asia(Fig. 2.4d). The synthesis did not support the claim thatthe African Sahel is a desertification “hot spot” at thepresent time. However, it found major gaps in desertifi-cation studies, including around the Mediterranean Ba-sin, in eastern Africa, in parts of South America (in north-ern Argentina, Paraguay, Bolivia, Peru and Ecuador) andin the USA. If dryland degradation data were availablein compatible format for all the continents, the globaldistribution of the most degraded drylands could be dif-ferent, but the patterns observed in Asia would most likelyremain the same.
While there continue to be major gaps in our under-standing of the rates of desertification, there have beenvarious attempts in the past to assess the magnitude ofthe problem and provide a baseline for monitoring (e.g.,
Lamprey 1975; Dregne 1977, 1983; Mabbutt 1984). TheWorld Atlas of Desertification, published by the UnitedNations Environment Program (UNEP), estimated thatglobal drylands cover about 5 160 million ha, and that70% of all susceptible drylands suffer from some formof land degradation in varying degrees (Middleton andThomas 1992). The second edition of the World Atlas ofDesertification (Middleton and Thomas 1997) incorpo-rated vegetation changes (in addition to the soil degra-dation information in the first edition). UNCCD esti-mated that 20–25% of the Earth’s land surface is affectedby desertification.
The Global Assessment of Human-induced Soil Deg-radation (GLASOD), an effort led by the InternationalSoil and Reference Information Center (ISRIC), was thelast global survey conducted under the sponsorship ofUNEP (Oldeman et al. 1991). It was a qualitative assess-ment based on the opinions of about 250 regional soildegradation experts, showing degradation type, extent,degree and human causes. Although it may be ‘the bestrepresentation of world soil degradation’ (Dregne 2002),it has been criticized widely (Biswas et al. 1987; Reynolds2001; Reynolds and Stafford-Smith 2002; Prince 2004).Another example of exaggerated claims of advancingdeserts stems from the alleged advance of the Saharasouthwards in the last 17 years (Lamprey 1975; DesertEncroachment Control and Rehabilitation Programme
Fig. 2.4d. Results from the LUCC-MA Rapid Land-Cover Change Assessment showing major areas of degraded land in the world between1980 and 2000
2.3 · Most Rapid Land-Cover Changes of the Last Decades: Rapid and Extensive

CHAPTER 2 · Global Land-Cover Change: Recent Progress, Remaining Challenges28
1976; Smith 1986; Lamprey 1988; Suliman 1988). Thisclaim has also been discredited by the studies of Tuckeret al. (1991) and Prince et al. (1998), although there aresome areas showing signs of degradation (Ringrose andMatheson 1992). Following an analysis of all availableglobal information sources, Dregne (2002) concluded thatthere is still a pressing need for more reliable data. An-other recent data-driven effort is the work of Eswaranet al. (2003) who mapped global vulnerability to deser-tification using the FAO/UNESCO Soil Map of the World(FAO 1992). Using a vulnerability assessment methodol-ogy (Eswaran and Reich 1998), the map shows vulner-ability to, but not actual desertification. Therefore, it isanother type of expert interpretation that does not al-low for change detection and, thus, monitoring.
2.3.6 Summary and Conclusions
The emergence of remote sensing has proved to be a valu-able tool to monitor large-scale changes in land cover.Coarse and fine spatial resolution satellite sensors havebeen used to measure tropical deforestation (FAO 2001a;Achard et al. 2002; DeFries et al. 2002), and change innighttime city lights, which is a proxy for changes in ur-ban extent and electrification (Elvidge et al. 1997, 2001).While numerous local scale studies have mapped andquantified land-cover change using fine resolution re-mote sensing data, there are a few subnational- to na-tional-scale studies (Skole and Tucker 1993; PathfinderHumid Tropical Deforestation Project 1998), and remark-ably few such studies at the continental to global scales(DeFries et al. 2002). A few studies have used national-scale forest inventory and agricultural census data, insome cases along with remote sensing data, to estimaterates and geographic patterns of continental-to-globalscale changes in forest cover and agricultural lands(Houghton et al. 1999; Ramankutty and Foley 1999; KleinGoldewijk 2001). Overall, the quantification of areas ofrapid land-cover change still suffers from large uncer-tainties (Lepers et al. 2005).
Despite the major uncertainties in the data sets, theLUCC-MA assessment revealed that:
� Land-cover change is not randomly or uniformly dis-tributed but is clustered in some locations. For ex-ample, deforestation mostly takes place at the edge oflarge forest areas and along major transportation net-works (e.g., in the southern Amazon Basin).
� The land-cover change data sets have many gaps, andtherefore it is possible that rapid change is occurringin many parts of the world but is not identified on thesynthesis maps. Moreover, it is also possible that manylocations not identified as undergoing rapid land-cover change are experiencing other ecological im-pacts.
� Different parts of the world are experiencing differ-ent phases of land-cover transition (e.g., a decrease incropland in temperate zones and an increase in thetropics).
� Dryland changes are the most poorly understood,because of difficulties in conceptualization, difficul-ties in satellite interpretation in these regions, and aninability to distinguish human-induced trends fromclimate-driven interannual variability in vegetationcover.
� The Amazon Basin is a major hot spot of tropical de-forestation. Rapid cropland increase, often associatedwith large-scale deforestation, is most prominent inSoutheast Asia. Forest degradation in Boreal Eurasiais increasing rapidly, mostly as a result of logging andincreased fire frequency. The southeastern US andeastern China have experienced a rapid decline incropland area. Asia currently has the greatest concen-tration of areas undergoing rapid land-cover changes,in particular dryland degradation. Existing data donot support the claim that the African Sahel is a de-sertification hot spot. Many of the most populated andrapidly changing cities are found in the tropics.
� Much of our information on tropical land-coverchange comes from remotely-sensed land-cover data,while information on change in the extra-tropical re-gions comes predominantly from census data. System-atic analyses to identify land-cover change has beenpredominantly done in the tropics, because of the in-terest in tropical deforestation and, possibly, due tothe lower availability and reliability of census data inthe tropics.
Furthermore, in the context of a global synthesis, theLUCC-MA study also made several general recommen-dations for future observations and research:
� Future synthesis should use a combination of global-scale coarse-resolution data as presented here, com-bined with finer resolution satellite imagery as wellas ground-truth data for a subset of locations, a frame-work also advocated by the Global Observations of For-est Cover and Land Dynamics (GOFC-GOLD) panel ofthe Global Terrestrial Observing System (GTOS).
� Data producers should adopt a standardized, land-cover classification system. We recommend wideadoption of the classification system proposed by FAO(Di Gregorio and Jansen 2000b).
� As a complement to categorical land-cover represen-tations, a continuous description of land cover (i.e.,in terms of fractional tree cover or crop cover) shouldbe more widely adopted whenever possible as it of-fers greater ease for comparison of different databases,and the ability to identify land-cover modifications,in addition to conversions (DeFries et al. 1995#a/b#;Ramankutty and Foley 1998).
29
� Operational monitoring of land cover should be ex-tended to regions that are not considered “hot spots”today, but where rapid changes may still take placeand catch the scientific community by surprise.
� Systematic, consistent measurements of soil proper-ties should be undertaken at a global scale, at a rela-tively fine resolution, since soil attributes are an im-portant component of land cover.
� New empirical work is required based on conceptualadvances in dealing with definitions of desertification(Reynolds and Stafford-Smith 2002) and urbanization.
� There is an urgent need for systematic observationson the still poorly measured processes of land-coverchange (see Sect. 2.5.1).
2.4 The Complexity of Land-Cover Change
2.4.1 The Poorly Documented Changes
The BIOME 300 project and the Rapid Land-Cover ChangeAssessment provided initial estimates of the rates of changeof several important land-cover types at the global scale,over the last 300 years and over the last two decades, re-spectively. However, local-to-national scale studies high-light the significance and ecological importance of otherforms of rapid land-cover change that are thought to bewidespread but still poorly documented globally. Both theextent and the precise location of these changes, oftenmodifications rather than conversions, are barely under-stood. Prominent among these are changes in the (sub)-tropical dry forests; forest-cover changes resulting fromselective logging, fires, and insect damage; drainage or otherforms of alteration of wetlands; soil erosion and degrada-tion in croplands; changes in the extent and productivecapacity of pastoral lands; and dryland degradation, alsoreferred to as desertification (Lambin et al. 2003). Otherpoorly documented changes at the global scale relate to(sub)urban and other infrastructure extension and theexpansion of non-food crops such as sugar, tea and tobacco,primarily driven by shifts in lifestyles (Heilig 1994).
2.4.1.1 Changes in (Sub-)Tropical Dry Forests
Globally, dry forest or woodland ecosystems cover agreater area than humid forests but changes are not welldocumented. More so than in rain forest zones, the dryforest life zone is greatly affected by human activities in-cluding conversion for agricultural uses and overexploita-tion through fuel and pole wood collection, even in pro-tected areas (Janzen 1988; Solbrig 1993). While dry forestsand woodlands in South and Southeast Asia have beenmostly converted into other covers (including bare, erodedsoils), large portions of the (sub)tropical dry forest life zonestill exist in Africa and Latin America. Local- to subna-
tional-scale studies highlight the significance and ecologi-cal importance of rapid land-cover change there.
The Miombo woodlands in the Central African Plateauform the world’s largest contiguous area in dry forest(Mayaux et al. 2004). Local evidence suggests exception-ally high rates of change, especially in the late 20th century.For example, Lusitu in Southern Zambia experienced anannual rate of land-cover change of 4.0% between 1986and 1997 (Petit et al. 2002), while in the Lake MalawiNational Park of southern Malawi, massive wood extrac-tion for rural industries caused a rapid loss of closedcanopy cover between 1982 and 1990, replaced by sparsewoodland cover which increased by almost 300% (Ab-bot and Homewood 1999).
Much of the rapid deforestation in the 1990s was in sub-tropical South America, particularly in the Brazilian Cer-rado (Jepson 2005). Rapid deforestation in the Santa Cruzdepartment of Bolivia, in the vicinity of Mennonite settle-ments and more recently in industrial soybean farms, aswell as in the Chaco region of Argentina have been docu-mented (Steininger 2001; Zak and Cabido 2002). Estimatesof land-cover loss for the Brazilian Cerrado vary between40 and 80% of the original cover. In addition to soybeans,cattle ranching and mechanized commercial agricultureincluding cotton, rice and maize, have expanded rapidlyduring the past three decades. Exceptionally high con-version and modification was seen since 1970 in RioGrande do Sul and Paraná, and since 2003 in Mato Grosso,and further stimulated new agricultural frontiers in thestates of Minas Gerais, Goiás, Bahia, Tocantins and Ma-ranhão (Jepson 2005). Exceptionally high rates of defor-estation have been demonstrated for North-CentralYucatán, a region dominated by tropical dry forest veg-etation, experiencing exponential population growth andland-use development (Sohn et al. 1999). Similarly, signifi-cant deforestation has taken place in southern Yucatán,leading to a landscape increasingly dominated by second-ary forests and opened lands (Turner II et al. 2004).
In summary, land-cover changes in (sub)tropical dryforest and woodland ecosystems are thought to be wide-spread, but continental-to-global scale estimates are notavailable at this time. Remote sensing techniques, even30-m resolution Landsat TM data, have difficulty in dis-tinguishing different land-cover types in the dry season,while most rainy season images are contaminated bycloud cover (Asner 2001). Some potential solutions arethe inclusion of cloud-free rainy season images and sam-pling cloudy areas with very high-resolution images fromthe IKONOS™ satellite (Sanchez-Azofeifa et al. 2003), orthe use of Synthetic Aperture Radar (SAR) data (e.g.,Grover et al. 1999; Saatchi et al. 2000). Landsat TM ther-mal band 6 data, using continuous data rather than dis-crete classes, measure the emission of energy from theland surface and allow for the differentiation betweensuccessional stages of forest growth in dry forest ecosys-tems, (Southworth 2004).
2.4 · The Complexity of Land-Cover Change
CHAPTER 2 · Global Land-Cover Change: Recent Progress, Remaining Challenges30
2.4.1.2 Logging, Fire and Insect DamageTriggering Forest Change
Forest degradation following fires and (selective) logginghas been termed “cryptic deforestation” (Nepstad et al.1999a). In the Brazilian Amazon, Nepstad et al. (Nepstadet al. 1999a) have estimated that every year forest impov-erishment caused by selective logging and fires affects anarea at least as large as the area affected by forest-coverconversion. Similarly, biomass collapse around the edgesof forest fragments has also been estimated to be a signifi-cant contributor to land-cover change in Amazonia(Laurance et al. 1997). All of these subtle changes are notwell documented at the global scale. This is also true forlosses of forest associated with forest-management prac-tices (e.g., Canada and Russia), insect damage, and largefires (e.g., Indonesia in 1997 (Siegert et al. 2001; Page et al.2002), and in Russia in the late 1990s (Sukhinin et al. 2004)).
Fires play a significant, yet complex, role in their rela-tionship to land-use and land-cover change (see Box 2.7).While the dynamics of fire and how they interact withhumans, climate and vegetation is poorly understand,remote sensing has made rapid progress in document-ing fires at a global scale (Dwyer et al. 2000), both forthe mostly anthropogenic fires in tropical regions (Pereiraet al. 1999) and the mostly natural fires in boreal regions(Kasischke et al. 2002). At least three major efforts havebeen undertaken to document fires at the global scale.The Global Burnt Area (GBA 2000) data set derived fromSPOT Vegetation satellite data provides the first indepen-dent estimate of the area of vegetation burnt at the glo-bal scale in the year 2000 (Tansey et al. 2004). Anotherglobal inventory is the ATSR World Fire Atlas, a databaseof monthly global fire maps from 1995 to the present, pro-duced using the Along Track Scanning Radiometers (ATSR)on board of successive European Space Agency ERS andENVISAT satellites. The product has already been used tocompute the emissions of greenhouse gases and aero-sols from biomass burning and explore the impacts ontropical ozone levels (Schultz 2002; Duncan et al. 2003).Finally, GLOBSCAR is the European Space Agency’s ini-tiative to map the global distribution of burnt area usingthe ATSR-2 instrument on-board of the ERS-2 satellite(Simon et al. 2004). The product has been developed ata spatial resolution of one km at monthly time intervals.GLOBSCAR and GBA 2000 are complementary data sets.
2.4.1.3 Wetland Alterations
Changes in wetlands, including extensive drainage, are notwell documented at the global scale. Wetlands provide avaluable ecosystem service in terms of maintaining andimproving water quality (Steffen et al. 2004). In the devel-oped world, wetlands have been lost at a rapid rate histori-
cally, and although measures are actively being sought to-day to stem wetland losses and restore wetland acreage,the rate of wetland conversion can still be dramatic (Dahl1990). Maintenance and restoration of wetlands in devel-oped countries has undoubtedly contributed to the im-provement of water quality there, while the dominant trendin developing countries is still towards the conversion ofwetlands into other land uses (Steffen et al. 2004).
An attempt at attaining a global wetlands inventoryhas been initiated. GLOBWETLANDS is an ongoingproject of European Space Agency to develop remotesensing methods for a range of different wetland typesfocusing on five continents (North and South America,Africa, Asia, Europe). Satellite imagery, inventory mapsand digital elevation models of approximately 50 wet-lands and surrounding catchments are being analyzed.The project, which is supporting the 1971 RAMSAR Con-vention on Wetlands, will provide information about dif-ficult and inaccessible terrain, describe the local topog-raphy, map the types of wetland vegetation and monitorland-use/cover changes there.
2.4.1.4 Soil Erosion and Degradationin Cultivated Lands
Soil erosion and degradation in cultivated lands is poorlydocumented at the global scale, and remains a contro-versial issue. The Global Assessment of Human-inducedSoil Degradation (GLASOD) is the only global survey ofsoil degradation for both arid and humid regions, includ-ing the type, degree, extent, rate and even cause of soil deg-radation. The GLASOD database reflects the informedopinion of hundreds of scientists (Oldeman et al. 1991), andis still by far the best representation of world soil degrada-tion (Dregne 2002). However, in the context of drylands,the GLASOD database has been heavily criticized (e.g.,Reynolds 2001). Furthermore, any documentation of soilerosion and degradation suffers from methodological in-adequacies. For example, the severity of soil erosion andits impacts in the United States has been debated becauseof discrepancies between estimates based on models andobserved sediment budgets (Trimble and Crosson 2000).
The situation is further complicated by the fact thatnatural environmental change and variability interactswith human causes to trigger erosion and degradation.Highly variable environmental conditions amplify thepressures arising from high demands on land resources.For example, in the Iberian Peninsula during the 16th and17th centuries, the peak of the Little Ice Age coincided withlarge-scale clearing for cultivation following the consoli-dation of Christian rule over the region. This cultivationtriggered changes in surface hydrology and significantsoil erosion (Puigdefabregas 1998). Moreover, cultivationdoes not always result in deterioration of soil conditions,as evidenced by recent study evidence that highlights
31
situations across several African countries where popu-lation growth and agricultural intensification have beenaccompanied by improved soil (and water) resources(Tiffen et al. 1994; Mortimore and Adams 2001). Suchissues have made it difficult to document soil degrada-tion resulting from cultivation at a global scale.
2.4.1.5 Changes in Extent and Productivityof Grazing Lands
Worldwide, only few grazing lands are edaphically or cli-matically determined natural entities that, in the absenceof human impact, would persist unchanging within cli-mate epochs. In contrast, most grazing lands are main-tained in their current state by the interaction of humanand biophysical drivers (Solbrig 1993; Sneath 1998). Inthe temperate and tropical zones, rangelands are bothhighly dynamic and also resilient, moving through mul-tiple vegetation states, either as successional sequences orby shifting chaotically in response to the random interplayof human and biophysical drivers. Grazing lands are in-creasingly seen as non-equilibrium ecosystems (Walker1993). Furthermore, grazing lands are often also multi-func-tional landscapes, with grazing occurring on croplandsafter harvesting, grazing in wooded lands, grazing on natu-ral pastures versus planted pastures, etc. These features andthe wide spectre of definition render estimates of extentand productivity difficult to make. Few, complex pathwaysof grazing land modification can be identified qualitatively,but it remains difficult to attach quantitative figures to them(Lambin et al. 2001). Therefore, data provided by theFood and Agriculture Organization of the United Nations,for example, are to be treated with caution.
2.4.1.6 Dryland Degradation (Desertification)
As with soil degradation on croplands, desertification isstill unmeasured or poorly documented at the global scale(Lambin et al. 2003; Geist 2005). The notion of “deserti-fication” resonates with public perception of land changein drylands, especially in the Sahel-Sudan zone of sub-Saharan Africa. Desertification has become the domi-nant theme of an environmental convention – the UnitedNations Convention to Combat Desertification (UNCCD)– that emerged from the Rio-summit of 1992.
However, the definition of desertification, its causes,and extent remain widely disputed (Reynolds andStafford-Smith 2002). The concept covers a wide varietyof environmental change processes, taking place at arange of spatial and temporal scales. This makes it diffi-cult to measure desertification and even more difficultto provide a general accounts of its causes. Here we brieflyhighlight several of the major sources of uncertainty anddisputes surrounding desertification:
1. Desertification has most often been reported to oc-cur because of estimated “undesirable” changes in soiland vegetation properties. However, ‘undesirability’is a matter of perception. Cultivators are likely to havea different perspective than those herding or utiliz-ing forest products. Soil scientists and geomorpholo-gists are likely to have different perspectives frombotanists, ecologists, foresters and agronomists, notto mention economists.
2. Since the Sahel-drought in the late 1960s, there hasbeen discussion on whether environmental changecaused by climate change/variability should be in-cluded. The UNCCD definition (see Sect. 2.3.5) nowexplicitly acknowledges both ‘natural’ (climatic) and‘human’ induced factors. However, there is still theproblem of measuring desertification against a ‘base-line’. Multiple studies point out that dryland ecosys-tems may seldom be perceived as being in an equi-librium state, rather they fluctuate widely in responseto climate change and other external and internalcontrols (Behnke and Scoones 1993). For example,the Sahel drought of the seventies, which was thoughtto have led to permanent desertification, is now be-lieved to have been a temporary multi-decadal cli-mate anomaly, and the vegetation is now rebounding(Tucker et al. 1991).
3. Another issue is whether evidence for desertificationshould be derived on the basis of long-term responsessuch as soil degradation, and not of short-term eco-system dynamics such as vegetation changes. For ex-ample, the GLASOD assessment (see Sect. 2.5.1.4) es-timated that 19.5% of drylands worldwide were suf-fering from desertification, while another survey car-ried out by the International Center for Arid and Semi-arid Land Studies (ICASALS) estimated a much higherfigure of 69.5% due to their inclusion of vegetationchanges in addition to those areas affected by soil ero-sion (European Commission 2000).
4. Another controversy surrounding desertification re-lates to the notion of “irreversibility”. Should the con-cept be reserved for environmental changes that areirreversible or only very slowly reversible, relative toa ‘human’ time scale? The currently used UNCCD defi-nition does not include this requirement. Some sci-entists claim that most, if not all, desertification, es-pecially in an advanced state, “is often essentially ir-reversible” (Phillips 1993). This runs contrary to evi-dence that ‘for the vast majority of the drylands thewasteland end point never occurs’ (Dregne 2002). Ithas been estimated that the very severe or irrevers-ible desertification class includes only about 1.5% ofthe global drylands (Dregne 1983; Dregne and Chou1992). It is clear that changes in soil physical proper-ties, such as massive loss of fine-grained material fromthe topsoil due to wind erosion, may be only very slowlyreversible, while vegetation may recover rapidly.
2.4 · The Complexity of Land-Cover Change
CHAPTER 2 · Global Land-Cover Change: Recent Progress, Remaining Challenges32
In summary, many indicators of desertification havebeen suggested, including changes in both vegetation andsoil properties, responding to both climate and human in-duced changes. However, these processes do not necessar-ily occur in parallel – vegetation changes occur over annual-to-decadal timescales, while soil property changes occurover decadal-to-centennial timescales; similarly, the times-cales of the climatic and human drivers differ. Therefore, theuse of different indicators, different timescales, and differ-ent perspectives often leads to different interpretations. Forinstance, it is possible that one indicator (e.g., greening veg-etation) suggests decreasing desertification, while anotherindicator (e.g., soil erosion) suggests increasing desertifi-cation in the same location. These two observations are notcontradictory, yet the example indicates the inherent prob-lem with operationalizing the concept of desertification.
2.4.1.7 Extension of Industrial and Service EconomyInfrastructure
Apart from agricultural land uses, a broad range of otherland uses have gained importance since the middle of the18th century. This has mainly been due to the transitionfrom an agricultural to an industrial society, and later insome countries, to a service economy. Land uses related tonon-agrarian modes of land management include humanhabitation, manufacturing and industrial facilities, waterand energy supply infrastructure, (mass) tourist facilities,waste deposition and sanitation facilities, transport infra-structures, military establishments, bureaucratic and com-munication facilities, and many more (Heilig 1994).
Industrialization has affected practically every regionof the world, especially after World War II. The degreeof industrialization, however, differs widely across coun-tries, and is still an ongoing process in many parts of theworld. In the form of built-up or paved-over areas, in-frastructure is estimated to occupy only 2–3% of theEarth’s surface (Grübler 1994; Young 1999), but land usesrelated to industrialization have clearly outpaced con-ventional agricultural land uses in terms of the speed atwhich they occurred over the last decades.
No consistent global inventory exists, however, forquantifying industrial developments and their linkagesto rural landscapes. Global snapshots of nighttime lightsdetected by satellite illustrate the rapid changes in bothurban extent and electrification of the cities and theirsurroundings, but it is not clear yet how they can be fur-ther developed for land-cover change analysis beyondillustration purposes.
2.4.1.8 Life Style-Driven Changes and Their Impacts
With globally rising economic activities and living stan-dards, the structure of consumption has changed, open-
ing a wide-ranging potential for effects on land-use ex-pansion. Generally, with increasing incomes, the demandfor food initially increases and then stabilizes. This isaccompanied by an overall decline in the agriculturalsector in terms of the size of the labor force and the rev-enues to the state. This is particular to developed coun-tries, but the process of deagrarianization is also under-way in newly industrializing and even less developed coun-tries of Africa (Bryceson 1996). In addition, overallconsumption becomes diverted towards industrial goodsand services and more diverse food expenditures, with in-creasing share of non-food crops consumed (Dicken 1998).
Only national statistical data, such as those providedthe FAO, WTO, USDA and IFPRI are available to quan-tify life-style and consumption-change-driven land-cover changes. For example, clothing fashions since the17th century have driven the expansion of cotton planta-tions worldwide. The same is true for the fashion of con-suming stimulants such as coffee, tea and tobacco (Heilig1994). Tobacco, for example, is grown in more than 100countries, thus being the world’s most widespread non-food crop. Between 1982 and 1996, land under tobaccoglobally expanded at an average annual rate of 2%, whichwas slightly below the overall expansion rate of arableland in the same time period. FAO data show that thebulk of land under tobacco is located in low-income coun-tries of the (sub)tropical zones. Tobacco land expansionthere outpaced global tobacco expansion by factor of 5.In countries such as Pakistan, Philippines, China, Zim-babwe, Zambia, Uganda and Malawi, land under tobaccoincreased at rates up to 10 times higher than for arableland. Most importantly, three quarters of the tobaccogrown in the developing world are artificially cured va-rieties using heat from external sources such as woodand coal to dry leaves on the farm for the production ofAmerican blend type cigarettes. Wood from natural eco-systems, rather than from plantations, is most commonlyused by African tobacco producers. Based on crop-spe-cific wood consumption rates, deforestation related totobacco curing in the developing word can be estimatedto contribute to roughly 5% of total net losses of forestcover there in the 1990–1995 period (Geist 1999, 2000).
In sum, no global inventory exists to link shifts in pro-duction and consumption and life-style changes to land-cover outcomes in situ. It remains a major caveat that so-cial process-specific approaches to the study of land-coverchange (such as shifts in consumption, life style changes,remittances, agro-industrialization, contract farming) aswell as crop-specific approaches (such as the boom in non-food crops discussed here) cannot be fully substantiatedin quantitative terms, and proxy indicators need to be usedinstead (Sack 1992; Heilig 1994; Geist 1999). This results ina weak understanding of production-consumption rela-tionships; for example, in the example outlined above, wehad to resort to national-level statistical data to highlightthe declining economic importance of food cropping.
33
2.4.2 Characterizing the Complexity of Changes
2.4.2.1 Conversion Versus Modification of Land Cover
Land cover is defined by the attributes of the Earth’s landsurface and immediate subsurface, including biota, soil,topography, surface and groundwater, and human struc-tures. Land-cover data sets represent the land surface bya set of spatial units, each associated with attributes.These attributes can be either a single land-cover cat-egory (i.e., leading to a discrete or Boolean representa-tion of land cover) (Loveland et al. 2000) or a set of con-tinuous values of biophysical variables (i.e., leading to acontinuous representation of land cover) (DeFries et al.1995#a/b#). A discrete land-cover data set has the advan-tages of conciseness and clarity, but it has led to an over-emphasis of land-cover conversions and a neglect of land-cover modifications. Land-cover conversions are definedas the complete replacement of one land-cover type byanother (e.g., agricultural expansion, deforestation, orchange in urban extent). Land-cover modifications aremore subtle changes that affect the character of the landcover without changing its overall classification.
Recently, there has been increased recognition of theimportance of the processes of land-cover modification.For example, agricultural intensification – defined ashigher levels of inputs (including use of high-yieldingcrop varieties, fertilization, irrigation, and pesticides) andincreased output of cultivated or reared products per unitarea and time – permitted an increase in the world’s foodproduction over the last decades, outpacing human popu-lation growth (Matson et al. 1997; Tilman 1999). In theBrazilian Amazon, every year forest impoverishmentcaused by selective logging and fires affects an area atleast as large as that affected by forest-cover conversion(Nepstad et al. 1999b). Woody encroachment on the west-ern United States grasslands, following fire suppressionand overgrazing, may have contributed to a large carbonsink (Houghton et al. 1999; Pacala et al. 2001; Asner et al.2003). Declines in tree density and species richness inthe last half of the twentieth century were observed in aregion of Senegal in the West African Sahel, potentiallyindicative of desertification (Gonzalez 2001). Anotherstudy in western Sudan, a region that was allegedly af-fected by desertification, however, did not find any de-cline in the abundance of trees despite several decadesof droughts (Schlesinger and Gramenopoulos 1996).
The monitoring of land-cover conversion can be per-formed by a simple comparison of successive land-covermaps. In contrast, the detection of land-cover modifica-tions requires a continuous representation of land cover,where the surface attributes vary continuously in spaceand time, at the seasonal and interannual scales (DeFrieset al. 1995#a/b#; Lambin et al. 1999). This allows detec-tion of, for example, changes in tree density, in net pri-
mary productivity, or in the length of the growing sea-son. Earth observation from satellites provides repeti-tive and spatially explicit measurements of biophysicalsurface attributes, such as vegetation cover, biomass, veg-etation community structure, surface moisture, superfi-cial soil organic matter content, and landscape hetero-geneity. Analyses of multi-year time series of these at-tributes, their fine-scale spatial pattern, and their sea-sonal evolution have led to a broader view of land-coverchange. In particular, data from wide-field-of-view sat-ellite sensors reveal patterns of seasonal and interannualvariations in land-surface attributes that are driven notby land-use change, but rather by climatic variability.These variations include the impact on vegetation andsurface moisture of the El Niño Southern Oscillation(ENSO) phenomena (Eastman and Fulk 1993; Plisnieret al. 2000; Behrenfeld et al. 2001), natural disasters suchas floods and droughts (Lambin and Ehrlich 1997; Lupoet al. 2001), changes in the length of the growing seasonin boreal regions (Myneni et al. 1997), and fluctuationsin the southern margins of the Sahara driven by rainfallfluctuations (Tucker et al. 1991).
2.4.2.2 Progressive Versus EpisodicLand-Cover Changes
Time series of remote sensing data reveal that land-coverchanges do not always occur in a progressive and gradualway, but rather often show periods of rapid and abruptchange followed either by a quick recovery of ecosys-tems or by a nonequilibrium trajectory. Such short-termchanges, often caused by the interaction of climatic andland-use factors, have an important impact on ecosys-tem processes. For example, droughts in the African Sa-hel and their effects on vegetation are reinforced at thedecadal timescale through a feedback mechanism thatinvolves land-surface changes caused by the initial de-crease in rainfall (Zeng 1999; Wang and Eltahir 2000),although this mechanism is still disputed for the Sahel(Giannini et al. 2003; also see review by Xue et al. 2004).Grazing and conversion of semiarid grasslands to row-crop agriculture are the sources of another positive de-sertification feedback by increasing heterogeneity of soilresources in space and time (Schlesinger et al. 1990). Therole of the Amazonian forest as a carbon sink (in naturalforests) and source (from land-use changes and fires)varies from year to year as a result of interactive effectsbetween deforestation, abandonment of agricultural landreverting to forests, fires, and interannual climatic vari-ability (Tian et al. 1998; Houghton et al. 2000). In Indo-nesia, periodic El Niño-driven droughts lead to an in-crease in the forest’s susceptibility to fires. Accidental firesare more likely under these conditions and lead to thedevastation of large tracts of forests (Siegert et al. 2001)and to the release of huge amounts of carbon from peat-
2.4 · The Complexity of Land-Cover Change

CHAPTER 2 · Global Land-Cover Change: Recent Progress, Remaining Challenges34
land fires (Page et al. 2002). Large landholders also seizethe opportunity of drought conditions to burn large tractsof forest to convert them to plantations. Forests that havebeen affected by forest fragmentation, selective logging,or a first fire subsequently become even more vulner-able to fires as these factors interact synergistically withdrought (Cochrane 2001; Siegert et al. 2001).
In summary, both land-cover modifications and rapidland-cover changes need to be better accounted for inland-cover change studies. Climate-driven land-covermodifications do interact with land-use changes. Slowand localized land-cover conversion takes place againsta background of high temporal frequency regional-scalefluctuations in land-cover conditions caused by climaticvariability, and it is often linked through positive feed-backs with land-cover modifications. These multiple spa-tial and temporal scales of change, with interactions be-tween climate-driven and anthropogenic changes, are asignificant source of complexity in the assessment of land-cover changes. It is not surprising that the land-coverchanges for which the best data exist – deforestation,changes in the extent of cultivated lands, and urbanization– are processes of conversion that are not strongly af-fected by interannual climatic variability. By contrast, fewquantitative data exist at the global scale for processes ofland-cover modification that are heavily influenced byinterannual climatic fluctuations, e.g., desertification,forest degradation and rangeland modifications.
2.5 Power and Limitations of Remote Sensing
2.5.1 Remote Sensing of Global Land Cover
Recently, satellite-based observations of the Earth haveprovided a spatially and temporally consistent pictureof the state of global land cover. Earlier efforts were apainstaking compilation of different maps from differ-ent periods in time, and that were often inconsistent interms of the land-cover classes used. Satellite-based re-mote sensing began in 1959, with the first space photo-graph taken by the Explorer 6 satellite. NASA launchedLandsat 1 in 1972 to monitor the Earth’s natural resources.A series of Landsat satellites followed, with the most re-cent, Landsat 7, launched in 1999, making it the longestrunning space-based remote-sensing program.
Landsat, with 30 m spatial resolution multispectraldata, has become the workhorse for land-cover changestudies, and has been used extensively to study land-coverchange around the world. The first large-scale defores-tation assessment for the Brazilian Amazon was madeby Tardin and colleagues, (Tardin et al. 1980), who pio-neered the use of satellite remote-sensing imagery to mapdeforestation over a 5 million km2 area for years 1974 and1978. Nearly a decade later, new remote sensing surveysof deforestation were repeated for the Amazon (Tardinand Cunha 1989; Skole and Tucker 1993) and extendedfor much of the tropics (Chomentowski et al. 1994)through the NASA Pathfinder Humid Tropical Defores-tation project. The Pathfinder deforestation project alsopioneered in the dissemination of Remote Sensing im-agery and land-cover change maps for the tropics. Morerecently, Achard et al. (2002), through the TREES projectassociated with the Joint Research Center (JRC) of theEuropean Commission, used Landsat data to estimatedeforestation rates for the humid tropics. Such studiesare making it possible to monitor the impacts of humanland-use activities.
In addition to Landsat, there are other, similar, sensorsthat are being used to monitor land cover. In early 1978,the French launched the SPOT (Systeme Pour l’Observationde la Terre) program. The series of SPOT-1, -2, -3 and -4satellites have provided 20-m resolution multispectral data.The Indian Remote Sensing (IRS) program was launchedin 1998, with the capability of sensing land cover at23 m resolution in three different wavelength bands. Rus-sia and Japan have also launched satellites.
While such data cover the globe, the high spatial reso-lution of the data make it resource intensive to compileand classify over the entire globe. Moreover, cloud coverand lack of temporal data indicating vegetation phenol-ogy limit the usefulness of Landsat for global land-covermapping. With the use of moderate-resolution satellitesensors (~1 km resolution) acquired throughout the year,it has recently become possible to characterize land cover
Box 2.7. Fire on the landscape
Fire plays a significant, yet complex, role in relation to land-use/cover change in many parts of the world, including borealforests, Mediterranean ecosystems, tropical savannas and dry(or seasonally dry) forests. It may be perceived as a “natural”part of an ecosystem, as part of a “disturbance regime”, or asan integrated part of natural resource management.
While fires do occur naturally in many ecosystems, humanshave modified the fire regime significantly, both through in-creased burning in some places, and more recently, throughfire suppression. For example, when humans arrived in Aus-tralia roughly 40000 years ago, the fire frequency increasedgreatly (on the basis of fossil charcoal evidence, e.g., Singh andGeissler 1985), leading to extensive change in land cover. Nowa-days, fires are a common tool in natural resource management,including crop production (especially in shifting cultivationor “slash and burn” agriculture), rangeland management, for-estry and hunting.
While a clear correlation between fire occurrence andland-cover change may exist, the relationship between firesand land-cover change is complex. Clearing a closed canopyforest may create conditions that allow the development of aherbaceous layer. This may, in turn, help to sustain fire, andkeep out the woody vegetation. In other cases fires may bethe cause of land-cover change at a time scale of decades, yetat longer time scales it may be perceived as being part of theecosystem. Thus, individual species and whole ecosystems haveco-evolved with the prevailing fire regime, and over the mil-lennia of human induced fires. The structure and functioningof these ecosystems are shaped by the fire regime, and it maynot be appropriate to talk about fire as a ‘disturbance regime’in this context.
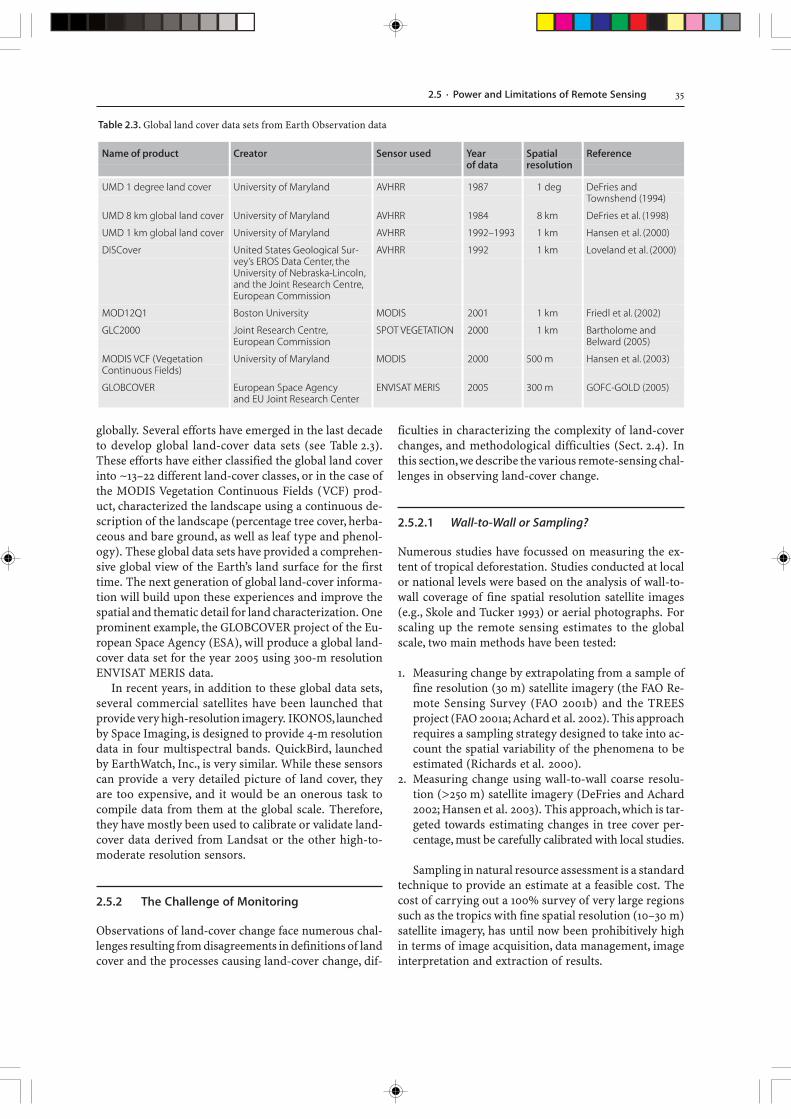
35
ficulties in characterizing the complexity of land-coverchanges, and methodological difficulties (Sect. 2.4). Inthis section, we describe the various remote-sensing chal-lenges in observing land-cover change.
2.5.2.1 Wall-to-Wall or Sampling?
Numerous studies have focussed on measuring the ex-tent of tropical deforestation. Studies conducted at localor national levels were based on the analysis of wall-to-wall coverage of fine spatial resolution satellite images(e.g., Skole and Tucker 1993) or aerial photographs. Forscaling up the remote sensing estimates to the globalscale, two main methods have been tested:
1. Measuring change by extrapolating from a sample offine resolution (30 m) satellite imagery (the FAO Re-mote Sensing Survey (FAO 2001b) and the TREESproject (FAO 2001a; Achard et al. 2002). This approachrequires a sampling strategy designed to take into ac-count the spatial variability of the phenomena to beestimated (Richards et al. 2000).
2. Measuring change using wall-to-wall coarse resolu-tion (>250 m) satellite imagery (DeFries and Achard2002; Hansen et al. 2003). This approach, which is tar-geted towards estimating changes in tree cover per-centage, must be carefully calibrated with local studies.
Sampling in natural resource assessment is a standardtechnique to provide an estimate at a feasible cost. Thecost of carrying out a 100% survey of very large regionssuch as the tropics with fine spatial resolution (10–30 m)satellite imagery, has until now been prohibitively highin terms of image acquisition, data management, imageinterpretation and extraction of results.
globally. Several efforts have emerged in the last decadeto develop global land-cover data sets (see Table 2.3).These efforts have either classified the global land coverinto ~13–22 different land-cover classes, or in the case ofthe MODIS Vegetation Continuous Fields (VCF) prod-uct, characterized the landscape using a continuous de-scription of the landscape (percentage tree cover, herba-ceous and bare ground, as well as leaf type and phenol-ogy). These global data sets have provided a comprehen-sive global view of the Earth’s land surface for the firsttime. The next generation of global land-cover informa-tion will build upon these experiences and improve thespatial and thematic detail for land characterization. Oneprominent example, the GLOBCOVER project of the Eu-ropean Space Agency (ESA), will produce a global land-cover data set for the year 2005 using 300-m resolutionENVISAT MERIS data.
In recent years, in addition to these global data sets,several commercial satellites have been launched thatprovide very high-resolution imagery. IKONOS, launchedby Space Imaging, is designed to provide 4-m resolutiondata in four multispectral bands. QuickBird, launchedby EarthWatch, Inc., is very similar. While these sensorscan provide a very detailed picture of land cover, theyare too expensive, and it would be an onerous task tocompile data from them at the global scale. Therefore,they have mostly been used to calibrate or validate land-cover data derived from Landsat or the other high-to-moderate resolution sensors.
2.5.2 The Challenge of Monitoring
Observations of land-cover change face numerous chal-lenges resulting from disagreements in definitions of landcover and the processes causing land-cover change, dif-
2.5 · Power and Limitations of Remote Sensing

CHAPTER 2 · Global Land-Cover Change: Recent Progress, Remaining Challenges36
There has been much debate surrounding the issue ofwhether “wall-to-wall” coverage is required to estimatedeforestation. Some researchers have argued that wall-to-wall coverage is required because deforestation occursin clusters, along roads and rivers, and is not randomlydistributed across the landscape (Tucker and Townshend2000). Tucker and Townshend (2000) suggested that ~80%of the total area needs to be covered to estimate deforesta-tion rates accurately. On the other hand, Czaplewski (2003)demonstrated that estimation accuracy is less related tothe percentage of samples, and rather a question of hav-ing sufficient number of samples, and that a robust sam-pling strategy can provide accurate estimates at globalto continental levels. Furthermore, the efficiency of thesample can be improved by using stratified sampling;indeed this technique has been used to estimate forestchange in the humid tropics (Achard et al. 2002). In thisparticular case, the stratification was created from thedelineation of “deforestation hot spot areas” (Achard et al.1998). However, it should be noted that the TREES(Achard et al. 2002) and FAO (FAO 2001a,b) Landsat-derived estimates can only be reported at continental orglobal levels as they were derived from a global-targetedsampling scheme. A statistical survey aiming at produc-ing national estimates would require a dedicated sam-pling scheme with a larger number of samples withinindividual countries as compared to the TREES and FAOFRA-2000 surveys. FAO is planning such a samplingstrategy for the remote sensing survey of their next FRA-2010 exercise, allowing the provision of national estimatesfor most countries (Mayaux et al. in press).
In summary, wall-to-wall coverage of fine resolutionsatellite images would be desirable to improve accuracyin estimates of deforestation. The 6.5% sample area ofthe TREES exercise and the 10% sample area of the FAORSS exercise provided estimates with 13% and 15% stan-dard error respectively (Achard et al. 2004). However, thecost and effort involved currently in making wall-to-wallestimates (10 to 15 times more than the FAO or TREESexercises), the marginal gain in accuracy, and problemswith persistent cloud cover in many parts of the world(Asner 2001), suggests that sampling strategies or coarse-resolution imagery will continue to be used for a longtime until methodologies improve and remote sensingimagery becomes cheaper.
2.5.2.2 Frequent Monitoring or Snapshots?
Deforestation is most often estimated by developing per-centage tree cover maps for the end points of the timeperiod under consideration, and subtracting the twoimages to estimate changes (DeFries et al. 2002) or bydeveloping forest-cover change maps directly from thecomparison of two images (Achard et al. 2002). For ex-ample, Achard et al. (2002) derived estimates of defores-
tation for the humid tropics by producing forest-coverchange maps by overlaying the forest-cover map for theyear 1990 with the satellite image of the year 1997. Pixelsthat showed a decrease in forest cover in visual interpre-tation of the two layers (image and map in 1990 versussatellite image in 1997) were classified as deforested, whilepixels that showed an increase in forest cover were clas-sified as regrowth. However, such interpretations of land-cover change from two (or more) snapshots may disguisethe full land-cover dynamics that occur within those twosnapshots. For example, if the snapshots are sufficientlyseparated in time, it is likely that some pixels could bedeforested and regain a full canopy cover between thetwo snapshots, and show no change. This is especiallythe case with “short fallow” systems, where land that iscleared for agriculture is abandoned and allowed to re-grow 2 to 3 years after the initial clearing. In the humidtropics the spectral signatures of regrowths may be con-fused with forest spectral signatures after as little as 10 to20 years. However, the ecological and physical proper-ties will be different. For example, biomass and soil car-bon will take a long time to recover to the original state.Moreover, the biodiversity of secondary forests is oftenlower than in a primary forest. Therefore, to adequatelyaddress issues such as the global carbon cycle and biodi-versity loss, it is important to measure the interannualvariability of land-cover change, preferably monitoringat least every 2 to 3 years, if not every year.
Furthermore, while satellite imagery has been usedmainly to identify initial clearing associated with land-use change, additional information is needed on the fateof the cleared land following the initial change. Is theland being cultivated or grazed? Is the land abandoned,and if so how long is it in agricultural use before aban-donment? Do subsequent conversions or changes in landmanagement occur following the initial use? Such infor-mation is difficult to discern at regional or global scalesand remains a challenge for remote sensing.
2.5.2.3 Spatial Resolution
As described in Sect. 2.5.1, high-spatial-resolution data(e.g., 30 m resolution from Landsat) has become the stan-dard for monitoring land-cover change. However, suchhigh-spatial resolution data are difficult to use at conti-nental-to-global scales because of the prohibitive cost ofthe data, the difficulty in manually classifying images,problems with cloud cover, as well as the effort involvedin classifying thousands of images (57 784 images to coverthe world). Moreover, because of all these issues, onlyone snapshot during the year is normally classified whenhigh-spatial-resolution data are used, and classifying theland cover is difficult unless images are chosen duringthe right season, and accuracies are low even then. Forexample, cultivated lands can look very similar to the

37
surrounding landscape during the non-growing season.Coarse-spatial resolution data have the obvious disad-vantage of being poor at identifying land-cover changefeatures that often occur at spatial scales that are finerthan that of the sensor. On the other hand, coarse-reso-lution data are less expensive (free to the user in manycases), are easier to handle, and have the full phenologi-cal information during the year to distinguish betweendifferent land uses (e.g., DeFries et al. 1995#a/b#;Loveland et al. 2000). They are also the only data setsthat have been used to obtain a globally complete char-acterization of land cover.
2.5.2.4 Harmonizing Land-Cover Classification Systems
A land-cover classification is a systematic framework todescribe the situation in the field using well-defined di-agnostic criteria (or classifiers) (Di Gregorio and Jansen2000b). A classification system provides names of classes,the criteria used to distinguish them, and the relation-ship between classes. Researchers have developed numer-ous classification systems to characterize landscapesaround the world. Some of the systems are a priori de-fined, and the observations are made to fit into the clas-sification system, while others allow the data, a poste-riori, to determine the classification system; similarly,while some systems are hierarchical, others are not (DiGregorio and Jansen 2000b). The profusion of land-coverchange research has also resulted in an overabundanceof land-cover classification systems. Unfortunately, thishas resulted in the inability to compare land-cover mapsmade by different groups for different locations, and evenmaps made by different groups for the same location bydifferent points in time. Consequently, it has becomeimpossible to scale the numerous local-scale land-covermapping efforts to the global scale. This has hamperedglobal scale synthesis efforts to identify rates, locations,and patterns of rapid land-cover change around theworld (Lepers et al. 2005).
There is no internationally accepted land-cover clas-sification system today (Di Gregorio and Jansen 2000b).Recognizing the need to meet this challenge, the FAOpromoted the development of LCCS (Land Cover Classi-fication System), a new hierarchical, a priori, classifica-tion system, which is flexible, but also has systematic andclear class boundary definitions (see Box 2.8). The LCCShas already been adopted by several regional and globalland-cover mapping efforts, including AFRICOVER(http://www.africover.org), as well as the GLC2000 glo-bal land-cover mapping effort. The LUCC project rec-ommended the adoption of LCCS to its members in 2000(McConnell and Moran 2001), as did the Global Observa-tion of Forest and Land Cover Dynamics (GOFC-GOLD),a panel of GTOS (Global Terrestrial Observing System)(Herold and Schmullius 2004). LCCS is endorsed and
promoted to all actors involved in land observations andmapping. Ongoing developments include capacity build-ing and LCCS application (e.g., UN Global Land CoverNetwork (GLCN) – http://www.glcn-lccs.org), harmoni-zation case studies, and the bridging of harmonizationand validation efforts towards operational terrestrial ob-servation (Herold et al. in press; Strahler et al. in press).
2.5.2.5 Integrating Stakeholders in Monitoring:How Can We Make Our Efforts Useful?
One purpose of monitoring land-use and land-coverchange is to create credible information about the stateof our landscapes that might be useful to those who man-age them. This will allow land managers to make funda-mental decisions about different futures for their land-scapes so that they can evaluate the trade-offs of thosedecisions (Box 2.1). The information on monitoring de-scribed in the previous sections goes one step towardcreating that credible database, but if this information isto be used locally, there are some fundamental challengesto be addressed. Effectively integrating stakeholders inmonitoring requires several steps, each of which alone isnot sufficient to allow credible monitoring informationto be relevant and legitimate to different actors. Despitethis, small improvements in the relevance, credibility, andlegitimacy of the process and practice of monitoring havethe potential to reap large benefits in linking science toaction (e.g., Clark et al. 2002; Cash 2003).
Potentially our most important challenge is that sci-entific interests drive many of the monitoring analyseswe do today, often resulting in information that has noconnection or relevance to the users (stakeholders), ei-ther in content or structure. This requires a turnabout inthat scientists need to listen to the questions that stake-holders ask, and design monitoring that sheds light onthose questions (Tomich et al. 2004). Much of our cred-ible science is left inaccessible to land managers in tech-nical publications. “Translator” organizations, like assess-ment institutions or NGOs, can help by linking scientistsand different actors together, and translating informa-tion into a mutual language and crossing institutionalboundaries (Cash 2003).
Another disconnect is that of scale. While remote sens-ing provides a coarse-scale understanding of land changes,many of the important, fine-scale changes in land useand land cover are invisible from all of our current re-mote sensing data platforms. For example, subtle changesin land use, like increased grazing pressure or fence build-ing, which have big impacts on land management, areoften impossible to see from satellite or aircraft-bornesensor. Thus, if global and regional-scale monitoring isto be relevant to local action, we need to make stronglinks across scales. Global and regional analyses can iden-tify hotspots of change, which can be translated into land-
2.5 · Power and Limitations of Remote Sensing

CHAPTER 2 · Global Land-Cover Change: Recent Progress, Remaining Challenges38
scape-level analyses by local teams. In turn, the localanalyses can confirm or revise coarse-scale analyses, ex-plain why changes are happening and anticipate the con-sequence of those changes. If these local scientific ef-forts are then linked to local land managers and policymakers, scientific information could inform local deci-sions. This has the side benefit of linking internationaland national scientific efforts and strengthening the ca-pacity of both of these groups to monitor change andlink to stakeholders.
One final need is to incorporate knowledge from dif-ferent sources, to strengthen the credibility of the finalmonitoring assessments produced. Outside of LUCC sci-ence, for example, agricultural scientists are finding thattheir efforts are more relevant, credible and legitimate ifthey integrate the long-term knowledge of farmers andherders with the insights and methods developed bymodern science (Humphries et al. 2000). Integration ofinformation from different sources will improve moni-toring efforts, make products more relevant to local prob-lems, but also open the channels of communication be-tween scientists and stakeholders, as they jointly evalu-ate shared information.
2.5.2.6 Summary and Conclusions
Remote sensing of land cover continues to face several chal-lenges including the need to attain both high spatial andtemporal resolution (30 m or less, and every 2–3 years, andmultiple seasons within a year), while at the same timeattaining large spatial coverage (continental-to-globalscales) over long time periods (multiple decades). It ap-pears that if wall-to-wall spatial coverage with high reso-lution imagery can be attained for smaller regions, whileunderstanding land-cover change over larger regions willcome from moderate-to-coarse resolution data or throughthe use of stratified sampling methods with higher reso-lution data. Furthermore, it is important to recognize thatthe appropriate resolution for remote sensing variesamong regions depending on the varying spatial scaleand patterns of land cover in different parts of the world.It is also important to understand the full land-coverchange dynamics using remote sensing, including theinitial clearing, the subsequent land uses, and abandon-ment and regrowth if any. A recent review concluded thatthe “creative use of remote sensing inputs as well as an-cillary data sources will improve the mapping of landcover more than further development of classifiers andalgorithms” (Woodcock and Ozdogan 2004). Standard-ized land-cover and land-use classification systems alsoneed to be developed and adopted to ensure compatibil-ity across different study regions.
To enable the continuous monitoring of land-coverchange and its consequences, critical developments areneeded in the global extension of monitoring programs,
enhanced capacity building especially in developingcountries, and the design of data collection, quality con-trol and statistical analysis programs (Balmford et al.2005). Remote sensing scientists need to pay more at-tention to the particular needs of the stakeholders forwhom the land-cover change information is being de-veloped, and incorporate them in the process from thebeginning.
2.6 Conclusions
In the last decade, significant advances have been madetoward estimating the rates and patterns of historicalland-cover change at global scales. For example, new glo-bal databases of land-cover changes during the last300 years have been developed, among many others.Collectively, these indicate that land-cover change dueto human land-use practices has occurred for millennia,and is not a recent phenomenon. The pace of change to-day is unprecedented; however, while rapid land-coverchanges in the tropics capture much public attention to-day, it is important to note that rapid and/or extensivechanges occur in the extratropical zones of the world aswell, and have certainly been the focus of rapid changesin the past.
Results from the BIOME 300 project indicate that, be-tween 1700 and 1990, global cropland area increased
Box 2.8. The Land-Cover Classification Systems LCCS 1 and 2
The Land Cover Classification System (LCCS) was developedand implemented by FAO and UNEP, to describe different land-cover features in a standardized way (Di Gregorio and Jansen2000a; McConnell and Moran 2001). LCCS provides a com-prehensive methodology for the description, characterization,classification and comparison of land-cover data worldwide.
LCCS is an a priori classification system, but uniquely pro-vides a scale independent, hierarchical, method for classify-ing land cover. The approach uses a set of universally validdiagnostic classification criteria that uniquely identify theland-cover classes worldwide and enables a comparison ofland-cover classes regardless of data source, sector or coun-try. LCCS is designed to operate in two phases. Eight majorland-cover types are defined in the initial step. At the secondlevel, land-cover classes are created by combining sets of pre-defined classifiers, which have been carefully defined to de-scribe land-cover variations present within each major land-cover type and also to avoid inappropriate combinations ofclassifiers. The system is highly flexible, while providing in-ternal consistency by allowing land-cover classes to be clearlycharacterized. The methodology is applicable at a variety ofmapping scales and to any geographic location. The diagnos-tic criteria used allow correlation with existing classificationsand legends, and can therefore serve as an internationally ac-ceptable reference standard for land cover.
A software program, now in its second version, has beendeveloped to assist in land-cover interpretation. Despite thelarge number of classes that can be created, the user deals withonly one classification at a time. A land-cover class is built upby a stepwise selection in which a number of classifiers areaggregated to derive the class. Updates to LCCS can be fol-lowed at http://www.africover.org/LCCS.htm.
39
nificant uncertainties persist about the rates andpatterns of change in the dry tropical forests; aboutforest-change dynamics due to fires, logging, and insectdamage; alteration of wetlands; soil erosion; drylanddegradation; expansion of built-up areas; and life-styledriven changes. Even with advances in remote sensing,significant challenges remain including the need tomonitor change with sufficient spatial and temporalresolution, the balancing of expensive wall-to-wallanalysis against the cheaper but potentially more in-accurate sampling schemes, and the inability to com-pare across studies using different land-cover classifi-cation systems.
The lessons learned from the LUCC global land-coverchange synthesis activities suggest future directions forresearch. It is important to use historical and paleo-datato understand past changes in order to place currentchanges in the proper perspective. For example, manyecosystems today are still responding to (recoveringfrom) past land-cover change (e.g., regrowing forests ofthe eastern USA). A long-term perspective will also helpunderstand non-linear behavior (i.e., hysteresis or thatexhibiting thresholds) resulting from the interaction be-tween fast and slowly changing components of the samesystem (e.g., climate variability interacting with shiftsin vegetation distribution and changes in soil proper-ties). Moreover, a long-term perspective allows the studyof land-use change as a process undergoing predictabletransitions with economic development.
Future monitoring methods must also maintain a glo-bal perspective, even if particular attention is paid to“hotspots” of land-cover change, lest some importantprocesses are missed in non-hotspot regions. Anotherpriority is to move beyond a focus on humid forest sys-tems, to study changes in agricultural lands, drylands,built-up areas, fires, wetland changes, among others. Theuse of coarse-resolution satellite data to identify loca-tions of rapid change, and then high-resolution datawithin those hotspots to estimate rates and patterns ofchange accurately seems like a promising idea. However,the challenge of connecting global land-cover changeestimates to narratives about land-cover change fromparticular places and times remains unresolved andneeds significant thought.
Land-change monitoring should also aim to charac-terize the full land-cover dynamics or land-use transi-tions, and these dynamics and transitions will requiresuperior detail in the land-cover classes analyzed. Theintegration of remote sensing data with other sources ofinformation including, for example, household surveys,census data, land economic surveys, is again a promisingdirection for future research.
Finally, more attention needs to be paid to integrat-ing stakeholders in monitoring systems, in order to im-prove the relevance, credibility, and legitimacy of moni-toring.
from ~3–4 million km2 in 1700 to ~15–18 million km2;while grazing land (the definition of which is prob-lematic) increased from ~500 million km2 in 1700 to3 100 million km2; forests decreased from ~53 million km2
to ~43–44 million km2; and savannas and grasslandsdecreased from 30–32 million km2 to 12–23 million km2.Much of the expansion of croplands came at the expenseof forests, while much of today’s grazing land was for-merly grassland. However, there are notable exceptionsto these trends – for example, the North American Prai-ries were lost mainly to croplands, and many Latin Ameri-can forests are being cleared for ranching.
The 20th century has witnessed an acceleration of thepace and intensity of land-cover change. Since the 1960s,spurred in part by the Green Revolution, a shift inland-use practices toward agricultural intensifica-tion has been observed. Indeed, between 1961 and 2002,while cropland areas increased by only 15%, irrigatedareas doubled, world fertilizer consumption increased4.5 times, and the number of tractors used in agri-culture increased 2.4 times. These drivers of land-coverchange during the 20th century have been modulatedby rapid and pervasive globalization. By removing re-gional and national barriers to global trade, globaliza-tion has enabled formerly economically isolated placesto be rapidly connected to global markets, often result-ing in substantial land-use and land-cover changes, asin the case of Borneo. Globalization and transportationinfrastructure has also enabled agricultural commodi-ties grown in distant locations to support urban cen-ters, resulting in agricultural abandonment in proxim-ity to these centers.
A recent assessment identified regions of the worldthat underwent the most rapid land-cover changes in thelast 20 years. The study found that the rapid land-coverchanges that have been observed are not randomly oruniformly distributed but clustered in particular loca-tions – for example, along the edges of forests and alongroads. More spatially-diffuse changes involving land-cover modifications (i.e., subtle changes that affect thecharacter of the land cover without changing its overallclassification; e.g., forest degradation from logging) havebeen more difficult to observe than land-cover conver-sions (i.e., the complete replacement of one cover typeby another). The study also found that different processesof land-cover change have taken place in different partsof the world over the last two decades; for example, adecrease in cropland area in temperate regions and anincrease in the tropics.
The advances in synthesizing land-cover change stud-ies to a global scale also revealed significant gaps inour knowledge. While the development of remote sens-ing techniques have allowed us to quantify land-coverchange more accurately, most of the recent studies ofthis change have focussed on the more-easily observedprocess of deforestation in the humid tropics. Sig-
2.6 · Conclusions


