Embed Size (px)
Citation preview
Ore Geology Reviews 84 (2017) 134–153
Contents lists available at ScienceDirect
Ore Geology Reviews
journal homepage: www.elsevier .com/ locate/oregeo
Review
Petrography, mineralogy and geochemistry of the Late Eocene ooliticironstones of the Jebel Ank, Southern Tunisian Atlas
http://dx.doi.org/10.1016/j.oregeorev.2016.12.0260169-1368/� 2017 Elsevier B.V. All rights reserved.
⇑ Corresponding author.E-mail address: [email protected] (H. Garnit).
Hechmi Garnit ⇑, Salah BouhlelUnité de Géochimie et Géologie de l’Environnement UR11ES16, Département de Géologie, Faculté des Sciences de Tunis, Université de Tunis El Manar, 2092 Tunis, Tunisia
a r t i c l e i n f o
Article history:Received 17 April 2016Received in revised form 22 October 2016Accepted 28 December 2016Available online 13 January 2017
Keywords:Geochemical characterizationOolitic ironstoneJebel AnkTunisia
a b s t r a c t
The oolitic ironstones ore deposit of Jebel Ank (central Tunisia), is a simply folded stratiform ore body ofabout 2.5–8 m thickness located in the upper part of the epicontinental Souar Formation (Late Eocene)and is covered by the continental Segui Formation (Mio-Pliocene). The deposit contains about 20 Mt ofore with an average grade of 50% Fe. Generally, oolitic iron deposition occurs in shallow water lagoonalenvironments. The Jebel Ank deposit lies between two regional disconformities (Late Eoceneand Miocene), and is evidence of a transitional stage at the end of regional regression before renewedtransgression. The footwall of the oolitic iron ore-bearing bed consists of a fine-grained sandstone bed(10–20 cm-thick) pinching out laterally westward into green clays. The hanging wall is composed ofthin-bedded limestone and clay alternations (2–3.5 m-thick).Iron occurs in the form of cryptocrystalline goethite with limited Al-Fe substitution. The goethite con-
tains around 48% Fe, 5% Al and up to 1.5% P. Jarosite, alunite and manganese minerals (cryptomelane,psilomelane and manjiorite) are supergene secondary minerals, probably related to descending surfacefluids. These manganese minerals occur as accessory minerals with the goethite and are most abundantat the lowermost part of the succession showing varied morphologies (local cement, space filling and freecentimeter sized nodules). Fe-oolites in the deposit are similar to those documented in many other ooliticironstone deposits. The dominant Fe-oolite type (>90%) has a concentrically laminated cortex with nonucleus. The nuclei of the oolites that do have a nucleus are most commonly detrital quartz grains.Major elements in high grade samples (Fe2O3 > 65%) vary within a limited range and show higher con-
centrations of SiO2 (average 7.85%) and Al2O3 (average 5.1%), with minor TiO2, MnO, MgO, Na2O, K2O, andSO3 (less than 1%). PAAS-normalized trace elements of bulk samples and Fe-oolite generally show similarbehavior, both are enriched in V, Co, Ni, Mo, As, Zn, and Y and are depleted in Cu, Rb, Zr, Nb, Ba, and Hf.Anomalous V, Cr, Ni, Zn, and REE-Y are correlated with goethite. PAAS-normalized REE-Y patterns of bothbulk samples and Fe-oolite show slight HREE enrichment, positive Ce with negative Y anomalies.The mineralogy (goethite and cryptomelane) along with the geochemistry (Si vs. Al; As + Cu + Mo + Pb
+ V + Zn vs. Ni + Co binary plots; Zn–Ni–Co triangular diagram, REE-Y content and patterns and Ce/Ce⁄ vs.Nd and Ce/Ce⁄ vs. YN/HoN binary plots) of the studied oolitic ironstone are congruent with a hydrogenetictype. While two possible sources of iron for Jebel Ank ironstone can be proposed: (i) submarine weath-ering of glauconite-rich sandstone and (ii) detrital iron from adjacent continental hinterland, the later isthe more plausible source of iron, based on paleogeographic setting, the occurrence of fine sandstoneunderlying the iron level, occurrence of Mn-ores in the lower part of the Fe-ores succession, high phos-phorous, zinc,
PREE-Y concentrations and Y/Ho ratios, and low La/Ce ratios.
� 2017 Elsevier B.V. All rights reserved.
Contents
1. Introduction . . . . . . . . . . . . . . . . . . . . . . . . . . . . . . . . . . . . . . . . . . . . . . . . . . . . . . . . . . . . . . . . . . . . . . . . . . . . . . . . . . . . . . . . . . . . . . . . . . . . . . . . . 1352. Geologic setting . . . . . . . . . . . . . . . . . . . . . . . . . . . . . . . . . . . . . . . . . . . . . . . . . . . . . . . . . . . . . . . . . . . . . . . . . . . . . . . . . . . . . . . . . . . . . . . . . . . . . . 136
2.1. Regional geology . . . . . . . . . . . . . . . . . . . . . . . . . . . . . . . . . . . . . . . . . . . . . . . . . . . . . . . . . . . . . . . . . . . . . . . . . . . . . . . . . . . . . . . . . . . . . . . . 136
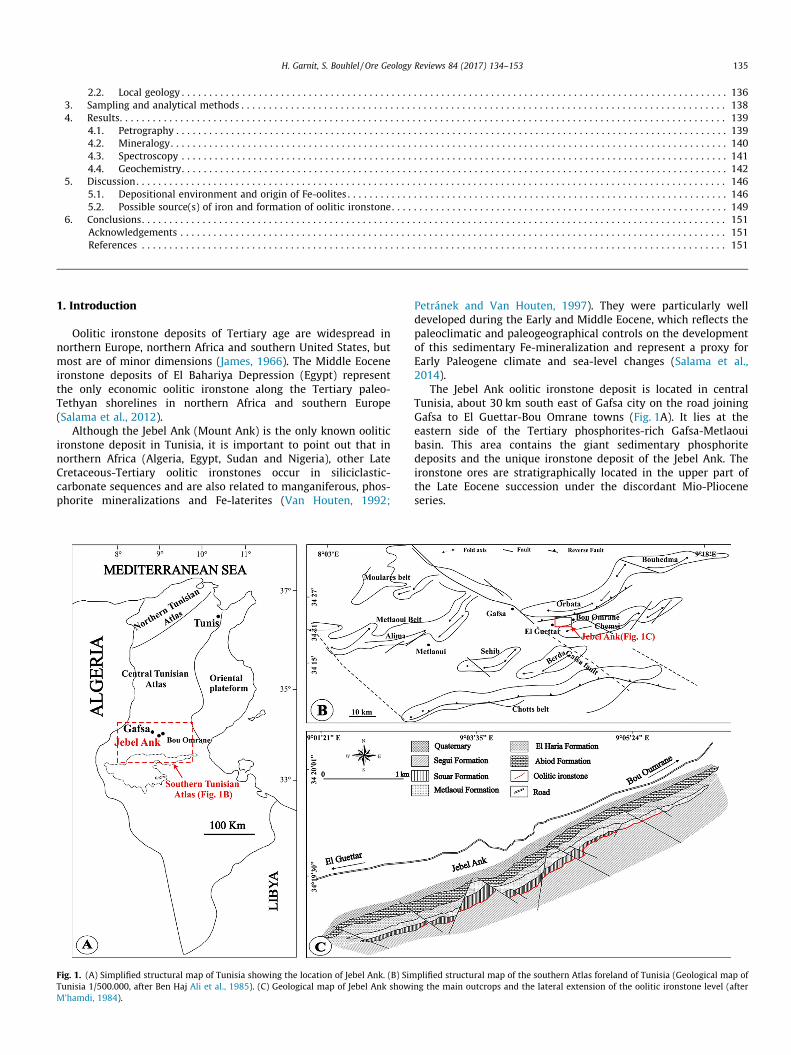
Fig. 1.TunisiaM’ham
H. Garnit, S. Bouhlel / Ore Geology Reviews 84 (2017) 134–153 135
2.2. Local geology . . . . . . . . . . . . . . . . . . . . . . . . . . . . . . . . . . . . . . . . . . . . . . . . . . . . . . . . . . . . . . . . . . . . . . . . . . . . . . . . . . . . . . . . . . . . . . . . . . . 136
3. Sampling and analytical methods . . . . . . . . . . . . . . . . . . . . . . . . . . . . . . . . . . . . . . . . . . . . . . . . . . . . . . . . . . . . . . . . . . . . . . . . . . . . . . . . . . . . . . . . 1384. Results. . . . . . . . . . . . . . . . . . . . . . . . . . . . . . . . . . . . . . . . . . . . . . . . . . . . . . . . . . . . . . . . . . . . . . . . . . . . . . . . . . . . . . . . . . . . . . . . . . . . . . . . . . . . . . 1394.1. Petrography . . . . . . . . . . . . . . . . . . . . . . . . . . . . . . . . . . . . . . . . . . . . . . . . . . . . . . . . . . . . . . . . . . . . . . . . . . . . . . . . . . . . . . . . . . . . . . . . . . . . 1394.2. Mineralogy. . . . . . . . . . . . . . . . . . . . . . . . . . . . . . . . . . . . . . . . . . . . . . . . . . . . . . . . . . . . . . . . . . . . . . . . . . . . . . . . . . . . . . . . . . . . . . . . . . . . . 1404.3. Spectroscopy . . . . . . . . . . . . . . . . . . . . . . . . . . . . . . . . . . . . . . . . . . . . . . . . . . . . . . . . . . . . . . . . . . . . . . . . . . . . . . . . . . . . . . . . . . . . . . . . . . . 1414.4. Geochemistry. . . . . . . . . . . . . . . . . . . . . . . . . . . . . . . . . . . . . . . . . . . . . . . . . . . . . . . . . . . . . . . . . . . . . . . . . . . . . . . . . . . . . . . . . . . . . . . . . . . 142
5. Discussion. . . . . . . . . . . . . . . . . . . . . . . . . . . . . . . . . . . . . . . . . . . . . . . . . . . . . . . . . . . . . . . . . . . . . . . . . . . . . . . . . . . . . . . . . . . . . . . . . . . . . . . . . . . 146
5.1. Depositional environment and origin of Fe-oolites . . . . . . . . . . . . . . . . . . . . . . . . . . . . . . . . . . . . . . . . . . . . . . . . . . . . . . . . . . . . . . . . . . . . . 1465.2. Possible source(s) of iron and formation of oolitic ironstone. . . . . . . . . . . . . . . . . . . . . . . . . . . . . . . . . . . . . . . . . . . . . . . . . . . . . . . . . . . . . 1496. Conclusions. . . . . . . . . . . . . . . . . . . . . . . . . . . . . . . . . . . . . . . . . . . . . . . . . . . . . . . . . . . . . . . . . . . . . . . . . . . . . . . . . . . . . . . . . . . . . . . . . . . . . . . . . . 151Acknowledgements . . . . . . . . . . . . . . . . . . . . . . . . . . . . . . . . . . . . . . . . . . . . . . . . . . . . . . . . . . . . . . . . . . . . . . . . . . . . . . . . . . . . . . . . . . . . . . . . . . . 151References . . . . . . . . . . . . . . . . . . . . . . . . . . . . . . . . . . . . . . . . . . . . . . . . . . . . . . . . . . . . . . . . . . . . . . . . . . . . . . . . . . . . . . . . . . . . . . . . . . . . . . . . . . 151
1. Introduction
Oolitic ironstone deposits of Tertiary age are widespread innorthern Europe, northern Africa and southern United States, butmost are of minor dimensions (James, 1966). The Middle Eoceneironstone deposits of El Bahariya Depression (Egypt) representthe only economic oolitic ironstone along the Tertiary paleo-Tethyan shorelines in northern Africa and southern Europe(Salama et al., 2012).
Although the Jebel Ank (Mount Ank) is the only known ooliticironstone deposit in Tunisia, it is important to point out that innorthern Africa (Algeria, Egypt, Sudan and Nigeria), other LateCretaceous-Tertiary oolitic ironstones occur in siliciclastic-carbonate sequences and are also related to manganiferous, phos-phorite mineralizations and Fe-laterites (Van Houten, 1992;
(A) Simplified structural map of Tunisia showing the location of Jebel Ank. (B) Sim1/500.000, after Ben Haj Ali et al., 1985). (C) Geological map of Jebel Ank showidi, 1984).
Petránek and Van Houten, 1997). They were particularly welldeveloped during the Early and Middle Eocene, which reflects thepaleoclimatic and paleogeographical controls on the developmentof this sedimentary Fe-mineralization and represent a proxy forEarly Paleogene climate and sea-level changes (Salama et al.,2014).
The Jebel Ank oolitic ironstone deposit is located in centralTunisia, about 30 km south east of Gafsa city on the road joiningGafsa to El Guettar-Bou Omrane towns (Fig. 1A). It lies at theeastern side of the Tertiary phosphorites-rich Gafsa-Metlaouibasin. This area contains the giant sedimentary phosphoritedeposits and the unique ironstone deposit of the Jebel Ank. Theironstone ores are stratigraphically located in the upper part ofthe Late Eocene succession under the discordant Mio-Plioceneseries.
plified structural map of the southern Atlas foreland of Tunisia (Geological map ofng the main outcrops and the lateral extension of the oolitic ironstone level (after
136 H. Garnit, S. Bouhlel / Ore Geology Reviews 84 (2017) 134–153
In 1932, the concession of Jebel Ank was acquired by the Com-pany of Phosphates of M’dhilla. During the period 1949–1960 geo-logical surveys and mineral processing testing were undertaken. Inthe early 1960s, the concession was recovered by the NationalOffice of Mines. Metallogenic investigations have revealed anapparently new economic potential. On March 2006, the conces-sion was granted by official directive to the Jebel Jerissa Society.Finally, in 2007 the exploration license was granted to the localMining and Steel Company. The company proceeded with a bene-ficiation and metallurgical testing program to define the ore gradedistribution, the economic resources, and the chemical quality ofthe ores. The calculated, proven reserves are about 5 Mt and theprobable, and possible resources are about 20 Mt with an averagegrade of 50% Fe.
The Jebel Ank deposit was described successively by Berthon(1922) and Gottis and Sainfeld (1952), who gave a brief geologicsettings and exploitation oriented description of the deposit.Sassi (1974) gave an overview of the stratigraphy of the regionand assigned an Eocene age to the Fe-mineralization.
The oolitic ironstone deposit of the Jebel Ank was first reportedby Berthon (1922) to be of Middle Eocene age. Gottis and Sainfeld(1952) reported that the Jebel Ank is unique, being the only knownoolitic ironstone of Tunisia. Nicolini (1967) defined the paleogeo-graphic and sedimentological context of the deposit and discussedsome similarities of the Ank oolitic Fe-ores with the Minette iron-stone of the Lorraine basin in France. M’hamdi (1984) gave anoverview of the mineralogy and petrography together with bulkchemical analysis and discussed the palaeogeographic controland possible Fe-sources.
Publications with detailed databases addressing the characteri-zation and genesis of the Fe-mineralization are scarce. Newinsights based on field, petrographic, mineralogical and geochem-ical studies of the ironstone deposit are provided in this article,using techniques such as X-ray diffraction (XRD), Scanning elec-tron microscopy and energy dispersive spectroscopy (SEM-EDS),Fourier transform infrared spectroscopy (FTIR), RAMAN spec-troscopy, Inductively Coupled Plasma-Mass Spectrometry (ICP-MS) and Laser ablation ICP-MS (LA-ICP-MS). The purpose of thisstudy is to characterize Fe-mineralization and discuss possibleore sources.
2. Geologic setting
2.1. Regional geology
The Jebel Ank deposit lies in the Southern Tunisian Atlas(Fig. 1A), which corresponds to a system of foreland fold and thrustbelts bordered to the east by the NW-SE trending Gafsa fault(Zargouni, 1985). This Atlasic domain is composed of NE-SW andE-W trending folds and NW-SE trending thrusts that form theMetlaoui-Gafsa belt and the Chotts belt (Zargouni, 1985; Zouariet al., 1990; Ben Ayed, 1993; Boukadi, 1994) (Fig. 1B). The JebelAnk area is delimited by several NE–SW to E–W structural linea-ments: the Orbata and Bouhedma belts to the north and northeast-ern, respectively; the Jebel Chemsi and Jebel Berda to the south andsouthwestern, respectively (Fig. 1B). These structural lineamentsmainly consist of asymmetric southeast-plunging anticlines coredby Late Cretaceous series rocks (Boukadi, 1985). This area isaffected by several NW–SE and E–W trending faults.
Several geometric and kinematic models have been proposedfor the Southern Tunisian Atlas folds and thrusts. They have beenvariously interpreted as: (i) fault propagation folding (e.g.Bensalem et al., 2010; Ahmadi et al., 2013); (ii) thick-skinned tec-tonics style folding involving the Paleozoic basement (Hlaiem,1999; Zouaghi et al., 2011); (iii) NW-SE oblique ramps and tear
faults (Said et al., 2011) with mixed tectonic style and deep-seated basement faults, shallower decollements within sedimen-tary cover, and salt diapirism (Gharbi et al., 2015).
The folds are composed of Cretaceous and Cenozoic series. Sub-surface data showed that some anticline cores and some faults areinjected by Triassic salt diapirs (Hlaiem, 1999; Zouaghi et al.,2005). The Cretaceous series are composed of carbonate rocks,shales, marls, sandstones, and evaporites. The Late Cretaceous ser-ies are composed of carbonates and are overlain by the Paleocenemarls. The Early to Middle Paleocene series are characterized bymarls and marly limestone, alternations of bioclastic carbonates,marls, and evaporites indicative of restricted environments. Duringthe Late Paleocene-Early Eocene, clays, carbonates, chert and phos-phorites were deposited. From the Middle to Late Eocene, massivegypsum beds intercalated with claystone were deposited. The LateEocene marked the end of marine sedimentation.
The Cretaceous-Cenozoic transition is marked by regionalunconformities, gaps, and condensed series (Burollet, 1956;Zargouni et al., 1985; Zouari et al., 1990; Boukadi, 1994; Zouaghiet al., 2005). The marine Cretaceous-Eocene series are mostly cov-ered by discordant Neogene continental formations made of detri-tal alluvial and fluvial deposits.
Outcrops and subsurface geology attest that the region was sub-jected to more than one phase of tectonic activity, mainly a N-Sextensional regime from the Triassic to Late Cretaceous and aNE-SW and NW-SE compressive regime from the Eocene to thepresent (Bouaziz et al., 2002). These periods are marked by princi-pal tectonic phases of compression trending NW-SE to N-S, whichare related to the mechanisms of collision between the African andEurasian plates (e.g. Dercourt et al., 1986).
2.2. Local geology
The Jebel Ank is located within the E-W-trending belts along theeastern side of the southern Atlas, approximately 30 km southeast-ern of the Gafsa city and 2 km south of the Bou Omrane town(Fig. 1B). The deposit is located on the eastern border of thephosphorites-rich Gafsa-Metaloui basin. In this border area, uneco-nomic stratiform phosphorites are exposed in two main zones:along the southern flank of the anticline of Orbata at Jebel Hamadiand Jebel Ank and along the northern flank and the western peri-clinal closure of the anticline of Jebel Chemsi (Fig. 1B). At JebelAnk, the phosphatic series is correlated with the phosphorite ofChouabine Formation of the Gafsa-Metlaoui basin.
The asymmetric synclinal structure of Jebel Ank is a part of anextended syncline structure trending WSW-ENE, about 20 km longstretching between Jebel Orbata to the north and Jebel Chemsi tothe south (Fig. 1B). Jebel Ank lies between latitudes 34�2001800–34�1903700N and longitudes 09�0102100–09�0600400E (Fig. 1C).
The synclinal structure is formed from the base and upward bythe Campanian limestones, the Paleocene (clays and marls), theEocene carbonates, and the Late Mio-Pliocene conglomerates,marls, sands and red clays. Two major NW-SE trending normalfaults divided the structure into three blocks (Fig. 1C). The dips ofrock units along the northern and southern flanks of Jebel Ank vary,with subvertical layers of the northern flank related to E-W trend-ing faults (Fig. 2A).
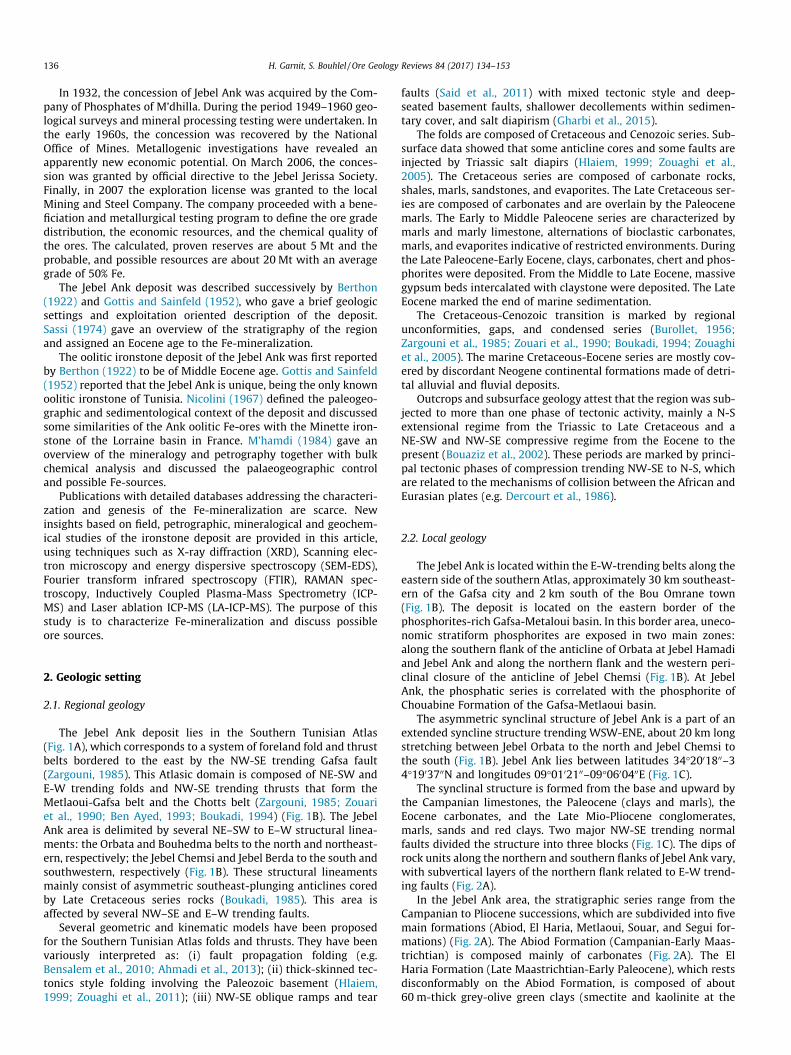
In the Jebel Ank area, the stratigraphic series range from theCampanian to Pliocene successions, which are subdivided into fivemain formations (Abiod, El Haria, Metlaoui, Souar, and Segui for-mations) (Fig. 2A). The Abiod Formation (Campanian-Early Maas-trichtian) is composed mainly of carbonates (Fig. 2A). The ElHaria Formation (Late Maastrichtian-Early Paleocene), which restsdisconformably on the Abiod Formation, is composed of about60 m-thick grey-olive green clays (smectite and kaolinite at the
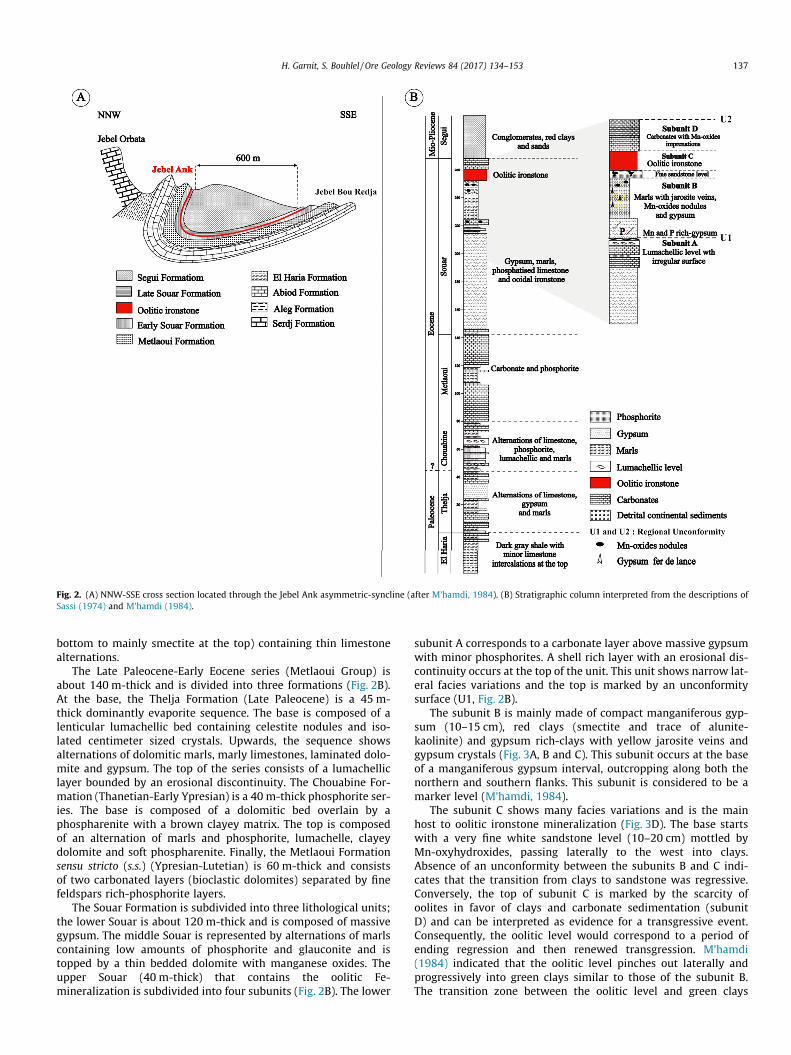
Fig. 2. (A) NNW-SSE cross section located through the Jebel Ank asymmetric-syncline (after M’hamdi, 1984). (B) Stratigraphic column interpreted from the descriptions ofSassi (1974) and M’hamdi (1984).
H. Garnit, S. Bouhlel / Ore Geology Reviews 84 (2017) 134–153 137
bottom to mainly smectite at the top) containing thin limestonealternations.
The Late Paleocene-Early Eocene series (Metlaoui Group) isabout 140 m-thick and is divided into three formations (Fig. 2B).At the base, the Thelja Formation (Late Paleocene) is a 45 m-thick dominantly evaporite sequence. The base is composed of alenticular lumachellic bed containing celestite nodules and iso-lated centimeter sized crystals. Upwards, the sequence showsalternations of dolomitic marls, marly limestones, laminated dolo-mite and gypsum. The top of the series consists of a lumachelliclayer bounded by an erosional discontinuity. The Chouabine For-mation (Thanetian-Early Ypresian) is a 40 m-thick phosphorite ser-ies. The base is composed of a dolomitic bed overlain by aphospharenite with a brown clayey matrix. The top is composedof an alternation of marls and phosphorite, lumachelle, clayeydolomite and soft phospharenite. Finally, the Metlaoui Formationsensu stricto (s.s.) (Ypresian-Lutetian) is 60 m-thick and consistsof two carbonated layers (bioclastic dolomites) separated by finefeldspars rich-phosphorite layers.
The Souar Formation is subdivided into three lithological units;the lower Souar is about 120 m-thick and is composed of massivegypsum. The middle Souar is represented by alternations of marlscontaining low amounts of phosphorite and glauconite and istopped by a thin bedded dolomite with manganese oxides. Theupper Souar (40 m-thick) that contains the oolitic Fe-mineralization is subdivided into four subunits (Fig. 2B). The lower
subunit A corresponds to a carbonate layer above massive gypsumwith minor phosphorites. A shell rich layer with an erosional dis-continuity occurs at the top of the unit. This unit shows narrow lat-eral facies variations and the top is marked by an unconformitysurface (U1, Fig. 2B).
The subunit B is mainly made of compact manganiferous gyp-sum (10–15 cm), red clays (smectite and trace of alunite-kaolinite) and gypsum rich-clays with yellow jarosite veins andgypsum crystals (Fig. 3A, B and C). This subunit occurs at the baseof a manganiferous gypsum interval, outcropping along both thenorthern and southern flanks. This subunit is considered to be amarker level (M’hamdi, 1984).
The subunit C shows many facies variations and is the mainhost to oolitic ironstone mineralization (Fig. 3D). The base startswith a very fine white sandstone level (10–20 cm) mottled byMn-oxyhydroxides, passing laterally to the west into clays.Absence of an unconformity between the subunits B and C indi-cates that the transition from clays to sandstone was regressive.Conversely, the top of subunit C is marked by the scarcity ofoolites in favor of clays and carbonate sedimentation (subunitD) and can be interpreted as evidence for a transgressive event.Consequently, the oolitic level would correspond to a period ofending regression and then renewed transgression. M’hamdi(1984) indicated that the oolitic level pinches out laterally andprogressively into green clays similar to those of the subunit B.The transition zone between the oolitic level and green clays
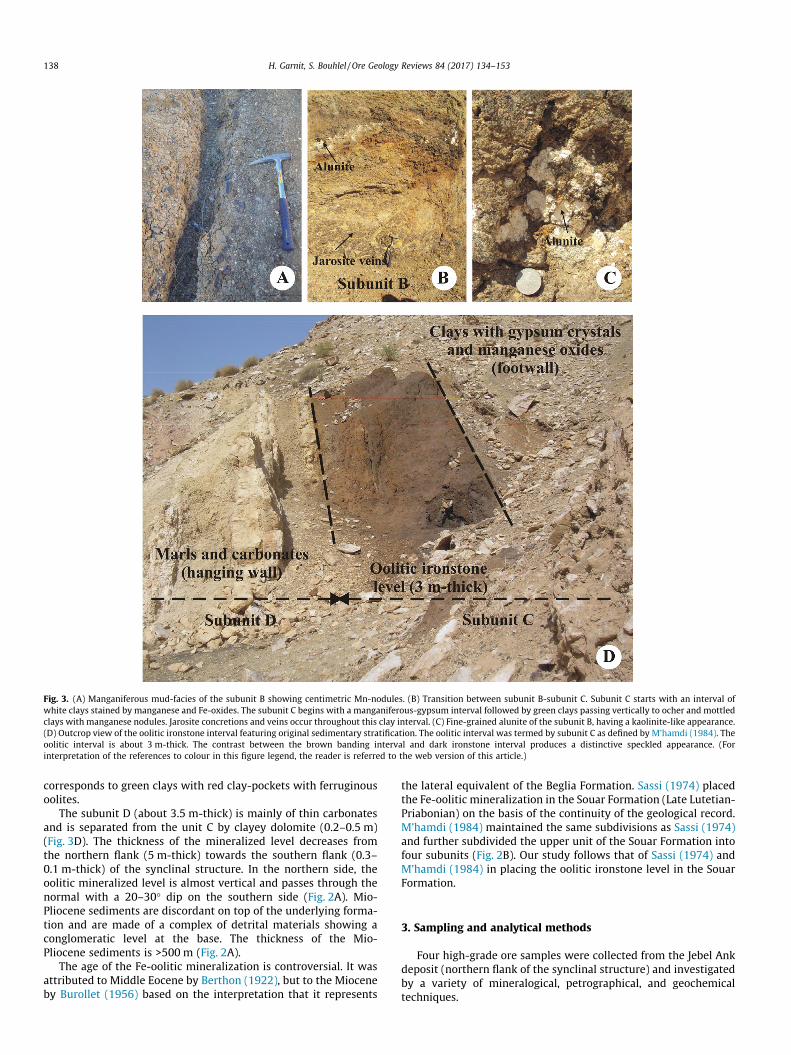
Fig. 3. (A) Manganiferous mud-facies of the subunit B showing centimetric Mn-nodules. (B) Transition between subunit B-subunit C. Subunit C starts with an interval ofwhite clays stained by manganese and Fe-oxides. The subunit C begins with a manganiferous-gypsum interval followed by green clays passing vertically to ocher and mottledclays with manganese nodules. Jarosite concretions and veins occur throughout this clay interval. (C) Fine-grained alunite of the subunit B, having a kaolinite-like appearance.(D) Outcrop view of the oolitic ironstone interval featuring original sedimentary stratification. The oolitic interval was termed by subunit C as defined by M’hamdi (1984). Theoolitic interval is about 3 m-thick. The contrast between the brown banding interval and dark ironstone interval produces a distinctive speckled appearance. (Forinterpretation of the references to colour in this figure legend, the reader is referred to the web version of this article.)
138 H. Garnit, S. Bouhlel / Ore Geology Reviews 84 (2017) 134–153
corresponds to green clays with red clay-pockets with ferruginousoolites.
The subunit D (about 3.5 m-thick) is mainly of thin carbonatesand is separated from the unit C by clayey dolomite (0.2–0.5 m)(Fig. 3D). The thickness of the mineralized level decreases fromthe northern flank (5 m-thick) towards the southern flank (0.3–0.1 m-thick) of the synclinal structure. In the northern side, theoolitic mineralized level is almost vertical and passes through thenormal with a 20–30� dip on the southern side (Fig. 2A). Mio-Pliocene sediments are discordant on top of the underlying forma-tion and are made of a complex of detrital materials showing aconglomeratic level at the base. The thickness of the Mio-Pliocene sediments is >500 m (Fig. 2A).
The age of the Fe-oolitic mineralization is controversial. It wasattributed to Middle Eocene by Berthon (1922), but to the Mioceneby Burollet (1956) based on the interpretation that it represents
the lateral equivalent of the Beglia Formation. Sassi (1974) placedthe Fe-oolitic mineralization in the Souar Formation (Late Lutetian-Priabonian) on the basis of the continuity of the geological record.M’hamdi (1984) maintained the same subdivisions as Sassi (1974)and further subdivided the upper unit of the Souar Formation intofour subunits (Fig. 2B). Our study follows that of Sassi (1974) andM’hamdi (1984) in placing the oolitic ironstone level in the SouarFormation.
3. Sampling and analytical methods
Four high-grade ore samples were collected from the Jebel Ankdeposit (northern flank of the synclinal structure) and investigatedby a variety of mineralogical, petrographical, and geochemicaltechniques.
H. Garnit, S. Bouhlel / Ore Geology Reviews 84 (2017) 134–153 139
The samples were prepared as polished thin sections for petro-graphic study under transmitted polarizing and reflected lightmicroscopes. The mineralogical analyses of samples were carriedout by XRD analysis with a Philips X’Pert diffractometer using CuKaradiation (1.54060 Å). Diffraction data were collected in the rangefrom 3 to 70 and interpreted using X’Pert HighScore Plus software.The accelerating voltage and filament current were maintained at40 kV and 40 mA, respectively. The bulk mineralogy was deter-mined by semi-quantitative (±5%) XRD. The diffraction analyseswere carried out in the Department of Geology, Faculty of Sciencesof Tunis, Tunisia.
The major element oxide contents (SiO2, Al2O3, Fe2O3, K2O,Na2O, MgO, CaO, MnO and TiO2) of the high-grade samples weredetermined by atomic absorption spectroscopy. Loss on ignition(LOI) was measured from the total weight after ignition at1000 �C for 2 h. Trace and rare earth element contents were deter-mined by ICP-MS using an Elan DRCe (Perkin Elmer/SCIEX) instru-ment at the Department of Earth Sciences, Università dellaCalabria, following the method described by Garnit et al. (2012).
SEM-EDS analyses were performed on polished sections, using ascanning electron microscope (ESEM FEG, QUANTA200, Philips),equipped with an energy dispersive X-ray analyzer with a Si/Licrystal detector (GENESIS-4000, EDAX). SEM analyses were carriedout at the Department of Earth Sciences, Università della Calabria,Italy.
In situ chemical analyses were performed by LA-ICP-MS fromindividual oolites mounted on polished sections and carried outat the Department of Earth Sciences, Università della Calabria, Italy,using an Elan DRCe (Perkin Elmer/SCIEX), operating either in nor-mal mode as a standard ICPMS instrument or in a dynamic reactioncell (DRC), connected to a New Wave UP213 solid-state Nd-YAGlaser probe (213 nm). Calibration was performed using the glassreference material NIST 612–50 ppm (Pearce et al., 1997) in con-junction with internal standardization applying FeO concentra-tions (Fryer et al., 1995) from scanning electron microscopy withenergy dispersive X-ray spectroscopy (SEM-EDX) (Francescoet al., 2005). In order to evaluate possible errors within each ana-lytical sequence, determinations of trace elements were also madeon a BCR 2G glass reference material as an unknown sample, andelement concentrations were compared with reference values fromthe literature (Gao et al., 2002). Accuracy, calculated as the differ-ence from reference values, was always better than 10%, and mostelements had values in the range of 5%.
Spectroscopic techniques were used to identify and providecomplementary information about the composition, crystal mor-phology, and degree of crystallization and atomic structure of someminerals. FTIR and Raman analyses were carried out at the Depart-ment of chemistry and Department of Physics, respectively, atUniversity of Sciences of Tunis. An FTIR spectrum was recordedusing a KBr pellet at room temperature by an Agilent ATR spec-trometer in the wavenumber range of 4000–400 cm�1 using fourscans with 2 cm�1 spectral resolution.
Raman measurements were performed at room temperaturewith a T64000 system equipped with a microscope in back-scattering configuration and using the 488 nm Ar+ laser line forexcitation and the incident laser power at 5 mW. The Raman shiftwas determined with an accuracy of 0.25 cm�1. FTIR and Ramandata were interpreted using OriginPro8 software.
4. Results
4.1. Petrography
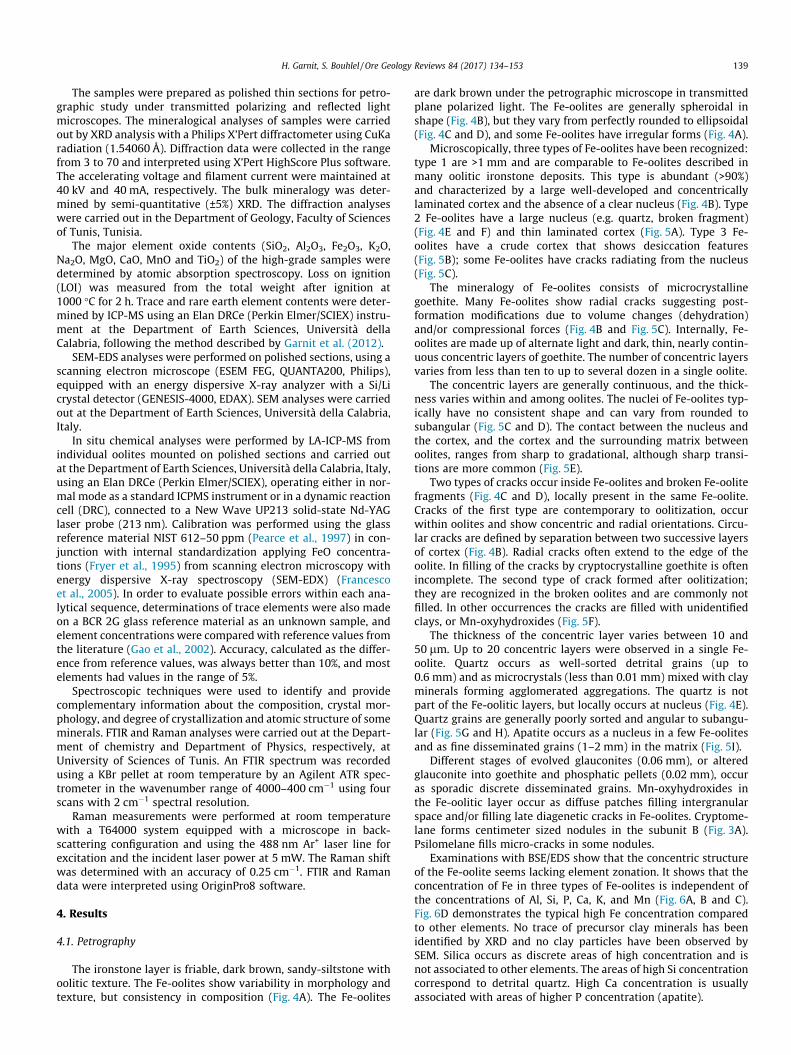
The ironstone layer is friable, dark brown, sandy-siltstone withoolitic texture. The Fe-oolites show variability in morphology andtexture, but consistency in composition (Fig. 4A). The Fe-oolites
are dark brown under the petrographic microscope in transmittedplane polarized light. The Fe-oolites are generally spheroidal inshape (Fig. 4B), but they vary from perfectly rounded to ellipsoidal(Fig. 4C and D), and some Fe-oolites have irregular forms (Fig. 4A).
Microscopically, three types of Fe-oolites have been recognized:type 1 are >1 mm and are comparable to Fe-oolites described inmany oolitic ironstone deposits. This type is abundant (>90%)and characterized by a large well-developed and concentricallylaminated cortex and the absence of a clear nucleus (Fig. 4B). Type2 Fe-oolites have a large nucleus (e.g. quartz, broken fragment)(Fig. 4E and F) and thin laminated cortex (Fig. 5A). Type 3 Fe-oolites have a crude cortex that shows desiccation features(Fig. 5B); some Fe-oolites have cracks radiating from the nucleus(Fig. 5C).
The mineralogy of Fe-oolites consists of microcrystallinegoethite. Many Fe-oolites show radial cracks suggesting post-formation modifications due to volume changes (dehydration)and/or compressional forces (Fig. 4B and Fig. 5C). Internally, Fe-oolites are made up of alternate light and dark, thin, nearly contin-uous concentric layers of goethite. The number of concentric layersvaries from less than ten to up to several dozen in a single oolite.
The concentric layers are generally continuous, and the thick-ness varies within and among oolites. The nuclei of Fe-oolites typ-ically have no consistent shape and can vary from rounded tosubangular (Fig. 5C and D). The contact between the nucleus andthe cortex, and the cortex and the surrounding matrix betweenoolites, ranges from sharp to gradational, although sharp transi-tions are more common (Fig. 5E).
Two types of cracks occur inside Fe-oolites and broken Fe-oolitefragments (Fig. 4C and D), locally present in the same Fe-oolite.Cracks of the first type are contemporary to oolitization, occurwithin oolites and show concentric and radial orientations. Circu-lar cracks are defined by separation between two successive layersof cortex (Fig. 4B). Radial cracks often extend to the edge of theoolite. In filling of the cracks by cryptocrystalline goethite is oftenincomplete. The second type of crack formed after oolitization;they are recognized in the broken oolites and are commonly notfilled. In other occurrences the cracks are filled with unidentifiedclays, or Mn-oxyhydroxides (Fig. 5F).
The thickness of the concentric layer varies between 10 and50 lm. Up to 20 concentric layers were observed in a single Fe-oolite. Quartz occurs as well-sorted detrital grains (up to0.6 mm) and as microcrystals (less than 0.01 mm) mixed with clayminerals forming agglomerated aggregations. The quartz is notpart of the Fe-oolitic layers, but locally occurs at nucleus (Fig. 4E).Quartz grains are generally poorly sorted and angular to subangu-lar (Fig. 5G and H). Apatite occurs as a nucleus in a few Fe-oolitesand as fine disseminated grains (1–2 mm) in the matrix (Fig. 5I).
Different stages of evolved glauconites (0.06 mm), or alteredglauconite into goethite and phosphatic pellets (0.02 mm), occuras sporadic discrete disseminated grains. Mn-oxyhydroxides inthe Fe-oolitic layer occur as diffuse patches filling intergranularspace and/or filling late diagenetic cracks in Fe-oolites. Cryptome-lane forms centimeter sized nodules in the subunit B (Fig. 3A).Psilomelane fills micro-cracks in some nodules.
Examinations with BSE/EDS show that the concentric structureof the Fe-oolite seems lacking element zonation. It shows that theconcentration of Fe in three types of Fe-oolites is independent ofthe concentrations of Al, Si, P, Ca, K, and Mn (Fig. 6A, B and C).Fig. 6D demonstrates the typical high Fe concentration comparedto other elements. No trace of precursor clay minerals has beenidentified by XRD and no clay particles have been observed bySEM. Silica occurs as discrete areas of high concentration and isnot associated to other elements. The areas of high Si concentrationcorrespond to detrital quartz. High Ca concentration is usuallyassociated with areas of higher P concentration (apatite).
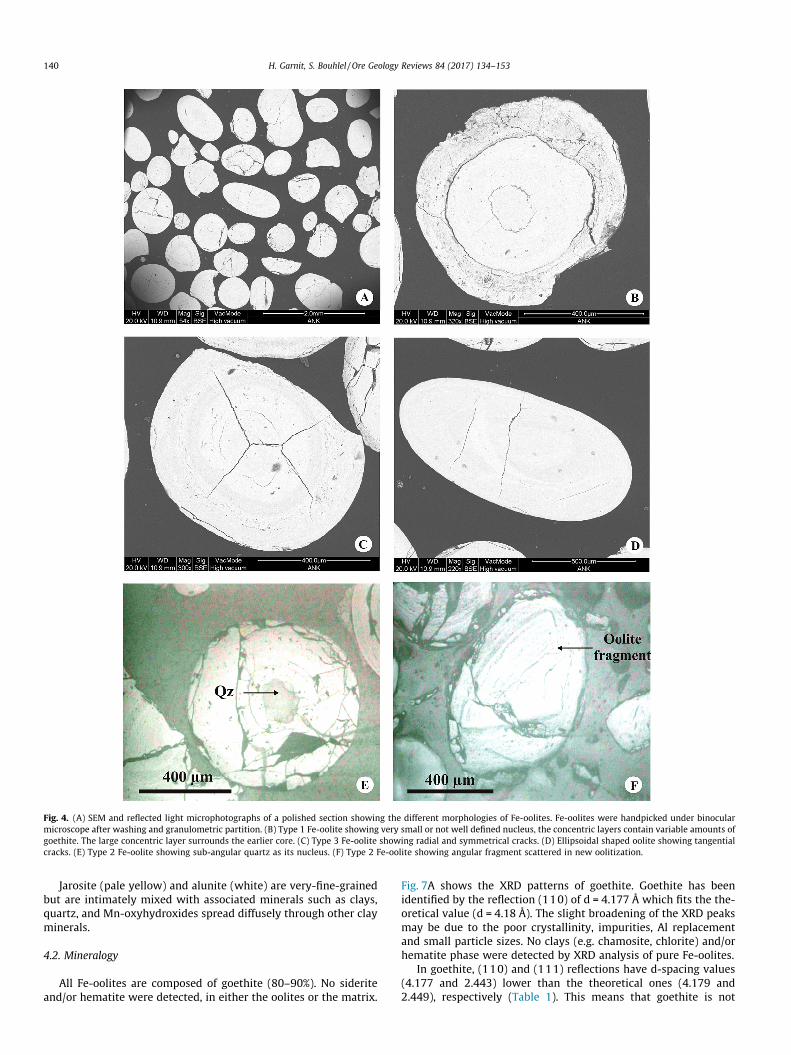
Fig. 4. (A) SEM and reflected light microphotographs of a polished section showing the different morphologies of Fe-oolites. Fe-oolites were handpicked under binocularmicroscope after washing and granulometric partition. (B) Type 1 Fe-oolite showing very small or not well defined nucleus, the concentric layers contain variable amounts ofgoethite. The large concentric layer surrounds the earlier core. (C) Type 3 Fe-oolite showing radial and symmetrical cracks. (D) Ellipsoidal shaped oolite showing tangentialcracks. (E) Type 2 Fe-oolite showing sub-angular quartz as its nucleus. (F) Type 2 Fe-oolite showing angular fragment scattered in new oolitization.
140 H. Garnit, S. Bouhlel / Ore Geology Reviews 84 (2017) 134–153
Jarosite (pale yellow) and alunite (white) are very-fine-grainedbut are intimately mixed with associated minerals such as clays,quartz, and Mn-oxyhydroxides spread diffusely through other clayminerals.
4.2. Mineralogy
All Fe-oolites are composed of goethite (80–90%). No sideriteand/or hematite were detected, in either the oolites or the matrix.
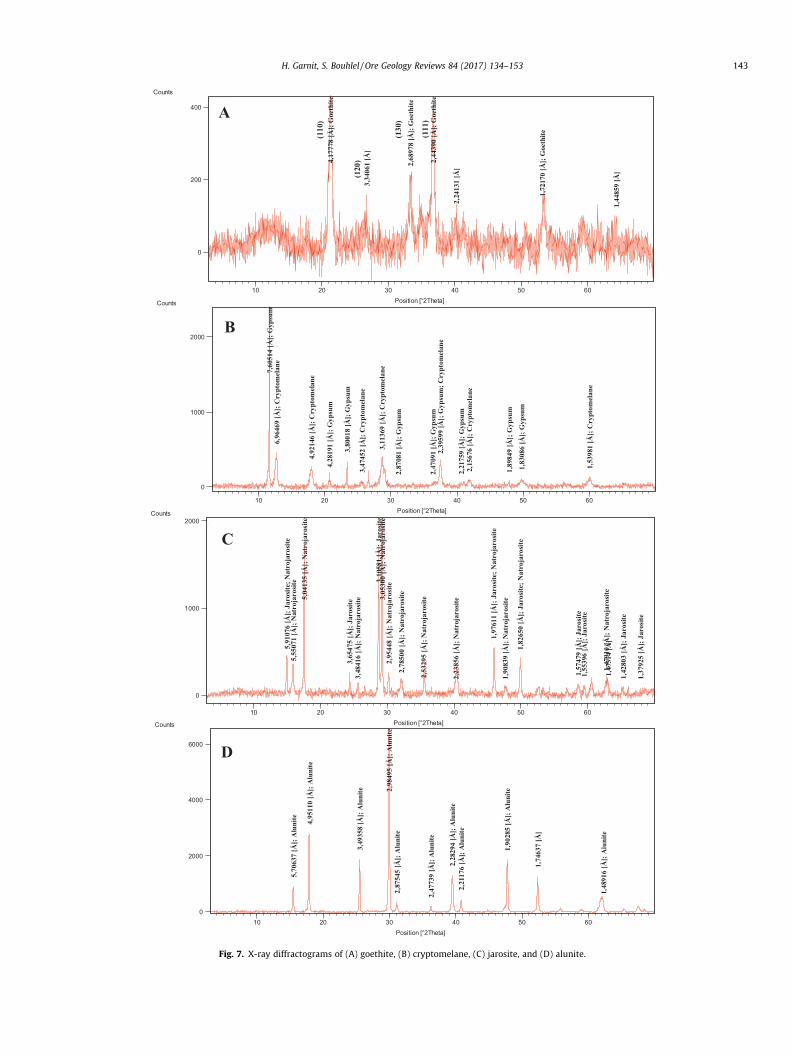
Fig. 7A shows the XRD patterns of goethite. Goethite has beenidentified by the reflection (110) of d = 4.177 Å which fits the the-oretical value (d = 4.18 Å). The slight broadening of the XRD peaksmay be due to the poor crystallinity, impurities, Al replacementand small particle sizes. No clays (e.g. chamosite, chlorite) and/orhematite phase were detected by XRD analysis of pure Fe-oolites.
In goethite, (110) and (111) reflections have d-spacing values(4.177 and 2.443) lower than the theoretical ones (4.179 and2.449), respectively (Table 1). This means that goethite is not
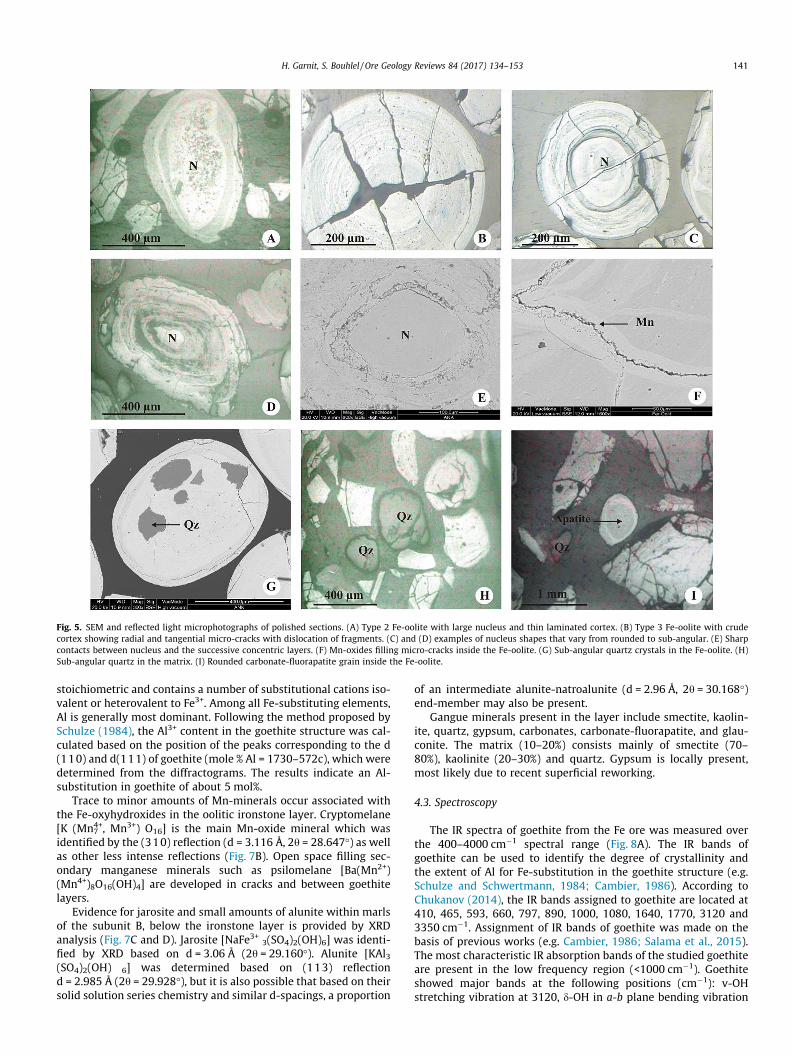
Fig. 5. SEM and reflected light microphotographs of polished sections. (A) Type 2 Fe-oolite with large nucleus and thin laminated cortex. (B) Type 3 Fe-oolite with crudecortex showing radial and tangential micro-cracks with dislocation of fragments. (C) and (D) examples of nucleus shapes that vary from rounded to sub-angular. (E) Sharpcontacts between nucleus and the successive concentric layers. (F) Mn-oxides filling micro-cracks inside the Fe-oolite. (G) Sub-angular quartz crystals in the Fe-oolite. (H)Sub-angular quartz in the matrix. (I) Rounded carbonate-fluorapatite grain inside the Fe-oolite.
H. Garnit, S. Bouhlel / Ore Geology Reviews 84 (2017) 134–153 141
stoichiometric and contains a number of substitutional cations iso-valent or heterovalent to Fe3+. Among all Fe-substituting elements,Al is generally most dominant. Following the method proposed bySchulze (1984), the Al3+ content in the goethite structure was cal-culated based on the position of the peaks corresponding to the d(110) and d(111) of goethite (mole % Al = 1730–572c), which weredetermined from the diffractograms. The results indicate an Al-substitution in goethite of about 5 mol%.
Trace to minor amounts of Mn-minerals occur associated withthe Fe-oxyhydroxides in the oolitic ironstone layer. Cryptomelane[K (Mn7
4+, Mn3+) O16] is the main Mn-oxide mineral which wasidentified by the (310) reflection (d = 3.116 Å, 2h = 28.647�) as wellas other less intense reflections (Fig. 7B). Open space filling sec-ondary manganese minerals such as psilomelane [Ba(Mn2+)(Mn4+)8O16(OH)4] are developed in cracks and between goethitelayers.
Evidence for jarosite and small amounts of alunite within marlsof the subunit B, below the ironstone layer is provided by XRDanalysis (Fig. 7C and D). Jarosite [NaFe3+ 3(SO4)2(OH)6] was identi-fied by XRD based on d = 3.06 Å (2h = 29.160�). Alunite [KAl3(SO4)2(OH) 6] was determined based on (113) reflectiond = 2.985 Å (2h = 29.928�), but it is also possible that based on theirsolid solution series chemistry and similar d-spacings, a proportion
of an intermediate alunite-natroalunite (d = 2.96 Å, 2h = 30.168�)end-member may also be present.
Gangue minerals present in the layer include smectite, kaolin-ite, quartz, gypsum, carbonates, carbonate-fluorapatite, and glau-conite. The matrix (10–20%) consists mainly of smectite (70–80%), kaolinite (20–30%) and quartz. Gypsum is locally present,most likely due to recent superficial reworking.
4.3. Spectroscopy
The IR spectra of goethite from the Fe ore was measured overthe 400–4000 cm�1 spectral range (Fig. 8A). The IR bands ofgoethite can be used to identify the degree of crystallinity andthe extent of Al for Fe-substitution in the goethite structure (e.g.Schulze and Schwertmann, 1984; Cambier, 1986). According toChukanov (2014), the IR bands assigned to goethite are located at410, 465, 593, 660, 797, 890, 1000, 1080, 1640, 1770, 3120 and3350 cm�1. Assignment of IR bands of goethite was made on thebasis of previous works (e.g. Cambier, 1986; Salama et al., 2015).The most characteristic IR absorption bands of the studied goethiteare present in the low frequency region (<1000 cm�1). Goethiteshowed major bands at the following positions (cm�1): v-OHstretching vibration at 3120, d-OH in a-b plane bending vibration
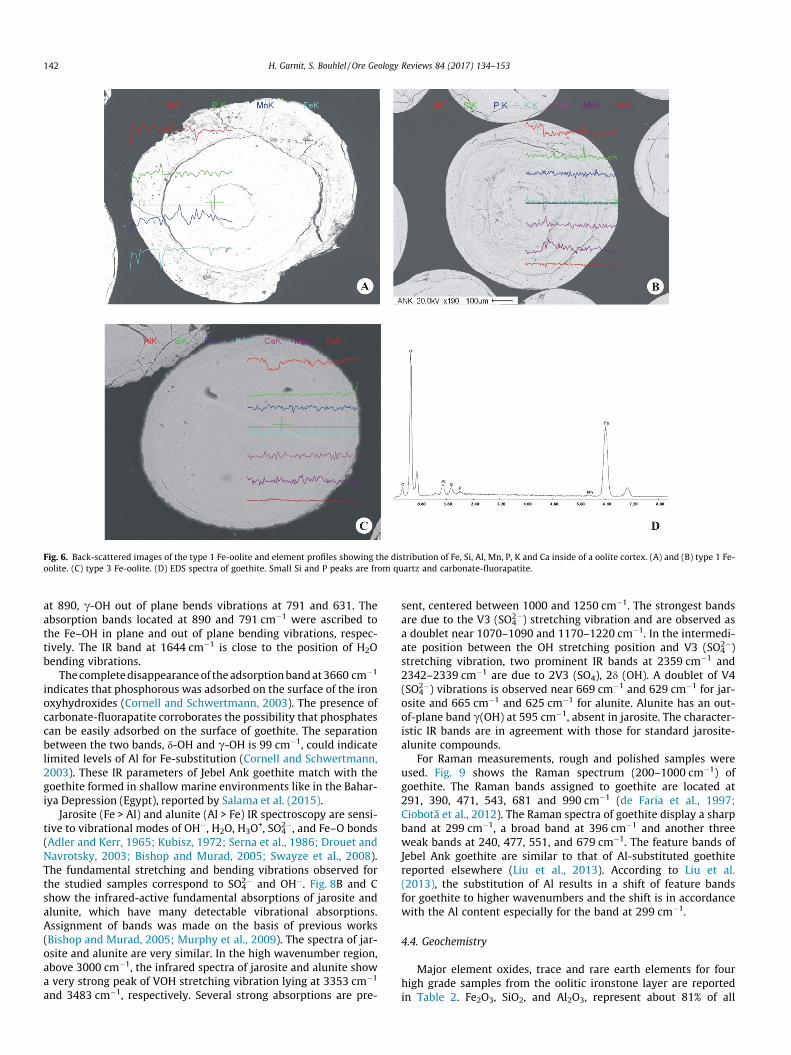
Fig. 6. Back-scattered images of the type 1 Fe-oolite and element profiles showing the distribution of Fe, Si, Al, Mn, P, K and Ca inside of a oolite cortex. (A) and (B) type 1 Fe-oolite. (C) type 3 Fe-oolite. (D) EDS spectra of goethite. Small Si and P peaks are from quartz and carbonate-fluorapatite.
142 H. Garnit, S. Bouhlel / Ore Geology Reviews 84 (2017) 134–153
at 890, c-OH out of plane bends vibrations at 791 and 631. Theabsorption bands located at 890 and 791 cm�1 were ascribed tothe Fe–OH in plane and out of plane bending vibrations, respec-tively. The IR band at 1644 cm�1 is close to the position of H2Obending vibrations.
Thecompletedisappearanceof theadsorptionbandat3660 cm�1
indicates that phosphorous was adsorbed on the surface of the ironoxyhydroxides (Cornell and Schwertmann, 2003). The presence ofcarbonate-fluorapatite corroborates the possibility that phosphatescan be easily adsorbed on the surface of goethite. The separationbetween the two bands, d-OH and c-OH is 99 cm�1, could indicatelimited levels of Al for Fe-substitution (Cornell and Schwertmann,2003). These IR parameters of Jebel Ank goethite match with thegoethite formed in shallow marine environments like in the Bahar-iya Depression (Egypt), reported by Salama et al. (2015).
Jarosite (Fe > Al) and alunite (Al > Fe) IR spectroscopy are sensi-tive to vibrational modes of OH�, H2O, H3O+, SO4
2�, and Fe–O bonds(Adler and Kerr, 1965; Kubisz, 1972; Serna et al., 1986; Drouet andNavrotsky, 2003; Bishop and Murad, 2005; Swayze et al., 2008).The fundamental stretching and bending vibrations observed forthe studied samples correspond to SO4
2� and OH�. Fig. 8B and Cshow the infrared-active fundamental absorptions of jarosite andalunite, which have many detectable vibrational absorptions.Assignment of bands was made on the basis of previous works(Bishop and Murad, 2005; Murphy et al., 2009). The spectra of jar-osite and alunite are very similar. In the high wavenumber region,above 3000 cm�1, the infrared spectra of jarosite and alunite showa very strong peak of VOH stretching vibration lying at 3353 cm�1
and 3483 cm�1, respectively. Several strong absorptions are pre-
sent, centered between 1000 and 1250 cm�1. The strongest bandsare due to the V3 (SO4
2�) stretching vibration and are observed asa doublet near 1070–1090 and 1170–1220 cm�1. In the intermedi-ate position between the OH stretching position and V3 (SO4
2�)stretching vibration, two prominent IR bands at 2359 cm�1 and2342–2339 cm�1 are due to 2V3 (SO4), 2d (OH). A doublet of V4(SO4
2�) vibrations is observed near 669 cm�1 and 629 cm�1 for jar-osite and 665 cm�1 and 625 cm�1 for alunite. Alunite has an out-of-plane band c(OH) at 595 cm�1, absent in jarosite. The character-istic IR bands are in agreement with those for standard jarosite-alunite compounds.
For Raman measurements, rough and polished samples wereused. Fig. 9 shows the Raman spectrum (200–1000 cm�1) ofgoethite. The Raman bands assigned to goethite are located at291, 390, 471, 543, 681 and 990 cm�1 (de Faria et al., 1997;Ciobota et al., 2012). The Raman spectra of goethite display a sharpband at 299 cm�1, a broad band at 396 cm�1 and another threeweak bands at 240, 477, 551, and 679 cm�1. The feature bands ofJebel Ank goethite are similar to that of Al-substituted goethitereported elsewhere (Liu et al., 2013). According to Liu et al.(2013), the substitution of Al results in a shift of feature bandsfor goethite to higher wavenumbers and the shift is in accordancewith the Al content especially for the band at 299 cm�1.
4.4. Geochemistry
Major element oxides, trace and rare earth elements for fourhigh grade samples from the oolitic ironstone layer are reportedin Table 2. Fe2O3, SiO2, and Al2O3, represent about 81% of all
Position [°2Theta]10 20 30 40 50 60
Counts
0
2000
4000
6000
5,70
637
[Å];
Alu
nite 4,95
110
[Å];
Alu
nite
3,49
358
[Å];
Alu
nite 2,
9849
5 [Å
]; A
luni
te2,
8754
5 [Å
]; A
luni
te
2,47
739
[Å];
Alu
nite
2,28
294
[Å];
Alu
nite
2,21
176
[Å];
Alu
nite
1,90
285
[Å];
Alu
nite
1,74
637
[Å]
1,48
916
[Å];
Alu
nite
alunite
Position [°2Theta]10 20 30 40 50 60
Counts
0
200
400
4,17
778
[Å];
Goe
thite
3,34
061
[Å]
2,68
978
[Å];
Goe
thite
2,44
390
[Å];
Goe
thite
2,24
131
[Å]
1,72
170
[Å];
Goe
thite
1,44
859
[Å]
ANK5
Position [°2Theta]10 20 30 40 50 60
Counts
0
1000
2000
5,91
076
[Å];
Jaro
site
; Nat
roja
rosi
te5,
5507
1 [Å
]; N
atro
jaro
site
5,04
135
[Å];
Nat
roja
rosi
te
3,65
475
[Å];
Jar
osite
3,48
416
[Å];
Nat
roja
rosi
te
3,10
581
[Å];
Jar
osite
3,05
300
[Å];
Nat
roja
rosi
te2,
9544
8 [Å
]; N
atro
jaro
site
2,78
500
[Å];
Nat
roja
rosit
e
2,53
295
[Å];
Nat
roja
rosi
te
2,23
856
[Å];
Nat
roja
rosit
e
1,97
611
[Å];
Jar
osite
; Nat
roja
rosit
e1,
9083
9 [Å
]; N
atro
jaro
site
1,82
650
[Å];
Jar
osite
; Nat
roja
rosi
te
1,57
479
[Å];
Jar
osite
1,55
396
[Å];
Jar
osite
1,47
910
[Å];
Nat
roja
rosi
te1,
4731
4 [Å
]
1,42
803
[Å];
Jar
osite
1,37
925
[Å];
Jar
osite
ANK7
Position [°2Theta]10 20 30 40 50 60
Counts
0
1000
2000
7,60
514
[Å];
Gyp
sum
6,96
469
[Å];
Cry
ptom
elan
e
4,92
146
[Å];
Cry
ptom
elan
e
4,28
191
[Å];
Gyp
sum
3,80
018
[Å];
Gyp
sum
3,47
452
[Å];
Cry
ptom
elan
e
3,11
369
[Å];
Cry
ptom
elan
e
2,87
081
[Å];
Gyp
sum
2,47
091
[Å];
Gyp
sum
2,39
599
[Å];
Gyp
sum
; Cry
ptom
elan
e
2,21
759
[Å];
Gyp
sum
2,15
676
[Å];
Cry
ptom
elan
e
1,89
849
[Å];
Gyp
sum
1,83
086
[Å];
Gyp
sum
1,53
981
[Å];
Cry
ptom
elan
e
ANK3(1
10)
(120
)
(130
)
(111
)
v
v
v
A
B
D
C
Fig. 7. X-ray diffractograms of (A) goethite, (B) cryptomelane, (C) jarosite, and (D) alunite.
H. Garnit, S. Bouhlel / Ore Geology Reviews 84 (2017) 134–153 143
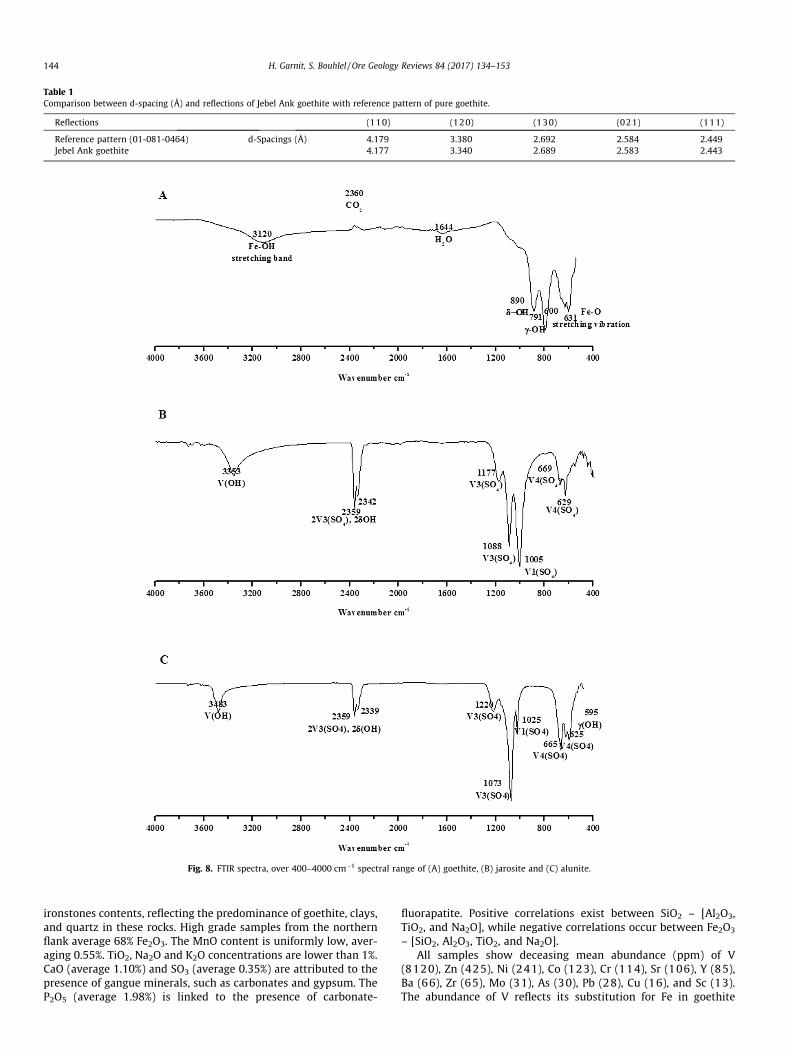
Table 1Comparison between d-spacing (Å) and reflections of Jebel Ank goethite with reference pattern of pure goethite.
Reflections (110) (120) (130) (021) (111)
Reference pattern (01-081-0464) d-Spacings (Å) 4.179 3.380 2.692 2.584 2.449Jebel Ank goethite 4.177 3.340 2.689 2.583 2.443
Fig. 8. FTIR spectra, over 400–4000 cm�1 spectral range of (A) goethite, (B) jarosite and (C) alunite.
144 H. Garnit, S. Bouhlel / Ore Geology Reviews 84 (2017) 134–153
ironstones contents, reflecting the predominance of goethite, clays,and quartz in these rocks. High grade samples from the northernflank average 68% Fe2O3. The MnO content is uniformly low, aver-aging 0.55%. TiO2, Na2O and K2O concentrations are lower than 1%.CaO (average 1.10%) and SO3 (average 0.35%) are attributed to thepresence of gangue minerals, such as carbonates and gypsum. TheP2O5 (average 1.98%) is linked to the presence of carbonate-
fluorapatite. Positive correlations exist between SiO2 – [Al2O3,TiO2, and Na2O], while negative correlations occur between Fe2O3
– [SiO2, Al2O3, TiO2, and Na2O].All samples show deceasing mean abundance (ppm) of V
(8120), Zn (425), Ni (241), Co (123), Cr (114), Sr (106), Y (85),Ba (66), Zr (65), Mo (31), As (30), Pb (28), Cu (16), and Sc (13).The abundance of V reflects its substitution for Fe in goethite
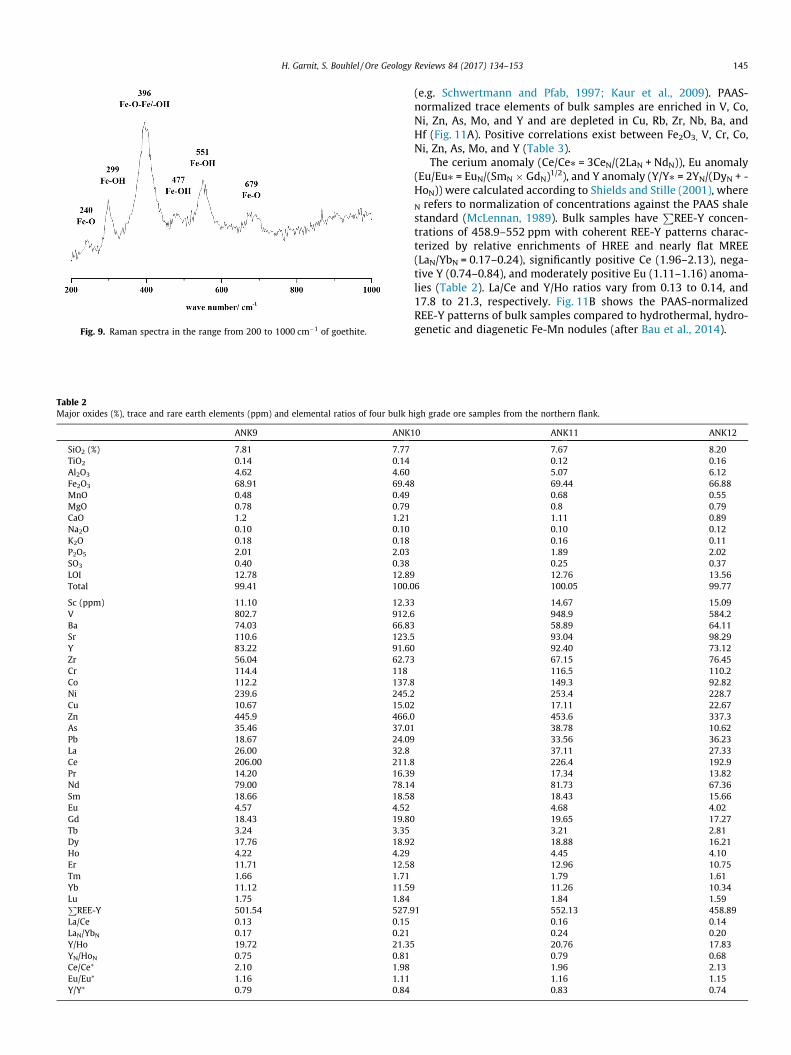
Fig. 9. Raman spectra in the range from 200 to 1000 cm�1 of goethite.
Table 2Major oxides (%), trace and rare earth elements (ppm) and elemental ratios of four bulk h
ANK9 ANK1
SiO2 (%) 7.81 7.77TiO2 0.14 0.14Al2O3 4.62 4.60Fe2O3 68.91 69.48MnO 0.48 0.49MgO 0.78 0.79CaO 1.2 1.21Na2O 0.10 0.10K2O 0.18 0.18P2O5 2.01 2.03SO3 0.40 0.38LOI 12.78 12.89Total 99.41 100.0
Sc (ppm) 11.10 12.33V 802.7 912.6Ba 74.03 66.83Sr 110.6 123.5Y 83.22 91.60Zr 56.04 62.73Cr 114.4 118Co 112.2 137.8Ni 239.6 245.2Cu 10.67 15.02Zn 445.9 466.0As 35.46 37.01Pb 18.67 24.09La 26.00 32.8Ce 206.00 211.8Pr 14.20 16.39Nd 79.00 78.14Sm 18.66 18.58Eu 4.57 4.52Gd 18.43 19.80Tb 3.24 3.35Dy 17.76 18.92Ho 4.22 4.29Er 11.71 12.58Tm 1.66 1.71Yb 11.12 11.59Lu 1.75 1.84P
REE-Y 501.54 527.9La/Ce 0.13 0.15LaN/YbN 0.17 0.21Y/Ho 19.72 21.35YN/HoN 0.75 0.81Ce/Ce⁄ 2.10 1.98Eu/Eu⁄ 1.16 1.11Y/Y⁄ 0.79 0.84
H. Garnit, S. Bouhlel / Ore Geology Reviews 84 (2017) 134–153 145
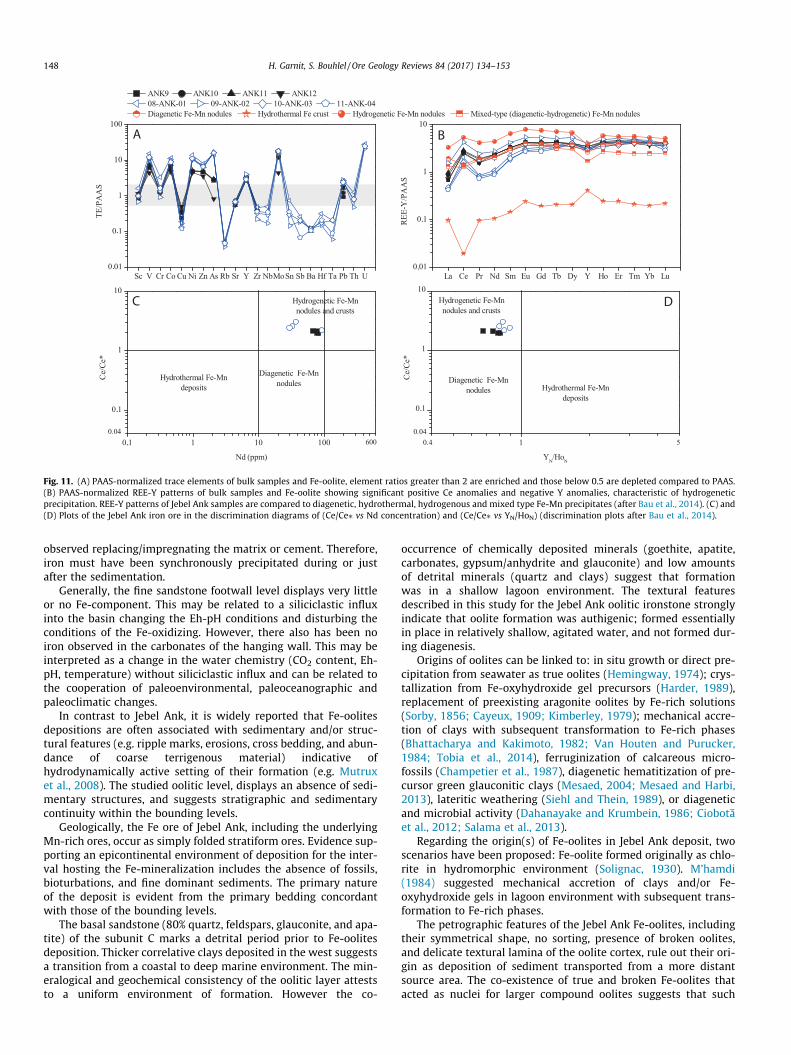
(e.g. Schwertmann and Pfab, 1997; Kaur et al., 2009). PAAS-normalized trace elements of bulk samples are enriched in V, Co,Ni, Zn, As, Mo, and Y and are depleted in Cu, Rb, Zr, Nb, Ba, andHf (Fig. 11A). Positive correlations exist between Fe2O3, V, Cr, Co,Ni, Zn, As, Mo, and Y (Table 3).
The cerium anomaly (Ce/Ce⁄ = 3CeN/(2LaN + NdN)), Eu anomaly(Eu/Eu⁄ = EuN/(SmN � GdN)1/2), and Y anomaly (Y/Y⁄ = 2YN/(DyN + -HoN)) were calculated according to Shields and Stille (2001), whereN refers to normalization of concentrations against the PAAS shalestandard (McLennan, 1989). Bulk samples have
PREE-Y concen-
trations of 458.9–552 ppm with coherent REE-Y patterns charac-terized by relative enrichments of HREE and nearly flat MREE(LaN/YbN = 0.17–0.24), significantly positive Ce (1.96–2.13), nega-tive Y (0.74–0.84), and moderately positive Eu (1.11–1.16) anoma-lies (Table 2). La/Ce and Y/Ho ratios vary from 0.13 to 0.14, and17.8 to 21.3, respectively. Fig. 11B shows the PAAS-normalizedREE-Y patterns of bulk samples compared to hydrothermal, hydro-genetic and diagenetic Fe-Mn nodules (after Bau et al., 2014).
igh grade ore samples from the northern flank.
0 ANK11 ANK12
7.67 8.200.12 0.165.07 6.1269.44 66.880.68 0.550.8 0.791.11 0.890.10 0.120.16 0.111.89 2.020.25 0.3712.76 13.56
6 100.05 99.77
14.67 15.09948.9 584.258.89 64.1193.04 98.2992.40 73.1267.15 76.45116.5 110.2149.3 92.82253.4 228.717.11 22.67453.6 337.338.78 10.6233.56 36.2337.11 27.33226.4 192.917.34 13.8281.73 67.3618.43 15.664.68 4.0219.65 17.273.21 2.8118.88 16.214.45 4.1012.96 10.751.79 1.6111.26 10.341.84 1.59
1 552.13 458.890.16 0.140.24 0.2020.76 17.830.79 0.681.96 2.131.16 1.150.83 0.74
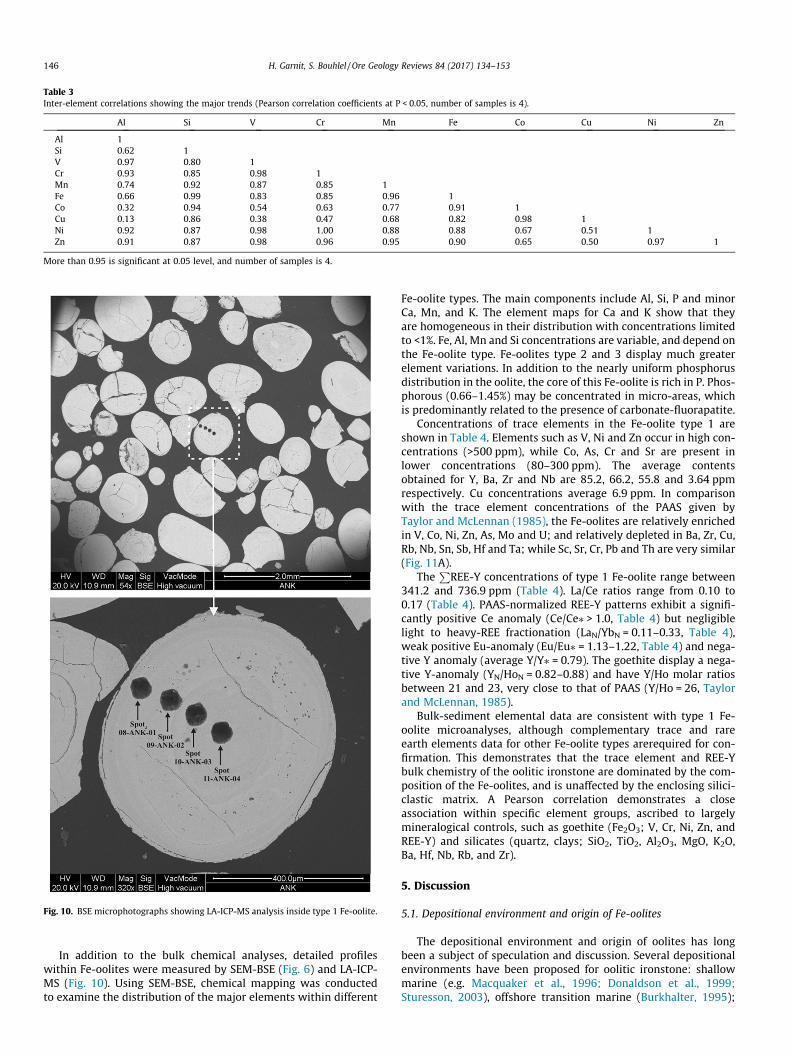
Table 3Inter-element correlations showing the major trends (Pearson correlation coefficients at P < 0.05, number of samples is 4).
Al Si V Cr Mn Fe Co Cu Ni Zn
Al 1Si 0.62 1V 0.97 0.80 1Cr 0.93 0.85 0.98 1Mn 0.74 0.92 0.87 0.85 1Fe 0.66 0.99 0.83 0.85 0.96 1Co 0.32 0.94 0.54 0.63 0.77 0.91 1Cu 0.13 0.86 0.38 0.47 0.68 0.82 0.98 1Ni 0.92 0.87 0.98 1.00 0.88 0.88 0.67 0.51 1Zn 0.91 0.87 0.98 0.96 0.95 0.90 0.65 0.50 0.97 1
More than 0.95 is significant at 0.05 level, and number of samples is 4.
Fig. 10. BSE microphotographs showing LA-ICP-MS analysis inside type 1 Fe-oolite.
146 H. Garnit, S. Bouhlel / Ore Geology Reviews 84 (2017) 134–153
In addition to the bulk chemical analyses, detailed profileswithin Fe-oolites were measured by SEM-BSE (Fig. 6) and LA-ICP-MS (Fig. 10). Using SEM-BSE, chemical mapping was conductedto examine the distribution of the major elements within different
Fe-oolite types. The main components include Al, Si, P and minorCa, Mn, and K. The element maps for Ca and K show that theyare homogeneous in their distribution with concentrations limitedto <1%. Fe, Al, Mn and Si concentrations are variable, and depend onthe Fe-oolite type. Fe-oolites type 2 and 3 display much greaterelement variations. In addition to the nearly uniform phosphorusdistribution in the oolite, the core of this Fe-oolite is rich in P. Phos-phorous (0.66–1.45%) may be concentrated in micro-areas, whichis predominantly related to the presence of carbonate-fluorapatite.
Concentrations of trace elements in the Fe-oolite type 1 areshown in Table 4. Elements such as V, Ni and Zn occur in high con-centrations (>500 ppm), while Co, As, Cr and Sr are present inlower concentrations (80–300 ppm). The average contentsobtained for Y, Ba, Zr and Nb are 85.2, 66.2, 55.8 and 3.64 ppmrespectively. Cu concentrations average 6.9 ppm. In comparisonwith the trace element concentrations of the PAAS given byTaylor and McLennan (1985), the Fe-oolites are relatively enrichedin V, Co, Ni, Zn, As, Mo and U; and relatively depleted in Ba, Zr, Cu,Rb, Nb, Sn, Sb, Hf and Ta; while Sc, Sr, Cr, Pb and Th are very similar(Fig. 11A).
TheP
REE-Y concentrations of type 1 Fe-oolite range between341.2 and 736.9 ppm (Table 4). La/Ce ratios range from 0.10 to0.17 (Table 4). PAAS-normalized REE-Y patterns exhibit a signifi-cantly positive Ce anomaly (Ce/Ce⁄ > 1.0, Table 4) but negligiblelight to heavy-REE fractionation (LaN/YbN = 0.11–0.33, Table 4),weak positive Eu-anomaly (Eu/Eu⁄ = 1.13–1.22, Table 4) and nega-tive Y anomaly (average Y/Y⁄ = 0.79). The goethite display a nega-tive Y-anomaly (YN/HoN = 0.82–0.88) and have Y/Ho molar ratiosbetween 21 and 23, very close to that of PAAS (Y/Ho = 26, Taylorand McLennan, 1985).
Bulk-sediment elemental data are consistent with type 1 Fe-oolite microanalyses, although complementary trace and rareearth elements data for other Fe-oolite types arerequired for con-firmation. This demonstrates that the trace element and REE-Ybulk chemistry of the oolitic ironstone are dominated by the com-position of the Fe-oolites, and is unaffected by the enclosing silici-clastic matrix. A Pearson correlation demonstrates a closeassociation within specific element groups, ascribed to largelymineralogical controls, such as goethite (Fe2O3; V, Cr, Ni, Zn, andREE-Y) and silicates (quartz, clays; SiO2, TiO2, Al2O3, MgO, K2O,Ba, Hf, Nb, Rb, and Zr).
5. Discussion
5.1. Depositional environment and origin of Fe-oolites
The depositional environment and origin of oolites has longbeen a subject of speculation and discussion. Several depositionalenvironments have been proposed for oolitic ironstone: shallowmarine (e.g. Macquaker et al., 1996; Donaldson et al., 1999;Sturesson, 2003), offshore transition marine (Burkhalter, 1995);
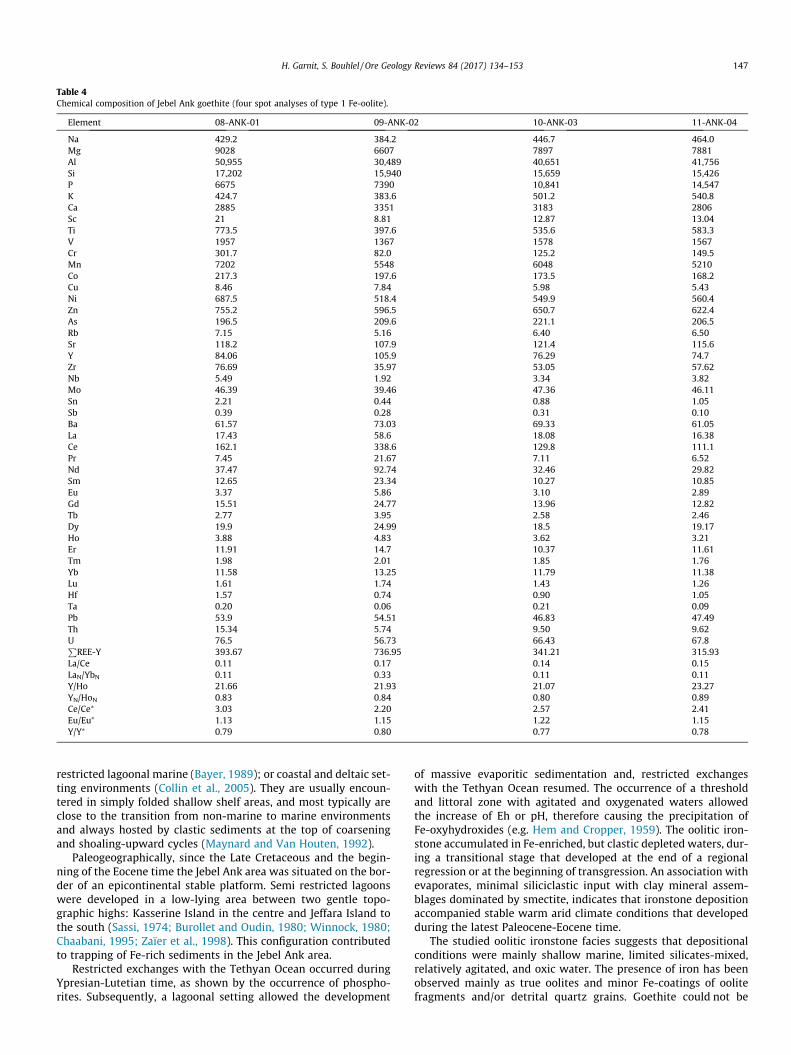
Table 4Chemical composition of Jebel Ank goethite (four spot analyses of type 1 Fe-oolite).
Element 08-ANK-01 09-ANK-02 10-ANK-03 11-ANK-04
Na 429.2 384.2 446.7 464.0Mg 9028 6607 7897 7881Al 50,955 30,489 40,651 41,756Si 17,202 15,940 15,659 15,426P 6675 7390 10,841 14,547K 424.7 383.6 501.2 540.8Ca 2885 3351 3183 2806Sc 21 8.81 12.87 13.04Ti 773.5 397.6 535.6 583.3V 1957 1367 1578 1567Cr 301.7 82.0 125.2 149.5Mn 7202 5548 6048 5210Co 217.3 197.6 173.5 168.2Cu 8.46 7.84 5.98 5.43Ni 687.5 518.4 549.9 560.4Zn 755.2 596.5 650.7 622.4As 196.5 209.6 221.1 206.5Rb 7.15 5.16 6.40 6.50Sr 118.2 107.9 121.4 115.6Y 84.06 105.9 76.29 74.7Zr 76.69 35.97 53.05 57.62Nb 5.49 1.92 3.34 3.82Mo 46.39 39.46 47.36 46.11Sn 2.21 0.44 0.88 1.05Sb 0.39 0.28 0.31 0.10Ba 61.57 73.03 69.33 61.05La 17.43 58.6 18.08 16.38Ce 162.1 338.6 129.8 111.1Pr 7.45 21.67 7.11 6.52Nd 37.47 92.74 32.46 29.82Sm 12.65 23.34 10.27 10.85Eu 3.37 5.86 3.10 2.89Gd 15.51 24.77 13.96 12.82Tb 2.77 3.95 2.58 2.46Dy 19.9 24.99 18.5 19.17Ho 3.88 4.83 3.62 3.21Er 11.91 14.7 10.37 11.61Tm 1.98 2.01 1.85 1.76Yb 11.58 13.25 11.79 11.38Lu 1.61 1.74 1.43 1.26Hf 1.57 0.74 0.90 1.05Ta 0.20 0.06 0.21 0.09Pb 53.9 54.51 46.83 47.49Th 15.34 5.74 9.50 9.62U 76.5 56.73 66.43 67.8P
REE-Y 393.67 736.95 341.21 315.93La/Ce 0.11 0.17 0.14 0.15LaN/YbN 0.11 0.33 0.11 0.11Y/Ho 21.66 21.93 21.07 23.27YN/HoN 0.83 0.84 0.80 0.89Ce/Ce⁄ 3.03 2.20 2.57 2.41Eu/Eu⁄ 1.13 1.15 1.22 1.15Y/Y⁄ 0.79 0.80 0.77 0.78
H. Garnit, S. Bouhlel / Ore Geology Reviews 84 (2017) 134–153 147
restricted lagoonal marine (Bayer, 1989); or coastal and deltaic set-ting environments (Collin et al., 2005). They are usually encoun-tered in simply folded shallow shelf areas, and most typically areclose to the transition from non-marine to marine environmentsand always hosted by clastic sediments at the top of coarseningand shoaling-upward cycles (Maynard and Van Houten, 1992).
Paleogeographically, since the Late Cretaceous and the begin-ning of the Eocene time the Jebel Ank area was situated on the bor-der of an epicontinental stable platform. Semi restricted lagoonswere developed in a low-lying area between two gentle topo-graphic highs: Kasserine Island in the centre and Jeffara Island tothe south (Sassi, 1974; Burollet and Oudin, 1980; Winnock, 1980;Chaabani, 1995; Zaïer et al., 1998). This configuration contributedto trapping of Fe-rich sediments in the Jebel Ank area.
Restricted exchanges with the Tethyan Ocean occurred duringYpresian-Lutetian time, as shown by the occurrence of phospho-rites. Subsequently, a lagoonal setting allowed the development
of massive evaporitic sedimentation and, restricted exchangeswith the Tethyan Ocean resumed. The occurrence of a thresholdand littoral zone with agitated and oxygenated waters allowedthe increase of Eh or pH, therefore causing the precipitation ofFe-oxyhydroxides (e.g. Hem and Cropper, 1959). The oolitic iron-stone accumulated in Fe-enriched, but clastic depleted waters, dur-ing a transitional stage that developed at the end of a regionalregression or at the beginning of transgression. An association withevaporates, minimal siliciclastic input with clay mineral assem-blages dominated by smectite, indicates that ironstone depositionaccompanied stable warm arid climate conditions that developedduring the latest Paleocene-Eocene time.
The studied oolitic ironstone facies suggests that depositionalconditions were mainly shallow marine, limited silicates-mixed,relatively agitated, and oxic water. The presence of iron has beenobserved mainly as true oolites and minor Fe-coatings of oolitefragments and/or detrital quartz grains. Goethite could not be
La Ce Pr Nd Sm Eu Gd Tb Dy Y Ho Er Tm Yb Lu0,01
0,1
1
10
Sc V Cr Co Cu Ni Zn As Rb Sr Y Zr NbMoSn Sb Ba Hf Ta Pb Th U0,01
0,1
1
10
100
0,1 1 10 100
0,1
1
10
1
0,1
1
10
DC
BA
REE
-Y/P
AA
S
ANK9 ANK10 ANK11 ANK12 08-ANK-01 09-ANK-02 10-ANK-03 11-ANK-04 Diagenetic Fe-Mn nodules Hydrothermal Fe crust Hydrogenetic Fe-Mn nodules Mixed-type (diagenetic-hydrogenetic) Fe-Mn nodules
600
.
.
.
TE/P
AA
S
.
. .
0.040.4 5
Hydrothermal Fe-Mndeposits
Diagenetic Fe-Mnnodules
Hydrogenetic Fe-Mnnodules and crusts
Hydrogenetic Fe-Mnnodules and crusts
Diagenetic Fe-Mnnodules
Hydrothermal Fe-Mndeposits
Ce/
Ce*
Nd (ppm)
.
0.04
Ce/
Ce*
YN/HoN
Fig. 11. (A) PAAS-normalized trace elements of bulk samples and Fe-oolite, element ratios greater than 2 are enriched and those below 0.5 are depleted compared to PAAS.(B) PAAS-normalized REE-Y patterns of bulk samples and Fe-oolite showing significant positive Ce anomalies and negative Y anomalies, characteristic of hydrogeneticprecipitation. REE-Y patterns of Jebel Ank samples are compared to diagenetic, hydrothermal, hydrogenous and mixed type Fe-Mn precipitates (after Bau et al., 2014). (C) and(D) Plots of the Jebel Ank iron ore in the discrimination diagrams of (Ce/Ce⁄ vs Nd concentration) and (Ce/Ce⁄ vs YN/HoN) (discrimination plots after Bau et al., 2014).
148 H. Garnit, S. Bouhlel / Ore Geology Reviews 84 (2017) 134–153
observed replacing/impregnating the matrix or cement. Therefore,iron must have been synchronously precipitated during or justafter the sedimentation.
Generally, the fine sandstone footwall level displays very littleor no Fe-component. This may be related to a siliciclastic influxinto the basin changing the Eh-pH conditions and disturbing theconditions of the Fe-oxidizing. However, there also has been noiron observed in the carbonates of the hanging wall. This may beinterpreted as a change in the water chemistry (CO2 content, Eh-pH, temperature) without siliciclastic influx and can be related tothe cooperation of paleoenvironmental, paleoceanographic andpaleoclimatic changes.
In contrast to Jebel Ank, it is widely reported that Fe-oolitesdepositions are often associated with sedimentary and/or struc-tural features (e.g. ripple marks, erosions, cross bedding, and abun-dance of coarse terrigenous material) indicative ofhydrodynamically active setting of their formation (e.g. Mutruxet al., 2008). The studied oolitic level, displays an absence of sedi-mentary structures, and suggests stratigraphic and sedimentarycontinuity within the bounding levels.
Geologically, the Fe ore of Jebel Ank, including the underlyingMn-rich ores, occur as simply folded stratiform ores. Evidence sup-porting an epicontinental environment of deposition for the inter-val hosting the Fe-mineralization includes the absence of fossils,bioturbations, and fine dominant sediments. The primary natureof the deposit is evident from the primary bedding concordantwith those of the bounding levels.
The basal sandstone (80% quartz, feldspars, glauconite, and apa-tite) of the subunit C marks a detrital period prior to Fe-oolitesdeposition. Thicker correlative clays deposited in the west suggestsa transition from a coastal to deep marine environment. The min-eralogical and geochemical consistency of the oolitic layer atteststo a uniform environment of formation. However the co-
occurrence of chemically deposited minerals (goethite, apatite,carbonates, gypsum/anhydrite and glauconite) and low amountsof detrital minerals (quartz and clays) suggest that formationwas in a shallow lagoon environment. The textural featuresdescribed in this study for the Jebel Ank oolitic ironstone stronglyindicate that oolite formation was authigenic; formed essentiallyin place in relatively shallow, agitated water, and not formed dur-ing diagenesis.
Origins of oolites can be linked to: in situ growth or direct pre-cipitation from seawater as true oolites (Hemingway, 1974); crys-tallization from Fe-oxyhydroxide gel precursors (Harder, 1989),replacement of preexisting aragonite oolites by Fe-rich solutions(Sorby, 1856; Cayeux, 1909; Kimberley, 1979); mechanical accre-tion of clays with subsequent transformation to Fe-rich phases(Bhattacharya and Kakimoto, 1982; Van Houten and Purucker,1984; Tobia et al., 2014), ferruginization of calcareous micro-fossils (Champetier et al., 1987), diagenetic hematitization of pre-cursor green glauconitic clays (Mesaed, 2004; Mesaed and Harbi,2013), lateritic weathering (Siehl and Thein, 1989), or diageneticand microbial activity (Dahanayake and Krumbein, 1986; Ciobotaet al., 2012; Salama et al., 2013).
Regarding the origin(s) of Fe-oolites in Jebel Ank deposit, twoscenarios have been proposed: Fe-oolite formed originally as chlo-rite in hydromorphic environment (Solignac, 1930). M’hamdi(1984) suggested mechanical accretion of clays and/or Fe-oxyhydroxide gels in lagoon environment with subsequent trans-formation to Fe-rich phases.
The petrographic features of the Jebel Ank Fe-oolites, includingtheir symmetrical shape, no sorting, presence of broken oolites,and delicate textural lamina of the oolite cortex, rule out their ori-gin as deposition of sediment transported from a more distantsource area. The co-existence of true and broken Fe-oolites thatacted as nuclei for larger compound oolites suggests that such
H. Garnit, S. Bouhlel / Ore Geology Reviews 84 (2017) 134–153 149
oolites were formed in a relatively agitated environment. However,oolites fragments scattered in these new oolitization events areangular, with no trace of reworking; this implies that ooliteshaven’t experienced significant transport. Fragmentation of theoolites was possibly an in situ process due to dehydration(Adeleye, 1975). The most probable mode of Fe-oolite formationwas within a shallow marine environment near, or at, the site ofironstone deposition. In addition, the presence of quartz and apa-tite (in the nuclei and incorporated into the cortex of the oolites)are reliable indicators of a possible accretionary model for the for-mation of oolites prior to ferruginization. The absence of carbona-ceous oolites in equivalent layers in the surrounding area indicatesthat the ferruginous oolites are probably primary depositional par-ticles (Salama et al., 2014).
No trace of precursor clay minerals has been identified by XRDand no clay particles have been observed by SEM. However, majoroxides, spectroscopic and microchemical analyses show low con-centrations of Al (<5 mol%), which rules out any replacement of aprecursor clay mineral by goethite (Maynard, 1986; Gehring,1989; Cotter, 1992; Salama et al., 2014). Microanalyses of goethite,show little aluminum, so derivation by oxidation of Fe-rich sili-cates is unlikely, and the iron must have been precipitated directlyas Fe(OH)3 and progressively oxidized to FeOOH.
This argument suggests that the goethite is of primary origin.Low Al-substitution (10�15 mol%) in goethite prevails in hydro-morphic, moderately acidic soils and calcareous environments,while substitution of 15�32 mol% is usually found in goethite fromhighly weathered soils of subtropical and tropical areas(Fitzpatrick and Schwertmann, 1982; Stucki et al., 1988). The uni-form fabrics exhibited by goethite indicate that few mechanismswere involved in its formation. Goethite can form either by inor-ganic or organic precipitation (e.g. Burkhalter, 1995; Salamaet al., 2013). Microbial contribution to the origin of the Jebel AnkFe-oolite can be suggested.
REE-Y patterns of Fe-oolites show distinctive positive Ceanomalies, indicative of strongly-oxidizing near surface conditions.Similarly a positive Ce anomaly has been found in some weather-ing profiles on various types of source rocks (Braun et al., 1990).Hydrogenous deposits are represented by a positive Ce anomaly,but hydrothermal deposits are characterized by negative Ceanomalies (Bau et al., 1996, 2014). The studied samples displayslight positive Ce anomalies which resemble the pattern ofhydrogenous Fe-Mn deposits.
Although the development of low-temperature supergeneweathering products underlying the oolitic layer produces a dis-tinctive paragenetic sequence, the occurrence of cryptomelane, jar-osite, and alunite in the ironstone sequence can be considered asfurther evidence of the type of weathering processes that occurredat Jebel Ank. Alunite and jarosite minerals were reported in theLate Eocene tidal clays associated with laminated primary gypsumand Fe-oxide at El Gnater site, central Tunisia (Gaied et al., 2015).Late diagenetic origin in reduced conditions and in evaporitic envi-ronment is proposed for alunite. However, jarosite was producedby oxidation of pyrite, which was very abundant in the claystonehost rock (Gaied et al., 2015). Their association with the ironstonesis considered as a proxy for subaerial weathering and post-diagenetic meteoric water alteration.
The association of few manganese minerals, with abundantgoethite, indicates that these minerals were formed from Fe-richsolutions with minor Mn. Fe and Mn were indeed derived fromthe same source and are fractionated to produce high Fe/Mn ratios.The low Mn/Fe ratio reflects high separation between the two ele-ments in the hydromorphic environment. They are mobile inreducing conditions (Pedersen and Price, 1982), but Mn requiresa higher oxidation potential to precipitate than Fe2+ (Canavanet al., 2007). It is reported by Baioumy et al. (2013), that the occur-
rence of Mn ores at the base of the oolitic layer indicates a super-gene origin from descending solutions as a source of Mn and Fe dueto the higher solubility of Mn compared to Fe. The Fe would haveprecipitated first in the upper part of the section close to the sourceof elements, and then Mn would be precipitated in the lower parts,far from the source (Baioumy et al., 2013). The formation of cryp-tomelane may have occurred at relatively final stages of weather-ing when local increases in pH and oxidizing conditions prevailedwith the presence of the K+ from smectite-bearing level.
5.2. Possible source(s) of iron and formation of oolitic ironstone
In general, there are different hypotheses regarding the sourceof the iron in oolitic ironstones. The Fe-enrichment can occur fromsupergene sedimentary processes (Van Houten and Arthur, 1989;Young, 1989a,b; Burkhalter, 1995; Macquaker et al., 1996) or theFe-enrichment is hypogene including hydrothermal and/or vol-canic sources. Fe-Mn oxyhydroxide precipitates, may be ofhydrothermal, hydrogenous, diagenetic or mixed-type(diagenetic-hydrogenetic) origins, this terminology is based onthe type of aqueous fluid from which the Fe-Mn oxyhydroxidesprecipitate (Bau et al., 2014).
Regarding the source(s) of iron for Jebel Ank oolitic ironstone,M’hamdi (1984) suggested two origins: (i) iron has been leachedfrom underlying sediments; (ii) iron was sourced from continentalweathering and was transported to the basin of sedimentation. Thelatter is most likely based on palaoegeographic evidence and thestrong correlation between iron, phosphorus and zinc.
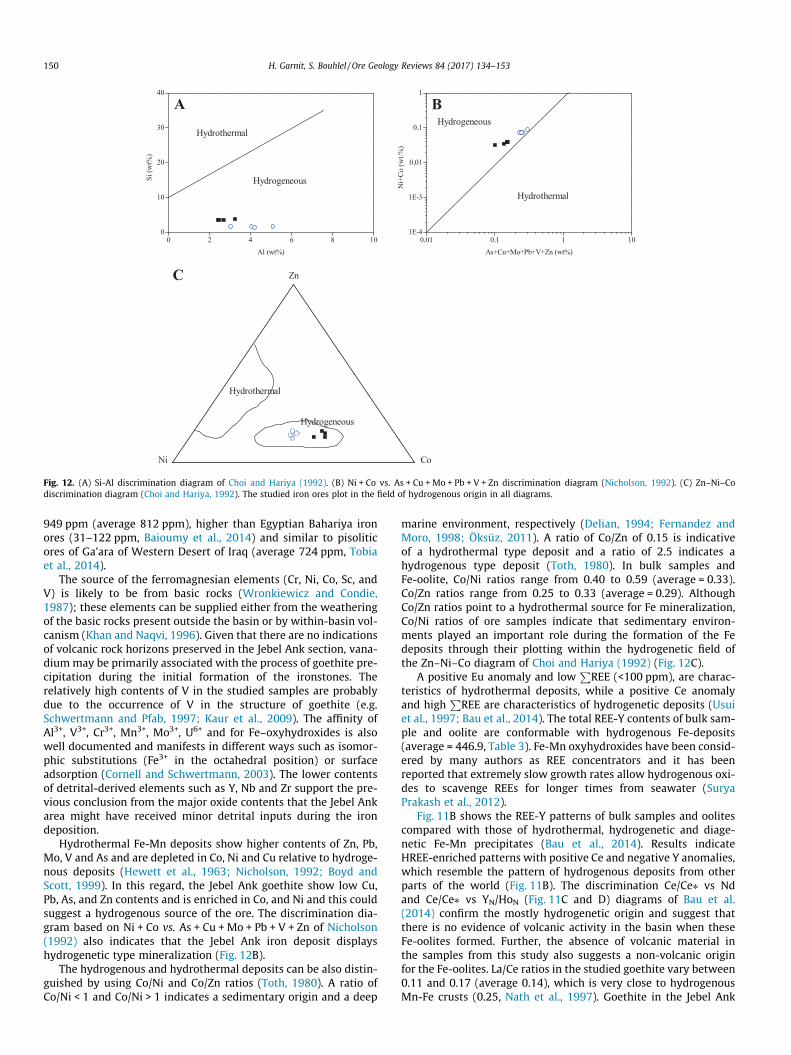
The oolitic ironstones clearly have elevated Fe2O3, SiO2, andAl2O3 but lesser MnO, and also lower amounts of CaO and MgO.In general, these element concentration trends are similar to thoseof the Eocene oolitic ironstones in other parts of the world (e.g., ElBahariya Depression, Egypt, as reported in Salama et al., 2012). Thenegative correlation of Fe2O3 with both SiO2 and Al2O3 reflects thedecreased deposition of detrital quartz grains and fine-graineddetrital clay minerals during Fe-deposition, which attest thatgoethite is primarily chemically precipitated. Si and Al data frombulk samples and Fe-oolite suggest a hydrogenous origin basedon their plotting in the hydrogenous field of the Si�Al discrimina-tion diagram of Choi and Hariya (1992) (Fig. 12A).
The relatively high content of P2O5, up to 2%, and low TiO2/Al2O3
(0.2–0.3) may indicate a continental source for the phosphorousand the iron, given that phosphorous generally is believed to beleached from a continental source and then migrates to the sedi-mentary basin of deposition (Millot, 1964; Chauvel, 1968, 1974;Price, 1976).
High P2O5 content are recorded in several oolitic ironstonedeposits that ranges from 0.2 to 0.8% but may sometimes exceed1.5% (Kennedy, 1990). In the oolitic iron ores of Aswan (Egypt),P2O5 ranges from 0.3 to 3.4 wt% and is positively correlated withCaO due the occurrence of P mainly as hydroxyapatite as massivegrains inside the oolites and/or in the ferruginous groundmass(Baioumy et al., 2017). The apatite in the Jebel Ank iron ores occursas rounded to subrounded, spherical and massive grains of about200 lm. Mineralogy shows that this apatite is carbonate-fluorapatite. These evidences suggest the detrital origin of thisgrains resulting from reworking of preexisting apatite grains.
Oolitic ironstones are recognized as being enriched in manytrace elements such as V, Ba, Sr, Co, Zr, Y, Ni, Zn, and Cu (e.g.Olsen et al., 1999; Salama et al., 2012; Tobia et al., 2014). In addi-tion, anomalous P, V, Cr, Ni, Zn, As, Mo, and U are commonly cor-related with Fe-oxyhydroxides (Salama et al., 2012).
In the Jebel Ank ironstones some trace elements are enrichedrelative to PAAS, whereas others are depleted (Fig. 11A). Vanadiumis one of the highly enriched elements in the Jebel Ank deposit,generally following Co, Ni and Zn. V content range from 584 to
0 2 4 6 8 100
10
20
30
40
0,01 0,1 1 101E-4
1E-3
0,01
0,1
1
Si (w
t%)
Al (wt%)
Ni+
Co
(wt.%
)
As+Cu+Mo+Pb+V+Zn (wt%)
C
B
Hydrothermal
Hydrogeneous
oCiN
Zn
Hydrothermal
Hydrogeneous
Hydrogeneous
Hydrothermal
A
. .
.
.
Fig. 12. (A) Si-Al discrimination diagram of Choi and Hariya (1992). (B) Ni + Co vs. As + Cu + Mo + Pb + V + Zn discrimination diagram (Nicholson, 1992). (C) Zn–Ni–Codiscrimination diagram (Choi and Hariya, 1992). The studied iron ores plot in the field of hydrogenous origin in all diagrams.
150 H. Garnit, S. Bouhlel / Ore Geology Reviews 84 (2017) 134–153
949 ppm (average 812 ppm), higher than Egyptian Bahariya ironores (31–122 ppm, Baioumy et al., 2014) and similar to pisoliticores of Ga’ara of Western Desert of Iraq (average 724 ppm, Tobiaet al., 2014).
The source of the ferromagnesian elements (Cr, Ni, Co, Sc, andV) is likely to be from basic rocks (Wronkiewicz and Condie,1987); these elements can be supplied either from the weatheringof the basic rocks present outside the basin or by within-basin vol-canism (Khan and Naqvi, 1996). Given that there are no indicationsof volcanic rock horizons preserved in the Jebel Ank section, vana-diummay be primarily associated with the process of goethite pre-cipitation during the initial formation of the ironstones. Therelatively high contents of V in the studied samples are probablydue to the occurrence of V in the structure of goethite (e.g.Schwertmann and Pfab, 1997; Kaur et al., 2009). The affinity ofAl3+, V3+, Cr3+, Mn3+, Mo3+, U6+ and for Fe–oxyhydroxides is alsowell documented and manifests in different ways such as isomor-phic substitutions (Fe3+ in the octahedral position) or surfaceadsorption (Cornell and Schwertmann, 2003). The lower contentsof detrital-derived elements such as Y, Nb and Zr support the pre-vious conclusion from the major oxide contents that the Jebel Ankarea might have received minor detrital inputs during the irondeposition.
Hydrothermal Fe-Mn deposits show higher contents of Zn, Pb,Mo, V and As and are depleted in Co, Ni and Cu relative to hydroge-nous deposits (Hewett et al., 1963; Nicholson, 1992; Boyd andScott, 1999). In this regard, the Jebel Ank goethite show low Cu,Pb, As, and Zn contents and is enriched in Co, and Ni and this couldsuggest a hydrogenous source of the ore. The discrimination dia-gram based on Ni + Co vs. As + Cu + Mo + Pb + V + Zn of Nicholson(1992) also indicates that the Jebel Ank iron deposit displayshydrogenetic type mineralization (Fig. 12B).
The hydrogenous and hydrothermal deposits can be also distin-guished by using Co/Ni and Co/Zn ratios (Toth, 1980). A ratio ofCo/Ni < 1 and Co/Ni > 1 indicates a sedimentary origin and a deep
marine environment, respectively (Delian, 1994; Fernandez andMoro, 1998; Öksüz, 2011). A ratio of Co/Zn of 0.15 is indicativeof a hydrothermal type deposit and a ratio of 2.5 indicates ahydrogenous type deposit (Toth, 1980). In bulk samples andFe-oolite, Co/Ni ratios range from 0.40 to 0.59 (average = 0.33).Co/Zn ratios range from 0.25 to 0.33 (average = 0.29). AlthoughCo/Zn ratios point to a hydrothermal source for Fe mineralization,Co/Ni ratios of ore samples indicate that sedimentary environ-ments played an important role during the formation of the Fedeposits through their plotting within the hydrogenetic field ofthe Zn–Ni–Co diagram of Choi and Hariya (1992) (Fig. 12C).
A positive Eu anomaly and lowP
REE (<100 ppm), are charac-teristics of hydrothermal deposits, while a positive Ce anomalyand high
PREE are characteristics of hydrogenetic deposits (Usui
et al., 1997; Bau et al., 2014). The total REE-Y contents of bulk sam-ple and oolite are conformable with hydrogenous Fe-deposits(average = 446.9, Table 3). Fe-Mn oxyhydroxides have been consid-ered by many authors as REE concentrators and it has beenreported that extremely slow growth rates allow hydrogenous oxi-des to scavenge REEs for longer times from seawater (SuryaPrakash et al., 2012).
Fig. 11B shows the REE-Y patterns of bulk samples and oolitescompared with those of hydrothermal, hydrogenetic and diage-netic Fe-Mn precipitates (Bau et al., 2014). Results indicateHREE-enriched patterns with positive Ce and negative Y anomalies,which resemble the pattern of hydrogenous deposits from otherparts of the world (Fig. 11B). The discrimination Ce/Ce⁄ vs Ndand Ce/Ce⁄ vs YN/HoN (Fig. 11C and D) diagrams of Bau et al.(2014) confirm the mostly hydrogenetic origin and suggest thatthere is no evidence of volcanic activity in the basin when theseFe-oolites formed. Further, the absence of volcanic material inthe samples from this study also suggests a non-volcanic originfor the Fe-oolites. La/Ce ratios in the studied goethite vary between0.11 and 0.17 (average 0.14), which is very close to hydrogenousMn-Fe crusts (0.25, Nath et al., 1997). Goethite in the Jebel Ank
H. Garnit, S. Bouhlel / Ore Geology Reviews 84 (2017) 134–153 151
deposit is purely hydrogenous and has received major contribu-tions from seawater.
The most probable source of Fe is from rocks that were exposedat surface during Eocene time, and were subjected to chemicalweathering and erosion under a humid, tropical climate. Theseproducts, dominated by amorphous Fe-oxyhydroxides, clays, andquartz, were transported by rivers and deposited in fluviatile andlacustrine environments located in the Jebel Ank area. Solignac(1930) reported that the oolitic layer pinchs out laterally to a glau-conite rich-sandstone layer. Submarine weathering of glauconitecould enhance dissolved Fe concentration in the seawater duringthe formation of the Jebel Ank ore. This scenario was recently con-sidered for the Middle Eocene Bahariya iron ores in Egypt(Baioumy et al., 2014). A continental origin for the iron fromweathering of adjacent areas can also be envisaged given thehigher phosphorus and zinc concentrations. The specific sourcearea for the oolitic iron is uncertain, but may lie somewhere tothe east, because as M’hamdi (1984) stated, the sandstone footwalllevel was separated from a shoreline to the west by the laterallyequivalent deeper water clays. The provenance of the large amountof iron in the Jebel Ank oolitic ironstones remains unresolved.However, a continental sedimentary source is most plausible.
There are many similarities between the Jebel Ank oolitic iron-stones and Tertiary ironstone deposits in Egypt studied by Salamaet al. (2012, 2014) and Baioumy et al. (2014, 2017). Similaritiesinclude: (i) lagoonal-shallow intertidal depositional environments;(ii) deposition during transgression–regression events; mineralassemblages (goethite, apatite, quartz, various Mn-bearing miner-als, Fe-sulfate minerals and clay minerals); (iii) oolitic textureformed as direct precipitation of Fe-rich minerals on suspendednuclei; (iv) Fe and Mn fractionation producing high Fe/Mn ratioscausing Fe precipitation in the upper part of the succession andMn in the lower part; (v) high V, Zn, Mo contents; and (vi) thelateritic materials produced by the weathering of the adjacent con-tinental masses, which are considered to be the main source ofiron.
In addition to the age difference, dissimilarities between theJebel Ank oolitic ironstones and Tertiary ironstone deposits inEgypt include: (i) consistency in lateral and vertical facies andhomogenous composition. absence of marine fauna, micro-organisms, ferruginized clasts and/or fossil, sedimentary features,and particle size sorting in Jebel Ank deposit; (ii) different iron-stone facies, paragenesis, and depositional stages controlled byvariations in pH–Eh, biological activities and climatic conditions;mixed hydrothermal and hydrogenous sources of the iron oredeposits in Egypt.
6. Conclusions
The Late Eocene Jebel Ank oolitic ironstone deposit is composedof goethite-oolites and reduced detrital non-ferruginous ganguedeposited in a near-shore shallow marine environment. The thick-ness of the oolitic iron layer is variable, ranging from a few cen-timeters to 8 m thick. The ironstone layer shows good verticalcontinuity and mineralogical and geochemical consistency. Fieldand petrographic investigations indicate that Fe-oolites are of pri-mary depositional origin. XRD, spectroscopic and mineral chemicalanalyses show low to negligible Al-Fe substitution in the goethitestructure, which rules out any replacement of a precursor mineralby goethite. The enriched V, Cr, Ni, Zn, and REE-Y contents are con-trolled by adsorption on goethite. Trace elements and REE discrim-ination diagrams show evidence of a hydrogenous origin. PAAS-normalized REE-Y patterns, positive Ce and negative Y anomaliesindicate oxic conditions. Fe enrichment in seawater could be duethe weathering of adjacent continental hinterland.
Acknowledgements
The authors thank Dr. Donatella Barca and Mariano Davollifrom Università della Calabria (Italy) for LA-ICP-MS and SEM anal-yses. We also thank Dr. Sheldon Skaggs from Bronx CommunityCollege, CUNY (USA) for clarification of the translation into English.Sophie Decree and Faraj Tobia are thanked for reviewing the manu-script and their extremely helpful comments and annotations. Weare grateful to Associate Editor Paul During for his contributions toincrease the quality of our paper.
References
Adeleye, D.R., 1975. Derivation of fragmentary oolites and pisolites from dessicationcracks. J. Sediment. Petrol. 45, 794–798.
Adler, H.H., Kerr, P.F., 1965. Variations in infrared spectra, molecular symmetry, andsite symmetry of sulfate minerals. Am. Mineral. 50, 132–147.
Ahmadi, R., Mercier, E., Ouali, J., 2013. Growth-strata geometry in fault-propagationfolds: a case study from the Gafsa basin, southern Tunisian Atlas. Swiss J.Geosci. 106, 91107.
Ben Haj Ali, M., Jedoui, Y., Dali, T., Ben Salem, H., Memmi, L., 1985. Carte géologiquede la Tunisie au 1/500 000. Edt. Service Géologique. Office National des Mines.
Baioumy, H.M., Khedr, M.Z., Ahmed, A.H., 2013. Mineralogy, geochemistry andorigin of Mn in the high-Mn iron ores, Bahariya Oasis, Egypt. Ore. Geol. Rev. 53,63–76.
Baioumy, H.M., Ahmed, A.H., Khedr, M.Z., 2014. A mixed hydrogenous andhydrothermal origin of the Bahariya iron ores, Egypt: evidences from thetrace and rare earth element geochemistry. J. Geochem. Explor. 146, 149–162.
Baioumy, H., Omran, M., Fabritius, T., 2017. Mineralogy, geochemistry and theorigin of high-phosphorus oolitic iron ores of Aswan, Egypt. Ore. Geol. Rev. 80,185–199.
Bau, M., Koschinsky, A., Dulski, P., Hein, J.R., 1996. Comparison of thepartitioningbehaviours of yttrium, rare earth elements, and titanium betweenhydrogeneticmarine ferromanganese crusts and seawater. Geochim.Cosmochim. Acta 60, 1709–1725.
Bau, M., Schmidt, K., Koschinsky, A., Hein, J., Kuhn, T., Usui, A., 2014. Discriminatingbetween different genetic types of marine ferro-manganese crusts and nodulesbased on rare earth elements and yttrium. Chem. Geol. 381, 1–9.
Bayer, U., 1989. Stratigraphic and environmental patterns of ironstone deposits. In:Young, T.P., Taylor, W.E.G. (Eds.), Phanerozoic Ironstones, vol. 46. Geol. Soc.Spec. Publ., pp. 105–117.
Ben Ayed, N., 1993. Evolution Tectonique De L’avant-Pays De La Chaîne Alpine De LaTunisie Du Début Du Mésozoïque À l’Actuel Thèse es-sciences. Univ. Paris Sud,Orsay, p. 347.
Bensalem, M.S., Ghanmi, M., Zargouni, F., 2010. Genesis of folds in external zone:application of fault propagation fold. Gafsa basin example (southern centralTunisia). Arab. J. Geosci. 4, 229–237.
Berthon, L., 1922. L’industrie minérale de la Tunisie. Tunis, 272p.Bhattacharya, D.P., Kakimoto, P., 1982. Origin of ferriferous ooids: an SEM study of
ironstone ooids and bauxite pisoids. J. Sed. Petrol. 52, 849–857.Bishop, J.L., Murad, E., 2005. The visible and infrared spectral properties of jarosite
and alunite. Am. Mineral. 90, 1100–1107.Bouaziz, S., Barrier, E., Soussi, M.M., Turki, M.M., Zouari, H., 2002. Tectonic evolution
of the northern African margin in Tunisia from paleostress data andsedimentary record. Tectonophysics 357, 227–253.
Boukadi, N., 1985. Evolution géodynamique et cinématique de la zoned’interférence de l’axe Nord-Sud et de la chaîne de Gafsa (Maknassy-Mezzouna et Jebel Bouhedma) Thèse Doct. 3ème cycle. Univ. Strasbourg,France, p. 143.
Boukadi, N., 1994. Structuration de l’Atlas de Tunisie. Signification géométrique etcinématique des nœuds et des zones d’interférences structurales au contact degrands couloirs tectoniques Thèse ès Sciences. Univ. Tunis II, Tunisia. 249p.
Boyd, T., Scott, S.D., 1999. Two-XRD-line ferrihydrite and Fe–Si–Mn oxyhydroxidemineralization from Franklin Seamount, western Woodlark Basin, Papua NewGuinea. Can. Mineral. 37, 973–990.
Braun, J.J., Pagel, M., Muller, J.P., Bilong, P., Michard, A., Guillet, B., 1990. Ceriumanomalies in lateritic profiles. Geochim. Cosmochim. Acta 54, 781–795.
Burkhalter, R.M., 1995. Ooidal ironstones and ferruginous microbialites: origin andrelation to sequence stratigraphy (Aalenian and Bajocian, Swiss Juramountains). Sedimentology 42, 57–74.
Burollet, P.F., 1956. Contribution à l’étude stratigraphique de la Tunisie Centrale.Annales des mines et de la géologie 18, 345.
Burollet, P.F., Oudin, J. P., 1980. Paléocène et Eocène en Tunisie – Pétrole etphosphate, Géologie Comparée des Gisements de Phosphate et de Pétrole.BRGM, Orléans, pp. 205–216.
Cambier, P., 1986. Infrared study of goethites of varying crystallinity and particlesize: I. Interpretation of OH and lattice frequencies. Clay Miner. 21, 191–200.
Canavan, R.W., Van Cappellen, P., Zwolsman, J.J.G., van den Berg, G.A., Slomp, C.P.,2007. Geochemistry of trace metals in a fresh water sediment: field results anddiagenetic modelling. Sci. Total Environ. 381, 263–279.
Cayeux, L., 1909. Les minerals de fer oolithiques de France. Tome 1: Minerais de ferprimaires. Imprimerie Nationale, Paris.
152 H. Garnit, S. Bouhlel / Ore Geology Reviews 84 (2017) 134–153
Chaabani, F., 1995. Dynamique De La Partie Orientale Du Bassin De Gafsa Au CrétacéEt auPaléogène: Etude Minéralogique Et Géochimique De La Série PhosphatéeEocène, Tunisie méridionale Thèse Doctrat d’ Etat. Université de Tunis II, Tunis.
Champetier, Y., Hambadou, E., Hambodou, H., 1987. Examples of biogenic support ofmineralisation in two oolitic iron oresLorraine (France) and Gara Djebilet(Algeria). Sediment. Geol. 51, 249255.
Chauvel, J.J., 1968. Contribution À L’étude Des Gisements De Fer De l’OrdovicienInférieur De Bretagne Thèse de doctorat Dr. ès-Sci. Nat.. Université de Rennes,Rennes, France.
Chauvel, J.J., 1974. Les minerais de fer de l’Ordovicien inferieur du bassin deBretagne, Anjou, France. Sedimentology 21, 127–147.
Choi, J.H., Hariya, Y., 1992. Geochemistry and depositional environment of MnOxide deposits in the Tokoro Belt, Northeastern Hokkaido. Econ. Geol. 87, 1265–1274.
Chukanov, N.V., 2014. Infrared Spectra of Mineral Species: Extended Library.Springer-Verlag GmbH, Dordrecht-Heidelberg-New York-London. 1716p.
Ciobota, V., Salama, W., Tarcea, N., Rösch, P., El Aref, M., Gaupp, R., Popp, J., 2012.Identification of minerals and organic materials in Middle Eocene ironstonesfrom the Bahariya Depression in the Western Desert of Egypt by means ofmicro-Raman spectroscopy. J. Raman Spectrosc. 43, 405–410.
Collin, P.Y., Loreau, J.P., Courville, P., 2005. Depositional environments and iron ooidformation incondensed sections (Callovian–Oxfordian, south-eastern Parisbasin, France). Sedimentology 52, 969–985.
Cornell, R.M., Schwertmann, U., 2003. The Iron Oxides: Structure, Properties,Reactions, Occurrences and Uses. Wiley-VCH, Weinheim, p. 664p.
Cotter, E., 1992. Diagenetic alteration of chamositic clay minerals to hematite inoolitic ironstone. J. Sed. Petrol. 62, 54–60.
Dahanayake, K., Krumbein, W.E., 1986. Microbial structures in ooidal ironformations. Miner. Deposita 21, 85–94.
de Faria, D.L.A., Venâncio Silva, S., de Oliveira, M.T., 1997. Raman microspectroscopyof some iron oxides and oxyhydroxides. J. Raman Spectrosc. 28, 873–878.
Delian, F., 1994. Geological and Geochemical Research of the Manganese Ore Bed (inChinese), M1. Weather Publishing Press, Beijing.
Dercourt, J., Zonenshain, L.P., Ricou, L.P., Kazmin, V.G., Le Pichon, X., Knipper, A.L.,Laurier, J.P., Bashenov, M.L., Boulin, J., Pechersky, D.H., Biju Duval, B., Savostin, L.A., Lepvrier, C., Geyssant, J., 1986. Geological evolution of the Tethys belt fromthe Atlantic to the Pamirs since the LIAS. Tectonophysics 123 (1–4), 241–315.
Donaldson, W.S., Olint, A.G., Longstaffe, F.J., 1999. Tectonic and eustatic control ondeposition and preservation of upper Cretaceous ooidal ironstone andassociated facies. Sedimentology 46, 1159–1182.
Drouet, C., Navrotsky, A., 2003. Synthesis, characterization and thermochemistry ofK-Na–H3O jarosites. Geochim. Cosmochim. Acta 67, 2063–2076.
Fernandez, A., Moro, M.C., 1998. Origin and depositional environment of Ordovicianstratiform iron mineralization from Zamora (NW Iberian Peninsula). Miner.Deposita 33, 606–619.
Fitzpatrick, R.W., Schwertmann, U., 1982. Al-substituted goethite. An indicator ofpedogenetic and other weathering environments in South Africa. Geoderma 27,335347.
Francesco, A.M.D., Bocci, M., Crisci, G.M., Lanzafame, U., 2005. Carratteriz-zazionearcheometrica della ossidiane del M.Arci: confronto fra metodologiatradizionale in XRF e metodologia XRF non distruttiva, Atti del III ConvegnoIternazionale ‘‘L’ossidiana del Monte Arci nel Meditterraneo”. Pau (OR) Ed.PTM(OR), pp. 117–128.
Fryer, B.J., Jackson, S.E., Longerich, H.P., 1995. The design, operation and role of thelaser-ablation microprobe coupled with an inductively coupled plasma-massspectrometer (LAM-ICP-MS) in the earth Sciences. Can. Mineral. 33, 303–312.
Gaied, M.E., Chaabani, F., Gallala, W., 2015. Alunite characterization in the upperEocene clay deposits of Central Tunisia: an implication to its genesis.Carbonates Evaporites 30, 347–356.
Gao, S., Liu, X., Yuan, H., Hattendorf, B., Gunther, D., Chen, L., Hu, S., 2002.Determination of forty-two major and trace elements in USGS and NIST SRMglasses by laser ablation-inductively coupled plasma-mass spectrometry.Geostandards Newsl. J. Geostand. Geoanal. 26 (2), 181–196.
Garnit, H., Bouhlel, S., Barca, D., Chtara, C., 2012. Application of LA-ICP-MStosedimentary phosphatic particles from Tunisian phosphorite deposits:Insights from trace elements and REE into paleo-depositional environments.Chem. Erde-Geochem. 72, 127–139.
Gehring, A.U., 1989. The formation of goethitic ooids in condensed deposits innorthern Switzerland. In: Young, T.P., Taylor, W.E.G. (Eds.), PhanerozoicIronstones, vol. 46. Geol. Soc. Spec. Publ., pp. 133–139.
Gharbi, M., Espurt, N., Masrouhi, A., Bellier, O., Amari, E.A., 2015. Style of Atlassictectonic deformation and geodynamic evolution of the southern Tethyanmargin, Tunisia. Mar. Pet. Geol. 66, 801816.
Gottis, C., Sainfeld, P., 1952. Les gîtes métallifères tunisiens. XIX Congrès Géolo. Int.Monographies régionales, 2ème série, Tunisie, 2, 104p.
Harder, H., 1989. Mineral genesis in ironstones: a model based upon laboratoryexperiments and petrographic observations. In: Young, T.P., Taylor, W.E.G.(Eds.), Phanerozoic Ironstones, vol. 46. Geol. Soc. Spec. Publ., pp. 9–18.
Hem, J.D., Cropper, W.H., 1959. Chemistry of iron in natural water – a survey offerrous-ferric chemical equilibria and redox potentials. U.S. Geol. Survey Water-Supply Paper 1459-A, 31.
Hemingway, J.E., 1974. Jurassic. In: Raynor, D.H., Hemingway, J.E. (Eds.), TheGeology and Mineral Resources of Yorkshire. Yorkshire Geological Society, pp.161–223.
Hewett, D.F., Fleischer, M., Conklin, N., 1963. Deposits of the manganese oxides:supplement. Econ. Geol. 58, 1–51.
Hlaiem, A., 1999. Halokinesis and structural evolution of the major features ineastern and southern Tunisian Atlas. Tectonophysics 306, 79–95.
James, H.L., 1966. Chemistry of the iron-rich sedimentary rocks. U.S. GeologicalSurvey Professional Papers 440-W1-W61.
Kaur, N., Singh, B., Kennedy, B.J., Grafe, M., 2009. The preparation andcharacterization of vanadium substituted goethite: the importance oftemperature. Geochim. Cosmohim. Acta 73, 582–593.
Kennedy, B.A., 1990. Surface Mining, Society for Mining, Metallurgy and ExplorationInc. second ed. Port City Press, Baltimore, Maryland, pp. 48–60.
Khan, R.M.K., Naqvi, S.M., 1996. Geology, geochemistry and genesis of BIF ofKushtagi schist belt, Archaean Dharwar Craton, India. Miner. Deposita 31 (1),123–133.
Kimberley, M.M., 1979. Origin of oolitic iron formations. J. Sed. Petrol. 49, 111–132.Kubisz, J., 1972. Studies on synthetic alkali-hydronium jarosites. III. Infrared
absorption study. Mineral. Polonica 3, 23–35.Liu, H., Chen, T., Zou, X., Qing, C., Frost, R.L., 2013. Effect of Al content on the
structure of Al-substituted goethite: a micro-Raman spectroscopic study. J.Raman Spectrosc. 44, 1609–1614.
M’hamdi, S., 1984. Le gisement de fer oolithique du J’bel Ank, Tunisie méridionale.Etude sédimentologique et géochimique Thèse de spécialité 3ème cycle.Université Louis Pasteur. 125p.
Macquaker, J.H.S., Taylor, K.G., Young, T.P., Curtis, C.D., 1996. Sedimentological andgeochemical controls on ooidal ironstone and ’’bone-bed’’ formation and somecomments on their sequence stratigraphical significance. In: Hesselbo, S.,Parkinson, D.N. (Eds.), Sequence Stratigraphy in British Geology, vol. 103. Geol.Soc. Spec. Publ., pp. 97–107.
Maynard, J.B., 1986. Geochemistry of oolitic iron ore, an electron microprobe study.Econ. Geol. 81, 1473–1483.
Maynard, J.B., Van Houten, F.B., 1992. Descriptive model of oolitic ironstones. In:Bliss, J.D. (Ed.), Developments in mineral deposit modeling. U.S. GeologicalSurvey Bulletin, pp. 39–40.
McLennan, S.M., 1989. Rare earth elements in sedimentary rocks: influence ofprovenanceand sedimentary processes. In: Lipin, B.R., McKay, G.A. (Eds.),Geochemistry and Mineralogy of Rare Earth Elements. Mineral. Soc. Am., pp.169–200.
Mesaed, A.A., 2004. Mechanism of formation of the Upper Eocene GlauconiticIronstones and Red Beds of Gabal Qalamoon area, Western Desert, Egypt. EgyptJ. Geol. 48, 17–44.
Mesaed, A.A., Harbi, R.T.H., 2013. Stratigraphic setting, facies types, depositionalenvironments and mechanism of formation of Ash Shumaysi ironstones, WadiAsh Shumaysi, Jeddah district, West Central Saudi Arabia. Arab. J. Geosci. 6,213–233.
Millot, G., 1964. Géologie des argiles. Masson et Cie Ed., 499 p.Murphy, P.J., Smith, A.M.L., Hudson-Edwards, K.A., Dubbin, W.E., Wright, K., 2009.
Raman and IR spectroscopic studies of aluntie-supergroup compoundscontaining Al, Cr3+, Fe3+ and V3+ at the B site. Can. Mineral. 47, 663681.
Mutrux, J., Maher, H., Shuster, R., Hays, T., 2008. Iron ooid beds of the CarolinefjelletFormation, Spitsbergen, Norway. Polar Res. 27, 28–43.
Nath, B.B., Pluger, W.L., Roelandts, I., 1997. Geochemical constraints onthehydrothermal origin of ferromanganese incrustations from theRodriguez triple junction, Indian Ocean. In: Nicholson, K., Hein, J.R., Bühn,B., Dasgupta, S. (Eds.), Manganese Mineralization: Geochemistry andMineralogy of Terrestrial and Marine Deposits, vol. 119. Geol. Soci. Lond.Spec. Publ., pp. 199–211.
Nicholson, K., 1992. Contrasting mineralogical–geochemical signatures ofmanganese oxides: guides to metallogenesis. Econ. Geol. 87, 1253–1264.
Nicolini, P., 1967. Remarques comparatives sur quelques élémentssédimentologiques et paléogéographiques liés aux gisements de fer de DjebelAnk (Tunisie) et de Lorraine (France). Miner. Deposita 2, 95–101.
Öksüz, N., 2011. Geochemical characteristics of the Eymir (Sorgun-Yozgat)manganese deposits, Turkey. J. Rare. Earths 29 (3), 287–296.
Olsen, R.A., Eccles, D.R., Collom, C.J., 1999. A study of potential co-product traceelements within the clear hills iron deposits, Northwestern Alberta. AGS/AEUBSpecial Report 08, 190p.
Pearce, N.J.G., Perkins, W.T., Westgate, J.A., Gorton, M.P., Jackson, S.E., Neal, C.R.,Chenery, S.P., 1997. A compilation of new and published major and trace datafor NIST SRM 610 and NIST SRM 612 glass reference materials. GeostandardsNewsl. J. Geostand. Geoanal. 21 (1), 115–144.
Pedersen, T.F., Price, N.B., 1982. The geology of manganese carbonate in PanamaBasin sediments. Geochim. Cosmochim. Acta 46, 59–68.
Petránek, J., Van Houten, F.B., 1997. Phanerozoic ooidal ironstones. Czech Geol.Surv., Special paper 7, 71.
Price, N.B., 1976. Chemical diagenesis in sediments. In: Riley, J.P., Chester, R. (Eds.),Chemical Oceanography, vol. 6. Acad. Press, Inc, United States (USA).
Said, A., Dominique, C., Baby, P., Ouali, J., 2011. Active oblique ramp faulting in theSouthern Tunisian Atlas. Tectonophysics 499, 178189.
Salama, W., El Aref, M.M., Gaupp, R., 2012. Mineralogical and geochemicalinvestigations of the Middle Eocene ironstones, El Bahariya Depression,Western Desert, Egypt. Gondwana Res. 22, 717–736.
Salama, W., El Aref, M.M., Gaupp, R., 2013. Mineral evolution and processes offerruginous microbialite accretion – an example from the Middle Eocenestromatolitic and ooidal ironstones of the Bahariya Depression, Western Desert,Egypt. Geobiology 11, 15–28.
Salama, W., El Aref, M., Gaupp, R., 2014. Facies analysis and palaeoclimaticsignificance of ironstones formed during the Eocene greenhouse.Sedimentology 61, 1594–1624.
H. Garnit, S. Bouhlel / Ore Geology Reviews 84 (2017) 134–153 153
Salama, W., El Aref, M., Gaupp, R., 2015. Spectroscopic characterization of iron oresformed in different geological environments using FTIR, XPS, Mössbauerspectroscopy and thermoanalyses. Spectrochim. Acta Mol. Biomol. Spectrosc.136, 1816–1826.
Sassi, S., 1974. La Sédimentation Phosphatée Au Paléocène Dans Le Sud Et Le CentreOuest De La Tunisie Thèse Doct. ès-Sci.. Univ. Paris Sud Orsay, France.
Schulze, D.G., 1984. The influence of aluminum on iron-oxides. 8: Unit celldimensions of Al-substituted goethites and estimation of Al from them. ClaysClay Miner. 32, 36–44.
Schulze, D.G., Schwertmann, U., 1984. The influence of aluminium on iron oxides. X:Properties of A1-substituted goethites. Clay Miner. 19, 521–539.
Schwertmann, U., Pfab, G., 1997. Structural vanadium and chromium in lateriticiron oxides: genetic implications. Geochim. Cosmochim. Acta 60, 4279–4283.
Serna, C.J., Cortina, C.P., Ramos, J.V.G., 1986. Infrared and Raman study of alunite–jarosite compounds. Spectrochim. Acta 42A, 729–734.
Shields, G., Stille, P., 2001. Diagenetic constraints on the use of cerium anomaliesaspalaeoseawater redox proxies: an isotopic and REE study of Cambrianphosphorites. Chem. Geol. 175, 29–48.
Siehl, A., Thein, J., 1989. Minette-type ironstones. In: Phanerozoic Ironstones. In:Young, T.P., Taylor, W.E.G. (Eds.), vol. 46. Geol. Soc. Spec. Publ., pp. 175–193.
Solignac, M., 1930. Les caractères minéralogiques du minerai de fer oolithique duJebel Ank (Tunisie méridionale). C.R. Aad. Sci. Paris 191, 107–109.
Sorby, H.C., 1856. On the origin of the Cleveland Hill Ironstone. Proceedings of theGeological and Polytechnic Society of the West Riding of Yorkshire, 3, 457–461.
Stucki, J.W., Goodman, B.A., Schwertmann, U. (Eds.), 1988. Iron in Soils and ClayMinerals. D. Reidel, Dordrecht. 893.
Sturesson, U., 2003. Lower Paleozoic iron oolites and volcanism from aBaltoscandian perspective. Sediment. Geol. 159, 241–256.
Surya Prakash, L., Ray, D., Paropkari, A.L., Mudholkar, A.V., Satyanarayanan, M.,Sreenivas, B., Chandrasekharam, D., Kota, D., Raju, K.A.K., Kaisary, S., Balaram, V.,Gurav, T., 2012. Distribution of REEs and yttrium among major geochemicalphases of marine Fe–Mn-oxides: comparative study between hydrogenous andhydrothermal deposits. Chem. Geol. 312–313, 127–137.
Swayze G.A., Desborough G.A., Smith K.S., Lowers H.A., Hammarstrom J.M., Diehl S.F., Leinz R.W., Driscoll R.L., 2008. Understanding jarosite – from mine waste toMars. In Characteristics of some natural jarosites 1055 UnderstandingContaminants Associated with Mineral Deposits (ed. P. L. Verplanck). USGSCircular. 1328, pp. 8–13.
Taylor, S.R., McLennan, S.M., 1985. The Continental Crust: Its Composition andEvolution. Blackwell Scientific Publications, London, pp. 42–52.
Tobia, F.H., Kettanah, Y.A., Mustafa, M.M., 2014. Petrography and geochemistry ofGa’ara sedimentary ironstones, Western Desert of Iraq. J. Afr. Earth Sci. 97, 261–272.
Toth, J.R., 1980. Deposition of submarine crusts rich in manganese and iron. Bull.Geol. Soc. Am. 91, 44–54.
Usui, A., Bau, M., Yamazaki, T., 1997. Manganese microchimneys buried in theCentral Pacific pelagic sediments: evidence of intraplate water circulation? Mar.Geol. 141, 269–285.
Van Houten, F.B., 1992. Review of Cenozoic ooidal ironstones. Sed. Geol. 78, 101–110.
Van Houten, F.B., Arthur, M.A., 1989. Temporal patterns among Phanerozoic ooliticironstones and oceanic anoxia. In: Young, T.P., Taylor, W.E.G. (Eds.), PhanerozoicIronstones: An Introduction and Review. Geological Society of London, London,pp. 33–49.
Van Houten, F.B., Purucker, M.E., 1984. Glauconitic peloids and chamositic ooids –favourable factors, constraints and problems. Earth Sci. Rev. 20, 211–243.
Winnock, E., 1980. Les dépôts de l’Eocene au Nord de l’Afrique: aperçupaléogéographique de l’ensemble. In: Géologie Comparée des Gisements dePhosphates et de Pétrole. BRGM, Orléans, pp. 219–243.
Wronkiewicz, D.J., Condie, K.C., 1987. Geochemistry of Archean shales from theWitwatersrand Supergroup, South Africa: Sourcearea weathering andprovenance. Geochim. Cosmochim. Acta 51, 24012416.
Young, T.P., 1989a. Phanerozoic ironstones: an introduction and review. In: Young,T.P., Taylor, W.E.G. (Eds.), Phanerozoic Ironstones, vol. 46. Geol. Soc. Spec. Publ.,pp. 9–25.
Young, T.P., 1989b. Eustatically controlled ooidal ironstone deposition: faciesrelationships of the Ordovician openshelf ironstones of Western Europe. In:Young, T.P., Taylor, W.E.G. (Eds.), Phanerozoic Ironstones, vol. 46. Geol. Soc.Spec. Publ., pp. 51–63.
Zaïer, A., Béji-Sassi, A., Sassi, S., Moody, R.T.J., 1998. Basin evolution and depositionduring the Early Paleocene in Tunisia. In: Macgregor, D.S., Moody, R.T.J., Clark-Lowes, D.D. (Eds.), Petroleum Geology of North Africa, vol. 132. Geol. Soc.London Spec. Publ., pp. 375–393.
Zargouni, F., 1985. Tectonique de l’Atlas méridional de Tunisie, évolutiongéométrique et cinématique des structures en zone de cisaillement Thèsed’Etat. Univ. Louis Pasteur, Strasbourg-Paris.
Zargouni, F., Rabiaa, M.C., Abbés, C., 1985. Rôle des couloirs de cisaillement de Gafsaet de Négrine-Tozeur dans la structuration du faisceau des plis des Chotts,éléments de l’accident sud-atlasique. CR Acad. Sci. Paris 301 (11), 831–883.
Zouaghi, T., Bédir, M., Inoubli, M.H., 2005. Structuration profonde des dépôts del’Albien–Maastrichtien en Tunisie centrale: nouvelle limite de l’archipel deKasserine et implications géodynamiques. C.R. Géosci. 337, 685–693.
Zouaghi, T., Ferhi, I., Bédir, M., Ben Youssef, M., Gasmi, M., Inoubli, M.H., 2011.Analysis of Cretaceous (Aptian) strata in central Tunisia, using 2D seismic dataand well logs. Afr. Earth Sci. 61, 38–61.
Zouari, H., Turki, M.M., Delteil, J., 1990. Nouvelles données sur l’évolutiontectonique de la chaîne de Gafsa. Bull. Soc. Géol. France 8, 621–628.


