Embed Size (px)
Citation preview

Relative oral bioavailability of lead from Dutch made grounds
Report 711701086/2009W.I. Hagens | N. Walraven | M. Minekus | R. Havenaar | J.P.A. Lijzen | A.G. Oomen

RIVM, P.O. Box 1, 3720 BA Bilthoven, the Netherlands Tel +31 30 274 91 11 www.rivm.nl
RIVM Report 711701086/2009
Relative oral bioavailability of lead from Dutch made grounds
W.I. Hagens1 N. Walraven2 M. Minekus3 R. Havenaar3 J.P.A. Lijzen4 A.G. Oomen1
1: RIVM, Centre for Substances and Integrated Risk Assessment (SIR), Bilthoven 2: Geoconnect, Castricum 3: TNO-quality of life, Zeist 4: RIVM, Laboratory for Ecological Risk Assessment (LER), Bilthoven Contact: RIVM/SIR [email protected] [email protected]
This investigation has been performed by order and for the account of the Ministery of Housing, Spatial Planning and the Environment (VROM), DGM-DP and DGR-LOK, within the framework of project M/711701/BE, Risico’s in relatie tot bodemkwaliteit/Implementatie biobeschikbaarheid mens.

RIVM Report 711701086
2
© RIVM 2009 Parts of this publication may be reproduced, provided acknowledgement is given to the 'National Institute for Public Health and the Environment', along with the title and year of publication.

RIVM Report 711701086
3
Abstract Relative oral bioavailability of lead from Dutch made grounds Several laboratory models exist for assessing the amount of lead that is released from soil and available for absorption by the gastrointestinal tract of children. Both the static in vitro digestion model (IVD) of the National Institute for Public Health and Environment (RIVM) and the dynamic Tiny-Tim model of the Netherlands Organisation for Applied Scientific Research (TNO) mimic the physiological conditions of the gastrointestinal tract of a child. However, the IVD model estimates a higher risk than the Tiny-Tim model. Exposure to too high levels of lead poses a particular health risk to children, one of which is a negative impact on IQ development. The soil in the historical inner (city) areas of many Dutch cities and villages is often polluted with lead. This lead originates from several sources, including the accumulation of lead-containing waste products and building rubble associated with centuries of urban development and industrial activities. This has resulted in a rubble layer that is referred to as made ground. Made grounds from different sources appear to have rather uniform soil characteristics, despite differences in the original soil lithology (clay, sand, loess). Possibly because of this uniformity, no relation has been observed between the release of lead from made grounds and soil characteristics. Results obtained using the IVD model, however, do indicate a qualitative relation between lead mineralogy and the release of lead from made grounds. The results of prior comparisons of the IVD and Tiny-TIM models using human and animal data are in close agreement. To obtain a definitive answer on the usability of these models in risk assessment, however, the RIVM recommends that additional validation tests be run using relevant human or animal data. This report offers policy-makers useful information on how to deal with lead bioavailability in the soil which allows a more precise risk assessment. Key words: lead, bioavailability, bioaccessibility, soil, in vitro digestion model

RIVM Report 711701086
4
Rapport in het kort Relatieve orale biobeschikbaarheid van lood uit Nederlandse stedelijke ophooglagen Er bestaan meerdere laboratoriummodellen die schatten hoeveel lood uit de bodem vrijkomt en bij kinderen in het maagdarmkanaal vrijkomt. Het model van het Rijksinstituut voor Volksgezondheid en Milieu (RIVM) schat het risico echter hoger in dan het model van de Nederlandse Organisatie voor Toegepast Natuurwetenschappelijk Onderzoek (TNO). Beide modellen, het Tiny-TIM-model van TNO en het in-vitrodigestie(IVD)model van het RIVM, bootsen in laboratoria de condities van het menselijke maagdarmkanaal na. Vooral kinderen zijn gevoelig voor de toxische effecten van lood. Een te hoge concentratie kan het IQ verminderen. De bodem van Nederlandse oude binnensteden is vaak verontreinigd met lood. Dat komt doordat veel Nederlandse dorpen en steden eeuwenlang zijn bewoond en de bewoners al heel lang lood in allerlei producten gebruiken. Deze bodem wordt de stedelijke ophooglaag genoemd. Er is geen relatie gevonden tussen bodemeigenschappen van de stedelijke ophooglagen en de mate waarin lood vrijkomt. Dat komt waarschijnlijk doordat de stedelijke ophooglaag vrij uniforme bodemeigenschappen heeft, ondanks de verschillen in de oorspronkelijke ondergrond (zand, klei, löss). Met het IVD-model is wel een verband gevonden tussen de chemische vorm van lood en de geschatte mate waarin het in het lichaam wordt opgenomen. Eerdere vergelijkingen tussen de modellen met gegevens van mensen of dieren kwamen wel overeen. Om uitsluitsel te krijgen over de bruikbaarheid van de modellen adviseert het RIVM om enkele testen in mens of dier uit te voeren, en deze resultaten te vergelijken met de resultaten van de modellen. Het rapport doet enkele handreikingen voor de manier waarop beleidsmakers kunnen omgaan met biobeschikbaarheid van lood in de bodem voor een humane risicobeoordeling. Trefwoorden: lood, relatieve biobeschikbaarheid, bioaccessibility, bodem, in-vitrodigestie(IVD)model

RIVM Report 711701086
5
Acknowledgements The sixteen cities that provided relevant soil information are acknowledged for their cooperation. The members of the NOBOWA-lood discussion groups are acknowledged for their relevant recommendations. Menno Duits, Peter Kootstra and Saskia Sterk (RIVM) are thanked for the experimental work with the in vitro digestion model. Gerard Boom (RIVM) is acknowledged for the metal analysis in the digestive juices, pellets and soils. Jan van de Kassteele (RIVM) is thanked for his statistical input throughout this project. The members of the BARGE (BioAccessibility Research Group Europe) are thanked for their help and suggestions throughout this project. Anton Roeloffzen (DCMR) is thanked for his support during the start of this project. Piet Otte and Martine Bakker (RIVM) are acknowledged for reviewing this report and for their help, input and support during the whole project.

RIVM Report 711701086
6

RIVM Report 711701086
7
Contents
SUMMARY ..........................................................................................................................................11
1 INTRODUCTION .......................................................................................................................13 1.1 BIOAVAILABILITY ..................................................................................................................14 1.2 THE RELATIVE BIOAVAILABILITY FACTOR .............................................................................14 1.3 CURRENT USE OF BIOAVAILABILITY IN RISK ASSESSMENT......................................................15 1.4 AIM OF THE RESEARCH...........................................................................................................16 1.5 APPROACH .............................................................................................................................17
2 SITE SELECTION, SAMPLING, PREPARATION OF SOILS ............................................19 2.1 SITE SELECTION .....................................................................................................................19 2.2 SOIL SAMPLING ......................................................................................................................20 2.3 SOIL PREPARATION ................................................................................................................20
2.3.1 The 2 kg part .................................................................................................................21 2.3.2 The 0.5 kg part ..............................................................................................................21
2.4 DISCUSSION ...........................................................................................................................22 2.5 CONCLUSIONS........................................................................................................................22
3 SOIL CHARACTERISATION ..................................................................................................23 3.1 INTRODUCTION ......................................................................................................................23 3.2 METHODS...............................................................................................................................23 3.3 RESULTS ................................................................................................................................24 3.4 DISCUSSION ...........................................................................................................................24 3.5 CONCLUSIONS........................................................................................................................27
4 LEAD CHARACTERISATION.................................................................................................29 4.1 INTRODUCTION ......................................................................................................................29 4.2 TOTAL LEAD DETECTION........................................................................................................29
4.2.1 Introduction ..................................................................................................................29 4.2.2 Methods.........................................................................................................................29 4.2.3 Results...........................................................................................................................30 4.2.4 Discussion.....................................................................................................................31
4.3 MULTI-ELEMENT ANALYSIS ...................................................................................................35 4.3.1 Introduction ..................................................................................................................35 4.3.2 Methods.........................................................................................................................35 4.3.3 Results...........................................................................................................................36 4.3.4 Discussion.....................................................................................................................38
4.4 LEAD ISOTOPE ANALYSIS .......................................................................................................39 4.4.1 Introduction ..................................................................................................................39 4.4.2 Methods.........................................................................................................................39 4.4.3 Results...........................................................................................................................40 4.4.4 Discussion.....................................................................................................................40
4.5 MINERALOGY AND PARTICLE SIZE .........................................................................................43 4.5.1 Methods.........................................................................................................................43 4.5.2 Results...........................................................................................................................43 4.5.3 Discussion.....................................................................................................................48

RIVM Report 711701086
8
4.6 CONCLUSIONS........................................................................................................................49 5 BIOACCESSIBILITY EXPERIMENTS: IVD MODEL.........................................................51
5.1 INTRODUCTION ......................................................................................................................51 5.1.1 Bioaccessibility .............................................................................................................51 5.1.2 Relative oral bioavailability..........................................................................................51 5.1.3 Physiological conditions...............................................................................................51 5.1.4 Application of relative oral bioavailability in risk assessment .....................................52 5.1.5 Validation of the IVD model .........................................................................................53
5.2 METHODS...............................................................................................................................55 5.2.1 Fasted conditions..........................................................................................................55 5.2.2 Fed conditions...............................................................................................................55 5.2.3 Lead analysis ................................................................................................................56
5.3 RESULTS ................................................................................................................................56 5.4 CONCLUSIONS........................................................................................................................57
6 CORRELATING SOIL CHARACTERISTICS WITH RELATIVE BIOAVAILABILITY59 6.1 INTRODUCTION ......................................................................................................................59 6.2 STATISTICAL METHODS..........................................................................................................59
6.2.1 Single regression analysis.............................................................................................59 6.2.2 Multiple regression analysis .........................................................................................59 6.2.3 Statistical software........................................................................................................60
6.3 RESULTS ................................................................................................................................60 6.3.1 Single regression analysis.............................................................................................60 6.3.2 Multiple regression analysis .........................................................................................62
6.4 DISCUSSION ...........................................................................................................................63 6.5 CONCLUSIONS........................................................................................................................64
7 CORRELATING LEAD CHARACTERISTICS WITH RELATIVE BIOAVAILABILITY.. .......................................................................................................................................................65
7.1 INTRODUCTION ......................................................................................................................65 7.2 METHODS...............................................................................................................................66 7.3 RESULTS ................................................................................................................................67 7.4 DISCUSSION ...........................................................................................................................69 7.5 CONCLUSION..........................................................................................................................72
8 BIOACCESSIBILITY EXPERIMENTS: TINY-TIM MODEL.............................................75 8.1 INTRODUCTION ......................................................................................................................75
8.1.1 Dynamic gastrointestinal conditions ............................................................................75 8.1.2 Simulation of gastrointestinal conditions in Tiny-TIM .................................................75
8.2 METHODS...............................................................................................................................77 8.2.1 Test products.................................................................................................................77 8.2.2 Test variations...............................................................................................................78 8.2.3 Experimental conditions ...............................................................................................79 8.2.4 Sampling and analysis ..................................................................................................80 8.2.5 Calculation of the bioaccessibility of lead ....................................................................80
8.3 RESULTS AND DISCUSSION.....................................................................................................80 8.3.1 Bioaccessibility of lead from lead acetate ....................................................................80 8.3.2 Bioaccessibility of lead from soils ................................................................................82
8.4 CONCLUSIONS........................................................................................................................83

RIVM Report 711701086
9
9 BIOACCESSIBILITY EXPERIMENTS: IVD AND TINY-TIM METHODS......................85 9.1 INTRODUCTION ......................................................................................................................85 9.2 METHODS...............................................................................................................................85 9.3 RESULTS ................................................................................................................................86 9.4 DISCUSSION ...........................................................................................................................88
9.4.1 Separation method: centrifugation versus ultrafiltration .............................................88 9.4.2 Calculation of the relative bioavailability ....................................................................90 9.4.3 Physiological conditions...............................................................................................91 9.4.4 Dynamic versus static ...................................................................................................92 9.4.5 The amount of soil introduced per digestion experiment ..............................................93 9.4.6 Bioaccessibility of lead from food and water................................................................93 9.4.7 Additional information on the bioaccessibility and bioavailability of lead from soil, food and water...............................................................................................................................94
9.5 CONCLUSION..........................................................................................................................95 9.6 RECOMMENDATIONS..............................................................................................................96
10 DISCUSSION ..........................................................................................................................99 10.1 LEAD CONTAMINATION..........................................................................................................99 10.2 MODELS TO ASSESS THE BIOAVAILABILITY OF LEAD IN RISK ASSESSMENT...........................100
10.2.1 In vivo models .............................................................................................................100 10.2.2 In vitro models ............................................................................................................100 10.2.3 Generic models ...........................................................................................................101
10.3 THE MADE GROUNDS............................................................................................................101 10.4 LEAD CHARACTERISTICS OF THE SOIL ..................................................................................101 10.5 THE RELATIVE ORAL BIOAVAILABILITY OF LEAD FROM SOIL................................................102 10.6 CORRELATING SOIL AND LEAD CHARACTERISTICS TO ORAL RELATIVE BIOAVAILABILITY....105
10.6.1 Correlating soil characteristics to relative oral bioavailability .................................105 10.6.2 Correlating lead characteristics to relative oral bioavailability ................................105
10.7 COMPARISON OF TINY-TIM AND IVD RESULTS...................................................................105 11 CONCLUSIONS AND RECOMMENDATIONS...............................................................109
11.1 THE MADE GROUND .............................................................................................................109 11.2 VARIATION IN TOTAL LEAD MEASUREMENT.........................................................................109 11.3 THE SOILS ARE HETEROGENIC IN LEAD.................................................................................110 11.4 CORRELATING SOIL AND LEAD CHARACTERISTICS TO ORAL RELATIVE BIOAVAILABILITY....110 11.5 THE DIFFERENCES IN RELATIVE ORAL BIOAVAILABILITY (IVD AND TINY-TIM)..................110
12 INTERNATIONAL: USE OF BIOAVAILABILITY OF LEAD FROM SOIL IN RISK ASSESSMENT...................................................................................................................................113
12.1 USA.....................................................................................................................................113 12.1.1 Comparison of IVD and RBLP bioaccessibility values...............................................113
12.2 DENMARK ............................................................................................................................114 12.3 UK.......................................................................................................................................114 12.4 CANADA ..............................................................................................................................115 12.5 BARGE ...............................................................................................................................115 12.6 INTERNATIONAL ORGANISATION FOR STANDARDIZATION...................................................115
REFERENCES...................................................................................................................................117

RIVM Report 711701086
10
APPENDIX 1......................................................................................................................................127
APPENDIX 2......................................................................................................................................129
APPENDIX 3......................................................................................................................................131
APPENDIX 4 .....................................................................................................................................134
APPENDIX 5......................................................................................................................................135
APPENDIX 6 .....................................................................................................................................136
APPENDIX 7 (available on the RIVM website; www.rivm.nl)
APPENDIX 8 (available on the RIVM website; www.rivm.nl)

RIVM Report 711701086
11
Summary Many sites in the Netherlands are contaminated with lead. This lead may form a potential health risk. Especially young children are at risk since children ingest larger quantities of soil than adults because of hand-to-mouth behaviour. Moreover, it is known that children are susceptible to lead. By using knowledge on the bioavailability of lead to the human body, the human risk assessment of contaminated soil can be made more realistic. Insight into the bioavailability can be obtained from models that simulate the human digestion process (in vitro digestion models). These physiologically based in vitro models estimate the fraction of lead that can be released from the soil after ingestion (bioaccessible fraction). Bioaccessibility is a sub-process of bioavailability, which refers to the fraction of a substance that reaches the systemic circulation. The bioaccessible fraction can be translated into a relative oral bioavailability factor, which represents the bioavailability of lead from soil relative to the bioavailability as assumed in the toxicological reference value for lead. The relative bioavailability factor can directly be applied in human health risk assessment of contaminated soils. The aim of the present research was to improve human health risk assessment for made grounds (in Dutch: stedelijke ophooglaag) by deriving one or more correction factor(s) for the relative bioavailability of lead from these soils so that information on the bioavailability of lead from soil can be estimated with information on soil and/or lead characteristics. Made ground is defined as the man-made soil layer that is applied on the original soil lithology. This specific rubble containing layer is laid down to prepare the soil for city use (consolidate, raise or fill the original soil). In order to cover the most relevant areas in the Netherlands, ninety made grounds were collected in this project. Soils were selected on soil lithology (dune sands, loess, fluviatile sand/clay, aeolian sand and marine sand/clay) and type of lead contamination. Of these made grounds from in total sixteen different Dutch cities, specific lead and soil characteristics were determined. The bioaccessibility of lead from the soils was determined by the in vitro digestion (IVD) model of the National Institute for Public Health and the Environment (RIVM). Out of the total ninety samples, sixteen representative soils were selected for additional bioaccessibility experiments with the Tiny-Tim model of the Netherlands Organisation for Applied Scientific Research (TNO). The made grounds appear to have rather uniform soil characteristics, despite the differences in original subsoil. Possibly because of this uniformity, no relation has been observed between the release of lead from made grounds and soil characteristics. Results obtained using the IVD model, however, do indicate a qualitative relation between lead mineralogy and the bioavailability of lead from made grounds. The relative oral bioavailability factor of lead from made grounds as estimated by IVD can be characterised as high, whereas this factor estimated by Tiny-TIM can be characterised as low. When applied in risk assessment, these different results could lead to different decisions

RIVM Report 711701086
12
concerning remediation and/or risk based soil management measures. Both models have, as far as possible, been compared to bioavailability data from animal and human studies, e.g. in vivo data. The similarity with in vivo data appeared to be good for most cases. Nevertheless, both models show some unexpected findings, i.e. in some cases a higher bioaccessible for lead from soil was observed than lead from water for the IVD model, while the Tiny-TIM model resulted in low bioaccessibility values for lead from food spiked with lead. Yet, correlations between in vitro and in vivo data (IVD) or a direct comparison between bioaccessibility and bioavailability of specific soils (IVD and Tiny-TIM) were in general satisfactory. Hence, based on the present information, neither IVD nor Tiny-TIM could be assigned as providing incorrect bioaccessibility data. Yet, it is clear that the bioaccessibility results of the made grounds are so different between both models that they cannot both be true. The present research was not intended to be able to identify the most appropriate in vitro digestion model, making it impossible to assign at present the model that provides the most realistic data. Therefore, various scenarios are identified for future directions for bioavailability of lead from soil in human health risk assessment.

RIVM Report 711701086
13
1 Introduction In the Netherlands, the natural lead content of soils varies from 1.6 to 32 mg/kg (AW2000, 2004; Groot et al., 1998). However, at many sites, the lead concentration in soil often exceeds the present Intervention Value in the Netherlands (530 mg/kg). The soil in Dutch cities and villages can be contaminated with lead. This lead originates from several sources including old city waste and historic (industrial) activities. In previous times, this waste (coal ashes, lead glazed rooftiles and potsherds, lead-based paint, building waste) used to be dumped in backyards, or just outside the city walls. Due to city growth and city renewal (including the use of former industrial sites) many of these areas with this lead-polluted made ground (in Dutch: stedelijke ophooglaag) are nowadays residential areas. Repeated human contact (exposure) with these urban soils may form a health risk. Especially young children may be at risk since children ingest larger quantities of soil particles than adults because of hand-to-mouth behaviour (Lijzen et al., 2001). Moreover, it is known that children absorb lead better than adults do. It is assumed that lead is (partly) absorbed by the same mechanism as calcium (Diamond et al., 1997). Calcium is better absorbed in children than in adults as growth demands more calcium (Clarkson, 1993). Also from a toxicological point of view, children are the group at risk. Lead already affects children at low doses, resulting, among others, in impaired neurobehavioral functioning and decreased haemoglobin levels (IPCS, 1995). In order to derive an Intervention Value for lead in soil, various assumptions were made. One of these assumptions used to be that the bioavailability of lead from soil equals the bioavailability of lead in the studies underlying the toxicological reference value. The toxicological reference value is in this case the Maximum permissible Risk (MPR), i.e. the amount of lead that children can daily be exposed to without any adverse effect. The studies underlying the toxicological reference value were performed in children that were exposed to lead via their normal diet (Ziegler et al., 1978; Ryu et al., 1983; Baars et al., 2001). Hence, the bioavailability of lead in these studies is associated with the intake of food. Many studies (in vitro and in vivo) indicate that the bioavailability of lead from soil may be lower than the bioavailability of lead from food (Freeman et al., 1994; Casteel et al., 1997; Fries et al., 1989; Freeman et al., 1996; Schroder et al., 2004). If this is the case the risks associated with the present Intervention Value for lead in soil may be overestimated. If the bioavailability of lead from soil could be taken into account in the human risk assessment of lead in soil, costs associated with soil remediation and public commotion could be avoided or reduced, whereas the safety for human health is warranted. In the past decade, RIVM has investigated the bioavailability of lead from soil and developed a method to estimate the bioavailability of lead from soil by using an in vitro digestion model (Oomen et al., 2003; Oomen et al., 2006). Furthermore, the application of this information in the present risk assessment of lead from soil has been described (Lijzen et al., 2006). One of the findings with historically contaminated soils was that the bioavailability of lead is influenced by the soil characteristics and lead speciation (Oomen et al., 2006). This implies that information on the bioavailability of lead from soil is site-specific. However, it also suggests that the

RIVM Report 711701086
14
bioaccessibility of lead from soil may be predicted from information on the lead and/or soil characteristics. It may therefore be possible to derive general information about the bioaccessibility and relative bioavailability of lead from soil for specific soils and/or lead types.
1.1 Bioavailability According to the general interpretation in pharmacology, oral bioavailability (F) is defined as the fraction of an orally administered dose that reaches the systemic circulation. Oral bioavailability (F) can be divided into three different major processes (equation 1; Oomen et al., 2006). (1) B A HF F F F= × × After ingestion of soil, the total bioavailability (F) depends on the amount of contaminant that is released from the matrix (i.e. soil) during digestion in the gastrointestinal tract. This is referred to as bioaccessibility, (with FB the bioaccessible fraction). Part of the bioaccessible fraction is transported across the intestinal epithelium and reaches the portal vein (absorbed fraction; FA). Metabolization of the contaminant may occur in the intestinal epithelium and/or in the liver (first-pass effect). The fraction that is not metabolized (FH) is transported throughout the body and represents the bioavailable fraction (F). Please note that lead is not metabolized, resulting in a FH fraction of 1 (More information can be found in (Oomen et al., 2006)).
1.2 The relative bioavailability factor In the body, not all bioaccessible lead (i.e. the lead released from the matrix) will become bioavailable (i.e. reach the systemic circulation). Therefore, the in vitro determined bioaccessibility value of lead from soil (FB,soil) should be converted to a bioavailability value (F) of total lead in the body (see also equation 1). The bioavailability of lead from soil (Fsoil) is not equal to the bioavailability of dietary lead based on the studies that were used for deducting the Maximum Permissible Risk (MPRhuman) for lead (FMPR) (IPCS, 1995; FAO/WHO, 1993; (Baars et al., 2001). To account for the difference in bioavailability of dietary lead and lead from soil, the relative bioavailability correction factor (Rel F) can be used. This relative bioavailability correction factor (Rel F) for lead from soil is calculated by dividing the bioavailability of lead from soil (Fsoil) by the bioavailability of lead from the MPR studies (FMPR). The relative F is therefore the ratio of two bioavailability values, Fsoil and FMPR (equation 2; Oomen et al., 2006). The Rel F can be applied in risk assessment to account for the difference in bioavailability of lead between lead from soil and dietary lead (Oomen et al., 2006).
(2) lead from soillead
dietary lead
F FF
Rel =

RIVM Report 711701086
15
(3) B,soil A,soil H,soil B,soil A,soillead
B,MPR A,MPR H,MPR B,MPR A,MPR
F F F F F F =
F F F F FRel
× × ×=
× × ×
If lead is the contaminant, no metabolization is expected, resulting in a FH, soil fraction of 1. For FMPR a value of 0.4 is used, as it is assumed that the bioavailability of dietary lead in the studies underlying the MPR was 40 %. In addition, for the “average physiological state”, the fraction of bioaccessible lead that is absorbed is assumed to be 0.8 (FA, soil = 0.8), based on a FA,fed for children of 0.62 and a worst case assumption of FA,fasted for children of 1. Further details are explained in Oomen et al., (2006). If these values are introduced in equation 3, the relationship between relative bioavailability factor and bioaccessibility of lead from soil becomes:
(4) B,soil A,average,children B,soil B,soilB,soil
MPR
F F F 0.8 F F 2 F
F 0.4 0.5Rel
× ×= = = = ×
The relative bioaccessibility, as derived with equation 4, is valid for orally ingested soil.
1.3 Current use of bioavailability in risk assessment In the present risk assessment of contaminated soils, the potential risk (for children) might be overestimated since information concerning the oral bioavailability of lead from soil by the human body is missing. This overestimation could lead to unnecessary remediation of sites resulting in high clean up costs and possible social unrest in contaminated areas. The Dutch risk assessment for lead is based on a criterion laid down by the FAO/WHO (1993) and the IPCS (1995). The recommendation is to avoid blood lead levels above 50 μg/l, corresponding with a provisional tolerable weekly intake (PTWI) of 25 μg/kg body weight per week (equal to a Tolerable Daily Intake (TDI) of 3.6 μg/kg body weight per day (Baars et al., 2001)). This Maximum Permissible Risk (MPR) criterion is based on the bioavailability (F,MPR) of 40 % of dietary lead for children (Ziegler et al., 1978; Ryu et al., 1983). The present Dutch Intervention Value for lead in soil is 530 mg/kg dry matter for standard soil (10% organic matter and 25% clay). For other soil types a generic correction is used (VROM, 2006). The difference in bioavailability of lead from soil between soil and dietary lead is taken into account using a “default” intervention value correction factor for the relative oral bioaccessibility of 0.74. This factor is based on the P80 percentile of all the relative bioavailability factors determined for soil for fasted conditions (Rel Ffasted) up till 2006 of 0.87 (Lijzen et al., 2006). Moreover, the average physiological condition of the human gastrointestinal tract is taken into account (assumption of half fasted and half fed conditions). It is known that, the bioavailability of lead from soil is lower for fed (or average) conditions compared to fasted conditions, as the higher pH in the stomach decreases the release of lead from soil. Since exposure to lead is a chronic process, and children’s physiological state can be assumed to be sometimes

RIVM Report 711701086
16
fed, sometimes fasted, and sometimes in-between, the assumption of an average physiological state for the derivation of a relative bioavailability factor seems reasonable. Therefore, an “average physiological state” correction factor (CFAPS, 2006) was taken into account. This factor is based on the P80 percentile of the RIVM in vitro digestion (IVD) model performed with 11 soils for both fasted and fed conditions (CFAPS, 2006) up till 2006 (=0.854). Therefore, the provisional correction factor for the intervention value for relative bioavailability (P80 [Rel Ffasted, 2006] × P80 [CFAPS, 2006] = 0.87 × 0.854) was 0.74. Additional information on the derivation of this intervention value correction factor and information to assess the human health risk for specific sites can be found in the following reports (Oomen et al., 2006; Lijzen et al., 2006). As already indicated in 2006, the provisional correction factor for bioavailability of lead from soil (0.74) is based on a relative small number of soils. In 2008, a letter report updated the “average physiological state” correction factor with bioaccessibility data of lead (fasted and fed conditions) of additional soils (seventy soils in total) for derivation of CFAPS (P50 = 0.81; Hagens et al., 2008). These data are also included in this report. Furthermore, previous studies by Oomen et al. (2006) suggested that the bioavailability of lead depends on soil characteristics and the lead speciation (Oomen et al., 2006). It was therefore decided to determine the bioavailability of lead from soil in a considerable number of soils. In order to focus the research, soils would be selected that provide the most beneficial information for policy makers and local authorities, i.e. the soils that regularly exceed the intervention value of lead and for which exposure to humans is considerable. These conditions especially hold for made grounds.
1.4 Aim of the research The aim of the present research is to improve human health risk assessment for made grounds by deriving one (or more) generic correction factor(s) for the relative bioavailability of lead from these typical city soils. In this way and with suitable data, based on soil characteristics and lead mineralogy only, the bioavailability of lead from soil might be estimated without site specific measurements. In this present research, a relative bioavailability factor is determined for a large number of made grounds (ninety) that are typical for old inner cities. In addition, relationships between relative bioavailability factors and soil and/or lead characteristics will be studied and recommendations on the application of Rel F in risk assessment will be made. In addition, the relative bioavailability of these soils as determined with the in vitro digestion (IVD) model of RIVM and the Tiny-TIM model of TNO will be compared and discussed.

RIVM Report 711701086
17
1.5 Approach To obtain the needed samples of made grounds representative for the Netherlands, Dutch cities were selected based on their original soil characteristics. The environmental services of these cities were asked to provide information on relevant locations with lead contamination within their city. Besides information about the contamination of the location, also information concerning the former use of the location and the lead and soil characteristics was gathered. Subsequently, ninety appropriate soils were selected and sampled. The bioaccessibility of lead from these soils was determined by the IVD digestion model. Subsequently, the lead and soil characteristics were determined, including total lead content, pH, organic matter and determination of the carbonate, iron, sulphur and clay content. On a subset of thirty soils a multi-element analysis was performed to determine the major, trace and lead isotopic composition of these soils, which provides information on the origin of lead. A smaller subset of sixteen representative soils was selected (including soils from all cities) for additional bioaccessibility experiments by the Tiny-TIM model of TNO. Moreover, the chemical composition and the particle size of the lead phases present in these sixteen soils was determined by scanning electronic microscopy. Relationships between the bioavailability of lead from soil with soil characteristics and lead speciation were investigated. Furthermore, the Tiny-TIM and IVD data, including the methodology were compared and discussed.

RIVM Report 711701086
18

RIVM Report 711701086
19
2 Site selection, sampling, preparation of soils
2.1 Site selection In order to cover the most relevant areas in the Netherlands, the sample sites (cities) were selected based on soil lithology. The number of sample sites was divided equally over cities that are located on the following subsoils: dune sands, loess, fluviatile clay/sand, marine clay/sand and aeolian sands (In Dutch: duinzand, loss, rivierklei/zand, zeeklei/zand and pleistoceen zand, respectively). Subsequently, made grounds must be present in the selected city. Preferably, the made ground should be present in the top soil (0-20 cm), since children are primarily exposed to this top soil layer. The sampled made grounds should contain a concentration of lead relevant for human health risks. Therefore, sites with a lead content of approximately one to five times the present Intervention Value of lead (530 mg/kg) were selected. In this study, the made ground is defined as the man-made soil layer that is applied on the original soil. This specific layer is laid down to prepare the soil for city use (consolidate, raise or fill the original soil). Made ground contains non-soil phases such as rubble, building waste, residential garbage and/or waste from former industrial activities. The characteristics of a specific made ground can be determined by (pre) investigation of the location (according to NEN 5740:1999). It was intended to sample up to three sites per city. From each sample location, two samples were taken from the made ground. Due to sampling difficulties (too low lead concentration, impenetrable layer or restricted access to the location) alterations were envisaged. The criteria for the selection of the soils in short:
• presence of a made ground • access to location and soil • lead contamination between 500 and 2500 mg/kg (~one to five times the current
intervention value) • selection of cities with different lithology (original soil) • selection of lead contamination from different sources • preferably, samples should be taken from the top soil (0-20 cm)
From May - July 2007, the environmental services of more than a dozen cities with known lead polluted soils were approached with the question to cooperate. The environmental services were asked to appoint sample sites that meet the criteria above. Based on this information, the final selection of sixteen cities was made (Table 2.1).

RIVM Report 711701086
20
2.2 Soil sampling In August – September 2007, ninety lead contaminated soil samples were collected by BKK bodemadvies (Meijel, the Netherlands) based on the information gathered during the soil selection phase. At the location, at least 2.5 kg mixed soil was sampled (according to NEN5740). The lead content of the soil sample was measured on-site with a portable XRF, a mobile detector capable of measuring a variety of elements including lead. If the concentration of lead was too low (< Intervention value of 530 mg lead/kg dry soil) or too high (> five times Intervention Value), the soil sample was discarded and a new sample was taken. Of each sample, a short description of the layer, including the made ground was given. In addition, of each location, a photograph was taken. An overview of the collected samples is represented in Table 2.1. It was intended to select up to three sample sites per city. Per sample location, two samples were taken from the “made ground”. However, sampling difficulties at the selected location (too low lead concentration as assessed with the portable XRF, impenetrable layer or restricted access to the location) caused some minor alterations in soil sampling. Table 2.1: Composition of the total set of samples from the made grounds, including their location.
2.3 Soil preparation The ninety field-wet soil samples (2.5 kg) were split in one part of 0.5 kg and one part of 2 kg (splitting performed by BLGG, Oosterbeek, the Netherlands).
Samples per city
Locations per city Lithology
1 Alkmaar 2 12 Den Haag 8 53 Haarlem 6 34 Echt-Susteren 9 45 Maastricht 8 46 Leiden 5 27 Schoonhoven 6 38 Wijk bij Duurstede 2 19 Zutphen 4 2
10 Groningen 6 211 Nijmegen 6 312 Utrecht 7 413 de Rijp 7 414 Delft 6 315 Rotterdam 6 316 Schiedam 2 1
90 samples 45 location 5 types of subsoil
Cities
16 cities
Marine sand / clay
Dune sand
Loess
Fluviatile sand / clay
Aeolian sands
1
2
3
4
5
6
78
9
10
11
13
1214
16 15
1
2
3
4
5
6
78
9
10
11
13
1214
16 15

RIVM Report 711701086
21
2.3.1 The 2 kg part The 2 kg part was processed according to NEN 5751. This preparation included drying, homogenisation, milling and sieving (2 mm) of the sample (performed by BLGG). The sample was evenly divided in four parts. − Part A was used to measure the bioaccessibility by the IVD method of RIVM. In addition,
part A was also used to measure the total lead content of the soil (Alcontrol). For this additional total lead measurement at Alcontrol, the soil (part A) was prepared according AS3000 (homogenisation and grinding to < 500 µm, in accordance with NEN 5709 followed by the microwave assisted destruction and lead detection).
− Part B was stored at the RIVM as a back-up sample. − Part C was send to TNO for the Tiny-TIM bioaccessibility experiments (for sixteen samples). − Part D was used by BLGG for the determination of the soil characteristics.
2.3.2 The 0.5 kg part The 0.5 kg field-wet subsamples were send to Deltares (Utrecht, the Netherlands) for preparation and additional analyses. Deltares prepared sixteen soil samples for scanning electron microprobe (SEM) analysis and thirty samples for ICP major, trace and Pb isotope analysis (aluminium (Al), barium (Ba), calcium (Ca), cerium (Ce) , cobalt (Co), chromium (Cr) , copper (Cu), iron (Fe), potassium (K), lithium (Li), magnesium (Mg), manganese (Mn), sodium (Na), nickel (Ni), phosphorus (P), lead (Pb), sulphur (S), strontium (Sr), titanium (Ti), vanadium (V), yttrium (Y), zinc (Zn) , zirconium (Zr), arsenic (As), cadmium (Cd), antimony (Sb), tin (Sn), silver (Ag) and the 206Pb/207Pb and 208Pb/206Pb ratios). For SEM analysis, approximately 400 g of each selected soil sample was freeze dried to avoid clottering and hardening of the samples. For optimal SEM analysis, the physical structure of the soil samples must not be altered by the preparation process. The sixteen freeze dried soil samples were send to CORUS (IJmuiden, the Netherlands) for SEM analysis. CORUS cast the soil samples in epoxy resin, made polished sections of the cast samples and coated the polished sections with carbon prior to the SEM analysis. For ICP analysis, approximately 40 g of each selected soil sample was freeze dried. The dried soil samples were digested according to the following procedure: subsamples of 0.125 g were weighed into Savillex 50 ml Teflon vessels and 1 ml 16 M HNO3, 1.5 ml 12 M HClO4 and 2.5 ml 29 M HF was added. The vessels were closed and heated overnight in an aluminium heating block at 90ºC. The vessels were opened and evaporated to incipient dryness in an aluminium heating block at a maximum temperature of 160ºC. Five ml 16 M HNO3 was added and the open vessels were heated for 1 hour in an aluminium heating block at 90ºC. Finally 20 ml 1 M HNO3 was added and the open vessels were heated for 2 hours in an aluminium heating block at 90ºC. After cooling and dilution (about a 1000 times) digestions were ready for ICP analyses.

RIVM Report 711701086
22
2.4 Discussion In 2007, RIVM published a guideline for determination of oral bioavailability of lead from soil, including guidance on soil sampling and preparation (Hagens et al., 2007). The soil sampling strategy, as outlined in the guideline, was not followed completely in the present research (see also section 2.6 of the guideline (Hagens et al., 2007)). The sampling strategy in the guideline is to obtain an average soil sample of the location. To acquire an average sample, fifty small digs of the location are combined to one blended sample. Due to the specific research question of this project, combined with the above mentioned criteria, an “average” sample is not suitable. In that case differences in soil characteristics and lead speciation would be levelled out. Rather, a single soil sample (of 2.5 kg) from the made ground contaminated with lead (> Intervention value of lead) was used for the present research. For other aspects of soil sampling and preparation, i.e sieving, splitting and drying of the soil, the guideline is followed.
2.5 Conclusions Sixteen cities were selected for soil sampling based on the selection criteria 1) difference in lithology and 2) presence of lead polluted “made ground”. The presence of the “made ground” was confirmed visually in the field. With a portable XRF, only lead polluted soils were selected for further research. This sampling strategy resulted in a total of ninety soil samples that represent lead polluted “made grounds” in many Dutch cities and villages.

RIVM Report 711701086
23
3 Soil characterisation
3.1 Introduction As mentioned in chapter 1, the bioavailability of lead from soil may be different than the bioavailability of lead from food (Freeman et al., 1994; Casteel et al., 1997; Fries et al., 1989; Freeman et al., 1996; Schroder et al., 2004). According to these studies, this difference might be caused by specific soil characteristics (addressed in this chapter) and lead characteristics (addressed in chapter 4), Of the soil characteristics, the pH, organic matter, clay (lutum), calcium carbonate, total sulphur and reactive iron content are determined for each made ground.
3.2 Methods After collection of all the ninety samples (2.5 kg), the samples were pre-treated for further analysis. The soil characteristics were analysed on Part D of each soil (see section 2.3.1). Of each soil, the following characteristics were determined (by BLGG), according to current guidelines: soil pH, organic matter, clay (lutum), calcium carbonate, total sulphur and reactive iron content. All measurements are single measurements (no multiple determinations of the characteristics). Soil pH. The soil pH is determined according the international standard for the routine determination of pH. This method uses a glass electrode in a 1:5 (volume fraction) suspension of soil in 0.01 mol/l calcium chloride (NEN-ISO 10390:2005). Organic matter. The organic matter of the pre-treated soils is determined by the (international) standard NEN 5754, NEN-ISO 11465. This method determines the organic content of soil on a mass basis as loss-on ignition. Clay. The clay content (in Dutch: lutum) in each soil is determined by sieve and pipette according to the standard NEN 5753. Calcium carbonate. The calcium carbonate content in each soil is determined according to the international standard NEN-ISO 10693. Total sulphur. The total sulphur content in each soil is determined following the international standard ISO 15178. This determination uses the dry combustion method. Reactive iron. The reactive iron content in an ammonium oxalate-oxalic acid extract of each soil sample is determined following standard NEN 5776.

RIVM Report 711701086
24
3.3 Results The soil characteristics are determined for the ninety soils from made grounds. These results are listed in Appendix 1 of this report. A summary of the results is represented in Table 3.1. This table includes the average values and standard deviation of the ninety made grounds for each determined soil characteristic. In addition, the lowest and highest value of the ninety made grounds is indicated. Table 3.1: Averaged soil characteristics of the made grounds, including the standard deviation, highest and lowest value measured.
pH Organic matter Clay Carbonate
content Total Sulphur Iron content
% % % CaCO3 mg S/kg mmol Fe/kg
7.1 6.7 7 2.9 1408 890.5 4.7 5 2.4 2518 61
6.0 1.4 1 0.2 171 289.5 21.8 24 11.7 17986 319
Made groundsSoil characteristics
(n = 90 samples)
AverageStandard deviation
LowestHighest
3.4 Discussion To interpret the data, listed in Table 3.1, these values are compared with published values of hundred unpolluted rural Dutch soils (only background exposed soils). In this recent study, referred to as “achtergrondwaarden 2000” (AW2000, 2004), the background concentrations for in total 252 contaminants have been determined. The soils were taken from nature reserves and farms in the Netherlands in order to compile a database of unexposed Dutch rural soil values for both the top soil (0-20 cm) and the subsoil (50-100 cm). Moreover, several soil characteristics were analysed and reported. The results of the AW2000 are based on 100 (unexposed) sites throughout the Netherlands with different lithology. These sites were sampled throughout the Netherlands, based on a stratified, random sampling strategy (Figure 3.1; AW2000, 2004). The average soil characteristics of the examined soils are summarized in Table 3.2. For comparison, the soil characteristics of the “made ground” are also given this table.

RIVM Report 711701086
25
Figure 3.1: The soil lithology in the Netherlands, indicated with different colours (left panel) and the random selected soil locations for AW2000, indicated with numbers (right panel) (adapted from the AW2000 report, Figures 1 and 2, AW2000, 2004). Table 3.2: Averaged soil characteristics, including the standard deviation, from rural, background exposed soils in the Netherlands (AW2000, reported in 2004) and the made ground (present study).
top soil (0-10cm) subsoil (50-100cm)Samples (#) 100 100 90organic matter (%) 8.1 4.3 6.7standard deviation 11.2 10.5 4.7clay (%, < 2µm) 11.6 10.5 7.0standard deviation 11.5 11.3 5.0pH 5.6 6.0 7.1standard deviation 1.4 1.3 0.5CaCO3 (%) 1.1 1.3 2.9standard deviation 2.3 2.5 2.41: Background values of soils in the Netherlands (Achtergrondwaarden 2000, reported in 2004)2: This study, 2009NB: Reactive iron and total sulphur content were not reported in the AW2000 study
Rural, background exposed soil (Netherlands)1
Made ground2

RIVM Report 711701086
26
0
2
4
6
8
10
pHM
ade
grou
nds
Rur
al to
psoi
ls
Rur
al su
bsoi
ls
0
20
40
60
80
OM (wt %)
Mad
e gr
ound
s
Rur
al to
psoi
ls
Rur
al s
ubso
ils
0
20
40
60
Clay (wt %)
Mad
e gr
ound
s
Rur
al to
psoi
ls
Rur
al su
bsoi
ls
0
4
8
12
CaCO3 (wt %)
Mad
e gr
ound
s
Rur
al to
psoi
ls
Rur
al su
bsoi
ls
Figure 3.2: Box-and-whisker plots of the soil characteristics pH, organic matter (OM), clay (lutum) and calcium carbonate from ninety made grounds (this study) and hundred rural, background exposed soils in the Netherlands (AW2000, reported in 2004). The whiskers represent the lower and upper quartile (25 and 75 percentile). Table 3.2 and Figure 3.2 indicate that the average clay (lutum) content and organic matter content (top and subsoil) of the rural soils are comparable with the made grounds. However, the standard deviation of the rural soils is larger compared to the made grounds. Moreover, the pH of the made ground is higher than the average background exposed soils. It is suggested that the higher calcium carbonate content accounts for this difference in pH. Calcium carbonate in the made ground is amongst others included in the rubble and poses the capacity to buffer the soil. This will most likely result in a higher pH compared to the rural soils that do not contain rubble particles containing calcium (Table 3.2, Figure 3.2). No large differences in soil characteristics (pH, carbonate content, clay and organic matter, Table 3.1) were identified for the made ground originating from five different types of subsoils (Table 3.2, Figure 3.2). Therefore, it can be concluded that the “made ground” shows rather uniform soil characteristics. The specific “made ground” is a rubble containing layer on top of the original lithology. The relationship between the bioaccessibility of lead from a “made ground” and the soil characteristics could therefore, in principle, be applicable for any lead contaminated made ground. This conclusion does not rule out exceptions in which a “made ground” shows deviating soil characteristics.

RIVM Report 711701086
27
3.5 Conclusions Although the ninety made grounds were taken from sites that have, in total, five different soil types, the made grounds show a remarkable similarity in soil characteristics. It is concluded, based on the soil pH, organic matter, clay and carbonate content, that the determined soil characteristics are typical “made ground” characteristics. Therefore, the relationship between the bioaccessibility of lead from a “made ground” and the soil characteristics could, in general, be applicable for any lead contaminated made ground.

RIVM Report 711701086
28

RIVM Report 711701086
29
4 Lead characterisation
4.1 Introduction The aim of the present research is to examine the bioavailability of lead from specific made grounds and to link the bioavailability to soil and lead characteristics. In order to examine the relationship between lead bioavailability and specific lead characteristics, lead was characterized by the determination of:
1. the total concentration of lead in the made grounds; 2. the source of lead in the made grounds; 3. the primary and secondary lead phases. The mineralogy of lead that entered the soil
(primary lead phase) can dissolve over time and form secondary lead containing minerals;
4. the chemical composition and size (diameter) of the lead phases. Based on previous research by e.g. Steele et al., (1990), Cotter-Howells and Thornton (1991), Davis et al., (1993), Ruby et al., (1992, 1996, 1999), Rieuwerts et al., (2000), Hettiarachchi and Pierzynski (2004) and Walraven et al., (in prep.) it is known that the chemical composition of the anthropogenic lead source and size of lead in soils might be associated with the bioaccessibility of lead from soils.
4.2 Total lead detection
4.2.1 Introduction The total lead content of the soils is determined with various methods (XRF, real total ICP and so-called total ICP) by various institutes (RIVM, TNO Quality of Life, Deltares, Alcontrol and BKK Bodemadvies). Moreover, since each in vitro digestion experiment contains a detection of the released lead from soil into the chyme (the bioaccessible lead fraction) and a measurement of the total lead that remains in the soil, a mass balance (released lead from soil + remained lead in soil) should, in principle, equal the total lead in the soil prior to experimentation. These experiments are performed twice (in duplo). Therefore, ninety mass balance estimations in duplo of the total lead concentration are obtained.
4.2.2 Methods Lead was detected in soil by several methods:
Field-XRF method. BKK Bodemadvies determined the total lead content of all soil samples with a NITON portable XRF. The measuring time was set at 2 minutes per soil sample.
RIVM method. The total lead concentration in the ninety soils was detected by a method based on the microwave assisted destruction of the soil according to NEN 6961, except

RIVM Report 711701086
30
that a 1:3 dilution of aqua regia with distilled water was used. Following the destruction, the soluble lead in the acidic mixture was detected with ICP-MS according NEN-ISO 17294-2.
Alcontrol method. The total lead concentration in the ninety soils was measured by a method according to NEN 6961: microwave assisted destruction of soil with undiluted aqua regia. Following the destruction, the soluble lead in the acidic mixture was detected with ICP-AES according NEN 6966. Deltares method. The soil samples were digested according to the method described in section 2.3.2. Following the destruction, the soluble lead was detected with ICP-AES analyses in accordance with NEN 6966.
In addition, lead was detected in chyme. For the RIVM method, the chyme was diluted with 0.1 M HNO3, after which the concentration of lead was determined with ICP-MS according to NEN-ISO 17294-2. Note that for the RIVM in vitro digestion (IVD) experiment (chapter 5), the part of lead that remains attached to the digested soil (pellet) is separated from the soluble lead in the digestion juice (chyme) by centrifugation. The part of lead in the chyme is referred to as the bioaccessible fraction of lead. Furthermore, lead was detected in the pellet obtained after the IVD digestion experiment. For the RIVM method, the total lead concentration in the pellets (i.e. the digested soil after in vitro digestion) was detected by a method based on the microwave assisted destruction of the soil according to NEN 6961, except that a 1:3 dilution of aqua regia with distilled water was used. Following the destruction, the soluble lead in the acidic mixture was detected with ICP-MS according NEN-ISO 17294-2. In theory, the amount of the contaminant in the chyme and pellet should equal the amount of contaminant in the soil before the start of the digestion (mass balance). This mass balance can be used to evaluate the quality of the experiments.
4.2.3 Results The total lead concentrations of the soils is determined with several different methods (field XRF, RIVM, Alcontrol (ninety soils), HF (thirty soils), TNO (sixteen soils) and by calculating a mass balance (ninety soils, in duplo). These data are listed in Appendix 2 of this report. A summary of the results is presented in Table 4.1. This table includes the average values of the ninety soils for each method.

RIVM Report 711701086
31
Table 4.1: Averaged total lead concentrations of the soil samples from made grounds (note the difference in the number of samples).
field-XRF ICP-MS ICP-AES HF
BKK RIVM Alcontrol Duplo I Duplo II TNO Deltares90 90 90 90 90 16 30
845 1268 1148 1061 1244 1268 1501
Made grouds Mass balance: Chyme + Pellet
Amount of samples
Total lead detection in soil (mg Pb/kg soil)
Average lead
4.2.4 Discussion As can be seen in Table 4.1, the determined lead concentration for a specific soil can differ substantially with the different methods. Therefore, the choice for a specific lead detection method to use for the calculation of the bioaccessibility of lead from soil will have an impact on the calculated bioaccessibility of lead from soil. The bioaccessibility of lead from soil is calculated by dividing the amount of lead released from the soil in the in vitro digestion by the total lead concentration found in the soil. In Table 4.1, the portable Field XRF method results in the lowest average lead concentrations. It is suggested that this method underestimates the total lead concentration in soil since this measurement was performed on the wet soil. Moreover, this method was only used to check whether the lead concentrations were high enough to include the soils in this study. Therefore, the concentration obtained with the field-XRF can be considered to be indicative. Moreover, the highest lead concentrations in the soils were detected with the HF method, performed at Deltares. On average, the HF method (n=30) is able to detect 18 % more lead in soil compared to the same thirty soils measured by RIVM method. Lastly, the total lead determinations, performed at RIVM, Alcontrol and TNO show smaller variations in average lead concentration than when compared with results with HF destruction and field-XRF. The Alcontrol method detects systematically less total lead in soil compared to the soils measured by RIVM (n=90) and TNO (n=16) (see also section 4.2.4.1). Yet, for individual soils, considerable differences in detected total lead concentration can be observed between RIVM, Alcontrol and TNO. Heterogeneity of the soil samples is another source of variation of total lead concentration. It is possible that, for instance, lead is associated with rubble particles in the made ground. Although these soils (sieved to < 2 mm) were intensively mixed, it may be that the lead is not evenly divided in the soil, resulting in variations in lead content per measured soil sample. To solve this problem, it is recommended to measure the total lead concentration per method at least in duplo or triplo to obtain an average lead concentration per sample. It is expected that the destruction method used will have impact on the total lead detection in soils. It is known that destruction with aqua regia will not dissolve all lead in soil. Only HF destruction will completely dissolve all lead from soil, since this method also dissolves immobile and encapsulated lead. For risk assessment, it can be assumed that this immobile and encapsulated part of lead from soil will not be bioavailable and therefore not cause a potential health risk. After

RIVM Report 711701086
32
all, if a microwave digestion with aqua regia is not able to release this stable part of lead from soil, it can be expected that the human gastric tract will also not be able to release the lead from this immobile and encapsulated matrix. For the calculation of the bioaccessibility of lead from soil, the HF total lead measurements can, in principle, be used, as this provides for certain the total amount of lead in soil. However, the obtained bioaccessibility calculated with total lead in soil obtained with HF destruction results will not equal the bioaccessibility calculated with total lead in soil obtained with the microwave assisted aqua regia destruction. As this latter method is normally used as a default, is cheaper, less labour intensive and, relative to the HF method, less dangerous to perform, the microwave assisted aqua regia destruction is the preferred method of choice by NEN. However, the results of the RIVM and Alcontrol method, based on the microwave assisted aqua regia destruction are not quite comparable. Therefore, a more thorough discussion is needed to appoint the method of choice for the calculation of the bioaccessibility of lead from soil in this study.
4.2.4.1 Lead detection: comparison of RIVM and Alcontrol method The total lead concentrations obtained with the RIVM and Alcontrol method are significantly different, based on the Wilcoxon signed rank test. Figure 4.1 reveals the X-Y scatter plot of the total lead concentration determined with the Alcontrol method (x-axis) versus the RIVM method (Y-axis). With the statistical software package R 2.7.1 (R Development Core Team, 2008), four outliers were detected, being sample 8, 22, 55 and 63. These outliers were excluded from the database prior to making the XY-scatter plot. It is noted that the Wilcoxon signed rank test revealed a significant outcome before and after the exclusion of the four identified outliers. The systematic difference in both methods is ~20 %, based on the slope of the trendline. This implicates that the RIVM method detects about 20 % higher lead concentration compared to measurements from the same soil by the Alcontrol method. As a consequence, the calculated bioaccessibility values and the relative oral bioavailability factors, based on RIVM and Alcontrol total lead data, are significantly different. Therefore, the choice which method for total lead analysis is used for the determination of the bioaccessibility of lead from soil will, unfortunately, influence the outcome of the risk assessment for these soils.

RIVM Report 711701086
33
Figure 4.1: The X-Y scatter plot of the total lead concentration in soil determined with the Alcontrol method (X-axis) versus the RIVM method (Y-axis). A trendline is plotted in this graph, including the equation and the R2 of the trendline. Also, the Y=X line is plotted in this figure. There are two main differences identified between the Alcontrol and RIVM lead detection method, being the method for lead detection (1) and the destruction method of the soil (2).
4.2.4.2 Lead detection The RIVM and Alcontrol method use a different detection technique to determine the dissolved lead after the destruction step. • The RIVM lead detection method uses the ICP-MS technique according NEN-ISO 17294-2. • The Alcontrol lead detection method uses the ICP-AES technique according NEN 6966. It is expected that the detection method used will not account for the considerable differences found in estimated lead concentrations in soils. Both methods are performed according standard guidelines and use appropriate quality controls.
4.2.4.3 Destruction method Prior to lead detection, the soils are destructed in a microwave to dissolve the lead in a hot and acid mixture under pressure. • The RIVM destruction method is based on the current NEN 6961-guideline. However, in
contradiction with the guideline, the RIVM method used diluted aqua regia (1:3) with water. • The Alcontrol destruction method is according to the current NEN 6961-guideline.
y = 1.22xR2 = 0.80
0
1000
2000
3000
4000
5000
6000
0 1000 2000 3000 4000 5000 6000
Total lead Alcontrol method (mg Pb/kg)
Tota
l lea
d R
IVM
met
hod
(mg
Pb/
kg)
Y=X
Linear (RIVM versus Alcontrol)

RIVM Report 711701086
34
It could be anticipated that undiluted aqua regia would be able to dissolve more lead in soil. This would results in higher lead concentrations determined by the Alcontrol method compared to the RIVM method. However, the RIVM method, with diluted aqua regia, revealed systematically higher lead concentrations from soil (20 %), compared to the Alcontrol method. An explanation for this result could be that next to the dilution of the aqua regia, also the conditions inside the microwave (pressure, temperature and time) are important for the result of the microwave assisted digestion. Moreover, the NEN 6961 guideline specifies the destruction conditions as a range in temperature and time (Figure 4.2). Hence, the exact destruction conditions can vary within the specified range. This is probably the reason for the systemic difference in the outcome of the total lead concentration in the soils.
Figure 4.2: The range of the destruction temperature and corresponding destruction time, indicated in grey. This picture represents Figure 1 from the NEN 6961:2005 guideline and is reproduced with permission from NEN (Delft, the Netherlands; www.nen.nl). In addition, a previous RIVM report described the optimisation of the destruction method with soils. In this study, several different dilutions of aqua regia were tested (under the same microwave conditions). As a result, no differences were observed between diluted and undiluted aqua regia destruction (and the subsequent lead detection) of the reference soil Montana Soil 2710 (Van der Velde-Koerts, 1997). So, probably, the difference in microwave conditions and not the dilution of aqua regia is responsible for the different results of RIVM and Alcontrol method. The reference soil Montana Soil 2710, certified by NIST (National Institute for Standardization and Technology), was also studied in the present study by the RIVM. The thus obtained values for
Destruction time (min)
Des
truct
ion
tem
pera
ture
(°C
)
Destruction time (min)
Des
truct
ion
tem
pera
ture
(°C
)

RIVM Report 711701086
35
lead were close to the certified lead concentration of MS2710 (5519 mg/kg measured by RIVM versus 5532 mg/kg certified by NIST).
4.2.4.4 Decision for the total lead detection method in soil Based on the above considerations, it was concluded that although the RIVM method was not performed according to the NEN 6961 guideline, the obtained lead concentrations were in agreement with the reference soil MS 2710 and the reported TNO lead concentrations (chapter 8). It is recognized that, since the NEN 6961 guideline specifies temperature and time as a range, lab to lab differences can occur (Figure 4.2). The data obtained with the Alcontrol method resulted in lower lead concentrations as expected. Therefore, in this study, the preference was given to the total lead data obtained with the RIVM method. Hence, the bioaccessibility of lead from soil is calculated with total lead concentrations in soil obtained with the RIVM method.
4.3 Multi-element analysis
4.3.1 Introduction Made grounds can be polluted with various lead sources, e.g. lead-glazed potsherds, white lead, industrial waste, etc. These lead sources can contain, besides lead, various other metals, like iron, zinc, copper, arsenic, barium, nickel, chromium, cadmium, tin, antimony and silver. The presence and content of metals in the soil samples, can give information about the anthropogenic lead sources in the soil samples, and can thus indicate the origin of the lead pollution. Multi-element analysis in combination with “fuzzy c-means (FCM)” clustering is performed to characterize the lead pollution in thirty selected samples. The results of the multi-element and FCM cluster analysis are used to determine if the made grounds are polluted with the expected lead sources, based on historic information and/or pre-investigation of the sites. The expected lead sources are white lead, ceramic industry slag, vitriol slag, zinc white slag and city waste (mixture of e.g. lead-glazed potsherds, coals ashes, lead based paint flakes and chips of lead sheets). White lead and ceramic industry slag (mainly lead glazed rooftiles) are characterized by high amounts of lead and can be accompanied with trace amounts of e.g. silver and antimony. Vitriol slag is dominated by high contents of iron, sulphur, zinc, lead and barium. These are the waste products of pyrite ore. The chemical composition of zinc white slag resembles that of vitriol slag, but can be distinguished based on the higher zinc content in relation to the iron, sulphur, lead and barium content. Since city waste is a mixture of various lead sources and other heavy metal sources, the chemical composition of this source can be variable. However, city waste is mainly dominated by high contents of lead and zinc.
4.3.2 Methods The thirty selected soil samples are prepared according to the method described in section 2.3.2. Aluminium (Al), barium (Ba), calcium (Ca), cerium (Ce), cobalt (Co), chromium (Cr), copper (Cu), iron (Fe), potassium (K), lithium (Li), magnesium (Mg), manganese (Mn), sodium (Na),

RIVM Report 711701086
36
nickel (Ni), phosphorus (P), lead (Pb), sulphur (S), strontium (Sr), titanium (Ti), vanadium (V), yttrium (Y), zinc (Zn) and zirconium (Zr) content is determined with an ICP-AES according NEN 6966. The arsenic (As), cadmium (Cd), antimony (Sb), tin (Sn) and silver (Ag) content is determined according NEN-ISO 17294-2.
4.3.2.1 Fuzzy c-means clustering Fuzzy c-means (FCM) clustering is used to try to subdivide the multi-element dataset into homogeneous groups. FCM clustering is chosen as clustering technique because it allows some vagueness in the description of the cluster model and thus deals better with overlap between clusters. A statistical technique to evaluate the FCM clustering is non-linear mapping. FCM clustering and non-linear mapping are based on different theoretical considerations, and thus any similarities between the data structures elucidated in the application of both techniques are a strong indication of their true existence (Vriend et al., 1988). For the present dataset, the aim was to label clusters based upon differences in lead sources. To eliminate the influence of lithological differences between the made grounds, the clustering is performed on the enriched metal content of the samples. Van der Veer (2006) developed an enrichment/depletion model based on the aluminium content of soils to estimate enrichment/depletion of elements in Dutch soils. This model is used to calculate the enriched content (pollution) of metals in the made grounds. For more details see Van der Veer (2006).
4.3.3 Results The results of the multi-element analysis are listed in Appendix 3. The enrichment/depletion model of Van der Veer (2006) shows that the lead, zinc, copper, arsenic, nickel, antimony, tin and barium content is enriched in the majority of the thirty selected samples. The elements titanium, chromium, potassium, lithium, magnesium, vanadium and yttrium were not, or only incidentally, enriched in the made grounds. The model of Van der Veer (2006) cannot be applied for sodium, calcium, strontium, manganese, sulphur, phosphorus, cadmium, mercury, molybdenum and zirconium. These elements were therefore beforehand excluded from the FCM clustering analysis. Van der Veer (2006) did not include cerium, cobalt and silver in his enrichment/depletion model. Since silver is known to be present in the lead ore galenite, it was decided to include the silver data in the clustering analysis. Since the number of samples was limited, 6 enriched elements were selected for the FCM cluster analysis: EPb, EZn, EFe, ESb, EBa and EAg. The content of these elements is listed in Appendix 4. This selection is based on the expected chemical differences between the lead sources. In order to obtain a meaningful FCM clustering, the dataset has been examined for missing values and for deviations from normality. Missing values are omitted for statistical purposes. Normal probability plots show that the enriched elements EPb, EZn, ESb, EFe, EBa and EAg have a lognormal distribution.

RIVM Report 711701086
37
The model criteria for determining the number of clusters indicated an initial best fit for five clusters. This agrees with the number as determined based on field data, geochemical interpretability and unimodality of the distribution. One sample could not be assigned to a cluster (sample 61) and is labelled as undefined. From each cluster a cluster centre composition is calculated (Table 4.2). These compositions represent the end-members of the different clusters. Each cluster is briefly described below. Table 4.2: Cluster centre composition (six selected enriched elements) for the selected made grounds.
Cluster 1 Cluster 2 Cluster 3 Cluster 4 Cluster 5n=2 n=7 n=12 n=6 n=2
EPb (mg/kg) 2681 1665 747 1494 1899EZn (mg/kg) 507 377 256 1183 6585ESb (mg/kg) 2,7 2,5 1,2 7,5 22EFe (wt%) 0,1 0,3 0,3 1,3 6,9EBa (mg/kg) 194 119 75 260 5635EAg (mg/kg) 12 1,3 1,0 1,5 3,6
Enriched element
Cluster 1. Typical for this cluster is the very high EPb enrichment of lead and silver content (Table 4.2). Only two samples are allocated to this cluster. These are the samples from Schoonhoven. Schoonhoven is known for its white lead production. Most likely galenite was the main ore for the white lead production. This ore contained silver as trace metal. Hence, the soils in cluster 1 likely contain mostly white lead. Cluster 2. This cluster shows a cluster centre with a relatively high EPb content, with comparatively low EZn, ESb, EFe, EBa and EAg content (Table 4.2). This metal association points at a lead dominant pollution as found in soils (solely) polluted with lead containing waste material (i.e. white lead, lead-based paint, lead-glazed potsherds and chips of lead sheets). Cluster 3. Samples assigned to Cluster 3 have the lowest content of EPb, EZn, ESb, EBa en EAg (Table 4.2). These samples are the least polluted of all samples. This cluster contains, in comparison with Cluster 2, a higher relative content of other metals in relation to the EPb content. This cluster is indicative for the presence of a mixture of various metal sources. Cluster 4. This cluster shows similarities in composition to Cluster 3, but has a higher content in all metals (Table 4.2). In this cluster the EZn content is almost as high as the EPb content. Like Cluster 3, soils assigned to Cluster 4 are polluted with a mixture of various metal sources (including lead sources). Cluster 5. Typical for this cluster is the very high EZn and EBa content, which is higher than the EPb content (Table 4.2). Only two samples are assigned to this cluster, sample 69 from Maastricht and sample 88 from Utrecht. Although these samples are assigned to the same cluster, there are some chemical differences. In Appendix 3, it can be seen that sample 88 also has high iron content, whereas the iron content of sample 69 is lower. This will be discussed in section 4.3.4. The cluster to which each of the selected made grounds is assigned, is given in Appendix 4.

RIVM Report 711701086
38
4.3.4 Discussion The main aim of the multi-element analysis is to characterize the lead pollution and to determine if the expected lead sources are present in the made grounds (Appendix 3). The multi-element analysis confirms that the anthropogenic lead source in samples 1 and 2 (Schoonhoven) is white lead. At four other sample sites (one in Utrecht, two in Delft and one in Rotterdam), white lead was also expected to be present in the sampled soils (Appendix 4). However, unlike Schoonhoven, the white lead production sites in Utrecht, Delft and Rotterdam are previously remediated. At these remediated sites, white lead is only present outside the remediation boundaries. Samples were therefore taken just outside these boundaries. It is however uncertain if these samples contain white lead, since the distance to the former white lead production site is substantial. Indeed, Appendix 4 shows that three of the four possible samples polluted with white lead are assigned to Cluster 2, indicating that these samples are mainly polluted with lead containing waste material. This means that these samples can contain white lead, but the presence of other lead sources (e.g. lead-glazed potsherds and chips of lead sheets) cannot be excluded. Additional lead isotope and SEM analysis are performed for verification (sections 4.3 and 4.4). The other samples that are assigned to Cluster 2 are expected to be polluted with city waste (Zutphen and De Rijp: n=3) and slag of a ceramic factory (Echt-Susteren: n=1). Soils in De Rijp and Echt-Susteren are known to be mainly polluted with potsherds of lead glazed ceramics (Walraven et al., 1997; Lyons Business Support, 1999). In these samples the expected lead sources are confirmed by the multi-element analysis results. The samples, which are assigned to Cluster 3, are expected to be polluted with city waste (n=9) and waste products of the ceramic industry (n=3). According to the FCM cluster analysis, these soils are polluted with lead, but are enriched by other metals. This was expected for the soils that are polluted with city waste, but not for the soils that are polluted with ceramic industry slag. It was assumed that these latter soils would mainly be polluted with lead (like Cluster 2). These soils might contain other lead sources besides ceramic slag. All samples, which are assigned to Cluster 4, are expected to be polluted with city waste (n=6). According to the FCM cluster analysis, these soils are more polluted more with lead in comparison with Cluster 3, and are also enriched in other metals besides lead. The chemical composition of the samples assigned to Cluster 4 matches with the chemical composition of the expected lead sources. The two samples assigned to Cluster 5 (Utrecht, sample 88 and Maastricht, sample 69) are mainly polluted with zinc and barium (Table 4.2). In Utrecht (sample 88) the soil is polluted with the pyrite (FeS2) ores and waste products of the vitriol production plant that was operational between 1835 and 1877. This explains the high iron and sulphur content of this soil. Pyrite ore can also contain barite (BaSO4) and galenite (PbS). In Maastricht (sample 69) zinc white has been produced from 1879 till 1945. Most likely sphalerite ((Zn, Fe)S) has been used as zinc ore. This explains the high zinc and sulphur content of this soil. This ore can also contain barite (BaSO4)

RIVM Report 711701086
39
and galenite (PbS). The expected sources at these sample sites are confirmed by the multi-element results. Based on multi-element analysis in combination with FCM clustering, the expected lead sources in the samples could be confirmed, except for:
1) four samples polluted with the expected lead source “white lead / city waste”. Not enough information is available to determine if white lead is present;
2) two samples polluted with “ceramic industry slag” (Maastricht, sample 71 and Echt-Sustern, sample 85). These samples might also contain other Pb sources.
In addition, the lead source in the samples from De Rijp (sample 17) and Echt-Susteren (sample 77) is most likely lead glazed potsherds (ceramics).
4.4 Lead isotope analysis
4.4.1 Introduction Lead isotope analysis is performed to further characterize the thirty selected soil samples and determine in more detail which lead source is responsible for the lead pollution in the soil. Lead consists of four stable isotopes: 204Pb, 206Pb, 207Pb and 208Pb. 204Pb is non-radiogenic and 206Pb, 207Pb and 208Pb are formed by the radioactive decay of 238U, 235U and 232Th, respectively. Therefore, the ratios of these stable lead isotopes vary according to the geological history of the sample and the concentration of lead (Pb), uranium (U) and thorium (Th). In general it can be stated that the older the rock, the lower the 206Pb/207Pb ratio and the higher the 208Pb/206Pb ratio. Several researchers demonstrated that lead isotope analysis is very useful to identify the anthropogenic lead source in the environment (e.g. Walraven et al., 1997; Walraven, in prep.). In the Netherlands the lead isotopic composition of anthropogenic lead sources differs clearly from natural lead and various anthropogenic lead sources have characteristic 206Pb/207Pb and 208Pb/206Pb ratios. So far, the lead isotopic composition of various lead sources in Dutch soils, e.g. coals ashes, leaded gasoline, Roman lead artefacts, car battery lead, lead based paint and gunshot lead, has been determined (Walraven, in prep.). Unfortunately no lead isotope analysis has been performed for white lead yet.
4.4.2 Methods The thirty selected soil samples are prepared according to the method described in section 2.3.2. The lead isotopic ratios used in this study are 206Pb/207Pb and 208Pb/206Pb. These ratios are the most cited ratios in environmental studies. To diminish mass bias in relation to differences in lead concentration, the solutions were diluted with 1 M HNO3 to a concentration of ± 50 ng/kg prior to being introduced into the mass spectrometer (ICP-MS). Data were taken in the peak jumping mode with three data points

RIVM Report 711701086
40
acquired across each peak at masses m/z 201, 204, 206, 207 and 208. The dwell time for masses 204, 206, 207 and 208 was respectively 50, 20, 20, 20 ms/channel. This was done to obtain comparable precision for the four lead isotopes. Ten runs were measured for each sample. For mass bias correction, a sample of NIST SRM 981 standard was run after each batch of 6 samples. All 206Pb/207Pb and 208Pb/206Pb ratios were determined with a precision of 2 RSD < 0.30 % and 2 RSD < 0.6 % respectively. The absolute accuracy of 206Pb/207Pb and 208Pb/206Pb of the measured ISE 921 sample was 1.166 ± 0.003 (2 SD) and 2.096 ± 0.002 (2 SD) respectively. Blanks and reagents used, were also measured with ICP-MS and appeared to contain negligible amounts of lead (< 20 ng/kg).
4.4.3 Results The results of the lead isotope analysis are listed in Appendix 5. The 206Pb/207Pb and 208Pb/206Pb ratios of the thirty selected soil samples vary from 1,094 to 1,180 and from 2,079 to 2,164 respectively. A sample from Maastricht (sample 73) has a very distinct lead isotopic composition: 206Pb/207Pb and 208Pb/206Pb are 1,094 and 2,164 respectively. When this sample is not taken into account the 206Pb/207Pb and 208Pb/206Pb ratios of the samples vary from 1.146 to 1,180 and from 2,079 to 2,118 respectively. The made grounds are labelled after the FCM cluster they are assigned to (section 4.2) and are plotted in Figure 4.3.
4.4.4 Discussion To characterize the anthropogenic lead sources in the selected made grounds, the 208Pb/206Pb ratios of the made grounds were plotted versus the 206Pb/207Pb ratios in a so-called 3-isotope plot (Figure 4.3). This plot also includes data of lead origins that may be responsible for anthropogenic lead in the studied made grounds. The ellipses in this figure include the majority of samples of a specific origin (e.g., roadside soils, Dutch subsoil samples) or group of sources (e.g., lead ores and charcoal from Germany and Belgium, lead ores from former Belgian Congo). Generally, lead sources plotted in this 3-isotope plot form more or less a straight line, in which the geological old sources plot in the upper left corner of the graph, and the young sources plot in the lower right corner.

RIVM Report 711701086
41
Figure 4.3: 208Pb/206Pb versus 206Pb/207Pb ratios in the made grounds. Ellipses include 208Pb/206Pb-206Pb/207Pb ratios of (groups) of possible lead origins: Dutch (n=10) and Belgian (n=10) charcoal samples (Walraven, in prep.); galena samples from Belgian (n=60) and Germany (n=18) and lead containing waste material from De Rijp, Fijnaart en Wijk bij Duurstede (n=16); galena samples from former Belgian Congo, Katangan system (n=14) (Doe and Rohrbough, 1977; Pasteels et al., 1980; Cauet et al., 1982; Large et al., 1983; Walraven, in prep.); roadside soil (NL) samples (n=16) (Walraven, in prep.); subsoil (NL) samples (n=358) (Walraven, in prep.). cs=ceramic slag, zs=zinc white slag, wl=possible white lead, vs=vitriol slag. Figure 4.3 shows that the lead isotopic composition of the polluted made grounds differs from the unpolluted soils in the Netherlands. This confirms that made grounds are polluted with lead. The majority of the made ground reveal lead isotopic compositions that matches with the lead isotopic composition of:
Composition 1. Lead ores (and coal ashes) from Belgium and Germany. This lead, is present in the made ground as waste material (e.g. lead glass fragments, lead glazed potsherds, lead based paint flakes, coal ashes and industrial lead slag). Previous studies identified that anthropogenic lead in made grounds of De Rijp, Fijnaart and Wijk bij Duurstede mainly originated from these Belgium and German lead ores (Walraven et al., 1997; Walraven, in prep.).
1.09 1.1 1.14 1.15 1.16 1.17 1.18 1.19
206Pb/207Pb
2.07
2.08
2.09
2.1
2.11
2.12
2.17
208Pb/206Pb
Clusters1: white lead2: Pb containing city waste3: Mixed city waste I4: Mixed city waste II5: Zn-Ba-Pb pollution
wl
wl
wl
cs
wl
cs
cs
cs
zs
vs
Unpolluted soilsin The Netherlands
Coal from Belgiumand the Netherlands
Roadsidesoils
a.o. Pb ores from Begium and Gemany
a.o. Pb ores fromformer Belgian Congo

RIVM Report 711701086
42
Composition 2. Lead ores from Belgian Congo. Until this study, no made grounds with lead isotopic compositions that differed from Belgium and German lead ores and Dutch and Belgian coals were encountered (Composition 1). The lead isotopic composition of these deviating samples, matches with the lead isotopic composition of lead ores from Belgian Congo. Based on lead isotopic measurement on zinc ashes from zinc smelters in De Kempen, it is known that large quantities of lead and zinc ores from Belgian Congo were shipped to the Netherlands (Walraven, 2008). Most likely these ores were also used for the production of lead based materials (e.g. lead glazed ceramics). It might, however, also be possible that the lead ores originate from small scale mines in Italy (Sardinia), which have comparable lead isotopic compositions with Belgian Congo. However, this is unlikely since the Belgian Congo mines were very large and products were exported throughout the world. Composition 3. One sample (Maastricht; sample 73) has a very distinct lead isotopic composition. This lead isotopic composition matches that of roadside soils. Therefore, this sample might be polluted with lead that originates from leaded gasoline.
The made grounds in Figure 4.3 are labelled after the FCM cluster they are assigned to (section 4.2). The two samples assigned to the white lead cluster (Schoonhoven, sample 1 and sample 3) have characteristic lead isotopic compositions. The lead isotopic compositions of one of the made grounds (Utrecht, sample 8), that might be polluted with white lead (labelled with wl), does not differ very much from the white lead pollution in Schoonhoven. The lead isotopic compositions of the other three sites with supposed white lead pollution (Delft and Rotterdam) differ considerable from the lead isotopic compositions of the white lead polluted soils from Schoonhoven. Nevertheless, the lead isotopic composition of these three samples relate rather well. Unfortunately there is not yet a lead isotopic database of produced white lead in the Netherlands. Therefore it is not possible to confirm that these samples are really polluted with white lead. The samples assigned to the other FCM clusters did not reveal distinct Pb isotopic compositions. Interestingly, the lead isotopic composition of the zinc white slag (zs) and the white lead pollution in Schoonhoven are quite similar. Most likely the zinc white and white lead are produced form ores from the same geographical region (Belgian Congo). The lead isotopic composition of the vitriol slag matches with that of German and Belgium ores. It is known that the pyrite ore from which vitriol is made in Utrecht came from Germany. Contrary to the ‘narrow’ lead isotopic composition of roadside soils, toemaakdekken in Zuid-Holland, Zn ashes in De Kempen and lead polluted soils in De Rijp (Walraven et al., 1997; Walraven, 2008; Walraven, in prep.), the lead isotopic composition of the made grounds, studied in this research, is quite diverse. This is most likely caused by the large geographical spread of the sample locations in this study compared to the other studies. The lead containing materials that polluted these made grounds in the Netherlands are obviously made from lead ores that originated from several countries, with different geological ages. In general, it can be assumed that lead isotopic compositions are very comparable on a local scale, whereas on a national scale the differences can be substantial.

RIVM Report 711701086
43
4.5 Mineralogy and particle size
4.5.1 Methods Scanning Electronic Microscopy (SEM) images of sixteen selected soil samples were made to study the chemical compositions and particle sizes (diameter) of the anthropogenic lead phases (both primary and secondary) present in these made grounds. The sixteen selected soil samples are prepared according to the method described in section 2.3.2. A microprobe equipped with an Energy Dispersive röntgen fluorescence Spectrometer (EDS) was used for the chemical analysis. From each sample an element map for lead (Pb), phosphorus (P) and silicon (Si) was made. Based on these three elements the following anthropogenic groups can be distinguished: 1. lead, lead oxide or lead carbonate; 2. lead apatite; 3. lead glass/glaze. From each sample the most representative primary and secondary lead phases were analyzed, both for chemical composition and particle size (diameter). The lead content of organic matter was also determined. Only organic matter particles with a SiO2 content <20 % were selected.
4.5.2 Results The results of the SEM analysis are listed in Appendix 7 (available on the RIVM website; www.rivm.nl). The SEM images are shown in Appendix 8 (available on the RIVM website; www.rivm.nl). A summary of the SEM results (primary and secondary lead phases, grain size and mean lead content of the organic matter particles) is given in Table 4.3. In the calculation of the mean lead content of organic matter particles, missing values and/or values “less than” the detection limit are, following a simple substitution method (Sanford et al., 1993), replaced by 0.75 times the detection limit as default).

RIVM Report 711701086
44
Table 4.3: FCM cluster labels, lead isotopic compositions, and primary and secondary lead phases, particle size and the mean lead content of organic matter as determined with the SEM in the sixteen selected made grounds.
- absent; +- few particles present; + several particles present; ++ large number of particles present; () diameter of Pb phase; [] mean Pb content (in wt %) of organic matter particles.
Pb isotopes Primary Pb phases Secondary Pb phases Sample location
FCM cluster
206Pb/20
7Pb
208Pb/
206Pb
Pb, Pb oxide
Pb carbonate
Pb glass /glaze
Pb-S Pb-
apatite Pb-organic
matter Pb-S Pb-Fe
1 Schoonhoven 1 1,146 2,114 ++ (10 μm)
+ (10-15 μm) - + (5-15) ++
[n=7: 0.440]
- -
11 Utrecht 4 1,160 2,101 -
- - + (10-30 μm) ++
[n=11: 0.160]
- + (<5-10 μm)
17 De Rijp 2 1,175 2,090 - ++ (20-675 μm) - + (1 particle:
25 μm)
+-
[n=19: 0.020]
- -
21 Haarlem 4 1,172 2,091 + (<5-75 μm)
- +- (1 particle:
5 μm)
+ (10-80 μm) +
[n=21: 0.230]
+- (1 particle:
5 μm)
+
27 Alkmaar 3 1,170 2,097 + (5 μm)
+ (15-55 μm) - ++ (5-70 μm) +
[n=6: 0.087]
- -
29 Leiden 3 1,170 2,099 -
+ (5-15 μm) - + (25 μm) +-
[n=11: 0.004]
- -
33 Delft 2 1,176 2,087 + (10-35 μm)
+ (375 μm – 2,8
mm)
- ++ (20-40
μm)
+
[n=12: 0.295]
- + (vein)
43 Den Haag 4 1,174 2,088 -
- + (5-200 μm) + (40-90 μm) +
[n=18: 0.270]
+ (5-200 μm) -
45 Rotterdam 3 1,164 2,094 +- (1 particle:
125 μm)
+ (2 particles:
50-95 μm)
- - +
[n=21: 0.030]
- -
51 Schiedam 3 1,159 2,094 -
+- (1 particle: 50
μm)
+- (1 particle:
50 μm)
+- (1 particle:
10 μm)
+
[n=8: 0.120]
+- (1 particle:
50 μm)
-
53 Groningen 3 1,179 2,081 +- (1 particle 15
μm)
- - ++ (<5-20
μm)
++
[n=18: 0.110]
- -
59 Zutphen 2 1,169 2,095 + (40-55 μm)
+ (5-10 μm) - + (5-215 μm) +
[n=15: 0.100]
- -
63 Nijmegen 4 1,158 2,102 ++ (2-195 μm)
- - +- (1 particle:
30 μm)
++
[n=12: 0.335]
- -
69 Maastricht 5 1,147 2,112 -
- - - -+
[n=15: 0.004]
- -
71 Maastricht 3 1,161 2,095 +- (1 particle: 5
μm)
+ (10-40 μm) - - -+
[n=23: 0.004]
- -
77 Echt-
Susteren
2 1,154 2,105 +- (1 particle) ++ (5-70: 1
particle 250 μm)
- - -
[n=2: 0.004]
- -

RIVM Report 711701086
45
4.5.2.1 Primary lead phases Primary lead phases are the lead containing particles that entered the soil (e.g. lead glass, elemental lead (bullet) and white lead (paint)). Two groups of primary lead phases are distinguished:
1) Elemental lead, lead oxide and/or lead carbonate. These phases are characterized by a very high lead content (> 90 wt %). With the SEM/EDS technique it was not possible to distinguish between elemental lead, lead oxide and/or lead carbonate (due to the inaccuracy of the C and O analysis). In Figure 4.4, examples of SEM photos of elemental lead, lead oxide and/or lead carbonate are given.
2) Lead glass or lead glaze. Lead glass is characterized by a high SiO2 and lead content. Lead glaze is often present on clay (ceramic) and is therefore characterized by a high Al2O3, SiO2 and lead content. In Figure 4.4, examples of SEM photos of lead glass/glaze are given.
Some samples contain Pb-S phases. These phases can both be 1) sulfates or sulfides and 2) primary or secondary minerals. They are therefore listed as primary and secondary minerals in Table 4.3. In Table 4.3 can be seen that the samples from De Rijp, Leiden, Maastricht (71) and Echt-Susteren are mainly polluted with the primary lead phases lead glass and/or lead glaze. The diameter of these phases is relatively large. The samples from Schoonhoven, Haarlem and Nijmegen are mainly polluted with elemental lead, lead oxide and/or lead carbonate. The diameter of these primary lead phases is relative small. The samples from Alkmaar, Rotterdam, Delft and Zutphen are polluted both with lead, lead oxide and/or lead carbonate and lead glass/ glaze. Primary lead phases in samples from Utrecht, Den Haag, Schiedam and Groningen are observed in the elemental maps, but the diameter is so small (<10 μm), that they are hard to find for EDS measurements. No primary phases were observed in the sample from Maastricht (69).
4.5.2.2 Secondary Pb phases Over time, primary lead phases can dissolve and secondary lead phases can be formed. In total, four secondary lead phases are distinguished:
1) Lead apatite. Minerals belonging to the apatite group have the following general formula A5(XO4)3-(F, Cl, OH), where A=Pb, Ba, Ca, Ce, Na and Sr, and X=As, P, Si and V. Lead apatites in made grounds are characterized by high contents of Pb, Ca, P (P2O5) and/or Cl. The lead apatite Pb5(PO4)3Cl is known to be very stable (Ruby et al., 1999). Lead apatite can be newly formed or formed through adsorption or substitution of lead on already existing apatite (e.g bone flakes);
2) Pb-OM: Lead adsorbed to organic matter (OM); 3) Fe-Pb: Lead adsorbed to reactive iron; 4) Pb-S: Lead sulphate or lead sulfide (galenite). This phase can also have a primary nature.

RIVM Report 711701086
46
Several lead apatite minerals are detected in the made grounds from Schoonhoven, Utrecht, Haarlem, Alkmaar, Leiden, Delft, Den Haag, Groningen and Zutphen (Table 4.3). The lead content in the lead apatite minerals varies from 4 to 86 wt %. In illustration a SEM analysis of a lead apatite mineral and its chemical composition is shown in Figure 4.4. In the other city soils, none or very limited amounts of apetite minerals were detected. The mean lead content of the organic matter particles in the made grounds varies from 0.004 wt % to 0.440 wt % (Table 4.3). The lowest mean lead content in organic matter (0.004 to 0.03 wt %) is measured in the made grounds that contain lead glass and/or lead glaze as main primary lead source. The highest mean lead content (0.335-0.440 wt %) is measured in the samples with the highest amount of lead, lead oxide and/or lead carbonate particles. In one sample (Den Haag, sample 43) a substantial number of Pb-S phases are detected (Appendix 7 and 8, available on the RIVM website; www.rivm.nl). Based on the available information, it is not possible to determine if these are primary or secondary phases. In two samples (Utrecht, sample 11, and Delft, sample 33), lead is found in association with reactive iron (Appendix 7 and 8, available on the RIVM website; www.rivm.nl). In both samples lead seems to be adsorbed to the surface of Fe phases.

RIVM Report 711701086
47
Figure 4.4: Examples of primary and secondary lead phases, and their chemical composition, in made grounds.
Photo 1. Pb glass/glaze particle in soil sample
from Maastricht (77). Photo 2. Pb glass/glaze particle (Pb glazed
potsherd) in soil sample from De Rijp (17).
Photo 3. Pb oxide in soil sample from
Nijmegen (63). Photo 4 Elemental Pb, Pb oxide or Pb carbonate
in soil sample from Haarlem (21).
Photo 5. Pb apatite in soil sample from
Alkmaar (27).
Photo Point Al2O3 SiO2 P Fe2O3 CaO Pb 1 1 5 29 <1 <1 4 60 2 1, 2 6 34-36 <1 2 2 50-53 3 1 <1 <1 <1 <1 <1 99 4 1, 2 <1 <1 <1 <1 <1 97 5 - 1-2 0-7 17-18 2-3 8-10 57-68

RIVM Report 711701086
48
4.5.3 Discussion Based on the SEM data the sixteen selected made grounds can be divided into five groups:
1) Soils mainly polluted with lead glass or lead glaze (De Rijp 17, Leiden 29, Maastricht 71 and Echt-Susteren 77). The diameter of these primary phases is relatively large (up to 675 μm). These samples contain no to very few secondary lead phases and the lead content of organic matter particles is very low (0.004 to 0.020 wt %). It is concluded that the solubility of these primary minerals is relatively low, due to the small reactive surface and the incorporation of lead in a glass matrix. This low solubility resulted in the formation of no to very little secondary lead phases.
2) Soils mainly polluted with lead, lead oxide or lead carbonate (Schoonhoven 1, Haarlem 21 en Nijmegen 63). The diameters of these primary lead phases are relatively small. The mean lead content of organic matter in these samples is relatively high (0.230-0.440 wt %) and two out of three samples contain lead apatite. It is concluded that the solubility of these primary lead phases is relatively high, due to the large reactive surface and the presence of the substantial amount of secondary lead phases. This is confirmed by the dissolution holes in the primary lead phases in the soil from Nijmegen (Appendix 8). The newly formed secondary lead phases are (under the prevailing soil conditions) less mobile than the primary lead phases.
3) Soils polluted with multiple primary sources (Alkmaar 27, Rotterdam 45, Delft 33 and Zutphen 59). The organic matter particles in these soils have an intermediate mean lead content (0.030 to 0.295 wt %). The solubility of these soils is suspected to lie between group 1 and 2.
4) Soils polluted with very fine primary lead phases (Utrecht 11, Den Haag 43, Schiedam 51 and Groningen 53). These particles are observed in the elemental maps, but could not be traced for EDS measurement. Based on the presence of the secondary minerals lead apatite and lead containing organic matter (mean lead content: 0.11-0.27 wt %), they most likely contain at least fine lead, lead oxide or lead carbonate particles.
5) No primary phases were observed in the sample from Maastricht (69). The main pollution source of this sample is zinc white and is characterized with a high zinc (Zn) and barium (Ba) content (Table 4.3, Appendix 3).
The soils in Schoonhoven (1), Maastricht (71) and Echt-Susteren (77), and Maastricht (69) were expected to be polluted with white lead, ceramic slag and zinc white, respectively. This is confirmed by the SEM results. The expected lead source in the soils in Utrecht (8), Delft (33 and 38) and Rotterdam (47) was white lead or city waste. Of these soils, only the sample from Delft (33) was further analysed with the SEM. Based on the SEM results is concluded that the made ground sample from Delft (33) is polluted with a mix of lead sources (e.g. lead, lead oxide and/or lead carbonate, and lead glass/glaze). White lead is not the primary lead source in this sample.

RIVM Report 711701086
49
Walraven et al., (1997) studied lead pollution in soils from De Rijp and concluded glazed rooftiles and pottery) was the main lead source. This finding is confirmed in this study (sample 17) by the SEM results (Table 4.3). All other made grounds were expected to be polluted with city waste in general, which is confirmed by the SEM results. Several studies mentioned and/or showed that the bioavailability of lead in soil is influenced by: 1) the chemical composition of the anthropogenic lead source and its solubility; 2) the specific reactive surface of lead in soils; 3) the soil type, and capacity to form secondary lead phases. The influence of the soil and lead characteristics that lead glass / glaze (remnants of on the bioavailability of lead will be further discussed in chapters 6 and 7.
4.6 Conclusions Although the aim of this study was not to review and discuss the different methods to determine the total lead concentration in soil, it was found that these different quantification methods for total lead detection resulted in different total lead concentrations in the soils. These significant differences in total lead concentration will results in differences in the calculated bioaccessibility. Based on the considerations in section 4.1, it was concluded that although the RIVM method was not performed according the NEN 6961 guideline, the obtained lead concentrations were in agreement with reference material and other data (from TNO) that were obtained according to the NEN guideline. The data obtained with the Alcontrol method resulted in significantly lower (10 %) lead concentrations compared to data from RIVM and TNO. The NEN 6961 guideline specifies the soil destruction conditions as a range in temperature and time. Hence, the exact destruction conditions can vary within the specified range. This probably results in variation in the outcome. In this report, the bioaccessibility of lead from soil is calculated with lead concentrations in soil obtained with the RIVM method (section 4.1). The present study indicates that large systematic differences in total lead concentration are obtained when using different destruction conditions, even if the destruction conditions are within the range indicted by the NEN 6961 guideline. This is of concern if the measured concentrations are used for risk assessment purposes. Therefore, it is recommended to develop more specific guidelines for the destruction of soil. Due to the origin of the samples (made ground), small variations found in total lead concentration in one single soil sample may be due to the heterogenic distribution of the lead in the soil. As identified with multi-element analysis and SEM pictures, part of the lead (both primary and secondary phases) is associated with rubbish particles in these soils. Although the soils were sieved (< 2 mm) and extensively mixed, it may be that the lead is not evenly distributed

RIVM Report 711701086
50
throughout the soil, resulting in small variations in lead content per subsample used for analysis. To solve this problem, it is recommended to measure the total lead concentration per method at least in duplo or triplo to obtain an average lead concentration per sample. Since all lead detection techniques face the same difficulties with the heterogeneity of lead in the soils, it is thought a systematic difference in average total lead concentration (Table 4.1) cannot be explained by the heterogeneity of the soils. Multi-element, lead isotope and SEM analyses were performed to determine the origin of the lead pollution, present in made grounds. This included the identification of the chemical composition and particle size (diameter) of the primary and secondary lead phases. Various anthropogenic lead sources were distinguished in the thirty selected samples: white lead, ceramic industry slag, vitriol slag, zinc white slag and city waste (mixture of e.g. lead-glazed potsherds, coals ashes, lead based paint flakes and chips of lead sheets). In most samples, the expected lead sources, based on historical information, matched with the determined lead source. However, the presence of white lead in the samples from Utrecht (8), Delft (33 and 38) and Rotterdam (47) could not be confirmed. In addition, some samples, expected to be polluted with ceramic industry slag (Echt-Susteren), also contained another lead source (city waste). Based on the chemical composition and particle size of the primary and secondary lead phases, the sixteen selected made grounds can be divided in the four following groups: • soils mainly polluted with lead glass or lead glaze; • soils mainly polluted with lead, lead oxide or lead carbonate; • soils polluted with both primary sources; • soils polluted with very fine primary lead phases.
No primary phases were observed in the sample from Maastricht (69). The main pollution source of this sample is zinc white and is characterized by a high zinc and barium content.

RIVM Report 711701086
51
5 Bioaccessibility experiments: IVD model
5.1 Introduction
5.1.1 Bioaccessibility Insight into the bioavailability of lead can be obtained by simulating the human digestion process. With in vitro digestion models, the amount of contaminant (i.e. lead) that is released from the matrix (i.e. soil) at simulated physiological conditions is investigated. This is referred to as bioaccessibility (with the bioaccessible lead fraction FB). This estimated (bioaccessible) amount of lead is, in principle, available for uptake in the body (Oomen et al., 2006). With information on the bioaccessibility and bioavailability (in the latter, also absorption through the intestine and first-pass metabolism are taken into account) of lead from soil, risk assessment of contaminated sites can be refined. In a previous report, the scientific basis of the in vitro digestion (IVD) method of RIVM has been described (Hagens et al., 2008).
5.1.2 Relative oral bioavailability In the body, not all bioaccessible lead (i.e. fraction of lead that is released from the matrix) will become bioavailable (i.e. fraction of lead that reached the systemic circulation). Therefore, the in vitro determined bioaccessibility value of lead from soil (FB,soil) should be converted to a bioavailability value (F) representing the fraction of total lead that reached the systemic circulation (see also formula 1). To account for the difference in bioavailability of dietary lead and lead from soil, the relative bioavailability factor (Rel F) can be calculated. This relative bioavailability factor (Rel F) for lead from soil is calculated by dividing the bioavailability of lead from soil (Fsoil) by the bioavailability of lead from the MPR studies (FMPR). The relative F is therefore a ratio of two bioavailability values (see equation 5; (Oomen et al., 2006)).
(5) B,soil A,average,children B,soil B,soilB,soil
MPR
F F F 0.8 F F 2 F
F 0.4 0.5Rel
× ×= = = = ×
5.1.3 Physiological conditions From literature, it is known that lead is better absorbed in fasted conditions and, hence, more bioavailable, than in fed conditions (James et al., 1985; Heard et al., 1982; Heard et al., 1983; Blake et al., 1983). Also the bioaccessibility appears to be higher for fasted conditions (Oomen et al., 2006; Lijzen et al., 2006). Based on the higher bioaccessibility and higher absorption of lead for fasted conditions, the fasted state is the most conservative state to assess a relative bioavailability factor of lead from soil (i.e gives the highest relative oral bioavailability factor). The choice of the physiological condition (i.e. fasted, fed or average fed/fasted) that is used to estimate the relative oral bioavailability factor of lead from soil influences the value of the relative bioavailability factor to be used in current risk assessment.

RIVM Report 711701086
52
As exposure to lead via soil is assumed to be a chronic process (Oomen et al., 2006), the “average physiological state” conditions in risk assessment will be more realistic than fasted conditions (Hagens et al., 2008). The rationale behind this “average physiological state” condition is that a child will not always be totally fed or fasted when contact with soil occurs. With the IVD model an estimation of the relative oral bioavailability of lead from soil can be made. To estimate the bioavailability of lead from soil for the “average physiological state”, the same soil should be analyzed with the in vitro digestion method for both fasted and fed conditions. However, another possibility is to derive an “average physiological state” correction factor (CFAPS) to estimate the bioaccessibility of lead from soil for the “average physiological state” based on a conversion of the bioaccessibility for only fasted (or fed) conditions. In a recent study, this “average physiological state” correction factor (CFAPS) was derived based on 75 soil samples for which the bioaccessibility was determined for both fasted and fed conditions (Hagens et al., 2008). The relative bioavailability (see equation 5) can be calculated for the average physiological state (APS) conditions (see equations 6A and 6B; (Hagens et al., 2008)). (6A) Rel FAPS = FB,soil, fasted + FB,soil fed
(6B) Rel FAPS = 2 × FB, soil, fasted × CFAPS In Table 5.1, the percentile values for the CFAPS are given. In this report on “made grounds” the P50 percentile value is used to estimate the bioaccessibility for average physiological state based on the bioaccessibility of lead from soil for fasted conditions. This P50 represents a realistic correction factor since for this correction no worst case assumption is required. Table 5.1: Percentile values of the “average physiological state” correction factor (CFAPS) for IVD bioaccessibility data (Hagens et al., 2008).
Percentile Correction factorP50 0.809P60 0.828P70 0.859P80 0.922P90 0.961P95 0.984
"Average physiological state" correction factor
(CFAPS)
5.1.4 Application of relative oral bioavailability in risk assessment Taken together, based on the three previous sections, the bioaccessibility of lead from soil for fasted conditions is determined in vitro and subsequently transformed to the bioaccessibility of lead from soil for the average physiological state of a child. This value can be translated in the

RIVM Report 711701086
53
relative oral bioavailability factor of lead from soil for average physiological conditions. This derived relative oral bioavailability factor for the average physiological state can be implemented into risk assessment of lead by humans via ingestion of soil according to the Sanscrit methodology, offering an alternative for the default approach ( Lijzen et al., 2006; Otte and Wintersen, 2007). Sanscrit (sanerings criterium; remediation criterion) is an online program (www.risicotoolboxbodem.nl) for (local) authorities to decide on the necessity of remediation in order to prevent negative consequences of soil contamination.
5.1.5 Validation of the IVD model Previously, the bioaccessibility results of the IVD model have been compared to in vivo bioavailability studies of lead from soil in juvenile swines. The correlation between bioaccessibility as determined by the IVD (using 0.06 gram soil) and relative bioavailability of lead from soil as determined in vivo in juvenile swines (Casteel et al., 2006) was satisfactory, whereas also the slope of the line was according theoretical expectations (Figure 5.1; Oomen et al., 2006). Note that relative in this comparison refers to the bioaccessibility or bioavailability of lead from soil relative to the bioaccessibility or bioavailability of lead acetate, a highly soluble lead salt. Furthermore, the in vitro bioaccessibility of lead from soil for both fasted and fed conditions was in agreement with the oral bioavailability of lead from soil as determined in a human study (Maddaloni et al., 1998; Oomen et al., 2006). By using 0.06 gram of soil per digestion tube, the pH during in vitro digestion is usually not affected by the soil, so that in almost all cases the results can be used (i.e. no rejection of data caused by suboptimal pH incubation). Also the solid-to-liquid ratio is within the realistic range, similar to the hand-to-mouth amount of soil ingested daily by children. However a disadvantage is that the small aliquot of soil (0.06 g) taken for bioaccessibility determination might not be representative for the entire soil due to heterogeneity of the soil (Oomen et al., 2006).

RIVM Report 711701086
54
Figure 5.1: Correlation of lead between relative in vivo bioavailability data obtained with juvenile swine studies (US-EPA, 2004; Schroder et al., 2004; Ruby et al., 1999) and relative in vitro bioaccessibility data obtained with the IVD model (both 0.6 and 0.06 grams per digestion tube; Oomen et al., 2006). The data indicated with the open squares are not included in the correlation as they displayed very high, not-physiological gastric pH values during the in vitro digestion (Suboptimal pH incubations). The triangles represent the data of lead bioavailability from Bunker Hill soil, which was determined in adult volunteers (Maddaloni et al., 1998; NB: Bunker Hill data not included in correlation). The full line indicates a linear fit to the data with a forced intercept through zero, i.e. if a compound is not bioaccessible it should not be bioavailable either. The dotted lines indicate the associated 90 % interval of the fitted lines. This correlation graph is taken from the previous RIVM report by Oomen et al., (2006).
Intestine 0.06 g soil per digestion tube
y = 1.1636xR2 = 0.6588
0
25
50
75
100
0 25 50 75 100Relative in vivo bioavailability
Rel
ativ
e in
vitr
o b
ioac
cess
ibili
ty
soil in pig soil in human soil in pig - incorrect pH90 percentile low 90 percentile high Linear (soil in pig)
Intestine 0.6 g soil per digestion tube
y = 0.691xR2 = 0.8119
0
25
50
75
100
0 25 50 75 100Relative in vivo bioavailability
Rel
ativ
e in
vitr
o bi
oacc
essi
bilit
y
soil in pig soil in human soil in pig - incorrect pH90 percentile low 90 percentile high Linear (soil in pig)

RIVM Report 711701086
55
5.2 Methods The RIVM in vitro digestion (IVD) model can simulate both fasted and fed conditions of the human gastrointestinal tract. The differences in physiology between fasted and fed state changes the bioaccessibility of contaminants, as pH, salt and enzyme concentrations are different. In the present study, the digestion model simulating fasted conditions was used to study the bioaccessibility of lead from the ninety soils. The IVD model for fasted conditions is described by Sips et al., (2001); Oomen et al., (2003) and Versantvoort et al.,(2005).
5.2.1 Fasted conditions The in vitro digestion model for fasted conditions starts by introducing 9 ml of saliva of pH 6.5 ± 0.2 to 0.06 g of soil (dry weight). This mixture is rotated end-over-end for 5 minutes at 55 rpm. Subsequently, 13.5 ml of gastric juice (pH 1.1 ± 0.1) is added, and the mixture is rotated for 2 h at 37 °C after which the pH of the mixture is measured. The mixture of saliva and gastric juice usually has a pH of about 1.2, and the allowed pH interval in the presence of soil is 1.5 ± 0.5. Finally, 27 ml of duodenal juice (pH 7.8 ± 0.2) and 9 ml bile juice (pH 8.0 ± 0.2) are added simultaneously. The pH of the total mixture of juices is 6.0 ± 0.5. This mixture is rotated for another 2 h at 37 °C. After incubation, the pH of this mixture with intestinal juices is measured. The allowed pH interval is 6.0 ± 0.5, also depending on the soil. All digestive juices are heated to 37 ± 2 °C. Mixing is done in a rotator that is also heated to 37 ± 2 °C. At the end of the in vitro digestion process, the digestion tubes are centrifuged for 5 minutes at 3000 g, yielding the chyme (the supernatant) and the digested soil (the pellet). If needed, samples can be taken from the stomach and intestinal phase to obtain information on the bioaccessibility of the contaminant. The bioaccessibility values of the ninety soil samples were measured for the fasted state (in duplo) with 0.06 gram of soil. In addition, reference soil (NIST Montana Soil 2710) and a blank (duplo) were measured (fasted conditions, no soil). The lead concentration in the blank was used to correct for the background concentration of lead during the experiments. Furthermore, the bioaccessibility of lead from a spiked lead acetate solution was determined with this model in order to estimate the bioaccessibility of soluble lead with the IVD method. More information on this spiked experiment can be found in chapter 9.
5.2.2 Fed conditions The in vitro digestion simulating fed conditions starts by introducing 0.04 g of soil (dry weight) or a spiked solution to 6 ml stimulated saliva (pH 6.8 ± 0.2) and 4.5 g food (Olvarit infant food product numbers 15M52 or 15M62, Nutricia®, the Netherlands). By introducing 0.04 g in the digestion experiment, the solid-to-liquid ratio is comparable to the in vitro digestion experiment for fasted conditions with 0.06 g. The mixture of saliva, food and soil is rotated end-over-end for 5 minutes at 37 °C. Subsequently, 12 ml of stimulated gastric juice (pH 1.3 ± 0.1) is added and the mixture is rotated end-over-end (55 rpm) for 2 h at 37 °C. The pH of the gastric fluid is determined, and the allowed interval is 2.5 ± 0.5. Subsequently, 12 ml stimulated duodenal juice (pH 8.1 ± 0.2), 6 ml stimulated bile (pH 8.2 ± 0.2), and 2 ml sodium bicarbonate (84.7 g/l) are

RIVM Report 711701086
56
added simultaneously. The pH of the final mixture of juices is 6.5 ± 0.5. The mixture is rotated for another 2 h at 37 °C and the pH of the chyme was determined, with the allowed pH-interval 6.5 ± 0.5. Separation of chyme and pellet was obtained by centrifugation at 3000 g for 5 minutes. At the end of the in vitro digestion process, the digestion tubes are centrifuged for 5 minutes at 3000 g, yielding the chyme (the supernatant) and the digested soil (the pellet). If needed, samples can be taken from the stomach and intestinal phase to obtain information on the bioaccessibility of the contaminant. The bioaccessibility of lead from a spiked lead acetate solution with food was determined with this model (more information see chapter 9).
5.2.3 Lead analysis The analysis of lead in chyme and pellet is described in chapter 4. The total lead determination, as performed by the RIVM, is used for calculating the bioaccessibility.
5.3 Results The bioaccessibility of lead (for fasted situations) determined by the RIVM in vitro digestion (IVD) model was calculated according the guideline for determining the oral bioavailability of lead from soil (Hagens et al., 2007). For each soil, the lead concentration in chyme (bioaccessible fraction) was divided by the total lead content of the soil (as measured by RIVM). Since the in vitro digestion experiments were performed in duplo for each soil, the average bioaccessibility for fasted conditions was calculated. The bioaccessibility of lead from soil for fasted conditions was translated to the bioaccessibility of lead from soil for the average physiological state of a child with the previously derived CFAPS (Hagens et al., 2008). This results in a more realistic assumption of the potential human health risk since the bioavailability of lead from soil for the average physiological state is lower compared to fasted condition. The relative oral bioavailability for the average physiological state was calculated per sample based on equation 6B. The values of all ninety soils are listed in Appendix 6 of this report. A summary of the results is presented in Table 5.2. This table includes the average bioaccessibility value for fasted and average physiological state conditions. Moreover, the relative oral bioavailability for average physiological state conditions, standard deviations and the P50-P95 percentile values of the bioaccessibility and relative bioavailability values of the ninety soils are calculated. The in vitro digestion was performed in duplo. The difference in the duplo values can be due to the digestion procedure, but also due to the heterogeneity of the soil. On average, the variation within the duplo measurements was 20 %. For the homogeneous reference soil, the variation was respectively 9 %, 3 % and 1 % for the three duplos of different digestion experiments. This suggests that most of the variation is due to the heterogeneity of the soil. From some sites, two samples were collected. The average variation within the two samples from the same location was 25 %.

RIVM Report 711701086
57
The estimated relative oral bioavailability factor of lead from soil for the average physiological state can be introduced in risk assessment (Sanscrit; Otte and Wintersen, 2007) and results in a refinement of the actual risk compared to the situation where correction for oral bioavailability is not considered. Table 5.2: The average bioaccessibility values of lead from soil for fasted conditions, average physiological state (APS) conditions and the relative bioavailability factor for the average physiological state for the ninety soils. Furthermore, the standard deviation and P50-P90 percentiles are given. Please note that a bioaccessibility (APS) of 50% results in a relative bioavailability factor (APS) of 1.
Bioaccessibility % FASTED
Bioaccessibility % APS
Relative bioavailability factor APS
number of soils 90 90 90Average 44.5 36.1 0.72Standard deviation 16.1 13.0 0.26Lowest value 6.7 5.4 0.11Higest value 109.1 88.4 1.77Percentile 50 41.4 33.5 0.67Percentile 60 44.0 35.7 0.71Percentile 70 48.3 39.1 0.78Percentile 80 56.1 45.5 0.91Percentile 90 62.9 50.9 1.02
RIVM data 90 soils
5.4 Conclusions In conclusion, relative oral bioavailability values for the average physiological state condition of the ninety “made grounds” samples have been determined (Table 5.2) with the RIVM in vitro digestion (IVD) model. In short, the relative oral bioavailability factor ranged between 0.11 and 1.77 with 0.72 as average. The calculated 50-90 percentile ranged between 0.67 and 1.02. Policy makers should decide on the percentile value to be used in risk assessment, which in turn depends on the level of conservatism that is desired.

RIVM Report 711701086
58

RIVM Report 711701086
59
6 Correlating soil characteristics with relative bioavailability
6.1 Introduction Previous results on the bioavailability of lead from soil indicated that the bioavailability of lead is influenced by the soil characteristics (Oomen et al., 2006). This implies that information on the bioavailability of lead from soil is site-specific. It also indicates that the bioaccessibility of lead from soil may be predicted from information on the soil characteristics. The aim of the present research is to investigate if a prediction of the relative oral bioavailability can be made as a function of several soil characteristics including pH, total sulphur, carbonate content, organic matter, clay, iron content and the total lead content (as measured by the RIVM) for the made grounds.
6.2 Statistical methods
6.2.1 Single regression analysis Soil characteristics including the soil lithology, pH, total sulphur, carbonate content, organic matter, clay, iron content and the total lead content (as measured by the RIVM method) for all ninety soils are presented in section 3.3 and 4.2 and Appendix 1 and 2. The relative oral bioavailability of lead for the average physiological state is derived in section 5.3 (Appendix 6) for all ninety soils. A single regression correlation plot is drawn for the relative oral bioavailability with each soil characteristic separately (Figure 6.1).
6.2.2 Multiple regression analysis To investigate if multiple soil characteristics can be used to estimate the relative bioavailability, a prediction model is applied. The prediction model for the relative oral bioavailability for the average physiological state conditions is a multiple linear regression model. Schematically, this model looks like equation 7 (Van de Kassteele, personal communication, 2008): (7) log(Rel bioavailability) = soil lithology + pH + log(sulphur) + log(carbonate) +
log(organic matter) + log(clay) + log(iron) + log(total Pb) + ε Because most of the distributions of these variables are highly skewed to the right, a log transformation is applied to all of them, except pH and soil lithology. The residue ε is assumed to have a normal distribution. Because not all variables need to be associated with relative oral bioavailability, an automatic model selection procedure based on the AIC is performed. The AIC (Akaike’s Information Criterion) is a measure of the goodness of fit of an estimated statistical model. This procedure puts variables out and into the model based on its significance, refits it, and

RIVM Report 711701086
60
compares it with the previously found model. The AIC is a measure which is a trade-off between the model deviance and the number of parameters. This procedure is repeated until the AIC is minimized (Venables and Ripley, 2002).
6.2.3 Statistical software To statistically analyse the correlation between soil characteristics and the relative oral bioavailability of lead, the statistical software package R 2.7.1 is used (R Development Core Team, 2008).
6.3 Results
6.3.1 Single regression analysis In Figure 6.1, various plots are represented that visualize the single correlations of the relative oral bioavailability of lead with each soil property. In these plots, also a “best fit” trend line is included. Soil 88 was omitted from the total data collection. This point was detected as an outlier data point (see section 6.3.2 for additional information regarding this single point).

RIVM Report 711701086
61
Figure 6.1: The relative oral bioavailability of lead for the average physiological state (APS; expressed as %) correlated with soil characteristics. The relative bioavailability is derived from the bioaccessibility determined with the IVD model. A: Soil lithology. In this graph, the numbers on the x-axe (1, 2, 3, 4 and 5) represents fluviatile sand, aeolian sand, marine sand, dune sand and loess respectively. B: Soil pH. C: Total sulphur content (expressed as mg S/kg soil). D: Clay content (expressed as %). E: Carbonate content (expressed as %). F: Organic matter (expressed as %). G: Iron content (expressed as nmol Fe/kg soil). H: total lead content, as measured by the RIVM method (expressed as mg Pb/kg soil). In these plots (except Plot 6.1A), also a “best fit” trend line is added. Soil 88 was identified as an outlier and therefore omitted from the total data collection.
0
20
40
60
80
100
120
140
160
180
0 1 2 3 4 5
lithology
rel.
bioa
vaila
bilit
y (%
, APS
)
0
20
40
60
80
100
120
140
160
180
5 6 7 8 9 10
soil pH
rel.
bioa
vaila
bilit
y (%
, APS
)
0
20
40
60
80
100
120
140
160
180
0 5000 10000 15000 20000
Total sulphur content (mgS /kg)
rel.
bioa
vaila
bilit
y (%
, APS
)
0
20
40
60
80
100
120
140
160
180
0 2 4 6 8 10 12
Carbonate content (%)
rel.
bioa
vaila
bilit
y (%
, APS
)
0
20
40
60
80
100
120
140
160
180
0 5 10 15 20
Organic matter (%)
rel.
bioa
vaila
bilit
y (%
, APS
)
0
20
40
60
80
100
120
140
160
180
0 5 10 15 20 25
Clay (%)
rel.
bioa
vaila
bilit
y (%
, APS
)
0
20
40
60
80
100
120
140
160
180
0 50 100 150 200 250 300 350
Iron content (nmol Fe/kg))
rel.
bioa
vaila
bilit
y (%
, AP
S)
0
20
40
60
80
100
120
140
160
180
0 500 1000 1500 2000 2500 3000 3500 4000 4500
Total lead (mg Pb/kg; RIVM method)
rel.
bioa
vaila
bilit
y (%
, APS
)
A B
C D
E F
G H
0
20
40
60
80
100
120
140
160
180
0 1 2 3 4 5
lithology
rel.
bioa
vaila
bilit
y (%
, APS
)
0
20
40
60
80
100
120
140
160
180
5 6 7 8 9 10
soil pH
rel.
bioa
vaila
bilit
y (%
, APS
)
0
20
40
60
80
100
120
140
160
180
0 5000 10000 15000 20000
Total sulphur content (mgS /kg)
rel.
bioa
vaila
bilit
y (%
, APS
)
0
20
40
60
80
100
120
140
160
180
0 2 4 6 8 10 12
Carbonate content (%)
rel.
bioa
vaila
bilit
y (%
, APS
)
0
20
40
60
80
100
120
140
160
180
0 5 10 15 20
Organic matter (%)
rel.
bioa
vaila
bilit
y (%
, APS
)
0
20
40
60
80
100
120
140
160
180
0 5 10 15 20 25
Clay (%)
rel.
bioa
vaila
bilit
y (%
, APS
)
0
20
40
60
80
100
120
140
160
180
0 50 100 150 200 250 300 350
Iron content (nmol Fe/kg))
rel.
bioa
vaila
bilit
y (%
, AP
S)
0
20
40
60
80
100
120
140
160
180
0 500 1000 1500 2000 2500 3000 3500 4000 4500
Total lead (mg Pb/kg; RIVM method)
rel.
bioa
vaila
bilit
y (%
, APS
)
A B
C D
E F
G H

RIVM Report 711701086
62
6.3.2 Multiple regression analysis The predictive multiple linear regression model for relative oral bioavailability as a function of the previously indicated soil properties was optimized and runned. As a result, the relation between the relative oral bioavailability and the soil properties was weak. The statistical results of the fitted model are summarized in Table 6.1. As can be seen in Table 6.1, only total lead concentration revealed a significant correlation with the relative oral bioavailability (P-value < 0.05). This suggests that the relative oral bioavailability decreases if the total lead content of the soil increases (Figure 6.1H). However, for this predicted model, the fraction of variance explained by the model is 11 % (= Multiple R-squared). Based on this low R-square of the model, the predictive power for the relative oral bioavailability, based on these measured soil characteristics is questionable. To visualize the predictive power of this model, the observed log of the relative bioavailability (i.e. the presently derived values) was plotted against the predicted log of the relative oral bioavailability (Figure 6.2). This figure indicates that the predictive power of the model is very low.
Figure 6.2: Observed log of the relative oral bioavailability for the average physiological state, (expressed as %) versus the predicted log of the relative oral bioavailability for the average physiological state (expressed as %). The solid line represents the 1:1 line.
3.5 4.0 4.5 5.0
3.5
4.0
4.5
5.0
12
3
4
56
7
8
9
10
11
12
13
14
15
16
17
1819
20
21
22
23
242526
27
28
29
30
31
32
33
34
35
36
37
38
3940
41
42
4344
4546
474849 50
51
52
53
54
55
56
57
5859 60
61
62
63
64
65
666768
69
7071
72
73
74
75
76 77
78
79
80
81
8283
8485
86
87
89
90
Predicted log (relative oral bioavailability of lead, APS, %)
Obs
erve
dlo
g (r
elat
ive
oral
bioa
vaila
bilit
yof
lead
, AP
S, %
)

RIVM Report 711701086
63
Table 6.1: ANOVA table of the statistical results of the fitted prediction model (without soil sample 88). Significant correlation (P < 0.05) is indicated with a “ * ”. Soil characteristicsLithology (5 types of subsoil) 0.2739pH 0.2716log total sulpher content 0.0804log carbonate content 0.9879log organic matter 0.5503log clay 0.2095log iron content 0.7918log total lead 0.0082 *
P-value
The multiple regression analysis was repeated by including 2-way interaction terms of the soil characteristics. This means that each combination of two soil characteristics is also included in the prediction model as a possible description parameter of the relative oral bioavailability. Based on this more sophisticated model with up to eighty (combined) input parameters, the R-squared increased to 77 %. This may look good, however a model with up to eighty input parameters might overfit the outcome. To verify this version of the 2-way interactions regression model, half the observed values of the relative oral bioavailability were used to fit the model. Subsequently, this model was used to predict the other half of the relative oral bioavailability values. Strikingly, the predicted relative oral bioavailability values showed no resemblance with their known values. Apparently, this model with 2-way interactions overfits the data, resulting in useless predictions and can therefore not be used (Data of the 2-way multiple regression model are not shown).
6.4 Discussion The aim of this research was to make a prediction model for the relative oral bioavailability as a function of several soil characteristics including the soil lithology, pH, total sulphur, carbonate content, organic matter, clay, iron content and total lead content (as measured by the RIVM method) for all ninety made grounds. Based on the multiple regression diagnostics, sample 88 is omitted from the dataset as an outlier. This specific soil is taken near a former “vitriol” factory. In this factory, sulphuric acid was produced. Due to this specific activity, the location is not considered as a typical made ground, providing a physical explanation for the outlier. Based on the regression analyses, the measured soil characteristics are not able to predict the relative oral bioavailability of lead for the average physiological phase. The predictive power of the “1-way interaction” multiple regression analysis is too low. A more sophisticated 2-way interaction multiple regression analysis with eighty input parameters analysis overfitted the predicted model. This suggests that within the given data set, soil characteristics are not predictive for the bioaccessibility and the there from derived relative bioavailability.

RIVM Report 711701086
64
Although the lack of correlation between the relative oral bioavailability of lead from soil and their soil characteristics seems to be in contradiction with previous findings in which at least organic matter seemed to influence the bioaccessibility of lead from soil (Oomen et al., 2006), this may also be due to the homogeneity of the made ground. As the soil characteristics within made ground show relatively little variation, the statistical power must be very high to find a correlation. Moreover, the average relative bioavailability factor for the made grounds is also rather uniform (0.72 ± 0.26; n=90). Therefore, there might be a correlation between soil characteristics and relative bioavailability, in which case the typical soil characteristics for the made ground would result in a bioaccessibility of 44.5 ± 16 % and a relative bioavailability factor of 0.72 ± 0.26. In addition, lead speciation may affect the bioaccessibility, which is investigated in chapter 7.
6.5 Conclusions Within the given set of ninety soils with its soil characteristics (including the soil lithology, pH, total sulphur, carbonate content, organic matter, clay, iron content and the total lead content), it is not possible to predict the relative oral bioavailability of lead for the average physiological state. In other words, the soil characteristics do not correlate with the reported relative oral bioavailability factors of the soils. This may be due to the homogeneity of the made ground. As the soil characteristics within the made grounds show relatively little variation, the statistical power must be very high to find a correlation. If the made grounds are considered as a specific soil type with typical soil characteristics, the averaged overall relative bioavailability factor would be 0.72 ± 0.26 (section 5.3; Table 5.2) In addition, lead speciation may affect the bioaccessibility, which may explain part of the variation.

RIVM Report 711701086
65
7 Correlating lead characteristics with relative bioavailability
7.1 Introduction Previous studies on the bioavailability of lead from soil indicated that the bioavailability of lead is influenced by:
1. the chemical composition of the anthropogenic lead source and its solubility (Steele et al., 1990; Cotter-Howells and Thornton, 1991; Davis et al., 1993; Ruby et al., 1992, 1996, 1999; Rieuwerts et al., 2000; Hettiarachchi and Pierzynski, 2004);
2. the specific reactive surface of lead in soils (Steele et al., 1990; Ruby et al., 1992, 1999). 3. the soil type, and capacity to form secondary lead phases (Davis et al., 1994; Casteel et
al., 1997; Rieuwerts et al., 1998a,b, 2000; Ruby et al., 1999; Yang et al., 2003; Hettiarachchi and Pierzynski, 2004).
Figure 7.1 provides a schematic overview of these processes that are believed to control the bioavailability of lead in soil (after Ruby et al., 1999). Different lead forms exhibit different rates of lead dissolution, depending on their chemistry and particle size distribution, the mechanism by which they dissolve (e.g. surface reaction or transport-controlled dissolution kinetics), and the geochemistry of the soils in which they are present. This indicates that the bioavailability of lead from soil may be predicted based on information on the lead characteristics. The objective of this part of the research is to determine if relative oral bioavailability of lead is related to lead characteristics. If such a relationship exists, the dependence is quantified.

RIVM Report 711701086
66
Figure 7.1: Schematic overview of how different lead species, particle sizes, and morphologies affect lead bioavailability (after Ruby et al., 1999, with permission).
7.2 Methods To determine if lead mineralogy and particle size are related to relative bioavailability of lead from soil, the Scanning Electronic Microscopy (SEM) images (Figure 4.4; Appendix 7 and 8, available on the RIVM website; www.rivm.nl) of the sixteen selected soil samples are ranked based on the primary lead phases present (P), the particle size (P) and the secondary lead phases present (S). Since the relative oral bioavailability of lead for the average physiological state could not be predicted based on the measured soil characteristics (including the soil lithology, pH, total sulphur, carbonate content, organic matter, clay, iron content and the total lead content; chapter 6), soil characteristics were not taken into account in the classification. Each of the lead characteristics (primary phases and particle size) is assigned a value on a 1-4 scale (Table 7.1). If both lead apatite and lead adsorbed to organic matter
Pb0
Fe-Pb oxides
PbCO3
Pb0PbO PbAsO4
Slag
PbCO3PbS
Quartz
PbS PbS PbS PbS PbS PbS PbS PbS
Particle size
Rinding/Encapsulation
PbS Fe-Pb oxides Fe-Pb sulfates Pb3O4 Pb(OH)+ Pb0 PbSO4 PbO, Pb(OH)2 PbCl- Pb5(PO4)3Cl Mn-Pb oxides PbCO3 PbBrCl
PbCrO4 PbAsO4 [-------------Pb phosphates---------]
Bioavailability Increasing Decreasing
Constant particle size

RIVM Report 711701086
67
(mean lead > 0.05 wt %) are present, the sample is assigned a value of -1 (Table 7.1). This is done to correct for the higher stability of secondary minerals compared to the primary minerals. The sum of the values constitutes the so called PPS index, in which the PPS stands for Primary lead phases, Particle size and Secondary lead phases. A PPS index of 1 predicts that lead in a soil samples is not readily bioavailable and a PPS index of 8 predicts that the lead pollution is very bioavailable. It is recognized that the PPS index is arbitrary, but based on the available data, this is the most attainable way to present the data. Table 7.1: The PPS ranking system (Primary lead phases, Particle size and Secondary lead phases).
P P S -See also figure 7.1 Primary lead phases Particle size Secondary lead phasesPbS; Pb0 ; Pb5(PO4)3Cl ; Pb glass/glaze 1Fe-Pb oxides ; PbSO4 ; PbCrO4 ; Pb phosphate 2Pb oxides and carbonates (e.g. Pb3O4) 3Pb-halides (e.g. PbCl) 4Particles (<10 to > 500 µm) 1Particles (<10 to 500 µm) 2Particles (<10 to 100 µm) 3Particles (<15 µm) 4Secondary Pb-apetite / Pb-Organic Matter -1
Lead characteristicCategory
In this study, two groups of primary lead phases are distinguished: 1) Elemental lead (Pb0), lead oxide and/or lead carbonates and 2) lead glass and lead glaze. Group 1 is ranked as Category 3 (lead oxides and lead carbonates). Since the sampled soils are mainly aerobic, present elemental lead is most likely oxidized to lead oxides. Group 2 is ranked as Category 1. In case both groups of primary lead phases are present in a made ground’ sample, the sample is ranked as a Category 3 (worst case scenario).
7.3 Results The results of the PPS ranking are listed in Table 7.2. The PPS ranking varies from 2 to 6. The soil sample from De Rijp revealed the lowest PPS ranking (2). This is due to the presence of large particles of lead glass/glaze. Three samples were rated with a PPS ranking of 4. These are the made grounds from Nijmegen, Maastricht (sample 71) and Echt-Susteren. Five made grounds were ranked as PPS Category 5 and five samples were ranked as PPS Category 6. Except for the soil sample from Leiden, these are all soils polluted with very fine primary lead phases, consisting of elemental lead, lead oxide and/or lead carbonate. Based on the obtained results, it was not possible to rank the sample from Maastricht (sample 69).

RIVM Report 711701086
68
Table 7.2: The results of the PPS ranking. P P S PPS
Primary lead phases Particle size Secondary lead phases ranking
1 Schoonhoven 3 4 -1 611 Utrecht 3 4 -1 617 de Rijp 1 1 221 Haarlem 3 3 -1 527 Alkmaar 3 3 -1 529 Leiden 1 4 533 Delft 3 3 -1 543 Den Haag 3 4 -1 645 Rotterdam 3 2 551 Schiedam 3 4 -1 653 Groningen 3 4 -1 659 Zutphen 3 3 -1 563 Nijmegen 3 2 -1 469 Maastricht ? ? ? n.d.71 Maastricht 1 3 477 Echt-Susteren 1 3 4
Soil number
City
n.d: Not determined, since this sample (69) is mainly polluted with zinc white (primary lead phases were not detected with SEM in this sample). In four samples (Utrecht, Den Haag, Schiedam and Groningen) the primary lead phases are visible (Appendix 7 and 8, available on the RIVM website; www.rivm.nl) but so small that it was not possible to analyse them with SEM/EDS. Based on the small particle size and presence of the secondary minerals lead-apatite, lead-organic matter and/or lead-reactive iron in these samples, it was assumed that the primary minerals were lead, lead oxides and/or lead carbonates. In one sample (Maastricht 69) no primary lead phases were found at all. Based on the obtained results, it was not possible to rank this sample. In Figure 7.2 the relative oral bioavailability of lead for the average physiological state, determined by both the IVD (chapter 5) and Tiny-TIM model (chapter 8), are plotted versus the PPS ranking. This ranking takes, besides the primary lead phases, also the particle size and presence of secondary lead phases into account.

RIVM Report 711701086
69
Figure 7.2: Relative oral bioaccessibility factor for lead for the average physiological state (APS) versus the PPS ranking of the sixteen selected “made ground” samples. The sample numbers are indicated in the graph. Sample Maastricht 69 is not included, since it is mainly polluted with zinc white (primary lead phases were not detected with SEM in this sample). Figure 7.2 suggests a quantitative positive correlation between the relative oral bioavailability factor for lead (APS), as determined with the IVD model and the PPS ranking (Figure 7.2; left panel). This quantitative positive correlation is not determined between the relative oral bioavailability factor for lead (APS), as determined with the Tiny-TIM model and the PPS ranking (Figure 7.2; right panel). However, based on the limited number of samples (n=16) and the qualitative nature of the arbitrary PPS ranking, no firm conclusions can be drawn on these relationships.
7.4 Discussion Based on the results of the multi-element and lead isotope analysis only, limited information is obtained to study the relationship between lead mineralogy and oral bioavailability in detail. SEM analysis is essential to get information about the primary and secondary lead phases and particle size. Figure 7.2 shows no positive correlation between the relative oral bioavailability factor for lead (APS), as determined with the Tiny-TIM model, and the PPS ranking. This suggest that the
2 3 4 5 6PPS ranking
0
0.4
0.8
1.2
1
11
1721
33
43
4551
53
63
71
77
29
59
27
2 3 4 5 6PPS ranking
0
0.4
0.8
1.2
1, 1117 21, 45, 59
2729, 33
4351536371
77
Relative bioavailability factor for the avarage physiological state conditionsversus PPS ranking
IVD Tiny-TIM
Rel
F (A
PS
)
2 3 4 5 6PPS ranking
0
0.4
0.8
1.2
1
11
1721
33
43
4551
53
63
71
77
29
59
27
2 3 4 5 6PPS ranking
0
0.4
0.8
1.2
1, 1117 21, 45, 59
2729, 33
4351536371
77
Relative bioavailability factor for the avarage physiological state conditionsversus PPS ranking
IVD Tiny-TIM
Rel
F (A
PS
)

RIVM Report 711701086
70
bioavailability of lead (APS %), as determined with the Tiny-TIM model, is not influenced by the primary and secondary lead phases present and the particle size of these phases. In contrast, Figure 7.2 reveals a general increase in relative oral bioavailability factor for lead (APS) as determined with the IVD model with an increase in PPS ranking. This suggests that relative oral bioavailability of lead in made grounds, as determined with the IVD model, depends on the primary lead phases and its particle size and the secondary lead phases formed. One sample (Utrecht 11) has a deviating relative oral bioavailability (IVD model) as would be expected from the PPS ranking. (circle in Figure 7.2). The primary lead phases in this sample are visible (Appendix 7 and 8, available on the RIVM website; www.rivm.nl) but so small that it was not possible to analyse them with SEM/EDS. Based on the small particle size and presence of the secondary minerals lead-apatite, lead-organic matter and lead-reactive iron, it was assumed that the primary minerals were lead, lead oxides and/or lead carbonates. However, if the primary minerals are lead glass / glaze particles, the PPS ranking will become 4 in stead of 6. In addition, the soil sample from Utrecht (11) contains the relatively stable secondary lead phase Fe-Pb, resulting in a relative low bioavailability (IVD model). This exemplifies the arbitrary nature of the PPS ranking system. Since only sixteen made grounds were analysed with the SEM, it was not possible to determine the PPS ranking of all ninety samples. However, in some cities, the lead source is quite uniform. In Schoonhoven (n=6), De Rijp (n=7) and Echt-Susteren (n=9) the primary lead sources are mainly white lead, lead glazed potsherds (city waste) and ceramic industry slag. The lead sources in Maastricht (69) and Utrecht (88) are quite unique. At these sites the soil is polluted with zinc white slag and vitriol slag respectively. The relative oral bioavailability factor (APS) for lead in these soils, as determined with the IVD model, are plotted in a box-whisker plot (Figure 7.3).

RIVM Report 711701086
71
Figure 7.3: Box-and-whisker plot of the relative oral bioavailability factor for lead for average physiological state conditions, as determined with the IVD model, in soils of Utrecht (vitriol; 88) De Rijp (17), Echt-Susteren (77), Schoonhoven (1) and Maastricht (69). Outliers are indicated with ●. The whiskers represent the lower and upper quartile (25 and 75 percentile). Figure 7.3 shows that the soil polluted with vitriol slag (Utrecht 88) has the lowest relative oral bioavailability factor (APS) for lead from soil. Oxidation of pyrite slag (main ore in vitriol production) is known to result in a very low soil pH. In the past, the soil pH at this site has been very low (Walraven, 2007). Primary lead sources that are exposed to low soil pHs will form stable secondary lead minerals (e.g. lead sulphate and iron-lead sulphate). In an in vitro digestion experiment, these secondary phases will also be stable in the acidic environment of the stomach compartment and hence will be less bioavailable (Ruby et al., 1999). This might explain the low relative oral bioavailability factor (APS) for lead found for soil sample 88 from Utrecht.
0
0.2
0.4
0.6
0.8
1.0
1.2
Utre
c ht-v
itrio
l
De
Rijp
Echt
-Sus
tere
n
S cho
onho
ven
Maa
stric
h t-z
inc
wh i
te
Rel
F (A
PS
)
0
0.2
0.4
0.6
0.8
1.0
1.2
Utre
c ht-v
itrio
l
De
Rijp
Echt
-Sus
tere
n
S cho
onho
ven
Maa
stric
h t-z
inc
wh i
te
Rel
F (A
PS
)

RIVM Report 711701086
72
The relative oral bioavailability factors (APS) for lead from the soils from De Rijp are also relatively low compared to the other samples (Appendix 6; Figure 7.3). This is due to the low solubility of lead glass/glaze remnants. Such low values were also expected for the soils from Echt-Susteren. These soils are polluted with slag from the ceramic industry (mainly rooftile production). Nevertheless, the relative oral bioavailability factor (APS) for lead in soils from Echt-Sustern are higher than in soils from De Rijp. This might be explained by the smaller particle size of the primary sources in Echt-Susteren (Table 7.3). The relative oral bioavailability factor (APS) for lead from soils from Schoonhoven are quite constant. These soils are polluted with white lead. Obviously the solubility of white lead particles is quite constant. The relative oral bioavailability values (APS) for lead from the zinc white slag containing soil (Maastricht 69) is comparable with that of white lead. Both sources have small particle sizes. Based on the observed relationship between the PPS ranking and the relative oral bioavailability factor for lead (APS), as determined by the IVD model, it is possible to predict the relative oral bioavailability of lead if information about the mineralogy and particle size of the lead phases is available. However, due to the limited number of samples analyzed with the SEM (n=16) and the nature of the ranking system (qualitative and not quantitative), it is only possible to predict if bioavailability values will be low, medium or high. Nevertheless, this information could help in determining remediation strategies and priority ranking of made grounds which are polluted with lead. This information also helps in understanding the factors that affect bioaccessibility and relative oral bioavailability of lead from soil.
7.5 Conclusion The relative oral bioavailability factor (APS) for lead from soil, as determined with the IVD model, shows a trend with the primary and secondary lead phases, and the particle size of these lead phases present in the soil as determined with SEM, lead isotopic tracing and multi element analysis. In general, the highest relative bioavailability values are determined in soils with small particles (<15 μm) of anthropogenic lead, lead oxide and/or lead carbonate. The lowest relative bioavailability values are measured in the soils with large lead glass/glaze particles (<10 to >500 μm). Moreover, the relative bioavailability of lead from soil decreases when secondary lead phases (lead apatite, Pb-OM and Fe-Pb) are present. No relationship is found between the relative oral bioavailability (APS) for lead, as determined with the Tiny-TIM model, and the determined lead characteristics of the soil. The differences between the Tiny-TIM and IVD model are addressed in chapter 9 of this report.

RIVM Report 711701086
73
Based on the limited number of samples (n=16) and the qualitative nature of the relationship between relative oral bioavailability of lead from soil and the lead characteristics, it is only possible to predict if the relative bioavailability of lead will be low, medium or high, based on lead characteristics. Nevertheless, this information could help in determining remediation strategies and priority ranking of made grounds which are polluted with lead. This information also helps in understanding the factors that affect bioaccessibility and relative oral bioavailability of lead from soil.

RIVM Report 711701086
74

RIVM Report 711701086
75
8 Bioaccessibility experiments: Tiny-TIM model
8.1 Introduction
8.1.1 Dynamic gastrointestinal conditions The gastrointestinal tract consists of a series of compartments (stomach, small-intestine, large intestine) through which a meal is transferred. Each compartment performs a specific task during the digestion process. Therefore, the meal is exposed to constantly changing conditions. Not only because it travels through different compartments but also because the conditions change in each compartment in time. The meal is swallowed with saliva from the oral cavity, pre-digested in the stomach by gastric acid and enzymes, but at the same time gradually emptied from the stomach. A common misconception is that the pH in the stomach is always low. In vivo, the gastric pH increases after intake of a meal due to the meal pH and its buffer capacity, while after that the pH decreases again due to secretion of gastric acid. The combination of gradual gastric secretion and gastric emptying results in constantly changing gastric conditions to which the meal is exposed. Also in the small intestine the conditions change in time and differ between different parts of the small intestine. Pancreatic juice and bile are secreted and mixed with the meal in the upper part of the small intestine (duodenum). During the digestion process, the intestinal content is mixed and this mixture travels through the gut by peristaltic movements, while digestive products are removed from the gut by absorption through the gut wall. Important factors that determine the fate of ingested compound are: • the pH in time and in different parts of the stomach (gastric acid) and small intestine
(bicarbonate); • concentration of salivary, gastric and pancreatic enzymes and bile; • continuous mixing and gastro-intestinal transit times; • removal of (digested / released) compounds that are available for absorption; • realistic transit times that determine the exposure of meal compounds to the different
conditions. These dynamic gastro-intestinal conditions are strongly depending on age (infants/children, adults, elderly), fasting state or fed state, including type of meal, and health status.
8.1.2 Simulation of gastrointestinal conditions in Tiny-TIM The TNO in vitro gastro-Intestinal Models (TIM systems) simulate to a high degree the successive dynamic processes in the stomach, the small intestine (TIM-1; Minekus et al., 1995) and in the large intestine (TIM-2; Minekus et al., 1999).

RIVM Report 711701086
76
Figure 8.1: Picture of a cabinet with two separate Tiny-TIM units (top-left) and a cabinet with a TIM-1 system (top-right). Bottom picture represents the Tiny-TIM system for rapid screening of food products (proteins, carbohydrates).
These models are unique tools to study the stability, release, dissolution, absorption and bioconversion of nutrients, chemicals, bioactive compounds and pharmaceuticals in the gastrointestinal tract. This includes the high predictive quality of the TIM system for determining the bioaccessibility of metals from various foods, such as iron (Haraldsson et al., 2005; Salovaara et al., 2003; Larsson et al.,1997), calcium (Smeets-Peeters et al., 1999), magnesium and zinc

RIVM Report 711701086
77
(TNO report) as well as the binding capacity of soil to inhibit the bioaccessibility of toxic compounds (Dominy et al., 2004). Moreover, the Tiny-TIM has been validated in comparison with in vivo studies for the determination of protein digestion and bioaccessibility of aminoa cids (protein quality) in foods (Schaafsma, 2005) and the digestion of carbohydrates (TNO Report) and the determination of bioaccessibility of lead from soil (Oomen et al., 2002). Specific protocols have been developed and tested to simulate the gastrointestinal conditions of infants, adults and elderly, as well as dogs, pigs and calves. In these studies the average physiological conditions under fasting state (intake of compounds/drugs with water) and fed state (intake of different types of meals whether or not with specific compounds/drugs) are simulated. However, also the inter-individual variation as well as abnormal or specific conditions of humans can also be simulated in a reproducible way in the TIM systems. Although these TIM systems show a high predictive quality for the in vivo situation, a drawback is the labour intensiveness of the experiments and the related costs. It is also not always necessary to generate the large amount of experimental data as with the TIM-1 system. As an alternative to the TIM-1, a relatively simplified dynamic system has been developed (Tiny-TIM system, Figure 8.1). This Tiny-TIM system has the same technology as TIM-1 (Figure 8.1), with the exception that the small intestinal transit is simulated in one compartment instead of three compartments, without small intestinal efflux.
8.2 Methods
8.2.1 Test products The reference solution, meals and soils (Table 8.1) were supplied by the RIVM.

RIVM Report 711701086
78
Table 8.1: Test materials used in this study.
8.2.2 Test variations
8.2.2.1 Lead acetate solutions To determine the (maximum) bioaccessibility of lead, two doses of soluble lead acetate were tested in Tiny-TIM in single experiments. A solution of lead acetate (1 g/l) was mixed with artificial saliva and water to obtain a total oral intake 1 mg (low dose) and 8 mg (high dose) of lead acetate in 125 g saliva/water mixture per intake.
8.2.2.2 Meals spiked with lead acetate To determine the effect of a food matrix on the bioaccessibility of lead, two types of meals were tested with two doses of lead acetate in single experiments. Leek and mushroom meal (Olvarit infant food: 15M52; Nutricia, the Netherlands) and noodles meal (Olvarit infant food: 15M62; Nutricia, the Netherlands) were spiked with lead acetate to study the effect of food matrix on the bioaccessibility of soluble lead. For each meal, a portion of 75 g was mixed with lead acetate solution, artificial saliva and water until a total intake of 125 g. Lead acetate was added to obtain a low dose of 1.25 mg and a high dose of 6.25 mg lead acetate per meal. Each meal and dose was tested in single experiments.
ref. Pb solution lead acetate solution 1 g /L meals Olvarit infant food 15M52: Leek/mushrooms (Nutricia, the Netherlands Olvarit infant food 15M62: Noodles (Nutricia, the Netherlands) Soils category ID nr location River clay / sand 1 Schoonhoven 29 Leiden 59 Zutphen Sand 11 Utrecht 53 Groningen 63 Nijmegen Dune sand 21 Haarlem 27 Alkmaar 43 Den Haag Löss 69 Maastricht 71 Maastricht 77 Echt Susteren Sea clay 17 De Rijp 33 Delft 45 Rotterdam 51 Schiedam reference soil MS Montana soil 2710

RIVM Report 711701086
79
8.2.2.3 Soils The bioaccessibility of lead was tested in sixteen different soil samples from made grounds. These sixteen soils were a representative subset of the ninety soils gathered in total for this research (chapter 2). These sixteen soils were samples originated from fifteen different cities with at least three soils per lithology (dune sands, loess, fluviatile sand/clay, aeolian sand and marine sand/clay). A reference soil (Montana soil 2710, NIST) was also included in this study. The soils were tested in the duplicate experiments by mixing 5 g of soil with 120 g artificial saliva and drinking water.
8.2.3 Experimental conditions The experiments in Tiny-TIM were performed under simulation of the average physiological conditions of the gastrointestinal tract of young children after the (unintended) intake of soil on an almost empty stomach (more or less between fasting and fed state). The simulated parameters were among others: • body temperature of 37°C; • swallowing of artificial saliva with amylase; • pH curve in the stomach compartment in relation to the secretion of gastric acid (from pH 5 to
2 in 90 min, Figure 8.2); • concentrations of pepsin and gastric-lipase in the stomach; • gradual gastric emptying of the meal (Figure 8.2); • secretion in the intestinal compartment of bicarbonate to control the intestinal pH at 6.8-7.0; • secretion of pancreatic enzymes, bile and intestinal electrolytes; • peristaltic mixing in the stomach and small intestine compartments. A membrane unit was connected to the intestinal compartment (Figure 8.1) for the continuous removal of released and digested small molecule weight (MW) compounds (< 10 kD) and water.
Figure 8.2: Gastric emptying (straight line) and gastric pH profile (dotted line) of the Tiny-TIM model.
0123456789
10
0 60 120 180 240 300 360
time (min)
pH
0102030405060708090100
%O
I

RIVM Report 711701086
80
8.2.4 Sampling and analysis Samples were taken from the standard solution, meals and soils before digestion to determine lead intake. During the 6-hour Tiny-TIM experiment one pooled sample was collected from the dialysate (0-360 min). Analyses of this sample generate data on the bioaccessibility of lead from the polluted soil. At the end of the experiment the residue in the gastric compartment was collected to determine the remaining lead in the gastric compartment (for details on the determination of lead, see section 4.2). All samples are stored at -20 o Celsius.
8.2.5 Calculation of the bioaccessibility of lead In vivo processes of absorption via an active transport mechanism cannot be modelled in this in vitro system. The TIM systems predict the quantity of compound that becomes potentially available for absorption by measuring the dialysis of solublised compounds through the membranes. This dialysis process depends on molecular size and concentration gradient. Since in Tiny-TIM the dialyser is connected to the small intestine compartment, it is only possible to calculate the bioaccessibility of the fraction that has entered the small intestine compartment. This fraction is referred to as duodenal efflux (DE) and it also implies that test material that has not been emptied from the gastric compartment during the experiment is not included in the calculation.
Bioaccessibility is not the same as bioavailability. section 9.4.1 addresses these different terms for both the IVD and the Tiny-Tim method in more detail. For the Tiny-Tim method, bioaccessibility is expressed as the percentage of test material that is dialysed of the duodenal efflux according to the following equation 8:
(8) Bioaccessibility (as % DE) = %100⋅DEDial
Duodenal Efflux (DE) = input - gastric residue Input = Amount of lead (mg) in the meal Dial = Total amount of lead that is dialysed Gastric residue = The residual amount of lead in the gastric compartment after the experiment
8.3 Results and Discussion
8.3.1 Bioaccessibility of lead from lead acetate The experiments with reference solutions with and without a meal were tested in Tiny-TIM in singular experiments. This does not allow any statistical evaluation of the results.

RIVM Report 711701086
81
8.3.1.1 Dose dependency After the oral intake of the low dose of soluble lead acetate (1 mg) without a meal matrix the bioaccessibility of lead was 66 % (Table 8.2). After the intake of the high dose of soluble lead acetate (8 mg), the bioaccessibility of lead was 56 %. This means that the bioaccessibility of lead decreases with increasing lead concentrations without a meal matrix. This is in agreement with previous experiments performed by the BARGE group (Oomen et al., 2002) and with literature date (Heard and Chamberlain, 1982) in which a dose depending bioavailability of lead was found. This dose or concentration depending effect on the bioaccessibility of lead was also found for the experiments with the two different types of meal matrices (Table 8.2). This is consistent with observations on in vivo bioavailability (Aungst et al., 1981; Casteel et al., 2006) in which also a concentration depended bioavailability was found.
8.3.1.2 Effect of meal matrix When the oral intake of lead acetate solution was combined with the intake of a meal instead of with water, a strong decrease in bioaccessibility of lead was found for both types of meals (Table 8.2). For the high intake of lead acetate the bioaccessibility decreased from 56 % to 9 % for both type of meals. For the low lead acetate intake it decreased from 66 % to 16 % and 13 % for the two types of meals. This means that the findings are very consistent in relation to the concentration and the meal matrix. This food matrix effect was also observed in human adults by Rabinowitz et al., 1980. They found lead absorption (estimated from the difference between lead intake and fecal excretion) of 35 ± 13 % for ingestion without food and 8.2 ± 2.8 % for lead intake with a food matrix. These effects have been explained by Rabinowitz et al.,(1980) by competition for absorption by carrier proteins or binding of lead to poorly absorbed compounds. Carrier proteins are not included in the Tiny-TIM system and therefore the results should be explained by the binding with poorly absorbed food components. Heard and Chamberlain (1982) as well as James et al.,(1985) found an even stronger food effect on lead absorption. Under fasting state the absorption of lead (in adults) was 63 % and 61 %, respectively, and under the fed state, with a meal matrix is was 3 % and 3.5 %, respectively. The data found in Tiny-TIM are close to these reported in vivo data: 56-66 % bioaccessibility for lead acetate under fasting state and 9-16 % bioaccessibility from lead acetate in a meal matrix. The net absorption (= intake minus faecal excretion) of lead from food in young children (0-2 years old) is estimated by Ziegler et al.,(1978). Absorption was correlated with oral intake and averaged 26 %. In 10 subjects with intakes above 9-17 µg/kg/day the mean absorption was 40 % (Ziegler et al., 1978). Gulson et al.,(2001) also found relatively high lead uptakes in infants (0-6 months). Bioavailability of lead ranged from 40-65 % for breast milk as the only dietary source, 15-70 % for breast milk and infant formula as the dietary sources, and 20-80 % for infant formula and beikost (i.e. foods other than milk or formula) as dietary sources. Mushak (1998) suggested that diet rather than physiological changes are responsible for the higher uptake found

RIVM Report 711701086
82
for children. The meals tested in the present study consisted of other ingredients than mainly milk as consumed by babies. Hence, the lower bioaccessibility of lead from the spiked food matrix might be due to the difference in food types. Another explanation for the difference in dietary lead bioaccessibility in Tiny-TIM and lead bioavailability of 40 % according to Ziegler et al.,(1978) can be that the lead dose in the Tiny-TIM experiments was much higher than those used in the in vivo studies. Since we found a negative trend between the two doses and bioaccessibility, it might be that the bioaccessibility of lead in Tiny-TIM will increase after intake of lower amounts of lead in a milk based meal matrix.
8.3.2 Bioaccessibility of lead from soils The bioaccessibility values of lead (expressed as % of DE) from the sixteen selected made grounds are shown in Table 8.2. The duplicate experiments show good reproducibility as indicated by the small range (error bars). The results show an overall low bioaccessibility of lead for the different soil types (less than 10 %). The bioaccessibility of lead from the reference soil (Montana Soil 2710; NIST) was 2.2 %. Although this seems to be in agreement with in vivo data from rats (0.63 % absolute bioavailability; Ellickson et al., 2001), it should be stated that the recovery of lead from the animals was incomplete (45-70 %). The bioaccessibility of lead from the Montana reference soil, estimated with the Tiny-TIM (2 %) was similar to the obtained absolute bioavailability value in rats (0.63 %; Ellickson et al., 2001). In a previous study with reference Bunker Hill soil, it was shown that the bioaccessibility of lead in the Tiny-TIM experiments was 32 % for the fasting state and 7 % for the fed state. In the human study it was found that the bioavailability was 26 % and 2.5 %, respectively (Table 9.2). The bioaccessibility data, estimated with the Tiny-TIM system was close to the bioavailability data obtained in this human adults study.

RIVM Report 711701086
83
Table 8.2: Bioaccessibility of lead from the different sources tested in the Tiny-TIM system simulating the gastro-intestinal conditions of children.
8.4 Conclusions Although only two concentrations of lead acetate and two different types of meal matrices spiked with lead acetate were tested, the Tiny-TIM experiments, showed the effect of dose of lead and food matrix on the bioaccessibility of lead. This was also found to a similar extent in variously published in vivo studies (Rabinowitz et al., 1980; Heard and Chamberlain, 1982, James et al.,1985). The bioaccessibility of lead in the presence of a food matrix (9-16 %) is similar to those obtained with adults. Gulson et al., (1997) suggests that absorption in children aged 6-11 years is similar to that in adults (10-15 %). However, the bioaccessibility values as tested in Tiny-TIM were lower as the bioavailability obtained with toddlers (0-2 years, 40 % in the study by Ziegler et al.,1978; Ryu et al., 1983) after the intake of a lower levels of lead. Seeing the demonstrated negative dose-bioaccessibility relation, this difference can possibly be explained by the different diets and/or the
Category Test material Bioaccessibility (%) Standard deviation
Ref. Pb solution Low (1 mg PbAc) 65.9 High (8 mg PbAc) 56.2 Meal leek low (1.25 mg PbAc) 16.4 leek high (6.25 mg PbAC) 8.9 noodles low (1.25 mg PbAc) 13.2 noodles high (6.25 mg PbAc) 9.1 River clay / sand 1 Schoonhoven 4.4 0.0 29 Leiden 4.9 0.9 59 Zutphen 3.7 0.6 Sand 11 Utrecht 2.9 0.2 53 Groningen 2.2 0.4 63 Nijmegen 9.2 1.2 Dune sand 21 Haarlem 1.1 0.1 27 Alkmaar 2.8 0.4 43 Den Haag 2.0 0.1 Löss 69 Maastricht 4.0 0.4 71 Maastricht 7.9 0.7 77 Echt Susteren 9.9 3.2 Sea clay 17 De Rijp 2.1 0.2 33 Delft 7.1 1.6 45 Rotterdam 1.5 0.2 51 Schiedam 10.0 0.6 Reference soil MS Montana soil 2710 2.2 0.5

RIVM Report 711701086
84
high lead dose used in the Tiny-TIM experiments. Further experiments with formula milk containing a realistic low dose of lead would be interesting for further testing. The sixteen made grounds, tested with the Tiny-TIM system revealed an overall low (<10 %) bioaccessibility of lead. These findings are consistent with the results from previous Tiny-TIM experiments with similar types of soil samples (Oomen et al., 2002; Van de Wiele et al., 2007; Various TNO Reports on bioaccessibility of lead from various soils/locations in the Netherlands, available via [email protected]). Also the obtained bioaccessibility of lead in the reference soil was similar to that obtained in vivo (Van de Wiele et al., 2007).

RIVM Report 711701086
85
9 Bioaccessibility experiments: IVD and Tiny-TIM methods
9.1 Introduction Obviously, in vivo studies (preferably in humans) would be the method of choice to estimate the bioavailability of lead from soil. It is also obvious that this is not (always) possible due to economic and ethical reasons. To estimate the bioavailability of lead from soil, in vitro models can be used. In this document, the results of two different in vitro digestion methods are discussed. Out of the total ninety samples from 45 sites, sixteen representative soils from sixteen sites were selected (which included soils from all cities and all types of lithology; additional information is given in section 2.4)) for additional experiments. Of these sixteen soil samples the bioaccessibility and relative oral bioavailability of lead was determined with two different in vitro digestion models: the RIVM in vitro digestion (IVD) model (details described in chapter 6) and the TNO Tiny-TIM model (chapter 8 describes the details). In this chapter, the results of both models for these selected sixteen soils will be compared and discussed.
9.2 Methods For comparison the results of both models are presented in the following manner: • Total lead measurements. The soils used in the IVD and Tiny-TIM bioaccessibility
experiments are the same. Therefore, the total lead concentration should, in principle, be the same. Although both TNO and RIVM determined the total lead concentration separately, resulting in some differences which can be ascribed to the analytical variation and soil heterogeneity, one total lead concentration was used in the calculation of the bioaccessibility. The calculated bioaccessibility for IVD and Tiny-TIM are based on the total lead concentration as measured by RIVM to keep the link with all ninety soils of which RIVM determined the bioaccessibility and total lead concentration.
• Average physiological state correction. The IVD experiments were performed simulating fasted conditions. The Tiny-TIM method simulated the average physiological state as default situation, although no food was included in the experiments with soil. The bioaccessibility values for fasted conditions, as estimated with the IVD method can be corrected with a recently derived “average physiological state” correction factor (CFAPS). The CFAPS (of 0.81) represents the 50 percentile of seventy lead bioaccessibility measurements from soil for both fasted and fed conditions (Hagens et al., 2008).
• Relative oral bioavailability factor. In addition to the bioaccessibility, the relative bioavailability for the soils for both IVD and Tiny-TIM measurements is calculated. The

RIVM Report 711701086
86
translation from bioaccessibility to relative bioavailability is different for the methods. This different conversion is addressed in section 9.4.2.
Taken together, the relative bioavailability values for the average physiological state of both IVD and Tiny-TIM are compared. These values are calculated, based on the total lead concentration in soil, determined by RIVM.
9.3 Results The bioaccessibility and relative oral bioavailability values of lead from the sixteen selected soils, as measured by IVD and Tiny-TIM, are listed in Table 9.1. This table also includes average values, standard deviations and the P50-P95 percentile values. Table 9.1: The bioaccessibility for fasted conditions (IVD); average physiological state (IVD and Tiny-TIM) and relative bioavailability for the average physiological state (IVD and Tiny-TIM) of lead for sixteen selected soils. Furthermore, the average values, standard deviations and the P50-P90 percentiles are given. Please note that all values are expressed as (%) except total lead (mg Pb/kg soil).
Soil
total lead (ICP-MS by RIVM)
mg Pb /kg soil
1 Schoonhoven 2556 43.4 35.2 0.70 4.5 0.1111 Utrecht 952 31.8 25.8 0.52 4.8 0.1217 de Rijp 1947 26.0 21.1 0.42 1.6 0.0421 Haarlem 1053 30.8 24.9 0.50 2.1 0.0527 Alkmaar 773 30.1 24.4 0.49 7.6 0.1929 Leiden 659 42.2 34.2 0.68 4.9 0.1233 Delft 2213 38.8 31.4 0.63 4.8 0.1243 Den Haag 1628 53.4 43.3 0.87 2.7 0.0745 Rotterdam 783 42.2 34.2 0.68 1.9 0.0551 Schiedam 537 46.9 38.0 0.76 6.0 0.1553 Groningen 740 63.3 51.3 1.03 3.6 0.0959 Zutphen 1222 37.8 30.7 0.61 2.2 0.0663 Nijmegen 2644 24.9 20.2 0.40 4.8 0.1269 Maastricht 890 43.9 35.6 0.71 3.3 0.0871 Maastricht 1029 31.0 25.1 0.50 5.9 0.1577 Echt-Susteren 421 39.8 32.2 0.64 8.3 0.21
39.2 31.7 0.63 4.3 0.1124.9 20.2 0.40 1.6 0.0463.3 51.3 1.03 8.3 0.2139.3 31.8 0.64 4.6 0.1242.2 34.2 0.68 4.8 0.1242.8 34.7 0.69 4.9 0.1243.9 35.6 0.71 5.9 0.1550.1 40.6 0.81 6.8 0.17
tiny-TIM
Bioaccessibility % APS
Relative Bioavailability factor (APS)
Relative Bioavailability factor (APS)
IVD
Bioaccessibility % FASTED
Bioaccessibility % APS
AverageLowest valueHigest value
Soil number City
Percentile 90
Percentile 60Percentile 70Percentile 80
Percentile 50
Table 9.1 reveals that there are large differences between the bioaccessibility determined by the IVD and Tiny-TIM methods and the derived relative bioavailability factor. To investigate whether the IVD relative bioavailability factors correlate with the relative bioaccessibility factors of Tiny-TIM, a scatter graph was plotted with the Tiny-TIM values on the x-axis and IVD values on the y-axis (Figure 9.1). Clearly, no correlation was observed between

RIVM Report 711701086
87
both models. This indicates that a soil for which a high relative bioavailability value in one model was measured, not necessarily lead to a high relative bioaccessibility values in the other model.
53
43
691 51
77
277111
33
29
59
17 6321
45
69
6371
33
1 29
59
1745
5343
1121
27
51
77
RIVM total leady = -0.3x + 67
R2 = 0.01
TNO total leady = 1.6x + 41.9
R2 = 0.360.00
0.20
0.40
0.60
0.80
1.00
0.00 0.05 0.10 0.15 0.20 0.25
Relative bioavailability factor (APS) tiny-TIM
Rel
ativ
e bi
oava
ilabi
lity
fact
or (A
PS
) IV
D
RIVM total lead
TNO total lead
Figure 9.1: Correlation of the relative bioavailability of lead per soil estimated with the bioaccessibility of the IVD and Tiny-TIM model. Data calculated with total lead in soils as measured by RIVM are shown as black circles, and total lead measured by TNO as open triangles. The numbers represent the numbers of the soil sample. Please note that no correlation was observed (R2=0.01) for the correlation with the RIVM total lead measurements. When the relative bioavailability factors were calculated with the total lead in soil values determined by TNO, a slight correlation was observed (see triangles). An explanation of this observed difference in correlation (Figure 9.1) could be that the total lead concentration, as measured by RIVM and TNO show differences (Figure 9.2), especially for a few soils. Yet, both approaches (i.e. calculation of relative oral bioavailability factor, based on the total lead concentrations obtained with the RIVM method or with the TNO method) show no or little correlation between the IVD and Tiny-TIM data, indicating that it is very unlikely that there is a real correlation that is obscured by the total lead determination.
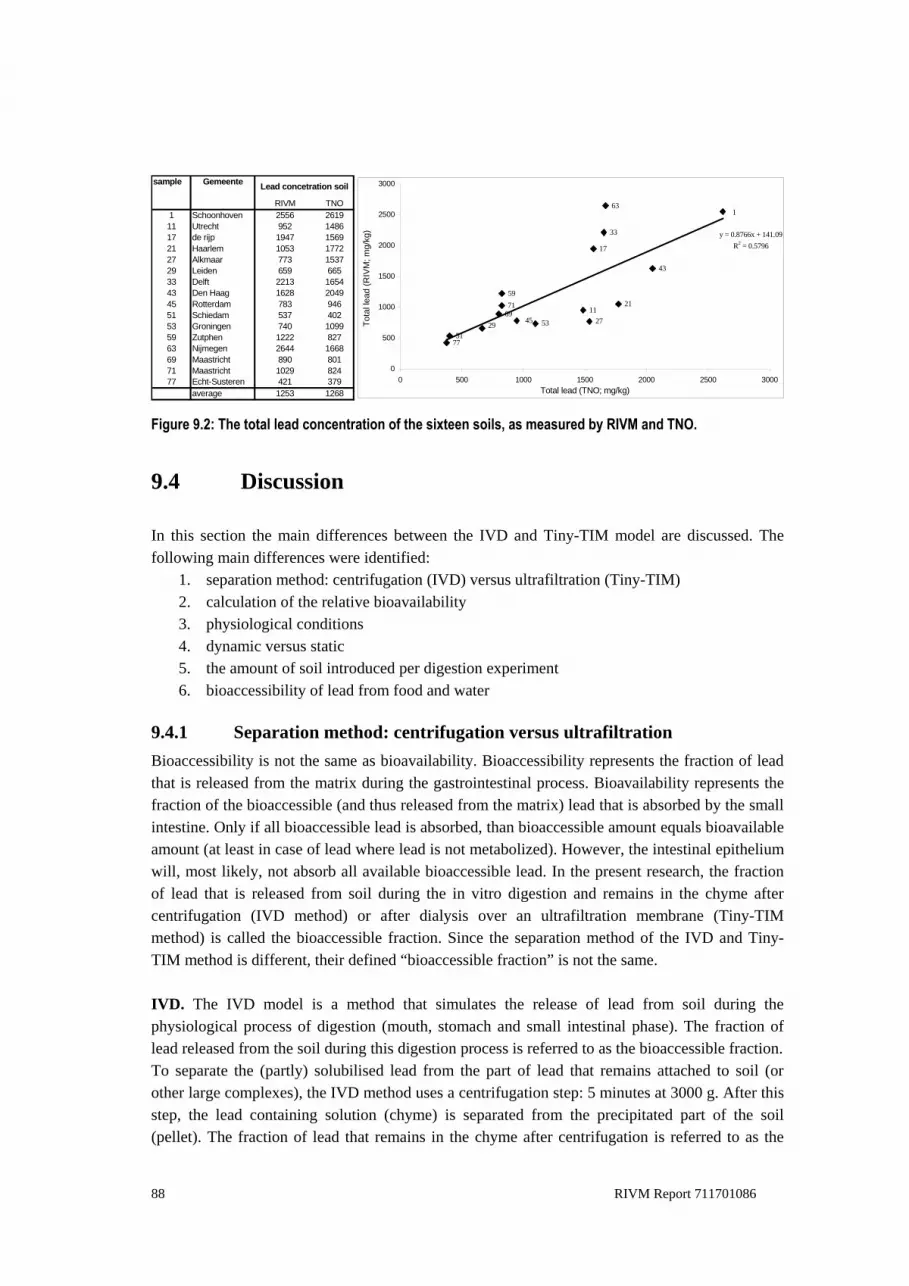
RIVM Report 711701086
88
sample Gemeente
RIVM TNO1 Schoonhoven 2556 261911 Utrecht 952 148617 de rijp 1947 156921 Haarlem 1053 177227 Alkmaar 773 153729 Leiden 659 66533 Delft 2213 165443 Den Haag 1628 204945 Rotterdam 783 94651 Schiedam 537 40253 Groningen 740 109959 Zutphen 1222 82763 Nijmegen 2644 166869 Maastricht 890 80171 Maastricht 1029 82477 Echt-Susteren 421 379
average 1253 1268
Lead concetration soil
53
43
69
1
5177
27
71 11
33
29
59
17
63
21
45
y = 0.8766x + 141.09R2 = 0.5796
0
500
1000
1500
2000
2500
3000
0 500 1000 1500 2000 2500 3000Total lead (TNO; mg/kg)
Tota
l lea
d (R
IVM
; mg/
kg)
Figure 9.2: The total lead concentration of the sixteen soils, as measured by RIVM and TNO.
9.4 Discussion In this section the main differences between the IVD and Tiny-TIM model are discussed. The following main differences were identified:
1. separation method: centrifugation (IVD) versus ultrafiltration (Tiny-TIM) 2. calculation of the relative bioavailability 3. physiological conditions 4. dynamic versus static 5. the amount of soil introduced per digestion experiment 6. bioaccessibility of lead from food and water
9.4.1 Separation method: centrifugation versus ultrafiltration Bioaccessibility is not the same as bioavailability. Bioaccessibility represents the fraction of lead that is released from the matrix during the gastrointestinal process. Bioavailability represents the fraction of the bioaccessible (and thus released from the matrix) lead that is absorbed by the small intestine. Only if all bioaccessible lead is absorbed, than bioaccessible amount equals bioavailable amount (at least in case of lead where lead is not metabolized). However, the intestinal epithelium will, most likely, not absorb all available bioaccessible lead. In the present research, the fraction of lead that is released from soil during the in vitro digestion and remains in the chyme after centrifugation (IVD method) or after dialysis over an ultrafiltration membrane (Tiny-TIM method) is called the bioaccessible fraction. Since the separation method of the IVD and Tiny-TIM method is different, their defined “bioaccessible fraction” is not the same. IVD. The IVD model is a method that simulates the release of lead from soil during the physiological process of digestion (mouth, stomach and small intestinal phase). The fraction of lead released from the soil during this digestion process is referred to as the bioaccessible fraction. To separate the (partly) solubilised lead from the part of lead that remains attached to soil (or other large complexes), the IVD method uses a centrifugation step: 5 minutes at 3000 g. After this step, the lead containing solution (chyme) is separated from the precipitated part of the soil (pellet). The fraction of lead that remains in the chyme after centrifugation is referred to as the

RIVM Report 711701086
89
bioaccessible fraction (FB). Part of the bioaccessible fraction is transported across the intestinal epithelium and reaches the portal vein (absorbed fraction; FA). Metabolization of the contaminant may occur in the intestinal epithelium and/or in the liver (first-pass effect). The fraction that is not metabolized (FH) is transported throughout the body and represents the bioavailable fraction (F). To derive the oral bioavailability (F) of lead, the bioaccessibility (FB), together with information on the absorption (FA) and metabolism (FH) of lead in the body is needed (equation 9): (9) F= FB × FA × FH Please note that for lead, no metabolization is expected, resulting in a FH fraction of 1 (More information can be found in (Oomen et al., 2006). This results in equation 10: (10) F= FB × FA From previous studies, it is estimated that children under average physiological state (half fed, half fasted) absorb 80 % of the bioaccessible lead (FA, children, APS ; 80 %; Oomen et al., 2006). For adults this fraction is lower as adults absorb less lead than children. This approach might result in an overestimation of the bioavailable lead fraction since in the derivation of the absorption fraction mentioned above (FA, Children APS), due to absence of information, the “worst case assumption” of 100 % absorption of bioaccessible lead by children for fasted conditions (FA, children, fasted) is used. For FA,children,fed more information in the literature is available. Although this probably depends on the type of food, a realistic value of 0.62 is applied. More information can be found in Oomen et al. (2006). Tiny-TIM. The Tiny-TIM method estimates the fraction of lead released from soil and dialysed through a 10 kD ultrafiltration membrane. This method separates solublised lead (lead ions) and very small lead complexes (< 10 kD) from the rest of the soil (including lead complexes > 10 kD). The thus determined bioaccessible fraction of the Tiny-TIM might be interpreted as the fraction of lead that is, in principle, readily available for intestinal absorption (bioavailability). Due to sink conditions during dialysis, the flux of freely dissolved lead and small lead complexes over the ultrafiltration membrane is kept high. It is unclear whether the Tiny-TIM method can underestimate or overestimate the bioaccessibility and absorption of lead. On the one side, free lead and small lead complexes can diffuse across the 10 kD filter, resulting in a maximum flux of freely dissolved lead and small lead complexes across the membrane. On the other side, active transport processes and higher absorption of lead in children compared to adults are not taken into account. It is known that:
1. lead uptake occurs as lead-ion, very small, soluble lead-complexes, from micelles and by endocytosis (i.e. the process by which cells absorb material from outside the cell by engulfing it with their cell membrane), especially in babies (Mushak, 1991). However, the contribution of this specific absorption route for children and adults is probably small.

RIVM Report 711701086
90
2. lead absorption is characterized by passive diffusion and active carrier-mediated transport (Mushak, 1991). However, the contribution of active carrier mediated transport to the total absorption process of lead is not known.
3. the absorption of lead from the gastrointestinal tract in children is much greater than in adults (Alexander et al., 1974), associated with increased calcium needs due to (bone) growth. This suggests that active transport across the intestinal epithelium may be greater for children than adults.
Taken together, it is clear that the separation method to determine the bioaccessible fraction for the Tiny-TIM and IVD method is different. In previous experiments, the IVD method with ultrafiltration in stead of centrifugation revealed that the lead fraction determined after ultrafiltration was much smaller than after centrifugation. In other words, the bioaccessibility based on the Tiny-TIM experiments is lower than based on the IVD method. This indicates that the separation method of chyme and pellet can result in large differences in in vitro bioaccessibility (Table 9.2 and section 9.4). Table 9.2: The effect of the separation of chyme and pellet with the IVD method has been studied for Bunker Hill soil. It should be noted that ultrafiltration in these IVD experiments is not the same as the ultrafiltration performed with the Tiny-TIM model. The Tiny-TIM model uses dialysis with sink conditions.
IVD 1:1000 Centrifugation 47.4 3.2 3IVD 1:100 Centrifugation 31.8 2.5 3tiny-TIM 1:51 Ultrafiltration 32.5 4.5 2IVD 1:1000 Centrifugation 36.1 6 4IVD 1:250 Centrifugation 28.2 6.7 18IVD 1:250 Ultrafiltration 3.1 2.7 3IVD 1:100 Centrifugation 25 3.5 4tiny-TIM 1:51 Ultrafiltration 7 1.5 2
Soil Fysiological condition
Bioaccessibility model
Solid-to-Liquid ratio
Separation method
in vitro bioaccessibility (%) Human bioavailability
Bunker Hill
avarage
standard
number
Bunker Hill
Fed
Fasted 26
2.5
As the bioaccessibility measured by the IVD method is determined in a different manner than the bioaccessible fraction in the Tiny-TIM method, these values cannot be compared directly. For comparison, the data are expressed as relative bioavailability. For this translation it is necessary to compare the bioaccessibility of lead from soil with the estimated bioaccessibility of the toxicological reference limits (maximum permissible risk or MPR).
9.4.2 Calculation of the relative bioavailability From previous studies, it is known that the bioavailability of lead from food was 40 % in children (Ziegler et al., 1978; Ryu et al., 1983). These studies were used by the FAO/WHO and IPCS to derive a tolerable daily intake (TDI) of 3.6 µg lead/kg body weight/day for children. This value is used in Dutch risk assessment for lead as the maximal permissible risk (MPR). To assess the risk of lead from soil, the relative bioavailability factor is used. The relative bioavailability factor represents the estimated bioavailability of lead from soil divided by the bioavailability of dietary lead found in the studies with children used as the basis for risk assessment of lead (= 40 % or FMPR = 0.4; (Ziegler et al., 1978; Ryu et al., 1983; Baars et al., 2001)). In other words, the estimated bioaccessibility of lead from soils is correlated to the

RIVM Report 711701086
91
toxicological data of lead bioavailability in children in order to compare the risk of lead from soil with the present toxicological limits. The relationship between the relative bioavailability and bioaccessibility of lead from soil becomes:
(11) soil soil
MPR
F FRel F=F 0.4
= (see Oomen et al., 2006)
IVD. Fsoil represents the bioavailability of lead from soil. This is the bioaccessible fraction (measured with the IVD model) times the fraction absorbed (FA = 0.8; section 9.2.2 of Oomen et al., 2006). Thus:
(12) for the IVD model: soil a b bb,RIVM
MPR
F F F 0.8 FRel F= 2 FF 0.4 0.4
× ×= = = ×
Tiny-TIM. Fsoil represents the bioavailability of lead from soil. For Tiny-TIM, Fsoil equals Fb, since, as a worst case, complete absorption of the bioaccessible fraction is assumed, (Fa = 1). Therefore, the bioaccessibility, determined with the Tiny-TIM method can be regarded as the maximum fraction that can become bioavailable. Thus:
(13) for the Tiny-TIM model: b,TNOsoilb,TNO
MPR
FFRel F= 2.5 FF 0.4
= = ×
Based on the above calculations, the relative bioavailability of lead from soil can be calculated by multiplying the IVD output value (Fb,soil) by 2 and the Tiny-TIM output value by (Fsoil) 2.5.
9.4.3 Physiological conditions The physiological state affects the physicochemical condition in the gastrointestinal tract. This in turn influences the release of lead from the soil. For instance, in fasted conditions, the pH in the stomach is lower. This lower pH for simulated fasted conditions results in a higher release of lead from soil than for fed conditions. IVD. The IVD model simulates fasted conditions as a default. For fasted conditions, the stomach compartment applies pH 1.5 for 2 hours. It is possible to run the model for fed conditions, and it is also possible to apply a specific “average physiological state” correction. This correction factor is based on the bioaccessibility results for fasted and fed conditions from seventy samples (Hagens et al., 2008). These simulated fed conditions also include food. In this comparison study, the default (fasted) conditions were simulated. Tiny-TIM. The Tiny-TIM model simulates the average physiological state of a child (physiological conditions after ingestion of a small meal, without the food itself.

RIVM Report 711701086
92
9.4.4 Dynamic versus static IVD. The IVD model is a static model in which the conditions of mouth, stomach and small intestine are simulated after each other in a test tube. Hence, the digestive mixture in the stomach is abruptly changed into the digestive mixture in the intestine by addition of intestinal juices. The physiological conditions during a specific phase, i.e. stomach or intestinal phase, do not change. This approach is a simplification of the dynamic nature of the human gastrointestinal transit, but also makes the IVD model relatively simple so that many samples can be run simultaneously. Tiny-TIM. With the Tiny-TIM model, the average physiological conditions are mimicked with a dynamic model. In this dynamic model, the digestive juice gradually goes from one compartment to the next. Also the pH in a compartment changes in time and digestive juices are added gradually. In Figure 9.3, the pH curve in the stomach in relation to the secretion of gastric acid is represented. Hence, the Tiny-TIM model closely simulates this feature of the human digestion process.
Figure 9.3. Gastric emptying (straight line) and the gastric pH profile (dotted line) as applied in the Tiny-TIM model. As shown in Figure 9.3, the pH of the stomach compartment gradually declines from pH 5 to pH 2 in 90 minutes. After 90 minutes, already 65 % of the stomach compartment is emptied in the intestinal compartment. In this intestinal compartment, the pH is stable at 6.8 to 7.0. This implies that less then 50 % of the stomach fraction is incubated at a pH of 2. It is known that the pH in the stomach has a large impact on the release of lead from soil (bioaccessibility). Hence, the dynamics of the Tiny Tim model may have a physiological relevant effect on the bioaccessibility of lead.
0123456789
10
0 60 120 180 240 300 360
time (min)
pH
0102030405060708090100
%O
I

RIVM Report 711701086
93
The stomach compartment in the IVD model mimics the fasted conditions and applies 120 minutes at a pH of 1.5 ± 0.5. These differences in the models are expected to result in a higher release of lead from soil for the IVD than for the Tiny-TIM method (mimicking the average physiological state), since the stomach conditions of the IVD model are more tough (lower pH) compared to the Tiny-Tim conditions.
9.4.5 The amount of soil introduced per digestion experiment IVD. The IVD method is optimized for risk assessment purposes. As seen in Figure 5.1, the choice was made to use 0.06 grams (= 60 mg) of soil per digestion experiment. This represents a solid-to-liquid ratio of 1:1000. This small amount of soil mimics the hand-to-mouth behaviour intake scenario of a child. Soil particles will stick to its hands and when a hand is put into the mouth, the soil particles can be ingested. In current risk assessment of contaminated soils, an average soil consumption of 100 mg a day is assumed (Lijzen et al., 2001). This amount of soil is based on several studies that quantified the soil ingestion by hand-to-mouth behaviour of a child (Schmidt, 1999; Davis et al., 1990; Calabrese et al., 1989; Van Wijnen et al., 1990; Reed et al., 1999; Stanek et al., 1998). As shown in Table 9.2 and Table 10.2, using 60 mg of Bunker Hill soil per digestion tube resulted in higher bioaccessibility values for lead for both fasted and fed conditions compared to 600 mg of soil. Based on the correlation between in vitro bioaccessibility determined with the IVD method and the in vivo bioavailability determined in swine studies, using 60 mg might lead to a slight overestimation of the actual risk. The slope of the correlation line is 1.16, whereas a slope of 1 is theoretically expected. This suggests an overestimation of about 16 %. Based on the same study, using 600 mg of soil per digestion might, the slope of the correlation line is 0.69, resulting in an underestimation of about 30 %. Tiny-TIM. The Tiny-TIM model uses 5 grams of soil per digestion experiment. For risk assessment purposes, this amount of soil does not mimic the exposure scenario “hand-to-mouth behaviour” for a child. The high amount of soil per digestion might influence the outcome of the Tiny-TIM model.
9.4.6 Bioaccessibility of lead from food and water As indicated earlier, it is known that the bioavailability of lead from food was 40 % in children (Ziegler et al., 1978; Ryu et al., 1983). To compare the IVD and Tiny-TIM method with this absorption study in children, soluble lead acetate and food spiked with lead-acetate were digested with both models. Both models showed comparable bioaccessibility values for the studies with soluble lead acetate (~50 % for IVD and 60 % for Tiny-TIM; Table 9.3). Surprisingly, some IVD bioaccessibility values of lead from soil are higher than lead-acetate from water. This suggests that lead from soil would, in some cases, be more available than soluble lead from water. These finding are unlikely and therefore not expected. The bioaccessibility of lead from spiked food revealed large differences between both models. The IVD model resulted in ~50 % bioaccessibility of lead. As it is assumed that all bioaccessible lead in fed conditions is absorbed (FA,fed=1) by children, the obtained bioaccessibility results are

RIVM Report 711701086
94
in line with expectations for young children (40 % bioavailability of dietary lead in children; Ziegler et al., 1978; Ryu et al., 1983). The bioaccessibility results of IVD model for lead in water and food are similar. The human bioavailability of lead from water ranges between 30 and 70 %, which includes the dietary bioavailability of 40 %. This may (partly) be due to different physiological conditions: fasted for water and fed for food and/or the binding of lead to particles present in the food. In Tiny-TIM experiments a relative bioaccessibility was found of 9 to 16 %, depending on type of meal matrix and concentration of the spiked lead acetate. Similar food effects were reported by Rabinowitz et al.,(1980), Heard and Chamberlain (1982) as well as James et al.,(1985). But, this bioaccessibility was lower than the studies with dietary lead in milk based food in young children (26-40 % bioavailability; Ziegler et al., 1978; Ryu et al., 1983). However, the lead levels used in the present study in Tiny-TIM were higher and in a different meal matrix than in the in vivo dietary lead studies. It might be that the bioaccessibility of lead in Tiny-TIM will increase if concentrations of lead were tested as low as in the experiments of Ziegler et al., (1978) and in the same matrix. Note that for the derivation of the relative bioavailability of lead from soil, the literature value of 40 % bioavailability of dietary lead is used. Derivation of the relative oral bioavailability, based on the bioaccessibility of lead from soil relative to the bioaccessibility of lead from food as estimated in the present studies (with IVD ~50 % and tiny-TIM ~12 % bioaccessibility from food) would result in much more comparable relative bioavailability values between IVD and tiny-TIM. Based on the above assumptions the relative bioavailability of lead from soil can be calculated by multiplying the tiny-TIM output value by (Fsoil) 8.3 instead of 2.5 (see equation 13).
9.4.7 Additional information on the bioaccessibility and bioavailability of lead from soil, food and water
Previously, the IVD model has been validated with in vivo bioavailability data (Oomen et al., 2006) The correlation between the relative bioaccessibility determined by the IVD model and relative bioavailability of lead from soil determined in juvenile swines was satisfactory (see chapter 5, Figure 5.1; Oomen et al., 2006). For the experiments in which the intestinal bioaccessibility was determined from 0.06 g soil per digestion tube, the r2-value of the correlation was 0.6588, whereas also the slope of the line was according expectations (y=1.16x; Oomen et al., 2006). In a previous study with reference Bunker Hill soil, it was shown that the bioaccessibility of lead in the Tiny-TIM experiments was 32 % for the fasting state and 7 % for the fed state. In the human study it was found that the bioavailability was 26 % and 2.5 %, respectively (Table 9.3). The bioaccessibility data, estimated with the Tiny-TIM system were close to the bioavailability data obtained in this human adults study.

RIVM Report 711701086
95
Table 9.3: Additional information on the bioaccessibility and bioavailability of lead in soils, food and water.
tiny-TIM IVDin vivo
default: 0.6 gram soil Child Adult animalsFlanderes1 fasted 614 13 ± 3 66 ± 9Oker 111 fasted 5750 4 ± 1 29 ± 2 1.7 ± 0.3 (55% RBA)8
Montana 27103 fasted 5532 2.2 ± 0.5 gram: 43 ± 6) 0.7 ± 0.39
Montana 27111 fasted 1046 17 ± 3 11 ± 2Bunker Hill2 fasted 2924 32.5 ± 5 31.8 ± 3 (1:100) 26.2 ± 84
Bunker Hill2 fasted 2924 47.4 ± 3 (1:1000; 0.06 gram)Bunker Hill2 fed 2924 7.0 ± 1.5 23.9 ± 2 (1:100) 2.5 ± 1.74
Bunker Hill2 fed 2924 38.8 ± 2 (1:1000; 0.06 gram)Olvarit Prei3 fed low 16.4 52.3 ± 12.2 42 5
Olvarit Prei3 fed high 8.9 49.6 ± 14.9 53 6
Olvarit Noodles3 fed low 13.2 40.2 ± 1.2Olvarit Noodles3 fed high 9.1 57.6 ± 2.1Spike solution3 fasted low 65.9 52.5 ± 0.1 rangeSpike solution3 fasted high 56.2 51.4 ± 0.3 30-70 7
Sources:1: Oomen et al., 20022: Van der Wiele et al., 20073: This study, 20094: Maddaloni et al., 19985: Ziegler et al., 19736: Alexander et al., 19737: Heard et al., 1982, 1983; James et al.,1985; Rabinowitz et al., 19808: Marschner et al., 2006 (minipigs)9: Ellickson et al., 2001 (rats)
Oral bioavailability (%)
in vivo humanSoil physiological state
Lead concentration soil (mg/kg)
bioaccessibility (%)
In Table 9.3, Additional information on the bioaccessibility and bioavailability of lead various matrixes (soil, food and water) is presented. Note that the in vivo data of lead from Bunker Hill soil is based on voluntary human studies. In this human study, only the absolute bioavailability of lead from Bunker Hill by adult human volunteers is given and not the relative oral bioavailability (Maddaloni et al., 1998). In a study in minipigs, the bioavailability of lead from Oker11 soils was 1.7 ± 0.3 % (absolute value) with a low lead recovery (Marschner et al., 2006). However, the relative bioavailability of lead from Oker11 was 55 % (relative to a lead acetate solution). Although the absolute bioavailability of lead from Oker11 seems to be in agreement with the bioaccessibility of TIM, the large difference between absolute and relative bioavailability (relative to lead acetate which has a high bioaccessibility and bioavailability) indicates that this study is not reliable and should not be used for validation. The bioavailability of lead from Montana 2710 was 0.7 % in rats (Ellickson et al., 2001). This value is in agreement with the bioaccessibility values of Tiny-TIM. However, it should be noted that rats have a different physiology than humans.
9.5 Conclusion The estimation of the bioavailability of lead from soil by in vitro digestion models and subsequently the assessment of potential risk of lead contaminated soil for children is accompanied with uncertainties. The IVD model might overestimate the bioaccessibility of lead from soil leading to an overestimation of the potential risk for children, since:

RIVM Report 711701086
96
• the centrifugation step to separate the released lead with the remaining soil could result in the presence of insoluble large lead-complexes in the liquid fraction. These lead complexes increase the estimated bioaccessibility of lead. However, this should in principle be corrected for by multiplying with FA, derived in Oomen et al. (2006).
• the derived absorption fraction for average physiological conditions for children of 80 % (Fa = 0.8) is based on a “worst case scenario” (Oomen et al., 2006).
• the smaller solid to liquid ratio (1:1000) results in a higher bioaccessibility of lead from soil as with a solid to liquid ratio of 1:100 (Table 9.2; Van de Wiele et al., 2007).
• surprisingly, some RIVM bioaccessibility values of lead from soil are higher than lead-acetate from water.
It is unknown whether the Tiny-TIM model results in an under- or overestimation of the total lead bioavailability for a child since:
• the Tiny-TIM model aims to include the maximum absorption of lead by using sink conditions after an ultrafiltration membrane with a cut-off of 10 kD. Hence, all the free lead and small lead complexes that can diffuse across this membrane are included.
• although the ultrafiltration membrane does not include active absorption processes, which are expected to be especially important for children, the lead should first be bioaccessible before active transport, as measured in Tiny-TIM.
• the bioaccessibility of lead(acetate) from food measured with the Tiny-TIM model (~12 %) does not directly correlate well with the absorption of lead from food in young children (~26-40 %, (Ziegler et al., 1978; Ryu et al., 1983).
Taken together, two models (IVD and Tiny-TIM) are used to estimate the bioaccessibility of lead from soil and subsequently estimate the potential exposure of lead from soil for children. These models are fundamentally different and so are the bioaccessibility results. Both models have, for as far as possible, been compared to vivo data. These comparisons with vivo data appeared to be fine for most cases, although both models show some unexpected findings, i.e. higher bioaccessible values for lead from soil than from water for IVD and low bioaccessibility values for lead from food for Tiny-TIM. Therefore, with the present knowledge, the model that results in better bioavailability values than the other model cannot be chosen.
9.6 Recommendations As there are many sites in the Netherlands with a lead contamination around or just above the present Dutch intervention value of 530 mg/kg, there is a clear need to look for possibilities to assess the health risk to children carefully but also without introducing additional conservatism. In other words, children should not be exposed to lead in soils that result in adverse health effects. In

RIVM Report 711701086
97
addition, unnecessary and expensive soil remediation due to conservative risk assessment should be avoided. It is clear that the present research does not give an indisputable answer which can be directly applied for decisions on soil remediation and soil management. In order to continue from the present situation, there are several options: 1) investigate the differences between the IVD and Tiny-TIM model, and their effect on
bioaccessibility (technical differences). More specifically: • study the separation method, e.g. ultrafiltration for IVD model, centrifugation for Tiny-TIM
model. • study the effect of the dynamics as applied in the Tiny-TIM model (gradual transit of gastric
contents to intestinal compartment): Tiny-TIM at static conditions and IVD at dynamic conditions with comparable pH.
• perform experiments with comparable physiological status (completely fasted conditions and fed conditions for both models).
• investigate the effect of the amount of soil per digestion on the bioaccessibility. This technical research on the differences between the IVD and Tiny-TIM model will increase understanding in the magnitude of the effect of various parameters on bioaccessibility and thus in the models. However, if no “golden standard” (i.e. true bioavailability values) is available for validation of the models, no conclusions can be drawn if one of the models can be used in risk assessment of contaminated soils. 2) Present this report to a group of international experts in the field of soil bioavailability, risk
assessment and gastrointestinal transport. These experts are asked to review the report and discuss the potential use for the applicability of the IVD and Tiny-TIM models in risk assessment studies. In addition, the experts are asked to indicate which information and which studies are needed to validate the models in order to appoint the most appropriate method for application in risk assessment. If needed, the outcome of this international review can be discussed in a special organized workshop. This workshop could provide a validation strategy for both models with relevant Dutch soils.
3) Perform in vivo studies in pigs or humans to validate the bioaccessibility of relevant Dutch
soils (e.g. made grounds) determined by IVD and Tiny-TIM. In this manner, the models can be compared to each other and to the actual vivo bioavailability. This would enable a conclusion if one of the models can be used in risk assessment.
4) Derive an “intervention value” above which, in principle, the blood-lead concentrations of
children living at the contaminated site should be determined. This provides a direct answer on the potential health risk for children, as the risk assessment is based on avoiding blood lead concentrations above 10 μg/dl. If soils are sampled from the same sites, and bioaccessibility is determined from these soils, in time the correlation between blood-lead and bioaccessibility can be investigated.

RIVM Report 711701086
98

RIVM Report 711701086
99
10 Discussion
10.1 Lead contamination Population based epidemiologic studies have reported adverse effects in children at blood lead levels of 10 µg/dl and above (IPCS 1995; FAO/WHO 1993; Baars et al., 2001). Unfortunately, the soils that are associated with elevated blood lead levels in children remain poorly investigated. Several studies indicate that a correlation between environmental lead contamination and blood lead levels in children exist. However, such a correlation was not found by other studies. Below, two studies are discussed briefly. In an American epidemiological study, it is reported that a lead-contaminated location significantly increased the blood-lead levels in children. A large scale clean-up of lead contaminated soils greater than (or equal to) 1000 mg/kg resulted in a decrease in the overall blood lead levels in children in the remediated area over time. Moreover, in 2001, only 3 % of all children (up to age 9) had blood lead levels above 10 µg lead/dl blood compared to 46 % in 1988 (before remediation) (Sheldrake and Stifelman, 2003). Although the effects of the ban of leaded fuel was not taken into account, this epidemiologic study suggests that exposure to environmental lead can result in elevated blood lead concentrations in children. In a recent epidemiological study in Mount Isa (Queensland, Australia), a region with a long history of lead mining and associated activities, the blood lead levels of 400 children (< 4 years) were examined. This study reported that the average blood lead level for the tested children was 5.0 µg/dl (lowest: 1.3 µg/dl; highest 31.5 µg/dl). In total 45 children (11.3 %) revealed blood levels greater than (or equal to) 10 µg/dl. Children under 3 years of age were more likely to have elevated blood-lead levels, probably associated with increased hand-to-mouth behaviour. A questionnaire to appoint risk factors revealed that over 80 % of the children with elevated blood levels had access to bare soil in house surroundings. This suggests that in these cases, exposure to lead via soil is driving the blood lead levels. Unfortunately, this study only mentions the presence of elevated lead levels in the whole area. The actual lead concentrations are not known. Although these specific lead concentrations in soil were not reported in this study, this epidemiologic study suggests that exposure to environmental lead is relevant for children (Queensland Health, 2007). Up till now, some studies suggest that environmental lead correlates with the blood lead levels in children and other studies suggest the opposite. However, the origin of this lead can be from several sources, including soil, dust, paint, food and leaded fuel. Therefore, there is a need to perform a meta-analysis on the lead concentration in soil and the reported blood lead levels in children, based on the available studies. Moreover, new epidemiologic blood-lead level research in children to explore the contribution of lead exposure lead via soil, compared to lead exposure via inhalation or ingestion of, for example, house dust, paint and food could be relevant. An advantage of recent and future studies is that lead exposure from leaded fuel will not significantly influence the results.

RIVM Report 711701086
100
10.2 Models to assess the bioavailability of lead in risk assessment
In standard risk assessment of contaminated soils, the potential risk (for children) might be overrated since not all lead in the soil will be bioavailable to the body. Amongst others, this process is influenced by several soil and lead specific characteristics (Ruby et al., 1999; Walraven et al., in preparation). Therefore, site specific information on lead and soil can make the risk assessment more realistic.
10.2.1 In vivo models The most genuine data of the bioavailability of lead from contaminated soils can be obtained with human experiments. Of course, it is not possible to perform these experiments, amongst others due to ethical considerations and extreme high cost. In vivo animal experiments are an alternative to determine the bioavailability of lead from soil. As a representative model for the humane juvenile gastrointestinal tract, the juvenile swine model is generally accepted (Casteel et al., 2006). The swine have several gastric features in common with humans (Interspecies database: De Zwart et al., 1999). For example, the stomach in juvenile swine is similar to that of human children based on physiological conditions and anatomy. Rat, mice and rabbit are not suitable for bioavailability experiments with lead since these animals are continuous feeders. This implicates that the animal’s stomach is never empty, influencing the physiological state of the model compared to the human situation. The juvenile swine model is accepted by the US EPA as a representative model for children (Casteel et al., 2006). However, the use of in vivo animal models for bioavailability assessments used in human risk assessment is inefficient on a site specific basis. These in vivo models are more expensive and more time consuming compared to in vitro methods. Moreover, the use of animal studies may be disputed due to ethical issues.
10.2.2 In vitro models With in vitro digestion models, the potential risk to lead in soil can be estimated by the amount of contaminant (i.e. lead) that can be released from the matrix (i.e. soil) after ingestion (bioaccessibility) and is, in principle, ready for uptake in the human body (Oomen et al., 2006). In vitro models can simulate the release of the contaminant from the matrix both for fasted and fed physiological conditions. Before application in risk assessment, in vitro digestion models need validation with known in vivo data. The advantage to estimate oral bioavailability with in vitro models is that these experiments are fast and can be performed at low cost. The RIVM in vitro digestion (IVD) model (Oomen et al., 2006) and the TNO Tiny-TIM model are two examples of in vitro models to predict the potential risk. In the present study, both models are used. The outcome of the in vitro digestion models is compared and discussed in this report.

RIVM Report 711701086
101
10.2.3 Generic models Pharmacokinetic modelling is currently considered for broad application in lead risk assessment (LDAI Lead Risk Assessment Working Group, 2008). One of the models, the Integrated Exposure Uptake and Biokinetic (IEUBK) Model for Lead in Children, developed by the US-EPA, is a classical multi-compartmental pharmacokinetic model linked to an exposure and probabilistic model of blood lead distributions in populations of children (ages 6 months to 7 years). This model is able to predict the probability of elevated blood lead concentrations in children that are exposed to lead in multiple environmental media (US-EPA, 2002). In the IEUBK model, the oral bioavailability of dietary lead is assumed to be 50 % in children and the lead ingested in the form of soil and dust is assumed to be bioavailable for 30 % as a default (US-EPA, 2002; Oomen et al., 2006b). This results in the default relative bioavailability of lead from soil and dust of 60 %. The default assumption of 60 % relative bioavailability is overruled when site-specific information on the bioavailability of lead from soil is available. Previously, only bioavailability results from in vivo studies with swine were used. However, in 2008, the US-EPA published a Standard Operating Procedure for an in vitro bioaccessibility assay for lead that can be used for site specific risk assessment of lead in soil (US-EPA, 2008).
10.3 The made grounds The made ground is defined as the man-made soil layer that is applied on the original soil lithology. This specific layer is laid down to prepare the soil for city use (consolidate, raise or fill the original soil). Made ground contains non-soil phases such as rubble, building waste, residential garbage and/or waste from former industrial activities. In the present research, the relative bioavailability factor for lead from a large number of made grounds (ninety) that are typical for old inner cities is determined. In addition, relationships between the relative bioavailability factor of lead from these soils and specific characteristics of soil and lead were examined. The aim was to derive a possible (set of) correction factor(s) for the relative oral bioavailability of lead from lead contaminated made grounds so that site specific information on the bioavailability of lead from soil is generally not required. Although the ninety made grounds were taken from sites that have, in total, five different soil types, the made grounds show remarkable resemblance in estimated soil characteristics, especially for soil pH, organic matter, clay and carbonate content. Compared to other Dutch soils (AW2000, 2004), the pH of the made grounds are relatively high, probably due to the presence of calcium containing rubble. This suggests that these are typical made ground characteristics.
10.4 Lead characteristics of the soil Although the aim of this study was not to review and discuss the different methods to detect the total lead concentration in soil, it can be concluded that the method that is used to determine the

RIVM Report 711701086
102
lead concentration influences for the overall outcome of the bioaccessibility. The differences found in total lead concentration of the soil between the used total lead determination methods are considerable and therefore off concern if the measured concentrations are used for risk assessment purposes. Therefore, it is recommended to establish more specific guidelines for the destruction of soil in order to reproducibly determine total lead concentrations between laboratories. In addition to the different methods to detect the total lead concentration in soils, the heterogeneity of the soil can result in variations found in total lead concentration of the same soil. Although the soils were sieved (< 2 mm) and extensively mixed, it may be that the lead is not evenly distributed in the soil, resulting in variations in lead concentration per measured soil sample.
10.5 The relative oral bioavailability of lead from soil In total, the relative oral bioavailability values of lead from ninety samples were calculated with the bioaccessibility determined with the IVD model. Out of the total set of ninety soil samples, sixteen soils were selected (including all cities and lithology types) for additional experiments. For these sixteen soil samples the bioaccessibility and relative oral bioavailability of lead was also determined with the Tiny-TIM model. The differences between the IVD and Tiny-TIM method are addressed in chapter 9. With the IVD model, the bioaccessibility and relative oral bioavailability factor for the fasted situation of lead was measured. Subsequently, the data was converted to the average physiological state. Percentile values (P50-P90) for the relative bioavailability factor for the average physiological state were calculated based on the ninety soils (Table 10.1). In 2006, the 80th to 90th percentiles of the relative bioavailability factors of the data up till that moment for fasted condition were reported (Oomen et al., 2006);(Lijzen et al., 2006). This set of previous data was obtained from all kinds of soil, with organic mater <20 % including city soils, shooting range, etc. The “toemaakdekken” soils are excluded from the previous data set since their organic matter content is >20 %. In Table 10.1, these percentile values (P80-P90) are compared with percentile values (P50-P90) of the present study on made grounds. The percentile values for the bioaccessibility and relative bioavailability factor of lead are considerable higher for the made grounds compared with the previous data.

RIVM Report 711701086
103
Table 10.1: The bioaccessibility and relative bioavailability of lead from the made grounds compared with previous data for different types of soil (up till 2006).
41.4 0.83 33.5 0.6744.0 0.88 35.7 0.7148.3 0.97 39.1 0.7856.1 1.12 45.5 0.91 43.5 0.87 35.2 0.7060.0 1.20 48.6 0.97 44.0 0.88 35.6 0.7162.9 1.26 50.9 1.02 48.5 0.97 39.3 0.79
Percentile 70
Bioaccessibility (%)
Relative bioavailability
factor
Percentile 85Percentile 80
Percentile 50
average physiological state average physiological state
Percentile 90
Percentile 60
Bioaccessibility (%)
Relative bioavailability
factor
Bioaccessibility (%)
This research (90 made grounds) Reasearch till 2006 (from soils with organic matter content < 20%)fasted condions
Relative bioavailability
factor
fasted condions
Bioaccessibility (%)
Relative bioavailability
factor
The relative bioavailability factor of lead for the fasted situation is higher than “1” (P80-P90) for the soils measured in this research (the ninety made grounds). This indicates that the calculated exposure of a child to a certain amount of lead from soil for fasted conditions appears to be higher than from lead in the diet (fed conditions by definition), i.e. the conditions used to derive the TDI (Oomen et al., 2006). This may be due to the physiological state. The gastric pH is lower for fasted conditions than for fed conditions, resulting is a higher potential to mobilize lead from soil, and thus in a higher bioaccessibility of lead from soil. The bioaccessibility of lead from soil is known to be lower for fed conditions than for fasted conditions. If a relative bioavailability factor of lead from soil relative to lead in the diet would be based on fed conditions, this factor is expected to be smaller than “1”.A relative bioavailability factor of “1” indicates that site specific reduction of the potential risk is not possible for the presently indication conditions. Compared to the previous results (Oomen et al., 2006), the bioaccessibility and relative bioavailability factor of lead from the made grounds that were measured during this research are higher. This difference can be (partly) ascribed to the amount of soil in the in vitro digestion. In previous experiments, 0.6 grams of soil per digestion were used, whereas 0.06 grams soil were used in the present research In Table 10.2, the difference in bioaccessibility of lead from 0.6 and 0.06 g soil is given for Bunker Hill as an example (Van de Wiele et al., 2007). These samples were used in a BARGE round robin study (BARGE, 2008). The effect of the amount of soil per digestion (0.6 versus 0.06 g) can also be quantified by the difference in the slope of the correlation line in the vitro-vivo comparison (see Figure 5.1). For 0.06 g soil per digestion, the slope in the intestinal compartment was 1.16, whereas the slope was 0.69 for 0.6 g soil per digestion. In theory, the slope of the line in the vitro-vivo comparison should be 1.

RIVM Report 711701086
104
Table 10.2: The bioaccessibility of lead from Bunker Hill for fasted and fed conditions with 0.6 and 0.06 grams soil per IVD digestion experiment. Furthermore, the slope and R2 of the in vivo-in vitro validation study are given.
average standard number ofdeviation experiments
0.06 gram 1:1000 47.4 3.2 30.6 gram 1:100 31.8 2.5 30.06 gram 1:1000 36.1 6 40.6 gram 1:100 25 3.5 4
0.06 gram 1.16 0.660.6 gram 0.69 0.81
in vivo- in vitro validation study (See also Figure 5.1)
Oomen et al., (2006) Slope: R2:
Solid-to-Liquid ratioSoil
in vitro bioaccessibility (%) Lead concentration soil
(mg/kg)
Physiological condition
Amount of soil
Fasted
Fed2924Bunker Hill
Based on the same validation studies with in vivo data from juvenile swine, see Figure 5.1 and details in Oomen et al. (2006), it was decided to determine the bioaccessibility of lead from soil with 0.06 grams of soil per in vitro digestion. For the experiments in which the intestinal bioaccessibility was determined from 0.06 g soil per digestion tube, the r2-value of the correlation was 0.66, whereas also the slope of the line was according theoretical expectations (Oomen et al., 2006). By using such a small amount of soil per digestion tube, the pH during in vitro digestion is usually not affected by the soil, so that in almost all cases the results can be used. Moreover, the solid to liquid ratio of 1:1000 (with 0.06 g of soil per digestion) simulates the small amount of 100 mg soil ingested by hand-to-mouth throughout the day (Oomen et al., 2006). Another divergence between the previous results (up till 2006) and the results obtained with the made grounds (this study) can be ascribed to the specific soil characteristics of the made grounds. As seen in chapter 3, the ninety soils measured in this research are quite similar in soil characteristics. The soils of the previous research were of different origin, leading to a wider range of soil characteristics and thus probably another range of bioaccessibility. The bioaccessibility of lead of these previously tested soils with different soil characteristics could be lower as the organic matter content of the soils tested up till 2006 was on average higher and a reverse trend with organic matter was observed (Oomen et al., 2006). Moreover, the lead contamination and lead speciation could account for the observed difference. The aim of the present study was to improve the estimation of the relative oral bioavailability of lead (Rel F) from made grounds by focussing on bioaccessibility (FB,soil). The bioaccessibility was chosen since the measurement of FB,soil can be performed with in vitro techniques, thereby addressing the uncertainty and variability1 of this variable. However, the other variables used in the calculation of Rel F (see equation 3; p. 13), namely the fraction of lead absorbed from soil (FA,soil) and from food (FA,MPR), and also the bioaccessible fraction of lead from food (FB,MPR) have uncertainty and variability as well. At present these are not considered in the calculation of
1 Variability is a property of a population and is inherent to the system being modelled, whereas uncertainty represents a partial lack of knowledge. As the quality of the data improves, the uncertainty about the exact value decreases, whereas the natural variability will not decrease with higher quality data.

RIVM Report 711701086
105
Rel F, and therefore are not taken into account in the current risk assessment of lead from soils. It is recommended to address this subject in the near future, preferably using a probabilistic approach. This will generate insight in the uncertainty and variability of Rel F and consequently, improve the risk assessment of lead form soils.
10.6 Correlating soil and lead characteristics to oral relative bioavailability
10.6.1 Correlating soil characteristics to relative oral bioavailability
The aim of this part of the study was to make a prediction model for the relative oral bioavailability, as measured by the IVD model, as a function of several soil characteristics for all ninety made grounds. In conclusion, it is not possible to predict the relative oral bioavailability of lead meaningfully based on soil characteristics only. The absence of a clear correlation can be ascribed to the homogeneity of the made ground. As the soil characteristics within the made ground show relatively little variation, the statistical power must be very high to find a correlation.
10.6.2 Correlating lead characteristics to relative oral bioavailability The aim of this part of the research was to explore the relationship between the relative oral bioavailability and several lead characteristics, including SEM analysis. These SEM results were used to develop a ranking system (referred to as PPS ranking system) that might predict bioavailability of lead based on the Primary lead phases, the Particle size and the Secondary lead phases present. In conclusion, a correlation is observed between the PPS ranking of lead characteristics and the relative oral bioavailability of lead (APS %) as determined by the IVD model. With the Tiny-TIM data, no correlation was present between the PPS ranking and the relative oral bioavailability factor. However, due to the limited number of samples analyzed with the SEM (n=16) and the qualitative nature of the PPS ranking system, it is only possible to predict bioavailability values as low, medium or high. Nevertheless, this information could help in determining remediation strategies and priority ranking of made grounds which are polluted with lead.
10.7 Comparison of Tiny-TIM and IVD results The soils used in the IVD and Tiny-TIM bioaccessibility experiments are the same. The results of the IVD and Tiny-TIM methods are given in Table 10.3. The results for IVD are given twice. IVD (I) describes the results gathered with the complete set of ninety soils, whereas IVD (II) only summarizes the data of the sixteen soils that were selected for additional research, including experiments with the Tiny-TIM model.

RIVM Report 711701086
106
Table 10.3: Data on the relative oral bioavailability factors as estimated for the average physiological state for both IVD and Tiny-TIM model. The bioavailability values of both IVD and Tiny-TIM methods are calculated with the total lead concentration determined by RIVM. Please note that the IVD (I) is based on the complete data set of ninety made grounds, whereas IVD (II) only contains the sixteen made grounds that were also tested by the Tiny-TIM method.
Number of soils 90 16 16average 0.72 0.63 0.11
Lowest value 0.11 0.40 0.04Higest value 1.77 1.03 0.21Percentile 50 0.67 0.64 0.12Percentile 60 0.71 0.68 0.12Percentile 70 0.78 0.69 0.12Percentile 80 0.91 0.71 0.15Percentile 90 1.02 0.81 0.17
relative oral bioavailability factoraverage physiological state
IVD (I) IVD (II) Tiny-TIM
Table 10.3 shows that the percentile values for the relative oral bioavailability factor determined by IVD are much higher compared to the values obtained with the Tiny-TIM methodology. When this information would be applied in risk assessment, the potential risk of lead in these made grounds for children would be higher if the health risk assessment is calculated with the relative oral bioavailability factor estimated with the IVD method. Obviously, the actual risk of lead depends on the soil, the child and exposure conditions, but not on the in vitro digestion model that is used. chapter 9 addresses the differences between the IVD and Tiny-TIM methodology in more detail. Both (IVD and Tiny-TIM) models are fundamentally different and so are their results. Both models have been compared to in vivo human and animal data (see chapter 5, 8 and 9). Based on these comparisons, neither IVD nor Tiny-TIM could be assigned as providing wrong bioaccessibility data. Correlations between in vitro and in vivo data (IVD) or direct comparison between bioaccessibility and bioavailability of specific soils (IVD and Tiny-TIM) were in general satisfactory. Yet, it is clear that the bioaccessibility results of the made grounds are so different between both models that they cannot both be true. The present research was not intended to be able to identify the most proper in vitro digestion model, making it impossible to assign, on the basis of the present information, the model that provides the most realistic bioavailability data. Therefore, various scenarios are identified for future directions:
• Investigate the differences between the IVD and Tiny-TIM model, and their effect on bioaccessibility (technical differences).
• Present this report to a group of international experts in the field of soil bioavailability, risk assessment and gastrointestinal transport.
• Perform in vivo studies in pigs or humans to validate the bioaccessibility of relevant Dutch soils (e.g. made grounds) determined by IVD and Tiny-TIM.

RIVM Report 711701086
107
• Derive an “intervention value” above which, in principle, the blood lead concentration of children should be determined.
For risk assessment purposes, irrespective for the chosen in vitro digestion model, an appropriate percentile value of the relative oral bioavailability should be chosen when a generic factor is applied in human health risk assessment of contaminated made grounds. An underestimation of the potential risk might result in a situation where children are at risk. However, an overestimation of the estimated potential risk of lead from made grounds will result in unnecessary remediation, accompanied with high cost and social unrest. The decision which percentile value should be used in risk assessment is a decision that should be made by policy makers, depending on the level of protection that is desired. The chosen percentile value of the relative oral bioavailability factor can be implemented into risk assessment of lead by humans via ingestion of soil according to the Sanscrit methodology, offering an alternative for the default approach in which a relative oral bioavailability factor of 0.74 is assumed. The derivation of this default value is given in section 1.3 and Lijzen et al. (2006).

RIVM Report 711701086
108

RIVM Report 711701086
109
11 Conclusions and recommendations As there are many sites in the Netherlands with a lead contamination around or just above the present Dutch intervention value of 530 mg/kg, there is a clear need to look for possibilities to assess the health risk to children carefully but also without conservatism. In other words, children should not be exposed to lead in soils that results in adverse health effects, but too strict soil interventions would be very expensive and should therefore also be avoided. The aim of the present research was to improve human health risk assessment for made grounds by deriving one or more generic correction factor(s) for the relative bioavailability of lead from these soils. In this way and with suitable, soil and lead characteristic based data, information on the bioavailability of lead from soil can be estimated without site specific measurements. Based on the results described in this report, the following conclusions can be made.
11.1 The made ground The soil characteristics of the made grounds originated from the different subsoils, i.e. different lithology. However, based on the soil pH, organic matter, clay and carbonate content, it is concluded that that the soils are remarkably similar. In other words, made grounds can be seen as a specific soil type with typical characteristics (chapter 3). Therefore, the relationship between the relative bioavailability of lead from a made ground and the soil characteristics could, in general, be applicable for any lead contaminated made ground from the cities in the Netherlands. In this research, the made ground is defined as the man-made soil layer that is applied on the original soil lithology. This specific layer is laid down to prepare the soil for city use (consolidate, raise or fill the original soil). The made ground contains non soil phases (rubble) originated from, for example, building waste, residential garbage and/or waste from former industrial activities.
11.2 Variation in total lead measurement Although the aim of this study was not to review and discuss the different methods to detect the total lead concentration in soil, substantial differences in the total lead concentrations between methods were detected. Therefore, the chosen method to measure the total lead in soil will influence the bioaccessibility of lead from soil. Subsequently, risk assessment of these soils will be influenced by the technique of total soil lead determination. Overall, the method for lead detection can lead to substantial differences in the calculated relative oral bioavailability factor. Based on the considerations described in section 4.1, the preference for total lead concentration to be used in bioaccessibility and bioavailability calculations was given to the data obtained by RIVM.

RIVM Report 711701086
110
The NEN 6961:2001 guideline specifies conditions for determination of total lead from soil as a range for possible temperature and pressure, see Figure 4.1. Hence, the exact destruction conditions can vary between laboratories. This will probably result in a different outcome. For more reproducible lead determination between laboratories, it might be relevant to develop more specific guidelines for the destruction of soil.
11.3 The soils are heterogenic in lead In addition to systematic variations in total lead concentration between methods for total lead analysis, also considerable differences in total lead in one single soil were observed. This is probably due to the heterogeneity of the soil on the micro-scale. Therefore, it is recommended to measure the total lead concentration per method at least in duplo to obtain an average lead concentration per sample and information on the variation in lead concentration.
11.4 Correlating soil and lead characteristics to oral relative bioavailability
As indicated, the primary aim of this research was to investigate the relationship between the relative oral bioavailability as a function of soil characteristics and lead mineralogy. No correlation could be found between the measured soil characteristics of the ninety made grounds and the relative oral bioavailability factor. The absence of a clear correlation can be ascribed to the homogeneity of the made ground. As the soil characteristics within the made ground show relatively little variation, the statistical power must be very high to find a correlation. For IVD, a clear trend (see chapter 7) was observed between relative oral bioavailability and a qualitative indication of the stability of the lead in the made ground based on lead mineralogy (referred to as PPS index, in which the PPS stands for Primary lead phases, Particle size and Secondary lead phases). Although only data from a limited number of made grounds were available (n=16), this result might indicate that the bioaccessibility of lead from soil is influenced by the lead characteristics. No trend or correlations was observed for the Tiny-TIM system.
11.5 The differences in relative oral bioavailability (IVD and Tiny-TIM)
The bioaccessibility and relative oral bioavailability of lead from the made grounds were determined with two in vitro digestion models (the IVD model of RIVM and the TNO Tiny-TIM; see Table 10.3 for a summary of the data). In conclusion, there are large differences between the

RIVM Report 711701086
111
bioaccessibility determined by the IVD and Tiny-TIM methods and the derived relative bioavailability factor. Both models have, for as far as possible, been compared to vivo data. These comparisons with vivo data appeared to be fine for most cases, although both models show some unexpected findings, i.e. in some cases a higher bioaccessible for lead from soil was observed than lead from water for the IVD model, the Tiny-TIM model resulted in low bioaccessibility values for lead from food. Yet, correlations between in vitro and in vivo data (IVD) or direct comparison between bioaccessibility and bioavailability of specific soils (IVD and Tiny-TIM) were in general satisfactory. Hence, based on the present information, neither IVD nor Tiny-TIM could be assigned as providing wrong bioaccessibility data. Yet, it is clear that the bioaccessibility results of the made grounds are so different between both models that they cannot both be true. The present research was not intended to be able to identify the most proper in vitro digestion model, making it impossible to assign at present the model that provides the most realistic data. Therefore, various scenarios are identified for future directions.
• Investigate the differences between the IVD and Tiny-TIM model, and their effect on bioaccessibility (technical differences). The differences in the models that expected to influence the bioaccessibility are discussed in chapter 9. This includes the separation method, the dynamics as applied in the Tiny-TIM model (gradual transit of gastric contents to intestinal compartment), the physiological status (completely fasted conditions and fed conditions for both models), and the effect of the amount of soil per digestion. The technical research on the differences between the IVD and Tiny-TIM model will increase the understanding in the magnitude of the effect of various parameters on bioaccessibility and thus in the models. However, if no “golden standard” (true bioavailability values) are available for validation of the models, no conclusions can be drawn whether one of the models can be used in risk assessment of contaminated soils.
• Present this report to a group of international experts in the field of soil
bioavailability, risk assessment and gastrointestinal transport. These experts are asked to review the report and discuss the potential use for the applicability of the IVD and Tiny-TIM models in risk assessment studies. In addition, the experts are asked to indicate which information and which studies are needed to validate the models in order to appoint the most appropriate method for application in risk assessment. If needed, the outcome of this international review can be discussed in a special organized workshop. This workshop could provide a validation strategy for both models with relevant Dutch soils.
• Perform in vivo studies in pigs or humans to validate the bioaccessibility of relevant
Dutch soils (e.g. made grounds) determined by IVD and Tiny-TIM. In this manner, the models can be compared to each other and to the actual and relevant in vivo bioavailability data. This would enable a conclusion if results of the IVD or Tiny-

RIVM Report 711701086
112
TIM underestimate, overestimate or accurately predict the potential health risk. These in vivo studies could indicate if one of the models can be used in risk assessment
• Derive an “intervention value” above which, in principle, the blood-lead
concentration of children should be determined. This provides a direct answer on the potential health risk for children, as the risk assessment lead blood is based on avoiding blood lead concentrations above 10 μg/dl. If soils are sampled from the same sites, and bioaccessibility is determined from these soils, in time, the correlation between blood-lead and bioaccessibility of lead from soil can be investigated.
In the present study, one of variables that determine the relative oral bioavailability from soil, namely the bioaccessibility of lead from soil, is measured using in vitro experiments. It is recommended that in the near future also the other variables (the fraction of lead absorbed from soil and from food, and the bioaccessible fraction of food), including their uncertainty and variability, is investigated, preferably in a probabilistic way. In general, it is important in risk assessment to use a model that reflects the potential risk of lead in soil for children as realistic as possible. An underestimation of the potential risk might result in a situation where children are at risk. However, an overestimation of the potential risk of lead from made grounds will result in unnecessary remediation, accompanied with high cost and social unrest. If it appears that the relative bioavailability factors determined by one of the models can be applied in risk assessment, the decision which percentile value of the relative bioavailability factor should be used in generic risk assessment of made grounds is a policy decision, depending on the level of protection that is desired. The chosen value of the relative oral bioavailability factor can be implemented into risk assessment of lead by humans via ingestion of soil according to the Sanscrit methodology (Otte and Wintersen, 2007). This would offer an alternative for the default approach in which a relative oral bioavailability factor of 0.74 is assumed for all Dutch soils.

RIVM Report 711701086
113
12 International: use of bioavailability of lead from soil in risk assessment
This chapter deals with how other countries deal with oral bioavailability in soil risk assessment, and serves as background information. The focus is on the countries USA, Denmark, UK and Canada as these countries are up front with research and policy on oral bioavailability of contaminants in soil. Also, the BARGE (BioAccessibility Reasearch Group Europe) and the new ISO guidance will be discussed briefly. Part of this chapter was reported in Oomen et al.(2006).
12.1 USA In the USA the risk of elevated blood lead levels in children (under the age of seven) from environmental lead from different sources is predicted by the Integrated Exposure Uptake Biokinetic (IEUBK) Model (US-EPA, 2002). Media that can act as sources of lead for a child include air, water, soil, dust, diet and other sources (e.g., lead paint). The bioavailability of ingested dietary lead in the IEUBK model is assumed to be 50 % in children. The bioavailability of lead ingested with soil and dust is assumed to be 30 %. Hence, the default relative bioavailability of lead from soil/dust relative to the bioavailability of dietary lead is 60 %. Site-specific information on the bioavailability may be used to change the default relative bioavailability value. Previously, only bioavailability results from in vivo studies with swine could be used for this matter. However, recently, the U.S. EPA published a Standard Operating Procedure for an in vitro bioaccessibility assay for lead (i.e, Relative Bioavailability Leaching Procedure, RBLP) that can be used for site specific risk assessment of lead in soil (US-EPA, 2007b; US-EPA, 2007a; US-EPA, 2008).
12.1.1 Comparison of IVD and RBLP bioaccessibility values The soils that were tested in the in vivo pig studies by the U.S. EPA (Casteel et al., 2006) to validate their in vitro RBLP method were generously given to the RIVM. The RIVM used these soils to validate the IVD model with the previously mentioned in vivo bioavailability results (Oomen et al., 2006). In 2007, the in vitro RBLP data of these soils were published (US-EPA OoSWaER, 2007a). To investigate whether the IVD bioaccessibility values correlate with the bioaccessibility values of the RBLP method, a scatter graph was plotted with the IVD values on the x-axis and the RBLP values on the y-axis (Figure 12.1). Clearly, the in vitro bioaccessibility results of the IVD and RBLP model show a strong correlation. The bioaccessibility values of the RBLP method are approximately 20 % higher compared to the IVD in vitro bioaccessibility results of the same soils. It is noted that no “intermediate” bioaccessible soils were amongst the test samples (bioaccessibility between 20 % and 60 %).

RIVM Report 711701086
114
y = 1.2099x + 2.7227R2 = 0.9569
0.0
20.0
40.0
60.0
80.0
100.0
0.0 20.0 40.0 60.0 80.0
IVD bioaccessibility (%) (RIVM)
RB
LP b
ioac
cess
ibili
ty (%
) (V
S)
Figure 12.1: Correlation of the bioaccessibility of lead per soil, estimated with the IVD model and RBLP model. These soils previously tested in vivo by the U.S. EPA for validation purposes (see Figure 5.1). It is noted that no “intermediate” bioaccessible soils were amongst the test samples (bioaccessibility between 20 % and 60 %).
12.2 Denmark The Danish Environmental Protection Agency has allowed for use of bioaccessibility data in evaluation of compliance with soil quality criteria and soil cut off values for lead and cadmium. The bioaccessibility data must be obtained using the Unified Barge Method (UBM) fasted state method with intestinal step (cadmium) or without intestinal step (lead). The UBM is based on the IVD method of the RIVM (Oomen et al., 2002; Van de Wiele et al., 2007). In Denmark, bioaccessibility and oral bioavailability are not currently part of the risk assessment of contaminated soil (Gron, personal comment, 2008).
12.3 UK The Environment Agency acts as an advisor to UK government on environmental issues including the assessment of risks to health from land contamination. The Environment Agency and the Department for Environment, Food and Rural Affairs (DEFRA) publish guidance documents on issues like dealing with land contamination in England and Wales, and set Soil Guideline Values for different contaminants. Oral bioavailability is recognised as an important factor in the

RIVM Report 711701086
115
exposure of humans to contaminants and is addressed in the guidance published by the Environment Agency and the DEFRA . Risk assessors using bioaccessibility testing as part of a risk assessment of contaminated soil are advised to treat the data with caution and to provide supporting evidence such as a scientifically robust test method suitable for the contaminant (Environmental Agency, 2005).
12.4 Canada Regulations and guidelines for contaminated site remediation in Canada are currently based on the total concentration of a substance in a particular substrate (soil, sediments or water). The activities of Bioaccessibility Research Canada (BARC), a newly formed network of parties interested in furthering the development and implementation of bioaccessibility in Canada, will focus on the development and validation of bioaccessibility methods resulting in more realistic exposure scenarios on risk assessment outcomes. The aim of BARC is the acceptance of the bioaccessibility models by Canadian regulators.
12.5 BARGE The BARGE (the Bioaccessibility Research Group of Europe) is a European network bringing together institutes and research groups to study human bioaccessibility of priority contaminants in soils such as arsenic, lead and cadmium via the gastrointestinal tract (BARGE; US-EPA, 2007). BARGE members including institutes from Belgium, France, Denmark, UK, Germany, Italy and the Netherlands. Also institutes from the US (Ohio State University) and Canada (Jacques Whitford Environment Limited and Royal Military College of Canada) are involved. Information is exchanged with the Bioaccessibility Research Canada (BARC). BARGE has been involved in comparing and evaluating the many models and systems that have been developed over the years to measure bioaccessibility and contaminant exposure (Oomen et al., 2002; Van de Wiele et al., 2007). A priority objective is to provide robust and defensible data on bioaccessibility that can be used in human health risk assessment and policy making.
12.6 International Organisation for Standardization In 2007, the ISO guidance ISO/TS 17924:2007 “Guidance on the application and selection of physiologically based extraction methods for the estimation of the human bioaccessibility/bioavailability of metals in soil” was published. This guidance deals with the assessment of human exposure from ingestion of soil and soil material. The guideline is to be used when choosing a physiologically based test procedure for the estimation of the human bioaccessibility/bioavailability of metals from contaminated soil in connection with the evaluation of the exposure related to human oral uptake. Suggestions are made for the use of as many generic-method elements as possible, but it is important that the choice of method is based on the

RIVM Report 711701086
116
needs of the specific investigation. Methods that are validated for specific metals and/or contexts are highlighted.
Up till now, no information is available that discusses the implementation of this guidance in
(inter)national soil risk assessment. In time, this information could result in better international
harmonisation of bioaccessibility research.

RIVM Report 711701086
117
References Alexander FW, Clayton BE and Delves HT (1974) Mineral and trace-metal balances in children
receiving normal and synthetic dietes. Quarterly Journal of Medicine, New Series 169, 89-111.
Angle CR, Manton WI, Stanek KL. (1995). Stable isotope identification of lead sources in preschool children. Clin Toxicol. 33: 657-662.
Angle CR and McIntire MS (1979) Environmental lead and children: the Omaha study. J Toxicol Environ Health 5, 855-70.
Aungst BJ, Dolce JA and Fung HL (1981) The effect of dose on the disposition of lead in rats after intravenous and oral administration. Toxicol Appl Pharmacol 61, 48-57.
AW2000 (2004) Achtergrondwaarden 2000. website (visited September 2008): http://www.senternovem.nl/Bodemplus/downloads/grondstromen/aw2000.asp
Baars AJ, Theelen RMC, Janssen PJCM, Hesse JM, Van Apeldoorn ME, Meijerink MCM, Verdam L and Zeilmaker MJ (2001). Re-evaluation of human-toxicological maximum permissible risk levels. Report no. 711701025, National Institute for Public Health and the Environment, Bilthoven.
BARGE, website (visited September 2008): http://www.bgs.ac.uk/barge/home.html.
Blake KCH, Barbezet GO and Mann M (1983) Effect of Dietary Constituents on the Gastrointestinal Absorption of 203Pb in Man. Environmental Research 30, 182-187.
Calabrese EJ, Barnes R, Stanek III EJ, Pastides H, Gilbert CE, Veneman P, Wang X, Lasztity A and Kostecki PT (1989) How much soil do young children ingest: an epidemiologic study. Regulatory Toxicology and Pharmacology 10, 123-137.
Casteel SW, Cowart RP, Weis CP, Henningsen GM, Hoffman E, Brattin WJ, Guzman RE, Starost MF, Payne JT, Stockham SL, Becker SV, Drexler JW and Turk JR (1997) Bioavailability of lead to juvenile swine dosed with soil from the smuggler mountain NPL site of Aspen, Colorado. Fundam. Appl. Toxicol. 36, 177-187.
Casteel SW, Weis CP, Henningsen GM and Brattin WJ (2006) Estimation of relative bioavailability of lead in soil and soil-like material using young swine. Environ. Health Perspect. 114, 1162-1171.
Cauet, S, Weis, D and Herbosch A (1982). Genetic study of Belgian lead zinc mineralizations in carbonate environments through lead isotopic geochemistry. Bulletin du BRGM (2), section II, nº 4: 329-341.

RIVM Report 711701086
118
Clarkson TW (1993) Molecular and ionic mimicry of toxic metals. Annu. Rev. Pharmacol. Toxicol. 32: 545-571.
Cotter-Howells J and Thornton I (1991). Sources and pathways of environmental lead to children in a Derbyshire mining village. Environ. Geochem. Health 13, 127-135.
Davis S and Waller P (1990) Quantitative estimates of soil ingestion in normal children between the ages of 2 and 7 years: population-based estimates using aluminium, silicon, and titanium as soil tracer elements. Archives of Environmental Health 45, 112-122.
Davis A, Dexler JW, Ruby MW and Nicholson A (1993). Micromineralogy of mine wastes in relation to lead bioavailability, Butte, Montana. Environ. Sci. Technol. 27, 1415-1425.
De Zwart LL, Rompelberg CJM, Sips AJAM, Welink J and Van Engelen JGM (1999). Anatomical and physiological differences between various species used in studies on the pharmacokinetics and toxicology of xenobiotics. A review of literature Report no. 623860010, National Institute for Public Health and the Environment, Bilthoven, the Netherlands.
Diamond GL, Goodrum PE, Felter SP (and) Ruoff WL (1997) Gastrointestinal absorption of metals. Drug Chem. Toxicol. 20, 345-368.
Doe BR and Rohrbough R (1977). Lead Isotope Data Bank: 3,458 samples and analyses cited. 79-66, United states Department of the Interior – Geological Survey.
Dominy NJ, Davoust E and Minekus M (2004). Adaptive function of soil consumption: an in vitro study modeling the human stomach and small intestine. J. Exp. Biol. 207: 319-324.
Ellickson KM, Meeker RJ, Gallo MA, Buckley BT and Lioy PJ (2001) Oral bioavailability of lead and arsenic from a NIST standard reference soil material. Arch. Environ. Contam. Toxicol. 40: 128-135.
Environmental Agency (2005) International workshop on the “potential use of bioaccessibility testing in risk assessment of land contamination”, Environmental Agency , Oxford, United Kingdom.
FAO/WHO (1993) Evaluation of certain food additives and contaminants. 41st Meeting of the Joint FAO/WHO Expert Committee on Food Addities. World Health Organisation Technical Report Series no. 837, Geneva, Switzerland.
Freeman GB, Johnson JD, Liao SC, Feder PI, Davis AO, Ruby MV, Schoof RA, Chaney RL and Bergstrom PD (1994) Absolute bioavailability of lead acetate and mining waste lead in rats. Toxicology 91, 151-163.
Freeman GB, Dill JA, Johnson JD, Kurtz PJ, Parham F and Matthews HB (1996) Comparative

RIVM Report 711701086
119
absorption of lead from contaminated soil and lead salts by weanling Fisher 344 rats. Fundam. Appl. Toxicol. 33, 109-119.
Fries GF, Marrow GS, and Somich CJ (1989) Oral bioavailability of aged polychlorinated biphenyl residues contained in soil. Bull.Environ.Contam.Toxicol. 43: 683-690.
Groot MSM, Bronswijk JJB, Willems WJ, de Haan T and del Castilho P (1998) Landelijk Meetnet Bodemkwaliteit. Resultaten 1995. RIVM report 714801024, National Institute for Public Health and the Environment, Bilthoven, the Netherlands.
Gulson BL, Mahaffey KR, Jameson CW, Vidal M, Law AJ, Mizon KJ, Smith AJM and Korsch MJ (1997) Dietary Lead Intakes for Mother/Child Pairs and Relevance to Pharmacokinetic Models. Environmental Health Perspectives 105: 1334-1342.
Gulson BL, Mizon KJ, Palmer JM, Patison N, Law AJ, Korsch MJ, Mahaffey KR and Donnelly JB (2001) Longitudinal study of daily intake and excretion of lead in newly born infants. Environ Res 85, 232-45.
Hagens WI, Sips AJAM, Lijzen JPA and Oomen AG (2007) Richtlijn: Meten aan de bioaccessibility van lood uit bodem. RIVM report 711701060, National Institute for Public Health and the Environment, Bilthoven, the Netherlands.
Hagens WI, Lijzen JPA, Sips AJAM and Oomen AG (2008) The bioaccessibility and relative bioavailability of lead from soils for fasted and fed conditions: Derivation of the “average physiological state” correction factor. RIVM letter report 711701080, National Institute for Public Health and the Environment, Bilthoven, the Netherlands.
Haraldsson A-K, Rimsten L, Alminger M, Andersson R, Aman P and Sandberg A-S (2005). Digestion of barley malt porridges in a gastrointestinal model: Iron dialysability, iron uptake by Caco-2 cells and degradation of ß-glucan. J. cearal Sci. 42: 243-254.
Heard MJ and Chamberlain AC (1982) Effect of minerals and food on uptake of lead from the gastrointestinal tract in humans. Hum.Toxicol. 1, 411-415.
Heard MJ and Chamberlain AC (1983) Uptake of lead by humans and effect of minerals and food. The Science of the Total Environment 30, 245-253.
Hettiarachchi GM and Pierzynski GM (2004). Soil lead bioavailability and in situ remediation of lead contaminated soils: a review. Environ. Progress 23, 78-93.
IPCS, (1995), Inorganic lead. International Programme on Chemical Safety, Environmental Health Criteria 165. World Health Organisation, Geneva, Switserland.
ISO/TS 17924:2007 Soil - Guidance on the application and selection of physiologically based extraction methods for the estimation of the human bioaccessibility / bioavailability of metals in soil.

RIVM Report 711701086
120
James HM, Hilburn ME and Blair JA (1985) Effects of meals and meal times on uptake of lead from the gastrointestinal tract in humans. Hum.Toxicol. 4, 401-407.
Larsson M, Minekus M and Havenaar R. (1997). Estimation of the bio-availability of iron and phosphorus in cereals using a dynamic in-vitro gastrointestinal model. J. Sci. Food Agric. 73: 99-106.
Large D, Schaeffer R and Höhndorf A. (1983). Lead isotope data from selected galena occurrences in the North Eifel and North Sauerland, Germany. Mineral. Deposita 18 : 235-243.
LDAI Lead Risk Assessment Working Group (2008) Voluntary risk assessment report on lead and some inorganic lead compounds: revised draft version 12 february 2008.
Lijzen JPA, Baars AJ, Otte PF, Rikken MGJ, Swartjes FA, Verbruggen EMJ and van Wezel AP (2001). Technical evaluation of the intervention values for soil/sediment and groundwater. Human and ecotoxicological risk assessment and derivation of risk limits for soil, aquatic sediment and groundwater. Report no. 711701023, National Institute for Public Health and the Environment, Bilthoven, the Netherlands.
Lijzen JPA, Oomen AG, Baars AJ, Swartjes FA and Otte PF (2006) Briefrapport: Risicogrenzen voor lood in de bodem; consequenties van orale biobeschikbaarheid op generieke humane risicobeoordeling, National Institute for Public Health and the Environment, Bilthoven, the Netherlands. (Available via [email protected]).
Lyons Business Support (1999). Raamsaneringsplan bedrijventerrein ‘De Loop’ te Echt. (Available via [email protected]).
Maddaloni M, Lolacono N, Manton W, Blum C, Drexler J and Graziano J (1998) Bioavailability of soilborne lead in adults, by stable isotope dilution. Environ. Health Perspect. 106, 1589-1594.
Marschner B, Welge P, Hack A, Wittsiepe J and Wilhelm M (2006) Comparison of soil Pb in vitro bioaccessibility and in vivo bioavailability with Pb pools from a sequential soil extraction. Environ Sci Technol 40, 2812-8.
Minekus M, Marteau P, Havenaar R and Huis in 't Veld JHJ (1995) A multicompartimental dynamic computer-controlled model simulating the stomach and small intestine. ATLA 23, 197-209.
Minekus M, Smeets-Peeters MJE, Bernalier A, Marol-Bonnin S, Havenaar R, Marteau P, Alric M, Fonty G and Huis in ‘t Veld JHJ (1999). A computer-controlled system to simulate conditions of the large intestine with peristaltic mixing, water absorption and absorption of fermentation products. Appl. Microb. Biotechn. 53: 108-114.

RIVM Report 711701086
121
Mushak P (1991) Gastro-intestinal absorption of lead in children and adults: overview of biological and biophysico-chemical aspects. Chem. Speciation Bioavailability 3, 87-104.
Mushak P (1998) Uses and limits of empirical data in measuring and modeling human lead exposure. Environ. Health Perspect. 106, 1467-1484.
NEN 5709:2006, Bodem – Monstervoorbehandeling voor de bepaling van organische en anorganische parameters in de grond.
NEN 5740:1999, Bodem - Onderzoeksstrategie bij verkennend onderzoek - Onderzoek naar de milieuhygiënische kwaliteit van de bodem.
NEN 5742:2001, Bodem – Monsterneming van grond en sediment ten behoeve van de bepaling van metalen, anorganische verbindingen, matig-vluchtige organische verbindingen en fysisch-chemische bodemkenmerken.
NEN 5752:1995, Bodem – Bepaling van het gehalte aan carbonaten in grond- Gravimetrische methode.
NEN 5753:2006, Bodem – Bepaling van het lutumgehalte en de korrelgrootteverdeling in grond met behulp van zeef en pipet.
NEN 5754:2005, Bodem – Bepaling van het gehalte aan organische stof op massabasis in grond en waterbodem volgens de gloeiverliesmethode.
NEN 5780:2006, Bodem – Bepaling van de potentiële kationenuitwisselingscapaciteit en uitwisselbare basische kationen in grond.
NEN 6950:2005, Bodem – Koepelnorm voor de bepaling van geselecteerde elementen in bodem, waterbodem en (zuiverings)slib.
NEN 6961:2005, Milieu – Ontsluiting met salpeterzuur en zoutzuur (Koningswater) voor de bepaling van geselecteerde elementen in water, waterbodem, slib, slibhoudend water, luchtstof, grond en bouwstoffen.
NEN 6966: 2005, Milieu - Analyse van geselecteerde elementen in water, eluaten en destruaten - Atomaire emissiespectrometrie met inductief gekoppeld plasma
NEN-EN-ISO 10390:2005, Bodem – Bepaling van de pH-waarde.
NEN-EN-ISO 17294-2:2004, Water – Toepassing van massaspectrometrie met inductief gekoppelde plasma (ICP-MS) – Deel 2: Bepaling van 62 elementen.
NVN 5725:1999, Nederlandse voornorm Bodem – Leidraad voor het uitvoeren van vooronderzoek bij verkennend, oriënterend en nader onderzoek. NEN, Delft, the Netherlands (www.nen.nl)

RIVM Report 711701086
122
Oomen AG, Hack A, Minekus M, Zeijdner E, Cornelis C, Schoeters G, Verstraete W, Wiele TVd, Wragg J, Rompelberg CJM, Sips AJAM andWijnen JV (2002) Comparison of five in vitro digestion models to study the bioaccessibility of soil contaminants. Environ. Sci. Technol. 36, 3326-3334.
Oomen AG, Rompelberg CJM, Bruil MA, Dobbe CJG, Pereboom DPKH and Sips AJAM (2003) Development of an in vitro digestion model for estimation of bioaccessibility of soil contaminants. Arch. Environ. Contam. Toxicol. 44, 281-287.
Oomen AG, Brandon EFA, Swartjes FA and Sips AJAM (2006) How can information on oral bioavailability improve human health risk assessment for lead-contaminated soils? Implementation and scientific basis. RIVM Report no. 711701042, National Institute for Public Health and the Environment, Bilthoven, the Netherlands
Oomen AG, van Eijkeren JCH and Lijzen JPA (2006b) Vergelijking van de humane risicobeoordeling van lood in de bodem aan de hand van de blootstellingsmodellen CSOIL en IEUBK SIR/RIVM letter report, PORS no. 10450 (Available via [email protected]).
Otte PF and Wintersen A (2007) Sanscrit toets. De handreiking. RIVM Briefrapport 711701073, National Institute for Public Health and the Environment, Bilthoven, the Netherlands.
Pasteels P, Netels V, DeJonghe L and Deutsch S (1980). La composition isotopique du plomb des gisements belges. Implications sur les plans génétique et économique (Note préliminaire). Bull. Soc. Belge Geol. 89 : 1234-136.
Queensland Health (2007) Mount Isa Community Lead Screening Program 2006-7: A report into the results of a blood-lead screening program of 1-4 year old children in Mount Isa, Queensland, Queensland Government.
R Development Core Team, 2008. R: A language and environment for statistical computing. R Foundation for Statistical Computing, Vienna, Austria. ISBN 3-900051-07-0, website (visited September 2008): http://www.R-project.org.
Rabinowitz MB, Kopple JD and Wetherill GW (1980) Effect of food intake and fasting on gastrointestinal lead absorption in humans. Am.J.Clin.Nutr. 33, 1784-1788.
Reed KJ, Jimenez M, Freeman NCG, Lioy PL (1999) Quantification of children’s hand and mouthing activities through a videotaping methodology. Journal of Exposure Analysis and Environmental Epidemiology 9, 513-520.
Rieuwerts J, Thornton I, Farago M and Ashmore M (1998a). Factors influencing metal bioavailability in soils: preliminary investigations for the development of a critical loads approach for metals. Chemical speciation and bioavailability 10, 61-75.

RIVM Report 711701086
123
Rieuwerts J, Thornton I, Farago M and Ashmore M (1998b). Quantifying the influence of soil properties on the solubility of metals by predictive modeling of secondary data. Chemical speciation and bioavailability 10, 83-94.
Rieuwerts JS, Farago ME, Cikrt M and Bencko V (2000). Differences in lead bioavailability between a smelting and a mining area. Water, Air, Soil Pollut. 122, 203-229.
Ruby MV, Davis A, Kempton JH, Drexler JW and Bergstrom PD (1992). Lead bioavailability: Dissolution kinetics under simulated gastric conditions. Environ. Sci. Technol. 26, 1242-1248.
Ruby MV, Davis A, Schoof R, Eberle S and Sellstone CM (1996). Estimation of bioavailability using a physiologically based extraction test. Environ. Sci. Technol. 30, 422-430.
Ruby MV, Schoof R, Brattin W, Goldade M, Post G, Harnois M, Mosby DE, Casteel SW, Berti W, Carpenter M, Edwards D, Cragin D and Chappell W (1999). Advances in evaluating the oral bioavailability of inorganics in soil for use in human health risk assessment. Environ. Sci. Technol. 33, 3697-3705.
Ryu JE, Ziegler EE, Nelson SE and Fomon SJ (1983) Dietary Intake of Lead and Blood Lead Concentration in Early Infancy. Am. J. Dis. Child 137, 886-891.
Sanford RF, Pierson CT, and Crovelli RA (1993). An objective replacement method for censored geochemical data. Math. Geol., 25: 59-80.
Salovaara S, Larsson Alminger M, Eklund-Jonsson C, Andlid T and Sandberg A.-S (2003). Prolonged transit time trough the stomach and small intestine improves iron dialyzability and uptake in vitro. J. Agric. Food Chem. 51: 5131-5136.
Schaafsma G (2005). The Protein Digestibility-Corrected Amino Acid Score (PDCAAS). A concept for describing protein quality in foods and food ingredients: A critical review. J. AOAC Internat. 88 (3): 988-994.
Schmidt CW (1999) A closer look at chemical exposure in children; new research initiatives should help regulators more accurately assess risks and set exposure tolerances. Environmental Science and Technology 33, 72A-75A.
Schroder JL, Basta NT, Casteel SW, Evans TJ, Payton ME and Si J (2004) Validation of the in vitro gastrointestinal model (IVG) to estimate relative bioavailable lead in contaminated soils. J. Environ. Qual. 33, 513-521.
Sheldrake S and Stifelman M (2003) A case study of lead contamination cleanup effectiveness at Bunker Hill. Sci Total Environ 303, 105-23.
Sips AJAM, Bruil MA, Dobbe CJG, van de Kamp E, Oomen AG, Pereboom DPKH, Rompelberg CJM and Zeilmaker MJ (2001) Bioaccessibility of contaminants from ingested soil in

RIVM Report 711701086
124
humans. Method development and research on the bioaccessibility of lead and benzo[a]pyrene. Report no. 711701012, National Institute for Public Health and the Environment, Bilthoven, the Netherlands.
Smeets-Peeters MJE, Minekus M, Havenaar R, Schaafsma G and Verstegen MWA (1999). Description of a dynamic in vitro model of the dog gastrointestinal tract and an evaluation of various transit times for protein and calcium. ATLA 27: 935-949.
Stanek EJ, Calabrese EJ, Mundt K, Pekow P and Yeatts KB (1998) Prevalence of soil mouthing/ingestion among healthy children aged 1 to 6. Journal of Soil Contamination 7, 227-242.
Steele MJ, Beck BD, Murphy BL and Strauss HS (1990). Assessing the contribution from lead in mining wastes to blood lead. Regul. Toxicol. Ppharmacol. 11, 158-190.
US-EPA OoSWaER (2002) Short sheet: overview of the IEUBK model for lead in children. Report no: EPA #PB 99-9635-8, U.S.-EPA, Washington DC, USA.
US-EPA OoSWaER (2004) Estimation of relative bioavailability of lead in soil and soil-like materials using in vivo and in vitro methods, US-EPA, Washington, DC.
US-EPA OoSWaER (2007a) Memorandum: Estimation of relative bioavailability of lead in soil and soil-like material using in vivo and in vitro methods. OSWER 9285.7-77, Washington DC, USA.
US-EPA OoSWaER (2007b) Memorandum: Guidance for evaluating oral bioavailability of metals in soils for use in human health risk assessment. OSWER 9285.7-80, Washington DC, USA.
US-EPA OoSWaER (2008) Standard Operating Procedure for an in vitro bioaccessibility assay for lead in soil. EPA 9200.1-86, Washington DC, USA.
US-EPA TWBC (2007) Proceedings: ISEA Bioavailability Symposium Durham, North Carolina; Use of in vitro bioaccessibility/relative bioavailability estimates for metals in regulatory settings: What is needed?, Washington DC, USA.
van de Wiele TR, Oomen AG, Wragg J, Cave M, Minekus M, Hack A, Cornelis C, Rompelberg CJ, De Zwart LL, Klinck B, Van Wijnen J, Verstraete W and Sips AJAM (2007) Comparison of five in vitro digestion models to in vivo experimental results: lead bioaccessibility in the human gastrointestinal tract. J Environ Sci Health A Tox Hazard Subst Environ Eng 42, 1203-11.
van den Berg GJ, Wolterbeek HT, De Goeij JJ and Beynen AC (1995) Absorption and retention studies of trace elements and minerals in rats using radiotracers and whole-body counting. Lab Anim 29: 66-77.

RIVM Report 711701086
125
van der Veer G (2006) Geochemical soil survey of the Netherlands. Atlas of major and tracé elements in topsoil and parent material; assessment of natural and anthropogenic enrichment factors. PhD thesis, Utrecht, the Netherlands.
van der Velde-Koerts T (1997) Optimalisatie van de destructie van vaste stoffen met magnetron en koningswater. RIVM report 502501063, National Institute for Public Health and the Environment, Bilthoven, the Netherlands.
van Wijnen JH, Clausing P and Brunekreef B (1990) Estimated soil ingestion by children. Environmental Research 51, 147-162.
Venables, WN and Ripley BD (2002). Modern Applied Statistics with S. 4th ed., Springer, New York.
Versantvoort CHM, Oomen AG, Van de Kamp E, Rompelberg CJM and Sips AJAM (2005) Applicability of an in vitro digestion model in assessing the bioaccessibility of mycotoxins from food. Food and Chemical Toxicology 43, 31-40.
Vriend SP, Van Gaans PFM, Middelburg J and De Nijs A (1988). The application of fuzzy c-means cluster analysis and non-linear mapping to geochemical datasets: examples from Portugal. Appl. Geochem. 3: 213-224.
VROM (2006) Notulen Loodoverleg d.d. 15 september 2006 Kenmerk NOBO-2006-143.
Walraven (in preparation). Lead isotope and multi-element analysis as tools to define source, behavior and risks of lead and related heavy metals in the environment. PhD thesis.
Walraven N, Oomen AG, Van Os B, Klaver G, Vriend S and Van Cappellen P (in preparation) Factors controlling the oral bioaccessibility of anthropogenic Pb in polluted soils. Environ. Sci. Technol.
Walraven, N (2007). Onderzoek naar de oorzaak en het gedrag van de zinkverontreiniging op locatie Anthoniedijk e.o. in de gemeente Utrecht. GeoConnect rapport GC 11-2007, Castricum, the Netherlands.
Walraven, N. (2008). Chemische karakterisatie van bodems verontreinigd met zinkassen. Deel 1: Fingerprinting op basis van ICP element en loodisotoop analyses. GeoConnect rapport, Castricum, The Netherlands.
Walraven N, Van Os BJH, Klaver G, Baker SP and Vriend SP (1997). Trace element concentrations and stable lead isotopes in soils as tracers of lead pollution in Graft-De Rijp, the Netherlands. J. Geochem. Explor. 59, 47-58.
Yang J-K, Barnett MO, Jardine PM and Brooks SC (2003) Factors controlling the bioaccessibility of arsenic(V) and lead(II) in soil. Soil and Sediment Contamination 12, 165-179.

RIVM Report 711701086
126
Ziegler EE, Edwards BB, Jensen RL, Mahaffey KR and Fomon SJ (1978) Absorption and retention of lead by infants. Pediatric Research 12, 29-34.

RIVM Report 711701086
127
Appendix 1 The soil characteristics for the ninety made grounds
pH total sulpher Carbonate content
Organic matter Clay Iron
content
CM mg S/kg % CaCO3 % % mmol Fe/kg
1 Schoonhoven Fluviatile sand / clay 30-60 6.9 973 5 7.2 16 762 Schoonhoven Fluviatile sand / clay 60-120 6.8 1297 1.7 9.2 11 893 Schoonhoven Fluviatile sand / clay 0-40 6.9 1687 2.5 8.6 9 1004 Schoonhoven Fluviatile sand / clay 0-40 7 990 2.7 9 9 1065 Schoonhoven Fluviatile sand / clay 0-10 7.2 1372 2.3 10.6 12 1046 Schoonhoven Fluviatile sand / clay 0-5 6 2193 0.2 14.8 17 1047 Utrecht Aeolian sands 30-50 6.6 729 3.8 5.8 6 618 Utrecht Aeolian sands 0-30 6.2 549 1.2 6.8 4 569 Utrecht Aeolian sands 30-60 7.8 579 4.5 4.2 8 7610 Utrecht Aeolian sands 30-60 6.9 761 2.4 10.8 4 8611 Utrecht Aeolian sands 0-30 6.6 1040 1.1 14 3 7712 Utrecht Aeolian sands 0-30 6.6 785 1.4 13.2 4 4513 Wijk bij Duurstede Fluviatile sand / clay 0-50 6.6 468 2.7 5.8 6 5914 Wijk bij Duurstede Fluviatile sand / clay 0-50 6.5 540 1.7 9.2 4 5915 de Rijp Marine sand / clay 0-20 6.8 1119 1.6 10.6 7 9616 de Rijp Marine sand / clay 0-20 6.7 1338 0.8 12.6 9 15517 de Rijp Marine sand / clay 0-20 6.8 1343 1.5 10.4 7 11318 de Rijp Marine sand / clay 20-40 6.9 1076 1.2 7.8 20 15619 de Rijp Marine sand / clay 20-40 7.1 1506 3.3 8.6 24 15420 de Rijp Marine sand / clay 20-40 6.9 1784 0.4 14.8 22 20321 Haarlem Dune sand 0-90 6.7 424 1 3 1 3822 Haarlem Dune sand 0-90 6.6 272 0.9 3.2 1 3523 Haarlem Dune sand 0-40 6.7 597 1 5.6 2 6424 Haarlem Dune sand 0-40 6.4 558 0.4 5.8 2 7525 Haarlem Dune sand 40-80 6.8 586 2.8 4.2 1 6226 Haarlem Dune sand 40-80 6.9 769 4.5 6 2 8527 Alkmaar Dune sand 0-50 7 404 0.7 4.4 3 3928 Alkmaar Dune sand 0-50 6.9 686 1.1 5.6 1 8429 Leiden Fluviatile sand / clay 0-80 6.9 557 1.5 5 3 4730 Leiden Fluviatile sand / clay 0-80 7 729 1.8 5 3 3831 Leiden Fluviatile sand / clay 10-50 7.3 1785 7 7 6 21032 Leiden Fluviatile sand / clay 10-50 7.4 1338 4.6 9.8 6 24933 Delft Marine sand / clay 0-40 7 698 3.6 6.2 2 3834 Delft Marine sand / clay 0-40 7.1 791 3.7 6.8 3 4635 Delft Marine sand / clay 0-20 7.4 456 4.2 3 7 11536 Delft Marine sand / clay 0-20 7.4 487 3.9 4.6 7 21237 Delft Marine sand / clay 20-80 7.4 444 4.7 5.2 3 5438 Delft Marine sand / clay 20-80 7.4 343 4.2 2.4 2 3939 Den Haag Dune sand 20-60 6.8 484 2.5 3.6 2 3440 Den Haag Dune sand 50-120 8 574 9.5 2.2 1 6441 Den Haag Dune sand 50-120 7.4 231 2.3 2.2 1 3442 Den Haag Dune sand 100-120 7.2 261 1.5 2.6 1 3743 Den Haag Dune sand 100-120 6.9 322 1.4 3 1 6044 Den Haag Dune sand 30-90 7.2 231 2.8 1.4 1 4045 Rotterdam Marine sand / clay 0-80 7.2 1365 2.4 12 9 12446 Rotterdam Marine sand / clay 0-80 7.1 2315 2.4 20.6 8 17147 Rotterdam Marine sand / clay 0-50 6.8 1375 0.2 12.8 15 111
Soil number City Sediment
composition
Sample depth
Soil characteristics

RIVM Report 711701086
128
Appendix 1 (continued) The soil characteristics for the ninety made grounds
pH total sulpher
Carbonate content
Organic matter Clay Iron
content
CM mg S/kg % CaCO3 % % mmol Fe/kg
48 Rotterdam Marine sand / clay 0-50 6.6 1071 1.4 10.6 10 8949 Rotterdam Marine sand / clay 0-50 6.7 1660 2.3 10.2 11 9750 Rotterdam Marine sand / clay 0-50 6.8 1077 0.7 9.8 15 10851 Schiedam Marine sand / clay 30-60 7.1 424 2.7 4.4 6 5952 Schiedam Marine sand / clay 30-60 7.1 394 1.3 4.6 6 5253 Groningen Aeolian sands 20-60 6.4 1018 0.6 21.8 9 13654 Groningen Aeolian sands 50-120 6.6 1372 0.6 16.2 11 11855 Groningen Aeolian sands 100-120 6.6 1257 0.7 17.8 7 11456 Groningen Aeolian sands 30-90 6.8 1150 1 16.8 9 13857 Groningen Aeolian sands 50-120 7.4 473 9.3 1.8 2 3658 Groningen Aeolian sands 100-120 7.5 735 11.7 1.8 2 3559 Zutphen Fluviatile sand / clay 0-30 7.1 497 2.6 6 4 5460 Zutphen Fluviatile sand / clay 0-30 6.9 456 1.5 6 3 4961 Zutphen Fluviatile sand / clay 0-60 6.6 811 1.4 8.8 3 8962 Zutphen Fluviatile sand / clay 0-60 6.7 628 1.9 7.6 4 5963 Nijmegen Aeolian sands 0-100 7.5 463 10.9 2.6 2 4364 Nijmegen Aeolian sands 0-100 7.6 423 9.9 1.6 1 4665 Nijmegen Aeolian sands 0-30 7.2 283 1.1 3.4 3 5866 Nijmegen Aeolian sands 0-30 6.8 262 0.4 2.8 2 5067 Nijmegen Aeolian sands 30-120 7.4 272 4.9 2 2 4868 Nijmegen Aeolian sands 30-120 7.7 403 6 2.6 1 6269 Maastricht Loess 0-30 7.4 3423 1.9 6 8 16570 Maastricht Loess 0-50 7.2 3676 2 7.4 8 15671 Maastricht Loess 50-100 7.4 17986 1.6 5.2 13 8372 Maastricht Loess 70-100 7.3 660 1.6 4 16 8273 Maastricht Loess 70-100 7.4 912 1.6 6.6 11 8574 Maastricht Loess 0-50 8 8064 4.5 5.2 6 28675 Maastricht Loess 0-30 8.1 9507 5.1 17.4 4 31976 Maastricht Loess 0-30 8.1 7910 4.5 5 6 29077 Echt-Susteren Loess 0-30 7.2 306 0.5 2.4 20 7378 Echt-Susteren Loess 0-30 7.5 485 2.6 2 10 5179 Echt-Susteren Loess 0-30 7.2 458 0.7 2.2 18 6680 Echt-Susteren Loess 0-30 7.5 252 2.5 1.4 7 3981 Echt-Susteren Loess 0-30 7.6 322 2.7 1.6 7 4382 De Rijp Marine sand / clay 20-40 7 1539 1.6 9.2 12 14583 Echt-Susteren Loess 0-30 7.7 171 3.1 1.6 7 4084 Echt-Susteren Loess 0-30 7.6 212 2.8 1.4 7 4285 Echt-Susteren Loess 0-30 7.6 232 2.8 1.4 6 4186 Echt-Susteren Loess 0-30 7.7 383 2.7 1.4 7 4187 Leiden Fluviatile sand / clay 20-40 7.5 2558 5.4 10.6 6 13788 Utrecht Fluviatile sand / clay 50-90 7.2 10047 1.2 1.4 8 3389 Den Haag Dune sand 7.5 494 5 3 1 2890 Den Haag Dune sand 9.5 778 9 4.4 1 35
7.1 1408 2.9 6.7 6.6 88.96 171 0.2 1.4 1 28
9.5 17986 11.7 21.8 24 319
Soil characteristics
Soil number City Sediment
composition
Lowest valueHigest value
Average
Sample depth

RIVM Report 711701086
129
Appendix 2 The total lead concentrations for the ninety made grounds determined by different methods
field-XRF ICP-MS ICP-AES HF
BKK RIVM Alcontrol Duplo I Duplo II TNO Deltares1 Schoonhoven 1996 2556 1800 1800 1805 2618.5 26542 Schoonhoven 1342 1778 1000 1476 12763 Schoonhoven 1897 2383 2300 2154 2165 27424 Schoonhoven 759 1142 940 973 8535 Schoonhoven 866 1523 1300 884 14016 Schoonhoven 614 783 440 656 6377 Utrecht 1387 1443 1600 971 10168 Utrecht 1342 1651 3700 1677 3442 20609 Utrecht 891 1237 900 1970 116110 Utrecht 956 1275 930 1244 100011 Utrecht 775 952 810 606 625 1485.5 112412 Utrecht 916 927 890 1304 89113 Wijk bij Duurstede 392 639 480 445 29214 Wijk bij Duurstede 676 1431 730 973 109815 de Rijp 534 965 710 580 61316 de Rijp 891 2335 1100 1430 1760117 de Rijp 539 1947 920 906 956 1568.5 135718 de Rijp 386 540 480 463 53019 de Rijp 1038 1549 1700 1543 1115 441620 de Rijp 550 1668 810 843 73521 Haarlem 520 1053 1100 1250 563 1771.5 95922 Haarlem 548 658 5400 679 73023 Haarlem 458 547 390 696 68024 Haarlem 537 614 450 410 46125 Haarlem 630 706 560 579 49926 Haarlem 1233 2262 1500 1409 583427 Alkmaar 533 773 810 493 590 1536.5 65828 Alkmaar 692 769 770 749 59029 Leiden 551 659 530 517 517 665 53730 Leiden 526 841 520 476 46231 Leiden 522 866 610 679 574 105832 Leiden 808 1366 1200 1002 127633 Delft 1895 2213 1400 3059 1621 1653.5 206034 Delft 2115 2218 2000 2123 196035 Delft 700 1790 2300 2011 1437 108536 Delft 543 922 880 1426 140637 Delft 562 1320 1200 660 49838 Delft 407 535 430 482 461 79839 Den Haag 474 481 460 405 471 77440 Den Haag 975 1088 760 897 110741 Den Haag 411 537 520 757 131042 Den Haag 860 989 760 1126 85843 Den Haag 1517 1628 1000 1352 1315 2049 247844 Den Haag 684 744 700 649 59045 Rotterdam 487 783 640 589 623 945.5 73046 Rotterdam 486 931 690 793 74847 Rotterdam 935 1283 1300 1315 1078 1822
sample number City
Total lead detection in sample (mg/kg )
Mass balans Chyme + Pellet
(N.B: only sixteen soils were studies in the Tiny-TIM method; total lead of thirty soils were determined with the HF destruction)

RIVM Report 711701086
130
Appendix 2 (continued) The total lead concentrations for the ninety made grounds determined by different methods
field-XRF ICP-MS ICP-AES HF
BKK RIVM Alcontrol Duplo I Duplo II TNO Deltares48 Rotterdam 2326 3613 2800 3633 296649 Rotterdam 758 1488 1100 1426 115650 Rotterdam 810 929 770 844 80751 Schiedam 358 537 370 403 347 402 60652 Schiedam 507 528 420 710 55053 Groningen 539 740 480 849 862 1099 81354 Groningen 464 715 400 510 66755 Groningen 532 789 2800 860 63956 Groningen 493 841 360 1150 81057 Groningen 1245 2088 1900 1428 258958 Groningen 1630 3232 2100 1957 211459 Zutphen 1356 1222 660 1719 756 826.5 89460 Zutphen 679 755 750 721 82161 Zutphen 1357 1245 1300 1106 1063 117462 Zutphen 544 563 470 279 45563 Nijmegen 1610 2644 4800 1706 1759 1667.5 263964 Nijmegen 1534 2188 2200 1616 165565 Nijmegen 577 689 1300 612 56066 Nijmegen 397 509 400 403 36967 Nijmegen 678 1166 1700 759 129968 Nijmegen 782 1220 1200 882 75869 Maastricht 599 890 680 935 738 800.5 113870 Maastricht 687 951 720 647 70871 Maastricht 668 1029 860 803 696 824 86772 Maastricht 976 245 1100 716 62673 Maastricht 1365 1402 920 2208 1025 75674 Maastricht 1054 1765 1300 1488 134575 Maastricht 2832 4319 3500 3345 362276 Maastricht 1083 1671 1200 1361 126077 Echt-Susteren 313 421 410 339 256 378.5 224078 Echt-Susteren 596 4356 3000 2201 199779 Echt-Susteren 371 637 560 513 49180 Echt-Susteren 486 845 610 411 49681 Echt-Susteren 560 832 660 490 53982 De Rijp 545 1151 1000 1038 92383 Echt-Susteren 562 893 670 651 99784 Echt-Susteren 520 700 540 636 59085 Echt-Susteren 539 721 580 574 580 109686 Echt-Susteren 427 604 520 487 103887 Leiden 428 699 630 488 54888 Utrecht 1840 2805 1900 1736 2026 328189 Den Haag 489 802 610 591 464 70190 Den Haag 602 1373 690 810 555
854 1321 1185 1071 1035 857 1501313 245 360 279 256 379 537
2832 4356 5400 3633 17601 2619 4416
sample number City Mass balans Chyme
+ Pellet
Total lead detection in sample (mg/kg)
AverageLowest valueHighest value
((N.B: only sixteen soils were studies in the Tiny-TIM method; total lead of thirty soils were determined with the HF destruction)

RIVM Report 711701086
131
Appendix 3 The results of the multi-element analysis determined for thirty soils
Al Ba Ca Ce Co Cr Cu Fe Soil City Expected Pb source (mg/kg)
1 Schoonhoven White lead 43708 453 25967 50 12 65 139 22340 3 Schoonhoven White lead 38472 550 19884 49 10 79 159 21661 8 Utrecht White lead/city waste 33792 504 13214 46 15 64 134 21838 11 Utrecht City waste 30000 458 12709 36 26 119 152 120924 17 de Rijp City waste 29708 456 15878 31 13 44 121 18389 19 de Rijp City waste 42400 259 22765 48 11 53 168 30560 21 Haarlem City waste 22330 335 13392 22 5 21 390 9607 27 Alkmaar City waste 21063 339 8938 22 5 34 47 10319 29 Leiden City waste 21469 292 9299 22 4 22 42 9765 31 Leiden City waste 32038 805 37510 35 14 56 209 51427 33 Delft White lead/city waste 24394 390 30600 24 9 26 58 11403 35 Delft City waste 23011 223 19177 28 7 29 74 28843 38 Delft White lead/city waste 20908 247 27627 26 5 23 89 9837 39 Den Haag City waste 19441 311 22006 42 4 19 28 15525 43 Den Haag City waste 19619 340 15005 24 6 33 810 15558 45 Rotterdam City waste 28315 456 35238 32 8 45 127 20654 47 Rotterdam White lead/city waste 48584 396 9442 56 11 67 85 28502 51 Schiedam City waste 40442 483 17930 52 19 51 90 19993 53 Groningen City waste 23242 277 18868 25 5 28 54 16278 57 Groningen City waste 16203 623 45387 22 2 18 116 6792 59 Zutphen City waste 21658 352 16103 27 7 38 79 12191 61 Zutphen City waste 25954 427 18675 29 11 31 59 22635 63 Nijmegen City waste 19043 617 58062 24 5 28 95 10200 69 Maastricht Zn white slag 31353 >8413 15008 49 121 55 556 40225 71 Maastricht Ceramic industry slag 47824 390 28062 69 18 64 67 31423 73 Maastricht Ceramic industry slag 50262 372 4958 77 21 68 30 32875 77 Echt-Susteren Ceramic industry slag 52084 383 11394 59 146 56 77 29795 85 Echt-Susteren Ceramic industry slag 32440 288 18169 53 16 48 40 27724 88 Utrecht Vitriol slag 20146 >4437 4142 16 14 25 88 >219232 89 Den Haag City waste 20145 345 44955 23 6 20 30 10768

RIVM Report 711701086
132
Appendix 3 (continued) The results of the multi-element analysis determined for thirty soils
Soil City K Li Mg Mn Na Ni P Pb S Sr (mg/kg) 1 Schoonhoven 15265 42 6964 489 6041 40 1121 2654 967 128 3 Schoonhoven 14030 37 6057 259 4421 37 1363 2742 2068 119 8 Utrecht 11838 45 2932 379 4255 57 2195 2060 893 119 11 Utrecht 10221 47 2984 773 3637 94 1897 1124 1058 126 17 de Rijp 10091 26 2868 383 4748 30 2894 1357 1522 139 19 de Rijp 13018 37 5512 680 4517 32 1827 4416 1395 151 21 Haarlem 11427 15 1540 226 5695 13 2687 959 301 101 27 Alkmaar 9776 13 2040 268 5066 13 1361 658 407 89 29 Leiden 10280 16 1778 215 4934 13 1035 537 366 77 31 Leiden 10835 38 3871 540 5886 62 2001 1058 2453 196 33 Delft 9858 21 2197 278 4881 20 1275 2060 792 177 35 Delft 9608 17 2514 412 3825 18 726 1085 397 98 38 Delft 9305 17 2357 240 4516 15 2216 798 269 139 39 Den Haag 9551 14 1634 211 4509 12 4501 774 520 178 43 Den Haag 8617 18 1388 219 3887 69 1715 2478 1301 111 45 Rotterdam 9836 33 2986 363 4021 32 2006 730 1365 155 47 Rotterdam 15258 44 5404 401 5746 37 921 1822 948 101 51 Schiedam 12599 52 3885 443 5239 69 1208 606 494 160 53 Groningen 9504 16 2259 382 3111 13 1742 813 869 110 57 Groningen 8345 11 2069 165 3669 9 458 2048 551 197 59 Zutphen 9785 21 1754 398 4024 20 2416 894 438 95 61 Zutphen 12700 26 2631 385 3615 27 2379 1174 858 119 63 Nijmegen 8807 19 1922 238 3202 16 456 2639 506 107 69 Maastricht 9697 29 3486 1476 2708 366 590 1138 3866 152 71 Maastricht 13859 46 4061 828 3704 44 810 867 12520 557 73 Maastricht 14747 41 4174 1105 3429 45 768 756 179 72 77 Echt-Susteren 12074 51 2737 667 3545 38 759 2240 473 91 85 Echt-Susteren 9858 28 3267 624 3350 36 594 1096 269 82 88 Utrecht 8814 16 1345 452 3653 70 344 3281 12027 94 89 Den Haag 9030 17 1441 210 4442 17 788 701 532 165

RIVM Report 711701086
133
Appendix 3 (continued) The results of the multi-element analysis determined for thirty soils Soil City Ti V Y Zn Zr Cd As Ag Sn Sb (mg/kg) 1 Schoonhoven 2457 61 15 431 82 1,8 26 11 18 2,8 3 Schoonhoven 2041 57 14 732 64 3,4 31 16 39 3,6 8 Utrecht 1554 81 14 615 59 1,8 22 2,2 14 3,4 11 Utrecht 1458 77 15 738 128 1,5 26 1,1 10 3,8 17 de Rijp 1321 57 11 452 56 1,5 32 1,2 19 2,4 19 de Rijp 2359 72 14 156 69 1,5 30 1,9 31 3,1 21 Haarlem 765 19 5 532 25 1,9 21 1,2 22 16 27 Alkmaar 977 22 6 258 25 1,1 21 0,9 10 1,5 29 Leiden 999 23 7 305 43 0,8 23 1,0 8,1 1,3 31 Leiden 1784 52 11 1776 63 17 42 1,4 421 14 33 Delft 1236 36 9 916 45 2,8 18 0,9 48 3,1 35 Delft 1461 40 8 161 48 0,7 16 0,7 13 2,8 38 Delft 1049 26 7 156 29 2,0 16 1,1 47 2,0 39 Den Haag 828 23 29 521 34 1,2 13 1,1 13 1,8 43 Den Haag 796 37 8 1386 27 3,3 241 3,7 44 7,5 45 Rotterdam 1487 46 11 362 49 1,6 19 1,3 21 3,9 47 Rotterdam 2852 72 17 223 83 1,2 33 1,3 15 2,6 51 Schiedam 2045 90 17 418 67 1,5 25 1,0 14 2,4 53 Groningen 1567 36 8 135 73 0,5 19 1,2 6,8 1,0 57 Groningen 1255 22 6 2417 64 3,7 13 1,6 60 8,9 59 Zutphen 1108 29 9 501 39 1,2 18 1,5 14 6,6 61 Zutphen 1006 33 8 1112 43 2,8 17 0,9 45 2,6 63 Nijmegen 866 25 7 1861 43 2,9 13 1,4 47 8,2 69 Maastricht 2361 61 16 >8634 116 34 174 5,4 28 29 71 Maastricht 3426 73 20 762 160 2,6 30 1,0 7,7 2,2 73 Maastricht 3389 75 23 197 136 0,8 28 1,1 2,9 1,4 77 Echt-Susteren 3327 69 17 464 131 2,2 31 1,1 20 2,6 85 Echt-Susteren 2362 55 14 258 181 0,7 25 1,3 2,7 1,2 88 Utrecht 1175 29 4 5442 35 1,5 186 2,5 3,9 18 89 Den Haag 845 27 7 332 36 0,9 19 0,9 8,9 1,5

RIVM Report 711701086
134
Appendix 4 The results of Fuzzy c-means clustering determined for thirty soils Soil number
City EFe EPb EZn ESb EBa FCM cluster
(mg/kg) 1 Schoonhoven -132 2635 375 2 150 1 3 Schoonhoven 119 2725 685 3 266 1 8 Utrecht 423 2045 575 3 235 2 11 Utrecht 10562 1110 703 3 203 4 17 de Rijp 327 1343 417 2 202 2 19 de Rijp 770 4398 103 3 -39 2 21 Haarlem -101 947 508 16 107 4 27 Alkmaar 47 648 236 1 116 3 29 Leiden -33 526 283 1 67 3 31 Leiden 3488 1043 1738 14 543 4 33 Delft -48 2048 889 3 155 2 35 Delft 1781 1074 136 2 -8 3 38 Delft 8 787 135 2 24 3 39 Den Haag 667 764 502 1 93 3 43 Den Haag 659 2468 1367 7 121 4 45 Rotterdam 638 716 329 3 207 3 47 Rotterdam 187 1801 160 2 76 2 51 Schiedam -168 588 367 2 192 3 53 Groningen 510 802 110 1 46 3 57 Groningen -9 2039 2403 9 416 4 59 Zutphen 198 883 478 6 127 2 61 Zutphen 980 1161 1083 2 186 2 63 Nijmegen 158 2629 1842 8 400 4 69 Maastricht 2410 1123 8597 28 8153 5 71 Maastricht 525 846 700 2 73 3 73 Maastricht 521 734 132 1 46 3 77 Echt-Susteren 102 2218 395 2 51 2 85 Echt-Susteren 1094 1081 220 1 25 3 88 Utrecht 20994 3270 5422 18 4216 5 89 Den Haag 148 691 312 1 124 3

RIVM Report 711701086
135
Appendix 5 The results of the lead isotope analysis determined for thirty soils Soil number
City 206Pb/207Pb 208Pb/206Pb
1 Schoonhoven 1,146 2,114 3 Schoonhoven 1,149 2,118 8 Utrecht 1,156 2,110 11 Utrecht 1,160 2,101 17 de Rijp 1,175 2,090 19 de Rijp 1,174 2,088 21 Haarlem 1,172 2,091 27 Alkmaar 1,170 2,097 29 Leiden 1,170 2,099 31 Leiden 1,160 2,104 33 Delft 1,176 2,087 35 Delft 1,174 2,086 38 Delft 1,179 2,088 39 Den Haag 1,174 2,089 43 Den Haag 1,174 2,088 45 Rotterdam 1,164 2,094 47 Rotterdam 1,180 2,079 51 Schiedam 1,159 2,094 53 Groningen 1,179 2,081 57 Groningen 1,161 2,094 59 Zutphen 1,169 2,095 61 Zutphen 1,166 2,093 63 Nijmegen 1,158 2,102 69 Maastricht 1,147 2,112 71 Maastricht 1,161 2,095 73 Maastricht 1,094 2,164 77 Echt-Susteren 1,154 2,105 85 Echt-Susteren 1,159 2,101 88 Utrecht 1,170 2,087 89 Den Haag 1,168 2,091

RIVM Report 711701086
136
Appendix 6 The results of the IVD digestion method for ninety made grounds
Soiltotal lead (ICP-MS by
RIVM in mg/kg)
1 Schoonhoven 2556 43.4 35.2 0.702 Schoonhoven 1778 41.6 33.7 0.673 Schoonhoven 2383 54.0 43.8 0.884 Schoonhoven 1142 44.2 35.8 0.725 Schoonhoven 1523 37.5 30.4 0.616 Schoonhoven 783 39.9 32.3 0.657 Utrecht 1443 35.3 28.6 0.578 Utrecht 1651 82.1 66.5 1.339 Utrecht 1237 62.8 50.9 1.0210 Utrecht 1275 42.4 34.3 0.6911 Utrecht 952 31.8 25.8 0.5212 Utrecht 927 56.1 45.4 0.9113 Wijk bij Duurstede 639 31.4 25.5 0.5114 Wijk bij Duurstede 1431 38.1 30.9 0.6215 de Rijp 965 32.9 26.7 0.5316 de Rijp 2335 29.0 23.5 0.4717 de Rijp 1947 26.0 21.1 0.4218 de Rijp 540 32.4 26.2 0.5219 de Rijp 1549 30.6 24.8 0.5020 de Rijp 1668 15.9 12.8 0.2621 Haarlem 1053 30.8 24.9 0.5022 Haarlem 658 56.8 46.0 0.9223 Haarlem 547 65.2 52.8 1.0624 Haarlem 614 37.2 30.1 0.6025 Haarlem 706 38.1 30.8 0.6226 Haarlem 2262 35.7 28.9 0.5827 Alkmaar 773 30.1 24.4 0.4928 Alkmaar 769 33.6 27.2 0.5429 Leiden 659 42.2 34.2 0.6830 Leiden 841 31.4 25.4 0.5131 Leiden 866 24.8 20.1 0.4032 Leiden 1366 31.6 25.6 0.5133 Delft 2213 38.8 31.4 0.6334 Delft 2218 48.0 38.9 0.7835 Delft 1790 30.4 24.7 0.4936 Delft 922 87.2 70.7 1.4137 Delft 1320 22.1 17.9 0.3638 Delft 535 55.8 45.2 0.9039 Den Haag 481 61.9 50.1 1.0040 Den Haag 1088 61.5 49.8 1.0041 Den Haag 537 76.6 62.1 1.2442 Den Haag 989 62.8 50.9 1.0243 Den Haag 1628 53.4 43.3 0.8744 Den Haag 744 48.6 39.4 0.7945 Rotterdam 783 42.2 34.2 0.6846 Rotterdam 931 45.5 36.9 0.7447 Rotterdam 1283 58.1 47.0 0.9448 Rotterdam 3613 58.3 47.3 0.9549 Rotterdam 1488 54.4 44.0 0.88
Relative bioavailability
factor APS
Soil number City Bioaccessibility %
(fasted)Bioaccessibility %
APS

RIVM Report 711701086
137
Appendix 6 (continued): The results of the IVD digestion method for ninety made grounds
Soiltotal lead (ICP-MS by
RIVM in mg/kg)
50 Rotterdam 929 54.2 43.9 0.8851 Schiedam 537 46.9 38.0 0.7652 Schiedam 528 76.5 61.9 1.2453 Groningen 740 63.3 51.3 1.0354 Groningen 715 46.8 37.9 0.7655 Groningen 789 52.1 42.2 0.8456 Groningen 841 73.3 59.4 1.1957 Groningen 2088 60.9 49.4 0.9958 Groningen 3232 41.4 33.5 0.6759 Zutphen 1222 37.8 30.7 0.6160 Zutphen 755 37.6 30.5 0.6161 Zutphen 1245 31.1 25.2 0.5062 Zutphen 563 37.8 30.6 0.6163 Nijmegen 2644 24.9 20.2 0.4064 Nijmegen 2188 28.4 23.0 0.4665 Nijmegen 689 46.0 37.3 0.7566 Nijmegen 509 39.9 32.3 0.6567 Nijmegen 1166 39.7 32.2 0.6468 Nijmegen 1220 39.1 31.7 0.6369 Maastricht 890 43.9 35.6 0.7170 Maastricht 951 34.1 27.6 0.5571 Maastricht 1029 31.0 25.1 0.5072 Maastricht 245 109.1 88.4 1.7773 Maastricht 1402 26.5 21.4 0.4374 Maastricht 1765 41.4 33.6 0.6775 Maastricht 4319 35.9 29.0 0.5876 Maastricht 1671 41.1 33.3 0.6777 Echt-Susteren 421 39.8 32.2 0.6478 Echt-Susteren 4356 32.7 26.5 0.5379 Echt-Susteren 637 43.2 35.0 0.7080 Echt-Susteren 845 35.3 28.6 0.5781 Echt-Susteren 832 42.1 34.1 0.6882 De Rijp 1151 48.0 38.9 0.7883 Echt-Susteren 893 46.3 37.5 0.7584 Echt-Susteren 700 56.5 45.7 0.9185 Echt-Susteren 721 53.9 43.6 0.8786 Echt-Susteren 604 72.1 58.4 1.1787 Leiden 699 40.0 32.4 0.6588 Utrecht 2805 6.7 5.4 0.1189 Den Haag 802 48.1 39.0 0.7890 Den Haag 1373 30.8 24.9 0.50
44.5 36.1 0.726.7 5.4 0.11
109.1 88.4 1.7741.4 33.5 0.6744.0 35.7 0.7148.3 39.1 0.7856.1 45.5 0.9162.9 50.9 1.02
Percentile 50Percentile 60Percentile 70
Relative bioavailability
factor APS
Percentile 80Percentile 90
Bioaccessibility % APS
AverageLowest valueHigest value
Bioaccessibility % (fasted)
Soil number City

RIVM
National Institute
for Public Health
and the Environment
P.O. Box 1
3720 BA Bilthoven
The Netherlands
www.rivm.com