Embed Size (px)
Citation preview
Relationship marketing as a tool to improve
business activities at Helsinki Bakery
Dung Nguyen
2020 Laurea
Laurea University of Applied Sciences
Relationship Marketing as a tool to improve business activities at
Helsinki Bakery
Dung Nguyen
Restaurant Entrepreneurship
Bachelor’s Thesis
May, 2020
Laurea University of Applied Sciences Abstract
Degree Programme in Restaurant Entrepreneurship
Bachelor’s Thesis
Dung Nguyen
Relationship Marketing as a Tool to Improve Business Activities at Helsinki Bakery Year
2020 Number of pages 54
Nowadays, with the trend of globalization, the service industry is becoming more competitive and complex. Hence, building a strong relationship with customers as well as maintaining cus-tomer satisfaction and loyalty are crucial factors for enterprises to grow sustainably. Focusing on retaining current customers is a profitable strategy since it is said to be five to six times cheaper than attracting new customers. There are many techniques, which businesses can use, to strengthen and develop customer relationships.
The topic of this thesis is to use relationship marketing as a tool to improve business activi-ties. Hence, the outcome of the thesis is a relationship marketing plan that helps increase sales at the commissioner company. This is a project-based thesis, whose commissioner is Helsinki Bakery. It is a small size coffee and bakery shop located in Helsinki. The thesis will help the company answer two questions; what relationship marketing is and how it can im-prove the company business performances by using theories regarding relationship marketing, customer loyalty, customer retention, and several marketing strategies. Moreover, this thesis helps the company acknowledge the importance of maintaining customer relationship in de-veloping their business. The thesis also highlights the theoretical framework of customer loy-alty, customer retention, and relationship life cycle.
Qualitative and quantitative research methods were used in order to gather data and infor-mation on the commissioner company as well as other competitors and customers. Bench-marking and observation methods were used at peer businesses to study and compare perfor-mances with the commissioner company. In addition, in order to obtain information on the case company and its customers, an interview and a survey were implemented. The research was conducted from January to March 2020.
As a result, a relationship marketing plan was drawn up on basis of the studied theoretical background and research development process. The author produced three development plans regarding products, the service, and loyalty program. In order to create more diversity in the case company product line, new revamped products and a seasonal menu were sug-gested, which answer customer demand. Moreover, a new café layout is introduced, which provides more seats, tables, as well as reduce the confusion for customers when purchasing. Membership cards for loyal buyers with attractive rewards and several promotion programs for students and regular consumers are offered to enhance customer loyalty and business ac-tivities.
Keywords: Customer Loyalty, Customer Retention, Relationship Marketing
Contents
1 Introduction ............................................................................................. 5 2 Case company overview ............................................................................... 6 3 Relationship Marketing ................................................................................. 6
3.1 Relationship marketing definition .......................................................... 7 3.2 The influences of relationship marketing on food and beverages industry ........... 8 3.3 Six components of relationship marketing orientation .................................. 8 3.4 Consumer relationship life cycle .......................................................... 12
4 Relationship marketing strategy in theory ........................................................ 14 4.1 Service quality ............................................................................... 15 4.2 Price perception ............................................................................. 16 4.3 Branding ...................................................................................... 17 4.4 Loyalty Program ............................................................................. 18
5 Research and implementation process ............................................................ 19 5.1 Benchmarking ................................................................................ 20 5.2 Semi-structured interview ................................................................. 21 5.3 Survey ......................................................................................... 22
6 Research result ........................................................................................ 23 6.1 Result from observation at Patisserie Teemu Aura .................................... 23 6.2 Result from observation at Brooklyn Cafe Baking Co .................................. 26 6.3 Result from observation at Helsinki Bakery ............................................. 29 6.4 Result from interview with the company owner ........................................ 31 6.5 Benchmarking summary .................................................................... 32 6.6 Result from Helsinki Bakery’s customers survey ........................................ 33
7 Relationship Marketing plan ......................................................................... 39 7.1 Service development ........................................................................ 39 7.2 Product development ....................................................................... 42 7.3 Loyalty Programs ............................................................................ 45
8 Conclusion ............................................................................................. 47 References .................................................................................................. 49 Figures ....................................................................................................... 53 Table ......................................................................................................... 54 Appendices .................................................................................................. 55
5
1 Introduction
In the service industry, maintaining a good relationship with customers is an essential factor
for a business to grow successfully and sustainably, especially for small size business. It is also
a profitable strategy to focus on retaining current customers since it is said to be five to six
times cheaper than to attract new customers. There are many techniques that businesses can
use to strengthen and develop the customer relationship. However, marketing theory empha-
sizes relationship marketing as an effective method in this regard.
The topic of this thesis is using relationship marketing to improve business activities. Hence,
the outcome of the thesis is a relationship marketing plan that helps increase sales activities
at the case company. This is a project-based thesis which the case company is Helsinki Bakery
- a small size coffee and bakery shop located in Helsinki. The thesis will help the company an-
swer two questions; what relationship marketing is and how it can improve the company busi-
ness performances by using theories regarding relationship marketing, customer loyalty, cus-
tomer retention, and several marketing strategies.
After studying the theoretical background, qualitative and quantitative research methods will
be used in order to gather data and information from the case company as well as other com-
petitors and customers. The author uses benchmarking and observation methods at peer busi-
nesses to study and compare performances with the case company. In addition, in order to
obtain information from the case company and its customers, interview and survey methodol-
ogy will be put into practice.
Moreover, this thesis will help the company acknowledge the importance of maintaining cus-
tomer relationships in developing their business and learn about the theoretical framework of
customer loyalty, customer retention, and relationship life cycle. As a result, the outcome is
a relationship marketing plan that will help the case company generate more profit from its
existing customers. The company will receive well-planned relationship marketing plans,
which will step by step improve their business activities and performances.
In this thesis, the author first introduces the case company overview, which includes it’s his-
tory, the owner’s story, products, and visions, followed by the theoretical background chap-
ter that covers relationship marketing definition, orientation, strategy, and customer rela-
tionship life cycle. After that, information regarding research and development tasks and
their results are explained. The last chapter is the conclusion, which summarizes the whole
research, especially the outcome of this thesis.
6
2 Case company overview
Helsinki Bakery is a French-style pastry shop located in Pikku Huopalahti in Helsinki. It is an
artisan bakery and coffee shop that offers different types of French pastries, desserts, and
home-brewed coffee. The company was founded by an Estonian pastry chef in 2018. There
are currently six people working for the company, which consist of two people on the man-
agement team, two pastry chefs, and one waitress. (Helsinki Bakery 2020.)
The owner’s vision is to introduce the new bakery concept and taste to Finnish customers.
She wants the products to focus on design, quality, and taste. The bakery was constructed
with an open-kitchen style so that consumers can enjoy the cakes and observe how they are
made at the same time. The owner wants to make customers feel like they are at their own
home, so she decided to build the kitchen with a cozy, home-baked concept of brown and
dark yellow tones, which is different from the traditional white metal kitchen. (Helsinki Ba-
kery 2020.)
At Helsinki Bakery, all products are made freshly from scratch with high-quality ingredients.
Through the open-kitchen view, customers can see clearly how the ingredients are used, how
products are made, which will help buyers build trust in the company. Besides pastries and
beverages, the company also offers baking courses for customers who interested in baking.
The bakery has published dozens of courses so far during their first year of business. Their
well-known baking courses include macarons, tart & tartlet, chocolate truffle, and other sea-
sonal goods. Furthermore, the company also offers catering services and private event hosting
for other businesses. (Helsinki Bakery 2020.)
3 Relationship Marketing
Nowadays, with the trend of globalization, the service industry is becoming more competitive
and complex. Hence, building a strong relationship with customers as well as maintaining cus-
tomer satisfaction and loyalty are crucial factors for enterprises to grow sustainably. In this
new era, marketing is not just development, distribution, and sales but also is moving forward
to build and to maintain long-term, mutually beneficial relationships with customers. This
philosophy is defined as Relationship Marketing. (Bruhn 2002, 17.)
There are many types of research done to measure the impact of relationship marketing on
the loyalty of the customer. The purpose of relationship marketing is no longer strange for
companies. Currently, the food and beverage industry in Finland has grown very fast, leading
to an increasing level of competition, which means customers have a lot more choice and also
hard to satisfied. Therefore, loyal customers become even more critical in the existence and
development of enterprises. (Grönroos 2000, 27.)
7
In this chapter, the author clarifies the definition of relationship marketing and its effect on
the food and beverage industry. Moreover, theories about relationship marketing orientation
are introduced, which studies six components of the relationship foundation: trust, bonding,
communication, shared value, empathy, and reciprocity. In addition, the progress and defini-
tion of customer retention and customer loyalty are explained in the customer relationship
life cycle subchapter.
3.1 Relationship marketing definition
The term relationship marketing was originated in Europe during the 1980s, where businesses
quickly began to use it as a new marketing strategy. After being introduced in several North
American universities, relationship marketing was welcome discussed and used in various in-
dustries around North America and around the world. According to the author, relationship
marketing is understanding and managing the relationship between customers and businesses
to create and strengthen customers' loyalty and trust toward the company. (Baron, Conway &
Warnaby 2010, 5.)
Traditional Marketing Relationship Marketing
Focus on single sales Focus on customer retention
Single customer contact Continuous customer contact
Oriented to product features Oriented to customer value
Short-term horizontal Long-term horizontal
Low emphasis on service High emphasis on service
Limited engagement to meeting High engagement to meeting
Production staff quality concerns only All staff quality concerns
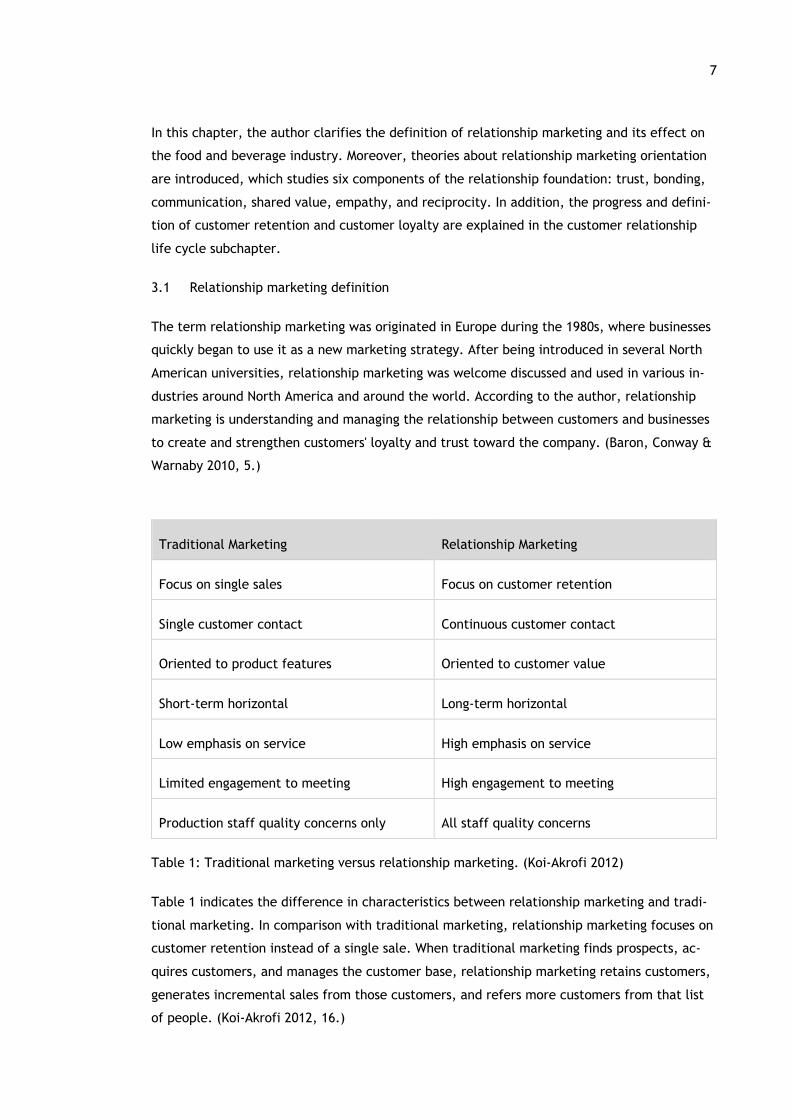
Table 1: Traditional marketing versus relationship marketing. (Koi-Akrofi 2012)
Table 1 indicates the difference in characteristics between relationship marketing and tradi-
tional marketing. In comparison with traditional marketing, relationship marketing focuses on
customer retention instead of a single sale. When traditional marketing finds prospects, ac-
quires customers, and manages the customer base, relationship marketing retains customers,
generates incremental sales from those customers, and refers more customers from that list
of people. (Koi-Akrofi 2012, 16.)
8
3.2 The influences of relationship marketing on food and beverages industry
Service businesses see customer retention as a critical strategy, reflecting a long-term vision.
With increasing competition in the food and beverage industry, the cost to attract a new cus-
tomer is five or six times the cost of retaining an old one. Focusing on only current sales can
result in customer defection, which can affect future profit and cause negative words of
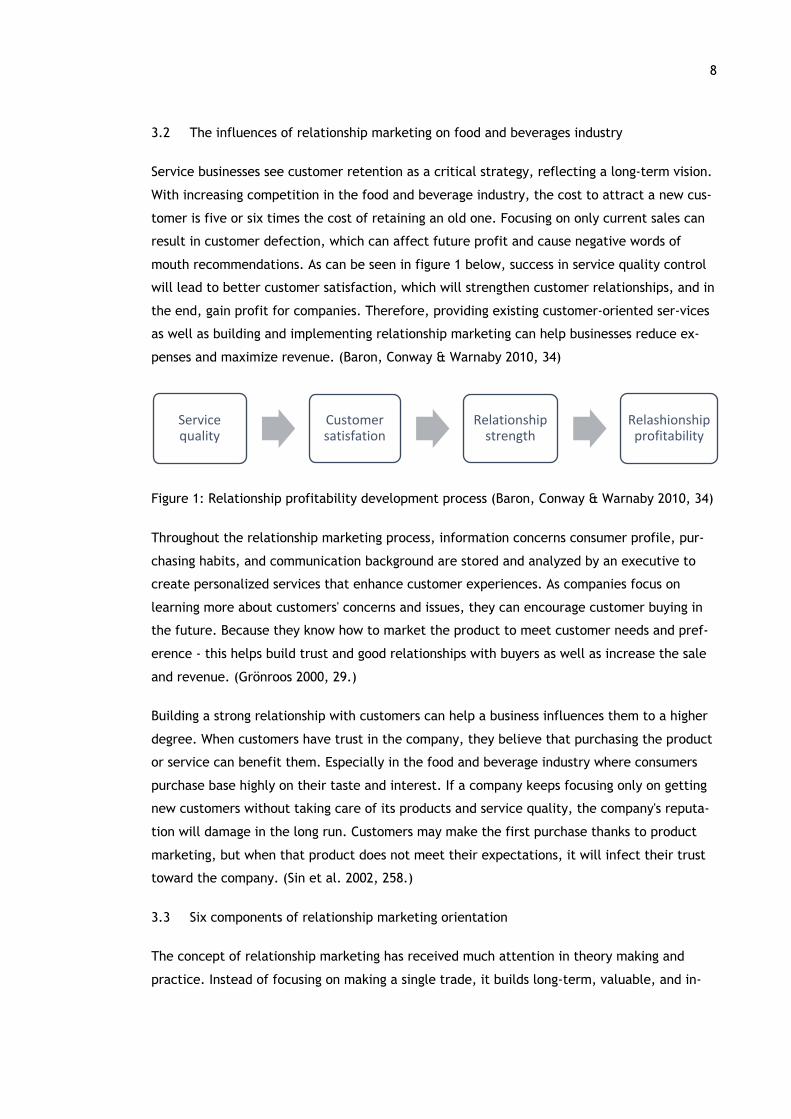
mouth recommendations. As can be seen in figure 1 below, success in service quality control
will lead to better customer satisfaction, which will strengthen customer relationships, and in
the end, gain profit for companies. Therefore, providing existing customer-oriented ser-vices
as well as building and implementing relationship marketing can help businesses reduce ex-
penses and maximize revenue. (Baron, Conway & Warnaby 2010, 34)
Figure 1: Relationship profitability development process (Baron, Conway & Warnaby 2010, 34)
Throughout the relationship marketing process, information concerns consumer profile, pur-
chasing habits, and communication background are stored and analyzed by an executive to
create personalized services that enhance customer experiences. As companies focus on
learning more about customers' concerns and issues, they can encourage customer buying in
the future. Because they know how to market the product to meet customer needs and pref-
erence - this helps build trust and good relationships with buyers as well as increase the sale
and revenue. (Grönroos 2000, 29.)
Building a strong relationship with customers can help a business influences them to a higher
degree. When customers have trust in the company, they believe that purchasing the product
or service can benefit them. Especially in the food and beverage industry where consumers
purchase base highly on their taste and interest. If a company keeps focusing only on getting
new customers without taking care of its products and service quality, the company's reputa-
tion will damage in the long run. Customers may make the first purchase thanks to product
marketing, but when that product does not meet their expectations, it will infect their trust
toward the company. (Sin et al. 2002, 258.)
3.3 Six components of relationship marketing orientation
The concept of relationship marketing has received much attention in theory making and
practice. Instead of focusing on making a single trade, it builds long-term, valuable, and in-
Service quality
Customer satisfation
Relationship strength
Relashionship profitability
9
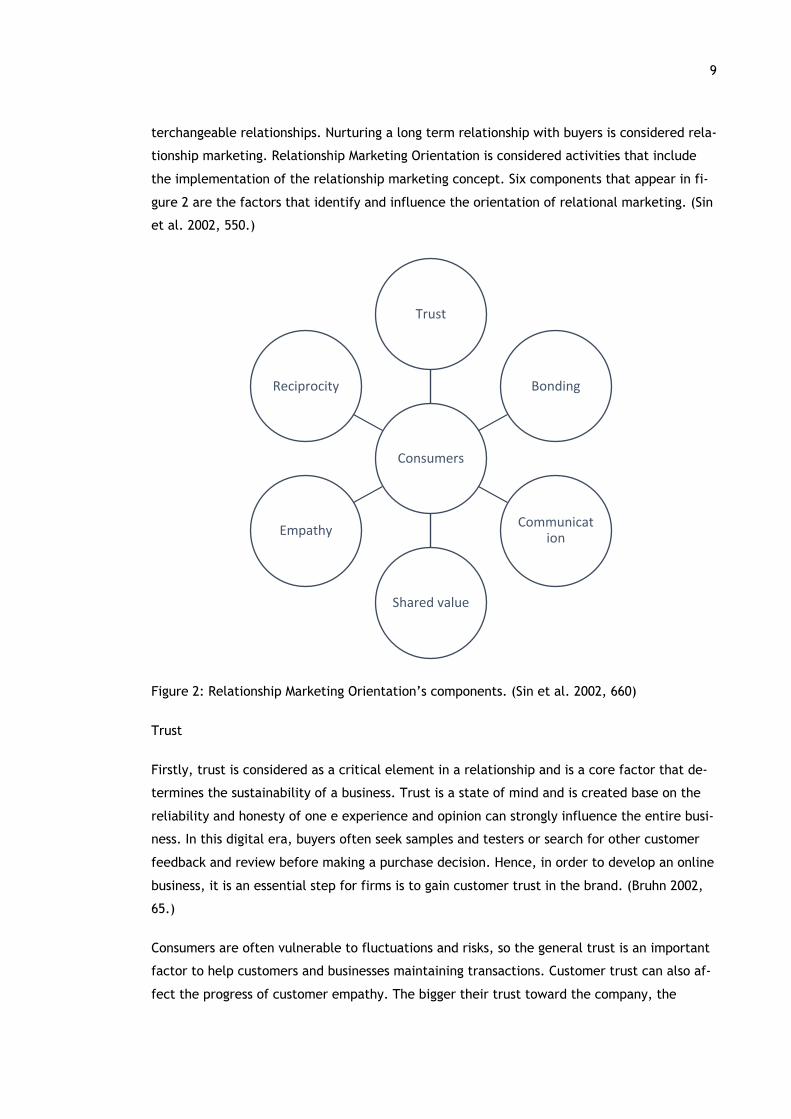
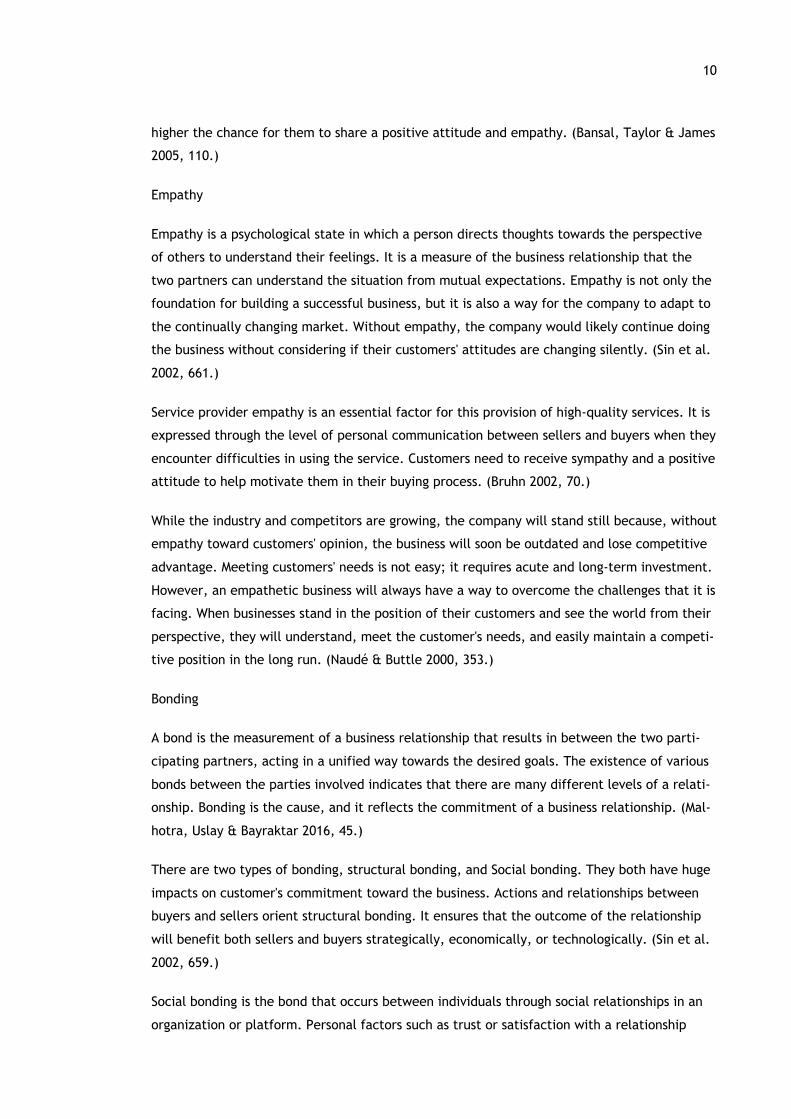
terchangeable relationships. Nurturing a long term relationship with buyers is considered rela-
tionship marketing. Relationship Marketing Orientation is considered activities that include
the implementation of the relationship marketing concept. Six components that appear in fi-
gure 2 are the factors that identify and influence the orientation of relational marketing. (Sin
et al. 2002, 550.)
Figure 2: Relationship Marketing Orientation’s components. (Sin et al. 2002, 660)
Trust
Firstly, trust is considered as a critical element in a relationship and is a core factor that de-
termines the sustainability of a business. Trust is a state of mind and is created base on the
reliability and honesty of one e experience and opinion can strongly influence the entire busi-
ness. In this digital era, buyers often seek samples and testers or search for other customer
feedback and review before making a purchase decision. Hence, in order to develop an online
business, it is an essential step for firms is to gain customer trust in the brand. (Bruhn 2002,
65.)
Consumers are often vulnerable to fluctuations and risks, so the general trust is an important
factor to help customers and businesses maintaining transactions. Customer trust can also af-
fect the progress of customer empathy. The bigger their trust toward the company, the
Consumers
Trust
Bonding
Communication
Shared value
Empathy
Reciprocity
10
higher the chance for them to share a positive attitude and empathy. (Bansal, Taylor & James
2005, 110.)
Empathy
Empathy is a psychological state in which a person directs thoughts towards the perspective
of others to understand their feelings. It is a measure of the business relationship that the
two partners can understand the situation from mutual expectations. Empathy is not only the
foundation for building a successful business, but it is also a way for the company to adapt to
the continually changing market. Without empathy, the company would likely continue doing
the business without considering if their customers' attitudes are changing silently. (Sin et al.
2002, 661.)
Service provider empathy is an essential factor for this provision of high-quality services. It is
expressed through the level of personal communication between sellers and buyers when they
encounter difficulties in using the service. Customers need to receive sympathy and a positive
attitude to help motivate them in their buying process. (Bruhn 2002, 70.)
While the industry and competitors are growing, the company will stand still because, without
empathy toward customers' opinion, the business will soon be outdated and lose competitive
advantage. Meeting customers' needs is not easy; it requires acute and long-term investment.
However, an empathetic business will always have a way to overcome the challenges that it is
facing. When businesses stand in the position of their customers and see the world from their
perspective, they will understand, meet the customer's needs, and easily maintain a competi-
tive position in the long run. (Naudé & Buttle 2000, 353.)
Bonding
A bond is the measurement of a business relationship that results in between the two parti-
cipating partners, acting in a unified way towards the desired goals. The existence of various
bonds between the parties involved indicates that there are many different levels of a relati-
onship. Bonding is the cause, and it reflects the commitment of a business relationship. (Mal-
hotra, Uslay & Bayraktar 2016, 45.)
There are two types of bonding, structural bonding, and Social bonding. They both have huge
impacts on customer's commitment toward the business. Actions and relationships between
buyers and sellers orient structural bonding. It ensures that the outcome of the relationship
will benefit both sellers and buyers strategically, economically, or technologically. (Sin et al.
2002, 659.)
Social bonding is the bond that occurs between individuals through social relationships in an
organization or platform. Personal factors such as trust or satisfaction with a relationship
11
partner play an important role in developing social relationships. Better individual bonding
between buyers and sellers will result in a higher commitment to maintaining the relati-
onship. (Sin et al. 2002, 660.)
Communication
Communication is defined as a formal and informal information exchange between customers
and service providers. It helps to build trust by handling the conflicts that focus on customer's
feelings and expectations. Communication is what keeps the relationship from falling apart
and creates co-operation and trust in partnerships. (Smith & Kawasaki 2011, 115.)
Communication plays a vital role in relationship marketing by building and maintaining relati-
onships with customers and leverages impact on company branding. It also has a positive and
direct impact on the level of relationship commitment between suppliers and retailers. Effec-
tive communication helps to enhance problem-solving skills, to address changes, resolve dif-
ferences, and explore potential solutions. (Malhotra, Uslay & Bayraktar 2016, 67.)
In the world of business, communication is everything from making sure everyone is one the
same page to motivate colleges towards better productivity. The importance of communica-
tion in the service business is that without information exchange, customers and sellers may
end up in conflict. Internal communication between employee and employer is also very cru-
cial for business efficiency and the company's competitive advantages. (Kleinaltenkamp & Eh-
ret 2006, 78.)
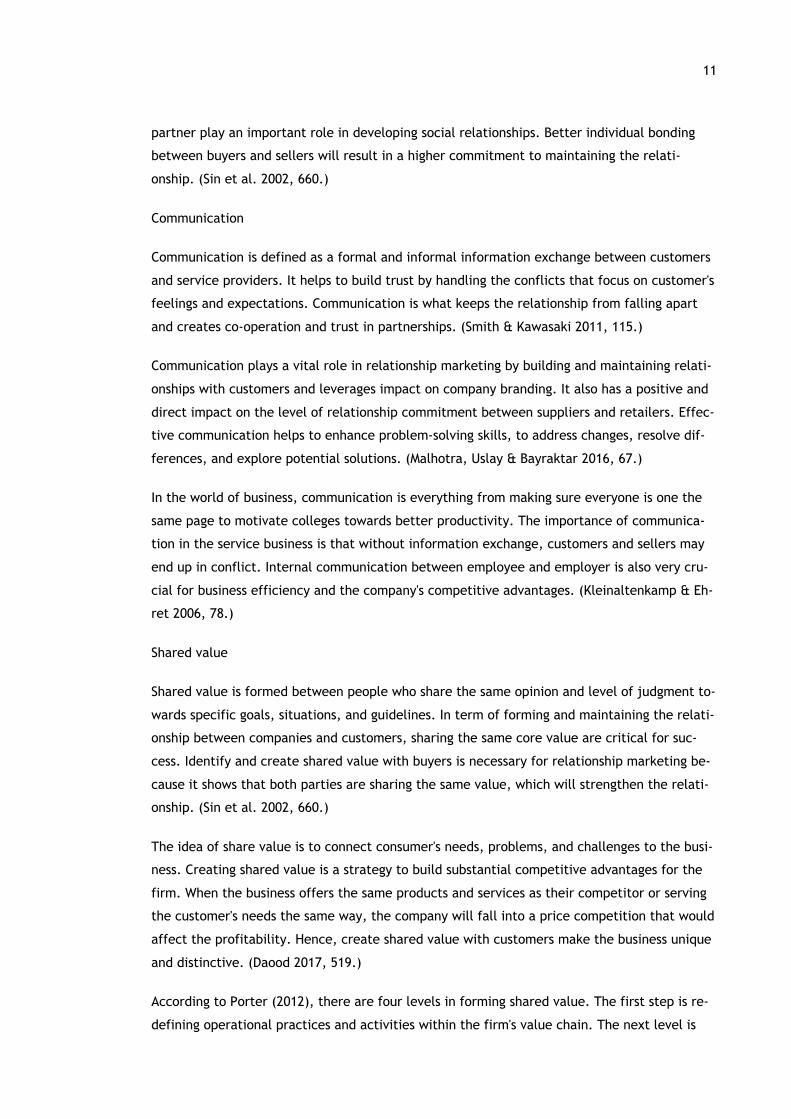
Shared value
Shared value is formed between people who share the same opinion and level of judgment to-
wards specific goals, situations, and guidelines. In term of forming and maintaining the relati-
onship between companies and customers, sharing the same core value are critical for suc-
cess. Identify and create shared value with buyers is necessary for relationship marketing be-
cause it shows that both parties are sharing the same value, which will strengthen the relati-
onship. (Sin et al. 2002, 660.)
The idea of share value is to connect consumer's needs, problems, and challenges to the busi-
ness. Creating shared value is a strategy to build substantial competitive advantages for the
firm. When the business offers the same products and services as their competitor or serving
the customer's needs the same way, the company will fall into a price competition that would
affect the profitability. Hence, create shared value with customers make the business unique
and distinctive. (Daood 2017, 519.)
According to Porter (2012), there are four levels in forming shared value. The first step is re-
defining operational practices and activities within the firm's value chain. The next level is
12
reconceiving companies' products, services, and value propositions. The third stage is creating
the supporting institutions and organizations in the communities. Finally, the company can
collaboratively to generate shared value on broader aspects, for example, economic and so-
cial issues. (Porter 2012, 13.)
Reciprocity
Reciprocation is a beneficial method to stimulate a connection in favor-giving and agreement.
It means that when someone does someone else a favor, that person should do one in return
because they feel indebted to reciprocate. Reciprocity is a measure of business relationships
that provides support or gives permits to the other party's corresponding or subsequent sup-
port. The reciprocity rule is firmly entrenched in our society that we become obliged to repay
kindnesses, invitations, and gifts. (Sin et al. 2002, 661.)
There are two types of reciprocation, emotional and material. Emotional reciprocation is
when people give others compliments or understanding to make them feel better about them-
selves. Material reciprocation concerning tangible things like money, products, or services.
Reciprocity is a measure of business relationships that provides support or gives permits to
the other party's corresponding or subsequent support. The reciprocity rule is firmly entren-
ched in our society that we become obliged to repay kindnesses, invitations, and gifts. (Mal-
hotra, Uslay & Bayraktar 2016, 59.)
Studies and experience have shown that a marketing strategy that has a free sample com-
ponent creates a relationship of indebtedness between the merchant and the buyer. The ap-
proach is helpful because the person who receives the unexpected benefit has a few insuffi-
cient opportunities to reciprocate. (Angelini 2018, 17.)
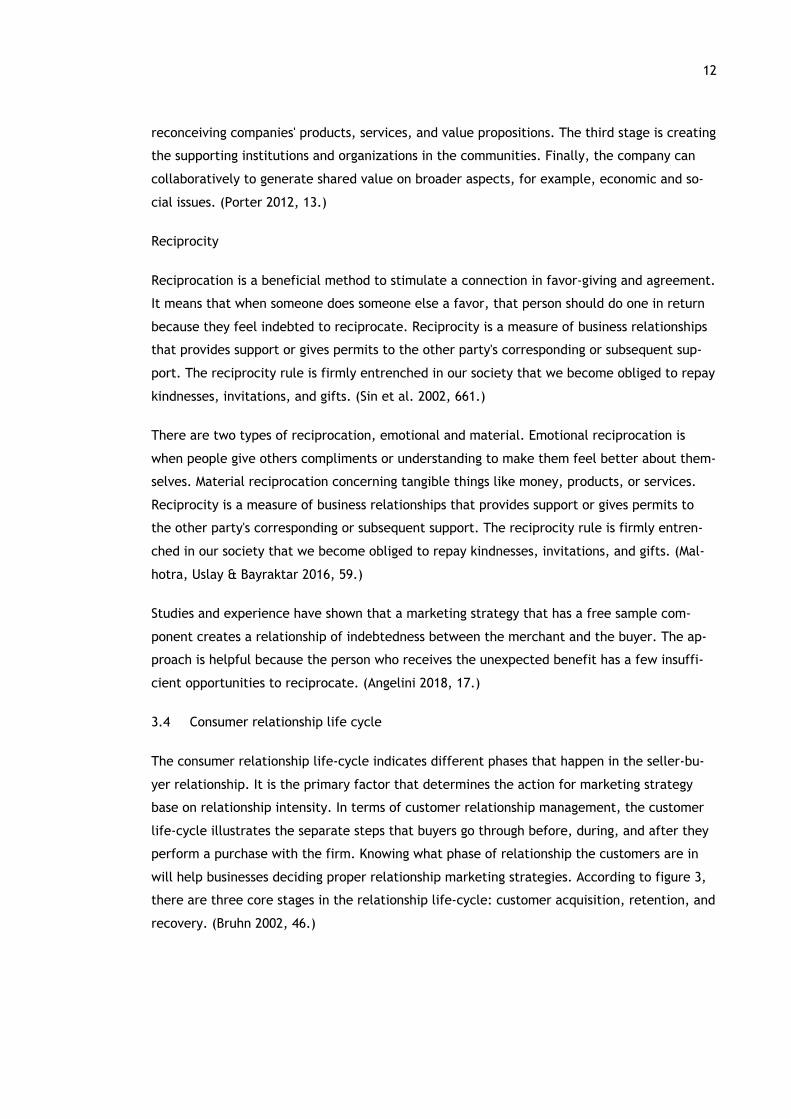
3.4 Consumer relationship life cycle
The consumer relationship life-cycle indicates different phases that happen in the seller-bu-
yer relationship. It is the primary factor that determines the action for marketing strategy
base on relationship intensity. In terms of customer relationship management, the customer
life-cycle illustrates the separate steps that buyers go through before, during, and after they
perform a purchase with the firm. Knowing what phase of relationship the customers are in
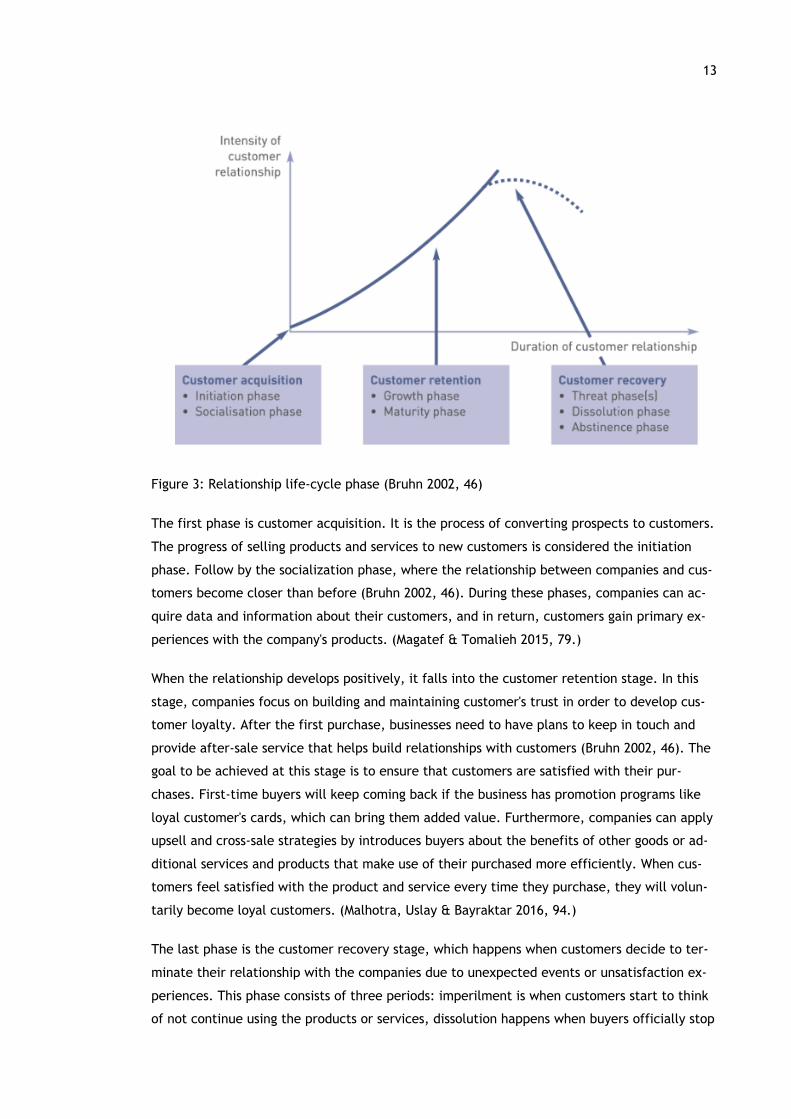
will help businesses deciding proper relationship marketing strategies. According to figure 3,
there are three core stages in the relationship life-cycle: customer acquisition, retention, and
recovery. (Bruhn 2002, 46.)
13
Figure 3: Relationship life-cycle phase (Bruhn 2002, 46)
The first phase is customer acquisition. It is the process of converting prospects to customers.
The progress of selling products and services to new customers is considered the initiation
phase. Follow by the socialization phase, where the relationship between companies and cus-
tomers become closer than before (Bruhn 2002, 46). During these phases, companies can ac-
quire data and information about their customers, and in return, customers gain primary ex-
periences with the company's products. (Magatef & Tomalieh 2015, 79.)
When the relationship develops positively, it falls into the customer retention stage. In this
stage, companies focus on building and maintaining customer's trust in order to develop cus-
tomer loyalty. After the first purchase, businesses need to have plans to keep in touch and
provide after-sale service that helps build relationships with customers (Bruhn 2002, 46). The
goal to be achieved at this stage is to ensure that customers are satisfied with their pur-
chases. First-time buyers will keep coming back if the business has promotion programs like
loyal customer's cards, which can bring them added value. Furthermore, companies can apply
upsell and cross-sale strategies by introduces buyers about the benefits of other goods or ad-
ditional services and products that make use of their purchased more efficiently. When cus-
tomers feel satisfied with the product and service every time they purchase, they will volun-
tarily become loyal customers. (Malhotra, Uslay & Bayraktar 2016, 94.)
The last phase is the customer recovery stage, which happens when customers decide to ter-
minate their relationship with the companies due to unexpected events or unsatisfaction ex-
periences. This phase consists of three periods: imperilment is when customers start to think
of not continue using the products or services, dissolution happens when buyers officially stop
14
the purchasing activities or cancel subscription or membership with the companies, and absti-
nence is when the companies lost that customer. In order to secure profit and positive image,
companies must apply the customer-oriented recovery strategy that can gain back the lost
buyers. (Angelini 2018, 55.)
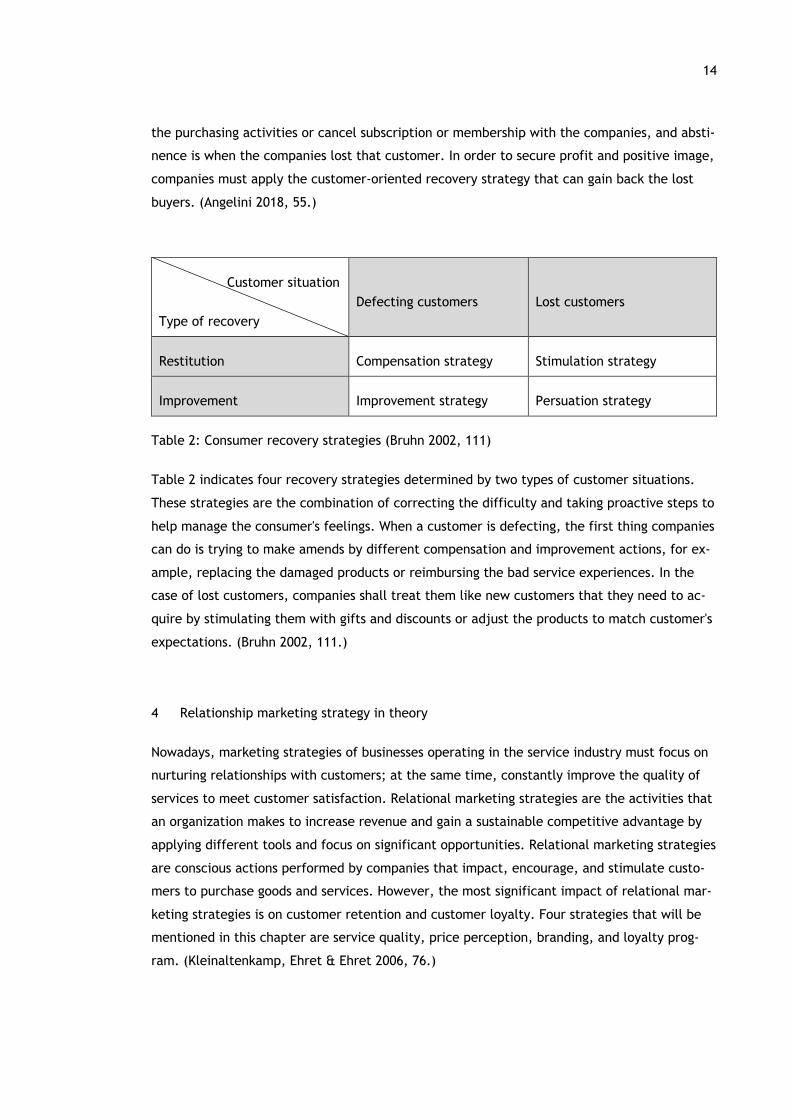
Customer situation
Type of recovery Defecting customers Lost customers
Restitution Compensation strategy Stimulation strategy
Improvement Improvement strategy Persuation strategy
Table 2: Consumer recovery strategies (Bruhn 2002, 111)
Table 2 indicates four recovery strategies determined by two types of customer situations.
These strategies are the combination of correcting the difficulty and taking proactive steps to
help manage the consumer's feelings. When a customer is defecting, the first thing companies
can do is trying to make amends by different compensation and improvement actions, for ex-
ample, replacing the damaged products or reimbursing the bad service experiences. In the
case of lost customers, companies shall treat them like new customers that they need to ac-
quire by stimulating them with gifts and discounts or adjust the products to match customer's
expectations. (Bruhn 2002, 111.)
4 Relationship marketing strategy in theory
Nowadays, marketing strategies of businesses operating in the service industry must focus on
nurturing relationships with customers; at the same time, constantly improve the quality of
services to meet customer satisfaction. Relational marketing strategies are the activities that
an organization makes to increase revenue and gain a sustainable competitive advantage by
applying different tools and focus on significant opportunities. Relational marketing strategies
are conscious actions performed by companies that impact, encourage, and stimulate custo-
mers to purchase goods and services. However, the most significant impact of relational mar-
keting strategies is on customer retention and customer loyalty. Four strategies that will be
mentioned in this chapter are service quality, price perception, branding, and loyalty prog-
ram. (Kleinaltenkamp, Ehret & Ehret 2006, 76.)
15
4.1 Service quality
According to Grönroos (2000), service is a process of a series of intangibles activities usually
provide solutions for customer problems, but not necessarily always include the interaction
between customers and employee, physical resources or systems of the service supplier. Com-
pared to physical products, services are said to be invisible, heterogeneous, is produced and
consumed at the same time. This definition implies that the service is a constant process of
interaction between customers and service providers. Therefore, in the service context, the
relationship between customer and service provider can be used as a core for marketing.
(Grönroos 2000, 110.)
In order to retain loyal customers who will bring long-term profits for companies, the service
provider needs to use the relationships to manage customers by providing what they need and
want. Service quality is a subjective perceived by customers in interacting with the service
provider. It is an evaluation of consumers toward the business as a whole. What customers
feel in the interaction process will have a significant impact on their evaluation of the service
quality. Due to the unique characteristics attributes of the service, evaluating the quality of
service is more complicated compared to the product's quality assessment (Smith, Kawasaki
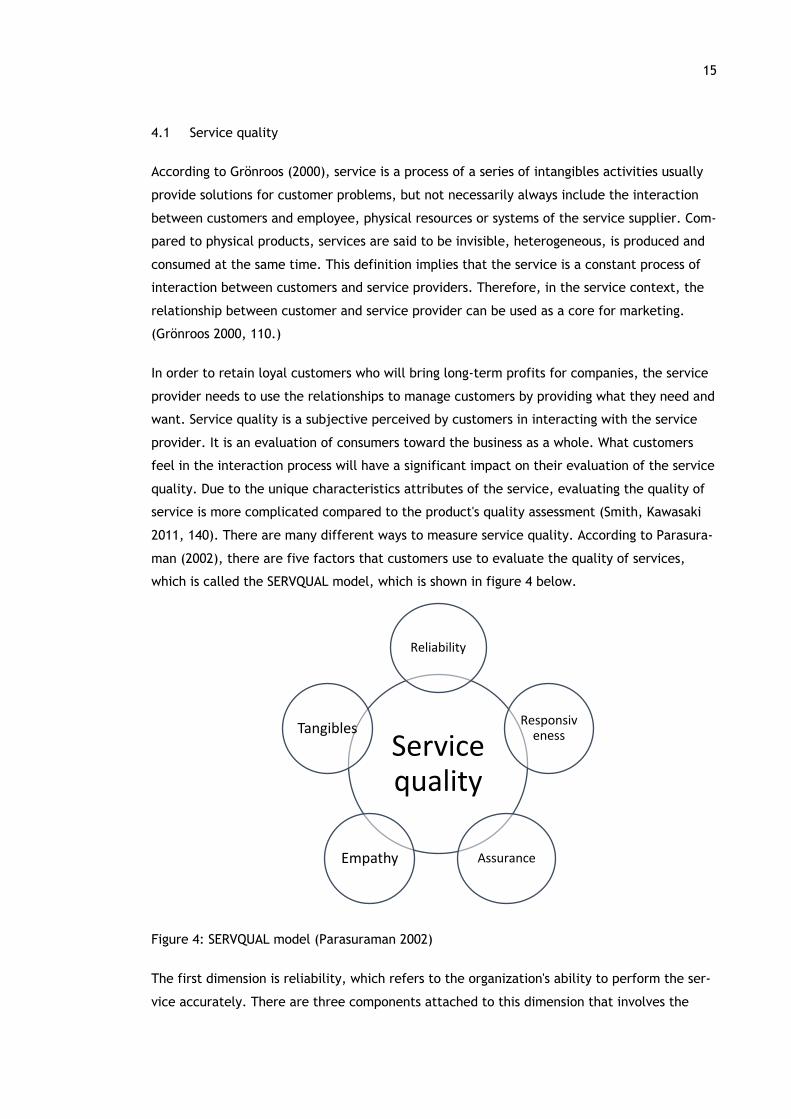
2011, 140). There are many different ways to measure service quality. According to Parasura-
man (2002), there are five factors that customers use to evaluate the quality of services,
which is called the SERVQUAL model, which is shown in figure 4 below.
Figure 4: SERVQUAL model (Parasuraman 2002)
The first dimension is reliability, which refers to the organization's ability to perform the ser-
vice accurately. There are three components attached to this dimension that involves the
Service quality
Reliability
Responsiveness
AssuranceEmpathy
Tangibles
16
ability to complete the service on time, consistently and error-free every time. The next di-
mension is responsiveness, which means the ability to respond to customer's needs promptly.
Keeping customers waiting when there is no apparent reason generates a negative perception
among consumers. Assurance is another factor that determines the customer's evaluation. It
relies on the employee's ability to establish trust and confidence with the customers. Assur-
ance is created based on the service provider's knowledge and the ability to maintain courte-
ous communication. Four components that characterize this dimension are competence, re-
spect for buyers, productive communication, and positive attitude to consumers. Empathy is
the fourth dimension of service quality. It is formed when the company shows care and genu-
ine concern for their clients. The final dimension involves the tangibles, which refer to the
firm's aesthetic and the visual appeal of the company, such as the appearance of facilities,
equipment, and staff. (Behara Ravi & Fisher Warren 2002, 117.)
4.2 Price perception
Price is the monetary cost that customers have to pay when buying products or services. It is
an essential factor that influences customers' purchasing decisions. Customers often choose
their service providers based on the price perceived. They are willing to pay different prices
for different demands and needs. Hence, the perceived price may vary from each customer.
The price, which is higher than consumer perception, can negatively influence consumption
purchasing probability. (Peng & Wang 2006, 22.)
Price perception is also related to price searching because consumers are attracted by the
perception of service quality and price awareness during the research process. Buyers often
assess the quality of service, and the price of products depends on the principle of fairness.
People pay for the products that they perceive have value. If they feel that the price offered
by the company is reasonable, they are willing to make the transaction with the service provi-
der. (Sin et al. 2002, 610.)
According to Cheng (2010), price perceived can be measured by two dimensions. The first fac-
tor is the rationality of the price, which reflects how customers consider the company's prices
compare to other competitors. The other dimension is currency value, which means the stan-
dard status of service providers on price. In general, high-quality services are considered to
have a higher price and vice versa. Many researchers have shown that price perception af-
fects satisfaction and customer trust (Peng & Wang 2006, 22). Frequent change in customer's
decisions is mainly due to price issues, high perception prices, and unreasonable. Therefore,
to increase customer loyalty, service companies need to manage the perceived price actively.
(Cheng, Lai & Yeung 2010.)
17
4.3 Branding
Branding is the process of creating positive awareness of a company, product, or service in
the minds of their customers. A successful brand must create consistency in using logo, de-
sign, vision, and theme for marketing and communications. Effective branding helps compa-
nies differentiate themselves from competitors and build a loyal customer base that increases
the value of the business. (Hansen & Christensen 2003, 115.)
A brand is the company's reputation, representing the generally standard expectation of con-
sumers when they decide to try out its services. In order to successfully build a brand, a res-
taurant business has to solidify its reputation in the market. This task can be executed by
being able to deliver its promises, both product-wise and services-wise, meeting and surpas-
sing the expectations of its customers consistently, and sustaining the promised quality of its
offerings. These are the best ways to secure businesses place in the market and within custo-
mer mind. (Grönroos 2000, 325.)
Branding is considered both a strategical as well as a financial asset. It is not just a motiva-
tion for product marketing but also an essential issue for service companies to gain customer
loyalty. Successful branding allows the company to set higher price perception for its prod-
ucts and service because customers associate higher quality to branded products, and they
are willing to pay more than for a generic version (Miletsky & Smith 2009, 7). With branding,
companies earn a higher market share while lowering the cost of sale, because the estab-
lished brand makes it easier to launch new products with less marketing expenses as consum-
ers are familiar with the brand and quality offered. Besides marketing advantages, popular
brands also help businesses recruit talented and passionate employees. (Kompella 2014, 244.)
The development of customer's perception of the company brand is based on their experi-
ences using the services and products. Therefore, the customer's opinion in each interaction
with the brand is essential for companies to maintain their image. The development of cus-
tomer's perception of the company brand is based on their experiences using the services and
products. Moreover, customers are capable of creating a company's brand image in several
ways, such as using word of mouth. A positive brand image makes it easier for a company to
conduct its brand value to consumers. A neutral or unfamiliar image can not cause any da-
mage, but it does not increase the effectiveness of communication and word of mouth. Howe-
ver, a negative image will damage the brand, customer's trust toward the company, and
reduce sales. Therefore, to build a brand image positively, the company must meet customer
expectations and provide more benefits for customers. (Grönroos 2000, 340.)
There are three factors that companies should consider when defining their brand. The first
element is the promise. It is the core value that companies guarantee to give to their custo-
mers. Promises can be about the product's quality, how their service can change the customer
18
lifestyle. The second factor that every brand should have is personality. With a clear defined
characteristic, the brand can attract their target customers who are sharing the same style
(Hansen & Christensen 2003, 314). The last element is a unique selling position. It will differ-
entiate the company from its competitors. A brand needs to create at least one quality that is
unique in the market. (Miletsky & Smith 2009, 4.)
4.4 Loyalty Program
Loyalty programs are defined as marketing strategies created by businesses to encourage cus-
tomers to buy or use the services of companies incorporated with the programs. Those are
the benefits, incentives, and promotions that the company offers to its customers, expecting
that they will continue to create value for the business in the long run. Customers can get
benefits from those loyalty programs with special promotions, coupons, or invitation to pri-
vate product release events. (Singh & Khan 2012, 2.)
According to Magatef (2015), before spending the budget on loyalty programs, companies
should first categorize their customer base in different groups so that they can create suita-
ble programs for each group. Understanding and identifying the right customers not only helps
businesses to design a loyalty customer program that is suitable for customers but also can
help create selected promotions. Base on customer purchasing behaviour, there are five seg-
mentations that companies should take into account. The first group is the hunter, who often
compare prices between different sellers and choose for the cheapest option. Customers in
this group are mostly students and those with low incomes. For this audience, the loyalty
program must promise a regular discount or benefits affecting the value of orders such as free
delivery. The next group is the achievers, who like to accomplish and unlock certain goals or
levels. For this group, the program should apply gamification such as creating badges that
users can collect, or creating goals or different levels of loyalty cards. (Liu 2007, 25)
The third customer segment is the luxury shoppers or brand-conscious consumers. In opposite
with hunters, these customers pay attention to the brand as if the quality of the brand repre-
sents their personal image. Therefore, loyalty programs for this group of customers must con-
tain customize, sophistication, and elegance factors. The last two groups of buyers are the
creatures of habit and the experimenters. They are considered to have the opposite charac-
teristic with each other. If creatures of habit are loyal to an experience or behaviour, experi-
menters are those who always eager to try new products and experiences. In order to please
the creatures of habit, the customer program should minimize the intermediary steps so that
the buying behaviour becomes as effortless and mindless as possible. Meanwhile, to attract
experimenters, The program needs to introduce new products as well as incentives like pro-
motion, discount, or gift. (Liu 2007, 28)
19
According to Leventhal (2006), there are several types of program which companies can
choose to follow. The most basic form of the program is the loyalty customer card or mem-
bership card. This strategy is proved to not only benefit buyers but also for the firms. By offe-
ring this program to customers, the businesses have opportunities to collect customer infor-
mation, for example, phone number, email, date of births, which can be used for other mar-
keting campaigns. With the point-based system, customers will be rewarded with points for
every action they perform on the product or service of the business, reaching certain levels
can help them redeem points for gifts or exchange points for benefits. Most businesses using
this model will focus on encouraging consumers to spend more money on their products and
services as the more money they contribute, the more points they accumulate. (Magatef &
Tomalieh 2015, 79.)
In the personalized model, customers earn their preferences based on their personal informa-
tion and behaviour. Making cards with customers' names, having special offers for them on
their birthdays, create separate deals, and coupons for products that match customer's inter-
ests are some of the many ways to personalize customer programs. A tier-based model
creates different levels of incentives with benefits that increase along with the involvement
level of customers in the company's products and services. In addition, the sellers can com-
bine this model with the point-based system to create various levels of points with different
rewards programs for customers to unlock. (Magatef & Tomalieh 2015, 80.)
5 Research and implementation process
In every business, a research and development plan is a crucial part of strategic planning,
demonstrating what needs to be done to actualize the goal. A research plan is not only
needed at the starting phase of the company but also when businesses move through stages of
their development. Its primary function is to reflect, review, and refine customers' value
proposition, therefore helping the businesses to innovate themselves. (Kumar 2019, 51.)
In this chapter, the author introduces the research process and methods used to collect the
data needed for the study. Both qualitative and quantitative research methods are used base
on the purpose of the research. Benchmarking, observation, and interview methods are ap-
plied to gain qualitative information from other peer businesses in the industry, while a sur-
vey is designed to collect and analyze the case company's existing customer's opinion. All re-
searches are done throughout the period from January to March.
20
5.1 Benchmarking
The first qualitative method the author chooses to apply in this thesis is benchmarking. It is
the process of observation and comparison of different segments in businesses or organiza-
tions. The purpose of using benchmarking is to evaluate the company's current operation and
develop current products or services by analyzing other successful businesses in the same cat-
egory. This tool is often done to compare with those that are best in the industry, which
means it is seen as a way to identify the leaders in the field, recognize the gap, and take ac-
tion to reduce that gap. By using benchmarking, the company can determine the advantages
of other businesses and learn from their performances. (Kumar 2019, 140.)
There are three steps in performing the benchmarking method. First of all, companies need
to decide what criteria they want to benchmark and improve in their business. Secondly, they
have to choose which businesses within the same industry have the criteria they want to re-
search. The last step is conducting the research in order to find opportunities to improve.
Data and information on benchmarking in this thesis are collected by the observation method.
The reason for choosing observation is because it allows the author to gather information in
the most authentic way. This method provides a more realistic perspective and describes cus-
tomer behavior better than other hypothetical methods. It also allows researchers to create
hypothetical situations and collect actual customer responses, rather than predicting it
through existing data. (Creswell 2018, 190.)
Among different bakeries and coffee shops in the Helsinki area, the author selects Patisserie
Teemu Aura at Siltasaarenkatu 12 and Brooklyn Cafe Baking & Co at Fredrikinkstu 25 as well
as the case company Helsinki Bakery as the destinations to conduct the research. The reason
for choosing these companies is because of their stable position in the industry, strong brand
recognition, and successful customer relationship management. The focus areas of this re-
search are product, service, and branding because those are clarified in the theoretical chap-
ter, the factors that affect the relationship between companies and customers. Moreover, the
writer decides the objects of the observation are both customers and sellers in order to ex-
amine both sides of the service process.
Product Service Branding
Price
Quality
Taste
Customer journey
Waiting time
Serving skill
Interior design
Cake design
Overall Ambiance
21
Variety Staff attitude Other design
Table 3: Guideline for observation process
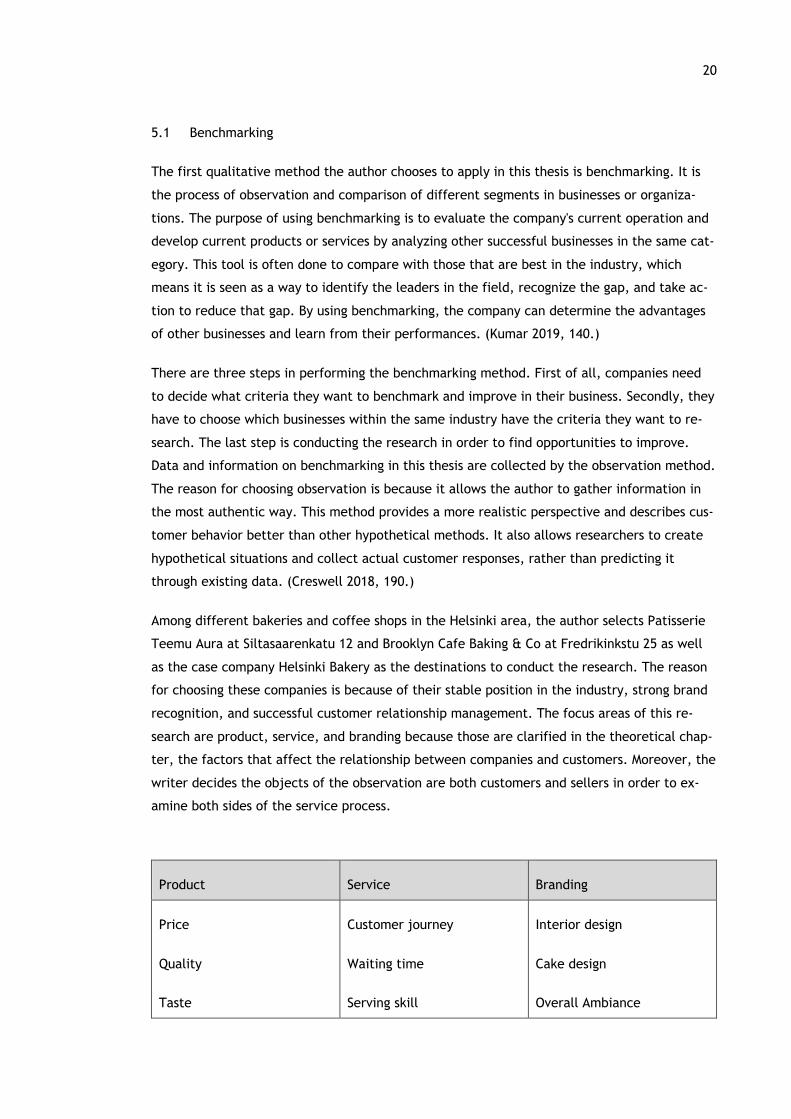
After deciding on the destinations, focus areas, and objects of the research, a guideline is
created, which contains a checklist for the observation process. The detailed guideline is
shown in table 3. As explained in the theoretical part, those criteria chosen are necessary to
create the relationship marketing plans. During the process, the author acts as a regular cus-
tomer who comes to experiment the products and service, at the same time, inspect other
customers behavior and business's operation. The author observes according to the given gui-
deline and takes notes to record the information.
5.2 Semi-structured interview
Interview is a research method that helps gather qualitative data by interacting one-on-one
with the participant. Interviewing can be considered the quickest technique for collecting
data. This type of research can be done through face-to-face meetings or via online plat-
forms, for example, skype and phone call. In order to receive useful and reliable information
from the interview method, the survey facilitator must have the skills to capture and investi-
gate data to avoid missing important information (Creswell 2018, 190). The author decides to
use the semi-structured interview in this research because it helps develop a deep under-
standing of the topic necessary for producing relevant and meaningful interview questions.
Semi-structured interviews are conducted based on a list of questions regarding topics needed
to approach. Moreover, the order and manner of questioning may be changed depending on
the context and characteristics of the interviewee. Hence, it allows the interviewer to ask
follow-up questions to explore additional information. (Fontana & Prokos 2007, 230.)
The type of semi-structured interview used in this research is an in-depth interview. It is used
to deepen a specific topic and to gather as much information as possible on the topic. In-
depth interviews use a semi-structured guideline based on research topics to find out which
questions are appropriate. Interviewers can establish relationships with participants to make
them more comfortable, which can create more in-depth feedback, especially when the topic
of the interview involves sensitive topics. Furthermore, the interviewer can observe changes
in voice tone and word choice to obtain a deeper understanding of the interviewee. (Kumar
2019, 160.)
Questions that are used in an in-depth interview are usually concern with describing a sub-
ject, event, person, place, or experience. They are used to start the interview to make peo-
ple feel reassured by giving them a sense of initiative. Other types are structure questions to
find out how the audience arranges their knowledge, opposition questions to compares and
22
discuss the meaning of different topics, and opinion questions to learn about the process of
thinking and analysis of the objects and the interviewee's opinions and perception about cer-
tain issues. Before conducting the interview, the interviewer needs to clarify the goals and
objects of the interview and carefully introduce them to the interviewee so that their an-
swers will not go off-topic. (Kumar 2019, 160.)
In this research, an in-depth interview is conducted with the case company owner regarding
the company's current strategies for product, service, branding, and relationship marketing.
The reason for choosing this topic is to identify problems in the current situation, areas that
can be improved to produce future relationship marketing plans. The interview questions are
listed in the appendix 1 section. The interview was arranged at the Helsinki Bakery store and
contained three parts: introduction, body, and conclusion. In the introduction period, the au-
thor greets and introduces the goals and topics of the interview to create a relaxing environ-
ment for the interviewee. The interview process is recorded with interviewee permission. In
the end, the author goes through all the questions and ask for comment and feedback from
the interviewee.
5.3 Survey
A survey is a quantitative research method that can be considered simply a list of questions,
some of which have open answers, the others with assigned choices, which researchers want
customers to participate by answering. Market research by this method with a brief question-
naire can help companies gets straight to the point and quickly analyze a representative
group of customers for the target market. The larger the sample group, the higher the accu-
racy of the survey results. There are two situations in which the survey question's characteris-
tics differ. Firstly, if the company has a specific reason for conducting a survey, then the
questions and answers often require exact details. In other situations, when firms are trying
to learn about broad concepts, open-ended questions are more suitable and helpful. (Yanow
& Schwartz-Shea 2013, 85.)
There are several steps companies must go through when designing a survey. First of all, re-
searchers need to clarify the purposes, objects of the questionnaire, and the size of the tar-
get group. After that, they must choose between using a cross-sectional or longitudinal data
collecting process. Cross-sectional means the data will be collected together in one time,
while with the longitudinal process, the information will be gathered over periods of time. Af-
ter having the question list done, the team should try the newly-finished survey on a test
group, preferably employees or a selected small group of customers, to make sure that there
is no misunderstanding in the process (Creswell 2018, 157). The length of the survey should
also be considered for keeping the participant's interests. The last important skill required is
the ability to analyze and use the survey's results properly. If the results are numbers, it is
23
best to present them in graphs to see better the changes in percentage. In other cases, if the
answers are under text form, it is more objective to focus on a group of people that have the
same answer to acquire different viewpoints. (Yanow & Schwartz-Shea 2013, 106.)
In this survey research, the purpose is to collect information regarding the current customer
perspective and feedback toward the case company's product, service, and brand. By collect-
ing customer's opinions on given topics, the author can identify the possible dissatisfaction.
The results of this survey will help generate new relationship marketing strategies base on
customer needs. With permission from the case company owner, the survey will take place in
both online and in-person form. Speaking of in-person survey, a printed list of questions is
given to each customer who purchases in-store. The in-person survey was given to 75 people
and 60 of them answered. Meanwhile, the author prepares an online survey using the Google
Forms platform, which is sent together with the confirmation email when the customer makes
the purchase online. 66 survey was sent out, while 40 answers were received. The details of
survey questions are noted in the appendix 2 section.
6 Research result
This chapter provides information regarding the results from previous qualitative and quanti-
tative researches. Data collected in each research process are analyzed together to produce
the final result. The outcome of the benchmarking and observation processes at Patisserie
Teemu Aura and Brooklyn Baking Co is presented first, followed by results from observation at
Helsinki Bakery and in-depth interview with the case company owner. The last section shows
results from the survey, which participated by 40 online and 60 in-store customers at Helsinki
Bakery.
6.1 Result from observation at Patisserie Teemu Aura
Patisserie Teemu Aura (former Teemu & Markus) is a cafe-bakery shop founded by two Finish
in 2011. Their first shop was based in Helsinki on Yrjönkatu then started expanding to open
another bakery-in-shop at K-Supermarket Redi. In November 2019, a new chapter turned
around when one partner left the company. The name was then changed to Patisserie Teemu
Aura. In December, a new shop was opened in the main street of Hakaniemi, located next to
Hakaniemi Market Square.
The observation at Patisserie Teemu Aura took place first on a Friday evening from 3 pm to 6
pm. However, after knowing that the shop serves a different breakfast and brunch menu on
the weekend, the author decided to do another observation on a Saturday morning from 11
am to 1 pm in order to fully observe their products and services. The cafe located in a good
24
spot which was very easy to discover with lots of people and vehicles passing by. The shop ca-
pacity is 15 people with a one-person side window-facing table and 4 group tables.
Product
Patisserie Teemu Aura offers a wide selection of baked goods like bread, bun, French pastry,
and cake, along with various types of beverages. The bakery is very famous for its artisan
bread, which variated from basic sourdough to multigrain and sour garlic bread. They also
have on the menu several Finnish's favorite flavors of croissant and buns, for instance, al-
mond, chocolate, cinnamon, cardamom, and butter. Their cake collection includes cheese-
cake, mousse, and wide ranges of macarons. The products inventively combine both modern
and classic baking and boldly blend different tastes.
Besides bakery products, the cafe also serves various menus of breakfast and brunch. Break-
fast is available every day from 7.30 am to 10.30 am while the lunch menu is served from 11
am to 2 pm every day. Saturday is all-day breakfast, but customers can still order lunch menu
from 11 am onwards. Their breakfast menus allow customers to choose from an already made
set, or they can assemble a breakfast platter base on their preferences. The breakfast option
varied with bread, croissant, coffee, and tea to porridge, yogurt bow, smoothies, and juices.
For lunch menus, the shop offers different soups served with bread and various types of salad
with salmon, chicken, or tofu. Both of their breakfast and lunch options are available for
takeaway.
Service
On Friday afternoon, when the author arrived, the seat was already half packed with custom-
ers, and there was also a short line of takeaway guests. There was plenty of activity at the
counter. The small space has room for up to fifteen seats, but many also seem to be picking
up bread and pastries. The customer journey at Patisserie Teemu includes the following
steps: step in the queue, order and pay, find seats, and wait for the drinks. The cafe seating
area is mostly on the left side of the shop, while the cake and order counter is on the right
side. Drink options and prices are shown on a big blackboard which located next to the cash-
ier. Cakes and bread are each placed with a name and price card in front, which was informa-
tive for customers.
The author was greeted in Finnish, then later, the staff change to English when knowing the
author does not speak Finnish. The author was a little hesitant when ordering since there
were quite many options to choose from their menu. The waitress noticed and gave her rec-
ommendation on the shop's best-selling pastries. The whole process was smooth and pleasant,
while the staff was friendly, professional, and helpful. If customers order cold pastries, they
25
will get them at the counter before paying, while hot pastries and drinks are brought later by
the waitress to the table.
During the observation period, 30 percent of customers are takeaway buyers. On the one
hand, among the rest 70 percent, half of them came alone and were sitting in the single-per-
son table with their phones or computers. Those customers mostly had a cup of drink, and
some ordered a small cake or bun. They spent around an hour and a half in the shop. The
other half was group customers who came in a group of two to four people. They mostly or-
dered a drink for each and two pieces of cake to share and spent around an hour to two at
the cafe to chat.
The majority of consumers show happy and satisfy reactions toward the food and service.
Some of them, mostly the young generation, came for the products since they took lots of
pictures and gave comments about the cakes. Others were like they need a place to hang out
that serves coffee. On the other hand, most of the takeaway customers are middle-aged and
older, who came to buy mostly bread for their family.
On Saturday morning, the author came to observe how the cafe runs their breakfast and lunch
menus. In the morning, the majority of buyers ordered from the breakfast menu. They came
in groups of two or more and stayed for around two hours. Breakfast and lunch menus are or-
dered from the counter and brought later to the table. The portion of breakfast was appropri-
ate for breakfast though the cost was a bit pricey. However, customers enjoyed their foods,
and 70 percent of them ordered more pastries with coffee after breakfast.
The author waited around 15 minutes for the food, which was quite long for an avocado toast.
Other customers seemed to experience the same though they did not get bothered by that. It
was busier during lunchtime from 11.30 am to 1 pm which the cafe was full most of the time.
People ordered mostly salmon soup, which is a typical Finnish dish. Since the lunch was newly
introduced, lots of customers showed confusion and the staff was explaining very kindly and
patiently. In general, the soup was all hot when it is served; people can see from the steam
coming out of the bow, while salads looked fresh and appetizing.
Brand
Patisserie Teemu has a modern, subtle, and elegant overall branding and design. The con-
sistency in their design from cake idea to the interior, logo, and social media platform proves
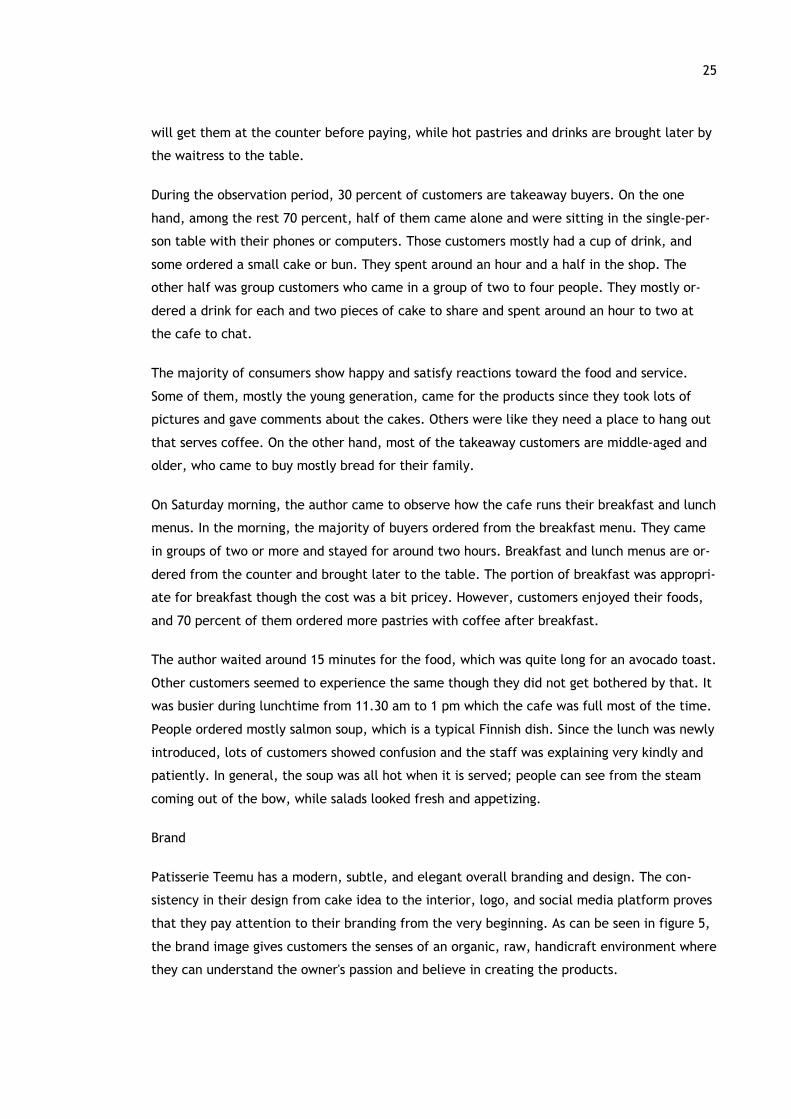
that they pay attention to their branding from the very beginning. As can be seen in figure 5,
the brand image gives customers the senses of an organic, raw, handicraft environment where
they can understand the owner's passion and believe in creating the products.
26
Figure 5: Product from Patisserie Teemu Aura (Website of Patisserie Teemu Aura 2019)
Their logo and brand recognition are straightforward and elegant, which easy for customers
to remember and recognize. The "trademarks" of the original Patisserie were the lavish flower
bowls and saucers of the Dutch Pip Studio. The line continues in the interior of the new
venue, which is dominated by earthy pink. The new shop is decorated with fluffy pillows,
marble surfaces, and trendy pink dry flowers, which gives a general cozy feeling but still has
a sense of luxurious and elegant.
The new shop was created a bit differently, which focuses not only on selling pastries and
coffee but also serves wide ranges of breakfast sets and lunch menus. This explains the new
interior design of the shop, which creates a more diner environment for customers. From the
website, customers can find detailed information regarding the ingredients in all of the Patis-
serie products. Furthermore, cakes are designed with creative looks, color, and flavor. The
owner uses a colorful but subtle tone that still matches with the overall branding. Their logo
is found in each of their cake decoration and also takeaway bags, which is a great way to pro-
mote their brand effortlessly.
6.2 Result from observation at Brooklyn Cafe Baking Co
Brooklyn Cafe is a coffee shop established in 2011 by two sisters originally from Brooklyn who
have passions for baking and coffee. The shop is located in Punavori area, or so call design
district in Helsinki. The exact address of the shop is Fredrikinkatu 19. The cafe soon became
popular among local customers as well as tourists for their amazing cupcakes, bagels, and
coffee. Later in 2012, two sisters Sharron and Brenda Todd, established another bakery on
Fredrikinkatu 25, providing more baked goods for their customers. The company name was
later changed to Brooklyn Baking Co in 2017. A year later, in 2018, they established the sec-
ond coffee shop in the Aalto University campus in Otaniemi.
27
The observation took place on a Saturday morning at the coffee shop on Fredrikinkatu 19. The
author also attempted to buy takeaway products from the bakery on Fredrikinkatu 25 to un-
derstand their product and service fully. Both locations are near the tram stop and easy to
discover. The coffee shop was a tiny space at first with under ten seats. However, with love
from their customers, it was expanded in 2017 to the adjacent space create a medium-size
store with around 25 seats.
Product
Brooklyn cafe offers a huge menu of specialty coffee, cookies, and bagels. There are also sev-
eral brunch menus available only at Otaniemi location, which serves pancake, bagels, and
other American classic brunches. Brooklyn cafe is very famous for its bagels. There is a total
of six different types of bagels, together with over ten fillings, which includes vegan and veg-
etarian options. Their fillings are diverse, which contain both sweet and savory taste, for ex-
ample, cream cheese, turkey, tuna, pepperoni or Nutella, banana, peanut, and jam.
Besides bagels, the coffee selections at Brooklyn cafe are very plentiful compare to other cof-
fee shops nearby. They use only dark roasted coffee beans and a private label filtered coffee
brand called Fulton Street Blend. Customers who tried and loved the coffee can purchase cof-
fee beans from the shop which available in a 250-gram package. Along with coffee, there are
many more drink options customers can try, for example, chai latte, milkshakes, seven differ-
ent types of tea, iced drink, juices, and smoothies.
Available at Brooklyn Bakery, which located a few steps from the cafe, are extensive selec-
tions of cupcakes cakes. There is currently a sum of ten classic cupcakes and eleven specialty
cupcakes. They are famous for their creative and innovative use of ingredients that customers
cannot find anywhere else. Classic cupcakes include chocolate, peanut butter, Nutella, va-
nilla, orange, and cream cheese, while specialty goods are combinations of cookies and
cream, popcorn and chocolate, toffee pretzel, and walnuts. Cupcakes are sold in a pack of 12
pieces in two sizes, standard and mini cupcakes. Customers can choose from different flavors
at the bakery, but when purchasing online, the minimum amount for one flavor is 12 pieces.
Most of their cupcakes tastes are available in big cakes, which appropriate for celebration,
birthday, and wedding.
Service
On Saturday morning, when the author arrived, the shop was almost full of customers having
breakfast on the first of their weekend. The customer journey at Brooklyn Cafe is stepping in,
make orders and pay, find tables, and wait for the products. The cashier counter is placed
right after the entrance door on the new side of the cafe. Few boxes of cookies in different
flavors are put on the counter. On the right side of the cashier, customers can find the big
28
menu written with white chalk on a big black chalk wall. The author found that the menu is
very detail but quite confusing for first-time customers. However, the staff carefully ex-
plained about the products, what are their specialties, and their recommendation after see-
ing the author struggling.
The staff was very witty as they noticed and greeted every single customer with a big smile.
The author was greeted and served in English. After making the order, the author chose a ta-
ble located next to the cashier to have a better view of their operation. Foods and drinks
were brought to the table by the staff while the water supply was self-serve. Water bottles
and cups were put on a shelf, which lay the middle area of the shop. It took around 20
minutes for the author to receive food and drinks as the shop was very crowded.
During the observation, 80 percent of the customers came in groups of 3 or more people. The
other 20 percent were single-customer or a group of 2 people. They mostly chose the single-
person window seat or a 2-chair table. Group customers were mostly friends and family mem-
bers who came for breakfast and chat. They stayed for around one hour, and most of them
ordered bagels with coffee or juice. The majority of customers enjoyed their food and left
with smiles.
Around 70% of consumers were locals when the rest were travelers. Most of the local custom-
ers are loyal customers as they greeted the staff in a very casual and friendly way. They also
made their order quickly since they are familiar with the menu. There were lots of interac-
tions and catch up conversations between the staff and loyal customers. As for visitors and
first-time buyers, the sellers were patient, willingly, and happy to introduce and help them
with their orders.
Brand
The café is owned by two North American sisters who have the dream of bringing their home
culture to Helsinki. Through Brooklyn Cafe, they successfully create an American atmosphere
in the heart of Helsinki. Their vision is not only to pursue the dream of baking but also to
build a strong community of people who share the same passion for cakes and coffee. The
team pays attention to every small detail that makes customers feel like they are in little
NewYork, from the concept to the products.
29
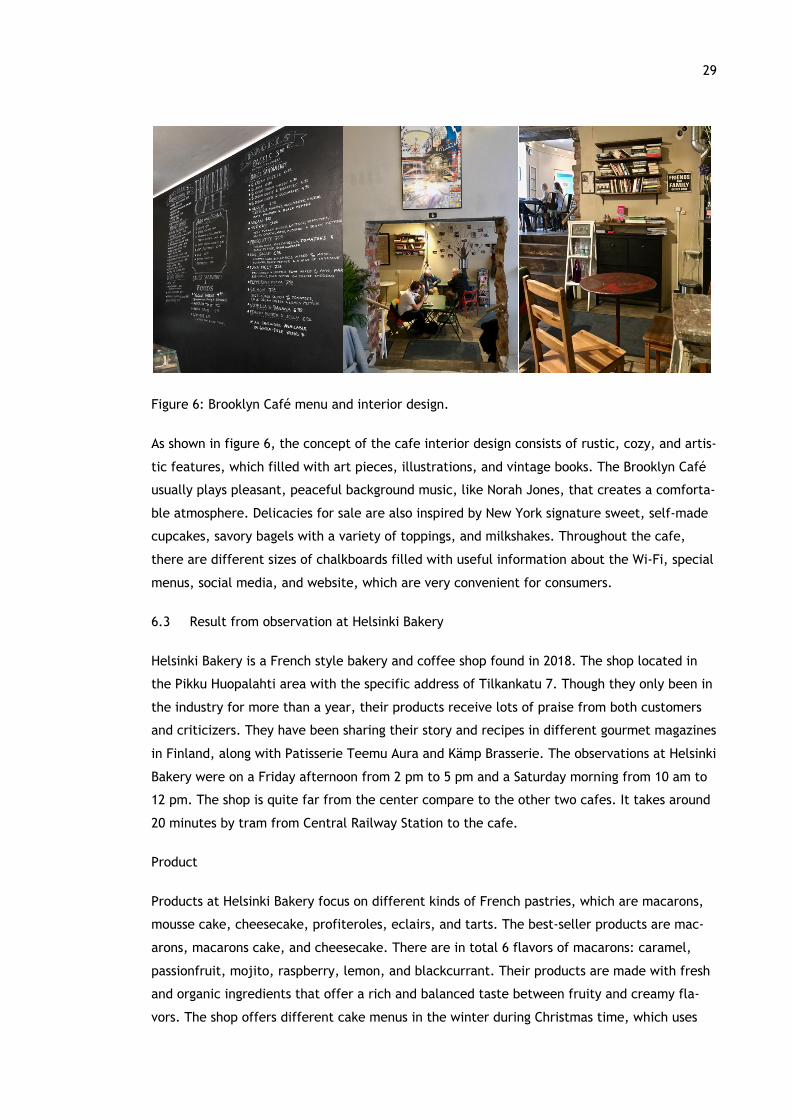
Figure 6: Brooklyn Café menu and interior design.
As shown in figure 6, the concept of the cafe interior design consists of rustic, cozy, and artis-
tic features, which filled with art pieces, illustrations, and vintage books. The Brooklyn Café
usually plays pleasant, peaceful background music, like Norah Jones, that creates a comforta-
ble atmosphere. Delicacies for sale are also inspired by New York signature sweet, self-made
cupcakes, savory bagels with a variety of toppings, and milkshakes. Throughout the cafe,
there are different sizes of chalkboards filled with useful information about the Wi-Fi, special
menus, social media, and website, which are very convenient for consumers.
6.3 Result from observation at Helsinki Bakery
Helsinki Bakery is a French style bakery and coffee shop found in 2018. The shop located in
the Pikku Huopalahti area with the specific address of Tilkankatu 7. Though they only been in
the industry for more than a year, their products receive lots of praise from both customers
and criticizers. They have been sharing their story and recipes in different gourmet magazines
in Finland, along with Patisserie Teemu Aura and Kämp Brasserie. The observations at Helsinki
Bakery were on a Friday afternoon from 2 pm to 5 pm and a Saturday morning from 10 am to
12 pm. The shop is quite far from the center compare to the other two cafes. It takes around
20 minutes by tram from Central Railway Station to the cafe.
Product
Products at Helsinki Bakery focus on different kinds of French pastries, which are macarons,
mousse cake, cheesecake, profiteroles, eclairs, and tarts. The best-seller products are mac-
arons, macarons cake, and cheesecake. There are in total 6 flavors of macarons: caramel,
passionfruit, mojito, raspberry, lemon, and blackcurrant. Their products are made with fresh
and organic ingredients that offer a rich and balanced taste between fruity and creamy fla-
vors. The shop offers different cake menus in the winter during Christmas time, which uses
30
festive and traditional winter ingredients like cinnamon, orange, mulled wine, and cider.
However, unlike other bakeries in, Helsinki Bakery currently does not offer bread or buns.
The cafe's drink options include filtered coffee, tea, juice, and hot chocolate, which are suit-
able for both children and adults. On the weekend, brunch sets are served from 10 am to 3
pm, which includes savory waffles with salmon or ham, eggs, hummus, side salads, juice, and
coffee.
Besides cakes and coffee, the bakery also hosts many baking courses for customers who want
to learn baking their products. The course varied from macarons, tarts & tartlets to chocolate
truffle. Baking courses are arranged mostly after working hours or at the weekend so that
working customers can attend easily. The capacity of each course differs from each other de-
pends on the baking difficulty levels. For example, macarons courses are available for 8 to 10
people, while tarts courses are suitable for 5 to 7 people only. In the workshop, baking mate-
rials, including recipes, tips, and tricks, are given by the bakery. They also prepared all the
ingredients needed, and at the end of the workshop, customers can bring their final products
home to share with friends and family.
Service
The cafe is located about 200 meters from the tram stop, next to a lake with many trails
route. The cafe offers around eight seats inside and six terrace seats. There is one 4-seat ta-
ble, two 2-seat tables next to the glass wall, and a one-side long table next to the window.
The customer journey was quite confusing for first-time buyers since there is no proper cash-
ier counter and visible menu list. Customers ordered their cakes by choosing from the cake
fridge, which is placed in the right corner of the shop. Cakes were introduced by the staff to
all customers since there were no names and price tags.
Customer journey at Helsinki Bakery was stepping in, order, pay/pay later, find tables, wait
for the food, pay. During the observation, some of the customers paid right after ordering
while some checked out before they leave. On Saturday morning, 50 percent of customers or-
dered the brunch set while the rest had coffee and cakes. Those who had brunch stayed for
around one hour and ordered extra cakes for their coffee. Around 40 percent of consumers
came after trekking in the nearby forest who are mostly couple with dogs. For those who or-
dered the brunch set, salad and juice were brought first, then the waffles and lastly coffee.
Brand
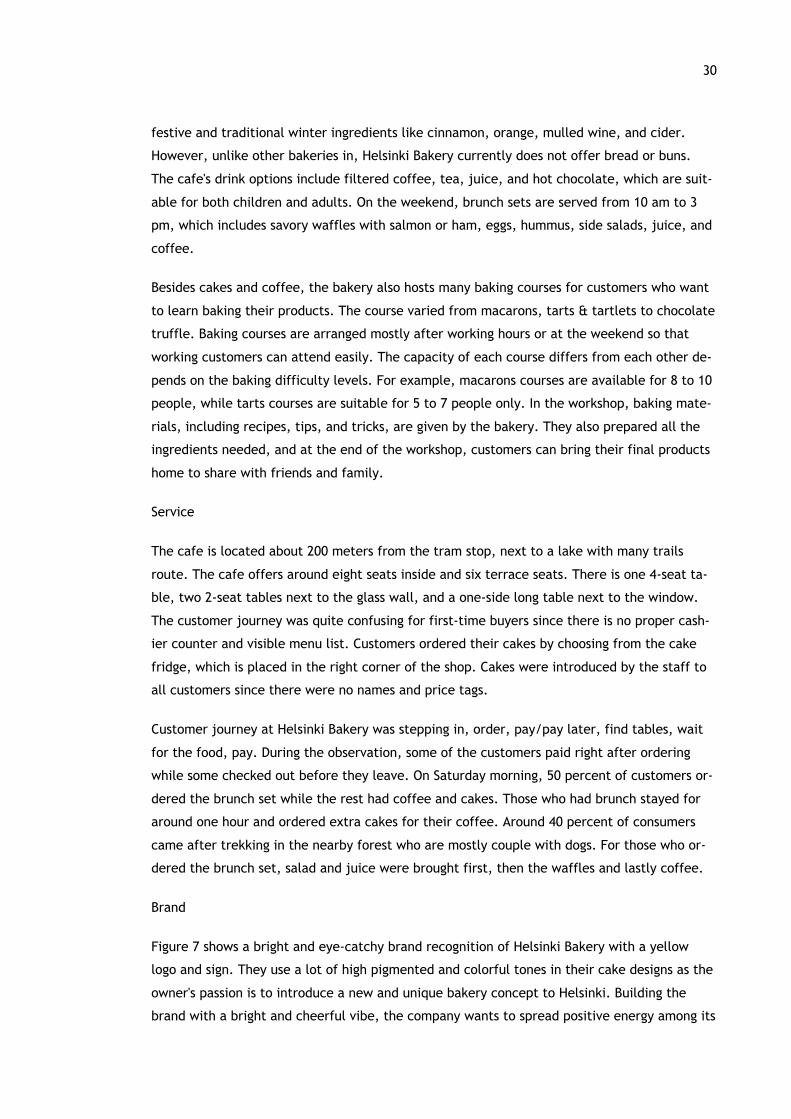
Figure 7 shows a bright and eye-catchy brand recognition of Helsinki Bakery with a yellow
logo and sign. They use a lot of high pigmented and colorful tones in their cake designs as the
owner's passion is to introduce a new and unique bakery concept to Helsinki. Building the
brand with a bright and cheerful vibe, the company wants to spread positive energy among its
31
customers. Colorful and fruit-inspired tones in the cafe product catalogs also bring out a re-
freshing and relaxing feeling.
Figure 7: Helsinki Bakery products and interior design.
These colors make products look more attractive and waken people's appetize. Furthermore,
the owner wants to create a cozy, home baked environment where buyers can enjoy the
cakes and observe the baking process. The kitchen is designed as an open kitchen with a mir-
ror wall that separated it from the cafe side so that customers who come to purchase can
watch how the cakes are made. This concept provides transparency in the company image
and builds customer's trust towards the brand.
6.4 Result from interview with the company owner
The company's core value is to bring high quality and innovative pastries to Finnish customers.
The owner defined their overall branding to be bright and cheerful, which spread positive en-
ergy. Colorful and high pigmented tones also present the freshness and authenticity of the in-
gredients. Furthermore, when making a cake design or marketing strategies, the company al-
ways put in mind the brand image to create consistency in their branding.
The business is suffering from creating customer retention as, according to the owner, only
40% of customers come back and repurchase. This situation is expected to be the result of the
nonexistence of relationship marketing. The company are aware of the term relationship mar-
keting but have not provided any loyalty programs for their customers. Customer data are col-
lected occasionally without any system.
According to the owner, business is not doing well from 9 am to 1 pm in the morning. Custom-
ers usually come looking for bread and buns and left without buying anything since the bakery
does not offer what they asked. The owner is aware of this situation. However, she wants to
32
focus on the quality of their products instead of quantity. She stated that with too many
product varieties, it is harder to keep track of the product quality.
The company described its service to be friendly and trustworthy. There is no menu or writ-
ten product's name and price tag. Instead of reading from the menu, it is the staff's duty to
introduce all available products for the customer, including the ingredients and price. Accord-
ing to the owner, she wants to create a closer relationship with buyers by maximizing the
conversation between staff and customers.
6.5 Benchmarking summary
This chapter provides a summary and comparison of results from three observations and one
interview process. In order to analyze the similarities and differences between products and
services of three businesses, data are put into tables according to their topic. Table 4 shows
the comparison of products and their prices. It is divided into three sectors: pastry, savory
menu, and drink. As can be seen from table 4, Helsinki Bakery has slightly higher prices for
pastry and cake with the differences of 0.5 euro. While only Patisserie Teemu offers bread,
Brooklyn Baking has significant varieties of flavors and sizes for cupcakes and bagels.
Furthermore, both cafés provide breakfast options, including sandwiches and bigger sets.
Prices are ranged from 12 euros to 18 euros for the breakfast set. In contrast, prices for the
drinks menu in Helsinki Bakery are significantly lower comparing to the other two. Helsinki
Bakery offers all drinks at the price of 2 euro, while at the remaining café, prices differ from
2.7 to 4 euros. Moreover, at the other two café, customers can find around three times more
options for coffee and tea.
Company
Product
Helsinki
Bakery
Patisserie
Teemu
Brooklyn
Baking Co
Pastry & cake Macarons 2 1.5 1.25 – 1.55 (mini
cupcake)
Small pastry 6 5.5 3.6 – 4 (cupcake)
Big cake 35 - 40 30 - 78 50 - 60
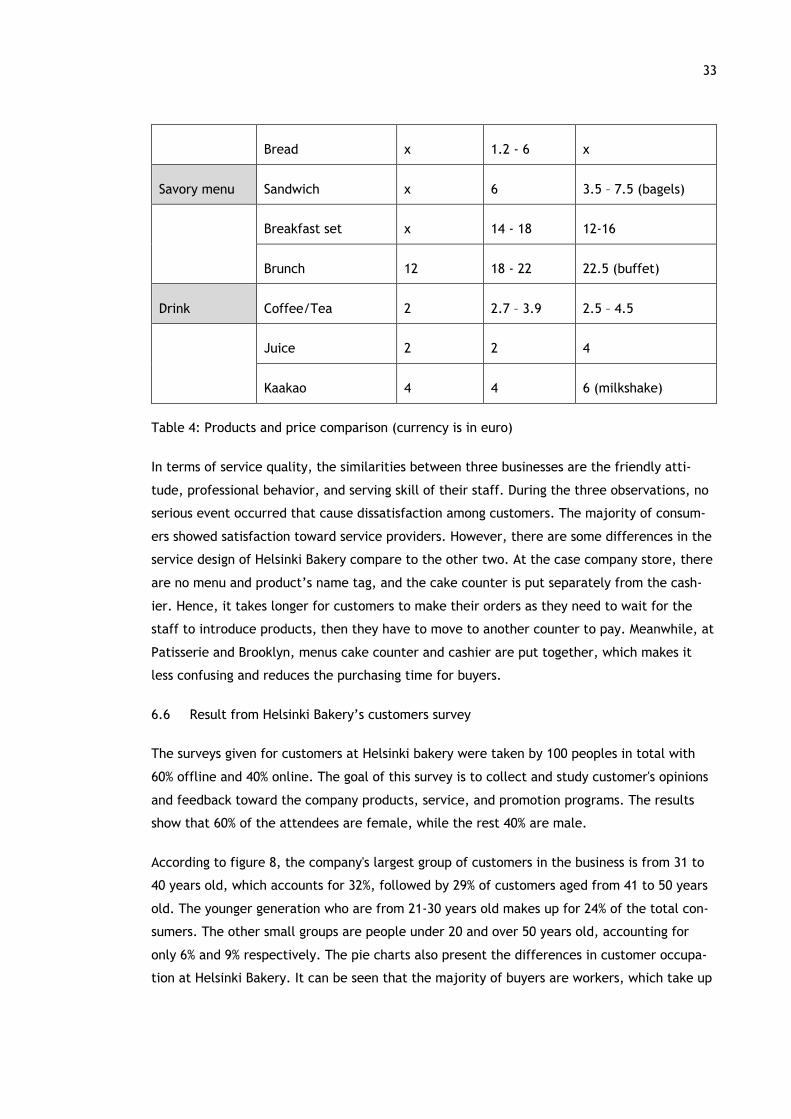
33
Bread x 1.2 - 6 x
Savory menu Sandwich x 6 3.5 – 7.5 (bagels)
Breakfast set x 14 - 18 12-16
Brunch 12 18 - 22 22.5 (buffet)
Drink Coffee/Tea 2 2.7 – 3.9 2.5 – 4.5
Juice 2 2 4
Kaakao 4 4 6 (milkshake)
Table 4: Products and price comparison (currency is in euro)
In terms of service quality, the similarities between three businesses are the friendly atti-
tude, professional behavior, and serving skill of their staff. During the three observations, no
serious event occurred that cause dissatisfaction among customers. The majority of consum-
ers showed satisfaction toward service providers. However, there are some differences in the
service design of Helsinki Bakery compare to the other two. At the case company store, there
are no menu and product’s name tag, and the cake counter is put separately from the cash-
ier. Hence, it takes longer for customers to make their orders as they need to wait for the
staff to introduce products, then they have to move to another counter to pay. Meanwhile, at
Patisserie and Brooklyn, menus cake counter and cashier are put together, which makes it
less confusing and reduces the purchasing time for buyers.
6.6 Result from Helsinki Bakery’s customers survey
The surveys given for customers at Helsinki bakery were taken by 100 peoples in total with
60% offline and 40% online. The goal of this survey is to collect and study customer's opinions
and feedback toward the company products, service, and promotion programs. The results
show that 60% of the attendees are female, while the rest 40% are male.
According to figure 8, the company's largest group of customers in the business is from 31 to
40 years old, which accounts for 32%, followed by 29% of customers aged from 41 to 50 years
old. The younger generation who are from 21-30 years old makes up for 24% of the total con-
sumers. The other small groups are people under 20 and over 50 years old, accounting for
only 6% and 9% respectively. The pie charts also present the differences in customer occupa-
tion at Helsinki Bakery. It can be seen that the majority of buyers are workers, which take up
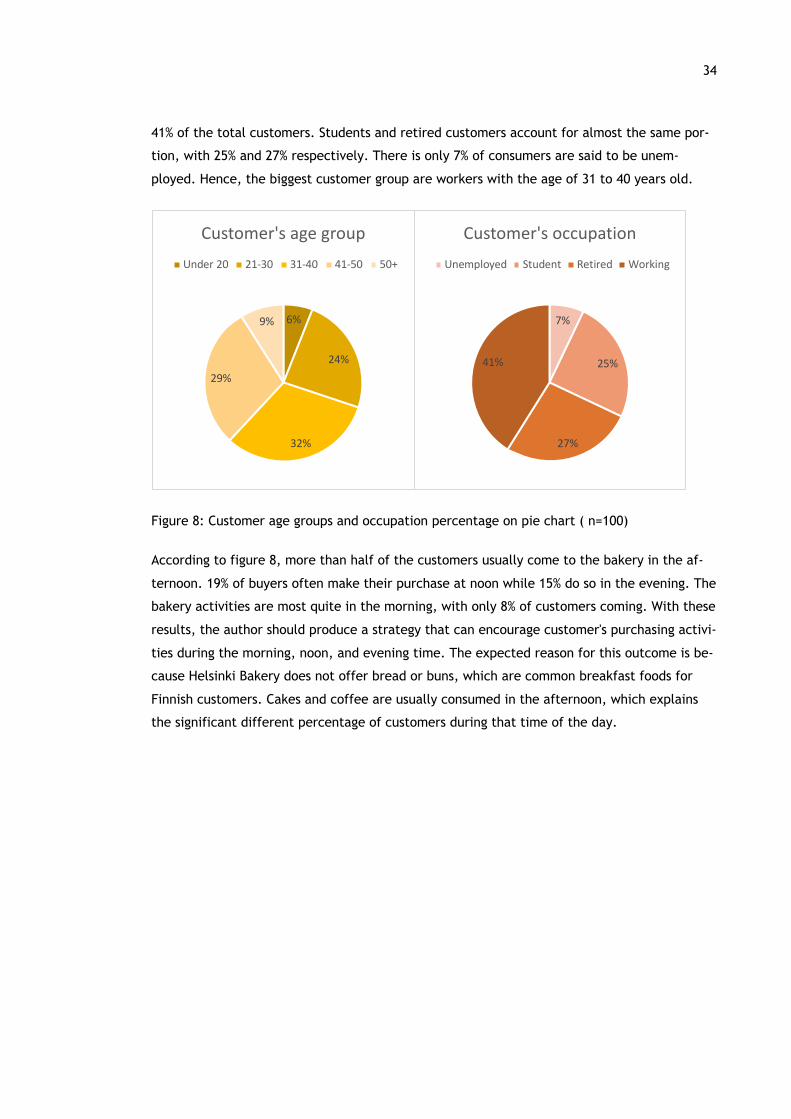
34
41% of the total customers. Students and retired customers account for almost the same por-
tion, with 25% and 27% respectively. There is only 7% of consumers are said to be unem-
ployed. Hence, the biggest customer group are workers with the age of 31 to 40 years old.
Figure 8: Customer age groups and occupation percentage on pie chart ( n=100)
According to figure 8, more than half of the customers usually come to the bakery in the af-
ternoon. 19% of buyers often make their purchase at noon while 15% do so in the evening. The
bakery activities are most quite in the morning, with only 8% of customers coming. With these
results, the author should produce a strategy that can encourage customer's purchasing activi-
ties during the morning, noon, and evening time. The expected reason for this outcome is be-
cause Helsinki Bakery does not offer bread or buns, which are common breakfast foods for
Finnish customers. Cakes and coffee are usually consumed in the afternoon, which explains
the significant different percentage of customers during that time of the day.
6%
24%
32%
29%
9%
Customer's age groupUnder 20 21-30 31-40 41-50 50+
7%
25%
27%
41%
Customer's occupationUnemployed Student Retired Working
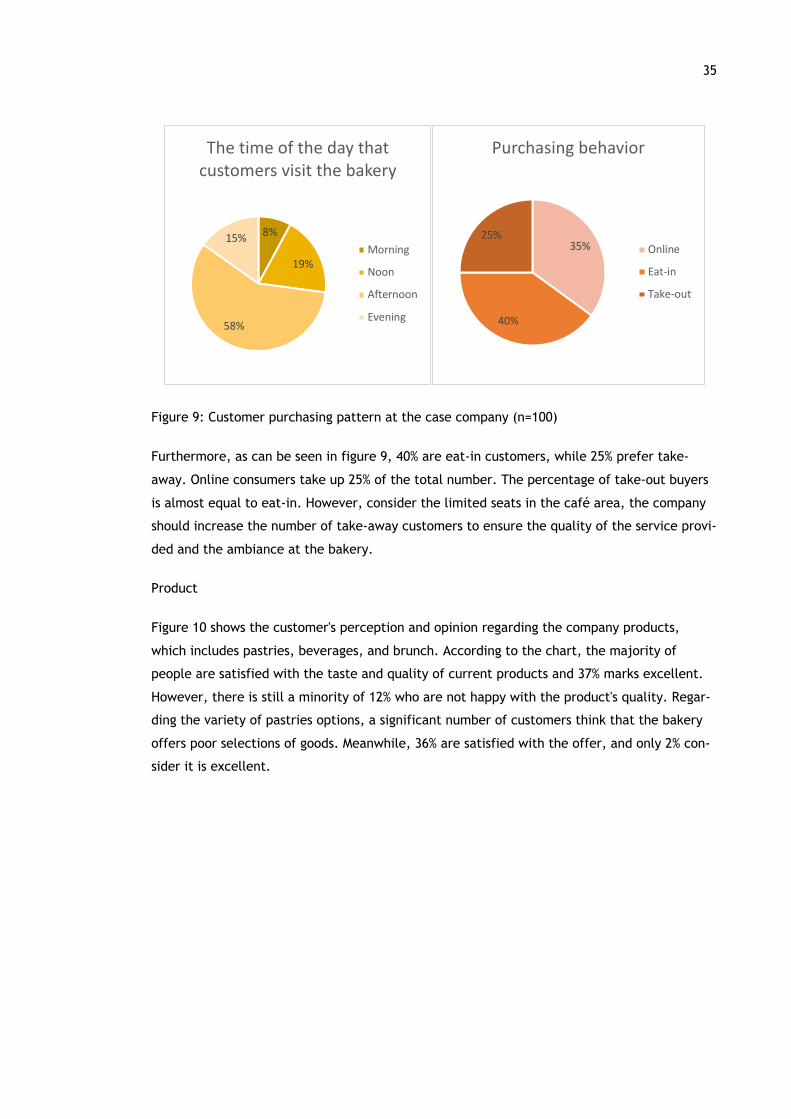
35
Figure 9: Customer purchasing pattern at the case company (n=100)
Furthermore, as can be seen in figure 9, 40% are eat-in customers, while 25% prefer take-
away. Online consumers take up 25% of the total number. The percentage of take-out buyers
is almost equal to eat-in. However, consider the limited seats in the café area, the company
should increase the number of take-away customers to ensure the quality of the service provi-
ded and the ambiance at the bakery.
Product
Figure 10 shows the customer's perception and opinion regarding the company products,
which includes pastries, beverages, and brunch. According to the chart, the majority of
people are satisfied with the taste and quality of current products and 37% marks excellent.
However, there is still a minority of 12% who are not happy with the product's quality. Regar-
ding the variety of pastries options, a significant number of customers think that the bakery
offers poor selections of goods. Meanwhile, 36% are satisfied with the offer, and only 2% con-
sider it is excellent.
8%
19%
58%
15%
The time of the day that customers visit the bakery
Morning
Noon
Afternoon
Evening
35%
40%
25%
Purchasing behavior
Online
Eat-in
Take-out
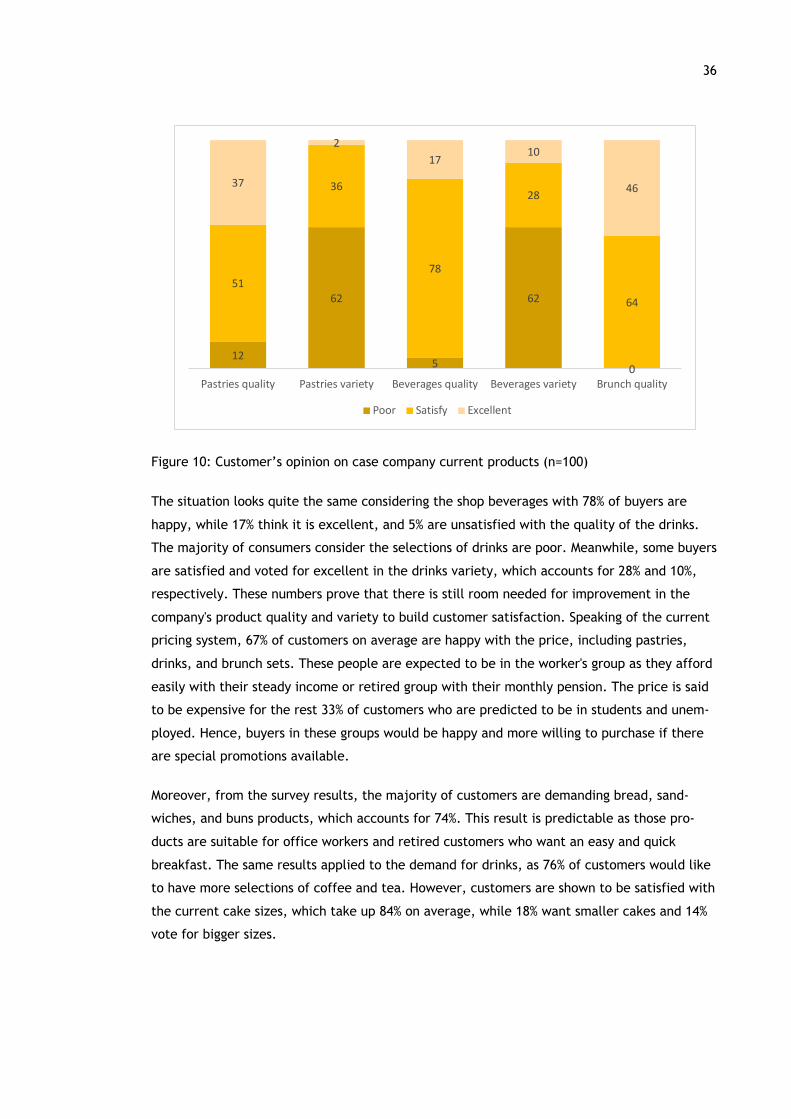
36
Figure 10: Customer’s opinion on case company current products (n=100)
The situation looks quite the same considering the shop beverages with 78% of buyers are
happy, while 17% think it is excellent, and 5% are unsatisfied with the quality of the drinks.
The majority of consumers consider the selections of drinks are poor. Meanwhile, some buyers
are satisfied and voted for excellent in the drinks variety, which accounts for 28% and 10%,
respectively. These numbers prove that there is still room needed for improvement in the
company's product quality and variety to build customer satisfaction. Speaking of the current
pricing system, 67% of customers on average are happy with the price, including pastries,
drinks, and brunch sets. These people are expected to be in the worker's group as they afford
easily with their steady income or retired group with their monthly pension. The price is said
to be expensive for the rest 33% of customers who are predicted to be in students and unem-
ployed. Hence, buyers in these groups would be happy and more willing to purchase if there
are special promotions available.
Moreover, from the survey results, the majority of customers are demanding bread, sand-
wiches, and buns products, which accounts for 74%. This result is predictable as those pro-
ducts are suitable for office workers and retired customers who want an easy and quick
breakfast. The same results applied to the demand for drinks, as 76% of customers would like
to have more selections of coffee and tea. However, customers are shown to be satisfied with
the current cake sizes, which take up 84% on average, while 18% want smaller cakes and 14%
vote for bigger sizes.
12
62
5
62
0
51
36
78
28
64
37
217
10
46
Pastries quality Pastries variety Beverages quality Beverages variety Brunch quality
Poor Satisfy Excellent
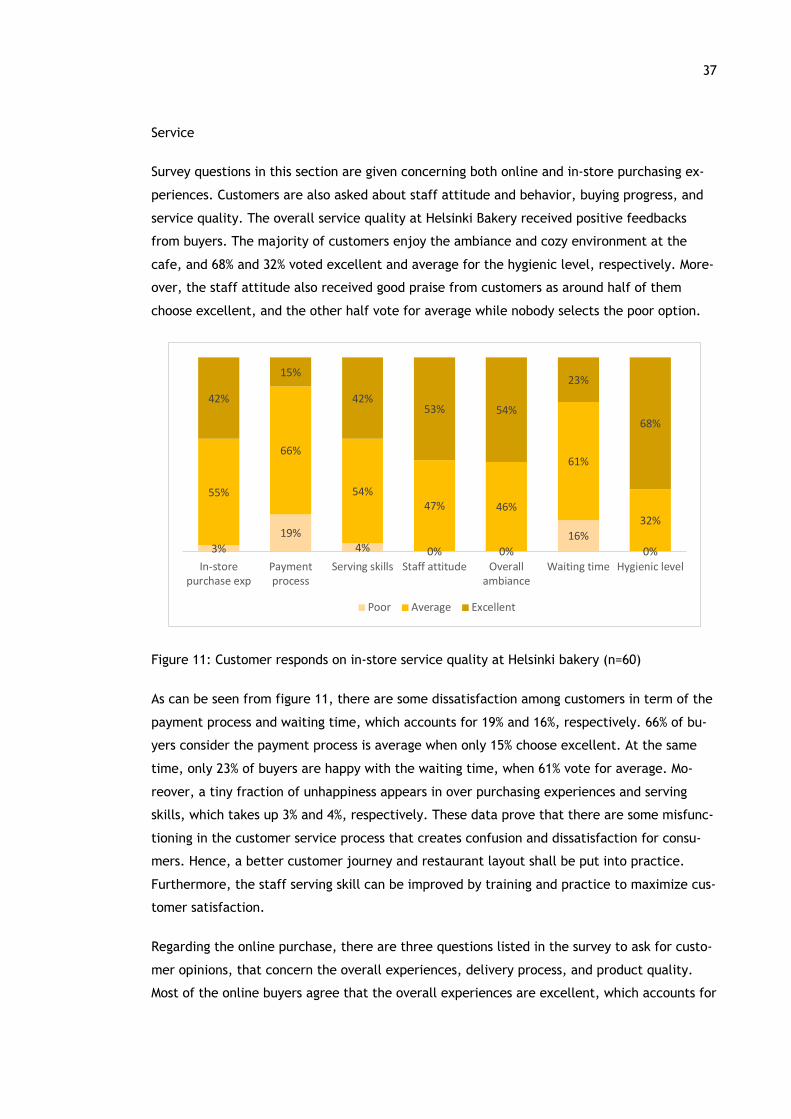
37
Service
Survey questions in this section are given concerning both online and in-store purchasing ex-
periences. Customers are also asked about staff attitude and behavior, buying progress, and
service quality. The overall service quality at Helsinki Bakery received positive feedbacks
from buyers. The majority of customers enjoy the ambiance and cozy environment at the
cafe, and 68% and 32% voted excellent and average for the hygienic level, respectively. More-
over, the staff attitude also received good praise from customers as around half of them
choose excellent, and the other half vote for average while nobody selects the poor option.
Figure 11: Customer responds on in-store service quality at Helsinki bakery (n=60)
As can be seen from figure 11, there are some dissatisfaction among customers in term of the
payment process and waiting time, which accounts for 19% and 16%, respectively. 66% of bu-
yers consider the payment process is average when only 15% choose excellent. At the same
time, only 23% of buyers are happy with the waiting time, when 61% vote for average. Mo-
reover, a tiny fraction of unhappiness appears in over purchasing experiences and serving
skills, which takes up 3% and 4%, respectively. These data prove that there are some misfunc-
tioning in the customer service process that creates confusion and dissatisfaction for consu-
mers. Hence, a better customer journey and restaurant layout shall be put into practice.
Furthermore, the staff serving skill can be improved by training and practice to maximize cus-
tomer satisfaction.
Regarding the online purchase, there are three questions listed in the survey to ask for custo-
mer opinions, that concern the overall experiences, delivery process, and product quality.
Most of the online buyers agree that the overall experiences are excellent, which accounts for
3%19%
4% 0% 0%16%
0%
55%
66%
54%47% 46%
61%
32%
42%
15%
42%53% 54%
23%
68%
In-storepurchase exp
Paymentprocess
Serving skills Staff attitude Overallambiance
Waiting time Hygienic level
Poor Average Excellent
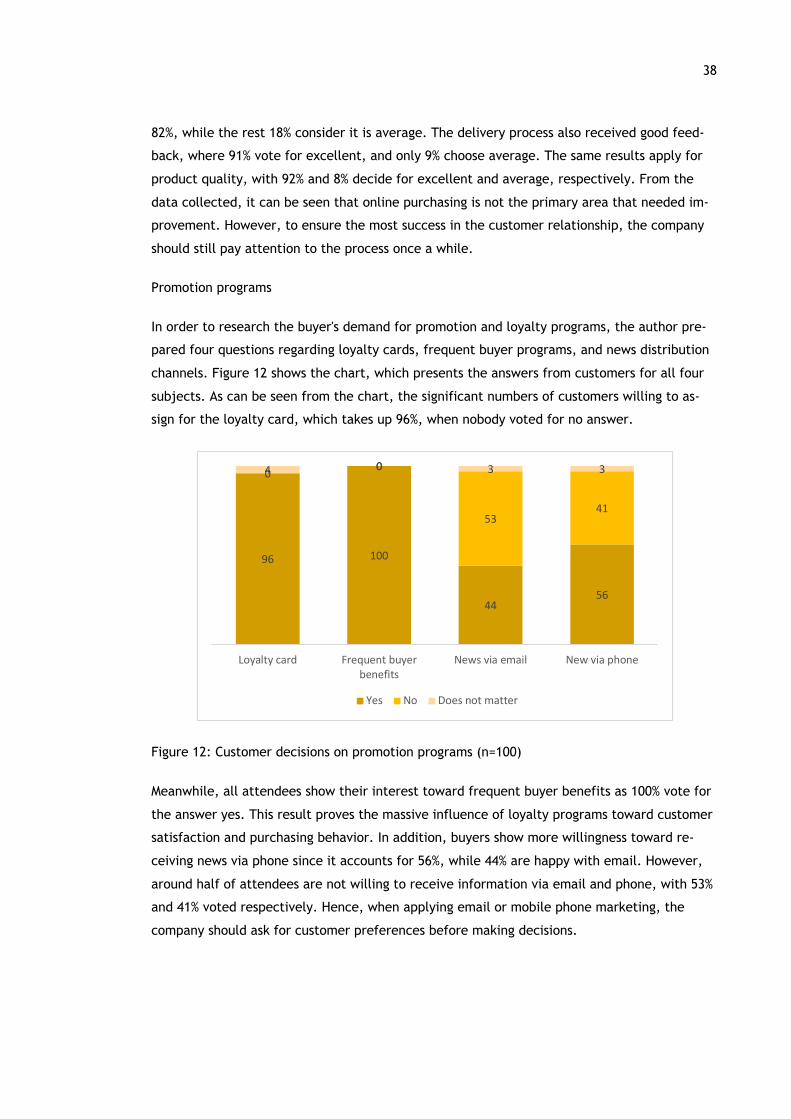
38
82%, while the rest 18% consider it is average. The delivery process also received good feed-
back, where 91% vote for excellent, and only 9% choose average. The same results apply for
product quality, with 92% and 8% decide for excellent and average, respectively. From the
data collected, it can be seen that online purchasing is not the primary area that needed im-
provement. However, to ensure the most success in the customer relationship, the company
should still pay attention to the process once a while.
Promotion programs
In order to research the buyer's demand for promotion and loyalty programs, the author pre-
pared four questions regarding loyalty cards, frequent buyer programs, and news distribution
channels. Figure 12 shows the chart, which presents the answers from customers for all four
subjects. As can be seen from the chart, the significant numbers of customers willing to as-
sign for the loyalty card, which takes up 96%, when nobody voted for no answer.
Figure 12: Customer decisions on promotion programs (n=100)
Meanwhile, all attendees show their interest toward frequent buyer benefits as 100% vote for
the answer yes. This result proves the massive influence of loyalty programs toward customer
satisfaction and purchasing behavior. In addition, buyers show more willingness toward re-
ceiving news via phone since it accounts for 56%, while 44% are happy with email. However,
around half of attendees are not willing to receive information via email and phone, with 53%
and 41% voted respectively. Hence, when applying email or mobile phone marketing, the
company should ask for customer preferences before making decisions.
96 100
4456
0 0
5341
4 0 3 3
Loyalty card Frequent buyerbenefits
News via email New via phone
Yes No Does not matter
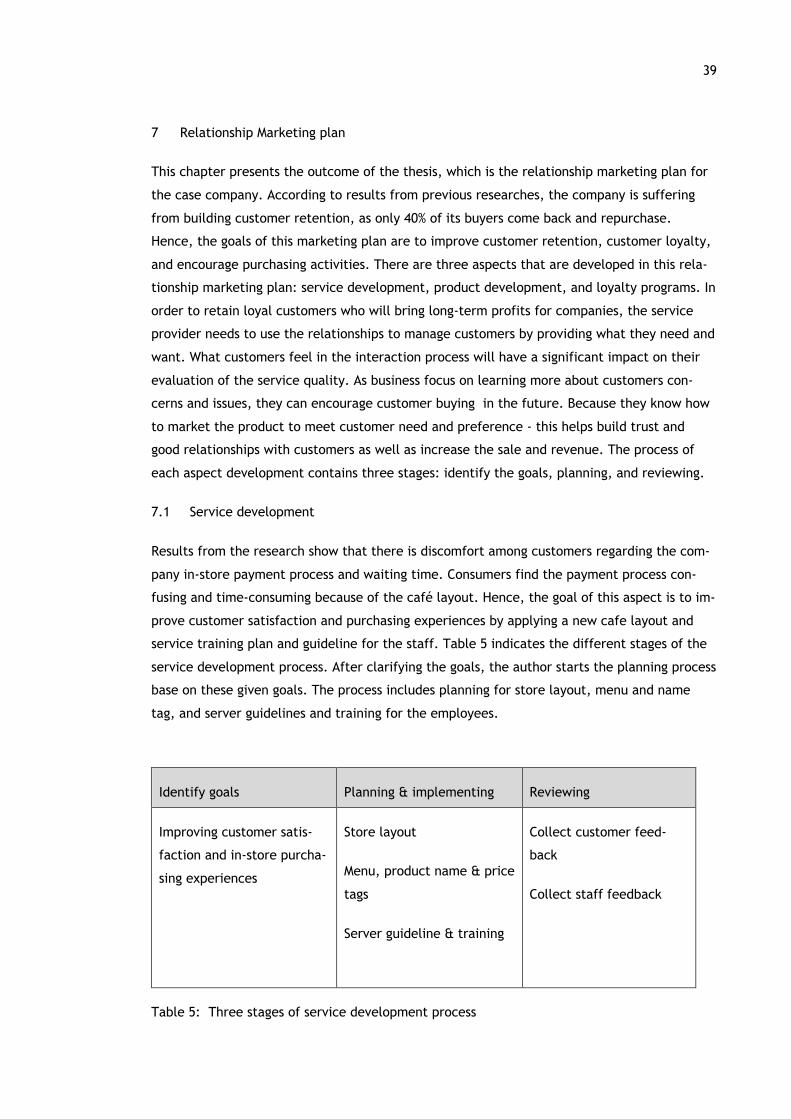
39
7 Relationship Marketing plan
This chapter presents the outcome of the thesis, which is the relationship marketing plan for
the case company. According to results from previous researches, the company is suffering
from building customer retention, as only 40% of its buyers come back and repurchase.
Hence, the goals of this marketing plan are to improve customer retention, customer loyalty,
and encourage purchasing activities. There are three aspects that are developed in this rela-
tionship marketing plan: service development, product development, and loyalty programs. In
order to retain loyal customers who will bring long-term profits for companies, the service
provider needs to use the relationships to manage customers by providing what they need and
want. What customers feel in the interaction process will have a significant impact on their
evaluation of the service quality. As business focus on learning more about customers con-
cerns and issues, they can encourage customer buying in the future. Because they know how
to market the product to meet customer need and preference - this helps build trust and
good relationships with customers as well as increase the sale and revenue. The process of
each aspect development contains three stages: identify the goals, planning, and reviewing.
7.1 Service development
Results from the research show that there is discomfort among customers regarding the com-
pany in-store payment process and waiting time. Consumers find the payment process con-
fusing and time-consuming because of the café layout. Hence, the goal of this aspect is to im-
prove customer satisfaction and purchasing experiences by applying a new cafe layout and
service training plan and guideline for the staff. Table 5 indicates the different stages of the
service development process. After clarifying the goals, the author starts the planning process
base on these given goals. The process includes planning for store layout, menu and name
tag, and server guidelines and training for the employees.
Identify goals Planning & implementing Reviewing
Improving customer satis-
faction and in-store purcha-
sing experiences
Store layout
Menu, product name & price
tags
Server guideline & training
Collect customer feed-
back
Collect staff feedback
Table 5: Three stages of service development process
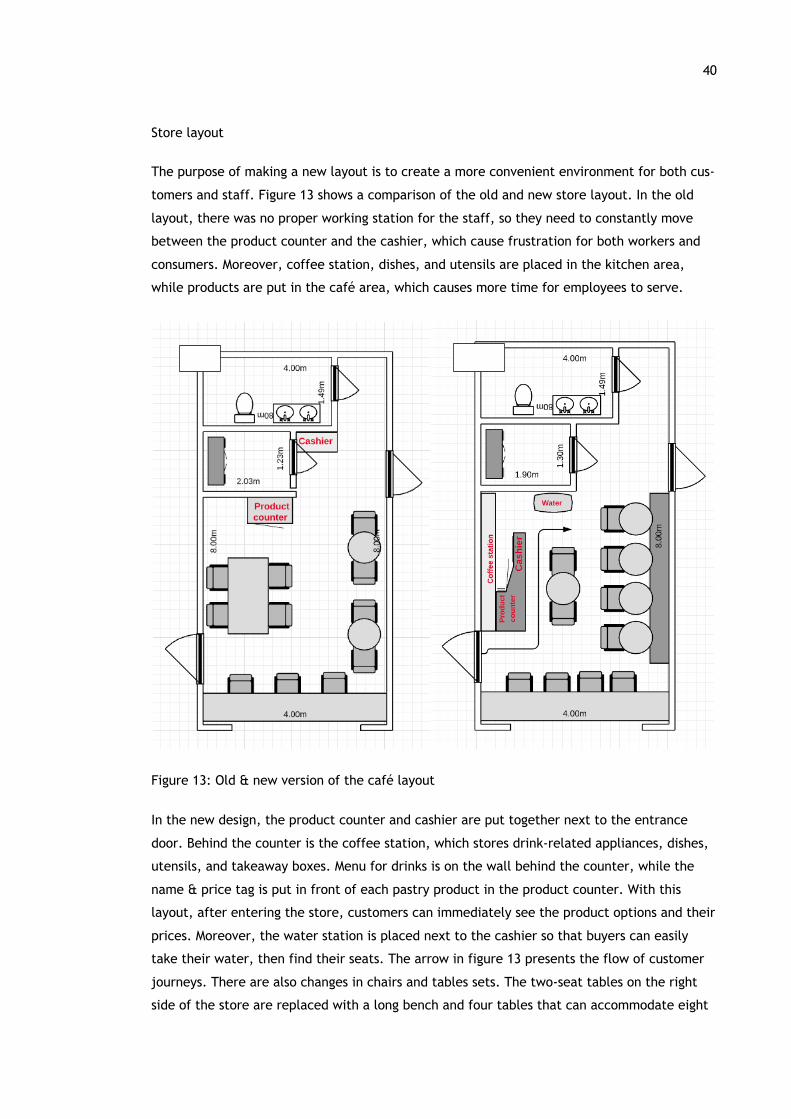
40
Store layout
The purpose of making a new layout is to create a more convenient environment for both cus-
tomers and staff. Figure 13 shows a comparison of the old and new store layout. In the old
layout, there was no proper working station for the staff, so they need to constantly move
between the product counter and the cashier, which cause frustration for both workers and
consumers. Moreover, coffee station, dishes, and utensils are placed in the kitchen area,
while products are put in the café area, which causes more time for employees to serve.
Figure 13: Old & new version of the café layout
In the new design, the product counter and cashier are put together next to the entrance
door. Behind the counter is the coffee station, which stores drink-related appliances, dishes,
utensils, and takeaway boxes. Menu for drinks is on the wall behind the counter, while the
name & price tag is put in front of each pastry product in the product counter. With this
layout, after entering the store, customers can immediately see the product options and their
prices. Moreover, the water station is placed next to the cashier so that buyers can easily
take their water, then find their seats. The arrow in figure 13 presents the flow of customer
journeys. There are also changes in chairs and tables sets. The two-seat tables on the right
side of the store are replaced with a long bench and four tables that can accommodate eight
Old New
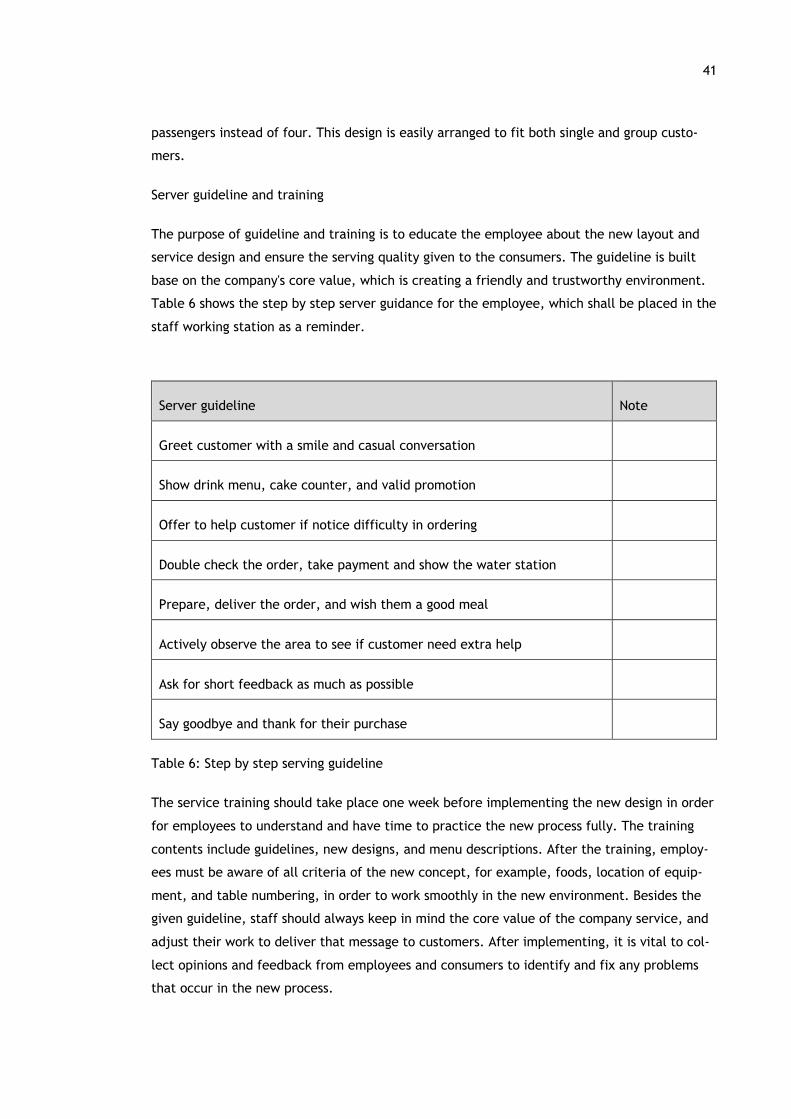
41
passengers instead of four. This design is easily arranged to fit both single and group custo-
mers.
Server guideline and training
The purpose of guideline and training is to educate the employee about the new layout and
service design and ensure the serving quality given to the consumers. The guideline is built
base on the company's core value, which is creating a friendly and trustworthy environment.
Table 6 shows the step by step server guidance for the employee, which shall be placed in the
staff working station as a reminder.
Server guideline Note
Greet customer with a smile and casual conversation
Show drink menu, cake counter, and valid promotion
Offer to help customer if notice difficulty in ordering
Double check the order, take payment and show the water station
Prepare, deliver the order, and wish them a good meal
Actively observe the area to see if customer need extra help
Ask for short feedback as much as possible
Say goodbye and thank for their purchase
Table 6: Step by step serving guideline
The service training should take place one week before implementing the new design in order
for employees to understand and have time to practice the new process fully. The training
contents include guidelines, new designs, and menu descriptions. After the training, employ-
ees must be aware of all criteria of the new concept, for example, foods, location of equip-
ment, and table numbering, in order to work smoothly in the new environment. Besides the
given guideline, staff should always keep in mind the core value of the company service, and
adjust their work to deliver that message to customers. After implementing, it is vital to col-
lect opinions and feedback from employees and consumers to identify and fix any problems
that occur in the new process.
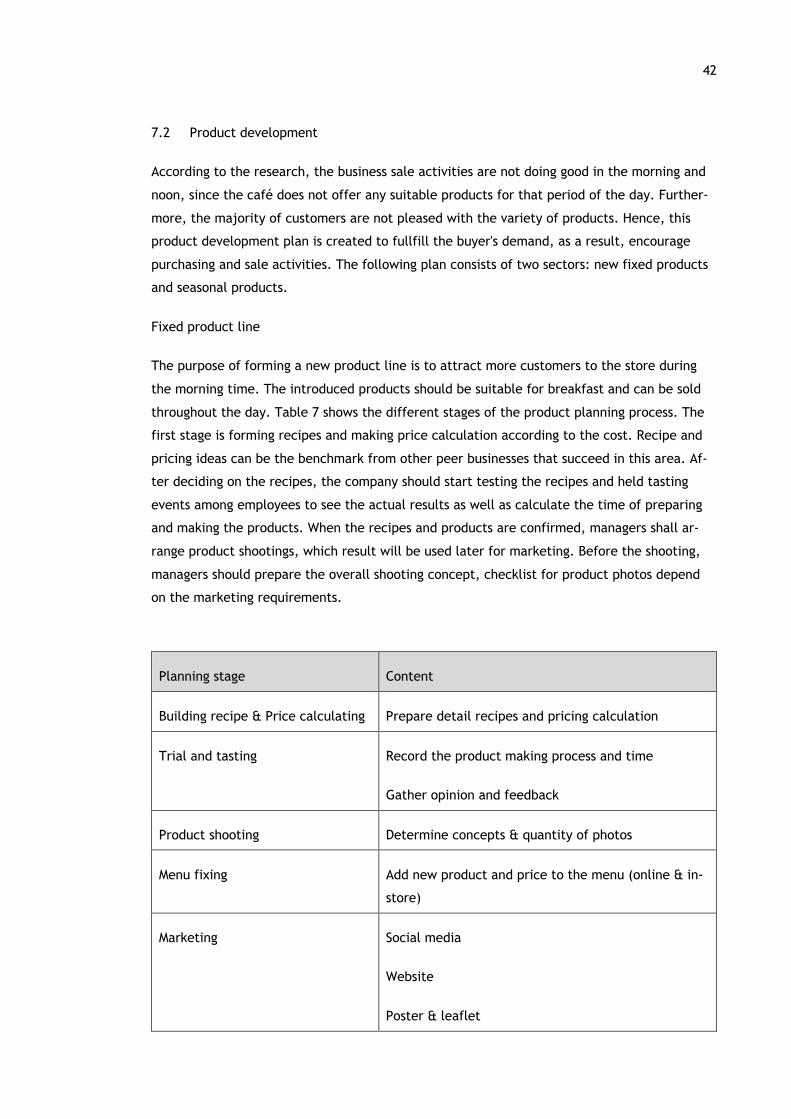
42
7.2 Product development
According to the research, the business sale activities are not doing good in the morning and
noon, since the café does not offer any suitable products for that period of the day. Further-
more, the majority of customers are not pleased with the variety of products. Hence, this
product development plan is created to fullfill the buyer's demand, as a result, encourage
purchasing and sale activities. The following plan consists of two sectors: new fixed products
and seasonal products.
Fixed product line
The purpose of forming a new product line is to attract more customers to the store during
the morning time. The introduced products should be suitable for breakfast and can be sold
throughout the day. Table 7 shows the different stages of the product planning process. The
first stage is forming recipes and making price calculation according to the cost. Recipe and
pricing ideas can be the benchmark from other peer businesses that succeed in this area. Af-
ter deciding on the recipes, the company should start testing the recipes and held tasting
events among employees to see the actual results as well as calculate the time of preparing
and making the products. When the recipes and products are confirmed, managers shall ar-
range product shootings, which result will be used later for marketing. Before the shooting,
managers should prepare the overall shooting concept, checklist for product photos depend
on the marketing requirements.
Planning stage Content
Building recipe & Price calculating Prepare detail recipes and pricing calculation
Trial and tasting Record the product making process and time
Gather opinion and feedback
Product shooting Determine concepts & quantity of photos
Menu fixing Add new product and price to the menu (online & in-
store)
Marketing Social media
Website
Poster & leaflet
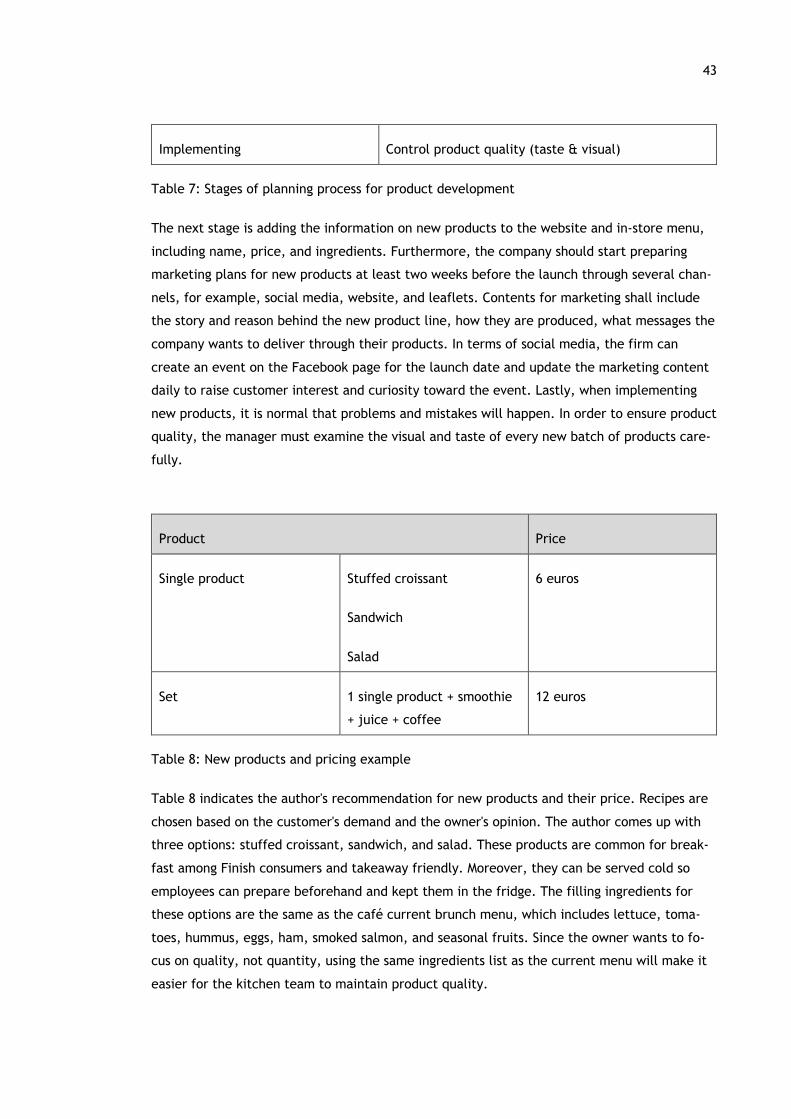
43
Implementing Control product quality (taste & visual)
Table 7: Stages of planning process for product development
The next stage is adding the information on new products to the website and in-store menu,
including name, price, and ingredients. Furthermore, the company should start preparing
marketing plans for new products at least two weeks before the launch through several chan-
nels, for example, social media, website, and leaflets. Contents for marketing shall include
the story and reason behind the new product line, how they are produced, what messages the
company wants to deliver through their products. In terms of social media, the firm can
create an event on the Facebook page for the launch date and update the marketing content
daily to raise customer interest and curiosity toward the event. Lastly, when implementing
new products, it is normal that problems and mistakes will happen. In order to ensure product
quality, the manager must examine the visual and taste of every new batch of products care-
fully.
Product Price
Single product Stuffed croissant
Sandwich
Salad
6 euros
Set 1 single product + smoothie
+ juice + coffee
12 euros
Table 8: New products and pricing example
Table 8 indicates the author's recommendation for new products and their price. Recipes are
chosen based on the customer's demand and the owner's opinion. The author comes up with
three options: stuffed croissant, sandwich, and salad. These products are common for break-
fast among Finish consumers and takeaway friendly. Moreover, they can be served cold so
employees can prepare beforehand and kept them in the fridge. The filling ingredients for
these options are the same as the café current brunch menu, which includes lettuce, toma-
toes, hummus, eggs, ham, smoked salmon, and seasonal fruits. Since the owner wants to fo-
cus on quality, not quantity, using the same ingredients list as the current menu will make it
easier for the kitchen team to maintain product quality.
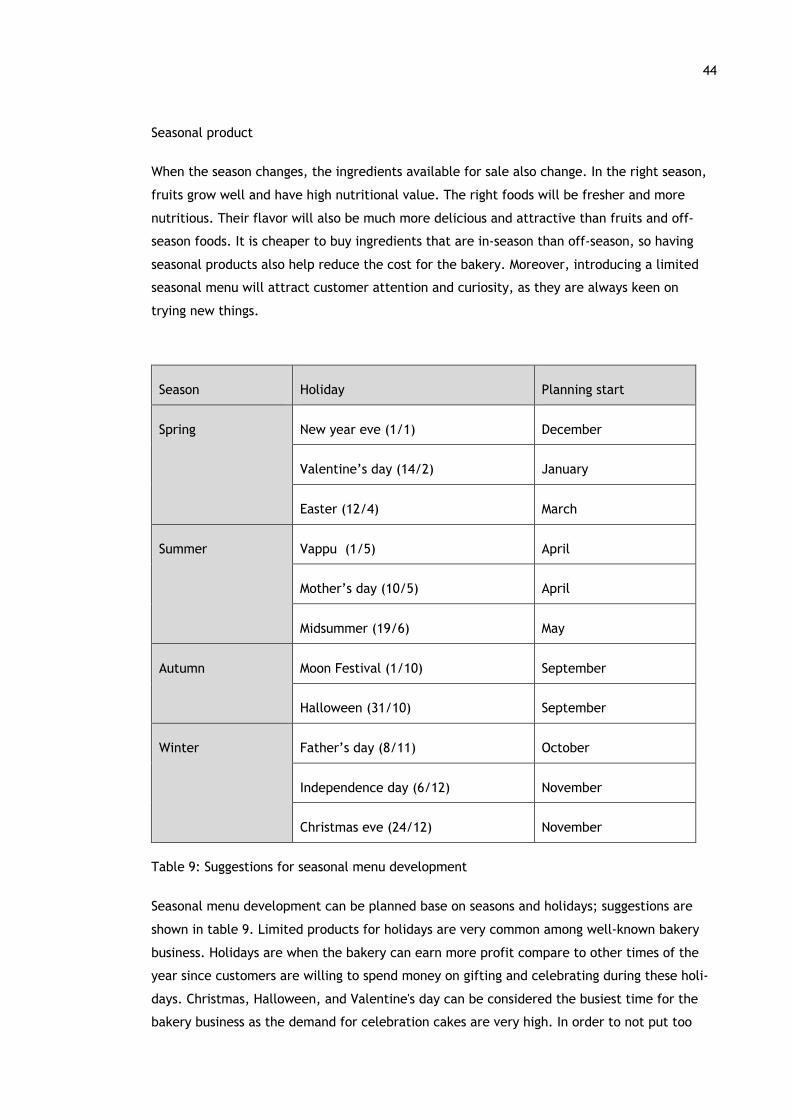
44
Seasonal product
When the season changes, the ingredients available for sale also change. In the right season,
fruits grow well and have high nutritional value. The right foods will be fresher and more
nutritious. Their flavor will also be much more delicious and attractive than fruits and off-
season foods. It is cheaper to buy ingredients that are in-season than off-season, so having
seasonal products also help reduce the cost for the bakery. Moreover, introducing a limited
seasonal menu will attract customer attention and curiosity, as they are always keen on
trying new things.
Season Holiday Planning start
Spring New year eve (1/1) December
Valentine’s day (14/2) January
Easter (12/4) March
Summer Vappu (1/5) April
Mother’s day (10/5) April
Midsummer (19/6) May
Autumn Moon Festival (1/10) September
Halloween (31/10) September
Winter Father’s day (8/11) October
Independence day (6/12) November
Christmas eve (24/12) November
Table 9: Suggestions for seasonal menu development
Seasonal menu development can be planned base on seasons and holidays; suggestions are
shown in table 9. Limited products for holidays are very common among well-known bakery
business. Holidays are when the bakery can earn more profit compare to other times of the
year since customers are willing to spend money on gifting and celebrating during these holi-
days. Christmas, Halloween, and Valentine's day can be considered the busiest time for the
bakery business as the demand for celebration cakes are very high. In order to not put too
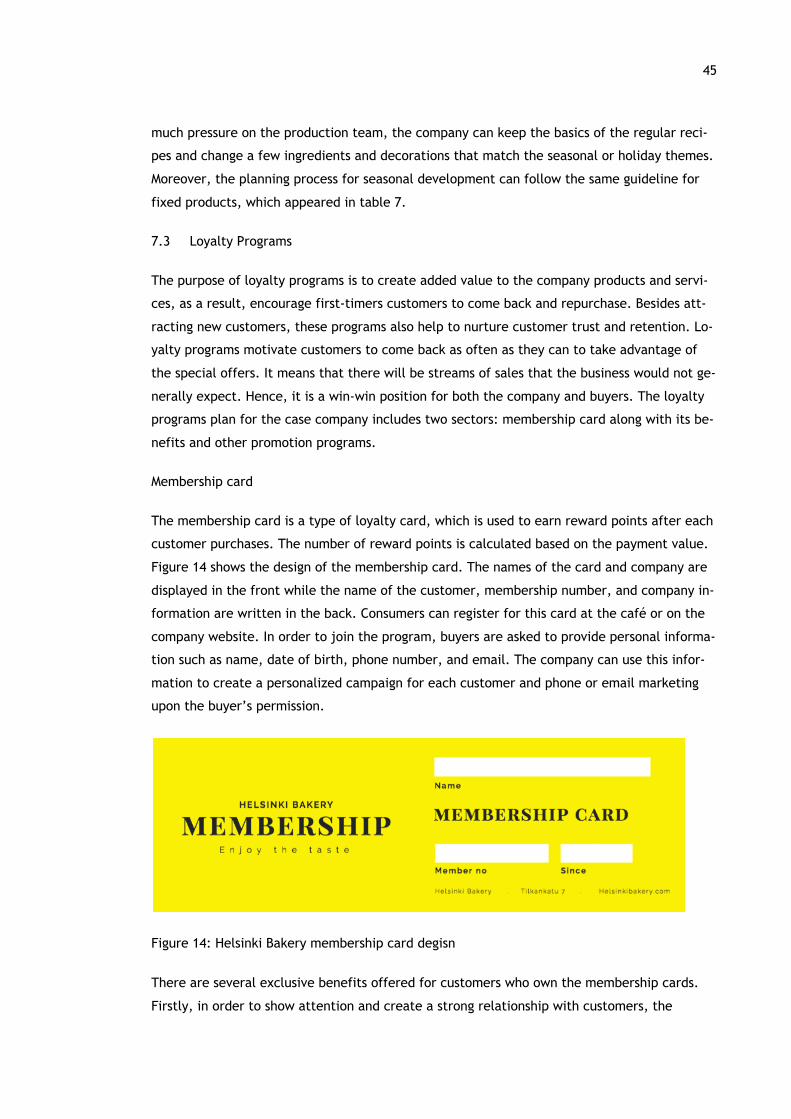
45
much pressure on the production team, the company can keep the basics of the regular reci-
pes and change a few ingredients and decorations that match the seasonal or holiday themes.
Moreover, the planning process for seasonal development can follow the same guideline for
fixed products, which appeared in table 7.
7.3 Loyalty Programs
The purpose of loyalty programs is to create added value to the company products and servi-
ces, as a result, encourage first-timers customers to come back and repurchase. Besides att-
racting new customers, these programs also help to nurture customer trust and retention. Lo-
yalty programs motivate customers to come back as often as they can to take advantage of
the special offers. It means that there will be streams of sales that the business would not ge-
nerally expect. Hence, it is a win-win position for both the company and buyers. The loyalty
programs plan for the case company includes two sectors: membership card along with its be-
nefits and other promotion programs.
Membership card
The membership card is a type of loyalty card, which is used to earn reward points after each
customer purchases. The number of reward points is calculated based on the payment value.
Figure 14 shows the design of the membership card. The names of the card and company are
displayed in the front while the name of the customer, membership number, and company in-
formation are written in the back. Consumers can register for this card at the café or on the
company website. In order to join the program, buyers are asked to provide personal informa-
tion such as name, date of birth, phone number, and email. The company can use this infor-
mation to create a personalized campaign for each customer and phone or email marketing
upon the buyer’s permission.
Figure 14: Helsinki Bakery membership card degisn
There are several exclusive benefits offered for customers who own the membership cards.
Firstly, in order to show attention and create a strong relationship with customers, the
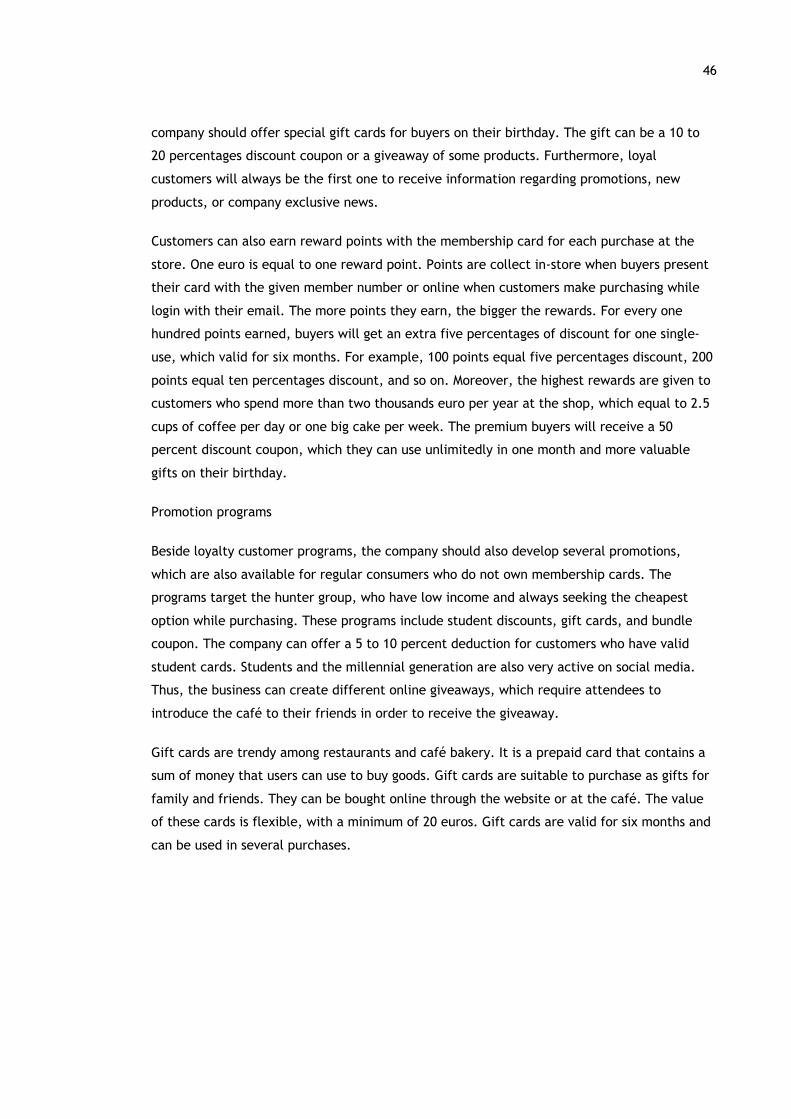
46
company should offer special gift cards for buyers on their birthday. The gift can be a 10 to
20 percentages discount coupon or a giveaway of some products. Furthermore, loyal
customers will always be the first one to receive information regarding promotions, new
products, or company exclusive news.
Customers can also earn reward points with the membership card for each purchase at the
store. One euro is equal to one reward point. Points are collect in-store when buyers present
their card with the given member number or online when customers make purchasing while
login with their email. The more points they earn, the bigger the rewards. For every one
hundred points earned, buyers will get an extra five percentages of discount for one single-
use, which valid for six months. For example, 100 points equal five percentages discount, 200
points equal ten percentages discount, and so on. Moreover, the highest rewards are given to
customers who spend more than two thousands euro per year at the shop, which equal to 2.5
cups of coffee per day or one big cake per week. The premium buyers will receive a 50
percent discount coupon, which they can use unlimitedly in one month and more valuable
gifts on their birthday.
Promotion programs
Beside loyalty customer programs, the company should also develop several promotions,
which are also available for regular consumers who do not own membership cards. The
programs target the hunter group, who have low income and always seeking the cheapest
option while purchasing. These programs include student discounts, gift cards, and bundle
coupon. The company can offer a 5 to 10 percent deduction for customers who have valid
student cards. Students and the millennial generation are also very active on social media.
Thus, the business can create different online giveaways, which require attendees to
introduce the café to their friends in order to receive the giveaway.
Gift cards are trendy among restaurants and café bakery. It is a prepaid card that contains a
sum of money that users can use to buy goods. Gift cards are suitable to purchase as gifts for
family and friends. They can be bought online through the website or at the café. The value
of these cards is flexible, with a minimum of 20 euros. Gift cards are valid for six months and
can be used in several purchases.
47
Figure 15: Example of coupon design
Another type of promotion program is bundle coupons, which allow consumers to purchase
large numbers of products in return for discounts. Figure 15 shows the example of the
coupon, where customers can buy nine coffees to get one free. The idea is that consumers
will buy nine coffees at once in order to have one cup for free. With these coupons, buyers
are granted 11 percent discounts, while the company is able to sell nine coffees instead of
one for a single purchase. Hence, buying in a bundle is beneficial for both buyers and the
business. Each time customers come to redeem their coffee, and one cup will be crossed out
in the coupon. The bundle coupons are valid for six months. This program is also applying for
other products such as cakes, breakfast, and brunch.
8 Conclusion
The purpose of this thesis is to publish a relationship marketing plan that can help the case
company improve its business activities. The company is suffering from maintaining customer
retention and loyalty, as according to the research, only 40 percent of first-timer consumer
comeback. Moreover, it is vital and more sustainable for the business to win back its current
customers, since the cost to do so is five times lower than obtaining new ones. The final rela-
tionship marketing plan will focus on building relationships with consumers and increase cus-
tomer satisfaction to encourage current buyer purchasing activities.
In order to produce a relationship marketing plan, the author first introduces the definition of
relationship marketing and how important it is toward the food and beverage industry. Relati-
onship marketing is understanding and managing the customer relationship and strengthen
48
customers' loyalty and trust toward the company. When customers have trust in the company,
they believe that purchasing the product or service can benefit them. There are six com-
ponents that form a relationship: trust, bonding, communication, shared value, empathy, and
reciprocity. By analyzing each component, the author understands what is essential in creat-
ing strong relationships.
In the development process, both qualitative and quantitative research methods are used
base on the purpose of the research. Benchmarking, observation, and interviews are applied
to gain from other peer businesses in the industry, while a survey is designed to collect and
analyze the case company's existing customer's opinion. By using benchmarking and observa-
tion methods, the author recognizes the differences in the case company services and prod-
ucts compare to other two successful businesses in the industry. The case company has a sig-
nificantly smaller menu and less variety of products. Furthermore, the business has a distinc-
tive shop layout and product presentation, which confuses its customers. Results from inter-
views and surveys show that those differences affect consumer satisfaction.
As a result, the relationship marketing plan is made base on the studied theoretical back-
ground and research development process. The author produces three development plans re-
garding product, service, and loyalty program. In order to create more diversity in the case
company product line, fixed products and seasonal menu are made which focus on providing
what customer are demanding. Moreover, a new café layout is introduced, which provides
more seats, tables, as well as reduce the confusion for customers when purchasing. Member-
ship cards for loyal buyers with attractive rewards and several promotion programs for stu-
dents and regular consumers are offered to enhance customer loyalty and business activities.
49
References
Printed sources
Angelini, A. 2018. The Value of the Customer Relationship. Turin, ITALY: Giappichelli.
Baron, S., Conway, T. & Warnaby, G. 2010. Relationship marketing. Los Angeles, USA: Sage.
Bruhn, M. 2002. Relationship marketing. Harlow, USA: Financial Times Prentice Hall.
Creswell, J.W. 2018. Research design. 5th International student edition. Los Angeles, USA:
SAGE.
Fontana, A. & Prokos, A.H. 2007. The Interview: From Formal to Postmodern. Walnut Creek,
USA: Routledge.
Grönroos, C. 2000. Service management and marketing. 2nd edition. Chichester, USA: Wiley.
Hansen, F. & Christensen, L.B. 2003. Branding and Advertising. Frederiksberg, DENMARK: Co-
penhagen Business School Press.
Kandampully, J. 2002. Relationship Marketing In Services. Bradford, UNITED KINGDOM: Emer-
ald Publishing Limited.
Kleinaltenkamp, M., Ehret, M. & Ehret, M. 2006. Relationship theory and business markets.
Bradford, UNITED KINGDOM: Emerald Publishing Limited.
Koi-Akrofi, G. & Koi-Akrofi, J. 2012. Relationship marketing tactics and customer loyalty: The
case of the Telecommunications industry in Ghana. Lap Lambert Academic Publishing.
Kompella, K. 2014. The Definitive Book of Branding. New Delhi, INDIA: SAGE Publications.
Kumar, R. 2019. Research methodology. Fifth edition. Los Angeles, USA: Sage.
Leventhal, R.C. 2006. Customer loyalty, retention, and customer relationship management.
GB: Emerald Publishing Limited.
Malhotra, N.K., Uslay, C. & Bayraktar, A. 2016. Relationship Marketing Re-Imagined: Market-
ing's Inevitable Shift from Exchanges to Value Cocreating Relationships. New York, UNITED
STATES: Business Expert Press.
Miletsky, J. & Smith, G.L. 2009. Perspectives™ On Branding. Boston, UNITED STATES: Course
Technology.
50
Parasuraman, A.P. 2002. Service quality and productivity: A synergistic perspective. Manag-
ing Service Quality, 12 , 6-9. USA: Emerald Group Publishing Limited
Parvatiyar, A. & Sheth, J.N. 2000. Handbook of Relationship Marketing. US: Sage Publica-tions
Inc.
Rodrigues, L.L.R. 2013. Service Quality Measurement: Issues and Perspectives. Hamburg, GER-
MANY: Diplomica Verlag.
Smith, M. & Kawasaki, G. 2011. The New Relationship Marketing: How to Build a Large, Loyal,
Profitable Network Using the Social Web. New York, UNITED STATES: John Wiley & Sons, In-
corporated.
Yanow, D. & Schwartz-Shea, P. 2013. Interpretation and Method: Empirical Research Methods
and the Interpretive Turn. Armonk, UNITED STATES: Routledge.
Electronic
Bansal, H.S., Taylor, S. & James, Y.S. 2005. “Migrating” to New Service Providers: Toward a
Unifying Framework of Consumers’ Switching Behaviors: Journal of the Academy of Marketing
Science. Accessed 20 February 2020
https://journals.sagepub.com/doi/abs/
Behara Ravi & Fisher Warren 2002. International Journal of Operations & Production Man-age-
ment, Service Quality. Modelling and evaluating service quality measurement using neural
networks, 22 (10), 1162-1185. Accessed 21 February 2020
https://www.researchgate.net/publication/241701888_Modelling_and_evaluating_ser-
vice_quality_measurement_using_neural_networks
Brady, M.K. & Cronin, J.J. 2001. Customer Orientation: Effects on Customer Service Percep-
tions and Outcome Behaviors. Journal of Service Research. Accessed 20 Febru-ary 2020
https://journals.sagepub.com/doi/abs/
Cheng, T.C.E., Lai, L.C.F. & Yeung, A. 2010. The Driving Forces of Customer Loyalty. Inter-
national Journal of E-Business Research. Accessed 21 February 2020
https://www.researchgate.net/publication/279397538_The_Driving_Forces_of_Cus-
tomer_Loyalty
Daood, A. 2017. Understanding "Creating Shared Value". Accessed 19 February 2020
51
https://www.researchgate.net/publication/323074844_Understanding_Creat-
ing_Shared_Value
Helsinki Bakery. Accessed 5 March 2020
https://helsinkibakery.fi/
Liu, Y. 2007. The Long-Term Impact of Loyalty Programs on Consumer Purchase Behavior and
Loyalty. Journal of Marketing. Accessed 21 February 2020
https://www.researchgate.net/publication/237396598_The_Long-Term_Impact_of_Loy-
alty_Programs_on_Consumer_Purchase_Behavior_and_Loyalty
Magatef, S. & Tomalieh, E. 2015. The Impact of Customer Loyalty Programs on Customer Re-
tention. International Journal of Business and Social Science, 6 (8), 78-93. Accessed 21 Feb-
ruary 2020
https://www.researchgate.net/publication/331833326_The_Impact_of_Customer_Loy-
alty_Programs_on_Customer_Retention
Michael E. Porter 2012. Creating Shared Value:
The Path Forward. FSG Shared Value Leadership Summit, , 1-17. Accessed 21 March 2020
https://www.hbs.edu/faculty/Publication%20Files/
Naudé, P. & Buttle, F. 2000. Assessing Relationship Quality. Industrial Marketing Manage-
ment, 29 (4), 237-361. Accessed 2 April 2020
https://researchers.mq.edu.au/en/publications/assessing-relationship-quality
Patisserie Teemu Aura. Accessed 26 March 2020
https://www.patisserietm.fi.
Peng Leong & Wang Qing 2006. Impact of Relationship Marketing Tactics (RMTs) on Switchers
and Stayers in a Competitive Service Industry. Journal of Marketing Management, 22 , 25-59.
Accessed 26 March 2020
https://www.researchgate.net/publication/247495185_Impact_of_Relationship_Market-
ing_Tactics_RMTs_on_Switchers_and_Stayers_in_a_Competitive_Service_Industry
52
Sin, L., Tse, A., Yau, O., Lee, J. & Chow, R. 2002. The Effect of Relationship Marketing Ori-
entation on Business Performance in a Service-Oriented Economy. Journal of Services Market-
ing, 16 , 656-676. Accessed 18 February 2020
https://www.researchgate.net/publication/235313563_The_Effect_of_Relationship_Market-
ing_Orientation_on_Business_Performance_in_a_Service-Oriented_Economy
Singh, R. & Khan, I. 2012. An Approach to Increase Customer Retention and Loyalty in B2C
World. An Approach to Increase Customer Retention and Loyalty in B2C World, 2 (6), 1-5. Ac-
cessed 24 March 2020
http://www.ijsrp.org/research_paper_jun2012/ijsrp-June-2012-40.pdf
Tracy G Harwood 2005. Developing Buyer-Seller Relationships Through Face-to-Face Negotia-
tions. Journal of Relationship Marketing, 4 (3,4), 105. Accessed 10 April 2020
https://www.researchgate.net/publication/232860920_Developing_Buyer-Seller_Relation-
ships_Through_Face-to-Face_Negotiations
53
Figures
Figure 1: Relationship profitability development process (Baron, Conway & Warnaby 2010, 34)
................................................................................................................. 8 Figure 2: Relationship Marketing Orientation’s components. (Sin et al. 2002, 660) ............. 9 Figure 3: Relationship life-cycle phase (Bruhn 2002, 46) ............................................ 13 Figure 4: SERVQUAL model (Parasuraman 2002) ...................................................... 15 Figure 5: Product from Patisserie Teemu Aura (Website of Patisserie Teemu Aura, 2019) .... 26 Figure 6: Brooklyn Café menu and interior design. ................................................... 29 Figure 7: Helsinki Bakery products and interior design. ............................................. 31 Figure 8: Customer age groups and occupation percentage on pie chart ( n=100) .............. 34 Figure 9: Customer purchasing pattern at the case company (n=100) ............................. 35 Figure 10: Customer’s opinion on case company current products (n=100) ...................... 36 Figure 11: Customer responds on in-store service quality at Helsinki bakery (n=60) ............ 37 Figure 12: Customer decisions on promotion programs (n=100) .................................... 38 Figure 13: Old & new version of the café layout ...................................................... 40 Figure 14: Helsinki Bakery membership card degisn .................................................. 45 Figure 15: Example of coupon design ................................................................... 47
54
Table
Table 1: Traditional marketing versus relationship marketing. (Koi-Akrofi 2012) ................ 7 Table 2: Consumer recovery strategies (Bruhn 2002, 111) .......................................... 14 Table 3: Guideline for observation process ............................................................ 21 Table 4: Products and price comparison (currency is in euro) ...................................... 33 Table 5: Three stages of service development process ............................................. 39 Table 6: Step by step serving guideline ................................................................ 41 Table 7: Stages of planning process for product development ..................................... 43 Table 8: New products and pricing example ........................................................... 43 Table 9: Suggestions for seasonal menu development ............................................... 44

55
Appendices
No table of contents entries found.
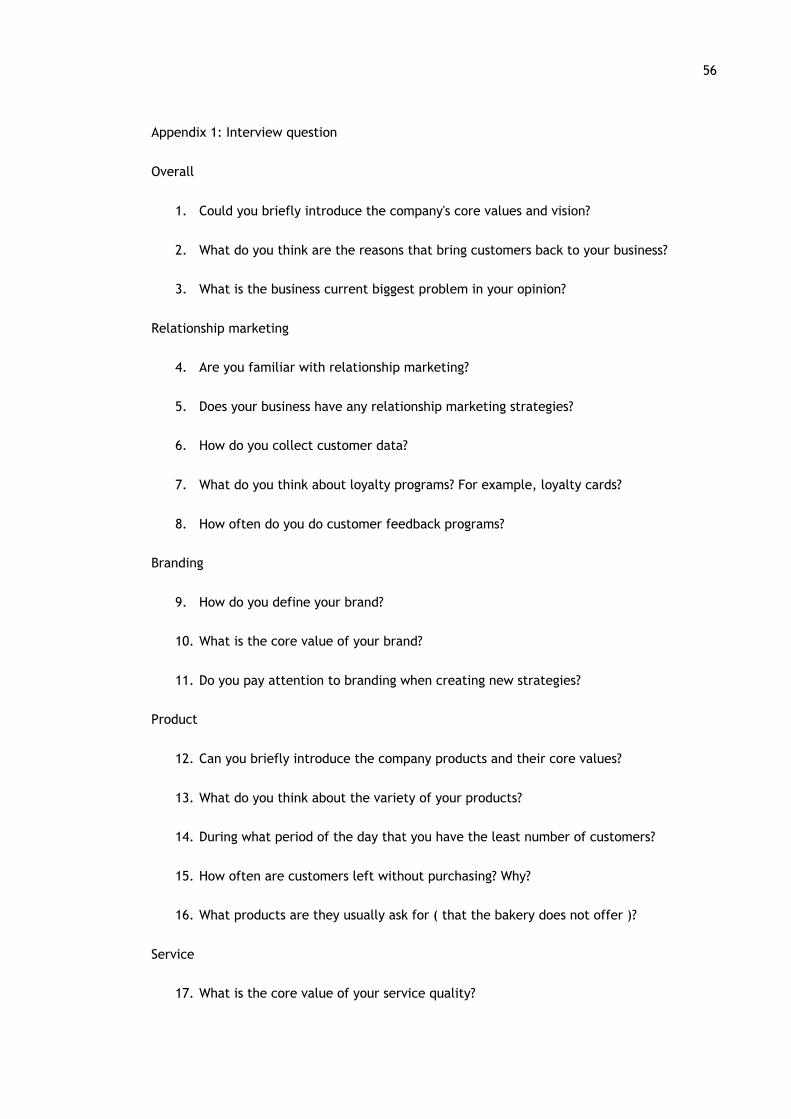
56
Appendix 1: Interview question
Overall
1. Could you briefly introduce the company's core values and vision?
2. What do you think are the reasons that bring customers back to your business?
3. What is the business current biggest problem in your opinion?
Relationship marketing
4. Are you familiar with relationship marketing?
5. Does your business have any relationship marketing strategies?
6. How do you collect customer data?
7. What do you think about loyalty programs? For example, loyalty cards?
8. How often do you do customer feedback programs?
Branding
9. How do you define your brand?
10. What is the core value of your brand?
11. Do you pay attention to branding when creating new strategies?
Product
12. Can you briefly introduce the company products and their core values?
13. What do you think about the variety of your products?
14. During what period of the day that you have the least number of customers?
15. How often are customers left without purchasing? Why?
16. What products are they usually ask for ( that the bakery does not offer )?
Service
17. What is the core value of your service quality?

57
18. What do you think about the company's current service quality?
19. How often do you provide service training for employees?
20. Is there any service guidelines for the staff?
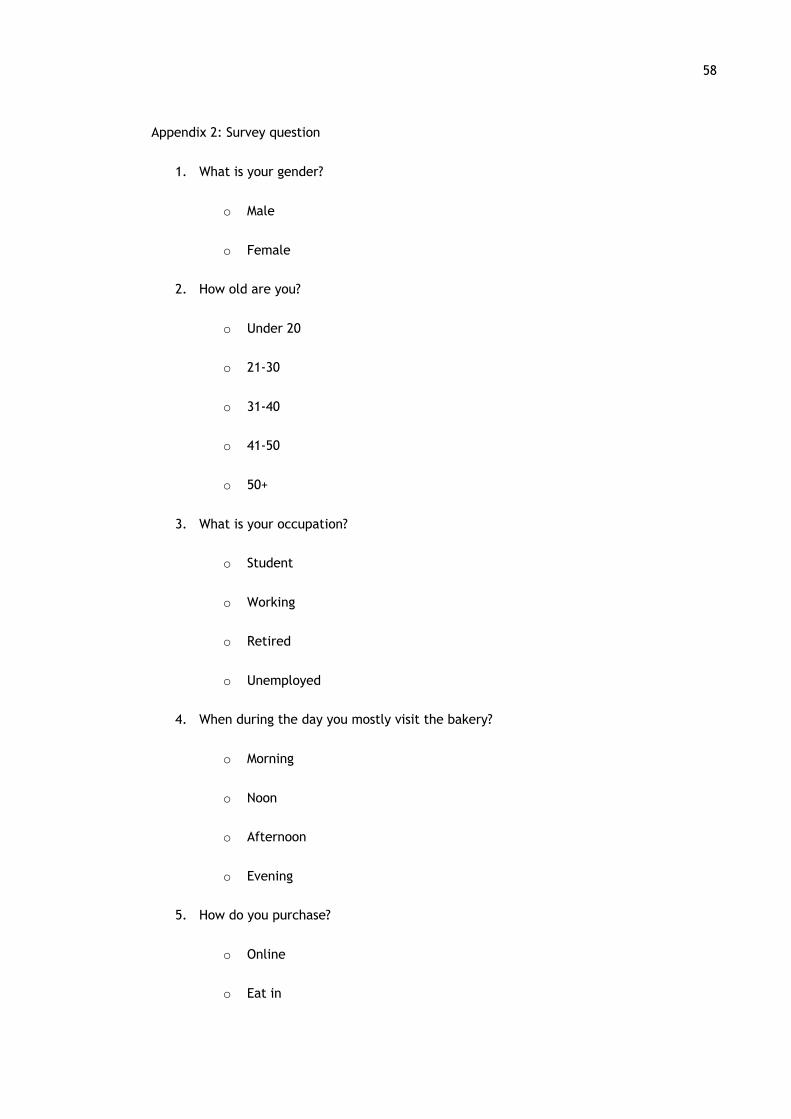
58
Appendix 2: Survey question
1. What is your gender?
o Male
o Female
2. How old are you?
o Under 20
o 21-30
o 31-40
o 41-50
o 50+
3. What is your occupation?
o Student
o Working
o Retired
o Unemployed
4. When during the day you mostly visit the bakery?
o Morning
o Noon
o Afternoon
o Evening
5. How do you purchase?
o Online
o Eat in
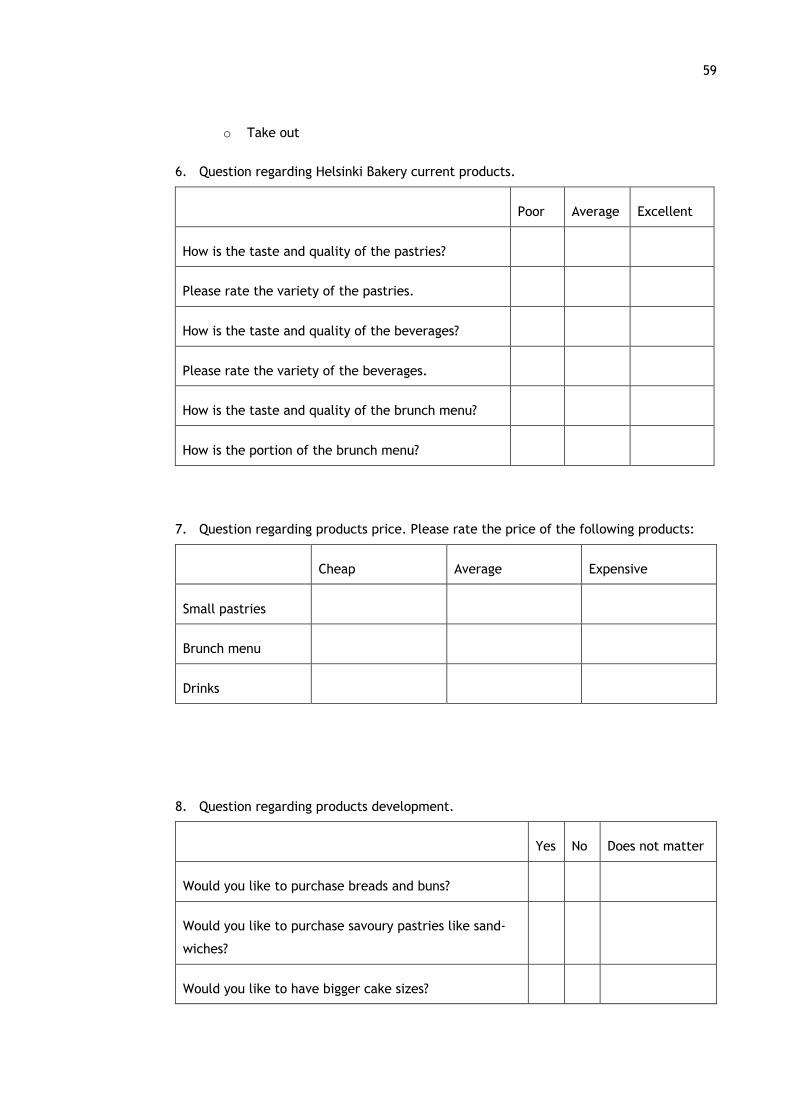
59
o Take out
6. Question regarding Helsinki Bakery current products.
Poor Average Excellent
How is the taste and quality of the pastries?
Please rate the variety of the pastries.
How is the taste and quality of the beverages?
Please rate the variety of the beverages.
How is the taste and quality of the brunch menu?
How is the portion of the brunch menu?
7. Question regarding products price. Please rate the price of the following products:
Cheap Average Expensive
Small pastries
Brunch menu
Drinks
8. Question regarding products development.
Yes No Does not matter
Would you like to purchase breads and buns?
Would you like to purchase savoury pastries like sand-
wiches?
Would you like to have bigger cake sizes?
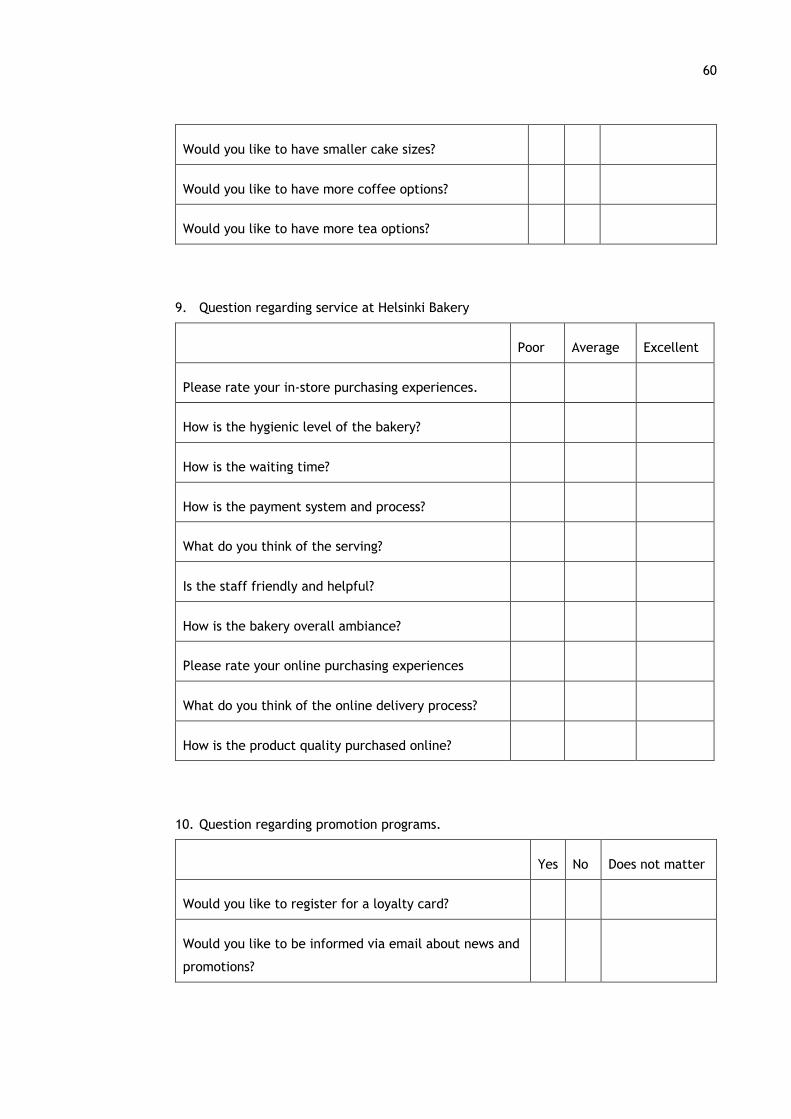
60
Would you like to have smaller cake sizes?
Would you like to have more coffee options?
Would you like to have more tea options?
9. Question regarding service at Helsinki Bakery
Poor Average Excellent
Please rate your in-store purchasing experiences.
How is the hygienic level of the bakery?
How is the waiting time?
How is the payment system and process?
What do you think of the serving?
Is the staff friendly and helpful?
How is the bakery overall ambiance?
Please rate your online purchasing experiences
What do you think of the online delivery process?
How is the product quality purchased online?
10. Question regarding promotion programs.
Yes No Does not matter
Would you like to register for a loyalty card?
Would you like to be informed via email about news and
promotions?

61
Would you like to be informed via mobile phone about
news and promotions?
Would you like to receive frequent buyer benefits?