Embed Size (px)
Citation preview

Resource
Regional Cell-Specific Tra
nscriptome MappingReveals Regulatory Complexity in the AdultDrosophila MidgutGraphical Abstract
Highlights
d Drosophila intestinal cells are transcriptionally diverse across
regions R1–R5
d GATAe, sna, and Ptx1 are key players in global and regional
ISC regulation
d Digestive enzymes are expressed cell type specifically in
regions
d P. entomophila infection causes a massive transcriptional
change in midgut cells
Dutta et al., 2015, Cell Reports 12, 346–358July 14, 2015 ª2015 The Authorshttp://dx.doi.org/10.1016/j.celrep.2015.06.009
Authors
Devanjali Dutta, Adam J. Dobson,
Philip L. Houtz, ..., Parthive H. Patel,
Bruce A. Edgar, Nicolas Buchon
[email protected] (B.A.E.),[email protected] (N.B.)
In Brief
In this study, Dutta et al. analyze the
transcriptomes ofDrosophila cells across
five midgut regions (R1–R5) under
physiological and infectious conditions.
They identify markers and transcriptional
factors regulating stem cells and regional
specificities. This resource will be useful
for studies on stem cells, regionalization,
midgut homeostasis, and immunity.
Accession Numbers
GSE61361

Cell Reports
Resource
Regional Cell-Specific TranscriptomeMapping Reveals Regulatory Complexityin the Adult DrosophilaMidgutDevanjali Dutta,1 Adam J. Dobson,2,4 Philip L. Houtz,2 Christine Glaßer,1 Jonathan Revah,2 Jerome Korzelius,1
Parthive H. Patel,1 Bruce A. Edgar,1,3,* and Nicolas Buchon2,3,*1German Cancer Research Center (DKFZ), Center for Molecular Biology Heidelberg University (ZMBH) Alliance, Im Neuenheimer Feld 282,
69120 Heidelberg, Germany2Department of Entomology, Cornell University, Ithaca, NY 14853, USA3Co-senior author4Present address: Institute of Healthy Ageing, University College London, London WC1E 6BT, UK
*Correspondence: [email protected] (B.A.E.), [email protected] (N.B.)
http://dx.doi.org/10.1016/j.celrep.2015.06.009This is an open access article under the CC BY-NC-ND license (http://creativecommons.org/licenses/by-nc-nd/4.0/).
SUMMARY
Deciphering contributions of specific cell types to or-gan function is experimentally challenging. TheDrosophila midgut is a dynamic organ with fivemorphologically and functionally distinct regions(R1–R5), each composed of multipotent intestinalstem cells (ISCs), progenitor enteroblasts (EBs), en-teroendocrine cells (EEs), enterocytes (ECs), andvisceral muscle (VM). To characterize cellularspecialization and regional function in this organ,we generated RNA-sequencing transcriptomes ofall five cell types isolated by FACS from each of thefive regions, R1–R5. In doing so, we identify tran-scriptional diversities among cell types and docu-ment regional differences within each cell type thatdefine further specialization. We validate cell-spe-cific and regional Gal4 drivers; demonstrate rolesfor transporter Smvt and transcription factorsGATAe, Sna, and Ptx1 in global and regional ISCregulation, and study the transcriptional responseof midgut cells upon infection. The resulting tran-scriptome database (http://flygutseq.buchonlab.com) will foster studies of regionalization, homeosta-sis, immunity, and cell-cell interactions.
INTRODUCTION
The intestine is a dynamic organ composed of specialized cells
that primarily perform the functions of digestion, absorption of
nutrients and water, and expulsion of waste. It also serves as a
major site of interaction with the external environment, which in-
cludes numerous microbes and chemicals. Fulfilling these multi-
ple roles requires the gut to be a highly homeostatic organ that
adapts in response to both extrinsic environmental cues and
intrinsic organismal signals.
346 Cell Reports 12, 346–358, July 14, 2015 ª2015 The Authors
The adult Drosophila midgut undergoes constant develop-
ment and renewal (Ohlstein and Spradling, 2006, 2007; Micchelli
and Perrimon, 2006; Jiang et al., 2009, 2011; Buchon et al., 2009;
Amcheslavsky et al., 2009). Intestinal stem cells (ISCs) express
the Notch ligand Delta (Dl) and proliferate throughout adult life,
renewing and generating transient bi-potent progenitors called
enteroblasts (EBs). ISCs and EBs are characterized by expres-
sion of the transcription factor (TF) escargot (esg). Upon activa-
tion of the Notch receptor by Delta, EBs express the TF Suppres-
sor-of-hairless (Su(H)) and differentiate predominantly into
absorptive enterocytes (ECs) that express Myosin1A (Myo1A)
and the POU domain TF Pdm1 (or nubbin). However, some
Su(H)+ EBs also differentiate into class II enteroendocrine cells
(EEs) that express the neuro-endocrine marker Prospero (pros)
and a specific combination of neuropeptides such as Tk and
DH31 (Beehler-Evans and Micchelli, 2015). Distinct pros+ EEs,
denoted as class I, express neuropeptides Ast A, B and arise
from Su(H)– EBs, which have not registered Notch activation.
Alternatively, it has recently been proposed that commitment
to EE lineage is established in a subpopulation of ISCs that ex-
press pros (Biteau and Jasper, 2014; Zeng and Hou, 2015).
The midgut is also surrounded by circular and longitudinal
visceral muscles (VMs), which facilitate peristalsis and serve as
a dynamic niche, secreting niche signals including Wg, the
epidermal growth factor receptor (EGFR) ligand Vn, and the
JAK-STAT ligand Upd1, together with adhesion molecules
(e.g., integrins) (Lin et al., 2008; Jiang et al., 2011; Biteau and
Jasper, 2011). In addition to these signaling pathways, JNK,
Dpp, andHippo signaling are all involved in regulating cell growth
and ISC proliferation in the midgut (Shaw et al., 2010; Tian and
Jiang, 2014; Guo et al., 2013). ISCs are also vital for sustaining
tissue regeneration following injury, apoptosis, and pathogenic
assaults (Buchon et al., 2010; Cordero et al., 2012). The digestive
tract is thus a complex mix of cells of distinct identity, develop-
mental origin, and differentiation states.
The adult Drosophila midgut has been described as being
divided into three distinct compartments, namely the anterior,
middle, and posterior regions, based largely on morphological
differences (Dimitriadis, 1991). Recent studies have revealed

finer compartmentalization, dividing the midgut into five major
regions (R1–R5, from anterior to posterior) that are transcrip-
tionally, functionally, and morphologically distinct. These can
be further sub-divided into 14 sub-regions (Buchon et al.,
2013a; Marianes and Spradling, 2013). The latter two studies
characterized gene expression differences among the five major
midgut regions and noted compartmentalization of digestive,
metabolic, and immune functions. However, cell-type-specific
gene expression was not assayed in these studies. Neverthe-
less, regional variation within cell types is quite obvious in the
fly’s midgut. For instance, ISCs show clear regional differences
in basal division rates and generate distinct regional subtypes of
epithelial cells along the gut (Marianes and Spradling, 2013;
Martorell et al., 2014). In the anterior-most region of the midgut
(R1), type I gastric stem cells (GaSCs) have been shown to
renew cells of the proventriculus, which is itself devoid of
ISCs (Singh et al., 2011). The middle midgut (R3) is basally re-
newed at very low levels and is inhabited by a population of
generally quiescent stem cells called type II GaSCs (Strand
and Micchelli, 2011). Understanding region-dependent and
cell-specific properties is key to understanding how the gut ful-
fills its physiological roles and maintains coordination and
harmonious function in the face of environmental variation
(e.g., pathogenic attacks or ingestion of food). Therefore, it is
important to profile the various intestinal cell types at the tran-
scriptome level so that they can be analyzed and manipulated
more extensively.
Here, we present a comprehensive transcriptome resource of
region-specific, cell-type-specific RNA-sequencing (RNA-seq)
profiles of Drosophilamidgut cell populations, including progen-
itors (ISCs and Su(H)+ EBs), differentiated epithelial cells (ECs
and EEs), and VMs, isolated using fluorescence-activated cell
sorting (FACS) (Dutta et al., 2013). Using cell-type-specific ge-
netic manipulations, we validate numerous predictions derived
from our RNA-seq data. This transcriptome dataset and its asso-
ciated online database at Flygut-seq (http://flygutseq.
buchonlab.com) will be valuable resources that should help
define the specialized functions of the different gut regions and
facilitate future studies using the Drosophila midgut.
RESULTS
Drosophila Midgut Cells Are Transcriptionally DiverseTo investigate variation in gene expression between midgut cell
populations across the five regions (R1–R5, Figure 1A), we
marked each respective cell type with GFP using cell-type-spe-
cific Gal4-based transcriptional ‘‘drivers’’ to activate a Gal4-
responsive transgene encoding GFP (UAS-GFP) as described
in Experimental Procedures. Pure populations of all five midgut
cell types from each of the five regions (R1–R5) were isolated us-
ing FACS, based on GFP intensity and cell size as determined by
forward light scatter (FSC). RNA was extracted from each cell
type of each region in biological duplicates, amplified, and sub-
jected to mRNA sequencing. Raw fastq reads were mapped
to the Drosophila genome using Tophat and reads were normal-
ized per kilobase per million mapped reads (RPKM). For dif-
ferential expression analysis, the DESeq package was used
(see Experimental Procedures and Supplemental Experimental
Procedures). Marker genotypes and the protocol used for
profiling midgut cell types can be found in the Experimental Pro-
cedures. For simplicity, we refer to the Su(H)+ cells as EBs
throughout the text. Su(H)-EBs committed to enteroendocrine
cell differentiation were not specifically profiled due to the lack
of a suitable marker.
We first determined overall transcriptome differences between
cell types by hierarchical clustering (Figure S1A). This indicated
that the mesodermally derived VM had a dramatically different
transcriptome compared to the endodermal cell types, suggest-
ing that the embryonic origin of tissues can still be detected in the
transcriptome of adult cells. Principal component analysis (PCA)
explained �35% of the total transcriptional variance in the first
two principal components (PCs), distinguishing EEs as the
most divergent endodermal cell population, potentially due to
their neuronal properties (Figure 1B). EBs were more similar to
ECs than some ISC populations, indicating as expected that
Su(H)+ EBs may be in the process of adopting the EC fate. esg
marks both EBs and ISCs, and accordingly, the transcriptome
of cells marked with esg overlapped with both profiles. As ana-
lyses encompassing partial overlapping cell populations would
skew the results, we excluded the esg+ cell profiles from subse-
quent statistical analyses. Because of its great divergence, we
also analyzed VMs separately from other cell types. Data from
esg+ cells and VMs can be found in Flygut-seq.
We found more than 50% of protein-coding genes in the
genome to be expressed in the adult midgut. Of these genes,
�40% (2,456) were differentially expressed (DE) among all four
cell types (ISCs, EBs, ECs, and EEs) using a criterion of at least
log2 fold change and a 5% false discovery rate (FDR) in a DE
analysis (Table S1) (Anders and Huber, 2010). Unbiased hierar-
chical clustering ordered the samples according to their devel-
opmental progression from progenitors (ISCs and EBs) to
differentiated cells (EEs and ECs). This was due to mostly non-
overlapping expression between these two classes of cells,
along with some cell-type-specific expression (Figure 1C).
Gene Ontology (GO) enrichment analysis of the genes enriched
in EEs revealed the high expression of G-protein-coupled
signaling pathway components and neuropeptides, while ECs
highly expressed serine endopeptidases and proteolytic genes
(Figures S1B and S1C; Table S2).
Applying a metric of R2-fold difference in mean expression
among the four cell types, we identified 159 genes that were en-
riched at least 2-fold in ISCs (ISC-high) and 509 genes that
showed extremely low expression in ISCs (by �1- to �10-fold)
compared to other epithelial cell types (Table S1). Stem cell-
high genes included the known ISC markers Delta, arm, mira,
and Robo2/lea (Bardin et al., 2010; Biteau and Jasper, 2014)
and sequence-specific DNA binding TFs such as sc, dys, snail
(sna), and ap (Table S1). GO analysis (Figure 1D; Table S2) re-
vealed that the ISC-high genes were enriched for functions in
cell-cycle regulation and stem cell proliferation. This trend was
driven by high expression of genes including polo, cdc2,
mad2, tum, and Cks30A, consistent with the fact that ISCs are
the only multipotent actively mitotic cell population in the
Drosophilamidgut. Interestingly, genes involved in fate decisions
and asymmetric stem cell division in neuronal progenitors, such
as pon,mira, bora, and jumu, were also highly expressed in ISCs.
Cell Reports 12, 346–358, July 14, 2015 ª2015 The Authors 347

Figure 1. Drosophila Midgut Cells Are Transcriptionally Dynamic
(A) Diagrammatic representation of the adult Drosophilamidgut cells, cell-type marker genes, and regions. R1–R5: regions of the midgut, fg: foregut, hg: hindgut,
BM: basement membrane.
(B) PCA (mean of all replicates) showing EEs are distant from other endodermal cell types. Numbers depict regions R1–R5.
(C) Normalized RPKM heatmap of differentially expressed genes (Table S1) (physiological and regions) shows cell type specific gene clusters. (Scale: Normalized
expression values increasing from blue to red. Scaling of matrices by row to a mean of 0 and SD of 2 (Z score normalization) shows relative expression patterns.)
(D) GO enrichment plot of ISC-high genes. Scale and size of balls represents p value. BP, biological processes; MF, molecular functions; CC, cellular
components.
Accordingly, ISCs have been reported to divide asymmetrically
in 79% of divisions (Goulas et al., 2012). Genes involved in chro-
matin organization and histone modification, such as ball, aurB,
and Df31, were also highly upregulated in ISCs. Using gene and
protein traps, we validated the expression patterns of a number
of ISC-high genes, verifying them to be highly expressed in ISCs
(Figure S1D).
To understand the progressive changes in gene expression
that occur as differentiation proceeds, we followed the expres-
348 Cell Reports 12, 346–358, July 14, 2015 ª2015 The Authors
sion patterns of the 2,456 differentially expressed genes and
found that the expression of 181 genes progressively increased
as differentiation proceeded from ISCs to EBs to ECs, including
genes involved in proteolysis, Ser6 and zTrypsin, mucins such as
Mucin-68E, and the oxidative stress response geneGstE9 (Table
S3). Only 41 genes decreased in expression from ISCs to EBs to
ECs, including the TF sna and epigenetic factors piwi and zuc
(Table S3), suggesting that these genes could be required for
stem cell maintenance and/or that their repression in EBs might

Figure 2. Novel Marker Genes and Role of
Smvt in ISC Functionality
(A) Stem cell-specific transporter genes:
CG10006,Smvt, andOatp58DC. GFP showing co-
localization with Delta antibody. Gal4 lines spe-
cifically mark ISCs and ISC-EB pairs. Boxes show
ISC-EB pairs. The red box shows rare GFP+ EB
cell. Scale bar, 50 mm.
(B) Quantification of ISCs and ISC-EB pairs for
CG10006, Smvt, and Oatp58Dc.
(C) Toy specifically marks EBs in the midgut. toy-
Gal4-UAS-GFP marks cells having small nuclei
that are negative for Delta and Prospero. Arrows
showing Delta-negative EBs adjacent Delta-posi-
tive ISCs in ISC-EB pairs.
(D) CG5160 specifically marks a fraction of EEs
and co-localizes with Prospero.
(E0 ) Ptx1 Gal4 is expressed in R3 cells.
(E0 0) exex Gal4 is expressed in cells of R1–R4, but
not R5.
be a prerequisite for differentiation. We identified 177 EB-high
genes, including twin of eyeless (toy), tor, and Ptth. 226 genes,
including neuropeptides Tk and DH31, were temporarily
repressed by at least 2-fold in EBs as compared to ISCs and
ECs (Table S1).
Altogether, our expression profiling showed that the
Drosophila midgut is a transcriptionally diverse tissue and char-
acterized differentiation as a complex process involving progres-
sive changes in gene expression from stem cells to differentiated
cells. It is noteworthy that the EB, typically viewed as a transient
intermediate cell type, displayed a distinct, unique transcrip-
tional profile.
Identification of Markers and Their Functionsin the MidgutTo find additional drivers and markers for intestinal cells, we
screened GAL4 enhancer traps of genes identified as cell-type
specific by our FACS/RNA-seq analysis. By this approach, we
identified the transporters Zip71B/CG10006, Smvt (primarily a
biotin transporter), and Oatp58Dc as specific markers for ISCs
and ISC-EB pairs, suggesting specific metabolic requirements
for ISCs (Figures 2A and 2B). The toy-Gal4 enhancer trap specif-
ically marked cells having small nuclei, adjacent toDelta+ ISCs in
the newly formed ISC-EB pairs. These cells were negative for
Cell Reports 12, 346–
Delta and Pros but positive for esg, con-
firming that toy specifically marks the
EBs in the gut (Figure 2C). We validated
CG5160 (a GTPase) as an EE-specific
gene that marks a fraction of Pros+ cells
(Figure 2D). Slit, the ligand for the ISC-
specific receptor Robo2/lea, was highly
enriched in EEs as reported previously
(Table S1) (Biteau and Jasper, 2014). No
specific Gal4 driver for ECs was found,
as the expression of most Gal4 lines of
EC-high genes partially overlapped with
the VMs. Ptx1-Gal4 was found to specif-
ically mark cells of the copper cell region
or R3, and exex-Gal4 specifically marked progenitors and EEs of
all regions but R5 (Figures 2E0 and 2E0 0).To study the function of the identified ‘‘ISC-high’’ genes, we
silenced the expression of these genes using the conditional
esg-Gal4 tub-Gal80ts (esg-Gal4ts) driver system, which allows
the conditional induction of UAS-linked RNAi and a marker
gene (UAS-GFP) in progenitor cells (ISCs and EBs; Jiang and
Edgar, 2009). Infection with a low dose of the gut pathogenPseu-
domonas entomophila stimulates ISC proliferation, which can be
measured by quantifying the number of phospho-histone 3+
(PH3+) cells. Within 3 days of Smvt silencing (with two different
SmvtRNAi lines) using the esg-Gal4ts driver, we observed a loss
of Delta+ ISCs (Figure S2A). Rounded GFP+ progenitor-like cells
were still present, whichwere both Pdm1– andPros– (markers for
ECs and EEs) (Figure S2B). To test if Smvt-depleted stem cells
could respond to damage and stress, we infected esgts >
SmvtRNAi flies with P. entomophila for 2 days. Strikingly, these
flies had shrunken midguts and were susceptible to infection
(Figures S2C and S2E). Quantification of PH3+ cells confirmed
a lack of proliferative response (Figures S2C and S2D). Further,
an increase in Smvt expression was also observed in ISCs
upon infection (Figure S2F). Next, SmvtRNAi was induced specif-
ically in ISCs using an ISC-specific driver, esg-Gal4; Su(H)Gal80,
Gal80ts.Within 7 days of induction ofSmvtRNAi, a loss of ISCswas
358, July 14, 2015 ª2015 The Authors 349

Figure 3. GATAe and Kayak Are Regulators
of StemCell Maintenance andRegeneration
in the Midgut
(A) Kaplan-Meier survival plot of esg-Gal4ts flies
expressing RNAi against GATAe upon infection
with P. entomophila bacteria (p < 0.0001, log-rank
[Mantel-Cox] test).
(B) Mitotic marker PH3+ counts confirming loss of
regeneration in esg-Gal4ts flies expressing
GATAeRNAi (n = 7).
(C and D)GATAe silencing inDl-Gal4ts flies causes
reduction in the number of Delta+ ISCs (quantified
in R2) and proliferative response upon infection.
(E) GATAe silencing in Su(H)-Gal4ts flies does not
inhibit proliferation or regenerative response upon
infection (ns, not significant).
(F) PH3+ cell quantifications showing reduced
regeneration potential in esg-Gal4ts flies express-
ing RNAi against Kayak.
(G and H) Kayak silencing in Dl-Gal4ts flies leads
to reduced proliferative response to infection,
without affecting number of Delta+ ISC (quantified
in R2).
observed, specifically in R1 and R5 (Figure S2G). Conversely,
silencing Smvt in Su(H)+ progenitor cells led to a mild increase
in proliferation, most likely due to cell stress in EBs, which in
turn induced ISC proliferation. However, functional Delta+ ISCs
were still present in thesemidguts, which could respond to infec-
tion (Figure S2H). Altogether, we identified cell- and regional-
marker genes, and our results elucidated the crucial role of
Smvt in maintaining functional ISCs and regulating midgut
homeostasis.
The TFs GATAe and Kayak Regulate ISC Maintenanceand Midgut HomeostasisNext, as a potential way to find candidate TFs that might regulate
ISCs, we used the i-cisTarget program (Herrmann et al., 2012) to
identify TF binding sites enriched in the promoters of ISC-high
genes (Table S1). In this gene set, we found enrichment for bind-
ing sites for the TFs sna, kayak,Da,Ase, lola,GATAe, andGATAd
(Table S4). Similarly, we identified transcriptional regulators of
EB-, EC-, and EE-specific genes, some of which were also spe-
cifically expressed in the same cell types as their predicted tar-
gets, such as toy and onecut (Figure 2C; Table S5).
To test whether our predicted ISC regulatory TFs are
important for ISC function, we first depleted several of them
in ISCs and EBs using an esg-Gal4ts driver and RNAi. After
7 days of expressing two different RNAi constructs against
GATAe and 24 hr of P. entomophila infection, mortality of flies
expressing GATAeRNAi increased relative to controls (Figure 3A),
with a significant decrease in the regenerative response (Fig-
350 Cell Reports 12, 346–358, July 14, 2015 ª2015 The Authors
ure 3B). We observed no effect of RNAi
against GATAd, indicating that GATAe
is the principle GATA factor required for
midgut regeneration (data not shown).
GATAeRNAi was then induced separately
in ISCs and EBs using the Delta-Gal4
tub-Gal80ts (Delta-Gal4ts), esg-Gal4; Su(H)Gal80 Gal80ts, or
Su(H)-Gal4 tub-Gal80ts (Su(H)-Gal4ts) driver lines (specific to
ISCs and EBs, respectively). Upon silencing GATAe with
Delta-Gal4ts for 7 days, reduced number of GFP+ ISCs and a
drop in the regenerative potential upon infection was observed
(Figures 3C, 3D, and S3A). Induction of GATAeRNAi under the
control of Su(H)-Gal4ts also caused GFP+ cell loss, although
these flies displayed a normal regenerative response upon
infection (Figures 3E, S3B, and S3C).
Upon expressing RNAi against Kayak under esg-Gal4ts or
Delta-Gal4ts flies for 7 days, we observed a reduced proliferative
response to infection, although the number of GFP+ ISCs re-
mained unchanged (Figures 3F–3H). Altogether, these results
demonstrate that GATAe acts in a cell-autonomous manner to
regulate ISC maintenance and that both Kayak and GATAe
have essential cell-autonomous functions in ISCs during midgut
homeostasis and regeneration.
Snail Regulates ISC Proliferation and ProgenitorDifferentiationSna is a Snail family TF that was predicted by i-cisTarget as a po-
tential regulator of ISCs. Using a sna-LacZ reporter line, we first
confirmed sna to be expressed specifically and primarily in R3,
R4, and R5 ISCs and also in newly formed ISC-EB pairs (Figures
4A and 4B). While sna was highly expressed in ISCs, it also
showed relatively high expression in EBs (Figure 4B). Co-staining
for Su(H), Snail-LacZ, and Delta revealed the existence of cells
(always in ISC-EB pairs) that were positive for all three markers,

Figure 4. Sna Regulates ISC Proliferation
and Progenitor Differentiation
(A) sna-6.1-lacZ specifically marks ISCs and ISC-
EB pairs.
(B) sna is highly expressed in ISCs of R3, R4, and
R5. EBs express considerably high levels of sna.
(C and D) Induction of UAS-sna in esg F/O flies
abolishes differentiation and leads to formation of
Pdm1–, Pros– three- to four-cell clusters. Full ar-
rows showing UAS-sna cell clusters negative for
Pros and Pdm1.
(E) esg-Gal4ts > SnaRNAi flies have GFP+ and Pros+,
Pdm1+ cells. Empty arrowheads show PH3+cells
(scale bar, 50 mm).
(F) snaRNAi induction in esg F/O flies for 7 days
leads to bigger cell clusters (scale bar, 25 mm).
(G) Quantification of PH3+ cells shows that
silencing of sna in esg-Gal4; Su(H)Gal80, Gal80ts
flies leads to higher proliferation rates (p < 0.0038,
Student’s t test with Welch’s correction).
(H) Overexpression of sna in ISCs leads to slowly
dividing three- to four-cell cluster; however, ISCs
are still responsive to infection stress (n = 6).
confirming previous reports (Bardin et al., 2010; Ohlstein and
Spradling, 2007), indicating that Delta expression is maintained
in early EBs (Figure S4A). sna expression was found to be down-
regulated in ISCs and EBs upon infection (Figure S4D). Expres-
sion of sna also progressively decreases from ISCs to EBs to
ECs, suggesting that snamay need to be downregulated for dif-
ferentiation (Table S3). Consistent with this notion, overexpres-
sion of sna specifically in EBs for 5 days using Su(H)-Gal4ts led
to increased numbers of Su(H)+ cells (Figure S4B). We further
used the esgF/O lineage-tracing system to drive UAS-sna, thus
locking sna expression ‘‘on’’ in the ISC lineage. After 14 days
of UAS-sna induction under esgF/O control, clusters (clones) of
three to four small cells formed that were negative for differenti-
ationmarkers of both ECs (Pdm1) and EEs (Prospero; Figures 4C
and 4D). Thus, enforced sna expression completely blocked the
differentiation of progenitor cells. These midguts also had
reduced cell proliferation compared to controls and isolated
Delta+ ISC cells were observed, whereas control guts typically
had two or more Delta+ ISCs in each cluster (Figures 4H and
S4C). Upon infection with P. entomophila, flies overexpressing
sna could still respond by increasing the ISC division rate, indi-
Cell Reports 12, 346–
cating that these cells were viable and re-
tained stem cell behavior (Figure 4H).
Conversely, sna silencing using esg-
Gal4ts or esg-Gal4; Su(H)Gal80, Gal80ts
(ISC driver) flies for 10 days led to an in-
crease in Delta+ cells (Figure S4F) and
ISC proliferation rates (Figures 4E0 0, 4G,
and S4E). Regular cellular architecture
as observed with Armadillo staining
became aberrant in sna-depleted mid-
guts (Figure S4G). Many esg+ Pdm1+
and esg+ Pros+ double-positive cells
were observed, suggesting that loss of
sna in EBs may lead to precocious differentiation (Figures 4E0
and 4E0 0). After 7 days of snaRNAi induction by esgF/O, clusters
of nine or ten cells were formed as compared to clusters of
two or three cells in controls (Figure 4F), indicating increased
ISC proliferation. It remains to be determined whether this in-
crease in proliferation upon sna silencing is a direct cell-autono-
mous effect in ISCs or the indirect consequence of a stress
response triggered by loss of sna.
Intestinal Stem Cells Are Regionally SpecializedHierarchical clustering of ISCs across midgut regions revealed
that R1 ISCs (which included some type I GaSCs) and R3 ISCs
(the type II GASCs) were quite distinct from the ISCs of R2,
R4, and R5 (Figure 5A). Expression of all ISC-high genes,
including the Notch ligand Delta and sna, varied in ISCs along
the midgut by �1.5- to 2-fold, and 920 genes showed regional
variation in expression in ISCs (Figure 5C). GO analysis of
these genes revealed strong enrichment for genes involved
in transmembrane transport, ATP-hydrolysis-coupled proton
transport, and proteolysis (Table S6). Key genes in those cat-
egories, such as vacuolar H+ ATPases, were found to be R3
358, July 14, 2015 ª2015 The Authors 351

Figure 5. Distinct Specificities of ISCs Influence Regional Behavior
(A) Cluster dendogram of ISCs in regions R1–R5. R1 and R3 ISCs are distinct from other regions.
(B) Expression of regulatory genes across regions. lab and Ptx1 are highly expressed in R3 ISCs, and cell-cycle genes are weakly expressed in R3.
(C) Expression of (showing top 50) stem cell-specific genes varies across regions.
(D) lab overexpression in esg-Gal4ts flies partially abolishes regenerative response in flies upon infection.
(E) Ptx1 silencing in esg-Gal4ts flies accelerates proliferation of R3 ISCs, causing full renewal of the R3 region as compared to R3 in control flies (scale bar, 25 mm).
(F) Quantification of PH3+ cells upon Labial overexpression.
(G) PH3+ cell quantification in R3 of esg-Gal4ts > Ptx1RNAi flies (p < 0.0001, Student’s t test with Welch’s correction).
(H) Length of R3 region decreases upon Ptx1 silencing (n = 6–7).
(I) Ptx1 silencing in esg-Gal4ts flies leads to loss of R3 acidity as shown by bromophenol blue staining.
352 Cell Reports 12, 346–358, July 14, 2015 ª2015 The Authors

specific (>3- to 12-fold as compared to other regions), the
most acidic compartment of the midgut, suggesting a special-
ization of R3 ISCs to their physiological function (Table S6).
We successfully validated the regional expression of a number
of ISC-high genes using Gal4 enhancer trap lines and GFP
gene traps. These included sna, polo, Smvt, Oatp59Dc, and
mira (Figure S5A).
Pro-proliferative components of the EGFR and JAK-STAT
pathways were found to be most highly expressed in R2, R4,
and R5 ISCs, suggesting that quantitative differences in activ-
ity of these pathways could account for regional differences in
ISC proliferation (Figure S5B). R3 ISCs also expressed low
levels of cell-cycle regulatory genes, such as cdc2c, Psf1,
Sld5, Rfc38, and cort (Figure 5B), accounting for their quies-
cent nature. Interestingly, they also expressed high levels of
the regionalized TFs labial (lab) and Ptx1, suggesting that these
TFs might directly modify the regional properties of R3 ISCs
(Figures 2E0 and 5B).
As Delta+ ISC numbers are low in R3, we used the esg-Gal4ts
instead of the Dl-Gal4ts driver for functional tests of lab and Ptx1.
Ectopic expression of UAS-lab in esg-Gal4ts flies led to a partial
loss of regenerative capacity in all midgut regions after
P. entomophila infection, suggesting that lab overexpression in
ISCs outside R3 could block proliferation (Figures 5D and 5F).
Knockdown of lab by RNAi in progenitor cells did not change
regional identity or turnover rates in R3 (data not shown). In
contrast, silencing Ptx1 by expressing RNAi using the esgF/O or
esg-Gal4ts systems led to accelerated ISC proliferation and
epithelial renewal in R3 (Figures 5E, 5G, and S5C). No increase
in proliferation was observed in R3 upon expression of Ptx1RNAi
specifically in ECs, confirming that loss of Ptx1 accelerates pro-
liferation in R3 by acting autonomously in progenitors (Figures
S5E and S5F). Curiously, the R3 region was also shortened in
Ptx1RNAi-expressing flies, and bromophenol blue staining re-
vealed a complete loss of R3 acidity (loss of yellowish color)
upon Ptx1 silencing in both Myo1A-Gal4ts and esg-Gal4ts flies
(Figures 5H, 5I, and S5D) indicating a role of Ptx1 in the normal
function of the R3 region. Altogether, our results confirm that
the R3-specific TFs Ptx1 and lab modulate the regional proper-
ties of R3 ISCs in the region.
The Transcriptomes of Differentiated ECs, EEs, and EBsVary by Midgut RegionTranscriptomes of differentiated epithelial cells (ECs and EEs)
displayed more regional variation in expression than progenitor
cells, consistent with their varied morphology (Figures 6A, S6A,
and S6B). We examined cell-specific expression of digestive en-
zymes and nutrient transporters and found some of them to be
cell-type and regionally specific, mainly in the differentiated
ECs, EEs, and VMs. (Figure 6B). While glycoside hydrolases
like Amy-d, Hexo1, Cda9, and lipase CG6271 were primarily ex-
pressed in R1 and R3, serine type peptidases like Fur1, Jon44E,
and Ser6were highly expressed by the ECs, EEs, and VMs of R4
and R5 (Figure 6B). Glucose transporter Glut1 was expressed in
R1 VMs, ECs, and EEs, and amino acid transporters NAAT1 and
EAAT1 were expressed primarily in VMs of R1 and R5.
Genes that varied regionally in ECswere enriched in 31 biolog-
ical process GO terms including ATP-dependent proteolysis and
aminoglycan metabolic process (Figure 6B; Table S6). Genes
involved in immune regulation are also strongly patterned, espe-
cially in enterocytes (Buchon et al., 2013a). Likewise, genes en-
coding peptidoglycan recognition proteins (PGRPs) displayed
high regional specificity. For instance, PGRP-SD was primarily
expressed in R1 and R4, whereas expression of PGRP-SC1a
was highest in R3 and R4, indicative of regionalized regulation
of immune defense in the gut (Figure 6C).
EEs showed particularly strong differences in expression by
region (Figures 6A, 6D, and S6A). 35 biological process GO
terms were significantly enriched among differentially expressed
genes in EEs across regions. These included the transmembrane
transport-GPCR signaling pathway and humoral immune
response (Table S6). We detected a patterned expression of all
known neuropeptide hormones, including Tk, Dh31, Ast-A,
Mip,NPF,Bursicon, andCCHamide-1, 2, along the gut (Veenstra
et al., 2008; Scopelliti et al., 2014) (Figure 6D). In agreement with
our genomic data, Tk-Gal4 displayed a distinct regionalized
expression pattern (compare Figure 6D and Figure S6C). Hor-
mones not previously detected in the gut, such as CCAP, were
also expressed specifically in EEs (Table S1).
Genes differentially expressed in EBs across regions showed
72 enriched GO functions. These included ‘‘open tracheal sys-
tem’’ and ‘‘regulation of anatomical structure size’’ (Table S6).
These results show that each midgut cell population has its
own exclusive regional expression pattern. Interestingly, some
consistency was observed among the genes that were regionally
expressed in progenitors and differentiated cells for each region,
suggesting that regionality might be inherited through the stem
cell lineage or regional identity could be coordinated by posi-
tional cues.
VM Cells Express Growth Factors in a Region-SpecificMannerRemarkably, mesodermally derived VMs were the most variable
in gene expression across midgut regions as compared to other
cell types (Figure S1A; Table S6). 108 biological process GO
terms, including regulation of hormone levels and digestive tract
development, were significantly enriched among the genes
differentially expressed by region in VMs (Table S6). Notably,
the morphogens Wnt1/wg, Wnt4, Wnt6, and WntD had their
highest expression in VMs and were expressed in gradients, pri-
marily in R1 and R5, in agreement with a previous study on gut
regionalization (Figure S6D; Buchon et al., 2013a). The EGFR
ligand Vn, involved in ISC proliferation, was preferentially ex-
pressed in the VMs of R4 and R5, the most proliferative regions
of the gut (Figure 6E). The morphogen Dpp was specifically ex-
pressed in the VMs in a regionalized manner (Figure 6E). These
results illustrate that paracrine signals from VMs differ quantita-
tively and qualitatively between different regions, suggesting that
these could modulate regional identity and cell behavior along
the gut.
Infection Induces Massive Transcriptional Responsesin Midgut CellsInfection massively alters gut structure, and this confounded our
attempts to sort cells from specific regions. Instead, we moni-
tored changes in the transcriptome of each cell type FACS
Cell Reports 12, 346–358, July 14, 2015 ª2015 The Authors 353
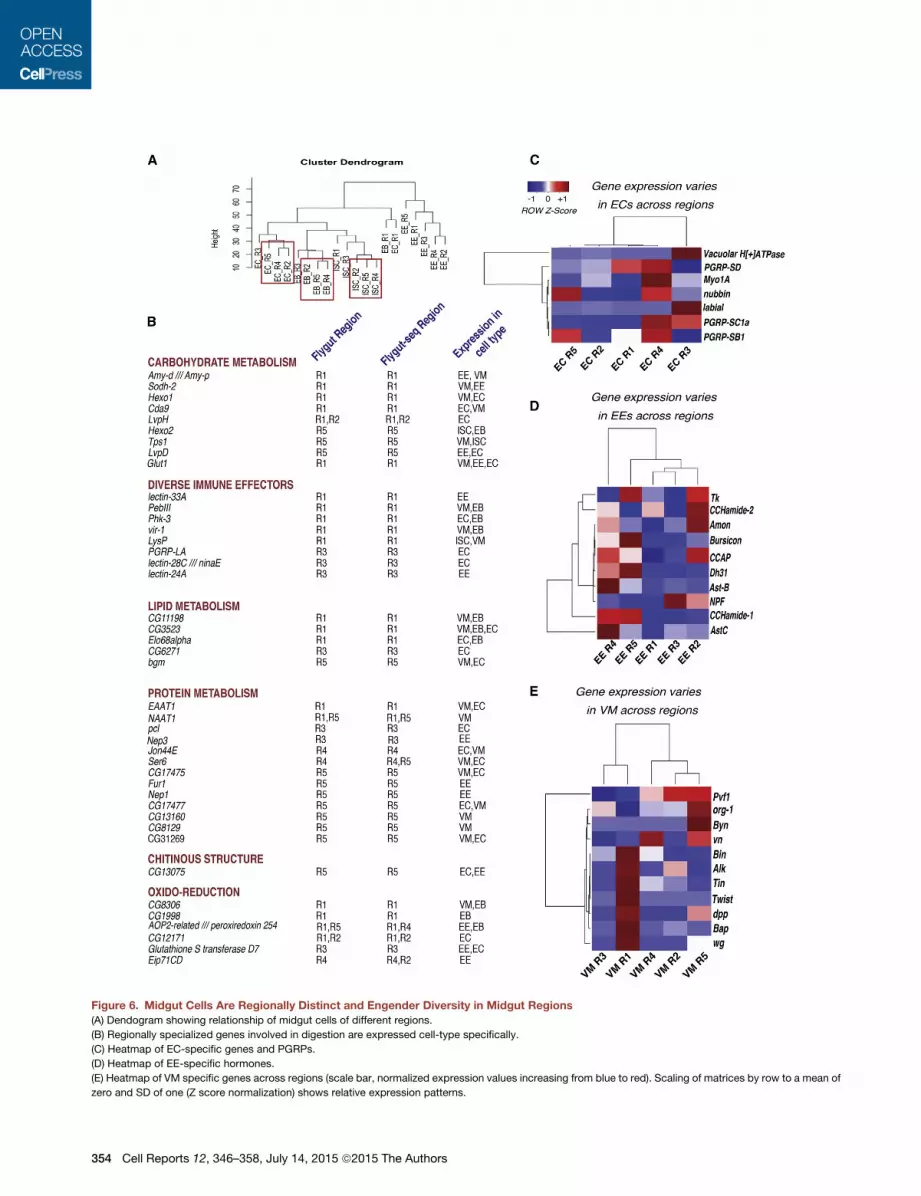
Figure 6. Midgut Cells Are Regionally Distinct and Engender Diversity in Midgut Regions
(A) Dendogram showing relationship of midgut cells of different regions.
(B) Regionally specialized genes involved in digestion are expressed cell-type specifically.
(C) Heatmap of EC-specific genes and PGRPs.
(D) Heatmap of EE-specific hormones.
(E) Heatmap of VM specific genes across regions (scale bar, normalized expression values increasing from blue to red). Scaling of matrices by row to a mean of
zero and SD of one (Z score normalization) shows relative expression patterns.
354 Cell Reports 12, 346–358, July 14, 2015 ª2015 The Authors

Figure 7. Cell-Type-Specific Responses upon Infection with P. entomophila
(A) Cluster dendogram showing infection leads to huge cell-type-specific responses. I, infected; P, physiological.
(B) Antimicrobial peptide (AMP) expression increases in EEs upon infection (UC, unchallenged; Pe, P. entomophila). Scale bar, normalized expression values
increasing from blue to red.
(C) Kaplan-Meier survival plot showing EE-depleted flies have higher susceptibility to infection as compared to controls (p < 0.0001, log-rank [Mantel-Cox] test,
3 3 15 animals/genotype).
(D) Model of intestinal response upon P. entomophila infection.
sorted from whole midguts following enteric infection with
P. entomophila. Rapid epithelium renewal following infection is
expected to change the specificity of our GFP cell markers, since
GFP is a relatively stable protein and is transmitted to daughter
cells following ISC division. To minimize this problem, we sorted
cells both based on GFP marker expression and cell size (see
Experimental Procedures). Genes involved in cell-cycle progres-
sion (polo, cdc2, tum, and Cks30A) and the ISC marker Delta re-
mained expressed in ISCs andwere not highly expressed in EBs.
Similarly, pros and Rab3 remained EE specific and toy remained
EB specific (Figure S6E; Table S7), indicating that our sorting
method did not grossly compromise cell specificity.
Across all cell types, a total of 6,734 genes were differentially
expressed after infection by P. entomophila, indicating that
infection leads to a massive shift in the midgut transcriptional
landscape (Table S7). GO enrichment analysis indicated that
expression of genes involved in cell differentiation (pros, nubbin,
pdm2, and pdm3), transport (Smvt and ABCB7), and antimicro-
bial peptides (AMPs; AttA, AttC, and CecA2; Table S8) were
among the most affected. 1,833 genes were differentially ex-
pressed in ISCs and 2646 in EBs. ECs and EEs also displayed
significant responses, but to a lesser extent, with 233 and 453
genes differentially expressed, respectively (Figure 7A). In ECs,
infection altered the expression of genes involved in ribosome
biogenesis, transport, DNA repair, and DNA replication genes
like Fen1, Pms2, and Rad9 and immunity effectors like AttD
and PGRP-SB1 (Tables S7 and S8). This is in agreement with
our data showing that new ECs endocycle upon infection to
grow, generating larger cells than at homeostasis (B.A.E. and
J. Xiang, unpublished data).
While ECs are known to be the front line in immune defense
(Miron and Cristea, 2012), expression of many AMPs was strik-
ingly induced in EEs upon infection (Figure 7B). Some of these
AMPs were much more strongly induced in EEs, whereas others
were more highly induced in ECs or EBs, suggesting cell-type-
specific regulation of the immune response (Figure 7B). To test
whether EEs are important in responding to pathogens, we
ablated them by expressing UAS-rpr (Reaper) for 3 days with
Cell Reports 12, 346–358, July 14, 2015 ª2015 The Authors 355

the EE-specific Gal4 driver Pros-v1-Gal4ts. While unchallenged
EE-depleted flies survived for at least 15 days, they were more
susceptible to P. entomophila infection than controls (Figure 7C).
Upon infection, EBs also produced AMPs and specifically acti-
vated genes involved in organ development (e.g., abd-A,
Actin57B, and ao), consistent with a dual role in the immune
response and in the direct reconstruction of the tissue (Tables
S7 and S8). ISCs did not seem to contribute to the production
of immune effectors. Altogether, these results show that infec-
tion generates massive changes in transcription in all cell types,
ranging from ISC activation and immune induction in EBs, ECs,
and EEs to hormonal alterations.
DISCUSSION
A Unique ISC-Specific Gene Repertoire Associated withStemnessIn our analysis, we uncovered genes highly expressed in ISCs
and identified enriched cis-regulatory motifs upstream of these
‘‘ISC-high’’ genes. This approach identified GATAe, sna, Fos
(Kayak), and Ptx1 as central regulators of ISC behavior and
paved the way for future studies on more factors that could in-
fluence ISC functionality. We confirmed sna as a regional ISC-
high gene that regulates stem cell differentiation in the midgut
similar to its paralog, escargot (esg) (Korzelius et al., 2014). In
contrast, GATAe functions in ISC maintenance, much like its
mammalian homolog, GATA6, which is involved in the mainte-
nance and proliferation of stem cells and colorectal cancer
(Beuling et al., 2012; Whissell et al., 2014). Kay (the fly homolog
of Fos) and Da had previously been identified as TFs that control
ISC activity and fate (Biteau and Jasper, 2011; Bardin et al.,
2010). Thus, our results indicate that stem cell activity is
controlled not by a single factor but by a combinatorial network
of autonomously acting TFs such as GATAe, kayak, and sna and
previously studied da, esg, and sc, which in concert regulate
stemness in the midgut. This dataset could be a useful resource
for identifying mammalian homologs with similar functions in
stem and cancer cells and in understanding TF regulatory net-
works in mammals.
The primary source of biotin forDrosophila is dietary yeast and
enteric bacteria. Interestingly, we show that the biotin trans-
porter Smvt (Camporeale et al., 2007) is essential for ISC main-
tenance and homeostasis, signifying the importance of nutrients
derived from symbiotic organisms in regulating intestinal homeo-
stasis and ISC function (Buchon et al., 2009, 2013b).
Regional Cell Specialization Influenced Regional Formand FunctionAn evolutionarily conserved feature of the gastrointestinal tract is
the division of function between specialized regions. Our study
reveals that all cell types of theDrosophilamidgut have profound
regional variation in their gene expression. Nevertheless, differ-
ences between intestinal cell types were even more pronounced
than regional variations within a specific cell type (Figure 1B). For
all cell types, we consistently found the cells of regions R1 and
R3 to be vastly different from those of the other regions (Figures
1B and S6A). This suggests that the specialization of all cells in a
region is coordinated.
356 Cell Reports 12, 346–358, July 14, 2015 ª2015 The Authors
In the gut epithelium proper, differentiated cells showed the
most regionalization,with EEsbeing themost variant between re-
gions. In agreement with recent studies documenting enteroen-
docrine cell diversity in the midgut (Beehler-Evans andMicchelli,
2015; Veenstra et al., 2008), our results indicate that there are
multiple subtypes of the hormone secreting EEs that likely have
regionalized functions. EBs and ECs also showed clear regional
specificities, including altered expression of genes involved in
metabolism and digestion. Although lipases, glycoside hydro-
lases, and glucose transporters were highly expressed in the
anterior midgut, serine endopeptidases and amino acid trans-
porters were primarily expressed in the posterior midgut cells,
consistent with the premise that digestion is highly compartmen-
talized (Buchon et al., 2013a; Marianes and Spradling, 2013).
Remarkably, multipotent ISCs also displayed transcriptional
variation along the length of the gut. Different ISC populations
differ in the levels of effectors and targets in key signaling path-
ways, such as EGFR/Ras/MAPK, Wnt, and JAK/STAT, also
showing distinct qualitative differences. Of note, ISCs of the
acidic R3 express vacuolar H+ ATPases, indicating an adapta-
tion of ISCs to their local environment. Our tests showed that
the R3-specific TFs Ptx1 and lab are important for maintaining
these regional ISC regional properties. We identified additional
regionalized TFs like exex and Drm, and some of these are likely
to control other regional properties. While regionalized gene
expression almost certainly determines regional differences in
cell morphology and function, enteric environment factors
(e.g., microbiota and nutrition distributions) within the gut might
also influence regional characteristics.
The transcriptome of visceral muscles varied strongly by re-
gion, and studies have suggested that regional identities in the
gut are maintained by gradients of morphogens (Buchon et al.,
2013a; Li et al., 2013). Accordingly, the morphogens Wg,
Wnt 4, Wnt 6, WntD, Dpp, and Vn were expressed in gradients
in VM cells, suggesting roles for these components of the stem
cell niche in defining a region’s transcriptional signature. How-
ever, we noticed that spatial expression of lowly expressed li-
gands like Dpp and Upd3 varied from previous reports (Jiang
et al., 2009; Tian and Jiang, 2014), and thus, this dataset should
be used with discretion in such cases. Solely based on gene
expression data, we cannot determine whether the ISCs or niche
cells such as VMs are primary in establishing and maintaining
regionalization. It will be interesting to test whether differences
in the niche are driven by gut-extrinsic factors or whether ISCs
engineer their own niche through self-reinforcing feedback, for
instance, by epigenetic programming of daughter cells. We
hope that our data will guide future experiments that test
the cross-talk between stem cells and the niche in midgut
regionalization.
Differentiated EEs and ECs Combat Enteric InfectionWe uncovered an unexpected role for EEs as potential players in
the immune response to pathogens by inducing AMP expression
along with ECs and EBs. Interestingly, the different cell types
produce different combinations of AMPs, suggesting a speciali-
zation by cell type in the immune response, as also found in the
mammalian digestive tract (Peterson and Artis, 2014). We pro-
pose a model (Figure 7D) wherein infection either directly

activates EEs to express AMPs or the damaged ECs signal ISCs
to proliferate and EEs to produce AMPs. Further studies will be
required to clearly define the response of EEs to infection.
In conclusion, we have systematically characterized transcrip-
tion by genomic analysis of regions and cell types in the
Drosophila midgut. Gut regionalization is a critical factor for hu-
man health, as diseases of intestinal origin are often regionalized.
We hope that the dataset we provide (http://flygutseq.
buchonlab.com/) will help to pave the way for future studies
that elucidate the complex interplay among midgut cells, re-
gions, and microbes that will promote our understanding of gut
physiology and homeostasis.
EXPERIMENTAL PROCEDURES
Fly Strains and Crosses
Flies for all experiments were maintained at 18�C or 25�C. 7- to 10-day-old fe-
male flies were used for all expression profiling experiments. Flies were shifted
for 3 days to 29�C prior to dissection and FACS sorting. The following fly lines
were used to select different cell populations: esg-Gal4 UAS-GFP; tub-Gal80ts
(ISCs and EBs), Dl-Gal4 UAS-CD8-GFP (ISCs), Su(H)GBE-Gal4 UAS-GFP;
tub-Gal80ts (EBs), Myo1A-Gal4; tub-Gal80ts UAS-GFP (ECs), How-
Gal4 UAS-GFP; tub-Gal80ts (VM), and Rab3-YFP or tub-Gal80ts UAS-GFP;
Pros-v1-Gal4 for (EEs).
For functional tests we used the following genotypes: Dl-Gal4 UAS-GFP;
tub-Gal80ts or esg-Gal4 UAS-GFP; tub-Gal80ts Su(H)GBE-tub-Gal80 (for
ISCs), w; UAS-Snail; Tk-Gal4; VDRC stocks SmvtRNAi - v102662, v40650;
SnailRNAi - v6232, v50004; Ptx1RNAi- v10778, and v19831; and Bloomington
TRiP lines GATAeRNAi - 33748, 34641 and 34907; LabialRNAi- 26753.
RNA Sample Preparation for Sequencing
For region-specific cell-type profiling, individual regions were dissected and
dissociated as described in Dutta et al. (2013). Briefly, 100–150 guts were
dissected in RNase-free PBS and dissociated for 45 min to 1 hr using 100 ml
elastase (4 mg/ml stock) in 400 ml PBS (final concentration 0.8 mg/ml) at
27�C with frequent pipetting. Different filter sizes were used (25 mm for ISCs,
40 mm for EBs and EEs, 70 mm for ECs, and 100 mm for VMs. Cells were
then sorted based on intensity of marker expression using FACS Aria III (BD
Biosciences), with 85- to 100-mm nozzle sizes. More than 2,000 cells were
sorted for cell-type-specific profiling. Visceral muscle cells are large syncytia;
hence, a longer andmore vigorous treatment with 150 ml elastase was done for
1.5–2 hr for each region. Cells were sorted straight into RNA extraction buffer.
Extracted RNAwas amplified as described previously (Dutta et al., 2013), con-
verted to cDNA, and sequenced using an Illumina HiSeq2000 machine. The
RNA-seq protocol is detailed in the Supplemental Experimental Procedures.
Mapping, Quantification, and Visualization
Raw fastq reads weremapped to theDrosophila genome (Drosophila_melano-
gaster.BDGP5.70.dna.toplevel.fa) using Tophat 2.0.9, allowing two mis-
matches. Integrated Genomics Viewer was used to visualize mapped reads.
Unmapped reads were discarded. Python package HTSeq version 0.5.4p5
was used to generate raw counts, and DESeq (p value adjustment 0.05 by
the Benjamini-Hochberg method) was used for differential expression
analysis.
cis-Regulatory Module Prediction
Regulatory elements andCRMswere predicted using the integrative genomics
method i-cisTarget (Herrmann et al., 2012). Regionmappingwas set to default:
5 kb upstream, 50 UTR, and first intron for prediction of potential transcriptional
regulators.
Immunofluorescence and Gal4 Line Screen
After dissection and paraformaldehyde fixation, midguts were stained with an-
tibodies as per standard protocols (Jiang et al., 2009). Gal4 enhancer traps
were crossed to UAS-nls-GFP flies, and co-localization of GFP-marked cells
and Delta- or Pros-positive cells was examined using a Leica SP5 (three bio-
logical replicates) to check for specificity of gene expression in cells. Source
of antibodies used can be found in the Supplemental Experimental
Procedures.
Survival Experiments and Mitotic Index
Adult flies were shifted to 29�C for 2–3 days before infection and flies were in-
fected with P. entomophila for 48 hr. The number of living flies were counted
roughly every 12–24 hr. Mitotic index was determined by counting the number
of PH3-positive cells from 6–15 whole female midguts from three independent
experiments.
Bromophenol Blue Staining
Flies were maintained on 0.3% bromophenol blue diet for 24 hr following
7 days induction of RNAi at 29�C on standard food.
Additional Methods
Details regarding mRNA sequencing, RPKM normalization, bacterial infection,
FACS, and image analysis protocols are provided in the Supplemental Exper-
imental Procedures.
ACCESSION NUMBERS
The data discussed in this publication have been deposited to the NCBI GEO
and are available under accession number GEO:GSE61361.
SUPPLEMENTAL INFORMATION
Supplemental Information includes Supplemental Experimental Procedures,
six figures, and eight tables and can be found with this article online at
http://dx.doi.org/10.1016/j.celrep.2015.06.009.
AUTHOR CONTRIBUTIONS
D.D., B.A.E., and N.B. conceptualized the project and wrote the manuscript.
D.D. and N.B. generated RNA-seq datasets. D.D. standardized FACS
methods and performed validation experiments. A.J.D., C.G., D.D., and N.B.
performed data analysis. P.L.H. and J.K. helped with experiments on Ptx1
and GATAe and Snail. J.R. designed the Flygut-seq website. A.J.D. and
P.H.P. gave valuable comments during the preparation of the manuscript.
ACKNOWLEDGMENTS
We thank Monika Langlotz and David Ibberson from University of Heidelberg
for help with FACS and RNA sequencing. We are grateful to Maria Leptin, Nor-
bert Perrimon, Craig Micchelli, Joaquin de Navascues, M. Gonzalez-Gaitan,
James C Hombrıa, Steven Hou, Susan Eaton, and Huaqi Jiang for fly stocks
and antibodies. Funded by DFG SFB873, DKFZ A220, and ERC Advanced
Grant 26515 to B.A.E., and N.B. was supported by the Empire State Stem
Cell Fund through New York State Department of Health NYSTEM contract
C029542.
Received: October 9, 2014
Revised: April 2, 2015
Accepted: June 2, 2015
Published: July 2, 2015
REFERENCES
Amcheslavsky, A., Jiang, J., and Ip, Y.T. (2009). Tissue damage-induced intes-
tinal stem cell division in Drosophila. Cell Stem Cell 4, 49–61.
Anders, S., and Huber,W. (2010). Differential expression analysis for sequence
count data. Genome Biol. 11, R106.
Bardin, A.J., Perdigoto, C.N., Southall, T.D., Brand, A.H., and Schweisguth, F.
(2010). Transcriptional control of stem cell maintenance in the Drosophila in-
testine. Development 137, 705–714.
Cell Reports 12, 346–358, July 14, 2015 ª2015 The Authors 357

Beehler-Evans, R., and Micchelli, C.A. (2015). Generation of enteroendocrine
cell diversity in midgut stem cell lineages. Development 142, 654–664.
Beuling, E., Aronson, B.E., Tran, L.M.D., Stapleton, K.A., ter Horst, E.N., Viss-
ers, L.A., Verzi, M.P., and Krasinski, S.D. (2012). GATA6 is required for prolif-
eration, migration, secretory cell maturation, and gene expression in the
mature mouse colon. Mol. Cell. Biol. 32, 3392–3402.
Biteau, B., and Jasper, H. (2011). EGF signaling regulates the proliferation of
intestinal stem cells in Drosophila. Development 138, 1045–1055.
Biteau, B., and Jasper, H. (2014). Slit/Robo signaling regulates cell fate deci-
sions in the intestinal stem cell lineage of Drosophila. Cell Rep. 7, 1867–1875.
Buchon, N., Broderick, N.A., Chakrabarti, S., and Lemaitre, B. (2009). Invasive
and indigenous microbiota impact intestinal stem cell activity through multiple
pathways in Drosophila. Genes Dev. 23, 2333–2344.
Buchon, N., Broderick, N.A., Kuraishi, T., and Lemaitre, B. (2010). Drosophila
EGFR pathway coordinates stem cell proliferation and gut remodeling
following infection. BMC Biol. 8, 152.
Buchon, N., Osman, D., David, F.P.A., Fang, H.Y., Boquete, J.-P., Deplancke,
B., and Lemaitre, B. (2013a). Morphological and molecular characterization of
adult midgut compartmentalization in Drosophila. Cell Rep. 3, 1725–1738.
Buchon, N., Broderick, N.A., and Lemaitre, B. (2013b). Gut homeostasis in a
microbial world: insights from Drosophila melanogaster. Nat. Rev. Microbiol.
11, 615–626.
Camporeale, G., Zempleni, J., and Eissenberg, J.C. (2007). Susceptibility to
heat stress and aberrant gene expression patterns in holocarboxylase synthe-
tase-deficient Drosophila melanogaster are caused by decreased biotinylation
of histones, not of carboxylases. J. Nutr. 137, 885–889.
Cordero, J.B., Stefanatos, R.K., Scopelliti, A., Vidal, M., and Sansom, O.J.
(2012). Inducible progenitor-derived Wingless regulates adult midgut regener-
ation in Drosophila. EMBO J. 31, 3901–3917.
Dimitriadis, V.K. (1991). Fine structure of the midgut of adult Drosophila auraria
and its relationship to the sites of acidophilic secretion. J. Insect Physiol. 37,
167–177.
Dutta, D., Xiang, J., and Edgar, B.A. (2013). RNA expression profiling from
FACS-isolated cells of the Drosophila intestine. Curr. Protoc. Stem Cell Biol.
27, Unit 2F.2.
Goulas, S., Conder, R., and Knoblich, J.A. (2012). The Par complex and integ-
rins direct asymmetric cell division in adult intestinal stem cells. Cell Stem Cell
11, 529–540.
Guo, Z., Driver, I., and Ohlstein, B. (2013). Injury-induced BMP signaling nega-
tively regulates Drosophila midgut homeostasis. J. Cell Biol. 201, 945–961.
Herrmann, C., Van de Sande, B., Potier, D., and Aerts, S. (2012). i-cisTarget: an
integrative genomics method for the prediction of regulatory features and cis-
regulatory modules. Nucleic Acids Res. 40, e114.
Jiang, H., and Edgar, B.A. (2009). EGFR signaling regulates the proliferation of
Drosophila adult midgut progenitors. Development 136, 483–493.
Jiang, H., Patel, P.H., Kohlmaier, A., Grenley, M.O., McEwen, D.G., and Edgar,
B.A. (2009). Cytokine/Jak/Stat signaling mediates regeneration and homeo-
stasis in the Drosophila midgut. Cell 137, 1343–1355.
Jiang, H., Grenley, M.O., Bravo, M.-J., Blumhagen, R.Z., and Edgar, B.A.
(2011). EGFR/Ras/MAPK signaling mediates adult midgut epithelial homeo-
stasis and regeneration in Drosophila. Cell Stem Cell 8, 84–95.
358 Cell Reports 12, 346–358, July 14, 2015 ª2015 The Authors
Korzelius, J., Naumann, S.K., Loza-Coll, M.A., Chan, J.S., Dutta, D., Oberheim,
J., Glaßer, C., Southall, T.D., Brand, A.H., Jones, D.L., and Edgar, B.A. (2014).
Escargot maintains stemness and suppresses differentiation in Drosophila in-
testinal stem cells. EMBO J. 33, 2967–2982.
Li, H., Qi, Y., and Jasper, H. (2013). Dpp signaling determines regional stem
cell identity in the regenerating adult Drosophila gastrointestinal tract. Cell
Rep. 4, 10–18.
Lin, G., Xu, N., and Xi, R. (2008). Paracrine Wingless signalling controls self-
renewal of Drosophila intestinal stem cells. Nature 455, 1119–1123.
Marianes, A., and Spradling, A.C. (2013). Physiological and stem cell compart-
mentalization within the Drosophila midgut. eLife 2, e00886.
Martorell, O., Merlos-Suarez, A., Campbell, K., Barriga, F.M., Christov, C.P.,
Miguel-Aliaga, I., Batlle, E., Casanova, J., and Casali, A. (2014). Conserved
mechanisms of tumorigenesis in the Drosophila adult midgut. PLoS ONE 9,
e88413.
Micchelli, C.A., and Perrimon, N. (2006). Evidence that stem cells reside in the
adult Drosophila midgut epithelium. Nature 439, 475–479.
Miron, N., and Cristea, V. (2012). Enterocytes: active cells in tolerance to food
and microbial antigens in the gut. Clin. Exp. Immunol. 167, 405–412.
Ohlstein, B., and Spradling, A. (2006). The adult Drosophila posterior midgut is
maintained by pluripotent stem cells. Nature 439, 470–474.
Ohlstein, B., and Spradling, A. (2007). Multipotent Drosophila intestinal stem
cells specify daughter cell fates by differential notch signaling. Science 315,
988–992.
Peterson, L.W., and Artis, D. (2014). Intestinal epithelial cells: regulators of bar-
rier function and immune homeostasis. Nat. Rev. Immunol. 14, 141–153.
Scopelliti, A., Cordero, J.B., Diao, F., Strathdee, K., White, B.H., Sansom, O.J.,
and Vidal, M. (2014). Local control of intestinal stem cell homeostasis by enter-
oendocrine cells in the adult Drosophila midgut. Curr. Biol. 24, 1199–1211.
Shaw, R.L., Kohlmaier, A., Polesello, C., Veelken, C., Edgar, B.A., and Tapon,
N. (2010). The Hippo pathway regulates intestinal stem cell proliferation during
Drosophila adult midgut regeneration. Development 137, 4147–4158.
Singh, S.R., Zeng, X., Zheng, Z., and Hou, S.X. (2011). The adult Drosophila
gastric and stomach organs are maintained by a multipotent stem cell pool
at the foregut/midgut junction in the cardia (proventriculus). Cell Cycle 10,
1109–1120.
Strand, M., and Micchelli, C.A. (2011). Quiescent gastric stem cells maintain
the adult Drosophila stomach. Proc. Natl. Acad. Sci. USA 108, 17696–
17701.
Tian, A., and Jiang, J. (2014). Intestinal epithelium-derived BMP controls stem
cell self-renewal in Drosophila adult midgut. eLife 3, e01857.
Veenstra, J.A., Agricola, H.-J., and Sellami, A. (2008). Regulatory peptides in
fruit fly midgut. Cell Tissue Res. 334, 499–516.
Whissell, G., Montagni, E., Martinelli, P., Hernando-Momblona, X., Sevillano,
M., Jung, P., Cortina, C., Calon, A., Abuli, A., Castells, A., et al. (2014). The tran-
scription factor GATA6 enables self-renewal of colon adenoma stem cells by
repressing BMP gene expression. Nat. Cell Biol. 16, 695–707.
Zeng, X., and Hou, S.X. (2015). Enteroendocrine cells are generated from stem
cells through a distinct progenitor in the adult Drosophila posterior midgut.
Development 142, 644–653.