Embed Size (px)
Citation preview
Annual report including audited financial statements as at 31st December 2019
RAM (LUX) SYSTEMATIC FUNDS Société d'Investissement à Capital Variable with multiple sub-funds Luxembourg
R.C.S. Luxembourg B90383
The report is the English translation of the annual report including audited financial statements respectively unaudited semi-annual report in French. In case of a discrepancy of content and/or meaning between the French and English versions, the French version shall prevail. Subscriptions may only be carried out on the basis of this prospectus accompanied by the Articles of Association and the factsheet of each sub-fund and on the basis of the key investor information document ("KIID"). The prospectus must be distributed along with the latest annual report including audited financial statements and semi-annual report, if the latter is more recent than the annual report.
Information for Investors in Germany
No distribution notice has been filed in Germany for the below sub-funds pursuant to section 310 of the Investment
Code; because of this, Shares of the sub-funds may not be distributed publicly to investors falling within the scope of the
German Investment Code: RAM (LUX) SYSTEMATIC FUNDS - LONG/SHORT SUSTAINABLE EQUITIES
RAM (LUX) SYSTEMATIC FUNDS
Table of contents
1
Organisation ........................................................................................................................................... 3
Additional information for investors in Germany, Austria and Switzerland.................................... 6
Report on activities of the Board of Directors .................................................................................... 7
Audit report ............................................................................................................................................ 9
Combined statement of net assets .................................................................................................... 12
Combined statement of operations and other changes in net assets ........................................... 13
RAM (LUX) SYSTEMATIC FUNDS - EUROPEAN EQUITIES ............................................................. 14
Statement of net assets ..................................................................................................................... 14
Statement of operations and other changes in net assets ................................................................. 15
Statistical information ......................................................................................................................... 16
Statement of investments and other net assets ................................................................................. 18
Industrial and geographical classification of investments .................................................................. 29
RAM (LUX) SYSTEMATIC FUNDS - NORTH AMERICAN EQUITIES ................................................ 31
Statement of net assets ..................................................................................................................... 31
Statement of operations and other changes in net assets ................................................................. 32
Statistical information ......................................................................................................................... 33
Statement of investments and other net assets ................................................................................. 35
Industrial and geographical classification of investments .................................................................. 41
RAM (LUX) SYSTEMATIC FUNDS - GLOBAL SUSTAINABLE INCOME EQUITIES ........................ 42
Statement of net assets ..................................................................................................................... 42
Statement of operations and other changes in net assets ................................................................. 43
Statistical information ......................................................................................................................... 44
Statement of investments and other net assets ................................................................................. 46
Industrial and geographical classification of investments .................................................................. 50
RAM (LUX) SYSTEMATIC FUNDS - EMERGING MARKETS EQUITIES ........................................... 52
Statement of net assets ..................................................................................................................... 52
Statement of operations and other changes in net assets ................................................................. 53
Statistical information ......................................................................................................................... 54
Statement of investments and other net assets ................................................................................. 57
Industrial and geographical classification of investments .................................................................. 81
RAM (LUX) SYSTEMATIC FUNDS - EMERGING MARKETS CORE EQUITIES ............................... 83
Statement of net assets ..................................................................................................................... 83
Statement of operations and other changes in net assets ................................................................. 84
Statistical information ......................................................................................................................... 85
Statement of investments and other net assets ................................................................................. 86
Industrial and geographical classification of investments .................................................................. 91
RAM (LUX) SYSTEMATIC FUNDS - LONG/SHORT EUROPEAN EQUITIES .................................... 93
Statement of net assets ..................................................................................................................... 93
Statement of operations and other changes in net assets ................................................................. 94
Statistical information ......................................................................................................................... 95
Statement of investments and other net assets ................................................................................. 97
Industrial and geographical classification of investments ................................................................ 106
RAM (LUX) SYSTEMATIC FUNDS - LONG/SHORT EMERGING MARKETS EQUITIES ............... 108
Statement of net assets ................................................................................................................... 108
Statement of operations and other changes in net assets ............................................................... 109
Statistical information ....................................................................................................................... 110
Statement of investments and other net assets ............................................................................... 112
Industrial and geographical classification of investments ................................................................ 119
RAM (LUX) SYSTEMATIC FUNDS
Table of contents (continued)
2
RAM (LUX) SYSTEMATIC FUNDS - LONG/SHORT GLOBAL EQUITIES ....................................... 121
Statement of net assets ................................................................................................................... 121
Statement of operations and other changes in net assets ............................................................... 122
Statistical information ....................................................................................................................... 123
Statement of investments and other net assets ............................................................................... 125
Industrial and geographical classification of investments ................................................................ 132
RAM (LUX) SYSTEMATIC FUNDS - GLOBAL MULTI-ASSET FUND ............................................. 134
Statement of net assets ................................................................................................................... 134
Statement of operations and other changes in net assets ............................................................... 135
Statistical information ....................................................................................................................... 136
Statement of investments and other net assets ............................................................................... 138
Industrial and geographical classification of investments ................................................................ 139
Notes to the financial statements .................................................................................................... 140
Additional information (unaudited) .................................................................................................. 203
RAM (LUX) SYSTEMATIC FUNDS
3
Organisation
Registered Office 14, Boulevard Royal L-2449 LUXEMBOURG Board of Directors of the SICAV Chairman Roberto ZITO Chief Operating Officer RAM Active Investments S.A. Société Anonyme 8, Rue du Rhône CH-1204 GENEVA Directors Jean DE COURREGES Independent Director 2, Rue Jean l’Aveugle L-1148 LUXEMBOURG Grégoire GLOTIN Sales & Marketing RAM Active Investments (Europe) S.A. Société Anonyme 51, Avenue John F. Kennedy L-1855 LUXEMBOURG Philippe WAGENER General Manager RAM Active Investments (Europe) S.A. Société Anonyme 51, Avenue John F. Kennedy L-1855 LUXEMBOURG Management Company RAM Active Investments (Europe) S.A. Société Anonyme 51, Avenue John F. Kennedy L -1855 LUXEMBOURG Board of Directors of the Management Company Chairman Roberto ZITO Chief Operating Officer RAM Active Investments S.A. Société Anonyme 8, Rue du Rhône CH-1204 GENEVA Directors Thomas de SAINT-SEINE Chief Executive Officer RAM Active Investments S.A. Société Anonyme 8, Rue du Rhône CH-1204 GENEVA
RAM (LUX) SYSTEMATIC FUNDS
Organisation (continued)
4
Pierre-Olivier POURCELOT Head of Sales & Marketing RAM Active Investments S.A. Société Anonyme 8, Rue du Rhône CH-1204 GENEVA Philippe WAGENER General Manager RAM Active Investments (Europe) S.A. Société Anonyme 51, Avenue John F. Kennedy L-1855 LUXEMBOURG Yves WAGNER Independent Director The Director’s Office, Luxembourg 19, Rue de Bitbourg L-1273 LUXEMBOURG Managers of the Management Company Philippe WAGENER General Manager RAM Active Investments (Europe) S.A. Société Anonyme 51, Avenue John F. Kennedy L-1855 LUXEMBOURG Yves WAGNER Independent Director The Director’s Office, Luxembourg 19, Rue de Bitbourg L-1273 LUXEMBOURG ESG Advisory Committee Emmanuel HAUPTMANN (environmental, social and Senior Equity Fund Manager, Partner gouvernance criteria) RAM Active Investments SA, GENEVA of the SICAV’s Board of Directors Nicolas JAMET Senior Quantitative Analyst, Executive Director RAM Active Investments SA, GENEVA Cyrille JOYE Head of Client Services, Executive Director RAM Active Investments SA, GENEVA Benjamin LI
Head of Socially Responsible Investing and CSR Managing Director
RAM Active Investments SA, GENEVA Investment Manager RAM Active Investments S.A. Société Anonyme 8, Rue du Rhône CH-1204 GENEVA
RAM (LUX) SYSTEMATIC FUNDS
Organisation (continued)
5
Depositary, Principal Paying BANQUE DE LUXEMBOURG Agent and Central Administration Société Anonyme 14, Boulevard Royal L-2449 LUXEMBOURG Central Administration’s Subcontractor EUROPEAN FUND ADMINISTRATION S.A. Société Anonyme 2, Rue d’Alsace L-1122 LUXEMBOURG Auditor PRICEWATERHOUSECOOPERS, Société coopérative 2, Rue Gerhard Mercator L-2182 LUXEMBOURG Representative and Distributor RAM Active Investments S.A. in Switzerland Société Anonyme 8, Rue du Rhône CH-1204 GENEVA Payment Services in Switzerland CACEIS BANK, Paris, Nyon/Switzerland Branch Route de Signy, 35 CH-1260 NYON Paying and Information Agent MARCARD, STEIN & CO AG in Germany Ballindamm 36 D-20095 HAMBURG Paying and Information Agent ERSTE BANK DER ÖSTERREICHISCHEN in Austria SPARKASSEN AG Am Belvedere 1 A-1100 VIENNA
RAM (LUX) SYSTEMATIC FUNDS
6
Additional information for investors in Germany, Austria and Switzerland
For the distribution of the SICAV’s shares in Germany, MARCARD, STEIN & CO AG is appointed paying and information agent. The paying and information agent in Germany accepts the redemption and conversion orders. For the distribution of the SICAV’s shares in Austria, ERSTE BANK DER ÖSTERREICHISCHEN SPARKASSEN AG is appointed paying and information agent. In this capacity, the aforementioned agent ensures that Austrian investors are able to make subscription payments and to receive income corresponding to repayments on redemptions and distributions of dividends. For the distribution of the SICAV’s shares in Switzerland: Representative and distributor in Switzerland: RAM Active Investments S.A. in Switzerland has been appointed as the representative of the SICAV and of companies that have contracted commitments to the SICAV`s shareholders for Switzerland. In this capacity, RAM Active Investments S.A. is also responsible for distributing the shares of the SICAV, in or from Switzerland. Payment service in Switzerland: CACEIS BANK, Paris, Nyon/Switzerland Branch is appointed as paying office of the SICAV for Switzerland.
RAM (LUX) SYSTEMATIC FUNDS
7
Report on activities of the Board of Directors
2019 review From stocks to government debt securities, corporate bonds to commodities, no matter which asset class investors selected, 2019 proved to be one of the best for all types of investors, with almost all asset classes ending the year in the green. After a mediocre 2018, global equity markets as a whole posted significant gains in 2019. Boosted by an ever-more accommodative monetary policy from major central banks around the world and optimism that the trade war could finally be resolved, stocks have had one of their best years since the global financial crisis. This may sound a little too good to be true, as markets are facing a handful of unprecedented risks as the year draws to a close, such as a costly trade war with China, an attempt to impeach the US President, signs of slower growth in major economies and many other geopolitical concerns. In 2019, global markets recovered from a pullback in the autumn of 2018, which was long overdue, when fears of a global slowdown hit stocks. Stocks rallied when it became clear that the US central bank had decided against any new interest rate rises. Indeed, the Fed abruptly reversed its course of action with three rate cuts, and also started to expand its balance sheet again. The MSCI World index, which tracks equities in developed countries, jumped nearly 24% in 2019 - its strongest performance since 2009. The American technology giants soared and equities in the euro zone and Asia rose significantly, providing the momentum for this rally. It goes without saying that Brexit also had an impact on returns in Europe throughout the year. Many global investors avoided UK and even European stocks due to the high level of economic and political uncertainty in the UK. Bearish bets on equity volatility also showed that, beneath the veneer of euphoria on European and American stock markets, a storm was brewing. Towards the end of the year, many sources of volatility came to the fore, such as the protectionist rhetoric of the United States, the haphazard course of the central banks and the marked deceleration in global growth. Moreover, the most worrying aspect remains the level of global debt. In China, the level of defaults reached the total recorded in the previous year, a clear sign of the tensions on credit markets and the difficulties faced by companies. On the eve of 2020, the SICAV adopted a more cautious approach, in particular through portfolio diversification and the availability of liquidity. Investors must also manage their exposure and liquidity levels accordingly in a climate of renewed market volatility. Largely negative economic developments have been overshadowed by the progress of trade negotiations. Despite the fact that volatility still gripped the markets at the end of the year, this trend did not affect the positive performance. Indeed, from a strategic point of view, momentum investing posted significant returns, as did fundamental and machine learning strategies, while the defensive strategy was the only one to underperform the overall market (mainly due to a marked increase in appetite for risk). In the United Kingdom, the rotation out of defensive sectors into cyclical sectors continued and portfolios were able to benefit from it. Outlook for 2020 In 2019, just about every investable asset class posted negative or unchanged returns. With the trade war still unresolved and elections on the horizon, Wall Street has forecast modest gains in 2020. At the very start of 2020, optimism increased about the possibility that the global economy would come out of its trade-induced slowdown and the weak profitability would start to improve. The major central banks were in the process of “quantitative tightening”, i.e. the Fed and other banks were slowly reducing their balance sheets by selling tens of billions of dollars in bonds each month.
RAM (LUX) SYSTEMATIC FUNDS
Report on activities of the Board of Directors (continued)
8
However, from mid-January 2020 onwards, global markets reacted to and could continue to be impacted by the spread of a new coronavirus known as COVID-19. Anxiety spread through the markets and volatility rose sharply. Indeed, investors should focus on the effects of the COVID-19 pandemic: its emergence has resulted in travel and border restrictions, quarantines, supply chain disruptions, declining consumer demand and general market uncertainty. This scenario has led to fears of slower economic growth, at least in the short term. Even if on the equity market the liquidity of securities seems to be manageable within the portfolios, the virus has exposed pre-existing instabilities; in particular, a bull market that has been driven by injections of liquidity and the passive investments of central banks and not necessarily by fundamental factors, which could have negative repercussions on the performance of equity markets and related strategies. We have to go back to the early 2000s to find a similar situation. Thus, the potential impact on the broader economy is the main concern. Luxembourg, 19th March 2020 The Board of Directors Note: The information in this report represents historical data and is not an indication of future results.
PricewaterhouseCoopers, Société coopérative, 2 rue Gerhard Mercator, B.P. 1443, L-1014 LuxembourgT : +352 494848 1, F : +352 494848 2900, www.pwc.lu Cabinet de révision agréé. Expert-comptable (autorisation gouvernementale n°10028256)R.C.S. Luxembourg B 65 477 - TVA LU25482518
Audit report
To the Shareholders ofRAM (LUX) SYSTEMATIC FUNDS
Our opinion
In our opinion, the accompanying annual accounts give a true and fair view of the financial position of RAM (LUX) SYSTEMATIC FUNDS (the “Fund”) and of each of its sub-funds as at 31 December 2019, and of the results of their operations and changes in their net assets for the year then ended in accordance with Luxembourg legal and regulatory requirements relating to the preparation and presentation of the annual accounts.
What we have audited
The Fund’s annual accounts comprise:
the combined statement of net assets for the Fund and the statement of net assets for each of the sub-funds as at 31 December 2019;
the combined statement of operations and other changes in net assets for the Fund and the statement of operations and other changes in net assets for each of the sub-funds for the year then ended;
the statement of investments and other net assets as at 31 December 2019; and the notes to the annual accounts, which include a summary of significant accounting policies.
Basis for opinion
We conducted our audit in accordance with the Law of 23 July 2016 on the audit profession (Law of 23 July 2016) and with International Standards on Auditing (ISAs) as adopted for Luxembourg by the “Commission de Surveillance du Secteur Financier” (CSSF). Our responsibilities under the Law of 23 July 2016 and ISAs as adopted for Luxembourg by the CSSF are further described in the “Responsibilities of the “Réviseur d’entreprises agréé” for the audit of the annual accounts” section of our report.
We believe that the audit evidence we have obtained is sufficient and appropriate to provide a basis for our opinion.
We are independent of the Fund in accordance with the International Ethics Standards Board for Accountants’ Code of Ethics for Professional Accountants (IESBA Code) as adopted for Luxembourg by the CSSF together with the ethical requirements that are relevant to our audit of the annual accounts. We have fulfilled our other ethical responsibilities under those ethical requirements.
Other information
The Board of Directors of the Fund is responsible for the other information. The other information comprises the information stated in the annual report but does not include the annual accounts and our audit report thereon.
Our opinion on the annual accounts does not cover the other information and we do not express any form of assurance conclusion thereon.
10
In connection with our audit of the annual accounts, our responsibility is to read the other information identified above and, in doing so, consider whether the other information is materially inconsistent with the annual accounts or our knowledge obtained in the audit, or otherwise appears to be materially misstated. If, based on the work we have performed, we conclude that there is a material misstatement of this other information, we are required to report that fact. We have nothing to report in this regard.
Responsibilities of the Board of Directors of the Fund for the annual accounts
The Board of Directors of the Fund is responsible for the preparation and fair presentation of the annual accounts in accordance with Luxembourg legal and regulatory requirements relating to the preparation and presentation of the annual accounts, and for such internal control as the Board of Directors of the Fund determines is necessary to enable the preparation of annual accounts that are free from material misstatement, whether due to fraud or error.
In preparing the annual accounts, the Board of Directors of the Fund is responsible for assessing the Fund’s and each of its sub-funds' ability to continue as a going concern, disclosing, as applicable, matters related to going concern and using the going concern basis of accounting unless the Board of Directors of the Fund either intends to liquidate the Fund or close any of its sub-funds or to cease operations, or has no realistic alternative but to do so.
Responsibilities of the “Réviseur d’entreprises agréé” for the audit of the annual accounts
The objectives of our audit are to obtain reasonable assurance about whether the annual accounts as a whole are free from material misstatement, whether due to fraud or error, and to issue an audit report that includes our opinion. Reasonable assurance is a high level of assurance, but is not a guarantee that an audit conducted in accordance with the Law of 23 July 2016 and with ISAs as adopted for Luxembourg by the CSSF will always detect a material misstatement when it exists. Misstatements can arise from fraud or error and are considered material if, individually or in the aggregate, they could reasonably be expected to influence the economic decisions of users taken on the basis of these annual accounts.
As part of an audit in accordance with the Law of 23 July 2016 and with ISAs as adopted for Luxembourg by the CSSF, we exercise professional judgment and maintain professional scepticism throughout the audit. We also:
identify and assess the risks of material misstatement of the annual accounts, whether due to fraud or error, design and perform audit procedures responsive to those risks, and obtain audit evidence that is sufficient and appropriate to provide a basis for our opinion. The risk of not detecting a material misstatement resulting from fraud is higher than for one resulting from error, as fraud may involve collusion, forgery, intentional omissions, misrepresentations, or the override of internal control;
obtain an understanding of internal control relevant to the audit in order to design audit procedures that are appropriate in the circumstances, but not for the purpose of expressing an opinion on the effectiveness of the Fund’s internal control;
evaluate the appropriateness of accounting policies used and the reasonableness of accounting estimates and related disclosures made by the Board of Directors of the Fund;
11
conclude on the appropriateness of the Board of Directors of the Fund’s use of the going concern basis of accounting and, based on the audit evidence obtained, whether a material uncertainty exists related to events or conditions that may cast significant doubt on the Fund’s or any of its sub-funds' ability to continue as a going concern. If we conclude that a material uncertainty exists, we are required to draw attention in our audit report to the related disclosures in the annual accounts or, if such disclosures are inadequate, to modify our opinion. Our conclusions are based on the audit evidence obtained up to the date of our audit report. However, future events or conditions may cause the Fund or any of its sub-funds (except for RAM (LUX) SYSTEMATIC FUNDS - EMERGING MARKETS CORE EQUITIES which was liquidated on 12 February 2020 ) to cease to continue as a going concern;
evaluate the overall presentation, structure and content of the annual accounts, including the disclosures, and whether the annual accounts represent the underlying transactions and events in a manner that achieves fair presentation.
We communicate with those charged with governance regarding, among other matters, the planned scope and timing of the audit and significant audit findings, including any significant deficiencies in internal control that we identify during our audit.
PricewaterhouseCoopers, Société coopérativeRepresented by
Cécile Liégeois
Luxembourg, 20 March 2020
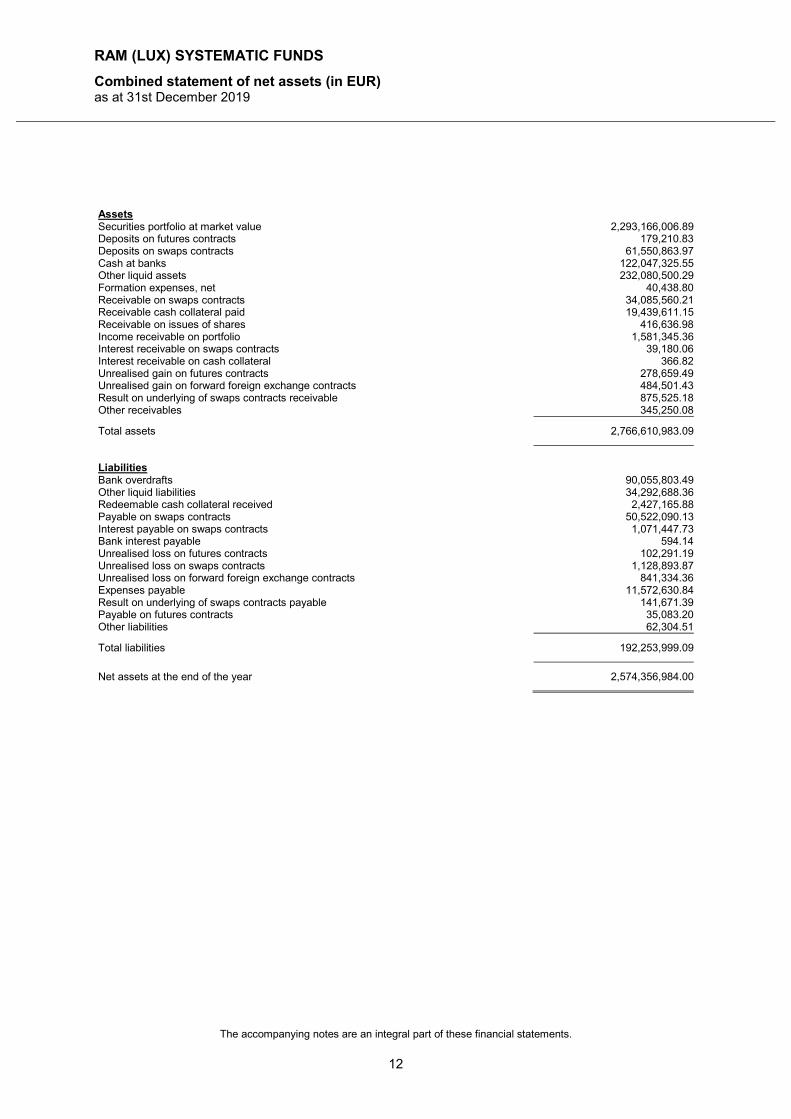
RAM (LUX) SYSTEMATIC FUNDS
Combined statement of net assets (in EUR) as at 31st December 2019
The accompanying notes are an integral part of these financial statements.
12
Assets Securities portfolio at market value 2,293,166,006.89Deposits on futures contracts 179,210.83Deposits on swaps contracts 61,550,863.97Cash at banks 122,047,325.55Other liquid assets 232,080,500.29Formation expenses, net 40,438.80Receivable on swaps contracts 34,085,560.21Receivable cash collateral paid 19,439,611.15Receivable on issues of shares 416,636.98Income receivable on portfolio 1,581,345.36Interest receivable on swaps contracts 39,180.06Interest receivable on cash collateral 366.82Unrealised gain on futures contracts 278,659.49Unrealised gain on forward foreign exchange contracts 484,501.43Result on underlying of swaps contracts receivable 875,525.18Other receivables 345,250.08
Total assets 2,766,610,983.09
Liabilities Bank overdrafts 90,055,803.49Other liquid liabilities 34,292,688.36Redeemable cash collateral received 2,427,165.88Payable on swaps contracts 50,522,090.13Interest payable on swaps contracts 1,071,447.73Bank interest payable 594.14Unrealised loss on futures contracts 102,291.19Unrealised loss on swaps contracts 1,128,893.87Unrealised loss on forward foreign exchange contracts 841,334.36Expenses payable 11,572,630.84Result on underlying of swaps contracts payable 141,671.39Payable on futures contracts 35,083.20Other liabilities 62,304.51
Total liabilities 192,253,999.09
Net assets at the end of the year 2,574,356,984.00
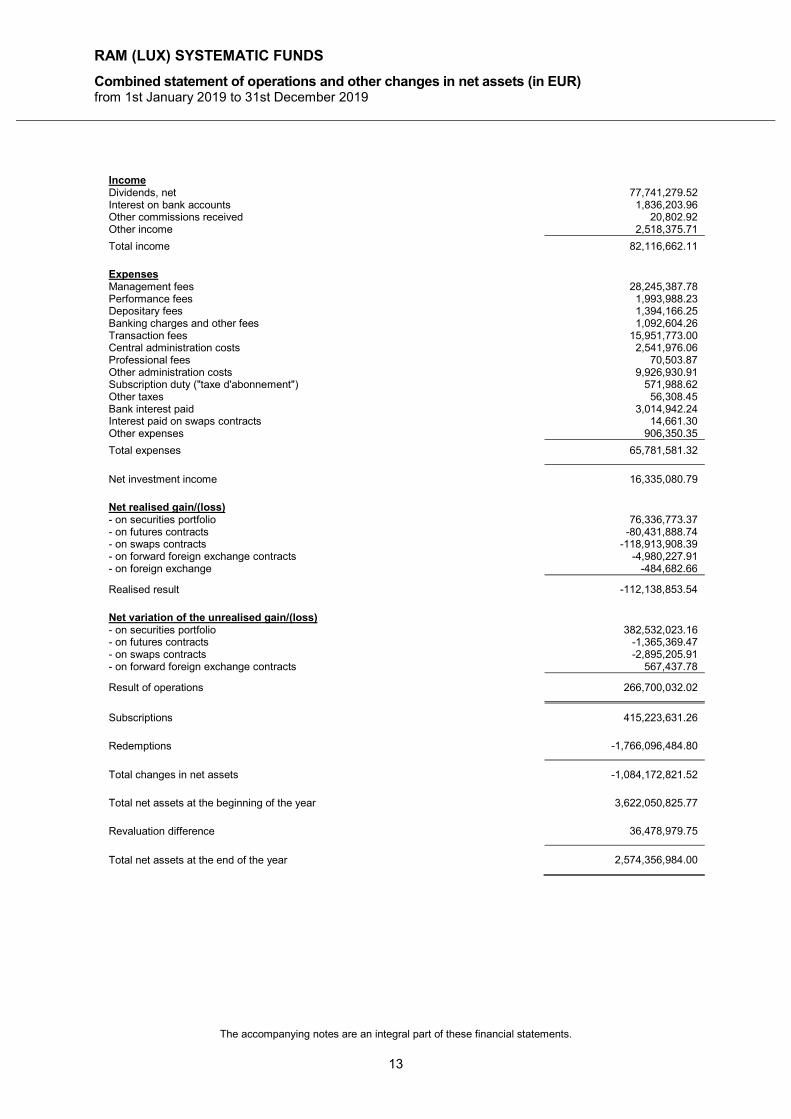
RAM (LUX) SYSTEMATIC FUNDS
Combined statement of operations and other changes in net assets (in EUR) from 1st January 2019 to 31st December 2019
The accompanying notes are an integral part of these financial statements.
13
Income Dividends, net 77,741,279.52 Interest on bank accounts 1,836,203.96 Other commissions received 20,802.92 Other income 2,518,375.71
Total income 82,116,662.11
Expenses Management fees 28,245,387.78 Performance fees 1,993,988.23 Depositary fees 1,394,166.25 Banking charges and other fees 1,092,604.26 Transaction fees 15,951,773.00 Central administration costs 2,541,976.06 Professional fees 70,503.87 Other administration costs 9,926,930.91 Subscription duty ("taxe d'abonnement") 571,988.62 Other taxes 56,308.45 Bank interest paid 3,014,942.24 Interest paid on swaps contracts 14,661.30 Other expenses 906,350.35
Total expenses 65,781,581.32
Net investment income 16,335,080.79
Net realised gain/(loss) - on securities portfolio 76,336,773.37 - on futures contracts -80,431,888.74 - on swaps contracts -118,913,908.39 - on forward foreign exchange contracts -4,980,227.91 - on foreign exchange -484,682.66
Realised result -112,138,853.54
Net variation of the unrealised gain/(loss) - on securities portfolio 382,532,023.16 - on futures contracts -1,365,369.47 - on swaps contracts -2,895,205.91 - on forward foreign exchange contracts 567,437.78
Result of operations 266,700,032.02
Subscriptions 415,223,631.26
Redemptions -1,766,096,484.80
Total changes in net assets -1,084,172,821.52
Total net assets at the beginning of the year 3,622,050,825.77
Revaluation difference 36,478,979.75
Total net assets at the end of the year 2,574,356,984.00
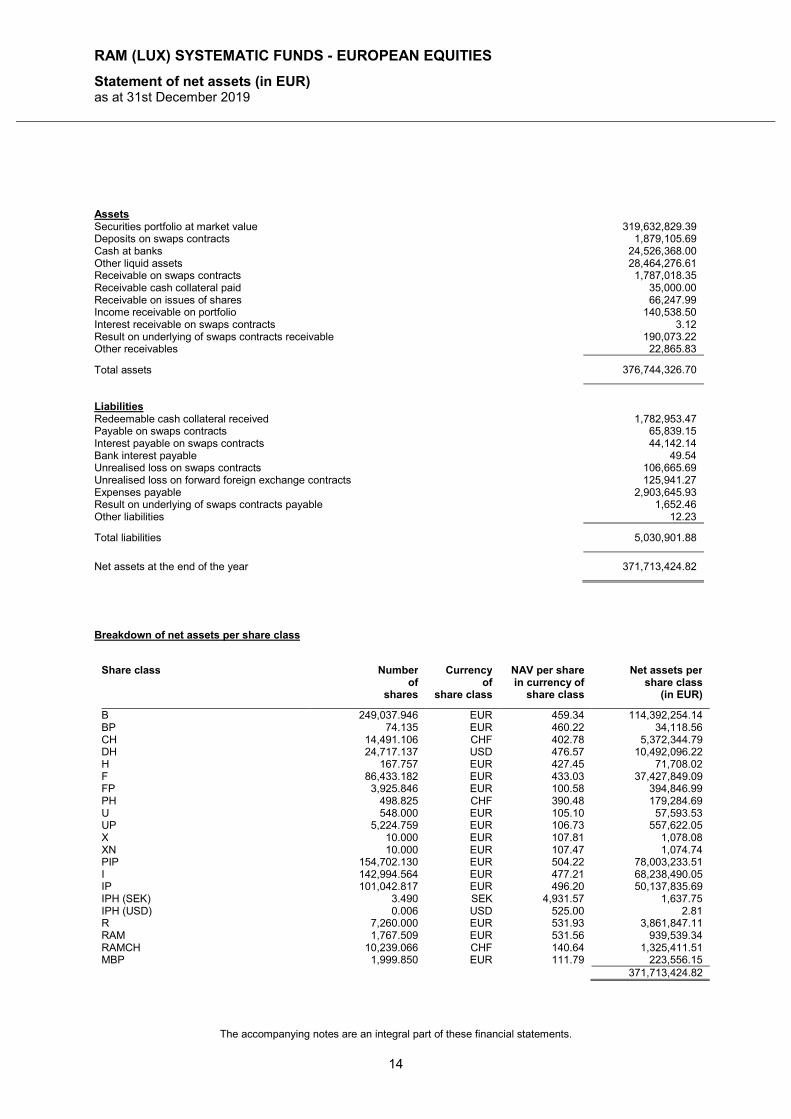
RAM (LUX) SYSTEMATIC FUNDS - EUROPEAN EQUITIES
Statement of net assets (in EUR) as at 31st December 2019
The accompanying notes are an integral part of these financial statements.
14
Assets Securities portfolio at market value 319,632,829.39 Deposits on swaps contracts 1,879,105.69 Cash at banks 24,526,368.00 Other liquid assets 28,464,276.61 Receivable on swaps contracts 1,787,018.35 Receivable cash collateral paid 35,000.00 Receivable on issues of shares 66,247.99 Income receivable on portfolio 140,538.50 Interest receivable on swaps contracts 3.12 Result on underlying of swaps contracts receivable 190,073.22 Other receivables 22,865.83
Total assets 376,744,326.70
Liabilities Redeemable cash collateral received 1,782,953.47 Payable on swaps contracts 65,839.15 Interest payable on swaps contracts 44,142.14 Bank interest payable 49.54 Unrealised loss on swaps contracts 106,665.69 Unrealised loss on forward foreign exchange contracts 125,941.27 Expenses payable 2,903,645.93 Result on underlying of swaps contracts payable 1,652.46 Other liabilities 12.23
Total liabilities 5,030,901.88
Net assets at the end of the year 371,713,424.82
Breakdown of net assets per share class
Share class Number of
shares
Currency of
share class
NAV per share in currency of
share class
Net assets per share class
(in EUR)
B 249,037.946 EUR 459.34 114,392,254.14 BP 74.135 EUR 460.22 34,118.56 CH 14,491.106 CHF 402.78 5,372,344.79 DH 24,717.137 USD 476.57 10,492,096.22 H 167.757 EUR 427.45 71,708.02 F 86,433.182 EUR 433.03 37,427,849.09 FP 3,925.846 EUR 100.58 394,846.99 PH 498.825 CHF 390.48 179,284.69 U 548.000 EUR 105.10 57,593.53 UP 5,224.759 EUR 106.73 557,622.05 X 10.000 EUR 107.81 1,078.08 XN 10.000 EUR 107.47 1,074.74 PIP 154,702.130 EUR 504.22 78,003,233.51 I 142,994.564 EUR 477.21 68,238,490.05 IP 101,042.817 EUR 496.20 50,137,835.69 IPH (SEK) 3.490 SEK 4,931.57 1,637.75 IPH (USD) 0.006 USD 525.00 2.81 R 7,260.000 EUR 531.93 3,861,847.11 RAM 1,767.509 EUR 531.56 939,539.34 RAMCH 10,239.066 CHF 140.64 1,325,411.51 MBP 1,999.850 EUR 111.79 223,556.15 371,713,424.82
RAM (LUX) SYSTEMATIC FUNDS - EUROPEAN EQUITIES
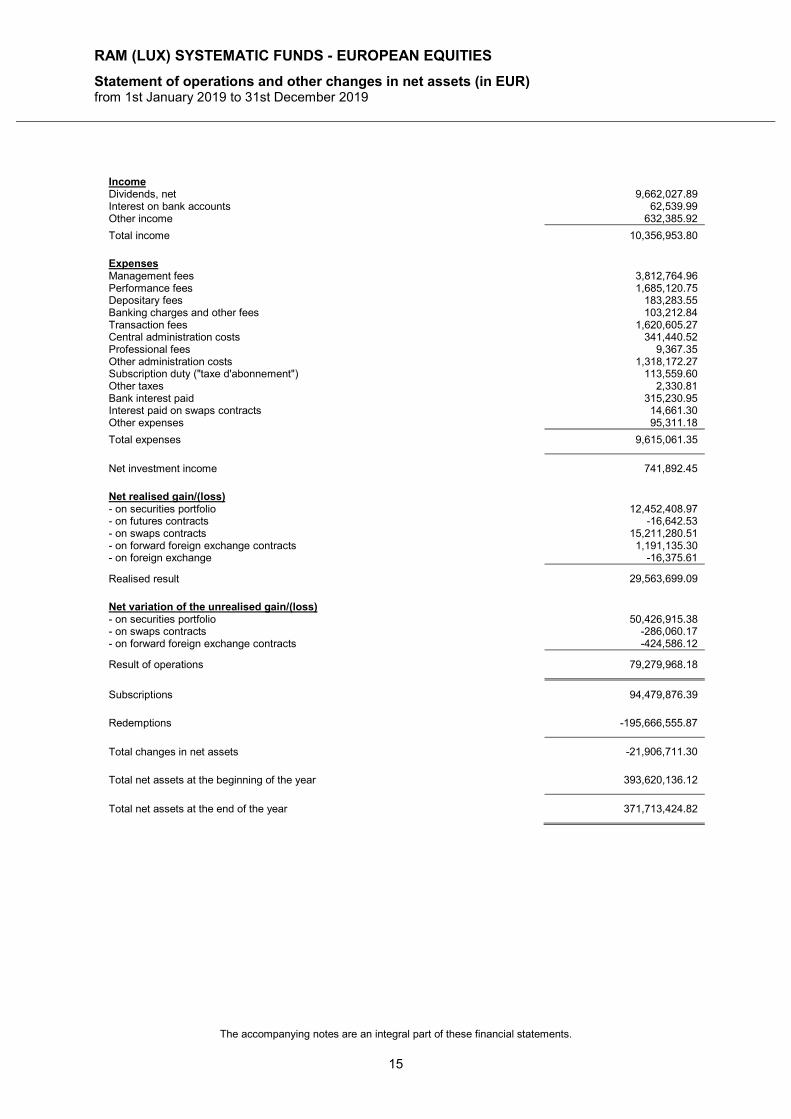
Statement of operations and other changes in net assets (in EUR) from 1st January 2019 to 31st December 2019
The accompanying notes are an integral part of these financial statements.
15
Income Dividends, net 9,662,027.89 Interest on bank accounts 62,539.99 Other income 632,385.92
Total income 10,356,953.80
Expenses Management fees 3,812,764.96 Performance fees 1,685,120.75 Depositary fees 183,283.55 Banking charges and other fees 103,212.84 Transaction fees 1,620,605.27 Central administration costs 341,440.52 Professional fees 9,367.35 Other administration costs 1,318,172.27 Subscription duty ("taxe d'abonnement") 113,559.60 Other taxes 2,330.81 Bank interest paid 315,230.95 Interest paid on swaps contracts 14,661.30 Other expenses 95,311.18
Total expenses 9,615,061.35
Net investment income 741,892.45
Net realised gain/(loss) - on securities portfolio 12,452,408.97 - on futures contracts -16,642.53 - on swaps contracts 15,211,280.51 - on forward foreign exchange contracts 1,191,135.30 - on foreign exchange -16,375.61
Realised result 29,563,699.09
Net variation of the unrealised gain/(loss) - on securities portfolio 50,426,915.38 - on swaps contracts -286,060.17 - on forward foreign exchange contracts -424,586.12
Result of operations 79,279,968.18
Subscriptions 94,479,876.39
Redemptions -195,666,555.87
Total changes in net assets -21,906,711.30
Total net assets at the beginning of the year 393,620,136.12
Total net assets at the end of the year 371,713,424.82
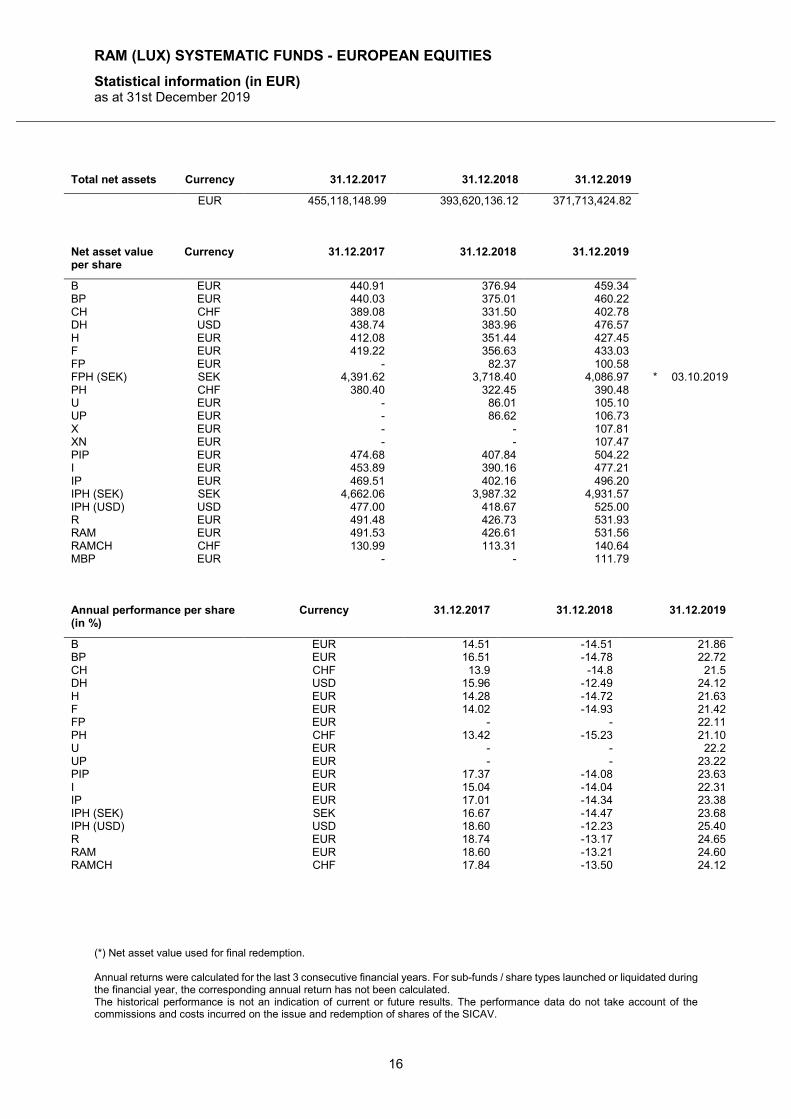
RAM (LUX) SYSTEMATIC FUNDS - EUROPEAN EQUITIES
Statistical information (in EUR) as at 31st December 2019
(*) Net asset value used for final redemption. Annual returns were calculated for the last 3 consecutive financial years. For sub-funds / share types launched or liquidated during the financial year, the corresponding annual return has not been calculated. The historical performance is not an indication of current or future results. The performance data do not take account of the commissions and costs incurred on the issue and redemption of shares of the SICAV.
16
Total net assets Currency 31.12.2017 31.12.2018 31.12.2019
EUR 455,118,148.99 393,620,136.12 371,713,424.82
Net asset value per share
Currency 31.12.2017 31.12.2018 31.12.2019
B EUR 440.91 376.94 459.34 BP EUR 440.03 375.01 460.22 CH CHF 389.08 331.50 402.78 DH USD 438.74 383.96 476.57 H EUR 412.08 351.44 427.45 F EUR 419.22 356.63 433.03 FP EUR - 82.37 100.58 FPH (SEK) SEK 4,391.62 3,718.40 4,086.97 * 03.10.2019 PH CHF 380.40 322.45 390.48 U EUR - 86.01 105.10 UP EUR - 86.62 106.73 X EUR - - 107.81 XN EUR - - 107.47 PIP EUR 474.68 407.84 504.22 I EUR 453.89 390.16 477.21 IP EUR 469.51 402.16 496.20 IPH (SEK) SEK 4,662.06 3,987.32 4,931.57 IPH (USD) USD 477.00 418.67 525.00 R EUR 491.48 426.73 531.93 RAM EUR 491.53 426.61 531.56 RAMCH CHF 130.99 113.31 140.64 MBP EUR - - 111.79
Annual performance per share (in %)
Currency 31.12.2017 31.12.2018 31.12.2019
B EUR 14.51 -14.51 21.86 BP EUR 16.51 -14.78 22.72 CH CHF 13.9 -14.8 21.5 DH USD 15.96 -12.49 24.12 H EUR 14.28 -14.72 21.63 F EUR 14.02 -14.93 21.42 FP EUR - - 22.11 PH CHF 13.42 -15.23 21.10 U EUR - - 22.2 UP EUR - - 23.22 PIP EUR 17.37 -14.08 23.63 I EUR 15.04 -14.04 22.31 IP EUR 17.01 -14.34 23.38 IPH (SEK) SEK 16.67 -14.47 23.68 IPH (USD) USD 18.60 -12.23 25.40 R EUR 18.74 -13.17 24.65 RAM EUR 18.60 -13.21 24.60 RAMCH CHF 17.84 -13.50 24.12
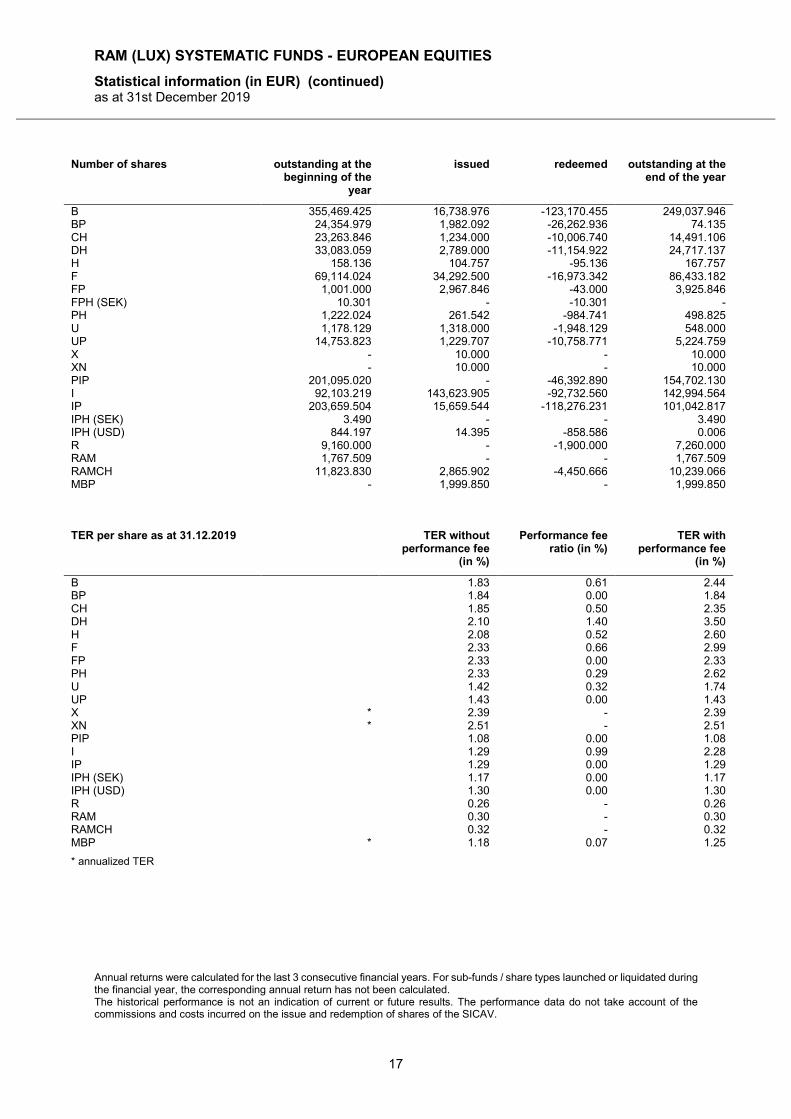
RAM (LUX) SYSTEMATIC FUNDS - EUROPEAN EQUITIES
Statistical information (in EUR) (continued) as at 31st December 2019
Annual returns were calculated for the last 3 consecutive financial years. For sub-funds / share types launched or liquidated during the financial year, the corresponding annual return has not been calculated. The historical performance is not an indication of current or future results. The performance data do not take account of the commissions and costs incurred on the issue and redemption of shares of the SICAV.
17
Number of shares outstanding at the beginning of the
year
issued redeemed outstanding at the end of the year
B 355,469.425 16,738.976 -123,170.455 249,037.946 BP 24,354.979 1,982.092 -26,262.936 74.135 CH 23,263.846 1,234.000 -10,006.740 14,491.106 DH 33,083.059 2,789.000 -11,154.922 24,717.137 H 158.136 104.757 -95.136 167.757 F 69,114.024 34,292.500 -16,973.342 86,433.182 FP 1,001.000 2,967.846 -43.000 3,925.846 FPH (SEK) 10.301 - -10.301 - PH 1,222.024 261.542 -984.741 498.825 U 1,178.129 1,318.000 -1,948.129 548.000 UP 14,753.823 1,229.707 -10,758.771 5,224.759 X - 10.000 - 10.000 XN - 10.000 - 10.000 PIP 201,095.020 - -46,392.890 154,702.130 I 92,103.219 143,623.905 -92,732.560 142,994.564 IP 203,659.504 15,659.544 -118,276.231 101,042.817 IPH (SEK) 3.490 - - 3.490 IPH (USD) 844.197 14.395 -858.586 0.006 R 9,160.000 - -1,900.000 7,260.000 RAM 1,767.509 - - 1,767.509 RAMCH 11,823.830 2,865.902 -4,450.666 10,239.066 MBP - 1,999.850 - 1,999.850
TER per share as at 31.12.2019 TER without
performance fee (in %)
Performance fee ratio (in %)
TER with performance fee
(in %)
B 1.83 0.61 2.44 BP 1.84 0.00 1.84 CH 1.85 0.50 2.35 DH 2.10 1.40 3.50 H 2.08 0.52 2.60 F 2.33 0.66 2.99 FP 2.33 0.00 2.33 PH 2.33 0.29 2.62 U 1.42 0.32 1.74 UP 1.43 0.00 1.43 X * 2.39 - 2.39 XN * 2.51 - 2.51 PIP 1.08 0.00 1.08 I 1.29 0.99 2.28 IP 1.29 0.00 1.29 IPH (SEK) 1.17 0.00 1.17 IPH (USD) 1.30 0.00 1.30 R 0.26 - 0.26 RAM 0.30 - 0.30 RAMCH 0.32 - 0.32 MBP * 1.18 0.07 1.25
* annualized TER
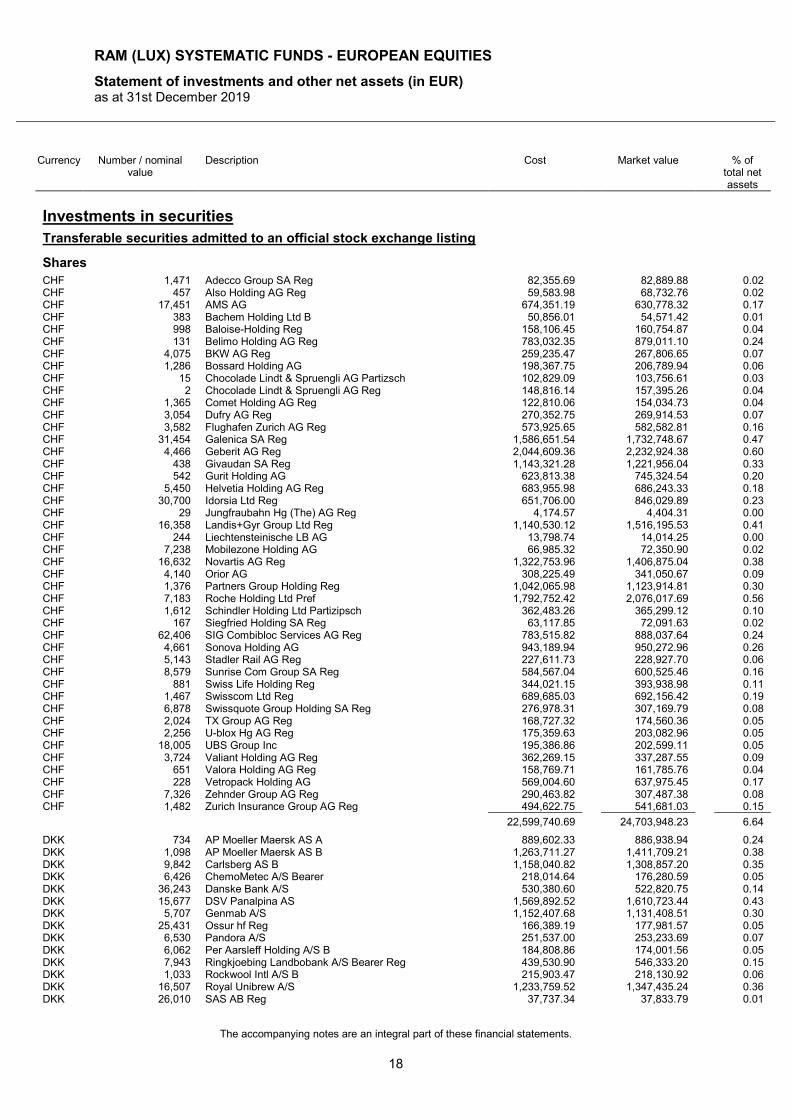
RAM (LUX) SYSTEMATIC FUNDS - EUROPEAN EQUITIES
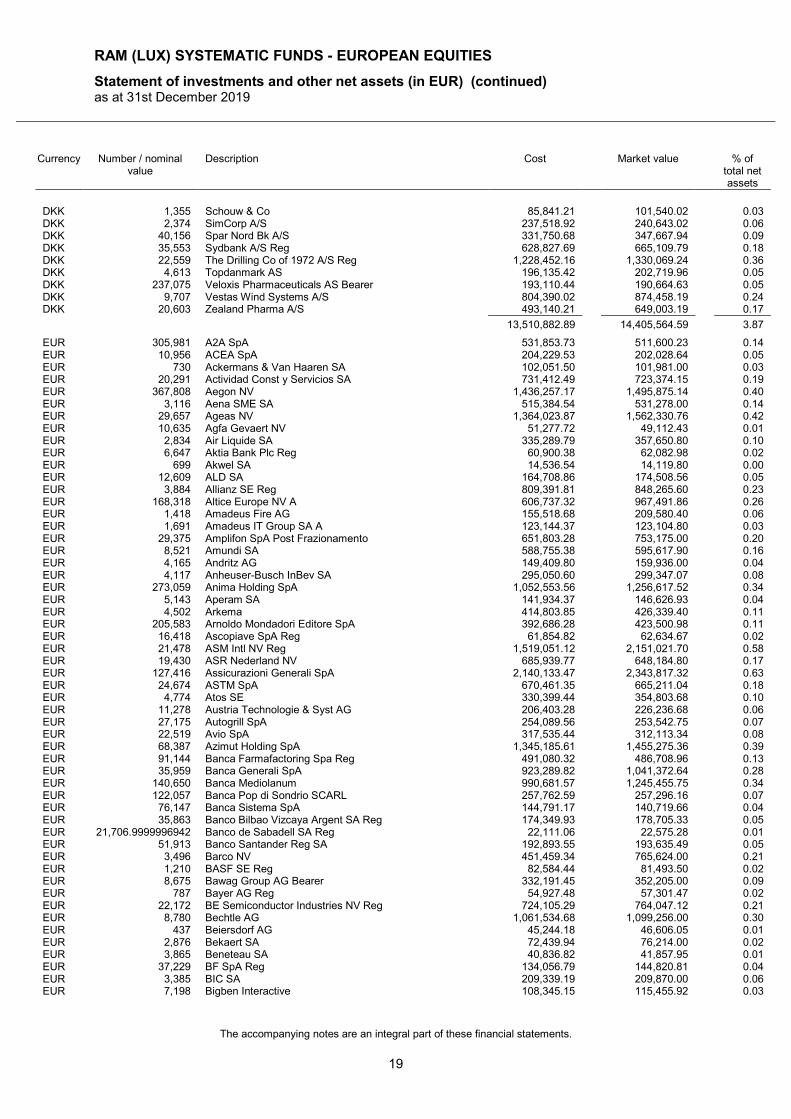
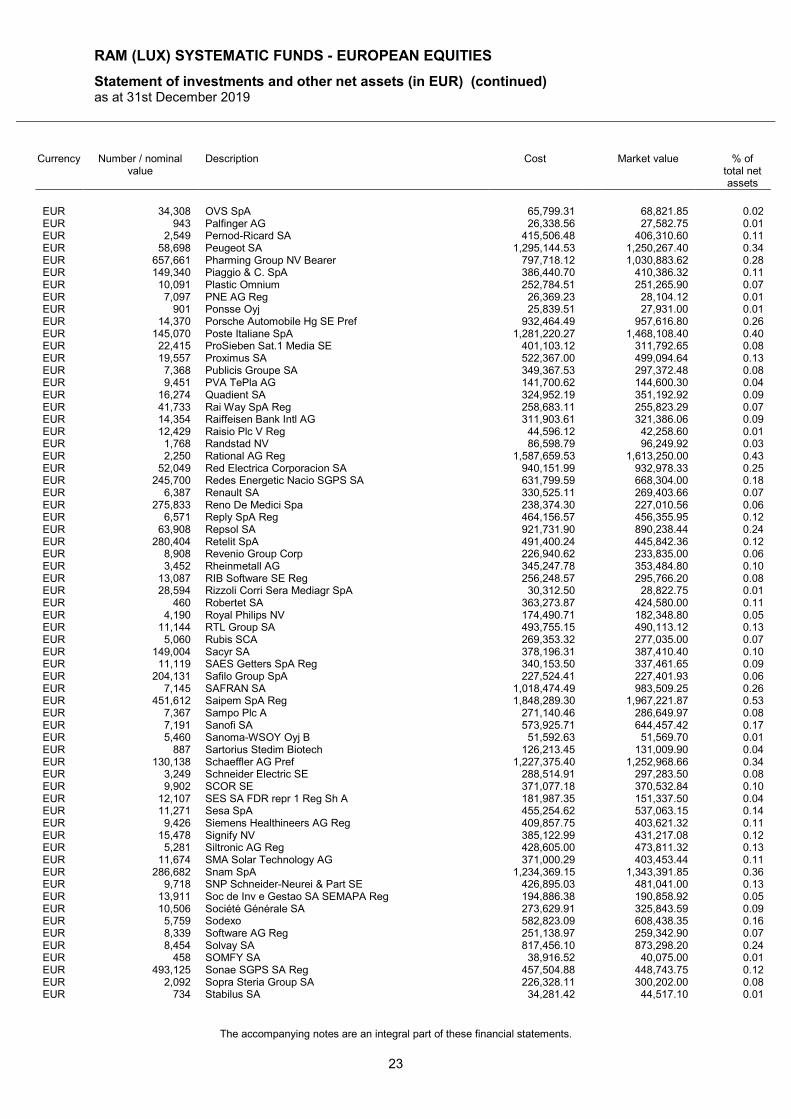
Statement of investments and other net assets (in EUR) as at 31st December 2019
The accompanying notes are an integral part of these financial statements.
18
Currency Number / nominal value
Description Cost Market value % of total net assets
Investments in securities
Transferable securities admitted to an official stock exchange listing
Shares
CHF 1,471 Adecco Group SA Reg 82,355.69 82,889.88 0.02 CHF 457 Also Holding AG Reg 59,583.98 68,732.76 0.02 CHF 17,451 AMS AG 674,351.19 630,778.32 0.17 CHF 383 Bachem Holding Ltd B 50,856.01 54,571.42 0.01 CHF 998 Baloise-Holding Reg 158,106.45 160,754.87 0.04 CHF 131 Belimo Holding AG Reg 783,032.35 879,011.10 0.24 CHF 4,075 BKW AG Reg 259,235.47 267,806.65 0.07 CHF 1,286 Bossard Holding AG 198,367.75 206,789.94 0.06 CHF 15 Chocolade Lindt & Spruengli AG Partizsch 102,829.09 103,756.61 0.03 CHF 2 Chocolade Lindt & Spruengli AG Reg 148,816.14 157,395.26 0.04 CHF 1,365 Comet Holding AG Reg 122,810.06 154,034.73 0.04 CHF 3,054 Dufry AG Reg 270,352.75 269,914.53 0.07 CHF 3,582 Flughafen Zurich AG Reg 573,925.65 582,582.81 0.16 CHF 31,454 Galenica SA Reg 1,586,651.54 1,732,748.67 0.47 CHF 4,466 Geberit AG Reg 2,044,609.36 2,232,924.38 0.60 CHF 438 Givaudan SA Reg 1,143,321.28 1,221,956.04 0.33 CHF 542 Gurit Holding AG 623,813.38 745,324.54 0.20 CHF 5,450 Helvetia Holding AG Reg 683,955.98 686,243.33 0.18 CHF 30,700 Idorsia Ltd Reg 651,706.00 846,029.89 0.23 CHF 29 Jungfraubahn Hg (The) AG Reg 4,174.57 4,404.31 0.00 CHF 16,358 Landis+Gyr Group Ltd Reg 1,140,530.12 1,516,195.53 0.41 CHF 244 Liechtensteinische LB AG 13,798.74 14,014.25 0.00 CHF 7,238 Mobilezone Holding AG 66,985.32 72,350.90 0.02 CHF 16,632 Novartis AG Reg 1,322,753.96 1,406,875.04 0.38 CHF 4,140 Orior AG 308,225.49 341,050.67 0.09 CHF 1,376 Partners Group Holding Reg 1,042,065.98 1,123,914.81 0.30 CHF 7,183 Roche Holding Ltd Pref 1,792,752.42 2,076,017.69 0.56 CHF 1,612 Schindler Holding Ltd Partizipsch 362,483.26 365,299.12 0.10 CHF 167 Siegfried Holding SA Reg 63,117.85 72,091.63 0.02 CHF 62,406 SIG Combibloc Services AG Reg 783,515.82 888,037.64 0.24 CHF 4,661 Sonova Holding AG 943,189.94 950,272.96 0.26 CHF 5,143 Stadler Rail AG Reg 227,611.73 228,927.70 0.06 CHF 8,579 Sunrise Com Group SA Reg 584,567.04 600,525.46 0.16 CHF 881 Swiss Life Holding Reg 344,021.15 393,938.98 0.11 CHF 1,467 Swisscom Ltd Reg 689,685.03 692,156.42 0.19 CHF 6,878 Swissquote Group Holding SA Reg 276,978.31 307,169.79 0.08 CHF 2,024 TX Group AG Reg 168,727.32 174,560.36 0.05 CHF 2,256 U-blox Hg AG Reg 175,359.63 203,082.96 0.05 CHF 18,005 UBS Group Inc 195,386.86 202,599.11 0.05 CHF 3,724 Valiant Holding AG Reg 362,269.15 337,287.55 0.09 CHF 651 Valora Holding AG Reg 158,769.71 161,785.76 0.04 CHF 228 Vetropack Holding AG 569,004.60 637,975.45 0.17 CHF 7,326 Zehnder Group AG Reg 290,463.82 307,487.38 0.08 CHF 1,482 Zurich Insurance Group AG Reg 494,622.75 541,681.03 0.15
22,599,740.69 24,703,948.23 6.64
DKK 734 AP Moeller Maersk AS A 889,602.33 886,938.94 0.24 DKK 1,098 AP Moeller Maersk AS B 1,263,711.27 1,411,709.21 0.38 DKK 9,842 Carlsberg AS B 1,158,040.82 1,308,857.20 0.35 DKK 6,426 ChemoMetec A/S Bearer 218,014.64 176,280.59 0.05 DKK 36,243 Danske Bank A/S 530,380.60 522,820.75 0.14 DKK 15,677 DSV Panalpina AS 1,569,892.52 1,610,723.44 0.43 DKK 5,707 Genmab A/S 1,152,407.68 1,131,408.51 0.30 DKK 25,431 Ossur hf Reg 166,389.19 177,981.57 0.05 DKK 6,530 Pandora A/S 251,537.00 253,233.69 0.07 DKK 6,062 Per Aarsleff Holding A/S B 184,808.86 174,001.56 0.05 DKK 7,943 Ringkjoebing Landbobank A/S Bearer Reg 439,530.90 546,333.20 0.15 DKK 1,033 Rockwool Intl A/S B 215,903.47 218,130.92 0.06 DKK 16,507 Royal Unibrew A/S 1,233,759.52 1,347,435.24 0.36 DKK 26,010 SAS AB Reg 37,737.34 37,833.79 0.01
RAM (LUX) SYSTEMATIC FUNDS - EUROPEAN EQUITIES
Statement of investments and other net assets (in EUR) (continued) as at 31st December 2019
The accompanying notes are an integral part of these financial statements.
19
Currency Number / nominal value
Description Cost Market value % of total net assets
DKK 1,355 Schouw & Co 85,841.21 101,540.02 0.03 DKK 2,374 SimCorp A/S 237,518.92 240,643.02 0.06 DKK 40,156 Spar Nord Bk A/S 331,750.68 347,667.94 0.09 DKK 35,553 Sydbank A/S Reg 628,827.69 665,109.79 0.18 DKK 22,559 The Drilling Co of 1972 A/S Reg 1,228,452.16 1,330,069.24 0.36 DKK 4,613 Topdanmark AS 196,135.42 202,719.96 0.05 DKK 237,075 Veloxis Pharmaceuticals AS Bearer 193,110.44 190,664.63 0.05 DKK 9,707 Vestas Wind Systems A/S 804,390.02 874,458.19 0.24 DKK 20,603 Zealand Pharma A/S 493,140.21 649,003.19 0.17
13,510,882.89 14,405,564.59 3.87
EUR 305,981 A2A SpA 531,853.73 511,600.23 0.14 EUR 10,956 ACEA SpA 204,229.53 202,028.64 0.05 EUR 730 Ackermans & Van Haaren SA 102,051.50 101,981.00 0.03 EUR 20,291 Actividad Const y Servicios SA 731,412.49 723,374.15 0.19 EUR 367,808 Aegon NV 1,436,257.17 1,495,875.14 0.40 EUR 3,116 Aena SME SA 515,384.54 531,278.00 0.14 EUR 29,657 Ageas NV 1,364,023.87 1,562,330.76 0.42 EUR 10,635 Agfa Gevaert NV 51,277.72 49,112.43 0.01 EUR 2,834 Air Liquide SA 335,289.79 357,650.80 0.10 EUR 6,647 Aktia Bank Plc Reg 60,900.38 62,082.98 0.02 EUR 699 Akwel SA 14,536.54 14,119.80 0.00 EUR 12,609 ALD SA 164,708.86 174,508.56 0.05 EUR 3,884 Allianz SE Reg 809,391.81 848,265.60 0.23 EUR 168,318 Altice Europe NV A 606,737.32 967,491.86 0.26 EUR 1,418 Amadeus Fire AG 155,518.68 209,580.40 0.06 EUR 1,691 Amadeus IT Group SA A 123,144.37 123,104.80 0.03 EUR 29,375 Amplifon SpA Post Frazionamento 651,803.28 753,175.00 0.20 EUR 8,521 Amundi SA 588,755.38 595,617.90 0.16 EUR 4,165 Andritz AG 149,409.80 159,936.00 0.04 EUR 4,117 Anheuser-Busch InBev SA 295,050.60 299,347.07 0.08 EUR 273,059 Anima Holding SpA 1,052,553.56 1,256,617.52 0.34 EUR 5,143 Aperam SA 141,934.37 146,626.93 0.04 EUR 4,502 Arkema 414,803.85 426,339.40 0.11 EUR 205,583 Arnoldo Mondadori Editore SpA 392,686.28 423,500.98 0.11 EUR 16,418 Ascopiave SpA Reg 61,854.82 62,634.67 0.02 EUR 21,478 ASM Intl NV Reg 1,519,051.12 2,151,021.70 0.58 EUR 19,430 ASR Nederland NV 685,939.77 648,184.80 0.17 EUR 127,416 Assicurazioni Generali SpA 2,140,133.47 2,343,817.32 0.63 EUR 24,674 ASTM SpA 670,461.35 665,211.04 0.18 EUR 4,774 Atos SE 330,399.44 354,803.68 0.10 EUR 11,278 Austria Technologie & Syst AG 206,403.28 226,236.68 0.06 EUR 27,175 Autogrill SpA 254,089.56 253,542.75 0.07 EUR 22,519 Avio SpA 317,535.44 312,113.34 0.08 EUR 68,387 Azimut Holding SpA 1,345,185.61 1,455,275.36 0.39 EUR 91,144 Banca Farmafactoring Spa Reg 491,080.32 486,708.96 0.13 EUR 35,959 Banca Generali SpA 923,289.82 1,041,372.64 0.28 EUR 140,650 Banca Mediolanum 990,681.57 1,245,455.75 0.34 EUR 122,057 Banca Pop di Sondrio SCARL 257,762.59 257,296.16 0.07 EUR 76,147 Banca Sistema SpA 144,791.17 140,719.66 0.04 EUR 35,863 Banco Bilbao Vizcaya Argent SA Reg 174,349.93 178,705.33 0.05 EUR 21,706.9999996942 Banco de Sabadell SA Reg 22,111.06 22,575.28 0.01 EUR 51,913 Banco Santander Reg SA 192,893.55 193,635.49 0.05 EUR 3,496 Barco NV 451,459.34 765,624.00 0.21 EUR 1,210 BASF SE Reg 82,584.44 81,493.50 0.02 EUR 8,675 Bawag Group AG Bearer 332,191.45 352,205.00 0.09 EUR 787 Bayer AG Reg 54,927.48 57,301.47 0.02 EUR 22,172 BE Semiconductor Industries NV Reg 724,105.29 764,047.12 0.21 EUR 8,780 Bechtle AG 1,061,534.68 1,099,256.00 0.30 EUR 437 Beiersdorf AG 45,244.18 46,606.05 0.01 EUR 2,876 Bekaert SA 72,439.94 76,214.00 0.02 EUR 3,865 Beneteau SA 40,836.82 41,857.95 0.01 EUR 37,229 BF SpA Reg 134,056.79 144,820.81 0.04 EUR 3,385 BIC SA 209,339.19 209,870.00 0.06 EUR 7,198 Bigben Interactive 108,345.15 115,455.92 0.03
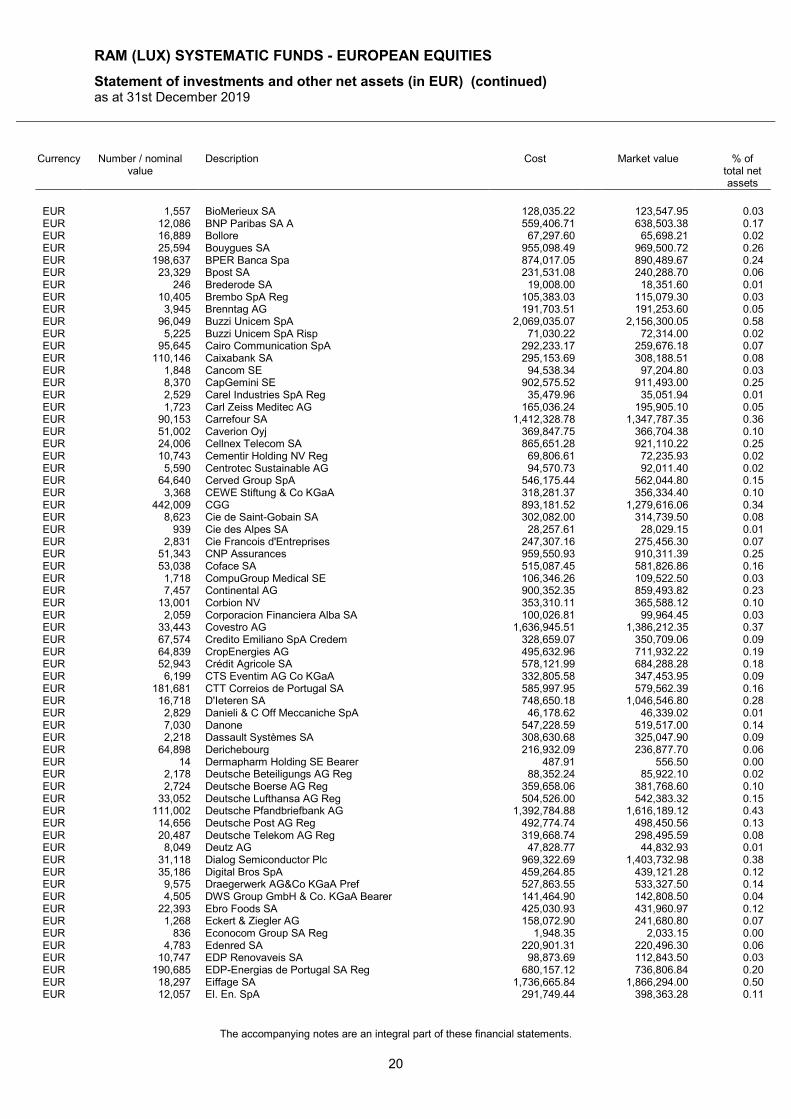
RAM (LUX) SYSTEMATIC FUNDS - EUROPEAN EQUITIES
Statement of investments and other net assets (in EUR) (continued) as at 31st December 2019
The accompanying notes are an integral part of these financial statements.
20
Currency Number / nominal value
Description Cost Market value % of total net assets
EUR 1,557 BioMerieux SA 128,035.22 123,547.95 0.03 EUR 12,086 BNP Paribas SA A 559,406.71 638,503.38 0.17 EUR 16,889 Bollore 67,297.60 65,698.21 0.02 EUR 25,594 Bouygues SA 955,098.49 969,500.72 0.26 EUR 198,637 BPER Banca Spa 874,017.05 890,489.67 0.24 EUR 23,329 Bpost SA 231,531.08 240,288.70 0.06 EUR 246 Brederode SA 19,008.00 18,351.60 0.01 EUR 10,405 Brembo SpA Reg 105,383.03 115,079.30 0.03 EUR 3,945 Brenntag AG 191,703.51 191,253.60 0.05 EUR 96,049 Buzzi Unicem SpA 2,069,035.07 2,156,300.05 0.58 EUR 5,225 Buzzi Unicem SpA Risp 71,030.22 72,314.00 0.02 EUR 95,645 Cairo Communication SpA 292,233.17 259,676.18 0.07 EUR 110,146 Caixabank SA 295,153.69 308,188.51 0.08 EUR 1,848 Cancom SE 94,538.34 97,204.80 0.03 EUR 8,370 CapGemini SE 902,575.52 911,493.00 0.25 EUR 2,529 Carel Industries SpA Reg 35,479.96 35,051.94 0.01 EUR 1,723 Carl Zeiss Meditec AG 165,036.24 195,905.10 0.05 EUR 90,153 Carrefour SA 1,412,328.78 1,347,787.35 0.36 EUR 51,002 Caverion Oyj 369,847.75 366,704.38 0.10 EUR 24,006 Cellnex Telecom SA 865,651.28 921,110.22 0.25 EUR 10,743 Cementir Holding NV Reg 69,806.61 72,235.93 0.02 EUR 5,590 Centrotec Sustainable AG 94,570.73 92,011.40 0.02 EUR 64,640 Cerved Group SpA 546,175.44 562,044.80 0.15 EUR 3,368 CEWE Stiftung & Co KGaA 318,281.37 356,334.40 0.10 EUR 442,009 CGG 893,181.52 1,279,616.06 0.34 EUR 8,623 Cie de Saint-Gobain SA 302,082.00 314,739.50 0.08 EUR 939 Cie des Alpes SA 28,257.61 28,029.15 0.01 EUR 2,831 Cie Francois d'Entreprises 247,307.16 275,456.30 0.07 EUR 51,343 CNP Assurances 959,550.93 910,311.39 0.25 EUR 53,038 Coface SA 515,087.45 581,826.86 0.16 EUR 1,718 CompuGroup Medical SE 106,346.26 109,522.50 0.03 EUR 7,457 Continental AG 900,352.35 859,493.82 0.23 EUR 13,001 Corbion NV 353,310.11 365,588.12 0.10 EUR 2,059 Corporacion Financiera Alba SA 100,026.81 99,964.45 0.03 EUR 33,443 Covestro AG 1,636,945.51 1,386,212.35 0.37 EUR 67,574 Credito Emiliano SpA Credem 328,659.07 350,709.06 0.09 EUR 64,839 CropEnergies AG 495,632.96 711,932.22 0.19 EUR 52,943 Crédit Agricole SA 578,121.99 684,288.28 0.18 EUR 6,199 CTS Eventim AG Co KGaA 332,805.58 347,453.95 0.09 EUR 181,681 CTT Correios de Portugal SA 585,997.95 579,562.39 0.16 EUR 16,718 D'Ieteren SA 748,650.18 1,046,546.80 0.28 EUR 2,829 Danieli & C Off Meccaniche SpA 46,178.62 46,339.02 0.01 EUR 7,030 Danone 547,228.59 519,517.00 0.14 EUR 2,218 Dassault Systèmes SA 308,630.68 325,047.90 0.09 EUR 64,898 Derichebourg 216,932.09 236,877.70 0.06 EUR 14 Dermapharm Holding SE Bearer 487.91 556.50 0.00 EUR 2,178 Deutsche Beteiligungs AG Reg 88,352.24 85,922.10 0.02 EUR 2,724 Deutsche Boerse AG Reg 359,658.06 381,768.60 0.10 EUR 33,052 Deutsche Lufthansa AG Reg 504,526.00 542,383.32 0.15 EUR 111,002 Deutsche Pfandbriefbank AG 1,392,784.88 1,616,189.12 0.43 EUR 14,656 Deutsche Post AG Reg 492,774.74 498,450.56 0.13 EUR 20,487 Deutsche Telekom AG Reg 319,668.74 298,495.59 0.08 EUR 8,049 Deutz AG 47,828.77 44,832.93 0.01 EUR 31,118 Dialog Semiconductor Plc 969,322.69 1,403,732.98 0.38 EUR 35,186 Digital Bros SpA 459,264.85 439,121.28 0.12 EUR 9,575 Draegerwerk AG&Co KGaA Pref 527,863.55 533,327.50 0.14 EUR 4,505 DWS Group GmbH & Co. KGaA Bearer 141,464.90 142,808.50 0.04 EUR 22,393 Ebro Foods SA 425,030.93 431,960.97 0.12 EUR 1,268 Eckert & Ziegler AG 158,072.90 241,680.80 0.07 EUR 836 Econocom Group SA Reg 1,948.35 2,033.15 0.00 EUR 4,783 Edenred SA 220,901.31 220,496.30 0.06 EUR 10,747 EDP Renovaveis SA 98,873.69 112,843.50 0.03 EUR 190,685 EDP-Energias de Portugal SA Reg 680,157.12 736,806.84 0.20 EUR 18,297 Eiffage SA 1,736,665.84 1,866,294.00 0.50 EUR 12,057 El. En. SpA 291,749.44 398,363.28 0.11
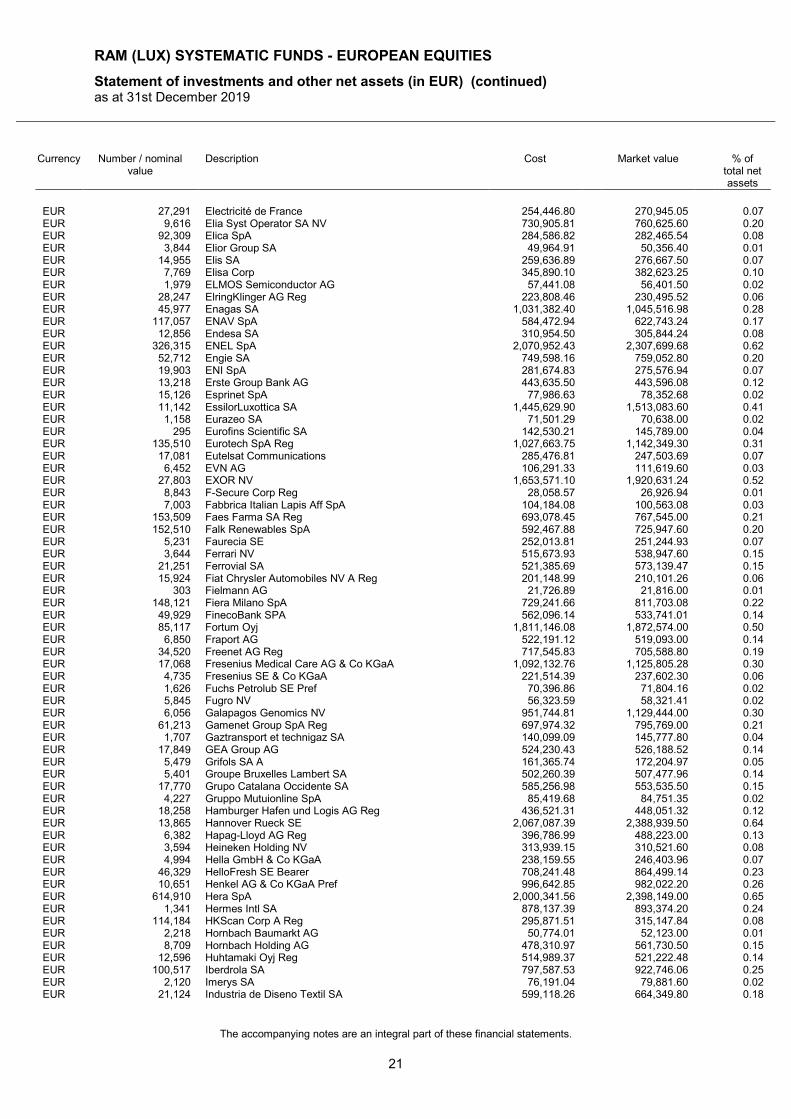
RAM (LUX) SYSTEMATIC FUNDS - EUROPEAN EQUITIES
Statement of investments and other net assets (in EUR) (continued) as at 31st December 2019
The accompanying notes are an integral part of these financial statements.
21
Currency Number / nominal value
Description Cost Market value % of total net assets
EUR 27,291 Electricité de France 254,446.80 270,945.05 0.07 EUR 9,616 Elia Syst Operator SA NV 730,905.81 760,625.60 0.20 EUR 92,309 Elica SpA 284,586.82 282,465.54 0.08 EUR 3,844 Elior Group SA 49,964.91 50,356.40 0.01 EUR 14,955 Elis SA 259,636.89 276,667.50 0.07 EUR 7,769 Elisa Corp 345,890.10 382,623.25 0.10 EUR 1,979 ELMOS Semiconductor AG 57,441.08 56,401.50 0.02 EUR 28,247 ElringKlinger AG Reg 223,808.46 230,495.52 0.06 EUR 45,977 Enagas SA 1,031,382.40 1,045,516.98 0.28 EUR 117,057 ENAV SpA 584,472.94 622,743.24 0.17 EUR 12,856 Endesa SA 310,954.50 305,844.24 0.08 EUR 326,315 ENEL SpA 2,070,952.43 2,307,699.68 0.62 EUR 52,712 Engie SA 749,598.16 759,052.80 0.20 EUR 19,903 ENI SpA 281,674.83 275,576.94 0.07 EUR 13,218 Erste Group Bank AG 443,635.50 443,596.08 0.12 EUR 15,126 Esprinet SpA 77,986.63 78,352.68 0.02 EUR 11,142 EssilorLuxottica SA 1,445,629.90 1,513,083.60 0.41 EUR 1,158 Eurazeo SA 71,501.29 70,638.00 0.02 EUR 295 Eurofins Scientific SA 142,530.21 145,789.00 0.04 EUR 135,510 Eurotech SpA Reg 1,027,663.75 1,142,349.30 0.31 EUR 17,081 Eutelsat Communications 285,476.81 247,503.69 0.07 EUR 6,452 EVN AG 106,291.33 111,619.60 0.03 EUR 27,803 EXOR NV 1,653,571.10 1,920,631.24 0.52 EUR 8,843 F-Secure Corp Reg 28,058.57 26,926.94 0.01 EUR 7,003 Fabbrica Italian Lapis Aff SpA 104,184.08 100,563.08 0.03 EUR 153,509 Faes Farma SA Reg 693,078.45 767,545.00 0.21 EUR 152,510 Falk Renewables SpA 592,467.88 725,947.60 0.20 EUR 5,231 Faurecia SE 252,013.81 251,244.93 0.07 EUR 3,644 Ferrari NV 515,673.93 538,947.60 0.15 EUR 21,251 Ferrovial SA 521,385.69 573,139.47 0.15 EUR 15,924 Fiat Chrysler Automobiles NV A Reg 201,148.99 210,101.26 0.06 EUR 303 Fielmann AG 21,726.89 21,816.00 0.01 EUR 148,121 Fiera Milano SpA 729,241.66 811,703.08 0.22 EUR 49,929 FinecoBank SPA 562,096.14 533,741.01 0.14 EUR 85,117 Fortum Oyj 1,811,146.08 1,872,574.00 0.50 EUR 6,850 Fraport AG 522,191.12 519,093.00 0.14 EUR 34,520 Freenet AG Reg 717,545.83 705,588.80 0.19 EUR 17,068 Fresenius Medical Care AG & Co KGaA 1,092,132.76 1,125,805.28 0.30 EUR 4,735 Fresenius SE & Co KGaA 221,514.39 237,602.30 0.06 EUR 1,626 Fuchs Petrolub SE Pref 70,396.86 71,804.16 0.02 EUR 5,845 Fugro NV 56,323.59 58,321.41 0.02 EUR 6,056 Galapagos Genomics NV 951,744.81 1,129,444.00 0.30 EUR 61,213 Gamenet Group SpA Reg 697,974.32 795,769.00 0.21 EUR 1,707 Gaztransport et technigaz SA 140,099.09 145,777.80 0.04 EUR 17,849 GEA Group AG 524,230.43 526,188.52 0.14 EUR 5,479 Grifols SA A 161,365.74 172,204.97 0.05 EUR 5,401 Groupe Bruxelles Lambert SA 502,260.39 507,477.96 0.14 EUR 17,770 Grupo Catalana Occidente SA 585,256.98 553,535.50 0.15 EUR 4,227 Gruppo Mutuionline SpA 85,419.68 84,751.35 0.02 EUR 18,258 Hamburger Hafen und Logis AG Reg 436,521.31 448,051.32 0.12 EUR 13,865 Hannover Rueck SE 2,067,087.39 2,388,939.50 0.64 EUR 6,382 Hapag-Lloyd AG Reg 396,786.99 488,223.00 0.13 EUR 3,594 Heineken Holding NV 313,939.15 310,521.60 0.08 EUR 4,994 Hella GmbH & Co KGaA 238,159.55 246,403.96 0.07 EUR 46,329 HelloFresh SE Bearer 708,241.48 864,499.14 0.23 EUR 10,651 Henkel AG & Co KGaA Pref 996,642.85 982,022.20 0.26 EUR 614,910 Hera SpA 2,000,341.56 2,398,149.00 0.65 EUR 1,341 Hermes Intl SA 878,137.39 893,374.20 0.24 EUR 114,184 HKScan Corp A Reg 295,871.51 315,147.84 0.08 EUR 2,218 Hornbach Baumarkt AG 50,774.01 52,123.00 0.01 EUR 8,709 Hornbach Holding AG 478,310.97 561,730.50 0.15 EUR 12,596 Huhtamaki Oyj Reg 514,989.37 521,222.48 0.14 EUR 100,517 Iberdrola SA 797,587.53 922,746.06 0.25 EUR 2,120 Imerys SA 76,191.04 79,881.60 0.02 EUR 21,124 Industria de Diseno Textil SA 599,118.26 664,349.80 0.18
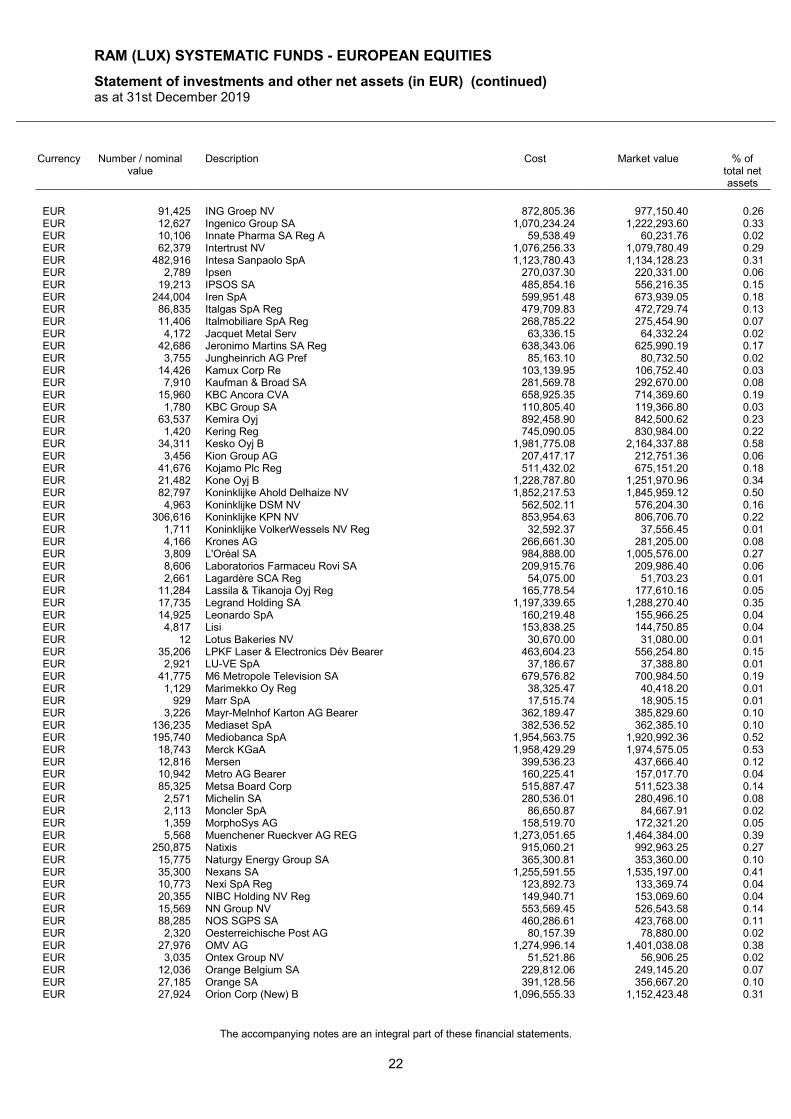
RAM (LUX) SYSTEMATIC FUNDS - EUROPEAN EQUITIES
Statement of investments and other net assets (in EUR) (continued) as at 31st December 2019
The accompanying notes are an integral part of these financial statements.
22
Currency Number / nominal value
Description Cost Market value % of total net assets
EUR 91,425 ING Groep NV 872,805.36 977,150.40 0.26 EUR 12,627 Ingenico Group SA 1,070,234.24 1,222,293.60 0.33 EUR 10,106 Innate Pharma SA Reg A 59,538.49 60,231.76 0.02 EUR 62,379 Intertrust NV 1,076,256.33 1,079,780.49 0.29 EUR 482,916 Intesa Sanpaolo SpA 1,123,780.43 1,134,128.23 0.31 EUR 2,789 Ipsen 270,037.30 220,331.00 0.06 EUR 19,213 IPSOS SA 485,854.16 556,216.35 0.15 EUR 244,004 Iren SpA 599,951.48 673,939.05 0.18 EUR 86,835 Italgas SpA Reg 479,709.83 472,729.74 0.13 EUR 11,406 Italmobiliare SpA Reg 268,785.22 275,454.90 0.07 EUR 4,172 Jacquet Metal Serv 63,336.15 64,332.24 0.02 EUR 42,686 Jeronimo Martins SA Reg 638,343.06 625,990.19 0.17 EUR 3,755 Jungheinrich AG Pref 85,163.10 80,732.50 0.02 EUR 14,426 Kamux Corp Re 103,139.95 106,752.40 0.03 EUR 7,910 Kaufman & Broad SA 281,569.78 292,670.00 0.08 EUR 15,960 KBC Ancora CVA 658,925.35 714,369.60 0.19 EUR 1,780 KBC Group SA 110,805.40 119,366.80 0.03 EUR 63,537 Kemira Oyj 892,458.90 842,500.62 0.23 EUR 1,420 Kering Reg 745,090.05 830,984.00 0.22 EUR 34,311 Kesko Oyj B 1,981,775.08 2,164,337.88 0.58 EUR 3,456 Kion Group AG 207,417.17 212,751.36 0.06 EUR 41,676 Kojamo Plc Reg 511,432.02 675,151.20 0.18 EUR 21,482 Kone Oyj B 1,228,787.80 1,251,970.96 0.34 EUR 82,797 Koninklijke Ahold Delhaize NV 1,852,217.53 1,845,959.12 0.50 EUR 4,963 Koninklijke DSM NV 562,502.11 576,204.30 0.16 EUR 306,616 Koninklijke KPN NV 853,954.63 806,706.70 0.22 EUR 1,711 Koninklijke VolkerWessels NV Reg 32,592.37 37,556.45 0.01 EUR 4,166 Krones AG 266,661.30 281,205.00 0.08 EUR 3,809 L'Oréal SA 984,888.00 1,005,576.00 0.27 EUR 8,606 Laboratorios Farmaceu Rovi SA 209,915.76 209,986.40 0.06 EUR 2,661 Lagardère SCA Reg 54,075.00 51,703.23 0.01 EUR 11,284 Lassila & Tikanoja Oyj Reg 165,778.54 177,610.16 0.05 EUR 17,735 Legrand Holding SA 1,197,339.65 1,288,270.40 0.35 EUR 14,925 Leonardo SpA 160,219.48 155,966.25 0.04 EUR 4,817 Lisi 153,838.25 144,750.85 0.04 EUR 12 Lotus Bakeries NV 30,670.00 31,080.00 0.01 EUR 35,206 LPKF Laser & Electronics Dév Bearer 463,604.23 556,254.80 0.15 EUR 2,921 LU-VE SpA 37,186.67 37,388.80 0.01 EUR 41,775 M6 Metropole Television SA 679,576.82 700,984.50 0.19 EUR 1,129 Marimekko Oy Reg 38,325.47 40,418.20 0.01 EUR 929 Marr SpA 17,515.74 18,905.15 0.01 EUR 3,226 Mayr-Melnhof Karton AG Bearer 362,189.47 385,829.60 0.10 EUR 136,235 Mediaset SpA 382,536.52 362,385.10 0.10 EUR 195,740 Mediobanca SpA 1,954,563.75 1,920,992.36 0.52 EUR 18,743 Merck KGaA 1,958,429.29 1,974,575.05 0.53 EUR 12,816 Mersen 399,536.23 437,666.40 0.12 EUR 10,942 Metro AG Bearer 160,225.41 157,017.70 0.04 EUR 85,325 Metsa Board Corp 515,887.47 511,523.38 0.14 EUR 2,571 Michelin SA 280,536.01 280,496.10 0.08 EUR 2,113 Moncler SpA 86,650.87 84,667.91 0.02 EUR 1,359 MorphoSys AG 158,519.70 172,321.20 0.05 EUR 5,568 Muenchener Rueckver AG REG 1,273,051.65 1,464,384.00 0.39 EUR 250,875 Natixis 915,060.21 992,963.25 0.27 EUR 15,775 Naturgy Energy Group SA 365,300.81 353,360.00 0.10 EUR 35,300 Nexans SA 1,255,591.55 1,535,197.00 0.41 EUR 10,773 Nexi SpA Reg 123,892.73 133,369.74 0.04 EUR 20,355 NIBC Holding NV Reg 149,940.71 153,069.60 0.04 EUR 15,569 NN Group NV 553,569.45 526,543.58 0.14 EUR 88,285 NOS SGPS SA 460,286.61 423,768.00 0.11 EUR 2,320 Oesterreichische Post AG 80,157.39 78,880.00 0.02 EUR 27,976 OMV AG 1,274,996.14 1,401,038.08 0.38 EUR 3,035 Ontex Group NV 51,521.86 56,906.25 0.02 EUR 12,036 Orange Belgium SA 229,812.06 249,145.20 0.07 EUR 27,185 Orange SA 391,128.56 356,667.20 0.10 EUR 27,924 Orion Corp (New) B 1,096,555.33 1,152,423.48 0.31
RAM (LUX) SYSTEMATIC FUNDS - EUROPEAN EQUITIES
Statement of investments and other net assets (in EUR) (continued) as at 31st December 2019
The accompanying notes are an integral part of these financial statements.
23
Currency Number / nominal value
Description Cost Market value % of total net assets
EUR 34,308 OVS SpA 65,799.31 68,821.85 0.02 EUR 943 Palfinger AG 26,338.56 27,582.75 0.01 EUR 2,549 Pernod-Ricard SA 415,506.48 406,310.60 0.11 EUR 58,698 Peugeot SA 1,295,144.53 1,250,267.40 0.34 EUR 657,661 Pharming Group NV Bearer 797,718.12 1,030,883.62 0.28 EUR 149,340 Piaggio & C. SpA 386,440.70 410,386.32 0.11 EUR 10,091 Plastic Omnium 252,784.51 251,265.90 0.07 EUR 7,097 PNE AG Reg 26,369.23 28,104.12 0.01 EUR 901 Ponsse Oyj 25,839.51 27,931.00 0.01 EUR 14,370 Porsche Automobile Hg SE Pref 932,464.49 957,616.80 0.26 EUR 145,070 Poste Italiane SpA 1,281,220.27 1,468,108.40 0.40 EUR 22,415 ProSieben Sat.1 Media SE 401,103.12 311,792.65 0.08 EUR 19,557 Proximus SA 522,367.00 499,094.64 0.13 EUR 7,368 Publicis Groupe SA 349,367.53 297,372.48 0.08 EUR 9,451 PVA TePla AG 141,700.62 144,600.30 0.04 EUR 16,274 Quadient SA 324,952.19 351,192.92 0.09 EUR 41,733 Rai Way SpA Reg 258,683.11 255,823.29 0.07 EUR 14,354 Raiffeisen Bank Intl AG 311,903.61 321,386.06 0.09 EUR 12,429 Raisio Plc V Reg 44,596.12 42,258.60 0.01 EUR 1,768 Randstad NV 86,598.79 96,249.92 0.03 EUR 2,250 Rational AG Reg 1,587,659.53 1,613,250.00 0.43 EUR 52,049 Red Electrica Corporacion SA 940,151.99 932,978.33 0.25 EUR 245,700 Redes Energetic Nacio SGPS SA 631,799.59 668,304.00 0.18 EUR 6,387 Renault SA 330,525.11 269,403.66 0.07 EUR 275,833 Reno De Medici Spa 238,374.30 227,010.56 0.06 EUR 6,571 Reply SpA Reg 464,156.57 456,355.95 0.12 EUR 63,908 Repsol SA 921,731.90 890,238.44 0.24 EUR 280,404 Retelit SpA 491,400.24 445,842.36 0.12 EUR 8,908 Revenio Group Corp 226,940.62 233,835.00 0.06 EUR 3,452 Rheinmetall AG 345,247.78 353,484.80 0.10 EUR 13,087 RIB Software SE Reg 256,248.57 295,766.20 0.08 EUR 28,594 Rizzoli Corri Sera Mediagr SpA 30,312.50 28,822.75 0.01 EUR 460 Robertet SA 363,273.87 424,580.00 0.11 EUR 4,190 Royal Philips NV 174,490.71 182,348.80 0.05 EUR 11,144 RTL Group SA 493,755.15 490,113.12 0.13 EUR 5,060 Rubis SCA 269,353.32 277,035.00 0.07 EUR 149,004 Sacyr SA 378,196.31 387,410.40 0.10 EUR 11,119 SAES Getters SpA Reg 340,153.50 337,461.65 0.09 EUR 204,131 Safilo Group SpA 227,524.41 227,401.93 0.06 EUR 7,145 SAFRAN SA 1,018,474.49 983,509.25 0.26 EUR 451,612 Saipem SpA Reg 1,848,289.30 1,967,221.87 0.53 EUR 7,367 Sampo Plc A 271,140.46 286,649.97 0.08 EUR 7,191 Sanofi SA 573,925.71 644,457.42 0.17 EUR 5,460 Sanoma-WSOY Oyj B 51,592.63 51,569.70 0.01 EUR 887 Sartorius Stedim Biotech 126,213.45 131,009.90 0.04 EUR 130,138 Schaeffler AG Pref 1,227,375.40 1,252,968.66 0.34 EUR 3,249 Schneider Electric SE 288,514.91 297,283.50 0.08 EUR 9,902 SCOR SE 371,077.18 370,532.84 0.10 EUR 12,107 SES SA FDR repr 1 Reg Sh A 181,987.35 151,337.50 0.04 EUR 11,271 Sesa SpA 455,254.62 537,063.15 0.14 EUR 9,426 Siemens Healthineers AG Reg 409,857.75 403,621.32 0.11 EUR 15,478 Signify NV 385,122.99 431,217.08 0.12 EUR 5,281 Siltronic AG Reg 428,605.00 473,811.32 0.13 EUR 11,674 SMA Solar Technology AG 371,000.29 403,453.44 0.11 EUR 286,682 Snam SpA 1,234,369.15 1,343,391.85 0.36 EUR 9,718 SNP Schneider-Neurei & Part SE 426,895.03 481,041.00 0.13 EUR 13,911 Soc de Inv e Gestao SA SEMAPA Reg 194,886.38 190,858.92 0.05 EUR 10,506 Société Générale SA 273,629.91 325,843.59 0.09 EUR 5,759 Sodexo 582,823.09 608,438.35 0.16 EUR 8,339 Software AG Reg 251,138.97 259,342.90 0.07 EUR 8,454 Solvay SA 817,456.10 873,298.20 0.24 EUR 458 SOMFY SA 38,916.52 40,075.00 0.01 EUR 493,125 Sonae SGPS SA Reg 457,504.88 448,743.75 0.12 EUR 2,092 Sopra Steria Group SA 226,328.11 300,202.00 0.08 EUR 734 Stabilus SA 34,281.42 44,517.10 0.01
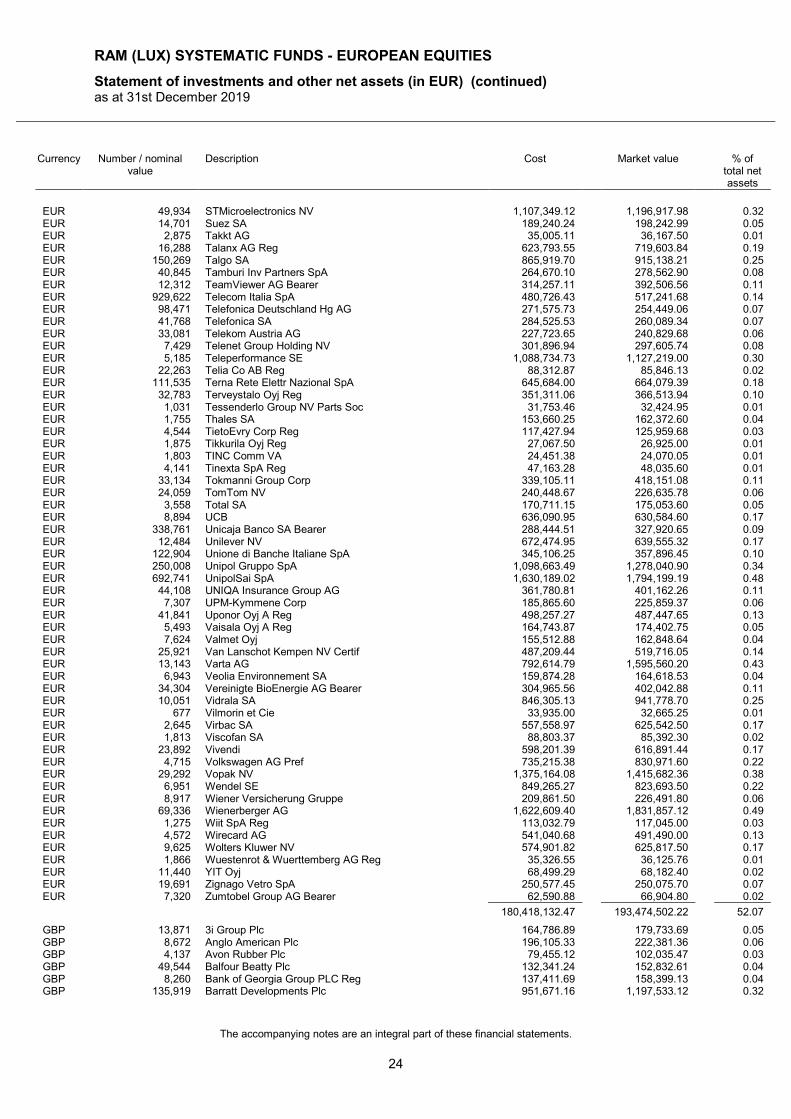
RAM (LUX) SYSTEMATIC FUNDS - EUROPEAN EQUITIES
Statement of investments and other net assets (in EUR) (continued) as at 31st December 2019
The accompanying notes are an integral part of these financial statements.
24
Currency Number / nominal value
Description Cost Market value % of total net assets
EUR 49,934 STMicroelectronics NV 1,107,349.12 1,196,917.98 0.32 EUR 14,701 Suez SA 189,240.24 198,242.99 0.05 EUR 2,875 Takkt AG 35,005.11 36,167.50 0.01 EUR 16,288 Talanx AG Reg 623,793.55 719,603.84 0.19 EUR 150,269 Talgo SA 865,919.70 915,138.21 0.25 EUR 40,845 Tamburi Inv Partners SpA 264,670.10 278,562.90 0.08 EUR 12,312 TeamViewer AG Bearer 314,257.11 392,506.56 0.11 EUR 929,622 Telecom Italia SpA 480,726.43 517,241.68 0.14 EUR 98,471 Telefonica Deutschland Hg AG 271,575.73 254,449.06 0.07 EUR 41,768 Telefonica SA 284,525.53 260,089.34 0.07 EUR 33,081 Telekom Austria AG 227,723.65 240,829.68 0.06 EUR 7,429 Telenet Group Holding NV 301,896.94 297,605.74 0.08 EUR 5,185 Teleperformance SE 1,088,734.73 1,127,219.00 0.30 EUR 22,263 Telia Co AB Reg 88,312.87 85,846.13 0.02 EUR 111,535 Terna Rete Elettr Nazional SpA 645,684.00 664,079.39 0.18 EUR 32,783 Terveystalo Oyj Reg 351,311.06 366,513.94 0.10 EUR 1,031 Tessenderlo Group NV Parts Soc 31,753.46 32,424.95 0.01 EUR 1,755 Thales SA 153,660.25 162,372.60 0.04 EUR 4,544 TietoEvry Corp Reg 117,427.94 125,959.68 0.03 EUR 1,875 Tikkurila Oyj Reg 27,067.50 26,925.00 0.01 EUR 1,803 TINC Comm VA 24,451.38 24,070.05 0.01 EUR 4,141 Tinexta SpA Reg 47,163.28 48,035.60 0.01 EUR 33,134 Tokmanni Group Corp 339,105.11 418,151.08 0.11 EUR 24,059 TomTom NV 240,448.67 226,635.78 0.06 EUR 3,558 Total SA 170,711.15 175,053.60 0.05 EUR 8,894 UCB 636,090.95 630,584.60 0.17 EUR 338,761 Unicaja Banco SA Bearer 288,444.51 327,920.65 0.09 EUR 12,484 Unilever NV 672,474.95 639,555.32 0.17 EUR 122,904 Unione di Banche Italiane SpA 345,106.25 357,896.45 0.10 EUR 250,008 Unipol Gruppo SpA 1,098,663.49 1,278,040.90 0.34 EUR 692,741 UnipolSai SpA 1,630,189.02 1,794,199.19 0.48 EUR 44,108 UNIQA Insurance Group AG 361,780.81 401,162.26 0.11 EUR 7,307 UPM-Kymmene Corp 185,865.60 225,859.37 0.06 EUR 41,841 Uponor Oyj A Reg 498,257.27 487,447.65 0.13 EUR 5,493 Vaisala Oyj A Reg 164,743.87 174,402.75 0.05 EUR 7,624 Valmet Oyj 155,512.88 162,848.64 0.04 EUR 25,921 Van Lanschot Kempen NV Certif 487,209.44 519,716.05 0.14 EUR 13,143 Varta AG 792,614.79 1,595,560.20 0.43 EUR 6,943 Veolia Environnement SA 159,874.28 164,618.53 0.04 EUR 34,304 Vereinigte BioEnergie AG Bearer 304,965.56 402,042.88 0.11 EUR 10,051 Vidrala SA 846,305.13 941,778.70 0.25 EUR 677 Vilmorin et Cie 33,935.00 32,665.25 0.01 EUR 2,645 Virbac SA 557,558.97 625,542.50 0.17 EUR 1,813 Viscofan SA 88,803.37 85,392.30 0.02 EUR 23,892 Vivendi 598,201.39 616,891.44 0.17 EUR 4,715 Volkswagen AG Pref 735,215.38 830,971.60 0.22 EUR 29,292 Vopak NV 1,375,164.08 1,415,682.36 0.38 EUR 6,951 Wendel SE 849,265.27 823,693.50 0.22 EUR 8,917 Wiener Versicherung Gruppe 209,861.50 226,491.80 0.06 EUR 69,336 Wienerberger AG 1,622,609.40 1,831,857.12 0.49 EUR 1,275 Wiit SpA Reg 113,032.79 117,045.00 0.03 EUR 4,572 Wirecard AG 541,040.68 491,490.00 0.13 EUR 9,625 Wolters Kluwer NV 574,901.82 625,817.50 0.17 EUR 1,866 Wuestenrot & Wuerttemberg AG Reg 35,326.55 36,125.76 0.01 EUR 11,440 YIT Oyj 68,499.29 68,182.40 0.02 EUR 19,691 Zignago Vetro SpA 250,577.45 250,075.70 0.07 EUR 7,320 Zumtobel Group AG Bearer 62,590.88 66,904.80 0.02
180,418,132.47 193,474,502.22 52.07
GBP 13,871 3i Group Plc 164,786.89 179,733.69 0.05 GBP 8,672 Anglo American Plc 196,105.33 222,381.36 0.06 GBP 4,137 Avon Rubber Plc 79,455.12 102,035.47 0.03 GBP 49,544 Balfour Beatty Plc 132,341.24 152,832.61 0.04 GBP 8,260 Bank of Georgia Group PLC Reg 137,411.69 158,399.13 0.04 GBP 135,919 Barratt Developments Plc 951,671.16 1,197,533.12 0.32
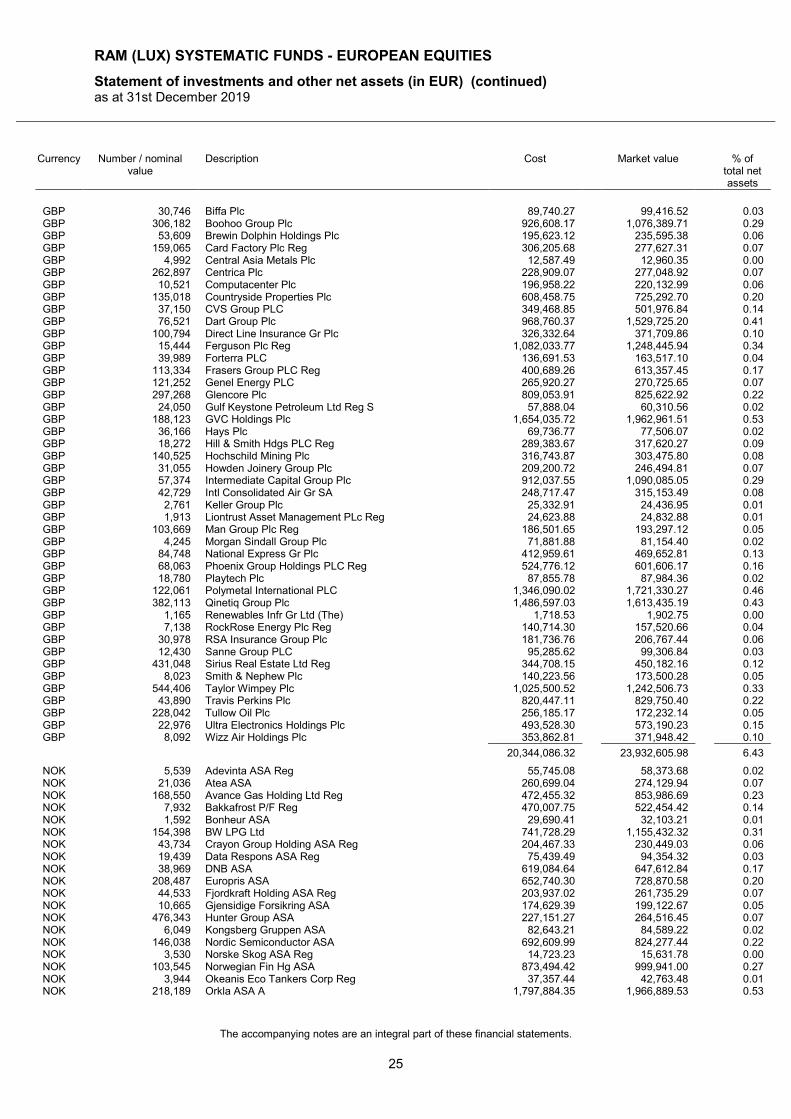
RAM (LUX) SYSTEMATIC FUNDS - EUROPEAN EQUITIES
Statement of investments and other net assets (in EUR) (continued) as at 31st December 2019
The accompanying notes are an integral part of these financial statements.
25
Currency Number / nominal value
Description Cost Market value % of total net assets
GBP 30,746 Biffa Plc 89,740.27 99,416.52 0.03 GBP 306,182 Boohoo Group Plc 926,608.17 1,076,389.71 0.29 GBP 53,609 Brewin Dolphin Holdings Plc 195,623.12 235,595.38 0.06 GBP 159,065 Card Factory Plc Reg 306,205.68 277,627.31 0.07 GBP 4,992 Central Asia Metals Plc 12,587.49 12,960.35 0.00 GBP 262,897 Centrica Plc 228,909.07 277,048.92 0.07 GBP 10,521 Computacenter Plc 196,958.22 220,132.99 0.06 GBP 135,018 Countryside Properties Plc 608,458.75 725,292.70 0.20 GBP 37,150 CVS Group PLC 349,468.85 501,976.84 0.14 GBP 76,521 Dart Group Plc 968,760.37 1,529,725.20 0.41 GBP 100,794 Direct Line Insurance Gr Plc 326,332.64 371,709.86 0.10 GBP 15,444 Ferguson Plc Reg 1,082,033.77 1,248,445.94 0.34 GBP 39,989 Forterra PLC 136,691.53 163,517.10 0.04 GBP 113,334 Frasers Group PLC Reg 400,689.26 613,357.45 0.17 GBP 121,252 Genel Energy PLC 265,920.27 270,725.65 0.07 GBP 297,268 Glencore Plc 809,053.91 825,622.92 0.22 GBP 24,050 Gulf Keystone Petroleum Ltd Reg S 57,888.04 60,310.56 0.02 GBP 188,123 GVC Holdings Plc 1,654,035.72 1,962,961.51 0.53 GBP 36,166 Hays Plc 69,736.77 77,506.07 0.02 GBP 18,272 Hill & Smith Hdgs PLC Reg 289,383.67 317,620.27 0.09 GBP 140,525 Hochschild Mining Plc 316,743.87 303,475.80 0.08 GBP 31,055 Howden Joinery Group Plc 209,200.72 246,494.81 0.07 GBP 57,374 Intermediate Capital Group Plc 912,037.55 1,090,085.05 0.29 GBP 42,729 Intl Consolidated Air Gr SA 248,717.47 315,153.49 0.08 GBP 2,761 Keller Group Plc 25,332.91 24,436.95 0.01 GBP 1,913 Liontrust Asset Management PLc Reg 24,623.88 24,832.88 0.01 GBP 103,669 Man Group Plc Reg 186,501.65 193,297.12 0.05 GBP 4,245 Morgan Sindall Group Plc 71,881.88 81,154.40 0.02 GBP 84,748 National Express Gr Plc 412,959.61 469,652.81 0.13 GBP 68,063 Phoenix Group Holdings PLC Reg 524,776.12 601,606.17 0.16 GBP 18,780 Playtech Plc 87,855.78 87,984.36 0.02 GBP 122,061 Polymetal International PLC 1,346,090.02 1,721,330.27 0.46 GBP 382,113 Qinetiq Group Plc 1,486,597.03 1,613,435.19 0.43 GBP 1,165 Renewables Infr Gr Ltd (The) 1,718.53 1,902.75 0.00 GBP 7,138 RockRose Energy Plc Reg 140,714.30 157,520.66 0.04 GBP 30,978 RSA Insurance Group Plc 181,736.76 206,767.44 0.06 GBP 12,430 Sanne Group PLC 95,285.62 99,306.84 0.03 GBP 431,048 Sirius Real Estate Ltd Reg 344,708.15 450,182.16 0.12 GBP 8,023 Smith & Nephew Plc 140,223.56 173,500.28 0.05 GBP 544,406 Taylor Wimpey Plc 1,025,500.52 1,242,506.73 0.33 GBP 43,890 Travis Perkins Plc 820,447.11 829,750.40 0.22 GBP 228,042 Tullow Oil Plc 256,185.17 172,232.14 0.05 GBP 22,976 Ultra Electronics Holdings Plc 493,528.30 573,190.23 0.15 GBP 8,092 Wizz Air Holdings Plc 353,862.81 371,948.42 0.10
20,344,086.32 23,932,605.98 6.43
NOK 5,539 Adevinta ASA Reg 55,745.08 58,373.68 0.02 NOK 21,036 Atea ASA 260,699.04 274,129.94 0.07 NOK 168,550 Avance Gas Holding Ltd Reg 472,455.32 853,986.69 0.23 NOK 7,932 Bakkafrost P/F Reg 470,007.75 522,454.42 0.14 NOK 1,592 Bonheur ASA 29,690.41 32,103.21 0.01 NOK 154,398 BW LPG Ltd 741,728.29 1,155,432.32 0.31 NOK 43,734 Crayon Group Holding ASA Reg 204,467.33 230,449.03 0.06 NOK 19,439 Data Respons ASA Reg 75,439.49 94,354.32 0.03 NOK 38,969 DNB ASA 619,084.64 647,612.84 0.17 NOK 208,487 Europris ASA 652,740.30 728,870.58 0.20 NOK 44,533 Fjordkraft Holding ASA Reg 203,937.02 261,735.29 0.07 NOK 10,665 Gjensidige Forsikring ASA 174,629.39 199,122.67 0.05 NOK 476,343 Hunter Group ASA 227,151.27 264,516.45 0.07 NOK 6,049 Kongsberg Gruppen ASA 82,643.21 84,589.22 0.02 NOK 146,038 Nordic Semiconductor ASA 692,609.99 824,277.44 0.22 NOK 3,530 Norske Skog ASA Reg 14,723.23 15,631.78 0.00 NOK 103,545 Norwegian Fin Hg ASA 873,494.42 999,941.00 0.27 NOK 3,944 Okeanis Eco Tankers Corp Reg 37,357.44 42,763.48 0.01 NOK 218,189 Orkla ASA A 1,797,884.35 1,966,889.53 0.53
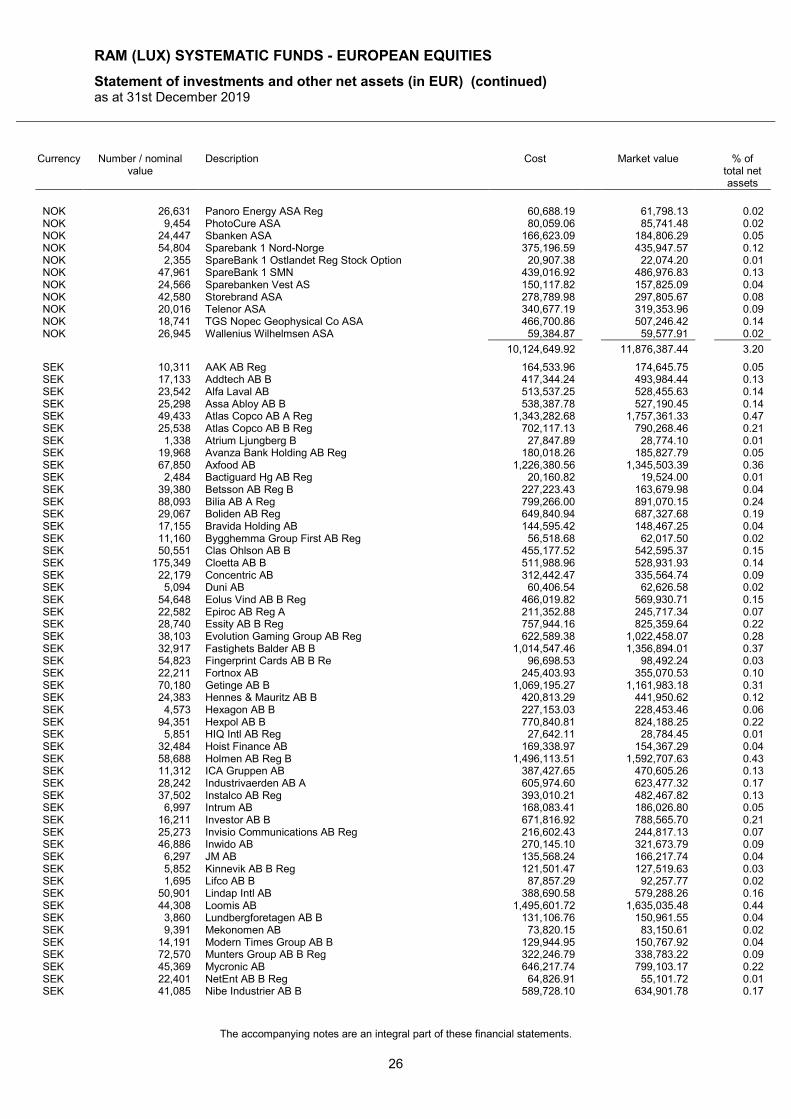
RAM (LUX) SYSTEMATIC FUNDS - EUROPEAN EQUITIES
Statement of investments and other net assets (in EUR) (continued) as at 31st December 2019
The accompanying notes are an integral part of these financial statements.
26
Currency Number / nominal value
Description Cost Market value % of total net assets
NOK 26,631 Panoro Energy ASA Reg 60,688.19 61,798.13 0.02 NOK 9,454 PhotoCure ASA 80,059.06 85,741.48 0.02 NOK 24,447 Sbanken ASA 166,623.09 184,806.29 0.05 NOK 54,804 Sparebank 1 Nord-Norge 375,196.59 435,947.57 0.12 NOK 2,355 SpareBank 1 Ostlandet Reg Stock Option 20,907.38 22,074.20 0.01 NOK 47,961 SpareBank 1 SMN 439,016.92 486,976.83 0.13 NOK 24,566 Sparebanken Vest AS 150,117.82 157,825.09 0.04 NOK 42,580 Storebrand ASA 278,789.98 297,805.67 0.08 NOK 20,016 Telenor ASA 340,677.19 319,353.96 0.09 NOK 18,741 TGS Nopec Geophysical Co ASA 466,700.86 507,246.42 0.14 NOK 26,945 Wallenius Wilhelmsen ASA 59,384.87 59,577.91 0.02
10,124,649.92 11,876,387.44 3.20
SEK 10,311 AAK AB Reg 164,533.96 174,645.75 0.05 SEK 17,133 Addtech AB B 417,344.24 493,984.44 0.13 SEK 23,542 Alfa Laval AB 513,537.25 528,455.63 0.14 SEK 25,298 Assa Abloy AB B 538,387.78 527,190.45 0.14 SEK 49,433 Atlas Copco AB A Reg 1,343,282.68 1,757,361.33 0.47 SEK 25,538 Atlas Copco AB B Reg 702,117.13 790,268.46 0.21 SEK 1,338 Atrium Ljungberg B 27,847.89 28,774.10 0.01 SEK 19,968 Avanza Bank Holding AB Reg 180,018.26 185,827.79 0.05 SEK 67,850 Axfood AB 1,226,380.56 1,345,503.39 0.36 SEK 2,484 Bactiguard Hg AB Reg 20,160.82 19,524.00 0.01 SEK 39,380 Betsson AB Reg B 227,223.43 163,679.98 0.04 SEK 88,093 Bilia AB A Reg 799,266.00 891,070.15 0.24 SEK 29,067 Boliden AB Reg 649,840.94 687,327.68 0.19 SEK 17,155 Bravida Holding AB 144,595.42 148,467.25 0.04 SEK 11,160 Bygghemma Group First AB Reg 56,518.68 62,017.50 0.02 SEK 50,551 Clas Ohlson AB B 455,177.52 542,595.37 0.15 SEK 175,349 Cloetta AB B 511,988.96 528,931.93 0.14 SEK 22,179 Concentric AB 312,442.47 335,564.74 0.09 SEK 5,094 Duni AB 60,406.54 62,626.58 0.02 SEK 54,648 Eolus Vind AB B Reg 466,019.82 569,930.71 0.15 SEK 22,582 Epiroc AB Reg A 211,352.88 245,717.34 0.07 SEK 28,740 Essity AB B Reg 757,944.16 825,359.64 0.22 SEK 38,103 Evolution Gaming Group AB Reg 622,589.38 1,022,458.07 0.28 SEK 32,917 Fastighets Balder AB B 1,014,547.46 1,356,894.01 0.37 SEK 54,823 Fingerprint Cards AB B Re 96,698.53 98,492.24 0.03 SEK 22,211 Fortnox AB 245,403.93 355,070.53 0.10 SEK 70,180 Getinge AB B 1,069,195.27 1,161,983.18 0.31 SEK 24,383 Hennes & Mauritz AB B 420,813.29 441,950.62 0.12 SEK 4,573 Hexagon AB B 227,153.03 228,453.46 0.06 SEK 94,351 Hexpol AB B 770,840.81 824,188.25 0.22 SEK 5,851 HIQ Intl AB Reg 27,642.11 28,784.45 0.01 SEK 32,484 Hoist Finance AB 169,338.97 154,367.29 0.04 SEK 58,688 Holmen AB Reg B 1,496,113.51 1,592,707.63 0.43 SEK 11,312 ICA Gruppen AB 387,427.65 470,605.26 0.13 SEK 28,242 Industrivaerden AB A 605,974.60 623,477.32 0.17 SEK 37,502 Instalco AB Reg 393,010.21 482,467.82 0.13 SEK 6,997 Intrum AB 168,083.41 186,026.80 0.05 SEK 16,211 Investor AB B 671,816.92 788,565.70 0.21 SEK 25,273 Invisio Communications AB Reg 216,602.43 244,817.13 0.07 SEK 46,886 Inwido AB 270,145.10 321,673.79 0.09 SEK 6,297 JM AB 135,568.24 166,217.74 0.04 SEK 5,852 Kinnevik AB B Reg 121,501.47 127,519.63 0.03 SEK 1,695 Lifco AB B 87,857.29 92,257.77 0.02 SEK 50,901 Lindap Intl AB 388,690.58 579,288.26 0.16 SEK 44,308 Loomis AB 1,495,601.72 1,635,035.48 0.44 SEK 3,860 Lundbergforetagen AB B 131,106.76 150,961.55 0.04 SEK 9,391 Mekonomen AB 73,820.15 83,150.61 0.02 SEK 14,191 Modern Times Group AB B 129,944.95 150,767.92 0.04 SEK 72,570 Munters Group AB B Reg 322,246.79 338,783.22 0.09 SEK 45,369 Mycronic AB 646,217.74 799,103.17 0.22 SEK 22,401 NetEnt AB B Reg 64,826.91 55,101.72 0.01 SEK 41,085 Nibe Industrier AB B 589,728.10 634,901.78 0.17
RAM (LUX) SYSTEMATIC FUNDS - EUROPEAN EQUITIES
Statement of investments and other net assets (in EUR) (continued) as at 31st December 2019
The accompanying notes are an integral part of these financial statements.
27
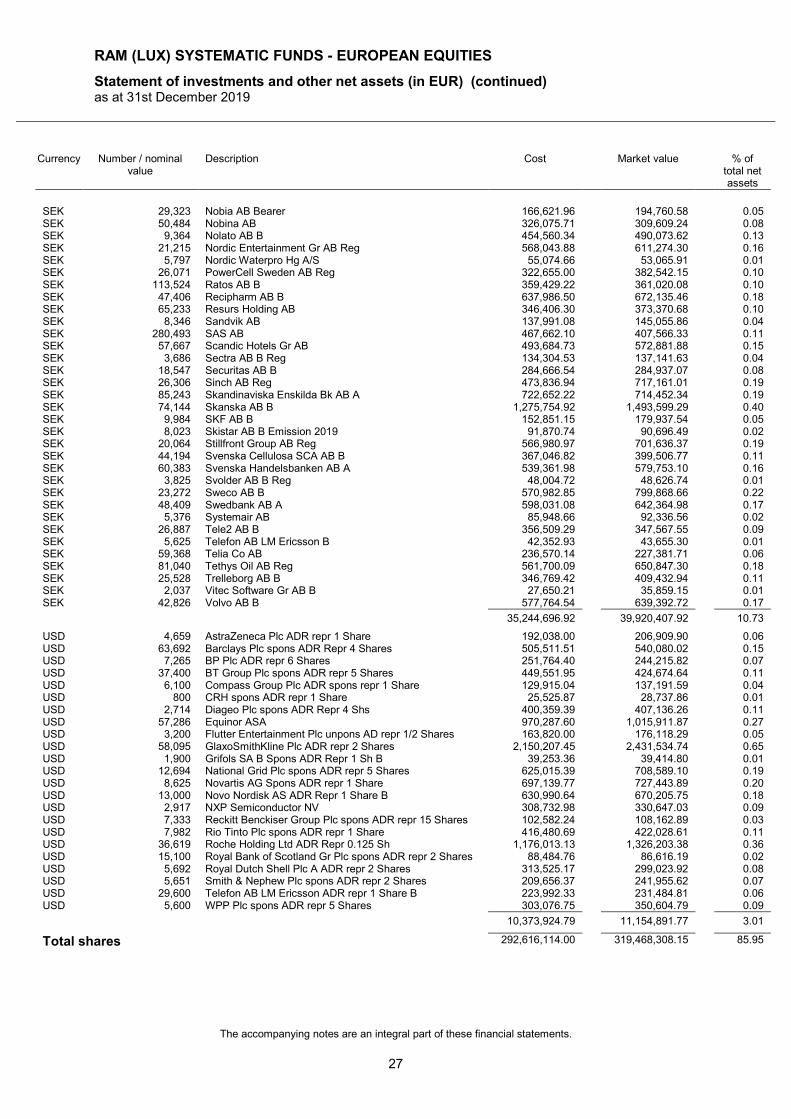
Currency Number / nominal value
Description Cost Market value % of total net assets
SEK 29,323 Nobia AB Bearer 166,621.96 194,760.58 0.05 SEK 50,484 Nobina AB 326,075.71 309,609.24 0.08 SEK 9,364 Nolato AB B 454,560.34 490,073.62 0.13 SEK 21,215 Nordic Entertainment Gr AB Reg 568,043.88 611,274.30 0.16 SEK 5,797 Nordic Waterpro Hg A/S 55,074.66 53,065.91 0.01 SEK 26,071 PowerCell Sweden AB Reg 322,655.00 382,542.15 0.10 SEK 113,524 Ratos AB B 359,429.22 361,020.08 0.10 SEK 47,406 Recipharm AB B 637,986.50 672,135.46 0.18 SEK 65,233 Resurs Holding AB 346,406.30 373,370.68 0.10 SEK 8,346 Sandvik AB 137,991.08 145,055.86 0.04 SEK 280,493 SAS AB 467,662.10 407,566.33 0.11 SEK 57,667 Scandic Hotels Gr AB 493,684.73 572,881.88 0.15 SEK 3,686 Sectra AB B Reg 134,304.53 137,141.63 0.04 SEK 18,547 Securitas AB B 284,666.54 284,937.07 0.08 SEK 26,306 Sinch AB Reg 473,836.94 717,161.01 0.19 SEK 85,243 Skandinaviska Enskilda Bk AB A 722,652.22 714,452.34 0.19 SEK 74,144 Skanska AB B 1,275,754.92 1,493,599.29 0.40 SEK 9,984 SKF AB B 152,851.15 179,937.54 0.05 SEK 8,023 Skistar AB B Emission 2019 91,870.74 90,696.49 0.02 SEK 20,064 Stillfront Group AB Reg 566,980.97 701,636.37 0.19 SEK 44,194 Svenska Cellulosa SCA AB B 367,046.82 399,506.77 0.11 SEK 60,383 Svenska Handelsbanken AB A 539,361.98 579,753.10 0.16 SEK 3,825 Svolder AB B Reg 48,004.72 48,626.74 0.01 SEK 23,272 Sweco AB B 570,982.85 799,868.66 0.22 SEK 48,409 Swedbank AB A 598,031.08 642,364.98 0.17 SEK 5,376 Systemair AB 85,948.66 92,336.56 0.02 SEK 26,887 Tele2 AB B 356,509.29 347,567.55 0.09 SEK 5,625 Telefon AB LM Ericsson B 42,352.93 43,655.30 0.01 SEK 59,368 Telia Co AB 236,570.14 227,381.71 0.06 SEK 81,040 Tethys Oil AB Reg 561,700.09 650,847.30 0.18 SEK 25,528 Trelleborg AB B 346,769.42 409,432.94 0.11 SEK 2,037 Vitec Software Gr AB B 27,650.21 35,859.15 0.01 SEK 42,826 Volvo AB B 577,764.54 639,392.72 0.17
35,244,696.92 39,920,407.92 10.73
USD 4,659 AstraZeneca Plc ADR repr 1 Share 192,038.00 206,909.90 0.06 USD 63,692 Barclays Plc spons ADR Repr 4 Shares 505,511.51 540,080.02 0.15 USD 7,265 BP Plc ADR repr 6 Shares 251,764.40 244,215.82 0.07 USD 37,400 BT Group Plc spons ADR repr 5 Shares 449,551.95 424,674.64 0.11 USD 6,100 Compass Group Plc ADR spons repr 1 Share 129,915.04 137,191.59 0.04 USD 800 CRH spons ADR repr 1 Share 25,525.87 28,737.86 0.01 USD 2,714 Diageo Plc spons ADR Repr 4 Shs 400,359.39 407,136.26 0.11 USD 57,286 Equinor ASA 970,287.60 1,015,911.87 0.27 USD 3,200 Flutter Entertainment Plc unpons AD repr 1/2 Shares 163,820.00 176,118.29 0.05 USD 58,095 GlaxoSmithKline Plc ADR repr 2 Shares 2,150,207.45 2,431,534.74 0.65 USD 1,900 Grifols SA B Spons ADR Repr 1 Sh B 39,253.36 39,414.80 0.01 USD 12,694 National Grid Plc spons ADR repr 5 Shares 625,015.39 708,589.10 0.19 USD 8,625 Novartis AG Spons ADR repr 1 Share 697,139.77 727,443.89 0.20 USD 13,000 Novo Nordisk AS ADR Repr 1 Share B 630,990.64 670,205.75 0.18 USD 2,917 NXP Semiconductor NV 308,732.98 330,647.03 0.09 USD 7,333 Reckitt Benckiser Group Plc spons ADR repr 15 Shares 102,582.24 108,162.89 0.03 USD 7,982 Rio Tinto Plc spons ADR repr 1 Share 416,480.69 422,028.61 0.11 USD 36,619 Roche Holding Ltd ADR Repr 0.125 Sh 1,176,013.13 1,326,203.38 0.36 USD 15,100 Royal Bank of Scotland Gr Plc spons ADR repr 2 Shares 88,484.76 86,616.19 0.02 USD 5,692 Royal Dutch Shell Plc A ADR repr 2 Shares 313,525.17 299,023.92 0.08 USD 5,651 Smith & Nephew Plc spons ADR repr 2 Shares 209,656.37 241,955.62 0.07 USD 29,600 Telefon AB LM Ericsson ADR repr 1 Share B 223,992.33 231,484.81 0.06 USD 5,600 WPP Plc spons ADR repr 5 Shares 303,076.75 350,604.79 0.09
10,373,924.79 11,154,891.77 3.01
Total shares 292,616,114.00 319,468,308.15 85.95
RAM (LUX) SYSTEMATIC FUNDS - EUROPEAN EQUITIES
Statement of investments and other net assets (in EUR) (continued) as at 31st December 2019
The accompanying notes are an integral part of these financial statements.
28
Currency Number / nominal value
Description Cost Market value % of total net assets
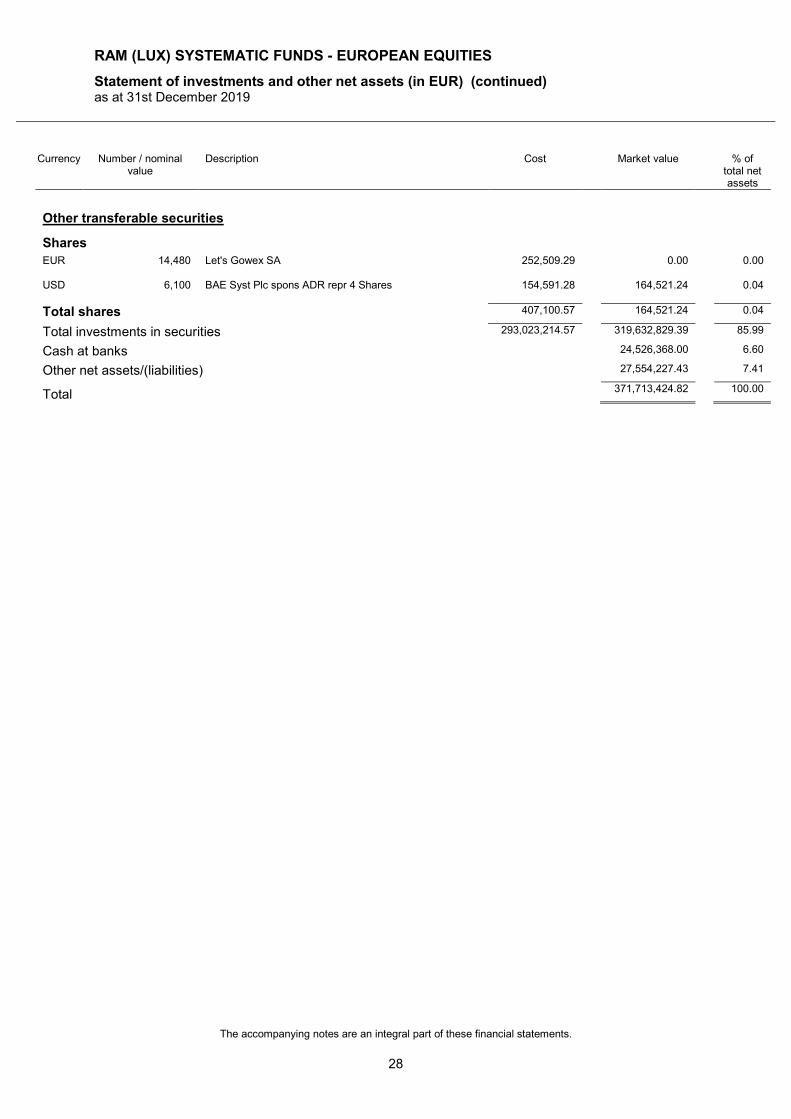
Other transferable securities
Shares
EUR 14,480 Let's Gowex SA 252,509.29 0.00 0.00 USD 6,100 BAE Syst Plc spons ADR repr 4 Shares 154,591.28 164,521.24 0.04
Total shares 407,100.57 164,521.24 0.04
Total investments in securities 293,023,214.57 319,632,829.39 85.99
Cash at banks 24,526,368.00 6.60
Other net assets/(liabilities) 27,554,227.43 7.41
Total 371,713,424.82 100.00
RAM (LUX) SYSTEMATIC FUNDS - EUROPEAN EQUITIES
Industrial and geographical classification of investments as at 31st December 2019
29
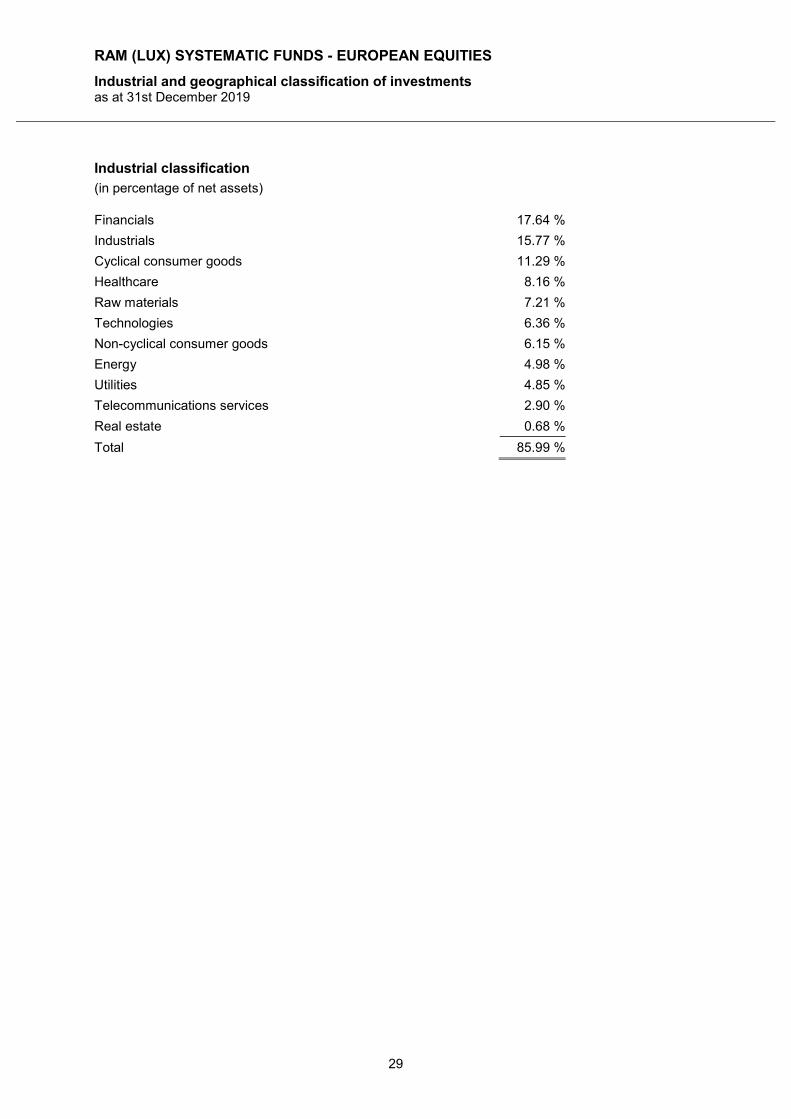
Industrial classification
(in percentage of net assets)
Financials 17.64 %
Industrials 15.77 %
Cyclical consumer goods 11.29 %
Healthcare 8.16 %
Raw materials 7.21 %
Technologies 6.36 %
Non-cyclical consumer goods 6.15 %
Energy 4.98 %
Utilities 4.85 %
Telecommunications services 2.90 %
Real estate 0.68 %
Total 85.99 %
RAM (LUX) SYSTEMATIC FUNDS - EUROPEAN EQUITIES
Industrial and geographical classification of investments (continued) as at 31st December 2019
30
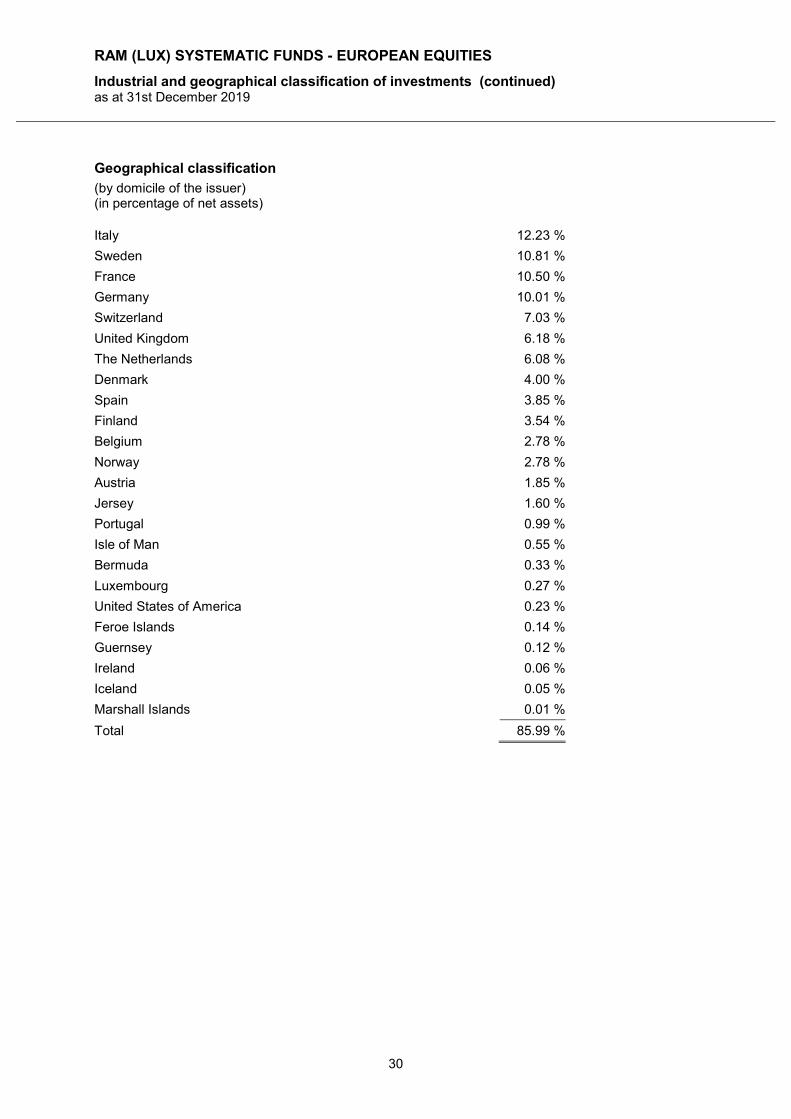
Geographical classification
(by domicile of the issuer) (in percentage of net assets)
Italy 12.23 %
Sweden 10.81 %
France 10.50 %
Germany 10.01 %
Switzerland 7.03 %
United Kingdom 6.18 %
The Netherlands 6.08 %
Denmark 4.00 %
Spain 3.85 %
Finland 3.54 %
Belgium 2.78 %
Norway 2.78 %
Austria 1.85 %
Jersey 1.60 %
Portugal 0.99 %
Isle of Man 0.55 %
Bermuda 0.33 %
Luxembourg 0.27 %
United States of America 0.23 %
Feroe Islands 0.14 %
Guernsey 0.12 %
Ireland 0.06 %
Iceland 0.05 %
Marshall Islands 0.01 %
Total 85.99 %
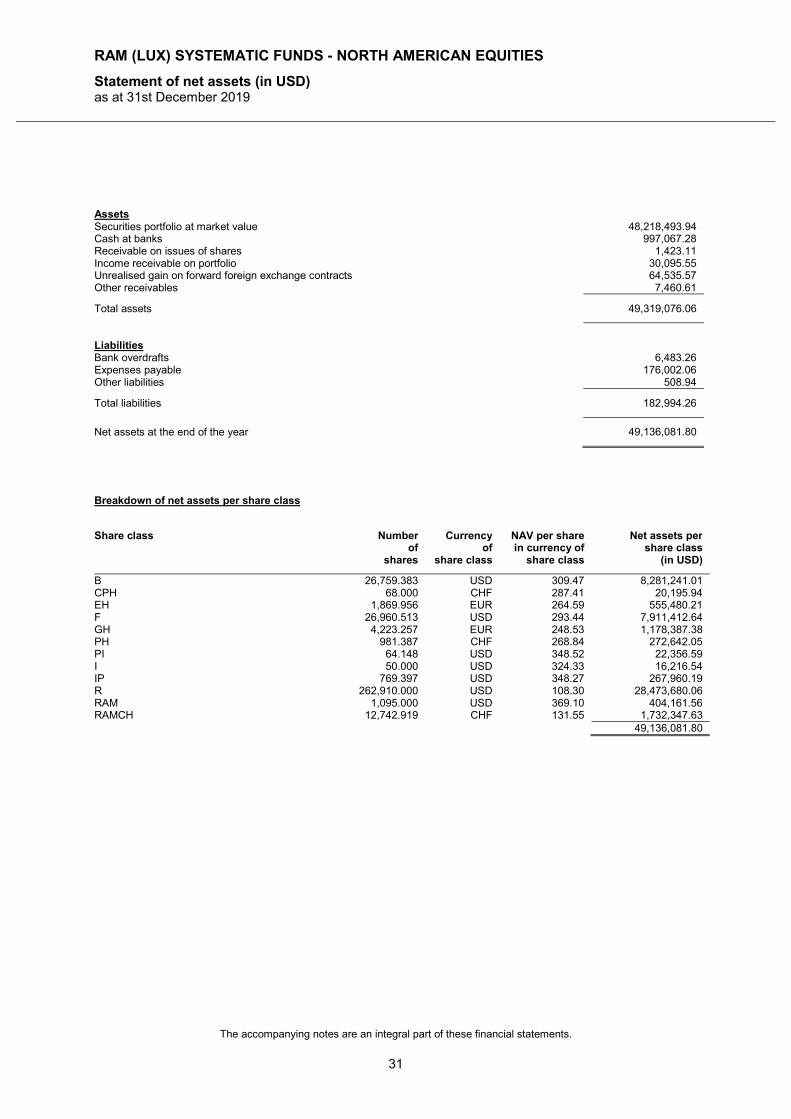
RAM (LUX) SYSTEMATIC FUNDS - NORTH AMERICAN EQUITIES
Statement of net assets (in USD) as at 31st December 2019
The accompanying notes are an integral part of these financial statements.
31
Assets Securities portfolio at market value 48,218,493.94 Cash at banks 997,067.28 Receivable on issues of shares 1,423.11 Income receivable on portfolio 30,095.55 Unrealised gain on forward foreign exchange contracts 64,535.57 Other receivables 7,460.61
Total assets 49,319,076.06
Liabilities Bank overdrafts 6,483.26 Expenses payable 176,002.06 Other liabilities 508.94
Total liabilities 182,994.26
Net assets at the end of the year 49,136,081.80
Breakdown of net assets per share class
Share class Number of
shares
Currency of
share class
NAV per share in currency of
share class
Net assets per share class
(in USD)
B 26,759.383 USD 309.47 8,281,241.01 CPH 68.000 CHF 287.41 20,195.94 EH 1,869.956 EUR 264.59 555,480.21 F 26,960.513 USD 293.44 7,911,412.64 GH 4,223.257 EUR 248.53 1,178,387.38 PH 981.387 CHF 268.84 272,642.05 PI 64.148 USD 348.52 22,356.59 I 50.000 USD 324.33 16,216.54 IP 769.397 USD 348.27 267,960.19 R 262,910.000 USD 108.30 28,473,680.06 RAM 1,095.000 USD 369.10 404,161.56 RAMCH 12,742.919 CHF 131.55 1,732,347.63 49,136,081.80
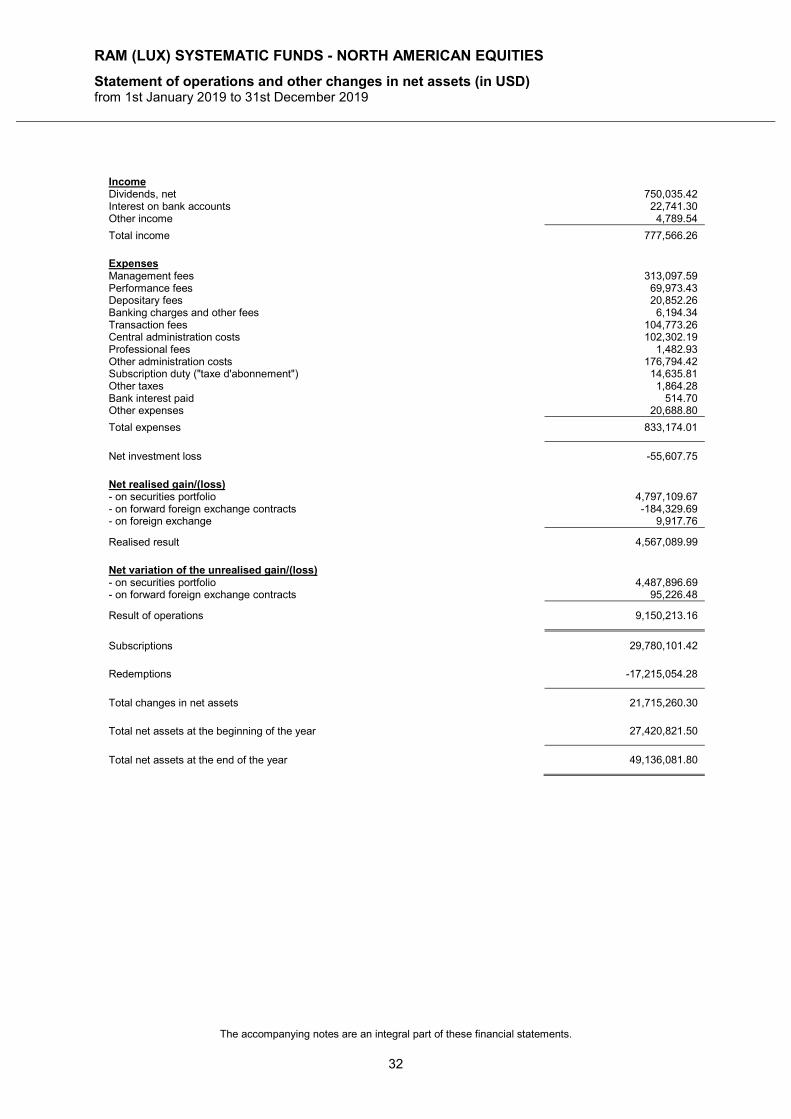
RAM (LUX) SYSTEMATIC FUNDS - NORTH AMERICAN EQUITIES
Statement of operations and other changes in net assets (in USD) from 1st January 2019 to 31st December 2019
The accompanying notes are an integral part of these financial statements.
32
Income Dividends, net 750,035.42 Interest on bank accounts 22,741.30 Other income 4,789.54
Total income 777,566.26
Expenses Management fees 313,097.59 Performance fees 69,973.43 Depositary fees 20,852.26 Banking charges and other fees 6,194.34 Transaction fees 104,773.26 Central administration costs 102,302.19 Professional fees 1,482.93 Other administration costs 176,794.42 Subscription duty ("taxe d'abonnement") 14,635.81 Other taxes 1,864.28 Bank interest paid 514.70 Other expenses 20,688.80
Total expenses 833,174.01
Net investment loss -55,607.75
Net realised gain/(loss) - on securities portfolio 4,797,109.67 - on forward foreign exchange contracts -184,329.69 - on foreign exchange 9,917.76
Realised result 4,567,089.99
Net variation of the unrealised gain/(loss) - on securities portfolio 4,487,896.69 - on forward foreign exchange contracts 95,226.48
Result of operations 9,150,213.16
Subscriptions 29,780,101.42
Redemptions -17,215,054.28
Total changes in net assets 21,715,260.30
Total net assets at the beginning of the year 27,420,821.50
Total net assets at the end of the year 49,136,081.80
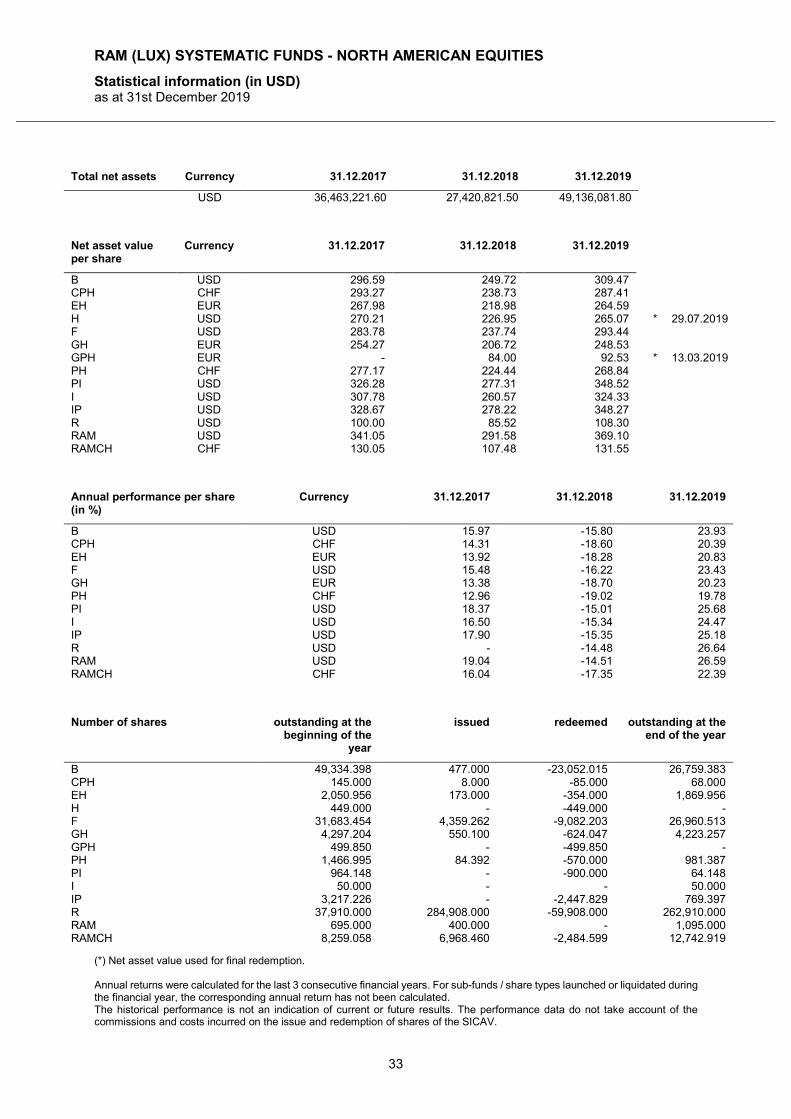
RAM (LUX) SYSTEMATIC FUNDS - NORTH AMERICAN EQUITIES
Statistical information (in USD) as at 31st December 2019
(*) Net asset value used for final redemption. Annual returns were calculated for the last 3 consecutive financial years. For sub-funds / share types launched or liquidated during the financial year, the corresponding annual return has not been calculated. The historical performance is not an indication of current or future results. The performance data do not take account of the commissions and costs incurred on the issue and redemption of shares of the SICAV.
33
Total net assets Currency 31.12.2017 31.12.2018 31.12.2019
USD 36,463,221.60 27,420,821.50 49,136,081.80
Net asset value per share
Currency 31.12.2017 31.12.2018 31.12.2019
B USD 296.59 249.72 309.47 CPH CHF 293.27 238.73 287.41 EH EUR 267.98 218.98 264.59 H USD 270.21 226.95 265.07 * 29.07.2019 F USD 283.78 237.74 293.44 GH EUR 254.27 206.72 248.53 GPH EUR - 84.00 92.53 * 13.03.2019 PH CHF 277.17 224.44 268.84 PI USD 326.28 277.31 348.52 I USD 307.78 260.57 324.33 IP USD 328.67 278.22 348.27 R USD 100.00 85.52 108.30 RAM USD 341.05 291.58 369.10 RAMCH CHF 130.05 107.48 131.55
Annual performance per share (in %)
Currency 31.12.2017 31.12.2018 31.12.2019
B USD 15.97 -15.80 23.93 CPH CHF 14.31 -18.60 20.39 EH EUR 13.92 -18.28 20.83 F USD 15.48 -16.22 23.43 GH EUR 13.38 -18.70 20.23 PH CHF 12.96 -19.02 19.78 PI USD 18.37 -15.01 25.68 I USD 16.50 -15.34 24.47 IP USD 17.90 -15.35 25.18 R USD - -14.48 26.64 RAM USD 19.04 -14.51 26.59 RAMCH CHF 16.04 -17.35 22.39
Number of shares outstanding at the
beginning of the year
issued redeemed outstanding at the end of the year
B 49,334.398 477.000 -23,052.015 26,759.383 CPH 145.000 8.000 -85.000 68.000 EH 2,050.956 173.000 -354.000 1,869.956 H 449.000 - -449.000 - F 31,683.454 4,359.262 -9,082.203 26,960.513 GH 4,297.204 550.100 -624.047 4,223.257 GPH 499.850 - -499.850 - PH 1,466.995 84.392 -570.000 981.387 PI 964.148 - -900.000 64.148 I 50.000 - - 50.000 IP 3,217.226 - -2,447.829 769.397 R 37,910.000 284,908.000 -59,908.000 262,910.000 RAM 695.000 400.000 - 1,095.000 RAMCH 8,259.058 6,968.460 -2,484.599 12,742.919
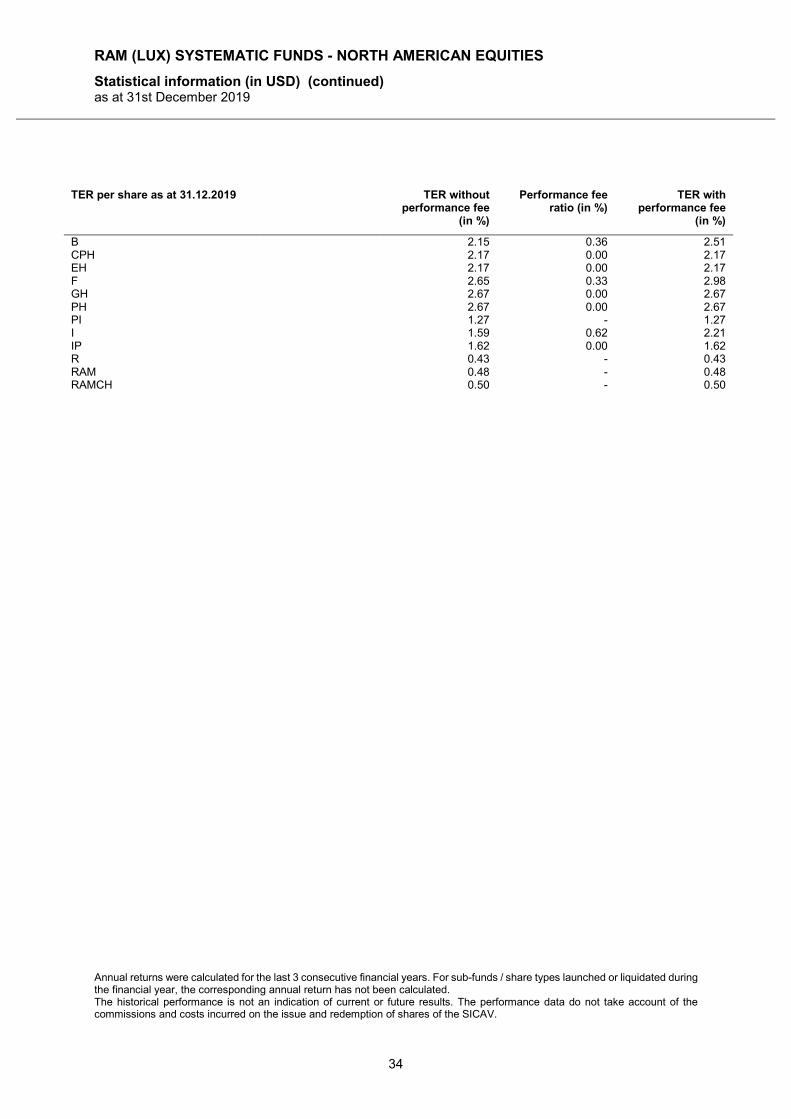
RAM (LUX) SYSTEMATIC FUNDS - NORTH AMERICAN EQUITIES
Statistical information (in USD) (continued) as at 31st December 2019
Annual returns were calculated for the last 3 consecutive financial years. For sub-funds / share types launched or liquidated during the financial year, the corresponding annual return has not been calculated. The historical performance is not an indication of current or future results. The performance data do not take account of the commissions and costs incurred on the issue and redemption of shares of the SICAV.
34
TER per share as at 31.12.2019 TER without
performance fee (in %)
Performance fee ratio (in %)
TER with performance fee
(in %)
B 2.15 0.36 2.51 CPH 2.17 0.00 2.17 EH 2.17 0.00 2.17 F 2.65 0.33 2.98 GH 2.67 0.00 2.67 PH 2.67 0.00 2.67 PI 1.27 - 1.27 I 1.59 0.62 2.21 IP 1.62 0.00 1.62 R 0.43 - 0.43 RAM 0.48 - 0.48 RAMCH 0.50 - 0.50
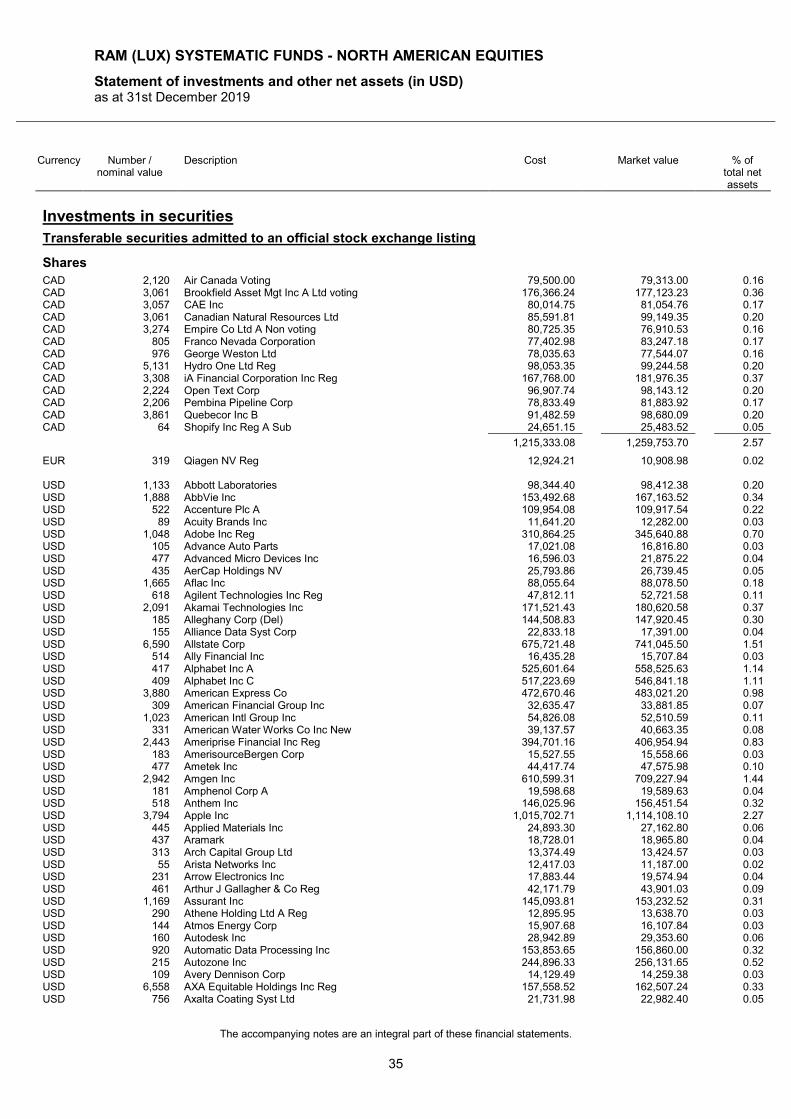
RAM (LUX) SYSTEMATIC FUNDS - NORTH AMERICAN EQUITIES
Statement of investments and other net assets (in USD) as at 31st December 2019
The accompanying notes are an integral part of these financial statements.
35
Currency Number / nominal value
Description Cost Market value % of total net assets
Investments in securities
Transferable securities admitted to an official stock exchange listing
Shares
CAD 2,120 Air Canada Voting 79,500.00 79,313.00 0.16 CAD 3,061 Brookfield Asset Mgt Inc A Ltd voting 176,366.24 177,123.23 0.36 CAD 3,057 CAE Inc 80,014.75 81,054.76 0.17 CAD 3,061 Canadian Natural Resources Ltd 85,591.81 99,149.35 0.20 CAD 3,274 Empire Co Ltd A Non voting 80,725.35 76,910.53 0.16 CAD 805 Franco Nevada Corporation 77,402.98 83,247.18 0.17 CAD 976 George Weston Ltd 78,035.63 77,544.07 0.16 CAD 5,131 Hydro One Ltd Reg 98,053.35 99,244.58 0.20 CAD 3,308 iA Financial Corporation Inc Reg 167,768.00 181,976.35 0.37 CAD 2,224 Open Text Corp 96,907.74 98,143.12 0.20 CAD 2,206 Pembina Pipeline Corp 78,833.49 81,883.92 0.17 CAD 3,861 Quebecor Inc B 91,482.59 98,680.09 0.20 CAD 64 Shopify Inc Reg A Sub 24,651.15 25,483.52 0.05
1,215,333.08 1,259,753.70 2.57
EUR 319 Qiagen NV Reg 12,924.21 10,908.98 0.02 USD 1,133 Abbott Laboratories 98,344.40 98,412.38 0.20 USD 1,888 AbbVie Inc 153,492.68 167,163.52 0.34 USD 522 Accenture Plc A 109,954.08 109,917.54 0.22 USD 89 Acuity Brands Inc 11,641.20 12,282.00 0.03 USD 1,048 Adobe Inc Reg 310,864.25 345,640.88 0.70 USD 105 Advance Auto Parts 17,021.08 16,816.80 0.03 USD 477 Advanced Micro Devices Inc 16,596.03 21,875.22 0.04 USD 435 AerCap Holdings NV 25,793.86 26,739.45 0.05 USD 1,665 Aflac Inc 88,055.64 88,078.50 0.18 USD 618 Agilent Technologies Inc Reg 47,812.11 52,721.58 0.11 USD 2,091 Akamai Technologies Inc 171,521.43 180,620.58 0.37 USD 185 Alleghany Corp (Del) 144,508.83 147,920.45 0.30 USD 155 Alliance Data Syst Corp 22,833.18 17,391.00 0.04 USD 6,590 Allstate Corp 675,721.48 741,045.50 1.51 USD 514 Ally Financial Inc 16,435.28 15,707.84 0.03 USD 417 Alphabet Inc A 525,601.64 558,525.63 1.14 USD 409 Alphabet Inc C 517,223.69 546,841.18 1.11 USD 3,880 American Express Co 472,670.46 483,021.20 0.98 USD 309 American Financial Group Inc 32,635.47 33,881.85 0.07 USD 1,023 American Intl Group Inc 54,826.08 52,510.59 0.11 USD 331 American Water Works Co Inc New 39,137.57 40,663.35 0.08 USD 2,443 Ameriprise Financial Inc Reg 394,701.16 406,954.94 0.83 USD 183 AmerisourceBergen Corp 15,527.55 15,558.66 0.03 USD 477 Ametek Inc 44,417.74 47,575.98 0.10 USD 2,942 Amgen Inc 610,599.31 709,227.94 1.44 USD 181 Amphenol Corp A 19,598.68 19,589.63 0.04 USD 518 Anthem Inc 146,025.96 156,451.54 0.32 USD 3,794 Apple Inc 1,015,702.71 1,114,108.10 2.27 USD 445 Applied Materials Inc 24,893.30 27,162.80 0.06 USD 437 Aramark 18,728.01 18,965.80 0.04 USD 313 Arch Capital Group Ltd 13,374.49 13,424.57 0.03 USD 55 Arista Networks Inc 12,417.03 11,187.00 0.02 USD 231 Arrow Electronics Inc 17,883.44 19,574.94 0.04 USD 461 Arthur J Gallagher & Co Reg 42,171.79 43,901.03 0.09 USD 1,169 Assurant Inc 145,093.81 153,232.52 0.31 USD 290 Athene Holding Ltd A Reg 12,895.95 13,638.70 0.03 USD 144 Atmos Energy Corp 15,907.68 16,107.84 0.03 USD 160 Autodesk Inc 28,942.89 29,353.60 0.06 USD 920 Automatic Data Processing Inc 153,853.65 156,860.00 0.32 USD 215 Autozone Inc 244,896.33 256,131.65 0.52 USD 109 Avery Dennison Corp 14,129.49 14,259.38 0.03 USD 6,558 AXA Equitable Holdings Inc Reg 157,558.52 162,507.24 0.33 USD 756 Axalta Coating Syst Ltd 21,731.98 22,982.40 0.05
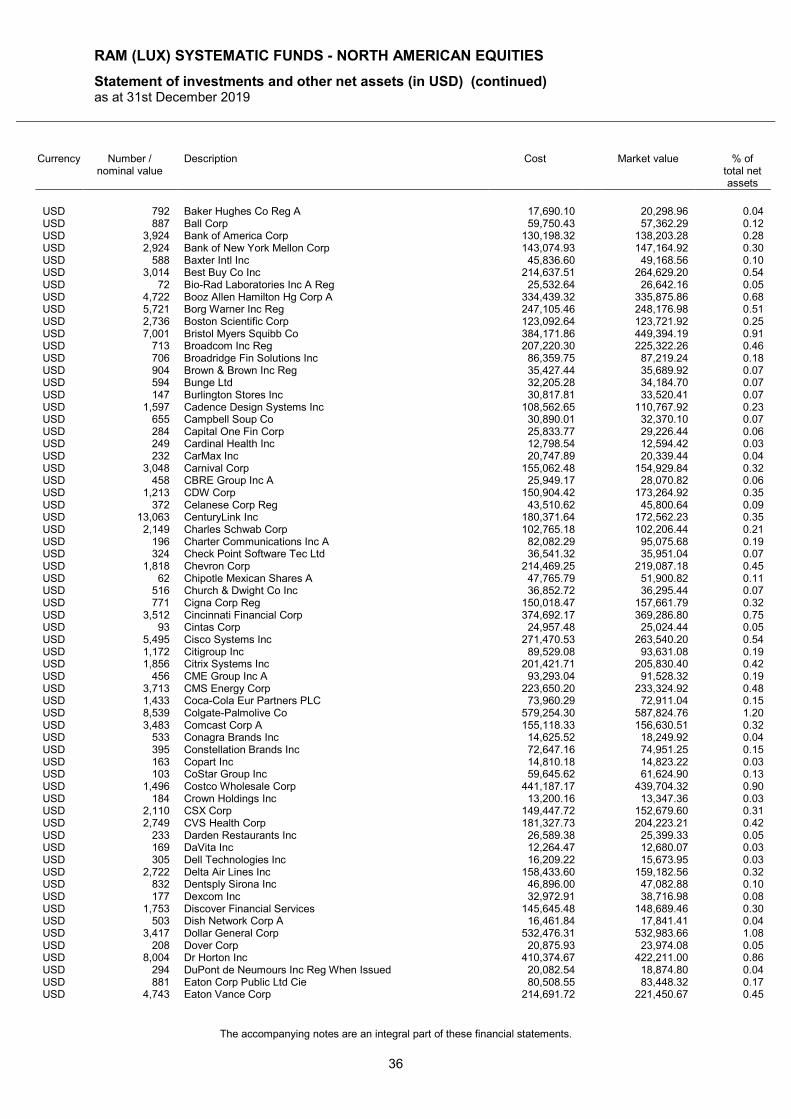
RAM (LUX) SYSTEMATIC FUNDS - NORTH AMERICAN EQUITIES
Statement of investments and other net assets (in USD) (continued) as at 31st December 2019
The accompanying notes are an integral part of these financial statements.
36
Currency Number / nominal value
Description Cost Market value % of total net assets
USD 792 Baker Hughes Co Reg A 17,690.10 20,298.96 0.04 USD 887 Ball Corp 59,750.43 57,362.29 0.12 USD 3,924 Bank of America Corp 130,198.32 138,203.28 0.28 USD 2,924 Bank of New York Mellon Corp 143,074.93 147,164.92 0.30 USD 588 Baxter Intl Inc 45,836.60 49,168.56 0.10 USD 3,014 Best Buy Co Inc 214,637.51 264,629.20 0.54 USD 72 Bio-Rad Laboratories Inc A Reg 25,532.64 26,642.16 0.05 USD 4,722 Booz Allen Hamilton Hg Corp A 334,439.32 335,875.86 0.68 USD 5,721 Borg Warner Inc Reg 247,105.46 248,176.98 0.51 USD 2,736 Boston Scientific Corp 123,092.64 123,721.92 0.25 USD 7,001 Bristol Myers Squibb Co 384,171.86 449,394.19 0.91 USD 713 Broadcom Inc Reg 207,220.30 225,322.26 0.46 USD 706 Broadridge Fin Solutions Inc 86,359.75 87,219.24 0.18 USD 904 Brown & Brown Inc Reg 35,427.44 35,689.92 0.07 USD 594 Bunge Ltd 32,205.28 34,184.70 0.07 USD 147 Burlington Stores Inc 30,817.81 33,520.41 0.07 USD 1,597 Cadence Design Systems Inc 108,562.65 110,767.92 0.23 USD 655 Campbell Soup Co 30,890.01 32,370.10 0.07 USD 284 Capital One Fin Corp 25,833.77 29,226.44 0.06 USD 249 Cardinal Health Inc 12,798.54 12,594.42 0.03 USD 232 CarMax Inc 20,747.89 20,339.44 0.04 USD 3,048 Carnival Corp 155,062.48 154,929.84 0.32 USD 458 CBRE Group Inc A 25,949.17 28,070.82 0.06 USD 1,213 CDW Corp 150,904.42 173,264.92 0.35 USD 372 Celanese Corp Reg 43,510.62 45,800.64 0.09 USD 13,063 CenturyLink Inc 180,371.64 172,562.23 0.35 USD 2,149 Charles Schwab Corp 102,765.18 102,206.44 0.21 USD 196 Charter Communications Inc A 82,082.29 95,075.68 0.19 USD 324 Check Point Software Tec Ltd 36,541.32 35,951.04 0.07 USD 1,818 Chevron Corp 214,469.25 219,087.18 0.45 USD 62 Chipotle Mexican Shares A 47,765.79 51,900.82 0.11 USD 516 Church & Dwight Co Inc 36,852.72 36,295.44 0.07 USD 771 Cigna Corp Reg 150,018.47 157,661.79 0.32 USD 3,512 Cincinnati Financial Corp 374,692.17 369,286.80 0.75 USD 93 Cintas Corp 24,957.48 25,024.44 0.05 USD 5,495 Cisco Systems Inc 271,470.53 263,540.20 0.54 USD 1,172 Citigroup Inc 89,529.08 93,631.08 0.19 USD 1,856 Citrix Systems Inc 201,421.71 205,830.40 0.42 USD 456 CME Group Inc A 93,293.04 91,528.32 0.19 USD 3,713 CMS Energy Corp 223,650.20 233,324.92 0.48 USD 1,433 Coca-Cola Eur Partners PLC 73,960.29 72,911.04 0.15 USD 8,539 Colgate-Palmolive Co 579,254.30 587,824.76 1.20 USD 3,483 Comcast Corp A 155,118.33 156,630.51 0.32 USD 533 Conagra Brands Inc 14,625.52 18,249.92 0.04 USD 395 Constellation Brands Inc 72,647.16 74,951.25 0.15 USD 163 Copart Inc 14,810.18 14,823.22 0.03 USD 103 CoStar Group Inc 59,645.62 61,624.90 0.13 USD 1,496 Costco Wholesale Corp 441,187.17 439,704.32 0.90 USD 184 Crown Holdings Inc 13,200.16 13,347.36 0.03 USD 2,110 CSX Corp 149,447.72 152,679.60 0.31 USD 2,749 CVS Health Corp 181,327.73 204,223.21 0.42 USD 233 Darden Restaurants Inc 26,589.38 25,399.33 0.05 USD 169 DaVita Inc 12,264.47 12,680.07 0.03 USD 305 Dell Technologies Inc 16,209.22 15,673.95 0.03 USD 2,722 Delta Air Lines Inc 158,433.60 159,182.56 0.32 USD 832 Dentsply Sirona Inc 46,896.00 47,082.88 0.10 USD 177 Dexcom Inc 32,972.91 38,716.98 0.08 USD 1,753 Discover Financial Services 145,645.48 148,689.46 0.30 USD 503 Dish Network Corp A 16,461.84 17,841.41 0.04 USD 3,417 Dollar General Corp 532,476.31 532,983.66 1.08 USD 208 Dover Corp 20,875.93 23,974.08 0.05 USD 8,004 Dr Horton Inc 410,374.67 422,211.00 0.86 USD 294 DuPont de Neumours Inc Reg When Issued 20,082.54 18,874.80 0.04 USD 881 Eaton Corp Public Ltd Cie 80,508.55 83,448.32 0.17 USD 4,743 Eaton Vance Corp 214,691.72 221,450.67 0.45
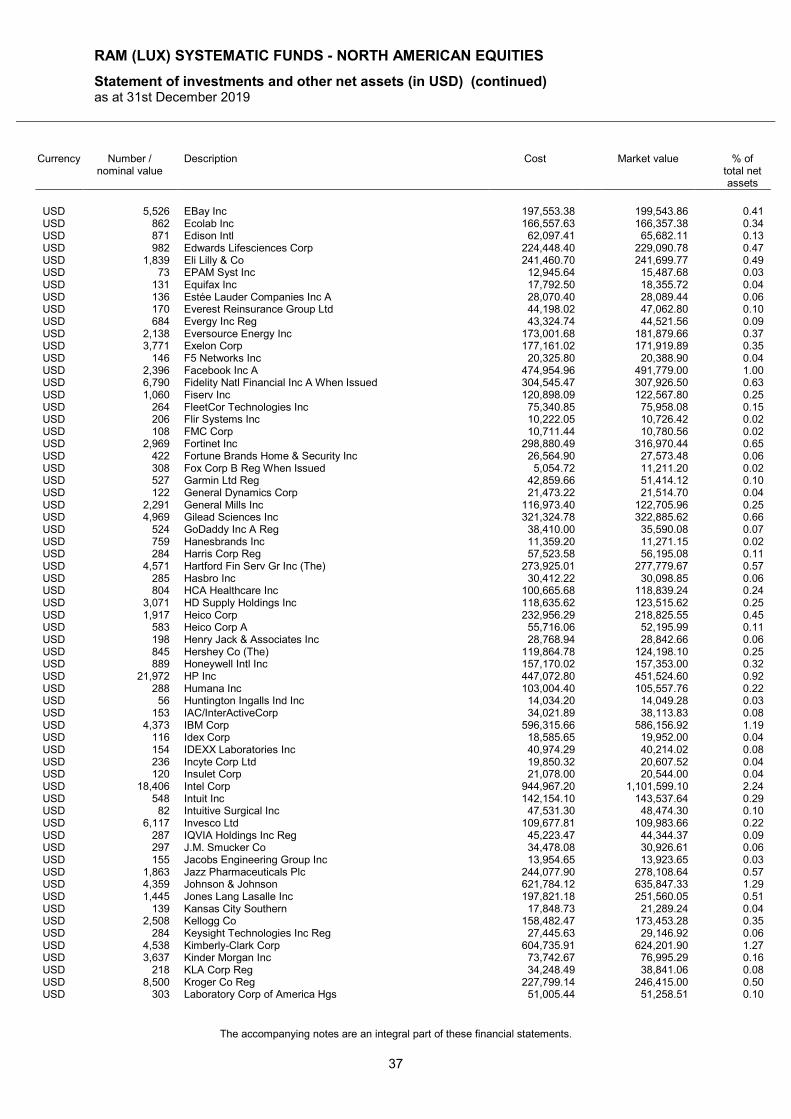
RAM (LUX) SYSTEMATIC FUNDS - NORTH AMERICAN EQUITIES
Statement of investments and other net assets (in USD) (continued) as at 31st December 2019
The accompanying notes are an integral part of these financial statements.
37
Currency Number / nominal value
Description Cost Market value % of total net assets
USD 5,526 EBay Inc 197,553.38 199,543.86 0.41 USD 862 Ecolab Inc 166,557.63 166,357.38 0.34 USD 871 Edison Intl 62,097.41 65,682.11 0.13 USD 982 Edwards Lifesciences Corp 224,448.40 229,090.78 0.47 USD 1,839 Eli Lilly & Co 241,460.70 241,699.77 0.49 USD 73 EPAM Syst Inc 12,945.64 15,487.68 0.03 USD 131 Equifax Inc 17,792.50 18,355.72 0.04 USD 136 Estée Lauder Companies Inc A 28,070.40 28,089.44 0.06 USD 170 Everest Reinsurance Group Ltd 44,198.02 47,062.80 0.10 USD 684 Evergy Inc Reg 43,324.74 44,521.56 0.09 USD 2,138 Eversource Energy Inc 173,001.68 181,879.66 0.37 USD 3,771 Exelon Corp 177,161.02 171,919.89 0.35 USD 146 F5 Networks Inc 20,325.80 20,388.90 0.04 USD 2,396 Facebook Inc A 474,954.96 491,779.00 1.00 USD 6,790 Fidelity Natl Financial Inc A When Issued 304,545.47 307,926.50 0.63 USD 1,060 Fiserv Inc 120,898.09 122,567.80 0.25 USD 264 FleetCor Technologies Inc 75,340.85 75,958.08 0.15 USD 206 Flir Systems Inc 10,222.05 10,726.42 0.02 USD 108 FMC Corp 10,711.44 10,780.56 0.02 USD 2,969 Fortinet Inc 298,880.49 316,970.44 0.65 USD 422 Fortune Brands Home & Security Inc 26,564.90 27,573.48 0.06 USD 308 Fox Corp B Reg When Issued 5,054.72 11,211.20 0.02 USD 527 Garmin Ltd Reg 42,859.66 51,414.12 0.10 USD 122 General Dynamics Corp 21,473.22 21,514.70 0.04 USD 2,291 General Mills Inc 116,973.40 122,705.96 0.25 USD 4,969 Gilead Sciences Inc 321,324.78 322,885.62 0.66 USD 524 GoDaddy Inc A Reg 38,410.00 35,590.08 0.07 USD 759 Hanesbrands Inc 11,359.20 11,271.15 0.02 USD 284 Harris Corp Reg 57,523.58 56,195.08 0.11 USD 4,571 Hartford Fin Serv Gr Inc (The) 273,925.01 277,779.67 0.57 USD 285 Hasbro Inc 30,412.22 30,098.85 0.06 USD 804 HCA Healthcare Inc 100,665.68 118,839.24 0.24 USD 3,071 HD Supply Holdings Inc 118,635.62 123,515.62 0.25 USD 1,917 Heico Corp 232,956.29 218,825.55 0.45 USD 583 Heico Corp A 55,716.06 52,195.99 0.11 USD 198 Henry Jack & Associates Inc 28,768.94 28,842.66 0.06 USD 845 Hershey Co (The) 119,864.78 124,198.10 0.25 USD 889 Honeywell Intl Inc 157,170.02 157,353.00 0.32 USD 21,972 HP Inc 447,072.80 451,524.60 0.92 USD 288 Humana Inc 103,004.40 105,557.76 0.22 USD 56 Huntington Ingalls Ind Inc 14,034.20 14,049.28 0.03 USD 153 IAC/InterActiveCorp 34,021.89 38,113.83 0.08 USD 4,373 IBM Corp 596,315.66 586,156.92 1.19 USD 116 Idex Corp 18,585.65 19,952.00 0.04 USD 154 IDEXX Laboratories Inc 40,974.29 40,214.02 0.08 USD 236 Incyte Corp Ltd 19,850.32 20,607.52 0.04 USD 120 Insulet Corp 21,078.00 20,544.00 0.04 USD 18,406 Intel Corp 944,967.20 1,101,599.10 2.24 USD 548 Intuit Inc 142,154.10 143,537.64 0.29 USD 82 Intuitive Surgical Inc 47,531.30 48,474.30 0.10 USD 6,117 Invesco Ltd 109,677.81 109,983.66 0.22 USD 287 IQVIA Holdings Inc Reg 45,223.47 44,344.37 0.09 USD 297 J.M. Smucker Co 34,478.08 30,926.61 0.06 USD 155 Jacobs Engineering Group Inc 13,954.65 13,923.65 0.03 USD 1,863 Jazz Pharmaceuticals Plc 244,077.90 278,108.64 0.57 USD 4,359 Johnson & Johnson 621,784.12 635,847.33 1.29 USD 1,445 Jones Lang Lasalle Inc 197,821.18 251,560.05 0.51 USD 139 Kansas City Southern 17,848.73 21,289.24 0.04 USD 2,508 Kellogg Co 158,482.47 173,453.28 0.35 USD 284 Keysight Technologies Inc Reg 27,445.63 29,146.92 0.06 USD 4,538 Kimberly-Clark Corp 604,735.91 624,201.90 1.27 USD 3,637 Kinder Morgan Inc 73,742.67 76,995.29 0.16 USD 218 KLA Corp Reg 34,248.49 38,841.06 0.08 USD 8,500 Kroger Co Reg 227,799.14 246,415.00 0.50 USD 303 Laboratory Corp of America Hgs 51,005.44 51,258.51 0.10
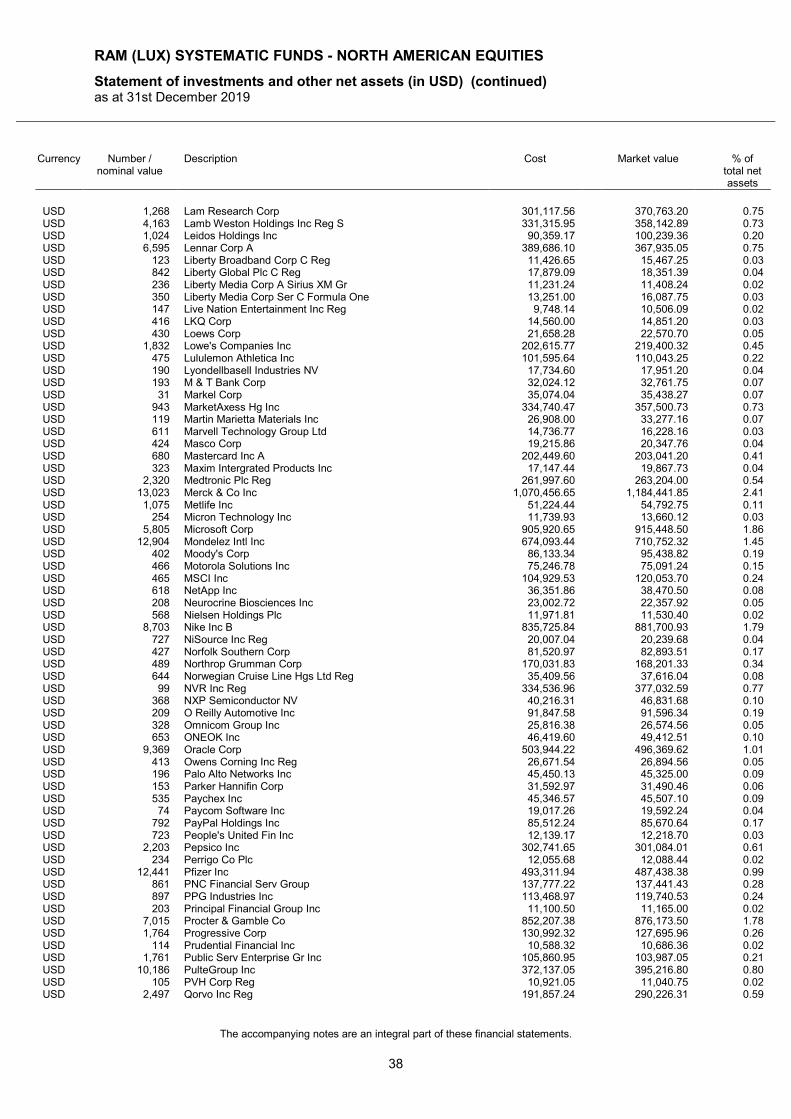
RAM (LUX) SYSTEMATIC FUNDS - NORTH AMERICAN EQUITIES
Statement of investments and other net assets (in USD) (continued) as at 31st December 2019
The accompanying notes are an integral part of these financial statements.
38
Currency Number / nominal value
Description Cost Market value % of total net assets
USD 1,268 Lam Research Corp 301,117.56 370,763.20 0.75 USD 4,163 Lamb Weston Holdings Inc Reg S 331,315.95 358,142.89 0.73 USD 1,024 Leidos Holdings Inc 90,359.17 100,239.36 0.20 USD 6,595 Lennar Corp A 389,686.10 367,935.05 0.75 USD 123 Liberty Broadband Corp C Reg 11,426.65 15,467.25 0.03 USD 842 Liberty Global Plc C Reg 17,879.09 18,351.39 0.04 USD 236 Liberty Media Corp A Sirius XM Gr 11,231.24 11,408.24 0.02 USD 350 Liberty Media Corp Ser C Formula One 13,251.00 16,087.75 0.03 USD 147 Live Nation Entertainment Inc Reg 9,748.14 10,506.09 0.02 USD 416 LKQ Corp 14,560.00 14,851.20 0.03 USD 430 Loews Corp 21,658.28 22,570.70 0.05 USD 1,832 Lowe's Companies Inc 202,615.77 219,400.32 0.45 USD 475 Lululemon Athletica Inc 101,595.64 110,043.25 0.22 USD 190 Lyondellbasell Industries NV 17,734.60 17,951.20 0.04 USD 193 M & T Bank Corp 32,024.12 32,761.75 0.07 USD 31 Markel Corp 35,074.04 35,438.27 0.07 USD 943 MarketAxess Hg Inc 334,740.47 357,500.73 0.73 USD 119 Martin Marietta Materials Inc 26,908.00 33,277.16 0.07 USD 611 Marvell Technology Group Ltd 14,736.77 16,228.16 0.03 USD 424 Masco Corp 19,215.86 20,347.76 0.04 USD 680 Mastercard Inc A 202,449.60 203,041.20 0.41 USD 323 Maxim Intergrated Products Inc 17,147.44 19,867.73 0.04 USD 2,320 Medtronic Plc Reg 261,997.60 263,204.00 0.54 USD 13,023 Merck & Co Inc 1,070,456.65 1,184,441.85 2.41 USD 1,075 Metlife Inc 51,224.44 54,792.75 0.11 USD 254 Micron Technology Inc 11,739.93 13,660.12 0.03 USD 5,805 Microsoft Corp 905,920.65 915,448.50 1.86 USD 12,904 Mondelez Intl Inc 674,093.44 710,752.32 1.45 USD 402 Moody's Corp 86,133.34 95,438.82 0.19 USD 466 Motorola Solutions Inc 75,246.78 75,091.24 0.15 USD 465 MSCI Inc 104,929.53 120,053.70 0.24 USD 618 NetApp Inc 36,351.86 38,470.50 0.08 USD 208 Neurocrine Biosciences Inc 23,002.72 22,357.92 0.05 USD 568 Nielsen Holdings Plc 11,971.81 11,530.40 0.02 USD 8,703 Nike Inc B 835,725.84 881,700.93 1.79 USD 727 NiSource Inc Reg 20,007.04 20,239.68 0.04 USD 427 Norfolk Southern Corp 81,520.97 82,893.51 0.17 USD 489 Northrop Grumman Corp 170,031.83 168,201.33 0.34 USD 644 Norwegian Cruise Line Hgs Ltd Reg 35,409.56 37,616.04 0.08 USD 99 NVR Inc Reg 334,536.96 377,032.59 0.77 USD 368 NXP Semiconductor NV 40,216.31 46,831.68 0.10 USD 209 O Reilly Automotive Inc 91,847.58 91,596.34 0.19 USD 328 Omnicom Group Inc 25,816.38 26,574.56 0.05 USD 653 ONEOK Inc 46,419.60 49,412.51 0.10 USD 9,369 Oracle Corp 503,944.22 496,369.62 1.01 USD 413 Owens Corning Inc Reg 26,671.54 26,894.56 0.05 USD 196 Palo Alto Networks Inc 45,450.13 45,325.00 0.09 USD 153 Parker Hannifin Corp 31,592.97 31,490.46 0.06 USD 535 Paychex Inc 45,346.57 45,507.10 0.09 USD 74 Paycom Software Inc 19,017.26 19,592.24 0.04 USD 792 PayPal Holdings Inc 85,512.24 85,670.64 0.17 USD 723 People's United Fin Inc 12,139.17 12,218.70 0.03 USD 2,203 Pepsico Inc 302,741.65 301,084.01 0.61 USD 234 Perrigo Co Plc 12,055.68 12,088.44 0.02 USD 12,441 Pfizer Inc 493,311.94 487,438.38 0.99 USD 861 PNC Financial Serv Group 137,777.22 137,441.43 0.28 USD 897 PPG Industries Inc 113,468.97 119,740.53 0.24 USD 203 Principal Financial Group Inc 11,100.50 11,165.00 0.02 USD 7,015 Procter & Gamble Co 852,207.38 876,173.50 1.78 USD 1,764 Progressive Corp 130,992.32 127,695.96 0.26 USD 114 Prudential Financial Inc 10,588.32 10,686.36 0.02 USD 1,761 Public Serv Enterprise Gr Inc 105,860.95 103,987.05 0.21 USD 10,186 PulteGroup Inc 372,137.05 395,216.80 0.80 USD 105 PVH Corp Reg 10,921.05 11,040.75 0.02 USD 2,497 Qorvo Inc Reg 191,857.24 290,226.31 0.59
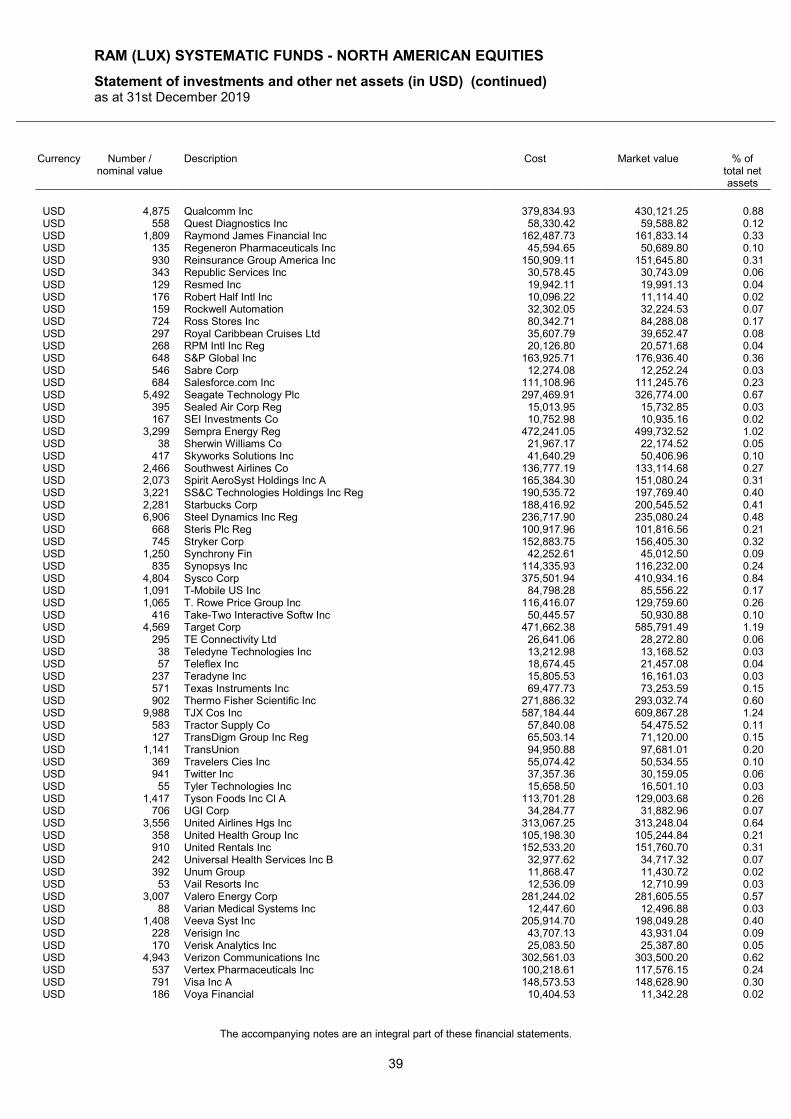
RAM (LUX) SYSTEMATIC FUNDS - NORTH AMERICAN EQUITIES
Statement of investments and other net assets (in USD) (continued) as at 31st December 2019
The accompanying notes are an integral part of these financial statements.
39
Currency Number / nominal value
Description Cost Market value % of total net assets
USD 4,875 Qualcomm Inc 379,834.93 430,121.25 0.88 USD 558 Quest Diagnostics Inc 58,330.42 59,588.82 0.12 USD 1,809 Raymond James Financial Inc 162,487.73 161,833.14 0.33 USD 135 Regeneron Pharmaceuticals Inc 45,594.65 50,689.80 0.10 USD 930 Reinsurance Group America Inc 150,909.11 151,645.80 0.31 USD 343 Republic Services Inc 30,578.45 30,743.09 0.06 USD 129 Resmed Inc 19,942.11 19,991.13 0.04 USD 176 Robert Half Intl Inc 10,096.22 11,114.40 0.02 USD 159 Rockwell Automation 32,302.05 32,224.53 0.07 USD 724 Ross Stores Inc 80,342.71 84,288.08 0.17 USD 297 Royal Caribbean Cruises Ltd 35,607.79 39,652.47 0.08 USD 268 RPM Intl Inc Reg 20,126.80 20,571.68 0.04 USD 648 S&P Global Inc 163,925.71 176,936.40 0.36 USD 546 Sabre Corp 12,274.08 12,252.24 0.03 USD 684 Salesforce.com Inc 111,108.96 111,245.76 0.23 USD 5,492 Seagate Technology Plc 297,469.91 326,774.00 0.67 USD 395 Sealed Air Corp Reg 15,013.95 15,732.85 0.03 USD 167 SEI Investments Co 10,752.98 10,935.16 0.02 USD 3,299 Sempra Energy Reg 472,241.05 499,732.52 1.02 USD 38 Sherwin Williams Co 21,967.17 22,174.52 0.05 USD 417 Skyworks Solutions Inc 41,640.29 50,406.96 0.10 USD 2,466 Southwest Airlines Co 136,777.19 133,114.68 0.27 USD 2,073 Spirit AeroSyst Holdings Inc A 165,384.30 151,080.24 0.31 USD 3,221 SS&C Technologies Holdings Inc Reg 190,535.72 197,769.40 0.40 USD 2,281 Starbucks Corp 188,416.92 200,545.52 0.41 USD 6,906 Steel Dynamics Inc Reg 236,717.90 235,080.24 0.48 USD 668 Steris Plc Reg 100,917.96 101,816.56 0.21 USD 745 Stryker Corp 152,883.75 156,405.30 0.32 USD 1,250 Synchrony Fin 42,252.61 45,012.50 0.09 USD 835 Synopsys Inc 114,335.93 116,232.00 0.24 USD 4,804 Sysco Corp 375,501.94 410,934.16 0.84 USD 1,091 T-Mobile US Inc 84,798.28 85,556.22 0.17 USD 1,065 T. Rowe Price Group Inc 116,416.07 129,759.60 0.26 USD 416 Take-Two Interactive Softw Inc 50,445.57 50,930.88 0.10 USD 4,569 Target Corp 471,662.38 585,791.49 1.19 USD 295 TE Connectivity Ltd 26,641.06 28,272.80 0.06 USD 38 Teledyne Technologies Inc 13,212.98 13,168.52 0.03 USD 57 Teleflex Inc 18,674.45 21,457.08 0.04 USD 237 Teradyne Inc 15,805.53 16,161.03 0.03 USD 571 Texas Instruments Inc 69,477.73 73,253.59 0.15 USD 902 Thermo Fisher Scientific Inc 271,886.32 293,032.74 0.60 USD 9,988 TJX Cos Inc 587,184.44 609,867.28 1.24 USD 583 Tractor Supply Co 57,840.08 54,475.52 0.11 USD 127 TransDigm Group Inc Reg 65,503.14 71,120.00 0.15 USD 1,141 TransUnion 94,950.88 97,681.01 0.20 USD 369 Travelers Cies Inc 55,074.42 50,534.55 0.10 USD 941 Twitter Inc 37,357.36 30,159.05 0.06 USD 55 Tyler Technologies Inc 15,658.50 16,501.10 0.03 USD 1,417 Tyson Foods Inc Cl A 113,701.28 129,003.68 0.26 USD 706 UGI Corp 34,284.77 31,882.96 0.07 USD 3,556 United Airlines Hgs Inc 313,067.25 313,248.04 0.64 USD 358 United Health Group Inc 105,198.30 105,244.84 0.21 USD 910 United Rentals Inc 152,533.20 151,760.70 0.31 USD 242 Universal Health Services Inc B 32,977.62 34,717.32 0.07 USD 392 Unum Group 11,868.47 11,430.72 0.02 USD 53 Vail Resorts Inc 12,536.09 12,710.99 0.03 USD 3,007 Valero Energy Corp 281,244.02 281,605.55 0.57 USD 88 Varian Medical Systems Inc 12,447.60 12,496.88 0.03 USD 1,408 Veeva Syst Inc 205,914.70 198,049.28 0.40 USD 228 Verisign Inc 43,707.13 43,931.04 0.09 USD 170 Verisk Analytics Inc 25,083.50 25,387.80 0.05 USD 4,943 Verizon Communications Inc 302,561.03 303,500.20 0.62 USD 537 Vertex Pharmaceuticals Inc 100,218.61 117,576.15 0.24 USD 791 Visa Inc A 148,573.53 148,628.90 0.30 USD 186 Voya Financial 10,404.53 11,342.28 0.02
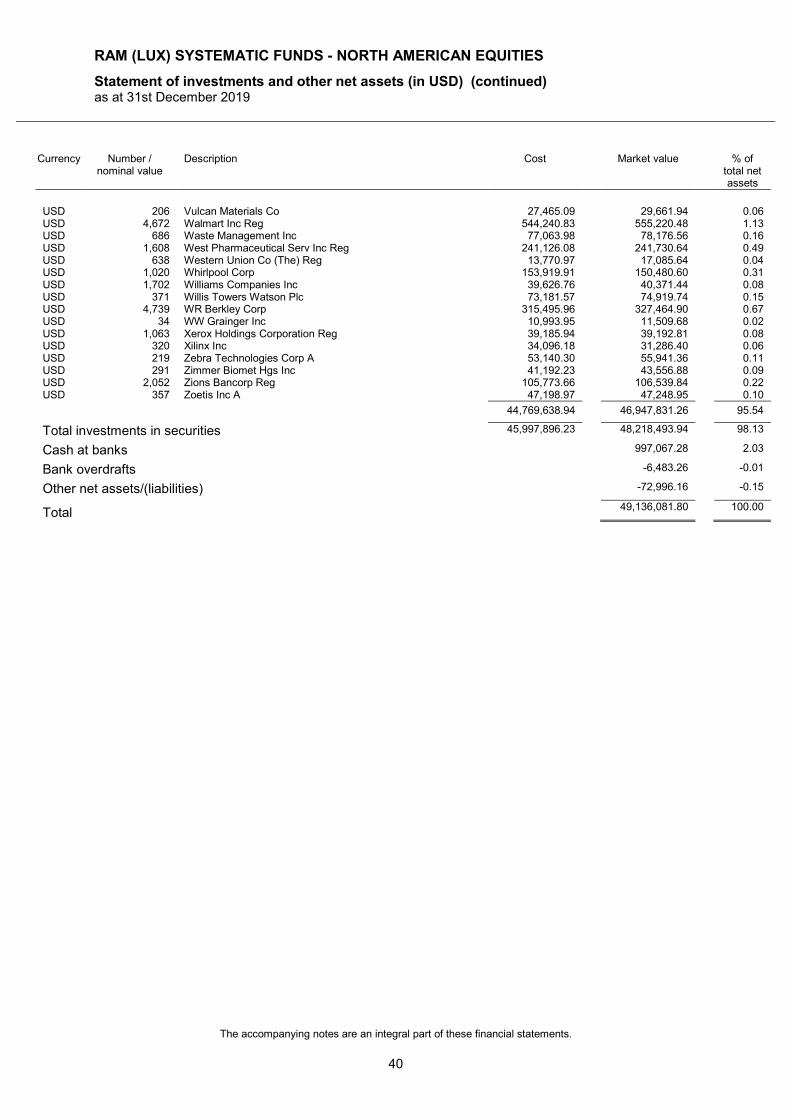
RAM (LUX) SYSTEMATIC FUNDS - NORTH AMERICAN EQUITIES
Statement of investments and other net assets (in USD) (continued) as at 31st December 2019
The accompanying notes are an integral part of these financial statements.
40
Currency Number / nominal value
Description Cost Market value % of total net assets
USD 206 Vulcan Materials Co 27,465.09 29,661.94 0.06 USD 4,672 Walmart Inc Reg 544,240.83 555,220.48 1.13 USD 686 Waste Management Inc 77,063.98 78,176.56 0.16 USD 1,608 West Pharmaceutical Serv Inc Reg 241,126.08 241,730.64 0.49 USD 638 Western Union Co (The) Reg 13,770.97 17,085.64 0.04 USD 1,020 Whirlpool Corp 153,919.91 150,480.60 0.31 USD 1,702 Williams Companies Inc 39,626.76 40,371.44 0.08 USD 371 Willis Towers Watson Plc 73,181.57 74,919.74 0.15 USD 4,739 WR Berkley Corp 315,495.96 327,464.90 0.67 USD 34 WW Grainger Inc 10,993.95 11,509.68 0.02 USD 1,063 Xerox Holdings Corporation Reg 39,185.94 39,192.81 0.08 USD 320 Xilinx Inc 34,096.18 31,286.40 0.06 USD 219 Zebra Technologies Corp A 53,140.30 55,941.36 0.11 USD 291 Zimmer Biomet Hgs Inc 41,192.23 43,556.88 0.09 USD 2,052 Zions Bancorp Reg 105,773.66 106,539.84 0.22 USD 357 Zoetis Inc A 47,198.97 47,248.95 0.10
44,769,638.94 46,947,831.26 95.54
Total investments in securities 45,997,896.23 48,218,493.94 98.13
Cash at banks 997,067.28 2.03
Bank overdrafts -6,483.26 -0.01
Other net assets/(liabilities) -72,996.16 -0.15
Total 49,136,081.80 100.00
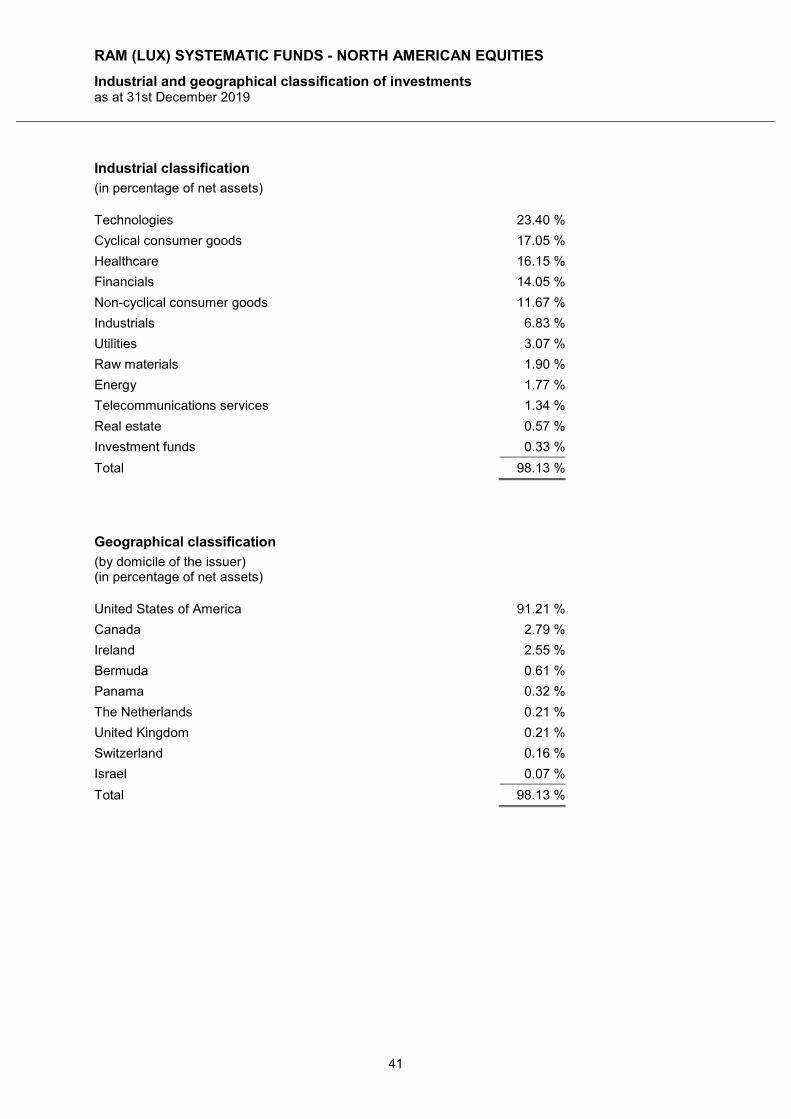
RAM (LUX) SYSTEMATIC FUNDS - NORTH AMERICAN EQUITIES
Industrial and geographical classification of investments as at 31st December 2019
41
Industrial classification
(in percentage of net assets)
Technologies 23.40 %
Cyclical consumer goods 17.05 %
Healthcare 16.15 %
Financials 14.05 %
Non-cyclical consumer goods 11.67 %
Industrials 6.83 %
Utilities 3.07 %
Raw materials 1.90 %
Energy 1.77 %
Telecommunications services 1.34 %
Real estate 0.57 %
Investment funds 0.33 %
Total 98.13 %
Geographical classification
(by domicile of the issuer) (in percentage of net assets)
United States of America 91.21 %
Canada 2.79 %
Ireland 2.55 %
Bermuda 0.61 %
Panama 0.32 %
The Netherlands 0.21 %
United Kingdom 0.21 %
Switzerland 0.16 %
Israel 0.07 %
Total 98.13 %
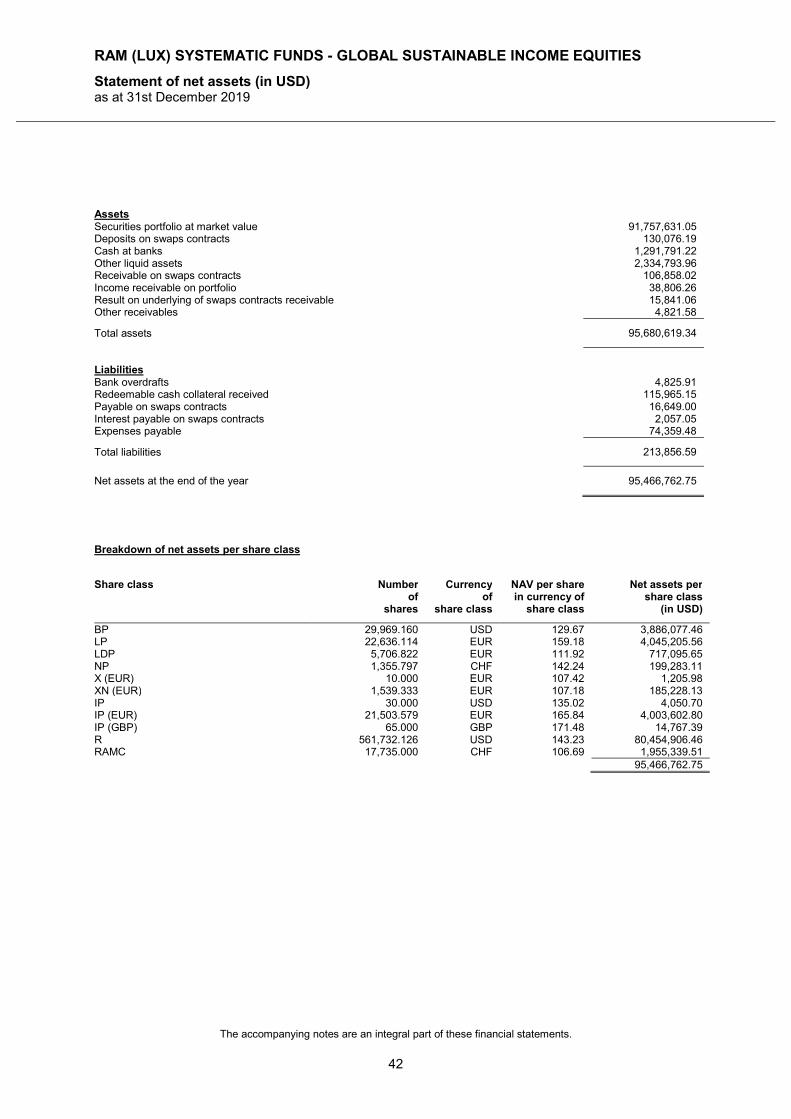
RAM (LUX) SYSTEMATIC FUNDS - GLOBAL SUSTAINABLE INCOME EQUITIES
Statement of net assets (in USD) as at 31st December 2019
The accompanying notes are an integral part of these financial statements.
42
Assets Securities portfolio at market value 91,757,631.05 Deposits on swaps contracts 130,076.19 Cash at banks 1,291,791.22 Other liquid assets 2,334,793.96 Receivable on swaps contracts 106,858.02 Income receivable on portfolio 38,806.26 Result on underlying of swaps contracts receivable 15,841.06 Other receivables 4,821.58
Total assets 95,680,619.34
Liabilities Bank overdrafts 4,825.91 Redeemable cash collateral received 115,965.15 Payable on swaps contracts 16,649.00 Interest payable on swaps contracts 2,057.05 Expenses payable 74,359.48
Total liabilities 213,856.59
Net assets at the end of the year 95,466,762.75
Breakdown of net assets per share class
Share class Number of
shares
Currency of
share class
NAV per share in currency of
share class
Net assets per share class
(in USD)
BP 29,969.160 USD 129.67 3,886,077.46 LP 22,636.114 EUR 159.18 4,045,205.56 LDP 5,706.822 EUR 111.92 717,095.65 NP 1,355.797 CHF 142.24 199,283.11 X (EUR) 10.000 EUR 107.42 1,205.98 XN (EUR) 1,539.333 EUR 107.18 185,228.13 IP 30.000 USD 135.02 4,050.70 IP (EUR) 21,503.579 EUR 165.84 4,003,602.80 IP (GBP) 65.000 GBP 171.48 14,767.39 R 561,732.126 USD 143.23 80,454,906.46 RAMC 17,735.000 CHF 106.69 1,955,339.51 95,466,762.75
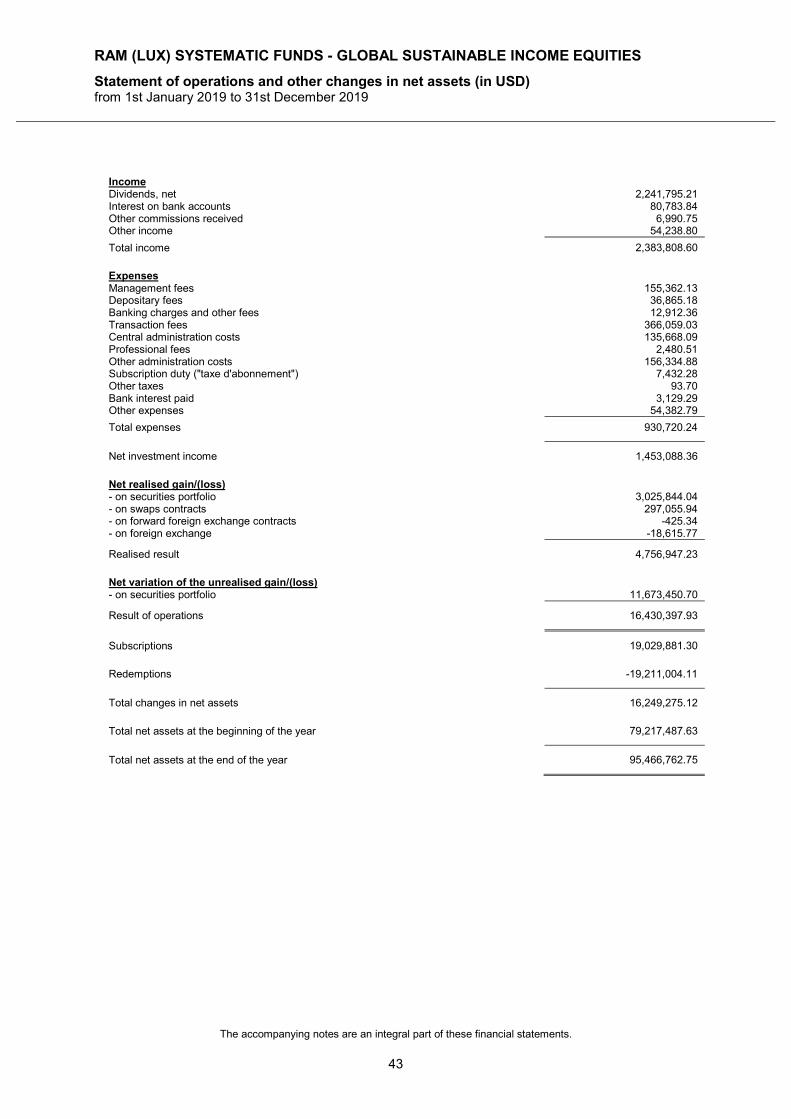
RAM (LUX) SYSTEMATIC FUNDS - GLOBAL SUSTAINABLE INCOME EQUITIES
Statement of operations and other changes in net assets (in USD) from 1st January 2019 to 31st December 2019
The accompanying notes are an integral part of these financial statements.
43
Income Dividends, net 2,241,795.21 Interest on bank accounts 80,783.84 Other commissions received 6,990.75 Other income 54,238.80
Total income 2,383,808.60
Expenses Management fees 155,362.13 Depositary fees 36,865.18 Banking charges and other fees 12,912.36 Transaction fees 366,059.03 Central administration costs 135,668.09 Professional fees 2,480.51 Other administration costs 156,334.88 Subscription duty ("taxe d'abonnement") 7,432.28 Other taxes 93.70 Bank interest paid 3,129.29 Other expenses 54,382.79
Total expenses 930,720.24
Net investment income 1,453,088.36
Net realised gain/(loss) - on securities portfolio 3,025,844.04 - on swaps contracts 297,055.94 - on forward foreign exchange contracts -425.34 - on foreign exchange -18,615.77
Realised result 4,756,947.23
Net variation of the unrealised gain/(loss) - on securities portfolio 11,673,450.70
Result of operations 16,430,397.93
Subscriptions 19,029,881.30
Redemptions -19,211,004.11
Total changes in net assets 16,249,275.12
Total net assets at the beginning of the year 79,217,487.63
Total net assets at the end of the year 95,466,762.75
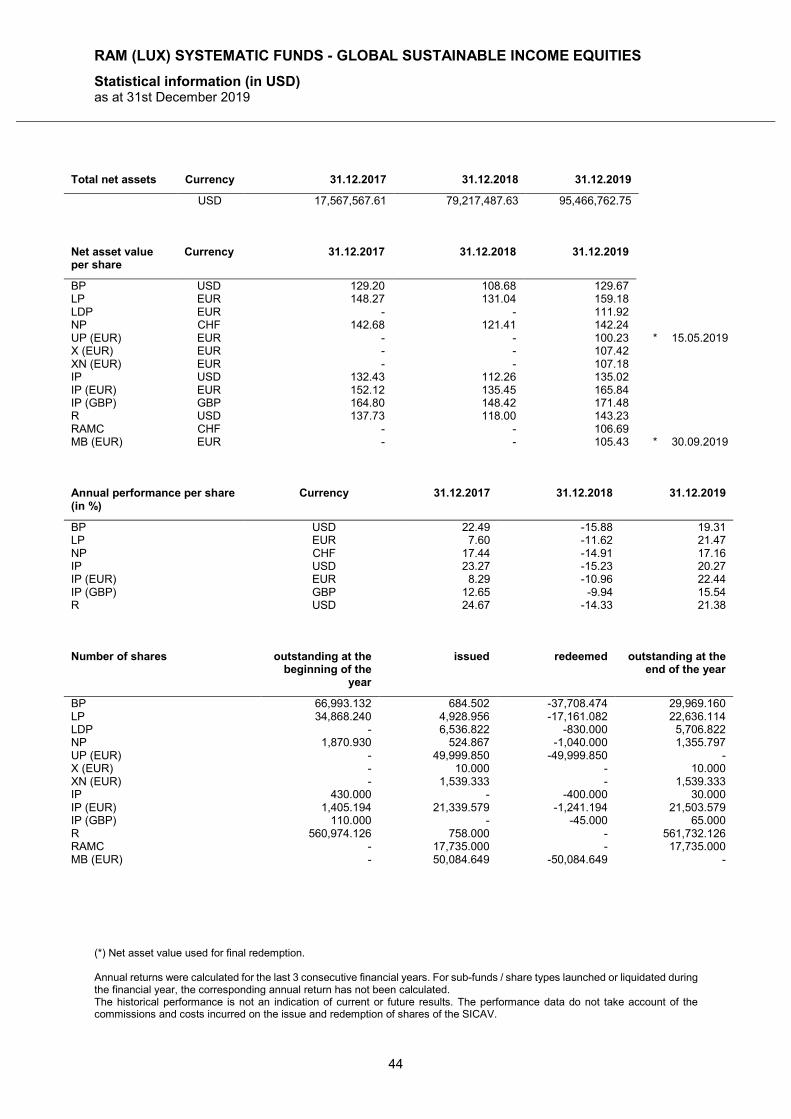
RAM (LUX) SYSTEMATIC FUNDS - GLOBAL SUSTAINABLE INCOME EQUITIES
Statistical information (in USD) as at 31st December 2019
(*) Net asset value used for final redemption. Annual returns were calculated for the last 3 consecutive financial years. For sub-funds / share types launched or liquidated during the financial year, the corresponding annual return has not been calculated. The historical performance is not an indication of current or future results. The performance data do not take account of the commissions and costs incurred on the issue and redemption of shares of the SICAV.
44
Total net assets Currency 31.12.2017 31.12.2018 31.12.2019
USD 17,567,567.61 79,217,487.63 95,466,762.75
Net asset value per share
Currency 31.12.2017 31.12.2018 31.12.2019
BP USD 129.20 108.68 129.67 LP EUR 148.27 131.04 159.18 LDP EUR - - 111.92 NP CHF 142.68 121.41 142.24 UP (EUR) EUR - - 100.23 * 15.05.2019 X (EUR) EUR - - 107.42 XN (EUR) EUR - - 107.18 IP USD 132.43 112.26 135.02 IP (EUR) EUR 152.12 135.45 165.84 IP (GBP) GBP 164.80 148.42 171.48 R USD 137.73 118.00 143.23 RAMC CHF - - 106.69 MB (EUR) EUR - - 105.43 * 30.09.2019
Annual performance per share (in %)
Currency 31.12.2017 31.12.2018 31.12.2019
BP USD 22.49 -15.88 19.31 LP EUR 7.60 -11.62 21.47 NP CHF 17.44 -14.91 17.16 IP USD 23.27 -15.23 20.27 IP (EUR) EUR 8.29 -10.96 22.44 IP (GBP) GBP 12.65 -9.94 15.54 R USD 24.67 -14.33 21.38
Number of shares outstanding at the
beginning of the year
issued redeemed outstanding at the end of the year
BP 66,993.132 684.502 -37,708.474 29,969.160 LP 34,868.240 4,928.956 -17,161.082 22,636.114 LDP - 6,536.822 -830.000 5,706.822 NP 1,870.930 524.867 -1,040.000 1,355.797 UP (EUR) - 49,999.850 -49,999.850 - X (EUR) - 10.000 - 10.000 XN (EUR) - 1,539.333 - 1,539.333 IP 430.000 - -400.000 30.000 IP (EUR) 1,405.194 21,339.579 -1,241.194 21,503.579 IP (GBP) 110.000 - -45.000 65.000 R 560,974.126 758.000 - 561,732.126 RAMC - 17,735.000 - 17,735.000 MB (EUR) - 50,084.649 -50,084.649 -
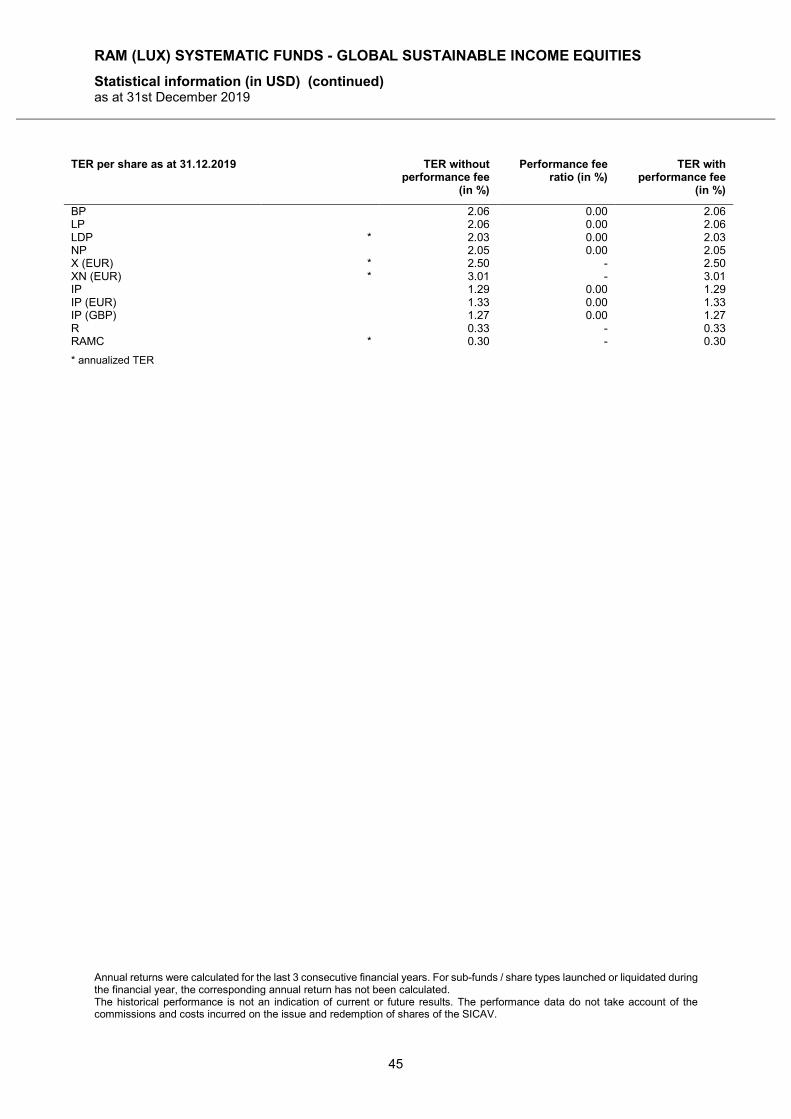
RAM (LUX) SYSTEMATIC FUNDS - GLOBAL SUSTAINABLE INCOME EQUITIES
Statistical information (in USD) (continued) as at 31st December 2019
Annual returns were calculated for the last 3 consecutive financial years. For sub-funds / share types launched or liquidated during the financial year, the corresponding annual return has not been calculated. The historical performance is not an indication of current or future results. The performance data do not take account of the commissions and costs incurred on the issue and redemption of shares of the SICAV.
45
TER per share as at 31.12.2019 TER without performance fee
(in %)
Performance fee ratio (in %)
TER with performance fee
(in %)
BP 2.06 0.00 2.06 LP 2.06 0.00 2.06 LDP * 2.03 0.00 2.03 NP 2.05 0.00 2.05 X (EUR) * 2.50 - 2.50 XN (EUR) * 3.01 - 3.01 IP 1.29 0.00 1.29 IP (EUR) 1.33 0.00 1.33 IP (GBP) 1.27 0.00 1.27 R 0.33 - 0.33 RAMC * 0.30 - 0.30
* annualized TER
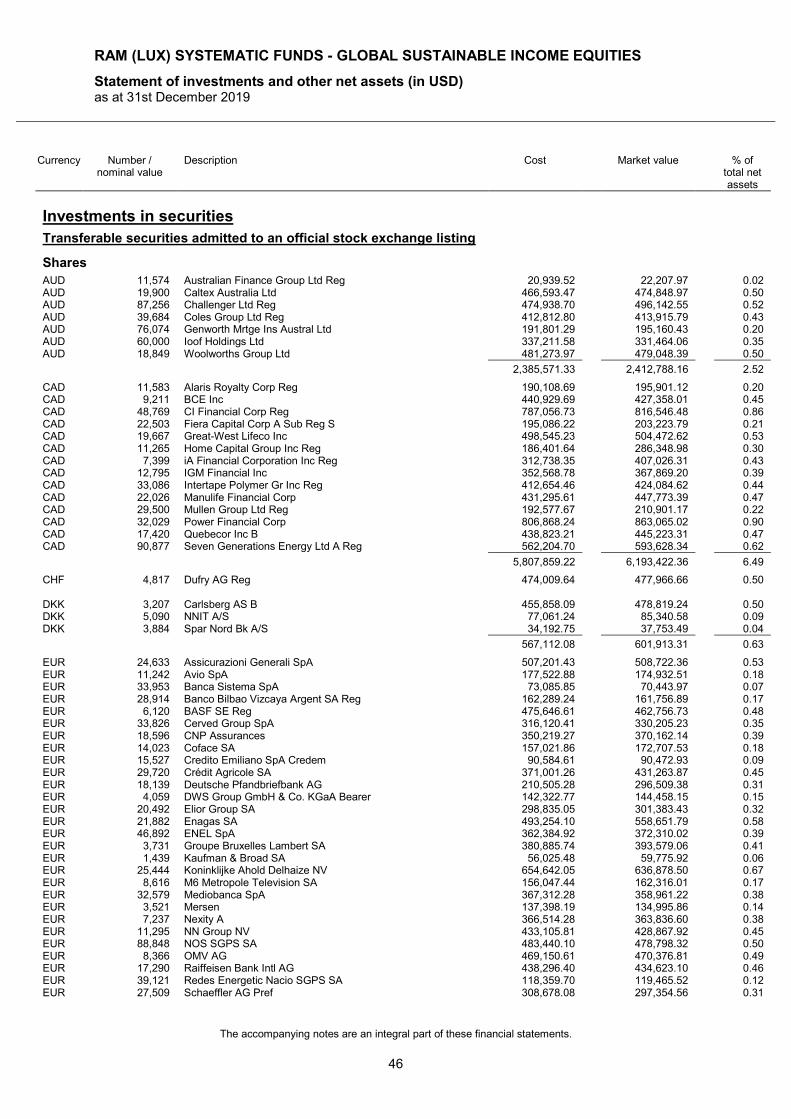
RAM (LUX) SYSTEMATIC FUNDS - GLOBAL SUSTAINABLE INCOME EQUITIES
Statement of investments and other net assets (in USD) as at 31st December 2019
The accompanying notes are an integral part of these financial statements.
46
Currency Number / nominal value
Description Cost Market value % of total net assets
Investments in securities
Transferable securities admitted to an official stock exchange listing
Shares
AUD 11,574 Australian Finance Group Ltd Reg 20,939.52 22,207.97 0.02 AUD 19,900 Caltex Australia Ltd 466,593.47 474,848.97 0.50 AUD 87,256 Challenger Ltd Reg 474,938.70 496,142.55 0.52 AUD 39,684 Coles Group Ltd Reg 412,812.80 413,915.79 0.43 AUD 76,074 Genworth Mrtge Ins Austral Ltd 191,801.29 195,160.43 0.20 AUD 60,000 Ioof Holdings Ltd 337,211.58 331,464.06 0.35 AUD 18,849 Woolworths Group Ltd 481,273.97 479,048.39 0.50
2,385,571.33 2,412,788.16 2.52
CAD 11,583 Alaris Royalty Corp Reg 190,108.69 195,901.12 0.20 CAD 9,211 BCE Inc 440,929.69 427,358.01 0.45 CAD 48,769 CI Financial Corp Reg 787,056.73 816,546.48 0.86 CAD 22,503 Fiera Capital Corp A Sub Reg S 195,086.22 203,223.79 0.21 CAD 19,667 Great-West Lifeco Inc 498,545.23 504,472.62 0.53 CAD 11,265 Home Capital Group Inc Reg 186,401.64 286,348.98 0.30 CAD 7,399 iA Financial Corporation Inc Reg 312,738.35 407,026.31 0.43 CAD 12,795 IGM Financial Inc 352,568.78 367,869.20 0.39 CAD 33,086 Intertape Polymer Gr Inc Reg 412,654.46 424,084.62 0.44 CAD 22,026 Manulife Financial Corp 431,295.61 447,773.39 0.47 CAD 29,500 Mullen Group Ltd Reg 192,577.67 210,901.17 0.22 CAD 32,029 Power Financial Corp 806,868.24 863,065.02 0.90 CAD 17,420 Quebecor Inc B 438,823.21 445,223.31 0.47 CAD 90,877 Seven Generations Energy Ltd A Reg 562,204.70 593,628.34 0.62
5,807,859.22 6,193,422.36 6.49
CHF 4,817 Dufry AG Reg 474,009.64 477,966.66 0.50 DKK 3,207 Carlsberg AS B 455,858.09 478,819.24 0.50 DKK 5,090 NNIT A/S 77,061.24 85,340.58 0.09 DKK 3,884 Spar Nord Bk A/S 34,192.75 37,753.49 0.04
567,112.08 601,913.31 0.63
EUR 24,633 Assicurazioni Generali SpA 507,201.43 508,722.36 0.53 EUR 11,242 Avio SpA 177,522.88 174,932.51 0.18 EUR 33,953 Banca Sistema SpA 73,085.85 70,443.97 0.07 EUR 28,914 Banco Bilbao Vizcaya Argent SA Reg 162,289.24 161,756.89 0.17 EUR 6,120 BASF SE Reg 475,646.61 462,756.73 0.48 EUR 33,826 Cerved Group SpA 316,120.41 330,205.23 0.35 EUR 18,596 CNP Assurances 350,219.27 370,162.14 0.39 EUR 14,023 Coface SA 157,021.86 172,707.53 0.18 EUR 15,527 Credito Emiliano SpA Credem 90,584.61 90,472.93 0.09 EUR 29,720 Crédit Agricole SA 371,001.26 431,263.87 0.45 EUR 18,139 Deutsche Pfandbriefbank AG 210,505.28 296,509.38 0.31 EUR 4,059 DWS Group GmbH & Co. KGaA Bearer 142,322.77 144,458.15 0.15 EUR 20,492 Elior Group SA 298,835.05 301,383.43 0.32 EUR 21,882 Enagas SA 493,254.10 558,651.79 0.58 EUR 46,892 ENEL SpA 362,384.92 372,310.02 0.39 EUR 3,731 Groupe Bruxelles Lambert SA 380,885.74 393,579.06 0.41 EUR 1,439 Kaufman & Broad SA 56,025.48 59,775.92 0.06 EUR 25,444 Koninklijke Ahold Delhaize NV 654,642.05 636,878.50 0.67 EUR 8,616 M6 Metropole Television SA 156,047.44 162,316.01 0.17 EUR 32,579 Mediobanca SpA 367,312.28 358,961.22 0.38 EUR 3,521 Mersen 137,398.19 134,995.86 0.14 EUR 7,237 Nexity A 366,514.28 363,836.60 0.38 EUR 11,295 NN Group NV 433,105.81 428,867.92 0.45 EUR 88,848 NOS SGPS SA 483,440.10 478,798.32 0.50 EUR 8,366 OMV AG 469,150.61 470,376.81 0.49 EUR 17,290 Raiffeisen Bank Intl AG 438,296.40 434,623.10 0.46 EUR 39,121 Redes Energetic Nacio SGPS SA 118,359.70 119,465.52 0.12 EUR 27,509 Schaeffler AG Pref 308,678.08 297,354.56 0.31
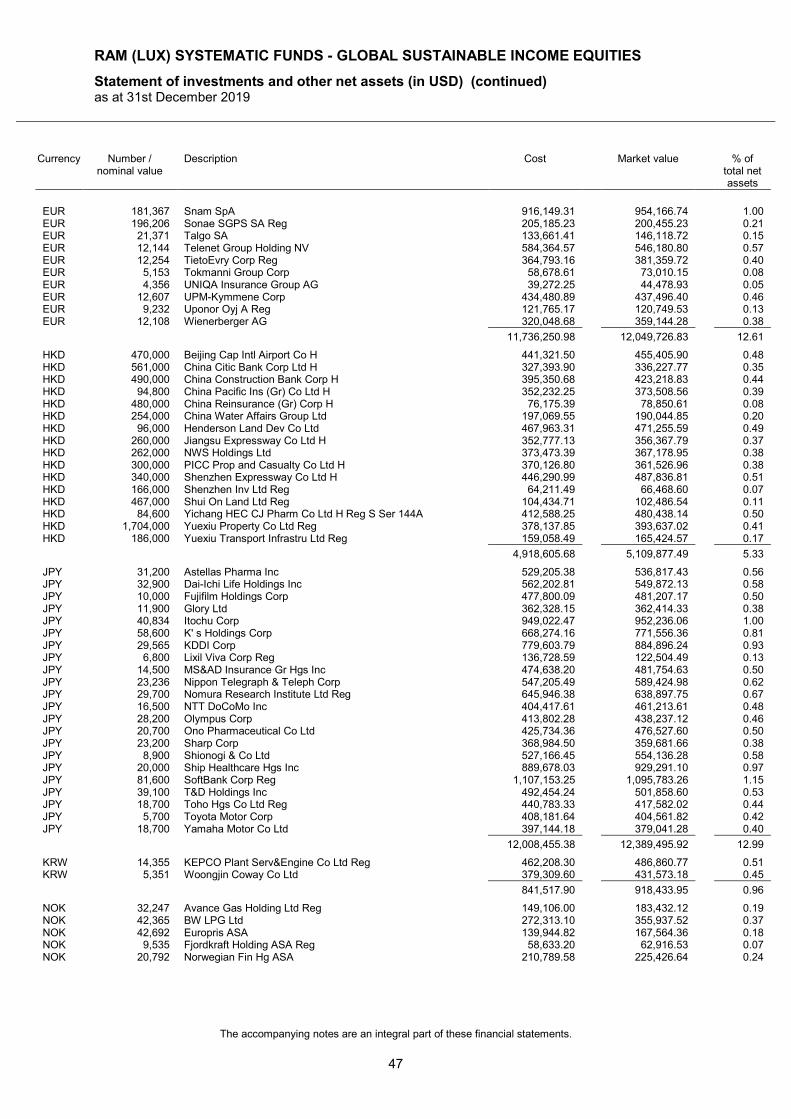
RAM (LUX) SYSTEMATIC FUNDS - GLOBAL SUSTAINABLE INCOME EQUITIES
Statement of investments and other net assets (in USD) (continued) as at 31st December 2019
The accompanying notes are an integral part of these financial statements.
47
Currency Number / nominal value
Description Cost Market value % of total net assets
EUR 181,367 Snam SpA 916,149.31 954,166.74 1.00 EUR 196,206 Sonae SGPS SA Reg 205,185.23 200,455.23 0.21 EUR 21,371 Talgo SA 133,661.41 146,118.72 0.15 EUR 12,144 Telenet Group Holding NV 584,364.57 546,180.80 0.57 EUR 12,254 TietoEvry Corp Reg 364,793.16 381,359.72 0.40 EUR 5,153 Tokmanni Group Corp 58,678.61 73,010.15 0.08 EUR 4,356 UNIQA Insurance Group AG 39,272.25 44,478.93 0.05 EUR 12,607 UPM-Kymmene Corp 434,480.89 437,496.40 0.46 EUR 9,232 Uponor Oyj A Reg 121,765.17 120,749.53 0.13 EUR 12,108 Wienerberger AG 320,048.68 359,144.28 0.38
11,736,250.98 12,049,726.83 12.61
HKD 470,000 Beijing Cap Intl Airport Co H 441,321.50 455,405.90 0.48 HKD 561,000 China Citic Bank Corp Ltd H 327,393.90 336,227.77 0.35 HKD 490,000 China Construction Bank Corp H 395,350.68 423,218.83 0.44 HKD 94,800 China Pacific Ins (Gr) Co Ltd H 352,232.25 373,508.56 0.39 HKD 480,000 China Reinsurance (Gr) Corp H 76,175.39 78,850.61 0.08 HKD 254,000 China Water Affairs Group Ltd 197,069.55 190,044.85 0.20 HKD 96,000 Henderson Land Dev Co Ltd 467,963.31 471,255.59 0.49 HKD 260,000 Jiangsu Expressway Co Ltd H 352,777.13 356,367.79 0.37 HKD 262,000 NWS Holdings Ltd 373,473.39 367,178.95 0.38 HKD 300,000 PICC Prop and Casualty Co Ltd H 370,126.80 361,526.96 0.38 HKD 340,000 Shenzhen Expressway Co Ltd H 446,290.99 487,836.81 0.51 HKD 166,000 Shenzhen Inv Ltd Reg 64,211.49 66,468.60 0.07 HKD 467,000 Shui On Land Ltd Reg 104,434.71 102,486.54 0.11 HKD 84,600 Yichang HEC CJ Pharm Co Ltd H Reg S Ser 144A 412,588.25 480,438.14 0.50 HKD 1,704,000 Yuexiu Property Co Ltd Reg 378,137.85 393,637.02 0.41 HKD 186,000 Yuexiu Transport Infrastru Ltd Reg 159,058.49 165,424.57 0.17
4,918,605.68 5,109,877.49 5.33
JPY 31,200 Astellas Pharma Inc 529,205.38 536,817.43 0.56 JPY 32,900 Dai-Ichi Life Holdings Inc 562,202.81 549,872.13 0.58 JPY 10,000 Fujifilm Holdings Corp 477,800.09 481,207.17 0.50 JPY 11,900 Glory Ltd 362,328.15 362,414.33 0.38 JPY 40,834 Itochu Corp 949,022.47 952,236.06 1.00 JPY 58,600 K' s Holdings Corp 668,274.16 771,556.36 0.81 JPY 29,565 KDDI Corp 779,603.79 884,896.24 0.93 JPY 6,800 Lixil Viva Corp Reg 136,728.59 122,504.49 0.13 JPY 14,500 MS&AD Insurance Gr Hgs Inc 474,638.20 481,754.63 0.50 JPY 23,236 Nippon Telegraph & Teleph Corp 547,205.49 589,424.98 0.62 JPY 29,700 Nomura Research Institute Ltd Reg 645,946.38 638,897.75 0.67 JPY 16,500 NTT DoCoMo Inc 404,417.61 461,213.61 0.48 JPY 28,200 Olympus Corp 413,802.28 438,237.12 0.46 JPY 20,700 Ono Pharmaceutical Co Ltd 425,734.36 476,527.60 0.50 JPY 23,200 Sharp Corp 368,984.50 359,681.66 0.38 JPY 8,900 Shionogi & Co Ltd 527,166.45 554,136.28 0.58 JPY 20,000 Ship Healthcare Hgs Inc 889,678.03 929,291.10 0.97 JPY 81,600 SoftBank Corp Reg 1,107,153.25 1,095,783.26 1.15 JPY 39,100 T&D Holdings Inc 492,454.24 501,858.60 0.53 JPY 18,700 Toho Hgs Co Ltd Reg 440,783.33 417,582.02 0.44 JPY 5,700 Toyota Motor Corp 408,181.64 404,561.82 0.42 JPY 18,700 Yamaha Motor Co Ltd 397,144.18 379,041.28 0.40
12,008,455.38 12,389,495.92 12.99
KRW 14,355 KEPCO Plant Serv&Engine Co Ltd Reg 462,208.30 486,860.77 0.51 KRW 5,351 Woongjin Coway Co Ltd 379,309.60 431,573.18 0.45
841,517.90 918,433.95 0.96
NOK 32,247 Avance Gas Holding Ltd Reg 149,106.00 183,432.12 0.19 NOK 42,365 BW LPG Ltd 272,313.10 355,937.52 0.37 NOK 42,692 Europris ASA 139,944.82 167,564.36 0.18 NOK 9,535 Fjordkraft Holding ASA Reg 58,633.20 62,916.53 0.07 NOK 20,792 Norwegian Fin Hg ASA 210,789.58 225,426.64 0.24
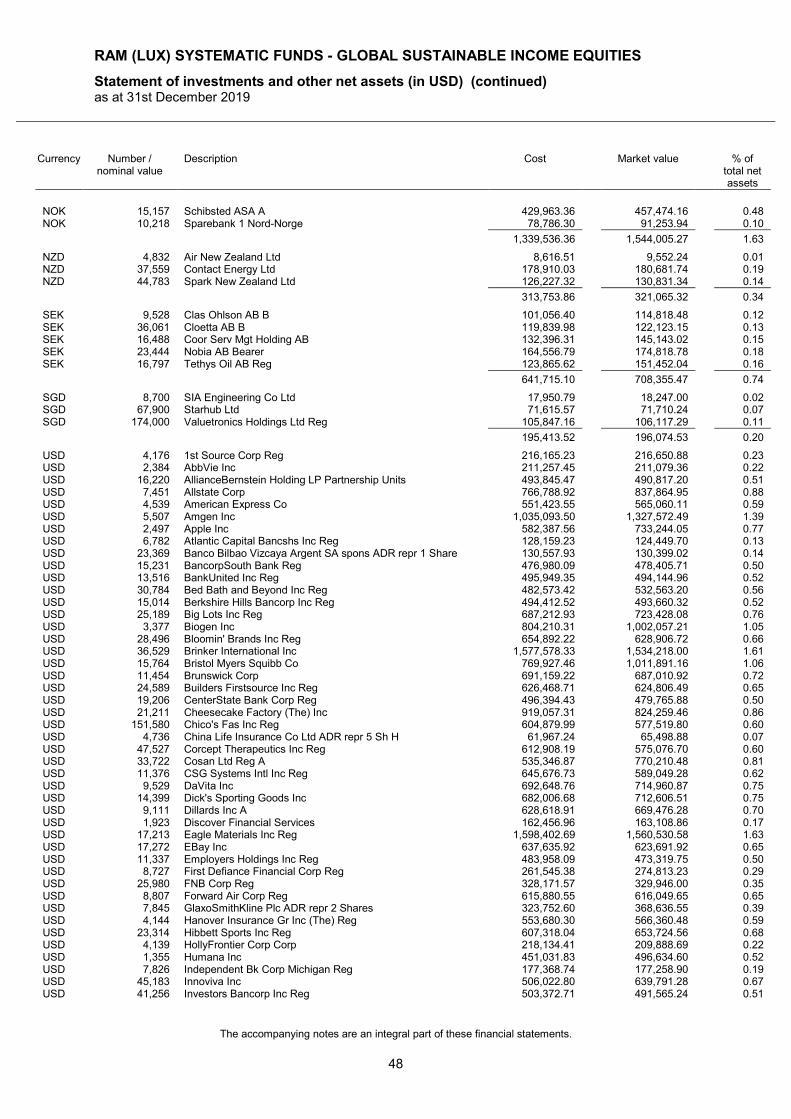
RAM (LUX) SYSTEMATIC FUNDS - GLOBAL SUSTAINABLE INCOME EQUITIES
Statement of investments and other net assets (in USD) (continued) as at 31st December 2019
The accompanying notes are an integral part of these financial statements.
48
Currency Number / nominal value
Description Cost Market value % of total net assets
NOK 15,157 Schibsted ASA A 429,963.36 457,474.16 0.48 NOK 10,218 Sparebank 1 Nord-Norge 78,786.30 91,253.94 0.10
1,339,536.36 1,544,005.27 1.63
NZD 4,832 Air New Zealand Ltd 8,616.51 9,552.24 0.01 NZD 37,559 Contact Energy Ltd 178,910.03 180,681.74 0.19 NZD 44,783 Spark New Zealand Ltd 126,227.32 130,831.34 0.14
313,753.86 321,065.32 0.34
SEK 9,528 Clas Ohlson AB B 101,056.40 114,818.48 0.12 SEK 36,061 Cloetta AB B 119,839.98 122,123.15 0.13 SEK 16,488 Coor Serv Mgt Holding AB 132,396.31 145,143.02 0.15 SEK 23,444 Nobia AB Bearer 164,556.79 174,818.78 0.18 SEK 16,797 Tethys Oil AB Reg 123,865.62 151,452.04 0.16
641,715.10 708,355.47 0.74
SGD 8,700 SIA Engineering Co Ltd 17,950.79 18,247.00 0.02 SGD 67,900 Starhub Ltd 71,615.57 71,710.24 0.07 SGD 174,000 Valuetronics Holdings Ltd Reg 105,847.16 106,117.29 0.11
195,413.52 196,074.53 0.20
USD 4,176 1st Source Corp Reg 216,165.23 216,650.88 0.23 USD 2,384 AbbVie Inc 211,257.45 211,079.36 0.22 USD 16,220 AllianceBernstein Holding LP Partnership Units 493,845.47 490,817.20 0.51 USD 7,451 Allstate Corp 766,788.92 837,864.95 0.88 USD 4,539 American Express Co 551,423.55 565,060.11 0.59 USD 5,507 Amgen Inc 1,035,093.50 1,327,572.49 1.39 USD 2,497 Apple Inc 582,387.56 733,244.05 0.77 USD 6,782 Atlantic Capital Bancshs Inc Reg 128,159.23 124,449.70 0.13 USD 23,369 Banco Bilbao Vizcaya Argent SA spons ADR repr 1 Share 130,557.93 130,399.02 0.14 USD 15,231 BancorpSouth Bank Reg 476,980.09 478,405.71 0.50 USD 13,516 BankUnited Inc Reg 495,949.35 494,144.96 0.52 USD 30,784 Bed Bath and Beyond Inc Reg 482,573.42 532,563.20 0.56 USD 15,014 Berkshire Hills Bancorp Inc Reg 494,412.52 493,660.32 0.52 USD 25,189 Big Lots Inc Reg 687,212.93 723,428.08 0.76 USD 3,377 Biogen Inc 804,210.31 1,002,057.21 1.05 USD 28,496 Bloomin' Brands Inc Reg 654,892.22 628,906.72 0.66 USD 36,529 Brinker International Inc 1,577,578.33 1,534,218.00 1.61 USD 15,764 Bristol Myers Squibb Co 769,927.46 1,011,891.16 1.06 USD 11,454 Brunswick Corp 691,159.22 687,010.92 0.72 USD 24,589 Builders Firstsource Inc Reg 626,468.71 624,806.49 0.65 USD 19,206 CenterState Bank Corp Reg 496,394.43 479,765.88 0.50 USD 21,211 Cheesecake Factory (The) Inc 919,057.31 824,259.46 0.86 USD 151,580 Chico's Fas Inc Reg 604,879.99 577,519.80 0.60 USD 4,736 China Life Insurance Co Ltd ADR repr 5 Sh H 61,967.24 65,498.88 0.07 USD 47,527 Corcept Therapeutics Inc Reg 612,908.19 575,076.70 0.60 USD 33,722 Cosan Ltd Reg A 535,346.87 770,210.48 0.81 USD 11,376 CSG Systems Intl Inc Reg 645,676.73 589,049.28 0.62 USD 9,529 DaVita Inc 692,648.76 714,960.87 0.75 USD 14,399 Dick's Sporting Goods Inc 682,006.68 712,606.51 0.75 USD 9,111 Dillards Inc A 628,618.91 669,476.28 0.70 USD 1,923 Discover Financial Services 162,456.96 163,108.86 0.17 USD 17,213 Eagle Materials Inc Reg 1,598,402.69 1,560,530.58 1.63 USD 17,272 EBay Inc 637,635.92 623,691.92 0.65 USD 11,337 Employers Holdings Inc Reg 483,958.09 473,319.75 0.50 USD 8,727 First Defiance Financial Corp Reg 261,545.38 274,813.23 0.29 USD 25,980 FNB Corp Reg 328,171.57 329,946.00 0.35 USD 8,807 Forward Air Corp Reg 615,880.55 616,049.65 0.65 USD 7,845 GlaxoSmithKline Plc ADR repr 2 Shares 323,752.60 368,636.55 0.39 USD 4,144 Hanover Insurance Gr Inc (The) Reg 553,680.30 566,360.48 0.59 USD 23,314 Hibbett Sports Inc Reg 607,318.04 653,724.56 0.68 USD 4,139 HollyFrontier Corp Corp 218,134.41 209,888.69 0.22 USD 1,355 Humana Inc 451,031.83 496,634.60 0.52 USD 7,826 Independent Bk Corp Michigan Reg 177,368.74 177,258.90 0.19 USD 45,183 Innoviva Inc 506,022.80 639,791.28 0.67 USD 41,256 Investors Bancorp Inc Reg 503,372.71 491,565.24 0.51
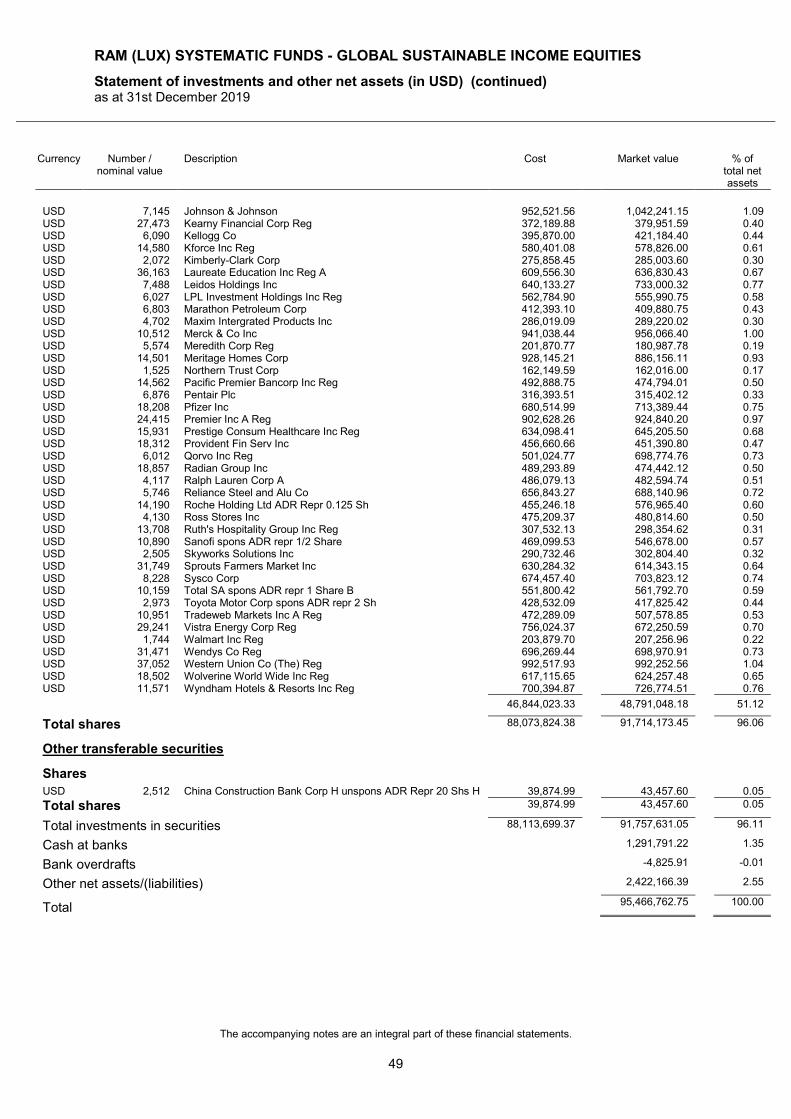
RAM (LUX) SYSTEMATIC FUNDS - GLOBAL SUSTAINABLE INCOME EQUITIES
Statement of investments and other net assets (in USD) (continued) as at 31st December 2019
The accompanying notes are an integral part of these financial statements.
49
Currency Number / nominal value
Description Cost Market value % of total net assets
USD 7,145 Johnson & Johnson 952,521.56 1,042,241.15 1.09 USD 27,473 Kearny Financial Corp Reg 372,189.88 379,951.59 0.40 USD 6,090 Kellogg Co 395,870.00 421,184.40 0.44 USD 14,580 Kforce Inc Reg 580,401.08 578,826.00 0.61 USD 2,072 Kimberly-Clark Corp 275,858.45 285,003.60 0.30 USD 36,163 Laureate Education Inc Reg A 609,556.30 636,830.43 0.67 USD 7,488 Leidos Holdings Inc 640,133.27 733,000.32 0.77 USD 6,027 LPL Investment Holdings Inc Reg 562,784.90 555,990.75 0.58 USD 6,803 Marathon Petroleum Corp 412,393.10 409,880.75 0.43 USD 4,702 Maxim Intergrated Products Inc 286,019.09 289,220.02 0.30 USD 10,512 Merck & Co Inc 941,038.44 956,066.40 1.00 USD 5,574 Meredith Corp Reg 201,870.77 180,987.78 0.19 USD 14,501 Meritage Homes Corp 928,145.21 886,156.11 0.93 USD 1,525 Northern Trust Corp 162,149.59 162,016.00 0.17 USD 14,562 Pacific Premier Bancorp Inc Reg 492,888.75 474,794.01 0.50 USD 6,876 Pentair Plc 316,393.51 315,402.12 0.33 USD 18,208 Pfizer Inc 680,514.99 713,389.44 0.75 USD 24,415 Premier Inc A Reg 902,628.26 924,840.20 0.97 USD 15,931 Prestige Consum Healthcare Inc Reg 634,098.41 645,205.50 0.68 USD 18,312 Provident Fin Serv Inc 456,660.66 451,390.80 0.47 USD 6,012 Qorvo Inc Reg 501,024.77 698,774.76 0.73 USD 18,857 Radian Group Inc 489,293.89 474,442.12 0.50 USD 4,117 Ralph Lauren Corp A 486,079.13 482,594.74 0.51 USD 5,746 Reliance Steel and Alu Co 656,843.27 688,140.96 0.72 USD 14,190 Roche Holding Ltd ADR Repr 0.125 Sh 455,246.18 576,965.40 0.60 USD 4,130 Ross Stores Inc 475,209.37 480,814.60 0.50 USD 13,708 Ruth's Hospitality Group Inc Reg 307,532.13 298,354.62 0.31 USD 10,890 Sanofi spons ADR repr 1/2 Share 469,099.53 546,678.00 0.57 USD 2,505 Skyworks Solutions Inc 290,732.46 302,804.40 0.32 USD 31,749 Sprouts Farmers Market Inc 630,284.32 614,343.15 0.64 USD 8,228 Sysco Corp 674,457.40 703,823.12 0.74 USD 10,159 Total SA spons ADR repr 1 Share B 551,800.42 561,792.70 0.59 USD 2,973 Toyota Motor Corp spons ADR repr 2 Sh 428,532.09 417,825.42 0.44 USD 10,951 Tradeweb Markets Inc A Reg 472,289.09 507,578.85 0.53 USD 29,241 Vistra Energy Corp Reg 756,024.37 672,250.59 0.70 USD 1,744 Walmart Inc Reg 203,879.70 207,256.96 0.22 USD 31,471 Wendys Co Reg 696,269.44 698,970.91 0.73 USD 37,052 Western Union Co (The) Reg 992,517.93 992,252.56 1.04 USD 18,502 Wolverine World Wide Inc Reg 617,115.65 624,257.48 0.65 USD 11,571 Wyndham Hotels & Resorts Inc Reg 700,394.87 726,774.51 0.76
46,844,023.33 48,791,048.18 51.12
Total shares 88,073,824.38 91,714,173.45 96.06
Other transferable securities
Shares
USD 2,512 China Construction Bank Corp H unspons ADR Repr 20 Shs H 39,874.99 43,457.60 0.05
Total shares 39,874.99 43,457.60 0.05
Total investments in securities 88,113,699.37 91,757,631.05 96.11
Cash at banks 1,291,791.22 1.35
Bank overdrafts -4,825.91 -0.01
Other net assets/(liabilities) 2,422,166.39 2.55
Total 95,466,762.75 100.00
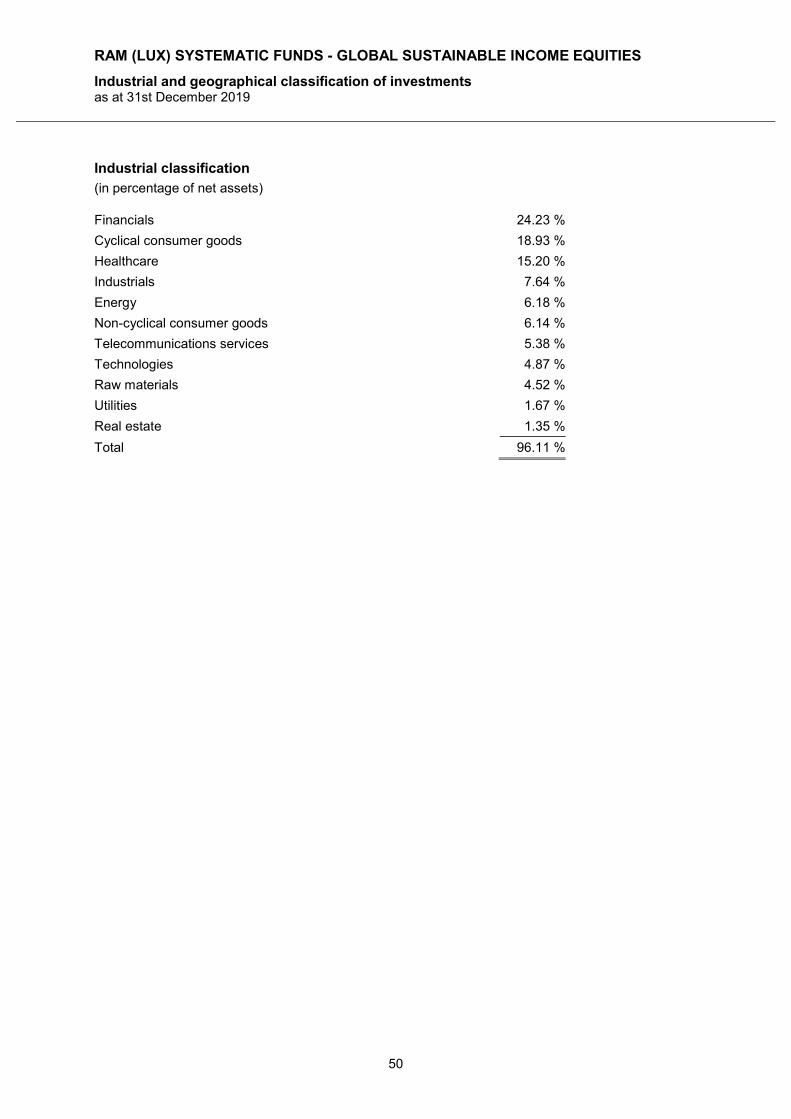
RAM (LUX) SYSTEMATIC FUNDS - GLOBAL SUSTAINABLE INCOME EQUITIES
Industrial and geographical classification of investments as at 31st December 2019
50
Industrial classification
(in percentage of net assets)
Financials 24.23 %
Cyclical consumer goods 18.93 %
Healthcare 15.20 %
Industrials 7.64 %
Energy 6.18 %
Non-cyclical consumer goods 6.14 %
Telecommunications services 5.38 %
Technologies 4.87 %
Raw materials 4.52 %
Utilities 1.67 %
Real estate 1.35 %
Total 96.11 %
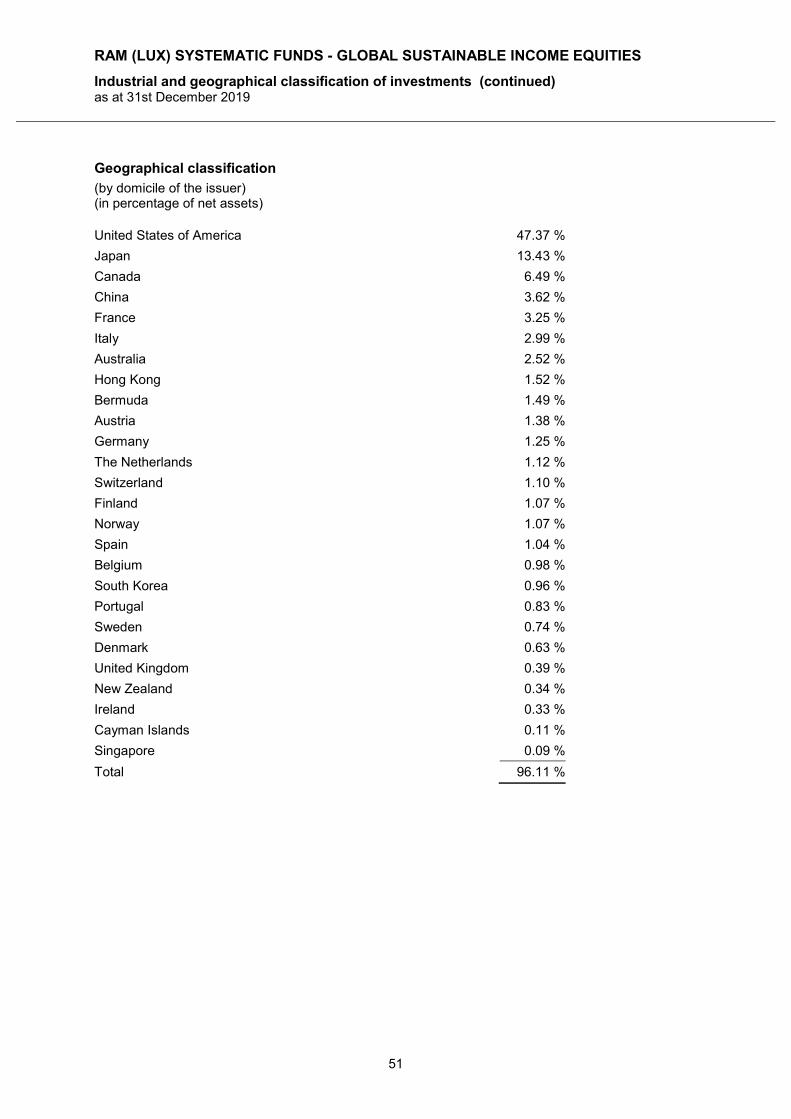
RAM (LUX) SYSTEMATIC FUNDS - GLOBAL SUSTAINABLE INCOME EQUITIES
Industrial and geographical classification of investments (continued) as at 31st December 2019
51
Geographical classification
(by domicile of the issuer) (in percentage of net assets)
United States of America 47.37 %
Japan 13.43 %
Canada 6.49 %
China 3.62 %
France 3.25 %
Italy 2.99 %
Australia 2.52 %
Hong Kong 1.52 %
Bermuda 1.49 %
Austria 1.38 %
Germany 1.25 %
The Netherlands 1.12 %
Switzerland 1.10 %
Finland 1.07 %
Norway 1.07 %
Spain 1.04 %
Belgium 0.98 %
South Korea 0.96 %
Portugal 0.83 %
Sweden 0.74 %
Denmark 0.63 %
United Kingdom 0.39 %
New Zealand 0.34 %
Ireland 0.33 %
Cayman Islands 0.11 %
Singapore 0.09 %
Total 96.11 %
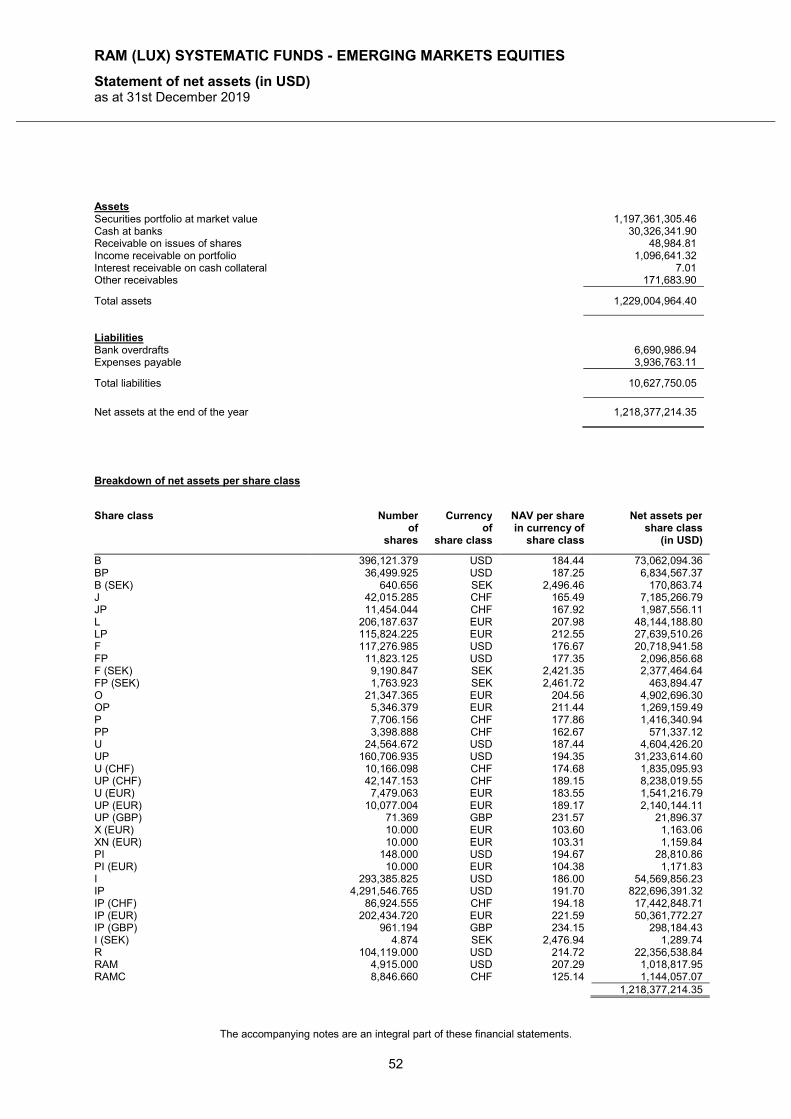
RAM (LUX) SYSTEMATIC FUNDS - EMERGING MARKETS EQUITIES
Statement of net assets (in USD) as at 31st December 2019
The accompanying notes are an integral part of these financial statements.
52
Assets Securities portfolio at market value 1,197,361,305.46 Cash at banks 30,326,341.90 Receivable on issues of shares 48,984.81 Income receivable on portfolio 1,096,641.32 Interest receivable on cash collateral 7.01 Other receivables 171,683.90
Total assets 1,229,004,964.40
Liabilities Bank overdrafts 6,690,986.94 Expenses payable 3,936,763.11
Total liabilities 10,627,750.05
Net assets at the end of the year 1,218,377,214.35
Breakdown of net assets per share class
Share class Number of
shares
Currency of
share class
NAV per share in currency of
share class
Net assets per share class
(in USD)
B 396,121.379 USD 184.44 73,062,094.36 BP 36,499.925 USD 187.25 6,834,567.37 B (SEK) 640.656 SEK 2,496.46 170,863.74 J 42,015.285 CHF 165.49 7,185,266.79 JP 11,454.044 CHF 167.92 1,987,556.11 L 206,187.637 EUR 207.98 48,144,188.80 LP 115,824.225 EUR 212.55 27,639,510.26 F 117,276.985 USD 176.67 20,718,941.58 FP 11,823.125 USD 177.35 2,096,856.68 F (SEK) 9,190.847 SEK 2,421.35 2,377,464.64 FP (SEK) 1,763.923 SEK 2,461.72 463,894.47 O 21,347.365 EUR 204.56 4,902,696.30 OP 5,346.379 EUR 211.44 1,269,159.49 P 7,706.156 CHF 177.86 1,416,340.94 PP 3,398.888 CHF 162.67 571,337.12 U 24,564.672 USD 187.44 4,604,426.20 UP 160,706.935 USD 194.35 31,233,614.60 U (CHF) 10,166.098 CHF 174.68 1,835,095.93 UP (CHF) 42,147.153 CHF 189.15 8,238,019.55 U (EUR) 7,479.063 EUR 183.55 1,541,216.79 UP (EUR) 10,077.004 EUR 189.17 2,140,144.11 UP (GBP) 71.369 GBP 231.57 21,896.37 X (EUR) 10.000 EUR 103.60 1,163.06 XN (EUR) 10.000 EUR 103.31 1,159.84 PI 148.000 USD 194.67 28,810.86 PI (EUR) 10.000 EUR 104.38 1,171.83 I 293,385.825 USD 186.00 54,569,856.23 IP 4,291,546.765 USD 191.70 822,696,391.32 IP (CHF) 86,924.555 CHF 194.18 17,442,848.71 IP (EUR) 202,434.720 EUR 221.59 50,361,772.27 IP (GBP) 961.194 GBP 234.15 298,184.43 I (SEK) 4.874 SEK 2,476.94 1,289.74 R 104,119.000 USD 214.72 22,356,538.84 RAM 4,915.000 USD 207.29 1,018,817.95 RAMC 8,846.660 CHF 125.14 1,144,057.07 1,218,377,214.35
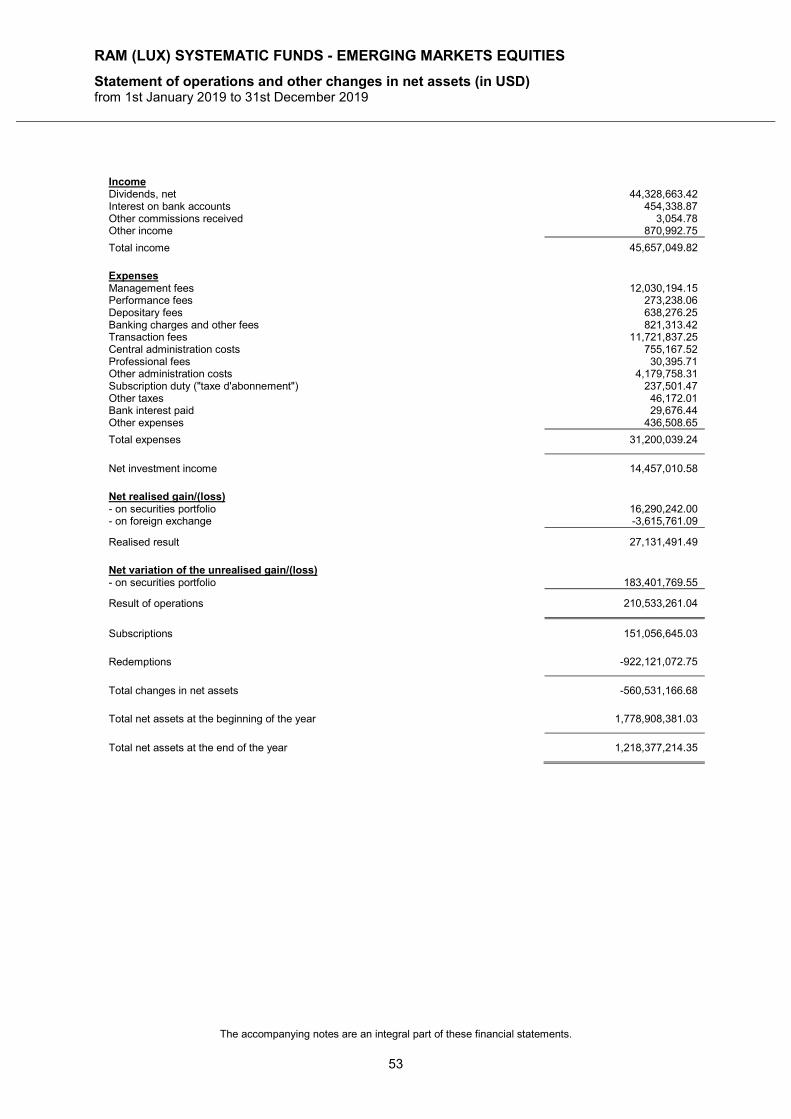
RAM (LUX) SYSTEMATIC FUNDS - EMERGING MARKETS EQUITIES
Statement of operations and other changes in net assets (in USD) from 1st January 2019 to 31st December 2019
The accompanying notes are an integral part of these financial statements.
53
Income Dividends, net 44,328,663.42 Interest on bank accounts 454,338.87 Other commissions received 3,054.78 Other income 870,992.75
Total income 45,657,049.82
Expenses Management fees 12,030,194.15 Performance fees 273,238.06 Depositary fees 638,276.25 Banking charges and other fees 821,313.42 Transaction fees 11,721,837.25 Central administration costs 755,167.52 Professional fees 30,395.71 Other administration costs 4,179,758.31 Subscription duty ("taxe d'abonnement") 237,501.47 Other taxes 46,172.01 Bank interest paid 29,676.44 Other expenses 436,508.65
Total expenses 31,200,039.24
Net investment income 14,457,010.58
Net realised gain/(loss) - on securities portfolio 16,290,242.00 - on foreign exchange -3,615,761.09
Realised result 27,131,491.49
Net variation of the unrealised gain/(loss) - on securities portfolio 183,401,769.55
Result of operations 210,533,261.04
Subscriptions 151,056,645.03
Redemptions -922,121,072.75
Total changes in net assets -560,531,166.68
Total net assets at the beginning of the year 1,778,908,381.03
Total net assets at the end of the year 1,218,377,214.35
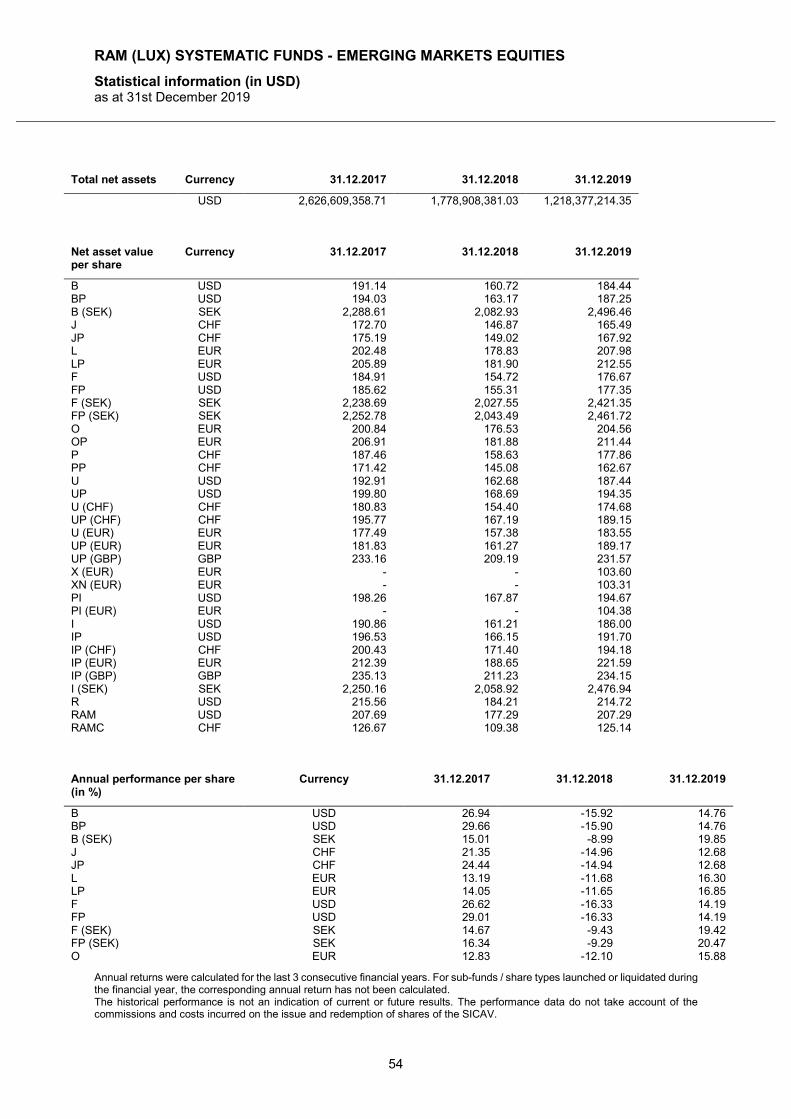
RAM (LUX) SYSTEMATIC FUNDS - EMERGING MARKETS EQUITIES
Statistical information (in USD) as at 31st December 2019
Annual returns were calculated for the last 3 consecutive financial years. For sub-funds / share types launched or liquidated during the financial year, the corresponding annual return has not been calculated. The historical performance is not an indication of current or future results. The performance data do not take account of the commissions and costs incurred on the issue and redemption of shares of the SICAV.
54
Total net assets Currency 31.12.2017 31.12.2018 31.12.2019
USD 2,626,609,358.71 1,778,908,381.03 1,218,377,214.35
Net asset value per share
Currency 31.12.2017 31.12.2018 31.12.2019
B USD 191.14 160.72 184.44 BP USD 194.03 163.17 187.25 B (SEK) SEK 2,288.61 2,082.93 2,496.46 J CHF 172.70 146.87 165.49 JP CHF 175.19 149.02 167.92 L EUR 202.48 178.83 207.98 LP EUR 205.89 181.90 212.55 F USD 184.91 154.72 176.67 FP USD 185.62 155.31 177.35 F (SEK) SEK 2,238.69 2,027.55 2,421.35 FP (SEK) SEK 2,252.78 2,043.49 2,461.72 O EUR 200.84 176.53 204.56 OP EUR 206.91 181.88 211.44 P CHF 187.46 158.63 177.86 PP CHF 171.42 145.08 162.67 U USD 192.91 162.68 187.44 UP USD 199.80 168.69 194.35 U (CHF) CHF 180.83 154.40 174.68 UP (CHF) CHF 195.77 167.19 189.15 U (EUR) EUR 177.49 157.38 183.55 UP (EUR) EUR 181.83 161.27 189.17 UP (GBP) GBP 233.16 209.19 231.57 X (EUR) EUR - - 103.60 XN (EUR) EUR - - 103.31 PI USD 198.26 167.87 194.67 PI (EUR) EUR - - 104.38 I USD 190.86 161.21 186.00 IP USD 196.53 166.15 191.70 IP (CHF) CHF 200.43 171.40 194.18 IP (EUR) EUR 212.39 188.65 221.59 IP (GBP) GBP 235.13 211.23 234.15 I (SEK) SEK 2,250.16 2,058.92 2,476.94 R USD 215.56 184.21 214.72 RAM USD 207.69 177.29 207.29 RAMC CHF 126.67 109.38 125.14
Annual performance per share (in %)
Currency 31.12.2017 31.12.2018 31.12.2019
B USD 26.94 -15.92 14.76 BP USD 29.66 -15.90 14.76 B (SEK) SEK 15.01 -8.99 19.85 J CHF 21.35 -14.96 12.68 JP CHF 24.44 -14.94 12.68 L EUR 13.19 -11.68 16.30 LP EUR 14.05 -11.65 16.85 F USD 26.62 -16.33 14.19 FP USD 29.01 -16.33 14.19 F (SEK) SEK 14.67 -9.43 19.42 FP (SEK) SEK 16.34 -9.29 20.47 O EUR 12.83 -12.10 15.88
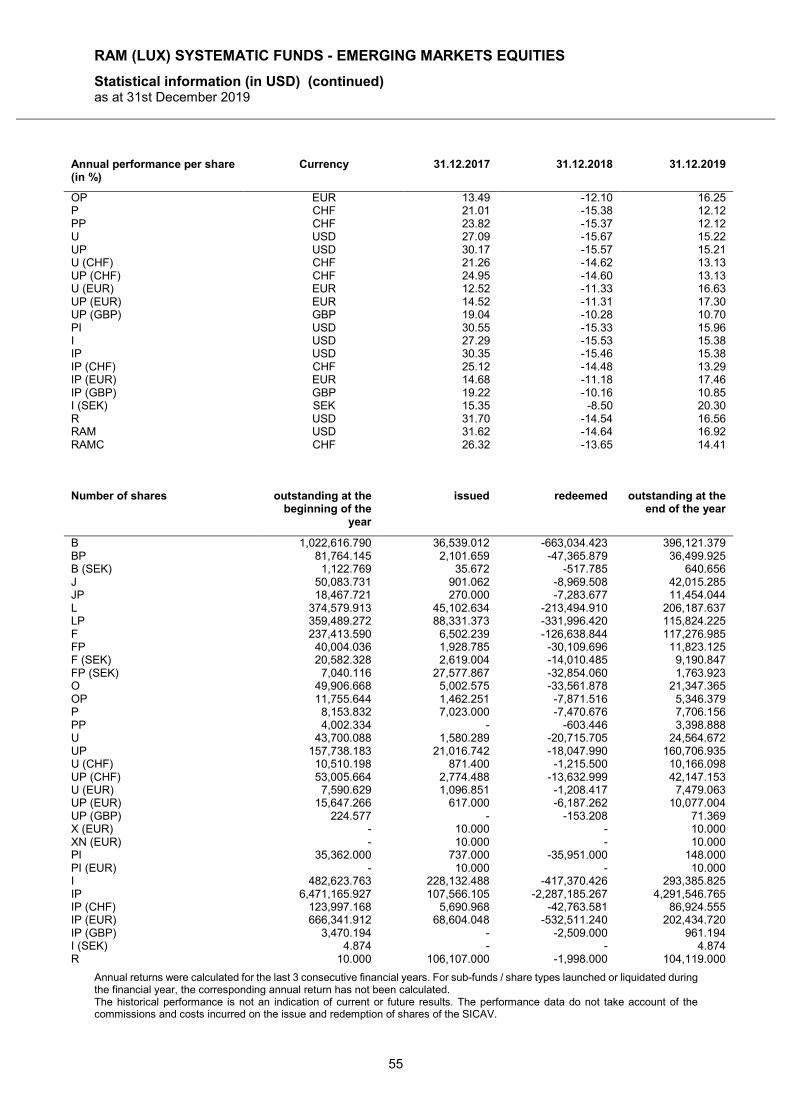
RAM (LUX) SYSTEMATIC FUNDS - EMERGING MARKETS EQUITIES
Statistical information (in USD) (continued) as at 31st December 2019
Annual returns were calculated for the last 3 consecutive financial years. For sub-funds / share types launched or liquidated during the financial year, the corresponding annual return has not been calculated. The historical performance is not an indication of current or future results. The performance data do not take account of the commissions and costs incurred on the issue and redemption of shares of the SICAV.
55
Annual performance per share (in %)
Currency 31.12.2017 31.12.2018 31.12.2019
OP EUR 13.49 -12.10 16.25 P CHF 21.01 -15.38 12.12 PP CHF 23.82 -15.37 12.12 U USD 27.09 -15.67 15.22 UP USD 30.17 -15.57 15.21 U (CHF) CHF 21.26 -14.62 13.13 UP (CHF) CHF 24.95 -14.60 13.13 U (EUR) EUR 12.52 -11.33 16.63 UP (EUR) EUR 14.52 -11.31 17.30 UP (GBP) GBP 19.04 -10.28 10.70 PI USD 30.55 -15.33 15.96 I USD 27.29 -15.53 15.38 IP USD 30.35 -15.46 15.38 IP (CHF) CHF 25.12 -14.48 13.29 IP (EUR) EUR 14.68 -11.18 17.46 IP (GBP) GBP 19.22 -10.16 10.85 I (SEK) SEK 15.35 -8.50 20.30 R USD 31.70 -14.54 16.56 RAM USD 31.62 -14.64 16.92 RAMC CHF 26.32 -13.65 14.41
Number of shares outstanding at the
beginning of the year
issued redeemed outstanding at the end of the year
B 1,022,616.790 36,539.012 -663,034.423 396,121.379 BP 81,764.145 2,101.659 -47,365.879 36,499.925 B (SEK) 1,122.769 35.672 -517.785 640.656 J 50,083.731 901.062 -8,969.508 42,015.285 JP 18,467.721 270.000 -7,283.677 11,454.044 L 374,579.913 45,102.634 -213,494.910 206,187.637 LP 359,489.272 88,331.373 -331,996.420 115,824.225 F 237,413.590 6,502.239 -126,638.844 117,276.985 FP 40,004.036 1,928.785 -30,109.696 11,823.125 F (SEK) 20,582.328 2,619.004 -14,010.485 9,190.847 FP (SEK) 7,040.116 27,577.867 -32,854.060 1,763.923 O 49,906.668 5,002.575 -33,561.878 21,347.365 OP 11,755.644 1,462.251 -7,871.516 5,346.379 P 8,153.832 7,023.000 -7,470.676 7,706.156 PP 4,002.334 - -603.446 3,398.888 U 43,700.088 1,580.289 -20,715.705 24,564.672 UP 157,738.183 21,016.742 -18,047.990 160,706.935 U (CHF) 10,510.198 871.400 -1,215.500 10,166.098 UP (CHF) 53,005.664 2,774.488 -13,632.999 42,147.153 U (EUR) 7,590.629 1,096.851 -1,208.417 7,479.063 UP (EUR) 15,647.266 617.000 -6,187.262 10,077.004 UP (GBP) 224.577 - -153.208 71.369 X (EUR) - 10.000 - 10.000 XN (EUR) - 10.000 - 10.000 PI 35,362.000 737.000 -35,951.000 148.000 PI (EUR) - 10.000 - 10.000 I 482,623.763 228,132.488 -417,370.426 293,385.825 IP 6,471,165.927 107,566.105 -2,287,185.267 4,291,546.765 IP (CHF) 123,997.168 5,690.968 -42,763.581 86,924.555 IP (EUR) 666,341.912 68,604.048 -532,511.240 202,434.720 IP (GBP) 3,470.194 - -2,509.000 961.194 I (SEK) 4.874 - - 4.874 R 10.000 106,107.000 -1,998.000 104,119.000
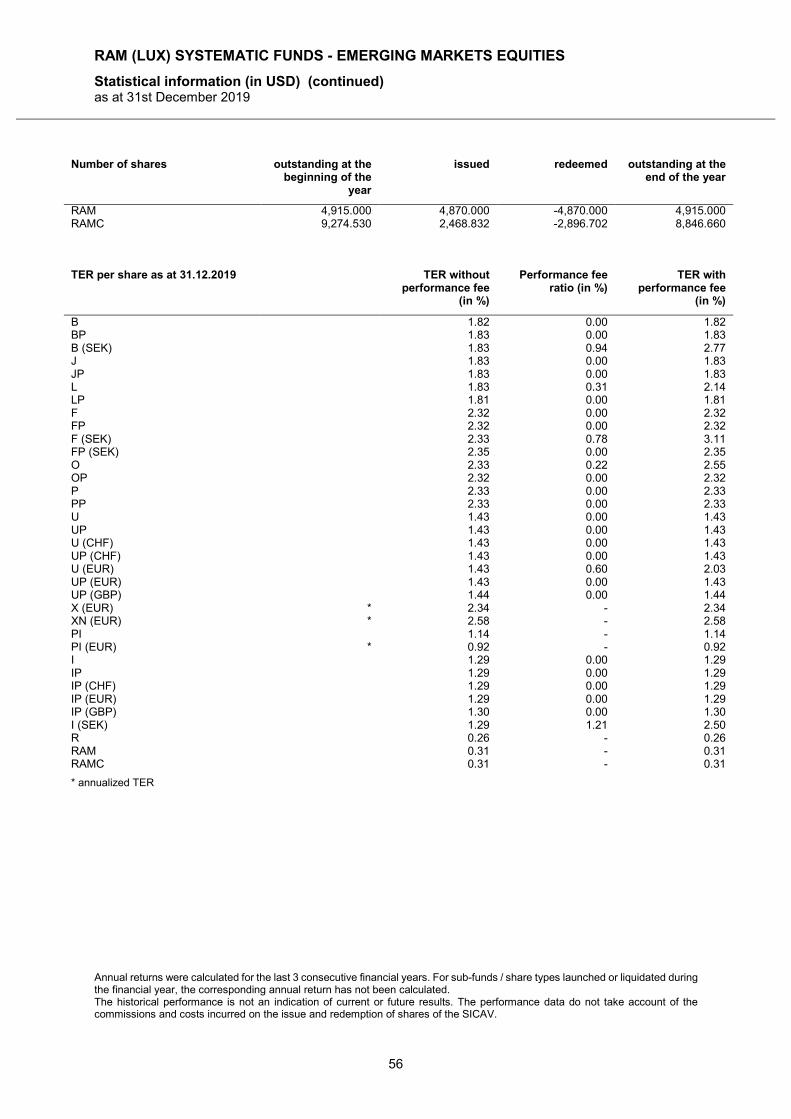
RAM (LUX) SYSTEMATIC FUNDS - EMERGING MARKETS EQUITIES
Statistical information (in USD) (continued) as at 31st December 2019
Annual returns were calculated for the last 3 consecutive financial years. For sub-funds / share types launched or liquidated during the financial year, the corresponding annual return has not been calculated. The historical performance is not an indication of current or future results. The performance data do not take account of the commissions and costs incurred on the issue and redemption of shares of the SICAV.
56
Number of shares outstanding at the beginning of the
year
issued redeemed outstanding at the end of the year
RAM 4,915.000 4,870.000 -4,870.000 4,915.000 RAMC 9,274.530 2,468.832 -2,896.702 8,846.660
TER per share as at 31.12.2019 TER without
performance fee (in %)
Performance fee ratio (in %)
TER with performance fee
(in %)
B 1.82 0.00 1.82 BP 1.83 0.00 1.83 B (SEK) 1.83 0.94 2.77 J 1.83 0.00 1.83 JP 1.83 0.00 1.83 L 1.83 0.31 2.14 LP 1.81 0.00 1.81 F 2.32 0.00 2.32 FP 2.32 0.00 2.32 F (SEK) 2.33 0.78 3.11 FP (SEK) 2.35 0.00 2.35 O 2.33 0.22 2.55 OP 2.32 0.00 2.32 P 2.33 0.00 2.33 PP 2.33 0.00 2.33 U 1.43 0.00 1.43 UP 1.43 0.00 1.43 U (CHF) 1.43 0.00 1.43 UP (CHF) 1.43 0.00 1.43 U (EUR) 1.43 0.60 2.03 UP (EUR) 1.43 0.00 1.43 UP (GBP) 1.44 0.00 1.44 X (EUR) * 2.34 - 2.34 XN (EUR) * 2.58 - 2.58 PI 1.14 - 1.14 PI (EUR) * 0.92 - 0.92 I 1.29 0.00 1.29 IP 1.29 0.00 1.29 IP (CHF) 1.29 0.00 1.29 IP (EUR) 1.29 0.00 1.29 IP (GBP) 1.30 0.00 1.30 I (SEK) 1.29 1.21 2.50 R 0.26 - 0.26 RAM 0.31 - 0.31 RAMC 0.31 - 0.31
* annualized TER
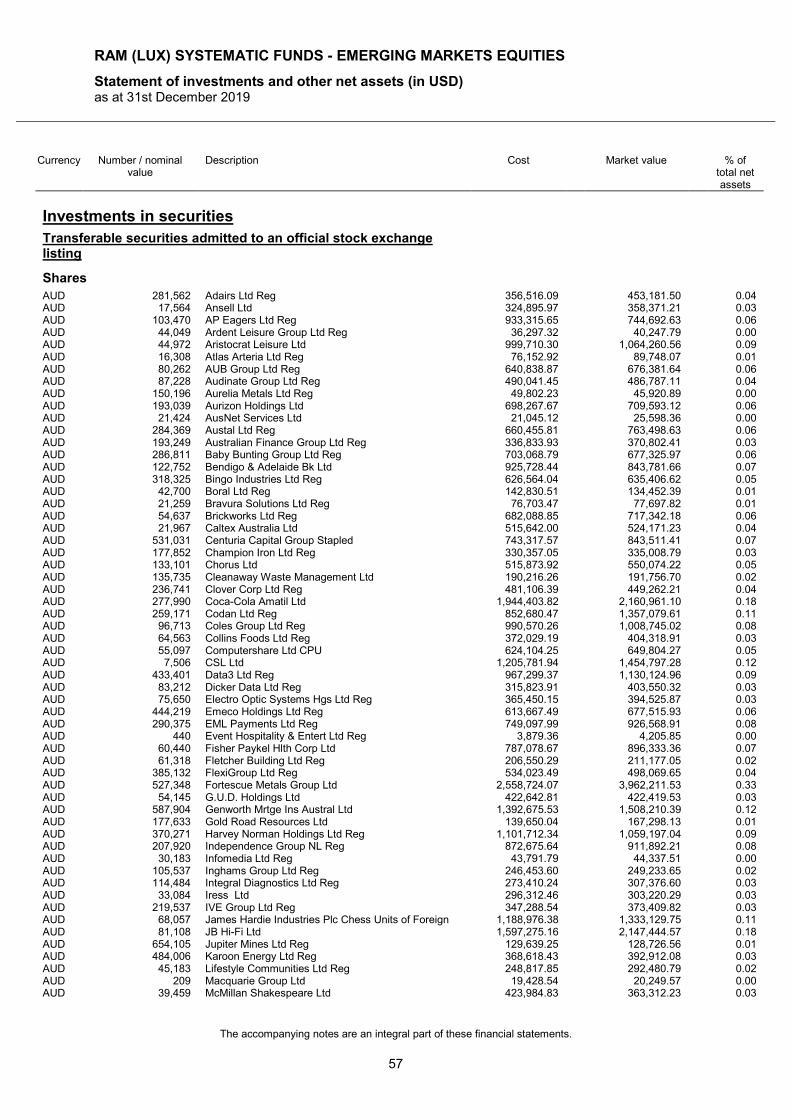
RAM (LUX) SYSTEMATIC FUNDS - EMERGING MARKETS EQUITIES
Statement of investments and other net assets (in USD) as at 31st December 2019
The accompanying notes are an integral part of these financial statements.
57
Currency Number / nominal value
Description Cost Market value % of total net assets
Investments in securities
Transferable securities admitted to an official stock exchange listing
Shares
AUD 281,562 Adairs Ltd Reg 356,516.09 453,181.50 0.04 AUD 17,564 Ansell Ltd 324,895.97 358,371.21 0.03 AUD 103,470 AP Eagers Ltd Reg 933,315.65 744,692.63 0.06 AUD 44,049 Ardent Leisure Group Ltd Reg 36,297.32 40,247.79 0.00 AUD 44,972 Aristocrat Leisure Ltd 999,710.30 1,064,260.56 0.09 AUD 16,308 Atlas Arteria Ltd Reg 76,152.92 89,748.07 0.01 AUD 80,262 AUB Group Ltd Reg 640,838.87 676,381.64 0.06 AUD 87,228 Audinate Group Ltd Reg 490,041.45 486,787.11 0.04 AUD 150,196 Aurelia Metals Ltd Reg 49,802.23 45,920.89 0.00 AUD 193,039 Aurizon Holdings Ltd 698,267.67 709,593.12 0.06 AUD 21,424 AusNet Services Ltd 21,045.12 25,598.36 0.00 AUD 284,369 Austal Ltd Reg 660,455.81 763,498.63 0.06 AUD 193,249 Australian Finance Group Ltd Reg 336,833.93 370,802.41 0.03 AUD 286,811 Baby Bunting Group Ltd Reg 703,068.79 677,325.97 0.06 AUD 122,752 Bendigo & Adelaide Bk Ltd 925,728.44 843,781.66 0.07 AUD 318,325 Bingo Industries Ltd Reg 626,564.04 635,406.62 0.05 AUD 42,700 Boral Ltd Reg 142,830.51 134,452.39 0.01 AUD 21,259 Bravura Solutions Ltd Reg 76,703.47 77,697.82 0.01 AUD 54,637 Brickworks Ltd Reg 682,088.85 717,342.18 0.06 AUD 21,967 Caltex Australia Ltd 515,642.00 524,171.23 0.04 AUD 531,031 Centuria Capital Group Stapled 743,317.57 843,511.41 0.07 AUD 177,852 Champion Iron Ltd Reg 330,357.05 335,008.79 0.03 AUD 133,101 Chorus Ltd 515,873.92 550,074.22 0.05 AUD 135,735 Cleanaway Waste Management Ltd 190,216.26 191,756.70 0.02 AUD 236,741 Clover Corp Ltd Reg 481,106.39 449,262.21 0.04 AUD 277,990 Coca-Cola Amatil Ltd 1,944,403.82 2,160,961.10 0.18 AUD 259,171 Codan Ltd Reg 852,680.47 1,357,079.61 0.11 AUD 96,713 Coles Group Ltd Reg 990,570.26 1,008,745.02 0.08 AUD 64,563 Collins Foods Ltd Reg 372,029.19 404,318.91 0.03 AUD 55,097 Computershare Ltd CPU 624,104.25 649,804.27 0.05 AUD 7,506 CSL Ltd 1,205,781.94 1,454,797.28 0.12 AUD 433,401 Data3 Ltd Reg 967,299.37 1,130,124.96 0.09 AUD 83,212 Dicker Data Ltd Reg 315,823.91 403,550.32 0.03 AUD 75,650 Electro Optic Systems Hgs Ltd Reg 365,450.15 394,525.87 0.03 AUD 444,219 Emeco Holdings Ltd Reg 613,667.49 677,515.93 0.06 AUD 290,375 EML Payments Ltd Reg 749,097.99 926,568.91 0.08 AUD 440 Event Hospitality & Entert Ltd Reg 3,879.36 4,205.85 0.00 AUD 60,440 Fisher Paykel Hlth Corp Ltd 787,078.67 896,333.36 0.07 AUD 61,318 Fletcher Building Ltd Reg 206,550.29 211,177.05 0.02 AUD 385,132 FlexiGroup Ltd Reg 534,023.49 498,069.65 0.04 AUD 527,348 Fortescue Metals Group Ltd 2,558,724.07 3,962,211.53 0.33 AUD 54,145 G.U.D. Holdings Ltd 422,642.81 422,419.53 0.03 AUD 587,904 Genworth Mrtge Ins Austral Ltd 1,392,675.53 1,508,210.39 0.12 AUD 177,633 Gold Road Resources Ltd 139,650.04 167,298.13 0.01 AUD 370,271 Harvey Norman Holdings Ltd Reg 1,101,712.34 1,059,197.04 0.09 AUD 207,920 Independence Group NL Reg 872,675.64 911,892.21 0.08 AUD 30,183 Infomedia Ltd Reg 43,791.79 44,337.51 0.00 AUD 105,537 Inghams Group Ltd Reg 246,453.60 249,233.65 0.02 AUD 114,484 Integral Diagnostics Ltd Reg 273,410.24 307,376.60 0.03 AUD 33,084 Iress Ltd 296,312.46 303,220.29 0.03 AUD 219,537 IVE Group Ltd Reg 347,288.54 373,409.82 0.03 AUD 68,057 James Hardie Industries Plc Chess Units of Foreign 1,188,976.38 1,333,129.75 0.11 AUD 81,108 JB Hi-Fi Ltd 1,597,275.16 2,147,444.57 0.18 AUD 654,105 Jupiter Mines Ltd Reg 129,639.25 128,726.56 0.01 AUD 484,006 Karoon Energy Ltd Reg 368,618.43 392,912.08 0.03 AUD 45,183 Lifestyle Communities Ltd Reg 248,817.85 292,480.79 0.02 AUD 209 Macquarie Group Ltd 19,428.54 20,249.57 0.00 AUD 39,459 McMillan Shakespeare Ltd 423,984.83 363,312.23 0.03
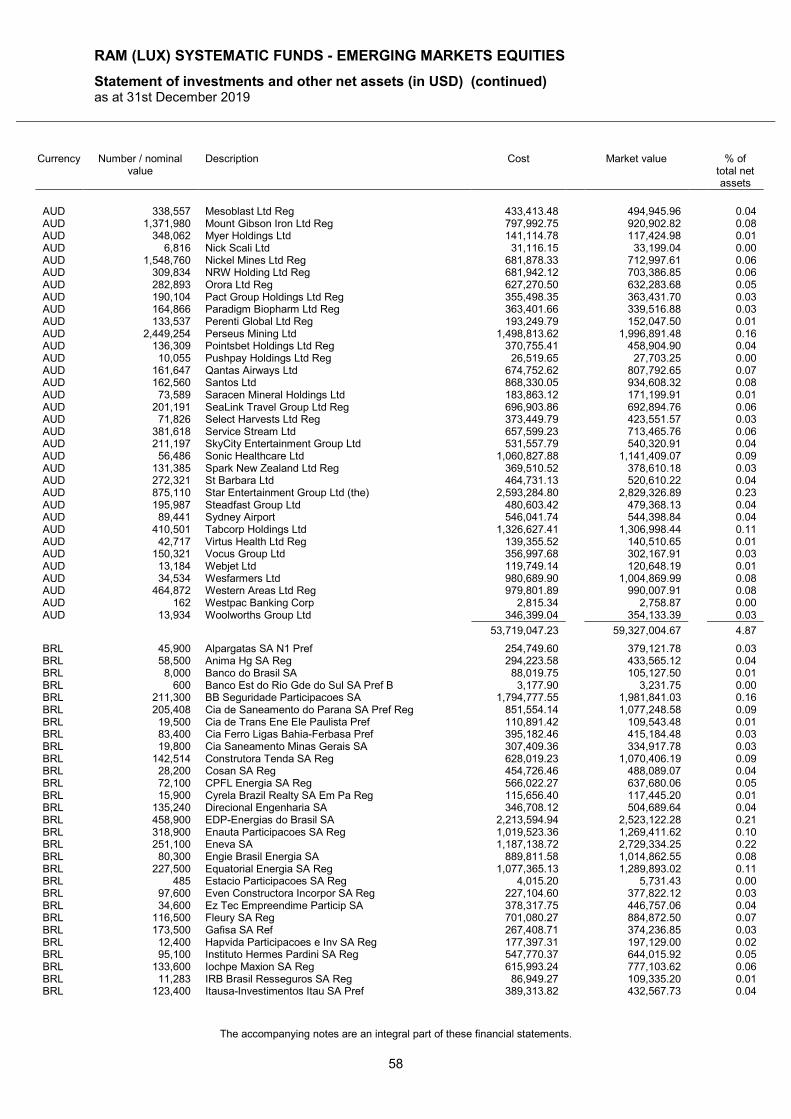
RAM (LUX) SYSTEMATIC FUNDS - EMERGING MARKETS EQUITIES
Statement of investments and other net assets (in USD) (continued) as at 31st December 2019
The accompanying notes are an integral part of these financial statements.
58
Currency Number / nominal value
Description Cost Market value % of total net assets
AUD 338,557 Mesoblast Ltd Reg 433,413.48 494,945.96 0.04 AUD 1,371,980 Mount Gibson Iron Ltd Reg 797,992.75 920,902.82 0.08 AUD 348,062 Myer Holdings Ltd 141,114.78 117,424.98 0.01 AUD 6,816 Nick Scali Ltd 31,116.15 33,199.04 0.00 AUD 1,548,760 Nickel Mines Ltd Reg 681,878.33 712,997.61 0.06 AUD 309,834 NRW Holding Ltd Reg 681,942.12 703,386.85 0.06 AUD 282,893 Orora Ltd Reg 627,270.50 632,283.68 0.05 AUD 190,104 Pact Group Holdings Ltd Reg 355,498.35 363,431.70 0.03 AUD 164,866 Paradigm Biopharm Ltd Reg 363,401.66 339,516.88 0.03 AUD 133,537 Perenti Global Ltd Reg 193,249.79 152,047.50 0.01 AUD 2,449,254 Perseus Mining Ltd 1,498,813.62 1,996,891.48 0.16 AUD 136,309 Pointsbet Holdings Ltd Reg 370,755.41 458,904.90 0.04 AUD 10,055 Pushpay Holdings Ltd Reg 26,519.65 27,703.25 0.00 AUD 161,647 Qantas Airways Ltd 674,752.62 807,792.65 0.07 AUD 162,560 Santos Ltd 868,330.05 934,608.32 0.08 AUD 73,589 Saracen Mineral Holdings Ltd 183,863.12 171,199.91 0.01 AUD 201,191 SeaLink Travel Group Ltd Reg 696,903.86 692,894.76 0.06 AUD 71,826 Select Harvests Ltd Reg 373,449.79 423,551.57 0.03 AUD 381,618 Service Stream Ltd 657,599.23 713,465.76 0.06 AUD 211,197 SkyCity Entertainment Group Ltd 531,557.79 540,320.91 0.04 AUD 56,486 Sonic Healthcare Ltd 1,060,827.88 1,141,409.07 0.09 AUD 131,385 Spark New Zealand Ltd Reg 369,510.52 378,610.18 0.03 AUD 272,321 St Barbara Ltd 464,731.13 520,610.22 0.04 AUD 875,110 Star Entertainment Group Ltd (the) 2,593,284.80 2,829,326.89 0.23 AUD 195,987 Steadfast Group Ltd 480,603.42 479,368.13 0.04 AUD 89,441 Sydney Airport 546,041.74 544,398.84 0.04 AUD 410,501 Tabcorp Holdings Ltd 1,326,627.41 1,306,998.44 0.11 AUD 42,717 Virtus Health Ltd Reg 139,355.52 140,510.65 0.01 AUD 150,321 Vocus Group Ltd 356,997.68 302,167.91 0.03 AUD 13,184 Webjet Ltd 119,749.14 120,648.19 0.01 AUD 34,534 Wesfarmers Ltd 980,689.90 1,004,869.99 0.08 AUD 464,872 Western Areas Ltd Reg 979,801.89 990,007.91 0.08 AUD 162 Westpac Banking Corp 2,815.34 2,758.87 0.00 AUD 13,934 Woolworths Group Ltd 346,399.04 354,133.39 0.03
53,719,047.23 59,327,004.67 4.87
BRL 45,900 Alpargatas SA N1 Pref 254,749.60 379,121.78 0.03 BRL 58,500 Anima Hg SA Reg 294,223.58 433,565.12 0.04 BRL 8,000 Banco do Brasil SA 88,019.75 105,127.50 0.01 BRL 600 Banco Est do Rio Gde do Sul SA Pref B 3,177.90 3,231.75 0.00 BRL 211,300 BB Seguridade Participacoes SA 1,794,777.55 1,981,841.03 0.16 BRL 205,408 Cia de Saneamento do Parana SA Pref Reg 851,554.14 1,077,248.58 0.09 BRL 19,500 Cia de Trans Ene Ele Paulista Pref 110,891.42 109,543.48 0.01 BRL 83,400 Cia Ferro Ligas Bahia-Ferbasa Pref 395,182.46 415,184.48 0.03 BRL 19,800 Cia Saneamento Minas Gerais SA 307,409.36 334,917.78 0.03 BRL 142,514 Construtora Tenda SA Reg 628,019.23 1,070,406.19 0.09 BRL 28,200 Cosan SA Reg 454,726.46 488,089.07 0.04 BRL 72,100 CPFL Energia SA Reg 566,022.27 637,680.06 0.05 BRL 15,900 Cyrela Brazil Realty SA Em Pa Reg 115,656.40 117,445.20 0.01 BRL 135,240 Direcional Engenharia SA 346,708.12 504,689.64 0.04 BRL 458,900 EDP-Energias do Brasil SA 2,213,594.94 2,523,122.28 0.21 BRL 318,900 Enauta Participacoes SA Reg 1,019,523.36 1,269,411.62 0.10 BRL 251,100 Eneva SA 1,187,138.72 2,729,334.25 0.22 BRL 80,300 Engie Brasil Energia SA 889,811.58 1,014,862.55 0.08 BRL 227,500 Equatorial Energia SA Reg 1,077,365.13 1,289,893.02 0.11 BRL 485 Estacio Participacoes SA Reg 4,015.20 5,731.43 0.00 BRL 97,600 Even Constructora Incorpor SA Reg 227,104.60 377,822.12 0.03 BRL 34,600 Ez Tec Empreendime Particip SA 378,317.75 446,757.06 0.04 BRL 116,500 Fleury SA Reg 701,080.27 884,872.50 0.07 BRL 173,500 Gafisa SA Ref 267,408.71 374,236.85 0.03 BRL 12,400 Hapvida Participacoes e Inv SA Reg 177,397.31 197,129.00 0.02 BRL 95,100 Instituto Hermes Pardini SA Reg 547,770.37 644,015.92 0.05 BRL 133,600 Iochpe Maxion SA Reg 615,993.24 777,103.62 0.06 BRL 11,283 IRB Brasil Resseguros SA Reg 86,949.27 109,335.20 0.01 BRL 123,400 Itausa-Investimentos Itau SA Pref 389,313.82 432,567.73 0.04
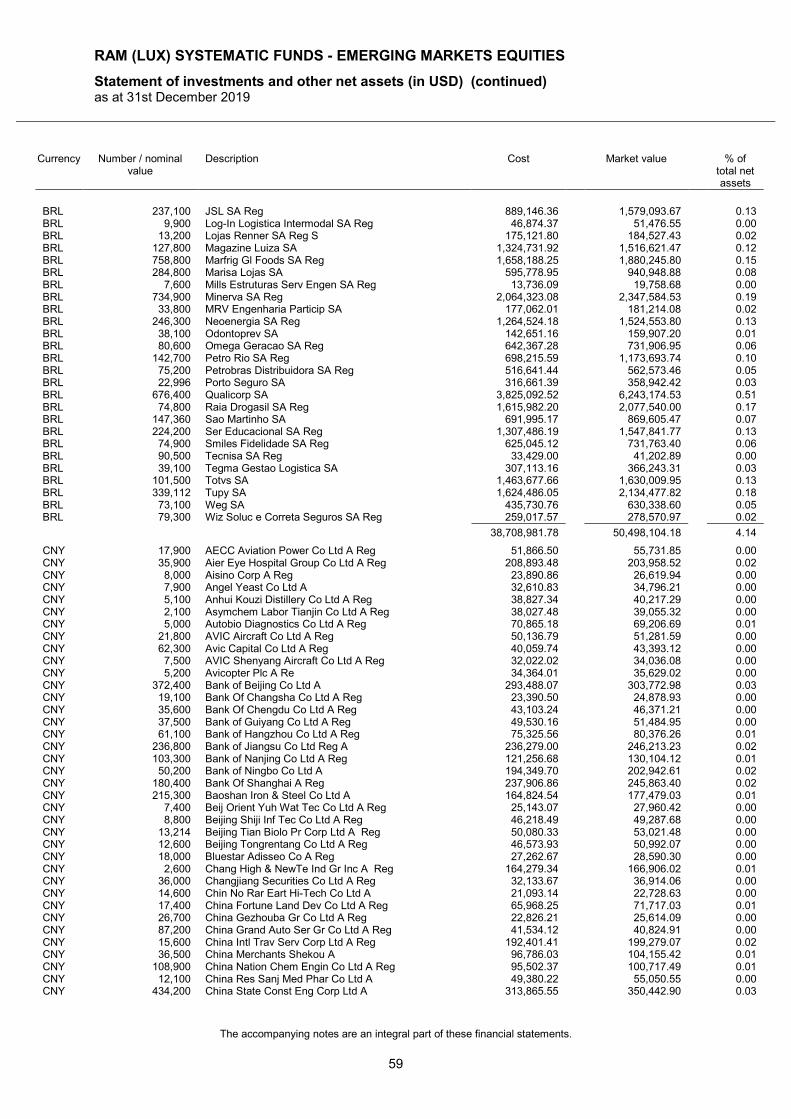
RAM (LUX) SYSTEMATIC FUNDS - EMERGING MARKETS EQUITIES
Statement of investments and other net assets (in USD) (continued) as at 31st December 2019
The accompanying notes are an integral part of these financial statements.
59
Currency Number / nominal value
Description Cost Market value % of total net assets
BRL 237,100 JSL SA Reg 889,146.36 1,579,093.67 0.13 BRL 9,900 Log-In Logistica Intermodal SA Reg 46,874.37 51,476.55 0.00 BRL 13,200 Lojas Renner SA Reg S 175,121.80 184,527.43 0.02 BRL 127,800 Magazine Luiza SA 1,324,731.92 1,516,621.47 0.12 BRL 758,800 Marfrig Gl Foods SA Reg 1,658,188.25 1,880,245.80 0.15 BRL 284,800 Marisa Lojas SA 595,778.95 940,948.88 0.08 BRL 7,600 Mills Estruturas Serv Engen SA Reg 13,736.09 19,758.68 0.00 BRL 734,900 Minerva SA Reg 2,064,323.08 2,347,584.53 0.19 BRL 33,800 MRV Engenharia Particip SA 177,062.01 181,214.08 0.02 BRL 246,300 Neoenergia SA Reg 1,264,524.18 1,524,553.80 0.13 BRL 38,100 Odontoprev SA 142,651.16 159,907.20 0.01 BRL 80,600 Omega Geracao SA Reg 642,367.28 731,906.95 0.06 BRL 142,700 Petro Rio SA Reg 698,215.59 1,173,693.74 0.10 BRL 75,200 Petrobras Distribuidora SA Reg 516,641.44 562,573.46 0.05 BRL 22,996 Porto Seguro SA 316,661.39 358,942.42 0.03 BRL 676,400 Qualicorp SA 3,825,092.52 6,243,174.53 0.51 BRL 74,800 Raia Drogasil SA Reg 1,615,982.20 2,077,540.00 0.17 BRL 147,360 Sao Martinho SA 691,995.17 869,605.47 0.07 BRL 224,200 Ser Educacional SA Reg 1,307,486.19 1,547,841.77 0.13 BRL 74,900 Smiles Fidelidade SA Reg 625,045.12 731,763.40 0.06 BRL 90,500 Tecnisa SA Reg 33,429.00 41,202.89 0.00 BRL 39,100 Tegma Gestao Logistica SA 307,113.16 366,243.31 0.03 BRL 101,500 Totvs SA 1,463,677.66 1,630,009.95 0.13 BRL 339,112 Tupy SA 1,624,486.05 2,134,477.82 0.18 BRL 73,100 Weg SA 435,730.76 630,338.60 0.05 BRL 79,300 Wiz Soluc e Correta Seguros SA Reg 259,017.57 278,570.97 0.02
38,708,981.78 50,498,104.18 4.14
CNY 17,900 AECC Aviation Power Co Ltd A Reg 51,866.50 55,731.85 0.00 CNY 35,900 Aier Eye Hospital Group Co Ltd A Reg 208,893.48 203,958.52 0.02 CNY 8,000 Aisino Corp A Reg 23,890.86 26,619.94 0.00 CNY 7,900 Angel Yeast Co Ltd A 32,610.83 34,796.21 0.00 CNY 5,100 Anhui Kouzi Distillery Co Ltd A Reg 38,827.34 40,217.29 0.00 CNY 2,100 Asymchem Labor Tianjin Co Ltd A Reg 38,027.48 39,055.32 0.00 CNY 5,000 Autobio Diagnostics Co Ltd A Reg 70,865.18 69,206.69 0.01 CNY 21,800 AVIC Aircraft Co Ltd A Reg 50,136.79 51,281.59 0.00 CNY 62,300 Avic Capital Co Ltd A Reg 40,059.74 43,393.12 0.00 CNY 7,500 AVIC Shenyang Aircraft Co Ltd A Reg 32,022.02 34,036.08 0.00 CNY 5,200 Avicopter Plc A Re 34,364.01 35,629.02 0.00 CNY 372,400 Bank of Beijing Co Ltd A 293,488.07 303,772.98 0.03 CNY 19,100 Bank Of Changsha Co Ltd A Reg 23,390.50 24,878.93 0.00 CNY 35,600 Bank Of Chengdu Co Ltd A Reg 43,103.24 46,371.21 0.00 CNY 37,500 Bank of Guiyang Co Ltd A Reg 49,530.16 51,484.95 0.00 CNY 61,100 Bank of Hangzhou Co Ltd A Reg 75,325.56 80,376.26 0.01 CNY 236,800 Bank of Jiangsu Co Ltd Reg A 236,279.00 246,213.23 0.02 CNY 103,300 Bank of Nanjing Co Ltd A Reg 121,256.68 130,104.12 0.01 CNY 50,200 Bank of Ningbo Co Ltd A 194,349.70 202,942.61 0.02 CNY 180,400 Bank Of Shanghai A Reg 237,906.86 245,863.40 0.02 CNY 215,300 Baoshan Iron & Steel Co Ltd A 164,824.54 177,479.03 0.01 CNY 7,400 Beij Orient Yuh Wat Tec Co Ltd A Reg 25,143.07 27,960.42 0.00 CNY 8,800 Beijing Shiji Inf Tec Co Ltd A Reg 46,218.49 49,287.68 0.00 CNY 13,214 Beijing Tian Biolo Pr Corp Ltd A Reg 50,080.33 53,021.48 0.00 CNY 12,600 Beijing Tongrentang Co Ltd A Reg 46,573.93 50,992.07 0.00 CNY 18,000 Bluestar Adisseo Co A Reg 27,262.67 28,590.30 0.00 CNY 2,600 Chang High & NewTe Ind Gr Inc A Reg 164,279.34 166,906.02 0.01 CNY 36,000 Changjiang Securities Co Ltd A Reg 32,133.67 36,914.06 0.00 CNY 14,600 Chin No Rar Eart Hi-Tech Co Ltd A 21,093.14 22,728.63 0.00 CNY 17,400 China Fortune Land Dev Co Ltd A Reg 65,968.25 71,717.03 0.01 CNY 26,700 China Gezhouba Gr Co Ltd A Reg 22,826.21 25,614.09 0.00 CNY 87,200 China Grand Auto Ser Gr Co Ltd A Reg 41,534.12 40,824.91 0.00 CNY 15,600 China Intl Trav Serv Corp Ltd A Reg 192,401.41 199,279.07 0.02 CNY 36,500 China Merchants Shekou A 96,786.03 104,155.42 0.01 CNY 108,900 China Nation Chem Engin Co Ltd A Reg 95,502.37 100,717.49 0.01 CNY 12,100 China Res Sanj Med Phar Co Ltd A 49,380.22 55,050.55 0.00 CNY 434,200 China State Const Eng Corp Ltd A 313,865.55 350,442.90 0.03
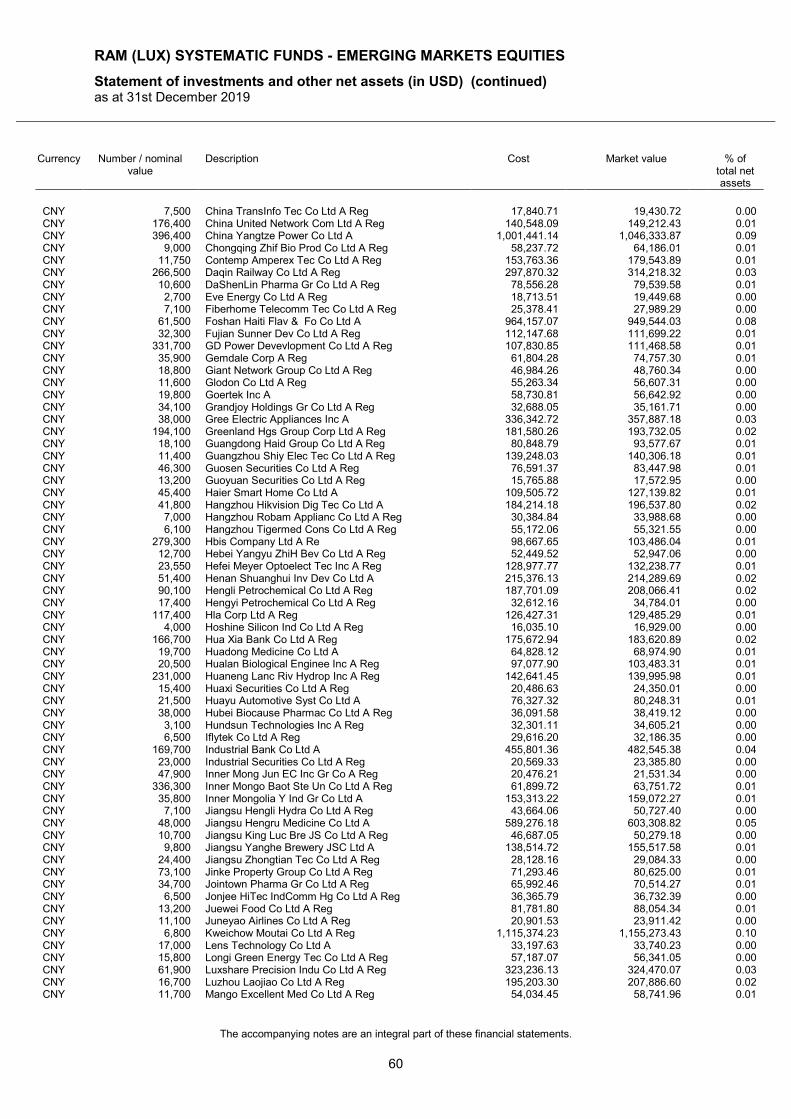
RAM (LUX) SYSTEMATIC FUNDS - EMERGING MARKETS EQUITIES
Statement of investments and other net assets (in USD) (continued) as at 31st December 2019
The accompanying notes are an integral part of these financial statements.
60
Currency Number / nominal value
Description Cost Market value % of total net assets
CNY 7,500 China TransInfo Tec Co Ltd A Reg 17,840.71 19,430.72 0.00 CNY 176,400 China United Network Com Ltd A Reg 140,548.09 149,212.43 0.01 CNY 396,400 China Yangtze Power Co Ltd A 1,001,441.14 1,046,333.87 0.09 CNY 9,000 Chongqing Zhif Bio Prod Co Ltd A Reg 58,237.72 64,186.01 0.01 CNY 11,750 Contemp Amperex Tec Co Ltd A Reg 153,763.36 179,543.89 0.01 CNY 266,500 Daqin Railway Co Ltd A Reg 297,870.32 314,218.32 0.03 CNY 10,600 DaShenLin Pharma Gr Co Ltd A Reg 78,556.28 79,539.58 0.01 CNY 2,700 Eve Energy Co Ltd A Reg 18,713.51 19,449.68 0.00 CNY 7,100 Fiberhome Telecomm Tec Co Ltd A Reg 25,378.41 27,989.29 0.00 CNY 61,500 Foshan Haiti Flav & Fo Co Ltd A 964,157.07 949,544.03 0.08 CNY 32,300 Fujian Sunner Dev Co Ltd A Reg 112,147.68 111,699.22 0.01 CNY 331,700 GD Power Devevlopment Co Ltd A Reg 107,830.85 111,468.58 0.01 CNY 35,900 Gemdale Corp A Reg 61,804.28 74,757.30 0.01 CNY 18,800 Giant Network Group Co Ltd A Reg 46,984.26 48,760.34 0.00 CNY 11,600 Glodon Co Ltd A Reg 55,263.34 56,607.31 0.00 CNY 19,800 Goertek Inc A 58,730.81 56,642.92 0.00 CNY 34,100 Grandjoy Holdings Gr Co Ltd A Reg 32,688.05 35,161.71 0.00 CNY 38,000 Gree Electric Appliances Inc A 336,342.72 357,887.18 0.03 CNY 194,100 Greenland Hgs Group Corp Ltd A Reg 181,580.26 193,732.05 0.02 CNY 18,100 Guangdong Haid Group Co Ltd A Reg 80,848.79 93,577.67 0.01 CNY 11,400 Guangzhou Shiy Elec Tec Co Ltd A Reg 139,248.03 140,306.18 0.01 CNY 46,300 Guosen Securities Co Ltd A Reg 76,591.37 83,447.98 0.01 CNY 13,200 Guoyuan Securities Co Ltd A Reg 15,765.88 17,572.95 0.00 CNY 45,400 Haier Smart Home Co Ltd A 109,505.72 127,139.82 0.01 CNY 41,800 Hangzhou Hikvision Dig Tec Co Ltd A 184,214.18 196,537.80 0.02 CNY 7,000 Hangzhou Robam Applianc Co Ltd A Reg 30,384.84 33,988.68 0.00 CNY 6,100 Hangzhou Tigermed Cons Co Ltd A Reg 55,172.06 55,321.55 0.00 CNY 279,300 Hbis Company Ltd A Re 98,667.65 103,486.04 0.01 CNY 12,700 Hebei Yangyu ZhiH Bev Co Ltd A Reg 52,449.52 52,947.06 0.00 CNY 23,550 Hefei Meyer Optoelect Tec Inc A Reg 128,977.77 132,238.77 0.01 CNY 51,400 Henan Shuanghui Inv Dev Co Ltd A 215,376.13 214,289.69 0.02 CNY 90,100 Hengli Petrochemical Co Ltd A Reg 187,701.09 208,066.41 0.02 CNY 17,400 Hengyi Petrochemical Co Ltd A Reg 32,612.16 34,784.01 0.00 CNY 117,400 Hla Corp Ltd A Reg 126,427.31 129,485.29 0.01 CNY 4,000 Hoshine Silicon Ind Co Ltd A Reg 16,035.10 16,929.00 0.00 CNY 166,700 Hua Xia Bank Co Ltd A Reg 175,672.94 183,620.89 0.02 CNY 19,700 Huadong Medicine Co Ltd A 64,828.12 68,974.90 0.01 CNY 20,500 Hualan Biological Enginee Inc A Reg 97,077.90 103,483.31 0.01 CNY 231,000 Huaneng Lanc Riv Hydrop Inc A Reg 142,641.45 139,995.98 0.01 CNY 15,400 Huaxi Securities Co Ltd A Reg 20,486.63 24,350.01 0.00 CNY 21,500 Huayu Automotive Syst Co Ltd A 76,327.32 80,248.31 0.01 CNY 38,000 Hubei Biocause Pharmac Co Ltd A Reg 36,091.58 38,419.12 0.00 CNY 3,100 Hundsun Technologies Inc A Reg 32,301.11 34,605.21 0.00 CNY 6,500 Iflytek Co Ltd A Reg 29,616.20 32,186.35 0.00 CNY 169,700 Industrial Bank Co Ltd A 455,801.36 482,545.38 0.04 CNY 23,000 Industrial Securities Co Ltd A Reg 20,569.33 23,385.80 0.00 CNY 47,900 Inner Mong Jun EC Inc Gr Co A Reg 20,476.21 21,531.34 0.00 CNY 336,300 Inner Mongo Baot Ste Un Co Ltd A Reg 61,899.72 63,751.72 0.01 CNY 35,800 Inner Mongolia Y Ind Gr Co Ltd A 153,313.22 159,072.27 0.01 CNY 7,100 Jiangsu Hengli Hydra Co Ltd A Reg 43,664.06 50,727.40 0.00 CNY 48,000 Jiangsu Hengru Medicine Co Ltd A 589,276.18 603,308.82 0.05 CNY 10,700 Jiangsu King Luc Bre JS Co Ltd A Reg 46,687.05 50,279.18 0.00 CNY 9,800 Jiangsu Yanghe Brewery JSC Ltd A 138,514.72 155,517.58 0.01 CNY 24,400 Jiangsu Zhongtian Tec Co Ltd A Reg 28,128.16 29,084.33 0.00 CNY 73,100 Jinke Property Group Co Ltd A Reg 71,293.46 80,625.00 0.01 CNY 34,700 Jointown Pharma Gr Co Ltd A Reg 65,992.46 70,514.27 0.01 CNY 6,500 Jonjee HiTec IndComm Hg Co Ltd A Reg 36,365.79 36,732.39 0.00 CNY 13,200 Juewei Food Co Ltd A Reg 81,781.80 88,054.34 0.01 CNY 11,100 Juneyao Airlines Co Ltd A Reg 20,901.53 23,911.42 0.00 CNY 6,800 Kweichow Moutai Co Ltd A Reg 1,115,374.23 1,155,273.43 0.10 CNY 17,000 Lens Technology Co Ltd A 33,197.63 33,740.23 0.00 CNY 15,800 Longi Green Energy Tec Co Ltd A Reg 57,187.07 56,341.05 0.00 CNY 61,900 Luxshare Precision Indu Co Ltd A Reg 323,236.13 324,470.07 0.03 CNY 16,700 Luzhou Laojiao Co Ltd A Reg 195,203.30 207,886.60 0.02 CNY 11,700 Mango Excellent Med Co Ltd A Reg 54,034.45 58,741.96 0.01
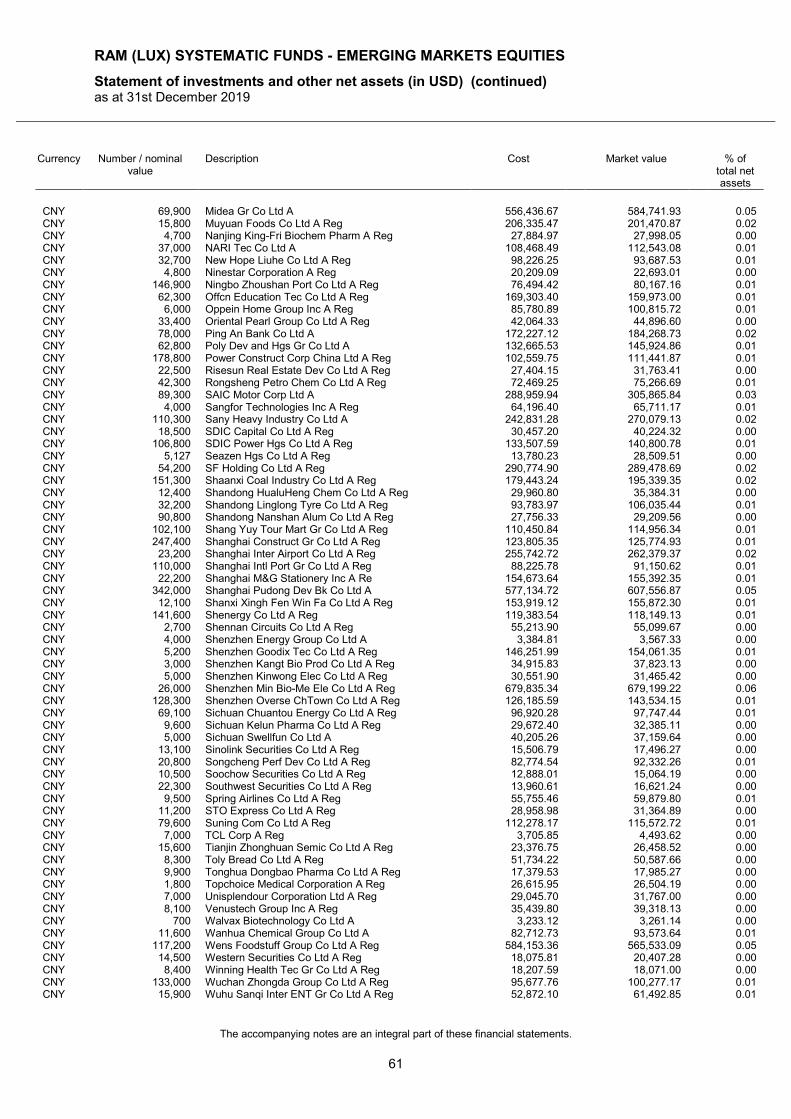
RAM (LUX) SYSTEMATIC FUNDS - EMERGING MARKETS EQUITIES
Statement of investments and other net assets (in USD) (continued) as at 31st December 2019
The accompanying notes are an integral part of these financial statements.
61
Currency Number / nominal value
Description Cost Market value % of total net assets
CNY 69,900 Midea Gr Co Ltd A 556,436.67 584,741.93 0.05 CNY 15,800 Muyuan Foods Co Ltd A Reg 206,335.47 201,470.87 0.02 CNY 4,700 Nanjing King-Fri Biochem Pharm A Reg 27,884.97 27,998.05 0.00 CNY 37,000 NARI Tec Co Ltd A 108,468.49 112,543.08 0.01 CNY 32,700 New Hope Liuhe Co Ltd A Reg 98,226.25 93,687.53 0.01 CNY 4,800 Ninestar Corporation A Reg 20,209.09 22,693.01 0.00 CNY 146,900 Ningbo Zhoushan Port Co Ltd A Reg 76,494.42 80,167.16 0.01 CNY 62,300 Offcn Education Tec Co Ltd A Reg 169,303.40 159,973.00 0.01 CNY 6,000 Oppein Home Group Inc A Reg 85,780.89 100,815.72 0.01 CNY 33,400 Oriental Pearl Group Co Ltd A Reg 42,064.33 44,896.60 0.00 CNY 78,000 Ping An Bank Co Ltd A 172,227.12 184,268.73 0.02 CNY 62,800 Poly Dev and Hgs Gr Co Ltd A 132,665.53 145,924.86 0.01 CNY 178,800 Power Construct Corp China Ltd A Reg 102,559.75 111,441.87 0.01 CNY 22,500 Risesun Real Estate Dev Co Ltd A Reg 27,404.15 31,763.41 0.00 CNY 42,300 Rongsheng Petro Chem Co Ltd A Reg 72,469.25 75,266.69 0.01 CNY 89,300 SAIC Motor Corp Ltd A 288,959.94 305,865.84 0.03 CNY 4,000 Sangfor Technologies Inc A Reg 64,196.40 65,711.17 0.01 CNY 110,300 Sany Heavy Industry Co Ltd A 242,831.28 270,079.13 0.02 CNY 18,500 SDIC Capital Co Ltd A Reg 30,457.20 40,224.32 0.00 CNY 106,800 SDIC Power Hgs Co Ltd A Reg 133,507.59 140,800.78 0.01 CNY 5,127 Seazen Hgs Co Ltd A Reg 13,780.23 28,509.51 0.00 CNY 54,200 SF Holding Co Ltd A Reg 290,774.90 289,478.69 0.02 CNY 151,300 Shaanxi Coal Industry Co Ltd A Reg 179,443.24 195,339.35 0.02 CNY 12,400 Shandong HualuHeng Chem Co Ltd A Reg 29,960.80 35,384.31 0.00 CNY 32,200 Shandong Linglong Tyre Co Ltd A Reg 93,783.97 106,035.44 0.01 CNY 90,800 Shandong Nanshan Alum Co Ltd A Reg 27,756.33 29,209.56 0.00 CNY 102,100 Shang Yuy Tour Mart Gr Co Ltd A Reg 110,450.84 114,956.34 0.01 CNY 247,400 Shanghai Construct Gr Co Ltd A Reg 123,805.35 125,774.93 0.01 CNY 23,200 Shanghai Inter Airport Co Ltd A Reg 255,742.72 262,379.37 0.02 CNY 110,000 Shanghai Intl Port Gr Co Ltd A Reg 88,225.78 91,150.62 0.01 CNY 22,200 Shanghai M&G Stationery Inc A Re 154,673.64 155,392.35 0.01 CNY 342,000 Shanghai Pudong Dev Bk Co Ltd A 577,134.72 607,556.87 0.05 CNY 12,100 Shanxi Xingh Fen Win Fa Co Ltd A Reg 153,919.12 155,872.30 0.01 CNY 141,600 Shenergy Co Ltd A Reg 119,383.54 118,149.13 0.01 CNY 2,700 Shennan Circuits Co Ltd A Reg 55,213.90 55,099.67 0.00 CNY 4,000 Shenzhen Energy Group Co Ltd A 3,384.81 3,567.33 0.00 CNY 5,200 Shenzhen Goodix Tec Co Ltd A Reg 146,251.99 154,061.35 0.01 CNY 3,000 Shenzhen Kangt Bio Prod Co Ltd A Reg 34,915.83 37,823.13 0.00 CNY 5,000 Shenzhen Kinwong Elec Co Ltd A Reg 30,551.90 31,465.42 0.00 CNY 26,000 Shenzhen Min Bio-Me Ele Co Ltd A Reg 679,835.34 679,199.22 0.06 CNY 128,300 Shenzhen Overse ChTown Co Ltd A Reg 126,185.59 143,534.15 0.01 CNY 69,100 Sichuan Chuantou Energy Co Ltd A Reg 96,920.28 97,747.44 0.01 CNY 9,600 Sichuan Kelun Pharma Co Ltd A Reg 29,672.40 32,385.11 0.00 CNY 5,000 Sichuan Swellfun Co Ltd A 40,205.26 37,159.64 0.00 CNY 13,100 Sinolink Securities Co Ltd A Reg 15,506.79 17,496.27 0.00 CNY 20,800 Songcheng Perf Dev Co Ltd A Reg 82,774.54 92,332.26 0.01 CNY 10,500 Soochow Securities Co Ltd A Reg 12,888.01 15,064.19 0.00 CNY 22,300 Southwest Securities Co Ltd A Reg 13,960.61 16,621.24 0.00 CNY 9,500 Spring Airlines Co Ltd A Reg 55,755.46 59,879.80 0.01 CNY 11,200 STO Express Co Ltd A Reg 28,958.98 31,364.89 0.00 CNY 79,600 Suning Com Co Ltd A Reg 112,278.17 115,572.72 0.01 CNY 7,000 TCL Corp A Reg 3,705.85 4,493.62 0.00 CNY 15,600 Tianjin Zhonghuan Semic Co Ltd A Reg 23,376.75 26,458.52 0.00 CNY 8,300 Toly Bread Co Ltd A Reg 51,734.22 50,587.66 0.00 CNY 9,900 Tonghua Dongbao Pharma Co Ltd A Reg 17,379.53 17,985.27 0.00 CNY 1,800 Topchoice Medical Corporation A Reg 26,615.95 26,504.19 0.00 CNY 7,000 Unisplendour Corporation Ltd A Reg 29,045.70 31,767.00 0.00 CNY 8,100 Venustech Group Inc A Reg 35,439.80 39,318.13 0.00 CNY 700 Walvax Biotechnology Co Ltd A 3,233.12 3,261.14 0.00 CNY 11,600 Wanhua Chemical Group Co Ltd A 82,712.73 93,573.64 0.01 CNY 117,200 Wens Foodstuff Group Co Ltd A Reg 584,153.36 565,533.09 0.05 CNY 14,500 Western Securities Co Ltd A Reg 18,075.81 20,407.28 0.00 CNY 8,400 Winning Health Tec Gr Co Ltd A Reg 18,207.59 18,071.00 0.00 CNY 133,000 Wuchan Zhongda Group Co Ltd A Reg 95,677.76 100,277.17 0.01 CNY 15,900 Wuhu Sanqi Inter ENT Gr Co Ltd A Reg 52,872.10 61,492.85 0.01
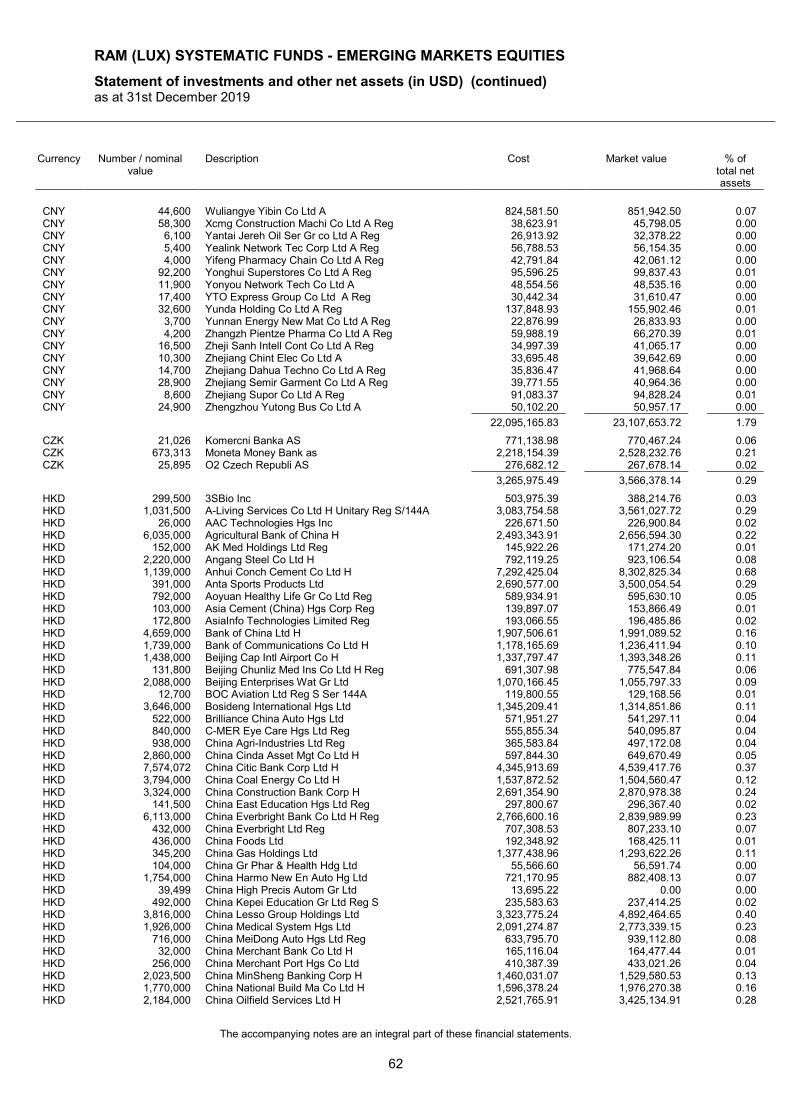
RAM (LUX) SYSTEMATIC FUNDS - EMERGING MARKETS EQUITIES
Statement of investments and other net assets (in USD) (continued) as at 31st December 2019
The accompanying notes are an integral part of these financial statements.
62
Currency Number / nominal value
Description Cost Market value % of total net assets
CNY 44,600 Wuliangye Yibin Co Ltd A 824,581.50 851,942.50 0.07 CNY 58,300 Xcmg Construction Machi Co Ltd A Reg 38,623.91 45,798.05 0.00 CNY 6,100 Yantai Jereh Oil Ser Gr co Ltd A Reg 26,913.92 32,378.22 0.00 CNY 5,400 Yealink Network Tec Corp Ltd A Reg 56,788.53 56,154.35 0.00 CNY 4,000 Yifeng Pharmacy Chain Co Ltd A Reg 42,791.84 42,061.12 0.00 CNY 92,200 Yonghui Superstores Co Ltd A Reg 95,596.25 99,837.43 0.01 CNY 11,900 Yonyou Network Tech Co Ltd A 48,554.56 48,535.16 0.00 CNY 17,400 YTO Express Group Co Ltd A Reg 30,442.34 31,610.47 0.00 CNY 32,600 Yunda Holding Co Ltd A Reg 137,848.93 155,902.46 0.01 CNY 3,700 Yunnan Energy New Mat Co Ltd A Reg 22,876.99 26,833.93 0.00 CNY 4,200 Zhangzh Pientze Pharma Co Ltd A Reg 59,988.19 66,270.39 0.01 CNY 16,500 Zheji Sanh Intell Cont Co Ltd A Reg 34,997.39 41,065.17 0.00 CNY 10,300 Zhejiang Chint Elec Co Ltd A 33,695.48 39,642.69 0.00 CNY 14,700 Zhejiang Dahua Techno Co Ltd A Reg 35,836.47 41,968.64 0.00 CNY 28,900 Zhejiang Semir Garment Co Ltd A Reg 39,771.55 40,964.36 0.00 CNY 8,600 Zhejiang Supor Co Ltd A Reg 91,083.37 94,828.24 0.01 CNY 24,900 Zhengzhou Yutong Bus Co Ltd A 50,102.20 50,957.17 0.00
22,095,165.83 23,107,653.72 1.79
CZK 21,026 Komercni Banka AS 771,138.98 770,467.24 0.06 CZK 673,313 Moneta Money Bank as 2,218,154.39 2,528,232.76 0.21 CZK 25,895 O2 Czech Republi AS 276,682.12 267,678.14 0.02
3,265,975.49 3,566,378.14 0.29
HKD 299,500 3SBio Inc 503,975.39 388,214.76 0.03 HKD 1,031,500 A-Living Services Co Ltd H Unitary Reg S/144A 3,083,754.58 3,561,027.72 0.29 HKD 26,000 AAC Technologies Hgs Inc 226,671.50 226,900.84 0.02 HKD 6,035,000 Agricultural Bank of China H 2,493,343.91 2,656,594.30 0.22 HKD 152,000 AK Med Holdings Ltd Reg 145,922.26 171,274.20 0.01 HKD 2,220,000 Angang Steel Co Ltd H 792,119.25 923,106.54 0.08 HKD 1,139,000 Anhui Conch Cement Co Ltd H 7,292,425.04 8,302,825.34 0.68 HKD 391,000 Anta Sports Products Ltd 2,690,577.00 3,500,054.54 0.29 HKD 792,000 Aoyuan Healthy Life Gr Co Ltd Reg 589,934.91 595,630.10 0.05 HKD 103,000 Asia Cement (China) Hgs Corp Reg 139,897.07 153,866.49 0.01 HKD 172,800 AsiaInfo Technologies Limited Reg 193,066.55 196,485.86 0.02 HKD 4,659,000 Bank of China Ltd H 1,907,506.61 1,991,089.52 0.16 HKD 1,739,000 Bank of Communications Co Ltd H 1,178,165.69 1,236,411.94 0.10 HKD 1,438,000 Beijing Cap Intl Airport Co H 1,337,797.47 1,393,348.26 0.11 HKD 131,800 Beijing Chunliz Med Ins Co Ltd H Reg 691,307.98 775,547.84 0.06 HKD 2,088,000 Beijing Enterprises Wat Gr Ltd 1,070,166.45 1,055,797.33 0.09 HKD 12,700 BOC Aviation Ltd Reg S Ser 144A 119,800.55 129,168.56 0.01 HKD 3,646,000 Bosideng International Hgs Ltd 1,345,209.41 1,314,851.86 0.11 HKD 522,000 Brilliance China Auto Hgs Ltd 571,951.27 541,297.11 0.04 HKD 840,000 C-MER Eye Care Hgs Ltd Reg 555,855.34 540,095.87 0.04 HKD 938,000 China Agri-Industries Ltd Reg 365,583.84 497,172.08 0.04 HKD 2,860,000 China Cinda Asset Mgt Co Ltd H 597,844.30 649,670.49 0.05 HKD 7,574,072 China Citic Bank Corp Ltd H 4,345,913.69 4,539,417.76 0.37 HKD 3,794,000 China Coal Energy Co Ltd H 1,537,872.52 1,504,560.47 0.12 HKD 3,324,000 China Construction Bank Corp H 2,691,354.90 2,870,978.38 0.24 HKD 141,500 China East Education Hgs Ltd Reg 297,800.67 296,367.40 0.02 HKD 6,113,000 China Everbright Bank Co Ltd H Reg 2,766,600.16 2,839,989.99 0.23 HKD 432,000 China Everbright Ltd Reg 707,308.53 807,233.10 0.07 HKD 436,000 China Foods Ltd 192,348.92 168,425.11 0.01 HKD 345,200 China Gas Holdings Ltd 1,377,438.96 1,293,622.26 0.11 HKD 104,000 China Gr Phar & Health Hdg Ltd 55,566.60 56,591.74 0.00 HKD 1,754,000 China Harmo New En Auto Hg Ltd 721,170.95 882,408.13 0.07 HKD 39,499 China High Precis Autom Gr Ltd 13,695.22 0.00 0.00 HKD 492,000 China Kepei Education Gr Ltd Reg S 235,583.63 237,414.25 0.02 HKD 3,816,000 China Lesso Group Holdings Ltd 3,323,775.24 4,892,464.65 0.40 HKD 1,926,000 China Medical System Hgs Ltd 2,091,274.87 2,773,339.15 0.23 HKD 716,000 China MeiDong Auto Hgs Ltd Reg 633,795.70 939,112.80 0.08 HKD 32,000 China Merchant Bank Co Ltd H 165,116.04 164,477.44 0.01 HKD 256,000 China Merchant Port Hgs Co Ltd 410,387.39 433,021.26 0.04 HKD 2,023,500 China MinSheng Banking Corp H 1,460,031.07 1,529,580.53 0.13 HKD 1,770,000 China National Build Ma Co Ltd H 1,596,378.24 1,976,270.38 0.16 HKD 2,184,000 China Oilfield Services Ltd H 2,521,765.91 3,425,134.91 0.28
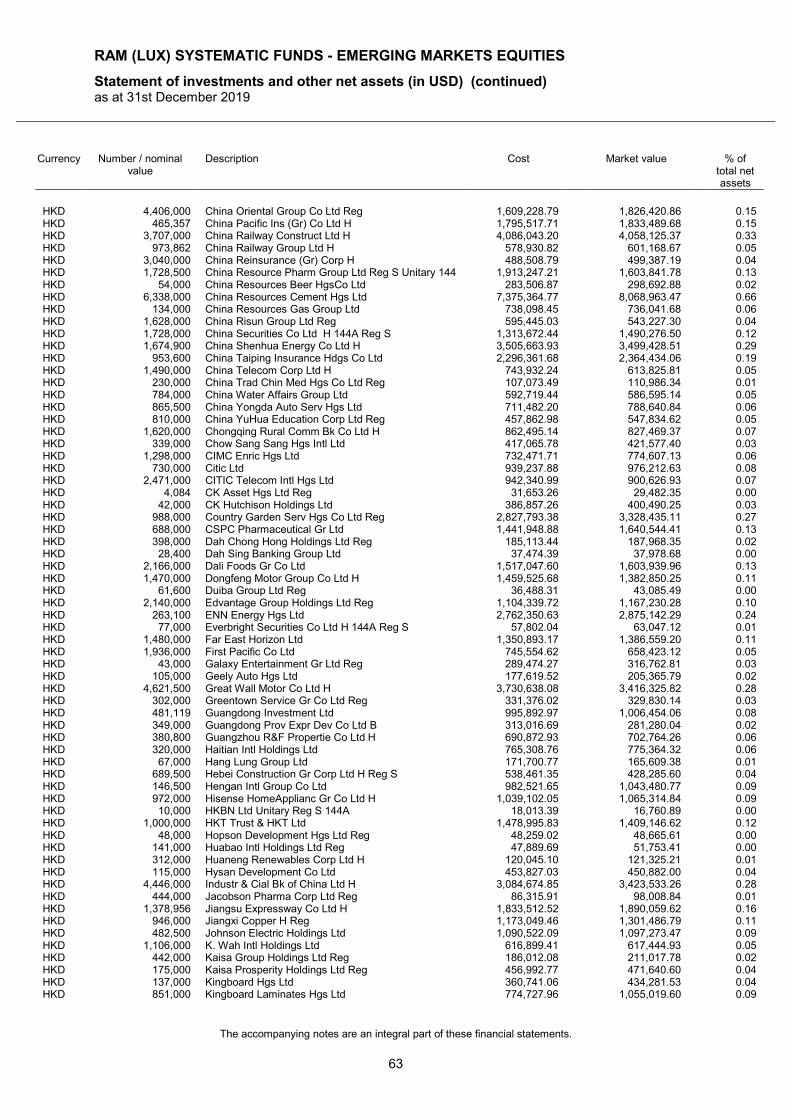
RAM (LUX) SYSTEMATIC FUNDS - EMERGING MARKETS EQUITIES
Statement of investments and other net assets (in USD) (continued) as at 31st December 2019
The accompanying notes are an integral part of these financial statements.
63
Currency Number / nominal value
Description Cost Market value % of total net assets
HKD 4,406,000 China Oriental Group Co Ltd Reg 1,609,228.79 1,826,420.86 0.15 HKD 465,357 China Pacific Ins (Gr) Co Ltd H 1,795,517.71 1,833,489.68 0.15 HKD 3,707,000 China Railway Construct Ltd H 4,086,043.20 4,058,125.37 0.33 HKD 973,862 China Railway Group Ltd H 578,930.82 601,168.67 0.05 HKD 3,040,000 China Reinsurance (Gr) Corp H 488,508.79 499,387.19 0.04 HKD 1,728,500 China Resource Pharm Group Ltd Reg S Unitary 144 1,913,247.21 1,603,841.78 0.13 HKD 54,000 China Resources Beer HgsCo Ltd 283,506.87 298,692.88 0.02 HKD 6,338,000 China Resources Cement Hgs Ltd 7,375,364.77 8,068,963.47 0.66 HKD 134,000 China Resources Gas Group Ltd 738,098.45 736,041.68 0.06 HKD 1,628,000 China Risun Group Ltd Reg 595,445.03 543,227.30 0.04 HKD 1,728,000 China Securities Co Ltd H 144A Reg S 1,313,672.44 1,490,276.50 0.12 HKD 1,674,900 China Shenhua Energy Co Ltd H 3,505,663.93 3,499,428.51 0.29 HKD 953,600 China Taiping Insurance Hdgs Co Ltd 2,296,361.68 2,364,434.06 0.19 HKD 1,490,000 China Telecom Corp Ltd H 743,932.24 613,825.81 0.05 HKD 230,000 China Trad Chin Med Hgs Co Ltd Reg 107,073.49 110,986.34 0.01 HKD 784,000 China Water Affairs Group Ltd 592,719.44 586,595.14 0.05 HKD 865,500 China Yongda Auto Serv Hgs Ltd 711,482.20 788,640.84 0.06 HKD 810,000 China YuHua Education Corp Ltd Reg 457,862.98 547,834.62 0.05 HKD 1,620,000 Chongqing Rural Comm Bk Co Ltd H 862,495.14 827,469.37 0.07 HKD 339,000 Chow Sang Sang Hgs Intl Ltd 417,065.78 421,577.40 0.03 HKD 1,298,000 CIMC Enric Hgs Ltd 732,471.71 774,607.13 0.06 HKD 730,000 Citic Ltd 939,237.88 976,212.63 0.08 HKD 2,471,000 CITIC Telecom Intl Hgs Ltd 942,340.99 900,626.93 0.07 HKD 4,084 CK Asset Hgs Ltd Reg 31,653.26 29,482.35 0.00 HKD 42,000 CK Hutchison Holdings Ltd 386,857.26 400,490.25 0.03 HKD 988,000 Country Garden Serv Hgs Co Ltd Reg 2,827,793.38 3,328,435.11 0.27 HKD 688,000 CSPC Pharmaceutical Gr Ltd 1,441,948.88 1,640,544.41 0.13 HKD 398,000 Dah Chong Hong Holdings Ltd Reg 185,113.44 187,968.35 0.02 HKD 28,400 Dah Sing Banking Group Ltd 37,474.39 37,978.68 0.00 HKD 2,166,000 Dali Foods Gr Co Ltd 1,517,047.60 1,603,939.96 0.13 HKD 1,470,000 Dongfeng Motor Group Co Ltd H 1,459,525.68 1,382,850.25 0.11 HKD 61,600 Duiba Group Ltd Reg 36,488.31 43,085.49 0.00 HKD 2,140,000 Edvantage Group Holdings Ltd Reg 1,104,339.72 1,167,230.28 0.10 HKD 263,100 ENN Energy Hgs Ltd 2,762,350.63 2,875,142.29 0.24 HKD 77,000 Everbright Securities Co Ltd H 144A Reg S 57,802.04 63,047.12 0.01 HKD 1,480,000 Far East Horizon Ltd 1,350,893.17 1,386,559.20 0.11 HKD 1,936,000 First Pacific Co Ltd 745,554.62 658,423.12 0.05 HKD 43,000 Galaxy Entertainment Gr Ltd Reg 289,474.27 316,762.81 0.03 HKD 105,000 Geely Auto Hgs Ltd 177,619.52 205,365.79 0.02 HKD 4,621,500 Great Wall Motor Co Ltd H 3,730,638.08 3,416,325.82 0.28 HKD 302,000 Greentown Service Gr Co Ltd Reg 331,376.02 329,830.14 0.03 HKD 481,119 Guangdong Investment Ltd 995,892.97 1,006,454.06 0.08 HKD 349,000 Guangdong Prov Expr Dev Co Ltd B 313,016.69 281,280.04 0.02 HKD 380,800 Guangzhou R&F Propertie Co Ltd H 690,872.93 702,764.26 0.06 HKD 320,000 Haitian Intl Holdings Ltd 765,308.76 775,364.32 0.06 HKD 67,000 Hang Lung Group Ltd 171,700.77 165,609.38 0.01 HKD 689,500 Hebei Construction Gr Corp Ltd H Reg S 538,461.35 428,285.60 0.04 HKD 146,500 Hengan Intl Group Co Ltd 982,521.65 1,043,480.77 0.09 HKD 972,000 Hisense HomeApplianc Gr Co Ltd H 1,039,102.05 1,065,314.84 0.09 HKD 10,000 HKBN Ltd Unitary Reg S 144A 18,013.39 16,760.89 0.00 HKD 1,000,000 HKT Trust & HKT Ltd 1,478,995.83 1,409,146.62 0.12 HKD 48,000 Hopson Development Hgs Ltd Reg 48,259.02 48,665.61 0.00 HKD 141,000 Huabao Intl Holdings Ltd Reg 47,889.69 51,753.41 0.00 HKD 312,000 Huaneng Renewables Corp Ltd H 120,045.10 121,325.21 0.01 HKD 115,000 Hysan Development Co Ltd 453,827.03 450,882.00 0.04 HKD 4,446,000 Industr & Cial Bk of China Ltd H 3,084,674.85 3,423,533.26 0.28 HKD 444,000 Jacobson Pharma Corp Ltd Reg 86,315.91 98,008.84 0.01 HKD 1,378,956 Jiangsu Expressway Co Ltd H 1,833,512.52 1,890,059.62 0.16 HKD 946,000 Jiangxi Copper H Reg 1,173,049.46 1,301,486.79 0.11 HKD 482,500 Johnson Electric Holdings Ltd 1,090,522.09 1,097,273.47 0.09 HKD 1,106,000 K. Wah Intl Holdings Ltd 616,899.41 617,444.93 0.05 HKD 442,000 Kaisa Group Holdings Ltd Reg 186,012.08 211,017.78 0.02 HKD 175,000 Kaisa Prosperity Holdings Ltd Reg 456,992.77 471,640.60 0.04 HKD 137,000 Kingboard Hgs Ltd 360,741.06 434,281.53 0.04 HKD 851,000 Kingboard Laminates Hgs Ltd 774,727.96 1,055,019.60 0.09
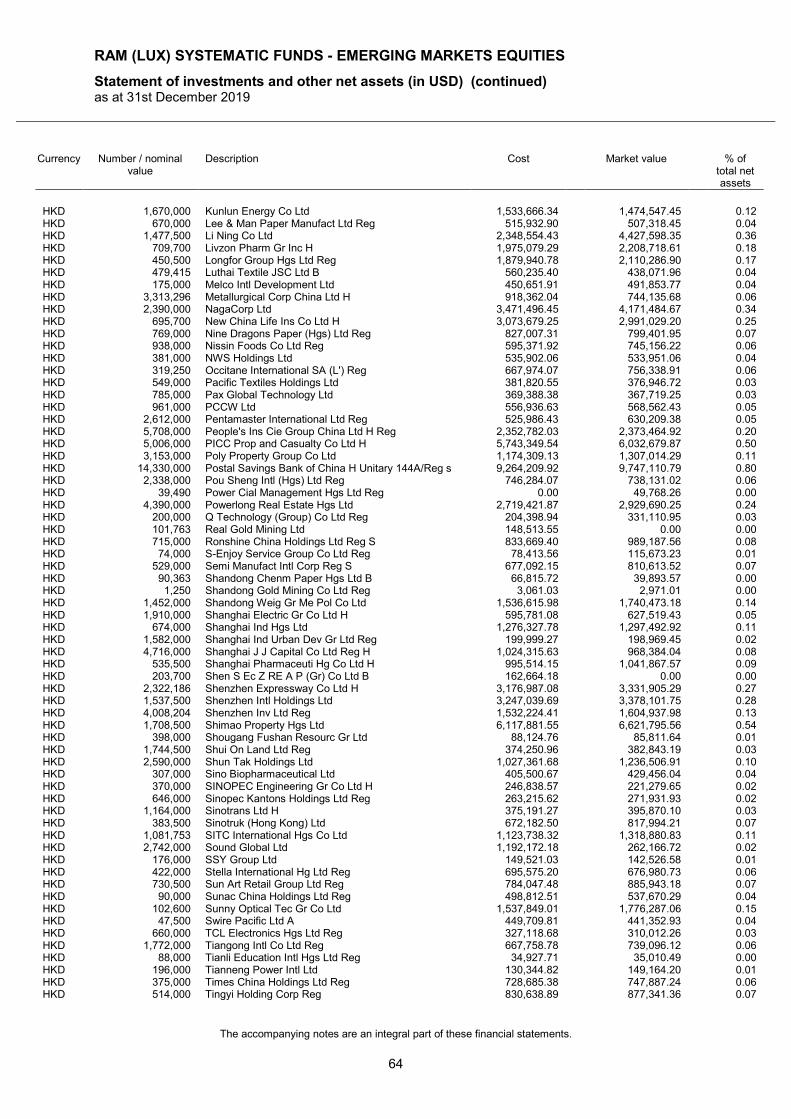
RAM (LUX) SYSTEMATIC FUNDS - EMERGING MARKETS EQUITIES
Statement of investments and other net assets (in USD) (continued) as at 31st December 2019
The accompanying notes are an integral part of these financial statements.
64
Currency Number / nominal value
Description Cost Market value % of total net assets
HKD 1,670,000 Kunlun Energy Co Ltd 1,533,666.34 1,474,547.45 0.12 HKD 670,000 Lee & Man Paper Manufact Ltd Reg 515,932.90 507,318.45 0.04 HKD 1,477,500 Li Ning Co Ltd 2,348,554.43 4,427,598.35 0.36 HKD 709,700 Livzon Pharm Gr Inc H 1,975,079.29 2,208,718.61 0.18 HKD 450,500 Longfor Group Hgs Ltd Reg 1,879,940.78 2,110,286.90 0.17 HKD 479,415 Luthai Textile JSC Ltd B 560,235.40 438,071.96 0.04 HKD 175,000 Melco Intl Development Ltd 450,651.91 491,853.77 0.04 HKD 3,313,296 Metallurgical Corp China Ltd H 918,362.04 744,135.68 0.06 HKD 2,390,000 NagaCorp Ltd 3,471,496.45 4,171,484.67 0.34 HKD 695,700 New China Life Ins Co Ltd H 3,073,679.25 2,991,029.20 0.25 HKD 769,000 Nine Dragons Paper (Hgs) Ltd Reg 827,007.31 799,401.95 0.07 HKD 938,000 Nissin Foods Co Ltd Reg 595,371.92 745,156.22 0.06 HKD 381,000 NWS Holdings Ltd 535,902.06 533,951.06 0.04 HKD 319,250 Occitane International SA (L') Reg 667,974.07 756,338.91 0.06 HKD 549,000 Pacific Textiles Holdings Ltd 381,820.55 376,946.72 0.03 HKD 785,000 Pax Global Technology Ltd 369,388.38 367,719.25 0.03 HKD 961,000 PCCW Ltd 556,936.63 568,562.43 0.05 HKD 2,612,000 Pentamaster International Ltd Reg 525,986.43 630,209.38 0.05 HKD 5,708,000 People's Ins Cie Group China Ltd H Reg 2,352,782.03 2,373,464.92 0.20 HKD 5,006,000 PICC Prop and Casualty Co Ltd H 5,743,349.54 6,032,679.87 0.50 HKD 3,153,000 Poly Property Group Co Ltd 1,174,309.13 1,307,014.29 0.11 HKD 14,330,000 Postal Savings Bank of China H Unitary 144A/Reg s 9,264,209.92 9,747,110.79 0.80 HKD 2,338,000 Pou Sheng Intl (Hgs) Ltd Reg 746,284.07 738,131.02 0.06 HKD 39,490 Power Cial Management Hgs Ltd Reg 0.00 49,768.26 0.00 HKD 4,390,000 Powerlong Real Estate Hgs Ltd 2,719,421.87 2,929,690.25 0.24 HKD 200,000 Q Technology (Group) Co Ltd Reg 204,398.94 331,110.95 0.03 HKD 101,763 Real Gold Mining Ltd 148,513.55 0.00 0.00 HKD 715,000 Ronshine China Holdings Ltd Reg S 833,669.40 989,187.56 0.08 HKD 74,000 S-Enjoy Service Group Co Ltd Reg 78,413.56 115,673.23 0.01 HKD 529,000 Semi Manufact Intl Corp Reg S 677,092.15 810,613.52 0.07 HKD 90,363 Shandong Chenm Paper Hgs Ltd B 66,815.72 39,893.57 0.00 HKD 1,250 Shandong Gold Mining Co Ltd Reg 3,061.03 2,971.01 0.00 HKD 1,452,000 Shandong Weig Gr Me Pol Co Ltd 1,536,615.98 1,740,473.18 0.14 HKD 1,910,000 Shanghai Electric Gr Co Ltd H 595,781.08 627,519.43 0.05 HKD 674,000 Shanghai Ind Hgs Ltd 1,276,327.78 1,297,492.92 0.11 HKD 1,582,000 Shanghai Ind Urban Dev Gr Ltd Reg 199,999.27 198,969.45 0.02 HKD 4,716,000 Shanghai J J Capital Co Ltd Reg H 1,024,315.63 968,384.04 0.08 HKD 535,500 Shanghai Pharmaceuti Hg Co Ltd H 995,514.15 1,041,867.57 0.09 HKD 203,700 Shen S Ec Z RE A P (Gr) Co Ltd B 162,664.18 0.00 0.00 HKD 2,322,186 Shenzhen Expressway Co Ltd H 3,176,987.08 3,331,905.29 0.27 HKD 1,537,500 Shenzhen Intl Holdings Ltd 3,247,039.69 3,378,101.75 0.28 HKD 4,008,204 Shenzhen Inv Ltd Reg 1,532,224.41 1,604,937.98 0.13 HKD 1,708,500 Shimao Property Hgs Ltd 6,117,881.55 6,621,795.56 0.54 HKD 398,000 Shougang Fushan Resourc Gr Ltd 88,124.76 85,811.64 0.01 HKD 1,744,500 Shui On Land Ltd Reg 374,250.96 382,843.19 0.03 HKD 2,590,000 Shun Tak Holdings Ltd 1,027,361.68 1,236,506.91 0.10 HKD 307,000 Sino Biopharmaceutical Ltd 405,500.67 429,456.04 0.04 HKD 370,000 SINOPEC Engineering Gr Co Ltd H 246,838.57 221,279.65 0.02 HKD 646,000 Sinopec Kantons Holdings Ltd Reg 263,215.62 271,931.93 0.02 HKD 1,164,000 Sinotrans Ltd H 375,191.27 395,870.10 0.03 HKD 383,500 Sinotruk (Hong Kong) Ltd 672,182.50 817,994.21 0.07 HKD 1,081,753 SITC International Hgs Co Ltd 1,123,738.32 1,318,880.83 0.11 HKD 2,742,000 Sound Global Ltd 1,192,172.18 262,166.72 0.02 HKD 176,000 SSY Group Ltd 149,521.03 142,526.58 0.01 HKD 422,000 Stella International Hg Ltd Reg 695,575.20 676,980.73 0.06 HKD 730,500 Sun Art Retail Group Ltd Reg 784,047.48 885,943.18 0.07 HKD 90,000 Sunac China Holdings Ltd Reg 498,812.51 537,670.29 0.04 HKD 102,600 Sunny Optical Tec Gr Co Ltd 1,537,849.01 1,776,287.06 0.15 HKD 47,500 Swire Pacific Ltd A 449,709.81 441,352.93 0.04 HKD 660,000 TCL Electronics Hgs Ltd Reg 327,118.68 310,012.26 0.03 HKD 1,772,000 Tiangong Intl Co Ltd Reg 667,758.78 739,096.12 0.06 HKD 88,000 Tianli Education Intl Hgs Ltd Reg 34,927.71 35,010.49 0.00 HKD 196,000 Tianneng Power Intl Ltd 130,344.82 149,164.20 0.01 HKD 375,000 Times China Holdings Ltd Reg 728,685.38 747,887.24 0.06 HKD 514,000 Tingyi Holding Corp Reg 830,638.89 877,341.36 0.07
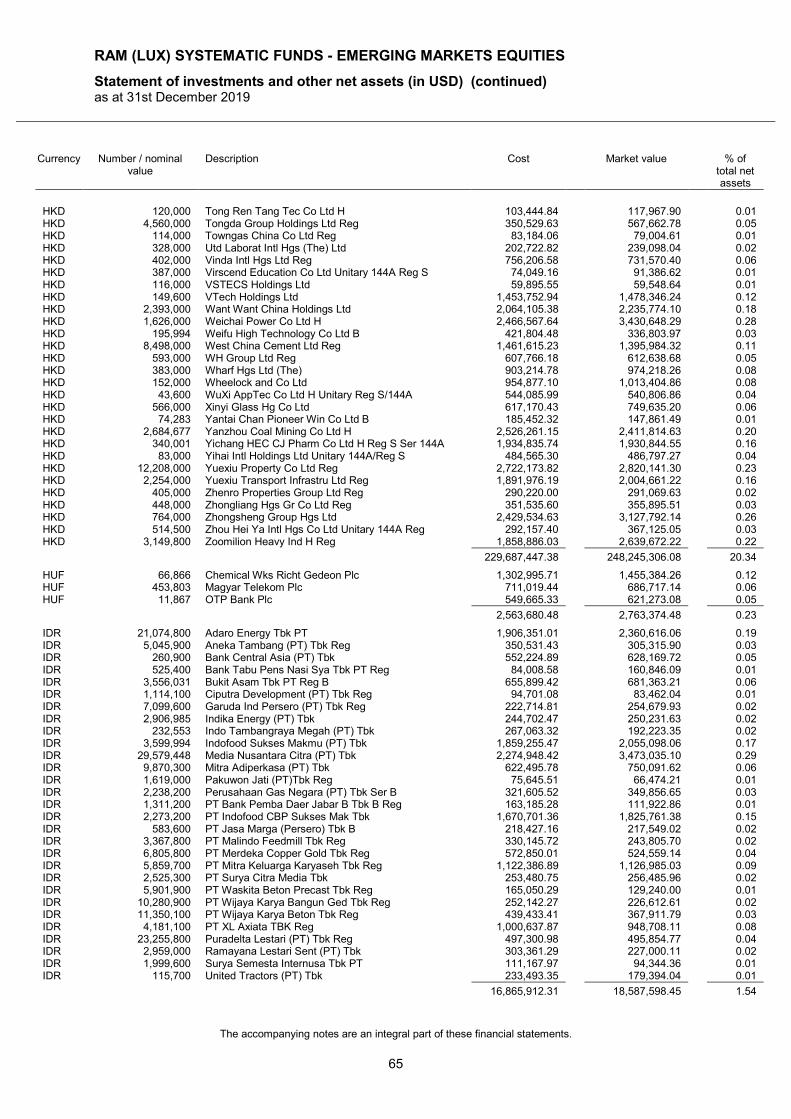
RAM (LUX) SYSTEMATIC FUNDS - EMERGING MARKETS EQUITIES
Statement of investments and other net assets (in USD) (continued) as at 31st December 2019
The accompanying notes are an integral part of these financial statements.
65
Currency Number / nominal value
Description Cost Market value % of total net assets
HKD 120,000 Tong Ren Tang Tec Co Ltd H 103,444.84 117,967.90 0.01 HKD 4,560,000 Tongda Group Holdings Ltd Reg 350,529.63 567,662.78 0.05 HKD 114,000 Towngas China Co Ltd Reg 83,184.06 79,004.61 0.01 HKD 328,000 Utd Laborat Intl Hgs (The) Ltd 202,722.82 239,098.04 0.02 HKD 402,000 Vinda Intl Hgs Ltd Reg 756,206.58 731,570.40 0.06 HKD 387,000 Virscend Education Co Ltd Unitary 144A Reg S 74,049.16 91,386.62 0.01 HKD 116,000 VSTECS Holdings Ltd 59,895.55 59,548.64 0.01 HKD 149,600 VTech Holdings Ltd 1,453,752.94 1,478,346.24 0.12 HKD 2,393,000 Want Want China Holdings Ltd 2,064,105.38 2,235,774.10 0.18 HKD 1,626,000 Weichai Power Co Ltd H 2,466,567.64 3,430,648.29 0.28 HKD 195,994 Weifu High Technology Co Ltd B 421,804.48 336,803.97 0.03 HKD 8,498,000 West China Cement Ltd Reg 1,461,615.23 1,395,984.32 0.11 HKD 593,000 WH Group Ltd Reg 607,766.18 612,638.68 0.05 HKD 383,000 Wharf Hgs Ltd (The) 903,214.78 974,218.26 0.08 HKD 152,000 Wheelock and Co Ltd 954,877.10 1,013,404.86 0.08 HKD 43,600 WuXi AppTec Co Ltd H Unitary Reg S/144A 544,085.99 540,806.86 0.04 HKD 566,000 Xinyi Glass Hg Co Ltd 617,170.43 749,635.20 0.06 HKD 74,283 Yantai Chan Pioneer Win Co Ltd B 185,452.32 147,861.49 0.01 HKD 2,684,677 Yanzhou Coal Mining Co Ltd H 2,526,261.15 2,411,814.63 0.20 HKD 340,001 Yichang HEC CJ Pharm Co Ltd H Reg S Ser 144A 1,934,835.74 1,930,844.55 0.16 HKD 83,000 Yihai Intl Holdings Ltd Unitary 144A/Reg S 484,565.30 486,797.27 0.04 HKD 12,208,000 Yuexiu Property Co Ltd Reg 2,722,173.82 2,820,141.30 0.23 HKD 2,254,000 Yuexiu Transport Infrastru Ltd Reg 1,891,976.19 2,004,661.22 0.16 HKD 405,000 Zhenro Properties Group Ltd Reg 290,220.00 291,069.63 0.02 HKD 448,000 Zhongliang Hgs Gr Co Ltd Reg 351,535.60 355,895.51 0.03 HKD 764,000 Zhongsheng Group Hgs Ltd 2,429,534.63 3,127,792.14 0.26 HKD 514,500 Zhou Hei Ya Intl Hgs Co Ltd Unitary 144A Reg 292,157.40 367,125.05 0.03 HKD 3,149,800 Zoomilion Heavy Ind H Reg 1,858,886.03 2,639,672.22 0.22
229,687,447.38 248,245,306.08 20.34
HUF 66,866 Chemical Wks Richt Gedeon Plc 1,302,995.71 1,455,384.26 0.12 HUF 453,803 Magyar Telekom Plc 711,019.44 686,717.14 0.06 HUF 11,867 OTP Bank Plc 549,665.33 621,273.08 0.05
2,563,680.48 2,763,374.48 0.23
IDR 21,074,800 Adaro Energy Tbk PT 1,906,351.01 2,360,616.06 0.19 IDR 5,045,900 Aneka Tambang (PT) Tbk Reg 350,531.43 305,315.90 0.03 IDR 260,900 Bank Central Asia (PT) Tbk 552,224.89 628,169.72 0.05 IDR 525,400 Bank Tabu Pens Nasi Sya Tbk PT Reg 84,008.58 160,846.09 0.01 IDR 3,556,031 Bukit Asam Tbk PT Reg B 655,899.42 681,363.21 0.06 IDR 1,114,100 Ciputra Development (PT) Tbk Reg 94,701.08 83,462.04 0.01 IDR 7,099,600 Garuda Ind Persero (PT) Tbk Reg 222,714.81 254,679.93 0.02 IDR 2,906,985 Indika Energy (PT) Tbk 244,702.47 250,231.63 0.02 IDR 232,553 Indo Tambangraya Megah (PT) Tbk 267,063.32 192,223.35 0.02 IDR 3,599,994 Indofood Sukses Makmu (PT) Tbk 1,859,255.47 2,055,098.06 0.17 IDR 29,579,448 Media Nusantara Citra (PT) Tbk 2,274,948.42 3,473,035.10 0.29 IDR 9,870,300 Mitra Adiperkasa (PT) Tbk 622,495.78 750,091.62 0.06 IDR 1,619,000 Pakuwon Jati (PT)Tbk Reg 75,645.51 66,474.21 0.01 IDR 2,238,200 Perusahaan Gas Negara (PT) Tbk Ser B 321,605.52 349,856.65 0.03 IDR 1,311,200 PT Bank Pemba Daer Jabar B Tbk B Reg 163,185.28 111,922.86 0.01 IDR 2,273,200 PT Indofood CBP Sukses Mak Tbk 1,670,701.36 1,825,761.38 0.15 IDR 583,600 PT Jasa Marga (Persero) Tbk B 218,427.16 217,549.02 0.02 IDR 3,367,800 PT Malindo Feedmill Tbk Reg 330,145.72 243,805.70 0.02 IDR 6,805,800 PT Merdeka Copper Gold Tbk Reg 572,850.01 524,559.14 0.04 IDR 5,859,700 PT Mitra Keluarga Karyaseh Tbk Reg 1,122,386.89 1,126,985.03 0.09 IDR 2,525,300 PT Surya Citra Media Tbk 253,480.75 256,485.96 0.02 IDR 5,901,900 PT Waskita Beton Precast Tbk Reg 165,050.29 129,240.00 0.01 IDR 10,280,900 PT Wijaya Karya Bangun Ged Tbk Reg 252,142.27 226,612.61 0.02 IDR 11,350,100 PT Wijaya Karya Beton Tbk Reg 439,433.41 367,911.79 0.03 IDR 4,181,100 PT XL Axiata TBK Reg 1,000,637.87 948,708.11 0.08 IDR 23,255,800 Puradelta Lestari (PT) Tbk Reg 497,300.98 495,854.77 0.04 IDR 2,959,000 Ramayana Lestari Sent (PT) Tbk 303,361.29 227,000.11 0.02 IDR 1,999,600 Surya Semesta Internusa Tbk PT 111,167.97 94,344.36 0.01 IDR 115,700 United Tractors (PT) Tbk 233,493.35 179,394.04 0.01
16,865,912.31 18,587,598.45 1.54
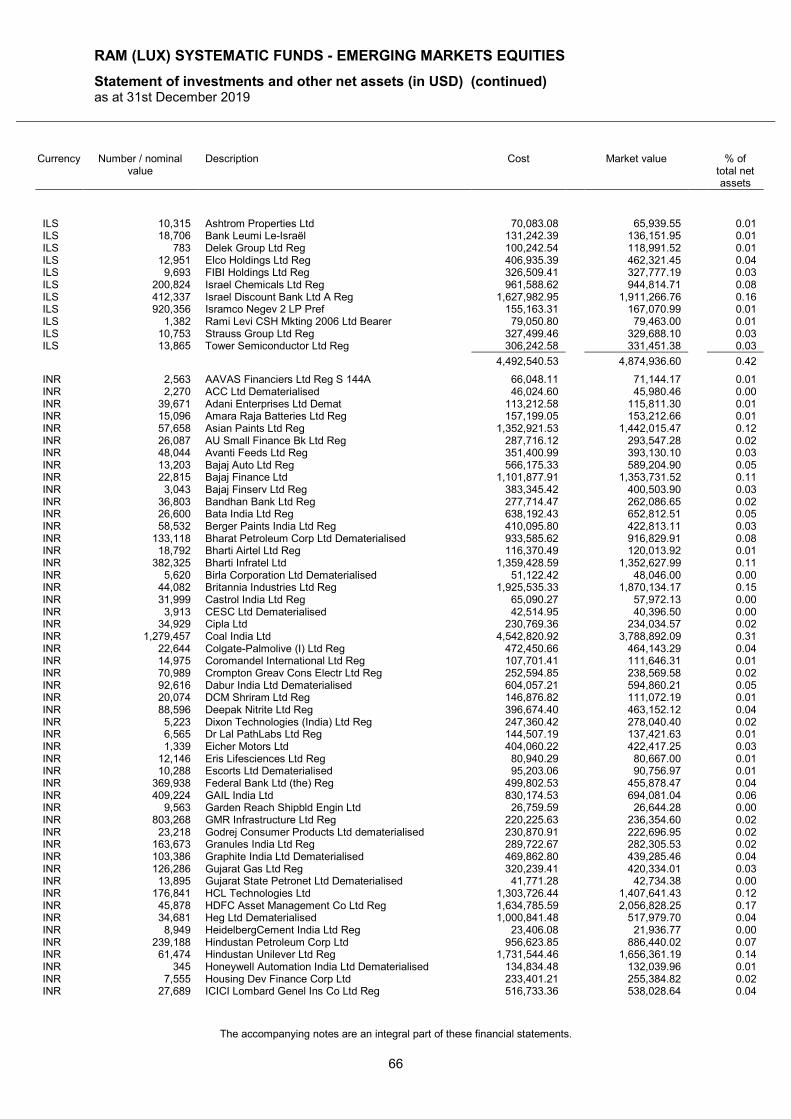
RAM (LUX) SYSTEMATIC FUNDS - EMERGING MARKETS EQUITIES
Statement of investments and other net assets (in USD) (continued) as at 31st December 2019
The accompanying notes are an integral part of these financial statements.
66
Currency Number / nominal value
Description Cost Market value % of total net assets
ILS 10,315 Ashtrom Properties Ltd 70,083.08 65,939.55 0.01 ILS 18,706 Bank Leumi Le-Israël 131,242.39 136,151.95 0.01 ILS 783 Delek Group Ltd Reg 100,242.54 118,991.52 0.01 ILS 12,951 Elco Holdings Ltd Reg 406,935.39 462,321.45 0.04 ILS 9,693 FIBI Holdings Ltd Reg 326,509.41 327,777.19 0.03 ILS 200,824 Israel Chemicals Ltd Reg 961,588.62 944,814.71 0.08 ILS 412,337 Israel Discount Bank Ltd A Reg 1,627,982.95 1,911,266.76 0.16 ILS 920,356 Isramco Negev 2 LP Pref 155,163.31 167,070.99 0.01 ILS 1,382 Rami Levi CSH Mkting 2006 Ltd Bearer 79,050.80 79,463.00 0.01 ILS 10,753 Strauss Group Ltd Reg 327,499.46 329,688.10 0.03 ILS 13,865 Tower Semiconductor Ltd Reg 306,242.58 331,451.38 0.03
4,492,540.53 4,874,936.60 0.42
INR 2,563 AAVAS Financiers Ltd Reg S 144A 66,048.11 71,144.17 0.01 INR 2,270 ACC Ltd Dematerialised 46,024.60 45,980.46 0.00 INR 39,671 Adani Enterprises Ltd Demat 113,212.58 115,811.30 0.01 INR 15,096 Amara Raja Batteries Ltd Reg 157,199.05 153,212.66 0.01 INR 57,658 Asian Paints Ltd Reg 1,352,921.53 1,442,015.47 0.12 INR 26,087 AU Small Finance Bk Ltd Reg 287,716.12 293,547.28 0.02 INR 48,044 Avanti Feeds Ltd Reg 351,400.99 393,130.10 0.03 INR 13,203 Bajaj Auto Ltd Reg 566,175.33 589,204.90 0.05 INR 22,815 Bajaj Finance Ltd 1,101,877.91 1,353,731.52 0.11 INR 3,043 Bajaj Finserv Ltd Reg 383,345.42 400,503.90 0.03 INR 36,803 Bandhan Bank Ltd Reg 277,714.47 262,086.65 0.02 INR 26,600 Bata India Ltd Reg 638,192.43 652,812.51 0.05 INR 58,532 Berger Paints India Ltd Reg 410,095.80 422,813.11 0.03 INR 133,118 Bharat Petroleum Corp Ltd Dematerialised 933,585.62 916,829.91 0.08 INR 18,792 Bharti Airtel Ltd Reg 116,370.49 120,013.92 0.01 INR 382,325 Bharti Infratel Ltd 1,359,428.59 1,352,627.99 0.11 INR 5,620 Birla Corporation Ltd Dematerialised 51,122.42 48,046.00 0.00 INR 44,082 Britannia Industries Ltd Reg 1,925,535.33 1,870,134.17 0.15 INR 31,999 Castrol India Ltd Reg 65,090.27 57,972.13 0.00 INR 3,913 CESC Ltd Dematerialised 42,514.95 40,396.50 0.00 INR 34,929 Cipla Ltd 230,769.36 234,034.57 0.02 INR 1,279,457 Coal India Ltd 4,542,820.92 3,788,892.09 0.31 INR 22,644 Colgate-Palmolive (I) Ltd Reg 472,450.66 464,143.29 0.04 INR 14,975 Coromandel International Ltd Reg 107,701.41 111,646.31 0.01 INR 70,989 Crompton Greav Cons Electr Ltd Reg 252,594.85 238,569.58 0.02 INR 92,616 Dabur India Ltd Dematerialised 604,057.21 594,860.21 0.05 INR 20,074 DCM Shriram Ltd Reg 146,876.82 111,072.19 0.01 INR 88,596 Deepak Nitrite Ltd Reg 396,674.40 463,152.12 0.04 INR 5,223 Dixon Technologies (India) Ltd Reg 247,360.42 278,040.40 0.02 INR 6,565 Dr Lal PathLabs Ltd Reg 144,507.19 137,421.63 0.01 INR 1,339 Eicher Motors Ltd 404,060.22 422,417.25 0.03 INR 12,146 Eris Lifesciences Ltd Reg 80,940.29 80,667.00 0.01 INR 10,288 Escorts Ltd Dematerialised 95,203.06 90,756.97 0.01 INR 369,938 Federal Bank Ltd (the) Reg 499,802.53 455,878.47 0.04 INR 409,224 GAIL India Ltd 830,174.53 694,081.04 0.06 INR 9,563 Garden Reach Shipbld Engin Ltd 26,759.59 26,644.28 0.00 INR 803,268 GMR Infrastructure Ltd Reg 220,225.63 236,354.60 0.02 INR 23,218 Godrej Consumer Products Ltd dematerialised 230,870.91 222,696.95 0.02 INR 163,673 Granules India Ltd Reg 289,722.67 282,305.53 0.02 INR 103,386 Graphite India Ltd Dematerialised 469,862.80 439,285.46 0.04 INR 126,286 Gujarat Gas Ltd Reg 320,239.41 420,334.01 0.03 INR 13,895 Gujarat State Petronet Ltd Dematerialised 41,771.28 42,734.38 0.00 INR 176,841 HCL Technologies Ltd 1,303,726.44 1,407,641.43 0.12 INR 45,878 HDFC Asset Management Co Ltd Reg 1,634,785.59 2,056,828.25 0.17 INR 34,681 Heg Ltd Dematerialised 1,000,841.48 517,979.70 0.04 INR 8,949 HeidelbergCement India Ltd Reg 23,406.08 21,936.77 0.00 INR 239,188 Hindustan Petroleum Corp Ltd 956,623.85 886,440.02 0.07 INR 61,474 Hindustan Unilever Ltd Reg 1,731,544.46 1,656,361.19 0.14 INR 345 Honeywell Automation India Ltd Dematerialised 134,834.48 132,039.96 0.01 INR 7,555 Housing Dev Finance Corp Ltd 233,401.21 255,384.82 0.02 INR 27,689 ICICI Lombard Genel Ins Co Ltd Reg 516,733.36 538,028.64 0.04
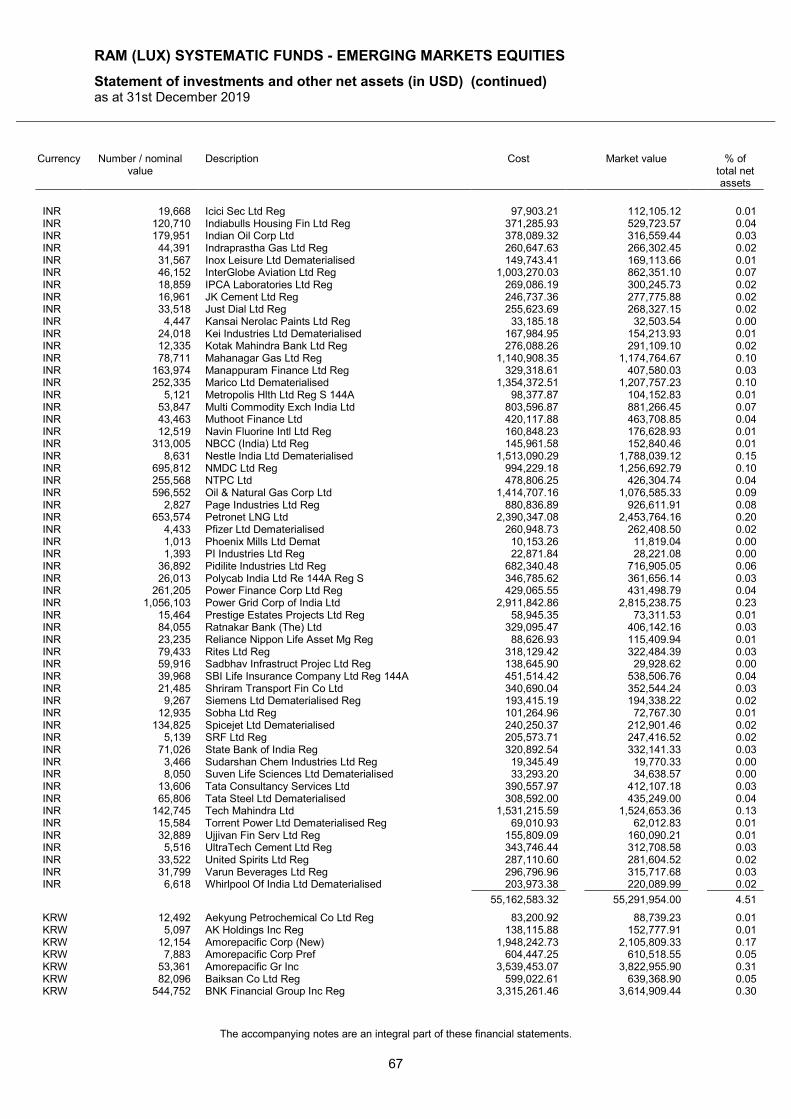
RAM (LUX) SYSTEMATIC FUNDS - EMERGING MARKETS EQUITIES
Statement of investments and other net assets (in USD) (continued) as at 31st December 2019
The accompanying notes are an integral part of these financial statements.
67
Currency Number / nominal value
Description Cost Market value % of total net assets
INR 19,668 Icici Sec Ltd Reg 97,903.21 112,105.12 0.01 INR 120,710 Indiabulls Housing Fin Ltd Reg 371,285.93 529,723.57 0.04 INR 179,951 Indian Oil Corp Ltd 378,089.32 316,559.44 0.03 INR 44,391 Indraprastha Gas Ltd Reg 260,647.63 266,302.45 0.02 INR 31,567 Inox Leisure Ltd Dematerialised 149,743.41 169,113.66 0.01 INR 46,152 InterGlobe Aviation Ltd Reg 1,003,270.03 862,351.10 0.07 INR 18,859 IPCA Laboratories Ltd Reg 269,086.19 300,245.73 0.02 INR 16,961 JK Cement Ltd Reg 246,737.36 277,775.88 0.02 INR 33,518 Just Dial Ltd Reg 255,623.69 268,327.15 0.02 INR 4,447 Kansai Nerolac Paints Ltd Reg 33,185.18 32,503.54 0.00 INR 24,018 Kei Industries Ltd Dematerialised 167,984.95 154,213.93 0.01 INR 12,335 Kotak Mahindra Bank Ltd Reg 276,088.26 291,109.10 0.02 INR 78,711 Mahanagar Gas Ltd Reg 1,140,908.35 1,174,764.67 0.10 INR 163,974 Manappuram Finance Ltd Reg 329,318.61 407,580.03 0.03 INR 252,335 Marico Ltd Dematerialised 1,354,372.51 1,207,757.23 0.10 INR 5,121 Metropolis Hlth Ltd Reg S 144A 98,377.87 104,152.83 0.01 INR 53,847 Multi Commodity Exch India Ltd 803,596.87 881,266.45 0.07 INR 43,463 Muthoot Finance Ltd 420,117.88 463,708.85 0.04 INR 12,519 Navin Fluorine Intl Ltd Reg 160,848.23 176,628.93 0.01 INR 313,005 NBCC (India) Ltd Reg 145,961.58 152,840.46 0.01 INR 8,631 Nestle India Ltd Dematerialised 1,513,090.29 1,788,039.12 0.15 INR 695,812 NMDC Ltd Reg 994,229.18 1,256,692.79 0.10 INR 255,568 NTPC Ltd 478,806.25 426,304.74 0.04 INR 596,552 Oil & Natural Gas Corp Ltd 1,414,707.16 1,076,585.33 0.09 INR 2,827 Page Industries Ltd Reg 880,836.89 926,611.91 0.08 INR 653,574 Petronet LNG Ltd 2,390,347.08 2,453,764.16 0.20 INR 4,433 Pfizer Ltd Dematerialised 260,948.73 262,408.50 0.02 INR 1,013 Phoenix Mills Ltd Demat 10,153.26 11,819.04 0.00 INR 1,393 PI Industries Ltd Reg 22,871.84 28,221.08 0.00 INR 36,892 Pidilite Industries Ltd Reg 682,340.48 716,905.05 0.06 INR 26,013 Polycab India Ltd Re 144A Reg S 346,785.62 361,656.14 0.03 INR 261,205 Power Finance Corp Ltd Reg 429,065.55 431,498.79 0.04 INR 1,056,103 Power Grid Corp of India Ltd 2,911,842.86 2,815,238.75 0.23 INR 15,464 Prestige Estates Projects Ltd Reg 58,945.35 73,311.53 0.01 INR 84,055 Ratnakar Bank (The) Ltd 329,095.47 406,142.16 0.03 INR 23,235 Reliance Nippon Life Asset Mg Reg 88,626.93 115,409.94 0.01 INR 79,433 Rites Ltd Reg 318,129.42 322,484.39 0.03 INR 59,916 Sadbhav Infrastruct Projec Ltd Reg 138,645.90 29,928.62 0.00 INR 39,968 SBI Life Insurance Company Ltd Reg 144A 451,514.42 538,506.76 0.04 INR 21,485 Shriram Transport Fin Co Ltd 340,690.04 352,544.24 0.03 INR 9,267 Siemens Ltd Dematerialised Reg 193,415.19 194,338.22 0.02 INR 12,935 Sobha Ltd Reg 101,264.96 72,767.30 0.01 INR 134,825 Spicejet Ltd Dematerialised 240,250.37 212,901.46 0.02 INR 5,139 SRF Ltd Reg 205,573.71 247,416.52 0.02 INR 71,026 State Bank of India Reg 320,892.54 332,141.33 0.03 INR 3,466 Sudarshan Chem Industries Ltd Reg 19,345.49 19,770.33 0.00 INR 8,050 Suven Life Sciences Ltd Dematerialised 33,293.20 34,638.57 0.00 INR 13,606 Tata Consultancy Services Ltd 390,557.97 412,107.18 0.03 INR 65,806 Tata Steel Ltd Dematerialised 308,592.00 435,249.00 0.04 INR 142,745 Tech Mahindra Ltd 1,531,215.59 1,524,653.36 0.13 INR 15,584 Torrent Power Ltd Dematerialised Reg 69,010.93 62,012.83 0.01 INR 32,889 Ujjivan Fin Serv Ltd Reg 155,809.09 160,090.21 0.01 INR 5,516 UltraTech Cement Ltd Reg 343,746.44 312,708.58 0.03 INR 33,522 United Spirits Ltd Reg 287,110.60 281,604.52 0.02 INR 31,799 Varun Beverages Ltd Reg 296,796.96 315,717.68 0.03 INR 6,618 Whirlpool Of India Ltd Dematerialised 203,973.38 220,089.99 0.02
55,162,583.32 55,291,954.00 4.51
KRW 12,492 Aekyung Petrochemical Co Ltd Reg 83,200.92 88,739.23 0.01 KRW 5,097 AK Holdings Inc Reg 138,115.88 152,777.91 0.01 KRW 12,154 Amorepacific Corp (New) 1,948,242.73 2,105,809.33 0.17 KRW 7,883 Amorepacific Corp Pref 604,447.25 610,518.55 0.05 KRW 53,361 Amorepacific Gr Inc 3,539,453.07 3,822,955.90 0.31 KRW 82,096 Baiksan Co Ltd Reg 599,022.61 639,368.90 0.05 KRW 544,752 BNK Financial Group Inc Reg 3,315,261.46 3,614,909.44 0.30
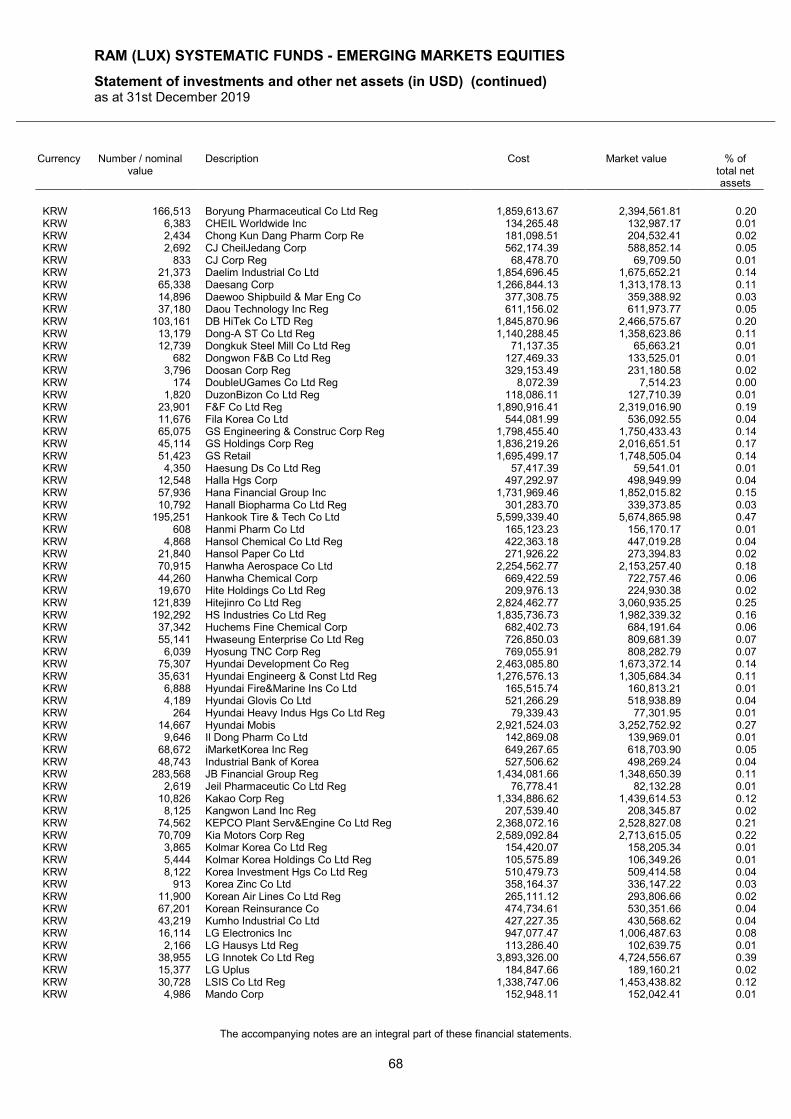
RAM (LUX) SYSTEMATIC FUNDS - EMERGING MARKETS EQUITIES
Statement of investments and other net assets (in USD) (continued) as at 31st December 2019
The accompanying notes are an integral part of these financial statements.
68
Currency Number / nominal value
Description Cost Market value % of total net assets
KRW 166,513 Boryung Pharmaceutical Co Ltd Reg 1,859,613.67 2,394,561.81 0.20 KRW 6,383 CHEIL Worldwide Inc 134,265.48 132,987.17 0.01 KRW 2,434 Chong Kun Dang Pharm Corp Re 181,098.51 204,532.41 0.02 KRW 2,692 CJ CheilJedang Corp 562,174.39 588,852.14 0.05 KRW 833 CJ Corp Reg 68,478.70 69,709.50 0.01 KRW 21,373 Daelim Industrial Co Ltd 1,854,696.45 1,675,652.21 0.14 KRW 65,338 Daesang Corp 1,266,844.13 1,313,178.13 0.11 KRW 14,896 Daewoo Shipbuild & Mar Eng Co 377,308.75 359,388.92 0.03 KRW 37,180 Daou Technology Inc Reg 611,156.02 611,973.77 0.05 KRW 103,161 DB HiTek Co LTD Reg 1,845,870.96 2,466,575.67 0.20 KRW 13,179 Dong-A ST Co Ltd Reg 1,140,288.45 1,358,623.86 0.11 KRW 12,739 Dongkuk Steel Mill Co Ltd Reg 71,137.35 65,663.21 0.01 KRW 682 Dongwon F&B Co Ltd Reg 127,469.33 133,525.01 0.01 KRW 3,796 Doosan Corp Reg 329,153.49 231,180.58 0.02 KRW 174 DoubleUGames Co Ltd Reg 8,072.39 7,514.23 0.00 KRW 1,820 DuzonBizon Co Ltd Reg 118,086.11 127,710.39 0.01 KRW 23,901 F&F Co Ltd Reg 1,890,916.41 2,319,016.90 0.19 KRW 11,676 Fila Korea Co Ltd 544,081.99 536,092.55 0.04 KRW 65,075 GS Engineering & Construc Corp Reg 1,798,455.40 1,750,433.43 0.14 KRW 45,114 GS Holdings Corp Reg 1,836,219.26 2,016,651.51 0.17 KRW 51,423 GS Retail 1,695,499.17 1,748,505.04 0.14 KRW 4,350 Haesung Ds Co Ltd Reg 57,417.39 59,541.01 0.01 KRW 12,548 Halla Hgs Corp 497,292.97 498,949.99 0.04 KRW 57,936 Hana Financial Group Inc 1,731,969.46 1,852,015.82 0.15 KRW 10,792 Hanall Biopharma Co Ltd Reg 301,283.70 339,373.85 0.03 KRW 195,251 Hankook Tire & Tech Co Ltd 5,599,339.40 5,674,865.98 0.47 KRW 608 Hanmi Pharm Co Ltd 165,123.23 156,170.17 0.01 KRW 4,868 Hansol Chemical Co Ltd Reg 422,363.18 447,019.28 0.04 KRW 21,840 Hansol Paper Co Ltd 271,926.22 273,394.83 0.02 KRW 70,915 Hanwha Aerospace Co Ltd 2,254,562.77 2,153,257.40 0.18 KRW 44,260 Hanwha Chemical Corp 669,422.59 722,757.46 0.06 KRW 19,670 Hite Holdings Co Ltd Reg 209,976.13 224,930.38 0.02 KRW 121,839 Hitejinro Co Ltd Reg 2,824,462.77 3,060,935.25 0.25 KRW 192,292 HS Industries Co Ltd Reg 1,835,736.73 1,982,339.32 0.16 KRW 37,342 Huchems Fine Chemical Corp 682,402.73 684,191.64 0.06 KRW 55,141 Hwaseung Enterprise Co Ltd Reg 726,850.03 809,681.39 0.07 KRW 6,039 Hyosung TNC Corp Reg 769,055.91 808,282.79 0.07 KRW 75,307 Hyundai Development Co Reg 2,463,085.80 1,673,372.14 0.14 KRW 35,631 Hyundai Engineerg & Const Ltd Reg 1,276,576.13 1,305,684.34 0.11 KRW 6,888 Hyundai Fire&Marine Ins Co Ltd 165,515.74 160,813.21 0.01 KRW 4,189 Hyundai Glovis Co Ltd 521,266.29 518,938.89 0.04 KRW 264 Hyundai Heavy Indus Hgs Co Ltd Reg 79,339.43 77,301.95 0.01 KRW 14,667 Hyundai Mobis 2,921,524.03 3,252,752.92 0.27 KRW 9,646 Il Dong Pharm Co Ltd 142,869.08 139,969.01 0.01 KRW 68,672 iMarketKorea Inc Reg 649,267.65 618,703.90 0.05 KRW 48,743 Industrial Bank of Korea 527,506.62 498,269.24 0.04 KRW 283,568 JB Financial Group Reg 1,434,081.66 1,348,650.39 0.11 KRW 2,619 Jeil Pharmaceutic Co Ltd Reg 76,778.41 82,132.28 0.01 KRW 10,826 Kakao Corp Reg 1,334,886.62 1,439,614.53 0.12 KRW 8,125 Kangwon Land Inc Reg 207,539.40 208,345.87 0.02 KRW 74,562 KEPCO Plant Serv&Engine Co Ltd Reg 2,368,072.16 2,528,827.08 0.21 KRW 70,709 Kia Motors Corp Reg 2,589,092.84 2,713,615.05 0.22 KRW 3,865 Kolmar Korea Co Ltd Reg 154,420.07 158,205.34 0.01 KRW 5,444 Kolmar Korea Holdings Co Ltd Reg 105,575.89 106,349.26 0.01 KRW 8,122 Korea Investment Hgs Co Ltd Reg 510,479.73 509,414.58 0.04 KRW 913 Korea Zinc Co Ltd 358,164.37 336,147.22 0.03 KRW 11,900 Korean Air Lines Co Ltd Reg 265,111.12 293,806.66 0.02 KRW 67,201 Korean Reinsurance Co 474,734.61 530,351.66 0.04 KRW 43,219 Kumho Industrial Co Ltd 427,227.35 430,568.62 0.04 KRW 16,114 LG Electronics Inc 947,077.47 1,006,487.63 0.08 KRW 2,166 LG Hausys Ltd Reg 113,286.40 102,639.75 0.01 KRW 38,955 LG Innotek Co Ltd Reg 3,893,326.00 4,724,556.67 0.39 KRW 15,377 LG Uplus 184,847.66 189,160.21 0.02 KRW 30,728 LSIS Co Ltd Reg 1,338,747.06 1,453,438.82 0.12 KRW 4,986 Mando Corp 152,948.11 152,042.41 0.01
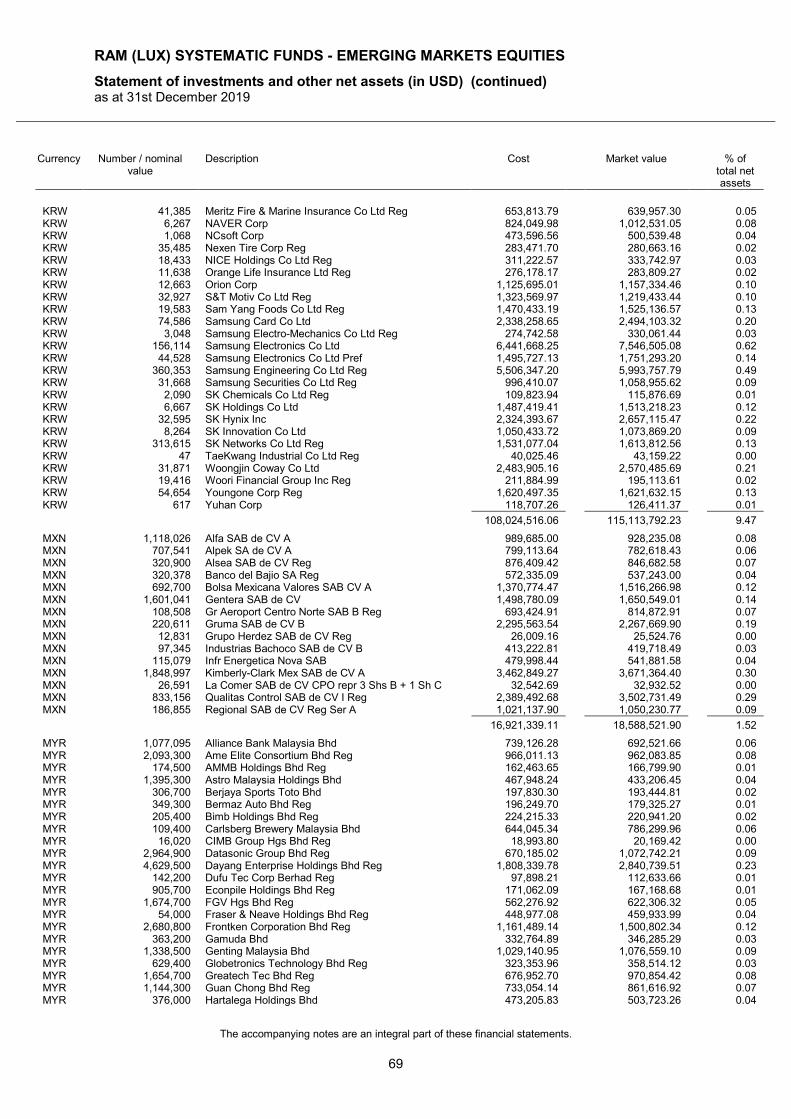
RAM (LUX) SYSTEMATIC FUNDS - EMERGING MARKETS EQUITIES
Statement of investments and other net assets (in USD) (continued) as at 31st December 2019
The accompanying notes are an integral part of these financial statements.
69
Currency Number / nominal value
Description Cost Market value % of total net assets
KRW 41,385 Meritz Fire & Marine Insurance Co Ltd Reg 653,813.79 639,957.30 0.05 KRW 6,267 NAVER Corp 824,049.98 1,012,531.05 0.08 KRW 1,068 NCsoft Corp 473,596.56 500,539.48 0.04 KRW 35,485 Nexen Tire Corp Reg 283,471.70 280,663.16 0.02 KRW 18,433 NICE Holdings Co Ltd Reg 311,222.57 333,742.97 0.03 KRW 11,638 Orange Life Insurance Ltd Reg 276,178.17 283,809.27 0.02 KRW 12,663 Orion Corp 1,125,695.01 1,157,334.46 0.10 KRW 32,927 S&T Motiv Co Ltd Reg 1,323,569.97 1,219,433.44 0.10 KRW 19,583 Sam Yang Foods Co Ltd Reg 1,470,433.19 1,525,136.57 0.13 KRW 74,586 Samsung Card Co Ltd 2,338,258.65 2,494,103.32 0.20 KRW 3,048 Samsung Electro-Mechanics Co Ltd Reg 274,742.58 330,061.44 0.03 KRW 156,114 Samsung Electronics Co Ltd 6,441,668.25 7,546,505.08 0.62 KRW 44,528 Samsung Electronics Co Ltd Pref 1,495,727.13 1,751,293.20 0.14 KRW 360,353 Samsung Engineering Co Ltd Reg 5,506,347.20 5,993,757.79 0.49 KRW 31,668 Samsung Securities Co Ltd Reg 996,410.07 1,058,955.62 0.09 KRW 2,090 SK Chemicals Co Ltd Reg 109,823.94 115,876.69 0.01 KRW 6,667 SK Holdings Co Ltd 1,487,419.41 1,513,218.23 0.12 KRW 32,595 SK Hynix Inc 2,324,393.67 2,657,115.47 0.22 KRW 8,264 SK Innovation Co Ltd 1,050,433.72 1,073,869.20 0.09 KRW 313,615 SK Networks Co Ltd Reg 1,531,077.04 1,613,812.56 0.13 KRW 47 TaeKwang Industrial Co Ltd Reg 40,025.46 43,159.22 0.00 KRW 31,871 Woongjin Coway Co Ltd 2,483,905.16 2,570,485.69 0.21 KRW 19,416 Woori Financial Group Inc Reg 211,884.99 195,113.61 0.02 KRW 54,654 Youngone Corp Reg 1,620,497.35 1,621,632.15 0.13 KRW 617 Yuhan Corp 118,707.26 126,411.37 0.01
108,024,516.06 115,113,792.23 9.47
MXN 1,118,026 Alfa SAB de CV A 989,685.00 928,235.08 0.08 MXN 707,541 Alpek SA de CV A 799,113.64 782,618.43 0.06 MXN 320,900 Alsea SAB de CV Reg 876,409.42 846,682.58 0.07 MXN 320,378 Banco del Bajio SA Reg 572,335.09 537,243.00 0.04 MXN 692,700 Bolsa Mexicana Valores SAB CV A 1,370,774.47 1,516,266.98 0.12 MXN 1,601,041 Gentera SAB de CV 1,498,780.09 1,650,549.01 0.14 MXN 108,508 Gr Aeroport Centro Norte SAB B Reg 693,424.91 814,872.91 0.07 MXN 220,611 Gruma SAB de CV B 2,295,563.54 2,267,669.90 0.19 MXN 12,831 Grupo Herdez SAB de CV Reg 26,009.16 25,524.76 0.00 MXN 97,345 Industrias Bachoco SAB de CV B 413,222.81 419,718.49 0.03 MXN 115,079 Infr Energetica Nova SAB 479,998.44 541,881.58 0.04 MXN 1,848,997 Kimberly-Clark Mex SAB de CV A 3,462,849.27 3,671,364.40 0.30 MXN 26,591 La Comer SAB de CV CPO repr 3 Shs B + 1 Sh C 32,542.69 32,932.52 0.00 MXN 833,156 Qualitas Control SAB de CV I Reg 2,389,492.68 3,502,731.49 0.29 MXN 186,855 Regional SAB de CV Reg Ser A 1,021,137.90 1,050,230.77 0.09
16,921,339.11 18,588,521.90 1.52
MYR 1,077,095 Alliance Bank Malaysia Bhd 739,126.28 692,521.66 0.06 MYR 2,093,300 Ame Elite Consortium Bhd Reg 966,011.13 962,083.85 0.08 MYR 174,500 AMMB Holdings Bhd Reg 162,463.65 166,799.90 0.01 MYR 1,395,300 Astro Malaysia Holdings Bhd 467,948.24 433,206.45 0.04 MYR 306,700 Berjaya Sports Toto Bhd 197,830.30 193,444.81 0.02 MYR 349,300 Bermaz Auto Bhd Reg 196,249.70 179,325.27 0.01 MYR 205,400 Bimb Holdings Bhd Reg 224,215.33 220,941.20 0.02 MYR 109,400 Carlsberg Brewery Malaysia Bhd 644,045.34 786,299.96 0.06 MYR 16,020 CIMB Group Hgs Bhd Reg 18,993.80 20,169.42 0.00 MYR 2,964,900 Datasonic Group Bhd Reg 670,185.02 1,072,742.21 0.09 MYR 4,629,500 Dayang Enterprise Holdings Bhd Reg 1,808,339.78 2,840,739.51 0.23 MYR 142,200 Dufu Tec Corp Berhad Reg 97,898.21 112,633.66 0.01 MYR 905,700 Econpile Holdings Bhd Reg 171,062.09 167,168.68 0.01 MYR 1,674,700 FGV Hgs Bhd Reg 562,276.92 622,306.32 0.05 MYR 54,000 Fraser & Neave Holdings Bhd Reg 448,977.08 459,933.99 0.04 MYR 2,680,800 Frontken Corporation Bhd Reg 1,161,489.14 1,500,802.34 0.12 MYR 363,200 Gamuda Bhd 332,764.89 346,285.29 0.03 MYR 1,338,500 Genting Malaysia Bhd 1,029,140.95 1,076,559.10 0.09 MYR 629,400 Globetronics Technology Bhd Reg 323,353.96 358,514.12 0.03 MYR 1,654,700 Greatech Tec Bhd Reg 676,952.70 970,854.42 0.08 MYR 1,144,300 Guan Chong Bhd Reg 733,054.14 861,616.92 0.07 MYR 376,000 Hartalega Holdings Bhd 473,205.83 503,723.26 0.04
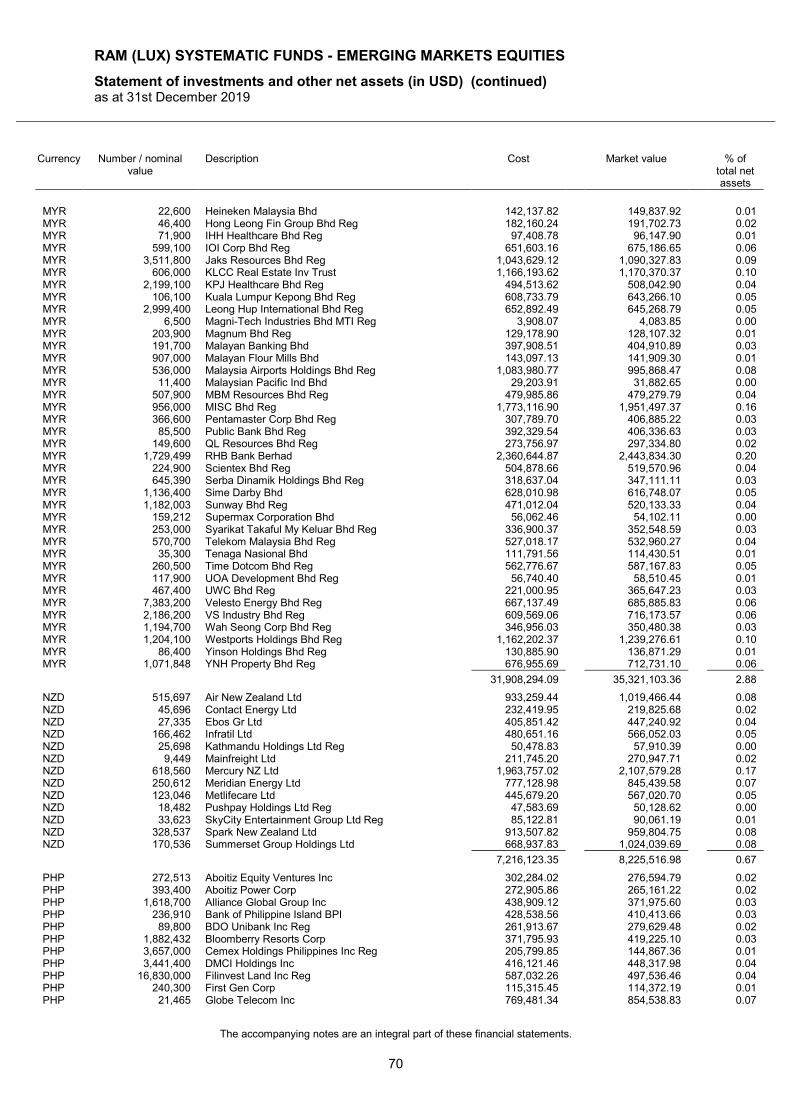
RAM (LUX) SYSTEMATIC FUNDS - EMERGING MARKETS EQUITIES
Statement of investments and other net assets (in USD) (continued) as at 31st December 2019
The accompanying notes are an integral part of these financial statements.
70
Currency Number / nominal value
Description Cost Market value % of total net assets
MYR 22,600 Heineken Malaysia Bhd 142,137.82 149,837.92 0.01 MYR 46,400 Hong Leong Fin Group Bhd Reg 182,160.24 191,702.73 0.02 MYR 71,900 IHH Healthcare Bhd Reg 97,408.78 96,147.90 0.01 MYR 599,100 IOI Corp Bhd Reg 651,603.16 675,186.65 0.06 MYR 3,511,800 Jaks Resources Bhd Reg 1,043,629.12 1,090,327.83 0.09 MYR 606,000 KLCC Real Estate Inv Trust 1,166,193.62 1,170,370.37 0.10 MYR 2,199,100 KPJ Healthcare Bhd Reg 494,513.62 508,042.90 0.04 MYR 106,100 Kuala Lumpur Kepong Bhd Reg 608,733.79 643,266.10 0.05 MYR 2,999,400 Leong Hup International Bhd Reg 652,892.49 645,268.79 0.05 MYR 6,500 Magni-Tech Industries Bhd MTI Reg 3,908.07 4,083.85 0.00 MYR 203,900 Magnum Bhd Reg 129,178.90 128,107.32 0.01 MYR 191,700 Malayan Banking Bhd 397,908.51 404,910.89 0.03 MYR 907,000 Malayan Flour Mills Bhd 143,097.13 141,909.30 0.01 MYR 536,000 Malaysia Airports Holdings Bhd Reg 1,083,980.77 995,868.47 0.08 MYR 11,400 Malaysian Pacific Ind Bhd 29,203.91 31,882.65 0.00 MYR 507,900 MBM Resources Bhd Reg 479,985.86 479,279.79 0.04 MYR 956,000 MISC Bhd Reg 1,773,116.90 1,951,497.37 0.16 MYR 366,600 Pentamaster Corp Bhd Reg 307,789.70 406,885.22 0.03 MYR 85,500 Public Bank Bhd Reg 392,329.54 406,336.63 0.03 MYR 149,600 QL Resources Bhd Reg 273,756.97 297,334.80 0.02 MYR 1,729,499 RHB Bank Berhad 2,360,644.87 2,443,834.30 0.20 MYR 224,900 Scientex Bhd Reg 504,878.66 519,570.96 0.04 MYR 645,390 Serba Dinamik Holdings Bhd Reg 318,637.04 347,111.11 0.03 MYR 1,136,400 Sime Darby Bhd 628,010.98 616,748.07 0.05 MYR 1,182,003 Sunway Bhd Reg 471,012.04 520,133.33 0.04 MYR 159,212 Supermax Corporation Bhd 56,062.46 54,102.11 0.00 MYR 253,000 Syarikat Takaful My Keluar Bhd Reg 336,900.37 352,548.59 0.03 MYR 570,700 Telekom Malaysia Bhd Reg 527,018.17 532,960.27 0.04 MYR 35,300 Tenaga Nasional Bhd 111,791.56 114,430.51 0.01 MYR 260,500 Time Dotcom Bhd Reg 562,776.67 587,167.83 0.05 MYR 117,900 UOA Development Bhd Reg 56,740.40 58,510.45 0.01 MYR 467,400 UWC Bhd Reg 221,000.95 365,647.23 0.03 MYR 7,383,200 Velesto Energy Bhd Reg 667,137.49 685,885.83 0.06 MYR 2,186,200 VS Industry Bhd Reg 609,569.06 716,173.57 0.06 MYR 1,194,700 Wah Seong Corp Bhd Reg 346,956.03 350,480.38 0.03 MYR 1,204,100 Westports Holdings Bhd Reg 1,162,202.37 1,239,276.61 0.10 MYR 86,400 Yinson Holdings Bhd Reg 130,885.90 136,871.29 0.01 MYR 1,071,848 YNH Property Bhd Reg 676,955.69 712,731.10 0.06
31,908,294.09 35,321,103.36 2.88
NZD 515,697 Air New Zealand Ltd 933,259.44 1,019,466.44 0.08 NZD 45,696 Contact Energy Ltd 232,419.95 219,825.68 0.02 NZD 27,335 Ebos Gr Ltd 405,851.42 447,240.92 0.04 NZD 166,462 Infratil Ltd 480,651.16 566,052.03 0.05 NZD 25,698 Kathmandu Holdings Ltd Reg 50,478.83 57,910.39 0.00 NZD 9,449 Mainfreight Ltd 211,745.20 270,947.71 0.02 NZD 618,560 Mercury NZ Ltd 1,963,757.02 2,107,579.28 0.17 NZD 250,612 Meridian Energy Ltd 777,128.98 845,439.58 0.07 NZD 123,046 Metlifecare Ltd 445,679.20 567,020.70 0.05 NZD 18,482 Pushpay Holdings Ltd Reg 47,583.69 50,128.62 0.00 NZD 33,623 SkyCity Entertainment Group Ltd Reg 85,122.81 90,061.19 0.01 NZD 328,537 Spark New Zealand Ltd 913,507.82 959,804.75 0.08 NZD 170,536 Summerset Group Holdings Ltd 668,937.83 1,024,039.69 0.08
7,216,123.35 8,225,516.98 0.67
PHP 272,513 Aboitiz Equity Ventures Inc 302,284.02 276,594.79 0.02 PHP 393,400 Aboitiz Power Corp 272,905.86 265,161.22 0.02 PHP 1,618,700 Alliance Global Group Inc 438,909.12 371,975.60 0.03 PHP 236,910 Bank of Philippine Island BPI 428,538.56 410,413.66 0.03 PHP 89,800 BDO Unibank Inc Reg 261,913.67 279,629.48 0.02 PHP 1,882,432 Bloomberry Resorts Corp 371,795.93 419,225.10 0.03 PHP 3,657,000 Cemex Holdings Philippines Inc Reg 205,799.85 144,867.36 0.01 PHP 3,441,400 DMCI Holdings Inc 416,121.46 448,317.98 0.04 PHP 16,830,000 Filinvest Land Inc Reg 587,032.26 497,536.46 0.04 PHP 240,300 First Gen Corp 115,315.45 114,372.19 0.01 PHP 21,465 Globe Telecom Inc 769,481.34 854,538.83 0.07
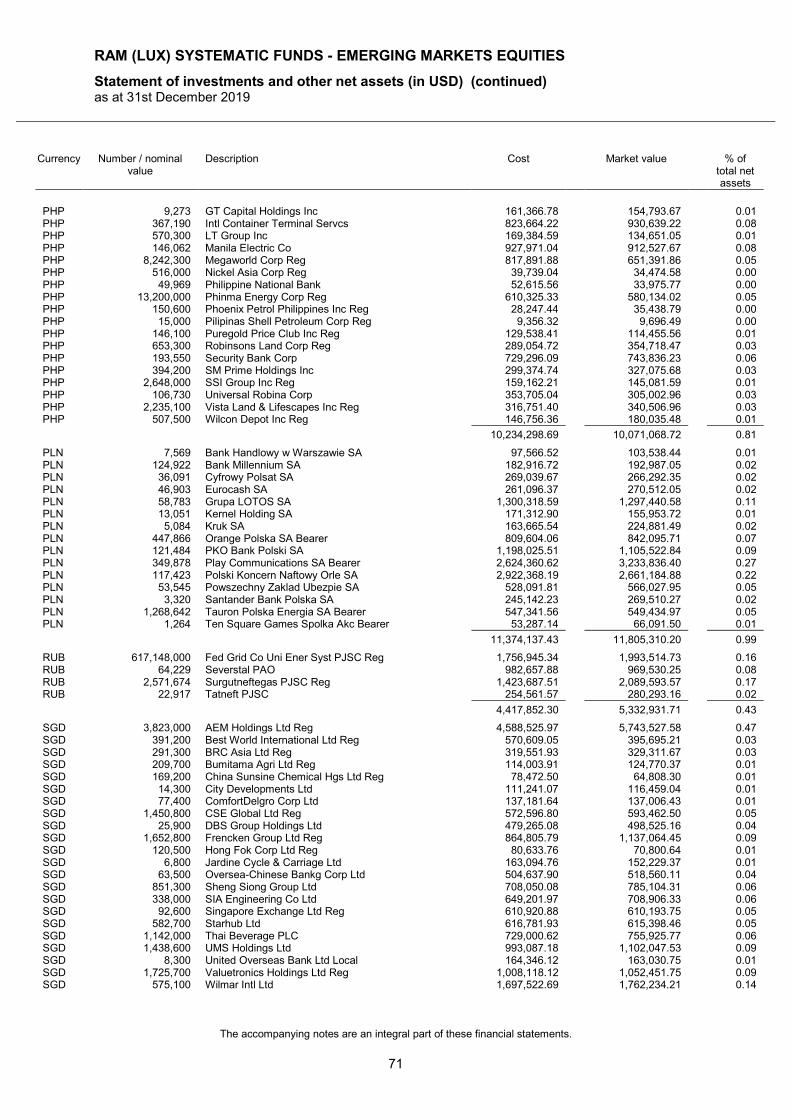
RAM (LUX) SYSTEMATIC FUNDS - EMERGING MARKETS EQUITIES
Statement of investments and other net assets (in USD) (continued) as at 31st December 2019
The accompanying notes are an integral part of these financial statements.
71
Currency Number / nominal value
Description Cost Market value % of total net assets
PHP 9,273 GT Capital Holdings Inc 161,366.78 154,793.67 0.01 PHP 367,190 Intl Container Terminal Servcs 823,664.22 930,639.22 0.08 PHP 570,300 LT Group Inc 169,384.59 134,651.05 0.01 PHP 146,062 Manila Electric Co 927,971.04 912,527.67 0.08 PHP 8,242,300 Megaworld Corp Reg 817,891.88 651,391.86 0.05 PHP 516,000 Nickel Asia Corp Reg 39,739.04 34,474.58 0.00 PHP 49,969 Philippine National Bank 52,615.56 33,975.77 0.00 PHP 13,200,000 Phinma Energy Corp Reg 610,325.33 580,134.02 0.05 PHP 150,600 Phoenix Petrol Philippines Inc Reg 28,247.44 35,438.79 0.00 PHP 15,000 Pilipinas Shell Petroleum Corp Reg 9,356.32 9,696.49 0.00 PHP 146,100 Puregold Price Club Inc Reg 129,538.41 114,455.56 0.01 PHP 653,300 Robinsons Land Corp Reg 289,054.72 354,718.47 0.03 PHP 193,550 Security Bank Corp 729,296.09 743,836.23 0.06 PHP 394,200 SM Prime Holdings Inc 299,374.74 327,075.68 0.03 PHP 2,648,000 SSI Group Inc Reg 159,162.21 145,081.59 0.01 PHP 106,730 Universal Robina Corp 353,705.04 305,002.96 0.03 PHP 2,235,100 Vista Land & Lifescapes Inc Reg 316,751.40 340,506.96 0.03 PHP 507,500 Wilcon Depot Inc Reg 146,756.36 180,035.48 0.01
10,234,298.69 10,071,068.72 0.81
PLN 7,569 Bank Handlowy w Warszawie SA 97,566.52 103,538.44 0.01 PLN 124,922 Bank Millennium SA 182,916.72 192,987.05 0.02 PLN 36,091 Cyfrowy Polsat SA 269,039.67 266,292.35 0.02 PLN 46,903 Eurocash SA 261,096.37 270,512.05 0.02 PLN 58,783 Grupa LOTOS SA 1,300,318.59 1,297,440.58 0.11 PLN 13,051 Kernel Holding SA 171,312.90 155,953.72 0.01 PLN 5,084 Kruk SA 163,665.54 224,881.49 0.02 PLN 447,866 Orange Polska SA Bearer 809,604.06 842,095.71 0.07 PLN 121,484 PKO Bank Polski SA 1,198,025.51 1,105,522.84 0.09 PLN 349,878 Play Communications SA Bearer 2,624,360.62 3,233,836.40 0.27 PLN 117,423 Polski Koncern Naftowy Orle SA 2,922,368.19 2,661,184.88 0.22 PLN 53,545 Powszechny Zaklad Ubezpie SA 528,091.81 566,027.95 0.05 PLN 3,320 Santander Bank Polska SA 245,142.23 269,510.27 0.02 PLN 1,268,642 Tauron Polska Energia SA Bearer 547,341.56 549,434.97 0.05 PLN 1,264 Ten Square Games Spolka Akc Bearer 53,287.14 66,091.50 0.01
11,374,137.43 11,805,310.20 0.99
RUB 617,148,000 Fed Grid Co Uni Ener Syst PJSC Reg 1,756,945.34 1,993,514.73 0.16 RUB 64,229 Severstal PAO 982,657.88 969,530.25 0.08 RUB 2,571,674 Surgutneftegas PJSC Reg 1,423,687.51 2,089,593.57 0.17 RUB 22,917 Tatneft PJSC 254,561.57 280,293.16 0.02
4,417,852.30 5,332,931.71 0.43
SGD 3,823,000 AEM Holdings Ltd Reg 4,588,525.97 5,743,527.58 0.47 SGD 391,200 Best World International Ltd Reg 570,609.05 395,695.21 0.03 SGD 291,300 BRC Asia Ltd Reg 319,551.93 329,311.67 0.03 SGD 209,700 Bumitama Agri Ltd Reg 114,003.91 124,770.37 0.01 SGD 169,200 China Sunsine Chemical Hgs Ltd Reg 78,472.50 64,808.30 0.01 SGD 14,300 City Developments Ltd 111,241.07 116,459.04 0.01 SGD 77,400 ComfortDelgro Corp Ltd 137,181.64 137,006.43 0.01 SGD 1,450,800 CSE Global Ltd Reg 572,596.80 593,462.50 0.05 SGD 25,900 DBS Group Holdings Ltd 479,265.08 498,525.16 0.04 SGD 1,652,800 Frencken Group Ltd Reg 864,805.79 1,137,064.45 0.09 SGD 120,500 Hong Fok Corp Ltd Reg 80,633.76 70,800.64 0.01 SGD 6,800 Jardine Cycle & Carriage Ltd 163,094.76 152,229.37 0.01 SGD 63,500 Oversea-Chinese Bankg Corp Ltd 504,637.90 518,560.11 0.04 SGD 851,300 Sheng Siong Group Ltd 708,050.08 785,104.31 0.06 SGD 338,000 SIA Engineering Co Ltd 649,201.97 708,906.33 0.06 SGD 92,600 Singapore Exchange Ltd Reg 610,920.88 610,193.75 0.05 SGD 582,700 Starhub Ltd 616,781.93 615,398.46 0.05 SGD 1,142,000 Thai Beverage PLC 729,000.62 755,925.77 0.06 SGD 1,438,600 UMS Holdings Ltd 993,087.18 1,102,047.53 0.09 SGD 8,300 United Overseas Bank Ltd Local 164,346.12 163,030.75 0.01 SGD 1,725,700 Valuetronics Holdings Ltd Reg 1,008,118.12 1,052,451.75 0.09 SGD 575,100 Wilmar Intl Ltd 1,697,522.69 1,762,234.21 0.14
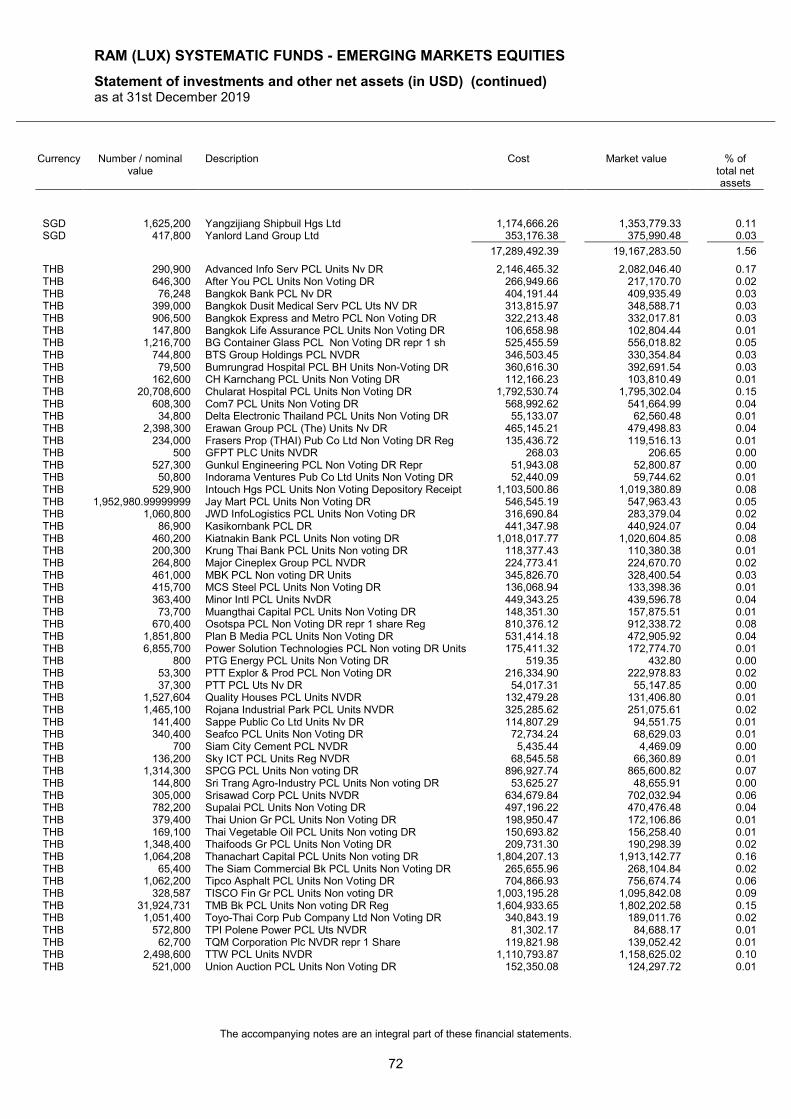
RAM (LUX) SYSTEMATIC FUNDS - EMERGING MARKETS EQUITIES
Statement of investments and other net assets (in USD) (continued) as at 31st December 2019
The accompanying notes are an integral part of these financial statements.
72
Currency Number / nominal value
Description Cost Market value % of total net assets
SGD 1,625,200 Yangzijiang Shipbuil Hgs Ltd 1,174,666.26 1,353,779.33 0.11 SGD 417,800 Yanlord Land Group Ltd 353,176.38 375,990.48 0.03
17,289,492.39 19,167,283.50 1.56
THB 290,900 Advanced Info Serv PCL Units Nv DR 2,146,465.32 2,082,046.40 0.17 THB 646,300 After You PCL Units Non Voting DR 266,949.66 217,170.70 0.02 THB 76,248 Bangkok Bank PCL Nv DR 404,191.44 409,935.49 0.03 THB 399,000 Bangkok Dusit Medical Serv PCL Uts NV DR 313,815.97 348,588.71 0.03 THB 906,500 Bangkok Express and Metro PCL Non Voting DR 322,213.48 332,017.81 0.03 THB 147,800 Bangkok Life Assurance PCL Units Non Voting DR 106,658.98 102,804.44 0.01 THB 1,216,700 BG Container Glass PCL Non Voting DR repr 1 sh 525,455.59 556,018.82 0.05 THB 744,800 BTS Group Holdings PCL NVDR 346,503.45 330,354.84 0.03 THB 79,500 Bumrungrad Hospital PCL BH Units Non-Voting DR 360,616.30 392,691.54 0.03 THB 162,600 CH Karnchang PCL Units Non Voting DR 112,166.23 103,810.49 0.01 THB 20,708,600 Chularat Hospital PCL Units Non Voting DR 1,792,530.74 1,795,302.04 0.15 THB 608,300 Com7 PCL Units Non Voting DR 568,992.62 541,664.99 0.04 THB 34,800 Delta Electronic Thailand PCL Units Non Voting DR 55,133.07 62,560.48 0.01 THB 2,398,300 Erawan Group PCL (The) Units Nv DR 465,145.21 479,498.83 0.04 THB 234,000 Frasers Prop (THAI) Pub Co Ltd Non Voting DR Reg 135,436.72 119,516.13 0.01 THB 500 GFPT PLC Units NVDR 268.03 206.65 0.00 THB 527,300 Gunkul Engineering PCL Non Voting DR Repr 51,943.08 52,800.87 0.00 THB 50,800 Indorama Ventures Pub Co Ltd Units Non Voting DR 52,440.09 59,744.62 0.01 THB 529,900 Intouch Hgs PCL Units Non Voting Depository Receipt 1,103,500.86 1,019,380.89 0.08 THB 1,952,980.99999999 Jay Mart PCL Units Non Voting DR 546,545.19 547,963.43 0.05 THB 1,060,800 JWD InfoLogistics PCL Units Non Voting DR 316,690.84 283,379.04 0.02 THB 86,900 Kasikornbank PCL DR 441,347.98 440,924.07 0.04 THB 460,200 Kiatnakin Bank PCL Units Non voting DR 1,018,017.77 1,020,604.85 0.08 THB 200,300 Krung Thai Bank PCL Units Non voting DR 118,377.43 110,380.38 0.01 THB 264,800 Major Cineplex Group PCL NVDR 224,773.41 224,670.70 0.02 THB 461,000 MBK PCL Non voting DR Units 345,826.70 328,400.54 0.03 THB 415,700 MCS Steel PCL Units Non Voting DR 136,068.94 133,398.36 0.01 THB 363,400 Minor Intl PCL Units NvDR 449,343.25 439,596.78 0.04 THB 73,700 Muangthai Capital PCL Units Non Voting DR 148,351.30 157,875.51 0.01 THB 670,400 Osotspa PCL Non Voting DR repr 1 share Reg 810,376.12 912,338.72 0.08 THB 1,851,800 Plan B Media PCL Units Non Voting DR 531,414.18 472,905.92 0.04 THB 6,855,700 Power Solution Technologies PCL Non voting DR Units 175,411.32 172,774.70 0.01 THB 800 PTG Energy PCL Units Non Voting DR 519.35 432.80 0.00 THB 53,300 PTT Explor & Prod PCL Non Voting DR 216,334.90 222,978.83 0.02 THB 37,300 PTT PCL Uts Nv DR 54,017.31 55,147.85 0.00 THB 1,527,604 Quality Houses PCL Units NVDR 132,479.28 131,406.80 0.01 THB 1,465,100 Rojana Industrial Park PCL Units NVDR 325,285.62 251,075.61 0.02 THB 141,400 Sappe Public Co Ltd Units Nv DR 114,807.29 94,551.75 0.01 THB 340,400 Seafco PCL Units Non Voting DR 72,734.24 68,629.03 0.01 THB 700 Siam City Cement PCL NVDR 5,435.44 4,469.09 0.00 THB 136,200 Sky ICT PCL Units Reg NVDR 68,545.58 66,360.89 0.01 THB 1,314,300 SPCG PCL Units Non voting DR 896,927.74 865,600.82 0.07 THB 144,800 Sri Trang Agro-Industry PCL Units Non voting DR 53,625.27 48,655.91 0.00 THB 305,000 Srisawad Corp PCL Units NVDR 634,679.84 702,032.94 0.06 THB 782,200 Supalai PCL Units Non Voting DR 497,196.22 470,476.48 0.04 THB 379,400 Thai Union Gr PCL Units Non Voting DR 198,950.47 172,106.86 0.01 THB 169,100 Thai Vegetable Oil PCL Units Non voting DR 150,693.82 156,258.40 0.01 THB 1,348,400 Thaifoods Gr PCL Units Non Voting DR 209,731.30 190,298.39 0.02 THB 1,064,208 Thanachart Capital PCL Units Non voting DR 1,804,207.13 1,913,142.77 0.16 THB 65,400 The Siam Commercial Bk PCL Units Non Voting DR 265,655.96 268,104.84 0.02 THB 1,062,200 Tipco Asphalt PCL Units Non Voting DR 704,866.93 756,674.74 0.06 THB 328,587 TISCO Fin Gr PCL Units Non voting DR 1,003,195.28 1,095,842.08 0.09 THB 31,924,731 TMB Bk PCL Units Non voting DR Reg 1,604,933.65 1,802,202.58 0.15 THB 1,051,400 Toyo-Thai Corp Pub Company Ltd Non Voting DR 340,843.19 189,011.76 0.02 THB 572,800 TPI Polene Power PCL Uts NVDR 81,302.17 84,688.17 0.01 THB 62,700 TQM Corporation Plc NVDR repr 1 Share 119,821.98 139,052.42 0.01 THB 2,498,600 TTW PCL Units NVDR 1,110,793.87 1,158,625.02 0.10 THB 521,000 Union Auction PCL Units Non Voting DR 152,350.08 124,297.72 0.01
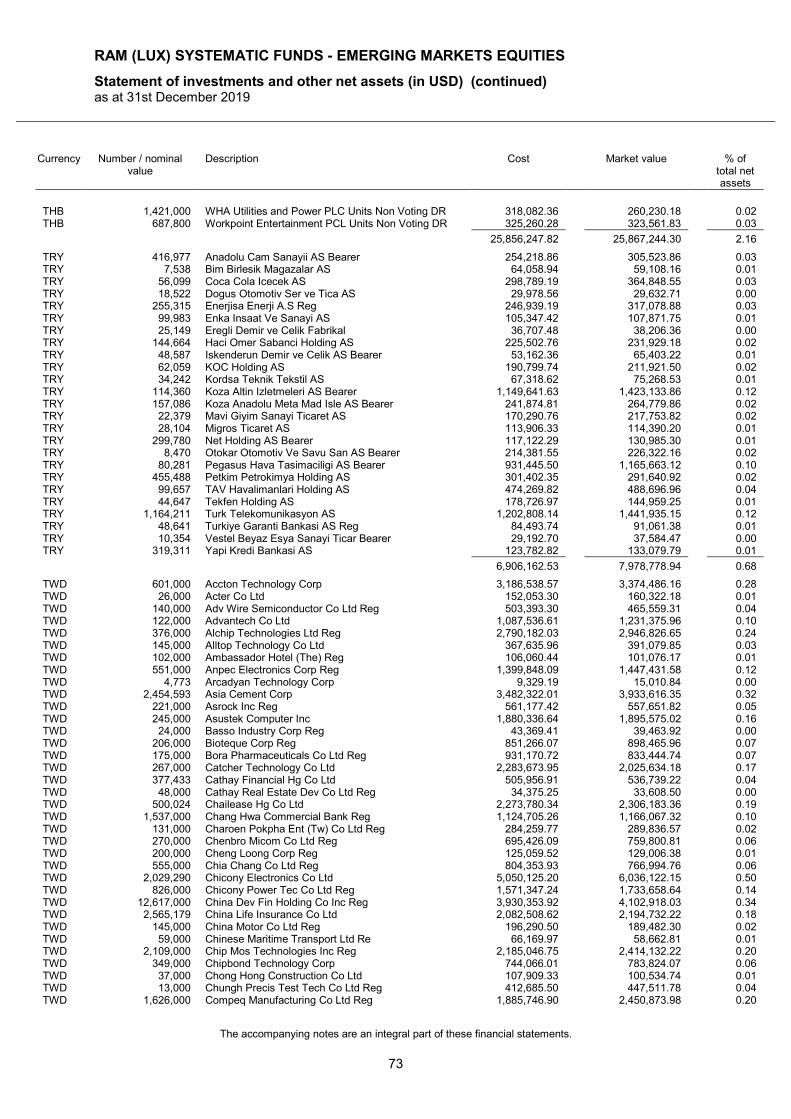
RAM (LUX) SYSTEMATIC FUNDS - EMERGING MARKETS EQUITIES
Statement of investments and other net assets (in USD) (continued) as at 31st December 2019
The accompanying notes are an integral part of these financial statements.
73
Currency Number / nominal value
Description Cost Market value % of total net assets
THB 1,421,000 WHA Utilities and Power PLC Units Non Voting DR 318,082.36 260,230.18 0.02 THB 687,800 Workpoint Entertainment PCL Units Non Voting DR 325,260.28 323,561.83 0.03
25,856,247.82 25,867,244.30 2.16
TRY 416,977 Anadolu Cam Sanayii AS Bearer 254,218.86 305,523.86 0.03 TRY 7,538 Bim Birlesik Magazalar AS 64,058.94 59,108.16 0.01 TRY 56,099 Coca Cola Icecek AS 298,789.19 364,848.55 0.03 TRY 18,522 Dogus Otomotiv Ser ve Tica AS 29,978.56 29,632.71 0.00 TRY 255,315 Enerjisa Enerji A.S Reg 246,939.19 317,078.88 0.03 TRY 99,983 Enka Insaat Ve Sanayi AS 105,347.42 107,871.75 0.01 TRY 25,149 Eregli Demir ve Celik Fabrikal 36,707.48 38,206.36 0.00 TRY 144,664 Haci Omer Sabanci Holding AS 225,502.76 231,929.18 0.02 TRY 48,587 Iskenderun Demir ve Celik AS Bearer 53,162.36 65,403.22 0.01 TRY 62,059 KOC Holding AS 190,799.74 211,921.50 0.02 TRY 34,242 Kordsa Teknik Tekstil AS 67,318.62 75,268.53 0.01 TRY 114,360 Koza Altin Izletmeleri AS Bearer 1,149,641.63 1,423,133.86 0.12 TRY 157,086 Koza Anadolu Meta Mad Isle AS Bearer 241,874.81 264,779.86 0.02 TRY 22,379 Mavi Giyim Sanayi Ticaret AS 170,290.76 217,753.82 0.02 TRY 28,104 Migros Ticaret AS 113,906.33 114,390.20 0.01 TRY 299,780 Net Holding AS Bearer 117,122.29 130,985.30 0.01 TRY 8,470 Otokar Otomotiv Ve Savu San AS Bearer 214,381.55 226,322.16 0.02 TRY 80,281 Pegasus Hava Tasimaciligi AS Bearer 931,445.50 1,165,663.12 0.10 TRY 455,488 Petkim Petrokimya Holding AS 301,402.35 291,640.92 0.02 TRY 99,657 TAV Havalimanlari Holding AS 474,269.82 488,696.96 0.04 TRY 44,647 Tekfen Holding AS 178,726.97 144,959.25 0.01 TRY 1,164,211 Turk Telekomunikasyon AS 1,202,808.14 1,441,935.15 0.12 TRY 48,641 Turkiye Garanti Bankasi AS Reg 84,493.74 91,061.38 0.01 TRY 10,354 Vestel Beyaz Esya Sanayi Ticar Bearer 29,192.70 37,584.47 0.00 TRY 319,311 Yapi Kredi Bankasi AS 123,782.82 133,079.79 0.01
6,906,162.53 7,978,778.94 0.68
TWD 601,000 Accton Technology Corp 3,186,538.57 3,374,486.16 0.28 TWD 26,000 Acter Co Ltd 152,053.30 160,322.18 0.01 TWD 140,000 Adv Wire Semiconductor Co Ltd Reg 503,393.30 465,559.31 0.04 TWD 122,000 Advantech Co Ltd 1,087,536.61 1,231,375.96 0.10 TWD 376,000 Alchip Technologies Ltd Reg 2,790,182.03 2,946,826.65 0.24 TWD 145,000 Alltop Technology Co Ltd 367,635.96 391,079.85 0.03 TWD 102,000 Ambassador Hotel (The) Reg 106,060.44 101,076.17 0.01 TWD 551,000 Anpec Electronics Corp Reg 1,399,848.09 1,447,431.58 0.12 TWD 4,773 Arcadyan Technology Corp 9,329.19 15,010.84 0.00 TWD 2,454,593 Asia Cement Corp 3,482,322.01 3,933,616.35 0.32 TWD 221,000 Asrock Inc Reg 561,177.42 557,651.82 0.05 TWD 245,000 Asustek Computer Inc 1,880,336.64 1,895,575.02 0.16 TWD 24,000 Basso Industry Corp Reg 43,369.41 39,463.92 0.00 TWD 206,000 Bioteque Corp Reg 851,266.07 898,465.96 0.07 TWD 175,000 Bora Pharmaceuticals Co Ltd Reg 931,170.72 833,444.74 0.07 TWD 267,000 Catcher Technology Co Ltd 2,283,673.95 2,025,634.18 0.17 TWD 377,433 Cathay Financial Hg Co Ltd 505,956.91 536,739.22 0.04 TWD 48,000 Cathay Real Estate Dev Co Ltd Reg 34,375.25 33,608.50 0.00 TWD 500,024 Chailease Hg Co Ltd 2,273,780.34 2,306,183.36 0.19 TWD 1,537,000 Chang Hwa Commercial Bank Reg 1,124,705.26 1,166,067.32 0.10 TWD 131,000 Charoen Pokpha Ent (Tw) Co Ltd Reg 284,259.77 289,836.57 0.02 TWD 270,000 Chenbro Micom Co Ltd Reg 695,426.09 759,800.81 0.06 TWD 200,000 Cheng Loong Corp Reg 125,059.52 129,006.38 0.01 TWD 555,000 Chia Chang Co Ltd Reg 804,353.93 766,994.76 0.06 TWD 2,029,290 Chicony Electronics Co Ltd 5,050,125.20 6,036,122.15 0.50 TWD 826,000 Chicony Power Tec Co Ltd Reg 1,571,347.24 1,733,658.64 0.14 TWD 12,617,000 China Dev Fin Holding Co Inc Reg 3,930,353.92 4,102,918.03 0.34 TWD 2,565,179 China Life Insurance Co Ltd 2,082,508.62 2,194,732.22 0.18 TWD 145,000 China Motor Co Ltd Reg 196,290.50 189,482.30 0.02 TWD 59,000 Chinese Maritime Transport Ltd Re 66,169.97 58,662.81 0.01 TWD 2,109,000 Chip Mos Technologies Inc Reg 2,185,046.75 2,414,132.22 0.20 TWD 349,000 Chipbond Technology Corp 744,066.01 783,824.07 0.06 TWD 37,000 Chong Hong Construction Co Ltd 107,909.33 100,534.74 0.01 TWD 13,000 Chungh Precis Test Tech Co Ltd Reg 412,685.50 447,511.78 0.04 TWD 1,626,000 Compeq Manufacturing Co Ltd Reg 1,885,746.90 2,450,873.98 0.20
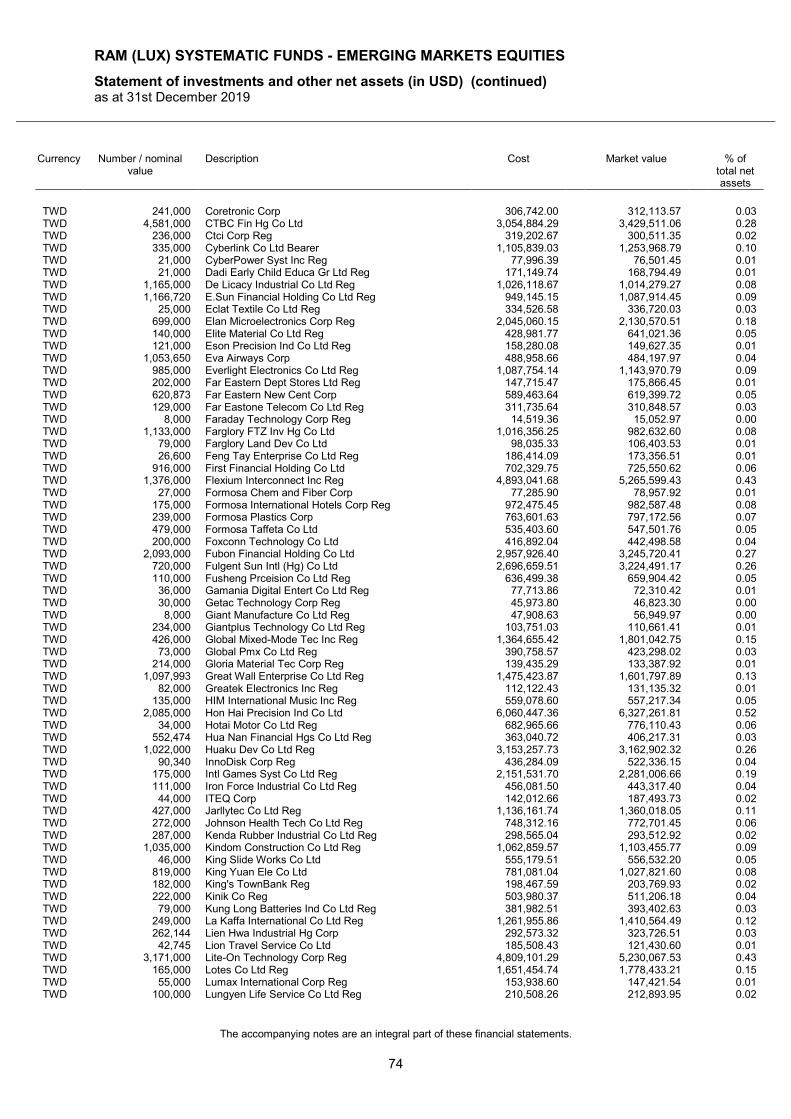
RAM (LUX) SYSTEMATIC FUNDS - EMERGING MARKETS EQUITIES
Statement of investments and other net assets (in USD) (continued) as at 31st December 2019
The accompanying notes are an integral part of these financial statements.
74
Currency Number / nominal value
Description Cost Market value % of total net assets
TWD 241,000 Coretronic Corp 306,742.00 312,113.57 0.03 TWD 4,581,000 CTBC Fin Hg Co Ltd 3,054,884.29 3,429,511.06 0.28 TWD 236,000 Ctci Corp Reg 319,202.67 300,511.35 0.02 TWD 335,000 Cyberlink Co Ltd Bearer 1,105,839.03 1,253,968.79 0.10 TWD 21,000 CyberPower Syst Inc Reg 77,996.39 76,501.45 0.01 TWD 21,000 Dadi Early Child Educa Gr Ltd Reg 171,149.74 168,794.49 0.01 TWD 1,165,000 De Licacy Industrial Co Ltd Reg 1,026,118.67 1,014,279.27 0.08 TWD 1,166,720 E.Sun Financial Holding Co Ltd Reg 949,145.15 1,087,914.45 0.09 TWD 25,000 Eclat Textile Co Ltd Reg 334,526.58 336,720.03 0.03 TWD 699,000 Elan Microelectronics Corp Reg 2,045,060.15 2,130,570.51 0.18 TWD 140,000 Elite Material Co Ltd Reg 428,981.77 641,021.36 0.05 TWD 121,000 Eson Precision Ind Co Ltd Reg 158,280.08 149,627.35 0.01 TWD 1,053,650 Eva Airways Corp 488,958.66 484,197.97 0.04 TWD 985,000 Everlight Electronics Co Ltd Reg 1,087,754.14 1,143,970.79 0.09 TWD 202,000 Far Eastern Dept Stores Ltd Reg 147,715.47 175,866.45 0.01 TWD 620,873 Far Eastern New Cent Corp 589,463.64 619,399.72 0.05 TWD 129,000 Far Eastone Telecom Co Ltd Reg 311,735.64 310,848.57 0.03 TWD 8,000 Faraday Technology Corp Reg 14,519.36 15,052.97 0.00 TWD 1,133,000 Farglory FTZ Inv Hg Co Ltd 1,016,356.25 982,632.60 0.08 TWD 79,000 Farglory Land Dev Co Ltd 98,035.33 106,403.53 0.01 TWD 26,600 Feng Tay Enterprise Co Ltd Reg 186,414.09 173,356.51 0.01 TWD 916,000 First Financial Holding Co Ltd 702,329.75 725,550.62 0.06 TWD 1,376,000 Flexium Interconnect Inc Reg 4,893,041.68 5,265,599.43 0.43 TWD 27,000 Formosa Chem and Fiber Corp 77,285.90 78,957.92 0.01 TWD 175,000 Formosa International Hotels Corp Reg 972,475.45 982,587.48 0.08 TWD 239,000 Formosa Plastics Corp 763,601.63 797,172.56 0.07 TWD 479,000 Formosa Taffeta Co Ltd 535,403.60 547,501.76 0.05 TWD 200,000 Foxconn Technology Co Ltd 416,892.04 442,498.58 0.04 TWD 2,093,000 Fubon Financial Holding Co Ltd 2,957,926.40 3,245,720.41 0.27 TWD 720,000 Fulgent Sun Intl (Hg) Co Ltd 2,696,659.51 3,224,491.17 0.26 TWD 110,000 Fusheng Prceision Co Ltd Reg 636,499.38 659,904.42 0.05 TWD 36,000 Gamania Digital Entert Co Ltd Reg 77,713.86 72,310.42 0.01 TWD 30,000 Getac Technology Corp Reg 45,973.80 46,823.30 0.00 TWD 8,000 Giant Manufacture Co Ltd Reg 47,908.63 56,949.97 0.00 TWD 234,000 Giantplus Technology Co Ltd Reg 103,751.03 110,661.41 0.01 TWD 426,000 Global Mixed-Mode Tec Inc Reg 1,364,655.42 1,801,042.75 0.15 TWD 73,000 Global Pmx Co Ltd Reg 390,758.57 423,298.02 0.03 TWD 214,000 Gloria Material Tec Corp Reg 139,435.29 133,387.92 0.01 TWD 1,097,993 Great Wall Enterprise Co Ltd Reg 1,475,423.87 1,601,797.89 0.13 TWD 82,000 Greatek Electronics Inc Reg 112,122.43 131,135.32 0.01 TWD 135,000 HIM International Music Inc Reg 559,078.60 557,217.34 0.05 TWD 2,085,000 Hon Hai Precision Ind Co Ltd 6,060,447.36 6,327,261.81 0.52 TWD 34,000 Hotai Motor Co Ltd Reg 682,965.66 776,110.43 0.06 TWD 552,474 Hua Nan Financial Hgs Co Ltd Reg 363,040.72 406,217.31 0.03 TWD 1,022,000 Huaku Dev Co Ltd Reg 3,153,257.73 3,162,902.32 0.26 TWD 90,340 InnoDisk Corp Reg 436,284.09 522,336.15 0.04 TWD 175,000 Intl Games Syst Co Ltd Reg 2,151,531.70 2,281,006.66 0.19 TWD 111,000 Iron Force Industrial Co Ltd Reg 456,081.50 443,317.40 0.04 TWD 44,000 ITEQ Corp 142,012.66 187,493.73 0.02 TWD 427,000 Jarllytec Co Ltd Reg 1,136,161.74 1,360,018.05 0.11 TWD 272,000 Johnson Health Tech Co Ltd Reg 748,312.16 772,701.45 0.06 TWD 287,000 Kenda Rubber Industrial Co Ltd Reg 298,565.04 293,512.92 0.02 TWD 1,035,000 Kindom Construction Co Ltd Reg 1,062,859.57 1,103,455.77 0.09 TWD 46,000 King Slide Works Co Ltd 555,179.51 556,532.20 0.05 TWD 819,000 King Yuan Ele Co Ltd 781,081.04 1,027,821.60 0.08 TWD 182,000 King's TownBank Reg 198,467.59 203,769.93 0.02 TWD 222,000 Kinik Co Reg 503,980.37 511,206.18 0.04 TWD 79,000 Kung Long Batteries Ind Co Ltd Reg 381,982.51 393,402.63 0.03 TWD 249,000 La Kaffa International Co Ltd Reg 1,261,955.86 1,410,564.49 0.12 TWD 262,144 Lien Hwa Industrial Hg Corp 292,573.32 323,726.51 0.03 TWD 42,745 Lion Travel Service Co Ltd 185,508.43 121,430.60 0.01 TWD 3,171,000 Lite-On Technology Corp Reg 4,809,101.29 5,230,067.53 0.43 TWD 165,000 Lotes Co Ltd Reg 1,651,454.74 1,778,433.21 0.15 TWD 55,000 Lumax International Corp Reg 153,938.60 147,421.54 0.01 TWD 100,000 Lungyen Life Service Co Ltd Reg 210,508.26 212,893.95 0.02
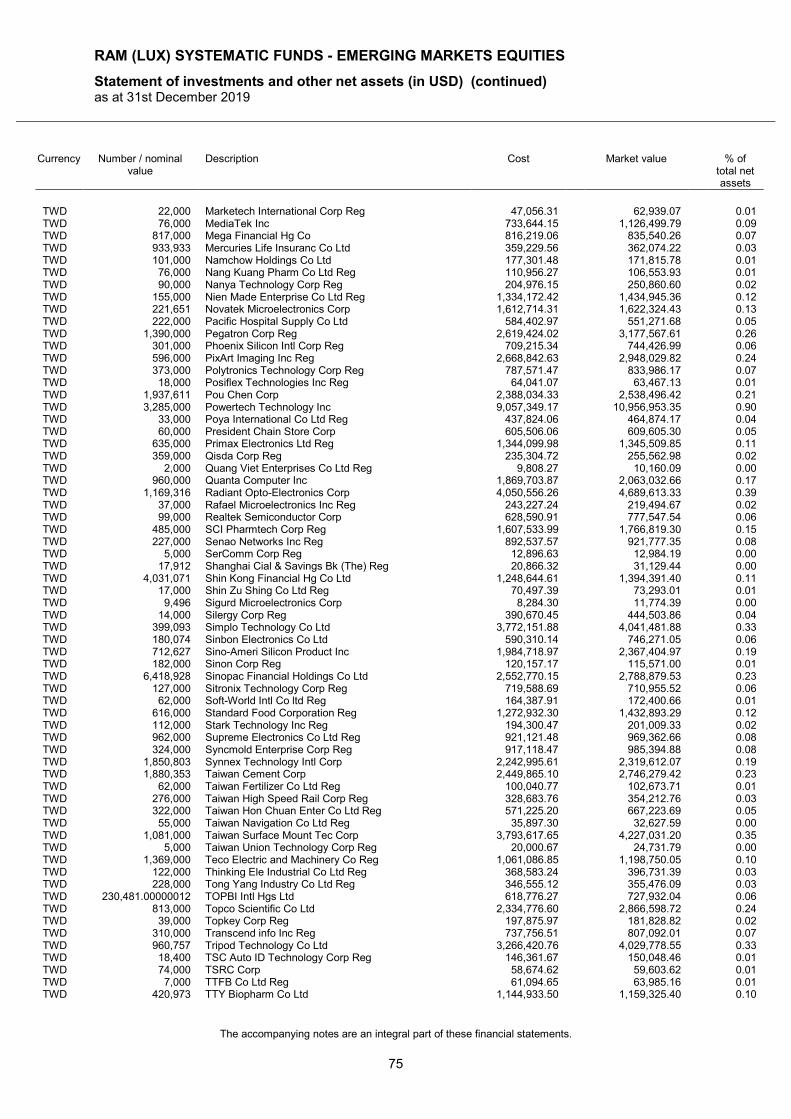
RAM (LUX) SYSTEMATIC FUNDS - EMERGING MARKETS EQUITIES
Statement of investments and other net assets (in USD) (continued) as at 31st December 2019
The accompanying notes are an integral part of these financial statements.
75
Currency Number / nominal value
Description Cost Market value % of total net assets
TWD 22,000 Marketech International Corp Reg 47,056.31 62,939.07 0.01 TWD 76,000 MediaTek Inc 733,644.15 1,126,499.79 0.09 TWD 817,000 Mega Financial Hg Co 816,219.06 835,540.26 0.07 TWD 933,933 Mercuries Life Insuranc Co Ltd 359,229.56 362,074.22 0.03 TWD 101,000 Namchow Holdings Co Ltd 177,301.48 171,815.78 0.01 TWD 76,000 Nang Kuang Pharm Co Ltd Reg 110,956.27 106,553.93 0.01 TWD 90,000 Nanya Technology Corp Reg 204,976.15 250,860.60 0.02 TWD 155,000 Nien Made Enterprise Co Ltd Reg 1,334,172.42 1,434,945.36 0.12 TWD 221,651 Novatek Microelectronics Corp 1,612,714.31 1,622,324.43 0.13 TWD 222,000 Pacific Hospital Supply Co Ltd 584,402.97 551,271.68 0.05 TWD 1,390,000 Pegatron Corp Reg 2,619,424.02 3,177,567.61 0.26 TWD 301,000 Phoenix Silicon Intl Corp Reg 709,215.34 744,426.99 0.06 TWD 596,000 PixArt Imaging Inc Reg 2,668,842.63 2,948,029.82 0.24 TWD 373,000 Polytronics Technology Corp Reg 787,571.47 833,986.17 0.07 TWD 18,000 Posiflex Technologies Inc Reg 64,041.07 63,467.13 0.01 TWD 1,937,611 Pou Chen Corp 2,388,034.33 2,538,496.42 0.21 TWD 3,285,000 Powertech Technology Inc 9,057,349.17 10,956,953.35 0.90 TWD 33,000 Poya International Co Ltd Reg 437,824.06 464,874.17 0.04 TWD 60,000 President Chain Store Corp 605,506.06 609,605.30 0.05 TWD 635,000 Primax Electronics Ltd Reg 1,344,099.98 1,345,509.85 0.11 TWD 359,000 Qisda Corp Reg 235,304.72 255,562.98 0.02 TWD 2,000 Quang Viet Enterprises Co Ltd Reg 9,808.27 10,160.09 0.00 TWD 960,000 Quanta Computer Inc 1,869,703.87 2,063,032.66 0.17 TWD 1,169,316 Radiant Opto-Electronics Corp 4,050,556.26 4,689,613.33 0.39 TWD 37,000 Rafael Microelectronics Inc Reg 243,227.24 219,494.67 0.02 TWD 99,000 Realtek Semiconductor Corp 628,590.91 777,547.54 0.06 TWD 485,000 SCI Pharmtech Corp Reg 1,607,533.99 1,766,819.30 0.15 TWD 227,000 Senao Networks Inc Reg 892,537.57 921,777.35 0.08 TWD 5,000 SerComm Corp Reg 12,896.63 12,984.19 0.00 TWD 17,912 Shanghai Cial & Savings Bk (The) Reg 20,866.32 31,129.44 0.00 TWD 4,031,071 Shin Kong Financial Hg Co Ltd 1,248,644.61 1,394,391.40 0.11 TWD 17,000 Shin Zu Shing Co Ltd Reg 70,497.39 73,293.01 0.01 TWD 9,496 Sigurd Microelectronics Corp 8,284.30 11,774.39 0.00 TWD 14,000 Silergy Corp Reg 390,670.45 444,503.86 0.04 TWD 399,093 Simplo Technology Co Ltd 3,772,151.88 4,041,481.88 0.33 TWD 180,074 Sinbon Electronics Co Ltd 590,310.14 746,271.05 0.06 TWD 712,627 Sino-Ameri Silicon Product Inc 1,984,718.97 2,367,404.97 0.19 TWD 182,000 Sinon Corp Reg 120,157.17 115,571.00 0.01 TWD 6,418,928 Sinopac Financial Holdings Co Ltd 2,552,770.15 2,788,879.53 0.23 TWD 127,000 Sitronix Technology Corp Reg 719,588.69 710,955.52 0.06 TWD 62,000 Soft-World Intl Co ltd Reg 164,387.91 172,400.66 0.01 TWD 616,000 Standard Food Corporation Reg 1,272,932.30 1,432,893.29 0.12 TWD 112,000 Stark Technology Inc Reg 194,300.47 201,009.33 0.02 TWD 962,000 Supreme Electronics Co Ltd Reg 921,121.48 969,362.66 0.08 TWD 324,000 Syncmold Enterprise Corp Reg 917,118.47 985,394.88 0.08 TWD 1,850,803 Synnex Technology Intl Corp 2,242,995.61 2,319,612.07 0.19 TWD 1,880,353 Taiwan Cement Corp 2,449,865.10 2,746,279.42 0.23 TWD 62,000 Taiwan Fertilizer Co Ltd Reg 100,040.77 102,673.71 0.01 TWD 276,000 Taiwan High Speed Rail Corp Reg 328,683.76 354,212.76 0.03 TWD 322,000 Taiwan Hon Chuan Enter Co Ltd Reg 571,225.20 667,223.69 0.05 TWD 55,000 Taiwan Navigation Co Ltd Reg 35,897.30 32,627.59 0.00 TWD 1,081,000 Taiwan Surface Mount Tec Corp 3,793,617.65 4,227,031.20 0.35 TWD 5,000 Taiwan Union Technology Corp Reg 20,000.67 24,731.79 0.00 TWD 1,369,000 Teco Electric and Machinery Co Reg 1,061,086.85 1,198,750.05 0.10 TWD 122,000 Thinking Ele Industrial Co Ltd Reg 368,583.24 396,731.39 0.03 TWD 228,000 Tong Yang Industry Co Ltd Reg 346,555.12 355,476.09 0.03 TWD 230,481.00000012 TOPBI Intl Hgs Ltd 618,776.27 727,932.04 0.06 TWD 813,000 Topco Scientific Co Ltd 2,334,776.60 2,866,598.72 0.24 TWD 39,000 Topkey Corp Reg 197,875.97 181,828.82 0.02 TWD 310,000 Transcend info Inc Reg 737,756.51 807,092.01 0.07 TWD 960,757 Tripod Technology Co Ltd 3,266,420.76 4,029,778.55 0.33 TWD 18,400 TSC Auto ID Technology Corp Reg 146,361.67 150,048.46 0.01 TWD 74,000 TSRC Corp 58,674.62 59,603.62 0.01 TWD 7,000 TTFB Co Ltd Reg 61,094.65 63,985.16 0.01 TWD 420,973 TTY Biopharm Co Ltd 1,144,933.50 1,159,325.40 0.10
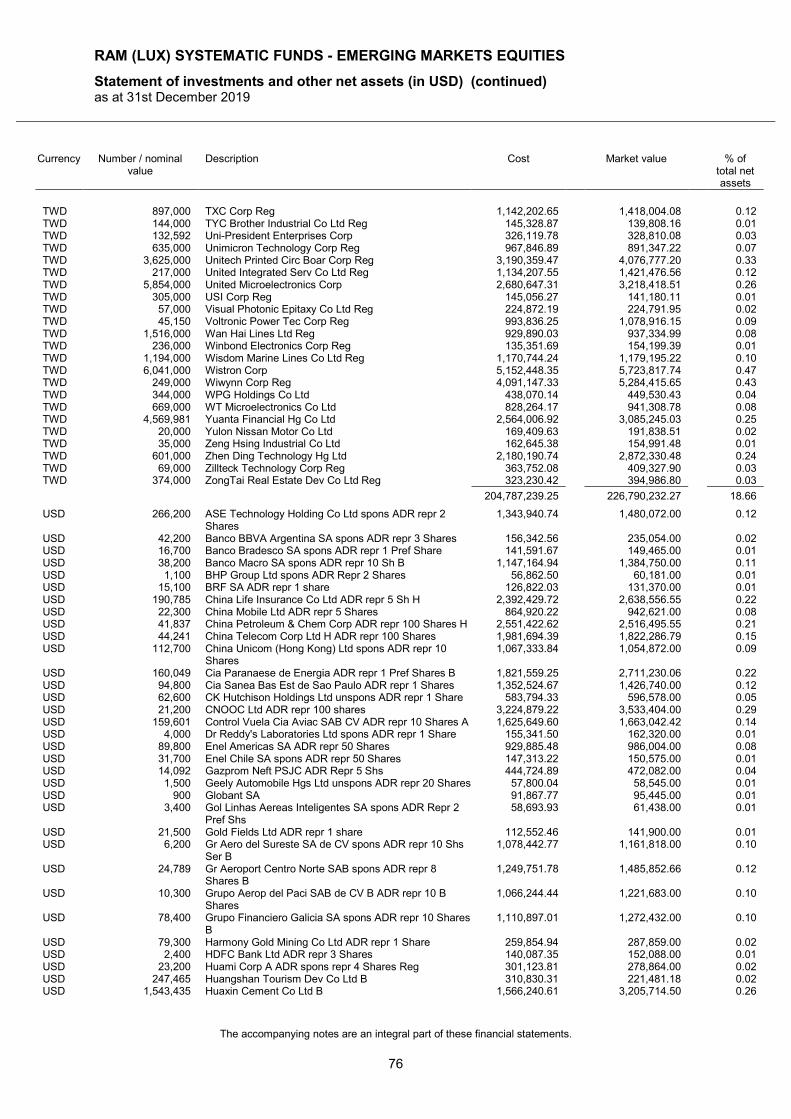
RAM (LUX) SYSTEMATIC FUNDS - EMERGING MARKETS EQUITIES
Statement of investments and other net assets (in USD) (continued) as at 31st December 2019
The accompanying notes are an integral part of these financial statements.
76
Currency Number / nominal value
Description Cost Market value % of total net assets
TWD 897,000 TXC Corp Reg 1,142,202.65 1,418,004.08 0.12 TWD 144,000 TYC Brother Industrial Co Ltd Reg 145,328.87 139,808.16 0.01 TWD 132,592 Uni-President Enterprises Corp 326,119.78 328,810.08 0.03 TWD 635,000 Unimicron Technology Corp Reg 967,846.89 891,347.22 0.07 TWD 3,625,000 Unitech Printed Circ Boar Corp Reg 3,190,359.47 4,076,777.20 0.33 TWD 217,000 United Integrated Serv Co Ltd Reg 1,134,207.55 1,421,476.56 0.12 TWD 5,854,000 United Microelectronics Corp 2,680,647.31 3,218,418.51 0.26 TWD 305,000 USI Corp Reg 145,056.27 141,180.11 0.01 TWD 57,000 Visual Photonic Epitaxy Co Ltd Reg 224,872.19 224,791.95 0.02 TWD 45,150 Voltronic Power Tec Corp Reg 993,836.25 1,078,916.15 0.09 TWD 1,516,000 Wan Hai Lines Ltd Reg 929,890.03 937,334.99 0.08 TWD 236,000 Winbond Electronics Corp Reg 135,351.69 154,199.39 0.01 TWD 1,194,000 Wisdom Marine Lines Co Ltd Reg 1,170,744.24 1,179,195.22 0.10 TWD 6,041,000 Wistron Corp 5,152,448.35 5,723,817.74 0.47 TWD 249,000 Wiwynn Corp Reg 4,091,147.33 5,284,415.65 0.43 TWD 344,000 WPG Holdings Co Ltd 438,070.14 449,530.43 0.04 TWD 669,000 WT Microelectronics Co Ltd 828,264.17 941,308.78 0.08 TWD 4,569,981 Yuanta Financial Hg Co Ltd 2,564,006.92 3,085,245.03 0.25 TWD 20,000 Yulon Nissan Motor Co Ltd 169,409.63 191,838.51 0.02 TWD 35,000 Zeng Hsing Industrial Co Ltd 162,645.38 154,991.48 0.01 TWD 601,000 Zhen Ding Technology Hg Ltd 2,180,190.74 2,872,330.48 0.24 TWD 69,000 Zillteck Technology Corp Reg 363,752.08 409,327.90 0.03 TWD 374,000 ZongTai Real Estate Dev Co Ltd Reg 323,230.42 394,986.80 0.03
204,787,239.25 226,790,232.27 18.66
USD 266,200 ASE Technology Holding Co Ltd spons ADR repr 2 Shares
1,343,940.74 1,480,072.00 0.12
USD 42,200 Banco BBVA Argentina SA spons ADR repr 3 Shares 156,342.56 235,054.00 0.02 USD 16,700 Banco Bradesco SA spons ADR repr 1 Pref Share 141,591.67 149,465.00 0.01 USD 38,200 Banco Macro SA spons ADR repr 10 Sh B 1,147,164.94 1,384,750.00 0.11 USD 1,100 BHP Group Ltd spons ADR Repr 2 Shares 56,862.50 60,181.00 0.01 USD 15,100 BRF SA ADR repr 1 share 126,822.03 131,370.00 0.01 USD 190,785 China Life Insurance Co Ltd ADR repr 5 Sh H 2,392,429.72 2,638,556.55 0.22 USD 22,300 China Mobile Ltd ADR repr 5 Shares 864,920.22 942,621.00 0.08 USD 41,837 China Petroleum & Chem Corp ADR repr 100 Shares H 2,551,422.62 2,516,495.55 0.21 USD 44,241 China Telecom Corp Ltd H ADR repr 100 Shares 1,981,694.39 1,822,286.79 0.15 USD 112,700 China Unicom (Hong Kong) Ltd spons ADR repr 10
Shares 1,067,333.84 1,054,872.00 0.09
USD 160,049 Cia Paranaese de Energia ADR repr 1 Pref Shares B 1,821,559.25 2,711,230.06 0.22 USD 94,800 Cia Sanea Bas Est de Sao Paulo ADR repr 1 Shares 1,352,524.67 1,426,740.00 0.12 USD 62,600 CK Hutchison Holdings Ltd unspons ADR repr 1 Share 583,794.33 596,578.00 0.05 USD 21,200 CNOOC Ltd ADR repr 100 shares 3,224,879.22 3,533,404.00 0.29 USD 159,601 Control Vuela Cia Aviac SAB CV ADR repr 10 Shares A 1,625,649.60 1,663,042.42 0.14 USD 4,000 Dr Reddy's Laboratories Ltd spons ADR repr 1 Share 155,341.50 162,320.00 0.01 USD 89,800 Enel Americas SA ADR repr 50 Shares 929,885.48 986,004.00 0.08 USD 31,700 Enel Chile SA spons ADR repr 50 Shares 147,313.22 150,575.00 0.01 USD 14,092 Gazprom Neft PSJC ADR Repr 5 Shs 444,724.89 472,082.00 0.04 USD 1,500 Geely Automobile Hgs Ltd unspons ADR repr 20 Shares 57,800.04 58,545.00 0.01 USD 900 Globant SA 91,867.77 95,445.00 0.01 USD 3,400 Gol Linhas Aereas Inteligentes SA spons ADR Repr 2
Pref Shs 58,693.93 61,438.00 0.01
USD 21,500 Gold Fields Ltd ADR repr 1 share 112,552.46 141,900.00 0.01 USD 6,200 Gr Aero del Sureste SA de CV spons ADR repr 10 Shs
Ser B 1,078,442.77 1,161,818.00 0.10
USD 24,789 Gr Aeroport Centro Norte SAB spons ADR repr 8 Shares B
1,249,751.78 1,485,852.66 0.12
USD 10,300 Grupo Aerop del Paci SAB de CV B ADR repr 10 B Shares
1,066,244.44 1,221,683.00 0.10
USD 78,400 Grupo Financiero Galicia SA spons ADR repr 10 Shares B
1,110,897.01 1,272,432.00 0.10
USD 79,300 Harmony Gold Mining Co Ltd ADR repr 1 Share 259,854.94 287,859.00 0.02 USD 2,400 HDFC Bank Ltd ADR repr 3 Shares 140,087.35 152,088.00 0.01 USD 23,200 Huami Corp A ADR spons repr 4 Shares Reg 301,123.81 278,864.00 0.02 USD 247,465 Huangshan Tourism Dev Co Ltd B 310,830.31 221,481.18 0.02 USD 1,543,435 Huaxin Cement Co Ltd B 1,566,240.61 3,205,714.50 0.26

RAM (LUX) SYSTEMATIC FUNDS - EMERGING MARKETS EQUITIES
Statement of investments and other net assets (in USD) (continued) as at 31st December 2019
The accompanying notes are an integral part of these financial statements.
77
Currency Number / nominal value
Description Cost Market value % of total net assets
USD 27,200 ICICI Bank Ltd ADR repr 2 Shares 386,719.59 410,448.00 0.03 USD 4,300 Impala Platinum Holdings Ltd spons ADR repr 1 Share 32,870.00 44,032.00 0.00 USD 9,200 Industr & Cial Bk of China Ltd H unspons ADR Repr 20
Shs 132,844.85 141,358.00 0.01
USD 101,100 Infosys Ltd spons ADR repr 1 Share 1,052,629.47 1,043,352.00 0.09 USD 220,900 Inner Mongol Yitai Coal Co Ltd B 225,469.84 178,929.00 0.01 USD 3,800 Jardine Matheson Holdings Ltd 207,975.91 211,280.00 0.02 USD 14,797 Jardine Strategic Hgs Ltd 461,481.61 453,528.05 0.04 USD 80,935 KB Financial Gr Inc ADR repr 1 Share 3,014,137.94 3,348,280.95 0.28 USD 222,635 KT Corp spons ADR repr 0.5 Share 2,676,205.92 2,582,566.00 0.21 USD 174,782 Lao Feng Xiang Co Ltd B 599,685.96 571,711.92 0.05 USD 37,700 Latam Airlines Gr SA spons ADR repr 1 Share 414,411.58 383,032.00 0.03 USD 8,000 LG Display Co Ltd spons ADR repr 0.5 Shares 50,224.00 55,520.00 0.00 USD 45,600 Mandarin Oriental Intl Ltd 75,861.93 82,992.00 0.01 USD 56,100 Momo Inc spons ADR repr 2 Shares A 2,025,892.15 1,879,350.00 0.15 USD 1,000 Netease Inc ADR Repr 1 Share 303,648.50 306,640.00 0.03 USD 21,600 New Oriental Educ & Tec Gr Inc ADR repr 1 Share 2,555,190.34 2,619,000.00 0.22 USD 1,328 Nice Ltd spons ADR repr 1 Share 199,967.63 206,039.20 0.02 USD 97,480 Oil Co Lukoil PJSC spons ADR repr 1 Share 8,414,078.53 9,668,066.40 0.79 USD 36,427 PetroChina Co Ltd ADR repr 100 H Shares 1,832,996.30 1,833,370.91 0.15 USD 63,900 Petroleo Brasileiro SA spons ADR repr 2 Shares 968,631.89 1,018,566.00 0.08 USD 143,693 Phosagro PJSC spons GDR repr 1/3 Reg Shares 1,835,943.99 1,824,901.10 0.15 USD 20,700 Ping An Ins Gr Co of Cn Ltd spons ADR repr 2 Shares
H Reg 493,546.60 492,660.00 0.04
USD 16,900 PLDT inc Spons ADR repr 1 Share 352,261.70 337,831.00 0.03 USD 137,270 Rosneft Oil Co GDR repr 1 Share Reg 968,965.09 989,442.16 0.08 USD 981,739 Shanghai Baosight Softw Co Ltd B 1,563,186.95 1,873,158.01 0.15 USD 493,100 Shanghai Chlor-Alkali Chemical B 351,987.48 277,122.20 0.02 USD 198,107 Shanghai Ji Jia Intl Ho Co Ltd B 472,761.68 374,620.34 0.03 USD 42,501 Shinhan Financial Group Co Ltd spons ADR repr 1
Share 1,645,947.74 1,618,013.07 0.13
USD 119,100 Sibanye-Stillwater Ltd ADR repr 4 Shares 881,908.03 1,182,663.00 0.10 USD 15,888 Sinopec Shanghai Petroc Co Ltd spons ADR repr 100
Shares H 462,981.17 485,378.40 0.04
USD 28,700 SK Telecom Co Ltd ADR repr 0.111 Share 654,463.40 663,257.00 0.05 USD 457,986 Surgutneftegas PJSC ADR repr 10 Shares 2,374,723.26 3,693,657.09 0.30 USD 24,300 Taiwan Semiconduct Mfg Co Ltd ADR repr 5 Shares 1,236,963.51 1,411,830.00 0.12 USD 52,686 Tatneft PJSC spons ADR repr 6 Shares 3,566,406.35 3,891,387.96 0.32 USD 137,800 Telefonica Brasil SA spons ADR repr 1 Share 1,861,634.86 1,973,296.00 0.16 USD 279,600 Tim Participacoes SA spons ADR repr 5 Shares 4,523,606.29 5,343,156.00 0.44 USD 22,000 Transportadora de Gas spons ADR repr 5 Shares B
Reg 134,747.80 157,740.00 0.01
USD 4,400 Turkcell Iletisim Hizmet ADR repr 2.5 Sh 25,916.44 25,520.00 0.00 USD 60,900 Ultrapar Particip SA spons ADR repr 1 Share 305,377.56 381,234.00 0.03 USD 350,697 United Microelectronics Corp ADR repr 5 Shares 828,204.98 939,867.96 0.08 USD 435,600 Vipshop Holdings Ltd spons ADR repr 2 Shares 4,001,623.98 6,172,452.00 0.51 USD 15,000 Westpac Banking Corp spons ADR repr 1 Share 282,763.87 254,700.00 0.02 USD 106,909 Wipro Ltd spons ADR repr 1 Share 400,420.95 400,908.75 0.03 USD 32,562 WNS Holdings spons ADR repr 1 Share 1,566,493.35 2,153,976.30 0.18 USD 4,745 Woori Financial Group Inc ADR spons repr 3 Share 144,247.54 143,583.70 0.01 USD 5,500 ZTO Express (Cayman) Inc A spons ADS repr 1 Share A 115,355.50 128,425.00 0.01
86,203,948.62 97,991,663.18 8.04
ZAR 110,841 Adcock Ingram Holdings Ltd 497,765.16 426,500.65 0.04 ZAR 238,464 African Rainbow Minerals Ltd 2,385,489.31 2,792,311.31 0.23 ZAR 96,042 Allied Ele Corp Ltd Altron A Reg 173,324.58 158,734.61 0.01 ZAR 48,918 Anglo American Platinum Ltd 2,264,613.69 4,575,645.64 0.38 ZAR 65,371 Astral Foods Ltd 946,481.51 1,015,648.49 0.08 ZAR 32,404 Barclays Africa Group Ltd Reg 329,480.58 346,144.07 0.03 ZAR 107,024 Barloworld Ltd 882,272.15 863,215.34 0.07 ZAR 53,549 Bid Corp Ltd Reg 1,191,435.86 1,265,144.26 0.10 ZAR 101,125 Bidvest Group Ltd 1,417,471.04 1,481,573.93 0.12 ZAR 173,128 Brait SE 181,740.26 172,179.16 0.01 ZAR 4,811 Capitec Bank Holdings Ltd 447,788.17 497,801.47 0.04 ZAR 165,372 Clicks Group Ltd 2,555,378.27 3,035,988.83 0.25
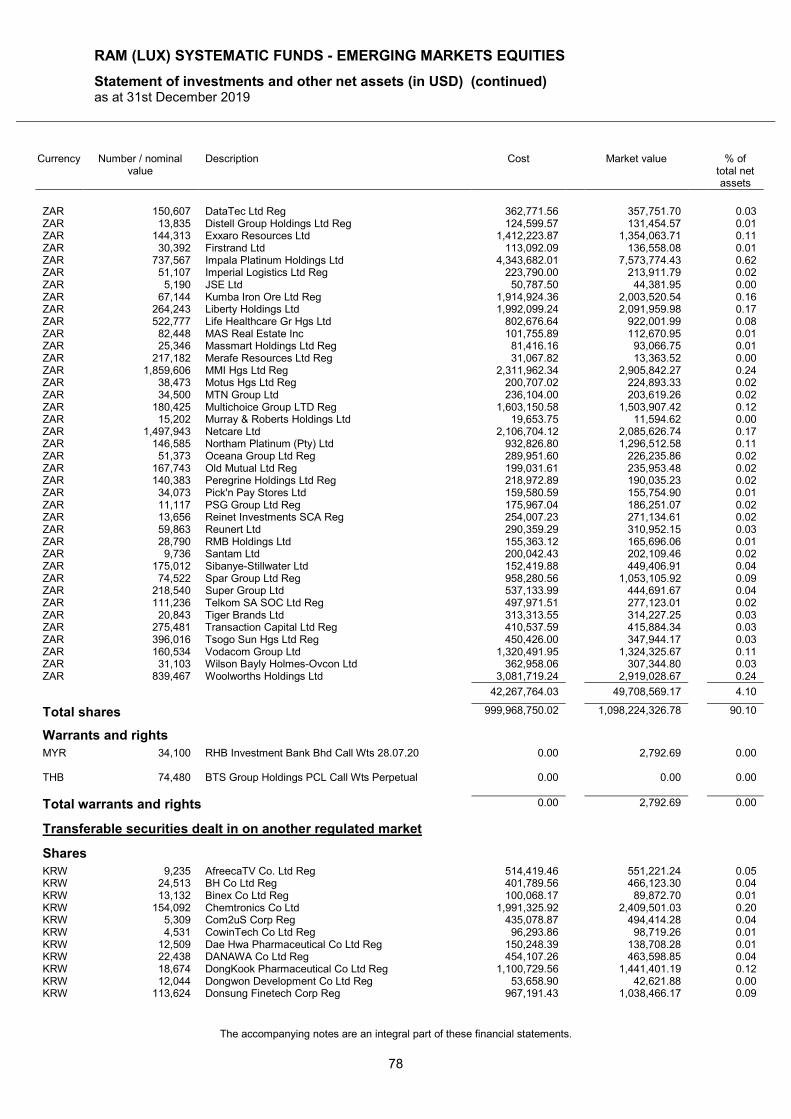
RAM (LUX) SYSTEMATIC FUNDS - EMERGING MARKETS EQUITIES
Statement of investments and other net assets (in USD) (continued) as at 31st December 2019
The accompanying notes are an integral part of these financial statements.
78
Currency Number / nominal value
Description Cost Market value % of total net assets
ZAR 150,607 DataTec Ltd Reg 362,771.56 357,751.70 0.03 ZAR 13,835 Distell Group Holdings Ltd Reg 124,599.57 131,454.57 0.01 ZAR 144,313 Exxaro Resources Ltd 1,412,223.87 1,354,063.71 0.11 ZAR 30,392 Firstrand Ltd 113,092.09 136,558.08 0.01 ZAR 737,567 Impala Platinum Holdings Ltd 4,343,682.01 7,573,774.43 0.62 ZAR 51,107 Imperial Logistics Ltd Reg 223,790.00 213,911.79 0.02 ZAR 5,190 JSE Ltd 50,787.50 44,381.95 0.00 ZAR 67,144 Kumba Iron Ore Ltd Reg 1,914,924.36 2,003,520.54 0.16 ZAR 264,243 Liberty Holdings Ltd 1,992,099.24 2,091,959.98 0.17 ZAR 522,777 Life Healthcare Gr Hgs Ltd 802,676.64 922,001.99 0.08 ZAR 82,448 MAS Real Estate Inc 101,755.89 112,670.95 0.01 ZAR 25,346 Massmart Holdings Ltd Reg 81,416.16 93,066.75 0.01 ZAR 217,182 Merafe Resources Ltd Reg 31,067.82 13,363.52 0.00 ZAR 1,859,606 MMI Hgs Ltd Reg 2,311,962.34 2,905,842.27 0.24 ZAR 38,473 Motus Hgs Ltd Reg 200,707.02 224,893.33 0.02 ZAR 34,500 MTN Group Ltd 236,104.00 203,619.26 0.02 ZAR 180,425 Multichoice Group LTD Reg 1,603,150.58 1,503,907.42 0.12 ZAR 15,202 Murray & Roberts Holdings Ltd 19,653.75 11,594.62 0.00 ZAR 1,497,943 Netcare Ltd 2,106,704.12 2,085,626.74 0.17 ZAR 146,585 Northam Platinum (Pty) Ltd 932,826.80 1,296,512.58 0.11 ZAR 51,373 Oceana Group Ltd Reg 289,951.60 226,235.86 0.02 ZAR 167,743 Old Mutual Ltd Reg 199,031.61 235,953.48 0.02 ZAR 140,383 Peregrine Holdings Ltd Reg 218,972.89 190,035.23 0.02 ZAR 34,073 Pick'n Pay Stores Ltd 159,580.59 155,754.90 0.01 ZAR 11,117 PSG Group Ltd Reg 175,967.04 186,251.07 0.02 ZAR 13,656 Reinet Investments SCA Reg 254,007.23 271,134.61 0.02 ZAR 59,863 Reunert Ltd 290,359.29 310,952.15 0.03 ZAR 28,790 RMB Holdings Ltd 155,363.12 165,696.06 0.01 ZAR 9,736 Santam Ltd 200,042.43 202,109.46 0.02 ZAR 175,012 Sibanye-Stillwater Ltd 152,419.88 449,406.91 0.04 ZAR 74,522 Spar Group Ltd Reg 958,280.56 1,053,105.92 0.09 ZAR 218,540 Super Group Ltd 537,133.99 444,691.67 0.04 ZAR 111,236 Telkom SA SOC Ltd Reg 497,971.51 277,123.01 0.02 ZAR 20,843 Tiger Brands Ltd 313,313.55 314,227.25 0.03 ZAR 275,481 Transaction Capital Ltd Reg 410,537.59 415,884.34 0.03 ZAR 396,016 Tsogo Sun Hgs Ltd Reg 450,426.00 347,944.17 0.03 ZAR 160,534 Vodacom Group Ltd 1,320,491.95 1,324,325.67 0.11 ZAR 31,103 Wilson Bayly Holmes-Ovcon Ltd 362,958.06 307,344.80 0.03 ZAR 839,467 Woolworths Holdings Ltd 3,081,719.24 2,919,028.67 0.24
42,267,764.03 49,708,569.17 4.10
Total shares 999,968,750.02 1,098,224,326.78 90.10
Warrants and rights
MYR 34,100 RHB Investment Bank Bhd Call Wts 28.07.20 0.00 2,792.69 0.00 THB 74,480 BTS Group Holdings PCL Call Wts Perpetual 0.00 0.00 0.00
Total warrants and rights 0.00 2,792.69 0.00
Transferable securities dealt in on another regulated market
Shares
KRW 9,235 AfreecaTV Co. Ltd Reg 514,419.46 551,221.24 0.05 KRW 24,513 BH Co Ltd Reg 401,789.56 466,123.30 0.04 KRW 13,132 Binex Co Ltd Reg 100,068.17 89,872.70 0.01 KRW 154,092 Chemtronics Co Ltd 1,991,325.92 2,409,501.03 0.20 KRW 5,309 Com2uS Corp Reg 435,078.87 494,414.28 0.04 KRW 4,531 CowinTech Co Ltd Reg 96,293.86 98,719.26 0.01 KRW 12,509 Dae Hwa Pharmaceutical Co Ltd Reg 150,248.39 138,708.28 0.01 KRW 22,438 DANAWA Co Ltd Reg 454,107.26 463,598.85 0.04 KRW 18,674 DongKook Pharmaceutical Co Ltd Reg 1,100,729.56 1,441,401.19 0.12 KRW 12,044 Dongwon Development Co Ltd Reg 53,658.90 42,621.88 0.00 KRW 113,624 Donsung Finetech Corp Reg 967,191.43 1,038,466.17 0.09
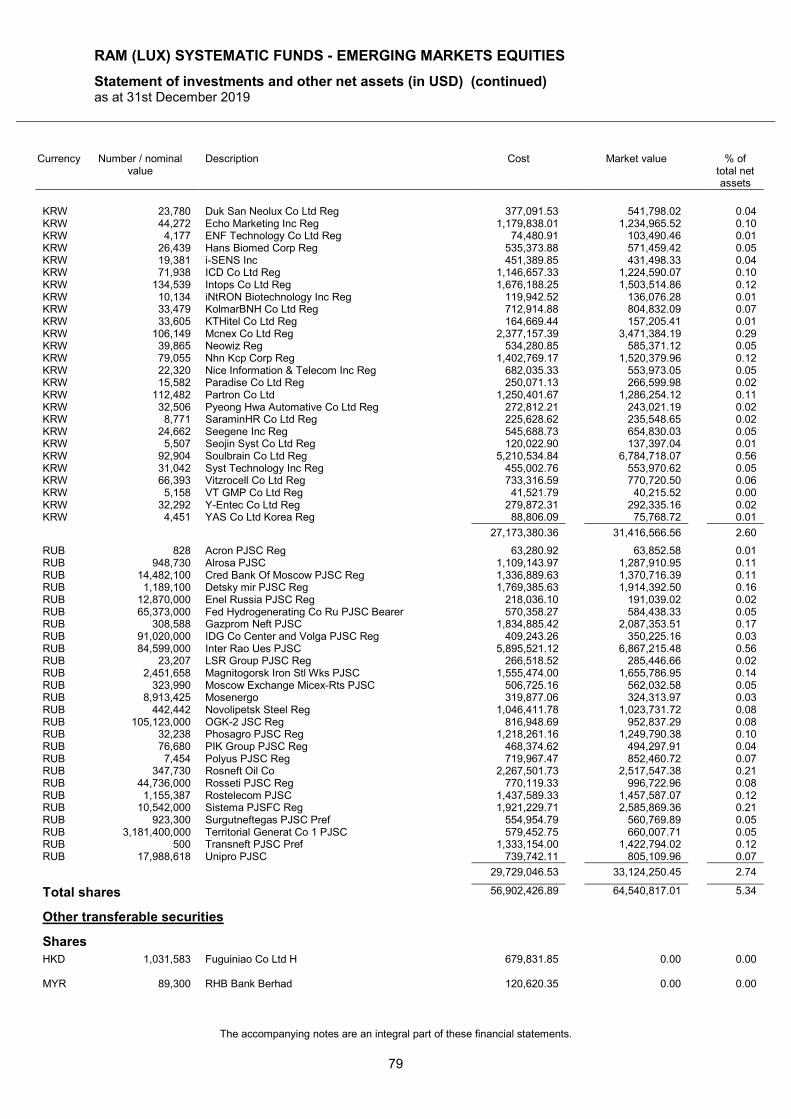
RAM (LUX) SYSTEMATIC FUNDS - EMERGING MARKETS EQUITIES
Statement of investments and other net assets (in USD) (continued) as at 31st December 2019
The accompanying notes are an integral part of these financial statements.
79
Currency Number / nominal value
Description Cost Market value % of total net assets
KRW 23,780 Duk San Neolux Co Ltd Reg 377,091.53 541,798.02 0.04 KRW 44,272 Echo Marketing Inc Reg 1,179,838.01 1,234,965.52 0.10 KRW 4,177 ENF Technology Co Ltd Reg 74,480.91 103,490.46 0.01 KRW 26,439 Hans Biomed Corp Reg 535,373.88 571,459.42 0.05 KRW 19,381 i-SENS Inc 451,389.85 431,498.33 0.04 KRW 71,938 ICD Co Ltd Reg 1,146,657.33 1,224,590.07 0.10 KRW 134,539 Intops Co Ltd Reg 1,676,188.25 1,503,514.86 0.12 KRW 10,134 iNtRON Biotechnology Inc Reg 119,942.52 136,076.28 0.01 KRW 33,479 KolmarBNH Co Ltd Reg 712,914.88 804,832.09 0.07 KRW 33,605 KTHitel Co Ltd Reg 164,669.44 157,205.41 0.01 KRW 106,149 Mcnex Co Ltd Reg 2,377,157.39 3,471,384.19 0.29 KRW 39,865 Neowiz Reg 534,280.85 585,371.12 0.05 KRW 79,055 Nhn Kcp Corp Reg 1,402,769.17 1,520,379.96 0.12 KRW 22,320 Nice Information & Telecom Inc Reg 682,035.33 553,973.05 0.05 KRW 15,582 Paradise Co Ltd Reg 250,071.13 266,599.98 0.02 KRW 112,482 Partron Co Ltd 1,250,401.67 1,286,254.12 0.11 KRW 32,506 Pyeong Hwa Automative Co Ltd Reg 272,812.21 243,021.19 0.02 KRW 8,771 SaraminHR Co Ltd Reg 225,628.62 235,548.65 0.02 KRW 24,662 Seegene Inc Reg 545,688.73 654,830.03 0.05 KRW 5,507 Seojin Syst Co Ltd Reg 120,022.90 137,397.04 0.01 KRW 92,904 Soulbrain Co Ltd Reg 5,210,534.84 6,784,718.07 0.56 KRW 31,042 Syst Technology Inc Reg 455,002.76 553,970.62 0.05 KRW 66,393 Vitzrocell Co Ltd Reg 733,316.59 770,720.50 0.06 KRW 5,158 VT GMP Co Ltd Reg 41,521.79 40,215.52 0.00 KRW 32,292 Y-Entec Co Ltd Reg 279,872.31 292,335.16 0.02 KRW 4,451 YAS Co Ltd Korea Reg 88,806.09 75,768.72 0.01
27,173,380.36 31,416,566.56 2.60
RUB 828 Acron PJSC Reg 63,280.92 63,852.58 0.01 RUB 948,730 Alrosa PJSC 1,109,143.97 1,287,910.95 0.11 RUB 14,482,100 Cred Bank Of Moscow PJSC Reg 1,336,889.63 1,370,716.39 0.11 RUB 1,189,100 Detsky mir PJSC Reg 1,769,385.63 1,914,392.50 0.16 RUB 12,870,000 Enel Russia PJSC Reg 218,036.10 191,039.02 0.02 RUB 65,373,000 Fed Hydrogenerating Co Ru PJSC Bearer 570,358.27 584,438.33 0.05 RUB 308,588 Gazprom Neft PJSC 1,834,885.42 2,087,353.51 0.17 RUB 91,020,000 IDG Co Center and Volga PJSC Reg 409,243.26 350,225.16 0.03 RUB 84,599,000 Inter Rao Ues PJSC 5,895,521.12 6,867,215.48 0.56 RUB 23,207 LSR Group PJSC Reg 266,518.52 285,446.66 0.02 RUB 2,451,658 Magnitogorsk Iron Stl Wks PJSC 1,555,474.00 1,655,786.95 0.14 RUB 323,990 Moscow Exchange Micex-Rts PJSC 506,725.16 562,032.58 0.05 RUB 8,913,425 Mosenergo 319,877.06 324,313.97 0.03 RUB 442,442 Novolipetsk Steel Reg 1,046,411.78 1,023,731.72 0.08 RUB 105,123,000 OGK-2 JSC Reg 816,948.69 952,837.29 0.08 RUB 32,238 Phosagro PJSC Reg 1,218,261.16 1,249,790.38 0.10 RUB 76,680 PIK Group PJSC Reg 468,374.62 494,297.91 0.04 RUB 7,454 Polyus PJSC Reg 719,967.47 852,460.72 0.07 RUB 347,730 Rosneft Oil Co 2,267,501.73 2,517,547.38 0.21 RUB 44,736,000 Rosseti PJSC Reg 770,119.33 996,722.96 0.08 RUB 1,155,387 Rostelecom PJSC 1,437,589.33 1,457,587.07 0.12 RUB 10,542,000 Sistema PJSFC Reg 1,921,229.71 2,585,869.36 0.21 RUB 923,300 Surgutneftegas PJSC Pref 554,954.79 560,769.89 0.05 RUB 3,181,400,000 Territorial Generat Co 1 PJSC 579,452.75 660,007.71 0.05 RUB 500 Transneft PJSC Pref 1,333,154.00 1,422,794.02 0.12 RUB 17,988,618 Unipro PJSC 739,742.11 805,109.96 0.07
29,729,046.53 33,124,250.45 2.74
Total shares 56,902,426.89 64,540,817.01 5.34
Other transferable securities
Shares
HKD 1,031,583 Fuguiniao Co Ltd H 679,831.85 0.00 0.00 MYR 89,300 RHB Bank Berhad 120,620.35 0.00 0.00
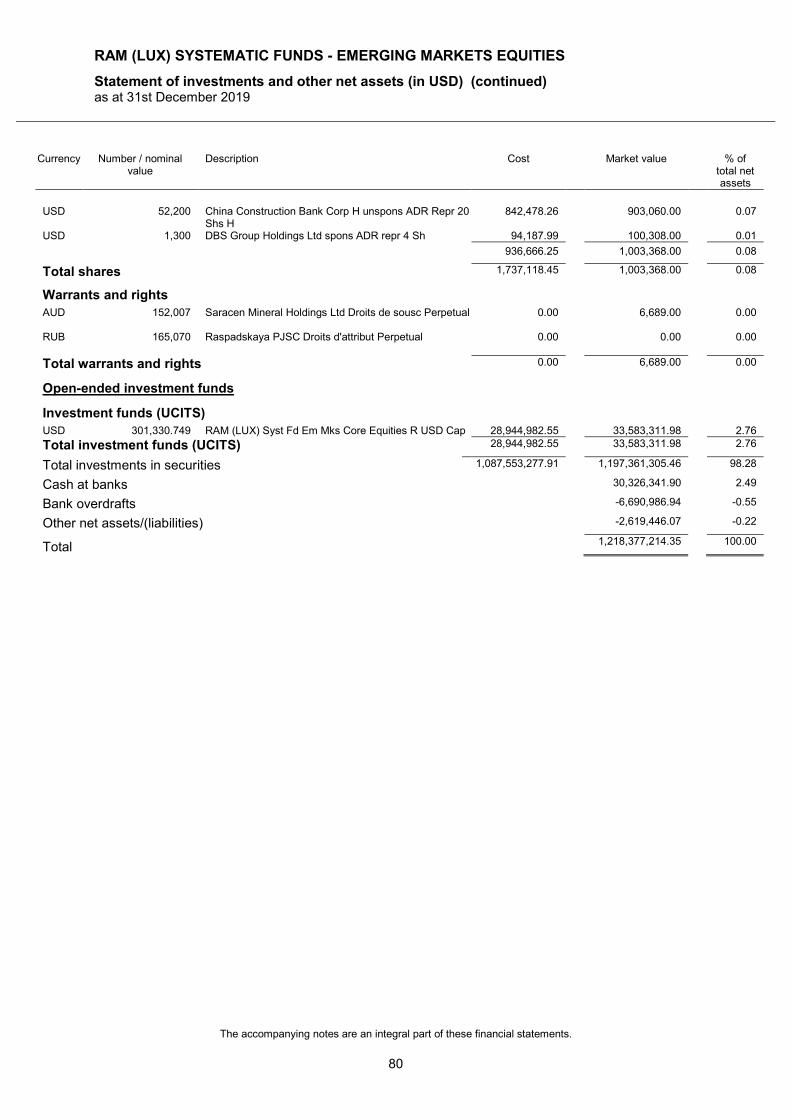
RAM (LUX) SYSTEMATIC FUNDS - EMERGING MARKETS EQUITIES
Statement of investments and other net assets (in USD) (continued) as at 31st December 2019
The accompanying notes are an integral part of these financial statements.
80
Currency Number / nominal value
Description Cost Market value % of total net assets
USD 52,200 China Construction Bank Corp H unspons ADR Repr 20
Shs H 842,478.26 903,060.00 0.07
USD 1,300 DBS Group Holdings Ltd spons ADR repr 4 Sh 94,187.99 100,308.00 0.01
936,666.25 1,003,368.00 0.08
Total shares 1,737,118.45 1,003,368.00 0.08
Warrants and rights
AUD 152,007 Saracen Mineral Holdings Ltd Droits de sousc Perpetual 0.00 6,689.00 0.00 RUB 165,070 Raspadskaya PJSC Droits d'attribut Perpetual 0.00 0.00 0.00
Total warrants and rights 0.00 6,689.00 0.00
Open-ended investment funds
Investment funds (UCITS)
USD 301,330.749 RAM (LUX) Syst Fd Em Mks Core Equities R USD Cap 28,944,982.55 33,583,311.98 2.76
Total investment funds (UCITS) 28,944,982.55 33,583,311.98 2.76
Total investments in securities 1,087,553,277.91 1,197,361,305.46 98.28
Cash at banks 30,326,341.90 2.49
Bank overdrafts -6,690,986.94 -0.55
Other net assets/(liabilities) -2,619,446.07 -0.22
Total 1,218,377,214.35 100.00
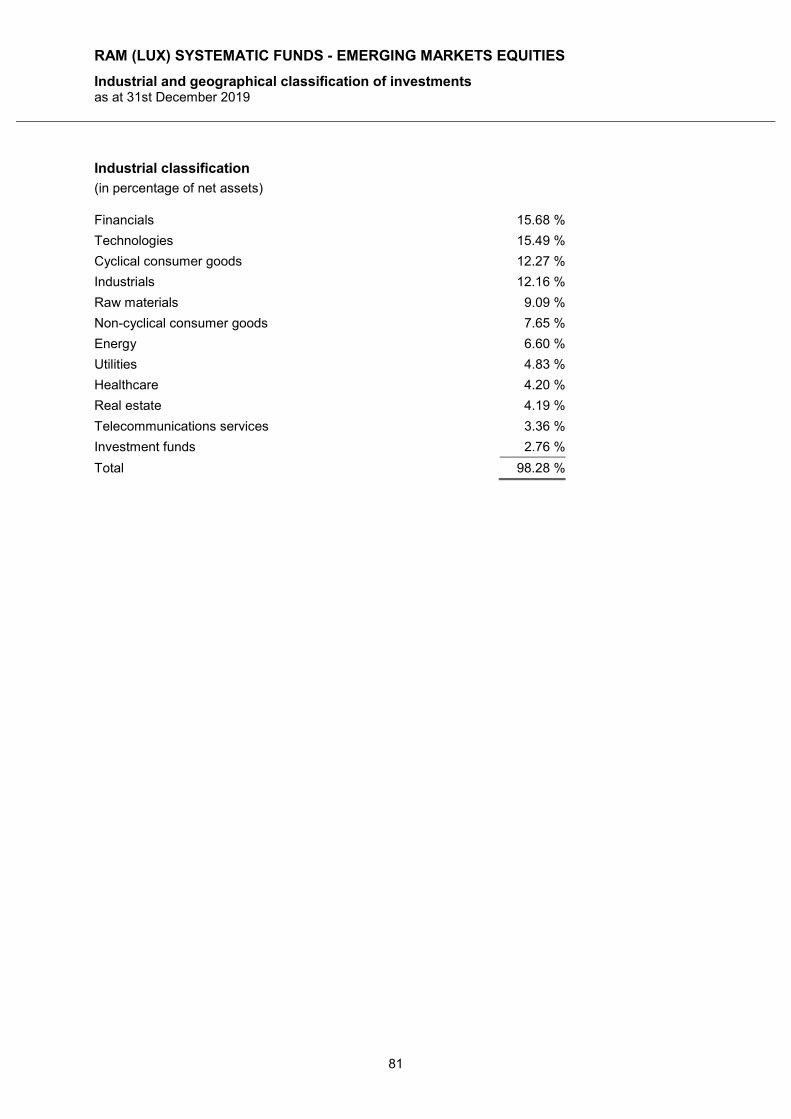
RAM (LUX) SYSTEMATIC FUNDS - EMERGING MARKETS EQUITIES
Industrial and geographical classification of investments as at 31st December 2019
81
Industrial classification
(in percentage of net assets)
Financials 15.68 %
Technologies 15.49 %
Cyclical consumer goods 12.27 %
Industrials 12.16 %
Raw materials 9.09 %
Non-cyclical consumer goods 7.65 %
Energy 6.60 %
Utilities 4.83 %
Healthcare 4.20 %
Real estate 4.19 %
Telecommunications services 3.36 %
Investment funds 2.76 %
Total 98.28 %
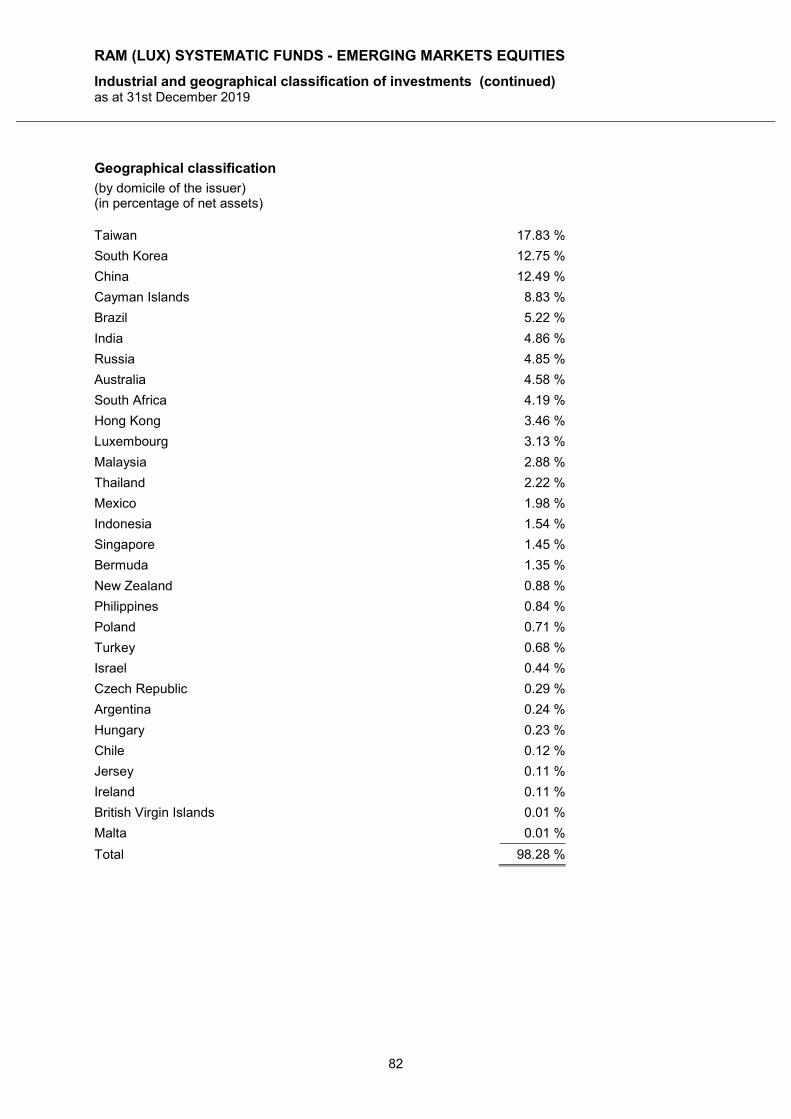
RAM (LUX) SYSTEMATIC FUNDS - EMERGING MARKETS EQUITIES
Industrial and geographical classification of investments (continued) as at 31st December 2019
82
Geographical classification
(by domicile of the issuer) (in percentage of net assets)
Taiwan 17.83 %
South Korea 12.75 %
China 12.49 %
Cayman Islands 8.83 %
Brazil 5.22 %
India 4.86 %
Russia 4.85 %
Australia 4.58 %
South Africa 4.19 %
Hong Kong 3.46 %
Luxembourg 3.13 %
Malaysia 2.88 %
Thailand 2.22 %
Mexico 1.98 %
Indonesia 1.54 %
Singapore 1.45 %
Bermuda 1.35 %
New Zealand 0.88 %
Philippines 0.84 %
Poland 0.71 %
Turkey 0.68 %
Israel 0.44 %
Czech Republic 0.29 %
Argentina 0.24 %
Hungary 0.23 %
Chile 0.12 %
Jersey 0.11 %
Ireland 0.11 %
British Virgin Islands 0.01 %
Malta 0.01 %
Total 98.28 %
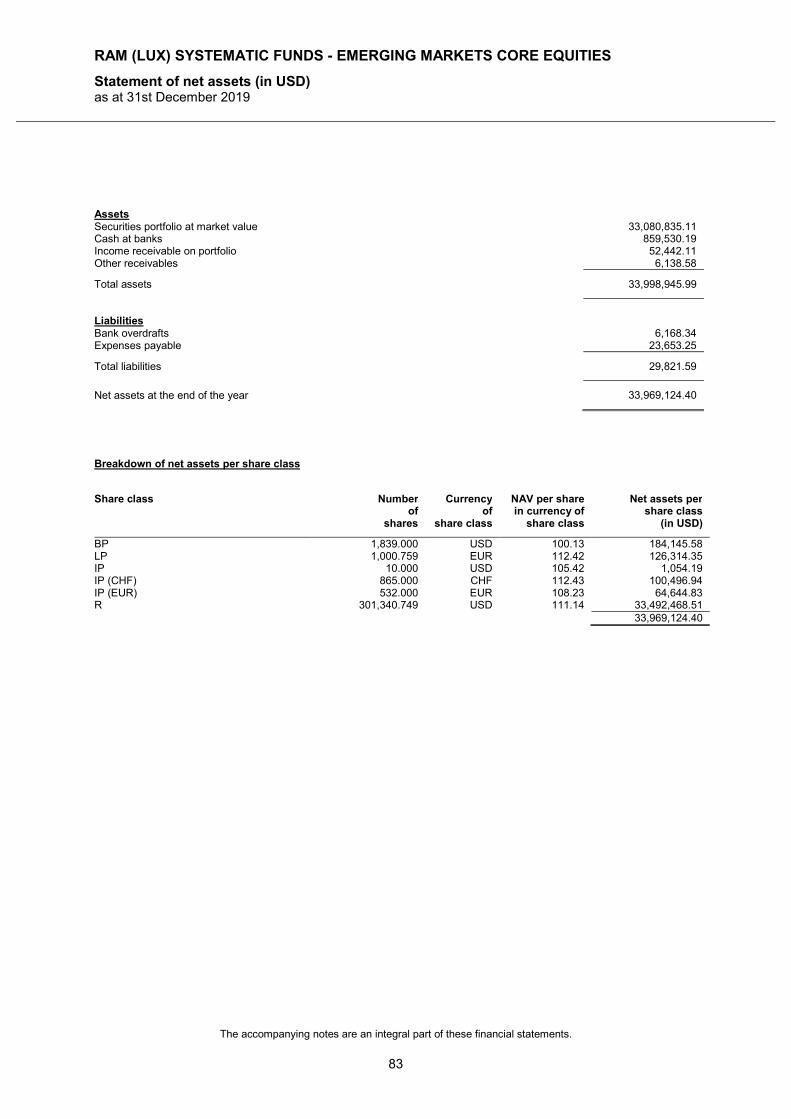
RAM (LUX) SYSTEMATIC FUNDS - EMERGING MARKETS CORE EQUITIES
Statement of net assets (in USD) as at 31st December 2019
The accompanying notes are an integral part of these financial statements.
83
Assets Securities portfolio at market value 33,080,835.11 Cash at banks 859,530.19 Income receivable on portfolio 52,442.11 Other receivables 6,138.58
Total assets 33,998,945.99
Liabilities Bank overdrafts 6,168.34 Expenses payable 23,653.25
Total liabilities 29,821.59
Net assets at the end of the year 33,969,124.40
Breakdown of net assets per share class
Share class Number of
shares
Currency of
share class
NAV per share in currency of
share class
Net assets per share class
(in USD)
BP 1,839.000 USD 100.13 184,145.58 LP 1,000.759 EUR 112.42 126,314.35 IP 10.000 USD 105.42 1,054.19 IP (CHF) 865.000 CHF 112.43 100,496.94 IP (EUR) 532.000 EUR 108.23 64,644.83 R 301,340.749 USD 111.14 33,492,468.51 33,969,124.40
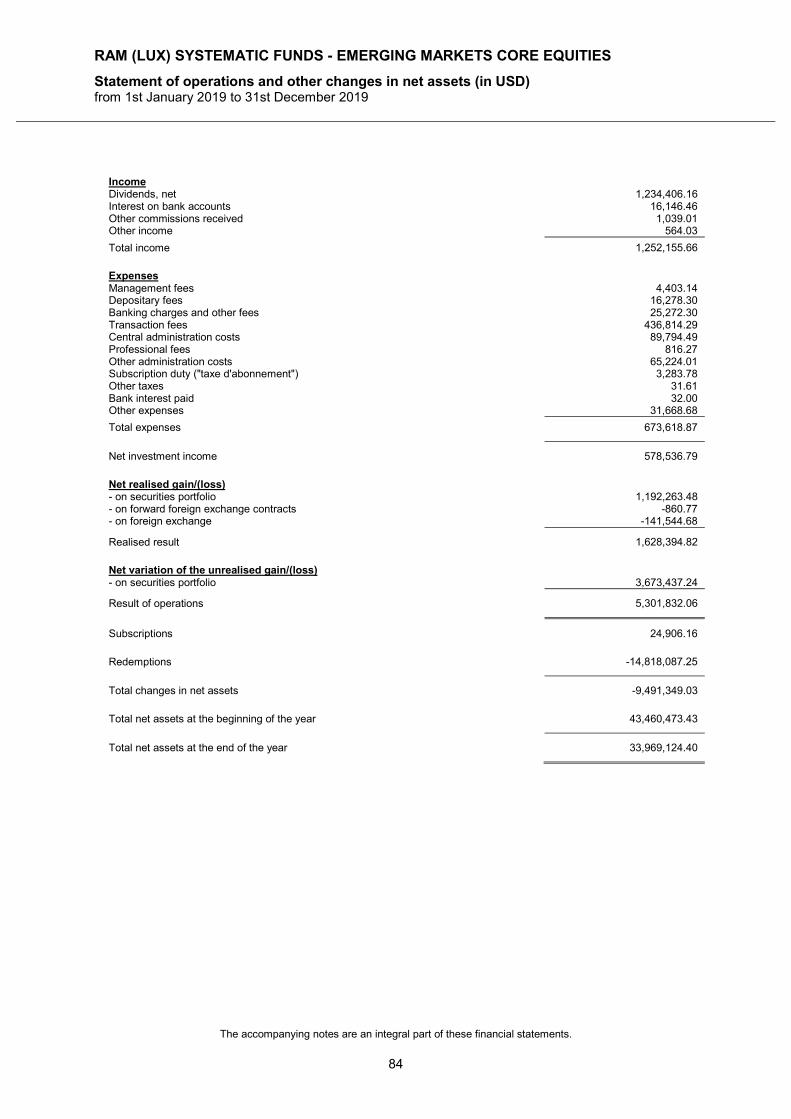
RAM (LUX) SYSTEMATIC FUNDS - EMERGING MARKETS CORE EQUITIES
Statement of operations and other changes in net assets (in USD) from 1st January 2019 to 31st December 2019
The accompanying notes are an integral part of these financial statements.
84
Income Dividends, net 1,234,406.16 Interest on bank accounts 16,146.46 Other commissions received 1,039.01 Other income 564.03
Total income 1,252,155.66
Expenses Management fees 4,403.14 Depositary fees 16,278.30 Banking charges and other fees 25,272.30 Transaction fees 436,814.29 Central administration costs 89,794.49 Professional fees 816.27 Other administration costs 65,224.01 Subscription duty ("taxe d'abonnement") 3,283.78 Other taxes 31.61 Bank interest paid 32.00 Other expenses 31,668.68
Total expenses 673,618.87
Net investment income 578,536.79
Net realised gain/(loss) - on securities portfolio 1,192,263.48 - on forward foreign exchange contracts -860.77 - on foreign exchange -141,544.68
Realised result 1,628,394.82
Net variation of the unrealised gain/(loss) - on securities portfolio 3,673,437.24
Result of operations 5,301,832.06
Subscriptions 24,906.16
Redemptions -14,818,087.25
Total changes in net assets -9,491,349.03
Total net assets at the beginning of the year 43,460,473.43
Total net assets at the end of the year 33,969,124.40
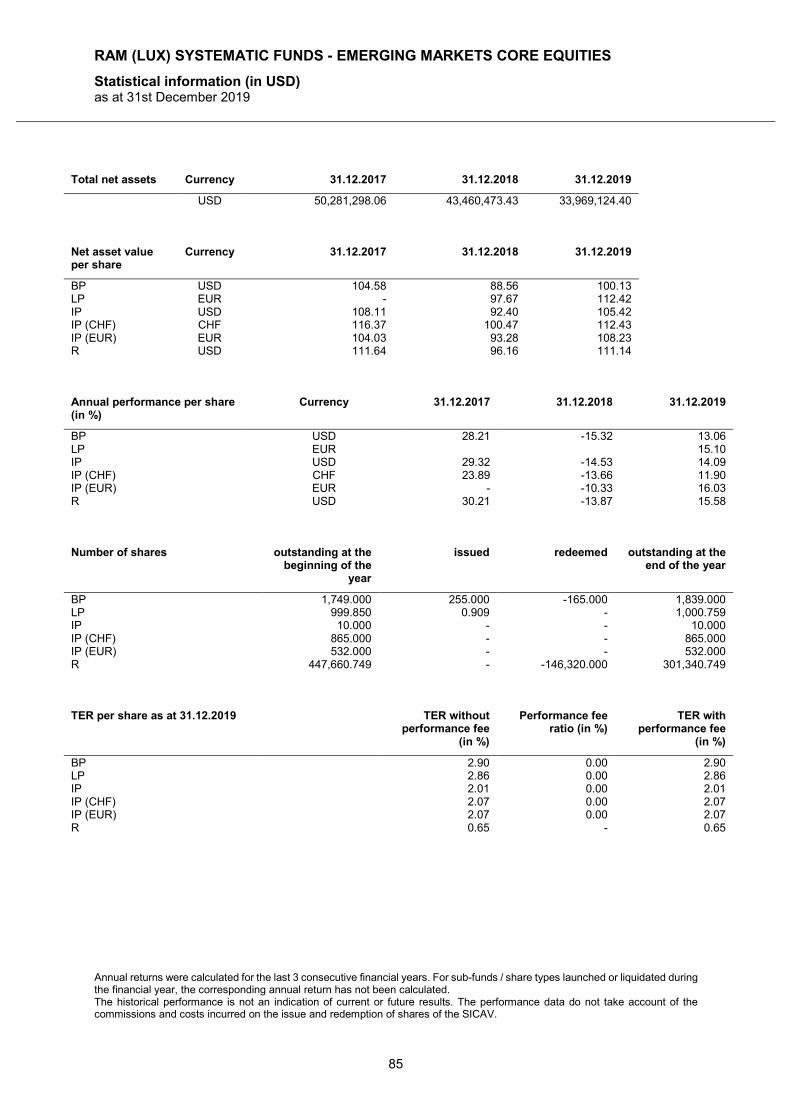
RAM (LUX) SYSTEMATIC FUNDS - EMERGING MARKETS CORE EQUITIES
Statistical information (in USD) as at 31st December 2019
Annual returns were calculated for the last 3 consecutive financial years. For sub-funds / share types launched or liquidated during the financial year, the corresponding annual return has not been calculated. The historical performance is not an indication of current or future results. The performance data do not take account of the commissions and costs incurred on the issue and redemption of shares of the SICAV.
85
Total net assets Currency 31.12.2017 31.12.2018 31.12.2019
USD 50,281,298.06 43,460,473.43 33,969,124.40
Net asset value per share
Currency 31.12.2017 31.12.2018 31.12.2019
BP USD 104.58 88.56 100.13 LP EUR - 97.67 112.42 IP USD 108.11 92.40 105.42 IP (CHF) CHF 116.37 100.47 112.43 IP (EUR) EUR 104.03 93.28 108.23 R USD 111.64 96.16 111.14
Annual performance per share (in %)
Currency 31.12.2017 31.12.2018 31.12.2019
BP USD 28.21 -15.32 13.06 LP EUR 15.10 IP USD 29.32 -14.53 14.09 IP (CHF) CHF 23.89 -13.66 11.90 IP (EUR) EUR - -10.33 16.03 R USD 30.21 -13.87 15.58
Number of shares outstanding at the
beginning of the year
issued redeemed outstanding at the end of the year
BP 1,749.000 255.000 -165.000 1,839.000 LP 999.850 0.909 - 1,000.759 IP 10.000 - - 10.000 IP (CHF) 865.000 - - 865.000 IP (EUR) 532.000 - - 532.000 R 447,660.749 - -146,320.000 301,340.749
TER per share as at 31.12.2019 TER without
performance fee (in %)
Performance fee ratio (in %)
TER with performance fee
(in %)
BP 2.90 0.00 2.90 LP 2.86 0.00 2.86 IP 2.01 0.00 2.01 IP (CHF) 2.07 0.00 2.07 IP (EUR) 2.07 0.00 2.07 R 0.65 - 0.65
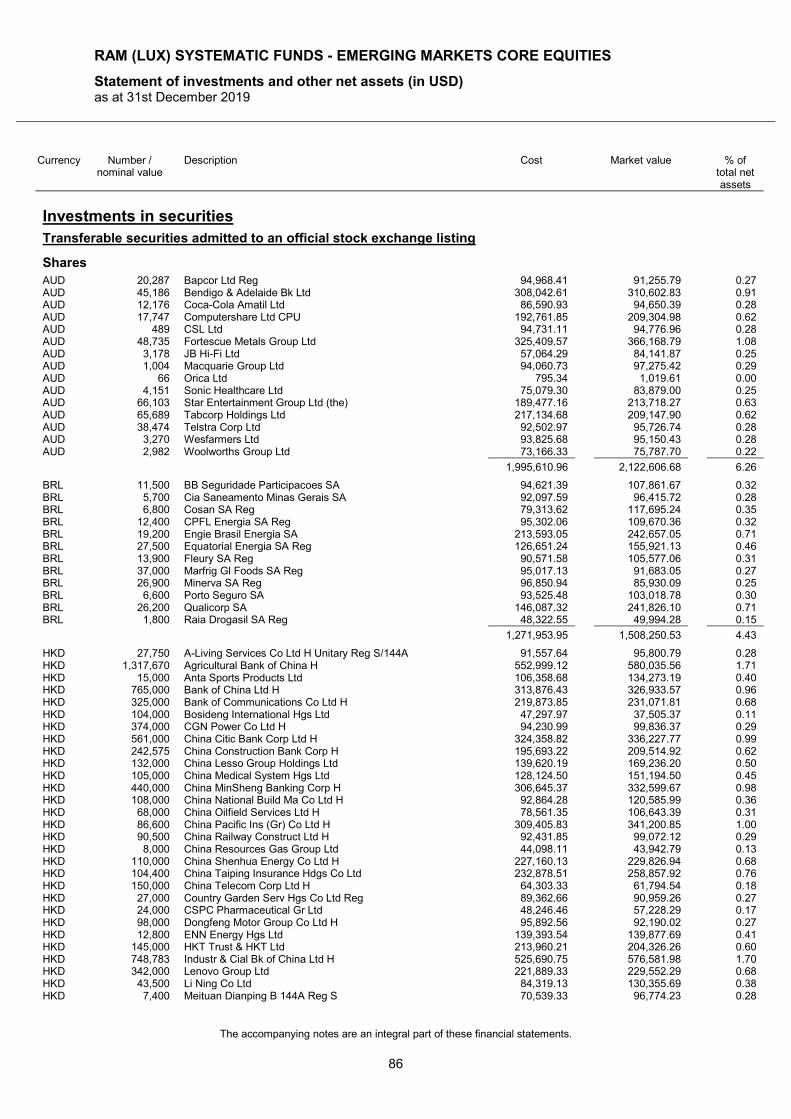
RAM (LUX) SYSTEMATIC FUNDS - EMERGING MARKETS CORE EQUITIES
Statement of investments and other net assets (in USD) as at 31st December 2019
The accompanying notes are an integral part of these financial statements.
86
Currency Number / nominal value
Description Cost Market value % of total net assets
Investments in securities
Transferable securities admitted to an official stock exchange listing
Shares
AUD 20,287 Bapcor Ltd Reg 94,968.41 91,255.79 0.27 AUD 45,186 Bendigo & Adelaide Bk Ltd 308,042.61 310,602.83 0.91 AUD 12,176 Coca-Cola Amatil Ltd 86,590.93 94,650.39 0.28 AUD 17,747 Computershare Ltd CPU 192,761.85 209,304.98 0.62 AUD 489 CSL Ltd 94,731.11 94,776.96 0.28 AUD 48,735 Fortescue Metals Group Ltd 325,409.57 366,168.79 1.08 AUD 3,178 JB Hi-Fi Ltd 57,064.29 84,141.87 0.25 AUD 1,004 Macquarie Group Ltd 94,060.73 97,275.42 0.29 AUD 66 Orica Ltd 795.34 1,019.61 0.00 AUD 4,151 Sonic Healthcare Ltd 75,079.30 83,879.00 0.25 AUD 66,103 Star Entertainment Group Ltd (the) 189,477.16 213,718.27 0.63 AUD 65,689 Tabcorp Holdings Ltd 217,134.68 209,147.90 0.62 AUD 38,474 Telstra Corp Ltd 92,502.97 95,726.74 0.28 AUD 3,270 Wesfarmers Ltd 93,825.68 95,150.43 0.28 AUD 2,982 Woolworths Group Ltd 73,166.33 75,787.70 0.22
1,995,610.96 2,122,606.68 6.26
BRL 11,500 BB Seguridade Participacoes SA 94,621.39 107,861.67 0.32 BRL 5,700 Cia Saneamento Minas Gerais SA 92,097.59 96,415.72 0.28 BRL 6,800 Cosan SA Reg 79,313.62 117,695.24 0.35 BRL 12,400 CPFL Energia SA Reg 95,302.06 109,670.36 0.32 BRL 19,200 Engie Brasil Energia SA 213,593.05 242,657.05 0.71 BRL 27,500 Equatorial Energia SA Reg 126,651.24 155,921.13 0.46 BRL 13,900 Fleury SA Reg 90,571.58 105,577.06 0.31 BRL 37,000 Marfrig Gl Foods SA Reg 95,017.13 91,683.05 0.27 BRL 26,900 Minerva SA Reg 96,850.94 85,930.09 0.25 BRL 6,600 Porto Seguro SA 93,525.48 103,018.78 0.30 BRL 26,200 Qualicorp SA 146,087.32 241,826.10 0.71 BRL 1,800 Raia Drogasil SA Reg 48,322.55 49,994.28 0.15
1,271,953.95 1,508,250.53 4.43
HKD 27,750 A-Living Services Co Ltd H Unitary Reg S/144A 91,557.64 95,800.79 0.28 HKD 1,317,670 Agricultural Bank of China H 552,999.12 580,035.56 1.71 HKD 15,000 Anta Sports Products Ltd 106,358.68 134,273.19 0.40 HKD 765,000 Bank of China Ltd H 313,876.43 326,933.57 0.96 HKD 325,000 Bank of Communications Co Ltd H 219,873.85 231,071.81 0.68 HKD 104,000 Bosideng International Hgs Ltd 47,297.97 37,505.37 0.11 HKD 374,000 CGN Power Co Ltd H 94,230.99 99,836.37 0.29 HKD 561,000 China Citic Bank Corp Ltd H 324,358.82 336,227.77 0.99 HKD 242,575 China Construction Bank Corp H 195,693.22 209,514.92 0.62 HKD 132,000 China Lesso Group Holdings Ltd 139,620.19 169,236.20 0.50 HKD 105,000 China Medical System Hgs Ltd 128,124.50 151,194.50 0.45 HKD 440,000 China MinSheng Banking Corp H 306,645.37 332,599.67 0.98 HKD 108,000 China National Build Ma Co Ltd H 92,864.28 120,585.99 0.36 HKD 68,000 China Oilfield Services Ltd H 78,561.35 106,643.39 0.31 HKD 86,600 China Pacific Ins (Gr) Co Ltd H 309,405.83 341,200.85 1.00 HKD 90,500 China Railway Construct Ltd H 92,431.85 99,072.12 0.29 HKD 8,000 China Resources Gas Group Ltd 44,098.11 43,942.79 0.13 HKD 110,000 China Shenhua Energy Co Ltd H 227,160.13 229,826.94 0.68 HKD 104,400 China Taiping Insurance Hdgs Co Ltd 232,878.51 258,857.92 0.76 HKD 150,000 China Telecom Corp Ltd H 64,303.33 61,794.54 0.18 HKD 27,000 Country Garden Serv Hgs Co Ltd Reg 89,362.66 90,959.26 0.27 HKD 24,000 CSPC Pharmaceutical Gr Ltd 48,246.46 57,228.29 0.17 HKD 98,000 Dongfeng Motor Group Co Ltd H 95,892.56 92,190.02 0.27 HKD 12,800 ENN Energy Hgs Ltd 139,393.54 139,877.69 0.41 HKD 145,000 HKT Trust & HKT Ltd 213,960.21 204,326.26 0.60 HKD 748,783 Industr & Cial Bk of China Ltd H 525,690.75 576,581.98 1.70 HKD 342,000 Lenovo Group Ltd 221,889.33 229,552.29 0.68 HKD 43,500 Li Ning Co Ltd 84,319.13 130,355.69 0.38 HKD 7,400 Meituan Dianping B 144A Reg S 70,539.33 96,774.23 0.28
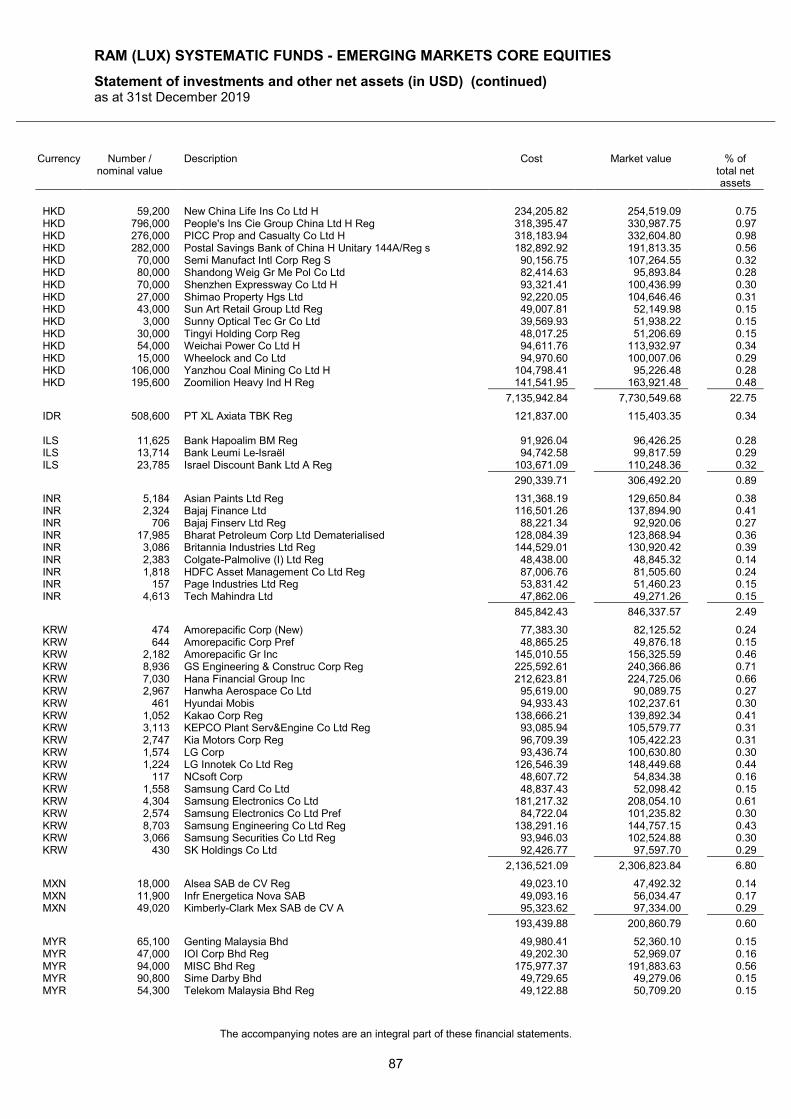
RAM (LUX) SYSTEMATIC FUNDS - EMERGING MARKETS CORE EQUITIES
Statement of investments and other net assets (in USD) (continued) as at 31st December 2019
The accompanying notes are an integral part of these financial statements.
87
Currency Number / nominal value
Description Cost Market value % of total net assets
HKD 59,200 New China Life Ins Co Ltd H 234,205.82 254,519.09 0.75 HKD 796,000 People's Ins Cie Group China Ltd H Reg 318,395.47 330,987.75 0.97 HKD 276,000 PICC Prop and Casualty Co Ltd H 318,183.94 332,604.80 0.98 HKD 282,000 Postal Savings Bank of China H Unitary 144A/Reg s 182,892.92 191,813.35 0.56 HKD 70,000 Semi Manufact Intl Corp Reg S 90,156.75 107,264.55 0.32 HKD 80,000 Shandong Weig Gr Me Pol Co Ltd 82,414.63 95,893.84 0.28 HKD 70,000 Shenzhen Expressway Co Ltd H 93,321.41 100,436.99 0.30 HKD 27,000 Shimao Property Hgs Ltd 92,220.05 104,646.46 0.31 HKD 43,000 Sun Art Retail Group Ltd Reg 49,007.81 52,149.98 0.15 HKD 3,000 Sunny Optical Tec Gr Co Ltd 39,569.93 51,938.22 0.15 HKD 30,000 Tingyi Holding Corp Reg 48,017.25 51,206.69 0.15 HKD 54,000 Weichai Power Co Ltd H 94,611.76 113,932.97 0.34 HKD 15,000 Wheelock and Co Ltd 94,970.60 100,007.06 0.29 HKD 106,000 Yanzhou Coal Mining Co Ltd H 104,798.41 95,226.48 0.28 HKD 195,600 Zoomilion Heavy Ind H Reg 141,541.95 163,921.48 0.48
7,135,942.84 7,730,549.68 22.75
IDR 508,600 PT XL Axiata TBK Reg 121,837.00 115,403.35 0.34 ILS 11,625 Bank Hapoalim BM Reg 91,926.04 96,426.25 0.28 ILS 13,714 Bank Leumi Le-Israël 94,742.58 99,817.59 0.29 ILS 23,785 Israel Discount Bank Ltd A Reg 103,671.09 110,248.36 0.32
290,339.71 306,492.20 0.89
INR 5,184 Asian Paints Ltd Reg 131,368.19 129,650.84 0.38 INR 2,324 Bajaj Finance Ltd 116,501.26 137,894.90 0.41 INR 706 Bajaj Finserv Ltd Reg 88,221.34 92,920.06 0.27 INR 17,985 Bharat Petroleum Corp Ltd Dematerialised 128,084.39 123,868.94 0.36 INR 3,086 Britannia Industries Ltd Reg 144,529.01 130,920.42 0.39 INR 2,383 Colgate-Palmolive (I) Ltd Reg 48,438.00 48,845.32 0.14 INR 1,818 HDFC Asset Management Co Ltd Reg 87,006.76 81,505.60 0.24 INR 157 Page Industries Ltd Reg 53,831.42 51,460.23 0.15 INR 4,613 Tech Mahindra Ltd 47,862.06 49,271.26 0.15
845,842.43 846,337.57 2.49
KRW 474 Amorepacific Corp (New) 77,383.30 82,125.52 0.24 KRW 644 Amorepacific Corp Pref 48,865.25 49,876.18 0.15 KRW 2,182 Amorepacific Gr Inc 145,010.55 156,325.59 0.46 KRW 8,936 GS Engineering & Construc Corp Reg 225,592.61 240,366.86 0.71 KRW 7,030 Hana Financial Group Inc 212,623.81 224,725.06 0.66 KRW 2,967 Hanwha Aerospace Co Ltd 95,619.00 90,089.75 0.27 KRW 461 Hyundai Mobis 94,933.43 102,237.61 0.30 KRW 1,052 Kakao Corp Reg 138,666.21 139,892.34 0.41 KRW 3,113 KEPCO Plant Serv&Engine Co Ltd Reg 93,085.94 105,579.77 0.31 KRW 2,747 Kia Motors Corp Reg 96,709.39 105,422.23 0.31 KRW 1,574 LG Corp 93,436.74 100,630.80 0.30 KRW 1,224 LG Innotek Co Ltd Reg 126,546.39 148,449.68 0.44 KRW 117 NCsoft Corp 48,607.72 54,834.38 0.16 KRW 1,558 Samsung Card Co Ltd 48,837.43 52,098.42 0.15 KRW 4,304 Samsung Electronics Co Ltd 181,217.32 208,054.10 0.61 KRW 2,574 Samsung Electronics Co Ltd Pref 84,722.04 101,235.82 0.30 KRW 8,703 Samsung Engineering Co Ltd Reg 138,291.16 144,757.15 0.43 KRW 3,066 Samsung Securities Co Ltd Reg 93,946.03 102,524.88 0.30 KRW 430 SK Holdings Co Ltd 92,426.77 97,597.70 0.29
2,136,521.09 2,306,823.84 6.80
MXN 18,000 Alsea SAB de CV Reg 49,023.10 47,492.32 0.14 MXN 11,900 Infr Energetica Nova SAB 49,093.16 56,034.47 0.17 MXN 49,020 Kimberly-Clark Mex SAB de CV A 95,323.62 97,334.00 0.29
193,439.88 200,860.79 0.60
MYR 65,100 Genting Malaysia Bhd 49,980.41 52,360.10 0.15 MYR 47,000 IOI Corp Bhd Reg 49,202.30 52,969.07 0.16 MYR 94,000 MISC Bhd Reg 175,977.37 191,883.63 0.56 MYR 90,800 Sime Darby Bhd 49,729.65 49,279.06 0.15 MYR 54,300 Telekom Malaysia Bhd Reg 49,122.88 50,709.20 0.15
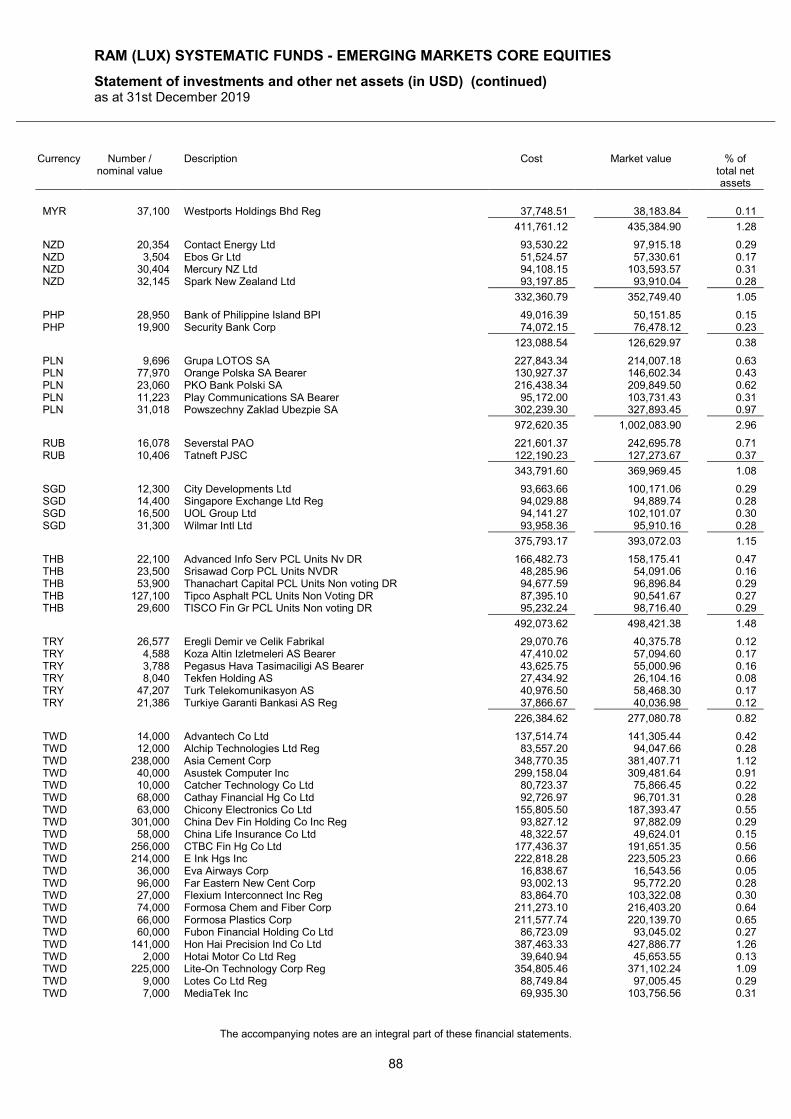
RAM (LUX) SYSTEMATIC FUNDS - EMERGING MARKETS CORE EQUITIES
Statement of investments and other net assets (in USD) (continued) as at 31st December 2019
The accompanying notes are an integral part of these financial statements.
88
Currency Number / nominal value
Description Cost Market value % of total net assets
MYR 37,100 Westports Holdings Bhd Reg 37,748.51 38,183.84 0.11
411,761.12 435,384.90 1.28
NZD 20,354 Contact Energy Ltd 93,530.22 97,915.18 0.29 NZD 3,504 Ebos Gr Ltd 51,524.57 57,330.61 0.17 NZD 30,404 Mercury NZ Ltd 94,108.15 103,593.57 0.31 NZD 32,145 Spark New Zealand Ltd 93,197.85 93,910.04 0.28
332,360.79 352,749.40 1.05
PHP 28,950 Bank of Philippine Island BPI 49,016.39 50,151.85 0.15 PHP 19,900 Security Bank Corp 74,072.15 76,478.12 0.23
123,088.54 126,629.97 0.38
PLN 9,696 Grupa LOTOS SA 227,843.34 214,007.18 0.63 PLN 77,970 Orange Polska SA Bearer 130,927.37 146,602.34 0.43 PLN 23,060 PKO Bank Polski SA 216,438.34 209,849.50 0.62 PLN 11,223 Play Communications SA Bearer 95,172.00 103,731.43 0.31 PLN 31,018 Powszechny Zaklad Ubezpie SA 302,239.30 327,893.45 0.97
972,620.35 1,002,083.90 2.96
RUB 16,078 Severstal PAO 221,601.37 242,695.78 0.71 RUB 10,406 Tatneft PJSC 122,190.23 127,273.67 0.37
343,791.60 369,969.45 1.08
SGD 12,300 City Developments Ltd 93,663.66 100,171.06 0.29 SGD 14,400 Singapore Exchange Ltd Reg 94,029.88 94,889.74 0.28 SGD 16,500 UOL Group Ltd 94,141.27 102,101.07 0.30 SGD 31,300 Wilmar Intl Ltd 93,958.36 95,910.16 0.28
375,793.17 393,072.03 1.15
THB 22,100 Advanced Info Serv PCL Units Nv DR 166,482.73 158,175.41 0.47 THB 23,500 Srisawad Corp PCL Units NVDR 48,285.96 54,091.06 0.16 THB 53,900 Thanachart Capital PCL Units Non voting DR 94,677.59 96,896.84 0.29 THB 127,100 Tipco Asphalt PCL Units Non Voting DR 87,395.10 90,541.67 0.27 THB 29,600 TISCO Fin Gr PCL Units Non voting DR 95,232.24 98,716.40 0.29
492,073.62 498,421.38 1.48
TRY 26,577 Eregli Demir ve Celik Fabrikal 29,070.76 40,375.78 0.12 TRY 4,588 Koza Altin Izletmeleri AS Bearer 47,410.02 57,094.60 0.17 TRY 3,788 Pegasus Hava Tasimaciligi AS Bearer 43,625.75 55,000.96 0.16 TRY 8,040 Tekfen Holding AS 27,434.92 26,104.16 0.08 TRY 47,207 Turk Telekomunikasyon AS 40,976.50 58,468.30 0.17 TRY 21,386 Turkiye Garanti Bankasi AS Reg 37,866.67 40,036.98 0.12
226,384.62 277,080.78 0.82
TWD 14,000 Advantech Co Ltd 137,514.74 141,305.44 0.42 TWD 12,000 Alchip Technologies Ltd Reg 83,557.20 94,047.66 0.28 TWD 238,000 Asia Cement Corp 348,770.35 381,407.71 1.12 TWD 40,000 Asustek Computer Inc 299,158.04 309,481.64 0.91 TWD 10,000 Catcher Technology Co Ltd 80,723.37 75,866.45 0.22 TWD 68,000 Cathay Financial Hg Co Ltd 92,726.97 96,701.31 0.28 TWD 63,000 Chicony Electronics Co Ltd 155,805.50 187,393.47 0.55 TWD 301,000 China Dev Fin Holding Co Inc Reg 93,827.12 97,882.09 0.29 TWD 58,000 China Life Insurance Co Ltd 48,322.57 49,624.01 0.15 TWD 256,000 CTBC Fin Hg Co Ltd 177,436.37 191,651.35 0.56 TWD 214,000 E Ink Hgs Inc 222,818.28 223,505.23 0.66 TWD 36,000 Eva Airways Corp 16,838.67 16,543.56 0.05 TWD 96,000 Far Eastern New Cent Corp 93,002.13 95,772.20 0.28 TWD 27,000 Flexium Interconnect Inc Reg 83,864.70 103,322.08 0.30 TWD 74,000 Formosa Chem and Fiber Corp 211,273.10 216,403.20 0.64 TWD 66,000 Formosa Plastics Corp 211,577.74 220,139.70 0.65 TWD 60,000 Fubon Financial Holding Co Ltd 86,723.09 93,045.02 0.27 TWD 141,000 Hon Hai Precision Ind Co Ltd 387,463.33 427,886.77 1.26 TWD 2,000 Hotai Motor Co Ltd Reg 39,640.94 45,653.55 0.13 TWD 225,000 Lite-On Technology Corp Reg 354,805.46 371,102.24 1.09 TWD 9,000 Lotes Co Ltd Reg 88,749.84 97,005.45 0.29 TWD 7,000 MediaTek Inc 69,935.30 103,756.56 0.31
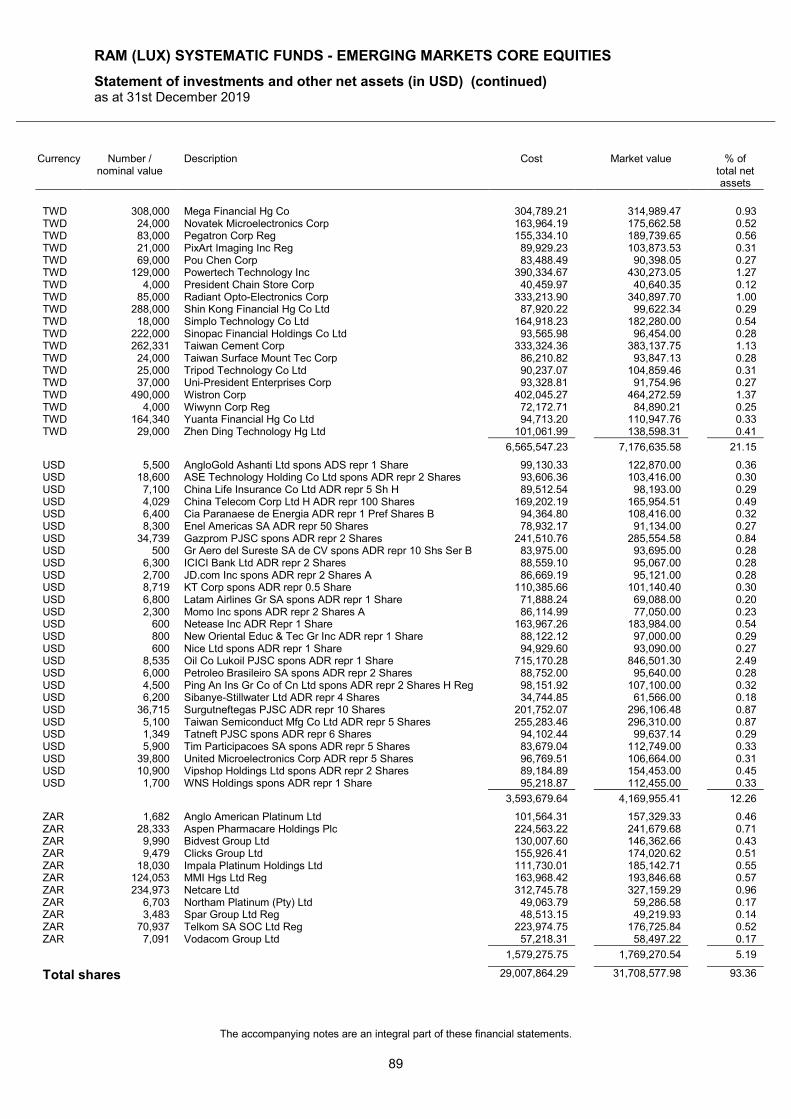
RAM (LUX) SYSTEMATIC FUNDS - EMERGING MARKETS CORE EQUITIES
Statement of investments and other net assets (in USD) (continued) as at 31st December 2019
The accompanying notes are an integral part of these financial statements.
89
Currency Number / nominal value
Description Cost Market value % of total net assets
TWD 308,000 Mega Financial Hg Co 304,789.21 314,989.47 0.93 TWD 24,000 Novatek Microelectronics Corp 163,964.19 175,662.58 0.52 TWD 83,000 Pegatron Corp Reg 155,334.10 189,739.65 0.56 TWD 21,000 PixArt Imaging Inc Reg 89,929.23 103,873.53 0.31 TWD 69,000 Pou Chen Corp 83,488.49 90,398.05 0.27 TWD 129,000 Powertech Technology Inc 390,334.67 430,273.05 1.27 TWD 4,000 President Chain Store Corp 40,459.97 40,640.35 0.12 TWD 85,000 Radiant Opto-Electronics Corp 333,213.90 340,897.70 1.00 TWD 288,000 Shin Kong Financial Hg Co Ltd 87,920.22 99,622.34 0.29 TWD 18,000 Simplo Technology Co Ltd 164,918.23 182,280.00 0.54 TWD 222,000 Sinopac Financial Holdings Co Ltd 93,565.98 96,454.00 0.28 TWD 262,331 Taiwan Cement Corp 333,324.36 383,137.75 1.13 TWD 24,000 Taiwan Surface Mount Tec Corp 86,210.82 93,847.13 0.28 TWD 25,000 Tripod Technology Co Ltd 90,237.07 104,859.46 0.31 TWD 37,000 Uni-President Enterprises Corp 93,328.81 91,754.96 0.27 TWD 490,000 Wistron Corp 402,045.27 464,272.59 1.37 TWD 4,000 Wiwynn Corp Reg 72,172.71 84,890.21 0.25 TWD 164,340 Yuanta Financial Hg Co Ltd 94,713.20 110,947.76 0.33 TWD 29,000 Zhen Ding Technology Hg Ltd 101,061.99 138,598.31 0.41
6,565,547.23 7,176,635.58 21.15
USD 5,500 AngloGold Ashanti Ltd spons ADS repr 1 Share 99,130.33 122,870.00 0.36 USD 18,600 ASE Technology Holding Co Ltd spons ADR repr 2 Shares 93,606.36 103,416.00 0.30 USD 7,100 China Life Insurance Co Ltd ADR repr 5 Sh H 89,512.54 98,193.00 0.29 USD 4,029 China Telecom Corp Ltd H ADR repr 100 Shares 169,202.19 165,954.51 0.49 USD 6,400 Cia Paranaese de Energia ADR repr 1 Pref Shares B 94,364.80 108,416.00 0.32 USD 8,300 Enel Americas SA ADR repr 50 Shares 78,932.17 91,134.00 0.27 USD 34,739 Gazprom PJSC spons ADR repr 2 Shares 241,510.76 285,554.58 0.84 USD 500 Gr Aero del Sureste SA de CV spons ADR repr 10 Shs Ser B 83,975.00 93,695.00 0.28 USD 6,300 ICICI Bank Ltd ADR repr 2 Shares 88,559.10 95,067.00 0.28 USD 2,700 JD.com Inc spons ADR repr 2 Shares A 86,669.19 95,121.00 0.28 USD 8,719 KT Corp spons ADR repr 0.5 Share 110,385.66 101,140.40 0.30 USD 6,800 Latam Airlines Gr SA spons ADR repr 1 Share 71,888.24 69,088.00 0.20 USD 2,300 Momo Inc spons ADR repr 2 Shares A 86,114.99 77,050.00 0.23 USD 600 Netease Inc ADR Repr 1 Share 163,967.26 183,984.00 0.54 USD 800 New Oriental Educ & Tec Gr Inc ADR repr 1 Share 88,122.12 97,000.00 0.29 USD 600 Nice Ltd spons ADR repr 1 Share 94,929.60 93,090.00 0.27 USD 8,535 Oil Co Lukoil PJSC spons ADR repr 1 Share 715,170.28 846,501.30 2.49 USD 6,000 Petroleo Brasileiro SA spons ADR repr 2 Shares 88,752.00 95,640.00 0.28 USD 4,500 Ping An Ins Gr Co of Cn Ltd spons ADR repr 2 Shares H Reg 98,151.92 107,100.00 0.32 USD 6,200 Sibanye-Stillwater Ltd ADR repr 4 Shares 34,744.85 61,566.00 0.18 USD 36,715 Surgutneftegas PJSC ADR repr 10 Shares 201,752.07 296,106.48 0.87 USD 5,100 Taiwan Semiconduct Mfg Co Ltd ADR repr 5 Shares 255,283.46 296,310.00 0.87 USD 1,349 Tatneft PJSC spons ADR repr 6 Shares 94,102.44 99,637.14 0.29 USD 5,900 Tim Participacoes SA spons ADR repr 5 Shares 83,679.04 112,749.00 0.33 USD 39,800 United Microelectronics Corp ADR repr 5 Shares 96,769.51 106,664.00 0.31 USD 10,900 Vipshop Holdings Ltd spons ADR repr 2 Shares 89,184.89 154,453.00 0.45 USD 1,700 WNS Holdings spons ADR repr 1 Share 95,218.87 112,455.00 0.33
3,593,679.64 4,169,955.41 12.26
ZAR 1,682 Anglo American Platinum Ltd 101,564.31 157,329.33 0.46 ZAR 28,333 Aspen Pharmacare Holdings Plc 224,563.22 241,679.68 0.71 ZAR 9,990 Bidvest Group Ltd 130,007.60 146,362.66 0.43 ZAR 9,479 Clicks Group Ltd 155,926.41 174,020.62 0.51 ZAR 18,030 Impala Platinum Holdings Ltd 111,730.01 185,142.71 0.55 ZAR 124,053 MMI Hgs Ltd Reg 163,968.42 193,846.68 0.57 ZAR 234,973 Netcare Ltd 312,745.78 327,159.29 0.96 ZAR 6,703 Northam Platinum (Pty) Ltd 49,063.79 59,286.58 0.17 ZAR 3,483 Spar Group Ltd Reg 48,513.15 49,219.93 0.14 ZAR 70,937 Telkom SA SOC Ltd Reg 223,974.75 176,725.84 0.52 ZAR 7,091 Vodacom Group Ltd 57,218.31 58,497.22 0.17
1,579,275.75 1,769,270.54 5.19
Total shares 29,007,864.29 31,708,577.98 93.36
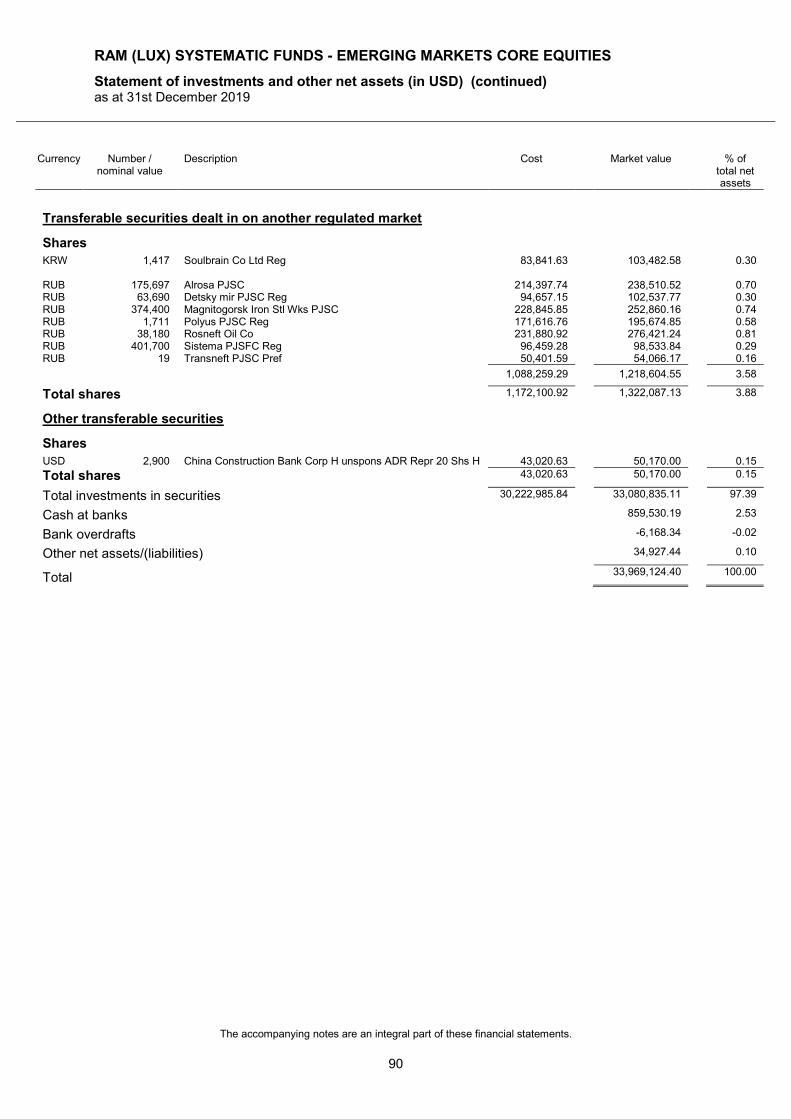
RAM (LUX) SYSTEMATIC FUNDS - EMERGING MARKETS CORE EQUITIES
Statement of investments and other net assets (in USD) (continued) as at 31st December 2019
The accompanying notes are an integral part of these financial statements.
90
Currency Number / nominal value
Description Cost Market value % of total net assets
Transferable securities dealt in on another regulated market
Shares
KRW 1,417 Soulbrain Co Ltd Reg 83,841.63 103,482.58 0.30 RUB 175,697 Alrosa PJSC 214,397.74 238,510.52 0.70 RUB 63,690 Detsky mir PJSC Reg 94,657.15 102,537.77 0.30 RUB 374,400 Magnitogorsk Iron Stl Wks PJSC 228,845.85 252,860.16 0.74 RUB 1,711 Polyus PJSC Reg 171,616.76 195,674.85 0.58 RUB 38,180 Rosneft Oil Co 231,880.92 276,421.24 0.81 RUB 401,700 Sistema PJSFC Reg 96,459.28 98,533.84 0.29 RUB 19 Transneft PJSC Pref 50,401.59 54,066.17 0.16
1,088,259.29 1,218,604.55 3.58
Total shares 1,172,100.92 1,322,087.13 3.88
Other transferable securities
Shares
USD 2,900 China Construction Bank Corp H unspons ADR Repr 20 Shs H 43,020.63 50,170.00 0.15
Total shares 43,020.63 50,170.00 0.15
Total investments in securities 30,222,985.84 33,080,835.11 97.39
Cash at banks 859,530.19 2.53
Bank overdrafts -6,168.34 -0.02
Other net assets/(liabilities) 34,927.44 0.10
Total 33,969,124.40 100.00

RAM (LUX) SYSTEMATIC FUNDS - EMERGING MARKETS CORE EQUITIES
Industrial and geographical classification of investments as at 31st December 2019
91
Industrial classification
(in percentage of net assets)
Financials 26.51 %
Technologies 17.78 %
Raw materials 10.67 %
Energy 8.72 %
Industrials 7.57 %
Cyclical consumer goods 6.94 %
Telecommunications services 5.30 %
Non-cyclical consumer goods 4.79 %
Utilities 3.96 %
Healthcare 3.41 %
Real estate 1.74 %
Total 97.39 %
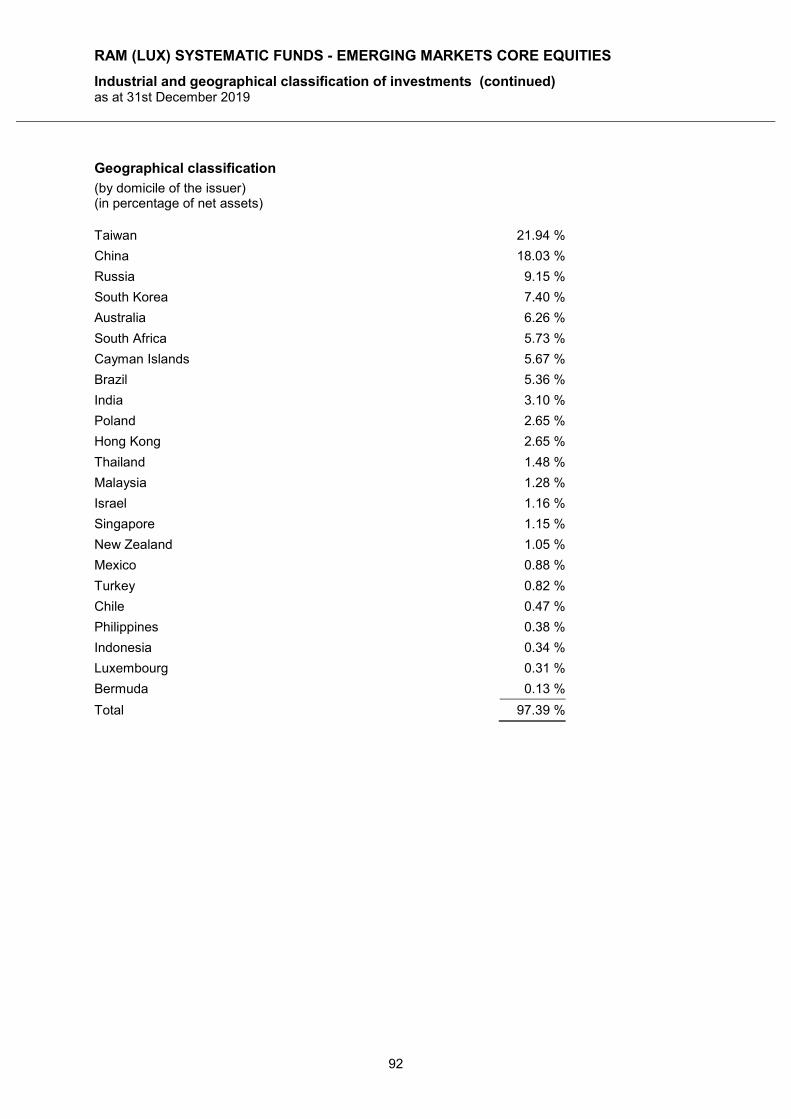
RAM (LUX) SYSTEMATIC FUNDS - EMERGING MARKETS CORE EQUITIES
Industrial and geographical classification of investments (continued) as at 31st December 2019
92
Geographical classification
(by domicile of the issuer) (in percentage of net assets)
Taiwan 21.94 %
China 18.03 %
Russia 9.15 %
South Korea 7.40 %
Australia 6.26 %
South Africa 5.73 %
Cayman Islands 5.67 %
Brazil 5.36 %
India 3.10 %
Poland 2.65 %
Hong Kong 2.65 %
Thailand 1.48 %
Malaysia 1.28 %
Israel 1.16 %
Singapore 1.15 %
New Zealand 1.05 %
Mexico 0.88 %
Turkey 0.82 %
Chile 0.47 %
Philippines 0.38 %
Indonesia 0.34 %
Luxembourg 0.31 %
Bermuda 0.13 %
Total 97.39 %
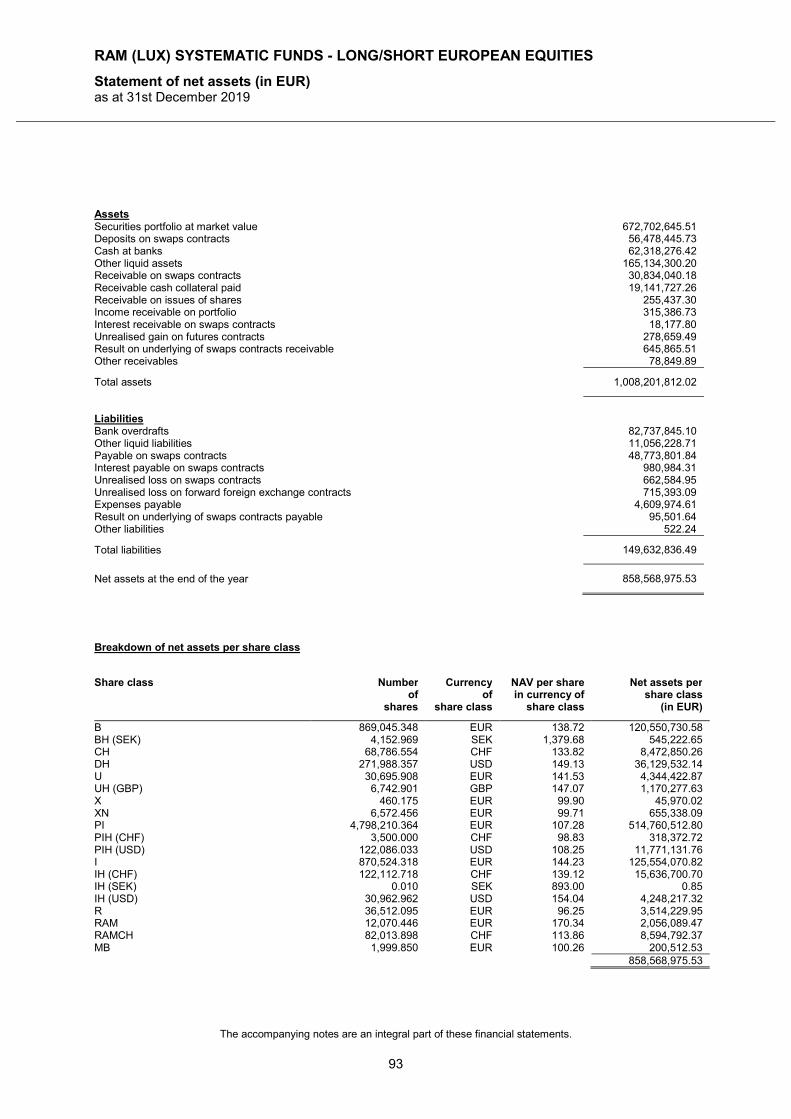
RAM (LUX) SYSTEMATIC FUNDS - LONG/SHORT EUROPEAN EQUITIES
Statement of net assets (in EUR) as at 31st December 2019
The accompanying notes are an integral part of these financial statements.
93
Assets Securities portfolio at market value 672,702,645.51 Deposits on swaps contracts 56,478,445.73 Cash at banks 62,318,276.42 Other liquid assets 165,134,300.20 Receivable on swaps contracts 30,834,040.18 Receivable cash collateral paid 19,141,727.26 Receivable on issues of shares 255,437.30 Income receivable on portfolio 315,386.73 Interest receivable on swaps contracts 18,177.80 Unrealised gain on futures contracts 278,659.49 Result on underlying of swaps contracts receivable 645,865.51 Other receivables 78,849.89
Total assets 1,008,201,812.02
Liabilities Bank overdrafts 82,737,845.10 Other liquid liabilities 11,056,228.71 Payable on swaps contracts 48,773,801.84 Interest payable on swaps contracts 980,984.31 Unrealised loss on swaps contracts 662,584.95 Unrealised loss on forward foreign exchange contracts 715,393.09 Expenses payable 4,609,974.61 Result on underlying of swaps contracts payable 95,501.64 Other liabilities 522.24
Total liabilities 149,632,836.49
Net assets at the end of the year 858,568,975.53
Breakdown of net assets per share class
Share class Number of
shares
Currency of
share class
NAV per share in currency of
share class
Net assets per share class
(in EUR)
B 869,045.348 EUR 138.72 120,550,730.58 BH (SEK) 4,152.969 SEK 1,379.68 545,222.65 CH 68,786.554 CHF 133.82 8,472,850.26 DH 271,988.357 USD 149.13 36,129,532.14 U 30,695.908 EUR 141.53 4,344,422.87 UH (GBP) 6,742.901 GBP 147.07 1,170,277.63 X 460.175 EUR 99.90 45,970.02 XN 6,572.456 EUR 99.71 655,338.09 PI 4,798,210.364 EUR 107.28 514,760,512.80 PIH (CHF) 3,500.000 CHF 98.83 318,372.72 PIH (USD) 122,086.033 USD 108.25 11,771,131.76 I 870,524.318 EUR 144.23 125,554,070.82 IH (CHF) 122,112.718 CHF 139.12 15,636,700.70 IH (SEK) 0.010 SEK 893.00 0.85 IH (USD) 30,962.962 USD 154.04 4,248,217.32 R 36,512.095 EUR 96.25 3,514,229.95 RAM 12,070.446 EUR 170.34 2,056,089.47 RAMCH 82,013.898 CHF 113.86 8,594,792.37 MB 1,999.850 EUR 100.26 200,512.53 858,568,975.53
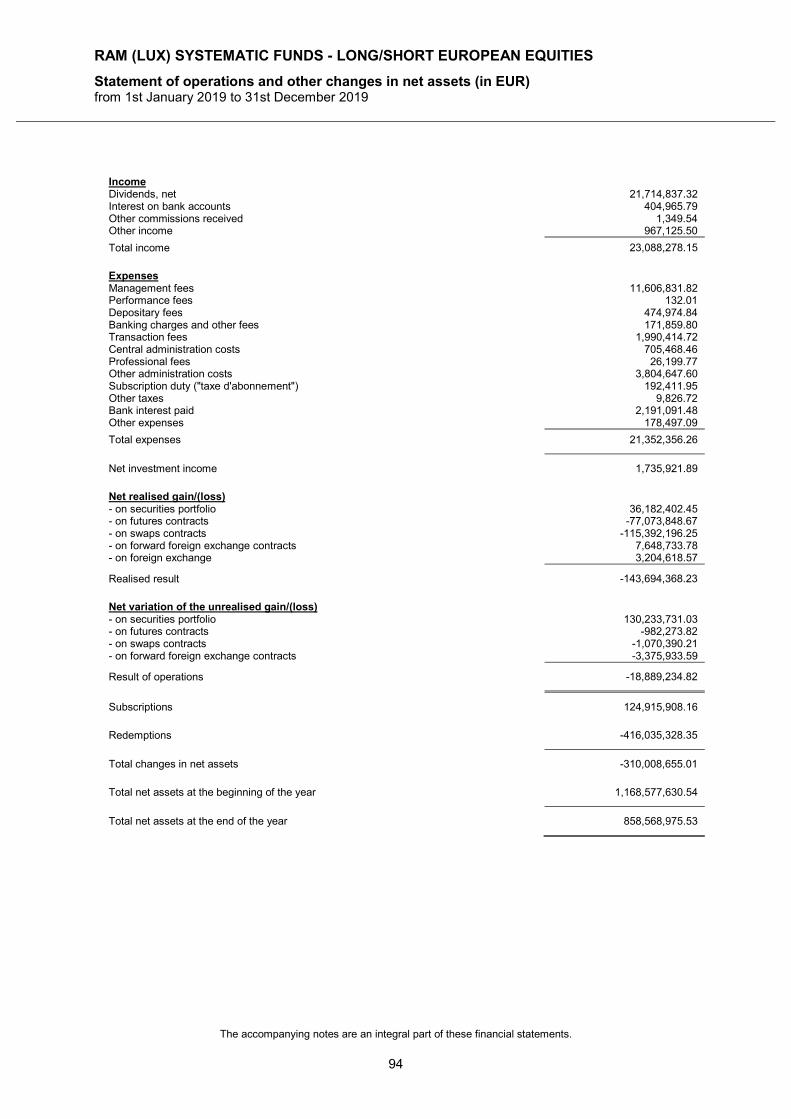
RAM (LUX) SYSTEMATIC FUNDS - LONG/SHORT EUROPEAN EQUITIES
Statement of operations and other changes in net assets (in EUR) from 1st January 2019 to 31st December 2019
The accompanying notes are an integral part of these financial statements.
94
Income Dividends, net 21,714,837.32 Interest on bank accounts 404,965.79 Other commissions received 1,349.54 Other income 967,125.50
Total income 23,088,278.15
Expenses Management fees 11,606,831.82 Performance fees 132.01 Depositary fees 474,974.84 Banking charges and other fees 171,859.80 Transaction fees 1,990,414.72 Central administration costs 705,468.46 Professional fees 26,199.77 Other administration costs 3,804,647.60 Subscription duty ("taxe d'abonnement") 192,411.95 Other taxes 9,826.72 Bank interest paid 2,191,091.48 Other expenses 178,497.09
Total expenses 21,352,356.26
Net investment income 1,735,921.89
Net realised gain/(loss) - on securities portfolio 36,182,402.45 - on futures contracts -77,073,848.67 - on swaps contracts -115,392,196.25 - on forward foreign exchange contracts 7,648,733.78 - on foreign exchange 3,204,618.57
Realised result -143,694,368.23
Net variation of the unrealised gain/(loss) - on securities portfolio 130,233,731.03 - on futures contracts -982,273.82 - on swaps contracts -1,070,390.21 - on forward foreign exchange contracts -3,375,933.59
Result of operations -18,889,234.82
Subscriptions 124,915,908.16
Redemptions -416,035,328.35
Total changes in net assets -310,008,655.01
Total net assets at the beginning of the year 1,168,577,630.54
Total net assets at the end of the year 858,568,975.53
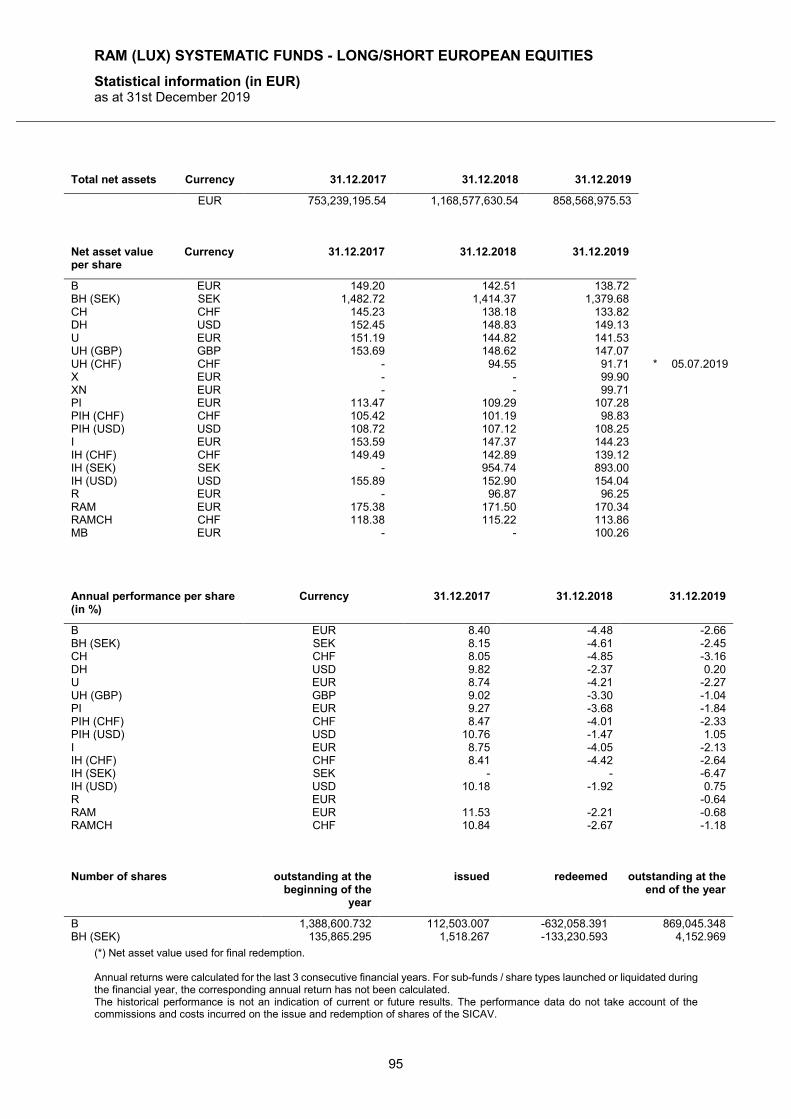
RAM (LUX) SYSTEMATIC FUNDS - LONG/SHORT EUROPEAN EQUITIES
Statistical information (in EUR) as at 31st December 2019
(*) Net asset value used for final redemption. Annual returns were calculated for the last 3 consecutive financial years. For sub-funds / share types launched or liquidated during the financial year, the corresponding annual return has not been calculated. The historical performance is not an indication of current or future results. The performance data do not take account of the commissions and costs incurred on the issue and redemption of shares of the SICAV.
95
Total net assets Currency 31.12.2017 31.12.2018 31.12.2019
EUR 753,239,195.54 1,168,577,630.54 858,568,975.53
Net asset value per share
Currency 31.12.2017 31.12.2018 31.12.2019
B EUR 149.20 142.51 138.72 BH (SEK) SEK 1,482.72 1,414.37 1,379.68 CH CHF 145.23 138.18 133.82 DH USD 152.45 148.83 149.13 U EUR 151.19 144.82 141.53 UH (GBP) GBP 153.69 148.62 147.07 UH (CHF) CHF - 94.55 91.71 * 05.07.2019 X EUR - - 99.90 XN EUR - - 99.71 PI EUR 113.47 109.29 107.28 PIH (CHF) CHF 105.42 101.19 98.83 PIH (USD) USD 108.72 107.12 108.25 I EUR 153.59 147.37 144.23 IH (CHF) CHF 149.49 142.89 139.12 IH (SEK) SEK - 954.74 893.00 IH (USD) USD 155.89 152.90 154.04 R EUR - 96.87 96.25 RAM EUR 175.38 171.50 170.34 RAMCH CHF 118.38 115.22 113.86 MB EUR - - 100.26
Annual performance per share (in %)
Currency 31.12.2017 31.12.2018 31.12.2019
B EUR 8.40 -4.48 -2.66 BH (SEK) SEK 8.15 -4.61 -2.45 CH CHF 8.05 -4.85 -3.16 DH USD 9.82 -2.37 0.20 U EUR 8.74 -4.21 -2.27 UH (GBP) GBP 9.02 -3.30 -1.04 PI EUR 9.27 -3.68 -1.84 PIH (CHF) CHF 8.47 -4.01 -2.33 PIH (USD) USD 10.76 -1.47 1.05 I EUR 8.75 -4.05 -2.13 IH (CHF) CHF 8.41 -4.42 -2.64 IH (SEK) SEK - - -6.47 IH (USD) USD 10.18 -1.92 0.75 R EUR -0.64 RAM EUR 11.53 -2.21 -0.68 RAMCH CHF 10.84 -2.67 -1.18
Number of shares outstanding at the
beginning of the year
issued redeemed outstanding at the end of the year
B 1,388,600.732 112,503.007 -632,058.391 869,045.348 BH (SEK) 135,865.295 1,518.267 -133,230.593 4,152.969
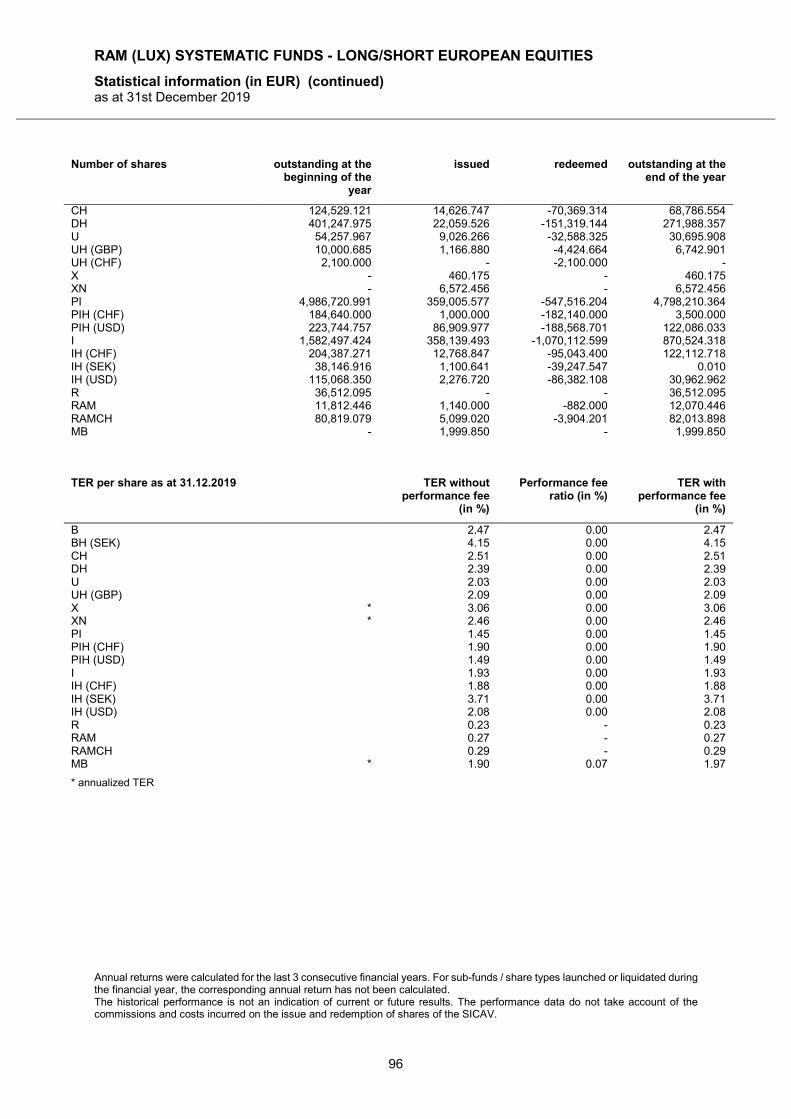
RAM (LUX) SYSTEMATIC FUNDS - LONG/SHORT EUROPEAN EQUITIES
Statistical information (in EUR) (continued) as at 31st December 2019
Annual returns were calculated for the last 3 consecutive financial years. For sub-funds / share types launched or liquidated during the financial year, the corresponding annual return has not been calculated. The historical performance is not an indication of current or future results. The performance data do not take account of the commissions and costs incurred on the issue and redemption of shares of the SICAV.
96
Number of shares outstanding at the beginning of the
year
issued redeemed outstanding at the end of the year
CH 124,529.121 14,626.747 -70,369.314 68,786.554 DH 401,247.975 22,059.526 -151,319.144 271,988.357 U 54,257.967 9,026.266 -32,588.325 30,695.908 UH (GBP) 10,000.685 1,166.880 -4,424.664 6,742.901 UH (CHF) 2,100.000 - -2,100.000 - X - 460.175 - 460.175 XN - 6,572.456 - 6,572.456 PI 4,986,720.991 359,005.577 -547,516.204 4,798,210.364 PIH (CHF) 184,640.000 1,000.000 -182,140.000 3,500.000 PIH (USD) 223,744.757 86,909.977 -188,568.701 122,086.033 I 1,582,497.424 358,139.493 -1,070,112.599 870,524.318 IH (CHF) 204,387.271 12,768.847 -95,043.400 122,112.718 IH (SEK) 38,146.916 1,100.641 -39,247.547 0.010 IH (USD) 115,068.350 2,276.720 -86,382.108 30,962.962 R 36,512.095 - - 36,512.095 RAM 11,812.446 1,140.000 -882.000 12,070.446 RAMCH 80,819.079 5,099.020 -3,904.201 82,013.898 MB - 1,999.850 - 1,999.850
TER per share as at 31.12.2019 TER without
performance fee (in %)
Performance fee ratio (in %)
TER with performance fee
(in %)
B 2.47 0.00 2.47 BH (SEK) 4.15 0.00 4.15 CH 2.51 0.00 2.51 DH 2.39 0.00 2.39 U 2.03 0.00 2.03 UH (GBP) 2.09 0.00 2.09 X * 3.06 0.00 3.06 XN * 2.46 0.00 2.46 PI 1.45 0.00 1.45 PIH (CHF) 1.90 0.00 1.90 PIH (USD) 1.49 0.00 1.49 I 1.93 0.00 1.93 IH (CHF) 1.88 0.00 1.88 IH (SEK) 3.71 0.00 3.71 IH (USD) 2.08 0.00 2.08 R 0.23 - 0.23 RAM 0.27 - 0.27 RAMCH 0.29 - 0.29 MB * 1.90 0.07 1.97
* annualized TER
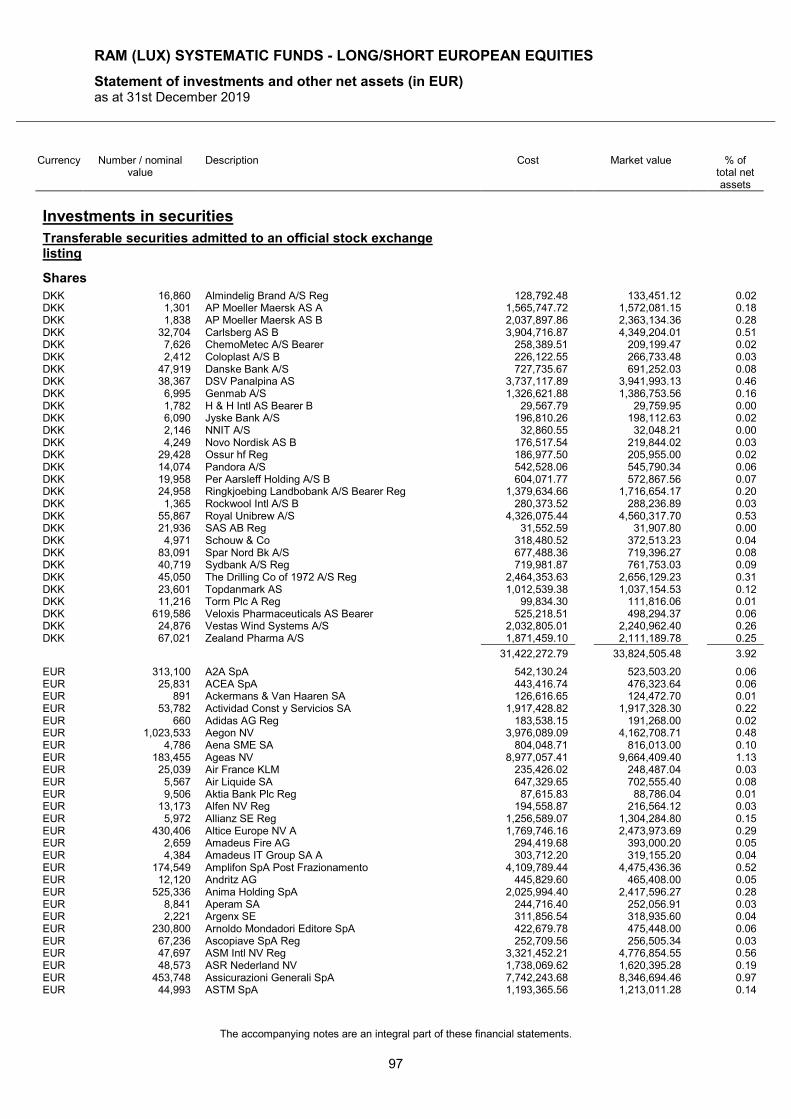
RAM (LUX) SYSTEMATIC FUNDS - LONG/SHORT EUROPEAN EQUITIES
Statement of investments and other net assets (in EUR) as at 31st December 2019
The accompanying notes are an integral part of these financial statements.
97
Currency Number / nominal value
Description Cost Market value % of total net assets
Investments in securities
Transferable securities admitted to an official stock exchange listing
Shares
DKK 16,860 Almindelig Brand A/S Reg 128,792.48 133,451.12 0.02 DKK 1,301 AP Moeller Maersk AS A 1,565,747.72 1,572,081.15 0.18 DKK 1,838 AP Moeller Maersk AS B 2,037,897.86 2,363,134.36 0.28 DKK 32,704 Carlsberg AS B 3,904,716.87 4,349,204.01 0.51 DKK 7,626 ChemoMetec A/S Bearer 258,389.51 209,199.47 0.02 DKK 2,412 Coloplast A/S B 226,122.55 266,733.48 0.03 DKK 47,919 Danske Bank A/S 727,735.67 691,252.03 0.08 DKK 38,367 DSV Panalpina AS 3,737,117.89 3,941,993.13 0.46 DKK 6,995 Genmab A/S 1,326,621.88 1,386,753.56 0.16 DKK 1,782 H & H Intl AS Bearer B 29,567.79 29,759.95 0.00 DKK 6,090 Jyske Bank A/S 196,810.26 198,112.63 0.02 DKK 2,146 NNIT A/S 32,860.55 32,048.21 0.00 DKK 4,249 Novo Nordisk AS B 176,517.54 219,844.02 0.03 DKK 29,428 Ossur hf Reg 186,977.50 205,955.00 0.02 DKK 14,074 Pandora A/S 542,528.06 545,790.34 0.06 DKK 19,958 Per Aarsleff Holding A/S B 604,071.77 572,867.56 0.07 DKK 24,958 Ringkjoebing Landbobank A/S Bearer Reg 1,379,634.66 1,716,654.17 0.20 DKK 1,365 Rockwool Intl A/S B 280,373.52 288,236.89 0.03 DKK 55,867 Royal Unibrew A/S 4,326,075.44 4,560,317.70 0.53 DKK 21,936 SAS AB Reg 31,552.59 31,907.80 0.00 DKK 4,971 Schouw & Co 318,480.52 372,513.23 0.04 DKK 83,091 Spar Nord Bk A/S 677,488.36 719,396.27 0.08 DKK 40,719 Sydbank A/S Reg 719,981.87 761,753.03 0.09 DKK 45,050 The Drilling Co of 1972 A/S Reg 2,464,353.63 2,656,129.23 0.31 DKK 23,601 Topdanmark AS 1,012,539.38 1,037,154.53 0.12 DKK 11,216 Torm Plc A Reg 99,834.30 111,816.06 0.01 DKK 619,586 Veloxis Pharmaceuticals AS Bearer 525,218.51 498,294.37 0.06 DKK 24,876 Vestas Wind Systems A/S 2,032,805.01 2,240,962.40 0.26 DKK 67,021 Zealand Pharma A/S 1,871,459.10 2,111,189.78 0.25
31,422,272.79 33,824,505.48 3.92
EUR 313,100 A2A SpA 542,130.24 523,503.20 0.06 EUR 25,831 ACEA SpA 443,416.74 476,323.64 0.06 EUR 891 Ackermans & Van Haaren SA 126,616.65 124,472.70 0.01 EUR 53,782 Actividad Const y Servicios SA 1,917,428.82 1,917,328.30 0.22 EUR 660 Adidas AG Reg 183,538.15 191,268.00 0.02 EUR 1,023,533 Aegon NV 3,976,089.09 4,162,708.71 0.48 EUR 4,786 Aena SME SA 804,048.71 816,013.00 0.10 EUR 183,455 Ageas NV 8,977,057.41 9,664,409.40 1.13 EUR 25,039 Air France KLM 235,426.02 248,487.04 0.03 EUR 5,567 Air Liquide SA 647,329.65 702,555.40 0.08 EUR 9,506 Aktia Bank Plc Reg 87,615.83 88,786.04 0.01 EUR 13,173 Alfen NV Reg 194,558.87 216,564.12 0.03 EUR 5,972 Allianz SE Reg 1,256,589.07 1,304,284.80 0.15 EUR 430,406 Altice Europe NV A 1,769,746.16 2,473,973.69 0.29 EUR 2,659 Amadeus Fire AG 294,419.68 393,000.20 0.05 EUR 4,384 Amadeus IT Group SA A 303,712.20 319,155.20 0.04 EUR 174,549 Amplifon SpA Post Frazionamento 4,109,789.44 4,475,436.36 0.52 EUR 12,120 Andritz AG 445,829.60 465,408.00 0.05 EUR 525,336 Anima Holding SpA 2,025,994.40 2,417,596.27 0.28 EUR 8,841 Aperam SA 244,716.40 252,056.91 0.03 EUR 2,221 Argenx SE 311,856.54 318,935.60 0.04 EUR 230,800 Arnoldo Mondadori Editore SpA 422,679.78 475,448.00 0.06 EUR 67,236 Ascopiave SpA Reg 252,709.56 256,505.34 0.03 EUR 47,697 ASM Intl NV Reg 3,321,452.21 4,776,854.55 0.56 EUR 48,573 ASR Nederland NV 1,738,069.62 1,620,395.28 0.19 EUR 453,748 Assicurazioni Generali SpA 7,742,243.68 8,346,694.46 0.97 EUR 44,993 ASTM SpA 1,193,365.56 1,213,011.28 0.14
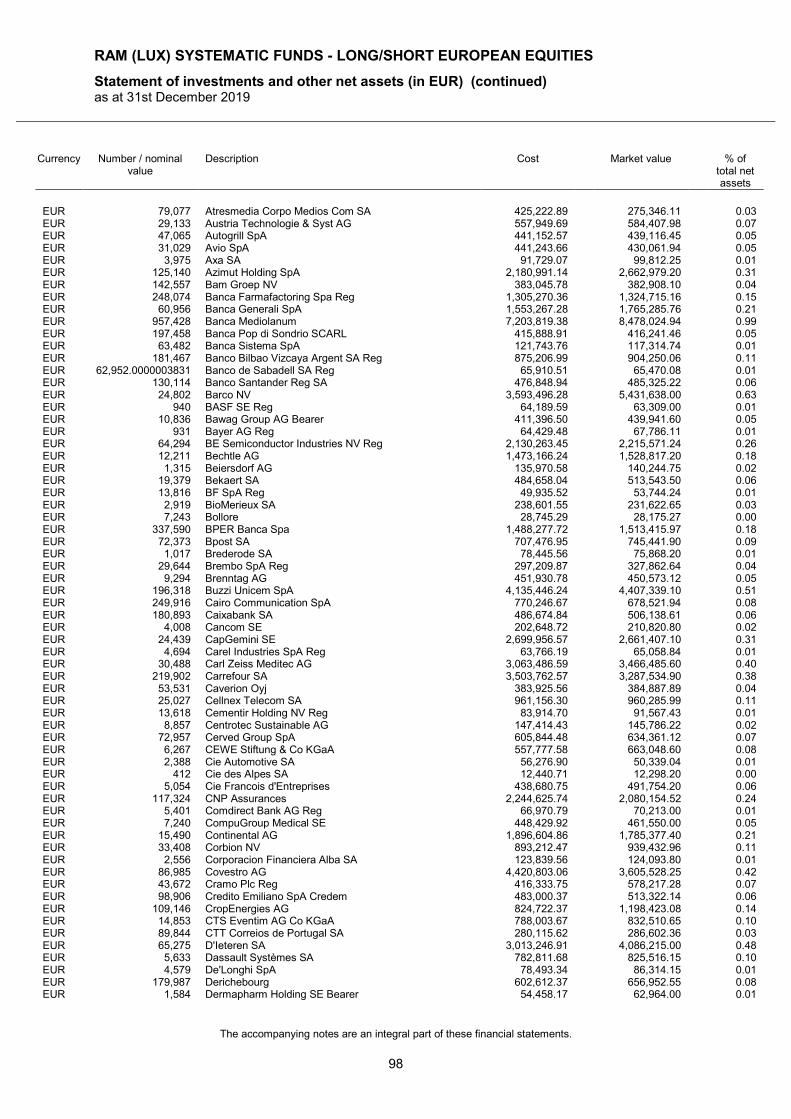
RAM (LUX) SYSTEMATIC FUNDS - LONG/SHORT EUROPEAN EQUITIES
Statement of investments and other net assets (in EUR) (continued) as at 31st December 2019
The accompanying notes are an integral part of these financial statements.
98
Currency Number / nominal value
Description Cost Market value % of total net assets
EUR 79,077 Atresmedia Corpo Medios Com SA 425,222.89 275,346.11 0.03 EUR 29,133 Austria Technologie & Syst AG 557,949.69 584,407.98 0.07 EUR 47,065 Autogrill SpA 441,152.57 439,116.45 0.05 EUR 31,029 Avio SpA 441,243.66 430,061.94 0.05 EUR 3,975 Axa SA 91,729.07 99,812.25 0.01 EUR 125,140 Azimut Holding SpA 2,180,991.14 2,662,979.20 0.31 EUR 142,557 Bam Groep NV 383,045.78 382,908.10 0.04 EUR 248,074 Banca Farmafactoring Spa Reg 1,305,270.36 1,324,715.16 0.15 EUR 60,956 Banca Generali SpA 1,553,267.28 1,765,285.76 0.21 EUR 957,428 Banca Mediolanum 7,203,819.38 8,478,024.94 0.99 EUR 197,458 Banca Pop di Sondrio SCARL 415,888.91 416,241.46 0.05 EUR 63,482 Banca Sistema SpA 121,743.76 117,314.74 0.01 EUR 181,467 Banco Bilbao Vizcaya Argent SA Reg 875,206.99 904,250.06 0.11 EUR 62,952.0000003831 Banco de Sabadell SA Reg 65,910.51 65,470.08 0.01 EUR 130,114 Banco Santander Reg SA 476,848.94 485,325.22 0.06 EUR 24,802 Barco NV 3,593,496.28 5,431,638.00 0.63 EUR 940 BASF SE Reg 64,189.59 63,309.00 0.01 EUR 10,836 Bawag Group AG Bearer 411,396.50 439,941.60 0.05 EUR 931 Bayer AG Reg 64,429.48 67,786.11 0.01 EUR 64,294 BE Semiconductor Industries NV Reg 2,130,263.45 2,215,571.24 0.26 EUR 12,211 Bechtle AG 1,473,166.24 1,528,817.20 0.18 EUR 1,315 Beiersdorf AG 135,970.58 140,244.75 0.02 EUR 19,379 Bekaert SA 484,658.04 513,543.50 0.06 EUR 13,816 BF SpA Reg 49,935.52 53,744.24 0.01 EUR 2,919 BioMerieux SA 238,601.55 231,622.65 0.03 EUR 7,243 Bollore 28,745.29 28,175.27 0.00 EUR 337,590 BPER Banca Spa 1,488,277.72 1,513,415.97 0.18 EUR 72,373 Bpost SA 707,476.95 745,441.90 0.09 EUR 1,017 Brederode SA 78,445.56 75,868.20 0.01 EUR 29,644 Brembo SpA Reg 297,209.87 327,862.64 0.04 EUR 9,294 Brenntag AG 451,930.78 450,573.12 0.05 EUR 196,318 Buzzi Unicem SpA 4,135,446.24 4,407,339.10 0.51 EUR 249,916 Cairo Communication SpA 770,246.67 678,521.94 0.08 EUR 180,893 Caixabank SA 486,674.84 506,138.61 0.06 EUR 4,008 Cancom SE 202,648.72 210,820.80 0.02 EUR 24,439 CapGemini SE 2,699,956.57 2,661,407.10 0.31 EUR 4,694 Carel Industries SpA Reg 63,766.19 65,058.84 0.01 EUR 30,488 Carl Zeiss Meditec AG 3,063,486.59 3,466,485.60 0.40 EUR 219,902 Carrefour SA 3,503,762.57 3,287,534.90 0.38 EUR 53,531 Caverion Oyj 383,925.56 384,887.89 0.04 EUR 25,027 Cellnex Telecom SA 961,156.30 960,285.99 0.11 EUR 13,618 Cementir Holding NV Reg 83,914.70 91,567.43 0.01 EUR 8,857 Centrotec Sustainable AG 147,414.43 145,786.22 0.02 EUR 72,957 Cerved Group SpA 605,844.48 634,361.12 0.07 EUR 6,267 CEWE Stiftung & Co KGaA 557,777.58 663,048.60 0.08 EUR 2,388 Cie Automotive SA 56,276.90 50,339.04 0.01 EUR 412 Cie des Alpes SA 12,440.71 12,298.20 0.00 EUR 5,054 Cie Francois d'Entreprises 438,680.75 491,754.20 0.06 EUR 117,324 CNP Assurances 2,244,625.74 2,080,154.52 0.24 EUR 5,401 Comdirect Bank AG Reg 66,970.79 70,213.00 0.01 EUR 7,240 CompuGroup Medical SE 448,429.92 461,550.00 0.05 EUR 15,490 Continental AG 1,896,604.86 1,785,377.40 0.21 EUR 33,408 Corbion NV 893,212.47 939,432.96 0.11 EUR 2,556 Corporacion Financiera Alba SA 123,839.56 124,093.80 0.01 EUR 86,985 Covestro AG 4,420,803.06 3,605,528.25 0.42 EUR 43,672 Cramo Plc Reg 416,333.75 578,217.28 0.07 EUR 98,906 Credito Emiliano SpA Credem 483,000.37 513,322.14 0.06 EUR 109,146 CropEnergies AG 824,722.37 1,198,423.08 0.14 EUR 14,853 CTS Eventim AG Co KGaA 788,003.67 832,510.65 0.10 EUR 89,844 CTT Correios de Portugal SA 280,115.62 286,602.36 0.03 EUR 65,275 D'Ieteren SA 3,013,246.91 4,086,215.00 0.48 EUR 5,633 Dassault Systèmes SA 782,811.68 825,516.15 0.10 EUR 4,579 De'Longhi SpA 78,493.34 86,314.15 0.01 EUR 179,987 Derichebourg 602,612.37 656,952.55 0.08 EUR 1,584 Dermapharm Holding SE Bearer 54,458.17 62,964.00 0.01
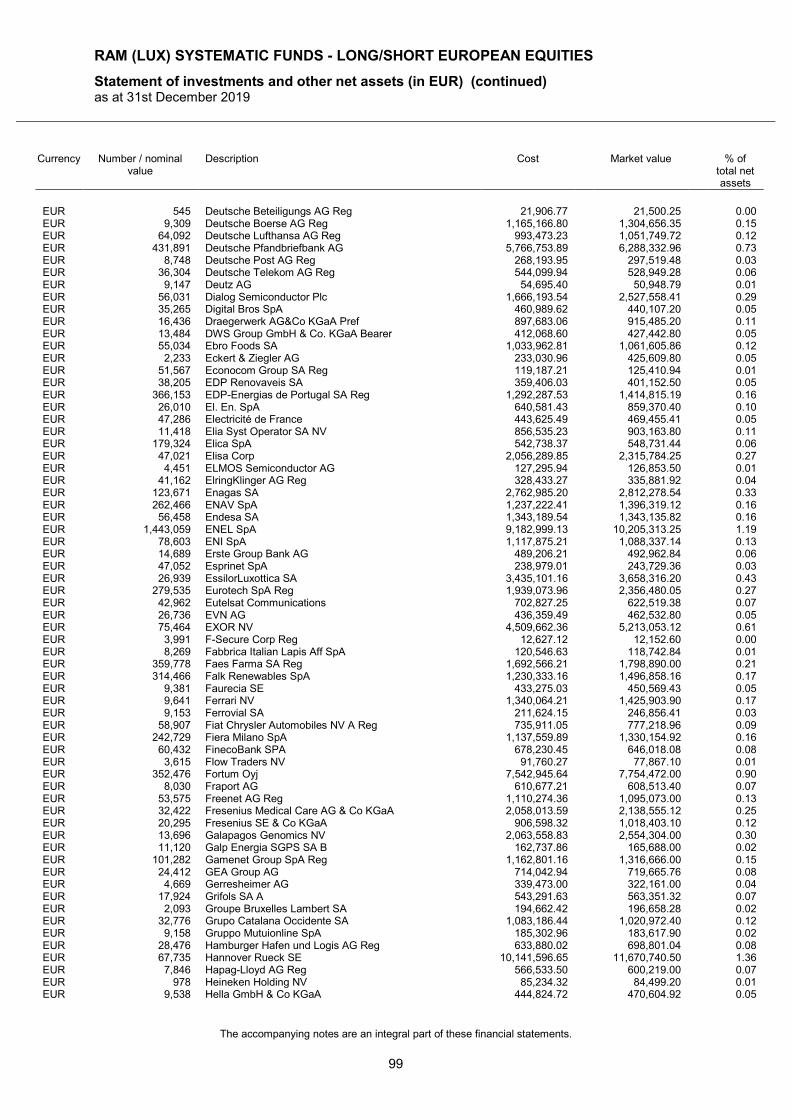
RAM (LUX) SYSTEMATIC FUNDS - LONG/SHORT EUROPEAN EQUITIES
Statement of investments and other net assets (in EUR) (continued) as at 31st December 2019
The accompanying notes are an integral part of these financial statements.
99
Currency Number / nominal value
Description Cost Market value % of total net assets
EUR 545 Deutsche Beteiligungs AG Reg 21,906.77 21,500.25 0.00 EUR 9,309 Deutsche Boerse AG Reg 1,165,166.80 1,304,656.35 0.15 EUR 64,092 Deutsche Lufthansa AG Reg 993,473.23 1,051,749.72 0.12 EUR 431,891 Deutsche Pfandbriefbank AG 5,766,753.89 6,288,332.96 0.73 EUR 8,748 Deutsche Post AG Reg 268,193.95 297,519.48 0.03 EUR 36,304 Deutsche Telekom AG Reg 544,099.94 528,949.28 0.06 EUR 9,147 Deutz AG 54,695.40 50,948.79 0.01 EUR 56,031 Dialog Semiconductor Plc 1,666,193.54 2,527,558.41 0.29 EUR 35,265 Digital Bros SpA 460,989.62 440,107.20 0.05 EUR 16,436 Draegerwerk AG&Co KGaA Pref 897,683.06 915,485.20 0.11 EUR 13,484 DWS Group GmbH & Co. KGaA Bearer 412,068.60 427,442.80 0.05 EUR 55,034 Ebro Foods SA 1,033,962.81 1,061,605.86 0.12 EUR 2,233 Eckert & Ziegler AG 233,030.96 425,609.80 0.05 EUR 51,567 Econocom Group SA Reg 119,187.21 125,410.94 0.01 EUR 38,205 EDP Renovaveis SA 359,406.03 401,152.50 0.05 EUR 366,153 EDP-Energias de Portugal SA Reg 1,292,287.53 1,414,815.19 0.16 EUR 26,010 El. En. SpA 640,581.43 859,370.40 0.10 EUR 47,286 Electricité de France 443,625.49 469,455.41 0.05 EUR 11,418 Elia Syst Operator SA NV 856,535.23 903,163.80 0.11 EUR 179,324 Elica SpA 542,738.37 548,731.44 0.06 EUR 47,021 Elisa Corp 2,056,289.85 2,315,784.25 0.27 EUR 4,451 ELMOS Semiconductor AG 127,295.94 126,853.50 0.01 EUR 41,162 ElringKlinger AG Reg 328,433.27 335,881.92 0.04 EUR 123,671 Enagas SA 2,762,985.20 2,812,278.54 0.33 EUR 262,466 ENAV SpA 1,237,222.41 1,396,319.12 0.16 EUR 56,458 Endesa SA 1,343,189.54 1,343,135.82 0.16 EUR 1,443,059 ENEL SpA 9,182,999.13 10,205,313.25 1.19 EUR 78,603 ENI SpA 1,117,875.21 1,088,337.14 0.13 EUR 14,689 Erste Group Bank AG 489,206.21 492,962.84 0.06 EUR 47,052 Esprinet SpA 238,979.01 243,729.36 0.03 EUR 26,939 EssilorLuxottica SA 3,435,101.16 3,658,316.20 0.43 EUR 279,535 Eurotech SpA Reg 1,939,073.96 2,356,480.05 0.27 EUR 42,962 Eutelsat Communications 702,827.25 622,519.38 0.07 EUR 26,736 EVN AG 436,359.49 462,532.80 0.05 EUR 75,464 EXOR NV 4,509,662.36 5,213,053.12 0.61 EUR 3,991 F-Secure Corp Reg 12,627.12 12,152.60 0.00 EUR 8,269 Fabbrica Italian Lapis Aff SpA 120,546.63 118,742.84 0.01 EUR 359,778 Faes Farma SA Reg 1,692,566.21 1,798,890.00 0.21 EUR 314,466 Falk Renewables SpA 1,230,333.16 1,496,858.16 0.17 EUR 9,381 Faurecia SE 433,275.03 450,569.43 0.05 EUR 9,641 Ferrari NV 1,340,064.21 1,425,903.90 0.17 EUR 9,153 Ferrovial SA 211,624.15 246,856.41 0.03 EUR 58,907 Fiat Chrysler Automobiles NV A Reg 735,911.05 777,218.96 0.09 EUR 242,729 Fiera Milano SpA 1,137,559.89 1,330,154.92 0.16 EUR 60,432 FinecoBank SPA 678,230.45 646,018.08 0.08 EUR 3,615 Flow Traders NV 91,760.27 77,867.10 0.01 EUR 352,476 Fortum Oyj 7,542,945.64 7,754,472.00 0.90 EUR 8,030 Fraport AG 610,677.21 608,513.40 0.07 EUR 53,575 Freenet AG Reg 1,110,274.36 1,095,073.00 0.13 EUR 32,422 Fresenius Medical Care AG & Co KGaA 2,058,013.59 2,138,555.12 0.25 EUR 20,295 Fresenius SE & Co KGaA 906,598.32 1,018,403.10 0.12 EUR 13,696 Galapagos Genomics NV 2,063,558.83 2,554,304.00 0.30 EUR 11,120 Galp Energia SGPS SA B 162,737.86 165,688.00 0.02 EUR 101,282 Gamenet Group SpA Reg 1,162,801.16 1,316,666.00 0.15 EUR 24,412 GEA Group AG 714,042.94 719,665.76 0.08 EUR 4,669 Gerresheimer AG 339,473.00 322,161.00 0.04 EUR 17,924 Grifols SA A 543,291.63 563,351.32 0.07 EUR 2,093 Groupe Bruxelles Lambert SA 194,662.42 196,658.28 0.02 EUR 32,776 Grupo Catalana Occidente SA 1,083,186.44 1,020,972.40 0.12 EUR 9,158 Gruppo Mutuionline SpA 185,302.96 183,617.90 0.02 EUR 28,476 Hamburger Hafen und Logis AG Reg 633,880.02 698,801.04 0.08 EUR 67,735 Hannover Rueck SE 10,141,596.65 11,670,740.50 1.36 EUR 7,846 Hapag-Lloyd AG Reg 566,533.50 600,219.00 0.07 EUR 978 Heineken Holding NV 85,234.32 84,499.20 0.01 EUR 9,538 Hella GmbH & Co KGaA 444,824.72 470,604.92 0.05
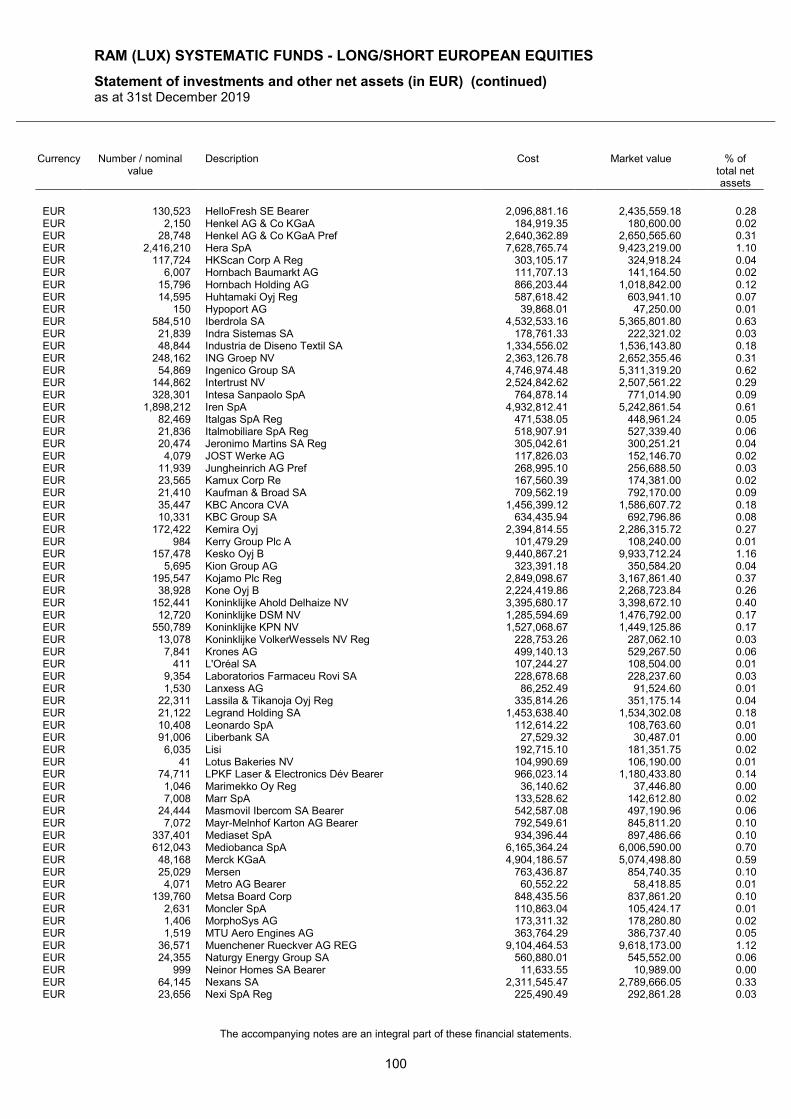
RAM (LUX) SYSTEMATIC FUNDS - LONG/SHORT EUROPEAN EQUITIES
Statement of investments and other net assets (in EUR) (continued) as at 31st December 2019
The accompanying notes are an integral part of these financial statements.
100
Currency Number / nominal value
Description Cost Market value % of total net assets
EUR 130,523 HelloFresh SE Bearer 2,096,881.16 2,435,559.18 0.28 EUR 2,150 Henkel AG & Co KGaA 184,919.35 180,600.00 0.02 EUR 28,748 Henkel AG & Co KGaA Pref 2,640,362.89 2,650,565.60 0.31 EUR 2,416,210 Hera SpA 7,628,765.74 9,423,219.00 1.10 EUR 117,724 HKScan Corp A Reg 303,105.17 324,918.24 0.04 EUR 6,007 Hornbach Baumarkt AG 111,707.13 141,164.50 0.02 EUR 15,796 Hornbach Holding AG 866,203.44 1,018,842.00 0.12 EUR 14,595 Huhtamaki Oyj Reg 587,618.42 603,941.10 0.07 EUR 150 Hypoport AG 39,868.01 47,250.00 0.01 EUR 584,510 Iberdrola SA 4,532,533.16 5,365,801.80 0.63 EUR 21,839 Indra Sistemas SA 178,761.33 222,321.02 0.03 EUR 48,844 Industria de Diseno Textil SA 1,334,556.02 1,536,143.80 0.18 EUR 248,162 ING Groep NV 2,363,126.78 2,652,355.46 0.31 EUR 54,869 Ingenico Group SA 4,746,974.48 5,311,319.20 0.62 EUR 144,862 Intertrust NV 2,524,842.62 2,507,561.22 0.29 EUR 328,301 Intesa Sanpaolo SpA 764,878.14 771,014.90 0.09 EUR 1,898,212 Iren SpA 4,932,812.41 5,242,861.54 0.61 EUR 82,469 Italgas SpA Reg 471,538.05 448,961.24 0.05 EUR 21,836 Italmobiliare SpA Reg 518,907.91 527,339.40 0.06 EUR 20,474 Jeronimo Martins SA Reg 305,042.61 300,251.21 0.04 EUR 4,079 JOST Werke AG 117,826.03 152,146.70 0.02 EUR 11,939 Jungheinrich AG Pref 268,995.10 256,688.50 0.03 EUR 23,565 Kamux Corp Re 167,560.39 174,381.00 0.02 EUR 21,410 Kaufman & Broad SA 709,562.19 792,170.00 0.09 EUR 35,447 KBC Ancora CVA 1,456,399.12 1,586,607.72 0.18 EUR 10,331 KBC Group SA 634,435.94 692,796.86 0.08 EUR 172,422 Kemira Oyj 2,394,814.55 2,286,315.72 0.27 EUR 984 Kerry Group Plc A 101,479.29 108,240.00 0.01 EUR 157,478 Kesko Oyj B 9,440,867.21 9,933,712.24 1.16 EUR 5,695 Kion Group AG 323,391.18 350,584.20 0.04 EUR 195,547 Kojamo Plc Reg 2,849,098.67 3,167,861.40 0.37 EUR 38,928 Kone Oyj B 2,224,419.86 2,268,723.84 0.26 EUR 152,441 Koninklijke Ahold Delhaize NV 3,395,680.17 3,398,672.10 0.40 EUR 12,720 Koninklijke DSM NV 1,285,594.69 1,476,792.00 0.17 EUR 550,789 Koninklijke KPN NV 1,527,068.67 1,449,125.86 0.17 EUR 13,078 Koninklijke VolkerWessels NV Reg 228,753.26 287,062.10 0.03 EUR 7,841 Krones AG 499,140.13 529,267.50 0.06 EUR 411 L'Oréal SA 107,244.27 108,504.00 0.01 EUR 9,354 Laboratorios Farmaceu Rovi SA 228,678.68 228,237.60 0.03 EUR 1,530 Lanxess AG 86,252.49 91,524.60 0.01 EUR 22,311 Lassila & Tikanoja Oyj Reg 335,814.26 351,175.14 0.04 EUR 21,122 Legrand Holding SA 1,453,638.40 1,534,302.08 0.18 EUR 10,408 Leonardo SpA 112,614.22 108,763.60 0.01 EUR 91,006 Liberbank SA 27,529.32 30,487.01 0.00 EUR 6,035 Lisi 192,715.10 181,351.75 0.02 EUR 41 Lotus Bakeries NV 104,990.69 106,190.00 0.01 EUR 74,711 LPKF Laser & Electronics Dév Bearer 966,023.14 1,180,433.80 0.14 EUR 1,046 Marimekko Oy Reg 36,140.62 37,446.80 0.00 EUR 7,008 Marr SpA 133,528.62 142,612.80 0.02 EUR 24,444 Masmovil Ibercom SA Bearer 542,587.08 497,190.96 0.06 EUR 7,072 Mayr-Melnhof Karton AG Bearer 792,549.61 845,811.20 0.10 EUR 337,401 Mediaset SpA 934,396.44 897,486.66 0.10 EUR 612,043 Mediobanca SpA 6,165,364.24 6,006,590.00 0.70 EUR 48,168 Merck KGaA 4,904,186.57 5,074,498.80 0.59 EUR 25,029 Mersen 763,436.87 854,740.35 0.10 EUR 4,071 Metro AG Bearer 60,552.22 58,418.85 0.01 EUR 139,760 Metsa Board Corp 848,435.56 837,861.20 0.10 EUR 2,631 Moncler SpA 110,863.04 105,424.17 0.01 EUR 1,406 MorphoSys AG 173,311.32 178,280.80 0.02 EUR 1,519 MTU Aero Engines AG 363,764.29 386,737.40 0.05 EUR 36,571 Muenchener Rueckver AG REG 9,104,464.53 9,618,173.00 1.12 EUR 24,355 Naturgy Energy Group SA 560,880.01 545,552.00 0.06 EUR 999 Neinor Homes SA Bearer 11,633.55 10,989.00 0.00 EUR 64,145 Nexans SA 2,311,545.47 2,789,666.05 0.33 EUR 23,656 Nexi SpA Reg 225,490.49 292,861.28 0.03
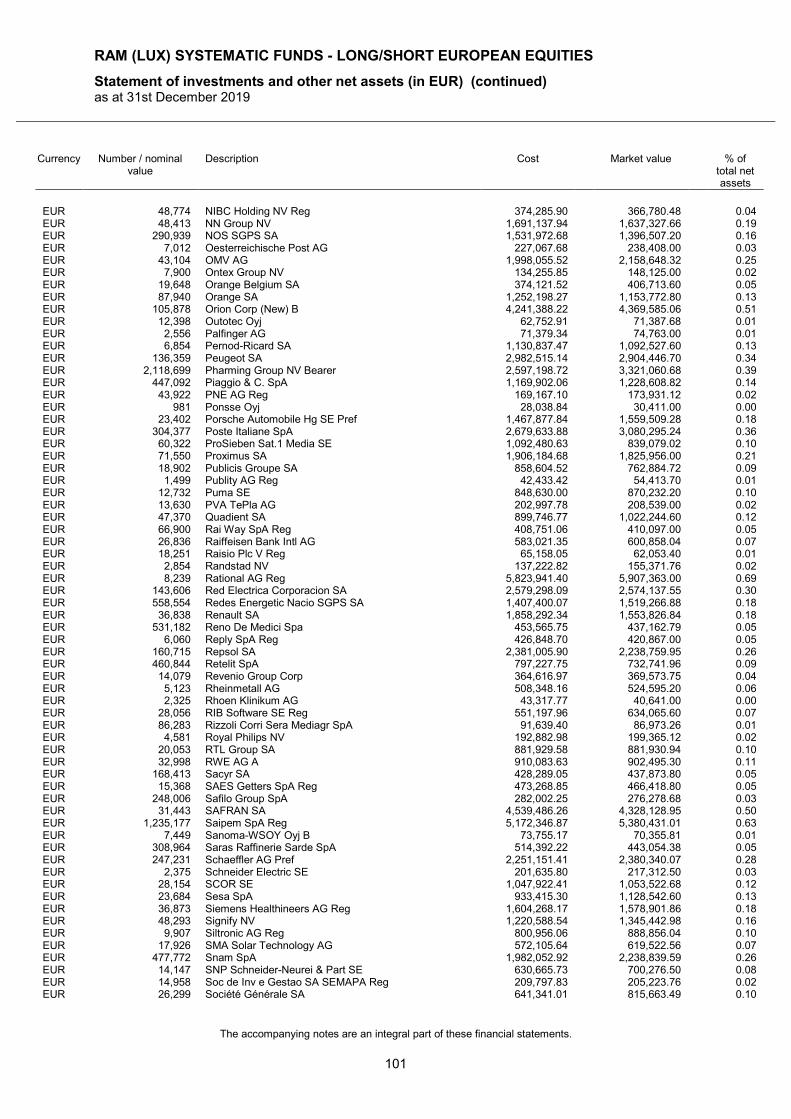
RAM (LUX) SYSTEMATIC FUNDS - LONG/SHORT EUROPEAN EQUITIES
Statement of investments and other net assets (in EUR) (continued) as at 31st December 2019
The accompanying notes are an integral part of these financial statements.
101
Currency Number / nominal value
Description Cost Market value % of total net assets
EUR 48,774 NIBC Holding NV Reg 374,285.90 366,780.48 0.04 EUR 48,413 NN Group NV 1,691,137.94 1,637,327.66 0.19 EUR 290,939 NOS SGPS SA 1,531,972.68 1,396,507.20 0.16 EUR 7,012 Oesterreichische Post AG 227,067.68 238,408.00 0.03 EUR 43,104 OMV AG 1,998,055.52 2,158,648.32 0.25 EUR 7,900 Ontex Group NV 134,255.85 148,125.00 0.02 EUR 19,648 Orange Belgium SA 374,121.52 406,713.60 0.05 EUR 87,940 Orange SA 1,252,198.27 1,153,772.80 0.13 EUR 105,878 Orion Corp (New) B 4,241,388.22 4,369,585.06 0.51 EUR 12,398 Outotec Oyj 62,752.91 71,387.68 0.01 EUR 2,556 Palfinger AG 71,379.34 74,763.00 0.01 EUR 6,854 Pernod-Ricard SA 1,130,837.47 1,092,527.60 0.13 EUR 136,359 Peugeot SA 2,982,515.14 2,904,446.70 0.34 EUR 2,118,699 Pharming Group NV Bearer 2,597,198.72 3,321,060.68 0.39 EUR 447,092 Piaggio & C. SpA 1,169,902.06 1,228,608.82 0.14 EUR 43,922 PNE AG Reg 169,167.10 173,931.12 0.02 EUR 981 Ponsse Oyj 28,038.84 30,411.00 0.00 EUR 23,402 Porsche Automobile Hg SE Pref 1,467,877.84 1,559,509.28 0.18 EUR 304,377 Poste Italiane SpA 2,679,633.88 3,080,295.24 0.36 EUR 60,322 ProSieben Sat.1 Media SE 1,092,480.63 839,079.02 0.10 EUR 71,550 Proximus SA 1,906,184.68 1,825,956.00 0.21 EUR 18,902 Publicis Groupe SA 858,604.52 762,884.72 0.09 EUR 1,499 Publity AG Reg 42,433.42 54,413.70 0.01 EUR 12,732 Puma SE 848,630.00 870,232.20 0.10 EUR 13,630 PVA TePla AG 202,997.78 208,539.00 0.02 EUR 47,370 Quadient SA 899,746.77 1,022,244.60 0.12 EUR 66,900 Rai Way SpA Reg 408,751.06 410,097.00 0.05 EUR 26,836 Raiffeisen Bank Intl AG 583,021.35 600,858.04 0.07 EUR 18,251 Raisio Plc V Reg 65,158.05 62,053.40 0.01 EUR 2,854 Randstad NV 137,222.82 155,371.76 0.02 EUR 8,239 Rational AG Reg 5,823,941.40 5,907,363.00 0.69 EUR 143,606 Red Electrica Corporacion SA 2,579,298.09 2,574,137.55 0.30 EUR 558,554 Redes Energetic Nacio SGPS SA 1,407,400.07 1,519,266.88 0.18 EUR 36,838 Renault SA 1,858,292.34 1,553,826.84 0.18 EUR 531,182 Reno De Medici Spa 453,565.75 437,162.79 0.05 EUR 6,060 Reply SpA Reg 426,848.70 420,867.00 0.05 EUR 160,715 Repsol SA 2,381,005.90 2,238,759.95 0.26 EUR 460,844 Retelit SpA 797,227.75 732,741.96 0.09 EUR 14,079 Revenio Group Corp 364,616.97 369,573.75 0.04 EUR 5,123 Rheinmetall AG 508,348.16 524,595.20 0.06 EUR 2,325 Rhoen Klinikum AG 43,317.77 40,641.00 0.00 EUR 28,056 RIB Software SE Reg 551,197.96 634,065.60 0.07 EUR 86,283 Rizzoli Corri Sera Mediagr SpA 91,639.40 86,973.26 0.01 EUR 4,581 Royal Philips NV 192,882.98 199,365.12 0.02 EUR 20,053 RTL Group SA 881,929.58 881,930.94 0.10 EUR 32,998 RWE AG A 910,083.63 902,495.30 0.11 EUR 168,413 Sacyr SA 428,289.05 437,873.80 0.05 EUR 15,368 SAES Getters SpA Reg 473,268.85 466,418.80 0.05 EUR 248,006 Safilo Group SpA 282,002.25 276,278.68 0.03 EUR 31,443 SAFRAN SA 4,539,486.26 4,328,128.95 0.50 EUR 1,235,177 Saipem SpA Reg 5,172,346.87 5,380,431.01 0.63 EUR 7,449 Sanoma-WSOY Oyj B 73,755.17 70,355.81 0.01 EUR 308,964 Saras Raffinerie Sarde SpA 514,392.22 443,054.38 0.05 EUR 247,231 Schaeffler AG Pref 2,251,151.41 2,380,340.07 0.28 EUR 2,375 Schneider Electric SE 201,635.80 217,312.50 0.03 EUR 28,154 SCOR SE 1,047,922.41 1,053,522.68 0.12 EUR 23,684 Sesa SpA 933,415.30 1,128,542.60 0.13 EUR 36,873 Siemens Healthineers AG Reg 1,604,268.17 1,578,901.86 0.18 EUR 48,293 Signify NV 1,220,588.54 1,345,442.98 0.16 EUR 9,907 Siltronic AG Reg 800,956.06 888,856.04 0.10 EUR 17,926 SMA Solar Technology AG 572,105.64 619,522.56 0.07 EUR 477,772 Snam SpA 1,982,052.92 2,238,839.59 0.26 EUR 14,147 SNP Schneider-Neurei & Part SE 630,665.73 700,276.50 0.08 EUR 14,958 Soc de Inv e Gestao SA SEMAPA Reg 209,797.83 205,223.76 0.02 EUR 26,299 Société Générale SA 641,341.01 815,663.49 0.10
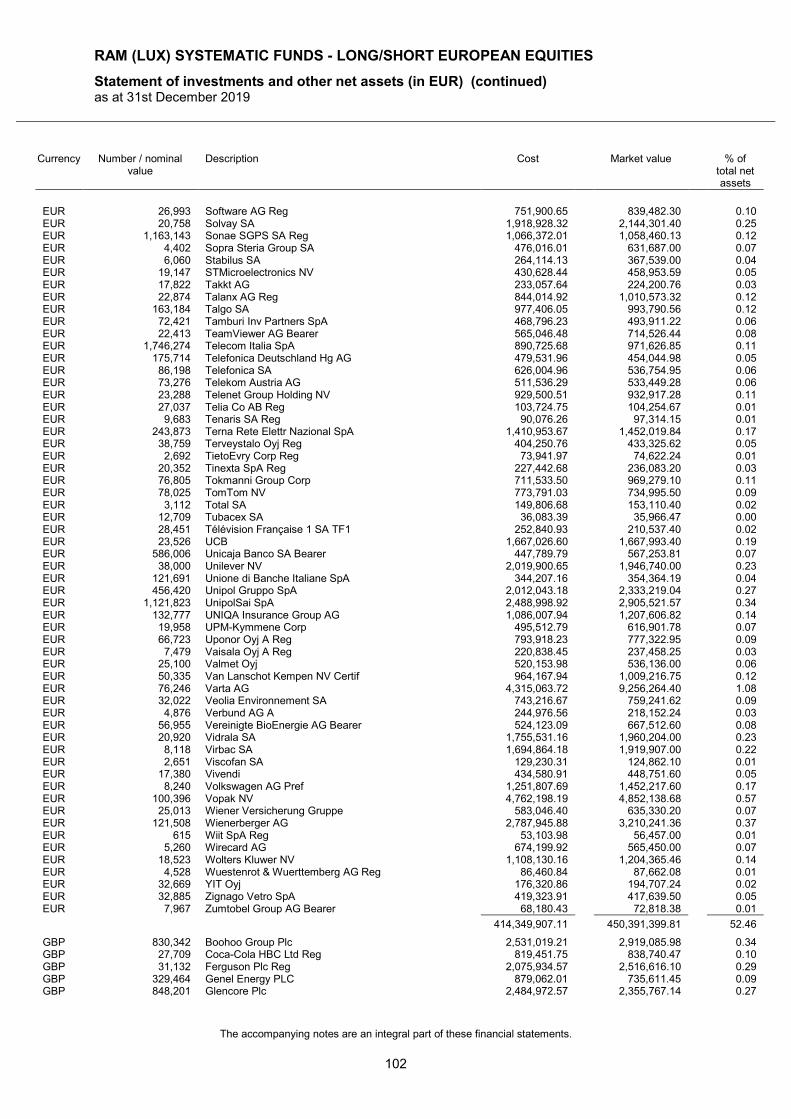
RAM (LUX) SYSTEMATIC FUNDS - LONG/SHORT EUROPEAN EQUITIES
Statement of investments and other net assets (in EUR) (continued) as at 31st December 2019
The accompanying notes are an integral part of these financial statements.
102
Currency Number / nominal value
Description Cost Market value % of total net assets
EUR 26,993 Software AG Reg 751,900.65 839,482.30 0.10 EUR 20,758 Solvay SA 1,918,928.32 2,144,301.40 0.25 EUR 1,163,143 Sonae SGPS SA Reg 1,066,372.01 1,058,460.13 0.12 EUR 4,402 Sopra Steria Group SA 476,016.01 631,687.00 0.07 EUR 6,060 Stabilus SA 264,114.13 367,539.00 0.04 EUR 19,147 STMicroelectronics NV 430,628.44 458,953.59 0.05 EUR 17,822 Takkt AG 233,057.64 224,200.76 0.03 EUR 22,874 Talanx AG Reg 844,014.92 1,010,573.32 0.12 EUR 163,184 Talgo SA 977,406.05 993,790.56 0.12 EUR 72,421 Tamburi Inv Partners SpA 468,796.23 493,911.22 0.06 EUR 22,413 TeamViewer AG Bearer 565,046.48 714,526.44 0.08 EUR 1,746,274 Telecom Italia SpA 890,725.68 971,626.85 0.11 EUR 175,714 Telefonica Deutschland Hg AG 479,531.96 454,044.98 0.05 EUR 86,198 Telefonica SA 626,004.96 536,754.95 0.06 EUR 73,276 Telekom Austria AG 511,536.29 533,449.28 0.06 EUR 23,288 Telenet Group Holding NV 929,500.51 932,917.28 0.11 EUR 27,037 Telia Co AB Reg 103,724.75 104,254.67 0.01 EUR 9,683 Tenaris SA Reg 90,076.26 97,314.15 0.01 EUR 243,873 Terna Rete Elettr Nazional SpA 1,410,953.67 1,452,019.84 0.17 EUR 38,759 Terveystalo Oyj Reg 404,250.76 433,325.62 0.05 EUR 2,692 TietoEvry Corp Reg 73,941.97 74,622.24 0.01 EUR 20,352 Tinexta SpA Reg 227,442.68 236,083.20 0.03 EUR 76,805 Tokmanni Group Corp 711,533.50 969,279.10 0.11 EUR 78,025 TomTom NV 773,791.03 734,995.50 0.09 EUR 3,112 Total SA 149,806.68 153,110.40 0.02 EUR 12,709 Tubacex SA 36,083.39 35,966.47 0.00 EUR 28,451 Télévision Française 1 SA TF1 252,840.93 210,537.40 0.02 EUR 23,526 UCB 1,667,026.60 1,667,993.40 0.19 EUR 586,006 Unicaja Banco SA Bearer 447,789.79 567,253.81 0.07 EUR 38,000 Unilever NV 2,019,900.65 1,946,740.00 0.23 EUR 121,691 Unione di Banche Italiane SpA 344,207.16 354,364.19 0.04 EUR 456,420 Unipol Gruppo SpA 2,012,043.18 2,333,219.04 0.27 EUR 1,121,823 UnipolSai SpA 2,488,998.92 2,905,521.57 0.34 EUR 132,777 UNIQA Insurance Group AG 1,086,007.94 1,207,606.82 0.14 EUR 19,958 UPM-Kymmene Corp 495,512.79 616,901.78 0.07 EUR 66,723 Uponor Oyj A Reg 793,918.23 777,322.95 0.09 EUR 7,479 Vaisala Oyj A Reg 220,838.45 237,458.25 0.03 EUR 25,100 Valmet Oyj 520,153.98 536,136.00 0.06 EUR 50,335 Van Lanschot Kempen NV Certif 964,167.94 1,009,216.75 0.12 EUR 76,246 Varta AG 4,315,063.72 9,256,264.40 1.08 EUR 32,022 Veolia Environnement SA 743,216.67 759,241.62 0.09 EUR 4,876 Verbund AG A 244,976.56 218,152.24 0.03 EUR 56,955 Vereinigte BioEnergie AG Bearer 524,123.09 667,512.60 0.08 EUR 20,920 Vidrala SA 1,755,531.16 1,960,204.00 0.23 EUR 8,118 Virbac SA 1,694,864.18 1,919,907.00 0.22 EUR 2,651 Viscofan SA 129,230.31 124,862.10 0.01 EUR 17,380 Vivendi 434,580.91 448,751.60 0.05 EUR 8,240 Volkswagen AG Pref 1,251,807.69 1,452,217.60 0.17 EUR 100,396 Vopak NV 4,762,198.19 4,852,138.68 0.57 EUR 25,013 Wiener Versicherung Gruppe 583,046.40 635,330.20 0.07 EUR 121,508 Wienerberger AG 2,787,945.88 3,210,241.36 0.37 EUR 615 Wiit SpA Reg 53,103.98 56,457.00 0.01 EUR 5,260 Wirecard AG 674,199.92 565,450.00 0.07 EUR 18,523 Wolters Kluwer NV 1,108,130.16 1,204,365.46 0.14 EUR 4,528 Wuestenrot & Wuerttemberg AG Reg 86,460.84 87,662.08 0.01 EUR 32,669 YIT Oyj 176,320.86 194,707.24 0.02 EUR 32,885 Zignago Vetro SpA 419,323.91 417,639.50 0.05 EUR 7,967 Zumtobel Group AG Bearer 68,180.43 72,818.38 0.01
414,349,907.11 450,391,399.81 52.46
GBP 830,342 Boohoo Group Plc 2,531,019.21 2,919,085.98 0.34 GBP 27,709 Coca-Cola HBC Ltd Reg 819,451.75 838,740.47 0.10 GBP 31,132 Ferguson Plc Reg 2,075,934.57 2,516,616.10 0.29 GBP 329,464 Genel Energy PLC 879,062.01 735,611.45 0.09 GBP 848,201 Glencore Plc 2,484,972.57 2,355,767.14 0.27
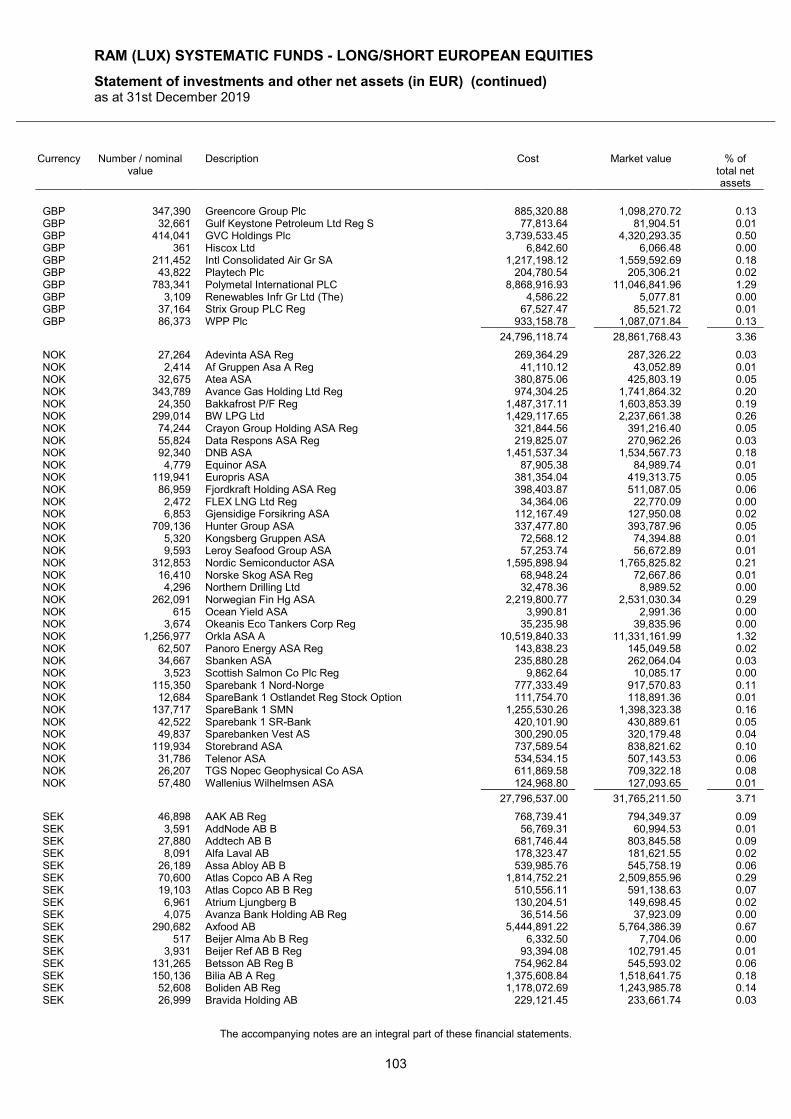
RAM (LUX) SYSTEMATIC FUNDS - LONG/SHORT EUROPEAN EQUITIES
Statement of investments and other net assets (in EUR) (continued) as at 31st December 2019
The accompanying notes are an integral part of these financial statements.
103
Currency Number / nominal value
Description Cost Market value % of total net assets
GBP 347,390 Greencore Group Plc 885,320.88 1,098,270.72 0.13 GBP 32,661 Gulf Keystone Petroleum Ltd Reg S 77,813.64 81,904.51 0.01 GBP 414,041 GVC Holdings Plc 3,739,533.45 4,320,293.35 0.50 GBP 361 Hiscox Ltd 6,842.60 6,066.48 0.00 GBP 211,452 Intl Consolidated Air Gr SA 1,217,198.12 1,559,592.69 0.18 GBP 43,822 Playtech Plc 204,780.54 205,306.21 0.02 GBP 783,341 Polymetal International PLC 8,868,916.93 11,046,841.96 1.29 GBP 3,109 Renewables Infr Gr Ltd (The) 4,586.22 5,077.81 0.00 GBP 37,164 Strix Group PLC Reg 67,527.47 85,521.72 0.01 GBP 86,373 WPP Plc 933,158.78 1,087,071.84 0.13
24,796,118.74 28,861,768.43 3.36
NOK 27,264 Adevinta ASA Reg 269,364.29 287,326.22 0.03 NOK 2,414 Af Gruppen Asa A Reg 41,110.12 43,052.89 0.01 NOK 32,675 Atea ASA 380,875.06 425,803.19 0.05 NOK 343,789 Avance Gas Holding Ltd Reg 974,304.25 1,741,864.32 0.20 NOK 24,350 Bakkafrost P/F Reg 1,487,317.11 1,603,853.39 0.19 NOK 299,014 BW LPG Ltd 1,429,117.65 2,237,661.38 0.26 NOK 74,244 Crayon Group Holding ASA Reg 321,844.56 391,216.40 0.05 NOK 55,824 Data Respons ASA Reg 219,825.07 270,962.26 0.03 NOK 92,340 DNB ASA 1,451,537.34 1,534,567.73 0.18 NOK 4,779 Equinor ASA 87,905.38 84,989.74 0.01 NOK 119,941 Europris ASA 381,354.04 419,313.75 0.05 NOK 86,959 Fjordkraft Holding ASA Reg 398,403.87 511,087.05 0.06 NOK 2,472 FLEX LNG Ltd Reg 34,364.06 22,770.09 0.00 NOK 6,853 Gjensidige Forsikring ASA 112,167.49 127,950.08 0.02 NOK 709,136 Hunter Group ASA 337,477.80 393,787.96 0.05 NOK 5,320 Kongsberg Gruppen ASA 72,568.12 74,394.88 0.01 NOK 9,593 Leroy Seafood Group ASA 57,253.74 56,672.89 0.01 NOK 312,853 Nordic Semiconductor ASA 1,595,898.94 1,765,825.82 0.21 NOK 16,410 Norske Skog ASA Reg 68,948.24 72,667.86 0.01 NOK 4,296 Northern Drilling Ltd 32,478.36 8,989.52 0.00 NOK 262,091 Norwegian Fin Hg ASA 2,219,800.77 2,531,030.34 0.29 NOK 615 Ocean Yield ASA 3,990.81 2,991.36 0.00 NOK 3,674 Okeanis Eco Tankers Corp Reg 35,235.98 39,835.96 0.00 NOK 1,256,977 Orkla ASA A 10,519,840.33 11,331,161.99 1.32 NOK 62,507 Panoro Energy ASA Reg 143,838.23 145,049.58 0.02 NOK 34,667 Sbanken ASA 235,880.28 262,064.04 0.03 NOK 3,523 Scottish Salmon Co Plc Reg 9,862.64 10,085.17 0.00 NOK 115,350 Sparebank 1 Nord-Norge 777,333.49 917,570.83 0.11 NOK 12,684 SpareBank 1 Ostlandet Reg Stock Option 111,754.70 118,891.36 0.01 NOK 137,717 SpareBank 1 SMN 1,255,530.26 1,398,323.38 0.16 NOK 42,522 Sparebank 1 SR-Bank 420,101.90 430,889.61 0.05 NOK 49,837 Sparebanken Vest AS 300,290.05 320,179.48 0.04 NOK 119,934 Storebrand ASA 737,589.54 838,821.62 0.10 NOK 31,786 Telenor ASA 534,534.15 507,143.53 0.06 NOK 26,207 TGS Nopec Geophysical Co ASA 611,869.58 709,322.18 0.08 NOK 57,480 Wallenius Wilhelmsen ASA 124,968.80 127,093.65 0.01
27,796,537.00 31,765,211.50 3.71
SEK 46,898 AAK AB Reg 768,739.41 794,349.37 0.09 SEK 3,591 AddNode AB B 56,769.31 60,994.53 0.01 SEK 27,880 Addtech AB B 681,746.44 803,845.58 0.09 SEK 8,091 Alfa Laval AB 178,323.47 181,621.55 0.02 SEK 26,189 Assa Abloy AB B 539,985.76 545,758.19 0.06 SEK 70,600 Atlas Copco AB A Reg 1,814,752.21 2,509,855.96 0.29 SEK 19,103 Atlas Copco AB B Reg 510,556.11 591,138.63 0.07 SEK 6,961 Atrium Ljungberg B 130,204.51 149,698.45 0.02 SEK 4,075 Avanza Bank Holding AB Reg 36,514.56 37,923.09 0.00 SEK 290,682 Axfood AB 5,444,891.22 5,764,386.39 0.67 SEK 517 Beijer Alma Ab B Reg 6,332.50 7,704.06 0.00 SEK 3,931 Beijer Ref AB B Reg 93,394.08 102,791.45 0.01 SEK 131,265 Betsson AB Reg B 754,962.84 545,593.02 0.06 SEK 150,136 Bilia AB A Reg 1,375,608.84 1,518,641.75 0.18 SEK 52,608 Boliden AB Reg 1,178,072.69 1,243,985.78 0.14 SEK 26,999 Bravida Holding AB 229,121.45 233,661.74 0.03
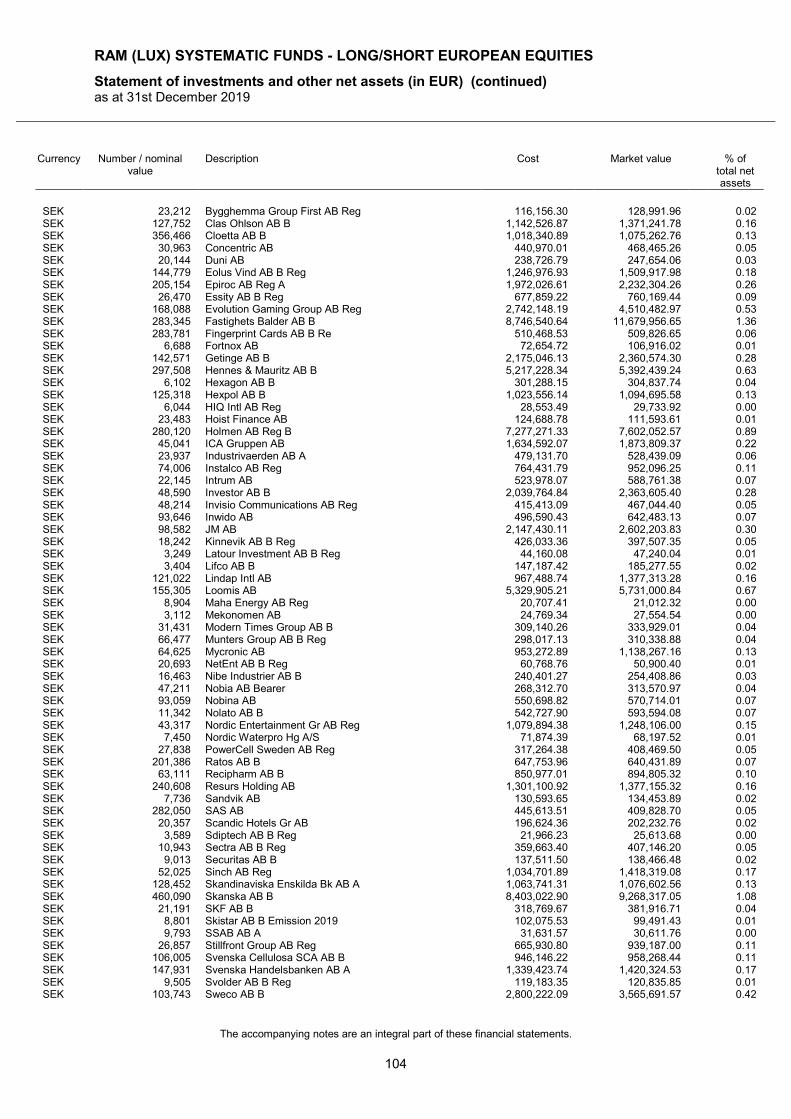
RAM (LUX) SYSTEMATIC FUNDS - LONG/SHORT EUROPEAN EQUITIES
Statement of investments and other net assets (in EUR) (continued) as at 31st December 2019
The accompanying notes are an integral part of these financial statements.
104
Currency Number / nominal value
Description Cost Market value % of total net assets
SEK 23,212 Bygghemma Group First AB Reg 116,156.30 128,991.96 0.02 SEK 127,752 Clas Ohlson AB B 1,142,526.87 1,371,241.78 0.16 SEK 356,466 Cloetta AB B 1,018,340.89 1,075,262.76 0.13 SEK 30,963 Concentric AB 440,970.01 468,465.26 0.05 SEK 20,144 Duni AB 238,726.79 247,654.06 0.03 SEK 144,779 Eolus Vind AB B Reg 1,246,976.93 1,509,917.98 0.18 SEK 205,154 Epiroc AB Reg A 1,972,026.61 2,232,304.26 0.26 SEK 26,470 Essity AB B Reg 677,859.22 760,169.44 0.09 SEK 168,088 Evolution Gaming Group AB Reg 2,742,148.19 4,510,482.97 0.53 SEK 283,345 Fastighets Balder AB B 8,746,540.64 11,679,956.65 1.36 SEK 283,781 Fingerprint Cards AB B Re 510,468.53 509,826.65 0.06 SEK 6,688 Fortnox AB 72,654.72 106,916.02 0.01 SEK 142,571 Getinge AB B 2,175,046.13 2,360,574.30 0.28 SEK 297,508 Hennes & Mauritz AB B 5,217,228.34 5,392,439.24 0.63 SEK 6,102 Hexagon AB B 301,288.15 304,837.74 0.04 SEK 125,318 Hexpol AB B 1,023,556.14 1,094,695.58 0.13 SEK 6,044 HIQ Intl AB Reg 28,553.49 29,733.92 0.00 SEK 23,483 Hoist Finance AB 124,688.78 111,593.61 0.01 SEK 280,120 Holmen AB Reg B 7,277,271.33 7,602,052.57 0.89 SEK 45,041 ICA Gruppen AB 1,634,592.07 1,873,809.37 0.22 SEK 23,937 Industrivaerden AB A 479,131.70 528,439.09 0.06 SEK 74,006 Instalco AB Reg 764,431.79 952,096.25 0.11 SEK 22,145 Intrum AB 523,978.07 588,761.38 0.07 SEK 48,590 Investor AB B 2,039,764.84 2,363,605.40 0.28 SEK 48,214 Invisio Communications AB Reg 415,413.09 467,044.40 0.05 SEK 93,646 Inwido AB 496,590.43 642,483.13 0.07 SEK 98,582 JM AB 2,147,430.11 2,602,203.83 0.30 SEK 18,242 Kinnevik AB B Reg 426,033.36 397,507.35 0.05 SEK 3,249 Latour Investment AB B Reg 44,160.08 47,240.04 0.01 SEK 3,404 Lifco AB B 147,187.42 185,277.55 0.02 SEK 121,022 Lindap Intl AB 967,488.74 1,377,313.28 0.16 SEK 155,305 Loomis AB 5,329,905.21 5,731,000.84 0.67 SEK 8,904 Maha Energy AB Reg 20,707.41 21,012.32 0.00 SEK 3,112 Mekonomen AB 24,769.34 27,554.54 0.00 SEK 31,431 Modern Times Group AB B 309,140.26 333,929.01 0.04 SEK 66,477 Munters Group AB B Reg 298,017.13 310,338.88 0.04 SEK 64,625 Mycronic AB 953,272.89 1,138,267.16 0.13 SEK 20,693 NetEnt AB B Reg 60,768.76 50,900.40 0.01 SEK 16,463 Nibe Industrier AB B 240,401.27 254,408.86 0.03 SEK 47,211 Nobia AB Bearer 268,312.70 313,570.97 0.04 SEK 93,059 Nobina AB 550,698.82 570,714.01 0.07 SEK 11,342 Nolato AB B 542,727.90 593,594.08 0.07 SEK 43,317 Nordic Entertainment Gr AB Reg 1,079,894.38 1,248,106.00 0.15 SEK 7,450 Nordic Waterpro Hg A/S 71,874.39 68,197.52 0.01 SEK 27,838 PowerCell Sweden AB Reg 317,264.38 408,469.50 0.05 SEK 201,386 Ratos AB B 647,753.96 640,431.89 0.07 SEK 63,111 Recipharm AB B 850,977.01 894,805.32 0.10 SEK 240,608 Resurs Holding AB 1,301,100.92 1,377,155.32 0.16 SEK 7,736 Sandvik AB 130,593.65 134,453.89 0.02 SEK 282,050 SAS AB 445,613.51 409,828.70 0.05 SEK 20,357 Scandic Hotels Gr AB 196,624.36 202,232.76 0.02 SEK 3,589 Sdiptech AB B Reg 21,966.23 25,613.68 0.00 SEK 10,943 Sectra AB B Reg 359,663.40 407,146.20 0.05 SEK 9,013 Securitas AB B 137,511.50 138,466.48 0.02 SEK 52,025 Sinch AB Reg 1,034,701.89 1,418,319.08 0.17 SEK 128,452 Skandinaviska Enskilda Bk AB A 1,063,741.31 1,076,602.56 0.13 SEK 460,090 Skanska AB B 8,403,022.90 9,268,317.05 1.08 SEK 21,191 SKF AB B 318,769.67 381,916.71 0.04 SEK 8,801 Skistar AB B Emission 2019 102,075.53 99,491.43 0.01 SEK 9,793 SSAB AB A 31,631.57 30,611.76 0.00 SEK 26,857 Stillfront Group AB Reg 665,930.80 939,187.00 0.11 SEK 106,005 Svenska Cellulosa SCA AB B 946,146.22 958,268.44 0.11 SEK 147,931 Svenska Handelsbanken AB A 1,339,423.74 1,420,324.53 0.17 SEK 9,505 Svolder AB B Reg 119,183.35 120,835.85 0.01 SEK 103,743 Sweco AB B 2,800,222.09 3,565,691.57 0.42
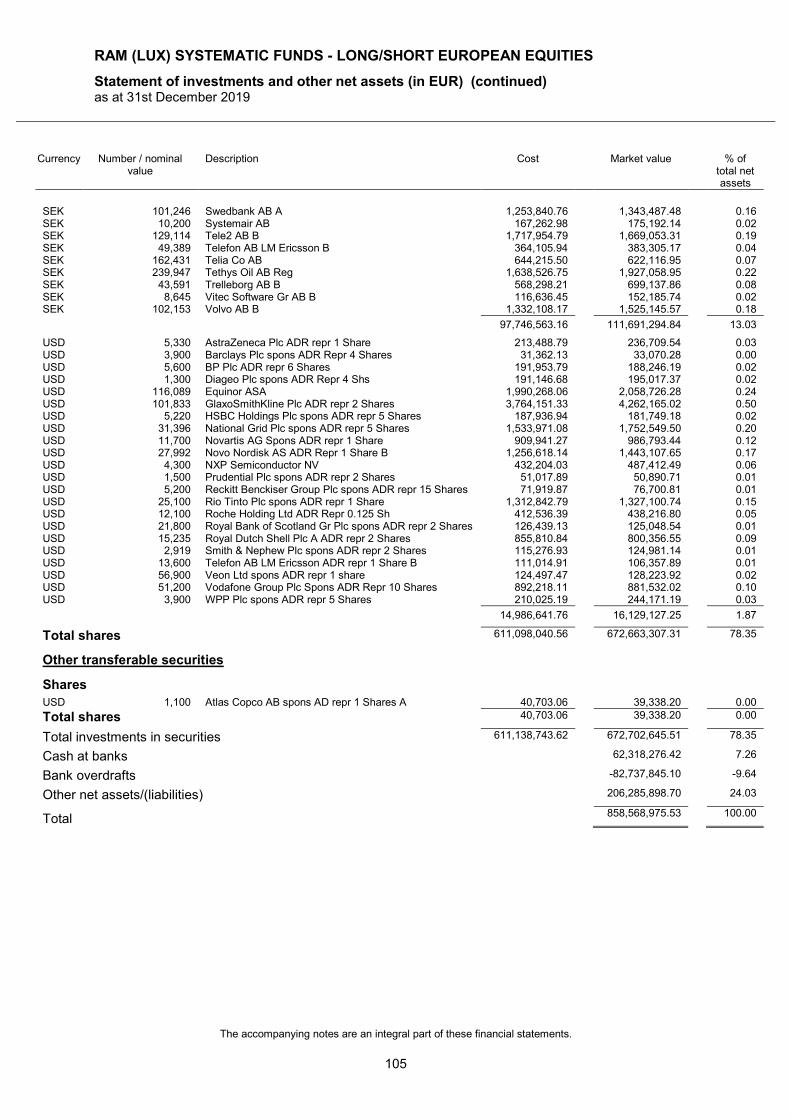
RAM (LUX) SYSTEMATIC FUNDS - LONG/SHORT EUROPEAN EQUITIES
Statement of investments and other net assets (in EUR) (continued) as at 31st December 2019
The accompanying notes are an integral part of these financial statements.
105
Currency Number / nominal value
Description Cost Market value % of total net assets
SEK 101,246 Swedbank AB A 1,253,840.76 1,343,487.48 0.16 SEK 10,200 Systemair AB 167,262.98 175,192.14 0.02 SEK 129,114 Tele2 AB B 1,717,954.79 1,669,053.31 0.19 SEK 49,389 Telefon AB LM Ericsson B 364,105.94 383,305.17 0.04 SEK 162,431 Telia Co AB 644,215.50 622,116.95 0.07 SEK 239,947 Tethys Oil AB Reg 1,638,526.75 1,927,058.95 0.22 SEK 43,591 Trelleborg AB B 568,298.21 699,137.86 0.08 SEK 8,645 Vitec Software Gr AB B 116,636.45 152,185.74 0.02 SEK 102,153 Volvo AB B 1,332,108.17 1,525,145.57 0.18
97,746,563.16 111,691,294.84 13.03
USD 5,330 AstraZeneca Plc ADR repr 1 Share 213,488.79 236,709.54 0.03 USD 3,900 Barclays Plc spons ADR Repr 4 Shares 31,362.13 33,070.28 0.00 USD 5,600 BP Plc ADR repr 6 Shares 191,953.79 188,246.19 0.02 USD 1,300 Diageo Plc spons ADR Repr 4 Shs 191,146.68 195,017.37 0.02 USD 116,089 Equinor ASA 1,990,268.06 2,058,726.28 0.24 USD 101,833 GlaxoSmithKline Plc ADR repr 2 Shares 3,764,151.33 4,262,165.02 0.50 USD 5,220 HSBC Holdings Plc spons ADR repr 5 Shares 187,936.94 181,749.18 0.02 USD 31,396 National Grid Plc spons ADR repr 5 Shares 1,533,971.08 1,752,549.50 0.20 USD 11,700 Novartis AG Spons ADR repr 1 Share 909,941.27 986,793.44 0.12 USD 27,992 Novo Nordisk AS ADR Repr 1 Share B 1,256,618.14 1,443,107.65 0.17 USD 4,300 NXP Semiconductor NV 432,204.03 487,412.49 0.06 USD 1,500 Prudential Plc spons ADR repr 2 Shares 51,017.89 50,890.71 0.01 USD 5,200 Reckitt Benckiser Group Plc spons ADR repr 15 Shares 71,919.87 76,700.81 0.01 USD 25,100 Rio Tinto Plc spons ADR repr 1 Share 1,312,842.79 1,327,100.74 0.15 USD 12,100 Roche Holding Ltd ADR Repr 0.125 Sh 412,536.39 438,216.80 0.05 USD 21,800 Royal Bank of Scotland Gr Plc spons ADR repr 2 Shares 126,439.13 125,048.54 0.01 USD 15,235 Royal Dutch Shell Plc A ADR repr 2 Shares 855,810.84 800,356.55 0.09 USD 2,919 Smith & Nephew Plc spons ADR repr 2 Shares 115,276.93 124,981.14 0.01 USD 13,600 Telefon AB LM Ericsson ADR repr 1 Share B 111,014.91 106,357.89 0.01 USD 56,900 Veon Ltd spons ADR repr 1 share 124,497.47 128,223.92 0.02 USD 51,200 Vodafone Group Plc Spons ADR Repr 10 Shares 892,218.11 881,532.02 0.10 USD 3,900 WPP Plc spons ADR repr 5 Shares 210,025.19 244,171.19 0.03
14,986,641.76 16,129,127.25 1.87
Total shares 611,098,040.56 672,663,307.31 78.35
Other transferable securities
Shares
USD 1,100 Atlas Copco AB spons AD repr 1 Shares A 40,703.06 39,338.20 0.00
Total shares 40,703.06 39,338.20 0.00
Total investments in securities 611,138,743.62 672,702,645.51 78.35
Cash at banks 62,318,276.42 7.26
Bank overdrafts -82,737,845.10 -9.64
Other net assets/(liabilities) 206,285,898.70 24.03
Total 858,568,975.53 100.00
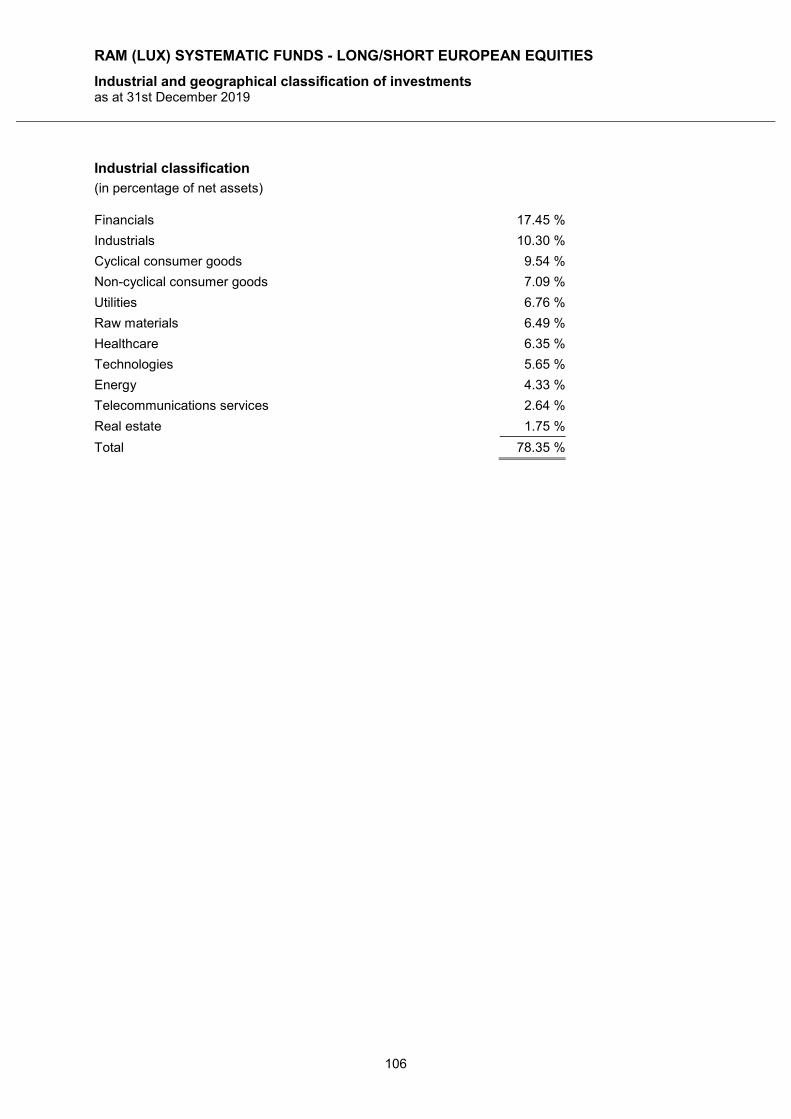
RAM (LUX) SYSTEMATIC FUNDS - LONG/SHORT EUROPEAN EQUITIES
Industrial and geographical classification of investments as at 31st December 2019
106
Industrial classification
(in percentage of net assets)
Financials 17.45 %
Industrials 10.30 %
Cyclical consumer goods 9.54 %
Non-cyclical consumer goods 7.09 %
Utilities 6.76 %
Raw materials 6.49 %
Healthcare 6.35 %
Technologies 5.65 %
Energy 4.33 %
Telecommunications services 2.64 %
Real estate 1.75 %
Total 78.35 %
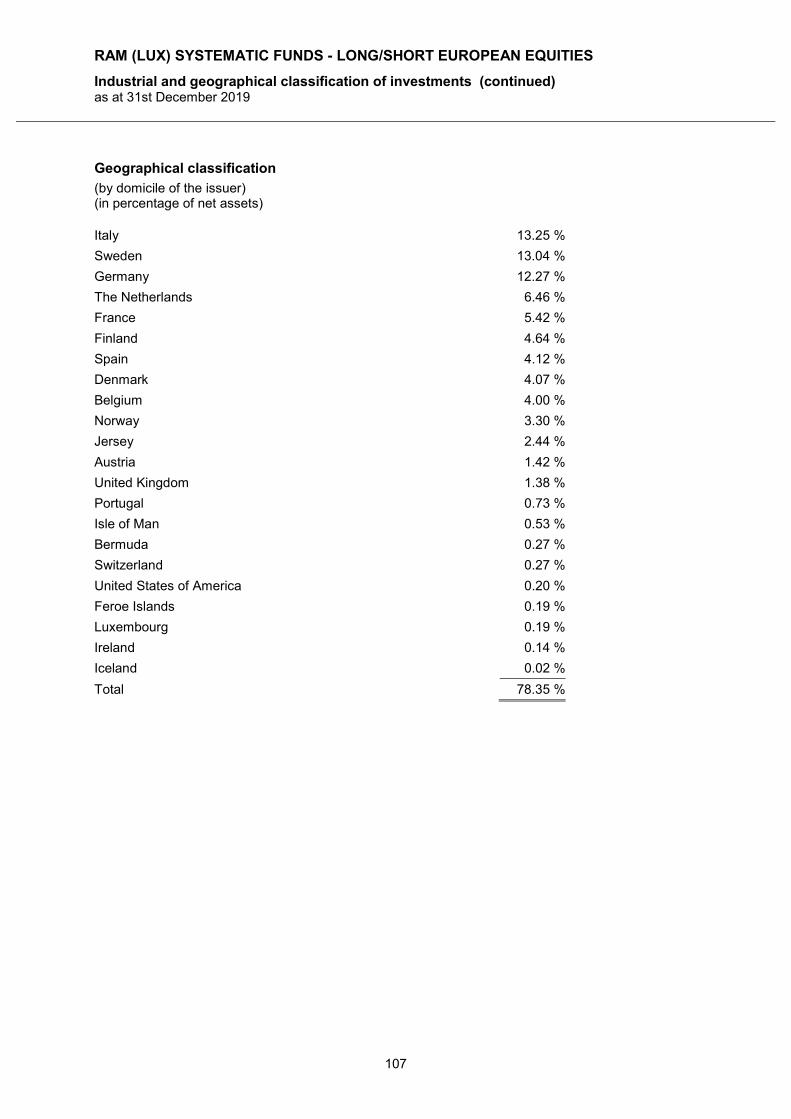
RAM (LUX) SYSTEMATIC FUNDS - LONG/SHORT EUROPEAN EQUITIES
Industrial and geographical classification of investments (continued) as at 31st December 2019
107
Geographical classification
(by domicile of the issuer) (in percentage of net assets)
Italy 13.25 %
Sweden 13.04 %
Germany 12.27 %
The Netherlands 6.46 %
France 5.42 %
Finland 4.64 %
Spain 4.12 %
Denmark 4.07 %
Belgium 4.00 %
Norway 3.30 %
Jersey 2.44 %
Austria 1.42 %
United Kingdom 1.38 %
Portugal 0.73 %
Isle of Man 0.53 %
Bermuda 0.27 %
Switzerland 0.27 %
United States of America 0.20 %
Feroe Islands 0.19 %
Luxembourg 0.19 %
Ireland 0.14 %
Iceland 0.02 %
Total 78.35 %
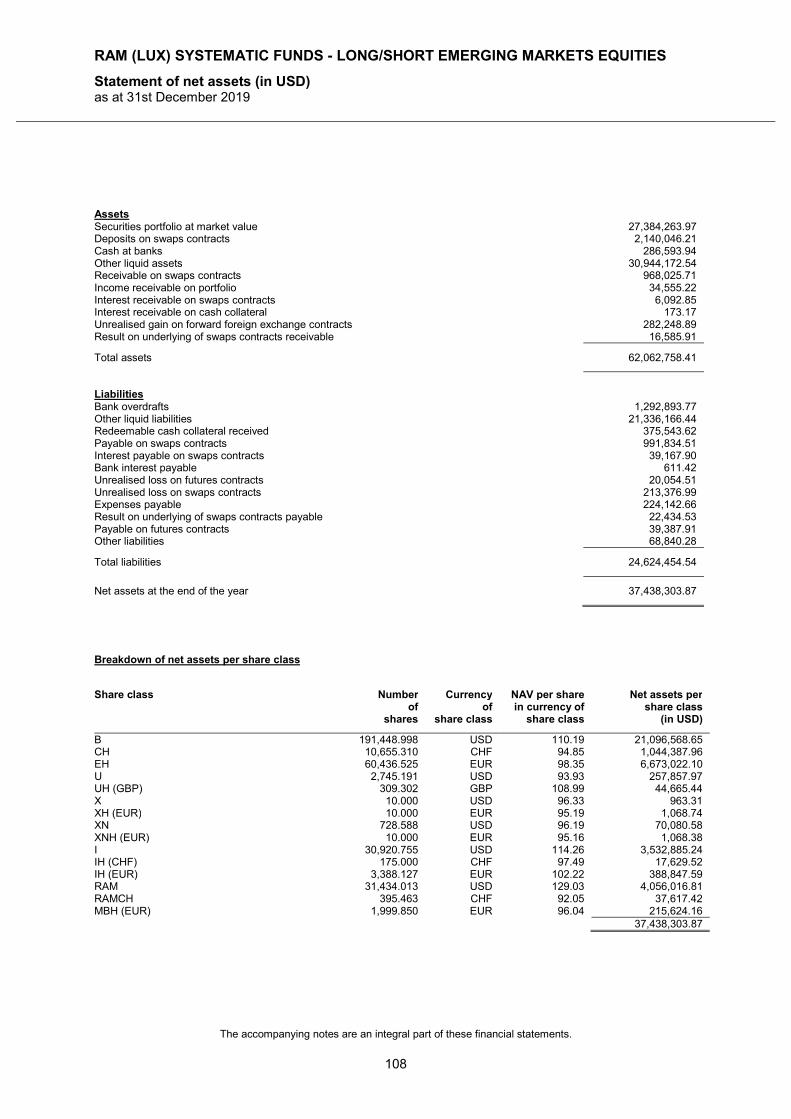
RAM (LUX) SYSTEMATIC FUNDS - LONG/SHORT EMERGING MARKETS EQUITIES
Statement of net assets (in USD) as at 31st December 2019
The accompanying notes are an integral part of these financial statements.
108
Assets Securities portfolio at market value 27,384,263.97 Deposits on swaps contracts 2,140,046.21 Cash at banks 286,593.94 Other liquid assets 30,944,172.54 Receivable on swaps contracts 968,025.71 Income receivable on portfolio 34,555.22 Interest receivable on swaps contracts 6,092.85 Interest receivable on cash collateral 173.17 Unrealised gain on forward foreign exchange contracts 282,248.89 Result on underlying of swaps contracts receivable 16,585.91
Total assets 62,062,758.41
Liabilities Bank overdrafts 1,292,893.77 Other liquid liabilities 21,336,166.44 Redeemable cash collateral received 375,543.62 Payable on swaps contracts 991,834.51 Interest payable on swaps contracts 39,167.90 Bank interest payable 611.42 Unrealised loss on futures contracts 20,054.51 Unrealised loss on swaps contracts 213,376.99 Expenses payable 224,142.66 Result on underlying of swaps contracts payable 22,434.53 Payable on futures contracts 39,387.91 Other liabilities 68,840.28
Total liabilities 24,624,454.54
Net assets at the end of the year 37,438,303.87
Breakdown of net assets per share class
Share class Number of
shares
Currency of
share class
NAV per share in currency of
share class
Net assets per share class
(in USD)
B 191,448.998 USD 110.19 21,096,568.65 CH 10,655.310 CHF 94.85 1,044,387.96 EH 60,436.525 EUR 98.35 6,673,022.10 U 2,745.191 USD 93.93 257,857.97 UH (GBP) 309.302 GBP 108.99 44,665.44 X 10.000 USD 96.33 963.31 XH (EUR) 10.000 EUR 95.19 1,068.74 XN 728.588 USD 96.19 70,080.58 XNH (EUR) 10.000 EUR 95.16 1,068.38 I 30,920.755 USD 114.26 3,532,885.24 IH (CHF) 175.000 CHF 97.49 17,629.52 IH (EUR) 3,388.127 EUR 102.22 388,847.59 RAM 31,434.013 USD 129.03 4,056,016.81 RAMCH 395.463 CHF 92.05 37,617.42 MBH (EUR) 1,999.850 EUR 96.04 215,624.16 37,438,303.87

RAM (LUX) SYSTEMATIC FUNDS - LONG/SHORT EMERGING MARKETS EQUITIES
Statement of operations and other changes in net assets (in USD) from 1st January 2019 to 31st December 2019
The accompanying notes are an integral part of these financial statements.
109
Income Dividends, net 1,390,026.74 Interest on bank accounts 335,195.75 Other commissions received 1,980.76 Other income 76,915.14
Total income 1,804,118.39
Expenses Management fees 814,477.37 Performance fees 1,083.97 Depositary fees 32,440.68 Banking charges and other fees 34,754.31 Transaction fees 583,903.29 Central administration costs 231,668.49 Professional fees 1,204.43 Other administration costs 330,522.16 Subscription duty ("taxe d'abonnement") 21,666.39 Other taxes 870.71 Bank interest paid 402,815.71 Other expenses 72,583.44
Total expenses 2,527,990.95
Net investment loss -723,872.56
Net realised gain/(loss) - on securities portfolio 638,730.89 - on futures contracts -4,121,227.16 - on swaps contracts -2,642,251.81 - on forward foreign exchange contracts -3,062,217.95 - on foreign exchange -332,063.58
Realised result -10,242,902.17
Net variation of the unrealised gain/(loss) - on securities portfolio 4,822,881.76 - on futures contracts -189,036.71 - on swaps contracts 139,441.18 - on forward foreign exchange contracts 1,040,879.58
Result of operations -4,428,736.36
Subscriptions 7,302,217.75
Redemptions -55,727,894.75
Total changes in net assets -52,854,413.36
Total net assets at the beginning of the year 90,292,717.23
Total net assets at the end of the year 37,438,303.87
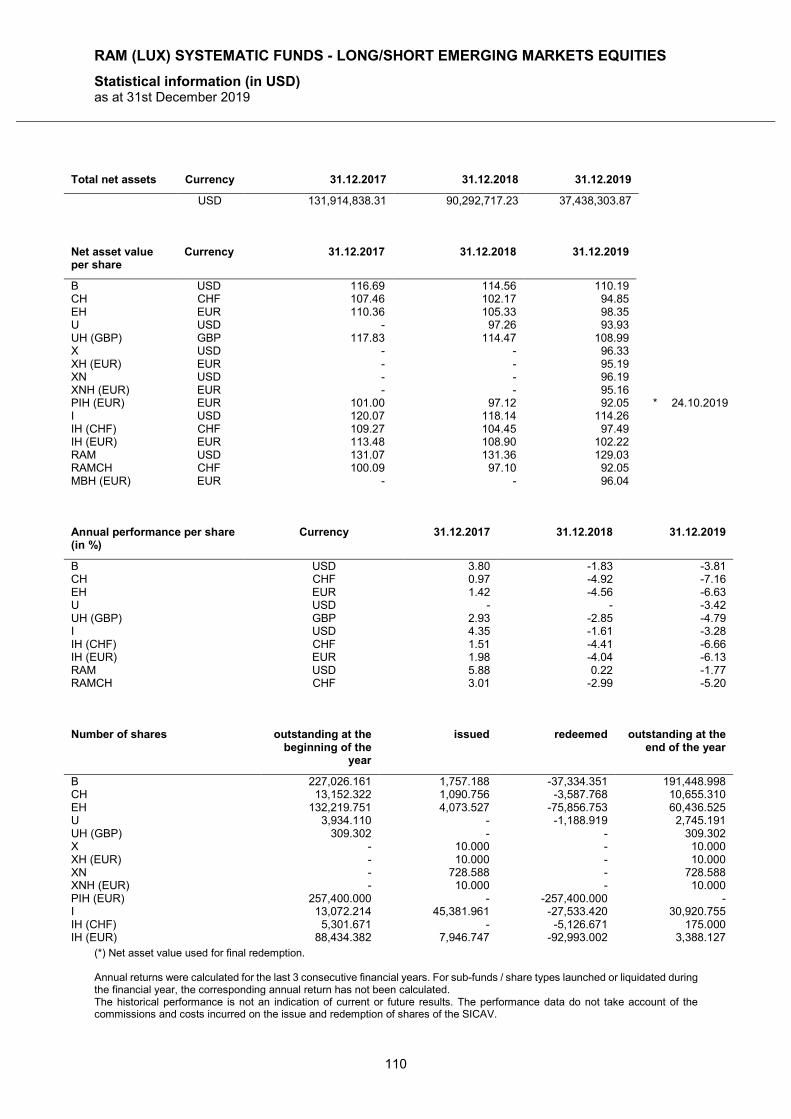
RAM (LUX) SYSTEMATIC FUNDS - LONG/SHORT EMERGING MARKETS EQUITIES
Statistical information (in USD) as at 31st December 2019
(*) Net asset value used for final redemption. Annual returns were calculated for the last 3 consecutive financial years. For sub-funds / share types launched or liquidated during the financial year, the corresponding annual return has not been calculated. The historical performance is not an indication of current or future results. The performance data do not take account of the commissions and costs incurred on the issue and redemption of shares of the SICAV.
110
Total net assets Currency 31.12.2017 31.12.2018 31.12.2019
USD 131,914,838.31 90,292,717.23 37,438,303.87
Net asset value per share
Currency 31.12.2017 31.12.2018 31.12.2019
B USD 116.69 114.56 110.19 CH CHF 107.46 102.17 94.85 EH EUR 110.36 105.33 98.35 U USD - 97.26 93.93 UH (GBP) GBP 117.83 114.47 108.99 X USD - - 96.33 XH (EUR) EUR - - 95.19 XN USD - - 96.19 XNH (EUR) EUR - - 95.16 PIH (EUR) EUR 101.00 97.12 92.05 * 24.10.2019 I USD 120.07 118.14 114.26 IH (CHF) CHF 109.27 104.45 97.49 IH (EUR) EUR 113.48 108.90 102.22 RAM USD 131.07 131.36 129.03 RAMCH CHF 100.09 97.10 92.05 MBH (EUR) EUR - - 96.04
Annual performance per share (in %)
Currency 31.12.2017 31.12.2018 31.12.2019
B USD 3.80 -1.83 -3.81 CH CHF 0.97 -4.92 -7.16 EH EUR 1.42 -4.56 -6.63 U USD - - -3.42 UH (GBP) GBP 2.93 -2.85 -4.79 I USD 4.35 -1.61 -3.28 IH (CHF) CHF 1.51 -4.41 -6.66 IH (EUR) EUR 1.98 -4.04 -6.13 RAM USD 5.88 0.22 -1.77 RAMCH CHF 3.01 -2.99 -5.20
Number of shares outstanding at the
beginning of the year
issued redeemed outstanding at the end of the year
B 227,026.161 1,757.188 -37,334.351 191,448.998 CH 13,152.322 1,090.756 -3,587.768 10,655.310 EH 132,219.751 4,073.527 -75,856.753 60,436.525 U 3,934.110 - -1,188.919 2,745.191 UH (GBP) 309.302 - - 309.302 X - 10.000 - 10.000 XH (EUR) - 10.000 - 10.000 XN - 728.588 - 728.588 XNH (EUR) - 10.000 - 10.000 PIH (EUR) 257,400.000 - -257,400.000 - I 13,072.214 45,381.961 -27,533.420 30,920.755 IH (CHF) 5,301.671 - -5,126.671 175.000 IH (EUR) 88,434.382 7,946.747 -92,993.002 3,388.127
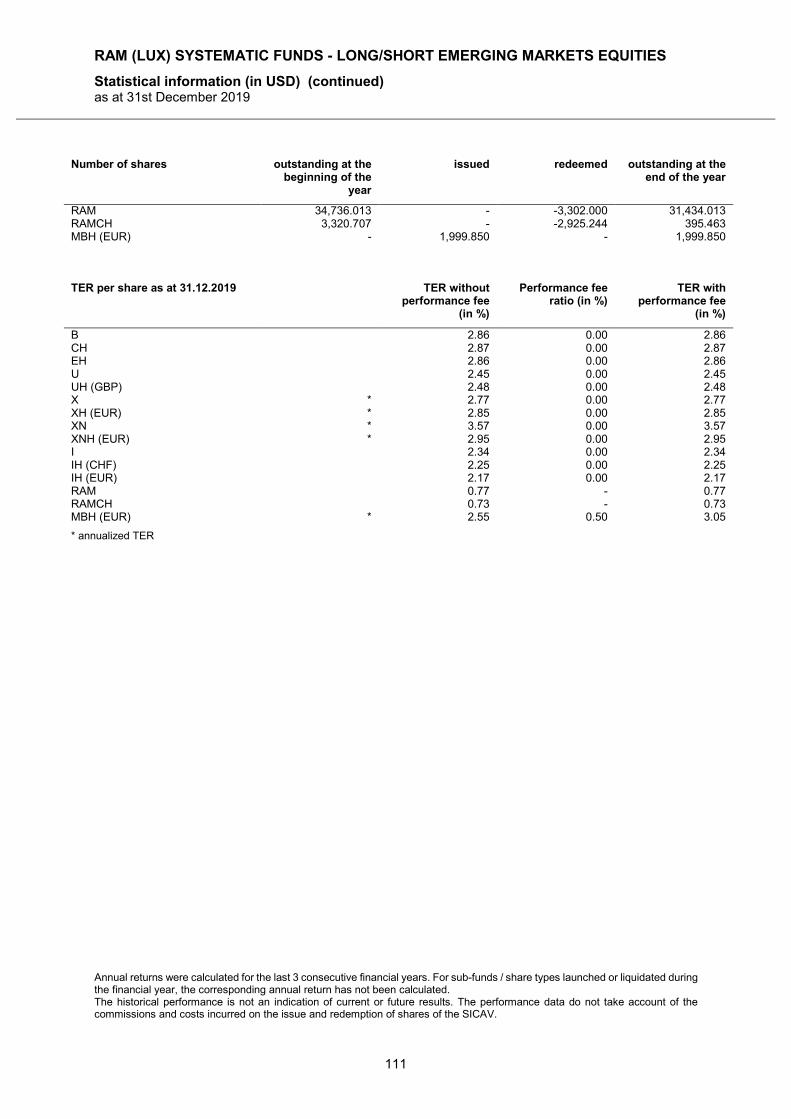
RAM (LUX) SYSTEMATIC FUNDS - LONG/SHORT EMERGING MARKETS EQUITIES
Statistical information (in USD) (continued) as at 31st December 2019
Annual returns were calculated for the last 3 consecutive financial years. For sub-funds / share types launched or liquidated during the financial year, the corresponding annual return has not been calculated. The historical performance is not an indication of current or future results. The performance data do not take account of the commissions and costs incurred on the issue and redemption of shares of the SICAV.
111
Number of shares outstanding at the beginning of the
year
issued redeemed outstanding at the end of the year
RAM 34,736.013 - -3,302.000 31,434.013 RAMCH 3,320.707 - -2,925.244 395.463 MBH (EUR) - 1,999.850 - 1,999.850
TER per share as at 31.12.2019 TER without
performance fee (in %)
Performance fee ratio (in %)
TER with performance fee
(in %)
B 2.86 0.00 2.86 CH 2.87 0.00 2.87 EH 2.86 0.00 2.86 U 2.45 0.00 2.45 UH (GBP) 2.48 0.00 2.48 X * 2.77 0.00 2.77 XH (EUR) * 2.85 0.00 2.85 XN * 3.57 0.00 3.57 XNH (EUR) * 2.95 0.00 2.95 I 2.34 0.00 2.34 IH (CHF) 2.25 0.00 2.25 IH (EUR) 2.17 0.00 2.17 RAM 0.77 - 0.77 RAMCH 0.73 - 0.73 MBH (EUR) * 2.55 0.50 3.05
* annualized TER
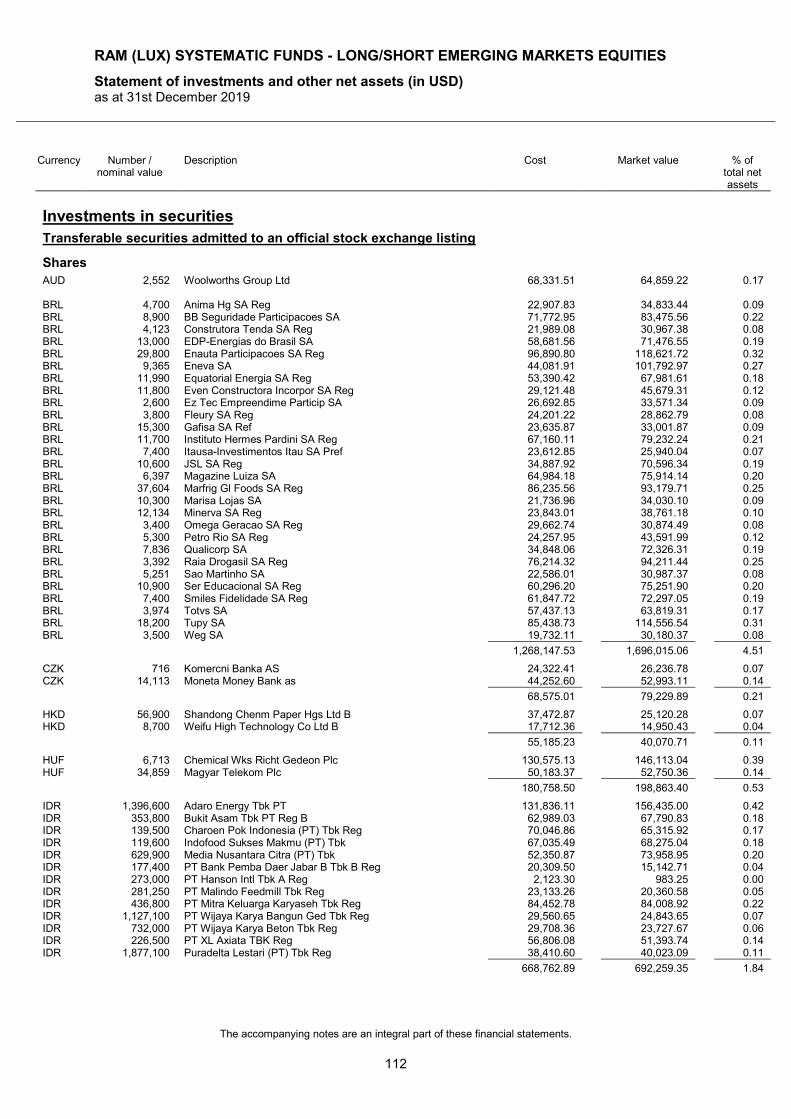
RAM (LUX) SYSTEMATIC FUNDS - LONG/SHORT EMERGING MARKETS EQUITIES
Statement of investments and other net assets (in USD) as at 31st December 2019
The accompanying notes are an integral part of these financial statements.
112
Currency Number / nominal value
Description Cost Market value % of total net assets
Investments in securities
Transferable securities admitted to an official stock exchange listing
Shares
AUD 2,552 Woolworths Group Ltd 68,331.51 64,859.22 0.17 BRL 4,700 Anima Hg SA Reg 22,907.83 34,833.44 0.09 BRL 8,900 BB Seguridade Participacoes SA 71,772.95 83,475.56 0.22 BRL 4,123 Construtora Tenda SA Reg 21,989.08 30,967.38 0.08 BRL 13,000 EDP-Energias do Brasil SA 58,681.56 71,476.55 0.19 BRL 29,800 Enauta Participacoes SA Reg 96,890.80 118,621.72 0.32 BRL 9,365 Eneva SA 44,081.91 101,792.97 0.27 BRL 11,990 Equatorial Energia SA Reg 53,390.42 67,981.61 0.18 BRL 11,800 Even Constructora Incorpor SA Reg 29,121.48 45,679.31 0.12 BRL 2,600 Ez Tec Empreendime Particip SA 26,692.85 33,571.34 0.09 BRL 3,800 Fleury SA Reg 24,201.22 28,862.79 0.08 BRL 15,300 Gafisa SA Ref 23,635.87 33,001.87 0.09 BRL 11,700 Instituto Hermes Pardini SA Reg 67,160.11 79,232.24 0.21 BRL 7,400 Itausa-Investimentos Itau SA Pref 23,612.85 25,940.04 0.07 BRL 10,600 JSL SA Reg 34,887.92 70,596.34 0.19 BRL 6,397 Magazine Luiza SA 64,984.18 75,914.14 0.20 BRL 37,604 Marfrig Gl Foods SA Reg 86,235.56 93,179.71 0.25 BRL 10,300 Marisa Lojas SA 21,736.96 34,030.10 0.09 BRL 12,134 Minerva SA Reg 23,843.01 38,761.18 0.10 BRL 3,400 Omega Geracao SA Reg 29,662.74 30,874.49 0.08 BRL 5,300 Petro Rio SA Reg 24,257.95 43,591.99 0.12 BRL 7,836 Qualicorp SA 34,848.06 72,326.31 0.19 BRL 3,392 Raia Drogasil SA Reg 76,214.32 94,211.44 0.25 BRL 5,251 Sao Martinho SA 22,586.01 30,987.37 0.08 BRL 10,900 Ser Educacional SA Reg 60,296.20 75,251.90 0.20 BRL 7,400 Smiles Fidelidade SA Reg 61,847.72 72,297.05 0.19 BRL 3,974 Totvs SA 57,437.13 63,819.31 0.17 BRL 18,200 Tupy SA 85,438.73 114,556.54 0.31 BRL 3,500 Weg SA 19,732.11 30,180.37 0.08
1,268,147.53 1,696,015.06 4.51
CZK 716 Komercni Banka AS 24,322.41 26,236.78 0.07 CZK 14,113 Moneta Money Bank as 44,252.60 52,993.11 0.14
68,575.01 79,229.89 0.21
HKD 56,900 Shandong Chenm Paper Hgs Ltd B 37,472.87 25,120.28 0.07 HKD 8,700 Weifu High Technology Co Ltd B 17,712.36 14,950.43 0.04
55,185.23 40,070.71 0.11
HUF 6,713 Chemical Wks Richt Gedeon Plc 130,575.13 146,113.04 0.39 HUF 34,859 Magyar Telekom Plc 50,183.37 52,750.36 0.14
180,758.50 198,863.40 0.53
IDR 1,396,600 Adaro Energy Tbk PT 131,836.11 156,435.00 0.42 IDR 353,800 Bukit Asam Tbk PT Reg B 62,989.03 67,790.83 0.18 IDR 139,500 Charoen Pok Indonesia (PT) Tbk Reg 70,046.86 65,315.92 0.17 IDR 119,600 Indofood Sukses Makmu (PT) Tbk 67,035.49 68,275.04 0.18 IDR 629,900 Media Nusantara Citra (PT) Tbk 52,350.87 73,958.95 0.20 IDR 177,400 PT Bank Pemba Daer Jabar B Tbk B Reg 20,309.50 15,142.71 0.04 IDR 273,000 PT Hanson Intl Tbk A Reg 2,123.30 983.25 0.00 IDR 281,250 PT Malindo Feedmill Tbk Reg 23,133.26 20,360.58 0.05 IDR 436,800 PT Mitra Keluarga Karyaseh Tbk Reg 84,452.78 84,008.92 0.22 IDR 1,127,100 PT Wijaya Karya Bangun Ged Tbk Reg 29,560.65 24,843.65 0.07 IDR 732,000 PT Wijaya Karya Beton Tbk Reg 29,708.36 23,727.67 0.06 IDR 226,500 PT XL Axiata TBK Reg 56,806.08 51,393.74 0.14 IDR 1,877,100 Puradelta Lestari (PT) Tbk Reg 38,410.60 40,023.09 0.11
668,762.89 692,259.35 1.84
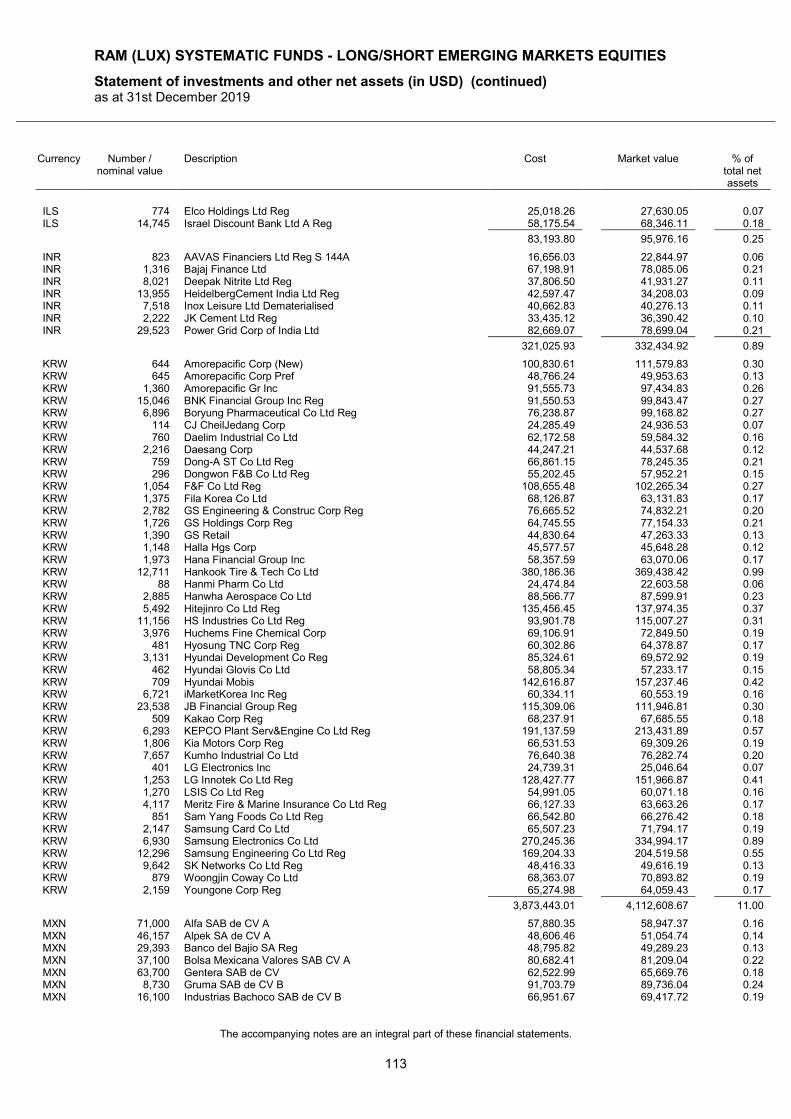
RAM (LUX) SYSTEMATIC FUNDS - LONG/SHORT EMERGING MARKETS EQUITIES
Statement of investments and other net assets (in USD) (continued) as at 31st December 2019
The accompanying notes are an integral part of these financial statements.
113
Currency Number / nominal value
Description Cost Market value % of total net assets
ILS 774 Elco Holdings Ltd Reg 25,018.26 27,630.05 0.07 ILS 14,745 Israel Discount Bank Ltd A Reg 58,175.54 68,346.11 0.18
83,193.80 95,976.16 0.25
INR 823 AAVAS Financiers Ltd Reg S 144A 16,656.03 22,844.97 0.06 INR 1,316 Bajaj Finance Ltd 67,198.91 78,085.06 0.21 INR 8,021 Deepak Nitrite Ltd Reg 37,806.50 41,931.27 0.11 INR 13,955 HeidelbergCement India Ltd Reg 42,597.47 34,208.03 0.09 INR 7,518 Inox Leisure Ltd Dematerialised 40,662.83 40,276.13 0.11 INR 2,222 JK Cement Ltd Reg 33,435.12 36,390.42 0.10 INR 29,523 Power Grid Corp of India Ltd 82,669.07 78,699.04 0.21
321,025.93 332,434.92 0.89
KRW 644 Amorepacific Corp (New) 100,830.61 111,579.83 0.30 KRW 645 Amorepacific Corp Pref 48,766.24 49,953.63 0.13 KRW 1,360 Amorepacific Gr Inc 91,555.73 97,434.83 0.26 KRW 15,046 BNK Financial Group Inc Reg 91,550.53 99,843.47 0.27 KRW 6,896 Boryung Pharmaceutical Co Ltd Reg 76,238.87 99,168.82 0.27 KRW 114 CJ CheilJedang Corp 24,285.49 24,936.53 0.07 KRW 760 Daelim Industrial Co Ltd 62,172.58 59,584.32 0.16 KRW 2,216 Daesang Corp 44,247.21 44,537.68 0.12 KRW 759 Dong-A ST Co Ltd Reg 66,861.15 78,245.35 0.21 KRW 296 Dongwon F&B Co Ltd Reg 55,202.45 57,952.21 0.15 KRW 1,054 F&F Co Ltd Reg 108,655.48 102,265.34 0.27 KRW 1,375 Fila Korea Co Ltd 68,126.87 63,131.83 0.17 KRW 2,782 GS Engineering & Construc Corp Reg 76,665.52 74,832.21 0.20 KRW 1,726 GS Holdings Corp Reg 64,745.55 77,154.33 0.21 KRW 1,390 GS Retail 44,830.64 47,263.33 0.13 KRW 1,148 Halla Hgs Corp 45,577.57 45,648.28 0.12 KRW 1,973 Hana Financial Group Inc 58,357.59 63,070.06 0.17 KRW 12,711 Hankook Tire & Tech Co Ltd 380,186.36 369,438.42 0.99 KRW 88 Hanmi Pharm Co Ltd 24,474.84 22,603.58 0.06 KRW 2,885 Hanwha Aerospace Co Ltd 88,566.77 87,599.91 0.23 KRW 5,492 Hitejinro Co Ltd Reg 135,456.45 137,974.35 0.37 KRW 11,156 HS Industries Co Ltd Reg 93,901.78 115,007.27 0.31 KRW 3,976 Huchems Fine Chemical Corp 69,106.91 72,849.50 0.19 KRW 481 Hyosung TNC Corp Reg 60,302.86 64,378.87 0.17 KRW 3,131 Hyundai Development Co Reg 85,324.61 69,572.92 0.19 KRW 462 Hyundai Glovis Co Ltd 58,805.34 57,233.17 0.15 KRW 709 Hyundai Mobis 142,616.87 157,237.46 0.42 KRW 6,721 iMarketKorea Inc Reg 60,334.11 60,553.19 0.16 KRW 23,538 JB Financial Group Reg 115,309.06 111,946.81 0.30 KRW 509 Kakao Corp Reg 68,237.91 67,685.55 0.18 KRW 6,293 KEPCO Plant Serv&Engine Co Ltd Reg 191,137.59 213,431.89 0.57 KRW 1,806 Kia Motors Corp Reg 66,531.53 69,309.26 0.19 KRW 7,657 Kumho Industrial Co Ltd 76,640.38 76,282.74 0.20 KRW 401 LG Electronics Inc 24,739.31 25,046.64 0.07 KRW 1,253 LG Innotek Co Ltd Reg 128,427.77 151,966.87 0.41 KRW 1,270 LSIS Co Ltd Reg 54,991.05 60,071.18 0.16 KRW 4,117 Meritz Fire & Marine Insurance Co Ltd Reg 66,127.33 63,663.26 0.17 KRW 851 Sam Yang Foods Co Ltd Reg 66,542.80 66,276.42 0.18 KRW 2,147 Samsung Card Co Ltd 65,507.23 71,794.17 0.19 KRW 6,930 Samsung Electronics Co Ltd 270,245.36 334,994.17 0.89 KRW 12,296 Samsung Engineering Co Ltd Reg 169,204.33 204,519.58 0.55 KRW 9,642 SK Networks Co Ltd Reg 48,416.33 49,616.19 0.13 KRW 879 Woongjin Coway Co Ltd 68,363.07 70,893.82 0.19 KRW 2,159 Youngone Corp Reg 65,274.98 64,059.43 0.17
3,873,443.01 4,112,608.67 11.00
MXN 71,000 Alfa SAB de CV A 57,880.35 58,947.37 0.16 MXN 46,157 Alpek SA de CV A 48,606.46 51,054.74 0.14 MXN 29,393 Banco del Bajio SA Reg 48,795.82 49,289.23 0.13 MXN 37,100 Bolsa Mexicana Valores SAB CV A 80,682.41 81,209.04 0.22 MXN 63,700 Gentera SAB de CV 62,522.99 65,669.76 0.18 MXN 8,730 Gruma SAB de CV B 91,703.79 89,736.04 0.24 MXN 16,100 Industrias Bachoco SAB de CV B 66,951.67 69,417.72 0.19
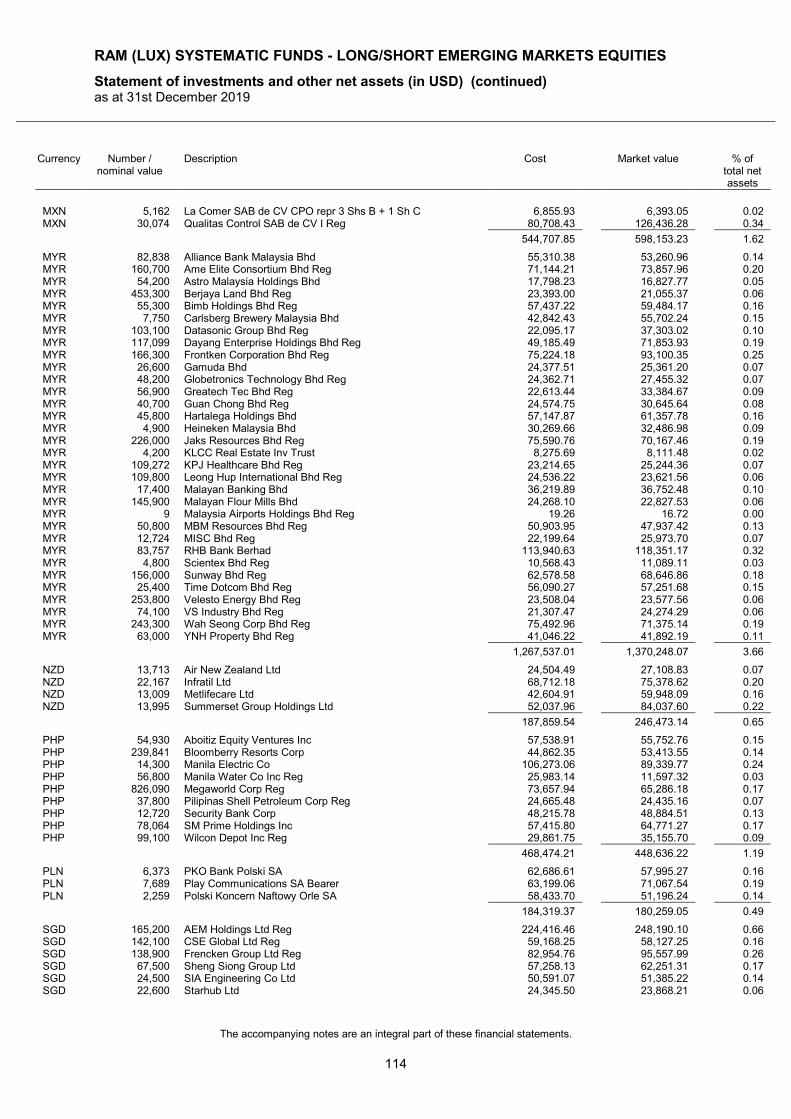
RAM (LUX) SYSTEMATIC FUNDS - LONG/SHORT EMERGING MARKETS EQUITIES
Statement of investments and other net assets (in USD) (continued) as at 31st December 2019
The accompanying notes are an integral part of these financial statements.
114
Currency Number / nominal value
Description Cost Market value % of total net assets
MXN 5,162 La Comer SAB de CV CPO repr 3 Shs B + 1 Sh C 6,855.93 6,393.05 0.02 MXN 30,074 Qualitas Control SAB de CV I Reg 80,708.43 126,436.28 0.34
544,707.85 598,153.23 1.62
MYR 82,838 Alliance Bank Malaysia Bhd 55,310.38 53,260.96 0.14 MYR 160,700 Ame Elite Consortium Bhd Reg 71,144.21 73,857.96 0.20 MYR 54,200 Astro Malaysia Holdings Bhd 17,798.23 16,827.77 0.05 MYR 453,300 Berjaya Land Bhd Reg 23,393.00 21,055.37 0.06 MYR 55,300 Bimb Holdings Bhd Reg 57,437.22 59,484.17 0.16 MYR 7,750 Carlsberg Brewery Malaysia Bhd 42,842.43 55,702.24 0.15 MYR 103,100 Datasonic Group Bhd Reg 22,095.17 37,303.02 0.10 MYR 117,099 Dayang Enterprise Holdings Bhd Reg 49,185.49 71,853.93 0.19 MYR 166,300 Frontken Corporation Bhd Reg 75,224.18 93,100.35 0.25 MYR 26,600 Gamuda Bhd 24,377.51 25,361.20 0.07 MYR 48,200 Globetronics Technology Bhd Reg 24,362.71 27,455.32 0.07 MYR 56,900 Greatech Tec Bhd Reg 22,613.44 33,384.67 0.09 MYR 40,700 Guan Chong Bhd Reg 24,574.75 30,645.64 0.08 MYR 45,800 Hartalega Holdings Bhd 57,147.87 61,357.78 0.16 MYR 4,900 Heineken Malaysia Bhd 30,269.66 32,486.98 0.09 MYR 226,000 Jaks Resources Bhd Reg 75,590.76 70,167.46 0.19 MYR 4,200 KLCC Real Estate Inv Trust 8,275.69 8,111.48 0.02 MYR 109,272 KPJ Healthcare Bhd Reg 23,214.65 25,244.36 0.07 MYR 109,800 Leong Hup International Bhd Reg 24,536.22 23,621.56 0.06 MYR 17,400 Malayan Banking Bhd 36,219.89 36,752.48 0.10 MYR 145,900 Malayan Flour Mills Bhd 24,268.10 22,827.53 0.06 MYR 9 Malaysia Airports Holdings Bhd Reg 19.26 16.72 0.00 MYR 50,800 MBM Resources Bhd Reg 50,903.95 47,937.42 0.13 MYR 12,724 MISC Bhd Reg 22,199.64 25,973.70 0.07 MYR 83,757 RHB Bank Berhad 113,940.63 118,351.17 0.32 MYR 4,800 Scientex Bhd Reg 10,568.43 11,089.11 0.03 MYR 156,000 Sunway Bhd Reg 62,578.58 68,646.86 0.18 MYR 25,400 Time Dotcom Bhd Reg 56,090.27 57,251.68 0.15 MYR 253,800 Velesto Energy Bhd Reg 23,508.04 23,577.56 0.06 MYR 74,100 VS Industry Bhd Reg 21,307.47 24,274.29 0.06 MYR 243,300 Wah Seong Corp Bhd Reg 75,492.96 71,375.14 0.19 MYR 63,000 YNH Property Bhd Reg 41,046.22 41,892.19 0.11
1,267,537.01 1,370,248.07 3.66
NZD 13,713 Air New Zealand Ltd 24,504.49 27,108.83 0.07 NZD 22,167 Infratil Ltd 68,712.18 75,378.62 0.20 NZD 13,009 Metlifecare Ltd 42,604.91 59,948.09 0.16 NZD 13,995 Summerset Group Holdings Ltd 52,037.96 84,037.60 0.22
187,859.54 246,473.14 0.65
PHP 54,930 Aboitiz Equity Ventures Inc 57,538.91 55,752.76 0.15 PHP 239,841 Bloomberry Resorts Corp 44,862.35 53,413.55 0.14 PHP 14,300 Manila Electric Co 106,273.06 89,339.77 0.24 PHP 56,800 Manila Water Co Inc Reg 25,983.14 11,597.32 0.03 PHP 826,090 Megaworld Corp Reg 73,657.94 65,286.18 0.17 PHP 37,800 Pilipinas Shell Petroleum Corp Reg 24,665.48 24,435.16 0.07 PHP 12,720 Security Bank Corp 48,215.78 48,884.51 0.13 PHP 78,064 SM Prime Holdings Inc 57,415.80 64,771.27 0.17 PHP 99,100 Wilcon Depot Inc Reg 29,861.75 35,155.70 0.09
468,474.21 448,636.22 1.19
PLN 6,373 PKO Bank Polski SA 62,686.61 57,995.27 0.16 PLN 7,689 Play Communications SA Bearer 63,199.06 71,067.54 0.19 PLN 2,259 Polski Koncern Naftowy Orle SA 58,433.70 51,196.24 0.14
184,319.37 180,259.05 0.49
SGD 165,200 AEM Holdings Ltd Reg 224,416.46 248,190.10 0.66 SGD 142,100 CSE Global Ltd Reg 59,168.25 58,127.25 0.16 SGD 138,900 Frencken Group Ltd Reg 82,954.76 95,557.99 0.26 SGD 67,500 Sheng Siong Group Ltd 57,258.13 62,251.31 0.17 SGD 24,500 SIA Engineering Co Ltd 50,591.07 51,385.22 0.14 SGD 22,600 Starhub Ltd 24,345.50 23,868.21 0.06
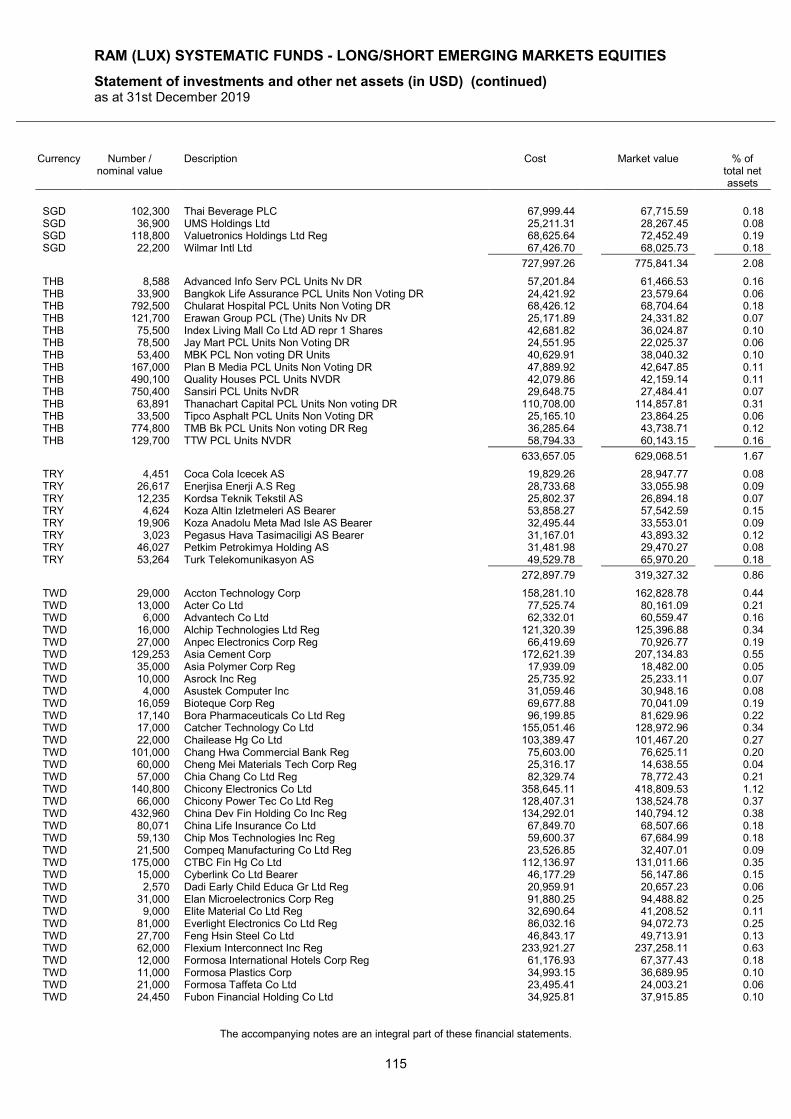
RAM (LUX) SYSTEMATIC FUNDS - LONG/SHORT EMERGING MARKETS EQUITIES
Statement of investments and other net assets (in USD) (continued) as at 31st December 2019
The accompanying notes are an integral part of these financial statements.
115
Currency Number / nominal value
Description Cost Market value % of total net assets
SGD 102,300 Thai Beverage PLC 67,999.44 67,715.59 0.18 SGD 36,900 UMS Holdings Ltd 25,211.31 28,267.45 0.08 SGD 118,800 Valuetronics Holdings Ltd Reg 68,625.64 72,452.49 0.19 SGD 22,200 Wilmar Intl Ltd 67,426.70 68,025.73 0.18
727,997.26 775,841.34 2.08
THB 8,588 Advanced Info Serv PCL Units Nv DR 57,201.84 61,466.53 0.16 THB 33,900 Bangkok Life Assurance PCL Units Non Voting DR 24,421.92 23,579.64 0.06 THB 792,500 Chularat Hospital PCL Units Non Voting DR 68,426.12 68,704.64 0.18 THB 121,700 Erawan Group PCL (The) Units Nv DR 25,171.89 24,331.82 0.07 THB 75,500 Index Living Mall Co Ltd AD repr 1 Shares 42,681.82 36,024.87 0.10 THB 78,500 Jay Mart PCL Units Non Voting DR 24,551.95 22,025.37 0.06 THB 53,400 MBK PCL Non voting DR Units 40,629.91 38,040.32 0.10 THB 167,000 Plan B Media PCL Units Non Voting DR 47,889.92 42,647.85 0.11 THB 490,100 Quality Houses PCL Units NVDR 42,079.86 42,159.14 0.11 THB 750,400 Sansiri PCL Units NvDR 29,648.75 27,484.41 0.07 THB 63,891 Thanachart Capital PCL Units Non voting DR 110,708.00 114,857.81 0.31 THB 33,500 Tipco Asphalt PCL Units Non Voting DR 25,165.10 23,864.25 0.06 THB 774,800 TMB Bk PCL Units Non voting DR Reg 36,285.64 43,738.71 0.12 THB 129,700 TTW PCL Units NVDR 58,794.33 60,143.15 0.16
633,657.05 629,068.51 1.67
TRY 4,451 Coca Cola Icecek AS 19,829.26 28,947.77 0.08 TRY 26,617 Enerjisa Enerji A.S Reg 28,733.68 33,055.98 0.09 TRY 12,235 Kordsa Teknik Tekstil AS 25,802.37 26,894.18 0.07 TRY 4,624 Koza Altin Izletmeleri AS Bearer 53,858.27 57,542.59 0.15 TRY 19,906 Koza Anadolu Meta Mad Isle AS Bearer 32,495.44 33,553.01 0.09 TRY 3,023 Pegasus Hava Tasimaciligi AS Bearer 31,167.01 43,893.32 0.12 TRY 46,027 Petkim Petrokimya Holding AS 31,481.98 29,470.27 0.08 TRY 53,264 Turk Telekomunikasyon AS 49,529.78 65,970.20 0.18
272,897.79 319,327.32 0.86
TWD 29,000 Accton Technology Corp 158,281.10 162,828.78 0.44 TWD 13,000 Acter Co Ltd 77,525.74 80,161.09 0.21 TWD 6,000 Advantech Co Ltd 62,332.01 60,559.47 0.16 TWD 16,000 Alchip Technologies Ltd Reg 121,320.39 125,396.88 0.34 TWD 27,000 Anpec Electronics Corp Reg 66,419.69 70,926.77 0.19 TWD 129,253 Asia Cement Corp 172,621.39 207,134.83 0.55 TWD 35,000 Asia Polymer Corp Reg 17,939.09 18,482.00 0.05 TWD 10,000 Asrock Inc Reg 25,735.92 25,233.11 0.07 TWD 4,000 Asustek Computer Inc 31,059.46 30,948.16 0.08 TWD 16,059 Bioteque Corp Reg 69,677.88 70,041.09 0.19 TWD 17,140 Bora Pharmaceuticals Co Ltd Reg 96,199.85 81,629.96 0.22 TWD 17,000 Catcher Technology Co Ltd 155,051.46 128,972.96 0.34 TWD 22,000 Chailease Hg Co Ltd 103,389.47 101,467.20 0.27 TWD 101,000 Chang Hwa Commercial Bank Reg 75,603.00 76,625.11 0.20 TWD 60,000 Cheng Mei Materials Tech Corp Reg 25,316.17 14,638.55 0.04 TWD 57,000 Chia Chang Co Ltd Reg 82,329.74 78,772.43 0.21 TWD 140,800 Chicony Electronics Co Ltd 358,645.11 418,809.53 1.12 TWD 66,000 Chicony Power Tec Co Ltd Reg 128,407.31 138,524.78 0.37 TWD 432,960 China Dev Fin Holding Co Inc Reg 134,292.01 140,794.12 0.38 TWD 80,071 China Life Insurance Co Ltd 67,849.70 68,507.66 0.18 TWD 59,130 Chip Mos Technologies Inc Reg 59,600.37 67,684.99 0.18 TWD 21,500 Compeq Manufacturing Co Ltd Reg 23,526.85 32,407.01 0.09 TWD 175,000 CTBC Fin Hg Co Ltd 112,136.97 131,011.66 0.35 TWD 15,000 Cyberlink Co Ltd Bearer 46,177.29 56,147.86 0.15 TWD 2,570 Dadi Early Child Educa Gr Ltd Reg 20,959.91 20,657.23 0.06 TWD 31,000 Elan Microelectronics Corp Reg 91,880.25 94,488.82 0.25 TWD 9,000 Elite Material Co Ltd Reg 32,690.64 41,208.52 0.11 TWD 81,000 Everlight Electronics Co Ltd Reg 86,032.16 94,072.73 0.25 TWD 27,700 Feng Hsin Steel Co Ltd 46,843.17 49,713.91 0.13 TWD 62,000 Flexium Interconnect Inc Reg 233,921.27 237,258.11 0.63 TWD 12,000 Formosa International Hotels Corp Reg 61,176.93 67,377.43 0.18 TWD 11,000 Formosa Plastics Corp 34,993.15 36,689.95 0.10 TWD 21,000 Formosa Taffeta Co Ltd 23,495.41 24,003.21 0.06 TWD 24,450 Fubon Financial Holding Co Ltd 34,925.81 37,915.85 0.10
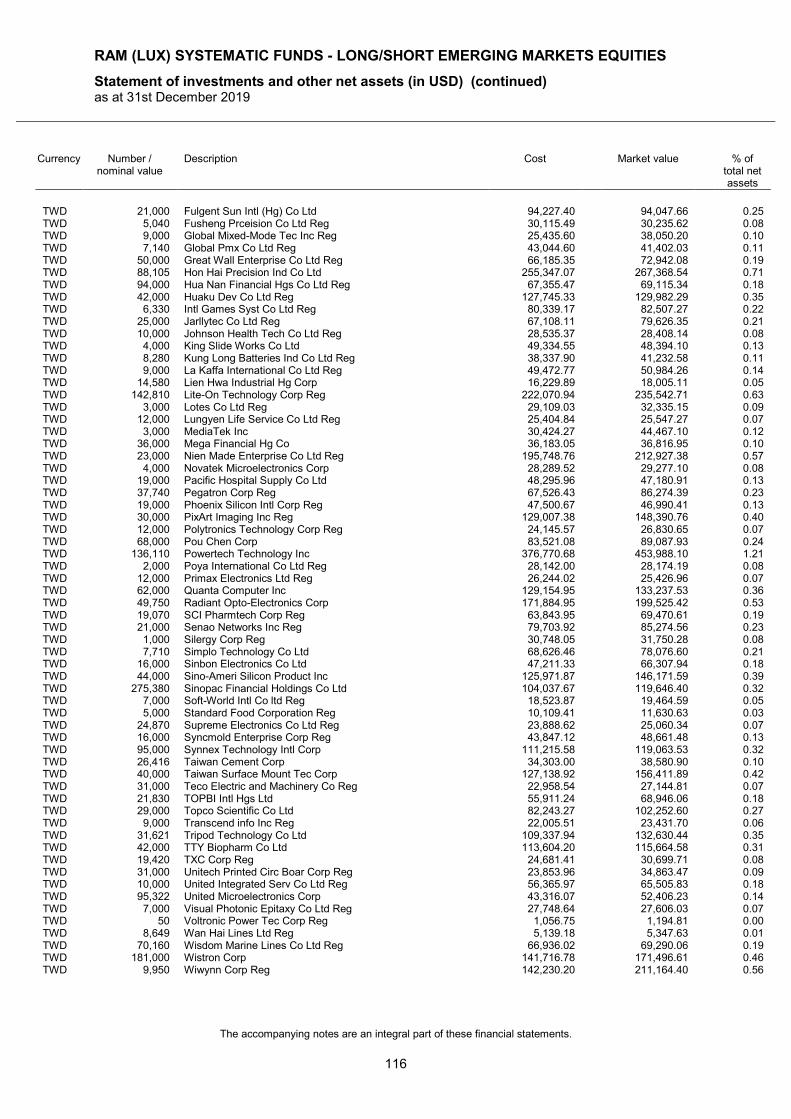
RAM (LUX) SYSTEMATIC FUNDS - LONG/SHORT EMERGING MARKETS EQUITIES
Statement of investments and other net assets (in USD) (continued) as at 31st December 2019
The accompanying notes are an integral part of these financial statements.
116
Currency Number / nominal value
Description Cost Market value % of total net assets
TWD 21,000 Fulgent Sun Intl (Hg) Co Ltd 94,227.40 94,047.66 0.25 TWD 5,040 Fusheng Prceision Co Ltd Reg 30,115.49 30,235.62 0.08 TWD 9,000 Global Mixed-Mode Tec Inc Reg 25,435.60 38,050.20 0.10 TWD 7,140 Global Pmx Co Ltd Reg 43,044.60 41,402.03 0.11 TWD 50,000 Great Wall Enterprise Co Ltd Reg 66,185.35 72,942.08 0.19 TWD 88,105 Hon Hai Precision Ind Co Ltd 255,347.07 267,368.54 0.71 TWD 94,000 Hua Nan Financial Hgs Co Ltd Reg 67,355.47 69,115.34 0.18 TWD 42,000 Huaku Dev Co Ltd Reg 127,745.33 129,982.29 0.35 TWD 6,330 Intl Games Syst Co Ltd Reg 80,339.17 82,507.27 0.22 TWD 25,000 Jarllytec Co Ltd Reg 67,108.11 79,626.35 0.21 TWD 10,000 Johnson Health Tech Co Ltd Reg 28,535.37 28,408.14 0.08 TWD 4,000 King Slide Works Co Ltd 49,334.55 48,394.10 0.13 TWD 8,280 Kung Long Batteries Ind Co Ltd Reg 38,337.90 41,232.58 0.11 TWD 9,000 La Kaffa International Co Ltd Reg 49,472.77 50,984.26 0.14 TWD 14,580 Lien Hwa Industrial Hg Corp 16,229.89 18,005.11 0.05 TWD 142,810 Lite-On Technology Corp Reg 222,070.94 235,542.71 0.63 TWD 3,000 Lotes Co Ltd Reg 29,109.03 32,335.15 0.09 TWD 12,000 Lungyen Life Service Co Ltd Reg 25,404.84 25,547.27 0.07 TWD 3,000 MediaTek Inc 30,424.27 44,467.10 0.12 TWD 36,000 Mega Financial Hg Co 36,183.05 36,816.95 0.10 TWD 23,000 Nien Made Enterprise Co Ltd Reg 195,748.76 212,927.38 0.57 TWD 4,000 Novatek Microelectronics Corp 28,289.52 29,277.10 0.08 TWD 19,000 Pacific Hospital Supply Co Ltd 48,295.96 47,180.91 0.13 TWD 37,740 Pegatron Corp Reg 67,526.43 86,274.39 0.23 TWD 19,000 Phoenix Silicon Intl Corp Reg 47,500.67 46,990.41 0.13 TWD 30,000 PixArt Imaging Inc Reg 129,007.38 148,390.76 0.40 TWD 12,000 Polytronics Technology Corp Reg 24,145.57 26,830.65 0.07 TWD 68,000 Pou Chen Corp 83,521.08 89,087.93 0.24 TWD 136,110 Powertech Technology Inc 376,770.68 453,988.10 1.21 TWD 2,000 Poya International Co Ltd Reg 28,142.00 28,174.19 0.08 TWD 12,000 Primax Electronics Ltd Reg 26,244.02 25,426.96 0.07 TWD 62,000 Quanta Computer Inc 129,154.95 133,237.53 0.36 TWD 49,750 Radiant Opto-Electronics Corp 171,884.95 199,525.42 0.53 TWD 19,070 SCI Pharmtech Corp Reg 63,843.95 69,470.61 0.19 TWD 21,000 Senao Networks Inc Reg 79,703.92 85,274.56 0.23 TWD 1,000 Silergy Corp Reg 30,748.05 31,750.28 0.08 TWD 7,710 Simplo Technology Co Ltd 68,626.46 78,076.60 0.21 TWD 16,000 Sinbon Electronics Co Ltd 47,211.33 66,307.94 0.18 TWD 44,000 Sino-Ameri Silicon Product Inc 125,971.87 146,171.59 0.39 TWD 275,380 Sinopac Financial Holdings Co Ltd 104,037.67 119,646.40 0.32 TWD 7,000 Soft-World Intl Co ltd Reg 18,523.87 19,464.59 0.05 TWD 5,000 Standard Food Corporation Reg 10,109.41 11,630.63 0.03 TWD 24,870 Supreme Electronics Co Ltd Reg 23,888.62 25,060.34 0.07 TWD 16,000 Syncmold Enterprise Corp Reg 43,847.12 48,661.48 0.13 TWD 95,000 Synnex Technology Intl Corp 111,215.58 119,063.53 0.32 TWD 26,416 Taiwan Cement Corp 34,303.00 38,580.90 0.10 TWD 40,000 Taiwan Surface Mount Tec Corp 127,138.92 156,411.89 0.42 TWD 31,000 Teco Electric and Machinery Co Reg 22,958.54 27,144.81 0.07 TWD 21,830 TOPBI Intl Hgs Ltd 55,911.24 68,946.06 0.18 TWD 29,000 Topco Scientific Co Ltd 82,243.27 102,252.60 0.27 TWD 9,000 Transcend info Inc Reg 22,005.51 23,431.70 0.06 TWD 31,621 Tripod Technology Co Ltd 109,337.94 132,630.44 0.35 TWD 42,000 TTY Biopharm Co Ltd 113,604.20 115,664.58 0.31 TWD 19,420 TXC Corp Reg 24,681.41 30,699.71 0.08 TWD 31,000 Unitech Printed Circ Boar Corp Reg 23,853.96 34,863.47 0.09 TWD 10,000 United Integrated Serv Co Ltd Reg 56,365.97 65,505.83 0.18 TWD 95,322 United Microelectronics Corp 43,316.07 52,406.23 0.14 TWD 7,000 Visual Photonic Epitaxy Co Ltd Reg 27,748.64 27,606.03 0.07 TWD 50 Voltronic Power Tec Corp Reg 1,056.75 1,194.81 0.00 TWD 8,649 Wan Hai Lines Ltd Reg 5,139.18 5,347.63 0.01 TWD 70,160 Wisdom Marine Lines Co Ltd Reg 66,936.02 69,290.06 0.19 TWD 181,000 Wistron Corp 141,716.78 171,496.61 0.46 TWD 9,950 Wiwynn Corp Reg 142,230.20 211,164.40 0.56
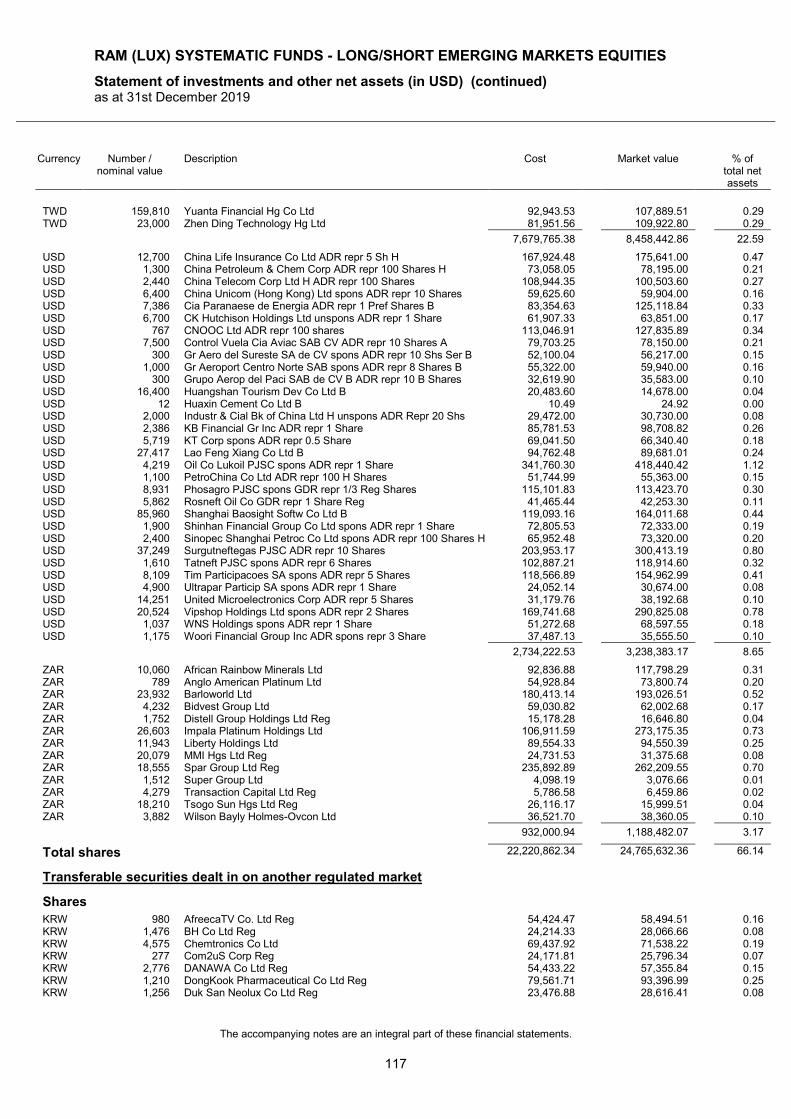
RAM (LUX) SYSTEMATIC FUNDS - LONG/SHORT EMERGING MARKETS EQUITIES
Statement of investments and other net assets (in USD) (continued) as at 31st December 2019
The accompanying notes are an integral part of these financial statements.
117
Currency Number / nominal value
Description Cost Market value % of total net assets
TWD 159,810 Yuanta Financial Hg Co Ltd 92,943.53 107,889.51 0.29 TWD 23,000 Zhen Ding Technology Hg Ltd 81,951.56 109,922.80 0.29
7,679,765.38 8,458,442.86 22.59
USD 12,700 China Life Insurance Co Ltd ADR repr 5 Sh H 167,924.48 175,641.00 0.47 USD 1,300 China Petroleum & Chem Corp ADR repr 100 Shares H 73,058.05 78,195.00 0.21 USD 2,440 China Telecom Corp Ltd H ADR repr 100 Shares 108,944.35 100,503.60 0.27 USD 6,400 China Unicom (Hong Kong) Ltd spons ADR repr 10 Shares 59,625.60 59,904.00 0.16 USD 7,386 Cia Paranaese de Energia ADR repr 1 Pref Shares B 83,354.63 125,118.84 0.33 USD 6,700 CK Hutchison Holdings Ltd unspons ADR repr 1 Share 61,907.33 63,851.00 0.17 USD 767 CNOOC Ltd ADR repr 100 shares 113,046.91 127,835.89 0.34 USD 7,500 Control Vuela Cia Aviac SAB CV ADR repr 10 Shares A 79,703.25 78,150.00 0.21 USD 300 Gr Aero del Sureste SA de CV spons ADR repr 10 Shs Ser B 52,100.04 56,217.00 0.15 USD 1,000 Gr Aeroport Centro Norte SAB spons ADR repr 8 Shares B 55,322.00 59,940.00 0.16 USD 300 Grupo Aerop del Paci SAB de CV B ADR repr 10 B Shares 32,619.90 35,583.00 0.10 USD 16,400 Huangshan Tourism Dev Co Ltd B 20,483.60 14,678.00 0.04 USD 12 Huaxin Cement Co Ltd B 10.49 24.92 0.00 USD 2,000 Industr & Cial Bk of China Ltd H unspons ADR Repr 20 Shs 29,472.00 30,730.00 0.08 USD 2,386 KB Financial Gr Inc ADR repr 1 Share 85,781.53 98,708.82 0.26 USD 5,719 KT Corp spons ADR repr 0.5 Share 69,041.50 66,340.40 0.18 USD 27,417 Lao Feng Xiang Co Ltd B 94,762.48 89,681.01 0.24 USD 4,219 Oil Co Lukoil PJSC spons ADR repr 1 Share 341,760.30 418,440.42 1.12 USD 1,100 PetroChina Co Ltd ADR repr 100 H Shares 51,744.99 55,363.00 0.15 USD 8,931 Phosagro PJSC spons GDR repr 1/3 Reg Shares 115,101.83 113,423.70 0.30 USD 5,862 Rosneft Oil Co GDR repr 1 Share Reg 41,465.44 42,253.30 0.11 USD 85,960 Shanghai Baosight Softw Co Ltd B 119,093.16 164,011.68 0.44 USD 1,900 Shinhan Financial Group Co Ltd spons ADR repr 1 Share 72,805.53 72,333.00 0.19 USD 2,400 Sinopec Shanghai Petroc Co Ltd spons ADR repr 100 Shares H 65,952.48 73,320.00 0.20 USD 37,249 Surgutneftegas PJSC ADR repr 10 Shares 203,953.17 300,413.19 0.80 USD 1,610 Tatneft PJSC spons ADR repr 6 Shares 102,887.21 118,914.60 0.32 USD 8,109 Tim Participacoes SA spons ADR repr 5 Shares 118,566.89 154,962.99 0.41 USD 4,900 Ultrapar Particip SA spons ADR repr 1 Share 24,052.14 30,674.00 0.08 USD 14,251 United Microelectronics Corp ADR repr 5 Shares 31,179.76 38,192.68 0.10 USD 20,524 Vipshop Holdings Ltd spons ADR repr 2 Shares 169,741.68 290,825.08 0.78 USD 1,037 WNS Holdings spons ADR repr 1 Share 51,272.68 68,597.55 0.18 USD 1,175 Woori Financial Group Inc ADR spons repr 3 Share 37,487.13 35,555.50 0.10
2,734,222.53 3,238,383.17 8.65
ZAR 10,060 African Rainbow Minerals Ltd 92,836.88 117,798.29 0.31 ZAR 789 Anglo American Platinum Ltd 54,928.84 73,800.74 0.20 ZAR 23,932 Barloworld Ltd 180,413.14 193,026.51 0.52 ZAR 4,232 Bidvest Group Ltd 59,030.82 62,002.68 0.17 ZAR 1,752 Distell Group Holdings Ltd Reg 15,178.28 16,646.80 0.04 ZAR 26,603 Impala Platinum Holdings Ltd 106,911.59 273,175.35 0.73 ZAR 11,943 Liberty Holdings Ltd 89,554.33 94,550.39 0.25 ZAR 20,079 MMI Hgs Ltd Reg 24,731.53 31,375.68 0.08 ZAR 18,555 Spar Group Ltd Reg 235,892.89 262,209.55 0.70 ZAR 1,512 Super Group Ltd 4,098.19 3,076.66 0.01 ZAR 4,279 Transaction Capital Ltd Reg 5,786.58 6,459.86 0.02 ZAR 18,210 Tsogo Sun Hgs Ltd Reg 26,116.17 15,999.51 0.04 ZAR 3,882 Wilson Bayly Holmes-Ovcon Ltd 36,521.70 38,360.05 0.10
932,000.94 1,188,482.07 3.17
Total shares 22,220,862.34 24,765,632.36 66.14
Transferable securities dealt in on another regulated market
Shares
KRW 980 AfreecaTV Co. Ltd Reg 54,424.47 58,494.51 0.16 KRW 1,476 BH Co Ltd Reg 24,214.33 28,066.66 0.08 KRW 4,575 Chemtronics Co Ltd 69,437.92 71,538.22 0.19 KRW 277 Com2uS Corp Reg 24,171.81 25,796.34 0.07 KRW 2,776 DANAWA Co Ltd Reg 54,433.22 57,355.84 0.15 KRW 1,210 DongKook Pharmaceutical Co Ltd Reg 79,561.71 93,396.99 0.25 KRW 1,256 Duk San Neolux Co Ltd Reg 23,476.88 28,616.41 0.08
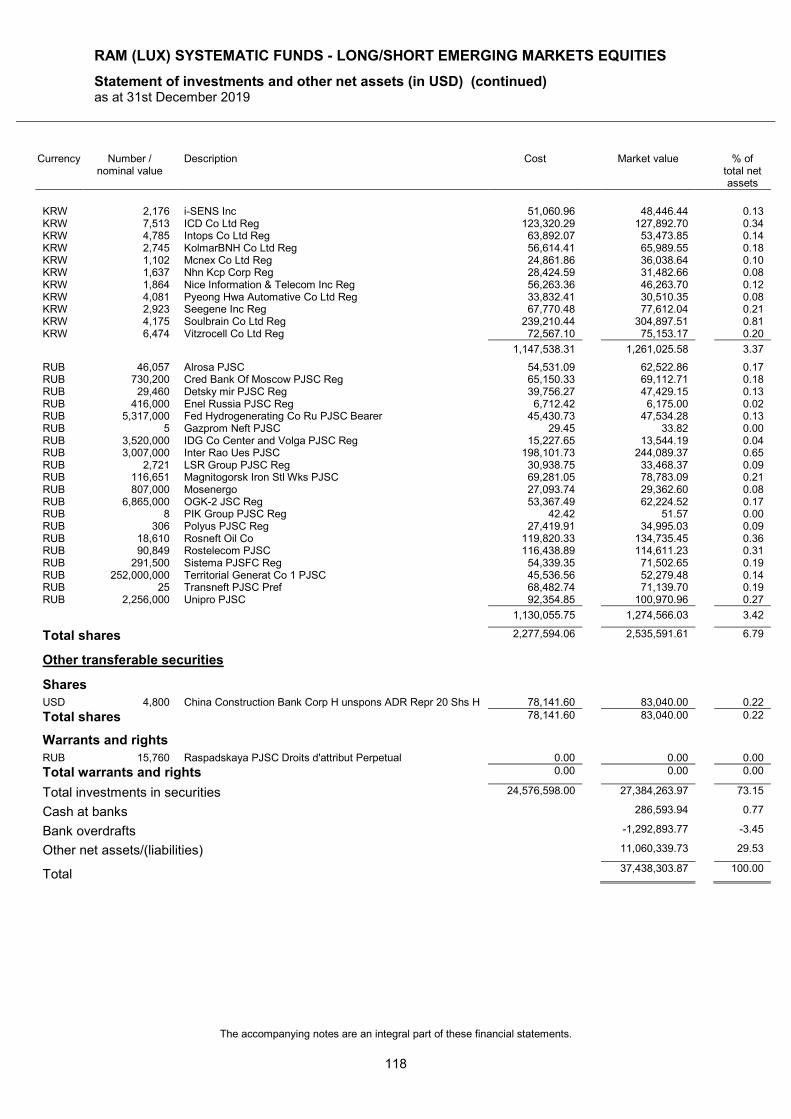
RAM (LUX) SYSTEMATIC FUNDS - LONG/SHORT EMERGING MARKETS EQUITIES
Statement of investments and other net assets (in USD) (continued) as at 31st December 2019
The accompanying notes are an integral part of these financial statements.
118
Currency Number / nominal value
Description Cost Market value % of total net assets
KRW 2,176 i-SENS Inc 51,060.96 48,446.44 0.13 KRW 7,513 ICD Co Ltd Reg 123,320.29 127,892.70 0.34 KRW 4,785 Intops Co Ltd Reg 63,892.07 53,473.85 0.14 KRW 2,745 KolmarBNH Co Ltd Reg 56,614.41 65,989.55 0.18 KRW 1,102 Mcnex Co Ltd Reg 24,861.86 36,038.64 0.10 KRW 1,637 Nhn Kcp Corp Reg 28,424.59 31,482.66 0.08 KRW 1,864 Nice Information & Telecom Inc Reg 56,263.36 46,263.70 0.12 KRW 4,081 Pyeong Hwa Automative Co Ltd Reg 33,832.41 30,510.35 0.08 KRW 2,923 Seegene Inc Reg 67,770.48 77,612.04 0.21 KRW 4,175 Soulbrain Co Ltd Reg 239,210.44 304,897.51 0.81 KRW 6,474 Vitzrocell Co Ltd Reg 72,567.10 75,153.17 0.20
1,147,538.31 1,261,025.58 3.37
RUB 46,057 Alrosa PJSC 54,531.09 62,522.86 0.17 RUB 730,200 Cred Bank Of Moscow PJSC Reg 65,150.33 69,112.71 0.18 RUB 29,460 Detsky mir PJSC Reg 39,756.27 47,429.15 0.13 RUB 416,000 Enel Russia PJSC Reg 6,712.42 6,175.00 0.02 RUB 5,317,000 Fed Hydrogenerating Co Ru PJSC Bearer 45,430.73 47,534.28 0.13 RUB 5 Gazprom Neft PJSC 29.45 33.82 0.00 RUB 3,520,000 IDG Co Center and Volga PJSC Reg 15,227.65 13,544.19 0.04 RUB 3,007,000 Inter Rao Ues PJSC 198,101.73 244,089.37 0.65 RUB 2,721 LSR Group PJSC Reg 30,938.75 33,468.37 0.09 RUB 116,651 Magnitogorsk Iron Stl Wks PJSC 69,281.05 78,783.09 0.21 RUB 807,000 Mosenergo 27,093.74 29,362.60 0.08 RUB 6,865,000 OGK-2 JSC Reg 53,367.49 62,224.52 0.17 RUB 8 PIK Group PJSC Reg 42.42 51.57 0.00 RUB 306 Polyus PJSC Reg 27,419.91 34,995.03 0.09 RUB 18,610 Rosneft Oil Co 119,820.33 134,735.45 0.36 RUB 90,849 Rostelecom PJSC 116,438.89 114,611.23 0.31 RUB 291,500 Sistema PJSFC Reg 54,339.35 71,502.65 0.19 RUB 252,000,000 Territorial Generat Co 1 PJSC 45,536.56 52,279.48 0.14 RUB 25 Transneft PJSC Pref 68,482.74 71,139.70 0.19 RUB 2,256,000 Unipro PJSC 92,354.85 100,970.96 0.27
1,130,055.75 1,274,566.03 3.42
Total shares 2,277,594.06 2,535,591.61 6.79
Other transferable securities
Shares
USD 4,800 China Construction Bank Corp H unspons ADR Repr 20 Shs H 78,141.60 83,040.00 0.22
Total shares 78,141.60 83,040.00 0.22
Warrants and rights
RUB 15,760 Raspadskaya PJSC Droits d'attribut Perpetual 0.00 0.00 0.00
Total warrants and rights 0.00 0.00 0.00
Total investments in securities 24,576,598.00 27,384,263.97 73.15
Cash at banks 286,593.94 0.77
Bank overdrafts -1,292,893.77 -3.45
Other net assets/(liabilities) 11,060,339.73 29.53
Total 37,438,303.87 100.00
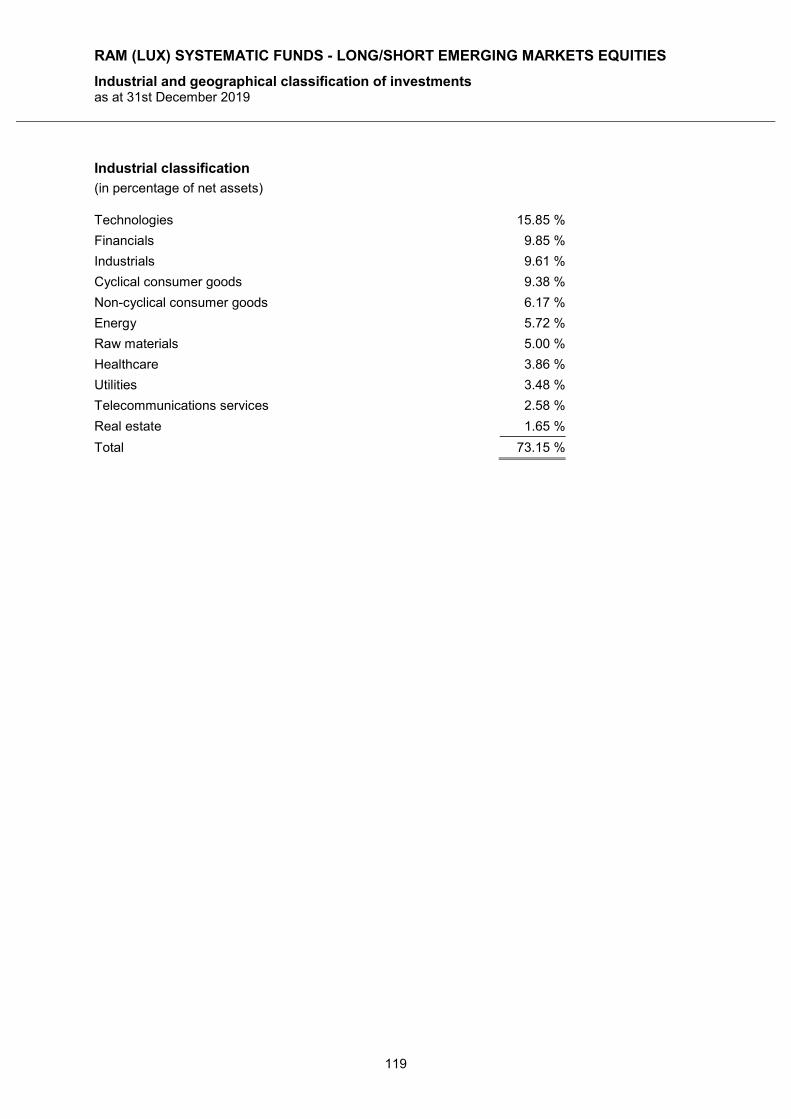
RAM (LUX) SYSTEMATIC FUNDS - LONG/SHORT EMERGING MARKETS EQUITIES
Industrial and geographical classification of investments as at 31st December 2019
119
Industrial classification
(in percentage of net assets)
Technologies 15.85 %
Financials 9.85 %
Industrials 9.61 %
Cyclical consumer goods 9.38 %
Non-cyclical consumer goods 6.17 %
Energy 5.72 %
Raw materials 5.00 %
Healthcare 3.86 %
Utilities 3.48 %
Telecommunications services 2.58 %
Real estate 1.65 %
Total 73.15 %
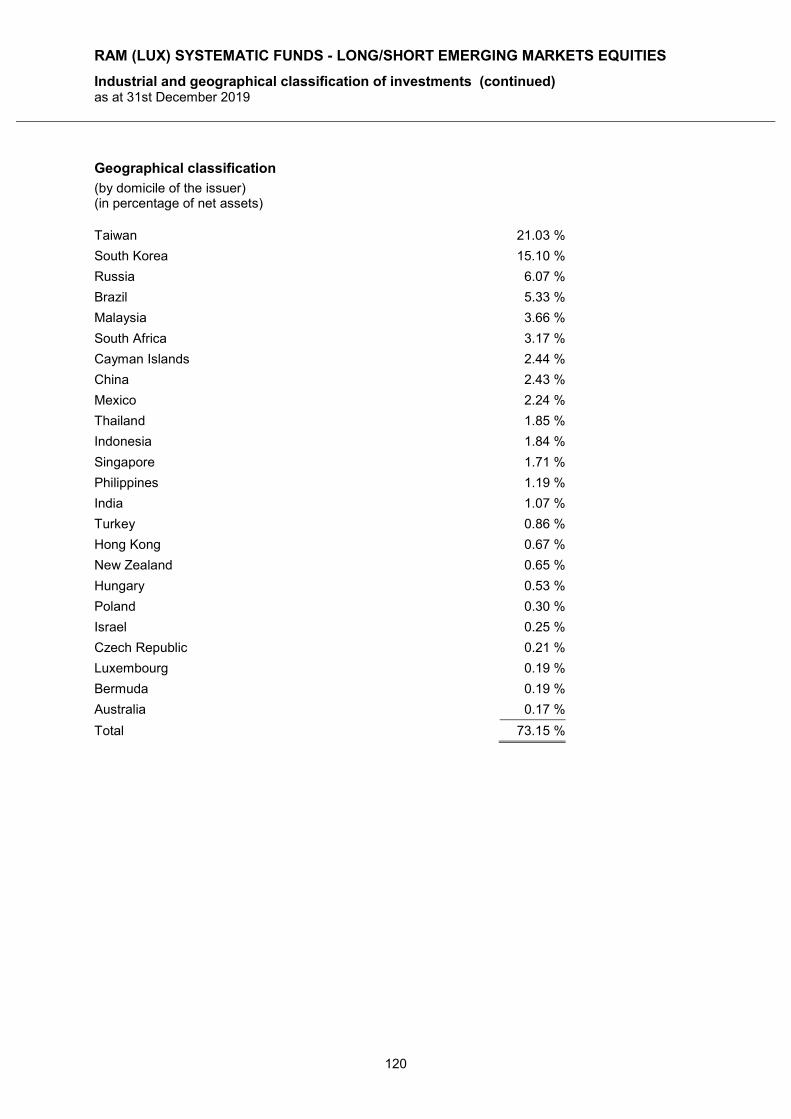
RAM (LUX) SYSTEMATIC FUNDS - LONG/SHORT EMERGING MARKETS EQUITIES
Industrial and geographical classification of investments (continued) as at 31st December 2019
120
Geographical classification
(by domicile of the issuer) (in percentage of net assets)
Taiwan 21.03 %
South Korea 15.10 %
Russia 6.07 %
Brazil 5.33 %
Malaysia 3.66 %
South Africa 3.17 %
Cayman Islands 2.44 %
China 2.43 %
Mexico 2.24 %
Thailand 1.85 %
Indonesia 1.84 %
Singapore 1.71 %
Philippines 1.19 %
India 1.07 %
Turkey 0.86 %
Hong Kong 0.67 %
New Zealand 0.65 %
Hungary 0.53 %
Poland 0.30 %
Israel 0.25 %
Czech Republic 0.21 %
Luxembourg 0.19 %
Bermuda 0.19 %
Australia 0.17 %
Total 73.15 %
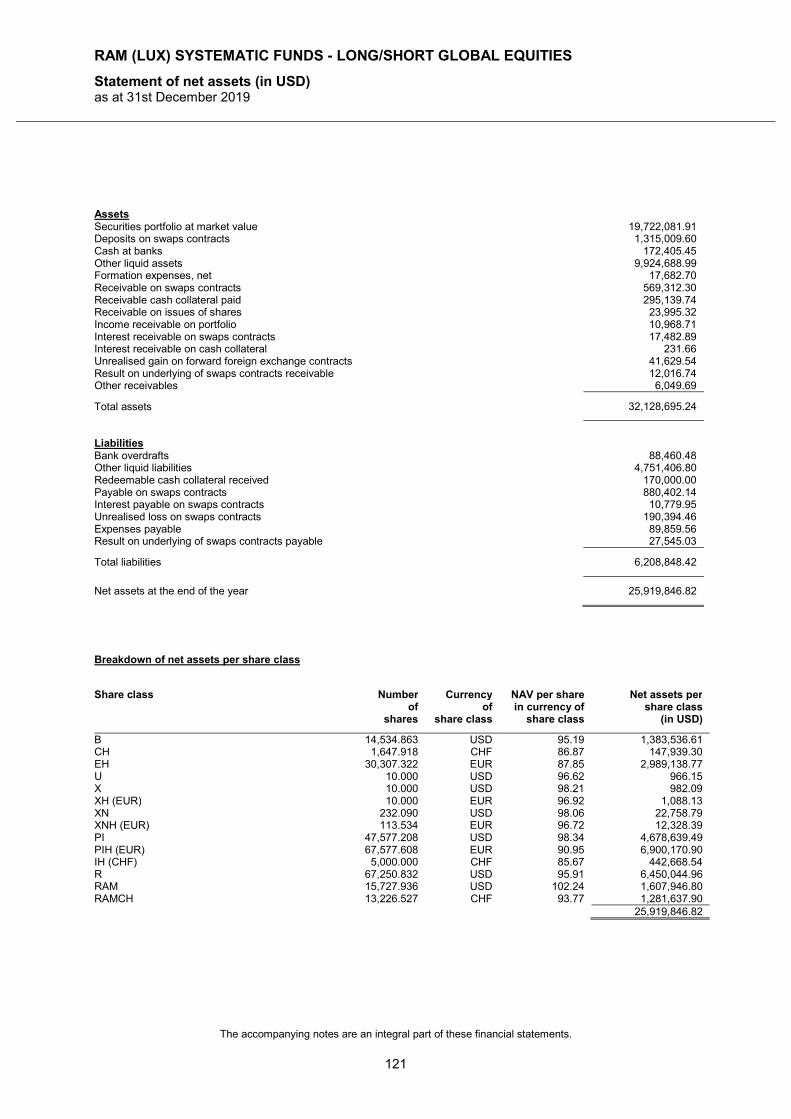
RAM (LUX) SYSTEMATIC FUNDS - LONG/SHORT GLOBAL EQUITIES
Statement of net assets (in USD) as at 31st December 2019
The accompanying notes are an integral part of these financial statements.
121
Assets Securities portfolio at market value 19,722,081.91 Deposits on swaps contracts 1,315,009.60 Cash at banks 172,405.45 Other liquid assets 9,924,688.99 Formation expenses, net 17,682.70 Receivable on swaps contracts 569,312.30 Receivable cash collateral paid 295,139.74 Receivable on issues of shares 23,995.32 Income receivable on portfolio 10,968.71 Interest receivable on swaps contracts 17,482.89 Interest receivable on cash collateral 231.66 Unrealised gain on forward foreign exchange contracts 41,629.54 Result on underlying of swaps contracts receivable 12,016.74 Other receivables 6,049.69
Total assets 32,128,695.24
Liabilities Bank overdrafts 88,460.48 Other liquid liabilities 4,751,406.80 Redeemable cash collateral received 170,000.00 Payable on swaps contracts 880,402.14 Interest payable on swaps contracts 10,779.95 Unrealised loss on swaps contracts 190,394.46 Expenses payable 89,859.56 Result on underlying of swaps contracts payable 27,545.03
Total liabilities 6,208,848.42
Net assets at the end of the year 25,919,846.82
Breakdown of net assets per share class
Share class Number of
shares
Currency of
share class
NAV per share in currency of
share class
Net assets per share class
(in USD)
B 14,534.863 USD 95.19 1,383,536.61 CH 1,647.918 CHF 86.87 147,939.30 EH 30,307.322 EUR 87.85 2,989,138.77 U 10.000 USD 96.62 966.15 X 10.000 USD 98.21 982.09 XH (EUR) 10.000 EUR 96.92 1,088.13 XN 232.090 USD 98.06 22,758.79 XNH (EUR) 113.534 EUR 96.72 12,328.39 PI 47,577.208 USD 98.34 4,678,639.49 PIH (EUR) 67,577.608 EUR 90.95 6,900,170.90 IH (CHF) 5,000.000 CHF 85.67 442,668.54 R 67,250.832 USD 95.91 6,450,044.96 RAM 15,727.936 USD 102.24 1,607,946.80 RAMCH 13,226.527 CHF 93.77 1,281,637.90 25,919,846.82
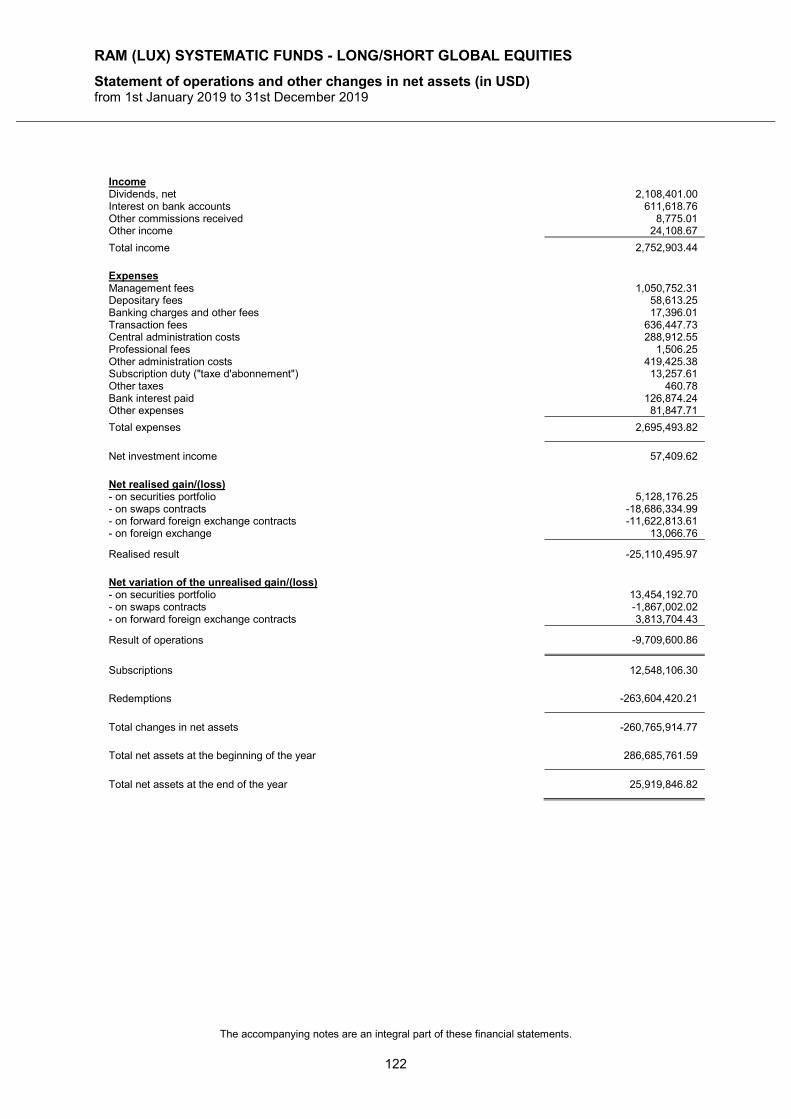
RAM (LUX) SYSTEMATIC FUNDS - LONG/SHORT GLOBAL EQUITIES
Statement of operations and other changes in net assets (in USD) from 1st January 2019 to 31st December 2019
The accompanying notes are an integral part of these financial statements.
122
Income Dividends, net 2,108,401.00 Interest on bank accounts 611,618.76 Other commissions received 8,775.01 Other income 24,108.67
Total income 2,752,903.44
Expenses Management fees 1,050,752.31 Depositary fees 58,613.25 Banking charges and other fees 17,396.01 Transaction fees 636,447.73 Central administration costs 288,912.55 Professional fees 1,506.25 Other administration costs 419,425.38 Subscription duty ("taxe d'abonnement") 13,257.61 Other taxes 460.78 Bank interest paid 126,874.24 Other expenses 81,847.71
Total expenses 2,695,493.82
Net investment income 57,409.62
Net realised gain/(loss) - on securities portfolio 5,128,176.25 - on swaps contracts -18,686,334.99 - on forward foreign exchange contracts -11,622,813.61 - on foreign exchange 13,066.76
Realised result -25,110,495.97
Net variation of the unrealised gain/(loss) - on securities portfolio 13,454,192.70 - on swaps contracts -1,867,002.02 - on forward foreign exchange contracts 3,813,704.43
Result of operations -9,709,600.86
Subscriptions 12,548,106.30
Redemptions -263,604,420.21
Total changes in net assets -260,765,914.77
Total net assets at the beginning of the year 286,685,761.59
Total net assets at the end of the year 25,919,846.82
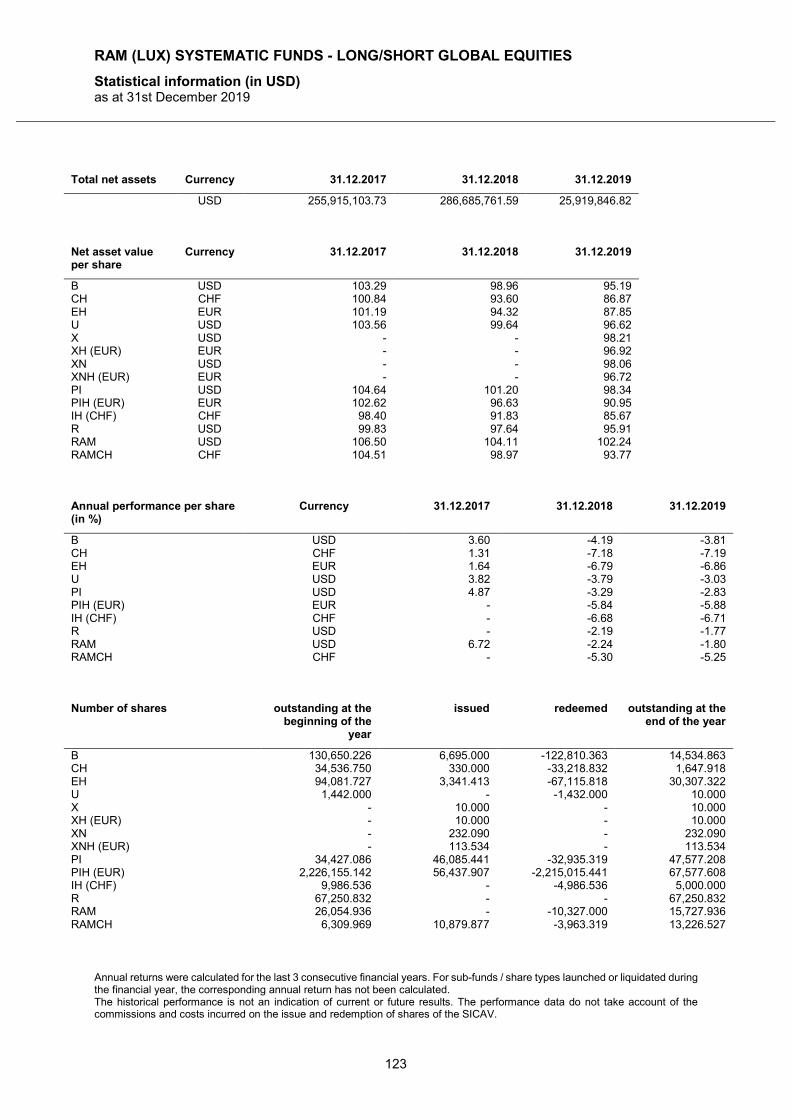
RAM (LUX) SYSTEMATIC FUNDS - LONG/SHORT GLOBAL EQUITIES
Statistical information (in USD) as at 31st December 2019
Annual returns were calculated for the last 3 consecutive financial years. For sub-funds / share types launched or liquidated during the financial year, the corresponding annual return has not been calculated. The historical performance is not an indication of current or future results. The performance data do not take account of the commissions and costs incurred on the issue and redemption of shares of the SICAV.
123
Total net assets Currency 31.12.2017 31.12.2018 31.12.2019
USD 255,915,103.73 286,685,761.59 25,919,846.82
Net asset value per share
Currency 31.12.2017 31.12.2018 31.12.2019
B USD 103.29 98.96 95.19 CH CHF 100.84 93.60 86.87 EH EUR 101.19 94.32 87.85 U USD 103.56 99.64 96.62 X USD - - 98.21 XH (EUR) EUR - - 96.92 XN USD - - 98.06 XNH (EUR) EUR - - 96.72 PI USD 104.64 101.20 98.34 PIH (EUR) EUR 102.62 96.63 90.95 IH (CHF) CHF 98.40 91.83 85.67 R USD 99.83 97.64 95.91 RAM USD 106.50 104.11 102.24 RAMCH CHF 104.51 98.97 93.77
Annual performance per share (in %)
Currency 31.12.2017 31.12.2018 31.12.2019
B USD 3.60 -4.19 -3.81 CH CHF 1.31 -7.18 -7.19 EH EUR 1.64 -6.79 -6.86 U USD 3.82 -3.79 -3.03 PI USD 4.87 -3.29 -2.83 PIH (EUR) EUR - -5.84 -5.88 IH (CHF) CHF - -6.68 -6.71 R USD - -2.19 -1.77 RAM USD 6.72 -2.24 -1.80 RAMCH CHF - -5.30 -5.25
Number of shares outstanding at the
beginning of the year
issued redeemed outstanding at the end of the year
B 130,650.226 6,695.000 -122,810.363 14,534.863 CH 34,536.750 330.000 -33,218.832 1,647.918 EH 94,081.727 3,341.413 -67,115.818 30,307.322 U 1,442.000 - -1,432.000 10.000 X - 10.000 - 10.000 XH (EUR) - 10.000 - 10.000 XN - 232.090 - 232.090 XNH (EUR) - 113.534 - 113.534 PI 34,427.086 46,085.441 -32,935.319 47,577.208 PIH (EUR) 2,226,155.142 56,437.907 -2,215,015.441 67,577.608 IH (CHF) 9,986.536 - -4,986.536 5,000.000 R 67,250.832 - - 67,250.832 RAM 26,054.936 - -10,327.000 15,727.936 RAMCH 6,309.969 10,879.877 -3,963.319 13,226.527
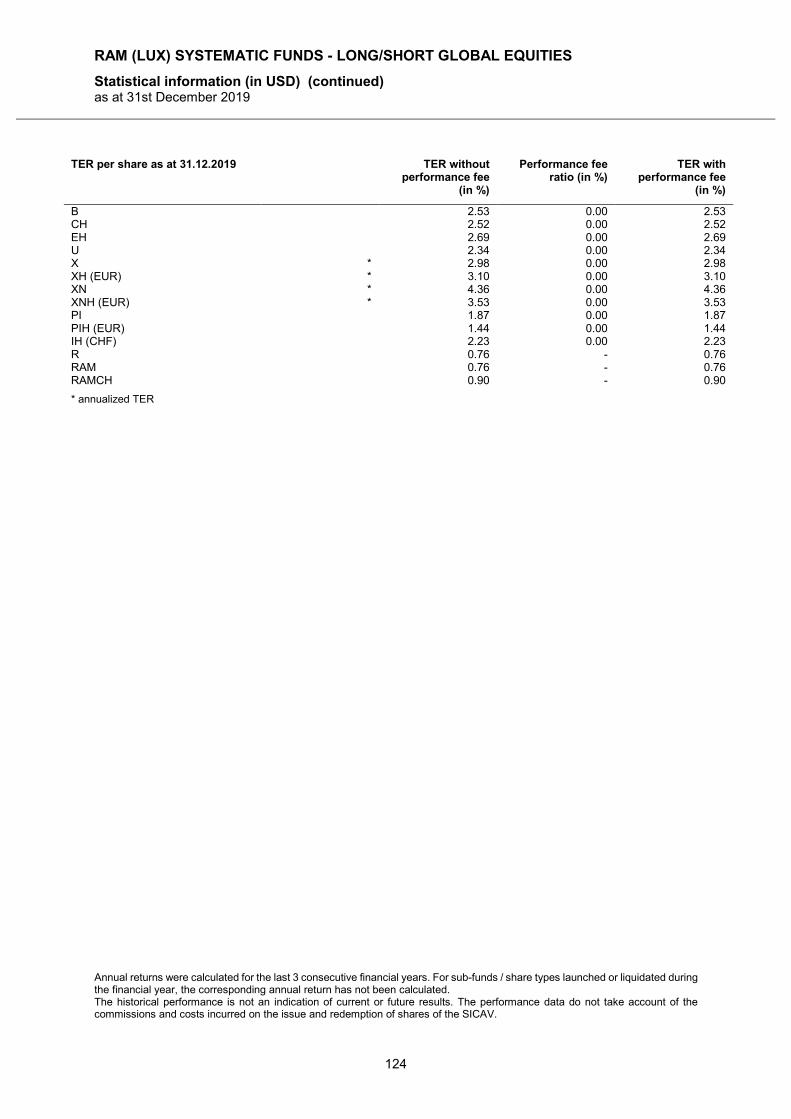
RAM (LUX) SYSTEMATIC FUNDS - LONG/SHORT GLOBAL EQUITIES
Statistical information (in USD) (continued) as at 31st December 2019
Annual returns were calculated for the last 3 consecutive financial years. For sub-funds / share types launched or liquidated during the financial year, the corresponding annual return has not been calculated. The historical performance is not an indication of current or future results. The performance data do not take account of the commissions and costs incurred on the issue and redemption of shares of the SICAV.
124
TER per share as at 31.12.2019 TER without performance fee
(in %)
Performance fee ratio (in %)
TER with performance fee
(in %)
B 2.53 0.00 2.53 CH 2.52 0.00 2.52 EH 2.69 0.00 2.69 U 2.34 0.00 2.34 X * 2.98 0.00 2.98 XH (EUR) * 3.10 0.00 3.10 XN * 4.36 0.00 4.36 XNH (EUR) * 3.53 0.00 3.53 PI 1.87 0.00 1.87 PIH (EUR) 1.44 0.00 1.44 IH (CHF) 2.23 0.00 2.23 R 0.76 - 0.76 RAM 0.76 - 0.76 RAMCH 0.90 - 0.90
* annualized TER
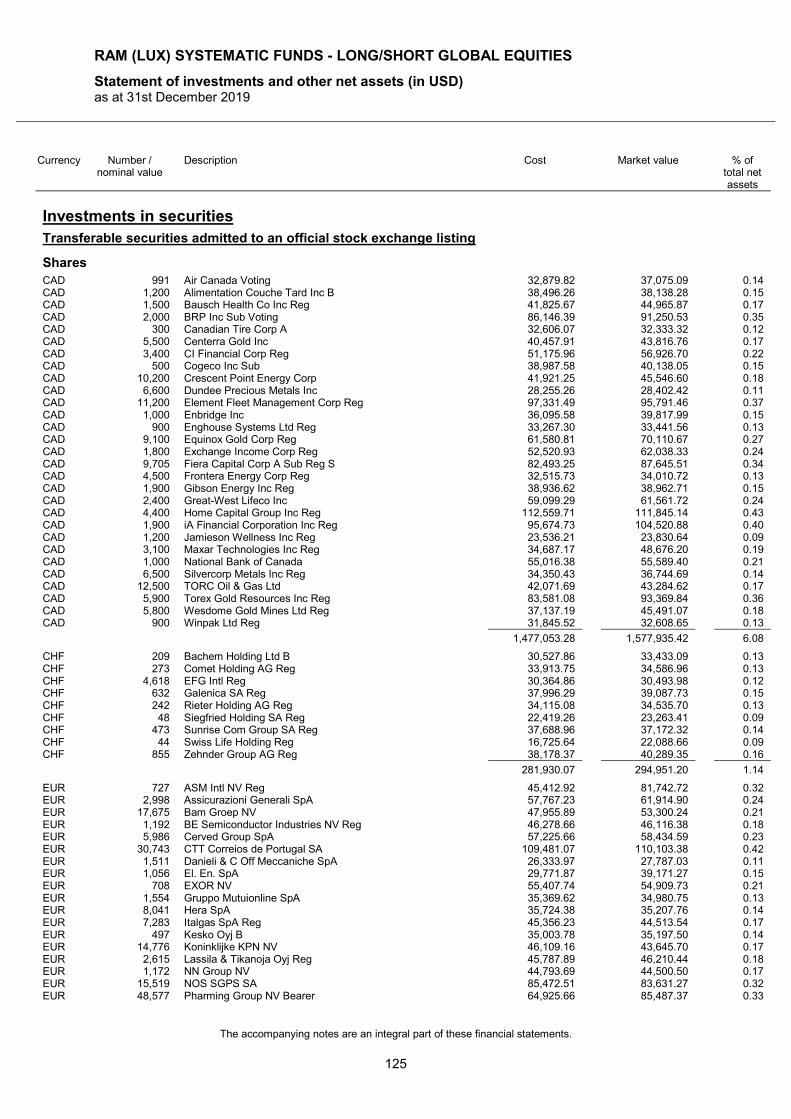
RAM (LUX) SYSTEMATIC FUNDS - LONG/SHORT GLOBAL EQUITIES
Statement of investments and other net assets (in USD) as at 31st December 2019
The accompanying notes are an integral part of these financial statements.
125
Currency Number / nominal value
Description Cost Market value % of total net assets
Investments in securities
Transferable securities admitted to an official stock exchange listing
Shares
CAD 991 Air Canada Voting 32,879.82 37,075.09 0.14 CAD 1,200 Alimentation Couche Tard Inc B 38,496.26 38,138.28 0.15 CAD 1,500 Bausch Health Co Inc Reg 41,825.67 44,965.87 0.17 CAD 2,000 BRP Inc Sub Voting 86,146.39 91,250.53 0.35 CAD 300 Canadian Tire Corp A 32,606.07 32,333.32 0.12 CAD 5,500 Centerra Gold Inc 40,457.91 43,816.76 0.17 CAD 3,400 CI Financial Corp Reg 51,175.96 56,926.70 0.22 CAD 500 Cogeco Inc Sub 38,987.58 40,138.05 0.15 CAD 10,200 Crescent Point Energy Corp 41,921.25 45,546.60 0.18 CAD 6,600 Dundee Precious Metals Inc 28,255.26 28,402.42 0.11 CAD 11,200 Element Fleet Management Corp Reg 97,331.49 95,791.46 0.37 CAD 1,000 Enbridge Inc 36,095.58 39,817.99 0.15 CAD 900 Enghouse Systems Ltd Reg 33,267.30 33,441.56 0.13 CAD 9,100 Equinox Gold Corp Reg 61,580.81 70,110.67 0.27 CAD 1,800 Exchange Income Corp Reg 52,520.93 62,038.33 0.24 CAD 9,705 Fiera Capital Corp A Sub Reg S 82,493.25 87,645.51 0.34 CAD 4,500 Frontera Energy Corp Reg 32,515.73 34,010.72 0.13 CAD 1,900 Gibson Energy Inc Reg 38,936.62 38,962.71 0.15 CAD 2,400 Great-West Lifeco Inc 59,099.29 61,561.72 0.24 CAD 4,400 Home Capital Group Inc Reg 112,559.71 111,845.14 0.43 CAD 1,900 iA Financial Corporation Inc Reg 95,674.73 104,520.88 0.40 CAD 1,200 Jamieson Wellness Inc Reg 23,536.21 23,830.64 0.09 CAD 3,100 Maxar Technologies Inc Reg 34,687.17 48,676.20 0.19 CAD 1,000 National Bank of Canada 55,016.38 55,589.40 0.21 CAD 6,500 Silvercorp Metals Inc Reg 34,350.43 36,744.69 0.14 CAD 12,500 TORC Oil & Gas Ltd 42,071.69 43,284.62 0.17 CAD 5,900 Torex Gold Resources Inc Reg 83,581.08 93,369.84 0.36 CAD 5,800 Wesdome Gold Mines Ltd Reg 37,137.19 45,491.07 0.18 CAD 900 Winpak Ltd Reg 31,845.52 32,608.65 0.13
1,477,053.28 1,577,935.42 6.08
CHF 209 Bachem Holding Ltd B 30,527.86 33,433.09 0.13 CHF 273 Comet Holding AG Reg 33,913.75 34,586.96 0.13 CHF 4,618 EFG Intl Reg 30,364.86 30,493.98 0.12 CHF 632 Galenica SA Reg 37,996.29 39,087.73 0.15 CHF 242 Rieter Holding AG Reg 34,115.08 34,535.70 0.13 CHF 48 Siegfried Holding SA Reg 22,419.26 23,263.41 0.09 CHF 473 Sunrise Com Group SA Reg 37,688.96 37,172.32 0.14 CHF 44 Swiss Life Holding Reg 16,725.64 22,088.66 0.09 CHF 855 Zehnder Group AG Reg 38,178.37 40,289.35 0.16
281,930.07 294,951.20 1.14
EUR 727 ASM Intl NV Reg 45,412.92 81,742.72 0.32 EUR 2,998 Assicurazioni Generali SpA 57,767.23 61,914.90 0.24 EUR 17,675 Bam Groep NV 47,955.89 53,300.24 0.21 EUR 1,192 BE Semiconductor Industries NV Reg 46,278.66 46,116.38 0.18 EUR 5,986 Cerved Group SpA 57,225.66 58,434.59 0.23 EUR 30,743 CTT Correios de Portugal SA 109,481.07 110,103.38 0.42 EUR 1,511 Danieli & C Off Meccaniche SpA 26,333.97 27,787.03 0.11 EUR 1,056 El. En. SpA 29,771.87 39,171.27 0.15 EUR 708 EXOR NV 55,407.74 54,909.73 0.21 EUR 1,554 Gruppo Mutuionline SpA 35,369.62 34,980.75 0.13 EUR 8,041 Hera SpA 35,724.38 35,207.76 0.14 EUR 7,283 Italgas SpA Reg 45,356.23 44,513.54 0.17 EUR 497 Kesko Oyj B 35,003.78 35,197.50 0.14 EUR 14,776 Koninklijke KPN NV 46,109.16 43,645.70 0.17 EUR 2,615 Lassila & Tikanoja Oyj Reg 45,787.89 46,210.44 0.18 EUR 1,172 NN Group NV 44,793.69 44,500.50 0.17 EUR 15,519 NOS SGPS SA 85,472.51 83,631.27 0.32 EUR 48,577 Pharming Group NV Bearer 64,925.66 85,487.37 0.33
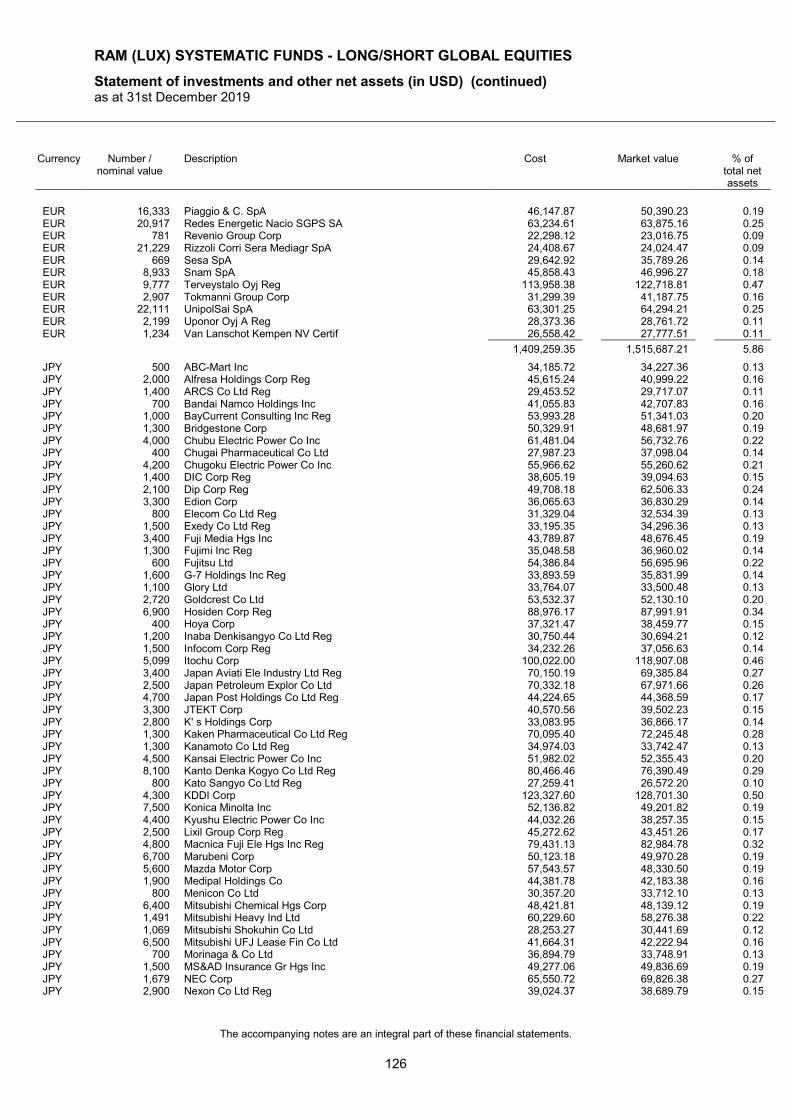
RAM (LUX) SYSTEMATIC FUNDS - LONG/SHORT GLOBAL EQUITIES
Statement of investments and other net assets (in USD) (continued) as at 31st December 2019
The accompanying notes are an integral part of these financial statements.
126
Currency Number / nominal value
Description Cost Market value % of total net assets
EUR 16,333 Piaggio & C. SpA 46,147.87 50,390.23 0.19 EUR 20,917 Redes Energetic Nacio SGPS SA 63,234.61 63,875.16 0.25 EUR 781 Revenio Group Corp 22,298.12 23,016.75 0.09 EUR 21,229 Rizzoli Corri Sera Mediagr SpA 24,408.67 24,024.47 0.09 EUR 669 Sesa SpA 29,642.92 35,789.26 0.14 EUR 8,933 Snam SpA 45,858.43 46,996.27 0.18 EUR 9,777 Terveystalo Oyj Reg 113,958.38 122,718.81 0.47 EUR 2,907 Tokmanni Group Corp 31,299.39 41,187.75 0.16 EUR 22,111 UnipolSai SpA 63,301.25 64,294.21 0.25 EUR 2,199 Uponor Oyj A Reg 28,373.36 28,761.72 0.11 EUR 1,234 Van Lanschot Kempen NV Certif 26,558.42 27,777.51 0.11
1,409,259.35 1,515,687.21 5.86
JPY 500 ABC-Mart Inc 34,185.72 34,227.36 0.13 JPY 2,000 Alfresa Holdings Corp Reg 45,615.24 40,999.22 0.16 JPY 1,400 ARCS Co Ltd Reg 29,453.52 29,717.07 0.11 JPY 700 Bandai Namco Holdings Inc 41,055.83 42,707.83 0.16 JPY 1,000 BayCurrent Consulting Inc Reg 53,993.28 51,341.03 0.20 JPY 1,300 Bridgestone Corp 50,329.91 48,681.97 0.19 JPY 4,000 Chubu Electric Power Co Inc 61,481.04 56,732.76 0.22 JPY 400 Chugai Pharmaceutical Co Ltd 27,987.23 37,098.04 0.14 JPY 4,200 Chugoku Electric Power Co Inc 55,966.62 55,260.62 0.21 JPY 1,400 DIC Corp Reg 38,605.19 39,094.63 0.15 JPY 2,100 Dip Corp Reg 49,708.18 62,506.33 0.24 JPY 3,300 Edion Corp 36,065.63 36,830.29 0.14 JPY 800 Elecom Co Ltd Reg 31,329.04 32,534.39 0.13 JPY 1,500 Exedy Co Ltd Reg 33,195.35 34,296.36 0.13 JPY 3,400 Fuji Media Hgs Inc 43,789.87 48,676.45 0.19 JPY 1,300 Fujimi Inc Reg 35,048.58 36,960.02 0.14 JPY 600 Fujitsu Ltd 54,386.84 56,695.96 0.22 JPY 1,600 G-7 Holdings Inc Reg 33,893.59 35,831.99 0.14 JPY 1,100 Glory Ltd 33,764.07 33,500.48 0.13 JPY 2,720 Goldcrest Co Ltd 53,532.37 52,130.10 0.20 JPY 6,900 Hosiden Corp Reg 88,976.17 87,991.91 0.34 JPY 400 Hoya Corp 37,321.47 38,459.77 0.15 JPY 1,200 Inaba Denkisangyo Co Ltd Reg 30,750.44 30,694.21 0.12 JPY 1,500 Infocom Corp Reg 34,232.26 37,056.63 0.14 JPY 5,099 Itochu Corp 100,022.00 118,907.08 0.46 JPY 3,400 Japan Aviati Ele Industry Ltd Reg 70,150.19 69,385.84 0.27 JPY 2,500 Japan Petroleum Explor Co Ltd 70,332.18 67,971.66 0.26 JPY 4,700 Japan Post Holdings Co Ltd Reg 44,224.65 44,368.59 0.17 JPY 3,300 JTEKT Corp 40,570.56 39,502.23 0.15 JPY 2,800 K' s Holdings Corp 33,083.95 36,866.17 0.14 JPY 1,300 Kaken Pharmaceutical Co Ltd Reg 70,095.40 72,245.48 0.28 JPY 1,300 Kanamoto Co Ltd Reg 34,974.03 33,742.47 0.13 JPY 4,500 Kansai Electric Power Co Inc 51,982.02 52,355.43 0.20 JPY 8,100 Kanto Denka Kogyo Co Ltd Reg 80,466.46 76,390.49 0.29 JPY 800 Kato Sangyo Co Ltd Reg 27,259.41 26,572.20 0.10 JPY 4,300 KDDI Corp 123,327.60 128,701.30 0.50 JPY 7,500 Konica Minolta Inc 52,136.82 49,201.82 0.19 JPY 4,400 Kyushu Electric Power Co Inc 44,032.26 38,257.35 0.15 JPY 2,500 Lixil Group Corp Reg 45,272.62 43,451.26 0.17 JPY 4,800 Macnica Fuji Ele Hgs Inc Reg 79,431.13 82,984.78 0.32 JPY 6,700 Marubeni Corp 50,123.18 49,970.28 0.19 JPY 5,600 Mazda Motor Corp 57,543.57 48,330.50 0.19 JPY 1,900 Medipal Holdings Co 44,381.78 42,183.38 0.16 JPY 800 Menicon Co Ltd 30,357.20 33,712.10 0.13 JPY 6,400 Mitsubishi Chemical Hgs Corp 48,421.81 48,139.12 0.19 JPY 1,491 Mitsubishi Heavy Ind Ltd 60,229.60 58,276.38 0.22 JPY 1,069 Mitsubishi Shokuhin Co Ltd 28,253.27 30,441.69 0.12 JPY 6,500 Mitsubishi UFJ Lease Fin Co Ltd 41,664.31 42,222.94 0.16 JPY 700 Morinaga & Co Ltd 36,894.79 33,748.91 0.13 JPY 1,500 MS&AD Insurance Gr Hgs Inc 49,277.06 49,836.69 0.19 JPY 1,679 NEC Corp 65,550.72 69,826.38 0.27 JPY 2,900 Nexon Co Ltd Reg 39,024.37 38,689.79 0.15
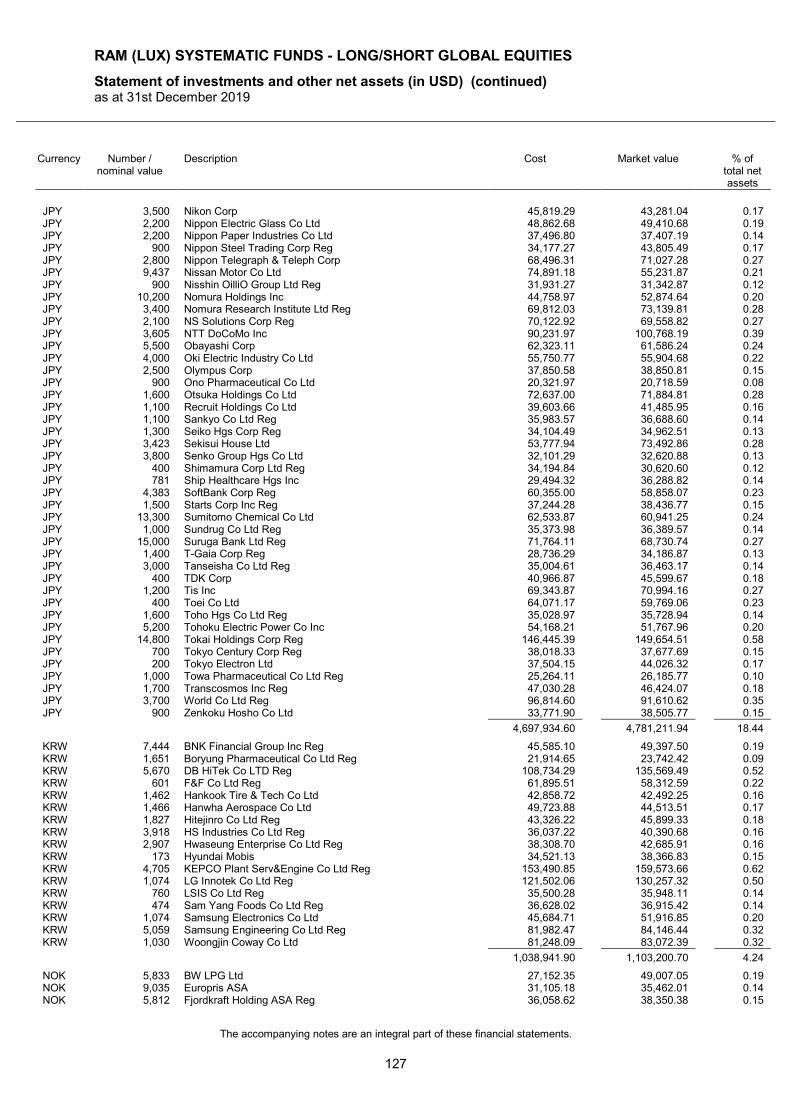
RAM (LUX) SYSTEMATIC FUNDS - LONG/SHORT GLOBAL EQUITIES
Statement of investments and other net assets (in USD) (continued) as at 31st December 2019
The accompanying notes are an integral part of these financial statements.
127
Currency Number / nominal value
Description Cost Market value % of total net assets
JPY 3,500 Nikon Corp 45,819.29 43,281.04 0.17 JPY 2,200 Nippon Electric Glass Co Ltd 48,862.68 49,410.68 0.19 JPY 2,200 Nippon Paper Industries Co Ltd 37,496.80 37,407.19 0.14 JPY 900 Nippon Steel Trading Corp Reg 34,177.27 43,805.49 0.17 JPY 2,800 Nippon Telegraph & Teleph Corp 68,496.31 71,027.28 0.27 JPY 9,437 Nissan Motor Co Ltd 74,891.18 55,231.87 0.21 JPY 900 Nisshin OilliO Group Ltd Reg 31,931.27 31,342.87 0.12 JPY 10,200 Nomura Holdings Inc 44,758.97 52,874.64 0.20 JPY 3,400 Nomura Research Institute Ltd Reg 69,812.03 73,139.81 0.28 JPY 2,100 NS Solutions Corp Reg 70,122.92 69,558.82 0.27 JPY 3,605 NTT DoCoMo Inc 90,231.97 100,768.19 0.39 JPY 5,500 Obayashi Corp 62,323.11 61,586.24 0.24 JPY 4,000 Oki Electric Industry Co Ltd 55,750.77 55,904.68 0.22 JPY 2,500 Olympus Corp 37,850.58 38,850.81 0.15 JPY 900 Ono Pharmaceutical Co Ltd 20,321.97 20,718.59 0.08 JPY 1,600 Otsuka Holdings Co Ltd 72,637.00 71,884.81 0.28 JPY 1,100 Recruit Holdings Co Ltd 39,603.66 41,485.95 0.16 JPY 1,100 Sankyo Co Ltd Reg 35,983.57 36,688.60 0.14 JPY 1,300 Seiko Hgs Corp Reg 34,104.49 34,962.51 0.13 JPY 3,423 Sekisui House Ltd 53,777.94 73,492.86 0.28 JPY 3,800 Senko Group Hgs Co Ltd 32,101.29 32,620.88 0.13 JPY 400 Shimamura Corp Ltd Reg 34,194.84 30,620.60 0.12 JPY 781 Ship Healthcare Hgs Inc 29,494.32 36,288.82 0.14 JPY 4,383 SoftBank Corp Reg 60,355.00 58,858.07 0.23 JPY 1,500 Starts Corp Inc Reg 37,244.28 38,436.77 0.15 JPY 13,300 Sumitomo Chemical Co Ltd 62,533.87 60,941.25 0.24 JPY 1,000 Sundrug Co Ltd Reg 35,373.98 36,389.57 0.14 JPY 15,000 Suruga Bank Ltd Reg 71,764.11 68,730.74 0.27 JPY 1,400 T-Gaia Corp Reg 28,736.29 34,186.87 0.13 JPY 3,000 Tanseisha Co Ltd Reg 35,004.61 36,463.17 0.14 JPY 400 TDK Corp 40,966.87 45,599.67 0.18 JPY 1,200 Tis Inc 69,343.87 70,994.16 0.27 JPY 400 Toei Co Ltd 64,071.17 59,769.06 0.23 JPY 1,600 Toho Hgs Co Ltd Reg 35,028.97 35,728.94 0.14 JPY 5,200 Tohoku Electric Power Co Inc 54,168.21 51,767.96 0.20 JPY 14,800 Tokai Holdings Corp Reg 146,445.39 149,654.51 0.58 JPY 700 Tokyo Century Corp Reg 38,018.33 37,677.69 0.15 JPY 200 Tokyo Electron Ltd 37,504.15 44,026.32 0.17 JPY 1,000 Towa Pharmaceutical Co Ltd Reg 25,264.11 26,185.77 0.10 JPY 1,700 Transcosmos Inc Reg 47,030.28 46,424.07 0.18 JPY 3,700 World Co Ltd Reg 96,814.60 91,610.62 0.35 JPY 900 Zenkoku Hosho Co Ltd 33,771.90 38,505.77 0.15
4,697,934.60 4,781,211.94 18.44
KRW 7,444 BNK Financial Group Inc Reg 45,585.10 49,397.50 0.19 KRW 1,651 Boryung Pharmaceutical Co Ltd Reg 21,914.65 23,742.42 0.09 KRW 5,670 DB HiTek Co LTD Reg 108,734.29 135,569.49 0.52 KRW 601 F&F Co Ltd Reg 61,895.51 58,312.59 0.22 KRW 1,462 Hankook Tire & Tech Co Ltd 42,858.72 42,492.25 0.16 KRW 1,466 Hanwha Aerospace Co Ltd 49,723.88 44,513.51 0.17 KRW 1,827 Hitejinro Co Ltd Reg 43,326.22 45,899.33 0.18 KRW 3,918 HS Industries Co Ltd Reg 36,037.22 40,390.68 0.16 KRW 2,907 Hwaseung Enterprise Co Ltd Reg 38,308.70 42,685.91 0.16 KRW 173 Hyundai Mobis 34,521.13 38,366.83 0.15 KRW 4,705 KEPCO Plant Serv&Engine Co Ltd Reg 153,490.85 159,573.66 0.62 KRW 1,074 LG Innotek Co Ltd Reg 121,502.06 130,257.32 0.50 KRW 760 LSIS Co Ltd Reg 35,500.28 35,948.11 0.14 KRW 474 Sam Yang Foods Co Ltd Reg 36,628.02 36,915.42 0.14 KRW 1,074 Samsung Electronics Co Ltd 45,684.71 51,916.85 0.20 KRW 5,059 Samsung Engineering Co Ltd Reg 81,982.47 84,146.44 0.32 KRW 1,030 Woongjin Coway Co Ltd 81,248.09 83,072.39 0.32
1,038,941.90 1,103,200.70 4.24
NOK 5,833 BW LPG Ltd 27,152.35 49,007.05 0.19 NOK 9,035 Europris ASA 31,105.18 35,462.01 0.14 NOK 5,812 Fjordkraft Holding ASA Reg 36,058.62 38,350.38 0.15
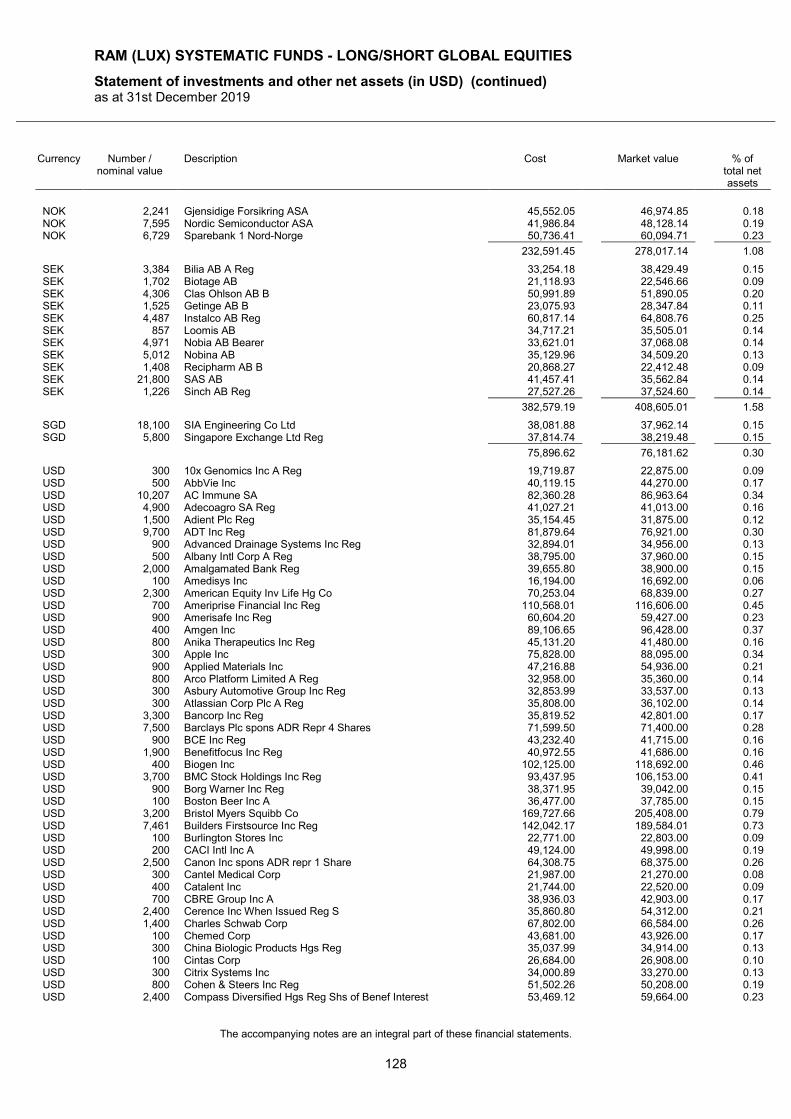
RAM (LUX) SYSTEMATIC FUNDS - LONG/SHORT GLOBAL EQUITIES
Statement of investments and other net assets (in USD) (continued) as at 31st December 2019
The accompanying notes are an integral part of these financial statements.
128
Currency Number / nominal value
Description Cost Market value % of total net assets
NOK 2,241 Gjensidige Forsikring ASA 45,552.05 46,974.85 0.18 NOK 7,595 Nordic Semiconductor ASA 41,986.84 48,128.14 0.19 NOK 6,729 Sparebank 1 Nord-Norge 50,736.41 60,094.71 0.23
232,591.45 278,017.14 1.08
SEK 3,384 Bilia AB A Reg 33,254.18 38,429.49 0.15 SEK 1,702 Biotage AB 21,118.93 22,546.66 0.09 SEK 4,306 Clas Ohlson AB B 50,991.89 51,890.05 0.20 SEK 1,525 Getinge AB B 23,075.93 28,347.84 0.11 SEK 4,487 Instalco AB Reg 60,817.14 64,808.76 0.25 SEK 857 Loomis AB 34,717.21 35,505.01 0.14 SEK 4,971 Nobia AB Bearer 33,621.01 37,068.08 0.14 SEK 5,012 Nobina AB 35,129.96 34,509.20 0.13 SEK 1,408 Recipharm AB B 20,868.27 22,412.48 0.09 SEK 21,800 SAS AB 41,457.41 35,562.84 0.14 SEK 1,226 Sinch AB Reg 27,527.26 37,524.60 0.14
382,579.19 408,605.01 1.58
SGD 18,100 SIA Engineering Co Ltd 38,081.88 37,962.14 0.15 SGD 5,800 Singapore Exchange Ltd Reg 37,814.74 38,219.48 0.15
75,896.62 76,181.62 0.30
USD 300 10x Genomics Inc A Reg 19,719.87 22,875.00 0.09 USD 500 AbbVie Inc 40,119.15 44,270.00 0.17 USD 10,207 AC Immune SA 82,360.28 86,963.64 0.34 USD 4,900 Adecoagro SA Reg 41,027.21 41,013.00 0.16 USD 1,500 Adient Plc Reg 35,154.45 31,875.00 0.12 USD 9,700 ADT Inc Reg 81,879.64 76,921.00 0.30 USD 900 Advanced Drainage Systems Inc Reg 32,894.01 34,956.00 0.13 USD 500 Albany Intl Corp A Reg 38,795.00 37,960.00 0.15 USD 2,000 Amalgamated Bank Reg 39,655.80 38,900.00 0.15 USD 100 Amedisys Inc 16,194.00 16,692.00 0.06 USD 2,300 American Equity Inv Life Hg Co 70,253.04 68,839.00 0.27 USD 700 Ameriprise Financial Inc Reg 110,568.01 116,606.00 0.45 USD 900 Amerisafe Inc Reg 60,604.20 59,427.00 0.23 USD 400 Amgen Inc 89,106.65 96,428.00 0.37 USD 800 Anika Therapeutics Inc Reg 45,131.20 41,480.00 0.16 USD 300 Apple Inc 75,828.00 88,095.00 0.34 USD 900 Applied Materials Inc 47,216.88 54,936.00 0.21 USD 800 Arco Platform Limited A Reg 32,958.00 35,360.00 0.14 USD 300 Asbury Automotive Group Inc Reg 32,853.99 33,537.00 0.13 USD 300 Atlassian Corp Plc A Reg 35,808.00 36,102.00 0.14 USD 3,300 Bancorp Inc Reg 35,819.52 42,801.00 0.17 USD 7,500 Barclays Plc spons ADR Repr 4 Shares 71,599.50 71,400.00 0.28 USD 900 BCE Inc Reg 43,232.40 41,715.00 0.16 USD 1,900 Benefitfocus Inc Reg 40,972.55 41,686.00 0.16 USD 400 Biogen Inc 102,125.00 118,692.00 0.46 USD 3,700 BMC Stock Holdings Inc Reg 93,437.95 106,153.00 0.41 USD 900 Borg Warner Inc Reg 38,371.95 39,042.00 0.15 USD 100 Boston Beer Inc A 36,477.00 37,785.00 0.15 USD 3,200 Bristol Myers Squibb Co 169,727.66 205,408.00 0.79 USD 7,461 Builders Firstsource Inc Reg 142,042.17 189,584.01 0.73 USD 100 Burlington Stores Inc 22,771.00 22,803.00 0.09 USD 200 CACI Intl Inc A 49,124.00 49,998.00 0.19 USD 2,500 Canon Inc spons ADR repr 1 Share 64,308.75 68,375.00 0.26 USD 300 Cantel Medical Corp 21,987.00 21,270.00 0.08 USD 400 Catalent Inc 21,744.00 22,520.00 0.09 USD 700 CBRE Group Inc A 38,936.03 42,903.00 0.17 USD 2,400 Cerence Inc When Issued Reg S 35,860.80 54,312.00 0.21 USD 1,400 Charles Schwab Corp 67,802.00 66,584.00 0.26 USD 100 Chemed Corp 43,681.00 43,926.00 0.17 USD 300 China Biologic Products Hgs Reg 35,037.99 34,914.00 0.13 USD 100 Cintas Corp 26,684.00 26,908.00 0.10 USD 300 Citrix Systems Inc 34,000.89 33,270.00 0.13 USD 800 Cohen & Steers Inc Reg 51,502.26 50,208.00 0.19 USD 2,400 Compass Diversified Hgs Reg Shs of Benef Interest 53,469.12 59,664.00 0.23
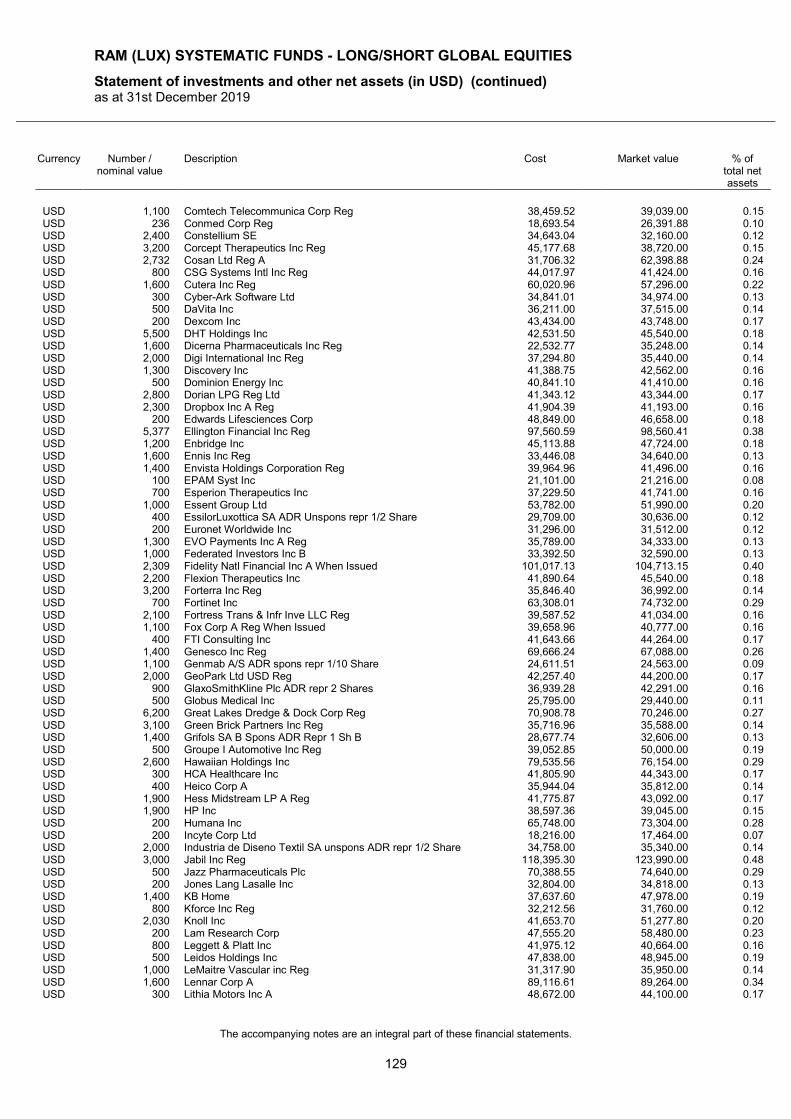
RAM (LUX) SYSTEMATIC FUNDS - LONG/SHORT GLOBAL EQUITIES
Statement of investments and other net assets (in USD) (continued) as at 31st December 2019
The accompanying notes are an integral part of these financial statements.
129
Currency Number / nominal value
Description Cost Market value % of total net assets
USD 1,100 Comtech Telecommunica Corp Reg 38,459.52 39,039.00 0.15 USD 236 Conmed Corp Reg 18,693.54 26,391.88 0.10 USD 2,400 Constellium SE 34,643.04 32,160.00 0.12 USD 3,200 Corcept Therapeutics Inc Reg 45,177.68 38,720.00 0.15 USD 2,732 Cosan Ltd Reg A 31,706.32 62,398.88 0.24 USD 800 CSG Systems Intl Inc Reg 44,017.97 41,424.00 0.16 USD 1,600 Cutera Inc Reg 60,020.96 57,296.00 0.22 USD 300 Cyber-Ark Software Ltd 34,841.01 34,974.00 0.13 USD 500 DaVita Inc 36,211.00 37,515.00 0.14 USD 200 Dexcom Inc 43,434.00 43,748.00 0.17 USD 5,500 DHT Holdings Inc 42,531.50 45,540.00 0.18 USD 1,600 Dicerna Pharmaceuticals Inc Reg 22,532.77 35,248.00 0.14 USD 2,000 Digi International Inc Reg 37,294.80 35,440.00 0.14 USD 1,300 Discovery Inc 41,388.75 42,562.00 0.16 USD 500 Dominion Energy Inc 40,841.10 41,410.00 0.16 USD 2,800 Dorian LPG Reg Ltd 41,343.12 43,344.00 0.17 USD 2,300 Dropbox Inc A Reg 41,904.39 41,193.00 0.16 USD 200 Edwards Lifesciences Corp 48,849.00 46,658.00 0.18 USD 5,377 Ellington Financial Inc Reg 97,560.59 98,560.41 0.38 USD 1,200 Enbridge Inc 45,113.88 47,724.00 0.18 USD 1,600 Ennis Inc Reg 33,446.08 34,640.00 0.13 USD 1,400 Envista Holdings Corporation Reg 39,964.96 41,496.00 0.16 USD 100 EPAM Syst Inc 21,101.00 21,216.00 0.08 USD 700 Esperion Therapeutics Inc 37,229.50 41,741.00 0.16 USD 1,000 Essent Group Ltd 53,782.00 51,990.00 0.20 USD 400 EssilorLuxottica SA ADR Unspons repr 1/2 Share 29,709.00 30,636.00 0.12 USD 200 Euronet Worldwide Inc 31,296.00 31,512.00 0.12 USD 1,300 EVO Payments Inc A Reg 35,789.00 34,333.00 0.13 USD 1,000 Federated Investors Inc B 33,392.50 32,590.00 0.13 USD 2,309 Fidelity Natl Financial Inc A When Issued 101,017.13 104,713.15 0.40 USD 2,200 Flexion Therapeutics Inc 41,890.64 45,540.00 0.18 USD 3,200 Forterra Inc Reg 35,846.40 36,992.00 0.14 USD 700 Fortinet Inc 63,308.01 74,732.00 0.29 USD 2,100 Fortress Trans & Infr Inve LLC Reg 39,587.52 41,034.00 0.16 USD 1,100 Fox Corp A Reg When Issued 39,658.96 40,777.00 0.16 USD 400 FTI Consulting Inc 41,643.66 44,264.00 0.17 USD 1,400 Genesco Inc Reg 69,666.24 67,088.00 0.26 USD 1,100 Genmab A/S ADR spons repr 1/10 Share 24,611.51 24,563.00 0.09 USD 2,000 GeoPark Ltd USD Reg 42,257.40 44,200.00 0.17 USD 900 GlaxoSmithKline Plc ADR repr 2 Shares 36,939.28 42,291.00 0.16 USD 500 Globus Medical Inc 25,795.00 29,440.00 0.11 USD 6,200 Great Lakes Dredge & Dock Corp Reg 70,908.78 70,246.00 0.27 USD 3,100 Green Brick Partners Inc Reg 35,716.96 35,588.00 0.14 USD 1,400 Grifols SA B Spons ADR Repr 1 Sh B 28,677.74 32,606.00 0.13 USD 500 Groupe I Automotive Inc Reg 39,052.85 50,000.00 0.19 USD 2,600 Hawaiian Holdings Inc 79,535.56 76,154.00 0.29 USD 300 HCA Healthcare Inc 41,805.90 44,343.00 0.17 USD 400 Heico Corp A 35,944.04 35,812.00 0.14 USD 1,900 Hess Midstream LP A Reg 41,775.87 43,092.00 0.17 USD 1,900 HP Inc 38,597.36 39,045.00 0.15 USD 200 Humana Inc 65,748.00 73,304.00 0.28 USD 200 Incyte Corp Ltd 18,216.00 17,464.00 0.07 USD 2,000 Industria de Diseno Textil SA unspons ADR repr 1/2 Share 34,758.00 35,340.00 0.14 USD 3,000 Jabil Inc Reg 118,395.30 123,990.00 0.48 USD 500 Jazz Pharmaceuticals Plc 70,388.55 74,640.00 0.29 USD 200 Jones Lang Lasalle Inc 32,804.00 34,818.00 0.13 USD 1,400 KB Home 37,637.60 47,978.00 0.19 USD 800 Kforce Inc Reg 32,212.56 31,760.00 0.12 USD 2,030 Knoll Inc 41,653.70 51,277.80 0.20 USD 200 Lam Research Corp 47,555.20 58,480.00 0.23 USD 800 Leggett & Platt Inc 41,975.12 40,664.00 0.16 USD 500 Leidos Holdings Inc 47,838.00 48,945.00 0.19 USD 1,000 LeMaitre Vascular inc Reg 31,317.90 35,950.00 0.14 USD 1,600 Lennar Corp A 89,116.61 89,264.00 0.34 USD 300 Lithia Motors Inc A 48,672.00 44,100.00 0.17
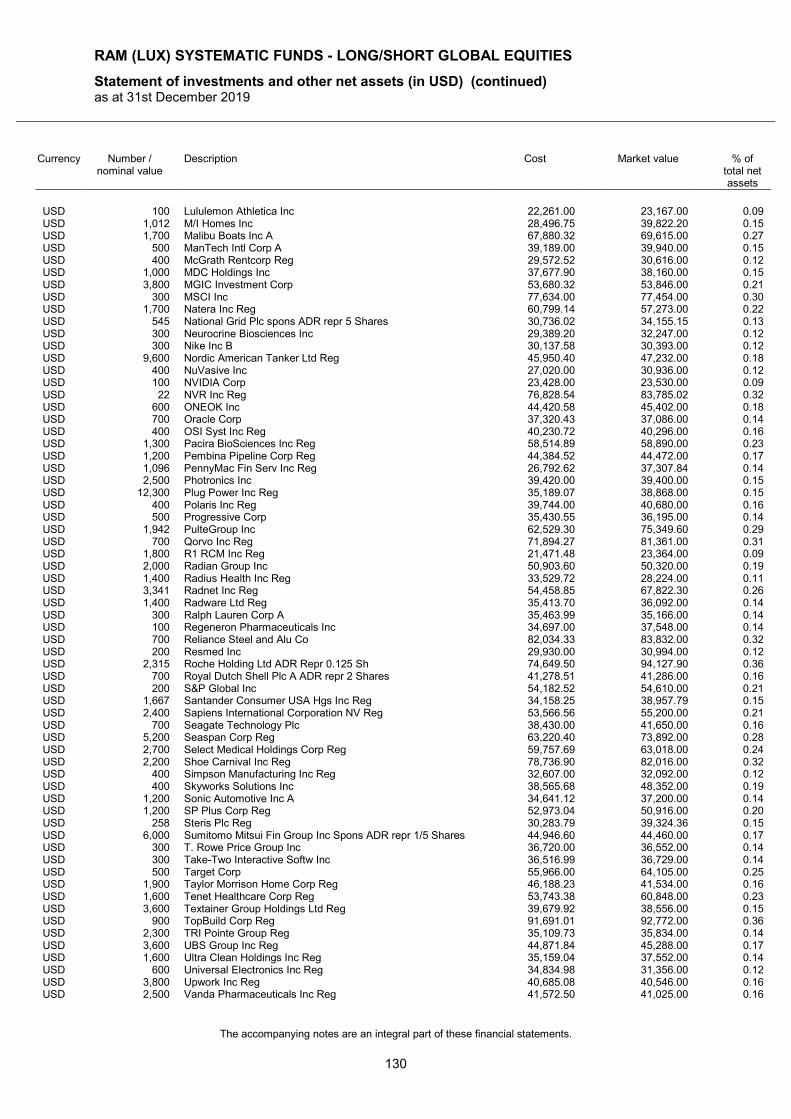
RAM (LUX) SYSTEMATIC FUNDS - LONG/SHORT GLOBAL EQUITIES
Statement of investments and other net assets (in USD) (continued) as at 31st December 2019
The accompanying notes are an integral part of these financial statements.
130
Currency Number / nominal value
Description Cost Market value % of total net assets
USD 100 Lululemon Athletica Inc 22,261.00 23,167.00 0.09 USD 1,012 M/I Homes Inc 28,496.75 39,822.20 0.15 USD 1,700 Malibu Boats Inc A 67,880.32 69,615.00 0.27 USD 500 ManTech Intl Corp A 39,189.00 39,940.00 0.15 USD 400 McGrath Rentcorp Reg 29,572.52 30,616.00 0.12 USD 1,000 MDC Holdings Inc 37,677.90 38,160.00 0.15 USD 3,800 MGIC Investment Corp 53,680.32 53,846.00 0.21 USD 300 MSCI Inc 77,634.00 77,454.00 0.30 USD 1,700 Natera Inc Reg 60,799.14 57,273.00 0.22 USD 545 National Grid Plc spons ADR repr 5 Shares 30,736.02 34,155.15 0.13 USD 300 Neurocrine Biosciences Inc 29,389.20 32,247.00 0.12 USD 300 Nike Inc B 30,137.58 30,393.00 0.12 USD 9,600 Nordic American Tanker Ltd Reg 45,950.40 47,232.00 0.18 USD 400 NuVasive Inc 27,020.00 30,936.00 0.12 USD 100 NVIDIA Corp 23,428.00 23,530.00 0.09 USD 22 NVR Inc Reg 76,828.54 83,785.02 0.32 USD 600 ONEOK Inc 44,420.58 45,402.00 0.18 USD 700 Oracle Corp 37,320.43 37,086.00 0.14 USD 400 OSI Syst Inc Reg 40,230.72 40,296.00 0.16 USD 1,300 Pacira BioSciences Inc Reg 58,514.89 58,890.00 0.23 USD 1,200 Pembina Pipeline Corp Reg 44,384.52 44,472.00 0.17 USD 1,096 PennyMac Fin Serv Inc Reg 26,792.62 37,307.84 0.14 USD 2,500 Photronics Inc 39,420.00 39,400.00 0.15 USD 12,300 Plug Power Inc Reg 35,189.07 38,868.00 0.15 USD 400 Polaris Inc Reg 39,744.00 40,680.00 0.16 USD 500 Progressive Corp 35,430.55 36,195.00 0.14 USD 1,942 PulteGroup Inc 62,529.30 75,349.60 0.29 USD 700 Qorvo Inc Reg 71,894.27 81,361.00 0.31 USD 1,800 R1 RCM Inc Reg 21,471.48 23,364.00 0.09 USD 2,000 Radian Group Inc 50,903.60 50,320.00 0.19 USD 1,400 Radius Health Inc Reg 33,529.72 28,224.00 0.11 USD 3,341 Radnet Inc Reg 54,458.85 67,822.30 0.26 USD 1,400 Radware Ltd Reg 35,413.70 36,092.00 0.14 USD 300 Ralph Lauren Corp A 35,463.99 35,166.00 0.14 USD 100 Regeneron Pharmaceuticals Inc 34,697.00 37,548.00 0.14 USD 700 Reliance Steel and Alu Co 82,034.33 83,832.00 0.32 USD 200 Resmed Inc 29,930.00 30,994.00 0.12 USD 2,315 Roche Holding Ltd ADR Repr 0.125 Sh 74,649.50 94,127.90 0.36 USD 700 Royal Dutch Shell Plc A ADR repr 2 Shares 41,278.51 41,286.00 0.16 USD 200 S&P Global Inc 54,182.52 54,610.00 0.21 USD 1,667 Santander Consumer USA Hgs Inc Reg 34,158.25 38,957.79 0.15 USD 2,400 Sapiens International Corporation NV Reg 53,566.56 55,200.00 0.21 USD 700 Seagate Technology Plc 38,430.00 41,650.00 0.16 USD 5,200 Seaspan Corp Reg 63,220.40 73,892.00 0.28 USD 2,700 Select Medical Holdings Corp Reg 59,757.69 63,018.00 0.24 USD 2,200 Shoe Carnival Inc Reg 78,736.90 82,016.00 0.32 USD 400 Simpson Manufacturing Inc Reg 32,607.00 32,092.00 0.12 USD 400 Skyworks Solutions Inc 38,565.68 48,352.00 0.19 USD 1,200 Sonic Automotive Inc A 34,641.12 37,200.00 0.14 USD 1,200 SP Plus Corp Reg 52,973.04 50,916.00 0.20 USD 258 Steris Plc Reg 30,283.79 39,324.36 0.15 USD 6,000 Sumitomo Mitsui Fin Group Inc Spons ADR repr 1/5 Shares 44,946.60 44,460.00 0.17 USD 300 T. Rowe Price Group Inc 36,720.00 36,552.00 0.14 USD 300 Take-Two Interactive Softw Inc 36,516.99 36,729.00 0.14 USD 500 Target Corp 55,966.00 64,105.00 0.25 USD 1,900 Taylor Morrison Home Corp Reg 46,188.23 41,534.00 0.16 USD 1,600 Tenet Healthcare Corp Reg 53,743.38 60,848.00 0.23 USD 3,600 Textainer Group Holdings Ltd Reg 39,679.92 38,556.00 0.15 USD 900 TopBuild Corp Reg 91,691.01 92,772.00 0.36 USD 2,300 TRI Pointe Group Reg 35,109.73 35,834.00 0.14 USD 3,600 UBS Group Inc Reg 44,871.84 45,288.00 0.17 USD 1,600 Ultra Clean Holdings Inc Reg 35,159.04 37,552.00 0.14 USD 600 Universal Electronics Inc Reg 34,834.98 31,356.00 0.12 USD 3,800 Upwork Inc Reg 40,685.08 40,546.00 0.16 USD 2,500 Vanda Pharmaceuticals Inc Reg 41,572.50 41,025.00 0.16
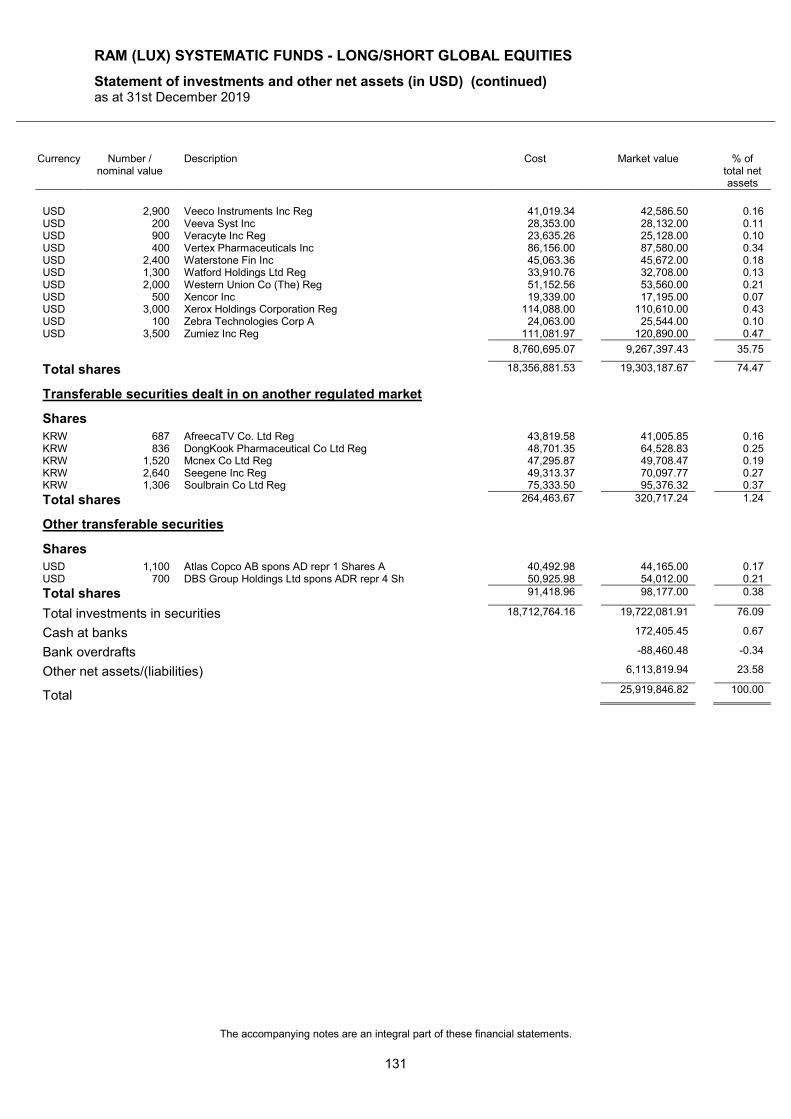
RAM (LUX) SYSTEMATIC FUNDS - LONG/SHORT GLOBAL EQUITIES
Statement of investments and other net assets (in USD) (continued) as at 31st December 2019
The accompanying notes are an integral part of these financial statements.
131
Currency Number / nominal value
Description Cost Market value % of total net assets
USD 2,900 Veeco Instruments Inc Reg 41,019.34 42,586.50 0.16 USD 200 Veeva Syst Inc 28,353.00 28,132.00 0.11 USD 900 Veracyte Inc Reg 23,635.26 25,128.00 0.10 USD 400 Vertex Pharmaceuticals Inc 86,156.00 87,580.00 0.34 USD 2,400 Waterstone Fin Inc 45,063.36 45,672.00 0.18 USD 1,300 Watford Holdings Ltd Reg 33,910.76 32,708.00 0.13 USD 2,000 Western Union Co (The) Reg 51,152.56 53,560.00 0.21 USD 500 Xencor Inc 19,339.00 17,195.00 0.07 USD 3,000 Xerox Holdings Corporation Reg 114,088.00 110,610.00 0.43 USD 100 Zebra Technologies Corp A 24,063.00 25,544.00 0.10 USD 3,500 Zumiez Inc Reg 111,081.97 120,890.00 0.47
8,760,695.07 9,267,397.43 35.75
Total shares 18,356,881.53 19,303,187.67 74.47
Transferable securities dealt in on another regulated market
Shares
KRW 687 AfreecaTV Co. Ltd Reg 43,819.58 41,005.85 0.16 KRW 836 DongKook Pharmaceutical Co Ltd Reg 48,701.35 64,528.83 0.25 KRW 1,520 Mcnex Co Ltd Reg 47,295.87 49,708.47 0.19 KRW 2,640 Seegene Inc Reg 49,313.37 70,097.77 0.27 KRW 1,306 Soulbrain Co Ltd Reg 75,333.50 95,376.32 0.37
Total shares 264,463.67 320,717.24 1.24
Other transferable securities
Shares
USD 1,100 Atlas Copco AB spons AD repr 1 Shares A 40,492.98 44,165.00 0.17 USD 700 DBS Group Holdings Ltd spons ADR repr 4 Sh 50,925.98 54,012.00 0.21
Total shares 91,418.96 98,177.00 0.38
Total investments in securities 18,712,764.16 19,722,081.91 76.09
Cash at banks 172,405.45 0.67
Bank overdrafts -88,460.48 -0.34
Other net assets/(liabilities) 6,113,819.94 23.58
Total 25,919,846.82 100.00
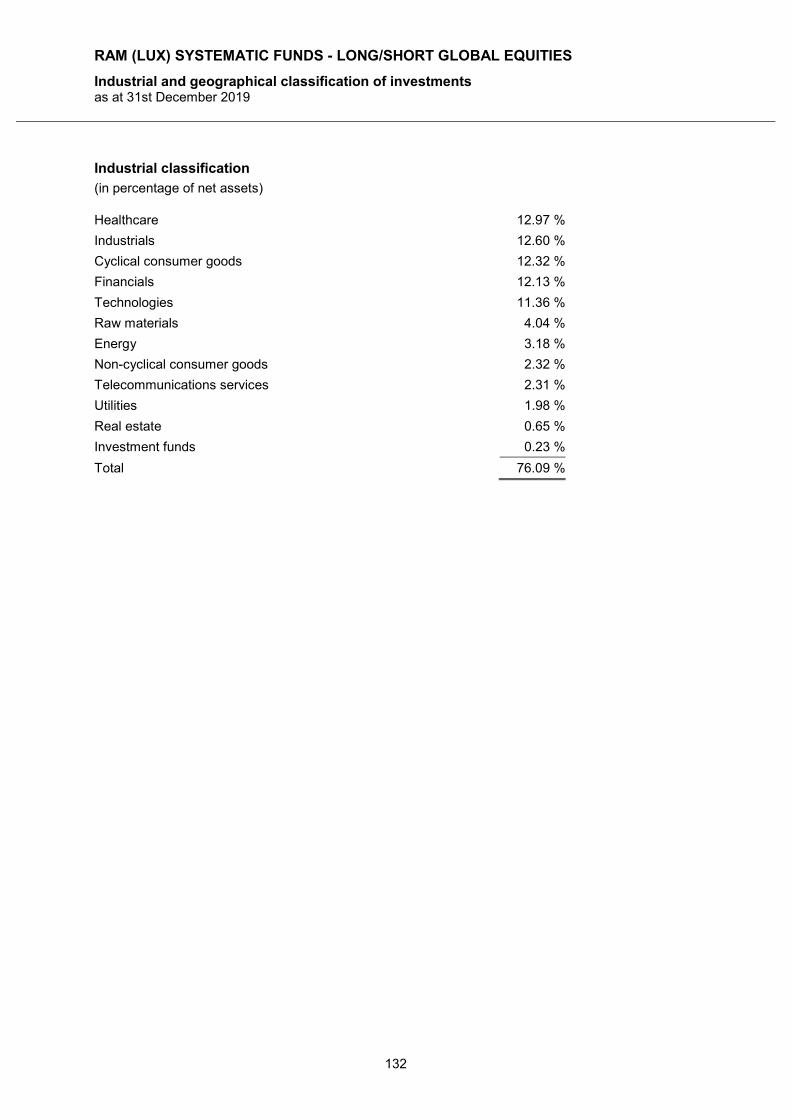
RAM (LUX) SYSTEMATIC FUNDS - LONG/SHORT GLOBAL EQUITIES
Industrial and geographical classification of investments as at 31st December 2019
132
Industrial classification
(in percentage of net assets)
Healthcare 12.97 %
Industrials 12.60 %
Cyclical consumer goods 12.32 %
Financials 12.13 %
Technologies 11.36 %
Raw materials 4.04 %
Energy 3.18 %
Non-cyclical consumer goods 2.32 %
Telecommunications services 2.31 %
Utilities 1.98 %
Real estate 0.65 %
Investment funds 0.23 %
Total 76.09 %
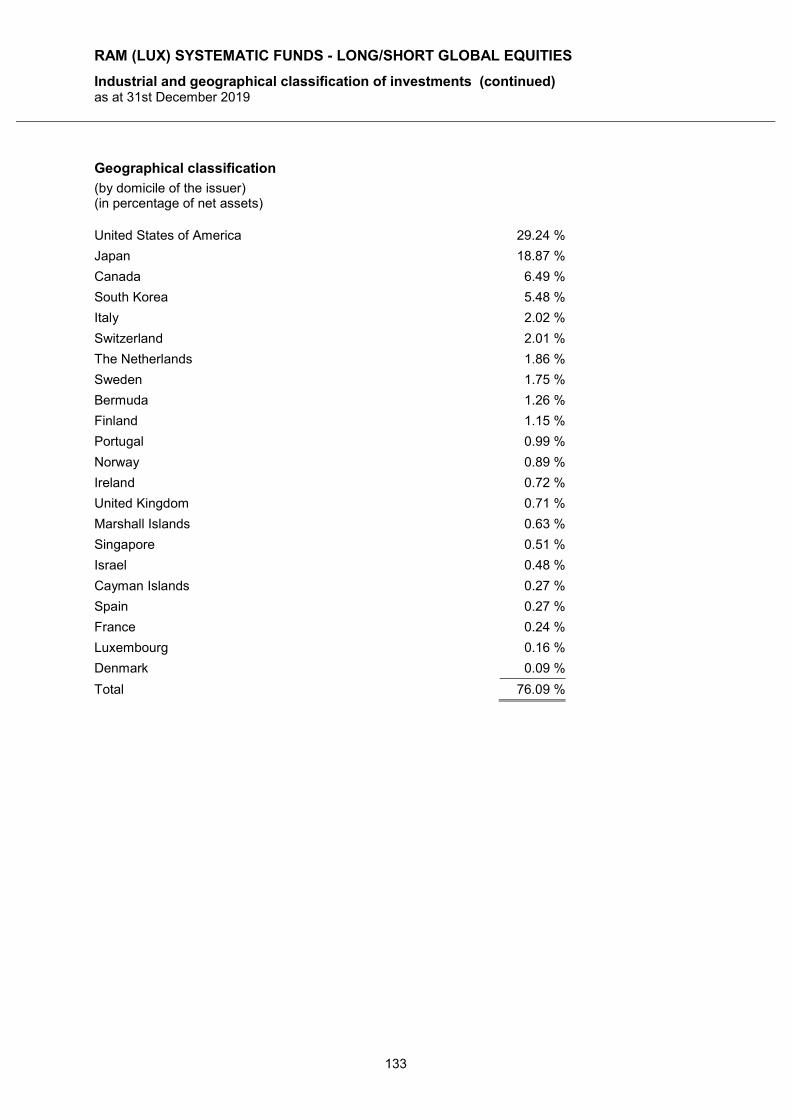
RAM (LUX) SYSTEMATIC FUNDS - LONG/SHORT GLOBAL EQUITIES
Industrial and geographical classification of investments (continued) as at 31st December 2019
133
Geographical classification
(by domicile of the issuer) (in percentage of net assets)
United States of America 29.24 %
Japan 18.87 %
Canada 6.49 %
South Korea 5.48 %
Italy 2.02 %
Switzerland 2.01 %
The Netherlands 1.86 %
Sweden 1.75 %
Bermuda 1.26 %
Finland 1.15 %
Portugal 0.99 %
Norway 0.89 %
Ireland 0.72 %
United Kingdom 0.71 %
Marshall Islands 0.63 %
Singapore 0.51 %
Israel 0.48 %
Cayman Islands 0.27 %
Spain 0.27 %
France 0.24 %
Luxembourg 0.16 %
Denmark 0.09 %
Total 76.09 %
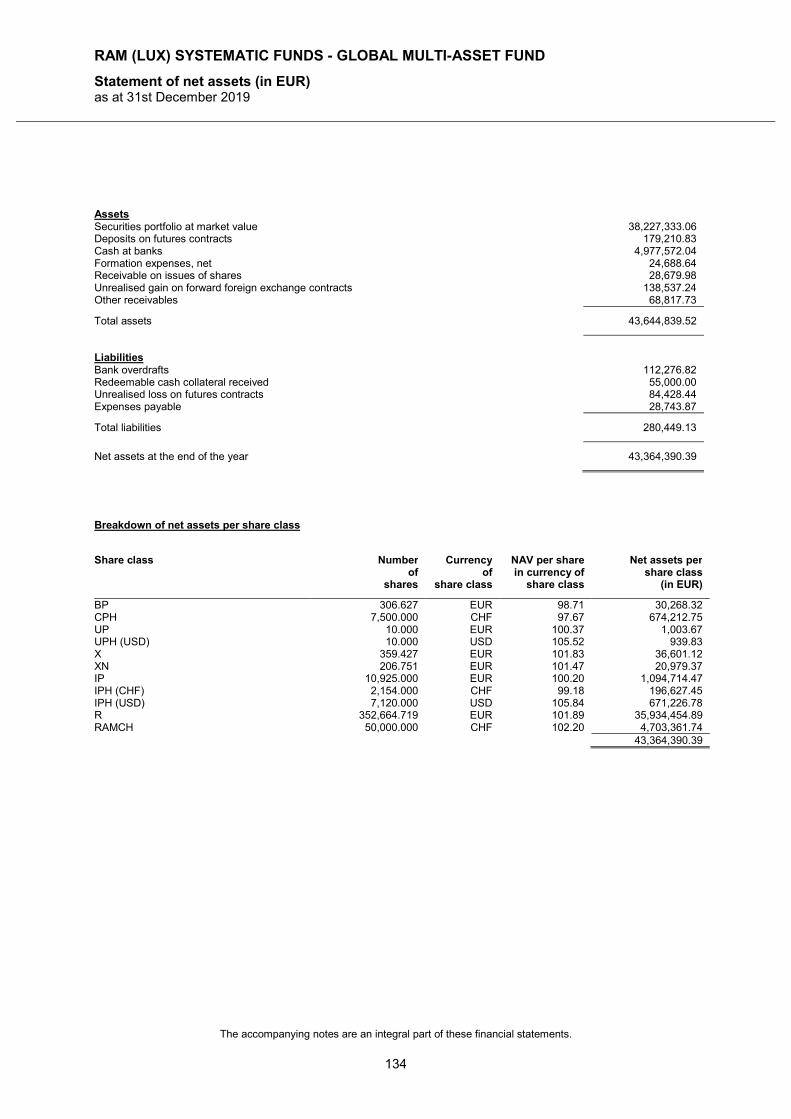
RAM (LUX) SYSTEMATIC FUNDS - GLOBAL MULTI-ASSET FUND
Statement of net assets (in EUR) as at 31st December 2019
The accompanying notes are an integral part of these financial statements.
134
Assets Securities portfolio at market value 38,227,333.06 Deposits on futures contracts 179,210.83 Cash at banks 4,977,572.04 Formation expenses, net 24,688.64 Receivable on issues of shares 28,679.98 Unrealised gain on forward foreign exchange contracts 138,537.24 Other receivables 68,817.73
Total assets 43,644,839.52
Liabilities Bank overdrafts 112,276.82 Redeemable cash collateral received 55,000.00 Unrealised loss on futures contracts 84,428.44 Expenses payable 28,743.87
Total liabilities 280,449.13
Net assets at the end of the year 43,364,390.39
Breakdown of net assets per share class
Share class Number of
shares
Currency of
share class
NAV per share in currency of
share class
Net assets per share class
(in EUR)
BP 306.627 EUR 98.71 30,268.32 CPH 7,500.000 CHF 97.67 674,212.75 UP 10.000 EUR 100.37 1,003.67 UPH (USD) 10.000 USD 105.52 939.83 X 359.427 EUR 101.83 36,601.12 XN 206.751 EUR 101.47 20,979.37 IP 10,925.000 EUR 100.20 1,094,714.47 IPH (CHF) 2,154.000 CHF 99.18 196,627.45 IPH (USD) 7,120.000 USD 105.84 671,226.78 R 352,664.719 EUR 101.89 35,934,454.89 RAMCH 50,000.000 CHF 102.20 4,703,361.74 43,364,390.39
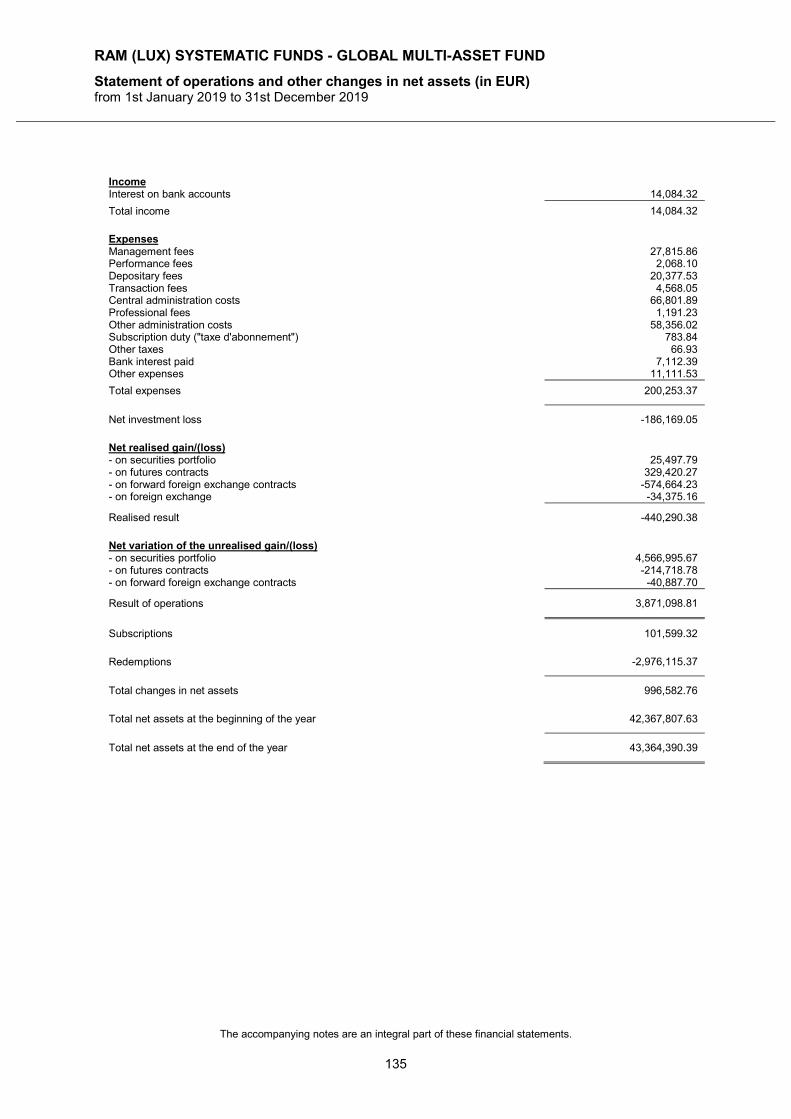
RAM (LUX) SYSTEMATIC FUNDS - GLOBAL MULTI-ASSET FUND
Statement of operations and other changes in net assets (in EUR) from 1st January 2019 to 31st December 2019
The accompanying notes are an integral part of these financial statements.
135
Income Interest on bank accounts 14,084.32
Total income 14,084.32
Expenses Management fees 27,815.86 Performance fees 2,068.10 Depositary fees 20,377.53 Transaction fees 4,568.05 Central administration costs 66,801.89 Professional fees 1,191.23 Other administration costs 58,356.02 Subscription duty ("taxe d'abonnement") 783.84 Other taxes 66.93 Bank interest paid 7,112.39 Other expenses 11,111.53
Total expenses 200,253.37
Net investment loss -186,169.05
Net realised gain/(loss) - on securities portfolio 25,497.79 - on futures contracts 329,420.27 - on forward foreign exchange contracts -574,664.23 - on foreign exchange -34,375.16
Realised result -440,290.38
Net variation of the unrealised gain/(loss) - on securities portfolio 4,566,995.67 - on futures contracts -214,718.78 - on forward foreign exchange contracts -40,887.70
Result of operations 3,871,098.81
Subscriptions 101,599.32
Redemptions -2,976,115.37
Total changes in net assets 996,582.76
Total net assets at the beginning of the year 42,367,807.63
Total net assets at the end of the year 43,364,390.39
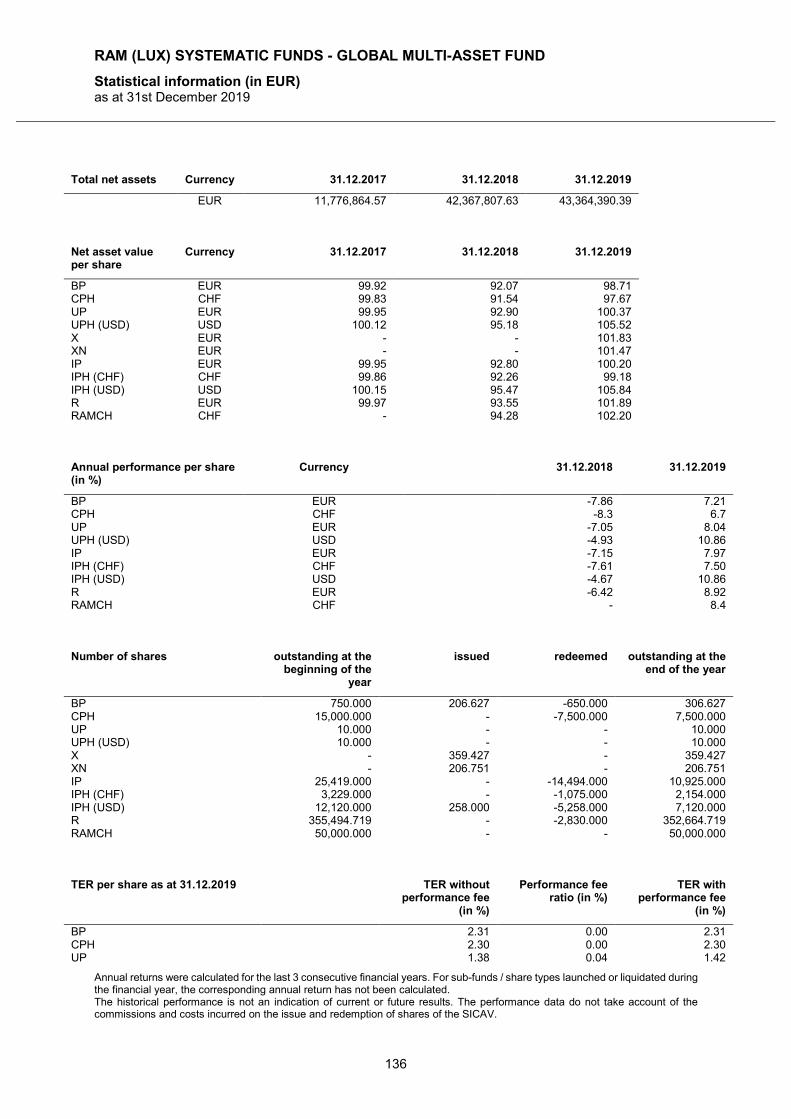
RAM (LUX) SYSTEMATIC FUNDS - GLOBAL MULTI-ASSET FUND
Statistical information (in EUR) as at 31st December 2019
Annual returns were calculated for the last 3 consecutive financial years. For sub-funds / share types launched or liquidated during the financial year, the corresponding annual return has not been calculated. The historical performance is not an indication of current or future results. The performance data do not take account of the commissions and costs incurred on the issue and redemption of shares of the SICAV.
136
Total net assets Currency 31.12.2017 31.12.2018 31.12.2019
EUR 11,776,864.57 42,367,807.63 43,364,390.39
Net asset value per share
Currency 31.12.2017 31.12.2018 31.12.2019
BP EUR 99.92 92.07 98.71 CPH CHF 99.83 91.54 97.67 UP EUR 99.95 92.90 100.37 UPH (USD) USD 100.12 95.18 105.52 X EUR - - 101.83 XN EUR - - 101.47 IP EUR 99.95 92.80 100.20 IPH (CHF) CHF 99.86 92.26 99.18 IPH (USD) USD 100.15 95.47 105.84 R EUR 99.97 93.55 101.89 RAMCH CHF - 94.28 102.20
Annual performance per share (in %)
Currency 31.12.2018 31.12.2019
BP EUR -7.86 7.21 CPH CHF -8.3 6.7 UP EUR -7.05 8.04 UPH (USD) USD -4.93 10.86 IP EUR -7.15 7.97 IPH (CHF) CHF -7.61 7.50 IPH (USD) USD -4.67 10.86 R EUR -6.42 8.92 RAMCH CHF - 8.4
Number of shares outstanding at the
beginning of the year
issued redeemed outstanding at the end of the year
BP 750.000 206.627 -650.000 306.627 CPH 15,000.000 - -7,500.000 7,500.000 UP 10.000 - - 10.000 UPH (USD) 10.000 - - 10.000 X - 359.427 - 359.427 XN - 206.751 - 206.751 IP 25,419.000 - -14,494.000 10,925.000 IPH (CHF) 3,229.000 - -1,075.000 2,154.000 IPH (USD) 12,120.000 258.000 -5,258.000 7,120.000 R 355,494.719 - -2,830.000 352,664.719 RAMCH 50,000.000 - - 50,000.000
TER per share as at 31.12.2019 TER without
performance fee (in %)
Performance fee ratio (in %)
TER with performance fee
(in %)
BP 2.31 0.00 2.31 CPH 2.30 0.00 2.30 UP 1.38 0.04 1.42
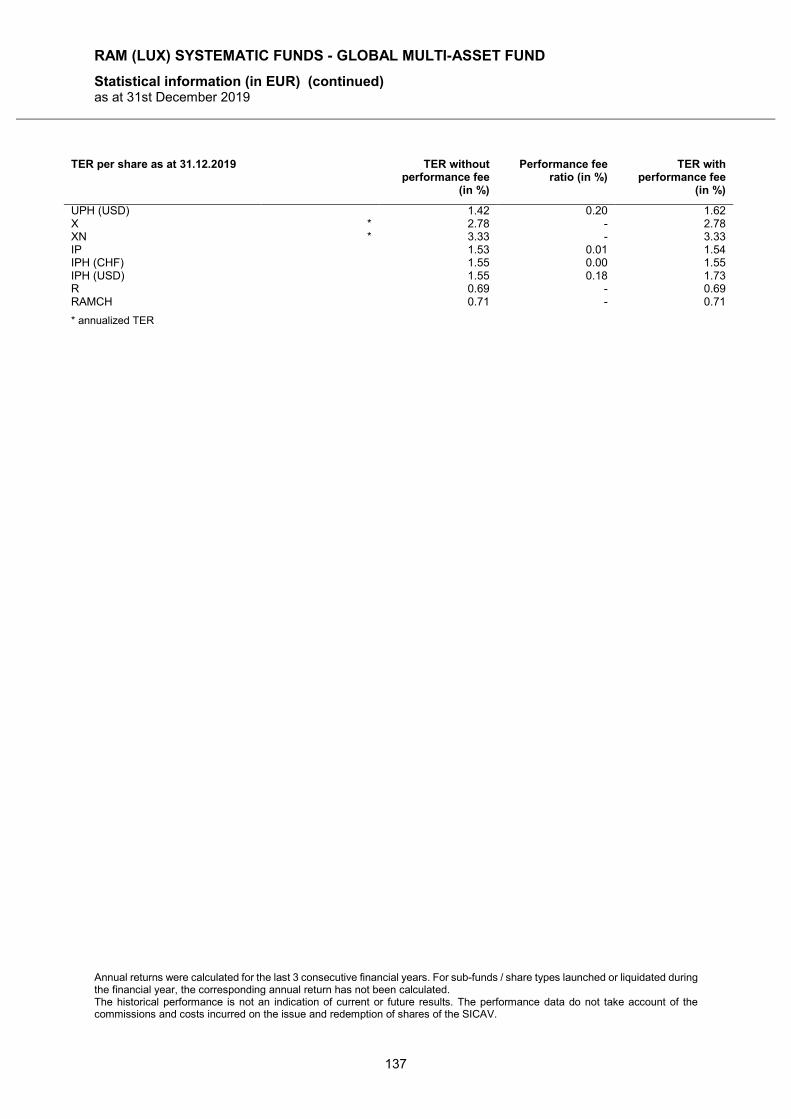
RAM (LUX) SYSTEMATIC FUNDS - GLOBAL MULTI-ASSET FUND
Statistical information (in EUR) (continued) as at 31st December 2019
Annual returns were calculated for the last 3 consecutive financial years. For sub-funds / share types launched or liquidated during the financial year, the corresponding annual return has not been calculated. The historical performance is not an indication of current or future results. The performance data do not take account of the commissions and costs incurred on the issue and redemption of shares of the SICAV.
137
TER per share as at 31.12.2019 TER without performance fee
(in %)
Performance fee ratio (in %)
TER with performance fee
(in %)
UPH (USD) 1.42 0.20 1.62 X * 2.78 - 2.78 XN * 3.33 - 3.33 IP 1.53 0.01 1.54 IPH (CHF) 1.55 0.00 1.55 IPH (USD) 1.55 0.18 1.73 R 0.69 - 0.69 RAMCH 0.71 - 0.71
* annualized TER
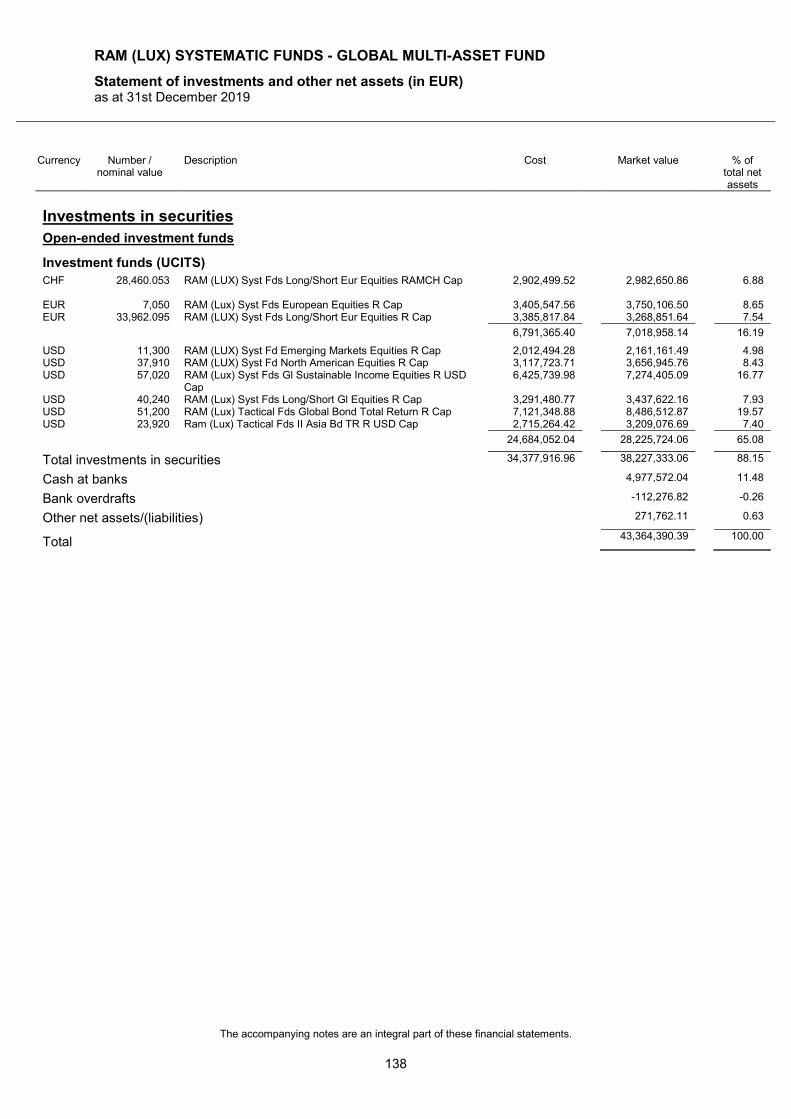
RAM (LUX) SYSTEMATIC FUNDS - GLOBAL MULTI-ASSET FUND
Statement of investments and other net assets (in EUR) as at 31st December 2019
The accompanying notes are an integral part of these financial statements.
138
Currency Number / nominal value
Description Cost Market value % of total net assets
Investments in securities
Open-ended investment funds
Investment funds (UCITS)
CHF 28,460.053 RAM (LUX) Syst Fds Long/Short Eur Equities RAMCH Cap 2,902,499.52 2,982,650.86 6.88 EUR 7,050 RAM (Lux) Syst Fds European Equities R Cap 3,405,547.56 3,750,106.50 8.65 EUR 33,962.095 RAM (LUX) Syst Fds Long/Short Eur Equities R Cap 3,385,817.84 3,268,851.64 7.54
6,791,365.40 7,018,958.14 16.19
USD 11,300 RAM (LUX) Syst Fd Emerging Markets Equities R Cap 2,012,494.28 2,161,161.49 4.98 USD 37,910 RAM (LUX) Syst Fd North American Equities R Cap 3,117,723.71 3,656,945.76 8.43 USD 57,020 RAM (Lux) Syst Fds Gl Sustainable Income Equities R USD
Cap 6,425,739.98 7,274,405.09 16.77
USD 40,240 RAM (Lux) Syst Fds Long/Short Gl Equities R Cap 3,291,480.77 3,437,622.16 7.93 USD 51,200 RAM (Lux) Tactical Fds Global Bond Total Return R Cap 7,121,348.88 8,486,512.87 19.57 USD 23,920 Ram (Lux) Tactical Fds II Asia Bd TR R USD Cap 2,715,264.42 3,209,076.69 7.40
24,684,052.04 28,225,724.06 65.08
Total investments in securities 34,377,916.96 38,227,333.06 88.15
Cash at banks 4,977,572.04 11.48
Bank overdrafts -112,276.82 -0.26
Other net assets/(liabilities) 271,762.11 0.63
Total 43,364,390.39 100.00
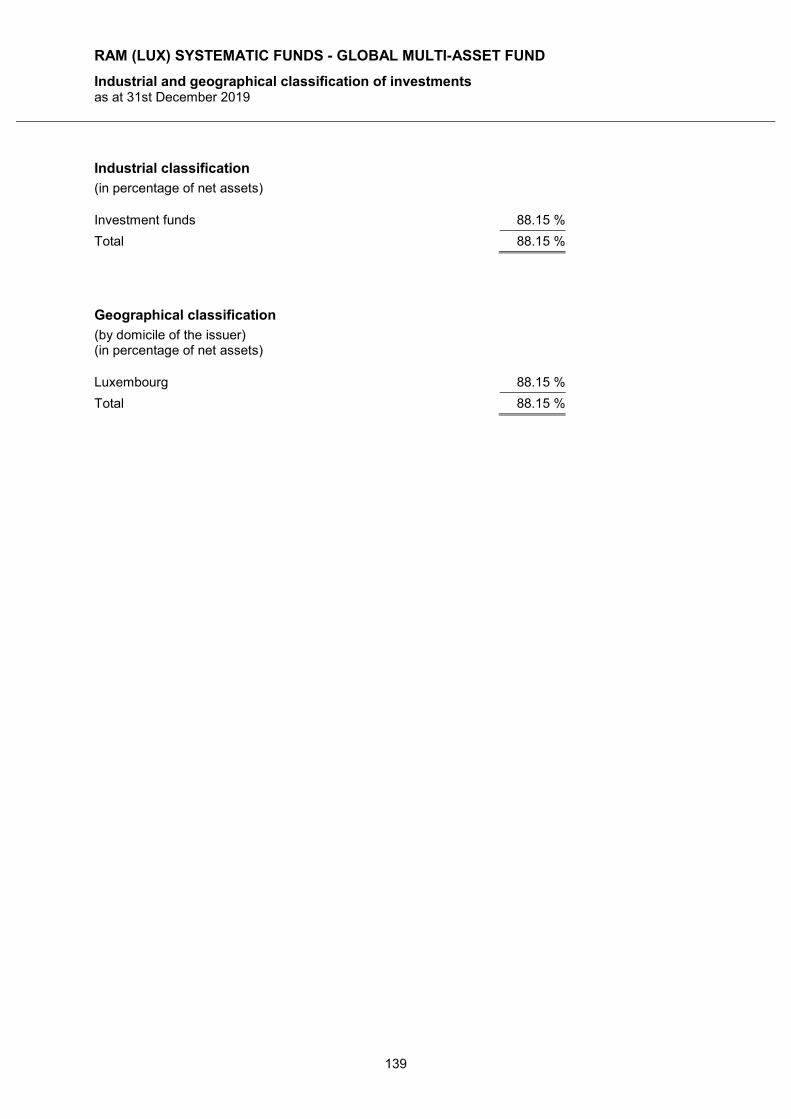
RAM (LUX) SYSTEMATIC FUNDS - GLOBAL MULTI-ASSET FUND
Industrial and geographical classification of investments as at 31st December 2019
139
Industrial classification
(in percentage of net assets)
Investment funds 88.15 %
Total 88.15 %
Geographical classification
(by domicile of the issuer) (in percentage of net assets)
Luxembourg 88.15 %
Total 88.15 %
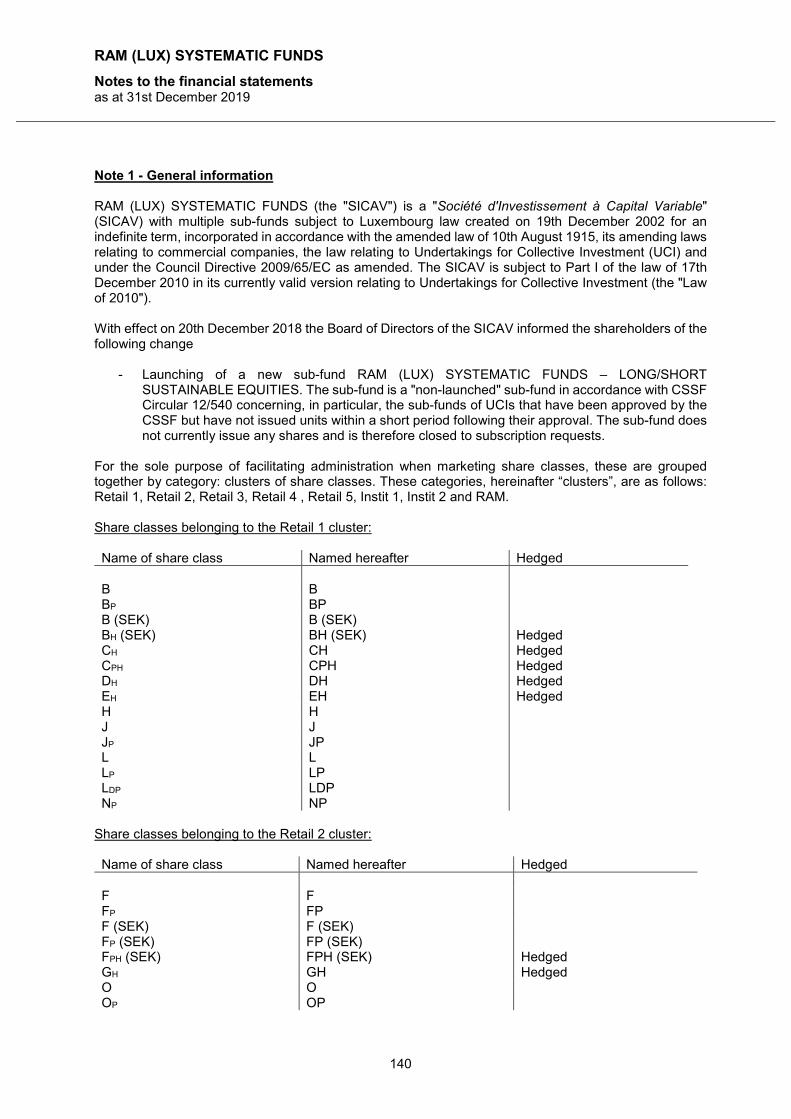
RAM (LUX) SYSTEMATIC FUNDS
Notes to the financial statements as at 31st December 2019
140
Note 1 - General information RAM (LUX) SYSTEMATIC FUNDS (the "SICAV") is a "Société d'Investissement à Capital Variable" (SICAV) with multiple sub-funds subject to Luxembourg law created on 19th December 2002 for an indefinite term, incorporated in accordance with the amended law of 10th August 1915, its amending laws relating to commercial companies, the law relating to Undertakings for Collective Investment (UCI) and under the Council Directive 2009/65/EC as amended. The SICAV is subject to Part I of the law of 17th December 2010 in its currently valid version relating to Undertakings for Collective Investment (the "Law of 2010"). With effect on 20th December 2018 the Board of Directors of the SICAV informed the shareholders of the following change
- Launching of a new sub-fund RAM (LUX) SYSTEMATIC FUNDS – LONG/SHORT SUSTAINABLE EQUITIES. The sub-fund is a "non-launched" sub-fund in accordance with CSSF Circular 12/540 concerning, in particular, the sub-funds of UCIs that have been approved by the CSSF but have not issued units within a short period following their approval. The sub-fund does not currently issue any shares and is therefore closed to subscription requests.
For the sole purpose of facilitating administration when marketing share classes, these are grouped together by category: clusters of share classes. These categories, hereinafter “clusters”, are as follows: Retail 1, Retail 2, Retail 3, Retail 4 , Retail 5, Instit 1, Instit 2 and RAM. Share classes belonging to the Retail 1 cluster: Name of share class Named hereafter Hedged B B BP BP B (SEK) B (SEK) BH (SEK) BH (SEK) Hedged CH CH Hedged CPH CPH Hedged DH DH Hedged EH EH Hedged H H J J JP JP L L LP LP LDP LDP NP NP
Share classes belonging to the Retail 2 cluster:
Name of share class Named hereafter Hedged F F FP FP F (SEK) F (SEK) FP (SEK) FP (SEK) FPH (SEK) FPH (SEK) Hedged GH GH Hedged O O OP OP
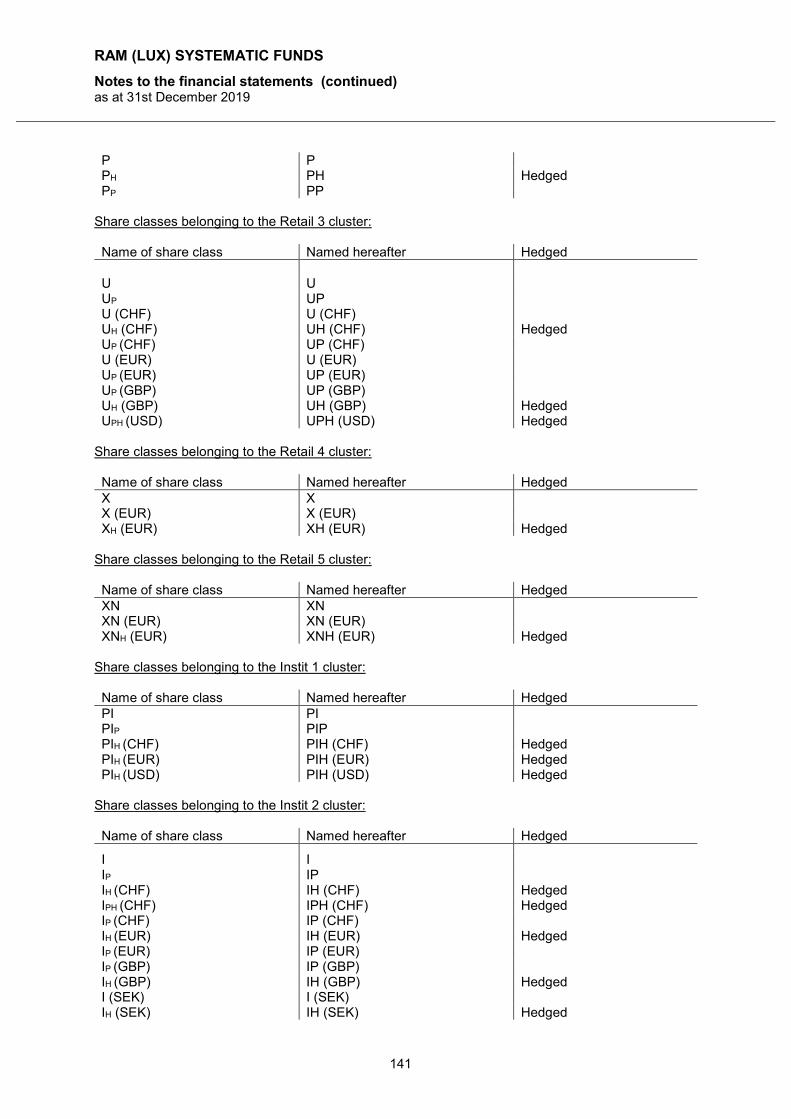
RAM (LUX) SYSTEMATIC FUNDS
Notes to the financial statements (continued) as at 31st December 2019
141
P P PH PH Hedged PP PP
Share classes belonging to the Retail 3 cluster:
Name of share class Named hereafter Hedged U U UP UP U (CHF) U (CHF) UH (CHF) UH (CHF) Hedged UP (CHF) UP (CHF) U (EUR) U (EUR) UP (EUR) UP (EUR) UP (GBP) UP (GBP) UH (GBP) UH (GBP) Hedged UPH (USD) UPH (USD) Hedged
Share classes belonging to the Retail 4 cluster:
Name of share class Named hereafter Hedged X X X (EUR) X (EUR)
XH (EUR) XH (EUR) Hedged
Share classes belonging to the Retail 5 cluster:
Name of share class Named hereafter Hedged XN XN XN (EUR) XN (EUR)
XNH (EUR) XNH (EUR) Hedged
Share classes belonging to the Instit 1 cluster: Name of share class Named hereafter Hedged PI PI PIP PIP PIH (CHF) PIH (CHF) Hedged PIH (EUR) PIH (EUR) Hedged PIH (USD) PIH (USD) Hedged
Share classes belonging to the Instit 2 cluster: Name of share class Named hereafter Hedged
I I IP IP IH (CHF) IH (CHF) Hedged IPH (CHF) IPH (CHF) Hedged IP (CHF) IP (CHF) IH (EUR) IH (EUR) Hedged IP (EUR) IP (EUR) IP (GBP) IP (GBP) IH (GBP) IH (GBP) Hedged I (SEK) I (SEK) IH (SEK) IH (SEK) Hedged
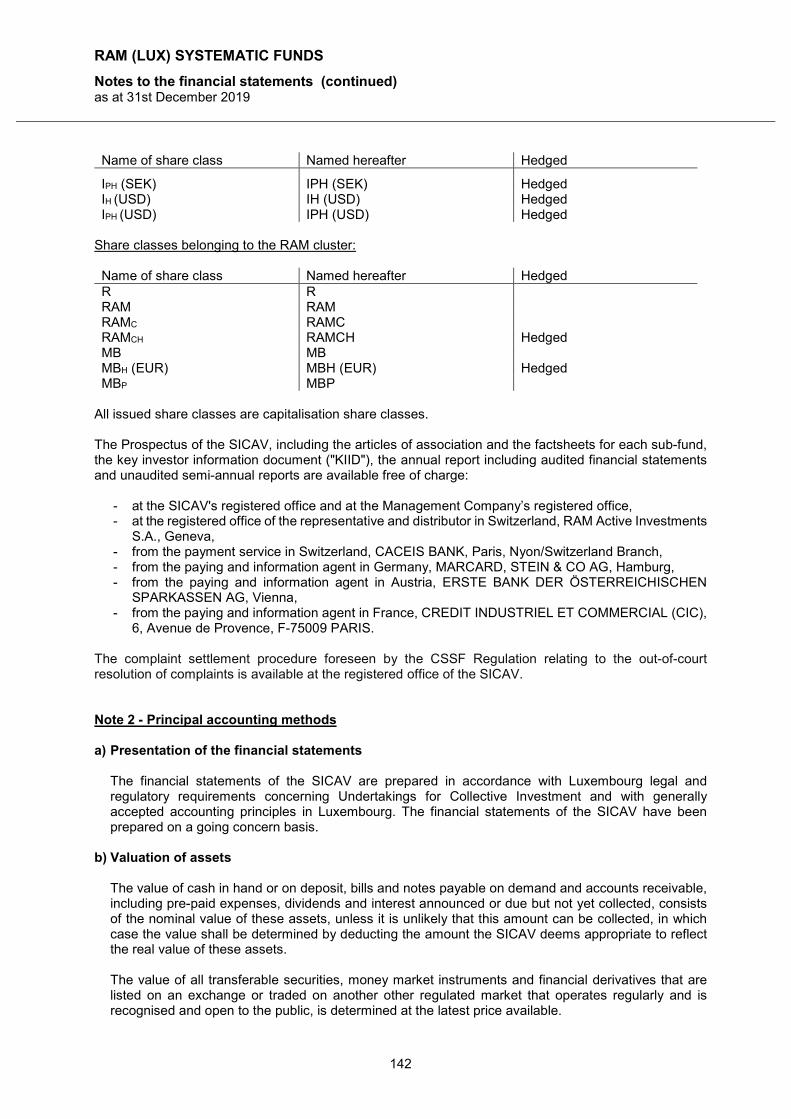
RAM (LUX) SYSTEMATIC FUNDS
Notes to the financial statements (continued) as at 31st December 2019
142
Name of share class Named hereafter Hedged
IPH (SEK) IPH (SEK) Hedged IH (USD) IH (USD) Hedged IPH (USD) IPH (USD) Hedged
Share classes belonging to the RAM cluster: Name of share class Named hereafter Hedged R R RAM RAM RAMC RAMC RAMCH RAMCH Hedged MB MB
MBH (EUR) MBH (EUR) Hedged MBP MBP
All issued share classes are capitalisation share classes. The Prospectus of the SICAV, including the articles of association and the factsheets for each sub-fund, the key investor information document ("KIID"), the annual report including audited financial statements and unaudited semi-annual reports are available free of charge:
- at the SICAV's registered office and at the Management Company’s registered office, - at the registered office of the representative and distributor in Switzerland, RAM Active Investments
S.A., Geneva, - from the payment service in Switzerland, CACEIS BANK, Paris, Nyon/Switzerland Branch, - from the paying and information agent in Germany, MARCARD, STEIN & CO AG, Hamburg, - from the paying and information agent in Austria, ERSTE BANK DER ÖSTERREICHISCHEN
SPARKASSEN AG, Vienna, - from the paying and information agent in France, CREDIT INDUSTRIEL ET COMMERCIAL (CIC),
6, Avenue de Provence, F-75009 PARIS. The complaint settlement procedure foreseen by the CSSF Regulation relating to the out-of-court resolution of complaints is available at the registered office of the SICAV. Note 2 - Principal accounting methods a) Presentation of the financial statements
The financial statements of the SICAV are prepared in accordance with Luxembourg legal and regulatory requirements concerning Undertakings for Collective Investment and with generally accepted accounting principles in Luxembourg. The financial statements of the SICAV have been prepared on a going concern basis.
b) Valuation of assets
The value of cash in hand or on deposit, bills and notes payable on demand and accounts receivable, including pre-paid expenses, dividends and interest announced or due but not yet collected, consists of the nominal value of these assets, unless it is unlikely that this amount can be collected, in which case the value shall be determined by deducting the amount the SICAV deems appropriate to reflect the real value of these assets.
The value of all transferable securities, money market instruments and financial derivatives that are listed on an exchange or traded on another other regulated market that operates regularly and is recognised and open to the public, is determined at the latest price available.
RAM (LUX) SYSTEMATIC FUNDS
Notes to the financial statements (continued) as at 31st December 2019
143
If company investments are listed on a stock exchange or traded on another regulated market that operates regularly and is recognised and open to the public and traded by market makers outside the stock market on which the investments are listed or the market on which they are traded, the Board of Directors may determine a principal market for the investments in question, which shall thereafter be valued at the last price available on this market.
Financial derivatives not listed on an official stock exchange or traded on any other regulated market that operates regularly and is recognised and open to the public are valued in accordance with market practice, as may be described in greater detail in the Prospectus.
Cash and money market instruments may be valued at their nominal value plus interest, or on the basis of the amortised cost method. Where practical, all other assets may be valued on the same basis.
The value of units representing any open-ended undertakings for collective investment is determined using the last official Net Asset Value (‟NAV‟) per unit or the last Net Asset Value estimate if this value is more recent than official Net Asset Value, provided that the Company is guaranteed that the valuation method used for this estimate is consistent with that used for the calculation of the official Net Asset Value.
In the case of:
- transferable securities, money market instruments and/or financial derivatives in the portfolio on the valuation day not listed or traded on a stock exchange or on another regulated market that operates regularly and is recognised and open to the public, or - transferable securities, money market instruments and/or financial derivatives listed and traded on a stock exchange or other such market whose prices determined do not, in the opinion of the Board of Directors, reflect the true value of these transferable securities, money market instruments and/or financial derivatives, or - financial derivatives traded over the counter and/or securities that represent undertakings for collective investment whose prices determined do not, in the opinion of the Board of Directors, reflect the true value of the financial derivatives or securities that represent undertakings for collective investment, the Board of Directors estimate their probable market value prudently and in good faith.
c) Acquisition cost of securities in the portfolio
The acquisition cost of the securities held by each sub-fund that are denominated in currencies other than the reference currency of the sub-fund is converted into this currency at the exchange rate prevailing on the date of purchase.
d) Net realised gain/(loss) on securities portfolio
The realised gains and losses on securities portfolio are calculated on the basis of the average acquisition cost and are disclosed net in the statement of operations and other changes in net assets.
e) Investment income
Dividend income is disclosed at the ex-date, net of any withholding tax.
Interest income accrued is recorded, net of any withholding tax.
RAM (LUX) SYSTEMATIC FUNDS
Notes to the financial statements (continued) as at 31st December 2019
144
f) Valuation of forward foreign exchange contracts
Forward foreign exchange contracts are valued at forward market rates for the remaining period from valuation date to the maturity of the contracts. Net unrealised gains or losses are disclosed in the statement of net assets. Net variation of unrealised gains and losses and net realised gains and losses are disclosed in the statement of operations and other changes in net assets.
g) Valuation of futures contracts
Open futures contracts are valued at the last settlement or close price on the stock exchanges or regulated markets. Unrealised gains or losses of open contracts are disclosed in the statement of net assets. Net variation of the unrealised gains or losses and net realised gains or losses are disclosed in the statement of operations and other changes in net assets.
h) Valuation of swaps contracts
Swaps contracts are registered on the off-balance sheet and valued on the basis of the recalculated market prices by using the traditional elements of pricing, considering the value, the volatility of the underlying, the interest rates and the residual value of the swap. Unrealised gains or losses are disclosed in the statement of net assets. Net variation of the unrealised gains or losses and net realised gains or losses are disclosed in the statement of operations and other changes in net assets.
i) Formation expenses
Formation expenses are amortised on a straight line basis over a period of five years. If the launch of a sub-fund occurs after the launch date of the SICAV, the formation expenses related to the launch of the new sub-fund is charged to such sub-fund alone and may be amortised over a maximum of five years with effect as from the sub-fund’s launch date.
j) Conversion of foreign currencies
Cash at banks, other net assets and liabilities and the market value of the securities in portfolio expressed in currencies other than the reference currency of the sub-fund are converted into this currency at the exchange rate prevailing on the date of the financial statements. Income and expenses expressed in currencies other than the reference currency of the sub-fund are converted into this currency at the exchange rate prevailing on the date of the transaction. Net realised gains or losses on foreign exchange are disclosed in the statement of operations and other changes in net assets.
k) Other liquid assets
The item "Other liquid assets" in the statement of net assets is mainly composed of treasury accounts held by the counterparties of the financial instruments and derivatives.
l) Bank overdrafts and other liquid liabilities
The caption "Bank overdrafts" disclosed in the statement of net assets is mainly composed of debt treasury accounts held by the banks. The caption "Other liquid liabilities" disclosed in the statement of net assets is mainly composed of debt treasury accounts held by the counterparties of the financial instruments and derivatives.
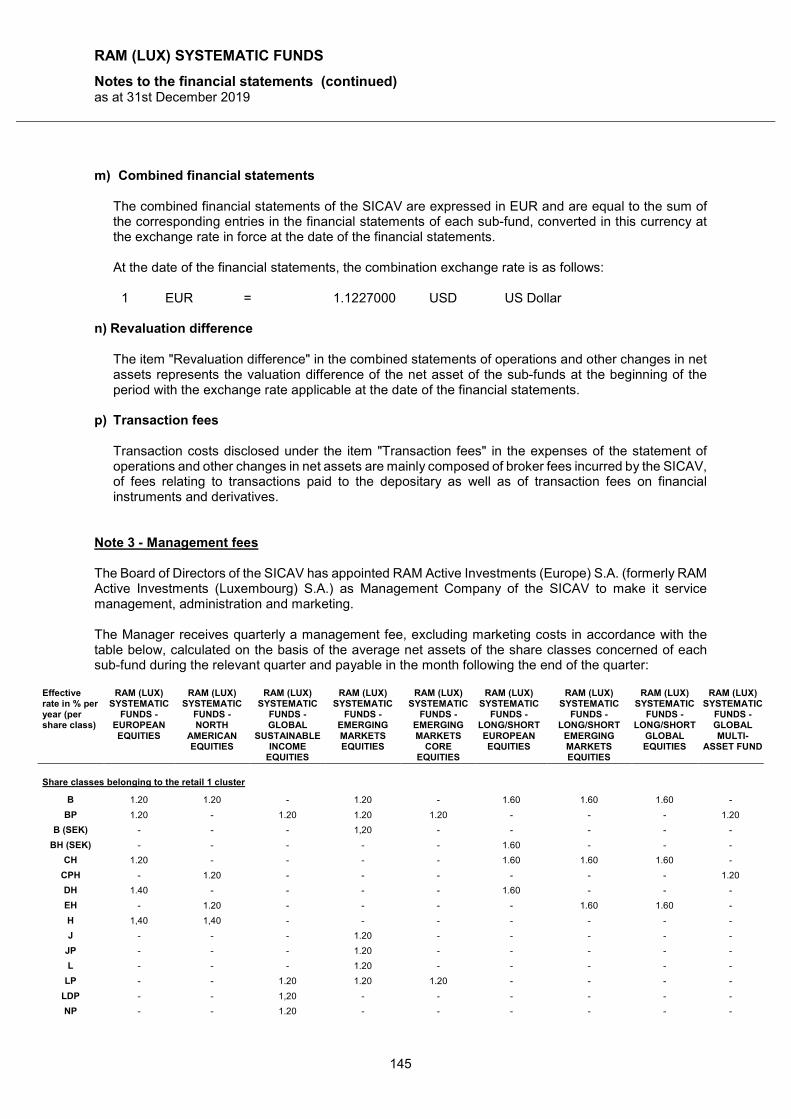
RAM (LUX) SYSTEMATIC FUNDS
Notes to the financial statements (continued) as at 31st December 2019
145
m) Combined financial statements
The combined financial statements of the SICAV are expressed in EUR and are equal to the sum of the corresponding entries in the financial statements of each sub-fund, converted in this currency at the exchange rate in force at the date of the financial statements.
At the date of the financial statements, the combination exchange rate is as follows:
1 EUR = 1.1227000 USD US Dollar
n) Revaluation difference
The item ʺRevaluation differenceʺ in the combined statements of operations and other changes in net assets represents the valuation difference of the net asset of the sub-funds at the beginning of the period with the exchange rate applicable at the date of the financial statements.
p) Transaction fees
Transaction costs disclosed under the item "Transaction fees" in the expenses of the statement of operations and other changes in net assets are mainly composed of broker fees incurred by the SICAV, of fees relating to transactions paid to the depositary as well as of transaction fees on financial instruments and derivatives.
Note 3 - Management fees The Board of Directors of the SICAV has appointed RAM Active Investments (Europe) S.A. (formerly RAM Active Investments (Luxembourg) S.A.) as Management Company of the SICAV to make it service management, administration and marketing. The Manager receives quarterly a management fee, excluding marketing costs in accordance with the table below, calculated on the basis of the average net assets of the share classes concerned of each sub-fund during the relevant quarter and payable in the month following the end of the quarter:
Effective rate in % per year (per share class)
RAM (LUX) SYSTEMATIC
FUNDS - EUROPEAN EQUITIES
RAM (LUX) SYSTEMATIC
FUNDS - NORTH
AMERICAN EQUITIES
RAM (LUX) SYSTEMATIC
FUNDS - GLOBAL
SUSTAINABLE INCOME
EQUITIES
RAM (LUX) SYSTEMATIC
FUNDS - EMERGING MARKETS EQUITIES
RAM (LUX) SYSTEMATIC
FUNDS - EMERGING MARKETS
CORE EQUITIES
RAM (LUX) SYSTEMATIC
FUNDS - LONG/SHORT EUROPEAN EQUITIES
RAM (LUX) SYSTEMATIC
FUNDS - LONG/SHORT
EMERGING MARKETS EQUITIES
RAM (LUX) SYSTEMATIC
FUNDS - LONG/SHORT
GLOBAL EQUITIES
RAM (LUX) SYSTEMATIC
FUNDS - GLOBAL MULTI-
ASSET FUND
Share classes belonging to the retail 1 cluster
B 1.20 1.20 - 1.20 - 1.60 1.60 1.60 -
BP 1.20 - 1.20 1.20 1.20 - - - 1.20
B (SEK) - - - 1,20 - - - - -
BH (SEK) - - - - - 1.60 - - -
CH 1.20 - - - - 1.60 1.60 1.60 -
CPH - 1.20 - - - - - - 1.20
DH 1.40 - - - - 1.60 - - -
EH - 1.20 - - - - 1.60 1.60 -
H 1,40 1,40 - - - - - - -
J - - - 1.20 - - - - -
JP - - - 1.20 - - - - -
L - - - 1.20 - - - - -
LP - - 1.20 1.20 1.20 - - - -
LDP - - 1,20 - - - - - -
NP - - 1.20 - - - - - -
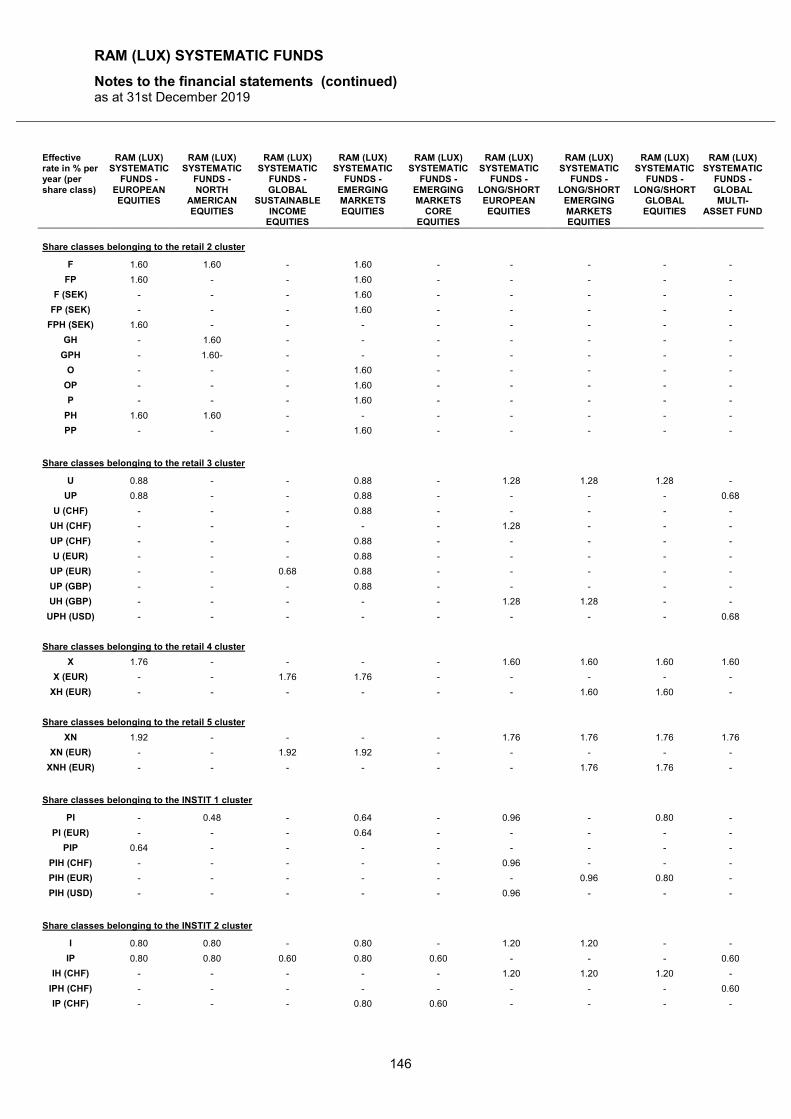
RAM (LUX) SYSTEMATIC FUNDS
Notes to the financial statements (continued) as at 31st December 2019
146
Effective rate in % per year (per share class)
RAM (LUX) SYSTEMATIC
FUNDS - EUROPEAN EQUITIES
RAM (LUX) SYSTEMATIC
FUNDS - NORTH
AMERICAN EQUITIES
RAM (LUX) SYSTEMATIC
FUNDS - GLOBAL
SUSTAINABLE INCOME
EQUITIES
RAM (LUX) SYSTEMATIC
FUNDS - EMERGING MARKETS EQUITIES
RAM (LUX) SYSTEMATIC
FUNDS - EMERGING MARKETS
CORE EQUITIES
RAM (LUX) SYSTEMATIC
FUNDS - LONG/SHORT EUROPEAN EQUITIES
RAM (LUX) SYSTEMATIC
FUNDS - LONG/SHORT
EMERGING MARKETS EQUITIES
RAM (LUX) SYSTEMATIC
FUNDS - LONG/SHORT
GLOBAL EQUITIES
RAM (LUX) SYSTEMATIC
FUNDS - GLOBAL MULTI-
ASSET FUND
Share classes belonging to the retail 2 cluster
F 1.60 1.60 - 1.60 - - - - -
FP 1.60 - - 1.60 - - - - -
F (SEK) - - - 1.60 - - - - -
FP (SEK) - - - 1.60 - - - - -
FPH (SEK) 1.60 - - - - - - - -
GH - 1.60 - - - - - - -
GPH - 1.60- - - - - - - -
O - - - 1.60 - - - - -
OP - - - 1.60 - - - - -
P - - - 1.60 - - - - -
PH 1.60 1.60 - - - - - - -
PP - - - 1.60 - - - - -
Share classes belonging to the retail 3 cluster
U 0.88 - - 0.88 - 1.28 1.28 1.28 -
UP 0.88 - - 0.88 - - - - 0.68
U (CHF) - - - 0.88 - - - - -
UH (CHF) - - - - - 1.28 - - -
UP (CHF) - - - 0.88 - - - - -
U (EUR) - - - 0.88 - - - - -
UP (EUR) - - 0.68 0.88 - - - - -
UP (GBP) - - - 0.88 - - - - -
UH (GBP) - - - - - 1.28 1.28 - -
UPH (USD) - - - - - - - - 0.68
Share classes belonging to the retail 4 cluster
X 1.76 - - - - 1.60 1.60 1.60 1.60
X (EUR) - - 1.76 1.76 - - - - -
XH (EUR) - - - - - - 1.60 1.60 -
Share classes belonging to the retail 5 cluster
XN 1.92 - - - - 1.76 1.76 1.76 1.76
XN (EUR) - - 1.92 1.92 - - - - -
XNH (EUR) - - - - - - 1.76 1.76 -
Share classes belonging to the INSTIT 1 cluster
PI - 0.48 - 0.64 - 0.96 - 0.80 -
PI (EUR) - - - 0.64 - - - - -
PIP 0.64 - - - - - - - -
PIH (CHF) - - - - - 0.96 - - -
PIH (EUR) - - - - - - 0.96 0.80 -
PIH (USD) - - - - - 0.96 - - -
Share classes belonging to the INSTIT 2 cluster
I 0.80 0.80 - 0.80 - 1.20 1.20 - -
IP 0.80 0.80 0.60 0.80 0.60 - - - 0.60
IH (CHF) - - - - - 1.20 1.20 1.20 -
IPH (CHF) - - - - - - - - 0.60
IP (CHF) - - - 0.80 0.60 - - - -
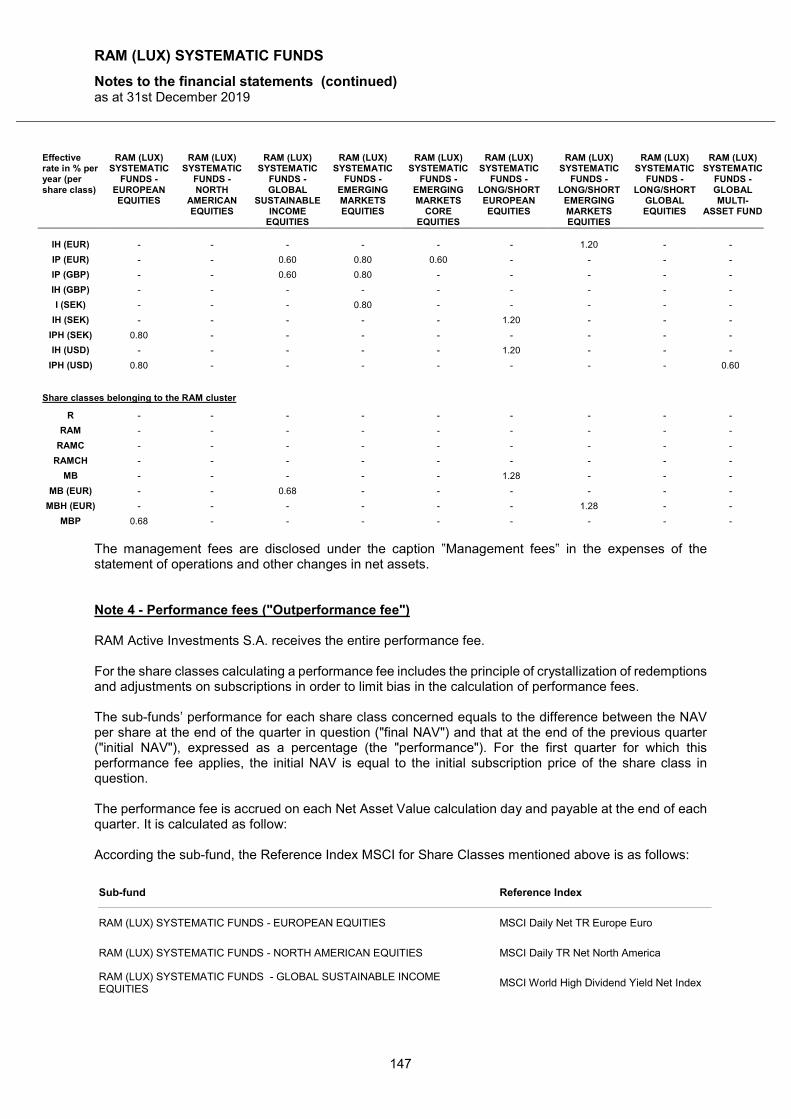
RAM (LUX) SYSTEMATIC FUNDS
Notes to the financial statements (continued) as at 31st December 2019
147
Effective rate in % per year (per share class)
RAM (LUX) SYSTEMATIC
FUNDS - EUROPEAN EQUITIES
RAM (LUX) SYSTEMATIC
FUNDS - NORTH
AMERICAN EQUITIES
RAM (LUX) SYSTEMATIC
FUNDS - GLOBAL
SUSTAINABLE INCOME
EQUITIES
RAM (LUX) SYSTEMATIC
FUNDS - EMERGING MARKETS EQUITIES
RAM (LUX) SYSTEMATIC
FUNDS - EMERGING MARKETS
CORE EQUITIES
RAM (LUX) SYSTEMATIC
FUNDS - LONG/SHORT EUROPEAN EQUITIES
RAM (LUX) SYSTEMATIC
FUNDS - LONG/SHORT
EMERGING MARKETS EQUITIES
RAM (LUX) SYSTEMATIC
FUNDS - LONG/SHORT
GLOBAL EQUITIES
RAM (LUX) SYSTEMATIC
FUNDS - GLOBAL MULTI-
ASSET FUND
IH (EUR) - - - - - - 1.20 - -
IP (EUR) - - 0.60 0.80 0.60 - - - -
IP (GBP) - - 0.60 0.80 - - - - -
IH (GBP) - - - - - - - - -
I (SEK) - - - 0.80 - - - - -
IH (SEK) - - - - - 1.20 - - -
IPH (SEK) 0.80 - - - - - - - -
IH (USD) - - - - - 1.20 - - -
IPH (USD) 0.80 - - - - - - - 0.60
Share classes belonging to the RAM cluster
R - - - - - - - - -
RAM - - - - - - - - -
RAMC - - - - - - - - -
RAMCH - - - - - - - - -
MB - - - - - 1.28 - - -
MB (EUR) - - 0.68 - - - - - -
MBH (EUR) - - - - - - 1.28 - -
MBP 0.68 - - - - - - - -
The management fees are disclosed under the caption ‟Management fees‟ in the expenses of the statement of operations and other changes in net assets. Note 4 - Performance fees ("Outperformance fee") RAM Active Investments S.A. receives the entire performance fee. For the share classes calculating a performance fee includes the principle of crystallization of redemptions and adjustments on subscriptions in order to limit bias in the calculation of performance fees. The sub-funds’ performance for each share class concerned equals to the difference between the NAV per share at the end of the quarter in question ("final NAV") and that at the end of the previous quarter ("initial NAV"), expressed as a percentage (the "performance"). For the first quarter for which this performance fee applies, the initial NAV is equal to the initial subscription price of the share class in question. The performance fee is accrued on each Net Asset Value calculation day and payable at the end of each quarter. It is calculated as follow: According the sub-fund, the Reference Index MSCI for Share Classes mentioned above is as follows:
Sub-fund Reference Index
RAM (LUX) SYSTEMATIC FUNDS - EUROPEAN EQUITIES MSCI Daily Net TR Europe Euro
RAM (LUX) SYSTEMATIC FUNDS - NORTH AMERICAN EQUITIES MSCI Daily TR Net North America
RAM (LUX) SYSTEMATIC FUNDS - GLOBAL SUSTAINABLE INCOME EQUITIES
MSCI World High Dividend Yield Net Index
RAM (LUX) SYSTEMATIC FUNDS
Notes to the financial statements (continued) as at 31st December 2019
148
Sub-fund Reference Index
RAM (LUX) SYSTEMATIC FUNDS - EMERGING MARKETS EQUITIES MSCI Daily TR Net Emerging Markets
RAM (LUX) SYSTEMATIC FUNDS - EMERGING MARKETS CORE EQUITIES MSCI Daily TR Net Emerging Markets
RAM (LUX) SYSTEMATIC FUNDS - EUROPEAN EQUITIES For the B, CH, DH, H, F, PH, I and U share classes: For each quarter in which the performance of the sub-fund exceeds the hurdle rate (minimum rate of return required) calculated pro rate temporis (the ‟outperformance‟), a fee of 15% of the outperformance is payable only if (1) the performance exceeds the hurdle rate calculated pro rata temporis and (2) the final NAV per share is greater than highest historic final NAV per share (the high watermark principal), in this case, the performance fee is paid on the difference between the final NAV per share and the high watermark. For the BP, FP, FPH (SEK), IP, IPH (SEK), IPH (USD) and UP share classes: For each quarter in which the performance of the share class exceeds the performance of the Reference Index, the MSCI offsetting any currency effect relative to the currency of the share class concerned, expressed as a performance fee is deducted is only payable if (1) the performance of the share class exceeds the performance of the Reference Index over the quarter and (2) the outperformance of the class over the quarter is higher than the highest quarterly outperformance (‟High Water Mark‟ principle). As such, in the event of a negative performance which nonetheless outperforms the reference index, a performance fee shall be due. For the MBP and PIP share classes: For each quarter in which the performance of the share class exceeds the performance of the Reference Index, the MSCI, offsetting any currency effect relative to the currency of the share class concerned, expressed as a percentage (the ‟outperformance‟, a fee of 10% of the outperformance calculated on the net assets the day before the performance fee is deducted is only payable if (1) the performance of the share class exceeds the performance of the Reference Index over the quarter and (2) the outperformance of the class over the quarter is higher than the higher historic quarterly outperformance (‟High Water Mark‟ principle). As such, in the event of a negative performance which nonetheless outperforms the reference index, a performance fee shall be due. Since 1st March 2019 the performance fee for the PIP share class does not apply (see note 15). For the X, XN, R, RAM and RAMCH share classes no performance fee is applied. RAM (LUX) SYSTEMATIC FUNDS - NORTH AMERICAN EQUITIES For the B, EH, H, GH, F and I share classes: For each quarter in which the performance of the sub-fund exceeds the hurdle (the minimum rate of return required) calculated pro rate temporis (the ‟outperformance‟), a fee of 10% of the outperformance is payable only if (1) the performance exceeds the hurdle rate calculated pro rate temporis and (2) the final NAV per share is greater than the highest historic final NAV per share (the high watermark principle); in this case, the performance fee is paid on the difference between the final NAV per share and the high watermark.
RAM (LUX) SYSTEMATIC FUNDS
Notes to the financial statements (continued) as at 31st December 2019
149
For the CPH, GPH, IP and PH share classes: For each quarter in which the performance of the share class exceeds the performance of the Reference Index, the MSCI, offsetting any currency effect relative to the currency of the share class concerned, expressed as a percentage (the ‟outperformance‟), a fee of 10% of the outperformance calculated on the net assets the day before the performance fee is deducted is only payable if (1) the performance of the share class exceeds the performance of the Reference Index over the quarter and (2) the outperformance of the class over the quarter is higher than the highest historic quarterly outperformance (‟High Water Mark‟ principle). As such, in the event of a negative performance which nonetheless outperforms the reference index, a performance fee shall be due. For the PI, R, RAM and RAMCH share classes no performance fee is applied. RAM (LUX) SYSTEMATIC GLOBAL SUSTAINABLE INCOME EQUITIES For the BP, LP, LDP, NP, IP, IP (EUR), IP (GBP) and UP (EUR) share classes: For each quarter in which the performance of the share class exceeds the performance of the MSCI, offsetting any currency effect relative to the currency of the share class concerned, expressed as a percentage (the ‟outperformance‟), a fee of 10% of the outperformance calculated on the net assets the day before the performance fee is deducted is only payable if (1) the performance of the share class exceeds the performance of the Reference Index over the quarter and (2) the outperformance of the class over the quarter is higher than the highest historic quarterly outperformance (‟High Water Mark‟ principle). As such, in the event of a negative performance which nonetheless outperforms the reference index, a performance fee shall be due. For the X (EUR), XN (EUR), MB (EUR), R et RAMC share classes no performance fee is applied. RAM (LUX) SYSTEMATIC - EMERGING MARKETS EQUITIES For the B, B (SEK), J, L, F, F (SEK), O, P, I, I (SEK), U, U (CHF) and U (EUR) share classes: For each quarter in which the performance of the sub-fund exceeds the minimum return rate (‟hurdle rate‟), a fee of 15% of the outperformance is only payable if (1) the performance exceeds the hurdle rate calculated pro rata temporis and (2) the final NAV per share is greater than the highest historic final NAV per share (the high watermark principle); in this case, the performance fee is paid on the difference between the final NAV per share and the high watermark. For the BP, JP, LP, FP, FP (SEK), OP, PP, IP, IP (CHF), IP (EUR), IP (GBP), PI (formerly PIP), PI (EUR), UP, UP (CHF), UP (EUR) and UP (GBP) share classes: For each quarter in which the performance of the share class exceeds the performance of the Reference Index, the MSCI, offsetting any currency effect relative to the currency of the share class concerned expressed as a performance (the ‟outperformance‟), a fee of 15% of the outperformance calculated on the net assets the day before the performance fee is deducted is only payable if (1) the performance exceeds the hurdle rate calculated pro rata temporis and (2) the final NAV per share (the high watermark principle); in this case, the performance fee is paid on the difference between the final NAV per share and the high watermark. As such, in the event of a negative performance which nonetheless outperforms the reference index, a performance fee shall be due. With effect on 26th August 2019, the performance fee for the PI (formerly PIP) share classes has been waived. The performance fee for the PI (formerly PIP) share classes was suspended since 1st March 2019 (see note 15). For the X (EUR), XN (EUR), R, RAM and RAMC share classes no performance fee is applied.
RAM (LUX) SYSTEMATIC FUNDS
Notes to the financial statements (continued) as at 31st December 2019
150
RAM (LUX) SYSTEMATIC - EMERGING MARKETS CORE EQUITIES For the BP, IP (CHF), IP (EUR), IP and LP share classes: For each quarter in which the performance of the share class exceeds the performance of the Reference Index, the MSCI, offsetting any currency effect relative to the currency of the share class concerned expressed as a performance (the ‟outperformance‟), a fee of 10% of the outperformance calculated on the net assets the day before the performance fee is deducted is only payable if (1) the performance of the share class exceeds the performance of the Reference Index over the quarter and (2) the outperformance of the class over the quarter is higher than the highest historic quarterly outperformance (‟High Water Mark‟ principle). As such, in the event of a negative performance which nonetheless outperforms the reference index, a performance fee shall be due. For the R share class no performance fee is applied. RAM (LUX) SYSTEMATIC FUNDS - LONG/SHORT EUROPEAN EQUITIES For the B, CH, DH, BH (SEK), I, IH (CHF), IH (SEK), IH (USD), MB, U, UH (CHF) and UH (GBP) share classes: For each quarter in which the performance of the sub-fund is positive, a fee of 20% of the performance achieved is payable If (1) the performance is positive over the quarter and (2) the final NAV is higher than the NAV when the last performance fee was due (the ‟High Water Mark‟). For the X, XN, PI, PIH (CHF) and PIH (USD) share classes: For each quarter in which the performance of the sub-fund is positive, a fee of 15% of the performance achieved is payable if (1) the performance is positive over the quarter and (2) the final NAV is higher than the NAV when the last performance fee was due (the ‟High Water Mark‟). For the R, RAM and RAMCH share classes no performance fee is applied. RAM (LUX) SYSTEMATIC FUNDS - LONG/SHORT EMERGING MARKETS EQUITIES For the B, CH, EH, I, IH (CHF), IH (EUR), MBH (EUR), U and UH (GBP) share classes: For each quarter in which the performance of the sub-fund is positive, a fee of 20% of the performance achieved is payable if (1) the performance is positive over the quarter and (2) the final NAV is higher than the NAV when the last performance fee was due (the ‟High Water Mark‟). For the X, XH (EUR), XN, XNH (EUR) and PIH (EUR) share class: For each quarter in which the performance of the sub-fund is positive, a fee of 15% of the performance achieved is payable if (1) the performance is positive over the quarter and (2) the final NAV is higher than the NAV when the last performance fee was due (the ‟High Water Mark‟). For the RAM and RAMCH share classes no performance fee is applied. RAM (LUX) SYSTEMATIC FUNDS - LONG/SHORT GLOBAL EQUITIES For the B, CH, EH, X, XH (EUR), XN, XNH (EUR), U, PI, PIH (EUR) and IH (CHF) share classes: For each quarter in which the performance of the sub-fund is positive, a fee of 15% of the performance achieved is payable if (1) the performance is positive over the quarter and (2) the final NAV is higher than the NAV when the last performance fee was due (the ‟High Water Mark‟). For the R, RAM and RAMCH share classes no performance fee is applied.
RAM (LUX) SYSTEMATIC FUNDS
Notes to the financial statements (continued) as at 31st December 2019
151
RAM (LUX) SYSTEMATIC FUNDS - GLOBAL MULTI-ASSET FUND For the BP, CPH, UP, UPH (USD), IP, IPH (CHF) and IPH (USD) share classes: For each quarter, calculated as follow:
- in EUR is 3% (p.a.) higher than the 3-month interbank rate in EUR, - in USD is 3% (p.a.) higher than the 3-month interbank rate in USD, - in CHF is 3% (p.a.) higher than the 3-month interbank rate in CHF, - in GBP is 3% (p.a.) higher than the 3-month interbank rate in GBP, - in SEK is 3% (p.a.) higher than the 3-month interbank rate in SEK
(hereinafter the ‟interbank rates plus 3% p.a.‟), expressed as a percentage (the ‟Outperformance‟), a fee of 10% of the outperformance calculated on the net assets the day before the performance fee is deducted is payable if (1) the performance of the share class exceeds the interbank rate plus 3% (p.a.) over the quarter, (2) the performance of the share class is positive and (3) the Outperformance of the class over the quarter is higher than the highest quarterly outperformance (‟High Water Mark‟ principle). For the X, XN, R and RAMCH share classes no performance fee is applied. At the date of the financial statements, a performance fee was recorded for the following sub-funds:
Sub-fund Currenc
y Amount
RAM (LUX) SYSTEMATIC FUNDS - EUROPEAN EQUITIES EUR 1,685,120.75
RAM (LUX) SYSTEMATIC FUNDS - NORTH AMERICAN EQUITIES USD 69,973.43
RAM (LUX) SYSTEMATIC FUNDS - GLOBAL SUSTAINABLE INCOME EQUITIES USD 0
RAM (LUX) SYSTEMATIC FUNDS - EMERGING MARKETS EQUITIES USD 273,238.06
RAM (LUX) SYSTEMATIC FUNDS - EMERGING MARKETS CORE EQUITIES USD 0
RAM (LUX) SYSTEMATIC FUNDS - LONG/SHORT EUROPEAN EQUITIES EUR 132.01
RAM (LUX) SYSTEMATIC FUNDS - LONG/SHORT EMERGING MARKETS EQUITIES USD 1,083.97
RAM (LUX) SYSTEMATIC FUNDS - LONG/SHORT GLOBAL EQUITIES USD 0
RAM (LUX) SYSTEMATIC FUNDS - GLOBAL MULTI-ASSET FUND EUR 2,068.10
Note 5 - Central Administration costs The item ‟Central Administration costs‟ disclosed in the statement of operations and other changes in net assets mainly composed of administration agent and domiciliation commissions. Note 6 - Other administration costs The caption ʺOther administration costsʺ disclosed in the statement of operations and other changes in net assets is mainly composed by commissions on administrative intervention, marketing fees, KIID fees, FUNDSQUARE fees and NAV publication fees. Note 7 - Subscription, redemption and conversion fees The shares are issued at the Net Asset Value, plus the following entry fee, which shall be paid to the Distribution Agents: For all share classes, except retail 4 cluster and retail 5 cluster, the entry fee is a maximum of 2% of the subscribed amount.
RAM (LUX) SYSTEMATIC FUNDS
Notes to the financial statements (continued) as at 31st December 2019
152
For the share class retail 4 cluster, the entrance fee is a maximum of 3% of the subscribed amount. For the share class retail 5 cluster, no entry fee is charged. No exit fee shall be levied for redeeming shares. Switches between sub-funds is carried out on each "Valuation Day" by converting shares from one sub-fund into shares of another sub-fund. No specific conversion fee shall be charged for share conversions. Note 8 - Subscription duty ("taxe d’abonnement") The SICAV is governed by Luxembourg laws. Pursuant to the legislation and regulations in force, the SICAV is subject to an annual subscription duty ("taxe d’abonnement") of 0.05% of its net assets, calculated and payable quarterly, on the basis of the net assets at the end of each quarter. A lower rate of 0.01% is applied to the classes PI, PIP, PIH (CHF), PIH (USD), PIH (EUR), I, IP, I (SEK), IH (SEK), IPH (SEK), IH (EUR), IP (EUR), IH (USD), IPH (USD), IH (CHF), IPH (CHF), IP (CHF), IP (GBP) and IH (GBP) shares reserved to institutional investors according to Article 174 (2) of the amended law of 17th December 2010. Pursuant to Article 175 (a) of the amended law of 17th December 2010, the net assets invested in UCIs that are already subject to the "taxe d’abonnement" are exempt from this tax. Note 9 - Total Expense Ratio ("TER") ("unaudited") The TER disclosed under "Statistical information" of this report is calculated in accordance with the "Guidelines on the calculation and disclosure of the TER of collective investment schemes" issued by the Swiss Funds & Asset Management Association "SFAMA" on 16th May 2008 as modified on 20th April 2015. The TER is calculated for the last 12 months preceding the date of this report. Transaction fees are not taken into account in the calculation of the TER. Note 10 - Changes occurring in the composition of the securities portfolio Changes in the composition of the securities portfolio during the current period are available on demand and free of charge: - from the registered office of the SICAV, - from the registered office of the Management Company, - from the registered office of the Representative and Distributor in Switzerland, RAM Active
Investments S.A., Geneva, - from the Payment Service in Switzerland, CACEIS BANK, Paris, Nyon/Switzerland Branch, - from the paying and information agent in Germany, MARCARD, STEIN & CO AG, Hamburg, - from the paying and information agent in Austria, ERSTE BANK DER ÖSTERREISCHICHEN
SPARKASSEN AG, Vienna.
RAM (LUX) SYSTEMATIC FUNDS
Notes to the financial statements (continued) as at 31st December 2019
153
Note 11 - Cross investments Pursuant to Article 181 (8) of the amended Law of 17th December 2010 relating to Undertakings for Collective Investment, the following sub-funds RAM (LUX) SYSTEMATIC FUNDS - EMERGING MARKETS EQUITIES and RAM (LUX) SYSTEMATIC FUNDS - GLOBAL MULTI-ASSET FUND invested in the sub-funds as described below as at 31st December 2019:
Sub-fund Description Currency Quantity Market value % of total net assets
RAM (LUX) SYSTEMATIC FUNDS - EMERGING MARKETS EQ
RAM (LUX) Syst Fd Em Mks Core Equities R USD Cap USD 301,330.75 33,583,311.98 2.76%
RAM (LUX) SYSTEMATIC FUNDS - GLOBAL MULTI-ASSET
RAM (LUX) Syst Fd Emerging Markets Equities R Cap EUR 11,300.00 2,161,161.49 4.98%
RAM (LUX) SYSTEMATIC FUNDS - GLOBAL MULTI-ASSET
RAM (LUX) Syst Fd North American Equities R Cap EUR 37,910.00 3,656,945.76 8.43%
RAM (LUX) SYSTEMATIC FUNDS - GLOBAL MULTI-ASSET
RAM (LUX) Syst Fds Long/Short Eur Equities R Cap EUR 33,962.10 3,268,851.64 7.54%
RAM (LUX) SYSTEMATIC FUNDS - GLOBAL MULTI-ASSET
RAM (LUX) Syst Fds Long/Short Eur Equities RAMCH Cap EUR 28,460.05 2,982,650.86 6.88%
RAM (LUX) SYSTEMATIC FUNDS - GLOBAL MULTI-ASSET
RAM (Lux) Syst Fds European Equities R Cap EUR 7,050.00 3,750,106.50 8.65%
RAM (LUX) SYSTEMATIC FUNDS - GLOBAL MULTI-ASSET
RAM (Lux) Syst Fds Gl Sustainable Income Equities R USD Cap EUR 57,020.00 7,274,405.09 16.77%
RAM (LUX) SYSTEMATIC FUNDS - GLOBAL MULTI-ASSET
RAM (Lux) Syst Fds Long/Short Gl Equities R Cap EUR 40,240.00 3,437,622.16 7.93%
The combined statement of net assets has not been adjusted to remove the impact of the above. The management fees detailed in note 3 are not applied to these assets. Note 12 - Forward foreign exchange contracts As at 31st December 2019, the below sub-funds of the SICAV are engaged in the following forward foreign exchange contracts:
RAM (LUX) SYSTEMATIC FUNDS - EUROPEAN EQUITIES Currency Purchases Currency Sales Maturity Unrealised result
(in EUR) Forward foreign exchange contracts linked to shares classes CH, PH, RAMCH (Banque de Luxembourg SA, Luxembourg)
CHF 60,000.00 EUR 55,244.19 10.01.2020 -13.94 CHF 7,991,465.31 EUR 7,323,127.41 10.01.2020 33,046.42 CHF 30,000.00 EUR 27,233.24 10.01.2020 381.85 CHF 150,000.00 EUR 136,773.33 10.01.2020 1,302.19 CHF 90,000.00 EUR 81,822.27 10.01.2020 1,023.02 CHF 30,000.00 EUR 27,261.70 10.01.2020 353.39 CHF 30,000.00 EUR 27,198.70 10.01.2020 416.39 CHF 90,000.00 EUR 82,017.63 10.01.2020 827.68 CHF 30,000.00 EUR 27,317.80 10.01.2020 297.30 CHF 30,000.00 EUR 27,535.67 10.01.2020 79.44 CHF 30,000.00 EUR 27,348.18 10.01.2020 266.92 CHF 30,000.00 EUR 27,330.49 10.01.2020 284.61 CHF 30,000.00 EUR 27,315.81 10.01.2020 299.29 CHF 30,000.00 EUR 27,316.06 10.01.2020 299.04 CHF 60,000.00 EUR 54,700.36 10.01.2020 529.85 CHF 60,000.00 EUR 54,797.22 10.01.2020 433.00 CHF 90,000.00 EUR 82,195.83 10.01.2020 649.49 CHF 60,000.00 EUR 54,864.37 10.01.2020 365.85 CHF 30,000.00 EUR 27,589.83 10.01.2020 25.29 CHF 30,000.00 EUR 27,566.76 10.01.2020 48.35 EUR 48,647.89 CHF 53,531.80 10.01.2020 -628.31
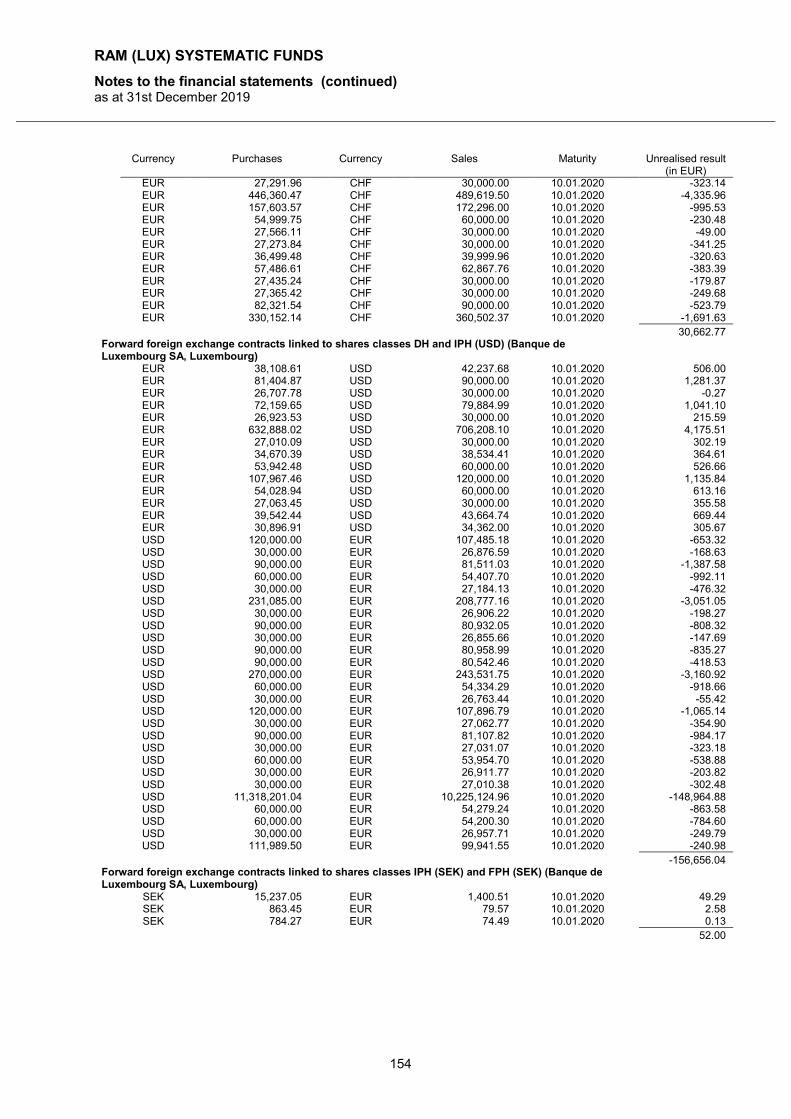
RAM (LUX) SYSTEMATIC FUNDS
Notes to the financial statements (continued) as at 31st December 2019
154
Currency Purchases Currency Sales Maturity Unrealised result (in EUR)
EUR 27,291.96 CHF 30,000.00 10.01.2020 -323.14 EUR 446,360.47 CHF 489,619.50 10.01.2020 -4,335.96 EUR 157,603.57 CHF 172,296.00 10.01.2020 -995.53 EUR 54,999.75 CHF 60,000.00 10.01.2020 -230.48 EUR 27,566.11 CHF 30,000.00 10.01.2020 -49.00 EUR 27,273.84 CHF 30,000.00 10.01.2020 -341.25 EUR 36,499.48 CHF 39,999.96 10.01.2020 -320.63 EUR 57,486.61 CHF 62,867.76 10.01.2020 -383.39 EUR 27,435.24 CHF 30,000.00 10.01.2020 -179.87 EUR 27,365.42 CHF 30,000.00 10.01.2020 -249.68 EUR 82,321.54 CHF 90,000.00 10.01.2020 -523.79 EUR 330,152.14 CHF 360,502.37 10.01.2020 -1,691.63 30,662.77 Forward foreign exchange contracts linked to shares classes DH and IPH (USD) (Banque de Luxembourg SA, Luxembourg)
EUR 38,108.61 USD 42,237.68 10.01.2020 506.00 EUR 81,404.87 USD 90,000.00 10.01.2020 1,281.37 EUR 26,707.78 USD 30,000.00 10.01.2020 -0.27 EUR 72,159.65 USD 79,884.99 10.01.2020 1,041.10 EUR 26,923.53 USD 30,000.00 10.01.2020 215.59 EUR 632,888.02 USD 706,208.10 10.01.2020 4,175.51 EUR 27,010.09 USD 30,000.00 10.01.2020 302.19 EUR 34,670.39 USD 38,534.41 10.01.2020 364.61 EUR 53,942.48 USD 60,000.00 10.01.2020 526.66 EUR 107,967.46 USD 120,000.00 10.01.2020 1,135.84 EUR 54,028.94 USD 60,000.00 10.01.2020 613.16 EUR 27,063.45 USD 30,000.00 10.01.2020 355.58 EUR 39,542.44 USD 43,664.74 10.01.2020 669.44 EUR 30,896.91 USD 34,362.00 10.01.2020 305.67 USD 120,000.00 EUR 107,485.18 10.01.2020 -653.32 USD 30,000.00 EUR 26,876.59 10.01.2020 -168.63 USD 90,000.00 EUR 81,511.03 10.01.2020 -1,387.58 USD 60,000.00 EUR 54,407.70 10.01.2020 -992.11 USD 30,000.00 EUR 27,184.13 10.01.2020 -476.32 USD 231,085.00 EUR 208,777.16 10.01.2020 -3,051.05 USD 30,000.00 EUR 26,906.22 10.01.2020 -198.27 USD 90,000.00 EUR 80,932.05 10.01.2020 -808.32 USD 30,000.00 EUR 26,855.66 10.01.2020 -147.69 USD 90,000.00 EUR 80,958.99 10.01.2020 -835.27 USD 90,000.00 EUR 80,542.46 10.01.2020 -418.53 USD 270,000.00 EUR 243,531.75 10.01.2020 -3,160.92 USD 60,000.00 EUR 54,334.29 10.01.2020 -918.66 USD 30,000.00 EUR 26,763.44 10.01.2020 -55.42 USD 120,000.00 EUR 107,896.79 10.01.2020 -1,065.14 USD 30,000.00 EUR 27,062.77 10.01.2020 -354.90 USD 90,000.00 EUR 81,107.82 10.01.2020 -984.17 USD 30,000.00 EUR 27,031.07 10.01.2020 -323.18 USD 60,000.00 EUR 53,954.70 10.01.2020 -538.88 USD 30,000.00 EUR 26,911.77 10.01.2020 -203.82 USD 30,000.00 EUR 27,010.38 10.01.2020 -302.48 USD 11,318,201.04 EUR 10,225,124.96 10.01.2020 -148,964.88 USD 60,000.00 EUR 54,279.24 10.01.2020 -863.58 USD 60,000.00 EUR 54,200.30 10.01.2020 -784.60 USD 30,000.00 EUR 26,957.71 10.01.2020 -249.79 USD 111,989.50 EUR 99,941.55 10.01.2020 -240.98 -156,656.04 Forward foreign exchange contracts linked to shares classes IPH (SEK) and FPH (SEK) (Banque de Luxembourg SA, Luxembourg)
SEK 15,237.05 EUR 1,400.51 10.01.2020 49.29 SEK 863.45 EUR 79.57 10.01.2020 2.58 SEK 784.27 EUR 74.49 10.01.2020 0.13 52.00
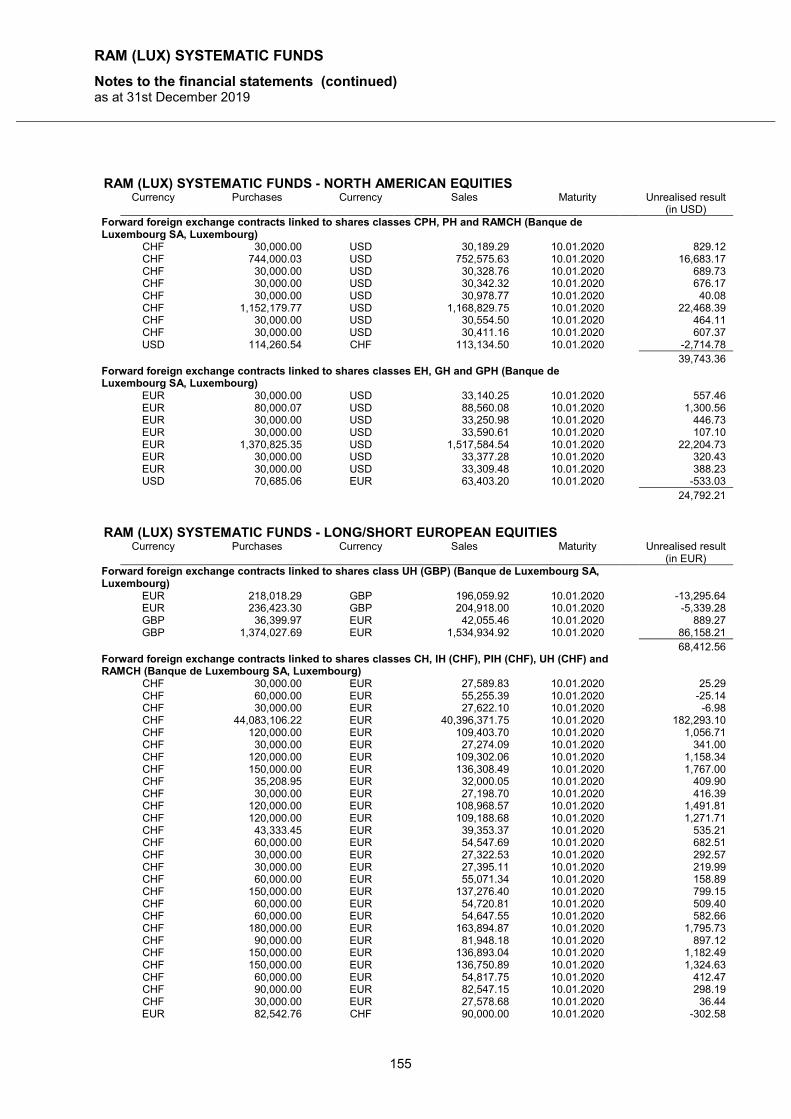
RAM (LUX) SYSTEMATIC FUNDS
Notes to the financial statements (continued) as at 31st December 2019
155
RAM (LUX) SYSTEMATIC FUNDS - NORTH AMERICAN EQUITIES Currency Purchases Currency Sales Maturity Unrealised result
(in USD) Forward foreign exchange contracts linked to shares classes CPH, PH and RAMCH (Banque de Luxembourg SA, Luxembourg)
CHF 30,000.00 USD 30,189.29 10.01.2020 829.12 CHF 744,000.03 USD 752,575.63 10.01.2020 16,683.17 CHF 30,000.00 USD 30,328.76 10.01.2020 689.73 CHF 30,000.00 USD 30,342.32 10.01.2020 676.17 CHF 30,000.00 USD 30,978.77 10.01.2020 40.08 CHF 1,152,179.77 USD 1,168,829.75 10.01.2020 22,468.39 CHF 30,000.00 USD 30,554.50 10.01.2020 464.11 CHF 30,000.00 USD 30,411.16 10.01.2020 607.37 USD 114,260.54 CHF 113,134.50 10.01.2020 -2,714.78 39,743.36 Forward foreign exchange contracts linked to shares classes EH, GH and GPH (Banque de Luxembourg SA, Luxembourg)
EUR 30,000.00 USD 33,140.25 10.01.2020 557.46 EUR 80,000.07 USD 88,560.08 10.01.2020 1,300.56 EUR 30,000.00 USD 33,250.98 10.01.2020 446.73 EUR 30,000.00 USD 33,590.61 10.01.2020 107.10 EUR 1,370,825.35 USD 1,517,584.54 10.01.2020 22,204.73 EUR 30,000.00 USD 33,377.28 10.01.2020 320.43 EUR 30,000.00 USD 33,309.48 10.01.2020 388.23 USD 70,685.06 EUR 63,403.20 10.01.2020 -533.03 24,792.21
RAM (LUX) SYSTEMATIC FUNDS - LONG/SHORT EUROPEAN EQUITIES Currency Purchases Currency Sales Maturity Unrealised result
(in EUR) Forward foreign exchange contracts linked to shares class UH (GBP) (Banque de Luxembourg SA, Luxembourg)
EUR 218,018.29 GBP 196,059.92 10.01.2020 -13,295.64 EUR 236,423.30 GBP 204,918.00 10.01.2020 -5,339.28 GBP 36,399.97 EUR 42,055.46 10.01.2020 889.27 GBP 1,374,027.69 EUR 1,534,934.92 10.01.2020 86,158.21 68,412.56 Forward foreign exchange contracts linked to shares classes CH, IH (CHF), PIH (CHF), UH (CHF) and RAMCH (Banque de Luxembourg SA, Luxembourg)
CHF 30,000.00 EUR 27,589.83 10.01.2020 25.29 CHF 60,000.00 EUR 55,255.39 10.01.2020 -25.14 CHF 30,000.00 EUR 27,622.10 10.01.2020 -6.98 CHF 44,083,106.22 EUR 40,396,371.75 10.01.2020 182,293.10 CHF 120,000.00 EUR 109,403.70 10.01.2020 1,056.71 CHF 30,000.00 EUR 27,274.09 10.01.2020 341.00 CHF 120,000.00 EUR 109,302.06 10.01.2020 1,158.34 CHF 150,000.00 EUR 136,308.49 10.01.2020 1,767.00 CHF 35,208.95 EUR 32,000.05 10.01.2020 409.90 CHF 30,000.00 EUR 27,198.70 10.01.2020 416.39 CHF 120,000.00 EUR 108,968.57 10.01.2020 1,491.81 CHF 120,000.00 EUR 109,188.68 10.01.2020 1,271.71 CHF 43,333.45 EUR 39,353.37 10.01.2020 535.21 CHF 60,000.00 EUR 54,547.69 10.01.2020 682.51 CHF 30,000.00 EUR 27,322.53 10.01.2020 292.57 CHF 30,000.00 EUR 27,395.11 10.01.2020 219.99 CHF 60,000.00 EUR 55,071.34 10.01.2020 158.89 CHF 150,000.00 EUR 137,276.40 10.01.2020 799.15 CHF 60,000.00 EUR 54,720.81 10.01.2020 509.40 CHF 60,000.00 EUR 54,647.55 10.01.2020 582.66 CHF 180,000.00 EUR 163,894.87 10.01.2020 1,795.73 CHF 90,000.00 EUR 81,948.18 10.01.2020 897.12 CHF 150,000.00 EUR 136,893.04 10.01.2020 1,182.49 CHF 150,000.00 EUR 136,750.89 10.01.2020 1,324.63 CHF 60,000.00 EUR 54,817.75 10.01.2020 412.47 CHF 90,000.00 EUR 82,547.15 10.01.2020 298.19 CHF 30,000.00 EUR 27,578.68 10.01.2020 36.44 EUR 82,542.76 CHF 90,000.00 10.01.2020 -302.58
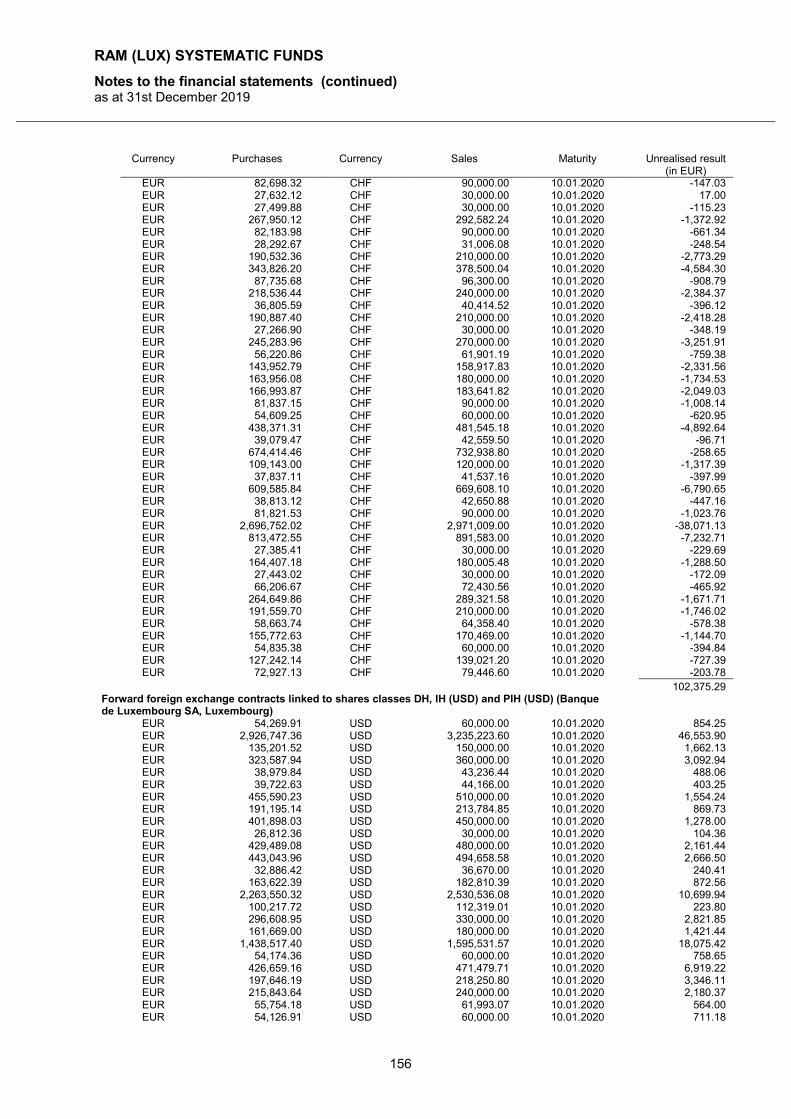
RAM (LUX) SYSTEMATIC FUNDS
Notes to the financial statements (continued) as at 31st December 2019
156
Currency Purchases Currency Sales Maturity Unrealised result (in EUR)
EUR 82,698.32 CHF 90,000.00 10.01.2020 -147.03 EUR 27,632.12 CHF 30,000.00 10.01.2020 17.00 EUR 27,499.88 CHF 30,000.00 10.01.2020 -115.23 EUR 267,950.12 CHF 292,582.24 10.01.2020 -1,372.92 EUR 82,183.98 CHF 90,000.00 10.01.2020 -661.34 EUR 28,292.67 CHF 31,006.08 10.01.2020 -248.54 EUR 190,532.36 CHF 210,000.00 10.01.2020 -2,773.29 EUR 343,826.20 CHF 378,500.04 10.01.2020 -4,584.30 EUR 87,735.68 CHF 96,300.00 10.01.2020 -908.79 EUR 218,536.44 CHF 240,000.00 10.01.2020 -2,384.37 EUR 36,805.59 CHF 40,414.52 10.01.2020 -396.12 EUR 190,887.40 CHF 210,000.00 10.01.2020 -2,418.28 EUR 27,266.90 CHF 30,000.00 10.01.2020 -348.19 EUR 245,283.96 CHF 270,000.00 10.01.2020 -3,251.91 EUR 56,220.86 CHF 61,901.19 10.01.2020 -759.38 EUR 143,952.79 CHF 158,917.83 10.01.2020 -2,331.56 EUR 163,956.08 CHF 180,000.00 10.01.2020 -1,734.53 EUR 166,993.87 CHF 183,641.82 10.01.2020 -2,049.03 EUR 81,837.15 CHF 90,000.00 10.01.2020 -1,008.14 EUR 54,609.25 CHF 60,000.00 10.01.2020 -620.95 EUR 438,371.31 CHF 481,545.18 10.01.2020 -4,892.64 EUR 39,079.47 CHF 42,559.50 10.01.2020 -96.71 EUR 674,414.46 CHF 732,938.80 10.01.2020 -258.65 EUR 109,143.00 CHF 120,000.00 10.01.2020 -1,317.39 EUR 37,837.11 CHF 41,537.16 10.01.2020 -397.99 EUR 609,585.84 CHF 669,608.10 10.01.2020 -6,790.65 EUR 38,813.12 CHF 42,650.88 10.01.2020 -447.16 EUR 81,821.53 CHF 90,000.00 10.01.2020 -1,023.76 EUR 2,696,752.02 CHF 2,971,009.00 10.01.2020 -38,071.13 EUR 813,472.55 CHF 891,583.00 10.01.2020 -7,232.71 EUR 27,385.41 CHF 30,000.00 10.01.2020 -229.69 EUR 164,407.18 CHF 180,005.48 10.01.2020 -1,288.50 EUR 27,443.02 CHF 30,000.00 10.01.2020 -172.09 EUR 66,206.67 CHF 72,430.56 10.01.2020 -465.92 EUR 264,649.86 CHF 289,321.58 10.01.2020 -1,671.71 EUR 191,559.70 CHF 210,000.00 10.01.2020 -1,746.02 EUR 58,663.74 CHF 64,358.40 10.01.2020 -578.38 EUR 155,772.63 CHF 170,469.00 10.01.2020 -1,144.70 EUR 54,835.38 CHF 60,000.00 10.01.2020 -394.84 EUR 127,242.14 CHF 139,021.20 10.01.2020 -727.39 EUR 72,927.13 CHF 79,446.60 10.01.2020 -203.78 102,375.29 Forward foreign exchange contracts linked to shares classes DH, IH (USD) and PIH (USD) (Banque de Luxembourg SA, Luxembourg)
EUR 54,269.91 USD 60,000.00 10.01.2020 854.25 EUR 2,926,747.36 USD 3,235,223.60 10.01.2020 46,553.90 EUR 135,201.52 USD 150,000.00 10.01.2020 1,662.13 EUR 323,587.94 USD 360,000.00 10.01.2020 3,092.94 EUR 38,979.84 USD 43,236.44 10.01.2020 488.06 EUR 39,722.63 USD 44,166.00 10.01.2020 403.25 EUR 455,590.23 USD 510,000.00 10.01.2020 1,554.24 EUR 191,195.14 USD 213,784.85 10.01.2020 869.73 EUR 401,898.03 USD 450,000.00 10.01.2020 1,278.00 EUR 26,812.36 USD 30,000.00 10.01.2020 104.36 EUR 429,489.08 USD 480,000.00 10.01.2020 2,161.44 EUR 443,043.96 USD 494,658.58 10.01.2020 2,666.50 EUR 32,886.42 USD 36,670.00 10.01.2020 240.41 EUR 163,622.39 USD 182,810.39 10.01.2020 872.56 EUR 2,263,550.32 USD 2,530,536.08 10.01.2020 10,699.94 EUR 100,217.72 USD 112,319.01 10.01.2020 223.80 EUR 296,608.95 USD 330,000.00 10.01.2020 2,821.85 EUR 161,669.00 USD 180,000.00 10.01.2020 1,421.44 EUR 1,438,517.40 USD 1,595,531.57 10.01.2020 18,075.42 EUR 54,174.36 USD 60,000.00 10.01.2020 758.65 EUR 426,659.16 USD 471,479.71 10.01.2020 6,919.22 EUR 197,646.19 USD 218,250.80 10.01.2020 3,346.11 EUR 215,843.64 USD 240,000.00 10.01.2020 2,180.37 EUR 55,754.18 USD 61,993.07 10.01.2020 564.00 EUR 54,126.91 USD 60,000.00 10.01.2020 711.18
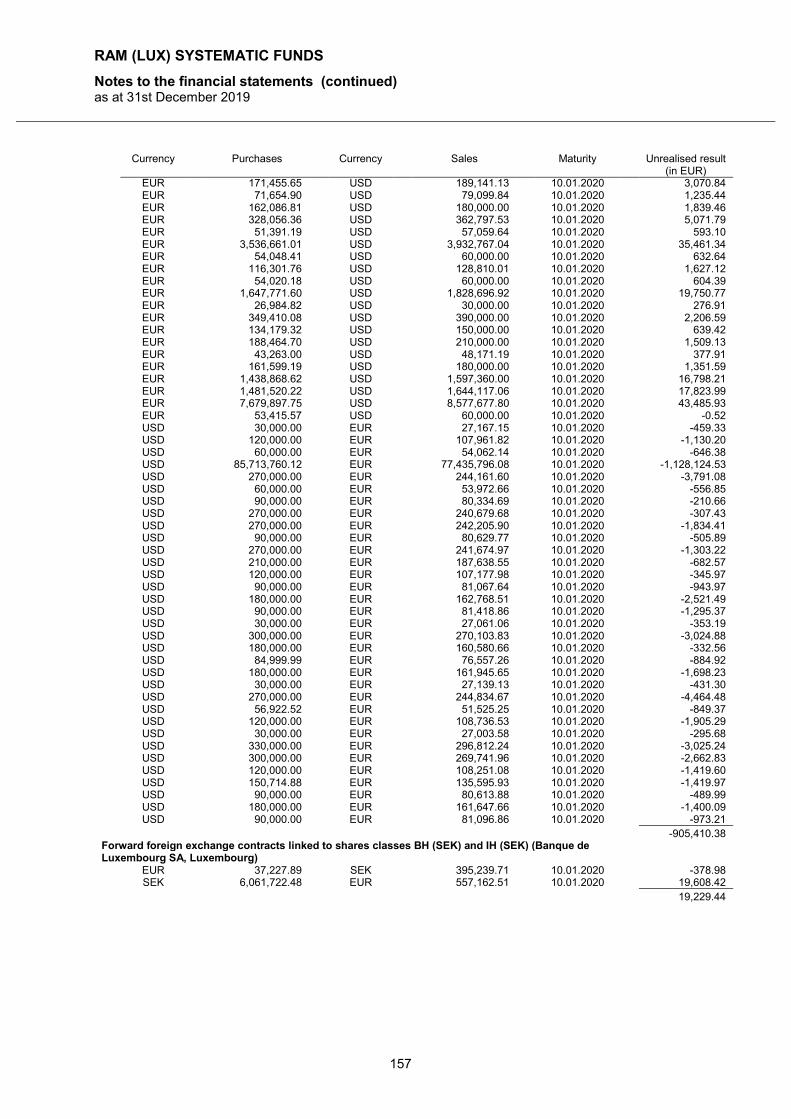
RAM (LUX) SYSTEMATIC FUNDS
Notes to the financial statements (continued) as at 31st December 2019
157
Currency Purchases Currency Sales Maturity Unrealised result (in EUR)
EUR 171,455.65 USD 189,141.13 10.01.2020 3,070.84 EUR 71,654.90 USD 79,099.84 10.01.2020 1,235.44 EUR 162,086.81 USD 180,000.00 10.01.2020 1,839.46 EUR 328,056.36 USD 362,797.53 10.01.2020 5,071.79 EUR 51,391.19 USD 57,059.64 10.01.2020 593.10 EUR 3,536,661.01 USD 3,932,767.04 10.01.2020 35,461.34 EUR 54,048.41 USD 60,000.00 10.01.2020 632.64 EUR 116,301.76 USD 128,810.01 10.01.2020 1,627.12 EUR 54,020.18 USD 60,000.00 10.01.2020 604.39 EUR 1,647,771.60 USD 1,828,696.92 10.01.2020 19,750.77 EUR 26,984.82 USD 30,000.00 10.01.2020 276.91 EUR 349,410.08 USD 390,000.00 10.01.2020 2,206.59 EUR 134,179.32 USD 150,000.00 10.01.2020 639.42 EUR 188,464.70 USD 210,000.00 10.01.2020 1,509.13 EUR 43,263.00 USD 48,171.19 10.01.2020 377.91 EUR 161,599.19 USD 180,000.00 10.01.2020 1,351.59 EUR 1,438,868.62 USD 1,597,360.00 10.01.2020 16,798.21 EUR 1,481,520.22 USD 1,644,117.06 10.01.2020 17,823.99 EUR 7,679,897.75 USD 8,577,677.80 10.01.2020 43,485.93 EUR 53,415.57 USD 60,000.00 10.01.2020 -0.52 USD 30,000.00 EUR 27,167.15 10.01.2020 -459.33 USD 120,000.00 EUR 107,961.82 10.01.2020 -1,130.20 USD 60,000.00 EUR 54,062.14 10.01.2020 -646.38 USD 85,713,760.12 EUR 77,435,796.08 10.01.2020 -1,128,124.53 USD 270,000.00 EUR 244,161.60 10.01.2020 -3,791.08 USD 60,000.00 EUR 53,972.66 10.01.2020 -556.85 USD 90,000.00 EUR 80,334.69 10.01.2020 -210.66 USD 270,000.00 EUR 240,679.68 10.01.2020 -307.43 USD 270,000.00 EUR 242,205.90 10.01.2020 -1,834.41 USD 90,000.00 EUR 80,629.77 10.01.2020 -505.89 USD 270,000.00 EUR 241,674.97 10.01.2020 -1,303.22 USD 210,000.00 EUR 187,638.55 10.01.2020 -682.57 USD 120,000.00 EUR 107,177.98 10.01.2020 -345.97 USD 90,000.00 EUR 81,067.64 10.01.2020 -943.97 USD 180,000.00 EUR 162,768.51 10.01.2020 -2,521.49 USD 90,000.00 EUR 81,418.86 10.01.2020 -1,295.37 USD 30,000.00 EUR 27,061.06 10.01.2020 -353.19 USD 300,000.00 EUR 270,103.83 10.01.2020 -3,024.88 USD 180,000.00 EUR 160,580.66 10.01.2020 -332.56 USD 84,999.99 EUR 76,557.26 10.01.2020 -884.92 USD 180,000.00 EUR 161,945.65 10.01.2020 -1,698.23 USD 30,000.00 EUR 27,139.13 10.01.2020 -431.30 USD 270,000.00 EUR 244,834.67 10.01.2020 -4,464.48 USD 56,922.52 EUR 51,525.25 10.01.2020 -849.37 USD 120,000.00 EUR 108,736.53 10.01.2020 -1,905.29 USD 30,000.00 EUR 27,003.58 10.01.2020 -295.68 USD 330,000.00 EUR 296,812.24 10.01.2020 -3,025.24 USD 300,000.00 EUR 269,741.96 10.01.2020 -2,662.83 USD 120,000.00 EUR 108,251.08 10.01.2020 -1,419.60 USD 150,714.88 EUR 135,595.93 10.01.2020 -1,419.97 USD 90,000.00 EUR 80,613.88 10.01.2020 -489.99 USD 180,000.00 EUR 161,647.66 10.01.2020 -1,400.09 USD 90,000.00 EUR 81,096.86 10.01.2020 -973.21 -905,410.38 Forward foreign exchange contracts linked to shares classes BH (SEK) and IH (SEK) (Banque de Luxembourg SA, Luxembourg)
EUR 37,227.89 SEK 395,239.71 10.01.2020 -378.98 SEK 6,061,722.48 EUR 557,162.51 10.01.2020 19,608.42 19,229.44
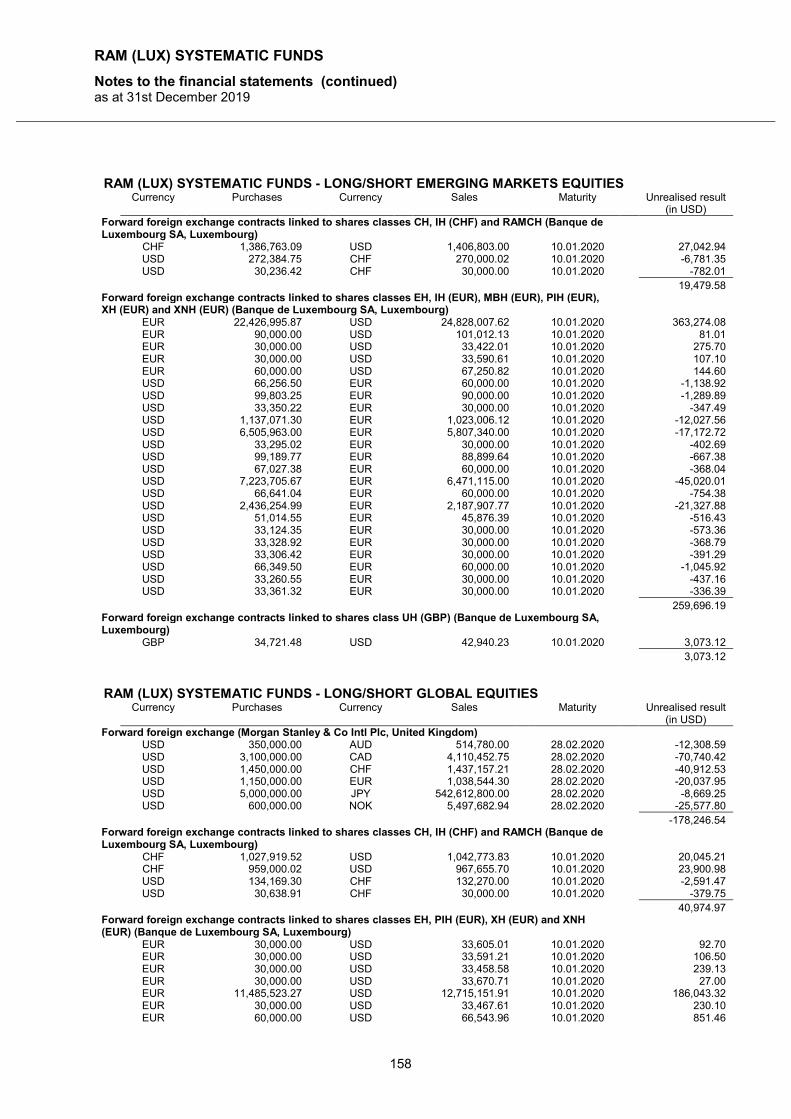
RAM (LUX) SYSTEMATIC FUNDS
Notes to the financial statements (continued) as at 31st December 2019
158
RAM (LUX) SYSTEMATIC FUNDS - LONG/SHORT EMERGING MARKETS EQUITIES Currency Purchases Currency Sales Maturity Unrealised result
(in USD) Forward foreign exchange contracts linked to shares classes CH, IH (CHF) and RAMCH (Banque de Luxembourg SA, Luxembourg)
CHF 1,386,763.09 USD 1,406,803.00 10.01.2020 27,042.94 USD 272,384.75 CHF 270,000.02 10.01.2020 -6,781.35 USD 30,236.42 CHF 30,000.00 10.01.2020 -782.01 19,479.58 Forward foreign exchange contracts linked to shares classes EH, IH (EUR), MBH (EUR), PIH (EUR), XH (EUR) and XNH (EUR) (Banque de Luxembourg SA, Luxembourg)
EUR 22,426,995.87 USD 24,828,007.62 10.01.2020 363,274.08 EUR 90,000.00 USD 101,012.13 10.01.2020 81.01 EUR 30,000.00 USD 33,422.01 10.01.2020 275.70 EUR 30,000.00 USD 33,590.61 10.01.2020 107.10 EUR 60,000.00 USD 67,250.82 10.01.2020 144.60 USD 66,256.50 EUR 60,000.00 10.01.2020 -1,138.92 USD 99,803.25 EUR 90,000.00 10.01.2020 -1,289.89 USD 33,350.22 EUR 30,000.00 10.01.2020 -347.49 USD 1,137,071.30 EUR 1,023,006.12 10.01.2020 -12,027.56 USD 6,505,963.00 EUR 5,807,340.00 10.01.2020 -17,172.72 USD 33,295.02 EUR 30,000.00 10.01.2020 -402.69 USD 99,189.77 EUR 88,899.64 10.01.2020 -667.38 USD 67,027.38 EUR 60,000.00 10.01.2020 -368.04 USD 7,223,705.67 EUR 6,471,115.00 10.01.2020 -45,020.01 USD 66,641.04 EUR 60,000.00 10.01.2020 -754.38 USD 2,436,254.99 EUR 2,187,907.77 10.01.2020 -21,327.88 USD 51,014.55 EUR 45,876.39 10.01.2020 -516.43 USD 33,124.35 EUR 30,000.00 10.01.2020 -573.36 USD 33,328.92 EUR 30,000.00 10.01.2020 -368.79 USD 33,306.42 EUR 30,000.00 10.01.2020 -391.29 USD 66,349.50 EUR 60,000.00 10.01.2020 -1,045.92 USD 33,260.55 EUR 30,000.00 10.01.2020 -437.16 USD 33,361.32 EUR 30,000.00 10.01.2020 -336.39 259,696.19 Forward foreign exchange contracts linked to shares class UH (GBP) (Banque de Luxembourg SA, Luxembourg)
GBP 34,721.48 USD 42,940.23 10.01.2020 3,073.12 3,073.12
RAM (LUX) SYSTEMATIC FUNDS - LONG/SHORT GLOBAL EQUITIES Currency Purchases Currency Sales Maturity Unrealised result
(in USD) Forward foreign exchange (Morgan Stanley & Co Intl Plc, United Kingdom) USD 350,000.00 AUD 514,780.00 28.02.2020 -12,308.59 USD 3,100,000.00 CAD 4,110,452.75 28.02.2020 -70,740.42 USD 1,450,000.00 CHF 1,437,157.21 28.02.2020 -40,912.53 USD 1,150,000.00 EUR 1,038,544.30 28.02.2020 -20,037.95 USD 5,000,000.00 JPY 542,612,800.00 28.02.2020 -8,669.25 USD 600,000.00 NOK 5,497,682.94 28.02.2020 -25,577.80 -178,246.54 Forward foreign exchange contracts linked to shares classes CH, IH (CHF) and RAMCH (Banque de Luxembourg SA, Luxembourg)
CHF 1,027,919.52 USD 1,042,773.83 10.01.2020 20,045.21 CHF 959,000.02 USD 967,655.70 10.01.2020 23,900.98 USD 134,169.30 CHF 132,270.00 10.01.2020 -2,591.47 USD 30,638.91 CHF 30,000.00 10.01.2020 -379.75 40,974.97 Forward foreign exchange contracts linked to shares classes EH, PIH (EUR), XH (EUR) and XNH (EUR) (Banque de Luxembourg SA, Luxembourg)
EUR 30,000.00 USD 33,605.01 10.01.2020 92.70 EUR 30,000.00 USD 33,591.21 10.01.2020 106.50 EUR 30,000.00 USD 33,458.58 10.01.2020 239.13 EUR 30,000.00 USD 33,670.71 10.01.2020 27.00 EUR 11,485,523.27 USD 12,715,151.91 10.01.2020 186,043.32 EUR 30,000.00 USD 33,467.61 10.01.2020 230.10 EUR 60,000.00 USD 66,543.96 10.01.2020 851.46
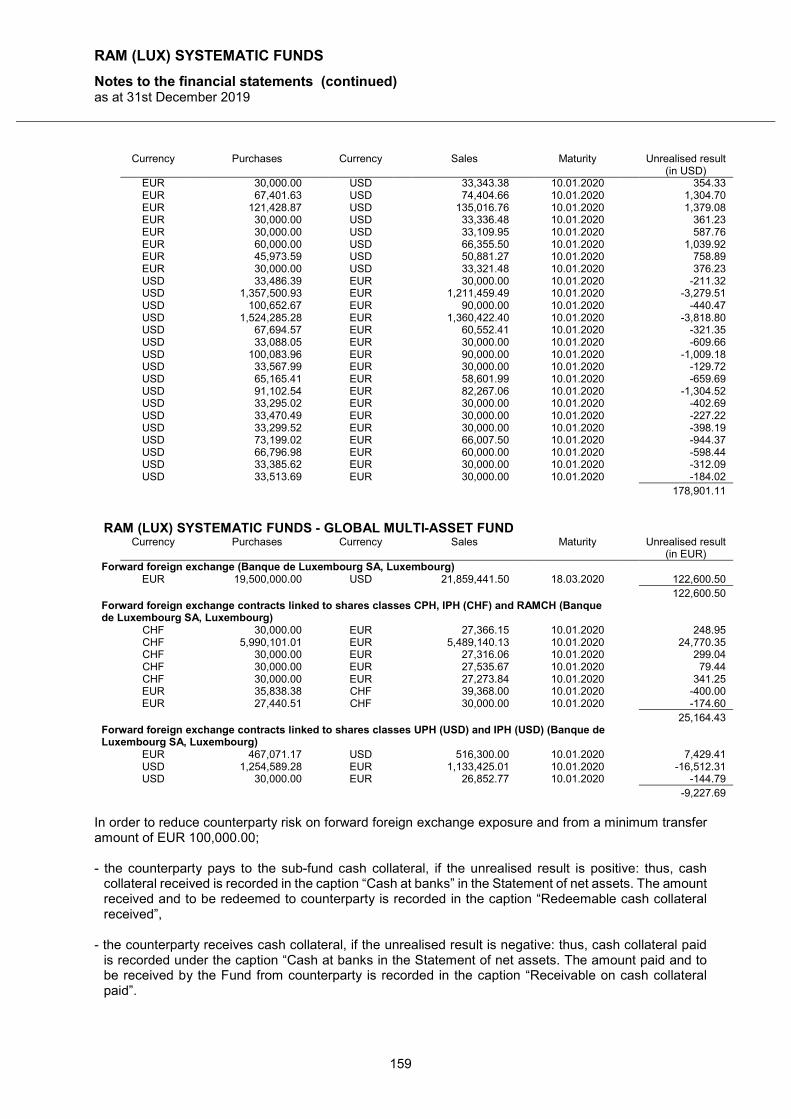
RAM (LUX) SYSTEMATIC FUNDS
Notes to the financial statements (continued) as at 31st December 2019
159
Currency Purchases Currency Sales Maturity Unrealised result (in USD)
EUR 30,000.00 USD 33,343.38 10.01.2020 354.33 EUR 67,401.63 USD 74,404.66 10.01.2020 1,304.70 EUR 121,428.87 USD 135,016.76 10.01.2020 1,379.08 EUR 30,000.00 USD 33,336.48 10.01.2020 361.23 EUR 30,000.00 USD 33,109.95 10.01.2020 587.76 EUR 60,000.00 USD 66,355.50 10.01.2020 1,039.92 EUR 45,973.59 USD 50,881.27 10.01.2020 758.89 EUR 30,000.00 USD 33,321.48 10.01.2020 376.23 USD 33,486.39 EUR 30,000.00 10.01.2020 -211.32 USD 1,357,500.93 EUR 1,211,459.49 10.01.2020 -3,279.51 USD 100,652.67 EUR 90,000.00 10.01.2020 -440.47 USD 1,524,285.28 EUR 1,360,422.40 10.01.2020 -3,818.80 USD 67,694.57 EUR 60,552.41 10.01.2020 -321.35 USD 33,088.05 EUR 30,000.00 10.01.2020 -609.66 USD 100,083.96 EUR 90,000.00 10.01.2020 -1,009.18 USD 33,567.99 EUR 30,000.00 10.01.2020 -129.72 USD 65,165.41 EUR 58,601.99 10.01.2020 -659.69 USD 91,102.54 EUR 82,267.06 10.01.2020 -1,304.52 USD 33,295.02 EUR 30,000.00 10.01.2020 -402.69 USD 33,470.49 EUR 30,000.00 10.01.2020 -227.22 USD 33,299.52 EUR 30,000.00 10.01.2020 -398.19 USD 73,199.02 EUR 66,007.50 10.01.2020 -944.37 USD 66,796.98 EUR 60,000.00 10.01.2020 -598.44 USD 33,385.62 EUR 30,000.00 10.01.2020 -312.09 USD 33,513.69 EUR 30,000.00 10.01.2020 -184.02 178,901.11
RAM (LUX) SYSTEMATIC FUNDS - GLOBAL MULTI-ASSET FUND Currency Purchases Currency Sales Maturity Unrealised result
(in EUR) Forward foreign exchange (Banque de Luxembourg SA, Luxembourg) EUR 19,500,000.00 USD 21,859,441.50 18.03.2020 122,600.50 122,600.50 Forward foreign exchange contracts linked to shares classes CPH, IPH (CHF) and RAMCH (Banque de Luxembourg SA, Luxembourg)
CHF 30,000.00 EUR 27,366.15 10.01.2020 248.95 CHF 5,990,101.01 EUR 5,489,140.13 10.01.2020 24,770.35 CHF 30,000.00 EUR 27,316.06 10.01.2020 299.04 CHF 30,000.00 EUR 27,535.67 10.01.2020 79.44 CHF 30,000.00 EUR 27,273.84 10.01.2020 341.25 EUR 35,838.38 CHF 39,368.00 10.01.2020 -400.00 EUR 27,440.51 CHF 30,000.00 10.01.2020 -174.60 25,164.43 Forward foreign exchange contracts linked to shares classes UPH (USD) and IPH (USD) (Banque de Luxembourg SA, Luxembourg)
EUR 467,071.17 USD 516,300.00 10.01.2020 7,429.41 USD 1,254,589.28 EUR 1,133,425.01 10.01.2020 -16,512.31 USD 30,000.00 EUR 26,852.77 10.01.2020 -144.79 -9,227.69
In order to reduce counterparty risk on forward foreign exchange exposure and from a minimum transfer amount of EUR 100,000.00; - the counterparty pays to the sub-fund cash collateral, if the unrealised result is positive: thus, cash
collateral received is recorded in the caption “Cash at banks” in the Statement of net assets. The amount received and to be redeemed to counterparty is recorded in the caption “Redeemable cash collateral received”,
- the counterparty receives cash collateral, if the unrealised result is negative: thus, cash collateral paid
is recorded under the caption “Cash at banks in the Statement of net assets. The amount paid and to be received by the Fund from counterparty is recorded in the caption “Receivable on cash collateral paid”.
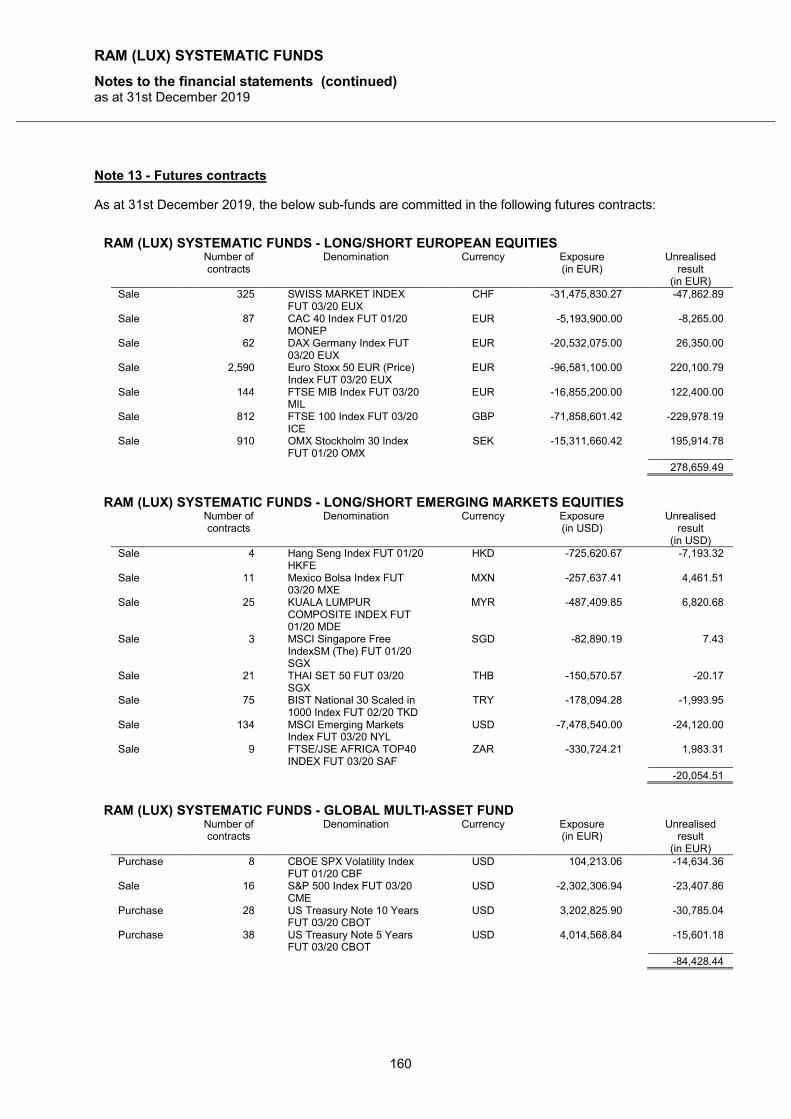
RAM (LUX) SYSTEMATIC FUNDS
Notes to the financial statements (continued) as at 31st December 2019
160
Note 13 - Futures contracts As at 31st December 2019, the below sub-funds are committed in the following futures contracts:
RAM (LUX) SYSTEMATIC FUNDS - LONG/SHORT EUROPEAN EQUITIES Number of
contracts Denomination Currency Exposure
(in EUR) Unrealised
result (in EUR)
Sale 325 SWISS MARKET INDEX FUT 03/20 EUX
CHF -31,475,830.27 -47,862.89
Sale 87 CAC 40 Index FUT 01/20 MONEP
EUR -5,193,900.00 -8,265.00
Sale 62 DAX Germany Index FUT 03/20 EUX
EUR -20,532,075.00 26,350.00
Sale 2,590 Euro Stoxx 50 EUR (Price) Index FUT 03/20 EUX
EUR -96,581,100.00 220,100.79
Sale 144 FTSE MIB Index FUT 03/20 MIL
EUR -16,855,200.00 122,400.00
Sale 812 FTSE 100 Index FUT 03/20 ICE
GBP -71,858,601.42 -229,978.19
Sale 910 OMX Stockholm 30 Index FUT 01/20 OMX
SEK -15,311,660.42 195,914.78
278,659.49
RAM (LUX) SYSTEMATIC FUNDS - LONG/SHORT EMERGING MARKETS EQUITIES Number of
contracts Denomination Currency Exposure
(in USD) Unrealised
result (in USD)
Sale 4 Hang Seng Index FUT 01/20 HKFE
HKD -725,620.67 -7,193.32
Sale 11 Mexico Bolsa Index FUT 03/20 MXE
MXN -257,637.41 4,461.51
Sale 25 KUALA LUMPUR COMPOSITE INDEX FUT 01/20 MDE
MYR -487,409.85 6,820.68
Sale 3 MSCI Singapore Free IndexSM (The) FUT 01/20 SGX
SGD -82,890.19 7.43
Sale 21 THAI SET 50 FUT 03/20 SGX
THB -150,570.57 -20.17
Sale 75 BIST National 30 Scaled in 1000 Index FUT 02/20 TKD
TRY -178,094.28 -1,993.95
Sale 134 MSCI Emerging Markets Index FUT 03/20 NYL
USD -7,478,540.00 -24,120.00
Sale 9 FTSE/JSE AFRICA TOP40 INDEX FUT 03/20 SAF
ZAR -330,724.21 1,983.31
-20,054.51
RAM (LUX) SYSTEMATIC FUNDS - GLOBAL MULTI-ASSET FUND Number of
contracts Denomination Currency Exposure
(in EUR) Unrealised
result (in EUR)
Purchase 8 CBOE SPX Volatility Index FUT 01/20 CBF
USD 104,213.06 -14,634.36
Sale 16 S&P 500 Index FUT 03/20 CME
USD -2,302,306.94 -23,407.86
Purchase 28 US Treasury Note 10 Years FUT 03/20 CBOT
USD 3,202,825.90 -30,785.04
Purchase 38 US Treasury Note 5 Years FUT 03/20 CBOT
USD 4,014,568.84 -15,601.18
-84,428.44
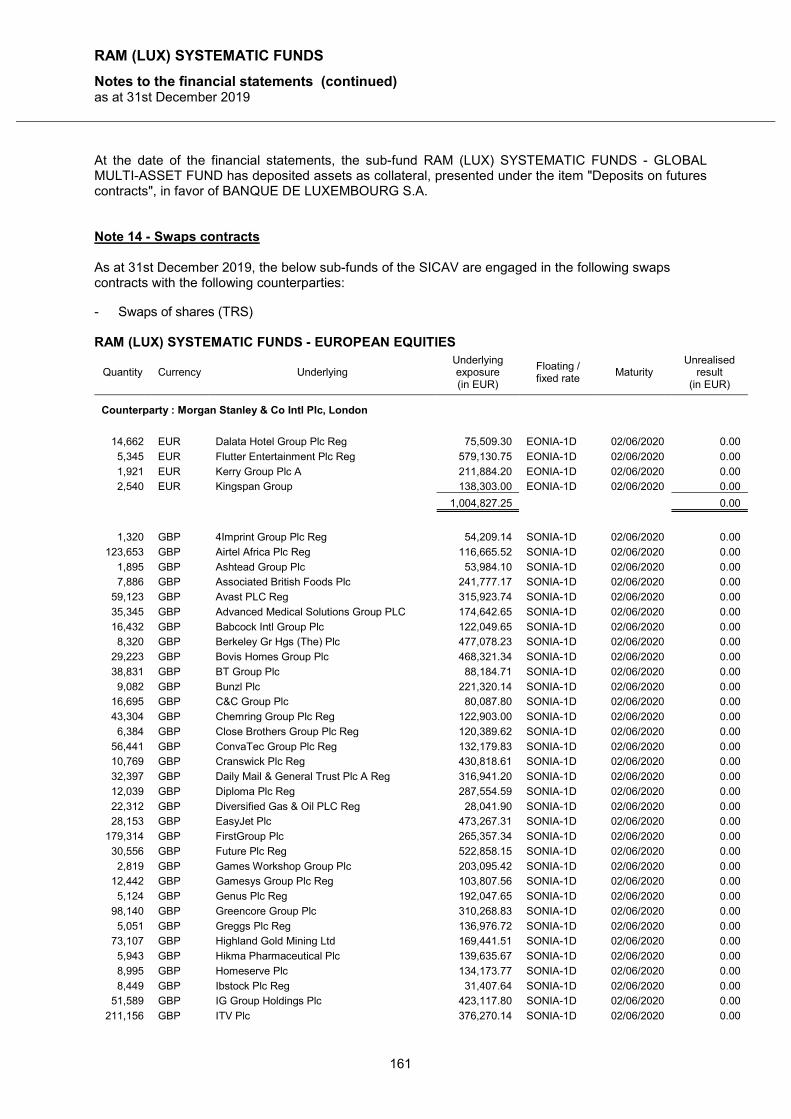
RAM (LUX) SYSTEMATIC FUNDS
Notes to the financial statements (continued) as at 31st December 2019
161
At the date of the financial statements, the sub-fund RAM (LUX) SYSTEMATIC FUNDS - GLOBAL MULTI-ASSET FUND has deposited assets as collateral, presented under the item "Deposits on futures contracts", in favor of BANQUE DE LUXEMBOURG S.A. Note 14 - Swaps contracts As at 31st December 2019, the below sub-funds of the SICAV are engaged in the following swaps contracts with the following counterparties: - Swaps of shares (TRS)
RAM (LUX) SYSTEMATIC FUNDS - EUROPEAN EQUITIES
Quantity Currency Underlying Underlying exposure (in EUR)
Floating / fixed rate
Maturity Unrealised
result (in EUR)
Counterparty : Morgan Stanley & Co Intl Plc, London
14,662 EUR Dalata Hotel Group Plc Reg 75,509.30 EONIA-1D 02/06/2020 0.00
5,345 EUR Flutter Entertainment Plc Reg 579,130.75 EONIA-1D 02/06/2020 0.00
1,921 EUR Kerry Group Plc A 211,884.20 EONIA-1D 02/06/2020 0.00
2,540 EUR Kingspan Group 138,303.00 EONIA-1D 02/06/2020 0.00
1,004,827.25 0.00
1,320 GBP 4Imprint Group Plc Reg 54,209.14 SONIA-1D 02/06/2020 0.00
123,653 GBP Airtel Africa Plc Reg 116,665.52 SONIA-1D 02/06/2020 0.00
1,895 GBP Ashtead Group Plc 53,984.10 SONIA-1D 02/06/2020 0.00
7,886 GBP Associated British Foods Plc 241,777.17 SONIA-1D 02/06/2020 0.00
59,123 GBP Avast PLC Reg 315,923.74 SONIA-1D 02/06/2020 0.00
35,345 GBP Advanced Medical Solutions Group PLC 174,642.65 SONIA-1D 02/06/2020 0.00
16,432 GBP Babcock Intl Group Plc 122,049.65 SONIA-1D 02/06/2020 0.00
8,320 GBP Berkeley Gr Hgs (The) Plc 477,078.23 SONIA-1D 02/06/2020 0.00
29,223 GBP Bovis Homes Group Plc 468,321.34 SONIA-1D 02/06/2020 0.00
38,831 GBP BT Group Plc 88,184.71 SONIA-1D 02/06/2020 0.00
9,082 GBP Bunzl Plc 221,320.14 SONIA-1D 02/06/2020 0.00
16,695 GBP C&C Group Plc 80,087.80 SONIA-1D 02/06/2020 0.00
43,304 GBP Chemring Group Plc Reg 122,903.00 SONIA-1D 02/06/2020 0.00
6,384 GBP Close Brothers Group Plc Reg 120,389.62 SONIA-1D 02/06/2020 0.00
56,441 GBP ConvaTec Group Plc Reg 132,179.83 SONIA-1D 02/06/2020 0.00
10,769 GBP Cranswick Plc Reg 430,818.61 SONIA-1D 02/06/2020 0.00
32,397 GBP Daily Mail & General Trust Plc A Reg 316,941.20 SONIA-1D 02/06/2020 0.00
12,039 GBP Diploma Plc Reg 287,554.59 SONIA-1D 02/06/2020 0.00
22,312 GBP Diversified Gas & Oil PLC Reg 28,041.90 SONIA-1D 02/06/2020 0.00
28,153 GBP EasyJet Plc 473,267.31 SONIA-1D 02/06/2020 0.00
179,314 GBP FirstGroup Plc 265,357.34 SONIA-1D 02/06/2020 0.00
30,556 GBP Future Plc Reg 522,858.15 SONIA-1D 02/06/2020 0.00
2,819 GBP Games Workshop Group Plc 203,095.42 SONIA-1D 02/06/2020 0.00
12,442 GBP Gamesys Group Plc Reg 103,807.56 SONIA-1D 02/06/2020 0.00
5,124 GBP Genus Plc Reg 192,047.65 SONIA-1D 02/06/2020 0.00
98,140 GBP Greencore Group Plc 310,268.83 SONIA-1D 02/06/2020 0.00
5,051 GBP Greggs Plc Reg 136,976.72 SONIA-1D 02/06/2020 0.00
73,107 GBP Highland Gold Mining Ltd 169,441.51 SONIA-1D 02/06/2020 0.00
5,943 GBP Hikma Pharmaceutical Plc 139,635.67 SONIA-1D 02/06/2020 0.00
8,995 GBP Homeserve Plc 134,173.77 SONIA-1D 02/06/2020 0.00
8,449 GBP Ibstock Plc Reg 31,407.64 SONIA-1D 02/06/2020 0.00
51,589 GBP IG Group Holdings Plc 423,117.80 SONIA-1D 02/06/2020 0.00
211,156 GBP ITV Plc 376,270.14 SONIA-1D 02/06/2020 0.00
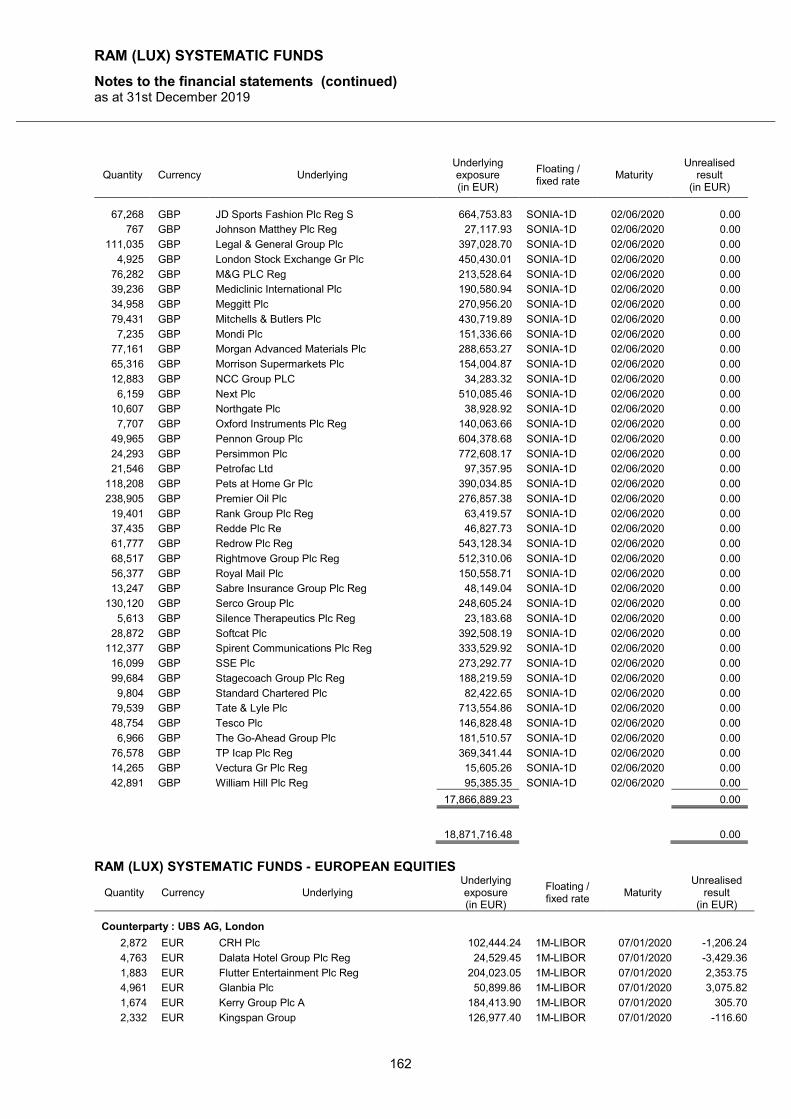
RAM (LUX) SYSTEMATIC FUNDS
Notes to the financial statements (continued) as at 31st December 2019
162
Quantity Currency Underlying Underlying exposure (in EUR)
Floating / fixed rate
Maturity Unrealised
result (in EUR)
67,268 GBP JD Sports Fashion Plc Reg S 664,753.83 SONIA-1D 02/06/2020 0.00
767 GBP Johnson Matthey Plc Reg 27,117.93 SONIA-1D 02/06/2020 0.00
111,035 GBP Legal & General Group Plc 397,028.70 SONIA-1D 02/06/2020 0.00
4,925 GBP London Stock Exchange Gr Plc 450,430.01 SONIA-1D 02/06/2020 0.00
76,282 GBP M&G PLC Reg 213,528.64 SONIA-1D 02/06/2020 0.00
39,236 GBP Mediclinic International Plc 190,580.94 SONIA-1D 02/06/2020 0.00
34,958 GBP Meggitt Plc 270,956.20 SONIA-1D 02/06/2020 0.00
79,431 GBP Mitchells & Butlers Plc 430,719.89 SONIA-1D 02/06/2020 0.00
7,235 GBP Mondi Plc 151,336.66 SONIA-1D 02/06/2020 0.00
77,161 GBP Morgan Advanced Materials Plc 288,653.27 SONIA-1D 02/06/2020 0.00
65,316 GBP Morrison Supermarkets Plc 154,004.87 SONIA-1D 02/06/2020 0.00
12,883 GBP NCC Group PLC 34,283.32 SONIA-1D 02/06/2020 0.00
6,159 GBP Next Plc 510,085.46 SONIA-1D 02/06/2020 0.00
10,607 GBP Northgate Plc 38,928.92 SONIA-1D 02/06/2020 0.00
7,707 GBP Oxford Instruments Plc Reg 140,063.66 SONIA-1D 02/06/2020 0.00
49,965 GBP Pennon Group Plc 604,378.68 SONIA-1D 02/06/2020 0.00
24,293 GBP Persimmon Plc 772,608.17 SONIA-1D 02/06/2020 0.00
21,546 GBP Petrofac Ltd 97,357.95 SONIA-1D 02/06/2020 0.00
118,208 GBP Pets at Home Gr Plc 390,034.85 SONIA-1D 02/06/2020 0.00
238,905 GBP Premier Oil Plc 276,857.38 SONIA-1D 02/06/2020 0.00
19,401 GBP Rank Group Plc Reg 63,419.57 SONIA-1D 02/06/2020 0.00
37,435 GBP Redde Plc Re 46,827.73 SONIA-1D 02/06/2020 0.00
61,777 GBP Redrow Plc Reg 543,128.34 SONIA-1D 02/06/2020 0.00
68,517 GBP Rightmove Group Plc Reg 512,310.06 SONIA-1D 02/06/2020 0.00
56,377 GBP Royal Mail Plc 150,558.71 SONIA-1D 02/06/2020 0.00
13,247 GBP Sabre Insurance Group Plc Reg 48,149.04 SONIA-1D 02/06/2020 0.00
130,120 GBP Serco Group Plc 248,605.24 SONIA-1D 02/06/2020 0.00
5,613 GBP Silence Therapeutics Plc Reg 23,183.68 SONIA-1D 02/06/2020 0.00
28,872 GBP Softcat Plc 392,508.19 SONIA-1D 02/06/2020 0.00
112,377 GBP Spirent Communications Plc Reg 333,529.92 SONIA-1D 02/06/2020 0.00
16,099 GBP SSE Plc 273,292.77 SONIA-1D 02/06/2020 0.00
99,684 GBP Stagecoach Group Plc Reg 188,219.59 SONIA-1D 02/06/2020 0.00
9,804 GBP Standard Chartered Plc 82,422.65 SONIA-1D 02/06/2020 0.00
79,539 GBP Tate & Lyle Plc 713,554.86 SONIA-1D 02/06/2020 0.00
48,754 GBP Tesco Plc 146,828.48 SONIA-1D 02/06/2020 0.00
6,966 GBP The Go-Ahead Group Plc 181,510.57 SONIA-1D 02/06/2020 0.00
76,578 GBP TP Icap Plc Reg 369,341.44 SONIA-1D 02/06/2020 0.00
14,265 GBP Vectura Gr Plc Reg 15,605.26 SONIA-1D 02/06/2020 0.00
42,891 GBP William Hill Plc Reg 95,385.35 SONIA-1D 02/06/2020 0.00
17,866,889.23 0.00
18,871,716.48 0.00
RAM (LUX) SYSTEMATIC FUNDS - EUROPEAN EQUITIES
Quantity Currency Underlying Underlying exposure (in EUR)
Floating / fixed rate
Maturity Unrealised
result (in EUR)
Counterparty : UBS AG, London
2,872 EUR CRH Plc 102,444.24 1M-LIBOR 07/01/2020 -1,206.24
4,763 EUR Dalata Hotel Group Plc Reg 24,529.45 1M-LIBOR 07/01/2020 -3,429.36
1,883 EUR Flutter Entertainment Plc Reg 204,023.05 1M-LIBOR 07/01/2020 2,353.75
4,961 EUR Glanbia Plc 50,899.86 1M-LIBOR 07/01/2020 3,075.82
1,674 EUR Kerry Group Plc A 184,413.90 1M-LIBOR 07/01/2020 305.70
2,332 EUR Kingspan Group 126,977.40 1M-LIBOR 07/01/2020 -116.60
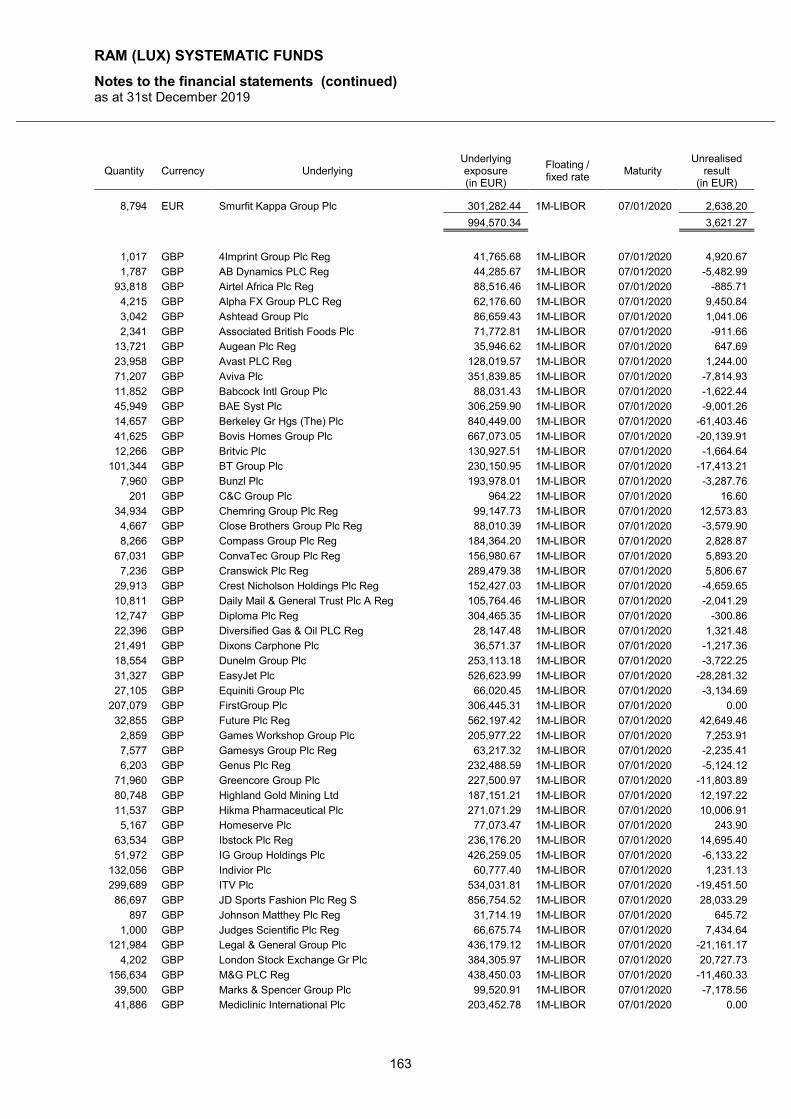
RAM (LUX) SYSTEMATIC FUNDS
Notes to the financial statements (continued) as at 31st December 2019
163
Quantity Currency Underlying Underlying exposure (in EUR)
Floating / fixed rate
Maturity Unrealised
result (in EUR)
8,794 EUR Smurfit Kappa Group Plc 301,282.44 1M-LIBOR 07/01/2020 2,638.20
994,570.34 3,621.27
1,017 GBP 4Imprint Group Plc Reg 41,765.68 1M-LIBOR 07/01/2020 4,920.67
1,787 GBP AB Dynamics PLC Reg 44,285.67 1M-LIBOR 07/01/2020 -5,482.99
93,818 GBP Airtel Africa Plc Reg 88,516.46 1M-LIBOR 07/01/2020 -885.71
4,215 GBP Alpha FX Group PLC Reg 62,176.60 1M-LIBOR 07/01/2020 9,450.84
3,042 GBP Ashtead Group Plc 86,659.43 1M-LIBOR 07/01/2020 1,041.06
2,341 GBP Associated British Foods Plc 71,772.81 1M-LIBOR 07/01/2020 -911.66
13,721 GBP Augean Plc Reg 35,946.62 1M-LIBOR 07/01/2020 647.69
23,958 GBP Avast PLC Reg 128,019.57 1M-LIBOR 07/01/2020 1,244.00
71,207 GBP Aviva Plc 351,839.85 1M-LIBOR 07/01/2020 -7,814.93
11,852 GBP Babcock Intl Group Plc 88,031.43 1M-LIBOR 07/01/2020 -1,622.44
45,949 GBP BAE Syst Plc 306,259.90 1M-LIBOR 07/01/2020 -9,001.26
14,657 GBP Berkeley Gr Hgs (The) Plc 840,449.00 1M-LIBOR 07/01/2020 -61,403.46
41,625 GBP Bovis Homes Group Plc 667,073.05 1M-LIBOR 07/01/2020 -20,139.91
12,266 GBP Britvic Plc 130,927.51 1M-LIBOR 07/01/2020 -1,664.64
101,344 GBP BT Group Plc 230,150.95 1M-LIBOR 07/01/2020 -17,413.21
7,960 GBP Bunzl Plc 193,978.01 1M-LIBOR 07/01/2020 -3,287.76
201 GBP C&C Group Plc 964.22 1M-LIBOR 07/01/2020 16.60
34,934 GBP Chemring Group Plc Reg 99,147.73 1M-LIBOR 07/01/2020 12,573.83
4,667 GBP Close Brothers Group Plc Reg 88,010.39 1M-LIBOR 07/01/2020 -3,579.90
8,266 GBP Compass Group Plc Reg 184,364.20 1M-LIBOR 07/01/2020 2,828.87
67,031 GBP ConvaTec Group Plc Reg 156,980.67 1M-LIBOR 07/01/2020 5,893.20
7,236 GBP Cranswick Plc Reg 289,479.38 1M-LIBOR 07/01/2020 5,806.67
29,913 GBP Crest Nicholson Holdings Plc Reg 152,427.03 1M-LIBOR 07/01/2020 -4,659.65
10,811 GBP Daily Mail & General Trust Plc A Reg 105,764.46 1M-LIBOR 07/01/2020 -2,041.29
12,747 GBP Diploma Plc Reg 304,465.35 1M-LIBOR 07/01/2020 -300.86
22,396 GBP Diversified Gas & Oil PLC Reg 28,147.48 1M-LIBOR 07/01/2020 1,321.48
21,491 GBP Dixons Carphone Plc 36,571.37 1M-LIBOR 07/01/2020 -1,217.36
18,554 GBP Dunelm Group Plc 253,113.18 1M-LIBOR 07/01/2020 -3,722.25
31,327 GBP EasyJet Plc 526,623.99 1M-LIBOR 07/01/2020 -28,281.32
27,105 GBP Equiniti Group Plc 66,020.45 1M-LIBOR 07/01/2020 -3,134.69
207,079 GBP FirstGroup Plc 306,445.31 1M-LIBOR 07/01/2020 0.00
32,855 GBP Future Plc Reg 562,197.42 1M-LIBOR 07/01/2020 42,649.46
2,859 GBP Games Workshop Group Plc 205,977.22 1M-LIBOR 07/01/2020 7,253.91
7,577 GBP Gamesys Group Plc Reg 63,217.32 1M-LIBOR 07/01/2020 -2,235.41
6,203 GBP Genus Plc Reg 232,488.59 1M-LIBOR 07/01/2020 -5,124.12
71,960 GBP Greencore Group Plc 227,500.97 1M-LIBOR 07/01/2020 -11,803.89
80,748 GBP Highland Gold Mining Ltd 187,151.21 1M-LIBOR 07/01/2020 12,197.22
11,537 GBP Hikma Pharmaceutical Plc 271,071.29 1M-LIBOR 07/01/2020 10,006.91
5,167 GBP Homeserve Plc 77,073.47 1M-LIBOR 07/01/2020 243.90
63,534 GBP Ibstock Plc Reg 236,176.20 1M-LIBOR 07/01/2020 14,695.40
51,972 GBP IG Group Holdings Plc 426,259.05 1M-LIBOR 07/01/2020 -6,133.22
132,056 GBP Indivior Plc 60,777.40 1M-LIBOR 07/01/2020 1,231.13
299,689 GBP ITV Plc 534,031.81 1M-LIBOR 07/01/2020 -19,451.50
86,697 GBP JD Sports Fashion Plc Reg S 856,754.52 1M-LIBOR 07/01/2020 28,033.29
897 GBP Johnson Matthey Plc Reg 31,714.19 1M-LIBOR 07/01/2020 645.72
1,000 GBP Judges Scientific Plc Reg 66,675.74 1M-LIBOR 07/01/2020 7,434.64
121,984 GBP Legal & General Group Plc 436,179.12 1M-LIBOR 07/01/2020 -21,161.17
4,202 GBP London Stock Exchange Gr Plc 384,305.97 1M-LIBOR 07/01/2020 20,727.73
156,634 GBP M&G PLC Reg 438,450.03 1M-LIBOR 07/01/2020 -11,460.33
39,500 GBP Marks & Spencer Group Plc 99,520.91 1M-LIBOR 07/01/2020 -7,178.56
41,886 GBP Mediclinic International Plc 203,452.78 1M-LIBOR 07/01/2020 0.00
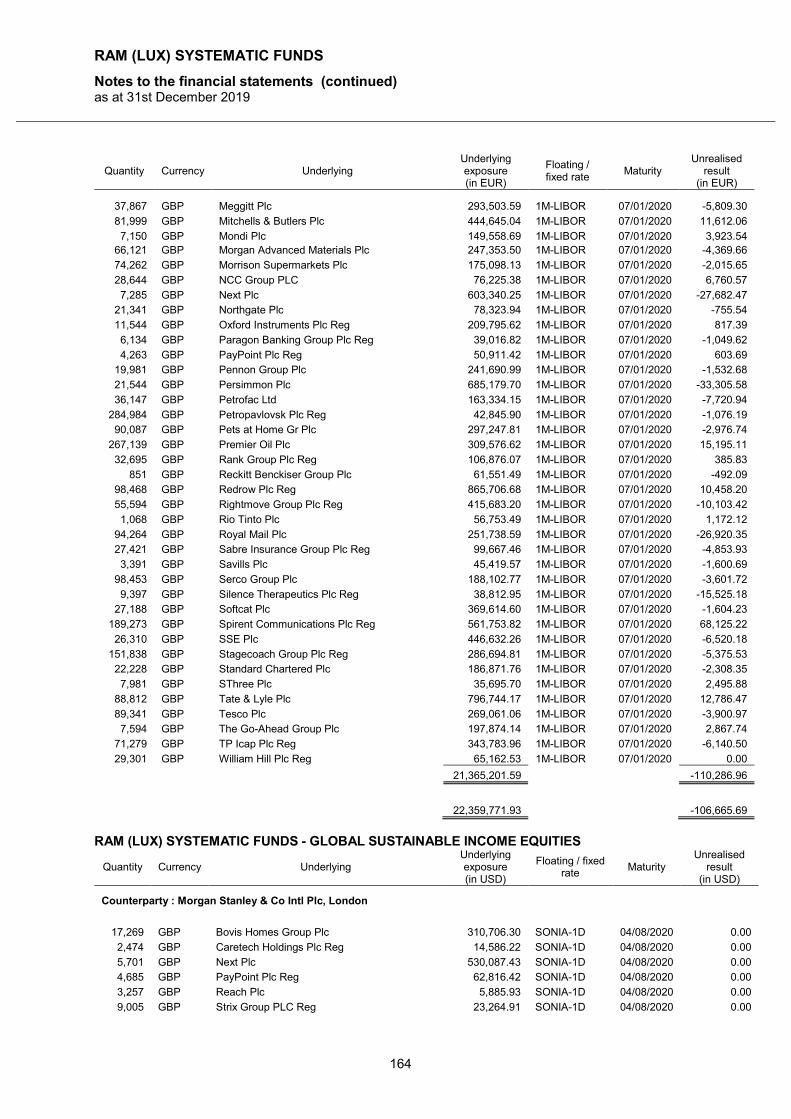
RAM (LUX) SYSTEMATIC FUNDS
Notes to the financial statements (continued) as at 31st December 2019
164
Quantity Currency Underlying Underlying exposure (in EUR)
Floating / fixed rate
Maturity Unrealised
result (in EUR)
37,867 GBP Meggitt Plc 293,503.59 1M-LIBOR 07/01/2020 -5,809.30
81,999 GBP Mitchells & Butlers Plc 444,645.04 1M-LIBOR 07/01/2020 11,612.06
7,150 GBP Mondi Plc 149,558.69 1M-LIBOR 07/01/2020 3,923.54 66,121 GBP Morgan Advanced Materials Plc 247,353.50 1M-LIBOR 07/01/2020 -4,369.66
74,262 GBP Morrison Supermarkets Plc 175,098.13 1M-LIBOR 07/01/2020 -2,015.65
28,644 GBP NCC Group PLC 76,225.38 1M-LIBOR 07/01/2020 6,760.57
7,285 GBP Next Plc 603,340.25 1M-LIBOR 07/01/2020 -27,682.47
21,341 GBP Northgate Plc 78,323.94 1M-LIBOR 07/01/2020 -755.54
11,544 GBP Oxford Instruments Plc Reg 209,795.62 1M-LIBOR 07/01/2020 817.39
6,134 GBP Paragon Banking Group Plc Reg 39,016.82 1M-LIBOR 07/01/2020 -1,049.62
4,263 GBP PayPoint Plc Reg 50,911.42 1M-LIBOR 07/01/2020 603.69
19,981 GBP Pennon Group Plc 241,690.99 1M-LIBOR 07/01/2020 -1,532.68
21,544 GBP Persimmon Plc 685,179.70 1M-LIBOR 07/01/2020 -33,305.58
36,147 GBP Petrofac Ltd 163,334.15 1M-LIBOR 07/01/2020 -7,720.94
284,984 GBP Petropavlovsk Plc Reg 42,845.90 1M-LIBOR 07/01/2020 -1,076.19
90,087 GBP Pets at Home Gr Plc 297,247.81 1M-LIBOR 07/01/2020 -2,976.74
267,139 GBP Premier Oil Plc 309,576.62 1M-LIBOR 07/01/2020 15,195.11
32,695 GBP Rank Group Plc Reg 106,876.07 1M-LIBOR 07/01/2020 385.83
851 GBP Reckitt Benckiser Group Plc 61,551.49 1M-LIBOR 07/01/2020 -492.09
98,468 GBP Redrow Plc Reg 865,706.68 1M-LIBOR 07/01/2020 10,458.20
55,594 GBP Rightmove Group Plc Reg 415,683.20 1M-LIBOR 07/01/2020 -10,103.42
1,068 GBP Rio Tinto Plc 56,753.49 1M-LIBOR 07/01/2020 1,172.12
94,264 GBP Royal Mail Plc 251,738.59 1M-LIBOR 07/01/2020 -26,920.35
27,421 GBP Sabre Insurance Group Plc Reg 99,667.46 1M-LIBOR 07/01/2020 -4,853.93
3,391 GBP Savills Plc 45,419.57 1M-LIBOR 07/01/2020 -1,600.69
98,453 GBP Serco Group Plc 188,102.77 1M-LIBOR 07/01/2020 -3,601.72
9,397 GBP Silence Therapeutics Plc Reg 38,812.95 1M-LIBOR 07/01/2020 -15,525.18
27,188 GBP Softcat Plc 369,614.60 1M-LIBOR 07/01/2020 -1,604.23
189,273 GBP Spirent Communications Plc Reg 561,753.82 1M-LIBOR 07/01/2020 68,125.22
26,310 GBP SSE Plc 446,632.26 1M-LIBOR 07/01/2020 -6,520.18
151,838 GBP Stagecoach Group Plc Reg 286,694.81 1M-LIBOR 07/01/2020 -5,375.53
22,228 GBP Standard Chartered Plc 186,871.76 1M-LIBOR 07/01/2020 -2,308.35
7,981 GBP SThree Plc 35,695.70 1M-LIBOR 07/01/2020 2,495.88
88,812 GBP Tate & Lyle Plc 796,744.17 1M-LIBOR 07/01/2020 12,786.47
89,341 GBP Tesco Plc 269,061.06 1M-LIBOR 07/01/2020 -3,900.97
7,594 GBP The Go-Ahead Group Plc 197,874.14 1M-LIBOR 07/01/2020 2,867.74
71,279 GBP TP Icap Plc Reg 343,783.96 1M-LIBOR 07/01/2020 -6,140.50
29,301 GBP William Hill Plc Reg 65,162.53 1M-LIBOR 07/01/2020 0.00
21,365,201.59 -110,286.96
22,359,771.93 -106,665.69
RAM (LUX) SYSTEMATIC FUNDS - GLOBAL SUSTAINABLE INCOME EQUITIES
Quantity Currency Underlying Underlying exposure (in USD)
Floating / fixed rate
Maturity Unrealised
result (in USD)
Counterparty : Morgan Stanley & Co Intl Plc, London
17,269 GBP Bovis Homes Group Plc 310,706.30 SONIA-1D 04/08/2020 0.00
2,474 GBP Caretech Holdings Plc Reg 14,586.22 SONIA-1D 04/08/2020 0.00
5,701 GBP Next Plc 530,087.43 SONIA-1D 04/08/2020 0.00
4,685 GBP PayPoint Plc Reg 62,816.42 SONIA-1D 04/08/2020 0.00
3,257 GBP Reach Plc 5,885.93 SONIA-1D 04/08/2020 0.00
9,005 GBP Strix Group PLC Reg 23,264.91 SONIA-1D 04/08/2020 0.00
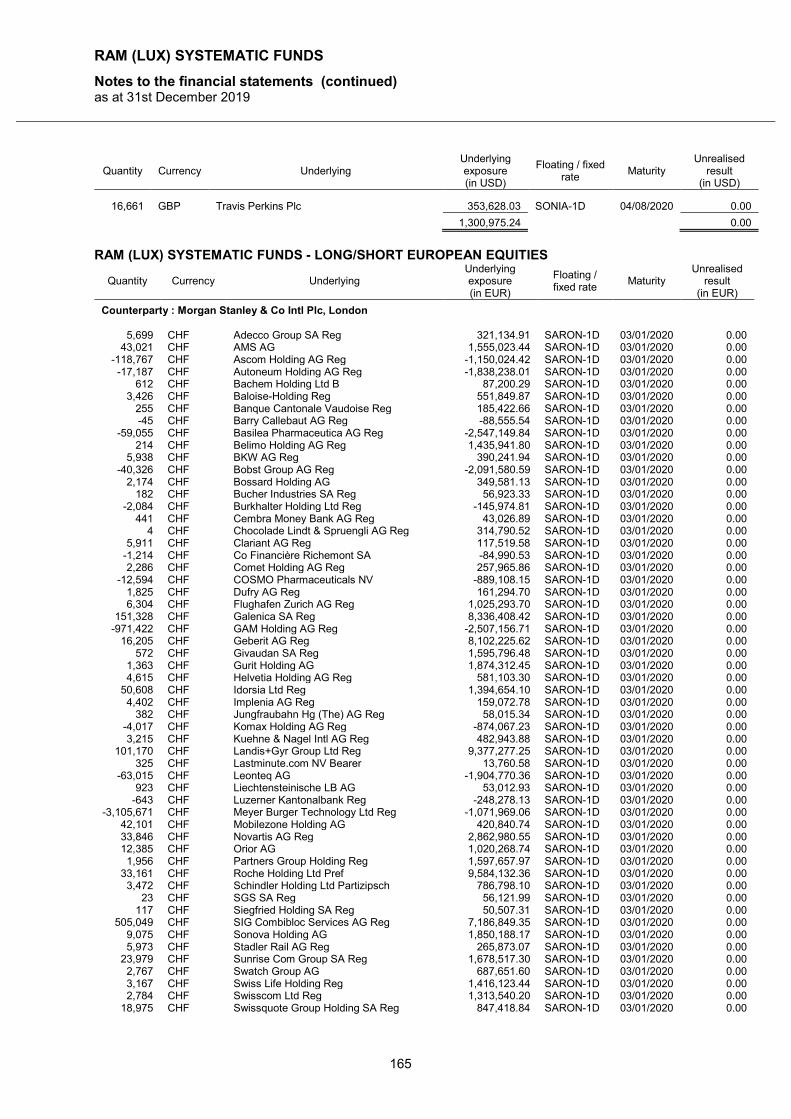
RAM (LUX) SYSTEMATIC FUNDS
Notes to the financial statements (continued) as at 31st December 2019
165
Quantity Currency Underlying Underlying exposure (in USD)
Floating / fixed rate
Maturity Unrealised
result (in USD)
16,661 GBP Travis Perkins Plc 353,628.03 SONIA-1D 04/08/2020 0.00
1,300,975.24 0.00
RAM (LUX) SYSTEMATIC FUNDS - LONG/SHORT EUROPEAN EQUITIES
Quantity Currency Underlying Underlying exposure (in EUR)
Floating / fixed rate
Maturity Unrealised
result (in EUR)
Counterparty : Morgan Stanley & Co Intl Plc, London
5,699 CHF Adecco Group SA Reg 321,134.91 SARON-1D 03/01/2020 0.00 43,021 CHF AMS AG 1,555,023.44 SARON-1D 03/01/2020 0.00
-118,767 CHF Ascom Holding AG Reg -1,150,024.42 SARON-1D 03/01/2020 0.00 -17,187 CHF Autoneum Holding AG Reg -1,838,238.01 SARON-1D 03/01/2020 0.00
612 CHF Bachem Holding Ltd B 87,200.29 SARON-1D 03/01/2020 0.00 3,426 CHF Baloise-Holding Reg 551,849.87 SARON-1D 03/01/2020 0.00
255 CHF Banque Cantonale Vaudoise Reg 185,422.66 SARON-1D 03/01/2020 0.00 -45 CHF Barry Callebaut AG Reg -88,555.54 SARON-1D 03/01/2020 0.00
-59,055 CHF Basilea Pharmaceutica AG Reg -2,547,149.84 SARON-1D 03/01/2020 0.00 214 CHF Belimo Holding AG Reg 1,435,941.80 SARON-1D 03/01/2020 0.00
5,938 CHF BKW AG Reg 390,241.94 SARON-1D 03/01/2020 0.00 -40,326 CHF Bobst Group AG Reg -2,091,580.59 SARON-1D 03/01/2020 0.00
2,174 CHF Bossard Holding AG 349,581.13 SARON-1D 03/01/2020 0.00 182 CHF Bucher Industries SA Reg 56,923.33 SARON-1D 03/01/2020 0.00
-2,084 CHF Burkhalter Holding Ltd Reg -145,974.81 SARON-1D 03/01/2020 0.00 441 CHF Cembra Money Bank AG Reg 43,026.89 SARON-1D 03/01/2020 0.00
4 CHF Chocolade Lindt & Spruengli AG Reg 314,790.52 SARON-1D 03/01/2020 0.00 5,911 CHF Clariant AG Reg 117,519.58 SARON-1D 03/01/2020 0.00
-1,214 CHF Co Financière Richemont SA -84,990.53 SARON-1D 03/01/2020 0.00 2,286 CHF Comet Holding AG Reg 257,965.86 SARON-1D 03/01/2020 0.00
-12,594 CHF COSMO Pharmaceuticals NV -889,108.15 SARON-1D 03/01/2020 0.00 1,825 CHF Dufry AG Reg 161,294.70 SARON-1D 03/01/2020 0.00 6,304 CHF Flughafen Zurich AG Reg 1,025,293.70 SARON-1D 03/01/2020 0.00
151,328 CHF Galenica SA Reg 8,336,408.42 SARON-1D 03/01/2020 0.00 -971,422 CHF GAM Holding AG Reg -2,507,156.71 SARON-1D 03/01/2020 0.00
16,205 CHF Geberit AG Reg 8,102,225.62 SARON-1D 03/01/2020 0.00 572 CHF Givaudan SA Reg 1,595,796.48 SARON-1D 03/01/2020 0.00
1,363 CHF Gurit Holding AG 1,874,312.45 SARON-1D 03/01/2020 0.00 4,615 CHF Helvetia Holding AG Reg 581,103.30 SARON-1D 03/01/2020 0.00
50,608 CHF Idorsia Ltd Reg 1,394,654.10 SARON-1D 03/01/2020 0.00 4,402 CHF Implenia AG Reg 159,072.78 SARON-1D 03/01/2020 0.00
382 CHF Jungfraubahn Hg (The) AG Reg 58,015.34 SARON-1D 03/01/2020 0.00 -4,017 CHF Komax Holding AG Reg -874,067.23 SARON-1D 03/01/2020 0.00 3,215 CHF Kuehne & Nagel Intl AG Reg 482,943.88 SARON-1D 03/01/2020 0.00
101,170 CHF Landis+Gyr Group Ltd Reg 9,377,277.25 SARON-1D 03/01/2020 0.00 325 CHF Lastminute.com NV Bearer 13,760.58 SARON-1D 03/01/2020 0.00
-63,015 CHF Leonteq AG -1,904,770.36 SARON-1D 03/01/2020 0.00 923 CHF Liechtensteinische LB AG 53,012.93 SARON-1D 03/01/2020 0.00
-643 CHF Luzerner Kantonalbank Reg -248,278.13 SARON-1D 03/01/2020 0.00 -3,105,671 CHF Meyer Burger Technology Ltd Reg -1,071,969.06 SARON-1D 03/01/2020 0.00
42,101 CHF Mobilezone Holding AG 420,840.74 SARON-1D 03/01/2020 0.00 33,846 CHF Novartis AG Reg 2,862,980.55 SARON-1D 03/01/2020 0.00 12,385 CHF Orior AG 1,020,268.74 SARON-1D 03/01/2020 0.00 1,956 CHF Partners Group Holding Reg 1,597,657.97 SARON-1D 03/01/2020 0.00
33,161 CHF Roche Holding Ltd Pref 9,584,132.36 SARON-1D 03/01/2020 0.00 3,472 CHF Schindler Holding Ltd Partizipsch 786,798.10 SARON-1D 03/01/2020 0.00
23 CHF SGS SA Reg 56,121.99 SARON-1D 03/01/2020 0.00 117 CHF Siegfried Holding SA Reg 50,507.31 SARON-1D 03/01/2020 0.00
505,049 CHF SIG Combibloc Services AG Reg 7,186,849.35 SARON-1D 03/01/2020 0.00 9,075 CHF Sonova Holding AG 1,850,188.17 SARON-1D 03/01/2020 0.00 5,973 CHF Stadler Rail AG Reg 265,873.07 SARON-1D 03/01/2020 0.00
23,979 CHF Sunrise Com Group SA Reg 1,678,517.30 SARON-1D 03/01/2020 0.00 2,767 CHF Swatch Group AG 687,651.60 SARON-1D 03/01/2020 0.00 3,167 CHF Swiss Life Holding Reg 1,416,123.44 SARON-1D 03/01/2020 0.00 2,784 CHF Swisscom Ltd Reg 1,313,540.20 SARON-1D 03/01/2020 0.00
18,975 CHF Swissquote Group Holding SA Reg 847,418.84 SARON-1D 03/01/2020 0.00
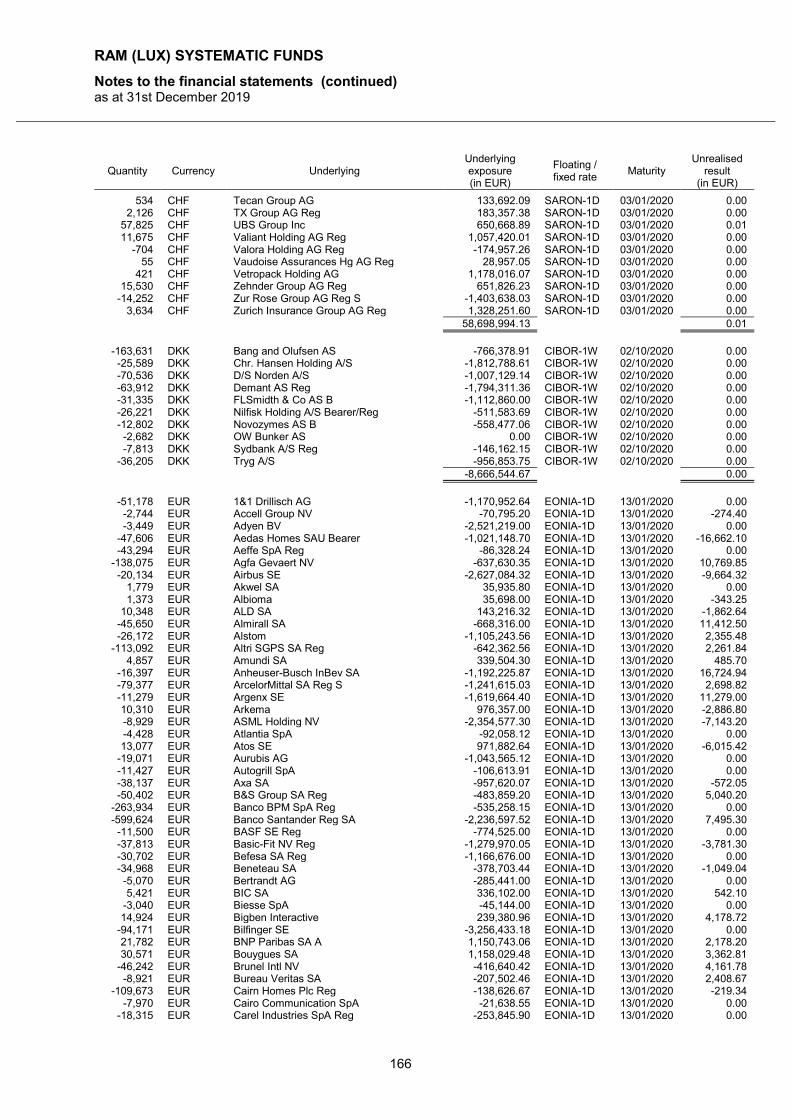
RAM (LUX) SYSTEMATIC FUNDS
Notes to the financial statements (continued) as at 31st December 2019
166
Quantity Currency Underlying Underlying exposure (in EUR)
Floating / fixed rate
Maturity Unrealised
result (in EUR)
534 CHF Tecan Group AG 133,692.09 SARON-1D 03/01/2020 0.00 2,126 CHF TX Group AG Reg 183,357.38 SARON-1D 03/01/2020 0.00
57,825 CHF UBS Group Inc 650,668.89 SARON-1D 03/01/2020 0.01 11,675 CHF Valiant Holding AG Reg 1,057,420.01 SARON-1D 03/01/2020 0.00
-704 CHF Valora Holding AG Reg -174,957.26 SARON-1D 03/01/2020 0.00 55 CHF Vaudoise Assurances Hg AG Reg 28,957.05 SARON-1D 03/01/2020 0.00
421 CHF Vetropack Holding AG 1,178,016.07 SARON-1D 03/01/2020 0.00 15,530 CHF Zehnder Group AG Reg 651,826.23 SARON-1D 03/01/2020 0.00
-14,252 CHF Zur Rose Group AG Reg S -1,403,638.03 SARON-1D 03/01/2020 0.00 3,634 CHF Zurich Insurance Group AG Reg 1,328,251.60 SARON-1D 03/01/2020 0.00
58,698,994.13 0.01
-163,631 DKK Bang and Olufsen AS -766,378.91 CIBOR-1W 02/10/2020 0.00 -25,589 DKK Chr. Hansen Holding A/S -1,812,788.61 CIBOR-1W 02/10/2020 0.00 -70,536 DKK D/S Norden A/S -1,007,129.14 CIBOR-1W 02/10/2020 0.00 -63,912 DKK Demant AS Reg -1,794,311.36 CIBOR-1W 02/10/2020 0.00 -31,335 DKK FLSmidth & Co AS B -1,112,860.00 CIBOR-1W 02/10/2020 0.00 -26,221 DKK Nilfisk Holding A/S Bearer/Reg -511,583.69 CIBOR-1W 02/10/2020 0.00 -12,802 DKK Novozymes AS B -558,477.06 CIBOR-1W 02/10/2020 0.00 -2,682 DKK OW Bunker AS 0.00 CIBOR-1W 02/10/2020 0.00 -7,813 DKK Sydbank A/S Reg -146,162.15 CIBOR-1W 02/10/2020 0.00
-36,205 DKK Tryg A/S -956,853.75 CIBOR-1W 02/10/2020 0.00 -8,666,544.67 0.00
-51,178 EUR 1&1 Drillisch AG -1,170,952.64 EONIA-1D 13/01/2020 0.00 -2,744 EUR Accell Group NV -70,795.20 EONIA-1D 13/01/2020 -274.40 -3,449 EUR Adyen BV -2,521,219.00 EONIA-1D 13/01/2020 0.00
-47,606 EUR Aedas Homes SAU Bearer -1,021,148.70 EONIA-1D 13/01/2020 -16,662.10 -43,294 EUR Aeffe SpA Reg -86,328.24 EONIA-1D 13/01/2020 0.00
-138,075 EUR Agfa Gevaert NV -637,630.35 EONIA-1D 13/01/2020 10,769.85 -20,134 EUR Airbus SE -2,627,084.32 EONIA-1D 13/01/2020 -9,664.32
1,779 EUR Akwel SA 35,935.80 EONIA-1D 13/01/2020 0.00 1,373 EUR Albioma 35,698.00 EONIA-1D 13/01/2020 -343.25
10,348 EUR ALD SA 143,216.32 EONIA-1D 13/01/2020 -1,862.64 -45,650 EUR Almirall SA -668,316.00 EONIA-1D 13/01/2020 11,412.50 -26,172 EUR Alstom -1,105,243.56 EONIA-1D 13/01/2020 2,355.48
-113,092 EUR Altri SGPS SA Reg -642,362.56 EONIA-1D 13/01/2020 2,261.84 4,857 EUR Amundi SA 339,504.30 EONIA-1D 13/01/2020 485.70
-16,397 EUR Anheuser-Busch InBev SA -1,192,225.87 EONIA-1D 13/01/2020 16,724.94 -79,377 EUR ArcelorMittal SA Reg S -1,241,615.03 EONIA-1D 13/01/2020 2,698.82 -11,279 EUR Argenx SE -1,619,664.40 EONIA-1D 13/01/2020 11,279.00 10,310 EUR Arkema 976,357.00 EONIA-1D 13/01/2020 -2,886.80 -8,929 EUR ASML Holding NV -2,354,577.30 EONIA-1D 13/01/2020 -7,143.20 -4,428 EUR Atlantia SpA -92,058.12 EONIA-1D 13/01/2020 0.00 13,077 EUR Atos SE 971,882.64 EONIA-1D 13/01/2020 -6,015.42
-19,071 EUR Aurubis AG -1,043,565.12 EONIA-1D 13/01/2020 0.00 -11,427 EUR Autogrill SpA -106,613.91 EONIA-1D 13/01/2020 0.00 -38,137 EUR Axa SA -957,620.07 EONIA-1D 13/01/2020 -572.05 -50,402 EUR B&S Group SA Reg -483,859.20 EONIA-1D 13/01/2020 5,040.20
-263,934 EUR Banco BPM SpA Reg -535,258.15 EONIA-1D 13/01/2020 0.00 -599,624 EUR Banco Santander Reg SA -2,236,597.52 EONIA-1D 13/01/2020 7,495.30 -11,500 EUR BASF SE Reg -774,525.00 EONIA-1D 13/01/2020 0.00 -37,813 EUR Basic-Fit NV Reg -1,279,970.05 EONIA-1D 13/01/2020 -3,781.30 -30,702 EUR Befesa SA Reg -1,166,676.00 EONIA-1D 13/01/2020 0.00 -34,968 EUR Beneteau SA -378,703.44 EONIA-1D 13/01/2020 -1,049.04 -5,070 EUR Bertrandt AG -285,441.00 EONIA-1D 13/01/2020 0.00 5,421 EUR BIC SA 336,102.00 EONIA-1D 13/01/2020 542.10
-3,040 EUR Biesse SpA -45,144.00 EONIA-1D 13/01/2020 0.00 14,924 EUR Bigben Interactive 239,380.96 EONIA-1D 13/01/2020 4,178.72
-94,171 EUR Bilfinger SE -3,256,433.18 EONIA-1D 13/01/2020 0.00 21,782 EUR BNP Paribas SA A 1,150,743.06 EONIA-1D 13/01/2020 2,178.20 30,571 EUR Bouygues SA 1,158,029.48 EONIA-1D 13/01/2020 3,362.81
-46,242 EUR Brunel Intl NV -416,640.42 EONIA-1D 13/01/2020 4,161.78 -8,921 EUR Bureau Veritas SA -207,502.46 EONIA-1D 13/01/2020 2,408.67
-109,673 EUR Cairn Homes Plc Reg -138,626.67 EONIA-1D 13/01/2020 -219.34 -7,970 EUR Cairo Communication SpA -21,638.55 EONIA-1D 13/01/2020 0.00
-18,315 EUR Carel Industries SpA Reg -253,845.90 EONIA-1D 13/01/2020 0.00
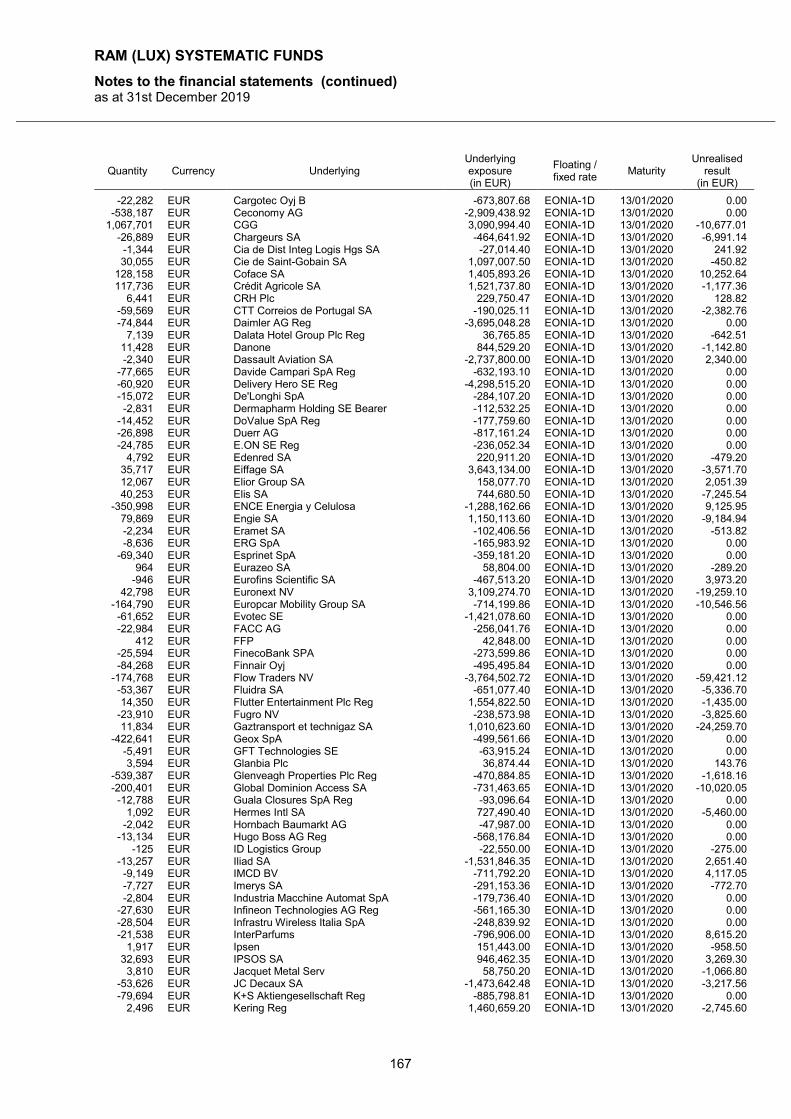
RAM (LUX) SYSTEMATIC FUNDS
Notes to the financial statements (continued) as at 31st December 2019
167
Quantity Currency Underlying Underlying exposure (in EUR)
Floating / fixed rate
Maturity Unrealised
result (in EUR)
-22,282 EUR Cargotec Oyj B -673,807.68 EONIA-1D 13/01/2020 0.00 -538,187 EUR Ceconomy AG -2,909,438.92 EONIA-1D 13/01/2020 0.00
1,067,701 EUR CGG 3,090,994.40 EONIA-1D 13/01/2020 -10,677.01 -26,889 EUR Chargeurs SA -464,641.92 EONIA-1D 13/01/2020 -6,991.14 -1,344 EUR Cia de Dist Integ Logis Hgs SA -27,014.40 EONIA-1D 13/01/2020 241.92 30,055 EUR Cie de Saint-Gobain SA 1,097,007.50 EONIA-1D 13/01/2020 -450.82
128,158 EUR Coface SA 1,405,893.26 EONIA-1D 13/01/2020 10,252.64 117,736 EUR Crédit Agricole SA 1,521,737.80 EONIA-1D 13/01/2020 -1,177.36
6,441 EUR CRH Plc 229,750.47 EONIA-1D 13/01/2020 128.82 -59,569 EUR CTT Correios de Portugal SA -190,025.11 EONIA-1D 13/01/2020 -2,382.76 -74,844 EUR Daimler AG Reg -3,695,048.28 EONIA-1D 13/01/2020 0.00
7,139 EUR Dalata Hotel Group Plc Reg 36,765.85 EONIA-1D 13/01/2020 -642.51 11,428 EUR Danone 844,529.20 EONIA-1D 13/01/2020 -1,142.80 -2,340 EUR Dassault Aviation SA -2,737,800.00 EONIA-1D 13/01/2020 2,340.00
-77,665 EUR Davide Campari SpA Reg -632,193.10 EONIA-1D 13/01/2020 0.00 -60,920 EUR Delivery Hero SE Reg -4,298,515.20 EONIA-1D 13/01/2020 0.00 -15,072 EUR De'Longhi SpA -284,107.20 EONIA-1D 13/01/2020 0.00 -2,831 EUR Dermapharm Holding SE Bearer -112,532.25 EONIA-1D 13/01/2020 0.00
-14,452 EUR DoValue SpA Reg -177,759.60 EONIA-1D 13/01/2020 0.00 -26,898 EUR Duerr AG -817,161.24 EONIA-1D 13/01/2020 0.00 -24,785 EUR E.ON SE Reg -236,052.34 EONIA-1D 13/01/2020 0.00
4,792 EUR Edenred SA 220,911.20 EONIA-1D 13/01/2020 -479.20 35,717 EUR Eiffage SA 3,643,134.00 EONIA-1D 13/01/2020 -3,571.70 12,067 EUR Elior Group SA 158,077.70 EONIA-1D 13/01/2020 2,051.39 40,253 EUR Elis SA 744,680.50 EONIA-1D 13/01/2020 -7,245.54
-350,998 EUR ENCE Energia y Celulosa -1,288,162.66 EONIA-1D 13/01/2020 9,125.95 79,869 EUR Engie SA 1,150,113.60 EONIA-1D 13/01/2020 -9,184.94 -2,234 EUR Eramet SA -102,406.56 EONIA-1D 13/01/2020 -513.82 -8,636 EUR ERG SpA -165,983.92 EONIA-1D 13/01/2020 0.00
-69,340 EUR Esprinet SpA -359,181.20 EONIA-1D 13/01/2020 0.00 964 EUR Eurazeo SA 58,804.00 EONIA-1D 13/01/2020 -289.20
-946 EUR Eurofins Scientific SA -467,513.20 EONIA-1D 13/01/2020 3,973.20 42,798 EUR Euronext NV 3,109,274.70 EONIA-1D 13/01/2020 -19,259.10
-164,790 EUR Europcar Mobility Group SA -714,199.86 EONIA-1D 13/01/2020 -10,546.56 -61,652 EUR Evotec SE -1,421,078.60 EONIA-1D 13/01/2020 0.00 -22,984 EUR FACC AG -256,041.76 EONIA-1D 13/01/2020 0.00
412 EUR FFP 42,848.00 EONIA-1D 13/01/2020 0.00 -25,594 EUR FinecoBank SPA -273,599.86 EONIA-1D 13/01/2020 0.00 -84,268 EUR Finnair Oyj -495,495.84 EONIA-1D 13/01/2020 0.00
-174,768 EUR Flow Traders NV -3,764,502.72 EONIA-1D 13/01/2020 -59,421.12 -53,367 EUR Fluidra SA -651,077.40 EONIA-1D 13/01/2020 -5,336.70 14,350 EUR Flutter Entertainment Plc Reg 1,554,822.50 EONIA-1D 13/01/2020 -1,435.00
-23,910 EUR Fugro NV -238,573.98 EONIA-1D 13/01/2020 -3,825.60 11,834 EUR Gaztransport et technigaz SA 1,010,623.60 EONIA-1D 13/01/2020 -24,259.70
-422,641 EUR Geox SpA -499,561.66 EONIA-1D 13/01/2020 0.00 -5,491 EUR GFT Technologies SE -63,915.24 EONIA-1D 13/01/2020 0.00 3,594 EUR Glanbia Plc 36,874.44 EONIA-1D 13/01/2020 143.76
-539,387 EUR Glenveagh Properties Plc Reg -470,884.85 EONIA-1D 13/01/2020 -1,618.16 -200,401 EUR Global Dominion Access SA -731,463.65 EONIA-1D 13/01/2020 -10,020.05 -12,788 EUR Guala Closures SpA Reg -93,096.64 EONIA-1D 13/01/2020 0.00
1,092 EUR Hermes Intl SA 727,490.40 EONIA-1D 13/01/2020 -5,460.00 -2,042 EUR Hornbach Baumarkt AG -47,987.00 EONIA-1D 13/01/2020 0.00
-13,134 EUR Hugo Boss AG Reg -568,176.84 EONIA-1D 13/01/2020 0.00 -125 EUR ID Logistics Group -22,550.00 EONIA-1D 13/01/2020 -275.00
-13,257 EUR Iliad SA -1,531,846.35 EONIA-1D 13/01/2020 2,651.40 -9,149 EUR IMCD BV -711,792.20 EONIA-1D 13/01/2020 4,117.05 -7,727 EUR Imerys SA -291,153.36 EONIA-1D 13/01/2020 -772.70 -2,804 EUR Industria Macchine Automat SpA -179,736.40 EONIA-1D 13/01/2020 0.00
-27,630 EUR Infineon Technologies AG Reg -561,165.30 EONIA-1D 13/01/2020 0.00 -28,504 EUR Infrastru Wireless Italia SpA -248,839.92 EONIA-1D 13/01/2020 0.00 -21,538 EUR InterParfums -796,906.00 EONIA-1D 13/01/2020 8,615.20
1,917 EUR Ipsen 151,443.00 EONIA-1D 13/01/2020 -958.50 32,693 EUR IPSOS SA 946,462.35 EONIA-1D 13/01/2020 3,269.30 3,810 EUR Jacquet Metal Serv 58,750.20 EONIA-1D 13/01/2020 -1,066.80
-53,626 EUR JC Decaux SA -1,473,642.48 EONIA-1D 13/01/2020 -3,217.56 -79,694 EUR K+S Aktiengesellschaft Reg -885,798.81 EONIA-1D 13/01/2020 0.00
2,496 EUR Kering Reg 1,460,659.20 EONIA-1D 13/01/2020 -2,745.60
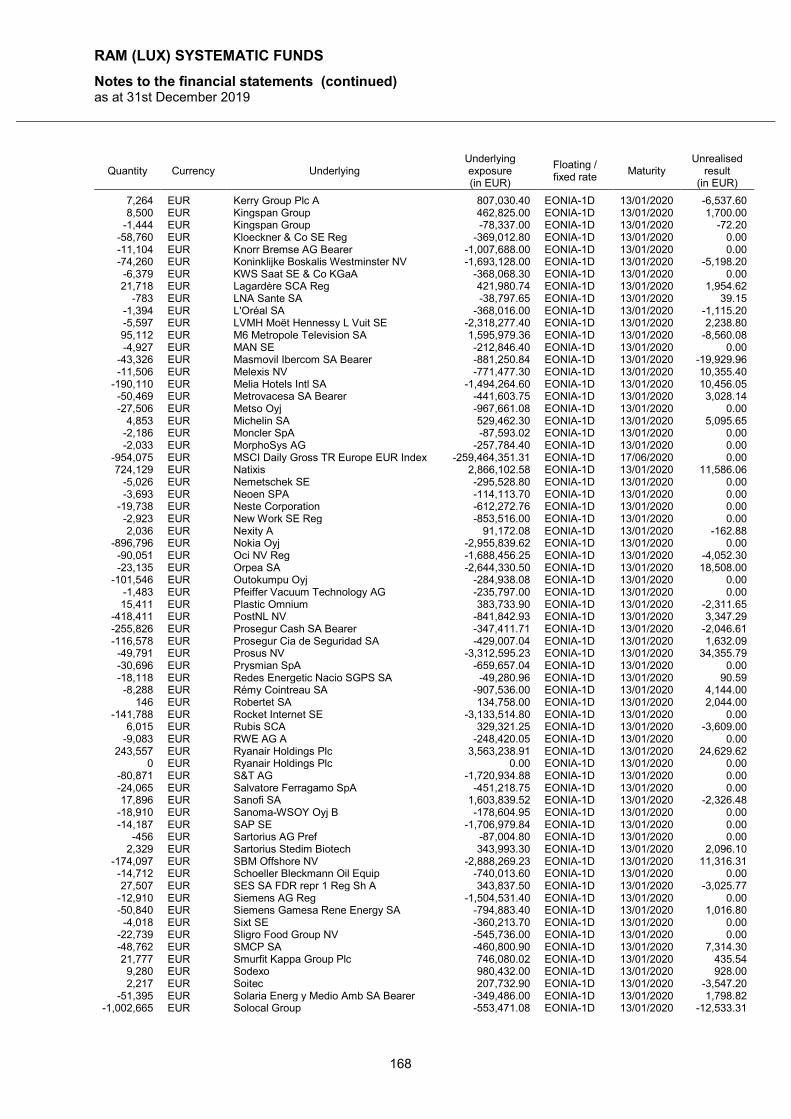
RAM (LUX) SYSTEMATIC FUNDS
Notes to the financial statements (continued) as at 31st December 2019
168
Quantity Currency Underlying Underlying exposure (in EUR)
Floating / fixed rate
Maturity Unrealised
result (in EUR)
7,264 EUR Kerry Group Plc A 807,030.40 EONIA-1D 13/01/2020 -6,537.60 8,500 EUR Kingspan Group 462,825.00 EONIA-1D 13/01/2020 1,700.00
-1,444 EUR Kingspan Group -78,337.00 EONIA-1D 13/01/2020 -72.20 -58,760 EUR Kloeckner & Co SE Reg -369,012.80 EONIA-1D 13/01/2020 0.00 -11,104 EUR Knorr Bremse AG Bearer -1,007,688.00 EONIA-1D 13/01/2020 0.00 -74,260 EUR Koninklijke Boskalis Westminster NV -1,693,128.00 EONIA-1D 13/01/2020 -5,198.20 -6,379 EUR KWS Saat SE & Co KGaA -368,068.30 EONIA-1D 13/01/2020 0.00 21,718 EUR Lagardère SCA Reg 421,980.74 EONIA-1D 13/01/2020 1,954.62
-783 EUR LNA Sante SA -38,797.65 EONIA-1D 13/01/2020 39.15 -1,394 EUR L'Oréal SA -368,016.00 EONIA-1D 13/01/2020 -1,115.20 -5,597 EUR LVMH Moët Hennessy L Vuit SE -2,318,277.40 EONIA-1D 13/01/2020 2,238.80 95,112 EUR M6 Metropole Television SA 1,595,979.36 EONIA-1D 13/01/2020 -8,560.08 -4,927 EUR MAN SE -212,846.40 EONIA-1D 13/01/2020 0.00
-43,326 EUR Masmovil Ibercom SA Bearer -881,250.84 EONIA-1D 13/01/2020 -19,929.96 -11,506 EUR Melexis NV -771,477.30 EONIA-1D 13/01/2020 10,355.40
-190,110 EUR Melia Hotels Intl SA -1,494,264.60 EONIA-1D 13/01/2020 10,456.05 -50,469 EUR Metrovacesa SA Bearer -441,603.75 EONIA-1D 13/01/2020 3,028.14 -27,506 EUR Metso Oyj -967,661.08 EONIA-1D 13/01/2020 0.00
4,853 EUR Michelin SA 529,462.30 EONIA-1D 13/01/2020 5,095.65 -2,186 EUR Moncler SpA -87,593.02 EONIA-1D 13/01/2020 0.00 -2,033 EUR MorphoSys AG -257,784.40 EONIA-1D 13/01/2020 0.00
-954,075 EUR MSCI Daily Gross TR Europe EUR Index -259,464,351.31 EONIA-1D 17/06/2020 0.00 724,129 EUR Natixis 2,866,102.58 EONIA-1D 13/01/2020 11,586.06
-5,026 EUR Nemetschek SE -295,528.80 EONIA-1D 13/01/2020 0.00 -3,693 EUR Neoen SPA -114,113.70 EONIA-1D 13/01/2020 0.00
-19,738 EUR Neste Corporation -612,272.76 EONIA-1D 13/01/2020 0.00 -2,923 EUR New Work SE Reg -853,516.00 EONIA-1D 13/01/2020 0.00 2,036 EUR Nexity A 91,172.08 EONIA-1D 13/01/2020 -162.88
-896,796 EUR Nokia Oyj -2,955,839.62 EONIA-1D 13/01/2020 0.00 -90,051 EUR Oci NV Reg -1,688,456.25 EONIA-1D 13/01/2020 -4,052.30 -23,135 EUR Orpea SA -2,644,330.50 EONIA-1D 13/01/2020 18,508.00
-101,546 EUR Outokumpu Oyj -284,938.08 EONIA-1D 13/01/2020 0.00 -1,483 EUR Pfeiffer Vacuum Technology AG -235,797.00 EONIA-1D 13/01/2020 0.00 15,411 EUR Plastic Omnium 383,733.90 EONIA-1D 13/01/2020 -2,311.65
-418,411 EUR PostNL NV -841,842.93 EONIA-1D 13/01/2020 3,347.29 -255,826 EUR Prosegur Cash SA Bearer -347,411.71 EONIA-1D 13/01/2020 -2,046.61 -116,578 EUR Prosegur Cia de Seguridad SA -429,007.04 EONIA-1D 13/01/2020 1,632.09 -49,791 EUR Prosus NV -3,312,595.23 EONIA-1D 13/01/2020 34,355.79 -30,696 EUR Prysmian SpA -659,657.04 EONIA-1D 13/01/2020 0.00 -18,118 EUR Redes Energetic Nacio SGPS SA -49,280.96 EONIA-1D 13/01/2020 90.59 -8,288 EUR Rémy Cointreau SA -907,536.00 EONIA-1D 13/01/2020 4,144.00
146 EUR Robertet SA 134,758.00 EONIA-1D 13/01/2020 2,044.00 -141,788 EUR Rocket Internet SE -3,133,514.80 EONIA-1D 13/01/2020 0.00
6,015 EUR Rubis SCA 329,321.25 EONIA-1D 13/01/2020 -3,609.00 -9,083 EUR RWE AG A -248,420.05 EONIA-1D 13/01/2020 0.00
243,557 EUR Ryanair Holdings Plc 3,563,238.91 EONIA-1D 13/01/2020 24,629.62 0 EUR Ryanair Holdings Plc 0.00 EONIA-1D 13/01/2020 0.00
-80,871 EUR S&T AG -1,720,934.88 EONIA-1D 13/01/2020 0.00 -24,065 EUR Salvatore Ferragamo SpA -451,218.75 EONIA-1D 13/01/2020 0.00 17,896 EUR Sanofi SA 1,603,839.52 EONIA-1D 13/01/2020 -2,326.48
-18,910 EUR Sanoma-WSOY Oyj B -178,604.95 EONIA-1D 13/01/2020 0.00 -14,187 EUR SAP SE -1,706,979.84 EONIA-1D 13/01/2020 0.00
-456 EUR Sartorius AG Pref -87,004.80 EONIA-1D 13/01/2020 0.00 2,329 EUR Sartorius Stedim Biotech 343,993.30 EONIA-1D 13/01/2020 2,096.10
-174,097 EUR SBM Offshore NV -2,888,269.23 EONIA-1D 13/01/2020 11,316.31 -14,712 EUR Schoeller Bleckmann Oil Equip -740,013.60 EONIA-1D 13/01/2020 0.00 27,507 EUR SES SA FDR repr 1 Reg Sh A 343,837.50 EONIA-1D 13/01/2020 -3,025.77
-12,910 EUR Siemens AG Reg -1,504,531.40 EONIA-1D 13/01/2020 0.00 -50,840 EUR Siemens Gamesa Rene Energy SA -794,883.40 EONIA-1D 13/01/2020 1,016.80 -4,018 EUR Sixt SE -360,213.70 EONIA-1D 13/01/2020 0.00
-22,739 EUR Sligro Food Group NV -545,736.00 EONIA-1D 13/01/2020 0.00 -48,762 EUR SMCP SA -460,800.90 EONIA-1D 13/01/2020 7,314.30 21,777 EUR Smurfit Kappa Group Plc 746,080.02 EONIA-1D 13/01/2020 435.54 9,280 EUR Sodexo 980,432.00 EONIA-1D 13/01/2020 928.00 2,217 EUR Soitec 207,732.90 EONIA-1D 13/01/2020 -3,547.20
-51,395 EUR Solaria Energ y Medio Amb SA Bearer -349,486.00 EONIA-1D 13/01/2020 1,798.82 -1,002,665 EUR Solocal Group -553,471.08 EONIA-1D 13/01/2020 -12,533.31
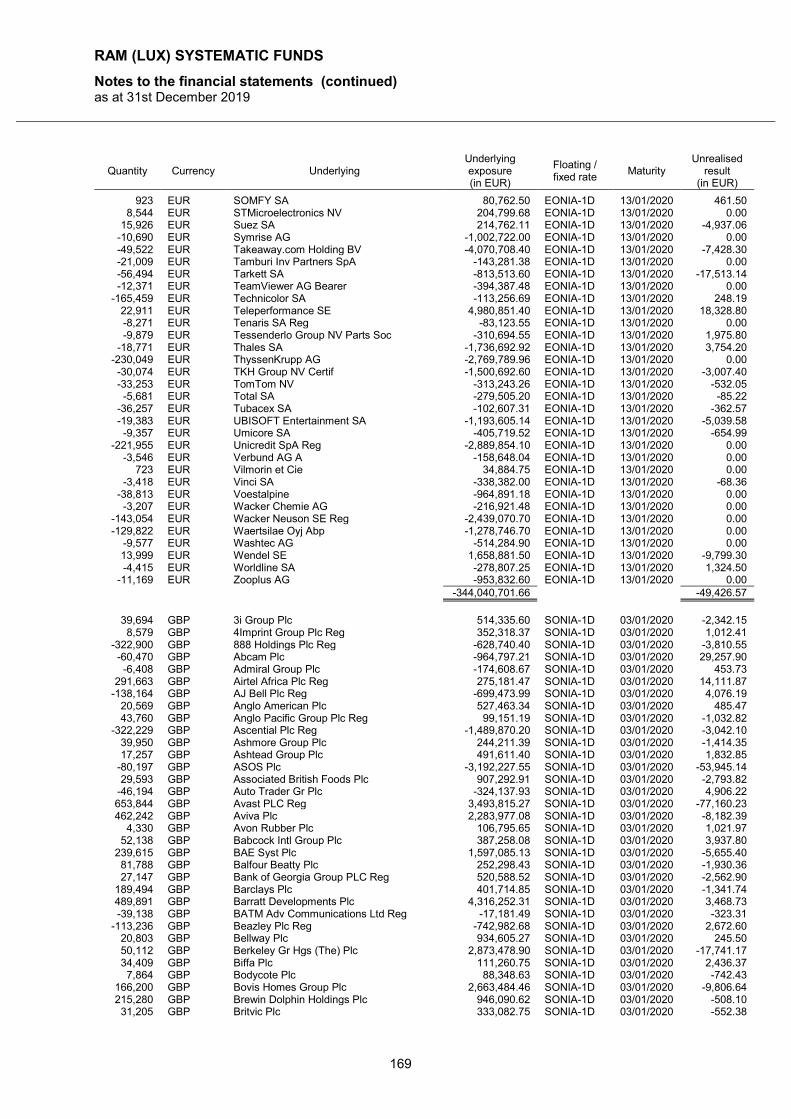
RAM (LUX) SYSTEMATIC FUNDS
Notes to the financial statements (continued) as at 31st December 2019
169
Quantity Currency Underlying Underlying exposure (in EUR)
Floating / fixed rate
Maturity Unrealised
result (in EUR)
923 EUR SOMFY SA 80,762.50 EONIA-1D 13/01/2020 461.50 8,544 EUR STMicroelectronics NV 204,799.68 EONIA-1D 13/01/2020 0.00
15,926 EUR Suez SA 214,762.11 EONIA-1D 13/01/2020 -4,937.06 -10,690 EUR Symrise AG -1,002,722.00 EONIA-1D 13/01/2020 0.00 -49,522 EUR Takeaway.com Holding BV -4,070,708.40 EONIA-1D 13/01/2020 -7,428.30 -21,009 EUR Tamburi Inv Partners SpA -143,281.38 EONIA-1D 13/01/2020 0.00 -56,494 EUR Tarkett SA -813,513.60 EONIA-1D 13/01/2020 -17,513.14 -12,371 EUR TeamViewer AG Bearer -394,387.48 EONIA-1D 13/01/2020 0.00
-165,459 EUR Technicolor SA -113,256.69 EONIA-1D 13/01/2020 248.19 22,911 EUR Teleperformance SE 4,980,851.40 EONIA-1D 13/01/2020 18,328.80 -8,271 EUR Tenaris SA Reg -83,123.55 EONIA-1D 13/01/2020 0.00 -9,879 EUR Tessenderlo Group NV Parts Soc -310,694.55 EONIA-1D 13/01/2020 1,975.80
-18,771 EUR Thales SA -1,736,692.92 EONIA-1D 13/01/2020 3,754.20 -230,049 EUR ThyssenKrupp AG -2,769,789.96 EONIA-1D 13/01/2020 0.00 -30,074 EUR TKH Group NV Certif -1,500,692.60 EONIA-1D 13/01/2020 -3,007.40 -33,253 EUR TomTom NV -313,243.26 EONIA-1D 13/01/2020 -532.05 -5,681 EUR Total SA -279,505.20 EONIA-1D 13/01/2020 -85.22
-36,257 EUR Tubacex SA -102,607.31 EONIA-1D 13/01/2020 -362.57 -19,383 EUR UBISOFT Entertainment SA -1,193,605.14 EONIA-1D 13/01/2020 -5,039.58 -9,357 EUR Umicore SA -405,719.52 EONIA-1D 13/01/2020 -654.99
-221,955 EUR Unicredit SpA Reg -2,889,854.10 EONIA-1D 13/01/2020 0.00 -3,546 EUR Verbund AG A -158,648.04 EONIA-1D 13/01/2020 0.00
723 EUR Vilmorin et Cie 34,884.75 EONIA-1D 13/01/2020 0.00 -3,418 EUR Vinci SA -338,382.00 EONIA-1D 13/01/2020 -68.36
-38,813 EUR Voestalpine -964,891.18 EONIA-1D 13/01/2020 0.00 -3,207 EUR Wacker Chemie AG -216,921.48 EONIA-1D 13/01/2020 0.00
-143,054 EUR Wacker Neuson SE Reg -2,439,070.70 EONIA-1D 13/01/2020 0.00 -129,822 EUR Waertsilae Oyj Abp -1,278,746.70 EONIA-1D 13/01/2020 0.00
-9,577 EUR Washtec AG -514,284.90 EONIA-1D 13/01/2020 0.00 13,999 EUR Wendel SE 1,658,881.50 EONIA-1D 13/01/2020 -9,799.30 -4,415 EUR Worldline SA -278,807.25 EONIA-1D 13/01/2020 1,324.50
-11,169 EUR Zooplus AG -953,832.60 EONIA-1D 13/01/2020 0.00 -344,040,701.66 -49,426.57
39,694 GBP 3i Group Plc 514,335.60 SONIA-1D 03/01/2020 -2,342.15 8,579 GBP 4Imprint Group Plc Reg 352,318.37 SONIA-1D 03/01/2020 1,012.41
-322,900 GBP 888 Holdings Plc Reg -628,740.40 SONIA-1D 03/01/2020 -3,810.55 -60,470 GBP Abcam Plc -964,797.21 SONIA-1D 03/01/2020 29,257.90 -6,408 GBP Admiral Group Plc -174,608.67 SONIA-1D 03/01/2020 453.73
291,663 GBP Airtel Africa Plc Reg 275,181.47 SONIA-1D 03/01/2020 14,111.87 -138,164 GBP AJ Bell Plc Reg -699,473.99 SONIA-1D 03/01/2020 4,076.19
20,569 GBP Anglo American Plc 527,463.34 SONIA-1D 03/01/2020 485.47 43,760 GBP Anglo Pacific Group Plc Reg 99,151.19 SONIA-1D 03/01/2020 -1,032.82
-322,229 GBP Ascential Plc Reg -1,489,870.20 SONIA-1D 03/01/2020 -3,042.10 39,950 GBP Ashmore Group Plc 244,211.39 SONIA-1D 03/01/2020 -1,414.35 17,257 GBP Ashtead Group Plc 491,611.40 SONIA-1D 03/01/2020 1,832.85
-80,197 GBP ASOS Plc -3,192,227.55 SONIA-1D 03/01/2020 -53,945.14 29,593 GBP Associated British Foods Plc 907,292.91 SONIA-1D 03/01/2020 -2,793.82
-46,194 GBP Auto Trader Gr Plc -324,137.93 SONIA-1D 03/01/2020 4,906.22 653,844 GBP Avast PLC Reg 3,493,815.27 SONIA-1D 03/01/2020 -77,160.23 462,242 GBP Aviva Plc 2,283,977.08 SONIA-1D 03/01/2020 -8,182.39
4,330 GBP Avon Rubber Plc 106,795.65 SONIA-1D 03/01/2020 1,021.97 52,138 GBP Babcock Intl Group Plc 387,258.08 SONIA-1D 03/01/2020 3,937.80
239,615 GBP BAE Syst Plc 1,597,085.13 SONIA-1D 03/01/2020 -5,655.40 81,788 GBP Balfour Beatty Plc 252,298.43 SONIA-1D 03/01/2020 -1,930.36 27,147 GBP Bank of Georgia Group PLC Reg 520,588.52 SONIA-1D 03/01/2020 -2,562.90
189,494 GBP Barclays Plc 401,714.85 SONIA-1D 03/01/2020 -1,341.74 489,891 GBP Barratt Developments Plc 4,316,252.31 SONIA-1D 03/01/2020 3,468.73 -39,138 GBP BATM Adv Communications Ltd Reg -17,181.49 SONIA-1D 03/01/2020 -323.31
-113,236 GBP Beazley Plc Reg -742,982.68 SONIA-1D 03/01/2020 2,672.60 20,803 GBP Bellway Plc 934,605.27 SONIA-1D 03/01/2020 245.50 50,112 GBP Berkeley Gr Hgs (The) Plc 2,873,478.90 SONIA-1D 03/01/2020 -17,741.17 34,409 GBP Biffa Plc 111,260.75 SONIA-1D 03/01/2020 2,436.37 7,864 GBP Bodycote Plc 88,348.63 SONIA-1D 03/01/2020 -742.43
166,200 GBP Bovis Homes Group Plc 2,663,484.46 SONIA-1D 03/01/2020 -9,806.64 215,280 GBP Brewin Dolphin Holdings Plc 946,090.62 SONIA-1D 03/01/2020 -508.10 31,205 GBP Britvic Plc 333,082.75 SONIA-1D 03/01/2020 -552.38
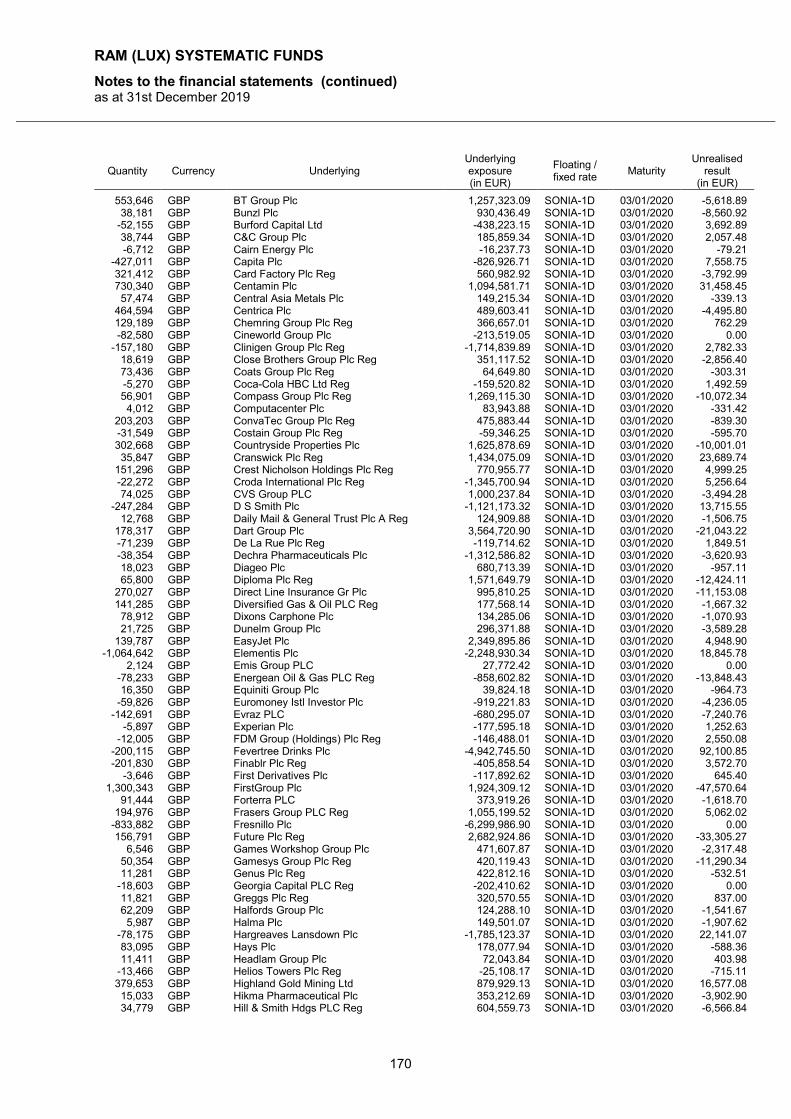
RAM (LUX) SYSTEMATIC FUNDS
Notes to the financial statements (continued) as at 31st December 2019
170
Quantity Currency Underlying Underlying exposure (in EUR)
Floating / fixed rate
Maturity Unrealised
result (in EUR)
553,646 GBP BT Group Plc 1,257,323.09 SONIA-1D 03/01/2020 -5,618.89 38,181 GBP Bunzl Plc 930,436.49 SONIA-1D 03/01/2020 -8,560.92
-52,155 GBP Burford Capital Ltd -438,223.15 SONIA-1D 03/01/2020 3,692.89 38,744 GBP C&C Group Plc 185,859.34 SONIA-1D 03/01/2020 2,057.48 -6,712 GBP Cairn Energy Plc -16,237.73 SONIA-1D 03/01/2020 -79.21
-427,011 GBP Capita Plc -826,926.71 SONIA-1D 03/01/2020 7,558.75 321,412 GBP Card Factory Plc Reg 560,982.92 SONIA-1D 03/01/2020 -3,792.99 730,340 GBP Centamin Plc 1,094,581.71 SONIA-1D 03/01/2020 31,458.45 57,474 GBP Central Asia Metals Plc 149,215.34 SONIA-1D 03/01/2020 -339.13
464,594 GBP Centrica Plc 489,603.41 SONIA-1D 03/01/2020 -4,495.80 129,189 GBP Chemring Group Plc Reg 366,657.01 SONIA-1D 03/01/2020 762.29 -82,580 GBP Cineworld Group Plc -213,519.05 SONIA-1D 03/01/2020 0.00
-157,180 GBP Clinigen Group Plc Reg -1,714,839.89 SONIA-1D 03/01/2020 2,782.33 18,619 GBP Close Brothers Group Plc Reg 351,117.52 SONIA-1D 03/01/2020 -2,856.40 73,436 GBP Coats Group Plc Reg 64,649.80 SONIA-1D 03/01/2020 -303.31 -5,270 GBP Coca-Cola HBC Ltd Reg -159,520.82 SONIA-1D 03/01/2020 1,492.59 56,901 GBP Compass Group Plc Reg 1,269,115.30 SONIA-1D 03/01/2020 -10,072.34 4,012 GBP Computacenter Plc 83,943.88 SONIA-1D 03/01/2020 -331.42
203,203 GBP ConvaTec Group Plc Reg 475,883.44 SONIA-1D 03/01/2020 -839.30 -31,549 GBP Costain Group Plc Reg -59,346.25 SONIA-1D 03/01/2020 -595.70 302,668 GBP Countryside Properties Plc 1,625,878.69 SONIA-1D 03/01/2020 -10,001.01 35,847 GBP Cranswick Plc Reg 1,434,075.09 SONIA-1D 03/01/2020 23,689.74
151,296 GBP Crest Nicholson Holdings Plc Reg 770,955.77 SONIA-1D 03/01/2020 4,999.25 -22,272 GBP Croda International Plc Reg -1,345,700.94 SONIA-1D 03/01/2020 5,256.64 74,025 GBP CVS Group PLC 1,000,237.84 SONIA-1D 03/01/2020 -3,494.28
-247,284 GBP D S Smith Plc -1,121,173.32 SONIA-1D 03/01/2020 13,715.55 12,768 GBP Daily Mail & General Trust Plc A Reg 124,909.88 SONIA-1D 03/01/2020 -1,506.75
178,317 GBP Dart Group Plc 3,564,720.90 SONIA-1D 03/01/2020 -21,043.22 -71,239 GBP De La Rue Plc Reg -119,714.62 SONIA-1D 03/01/2020 1,849.51 -38,354 GBP Dechra Pharmaceuticals Plc -1,312,586.82 SONIA-1D 03/01/2020 -3,620.93 18,023 GBP Diageo Plc 680,713.39 SONIA-1D 03/01/2020 -957.11 65,800 GBP Diploma Plc Reg 1,571,649.79 SONIA-1D 03/01/2020 -12,424.11
270,027 GBP Direct Line Insurance Gr Plc 995,810.25 SONIA-1D 03/01/2020 -11,153.08 141,285 GBP Diversified Gas & Oil PLC Reg 177,568.14 SONIA-1D 03/01/2020 -1,667.32 78,912 GBP Dixons Carphone Plc 134,285.06 SONIA-1D 03/01/2020 -1,070.93 21,725 GBP Dunelm Group Plc 296,371.88 SONIA-1D 03/01/2020 -3,589.28
139,787 GBP EasyJet Plc 2,349,895.86 SONIA-1D 03/01/2020 4,948.90 -1,064,642 GBP Elementis Plc -2,248,930.34 SONIA-1D 03/01/2020 18,845.78
2,124 GBP Emis Group PLC 27,772.42 SONIA-1D 03/01/2020 0.00 -78,233 GBP Energean Oil & Gas PLC Reg -858,602.82 SONIA-1D 03/01/2020 -13,848.43 16,350 GBP Equiniti Group Plc 39,824.18 SONIA-1D 03/01/2020 -964.73
-59,826 GBP Euromoney Istl Investor Plc -919,221.83 SONIA-1D 03/01/2020 -4,236.05 -142,691 GBP Evraz PLC -680,295.07 SONIA-1D 03/01/2020 -7,240.76
-5,897 GBP Experian Plc -177,595.18 SONIA-1D 03/01/2020 1,252.63 -12,005 GBP FDM Group (Holdings) Plc Reg -146,488.01 SONIA-1D 03/01/2020 2,550.08
-200,115 GBP Fevertree Drinks Plc -4,942,745.50 SONIA-1D 03/01/2020 92,100.85 -201,830 GBP Finablr Plc Reg -405,858.54 SONIA-1D 03/01/2020 3,572.70
-3,646 GBP First Derivatives Plc -117,892.62 SONIA-1D 03/01/2020 645.40 1,300,343 GBP FirstGroup Plc 1,924,309.12 SONIA-1D 03/01/2020 -47,570.64
91,444 GBP Forterra PLC 373,919.26 SONIA-1D 03/01/2020 -1,618.70 194,976 GBP Frasers Group PLC Reg 1,055,199.52 SONIA-1D 03/01/2020 5,062.02
-833,882 GBP Fresnillo Plc -6,299,986.90 SONIA-1D 03/01/2020 0.00 156,791 GBP Future Plc Reg 2,682,924.86 SONIA-1D 03/01/2020 -33,305.27
6,546 GBP Games Workshop Group Plc 471,607.87 SONIA-1D 03/01/2020 -2,317.48 50,354 GBP Gamesys Group Plc Reg 420,119.43 SONIA-1D 03/01/2020 -11,290.34 11,281 GBP Genus Plc Reg 422,812.16 SONIA-1D 03/01/2020 -532.51
-18,603 GBP Georgia Capital PLC Reg -202,410.62 SONIA-1D 03/01/2020 0.00 11,821 GBP Greggs Plc Reg 320,570.55 SONIA-1D 03/01/2020 837.00 62,209 GBP Halfords Group Plc 124,288.10 SONIA-1D 03/01/2020 -1,541.67 5,987 GBP Halma Plc 149,501.07 SONIA-1D 03/01/2020 -1,907.62
-78,175 GBP Hargreaves Lansdown Plc -1,785,123.37 SONIA-1D 03/01/2020 22,141.07 83,095 GBP Hays Plc 178,077.94 SONIA-1D 03/01/2020 -588.36 11,411 GBP Headlam Group Plc 72,043.84 SONIA-1D 03/01/2020 403.98
-13,466 GBP Helios Towers Plc Reg -25,108.17 SONIA-1D 03/01/2020 -715.11 379,653 GBP Highland Gold Mining Ltd 879,929.13 SONIA-1D 03/01/2020 16,577.08 15,033 GBP Hikma Pharmaceutical Plc 353,212.69 SONIA-1D 03/01/2020 -3,902.90 34,779 GBP Hill & Smith Hdgs PLC Reg 604,559.73 SONIA-1D 03/01/2020 -6,566.84
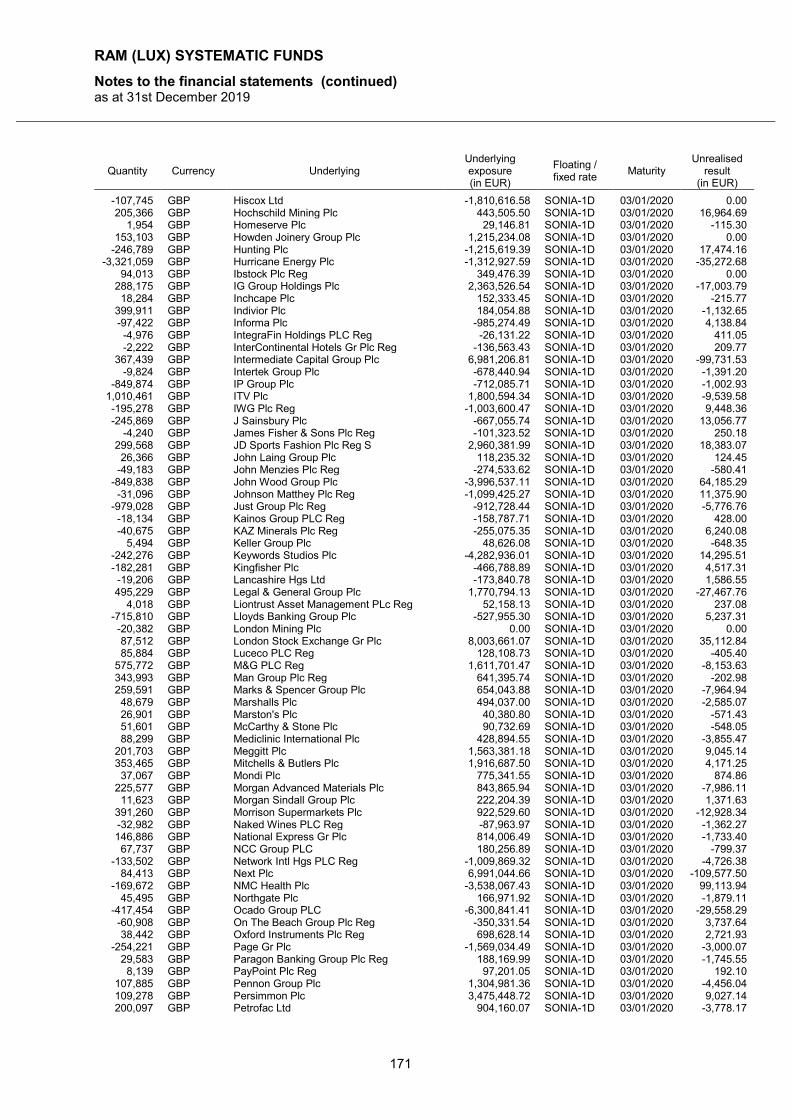
RAM (LUX) SYSTEMATIC FUNDS
Notes to the financial statements (continued) as at 31st December 2019
171
Quantity Currency Underlying Underlying exposure (in EUR)
Floating / fixed rate
Maturity Unrealised
result (in EUR)
-107,745 GBP Hiscox Ltd -1,810,616.58 SONIA-1D 03/01/2020 0.00 205,366 GBP Hochschild Mining Plc 443,505.50 SONIA-1D 03/01/2020 16,964.69
1,954 GBP Homeserve Plc 29,146.81 SONIA-1D 03/01/2020 -115.30 153,103 GBP Howden Joinery Group Plc 1,215,234.08 SONIA-1D 03/01/2020 0.00
-246,789 GBP Hunting Plc -1,215,619.39 SONIA-1D 03/01/2020 17,474.16 -3,321,059 GBP Hurricane Energy Plc -1,312,927.59 SONIA-1D 03/01/2020 -35,272.68
94,013 GBP Ibstock Plc Reg 349,476.39 SONIA-1D 03/01/2020 0.00 288,175 GBP IG Group Holdings Plc 2,363,526.54 SONIA-1D 03/01/2020 -17,003.79 18,284 GBP Inchcape Plc 152,333.45 SONIA-1D 03/01/2020 -215.77
399,911 GBP Indivior Plc 184,054.88 SONIA-1D 03/01/2020 -1,132.65 -97,422 GBP Informa Plc -985,274.49 SONIA-1D 03/01/2020 4,138.84 -4,976 GBP IntegraFin Holdings PLC Reg -26,131.22 SONIA-1D 03/01/2020 411.05 -2,222 GBP InterContinental Hotels Gr Plc Reg -136,563.43 SONIA-1D 03/01/2020 209.77
367,439 GBP Intermediate Capital Group Plc 6,981,206.81 SONIA-1D 03/01/2020 -99,731.53 -9,824 GBP Intertek Group Plc -678,440.94 SONIA-1D 03/01/2020 -1,391.20
-849,874 GBP IP Group Plc -712,085.71 SONIA-1D 03/01/2020 -1,002.93 1,010,461 GBP ITV Plc 1,800,594.34 SONIA-1D 03/01/2020 -9,539.58 -195,278 GBP IWG Plc Reg -1,003,600.47 SONIA-1D 03/01/2020 9,448.36 -245,869 GBP J Sainsbury Plc -667,055.74 SONIA-1D 03/01/2020 13,056.77
-4,240 GBP James Fisher & Sons Plc Reg -101,323.52 SONIA-1D 03/01/2020 250.18 299,568 GBP JD Sports Fashion Plc Reg S 2,960,381.99 SONIA-1D 03/01/2020 18,383.07 26,366 GBP John Laing Group Plc 118,235.32 SONIA-1D 03/01/2020 124.45
-49,183 GBP John Menzies Plc Reg -274,533.62 SONIA-1D 03/01/2020 -580.41 -849,838 GBP John Wood Group Plc -3,996,537.11 SONIA-1D 03/01/2020 64,185.29 -31,096 GBP Johnson Matthey Plc Reg -1,099,425.27 SONIA-1D 03/01/2020 11,375.90
-979,028 GBP Just Group Plc Reg -912,728.44 SONIA-1D 03/01/2020 -5,776.76 -18,134 GBP Kainos Group PLC Reg -158,787.71 SONIA-1D 03/01/2020 428.00 -40,675 GBP KAZ Minerals Plc Reg -255,075.35 SONIA-1D 03/01/2020 6,240.08
5,494 GBP Keller Group Plc 48,626.08 SONIA-1D 03/01/2020 -648.35 -242,276 GBP Keywords Studios Plc -4,282,936.01 SONIA-1D 03/01/2020 14,295.51 -182,281 GBP Kingfisher Plc -466,788.89 SONIA-1D 03/01/2020 4,517.31 -19,206 GBP Lancashire Hgs Ltd -173,840.78 SONIA-1D 03/01/2020 1,586.55 495,229 GBP Legal & General Group Plc 1,770,794.13 SONIA-1D 03/01/2020 -27,467.76
4,018 GBP Liontrust Asset Management PLc Reg 52,158.13 SONIA-1D 03/01/2020 237.08 -715,810 GBP Lloyds Banking Group Plc -527,955.30 SONIA-1D 03/01/2020 5,237.31 -20,382 GBP London Mining Plc 0.00 SONIA-1D 03/01/2020 0.00 87,512 GBP London Stock Exchange Gr Plc 8,003,661.07 SONIA-1D 03/01/2020 35,112.84 85,884 GBP Luceco PLC Reg 128,108.73 SONIA-1D 03/01/2020 -405.40
575,772 GBP M&G PLC Reg 1,611,701.47 SONIA-1D 03/01/2020 -8,153.63 343,993 GBP Man Group Plc Reg 641,395.74 SONIA-1D 03/01/2020 -202.98 259,591 GBP Marks & Spencer Group Plc 654,043.88 SONIA-1D 03/01/2020 -7,964.94 48,679 GBP Marshalls Plc 494,037.00 SONIA-1D 03/01/2020 -2,585.07 26,901 GBP Marston's Plc 40,380.80 SONIA-1D 03/01/2020 -571.43 51,601 GBP McCarthy & Stone Plc 90,732.69 SONIA-1D 03/01/2020 -548.05 88,299 GBP Mediclinic International Plc 428,894.55 SONIA-1D 03/01/2020 -3,855.47
201,703 GBP Meggitt Plc 1,563,381.18 SONIA-1D 03/01/2020 9,045.14 353,465 GBP Mitchells & Butlers Plc 1,916,687.50 SONIA-1D 03/01/2020 4,171.25 37,067 GBP Mondi Plc 775,341.55 SONIA-1D 03/01/2020 874.86
225,577 GBP Morgan Advanced Materials Plc 843,865.94 SONIA-1D 03/01/2020 -7,986.11 11,623 GBP Morgan Sindall Group Plc 222,204.39 SONIA-1D 03/01/2020 1,371.63
391,260 GBP Morrison Supermarkets Plc 922,529.60 SONIA-1D 03/01/2020 -12,928.34 -32,982 GBP Naked Wines PLC Reg -87,963.97 SONIA-1D 03/01/2020 -1,362.27 146,886 GBP National Express Gr Plc 814,006.49 SONIA-1D 03/01/2020 -1,733.40 67,737 GBP NCC Group PLC 180,256.89 SONIA-1D 03/01/2020 -799.37
-133,502 GBP Network Intl Hgs PLC Reg -1,009,869.32 SONIA-1D 03/01/2020 -4,726.38 84,413 GBP Next Plc 6,991,044.66 SONIA-1D 03/01/2020 -109,577.50
-169,672 GBP NMC Health Plc -3,538,067.43 SONIA-1D 03/01/2020 99,113.94 45,495 GBP Northgate Plc 166,971.92 SONIA-1D 03/01/2020 -1,879.11
-417,454 GBP Ocado Group PLC -6,300,841.41 SONIA-1D 03/01/2020 -29,558.29 -60,908 GBP On The Beach Group Plc Reg -350,331.54 SONIA-1D 03/01/2020 3,737.64 38,442 GBP Oxford Instruments Plc Reg 698,628.14 SONIA-1D 03/01/2020 2,721.93
-254,221 GBP Page Gr Plc -1,569,034.49 SONIA-1D 03/01/2020 -3,000.07 29,583 GBP Paragon Banking Group Plc Reg 188,169.99 SONIA-1D 03/01/2020 -1,745.55 8,139 GBP PayPoint Plc Reg 97,201.05 SONIA-1D 03/01/2020 192.10
107,885 GBP Pennon Group Plc 1,304,981.36 SONIA-1D 03/01/2020 -4,456.04 109,278 GBP Persimmon Plc 3,475,448.72 SONIA-1D 03/01/2020 9,027.14 200,097 GBP Petrofac Ltd 904,160.07 SONIA-1D 03/01/2020 -3,778.17
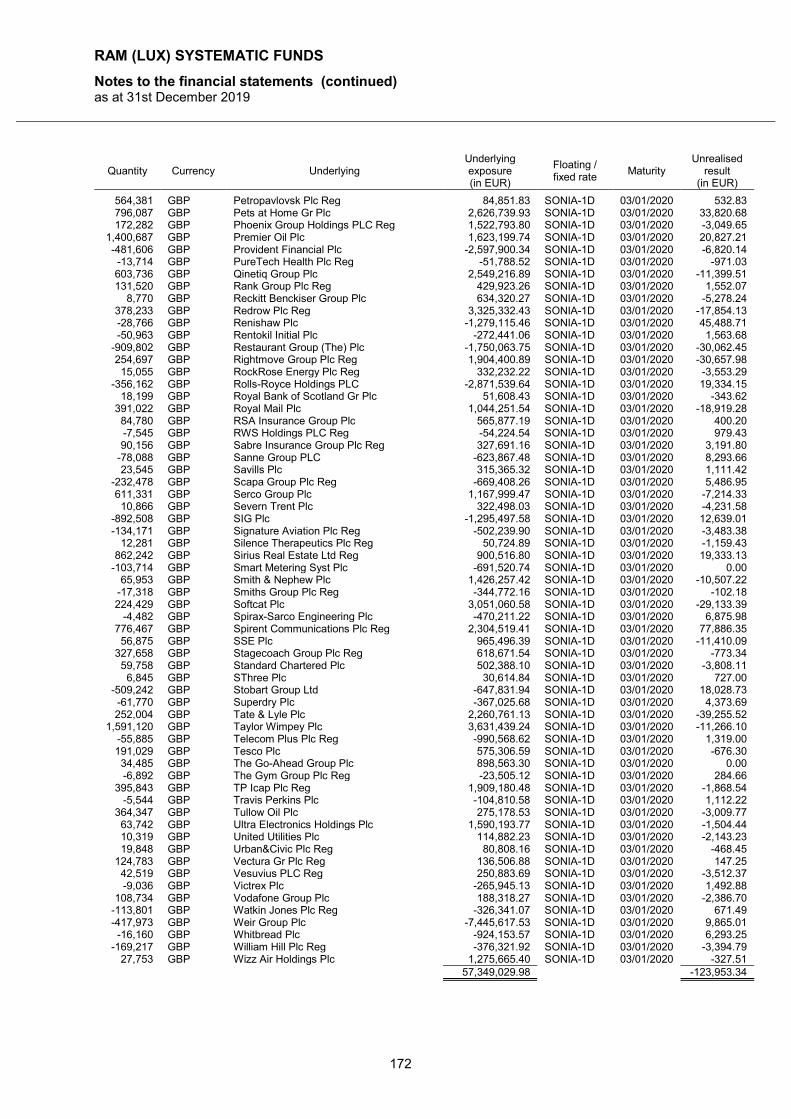
RAM (LUX) SYSTEMATIC FUNDS
Notes to the financial statements (continued) as at 31st December 2019
172
Quantity Currency Underlying Underlying exposure (in EUR)
Floating / fixed rate
Maturity Unrealised
result (in EUR)
564,381 GBP Petropavlovsk Plc Reg 84,851.83 SONIA-1D 03/01/2020 532.83 796,087 GBP Pets at Home Gr Plc 2,626,739.93 SONIA-1D 03/01/2020 33,820.68 172,282 GBP Phoenix Group Holdings PLC Reg 1,522,793.80 SONIA-1D 03/01/2020 -3,049.65
1,400,687 GBP Premier Oil Plc 1,623,199.74 SONIA-1D 03/01/2020 20,827.21 -481,606 GBP Provident Financial Plc -2,597,900.34 SONIA-1D 03/01/2020 -6,820.14 -13,714 GBP PureTech Health Plc Reg -51,788.52 SONIA-1D 03/01/2020 -971.03 603,736 GBP Qinetiq Group Plc 2,549,216.89 SONIA-1D 03/01/2020 -11,399.51 131,520 GBP Rank Group Plc Reg 429,923.26 SONIA-1D 03/01/2020 1,552.07
8,770 GBP Reckitt Benckiser Group Plc 634,320.27 SONIA-1D 03/01/2020 -5,278.24 378,233 GBP Redrow Plc Reg 3,325,332.43 SONIA-1D 03/01/2020 -17,854.13 -28,766 GBP Renishaw Plc -1,279,115.46 SONIA-1D 03/01/2020 45,488.71 -50,963 GBP Rentokil Initial Plc -272,441.06 SONIA-1D 03/01/2020 1,563.68
-909,802 GBP Restaurant Group (The) Plc -1,750,063.75 SONIA-1D 03/01/2020 -30,062.45 254,697 GBP Rightmove Group Plc Reg 1,904,400.89 SONIA-1D 03/01/2020 -30,657.98 15,055 GBP RockRose Energy Plc Reg 332,232.22 SONIA-1D 03/01/2020 -3,553.29
-356,162 GBP Rolls-Royce Holdings PLC -2,871,539.64 SONIA-1D 03/01/2020 19,334.15 18,199 GBP Royal Bank of Scotland Gr Plc 51,608.43 SONIA-1D 03/01/2020 -343.62
391,022 GBP Royal Mail Plc 1,044,251.54 SONIA-1D 03/01/2020 -18,919.28 84,780 GBP RSA Insurance Group Plc 565,877.19 SONIA-1D 03/01/2020 400.20 -7,545 GBP RWS Holdings PLC Reg -54,224.54 SONIA-1D 03/01/2020 979.43 90,156 GBP Sabre Insurance Group Plc Reg 327,691.16 SONIA-1D 03/01/2020 3,191.80
-78,088 GBP Sanne Group PLC -623,867.48 SONIA-1D 03/01/2020 8,293.66 23,545 GBP Savills Plc 315,365.32 SONIA-1D 03/01/2020 1,111.42
-232,478 GBP Scapa Group Plc Reg -669,408.26 SONIA-1D 03/01/2020 5,486.95 611,331 GBP Serco Group Plc 1,167,999.47 SONIA-1D 03/01/2020 -7,214.33 10,866 GBP Severn Trent Plc 322,498.03 SONIA-1D 03/01/2020 -4,231.58
-892,508 GBP SIG Plc -1,295,497.58 SONIA-1D 03/01/2020 12,639.01 -134,171 GBP Signature Aviation Plc Reg -502,239.90 SONIA-1D 03/01/2020 -3,483.38
12,281 GBP Silence Therapeutics Plc Reg 50,724.89 SONIA-1D 03/01/2020 -1,159.43 862,242 GBP Sirius Real Estate Ltd Reg 900,516.80 SONIA-1D 03/01/2020 19,333.13
-103,714 GBP Smart Metering Syst Plc -691,520.74 SONIA-1D 03/01/2020 0.00 65,953 GBP Smith & Nephew Plc 1,426,257.42 SONIA-1D 03/01/2020 -10,507.22
-17,318 GBP Smiths Group Plc Reg -344,772.16 SONIA-1D 03/01/2020 -102.18 224,429 GBP Softcat Plc 3,051,060.58 SONIA-1D 03/01/2020 -29,133.39
-4,482 GBP Spirax-Sarco Engineering Plc -470,211.22 SONIA-1D 03/01/2020 6,875.98 776,467 GBP Spirent Communications Plc Reg 2,304,519.41 SONIA-1D 03/01/2020 77,886.35 56,875 GBP SSE Plc 965,496.39 SONIA-1D 03/01/2020 -11,410.09
327,658 GBP Stagecoach Group Plc Reg 618,671.54 SONIA-1D 03/01/2020 -773.34 59,758 GBP Standard Chartered Plc 502,388.10 SONIA-1D 03/01/2020 -3,808.11 6,845 GBP SThree Plc 30,614.84 SONIA-1D 03/01/2020 727.00
-509,242 GBP Stobart Group Ltd -647,831.94 SONIA-1D 03/01/2020 18,028.73 -61,770 GBP Superdry Plc -367,025.68 SONIA-1D 03/01/2020 4,373.69 252,004 GBP Tate & Lyle Plc 2,260,761.13 SONIA-1D 03/01/2020 -39,255.52
1,591,120 GBP Taylor Wimpey Plc 3,631,439.24 SONIA-1D 03/01/2020 -11,266.10 -55,885 GBP Telecom Plus Plc Reg -990,568.62 SONIA-1D 03/01/2020 1,319.00 191,029 GBP Tesco Plc 575,306.59 SONIA-1D 03/01/2020 -676.30 34,485 GBP The Go-Ahead Group Plc 898,563.30 SONIA-1D 03/01/2020 0.00 -6,892 GBP The Gym Group Plc Reg -23,505.12 SONIA-1D 03/01/2020 284.66
395,843 GBP TP Icap Plc Reg 1,909,180.48 SONIA-1D 03/01/2020 -1,868.54 -5,544 GBP Travis Perkins Plc -104,810.58 SONIA-1D 03/01/2020 1,112.22
364,347 GBP Tullow Oil Plc 275,178.53 SONIA-1D 03/01/2020 -3,009.77 63,742 GBP Ultra Electronics Holdings Plc 1,590,193.77 SONIA-1D 03/01/2020 -1,504.44 10,319 GBP United Utilities Plc 114,882.23 SONIA-1D 03/01/2020 -2,143.23 19,848 GBP Urban&Civic Plc Reg 80,808.16 SONIA-1D 03/01/2020 -468.45
124,783 GBP Vectura Gr Plc Reg 136,506.88 SONIA-1D 03/01/2020 147.25 42,519 GBP Vesuvius PLC Reg 250,883.69 SONIA-1D 03/01/2020 -3,512.37 -9,036 GBP Victrex Plc -265,945.13 SONIA-1D 03/01/2020 1,492.88
108,734 GBP Vodafone Group Plc 188,318.27 SONIA-1D 03/01/2020 -2,386.70 -113,801 GBP Watkin Jones Plc Reg -326,341.07 SONIA-1D 03/01/2020 671.49 -417,973 GBP Weir Group Plc -7,445,617.53 SONIA-1D 03/01/2020 9,865.01 -16,160 GBP Whitbread Plc -924,153.57 SONIA-1D 03/01/2020 6,293.25
-169,217 GBP William Hill Plc Reg -376,321.92 SONIA-1D 03/01/2020 -3,394.79 27,753 GBP Wizz Air Holdings Plc 1,275,665.40 SONIA-1D 03/01/2020 -327.51
57,349,029.98 -123,953.34
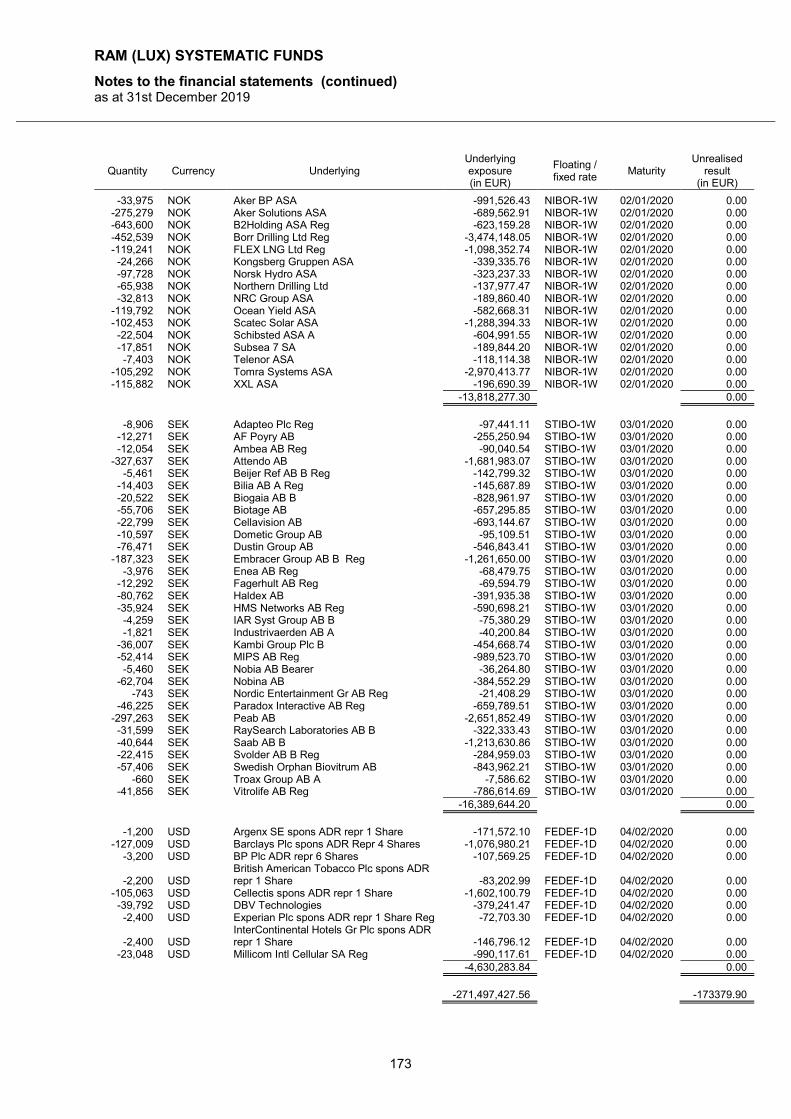
RAM (LUX) SYSTEMATIC FUNDS
Notes to the financial statements (continued) as at 31st December 2019
173
Quantity Currency Underlying Underlying exposure (in EUR)
Floating / fixed rate
Maturity Unrealised
result (in EUR)
-33,975 NOK Aker BP ASA -991,526.43 NIBOR-1W 02/01/2020 0.00 -275,279 NOK Aker Solutions ASA -689,562.91 NIBOR-1W 02/01/2020 0.00 -643,600 NOK B2Holding ASA Reg -623,159.28 NIBOR-1W 02/01/2020 0.00 -452,539 NOK Borr Drilling Ltd Reg -3,474,148.05 NIBOR-1W 02/01/2020 0.00 -119,241 NOK FLEX LNG Ltd Reg -1,098,352.74 NIBOR-1W 02/01/2020 0.00 -24,266 NOK Kongsberg Gruppen ASA -339,335.76 NIBOR-1W 02/01/2020 0.00 -97,728 NOK Norsk Hydro ASA -323,237.33 NIBOR-1W 02/01/2020 0.00 -65,938 NOK Northern Drilling Ltd -137,977.47 NIBOR-1W 02/01/2020 0.00 -32,813 NOK NRC Group ASA -189,860.40 NIBOR-1W 02/01/2020 0.00
-119,792 NOK Ocean Yield ASA -582,668.31 NIBOR-1W 02/01/2020 0.00 -102,453 NOK Scatec Solar ASA -1,288,394.33 NIBOR-1W 02/01/2020 0.00 -22,504 NOK Schibsted ASA A -604,991.55 NIBOR-1W 02/01/2020 0.00 -17,851 NOK Subsea 7 SA -189,844.20 NIBOR-1W 02/01/2020 0.00 -7,403 NOK Telenor ASA -118,114.38 NIBOR-1W 02/01/2020 0.00
-105,292 NOK Tomra Systems ASA -2,970,413.77 NIBOR-1W 02/01/2020 0.00 -115,882 NOK XXL ASA -196,690.39 NIBOR-1W 02/01/2020 0.00
-13,818,277.30 0.00
-8,906 SEK Adapteo Plc Reg -97,441.11 STIBO-1W 03/01/2020 0.00
-12,271 SEK AF Poyry AB -255,250.94 STIBO-1W 03/01/2020 0.00 -12,054 SEK Ambea AB Reg -90,040.54 STIBO-1W 03/01/2020 0.00
-327,637 SEK Attendo AB -1,681,983.07 STIBO-1W 03/01/2020 0.00 -5,461 SEK Beijer Ref AB B Reg -142,799.32 STIBO-1W 03/01/2020 0.00
-14,403 SEK Bilia AB A Reg -145,687.89 STIBO-1W 03/01/2020 0.00 -20,522 SEK Biogaia AB B -828,961.97 STIBO-1W 03/01/2020 0.00 -55,706 SEK Biotage AB -657,295.85 STIBO-1W 03/01/2020 0.00 -22,799 SEK Cellavision AB -693,144.67 STIBO-1W 03/01/2020 0.00 -10,597 SEK Dometic Group AB -95,109.51 STIBO-1W 03/01/2020 0.00 -76,471 SEK Dustin Group AB -546,843.41 STIBO-1W 03/01/2020 0.00
-187,323 SEK Embracer Group AB B Reg -1,261,650.00 STIBO-1W 03/01/2020 0.00 -3,976 SEK Enea AB Reg -68,479.75 STIBO-1W 03/01/2020 0.00
-12,292 SEK Fagerhult AB Reg -69,594.79 STIBO-1W 03/01/2020 0.00 -80,762 SEK Haldex AB -391,935.38 STIBO-1W 03/01/2020 0.00 -35,924 SEK HMS Networks AB Reg -590,698.21 STIBO-1W 03/01/2020 0.00 -4,259 SEK IAR Syst Group AB B -75,380.29 STIBO-1W 03/01/2020 0.00 -1,821 SEK Industrivaerden AB A -40,200.84 STIBO-1W 03/01/2020 0.00
-36,007 SEK Kambi Group Plc B -454,668.74 STIBO-1W 03/01/2020 0.00 -52,414 SEK MIPS AB Reg -989,523.70 STIBO-1W 03/01/2020 0.00 -5,460 SEK Nobia AB Bearer -36,264.80 STIBO-1W 03/01/2020 0.00
-62,704 SEK Nobina AB -384,552.29 STIBO-1W 03/01/2020 0.00 -743 SEK Nordic Entertainment Gr AB Reg -21,408.29 STIBO-1W 03/01/2020 0.00
-46,225 SEK Paradox Interactive AB Reg -659,789.51 STIBO-1W 03/01/2020 0.00 -297,263 SEK Peab AB -2,651,852.49 STIBO-1W 03/01/2020 0.00 -31,599 SEK RaySearch Laboratories AB B -322,333.43 STIBO-1W 03/01/2020 0.00 -40,644 SEK Saab AB B -1,213,630.86 STIBO-1W 03/01/2020 0.00 -22,415 SEK Svolder AB B Reg -284,959.03 STIBO-1W 03/01/2020 0.00 -57,406 SEK Swedish Orphan Biovitrum AB -843,962.21 STIBO-1W 03/01/2020 0.00
-660 SEK Troax Group AB A -7,586.62 STIBO-1W 03/01/2020 0.00 -41,856 SEK Vitrolife AB Reg -786,614.69 STIBO-1W 03/01/2020 0.00
-16,389,644.20 0.00
-1,200 USD Argenx SE spons ADR repr 1 Share -171,572.10 FEDEF-1D 04/02/2020 0.00
-127,009 USD Barclays Plc spons ADR Repr 4 Shares -1,076,980.21 FEDEF-1D 04/02/2020 0.00 -3,200 USD BP Plc ADR repr 6 Shares -107,569.25 FEDEF-1D 04/02/2020 0.00
-2,200 USD British American Tobacco Plc spons ADR repr 1 Share -83,202.99 FEDEF-1D 04/02/2020 0.00
-105,063 USD Cellectis spons ADR repr 1 Share -1,602,100.79 FEDEF-1D 04/02/2020 0.00 -39,792 USD DBV Technologies -379,241.47 FEDEF-1D 04/02/2020 0.00 -2,400 USD Experian Plc spons ADR repr 1 Share Reg -72,703.30 FEDEF-1D 04/02/2020 0.00
-2,400 USD InterContinental Hotels Gr Plc spons ADR repr 1 Share -146,796.12 FEDEF-1D 04/02/2020 0.00
-23,048 USD Millicom Intl Cellular SA Reg -990,117.61 FEDEF-1D 04/02/2020 0.00 -4,630,283.84 0.00
-271,497,427.56 -173379.90
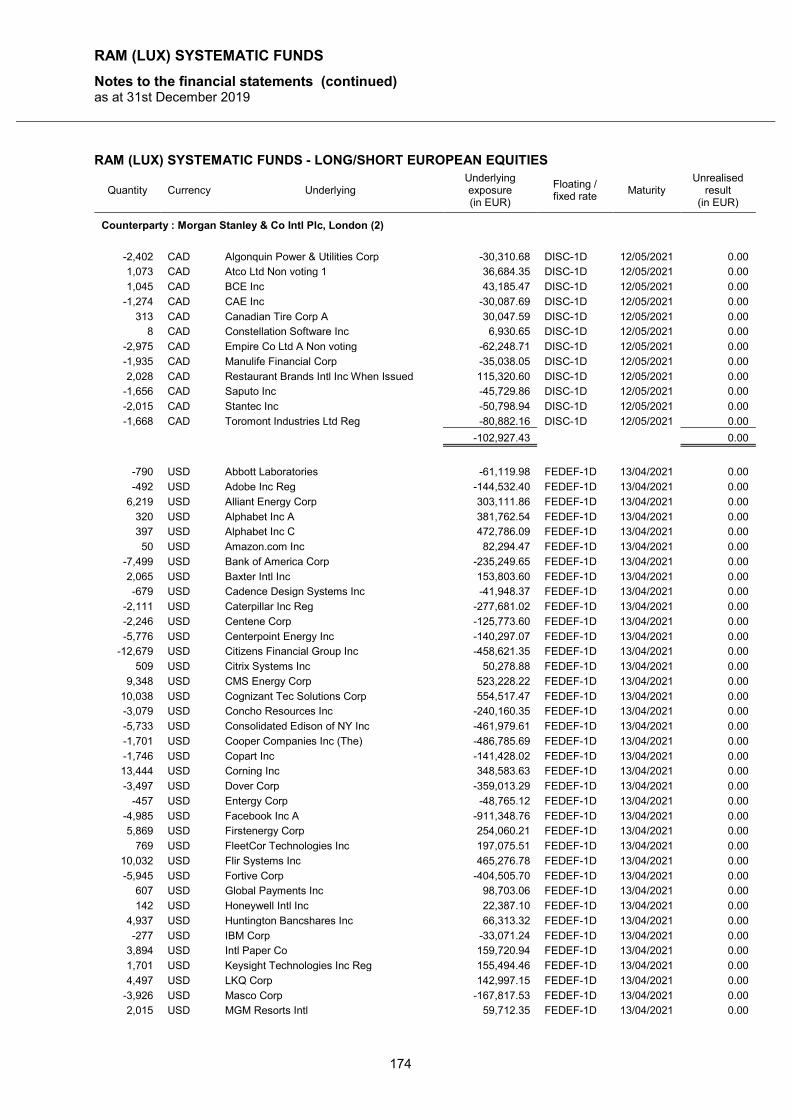
RAM (LUX) SYSTEMATIC FUNDS
Notes to the financial statements (continued) as at 31st December 2019
174
RAM (LUX) SYSTEMATIC FUNDS - LONG/SHORT EUROPEAN EQUITIES
Quantity Currency Underlying Underlying exposure (in EUR)
Floating / fixed rate
Maturity Unrealised
result (in EUR)
Counterparty : Morgan Stanley & Co Intl Plc, London (2)
-2,402 CAD Algonquin Power & Utilities Corp -30,310.68 DISC-1D 12/05/2021 0.00
1,073 CAD Atco Ltd Non voting 1 36,684.35 DISC-1D 12/05/2021 0.00
1,045 CAD BCE Inc 43,185.47 DISC-1D 12/05/2021 0.00
-1,274 CAD CAE Inc -30,087.69 DISC-1D 12/05/2021 0.00
313 CAD Canadian Tire Corp A 30,047.59 DISC-1D 12/05/2021 0.00
8 CAD Constellation Software Inc 6,930.65 DISC-1D 12/05/2021 0.00
-2,975 CAD Empire Co Ltd A Non voting -62,248.71 DISC-1D 12/05/2021 0.00
-1,935 CAD Manulife Financial Corp -35,038.05 DISC-1D 12/05/2021 0.00
2,028 CAD Restaurant Brands Intl Inc When Issued 115,320.60 DISC-1D 12/05/2021 0.00
-1,656 CAD Saputo Inc -45,729.86 DISC-1D 12/05/2021 0.00
-2,015 CAD Stantec Inc -50,798.94 DISC-1D 12/05/2021 0.00
-1,668 CAD Toromont Industries Ltd Reg -80,882.16 DISC-1D 12/05/2021 0.00
-102,927.43 0.00
-790 USD Abbott Laboratories -61,119.98 FEDEF-1D 13/04/2021 0.00
-492 USD Adobe Inc Reg -144,532.40 FEDEF-1D 13/04/2021 0.00
6,219 USD Alliant Energy Corp 303,111.86 FEDEF-1D 13/04/2021 0.00
320 USD Alphabet Inc A 381,762.54 FEDEF-1D 13/04/2021 0.00
397 USD Alphabet Inc C 472,786.09 FEDEF-1D 13/04/2021 0.00
50 USD Amazon.com Inc 82,294.47 FEDEF-1D 13/04/2021 0.00
-7,499 USD Bank of America Corp -235,249.65 FEDEF-1D 13/04/2021 0.00
2,065 USD Baxter Intl Inc 153,803.60 FEDEF-1D 13/04/2021 0.00
-679 USD Cadence Design Systems Inc -41,948.37 FEDEF-1D 13/04/2021 0.00
-2,111 USD Caterpillar Inc Reg -277,681.02 FEDEF-1D 13/04/2021 0.00
-2,246 USD Centene Corp -125,773.60 FEDEF-1D 13/04/2021 0.00
-5,776 USD Centerpoint Energy Inc -140,297.07 FEDEF-1D 13/04/2021 0.00
-12,679 USD Citizens Financial Group Inc -458,621.35 FEDEF-1D 13/04/2021 0.00
509 USD Citrix Systems Inc 50,278.88 FEDEF-1D 13/04/2021 0.00
9,348 USD CMS Energy Corp 523,228.22 FEDEF-1D 13/04/2021 0.00
10,038 USD Cognizant Tec Solutions Corp 554,517.47 FEDEF-1D 13/04/2021 0.00
-3,079 USD Concho Resources Inc -240,160.35 FEDEF-1D 13/04/2021 0.00
-5,733 USD Consolidated Edison of NY Inc -461,979.61 FEDEF-1D 13/04/2021 0.00
-1,701 USD Cooper Companies Inc (The) -486,785.69 FEDEF-1D 13/04/2021 0.00
-1,746 USD Copart Inc -141,428.02 FEDEF-1D 13/04/2021 0.00
13,444 USD Corning Inc 348,583.63 FEDEF-1D 13/04/2021 0.00
-3,497 USD Dover Corp -359,013.29 FEDEF-1D 13/04/2021 0.00
-457 USD Entergy Corp -48,765.12 FEDEF-1D 13/04/2021 0.00
-4,985 USD Facebook Inc A -911,348.76 FEDEF-1D 13/04/2021 0.00
5,869 USD Firstenergy Corp 254,060.21 FEDEF-1D 13/04/2021 0.00
769 USD FleetCor Technologies Inc 197,075.51 FEDEF-1D 13/04/2021 0.00
10,032 USD Flir Systems Inc 465,276.78 FEDEF-1D 13/04/2021 0.00
-5,945 USD Fortive Corp -404,505.70 FEDEF-1D 13/04/2021 0.00
607 USD Global Payments Inc 98,703.06 FEDEF-1D 13/04/2021 0.00
142 USD Honeywell Intl Inc 22,387.10 FEDEF-1D 13/04/2021 0.00
4,937 USD Huntington Bancshares Inc 66,313.32 FEDEF-1D 13/04/2021 0.00
-277 USD IBM Corp -33,071.24 FEDEF-1D 13/04/2021 0.00
3,894 USD Intl Paper Co 159,720.94 FEDEF-1D 13/04/2021 0.00
1,701 USD Keysight Technologies Inc Reg 155,494.46 FEDEF-1D 13/04/2021 0.00
4,497 USD LKQ Corp 142,997.15 FEDEF-1D 13/04/2021 0.00
-3,926 USD Masco Corp -167,817.53 FEDEF-1D 13/04/2021 0.00
2,015 USD MGM Resorts Intl 59,712.35 FEDEF-1D 13/04/2021 0.00
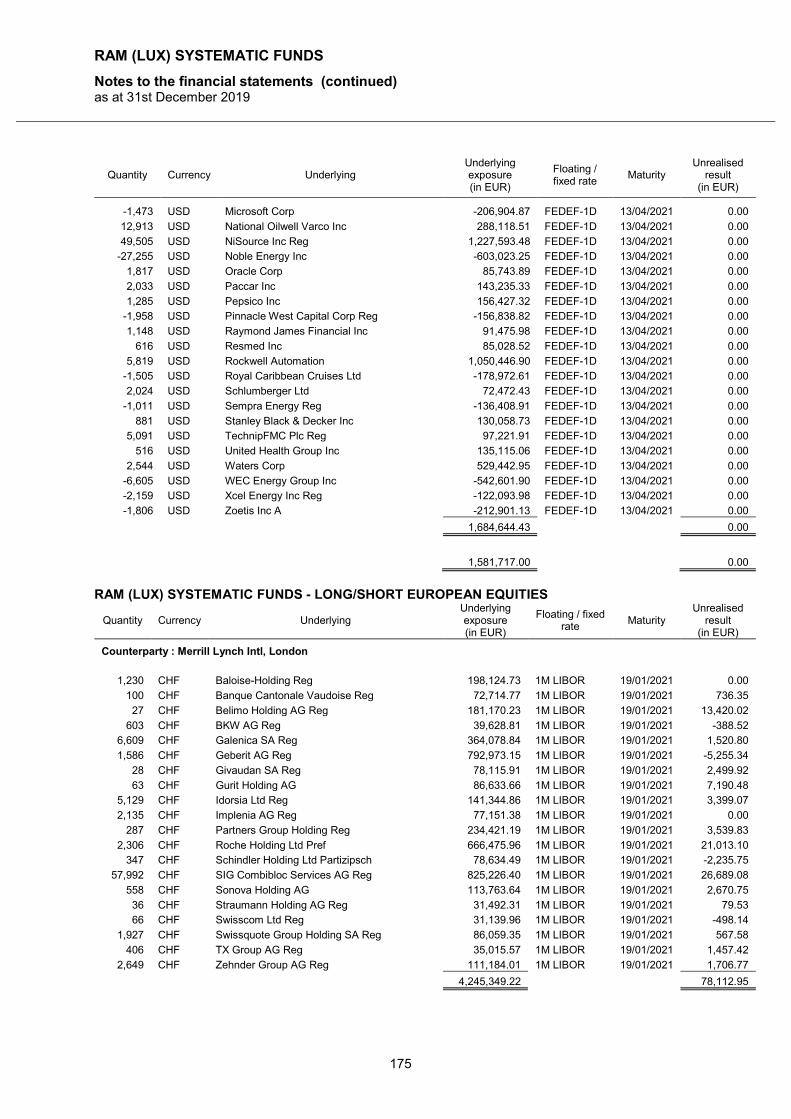
RAM (LUX) SYSTEMATIC FUNDS
Notes to the financial statements (continued) as at 31st December 2019
175
Quantity Currency Underlying Underlying exposure (in EUR)
Floating / fixed rate
Maturity Unrealised
result (in EUR)
-1,473 USD Microsoft Corp -206,904.87 FEDEF-1D 13/04/2021 0.00
12,913 USD National Oilwell Varco Inc 288,118.51 FEDEF-1D 13/04/2021 0.00
49,505 USD NiSource Inc Reg 1,227,593.48 FEDEF-1D 13/04/2021 0.00
-27,255 USD Noble Energy Inc -603,023.25 FEDEF-1D 13/04/2021 0.00
1,817 USD Oracle Corp 85,743.89 FEDEF-1D 13/04/2021 0.00
2,033 USD Paccar Inc 143,235.33 FEDEF-1D 13/04/2021 0.00
1,285 USD Pepsico Inc 156,427.32 FEDEF-1D 13/04/2021 0.00
-1,958 USD Pinnacle West Capital Corp Reg -156,838.82 FEDEF-1D 13/04/2021 0.00
1,148 USD Raymond James Financial Inc 91,475.98 FEDEF-1D 13/04/2021 0.00
616 USD Resmed Inc 85,028.52 FEDEF-1D 13/04/2021 0.00
5,819 USD Rockwell Automation 1,050,446.90 FEDEF-1D 13/04/2021 0.00
-1,505 USD Royal Caribbean Cruises Ltd -178,972.61 FEDEF-1D 13/04/2021 0.00
2,024 USD Schlumberger Ltd 72,472.43 FEDEF-1D 13/04/2021 0.00
-1,011 USD Sempra Energy Reg -136,408.91 FEDEF-1D 13/04/2021 0.00
881 USD Stanley Black & Decker Inc 130,058.73 FEDEF-1D 13/04/2021 0.00
5,091 USD TechnipFMC Plc Reg 97,221.91 FEDEF-1D 13/04/2021 0.00
516 USD United Health Group Inc 135,115.06 FEDEF-1D 13/04/2021 0.00
2,544 USD Waters Corp 529,442.95 FEDEF-1D 13/04/2021 0.00
-6,605 USD WEC Energy Group Inc -542,601.90 FEDEF-1D 13/04/2021 0.00
-2,159 USD Xcel Energy Inc Reg -122,093.98 FEDEF-1D 13/04/2021 0.00
-1,806 USD Zoetis Inc A -212,901.13 FEDEF-1D 13/04/2021 0.00
1,684,644.43 0.00
1,581,717.00 0.00
RAM (LUX) SYSTEMATIC FUNDS - LONG/SHORT EUROPEAN EQUITIES
Quantity Currency Underlying Underlying exposure (in EUR)
Floating / fixed rate
Maturity Unrealised
result (in EUR)
Counterparty : Merrill Lynch Intl, London
1,230 CHF Baloise-Holding Reg 198,124.73 1M LIBOR 19/01/2021 0.00
100 CHF Banque Cantonale Vaudoise Reg 72,714.77 1M LIBOR 19/01/2021 736.35
27 CHF Belimo Holding AG Reg 181,170.23 1M LIBOR 19/01/2021 13,420.02
603 CHF BKW AG Reg 39,628.81 1M LIBOR 19/01/2021 -388.52
6,609 CHF Galenica SA Reg 364,078.84 1M LIBOR 19/01/2021 1,520.80
1,586 CHF Geberit AG Reg 792,973.15 1M LIBOR 19/01/2021 -5,255.34
28 CHF Givaudan SA Reg 78,115.91 1M LIBOR 19/01/2021 2,499.92
63 CHF Gurit Holding AG 86,633.66 1M LIBOR 19/01/2021 7,190.48
5,129 CHF Idorsia Ltd Reg 141,344.86 1M LIBOR 19/01/2021 3,399.07
2,135 CHF Implenia AG Reg 77,151.38 1M LIBOR 19/01/2021 0.00
287 CHF Partners Group Holding Reg 234,421.19 1M LIBOR 19/01/2021 3,539.83
2,306 CHF Roche Holding Ltd Pref 666,475.96 1M LIBOR 19/01/2021 21,013.10
347 CHF Schindler Holding Ltd Partizipsch 78,634.49 1M LIBOR 19/01/2021 -2,235.75
57,992 CHF SIG Combibloc Services AG Reg 825,226.40 1M LIBOR 19/01/2021 26,689.08
558 CHF Sonova Holding AG 113,763.64 1M LIBOR 19/01/2021 2,670.75
36 CHF Straumann Holding AG Reg 31,492.31 1M LIBOR 19/01/2021 79.53
66 CHF Swisscom Ltd Reg 31,139.96 1M LIBOR 19/01/2021 -498.14
1,927 CHF Swissquote Group Holding SA Reg 86,059.35 1M LIBOR 19/01/2021 567.58
406 CHF TX Group AG Reg 35,015.57 1M LIBOR 19/01/2021 1,457.42
2,649 CHF Zehnder Group AG Reg 111,184.01 1M LIBOR 19/01/2021 1,706.77
4,245,349.22 78,112.95
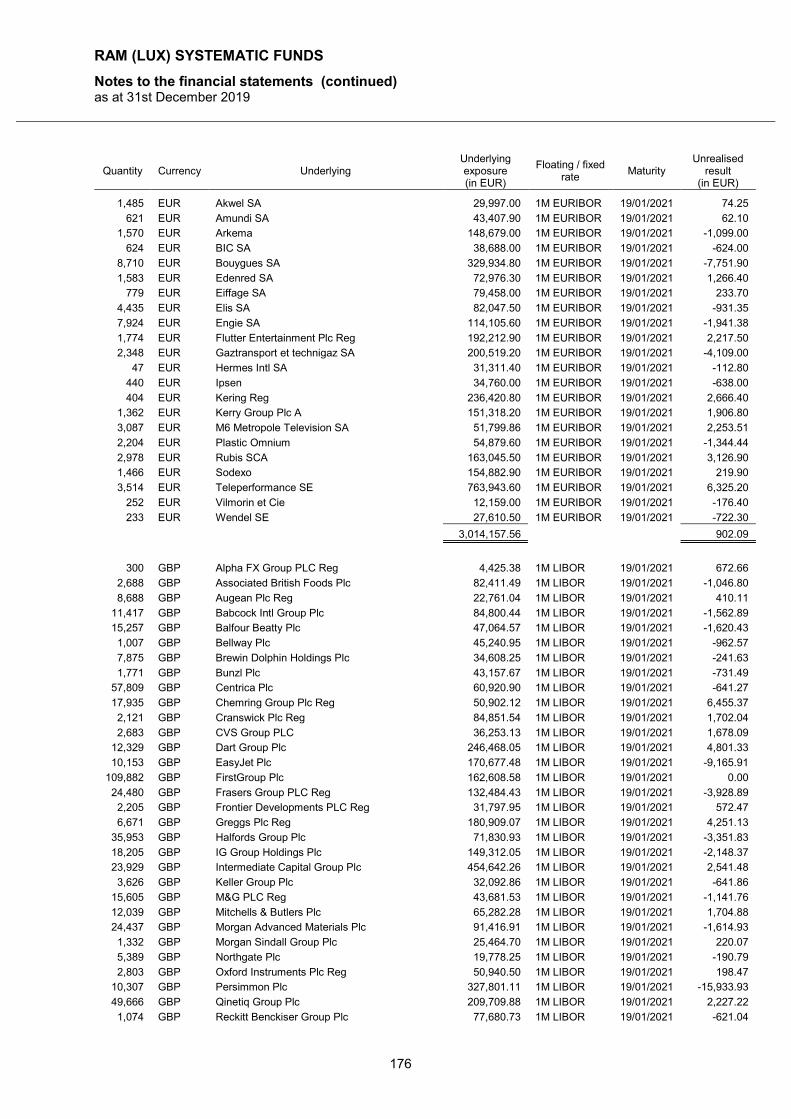
RAM (LUX) SYSTEMATIC FUNDS
Notes to the financial statements (continued) as at 31st December 2019
176
Quantity Currency Underlying Underlying exposure (in EUR)
Floating / fixed rate
Maturity Unrealised
result (in EUR)
1,485 EUR Akwel SA 29,997.00 1M EURIBOR 19/01/2021 74.25
621 EUR Amundi SA 43,407.90 1M EURIBOR 19/01/2021 62.10
1,570 EUR Arkema 148,679.00 1M EURIBOR 19/01/2021 -1,099.00
624 EUR BIC SA 38,688.00 1M EURIBOR 19/01/2021 -624.00
8,710 EUR Bouygues SA 329,934.80 1M EURIBOR 19/01/2021 -7,751.90
1,583 EUR Edenred SA 72,976.30 1M EURIBOR 19/01/2021 1,266.40
779 EUR Eiffage SA 79,458.00 1M EURIBOR 19/01/2021 233.70
4,435 EUR Elis SA 82,047.50 1M EURIBOR 19/01/2021 -931.35
7,924 EUR Engie SA 114,105.60 1M EURIBOR 19/01/2021 -1,941.38
1,774 EUR Flutter Entertainment Plc Reg 192,212.90 1M EURIBOR 19/01/2021 2,217.50
2,348 EUR Gaztransport et technigaz SA 200,519.20 1M EURIBOR 19/01/2021 -4,109.00
47 EUR Hermes Intl SA 31,311.40 1M EURIBOR 19/01/2021 -112.80
440 EUR Ipsen 34,760.00 1M EURIBOR 19/01/2021 -638.00
404 EUR Kering Reg 236,420.80 1M EURIBOR 19/01/2021 2,666.40
1,362 EUR Kerry Group Plc A 151,318.20 1M EURIBOR 19/01/2021 1,906.80
3,087 EUR M6 Metropole Television SA 51,799.86 1M EURIBOR 19/01/2021 2,253.51
2,204 EUR Plastic Omnium 54,879.60 1M EURIBOR 19/01/2021 -1,344.44
2,978 EUR Rubis SCA 163,045.50 1M EURIBOR 19/01/2021 3,126.90
1,466 EUR Sodexo 154,882.90 1M EURIBOR 19/01/2021 219.90
3,514 EUR Teleperformance SE 763,943.60 1M EURIBOR 19/01/2021 6,325.20
252 EUR Vilmorin et Cie 12,159.00 1M EURIBOR 19/01/2021 -176.40
233 EUR Wendel SE 27,610.50 1M EURIBOR 19/01/2021 -722.30
3,014,157.56 902.09
300 GBP Alpha FX Group PLC Reg 4,425.38 1M LIBOR 19/01/2021 672.66
2,688 GBP Associated British Foods Plc 82,411.49 1M LIBOR 19/01/2021 -1,046.80
8,688 GBP Augean Plc Reg 22,761.04 1M LIBOR 19/01/2021 410.11
11,417 GBP Babcock Intl Group Plc 84,800.44 1M LIBOR 19/01/2021 -1,562.89
15,257 GBP Balfour Beatty Plc 47,064.57 1M LIBOR 19/01/2021 -1,620.43
1,007 GBP Bellway Plc 45,240.95 1M LIBOR 19/01/2021 -962.57
7,875 GBP Brewin Dolphin Holdings Plc 34,608.25 1M LIBOR 19/01/2021 -241.63
1,771 GBP Bunzl Plc 43,157.67 1M LIBOR 19/01/2021 -731.49
57,809 GBP Centrica Plc 60,920.90 1M LIBOR 19/01/2021 -641.27
17,935 GBP Chemring Group Plc Reg 50,902.12 1M LIBOR 19/01/2021 6,455.37
2,121 GBP Cranswick Plc Reg 84,851.54 1M LIBOR 19/01/2021 1,702.04
2,683 GBP CVS Group PLC 36,253.13 1M LIBOR 19/01/2021 1,678.09
12,329 GBP Dart Group Plc 246,468.05 1M LIBOR 19/01/2021 4,801.33
10,153 GBP EasyJet Plc 170,677.48 1M LIBOR 19/01/2021 -9,165.91
109,882 GBP FirstGroup Plc 162,608.58 1M LIBOR 19/01/2021 0.00
24,480 GBP Frasers Group PLC Reg 132,484.43 1M LIBOR 19/01/2021 -3,928.89
2,205 GBP Frontier Developments PLC Reg 31,797.95 1M LIBOR 19/01/2021 572.47
6,671 GBP Greggs Plc Reg 180,909.07 1M LIBOR 19/01/2021 4,251.13
35,953 GBP Halfords Group Plc 71,830.93 1M LIBOR 19/01/2021 -3,351.83
18,205 GBP IG Group Holdings Plc 149,312.05 1M LIBOR 19/01/2021 -2,148.37
23,929 GBP Intermediate Capital Group Plc 454,642.26 1M LIBOR 19/01/2021 2,541.48
3,626 GBP Keller Group Plc 32,092.86 1M LIBOR 19/01/2021 -641.86
15,605 GBP M&G PLC Reg 43,681.53 1M LIBOR 19/01/2021 -1,141.76
12,039 GBP Mitchells & Butlers Plc 65,282.28 1M LIBOR 19/01/2021 1,704.88
24,437 GBP Morgan Advanced Materials Plc 91,416.91 1M LIBOR 19/01/2021 -1,614.93
1,332 GBP Morgan Sindall Group Plc 25,464.70 1M LIBOR 19/01/2021 220.07
5,389 GBP Northgate Plc 19,778.25 1M LIBOR 19/01/2021 -190.79
2,803 GBP Oxford Instruments Plc Reg 50,940.50 1M LIBOR 19/01/2021 198.47
10,307 GBP Persimmon Plc 327,801.11 1M LIBOR 19/01/2021 -15,933.93
49,666 GBP Qinetiq Group Plc 209,709.88 1M LIBOR 19/01/2021 2,227.22
1,074 GBP Reckitt Benckiser Group Plc 77,680.73 1M LIBOR 19/01/2021 -621.04
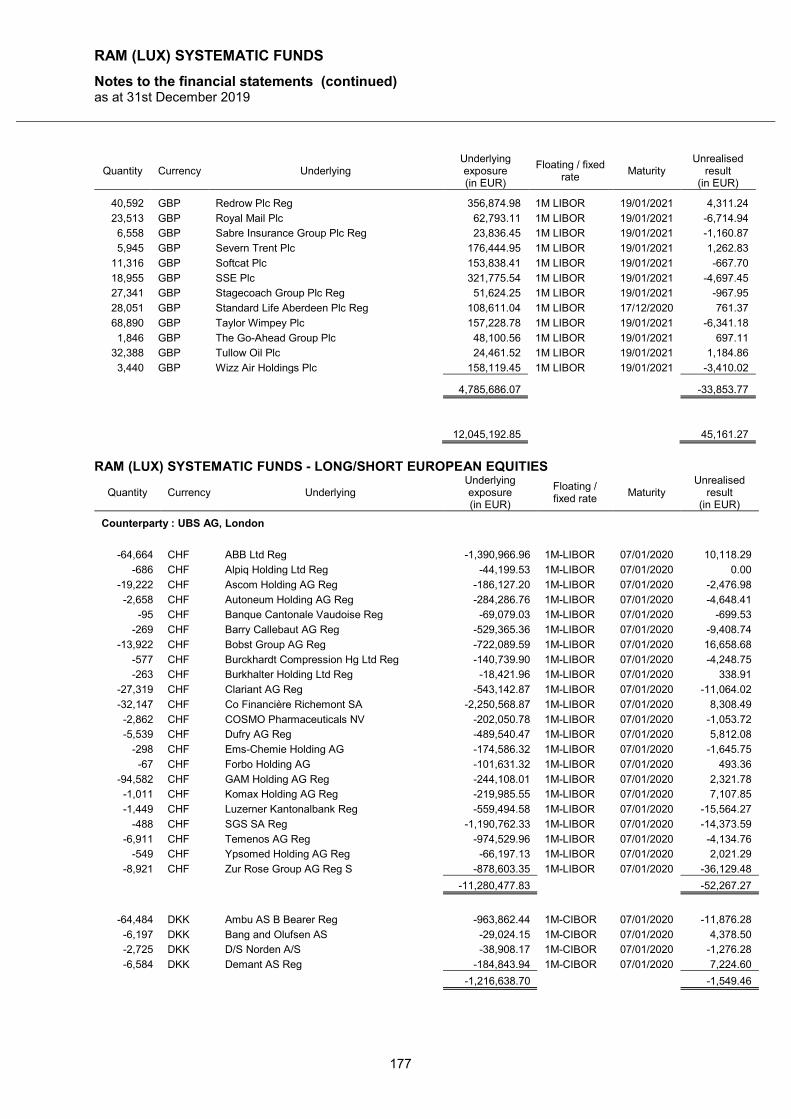
RAM (LUX) SYSTEMATIC FUNDS
Notes to the financial statements (continued) as at 31st December 2019
177
Quantity Currency Underlying Underlying exposure (in EUR)
Floating / fixed rate
Maturity Unrealised
result (in EUR)
40,592 GBP Redrow Plc Reg 356,874.98 1M LIBOR 19/01/2021 4,311.24
23,513 GBP Royal Mail Plc 62,793.11 1M LIBOR 19/01/2021 -6,714.94
6,558 GBP Sabre Insurance Group Plc Reg 23,836.45 1M LIBOR 19/01/2021 -1,160.87
5,945 GBP Severn Trent Plc 176,444.95 1M LIBOR 19/01/2021 1,262.83
11,316 GBP Softcat Plc 153,838.41 1M LIBOR 19/01/2021 -667.70
18,955 GBP SSE Plc 321,775.54 1M LIBOR 19/01/2021 -4,697.45
27,341 GBP Stagecoach Group Plc Reg 51,624.25 1M LIBOR 19/01/2021 -967.95
28,051 GBP Standard Life Aberdeen Plc Reg 108,611.04 1M LIBOR 17/12/2020 761.37
68,890 GBP Taylor Wimpey Plc 157,228.78 1M LIBOR 19/01/2021 -6,341.18
1,846 GBP The Go-Ahead Group Plc 48,100.56 1M LIBOR 19/01/2021 697.11
32,388 GBP Tullow Oil Plc 24,461.52 1M LIBOR 19/01/2021 1,184.86
3,440 GBP Wizz Air Holdings Plc 158,119.45 1M LIBOR 19/01/2021 -3,410.02
4,785,686.07 -33,853.77
12,045,192.85 45,161.27
RAM (LUX) SYSTEMATIC FUNDS - LONG/SHORT EUROPEAN EQUITIES
Quantity Currency Underlying Underlying exposure (in EUR)
Floating / fixed rate
Maturity Unrealised
result (in EUR)
Counterparty : UBS AG, London
-64,664 CHF ABB Ltd Reg -1,390,966.96 1M-LIBOR 07/01/2020 10,118.29
-686 CHF Alpiq Holding Ltd Reg -44,199.53 1M-LIBOR 07/01/2020 0.00
-19,222 CHF Ascom Holding AG Reg -186,127.20 1M-LIBOR 07/01/2020 -2,476.98
-2,658 CHF Autoneum Holding AG Reg -284,286.76 1M-LIBOR 07/01/2020 -4,648.41
-95 CHF Banque Cantonale Vaudoise Reg -69,079.03 1M-LIBOR 07/01/2020 -699.53
-269 CHF Barry Callebaut AG Reg -529,365.36 1M-LIBOR 07/01/2020 -9,408.74
-13,922 CHF Bobst Group AG Reg -722,089.59 1M-LIBOR 07/01/2020 16,658.68
-577 CHF Burckhardt Compression Hg Ltd Reg -140,739.90 1M-LIBOR 07/01/2020 -4,248.75
-263 CHF Burkhalter Holding Ltd Reg -18,421.96 1M-LIBOR 07/01/2020 338.91
-27,319 CHF Clariant AG Reg -543,142.87 1M-LIBOR 07/01/2020 -11,064.02
-32,147 CHF Co Financière Richemont SA -2,250,568.87 1M-LIBOR 07/01/2020 8,308.49
-2,862 CHF COSMO Pharmaceuticals NV -202,050.78 1M-LIBOR 07/01/2020 -1,053.72
-5,539 CHF Dufry AG Reg -489,540.47 1M-LIBOR 07/01/2020 5,812.08
-298 CHF Ems-Chemie Holding AG -174,586.32 1M-LIBOR 07/01/2020 -1,645.75
-67 CHF Forbo Holding AG -101,631.32 1M-LIBOR 07/01/2020 493.36
-94,582 CHF GAM Holding AG Reg -244,108.01 1M-LIBOR 07/01/2020 2,321.78
-1,011 CHF Komax Holding AG Reg -219,985.55 1M-LIBOR 07/01/2020 7,107.85
-1,449 CHF Luzerner Kantonalbank Reg -559,494.58 1M-LIBOR 07/01/2020 -15,564.27
-488 CHF SGS SA Reg -1,190,762.33 1M-LIBOR 07/01/2020 -14,373.59
-6,911 CHF Temenos AG Reg -974,529.96 1M-LIBOR 07/01/2020 -4,134.76
-549 CHF Ypsomed Holding AG Reg -66,197.13 1M-LIBOR 07/01/2020 2,021.29
-8,921 CHF Zur Rose Group AG Reg S -878,603.35 1M-LIBOR 07/01/2020 -36,129.48
-11,280,477.83 -52,267.27
-64,484 DKK Ambu AS B Bearer Reg -963,862.44 1M-CIBOR 07/01/2020 -11,876.28
-6,197 DKK Bang and Olufsen AS -29,024.15 1M-CIBOR 07/01/2020 4,378.50
-2,725 DKK D/S Norden A/S -38,908.17 1M-CIBOR 07/01/2020 -1,276.28
-6,584 DKK Demant AS Reg -184,843.94 1M-CIBOR 07/01/2020 7,224.60
-1,216,638.70 -1,549.46
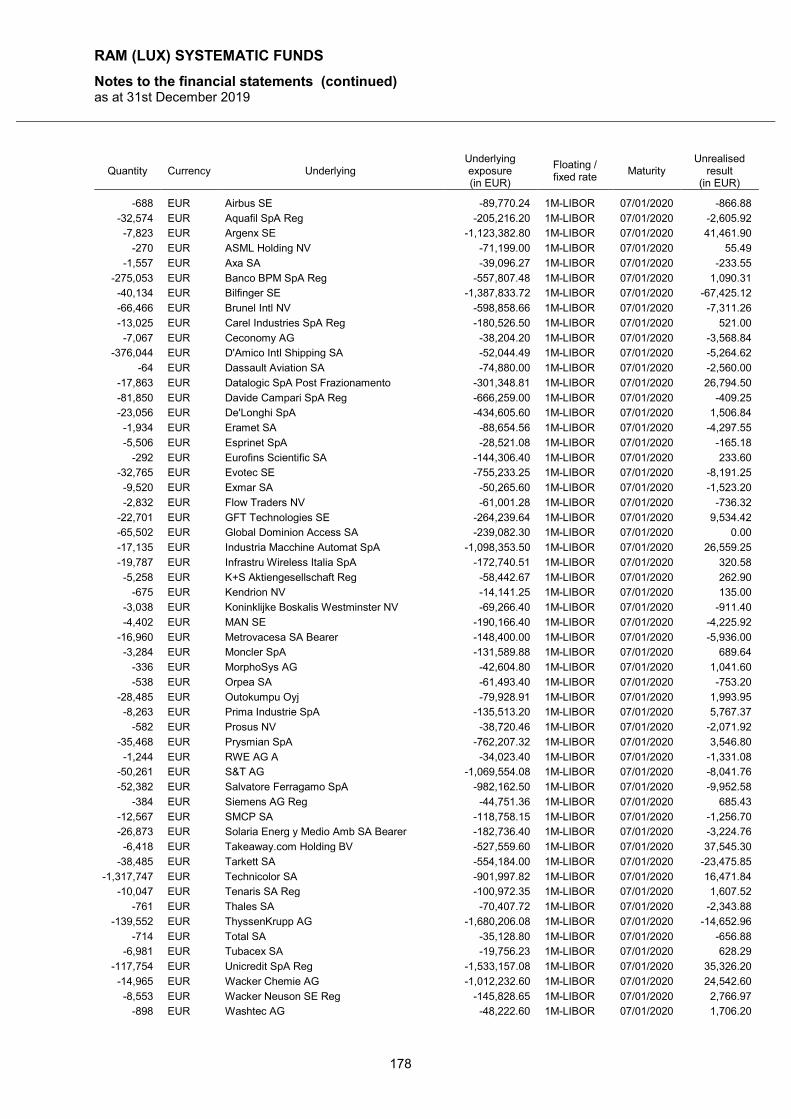
RAM (LUX) SYSTEMATIC FUNDS
Notes to the financial statements (continued) as at 31st December 2019
178
Quantity Currency Underlying Underlying exposure (in EUR)
Floating / fixed rate
Maturity Unrealised
result (in EUR)
-688 EUR Airbus SE -89,770.24 1M-LIBOR 07/01/2020 -866.88
-32,574 EUR Aquafil SpA Reg -205,216.20 1M-LIBOR 07/01/2020 -2,605.92
-7,823 EUR Argenx SE -1,123,382.80 1M-LIBOR 07/01/2020 41,461.90
-270 EUR ASML Holding NV -71,199.00 1M-LIBOR 07/01/2020 55.49
-1,557 EUR Axa SA -39,096.27 1M-LIBOR 07/01/2020 -233.55
-275,053 EUR Banco BPM SpA Reg -557,807.48 1M-LIBOR 07/01/2020 1,090.31
-40,134 EUR Bilfinger SE -1,387,833.72 1M-LIBOR 07/01/2020 -67,425.12
-66,466 EUR Brunel Intl NV -598,858.66 1M-LIBOR 07/01/2020 -7,311.26
-13,025 EUR Carel Industries SpA Reg -180,526.50 1M-LIBOR 07/01/2020 521.00
-7,067 EUR Ceconomy AG -38,204.20 1M-LIBOR 07/01/2020 -3,568.84
-376,044 EUR D'Amico Intl Shipping SA -52,044.49 1M-LIBOR 07/01/2020 -5,264.62
-64 EUR Dassault Aviation SA -74,880.00 1M-LIBOR 07/01/2020 -2,560.00
-17,863 EUR Datalogic SpA Post Frazionamento -301,348.81 1M-LIBOR 07/01/2020 26,794.50
-81,850 EUR Davide Campari SpA Reg -666,259.00 1M-LIBOR 07/01/2020 -409.25
-23,056 EUR De'Longhi SpA -434,605.60 1M-LIBOR 07/01/2020 1,506.84
-1,934 EUR Eramet SA -88,654.56 1M-LIBOR 07/01/2020 -4,297.55
-5,506 EUR Esprinet SpA -28,521.08 1M-LIBOR 07/01/2020 -165.18
-292 EUR Eurofins Scientific SA -144,306.40 1M-LIBOR 07/01/2020 233.60
-32,765 EUR Evotec SE -755,233.25 1M-LIBOR 07/01/2020 -8,191.25
-9,520 EUR Exmar SA -50,265.60 1M-LIBOR 07/01/2020 -1,523.20
-2,832 EUR Flow Traders NV -61,001.28 1M-LIBOR 07/01/2020 -736.32
-22,701 EUR GFT Technologies SE -264,239.64 1M-LIBOR 07/01/2020 9,534.42
-65,502 EUR Global Dominion Access SA -239,082.30 1M-LIBOR 07/01/2020 0.00
-17,135 EUR Industria Macchine Automat SpA -1,098,353.50 1M-LIBOR 07/01/2020 26,559.25
-19,787 EUR Infrastru Wireless Italia SpA -172,740.51 1M-LIBOR 07/01/2020 320.58
-5,258 EUR K+S Aktiengesellschaft Reg -58,442.67 1M-LIBOR 07/01/2020 262.90
-675 EUR Kendrion NV -14,141.25 1M-LIBOR 07/01/2020 135.00
-3,038 EUR Koninklijke Boskalis Westminster NV -69,266.40 1M-LIBOR 07/01/2020 -911.40
-4,402 EUR MAN SE -190,166.40 1M-LIBOR 07/01/2020 -4,225.92
-16,960 EUR Metrovacesa SA Bearer -148,400.00 1M-LIBOR 07/01/2020 -5,936.00
-3,284 EUR Moncler SpA -131,589.88 1M-LIBOR 07/01/2020 689.64
-336 EUR MorphoSys AG -42,604.80 1M-LIBOR 07/01/2020 1,041.60
-538 EUR Orpea SA -61,493.40 1M-LIBOR 07/01/2020 -753.20
-28,485 EUR Outokumpu Oyj -79,928.91 1M-LIBOR 07/01/2020 1,993.95
-8,263 EUR Prima Industrie SpA -135,513.20 1M-LIBOR 07/01/2020 5,767.37
-582 EUR Prosus NV -38,720.46 1M-LIBOR 07/01/2020 -2,071.92
-35,468 EUR Prysmian SpA -762,207.32 1M-LIBOR 07/01/2020 3,546.80
-1,244 EUR RWE AG A -34,023.40 1M-LIBOR 07/01/2020 -1,331.08
-50,261 EUR S&T AG -1,069,554.08 1M-LIBOR 07/01/2020 -8,041.76
-52,382 EUR Salvatore Ferragamo SpA -982,162.50 1M-LIBOR 07/01/2020 -9,952.58
-384 EUR Siemens AG Reg -44,751.36 1M-LIBOR 07/01/2020 685.43
-12,567 EUR SMCP SA -118,758.15 1M-LIBOR 07/01/2020 -1,256.70
-26,873 EUR Solaria Energ y Medio Amb SA Bearer -182,736.40 1M-LIBOR 07/01/2020 -3,224.76
-6,418 EUR Takeaway.com Holding BV -527,559.60 1M-LIBOR 07/01/2020 37,545.30
-38,485 EUR Tarkett SA -554,184.00 1M-LIBOR 07/01/2020 -23,475.85
-1,317,747 EUR Technicolor SA -901,997.82 1M-LIBOR 07/01/2020 16,471.84
-10,047 EUR Tenaris SA Reg -100,972.35 1M-LIBOR 07/01/2020 1,607.52
-761 EUR Thales SA -70,407.72 1M-LIBOR 07/01/2020 -2,343.88
-139,552 EUR ThyssenKrupp AG -1,680,206.08 1M-LIBOR 07/01/2020 -14,652.96
-714 EUR Total SA -35,128.80 1M-LIBOR 07/01/2020 -656.88
-6,981 EUR Tubacex SA -19,756.23 1M-LIBOR 07/01/2020 628.29
-117,754 EUR Unicredit SpA Reg -1,533,157.08 1M-LIBOR 07/01/2020 35,326.20
-14,965 EUR Wacker Chemie AG -1,012,232.60 1M-LIBOR 07/01/2020 24,542.60
-8,553 EUR Wacker Neuson SE Reg -145,828.65 1M-LIBOR 07/01/2020 2,766.97
-898 EUR Washtec AG -48,222.60 1M-LIBOR 07/01/2020 1,706.20
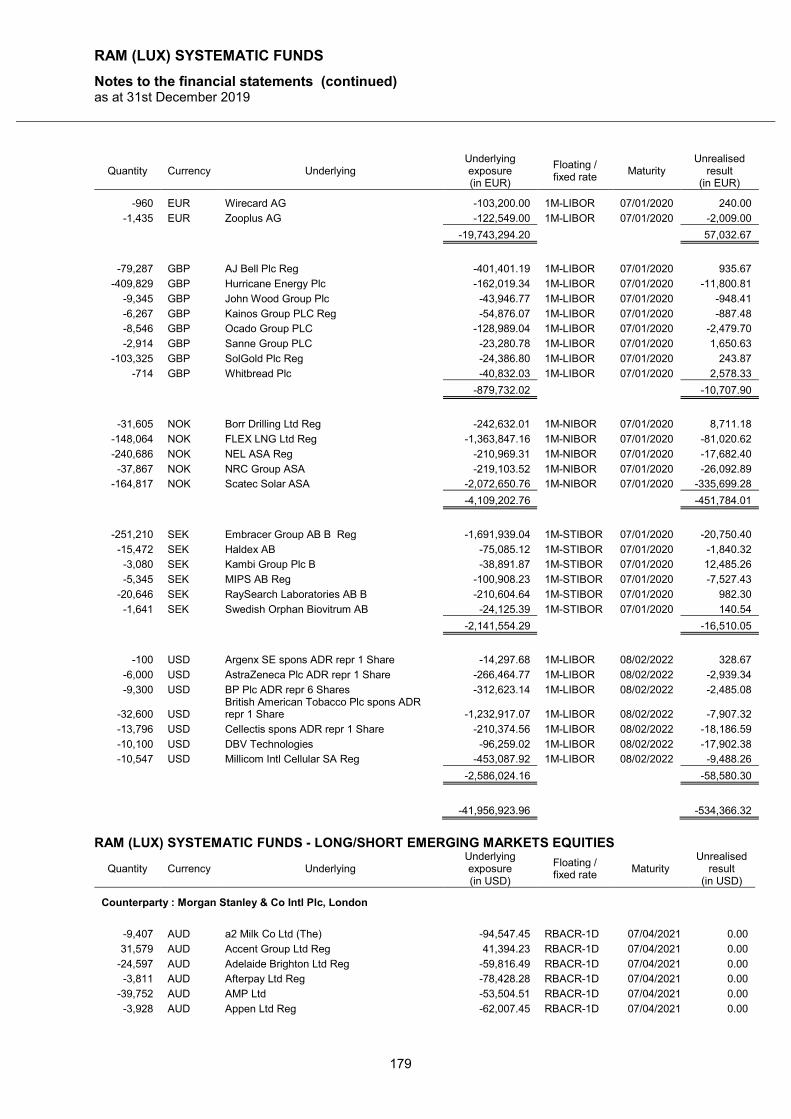
RAM (LUX) SYSTEMATIC FUNDS
Notes to the financial statements (continued) as at 31st December 2019
179
Quantity Currency Underlying Underlying exposure (in EUR)
Floating / fixed rate
Maturity Unrealised
result (in EUR)
-960 EUR Wirecard AG -103,200.00 1M-LIBOR 07/01/2020 240.00
-1,435 EUR Zooplus AG -122,549.00 1M-LIBOR 07/01/2020 -2,009.00
-19,743,294.20 57,032.67
-79,287 GBP AJ Bell Plc Reg -401,401.19 1M-LIBOR 07/01/2020 935.67
-409,829 GBP Hurricane Energy Plc -162,019.34 1M-LIBOR 07/01/2020 -11,800.81
-9,345 GBP John Wood Group Plc -43,946.77 1M-LIBOR 07/01/2020 -948.41
-6,267 GBP Kainos Group PLC Reg -54,876.07 1M-LIBOR 07/01/2020 -887.48
-8,546 GBP Ocado Group PLC -128,989.04 1M-LIBOR 07/01/2020 -2,479.70
-2,914 GBP Sanne Group PLC -23,280.78 1M-LIBOR 07/01/2020 1,650.63
-103,325 GBP SolGold Plc Reg -24,386.80 1M-LIBOR 07/01/2020 243.87
-714 GBP Whitbread Plc -40,832.03 1M-LIBOR 07/01/2020 2,578.33
-879,732.02 -10,707.90
-31,605 NOK Borr Drilling Ltd Reg -242,632.01 1M-NIBOR 07/01/2020 8,711.18
-148,064 NOK FLEX LNG Ltd Reg -1,363,847.16 1M-NIBOR 07/01/2020 -81,020.62
-240,686 NOK NEL ASA Reg -210,969.31 1M-NIBOR 07/01/2020 -17,682.40
-37,867 NOK NRC Group ASA -219,103.52 1M-NIBOR 07/01/2020 -26,092.89
-164,817 NOK Scatec Solar ASA -2,072,650.76 1M-NIBOR 07/01/2020 -335,699.28
-4,109,202.76 -451,784.01
-251,210 SEK Embracer Group AB B Reg -1,691,939.04 1M-STIBOR 07/01/2020 -20,750.40
-15,472 SEK Haldex AB -75,085.12 1M-STIBOR 07/01/2020 -1,840.32
-3,080 SEK Kambi Group Plc B -38,891.87 1M-STIBOR 07/01/2020 12,485.26
-5,345 SEK MIPS AB Reg -100,908.23 1M-STIBOR 07/01/2020 -7,527.43
-20,646 SEK RaySearch Laboratories AB B -210,604.64 1M-STIBOR 07/01/2020 982.30
-1,641 SEK Swedish Orphan Biovitrum AB -24,125.39 1M-STIBOR 07/01/2020 140.54
-2,141,554.29 -16,510.05
-100 USD Argenx SE spons ADR repr 1 Share -14,297.68 1M-LIBOR 08/02/2022 328.67
-6,000 USD AstraZeneca Plc ADR repr 1 Share -266,464.77 1M-LIBOR 08/02/2022 -2,939.34
-9,300 USD BP Plc ADR repr 6 Shares -312,623.14 1M-LIBOR 08/02/2022 -2,485.08
-32,600 USD British American Tobacco Plc spons ADR repr 1 Share -1,232,917.07 1M-LIBOR 08/02/2022 -7,907.32
-13,796 USD Cellectis spons ADR repr 1 Share -210,374.56 1M-LIBOR 08/02/2022 -18,186.59
-10,100 USD DBV Technologies -96,259.02 1M-LIBOR 08/02/2022 -17,902.38
-10,547 USD Millicom Intl Cellular SA Reg -453,087.92 1M-LIBOR 08/02/2022 -9,488.26
-2,586,024.16 -58,580.30
-41,956,923.96 -534,366.32
RAM (LUX) SYSTEMATIC FUNDS - LONG/SHORT EMERGING MARKETS EQUITIES
Quantity Currency Underlying Underlying exposure (in USD)
Floating / fixed rate
Maturity Unrealised
result (in USD)
Counterparty : Morgan Stanley & Co Intl Plc, London
-9,407 AUD a2 Milk Co Ltd (The) -94,547.45 RBACR-1D 07/04/2021 0.00
31,579 AUD Accent Group Ltd Reg 41,394.23 RBACR-1D 07/04/2021 0.00
-24,597 AUD Adelaide Brighton Ltd Reg -59,816.49 RBACR-1D 07/04/2021 0.00
-3,811 AUD Afterpay Ltd Reg -78,428.28 RBACR-1D 07/04/2021 0.00
-39,752 AUD AMP Ltd -53,504.51 RBACR-1D 07/04/2021 0.00
-3,928 AUD Appen Ltd Reg -62,007.45 RBACR-1D 07/04/2021 0.00
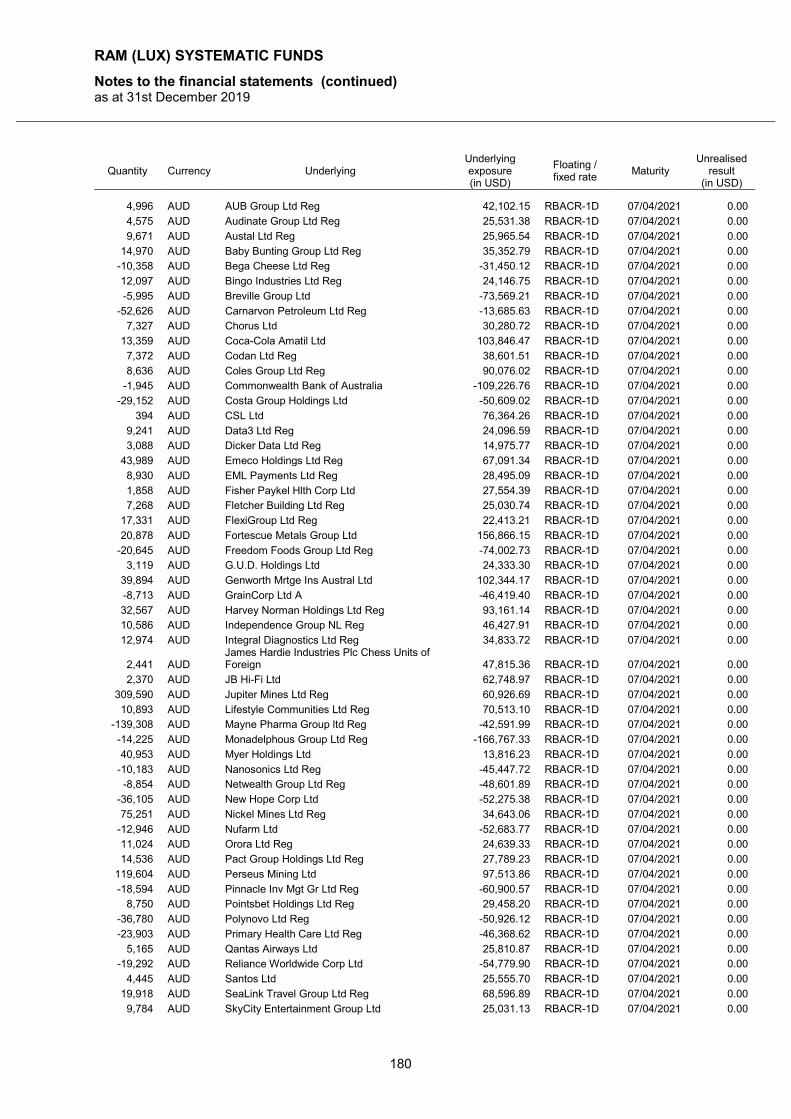
RAM (LUX) SYSTEMATIC FUNDS
Notes to the financial statements (continued) as at 31st December 2019
180
Quantity Currency Underlying Underlying exposure (in USD)
Floating / fixed rate
Maturity Unrealised
result (in USD)
4,996 AUD AUB Group Ltd Reg 42,102.15 RBACR-1D 07/04/2021 0.00
4,575 AUD Audinate Group Ltd Reg 25,531.38 RBACR-1D 07/04/2021 0.00
9,671 AUD Austal Ltd Reg 25,965.54 RBACR-1D 07/04/2021 0.00
14,970 AUD Baby Bunting Group Ltd Reg 35,352.79 RBACR-1D 07/04/2021 0.00
-10,358 AUD Bega Cheese Ltd Reg -31,450.12 RBACR-1D 07/04/2021 0.00
12,097 AUD Bingo Industries Ltd Reg 24,146.75 RBACR-1D 07/04/2021 0.00
-5,995 AUD Breville Group Ltd -73,569.21 RBACR-1D 07/04/2021 0.00
-52,626 AUD Carnarvon Petroleum Ltd Reg -13,685.63 RBACR-1D 07/04/2021 0.00
7,327 AUD Chorus Ltd 30,280.72 RBACR-1D 07/04/2021 0.00
13,359 AUD Coca-Cola Amatil Ltd 103,846.47 RBACR-1D 07/04/2021 0.00
7,372 AUD Codan Ltd Reg 38,601.51 RBACR-1D 07/04/2021 0.00
8,636 AUD Coles Group Ltd Reg 90,076.02 RBACR-1D 07/04/2021 0.00
-1,945 AUD Commonwealth Bank of Australia -109,226.76 RBACR-1D 07/04/2021 0.00
-29,152 AUD Costa Group Holdings Ltd -50,609.02 RBACR-1D 07/04/2021 0.00
394 AUD CSL Ltd 76,364.26 RBACR-1D 07/04/2021 0.00
9,241 AUD Data3 Ltd Reg 24,096.59 RBACR-1D 07/04/2021 0.00
3,088 AUD Dicker Data Ltd Reg 14,975.77 RBACR-1D 07/04/2021 0.00
43,989 AUD Emeco Holdings Ltd Reg 67,091.34 RBACR-1D 07/04/2021 0.00
8,930 AUD EML Payments Ltd Reg 28,495.09 RBACR-1D 07/04/2021 0.00
1,858 AUD Fisher Paykel Hlth Corp Ltd 27,554.39 RBACR-1D 07/04/2021 0.00
7,268 AUD Fletcher Building Ltd Reg 25,030.74 RBACR-1D 07/04/2021 0.00
17,331 AUD FlexiGroup Ltd Reg 22,413.21 RBACR-1D 07/04/2021 0.00
20,878 AUD Fortescue Metals Group Ltd 156,866.15 RBACR-1D 07/04/2021 0.00
-20,645 AUD Freedom Foods Group Ltd Reg -74,002.73 RBACR-1D 07/04/2021 0.00
3,119 AUD G.U.D. Holdings Ltd 24,333.30 RBACR-1D 07/04/2021 0.00
39,894 AUD Genworth Mrtge Ins Austral Ltd 102,344.17 RBACR-1D 07/04/2021 0.00
-8,713 AUD GrainCorp Ltd A -46,419.40 RBACR-1D 07/04/2021 0.00
32,567 AUD Harvey Norman Holdings Ltd Reg 93,161.14 RBACR-1D 07/04/2021 0.00
10,586 AUD Independence Group NL Reg 46,427.91 RBACR-1D 07/04/2021 0.00
12,974 AUD Integral Diagnostics Ltd Reg 34,833.72 RBACR-1D 07/04/2021 0.00
2,441 AUD James Hardie Industries Plc Chess Units of Foreign 47,815.36 RBACR-1D 07/04/2021 0.00
2,370 AUD JB Hi-Fi Ltd 62,748.97 RBACR-1D 07/04/2021 0.00
309,590 AUD Jupiter Mines Ltd Reg 60,926.69 RBACR-1D 07/04/2021 0.00
10,893 AUD Lifestyle Communities Ltd Reg 70,513.10 RBACR-1D 07/04/2021 0.00
-139,308 AUD Mayne Pharma Group ltd Reg -42,591.99 RBACR-1D 07/04/2021 0.00
-14,225 AUD Monadelphous Group Ltd Reg -166,767.33 RBACR-1D 07/04/2021 0.00
40,953 AUD Myer Holdings Ltd 13,816.23 RBACR-1D 07/04/2021 0.00
-10,183 AUD Nanosonics Ltd Reg -45,447.72 RBACR-1D 07/04/2021 0.00
-8,854 AUD Netwealth Group Ltd Reg -48,601.89 RBACR-1D 07/04/2021 0.00
-36,105 AUD New Hope Corp Ltd -52,275.38 RBACR-1D 07/04/2021 0.00
75,251 AUD Nickel Mines Ltd Reg 34,643.06 RBACR-1D 07/04/2021 0.00
-12,946 AUD Nufarm Ltd -52,683.77 RBACR-1D 07/04/2021 0.00
11,024 AUD Orora Ltd Reg 24,639.33 RBACR-1D 07/04/2021 0.00
14,536 AUD Pact Group Holdings Ltd Reg 27,789.23 RBACR-1D 07/04/2021 0.00
119,604 AUD Perseus Mining Ltd 97,513.86 RBACR-1D 07/04/2021 0.00
-18,594 AUD Pinnacle Inv Mgt Gr Ltd Reg -60,900.57 RBACR-1D 07/04/2021 0.00
8,750 AUD Pointsbet Holdings Ltd Reg 29,458.20 RBACR-1D 07/04/2021 0.00
-36,780 AUD Polynovo Ltd Reg -50,926.12 RBACR-1D 07/04/2021 0.00
-23,903 AUD Primary Health Care Ltd Reg -46,368.62 RBACR-1D 07/04/2021 0.00
5,165 AUD Qantas Airways Ltd 25,810.87 RBACR-1D 07/04/2021 0.00
-19,292 AUD Reliance Worldwide Corp Ltd -54,779.90 RBACR-1D 07/04/2021 0.00
4,445 AUD Santos Ltd 25,555.70 RBACR-1D 07/04/2021 0.00
19,918 AUD SeaLink Travel Group Ltd Reg 68,596.89 RBACR-1D 07/04/2021 0.00
9,784 AUD SkyCity Entertainment Group Ltd 25,031.13 RBACR-1D 07/04/2021 0.00
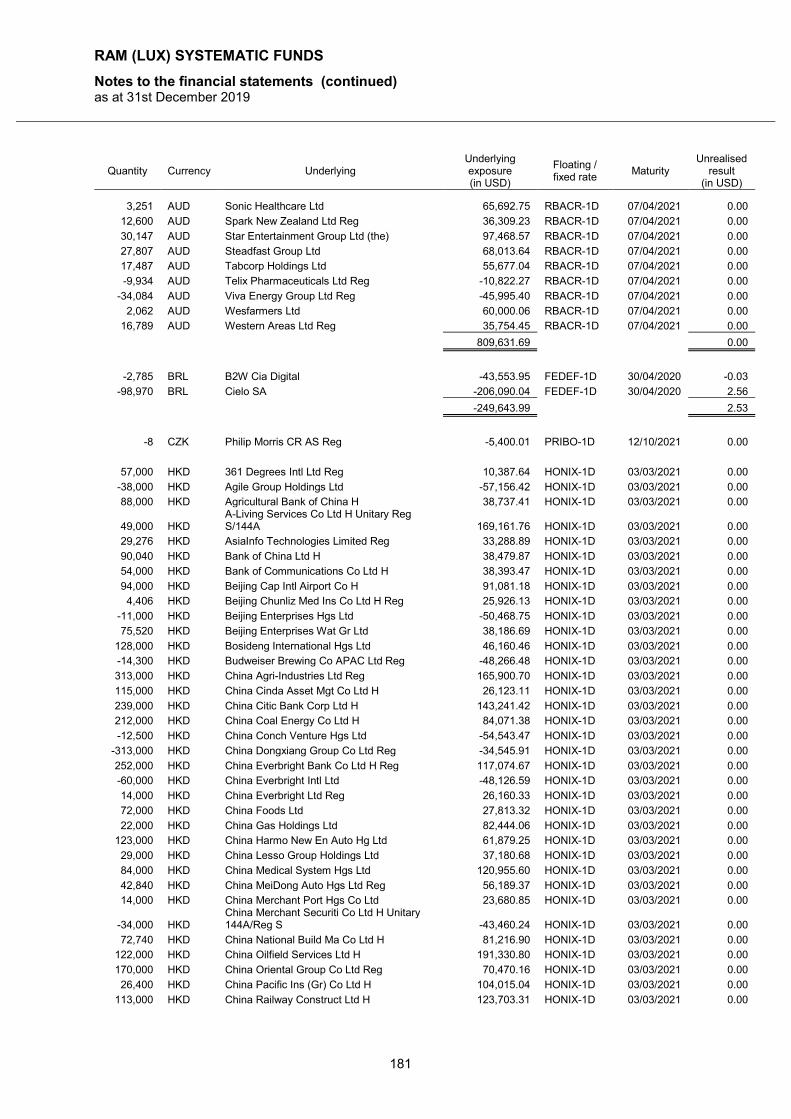
RAM (LUX) SYSTEMATIC FUNDS
Notes to the financial statements (continued) as at 31st December 2019
181
Quantity Currency Underlying Underlying exposure (in USD)
Floating / fixed rate
Maturity Unrealised
result (in USD)
3,251 AUD Sonic Healthcare Ltd 65,692.75 RBACR-1D 07/04/2021 0.00
12,600 AUD Spark New Zealand Ltd Reg 36,309.23 RBACR-1D 07/04/2021 0.00
30,147 AUD Star Entertainment Group Ltd (the) 97,468.57 RBACR-1D 07/04/2021 0.00
27,807 AUD Steadfast Group Ltd 68,013.64 RBACR-1D 07/04/2021 0.00
17,487 AUD Tabcorp Holdings Ltd 55,677.04 RBACR-1D 07/04/2021 0.00
-9,934 AUD Telix Pharmaceuticals Ltd Reg -10,822.27 RBACR-1D 07/04/2021 0.00
-34,084 AUD Viva Energy Group Ltd Reg -45,995.40 RBACR-1D 07/04/2021 0.00
2,062 AUD Wesfarmers Ltd 60,000.06 RBACR-1D 07/04/2021 0.00
16,789 AUD Western Areas Ltd Reg 35,754.45 RBACR-1D 07/04/2021 0.00
809,631.69 0.00
-2,785 BRL B2W Cia Digital -43,553.95 FEDEF-1D 30/04/2020 -0.03
-98,970 BRL Cielo SA -206,090.04 FEDEF-1D 30/04/2020 2.56
-249,643.99 2.53
-8 CZK Philip Morris CR AS Reg -5,400.01 PRIBO-1D 12/10/2021 0.00
57,000 HKD 361 Degrees Intl Ltd Reg 10,387.64 HONIX-1D 03/03/2021 0.00
-38,000 HKD Agile Group Holdings Ltd -57,156.42 HONIX-1D 03/03/2021 0.00
88,000 HKD Agricultural Bank of China H 38,737.41 HONIX-1D 03/03/2021 0.00
49,000 HKD A-Living Services Co Ltd H Unitary Reg S/144A 169,161.76 HONIX-1D 03/03/2021 0.00
29,276 HKD AsiaInfo Technologies Limited Reg 33,288.89 HONIX-1D 03/03/2021 0.00
90,040 HKD Bank of China Ltd H 38,479.87 HONIX-1D 03/03/2021 0.00
54,000 HKD Bank of Communications Co Ltd H 38,393.47 HONIX-1D 03/03/2021 0.00
94,000 HKD Beijing Cap Intl Airport Co H 91,081.18 HONIX-1D 03/03/2021 0.00
4,406 HKD Beijing Chunliz Med Ins Co Ltd H Reg 25,926.13 HONIX-1D 03/03/2021 0.00
-11,000 HKD Beijing Enterprises Hgs Ltd -50,468.75 HONIX-1D 03/03/2021 0.00
75,520 HKD Beijing Enterprises Wat Gr Ltd 38,186.69 HONIX-1D 03/03/2021 0.00
128,000 HKD Bosideng International Hgs Ltd 46,160.46 HONIX-1D 03/03/2021 0.00
-14,300 HKD Budweiser Brewing Co APAC Ltd Reg -48,266.48 HONIX-1D 03/03/2021 0.00
313,000 HKD China Agri-Industries Ltd Reg 165,900.70 HONIX-1D 03/03/2021 0.00
115,000 HKD China Cinda Asset Mgt Co Ltd H 26,123.11 HONIX-1D 03/03/2021 0.00
239,000 HKD China Citic Bank Corp Ltd H 143,241.42 HONIX-1D 03/03/2021 0.00
212,000 HKD China Coal Energy Co Ltd H 84,071.38 HONIX-1D 03/03/2021 0.00
-12,500 HKD China Conch Venture Hgs Ltd -54,543.47 HONIX-1D 03/03/2021 0.00
-313,000 HKD China Dongxiang Group Co Ltd Reg -34,545.91 HONIX-1D 03/03/2021 0.00
252,000 HKD China Everbright Bank Co Ltd H Reg 117,074.67 HONIX-1D 03/03/2021 0.00
-60,000 HKD China Everbright Intl Ltd -48,126.59 HONIX-1D 03/03/2021 0.00
14,000 HKD China Everbright Ltd Reg 26,160.33 HONIX-1D 03/03/2021 0.00
72,000 HKD China Foods Ltd 27,813.32 HONIX-1D 03/03/2021 0.00
22,000 HKD China Gas Holdings Ltd 82,444.06 HONIX-1D 03/03/2021 0.00
123,000 HKD China Harmo New En Auto Hg Ltd 61,879.25 HONIX-1D 03/03/2021 0.00
29,000 HKD China Lesso Group Holdings Ltd 37,180.68 HONIX-1D 03/03/2021 0.00
84,000 HKD China Medical System Hgs Ltd 120,955.60 HONIX-1D 03/03/2021 0.00
42,840 HKD China MeiDong Auto Hgs Ltd Reg 56,189.37 HONIX-1D 03/03/2021 0.00
14,000 HKD China Merchant Port Hgs Co Ltd 23,680.85 HONIX-1D 03/03/2021 0.00
-34,000 HKD China Merchant Securiti Co Ltd H Unitary 144A/Reg S -43,460.24 HONIX-1D 03/03/2021 0.00
72,740 HKD China National Build Ma Co Ltd H 81,216.90 HONIX-1D 03/03/2021 0.00
122,000 HKD China Oilfield Services Ltd H 191,330.80 HONIX-1D 03/03/2021 0.00
170,000 HKD China Oriental Group Co Ltd Reg 70,470.16 HONIX-1D 03/03/2021 0.00
26,400 HKD China Pacific Ins (Gr) Co Ltd H 104,015.04 HONIX-1D 03/03/2021 0.00
113,000 HKD China Railway Construct Ltd H 123,703.31 HONIX-1D 03/03/2021 0.00
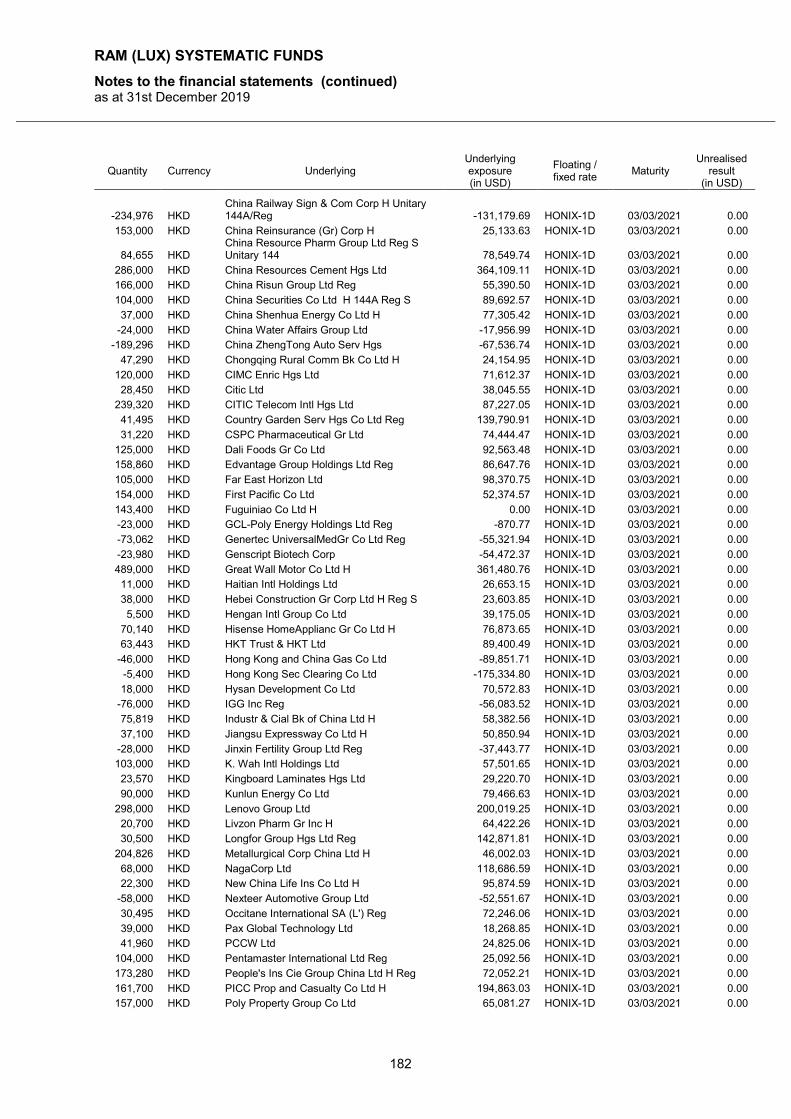
RAM (LUX) SYSTEMATIC FUNDS
Notes to the financial statements (continued) as at 31st December 2019
182
Quantity Currency Underlying Underlying exposure (in USD)
Floating / fixed rate
Maturity Unrealised
result (in USD)
-234,976 HKD China Railway Sign & Com Corp H Unitary 144A/Reg -131,179.69 HONIX-1D 03/03/2021 0.00
153,000 HKD China Reinsurance (Gr) Corp H 25,133.63 HONIX-1D 03/03/2021 0.00
84,655 HKD China Resource Pharm Group Ltd Reg S Unitary 144 78,549.74 HONIX-1D 03/03/2021 0.00
286,000 HKD China Resources Cement Hgs Ltd 364,109.11 HONIX-1D 03/03/2021 0.00
166,000 HKD China Risun Group Ltd Reg 55,390.50 HONIX-1D 03/03/2021 0.00
104,000 HKD China Securities Co Ltd H 144A Reg S 89,692.57 HONIX-1D 03/03/2021 0.00
37,000 HKD China Shenhua Energy Co Ltd H 77,305.42 HONIX-1D 03/03/2021 0.00
-24,000 HKD China Water Affairs Group Ltd -17,956.99 HONIX-1D 03/03/2021 0.00
-189,296 HKD China ZhengTong Auto Serv Hgs -67,536.74 HONIX-1D 03/03/2021 0.00
47,290 HKD Chongqing Rural Comm Bk Co Ltd H 24,154.95 HONIX-1D 03/03/2021 0.00
120,000 HKD CIMC Enric Hgs Ltd 71,612.37 HONIX-1D 03/03/2021 0.00
28,450 HKD Citic Ltd 38,045.55 HONIX-1D 03/03/2021 0.00
239,320 HKD CITIC Telecom Intl Hgs Ltd 87,227.05 HONIX-1D 03/03/2021 0.00
41,495 HKD Country Garden Serv Hgs Co Ltd Reg 139,790.91 HONIX-1D 03/03/2021 0.00
31,220 HKD CSPC Pharmaceutical Gr Ltd 74,444.47 HONIX-1D 03/03/2021 0.00
125,000 HKD Dali Foods Gr Co Ltd 92,563.48 HONIX-1D 03/03/2021 0.00
158,860 HKD Edvantage Group Holdings Ltd Reg 86,647.76 HONIX-1D 03/03/2021 0.00
105,000 HKD Far East Horizon Ltd 98,370.75 HONIX-1D 03/03/2021 0.00
154,000 HKD First Pacific Co Ltd 52,374.57 HONIX-1D 03/03/2021 0.00
143,400 HKD Fuguiniao Co Ltd H 0.00 HONIX-1D 03/03/2021 0.00
-23,000 HKD GCL-Poly Energy Holdings Ltd Reg -870.77 HONIX-1D 03/03/2021 0.00
-73,062 HKD Genertec UniversalMedGr Co Ltd Reg -55,321.94 HONIX-1D 03/03/2021 0.00
-23,980 HKD Genscript Biotech Corp -54,472.37 HONIX-1D 03/03/2021 0.00
489,000 HKD Great Wall Motor Co Ltd H 361,480.76 HONIX-1D 03/03/2021 0.00
11,000 HKD Haitian Intl Holdings Ltd 26,653.15 HONIX-1D 03/03/2021 0.00
38,000 HKD Hebei Construction Gr Corp Ltd H Reg S 23,603.85 HONIX-1D 03/03/2021 0.00
5,500 HKD Hengan Intl Group Co Ltd 39,175.05 HONIX-1D 03/03/2021 0.00
70,140 HKD Hisense HomeApplianc Gr Co Ltd H 76,873.65 HONIX-1D 03/03/2021 0.00
63,443 HKD HKT Trust & HKT Ltd 89,400.49 HONIX-1D 03/03/2021 0.00
-46,000 HKD Hong Kong and China Gas Co Ltd -89,851.71 HONIX-1D 03/03/2021 0.00
-5,400 HKD Hong Kong Sec Clearing Co Ltd -175,334.80 HONIX-1D 03/03/2021 0.00
18,000 HKD Hysan Development Co Ltd 70,572.83 HONIX-1D 03/03/2021 0.00
-76,000 HKD IGG Inc Reg -56,083.52 HONIX-1D 03/03/2021 0.00
75,819 HKD Industr & Cial Bk of China Ltd H 58,382.56 HONIX-1D 03/03/2021 0.00
37,100 HKD Jiangsu Expressway Co Ltd H 50,850.94 HONIX-1D 03/03/2021 0.00
-28,000 HKD Jinxin Fertility Group Ltd Reg -37,443.77 HONIX-1D 03/03/2021 0.00
103,000 HKD K. Wah Intl Holdings Ltd 57,501.65 HONIX-1D 03/03/2021 0.00
23,570 HKD Kingboard Laminates Hgs Ltd 29,220.70 HONIX-1D 03/03/2021 0.00
90,000 HKD Kunlun Energy Co Ltd 79,466.63 HONIX-1D 03/03/2021 0.00
298,000 HKD Lenovo Group Ltd 200,019.25 HONIX-1D 03/03/2021 0.00
20,700 HKD Livzon Pharm Gr Inc H 64,422.26 HONIX-1D 03/03/2021 0.00
30,500 HKD Longfor Group Hgs Ltd Reg 142,871.81 HONIX-1D 03/03/2021 0.00
204,826 HKD Metallurgical Corp China Ltd H 46,002.03 HONIX-1D 03/03/2021 0.00
68,000 HKD NagaCorp Ltd 118,686.59 HONIX-1D 03/03/2021 0.00
22,300 HKD New China Life Ins Co Ltd H 95,874.59 HONIX-1D 03/03/2021 0.00
-58,000 HKD Nexteer Automotive Group Ltd -52,551.67 HONIX-1D 03/03/2021 0.00
30,495 HKD Occitane International SA (L') Reg 72,246.06 HONIX-1D 03/03/2021 0.00
39,000 HKD Pax Global Technology Ltd 18,268.85 HONIX-1D 03/03/2021 0.00
41,960 HKD PCCW Ltd 24,825.06 HONIX-1D 03/03/2021 0.00
104,000 HKD Pentamaster International Ltd Reg 25,092.56 HONIX-1D 03/03/2021 0.00
173,280 HKD People's Ins Cie Group China Ltd H Reg 72,052.21 HONIX-1D 03/03/2021 0.00
161,700 HKD PICC Prop and Casualty Co Ltd H 194,863.03 HONIX-1D 03/03/2021 0.00
157,000 HKD Poly Property Group Co Ltd 65,081.27 HONIX-1D 03/03/2021 0.00
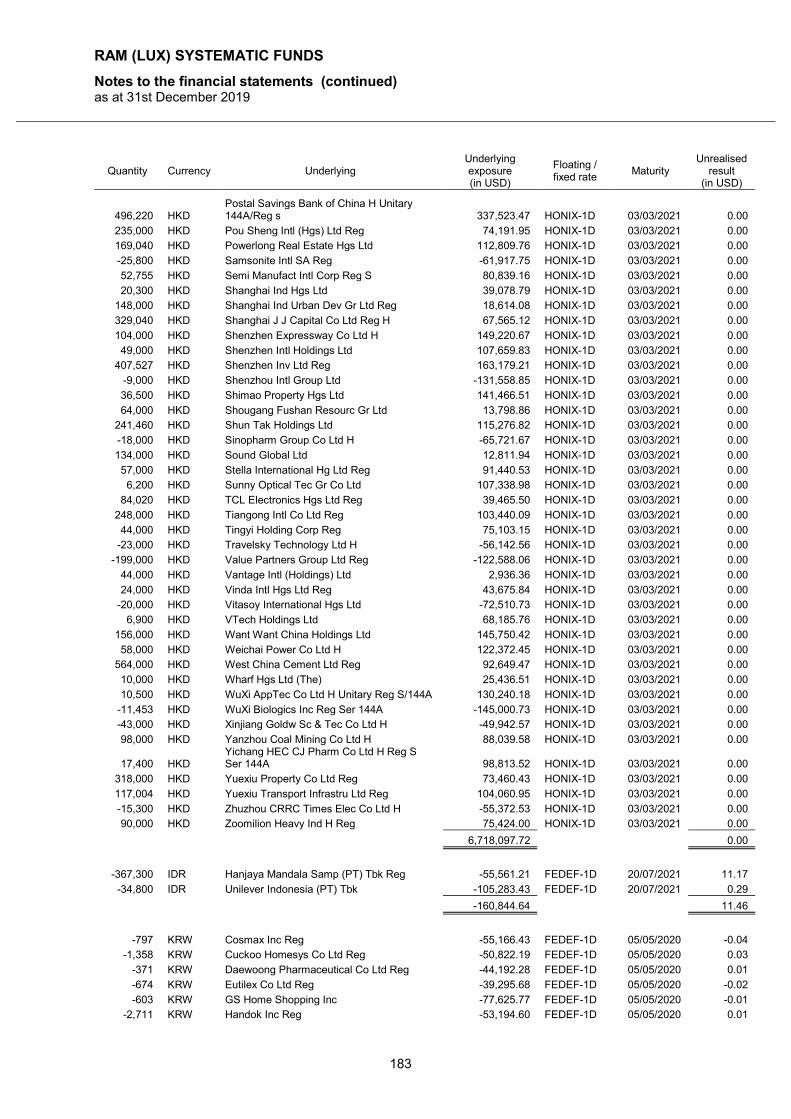
RAM (LUX) SYSTEMATIC FUNDS
Notes to the financial statements (continued) as at 31st December 2019
183
Quantity Currency Underlying Underlying exposure (in USD)
Floating / fixed rate
Maturity Unrealised
result (in USD)
496,220 HKD Postal Savings Bank of China H Unitary 144A/Reg s 337,523.47 HONIX-1D 03/03/2021 0.00
235,000 HKD Pou Sheng Intl (Hgs) Ltd Reg 74,191.95 HONIX-1D 03/03/2021 0.00
169,040 HKD Powerlong Real Estate Hgs Ltd 112,809.76 HONIX-1D 03/03/2021 0.00
-25,800 HKD Samsonite Intl SA Reg -61,917.75 HONIX-1D 03/03/2021 0.00
52,755 HKD Semi Manufact Intl Corp Reg S 80,839.16 HONIX-1D 03/03/2021 0.00
20,300 HKD Shanghai Ind Hgs Ltd 39,078.79 HONIX-1D 03/03/2021 0.00
148,000 HKD Shanghai Ind Urban Dev Gr Ltd Reg 18,614.08 HONIX-1D 03/03/2021 0.00
329,040 HKD Shanghai J J Capital Co Ltd Reg H 67,565.12 HONIX-1D 03/03/2021 0.00
104,000 HKD Shenzhen Expressway Co Ltd H 149,220.67 HONIX-1D 03/03/2021 0.00
49,000 HKD Shenzhen Intl Holdings Ltd 107,659.83 HONIX-1D 03/03/2021 0.00
407,527 HKD Shenzhen Inv Ltd Reg 163,179.21 HONIX-1D 03/03/2021 0.00
-9,000 HKD Shenzhou Intl Group Ltd -131,558.85 HONIX-1D 03/03/2021 0.00
36,500 HKD Shimao Property Hgs Ltd 141,466.51 HONIX-1D 03/03/2021 0.00
64,000 HKD Shougang Fushan Resourc Gr Ltd 13,798.86 HONIX-1D 03/03/2021 0.00
241,460 HKD Shun Tak Holdings Ltd 115,276.82 HONIX-1D 03/03/2021 0.00
-18,000 HKD Sinopharm Group Co Ltd H -65,721.67 HONIX-1D 03/03/2021 0.00
134,000 HKD Sound Global Ltd 12,811.94 HONIX-1D 03/03/2021 0.00
57,000 HKD Stella International Hg Ltd Reg 91,440.53 HONIX-1D 03/03/2021 0.00
6,200 HKD Sunny Optical Tec Gr Co Ltd 107,338.98 HONIX-1D 03/03/2021 0.00
84,020 HKD TCL Electronics Hgs Ltd Reg 39,465.50 HONIX-1D 03/03/2021 0.00
248,000 HKD Tiangong Intl Co Ltd Reg 103,440.09 HONIX-1D 03/03/2021 0.00
44,000 HKD Tingyi Holding Corp Reg 75,103.15 HONIX-1D 03/03/2021 0.00
-23,000 HKD Travelsky Technology Ltd H -56,142.56 HONIX-1D 03/03/2021 0.00
-199,000 HKD Value Partners Group Ltd Reg -122,588.06 HONIX-1D 03/03/2021 0.00
44,000 HKD Vantage Intl (Holdings) Ltd 2,936.36 HONIX-1D 03/03/2021 0.00
24,000 HKD Vinda Intl Hgs Ltd Reg 43,675.84 HONIX-1D 03/03/2021 0.00
-20,000 HKD Vitasoy International Hgs Ltd -72,510.73 HONIX-1D 03/03/2021 0.00
6,900 HKD VTech Holdings Ltd 68,185.76 HONIX-1D 03/03/2021 0.00
156,000 HKD Want Want China Holdings Ltd 145,750.42 HONIX-1D 03/03/2021 0.00
58,000 HKD Weichai Power Co Ltd H 122,372.45 HONIX-1D 03/03/2021 0.00
564,000 HKD West China Cement Ltd Reg 92,649.47 HONIX-1D 03/03/2021 0.00
10,000 HKD Wharf Hgs Ltd (The) 25,436.51 HONIX-1D 03/03/2021 0.00
10,500 HKD WuXi AppTec Co Ltd H Unitary Reg S/144A 130,240.18 HONIX-1D 03/03/2021 0.00
-11,453 HKD WuXi Biologics Inc Reg Ser 144A -145,000.73 HONIX-1D 03/03/2021 0.00
-43,000 HKD Xinjiang Goldw Sc & Tec Co Ltd H -49,942.57 HONIX-1D 03/03/2021 0.00
98,000 HKD Yanzhou Coal Mining Co Ltd H 88,039.58 HONIX-1D 03/03/2021 0.00
17,400 HKD Yichang HEC CJ Pharm Co Ltd H Reg S Ser 144A 98,813.52 HONIX-1D 03/03/2021 0.00
318,000 HKD Yuexiu Property Co Ltd Reg 73,460.43 HONIX-1D 03/03/2021 0.00
117,004 HKD Yuexiu Transport Infrastru Ltd Reg 104,060.95 HONIX-1D 03/03/2021 0.00
-15,300 HKD Zhuzhou CRRC Times Elec Co Ltd H -55,372.53 HONIX-1D 03/03/2021 0.00
90,000 HKD Zoomilion Heavy Ind H Reg 75,424.00 HONIX-1D 03/03/2021 0.00
6,718,097.72 0.00
-367,300 IDR Hanjaya Mandala Samp (PT) Tbk Reg -55,561.21 FEDEF-1D 20/07/2021 11.17
-34,800 IDR Unilever Indonesia (PT) Tbk -105,283.43 FEDEF-1D 20/07/2021 0.29
-160,844.64 11.46
-797 KRW Cosmax Inc Reg -55,166.43 FEDEF-1D 05/05/2020 -0.04
-1,358 KRW Cuckoo Homesys Co Ltd Reg -50,822.19 FEDEF-1D 05/05/2020 0.03
-371 KRW Daewoong Pharmaceutical Co Ltd Reg -44,192.28 FEDEF-1D 05/05/2020 0.01
-674 KRW Eutilex Co Ltd Reg -39,295.68 FEDEF-1D 05/05/2020 -0.02
-603 KRW GS Home Shopping Inc -77,625.77 FEDEF-1D 05/05/2020 -0.01
-2,711 KRW Handok Inc Reg -53,194.60 FEDEF-1D 05/05/2020 0.01
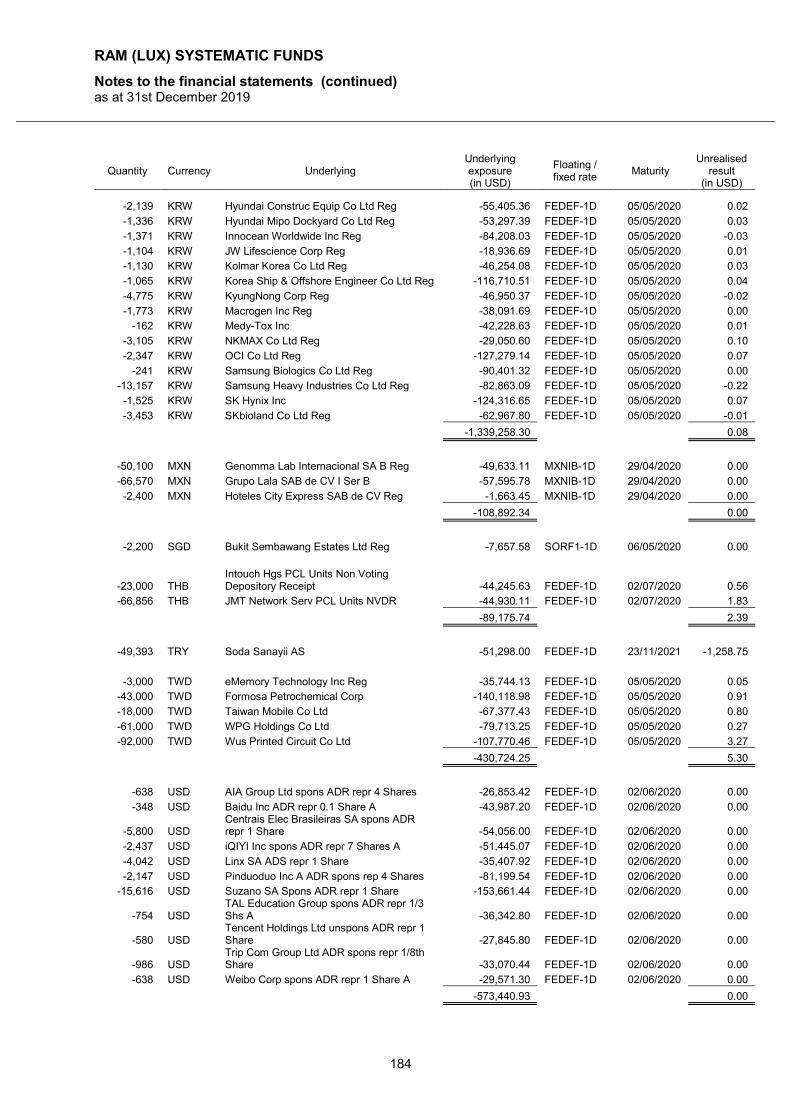
RAM (LUX) SYSTEMATIC FUNDS
Notes to the financial statements (continued) as at 31st December 2019
184
Quantity Currency Underlying Underlying exposure (in USD)
Floating / fixed rate
Maturity Unrealised
result (in USD)
-2,139 KRW Hyundai Construc Equip Co Ltd Reg -55,405.36 FEDEF-1D 05/05/2020 0.02
-1,336 KRW Hyundai Mipo Dockyard Co Ltd Reg -53,297.39 FEDEF-1D 05/05/2020 0.03
-1,371 KRW Innocean Worldwide Inc Reg -84,208.03 FEDEF-1D 05/05/2020 -0.03
-1,104 KRW JW Lifescience Corp Reg -18,936.69 FEDEF-1D 05/05/2020 0.01
-1,130 KRW Kolmar Korea Co Ltd Reg -46,254.08 FEDEF-1D 05/05/2020 0.03
-1,065 KRW Korea Ship & Offshore Engineer Co Ltd Reg -116,710.51 FEDEF-1D 05/05/2020 0.04
-4,775 KRW KyungNong Corp Reg -46,950.37 FEDEF-1D 05/05/2020 -0.02
-1,773 KRW Macrogen Inc Reg -38,091.69 FEDEF-1D 05/05/2020 0.00
-162 KRW Medy-Tox Inc -42,228.63 FEDEF-1D 05/05/2020 0.01
-3,105 KRW NKMAX Co Ltd Reg -29,050.60 FEDEF-1D 05/05/2020 0.10
-2,347 KRW OCI Co Ltd Reg -127,279.14 FEDEF-1D 05/05/2020 0.07
-241 KRW Samsung Biologics Co Ltd Reg -90,401.32 FEDEF-1D 05/05/2020 0.00
-13,157 KRW Samsung Heavy Industries Co Ltd Reg -82,863.09 FEDEF-1D 05/05/2020 -0.22
-1,525 KRW SK Hynix Inc -124,316.65 FEDEF-1D 05/05/2020 0.07
-3,453 KRW SKbioland Co Ltd Reg -62,967.80 FEDEF-1D 05/05/2020 -0.01
-1,339,258.30 0.08
-50,100 MXN Genomma Lab Internacional SA B Reg -49,633.11 MXNIB-1D 29/04/2020 0.00
-66,570 MXN Grupo Lala SAB de CV I Ser B -57,595.78 MXNIB-1D 29/04/2020 0.00
-2,400 MXN Hoteles City Express SAB de CV Reg -1,663.45 MXNIB-1D 29/04/2020 0.00
-108,892.34 0.00
-2,200 SGD Bukit Sembawang Estates Ltd Reg -7,657.58 SORF1-1D 06/05/2020 0.00
-23,000 THB Intouch Hgs PCL Units Non Voting Depository Receipt -44,245.63 FEDEF-1D 02/07/2020 0.56
-66,856 THB JMT Network Serv PCL Units NVDR -44,930.11 FEDEF-1D 02/07/2020 1.83
-89,175.74 2.39
-49,393 TRY Soda Sanayii AS -51,298.00 FEDEF-1D 23/11/2021 -1,258.75
-3,000 TWD eMemory Technology Inc Reg -35,744.13 FEDEF-1D 05/05/2020 0.05
-43,000 TWD Formosa Petrochemical Corp -140,118.98 FEDEF-1D 05/05/2020 0.91
-18,000 TWD Taiwan Mobile Co Ltd -67,377.43 FEDEF-1D 05/05/2020 0.80
-61,000 TWD WPG Holdings Co Ltd -79,713.25 FEDEF-1D 05/05/2020 0.27
-92,000 TWD Wus Printed Circuit Co Ltd -107,770.46 FEDEF-1D 05/05/2020 3.27
-430,724.25 5.30
-638 USD AIA Group Ltd spons ADR repr 4 Shares -26,853.42 FEDEF-1D 02/06/2020 0.00
-348 USD Baidu Inc ADR repr 0.1 Share A -43,987.20 FEDEF-1D 02/06/2020 0.00
-5,800 USD Centrais Elec Brasileiras SA spons ADR repr 1 Share -54,056.00 FEDEF-1D 02/06/2020 0.00
-2,437 USD iQIYI Inc spons ADR repr 7 Shares A -51,445.07 FEDEF-1D 02/06/2020 0.00
-4,042 USD Linx SA ADS repr 1 Share -35,407.92 FEDEF-1D 02/06/2020 0.00
-2,147 USD Pinduoduo Inc A ADR spons rep 4 Shares -81,199.54 FEDEF-1D 02/06/2020 0.00
-15,616 USD Suzano SA Spons ADR repr 1 Share -153,661.44 FEDEF-1D 02/06/2020 0.00
-754 USD TAL Education Group spons ADR repr 1/3 Shs A -36,342.80 FEDEF-1D 02/06/2020 0.00
-580 USD Tencent Holdings Ltd unspons ADR repr 1 Share -27,845.80 FEDEF-1D 02/06/2020 0.00
-986 USD Trip Com Group Ltd ADR spons repr 1/8th Share -33,070.44 FEDEF-1D 02/06/2020 0.00
-638 USD Weibo Corp spons ADR repr 1 Share A -29,571.30 FEDEF-1D 02/06/2020 0.00
-573,440.93 0.00
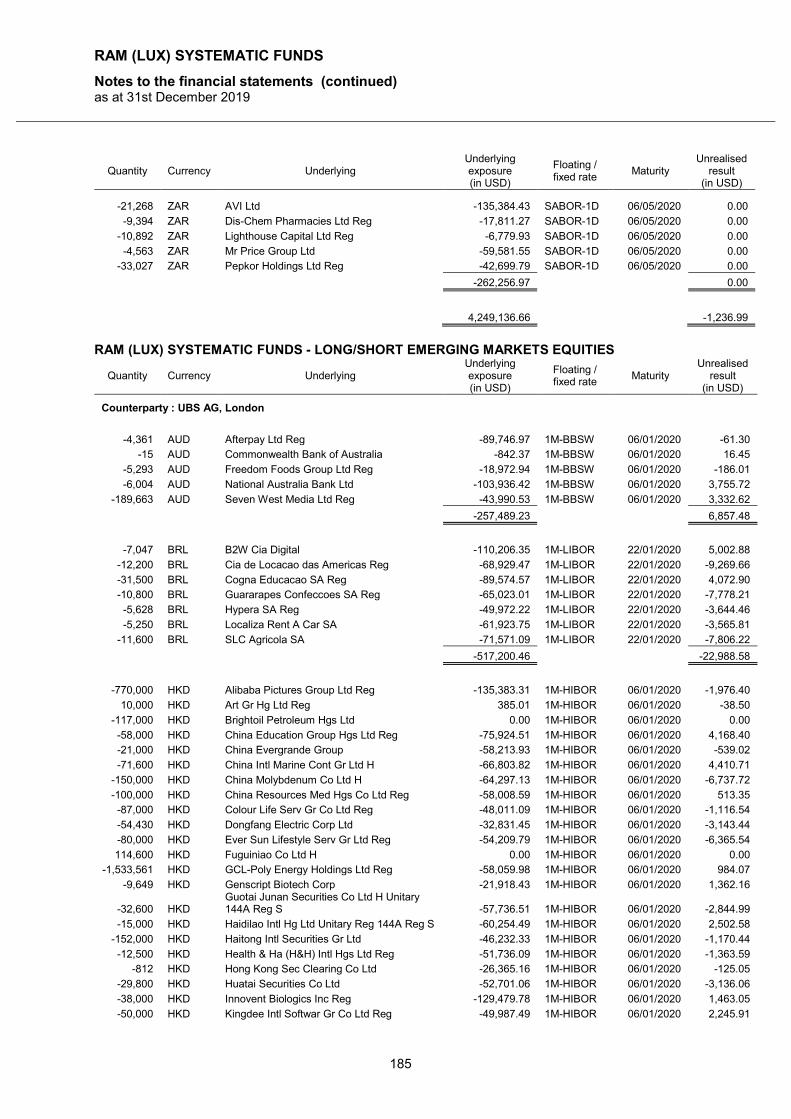
RAM (LUX) SYSTEMATIC FUNDS
Notes to the financial statements (continued) as at 31st December 2019
185
Quantity Currency Underlying Underlying exposure (in USD)
Floating / fixed rate
Maturity Unrealised
result (in USD)
-21,268 ZAR AVI Ltd -135,384.43 SABOR-1D 06/05/2020 0.00
-9,394 ZAR Dis-Chem Pharmacies Ltd Reg -17,811.27 SABOR-1D 06/05/2020 0.00
-10,892 ZAR Lighthouse Capital Ltd Reg -6,779.93 SABOR-1D 06/05/2020 0.00
-4,563 ZAR Mr Price Group Ltd -59,581.55 SABOR-1D 06/05/2020 0.00
-33,027 ZAR Pepkor Holdings Ltd Reg -42,699.79 SABOR-1D 06/05/2020 0.00
-262,256.97 0.00
4,249,136.66 -1,236.99
RAM (LUX) SYSTEMATIC FUNDS - LONG/SHORT EMERGING MARKETS EQUITIES
Quantity Currency Underlying Underlying exposure (in USD)
Floating / fixed rate
Maturity Unrealised
result (in USD)
Counterparty : UBS AG, London
-4,361 AUD Afterpay Ltd Reg -89,746.97 1M-BBSW 06/01/2020 -61.30
-15 AUD Commonwealth Bank of Australia -842.37 1M-BBSW 06/01/2020 16.45
-5,293 AUD Freedom Foods Group Ltd Reg -18,972.94 1M-BBSW 06/01/2020 -186.01
-6,004 AUD National Australia Bank Ltd -103,936.42 1M-BBSW 06/01/2020 3,755.72
-189,663 AUD Seven West Media Ltd Reg -43,990.53 1M-BBSW 06/01/2020 3,332.62
-257,489.23 6,857.48
-7,047 BRL B2W Cia Digital -110,206.35 1M-LIBOR 22/01/2020 5,002.88
-12,200 BRL Cia de Locacao das Americas Reg -68,929.47 1M-LIBOR 22/01/2020 -9,269.66
-31,500 BRL Cogna Educacao SA Reg -89,574.57 1M-LIBOR 22/01/2020 4,072.90
-10,800 BRL Guararapes Confeccoes SA Reg -65,023.01 1M-LIBOR 22/01/2020 -7,778.21
-5,628 BRL Hypera SA Reg -49,972.22 1M-LIBOR 22/01/2020 -3,644.46
-5,250 BRL Localiza Rent A Car SA -61,923.75 1M-LIBOR 22/01/2020 -3,565.81
-11,600 BRL SLC Agricola SA -71,571.09 1M-LIBOR 22/01/2020 -7,806.22
-517,200.46 -22,988.58
-770,000 HKD Alibaba Pictures Group Ltd Reg -135,383.31 1M-HIBOR 06/01/2020 -1,976.40
10,000 HKD Art Gr Hg Ltd Reg 385.01 1M-HIBOR 06/01/2020 -38.50
-117,000 HKD Brightoil Petroleum Hgs Ltd 0.00 1M-HIBOR 06/01/2020 0.00
-58,000 HKD China Education Group Hgs Ltd Reg -75,924.51 1M-HIBOR 06/01/2020 4,168.40
-21,000 HKD China Evergrande Group -58,213.93 1M-HIBOR 06/01/2020 -539.02
-71,600 HKD China Intl Marine Cont Gr Ltd H -66,803.82 1M-HIBOR 06/01/2020 4,410.71
-150,000 HKD China Molybdenum Co Ltd H -64,297.13 1M-HIBOR 06/01/2020 -6,737.72
-100,000 HKD China Resources Med Hgs Co Ltd Reg -58,008.59 1M-HIBOR 06/01/2020 513.35
-87,000 HKD Colour Life Serv Gr Co Ltd Reg -48,011.09 1M-HIBOR 06/01/2020 -1,116.54
-54,430 HKD Dongfang Electric Corp Ltd -32,831.45 1M-HIBOR 06/01/2020 -3,143.44
-80,000 HKD Ever Sun Lifestyle Serv Gr Ltd Reg -54,209.79 1M-HIBOR 06/01/2020 -6,365.54
114,600 HKD Fuguiniao Co Ltd H 0.00 1M-HIBOR 06/01/2020 0.00
-1,533,561 HKD GCL-Poly Energy Holdings Ltd Reg -58,059.98 1M-HIBOR 06/01/2020 984.07
-9,649 HKD Genscript Biotech Corp -21,918.43 1M-HIBOR 06/01/2020 1,362.16
-32,600 HKD Guotai Junan Securities Co Ltd H Unitary 144A Reg S -57,736.51 1M-HIBOR 06/01/2020 -2,844.99
-15,000 HKD Haidilao Intl Hg Ltd Unitary Reg 144A Reg S -60,254.49 1M-HIBOR 06/01/2020 2,502.58
-152,000 HKD Haitong Intl Securities Gr Ltd -46,232.33 1M-HIBOR 06/01/2020 -1,170.44
-12,500 HKD Health & Ha (H&H) Intl Hgs Ltd Reg -51,736.09 1M-HIBOR 06/01/2020 -1,363.59
-812 HKD Hong Kong Sec Clearing Co Ltd -26,365.16 1M-HIBOR 06/01/2020 -125.05
-29,800 HKD Huatai Securities Co Ltd -52,701.06 1M-HIBOR 06/01/2020 -3,136.06
-38,000 HKD Innovent Biologics Inc Reg -129,479.78 1M-HIBOR 06/01/2020 1,463.05
-50,000 HKD Kingdee Intl Softwar Gr Co Ltd Reg -49,987.49 1M-HIBOR 06/01/2020 2,245.91
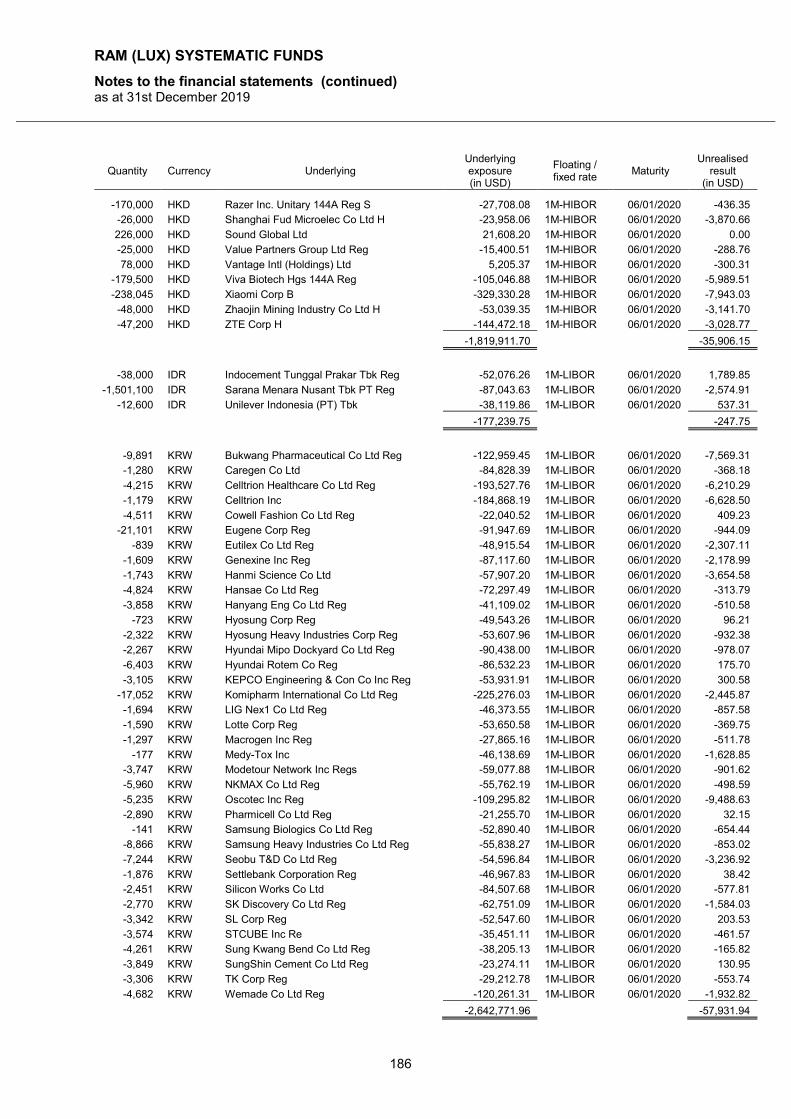
RAM (LUX) SYSTEMATIC FUNDS
Notes to the financial statements (continued) as at 31st December 2019
186
Quantity Currency Underlying Underlying exposure (in USD)
Floating / fixed rate
Maturity Unrealised
result (in USD)
-170,000 HKD Razer Inc. Unitary 144A Reg S -27,708.08 1M-HIBOR 06/01/2020 -436.35
-26,000 HKD Shanghai Fud Microelec Co Ltd H -23,958.06 1M-HIBOR 06/01/2020 -3,870.66
226,000 HKD Sound Global Ltd 21,608.20 1M-HIBOR 06/01/2020 0.00
-25,000 HKD Value Partners Group Ltd Reg -15,400.51 1M-HIBOR 06/01/2020 -288.76
78,000 HKD Vantage Intl (Holdings) Ltd 5,205.37 1M-HIBOR 06/01/2020 -300.31
-179,500 HKD Viva Biotech Hgs 144A Reg -105,046.88 1M-HIBOR 06/01/2020 -5,989.51
-238,045 HKD Xiaomi Corp B -329,330.28 1M-HIBOR 06/01/2020 -7,943.03
-48,000 HKD Zhaojin Mining Industry Co Ltd H -53,039.35 1M-HIBOR 06/01/2020 -3,141.70
-47,200 HKD ZTE Corp H -144,472.18 1M-HIBOR 06/01/2020 -3,028.77
-1,819,911.70 -35,906.15
-38,000 IDR Indocement Tunggal Prakar Tbk Reg -52,076.26 1M-LIBOR 06/01/2020 1,789.85
-1,501,100 IDR Sarana Menara Nusant Tbk PT Reg -87,043.63 1M-LIBOR 06/01/2020 -2,574.91
-12,600 IDR Unilever Indonesia (PT) Tbk -38,119.86 1M-LIBOR 06/01/2020 537.31
-177,239.75 -247.75
-9,891 KRW Bukwang Pharmaceutical Co Ltd Reg -122,959.45 1M-LIBOR 06/01/2020 -7,569.31
-1,280 KRW Caregen Co Ltd -84,828.39 1M-LIBOR 06/01/2020 -368.18
-4,215 KRW Celltrion Healthcare Co Ltd Reg -193,527.76 1M-LIBOR 06/01/2020 -6,210.29
-1,179 KRW Celltrion Inc -184,868.19 1M-LIBOR 06/01/2020 -6,628.50
-4,511 KRW Cowell Fashion Co Ltd Reg -22,040.52 1M-LIBOR 06/01/2020 409.23
-21,101 KRW Eugene Corp Reg -91,947.69 1M-LIBOR 06/01/2020 -944.09
-839 KRW Eutilex Co Ltd Reg -48,915.54 1M-LIBOR 06/01/2020 -2,307.11
-1,609 KRW Genexine Inc Reg -87,117.60 1M-LIBOR 06/01/2020 -2,178.99
-1,743 KRW Hanmi Science Co Ltd -57,907.20 1M-LIBOR 06/01/2020 -3,654.58
-4,824 KRW Hansae Co Ltd Reg -72,297.49 1M-LIBOR 06/01/2020 -313.79
-3,858 KRW Hanyang Eng Co Ltd Reg -41,109.02 1M-LIBOR 06/01/2020 -510.58
-723 KRW Hyosung Corp Reg -49,543.26 1M-LIBOR 06/01/2020 96.21
-2,322 KRW Hyosung Heavy Industries Corp Reg -53,607.96 1M-LIBOR 06/01/2020 -932.38
-2,267 KRW Hyundai Mipo Dockyard Co Ltd Reg -90,438.00 1M-LIBOR 06/01/2020 -978.07
-6,403 KRW Hyundai Rotem Co Reg -86,532.23 1M-LIBOR 06/01/2020 175.70
-3,105 KRW KEPCO Engineering & Con Co Inc Reg -53,931.91 1M-LIBOR 06/01/2020 300.58
-17,052 KRW Komipharm International Co Ltd Reg -225,276.03 1M-LIBOR 06/01/2020 -2,445.87
-1,694 KRW LIG Nex1 Co Ltd Reg -46,373.55 1M-LIBOR 06/01/2020 -857.58
-1,590 KRW Lotte Corp Reg -53,650.58 1M-LIBOR 06/01/2020 -369.75
-1,297 KRW Macrogen Inc Reg -27,865.16 1M-LIBOR 06/01/2020 -511.78
-177 KRW Medy-Tox Inc -46,138.69 1M-LIBOR 06/01/2020 -1,628.85
-3,747 KRW Modetour Network Inc Regs -59,077.88 1M-LIBOR 06/01/2020 -901.62
-5,960 KRW NKMAX Co Ltd Reg -55,762.19 1M-LIBOR 06/01/2020 -498.59
-5,235 KRW Oscotec Inc Reg -109,295.82 1M-LIBOR 06/01/2020 -9,488.63
-2,890 KRW Pharmicell Co Ltd Reg -21,255.70 1M-LIBOR 06/01/2020 32.15
-141 KRW Samsung Biologics Co Ltd Reg -52,890.40 1M-LIBOR 06/01/2020 -654.44
-8,866 KRW Samsung Heavy Industries Co Ltd Reg -55,838.27 1M-LIBOR 06/01/2020 -853.02
-7,244 KRW Seobu T&D Co Ltd Reg -54,596.84 1M-LIBOR 06/01/2020 -3,236.92
-1,876 KRW Settlebank Corporation Reg -46,967.83 1M-LIBOR 06/01/2020 38.42
-2,451 KRW Silicon Works Co Ltd -84,507.68 1M-LIBOR 06/01/2020 -577.81
-2,770 KRW SK Discovery Co Ltd Reg -62,751.09 1M-LIBOR 06/01/2020 -1,584.03
-3,342 KRW SL Corp Reg -52,547.60 1M-LIBOR 06/01/2020 203.53
-3,574 KRW STCUBE Inc Re -35,451.11 1M-LIBOR 06/01/2020 -461.57
-4,261 KRW Sung Kwang Bend Co Ltd Reg -38,205.13 1M-LIBOR 06/01/2020 -165.82
-3,849 KRW SungShin Cement Co Ltd Reg -23,274.11 1M-LIBOR 06/01/2020 130.95
-3,306 KRW TK Corp Reg -29,212.78 1M-LIBOR 06/01/2020 -553.74
-4,682 KRW Wemade Co Ltd Reg -120,261.31 1M-LIBOR 06/01/2020 -1,932.82
-2,642,771.96 -57,931.94
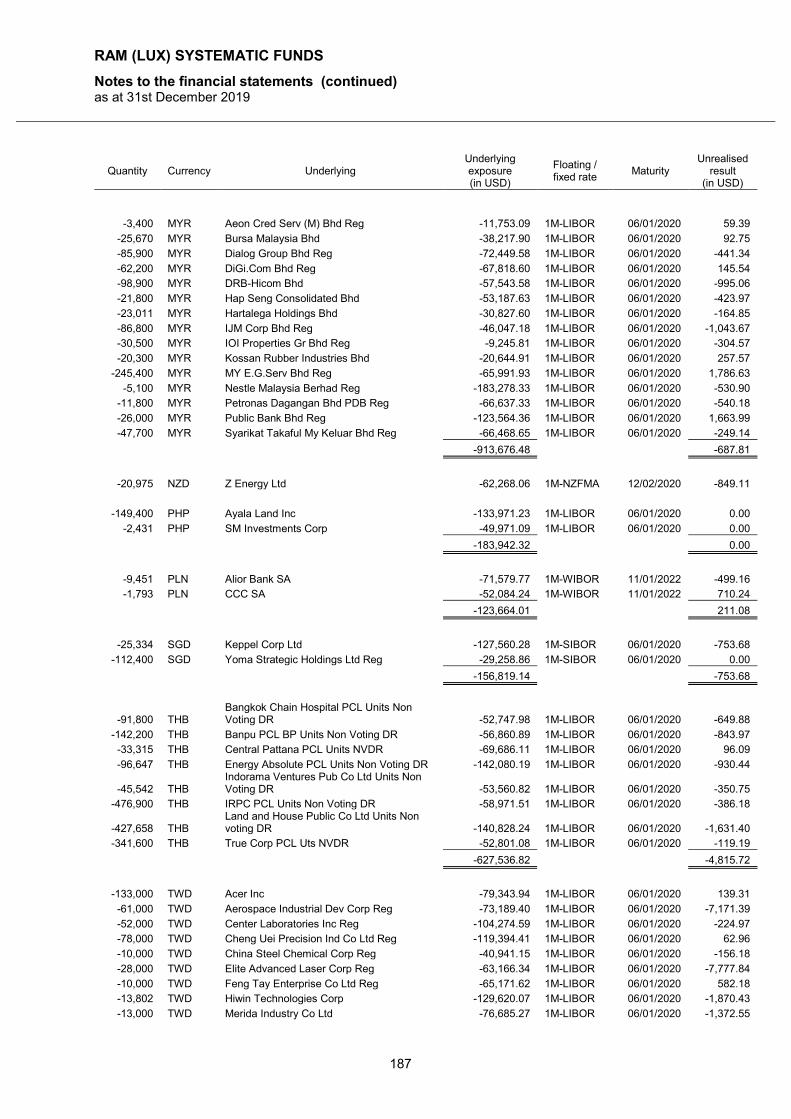
RAM (LUX) SYSTEMATIC FUNDS
Notes to the financial statements (continued) as at 31st December 2019
187
Quantity Currency Underlying Underlying exposure (in USD)
Floating / fixed rate
Maturity Unrealised
result (in USD)
-3,400 MYR Aeon Cred Serv (M) Bhd Reg -11,753.09 1M-LIBOR 06/01/2020 59.39
-25,670 MYR Bursa Malaysia Bhd -38,217.90 1M-LIBOR 06/01/2020 92.75
-85,900 MYR Dialog Group Bhd Reg -72,449.58 1M-LIBOR 06/01/2020 -441.34
-62,200 MYR DiGi.Com Bhd Reg -67,818.60 1M-LIBOR 06/01/2020 145.54
-98,900 MYR DRB-Hicom Bhd -57,543.58 1M-LIBOR 06/01/2020 -995.06
-21,800 MYR Hap Seng Consolidated Bhd -53,187.63 1M-LIBOR 06/01/2020 -423.97
-23,011 MYR Hartalega Holdings Bhd -30,827.60 1M-LIBOR 06/01/2020 -164.85
-86,800 MYR IJM Corp Bhd Reg -46,047.18 1M-LIBOR 06/01/2020 -1,043.67
-30,500 MYR IOI Properties Gr Bhd Reg -9,245.81 1M-LIBOR 06/01/2020 -304.57
-20,300 MYR Kossan Rubber Industries Bhd -20,644.91 1M-LIBOR 06/01/2020 257.57
-245,400 MYR MY E.G.Serv Bhd Reg -65,991.93 1M-LIBOR 06/01/2020 1,786.63
-5,100 MYR Nestle Malaysia Berhad Reg -183,278.33 1M-LIBOR 06/01/2020 -530.90
-11,800 MYR Petronas Dagangan Bhd PDB Reg -66,637.33 1M-LIBOR 06/01/2020 -540.18
-26,000 MYR Public Bank Bhd Reg -123,564.36 1M-LIBOR 06/01/2020 1,663.99
-47,700 MYR Syarikat Takaful My Keluar Bhd Reg -66,468.65 1M-LIBOR 06/01/2020 -249.14
-913,676.48 -687.81
-20,975 NZD Z Energy Ltd -62,268.06 1M-NZFMA 12/02/2020 -849.11
-149,400 PHP Ayala Land Inc -133,971.23 1M-LIBOR 06/01/2020 0.00
-2,431 PHP SM Investments Corp -49,971.09 1M-LIBOR 06/01/2020 0.00
-183,942.32 0.00
-9,451 PLN Alior Bank SA -71,579.77 1M-WIBOR 11/01/2022 -499.16
-1,793 PLN CCC SA -52,084.24 1M-WIBOR 11/01/2022 710.24
-123,664.01 211.08
-25,334 SGD Keppel Corp Ltd -127,560.28 1M-SIBOR 06/01/2020 -753.68
-112,400 SGD Yoma Strategic Holdings Ltd Reg -29,258.86 1M-SIBOR 06/01/2020 0.00
-156,819.14 -753.68
-91,800 THB Bangkok Chain Hospital PCL Units Non Voting DR -52,747.98 1M-LIBOR 06/01/2020 -649.88
-142,200 THB Banpu PCL BP Units Non Voting DR -56,860.89 1M-LIBOR 06/01/2020 -843.97
-33,315 THB Central Pattana PCL Units NVDR -69,686.11 1M-LIBOR 06/01/2020 96.09
-96,647 THB Energy Absolute PCL Units Non Voting DR -142,080.19 1M-LIBOR 06/01/2020 -930.44
-45,542 THB Indorama Ventures Pub Co Ltd Units Non Voting DR -53,560.82 1M-LIBOR 06/01/2020 -350.75
-476,900 THB IRPC PCL Units Non Voting DR -58,971.51 1M-LIBOR 06/01/2020 -386.18
-427,658 THB Land and House Public Co Ltd Units Non voting DR -140,828.24 1M-LIBOR 06/01/2020 -1,631.40
-341,600 THB True Corp PCL Uts NVDR -52,801.08 1M-LIBOR 06/01/2020 -119.19
-627,536.82 -4,815.72
-133,000 TWD Acer Inc -79,343.94 1M-LIBOR 06/01/2020 139.31
-61,000 TWD Aerospace Industrial Dev Corp Reg -73,189.40 1M-LIBOR 06/01/2020 -7,171.39
-52,000 TWD Center Laboratories Inc Reg -104,274.59 1M-LIBOR 06/01/2020 -224.97
-78,000 TWD Cheng Uei Precision Ind Co Ltd Reg -119,394.41 1M-LIBOR 06/01/2020 62.96
-10,000 TWD China Steel Chemical Corp Reg -40,941.15 1M-LIBOR 06/01/2020 -156.18
-28,000 TWD Elite Advanced Laser Corp Reg -63,166.34 1M-LIBOR 06/01/2020 -7,777.84
-10,000 TWD Feng Tay Enterprise Co Ltd Reg -65,171.62 1M-LIBOR 06/01/2020 582.18
-13,802 TWD Hiwin Technologies Corp -129,620.07 1M-LIBOR 06/01/2020 -1,870.43
-13,000 TWD Merida Industry Co Ltd -76,685.27 1M-LIBOR 06/01/2020 -1,372.55
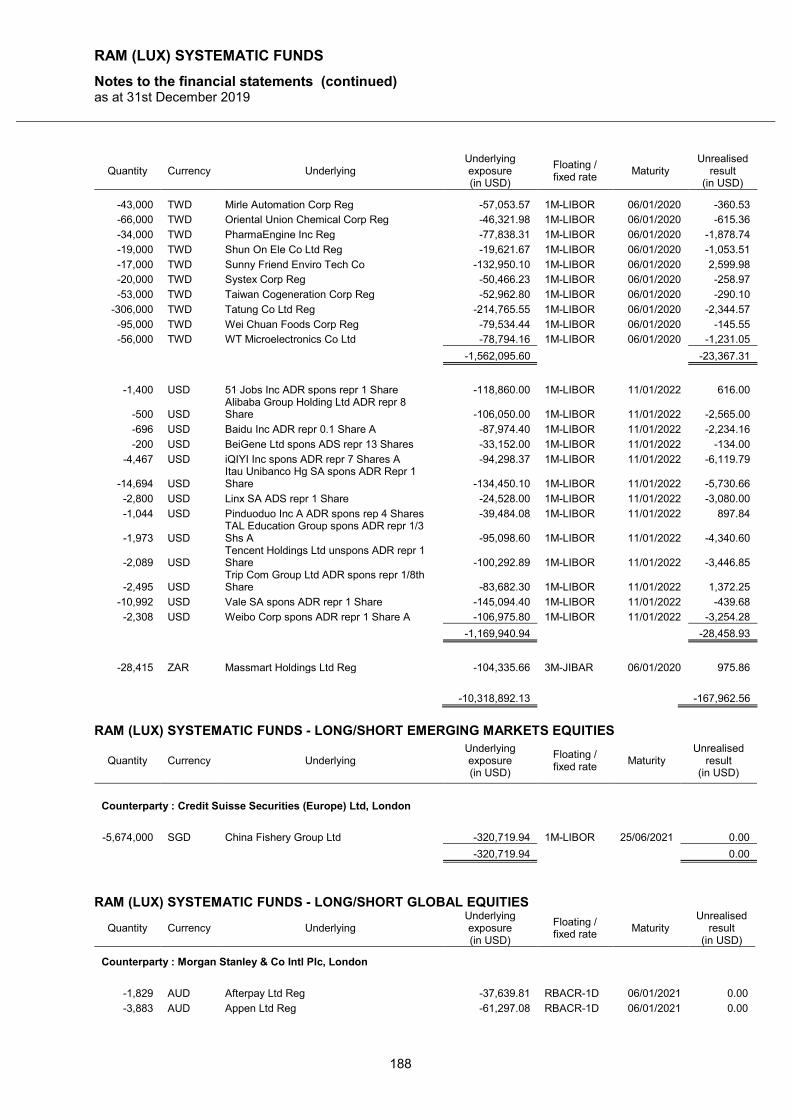
RAM (LUX) SYSTEMATIC FUNDS
Notes to the financial statements (continued) as at 31st December 2019
188
Quantity Currency Underlying Underlying exposure (in USD)
Floating / fixed rate
Maturity Unrealised
result (in USD)
-43,000 TWD Mirle Automation Corp Reg -57,053.57 1M-LIBOR 06/01/2020 -360.53
-66,000 TWD Oriental Union Chemical Corp Reg -46,321.98 1M-LIBOR 06/01/2020 -615.36
-34,000 TWD PharmaEngine Inc Reg -77,838.31 1M-LIBOR 06/01/2020 -1,878.74
-19,000 TWD Shun On Ele Co Ltd Reg -19,621.67 1M-LIBOR 06/01/2020 -1,053.51
-17,000 TWD Sunny Friend Enviro Tech Co -132,950.10 1M-LIBOR 06/01/2020 2,599.98
-20,000 TWD Systex Corp Reg -50,466.23 1M-LIBOR 06/01/2020 -258.97
-53,000 TWD Taiwan Cogeneration Corp Reg -52,962.80 1M-LIBOR 06/01/2020 -290.10
-306,000 TWD Tatung Co Ltd Reg -214,765.55 1M-LIBOR 06/01/2020 -2,344.57
-95,000 TWD Wei Chuan Foods Corp Reg -79,534.44 1M-LIBOR 06/01/2020 -145.55
-56,000 TWD WT Microelectronics Co Ltd -78,794.16 1M-LIBOR 06/01/2020 -1,231.05
-1,562,095.60 -23,367.31
-1,400 USD 51 Jobs Inc ADR spons repr 1 Share -118,860.00 1M-LIBOR 11/01/2022 616.00
-500 USD Alibaba Group Holding Ltd ADR repr 8 Share -106,050.00 1M-LIBOR 11/01/2022 -2,565.00
-696 USD Baidu Inc ADR repr 0.1 Share A -87,974.40 1M-LIBOR 11/01/2022 -2,234.16
-200 USD BeiGene Ltd spons ADS repr 13 Shares -33,152.00 1M-LIBOR 11/01/2022 -134.00
-4,467 USD iQIYI Inc spons ADR repr 7 Shares A -94,298.37 1M-LIBOR 11/01/2022 -6,119.79
-14,694 USD Itau Unibanco Hg SA spons ADR Repr 1 Share -134,450.10 1M-LIBOR 11/01/2022 -5,730.66
-2,800 USD Linx SA ADS repr 1 Share -24,528.00 1M-LIBOR 11/01/2022 -3,080.00
-1,044 USD Pinduoduo Inc A ADR spons rep 4 Shares -39,484.08 1M-LIBOR 11/01/2022 897.84
-1,973 USD TAL Education Group spons ADR repr 1/3 Shs A -95,098.60 1M-LIBOR 11/01/2022 -4,340.60
-2,089 USD Tencent Holdings Ltd unspons ADR repr 1 Share -100,292.89 1M-LIBOR 11/01/2022 -3,446.85
-2,495 USD Trip Com Group Ltd ADR spons repr 1/8th Share -83,682.30 1M-LIBOR 11/01/2022 1,372.25
-10,992 USD Vale SA spons ADR repr 1 Share -145,094.40 1M-LIBOR 11/01/2022 -439.68
-2,308 USD Weibo Corp spons ADR repr 1 Share A -106,975.80 1M-LIBOR 11/01/2022 -3,254.28
-1,169,940.94 -28,458.93
-28,415 ZAR Massmart Holdings Ltd Reg -104,335.66 3M-JIBAR 06/01/2020 975.86
-10,318,892.13 -167,962.56
RAM (LUX) SYSTEMATIC FUNDS - LONG/SHORT EMERGING MARKETS EQUITIES
Quantity Currency Underlying Underlying exposure (in USD)
Floating / fixed rate
Maturity Unrealised
result (in USD)
Counterparty : Credit Suisse Securities (Europe) Ltd, London
-5,674,000 SGD China Fishery Group Ltd -320,719.94 1M-LIBOR 25/06/2021 0.00
-320,719.94 0.00
RAM (LUX) SYSTEMATIC FUNDS - LONG/SHORT GLOBAL EQUITIES
Quantity Currency Underlying Underlying exposure (in USD)
Floating / fixed rate
Maturity Unrealised
result (in USD)
Counterparty : Morgan Stanley & Co Intl Plc, London
-1,829 AUD Afterpay Ltd Reg -37,639.81 RBACR-1D 06/01/2021 0.00
-3,883 AUD Appen Ltd Reg -61,297.08 RBACR-1D 06/01/2021 0.00
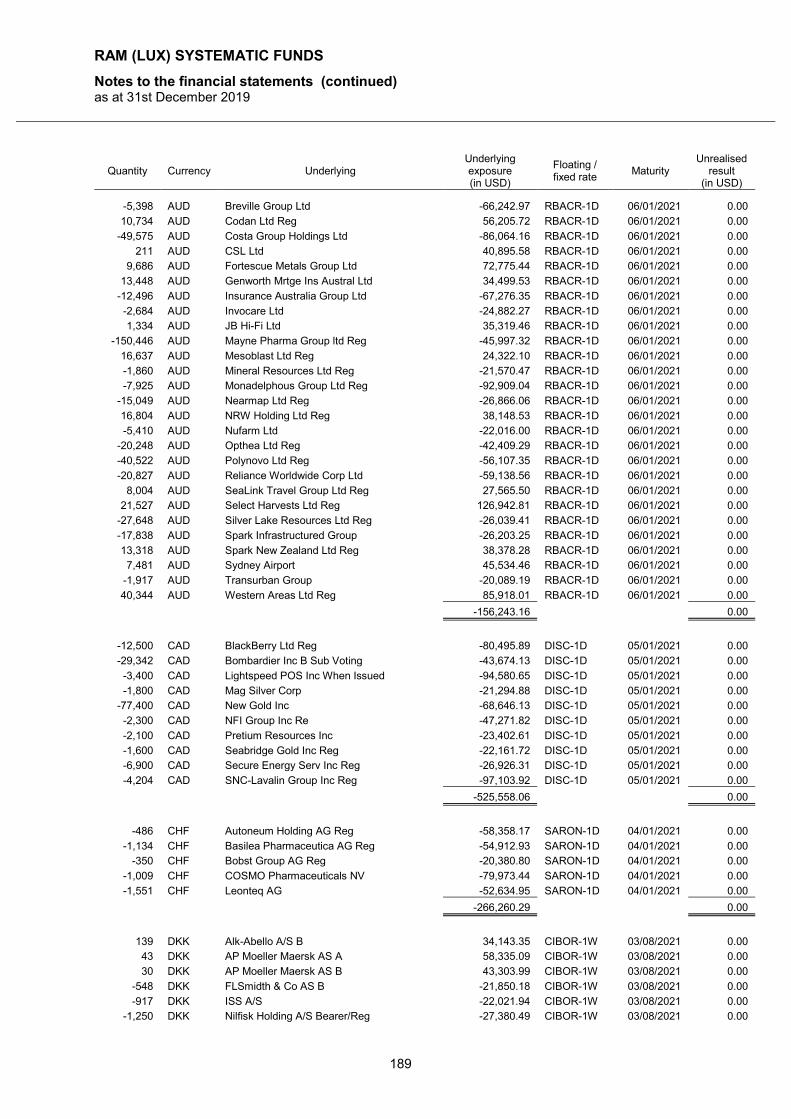
RAM (LUX) SYSTEMATIC FUNDS
Notes to the financial statements (continued) as at 31st December 2019
189
Quantity Currency Underlying Underlying exposure (in USD)
Floating / fixed rate
Maturity Unrealised
result (in USD)
-5,398 AUD Breville Group Ltd -66,242.97 RBACR-1D 06/01/2021 0.00
10,734 AUD Codan Ltd Reg 56,205.72 RBACR-1D 06/01/2021 0.00
-49,575 AUD Costa Group Holdings Ltd -86,064.16 RBACR-1D 06/01/2021 0.00
211 AUD CSL Ltd 40,895.58 RBACR-1D 06/01/2021 0.00
9,686 AUD Fortescue Metals Group Ltd 72,775.44 RBACR-1D 06/01/2021 0.00
13,448 AUD Genworth Mrtge Ins Austral Ltd 34,499.53 RBACR-1D 06/01/2021 0.00
-12,496 AUD Insurance Australia Group Ltd -67,276.35 RBACR-1D 06/01/2021 0.00
-2,684 AUD Invocare Ltd -24,882.27 RBACR-1D 06/01/2021 0.00
1,334 AUD JB Hi-Fi Ltd 35,319.46 RBACR-1D 06/01/2021 0.00
-150,446 AUD Mayne Pharma Group ltd Reg -45,997.32 RBACR-1D 06/01/2021 0.00
16,637 AUD Mesoblast Ltd Reg 24,322.10 RBACR-1D 06/01/2021 0.00
-1,860 AUD Mineral Resources Ltd Reg -21,570.47 RBACR-1D 06/01/2021 0.00
-7,925 AUD Monadelphous Group Ltd Reg -92,909.04 RBACR-1D 06/01/2021 0.00
-15,049 AUD Nearmap Ltd Reg -26,866.06 RBACR-1D 06/01/2021 0.00
16,804 AUD NRW Holding Ltd Reg 38,148.53 RBACR-1D 06/01/2021 0.00
-5,410 AUD Nufarm Ltd -22,016.00 RBACR-1D 06/01/2021 0.00
-20,248 AUD Opthea Ltd Reg -42,409.29 RBACR-1D 06/01/2021 0.00
-40,522 AUD Polynovo Ltd Reg -56,107.35 RBACR-1D 06/01/2021 0.00
-20,827 AUD Reliance Worldwide Corp Ltd -59,138.56 RBACR-1D 06/01/2021 0.00
8,004 AUD SeaLink Travel Group Ltd Reg 27,565.50 RBACR-1D 06/01/2021 0.00
21,527 AUD Select Harvests Ltd Reg 126,942.81 RBACR-1D 06/01/2021 0.00
-27,648 AUD Silver Lake Resources Ltd Reg -26,039.41 RBACR-1D 06/01/2021 0.00
-17,838 AUD Spark Infrastructured Group -26,203.25 RBACR-1D 06/01/2021 0.00
13,318 AUD Spark New Zealand Ltd Reg 38,378.28 RBACR-1D 06/01/2021 0.00
7,481 AUD Sydney Airport 45,534.46 RBACR-1D 06/01/2021 0.00
-1,917 AUD Transurban Group -20,089.19 RBACR-1D 06/01/2021 0.00
40,344 AUD Western Areas Ltd Reg 85,918.01 RBACR-1D 06/01/2021 0.00
-156,243.16 0.00
-12,500 CAD BlackBerry Ltd Reg -80,495.89 DISC-1D 05/01/2021 0.00
-29,342 CAD Bombardier Inc B Sub Voting -43,674.13 DISC-1D 05/01/2021 0.00
-3,400 CAD Lightspeed POS Inc When Issued -94,580.65 DISC-1D 05/01/2021 0.00
-1,800 CAD Mag Silver Corp -21,294.88 DISC-1D 05/01/2021 0.00
-77,400 CAD New Gold Inc -68,646.13 DISC-1D 05/01/2021 0.00
-2,300 CAD NFI Group Inc Re -47,271.82 DISC-1D 05/01/2021 0.00
-2,100 CAD Pretium Resources Inc -23,402.61 DISC-1D 05/01/2021 0.00
-1,600 CAD Seabridge Gold Inc Reg -22,161.72 DISC-1D 05/01/2021 0.00
-6,900 CAD Secure Energy Serv Inc Reg -26,926.31 DISC-1D 05/01/2021 0.00
-4,204 CAD SNC-Lavalin Group Inc Reg -97,103.92 DISC-1D 05/01/2021 0.00
-525,558.06 0.00
-486 CHF Autoneum Holding AG Reg -58,358.17 SARON-1D 04/01/2021 0.00
-1,134 CHF Basilea Pharmaceutica AG Reg -54,912.93 SARON-1D 04/01/2021 0.00
-350 CHF Bobst Group AG Reg -20,380.80 SARON-1D 04/01/2021 0.00
-1,009 CHF COSMO Pharmaceuticals NV -79,973.44 SARON-1D 04/01/2021 0.00
-1,551 CHF Leonteq AG -52,634.95 SARON-1D 04/01/2021 0.00
-266,260.29 0.00
139 DKK Alk-Abello A/S B 34,143.35 CIBOR-1W 03/08/2021 0.00
43 DKK AP Moeller Maersk AS A 58,335.09 CIBOR-1W 03/08/2021 0.00
30 DKK AP Moeller Maersk AS B 43,303.99 CIBOR-1W 03/08/2021 0.00
-548 DKK FLSmidth & Co AS B -21,850.18 CIBOR-1W 03/08/2021 0.00
-917 DKK ISS A/S -22,021.94 CIBOR-1W 03/08/2021 0.00
-1,250 DKK Nilfisk Holding A/S Bearer/Reg -27,380.49 CIBOR-1W 03/08/2021 0.00
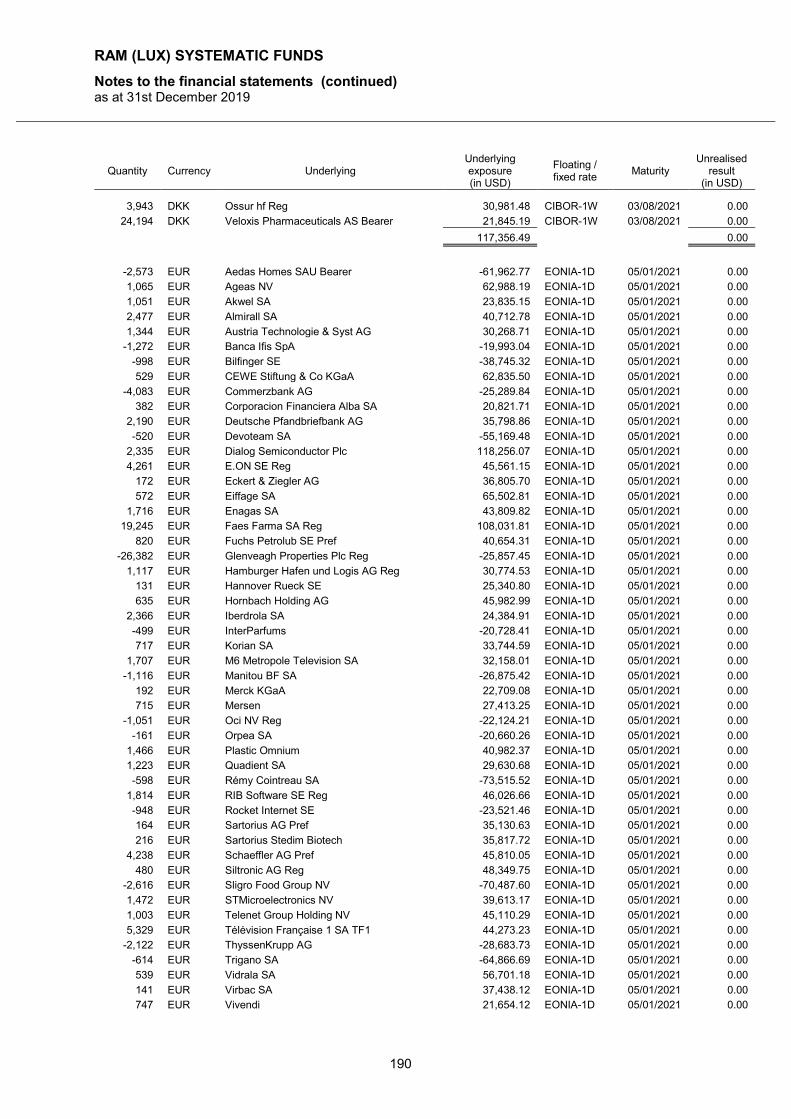
RAM (LUX) SYSTEMATIC FUNDS
Notes to the financial statements (continued) as at 31st December 2019
190
Quantity Currency Underlying Underlying exposure (in USD)
Floating / fixed rate
Maturity Unrealised
result (in USD)
3,943 DKK Ossur hf Reg 30,981.48 CIBOR-1W 03/08/2021 0.00
24,194 DKK Veloxis Pharmaceuticals AS Bearer 21,845.19 CIBOR-1W 03/08/2021 0.00
117,356.49 0.00
-2,573 EUR Aedas Homes SAU Bearer -61,962.77 EONIA-1D 05/01/2021 0.00
1,065 EUR Ageas NV 62,988.19 EONIA-1D 05/01/2021 0.00
1,051 EUR Akwel SA 23,835.15 EONIA-1D 05/01/2021 0.00
2,477 EUR Almirall SA 40,712.78 EONIA-1D 05/01/2021 0.00
1,344 EUR Austria Technologie & Syst AG 30,268.71 EONIA-1D 05/01/2021 0.00
-1,272 EUR Banca Ifis SpA -19,993.04 EONIA-1D 05/01/2021 0.00
-998 EUR Bilfinger SE -38,745.32 EONIA-1D 05/01/2021 0.00
529 EUR CEWE Stiftung & Co KGaA 62,835.50 EONIA-1D 05/01/2021 0.00
-4,083 EUR Commerzbank AG -25,289.84 EONIA-1D 05/01/2021 0.00
382 EUR Corporacion Financiera Alba SA 20,821.71 EONIA-1D 05/01/2021 0.00
2,190 EUR Deutsche Pfandbriefbank AG 35,798.86 EONIA-1D 05/01/2021 0.00
-520 EUR Devoteam SA -55,169.48 EONIA-1D 05/01/2021 0.00
2,335 EUR Dialog Semiconductor Plc 118,256.07 EONIA-1D 05/01/2021 0.00
4,261 EUR E.ON SE Reg 45,561.15 EONIA-1D 05/01/2021 0.00
172 EUR Eckert & Ziegler AG 36,805.70 EONIA-1D 05/01/2021 0.00
572 EUR Eiffage SA 65,502.81 EONIA-1D 05/01/2021 0.00
1,716 EUR Enagas SA 43,809.82 EONIA-1D 05/01/2021 0.00
19,245 EUR Faes Farma SA Reg 108,031.81 EONIA-1D 05/01/2021 0.00
820 EUR Fuchs Petrolub SE Pref 40,654.31 EONIA-1D 05/01/2021 0.00
-26,382 EUR Glenveagh Properties Plc Reg -25,857.45 EONIA-1D 05/01/2021 0.00
1,117 EUR Hamburger Hafen und Logis AG Reg 30,774.53 EONIA-1D 05/01/2021 0.00
131 EUR Hannover Rueck SE 25,340.80 EONIA-1D 05/01/2021 0.00
635 EUR Hornbach Holding AG 45,982.99 EONIA-1D 05/01/2021 0.00
2,366 EUR Iberdrola SA 24,384.91 EONIA-1D 05/01/2021 0.00
-499 EUR InterParfums -20,728.41 EONIA-1D 05/01/2021 0.00
717 EUR Korian SA 33,744.59 EONIA-1D 05/01/2021 0.00
1,707 EUR M6 Metropole Television SA 32,158.01 EONIA-1D 05/01/2021 0.00
-1,116 EUR Manitou BF SA -26,875.42 EONIA-1D 05/01/2021 0.00
192 EUR Merck KGaA 22,709.08 EONIA-1D 05/01/2021 0.00
715 EUR Mersen 27,413.25 EONIA-1D 05/01/2021 0.00
-1,051 EUR Oci NV Reg -22,124.21 EONIA-1D 05/01/2021 0.00
-161 EUR Orpea SA -20,660.26 EONIA-1D 05/01/2021 0.00
1,466 EUR Plastic Omnium 40,982.37 EONIA-1D 05/01/2021 0.00
1,223 EUR Quadient SA 29,630.68 EONIA-1D 05/01/2021 0.00
-598 EUR Rémy Cointreau SA -73,515.52 EONIA-1D 05/01/2021 0.00
1,814 EUR RIB Software SE Reg 46,026.66 EONIA-1D 05/01/2021 0.00
-948 EUR Rocket Internet SE -23,521.46 EONIA-1D 05/01/2021 0.00
164 EUR Sartorius AG Pref 35,130.63 EONIA-1D 05/01/2021 0.00
216 EUR Sartorius Stedim Biotech 35,817.72 EONIA-1D 05/01/2021 0.00
4,238 EUR Schaeffler AG Pref 45,810.05 EONIA-1D 05/01/2021 0.00
480 EUR Siltronic AG Reg 48,349.75 EONIA-1D 05/01/2021 0.00
-2,616 EUR Sligro Food Group NV -70,487.60 EONIA-1D 05/01/2021 0.00
1,472 EUR STMicroelectronics NV 39,613.17 EONIA-1D 05/01/2021 0.00
1,003 EUR Telenet Group Holding NV 45,110.29 EONIA-1D 05/01/2021 0.00
5,329 EUR Télévision Française 1 SA TF1 44,273.23 EONIA-1D 05/01/2021 0.00
-2,122 EUR ThyssenKrupp AG -28,683.73 EONIA-1D 05/01/2021 0.00
-614 EUR Trigano SA -64,866.69 EONIA-1D 05/01/2021 0.00
539 EUR Vidrala SA 56,701.18 EONIA-1D 05/01/2021 0.00
141 EUR Virbac SA 37,438.12 EONIA-1D 05/01/2021 0.00
747 EUR Vivendi 21,654.12 EONIA-1D 05/01/2021 0.00
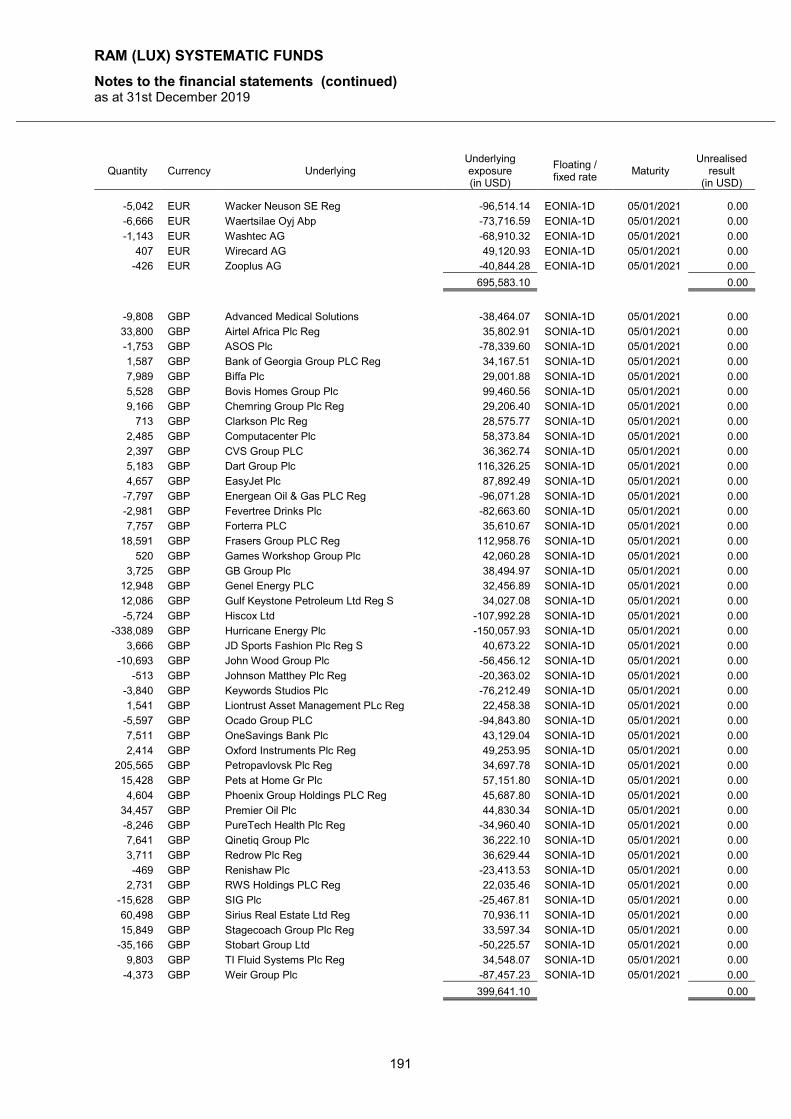
RAM (LUX) SYSTEMATIC FUNDS
Notes to the financial statements (continued) as at 31st December 2019
191
Quantity Currency Underlying Underlying exposure (in USD)
Floating / fixed rate
Maturity Unrealised
result (in USD)
-5,042 EUR Wacker Neuson SE Reg -96,514.14 EONIA-1D 05/01/2021 0.00
-6,666 EUR Waertsilae Oyj Abp -73,716.59 EONIA-1D 05/01/2021 0.00
-1,143 EUR Washtec AG -68,910.32 EONIA-1D 05/01/2021 0.00
407 EUR Wirecard AG 49,120.93 EONIA-1D 05/01/2021 0.00
-426 EUR Zooplus AG -40,844.28 EONIA-1D 05/01/2021 0.00
695,583.10 0.00
-9,808 GBP Advanced Medical Solutions -38,464.07 SONIA-1D 05/01/2021 0.00
33,800 GBP Airtel Africa Plc Reg 35,802.91 SONIA-1D 05/01/2021 0.00
-1,753 GBP ASOS Plc -78,339.60 SONIA-1D 05/01/2021 0.00
1,587 GBP Bank of Georgia Group PLC Reg 34,167.51 SONIA-1D 05/01/2021 0.00
7,989 GBP Biffa Plc 29,001.88 SONIA-1D 05/01/2021 0.00
5,528 GBP Bovis Homes Group Plc 99,460.56 SONIA-1D 05/01/2021 0.00
9,166 GBP Chemring Group Plc Reg 29,206.40 SONIA-1D 05/01/2021 0.00
713 GBP Clarkson Plc Reg 28,575.77 SONIA-1D 05/01/2021 0.00
2,485 GBP Computacenter Plc 58,373.84 SONIA-1D 05/01/2021 0.00
2,397 GBP CVS Group PLC 36,362.74 SONIA-1D 05/01/2021 0.00
5,183 GBP Dart Group Plc 116,326.25 SONIA-1D 05/01/2021 0.00
4,657 GBP EasyJet Plc 87,892.49 SONIA-1D 05/01/2021 0.00
-7,797 GBP Energean Oil & Gas PLC Reg -96,071.28 SONIA-1D 05/01/2021 0.00
-2,981 GBP Fevertree Drinks Plc -82,663.60 SONIA-1D 05/01/2021 0.00
7,757 GBP Forterra PLC 35,610.67 SONIA-1D 05/01/2021 0.00
18,591 GBP Frasers Group PLC Reg 112,958.76 SONIA-1D 05/01/2021 0.00
520 GBP Games Workshop Group Plc 42,060.28 SONIA-1D 05/01/2021 0.00
3,725 GBP GB Group Plc 38,494.97 SONIA-1D 05/01/2021 0.00
12,948 GBP Genel Energy PLC 32,456.89 SONIA-1D 05/01/2021 0.00
12,086 GBP Gulf Keystone Petroleum Ltd Reg S 34,027.08 SONIA-1D 05/01/2021 0.00
-5,724 GBP Hiscox Ltd -107,992.28 SONIA-1D 05/01/2021 0.00
-338,089 GBP Hurricane Energy Plc -150,057.93 SONIA-1D 05/01/2021 0.00
3,666 GBP JD Sports Fashion Plc Reg S 40,673.22 SONIA-1D 05/01/2021 0.00
-10,693 GBP John Wood Group Plc -56,456.12 SONIA-1D 05/01/2021 0.00
-513 GBP Johnson Matthey Plc Reg -20,363.02 SONIA-1D 05/01/2021 0.00
-3,840 GBP Keywords Studios Plc -76,212.49 SONIA-1D 05/01/2021 0.00
1,541 GBP Liontrust Asset Management PLc Reg 22,458.38 SONIA-1D 05/01/2021 0.00
-5,597 GBP Ocado Group PLC -94,843.80 SONIA-1D 05/01/2021 0.00
7,511 GBP OneSavings Bank Plc 43,129.04 SONIA-1D 05/01/2021 0.00
2,414 GBP Oxford Instruments Plc Reg 49,253.95 SONIA-1D 05/01/2021 0.00
205,565 GBP Petropavlovsk Plc Reg 34,697.78 SONIA-1D 05/01/2021 0.00
15,428 GBP Pets at Home Gr Plc 57,151.80 SONIA-1D 05/01/2021 0.00
4,604 GBP Phoenix Group Holdings PLC Reg 45,687.80 SONIA-1D 05/01/2021 0.00
34,457 GBP Premier Oil Plc 44,830.34 SONIA-1D 05/01/2021 0.00
-8,246 GBP PureTech Health Plc Reg -34,960.40 SONIA-1D 05/01/2021 0.00
7,641 GBP Qinetiq Group Plc 36,222.10 SONIA-1D 05/01/2021 0.00
3,711 GBP Redrow Plc Reg 36,629.44 SONIA-1D 05/01/2021 0.00
-469 GBP Renishaw Plc -23,413.53 SONIA-1D 05/01/2021 0.00
2,731 GBP RWS Holdings PLC Reg 22,035.46 SONIA-1D 05/01/2021 0.00
-15,628 GBP SIG Plc -25,467.81 SONIA-1D 05/01/2021 0.00
60,498 GBP Sirius Real Estate Ltd Reg 70,936.11 SONIA-1D 05/01/2021 0.00
15,849 GBP Stagecoach Group Plc Reg 33,597.34 SONIA-1D 05/01/2021 0.00
-35,166 GBP Stobart Group Ltd -50,225.57 SONIA-1D 05/01/2021 0.00
9,803 GBP TI Fluid Systems Plc Reg 34,548.07 SONIA-1D 05/01/2021 0.00
-4,373 GBP Weir Group Plc -87,457.23 SONIA-1D 05/01/2021 0.00
399,641.10 0.00
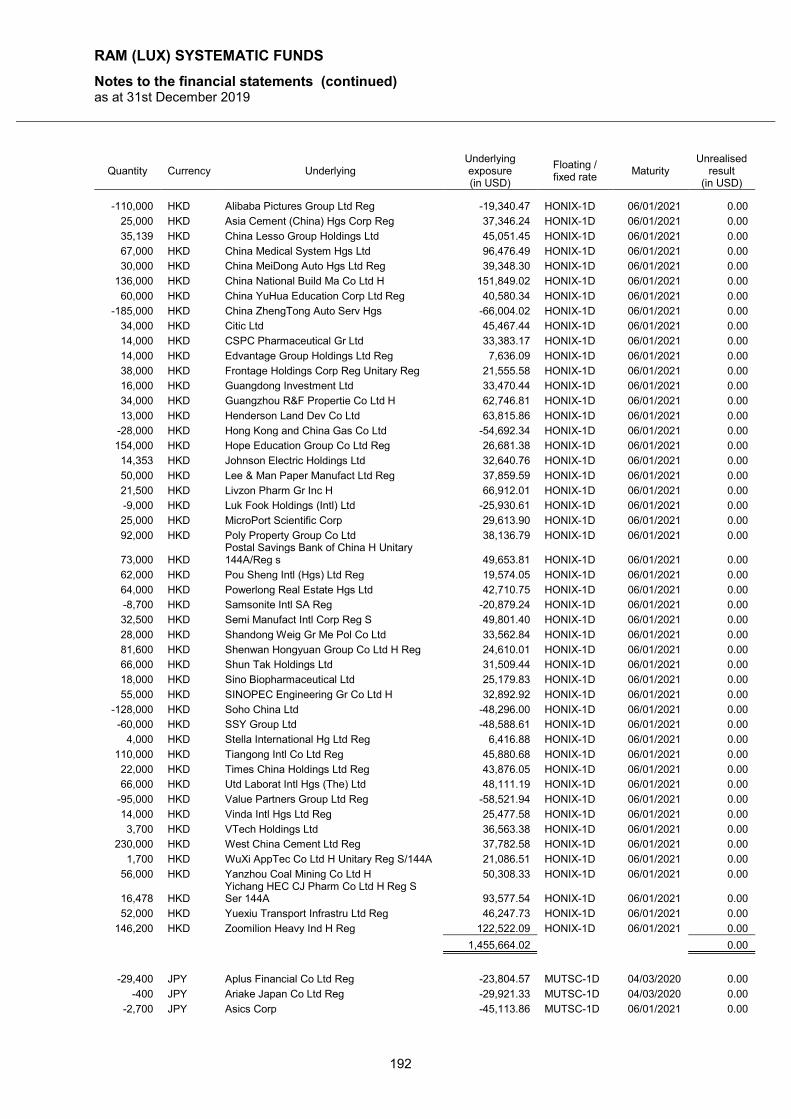
RAM (LUX) SYSTEMATIC FUNDS
Notes to the financial statements (continued) as at 31st December 2019
192
Quantity Currency Underlying Underlying exposure (in USD)
Floating / fixed rate
Maturity Unrealised
result (in USD)
-110,000 HKD Alibaba Pictures Group Ltd Reg -19,340.47 HONIX-1D 06/01/2021 0.00
25,000 HKD Asia Cement (China) Hgs Corp Reg 37,346.24 HONIX-1D 06/01/2021 0.00
35,139 HKD China Lesso Group Holdings Ltd 45,051.45 HONIX-1D 06/01/2021 0.00
67,000 HKD China Medical System Hgs Ltd 96,476.49 HONIX-1D 06/01/2021 0.00
30,000 HKD China MeiDong Auto Hgs Ltd Reg 39,348.30 HONIX-1D 06/01/2021 0.00
136,000 HKD China National Build Ma Co Ltd H 151,849.02 HONIX-1D 06/01/2021 0.00
60,000 HKD China YuHua Education Corp Ltd Reg 40,580.34 HONIX-1D 06/01/2021 0.00
-185,000 HKD China ZhengTong Auto Serv Hgs -66,004.02 HONIX-1D 06/01/2021 0.00
34,000 HKD Citic Ltd 45,467.44 HONIX-1D 06/01/2021 0.00
14,000 HKD CSPC Pharmaceutical Gr Ltd 33,383.17 HONIX-1D 06/01/2021 0.00
14,000 HKD Edvantage Group Holdings Ltd Reg 7,636.09 HONIX-1D 06/01/2021 0.00
38,000 HKD Frontage Holdings Corp Reg Unitary Reg 21,555.58 HONIX-1D 06/01/2021 0.00
16,000 HKD Guangdong Investment Ltd 33,470.44 HONIX-1D 06/01/2021 0.00
34,000 HKD Guangzhou R&F Propertie Co Ltd H 62,746.81 HONIX-1D 06/01/2021 0.00
13,000 HKD Henderson Land Dev Co Ltd 63,815.86 HONIX-1D 06/01/2021 0.00
-28,000 HKD Hong Kong and China Gas Co Ltd -54,692.34 HONIX-1D 06/01/2021 0.00
154,000 HKD Hope Education Group Co Ltd Reg 26,681.38 HONIX-1D 06/01/2021 0.00
14,353 HKD Johnson Electric Holdings Ltd 32,640.76 HONIX-1D 06/01/2021 0.00
50,000 HKD Lee & Man Paper Manufact Ltd Reg 37,859.59 HONIX-1D 06/01/2021 0.00
21,500 HKD Livzon Pharm Gr Inc H 66,912.01 HONIX-1D 06/01/2021 0.00
-9,000 HKD Luk Fook Holdings (Intl) Ltd -25,930.61 HONIX-1D 06/01/2021 0.00
25,000 HKD MicroPort Scientific Corp 29,613.90 HONIX-1D 06/01/2021 0.00
92,000 HKD Poly Property Group Co Ltd 38,136.79 HONIX-1D 06/01/2021 0.00
73,000 HKD Postal Savings Bank of China H Unitary 144A/Reg s 49,653.81 HONIX-1D 06/01/2021 0.00
62,000 HKD Pou Sheng Intl (Hgs) Ltd Reg 19,574.05 HONIX-1D 06/01/2021 0.00
64,000 HKD Powerlong Real Estate Hgs Ltd 42,710.75 HONIX-1D 06/01/2021 0.00
-8,700 HKD Samsonite Intl SA Reg -20,879.24 HONIX-1D 06/01/2021 0.00
32,500 HKD Semi Manufact Intl Corp Reg S 49,801.40 HONIX-1D 06/01/2021 0.00
28,000 HKD Shandong Weig Gr Me Pol Co Ltd 33,562.84 HONIX-1D 06/01/2021 0.00
81,600 HKD Shenwan Hongyuan Group Co Ltd H Reg 24,610.01 HONIX-1D 06/01/2021 0.00
66,000 HKD Shun Tak Holdings Ltd 31,509.44 HONIX-1D 06/01/2021 0.00
18,000 HKD Sino Biopharmaceutical Ltd 25,179.83 HONIX-1D 06/01/2021 0.00
55,000 HKD SINOPEC Engineering Gr Co Ltd H 32,892.92 HONIX-1D 06/01/2021 0.00
-128,000 HKD Soho China Ltd -48,296.00 HONIX-1D 06/01/2021 0.00
-60,000 HKD SSY Group Ltd -48,588.61 HONIX-1D 06/01/2021 0.00
4,000 HKD Stella International Hg Ltd Reg 6,416.88 HONIX-1D 06/01/2021 0.00
110,000 HKD Tiangong Intl Co Ltd Reg 45,880.68 HONIX-1D 06/01/2021 0.00
22,000 HKD Times China Holdings Ltd Reg 43,876.05 HONIX-1D 06/01/2021 0.00
66,000 HKD Utd Laborat Intl Hgs (The) Ltd 48,111.19 HONIX-1D 06/01/2021 0.00
-95,000 HKD Value Partners Group Ltd Reg -58,521.94 HONIX-1D 06/01/2021 0.00
14,000 HKD Vinda Intl Hgs Ltd Reg 25,477.58 HONIX-1D 06/01/2021 0.00
3,700 HKD VTech Holdings Ltd 36,563.38 HONIX-1D 06/01/2021 0.00
230,000 HKD West China Cement Ltd Reg 37,782.58 HONIX-1D 06/01/2021 0.00
1,700 HKD WuXi AppTec Co Ltd H Unitary Reg S/144A 21,086.51 HONIX-1D 06/01/2021 0.00
56,000 HKD Yanzhou Coal Mining Co Ltd H 50,308.33 HONIX-1D 06/01/2021 0.00
16,478 HKD Yichang HEC CJ Pharm Co Ltd H Reg S Ser 144A 93,577.54 HONIX-1D 06/01/2021 0.00
52,000 HKD Yuexiu Transport Infrastru Ltd Reg 46,247.73 HONIX-1D 06/01/2021 0.00
146,200 HKD Zoomilion Heavy Ind H Reg 122,522.09 HONIX-1D 06/01/2021 0.00
1,455,664.02 0.00
-29,400 JPY Aplus Financial Co Ltd Reg -23,804.57 MUTSC-1D 04/03/2020 0.00
-400 JPY Ariake Japan Co Ltd Reg -29,921.33 MUTSC-1D 04/03/2020 0.00
-2,700 JPY Asics Corp -45,113.86 MUTSC-1D 06/01/2021 0.00
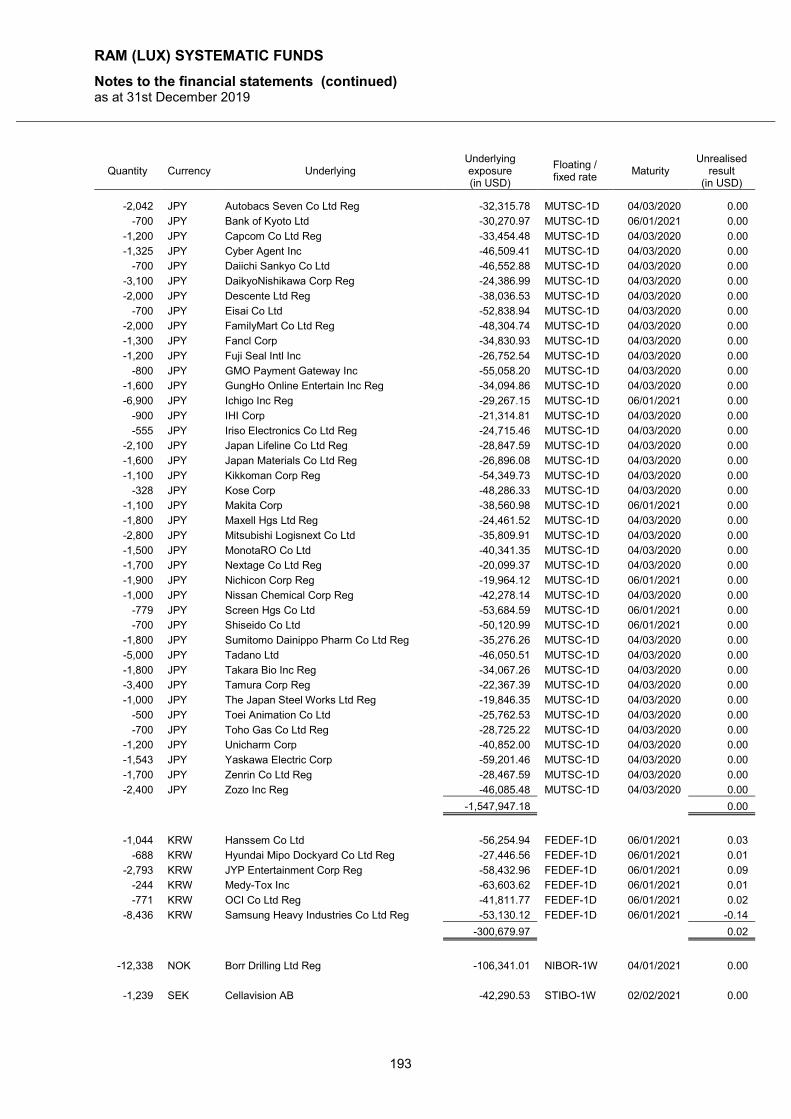
RAM (LUX) SYSTEMATIC FUNDS
Notes to the financial statements (continued) as at 31st December 2019
193
Quantity Currency Underlying Underlying exposure (in USD)
Floating / fixed rate
Maturity Unrealised
result (in USD)
-2,042 JPY Autobacs Seven Co Ltd Reg -32,315.78 MUTSC-1D 04/03/2020 0.00
-700 JPY Bank of Kyoto Ltd -30,270.97 MUTSC-1D 06/01/2021 0.00
-1,200 JPY Capcom Co Ltd Reg -33,454.48 MUTSC-1D 04/03/2020 0.00
-1,325 JPY Cyber Agent Inc -46,509.41 MUTSC-1D 04/03/2020 0.00
-700 JPY Daiichi Sankyo Co Ltd -46,552.88 MUTSC-1D 04/03/2020 0.00
-3,100 JPY DaikyoNishikawa Corp Reg -24,386.99 MUTSC-1D 04/03/2020 0.00
-2,000 JPY Descente Ltd Reg -38,036.53 MUTSC-1D 04/03/2020 0.00
-700 JPY Eisai Co Ltd -52,838.94 MUTSC-1D 04/03/2020 0.00
-2,000 JPY FamilyMart Co Ltd Reg -48,304.74 MUTSC-1D 04/03/2020 0.00
-1,300 JPY Fancl Corp -34,830.93 MUTSC-1D 04/03/2020 0.00
-1,200 JPY Fuji Seal Intl Inc -26,752.54 MUTSC-1D 04/03/2020 0.00
-800 JPY GMO Payment Gateway Inc -55,058.20 MUTSC-1D 04/03/2020 0.00
-1,600 JPY GungHo Online Entertain Inc Reg -34,094.86 MUTSC-1D 04/03/2020 0.00
-6,900 JPY Ichigo Inc Reg -29,267.15 MUTSC-1D 06/01/2021 0.00
-900 JPY IHI Corp -21,314.81 MUTSC-1D 04/03/2020 0.00
-555 JPY Iriso Electronics Co Ltd Reg -24,715.46 MUTSC-1D 04/03/2020 0.00
-2,100 JPY Japan Lifeline Co Ltd Reg -28,847.59 MUTSC-1D 04/03/2020 0.00
-1,600 JPY Japan Materials Co Ltd Reg -26,896.08 MUTSC-1D 04/03/2020 0.00
-1,100 JPY Kikkoman Corp Reg -54,349.73 MUTSC-1D 04/03/2020 0.00
-328 JPY Kose Corp -48,286.33 MUTSC-1D 04/03/2020 0.00
-1,100 JPY Makita Corp -38,560.98 MUTSC-1D 06/01/2021 0.00
-1,800 JPY Maxell Hgs Ltd Reg -24,461.52 MUTSC-1D 04/03/2020 0.00
-2,800 JPY Mitsubishi Logisnext Co Ltd -35,809.91 MUTSC-1D 04/03/2020 0.00
-1,500 JPY MonotaRO Co Ltd -40,341.35 MUTSC-1D 04/03/2020 0.00
-1,700 JPY Nextage Co Ltd Reg -20,099.37 MUTSC-1D 04/03/2020 0.00
-1,900 JPY Nichicon Corp Reg -19,964.12 MUTSC-1D 06/01/2021 0.00
-1,000 JPY Nissan Chemical Corp Reg -42,278.14 MUTSC-1D 04/03/2020 0.00
-779 JPY Screen Hgs Co Ltd -53,684.59 MUTSC-1D 06/01/2021 0.00
-700 JPY Shiseido Co Ltd -50,120.99 MUTSC-1D 06/01/2021 0.00
-1,800 JPY Sumitomo Dainippo Pharm Co Ltd Reg -35,276.26 MUTSC-1D 04/03/2020 0.00
-5,000 JPY Tadano Ltd -46,050.51 MUTSC-1D 04/03/2020 0.00
-1,800 JPY Takara Bio Inc Reg -34,067.26 MUTSC-1D 04/03/2020 0.00
-3,400 JPY Tamura Corp Reg -22,367.39 MUTSC-1D 04/03/2020 0.00
-1,000 JPY The Japan Steel Works Ltd Reg -19,846.35 MUTSC-1D 04/03/2020 0.00
-500 JPY Toei Animation Co Ltd -25,762.53 MUTSC-1D 04/03/2020 0.00
-700 JPY Toho Gas Co Ltd Reg -28,725.22 MUTSC-1D 04/03/2020 0.00
-1,200 JPY Unicharm Corp -40,852.00 MUTSC-1D 04/03/2020 0.00
-1,543 JPY Yaskawa Electric Corp -59,201.46 MUTSC-1D 04/03/2020 0.00
-1,700 JPY Zenrin Co Ltd Reg -28,467.59 MUTSC-1D 04/03/2020 0.00
-2,400 JPY Zozo Inc Reg -46,085.48 MUTSC-1D 04/03/2020 0.00
-1,547,947.18 0.00
-1,044 KRW Hanssem Co Ltd -56,254.94 FEDEF-1D 06/01/2021 0.03
-688 KRW Hyundai Mipo Dockyard Co Ltd Reg -27,446.56 FEDEF-1D 06/01/2021 0.01
-2,793 KRW JYP Entertainment Corp Reg -58,432.96 FEDEF-1D 06/01/2021 0.09
-244 KRW Medy-Tox Inc -63,603.62 FEDEF-1D 06/01/2021 0.01
-771 KRW OCI Co Ltd Reg -41,811.77 FEDEF-1D 06/01/2021 0.02
-8,436 KRW Samsung Heavy Industries Co Ltd Reg -53,130.12 FEDEF-1D 06/01/2021 -0.14
-300,679.97 0.02
-12,338 NOK Borr Drilling Ltd Reg -106,341.01 NIBOR-1W 04/01/2021 0.00
-1,239 SEK Cellavision AB -42,290.53 STIBO-1W 02/02/2021 0.00
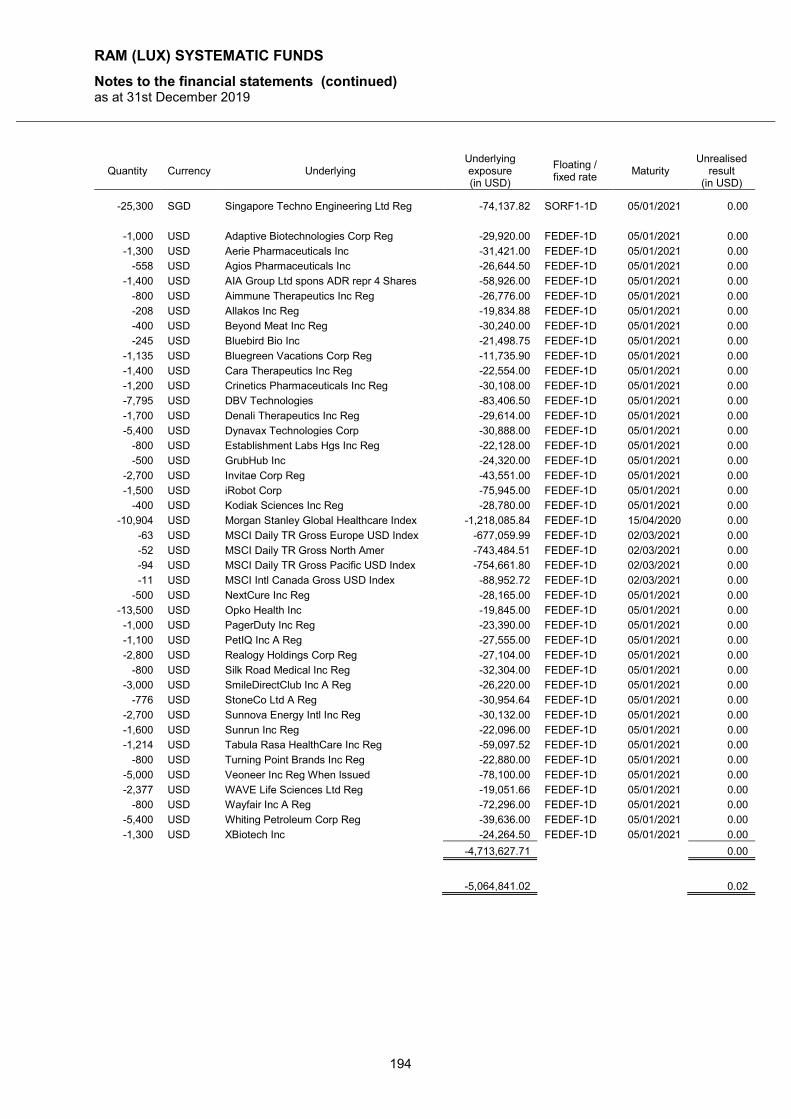
RAM (LUX) SYSTEMATIC FUNDS
Notes to the financial statements (continued) as at 31st December 2019
194
Quantity Currency Underlying Underlying exposure (in USD)
Floating / fixed rate
Maturity Unrealised
result (in USD)
-25,300 SGD Singapore Techno Engineering Ltd Reg -74,137.82 SORF1-1D 05/01/2021 0.00
-1,000 USD Adaptive Biotechnologies Corp Reg -29,920.00 FEDEF-1D 05/01/2021 0.00
-1,300 USD Aerie Pharmaceuticals Inc -31,421.00 FEDEF-1D 05/01/2021 0.00
-558 USD Agios Pharmaceuticals Inc -26,644.50 FEDEF-1D 05/01/2021 0.00
-1,400 USD AIA Group Ltd spons ADR repr 4 Shares -58,926.00 FEDEF-1D 05/01/2021 0.00
-800 USD Aimmune Therapeutics Inc Reg -26,776.00 FEDEF-1D 05/01/2021 0.00
-208 USD Allakos Inc Reg -19,834.88 FEDEF-1D 05/01/2021 0.00
-400 USD Beyond Meat Inc Reg -30,240.00 FEDEF-1D 05/01/2021 0.00
-245 USD Bluebird Bio Inc -21,498.75 FEDEF-1D 05/01/2021 0.00
-1,135 USD Bluegreen Vacations Corp Reg -11,735.90 FEDEF-1D 05/01/2021 0.00
-1,400 USD Cara Therapeutics Inc Reg -22,554.00 FEDEF-1D 05/01/2021 0.00
-1,200 USD Crinetics Pharmaceuticals Inc Reg -30,108.00 FEDEF-1D 05/01/2021 0.00
-7,795 USD DBV Technologies -83,406.50 FEDEF-1D 05/01/2021 0.00
-1,700 USD Denali Therapeutics Inc Reg -29,614.00 FEDEF-1D 05/01/2021 0.00
-5,400 USD Dynavax Technologies Corp -30,888.00 FEDEF-1D 05/01/2021 0.00
-800 USD Establishment Labs Hgs Inc Reg -22,128.00 FEDEF-1D 05/01/2021 0.00
-500 USD GrubHub Inc -24,320.00 FEDEF-1D 05/01/2021 0.00
-2,700 USD Invitae Corp Reg -43,551.00 FEDEF-1D 05/01/2021 0.00
-1,500 USD iRobot Corp -75,945.00 FEDEF-1D 05/01/2021 0.00
-400 USD Kodiak Sciences Inc Reg -28,780.00 FEDEF-1D 05/01/2021 0.00
-10,904 USD Morgan Stanley Global Healthcare Index -1,218,085.84 FEDEF-1D 15/04/2020 0.00
-63 USD MSCI Daily TR Gross Europe USD Index -677,059.99 FEDEF-1D 02/03/2021 0.00
-52 USD MSCI Daily TR Gross North Amer -743,484.51 FEDEF-1D 02/03/2021 0.00
-94 USD MSCI Daily TR Gross Pacific USD Index -754,661.80 FEDEF-1D 02/03/2021 0.00
-11 USD MSCI Intl Canada Gross USD Index -88,952.72 FEDEF-1D 02/03/2021 0.00
-500 USD NextCure Inc Reg -28,165.00 FEDEF-1D 05/01/2021 0.00
-13,500 USD Opko Health Inc -19,845.00 FEDEF-1D 05/01/2021 0.00
-1,000 USD PagerDuty Inc Reg -23,390.00 FEDEF-1D 05/01/2021 0.00
-1,100 USD PetIQ Inc A Reg -27,555.00 FEDEF-1D 05/01/2021 0.00
-2,800 USD Realogy Holdings Corp Reg -27,104.00 FEDEF-1D 05/01/2021 0.00
-800 USD Silk Road Medical Inc Reg -32,304.00 FEDEF-1D 05/01/2021 0.00
-3,000 USD SmileDirectClub Inc A Reg -26,220.00 FEDEF-1D 05/01/2021 0.00
-776 USD StoneCo Ltd A Reg -30,954.64 FEDEF-1D 05/01/2021 0.00
-2,700 USD Sunnova Energy Intl Inc Reg -30,132.00 FEDEF-1D 05/01/2021 0.00
-1,600 USD Sunrun Inc Reg -22,096.00 FEDEF-1D 05/01/2021 0.00
-1,214 USD Tabula Rasa HealthCare Inc Reg -59,097.52 FEDEF-1D 05/01/2021 0.00
-800 USD Turning Point Brands Inc Reg -22,880.00 FEDEF-1D 05/01/2021 0.00
-5,000 USD Veoneer Inc Reg When Issued -78,100.00 FEDEF-1D 05/01/2021 0.00
-2,377 USD WAVE Life Sciences Ltd Reg -19,051.66 FEDEF-1D 05/01/2021 0.00
-800 USD Wayfair Inc A Reg -72,296.00 FEDEF-1D 05/01/2021 0.00
-5,400 USD Whiting Petroleum Corp Reg -39,636.00 FEDEF-1D 05/01/2021 0.00
-1,300 USD XBiotech Inc -24,264.50 FEDEF-1D 05/01/2021 0.00
-4,713,627.71 0.00
-5,064,841.02 0.02
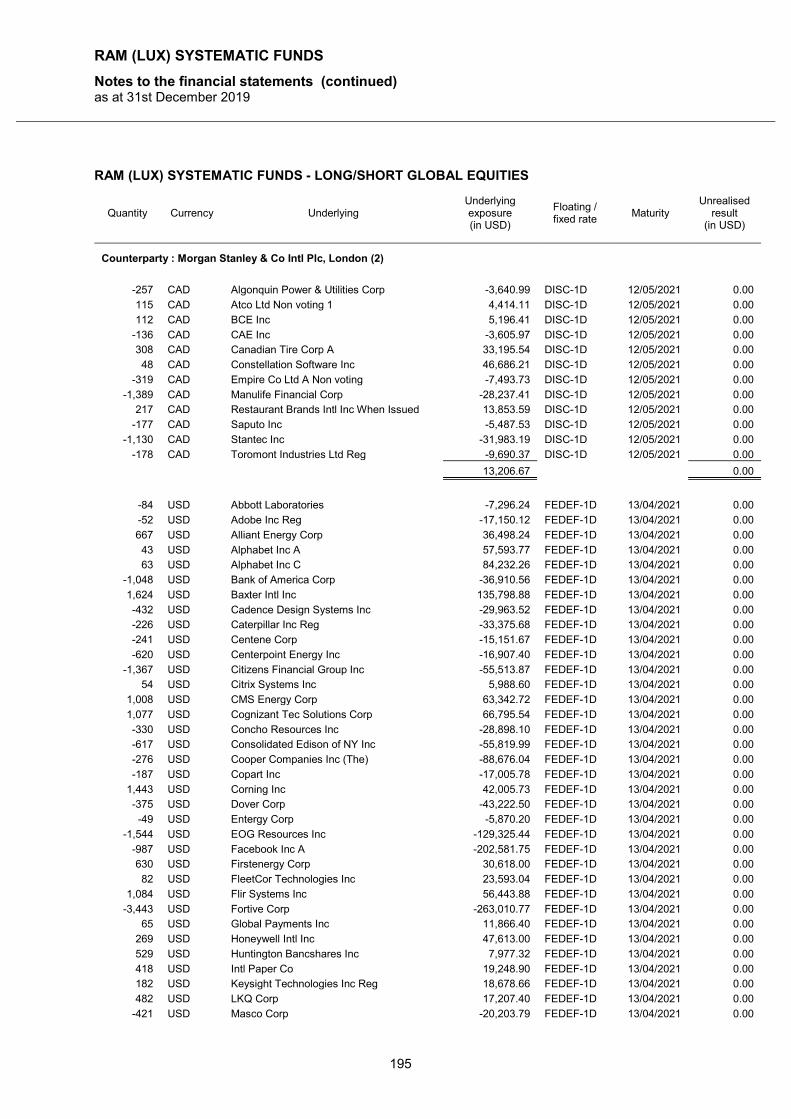
RAM (LUX) SYSTEMATIC FUNDS
Notes to the financial statements (continued) as at 31st December 2019
195
RAM (LUX) SYSTEMATIC FUNDS - LONG/SHORT GLOBAL EQUITIES
Quantity Currency Underlying Underlying exposure (in USD)
Floating / fixed rate
Maturity Unrealised
result (in USD)
Counterparty : Morgan Stanley & Co Intl Plc, London (2)
-257 CAD Algonquin Power & Utilities Corp -3,640.99 DISC-1D 12/05/2021 0.00
115 CAD Atco Ltd Non voting 1 4,414.11 DISC-1D 12/05/2021 0.00
112 CAD BCE Inc 5,196.41 DISC-1D 12/05/2021 0.00
-136 CAD CAE Inc -3,605.97 DISC-1D 12/05/2021 0.00
308 CAD Canadian Tire Corp A 33,195.54 DISC-1D 12/05/2021 0.00
48 CAD Constellation Software Inc 46,686.21 DISC-1D 12/05/2021 0.00
-319 CAD Empire Co Ltd A Non voting -7,493.73 DISC-1D 12/05/2021 0.00
-1,389 CAD Manulife Financial Corp -28,237.41 DISC-1D 12/05/2021 0.00
217 CAD Restaurant Brands Intl Inc When Issued 13,853.59 DISC-1D 12/05/2021 0.00
-177 CAD Saputo Inc -5,487.53 DISC-1D 12/05/2021 0.00
-1,130 CAD Stantec Inc -31,983.19 DISC-1D 12/05/2021 0.00
-178 CAD Toromont Industries Ltd Reg -9,690.37 DISC-1D 12/05/2021 0.00
13,206.67 0.00
-84 USD Abbott Laboratories -7,296.24 FEDEF-1D 13/04/2021 0.00
-52 USD Adobe Inc Reg -17,150.12 FEDEF-1D 13/04/2021 0.00
667 USD Alliant Energy Corp 36,498.24 FEDEF-1D 13/04/2021 0.00
43 USD Alphabet Inc A 57,593.77 FEDEF-1D 13/04/2021 0.00
63 USD Alphabet Inc C 84,232.26 FEDEF-1D 13/04/2021 0.00
-1,048 USD Bank of America Corp -36,910.56 FEDEF-1D 13/04/2021 0.00
1,624 USD Baxter Intl Inc 135,798.88 FEDEF-1D 13/04/2021 0.00
-432 USD Cadence Design Systems Inc -29,963.52 FEDEF-1D 13/04/2021 0.00
-226 USD Caterpillar Inc Reg -33,375.68 FEDEF-1D 13/04/2021 0.00
-241 USD Centene Corp -15,151.67 FEDEF-1D 13/04/2021 0.00
-620 USD Centerpoint Energy Inc -16,907.40 FEDEF-1D 13/04/2021 0.00
-1,367 USD Citizens Financial Group Inc -55,513.87 FEDEF-1D 13/04/2021 0.00
54 USD Citrix Systems Inc 5,988.60 FEDEF-1D 13/04/2021 0.00
1,008 USD CMS Energy Corp 63,342.72 FEDEF-1D 13/04/2021 0.00
1,077 USD Cognizant Tec Solutions Corp 66,795.54 FEDEF-1D 13/04/2021 0.00
-330 USD Concho Resources Inc -28,898.10 FEDEF-1D 13/04/2021 0.00
-617 USD Consolidated Edison of NY Inc -55,819.99 FEDEF-1D 13/04/2021 0.00
-276 USD Cooper Companies Inc (The) -88,676.04 FEDEF-1D 13/04/2021 0.00
-187 USD Copart Inc -17,005.78 FEDEF-1D 13/04/2021 0.00
1,443 USD Corning Inc 42,005.73 FEDEF-1D 13/04/2021 0.00
-375 USD Dover Corp -43,222.50 FEDEF-1D 13/04/2021 0.00
-49 USD Entergy Corp -5,870.20 FEDEF-1D 13/04/2021 0.00
-1,544 USD EOG Resources Inc -129,325.44 FEDEF-1D 13/04/2021 0.00
-987 USD Facebook Inc A -202,581.75 FEDEF-1D 13/04/2021 0.00
630 USD Firstenergy Corp 30,618.00 FEDEF-1D 13/04/2021 0.00
82 USD FleetCor Technologies Inc 23,593.04 FEDEF-1D 13/04/2021 0.00
1,084 USD Flir Systems Inc 56,443.88 FEDEF-1D 13/04/2021 0.00
-3,443 USD Fortive Corp -263,010.77 FEDEF-1D 13/04/2021 0.00
65 USD Global Payments Inc 11,866.40 FEDEF-1D 13/04/2021 0.00
269 USD Honeywell Intl Inc 47,613.00 FEDEF-1D 13/04/2021 0.00
529 USD Huntington Bancshares Inc 7,977.32 FEDEF-1D 13/04/2021 0.00
418 USD Intl Paper Co 19,248.90 FEDEF-1D 13/04/2021 0.00
182 USD Keysight Technologies Inc Reg 18,678.66 FEDEF-1D 13/04/2021 0.00
482 USD LKQ Corp 17,207.40 FEDEF-1D 13/04/2021 0.00
-421 USD Masco Corp -20,203.79 FEDEF-1D 13/04/2021 0.00
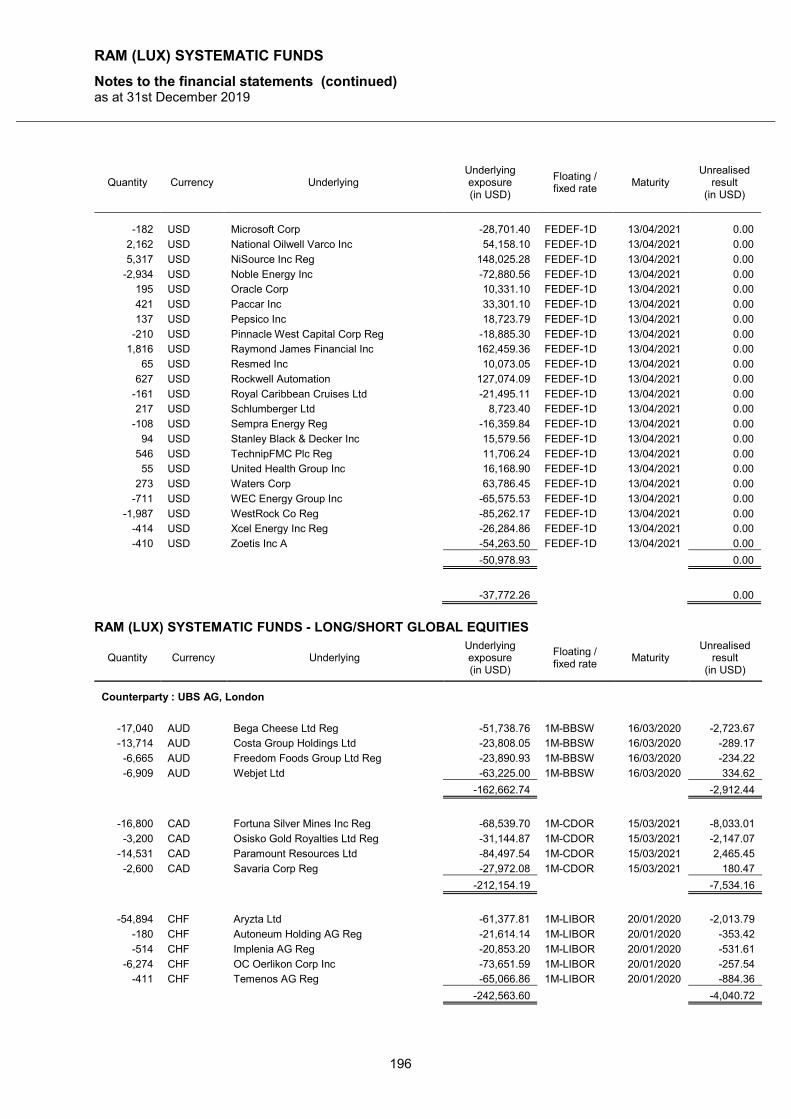
RAM (LUX) SYSTEMATIC FUNDS
Notes to the financial statements (continued) as at 31st December 2019
196
Quantity Currency Underlying Underlying exposure (in USD)
Floating / fixed rate
Maturity Unrealised
result (in USD)
-182 USD Microsoft Corp -28,701.40 FEDEF-1D 13/04/2021 0.00
2,162 USD National Oilwell Varco Inc 54,158.10 FEDEF-1D 13/04/2021 0.00
5,317 USD NiSource Inc Reg 148,025.28 FEDEF-1D 13/04/2021 0.00
-2,934 USD Noble Energy Inc -72,880.56 FEDEF-1D 13/04/2021 0.00
195 USD Oracle Corp 10,331.10 FEDEF-1D 13/04/2021 0.00
421 USD Paccar Inc 33,301.10 FEDEF-1D 13/04/2021 0.00
137 USD Pepsico Inc 18,723.79 FEDEF-1D 13/04/2021 0.00
-210 USD Pinnacle West Capital Corp Reg -18,885.30 FEDEF-1D 13/04/2021 0.00
1,816 USD Raymond James Financial Inc 162,459.36 FEDEF-1D 13/04/2021 0.00
65 USD Resmed Inc 10,073.05 FEDEF-1D 13/04/2021 0.00
627 USD Rockwell Automation 127,074.09 FEDEF-1D 13/04/2021 0.00
-161 USD Royal Caribbean Cruises Ltd -21,495.11 FEDEF-1D 13/04/2021 0.00
217 USD Schlumberger Ltd 8,723.40 FEDEF-1D 13/04/2021 0.00
-108 USD Sempra Energy Reg -16,359.84 FEDEF-1D 13/04/2021 0.00
94 USD Stanley Black & Decker Inc 15,579.56 FEDEF-1D 13/04/2021 0.00
546 USD TechnipFMC Plc Reg 11,706.24 FEDEF-1D 13/04/2021 0.00
55 USD United Health Group Inc 16,168.90 FEDEF-1D 13/04/2021 0.00
273 USD Waters Corp 63,786.45 FEDEF-1D 13/04/2021 0.00
-711 USD WEC Energy Group Inc -65,575.53 FEDEF-1D 13/04/2021 0.00
-1,987 USD WestRock Co Reg -85,262.17 FEDEF-1D 13/04/2021 0.00
-414 USD Xcel Energy Inc Reg -26,284.86 FEDEF-1D 13/04/2021 0.00
-410 USD Zoetis Inc A -54,263.50 FEDEF-1D 13/04/2021 0.00
-50,978.93 0.00
-37,772.26 0.00
RAM (LUX) SYSTEMATIC FUNDS - LONG/SHORT GLOBAL EQUITIES
Quantity Currency Underlying Underlying exposure (in USD)
Floating / fixed rate
Maturity Unrealised
result (in USD)
Counterparty : UBS AG, London
-17,040 AUD Bega Cheese Ltd Reg -51,738.76 1M-BBSW 16/03/2020 -2,723.67
-13,714 AUD Costa Group Holdings Ltd -23,808.05 1M-BBSW 16/03/2020 -289.17
-6,665 AUD Freedom Foods Group Ltd Reg -23,890.93 1M-BBSW 16/03/2020 -234.22
-6,909 AUD Webjet Ltd -63,225.00 1M-BBSW 16/03/2020 334.62
-162,662.74 -2,912.44
-16,800 CAD Fortuna Silver Mines Inc Reg -68,539.70 1M-CDOR 15/03/2021 -8,033.01
-3,200 CAD Osisko Gold Royalties Ltd Reg -31,144.87 1M-CDOR 15/03/2021 -2,147.07
-14,531 CAD Paramount Resources Ltd -84,497.54 1M-CDOR 15/03/2021 2,465.45
-2,600 CAD Savaria Corp Reg -27,972.08 1M-CDOR 15/03/2021 180.47
-212,154.19 -7,534.16
-54,894 CHF Aryzta Ltd -61,377.81 1M-LIBOR 20/01/2020 -2,013.79
-180 CHF Autoneum Holding AG Reg -21,614.14 1M-LIBOR 20/01/2020 -353.42
-514 CHF Implenia AG Reg -20,853.20 1M-LIBOR 20/01/2020 -531.61
-6,274 CHF OC Oerlikon Corp Inc -73,651.59 1M-LIBOR 20/01/2020 -257.54
-411 CHF Temenos AG Reg -65,066.86 1M-LIBOR 20/01/2020 -884.36
-242,563.60 -4,040.72
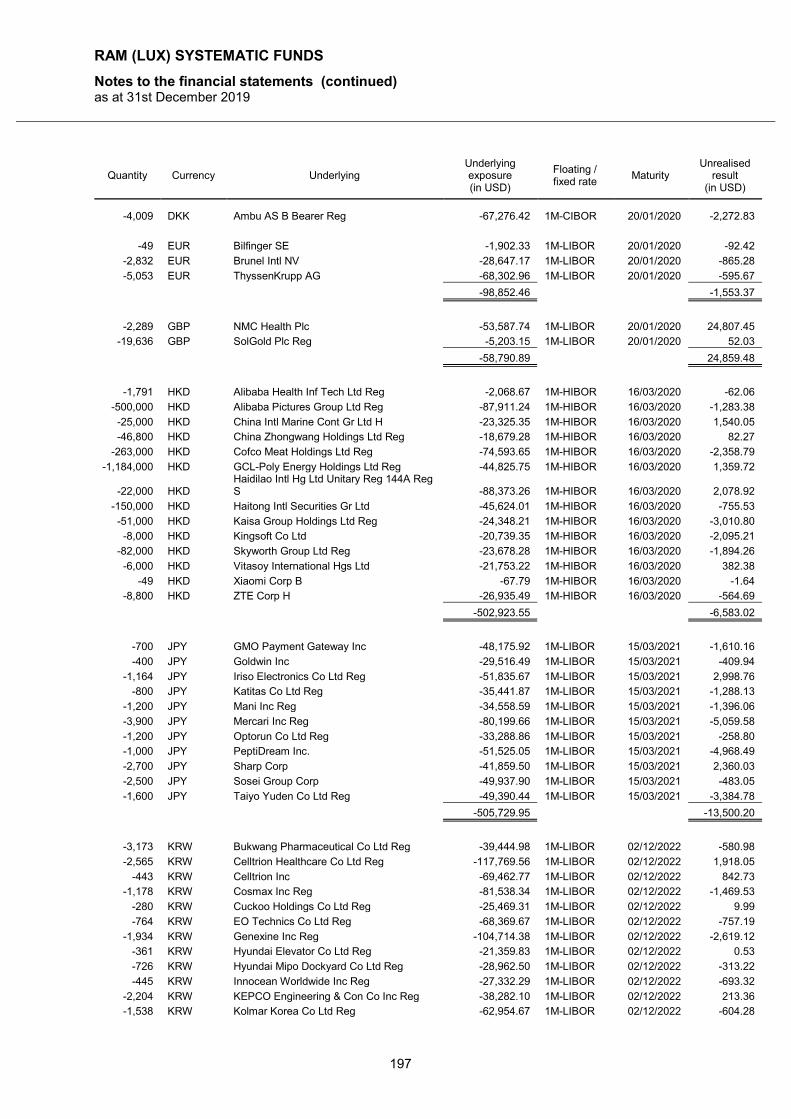
RAM (LUX) SYSTEMATIC FUNDS
Notes to the financial statements (continued) as at 31st December 2019
197
Quantity Currency Underlying Underlying exposure (in USD)
Floating / fixed rate
Maturity Unrealised
result (in USD)
-4,009 DKK Ambu AS B Bearer Reg -67,276.42 1M-CIBOR 20/01/2020 -2,272.83
-49 EUR Bilfinger SE -1,902.33 1M-LIBOR 20/01/2020 -92.42
-2,832 EUR Brunel Intl NV -28,647.17 1M-LIBOR 20/01/2020 -865.28
-5,053 EUR ThyssenKrupp AG -68,302.96 1M-LIBOR 20/01/2020 -595.67
-98,852.46 -1,553.37
-2,289 GBP NMC Health Plc -53,587.74 1M-LIBOR 20/01/2020 24,807.45
-19,636 GBP SolGold Plc Reg -5,203.15 1M-LIBOR 20/01/2020 52.03
-58,790.89 24,859.48
-1,791 HKD Alibaba Health Inf Tech Ltd Reg -2,068.67 1M-HIBOR 16/03/2020 -62.06
-500,000 HKD Alibaba Pictures Group Ltd Reg -87,911.24 1M-HIBOR 16/03/2020 -1,283.38
-25,000 HKD China Intl Marine Cont Gr Ltd H -23,325.35 1M-HIBOR 16/03/2020 1,540.05
-46,800 HKD China Zhongwang Holdings Ltd Reg -18,679.28 1M-HIBOR 16/03/2020 82.27
-263,000 HKD Cofco Meat Holdings Ltd Reg -74,593.65 1M-HIBOR 16/03/2020 -2,358.79
-1,184,000 HKD GCL-Poly Energy Holdings Ltd Reg -44,825.75 1M-HIBOR 16/03/2020 1,359.72
-22,000 HKD Haidilao Intl Hg Ltd Unitary Reg 144A Reg S -88,373.26 1M-HIBOR 16/03/2020 2,078.92
-150,000 HKD Haitong Intl Securities Gr Ltd -45,624.01 1M-HIBOR 16/03/2020 -755.53
-51,000 HKD Kaisa Group Holdings Ltd Reg -24,348.21 1M-HIBOR 16/03/2020 -3,010.80
-8,000 HKD Kingsoft Co Ltd -20,739.35 1M-HIBOR 16/03/2020 -2,095.21
-82,000 HKD Skyworth Group Ltd Reg -23,678.28 1M-HIBOR 16/03/2020 -1,894.26
-6,000 HKD Vitasoy International Hgs Ltd -21,753.22 1M-HIBOR 16/03/2020 382.38
-49 HKD Xiaomi Corp B -67.79 1M-HIBOR 16/03/2020 -1.64
-8,800 HKD ZTE Corp H -26,935.49 1M-HIBOR 16/03/2020 -564.69
-502,923.55 -6,583.02
-700 JPY GMO Payment Gateway Inc -48,175.92 1M-LIBOR 15/03/2021 -1,610.16
-400 JPY Goldwin Inc -29,516.49 1M-LIBOR 15/03/2021 -409.94
-1,164 JPY Iriso Electronics Co Ltd Reg -51,835.67 1M-LIBOR 15/03/2021 2,998.76
-800 JPY Katitas Co Ltd Reg -35,441.87 1M-LIBOR 15/03/2021 -1,288.13
-1,200 JPY Mani Inc Reg -34,558.59 1M-LIBOR 15/03/2021 -1,396.06
-3,900 JPY Mercari Inc Reg -80,199.66 1M-LIBOR 15/03/2021 -5,059.58
-1,200 JPY Optorun Co Ltd Reg -33,288.86 1M-LIBOR 15/03/2021 -258.80
-1,000 JPY PeptiDream Inc. -51,525.05 1M-LIBOR 15/03/2021 -4,968.49
-2,700 JPY Sharp Corp -41,859.50 1M-LIBOR 15/03/2021 2,360.03
-2,500 JPY Sosei Group Corp -49,937.90 1M-LIBOR 15/03/2021 -483.05
-1,600 JPY Taiyo Yuden Co Ltd Reg -49,390.44 1M-LIBOR 15/03/2021 -3,384.78
-505,729.95 -13,500.20
-3,173 KRW Bukwang Pharmaceutical Co Ltd Reg -39,444.98 1M-LIBOR 02/12/2022 -580.98
-2,565 KRW Celltrion Healthcare Co Ltd Reg -117,769.56 1M-LIBOR 02/12/2022 1,918.05
-443 KRW Celltrion Inc -69,462.77 1M-LIBOR 02/12/2022 842.73
-1,178 KRW Cosmax Inc Reg -81,538.34 1M-LIBOR 02/12/2022 -1,469.53
-280 KRW Cuckoo Holdings Co Ltd Reg -25,469.31 1M-LIBOR 02/12/2022 9.99
-764 KRW EO Technics Co Ltd Reg -68,369.67 1M-LIBOR 02/12/2022 -757.19
-1,934 KRW Genexine Inc Reg -104,714.38 1M-LIBOR 02/12/2022 -2,619.12
-361 KRW Hyundai Elevator Co Ltd Reg -21,359.83 1M-LIBOR 02/12/2022 0.53
-726 KRW Hyundai Mipo Dockyard Co Ltd Reg -28,962.50 1M-LIBOR 02/12/2022 -313.22
-445 KRW Innocean Worldwide Inc Reg -27,332.29 1M-LIBOR 02/12/2022 -693.32
-2,204 KRW KEPCO Engineering & Con Co Inc Reg -38,282.10 1M-LIBOR 02/12/2022 213.36
-1,538 KRW Kolmar Korea Co Ltd Reg -62,954.67 1M-LIBOR 02/12/2022 -604.28
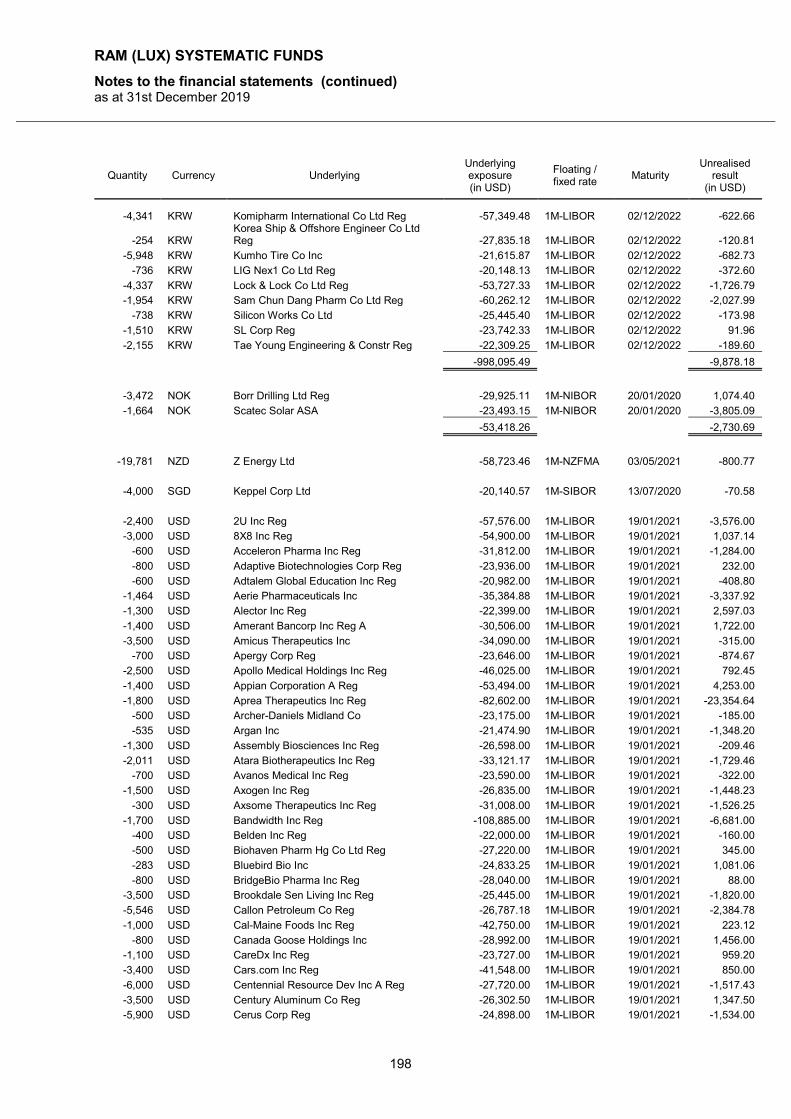
RAM (LUX) SYSTEMATIC FUNDS
Notes to the financial statements (continued) as at 31st December 2019
198
Quantity Currency Underlying Underlying exposure (in USD)
Floating / fixed rate
Maturity Unrealised
result (in USD)
-4,341 KRW Komipharm International Co Ltd Reg -57,349.48 1M-LIBOR 02/12/2022 -622.66
-254 KRW Korea Ship & Offshore Engineer Co Ltd Reg -27,835.18 1M-LIBOR 02/12/2022 -120.81
-5,948 KRW Kumho Tire Co Inc -21,615.87 1M-LIBOR 02/12/2022 -682.73
-736 KRW LIG Nex1 Co Ltd Reg -20,148.13 1M-LIBOR 02/12/2022 -372.60
-4,337 KRW Lock & Lock Co Ltd Reg -53,727.33 1M-LIBOR 02/12/2022 -1,726.79
-1,954 KRW Sam Chun Dang Pharm Co Ltd Reg -60,262.12 1M-LIBOR 02/12/2022 -2,027.99
-738 KRW Silicon Works Co Ltd -25,445.40 1M-LIBOR 02/12/2022 -173.98
-1,510 KRW SL Corp Reg -23,742.33 1M-LIBOR 02/12/2022 91.96
-2,155 KRW Tae Young Engineering & Constr Reg -22,309.25 1M-LIBOR 02/12/2022 -189.60
-998,095.49 -9,878.18
-3,472 NOK Borr Drilling Ltd Reg -29,925.11 1M-NIBOR 20/01/2020 1,074.40
-1,664 NOK Scatec Solar ASA -23,493.15 1M-NIBOR 20/01/2020 -3,805.09
-53,418.26 -2,730.69
-19,781 NZD Z Energy Ltd -58,723.46 1M-NZFMA 03/05/2021 -800.77
-4,000 SGD Keppel Corp Ltd -20,140.57 1M-SIBOR 13/07/2020 -70.58
-2,400 USD 2U Inc Reg -57,576.00 1M-LIBOR 19/01/2021 -3,576.00
-3,000 USD 8X8 Inc Reg -54,900.00 1M-LIBOR 19/01/2021 1,037.14
-600 USD Acceleron Pharma Inc Reg -31,812.00 1M-LIBOR 19/01/2021 -1,284.00
-800 USD Adaptive Biotechnologies Corp Reg -23,936.00 1M-LIBOR 19/01/2021 232.00
-600 USD Adtalem Global Education Inc Reg -20,982.00 1M-LIBOR 19/01/2021 -408.80
-1,464 USD Aerie Pharmaceuticals Inc -35,384.88 1M-LIBOR 19/01/2021 -3,337.92
-1,300 USD Alector Inc Reg -22,399.00 1M-LIBOR 19/01/2021 2,597.03
-1,400 USD Amerant Bancorp Inc Reg A -30,506.00 1M-LIBOR 19/01/2021 1,722.00
-3,500 USD Amicus Therapeutics Inc -34,090.00 1M-LIBOR 19/01/2021 -315.00
-700 USD Apergy Corp Reg -23,646.00 1M-LIBOR 19/01/2021 -874.67
-2,500 USD Apollo Medical Holdings Inc Reg -46,025.00 1M-LIBOR 19/01/2021 792.45
-1,400 USD Appian Corporation A Reg -53,494.00 1M-LIBOR 19/01/2021 4,253.00
-1,800 USD Aprea Therapeutics Inc Reg -82,602.00 1M-LIBOR 19/01/2021 -23,354.64
-500 USD Archer-Daniels Midland Co -23,175.00 1M-LIBOR 19/01/2021 -185.00
-535 USD Argan Inc -21,474.90 1M-LIBOR 19/01/2021 -1,348.20
-1,300 USD Assembly Biosciences Inc Reg -26,598.00 1M-LIBOR 19/01/2021 -209.46
-2,011 USD Atara Biotherapeutics Inc Reg -33,121.17 1M-LIBOR 19/01/2021 -1,729.46
-700 USD Avanos Medical Inc Reg -23,590.00 1M-LIBOR 19/01/2021 -322.00
-1,500 USD Axogen Inc Reg -26,835.00 1M-LIBOR 19/01/2021 -1,448.23
-300 USD Axsome Therapeutics Inc Reg -31,008.00 1M-LIBOR 19/01/2021 -1,526.25
-1,700 USD Bandwidth Inc Reg -108,885.00 1M-LIBOR 19/01/2021 -6,681.00
-400 USD Belden Inc Reg -22,000.00 1M-LIBOR 19/01/2021 -160.00
-500 USD Biohaven Pharm Hg Co Ltd Reg -27,220.00 1M-LIBOR 19/01/2021 345.00
-283 USD Bluebird Bio Inc -24,833.25 1M-LIBOR 19/01/2021 1,081.06
-800 USD BridgeBio Pharma Inc Reg -28,040.00 1M-LIBOR 19/01/2021 88.00
-3,500 USD Brookdale Sen Living Inc Reg -25,445.00 1M-LIBOR 19/01/2021 -1,820.00
-5,546 USD Callon Petroleum Co Reg -26,787.18 1M-LIBOR 19/01/2021 -2,384.78
-1,000 USD Cal-Maine Foods Inc Reg -42,750.00 1M-LIBOR 19/01/2021 223.12
-800 USD Canada Goose Holdings Inc -28,992.00 1M-LIBOR 19/01/2021 1,456.00
-1,100 USD CareDx Inc Reg -23,727.00 1M-LIBOR 19/01/2021 959.20
-3,400 USD Cars.com Inc Reg -41,548.00 1M-LIBOR 19/01/2021 850.00
-6,000 USD Centennial Resource Dev Inc A Reg -27,720.00 1M-LIBOR 19/01/2021 -1,517.43
-3,500 USD Century Aluminum Co Reg -26,302.50 1M-LIBOR 19/01/2021 1,347.50
-5,900 USD Cerus Corp Reg -24,898.00 1M-LIBOR 19/01/2021 -1,534.00
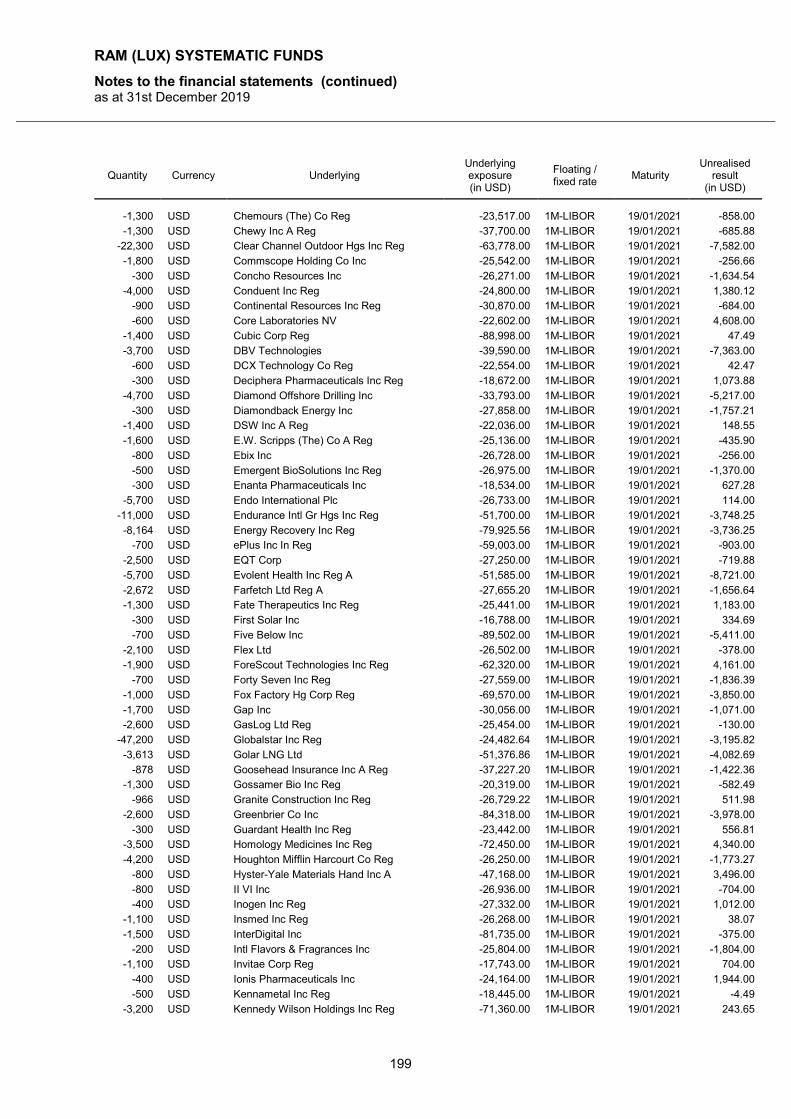
RAM (LUX) SYSTEMATIC FUNDS
Notes to the financial statements (continued) as at 31st December 2019
199
Quantity Currency Underlying Underlying exposure (in USD)
Floating / fixed rate
Maturity Unrealised
result (in USD)
-1,300 USD Chemours (The) Co Reg -23,517.00 1M-LIBOR 19/01/2021 -858.00
-1,300 USD Chewy Inc A Reg -37,700.00 1M-LIBOR 19/01/2021 -685.88
-22,300 USD Clear Channel Outdoor Hgs Inc Reg -63,778.00 1M-LIBOR 19/01/2021 -7,582.00
-1,800 USD Commscope Holding Co Inc -25,542.00 1M-LIBOR 19/01/2021 -256.66
-300 USD Concho Resources Inc -26,271.00 1M-LIBOR 19/01/2021 -1,634.54
-4,000 USD Conduent Inc Reg -24,800.00 1M-LIBOR 19/01/2021 1,380.12
-900 USD Continental Resources Inc Reg -30,870.00 1M-LIBOR 19/01/2021 -684.00
-600 USD Core Laboratories NV -22,602.00 1M-LIBOR 19/01/2021 4,608.00
-1,400 USD Cubic Corp Reg -88,998.00 1M-LIBOR 19/01/2021 47.49
-3,700 USD DBV Technologies -39,590.00 1M-LIBOR 19/01/2021 -7,363.00
-600 USD DCX Technology Co Reg -22,554.00 1M-LIBOR 19/01/2021 42.47
-300 USD Deciphera Pharmaceuticals Inc Reg -18,672.00 1M-LIBOR 19/01/2021 1,073.88
-4,700 USD Diamond Offshore Drilling Inc -33,793.00 1M-LIBOR 19/01/2021 -5,217.00
-300 USD Diamondback Energy Inc -27,858.00 1M-LIBOR 19/01/2021 -1,757.21
-1,400 USD DSW Inc A Reg -22,036.00 1M-LIBOR 19/01/2021 148.55
-1,600 USD E.W. Scripps (The) Co A Reg -25,136.00 1M-LIBOR 19/01/2021 -435.90
-800 USD Ebix Inc -26,728.00 1M-LIBOR 19/01/2021 -256.00
-500 USD Emergent BioSolutions Inc Reg -26,975.00 1M-LIBOR 19/01/2021 -1,370.00
-300 USD Enanta Pharmaceuticals Inc -18,534.00 1M-LIBOR 19/01/2021 627.28
-5,700 USD Endo International Plc -26,733.00 1M-LIBOR 19/01/2021 114.00
-11,000 USD Endurance Intl Gr Hgs Inc Reg -51,700.00 1M-LIBOR 19/01/2021 -3,748.25
-8,164 USD Energy Recovery Inc Reg -79,925.56 1M-LIBOR 19/01/2021 -3,736.25
-700 USD ePlus Inc In Reg -59,003.00 1M-LIBOR 19/01/2021 -903.00
-2,500 USD EQT Corp -27,250.00 1M-LIBOR 19/01/2021 -719.88
-5,700 USD Evolent Health Inc Reg A -51,585.00 1M-LIBOR 19/01/2021 -8,721.00
-2,672 USD Farfetch Ltd Reg A -27,655.20 1M-LIBOR 19/01/2021 -1,656.64
-1,300 USD Fate Therapeutics Inc Reg -25,441.00 1M-LIBOR 19/01/2021 1,183.00
-300 USD First Solar Inc -16,788.00 1M-LIBOR 19/01/2021 334.69
-700 USD Five Below Inc -89,502.00 1M-LIBOR 19/01/2021 -5,411.00
-2,100 USD Flex Ltd -26,502.00 1M-LIBOR 19/01/2021 -378.00
-1,900 USD ForeScout Technologies Inc Reg -62,320.00 1M-LIBOR 19/01/2021 4,161.00
-700 USD Forty Seven Inc Reg -27,559.00 1M-LIBOR 19/01/2021 -1,836.39
-1,000 USD Fox Factory Hg Corp Reg -69,570.00 1M-LIBOR 19/01/2021 -3,850.00
-1,700 USD Gap Inc -30,056.00 1M-LIBOR 19/01/2021 -1,071.00
-2,600 USD GasLog Ltd Reg -25,454.00 1M-LIBOR 19/01/2021 -130.00
-47,200 USD Globalstar Inc Reg -24,482.64 1M-LIBOR 19/01/2021 -3,195.82
-3,613 USD Golar LNG Ltd -51,376.86 1M-LIBOR 19/01/2021 -4,082.69
-878 USD Goosehead Insurance Inc A Reg -37,227.20 1M-LIBOR 19/01/2021 -1,422.36
-1,300 USD Gossamer Bio Inc Reg -20,319.00 1M-LIBOR 19/01/2021 -582.49
-966 USD Granite Construction Inc Reg -26,729.22 1M-LIBOR 19/01/2021 511.98
-2,600 USD Greenbrier Co Inc -84,318.00 1M-LIBOR 19/01/2021 -3,978.00
-300 USD Guardant Health Inc Reg -23,442.00 1M-LIBOR 19/01/2021 556.81
-3,500 USD Homology Medicines Inc Reg -72,450.00 1M-LIBOR 19/01/2021 4,340.00
-4,200 USD Houghton Mifflin Harcourt Co Reg -26,250.00 1M-LIBOR 19/01/2021 -1,773.27
-800 USD Hyster-Yale Materials Hand Inc A -47,168.00 1M-LIBOR 19/01/2021 3,496.00
-800 USD II VI Inc -26,936.00 1M-LIBOR 19/01/2021 -704.00
-400 USD Inogen Inc Reg -27,332.00 1M-LIBOR 19/01/2021 1,012.00
-1,100 USD Insmed Inc Reg -26,268.00 1M-LIBOR 19/01/2021 38.07
-1,500 USD InterDigital Inc -81,735.00 1M-LIBOR 19/01/2021 -375.00
-200 USD Intl Flavors & Fragrances Inc -25,804.00 1M-LIBOR 19/01/2021 -1,804.00
-1,100 USD Invitae Corp Reg -17,743.00 1M-LIBOR 19/01/2021 704.00
-400 USD Ionis Pharmaceuticals Inc -24,164.00 1M-LIBOR 19/01/2021 1,944.00
-500 USD Kennametal Inc Reg -18,445.00 1M-LIBOR 19/01/2021 -4.49
-3,200 USD Kennedy Wilson Holdings Inc Reg -71,360.00 1M-LIBOR 19/01/2021 243.65
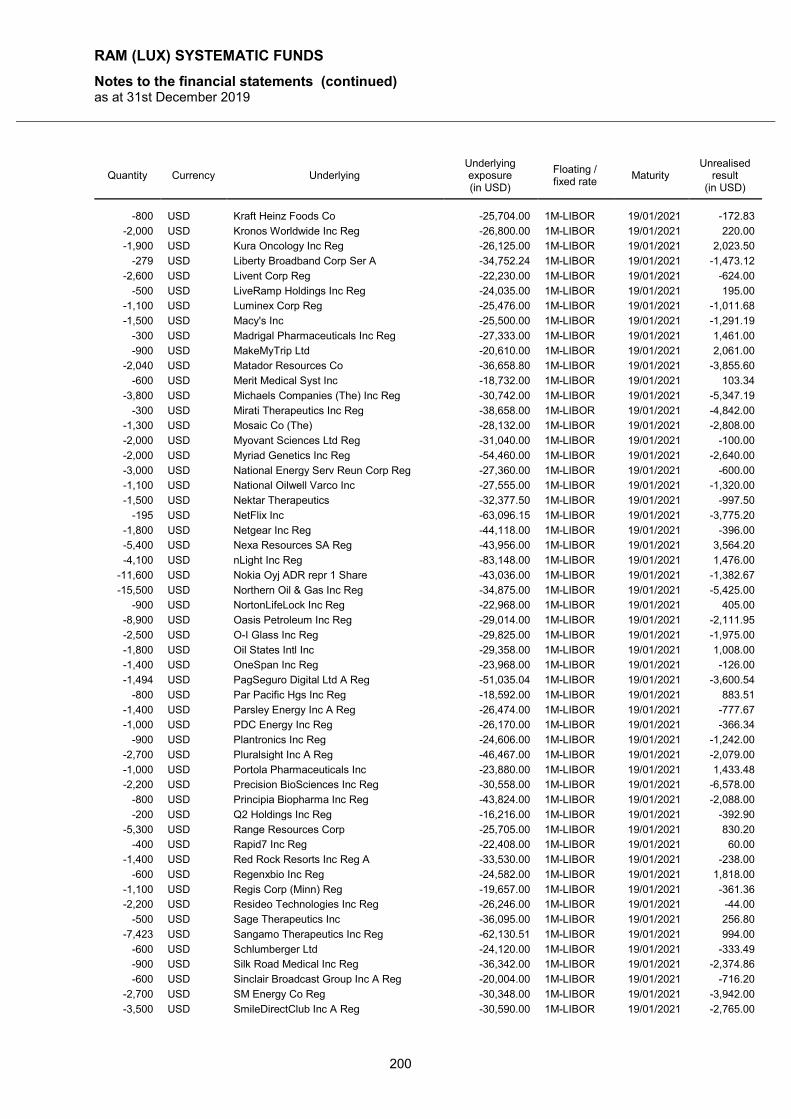
RAM (LUX) SYSTEMATIC FUNDS
Notes to the financial statements (continued) as at 31st December 2019
200
Quantity Currency Underlying Underlying exposure (in USD)
Floating / fixed rate
Maturity Unrealised
result (in USD)
-800 USD Kraft Heinz Foods Co -25,704.00 1M-LIBOR 19/01/2021 -172.83
-2,000 USD Kronos Worldwide Inc Reg -26,800.00 1M-LIBOR 19/01/2021 220.00
-1,900 USD Kura Oncology Inc Reg -26,125.00 1M-LIBOR 19/01/2021 2,023.50
-279 USD Liberty Broadband Corp Ser A -34,752.24 1M-LIBOR 19/01/2021 -1,473.12
-2,600 USD Livent Corp Reg -22,230.00 1M-LIBOR 19/01/2021 -624.00
-500 USD LiveRamp Holdings Inc Reg -24,035.00 1M-LIBOR 19/01/2021 195.00
-1,100 USD Luminex Corp Reg -25,476.00 1M-LIBOR 19/01/2021 -1,011.68
-1,500 USD Macy's Inc -25,500.00 1M-LIBOR 19/01/2021 -1,291.19
-300 USD Madrigal Pharmaceuticals Inc Reg -27,333.00 1M-LIBOR 19/01/2021 1,461.00
-900 USD MakeMyTrip Ltd -20,610.00 1M-LIBOR 19/01/2021 2,061.00
-2,040 USD Matador Resources Co -36,658.80 1M-LIBOR 19/01/2021 -3,855.60
-600 USD Merit Medical Syst Inc -18,732.00 1M-LIBOR 19/01/2021 103.34
-3,800 USD Michaels Companies (The) Inc Reg -30,742.00 1M-LIBOR 19/01/2021 -5,347.19
-300 USD Mirati Therapeutics Inc Reg -38,658.00 1M-LIBOR 19/01/2021 -4,842.00
-1,300 USD Mosaic Co (The) -28,132.00 1M-LIBOR 19/01/2021 -2,808.00
-2,000 USD Myovant Sciences Ltd Reg -31,040.00 1M-LIBOR 19/01/2021 -100.00
-2,000 USD Myriad Genetics Inc Reg -54,460.00 1M-LIBOR 19/01/2021 -2,640.00
-3,000 USD National Energy Serv Reun Corp Reg -27,360.00 1M-LIBOR 19/01/2021 -600.00
-1,100 USD National Oilwell Varco Inc -27,555.00 1M-LIBOR 19/01/2021 -1,320.00
-1,500 USD Nektar Therapeutics -32,377.50 1M-LIBOR 19/01/2021 -997.50
-195 USD NetFlix Inc -63,096.15 1M-LIBOR 19/01/2021 -3,775.20
-1,800 USD Netgear Inc Reg -44,118.00 1M-LIBOR 19/01/2021 -396.00
-5,400 USD Nexa Resources SA Reg -43,956.00 1M-LIBOR 19/01/2021 3,564.20
-4,100 USD nLight Inc Reg -83,148.00 1M-LIBOR 19/01/2021 1,476.00
-11,600 USD Nokia Oyj ADR repr 1 Share -43,036.00 1M-LIBOR 19/01/2021 -1,382.67
-15,500 USD Northern Oil & Gas Inc Reg -34,875.00 1M-LIBOR 19/01/2021 -5,425.00
-900 USD NortonLifeLock Inc Reg -22,968.00 1M-LIBOR 19/01/2021 405.00
-8,900 USD Oasis Petroleum Inc Reg -29,014.00 1M-LIBOR 19/01/2021 -2,111.95
-2,500 USD O-I Glass Inc Reg -29,825.00 1M-LIBOR 19/01/2021 -1,975.00
-1,800 USD Oil States Intl Inc -29,358.00 1M-LIBOR 19/01/2021 1,008.00
-1,400 USD OneSpan Inc Reg -23,968.00 1M-LIBOR 19/01/2021 -126.00
-1,494 USD PagSeguro Digital Ltd A Reg -51,035.04 1M-LIBOR 19/01/2021 -3,600.54
-800 USD Par Pacific Hgs Inc Reg -18,592.00 1M-LIBOR 19/01/2021 883.51
-1,400 USD Parsley Energy Inc A Reg -26,474.00 1M-LIBOR 19/01/2021 -777.67
-1,000 USD PDC Energy Inc Reg -26,170.00 1M-LIBOR 19/01/2021 -366.34
-900 USD Plantronics Inc Reg -24,606.00 1M-LIBOR 19/01/2021 -1,242.00
-2,700 USD Pluralsight Inc A Reg -46,467.00 1M-LIBOR 19/01/2021 -2,079.00
-1,000 USD Portola Pharmaceuticals Inc -23,880.00 1M-LIBOR 19/01/2021 1,433.48
-2,200 USD Precision BioSciences Inc Reg -30,558.00 1M-LIBOR 19/01/2021 -6,578.00
-800 USD Principia Biopharma Inc Reg -43,824.00 1M-LIBOR 19/01/2021 -2,088.00
-200 USD Q2 Holdings Inc Reg -16,216.00 1M-LIBOR 19/01/2021 -392.90
-5,300 USD Range Resources Corp -25,705.00 1M-LIBOR 19/01/2021 830.20
-400 USD Rapid7 Inc Reg -22,408.00 1M-LIBOR 19/01/2021 60.00
-1,400 USD Red Rock Resorts Inc Reg A -33,530.00 1M-LIBOR 19/01/2021 -238.00
-600 USD Regenxbio Inc Reg -24,582.00 1M-LIBOR 19/01/2021 1,818.00
-1,100 USD Regis Corp (Minn) Reg -19,657.00 1M-LIBOR 19/01/2021 -361.36
-2,200 USD Resideo Technologies Inc Reg -26,246.00 1M-LIBOR 19/01/2021 -44.00
-500 USD Sage Therapeutics Inc -36,095.00 1M-LIBOR 19/01/2021 256.80
-7,423 USD Sangamo Therapeutics Inc Reg -62,130.51 1M-LIBOR 19/01/2021 994.00
-600 USD Schlumberger Ltd -24,120.00 1M-LIBOR 19/01/2021 -333.49
-900 USD Silk Road Medical Inc Reg -36,342.00 1M-LIBOR 19/01/2021 -2,374.86
-600 USD Sinclair Broadcast Group Inc A Reg -20,004.00 1M-LIBOR 19/01/2021 -716.20
-2,700 USD SM Energy Co Reg -30,348.00 1M-LIBOR 19/01/2021 -3,942.00
-3,500 USD SmileDirectClub Inc A Reg -30,590.00 1M-LIBOR 19/01/2021 -2,765.00
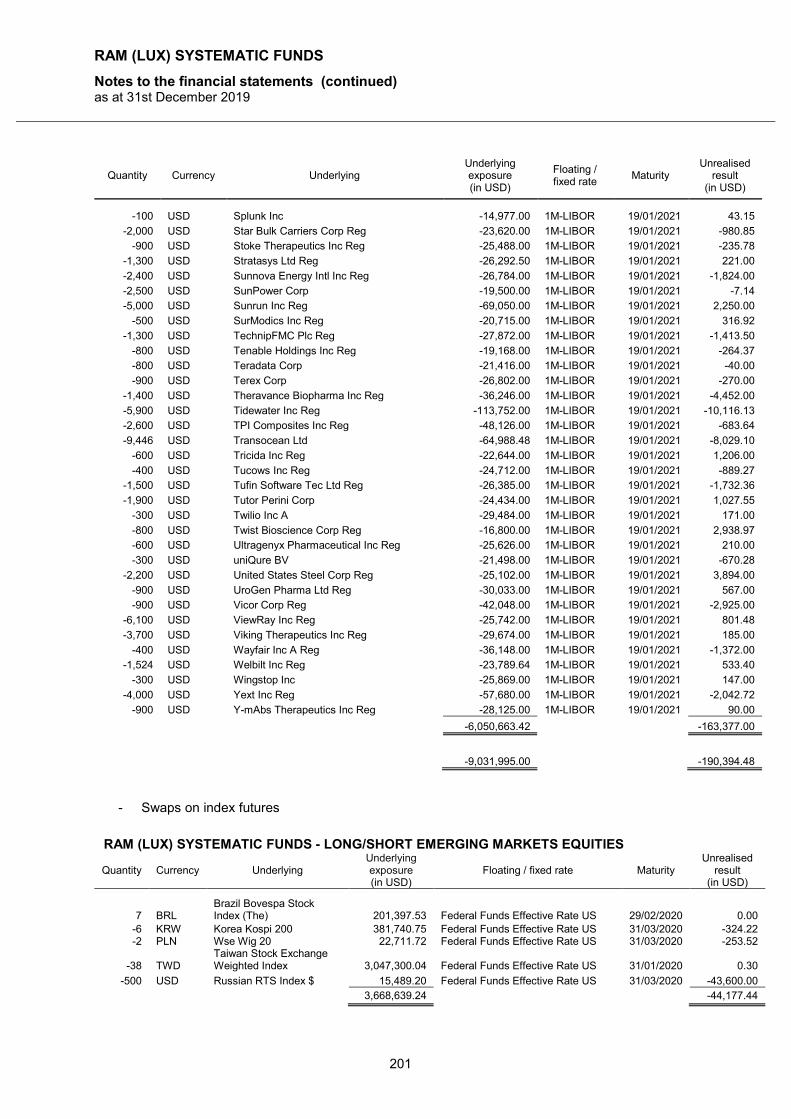
RAM (LUX) SYSTEMATIC FUNDS
Notes to the financial statements (continued) as at 31st December 2019
201
Quantity Currency Underlying Underlying exposure (in USD)
Floating / fixed rate
Maturity Unrealised
result (in USD)
-100 USD Splunk Inc -14,977.00 1M-LIBOR 19/01/2021 43.15
-2,000 USD Star Bulk Carriers Corp Reg -23,620.00 1M-LIBOR 19/01/2021 -980.85
-900 USD Stoke Therapeutics Inc Reg -25,488.00 1M-LIBOR 19/01/2021 -235.78
-1,300 USD Stratasys Ltd Reg -26,292.50 1M-LIBOR 19/01/2021 221.00
-2,400 USD Sunnova Energy Intl Inc Reg -26,784.00 1M-LIBOR 19/01/2021 -1,824.00
-2,500 USD SunPower Corp -19,500.00 1M-LIBOR 19/01/2021 -7.14
-5,000 USD Sunrun Inc Reg -69,050.00 1M-LIBOR 19/01/2021 2,250.00
-500 USD SurModics Inc Reg -20,715.00 1M-LIBOR 19/01/2021 316.92
-1,300 USD TechnipFMC Plc Reg -27,872.00 1M-LIBOR 19/01/2021 -1,413.50
-800 USD Tenable Holdings Inc Reg -19,168.00 1M-LIBOR 19/01/2021 -264.37
-800 USD Teradata Corp -21,416.00 1M-LIBOR 19/01/2021 -40.00
-900 USD Terex Corp -26,802.00 1M-LIBOR 19/01/2021 -270.00
-1,400 USD Theravance Biopharma Inc Reg -36,246.00 1M-LIBOR 19/01/2021 -4,452.00
-5,900 USD Tidewater Inc Reg -113,752.00 1M-LIBOR 19/01/2021 -10,116.13
-2,600 USD TPI Composites Inc Reg -48,126.00 1M-LIBOR 19/01/2021 -683.64
-9,446 USD Transocean Ltd -64,988.48 1M-LIBOR 19/01/2021 -8,029.10
-600 USD Tricida Inc Reg -22,644.00 1M-LIBOR 19/01/2021 1,206.00
-400 USD Tucows Inc Reg -24,712.00 1M-LIBOR 19/01/2021 -889.27
-1,500 USD Tufin Software Tec Ltd Reg -26,385.00 1M-LIBOR 19/01/2021 -1,732.36
-1,900 USD Tutor Perini Corp -24,434.00 1M-LIBOR 19/01/2021 1,027.55
-300 USD Twilio Inc A -29,484.00 1M-LIBOR 19/01/2021 171.00
-800 USD Twist Bioscience Corp Reg -16,800.00 1M-LIBOR 19/01/2021 2,938.97
-600 USD Ultragenyx Pharmaceutical Inc Reg -25,626.00 1M-LIBOR 19/01/2021 210.00
-300 USD uniQure BV -21,498.00 1M-LIBOR 19/01/2021 -670.28
-2,200 USD United States Steel Corp Reg -25,102.00 1M-LIBOR 19/01/2021 3,894.00
-900 USD UroGen Pharma Ltd Reg -30,033.00 1M-LIBOR 19/01/2021 567.00
-900 USD Vicor Corp Reg -42,048.00 1M-LIBOR 19/01/2021 -2,925.00
-6,100 USD ViewRay Inc Reg -25,742.00 1M-LIBOR 19/01/2021 801.48
-3,700 USD Viking Therapeutics Inc Reg -29,674.00 1M-LIBOR 19/01/2021 185.00
-400 USD Wayfair Inc A Reg -36,148.00 1M-LIBOR 19/01/2021 -1,372.00
-1,524 USD Welbilt Inc Reg -23,789.64 1M-LIBOR 19/01/2021 533.40
-300 USD Wingstop Inc -25,869.00 1M-LIBOR 19/01/2021 147.00
-4,000 USD Yext Inc Reg -57,680.00 1M-LIBOR 19/01/2021 -2,042.72
-900 USD Y-mAbs Therapeutics Inc Reg -28,125.00 1M-LIBOR 19/01/2021 90.00
-6,050,663.42 -163,377.00
-9,031,995.00 -190,394.48
- Swaps on index futures
RAM (LUX) SYSTEMATIC FUNDS - LONG/SHORT EMERGING MARKETS EQUITIES
Quantity Currency Underlying Underlying exposure (in USD)
Floating / fixed rate Maturity Unrealised
result (in USD)
7 BRL Brazil Bovespa Stock Index (The) 201,397.53 Federal Funds Effective Rate US 29/02/2020 0.00
-6 KRW Korea Kospi 200 381,740.75 Federal Funds Effective Rate US 31/03/2020 -324.22 -2 PLN Wse Wig 20 22,711.72 Federal Funds Effective Rate US 31/03/2020 -253.52
-38 TWD Taiwan Stock Exchange Weighted Index 3,047,300.04 Federal Funds Effective Rate US 31/01/2020 0.30
-500 USD Russian RTS Index $ 15,489.20 Federal Funds Effective Rate US 31/03/2020 -43,600.00
3,668,639.24 -44,177.44
RAM (LUX) SYSTEMATIC FUNDS
Notes to the financial statements (continued) as at 31st December 2019
202
Note 15 - Events With effect on 26th August 2019, the Board of Directors of the SICAV has decided : • to change the name of the PIP share classes to PI for the RAM (LUX) SYSTEMATIC FUNDS -
EMERGING MARKETS EQUITIES sub-fund ;
• to change the Valuation Day from every Friday to every bank business day in Luxembourg for the RAM (LUX) SYSTEMATIC FUNDS - LONG/SHORT EUROPEAN EQUITIES sub-fund.
With effect on 1st March 2019 the manager RAM Active Investments S.A. waived, in the interest of the shareholders, the performance fee for all the following share classes. This decision was taken in view of a possible commercial adaptation of the range of share classes offered and until the performance fee has been amended through an update to the prospectus: RAM (LUX) SYSTEMATIC FUNDS - EUROPEAN EQUITIES : share classes PIP RAM (LUX) SYSTEMATIC FUNDS - EMERGING MARKETS EQUITIES : share classes PI (formerly PIP).
Note 16 - Subsequent events With effect on 12th February 2020 the Board of Directors of the SICAV decided trough circular resolution dated 30th January 2020 to liquidate the RAM (LUX) SYSTEMATIC FUNDS - EMERGING MARKETS CORE EQUITIES sub-fund. With effect on 17th February 2020, a liquidation bonus was paid as follows: Share class Currency Amount BP USD 97.60 LP EUR 115.07 IP USD 102.86 IP (CHF) CHF 110.69 IP (EUR) EUR 108.81 R USD 108.60
With effect on 2nd January 2020 the manager RAM Active Investments S.A. waived, in the interest of the shareholders, the performance fee for all the following share classes. This decision was taken in view of a possible commercial adaptation of the range of share classes offered and until the performance fee has been amended through an update to the prospectus: RAM (LUX) SYSTEMATIC FUNDS - EUROPEAN EQUITIES : share classes B, CH, DH, H, F, PH, I, U RAM (LUX) SYSTEMATIC FUNDS - NORTH AMERICAN EQUITIES: share classes B, EH, H, GH, F, I RAM (LUX) SYSTEMATIC FUNDS - EMERGING MARKETS EQUITIES: share classes B, B (SEK), J, L, F, F (SEK), O, P, I, I (SEK), U, U (CHF), U (EUR). The Board of Directors of the SICAV has decided to foresee the launch of the RAM (LUX) SYSTEMATIC FUNDS - DIVERSIFIED ALPHA sub-fund. Initial subscription orders for the sub-fund will be accepted from 2nd December 2019 to 26th March 2020 at an initial price of 100 (in the reference currency of the share class) per share. The payment date is foreseen on 31st March 2020. The first expected NAV is dated on1st April 2020.
RAM (LUX) SYSTEMATIC FUNDS
Additional information (unaudited) as at 31st December 2019
203
1 - Risk management As required by Circular CSSF 11/512, the Board of Directors needs to determine the global risk exposure of the SICAV either by applying the commitment approach or the VaR approach. In terms of risk management, the Board of Directors of the SICAV decided to adopt, as a method of determining the global risk exposure:
- the commitment approach for the following sub-funds:
- RAM (LUX) SYSTEMATIC FUNDS - EUROPEAN EQUITIES - RAM (LUX) SYSTEMATIC FUNDS - NORTH AMERICAN EQUITIES - RAM (LUX) SYSTEMATIC FUNDS - GLOBAL SUSTAINABLE INCOME EQUITIES - RAM (LUX) SYSTEMATIC FUNDS - EMERGING MARKETS EQUITIES - RAM (LUX) SYSTEMATIC FUNDS - EMERGING MARKETS CORE EQUITIES
- the absolute VAR approach for the following sub-funds:
- RAM (LUX) SYSTEMATIC FUNDS - LONG/SHORT EUROPEAN EQUITIES - RAM (LUX) SYSTEMATIC FUNDS - LONG/SHORT EMERGING MARKETS EQUITIES - RAM (LUX) SYSTEMATIC FUNDS - LONG/SHORT GLOBAL EQUITIES - RAM (LUX) SYSTEMATIC FUNDS - GLOBAL MULTI-ASSET FUND
The absolute VaR is calculated according to the following parameters:
- Type of model: parametric - Confidence interval: 99 % - Period of observation: 90 days (daily) - Holding period: 20 days
For the observation period from 1st January 2019 to 31st December 2019 for the following sub-funds:
Sub-fund minimum VaR limit
maximum VaR limit
average VaR limit
Leverage value* as at 31/12/19
RAM (LUX) SYSTEMATIC FUNDS - LONG/SHORT EUROPEAN EQUITIES
2.5% 5.9% 3.6% 134.4%
RAM (LUX) SYSTEMATIC FUNDS - LONG/SHORT EMERGING MARKETS EQUITIES
2.4% 7.2% 3.5% 114.7%
RAM (LUX) SYSTEMATIC FUNDS - LONG/SHORT GLOBAL EQUITIES
2.4% 8.4% 4.8% 154.2%
RAM (LUX) SYSTEMATIC FUNDS - GLOBAL MULTI-ASSET FUND
1.5% 4.3% 2.4% 128.5%
*The leverage value is determined using the calculation method of the commitment, therefore after taking into account the netting or hedging provisions. 2 - Remuneration From 1st January 2019 until 31st December 2019 (the "Reference Period"), the total amount of wages and salaries paid-in cash and/or restricted securities by RAM Active Investments (Europe) S.A. (the "Management Company") to its entire staff (composed during the Reference Period in average of 8 employees) was EUR 1,008,841.22. In particular, during the Reference Period, the total amount of wages and salaries was split into fixed and variable remuneration as follows : - Fixed remuneration: EUR 799,840.47 - Variable remuneration: EUR 209,000.75
RAM (LUX) SYSTEMATIC FUNDS
Additional information (unaudited) (continued) as at 31st December 2019
204
No fees based on the performance of the Fund or carried interest are used to remunerate employees of the Company. The total amount of remuneration paid to senior management and members of staff (including outsourced staff) of the Company whose actions have a material impact on the risk profile of the Company or falling within the remuneration bracket of senior management and risk takers during the Reference Period was EUR 402,760.78. Please note that above figures are provided for overall services provided by the Company and they do not represent a breakdown at the level of the Fund. Details of the remuneration policy of the Management Company, including a description of the key remuneration elements and an overview of how remuneration is determined, is available under www.ram-ai.com. 3 - Information concerning the transparency of securities financing transactions and of reuse of cash collateral (regulation EU 2015/2365, hereafter "SFTR") During the reporting period, the following sub-funds of the SICAV engaged in transactions on TRS which are subject to the publication requirements of SFTR 2015/2365 concerning the transparency of securities
RAM (LUX) SYSTEMATIC FUNDS -
EUROPEAN EQUITIES
(in EUR)
RAM (LUX) SYSTEMATIC FUNDS -
GLOBAL SUSTAINABLE INCOME
EQUITIES
(in USD)
RAM (LUX) SYSTEMATIC FUNDS -
LONG/SHORT EUROPEAN EQUITIES
(in EUR)
RAM (LUX) SYSTEMATIC FUNDS -
LONG/SHORT EMERGING MARKETS
EQUITIES
(in USD)
RAM (LUX) SYSTEMATIC FUNDS -
LONG/SHORT GLOBAL EQUITIES
(in USD)
Global data: assets used for TRS
(sum of absolute unrealised results on TRS)
in absolute terms 772,455.95 0.00 4,251,745.71 268,450.45 429,873.10
as a percentage of net assets of the sub-funds 0.21% 0.00% 0.50% 0.72% 1.66%
Concentration data
10 largest collateral issuers for securities collateral
received
first Morgan Stanley & Co Intl Plc Morgan Stanley & Co Intl Plc Morgan Stanley & Co Intl Plc Morgan Stanley & Co Intl Plc Morgan Stanley & Co Intl Plc
gross volumes for open trades 1,879,105.69 130,076.19 56,478,445.73 1,677,153.21 1,315,009.60
second - - - Credit Suisse Securi Eu Ltd -
gross volumes for open trades - - - 462,893.00 -
Top 10 counterparties of total return swaps separately
first UBS AG London Morgan Stanley & Co Intl Plc Morgan Stanley & Co Intl Plc UBS AG London UBS AG London
gross volume of outstanding transactions 772,455.95 0.00 2,805,796.92 267,169.18 429,872.80
second Morgan Stanley & Co Intl Plc - UBS AG London Morgan Stanley & Co Intl Plc Morgan Stanley & Co Intl Plc
gross volume of outstanding transactions 0.00 - 1,206,117.88 1,281.27 0.30
third - - Merrill Lynch Intl Cred Suisse Securities EUR Ltd -
gross volume of outstanding transactions - - 239,830.91 0.00 -
Aggregate transaction data for TRS
Type and quality of the collateral received
securities collateral - - - - -
cash collateral 1,879,105.69 130,076.19 56,478,445.73 2,140,046.21 1,315,009.60
Collateral classified according to their residual
maturities
less than 1 day - - - - -
from 1 day to 1 w eek (= 7 days) - - - - -
f rom 1 w eek to 1 month (= 30 days) - - - - -
f rom 1 month to 3 months - - - - -
f rom 3 months to 1 year (= 365 days) - - - - -
above 1 year - - - - -
open maturity 1,879,105.69 130,076.19 56,478,445.73 2,140,046.21 1,315,009.60
Currencies of the collateral received USD, EUR USD EUR, USD USD USD
RAM (LUX) SYSTEMATIC FUNDS
Additional information (unaudited) (continued) as at 31st December 2019
205
RAM (LUX) SYSTEMATIC FUNDS -
EUROPEAN EQUITIES
(in EUR)
RAM (LUX) SYSTEMATIC FUNDS -
GLOBAL SUSTAINABLE INCOME
EQUITIES
(in USD)
RAM (LUX) SYSTEMATIC FUNDS -
LONG/SHORT EUROPEAN EQUITIES
(in EUR)
RAM (LUX) SYSTEMATIC FUNDS -
LONG/SHORT EMERGING MARKETS
EQUITIES
(in USD)
RAM (LUX) SYSTEMATIC FUNDS -
LONG/SHORT GLOBAL EQUITIES
(in USD)
TRS classified in accordance with the residual maturity
(absolute amounts)
less than 1 day - - - - -
from 1 day to 1 w eek (= 7 days) - - 3,262,309.29 - -
f rom 1 w eek to 1 month (= 30 days) - - 690,367.87 41,140.14 37,605.89
f rom 1 month to 3 months - - - 190,588.53 21,051.38
f rom 3 months to 1 year (= 365 days) 772,455.95 - - 11.06 70.58
above 1 year - - 299,068.55 36,710.72 371,145.25
open maturity - - - - -
Country (countries) in which the counterparties are
establishedGB GB GB GB GB
Type of settlement and clearing
tri-party - - - - -
central counterparty - - - - -
bilateral 772,455.95 0.00 4,251,745.71 268,450.45 429,873.10
Data on reuse of collateral received
% foreseen in prospectus
investment in deposits, high quality
government bonds, repurchase
transactions and short-term money
market UCITS
investment in deposits, high quality
government bonds, repurchase
transactions and short-term money
market UCITS
investment in deposits, high quality
government bonds, repurchase
transactions and short-term money
market UCITS
investment in deposits, high quality
government bonds, repurchase
transactions and short-term money
market UCITS
investment in deposits, high quality
government bonds, repurchase
transactions and short-term money
market UCITS
collateral received that is reused - - - - -
cash collateral reinvestment returns to the sub-funds - - - - -
Safekeeping of collateral received 1 1 1 2 1
number of depositaries Morgan Stanley & Co Intl Plc Morgan Stanley & Co Intl Plc Morgan Stanley & Co Intl PlcCredit Suisse Securi Eu Ltd,
Morgan Stanley & Co Intl PlcMorgan Stanley & Co Intl Plc
name of depositaries 1,879,105.69 130,076.19 56,478,445.73 2,140,046.21 1,315,009.60
amounts of assets received as collateral
Return and cost components for TRS
Return component of the sub-funds - - - - -
in absolute terms 0.00% 0.00% 0.00% 0.00% 0.00%
as a percentage of gross revenue - - - - -
Cost component of the sub-funds - - - - -
Return component of the capital management company
in absolute terms - - - - -
as a percentage of gross revenue 0.00% 0.00% 0.00% 0.00% 0.00%
Cost component of the capital management company - - - - -
Return component of third parties
in absolute terms - - - - -
as a percentage of gross revenue 0.00% 0.00% 0.00% 0.00% 0.00%
Cost component of third parties - - - - -


