Embed Size (px)
Citation preview
Telephone: +61 7 3295 9565
Facsimile: +61 7 3295 9566
Email: [email protected]
Web: www.qmc.com.au/QMIHSCHomePage.htm
Further information:
Conference Secretariat
GPO Box 908
Brisbane Qld 4001 Australia3-6 AUGUST 2003
JUPITERS TOWNSVILLE HOTEL & CASINO TOWNSVILLE QUEENSLAND
ACCEPTING THE CHALLENGE
QUEENSLAND MINING INDUSTRY
Health&SafetyC O N F E R E N C E 2 0 0 3
QUEENSLAND MINING INDUSTRY
Health&SafetyC O N F E R E N C E 2 0 0 3
Health & Safety Trust
appreciates the support of thefollowing sponsors:
ProceedingsConference
QU
EENSLA
ND
MIN
ING
IND
USTRY
Health
&Safety
CO
NF
ER
EN
CE
20
03
QMC 2003 Papers Cover 21/7/03 1:26 PM Page 1
Plenary PresentationsInnovations in seeking to provide an incident & injury free workplace during construction of the Hail Creek Coal Project..................1
Where Safety is the Priority & Zero Harm is the goal ............................................................................................................................7
The “Study on Workplace Environment & Health” ..............................................................................................................................11
Keynote PresentationsAn AcciMap of the Esso Australia Gas Plant Explosion........................................................................................................................16
An Occupational Health & Safety Research Perspective......................................................................................................................21
Concurrent PapersHealth Reporting in a Multinational Resources Company ...................................................................................................................22
Health Surveillance: Past History & Future Potential............................................................................................................................23
A Study of the Health & Safety aspects of Shiftwork & Rosters at the PCML........................................................................................29
Tracking Stress & Fatigue at Consolidated Rutile .................................................................................................................................35
Examining the Legal Implications of Being Fit for Work ......................................................................................................................37
Behaviour-based Safety: A Case Study Illustrating a Successful Approach............................................................................................45
Developing a Crisis Management Capability - Curragh Queensland Mining Pty Ltd Meets the Challenge ..........................................51
Evidence Shows Workplace Health Promotion Works - But How do you get your Employees to Attend?............................................55
The Implementation of Common Health Standards across Multiple Mining Operations & an Example of Practical Application .........63
National Industry Perspectives on Occupational Health Issues............................................................................................................67
Gaining that Support ...........................................................................................................................................................................69
Assessing Risk Assessments at Mount Isa Mines ..................................................................................................................................73
Safety Applications for GPS Systems in the Mining Industry ................................................................................................................75
Manual Handling - Reducing Injuries..................................................................................................................................................79
Technology Aimed at Improving Mine Safety ......................................................................................................................................81
Using Data to Identify Risk to Improve Safety & Health Performance..................................................................................................87
ACARP – Accepting the Safety Challenge............................................................................................................................................95
Counting the Cost of Injury & Poor Health - An Analysis of QCOS Data.............................................................................................99
What Works Best at Improving Mine Worker Safety & Why Does it Work ........................................................................................105
Improving Significant Incident Management in Underground Coal Mines.........................................................................................111
Using Knowledge Management to Improve Risk Management Strategies & Communications in Mines ............................................117
Challenge Test – Your Level 1 Emergency Exercise ............................................................................................................................124
Inertisation of Loveridge No.22 Coal Mine........................................................................................................................................127
Real Time Integrated Mine Ventilation Monitoring.............................................................................................................................133
Hydration Requirements of the WMC Fertilizers Workforce at Phosphate Hill ..................................................................................141
Southern Colliery - Face Bretby Handling System .............................................................................................................................145
No Go Zones on Vehicle Loading Cranes..........................................................................................................................................146
Southern Colliery - Longwall AFC Respirable/ Combustible Dust Suppression Sprays ......................................................................147
Minsup Isolation Lockout Device ......................................................................................................................................................148
Tail Light Cleaning Sprays for 773 Water Cart ...................................................................................................................................149
Reducing Hazards to Tyre Changing Employees ................................................................................................................................150
Shuttle Car Cab Modifications...........................................................................................................................................................151
Programmable Electronic Roof Bolter Controls..................................................................................................................................153
Monorail Chain - Removing Tool ......................................................................................................................................................153
Washdown System for EX3500 Shovels & Excavators........................................................................................................................154
Oxy–Acetylene Trolley ......................................................................................................................................................................155
CONTENTS
Inn
ova
tio
ns
NOTES
QMC 2003 Papers Cover 21/7/03 1:26 PM Page 2
Innovations in seeking toprovide an incident & injury freeworkplace during constructionof the Hail Creek Coal ProjectGraham Morgan, Hatch Associates
Synopsis
Hatch Associates and Hail Creek Coal developed a SafetyManagement System for the Hail Creek Coal Project thatdelivered a step change in site safety management. It was builtaround hazard identification, risk assessment and riskminimisation or elimination, for every task being undertaken.Hatch was responsible for the implementation of the systems,and to verify compliance and measure effectiveness.
Whilst encountering initial doubt and resistance, it was aproven success with the Project achieving, at the first attempt, anNSCA 5 Star rating for the safety management system andapplication. The railway portion of the project was also awardedthe Queensland Master Contractors’ Association 2002 SafetyAward.
The impact of the safety program has had a substantial effecton individuals and contractor organisations and shown thatleadership can and must change the approach to safetymanagement in the future. In many areas, the results should liftthe current construction industry standards.
Description of the Program
Hatch was appointed as the Project ManagementOrganisation for the Hail Creek Project in September 2001. Theclient was Pacific Coal, a wholly owned subsidiary of Rio Tintothat operates three other coal mines in Queensland.
One of the key criteria for award of the Project to Hatch wasthe demonstration given of our ability, preparedness andwillingness to manage safety on the site and to meet or exceedPacific Coal and Rio Tinto’s safety standards. It was the first majorconstruction project, carried out on a coal mine lease inQueensland, since the introduction of the new Queensland CoalMining Safety and Health Act 1999 (the Act) and Coal MiningSafety and Health Regulation 2001 (the Regulation). Therefore,the Safety Management System (SMS) used on the project, had tobe assembled to incorporate the features of the Act andRegulation.
The cornerstone of the SMS and what drove the way it wasadministered was the Vision. This was a joint developmentbetween the Hatch and Hail Creek team members and stated ourunconditional commitment to providing a safe and healthyworkplace for all employees.
From this vision, we established a Safety and Health Policy.The policy contained the vision and set out our stands andprinciples.
We were strongly influenced by the commitment and passionof the Hail Creek managers. They left us in no doubt as to thelevel of performance and dedication they required. Together, webelieved the following to be fact:
• Acceptance of the principle that all incidents and injuries canand must be prevented
• Leaders and Managers at all levels are responsible forworkplace safety
• Safety should have at least equal status along with otherprimary business objectives, such as time and cost
• The need to provide properly engineered and safe systems ofwork
• Unsafe acts and conditions, which may result in incidents,must be eliminated
• It is necessary to have all employees accept their responsibilityto work safely and to understand that it is to their advantage, aswell as to their Company, that they do so
• Incident prevention is good business. A safe project is usuallyan efficient and cost effective project
• Nobody wants to hurt themselves or other people.
With these beliefs and values, we set out to implement asafety management system that incorporated all of ourundertakings to Pacific Coal and each other, the provisions of thenew legislation and Hatch’s corporate commitment.
Hatch took with it into the project a basic safety managementsystem built around Hatch’s eleven key elements of safetymanagement:
• Leadership and commitment• Performance measurement and reporting• Involvement, communication and motivation• Contractor alignment• Training and competency• Hazard and risk management• Occupational health and hygiene• Safe systems of work• Incident reporting• Site management and • The environment.
1
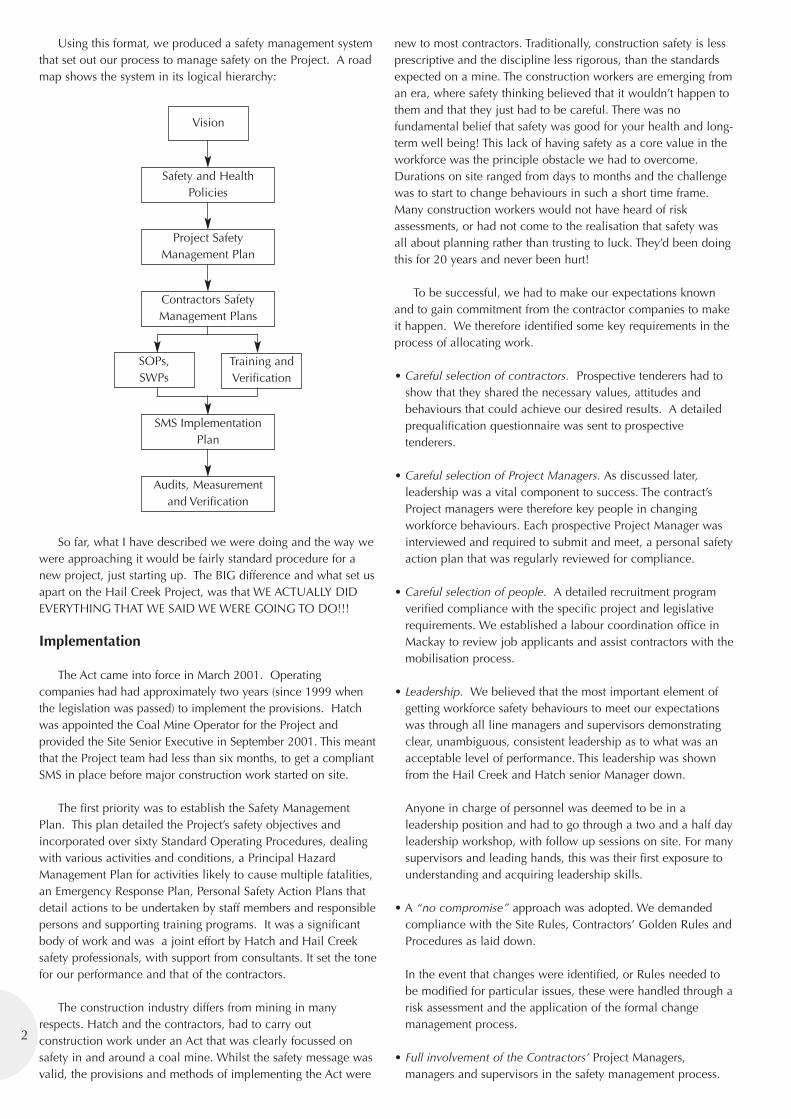
Using this format, we produced a safety management systemthat set out our process to manage safety on the Project. A roadmap shows the system in its logical hierarchy:
So far, what I have described we were doing and the way wewere approaching it would be fairly standard procedure for anew project, just starting up. The BIG difference and what set usapart on the Hail Creek Project, was that WE ACTUALLY DIDEVERYTHING THAT WE SAID WE WERE GOING TO DO!!!
Implementation
The Act came into force in March 2001. Operatingcompanies had had approximately two years (since 1999 whenthe legislation was passed) to implement the provisions. Hatchwas appointed the Coal Mine Operator for the Project andprovided the Site Senior Executive in September 2001. This meantthat the Project team had less than six months, to get a compliantSMS in place before major construction work started on site.
The first priority was to establish the Safety ManagementPlan. This plan detailed the Project’s safety objectives andincorporated over sixty Standard Operating Procedures, dealingwith various activities and conditions, a Principal HazardManagement Plan for activities likely to cause multiple fatalities,an Emergency Response Plan, Personal Safety Action Plans thatdetail actions to be undertaken by staff members and responsiblepersons and supporting training programs. It was a significantbody of work and was a joint effort by Hatch and Hail Creeksafety professionals, with support from consultants. It set the tonefor our performance and that of the contractors.
The construction industry differs from mining in manyrespects. Hatch and the contractors, had to carry outconstruction work under an Act that was clearly focussed onsafety in and around a coal mine. Whilst the safety message wasvalid, the provisions and methods of implementing the Act were
new to most contractors. Traditionally, construction safety is lessprescriptive and the discipline less rigorous, than the standardsexpected on a mine. The construction workers are emerging froman era, where safety thinking believed that it wouldn’t happen tothem and that they just had to be careful. There was nofundamental belief that safety was good for your health and long-term well being! This lack of having safety as a core value in theworkforce was the principle obstacle we had to overcome.Durations on site ranged from days to months and the challengewas to start to change behaviours in such a short time frame.Many construction workers would not have heard of riskassessments, or had not come to the realisation that safety wasall about planning rather than trusting to luck. They’d been doingthis for 20 years and never been hurt!
To be successful, we had to make our expectations knownand to gain commitment from the contractor companies to makeit happen. We therefore identified some key requirements in theprocess of allocating work.
• Careful selection of contractors. Prospective tenderers had toshow that they shared the necessary values, attitudes andbehaviours that could achieve our desired results. A detailedprequalification questionnaire was sent to prospectivetenderers.
• Careful selection of Project Managers. As discussed later,leadership was a vital component to success. The contract’sProject managers were therefore key people in changingworkforce behaviours. Each prospective Project Manager wasinterviewed and required to submit and meet, a personal safetyaction plan that was regularly reviewed for compliance.
• Careful selection of people. A detailed recruitment programverified compliance with the specific project and legislativerequirements. We established a labour coordination office inMackay to review job applicants and assist contractors with themobilisation process.
• Leadership. We believed that the most important element ofgetting workforce safety behaviours to meet our expectationswas through all line managers and supervisors demonstratingclear, unambiguous, consistent leadership as to what was anacceptable level of performance. This leadership was shownfrom the Hail Creek and Hatch senior Manager down.
Anyone in charge of personnel was deemed to be in aleadership position and had to go through a two and a half dayleadership workshop, with follow up sessions on site. For manysupervisors and leading hands, this was their first exposure tounderstanding and acquiring leadership skills.
• A “no compromise” approach was adopted. We demandedcompliance with the Site Rules, Contractors’ Golden Rules andProcedures as laid down.
In the event that changes were identified, or Rules needed tobe modified for particular issues, these were handled through arisk assessment and the application of the formal changemanagement process.
• Full involvement of the Contractors’ Project Managers,managers and supervisors in the safety management process.
2
Vision
Safety and HealthPolicies
Project SafetyManagement Plan
Contractors SafetyManagement Plans
SMS ImplementationPlan
Audits, Measurementand Verification
SOPs,SWPs
Training andVerification
3
The site personnel were team oriented and all matters thataffected the workforce were discussed via the Safety SteeringCommittee and Safety Implementation Committee. Thisinvolved all the contractors.
• Contractor Safety Management plans (SMP). These wereprepared by the Contractor and either written by them ormodelled using Hatch’s SMS. We made the SMS available toall Contractors on CD-Rom. After submission by theContractor, their SMPs were audited against a formal audittool developed to assess compliance. A score of over 90%was necessary before a plan was accepted. Contractorswere refused permission to mobilise until their plan hadbeen approved. In particular we were looking for clearevidence of:
• Ownership• Leadership• Commitment• Responsibility• Accountability• Verification
by the contractors in their plans.
• Safety meetings were held with the contractors beforemobilisation. The first was held in the post tender – pre awardperiod, where Hatch would interview the tenderers’ CEO, SiteProject Manager and Safety Adviser. The meeting took them indetail through the contract provisions and Hatch’s expectationsand obtained a commitment, at the highest level, that theywere prepared to meet those standards.
Once they were awarded a contract, we held a further kick-offmeeting with them, where we again went over the safetyperformance requirements on site.
The outcome from these meetings was that contractors wereunable to claim ignorance of what was going to be required atsite, or to say that they had not made appropriate allowancesin their contract price.
• Auditing and Inspection. Within two weeks of a contractormobilising to site we carried out a mini systems audit againsttheir SMP’s. For many contractors this was their first taste ofhaving to implement their SMP’s. Within one month, wecarried out a field audit and followed up with a secondsystems audit. Both these audit tools were designed for projectstart up. As the contract bedded down, Hatch developedanother audit tool that had greater depth of interrogation anddug down to ensure the systems were being correctly appliedand operating in the field.
In addition, Hail Creek, Rio Tinto, NSCA and external auditingbodies carried out regular third party auditing.
• Formal workplace inspections were carried out on a scheduledbasis (at least weekly) in each work area. The inspection teamconsisted of a representative from Hatch, Hail Creek, theContractor Project Manager and the area supervisor. Thisgroup had the power to stop work or change work methodsimmediately in the field, without referring back formanagement approval.
• Inductions. An induction was mandatory for all personnelcoming to site. This gave details of the Project’s expectationsand commitment to safety. The Project Manager and a HailCreek representative opened all site inductions. The SafetyManager delivered job hazard analysis (JHA) training, sohazard assessment and risk reduction skills were covered.Workforce numbers peaked at 900 and in eleven months,almost 2000 people received this induction.
• Support from Hail Creek Coal. This was one of the mostsignificant aspects of the Project’s success. Hail CreekManagement fully supported any initiative that could assist inimproving the safety performance. Program and costconsiderations were always secondary to the primary goal ofproviding a safe work place. Throughout the Project, I cannotrecall any occasion when Hatch has been denied orquestioned on a safety initiative or Hail Creek has failed tosupport a safety issue that we have proposed or needed. Thiskind of Client support and commitment bred the confidencenecessary to demand people to change their attitudes andbehaviours.
Safety Initiatives
A safety management system is ineffective unless it is live anddynamic. This requires leadership and motivation. We found thatas soon as leaders and managers lost focus, the level of incidentswould rise. We kept things alive and vibrant with a series ofSafety initiatives.
• Pre Start huddlesEvery work group attended a daily huddle at the start of theshift to discuss safety initiatives undertaken the previous shift;what made it safe or unsafe and what was going to be differentabout the next shift and how could we improve our collectivesafety performance.
• JHA (Job Hazard Analysis)This was the fundamental tool used by everybody on site toidentify hazards and assess and mitigate risks. A JHA wascompleted for every task and reviewed at the start of each shift.If a new person was introduced to the area or a new hazard, orconditions changed, the JHA had to be reviewed and, if it wasno longer applicable, it was re done.
• RESTART programThis was an initiative Hatch developed after witnessing asimilar program on the Comalco Aluminium Refinery project inGladstone. It was a formal program that empowered anybodyto stop a work group if there was an unsafe act or condition inthe area and go through a process of identification,communication and removal. The work crew then signed offon the revised work procedures and re-commenced work.
• Good Performance Safety AwardsThese were issued to workforce members who implementedbetter ways of doing things or showed good initiative and whodemonstrated a positive attitude to safety. A laminatedcertificate accompanied the award. Even though these were‘small’ gifts, they carried great kudos.
• “Getting the Message Across” ProgramThis was a program designed to ensure that sub contractors
mobilising were brought up to speed in the expectations of theSite as quickly as possible. It was a five-week program thatcommenced before the sub contractor mobilised andcontinued for the first month on site.
• “Refocus” ProgramsFrom time to time during the project, we would find ourattention and concentration wandering. We felt that the safetymanagement was starting to drift. This was often accompaniedwith a rise in incidents. The Refocus Programs were a chanceto regather ourselves and get us back to managing safety in aproactive way.
• “Safety Stars” ProgramA program used towards the end of the project to take the highsafety achievers from each contract group. These were thepeople who had impressed their Managers with their excellentsafety attitudes and who you would want to work with again.We involved them in workshops and challenged them to usetheir skills to explore ways to do “it” better and take the skillslearnt with them to the next job. This program gave positiverecognition amongst their peers, to the people who had showninitiative in safety leadership.
• Safety Behaviour Observations (SBO). The constructionworkforce initially treated this process of assessing workbehaviour with suspicion. They tended to feel threatened bybeing approached by a group of ‘heavies’. Over time, thesereservations disappeared and a “pick me!” attitude emerged.The discussions became very productive and built a goodbridge between workers and management.
• Sundowners with the Supervisors. This was a drink after workwith the contractor supervisors and Hatch Managers, on acompany by company basis. It was an informal discussion toget things out in the open. Once people realised that thesewere meant to be a positive exchange of views, a lot of ideasand concerns were put up for discussion and corrective actionsinitiated, often before they became issues.
• Incident Reporting and Lessons Learnt. There was a culture onsite that allowed people to feel comfortable in reportingincidents. Hatch was able to use the investigations and theresultant actions as proof that the process brought positivechanges back to the work place that improved safety. Thelesson learnt from the investigations were used at toolboxsessions and helped in preventing similar occurrences.
During the course of the project, there were several otherprograms initiated to encourage the contractors attain higherstandards. Some of these were applicable to individualcontractors, others were developed collectively and rolled outsite wide including.
• Hand protection and glove use• Working at heights• Confined space• Housekeeping• Barricading• Vehicle safety• Electrical Safety• Isolations and zero energy testing.
Learning & Competencies
It was recognised that people cannot perform as expectedunless they have acquired the necessary skills and competencies.The level of instruction and learning on the project was very highwith all companies making a positive commitment in this area.
Induction training was given to all employees, covering:
• Generic Induction – Basic safety principles• Hatch Induction – Site Rules, SOP’s and JHA’s• Contractor Induction – Golden Rules and specific company
procedures• Work Area Induction – Job Hazards and Risk analysis.
Training programs, with assessment and verification, wereproduced by Hatch for the Standard Operating Procedures andthe safety programs and safety initiatives. These were madeavailable to the contractors for their use.
In all, a person on site could expect to spend up to ten hoursa week in pre start huddles, formal training and toolbox meetingsand supervisors would spend up to six days leadership andcompetency training before being ready for site. Add to this thetime spent in JHA preparation, SBO’s, inspections, RESTARTprograms and the time would be significantly more. Theintensity of training and daily reinforcement was what kept theworkforce focussed.
The Act also called for workers to be deemed competent tocarry out designated tasks. This took the form of written andpractical tests carried out by authorised Assessors or a RegisteredTraining Authority.
Personal Changes by Individuals & the WorkforceCulture
To mobilise a contractor and get acceptance and compliancewith the site Rules and conditions and fully supporting the SafetyManagement Systems, took contractors, two to four months.Hatch worked closely with the contractors and helped themimplement the systems. Over time, came a realisation that therewas value in what was being asked for and the actions becamemore automatic and self sustaining. It was then that changes inthe safety culture became evident.
As construction contractors mobilised to site at differenttimes, the level of growth and development varied between workareas. It wasn’t until well into the Project that some uniformitywas achieved.
Hatch has witnessed the workforce change in the wayindividuals approach personal health and safety in the workplaceand at home. Comments were made that “I will never again goback to how I worked before Hail Creek”. This attitude isspreading and has been noticed on other projects, where workersfrom Hail Creek have been commended for the initiatives theybrought to that site.
This culture has led to high levels of commitment andmotivation in the workforce. However, the challenge wasconstantly there for managers and supervisors to maintainpositive attitudes. Communication directly between Hatch’s
4
Project Manager, Construction Manager, Area Managers and theworkforce worked hard at this.
Hatch acknowledges the part the contractors played. Thelevel of commitment by the on site Project Managers and theiroff site Management was an important factor in the successfulcoordination of the Site.
Innovations
The strong focus and level of effort expended by all sitepersonnel allowed innovations in safety management to be made.
It was almost a case that managing safety became the “real”job. Building the coal mine was something that just happened asa consequence.
Over the construction period, using the methods andprograms I have described, the Project was able to establish thefollowing.
• Creating a working environment where safety was the majorfocus and driver of the team, rather than the traditionalmeasures of time and cost
• Changing attitudes to working safely from a being a priority,which could change, to being a personal value and a way oflife, that was instinctive
• Striving for consistency of performance across the contractors,by coaching training and attention to detail
• Being proactive and being ahead of the game, planning forwhat’s coming up next and not being reactive
• Bringing the leaders together regularly to address commonissues and arrive at acceptable solutions
• Sharing information on recent incidents, both on and off site,in a way that the information gets to everybody on site andthen tool boxing lessons learnt
• Convincing people by leadership, perseverance, demonstrationand encouragement that the methods are effective and lettingthem witness the results
• Ensuring by assessments and verification that we wereemploying trained and competent companies and people
• Stopping work or suspending operations if necessary to getpeoples’ attention and changing what they were doing
• Recognising and rewarding people who had displayed goodsafety behaviours and doing this regularly.
• Not being afraid of having a “WOW” experience on site thattakes the workforce by surprise but gives an importantmessage.
Several staff members, when they arrived on site, expressedthe view that they didn’t have time to attend another safetymeeting, do another SBO, or go on another inspection. Therewas huge frustration at what they saw as an unrealistic level ofeffort required and for what? People were not going to change!
However, the issue was, that they were the ones who had tochange. Once the individual made this realisation, theyunderstood what was taking place and could move forward. Theyfound that people can change and that continuous reinforcementand application can get you there.
This realisation, that change is achievable, is one that hascome to nearly all involved with the Project. It is something theywill take away with them.
The Results
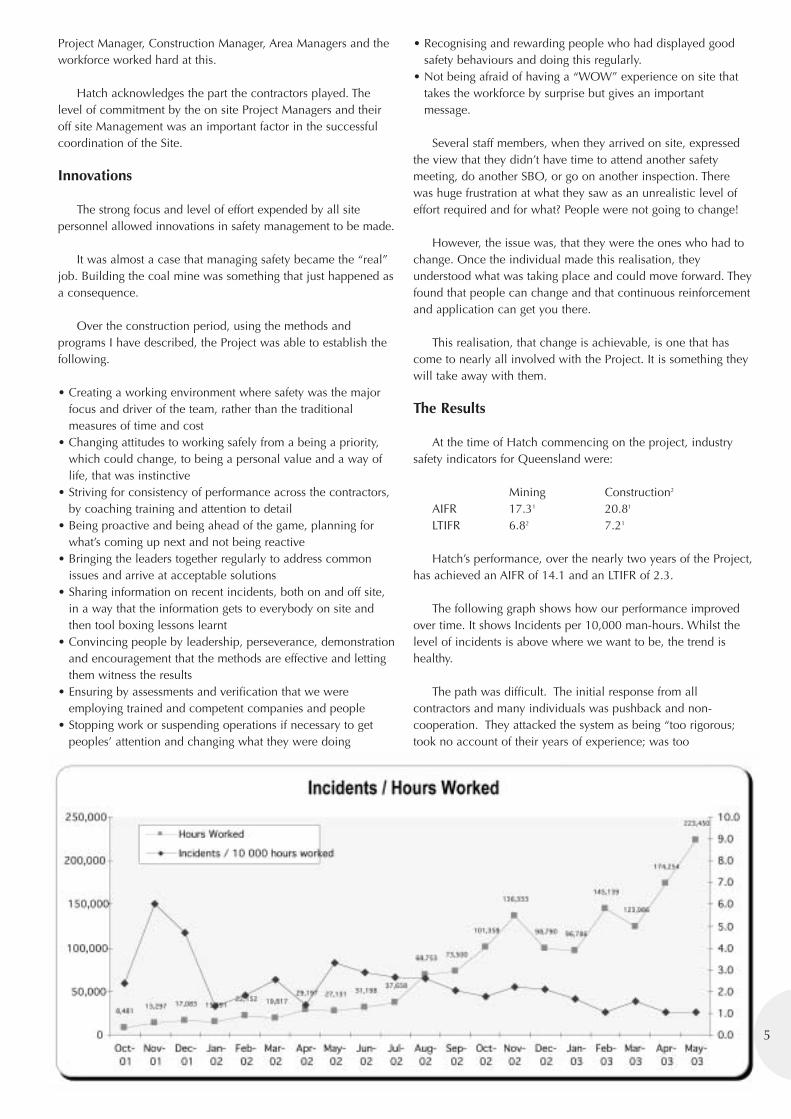
At the time of Hatch commencing on the project, industrysafety indicators for Queensland were:
Mining Construction2
AIFR 17.31 20.81
LTIFR 6.82 7.21
Hatch’s performance, over the nearly two years of the Project,has achieved an AIFR of 14.1 and an LTIFR of 2.3.
The following graph shows how our performance improvedover time. It shows Incidents per 10,000 man-hours. Whilst thelevel of incidents is above where we want to be, the trend ishealthy.
The path was difficult. The initial response from allcontractors and many individuals was pushback and non-cooperation. They attacked the system as being “too rigorous;took no account of their years of experience; was too
5
overpowering; showed little in the way of trust and respect; wasdetrimental to safety; cost too much, took too long” and so on.
However, there are significant benefits the safetymanagement system gave the Project:
• It reduced the level of incidents and injuries• It provided a safe system of work across the contractors and
participating companies• It can deliver a competitive advantage in the market place• It might cost initially but the paybacks more than compensate• If planned properly, it took no longer so the program did not
suffer• The quality was better• There was less re work• There was a generally happier workforce with less hassles• Better employee and industrial relations• Less absenteeism.
In terms of lessons learnt, or what we would do differently,the following points are worth making:
• Strong leadership and support is required from a client• Strong belief and commitment is required from all levels of
management. The message has to be driven from the top down• You cannot put too much effort into selecting your contractors
and, in turn their site Project Managers• A sound well thought out, relevant SMS must be available
early in the Project• Workforce participation and interaction is a powerful tool• Risk workshops give good early notice of hazards and risk that
require managing• Construction is a sceptical industry, but will improve its safety
performance if it can be demonstrated there are benefits• It requires an exceptional effort to get an exceptional result.
The experiences at Hail Creek have initiated major advancesto Hatch and all the participating contractors in making a stepchange in safety management, raising significantly the level ofperformance and the commitment to safety. There has been asignificant shift in culture in a number of areas.
As a proof of the capability of the site’s performance an auditby the NSCA in March 2003 gave the project a 5 Star rating atthe first attempt. The NSCA auditors awarded 5 Star Certificatesto Hatch and all the participating contractors. They commented“we have never seen anything as good as what we ran into upthere”. In late July, the MINEX Awards Evaluation Team visited usand we are hoping we will be successful at the PresentationNight in October.
With those sort of comments and recognition and the supportfrom Hail Creek and the contractors on site, we are encouragedthat Hatch has taken a big step for the industry towards providingan incident and injury free workplace.
References
1 National Workers’ Compensation Statistics database.
2 Queensland Government, Natural Resources and Mines, SafetyPerformance & Health Report 1 July 2000 to 30 June 2001.
6
Where Safety is the Priority& Zero Harm is the goal
Ged Carroll, Ok Tedi Mining Limited
Abstract
Ok Tedi Mining Limited operates the largest open – cutcopper and gold mine in Papua New Guinea with a workforceincluding contractors of about 3500 employees. The mine hasbeen in operation for almost 20 years and is situatedapproximately 15 kilometres from the border of Indonesia.
OTML operates in a developing country environment with amulticultural indigenous workforce, difficult climatic conditions,in excess of 10 metres of rainfall per annum and the main mineworkings located approximately 1700m above sea level, not tomention the numerous logistical challenges presented by ourdistance from major centres.
The risks when people, plant, equipment and environmentare combined increases the potential for incidents to occur.
OTML promotes the slogan that “Safety is Our Priority” and“Zero Harm“ our goal.
To achieve these objectives, we assess the risks andhazards confronting us at the commencement of everyshift.OTML recognises that as an integral part of best businesspractice, all risks must be identified, analysed and managedprofessionally.
In order to achieve this, OTML has developed “in house” ahighly sophisticated, and user friendly Integrated RiskManagement System that is still evolving and which provides theCompany safety efforts with the following attributes andcapabilities:
• A structured risk identification process including contractor’srisk
• An in - depth analysis of those risks utilising a numeric matrixmethodology to avoid subjectivity
• A clearly defined evaluation of the risks• A risk treatment profile with specific options for control or
elimination• An electronic action planning and tracking capacity• A continuous monitoring, control and review system• A risk communication strategy and process to embed the
culture of risk management permanently within the workforce.
This process involves a dedicated team of key personnel fromthe respective OTML business units meeting on a periodic basis
to systematically devise and implement methods to improve ourrisk management performance incorporating the following effortbased actions:
• Initiation of actions to prevent or reduce the adverse effects ofrisk
• Control and further treatment of risks until the level of riskbecomes acceptable
• Identify and record any problems relating to OTML’Smanagement of risk
• Initiate, recommend or provide solutions through designatedchannels
• Action and verify the implementation of solutions• Communicate and consult internally and externally as
appropriate• Documenting actions to provide accountability mechanisms
and similar tools.
The development of the aforementioned systems reflect thefact that OTML considers all team members and operators as our“Frontline Risk Managers” thereby practically embracing theOTML message of Safety being our Priority.
Why Develop the Safety Risk Management Systemto such a High Level
A comprehensive risk management system supports highperformance operations, low risk safe work practices andmaximises stakeholder value by being industry competitive.
Historically the company managed risk within the variousdepartments and this created some variances betweenmethodology and systems used and the resultant data wasfrequently in several shapes and forms. The Integrated RiskManagement system in addition to achieving site wideconsistency assists in achieving OTML’s Charter aspirations ofShared Purpose and Goals and identifies opportunities forcontinuous improvement.
Site wide centralised data handling is streamlined and moreeffective, operating through a central database allowing risksidentified site wide to be flagged for action. Loop closing isenhanced by the in built action planning mechanism thatallows automatic email alerts to be dispatched to the “risk”action owner 7 to 10 days prior to the end of a monthrequesting information on the status of the requiredtreatment/action.
7
Reports can be generated to meet all business needs indescending order from board level down to individuals anddepartmental teams throughout the mine operating units.
In a recent external audit conducted by the NOSAOrganisation the OTML team members were described as being“one of the most risk aware workforces we have encounteredthroughout our global site audits.”
Risk Management Current Status
The Integrated Risk Management System is now beingextended to other operational and business areas includingenvironmental risk.
Consistent with this we:
• Use appropriate risk assessment techniques at all levels of theorganisation and the resulting risk profiles are considered indecision-making
• Seek continuous improvement in managing threats andopportunities including taking business and stakeholderconsiderations into account
• Adopt and apply standards that reflect the company’scommitment to risk management and continually review ourperformance against these standards
• Ensure that risk management systems not only identify, assess,monitor and control threats but also identify furtherdevelopment opportunities
• Ensure that all employees and contractors are informed andunderstand their obligations in respect of the policy, standardsand guidelines
• Foster an ongoing risk knowledge culture by training andactive participation and hold individual employeesaccountable for managing self risks and risks in their area ofresponsibility
• Comply with OTML’s Risk Management Policy to eliminatefatality potential situations and sustain a ”Zero Harm” workenvironment
• Provide a consistent, integrated, multidisciplinary approachand language for the management of risks associated with allhazards at OTML by implementing risk reduction strategies forunacceptable risks, maintaining controls for acceptable risksand further enabling risk-informed decision-making
• Ensure that management and staff know what is required ofthem regarding managing risk thereby enhancing vertical andhorizontal communications
• Provide auditable criteria against which risk managementactivities can be measured.
Currently, OTML’s Safety Risk Management System is themain proactive component of the Risk Management Programwhere individual and generic risks are identified, analysed,evaluated, communicated and treated to enable continuousimprovement.
The system ensures that all hazards (threats) found to beunacceptable are urgently treated until the residual risk levelbecomes acceptable by means of Action Plans and the highestpriority risks being treated first. Any risk scenario, which has thepotential to adversely affect the safety or health of people or tocause damage to property or environment, is stored in thesystem.
Procedures are established and maintained for all personnelto identify and report hazards, incidents or any situationdetrimental to safety or environment. Once risks scenarios havebeen identified, they are assessed with regard to the likelihoodand magnitude of the potential consequences.
High and significant risks are evaluated and appropriatelyaddressed, including actions, systems and arrangements foreffectively managing these risks. Regular reviews of the status ofregistered risks and the effectiveness of control measures areconducted.
Control measures are prioritised and actions selected andapplied in accordance with the risk management Hierarchy ofControls (i.e. eliminate, reduce, isolate, protect, etc.)so as toensure that final risk levels are as low as is reasonablypracticable. Appropriate levels of residual risk transfer are inplace and monitored regularly for adequacy and coverage.
The natural Risk Owner or Risk Manager is identified andapproached to accept this role for each Risk Treatment ActionPlan. Risk allocations are based on the party’s ability to controlthe risk and included into contract documents in the case ofexternal parties. A Risk Manager/Owner is tasked with ensuringthat such Risk Treatment Action Plans are implemented.
Some responsibilities are given to individual workgroups whoare guided and encouraged to embrace a “Hierarchy of Controls”approach to manage and/or mitigate the identified residual riskinherent within their daily work duties.
The Risk Management Officer reports the progress of the risktreatment actions and any risk rating changes to all relevantpersonnel.
Risk Management System Elements
The OTML Risk Management System contains: policy andcommitment; planning; implementation and operations; checkingand corrective action; and management review elements.
• Policy and Commitment is aligned to the OTML CompanyCharter, OTML Risk Management Policy and Guidelines
• Planning activities involve the following process elements:context setting, risk identification, risk assessment and risktreatment planning
• Implementation and Operations, and Communication andReporting element involves risk treatment planimplementation, monitoring and communication with allinformation generated capture on the Risk Register
• Checking and Corrective Action involves Outputs Measuresand Performance Targets Indicator (KPI’s) reporting and auditingfeedback
• Management Review involves an annual management reviewand the development of a risk management systemimprovement plan.
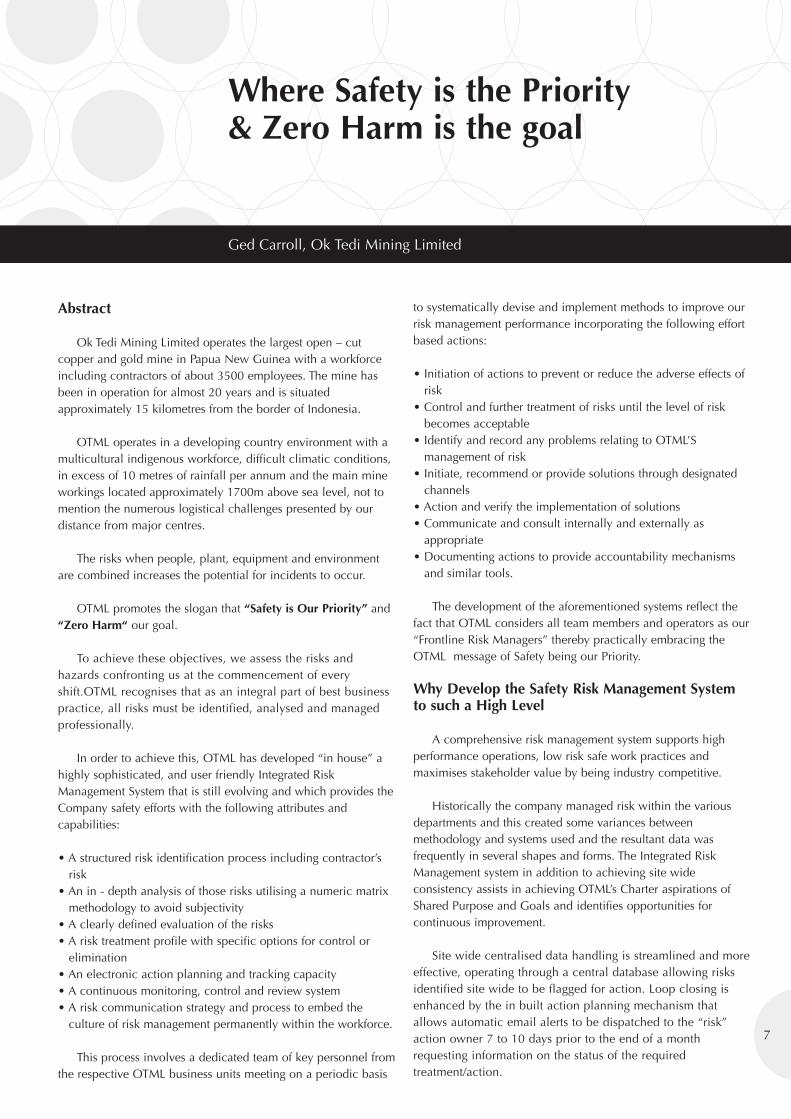
Refer to Figure 1 to illustrate the elements involved in thecontinuous improvement loop.
8
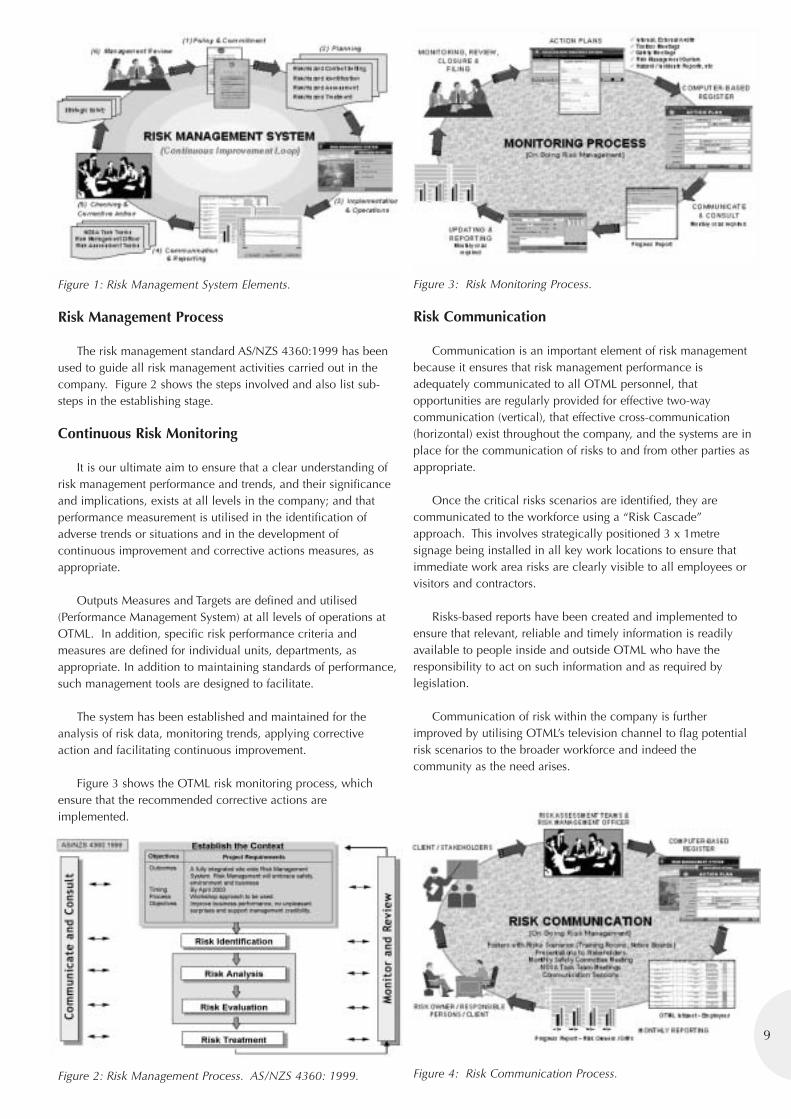
Figure 1: Risk Management System Elements.
Risk Management Process
The risk management standard AS/NZS 4360:1999 has beenused to guide all risk management activities carried out in thecompany. Figure 2 shows the steps involved and also list sub-steps in the establishing stage.
Continuous Risk Monitoring
It is our ultimate aim to ensure that a clear understanding ofrisk management performance and trends, and their significanceand implications, exists at all levels in the company; and thatperformance measurement is utilised in the identification ofadverse trends or situations and in the development ofcontinuous improvement and corrective actions measures, asappropriate.
Outputs Measures and Targets are defined and utilised(Performance Management System) at all levels of operations atOTML. In addition, specific risk performance criteria andmeasures are defined for individual units, departments, asappropriate. In addition to maintaining standards of performance,such management tools are designed to facilitate.
The system has been established and maintained for theanalysis of risk data, monitoring trends, applying correctiveaction and facilitating continuous improvement.
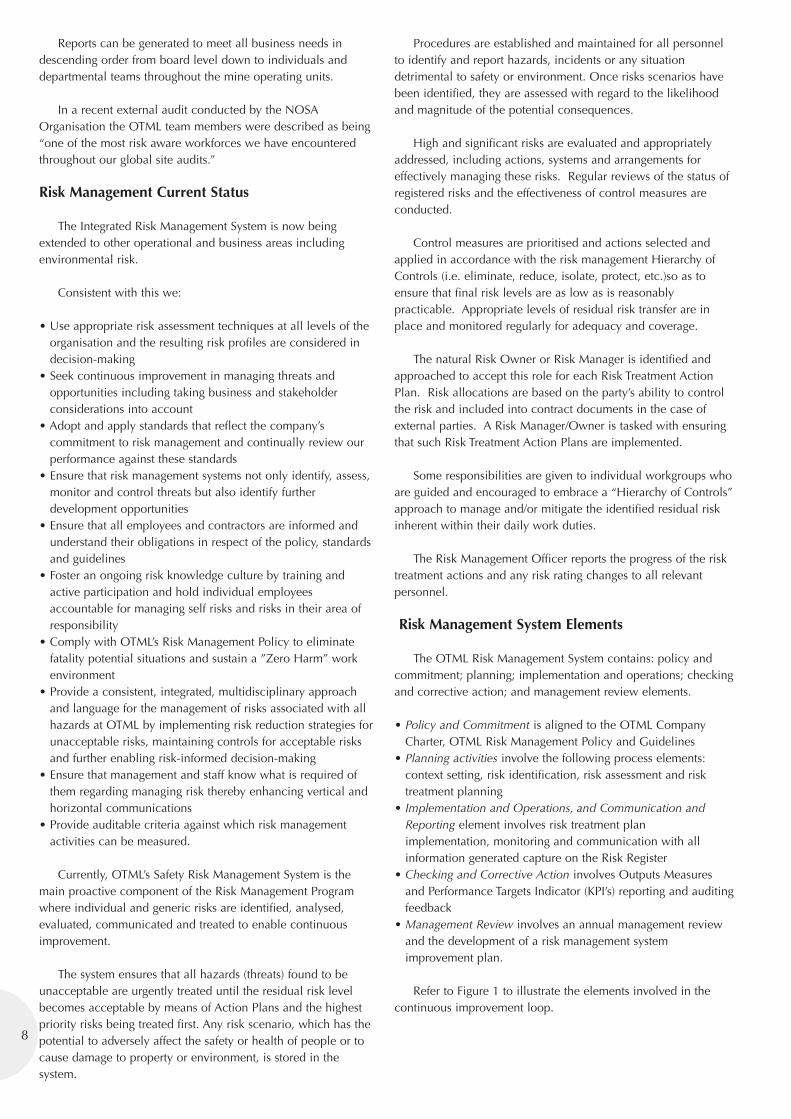
Figure 3 shows the OTML risk monitoring process, whichensure that the recommended corrective actions areimplemented.
Figure 2: Risk Management Process. AS/NZS 4360: 1999.
Figure 3: Risk Monitoring Process.
Risk Communication
Communication is an important element of risk managementbecause it ensures that risk management performance isadequately communicated to all OTML personnel, thatopportunities are regularly provided for effective two-waycommunication (vertical), that effective cross-communication(horizontal) exist throughout the company, and the systems are inplace for the communication of risks to and from other parties asappropriate.
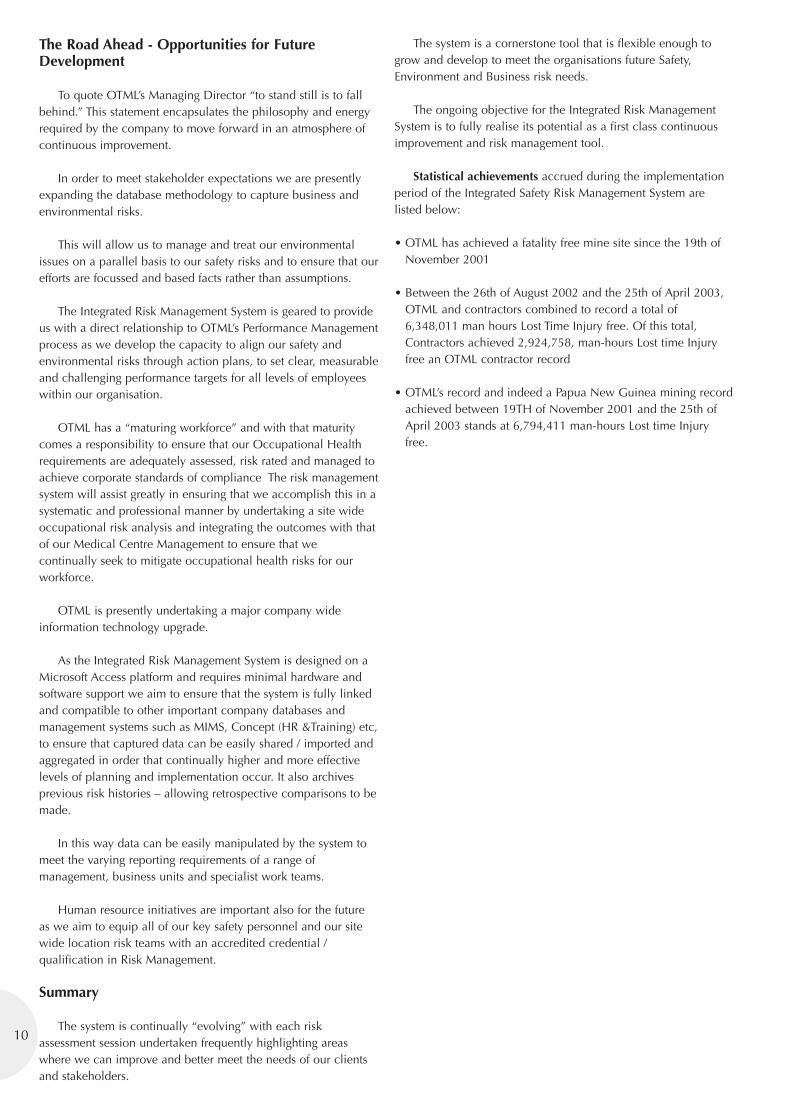
Once the critical risks scenarios are identified, they arecommunicated to the workforce using a “Risk Cascade”approach. This involves strategically positioned 3 x 1metresignage being installed in all key work locations to ensure thatimmediate work area risks are clearly visible to all employees orvisitors and contractors.
Risks-based reports have been created and implemented toensure that relevant, reliable and timely information is readilyavailable to people inside and outside OTML who have theresponsibility to act on such information and as required bylegislation.
Communication of risk within the company is furtherimproved by utilising OTML’s television channel to flag potentialrisk scenarios to the broader workforce and indeed thecommunity as the need arises.
Figure 4: Risk Communication Process.
9
The Road Ahead - Opportunities for FutureDevelopment
To quote OTML’s Managing Director “to stand still is to fallbehind.” This statement encapsulates the philosophy and energyrequired by the company to move forward in an atmosphere ofcontinuous improvement.
In order to meet stakeholder expectations we are presentlyexpanding the database methodology to capture business andenvironmental risks.
This will allow us to manage and treat our environmentalissues on a parallel basis to our safety risks and to ensure that ourefforts are focussed and based facts rather than assumptions.
The Integrated Risk Management System is geared to provideus with a direct relationship to OTML’s Performance Managementprocess as we develop the capacity to align our safety andenvironmental risks through action plans, to set clear, measurableand challenging performance targets for all levels of employeeswithin our organisation.
OTML has a “maturing workforce” and with that maturitycomes a responsibility to ensure that our Occupational Healthrequirements are adequately assessed, risk rated and managed toachieve corporate standards of compliance The risk managementsystem will assist greatly in ensuring that we accomplish this in asystematic and professional manner by undertaking a site wideoccupational risk analysis and integrating the outcomes with thatof our Medical Centre Management to ensure that wecontinually seek to mitigate occupational health risks for ourworkforce.
OTML is presently undertaking a major company wideinformation technology upgrade.
As the Integrated Risk Management System is designed on aMicrosoft Access platform and requires minimal hardware andsoftware support we aim to ensure that the system is fully linkedand compatible to other important company databases andmanagement systems such as MIMS, Concept (HR &Training) etc,to ensure that captured data can be easily shared / imported andaggregated in order that continually higher and more effectivelevels of planning and implementation occur. It also archivesprevious risk histories – allowing retrospective comparisons to bemade.
In this way data can be easily manipulated by the system tomeet the varying reporting requirements of a range ofmanagement, business units and specialist work teams.
Human resource initiatives are important also for the futureas we aim to equip all of our key safety personnel and our sitewide location risk teams with an accredited credential /qualification in Risk Management.
Summary
The system is continually “evolving” with each riskassessment session undertaken frequently highlighting areaswhere we can improve and better meet the needs of our clientsand stakeholders.
The system is a cornerstone tool that is flexible enough togrow and develop to meet the organisations future Safety,Environment and Business risk needs.
The ongoing objective for the Integrated Risk ManagementSystem is to fully realise its potential as a first class continuousimprovement and risk management tool.
Statistical achievements accrued during the implementationperiod of the Integrated Safety Risk Management System arelisted below:
• OTML has achieved a fatality free mine site since the 19th ofNovember 2001
• Between the 26th of August 2002 and the 25th of April 2003,OTML and contractors combined to record a total of6,348,011 man hours Lost Time Injury free. Of this total,Contractors achieved 2,924,758, man-hours Lost time Injuryfree an OTML contractor record
• OTML’s record and indeed a Papua New Guinea mining recordachieved between 19TH of November 2001 and the 25th ofApril 2003 stands at 6,794,411 man-hours Lost time Injuryfree.
10
The “Study on WorkplaceEnvironment & Health”: An Efficient & Productive Collaboration in OccupationalHealth & Safety between Industry (WMC Fertilizers) &University (James Cook University)Reinhold Muller1, Tony Carter1, Michael Ridd2 ,Tom Magee3, Matthew Wicking3
1School of Public Health and Tropical Medicine (SPHTM), 2School of Pharmacy and Molecular Sciences, James CookUniversity (JCU), 3WMC Fertilizers Pty Ltd (WMC)
Abstract
In 2001, WMC Fertilizers Pty Ltd at Phosphate Hillcommissioned the School of Public Health and TropicalMedicine (SPHTM) at James Cook University (JCU) in Townsvilleto develop, conduct and evaluate epidemiological researchstudies into the workplace environment and health as part oftheir pro-active approach to occupational health and safety. Overthe last two years, this scientific project has been established asan efficient and productive collaboration.
The first part of this presentation discusses the key-featuresessential for the success and bilateral benefit of an occupationalhealth research project in the specific collaborative settingbetween industry and university:
• Independence of Research • Involvement of the Workforce• Evidence-based Epidemiological Research• The Objectives are Tangible Results Achieved in a Practically
Relevant Time-Frame• Cost-Effectiveness.
In the context of the “Study on Workplace Environment andHealth”, a range of practice-oriented research studies inoccupational health and safety have been undertaken. The maingoal of the research project was to achieve tangible results withina practically effective time frame. This goal has been fullyaccomplished and a variety of practical solutions and resultingimprovements at WMC Fertilizers at Phosphate Hill wereachieved.
Some components and results of specific studies will bediscussed to examplify the practical research approach. Theseproject cover the general areas of
• Chemical environmental sampling and mapping, • Biological monitoring (annual health checks) and • Dehydration and fatigue management.
Introduction
In 2001, WMC Fertilizers at Phosphate Hill commissionedthe School of Public Health and Tropical Medicine at JamesCook University (Townsville) to develop, conduct and evaluateepidemiological research studies into the workplace environmentand health of the workforce at their Phosphate Hill operation.
Identified potential health issues before the start of the projectmainly related to chemicals in the workplace environment wherehydrogen fluoride, and sulphuric and phosphoric acids werestated as potentially hazardous chemicals at the Phosphate Hillsite.
The WMC Fertilizers plant at Phosphate Hill is located 150km south-west of Mount Isa. The plant is a fly-in/fly-out operationand employees predominantly work a “2 on / 1 off ratio”schedule of 12 hour shifts. The climatic conditions at PhosphateHill are harsh, with hot to very hot temperatures and an oftenextremely low humidity.
Considering the specific characteristics of the Phosphate Hillworkplace, JCU identified the following main research areas:
• Identification and quantification of occupational chemicalexposure
• Development and implementation of a chemical monitoringprogram
• Research into the potential (long-term) health effects of theidentified chemicals
• Development and implementation of a biological monitoringprogram
• Research into dehydration and fatigue management.
The key features necessary for this research collaborationbetween a university and the mining industry to be successful arediscussed, together with some the results of specific projects thatexemplify the bilaterally beneficial nature of the research projectin obtaining evidence-based knowledge and tangiblescientifically valid results during practically relevant time frames.
Examples of projects discussed cover the general areas of (1)chemical environmental sampling and mapping, (2) biologicalmonitoring (annual Health checks) and (3) dehydration andfatigue management.
Key Features of the Research Project
The following key-features are deemed essential for thesuccess and bilateral benefit of an occupational health researchproject in the specific collaborative setting between industry anduniversity:
(1) Independence of ResearchStudies carried out by university researchers are independent and
11
consequently enjoy a higher credibility compared to consultingwork carried out by agencies; this is also true with respect to theperceptions of the workforce. All content aspects of the “Studyon Workplace Environment and Health” were developed byresearchers at JCU. The role of WMC Fertilizers was restricted tologistical issues during the planning and conduct phase of theprojects in contrast to many consultancy contracts where theemployer often determines to a high degree the type, conductand scope of the project. It should also be emphasised that fullconfidentiality of the information provided by individual workersis guaranteed as WMC Fertilizers only has access to summary (aspresented in the respective reports), not individual data.
(2) Involvement of the WorkforceThe importance of workforce involvement as a vital componentof any epidemiological study cannot be overestimated. Above all,in this area of workplace health and safety, the employees cancontribute indispensable information (it’s their workplace afterall!) and the quality of quantitatively collected general healthinformation is directly related to the support of the workforce.The involvement of the workforce covers two main areas; activeparticipation and regular feedback. The presented studyincorporated from the outset a variety of different measures forensuring involvement in both areas.
Active participation: Annual qualitative focus group research iscarried out in many segments of the workforce (usually 6different groups) for the employees to have their say. Here theparticipants discuss with JCU researchers their perceptions ofworkplace and safety issues (including suggestions forimprovement) and the performance of the management and thesafety department in their working area. Additional questionsalso refer to their view of recent projects.
Feedback: Regular feedback to the workforce is achieved bypublishing each JCU report uncensored and in full length on theWMC Fertilizers intranet (this accessibility to the full informationgained is also a hallmark of independent research!). For specificaspects of the study, special “information flyers” summarising thefindings in plain language are also provided. Moreover, JCUfeatures prominently during a “safety day out” at least once peryear providing presentations followed by discussions on everyindividual project carried out on site. Additionally, the workforceand their families are kept up-to-date by regular contributions tothe “Fertilizer Facts”, the monthly site magazine.
(3) Evidence-based Epidemiological ResearchThe independence of the research also guarantees that JCUresearchers can follow stringent scientific methodology, with theconsequence that the results of the studies and the developedpolicies and procedures are strictly evidence-based and thereforevalid. It is important that the beneficiaries of any type of studyand research in the area of occupational health and safety arepeople, in this case, the employees. JCU has thereforeimplemented as much epidemiological studies (i.e. studiesreferring to actual people) as is possible.
(4) The Objectives are Tangible Results Achieved in a PracticallyRelevant Time-Frame
In contrast to some pure academic research, it is imperative thatthe main focus of an industry-university collaboration is onachieving practical solutions. JCU adopted this principle and thecomponents of this study discussed below will exemplify the
achievements in this area in more detail. In general it can bestated that the study has been running for two years and had to“start from scratch” in terms of epidemiological data.Considering this, the practical outcomes, also for previouslyunknown issues, seem impressive.
(5) Cost-EffectivenessUniversity research not only offers the previously discussedadvantages of independent and credible scientific research, but isalso highly cost-effective. The “Study on Workplace Environmentand Health” enrolled several doctorate students from the Schoolof Public Health, while a smaller research study into thehydration knowledge and behaviour of the workforce wasconducted with the help of undergraduate students as part of oneof their research methodology subjects.
The involvement of doctorate, graduate and undergraduatestudents, if carried out under strict supervision of a seniorexperienced person, is not only cost-effective but in thisparticular case also beneficial to all parties involved (the industrypartner, the university and the students) in the following way: Thestudents learn practical skills through their early exposure to“real-life” epidemiological research and are led to the field ofoccupational health and safety in the mining industry, anidentified area of personnel shortage where employmentopportunities for future graduates seem quite promising.
The “Study on Workplace Environment & Health”Examples of Components & Results
Having considered the key features of the “Study onWorkplace Environmental and Health”, some examples ofcomponents and results achieved in different areas ofoccupational Health and safety by the project are presented inthe following.
In the order of their discussion, these components exemplifypractical research studies and their results in the areas of:
(1) Chemical environmental sampling and mapping(2) Biological monitoring (annual Health check-ups) and (3) Fatigue and dehydration management.
(1) Environmental Chemical Sampling & Mapping
Environmental chemical sampling of the atmosphere wasundertaken as part of the JCU study. The air was sampled for arange of chemicals of potential concern. Sampling has so farbeen conducted in two phases: (1) predominantly “uniformsampling” in 2001 and (2) primarily “targeted sampling” in 2002.
The objective of the first sampling operations was to providea 'snapshot' of what might typically be observed in theatmosphere at the WMC Fertilizer site under routine operatingconditions. During this first sampling phase the majority of thesampling points were equally spread in a regular grid over thewhole site, while only the smaller part of the sampling pointswas concentrated in finer grids around the suspected sources.
The second phase of sampling was deliberately and highly“biased” towards detailed sampling at and around the identifiedsources of the first survey but nevertheless kept a wider grid overmost of the rest of the site to confirm (or otherwise) the general
12
13
pattern of distribution of the chemicals observed at the siteduring the initial sampling program.
The main chemicals sampled and measured were:
• Hydrogen Fluoride (HF)• Sulphuric Acid (H2SO4) and • Phosphoric Acid (H3PO4).
The sampling methodology was designed to ensure that thedetection limits for these chemicals were at least a factor of 10,and for HF close to a factor of 100 below the NationalOccupational Health and Safety Commission (NOHSC) TimeWeighted Average (TWA) values.
Detection limits and NOHSC TWA for the main analyteswere 0.03 (mg/m3) and 2.6 (mg/m3) for HF, 0.1 (mg/m3) and 1.0(mg/m3) for H2SO4 and 0.03 (mg/m3) and 1.0 (mg/m3) for H3PO4
respectively.
Approximately 200 samples (6 hour time weighted average)were obtained for the main analytes during the two samplingprograms. The initial sampling phase demonstrated thatdetectable HF concentrations were localised in and around thePhosphoric Acid plant and on the Gypsum Stack. These locationswere consequently the main focus for the second samplingoperation and detailed concentration maps were obtained forthese areas, such as the filter floor of the phosphoric acid plantwhere a grid of 25 measurements was taken.
The main results for the Phosphate Hill site referring toaround 200 (6 hour averaged) samples (taken as abovedescribed) can be summarised as follows:
(1) Only one single sample of phosphoric acid exceeded thedetection limit of 0.03 mg/m3 with a result of less than 6%of the NOHSC TWA.
(2) Twenty-three samples of sulphuric acid mist exceeded thedetection limit of 0.1 mg/m3 during the first sampling phaseand only one single sample during the second samplingprogram despite the above described deliberately biasedsampling procedure. All quantities above detection limit werebelow 15% of the NOHSC TWA with the exception of foursamples collected at the filter floor of the phosphoric acidplant where levels up to 75% of the NOHSC TWA were seen.The sole sample above detection limit of the second samplingphase reached approximately 10% of the NOHSC TWA.
(3) Hydrogen fluoride was detected in 40% and 60% of samplesduring the first and second round of the sampling programrespectively. The typical concentrations of detectablehydrogen fluoride around the site were below 4% of theNOHSC TWA with two marked exceptions; the phosphoricacid plant and its immediate surrounds and the gypsum stackwhere three samples (2.6, 2.7 and 2.8 mg/m3) revealedconcentrations at or above the NOHSC TWA of 2.6 mg/m3.
The interpretation of the results from the two samplingprograms can be summarised by stating that, under routineoperating conditions, the sampled chemicals do not appear toimply a significant risk to human health at the Phosphate Hillsite. It seems worth noting in this context that the only three
samples revealing values at or above NOHSC TWA wereobtained at locations where the use of PPE is compulsory.
The general agreement of the results for all analytes betweenthe two sampling operations indicates that the two surveysprovide a valid overview of the spatial distribution of thesampled chemicals around the Phosphate Hill site. The onlyobserved differences between the sampling operations disappearwhen the relative frequency of the samples at the respective sitesis taken into account. For instance, the observed increase ofdetectable amounts of hydrogen fluoride between the twosampling programs is explained by taking the deliberately biasedsampling strategy for the second sampling phase into account.
The only exception is the filter floor of the phosphoric acidplant where the observed decrease in detectable amounts ofsulphuric acid between the two sampling programs is attributableto engineering solutions. The significant decrease in samplescontaining a detectable amount of sulphuric acid mist (despitethe increased sampling frequency around the phosphoric acidplant) therefore demonstrates the effectivity of the implementedstructural solution.
(2) Biological Monitoring
As part of the biological monitoring process of the JCU studyat Phosphate Hill, a quantitative Health Survey has beenconducted annually since 2001. All employees of WMCFertilizers, as well as all contractors at Phosphate Hill, are invitedto participate.
The main aims of this annual Health Survey are to:
1) Determine the general health status of the workforce2) Create a baseline of the general health status as reference
data for future monitoring and/or surveillance projects andfor quasi-experimental intervention studies
3) Identify attributable fractions of relevant risk factors(occupational history, diet, smoking, alcohol etc)
4) Identify specific priorities for intervention strategies; and5) Contribute generally to a safer working environment.
The main components of the Health Survey comprise:
a) A full blood count, a liver function test and an ACR urine testb) A full respirometry (including changes after the use of
dilators) c) A basic physical examination (including visual acuity, joint
laxity, blood pressure); andd) A detailed health questionnaire covering basic
demographics, medical and occupational history,individual risk conditions and behaviour, currentmedications, smoking, alcohol consumption and detailedsymptoms pertinent to potential exposure to hydrogenfluorides and other relevant chemicals.
Personal confidential letters are delivered to each participantdetailing their results of the Health Survey.
The Health surveys are well received by the workforce and thisis reflected in a high participation rate (around half to two thirds)of the overall workforce. Taking into account that a substantialpercentage of this “overall workforce” are contractors who are not
necessarily on-site on a regular or permanent basis, the overallparticipation rates may even exceed the above estimates.
The main aim of this series of health surveys is the biologicallong-term monitoring of the workforce and to obtain baselineinformation for future quasi-experimental intervention studies.Therefore, the general results do generally not lend themselves tostand-alone interpretation. However, some findings can bedirectly used to develop specific recommendations towardshealth improvements of the workforce and are discussed in thefollowing.
More than one-quarter of all staff (compared to less than20.0% of the Australian population1) have a Body Mass Index(BMI) that is in a high-risk category for hypertension,cardiovascular disease and diabetes. Every third participant has ahigh-risk waist-to-hip ratio and close to half of the participatingworkforce is hypertensive, which both impose a substantialhealth risk with respect to a variety of cardiovascular diseasesand seem worth addressing. Similar statements hold true for theobserved high prevalence of (and likely synergisms with)smoking (35% compared to 24% for the Australian population)and significant levels of alcohol intake.
Consequently, the roles of Eurest in providing nutritionalinformation and low-fat food options and Trench Sportz infacilitating physical activity on-site seem justified. In this context,it seems worth noting that employees are significantly morelikely to engage in physical activity on-site (median 5 days) thanoff-site (median 3 days).
The main focus of the overall study, however, is onworkplace environment and occupational health and thereforespecific intervention programs to change the general life-styleseem beyond the scope of this project.
Almost every fifth participant of the first survey would havefailed the Queensland Transport heavy vehicle visual acuity test.This is disquieting, despite the fact that the visual acuity test(using only an eye-chart) cannot be regarded as a final diagnosis,and may actually overestimate the proportion of subjects withcompromised visual acuity.
A potentially compromised visual acuity was of coursementioned in the confidential personal letters and the apparentlyhigh percentage of such findings intensively discussed in therespective health reports and JCU presentations on site. Therespective percentage observed during the second health surveywas 5% with a coinciding increase in the use of a correctivelens. However, whether this improvement was attributable to thedescribed “interventions” remains unclear since the illuminationof the eye chart seems to have been unfavourable during the firsthealth survey.
An interesting finding with respect to respiratory parameterswas the observation that some employees had been previouslydiagnosed with and were currently suffering from asthma. Thisconstitutes a major workplace health risk as it is known thatexposure to inorganic gas mist and dust – above all incombination with physical activity – vastly increases the risk forasthma attacks and potentially serious consequences2. The resultalso indicated that the screening for asthma performed duringroutine entry examinations prior to employment was sub-optimal.
As a consequence, a detailed proposal for a more effectivepre-employment medical has been developed by the JCU teamand the logistics for the amalgamation of this proposal with newcorporate guidelines are currently under development.
Additionally, those employees identified with a history ofasthma or breathing obstruction were encouraged to develop anasthma management plan with their General Practitioner tocontrol and reduce the severity of their symptoms3.
While participants in this study have only marginally lessusual hours of sleep per night on- than off-site (median of 7compared to 8 hours), more than twice as many have less than 4hours sleep on at least one night on-site (45%) than off-site(18.0%). Sleepiness, in combination with low blood alcoholconcentrations and dehydration may influence injury risk andproductivity and currently implementations of random tests (suchas simple reaction time, dual task Mackworth clock vigilanceand symbol digit coding) are considered as assessments4 offatigue.
The biochemical blood analyses, self-reported symptomsand the observed colour of the collected urine samplesindicated considerable levels of dehydration in the workforcewhich led to the dehydration studies which are discussed in thefollowing.
(3) Dehydration Study
The series of dehydration studies illustrate the dynamics ofthe research process. Dehydration was identified as an importantissue during the standard components of the project and led to avariety of interesting specific research projects.
The first observation leading to this process was thatapproximately 16.0% of the workforce exhibited elevated serumalbumin levels and 10.0% of the workforce had elevated serumalbumin and potassium levels in combination. Both arebiochemical markers for dehydration5. Additionally it wasobserved that the most frequent self-reported symptoms in thehealth surveys were all discussed in the literature as closelyassociated with dehydration6; over 40% reported tired or strainedeyes, and close to 40% stated unusual fatigue and headachesduring the last 4 weeks while working on-site. A furtherindication for dehydration as a workplace issue came from thequalitative focus groups where people again complained aboutsymptoms consistent with dehydration.
Consequently, a study of the hydration status and hydrationneeds of the workforce was conducted and is reported in detailin an additional contribution to these proceedings. The main aimwas to determine the hydration status and hydration needs bymeasuring urine specific gravity (portable refractometer), fluidintake (questionnaire) and fluid loss (difference in weight andspecific questionnaire items).
This study found that two thirds of the workforce maintain orimprove their hydration status during their shift but those workingpredominantly in direct sunlight need to improve their hydrationbehaviour. Data collected for this study also allowed thedevelopment of detailed weight and task specific fluid inputtargets. The most surprising result, however, was that a majorityof the workforce arrived dehydrated for their shifts.
14
15
The prime target for improving the hydration status of theworkforce consequently shifted from the workplace to the camp,and an additional study was carried out on the hydrationknowledge of the workforce and their hydration behaviour atcamp. Third-year Occupational Therapy students were involvedin this project (as part of their research studies) and developed,piloted, adjusted and then administered a questionnaire to theworkforce in April/May this year.
At the time of writing, some data were still being analysed indetail. However, the main results clearly demonstrate that whilethe general hydration knowledge (risk factors for dehydration,what type of drinks are actually dehydrating etc.) of theworkforce is adequate, people simply don’t seem to drinkenough non-alcoholic beverages at camp. The stated averages ofone “cup”-equivalent of soft drink and 2 “cups” of water are byfar not sufficient to keep a person adequately hydrated.
Why is there a discrepancy between knowledge andbehaviour? One answer was found in the perceived obstacles tore-hydration in the questionnaires: Half of the comments statedreferred to the perceived poor taste of the tap water at camp anda similar proportion of comments relate to access to alternativesto tap water such as bottled water.
A number of possible practical solutions on how to mosteffectively address this critical issue are currently beinginvestigated. These include possible “engineering” solutions (suchas implementing additional water filters, increasing the numberof water fountains at camp, etc.) but will also have to bridge thegap between hydration knowledge and the respective behaviourby means of information campaigns and other educationalinterventions.
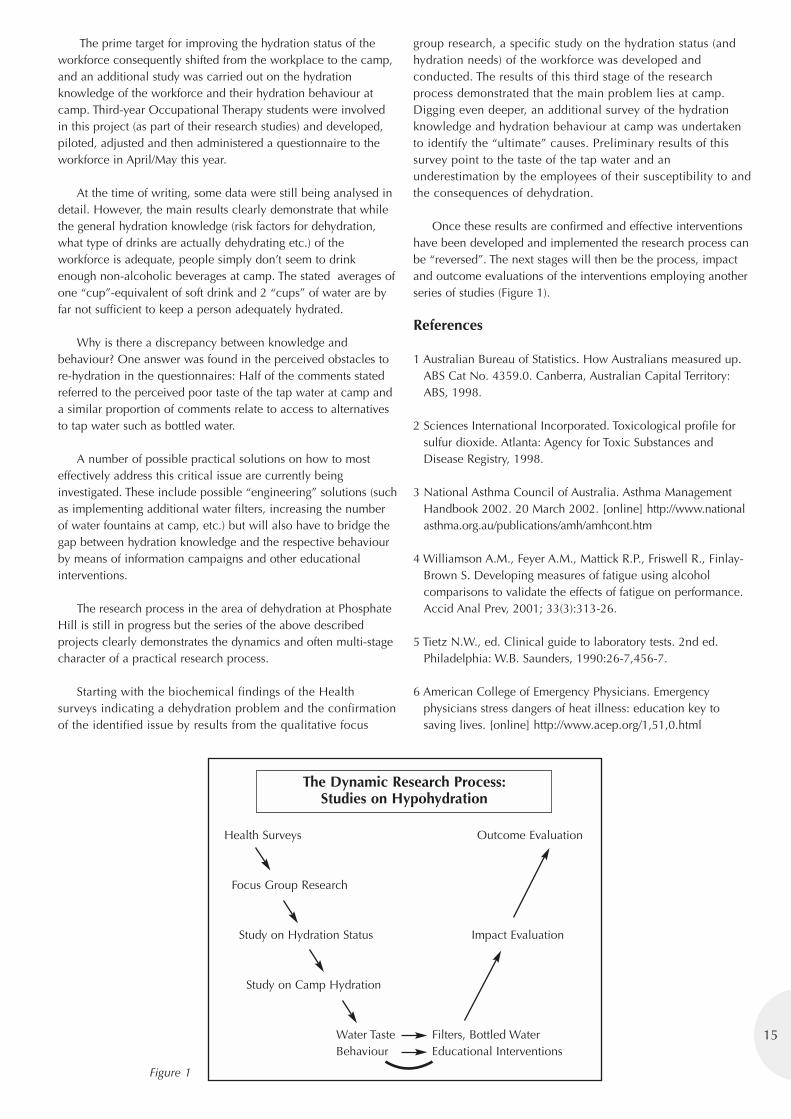
The research process in the area of dehydration at PhosphateHill is still in progress but the series of the above describedprojects clearly demonstrates the dynamics and often multi-stagecharacter of a practical research process.
Starting with the biochemical findings of the Healthsurveys indicating a dehydration problem and the confirmationof the identified issue by results from the qualitative focus
group research, a specific study on the hydration status (andhydration needs) of the workforce was developed andconducted. The results of this third stage of the researchprocess demonstrated that the main problem lies at camp.Digging even deeper, an additional survey of the hydrationknowledge and hydration behaviour at camp was undertakento identify the “ultimate” causes. Preliminary results of thissurvey point to the taste of the tap water and anunderestimation by the employees of their susceptibility to andthe consequences of dehydration.
Once these results are confirmed and effective interventionshave been developed and implemented the research process canbe “reversed”. The next stages will then be the process, impactand outcome evaluations of the interventions employing anotherseries of studies (Figure 1).
References
1 Australian Bureau of Statistics. How Australians measured up.ABS Cat No. 4359.0. Canberra, Australian Capital Territory:ABS, 1998.
2 Sciences International Incorporated. Toxicological profile forsulfur dioxide. Atlanta: Agency for Toxic Substances andDisease Registry, 1998.
3 National Asthma Council of Australia. Asthma ManagementHandbook 2002. 20 March 2002. [online] http://www.nationalasthma.org.au/publications/amh/amhcont.htm
4 Williamson A.M., Feyer A.M., Mattick R.P., Friswell R., Finlay-Brown S. Developing measures of fatigue using alcoholcomparisons to validate the effects of fatigue on performance.Accid Anal Prev, 2001; 33(3):313-26.
5 Tietz N.W., ed. Clinical guide to laboratory tests. 2nd ed.Philadelphia: W.B. Saunders, 1990:26-7,456-7.
6 American College of Emergency Physicians. Emergencyphysicians stress dangers of heat illness: education key tosaving lives. [online] http://www.acep.org/1,51,0.html
Figure 1
Health Surveys
Focus Group Research
Study on Hydration Status
Study on Camp Hydration
The Dynamic Research Process:Studies on Hypohydration
Outcome Evaluation
Impact Evaluation
Water Taste Filters, Bottled WaterBehaviour Educational Interventions
An AcciMap of the EssoAustralia Gas Plant Explosion
Andrew Hopkins, Australian National University
Abstract
This paper presents an AcciMap (causal diagram) of anaccident at Esso’s gas plant at Longford in Victoria. TheAcciMap is used to show how factors quite remote from theimmediate accident sequence contributed to the accident.Parties at the Royal Commission which investigated theaccident were quite selective in the causes they emphasised.The paper identifies three principles of selection which wereused: self-interest, accident prevention and legal liability. Theinterested reader will find full details of this accident in mybook (Hopkins, 2000).
On 25 September, 1998, an explosion occurred at an Essogas plant at Longford, near Melbourne, which killed two menand interrupted the gas supply to the state of Victoria for twoweeks. Because of the economic cost of this disruption the stategovernment set up a Royal Commission - the most powerfulinquiry possible. The inquiry uncovered an intricate causalnetwork, ranging from front line operator error right back tocompany and even government policy. This paper will outlinethe causal network by providing an AcciMap of the incident(Rasmussen, 1997). A number of features of the map will beexplained in the next sections. The paper will then examine thestrategies of causal explanation used by the parties represented atthe inquiry.
The Accident Sequence
Level 1, the bottom level of the diagram, lays out the events- physical processes and operator actions - which constitute theaccident sequence. The two irregular stars represent the criticaloutcomes – explosion and loss of gas supply. The circlesrepresent the operator errors which contributed to the accident.The sequence starts with the incorrect operation of a bypassvalve which allowed condensate to spill over into other parts ofthe system eventually causing the failure of the warm oil pumps.This led to a metal heat exchanger becoming super cold andtherefore brittle. Operators then made the error of restarting thewarm oil flow which caused the heat exchanger to fracture,allowing a large volume of gas to escape and ignite. Two menwere killed and eight others injured. Two other gas processingplants on the same site were not effectively isolated from gasplant 1 where the accident occurred, with the result that gassupply from all three plants at the site ceased. And becausethere was no alternative supply, Victoria was in chaos for twoweeks.
Increasing Causal Remoteness
The vertical axis involves a series of levels, increasinglyremote from the accident sequence just described. There is acertain amount of arbitrariness in the division into five discretelevels, but the basic principle is - the more remote the cause,the higher up the diagram it is located. The five levels arephysical, organisational, company, government/ regulatory andsocietal.
The Causal Connections
The arrows in the Figure 1 are to be understood as meaningcause in the following sense. One thing is said to be a cause ofanother if we can say: but for the first, the second would nothave occurred.
Defining cause in this way has various consequences. First,there is a theoretically unlimited number of factors orcircumstances giving rise to any particular event; thoserepresented here are ones which came to light at the RoyalCommission. It should be acknowledged, too, that not all thecausal factors identified in the inquiry are dealt with here. Inparticular, metallurgical causes have not been included.
Second, the definition implies that had any one of thesecausal pathways in the diagram been absent the outcome wouldprobably not have occurred. In particular, where more than onearrow enters a box, all are necessary preconditions. There is animplied logical AND in the diagram at such points.
Third, this notion of cause involves imagining an alternative(counter-factual) situation and inferring how things would haveturned out had this imagined situation existed. Obviously this isa speculative exercise and we are strictly only justified inspeaking about likely or probable outcomes. Most of the causalstatements implied in the diagram need to be understood asqualified in this way.
Drawing an AcciMap has the particular advantage ofclarifying the nature of the causal chains leading to the accident.It shows precisely how events or conditions quite remote fromthe accident amounted to essential preconditions. In the nextsection of the paper I should like to trace some of these chains,and readers will need to refer continually to figure 1. I shall notprovide a complete explanation of the diagram; readers wantingmore detail should consult Hopkins (2000).
16
17
The Absence of Engineers
Bourrier (1998) has shown how one way of ensuring highreliability operation in hazardous facilities is to maintainrelatively large numbers of engineering staff to oversee the workof plant operators. Where procedures need to be modified to getthe job done, engineers can supervise the modifications toensure that there are no unintended consequences. Wherequalified engineering staff are absent, plant operators are likely tomodify procedures themselves in ways which may not be optimaland which may lead, in the long run, to disaster.
This is what happened at Longford. Engineers who had beenpreviously been employed on site were withdrawn in 1992, aspart of a cost cutting strategy. Changes to plant design, whichwere made after that time, turned out to have problems, whichwere not properly addressed by engineers from head office inMelbourne. Moreover, the absence of engineers meant that plantoperators were not properly supervised. The result was that inorder to deal the with problems they were encountering,operators were forced to run the plant routinely in alarm mode.This de-sensitised them to the significance of alarms and led toan operator error, “incorrect bypass valve operation”, whichinitiated the accident sequence.
A further consequence of the absence of engineers on sitewas that there was no-one to warn plant operators againstreintroducing warm oil into the super cold heat exchanger.
The AcciMap, then, shows how the absence of engineerscontributed in a complex and multi-stranded way to theexplosion.
Focus on LTIs
Esso measured safety by its lost–time injury rate. It wasextraordinarily successful in reducing this figure effectively tozero. But the consequence of this emphasis was that thecompany paid insufficient attention to the management of majorhazards. The AcciMap highlights just how this focus on LTIs ledto the accident.
First, it distorted maintenance priorities. Equipment whichwas judged to be safety-critical was given a high priority. Butsince the safety focus was on LTIs, the judgements were aboutwhether the equipment breakdown was likely to cause routineslips, trips and falls. No attempt was made to ascertain whetherthe breakdowns might affect plant safety. The result was that avalve which was critical for plant safety was left unrepaired fortwo weeks, requiring operators to operate a bypass valvemanually. Incorrect manual operation began the accidentsequence.
There was a second way in which the focus on LTIscontributed to the accident. The incident reporting system wasused to report incidents which caused or had the potential tocause LTIs. It was not used to report process upsets which hadthe potential to endanger the whole plant. Thus, one monthbefore the accident, there was an incident involving loss of warmoil flow and abnormally low temperatures, so low that iceformed on pipes normally too hot to touch. By good luck ratherthan good management, this incident did not lead to disaster.Unfortunately, it was not reported in the incident reporting
system. Had it been, it would have been thoroughly investigatedand steps taken to prevent a recurrence. The steps would haveinvolved new procedures about what to do in the event of loss ofwarm oil flow, and training in the those procedures. Had thistraining and been provided, the crucial mistake of restarting thewarm oil system would not have been made on the day of theaccident.
Poor Auditing
A major audit by Exxon prior to the explosion gave Esso aclean bill of health. It was an audit which failed to convey anybad news to Esso’s board of directors. Any audit which conveysonly good news is a bad audit. Two particular failures will bementioned here. First, although the audit examined the incidentreporting system, it failed to notice that the system was not beingused to report major process upsets, not even system shutdowns.
Second, the audit failed to pick up that a basic hazardidentification procedure, called a HAZOP (hazard andoperability study), had not been carried out at gas plant 1 wherethe accident happened. The two other gas plants on the site hadbeen HAZOPed, but despite an Exxon policy introduced in theearly 90s in favour of HAZOPing all existing plants, Esso deferredindefinitely a plan to HAZOP gas plant 1, on the grounds of cost.
Had this HAZOP been carried out, it would have identifiedthe possibility of the loss of warm oil flow and the consequentembrittlement of certain metal pressure vessels. The recognitionof this danger would have led to the development of proceduresand training to deal with the possibility, and this certainly wouldhave precluded the operator error which triggered the explosion.
Exxon Control Failure
Exxon operated a policy of decentralising responsibility forsafety. Although it encouraged Esso to HAZOP its plants it didnot exercise any control over subsidiary companies in suchmatters and so, Esso was free to defer the HAZOP of GP1indefinitely.
Furthermore, gas plants 1, 2 and 3 were tightly connectedand the explosion at the first put the other two out of operationfor two weeks. This led to total loss of gas supply to the state ofVictoria for two weeks. Esso had failed to identify the hazards ofinterconnection and Exxon had failed to instruct its subsidiary inthis regard. The hazards of interconnectedness were highlightedin the Piper Alpha explosion, where gas from other platformsfuelled the fire on Piper Alpha. This is exactly what happened atLongford: gas from other plants fuelled the fire in gas plant 1.Exxon’s policy of decentralising responsibility for safety meantthat Esso Australia was free to ignore this critical lesson fromPiper Alpha.
The Inadequate Regulatory System
To claim that a regulatory system was a cause of an accidentmay seem artificial. I shall show in what follows that it was,indeed, a cause in the “but for” sense. The legislation whichapplied at Longford was the Victorian Occupational Health andSafety Act which emphasises self-regulation and seeks tominimise prescription. On the other hand, both upstream ofLongford, in the offshore oil fields, and downstream of Longford,
in the Victorian gas pipeline system, safety case regimes applied.A safety case regime requires that employers make a case to aregulatory authority showing how they have identified allhazards and describing the control strategies which have beenadopted. Had such a regime been in place at Longford itself, itwould almost certainly have resulted in Esso carrying out aHAZOP of gas plant 1 which would have identified the hazardswhich led to the explosion. Moreover, the federal governmenthad recommended the safety case regime be implemented atmajor hazard sites like Longford, but the state government hadnot done so. It is on this basis that it can be said that: but thefailure of the state government to impose a safety case regime onEsso at Longford, the accident would not have occurred.
Government Failure to Provide Alternative Gas Supply
Esso was the only supplier of gas to the state of Victoria andthe state was therefore very vulnerable to any loss of supply fromLongford. Although the government accepted responsibility forsecurity of supply, it had not developed storage reservoirs inVictoria or any pipeline connections with suppliers interstate,which would have enabled temporary interruptions of supplyfrom Longford to be dealt with. One party at the Commissionargued that the government’s failure in this respect was due to itsideology of privatisation and small government. This particularargument was not supported by the evidence and is indicated bya dotted line in the diagram.
Market Forces
At the top of the diagram, is what I have termed the societallevel. We live in an increasingly global, capitalist society inwhich competition and the market affect most aspects of ourlives. Market forces generated sustained cost-cutting by Essothroughout the 1990s which contributed to the accident in anumber of quite specific ways. It was the reason engineers werewithdrawn from the Longford site; it was the reason for themaintenance backlog; and it was the reason why the HAZOP ofgas plant 1 was deferred indefinitely. Each of these contributed tothe accident in ways which have already been discussed.
The impact of market forces on safety at Esso’s Victorian gasplant was part of a much broader pattern. In the UK, the oilindustry formalised its drive to reduce costs in what was calledthe Cost Reduction in the New Era (CRINE) initiative. CRINEsources asserted that “capital and operating costs have continuedto escalate … (and) unless urgent action is taken to reverse thistrend, the future of oil and gas development in the UK North Seawill be in serious jeopardy” (quoted in Whyte,1997:1151). Thethreat was from the international market place, in particular,cheaper production costs in Mexico, Vietnam, the Maldives,China, Indonesia and Malaysia. Toombs and Whyte (1998) arguethat that resources available for safety in the North Sea increasedin the aftermath of the Piper Alpha disaster in 1988 but that thecost cutting associated with CRINE saw a reduction in safety-related spending and a consequent impact on safety.
Moreover, the cost-cutting imperative drove largecorporations in the 1980s to decentralise (Baram, 1997), whichmeant that head offices handed over responsibility for safety tooperating subsidiaries. Consequently, in matters of safety,companies like Esso Australia were not subject to effectivecontrol by their parent company.
Principles of Selection
Numerous parties were represented at the Royal Commissionand none of them acknowledged all the causal factors identifiedabove. In their closing submissions, each emphasised particularcauses. The rest of this paper explores the principles of selection,or “stop rules” (Rasmussen, 1990) which they used. Three distinctprinciples will be discussed below and can be summarised hereas follows.
• Self-interest: select causes consistent with self-interest• Accident prevention: select causes which are most controllable• The legal perspective: select causes which generate legal liability.
Self Interest
Where parties had financial or reputational interests at stake,this guided their selection of cause above all else. In particular,those seeking to avoid blame or criticism focussed resolutely onfactors which assigned blame elsewhere, and denied, sometimesin the face of overwhelming evidence, the causal significance offactors which might have reflected adversely on themselves. Essoblamed the whole accident on errors by plant operators anddenied that any of the organisational failures uncovered by theCommission played any role in causing the accident. On theother hand, counsel for Esso’s workforce blamed the wholeaccident on Esso’s negligence.
The Insurance Council of Australia was likewise guided byfinancial interest in identifying negligence by Esso as the cause ofthe accident. The interruption of gas supply to Victorian industryhad caused more than one billion dollars worth of damage, andmuch of this was borne by insurance companies. They were thusout to recover from Esso and had a strong interest in a finding ofnegligence against Esso by the Commission. They thereforeemphasised causes at level 2 of the diagram.
Finally, the Victorian government was politically vulnerableto any criticism that government policy might have contributedto the loss of supply. Both the government and the regulatoryagency responsible for health and safety were represented at theinquiry. Both argued that Esso alone was responsible for theaccident and that neither the government, nor the regulator, noreven the regulatory system was in any way to blame. Again thecausal focus was at level 2.
It is obvious that parties with direct interests will be guidedby these interests in their selection of causes. Only where theparticipants have agendas not based on immediate self-interest,can other principles of causal selection come into play.
Accident Prevention
A second principle was followed for participants whoseprimary concern was accident prevention. It was to focus oncauses which are controllable, from the participant’s point ofview. Counsel Assisting the Commission adopted the accidentprevention approach and viewed the task of prevention from theperspective of management. He therefore emphasised causes atthe organisational level, since these are within the capacity ofmanagement to control. He had little to say about causes athigher levels and, interestingly, nothing to say about the physicalcauses at level 1.
18
19
The peak labour council in Victoria was also concernedabout accident prevention. It had no direct influence over Essoand therefore no capacity to bring about the kinds ofmanagement changes in Esso which might prevent a recurrence.However, it did have the potential to influence government andgovernment agencies. Its strategy, therefore, was to seek changesin the regulatory system which would compel Esso and similarcompanies to improve their management of safety. This was thepoint in the causal network where its intervention was likely tobe most effective. Hence it emphasised the inadequacies of theregulatory system as the cause of the accident.
The Legal Perspective
The Royal Commissioners themselves adopted a thirdprinciple of selection, namely to focus on causes which generatelegal liability. The Commission was asked under the terms ofreference to consider whether breaches by Esso of relevantlegislation had contributed to the accident. The factors whichmost directly created legal liability under the Victorian OHS Actwere lack of appropriate training and procedures to deal with theproblem of loss of warm oil flow. Accordingly, theCommissioners found that these were the “real causes” of theaccident. The special status of these causes is indicated on theAcciMap by the use of an octagonal box. The Commissionersrecognised most of the other factors sketched on the AcciMap,but they described them as “contributing factors”.
It needs to be noted that, for some parties, more than one ofthese principles was at work. For the Insurance Council ofAustralia, for example, the principle of self-interest coincidedwith the principle of selecting causes which generated legalliability.
Exclusions
Principles of selection are necessarily also principles ofexclusion. Two causes identified above were not selected foremphasis by any of the participants - market forces and Exxon’shands-off approach. This is worth elaborating.
Exxon was not a party to the proceedings, nor was itscontribution to the accident investigated, partly because of theway the terms of reference for the inquiry were drawn. AlthoughExxon’s management style was, as I have argued, a criticalcontributing factor, none of the three principles invited a focuson Exxon’s contribution by any of the parties.
The other factor ignored by all parties, despite the fact that, inan important sense, it was the ultimate cause of the disaster, wasthe market. There are obvious reasons for this blind spot.Capitalist society is a given – the taken-for-granted context of theworld of work. There is no realistic prospect of cutting ourselvesoff from global, market society in the interests of accidentprevention. Moreover, many would argue that, for other reasons,such a course of action is not even desirable. There was thereforenothing to be gained for any participant by drawing attention tothis ultimate cause.
However, the market is a cause which governmentsmotivated by accident prevention concerns would do well toacknowledge. Cost-cutting pressures stemming from marketforces are pervasive and inevitable. It is these pressures which
led to the organisational failures which have been identified.Safety depends, therefore, on bringing to bear countervailingpressures, and this is the role of government, via its regulatorysystem. It is vital that governments adopt regulatory strategieswith the potential to over-ride cost-cutting imperatives so as toensure that companies adopt and effectively implement thenecessary management systems.
Conclusion
This paper has demonstrated the value of the AcciMap indescribing the chains of causation which led to the accident at theEsso Longford gas plant. It has shown, too, that interested partieschose from among three principles in deciding which causes toemphasis: self interests, accident prevention and legal causation.
The strict “but for” logic used in constructing this particularAcciMap means that breaking any one link in the network ofcausation would probably have averted the accident. AcciMapsconstructed according to this logic are therefore useful tools foranyone interested in accident prevention. They suggest a widevariety of ways in which accidents can be prevented. Moreover,they suggest ways in which people at many different locationsboth inside and outside the organisations concerned cancontribute to accident prevention. Some writers have argued thatthe complexity of the accident causation process makesaccidents inevitable (Perrow, 1999). The implication of theAcciMap analysis is that this very complexity is what makesaccidents so preventable.
References
Baram, M. (1998). Process safety management and theimplications of organisational change. In A. Hale, & M. Baram(Ed.), Safety Management: The Challenge of Change (pp. 191-206). Oxford: Pergamon.
Bourrier, M. (1998). Elements for designing a self-correctingorganisation: examples from nuclear plants. In A. Hale, & M.Baram (Ed.), Safety Management: The Challenge of Change (pp.133-146). Oxford: Pergamon.
Hopkins, A (2000). Lessons from Longford: The Esso Gas PlantExplosion, Sydney: CCH.
Perrow, C. (1999). Normal Accidents (With New Afterword).Princeton: Princeton U.P.
Rasmussen, J., &. (1997). Risk management in a dynamic society:A modelling problem. Safety Science, 27(2/3), 183-213.
Rasmussen, J. (1990). Human error and the problem of causalityin analysis of accidents. Phil. Trans. Royal. Soc. London, B 327,449-462.
Toombs, S., & Whytle, D. (1998). Capital fights back: risk,regulation and profit in the UK offshore oil industry. Studies inPolitical Economy, 57(Autumn), 73-101.
Whyte, D. (1997). Moving the goalposts: The deregulation ofsafety in the post-Piper Alpha offshore oil industry. In J. Stanyer,& G. Stoker (Ed.), Contemporary Political Studies (pp. 1148-1160). Nottingham: Political Studies Association of the UK.
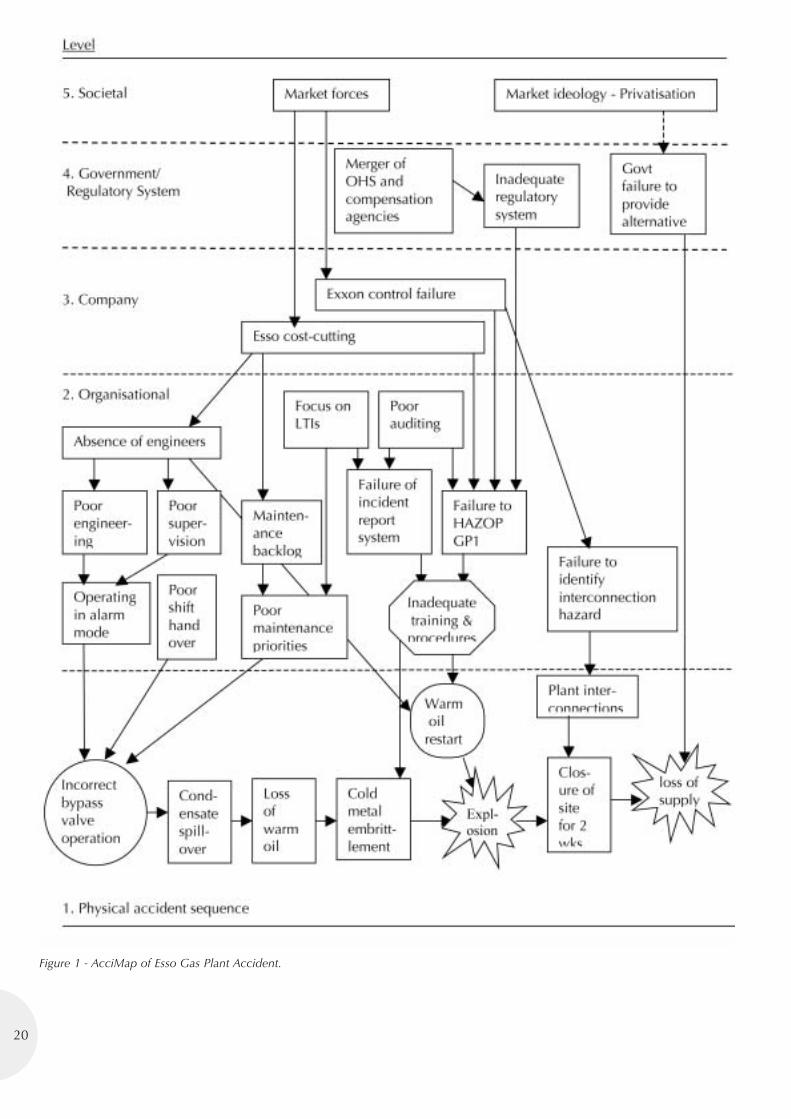
20
Figure 1 - AcciMap of Esso Gas Plant Accident.
21
An Occupational Health &Safety Research Perspective
Jeffery L. Kohler, National Institute for Occupational Safety & Health Pittsburgh
Over the past thirty years we have witnessed a dramaticreduction in mining fatalities, injuries, and work-related diseases.These reductions represent two, three, or even ten-fold decreasesfrom just a few decades ago. The credit for this remarkableachievement comes from many corners: research advancements;manufacturing innovations; labor and industry; miningengineering curricula that integrate health and safety practices,and stronger government regulations.
Despite these successes, data from recent years have shownlimited improvement in the health and safety numbers that weuse to measure our progress toward our ultimate goal of zeroinjuries and fatalities. This is especially troubling to all of us whobelieve that injury and impairment no longer need beconsequences of working in the mines.
The challenge before us is clear, and many in the miningindustry stand poised to accept this challenge. But exactly whatpath do we follow to achieve success? Perhaps there aremultiple legitimate paths, and in this presentation, I will describeand illustrate one course of action, briefly summarised in fivesteps. First, we must accurately characterise the presentcircumstances in relation to safety, looking for sentinel events,and acknowledge the changes in the industry that are takingplace. This characterisation will be helpful in the second step,which is to develop an understanding of the underlying causes ofthe problems. Next we propose very general interventions, thenascertain the barriers to these interventions. Once these areknown, we execute a focused effort to develop and instituteeffective interventions. The fifth step is to study and quantifyintervention effectiveness so that resources are allocated in afashion to effect the greatest health and safety benefits.
This approach is not particularly novel, and only takes onvalue when specific details are added. Although my view of thisis strongly influenced by mining safety and health issues in theUnited States, many of the lessons learned there are transferable,and indeed, many of the lessons learned in Australia and othermining countries have been successfully applied to improvehealth and safety in the U.S. The global nature of modernminerals production offers new and powerful opportunities tosolve old problems and prevent new ones. Goals of thispresentation are to identify specific examples that can be usefulas we accept this new challenge, and to identify collaborativeopportunities for achieving the vision of eliminating occupationalinjuries and illnesses from the workplace.
22
Health Reporting in aMultinational ResourcesCompany
Dr P Shanahan, BHP BILLITON
BHP Billiton is the world’s largest diversified resourcescompany with more than 35,000 employees and operations onevery continent. The scope of business apart from significantmining operations includes petroleum, with offshore facilitiesand onshore gas production, and a range of refinery and smeltingoperations for aluminium, chrome, manganese and nickel.Mining operations are focused on coal, iron ore, copper, chrome,bauxite, manganese, nickel, mineral sands and diamonds.Consequently a vast range of potential adverse health exposuresexist throughout the company with operations situated inregulatory environments that vary considerably.
Corporate reporting for health was significantly upgraded forBHP Billiton during the full year 2003. A primary purpose forcorporate reporting is to track performance towards targets forhealth. Health targets for BHP Billiton are strongly focused on leadindicators of exposure with secondary targets for lag indicators ofoccupational illness prevalence and incidence. Therefore, to assistmeaningful corporate reporting on health indices it was necessaryto develop and implement standardised occupational exposurelimits. These standards also include direction on sampling andanalysis processes to ensure validation of data.
The integration of health reporting was aligned with existingHSEC processes. Monthly reporting occurs for safety performancethroughout the company and for higher level incidents relating tohealth, environment and community. The process of reporting hasbeen set up on a company wide internet based program known asFirst Priority Enterprise. It was determined that health reportingshould be conducted on a six monthly basis. At this level it wouldbe possible to capture evolving issues in health during thereporting year, particularly in relation to shorter latency conditions.In terms of data required there will be a transitional period ofbuilding a higher level of detail and sophistication over a two yearperiod, particularly in relation to occupational hygiene data. Thiswill allow sites to adequately capture and organise data into amore formalised structure across the company. The aim is for alloperations to collect occupational hygiene data throughhomogeneous exposure groups.
The data being collected is aligned to the company healthtargets. Currently these targets are:
• All sites to complete a baseline survey on occupationalexposure hazards and establish an associated monitoring andhealth surveillance program by 30 June 2003
• Reduction of occupational exposures below internationallyaccepted limits by 30 June 2004 and a 20% reduction inincidence of occupational disease by 30 June 2007.
Reporting for year 2003 has therefore focused on
performance to the initial target of completion of the baselineexposure survey and medical surveillance program and alsoincluded the collection of baseline data on occupationalexposure and occupational illness. Occupational exposure datawill be aligned to occupational exposure limits derived fromleading authorities. Significant exposures existing in thecompany will be further investigated through company positionstatements which will lead to the development of a finalexposure limit based on thorough review of available literaturefrom global authorities. Reporting of occupational exposures ismore heavily weighted toward leading indicators as follows:
• Status of baseline exposure survey • Medicals required/completed• Employees potentially exposed > 85 dBA TWA• Employees potentially exposed at 50 - 100% of the
occupational exposure limit/up to three significant exposuresinvolved
• Employees potentially exposed at > 100% of the occupationalexposure limit/up to three significant exposures involved
• PPE compliance %/Existence of a formal PPE audit program.
Reporting of occupational illness data is focused on themajor categories of illness pertaining to our operations. OSHAcriteria are used as the definition for occupational illnesses.Illness data is a lag indicator. Categories reported are as follows:
• Prevalence of the specific occupational illness (Total activecases on site)
• Incidence of the specific occupational illness (New casesdiagnosed during the reporting period)
• Retirements due to occupational illness.
As a consequence of data received several initiatives havebeen set in place. This includes direct attention to operationswith specific occupational illness incidence of concern,development of a standard PPE compliance auditing guidelinefor use globally and work with specific operations throughprovision of guidance and resources to progress the baselineexposure survey.
In summary the development of meaningful corporatereporting requires a strong link for this data to defined healthtargets that operate throughout the company and are linked torelevant management KPI’s. The data should be strongly focusedon lead indicators that in particular measure exposure indices.Data must be linked to standardised measures and definitionsthat are used by all operations and supported by appropriateCorporate based guidelines when required. Reporting processesshould be linked to systems available for other components ofHSEC and periods of reporting allowing timely capture of data toinitiate actions.
23
Health Surveillance:Past History & Future Potential
Brian Lyne, Department of Natural Resources & Mines
Executive Summary
Mine safety is about eliminating or applying appropriatecontrols on occupational health hazards that have the potentialto cause disabling injury or illness.
A recent tripartite review of mine health surveillance inQueensland found a number of interesting opportunities tointroduce a new health surveillance process suitable for use inthe broad mining and quarrying industries throughoutQueensland.
The paper identifies these opportunities in a clear way andprovides an integrated three stage model to provide a practicaldirection for the future.
By working in partnership with industry stakeholders, it isanticipated that the a revised Health Surveillance Unit will assistindustry in either eliminating or better controlling occupationalhealth hazards found in mine and quarry work places.
Improved management of mine worker occupational healthpractices and assessments should pave the way for a quantumimprovement in the future safety statistics.
Many of the large mining companies as well as the MineralsCouncil of Australia have recognised the importance ofoccupational health management and have initiated strategiesand programs to achieve improved performance.
Several large mining companies have already commenceddevelopment of improved health management practices and thispaper provides a possible framework to harness their collectivelearning and in doing so minimise wasteful duplication of effortacross the industry.
By adopting this course of action it is anticipated thatsignificant progress can been made to achieving a mining andquarrying industry that, in the future, is free from disablingoccupational injury or illness.
Background
Occupational illness and disease in mineworkers has beenidentified as a serious problem for many centuries. Agricola(1484–1555) wrote extensively about many of the occupationalhealth problems he had identified in the local population of
mineworkers in Germany. In particular, he identified severalhealth hazards including those caused by various respirable dustsfound in mines.
Knowledge of health hazards increased slowly over thesucceeding centuries and it was not until the mid 1900’s thatmedical science could measure respirable dust levels andmodern medical management systems implemented.
Health surveillance of mineworkers in Queensland wasinitiated in 1982 when the Queensland Coal Board issued twoHealth Orders under the Coal Industry (Control) Act 1948. In1993 it was again upgraded and following the abolition of theBoard in 1997, the health surveillance requirements for thecoal industry were transferred into the coal mining legislation.With the introduction of the new Coal Mining Safety andHealth Act 1999 and the Coal Mining Safety and HealthRegulation 2001 the regulation included further changes to theCoal Mining (Industry Employees Health Scheme) Regulation1993 health scheme and it became the Coal Mine Workers’Health Scheme.
The current health surveillance program only applies in thecoal industry and utilises an approved health assessment form formedical practitioners to follow which is similar to a documentdeveloped and used by the medical division of the Coal ServicesPty Ltd ( ex Joint Coal Board). The prime focus of the medicalexaminations to date has been to monitor black lung disease(pneumoconiosis), hearing loss, eyesight and fitness of minesrescue trainees.
At the same time as the new coal mining legislation wasintroduced in 1999, the Mining and Quarrying Safety and HealthAct 1999 was enacted and included legislative requirements forhealth surveillance and medical assessments. The mines andquarries were not required to report the results of medicalassessments to the regulator and nor were they required toconduct medical examinations in accordance with an approvedform (as is the case for the coal industry).
In 2002, a report into an operational review of the MinesInspectorate for the period 1996/97 to 2001/02, determined thatthe inspectorate’s role in safety was well established but its rolein health was less defined. The report received ministerialendorsement in April 2002 and included a recommendation toreview the future role of the regulator in relation to healthsurveillance during 2002/03.
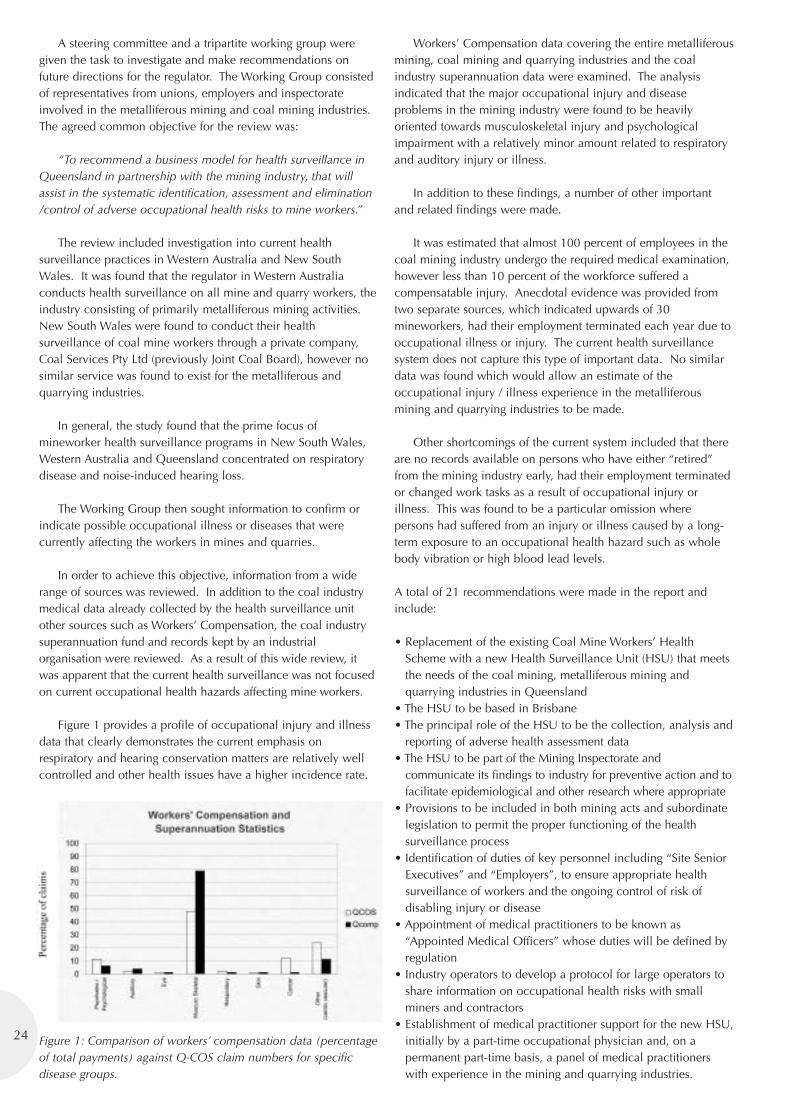
A steering committee and a tripartite working group weregiven the task to investigate and make recommendations onfuture directions for the regulator. The Working Group consistedof representatives from unions, employers and inspectorateinvolved in the metalliferous mining and coal mining industries.The agreed common objective for the review was:
“To recommend a business model for health surveillance inQueensland in partnership with the mining industry, that willassist in the systematic identification, assessment and elimination/control of adverse occupational health risks to mine workers.”
The review included investigation into current healthsurveillance practices in Western Australia and New SouthWales. It was found that the regulator in Western Australiaconducts health surveillance on all mine and quarry workers, theindustry consisting of primarily metalliferous mining activities.New South Wales were found to conduct their healthsurveillance of coal mine workers through a private company,Coal Services Pty Ltd (previously Joint Coal Board), however nosimilar service was found to exist for the metalliferous andquarrying industries.
In general, the study found that the prime focus ofmineworker health surveillance programs in New South Wales,Western Australia and Queensland concentrated on respiratorydisease and noise-induced hearing loss.
The Working Group then sought information to confirm orindicate possible occupational illness or diseases that werecurrently affecting the workers in mines and quarries.
In order to achieve this objective, information from a widerange of sources was reviewed. In addition to the coal industrymedical data already collected by the health surveillance unitother sources such as Workers’ Compensation, the coal industrysuperannuation fund and records kept by an industrialorganisation were reviewed. As a result of this wide review, itwas apparent that the current health surveillance was not focusedon current occupational health hazards affecting mine workers.
Figure 1 provides a profile of occupational injury and illnessdata that clearly demonstrates the current emphasis onrespiratory and hearing conservation matters are relatively wellcontrolled and other health issues have a higher incidence rate.
Figure 1: Comparison of workers’ compensation data (percentageof total payments) against Q-COS claim numbers for specificdisease groups.
Workers’ Compensation data covering the entire metalliferousmining, coal mining and quarrying industries and the coalindustry superannuation data were examined. The analysisindicated that the major occupational injury and diseaseproblems in the mining industry were found to be heavilyoriented towards musculoskeletal injury and psychologicalimpairment with a relatively minor amount related to respiratoryand auditory injury or illness.
In addition to these findings, a number of other importantand related findings were made.
It was estimated that almost 100 percent of employees in thecoal mining industry undergo the required medical examination,however less than 10 percent of the workforce suffered acompensatable injury. Anecdotal evidence was provided fromtwo separate sources, which indicated upwards of 30mineworkers, had their employment terminated each year due tooccupational illness or injury. The current health surveillancesystem does not capture this type of important data. No similardata was found which would allow an estimate of theoccupational injury / illness experience in the metalliferousmining and quarrying industries to be made.
Other shortcomings of the current system included that thereare no records available on persons who have either “retired”from the mining industry early, had their employment terminatedor changed work tasks as a result of occupational injury orillness. This was found to be a particular omission wherepersons had suffered from an injury or illness caused by a long-term exposure to an occupational health hazard such as wholebody vibration or high blood lead levels.
A total of 21 recommendations were made in the report andinclude:
• Replacement of the existing Coal Mine Workers’ HealthScheme with a new Health Surveillance Unit (HSU) that meetsthe needs of the coal mining, metalliferous mining andquarrying industries in Queensland
• The HSU to be based in Brisbane• The principal role of the HSU to be the collection, analysis and
reporting of adverse health assessment data • The HSU to be part of the Mining Inspectorate and
communicate its findings to industry for preventive action and tofacilitate epidemiological and other research where appropriate
• Provisions to be included in both mining acts and subordinatelegislation to permit the proper functioning of the healthsurveillance process
• Identification of duties of key personnel including “Site SeniorExecutives” and “Employers”, to ensure appropriate healthsurveillance of workers and the ongoing control of risk ofdisabling injury or disease
• Appointment of medical practitioners to be known as“Appointed Medical Officers” whose duties will be defined byregulation
• Industry operators to develop a protocol for large operators toshare information on occupational health risks with smallminers and contractors
• Establishment of medical practitioner support for the new HSU,initially by a part-time occupational physician and, on apermanent part-time basis, a panel of medical practitionerswith experience in the mining and quarrying industries.
24
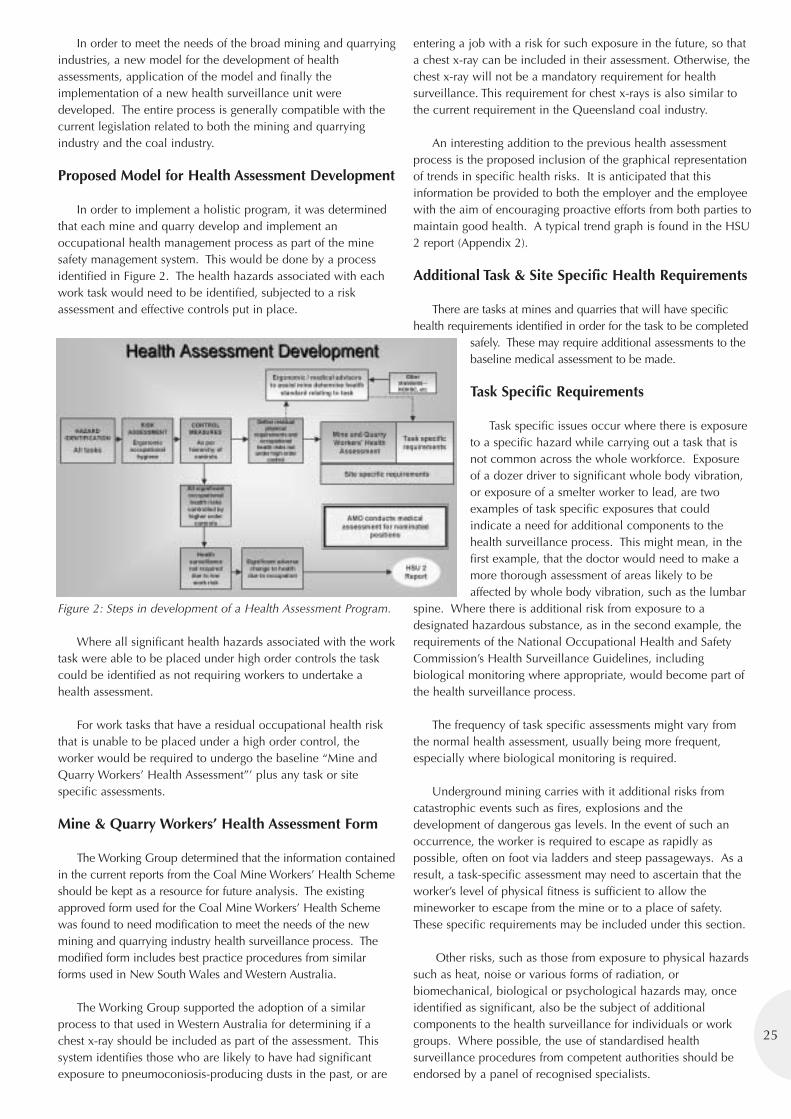
25
In order to meet the needs of the broad mining and quarryingindustries, a new model for the development of healthassessments, application of the model and finally theimplementation of a new health surveillance unit weredeveloped. The entire process is generally compatible with thecurrent legislation related to both the mining and quarryingindustry and the coal industry.
Proposed Model for Health Assessment Development
In order to implement a holistic program, it was determinedthat each mine and quarry develop and implement anoccupational health management process as part of the minesafety management system. This would be done by a processidentified in Figure 2. The health hazards associated with eachwork task would need to be identified, subjected to a riskassessment and effective controls put in place.
Figure 2: Steps in development of a Health Assessment Program.
Where all significant health hazards associated with the worktask were able to be placed under high order controls the taskcould be identified as not requiring workers to undertake ahealth assessment.
For work tasks that have a residual occupational health riskthat is unable to be placed under a high order control, theworker would be required to undergo the baseline “Mine andQuarry Workers’ Health Assessment”’ plus any task or sitespecific assessments.
Mine & Quarry Workers’ Health Assessment Form
The Working Group determined that the information containedin the current reports from the Coal Mine Workers’ Health Schemeshould be kept as a resource for future analysis. The existingapproved form used for the Coal Mine Workers’ Health Schemewas found to need modification to meet the needs of the newmining and quarrying industry health surveillance process. Themodified form includes best practice procedures from similarforms used in New South Wales and Western Australia.
The Working Group supported the adoption of a similarprocess to that used in Western Australia for determining if achest x-ray should be included as part of the assessment. Thissystem identifies those who are likely to have had significantexposure to pneumoconiosis-producing dusts in the past, or are
entering a job with a risk for such exposure in the future, so thata chest x-ray can be included in their assessment. Otherwise, thechest x-ray will not be a mandatory requirement for healthsurveillance. This requirement for chest x-rays is also similar tothe current requirement in the Queensland coal industry.
An interesting addition to the previous health assessmentprocess is the proposed inclusion of the graphical representationof trends in specific health risks. It is anticipated that thisinformation be provided to both the employer and the employeewith the aim of encouraging proactive efforts from both parties tomaintain good health. A typical trend graph is found in the HSU2 report (Appendix 2).
Additional Task & Site Specific Health Requirements
There are tasks at mines and quarries that will have specifichealth requirements identified in order for the task to be completed
safely. These may require additional assessments to thebaseline medical assessment to be made.
Task Specific Requirements
Task specific issues occur where there is exposureto a specific hazard while carrying out a task that isnot common across the whole workforce. Exposureof a dozer driver to significant whole body vibration,or exposure of a smelter worker to lead, are twoexamples of task specific exposures that couldindicate a need for additional components to thehealth surveillance process. This might mean, in thefirst example, that the doctor would need to make amore thorough assessment of areas likely to beaffected by whole body vibration, such as the lumbar
spine. Where there is additional risk from exposure to adesignated hazardous substance, as in the second example, therequirements of the National Occupational Health and SafetyCommission’s Health Surveillance Guidelines, includingbiological monitoring where appropriate, would become part ofthe health surveillance process.
The frequency of task specific assessments might vary fromthe normal health assessment, usually being more frequent,especially where biological monitoring is required.
Underground mining carries with it additional risks fromcatastrophic events such as fires, explosions and thedevelopment of dangerous gas levels. In the event of such anoccurrence, the worker is required to escape as rapidly aspossible, often on foot via ladders and steep passageways. As aresult, a task-specific assessment may need to ascertain that theworker’s level of physical fitness is sufficient to allow themineworker to escape from the mine or to a place of safety.These specific requirements may be included under this section.
Other risks, such as those from exposure to physical hazardssuch as heat, noise or various forms of radiation, orbiomechanical, biological or psychological hazards may, onceidentified as significant, also be the subject of additionalcomponents to the health surveillance for individuals or workgroups. Where possible, the use of standardised healthsurveillance procedures from competent authorities should beendorsed by a panel of recognised specialists.
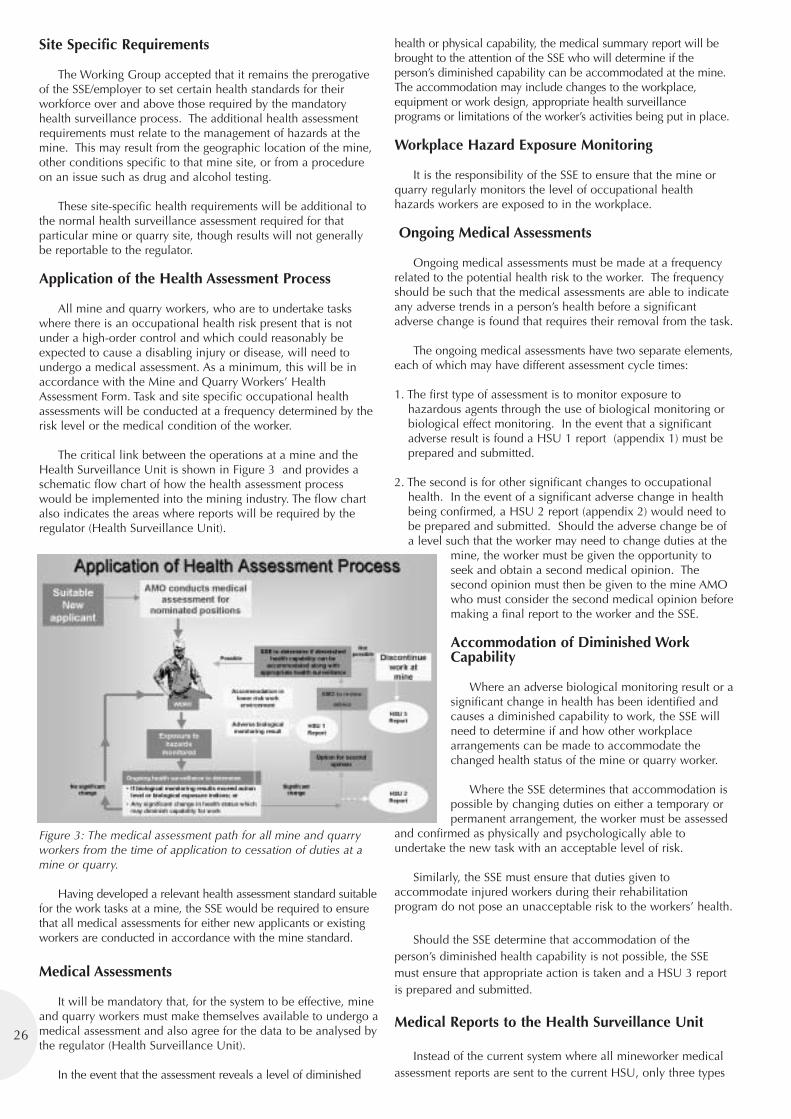
26
Site Specific Requirements
The Working Group accepted that it remains the prerogativeof the SSE/employer to set certain health standards for theirworkforce over and above those required by the mandatoryhealth surveillance process. The additional health assessmentrequirements must relate to the management of hazards at themine. This may result from the geographic location of the mine,other conditions specific to that mine site, or from a procedureon an issue such as drug and alcohol testing.
These site-specific health requirements will be additional tothe normal health surveillance assessment required for thatparticular mine or quarry site, though results will not generallybe reportable to the regulator.
Application of the Health Assessment Process
All mine and quarry workers, who are to undertake taskswhere there is an occupational health risk present that is notunder a high-order control and which could reasonably beexpected to cause a disabling injury or disease, will need toundergo a medical assessment. As a minimum, this will be inaccordance with the Mine and Quarry Workers’ HealthAssessment Form. Task and site specific occupational healthassessments will be conducted at a frequency determined by therisk level or the medical condition of the worker.
The critical link between the operations at a mine and theHealth Surveillance Unit is shown in Figure 3 and provides aschematic flow chart of how the health assessment processwould be implemented into the mining industry. The flow chartalso indicates the areas where reports will be required by theregulator (Health Surveillance Unit).
Figure 3: The medical assessment path for all mine and quarryworkers from the time of application to cessation of duties at amine or quarry.
Having developed a relevant health assessment standard suitablefor the work tasks at a mine, the SSE would be required to ensurethat all medical assessments for either new applicants or existingworkers are conducted in accordance with the mine standard.
Medical Assessments
It will be mandatory that, for the system to be effective, mineand quarry workers must make themselves available to undergo amedical assessment and also agree for the data to be analysed bythe regulator (Health Surveillance Unit).
In the event that the assessment reveals a level of diminished
health or physical capability, the medical summary report will bebrought to the attention of the SSE who will determine if theperson’s diminished capability can be accommodated at the mine.The accommodation may include changes to the workplace,equipment or work design, appropriate health surveillanceprograms or limitations of the worker’s activities being put in place.
Workplace Hazard Exposure Monitoring
It is the responsibility of the SSE to ensure that the mine orquarry regularly monitors the level of occupational healthhazards workers are exposed to in the workplace.
Ongoing Medical Assessments
Ongoing medical assessments must be made at a frequencyrelated to the potential health risk to the worker. The frequencyshould be such that the medical assessments are able to indicateany adverse trends in a person’s health before a significantadverse change is found that requires their removal from the task.
The ongoing medical assessments have two separate elements,each of which may have different assessment cycle times:
1. The first type of assessment is to monitor exposure tohazardous agents through the use of biological monitoring orbiological effect monitoring. In the event that a significantadverse result is found a HSU 1 report (appendix 1) must beprepared and submitted.
2. The second is for other significant changes to occupationalhealth. In the event of a significant adverse change in healthbeing confirmed, a HSU 2 report (appendix 2) would need tobe prepared and submitted. Should the adverse change be ofa level such that the worker may need to change duties at the
mine, the worker must be given the opportunity toseek and obtain a second medical opinion. Thesecond opinion must then be given to the mine AMOwho must consider the second medical opinion beforemaking a final report to the worker and the SSE.
Accommodation of Diminished WorkCapability
Where an adverse biological monitoring result or asignificant change in health has been identified andcauses a diminished capability to work, the SSE willneed to determine if and how other workplacearrangements can be made to accommodate thechanged health status of the mine or quarry worker.
Where the SSE determines that accommodation ispossible by changing duties on either a temporary orpermanent arrangement, the worker must be assessed
and confirmed as physically and psychologically able toundertake the new task with an acceptable level of risk.
Similarly, the SSE must ensure that duties given toaccommodate injured workers during their rehabilitationprogram do not pose an unacceptable risk to the workers’ health.
Should the SSE determine that accommodation of theperson’s diminished health capability is not possible, the SSEmust ensure that appropriate action is taken and a HSU 3 reportis prepared and submitted.
Medical Reports to the Health Surveillance Unit
Instead of the current system where all mineworker medicalassessment reports are sent to the current HSU, only three types
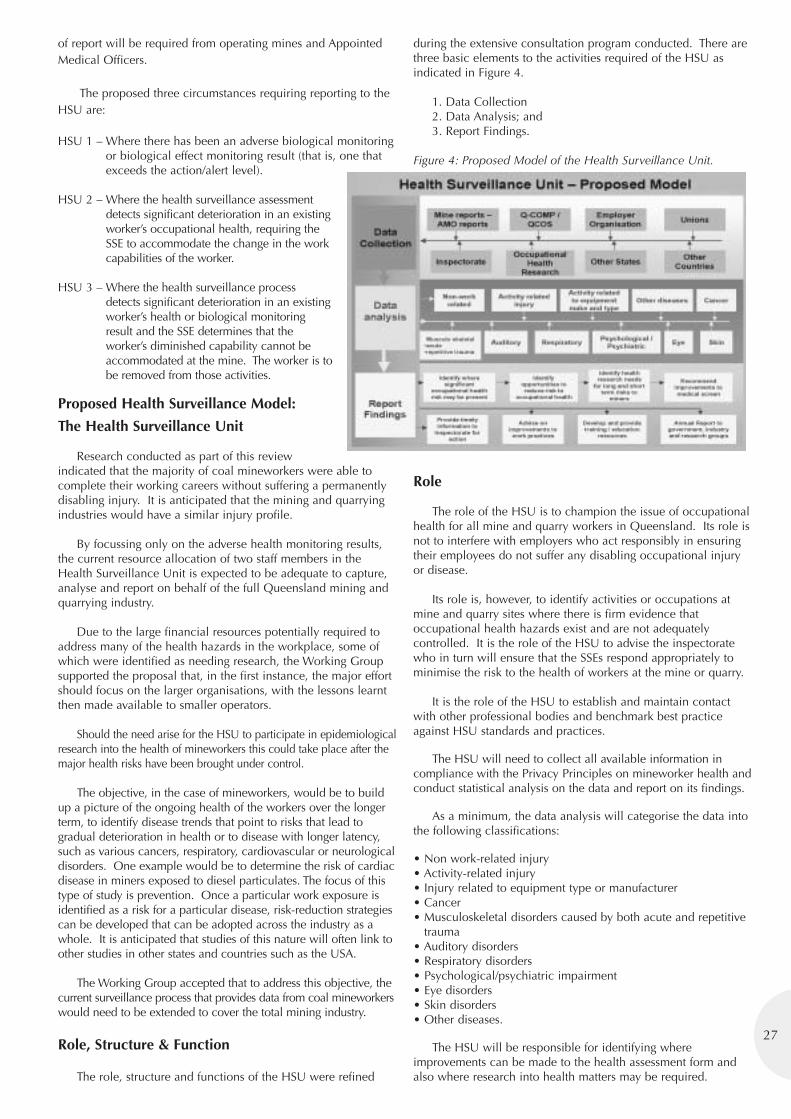
27
of report will be required from operating mines and AppointedMedical Officers.
The proposed three circumstances requiring reporting to theHSU are:
HSU 1 – Where there has been an adverse biological monitoringor biological effect monitoring result (that is, one thatexceeds the action/alert level).
HSU 2 – Where the health surveillance assessmentdetects significant deterioration in an existingworker’s occupational health, requiring theSSE to accommodate the change in the workcapabilities of the worker.
HSU 3 – Where the health surveillance processdetects significant deterioration in an existingworker’s health or biological monitoringresult and the SSE determines that theworker’s diminished capability cannot beaccommodated at the mine. The worker is tobe removed from those activities.
Proposed Health Surveillance Model:
The Health Surveillance Unit
Research conducted as part of this reviewindicated that the majority of coal mineworkers were able tocomplete their working careers without suffering a permanentlydisabling injury. It is anticipated that the mining and quarryingindustries would have a similar injury profile.
By focussing only on the adverse health monitoring results,the current resource allocation of two staff members in theHealth Surveillance Unit is expected to be adequate to capture,analyse and report on behalf of the full Queensland mining andquarrying industry.
Due to the large financial resources potentially required toaddress many of the health hazards in the workplace, some ofwhich were identified as needing research, the Working Groupsupported the proposal that, in the first instance, the major effortshould focus on the larger organisations, with the lessons learntthen made available to smaller operators.
Should the need arise for the HSU to participate in epidemiologicalresearch into the health of mineworkers this could take place after themajor health risks have been brought under control.
The objective, in the case of mineworkers, would be to buildup a picture of the ongoing health of the workers over the longerterm, to identify disease trends that point to risks that lead togradual deterioration in health or to disease with longer latency,such as various cancers, respiratory, cardiovascular or neurologicaldisorders. One example would be to determine the risk of cardiacdisease in miners exposed to diesel particulates. The focus of thistype of study is prevention. Once a particular work exposure isidentified as a risk for a particular disease, risk-reduction strategiescan be developed that can be adopted across the industry as awhole. It is anticipated that studies of this nature will often link toother studies in other states and countries such as the USA.
The Working Group accepted that to address this objective, thecurrent surveillance process that provides data from coal mineworkerswould need to be extended to cover the total mining industry.
Role, Structure & Function
The role, structure and functions of the HSU were refined
during the extensive consultation program conducted. There arethree basic elements to the activities required of the HSU asindicated in Figure 4.
1. Data Collection2. Data Analysis; and3. Report Findings.
Figure 4: Proposed Model of the Health Surveillance Unit.
Role
The role of the HSU is to champion the issue of occupationalhealth for all mine and quarry workers in Queensland. Its role isnot to interfere with employers who act responsibly in ensuringtheir employees do not suffer any disabling occupational injuryor disease.
Its role is, however, to identify activities or occupations atmine and quarry sites where there is firm evidence thatoccupational health hazards exist and are not adequatelycontrolled. It is the role of the HSU to advise the inspectoratewho in turn will ensure that the SSEs respond appropriately tominimise the risk to the health of workers at the mine or quarry.
It is the role of the HSU to establish and maintain contactwith other professional bodies and benchmark best practiceagainst HSU standards and practices.
The HSU will need to collect all available information incompliance with the Privacy Principles on mineworker health andconduct statistical analysis on the data and report on its findings.
As a minimum, the data analysis will categorise the data intothe following classifications:
• Non work-related injury• Activity-related injury• Injury related to equipment type or manufacturer• Cancer• Musculoskeletal disorders caused by both acute and repetitive
trauma• Auditory disorders• Respiratory disorders• Psychological/psychiatric impairment• Eye disorders• Skin disorders• Other diseases.
The HSU will be responsible for identifying whereimprovements can be made to the health assessment form andalso where research into health matters may be required.
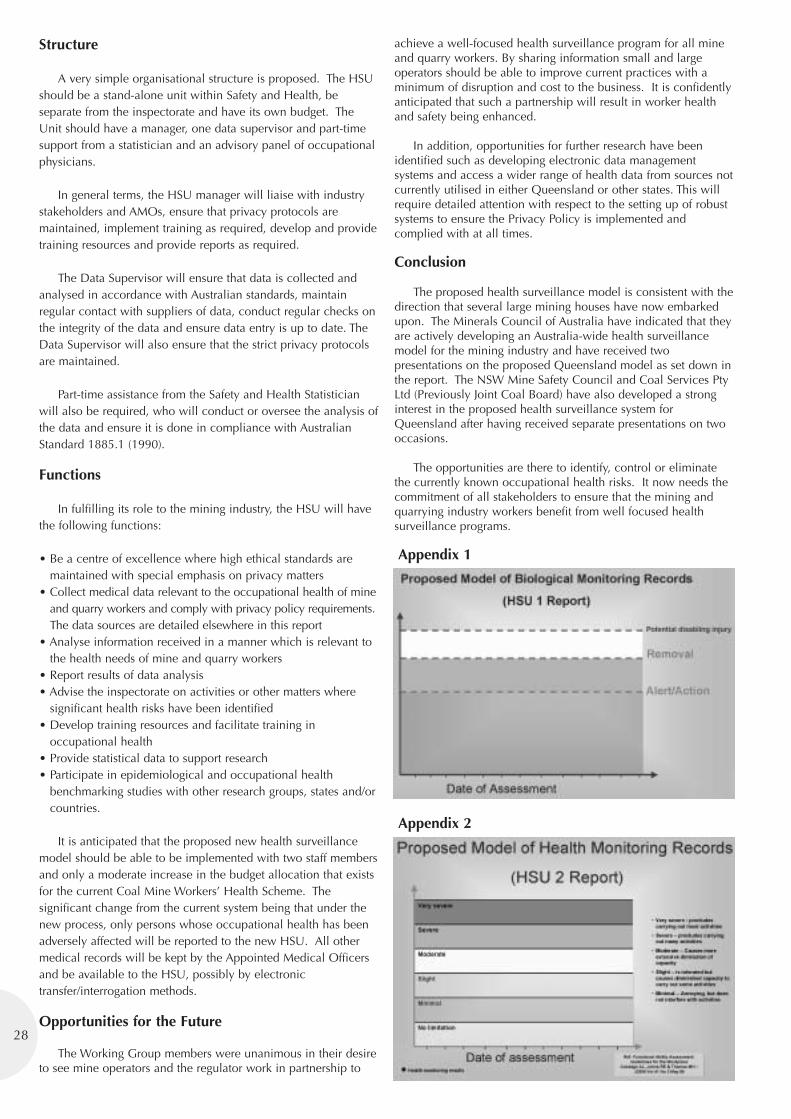
28
Structure
A very simple organisational structure is proposed. The HSUshould be a stand-alone unit within Safety and Health, beseparate from the inspectorate and have its own budget. TheUnit should have a manager, one data supervisor and part-timesupport from a statistician and an advisory panel of occupationalphysicians.
In general terms, the HSU manager will liaise with industrystakeholders and AMOs, ensure that privacy protocols aremaintained, implement training as required, develop and providetraining resources and provide reports as required.
The Data Supervisor will ensure that data is collected andanalysed in accordance with Australian standards, maintainregular contact with suppliers of data, conduct regular checks onthe integrity of the data and ensure data entry is up to date. TheData Supervisor will also ensure that the strict privacy protocolsare maintained.
Part-time assistance from the Safety and Health Statisticianwill also be required, who will conduct or oversee the analysis ofthe data and ensure it is done in compliance with AustralianStandard 1885.1 (1990).
Functions
In fulfilling its role to the mining industry, the HSU will havethe following functions:
• Be a centre of excellence where high ethical standards aremaintained with special emphasis on privacy matters
• Collect medical data relevant to the occupational health of mineand quarry workers and comply with privacy policy requirements.The data sources are detailed elsewhere in this report
• Analyse information received in a manner which is relevant tothe health needs of mine and quarry workers
• Report results of data analysis• Advise the inspectorate on activities or other matters where
significant health risks have been identified• Develop training resources and facilitate training in
occupational health• Provide statistical data to support research• Participate in epidemiological and occupational health
benchmarking studies with other research groups, states and/orcountries.
It is anticipated that the proposed new health surveillancemodel should be able to be implemented with two staff membersand only a moderate increase in the budget allocation that existsfor the current Coal Mine Workers’ Health Scheme. Thesignificant change from the current system being that under thenew process, only persons whose occupational health has beenadversely affected will be reported to the new HSU. All othermedical records will be kept by the Appointed Medical Officersand be available to the HSU, possibly by electronictransfer/interrogation methods.
Opportunities for the Future
The Working Group members were unanimous in their desireto see mine operators and the regulator work in partnership to
achieve a well-focused health surveillance program for all mineand quarry workers. By sharing information small and largeoperators should be able to improve current practices with aminimum of disruption and cost to the business. It is confidentlyanticipated that such a partnership will result in worker healthand safety being enhanced.
In addition, opportunities for further research have beenidentified such as developing electronic data managementsystems and access a wider range of health data from sources notcurrently utilised in either Queensland or other states. This willrequire detailed attention with respect to the setting up of robustsystems to ensure the Privacy Policy is implemented andcomplied with at all times.
Conclusion
The proposed health surveillance model is consistent with thedirection that several large mining houses have now embarkedupon. The Minerals Council of Australia have indicated that theyare actively developing an Australia-wide health surveillancemodel for the mining industry and have received twopresentations on the proposed Queensland model as set down inthe report. The NSW Mine Safety Council and Coal Services PtyLtd (Previously Joint Coal Board) have also developed a stronginterest in the proposed health surveillance system forQueensland after having received separate presentations on twooccasions.
The opportunities are there to identify, control or eliminatethe currently known occupational health risks. It now needs thecommitment of all stakeholders to ensure that the mining andquarrying industry workers benefit from well focused healthsurveillance programs.
Appendix 1
Appendix 2
29
A Study of the Health & Safetyaspects of Shiftwork & Rostersat the PCML
Caitlin Leary, PCML LimitedDavid Cliff, Minerals Industry Safety & Health Centre, University of Queensland
Abstract
This paper reports the conclusions of a study that wasundertaken to assess the safety risk and health aspects ofshiftwork and rosters at the Pasminco Century Mine Limited(PCML). PCML has guidelines in place to manage fatigue andwished to assess their effectiveness and the need for anychanges. In part, this recognition was catalysed by the paucity ofrelevant data and studies on shiftwork and commute rosters inthe metalliferous mining industry.
The health and safety performance at PCML is among thebest in the Australian Mining Industry. The system for managingfatigue is an integral part of the overall health and safetymanagement system at PCML.
In conclusion, the data show that sleep quality and quantitydoes not deteriorate over multiple 24-hour periods, and that acommute workplace that supports and promotes a recoveryenvironment will be less impacted by fatigue than a communitybased workplace where the recovery off-shift may be moredifficult and may lead to an accumulated sleep debt.
In addition, there is no evidence from this study to indicatethat fatigue as a result of the work rosters and shift cyclesworked is a significant contributor to accidents and incidents atPCML.
Introduction
The study was commissioned by PCML to evaluate theeffectiveness of the fatigue management initiatives that have beenimplemented at the Mine. Unlike other studies this projectfocuses purely on the safety risk and health aspects of fatiguewhilst employees are on site. The study does not cover social andeconomic aspects of shiftwork and roster influences off site or inthe domestic setting.
This distinction was principally made because PCML, incommon with all fly in fly out operations has a strong influenceover site conditions both during working hours and during restand recreation between shifts. This degree of control obviouslydoes not exist with a conventional residential based workforce.
Overview of Century Operation
PCML is one of the largest zinc mines in the world,
producing 880,000 tonnes of zinc concentrate and 70,000tonnes of lead concentrate annually.
Century’s operations comprise two sites being the open-cutmine site located at Lawn Hill and the port site at Karumba, bothin north west Queensland, Australia. Mining zinc, lead andsilver, the open cut mine is expected to operate until 2018.
PCML was the recipient of last years MINEX Awardpresented by the Minerals Council of Australia in recognition ofexcellence in the field of safety and health in the miningindustry. The fatigue management initiatives in place at Centurywere recognised as providing an industry benchmark for bestpractice.
Commute Roster Arrangements
Century employs approximately 570 personnel on a fly-in,fly-out basis who commute from a number of regional centres infar north Queensland. These include Townsville, Mt Isa,Normanton, Doomadgee, Burketown and Mornington Island.
There are four main roster cycles of twelve-hour shifts thatare worked at Century Mine. These rosters reflect the differentoperational requirements at the Sites. These include:
• A six week cycle of five days on followed by two days off forfour weeks, followed by seven days on and then seven days off
• 9/5 roster – nine days on followed by five days off (providingfour day overlap with opposite shift within two week period)
• 14/7 – fourteen days on followed by seven days off (providingone week overlap with another shift)
• 21/7- twenty-one days on followed by seven days off (oneweek on day shift followed by two weeks on night shift, or twoweeks on day shift followed by one week on night shift).
Personnel employed at the Port facility at Karumba live in thetown in purpose built rental accommodation and beingresidential, their responses are not included in this paper butwere included in the overall study.
Lifestyle at Darimah Village, Century Mine
The lifestyle at Century promotes a well-balanced approachto food, diet, exercise, sleep and social activities. All personnellive at the Darimah Village, and are provided with the followingfacilities:
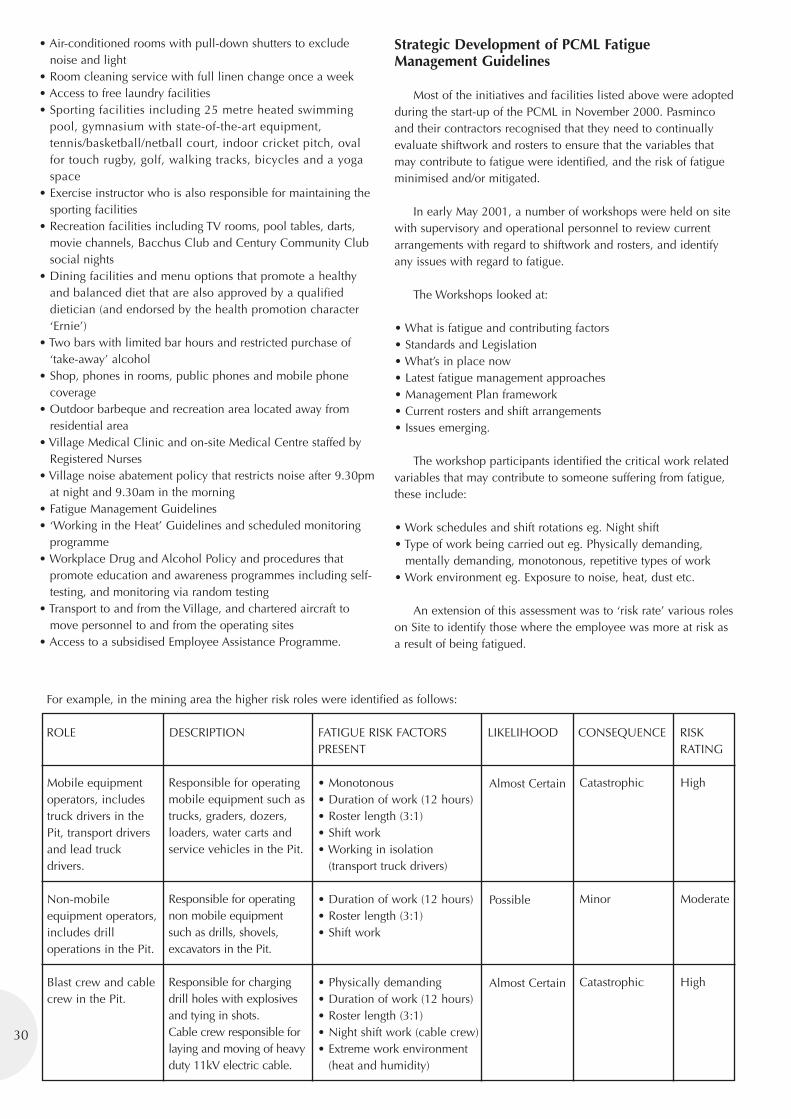
• Air-conditioned rooms with pull-down shutters to excludenoise and light
• Room cleaning service with full linen change once a week • Access to free laundry facilities• Sporting facilities including 25 metre heated swimming
pool, gymnasium with state-of-the-art equipment,tennis/basketball/netball court, indoor cricket pitch, ovalfor touch rugby, golf, walking tracks, bicycles and a yogaspace
• Exercise instructor who is also responsible for maintaining thesporting facilities
• Recreation facilities including TV rooms, pool tables, darts,movie channels, Bacchus Club and Century Community Clubsocial nights
• Dining facilities and menu options that promote a healthyand balanced diet that are also approved by a qualifieddietician (and endorsed by the health promotion character‘Ernie’)
• Two bars with limited bar hours and restricted purchase of‘take-away’ alcohol
• Shop, phones in rooms, public phones and mobile phonecoverage
• Outdoor barbeque and recreation area located away fromresidential area
• Village Medical Clinic and on-site Medical Centre staffed byRegistered Nurses
• Village noise abatement policy that restricts noise after 9.30pmat night and 9.30am in the morning
• Fatigue Management Guidelines • ‘Working in the Heat’ Guidelines and scheduled monitoring
programme• Workplace Drug and Alcohol Policy and procedures that
promote education and awareness programmes including self-testing, and monitoring via random testing
• Transport to and from the Village, and chartered aircraft tomove personnel to and from the operating sites
• Access to a subsidised Employee Assistance Programme.
Strategic Development of PCML FatigueManagement Guidelines
Most of the initiatives and facilities listed above were adoptedduring the start-up of the PCML in November 2000. Pasmincoand their contractors recognised that they need to continuallyevaluate shiftwork and rosters to ensure that the variables thatmay contribute to fatigue were identified, and the risk of fatigueminimised and/or mitigated.
In early May 2001, a number of workshops were held on sitewith supervisory and operational personnel to review currentarrangements with regard to shiftwork and rosters, and identifyany issues with regard to fatigue.
The Workshops looked at:
• What is fatigue and contributing factors• Standards and Legislation• What’s in place now • Latest fatigue management approaches• Management Plan framework• Current rosters and shift arrangements• Issues emerging.
The workshop participants identified the critical work relatedvariables that may contribute to someone suffering from fatigue,these include:
• Work schedules and shift rotations eg. Night shift• Type of work being carried out eg. Physically demanding,
mentally demanding, monotonous, repetitive types of work• Work environment eg. Exposure to noise, heat, dust etc.
An extension of this assessment was to ‘risk rate’ various roleson Site to identify those where the employee was more at risk asa result of being fatigued.
30
For example, in the mining area the higher risk roles were identified as follows:
ROLE DESCRIPTION FATIGUE RISK FACTORS LIKELIHOOD CONSEQUENCE RISK PRESENT RATING
Responsible for operatingmobile equipment such astrucks, graders, dozers,loaders, water carts andservice vehicles in the Pit.
Responsible for operatingnon mobile equipmentsuch as drills, shovels,excavators in the Pit.
Responsible for chargingdrill holes with explosivesand tying in shots.Cable crew responsible forlaying and moving of heavyduty 11kV electric cable.
Mobile equipmentoperators, includestruck drivers in the Pit, transport driversand lead truck drivers.
Non-mobileequipment operators,includes drilloperations in the Pit.
Blast crew and cablecrew in the Pit.
• Monotonous• Duration of work (12 hours)• Roster length (3:1)• Shift work • Working in isolation
(transport truck drivers)
• Duration of work (12 hours)• Roster length (3:1)• Shift work
• Physically demanding• Duration of work (12 hours)• Roster length (3:1)• Night shift work (cable crew)• Extreme work environment
(heat and humidity)
Almost Certain
Possible
Almost Certain
Catastrophic
Minor
Catastrophic
High
Moderate
High
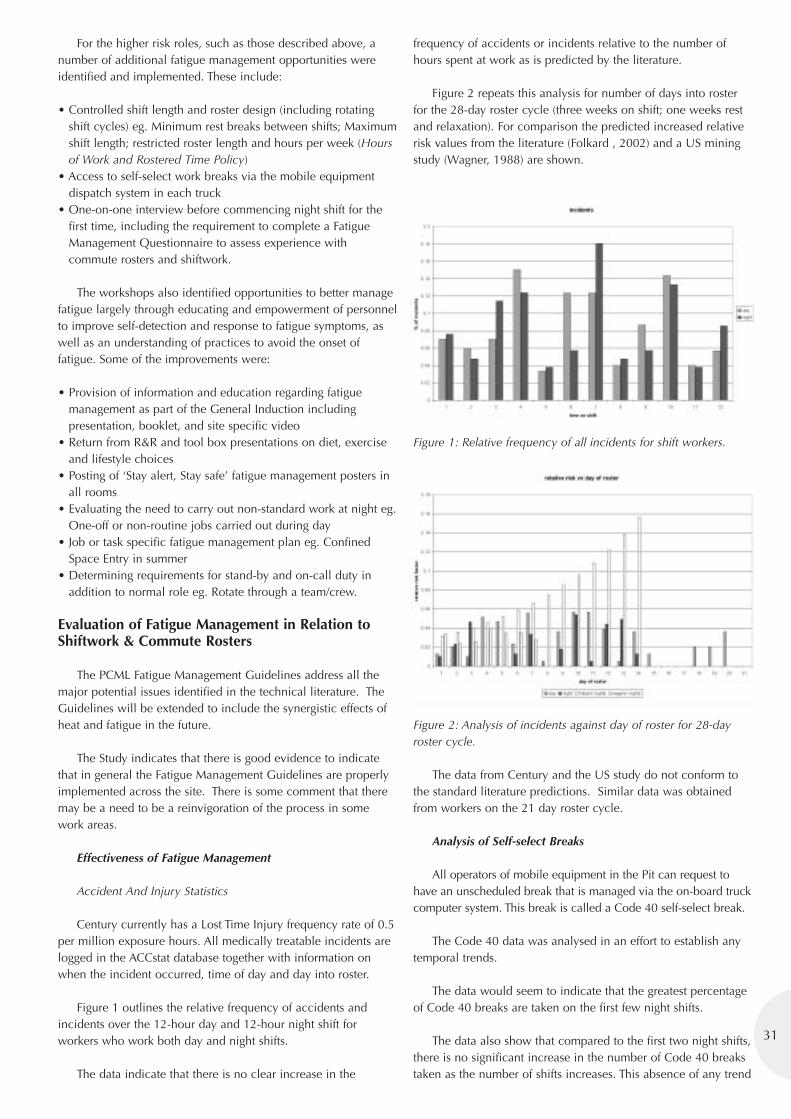
31
For the higher risk roles, such as those described above, anumber of additional fatigue management opportunities wereidentified and implemented. These include:
• Controlled shift length and roster design (including rotatingshift cycles) eg. Minimum rest breaks between shifts; Maximumshift length; restricted roster length and hours per week (Hoursof Work and Rostered Time Policy)
• Access to self-select work breaks via the mobile equipmentdispatch system in each truck
• One-on-one interview before commencing night shift for thefirst time, including the requirement to complete a FatigueManagement Questionnaire to assess experience withcommute rosters and shiftwork.
The workshops also identified opportunities to better managefatigue largely through educating and empowerment of personnelto improve self-detection and response to fatigue symptoms, aswell as an understanding of practices to avoid the onset offatigue. Some of the improvements were:
• Provision of information and education regarding fatiguemanagement as part of the General Induction includingpresentation, booklet, and site specific video
• Return from R&R and tool box presentations on diet, exerciseand lifestyle choices
• Posting of ‘Stay alert, Stay safe’ fatigue management posters inall rooms
• Evaluating the need to carry out non-standard work at night eg.One-off or non-routine jobs carried out during day
• Job or task specific fatigue management plan eg. ConfinedSpace Entry in summer
• Determining requirements for stand-by and on-call duty inaddition to normal role eg. Rotate through a team/crew.
Evaluation of Fatigue Management in Relation toShiftwork & Commute Rosters
The PCML Fatigue Management Guidelines address all themajor potential issues identified in the technical literature. TheGuidelines will be extended to include the synergistic effects ofheat and fatigue in the future.
The Study indicates that there is good evidence to indicatethat in general the Fatigue Management Guidelines are properlyimplemented across the site. There is some comment that theremay be a need to be a reinvigoration of the process in somework areas.
Effectiveness of Fatigue Management
Accident And Injury Statistics
Century currently has a Lost Time Injury frequency rate of 0.5per million exposure hours. All medically treatable incidents arelogged in the ACCstat database together with information onwhen the incident occurred, time of day and day into roster.
Figure 1 outlines the relative frequency of accidents andincidents over the 12-hour day and 12-hour night shift forworkers who work both day and night shifts.
The data indicate that there is no clear increase in the
frequency of accidents or incidents relative to the number ofhours spent at work as is predicted by the literature.
Figure 2 repeats this analysis for number of days into rosterfor the 28-day roster cycle (three weeks on shift; one weeks restand relaxation). For comparison the predicted increased relativerisk values from the literature (Folkard , 2002) and a US miningstudy (Wagner, 1988) are shown.
Figure 1: Relative frequency of all incidents for shift workers.
Figure 2: Analysis of incidents against day of roster for 28-dayroster cycle.
The data from Century and the US study do not conform tothe standard literature predictions. Similar data was obtainedfrom workers on the 21 day roster cycle.
Analysis of Self-select Breaks
All operators of mobile equipment in the Pit can request tohave an unscheduled break that is managed via the on-board truckcomputer system. This break is called a Code 40 self-select break.
The Code 40 data was analysed in an effort to establish anytemporal trends.
The data would seem to indicate that the greatest percentageof Code 40 breaks are taken on the first few night shifts.
The data also show that compared to the first two night shifts,there is no significant increase in the number of Code 40 breakstaken as the number of shifts increases. This absence of any trend
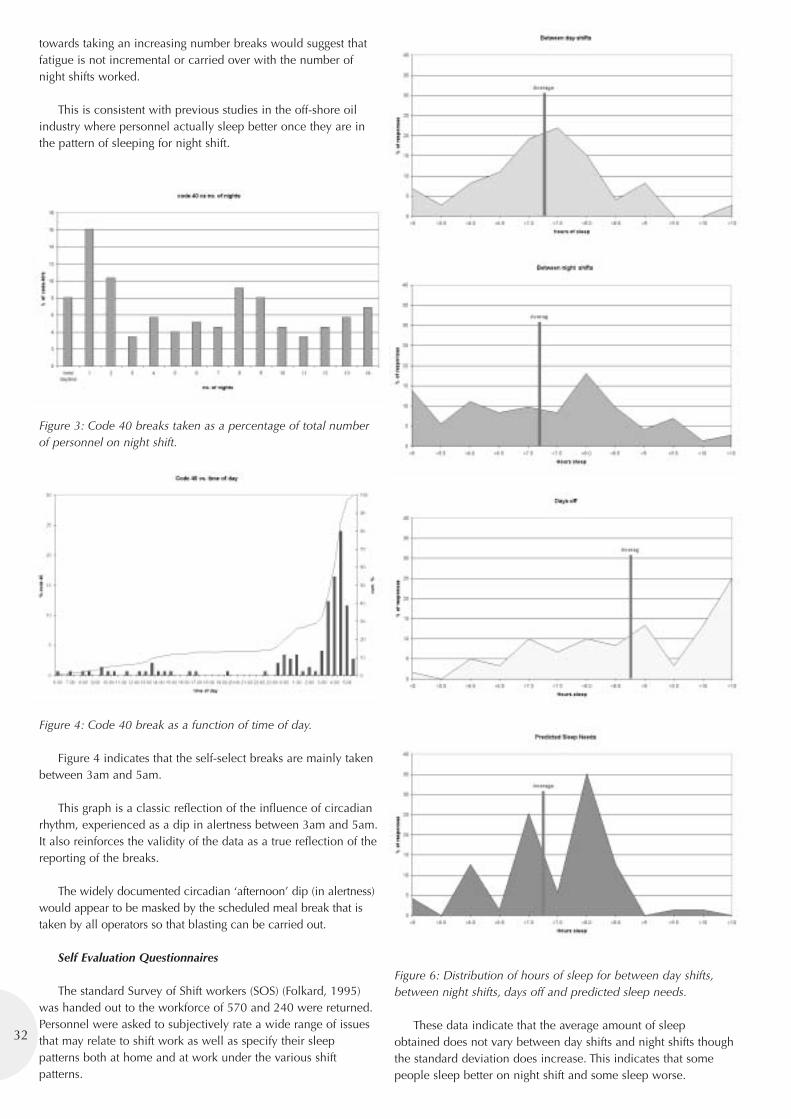
towards taking an increasing number breaks would suggest thatfatigue is not incremental or carried over with the number ofnight shifts worked.
This is consistent with previous studies in the off-shore oilindustry where personnel actually sleep better once they are inthe pattern of sleeping for night shift.
Figure 3: Code 40 breaks taken as a percentage of total numberof personnel on night shift.
Figure 4: Code 40 break as a function of time of day.
Figure 4 indicates that the self-select breaks are mainly takenbetween 3am and 5am.
This graph is a classic reflection of the influence of circadianrhythm, experienced as a dip in alertness between 3am and 5am.It also reinforces the validity of the data as a true reflection of thereporting of the breaks.
The widely documented circadian ‘afternoon’ dip (in alertness)would appear to be masked by the scheduled meal break that istaken by all operators so that blasting can be carried out.
Self Evaluation Questionnaires
The standard Survey of Shift workers (SOS) (Folkard, 1995)was handed out to the workforce of 570 and 240 were returned.Personnel were asked to subjectively rate a wide range of issuesthat may relate to shift work as well as specify their sleeppatterns both at home and at work under the various shiftpatterns.
Figure 6: Distribution of hours of sleep for between day shifts,between night shifts, days off and predicted sleep needs.
These data indicate that the average amount of sleepobtained does not vary between day shifts and night shifts thoughthe standard deviation does increase. This indicates that somepeople sleep better on night shift and some sleep worse.
32
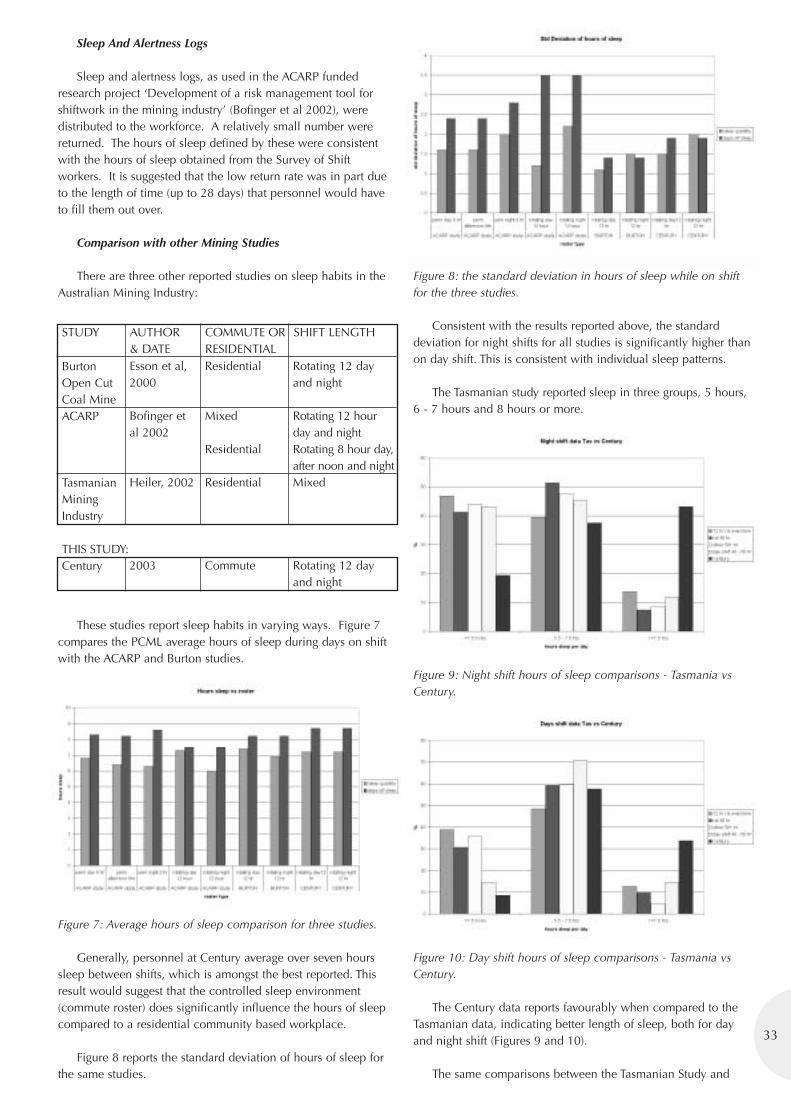
33
Sleep And Alertness Logs
Sleep and alertness logs, as used in the ACARP fundedresearch project ‘Development of a risk management tool forshiftwork in the mining industry’ (Bofinger et al 2002), weredistributed to the workforce. A relatively small number werereturned. The hours of sleep defined by these were consistentwith the hours of sleep obtained from the Survey of Shiftworkers. It is suggested that the low return rate was in part dueto the length of time (up to 28 days) that personnel would haveto fill them out over.
Comparison with other Mining Studies
There are three other reported studies on sleep habits in theAustralian Mining Industry:
These studies report sleep habits in varying ways. Figure 7compares the PCML average hours of sleep during days on shiftwith the ACARP and Burton studies.
Figure 7: Average hours of sleep comparison for three studies.
Generally, personnel at Century average over seven hourssleep between shifts, which is amongst the best reported. Thisresult would suggest that the controlled sleep environment(commute roster) does significantly influence the hours of sleepcompared to a residential community based workplace.
Figure 8 reports the standard deviation of hours of sleep forthe same studies.
Figure 8: the standard deviation in hours of sleep while on shiftfor the three studies.
Consistent with the results reported above, the standarddeviation for night shifts for all studies is significantly higher thanon day shift. This is consistent with individual sleep patterns.
The Tasmanian study reported sleep in three groups, 5 hours,6 - 7 hours and 8 hours or more.
Figure 9: Night shift hours of sleep comparisons - Tasmania vsCentury.
Figure 10: Day shift hours of sleep comparisons - Tasmania vsCentury.
The Century data reports favourably when compared to theTasmanian data, indicating better length of sleep, both for dayand night shift (Figures 9 and 10).
The same comparisons between the Tasmanian Study and
Burton Open CutCoal MineACARP
TasmanianMiningIndustry
THIS STUDY:Century
Esson et al,2000
Bofinger etal 2002
Heiler, 2002
2003
Residential
Mixed
Residential
Residential
Commute
Rotating 12 dayand night
Rotating 12 hourday and nightRotating 8 hour day,after noon and nightMixed
Rotating 12 dayand night
STUDY AUTHOR COMMUTE OR SHIFT LENGTH& DATE RESIDENTIAL
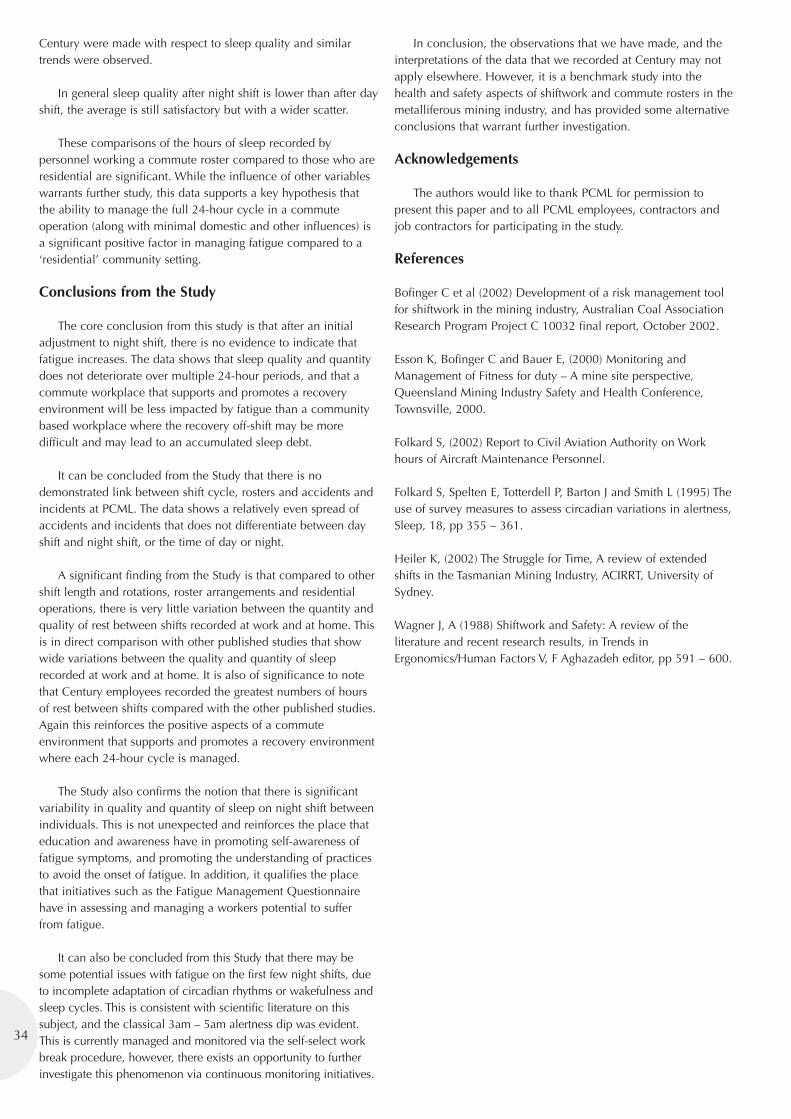
Century were made with respect to sleep quality and similartrends were observed.
In general sleep quality after night shift is lower than after dayshift, the average is still satisfactory but with a wider scatter.
These comparisons of the hours of sleep recorded bypersonnel working a commute roster compared to those who areresidential are significant. While the influence of other variableswarrants further study, this data supports a key hypothesis thatthe ability to manage the full 24-hour cycle in a commuteoperation (along with minimal domestic and other influences) isa significant positive factor in managing fatigue compared to a‘residential’ community setting.
Conclusions from the Study
The core conclusion from this study is that after an initialadjustment to night shift, there is no evidence to indicate thatfatigue increases. The data shows that sleep quality and quantitydoes not deteriorate over multiple 24-hour periods, and that acommute workplace that supports and promotes a recoveryenvironment will be less impacted by fatigue than a communitybased workplace where the recovery off-shift may be moredifficult and may lead to an accumulated sleep debt.
It can be concluded from the Study that there is nodemonstrated link between shift cycle, rosters and accidents andincidents at PCML. The data shows a relatively even spread ofaccidents and incidents that does not differentiate between dayshift and night shift, or the time of day or night.
A significant finding from the Study is that compared to othershift length and rotations, roster arrangements and residentialoperations, there is very little variation between the quantity andquality of rest between shifts recorded at work and at home. Thisis in direct comparison with other published studies that showwide variations between the quality and quantity of sleeprecorded at work and at home. It is also of significance to notethat Century employees recorded the greatest numbers of hoursof rest between shifts compared with the other published studies.Again this reinforces the positive aspects of a commuteenvironment that supports and promotes a recovery environmentwhere each 24-hour cycle is managed.
The Study also confirms the notion that there is significantvariability in quality and quantity of sleep on night shift betweenindividuals. This is not unexpected and reinforces the place thateducation and awareness have in promoting self-awareness offatigue symptoms, and promoting the understanding of practicesto avoid the onset of fatigue. In addition, it qualifies the placethat initiatives such as the Fatigue Management Questionnairehave in assessing and managing a workers potential to sufferfrom fatigue.
It can also be concluded from this Study that there may besome potential issues with fatigue on the first few night shifts, dueto incomplete adaptation of circadian rhythms or wakefulness andsleep cycles. This is consistent with scientific literature on thissubject, and the classical 3am – 5am alertness dip was evident.This is currently managed and monitored via the self-select workbreak procedure, however, there exists an opportunity to furtherinvestigate this phenomenon via continuous monitoring initiatives.
In conclusion, the observations that we have made, and theinterpretations of the data that we recorded at Century may notapply elsewhere. However, it is a benchmark study into thehealth and safety aspects of shiftwork and commute rosters in themetalliferous mining industry, and has provided some alternativeconclusions that warrant further investigation.
Acknowledgements
The authors would like to thank PCML for permission topresent this paper and to all PCML employees, contractors andjob contractors for participating in the study.
References
Bofinger C et al (2002) Development of a risk management toolfor shiftwork in the mining industry, Australian Coal AssociationResearch Program Project C 10032 final report, October 2002.
Esson K, Bofinger C and Bauer E, (2000) Monitoring andManagement of Fitness for duty – A mine site perspective,Queensland Mining Industry Safety and Health Conference,Townsville, 2000.
Folkard S, (2002) Report to Civil Aviation Authority on Workhours of Aircraft Maintenance Personnel.
Folkard S, Spelten E, Totterdell P, Barton J and Smith L (1995) Theuse of survey measures to assess circadian variations in alertness,Sleep, 18, pp 355 – 361.
Heiler K, (2002) The Struggle for Time, A review of extendedshifts in the Tasmanian Mining Industry, ACIRRT, University ofSydney.
Wagner J, A (1988) Shiftwork and Safety: A review of theliterature and recent research results, in Trends inErgonomics/Human Factors V, F Aghazadeh editor, pp 591 – 600.
34
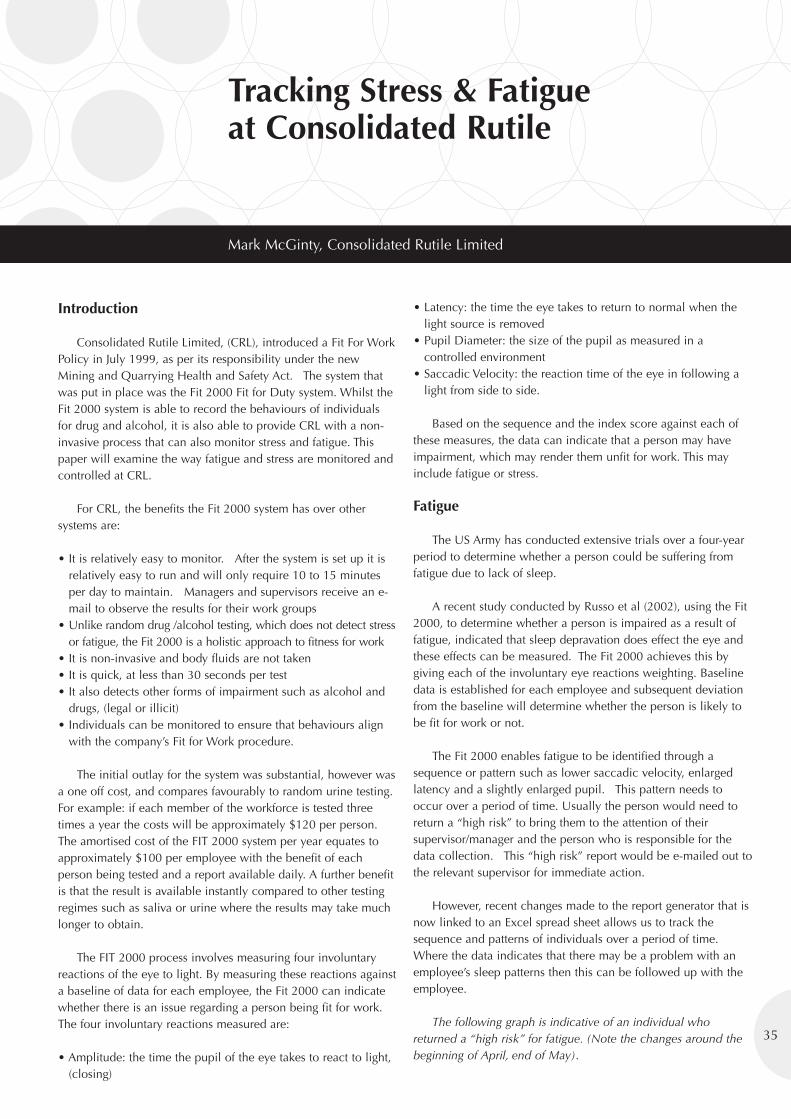
Tracking Stress & Fatigueat Consolidated Rutile
Mark McGinty, Consolidated Rutile Limited
Introduction
Consolidated Rutile Limited, (CRL), introduced a Fit For WorkPolicy in July 1999, as per its responsibility under the newMining and Quarrying Health and Safety Act. The system thatwas put in place was the Fit 2000 Fit for Duty system. Whilst theFit 2000 system is able to record the behaviours of individualsfor drug and alcohol, it is also able to provide CRL with a non-invasive process that can also monitor stress and fatigue. Thispaper will examine the way fatigue and stress are monitored andcontrolled at CRL.
For CRL, the benefits the Fit 2000 system has over othersystems are:
• It is relatively easy to monitor. After the system is set up it isrelatively easy to run and will only require 10 to 15 minutesper day to maintain. Managers and supervisors receive an e-mail to observe the results for their work groups
• Unlike random drug /alcohol testing, which does not detect stressor fatigue, the Fit 2000 is a holistic approach to fitness for work
• It is non-invasive and body fluids are not taken • It is quick, at less than 30 seconds per test• It also detects other forms of impairment such as alcohol and
drugs, (legal or illicit)• Individuals can be monitored to ensure that behaviours align
with the company’s Fit for Work procedure.
The initial outlay for the system was substantial, however wasa one off cost, and compares favourably to random urine testing.For example: if each member of the workforce is tested threetimes a year the costs will be approximately $120 per person.The amortised cost of the FIT 2000 system per year equates toapproximately $100 per employee with the benefit of eachperson being tested and a report available daily. A further benefitis that the result is available instantly compared to other testingregimes such as saliva or urine where the results may take muchlonger to obtain.
The FIT 2000 process involves measuring four involuntaryreactions of the eye to light. By measuring these reactions againsta baseline of data for each employee, the Fit 2000 can indicatewhether there is an issue regarding a person being fit for work.The four involuntary reactions measured are:
• Amplitude: the time the pupil of the eye takes to react to light,(closing)
• Latency: the time the eye takes to return to normal when thelight source is removed
• Pupil Diameter: the size of the pupil as measured in acontrolled environment
• Saccadic Velocity: the reaction time of the eye in following alight from side to side.
Based on the sequence and the index score against each ofthese measures, the data can indicate that a person may haveimpairment, which may render them unfit for work. This mayinclude fatigue or stress.
Fatigue
The US Army has conducted extensive trials over a four-yearperiod to determine whether a person could be suffering fromfatigue due to lack of sleep.
A recent study conducted by Russo et al (2002), using the Fit2000, to determine whether a person is impaired as a result offatigue, indicated that sleep depravation does effect the eye andthese effects can be measured. The Fit 2000 achieves this bygiving each of the involuntary eye reactions weighting. Baselinedata is established for each employee and subsequent deviationfrom the baseline will determine whether the person is likely tobe fit for work or not.
The Fit 2000 enables fatigue to be identified through asequence or pattern such as lower saccadic velocity, enlargedlatency and a slightly enlarged pupil. This pattern needs tooccur over a period of time. Usually the person would need toreturn a “high risk” to bring them to the attention of theirsupervisor/manager and the person who is responsible for thedata collection. This “high risk” report would be e-mailed out tothe relevant supervisor for immediate action.
However, recent changes made to the report generator that isnow linked to an Excel spread sheet allows us to track thesequence and patterns of individuals over a period of time.Where the data indicates that there may be a problem with anemployee’s sleep patterns then this can be followed up with theemployee.
The following graph is indicative of an individual whoreturned a “high risk” for fatigue. (Note the changes around thebeginning of April, end of May).
35
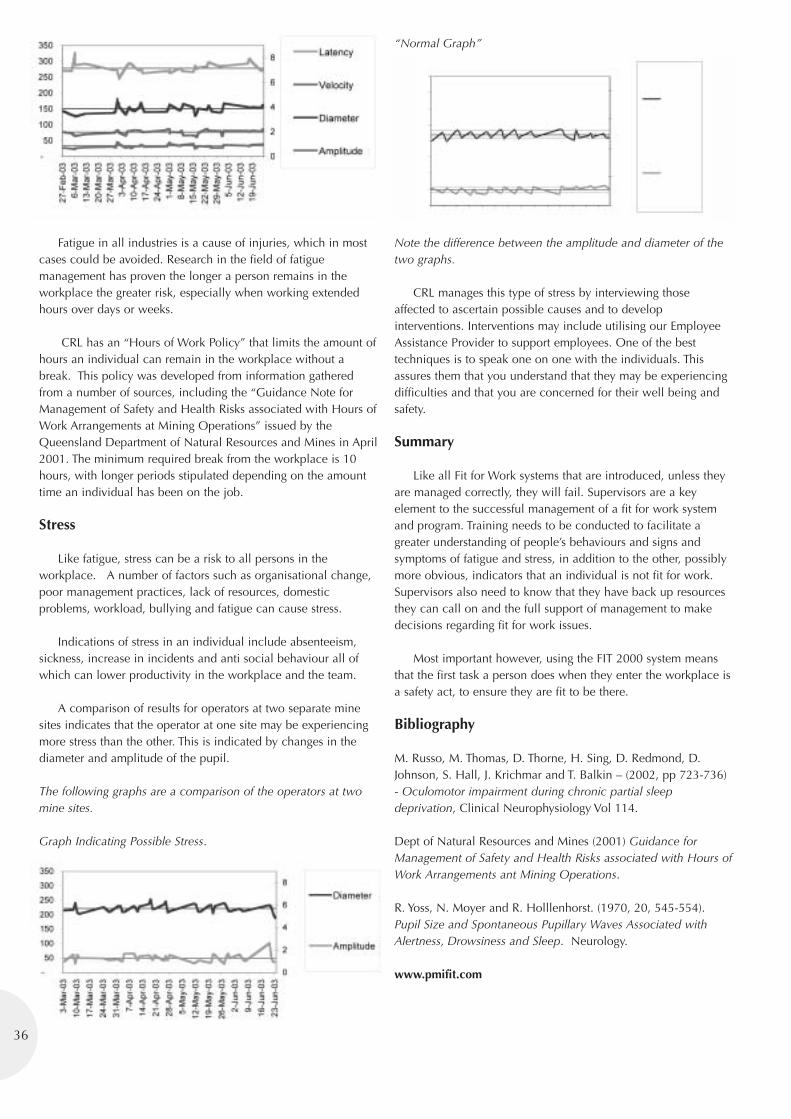
Fatigue in all industries is a cause of injuries, which in mostcases could be avoided. Research in the field of fatiguemanagement has proven the longer a person remains in theworkplace the greater risk, especially when working extendedhours over days or weeks.
CRL has an “Hours of Work Policy” that limits the amount ofhours an individual can remain in the workplace without abreak. This policy was developed from information gatheredfrom a number of sources, including the “Guidance Note forManagement of Safety and Health Risks associated with Hours ofWork Arrangements at Mining Operations” issued by theQueensland Department of Natural Resources and Mines in April2001. The minimum required break from the workplace is 10hours, with longer periods stipulated depending on the amounttime an individual has been on the job.
Stress
Like fatigue, stress can be a risk to all persons in theworkplace. A number of factors such as organisational change,poor management practices, lack of resources, domesticproblems, workload, bullying and fatigue can cause stress.
Indications of stress in an individual include absenteeism,sickness, increase in incidents and anti social behaviour all ofwhich can lower productivity in the workplace and the team.
A comparison of results for operators at two separate minesites indicates that the operator at one site may be experiencingmore stress than the other. This is indicated by changes in thediameter and amplitude of the pupil.
The following graphs are a comparison of the operators at twomine sites.
Graph Indicating Possible Stress.
“Normal Graph”
Note the difference between the amplitude and diameter of thetwo graphs.
CRL manages this type of stress by interviewing thoseaffected to ascertain possible causes and to developinterventions. Interventions may include utilising our EmployeeAssistance Provider to support employees. One of the besttechniques is to speak one on one with the individuals. Thisassures them that you understand that they may be experiencingdifficulties and that you are concerned for their well being andsafety.
Summary
Like all Fit for Work systems that are introduced, unless theyare managed correctly, they will fail. Supervisors are a keyelement to the successful management of a fit for work systemand program. Training needs to be conducted to facilitate agreater understanding of people’s behaviours and signs andsymptoms of fatigue and stress, in addition to the other, possiblymore obvious, indicators that an individual is not fit for work.Supervisors also need to know that they have back up resourcesthey can call on and the full support of management to makedecisions regarding fit for work issues.
Most important however, using the FIT 2000 system meansthat the first task a person does when they enter the workplace isa safety act, to ensure they are fit to be there.
Bibliography
M. Russo, M. Thomas, D. Thorne, H. Sing, D. Redmond, D.Johnson, S. Hall, J. Krichmar and T. Balkin – (2002, pp 723-736)- Oculomotor impairment during chronic partial sleepdeprivation, Clinical Neurophysiology Vol 114.
Dept of Natural Resources and Mines (2001) Guidance forManagement of Safety and Health Risks associated with Hours ofWork Arrangements ant Mining Operations.
R. Yoss, N. Moyer and R. Holllenhorst. (1970, 20, 545-554).Pupil Size and Spontaneous Pupillary Waves Associated withAlertness, Drowsiness and Sleep. Neurology.
www.pmifit.com
36
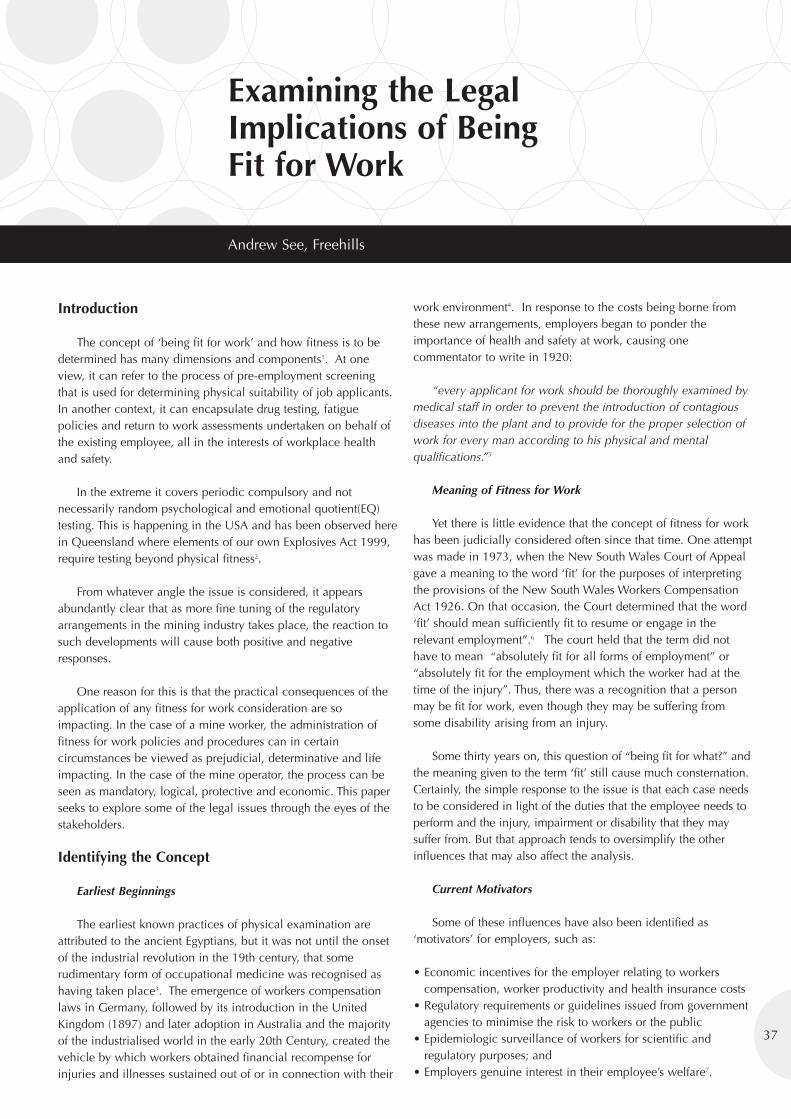
Examining the LegalImplications of BeingFit for Work
Andrew See, Freehills
Introduction
The concept of ‘being fit for work’ and how fitness is to bedetermined has many dimensions and components1. At oneview, it can refer to the process of pre-employment screeningthat is used for determining physical suitability of job applicants.In another context, it can encapsulate drug testing, fatiguepolicies and return to work assessments undertaken on behalf ofthe existing employee, all in the interests of workplace healthand safety.
In the extreme it covers periodic compulsory and notnecessarily random psychological and emotional quotient(EQ)testing. This is happening in the USA and has been observed herein Queensland where elements of our own Explosives Act 1999,require testing beyond physical fitness2.
From whatever angle the issue is considered, it appearsabundantly clear that as more fine tuning of the regulatoryarrangements in the mining industry takes place, the reaction tosuch developments will cause both positive and negativeresponses.
One reason for this is that the practical consequences of theapplication of any fitness for work consideration are soimpacting. In the case of a mine worker, the administration offitness for work policies and procedures can in certaincircumstances be viewed as prejudicial, determinative and lifeimpacting. In the case of the mine operator, the process can beseen as mandatory, logical, protective and economic. This paperseeks to explore some of the legal issues through the eyes of thestakeholders.
Identifying the Concept
Earliest Beginnings
The earliest known practices of physical examination areattributed to the ancient Egyptians, but it was not until the onsetof the industrial revolution in the 19th century, that somerudimentary form of occupational medicine was recognised ashaving taken place3. The emergence of workers compensationlaws in Germany, followed by its introduction in the UnitedKingdom (1897) and later adoption in Australia and the majorityof the industrialised world in the early 20th Century, created thevehicle by which workers obtained financial recompense forinjuries and illnesses sustained out of or in connection with their
work environment4. In response to the costs being borne fromthese new arrangements, employers began to ponder theimportance of health and safety at work, causing onecommentator to write in 1920:
“every applicant for work should be thoroughly examined bymedical staff in order to prevent the introduction of contagiousdiseases into the plant and to provide for the proper selection ofwork for every man according to his physical and mentalqualifications.”5
Meaning of Fitness for Work
Yet there is little evidence that the concept of fitness for workhas been judicially considered often since that time. One attemptwas made in 1973, when the New South Wales Court of Appealgave a meaning to the word ‘fit’ for the purposes of interpretingthe provisions of the New South Wales Workers CompensationAct 1926. On that occasion, the Court determined that the word‘fit’ should mean sufficiently fit to resume or engage in therelevant employment”.6 The court held that the term did nothave to mean “absolutely fit for all forms of employment” or“absolutely fit for the employment which the worker had at thetime of the injury”. Thus, there was a recognition that a personmay be fit for work, even though they may be suffering fromsome disability arising from an injury.
Some thirty years on, this question of “being fit for what?” andthe meaning given to the term ‘fit’ still cause much consternation.Certainly, the simple response to the issue is that each case needsto be considered in light of the duties that the employee needs toperform and the injury, impairment or disability that they maysuffer from. But that approach tends to oversimplify the otherinfluences that may also affect the analysis.
Current Motivators
Some of these influences have also been identified as‘motivators’ for employers, such as:
• Economic incentives for the employer relating to workerscompensation, worker productivity and health insurance costs
• Regulatory requirements or guidelines issued from governmentagencies to minimise the risk to workers or the public
• Epidemiologic surveillance of workers for scientific andregulatory purposes; and
• Employers genuine interest in their employee’s welfare7.
37
Logically, there are also relevant issues that may influence thebehaviour of workers and these include:-
• The right to work• Economic needs of the worker and/or family• Social needs of the worker; and• Other industrial and political influences.
Let us now consider the interrelationship of some of theseissues further.
Four aspects of Fitness for Work
Introduction
For the purposes of this analysis, the concept of ‘fitness forwork’ has been broken down into four general categories ofcase:-
• Pre-employment screening• Arising out of and in the course of employment• Assessment as a consequence of accident or injury; and• Random health testing.
At this point it is too early to consider compulsorycontinuous fitness testing regimes, as in the USA. It isbeginning here already in special types of employment(defence forces, defence intelligence) and may become moreprevalent in police and emergency recruits in the coming years.The categories of case are not mutually exclusive or exhaustive.As Figure 1 illustrates there are many aspects that make upfitness for work.
Figure 1: Issues identified within the fitness for work continuum.Source: MISHC. ACARP Scoping Study 2001.
The principal purpose for categorising into four general typesof case, is to isolate some of the unique aspects pertaining to thevarious aspects of fitness for work. These are now addressed inturn.
Pre-employment Screening
The first category of case that we examine is that of pre-employment screening. The preparedness to participate andsuccessfully undertake a medical examination can be a pre-requisite to the making of the employment contract. In cases ofthis type, the rights and obligations of the parties under thecontract are suspended until the employee is successfullyscreened8. The failure of an applicant to pass a ‘medical’ innormal circumstances, typically results in the contract eithercoming to an end or not being consummated. Where no bindingoffer of employment is in place, no contract is made.
As a result, many recruitment policies are framed along thefollowing lines.
Pre-employment Medical Examination
All applicants will be required to take a pre-employmentmedical examination to assess the prospective employee’s fitnessfor work. All offers of work are conditional on an applicantsatisfactorily undertaking the pre-employment medicalexamination and being assessed as fully fit for the work required.
To that end, a prospective employer is permitted to askmedical and psychological questions (including seekinginformation about an applicant’s compensation history) only ifthose questions relate to the essential requirements of theparticular job and the applicant’s ability to do that job. It isunlawful to ask any other medical or related questions at thisstage. If a question is asked that does not relate to therequirements of the position that the prospective employee hasapplied for, an unsuccessful applicant may then claim that theanswer to that question was a ground for discrimination.
The converse situation also applies in the case where anemployer uses extraneous information to assist in the making ofan appointment decision.
O’Neill v Burton Cables Pty Ltd
In O’Neill v Burton Cables Pty Ltd9, Burton Cables Pty Ltdwas found to have refused to have employed O’Neill as apurchasing officer, on the basis that he had provided informationto the examining medical officer that he had been suffering fromback problems. As it transpired on presentation to the examiningmedical officer, O’Neill had indicated that he was stiff and soreas a result of digging in his garden. The examining medical officerhad made the comments that O’Neill should have “been homein bed” and on that basis the company formed the view thatO’Neill should not be employed as there was a risk that hewould injure himself lifting goods. However it was held that therewas little information on which such a judgment could be made.No attempt was made to obtain additional information from thedoctor as to why these comments were included in the reportand the previous employer had actually indicated to BurtonCables that O’Neill had no time away from work with backproblems. In this case, the Victorian Equal Opportunity Boardfound that the company had treated O’Neill less favourably thanit would have treated an applicant who did not have a stiff back.The company was found to be in breach of the equalopportunity legislation.
Pre-employment screening should take place only after it hasbeen determined which applicants will be offered a job, with theoffer of employment made conditional upon the successfulcompletion of the medical examination. This is subject to theoverriding qualification that any disqualifying conditionsdiscovered as a result of the examination relate to the essentialrequirements of the job.
In ordinary circumstances, prospective employees should sign
38
39
a consent form before any testing is undertaken. That formshould also advise them, in detail, about the nature of the testthat they are undertaking and explain the criteria for thesuccessful completion of the test. The form should confirm thatthe testing is being undertaken by an independent medical expertand that the results of the tests will remain confidential.
Testing in the General Course of Employment
The second category of case that can be identified within thefitness for work continuum, places importance on the role of theemployee at work. In the case of the existing employee, it is anessential requirement of the contract of employment that theworker be ready, willing and able to perform the inherentrequirements of the position. State health and safety laws add tothat common law obligation.
In the case of mining, the capacity of the worker is oftenassessed within the following impairment dichotomy:-
(1) Cognitive impairment (eg alcohol, personal fatigue orimproper use of drugs); and
(2) Physical impairment (eg musculoskeletal injuries, sprains andstrains, major injuries etc).
The question as to whether it is reasonable or not to expectthat a worker must submit to ongoing health assessments so thatan employer may interrogate for signs of cognitive and physicalimpairment was addressed recently in the case of Blackadder vRamsey Butchering Services Pty Ltd10. In that case, Madgwick Jstated that there should be implied by law into contracts ofemployment where necessary, that an employer be able to requirean employee to furnish particulars and/or medical evidenceaffirming the employee’s continuing fitness to undertake duties. InBlackadder, the requirement to submit to a health test, came aboutbecause of a shift in work requirement and the precautionary stepthe employer was taking to ensure that the employee was capableof undertaking the alternate duties, having regard to a previousinjury that the employee had claimed to have suffered.
In Blackadder, the employee had agreed to the following:-“if hired my continued employment may be contingent upon
satisfactorily passing a physical examination at any time toestablish my capability to properly or safely perform my duties.”
Yet even in the absence of contract, the employer’sjustification for pursuing this right can be traced back to thedecision in Hamilton v Nuroof (WA) Pty Ltd11. In that case, theHigh Court held that an employer has an obligation to takereasonable care for the safety of the employee in all thecircumstances. These obligations are now well established understatute. An illustration of this is in the case of the safety andhealth obligations set out in Part 3 of the Mining and QuarryingSafety and Health Act 1999.
Against that back drop there seems to be little doubt that theright to test an employee in the general contract of employment,in certain circumstances, will be justified.
The major developing issue is not so much a unionchallenge to that right, but the dispute over the appropriate
medical examination. Unions are challenging the employer’sright to nominate their doctor of choice. They often claim thatthe employee has the right to nominate their own doctors andthe employer is bound by that doctor’s report.
There have been a significant number of dispute hearingsover this issue in the past 12 months. Unfortunately there is nodefinitive case law yet. The closest we have to the Courts’ viewon disputed medical opinion, is the decision of the Full Bench ofthe Australian Industrial Relations Commission (AIRC) in Lewis vMobil Oil12.
Assessment as a Consequence of Accident or Injury
The third discrete category of case, focuses on processes thatordinarily flow from workplace specific accident or injury. Thereare several issues that emerge here.
Firstly, aside from the moral obligation that employers mayhave to take responsibility for workers suffering injury or illnessas a result of their work, all workers compensation systemsrequire employers to take responsibility to rehabilitate workerssuffering from work related injury or illness. To this end, medicaland treatment providers become involved in all aspects ofassessment and treatment of an injured worker so as to:
• Establish diagnosis• Determine current treatment regimes and requirements to
maximise recovery• Establish prognosis and timeframes for recovery and return to
work if not at work• Provide the doctor with information regarding the workers’
current work status and progress; and • Provide details regarding pre-injury duties, hours and job
demands.
There are a myriad of potential outcomes that may resultfrom this form of assessment, these include:
• Return to same employer/same job• Return to same employer/modified job• Return to same employer/different job• Return to different employer/same job• Return to different employer/modified job• Return to different employer/different job• Retirement on ill health13.
Given this fact, it is perhaps unsurprising that the AIRC hasrequired some checks and balances in the assessment process.
(a) Right for a Worker to obtain a Second Medical Opinion
One case that has highlighted the degree of proceduralfairness that is expected from the parties by the AIRC is that ofHobbs v Capricorn Coal Mining Management Pty Ltd(CapCoal)14. The relevant facts are as follows.
Hobbs’ Case
Hobbs had been employed by CapCoal as a mine deputy inits Southern Colliery in August 1996. On 20 November 1997 heinjured his left knee, while undertaking an inspection
underground. He eventually underwent arthroscopic surgery onhis knee and because of complications was then unable tocontinue rehabilitation. Hobbs was deemed unfit for work by theNominated Medical Adviser (NMA) and his employment wasterminated. Hobbs then applied and was granted reinstatementby the AIRC.
However, Hobbs required a medical clearance before beingallowed to return to work. After some dispute, an arrangementwas reached between the parties that Hobbs would see theNMA and that the NMA’s report would be forwarded on toanother doctor for assessment. Hobbs did not attend theappointment with the second practitioner and based solely onthe NMA’s assessment, CapCoal attempted to find Hobbs aposition which would be suitable, given that his activities, as aresult of his injuries, was now restricted. Alternative duties wereunable to be found and again, CapCoal terminated Hobb’semployment.
Hobbs again applied and was reinstated by AIRC. The AIRCfound that this dismissal of Hobbs was harsh, unjust andunreasonable as CapCoal did not comply with the arrangementthat had been reached. The tribunal found that CapCoal hadmade their decision unilaterally based on one medical opinioncontrary to the parties arrangements.
In order to return to work, Hobbs again was required toundergo the agreed medical assessments. The procedures thistime were adhered to and again Hobbs was found to berestricted in the activities he performed. Again, no suitable dutieswere found for Hobbs and his employment was terminated.Again Hobbs applied for reinstatement but this time, it was foundthat the reinstatement was not harsh unjust or unreasonable. Onappeal, the Full Bench of the AIRC found that having regard tothe duty of care imposed on mine operators and the role of theNMA, the NMA relied on all relevant material and compliance ofdirections of the earlier agreement. The termination was genuineand thus, not harsh unjust or unreasonable.
This decision highlights several factors. Firstly that in theinterests of natural justice and procedural fairness both parties needto clearly understand the nature of the process and the proceduralsteps that are to be followed along the way. Secondly and perhapsmore fundamentally is the expectation that no decision will bemade to terminate one’s employment without having regard to allpossible relevant information that may assist the NMA andsubsequently the employer, coming to an ultimate conclusion as tothe ongoing capacity of the worker to continue in their role. It isinteresting to note, that following this decision, the relevantlegislation was amended in order to enshrine within the law theright of a worker to seek the second opinion of a medical specialistor NMA, in such cases where an employer was consideringterminating or redeploying an injured or impaired worker.
Random Health Testing
The fourth and final category of case that we deal withrelates to random health testing.
The right of employers to institute random testing, can alsobe claimed to arise from an implied term of the employee’scontract of employment. It has been argued that this impliedterm relates to the right of the employer to direct an employeeto carry out all lawful and reasonable commands. Naturally,there is a limit as to the directions that an employer can giveand certainly in the case of low risk industries, one wouldquestion in the absence of any other material issues, whethersuch a right would in fact exist.
In BHP Iron Ore -v- CFMEU15, the Western AustralianIndustrial Relations Commission in Court Session acknowledgedthe right of a company to introduce a policy of random drug andalcohol testing into the workplace, where there was otherwise nocontractual right to allow employers to test. Although theCommission emphasised in its decision that it had beenconcerned to only review the industrial principles in the contextof the mining industry.
BHP Iron Ore Pty Ltd v Construction, Mining, Energy and Other
At issue was the desire of the company to introduce a drugand alcohol program for all of its employees at each of itsworkplaces. The most controversial aspect of the proposed policywas that it required that an employee as a condition ofemployment submitted to random testing of a sample of theemployee’s urine. The Union’s objection to the proposal was thatthe drug testing element of the program constituted anunreasonable intrusion into the privacy of the employees andthat the urine testing for drugs is not a reliable indicator of actualimpairment or intoxication.
In addition the Union argued that there was little or noevidence of prevalence of drug use by employees within theworkplace or immediately before commencing work.
However the company argued that it was necessary to enableit to satisfy its obligations under the Mines Safety and HealthRegulation. The company also acknowledged the privacyconcerns raised by the Union and indicated that there were strictsecurity measures designed to avoid any publication of test resultand any other information given as part of the program.
Having regard to the expert evidence put forward by thecompany, the Court in Session considered that the testing processunder the scheme was not unreasonable.
Logically, in the case of the employer, the primary obligationis to fulfil its statutory obligations in the workplace. In itsdecision the Commission noted that there was little or no directevidence as to the extent, if at all, that the consumption of drugswas a problem at the workplace. Although having said that in thethree years prior to the decision:
• An employee was killed at work, when the haul truck she wasdriving overturned. She was found to have a significant levelof cannabis in her blood at the time of death and cannabisand a smoking pipe were found in the cab of the vehicle atthat time
• Employees were caught smoking cannabis in the workplace • Cannabis was found hidden in company equipment at various
worksites; and
there are a myriad of obvious legal issues that arise in the case ofrandom testing procedures. With respect to drug and alcoholtesting, the greatest concerns articulated at the time of thisdecision were the potential for breach of confidentiality and thefact that records generated by the employer were not privilegedfrom production in civil or criminal proceedings.
Less obvious issues of concern are likely to be raised in thecase of fatigue testing, although like all issues that flow from theemployment relationship, if handled poorly can lead tosignificant unrest. This could easily be manifested wherescreening processes caused supervisory intervention in anarbitrary fashion, with resultant claims of discrimination beinglevelled at those involved. Given the complex set of work and
40
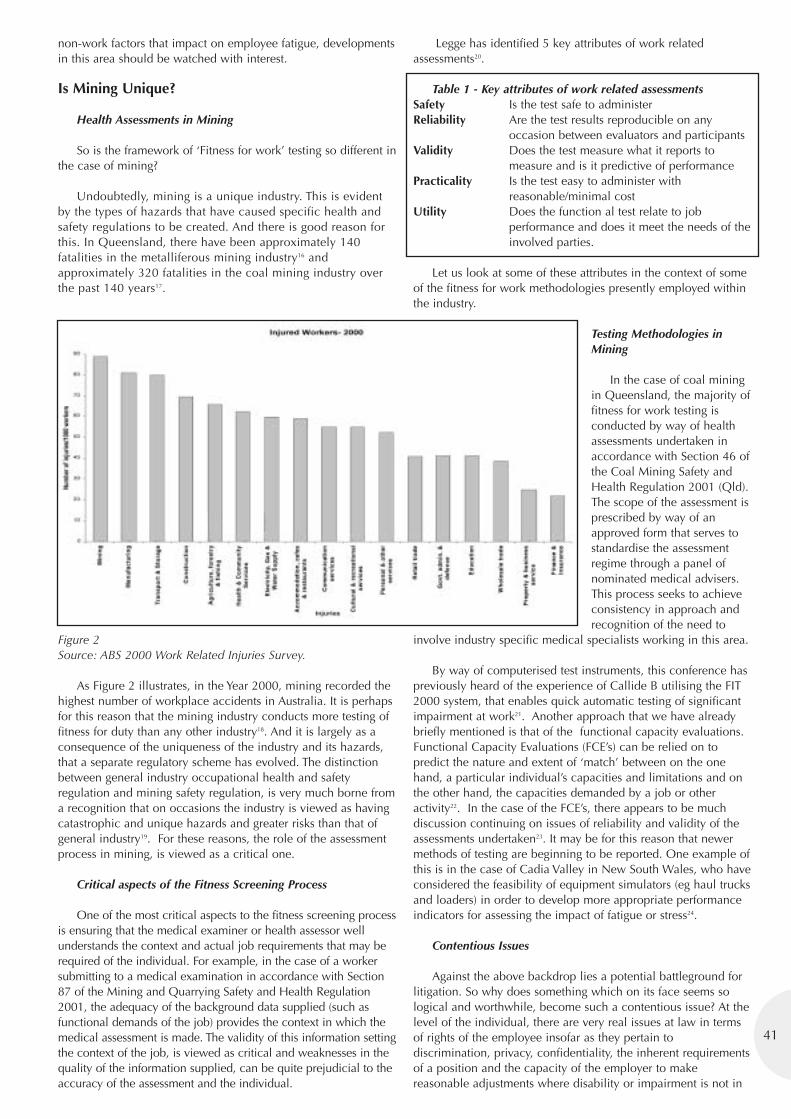
41
non-work factors that impact on employee fatigue, developmentsin this area should be watched with interest.
Is Mining Unique?
Health Assessments in Mining
So is the framework of ‘Fitness for work’ testing so different inthe case of mining?
Undoubtedly, mining is a unique industry. This is evidentby the types of hazards that have caused specific health andsafety regulations to be created. And there is good reason forthis. In Queensland, there have been approximately 140fatalities in the metalliferous mining industry16 andapproximately 320 fatalities in the coal mining industry overthe past 140 years17.
Figure 2Source: ABS 2000 Work Related Injuries Survey.
As Figure 2 illustrates, in the Year 2000, mining recorded thehighest number of workplace accidents in Australia. It is perhapsfor this reason that the mining industry conducts more testing offitness for duty than any other industry18. And it is largely as aconsequence of the uniqueness of the industry and its hazards,that a separate regulatory scheme has evolved. The distinctionbetween general industry occupational health and safetyregulation and mining safety regulation, is very much borne froma recognition that on occasions the industry is viewed as havingcatastrophic and unique hazards and greater risks than that ofgeneral industry19. For these reasons, the role of the assessmentprocess in mining, is viewed as a critical one.
Critical aspects of the Fitness Screening Process
One of the most critical aspects to the fitness screening processis ensuring that the medical examiner or health assessor wellunderstands the context and actual job requirements that may berequired of the individual. For example, in the case of a workersubmitting to a medical examination in accordance with Section87 of the Mining and Quarrying Safety and Health Regulation2001, the adequacy of the background data supplied (such asfunctional demands of the job) provides the context in which themedical assessment is made. The validity of this information settingthe context of the job, is viewed as critical and weaknesses in thequality of the information supplied, can be quite prejudicial to theaccuracy of the assessment and the individual.
Legge has identified 5 key attributes of work relatedassessments20.
Table 1 - Key attributes of work related assessmentsSafety Is the test safe to administerReliability Are the test results reproducible on any
occasion between evaluators and participantsValidity Does the test measure what it reports to
measure and is it predictive of performancePracticality Is the test easy to administer with
reasonable/minimal costUtility Does the function al test relate to job
performance and does it meet the needs of theinvolved parties.
Let us look at some of these attributes in the context of someof the fitness for work methodologies presently employed withinthe industry.
Testing Methodologies inMining
In the case of coal miningin Queensland, the majority offitness for work testing isconducted by way of healthassessments undertaken inaccordance with Section 46 ofthe Coal Mining Safety andHealth Regulation 2001 (Qld).The scope of the assessment isprescribed by way of anapproved form that serves tostandardise the assessmentregime through a panel ofnominated medical advisers.This process seeks to achieveconsistency in approach andrecognition of the need to
involve industry specific medical specialists working in this area.
By way of computerised test instruments, this conference haspreviously heard of the experience of Callide B utilising the FIT2000 system, that enables quick automatic testing of significantimpairment at work21. Another approach that we have alreadybriefly mentioned is that of the functional capacity evaluations.Functional Capacity Evaluations (FCE’s) can be relied on topredict the nature and extent of ‘match’ between on the onehand, a particular individual’s capacities and limitations and onthe other hand, the capacities demanded by a job or otheractivity22. In the case of the FCE’s, there appears to be muchdiscussion continuing on issues of reliability and validity of theassessments undertaken23. It may be for this reason that newermethods of testing are beginning to be reported. One example ofthis is in the case of Cadia Valley in New South Wales, who haveconsidered the feasibility of equipment simulators (eg haul trucksand loaders) in order to develop more appropriate performanceindicators for assessing the impact of fatigue or stress24.
Contentious Issues
Against the above backdrop lies a potential battleground forlitigation. So why does something which on its face seems sological and worthwhile, become such a contentious issue? At thelevel of the individual, there are very real issues at law in termsof rights of the employee insofar as they pertain todiscrimination, privacy, confidentiality, the inherent requirementsof a position and the capacity of the employer to makereasonable adjustments where disability or impairment is not in
itself a barrier to performance. For the employee, existing fitnessfor work testing procedures can be the stimulus for claims ofintimidation and unfair treatment.
In addition, there is anecdotal evidence that issues dobecome industrial, whether legitimate or not. Some of theapparent hostility manifests itself on the basis of a difference inviews as to what are the legal entitlements of the parties havingregard to the employment relationship. For example, one circularsent out within a mining district stated that the relevant Unionhad been advised by a statutory appointee that companies had acommon law right to send any mineworker to a nominatedmedical adviser. It went on further to indicate that this advice istotally inconsistent with the Union’s interpretation of the intent ofthe relevant Mining Act and will be rigorously opposed by theUnion. In that context, where consent to a process is notforthcoming, issues of medical assault and claims of acts againstyour will, also emerge.
The situation can be compounded further where disputationover which medical adviser is appropriate, also takes place. Wesee a worrying trend where the unions allege one doctor is pro-employer and the employers allege one doctor is pro-employee.This seems to go beyond the usual and understandable debatethat different doctors genuinely can interpret the same resultswith different outcomes.
Issues of Discrimination & Unfair Dismissal
General Principles of Anti-discrimination Law
Anti-discrimination law impacts on all four categories of acase. At both the state and federal level, there is legislationprohibiting discrimination in an employment situation. Forexample the Disability Discrimination Act 1992 (Cth) prohibitsdiscrimination on the basis of a disability which is defined atSection 4 of the Act to include:
(a) Total or partial loss of a person’s bodily or mental functions; or...(c) The presence in the body of organisms capable of causing
disease or illness; or...(g) A disorder, illness or disease that affects a person’s thought
processes, perception of reality, emotions or judgement orthat results in disturbed behaviour.
Section 15 of that Act provides that it is unlawful for anemployer to discriminate in determining who should be offeredemployment, deny an employee access to promotion transfer andtraining, dismiss an employee, or subject the employee to anyother detriment because of discrimination on the ground of aperson’s disability.
At the State level, the Anti Discrimination Act 1991 (Qld)prohibits discrimination on the basis of physical impairment.‘Impairment’ is defined in that Act in similar terms to thedefinition of ‘disability’ in the Disability Discrimination Act 1992(Cth).
When Discrimination is Permitted
Discrimination is permitted in certain circumstances. Underthe Federal Act, discrimination is permitted where:
(a) The disability prevents a person from carrying out the inherentrequirements of the particular employment; or
(b) In order to carry out those requirements, facilities would needto be provided which would impose an unjustifiable hardshipon the employer (section15(4)).
In the case of the Queensland Act, discrimination is lawfulwhere:
(a) The circumstances of the impairment are such that they wouldimpose unjustifiable hardship on the employer (section 36); or
(b) The discriminating act is done to protect the health and safetyof people at work(section 108); or
(c) If the discriminating act is done because of a genuineoccupational requirement for a position (section 25).
Additionally, some anti-discrimination legislation, forexample section 106 of the Anti-Discrimination Act 1991 (Qld)exempts discrimination in circumstances where it is necessary tocomply with other relevant state or federal laws.
Earlier on in the context of pre-employment screening, theissue of discrimination was briefly canvassed. The objectives ofthe anti-discrimination and industrial relations laws appearlargely the same. By far the majority of complaints in this areaare likely to arise where a worker is deemed to be no longerphysically capable of performing his or her duties. In cases ofthis type, termination is invariably a consequence of theincapacity of a worker to physically continue within the role orthe workplace. The importance of determining objectively whatare the occupational requirements of a position and whether ornot there can be some modification of duties (for example) so asto accommodate the impaired worker within the workplace,therefore become critical, as tribunals are asked to assesswhether a worker has been treated fairly as a consequence offitness for duty testing.
Termination of Employment
In the case of statutory protections given to workers undertermination law, the general considerations for the parties arelargely the same. There are several ways by which a contract ofemployment can come to an end. These include by:
• Mutual agreement• Serious breach of an essential term• Inability of one party to perform their duties within the
contract; or• By way of a supervening or frustrating event.
But against these basic common law rights, statutoryprovisions have been created and for the past decade now, thepotential remedies that are available to employees under statute,have become quite important in the way to proceed with theoutcomes of a fitness for work testing procedure.
(a) Remedies Available in the Federal Jurisdiction
At the Federal level, section 170CE(1) of the WorkplaceRelations Act 1996 (Cth) sets out the grounds by which anemployee whose employment has been terminated by anemployer may apply for the relief of the Australian IndustrialRelations Commission. (AIRC) These include:
• On the ground that the termination was harsh, unjust orunreasonable [Section 170CE(1)(a)]
• Temporary absence from work because of illness or injurywithin the meaning of the Regulation 30C [Section170CK(2)(a)] and
• Physical and mental disability [Section 170CK(2)(f)].
The case of Ian Hobbs v Capricorn Coal Management, hasalready been raised where the unilateral decision to terminate anemployee on the grounds of incapacity, was seen as a violation
42
43
of an approved process the result of which amounted to anaction that was harsh, unjust or unreasonable. What is becomingabundantly clear is that new battlelines are being drawn andbattles fought in cases where there is a lack of consistency inopinion among medical practitioners. At issue are competingviews as to the longer term prognosis of the worker and oftenallegations of premature decisions taken by employers toterminate workers in cases where ongoing rehabilitation oralternate duties should have or could have been provided.
The second potential ground available for the employee, is tomake an application on the basis of the physical disability arisingfrom the injury, in contravention of Section 170CK(2)(f) of theAct. In cases of this type, the application can be pursued througheither the Federal Court or the Australian Industrial RelationsCommission. Again reinstatement in these cases may be harderto secure than initially thought. One of the traditional tests thatthe AIRC must consider is the ‘practicability’ of the reinstatementhaving regard to all of the stakeholders.
The tension between the disability of the worker and the rightof the employer to secure and maintain a safe workplaceenvironment can be illustrated in the decision of Marshall J inPatterson v Newcrest Mining Ltd25, where he stated:
I am most reluctant to order the reinstatement of a employeeto her or his former position if so doing involved a real andsubstantial risk of the employee being seriously injured upon heror his return to the position occupied prior to the termination ofemployment.
It is for this reason that workers pleading termination on thecombined grounds of harsh, unjust and unreasonable as well asbased on discrimination, must now elect whether they pursuetheir claim in the Australian Industrial Relations Commission orthe Federal Court, on the basis that the difference in remediesavailable, appears to be in part in recognition of the complexitiesassociated with disability claims.
(b) Remedies Available at the State Level
With some minor exceptions, the provisions of the IndustrialRelations Act 1999 (Qld) are set out in fairly similar terms to thatof the Federal legislation. However there are two relevantprovisions within Part 5, Chapter 3 of the Act that deservecomment. Section 93 of the Act provides that it is unlawful toterminate an employee who becomes injured within the first 6months of that injury and under Section 95(2) an injuredemployee who was terminated because of that injury, may applyto the employer within 12 months after the injury forreinstatement to his or her former position. For the later situationto occur, the employee must give the employer a doctor’scertificate that certifies the employee’s fitness to return to workand in the event that the employee is not immediately reinstatedby the employer, the employee may apply to the QueenslandIndustrial Relations Commission for reinstatement. One wondersthe implications of these provisions where competing views ofmedical practitioners prevail and where for example, an NMAunder the Coal Mining laws has declared a person permanentlyunfit to work in mining.
Roles & Rights of Parties in a Fitness for WorkEnvironment
Recent Experiences within the Coal Industry(a) Role of Industry Safety & Health Representatives
Given the various legal issues that impact on the parties, it is
natural enough that the development of fitness for work policies atworkplaces often creates significant industrial unrest. This wasrecently observed in relation to the revision of the fatiguemanagement policy at Oaky Creek Mine26. At issue was the role ofthe industry safety and health representative and whether anautomatic right existed for the representative to be become involvedin the consultation processes imposed on a site senior executive.Section 10 of the Coal Mining Safety and Health Regulation 1991,sets outs the steps that must be taken in developing standardoperating procedures for managing and controlling hazards at amine. Section 42(6) of the Regulation sets out the consultationrequirements imposed on a site senior executive when developingfitness provisions, such as a fatigue management policy. Theserequirements include consulting with a cross section of workersinvolved in carrying out a task under the proposed procedure andproviding those workers with a copy of the draft standard operatingprocedure, or in this case the proposed draft policy.
The Oaky Creek Case
In this case, it was the submission of the employer, thatSections 10 and 42 of the Regulation had no bearing on the issue in dispute. The company argued that those sections onlyrelate to the creation of new health and safety procedures andhave no bearing on the requirements of the parties where theywish to revise existing procedures. This argument was rejected bythe court. The court held “nothing in Reg 42 suggests that to“develop” a procedure, means only to “create” one out ofnothing. Fryberg J makes clear that the capacity of arepresentative to participate in a review of the fatiguemanagement policy is likely to reside in at least one of theparagraphs within Section 118(1) of the Act, where the functionsof the representative are set out. However his Honour, concludedthat the mere fact that participation would have been within theambit of the functions of a representative, does not mean that therepresentative had an automatic right to participate in theprocess. Within the judgment his Honour illustrates this by givingan example of circumstances where a representative may not beinvited to attend, or where the workers specifically seek toexclude the representatives from the process.
This issue is likely to be one where much more industrialnegotiation shall take place.
(b) Role of Negotiating Agents in the Coal Industry
The second issue that remains largely unexplored is whetheran industry representative (or a lawyer for that matter) canassume the role of agent for workers where such agency issought to be established. His Honour declined to express a viewin relation to this issue, although on the basis that there is noexpressed function of agency set out within Section 118 of theCoal Mine Safety and Health Act 1999, it would seem fairlyunlikely that such a role would be consistent with the statutoryone for a representative that is already quite clearly defined. Thisissue is also most likely to surface again.
Rights of Lawyers to Monitor Health Assessments
Finally and on a lighter note, one wonders how much moresophisticated or legalistic, the concept of fitness for work willbecome. In the United States, for example, there exists the rightfor a defendant in a personal injuries proceeding to have amedical examination videotaped and to allow counsel tomonitor the examination from an adjoining room. In Freeman vLatherow & Ors, it was the defendants who sought to precludethe plaintiff from undertaking this taping, presumably in anattempt to spoil the validity of the medical assessment27.
Hopefully, this will not be illustrative of the future Australian way.
General Rights of the Worker
Finally, we briefly consider the rights of the worker. It is wellestablished that persons do not by virtue of their status asemployees lose their right to privacy and integrity of the person.An employer could not at common law assert any inherent right tosubject an employee to a physical examination without consent.Indeed, an employer or a doctor who forces a medicalexamination on a person may be liable to assault or battery.Section 245 Criminal Code 1889 (Qld) defines assault in wideterms to include striking, touching, applying force or threatening toapply force without that person’s consent. For example, the takingof blood against a person’s will and in the absence of any statutoryduty, will likely constitute assault under the Criminal Code.
However, while the employer cannot force an examination inthat sense, an employees refusal to comply with a lawful andreasonable request can still be grounds for termination of theemployment. That is, the laws will not protect an unreasonablerefusal to have a medical examination.
One final issue that is important to consider is the way inwhich the employer undertakes personal informationmanagement. It is imperative that an employer has anappropriate understanding of the privacy issues involved from theinitial occasion that employee information is collected through toprocesses for information disposal28. Employee medical recordswill need to be kept confidentially to ensure that the employerdoes not breach any fundamental principles. Employers shouldalso be mindful of the ‘need to know’ principle that logicallydiscourages medical information to be circulated freely withinHR departments during injury management processes.
Conclusions
Undoubtedly, fitness for work is an important issueconfronting both employers and past, present and futureemployees. This is especially so in the mining industry where therisks are higher, and the legislation tougher. Complex issuesabound in all categories of case. Consequently, employers andemployees should be aware of the rights, roles andresponsibilities that each hold when approaching the subject.
Advances in technology, medical specialisation and thegreater capacity of individuals to articulate their rights, will all bephenomena that assist in helping improve the policies andprocesses for ascertaining one’s fitness for work. Like mostworkplace issues, addressed fairly and objectively, appropriateoutcomes are achievable. What remains clear though is that“fitness for work” is a very complex issue. Given that medicalexaminations have been undertaken since ancient Egyptiantimes, there must be much that can be learnt from what has goneon to date. Clearly all stakeholders need to be put on notice thatthe processes are quite complex and that no easy answers lie inthe administration and aftermath of the testing procedure.
Bibliography
1 Bofinger C., Mahon E., Cliff D, & Heiler K., Fitness for DutyThe findings of the ACARP Scoping Study, Minerals IndustrySafety and Health Centre, University of Queensland, 2001.
2 See Section 33 of the Explosives Act 1999; and also ExplosivesInformation Bulletin No 41, Explosives Inspectorate, Safety andHealth, Department of Natural Resources and Mines.
3 Fraser T.M., Fitness for Work, Taylor and Francis, London, 1992.4 Sykes E, Sykes and Yerbury, Labour Law in Australia, Sydney,
Butterworths, 1980.
5 Fraser.T.M., op cit, p4.
6 Petrolo v John Lysaght (Australia) Ltd [1973] 2 NSWLR 550 at 557.
7 Himmelstein J.S & Pransky G.S., ‘Worker Fitness and RiskEvaluations’, Occupational Medicine, Volume 3, Number 2,April – June 1988.
8 Johnstone R., ‘Pre-employment Health Screening: The LegalFramework, Australian Journal of Labour Law, 1(2),1998,pp115-146 at 118.
9 (1986) Equal Opportunity Board, Victoria, 14 March 1986.EOC 92-159
10 (2002) 113 IR 461 at 476.
11 (1956) 96 CLR 18.
12 Print Q0400, 28 April 1998.
13 Barnett L. Rehabilitation: Restoring function after illness ofinjury’, Master OHS and Environment Guide, Sydney, CCH2003.
14 Australian Industrial Relations Commission, PR 903643, 30April 2001.
15 BHP Iron Ore Pty Ltd v Construction, Mining, EnergyTimberyards, Sawmills and Woodworkers Union (WABranch) WAIRC 19 June 1998
16 Queensland Department of Mines and Energy Safety andHealth Division Mines Inspectorate, Fatalities in theQueensland Metalliferous industry 1964-1999.
17 Queensland Department of Mines and Energy Safety andHealth Division Mines Inspectorate, Fatalities in theQueensland Coal Industry 1882-1999.
18 See key findings of the ACARP Scoping Study.
19 Gunnigham N., Johnstone .R., & Burritt P., The Developmentof a New Regulatory Model for Occupational Health andSafety in the New South Wales Coal Industry: An Issues Paperfor the New South Wales Department of Mineral Resources,unpublished, October 1999.
20 Legge.J., ‘Pre-employment functional assessments as aneffective tool of controlling work related musculoskeletaldisorders: A review’, Paper submitted toward Masters ofErgonomics Program, University of Queensland, 2003.
21 Hammet D & Baynes M., Personal fitness for duty testing atCallide Mine, Queensland Mining Industry Health and SafetyConference, August 2000.
22 Macdonald W.A., Performance Capacity Evaluation: Somecomments on its validity, 28th Annual Conference Paper,Ergonomics Society of Australia, 1992, p189.
23 Innes L. Straker L., Worth.D. (Ed), ‘Functional capacityassessment’, Moving in on Occupational Injury, Oxford,Butterworths – Heinemann, 2000.
24 Davidson G, Cadia Valley Operations, Fitness for WorkProcedure:A Changed Perspective, NSW Mining IndustryOccupational Health and Safety Conference, 2002.
25 Industrial Relations Court of Australia, PR 950674, 21December 1995.
26 Construction, Forestry, Mining and Energy Union v OakyCreek Coal Pty Ltd [2003] QSC 033.
27 District Court of Appeal of Florida, Second District Case.
28 Personal privacy protection in health care informationsystems, AS 4400-1995.
44
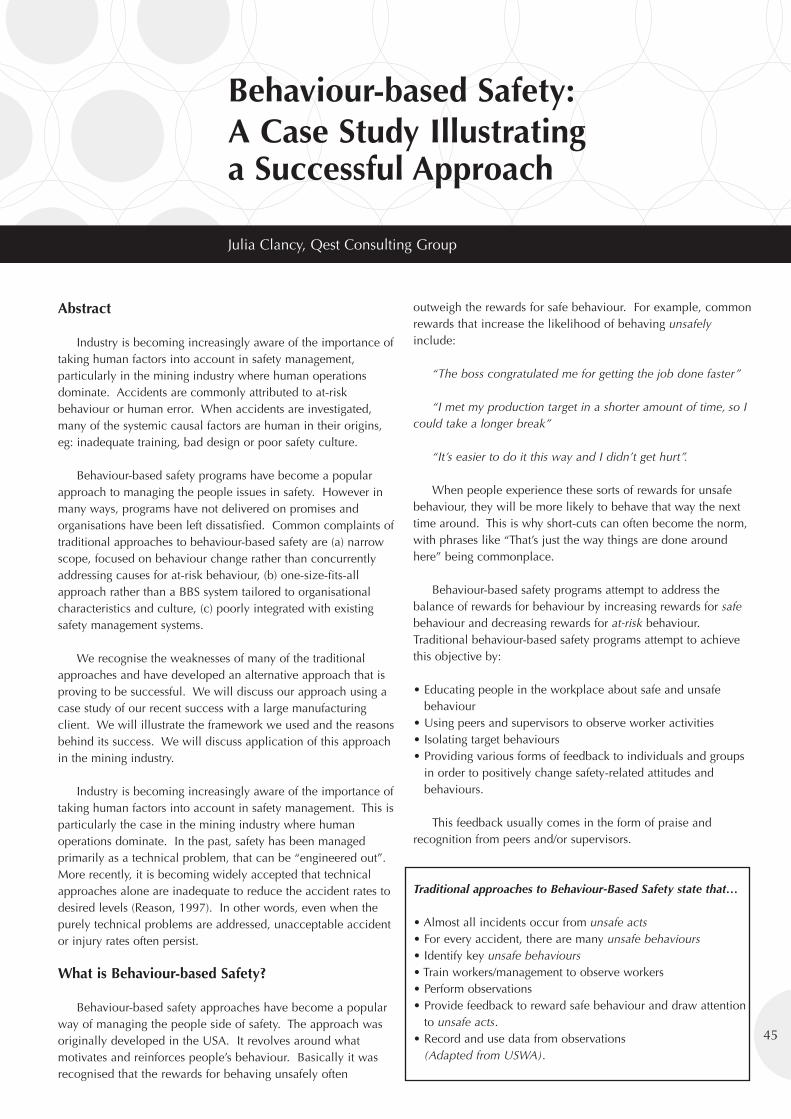
45
Behaviour-based Safety:A Case Study Illustratinga Successful Approach
Julia Clancy, Qest Consulting Group
Abstract
Industry is becoming increasingly aware of the importance oftaking human factors into account in safety management,particularly in the mining industry where human operationsdominate. Accidents are commonly attributed to at-riskbehaviour or human error. When accidents are investigated,many of the systemic causal factors are human in their origins,eg: inadequate training, bad design or poor safety culture.
Behaviour-based safety programs have become a popularapproach to managing the people issues in safety. However inmany ways, programs have not delivered on promises andorganisations have been left dissatisfied. Common complaints oftraditional approaches to behaviour-based safety are (a) narrowscope, focused on behaviour change rather than concurrentlyaddressing causes for at-risk behaviour, (b) one-size-fits-allapproach rather than a BBS system tailored to organisationalcharacteristics and culture, (c) poorly integrated with existingsafety management systems.
We recognise the weaknesses of many of the traditionalapproaches and have developed an alternative approach that isproving to be successful. We will discuss our approach using acase study of our recent success with a large manufacturingclient. We will illustrate the framework we used and the reasonsbehind its success. We will discuss application of this approachin the mining industry.
Industry is becoming increasingly aware of the importance oftaking human factors into account in safety management. This isparticularly the case in the mining industry where humanoperations dominate. In the past, safety has been managedprimarily as a technical problem, that can be “engineered out”.More recently, it is becoming widely accepted that technicalapproaches alone are inadequate to reduce the accident rates todesired levels (Reason, 1997). In other words, even when thepurely technical problems are addressed, unacceptable accidentor injury rates often persist.
What is Behaviour-based Safety?
Behaviour-based safety approaches have become a popularway of managing the people side of safety. The approach wasoriginally developed in the USA. It revolves around whatmotivates and reinforces people’s behaviour. Basically it wasrecognised that the rewards for behaving unsafely often
outweigh the rewards for safe behaviour. For example, commonrewards that increase the likelihood of behaving unsafelyinclude:
“The boss congratulated me for getting the job done faster”
“I met my production target in a shorter amount of time, so Icould take a longer break”
“It’s easier to do it this way and I didn’t get hurt”.
When people experience these sorts of rewards for unsafebehaviour, they will be more likely to behave that way the nexttime around. This is why short-cuts can often become the norm,with phrases like “That’s just the way things are done aroundhere” being commonplace.
Behaviour-based safety programs attempt to address thebalance of rewards for behaviour by increasing rewards for safebehaviour and decreasing rewards for at-risk behaviour.Traditional behaviour-based safety programs attempt to achievethis objective by:
• Educating people in the workplace about safe and unsafebehaviour
• Using peers and supervisors to observe worker activities• Isolating target behaviours• Providing various forms of feedback to individuals and groups
in order to positively change safety-related attitudes andbehaviours.
This feedback usually comes in the form of praise andrecognition from peers and/or supervisors.
Traditional approaches to Behaviour-Based Safety state that…
• Almost all incidents occur from unsafe acts• For every accident, there are many unsafe behaviours• Identify key unsafe behaviours• Train workers/management to observe workers• Perform observations• Provide feedback to reward safe behaviour and draw attention
to unsafe acts.• Record and use data from observations
(Adapted from USWA).
The fundamental concern about traditional behaviour-basedsafety programs is that to some extent, they assume that wealways have a choice as to whether to behave safely or unsafely.For example, there is an underlying assumption that if haul truckdrivers speed or drive recklessly, it is because they choose to doso. Behaviour-based safety programs suggest that if anindividual was rewarded for safe behaviour then safer drivingwould occur.
However, speeding or erratic driving can also be a result of anumber of other factors that are not necessarily under a person’scontrol, such as fatigue, poor vehicle design or a culture ofproduction before safety. Therefore, behaviour-based safetyprograms should not simply focus on individual behaviourchange. They need to simultaneously address individualbehaviour, systemic factors that contribute to unsafe acts andorganisational culture. While this conceptual transition isbeginning to occur (Manuele, 2000), many industries are stillstruggling with putting these new approaches into practice. Weillustrate our approach to behaviour-based safety that attempts toovercome this and other problems associated with traditionalapproaches to behaviour-based safety.
Case Study
A large paper manufacturing company in Australia recognisedthat many of the injuries and incidents that were occurring attwo of their paper mills were attributable to at-risk behaviour.Therefore, the introduction of a behaviour-based safety programwas seen to be an appropriate approach to address this issue.However, the initial pilot test of an “off-the-shelf” behaviour-based safety program was largely unsuccessful. This wasattributed to several factors, which can be summarised as:
• Failure to establish workforce buy-in and commitment to theprocess
• Workers and unions were concerned about the principlesbehind behaviour-based safety. That is because they saw it asan attempt to change worker behaviour. The program was seenas a way of management to “pass the buck” for safety to theworkforce and it was seen as a way of attributing blame forincidents to individual workers
• The program was too advanced for the current organisationand its workforce to cope with
• The program was not well integrated with existing systems andthe required infrastructure was not in place to support theprogram functioning.
These issues were taken into account and a revised strategywas formulated for the way forward. It involved four phases:
• Phase 1: Assessment
A “rich picture” of the current workplace and workforcecharacteristics was developed. This picture was developed via(a) an assessment of the current safety culture and (b) a review ofcurrent safety management systems. Safety management systemswere reviewed through interviews with key site personnel, usinga series of structured questions about the safety systems andprocedures currently in use.
Safety culture can be essentially characterised as “the waythings are done around here with respect to safety”. Safety
culture measures are a “snapshot” giving insight into the waypeople are thinking and feeling with respect to safety. Safetyculture was assessed by interviewing and surveying arepresentative cross-section of the workforce about theirperceptions and attitudes towards safety. A good understandingof the current culture was developed, giving management animportant insight into the way that the workforce “thinks” withrespect to safety. Some of the factors that were assessedincluded:
• Attitudes towards taking a pro-active involvement in safety • Perceptions of management commitment to improving safety in
the workplace, and • Attitudes towards short-cuts• Degree of complacency.
The major strengths and risk areas from a culture perspectivewere identified.
The major incident causes were also determined byreviewing a set of recent incidents. This was important indefining the key hazard areas and the sorts of tasks andbehaviours that were most critical to address.
• Phase 2: Design
The workforce were actively involved in the development ofthe new behaviour-based safety program. This involvedworkshopping the design of the program with key representativesfrom management, shop-floor and unions. The resulting programwas much simpler than the original program. It was recognisedthat starting with a simple program helps develop workforceacceptance, because it is more accessible and easy to grasp.Ideally, once the program is successfully implemented at asimple level, the workforce can then suggest improvements anddevelopments over time, which improves workforce ownership ofthe program.
The resulting program essentially consisted of a combinationof general hazard observation programs and behaviour-basedsafety programs. The key elements were that the program giveseveryone an easy way of reporting a hazard if they see one.Hazards could be behavioural in nature or they might be factorsthat might lead to unsafe behaviour/human error. Everyone one-site was trained to identify hazards and identify factors that cancontribute to human error and also to think creatively aboutpotential solutions. The trends from the hazard observationforms were also central to being able to detect underlyingsystemic issues and developing solutions.
• Phase 3: Implementation
The program was phased in over three months across twopaper mill sites. Every person working on-site (approximately700) was trained. Importantly, training groups were small(approximately 10 per group) to facilitate interaction and thetraining groups represented a cross-section of people across thesite. Representatives from management and shop-floor wereintegrated, which assisted in breaking down some long standinghierarchical barriers. Sessions were interactive. The behaviour-based safety program was actively “practiced” in the trainingroom and potential obstacles to success were identified andresolved during these training sessions.
46
47
Participants were not only taught how to participate in theprogram, they were also encouraged to actively brainstorm whya program such as this would be helpful in addressing safety attheir worksite. Participants became noticeably more enthusiasticand involved when they had generated their own reasons whythe program would be of value.
Participants were taught how to identify unsafe acts as well asto identify factors that might be contributing to unsafe acts, suchas hazardous conditions or procedures.
The training sessions were also used as a vehicle for culturechange. That is, aspects of the culture that had been detected asissues in the initial culture assessment to do with morale andworkplace satisfaction were addressed and one example of howthis was addressed was via interactive team-building exercisesincorporated into the training sessions.
• Phase 4: Follow-up
A commonly reported reason for program failure isinadequate follow-up once the program has been implemented.Informal strategies for follow-up included attendance at safetymeetings and “walking the floor” in order to identify anyobstacles to success. As would be expected with theimplementation of a new program, there were a number ofissues that threatened the success of the program. Many ofthese were detected by those on shop-floor once they began toparticipate in the program and those representatives whoidentified the problems were encouraged to be involved in thedevelopment of appropriate solutions. This assisted in buildingmorale and promoting a smooth implementation of theprogram.
To date, just under 6 months since program implementation,over 400 hazard observation forms have been lodged. Thehazards observed have been addressed via specific solutions (e.g.re-design of equipment) or by general solutions that help toaddress a range of similar hazards, (e.g. training programs fordetecting and recovering from human error). There has been areduction in medical treatment injuries since implementation ofthe program.
A formal follow-up assessment will take place approximately6-12 months after program implementation. This will involve re-measuring safety culture and safety performance and comparingthis to the original assessment in order to determine programsuccess. This is important in estimating return on investment, butalso very important in developing continuous improvementstrategies to avoid the program becoming stagnant.
Factors Behind Program Success
The implementation of a successful behaviour-based safetyprogram is reliant of a number of factors. Here we outline theprinciples that we believe are crucial to program success. Weuse examples from the case study above to demonstrate practicalstrategies for achieving these objectives. Where relevant, we alsodemonstrate how these principles improve on many of thetraditional approaches to behaviour-based safety and why theapproach that we took in the manufacturing industry might alsobe a beneficial approach to managing the people-related safetyissues in the mining industry.
1. Establish Workforce Acceptance & Commitment to theProgram
A behaviour-based safety program is all about effectingchange in an organisation. Managing the change process is acritical success factor for any new program introduced into theworkplace.
The challenge of the change process can be met in severalways. Essentially what is sought is workforce acceptance andcommitment to the process. A central aim is to get workers tobuy-in to the program and see the benefits for themselves. Thiscan be achieved in a number of ways. Firstly, involvingworkforce representatives in the design of the program enablesthem to feel as though they have control in the outcome andenables them to have a sense of ownership of the program.These representatives form a steering committee. Theserepresentatives become active advocates of the program, soselection of representatives who have credibility and influence atshop-floor level is important.
Another good strategy for getting workers to buy-in to theprogram is to get them to generate their own ideas as to thebenefits that can be realised with the introduction of abehaviour-based safety program. This can be done as part of thebehaviour-based safety program training sessions. Asking theworkforce to generate the advantages of the program increasesthe likelihood that they truly believe in the value of it, rather thansimply being told.
Once the program has been implemented, commitment canbe enhanced by the careful provision of prizes or rewards. Thereis much dispute over the pro’s and con’s of rewards given forsafety. The downside is that rewards may trivialise safety andrepresent safety as a “game” rather than as a core value.However, with behaviour-based safety programs, rewards may beuseful in acknowledging the identification of a very serioushazard or acknowledging an excellent recommendation for away to eliminate a hazard (Frederick & Lessin, 2000). It rewardscritical thinking and thoughtful involvement.
Finally, emphasis should be placed on the proactive nature ofthe program. It is important to show the workforce that thisprogram enlists the expertise of every person in the workplace indetecting and correcting the causes of injury before they occur.
2. Ensure that the Program is Applicable to your Organisation &its Unique Characteristics
Industries and organisations vary considerably in the type ofwork that is conducted, the way it is carried out, the organisationalstructure and the culture of the workforce. There are also specificworkforce factors, such as level of literacy and cultural backgroundthat also need to be carefully considered in the design or selectionof a suitable behaviour-based safety program.
Three factors are critical to ensure the applicability of theprogram to your organisation. Firstly, the need for pre-assessment of the characteristics and culture of your organisationshould not be underestimated. This will guide your selection ofthe type of behaviour-based safety program and development ofspecific goals and objectives that you want to achieve with theprogram.
Secondly, engaging the workforce in actively designing theprogram is important in ensuring that the workforce will acceptand use the program. A taskforce or committee made up of across-section of representative employees is recommended.Actively involve your workforce in the design of the specificcharacteristics of the program, e.g. what is going to be observed,who is going to observe, how is the information going to be fedback to the workers, can we integrate the process with othersystems and processes in place, and so on.
Thirdly, every organisation has certain tasks when safety ishabitually violated. For example, working on certain machinerywithout turning it off, walking across a conveyor that is active.These habits occur because taking a particular risk saves time orenergy but causes no personal injury. Workers will repeat thisbehaviour over and over until eventually this behaviour becomeshabit – behaviour that is chosen so quickly that it is anunconscious decision. The danger emerges when a set ofcircumstances arise that makes this behaviour more risky thanusual (eg. Equipment jams or protective devices fail). Thebarriers that usually prevent common behaviours from causinginjury are no longer present. This is when an injury occurswhich usually takes everyone by surprise. Accidents are notrandom but arise from the nature and function of theorganisation.
Therefore, the unique characteristics of the organisation needto be taken into account to determine what the behaviouralfactors are in this particular organisation that need to beconsidered. Those subtle, convenient and seemingly safebehaviours need to be identified as they form a fundamental partof ensuring that your behaviour-based safety program is relevantto your workplace.
3. A Holistic Approach to Addressing At-risk Behaviour
Traditional behaviour-based safety approaches attempt tochange worker behaviour. Targeting specific behaviour is a goodstart. As discussed, traditional approaches to behaviour-basedsafety focus their efforts here by rewarding safe behaviour. Whilethis can have some success, it not the complete picture.
It appears that many workplaces using these programs aremuch more likely not to address the hazards and systemic factorsthat are often the root cause of unsafe acts (Ref). Human factorsthinking has moved on from the old idea that our systems wouldbe safe “were it not for the erratic behaviour of some unreliablepeople (bad apples) in it” (Dekker, 2002).
The behaviour-based safety program must simultaneouslyaddress the specific behaviours and systemic factors thatcontribute to at-risk behaviour. In some ways, traditionalbehaviour-based safety programs have placed too muchemphasis on behaviour-change. This has been criticised as“turning the hierarchy of controls upside down, contradicting oneof the most widely accepted concepts in injury and illnessprevention” (Howe, 1998, p.6). Most approaches to behaviour-based safety include references to studies from the DuPontCompany which indicate that the “causes” of most industrialaccidents (up to 96% in some studies) are the “unsafe acts” ofworkers. According to these studies, very few industrialaccidents are caused by “unsafe conditions”. Our approachrecognises the need to address safety from both perspectives: the
unsafe act and the precursors that contribute to this unsafe act.
As James Reason suggests “free will is an illusion because ofrange of actions is always limited by the local circumstances”(1997). Workers need to be trained in understanding the factorsthat contribute to human error. Following the widely acceptedReason Model of Error (Reason, 1997), there needs to be adistinction between wilful at-risk behaviour versus behaviour thatstems from underlying systemic issues such as:
• Organisational culture, eg. a culture of complacency,production before safety
• Management decisions• Fatigue due to shift structures• Poor workplace design• Inadequate tools and equipment• Time Pressure• Inadequate Training.
Training needs to focus on hazard perception as well asbehaviour-observation techniques.
The data from observations should be capitalised on. Itprovides an excellent way of being able to identify patterns orsystemic issues contributing to at-risk behaviour in theworkplace. Good use of this data can guide where safety effortsand resources are targeted.
4. Ensure Appropriate Infrastructure to Support the Program
If the system that is developed fails to fit users' workpractices, then it will be underused and unlikely to facilitatecultural change (Tavistock Institute, UK).
The Tavistock Institute in England developed theSociotechnical Systems approach to managing change (Trist,1981). It was first developed in the 1930’s in the mining industryin the UK. It acknowledges that people are a core part oforganisations and looks at ensuring that structures and processesin the workplace are aligned or matched with people, in order tomaximise efficiency and job satisfaction. This is a centralprinciple for managing the smooth integration of a behaviour-based safety program into the workplace. Careful thought needsto be directed towards ensuring that there are appropriatestructures and processes in place to support rather than impedethe behaviour-based safety program. For example:
• Avenues for communication and feedback• Data collection and management processes, i.e. a centralised
database• Clear definition of roles and responsibilities.
There needs to be user-friendly procedures for observation,lodging forms, giving feedback, following up on identifiedhazards, and so on. The integration of the people with thesystem should be seamless.
Another point to make is that management are key players inthe process (Cook & McSween, 2000). Managers across alllevels must receive targeted training in their specific role in thebehaviour-based safety program. At the middle managementlevel, their role in the behaviour-based safety process centresaround:
48
49
• Detecting glitches in the system and resolving these• Maintaining workforce motivation and commitment to the
process• Leading by example and actively “walking the talk”.
Specific training is required for this level of the organisationacknowledging that they are the lynchpin in the process.
5. Establish Long-term Sustained Success
The ultimate aim of any behaviour-based safety program is todevelop and sustain a positive safety culture. Many programsappear promising to begin with, but once the initial momentumslows down, they do not result in sustained change.
It is important to assess safety culture to begin with anddevelop goals and objectives for the desired culture. The gapsbetween current and desired culture guide the design of thebehaviour-based safety program as a way of actively addressingthese weaknesses. It is equally important to conduct follow-upassessments to determine what aspects of safety performance andsafety culture have improved and where areas for furtherimprovement are evident.
In order to achieve sustained culture change, one of the keyproponents of behaviour-based safety programs hasacknowledged that it is important to start “small” and allowemployees time to get used to an observation and feedbackprocess before adding too much complexity (DePasquale &Geller, 1999). We achieved this by developing hazard clustercategories (e.g. People, Process and Plant related) rather thanidentifying specific target behaviours. In the next phase, criticalbehaviours within these clusters can be defined and this is bestdriven by the workforce.
It is important that the program is aligned with currentsystems and processes and ways of doing things. If the programis too far removed from other management systems, it increasesthe likelihood that the program will not be sustained over a longperiod of time. A good way of maintaining continuousimprovement and avoiding the program becoming “flavour of lastmonth”, is to write key performance indicators associated withthe program into management performance appraisals.
Finally, the bottom line is that behaviour-based safetyprograms need to demonstrate return on investment. We need tobe able to measure and track safety performance improvements.Difficulties with measuring safety are beginning to be overcome,by using a combination of measures that not only track poorsafety performance (eg. LTI rates) but also track system health(e.g. Safety Culture) (Dumsa, et al, in press). The initial pre-assessment of safety is vital in being able to demonstrateimprovements from baseline performance as a result of thebehaviour-based safety intervention.
Interestingly, an example of the link between good safetyperformance and good organisational performance is evidencedby Paul O’Neill, the former CEO of Alcoa in the U.S. His overallleadership strategy was to make safety improvements. Hisprinciple was that when organisations function at a high level insafety, many positive things follow, including improvements inmorale, communication and a sense of cohesiveness within theorganisation. These factors are commonly attributed to high
performing organisations (Peters & Waterman, 1982; Senge,1990). Some findings from research reveal that there are manyimportant side benefits of behaviour-based safety that improvegeneral organisational functioning. Some of these include:improved employee awareness, culture, communications,involvement, quality and productivity (Krause, 2002).
Conclusions
This paper has illustrated an approach to behaviour-basedsafety that was undertaken in the manufacturing industry. Theapproach has overcome many of the problems associated withmore traditional approaches to behaviour-based safety. Webelieve that this approach holds a lot of promise for the miningindustry. Mine sites face similar problems to manufacturing siteswith respect to managing people issues in safety. There appearsto be a requirement for a program that better integratesbehaviour observation and change with strategies for managinghuman error and it’s causal factors. There also appears to be aneed for a program that is both accessible and acceptable acrossthe entire workforce.
The case study outlined in this paper demonstrates that ourapproach to behaviour-based safety undertaken in a largeAustralian manufacturing organisation, in the first 6 months ofimplementation, has already begun to show significantimprovements in safety performance.
References
Cook, S., & McSween, T. (2000). The Role of Supervisors inBehavioural Safety Observations. American Society of SafetyEngineers, October.
Dekker, S. (2002). The Field Guide to Human ErrorInvestigations. Aldershot: Ashgate.
DePasquale, J.P., & Geller, E.S. (1999). Critical SuccessFactors for Behaviour-Based Safety: A Study of TwentyIndustry-wide Applications. Journal of Safety Research, 30(4),237-249.
Dumsa, A., Marrison, C., Boag, C., Hayes, J., Clancy, J., Casey,S., & Grey, E. (in press). Predicting Organisational SafetyPerformance: Key Safety Performance Indicators for Air TrafficControl. Australian Aviation Psychology Association Conference,December, 2003.
Frederick, J., & Lessin, N. (2000). Blame the Worker: The Rise ofBehavioural-Based Safety Programs. Multinational Monitor,November.
Howe, J. (1998). Warning: Behaviour-Based Safety Can BeHazardous to Your Health and Safety Program. OccupationalHealth and Safety – Newsletter of the UAW Health and SafetyDepartment, 4.
Kanter, E.M., Stein, B.A., & Jick, T.D. (1992). The Challenge ofOrganisational Change. Toronto: Maxwell Macmillan.
Krause, T.R. (2002). Cross-Functional Improvement: Behaviour-Based Safety as a Tool for Organisational Success. ProfessionalSafety, August.

Loafmann, B. (1998). Behaviour-Based Safety: Power andPitfalls. Professional Safety, August.
Manuele, F.A. (2000). Behavioural Safety: Looking Beyond theWorker. Occupational Hazards, October.
Petersen, D. (2000). Safety Management: Our Strengths andWeaknesses. Professional Safety, January.
Peters, T., & Waterman, R.H. (1982). In Search of Excellence.London: HarperCollins.
Reason, J. (1997). Managing the Risks of OrganisationalAccidents. Aldershot: Ashgate.
Reason, J. (1990). Human Error. Cambridge: CambridgeUniversity Press.
Sarkus, D.J. (2001). Safety and Psychology: Where to we gofrom here? Professional Safety, January.
Senge, P.M. (1990). The Fifth Discipline: The Art and Practice ofthe Learning Organisation. Sydney: Random House.
Trist, E. (1981). The Sociotechnical Perspective. In Van de Ven,A., & Joyce, W. (Eds.) Perspectives on Organisational Designand Behaviour. New York: Wiley.
USWA – United Steelworkers of America, Health Safety andEnvironment Department. The Steelworker Perspective onBehavioural Safety.
50
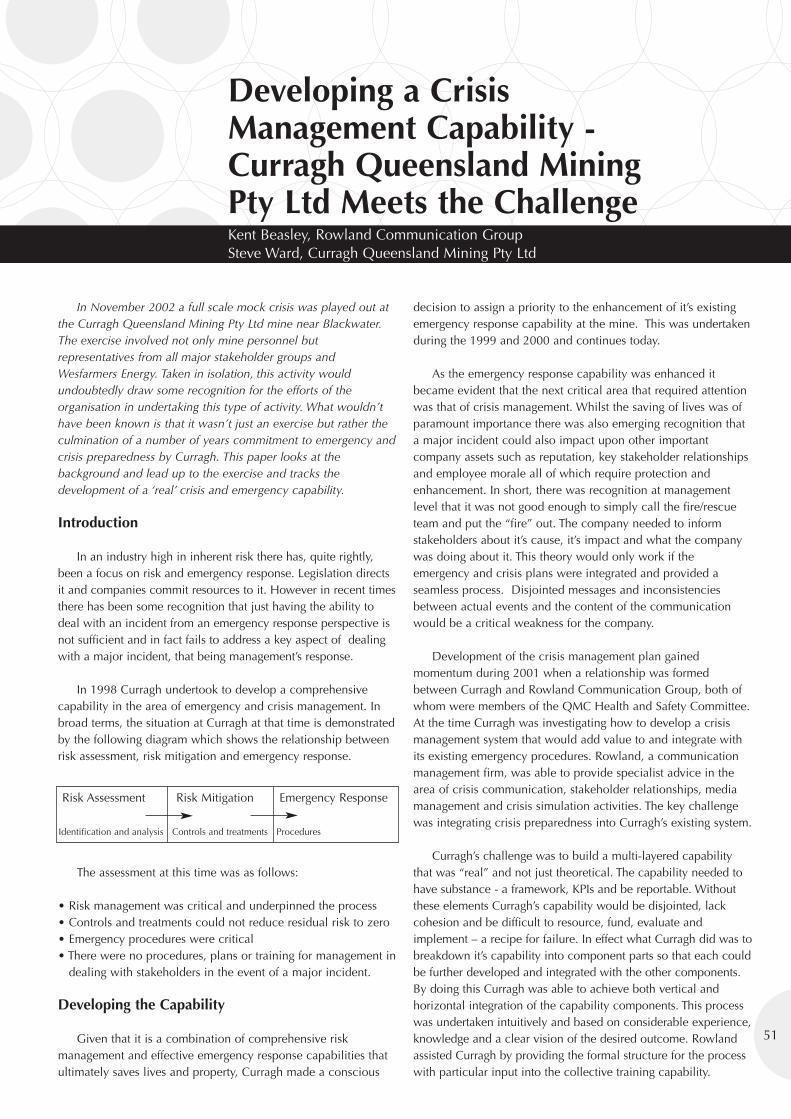
Developing a CrisisManagement Capability -Curragh Queensland MiningPty Ltd Meets the ChallengeKent Beasley, Rowland Communication GroupSteve Ward, Curragh Queensland Mining Pty Ltd
In November 2002 a full scale mock crisis was played out atthe Curragh Queensland Mining Pty Ltd mine near Blackwater.The exercise involved not only mine personnel butrepresentatives from all major stakeholder groups andWesfarmers Energy. Taken in isolation, this activity wouldundoubtedly draw some recognition for the efforts of theorganisation in undertaking this type of activity. What wouldn’thave been known is that it wasn’t just an exercise but rather theculmination of a number of years commitment to emergency andcrisis preparedness by Curragh. This paper looks at thebackground and lead up to the exercise and tracks thedevelopment of a ‘real’ crisis and emergency capability.
Introduction
In an industry high in inherent risk there has, quite rightly,been a focus on risk and emergency response. Legislation directsit and companies commit resources to it. However in recent timesthere has been some recognition that just having the ability todeal with an incident from an emergency response perspective isnot sufficient and in fact fails to address a key aspect of dealingwith a major incident, that being management’s response.
In 1998 Curragh undertook to develop a comprehensivecapability in the area of emergency and crisis management. Inbroad terms, the situation at Curragh at that time is demonstratedby the following diagram which shows the relationship betweenrisk assessment, risk mitigation and emergency response.
The assessment at this time was as follows:
• Risk management was critical and underpinned the process• Controls and treatments could not reduce residual risk to zero• Emergency procedures were critical• There were no procedures, plans or training for management in
dealing with stakeholders in the event of a major incident.
Developing the Capability
Given that it is a combination of comprehensive riskmanagement and effective emergency response capabilities thatultimately saves lives and property, Curragh made a conscious
decision to assign a priority to the enhancement of it’s existingemergency response capability at the mine. This was undertakenduring the 1999 and 2000 and continues today.
As the emergency response capability was enhanced itbecame evident that the next critical area that required attentionwas that of crisis management. Whilst the saving of lives was ofparamount importance there was also emerging recognition thata major incident could also impact upon other importantcompany assets such as reputation, key stakeholder relationshipsand employee morale all of which require protection andenhancement. In short, there was recognition at managementlevel that it was not good enough to simply call the fire/rescueteam and put the “fire” out. The company needed to informstakeholders about it’s cause, it’s impact and what the companywas doing about it. This theory would only work if theemergency and crisis plans were integrated and provided aseamless process. Disjointed messages and inconsistenciesbetween actual events and the content of the communicationwould be a critical weakness for the company.
Development of the crisis management plan gainedmomentum during 2001 when a relationship was formedbetween Curragh and Rowland Communication Group, both ofwhom were members of the QMC Health and Safety Committee.At the time Curragh was investigating how to develop a crisismanagement system that would add value to and integrate withits existing emergency procedures. Rowland, a communicationmanagement firm, was able to provide specialist advice in thearea of crisis communication, stakeholder relationships, mediamanagement and crisis simulation activities. The key challengewas integrating crisis preparedness into Curragh’s existing system.
Curragh’s challenge was to build a multi-layered capabilitythat was “real” and not just theoretical. The capability needed tohave substance - a framework, KPIs and be reportable. Withoutthese elements Curragh’s capability would be disjointed, lackcohesion and be difficult to resource, fund, evaluate andimplement – a recipe for failure. In effect what Curragh did was tobreakdown it’s capability into component parts so that each couldbe further developed and integrated with the other components.By doing this Curragh was able to achieve both vertical andhorizontal integration of the capability components. This processwas undertaken intuitively and based on considerable experience,knowledge and a clear vision of the desired outcome. Rowlandassisted Curragh by providing the formal structure for the processwith particular input into the collective training capability.
51
Risk Assessment Risk Mitigation Emergency Response
Identification and analysis Controls and treatments Procedures
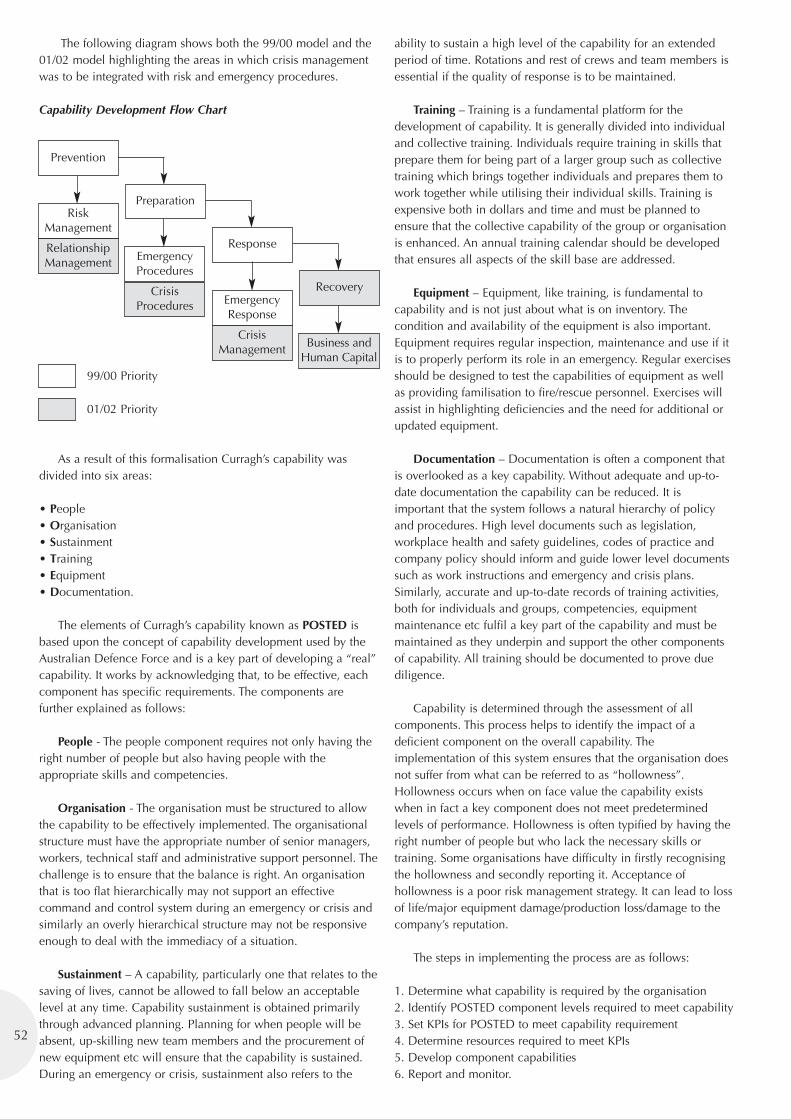
The following diagram shows both the 99/00 model and the01/02 model highlighting the areas in which crisis managementwas to be integrated with risk and emergency procedures.
Capability Development Flow Chart
99/00 Priority
01/02 Priority
As a result of this formalisation Curragh’s capability wasdivided into six areas:
• People• Organisation• Sustainment• Training• Equipment• Documentation.
The elements of Curragh’s capability known as POSTED isbased upon the concept of capability development used by theAustralian Defence Force and is a key part of developing a “real”capability. It works by acknowledging that, to be effective, eachcomponent has specific requirements. The components arefurther explained as follows:
People - The people component requires not only having theright number of people but also having people with theappropriate skills and competencies.
Organisation - The organisation must be structured to allowthe capability to be effectively implemented. The organisationalstructure must have the appropriate number of senior managers,workers, technical staff and administrative support personnel. Thechallenge is to ensure that the balance is right. An organisationthat is too flat hierarchically may not support an effectivecommand and control system during an emergency or crisis andsimilarly an overly hierarchical structure may not be responsiveenough to deal with the immediacy of a situation.
Sustainment – A capability, particularly one that relates to thesaving of lives, cannot be allowed to fall below an acceptablelevel at any time. Capability sustainment is obtained primarilythrough advanced planning. Planning for when people will beabsent, up-skilling new team members and the procurement ofnew equipment etc will ensure that the capability is sustained.During an emergency or crisis, sustainment also refers to the
ability to sustain a high level of the capability for an extendedperiod of time. Rotations and rest of crews and team members isessential if the quality of response is to be maintained.
Training – Training is a fundamental platform for thedevelopment of capability. It is generally divided into individualand collective training. Individuals require training in skills thatprepare them for being part of a larger group such as collectivetraining which brings together individuals and prepares them towork together while utilising their individual skills. Training isexpensive both in dollars and time and must be planned toensure that the collective capability of the group or organisationis enhanced. An annual training calendar should be developedthat ensures all aspects of the skill base are addressed.
Equipment – Equipment, like training, is fundamental tocapability and is not just about what is on inventory. Thecondition and availability of the equipment is also important.Equipment requires regular inspection, maintenance and use if itis to properly perform its role in an emergency. Regular exercisesshould be designed to test the capabilities of equipment as wellas providing familisation to fire/rescue personnel. Exercises willassist in highlighting deficiencies and the need for additional orupdated equipment.
Documentation – Documentation is often a component thatis overlooked as a key capability. Without adequate and up-to-date documentation the capability can be reduced. It isimportant that the system follows a natural hierarchy of policyand procedures. High level documents such as legislation,workplace health and safety guidelines, codes of practice andcompany policy should inform and guide lower level documentssuch as work instructions and emergency and crisis plans.Similarly, accurate and up-to-date records of training activities,both for individuals and groups, competencies, equipmentmaintenance etc fulfil a key part of the capability and must bemaintained as they underpin and support the other componentsof capability. All training should be documented to prove duediligence.
Capability is determined through the assessment of allcomponents. This process helps to identify the impact of adeficient component on the overall capability. Theimplementation of this system ensures that the organisation doesnot suffer from what can be referred to as “hollowness”.Hollowness occurs when on face value the capability existswhen in fact a key component does not meet predeterminedlevels of performance. Hollowness is often typified by having theright number of people but who lack the necessary skills ortraining. Some organisations have difficulty in firstly recognisingthe hollowness and secondly reporting it. Acceptance ofhollowness is a poor risk management strategy. It can lead to lossof life/major equipment damage/production loss/damage to thecompany’s reputation.
The steps in implementing the process are as follows:
1. Determine what capability is required by the organisation2. Identify POSTED component levels required to meet capability 3. Set KPIs for POSTED to meet capability requirement4. Determine resources required to meet KPIs5. Develop component capabilities6. Report and monitor.
52
Prevention
Recovery
Preparation
Response
RiskManagement
RelationshipManagement Emergency
Procedures
CrisisProcedures Emergency
Response
CrisisManagement Business and
Human Capital
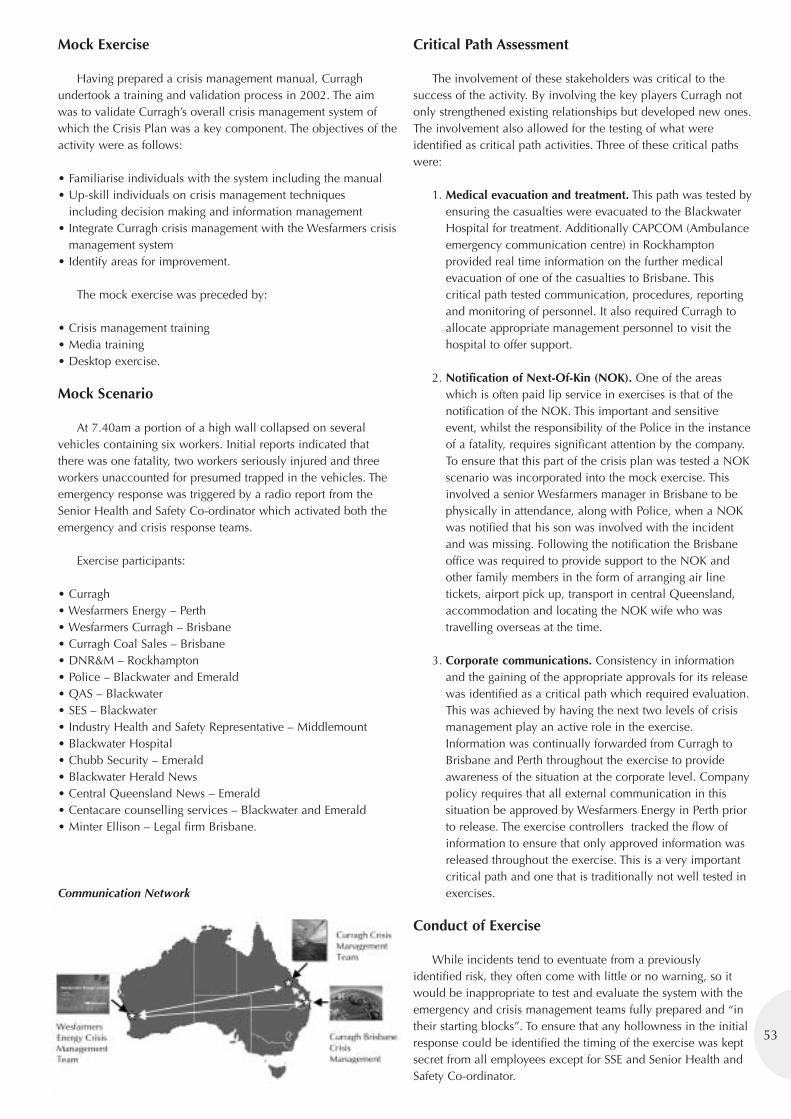
53
Mock Exercise
Having prepared a crisis management manual, Curraghundertook a training and validation process in 2002. The aimwas to validate Curragh’s overall crisis management system ofwhich the Crisis Plan was a key component. The objectives of theactivity were as follows:
• Familiarise individuals with the system including the manual• Up-skill individuals on crisis management techniques
including decision making and information management• Integrate Curragh crisis management with the Wesfarmers crisis
management system• Identify areas for improvement.
The mock exercise was preceded by:
• Crisis management training• Media training• Desktop exercise.
Mock Scenario
At 7.40am a portion of a high wall collapsed on severalvehicles containing six workers. Initial reports indicated thatthere was one fatality, two workers seriously injured and threeworkers unaccounted for presumed trapped in the vehicles. Theemergency response was triggered by a radio report from theSenior Health and Safety Co-ordinator which activated both theemergency and crisis response teams.
Exercise participants:
• Curragh• Wesfarmers Energy – Perth• Wesfarmers Curragh – Brisbane• Curragh Coal Sales – Brisbane• DNR&M – Rockhampton• Police – Blackwater and Emerald• QAS – Blackwater• SES – Blackwater• Industry Health and Safety Representative – Middlemount• Blackwater Hospital• Chubb Security – Emerald• Blackwater Herald News• Central Queensland News – Emerald• Centacare counselling services – Blackwater and Emerald• Minter Ellison – Legal firm Brisbane.
Communication Network
Critical Path Assessment
The involvement of these stakeholders was critical to thesuccess of the activity. By involving the key players Curragh notonly strengthened existing relationships but developed new ones.The involvement also allowed for the testing of what wereidentified as critical path activities. Three of these critical pathswere:
1. Medical evacuation and treatment. This path was tested byensuring the casualties were evacuated to the BlackwaterHospital for treatment. Additionally CAPCOM (Ambulanceemergency communication centre) in Rockhamptonprovided real time information on the further medicalevacuation of one of the casualties to Brisbane. Thiscritical path tested communication, procedures, reportingand monitoring of personnel. It also required Curragh toallocate appropriate management personnel to visit thehospital to offer support.
2. Notification of Next-Of-Kin (NOK). One of the areaswhich is often paid lip service in exercises is that of thenotification of the NOK. This important and sensitiveevent, whilst the responsibility of the Police in the instanceof a fatality, requires significant attention by the company.To ensure that this part of the crisis plan was tested a NOKscenario was incorporated into the mock exercise. Thisinvolved a senior Wesfarmers manager in Brisbane to bephysically in attendance, along with Police, when a NOKwas notified that his son was involved with the incidentand was missing. Following the notification the Brisbaneoffice was required to provide support to the NOK andother family members in the form of arranging air linetickets, airport pick up, transport in central Queensland,accommodation and locating the NOK wife who wastravelling overseas at the time.
3. Corporate communications. Consistency in informationand the gaining of the appropriate approvals for its releasewas identified as a critical path which required evaluation.This was achieved by having the next two levels of crisismanagement play an active role in the exercise.Information was continually forwarded from Curragh toBrisbane and Perth throughout the exercise to provideawareness of the situation at the corporate level. Companypolicy requires that all external communication in thissituation be approved by Wesfarmers Energy in Perth priorto release. The exercise controllers tracked the flow ofinformation to ensure that only approved information wasreleased throughout the exercise. This is a very importantcritical path and one that is traditionally not well tested inexercises.
Conduct of Exercise
While incidents tend to eventuate from a previouslyidentified risk, they often come with little or no warning, so itwould be inappropriate to test and evaluate the system with theemergency and crisis management teams fully prepared and “intheir starting blocks”. To ensure that any hollowness in the initialresponse could be identified the timing of the exercise was keptsecret from all employees except for SSE and Senior Health andSafety Co-ordinator.
The exercise was designed to test both the emergencyresponse and crisis management capabilities and focussedattention upon the integration of these two critical elements. Keyplayers were brought in to the activity in order to reflect, as bestas possible, the reality of the situation. Importantly keyrepresentatives from the Police, QAS and DNR&M were presentand interacted fully with the emergency response personnel andthe crisis management team members. Media interaction was amajor part of the exercise with both real and role-playing mediaon-site throughout the day. Unlike traditional exercises wheremedia play is post-processed and presented after the activity,media play in this exercise was presented in real time. This notonly included hourly radio news updates but included a majorTV news broadcast at around 1.30pm. By involving the media inthis way the crisis management team was able to review itscommunication strategy and determine its effectiveness andmake changes as necessary.
Debrief & Lessons Learnt
Exercises of this type provide tremendous benefit to theorganisation. To capitalise on the investment, debriefs and reportsare necessary to ensure that critical lessons are not only logged,but learnt. At the completion of the exercise a debrief with allplayers was conducted to capture immediate feedback on theactivity. This information was subsequently combined with moreformal feedback and delivered to Curragh in the form of awritten report.
Recommendations contained in the report were divided intoone of three areas:
• Sustain – Those policies, procedures, plans and actions thatwere deemed to be of an appropriate level
• Improve – Those policies, procedures, plans and actions thatwere deemed to require attention and enhancement if anacceptable level of competency is to be achieved in future
• Fix – Those policies, procedures, plans and actions that weredeemed to be inadequate or absent and must be fixed if anacceptable level of competency is to be achieved in future.
The exercise provided many valuable lessons for Curragh andWesfarmers. The key lessons included:
1. The importance of having a crisis plan that is fully integratedwith the emergency response plans
2. The benefit of bringing all stakeholders together in a mockexercise which allows for the transfer of information amongststakeholders and enhances the understanding of each othercapabilities, procedures and requirements
3. The importance of having a capability development modelsuch as POSTED to provide a framework for emergency andcrisis management capability development.
Participants’ Comments
As part of the exercise report comment was sought fromexternal participants to gain a better understanding of theirperceptions of the exercise. The following comments areindicative of the feedback.
Tom Kuzman – Managing Director Wesfarmers CurraghCrisis management systems have been a demanding management
task, but the national and international pressures have certainlymoved it to a very high priority over recent times. I believe thatRowland’s development and training programs have been veryhelpful and this has been significantly boosted by the recentmine-site mock exercise.
Bronwyn Murphy – CentacareInclusion in the Mock Exercise had significant learning value forCentacare. Lessons were learned by being on site and fullyinvolved in the incident that may not have otherwise beenpossible if our role in the mock did not include a realisticresponse. Congratulations to Management for supporting theconcept and to Rowland Communication Group for planningand implementing the mock exercise.
Pamela Sikora – Director of Nursing, Blackwater HospitalTo be invited to be a part of the exercise was most welcomed. Itis important for the hospital to work closely with other agenciesin a training situation so that should incidents like these occurwe are well prepared. We don’t have the luxury of secondchances in our business and the mock exercise provided anexcellent simulation for our team at the hospital. Both Curraghand Rowland should be congratulated for their efforts in makingit happen.
Senior Constable Greg Dwyer – Blackwater PoliceThe exercise provided an excellent forum for Curragh personneland other agencies to activate response procedures andgenuinely interact in a simulated environment. During theexercise I noted that Curragh personnel were committed toachieving a positive outcome and responding to the requirementsof other agencies and needs of affected individuals. I commendCurragh management for their commitment to developingeffective crisis management procedures.
Conclusion
Over the past five years Curragh has devoted significant effortand resources to the establishment and maintenance of aneffective emergency and crisis management capability. Thepartnership of Curragh and Rowland in developing the capabilityhas been very successful. This success can be attributed to:
• Commitment from senior management• Development of a clear capability definition• An understanding of the role all elements of POSTED play in
the capability development model• Specialist input from Rowland Communication Group in
specific areas such as exercises• Adequate funding and resourcing fire /rescue team and modern
equipment• Adequate funding and resourcing of policy development and
training• A self imposed evaluation and exercise continuum.
The mock exercise was not the start of the capabilitydevelopment process nor was it the finish but rather an importantpart of the overall Curragh emergency and crisis managementdevelopment process which is under continual review andenhancement. We hope and pray we never need to implementour processes for real!!54
Evidence Shows WorkplaceHealth Promotion Works -But How do you get yourEmployees to Attend?Leanne Scanes, Corporate Bodies International Pty Ltd
Abstract
To ensure improved health, reduced absenteeism andincreased productivity, it is essential health initiatives have a highparticipation rate. Choosing the most expensive and welldesigned initiative will not guarantee attendance. Voluntaryunpaid participation outside work hours is often the greatesthurdle faced when trying to implement workplace healthpromotion.
The range of health initiatives available is ever increasing.Health screenings, pamphlets, toolbox talks, seminars, multi -session programs, employment of a health practitioner andbuilding of gyms or sporting facilities all achieve varying degreesof participation. Even within the mining industry there is disputeover the most effective means of improving employee health.
Once an initiative has been selected the difficulty remainsconvincing employees to attend. An essential key is to knowwhat attracts employees to a program. Initiatives which addresstopics relevant to the workforce, are fun, interactive andpresented in an informal environment all achieve highattendance. One crucial factor in maintaining employeescommitment to the program, is the presenter’s ability tocommunicate the information with enthusiasm and generateongoing adherence.
The elements which attract employees to participate in ahealth initiative and the characteristics pertinent to ensuringcontinued attendance are explored in this paper.
Introduction
It has been established that no organisation can remainproductive without maintaining the health, job satisfaction andmorale of its employees (1). When considering the costs of poorhealth to business, and its increasing relevance, it becomesevident that initiatives need to be taken to reduce the incidenceof workplace accidents and injuries, and subsequent worker’scompensation claims (2). Health promotion programs are notcompulsory in Australia, however their popularity is growing.
There is increased recognition that Occupational Health andSafety (OH&S) legislation emphasises the need for a workplaceto be not only safe, but also healthy. The majority oforganisations are working to reduce workplace health hazards,such as exposure to noise, heat and dust. However the emerging
trend is to go beyond this legislative requirement and offer healthpromotion initiatives to encourage employees to achieve optimalhealth.
At the 1993 Minesafe International Conference, Ric CharltonCEO of Shell Australia, asked “Should lifestyle and healthpromotion of the workforce be the employer responsibilities?”Ten years on, this question remains unanswered, although mostcompanies are beginning to recognise the negative impact ofpoor health on business profitability, and the influence of anemployee’s lifestyle outside of work on their work performance.
Workplace health promotion activities are often separatedfrom OH&S issues. However the question is: should they beaddressed congruently? Employees are offered sunglasses,sunhats and sunscreen when working outdoors to prevent skincancer. Should companies go one step further and offer skincancer screening, or seminars on early detection of skin cancersas a further means of prevention? The rising implementation ofhealth promotion programs is beginning to set a trend in whichemployers are taking more responsibility for the employees’health and well being, whereas the employee accepts lessresponsibility. Programs must empower individuals to acceptresponsibility for their own health and well being. Ric Charltonadds, “If we believe that health promotion in the workplacereduces accidents, it should be part of an overall effort toimprove safety.”(Ric Charlton CEO of Shell,1993 Minesafeconference).
While in support of the use of health promotion strategies toimprove employee health, the concerns of unions, employeesand governments is that employers may seek to improveproductivity and moral in the workplace through high profilehealth promotion programs, at the expense of basic OH&SIssues(3).
The question over the responsibility of employers to offerhealth promotion will continue to be debated. However there islittle argument to negate that these programs do provide very realbenefits to the workplace(4). When used in conjunction withstringent OH&S standards the “two-pronged” approach toemployee health results in a synergy that will maximise thepositive outcome (3).
There is continuous acknowledgement that what employeesdo outside of work hours impacts on their health andproductivity as much as activities done at work (4). Employers
55
can justify the use of health promotion to assist workers toachieve better health and lifestyle habits. Adoption of primarycare strategies that address the underlying issues of poor healthresults in benefits to all concerned: the workers, their familiesand the employer (5).
The short term benefits of running health promotion programsare difficult to measure, such as improved staff moral andimproved employee/management relations (6). Another shortterm benefit is the organisation’s improved public image bydemonstrating a concern for the welfare of their employee base(7). This has a potential flow-on effect of improved staffrecruitment and retention.
The importance of long term and financial benefits tomeasure success becomes more apparent as the programprogresses. The three main financial concerns of mostworkplaces: productivity, running costs and staff turnover, can beabated with a successful health promotion program. Decreasedabsenteeism, improved productivity, improved fitness, reducedworkers compensation claims and fewer retirements due toillness (6), are all known benefits of workplace health promotion.
Australia is behind the developed world when it comes toplacing an increased emphasis on employee health. Onepossible reason is that Australian companies are not required topay the health care costs of employees. Rather, most companieshave their own policy regarding fitness and health requirementsfor employment. The majority of organisations in whichemployees undertake physical tasks require a pre-employmentmedical to ensure fitness for duty. However, many organisationslack ongoing monitoring of an employee’s health and fitnessduring their time of employment. If pre-employment fitness isvital, the same importance should be placed on an employee’shealth throughout their employment. Anecdotal evidence, andsimply looking around a worksite will reveal that this is not thecase.
Corporate Bodies International, a provider of health andlifestyle programs to the mining, and other blue collar industriesconducted a survey with two QLD coal mines in the BowenBasin (one underground and one opencut) and a quarry in theACT. After completion of the ‘Working Bodies’ program, a healthand lifestyle program designed specifically for blue collarworkers, 150 participants completed a questionnaire. Employeeswere asked for their reasons for joining the program. 46% saidbecause their “waist line was expanding” and 43% reported theyhad gained weight over the past 5 years. Due to the small samplesize it cannot be assumed this is a true indicator of the entireindustry, however it does give an insight. This research isintended to alert companies to a possible issue occurring onsitethat may require attention.
Many organisations report using health promotion incollaboration with an OH&S framework to improve employeehealth and well being. Mining and construction industries aremuch less likely to offer health promotion initiatives than whitecollar industries (4). Even when initiatives are offered they tendto be less intensive, whereby they do not achieve sustainablehealth and lifestyle change (4).
Blue collar industries, such as the mining industry, generallyhave a male dominated employee base. One of the most
common beliefs is that men don’t care about their health (8).However, people who work with men know that many moremen care about their health than generally reported. Essentiallythere are many more reasons, other than apathy, that limit aman’s ability to take steps to improve his health (8).
It is widely reported that blue collar workers (9) are the leasthealthy of all employment groups, and they are most likely toreport to work unwell. Many employers are actively addressingthis issue, as they recognise workers who are not fullyfunctioning affect production and can become a safety hazard.Presenting for work on time every day and going home in onepiece does not mean your workforce is healthy. Nor does a lowabsentee level indicate healthy employees(9). Lower productivitydue to unwell workers may be more prolific that thought (9).
What is known about men, especially in regards to bluecollar workers, is that they are less likely to participate whenthey view the health promotion strategy as something of norelevance to them. The failure of health programs to specificallyaddress the needs of these working men has resulted in manydrawing the conclusion that programs simply do not work withthis group of the population. However, programs designedspecifically for these workers, and presented with the rightapproach, result in a high degree of participation and measurablelong term health benefits (10).
Many organisations are now introducing health promotionprograms, with the aim to improve the health of every singleworker, particularly those at high risk (7). The aim to have allemployees attend a program can only be achieved by making itcompulsory. The reality is that not all employees want to becomehealthier, and programs should be voluntary. Attendance alonedoes not ensure participants will change their current health andlifestyle behaviours (J).
To make a program compulsory, the employer must run theprogram in work time, thereby contributing financially to the costof the program, and also bearing the costs of the resulting lostproduction. Two of the main benefits employers hope to achieveby running health promotion are increased production andimproved morale. Running programs in work time will impactnegatively on production schedules, and forced participation willonly harm morale. Evidence shows that despite programs beingrun in work time 100% employee attendance is not guaranteed(11). Corporate Bodies International has experience inconducting workplace health promotion programs within bluecollar industry, including the mining industry. Our researchindicates those programs which are voluntary and run outsidework time produce the greatest results. In addition, employeesfeel a sense of ownership over the program, as they are doing itin their own time, on a voluntary basis, and are less likely toquestion the company’s motive for such promotion.
Program success is often incorrectly measured byparticipation level. However, the number of program attendantsdoes not indicate the amount that actually made lifestyle changebased on the recommendations made. It is also incorrect to usethe drop out rate of the program as a measure of its ongoingsuccess (or failure) as some initiatives, such as flu vaccinationsdo not require the time commitment as multi-session programsaimed at changing employees’ established lifestyle habits. Aprogram can be deemed successful when the majority of
56
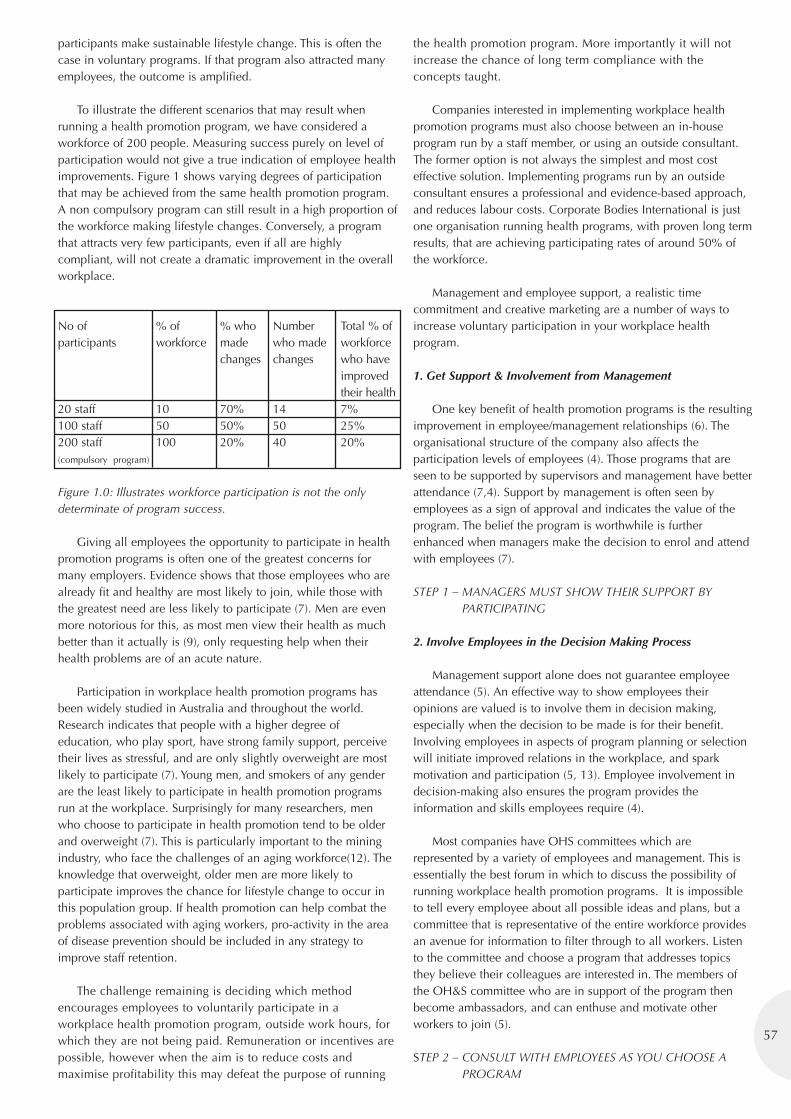
57
participants make sustainable lifestyle change. This is often thecase in voluntary programs. If that program also attracted manyemployees, the outcome is amplified.
To illustrate the different scenarios that may result whenrunning a health promotion program, we have considered aworkforce of 200 people. Measuring success purely on level ofparticipation would not give a true indication of employee healthimprovements. Figure 1 shows varying degrees of participationthat may be achieved from the same health promotion program.A non compulsory program can still result in a high proportion ofthe workforce making lifestyle changes. Conversely, a programthat attracts very few participants, even if all are highlycompliant, will not create a dramatic improvement in the overallworkplace.
No of % of % who Number Total % of participants workforce made who made workforce
changes changes who haveimprovedtheir health
20 staff 10 70% 14 7%100 staff 50 50% 50 25%200 staff 100 20% 40 20%(compulsory program)
Figure 1.0: Illustrates workforce participation is not the onlydeterminate of program success.
Giving all employees the opportunity to participate in healthpromotion programs is often one of the greatest concerns formany employers. Evidence shows that those employees who arealready fit and healthy are most likely to join, while those withthe greatest need are less likely to participate (7). Men are evenmore notorious for this, as most men view their health as muchbetter than it actually is (9), only requesting help when theirhealth problems are of an acute nature.
Participation in workplace health promotion programs hasbeen widely studied in Australia and throughout the world.Research indicates that people with a higher degree ofeducation, who play sport, have strong family support, perceivetheir lives as stressful, and are only slightly overweight are mostlikely to participate (7). Young men, and smokers of any genderare the least likely to participate in health promotion programsrun at the workplace. Surprisingly for many researchers, menwho choose to participate in health promotion tend to be olderand overweight (7). This is particularly important to the miningindustry, who face the challenges of an aging workforce(12). Theknowledge that overweight, older men are more likely toparticipate improves the chance for lifestyle change to occur inthis population group. If health promotion can help combat theproblems associated with aging workers, pro-activity in the areaof disease prevention should be included in any strategy toimprove staff retention.
The challenge remaining is deciding which methodencourages employees to voluntarily participate in aworkplace health promotion program, outside work hours, forwhich they are not being paid. Remuneration or incentives arepossible, however when the aim is to reduce costs andmaximise profitability this may defeat the purpose of running
the health promotion program. More importantly it will notincrease the chance of long term compliance with theconcepts taught.
Companies interested in implementing workplace healthpromotion programs must also choose between an in-houseprogram run by a staff member, or using an outside consultant.The former option is not always the simplest and most costeffective solution. Implementing programs run by an outsideconsultant ensures a professional and evidence-based approach,and reduces labour costs. Corporate Bodies International is justone organisation running health programs, with proven long termresults, that are achieving participating rates of around 50% ofthe workforce.
Management and employee support, a realistic timecommitment and creative marketing are a number of ways toincrease voluntary participation in your workplace healthprogram.
1. Get Support & Involvement from Management
One key benefit of health promotion programs is the resultingimprovement in employee/management relationships (6). Theorganisational structure of the company also affects theparticipation levels of employees (4). Those programs that areseen to be supported by supervisors and management have betterattendance (7,4). Support by management is often seen byemployees as a sign of approval and indicates the value of theprogram. The belief the program is worthwhile is furtherenhanced when managers make the decision to enrol and attendwith employees (7).
STEP 1 – MANAGERS MUST SHOW THEIR SUPPORT BYPARTICIPATING
2. Involve Employees in the Decision Making Process
Management support alone does not guarantee employeeattendance (5). An effective way to show employees theiropinions are valued is to involve them in decision making,especially when the decision to be made is for their benefit.Involving employees in aspects of program planning or selectionwill initiate improved relations in the workplace, and sparkmotivation and participation (5, 13). Employee involvement indecision-making also ensures the program provides theinformation and skills employees require (4).
Most companies have OHS committees which arerepresented by a variety of employees and management. This isessentially the best forum in which to discuss the possibility ofrunning workplace health promotion programs. It is impossibleto tell every employee about all possible ideas and plans, but acommittee that is representative of the entire workforce providesan avenue for information to filter through to all workers. Listento the committee and choose a program that addresses topicsthey believe their colleagues are interested in. The members ofthe OH&S committee who are in support of the program thenbecome ambassadors, and can enthuse and motivate otherworkers to join (5).
STEP 2 – CONSULT WITH EMPLOYEES AS YOU CHOOSE APROGRAM
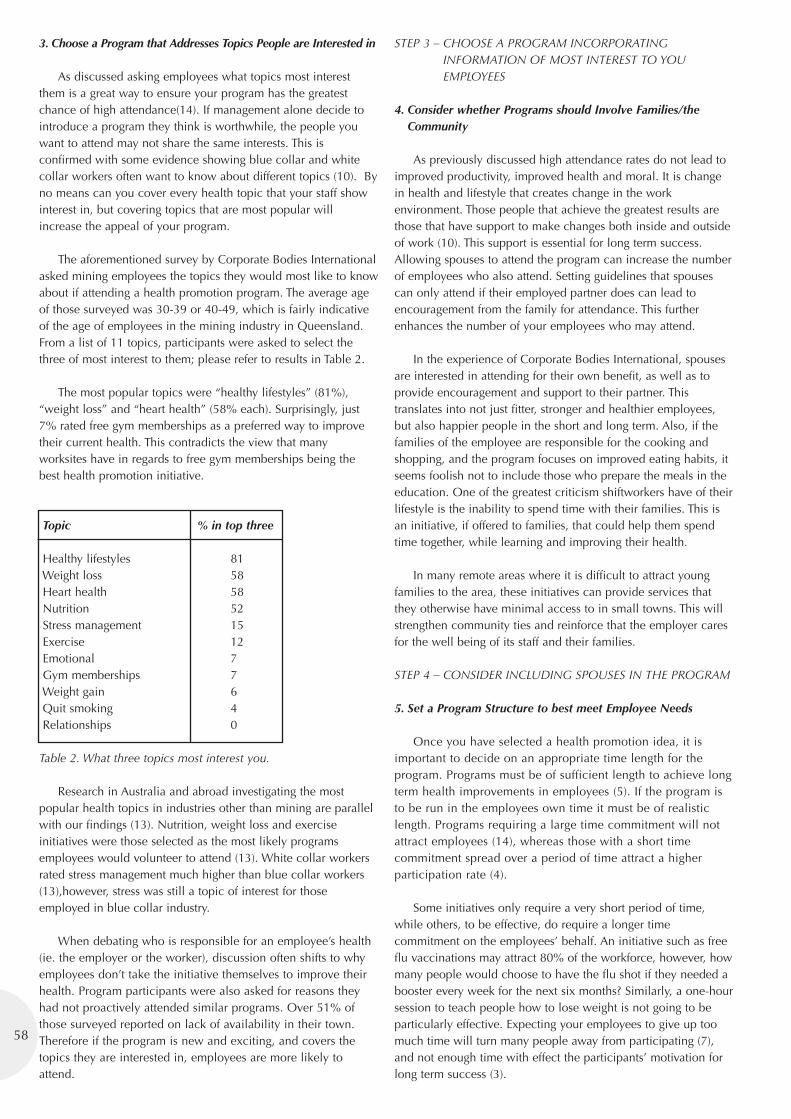
3. Choose a Program that Addresses Topics People are Interested in
As discussed asking employees what topics most interestthem is a great way to ensure your program has the greatestchance of high attendance(14). If management alone decide tointroduce a program they think is worthwhile, the people youwant to attend may not share the same interests. This isconfirmed with some evidence showing blue collar and whitecollar workers often want to know about different topics (10). Byno means can you cover every health topic that your staff showinterest in, but covering topics that are most popular willincrease the appeal of your program.
The aforementioned survey by Corporate Bodies Internationalasked mining employees the topics they would most like to knowabout if attending a health promotion program. The average ageof those surveyed was 30-39 or 40-49, which is fairly indicativeof the age of employees in the mining industry in Queensland.From a list of 11 topics, participants were asked to select thethree of most interest to them; please refer to results in Table 2.
The most popular topics were “healthy lifestyles” (81%),“weight loss” and “heart health” (58% each). Surprisingly, just7% rated free gym memberships as a preferred way to improvetheir current health. This contradicts the view that manyworksites have in regards to free gym memberships being thebest health promotion initiative.
Topic % in top three
Healthy lifestyles 81Weight loss 58Heart health 58Nutrition 52Stress management 15Exercise 12Emotional 7Gym memberships 7Weight gain 6Quit smoking 4Relationships 0
Table 2. What three topics most interest you.
Research in Australia and abroad investigating the mostpopular health topics in industries other than mining are parallelwith our findings (13). Nutrition, weight loss and exerciseinitiatives were those selected as the most likely programsemployees would volunteer to attend (13). White collar workersrated stress management much higher than blue collar workers(13),however, stress was still a topic of interest for thoseemployed in blue collar industry.
When debating who is responsible for an employee’s health(ie. the employer or the worker), discussion often shifts to whyemployees don’t take the initiative themselves to improve theirhealth. Program participants were also asked for reasons theyhad not proactively attended similar programs. Over 51% ofthose surveyed reported on lack of availability in their town.Therefore if the program is new and exciting, and covers thetopics they are interested in, employees are more likely toattend.
STEP 3 – CHOOSE A PROGRAM INCORPORATINGINFORMATION OF MOST INTEREST TO YOUEMPLOYEES
4. Consider whether Programs should Involve Families/theCommunity
As previously discussed high attendance rates do not lead toimproved productivity, improved health and moral. It is changein health and lifestyle that creates change in the workenvironment. Those people that achieve the greatest results arethose that have support to make changes both inside and outsideof work (10). This support is essential for long term success.Allowing spouses to attend the program can increase the numberof employees who also attend. Setting guidelines that spousescan only attend if their employed partner does can lead toencouragement from the family for attendance. This furtherenhances the number of your employees who may attend.
In the experience of Corporate Bodies International, spousesare interested in attending for their own benefit, as well as toprovide encouragement and support to their partner. Thistranslates into not just fitter, stronger and healthier employees,but also happier people in the short and long term. Also, if thefamilies of the employee are responsible for the cooking andshopping, and the program focuses on improved eating habits, itseems foolish not to include those who prepare the meals in theeducation. One of the greatest criticism shiftworkers have of theirlifestyle is the inability to spend time with their families. This isan initiative, if offered to families, that could help them spendtime together, while learning and improving their health.
In many remote areas where it is difficult to attract youngfamilies to the area, these initiatives can provide services thatthey otherwise have minimal access to in small towns. This willstrengthen community ties and reinforce that the employer caresfor the well being of its staff and their families.
STEP 4 – CONSIDER INCLUDING SPOUSES IN THE PROGRAM
5. Set a Program Structure to best meet Employee Needs
Once you have selected a health promotion idea, it isimportant to decide on an appropriate time length for theprogram. Programs must be of sufficient length to achieve longterm health improvements in employees (5). If the program isto be run in the employees own time it must be of realisticlength. Programs requiring a large time commitment will notattract employees (14), whereas those with a short timecommitment spread over a period of time attract a higherparticipation rate (4).
Some initiatives only require a very short period of time,while others, to be effective, do require a longer timecommitment on the employees’ behalf. An initiative such as freeflu vaccinations may attract 80% of the workforce, however, howmany people would choose to have the flu shot if they needed abooster every week for the next six months? Similarly, a one-hoursession to teach people how to lose weight is not going to beparticularly effective. Expecting your employees to give up toomuch time will turn many people away from participating (7),and not enough time with effect the participants’ motivation forlong term success (3).
58
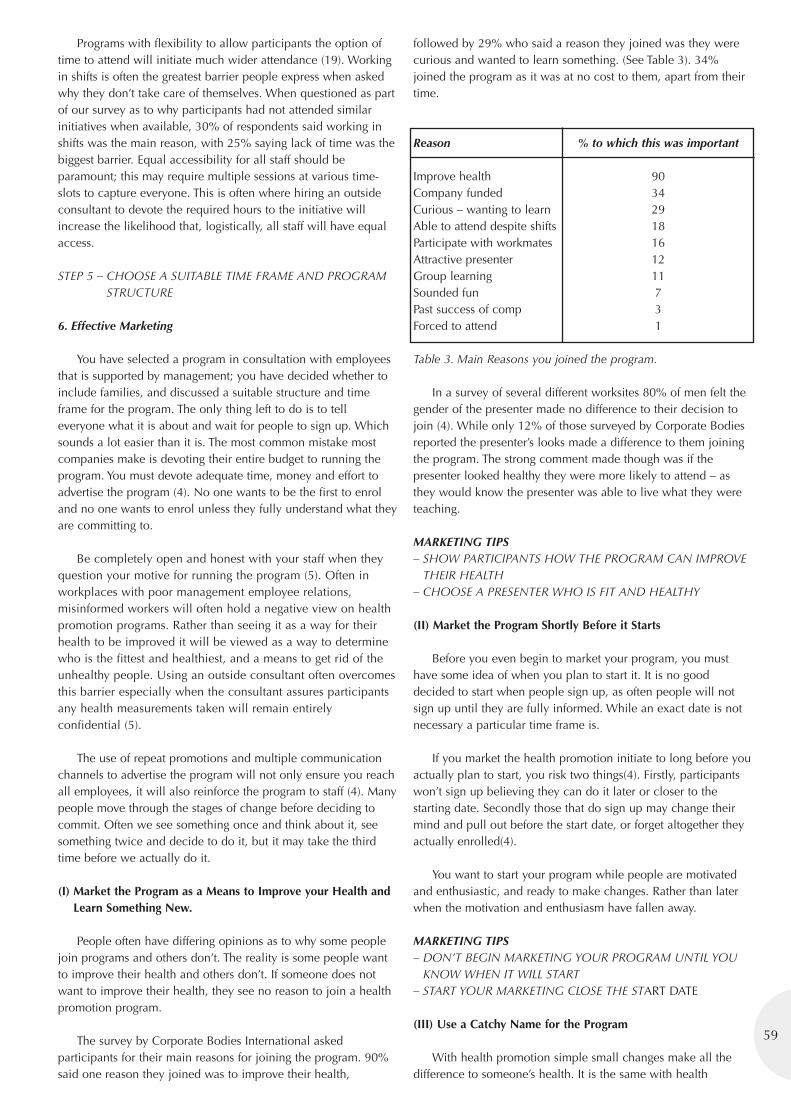
59
Programs with flexibility to allow participants the option oftime to attend will initiate much wider attendance (19). Workingin shifts is often the greatest barrier people express when askedwhy they don’t take care of themselves. When questioned as partof our survey as to why participants had not attended similarinitiatives when available, 30% of respondents said working inshifts was the main reason, with 25% saying lack of time was thebiggest barrier. Equal accessibility for all staff should beparamount; this may require multiple sessions at various time-slots to capture everyone. This is often where hiring an outsideconsultant to devote the required hours to the initiative willincrease the likelihood that, logistically, all staff will have equalaccess.
STEP 5 – CHOOSE A SUITABLE TIME FRAME AND PROGRAMSTRUCTURE
6. Effective Marketing
You have selected a program in consultation with employeesthat is supported by management; you have decided whether toinclude families, and discussed a suitable structure and timeframe for the program. The only thing left to do is to telleveryone what it is about and wait for people to sign up. Whichsounds a lot easier than it is. The most common mistake mostcompanies make is devoting their entire budget to running theprogram. You must devote adequate time, money and effort toadvertise the program (4). No one wants to be the first to enroland no one wants to enrol unless they fully understand what theyare committing to.
Be completely open and honest with your staff when theyquestion your motive for running the program (5). Often inworkplaces with poor management employee relations,misinformed workers will often hold a negative view on healthpromotion programs. Rather than seeing it as a way for theirhealth to be improved it will be viewed as a way to determinewho is the fittest and healthiest, and a means to get rid of theunhealthy people. Using an outside consultant often overcomesthis barrier especially when the consultant assures participantsany health measurements taken will remain entirelyconfidential (5).
The use of repeat promotions and multiple communicationchannels to advertise the program will not only ensure you reachall employees, it will also reinforce the program to staff (4). Manypeople move through the stages of change before deciding tocommit. Often we see something once and think about it, seesomething twice and decide to do it, but it may take the thirdtime before we actually do it.
(I) Market the Program as a Means to Improve your Health andLearn Something New.
People often have differing opinions as to why some peoplejoin programs and others don’t. The reality is some people wantto improve their health and others don’t. If someone does notwant to improve their health, they see no reason to join a healthpromotion program.
The survey by Corporate Bodies International askedparticipants for their main reasons for joining the program. 90%said one reason they joined was to improve their health,
followed by 29% who said a reason they joined was they werecurious and wanted to learn something. (See Table 3). 34%joined the program as it was at no cost to them, apart from theirtime.
Reason % to which this was important
Improve health 90Company funded 34Curious – wanting to learn 29Able to attend despite shifts 18Participate with workmates 16Attractive presenter 12Group learning 11Sounded fun 7Past success of comp 3Forced to attend 1
Table 3. Main Reasons you joined the program.
In a survey of several different worksites 80% of men felt thegender of the presenter made no difference to their decision tojoin (4). While only 12% of those surveyed by Corporate Bodiesreported the presenter’s looks made a difference to them joiningthe program. The strong comment made though was if thepresenter looked healthy they were more likely to attend – asthey would know the presenter was able to live what they wereteaching.
MARKETING TIPS– SHOW PARTICIPANTS HOW THE PROGRAM CAN IMPROVE
THEIR HEALTH – CHOOSE A PRESENTER WHO IS FIT AND HEALTHY
(II) Market the Program Shortly Before it Starts
Before you even begin to market your program, you musthave some idea of when you plan to start it. It is no gooddecided to start when people sign up, as often people will notsign up until they are fully informed. While an exact date is notnecessary a particular time frame is.
If you market the health promotion initiate to long before youactually plan to start, you risk two things(4). Firstly, participantswon’t sign up believing they can do it later or closer to thestarting date. Secondly those that do sign up may change theirmind and pull out before the start date, or forget altogether theyactually enrolled(4).
You want to start your program while people are motivatedand enthusiastic, and ready to make changes. Rather than laterwhen the motivation and enthusiasm have fallen away.
MARKETING TIPS– DON’T BEGIN MARKETING YOUR PROGRAM UNTIL YOU
KNOW WHEN IT WILL START– START YOUR MARKETING CLOSE THE START DATE
(III) Use a Catchy Name for the Program
With health promotion simple small changes make all thedifference to someone’s health. It is the same with health
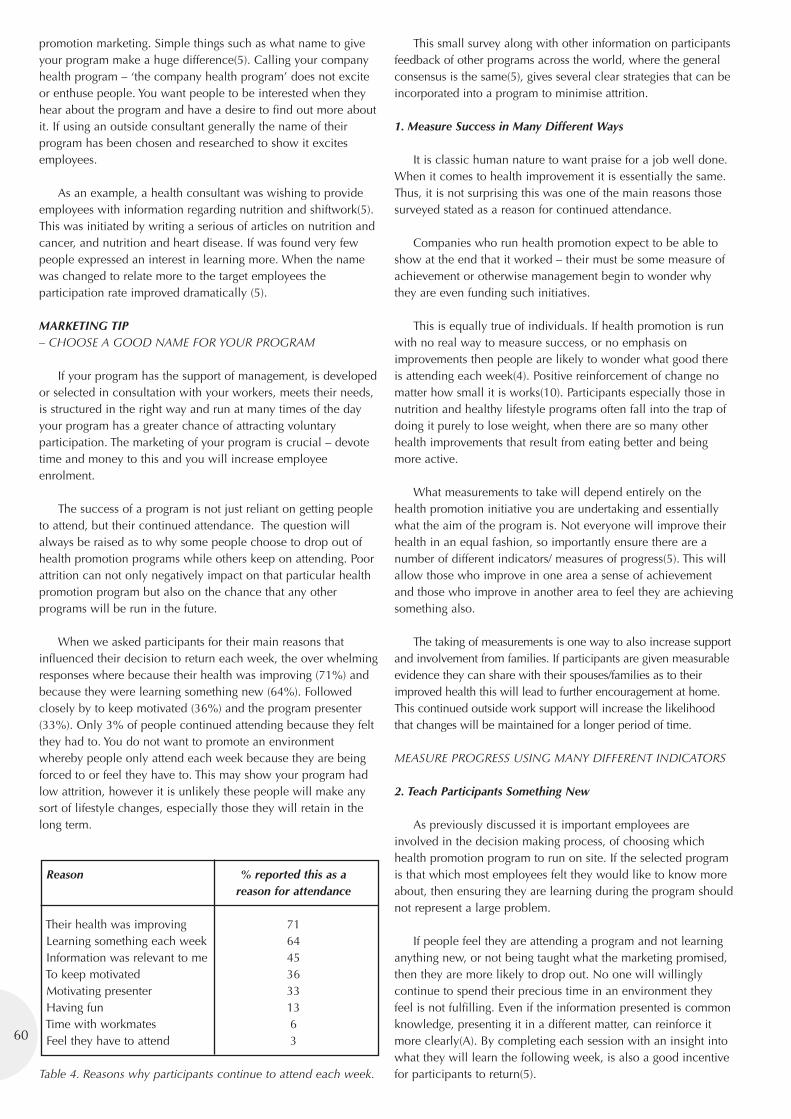
promotion marketing. Simple things such as what name to giveyour program make a huge difference(5). Calling your companyhealth program – ‘the company health program’ does not exciteor enthuse people. You want people to be interested when theyhear about the program and have a desire to find out more aboutit. If using an outside consultant generally the name of theirprogram has been chosen and researched to show it excitesemployees.
As an example, a health consultant was wishing to provideemployees with information regarding nutrition and shiftwork(5).This was initiated by writing a serious of articles on nutrition andcancer, and nutrition and heart disease. If was found very fewpeople expressed an interest in learning more. When the namewas changed to relate more to the target employees theparticipation rate improved dramatically (5).
MARKETING TIP– CHOOSE A GOOD NAME FOR YOUR PROGRAM
If your program has the support of management, is developedor selected in consultation with your workers, meets their needs,is structured in the right way and run at many times of the dayyour program has a greater chance of attracting voluntaryparticipation. The marketing of your program is crucial – devotetime and money to this and you will increase employeeenrolment.
The success of a program is not just reliant on getting peopleto attend, but their continued attendance. The question willalways be raised as to why some people choose to drop out ofhealth promotion programs while others keep on attending. Poorattrition can not only negatively impact on that particular healthpromotion program but also on the chance that any otherprograms will be run in the future.
When we asked participants for their main reasons thatinfluenced their decision to return each week, the over whelmingresponses where because their health was improving (71%) andbecause they were learning something new (64%). Followedclosely by to keep motivated (36%) and the program presenter(33%). Only 3% of people continued attending because they feltthey had to. You do not want to promote an environmentwhereby people only attend each week because they are beingforced to or feel they have to. This may show your program hadlow attrition, however it is unlikely these people will make anysort of lifestyle changes, especially those they will retain in thelong term.
Reason % reported this as a reason for attendance
Their health was improving 71Learning something each week 64Information was relevant to me 45To keep motivated 36Motivating presenter 33Having fun 13Time with workmates 6Feel they have to attend 3
Table 4. Reasons why participants continue to attend each week.
This small survey along with other information on participantsfeedback of other programs across the world, where the generalconsensus is the same(5), gives several clear strategies that can beincorporated into a program to minimise attrition.
1. Measure Success in Many Different Ways
It is classic human nature to want praise for a job well done.When it comes to health improvement it is essentially the same.Thus, it is not surprising this was one of the main reasons thosesurveyed stated as a reason for continued attendance.
Companies who run health promotion expect to be able toshow at the end that it worked – their must be some measure ofachievement or otherwise management begin to wonder whythey are even funding such initiatives.
This is equally true of individuals. If health promotion is runwith no real way to measure success, or no emphasis onimprovements then people are likely to wonder what good thereis attending each week(4). Positive reinforcement of change nomatter how small it is works(10). Participants especially those innutrition and healthy lifestyle programs often fall into the trap ofdoing it purely to lose weight, when there are so many otherhealth improvements that result from eating better and beingmore active.
What measurements to take will depend entirely on thehealth promotion initiative you are undertaking and essentiallywhat the aim of the program is. Not everyone will improve theirhealth in an equal fashion, so importantly ensure there are anumber of different indicators/ measures of progress(5). This willallow those who improve in one area a sense of achievementand those who improve in another area to feel they are achievingsomething also.
The taking of measurements is one way to also increase supportand involvement from families. If participants are given measurableevidence they can share with their spouses/families as to theirimproved health this will lead to further encouragement at home.This continued outside work support will increase the likelihoodthat changes will be maintained for a longer period of time.
MEASURE PROGRESS USING MANY DIFFERENT INDICATORS
2. Teach Participants Something New
As previously discussed it is important employees areinvolved in the decision making process, of choosing whichhealth promotion program to run on site. If the selected programis that which most employees felt they would like to know moreabout, then ensuring they are learning during the program shouldnot represent a large problem.
If people feel they are attending a program and not learninganything new, or not being taught what the marketing promised,then they are more likely to drop out. No one will willinglycontinue to spend their precious time in an environment theyfeel is not fulfilling. Even if the information presented is commonknowledge, presenting it in a different matter, can reinforce itmore clearly(A). By completing each session with an insight intowhat they will learn the following week, is also a good incentivefor participants to return(5).
60
61
PRESENT INFORMATION IN A NEW LIGHT
3. Make the Information Relevant
Not only do participants want to increase their knowledgeand awareness of how to improve their health they want to knowhow it relates to them, and how to put in into practice. If healthpromotion is done in a lecture style fashion, wherebyparticipants are told what to and what not to do, they areunlikely to keep attending and even less likely to put it intopractice.
People want to hear news they can use. There are threesimple steps to learning (5). Listen and forget, see and remember,do and understand(5). If the information is presented withsuggestions of how to put in into practice around currentlifestyles and work requirements, participants feel it is relevant tothem. With over 40% of those surveyed reporting the relevanceof the information was a reason they kept attending our program,it is a major contributing factor to attrition.
MAKE THE INFORMATION RELEVANT BY GIVING PRACTICALADVICE
4. Choose the Right Program Presenter
Often occupational health and safety staff within thecompany have been used to advise workers on ways to improvetheir health such as how to lose weight or reduce cholesterol(15). However, due to familiarity and limited ability to run acomprehensive program there is generally little or no significantchange in the behaviour of the individual (16). Neverunderestimate the impact the presenter has. There is a largefinancial and time commitment to investigate and run healthpromotion programs, sourcing a good program presented aids inhigh attendance levels throughout the program.
When a professional health provider is outsourced, there isgreater likelihood, that beneficial changes in health behaviourwill occur (17). When you are expecting your employees to turnup week after week, the program presenter needs to have rapportwith the group. Strong inter-personal skills, excellent verbalcommunication, sensitivity to the needs of the group and theindividual, as well as the ability to relate to your employees arecontributing factors that motivate participants to continueattending (18).
CHOOSE THE RIGHT PROGRAM PRESENTER
Participant retention during the running of the program,alongside a high initial enrolment rate, enhances the chance of alarge proportion of the workforce making health improvements.Multi-session programs are designed to teach employees manydiffering ways to improve their health. If participants attend allsessions of multi-component programs they are more likely to beable to select those components of the program they feel areeasy to incorporate into their current lifestyle.
Conclusion
Well designed and run health promotion programs work.There are few who have participated in such programs who willdisagree. Improved moral, better staff management relations,
decreased workers compensation costs/claims and reducedabsenteeism, these are all very real benefits.
It is frustrating that even the best planned and designedprograms do not elicit 100% attendance. Any program thatresults in health improvements in individuals must be viewed asa success. Management support and involvement, along sideemployee decision making increases your chance the programwill be well attended. By establishing a program structuresuitable to the workers, run at times they can attend, whichaddresses topics they are interested in can only further enhanceprogram enrolment.
Individuals have the ultimate decision of whether or not theywant to improve their health. Employers and workplace healthpromotion programs have the ability to empower individuals tomake changes, and offer avenues through which participantslearn how to implement changes. Get your employees tovoluntarily attend health promotion programs in their own time,and the battle is half over. The desire to change though remainswith the individual. We cannot force people to attend, nor canwe expect everyone to value their health in a positive light. Asemployers you can provide the water, make it appealing, lead thehorse to it, but you cannot force the horse to drink.
References
1) Bruhn, J.G. and Cordova, F.D. (1987). Promoting HealthyBehaviour in the Workplace. Health Values Vol 11: 2, pages39 – 48.
2) The National Steering Committee – Health Promotion in theWorkplace. (1995). Why promote health at work. CityGraphics, Canberra Australia.
3) Bellingham, K. (1991) Integrating health promotion with OHSobjectives. Occupational Health Magazine, August Pages 5-6.
4) Glasgow, R., McCaul, K., and Fisher, K. (1993) Participation inWorksite Health Promotion: A critique of the literature andrecommendations for future practice. Health EducationQuarterly Vol 20(3) pages 391-408.
5) Kapitan, R. (1989) Implementation considerations for worksitepromotion programmes. Journal of New Zealand DieteticsAssociation 43:1 pages 16-19.
6) R. Charlton (1993) Should lifestyle and health promotion ofthe workforce be employer responsibilities? Journal ofOccupational Health and Safety, Australia and New Zealand.Vol 9(6) Pages 585-589.
7) Mavis, B.E., Stachnik, T.J., Gibson, C.A and Stoffelmayr, B.E.(1992) Issues related to Participation in worksite healthpromotion: A preliminary study. American Journal of HealthPromotion, Sept/Oct Vol 7 (1), pages 53-60.
8) Baker, P.(2001) The state of men’s health. Mens Health JournalVol 1(1).
9) Korda, R.J., Strazdins, L., Broom, D.H. and Lim, L.L. (2002)The health of the Australian workforce: 1998-2001. Australianand New Zealand Journal of Public Health.

10) Lomas, L., (2003) Men at Work. Men’s Health Journal, Vol 2(1) pages 4-5.
11) Aldona, S. (2001) Financial Impact of Health Promotionprograms: a comprehensive review of the literature.American Journal of Health Promotion, vol 15 (5) pages 296-320.
12) Parker, A.W. (2002) The Aging Workforce: Perspectives andImplications. Qld Mining Industry Health and SafetyConference 2002. Pages 73-80.
13) Edington, M.P., Sharp, M.A., Vreeken, K., Yen, L. andEdington, W. (1997). Worksite Health Program Preferences byGender and Health Risk. American Journal of HealthBehaviour Vol 21: 3, pages 207-215.
14) Golaszewski, T. and Yen, L.T. (1992) DemographicCharacteristics of users of worksite health promotion writtenmaterials. American Journal of Health Promotion, May/JuneVol 6 (5), pages 359-363.
15) Pritchard, J.E., Nowson, C.A., Billington, T. and Ward, J.D.(2002). Benefits of a year-long workplace weight lossprogram on cardiovascular risk factors. Nutrition andDietetics, Vol 59: 2, Pages 87-96.
16) Egger, G. (2000). Intervening in mens nutrition: lessons fromthe Gutbuster men’s ‘waist loss’ program. Australian Journalof Nutrition and Dietetics Vol 57: 1, pages 46-49.
17) Grant, C.B and Brisbin, R.E. (1992). Worksite Wellness – TheKey to higher productivity and lower health costs. VanNostrand Reinhold, New York.
18) Various Authors (1993). Worksite Nutrition Programs.Random House New York.
19) Heanery, C.A, and Goetzel, R.Z (1997) A review of health-related outcomes of multi-component worksite healthpromotion programs.
62
The Implementation of CommonHealth Standards across MultipleMining Operations & an Exampleof Practical ApplicationS Stewart, Pacific Coal Pty Ltd; A Walters, Blair Athol Mine, Pacific Coal Pty Ltd I Firth, Rio Tinto HSE
Abstract
Rio Tinto, one of the world's largest mining and mineralprocessing companies, has developed occupational health (OH)Standards as minimum requirements for all of its managedoperations world wide. The OH Standards are a core element ofthe Rio Tinto occupational health strategy. They are due foradoption in 2003 and full implementation is expected by 2005.This means that we (Pacific Coal Pty Ltd) must have thesestandards fully implemented by the end of 2004, across all fouroperating sites (Blair Athol, Kestrel, Tarong, and Hail Creek).
This has raised a number of challenges for us, but already wehave been able to demonstrate results at an operational level thattranslate into improved business performance.
This paper examines briefly what those challenges are andhow we are going about ensuring successful implementation i.e.“successful” both in terms of:
• Meeting our compliance requirements, and• Ensuring that we will get, and continue to do so over time, real
value from the exercise at each of our operations.
The paper includes some background to the OH standards,outlines the process we followed to ensure that they would beimplemented as required, and identifies key learnings from theexercise – mistakes, critical factors, and those things doneparticularly well.
To demonstrate how these translate into results at anoperational level, a case study that deals with theimplementation of OH Standard B3 - “Manual Handling andVibration” is reviewed:
• What is required to make it work, and • The value we are beginning to get from it.
Introduction
We (Pacific Coal Pty Ltd) recognise that excellence inmanaging our health, safety and environmental responsibilities isessential to any long-term success. This is the basis on which ourOH standards have been developed.
We believe that soundly based standards, with performanceagainst them being verified by both the business operation and
Rio Tinto corporate, will achieve a step change in occupationalhealth awareness and performance. The Rio Tinto OH standardswere developed to represent best international practice. Theintent was to begin a process to improve our performance to thatof the best industries, rather than the best in the mining industry.
The intent of the standards is that we can demonstrate that it:
• Builds from compliance with applicable OH laws andregulations, to work in advance of routine industry standards,and
• Takes reasonable and effective actions to reduce adverseexposures as scientific knowledge changes – and often inadvance of legal requirements.
This latter is particularly important for diseases with long lagtimes of 10 to 30 years.
Challenges
There were a number challenges for our business inimplementing these standards.
Previous experience with implementation of Rio Tinto safetystandards indicated that this exercise was going to require theallocation of significant resources – people, dollars and time.
• We wanted concise and precise auditable standards, but wealso wanted guidance on how to meet the standards effectivelyand cost efficiently
• We were concerned that the timeframe we had been set tohave the standards implemented would necessitate a highercost than had been planned for in resourcing the right skills,and enough manpower, to meet the deadlines set.
• We also needed to improve interchange of information andexpertise between the health services of isolated sites
• Previous implementation of the safety standards had been doneon a site-by-site basis – we needed to eliminate theunnecessary duplication of work, but still meet the timeframeset, therefore necessitating parallel timeframes for work on thedifferent sites
• We needed to ensure that our line managers had ownership ofthese standards – this was a critical factor in determiningwhether or not we would see real benefits from this exercise.To ensure that they had a basic understanding of the standardsand why they are important, we needed to make the standardsrelevant to their every day work.
63
Structure & Scope of the OH Standards
The Rio Tinto OH standards reflect common industry issues.They contain two sections:
Section A - management system standards:
A1. General Health SystemsA2. Risk ManagementA3. Workplace MonitoringA4. Medical and First Aid TreatmentA5. Occupational Medical SurveillanceA6. Records
Section B - performance standards:
B1. Particulate and Gas ExposuresB2. Hearing ConservationB3. Manual Handling and VibrationB4. Hazardous SubstancesB5. RadiationB6. Thermal StressB7. Fitness for WorkB8. Legionnaires DiseaseB9. Travel and Remote Site HealthB10. Occupational Exposure Limits
The principles behind the management standards (Section A)are that each site must have a documented assessment of theirhealth risks (qualitative in the first instance, and quantitative ifdeemed necessary); and systems or processes in place to:
• Quantify, where necessary, exposures to a statistically validdegree
• Manage identified risks• Be able to ensure workers are fit for their work• Recognise any diseases that might develop; and• Maintain records of exposures and medical examinations.
Section B contains specific performance standards relating toprevention of diseases such as deafness, silicosis, musculo-skeletal harm, white finger and legionnaires. Generally, thesestandards are set at best international practice.
Development of OH Standards
Rio Tinto developed a common set of safety standards over a2-year period between1998 and 2000, and these were thenimplemented worldwide across the Rio Tinto businesses. Theimplementation of these standards has achieved a culture changeacross the Group.
Occupational health performance - measured in terms ofreported numbers of new cases per 10,000 employees - hadbeen reported annually since 1997. Measured performance didnot show continuous improvement. Hence, the charge was todevelop a similar set of standards for occupational health.Development of draft Rio Tinto OH standards commenced inearly 2000.
The first draft of the OH standards caused considerableconcern. It had been assumed that occupational healthprinciples were universal and therefore, the initial text had been
written by the corporate HSE group with no consultation. Thisinitial draft had also tried to blend standards with guidance onhow to achieve them. These were mistakes. Other concernswere the perceived resources required to implement them,particularly as the safety standards were consuming moreresources than originally anticipated.
Recovery of the situation was by a series of regionalworkshops at which managing directors and sites’ healthprofessionals were invited to comment on the text. From thesemeetings a significantly different draft was developed, shorterand composed of precise, auditable standards. This step wasessential to the long-term success of this exercise. It allowed thekey stakeholders in the various Rio Tinto group businesses(managing directors and sites’ health professionals) to develop apre-requisite level of ownership and understanding of the OHstandards, as well as an understanding of the types and level ofresources that would need to be allocated.
Concerns for adequacy of resources for implementation wasaddressed by extending the timeframe available forimplementation.
An additional action, which proved to be of real value, wasthat much of the material removed from the initial draft of theOH standards was used as the basis for occupational healthinformation and guidelines (OHIGs). The draft standards andOHIGs were placed on the company intranet to improveinterchange of information and expertise between the sites.
A final version of the OH standards - deemed auditable andcredible by the businesses - was agreed by the end of 2002.Although group businesses formally began implementation of theOH standards from the beginning of 2003, in some businessesthis process was already well underway (the work being basedon the draft version of the final OH standards). Pacific Coal isone of those businesses.
Implementation of Standards
At a Rio Tinto level, a compliance assessment process for theOH standards has commenced (2nd quarter 2003), integratedwith the current business and corporate HSE audit and reviewprogrammes.
All Rio Tinto managed businesses are required to be in fullcompliance with the OH standards by the end of 2004.
For Pacific Coal, implementation of these standards beganway back in early 2001, when our managing director and sitehealth professionals were invited to make comment on theoriginal version of the standards. Our people had spent the timerequired up front to understand the potential impact (both interms of “do nothing”, and the practical aspects of applying themin the workplace) and resource requirements of the proposedstandards, as well as establishing where the benefits for ourbusiness lay. This allowed them to help drive the review processand influence the final outcome. There are two important resultsfrom this process:
• A high level of ownership and working knowledge of thestandards, and
• A set of standards that are able to be applied at an operational
64
65
level, without ridiculous restrictions that are the result oftheoretically valid but highly impractical ‘rules’.
Implementation of the standards has begun in earnest atPacific Coal. We have made a number of decisions that areassisting us in minimising the resources we need to allocate tothis body of work, while still keeping to the timeframe allocated.
• We are combining the OH and S standards at a Pacific Coallevel, to eliminate unnecessary duplication of commonsystems. (Section A of both the OH and safety standards arevery closely aligned)
• Section A of the standards (management systems) is beingimplemented using a resource at corporate level, while SectionB of the standards is being implemented at a site level, usingcommon templates developed in conjunction with externalOH consultants with the requisite specialist skills (e.g.SIMTARS)
• We have made a deliberate decision not to start with a blanksheet of paper – we are working very closely with the Rio TintoHSE group, and other Australian Rio Tinto businesses, to ensurethat where-ever possible and practical, we are using whatothers have developed as an initial draft in areas where wehaven’t done the work, and sharing what we have done inthose areas we have.
A summary of the process we have used is as follows:
• Operational GM’s are accountable for the standards beingimplemented at each of their sites
• Corporate OHS Manager accountable for managing theimplementation project
• Baseline risk assessments for each of our sites • Prioritising areas for action• Developing action plans (at site and corporate level) and
coordinating the sites efforts so that we do not duplicate thework
• Separating action plans for sections A and B of the standards• Review our progress regularly• Once initial actions have been completed, re-do risk
assessment – document successes and areas for improvement• Repeat the “plan – do – review” process.
Absolutely critical to this process being successful is the“review our progress regularly” – it ensures the input of sufficientlevels of focus and effort. This takes the form of both internalprogress reports, and a “verification audit” to be carried out bymembers of the Rio Tinto HSE team (the first having beenscheduled for November this year).
So how does this translate into results at an operational level?A case study that deals with the implementation of OH StandardB3 – “Manual Handling and Vibration” is used to demonstratethe results we are seeing in our workplaces.
Musculo-skeletal disease (MSD) incorporates a group ofconditions commonly reported within the mining industry. Thedecision was made that OH standard B3 needed to focus on themain causes of MSD within Rio Tinto: vibration and manualhandling.
MSD has one of the highest incident rates of occupationaldisease within Rio Tinto, with musculo-skeletal incidence rates
per 10,000 employees ranging from 20 to 80.
This group of conditions varies from back pain, an increasingproblem in heavy equipment operators as increasing age andbody weight become issues, to the effects of repetitivemovements from jobs as varied as secretary and maintenancefitter.
Translation into Results at an Operational Level
We needed to ensure that our line managers had ownershipof these standards – this was a critical factor in determiningwhether or not we would see real benefits from this exercise. Toensure that they had a basic understanding of the standards andwhy they are important, we needed to make the standardsrelevant to their every day work.
This case study helps to demonstrate how we are achievingthis.
Manual Handling
Each of our operating sites has a requirement to reduce thenumber of Lost Time Injuries (LTI) incurred by 50% per annum,and combined LTI and Medical Treatment Cases (MTC) by 25%per annum.
At one of our sites, some basic analysis showed that 70% ofthe injuries incurred were sprains and strains. Turnover in theworkforce is low, so it is ageing, and typically carrying oldinjuries. Hence conventional manual handling and ergonomicstraining was not being effective
The decision was made to put into place on site a ManualHandling programme, which was expected to have a significantpositive impact on:
• Soft tissue injury reoccurrence• Wanagement of ‘old’ injuries• Workplace design improvements• Workforce knowledge base.
The programme focus was at 3 levels: site, team, andindividual.
At a site level the focus was on improving the site standardfor manual handling and ergonomics. An Occupational Therapistwas employed full-time on site (we recognised that we needed toallocate appropriate resource levels if we want positive, longterm results in our health performance).
At team level, the focus was on implementing the programmebased on a risk-based schedule – highest risk team first. Theprogramme included:
• Analysis of team statistics• Observations in the workplace • Training for the team• Changes to the workplace, tooling and work practices• Detailed feedback to the teams.
The work for this programme was carried out over periods ofweeks for each workplace. The occupational therapist was in the

workplace everyday, taking photos, speaking with personnel,coaching and explaining. Changes were made in consultationwith the personnel in the workplace. Success was measured bythe adoption of healthier workplaces, work practices and tooling– not just in injury statistics. These factors were important indetermining the programmes success.
At an individual level, the focus was to identify those thatwere most at risk (current or ‘old’ injuries, physical condition,work activities) and engage in personal coaching from thespecialist Occupational Therapist e.g. exercise regimes.
The results of this programme were measurable and notable.They are summarised as follows:
Year LTI’s due to sprains and strains2000 92001 72002 32003 to date 1
Through the process we used to implement this programme,we were able to demonstrate to our people that there was realvalue in the practical application of ‘better’ manual handling andergonomics – to the way in which they did their work, not justtheir health and safety performance statistics. The level ofownership for the changes made means that they are far morelikely to be sustained over time, and therefore have ongoingbenefits to both the individuals and Pacific Coal overall.
Summary
There is a requirement for Pacific Coal to implement the RioTinto OH standards by the end of 2004. These were developedover a 2-year period with significant input from site OHSprofessionals and senior line managers. The OH standards are acore element of Rio Tinto’s occupational health strategy, and aredesigned to be ahead of industry and legislative requirements.
The challenge faced by PCPL is to successfully implementthese standards at an operational level, and in the processensuring that we get, and continue to do so over time, real valuefrom the exercise at each of our operations. We have done thisby being involved in development of the standards at the earliestopportunity, by planning not to duplicate any workunnecessarily, and by ensuring that we could demonstrate realbenefits through practical application at an operational levelearly on. The case study presented shows that there aremeasurable benefits.
66
National Industry Perspectiveson Occupational Health Issues
Noel Wendt, Roche Mining, MCA Health Working Group
Safety and health is the number one priority of the MineralsCouncil of Australia (MCA). In pursuit of its vision of anAustralian minerals industry free of fatalities, injuries anddiseases, the MCA implements a comprehensive work programwith a focus on leadership, recognition, performancemeasurement and reporting, identifying best practice andpromoting continuous improvement.
The MCA through its Safety and Health Committeeencourages and facilitates the Australian minerals industryachieve excellence in safety and health performance and itsterms of reference are to:
• Identify and prioritise industry safety and health issues• Develop and implement a Council safety and health policy
and action plan to address priority issues and to support theCouncil’s safety and health leadership role
• Recognise safety and health excellence achieved by theindustry
• Provide timely and relevant information on safety and healthperformance and safety and health improvement initiatives
• Foster the safety and health initiatives developed through theCommittee and the Council into the minerals industry
• Promote the safety and health achievements of the industry tothe community
• Examine and report on such matters as may be requested bythe MCA Executive Committee
• Provide representation, as appropriate, to other bodies onsafety and health issues on behalf of the Council.
In 2002, recognising that the primary focus of the MCA safetyand health leadership program had been on safety and theelimination of fatalities and injuries, the MCA agreed that a keyfuture priority would be to increase the profile given to healthissues.
Key reasons for a focus on health included:
• The lack of comprehensive and consistent data across theindustry
• The difficulty in tracking the health of individuals movingbetween jurisdictions, companies and industries
• The long latency periods associated with some illnesses• The difficulty in establishing causation due to masking by
community health, lifestyle and other factors.
Previous work by the MCA had indicated health issues could
be categorised into four distinct groups:
• Issues of potentially high consequence with long periods oflatency, which from the incidence of cases appear to be undercontrol – cancers, respiratory diseases associated withexposure to substances such as silica, asbestos and coal dust
• Traditional health issues for which there are interventionsknown to be effective but which may not be implementedconsistently – noise induced hearing loss, exposure tohazardous substances
• Traditional health issues for which there are interventionsknown to be effective and which are generally quite wellimplemented – heat illness from exposure to heat, sunlight,and humidity
• Multi-factorial issues requiring new interventions –fatigue/fitness for duty, occupational stress.
An attempt to prioritise health priorities was limited by theavailability of comprehensive and consistent data and the needto rely on anecdotal information.
To give impetus to the MCA’s focus on health, a HealthWorking Group has been established to identify the key healthrisks in the minerals sector, provide advice on the most practicalguidance available in addressing these risks and explore apossible framework for the ongoing monitoring and reporting ofhealth performance within the minerals industry.
The key elements of the Health Working Group’s plan ofaction are to:
• Survey available data collections on the health of workers – theintention is to build a compendium of the important sources ofhealth data for workers in the minerals industry, including anindication of the data collected and any key findings based ananalysis of specific data sets. The data bases to be surveyedwill include relevant regulatory agencies and workerscompensation bodies in WA, Queensland and NSW, theNational Occupational Health and Safety Commission as wellas company data
• Identify the different approaches to health risk assessment andthe tools currently available or under development – It isconsidered important to determine how health risks can begiven adequate attention within an overall risk assessmentprocess and identify how chronic health effects can be ratedcompared to traumatic injuries
• Collate available data on the known health risks in the industry
67
and on the existing controls used to eliminate/minimise healthrisks - The initial health issues to be the focus of the HealthWorking Group are musculo-skeletal disorders includingvibration, noise induced hearing loss and exposure tohazardous substances.
• Collate and share guideline information on priority healthissues – In most cases the MCA will not be developingguidelines to address health issues, as there is no shortage ofinformation and guidance already available on the publicrecord. What is needed is to identify those guidelines whichbest meet the practical needs of mining operations
• Identify and promote appropriate performance measures forpriority health risks - Priority will be given to working towardsa suite of performance measures (lead and lag) to report onhealth issues and trends. Performance measures are alsoreceiving attention from the Health and Safety Taskforce of theInternational Council on Mining and Metals (ICMM) and theMCA will ensure that its activities are aligned with those of theICMM’s work program on health.
The focus of the MCA on health is very much a work inprogress with the clear objective of:
• Identifying the priority health issues for the minerals industry• Ensuring health is given adequate attention in company risk
assessments• Identifying and promoting practical guidance information for
key health priorities• Developing a suite of key health performance measures/
indicators as a basis for monitoring and reporting.
The overall objective of this work is to assist the industry tomanage occupational health issues effectively and be able toreport on trends as we currently do for fatalities and injuries inour industry. Until we have the ability to monitor ourperformance across the industry we will not in a position to saythat we as an industry are addressing the occupational health ofour workers.
68
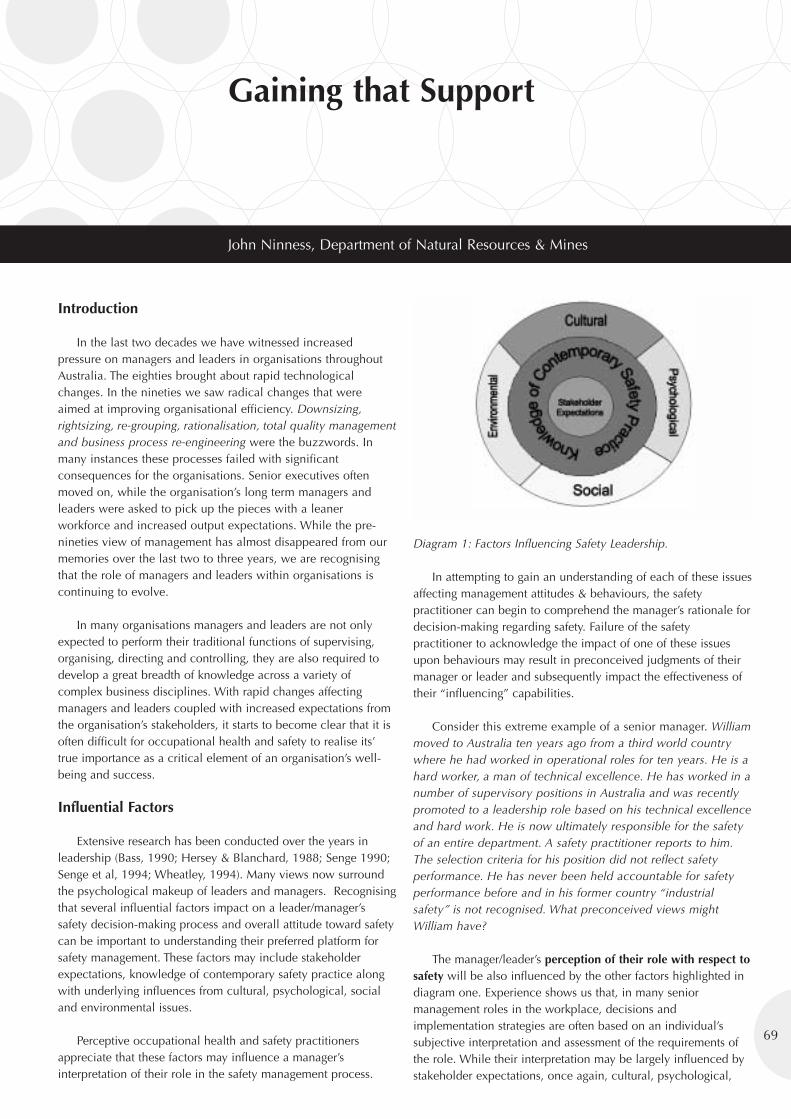
Gaining that Support
John Ninness, Department of Natural Resources & Mines
Introduction
In the last two decades we have witnessed increasedpressure on managers and leaders in organisations throughoutAustralia. The eighties brought about rapid technologicalchanges. In the nineties we saw radical changes that wereaimed at improving organisational efficiency. Downsizing,rightsizing, re-grouping, rationalisation, total quality managementand business process re-engineering were the buzzwords. Inmany instances these processes failed with significantconsequences for the organisations. Senior executives oftenmoved on, while the organisation’s long term managers andleaders were asked to pick up the pieces with a leanerworkforce and increased output expectations. While the pre-nineties view of management has almost disappeared from ourmemories over the last two to three years, we are recognisingthat the role of managers and leaders within organisations iscontinuing to evolve.
In many organisations managers and leaders are not onlyexpected to perform their traditional functions of supervising,organising, directing and controlling, they are also required todevelop a great breadth of knowledge across a variety ofcomplex business disciplines. With rapid changes affectingmanagers and leaders coupled with increased expectations fromthe organisation’s stakeholders, it starts to become clear that it isoften difficult for occupational health and safety to realise its’true importance as a critical element of an organisation’s well-being and success.
Influential Factors
Extensive research has been conducted over the years inleadership (Bass, 1990; Hersey & Blanchard, 1988; Senge 1990;Senge et al, 1994; Wheatley, 1994). Many views now surroundthe psychological makeup of leaders and managers. Recognisingthat several influential factors impact on a leader/manager’ssafety decision-making process and overall attitude toward safetycan be important to understanding their preferred platform forsafety management. These factors may include stakeholderexpectations, knowledge of contemporary safety practice alongwith underlying influences from cultural, psychological, socialand environmental issues.
Perceptive occupational health and safety practitionersappreciate that these factors may influence a manager’sinterpretation of their role in the safety management process.
Diagram 1: Factors Influencing Safety Leadership.
In attempting to gain an understanding of each of these issuesaffecting management attitudes & behaviours, the safetypractitioner can begin to comprehend the manager’s rationale fordecision-making regarding safety. Failure of the safetypractitioner to acknowledge the impact of one of these issuesupon behaviours may result in preconceived judgments of theirmanager or leader and subsequently impact the effectiveness oftheir “influencing” capabilities.
Consider this extreme example of a senior manager. Williammoved to Australia ten years ago from a third world countrywhere he had worked in operational roles for ten years. He is ahard worker, a man of technical excellence. He has worked in anumber of supervisory positions in Australia and was recentlypromoted to a leadership role based on his technical excellenceand hard work. He is now ultimately responsible for the safetyof an entire department. A safety practitioner reports to him.The selection criteria for his position did not reflect safetyperformance. He has never been held accountable for safetyperformance before and in his former country “industrialsafety” is not recognised. What preconceived views mightWilliam have?
The manager/leader’s perception of their role with respect tosafety will be also influenced by the other factors highlighted indiagram one. Experience shows us that, in many seniormanagement roles in the workplace, decisions andimplementation strategies are often based on an individual’ssubjective interpretation and assessment of the requirements ofthe role. While their interpretation may be largely influenced bystakeholder expectations, once again, cultural, psychological,
69
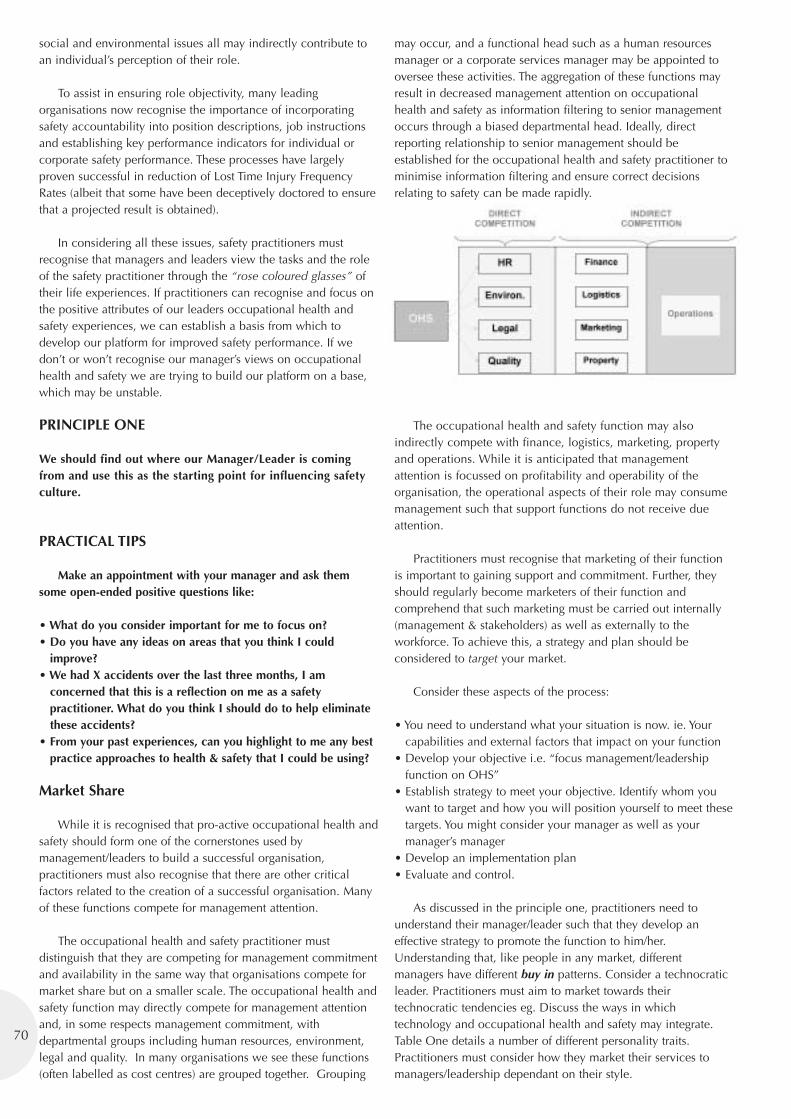
social and environmental issues all may indirectly contribute toan individual’s perception of their role.
To assist in ensuring role objectivity, many leadingorganisations now recognise the importance of incorporatingsafety accountability into position descriptions, job instructionsand establishing key performance indicators for individual orcorporate safety performance. These processes have largelyproven successful in reduction of Lost Time Injury FrequencyRates (albeit that some have been deceptively doctored to ensurethat a projected result is obtained).
In considering all these issues, safety practitioners mustrecognise that managers and leaders view the tasks and the roleof the safety practitioner through the “rose coloured glasses” oftheir life experiences. If practitioners can recognise and focus onthe positive attributes of our leaders occupational health andsafety experiences, we can establish a basis from which todevelop our platform for improved safety performance. If wedon’t or won’t recognise our manager’s views on occupationalhealth and safety we are trying to build our platform on a base,which may be unstable.
PRINCIPLE ONE
We should find out where our Manager/Leader is comingfrom and use this as the starting point for influencing safetyculture.
PRACTICAL TIPS
Make an appointment with your manager and ask themsome open-ended positive questions like:
• What do you consider important for me to focus on?• Do you have any ideas on areas that you think I could
improve?• We had X accidents over the last three months, I am
concerned that this is a reflection on me as a safetypractitioner. What do you think I should do to help eliminatethese accidents?
• From your past experiences, can you highlight to me any bestpractice approaches to health & safety that I could be using?
Market Share
While it is recognised that pro-active occupational health andsafety should form one of the cornerstones used bymanagement/leaders to build a successful organisation,practitioners must also recognise that there are other criticalfactors related to the creation of a successful organisation. Manyof these functions compete for management attention.
The occupational health and safety practitioner mustdistinguish that they are competing for management commitmentand availability in the same way that organisations compete formarket share but on a smaller scale. The occupational health andsafety function may directly compete for management attentionand, in some respects management commitment, withdepartmental groups including human resources, environment,legal and quality. In many organisations we see these functions(often labelled as cost centres) are grouped together. Grouping
may occur, and a functional head such as a human resourcesmanager or a corporate services manager may be appointed tooversee these activities. The aggregation of these functions mayresult in decreased management attention on occupationalhealth and safety as information filtering to senior managementoccurs through a biased departmental head. Ideally, directreporting relationship to senior management should beestablished for the occupational health and safety practitioner tominimise information filtering and ensure correct decisionsrelating to safety can be made rapidly.
The occupational health and safety function may alsoindirectly compete with finance, logistics, marketing, propertyand operations. While it is anticipated that managementattention is focussed on profitability and operability of theorganisation, the operational aspects of their role may consumemanagement such that support functions do not receive dueattention.
Practitioners must recognise that marketing of their functionis important to gaining support and commitment. Further, theyshould regularly become marketers of their function andcomprehend that such marketing must be carried out internally(management & stakeholders) as well as externally to theworkforce. To achieve this, a strategy and plan should beconsidered to target your market.
Consider these aspects of the process:
• You need to understand what your situation is now. ie. Yourcapabilities and external factors that impact on your function
• Develop your objective i.e. “focus management/leadershipfunction on OHS”
• Establish strategy to meet your objective. Identify whom youwant to target and how you will position yourself to meet thesetargets. You might consider your manager as well as yourmanager’s manager
• Develop an implementation plan• Evaluate and control.
As discussed in the principle one, practitioners need tounderstand their manager/leader such that they develop aneffective strategy to promote the function to him/her.Understanding that, like people in any market, differentmanagers have different buy in patterns. Consider a technocraticleader. Practitioners must aim to market towards theirtechnocratic tendencies eg. Discuss the ways in whichtechnology and occupational health and safety may integrate.Table One details a number of different personality traits.Practitioners must consider how they market their services tomanagers/leadership dependant on their style.
70
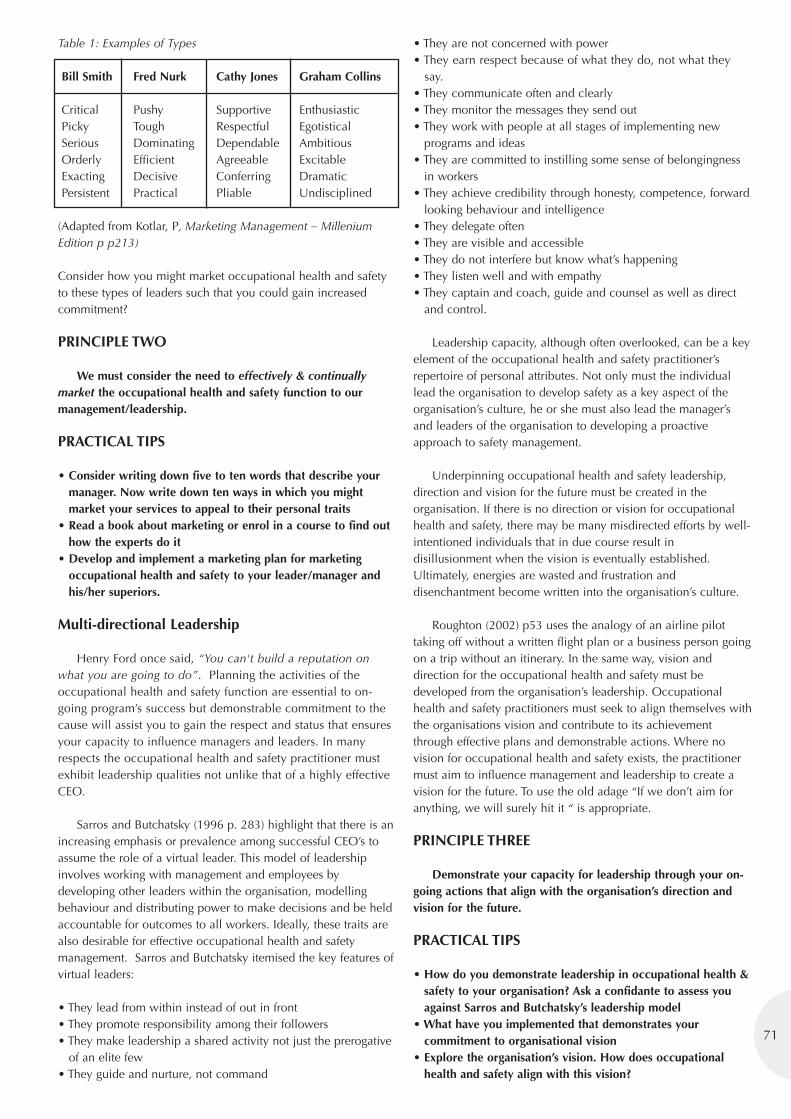
71
Table 1: Examples of Types
Bill Smith Fred Nurk Cathy Jones Graham Collins
Critical Pushy Supportive EnthusiasticPicky Tough Respectful EgotisticalSerious Dominating Dependable AmbitiousOrderly Efficient Agreeable ExcitableExacting Decisive Conferring DramaticPersistent Practical Pliable Undisciplined
(Adapted from Kotlar, P, Marketing Management – MilleniumEdition p p213)
Consider how you might market occupational health and safetyto these types of leaders such that you could gain increasedcommitment?
PRINCIPLE TWO
We must consider the need to effectively & continuallymarket the occupational health and safety function to ourmanagement/leadership.
PRACTICAL TIPS
• Consider writing down five to ten words that describe yourmanager. Now write down ten ways in which you mightmarket your services to appeal to their personal traits
• Read a book about marketing or enrol in a course to find outhow the experts do it
• Develop and implement a marketing plan for marketingoccupational health and safety to your leader/manager andhis/her superiors.
Multi-directional Leadership
Henry Ford once said, “You can't build a reputation onwhat you are going to do”. Planning the activities of theoccupational health and safety function are essential to on-going program’s success but demonstrable commitment to thecause will assist you to gain the respect and status that ensuresyour capacity to influence managers and leaders. In manyrespects the occupational health and safety practitioner mustexhibit leadership qualities not unlike that of a highly effectiveCEO.
Sarros and Butchatsky (1996 p. 283) highlight that there is anincreasing emphasis or prevalence among successful CEO’s toassume the role of a virtual leader. This model of leadershipinvolves working with management and employees bydeveloping other leaders within the organisation, modellingbehaviour and distributing power to make decisions and be heldaccountable for outcomes to all workers. Ideally, these traits arealso desirable for effective occupational health and safetymanagement. Sarros and Butchatsky itemised the key features ofvirtual leaders:
• They lead from within instead of out in front• They promote responsibility among their followers• They make leadership a shared activity not just the prerogative
of an elite few• They guide and nurture, not command
• They are not concerned with power• They earn respect because of what they do, not what they
say.• They communicate often and clearly• They monitor the messages they send out• They work with people at all stages of implementing new
programs and ideas• They are committed to instilling some sense of belongingness
in workers• They achieve credibility through honesty, competence, forward
looking behaviour and intelligence• They delegate often• They are visible and accessible• They do not interfere but know what’s happening• They listen well and with empathy• They captain and coach, guide and counsel as well as direct
and control.
Leadership capacity, although often overlooked, can be a keyelement of the occupational health and safety practitioner’srepertoire of personal attributes. Not only must the individuallead the organisation to develop safety as a key aspect of theorganisation’s culture, he or she must also lead the manager’sand leaders of the organisation to developing a proactiveapproach to safety management.
Underpinning occupational health and safety leadership,direction and vision for the future must be created in theorganisation. If there is no direction or vision for occupationalhealth and safety, there may be many misdirected efforts by well-intentioned individuals that in due course result indisillusionment when the vision is eventually established.Ultimately, energies are wasted and frustration anddisenchantment become written into the organisation’s culture.
Roughton (2002) p53 uses the analogy of an airline pilottaking off without a written flight plan or a business person goingon a trip without an itinerary. In the same way, vision anddirection for the occupational health and safety must bedeveloped from the organisation’s leadership. Occupationalhealth and safety practitioners must seek to align themselves withthe organisations vision and contribute to its achievementthrough effective plans and demonstrable actions. Where novision for occupational health and safety exists, the practitionermust aim to influence management and leadership to create avision for the future. To use the old adage “If we don’t aim foranything, we will surely hit it “ is appropriate.
PRINCIPLE THREE
Demonstrate your capacity for leadership through your on-going actions that align with the organisation’s direction andvision for the future.
PRACTICAL TIPS
• How do you demonstrate leadership in occupational health &safety to your organisation? Ask a confidante to assess youagainst Sarros and Butchatsky’s leadership model
• What have you implemented that demonstrates yourcommitment to organisational vision
• Explore the organisation’s vision. How does occupationalhealth and safety align with this vision?
Summary
One of the most fulfilling and often most frustrating issuesfacing the occupational health and safety practitioner is theirrelationship with managers and leaders. Availability of qualitytime with management will no doubt continue to be pressuredby operational responsibilities that are essential to survival of theorganisation. Practitioners must identify alternate strategies toultimately improve relationships and, influence leaders/managersto focus due attention on establishing a vision for an incidentfree working environment.
Not only must the occupational health and safety practitionerbe competent in light of the professional requirements, he/shemust also be skilled at objectively assessing their manager’sviewpoint, strategically marketing the occupational health andsafety function and demonstrating leadership traits that are inparallel with highly effective leaders.
References
Bass, B.M. (1990). Bass & Stogdill's handbook of leadership:theory, research, and managerial applications. (3rd ed.). NewYork: The Free Press.
Hersey, Paul & Blanchard, Kenneth H, Johnson, Dewey E..Management of Organisational Behaviour: Leading HumanResources (8th Edition) Pearson Education
Kotler, J. Marketing Management – The Millenium Edition, 2000,New Jersey, Prentice Hall.
Reed, Peter. Marketing Planning & Strategy, 2nd Edition, 1999,Marrickville, Harcourt Australia.
Roughton, James E, Developing an effective safety culture,2002,Woburn MA, Butterworth-Heinemann.
Sarros, JC & Butchatsky, O, Leadership – Australia's top CEOs:finding out what makes them the best. Sydney, Harper Business.
Wren, D.A. (1994). The evolution of management thought. 4thed. New York: John Wiley & Sons.
72
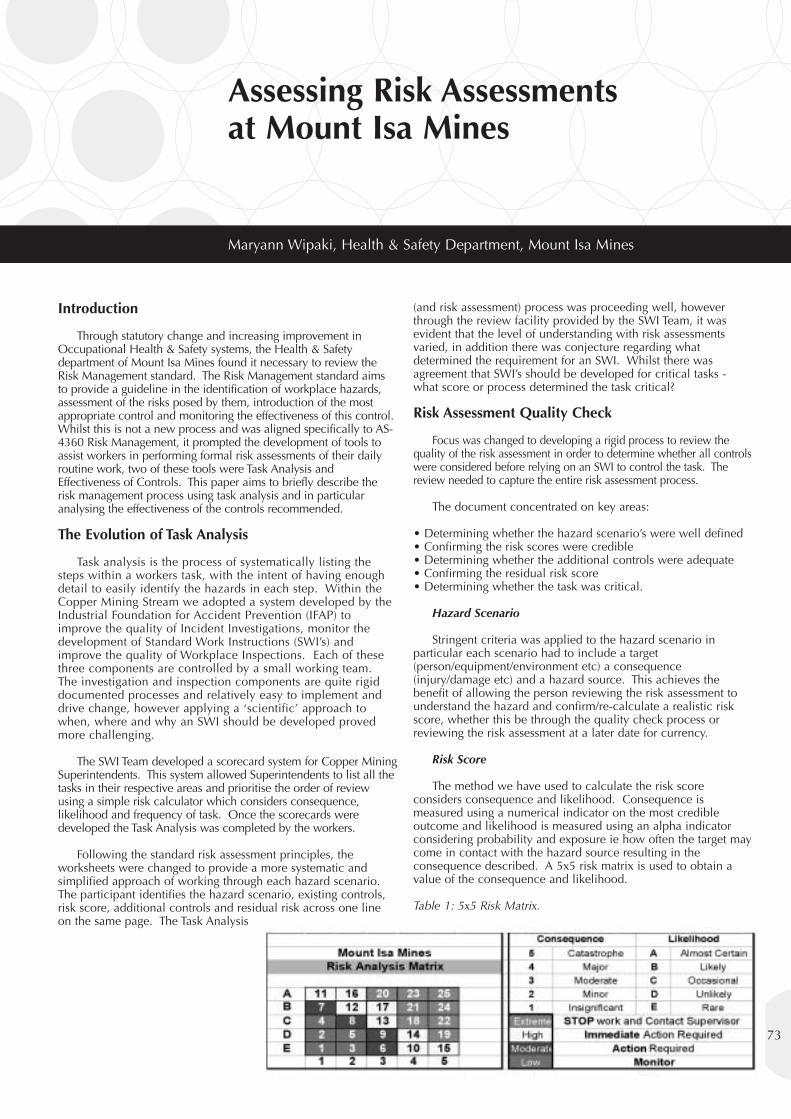
Assessing Risk Assessmentsat Mount Isa Mines
Maryann Wipaki, Health & Safety Department, Mount Isa Mines
Introduction
Through statutory change and increasing improvement inOccupational Health & Safety systems, the Health & Safetydepartment of Mount Isa Mines found it necessary to review theRisk Management standard. The Risk Management standard aimsto provide a guideline in the identification of workplace hazards,assessment of the risks posed by them, introduction of the mostappropriate control and monitoring the effectiveness of this control.Whilst this is not a new process and was aligned specifically to AS-4360 Risk Management, it prompted the development of tools toassist workers in performing formal risk assessments of their dailyroutine work, two of these tools were Task Analysis andEffectiveness of Controls. This paper aims to briefly describe therisk management process using task analysis and in particularanalysing the effectiveness of the controls recommended.
The Evolution of Task Analysis
Task analysis is the process of systematically listing thesteps within a workers task, with the intent of having enoughdetail to easily identify the hazards in each step. Within theCopper Mining Stream we adopted a system developed by theIndustrial Foundation for Accident Prevention (IFAP) toimprove the quality of Incident Investigations, monitor thedevelopment of Standard Work Instructions (SWI’s) andimprove the quality of Workplace Inspections. Each of thesethree components are controlled by a small working team.The investigation and inspection components are quite rigiddocumented processes and relatively easy to implement anddrive change, however applying a ‘scientific’ approach towhen, where and why an SWI should be developed provedmore challenging.
The SWI Team developed a scorecard system for Copper MiningSuperintendents. This system allowed Superintendents to list all thetasks in their respective areas and prioritise the order of reviewusing a simple risk calculator which considers consequence,likelihood and frequency of task. Once the scorecards weredeveloped the Task Analysis was completed by the workers.
Following the standard risk assessment principles, theworksheets were changed to provide a more systematic andsimplified approach of working through each hazard scenario.The participant identifies the hazard scenario, existing controls,risk score, additional controls and residual risk across one lineon the same page. The Task Analysis
(and risk assessment) process was proceeding well, howeverthrough the review facility provided by the SWI Team, it wasevident that the level of understanding with risk assessmentsvaried, in addition there was conjecture regarding whatdetermined the requirement for an SWI. Whilst there wasagreement that SWI’s should be developed for critical tasks -what score or process determined the task critical?
Risk Assessment Quality Check
Focus was changed to developing a rigid process to review thequality of the risk assessment in order to determine whether all controlswere considered before relying on an SWI to control the task. Thereview needed to capture the entire risk assessment process.
The document concentrated on key areas:
• Determining whether the hazard scenario’s were well defined• Confirming the risk scores were credible• Determining whether the additional controls were adequate• Confirming the residual risk score• Determining whether the task was critical.
Hazard Scenario
Stringent criteria was applied to the hazard scenario inparticular each scenario had to include a target(person/equipment/environment etc) a consequence(injury/damage etc) and a hazard source. This achieves thebenefit of allowing the person reviewing the risk assessment tounderstand the hazard and confirm/re-calculate a realistic riskscore, whether this be through the quality check process orreviewing the risk assessment at a later date for currency.
Risk Score
The method we have used to calculate the risk scoreconsiders consequence and likelihood. Consequence ismeasured using a numerical indicator on the most credibleoutcome and likelihood is measured using an alpha indicatorconsidering probability and exposure ie how often the target maycome in contact with the hazard source resulting in theconsequence described. A 5x5 risk matrix is used to obtain avalue of the consequence and likelihood.
Table 1: 5x5 Risk Matrix.
73
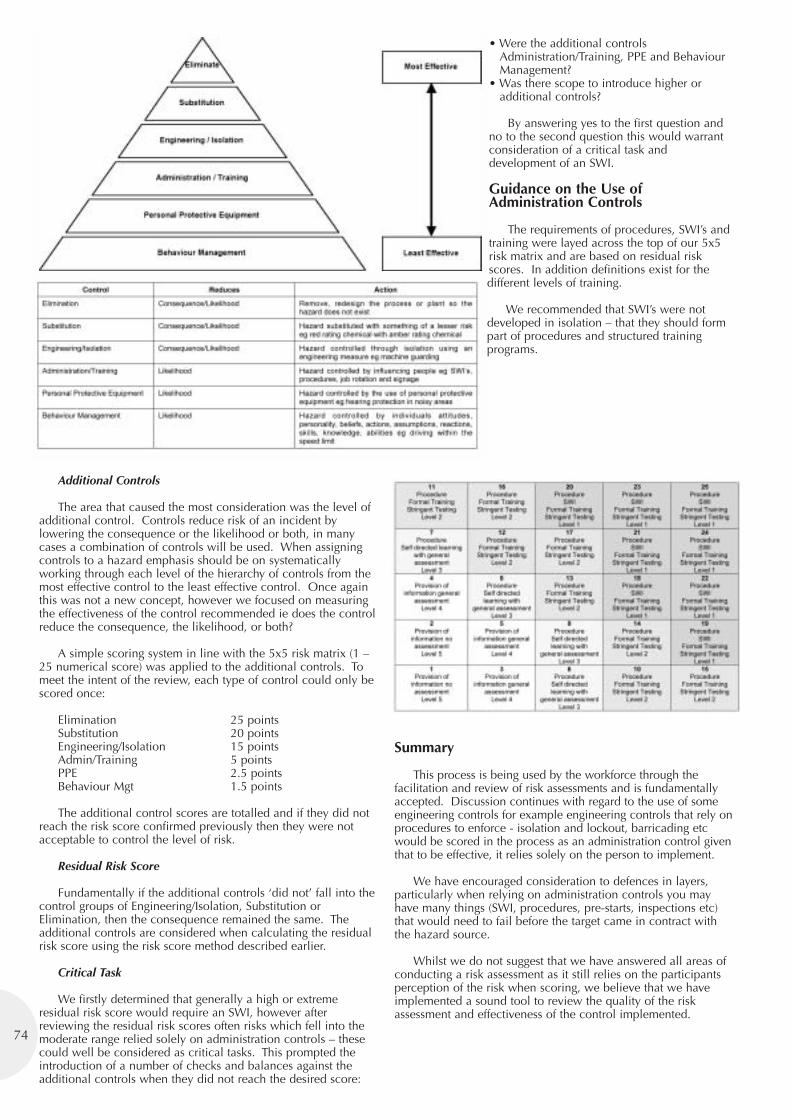
Additional Controls
The area that caused the most consideration was the level ofadditional control. Controls reduce risk of an incident bylowering the consequence or the likelihood or both, in manycases a combination of controls will be used. When assigningcontrols to a hazard emphasis should be on systematicallyworking through each level of the hierarchy of controls from themost effective control to the least effective control. Once againthis was not a new concept, however we focused on measuringthe effectiveness of the control recommended ie does the controlreduce the consequence, the likelihood, or both?
A simple scoring system in line with the 5x5 risk matrix (1 –25 numerical score) was applied to the additional controls. Tomeet the intent of the review, each type of control could only bescored once:
Elimination 25 pointsSubstitution 20 pointsEngineering/Isolation 15 pointsAdmin/Training 5 pointsPPE 2.5 pointsBehaviour Mgt 1.5 points
The additional control scores are totalled and if they did notreach the risk score confirmed previously then they were notacceptable to control the level of risk.
Residual Risk Score
Fundamentally if the additional controls ‘did not’ fall into thecontrol groups of Engineering/Isolation, Substitution orElimination, then the consequence remained the same. Theadditional controls are considered when calculating the residualrisk score using the risk score method described earlier.
Critical Task
We firstly determined that generally a high or extremeresidual risk score would require an SWI, however afterreviewing the residual risk scores often risks which fell into themoderate range relied solely on administration controls – thesecould well be considered as critical tasks. This prompted theintroduction of a number of checks and balances against theadditional controls when they did not reach the desired score:
• Were the additional controlsAdministration/Training, PPE and BehaviourManagement?
• Was there scope to introduce higher oradditional controls?
By answering yes to the first question andno to the second question this would warrantconsideration of a critical task anddevelopment of an SWI.
Guidance on the Use ofAdministration Controls
The requirements of procedures, SWI’s andtraining were layed across the top of our 5x5risk matrix and are based on residual riskscores. In addition definitions exist for thedifferent levels of training.
We recommended that SWI’s were notdeveloped in isolation – that they should formpart of procedures and structured trainingprograms.
Summary
This process is being used by the workforce through thefacilitation and review of risk assessments and is fundamentallyaccepted. Discussion continues with regard to the use of someengineering controls for example engineering controls that rely onprocedures to enforce - isolation and lockout, barricading etcwould be scored in the process as an administration control giventhat to be effective, it relies solely on the person to implement.
We have encouraged consideration to defences in layers,particularly when relying on administration controls you mayhave many things (SWI, procedures, pre-starts, inspections etc)that would need to fail before the target came in contract withthe hazard source.
Whilst we do not suggest that we have answered all areas ofconducting a risk assessment as it still relies on the participantsperception of the risk when scoring, we believe that we haveimplemented a sound tool to review the quality of the riskassessment and effectiveness of the control implemented.
74
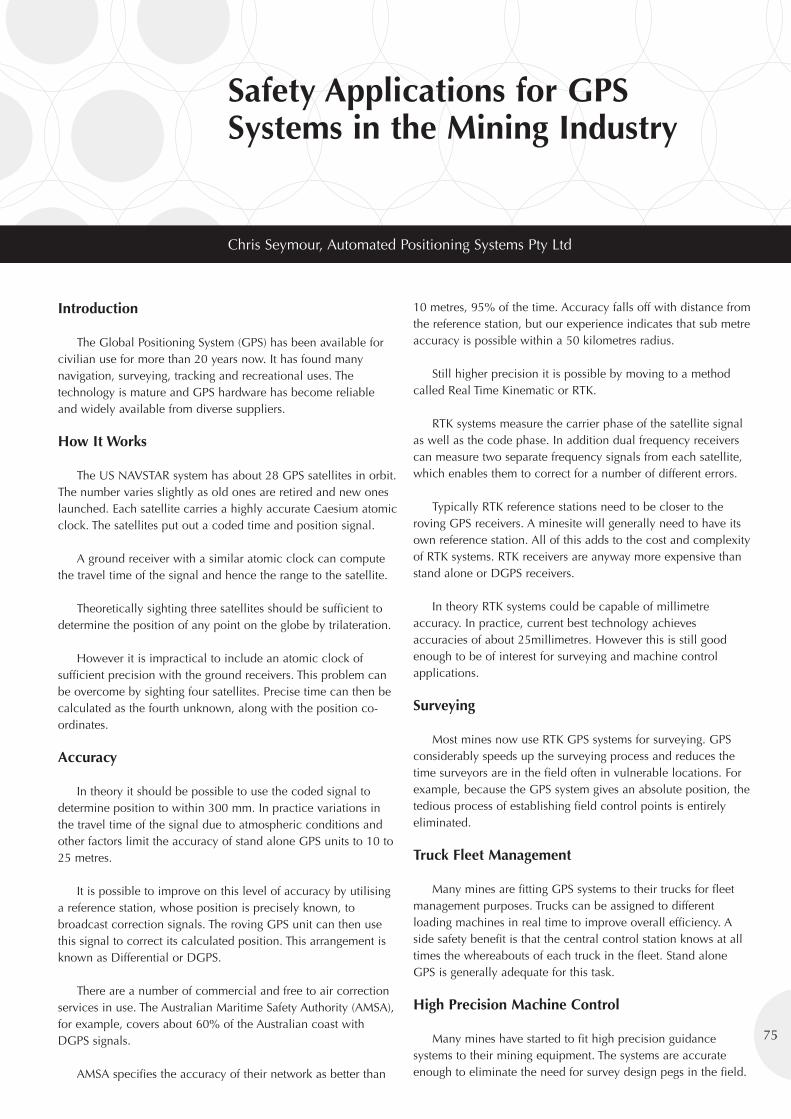
75
Safety Applications for GPSSystems in the Mining Industry
Chris Seymour, Automated Positioning Systems Pty Ltd
Introduction
The Global Positioning System (GPS) has been available forcivilian use for more than 20 years now. It has found manynavigation, surveying, tracking and recreational uses. Thetechnology is mature and GPS hardware has become reliableand widely available from diverse suppliers.
How It Works
The US NAVSTAR system has about 28 GPS satellites in orbit.The number varies slightly as old ones are retired and new oneslaunched. Each satellite carries a highly accurate Caesium atomicclock. The satellites put out a coded time and position signal.
A ground receiver with a similar atomic clock can computethe travel time of the signal and hence the range to the satellite.
Theoretically sighting three satellites should be sufficient todetermine the position of any point on the globe by trilateration.
However it is impractical to include an atomic clock ofsufficient precision with the ground receivers. This problem canbe overcome by sighting four satellites. Precise time can then becalculated as the fourth unknown, along with the position co-ordinates.
Accuracy
In theory it should be possible to use the coded signal todetermine position to within 300 mm. In practice variations inthe travel time of the signal due to atmospheric conditions andother factors limit the accuracy of stand alone GPS units to 10 to25 metres.
It is possible to improve on this level of accuracy by utilisinga reference station, whose position is precisely known, tobroadcast correction signals. The roving GPS unit can then usethis signal to correct its calculated position. This arrangement isknown as Differential or DGPS.
There are a number of commercial and free to air correctionservices in use. The Australian Maritime Safety Authority (AMSA),for example, covers about 60% of the Australian coast withDGPS signals.
AMSA specifies the accuracy of their network as better than
10 metres, 95% of the time. Accuracy falls off with distance fromthe reference station, but our experience indicates that sub metreaccuracy is possible within a 50 kilometres radius.
Still higher precision it is possible by moving to a methodcalled Real Time Kinematic or RTK.
RTK systems measure the carrier phase of the satellite signalas well as the code phase. In addition dual frequency receiverscan measure two separate frequency signals from each satellite,which enables them to correct for a number of different errors.
Typically RTK reference stations need to be closer to theroving GPS receivers. A minesite will generally need to have itsown reference station. All of this adds to the cost and complexityof RTK systems. RTK receivers are anyway more expensive thanstand alone or DGPS receivers.
In theory RTK systems could be capable of millimetreaccuracy. In practice, current best technology achievesaccuracies of about 25millimetres. However this is still goodenough to be of interest for surveying and machine controlapplications.
Surveying
Most mines now use RTK GPS systems for surveying. GPSconsiderably speeds up the surveying process and reduces thetime surveyors are in the field often in vulnerable locations. Forexample, because the GPS system gives an absolute position, thetedious process of establishing field control points is entirelyeliminated.
Truck Fleet Management
Many mines are fitting GPS systems to their trucks for fleetmanagement purposes. Trucks can be assigned to differentloading machines in real time to improve overall efficiency. Aside safety benefit is that the central control station knows at alltimes the whereabouts of each truck in the fleet. Stand aloneGPS is generally adequate for this task.
High Precision Machine Control
Many mines have started to fit high precision guidancesystems to their mining equipment. The systems are accurateenough to eliminate the need for survey design pegs in the field.
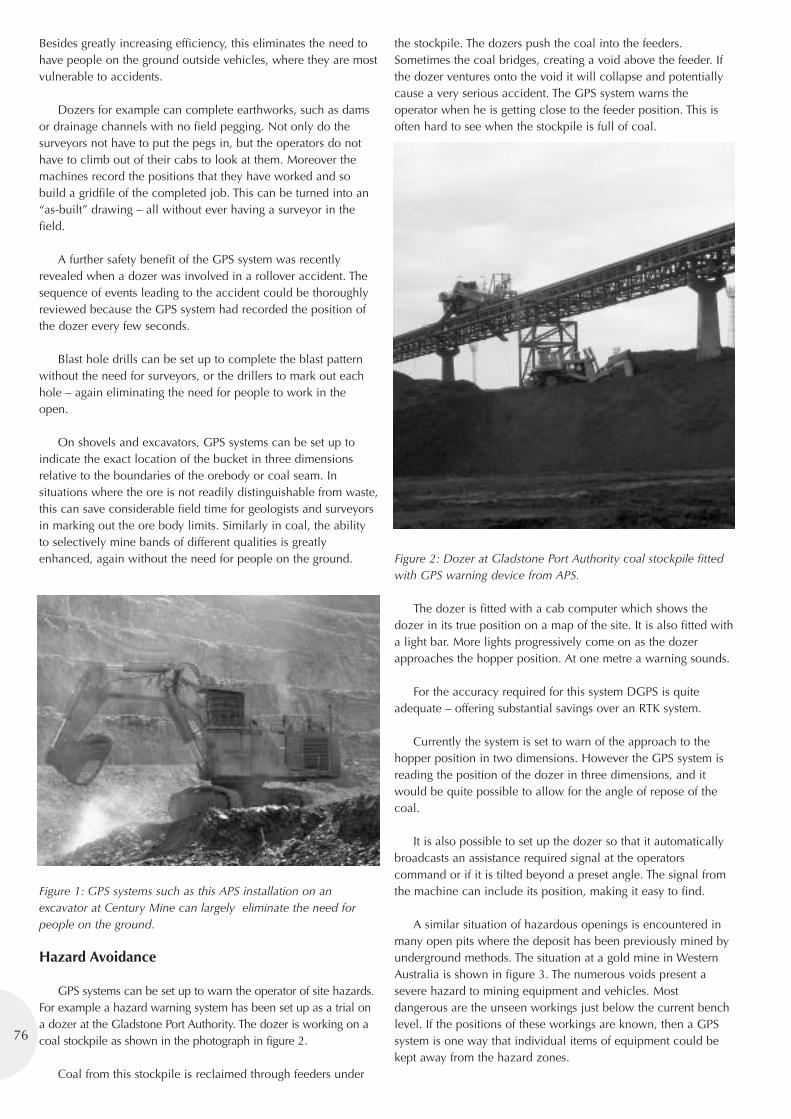
Besides greatly increasing efficiency, this eliminates the need tohave people on the ground outside vehicles, where they are mostvulnerable to accidents.
Dozers for example can complete earthworks, such as damsor drainage channels with no field pegging. Not only do thesurveyors not have to put the pegs in, but the operators do nothave to climb out of their cabs to look at them. Moreover themachines record the positions that they have worked and sobuild a gridfile of the completed job. This can be turned into an“as-built” drawing – all without ever having a surveyor in thefield.
A further safety benefit of the GPS system was recentlyrevealed when a dozer was involved in a rollover accident. Thesequence of events leading to the accident could be thoroughlyreviewed because the GPS system had recorded the position ofthe dozer every few seconds.
Blast hole drills can be set up to complete the blast patternwithout the need for surveyors, or the drillers to mark out eachhole – again eliminating the need for people to work in theopen.
On shovels and excavators, GPS systems can be set up toindicate the exact location of the bucket in three dimensionsrelative to the boundaries of the orebody or coal seam. Insituations where the ore is not readily distinguishable from waste,this can save considerable field time for geologists and surveyorsin marking out the ore body limits. Similarly in coal, the abilityto selectively mine bands of different qualities is greatlyenhanced, again without the need for people on the ground.
Figure 1: GPS systems such as this APS installation on anexcavator at Century Mine can largely eliminate the need forpeople on the ground.
Hazard Avoidance
GPS systems can be set up to warn the operator of site hazards.For example a hazard warning system has been set up as a trial ona dozer at the Gladstone Port Authority. The dozer is working on acoal stockpile as shown in the photograph in figure 2.
Coal from this stockpile is reclaimed through feeders under
the stockpile. The dozers push the coal into the feeders.Sometimes the coal bridges, creating a void above the feeder. Ifthe dozer ventures onto the void it will collapse and potentiallycause a very serious accident. The GPS system warns theoperator when he is getting close to the feeder position. This isoften hard to see when the stockpile is full of coal.
Figure 2: Dozer at Gladstone Port Authority coal stockpile fittedwith GPS warning device from APS.
The dozer is fitted with a cab computer which shows thedozer in its true position on a map of the site. It is also fitted witha light bar. More lights progressively come on as the dozerapproaches the hopper position. At one metre a warning sounds.
For the accuracy required for this system DGPS is quiteadequate – offering substantial savings over an RTK system.
Currently the system is set to warn of the approach to thehopper position in two dimensions. However the GPS system isreading the position of the dozer in three dimensions, and itwould be quite possible to allow for the angle of repose of thecoal.
It is also possible to set up the dozer so that it automaticallybroadcasts an assistance required signal at the operatorscommand or if it is tilted beyond a preset angle. The signal fromthe machine can include its position, making it easy to find.
A similar situation of hazardous openings is encountered inmany open pits where the deposit has been previously mined byunderground methods. The situation at a gold mine in WesternAustralia is shown in figure 3. The numerous voids present asevere hazard to mining equipment and vehicles. Mostdangerous are the unseen workings just below the current benchlevel. If the positions of these workings are known, then a GPSsystem is one way that individual items of equipment could bekept away from the hazard zones.
76
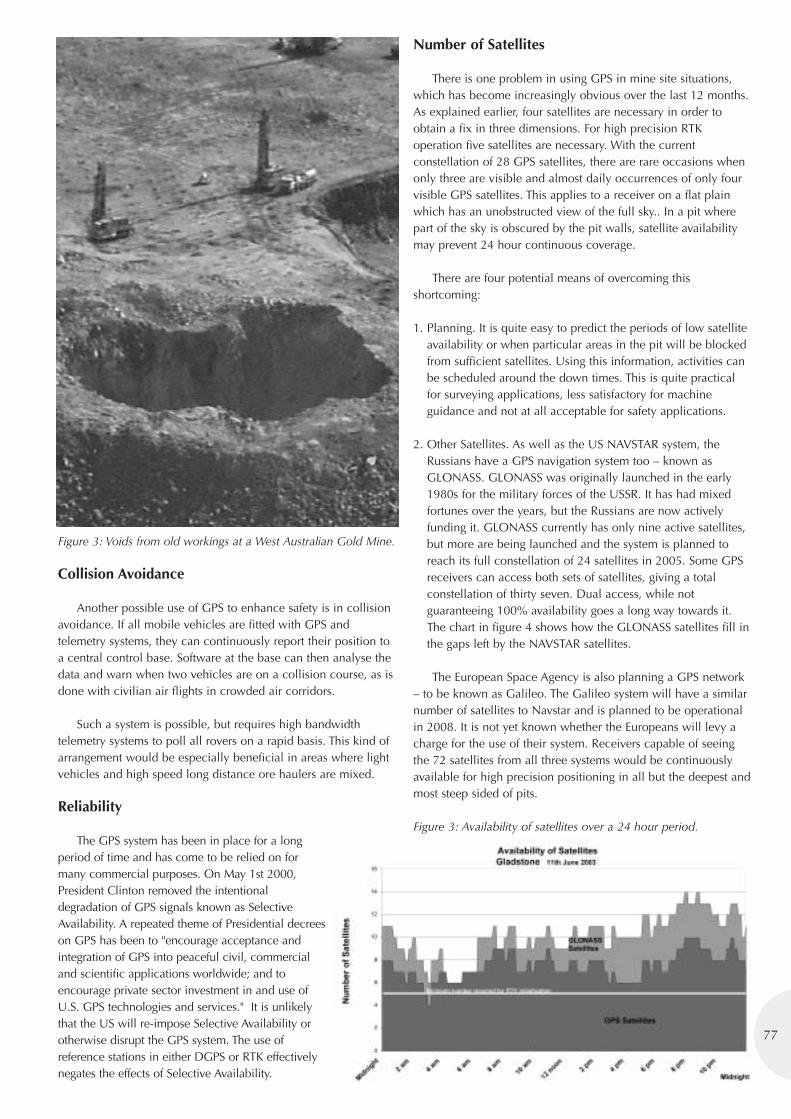
77
Figure 3: Voids from old workings at a West Australian Gold Mine.
Collision Avoidance
Another possible use of GPS to enhance safety is in collisionavoidance. If all mobile vehicles are fitted with GPS andtelemetry systems, they can continuously report their position toa central control base. Software at the base can then analyse thedata and warn when two vehicles are on a collision course, as isdone with civilian air flights in crowded air corridors.
Such a system is possible, but requires high bandwidthtelemetry systems to poll all rovers on a rapid basis. This kind ofarrangement would be especially beneficial in areas where lightvehicles and high speed long distance ore haulers are mixed.
Reliability
The GPS system has been in place for a longperiod of time and has come to be relied on formany commercial purposes. On May 1st 2000,President Clinton removed the intentionaldegradation of GPS signals known as SelectiveAvailability. A repeated theme of Presidential decreeson GPS has been to "encourage acceptance andintegration of GPS into peaceful civil, commercialand scientific applications worldwide; and toencourage private sector investment in and use ofU.S. GPS technologies and services." It is unlikelythat the US will re-impose Selective Availability orotherwise disrupt the GPS system. The use ofreference stations in either DGPS or RTK effectivelynegates the effects of Selective Availability.
Number of Satellites
There is one problem in using GPS in mine site situations,which has become increasingly obvious over the last 12 months.As explained earlier, four satellites are necessary in order toobtain a fix in three dimensions. For high precision RTKoperation five satellites are necessary. With the currentconstellation of 28 GPS satellites, there are rare occasions whenonly three are visible and almost daily occurrences of only fourvisible GPS satellites. This applies to a receiver on a flat plainwhich has an unobstructed view of the full sky.. In a pit wherepart of the sky is obscured by the pit walls, satellite availabilitymay prevent 24 hour continuous coverage.
There are four potential means of overcoming thisshortcoming:
1. Planning. It is quite easy to predict the periods of low satelliteavailability or when particular areas in the pit will be blockedfrom sufficient satellites. Using this information, activities canbe scheduled around the down times. This is quite practicalfor surveying applications, less satisfactory for machineguidance and not at all acceptable for safety applications.
2. Other Satellites. As well as the US NAVSTAR system, theRussians have a GPS navigation system too – known asGLONASS. GLONASS was originally launched in the early1980s for the military forces of the USSR. It has had mixedfortunes over the years, but the Russians are now activelyfunding it. GLONASS currently has only nine active satellites,but more are being launched and the system is planned toreach its full constellation of 24 satellites in 2005. Some GPSreceivers can access both sets of satellites, giving a totalconstellation of thirty seven. Dual access, while notguaranteeing 100% availability goes a long way towards it.The chart in figure 4 shows how the GLONASS satellites fill inthe gaps left by the NAVSTAR satellites.
The European Space Agency is also planning a GPS network– to be known as Galileo. The Galileo system will have a similarnumber of satellites to Navstar and is planned to be operationalin 2008. It is not yet known whether the Europeans will levy acharge for the use of their system. Receivers capable of seeingthe 72 satellites from all three systems would be continuouslyavailable for high precision positioning in all but the deepest andmost steep sided of pits.
Figure 3: Availability of satellites over a 24 hour period.
3. Inertial. In theory inertial guidance packages should becapable of retaining positions between sighting of GPSsatellites. Inertial packages have been well proven in highwallmining applications. In these applications they have been ableto maintain design pillars between entries to accuracies of afew centimetres over 500 metres. However current systems aretoo expensive and their ability to hold a position is too limitedfor application in most surface mining equipment.
4. Pseudolites. A number of groups are working on artificialsatellites or “Pseudolites”, which would be placed on the pitwalls. For various technical reasons, including the swampingof the weak satellite signals by the close pseudolite signal,none are yet commercial. However this technology has greatapplication for the future.
Conclusion
GPS survey and machine guidance applications are findingincreasing acceptance in the mining industry. Widespreadadoption of this technology has important safety benefits as a byproduct. In addition there are a number of applications whereGPS systems may be fitted for primary safety purposes. Lack ofsatellites is the major problem to be overcome, but there are anumber of possible solutions and more will be available in thefuture.
78
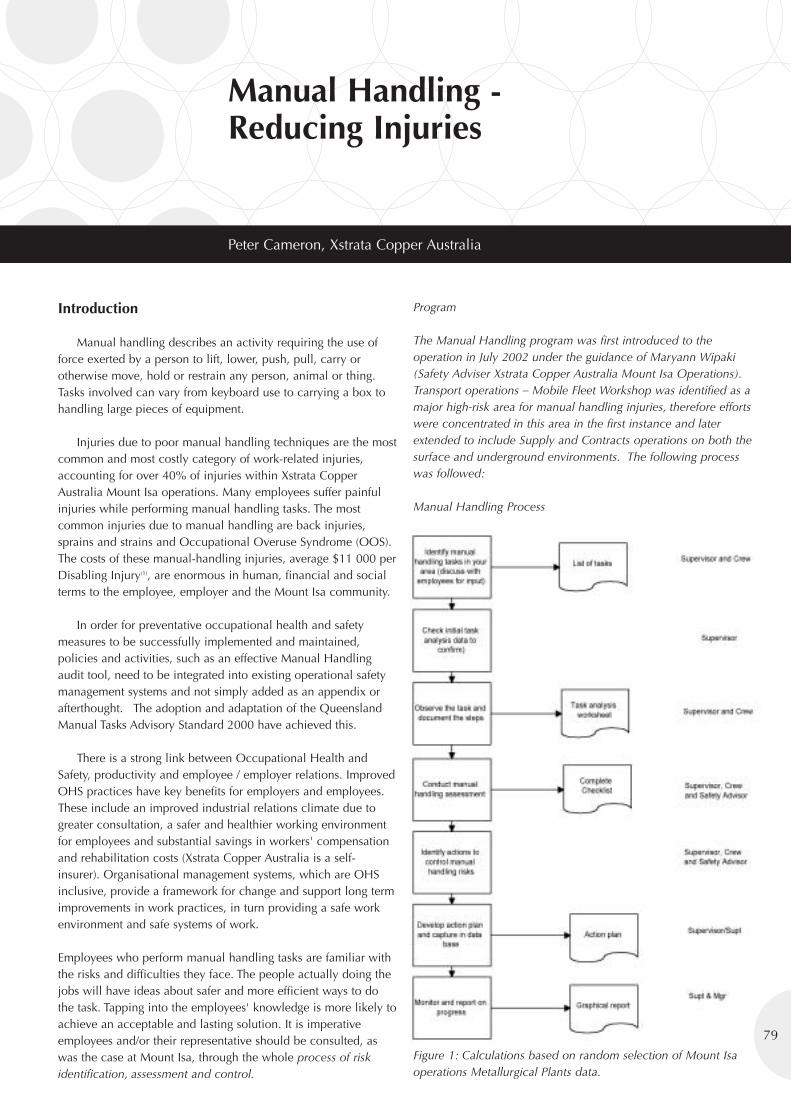
Manual Handling -Reducing Injuries
Peter Cameron, Xstrata Copper Australia
Introduction
Manual handling describes an activity requiring the use offorce exerted by a person to lift, lower, push, pull, carry orotherwise move, hold or restrain any person, animal or thing.Tasks involved can vary from keyboard use to carrying a box tohandling large pieces of equipment.
Injuries due to poor manual handling techniques are the mostcommon and most costly category of work-related injuries,accounting for over 40% of injuries within Xstrata CopperAustralia Mount Isa operations. Many employees suffer painfulinjuries while performing manual handling tasks. The mostcommon injuries due to manual handling are back injuries,sprains and strains and Occupational Overuse Syndrome (OOS).The costs of these manual-handling injuries, average $11 000 perDisabling Injury(1), are enormous in human, financial and socialterms to the employee, employer and the Mount Isa community.
In order for preventative occupational health and safetymeasures to be successfully implemented and maintained,policies and activities, such as an effective Manual Handlingaudit tool, need to be integrated into existing operational safetymanagement systems and not simply added as an appendix orafterthought. The adoption and adaptation of the QueenslandManual Tasks Advisory Standard 2000 have achieved this.
There is a strong link between Occupational Health andSafety, productivity and employee / employer relations. ImprovedOHS practices have key benefits for employers and employees.These include an improved industrial relations climate due togreater consultation, a safer and healthier working environmentfor employees and substantial savings in workers' compensationand rehabilitation costs (Xstrata Copper Australia is a self-insurer). Organisational management systems, which are OHSinclusive, provide a framework for change and support long termimprovements in work practices, in turn providing a safe workenvironment and safe systems of work.
Employees who perform manual handling tasks are familiar withthe risks and difficulties they face. The people actually doing thejobs will have ideas about safer and more efficient ways to dothe task. Tapping into the employees' knowledge is more likely toachieve an acceptable and lasting solution. It is imperativeemployees and/or their representative should be consulted, aswas the case at Mount Isa, through the whole process of riskidentification, assessment and control.
Program
The Manual Handling program was first introduced to theoperation in July 2002 under the guidance of Maryann Wipaki(Safety Adviser Xstrata Copper Australia Mount Isa Operations).Transport operations – Mobile Fleet Workshop was identified as amajor high-risk area for manual handling injuries, therefore effortswere concentrated in this area in the first instance and laterextended to include Supply and Contracts operations on both thesurface and underground environments. The following processwas followed:
Manual Handling Process
Figure 1: Calculations based on random selection of Mount Isaoperations Metallurgical Plants data.
79
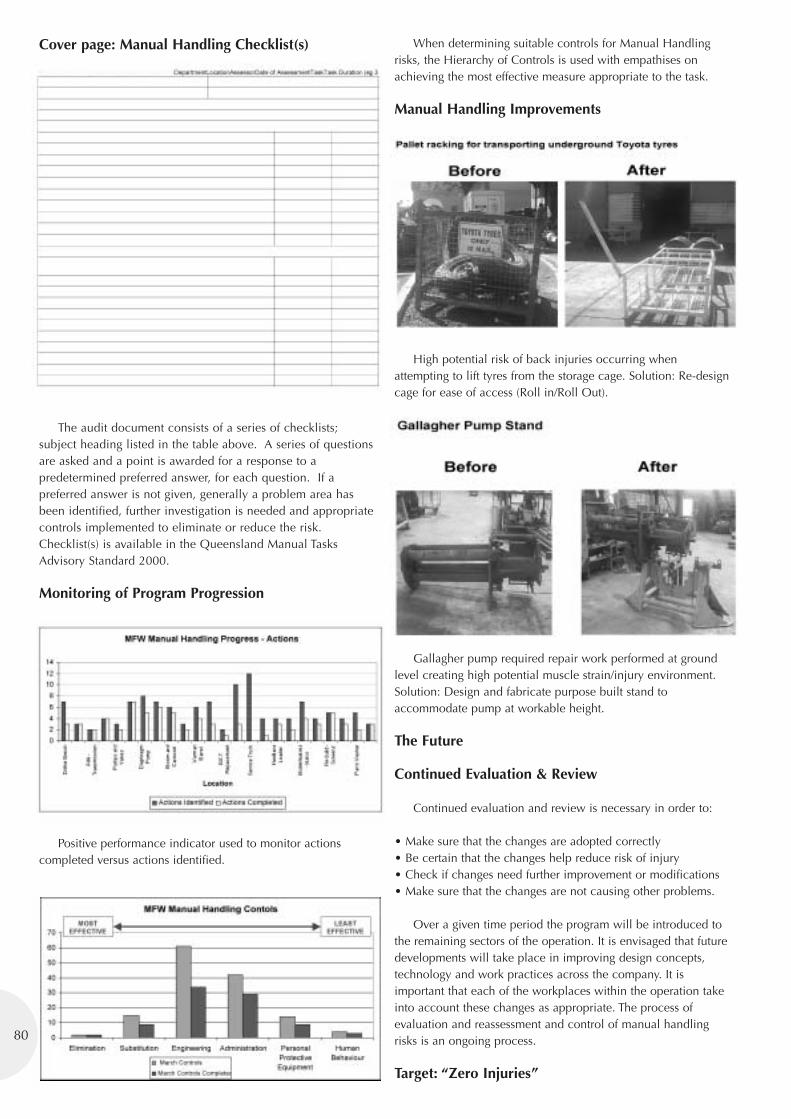
Cover page: Manual Handling Checklist(s)
The audit document consists of a series of checklists;subject heading listed in the table above. A series of questionsare asked and a point is awarded for a response to apredetermined preferred answer, for each question. If apreferred answer is not given, generally a problem area hasbeen identified, further investigation is needed and appropriatecontrols implemented to eliminate or reduce the risk.Checklist(s) is available in the Queensland Manual TasksAdvisory Standard 2000.
Monitoring of Program Progression
Positive performance indicator used to monitor actionscompleted versus actions identified.
When determining suitable controls for Manual Handlingrisks, the Hierarchy of Controls is used with empathises onachieving the most effective measure appropriate to the task.
Manual Handling Improvements
High potential risk of back injuries occurring whenattempting to lift tyres from the storage cage. Solution: Re-designcage for ease of access (Roll in/Roll Out).
Gallagher pump required repair work performed at groundlevel creating high potential muscle strain/injury environment.Solution: Design and fabricate purpose built stand toaccommodate pump at workable height.
The Future
Continued Evaluation & Review
Continued evaluation and review is necessary in order to:
• Make sure that the changes are adopted correctly• Be certain that the changes help reduce risk of injury• Check if changes need further improvement or modifications• Make sure that the changes are not causing other problems.
Over a given time period the program will be introduced tothe remaining sectors of the operation. It is envisaged that futuredevelopments will take place in improving design concepts,technology and work practices across the company. It isimportant that each of the workplaces within the operation takeinto account these changes as appropriate. The process ofevaluation and reassessment and control of manual handlingrisks is an ongoing process.
Target: “Zero Injuries”
80
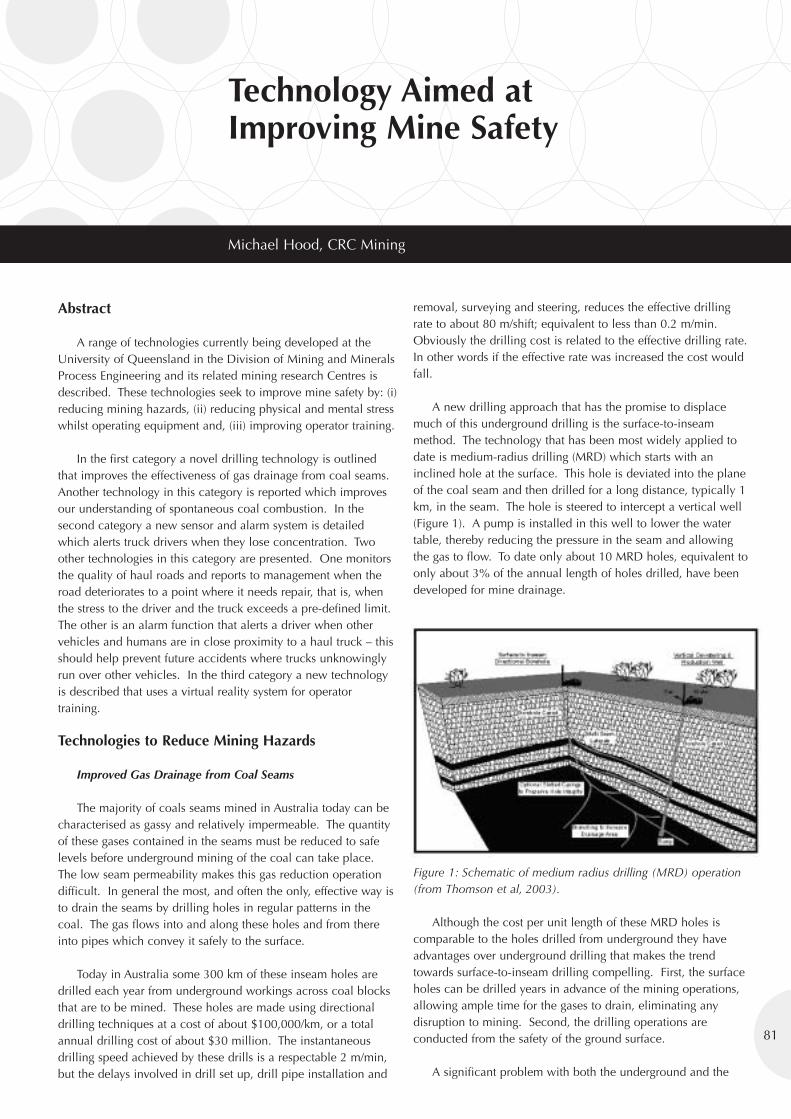
Technology Aimed atImproving Mine Safety
Michael Hood, CRC Mining
Abstract
A range of technologies currently being developed at theUniversity of Queensland in the Division of Mining and MineralsProcess Engineering and its related mining research Centres isdescribed. These technologies seek to improve mine safety by: (i)reducing mining hazards, (ii) reducing physical and mental stresswhilst operating equipment and, (iii) improving operator training.
In the first category a novel drilling technology is outlinedthat improves the effectiveness of gas drainage from coal seams.Another technology in this category is reported which improvesour understanding of spontaneous coal combustion. In thesecond category a new sensor and alarm system is detailedwhich alerts truck drivers when they lose concentration. Twoother technologies in this category are presented. One monitorsthe quality of haul roads and reports to management when theroad deteriorates to a point where it needs repair, that is, whenthe stress to the driver and the truck exceeds a pre-defined limit.The other is an alarm function that alerts a driver when othervehicles and humans are in close proximity to a haul truck – thisshould help prevent future accidents where trucks unknowinglyrun over other vehicles. In the third category a new technologyis described that uses a virtual reality system for operatortraining.
Technologies to Reduce Mining Hazards
Improved Gas Drainage from Coal Seams
The majority of coals seams mined in Australia today can becharacterised as gassy and relatively impermeable. The quantityof these gases contained in the seams must be reduced to safelevels before underground mining of the coal can take place.The low seam permeability makes this gas reduction operationdifficult. In general the most, and often the only, effective way isto drain the seams by drilling holes in regular patterns in thecoal. The gas flows into and along these holes and from thereinto pipes which convey it safely to the surface.
Today in Australia some 300 km of these inseam holes aredrilled each year from underground workings across coal blocksthat are to be mined. These holes are made using directionaldrilling techniques at a cost of about $100,000/km, or a totalannual drilling cost of about $30 million. The instantaneousdrilling speed achieved by these drills is a respectable 2 m/min,but the delays involved in drill set up, drill pipe installation and
removal, surveying and steering, reduces the effective drillingrate to about 80 m/shift; equivalent to less than 0.2 m/min.Obviously the drilling cost is related to the effective drilling rate.In other words if the effective rate was increased the cost wouldfall.
A new drilling approach that has the promise to displacemuch of this underground drilling is the surface-to-inseammethod. The technology that has been most widely applied todate is medium-radius drilling (MRD) which starts with aninclined hole at the surface. This hole is deviated into the planeof the coal seam and then drilled for a long distance, typically 1km, in the seam. The hole is steered to intercept a vertical well(Figure 1). A pump is installed in this well to lower the watertable, thereby reducing the pressure in the seam and allowingthe gas to flow. To date only about 10 MRD holes, equivalent toonly about 3% of the annual length of holes drilled, have beendeveloped for mine drainage.
Figure 1: Schematic of medium radius drilling (MRD) operation(from Thomson et al, 2003).
Although the cost per unit length of these MRD holes iscomparable to the holes drilled from underground they haveadvantages over underground drilling that makes the trendtowards surface-to-inseam drilling compelling. First, the surfaceholes can be drilled years in advance of the mining operations,allowing ample time for the gases to drain, eliminating anydisruption to mining. Second, the drilling operations areconducted from the safety of the ground surface.
A significant problem with both the underground and the
81
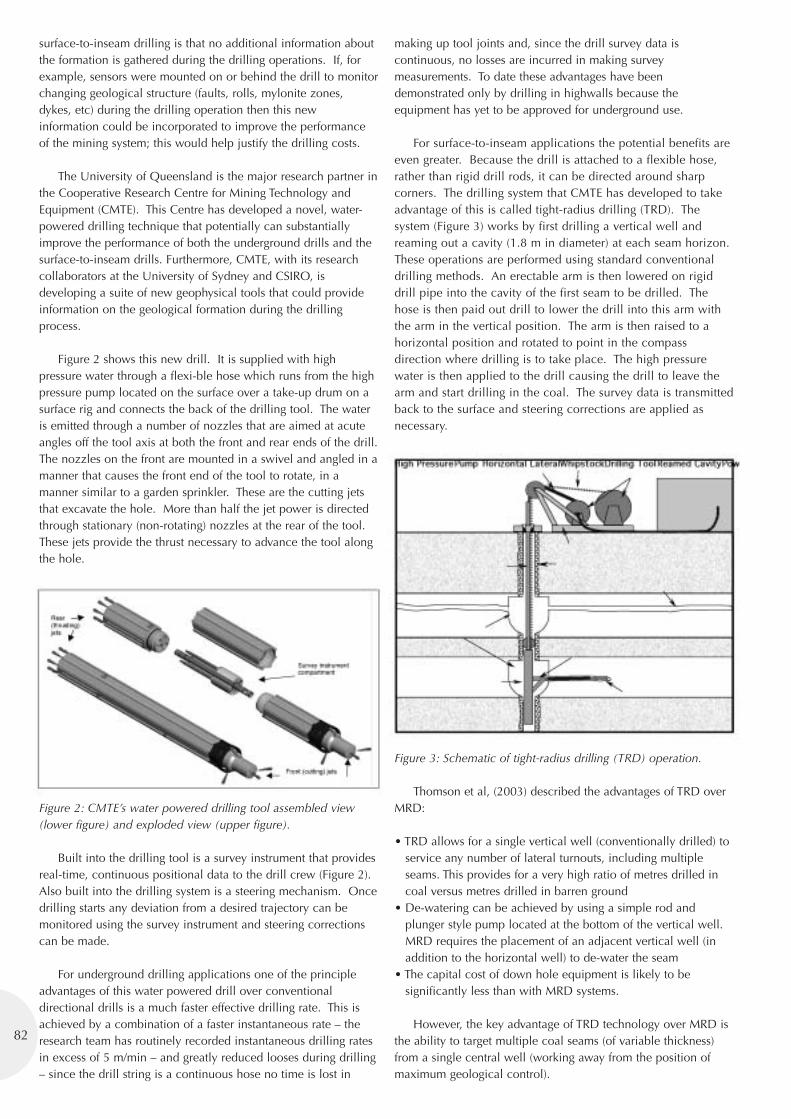
surface-to-inseam drilling is that no additional information aboutthe formation is gathered during the drilling operations. If, forexample, sensors were mounted on or behind the drill to monitorchanging geological structure (faults, rolls, mylonite zones,dykes, etc) during the drilling operation then this newinformation could be incorporated to improve the performanceof the mining system; this would help justify the drilling costs.
The University of Queensland is the major research partner inthe Cooperative Research Centre for Mining Technology andEquipment (CMTE). This Centre has developed a novel, water-powered drilling technique that potentially can substantiallyimprove the performance of both the underground drills and thesurface-to-inseam drills. Furthermore, CMTE, with its researchcollaborators at the University of Sydney and CSIRO, isdeveloping a suite of new geophysical tools that could provideinformation on the geological formation during the drillingprocess.
Figure 2 shows this new drill. It is supplied with highpressure water through a flexi-ble hose which runs from the highpressure pump located on the surface over a take-up drum on asurface rig and connects the back of the drilling tool. The wateris emitted through a number of nozzles that are aimed at acuteangles off the tool axis at both the front and rear ends of the drill.The nozzles on the front are mounted in a swivel and angled in amanner that causes the front end of the tool to rotate, in amanner similar to a garden sprinkler. These are the cutting jetsthat excavate the hole. More than half the jet power is directedthrough stationary (non-rotating) nozzles at the rear of the tool.These jets provide the thrust necessary to advance the tool alongthe hole.
Figure 2: CMTE’s water powered drilling tool assembled view(lower figure) and exploded view (upper figure).
Built into the drilling tool is a survey instrument that providesreal-time, continuous positional data to the drill crew (Figure 2).Also built into the drilling system is a steering mechanism. Oncedrilling starts any deviation from a desired trajectory can bemonitored using the survey instrument and steering correctionscan be made.
For underground drilling applications one of the principleadvantages of this water powered drill over conventionaldirectional drills is a much faster effective drilling rate. This isachieved by a combination of a faster instantaneous rate – theresearch team has routinely recorded instantaneous drilling ratesin excess of 5 m/min – and greatly reduced looses during drilling– since the drill string is a continuous hose no time is lost in
making up tool joints and, since the drill survey data iscontinuous, no losses are incurred in making surveymeasurements. To date these advantages have beendemonstrated only by drilling in highwalls because theequipment has yet to be approved for underground use.
For surface-to-inseam applications the potential benefits areeven greater. Because the drill is attached to a flexible hose,rather than rigid drill rods, it can be directed around sharpcorners. The drilling system that CMTE has developed to takeadvantage of this is called tight-radius drilling (TRD). Thesystem (Figure 3) works by first drilling a vertical well andreaming out a cavity (1.8 m in diameter) at each seam horizon.These operations are performed using standard conventionaldrilling methods. An erectable arm is then lowered on rigiddrill pipe into the cavity of the first seam to be drilled. Thehose is then paid out drill to lower the drill into this arm withthe arm in the vertical position. The arm is then raised to ahorizontal position and rotated to point in the compassdirection where drilling is to take place. The high pressurewater is then applied to the drill causing the drill to leave thearm and start drilling in the coal. The survey data is transmittedback to the surface and steering corrections are applied asnecessary.
Figure 3: Schematic of tight-radius drilling (TRD) operation.
Thomson et al, (2003) described the advantages of TRD overMRD:
• TRD allows for a single vertical well (conventionally drilled) toservice any number of lateral turnouts, including multipleseams. This provides for a very high ratio of metres drilled incoal versus metres drilled in barren ground
• De-watering can be achieved by using a simple rod andplunger style pump located at the bottom of the vertical well.MRD requires the placement of an adjacent vertical well (inaddition to the horizontal well) to de-water the seam
• The capital cost of down hole equipment is likely to besignificantly less than with MRD systems.
However, the key advantage of TRD technology over MRD isthe ability to target multiple coal seams (of variable thickness)from a single central well (working away from the position ofmaximum geological control).
82
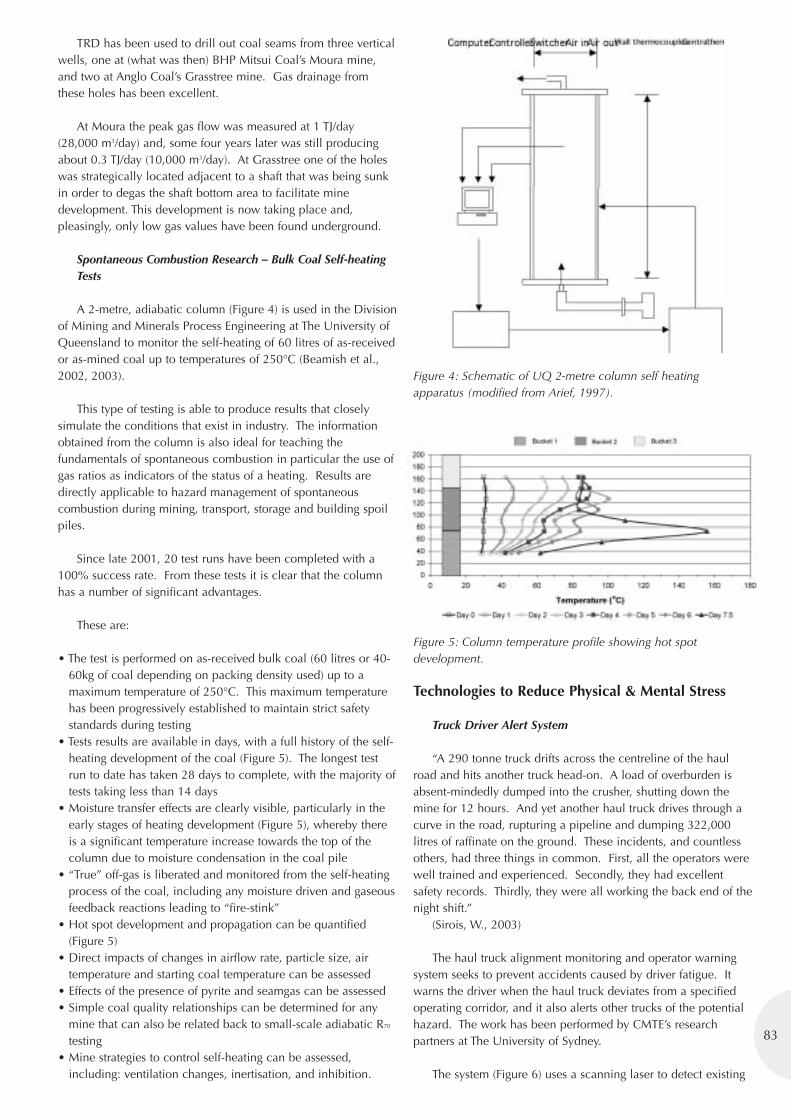
83
TRD has been used to drill out coal seams from three verticalwells, one at (what was then) BHP Mitsui Coal’s Moura mine,and two at Anglo Coal’s Grasstree mine. Gas drainage fromthese holes has been excellent.
At Moura the peak gas flow was measured at 1 TJ/day(28,000 m3/day) and, some four years later was still producingabout 0.3 TJ/day (10,000 m3/day). At Grasstree one of the holeswas strategically located adjacent to a shaft that was being sunkin order to degas the shaft bottom area to facilitate minedevelopment. This development is now taking place and,pleasingly, only low gas values have been found underground.
Spontaneous Combustion Research – Bulk Coal Self-heatingTests
A 2-metre, adiabatic column (Figure 4) is used in the Divisionof Mining and Minerals Process Engineering at The University ofQueensland to monitor the self-heating of 60 litres of as-receivedor as-mined coal up to temperatures of 250°C (Beamish et al.,2002, 2003).
This type of testing is able to produce results that closelysimulate the conditions that exist in industry. The informationobtained from the column is also ideal for teaching thefundamentals of spontaneous combustion in particular the use ofgas ratios as indicators of the status of a heating. Results aredirectly applicable to hazard management of spontaneouscombustion during mining, transport, storage and building spoilpiles.
Since late 2001, 20 test runs have been completed with a100% success rate. From these tests it is clear that the columnhas a number of significant advantages.
These are:
• The test is performed on as-received bulk coal (60 litres or 40-60kg of coal depending on packing density used) up to amaximum temperature of 250°C. This maximum temperaturehas been progressively established to maintain strict safetystandards during testing
• Tests results are available in days, with a full history of the self-heating development of the coal (Figure 5). The longest testrun to date has taken 28 days to complete, with the majority oftests taking less than 14 days
• Moisture transfer effects are clearly visible, particularly in theearly stages of heating development (Figure 5), whereby thereis a significant temperature increase towards the top of thecolumn due to moisture condensation in the coal pile
• “True” off-gas is liberated and monitored from the self-heatingprocess of the coal, including any moisture driven and gaseousfeedback reactions leading to “fire-stink”
• Hot spot development and propagation can be quantified(Figure 5)
• Direct impacts of changes in airflow rate, particle size, airtemperature and starting coal temperature can be assessed
• Effects of the presence of pyrite and seamgas can be assessed• Simple coal quality relationships can be determined for any
mine that can also be related back to small-scale adiabatic R70
testing• Mine strategies to control self-heating can be assessed,
including: ventilation changes, inertisation, and inhibition.
Figure 4: Schematic of UQ 2-metre column self heatingapparatus (modified from Arief, 1997).
Figure 5: Column temperature profile showing hot spotdevelopment.
Technologies to Reduce Physical & Mental Stress
Truck Driver Alert System
“A 290 tonne truck drifts across the centreline of the haulroad and hits another truck head-on. A load of overburden isabsent-mindedly dumped into the crusher, shutting down themine for 12 hours. And yet another haul truck drives through acurve in the road, rupturing a pipeline and dumping 322,000litres of raffinate on the ground. These incidents, and countlessothers, had three things in common. First, all the operators werewell trained and experienced. Secondly, they had excellentsafety records. Thirdly, they were all working the back end of thenight shift.”
(Sirois, W., 2003)
The haul truck alignment monitoring and operator warningsystem seeks to prevent accidents caused by driver fatigue. Itwarns the driver when the haul truck deviates from a specifiedoperating corridor, and it also alerts other trucks of the potentialhazard. The work has been performed by CMTE’s researchpartners at The University of Sydney.
The system (Figure 6) uses a scanning laser to detect existing
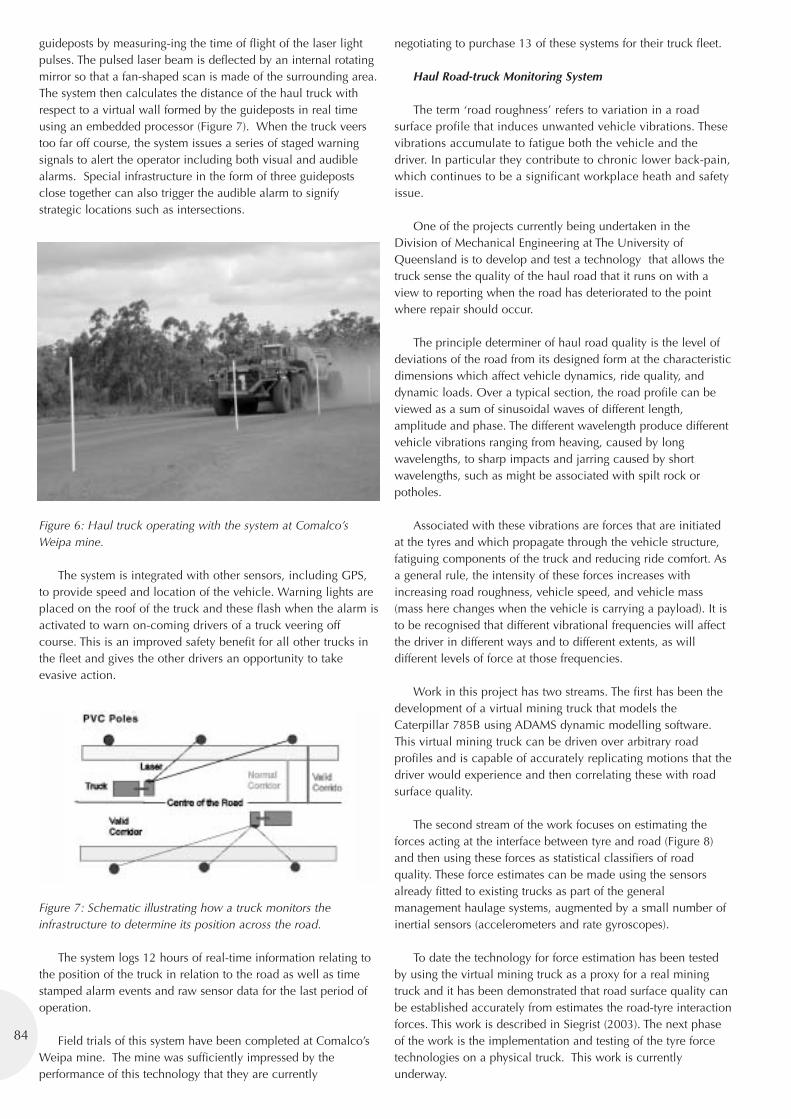
guideposts by measuring-ing the time of flight of the laser lightpulses. The pulsed laser beam is deflected by an internal rotatingmirror so that a fan-shaped scan is made of the surrounding area.The system then calculates the distance of the haul truck withrespect to a virtual wall formed by the guideposts in real timeusing an embedded processor (Figure 7). When the truck veerstoo far off course, the system issues a series of staged warningsignals to alert the operator including both visual and audiblealarms. Special infrastructure in the form of three guidepostsclose together can also trigger the audible alarm to signifystrategic locations such as intersections.
Figure 6: Haul truck operating with the system at Comalco’sWeipa mine.
The system is integrated with other sensors, including GPS,to provide speed and location of the vehicle. Warning lights areplaced on the roof of the truck and these flash when the alarm isactivated to warn on-coming drivers of a truck veering offcourse. This is an improved safety benefit for all other trucks inthe fleet and gives the other drivers an opportunity to takeevasive action.
Figure 7: Schematic illustrating how a truck monitors theinfrastructure to determine its position across the road.
The system logs 12 hours of real-time information relating tothe position of the truck in relation to the road as well as timestamped alarm events and raw sensor data for the last period ofoperation.
Field trials of this system have been completed at Comalco’sWeipa mine. The mine was sufficiently impressed by theperformance of this technology that they are currently
negotiating to purchase 13 of these systems for their truck fleet.
Haul Road-truck Monitoring System
The term ‘road roughness’ refers to variation in a roadsurface profile that induces unwanted vehicle vibrations. Thesevibrations accumulate to fatigue both the vehicle and thedriver. In particular they contribute to chronic lower back-pain,which continues to be a significant workplace heath and safetyissue.
One of the projects currently being undertaken in theDivision of Mechanical Engineering at The University ofQueensland is to develop and test a technology that allows thetruck sense the quality of the haul road that it runs on with aview to reporting when the road has deteriorated to the pointwhere repair should occur.
The principle determiner of haul road quality is the level ofdeviations of the road from its designed form at the characteristicdimensions which affect vehicle dynamics, ride quality, anddynamic loads. Over a typical section, the road profile can beviewed as a sum of sinusoidal waves of different length,amplitude and phase. The different wavelength produce differentvehicle vibrations ranging from heaving, caused by longwavelengths, to sharp impacts and jarring caused by shortwavelengths, such as might be associated with spilt rock orpotholes.
Associated with these vibrations are forces that are initiatedat the tyres and which propagate through the vehicle structure,fatiguing components of the truck and reducing ride comfort. Asa general rule, the intensity of these forces increases withincreasing road roughness, vehicle speed, and vehicle mass(mass here changes when the vehicle is carrying a payload). It isto be recognised that different vibrational frequencies will affectthe driver in different ways and to different extents, as willdifferent levels of force at those frequencies.
Work in this project has two streams. The first has been thedevelopment of a virtual mining truck that models theCaterpillar 785B using ADAMS dynamic modelling software.This virtual mining truck can be driven over arbitrary roadprofiles and is capable of accurately replicating motions that thedriver would experience and then correlating these with roadsurface quality.
The second stream of the work focuses on estimating theforces acting at the interface between tyre and road (Figure 8)and then using these forces as statistical classifiers of roadquality. These force estimates can be made using the sensorsalready fitted to existing trucks as part of the generalmanagement haulage systems, augmented by a small number ofinertial sensors (accelerometers and rate gyroscopes).
To date the technology for force estimation has been testedby using the virtual mining truck as a proxy for a real miningtruck and it has been demonstrated that road surface quality canbe established accurately from estimates the road-tyre interactionforces. This work is described in Siegrist (2003). The next phaseof the work is the implementation and testing of the tyre forcetechnologies on a physical truck. This work is currentlyunderway.
84
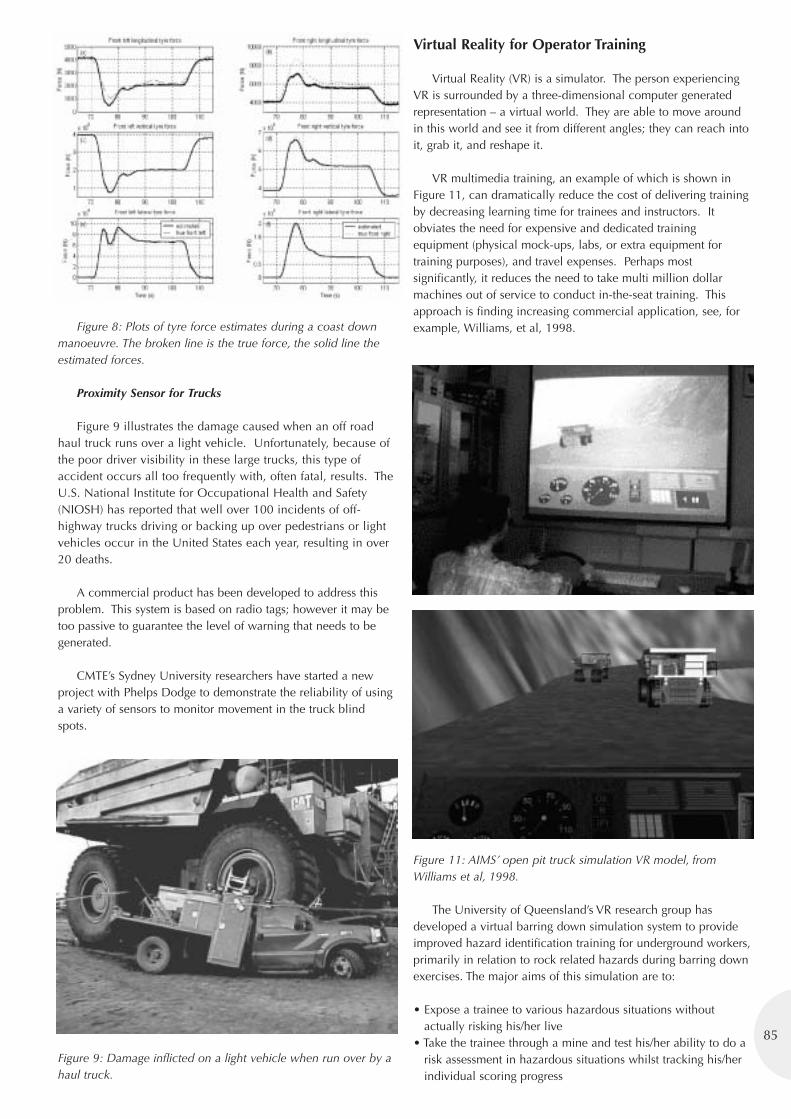
85
Figure 8: Plots of tyre force estimates during a coast downmanoeuvre. The broken line is the true force, the solid line theestimated forces.
Proximity Sensor for Trucks
Figure 9 illustrates the damage caused when an off roadhaul truck runs over a light vehicle. Unfortunately, because ofthe poor driver visibility in these large trucks, this type ofaccident occurs all too frequently with, often fatal, results. TheU.S. National Institute for Occupational Health and Safety(NIOSH) has reported that well over 100 incidents of off-highway trucks driving or backing up over pedestrians or lightvehicles occur in the United States each year, resulting in over20 deaths.
A commercial product has been developed to address thisproblem. This system is based on radio tags; however it may betoo passive to guarantee the level of warning that needs to begenerated.
CMTE’s Sydney University researchers have started a newproject with Phelps Dodge to demonstrate the reliability of usinga variety of sensors to monitor movement in the truck blindspots.
Figure 9: Damage inflicted on a light vehicle when run over by ahaul truck.
Virtual Reality for Operator Training
Virtual Reality (VR) is a simulator. The person experiencingVR is surrounded by a three-dimensional computer generatedrepresentation – a virtual world. They are able to move aroundin this world and see it from different angles; they can reach intoit, grab it, and reshape it.
VR multimedia training, an example of which is shown inFigure 11, can dramatically reduce the cost of delivering trainingby decreasing learning time for trainees and instructors. Itobviates the need for expensive and dedicated trainingequipment (physical mock-ups, labs, or extra equipment fortraining purposes), and travel expenses. Perhaps mostsignificantly, it reduces the need to take multi million dollarmachines out of service to conduct in-the-seat training. Thisapproach is finding increasing commercial application, see, forexample, Williams, et al, 1998.
Figure 11: AIMS’ open pit truck simulation VR model, fromWilliams et al, 1998.
The University of Queensland’s VR research group hasdeveloped a virtual barring down simulation system to provideimproved hazard identification training for underground workers,primarily in relation to rock related hazards during barring downexercises. The major aims of this simulation are to:
• Expose a trainee to various hazardous situations withoutactually risking his/her live
• Take the trainee through a mine and test his/her ability to do arisk assessment in hazardous situations whilst tracking his/herindividual scoring progress
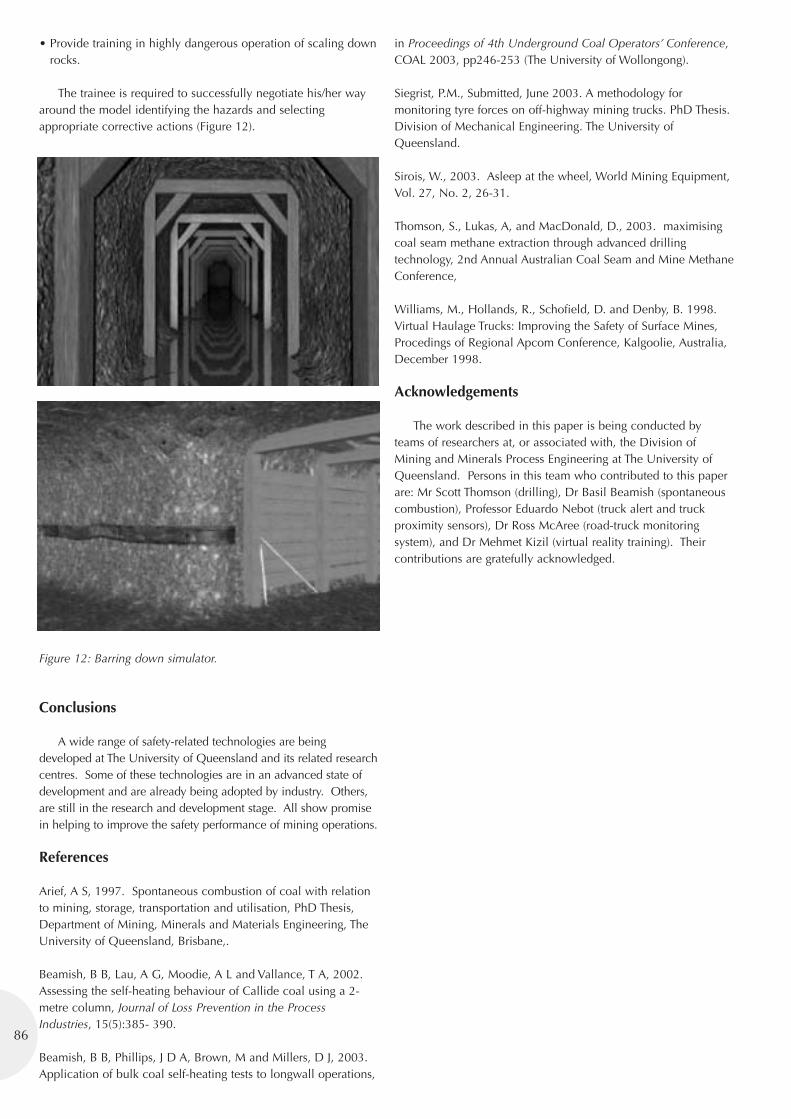
• Provide training in highly dangerous operation of scaling downrocks.
The trainee is required to successfully negotiate his/her wayaround the model identifying the hazards and selectingappropriate corrective actions (Figure 12).
Figure 12: Barring down simulator.
Conclusions
A wide range of safety-related technologies are beingdeveloped at The University of Queensland and its related researchcentres. Some of these technologies are in an advanced state ofdevelopment and are already being adopted by industry. Others,are still in the research and development stage. All show promisein helping to improve the safety performance of mining operations.
References
Arief, A S, 1997. Spontaneous combustion of coal with relationto mining, storage, transportation and utilisation, PhD Thesis,Department of Mining, Minerals and Materials Engineering, TheUniversity of Queensland, Brisbane,.
Beamish, B B, Lau, A G, Moodie, A L and Vallance, T A, 2002.Assessing the self-heating behaviour of Callide coal using a 2-metre column, Journal of Loss Prevention in the ProcessIndustries, 15(5):385- 390.
Beamish, B B, Phillips, J D A, Brown, M and Millers, D J, 2003.Application of bulk coal self-heating tests to longwall operations,
in Proceedings of 4th Underground Coal Operators’ Conference,COAL 2003, pp246-253 (The University of Wollongong).
Siegrist, P.M., Submitted, June 2003. A methodology formonitoring tyre forces on off-highway mining trucks. PhD Thesis.Division of Mechanical Engineering. The University ofQueensland.
Sirois, W., 2003. Asleep at the wheel, World Mining Equipment,Vol. 27, No. 2, 26-31.
Thomson, S., Lukas, A, and MacDonald, D., 2003. maximisingcoal seam methane extraction through advanced drillingtechnology, 2nd Annual Australian Coal Seam and Mine MethaneConference,
Williams, M., Hollands, R., Schofield, D. and Denby, B. 1998.Virtual Haulage Trucks: Improving the Safety of Surface Mines,Procedings of Regional Apcom Conference, Kalgoolie, Australia,December 1998.
Acknowledgements
The work described in this paper is being conducted byteams of researchers at, or associated with, the Division ofMining and Minerals Process Engineering at The University ofQueensland. Persons in this team who contributed to this paperare: Mr Scott Thomson (drilling), Dr Basil Beamish (spontaneouscombustion), Professor Eduardo Nebot (truck alert and truckproximity sensors), Dr Ross McAree (road-truck monitoringsystem), and Dr Mehmet Kizil (virtual reality training). Theircontributions are gratefully acknowledged.
86
Using Data to Identify Riskto Improve Safety & HealthPerformance
Rod Morrison, New South Wales Department of Mineral ResourcesAnn Williamson, University of New South Wales
Abstract
Using Data to Identify Risk to Improve Safety & HealthPerformance
The New South Wales Department of Mineral Resourcesobjective is to use data and information to undertake a detailedanalysis of incidents and accidents to identify risks so that thepredictable can be foreseen and avoided.
The Department of Mineral Resources has established acomputerised data base called COMET (COmmon MinesEnvironmenT) to capture information on accidents incidents,inspections, audits and accreditation in improving safety andenvironment performance.
This data together with data from Coal Mines Insurance andWorkCover N.S.W is being used to provide trend andcomparison information.
The NSW Injury Risk Management Research Centre at theUniversity of NSW has been engaged by the Department tocollate and prepare a detailed analysis of the data.
Through this process, five areas have been identified forfurther research. These being:
• Electrical energy• Mechanical equipment• Work environment• Hours of work• Contractors involvement accident and incidents.
The paper covers:
• The establishment of a mix of performance measures for theindustry to indicate whether the safety performance isimproving
• The provision of data to provide useful comparisons andbenchmarks against which companies can compareperformance
• The development of positive performance measures• The findings and outcomes of the detailed analysis of electrical
energy shocks• The provision of information to industry• An outline how the data is being used to determine
departmental operational priorities
• Future plans to undertake research into the other areasidentified.
Introduction
The development of performance measures in occupationaland health and safety as a means of indicating whether thestandard of performance is improving is not novel or innovative.The more recent debate has been about what are the mosteffective and relevant measures to show the true performance ofoccupational health and safety management.
The major review into Mine Safety in New South Walesconducted in 1997 by ACIL Economics and Policy Pty Ltd wasextremely critical of the credibility of traditional measures suchas Lost Time Injury Frequency Rate. It recommended that theappropriate measures should be a combination of those whichmeasure the process in place to manage major risk and preventserious injuries and death as well as measures safety outcomes.As a result, a recommendation was made to adopt a mix ofmeasures that might include traditional measures as well as newmeasures such as disabling injury and the action taken tomanage core risks together with a new set of measures to bedefined to enable individual sites to determine their safetyperformance.
A great deal of progress has been made in this field with awide suite of industry performance measures being adopted andsteps being taken to adopt a consistent approach by the variousjurisdictions across Australia through a National Mine SafetyFramework.
Industry has been encouraged to adopt a range of positiveperformance measures to look at what proactive action is beingtaken to prevent accidents and incidents.
The development of a wider selection of performancemeasures and the adoption of positive performance measures hasassisted in the understanding of occupational health and safetyperformance and has enabled trends to be identified andcomparisons to be made. It has, however, been limited inundertaking a detailed analysis of the actual risks and causes ofpoor performance that arise out of accidents and incidents.
This is the task that the New South Wales Department ofMineral Resources (DMR) is endeavouring to undertake. Theobjective is to analyse incidents and accidents to identify the
87
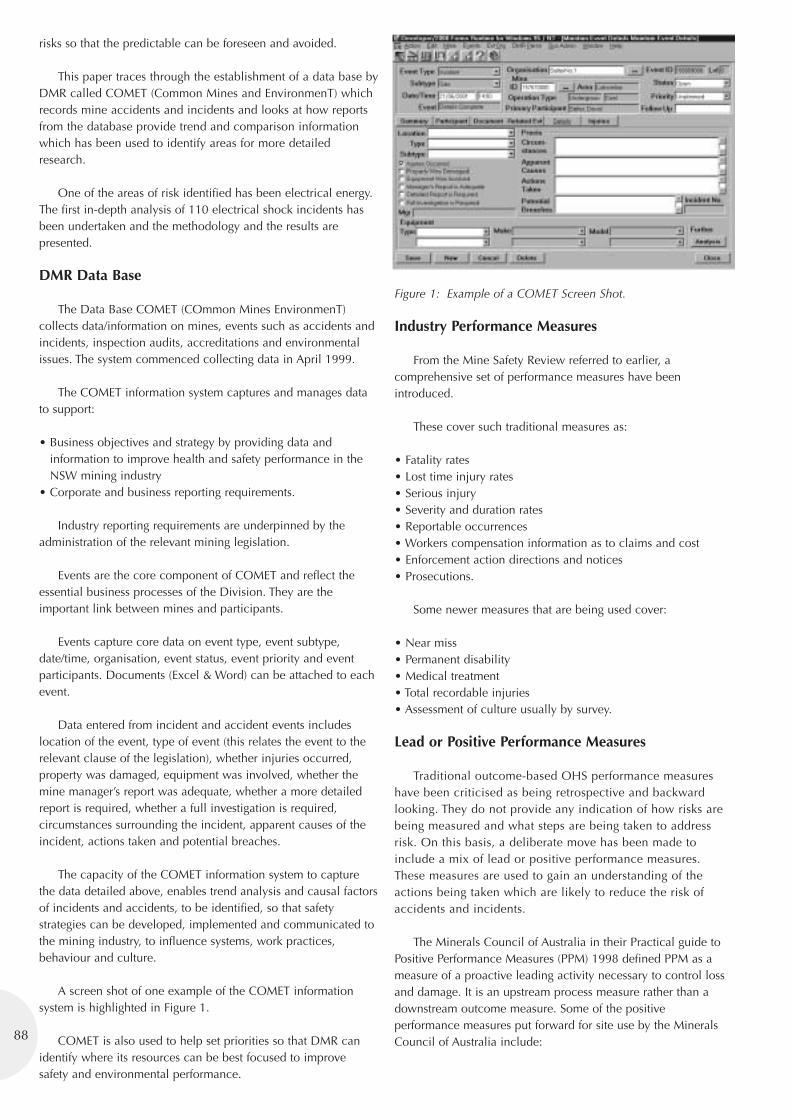
risks so that the predictable can be foreseen and avoided.
This paper traces through the establishment of a data base byDMR called COMET (Common Mines and EnvironmenT) whichrecords mine accidents and incidents and looks at how reportsfrom the database provide trend and comparison informationwhich has been used to identify areas for more detailedresearch.
One of the areas of risk identified has been electrical energy.The first in-depth analysis of 110 electrical shock incidents hasbeen undertaken and the methodology and the results arepresented.
DMR Data Base
The Data Base COMET (COmmon Mines EnvironmenT)collects data/information on mines, events such as accidents andincidents, inspection audits, accreditations and environmentalissues. The system commenced collecting data in April 1999.
The COMET information system captures and manages datato support:
• Business objectives and strategy by providing data andinformation to improve health and safety performance in theNSW mining industry
• Corporate and business reporting requirements.
Industry reporting requirements are underpinned by theadministration of the relevant mining legislation.
Events are the core component of COMET and reflect theessential business processes of the Division. They are theimportant link between mines and participants.
Events capture core data on event type, event subtype,date/time, organisation, event status, event priority and eventparticipants. Documents (Excel & Word) can be attached to eachevent.
Data entered from incident and accident events includeslocation of the event, type of event (this relates the event to therelevant clause of the legislation), whether injuries occurred,property was damaged, equipment was involved, whether themine manager’s report was adequate, whether a more detailedreport is required, whether a full investigation is required,circumstances surrounding the incident, apparent causes of theincident, actions taken and potential breaches.
The capacity of the COMET information system to capturethe data detailed above, enables trend analysis and causal factorsof incidents and accidents, to be identified, so that safetystrategies can be developed, implemented and communicated tothe mining industry, to influence systems, work practices,behaviour and culture.
A screen shot of one example of the COMET informationsystem is highlighted in Figure 1.
COMET is also used to help set priorities so that DMR canidentify where its resources can be best focused to improvesafety and environmental performance.
Figure 1: Example of a COMET Screen Shot.
Industry Performance Measures
From the Mine Safety Review referred to earlier, acomprehensive set of performance measures have beenintroduced.
These cover such traditional measures as:
• Fatality rates• Lost time injury rates• Serious injury• Severity and duration rates• Reportable occurrences• Workers compensation information as to claims and cost• Enforcement action directions and notices• Prosecutions.
Some newer measures that are being used cover:
• Near miss• Permanent disability• Medical treatment• Total recordable injuries• Assessment of culture usually by survey.
Lead or Positive Performance Measures
Traditional outcome-based OHS performance measureshave been criticised as being retrospective and backwardlooking. They do not provide any indication of how risks arebeing measured and what steps are being taken to addressrisk. On this basis, a deliberate move has been made toinclude a mix of lead or positive performance measures.These measures are used to gain an understanding of theactions being taken which are likely to reduce the risk ofaccidents and incidents.
The Minerals Council of Australia in their Practical guide toPositive Performance Measures (PPM) 1998 defined PPM as ameasure of a proactive leading activity necessary to control lossand damage. It is an upstream process measure rather than adownstream outcome measure. Some of the positiveperformance measures put forward for site use by the MineralsCouncil of Australia include:88
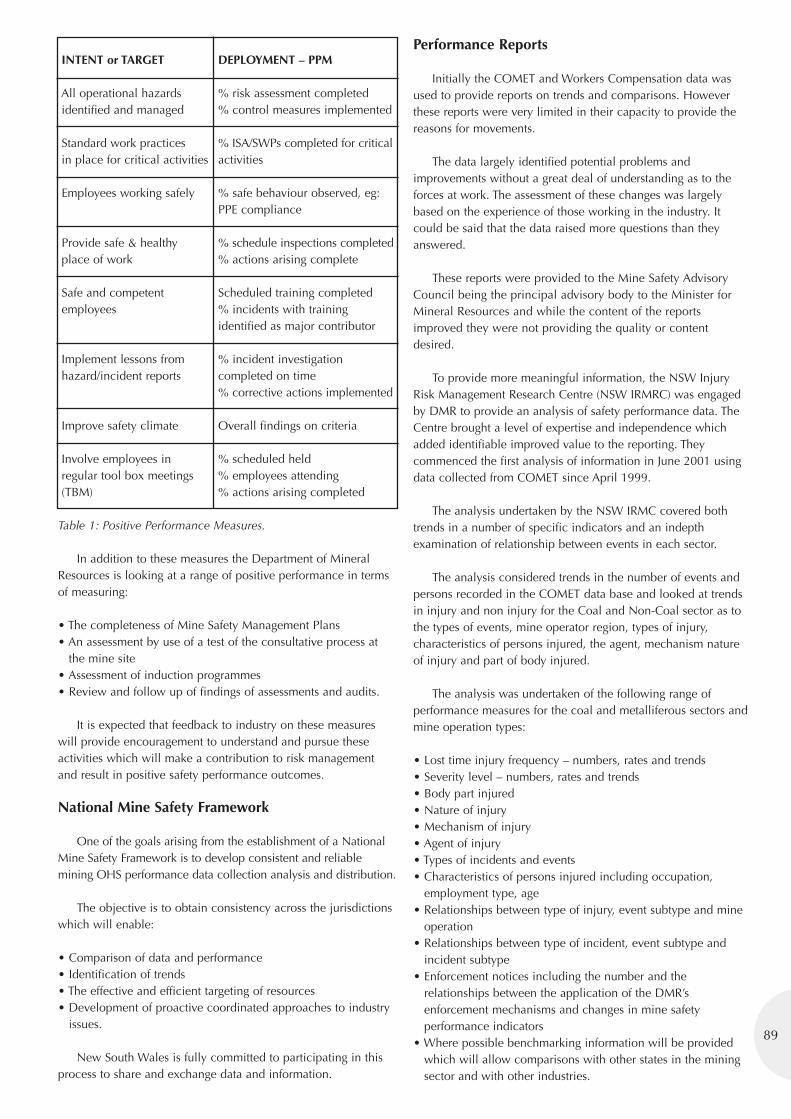
89
INTENT or TARGET DEPLOYMENT – PPM
All operational hazards % risk assessment completedidentified and managed % control measures implemented
Standard work practices % ISA/SWPs completed for criticalin place for critical activities activities
Employees working safely % safe behaviour observed, eg:PPE compliance
Provide safe & healthy % schedule inspections completedplace of work % actions arising complete
Safe and competent Scheduled training completedemployees % incidents with training
identified as major contributor
Implement lessons from % incident investigation hazard/incident reports completed on time
% corrective actions implemented
Improve safety climate Overall findings on criteria
Involve employees in % scheduled heldregular tool box meetings % employees attending(TBM) % actions arising completed
Table 1: Positive Performance Measures.
In addition to these measures the Department of MineralResources is looking at a range of positive performance in termsof measuring:
• The completeness of Mine Safety Management Plans• An assessment by use of a test of the consultative process at
the mine site• Assessment of induction programmes• Review and follow up of findings of assessments and audits.
It is expected that feedback to industry on these measureswill provide encouragement to understand and pursue theseactivities which will make a contribution to risk managementand result in positive safety performance outcomes.
National Mine Safety Framework
One of the goals arising from the establishment of a NationalMine Safety Framework is to develop consistent and reliablemining OHS performance data collection analysis and distribution.
The objective is to obtain consistency across the jurisdictionswhich will enable:
• Comparison of data and performance• Identification of trends• The effective and efficient targeting of resources• Development of proactive coordinated approaches to industry
issues.
New South Wales is fully committed to participating in thisprocess to share and exchange data and information.
Performance Reports
Initially the COMET and Workers Compensation data wasused to provide reports on trends and comparisons. Howeverthese reports were very limited in their capacity to provide thereasons for movements.
The data largely identified potential problems andimprovements without a great deal of understanding as to theforces at work. The assessment of these changes was largelybased on the experience of those working in the industry. Itcould be said that the data raised more questions than theyanswered.
These reports were provided to the Mine Safety AdvisoryCouncil being the principal advisory body to the Minister forMineral Resources and while the content of the reportsimproved they were not providing the quality or contentdesired.
To provide more meaningful information, the NSW InjuryRisk Management Research Centre (NSW IRMRC) was engagedby DMR to provide an analysis of safety performance data. TheCentre brought a level of expertise and independence whichadded identifiable improved value to the reporting. Theycommenced the first analysis of information in June 2001 usingdata collected from COMET since April 1999.
The analysis undertaken by the NSW IRMC covered bothtrends in a number of specific indicators and an indepthexamination of relationship between events in each sector.
The analysis considered trends in the number of events andpersons recorded in the COMET data base and looked at trendsin injury and non injury for the Coal and Non-Coal sector as tothe types of events, mine operator region, types of injury,characteristics of persons injured, the agent, mechanism natureof injury and part of body injured.
The analysis was undertaken of the following range ofperformance measures for the coal and metalliferous sectors andmine operation types:
• Lost time injury frequency – numbers, rates and trends• Severity level – numbers, rates and trends• Body part injured• Nature of injury• Mechanism of injury• Agent of injury• Types of incidents and events• Characteristics of persons injured including occupation,
employment type, age• Relationships between type of injury, event subtype and mine
operation• Relationships between type of incident, event subtype and
incident subtype• Enforcement notices including the number and the
relationships between the application of the DMR’senforcement mechanisms and changes in mine safetyperformance indicators
• Where possible benchmarking information will be providedwhich will allow comparisons with other states in the miningsector and with other industries.
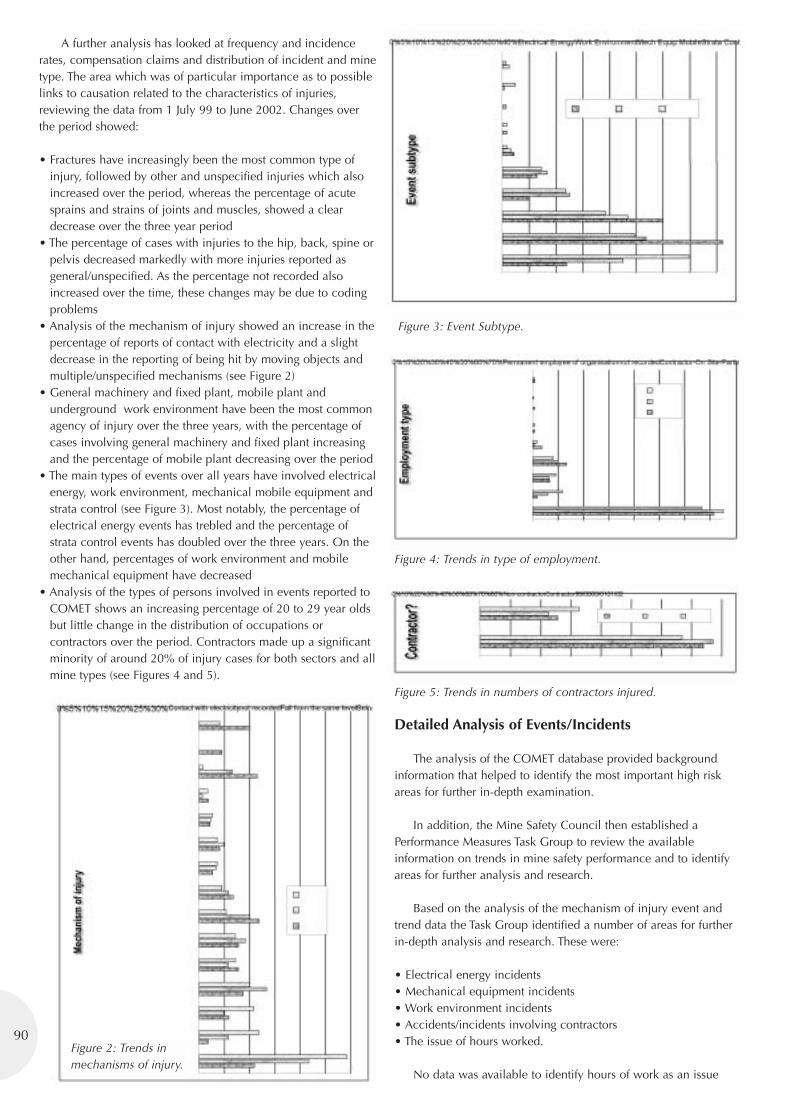
A further analysis has looked at frequency and incidencerates, compensation claims and distribution of incident and minetype. The area which was of particular importance as to possiblelinks to causation related to the characteristics of injuries,reviewing the data from 1 July 99 to June 2002. Changes overthe period showed:
• Fractures have increasingly been the most common type ofinjury, followed by other and unspecified injuries which alsoincreased over the period, whereas the percentage of acutesprains and strains of joints and muscles, showed a cleardecrease over the three year period
• The percentage of cases with injuries to the hip, back, spine orpelvis decreased markedly with more injuries reported asgeneral/unspecified. As the percentage not recorded alsoincreased over the time, these changes may be due to codingproblems
• Analysis of the mechanism of injury showed an increase in thepercentage of reports of contact with electricity and a slightdecrease in the reporting of being hit by moving objects andmultiple/unspecified mechanisms (see Figure 2)
• General machinery and fixed plant, mobile plant andunderground work environment have been the most commonagency of injury over the three years, with the percentage ofcases involving general machinery and fixed plant increasingand the percentage of mobile plant decreasing over the period
• The main types of events over all years have involved electricalenergy, work environment, mechanical mobile equipment andstrata control (see Figure 3). Most notably, the percentage ofelectrical energy events has trebled and the percentage ofstrata control events has doubled over the three years. On theother hand, percentages of work environment and mobilemechanical equipment have decreased
• Analysis of the types of persons involved in events reported toCOMET shows an increasing percentage of 20 to 29 year oldsbut little change in the distribution of occupations orcontractors over the period. Contractors made up a significantminority of around 20% of injury cases for both sectors and allmine types (see Figures 4 and 5).
Figure 3: Event Subtype.
Figure 4: Trends in type of employment.
Figure 5: Trends in numbers of contractors injured.
Detailed Analysis of Events/Incidents
The analysis of the COMET database provided backgroundinformation that helped to identify the most important high riskareas for further in-depth examination.
In addition, the Mine Safety Council then established aPerformance Measures Task Group to review the availableinformation on trends in mine safety performance and to identifyareas for further analysis and research.
Based on the analysis of the mechanism of injury event andtrend data the Task Group identified a number of areas for furtherin-depth analysis and research. These were:
• Electrical energy incidents• Mechanical equipment incidents• Work environment incidents• Accidents/incidents involving contractors• The issue of hours worked.
No data was available to identify hours of work as an issue
90Figure 2: Trends inmechanisms of injury.
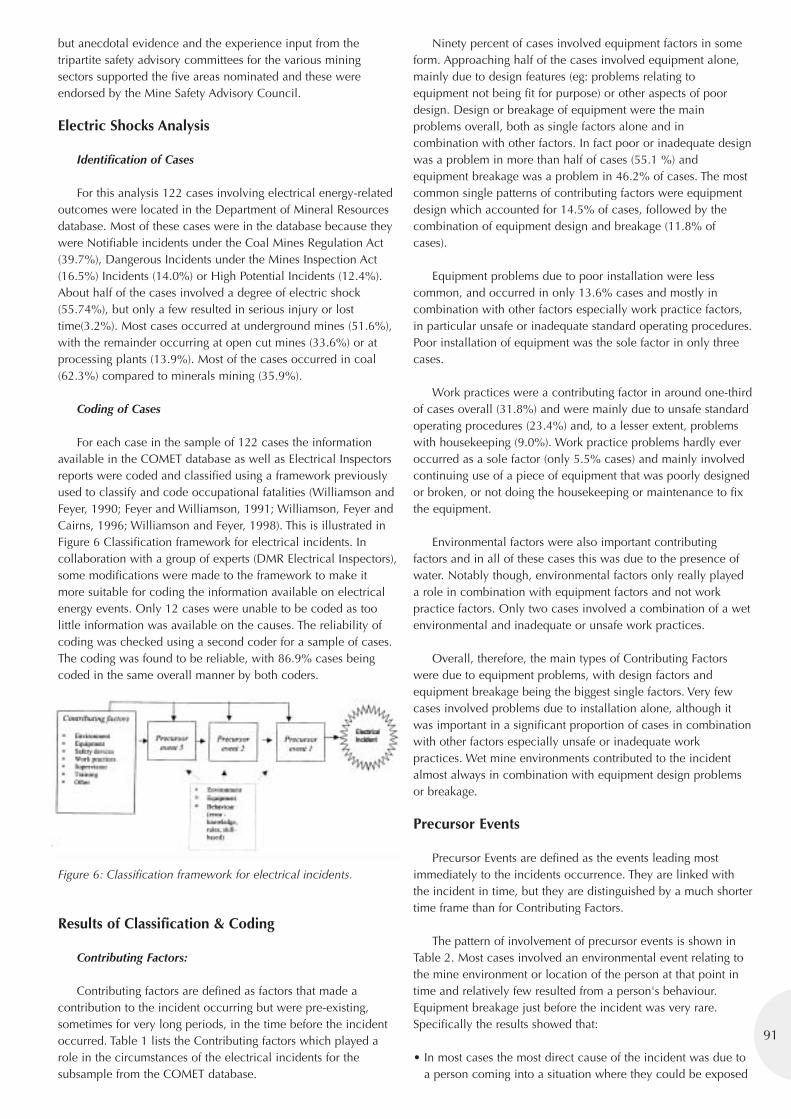
91
but anecdotal evidence and the experience input from thetripartite safety advisory committees for the various miningsectors supported the five areas nominated and these wereendorsed by the Mine Safety Advisory Council.
Electric Shocks Analysis
Identification of Cases
For this analysis 122 cases involving electrical energy-relatedoutcomes were located in the Department of Mineral Resourcesdatabase. Most of these cases were in the database because theywere Notifiable incidents under the Coal Mines Regulation Act(39.7%), Dangerous Incidents under the Mines Inspection Act(16.5%) Incidents (14.0%) or High Potential Incidents (12.4%).About half of the cases involved a degree of electric shock(55.74%), but only a few resulted in serious injury or losttime(3.2%). Most cases occurred at underground mines (51.6%),with the remainder occurring at open cut mines (33.6%) or atprocessing plants (13.9%). Most of the cases occurred in coal(62.3%) compared to minerals mining (35.9%).
Coding of Cases
For each case in the sample of 122 cases the informationavailable in the COMET database as well as Electrical Inspectorsreports were coded and classified using a framework previouslyused to classify and code occupational fatalities (Williamson andFeyer, 1990; Feyer and Williamson, 1991; Williamson, Feyer andCairns, 1996; Williamson and Feyer, 1998). This is illustrated inFigure 6 Classification framework for electrical incidents. Incollaboration with a group of experts (DMR Electrical Inspectors),some modifications were made to the framework to make itmore suitable for coding the information available on electricalenergy events. Only 12 cases were unable to be coded as toolittle information was available on the causes. The reliability ofcoding was checked using a second coder for a sample of cases.The coding was found to be reliable, with 86.9% cases beingcoded in the same overall manner by both coders.
Figure 6: Classification framework for electrical incidents.
Results of Classification & Coding
Contributing Factors:
Contributing factors are defined as factors that made acontribution to the incident occurring but were pre-existing,sometimes for very long periods, in the time before the incidentoccurred. Table 1 lists the Contributing factors which played arole in the circumstances of the electrical incidents for thesubsample from the COMET database.
Ninety percent of cases involved equipment factors in someform. Approaching half of the cases involved equipment alone,mainly due to design features (eg: problems relating toequipment not being fit for purpose) or other aspects of poordesign. Design or breakage of equipment were the mainproblems overall, both as single factors alone and incombination with other factors. In fact poor or inadequate designwas a problem in more than half of cases (55.1 %) andequipment breakage was a problem in 46.2% of cases. The mostcommon single patterns of contributing factors were equipmentdesign which accounted for 14.5% of cases, followed by thecombination of equipment design and breakage (11.8% ofcases).
Equipment problems due to poor installation were lesscommon, and occurred in only 13.6% cases and mostly incombination with other factors especially work practice factors,in particular unsafe or inadequate standard operating procedures.Poor installation of equipment was the sole factor in only threecases.
Work practices were a contributing factor in around one-thirdof cases overall (31.8%) and were mainly due to unsafe standardoperating procedures (23.4%) and, to a lesser extent, problemswith housekeeping (9.0%). Work practice problems hardly everoccurred as a sole factor (only 5.5% cases) and mainly involvedcontinuing use of a piece of equipment that was poorly designedor broken, or not doing the housekeeping or maintenance to fixthe equipment.
Environmental factors were also important contributingfactors and in all of these cases this was due to the presence ofwater. Notably though, environmental factors only really playeda role in combination with equipment factors and not workpractice factors. Only two cases involved a combination of a wetenvironmental and inadequate or unsafe work practices.
Overall, therefore, the main types of Contributing Factorswere due to equipment problems, with design factors andequipment breakage being the biggest single factors. Very fewcases involved problems due to installation alone, although itwas important in a significant proportion of cases in combinationwith other factors especially unsafe or inadequate workpractices. Wet mine environments contributed to the incidentalmost always in combination with equipment design problemsor breakage.
Precursor Events
Precursor Events are defined as the events leading mostimmediately to the incidents occurrence. They are linked withthe incident in time, but they are distinguished by a much shortertime frame than for Contributing Factors.
The pattern of involvement of precursor events is shown inTable 2. Most cases involved an environmental event relating tothe mine environment or location of the person at that point intime and relatively few resulted from a person's behaviour.Equipment breakage just before the incident was very rare.Specifically the results showed that:
• In most cases the most direct cause of the incident was due toa person coming into a situation where they could be exposed
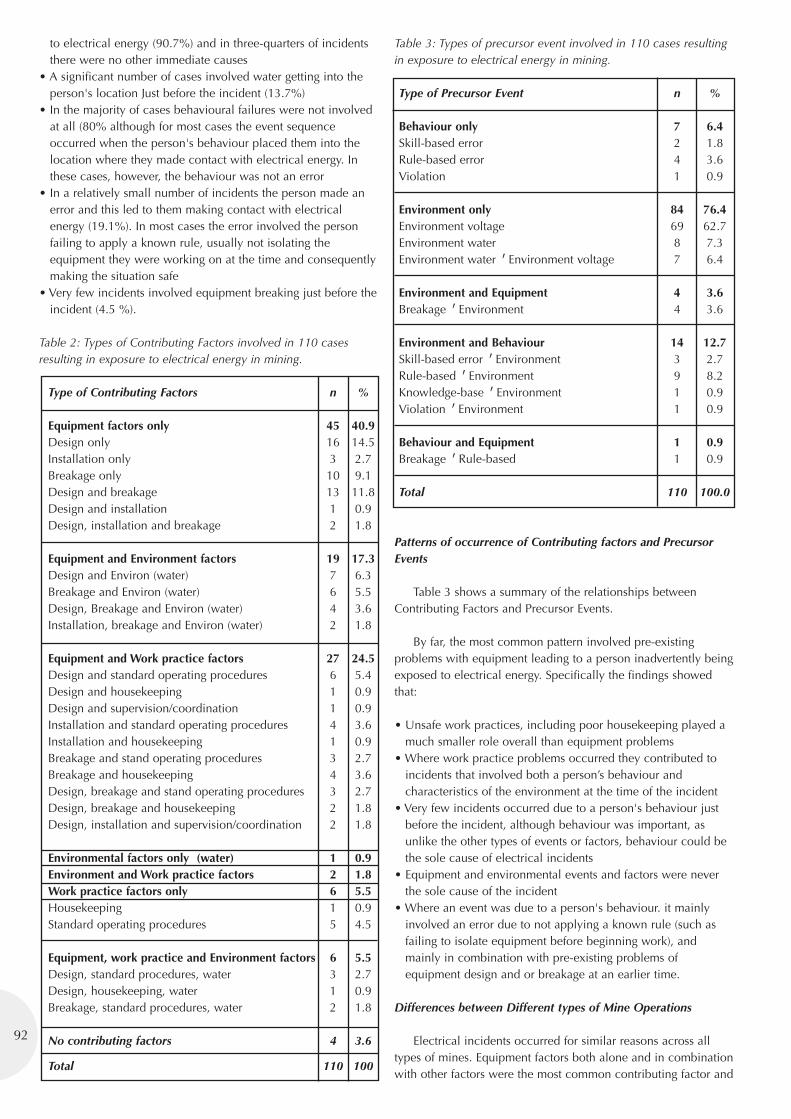
to electrical energy (90.7%) and in three-quarters of incidentsthere were no other immediate causes
• A significant number of cases involved water getting into theperson's location Just before the incident (13.7%)
• In the majority of cases behavioural failures were not involvedat all (80% although for most cases the event sequenceoccurred when the person's behaviour placed them into thelocation where they made contact with electrical energy. Inthese cases, however, the behaviour was not an error
• In a relatively small number of incidents the person made anerror and this led to them making contact with electricalenergy (19.1%). In most cases the error involved the personfailing to apply a known rule, usually not isolating theequipment they were working on at the time and consequentlymaking the situation safe
• Very few incidents involved equipment breaking just before theincident (4.5 %).
Table 2: Types of Contributing Factors involved in 110 casesresulting in exposure to electrical energy in mining.
Type of Contributing Factors n %
Equipment factors only 45 40.9Design only 16 14.5Installation only 3 2.7Breakage only 10 9.1Design and breakage 13 11.8Design and installation 1 0.9Design, installation and breakage 2 1.8
Equipment and Environment factors 19 17.3Design and Environ (water) 7 6.3Breakage and Environ (water) 6 5.5Design, Breakage and Environ (water) 4 3.6Installation, breakage and Environ (water) 2 1.8
Equipment and Work practice factors 27 24.5Design and standard operating procedures 6 5.4Design and housekeeping 1 0.9Design and supervision/coordination 1 0.9Installation and standard operating procedures 4 3.6Installation and housekeeping 1 0.9Breakage and stand operating procedures 3 2.7Breakage and housekeeping 4 3.6Design, breakage and stand operating procedures 3 2.7Design, breakage and housekeeping 2 1.8Design, installation and supervision/coordination 2 1.8
Environmental factors only (water) 1 0.9Environment and Work practice factors 2 1.8Work practice factors only 6 5.5Housekeeping 1 0.9Standard operating procedures 5 4.5
Equipment, work practice and Environment factors 6 5.5Design, standard procedures, water 3 2.7Design, housekeeping, water 1 0.9Breakage, standard procedures, water 2 1.8
No contributing factors 4 3.6
Total 110 100
Table 3: Types of precursor event involved in 110 cases resultingin exposure to electrical energy in mining.
Type of Precursor Event n %
Behaviour only 7 6.4Skill-based error 2 1.8Rule-based error 4 3.6Violation 1 0.9
Environment only 84 76.4Environment voltage 69 62.7Environment water 8 7.3Environment water ’Environment voltage 7 6.4
Environment and Equipment 4 3.6Breakage ’Environment 4 3.6
Environment and Behaviour 14 12.7Skill-based error ’Environment 3 2.7Rule-based ’Environment 9 8.2Knowledge-base ’Environment 1 0.9Violation ’Environment 1 0.9
Behaviour and Equipment 1 0.9Breakage ’Rule-based 1 0.9
Total 110 100.0
Patterns of occurrence of Contributing factors and PrecursorEvents
Table 3 shows a summary of the relationships betweenContributing Factors and Precursor Events.
By far, the most common pattern involved pre-existingproblems with equipment leading to a person inadvertently beingexposed to electrical energy. Specifically the findings showedthat:
• Unsafe work practices, including poor housekeeping played amuch smaller role overall than equipment problems
• Where work practice problems occurred they contributed toincidents that involved both a person’s behaviour andcharacteristics of the environment at the time of the incident
• Very few incidents occurred due to a person's behaviour justbefore the incident, although behaviour was important, asunlike the other types of events or factors, behaviour could bethe sole cause of electrical incidents
• Equipment and environmental events and factors were neverthe sole cause of the incident
• Where an event was due to a person's behaviour. it mainlyinvolved an error due to not applying a known rule (such asfailing to isolate equipment before beginning work), andmainly in combination with pre-existing problems ofequipment design and or breakage at an earlier time.
Differences between Different types of Mine Operations
Electrical incidents occurred for similar reasons across alltypes of mines. Equipment factors both alone and in combinationwith other factors were the most common contributing factor and
92
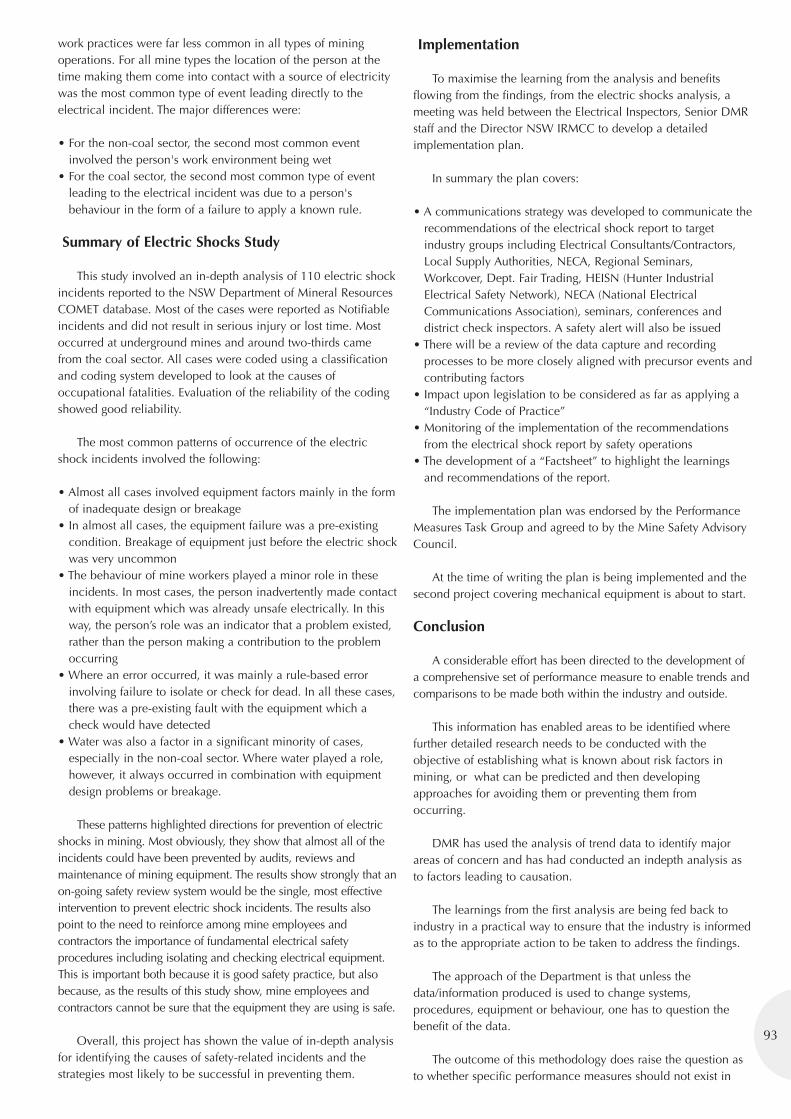
93
work practices were far less common in all types of miningoperations. For all mine types the location of the person at thetime making them come into contact with a source of electricitywas the most common type of event leading directly to theelectrical incident. The major differences were:
• For the non-coal sector, the second most common eventinvolved the person's work environment being wet
• For the coal sector, the second most common type of eventleading to the electrical incident was due to a person'sbehaviour in the form of a failure to apply a known rule.
Summary of Electric Shocks Study
This study involved an in-depth analysis of 110 electric shockincidents reported to the NSW Department of Mineral ResourcesCOMET database. Most of the cases were reported as Notifiableincidents and did not result in serious injury or lost time. Mostoccurred at underground mines and around two-thirds camefrom the coal sector. All cases were coded using a classificationand coding system developed to look at the causes ofoccupational fatalities. Evaluation of the reliability of the codingshowed good reliability.
The most common patterns of occurrence of the electricshock incidents involved the following:
• Almost all cases involved equipment factors mainly in the formof inadequate design or breakage
• In almost all cases, the equipment failure was a pre-existingcondition. Breakage of equipment just before the electric shockwas very uncommon
• The behaviour of mine workers played a minor role in theseincidents. In most cases, the person inadvertently made contactwith equipment which was already unsafe electrically. In thisway, the person’s role was an indicator that a problem existed,rather than the person making a contribution to the problemoccurring
• Where an error occurred, it was mainly a rule-based errorinvolving failure to isolate or check for dead. In all these cases,there was a pre-existing fault with the equipment which acheck would have detected
• Water was also a factor in a significant minority of cases,especially in the non-coal sector. Where water played a role,however, it always occurred in combination with equipmentdesign problems or breakage.
These patterns highlighted directions for prevention of electricshocks in mining. Most obviously, they show that almost all of theincidents could have been prevented by audits, reviews andmaintenance of mining equipment. The results show strongly that anon-going safety review system would be the single, most effectiveintervention to prevent electric shock incidents. The results alsopoint to the need to reinforce among mine employees andcontractors the importance of fundamental electrical safetyprocedures including isolating and checking electrical equipment.This is important both because it is good safety practice, but alsobecause, as the results of this study show, mine employees andcontractors cannot be sure that the equipment they are using is safe.
Overall, this project has shown the value of in-depth analysisfor identifying the causes of safety-related incidents and thestrategies most likely to be successful in preventing them.
Implementation
To maximise the learning from the analysis and benefitsflowing from the findings, from the electric shocks analysis, ameeting was held between the Electrical Inspectors, Senior DMRstaff and the Director NSW IRMCC to develop a detailedimplementation plan.
In summary the plan covers:
• A communications strategy was developed to communicate therecommendations of the electrical shock report to targetindustry groups including Electrical Consultants/Contractors,Local Supply Authorities, NECA, Regional Seminars,Workcover, Dept. Fair Trading, HEISN (Hunter IndustrialElectrical Safety Network), NECA (National ElectricalCommunications Association), seminars, conferences anddistrict check inspectors. A safety alert will also be issued
• There will be a review of the data capture and recordingprocesses to be more closely aligned with precursor events andcontributing factors
• Impact upon legislation to be considered as far as applying a“Industry Code of Practice”
• Monitoring of the implementation of the recommendationsfrom the electrical shock report by safety operations
• The development of a “Factsheet” to highlight the learningsand recommendations of the report.
The implementation plan was endorsed by the PerformanceMeasures Task Group and agreed to by the Mine Safety AdvisoryCouncil.
At the time of writing the plan is being implemented and thesecond project covering mechanical equipment is about to start.
Conclusion
A considerable effort has been directed to the development ofa comprehensive set of performance measure to enable trends andcomparisons to be made both within the industry and outside.
This information has enabled areas to be identified wherefurther detailed research needs to be conducted with theobjective of establishing what is known about risk factors inmining, or what can be predicted and then developingapproaches for avoiding them or preventing them fromoccurring.
DMR has used the analysis of trend data to identify majorareas of concern and has had conducted an indepth analysis asto factors leading to causation.
The learnings from the first analysis are being fed back toindustry in a practical way to ensure that the industry is informedas to the appropriate action to be taken to address the findings.
The approach of the Department is that unless thedata/information produced is used to change systems,procedures, equipment or behaviour, one has to question thebenefit of the data.
The outcome of this methodology does raise the question asto whether specific performance measures should not exist in
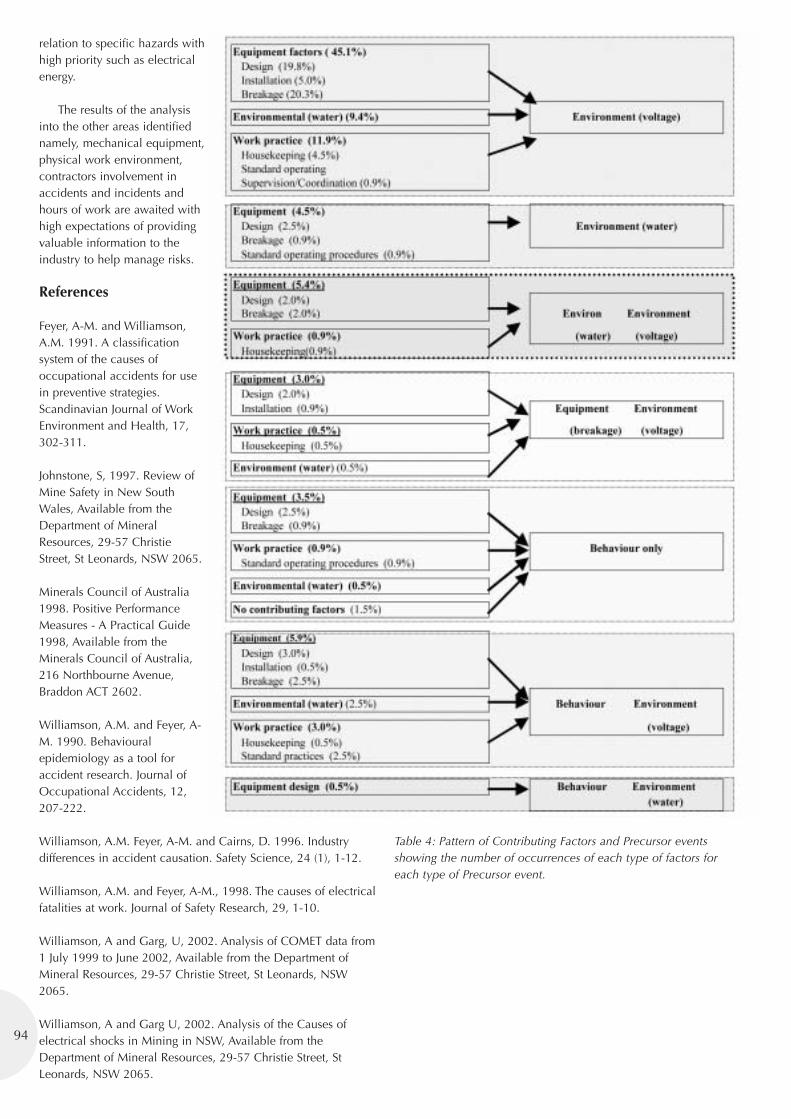
relation to specific hazards withhigh priority such as electricalenergy.
The results of the analysisinto the other areas identifiednamely, mechanical equipment,physical work environment,contractors involvement inaccidents and incidents andhours of work are awaited withhigh expectations of providingvaluable information to theindustry to help manage risks.
References
Feyer, A-M. and Williamson,A.M. 1991. A classificationsystem of the causes ofoccupational accidents for usein preventive strategies.Scandinavian Journal of WorkEnvironment and Health, 17,302-311.
Johnstone, S, 1997. Review ofMine Safety in New SouthWales, Available from theDepartment of MineralResources, 29-57 ChristieStreet, St Leonards, NSW 2065.
Minerals Council of Australia1998. Positive PerformanceMeasures - A Practical Guide1998, Available from theMinerals Council of Australia,216 Northbourne Avenue,Braddon ACT 2602.
Williamson, A.M. and Feyer, A-M. 1990. Behaviouralepidemiology as a tool foraccident research. Journal ofOccupational Accidents, 12,207-222.
Williamson, A.M. Feyer, A-M. and Cairns, D. 1996. Industrydifferences in accident causation. Safety Science, 24 (1), 1-12.
Williamson, A.M. and Feyer, A-M., 1998. The causes of electricalfatalities at work. Journal of Safety Research, 29, 1-10.
Williamson, A and Garg, U, 2002. Analysis of COMET data from1 July 1999 to June 2002, Available from the Department ofMineral Resources, 29-57 Christie Street, St Leonards, NSW2065.
Williamson, A and Garg U, 2002. Analysis of the Causes ofelectrical shocks in Mining in NSW, Available from theDepartment of Mineral Resources, 29-57 Christie Street, StLeonards, NSW 2065.
Table 4: Pattern of Contributing Factors and Precursor eventsshowing the number of occurrences of each type of factors foreach type of Precursor event.
94
ACARP – Accepting the Safety Challenge
Ross McKinnon, Australian Coal Research LtdRoger Wischusen, Australian Research Administration Pty Ltd
ACARP
The transfer of the collaborative research effort for theAustralian black coal industry from a CommonwealthGovernment administered scheme to an industry managedprogram took place in 1992. The program, Australian CoalAssociation Research Program (ACARP), has committedapproximately $110 million of direct industry funding towardsover 670 projects in that time.
The “charter” for ACARP is identified in two forms, one beingthe undertaking to the Commonwealth Government in aMemorandum of Understanding (MOU) with respect to theoverall objectives of the program, the other being identicalcontracts with each coal producer for the governance of programmanagement and administering the levies collected.
The MOU states that the program was established for thepurpose of;
• Providing strategic leadership to industry R&D and to act as acatalyst to stimulate R&D interest within the coal andassociated industries
• Improving the management and application of coal research inAustralia
• Ensuring the more effective use of Australia’s black coalresources
• Increasing the economic, environmental, safety and socialbenefits to the industry and the wider community
• Promoting the competitiveness, sustainable use andmanagement of Australia’s coal resources.
The emphasis within the objectives has changed in the periodbut the overall concept has stood the test of time and hassufficient flexibility within the boundaries to adapt to theindustry’s needs.
It is this flexibility that allows the program to respond to thechanging issues as they face the industry. Ten years ago theresults of the then Moura Enquiry were at the front of the list.These outcomes continue to drive improvements to minecommunication, exploration techniques and support for aidedand self rescue. However the program is also responding to thecommunity’s concern over greenhouse gas emissions. This areawas certainly not considered to be a likely candidate forcollaborative research dollars when ACARP was originallyestablished.
The flexibility has increased over the past ten years as theadministrative overheads were reduced and the industry formedtechnical committees became more confident in taking the reinsfrom the research community and driving the direction ofindustry funded research.
The direct industry commitment of $110 million representsabout $450 million of leveraged funding in total. Thisleveraged amount, traditionally about $3 total to $1 directACARP funding due to contributions from other sources (cashand in-kind support from industry employees/companies andresearch organisations), has been significantly increased inrecent times as a result of formal participation in two Co-operative Research Centres, CRC for Coal in SustainableDevelopment (CCSD) and CRC for Greenhouse GasTechnologies (CO2CRC).
The program mechanism relies on its strength of technicaland financial leverage provided by coal industry organisationsat all levels of the process to achieve outcomes for theindustry. It is ably supported by world ranking researchercompetence to the extent that the level of Australian technicalknow-how as applied to all aspects of the exploration,production and use of coal is up with the best, if not the best,in the world. Fifteen to twenty years ago the Australian coalindustry still relied heavily on imported technology. ACARPhas played an important role in bringing about the changedposition.
Australia is now seen by International OEMs as a crediblesource of technology. Equipment manufacturers haveenthusiastically joined the reborn Co-operative Research Centrefor Mining Technology and Equipment (CMTE) in its new formatas the CRC for Mining, including P&H, Mine Pro Services andKomatsu Australia. The Longwall automation project, which isbeing driven by an ACARP steering committee, enjoys the strongand interactive support of both major longwall manufacturers,Joy and DBT. Whilst ACARP will never have sufficient fundingnor a desire to pay fully for the necessary developments neededto ensure safer and more efficient equipment, the earlyinvestment of industry input through ACARP seed funding isensuring Australia does get heard.
Late last year it was considered appropriate to have anindustry assessment of the value of its own program and viewswere canvassed from those directly concerned. Some examplesof testimonials provided include the following;
95
“The collaborative support of ACARP and AMIRA for blastingresearch at the JKMRC has ensured that Australian mines haveaccess to world-class blasting technology.”
Professor Don McKee, DirectorSUSTAINABLE MINERALS INSTITUTE
“The application of the coal loss measurement techniquesdeveloped through ACARP has assisted our managers inunderstanding, measuring and reducing coal loss. If we’re toadvance mining technology and continue to drive down the costof producing coal, it’s critical that ACARP continues to supportwork on the more difficult problems faced by miningoperations.”
Bob McKerrow, Mining Operations ManagerTHIESS PTY LTD
“ACARP plays an important role in investing industry researchfunding in the future technologies. Without this investmentAustralia will inevitably lose the competitive edge that comeswith having access to the most advanced coal treatmenttechnology in the world.”
Russell Kempnich, Executive ChairmanSEDGMAN PTY LTD
“Our operations have benefited greatly from the sustainedinvestment in developing the enabling technologies. Thecumulative benefit of this ongoing investment is progressivelyimproving plant efficiency while driving down costs.”
Dr Richard Peck, Coal Technology ManagerANGLO COAL AUSTRALIA PTY LTD
“The ACARP program has produced a significant body ofresearch that is of high quality by international standards—someof which is outstanding. Geomechanics practice in theAustralian coal industry compares favourably with that of thecivil engineering and metalliferous mining disciplines.”
Coal Geomechanics Review, September 2001Professor Ted Brown ACGOLDER & ASSOCIATES PTY LTD
“The developmental work and long-term commitment thatACARP has invested in erosion studies have led the industry. Theresearch has provided the supporting science and confidencenecessary to commit the large expenditure associated withreshaping dragline spoil piles.”
Rob McNamara, former General Manager—EnvironmentMIM HOLDINGS LIMITED
“Over the past 10 years, the performance of a 50m3 draglinehas moved from an average of 11 million BCM to around 16million BCM. This improvement is due to many factors.However, without the early investments in research made byACARP and others, many of the wins with bucket and riggingdesign, operating control and productivity measurement wouldnot have been achieved.”
Mal Lees, Chief TechnologistPACIFIC COAL PTY LTD
“Productivity increases can be attributed to the cumulativeeffect of ACARP projects in conjunction with supporting industryinnovation and industrial rationalisation. The UDD draglinemodification will demonstrate the value of long-term investmentin dragline research and the contribution that ACARP funding has
played in developing this research capability.”Cam Davidson, Project Development ManagerBHP BILLITON MITSUBISHI ALLIANCE COAL OPERATIONSPTY LTD
Safety Component of ACARP
Identification of occupational health and safety features ofACARP commitment and success is not simple to extract.Largely due to the structure for managing the process of projectselection the usual method of reporting summary of fundscommitments is by the five technical categories of the ACARPindustry committees, underground, open cut, coal preparation,coal utilisation and greenhouse gas mitigation. However, themain difficulty arises because of the multi component content ofmany projects.
For example many (and perhaps the majority of) projectsaimed at improving the application of technology towardssolving a safety issue or production activity will potentiallyimprove both because of the interrelationship of the two.Notwithstanding this difficulty it is estimated that approximately25% of ACARP direct funding has had an occupational healthand safety objective/impact. A brief overview of some ACARPprojects is provided as an example with reference to this issue.
The key to successful underground safety and productivity isthe measurement and management of both the geotechnicalconditions and, increasingly, gas. Strata control and gasmanagement forms a significant component of the undergroundportfolio of ACARP projects.
Strata Control
Underground coal mining is an operation involving bulkmaterials extraction and handling, with the resulting rapiddevelopment of large voids that are designed to collapse. Thestress regime is quite different from most hard rock operations inthat mine management must control strata above locations thatare continuously changing/moving and responding to thesignificant stress changes caused by the mining of the targetedcoal section of the strata. This means that they have to achievemaximum control of softer material for a minimum cost, which iscertainly quite a challenge.
Project C11028 Self-Drilling Rock Bolt Technology - Theautomatic installation of rock bolts will improve operator safetyand increase productivity. This project is assisting to develop atechnique that is utilising an innovative self drilling bolt. A drillequipment manufacturer and a bolt manufacturer are workingtogether with the researchers, Ground Support Services andCSIRO, to refine a prototype bolting system that is set torevolutionise future bolting operations and eliminate the sourceof many lost time injuries.
Project C11056 Geophysical Assessment of Fracture Grouting- The Oaky Creek Coal Mine is working with CSIRO to quantifythe effectiveness of pre-grouting existing fracture zones in anattempt to improve the safe and efficient mining of coal that lieswithin this area. Again safety is a key driver of this importantfield of investigation, which, if successful, could lead toincreasing levels of production when confronting difficult groundconditions.
96
97
Gas Management
The challenge is firstly to know where gas is located, thequantity present, how it will respond to drainage strategies, the rateof gas make during production and resultant operator exposure.
Outburst events are known to be associated with geologicalstructure. ACARP projects C11038 Integration of Seismic Datafor Mine Planning - being undertaken by CSIRO, and C10020Investigation of Converted Wave Coal Seismic Reflection Data -by Velseis Pty Ltd are typical of the work being undertaken toadvance the use of geophysical techniques for locating suchstructure. ACARP‘s investment in translating the techniquesoriginally developed for the petroleum industry for coalexploration has led to Australia leading in the use of coalgeophysics. 3D geophysical mapping is now a standard processin the Bowen Basin. Six years ago the geologists employed agrid of exploration boreholes to delineate a coal reserve, withanomalies being checked by seismic. Today 3D seismic isroutinely used first, with drilling then employed selectively toresolve anomalies. The better definition of geological structure isproducing safer more productive operations.
Contained gas is currently used as the parameter fordetermining the propensity of specific coal to outburst. Thetechniques employed to drain this gas are challenging andnecessarily vary with the different seam characteristics.
Project C10012 Coordination of In-Seam Drilling andGas/Outburst Research - John Hanes, coordinates a number ofworkshops across the Queensland and New South Walesunderground operations where thoseresponsible for drainage, including the drillers,mining engineers, geologists and researchersreport on recent experiences. This sharing ofindustry experience is a key to ACARPsuccessfully advancing the state of knowledgein such a critical safety area.
Project C10017 Optimisation of Goaf Gas Drainage &Control Systems - Dr Rao Baluso, CSIRO Exploration and Mining,has successfully modelled the flow of gas through goafs and intoworkings. His modelling work provides management with areliable tool to assist them contain and control gas.
Project C11030 Variability of Coal Seam Parameters as theyImpact on Outbursts - CSIRO, has quantified all the parametersthat can contribute to an outburst event. In doing so they areworking toward a more accurate assessment of outburst potentialbeyond the simple and possibly over conservative use of only gascontained.
The Challenge
Most of the effort has been directed towards the safetycomponent of occupational health and safety. This has probablyarisen for a number of reasons including:
• Operational/technical people can better identify with the moreapplied sciences than the so called “soft sciences” usuallyassociated with occupational health issues
• Until fairly recently there was a hesitancy to delve into issuesthat may have an industrial relations connotation, and
• Other organisations, either associated with the coal industry(e.g. the former Joint Coal Board) or with industry generally,were addressing such issues on a wider front.
When I first gained employment in the Australian coalindustry almost fifty years ago the importance of safety wasrecognised, but at a very much lower level than today. Thiswas evident in the level of training given to new employees (orlack thereof), the attention to protective clothing, pre-employment and periodic medical examination and, essentially,a reliance on an understanding of compliance with mininglegislation.
There is no doubt that the technological features associatedwith mine safety have advanced enormously and that theappreciation of wider safety issues and attention to training arewell beyond that era, and much more aligned to present dayexpectations. There is also clear evidence of improved results.While it may not be relevant to draw on statistics from the mid1950s, for a number of reasons including differentcircumstances/bases adopted over the period, even more recentcomparisons demonstrate that advances have been made.
The average lost time injury frequency rate (number of losttime injuries per million hours worked) for the black coalindustry in Australia contributing to and covered by ACARP(operating in the four states of Queensland, New South Wales,Western Australia and Tasmania) has shown the following trendin the last ten years of available information.
Lost Time Injury Frequency Rate, Black Coal Industry
The above information requires a number of observations,including the size and nature of the operations contained in eachstate total, to provide the basis for a full appreciation, but it isfairly clear that there has been a trend moving in the rightdirection.
While the same state based information is not at hand forduration rate (average lost time for every lost time injury) andseverity rate (average number of days lost per million hoursworked) it seems that the trend with respect to these twomeasures for the coal industry in total in Australia (whichincludes Victorian and South Australian operations) has been ifanything worsening, in the case of severity rate in particular, orfairly static. The information on fatal injury frequency rate, whilevarying widely from year to year in relative terms, has not showna substantially favourable trend.
Comparisons with overseas coal industries show thatAustralia is ahead of others in many respects. The conclusionfrom any objective analysis though is that we have no basis forcomplacency. In reality it could be argued that we havetravelled the relatively easy distance towards what has to be theultimate goal, however that is defined.
State 92-93 93-94 94-95 95-96 96-97 97-98 98-99 99-00 00-01 01-02
QLD 40 34 31 26 24 16 13 12 11 8NSW 78 68 73 56 48 52 39 34 33 27WA 130 78 91 61 41 32 29 16 28 17TAS 37 10 29 30 19 14 0 7 35 20
A New Direction
The program continues to adapt to changing demands. It isinteresting to note that the industry’s determination to achievezero fatalities has caused the technical committees to begin toappreciate the importance and value of sociological science.
Advancing technology can not, and will not, guarantee zerofatalities. The industry must understand and address such issuesas fatigue, training and propensity to undertake risks if thisworthy goal is to be accomplished.
The approach to addressing issues utilising researchdisciplines in technical areas has been clearly evident withinACARP and this has been extended to a lot of safety issues,largely because of the clear association with production activitiesthat needed a technical approach. There is still evidence of areluctance to embrace the more occupational health andsociological aspects of the safety equation in the same approach.
Recent experience within ACARP would indicate that thechances of a “softer science” proposal being finally approved isprobably less than half that of the rest.
Understanding that there is an application for this science tosafety is not such a large step for the industry to take as it isalready seeing how this work can help achieve a sustainable coalmining industry on other issues. The industry recognises theimperative of community, environment and profitability. ACARPtechnical committees have currently evaluated 9 proposals withtitles such as:
• Mining Future in the Bowen Basin: Criteria for positiveCommunication and Decision Making
• Coal Mining Dependant Communities in Central Queensland:Industry/Community Engagement Strategies.
Just as technology cannot ensure a happy and mutuallybeneficial relationship with neighbouring communities and theregulatory bodies, technology alone will not solve all the safetyissues.
Conclusion
Safety will always be a key component of the ACARPprogram. The way we go about solving the problems is quiteobviously changing. Research is not, as the cynics would haveus believe, the constant rework of old solutions. As mines getdeeper and the resources become more difficult to mine safelyand efficiently ACARP will continue to provide a base fromwhich industry can confront difficult and demanding problemsboth technically and sociologically.
If we are to continue to make substantial gains in movingtowards our ultimate goals in occupational health and safety wewill surely need to apply proven research disciplines in newareas to assist. Technology and its advance will continue toprovide part of the solution by access to improved machines,electronics controls, processes, etc., but the users of thetechnology are far more complex. The final steps will require anexpanded approach to our research effort compared with thepast. These will include application of disciplines not effectivelyused to date.
ACARP is a powerful facility. It is owned and directed by theAustralian black coal industry. It has available to it valuablehuman resource skills, considerable financial leverage andaccess to excellent research competencies. The challenge is togain maximum value from the opportunities available through itsstrengths.
98
Counting the Cost ofInjury & Poor Health - An Analysis of QCOS Data
Bruce Ham, Queensland Coal & Oil Shale
Abstract
The Queensland Coal and Oil Shale (QCOS) Mining IndustrySuperannuation Fund provides the industry superannuationservice. QCOS pay out superannuation benefits to the familiesof deceased members and makes insurance payments to personswith chronic disabling health conditions. The following analysisexamines the QCOS death and total permanent disability datafrom 1998 to 2003 to provide the coal mining industry with aperspective on a previously unreported aspect of health andsafety outcomes.
The proportions of persons who leave the industry withcancers, heart disease and traumatic injuries are discussed in thecontext of data on the general population for the equivalent agegroups and the need to have health and safety managementsystems to manage health risks in the workplace.
Introduction
The complex interactions between workers and theirworkplace activities and environment, make it impossible todevelop a single measure of health and safety performance. Toassess the improvement in health and safety performance healthand safety professionals review a number of indicators. Accessto information on mine workers who have left the industry(including died) is limited by both organisational and privacylimitations. Two valuable sources of this information are QCOSand the National Deaths Index held by the Australian Institute ofHealth and Welfare (AIHW). A research report by SIMTARS / JCBHealth and Safety Trust on 2001 examined the AIHW data forheart disease (Bofinger and Ham, 2002a, 2002b).
As part of both the superannuation regulatory requirementsand a life and total permanent disability insurance business,QCOS make payments to clients (or their families) on claimsmade due to total permanent disability or death. De-identifieddata compiled from these claims is the basis for the examinationof a performance indicator that counts the cost of death and totalpermanent disability in the Queensland coal mining industry.The information derived from this analysis is placed in contextwith other sources of coal mining industry health and safety data.
Background on QCOS
QCOS is legislated under the Coal and Oil Shale MineWorkers’ Superannuation Act 1989 (with amendments to June
2000) as the coal mining industry’s superannuation and longservice leave entitlement provider. QCOS collects employersuperannuation and long service leave contributions from coalproducers and contractors servicing the mines on behalf ofapproximately 10,000 clients most of whom are paid under theCoal Industry Award. In 2002, QCOS reported that the totalfunds under management had grown to $ 909 million. Benefitspaid by the fund for 2001/02 were $45.6 million for which 4%was for deaths and 8% for incapacity.
Sources of Data
For both the superannuation regulatory requirements and alife and total permanent disability insurance business, paymentsare made to clients (or their families) on claims made due to totalpermanent disability or death. As clients reach 60 years of age,they may access their superannuation as either a lump sum or asan annuity. All funds must be withdrawn in this fashion by theage of 65 years. No data is there therefore collected on personsover 65 years and limited data is collected on persons older than60 years.
The data provided by QCOS included the age, experience,mine type and year of last work of the mine workers as well aswhether the worker was still working in the coal industry
In order to put the QCOS data into context, it is comparedwith related data sets published by the Department of NaturalResources and Mines (2002) and data compiled on deaths ofmine workers as part of a ‘Heart Disease Risk Factor’ researchproject undertaken by SIMTARS (Bofinger and Ham, 2002).
Method of Analysis
The 267 records provided by QCOS were classified into 10categories and analysed by category type, year and length ofexperience. For the purpose of analysis, the QCOS data hasbeen divided into groups consistent with the InternationalClassification of Disease (ICD Version 10). For occupational riskassessment purposes, a modification is made to the classificationsystem to capture information of deaths and total permanentdisability due to nervous and mental disorders such asdepression, suicide and alcoholism. Under the ICD, these maybe classified as external injuries which is often the clinicaloutcome.
The age distribution of the coal mining industry employees
99

was estimated from health assessment age distribution datapublished by the Department of Natural Resources and Mines(2002). Death rates by cause were estimated from the QCOSdata and compared with general community (male) datapublished by the Australian Institute of Health and Welfare(2002).
A method of estimating the total cost to the community ofdeath and total permanent disability was used to compare theQCOS data with costs estimated from other data sets publishedby the Department of Natural Resources and Mines (2002).
Results
The number of claims for total permanent disability (TPD)and death is provided in Table 1. The deaths show a highlyirregular pattern that indicates that data from individual years isof limited use for statistical analysis. As the insurance started in1997-98, data for 1998 should be considered as notrepresentative of a normal full year. The delays in lodging andassessing claims cause to data for 2002 and 2003 to beconsidered incomplete.
Table 1: QCOS Data - Deaths and TPD by Year.
Year Deaths TPD Total
1998 10 22 321999 8 65 732000 13 59 722001 6 46 522002 13 24 372003 1 0 1
Total 51 216 267
Table 2 shows deaths and TPD by age group. It should benoted that persons in the 30 to 45 age group dominate theworkforce. The table shows most TPD and deaths are in the 45to 60 age groups. The comparisons with the general populationare examined in a later section.
Table 2: Deaths and TPD by age group.
Age Group Deaths TPD Total
>25 1 3 425 - 29 4 6 1030 - 34 6 7 1335 - 39 6 21 2740 -44 4 25 2945 - 49 12 42 5450 - 54 10 62 7255 - 59 8 41 4960 –62 nil 9 8
Total 51 216 267
The most common disorder is musculo-skeletal disorders asshown in Table 3. Other common causes include externalcauses (injury), cancer, circulatory disease (heart attack and
stroke) and nerve and mental disorders. The average age ofsufferers of external causes is 41, while circulatory disease ismore likely to affect the oldest group at an average age of 53years.
A total of 51 deaths were reported in the QCOS data. Thecommon causes of death were cancer, external causes (injuries),circulatory disease and nervous / mental disorders. It should benoted that 1998 to 2002 has been a relatively good period withonly 8 deaths reported by the Mines Inspectorate. This comparesto 1994 when 11 deaths were reported largely as a result of theMoura Disaster.
Table 3: Death and TPD by cause.
Cause Deaths TPD Totals Av. Age
Cancer 14 20 34 51Circulatory disease 12 21 33 53Ear disorders 0 3 3Endocrine disorders 0 3 3Infectious diseases 0 5 5Musculo-skeletal disorders 0 83 83 47Nervous / mental disorders 9 43 52 48Respiratory disease 0 4 4External causes 13 32 45 41Other 3 2 5
Total 51 216 267 48
Table 4 shows that external causes dropped dramatically in2001. This coincided with the introduction of the newlegislation and increased drug and alcohol screening. Thereappears to be a decline in circulatory disease but a possibleincrease in nervous / mental disorders which is also reflected inother injury and workers compensation statistics. The 2002 datais incomplete because of time delays in lodging and processingclaims.
Table 4: Causes by year.
Cause Year Totals98 99 00 01 02
Cancer 5 7 7 7 8 34Circulatory disease 7 10 7 3 5 32Musculo-skeletal disorders 8 21 26 21 8 84Nervous/mental disorders 3 11 12 14 11 51External causes 7 13 16 5 4 45All Others 2 11 4 2 1 20
Totals 32 73 72 52 37 266
The Department of Natural Resources and Mines (2002)reports that underground miners represent 25% of the workforcebut suffer over a third of QCOS reported disorders shown inTable 5. One measure of the effectiveness of safety trainingprograms is the percentage of serious disorders that afflictworkers with less than five years experience. Table 5 shown that32% of underground disorders have serious conditions comparedto only 13% for open disorders. Work by Ham (2000) showed
100
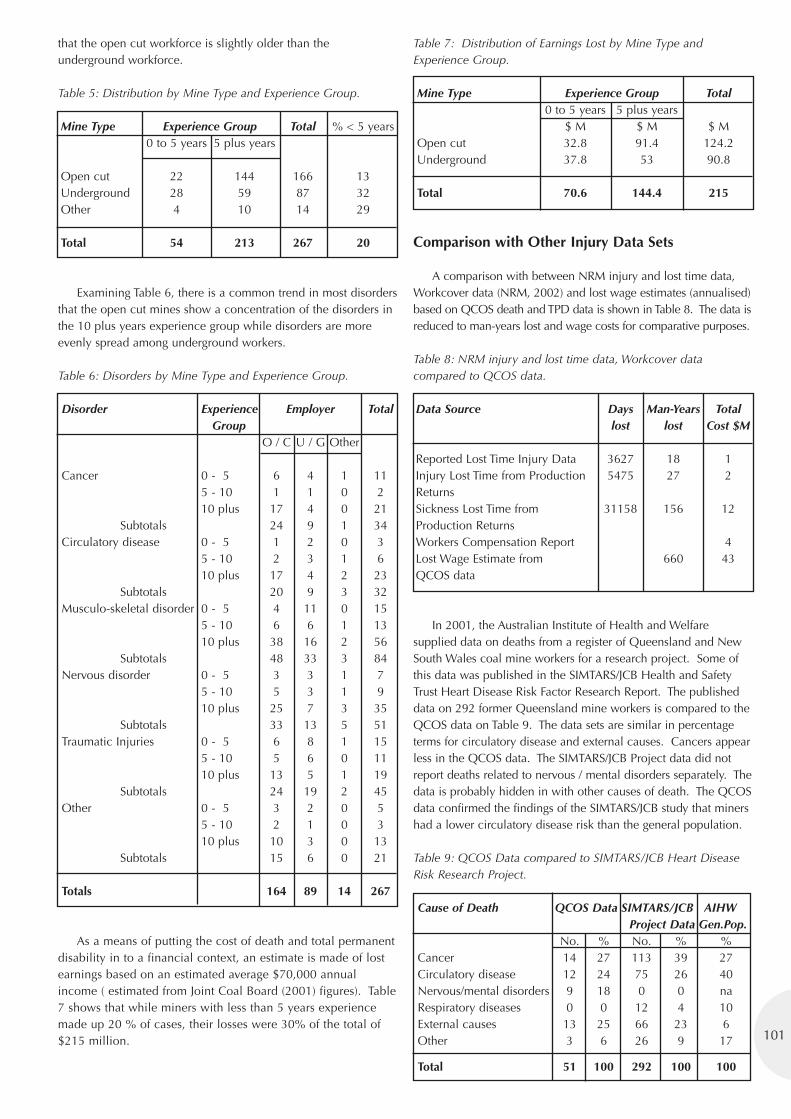
101
that the open cut workforce is slightly older than theunderground workforce.
Table 5: Distribution by Mine Type and Experience Group.
Mine Type Experience Group Total % < 5 years0 to 5 years 5 plus years
Open cut 22 144 166 13Underground 28 59 87 32Other 4 10 14 29
Total 54 213 267 20
Examining Table 6, there is a common trend in most disordersthat the open cut mines show a concentration of the disorders inthe 10 plus years experience group while disorders are moreevenly spread among underground workers.
Table 6: Disorders by Mine Type and Experience Group.
Disorder Experience Employer TotalGroup
O / C U / G Other
Cancer 0 - 5 6 4 1 115 - 10 1 1 0 210 plus 17 4 0 21
Subtotals 24 9 1 34Circulatory disease 0 - 5 1 2 0 3
5 - 10 2 3 1 610 plus 17 4 2 23
Subtotals 20 9 3 32Musculo-skeletal disorder 0 - 5 4 11 0 15
5 - 10 6 6 1 1310 plus 38 16 2 56
Subtotals 48 33 3 84Nervous disorder 0 - 5 3 3 1 7
5 - 10 5 3 1 910 plus 25 7 3 35
Subtotals 33 13 5 51Traumatic Injuries 0 - 5 6 8 1 15
5 - 10 5 6 0 1110 plus 13 5 1 19
Subtotals 24 19 2 45Other 0 - 5 3 2 0 5
5 - 10 2 1 0 310 plus 10 3 0 13
Subtotals 15 6 0 21
Totals 164 89 14 267
As a means of putting the cost of death and total permanentdisability in to a financial context, an estimate is made of lostearnings based on an estimated average $70,000 annualincome ( estimated from Joint Coal Board (2001) figures). Table7 shows that while miners with less than 5 years experiencemade up 20 % of cases, their losses were 30% of the total of$215 million.
Table 7: Distribution of Earnings Lost by Mine Type andExperience Group.
Mine Type Experience Group Total0 to 5 years 5 plus years
$ M $ M $ MOpen cut 32.8 91.4 124.2Underground 37.8 53 90.8
Total 70.6 144.4 215
Comparison with Other Injury Data Sets
A comparison with between NRM injury and lost time data,Workcover data (NRM, 2002) and lost wage estimates (annualised)based on QCOS death and TPD data is shown in Table 8. The data isreduced to man-years lost and wage costs for comparative purposes.
Table 8: NRM injury and lost time data, Workcover datacompared to QCOS data.
Data Source Days Man-Years Total lost lost Cost $M
Reported Lost Time Injury Data 3627 18 1Injury Lost Time from Production 5475 27 2ReturnsSickness Lost Time from 31158 156 12Production ReturnsWorkers Compensation Report 4Lost Wage Estimate from 660 43QCOS data
In 2001, the Australian Institute of Health and Welfaresupplied data on deaths from a register of Queensland and NewSouth Wales coal mine workers for a research project. Some ofthis data was published in the SIMTARS/JCB Health and SafetyTrust Heart Disease Risk Factor Research Report. The publisheddata on 292 former Queensland mine workers is compared to theQCOS data on Table 9. The data sets are similar in percentageterms for circulatory disease and external causes. Cancers appearless in the QCOS data. The SIMTARS/JCB Project data did notreport deaths related to nervous / mental disorders separately. Thedata is probably hidden in with other causes of death. The QCOSdata confirmed the findings of the SIMTARS/JCB study that minershad a lower circulatory disease risk than the general population.
Table 9: QCOS Data compared to SIMTARS/JCB Heart DiseaseRisk Research Project.
Cause of Death QCOS Data SIMTARS/JCB AIHWProject Data Gen.Pop.
No. % No. % %Cancer 14 27 113 39 27Circulatory disease 12 24 75 26 40Nervous/mental disorders 9 18 0 0 naRespiratory diseases 0 0 12 4 10External causes 13 25 66 23 6Other 3 6 26 9 17
Total 51 100 292 100 100
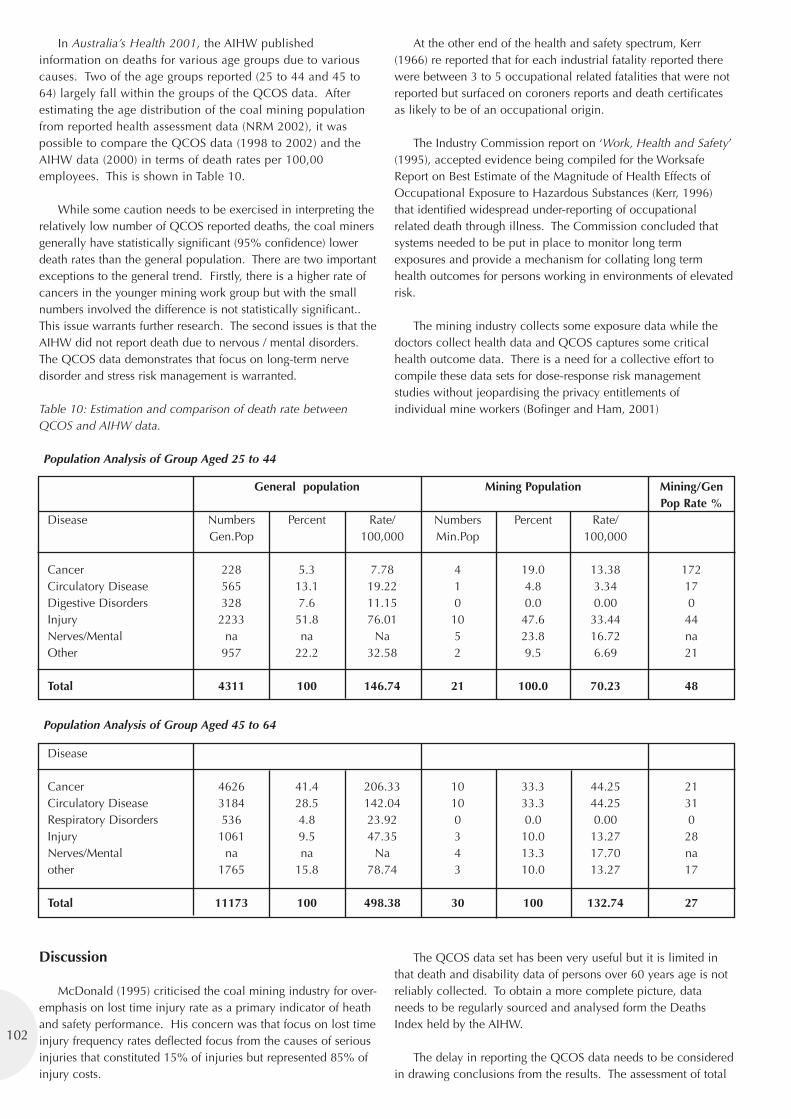
In Australia’s Health 2001, the AIHW publishedinformation on deaths for various age groups due to variouscauses. Two of the age groups reported (25 to 44 and 45 to64) largely fall within the groups of the QCOS data. Afterestimating the age distribution of the coal mining populationfrom reported health assessment data (NRM 2002), it waspossible to compare the QCOS data (1998 to 2002) and theAIHW data (2000) in terms of death rates per 100,00employees. This is shown in Table 10.
While some caution needs to be exercised in interpreting therelatively low number of QCOS reported deaths, the coal minersgenerally have statistically significant (95% confidence) lowerdeath rates than the general population. There are two importantexceptions to the general trend. Firstly, there is a higher rate ofcancers in the younger mining work group but with the smallnumbers involved the difference is not statistically significant..This issue warrants further research. The second issues is that theAIHW did not report death due to nervous / mental disorders.The QCOS data demonstrates that focus on long-term nervedisorder and stress risk management is warranted.
Table 10: Estimation and comparison of death rate betweenQCOS and AIHW data.
Population Analysis of Group Aged 25 to 44
Population Analysis of Group Aged 45 to 64
Discussion
McDonald (1995) criticised the coal mining industry for over-emphasis on lost time injury rate as a primary indicator of heathand safety performance. His concern was that focus on lost timeinjury frequency rates deflected focus from the causes of seriousinjuries that constituted 15% of injuries but represented 85% ofinjury costs.
At the other end of the health and safety spectrum, Kerr(1966) re reported that for each industrial fatality reported therewere between 3 to 5 occupational related fatalities that were notreported but surfaced on coroners reports and death certificatesas likely to be of an occupational origin.
The Industry Commission report on ‘Work, Health and Safety’(1995), accepted evidence being compiled for the WorksafeReport on Best Estimate of the Magnitude of Health Effects ofOccupational Exposure to Hazardous Substances (Kerr, 1996)that identified widespread under-reporting of occupationalrelated death through illness. The Commission concluded thatsystems needed to be put in place to monitor long termexposures and provide a mechanism for collating long termhealth outcomes for persons working in environments of elevatedrisk.
The mining industry collects some exposure data while thedoctors collect health data and QCOS captures some criticalhealth outcome data. There is a need for a collective effort tocompile these data sets for dose-response risk managementstudies without jeopardising the privacy entitlements ofindividual mine workers (Bofinger and Ham, 2001)
The QCOS data set has been very useful but it is limited inthat death and disability data of persons over 60 years age is notreliably collected. To obtain a more complete picture, dataneeds to be regularly sourced and analysed form the DeathsIndex held by the AIHW.
The delay in reporting the QCOS data needs to be consideredin drawing conclusions from the results. The assessment of total
102
General population Mining Population Mining/Gen Pop Rate %
Disease Numbers Percent Rate/ Numbers Percent Rate/Gen.Pop 100,000 Min.Pop 100,000
Cancer 228 5.3 7.78 4 19.0 13.38 172Circulatory Disease 565 13.1 19.22 1 4.8 3.34 17Digestive Disorders 328 7.6 11.15 0 0.0 0.00 0Injury 2233 51.8 76.01 10 47.6 33.44 44Nerves/Mental na na Na 5 23.8 16.72 naOther 957 22.2 32.58 2 9.5 6.69 21
Total 4311 100 146.74 21 100.0 70.23 48
Disease
Cancer 4626 41.4 206.33 10 33.3 44.25 21Circulatory Disease 3184 28.5 142.04 10 33.3 44.25 31Respiratory Disorders 536 4.8 23.92 0 0.0 0.00 0Injury 1061 9.5 47.35 3 10.0 13.27 28Nerves/Mental na na Na 4 13.3 17.70 naother 1765 15.8 78.74 3 10.0 13.27 17
Total 11173 100 498.38 30 100 132.74 27
103
permanent disability often takes 6 to 12 months to assess while afew cases may take several years. By late June only one casehad been reported for the 2003 year. In first six months of 2003,9 cases for 2002 were reported and a further six came from 1999to 2001. The delay in reporting may be incorrectly interpreted asdeclining rates of death and total permanent disability. The dropfrom 72 in 2000 to 52 in 2001 should be considered as real, butthe drop to 36 in 2002 should not be take as a reliable indicatoras more total permanent disabilities can be expected to bereported for 2002 in the future.
As the insurance program only began in 1997-98, the 1998data set should be regarded as underestimating the real extent oftotal permanent disabilities.
From a legislative perspective, section 6 of the Coal MiningSafety and Health Act 1999 states that the objective of the act isto protect the health and safety of persons at coal mines to beprotected and ensure that the risk of injury or illness ... be at anacceptable level’. While current systems that include safetymanagement plans deal effectively with the management of shortterm risks, the management of long term risks require an entirelydifferent approach.
Before the risks can be effectively managed anddemonstrated to be managed, it is necessary to establish aneffective data collection system. Division 2, Part 6 of the CoalMining Safety and Health Regulations 2001 (Coal Mine WorkersHealth Scheme) sets out a framework for the collection of longterm health and exposure monitoring. Importantly, sections 49and 53 require a safety management plan for monitoring ofworkers exposure to hazards with (presumably reliable) data tobe maintained for 30 years. The question of why should the databe kept for 30 years needs to be considered. From an evidencebased risk management perspective, the data has little meaning ifit can not be used to correlate cumulative exposure with theprogression of degenerative health outcomes.
One of the limitations of the regulation is that it is difficult tosystematically capture final health outcome data – either of death ortotal permanent disability. This is where the QCOS data on deathand total permanent disability is particularly valuable. While it maybe possible to extract largely the same data from the Workcover andAustralian Institute of Health and Welfare databases the processwould be complex, less reliable and would have a time lag.
As a part of employers’ obligations to have safetymanagement plans, there is a need to access reliable evidencebased risk assessments so that appropriate trigger levels formanagement of persons at risk can be set. As outlined above,the legislation sets out a frame work to collect the necessary datafor the evidence based research necessary to assess critical pointsof increasing risk. While technically it is feasible to obtain theexposure and health outcome data, there is also the issue ofconfidentiality of private health data. Ethics considerationsdemand workers to sign consent forms for researchers to gainaccess to medical records and health outcome data that need tobe analysed in conjunction with the exposure data.
Conclusions
A mechanism to use superannuation fund data to identifysome adverse long-term health outcomes has been demonstrated.
The data has been analysed and placed into the context ofrelated data sources. Musculo-skeletal disorders are the mostcommon cause of total permanent disability (83 of 267), but arenot identified as a cause of death. Nervous and mental disorders(52) are the second highest cause of death and total permanentdisability and represent the most common (14) cause of death.External causes (45) is the third most common issue reported inthe QCOS data. Other common causes of death are cancer (14deaths) and circulatory disease (12 deaths).
External cause injuries afflict younger persons where theaverage age is 41 years. By comparison, circulatory diseases arelikely in an older group where the average age is 53 years.
Underground coal mines constitute 25% of the workforce butsuffer 30% of QCOS reported disorders. With the open cutmines, the disorders are more focussed on the older/moreexperienced groups.
If the annual cost of injury is only counted in terms of dayslost from reported injury data, the estimated cost is only $1M,but Workcover statistics indicate a cost of $4M. This compareswith data from lost time returns indicating sickness may cost$12M per year. These statistics generally exclude QCOSreported death and disability that is costing the individual mineworkers and community approximately $43M per year.
Combining QCOS data and reported health assessment data,it has been possible to estimate death rates for various disordersfor mine workers in the 25 to 44 and 45 to 65 age groups.Comparing the results to those published for the generalAustralian population data, death are generally lower in the coalmining industry. While cancer appears more common in theyounger age group, small numbers prevent this from being astatistically significant difference.
The reporting structure for the general community does notrecognise nervous / mental disorders in the same way asclassified in the QCOS data which identifies it as a major issue.This concern is supported by data from the Inspectorate andWorkcover that identifies stress as a major growth area in bothmining and general population occupational disorders.
The classification of cause of death or total permanent notalways clear cut. Some cases have multiple causes in which thekey issues is a matter of personal judgement. There is almost acontinuum between back disorders, back pain, pain, depression,alcoholism and suicide. Again classification may be subjective.While the classification has largely followed the InternationalClassification of Diseases, a departure has been made for riskmanagement purposes for nervous and mental disorders. Thisgroup includes suicide and alcoholism as well as depression andpain.
The most ambiguous issue is back pain. Many people in theindustry have a level of back pain. The majority is believed to beassociated with a degeneration of the bones and cartilage in thespine that impinges on nerves within the spine. The ambiguitylies in the question is this a nerve or musculo-skeletal disorder.The approach taken in this paper is to classify it as a nervedisorder unless there is some additional reference to themusculo-skeletal system or traumatic injury.

The QCOS data set only commenced in 1998 and is limitedin that death and disability data of persons over 60 years age isnot reliably collected. To obtain a more complete picture, dataneeds to be regularly sourced and analysed from the DeathsIndex held by the AIHW. This data set overcomes the problemassociated with interstate migration.
This analysis has provided an industry wide perspective. As apart of the legislated obligation, mine operators are required tohave a Safety Management Plans to manage risks associated withhazardous exposures. There is a need to incorporate exposuredata with this style of data collection and analysis at the industryand corporate levels to demonstrate that long term workconditions and environments are being effectively managed andnot causing unacceptable risks. This is, however, a new challenge.
Bibliography
Australian Institute of Health and Welfare 2002, Australia’sHealth 2002, Canberra.
Bofinger C. and Ham BW. 2001, National Mining HeathDatabase – Feasibility Study – Research Report for the Joint CoalBoard Health and Safety Trust, SIMTARS, 2001.
Bofinger C. and Ham BW. 2002, Heart Disease Risk Factors inCoal Miners, Research Report for the Joint Coal Board Healthand Safety Trust, with Carmel Bofinger of SIMTARS, 2002.
Bofinger C. and Ham BW. 2002, Hearts, Health and CoalMining, Queensland Mining Industry Health and SafetyConference, Townsville, 2002.
Department of Natural Resources and Mines, 2002, "QueenslandMines and Quarries Safety Performance and Health Report,.Brisbane.
Ham B. W., 2000, The Role of the Health Surveillance Programin the Queensland Coal Mining Industry, Thesis for the award ofMaster of Applied Science (OHS) School of Public Health,Queensland University of Technology 2000.
Industry Commission 1995. Work, Health and Safety, Inquiry intoOccupational Health and Safety, Commonwealth of Australia.
Kerr C., Morelle S., Taylor R. Salkeld G. and Corbett S. 1996‘Report on Best Estimate of the Magnitude of Health Effects ofOccupational Exposure to Hazardous Substances Worksafe Sydney.
McDonald G. 1995. ‘Focus, don’t fiddle – the obscenity ofLTFR’, in Queensland Mining Industry Safety Conference,Yeppoon, Qld Mining Council.
QCOS Annual Report 2002, Queensland Coal and Oil ShaleMining Industry Superannuation Fund, Brisbane.
Queensland Government, Coal Mining Safety and Health Act 1999.
Queensland Government, Coal Mining Safety and HealthRegulations 2001.
Queensland Government, Coal and Oil Shale Mine WorkersSuperannuation Act 1989.
104
What Works Best atImproving Mine WorkerSafety & Why Does it Work
Carmel Bofinger, MISHC; Elizabeth Mahon, Simtars;Sue Leveritt, MISHC; David Cliff, MISHC
Abstract
This paper reports on the results of an ACARP funded projectthat investigated the effectiveness of safety programs at coalmines by determining the factors that lead to success.
There were two parts to the project. One investigated thestrategies used throughout the industry to plan and implementsafety programs. As part of the definition of what is happeningindustry-wide, a questionnaire investigating programs at all levelsfrom individual to corporate was distributed. To compensate forthe low response rate to the questionnaire, the conferenceproceedings for New South Wales and Queensland for the pastfive years were scanned. This information was combined withthe results of the survey to give a reasonable picture of what washappening in the industry.
The second part considered five different programs in place atminesites. Investigations and evaluations on individual projectswere undertaken at mines in Queensland and New South Wales.These programs include training, health interventions, audit, riskassessment and behavioural and attitudinal change and coverbasic safety programs through to fitness for duty programs. Theprograms were analysed using a program evaluation model.
The factors identified as the three most important for successwere the identification of the need for the program, actual andperceived commitment by management and allocation ofadequate resources.
Introduction
How do we know if a safety program is working?Traditionally, the coal industry has tended to look at thedownstream outcomes of safety programs such as accidentstatistics to ascertain the success or failure of a safety initiative.The limitations of these statistics as measures of programeffectiveness are recognised, however, such injury statistics andcompensation data may be of benefit in prioritising workplaceintervention strategies. When it comes to safety, the miningindustry is not plagued by new injuries, but rather findingeffective solutions to existing problems.
Program Drivers & Motivators
Understanding what drives a program is one of the mostimportant factors when determining a successful outcome.
Drivers assist in shaping a program’s goals and objectives. Atleast five factors may motivate the decision to implementprograms to address safety issues and these have been identifiedin one form or other as the drivers of safety programs. These fiveinclude:
1. Employer’s enlightened self-interest2. Information on hazards and controls3. Injury costs and workers compensation 4. Worker or Union pressure5. Legislation and Regulation.
Additionally we are now seeing an increasing awareness oftort liability due to the growth in the number of cases involvinglitigation for injury and associated large payouts.
Once the drivers have been identified, it is important toidentify both intrinsic and extrinsic motivating factors. Four typesof factors have been identified as determinants of workers’ safetymotivation:
• Safety climate of an organisation - safety climate refers toworkers’ interpretations of features, events and processes in thework environment that are relevant to their safety
• Task feedback - the rarity and delay of adverse effects fromsingle tasks can lead workers to engage in increasingly unsafeacts as workers develop a sense of “unrealistic optimism”based on experience of innocuous outcomes of unsafe acts
• Workgroup norms - these norms are informal rules the groupsadopt to regulate and regularise group members behaviour.Workgroup norms are most likely to have reached a highdegree of consensus and intensity when there are commongoals and interdependent within the team
• Organisational control systems – formal processes by whichthe organisation directs the members to action and monitorsbehaviour and results to ensure organisational goals areaccomplished.
Evaluation Techniques
To effectively assess the success of a safety program, theevaluation must match the objectives of the program beingevaluated. The reasons why safety programs are evaluated fallunder two broad categories:
1. to demonstrate accomplishment of proposed objectives2. to guide internal program decision-making.
105
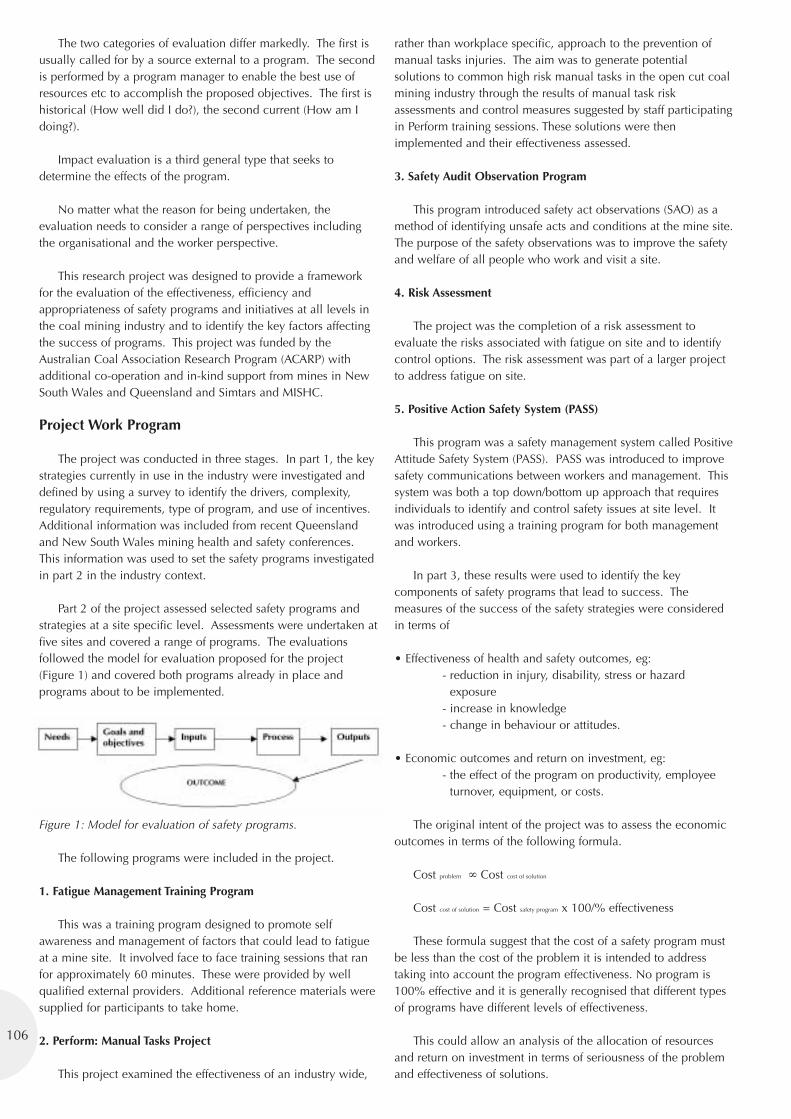
The two categories of evaluation differ markedly. The first isusually called for by a source external to a program. The secondis performed by a program manager to enable the best use ofresources etc to accomplish the proposed objectives. The first ishistorical (How well did I do?), the second current (How am Idoing?).
Impact evaluation is a third general type that seeks todetermine the effects of the program.
No matter what the reason for being undertaken, theevaluation needs to consider a range of perspectives includingthe organisational and the worker perspective.
This research project was designed to provide a frameworkfor the evaluation of the effectiveness, efficiency andappropriateness of safety programs and initiatives at all levels inthe coal mining industry and to identify the key factors affectingthe success of programs. This project was funded by theAustralian Coal Association Research Program (ACARP) withadditional co-operation and in-kind support from mines in NewSouth Wales and Queensland and Simtars and MISHC.
Project Work Program
The project was conducted in three stages. In part 1, the keystrategies currently in use in the industry were investigated anddefined by using a survey to identify the drivers, complexity,regulatory requirements, type of program, and use of incentives.Additional information was included from recent Queenslandand New South Wales mining health and safety conferences.This information was used to set the safety programs investigatedin part 2 in the industry context.
Part 2 of the project assessed selected safety programs andstrategies at a site specific level. Assessments were undertaken atfive sites and covered a range of programs. The evaluationsfollowed the model for evaluation proposed for the project(Figure 1) and covered both programs already in place andprograms about to be implemented.
Figure 1: Model for evaluation of safety programs.
The following programs were included in the project.
1. Fatigue Management Training Program
This was a training program designed to promote selfawareness and management of factors that could lead to fatigueat a mine site. It involved face to face training sessions that ranfor approximately 60 minutes. These were provided by wellqualified external providers. Additional reference materials weresupplied for participants to take home.
2. Perform: Manual Tasks Project
This project examined the effectiveness of an industry wide,
rather than workplace specific, approach to the prevention ofmanual tasks injuries. The aim was to generate potentialsolutions to common high risk manual tasks in the open cut coalmining industry through the results of manual task riskassessments and control measures suggested by staff participatingin Perform training sessions. These solutions were thenimplemented and their effectiveness assessed.
3. Safety Audit Observation Program
This program introduced safety act observations (SAO) as amethod of identifying unsafe acts and conditions at the mine site.The purpose of the safety observations was to improve the safetyand welfare of all people who work and visit a site.
4. Risk Assessment
The project was the completion of a risk assessment toevaluate the risks associated with fatigue on site and to identifycontrol options. The risk assessment was part of a larger projectto address fatigue on site.
5. Positive Action Safety System (PASS)
This program was a safety management system called PositiveAttitude Safety System (PASS). PASS was introduced to improvesafety communications between workers and management. Thissystem was both a top down/bottom up approach that requiresindividuals to identify and control safety issues at site level. Itwas introduced using a training program for both managementand workers.
In part 3, these results were used to identify the keycomponents of safety programs that lead to success. Themeasures of the success of the safety strategies were consideredin terms of
• Effectiveness of health and safety outcomes, eg:- reduction in injury, disability, stress or hazard
exposure- increase in knowledge- change in behaviour or attitudes.
• Economic outcomes and return on investment, eg:- the effect of the program on productivity, employee
turnover, equipment, or costs.
The original intent of the project was to assess the economicoutcomes in terms of the following formula.
Cost problem ∞ Cost cost of solution
Cost cost of solution = Cost safety program x 100/% effectiveness
These formula suggest that the cost of a safety program mustbe less than the cost of the problem it is intended to addresstaking into account the program effectiveness. No program is100% effective and it is generally recognised that different typesof programs have different levels of effectiveness.
This could allow an analysis of the allocation of resourcesand return on investment in terms of seriousness of the problemand effectiveness of solutions.
106
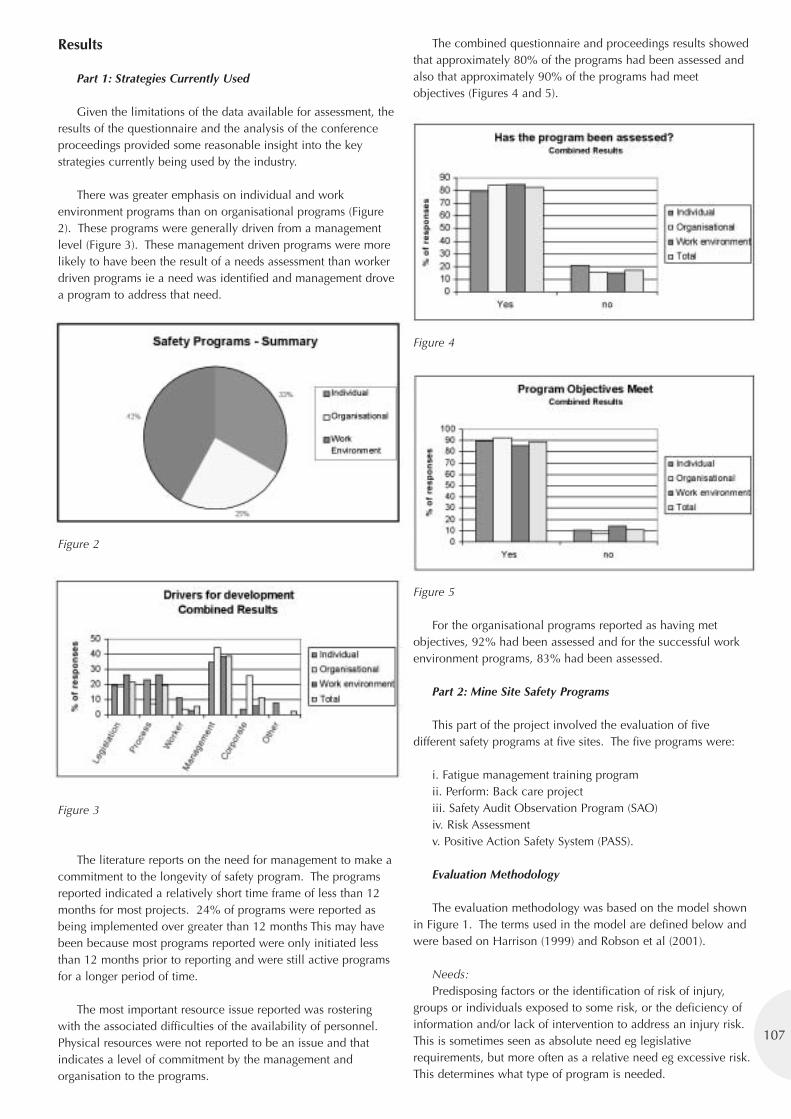
107
Results
Part 1: Strategies Currently Used
Given the limitations of the data available for assessment, theresults of the questionnaire and the analysis of the conferenceproceedings provided some reasonable insight into the keystrategies currently being used by the industry.
There was greater emphasis on individual and workenvironment programs than on organisational programs (Figure2). These programs were generally driven from a managementlevel (Figure 3). These management driven programs were morelikely to have been the result of a needs assessment than workerdriven programs ie a need was identified and management drovea program to address that need.
Figure 2
Figure 3
The literature reports on the need for management to make acommitment to the longevity of safety program. The programsreported indicated a relatively short time frame of less than 12months for most projects. 24% of programs were reported asbeing implemented over greater than 12 months This may havebeen because most programs reported were only initiated lessthan 12 months prior to reporting and were still active programsfor a longer period of time.
The most important resource issue reported was rosteringwith the associated difficulties of the availability of personnel.Physical resources were not reported to be an issue and thatindicates a level of commitment by the management andorganisation to the programs.
The combined questionnaire and proceedings results showedthat approximately 80% of the programs had been assessed andalso that approximately 90% of the programs had meetobjectives (Figures 4 and 5).
Figure 4
Figure 5
For the organisational programs reported as having metobjectives, 92% had been assessed and for the successful workenvironment programs, 83% had been assessed.
Part 2: Mine Site Safety Programs
This part of the project involved the evaluation of fivedifferent safety programs at five sites. The five programs were:
i. Fatigue management training program ii. Perform: Back care project iii. Safety Audit Observation Program (SAO)iv. Risk Assessment v. Positive Action Safety System (PASS).
Evaluation Methodology
The evaluation methodology was based on the model shownin Figure 1. The terms used in the model are defined below andwere based on Harrison (1999) and Robson et al (2001).
Needs:Predisposing factors or the identification of risk of injury,
groups or individuals exposed to some risk, or the deficiency ofinformation and/or lack of intervention to address an injury risk.This is sometimes seen as absolute need eg legislativerequirements, but more often as a relative need eg excessive risk.This determines what type of program is needed.
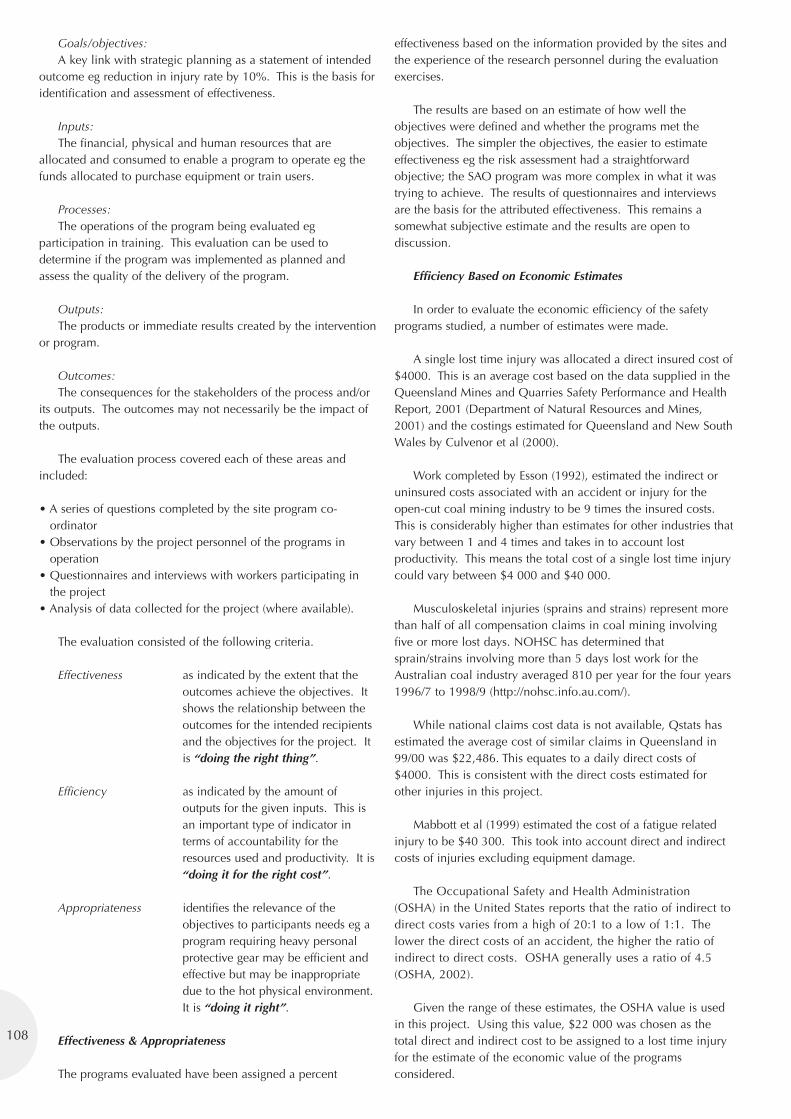
Goals/objectives:A key link with strategic planning as a statement of intended
outcome eg reduction in injury rate by 10%. This is the basis foridentification and assessment of effectiveness.
Inputs:The financial, physical and human resources that are
allocated and consumed to enable a program to operate eg thefunds allocated to purchase equipment or train users.
Processes:The operations of the program being evaluated eg
participation in training. This evaluation can be used todetermine if the program was implemented as planned andassess the quality of the delivery of the program.
Outputs:The products or immediate results created by the intervention
or program.
Outcomes:The consequences for the stakeholders of the process and/or
its outputs. The outcomes may not necessarily be the impact ofthe outputs.
The evaluation process covered each of these areas andincluded:
• A series of questions completed by the site program co-ordinator
• Observations by the project personnel of the programs inoperation
• Questionnaires and interviews with workers participating inthe project
• Analysis of data collected for the project (where available).
The evaluation consisted of the following criteria.
Effectiveness as indicated by the extent that theoutcomes achieve the objectives. Itshows the relationship between theoutcomes for the intended recipientsand the objectives for the project. Itis “doing the right thing”.
Efficiency as indicated by the amount ofoutputs for the given inputs. This isan important type of indicator interms of accountability for theresources used and productivity. It is“doing it for the right cost”.
Appropriateness identifies the relevance of theobjectives to participants needs eg aprogram requiring heavy personalprotective gear may be efficient andeffective but may be inappropriatedue to the hot physical environment.It is “doing it right”.
Effectiveness & Appropriateness
The programs evaluated have been assigned a percent
effectiveness based on the information provided by the sites andthe experience of the research personnel during the evaluationexercises.
The results are based on an estimate of how well theobjectives were defined and whether the programs met theobjectives. The simpler the objectives, the easier to estimateeffectiveness eg the risk assessment had a straightforwardobjective; the SAO program was more complex in what it wastrying to achieve. The results of questionnaires and interviewsare the basis for the attributed effectiveness. This remains asomewhat subjective estimate and the results are open todiscussion.
Efficiency Based on Economic Estimates
In order to evaluate the economic efficiency of the safetyprograms studied, a number of estimates were made.
A single lost time injury was allocated a direct insured cost of$4000. This is an average cost based on the data supplied in theQueensland Mines and Quarries Safety Performance and HealthReport, 2001 (Department of Natural Resources and Mines,2001) and the costings estimated for Queensland and New SouthWales by Culvenor et al (2000).
Work completed by Esson (1992), estimated the indirect oruninsured costs associated with an accident or injury for theopen-cut coal mining industry to be 9 times the insured costs.This is considerably higher than estimates for other industries thatvary between 1 and 4 times and takes in to account lostproductivity. This means the total cost of a single lost time injurycould vary between $4 000 and $40 000.
Musculoskeletal injuries (sprains and strains) represent morethan half of all compensation claims in coal mining involvingfive or more lost days. NOHSC has determined thatsprain/strains involving more than 5 days lost work for theAustralian coal industry averaged 810 per year for the four years1996/7 to 1998/9 (http://nohsc.info.au.com/).
While national claims cost data is not available, Qstats hasestimated the average cost of similar claims in Queensland in99/00 was $22,486. This equates to a daily direct costs of$4000. This is consistent with the direct costs estimated forother injuries in this project.
Mabbott et al (1999) estimated the cost of a fatigue relatedinjury to be $40 300. This took into account direct and indirectcosts of injuries excluding equipment damage.
The Occupational Safety and Health Administration(OSHA) in the United States reports that the ratio of indirect todirect costs varies from a high of 20:1 to a low of 1:1. Thelower the direct costs of an accident, the higher the ratio ofindirect to direct costs. OSHA generally uses a ratio of 4.5(OSHA, 2002).
Given the range of these estimates, the OSHA value is usedin this project. Using this value, $22 000 was chosen as thetotal direct and indirect cost to be assigned to a lost time injuryfor the estimate of the economic value of the programsconsidered.
108
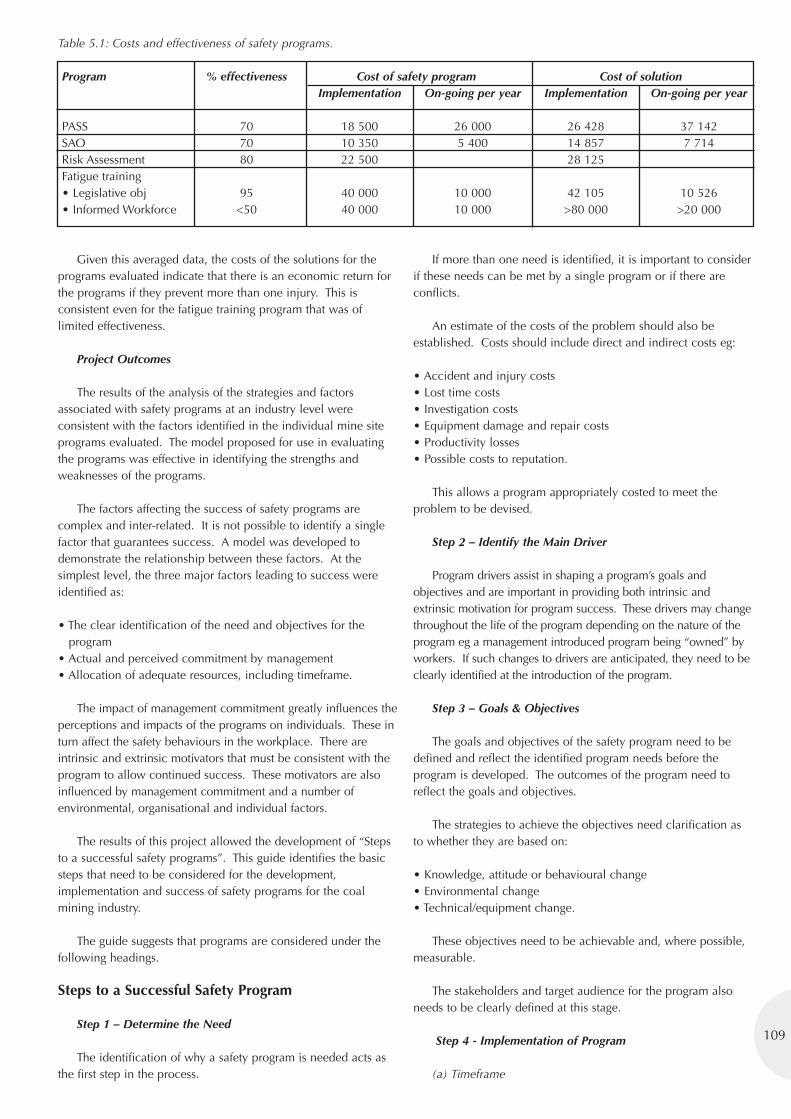
109
Table 5.1: Costs and effectiveness of safety programs.
Given this averaged data, the costs of the solutions for theprograms evaluated indicate that there is an economic return forthe programs if they prevent more than one injury. This isconsistent even for the fatigue training program that was oflimited effectiveness.
Project Outcomes
The results of the analysis of the strategies and factorsassociated with safety programs at an industry level wereconsistent with the factors identified in the individual mine siteprograms evaluated. The model proposed for use in evaluatingthe programs was effective in identifying the strengths andweaknesses of the programs.
The factors affecting the success of safety programs arecomplex and inter-related. It is not possible to identify a singlefactor that guarantees success. A model was developed todemonstrate the relationship between these factors. At thesimplest level, the three major factors leading to success wereidentified as:
• The clear identification of the need and objectives for theprogram
• Actual and perceived commitment by management• Allocation of adequate resources, including timeframe.
The impact of management commitment greatly influences theperceptions and impacts of the programs on individuals. These inturn affect the safety behaviours in the workplace. There areintrinsic and extrinsic motivators that must be consistent with theprogram to allow continued success. These motivators are alsoinfluenced by management commitment and a number ofenvironmental, organisational and individual factors.
The results of this project allowed the development of “Stepsto a successful safety programs”. This guide identifies the basicsteps that need to be considered for the development,implementation and success of safety programs for the coalmining industry.
The guide suggests that programs are considered under thefollowing headings.
Steps to a Successful Safety Program
Step 1 – Determine the Need
The identification of why a safety program is needed acts asthe first step in the process.
If more than one need is identified, it is important to considerif these needs can be met by a single program or if there areconflicts.
An estimate of the costs of the problem should also beestablished. Costs should include direct and indirect costs eg:
• Accident and injury costs• Lost time costs• Investigation costs• Equipment damage and repair costs• Productivity losses• Possible costs to reputation.
This allows a program appropriately costed to meet theproblem to be devised.
Step 2 – Identify the Main Driver
Program drivers assist in shaping a program’s goals andobjectives and are important in providing both intrinsic andextrinsic motivation for program success. These drivers may changethroughout the life of the program depending on the nature of theprogram eg a management introduced program being “owned” byworkers. If such changes to drivers are anticipated, they need to beclearly identified at the introduction of the program.
Step 3 – Goals & Objectives
The goals and objectives of the safety program need to bedefined and reflect the identified program needs before theprogram is developed. The outcomes of the program need toreflect the goals and objectives.
The strategies to achieve the objectives need clarification asto whether they are based on:
• Knowledge, attitude or behavioural change• Environmental change• Technical/equipment change.
These objectives need to be achievable and, where possible,measurable.
The stakeholders and target audience for the program alsoneeds to be clearly defined at this stage.
Step 4 - Implementation of Program
(a) Timeframe
Program % effectiveness Cost of safety program Cost of solutionImplementation On-going per year Implementation On-going per year
PASS 70 18 500 26 000 26 428 37 142SAO 70 10 350 5 400 14 857 7 714Risk Assessment 80 22 500 28 125Fatigue training• Legislative obj 95 40 000 10 000 42 105 10 526• Informed Workforce <50 40 000 10 000 >80 000 >20 000

The timeframe of the project should be defined as part of theinitial process.
(b) Identification and Allocation of Resources
The allocation of resources needs careful consideration if thegoals and objectives are to be met. Resources need to beappropriate and adequate.
Resources fall under the following categories:
• Physical resources eg equipment, training materials• Human resources eg trainers, co-operation of
supervisors and -management• Financial resources eg cost of time of program, effect on
productivity.
(c) Costs Estimates
Estimating the costs of the program allows a comparison ofthe cost of the problem with the cost of the solution and fills aneed for objective evidence to support claims of program costeffectiveness.
The programs costs need to include:
• Development costs;• Implementation costs;• On-going costs.
Step 5 – Evaluation
An evaluation of a safety program should consider theoutputs and the outcomes of the program.
• The overall worth of the program in terms of effectiveness,efficiency and appropriateness.
A copy of the guide in included in the project reportavailable from ACARP.
References
Culvenor J, Knowles J, Crowley S, 2000. Occupational Healthand Safety Priorities for the Australian Coal industry, AustralianCoal Association Research Program, Report No C 8025, March2000.
Department of Natural Resources and Mines, 2001. Queenslandmines and quarries safety performance and health report, 1 July2000 to 30 June 2001, Queensland Government.
Esson K J, 1992. A cost analysis of accidents and injuries in theopen cut coal mining industry, Masters Thesis, Ballarat UniversityCollege, Victorian Institute of Occupational Health and Safety.
Harrison J, 1999, Evaluation Injury Prevention Initiatives: Anannotated Bibliography, Research Centrre for injury Studies,Flinders University, South Australia, May 1999.
Mabbott N, Lydon M, Hartley L, Arnold P, 1999, Procedures anddevices to monitor operator alertness whilst operation machineryin open-cut coal mines. Stage 1: State –of-the-art-review,
Australian Coal Association Research Program, Report No RC7433, March 1999.
OSHA, 2002. Safety and Health Management Systems,Occupational Safety and Health Administration, US Departmentof Labor,http://www.osha.gov/SLTC/safetyhealth_ecat/mod1_costs.htm
Qstats,http://oesr.qld.gov.au/data/tables/compendium/table0500.htm
Robson L S, Shannon H S, Goldenhar L M, Hale, A R, 2001,Guide to evaluating the effectiveness of strategies for preventingwork injuries: How to show whether a safety intervention reallyworks, Department of Health and Human Services, DHHS(NIOSH) Publication No 2001-119, National Institute forOccupational Safety and Health , USA.
110
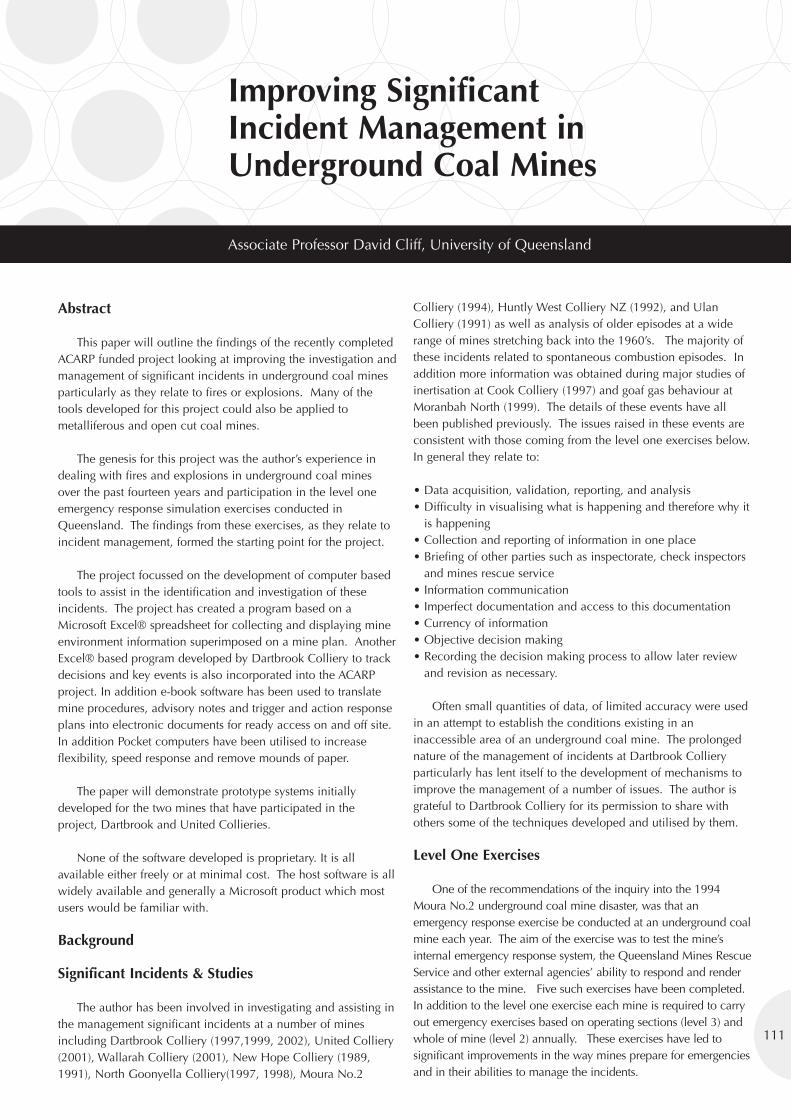
Improving SignificantIncident Management inUnderground Coal Mines
Associate Professor David Cliff, University of Queensland
Abstract
This paper will outline the findings of the recently completedACARP funded project looking at improving the investigation andmanagement of significant incidents in underground coal minesparticularly as they relate to fires or explosions. Many of thetools developed for this project could also be applied tometalliferous and open cut coal mines.
The genesis for this project was the author’s experience indealing with fires and explosions in underground coal minesover the past fourteen years and participation in the level oneemergency response simulation exercises conducted inQueensland. The findings from these exercises, as they relate toincident management, formed the starting point for the project.
The project focussed on the development of computer basedtools to assist in the identification and investigation of theseincidents. The project has created a program based on aMicrosoft Excel® spreadsheet for collecting and displaying mineenvironment information superimposed on a mine plan. AnotherExcel® based program developed by Dartbrook Colliery to trackdecisions and key events is also incorporated into the ACARPproject. In addition e-book software has been used to translatemine procedures, advisory notes and trigger and action responseplans into electronic documents for ready access on and off site.In addition Pocket computers have been utilised to increaseflexibility, speed response and remove mounds of paper.
The paper will demonstrate prototype systems initiallydeveloped for the two mines that have participated in theproject, Dartbrook and United Collieries.
None of the software developed is proprietary. It is allavailable either freely or at minimal cost. The host software is allwidely available and generally a Microsoft product which mostusers would be familiar with.
Background
Significant Incidents & Studies
The author has been involved in investigating and assisting inthe management significant incidents at a number of minesincluding Dartbrook Colliery (1997,1999, 2002), United Colliery(2001), Wallarah Colliery (2001), New Hope Colliery (1989,1991), North Goonyella Colliery(1997, 1998), Moura No.2
Colliery (1994), Huntly West Colliery NZ (1992), and UlanColliery (1991) as well as analysis of older episodes at a widerange of mines stretching back into the 1960’s. The majority ofthese incidents related to spontaneous combustion episodes. Inaddition more information was obtained during major studies ofinertisation at Cook Colliery (1997) and goaf gas behaviour atMoranbah North (1999). The details of these events have allbeen published previously. The issues raised in these events areconsistent with those coming from the level one exercises below.In general they relate to:
• Data acquisition, validation, reporting, and analysis• Difficulty in visualising what is happening and therefore why it
is happening• Collection and reporting of information in one place• Briefing of other parties such as inspectorate, check inspectors
and mines rescue service• Information communication • Imperfect documentation and access to this documentation• Currency of information• Objective decision making• Recording the decision making process to allow later review
and revision as necessary.
Often small quantities of data, of limited accuracy were usedin an attempt to establish the conditions existing in aninaccessible area of an underground coal mine. The prolongednature of the management of incidents at Dartbrook Collieryparticularly has lent itself to the development of mechanisms toimprove the management of a number of issues. The author isgrateful to Dartbrook Colliery for its permission to share withothers some of the techniques developed and utilised by them.
Level One Exercises
One of the recommendations of the inquiry into the 1994Moura No.2 underground coal mine disaster, was that anemergency response exercise be conducted at an underground coalmine each year. The aim of the exercise was to test the mine’sinternal emergency response system, the Queensland Mines RescueService and other external agencies’ ability to respond and renderassistance to the mine. Five such exercises have been completed.In addition to the level one exercise each mine is required to carryout emergency exercises based on operating sections (level 3) andwhole of mine (level 2) annually. These exercises have led tosignificant improvements in the way mines prepare for emergenciesand in their abilities to manage the incidents.
111
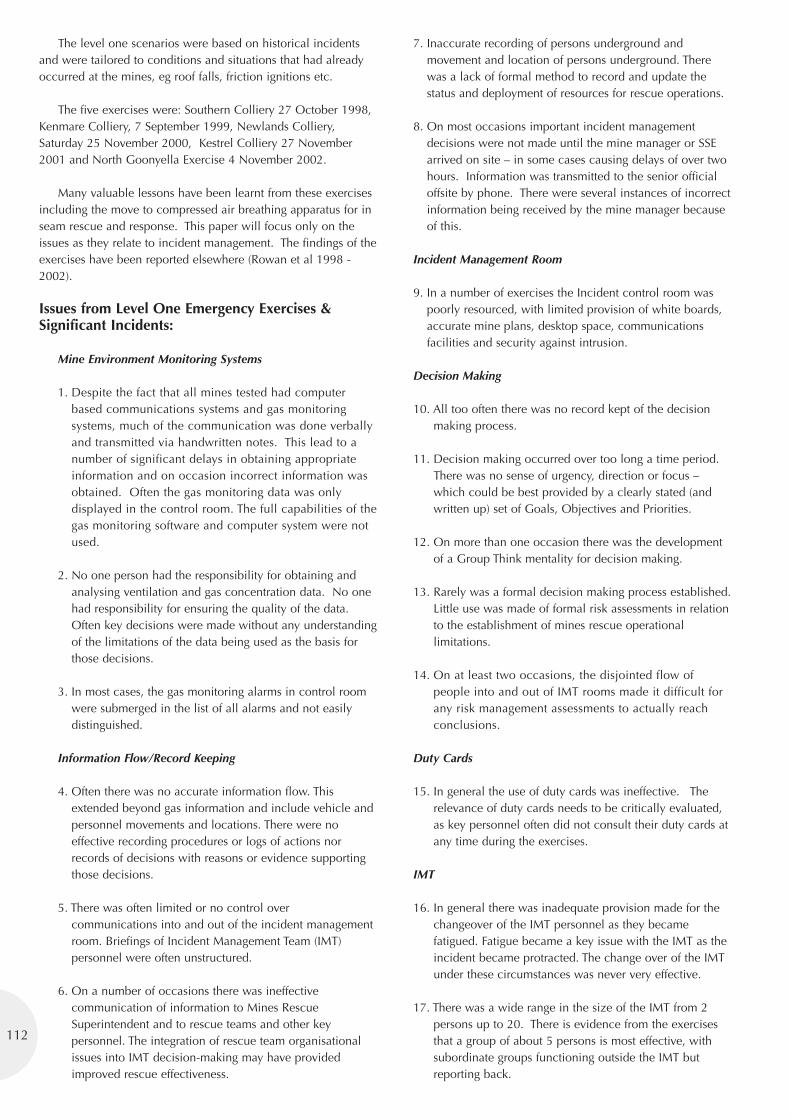
The level one scenarios were based on historical incidentsand were tailored to conditions and situations that had alreadyoccurred at the mines, eg roof falls, friction ignitions etc.
The five exercises were: Southern Colliery 27 October 1998,Kenmare Colliery, 7 September 1999, Newlands Colliery,Saturday 25 November 2000, Kestrel Colliery 27 November2001 and North Goonyella Exercise 4 November 2002.
Many valuable lessons have been learnt from these exercisesincluding the move to compressed air breathing apparatus for inseam rescue and response. This paper will focus only on theissues as they relate to incident management. The findings of theexercises have been reported elsewhere (Rowan et al 1998 -2002).
Issues from Level One Emergency Exercises &Significant Incidents:
Mine Environment Monitoring Systems
1. Despite the fact that all mines tested had computerbased communications systems and gas monitoringsystems, much of the communication was done verballyand transmitted via handwritten notes. This lead to anumber of significant delays in obtaining appropriateinformation and on occasion incorrect information wasobtained. Often the gas monitoring data was onlydisplayed in the control room. The full capabilities of thegas monitoring software and computer system were notused.
2. No one person had the responsibility for obtaining andanalysing ventilation and gas concentration data. No onehad responsibility for ensuring the quality of the data.Often key decisions were made without any understandingof the limitations of the data being used as the basis forthose decisions.
3. In most cases, the gas monitoring alarms in control roomwere submerged in the list of all alarms and not easilydistinguished.
Information Flow/Record Keeping
4. Often there was no accurate information flow. Thisextended beyond gas information and include vehicle andpersonnel movements and locations. There were noeffective recording procedures or logs of actions norrecords of decisions with reasons or evidence supportingthose decisions.
5. There was often limited or no control overcommunications into and out of the incident managementroom. Briefings of Incident Management Team (IMT)personnel were often unstructured.
6. On a number of occasions there was ineffectivecommunication of information to Mines RescueSuperintendent and to rescue teams and other keypersonnel. The integration of rescue team organisationalissues into IMT decision-making may have providedimproved rescue effectiveness.
7. Inaccurate recording of persons underground andmovement and location of persons underground. Therewas a lack of formal method to record and update thestatus and deployment of resources for rescue operations.
8. On most occasions important incident managementdecisions were not made until the mine manager or SSEarrived on site – in some cases causing delays of over twohours. Information was transmitted to the senior officialoffsite by phone. There were several instances of incorrectinformation being received by the mine manager becauseof this.
Incident Management Room
9. In a number of exercises the Incident control room waspoorly resourced, with limited provision of white boards,accurate mine plans, desktop space, communicationsfacilities and security against intrusion.
Decision Making
10. All too often there was no record kept of the decisionmaking process.
11. Decision making occurred over too long a time period.There was no sense of urgency, direction or focus –which could be best provided by a clearly stated (andwritten up) set of Goals, Objectives and Priorities.
12. On more than one occasion there was the developmentof a Group Think mentality for decision making.
13. Rarely was a formal decision making process established.Little use was made of formal risk assessments in relationto the establishment of mines rescue operationallimitations.
14. On at least two occasions, the disjointed flow ofpeople into and out of IMT rooms made it difficult forany risk management assessments to actually reachconclusions.
Duty Cards
15. In general the use of duty cards was ineffective. Therelevance of duty cards needs to be critically evaluated,as key personnel often did not consult their duty cards atany time during the exercises.
IMT
16. In general there was inadequate provision made for thechangeover of the IMT personnel as they becamefatigued. Fatigue became a key issue with the IMT as theincident became protracted. The change over of the IMTunder these circumstances was never very effective.
17. There was a wide range in the size of the IMT from 2persons up to 20. There is evidence from the exercisesthat a group of about 5 persons is most effective, withsubordinate groups functioning outside the IMT butreporting back.
112
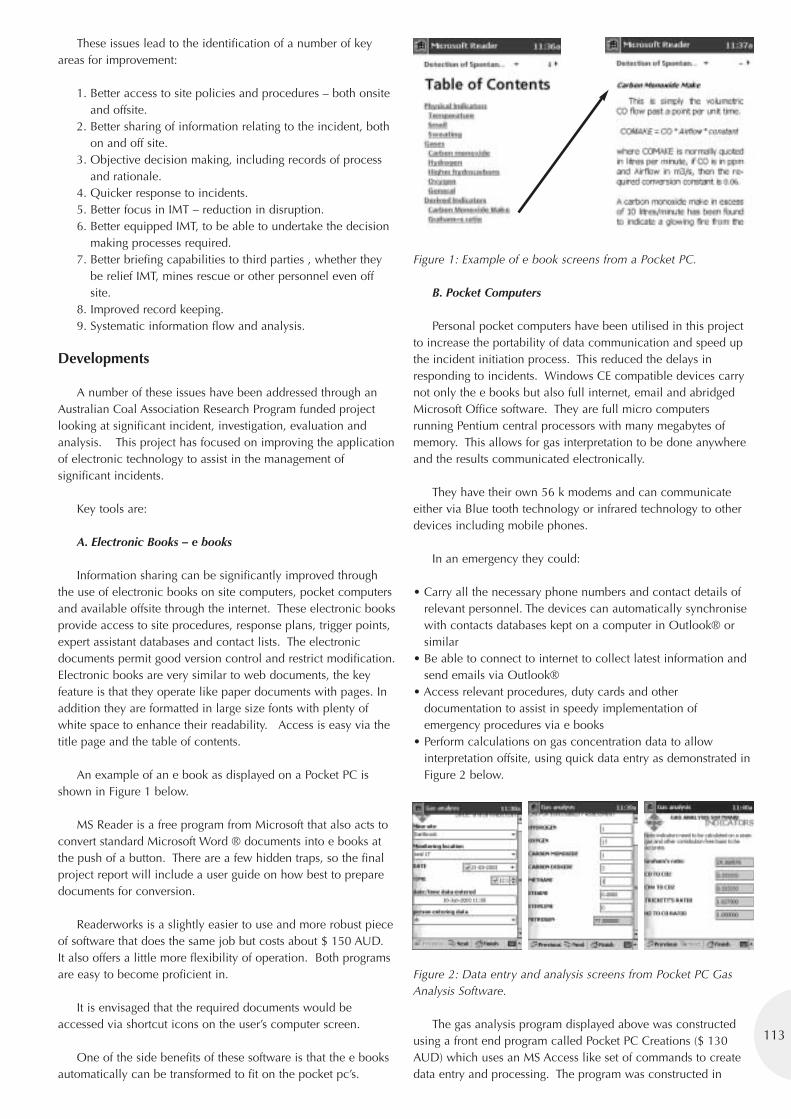
113
These issues lead to the identification of a number of keyareas for improvement:
1. Better access to site policies and procedures – both onsiteand offsite.
2. Better sharing of information relating to the incident, bothon and off site.
3. Objective decision making, including records of processand rationale.
4. Quicker response to incidents.5. Better focus in IMT – reduction in disruption.6. Better equipped IMT, to be able to undertake the decision
making processes required.7. Better briefing capabilities to third parties , whether they
be relief IMT, mines rescue or other personnel even offsite.
8. Improved record keeping.9. Systematic information flow and analysis.
Developments
A number of these issues have been addressed through anAustralian Coal Association Research Program funded projectlooking at significant incident, investigation, evaluation andanalysis. This project has focused on improving the applicationof electronic technology to assist in the management ofsignificant incidents.
Key tools are:
A. Electronic Books – e books
Information sharing can be significantly improved throughthe use of electronic books on site computers, pocket computersand available offsite through the internet. These electronic booksprovide access to site procedures, response plans, trigger points,expert assistant databases and contact lists. The electronicdocuments permit good version control and restrict modification.Electronic books are very similar to web documents, the keyfeature is that they operate like paper documents with pages. Inaddition they are formatted in large size fonts with plenty ofwhite space to enhance their readability. Access is easy via thetitle page and the table of contents.
An example of an e book as displayed on a Pocket PC isshown in Figure 1 below.
MS Reader is a free program from Microsoft that also acts toconvert standard Microsoft Word ® documents into e books atthe push of a button. There are a few hidden traps, so the finalproject report will include a user guide on how best to preparedocuments for conversion.
Readerworks is a slightly easier to use and more robust pieceof software that does the same job but costs about $ 150 AUD.It also offers a little more flexibility of operation. Both programsare easy to become proficient in.
It is envisaged that the required documents would beaccessed via shortcut icons on the user’s computer screen.
One of the side benefits of these software is that the e booksautomatically can be transformed to fit on the pocket pc’s.
Figure 1: Example of e book screens from a Pocket PC.
B. Pocket Computers
Personal pocket computers have been utilised in this projectto increase the portability of data communication and speed upthe incident initiation process. This reduced the delays inresponding to incidents. Windows CE compatible devices carrynot only the e books but also full internet, email and abridgedMicrosoft Office software. They are full micro computersrunning Pentium central processors with many megabytes ofmemory. This allows for gas interpretation to be done anywhereand the results communicated electronically.
They have their own 56 k modems and can communicateeither via Blue tooth technology or infrared technology to otherdevices including mobile phones.
In an emergency they could:
• Carry all the necessary phone numbers and contact details ofrelevant personnel. The devices can automatically synchronisewith contacts databases kept on a computer in Outlook® orsimilar
• Be able to connect to internet to collect latest information andsend emails via Outlook®
• Access relevant procedures, duty cards and otherdocumentation to assist in speedy implementation ofemergency procedures via e books
• Perform calculations on gas concentration data to allowinterpretation offsite, using quick data entry as demonstrated inFigure 2 below.
Figure 2: Data entry and analysis screens from Pocket PC GasAnalysis Software.
The gas analysis program displayed above was constructedusing a front end program called Pocket PC Creations ($ 130AUD) which uses an MS Access like set of commands to createdata entry and processing. The program was constructed in
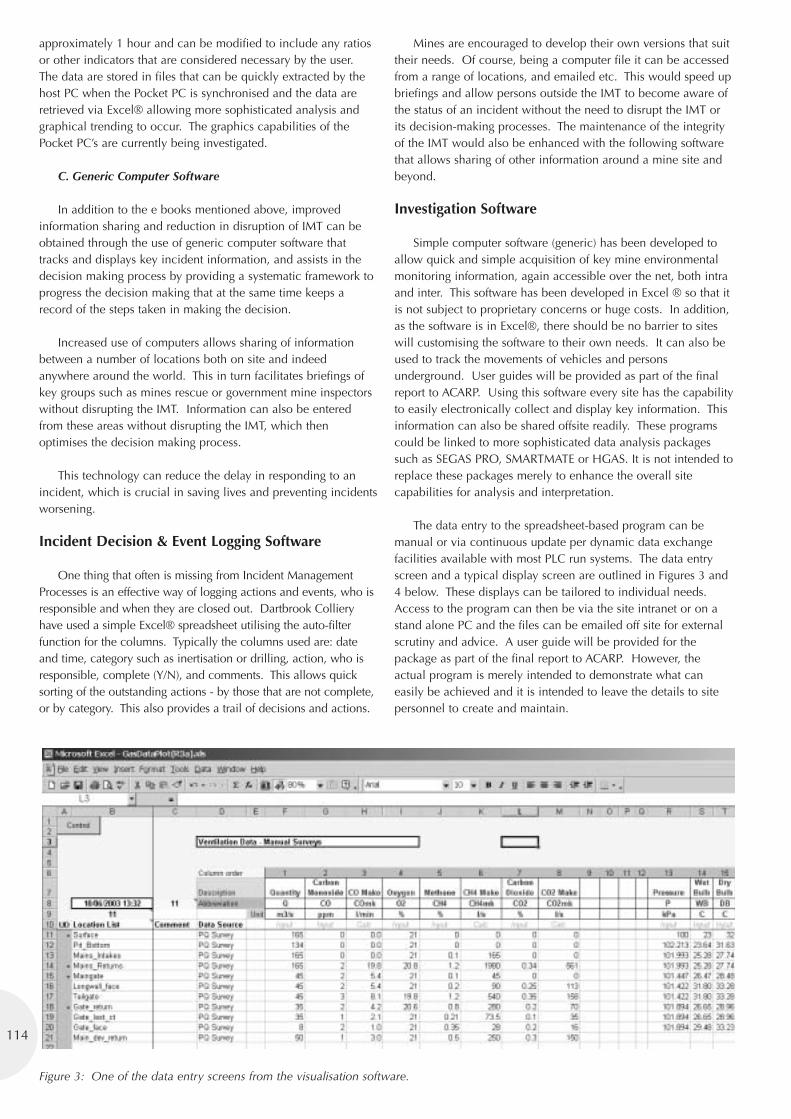
approximately 1 hour and can be modified to include any ratiosor other indicators that are considered necessary by the user.The data are stored in files that can be quickly extracted by thehost PC when the Pocket PC is synchronised and the data areretrieved via Excel® allowing more sophisticated analysis andgraphical trending to occur. The graphics capabilities of thePocket PC’s are currently being investigated.
C. Generic Computer Software
In addition to the e books mentioned above, improvedinformation sharing and reduction in disruption of IMT can beobtained through the use of generic computer software thattracks and displays key incident information, and assists in thedecision making process by providing a systematic framework toprogress the decision making that at the same time keeps arecord of the steps taken in making the decision.
Increased use of computers allows sharing of informationbetween a number of locations both on site and indeedanywhere around the world. This in turn facilitates briefings ofkey groups such as mines rescue or government mine inspectorswithout disrupting the IMT. Information can also be enteredfrom these areas without disrupting the IMT, which thenoptimises the decision making process.
This technology can reduce the delay in responding to anincident, which is crucial in saving lives and preventing incidentsworsening.
Incident Decision & Event Logging Software
One thing that often is missing from Incident ManagementProcesses is an effective way of logging actions and events, who isresponsible and when they are closed out. Dartbrook Collieryhave used a simple Excel® spreadsheet utilising the auto-filterfunction for the columns. Typically the columns used are: dateand time, category such as inertisation or drilling, action, who isresponsible, complete (Y/N), and comments. This allows quicksorting of the outstanding actions - by those that are not complete,or by category. This also provides a trail of decisions and actions.
Mines are encouraged to develop their own versions that suittheir needs. Of course, being a computer file it can be accessedfrom a range of locations, and emailed etc. This would speed upbriefings and allow persons outside the IMT to become aware ofthe status of an incident without the need to disrupt the IMT orits decision-making processes. The maintenance of the integrityof the IMT would also be enhanced with the following softwarethat allows sharing of other information around a mine site andbeyond.
Investigation Software
Simple computer software (generic) has been developed toallow quick and simple acquisition of key mine environmentalmonitoring information, again accessible over the net, both intraand inter. This software has been developed in Excel ® so that itis not subject to proprietary concerns or huge costs. In addition,as the software is in Excel®, there should be no barrier to siteswill customising the software to their own needs. It can also beused to track the movements of vehicles and personsunderground. User guides will be provided as part of the finalreport to ACARP. Using this software every site has the capabilityto easily electronically collect and display key information. Thisinformation can also be shared offsite readily. These programscould be linked to more sophisticated data analysis packagessuch as SEGAS PRO, SMARTMATE or HGAS. It is not intended toreplace these packages merely to enhance the overall sitecapabilities for analysis and interpretation.
The data entry to the spreadsheet-based program can bemanual or via continuous update per dynamic data exchangefacilities available with most PLC run systems. The data entryscreen and a typical display screen are outlined in Figures 3 and4 below. These displays can be tailored to individual needs.Access to the program can then be via the site intranet or on astand alone PC and the files can be emailed off site for externalscrutiny and advice. A user guide will be provided for thepackage as part of the final report to ACARP. However, theactual program is merely intended to demonstrate what caneasily be achieved and it is intended to leave the details to sitepersonnel to create and maintain.
114
Figure 3: One of the data entry screens from the visualisation software.
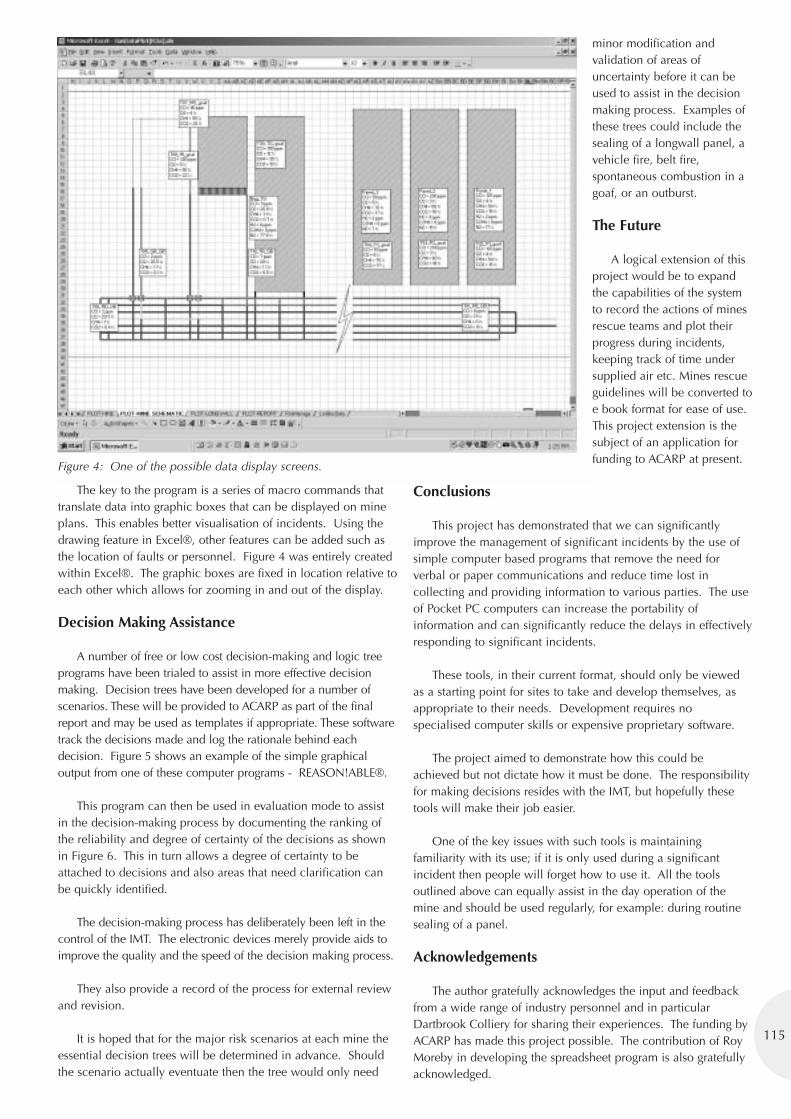
115
The key to the program is a series of macro commands thattranslate data into graphic boxes that can be displayed on mineplans. This enables better visualisation of incidents. Using thedrawing feature in Excel®, other features can be added such asthe location of faults or personnel. Figure 4 was entirely createdwithin Excel®. The graphic boxes are fixed in location relative toeach other which allows for zooming in and out of the display.
Decision Making Assistance
A number of free or low cost decision-making and logic treeprograms have been trialed to assist in more effective decisionmaking. Decision trees have been developed for a number ofscenarios. These will be provided to ACARP as part of the finalreport and may be used as templates if appropriate. These softwaretrack the decisions made and log the rationale behind eachdecision. Figure 5 shows an example of the simple graphicaloutput from one of these computer programs - REASON!ABLE®.
This program can then be used in evaluation mode to assistin the decision-making process by documenting the ranking ofthe reliability and degree of certainty of the decisions as shownin Figure 6. This in turn allows a degree of certainty to beattached to decisions and also areas that need clarification canbe quickly identified.
The decision-making process has deliberately been left in thecontrol of the IMT. The electronic devices merely provide aids toimprove the quality and the speed of the decision making process.
They also provide a record of the process for external reviewand revision.
It is hoped that for the major risk scenarios at each mine theessential decision trees will be determined in advance. Shouldthe scenario actually eventuate then the tree would only need
minor modification andvalidation of areas ofuncertainty before it can beused to assist in the decisionmaking process. Examples ofthese trees could include thesealing of a longwall panel, avehicle fire, belt fire,spontaneous combustion in agoaf, or an outburst.
The Future
A logical extension of thisproject would be to expandthe capabilities of the systemto record the actions of minesrescue teams and plot theirprogress during incidents,keeping track of time undersupplied air etc. Mines rescueguidelines will be converted toe book format for ease of use.This project extension is thesubject of an application forfunding to ACARP at present.
Conclusions
This project has demonstrated that we can significantlyimprove the management of significant incidents by the use ofsimple computer based programs that remove the need forverbal or paper communications and reduce time lost incollecting and providing information to various parties. The useof Pocket PC computers can increase the portability ofinformation and can significantly reduce the delays in effectivelyresponding to significant incidents.
These tools, in their current format, should only be viewedas a starting point for sites to take and develop themselves, asappropriate to their needs. Development requires nospecialised computer skills or expensive proprietary software.
The project aimed to demonstrate how this could beachieved but not dictate how it must be done. The responsibilityfor making decisions resides with the IMT, but hopefully thesetools will make their job easier.
One of the key issues with such tools is maintainingfamiliarity with its use; if it is only used during a significantincident then people will forget how to use it. All the toolsoutlined above can equally assist in the day operation of themine and should be used regularly, for example: during routinesealing of a panel.
Acknowledgements
The author gratefully acknowledges the input and feedbackfrom a wide range of industry personnel and in particularDartbrook Colliery for sharing their experiences. The funding byACARP has made this project possible. The contribution of RoyMoreby in developing the spreadsheet program is also gratefullyacknowledged.
Figure 4: One of the possible data display screens.
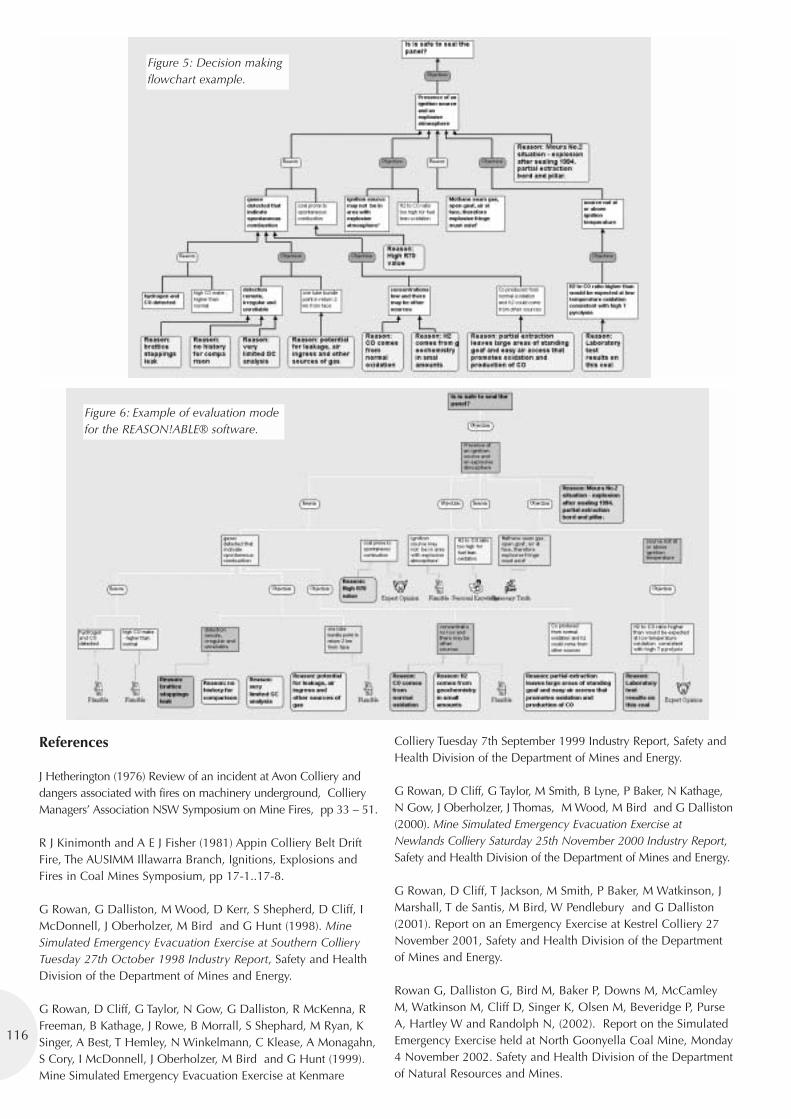
References
J Hetherington (1976) Review of an incident at Avon Colliery anddangers associated with fires on machinery underground, CollieryManagers’ Association NSW Symposium on Mine Fires, pp 33 – 51.
R J Kinimonth and A E J Fisher (1981) Appin Colliery Belt DriftFire, The AUSIMM Illawarra Branch, Ignitions, Explosions andFires in Coal Mines Symposium, pp 17-1..17-8.
G Rowan, G Dalliston, M Wood, D Kerr, S Shepherd, D Cliff, IMcDonnell, J Oberholzer, M Bird and G Hunt (1998). MineSimulated Emergency Evacuation Exercise at Southern CollieryTuesday 27th October 1998 Industry Report, Safety and HealthDivision of the Department of Mines and Energy.
G Rowan, D Cliff, G Taylor, N Gow, G Dalliston, R McKenna, RFreeman, B Kathage, J Rowe, B Morrall, S Shephard, M Ryan, KSinger, A Best, T Hemley, N Winkelmann, C Klease, A Monagahn,S Cory, I McDonnell, J Oberholzer, M Bird and G Hunt (1999).Mine Simulated Emergency Evacuation Exercise at Kenmare
Colliery Tuesday 7th September 1999 Industry Report, Safety andHealth Division of the Department of Mines and Energy.
G Rowan, D Cliff, G Taylor, M Smith, B Lyne, P Baker, N Kathage,N Gow, J Oberholzer, J Thomas, M Wood, M Bird and G Dalliston(2000). Mine Simulated Emergency Evacuation Exercise atNewlands Colliery Saturday 25th November 2000 Industry Report,Safety and Health Division of the Department of Mines and Energy.
G Rowan, D Cliff, T Jackson, M Smith, P Baker, M Watkinson, JMarshall, T de Santis, M Bird, W Pendlebury and G Dalliston(2001). Report on an Emergency Exercise at Kestrel Colliery 27November 2001, Safety and Health Division of the Departmentof Mines and Energy.
Rowan G, Dalliston G, Bird M, Baker P, Downs M, McCamleyM, Watkinson M, Cliff D, Singer K, Olsen M, Beveridge P, PurseA, Hartley W and Randolph N, (2002). Report on the SimulatedEmergency Exercise held at North Goonyella Coal Mine, Monday4 November 2002. Safety and Health Division of the Departmentof Natural Resources and Mines.
116
Figure 6: Example of evaluation modefor the REASON!ABLE® software.
Figure 5: Decision makingflowchart example.
Using Knowledge Managementto Improve Risk ManagementStrategies & Communicationsin MinesHayden Cater, Department of Primary Industries
Introduction
The management of health and safety risks, the effectivecommunication of risk management strategies and their controlsare key issues for all Australian mines. Most states are adoptingperformance-based legislation for the management of health andsafety. This approach places significant duties on employers andmine managers to effectively manage health and safety. Theapproach of performance based legislation is one of hazardidentification, risk assessment and control and requires mines toimplement management systems and procedures to controlmining risks.
The setting out of duties for employers and employees as wellas the use of risk management as a basis of health and safetylegislation has been in vogue for the past twenty years. Mostmining companies have a risk management program with a riskregister, procedures and processes to identify, assess and controlrisks. Significant resources are put into the management of healthand safety risks in the mining industry. So after many years ofusing risk management processes to manage health and safetyrisks how are we going? Well it would seem that we still have along way to go. As an industry we have high rates of injury andmany employees are still being killed as a result of workplaceaccidents compared to other industries. Last year there wereseven fatalities in the Australian Minerals Industries (MineralsCouncil of Australia, 2003, p 2).
In Australia high occupational injury and illness rates areundermining our economic performance and reducing livingstandards and the value of undertaking health and safety riskmanagement is being increasingly questioned (Viner 2002,Tillman and Robinson 2002, Harvey, 2002, Cross and Trethewy,2002).
At a national level the Occupational Health and SafetyCommission (1999: p 1) estimates more than one millionworking weeks were lost in 1996 - 97 due to work-relatedcompensated cases. In comparison, working days lost annuallydue to industrial disputes totalled only 650,400 in 1999(Australian Bureau of Statistics, 2001 [on-line]).
Risk Management in Mines
Mining today involves the use of cutting edge technologies,new equipment, changes to work processes and staffingarrangements. To survive and be profitable in a competitive
environment mine management and employees must be flexibleand move quickly. This involves making constant and ongoingchanges to the working environment. This can place unrelentingpressures on the management and employees of a mine toremain competitive. These developments also have the potentialto introduce new hazards and risks to the workplace.
To combat these problems the use of risk management isgrowing. It is used by many mines not only as a method ofmanaging health and safety risks but also as an effective way ofcoping with a more volatile economy, rapid changes intechnology, new equipment and avoiding costly mistakes.
Effective risk management on mine sites however is morethan just developing a procedure, undertaking risk assessmentsand having a risk register. Mines should develop strategies toregularly review their risk management profile. This meansconducting a review or audit of what the mine needs to knowabout the risks on site, identifying any gaps in its riskmanagement strategy and developing controls to ensure all risksare effectively controlled. As the workplace is constantlychanging mines also need to determine what their people knowabout health and safety risks and how that knowledge can beused by the organisation to reduce risks. An effective riskmanagement strategy also needs to ensure that the nature of therisks and their controls are communicated to the workforce.
At the same time the use of risk management is increasing,the management of health and safety risks is becoming morecomplex and difficult and there are signs that many organisationsare having difficulty managing risks using old techniques andparadigms because of the volatility and pace of change in theeconomy (Smallman 1996: p 246). Mining is not immune tothese pressures. Covello (1986: p 441) sums up the currentdebate about risk management and asks, "in response to thechanging economic conditions and the effects of globalisationare the traditional methods of managing risk and communicatingrisks adequate?" He suggests that to cope with the demands ofthe new economy and performance based legislation we need toseek improved risk management techniques and concepts.Knowledge management may be the key to unlocking thoseimprovements.
The principles of knowledge management can be used todevelop improved risk management techniques and concepts.Organisations including mining companies should considerdeveloping a knowledge management strategy to cope with our
117
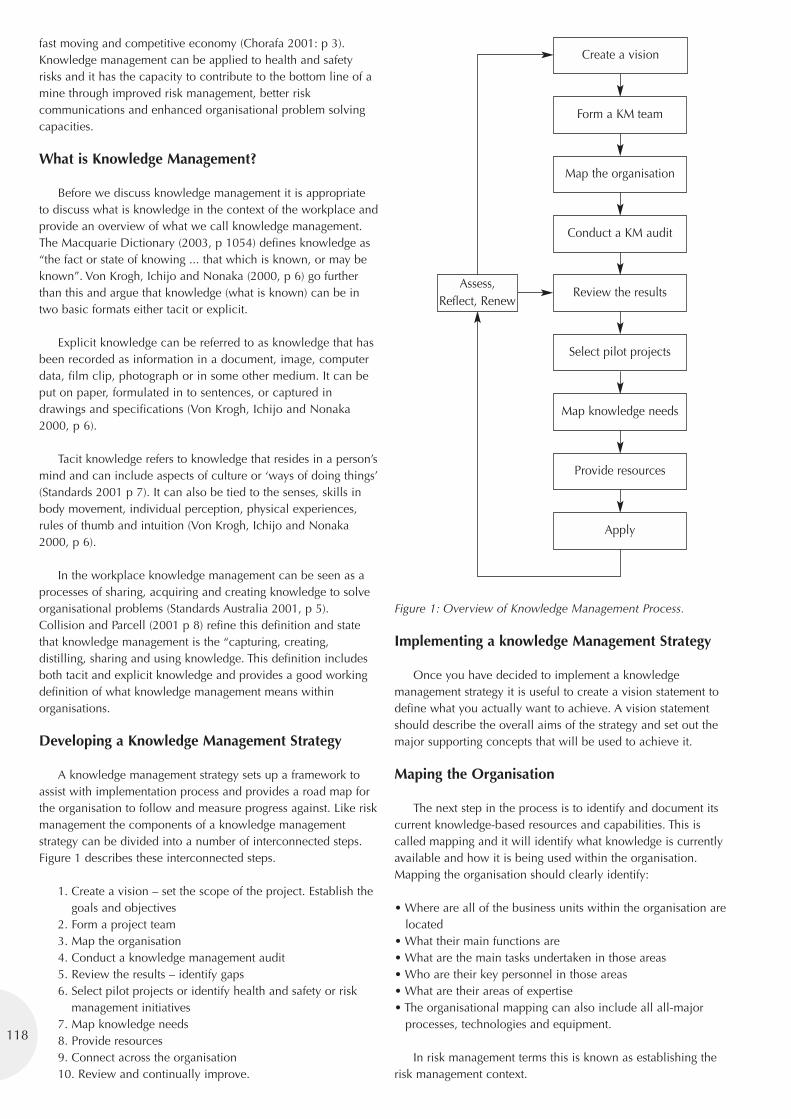
fast moving and competitive economy (Chorafa 2001: p 3).Knowledge management can be applied to health and safetyrisks and it has the capacity to contribute to the bottom line of amine through improved risk management, better riskcommunications and enhanced organisational problem solvingcapacities.
What is Knowledge Management?
Before we discuss knowledge management it is appropriateto discuss what is knowledge in the context of the workplace andprovide an overview of what we call knowledge management.The Macquarie Dictionary (2003, p 1054) defines knowledge as“the fact or state of knowing ... that which is known, or may beknown”. Von Krogh, Ichijo and Nonaka (2000, p 6) go furtherthan this and argue that knowledge (what is known) can be intwo basic formats either tacit or explicit.
Explicit knowledge can be referred to as knowledge that hasbeen recorded as information in a document, image, computerdata, film clip, photograph or in some other medium. It can beput on paper, formulated in to sentences, or captured indrawings and specifications (Von Krogh, Ichijo and Nonaka2000, p 6).
Tacit knowledge refers to knowledge that resides in a person’smind and can include aspects of culture or ‘ways of doing things’(Standards 2001 p 7). It can also be tied to the senses, skills inbody movement, individual perception, physical experiences,rules of thumb and intuition (Von Krogh, Ichijo and Nonaka2000, p 6).
In the workplace knowledge management can be seen as aprocesses of sharing, acquiring and creating knowledge to solveorganisational problems (Standards Australia 2001, p 5).Collision and Parcell (2001 p 8) refine this definition and statethat knowledge management is the “capturing, creating,distilling, sharing and using knowledge. This definition includesboth tacit and explicit knowledge and provides a good workingdefinition of what knowledge management means withinorganisations.
Developing a Knowledge Management Strategy
A knowledge management strategy sets up a framework toassist with implementation process and provides a road map forthe organisation to follow and measure progress against. Like riskmanagement the components of a knowledge managementstrategy can be divided into a number of interconnected steps.Figure 1 describes these interconnected steps.
1. Create a vision – set the scope of the project. Establish thegoals and objectives
2. Form a project team3. Map the organisation4. Conduct a knowledge management audit5. Review the results – identify gaps6. Select pilot projects or identify health and safety or risk
management initiatives7. Map knowledge needs8. Provide resources9. Connect across the organisation10. Review and continually improve.
Figure 1: Overview of Knowledge Management Process.
Implementing a knowledge Management Strategy
Once you have decided to implement a knowledgemanagement strategy it is useful to create a vision statement todefine what you actually want to achieve. A vision statementshould describe the overall aims of the strategy and set out themajor supporting concepts that will be used to achieve it.
Maping the Organisation
The next step in the process is to identify and document itscurrent knowledge-based resources and capabilities. This iscalled mapping and it will identify what knowledge is currentlyavailable and how it is being used within the organisation.Mapping the organisation should clearly identify:
• Where are all of the business units within the organisation arelocated
• What their main functions are• What are the main tasks undertaken in those areas• Who are their key personnel in those areas• What are their areas of expertise • The organisational mapping can also include all all-major
processes, technologies and equipment.
In risk management terms this is known as establishing therisk management context.
118
Form a KM team
Map the organisation
Conduct a KM audit
Review the results
Select pilot projects
Map knowledge needs
Provide resources
Apply
Create a vision
Assess,Reflect, Renew
119
Knowledge Management Audit
Once the organisation has been mapped an audit of eachbusiness unit or process should be conducted. This willdetermine how the organisation is currently managing its healthand safety risks and knowledge. The audit should include whatknowledge is available about controlling these health and safetyrisks and what knowledge should be collected, acquired orcreated. A knowledge management audit can reveal potentialknowledge gaps in the management of health and safety risks.Several techniques can be used to collect data such asquestionnaires, focus groups and critical incident technique.
Issues that could be raised during the audit include:
• What are the organisation’s highest health and safety risks?• What controls are in place to manage these risks?• Are these controls effective?• Why/why not?• What could be done to improve the management of specific
health and safety risks?• What could be done to improve the overall management of
health and safety?• How do you find out about health and safety? • Is this source reliable?• What is the best source of health and safety information?• How could health and safety communications be improved? • Where are health and safety resources located?• What specific skills people in relation to business functions,
health and safety and health and safety risks?
Although many organisations will already havecomprehensive hazard and risk registers. What they may nothave done is to subject them to this level of intense scrutinyand review. The objective of the knowledge management auditis to identify strategic gaps in the health and safety riskmanagement process and discover opportunities forimprovement.
The results will also form a baseline measurement of how theemployees of the organisation perceive how health and safetycommunications and knowledge is managed within theorganisation. Auditing offers opportunities for identifyingmethods of improving communication and safety management.
Identifying any Knowledge Gaps
The results of the knowledge management audit should beproperly documented. Once this is done a gap analysis shouldthen be conducted on the results of the audit. The purpose of thegap analysis is to identify what knowledge is currently availableagainst what is required to effectively manage health and safetyrisks. The audit should also identify any individuals and resourceswith particular knowledge that can assist the organisation toachieve its goals.
A gap analysis should be conducted against:
• Current risk management policies, procedures and processes• Existing health and safety Hazard and risk registers• Known sources of health and safety knowledge the
effectiveness of specific controls including procedures• Perceived health and safety needs
• The level of training provided/required• Communication methods.
The collection and analysis of this information will assist withcurrent risk management activities and future projects.
Knowledge Management Projects
Once the knowledge gaps within the organisation havebeen identified through the audit, projects and project teamscan be developed to apply knowledge management to varioushealth and safety and risks. Projects that could be developedinclude:
• Improvements to the overall risk management processes• A comprehensive review of hazard and risk registers (breadth
and depth)• The review of scope, application and completeness of health
and safety polices and procedures• The effectiveness of current risk controls• Benchmarking of health and safety systems, risk processes and
performance• Investigation and identification of new controls• A review of documentation systems• Identification and recording of tacit information• Developing skills and knowledge inventories• Recording and restructuring of explicit knowledge into a more
useable format• Improving communication methods• A review of general and specific training needs.
Establish Project Teams
The next phase of the strategy is to implement the findings ofthe gap analysis. This is done by establishing project teams towork on specific health and safety projects. These teams shouldbe cross-functional if possible to spread the benefits of theprojects as widely as possible. Leaders or champions of thegroup should be identified to facilitate the process for specificissues. The leaders or champions should be briefed on their roleand how the projects will be rolled out. This is a crucial phase ofthe implementation strategy and adequate resources should beprovided to ensure the success of the project.
To avoid different project groups working in isolation theorganisation should develop strategies to enhancecommunications not only throughout the organisation but alsowithin the teams themselves. The development of discussion orfocus groups, inter-team briefings, internal newsletter or web-sitecan be used to help communications. Many sites are part oflarger organisations and a dedicated web could be created sothat all sites can access and share information. The web sitecould form part of an existing portal or be an entirely new site.
Team Based Tools
There are many team-based tools that can be used to supportan implementation strategy.
Peer Assist
Peer assist is a meeting or a workshop where people areinvited from other project teams to share their experience,
insights and knowledge with a team who have requested somehelp. It is worthwhile holding a peer assist when a project teamis facing a challenge, where the knowledge and experience ofothers will really help. A peer assist:
• Targets a specific or technical or commercial challenge• Gains assistance and insight from people outside the team• Identifies possible approaches and new lines of inquiry• Promotes sharing and learning with each other• Develops strong networks amongst staff.
Benchmarking
Benchmarking against other business units and organisations.Benchmarking can be on specific issues such as high risks,developing controls, communication strategies etc to acquireknowledge.
Workshops & Discussion Groups
Knowledge workshops and focus groups are conductedwithin and across teams to share and create knowledge. Theycan be used to evaluate current risks, identify risks associatedwith new innovations or changes to the workplace. They can besimilar to an in depth after action review. They do not have to belimited to what went well. They can also be used to discuss whatcould have been done better and what would be done differentnext time.
Discussion groups and inter team briefings are less formaland are also used to promote knowledge throughout theorganisation. New and innovative approaches to managing riskscan be discussed.
After Action Reviews
After Action Reviews (AAR) are a deliberately short and sharpdiscussion and analysis session designed to aid team andindividual learning. The United States army first developed theprocess. The purpose of the AAR is to improve the ability ofsoldiers to learn from the midst of action and to improve teamworking. “An after action review is a professional discussion ofan event, focused on performance standards, that enablessoldiers to discover for themselves what happened, why ithappened, and how to sustain strengths and improve onweaknesses” (Collision and Parcell, 2001, p 77).
The format is quick and simple and should not take morethan twenty minutes. The AAR answers four simple questions:
• What was supposed to happen?• What actually happened?• Why where there differences?• What did we learn?
Web Based Tools
Web based tools allow work groups to connect acrossfunctional boundaries, time zones and distance. These sort oftools are very useful for geographically isolated people and sites.They allow people to become part of a community of knowledgeand if they are properly structured to have access to largesupport networks.
Corporate Yellow Pages
Corporate yellow pages are more than just a telephonedirectory. They are a searchable database where people can lookfor staff with relevant knowledge and experience. Corporateyellow pages can assist people to find the right source ofinformation at the right time. Typical information in corporateyellow pages can include:
• Name, Job Title, Position• Contact Details• Photograph• Structured Taxonomy of ‘areas of expertise’• Free text area• Internal and external web links• Qualifications• Membership of networks and teams.
To cut down of the time it takes to set up a corporate yellowpages many organisations have developed easy to fill intemplates for people to fill out. Useful information may alsoinclude areas that are currently working on and past projects.
Health & Safety Knowledge & Risk ManagementWeb Site
A knowledge or risk management site can be used toimprove communications contain links to corporate information,provide opportunities for assistance and requests for help.Content could include:
• Overview of the KM project• Results of the KM Audit• KM Data base – Yellow pages• Details of projects• Org chart and project teams• Ask the KM team questions• What’s new – messages from the team – photos etc• Help page – post questions and offers of help• Outside links.
Practical Knowledge Management
Knowledge Management is not just a concept or fad. It haspractical applications for a range of risk management situationsin the mining industry such as training, physical hazards andemergency management. All mines will have an emergencymanagement plan and should conduct emergency responseexercises. Many will also have a duty card system withdocumented roles and responsibilities for key personnel.Although such cards and exercises are of great value and can beused to prepare for emergencies they may not always coverevery contingency or issue that occurs during an emergencysituation.
In the event of an emergency or crisis situation how wellwould your mine handle it? How prepared would you be and doyou know everything you need to know to deal with andemergency situation? Emergency planning and response is onearea that knowledge management can be used at a practicallevel to improve a key risk management or safety issue.
All mines have a wealth of knowledge and experience but
120
121
how often is it left to the mine manager or health and safetyofficer to develop and review the mine’s emergency managementplan. How often do these people get the time and resources tofind out what people know and what skills they have. By usingknowledge management techniques to map, audit and identifyany gaps in the emergency management processes mines havean opportunity to make their emergency response plan andteams more effective and efficient.
Getting Started
A knowledge management project team reviewing anemergency management plan may need to consider some or allof the following issues:
• Emergency management team• Do you have the right people with relevant
knowledge of the events or hazard?• Do you have access to relevant technical experts and
information?• Are these people available when needed?• Do you have the right number of people to handle a
crisis?• Do these people need training, in what, where can
we source it?• Are there any gaps in the team or its training?
• Hazards and risks • Have all hazards and risks been identified and assessed?• Are they included in the plan?
• Emergency communications• Who is responsible, are people trained?• Are there adequate mine communication systems
including:• Telephones• Radios• Fax• E-mail• Back up communications if services fail
(electricity, phones)• Back up power supply?
• Coordination of emergency services• What services are available, who deals with them, are
our employees members of a particular service?• Who is responsible for communication, maintaining
relationships, training and liaison with external officers?• Are these groups familiar with the mine?• Have they been inducted/do they need to be?
• Police• Security• Ambulance• Doctors• Hospital• Fire fighters• Mine rescue• Flying doctor• SES• Coroner• Mines Inspectorate
• Provision of emergency equipment
• What is needed, where can we get it, is it alwaysavailable?
• Is additional rescue equipment required in specificcircumstances?
• Do we need specialist equipment e.g. Jaws of Life,rescues from height etc?
• Do we have people that can use it?
• Management of regulatory investigations• Are there adequate?• Facilities including communications available• Liaison officer (s)• Notification and reporting requirements
• Local medical services• Do they know what to expect?• If there is an overflow what happens?
• Managing the media• Who is authorised to speak?• Who writes any press releases?• Who are our contact personnel?• What should they say?• Who should be let on site?• What security do we need?• Do you have stock footage of the site to provide to
the media?• Do you have responses and explanations for key
questions?
• Debriefings for those involved• Debriefings/information for relatives• Coordination of employee/family assistance and support• How do we handle distraught family?• How do we deal with fatalities?• Where would we put any deceased while we treat the
casualties?
• Internal Investigations• Who shall conduct them?• Are people trained?• Collection and preservation of evidence• Report writing and photographs• Self incrimination.
• Business continuity• Are alternative plans needed to ensure that the mine
keeps operating (if appropriate).
The scope of the knowledge management review should beappropriate to the size and complexity of the mine. This can bedone using the above list as a starting point. Once the scope ofthe review has been decided the team should map the currentsituation of the mine and conduct an audit of knowledge andskills associated with emergency management.
Once this is done the team can then begin to identify anygaps in the emergency management plan and then develop astrategy to improve how the mine manages its potentialemergency situations. Once a plan has been developed a rangeof team and web based tools can be used to implement the plan.Appendix A contains a suggest contents of an emergencymanagement plan.
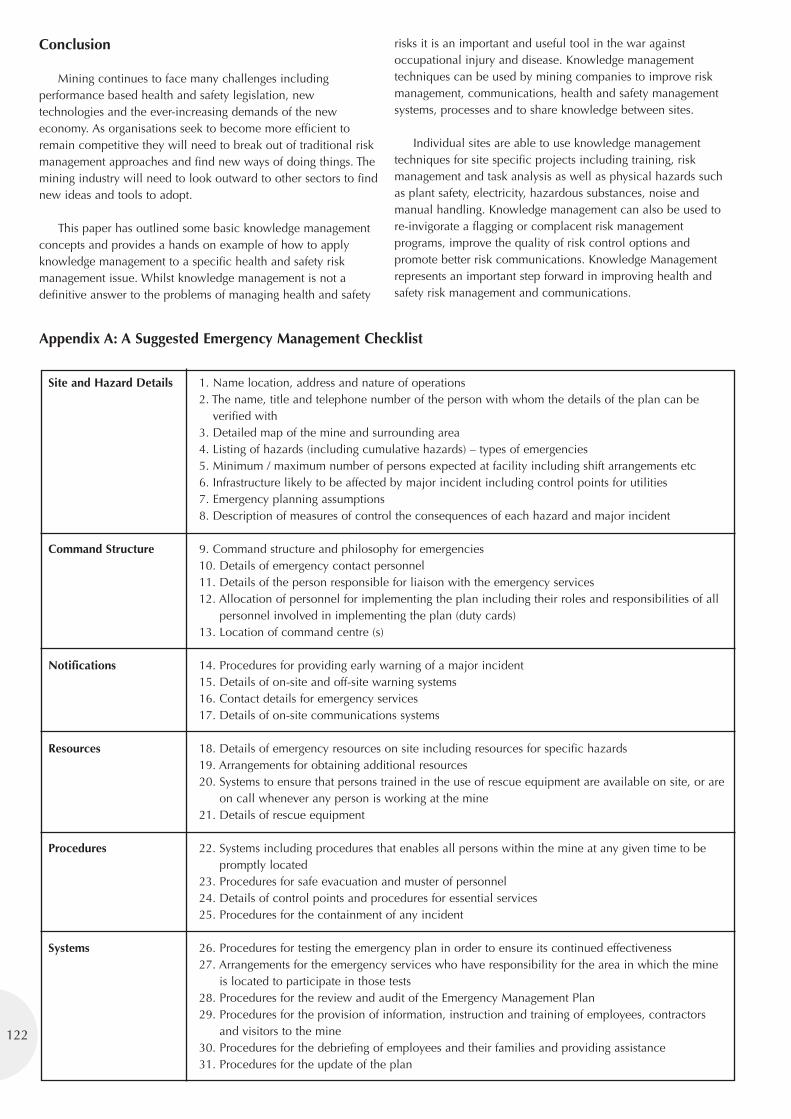
Conclusion
Mining continues to face many challenges includingperformance based health and safety legislation, newtechnologies and the ever-increasing demands of the neweconomy. As organisations seek to become more efficient toremain competitive they will need to break out of traditional riskmanagement approaches and find new ways of doing things. Themining industry will need to look outward to other sectors to findnew ideas and tools to adopt.
This paper has outlined some basic knowledge managementconcepts and provides a hands on example of how to applyknowledge management to a specific health and safety riskmanagement issue. Whilst knowledge management is not adefinitive answer to the problems of managing health and safety
risks it is an important and useful tool in the war againstoccupational injury and disease. Knowledge managementtechniques can be used by mining companies to improve riskmanagement, communications, health and safety managementsystems, processes and to share knowledge between sites.
Individual sites are able to use knowledge managementtechniques for site specific projects including training, riskmanagement and task analysis as well as physical hazards suchas plant safety, electricity, hazardous substances, noise andmanual handling. Knowledge management can also be used tore-invigorate a flagging or complacent risk managementprograms, improve the quality of risk control options andpromote better risk communications. Knowledge Managementrepresents an important step forward in improving health andsafety risk management and communications.
122
Site and Hazard Details 1. Name location, address and nature of operations2. The name, title and telephone number of the person with whom the details of the plan can be
verified with3. Detailed map of the mine and surrounding area4. Listing of hazards (including cumulative hazards) – types of emergencies5. Minimum / maximum number of persons expected at facility including shift arrangements etc6. Infrastructure likely to be affected by major incident including control points for utilities7. Emergency planning assumptions8. Description of measures of control the consequences of each hazard and major incident
Command Structure 9. Command structure and philosophy for emergencies10. Details of emergency contact personnel11. Details of the person responsible for liaison with the emergency services12. Allocation of personnel for implementing the plan including their roles and responsibilities of all
personnel involved in implementing the plan (duty cards)13. Location of command centre (s)
Notifications 14. Procedures for providing early warning of a major incident15. Details of on-site and off-site warning systems16. Contact details for emergency services17. Details of on-site communications systems
Resources 18. Details of emergency resources on site including resources for specific hazards19. Arrangements for obtaining additional resources20. Systems to ensure that persons trained in the use of rescue equipment are available on site, or are
on call whenever any person is working at the mine21. Details of rescue equipment
Procedures 22. Systems including procedures that enables all persons within the mine at any given time to bepromptly located
23. Procedures for safe evacuation and muster of personnel24. Details of control points and procedures for essential services25. Procedures for the containment of any incident
Systems 26. Procedures for testing the emergency plan in order to ensure its continued effectiveness27. Arrangements for the emergency services who have responsibility for the area in which the mine
is located to participate in those tests28. Procedures for the review and audit of the Emergency Management Plan29. Procedures for the provision of information, instruction and training of employees, contractors
and visitors to the mine30. Procedures for the debriefing of employees and their families and providing assistance31. Procedures for the update of the plan
Appendix A: A Suggested Emergency Management Checklist

123
References
Australian Bureau of Statistics (2002) [online]. available athttp://www.abs.gov.au/ausstats/[email protected]/0/8028FDAA59046FE9CA2568A9001393F6?Open
Chorafa, D. (2001). Managing Risk in the New Economy. NewYork, New York Institute of Finance.
Collision, C. and Parcell, G. (2000). Learning to Fly, PracticalLessons from One of the World's Leading KnowledgeManagement Companies. Milford, Capstone Publishing Inc.
Covello, V. T., Menkes, J., et al. (1986). Risk Evaluation andManagement. New York, Plenum Press.
Cross, J. and Trethewy, R. (2002) Influences on Risk AssessmentDecision, Safety in Australia, vol., no 24, no. 3, 27-31.
Harvey, J. (2002) Reliability of Risk Assessments: A StatisticalEvaluation of Results from Six Assessment Tools, Safety inAustralia, vol., no 24, no. 3, 22-25.
Maquarie University, (2003) The Maquarie Dictionary, RevisedThird Edition, The Maquarie Library Pty Ltd, Sydney.
Minerals Council of Australia (2003) Safety and HealthPerformance Report 2002 – 2002, Minerals Council of Australia,Dickson.
National Occupational Health and Safety Commission (1999)National OHS Improvement Framework, Canberra, NationalOccupational Health and Safety Commission.
Smallman, C. (1996). Challenging the Orthodoxy In RiskManagement Safety Science 22(1-3): pp. 245-262.
Standards Australia. (2001) HB275 - Knowledge Management, AFramework for Succeeding in the Knowledge Era, Sydney,Standards Australia.
Tillman, C. and Robinson, R. (2002) Seven Risk Paradigms,Safety in Australia, vol., no 24, no. 3, 17-2.
Viner, D. (2002) Risk Assessments – Do They Work?, Safety inAustralia, vol., no 24, no. 3, 12-16.
Von Krogh, G., Ichijo, K., et al. (2000). Enabling KnowledgeCreation, How to Unlock the Mystery of Tacit Knowledge andRelease the Power of Innovation. New York, Oxford UniversityPress.
Further Reading
Despres, C. and Chauvel, D. (2000). Knowledge Horizons, ThePresent and the Promise of Knowledge Management. Woburn,Butterworth-Heinemann.
Else, D. (1999 a). “Leadership - Transforming OccupationalHealth and Safety from a Problem Into a Competitive Edge forAustralia.” The Health and Safety Professional 8 (3): 1-9.
O'Dell, C. and Grayson, C. J. J. (1998). If Only We Knew What
We know, The Transfer of Internal Knowledge and Best Practice.New York, The Free Press.
Probst, G., Raub, S., et al. (2000). Managing Knowledge, BuildingBlocks for Success. New York, John Wiley and Sons.
Ruggles, R. and Holtshouse, D. (1999). The KnowledgeAdvantage. Dover, Capstone Publishing Inc.
Standards Australia. (2001) HB275 Supplement 1 – 2002International Best Practice – Case Studies in KnowledgeManagement, Sydney, Standards Australia.
Challenge Test –Your Level 1Emergency Exercise
David Reece, Department of Natural Resources & Mines
Abstract
The Level 1 Emergency Exercise has been conducted inQueensland Underground Coal Mines for the past five years andis a specific requirement of the Moura Inquiry findings.
The intent of this paper is to provide relevant information onpast, present and future actions that will affect underground coalmines and their emergency response systems. It is also of value toother mines (open cut and metalliferous) where the hazards maynot be the same yet suggestions and innovations may be utilised.
The paper is in four parts:
• Key recommendations from previous emergency exercises thatwarrant repeating for emphasis and as a backdrop the changeprocess later in the paper
• The proposal for and initial operation of a modified programfor Level 1 Emergency Exercises
• Findings and recommendations from the Emergency Exerciseconducted at Crinum in July
• The experience from Crinum’s perspective.
North Goonyella Recommendations – For Industry
It is not the intent nor is it appropriate to discuss the findingsand recommendations of the North Goonyella EmergencyExercise from November 2002 in this paper (due to the author’snon-participation in the exercise). This information has beendetailed and reported by Mr Greg Rowan and the ManagementTeam of that exercise and presented at industry forums since thattime.
However, a selection of the recommendations from this andprevious exercises are repeated here in order to reinforce theneed for them to be addressed by mines. This is clearly a sourceof frustration and concern as expressed by Emergency ExerciseManagement Teams (EEMT’s), industry personnel and the MinesInspectorate.
Duty Cards
Duty card systems are an excellent aid for initial response toan incident and are widely utilised. However, there is a need to“walk through” the intent and operation of all the cards, ensuringeffective interactions and identification of personnel, clear rolesand responsibilities with no duplication, training in the various
roles (including relief personnel and handovers) and clearfeedback systems to the IMT.
Incident Management Team (IMT)
As the key focal point for any incident the IMT will attract asignificant amount of attention, often due in part to hindsight andgenerally from people not in the “direct line of fire”.Nevertheless, all exercises have highlighted the need forimproved decision-making, communication and communicationsystems, data management systems and processes, fatiguemanagement and clear lines of authority. The EmergencyPreparedness Course as presented by both NSW and QLD MinesRescue Services coupled with the regular simulated exerciseswill go some way to addressing this issue.
Simple knowledge of monitoring system response times isalso being overlooked as a necessary piece of information inunderstanding an incident.
Incident Management Rooms
There is an ongoing need for effective tools and techniques(white boards, computer data bases, etc.) to assist in managing thesituation as well as aiding in the briefing and decision-makingprocesses. These must be of a style that suits the IMT best, butneed to be developed and refined through simulated use.
Underground Response
Communication systems failings continue to arise – eitherbetween Control or IMT and individuals underground, mainlywhen Self Contained Self Rescuer’s (SCSR’s) are used, or simplybetween a Control Room and the IMT.
Gas analysis by underground personnel without instrumentsis regularly raised as a deficiency though not easily answered – amine still needs a protocol even if it is as simple as “if in doubtassume the worst and use an SCSR”.
Protocols for emergency response (as opposed to escape)need to be developed as appropriate as the use of CompressedAir Breathing Apparatus becomes more prevalent.
Previous Recommendations
The information provided by each emergency exercise is a
124
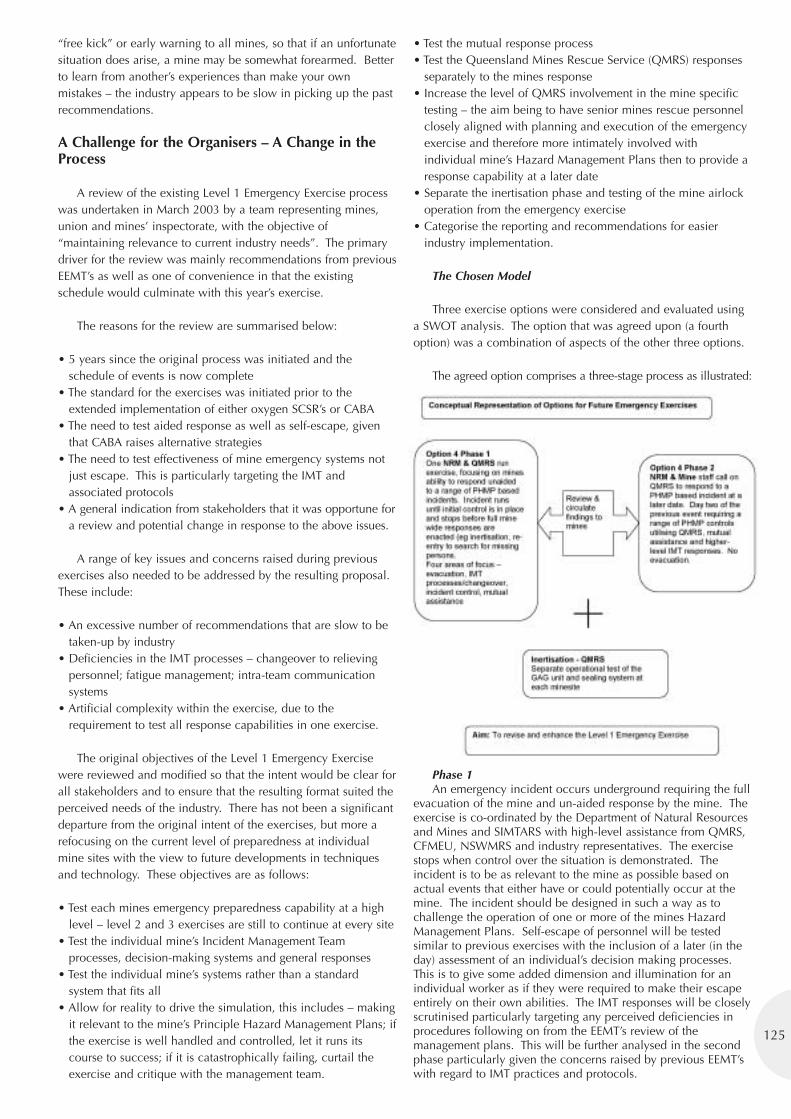
125
“free kick” or early warning to all mines, so that if an unfortunatesituation does arise, a mine may be somewhat forearmed. Betterto learn from another’s experiences than make your ownmistakes – the industry appears to be slow in picking up the pastrecommendations.
A Challenge for the Organisers – A Change in theProcess
A review of the existing Level 1 Emergency Exercise processwas undertaken in March 2003 by a team representing mines,union and mines’ inspectorate, with the objective of“maintaining relevance to current industry needs”. The primarydriver for the review was mainly recommendations from previousEEMT’s as well as one of convenience in that the existingschedule would culminate with this year’s exercise.
The reasons for the review are summarised below:
• 5 years since the original process was initiated and theschedule of events is now complete
• The standard for the exercises was initiated prior to theextended implementation of either oxygen SCSR’s or CABA
• The need to test aided response as well as self-escape, giventhat CABA raises alternative strategies
• The need to test effectiveness of mine emergency systems notjust escape. This is particularly targeting the IMT andassociated protocols
• A general indication from stakeholders that it was opportune fora review and potential change in response to the above issues.
A range of key issues and concerns raised during previousexercises also needed to be addressed by the resulting proposal.These include:
• An excessive number of recommendations that are slow to betaken-up by industry
• Deficiencies in the IMT processes – changeover to relievingpersonnel; fatigue management; intra-team communicationsystems
• Artificial complexity within the exercise, due to therequirement to test all response capabilities in one exercise.
The original objectives of the Level 1 Emergency Exercisewere reviewed and modified so that the intent would be clear forall stakeholders and to ensure that the resulting format suited theperceived needs of the industry. There has not been a significantdeparture from the original intent of the exercises, but more arefocusing on the current level of preparedness at individualmine sites with the view to future developments in techniquesand technology. These objectives are as follows:
• Test each mines emergency preparedness capability at a highlevel – level 2 and 3 exercises are still to continue at every site
• Test the individual mine’s Incident Management Teamprocesses, decision-making systems and general responses
• Test the individual mine’s systems rather than a standardsystem that fits all
• Allow for reality to drive the simulation, this includes – makingit relevant to the mine’s Principle Hazard Management Plans; ifthe exercise is well handled and controlled, let it runs itscourse to success; if it is catastrophically failing, curtail theexercise and critique with the management team.
• Test the mutual response process• Test the Queensland Mines Rescue Service (QMRS) responses
separately to the mines response• Increase the level of QMRS involvement in the mine specific
testing – the aim being to have senior mines rescue personnelclosely aligned with planning and execution of the emergencyexercise and therefore more intimately involved withindividual mine’s Hazard Management Plans then to provide aresponse capability at a later date
• Separate the inertisation phase and testing of the mine airlockoperation from the emergency exercise
• Categorise the reporting and recommendations for easierindustry implementation.
The Chosen Model
Three exercise options were considered and evaluated usinga SWOT analysis. The option that was agreed upon (a fourthoption) was a combination of aspects of the other three options.
The agreed option comprises a three-stage process as illustrated:
Phase 1 An emergency incident occurs underground requiring the full
evacuation of the mine and un-aided response by the mine. Theexercise is co-ordinated by the Department of Natural Resourcesand Mines and SIMTARS with high-level assistance from QMRS,CFMEU, NSWMRS and industry representatives. The exercisestops when control over the situation is demonstrated. Theincident is to be as relevant to the mine as possible based onactual events that either have or could potentially occur at themine. The incident should be designed in such a way as tochallenge the operation of one or more of the mines HazardManagement Plans. Self-escape of personnel will be testedsimilar to previous exercises with the inclusion of a later (in theday) assessment of an individual’s decision making processes.This is to give some added dimension and illumination for anindividual worker as if they were required to make their escapeentirely on their own abilities. The IMT responses will be closelyscrutinised particularly targeting any perceived deficiencies inprocedures following on from the EEMT’s review of themanagement plans. This will be further analysed in the secondphase particularly given the concerns raised by previous EEMT’swith regard to IMT practices and protocols.
Phase 2A new step, not without controversy. This will be an entirely
separate exercise to Phase 1, most likely but not necessarily,conducted at a different mine. It will be, in principle, the next dayor stage of an emergency incident following on from the minesinitial evacuation. It will follow on from Phase 1 to some degreebut will not exactly dovetail due to different mines idiosyncrasies.For instance, Phase 1 may see a mine fully evacuated due to a fireor explosion, Phase 2 could be the extended control of a firesituation due to spontaneous combustion, if the seam is so proneor the recovery of trapped mineworkers following the collapse ofstrata due to the Phase 1 fire (now extinguished) destroying roofsupport. The options will clearly depend on the individual minesparticular hazards. The focus will now, not only be on the IMTprocesses, but also those of external agency support – such asQMRS, or whoever the mine nominates as the external supportsystems for such an event. This will obviously necessitate adifferent level of co-ordination to the previous exercise and adifferent range of findings for all concerned. It will not require theevacuation of the affected mine – work should continue largelyunaffected. Some mines rescue operation is likely with a similarimpact to that of normal training sessions. The greatest impact willbe on the mine’s IMT who will need to be released to address the“situation”.
Both of the exercises will occur within a calendar year, withthe aim being to hold Phase 1 prior to this Health and SafetyConference, report the initial findings at the conference with apublicised report to industry shortly after. Then, identifying somelevel of initiation of the industry based recommendations ratherthan mine specific recommendations in place at the Phase 2exercise.
The addition of this second phase is also aimed at reducingthe issue of loss of corporate memory – more people exposed tothis style of exercise makes for a more robust industry.
Phase 3Finally the requirement for testing of the mine entry airlock
and coupling of the GAG Inertisation unit will occur at a timethat is mutually convenient to both the mine and the QMRS.This acknowledges the fact that it may not always be practicableor necessary to instigate these steps in every emergencyresponse. Similarly, it is recognised that fitting these steps inwith normal mine downtimes such as main fan outages is moreconducive to all parties.
A Challenge for Crinum
It must be stated very clearly at the outset that the EmergencyExercise Management Team (EEMT) had significant difficulty indevising an exercise that would stretch Crinum’s systems andretain credibility as a practicable exercise. This was mainlybecause of the mine’s robust ventilation system and the nature ofthe underground hazards. This is a commendable situation.
The objective of the EEMT was to create a situation ofsufficient magnitude that a full mine evacuation was necessarywith an integrated response from the mine’s IncidentManagement Team (IMT). This must be to a level of complexitythat all personnel are affected to some degree.
Crinum’s relevant particulars in brief:
Main Headings - 3 intakes, 2 returns.Conveyor belt (C Hdg) installed in the centre heading and issegregated from other roads.Transport roads are predominantly one way – travel inbyeusing A Hdg, outbye using B Hdg.The seam exhibits low/medium propensity to spontaneouscombustion.Seam gas is predominantly carbon dioxide at relatively low levels.Very little timber is used for strata support. It is mainly in theform of steel tendons or bolts with some steel square sets.Use is made of non-flammable lining of some work areas.
Construction of the Incident
Most major incidents that lead to a co-ordinated responsefrom a mine are generally as a result of a combination of failuresas illustrated by the Reason Model. Therefore in simulating theoccurrence of an incident each of these factors should beincluded: Organisational and System Factors, Task andEnvironmental Conditions, Individual and Team Actions andfinally, Absent or Failed Defences.
To this end the following material was reviewed in order togain an understanding of the mine, relevant existing hazards andpotential combinations of use:
• Hazard Management Plans• Operating Procedures• Mine Plans• Ventilation Model• Operational Layout of the mine• Incident Records.
The main difficulty in creating a suitable incident at Crinum isthat it is unlikely to affect other panels due to the ventilation system.Hence the need to actively enlist all aspect of the above model.
Unfortunately, it is not possible to reveal more of the incidentor findings at this stage with the exercise programmed to occurjust prior to the conference.
Findings & Recommendations from the CrinumExercise
Thanks and appreciation is extended to key personnel atCrinum Mine for their assistance and professionalism inconducting this exercise. Specifically: Steve Bullough, GaryMcSpadden, Mark McCamley, Peter Baker and Dan Cherry.
Secondly thanks go to the Emergency Exercise Team –particularly Martin Watkinson, Darren Brady and Kirrily Star whocarried the bulk of the load; Greg Dalliston, Wayne Hartley,Michael Downs, Peter Baker (NSWMRS), Seamus Devlin, RonStothard, Mark Donghi and Bruce McKinnon.
Responding to the Challenge – Crinum’s Perspective
Who’s Next?
The previous standard for Emergency Exercises is being redrafted,including the indicative schedule for locations of the exercise. Oneof the issues that hamper the EEMT is the difficulty in accessingPrinciple Hazard Management Plans, Ventilation Models and MinePlans for planning purposes. There is obviously an issue ofconfidentiality to be addressed, however, with the requirement of asecond phase to each exercise, it will be critical to obtain sufficientinformation for this process. Therefore, there will be requests for thisinformation at different times throughout the year as well as anindication of operational status of selected mines.
Bibliography
Recommendations for Level 1 Emergency Exercises – Aiming tomaintain relevance to current industry needs. March 2003. AReview of the existing system. Greg Dalliston, Michael Downs,Wayne Hartley, Mark McCamley, Alan Payne, Greg Rowan, DanTeale, David Reece, Martin Watkinson.
North Goonyella Level 1 Emergency Exercise Report. 2002. Greg Rowan.
The Complete Listing of Emergency Response Recommendations.2003 Kirrily Star.
126
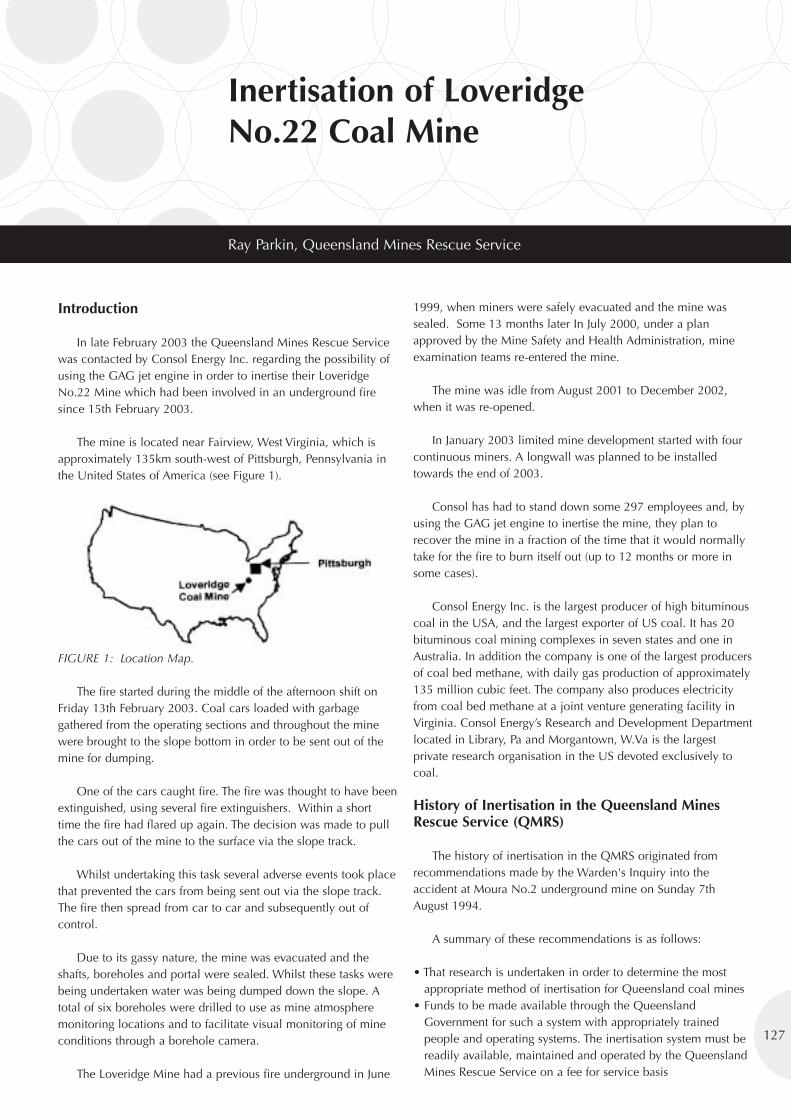
127
Inertisation of LoveridgeNo.22 Coal Mine
Ray Parkin, Queensland Mines Rescue Service
Introduction
In late February 2003 the Queensland Mines Rescue Servicewas contacted by Consol Energy Inc. regarding the possibility ofusing the GAG jet engine in order to inertise their LoveridgeNo.22 Mine which had been involved in an underground firesince 15th February 2003.
The mine is located near Fairview, West Virginia, which isapproximately 135km south-west of Pittsburgh, Pennsylvania inthe United States of America (see Figure 1).
FIGURE 1: Location Map.
The fire started during the middle of the afternoon shift onFriday 13th February 2003. Coal cars loaded with garbagegathered from the operating sections and throughout the minewere brought to the slope bottom in order to be sent out of themine for dumping.
One of the cars caught fire. The fire was thought to have beenextinguished, using several fire extinguishers. Within a shorttime the fire had flared up again. The decision was made to pullthe cars out of the mine to the surface via the slope track.
Whilst undertaking this task several adverse events took placethat prevented the cars from being sent out via the slope track.The fire then spread from car to car and subsequently out ofcontrol.
Due to its gassy nature, the mine was evacuated and theshafts, boreholes and portal were sealed. Whilst these tasks werebeing undertaken water was being dumped down the slope. Atotal of six boreholes were drilled to use as mine atmospheremonitoring locations and to facilitate visual monitoring of mineconditions through a borehole camera.
The Loveridge Mine had a previous fire underground in June
1999, when miners were safely evacuated and the mine wassealed. Some 13 months later In July 2000, under a planapproved by the Mine Safety and Health Administration, mineexamination teams re-entered the mine.
The mine was idle from August 2001 to December 2002,when it was re-opened.
In January 2003 limited mine development started with fourcontinuous miners. A longwall was planned to be installedtowards the end of 2003.
Consol has had to stand down some 297 employees and, byusing the GAG jet engine to inertise the mine, they plan torecover the mine in a fraction of the time that it would normallytake for the fire to burn itself out (up to 12 months or more insome cases).
Consol Energy Inc. is the largest producer of high bituminouscoal in the USA, and the largest exporter of US coal. It has 20bituminous coal mining complexes in seven states and one inAustralia. In addition the company is one of the largest producersof coal bed methane, with daily gas production of approximately135 million cubic feet. The company also produces electricityfrom coal bed methane at a joint venture generating facility inVirginia. Consol Energy’s Research and Development Departmentlocated in Library, Pa and Morgantown, W.Va is the largestprivate research organisation in the US devoted exclusively tocoal.
History of Inertisation in the Queensland MinesRescue Service (QMRS)
The history of inertisation in the QMRS originated fromrecommendations made by the Warden's Inquiry into theaccident at Moura No.2 underground mine on Sunday 7thAugust 1994.
A summary of these recommendations is as follows:
• That research is undertaken in order to determine the mostappropriate method of inertisation for Queensland coal mines
• Funds to be made available through the QueenslandGovernment for such a system with appropriately trainedpeople and operating systems. The inertisation system must bereadily available, maintained and operated by the QueenslandMines Rescue Service on a fee for service basis
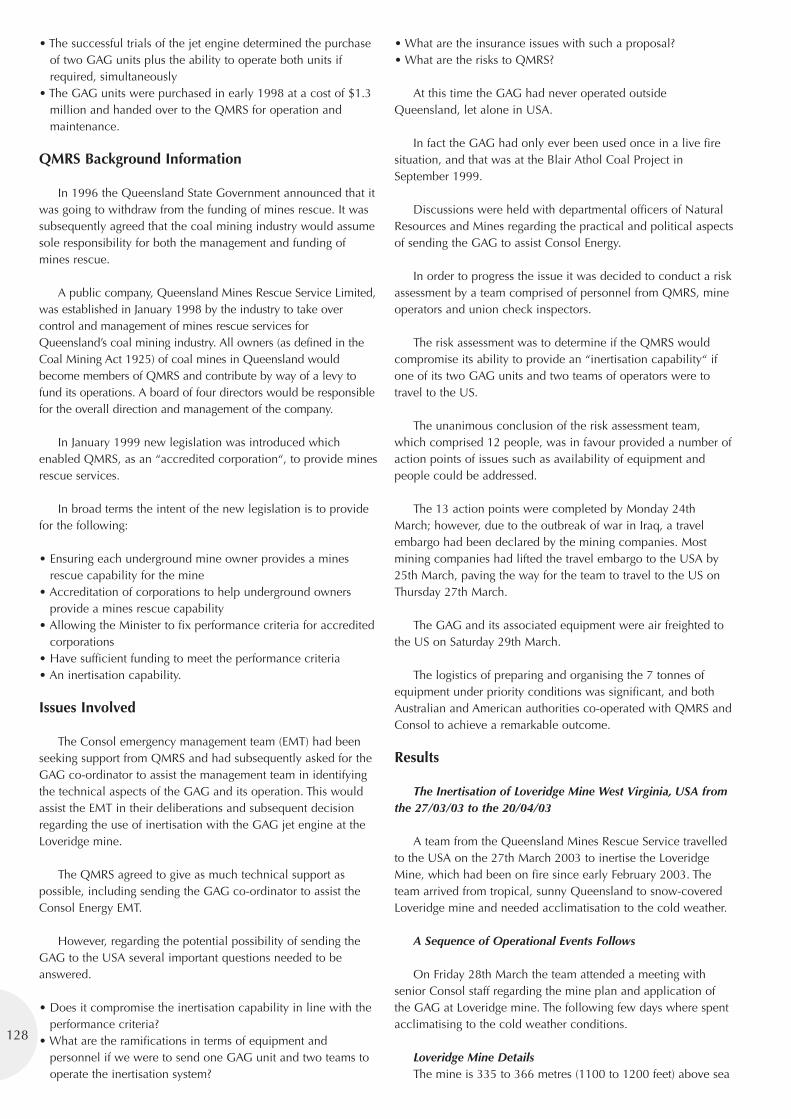
• The successful trials of the jet engine determined the purchaseof two GAG units plus the ability to operate both units ifrequired, simultaneously
• The GAG units were purchased in early 1998 at a cost of $1.3million and handed over to the QMRS for operation andmaintenance.
QMRS Background Information
In 1996 the Queensland State Government announced that itwas going to withdraw from the funding of mines rescue. It wassubsequently agreed that the coal mining industry would assumesole responsibility for both the management and funding ofmines rescue.
A public company, Queensland Mines Rescue Service Limited,was established in January 1998 by the industry to take overcontrol and management of mines rescue services forQueensland’s coal mining industry. All owners (as defined in theCoal Mining Act 1925) of coal mines in Queensland wouldbecome members of QMRS and contribute by way of a levy tofund its operations. A board of four directors would be responsiblefor the overall direction and management of the company.
In January 1999 new legislation was introduced whichenabled QMRS, as an “accredited corporation“, to provide minesrescue services.
In broad terms the intent of the new legislation is to providefor the following:
• Ensuring each underground mine owner provides a minesrescue capability for the mine
• Accreditation of corporations to help underground ownersprovide a mines rescue capability
• Allowing the Minister to fix performance criteria for accreditedcorporations
• Have sufficient funding to meet the performance criteria• An inertisation capability.
Issues Involved
The Consol emergency management team (EMT) had beenseeking support from QMRS and had subsequently asked for theGAG co-ordinator to assist the management team in identifyingthe technical aspects of the GAG and its operation. This wouldassist the EMT in their deliberations and subsequent decisionregarding the use of inertisation with the GAG jet engine at theLoveridge mine.
The QMRS agreed to give as much technical support aspossible, including sending the GAG co-ordinator to assist theConsol Energy EMT.
However, regarding the potential possibility of sending theGAG to the USA several important questions needed to beanswered.
• Does it compromise the inertisation capability in line with theperformance criteria?
• What are the ramifications in terms of equipment andpersonnel if we were to send one GAG unit and two teams tooperate the inertisation system?
• What are the insurance issues with such a proposal?• What are the risks to QMRS?
At this time the GAG had never operated outsideQueensland, let alone in USA.
In fact the GAG had only ever been used once in a live firesituation, and that was at the Blair Athol Coal Project inSeptember 1999.
Discussions were held with departmental officers of NaturalResources and Mines regarding the practical and political aspectsof sending the GAG to assist Consol Energy.
In order to progress the issue it was decided to conduct a riskassessment by a team comprised of personnel from QMRS, mineoperators and union check inspectors.
The risk assessment was to determine if the QMRS wouldcompromise its ability to provide an “inertisation capability“ ifone of its two GAG units and two teams of operators were totravel to the US.
The unanimous conclusion of the risk assessment team,which comprised 12 people, was in favour provided a number ofaction points of issues such as availability of equipment andpeople could be addressed.
The 13 action points were completed by Monday 24thMarch; however, due to the outbreak of war in Iraq, a travelembargo had been declared by the mining companies. Mostmining companies had lifted the travel embargo to the USA by25th March, paving the way for the team to travel to the US onThursday 27th March.
The GAG and its associated equipment were air freighted tothe US on Saturday 29th March.
The logistics of preparing and organising the 7 tonnes ofequipment under priority conditions was significant, and bothAustralian and American authorities co-operated with QMRS andConsol to achieve a remarkable outcome.
Results
The Inertisation of Loveridge Mine West Virginia, USA fromthe 27/03/03 to the 20/04/03
A team from the Queensland Mines Rescue Service travelledto the USA on the 27th March 2003 to inertise the LoveridgeMine, which had been on fire since early February 2003. Theteam arrived from tropical, sunny Queensland to snow-coveredLoveridge mine and needed acclimatisation to the cold weather.
A Sequence of Operational Events Follows
On Friday 28th March the team attended a meeting withsenior Consol staff regarding the mine plan and application ofthe GAG at Loveridge mine. The following few days where spentacclimatising to the cold weather conditions.
Loveridge Mine DetailsThe mine is 335 to 366 metres (1100 to 1200 feet) above sea
128
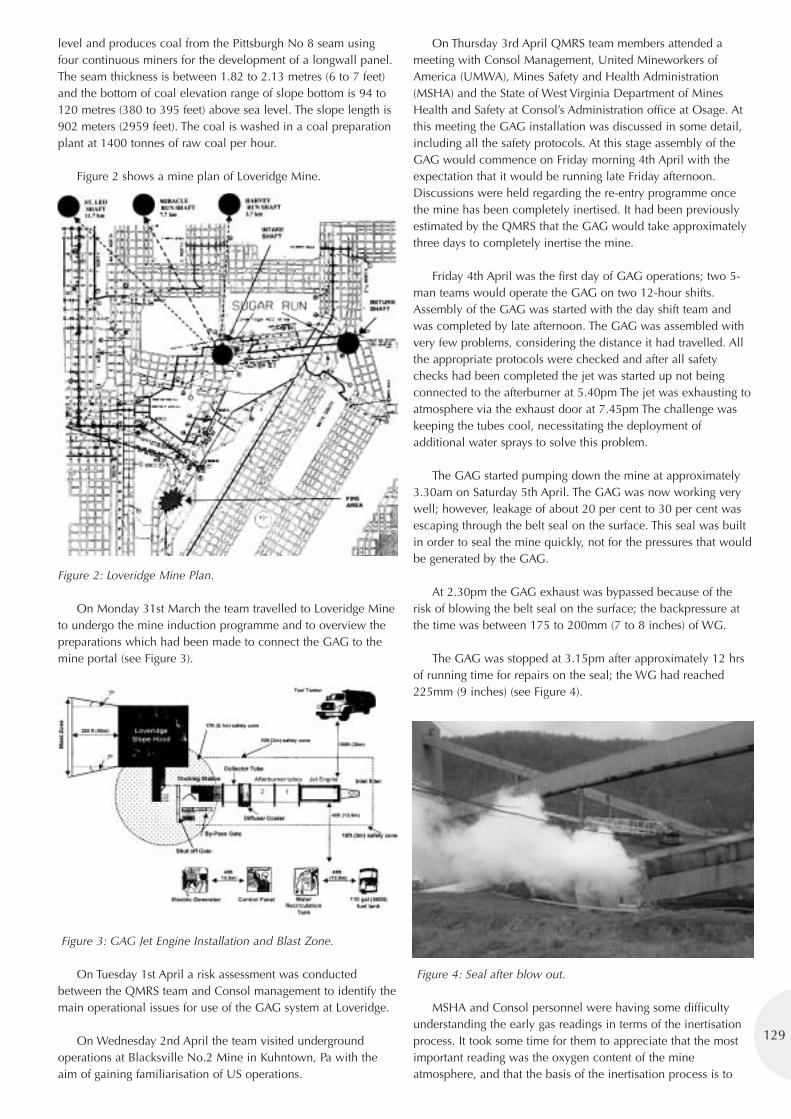
129
level and produces coal from the Pittsburgh No 8 seam usingfour continuous miners for the development of a longwall panel.The seam thickness is between 1.82 to 2.13 metres (6 to 7 feet)and the bottom of coal elevation range of slope bottom is 94 to120 metres (380 to 395 feet) above sea level. The slope length is902 meters (2959 feet). The coal is washed in a coal preparationplant at 1400 tonnes of raw coal per hour.
Figure 2 shows a mine plan of Loveridge Mine.
Figure 2: Loveridge Mine Plan.
On Monday 31st March the team travelled to Loveridge Mineto undergo the mine induction programme and to overview thepreparations which had been made to connect the GAG to themine portal (see Figure 3).
Figure 3: GAG Jet Engine Installation and Blast Zone.
On Tuesday 1st April a risk assessment was conductedbetween the QMRS team and Consol management to identify themain operational issues for use of the GAG system at Loveridge.
On Wednesday 2nd April the team visited undergroundoperations at Blacksville No.2 Mine in Kuhntown, Pa with theaim of gaining familiarisation of US operations.
On Thursday 3rd April QMRS team members attended ameeting with Consol Management, United Mineworkers ofAmerica (UMWA), Mines Safety and Health Administration(MSHA) and the State of West Virginia Department of MinesHealth and Safety at Consol’s Administration office at Osage. Atthis meeting the GAG installation was discussed in some detail,including all the safety protocols. At this stage assembly of theGAG would commence on Friday morning 4th April with theexpectation that it would be running late Friday afternoon.Discussions were held regarding the re-entry programme oncethe mine has been completely inertised. It had been previouslyestimated by the QMRS that the GAG would take approximatelythree days to completely inertise the mine.
Friday 4th April was the first day of GAG operations; two 5-man teams would operate the GAG on two 12-hour shifts.Assembly of the GAG was started with the day shift team andwas completed by late afternoon. The GAG was assembled withvery few problems, considering the distance it had travelled. Allthe appropriate protocols were checked and after all safetychecks had been completed the jet was started up not beingconnected to the afterburner at 5.40pm The jet was exhausting toatmosphere via the exhaust door at 7.45pm The challenge waskeeping the tubes cool, necessitating the deployment ofadditional water sprays to solve this problem.
The GAG started pumping down the mine at approximately3.30am on Saturday 5th April. The GAG was now working verywell; however, leakage of about 20 per cent to 30 per cent wasescaping through the belt seal on the surface. This seal was builtin order to seal the mine quickly, not for the pressures that wouldbe generated by the GAG.
At 2.30pm the GAG exhaust was bypassed because of therisk of blowing the belt seal on the surface; the backpressure atthe time was between 175 to 200mm (7 to 8 inches) of WG.
The GAG was stopped at 3.15pm after approximately 12 hrsof running time for repairs on the seal; the WG had reached225mm (9 inches) (see Figure 4).
Figure 4: Seal after blow out.
MSHA and Consol personnel were having some difficultyunderstanding the early gas readings in terms of the inertisationprocess. It took some time for them to appreciate that the mostimportant reading was the oxygen content of the mineatmosphere, and that the basis of the inertisation process is to
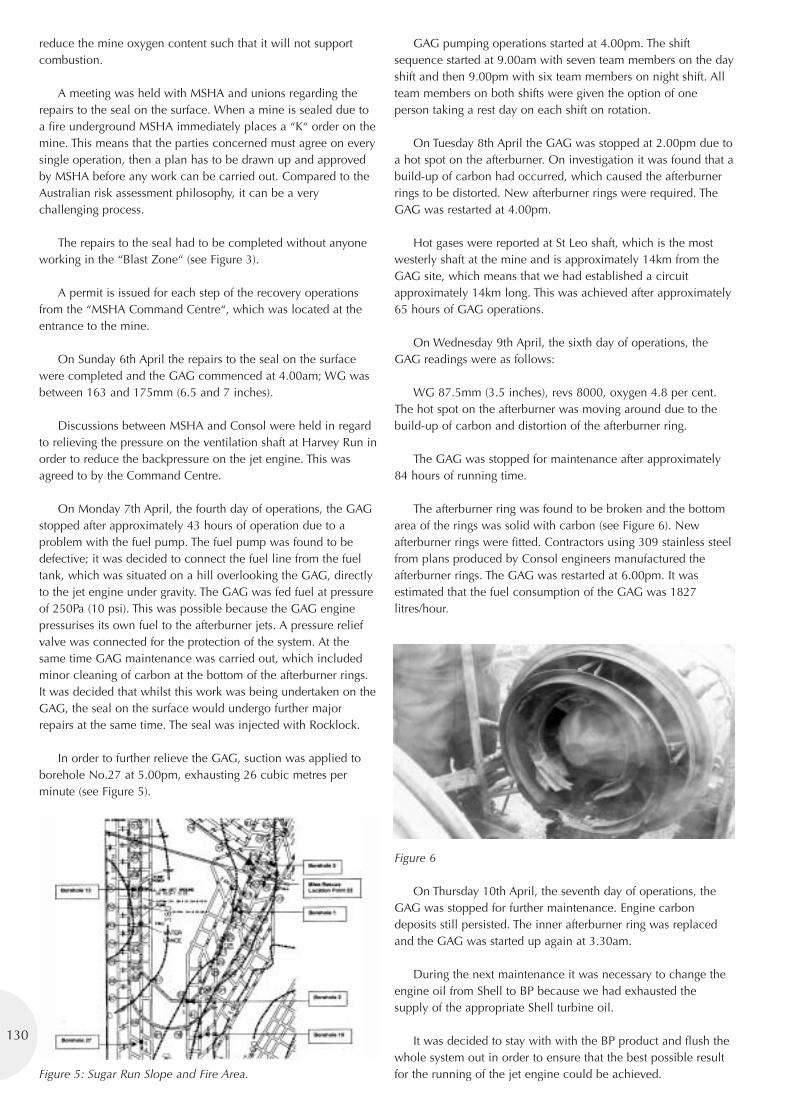
reduce the mine oxygen content such that it will not supportcombustion.
A meeting was held with MSHA and unions regarding therepairs to the seal on the surface. When a mine is sealed due toa fire underground MSHA immediately places a “K“ order on themine. This means that the parties concerned must agree on everysingle operation, then a plan has to be drawn up and approvedby MSHA before any work can be carried out. Compared to theAustralian risk assessment philosophy, it can be a verychallenging process.
The repairs to the seal had to be completed without anyoneworking in the “Blast Zone“ (see Figure 3).
A permit is issued for each step of the recovery operationsfrom the “MSHA Command Centre“, which was located at theentrance to the mine.
On Sunday 6th April the repairs to the seal on the surfacewere completed and the GAG commenced at 4.00am; WG wasbetween 163 and 175mm (6.5 and 7 inches).
Discussions between MSHA and Consol were held in regardto relieving the pressure on the ventilation shaft at Harvey Run inorder to reduce the backpressure on the jet engine. This wasagreed to by the Command Centre.
On Monday 7th April, the fourth day of operations, the GAGstopped after approximately 43 hours of operation due to aproblem with the fuel pump. The fuel pump was found to bedefective; it was decided to connect the fuel line from the fueltank, which was situated on a hill overlooking the GAG, directlyto the jet engine under gravity. The GAG was fed fuel at pressureof 250Pa (10 psi). This was possible because the GAG enginepressurises its own fuel to the afterburner jets. A pressure reliefvalve was connected for the protection of the system. At thesame time GAG maintenance was carried out, which includedminor cleaning of carbon at the bottom of the afterburner rings.It was decided that whilst this work was being undertaken on theGAG, the seal on the surface would undergo further majorrepairs at the same time. The seal was injected with Rocklock.
In order to further relieve the GAG, suction was applied toborehole No.27 at 5.00pm, exhausting 26 cubic metres perminute (see Figure 5).
Figure 5: Sugar Run Slope and Fire Area.
GAG pumping operations started at 4.00pm. The shiftsequence started at 9.00am with seven team members on the dayshift and then 9.00pm with six team members on night shift. Allteam members on both shifts were given the option of oneperson taking a rest day on each shift on rotation.
On Tuesday 8th April the GAG was stopped at 2.00pm due toa hot spot on the afterburner. On investigation it was found that abuild-up of carbon had occurred, which caused the afterburnerrings to be distorted. New afterburner rings were required. TheGAG was restarted at 4.00pm.
Hot gases were reported at St Leo shaft, which is the mostwesterly shaft at the mine and is approximately 14km from theGAG site, which means that we had established a circuitapproximately 14km long. This was achieved after approximately65 hours of GAG operations.
On Wednesday 9th April, the sixth day of operations, theGAG readings were as follows:
WG 87.5mm (3.5 inches), revs 8000, oxygen 4.8 per cent.The hot spot on the afterburner was moving around due to thebuild-up of carbon and distortion of the afterburner ring.
The GAG was stopped for maintenance after approximately84 hours of running time.
The afterburner ring was found to be broken and the bottomarea of the rings was solid with carbon (see Figure 6). Newafterburner rings were fitted. Contractors using 309 stainless steelfrom plans produced by Consol engineers manufactured theafterburner rings. The GAG was restarted at 6.00pm. It wasestimated that the fuel consumption of the GAG was 1827litres/hour.
Figure 6
On Thursday 10th April, the seventh day of operations, theGAG was stopped for further maintenance. Engine carbondeposits still persisted. The inner afterburner ring was replacedand the GAG was started up again at 3.30am.
During the next maintenance it was necessary to change theengine oil from Shell to BP because we had exhausted thesupply of the appropriate Shell turbine oil.
It was decided to stay with with the BP product and flush thewhole system out in order to ensure that the best possible resultfor the running of the jet engine could be achieved.
130
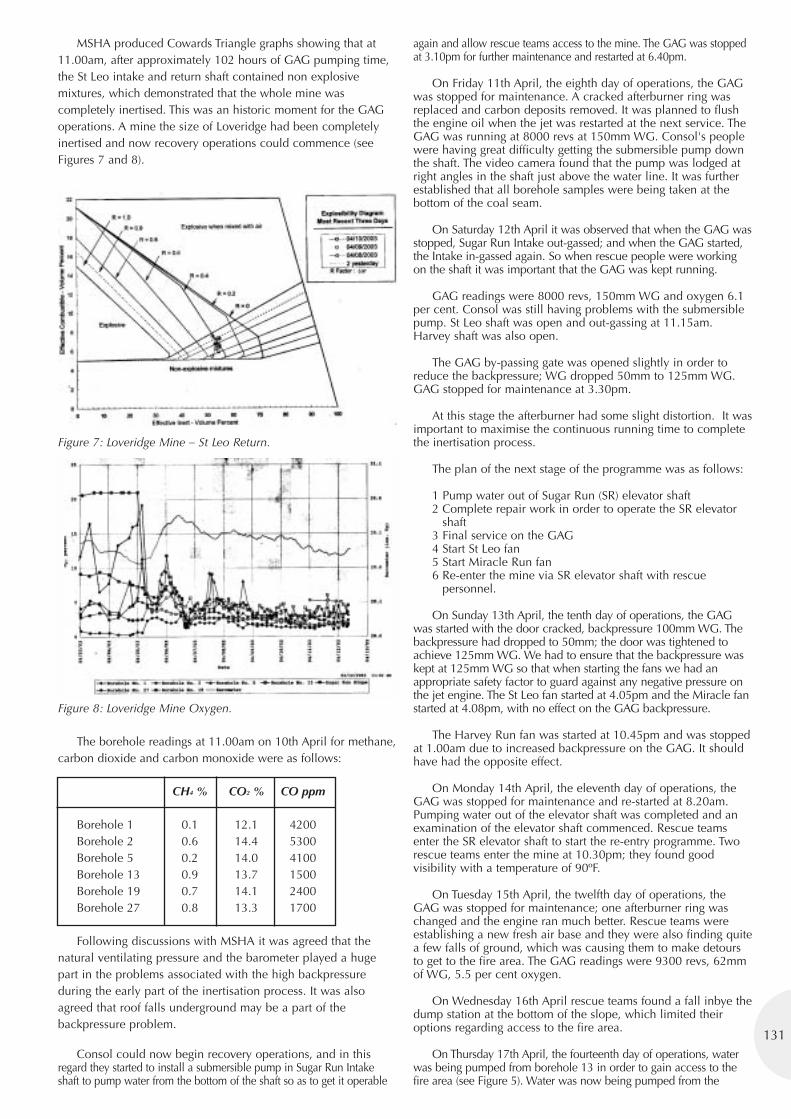
131
MSHA produced Cowards Triangle graphs showing that at11.00am, after approximately 102 hours of GAG pumping time,the St Leo intake and return shaft contained non explosivemixtures, which demonstrated that the whole mine wascompletely inertised. This was an historic moment for the GAGoperations. A mine the size of Loveridge had been completelyinertised and now recovery operations could commence (seeFigures 7 and 8).
Figure 7: Loveridge Mine – St Leo Return.
Figure 8: Loveridge Mine Oxygen.
The borehole readings at 11.00am on 10th April for methane,carbon dioxide and carbon monoxide were as follows:
CH4 % CO2 % CO ppm
Borehole 1 0.1 12.1 4200Borehole 2 0.6 14.4 5300Borehole 5 0.2 14.0 4100Borehole 13 0.9 13.7 1500Borehole 19 0.7 14.1 2400Borehole 27 0.8 13.3 1700
Following discussions with MSHA it was agreed that thenatural ventilating pressure and the barometer played a hugepart in the problems associated with the high backpressureduring the early part of the inertisation process. It was alsoagreed that roof falls underground may be a part of thebackpressure problem.
Consol could now begin recovery operations, and in thisregard they started to install a submersible pump in Sugar Run Intakeshaft to pump water from the bottom of the shaft so as to get it operable
again and allow rescue teams access to the mine. The GAG was stoppedat 3.10pm for further maintenance and restarted at 6.40pm.
On Friday 11th April, the eighth day of operations, the GAGwas stopped for maintenance. A cracked afterburner ring wasreplaced and carbon deposits removed. It was planned to flushthe engine oil when the jet was restarted at the next service. TheGAG was running at 8000 revs at 150mm WG. Consol's peoplewere having great difficulty getting the submersible pump downthe shaft. The video camera found that the pump was lodged atright angles in the shaft just above the water line. It was furtherestablished that all borehole samples were being taken at thebottom of the coal seam.
On Saturday 12th April it was observed that when the GAG wasstopped, Sugar Run Intake out-gassed; and when the GAG started,the Intake in-gassed again. So when rescue people were workingon the shaft it was important that the GAG was kept running.
GAG readings were 8000 revs, 150mm WG and oxygen 6.1per cent. Consol was still having problems with the submersiblepump. St Leo shaft was open and out-gassing at 11.15am.Harvey shaft was also open.
The GAG by-passing gate was opened slightly in order toreduce the backpressure; WG dropped 50mm to 125mm WG.GAG stopped for maintenance at 3.30pm.
At this stage the afterburner had some slight distortion. It wasimportant to maximise the continuous running time to completethe inertisation process.
The plan of the next stage of the programme was as follows:
1 Pump water out of Sugar Run (SR) elevator shaft2 Complete repair work in order to operate the SR elevator
shaft3 Final service on the GAG4 Start St Leo fan5 Start Miracle Run fan6 Re-enter the mine via SR elevator shaft with rescue
personnel.
On Sunday 13th April, the tenth day of operations, the GAGwas started with the door cracked, backpressure 100mm WG. Thebackpressure had dropped to 50mm; the door was tightened toachieve 125mm WG. We had to ensure that the backpressure waskept at 125mm WG so that when starting the fans we had anappropriate safety factor to guard against any negative pressure onthe jet engine. The St Leo fan started at 4.05pm and the Miracle fanstarted at 4.08pm, with no effect on the GAG backpressure.
The Harvey Run fan was started at 10.45pm and was stoppedat 1.00am due to increased backpressure on the GAG. It shouldhave had the opposite effect.
On Monday 14th April, the eleventh day of operations, theGAG was stopped for maintenance and re-started at 8.20am.Pumping water out of the elevator shaft was completed and anexamination of the elevator shaft commenced. Rescue teamsenter the SR elevator shaft to start the re-entry programme. Tworescue teams enter the mine at 10.30pm; they found goodvisibility with a temperature of 90ºF.
On Tuesday 15th April, the twelfth day of operations, theGAG was stopped for maintenance; one afterburner ring waschanged and the engine ran much better. Rescue teams wereestablishing a new fresh air base and they were also finding quitea few falls of ground, which was causing them to make detoursto get to the fire area. The GAG readings were 9300 revs, 62mmof WG, 5.5 per cent oxygen.
On Wednesday 16th April rescue teams found a fall inbye thedump station at the bottom of the slope, which limited theiroptions regarding access to the fire area.
On Thursday 17th April, the fourteenth day of operations, waterwas being pumped from borehole 13 in order to gain access to thefire area (see Figure 5). Water was now being pumped from the
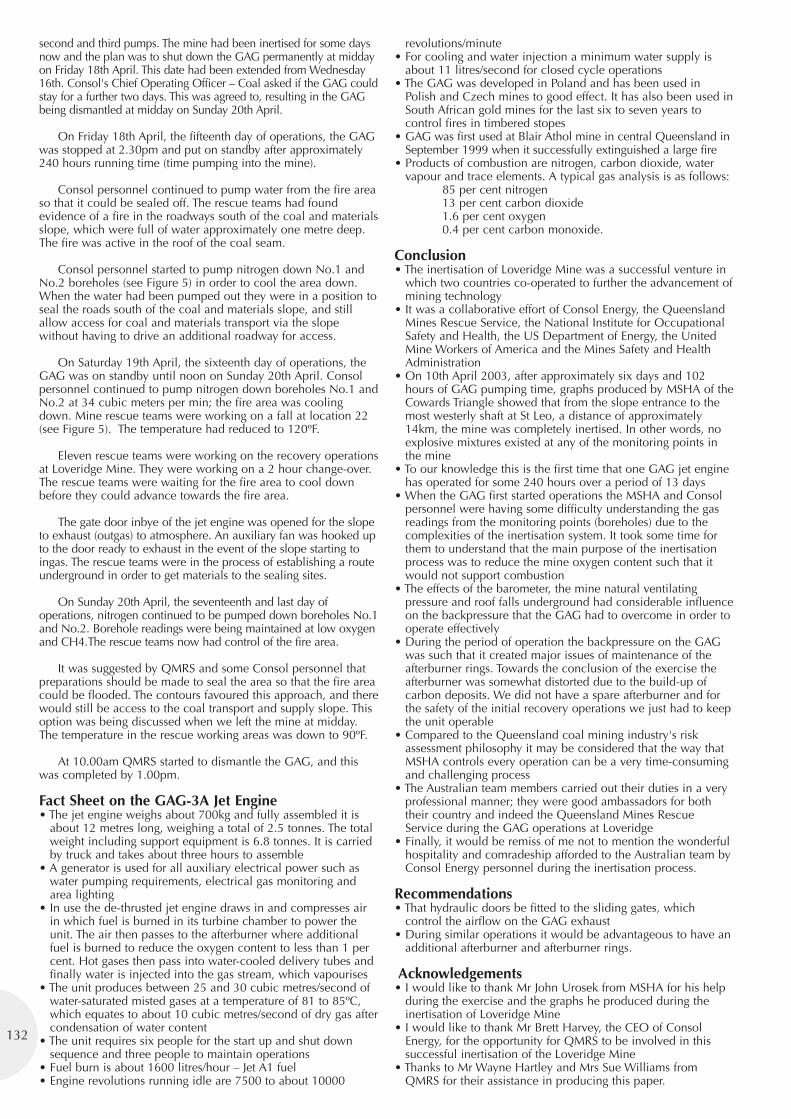
second and third pumps. The mine had been inertised for some daysnow and the plan was to shut down the GAG permanently at middayon Friday 18th April. This date had been extended from Wednesday16th. Consol's Chief Operating Officer – Coal asked if the GAG couldstay for a further two days. This was agreed to, resulting in the GAGbeing dismantled at midday on Sunday 20th April.
On Friday 18th April, the fifteenth day of operations, the GAGwas stopped at 2.30pm and put on standby after approximately240 hours running time (time pumping into the mine).
Consol personnel continued to pump water from the fire areaso that it could be sealed off. The rescue teams had foundevidence of a fire in the roadways south of the coal and materialsslope, which were full of water approximately one metre deep.The fire was active in the roof of the coal seam.
Consol personnel started to pump nitrogen down No.1 andNo.2 boreholes (see Figure 5) in order to cool the area down.When the water had been pumped out they were in a position toseal the roads south of the coal and materials slope, and stillallow access for coal and materials transport via the slopewithout having to drive an additional roadway for access.
On Saturday 19th April, the sixteenth day of operations, theGAG was on standby until noon on Sunday 20th April. Consolpersonnel continued to pump nitrogen down boreholes No.1 andNo.2 at 34 cubic meters per min; the fire area was coolingdown. Mine rescue teams were working on a fall at location 22(see Figure 5). The temperature had reduced to 120ºF.
Eleven rescue teams were working on the recovery operationsat Loveridge Mine. They were working on a 2 hour change-over.The rescue teams were waiting for the fire area to cool downbefore they could advance towards the fire area.
The gate door inbye of the jet engine was opened for the slopeto exhaust (outgas) to atmosphere. An auxiliary fan was hooked upto the door ready to exhaust in the event of the slope starting toingas. The rescue teams were in the process of establishing a routeunderground in order to get materials to the sealing sites.
On Sunday 20th April, the seventeenth and last day ofoperations, nitrogen continued to be pumped down boreholes No.1and No.2. Borehole readings were being maintained at low oxygenand CH4.The rescue teams now had control of the fire area.
It was suggested by QMRS and some Consol personnel thatpreparations should be made to seal the area so that the fire areacould be flooded. The contours favoured this approach, and therewould still be access to the coal transport and supply slope. Thisoption was being discussed when we left the mine at midday.The temperature in the rescue working areas was down to 90ºF.
At 10.00am QMRS started to dismantle the GAG, and thiswas completed by 1.00pm.
Fact Sheet on the GAG-3A Jet Engine• The jet engine weighs about 700kg and fully assembled it is
about 12 metres long, weighing a total of 2.5 tonnes. The totalweight including support equipment is 6.8 tonnes. It is carriedby truck and takes about three hours to assemble
• A generator is used for all auxiliary electrical power such aswater pumping requirements, electrical gas monitoring andarea lighting
• In use the de-thrusted jet engine draws in and compresses airin which fuel is burned in its turbine chamber to power theunit. The air then passes to the afterburner where additionalfuel is burned to reduce the oxygen content to less than 1 percent. Hot gases then pass into water-cooled delivery tubes andfinally water is injected into the gas stream, which vapourises
• The unit produces between 25 and 30 cubic metres/second ofwater-saturated misted gases at a temperature of 81 to 85ºC,which equates to about 10 cubic metres/second of dry gas aftercondensation of water content
• The unit requires six people for the start up and shut downsequence and three people to maintain operations
• Fuel burn is about 1600 litres/hour – Jet A1 fuel• Engine revolutions running idle are 7500 to about 10000
revolutions/minute• For cooling and water injection a minimum water supply is
about 11 litres/second for closed cycle operations• The GAG was developed in Poland and has been used in
Polish and Czech mines to good effect. It has also been used inSouth African gold mines for the last six to seven years tocontrol fires in timbered stopes
• GAG was first used at Blair Athol mine in central Queensland inSeptember 1999 when it successfully extinguished a large fire
• Products of combustion are nitrogen, carbon dioxide, watervapour and trace elements. A typical gas analysis is as follows:
85 per cent nitrogen13 per cent carbon dioxide1.6 per cent oxygen0.4 per cent carbon monoxide.
Conclusion• The inertisation of Loveridge Mine was a successful venture in
which two countries co-operated to further the advancement ofmining technology
• It was a collaborative effort of Consol Energy, the QueenslandMines Rescue Service, the National Institute for OccupationalSafety and Health, the US Department of Energy, the UnitedMine Workers of America and the Mines Safety and HealthAdministration
• On 10th April 2003, after approximately six days and 102hours of GAG pumping time, graphs produced by MSHA of theCowards Triangle showed that from the slope entrance to themost westerly shaft at St Leo, a distance of approximately14km, the mine was completely inertised. In other words, noexplosive mixtures existed at any of the monitoring points inthe mine
• To our knowledge this is the first time that one GAG jet enginehas operated for some 240 hours over a period of 13 days
• When the GAG first started operations the MSHA and Consolpersonnel were having some difficulty understanding the gasreadings from the monitoring points (boreholes) due to thecomplexities of the inertisation system. It took some time forthem to understand that the main purpose of the inertisationprocess was to reduce the mine oxygen content such that itwould not support combustion
• The effects of the barometer, the mine natural ventilatingpressure and roof falls underground had considerable influenceon the backpressure that the GAG had to overcome in order tooperate effectively
• During the period of operation the backpressure on the GAGwas such that it created major issues of maintenance of theafterburner rings. Towards the conclusion of the exercise theafterburner was somewhat distorted due to the build-up ofcarbon deposits. We did not have a spare afterburner and forthe safety of the initial recovery operations we just had to keepthe unit operable
• Compared to the Queensland coal mining industry's riskassessment philosophy it may be considered that the way thatMSHA controls every operation can be a very time-consumingand challenging process
• The Australian team members carried out their duties in a veryprofessional manner; they were good ambassadors for boththeir country and indeed the Queensland Mines RescueService during the GAG operations at Loveridge
• Finally, it would be remiss of me not to mention the wonderfulhospitality and comradeship afforded to the Australian team byConsol Energy personnel during the inertisation process.
Recommendations• That hydraulic doors be fitted to the sliding gates, which
control the airflow on the GAG exhaust• During similar operations it would be advantageous to have an
additional afterburner and afterburner rings.
Acknowledgements• I would like to thank Mr John Urosek from MSHA for his help
during the exercise and the graphs he produced during theinertisation of Loveridge Mine
• I would like to thank Mr Brett Harvey, the CEO of ConsolEnergy, for the opportunity for QMRS to be involved in thissuccessful inertisation of the Loveridge Mine
• Thanks to Mr Wayne Hartley and Mrs Sue Williams fromQMRS for their assistance in producing this paper.
132
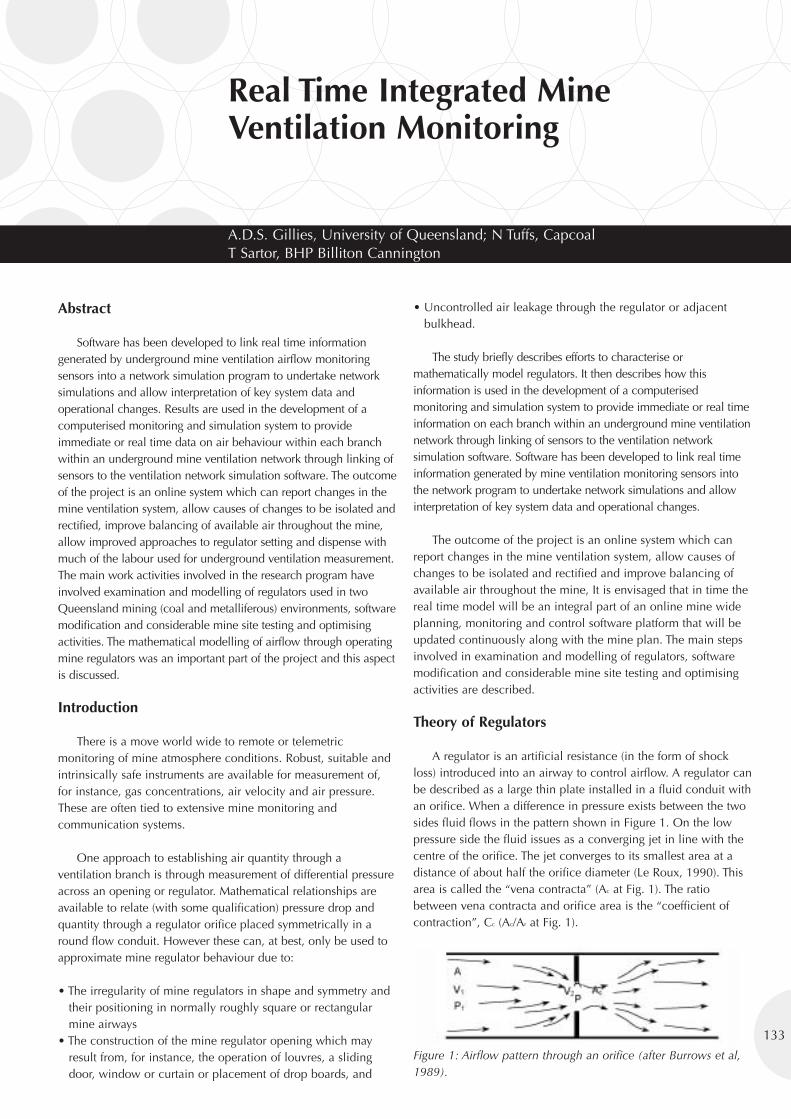
133
Real Time Integrated MineVentilation Monitoring
A.D.S. Gillies, University of Queensland; N Tuffs, CapcoalT Sartor, BHP Billiton Cannington
Abstract
Software has been developed to link real time informationgenerated by underground mine ventilation airflow monitoringsensors into a network simulation program to undertake networksimulations and allow interpretation of key system data andoperational changes. Results are used in the development of acomputerised monitoring and simulation system to provideimmediate or real time data on air behaviour within each branchwithin an underground mine ventilation network through linking ofsensors to the ventilation network simulation software. The outcomeof the project is an online system which can report changes in themine ventilation system, allow causes of changes to be isolated andrectified, improve balancing of available air throughout the mine,allow improved approaches to regulator setting and dispense withmuch of the labour used for underground ventilation measurement.The main work activities involved in the research program haveinvolved examination and modelling of regulators used in twoQueensland mining (coal and metalliferous) environments, softwaremodification and considerable mine site testing and optimisingactivities. The mathematical modelling of airflow through operatingmine regulators was an important part of the project and this aspectis discussed.
Introduction
There is a move world wide to remote or telemetricmonitoring of mine atmosphere conditions. Robust, suitable andintrinsically safe instruments are available for measurement of,for instance, gas concentrations, air velocity and air pressure.These are often tied to extensive mine monitoring andcommunication systems.
One approach to establishing air quantity through aventilation branch is through measurement of differential pressureacross an opening or regulator. Mathematical relationships areavailable to relate (with some qualification) pressure drop andquantity through a regulator orifice placed symmetrically in around flow conduit. However these can, at best, only be used toapproximate mine regulator behaviour due to:
• The irregularity of mine regulators in shape and symmetry andtheir positioning in normally roughly square or rectangularmine airways
• The construction of the mine regulator opening which mayresult from, for instance, the operation of louvres, a slidingdoor, window or curtain or placement of drop boards, and
• Uncontrolled air leakage through the regulator or adjacentbulkhead.
The study briefly describes efforts to characterise ormathematically model regulators. It then describes how thisinformation is used in the development of a computerisedmonitoring and simulation system to provide immediate or real timeinformation on each branch within an underground mine ventilationnetwork through linking of sensors to the ventilation networksimulation software. Software has been developed to link real timeinformation generated by mine ventilation monitoring sensors intothe network program to undertake network simulations and allowinterpretation of key system data and operational changes.
The outcome of the project is an online system which canreport changes in the mine ventilation system, allow causes ofchanges to be isolated and rectified and improve balancing ofavailable air throughout the mine, It is envisaged that in time thereal time model will be an integral part of an online mine wideplanning, monitoring and control software platform that will beupdated continuously along with the mine plan. The main stepsinvolved in examination and modelling of regulators, softwaremodification and considerable mine site testing and optimisingactivities are described.
Theory of Regulators
A regulator is an artificial resistance (in the form of shockloss) introduced into an airway to control airflow. A regulator canbe described as a large thin plate installed in a fluid conduit withan orifice. When a difference in pressure exists between the twosides fluid flows in the pattern shown in Figure 1. On the lowpressure side the fluid issues as a converging jet in line with thecentre of the orifice. The jet converges to its smallest area at adistance of about half the orifice diameter (Le Roux, 1990). Thisarea is called the “vena contracta” (Ac at Fig. 1). The ratiobetween vena contracta and orifice area is the “coefficient ofcontraction”, Cc (Ac/Ar at Fig. 1).
Figure 1: Airflow pattern through an orifice (after Burrows et al,1989).
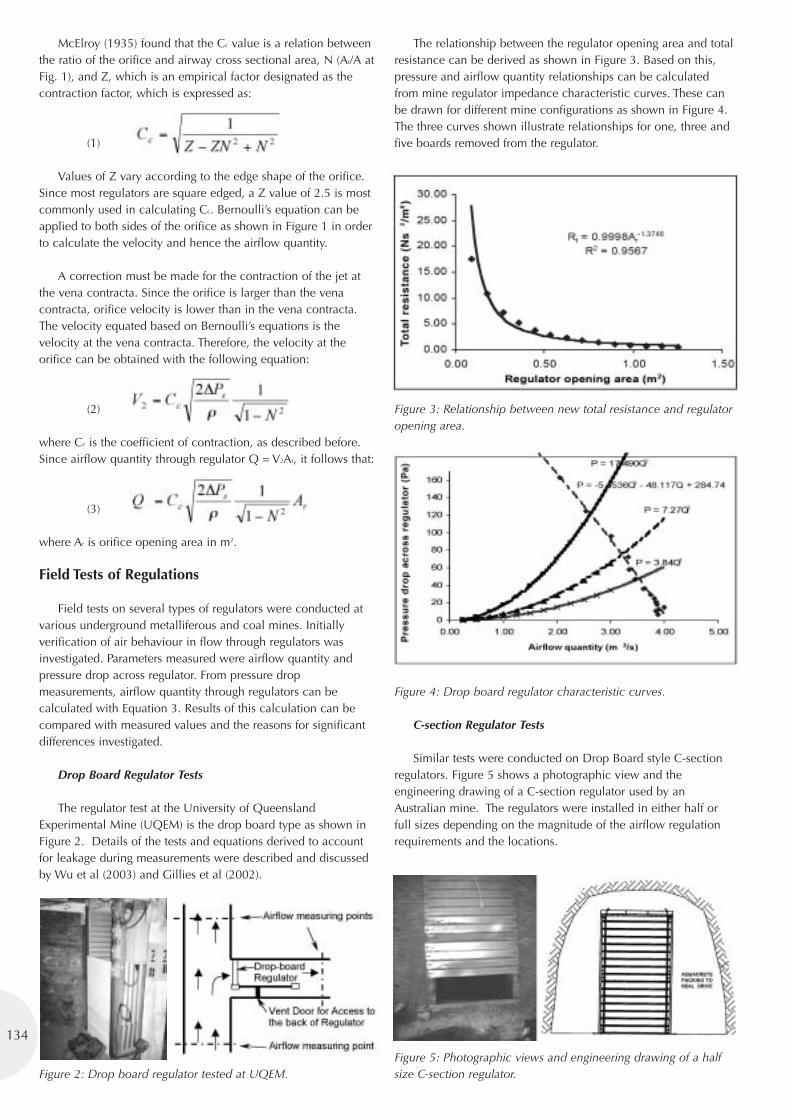
McElroy (1935) found that the Cc value is a relation betweenthe ratio of the orifice and airway cross sectional area, N (Ar/A atFig. 1), and Z, which is an empirical factor designated as thecontraction factor, which is expressed as:
(1)
Values of Z vary according to the edge shape of the orifice.Since most regulators are square edged, a Z value of 2.5 is mostcommonly used in calculating Cc. Bernoulli’s equation can beapplied to both sides of the orifice as shown in Figure 1 in orderto calculate the velocity and hence the airflow quantity.
A correction must be made for the contraction of the jet atthe vena contracta. Since the orifice is larger than the venacontracta, orifice velocity is lower than in the vena contracta.The velocity equated based on Bernoulli’s equations is thevelocity at the vena contracta. Therefore, the velocity at theorifice can be obtained with the following equation:
(2)
where Cc is the coefficient of contraction, as described before.Since airflow quantity through regulator Q = V2Ar, it follows that:
(3)
where Ar is orifice opening area in m2.
Field Tests of Regulations
Field tests on several types of regulators were conducted atvarious underground metalliferous and coal mines. Initiallyverification of air behaviour in flow through regulators wasinvestigated. Parameters measured were airflow quantity andpressure drop across regulator. From pressure dropmeasurements, airflow quantity through regulators can becalculated with Equation 3. Results of this calculation can becompared with measured values and the reasons for significantdifferences investigated.
Drop Board Regulator Tests
The regulator test at the University of QueenslandExperimental Mine (UQEM) is the drop board type as shown inFigure 2. Details of the tests and equations derived to accountfor leakage during measurements were described and discussedby Wu et al (2003) and Gillies et al (2002).
Figure 2: Drop board regulator tested at UQEM.
The relationship between the regulator opening area and totalresistance can be derived as shown in Figure 3. Based on this,pressure and airflow quantity relationships can be calculatedfrom mine regulator impedance characteristic curves. These canbe drawn for different mine configurations as shown in Figure 4.The three curves shown illustrate relationships for one, three andfive boards removed from the regulator.
Figure 3: Relationship between new total resistance and regulatoropening area.
Figure 4: Drop board regulator characteristic curves.
C-section Regulator Tests
Similar tests were conducted on Drop Board style C-sectionregulators. Figure 5 shows a photographic view and theengineering drawing of a C-section regulator used by anAustralian mine. The regulators were installed in either half orfull sizes depending on the magnitude of the airflow regulationrequirements and the locations.
Figure 5: Photographic views and engineering drawing of a halfsize C-section regulator.
134
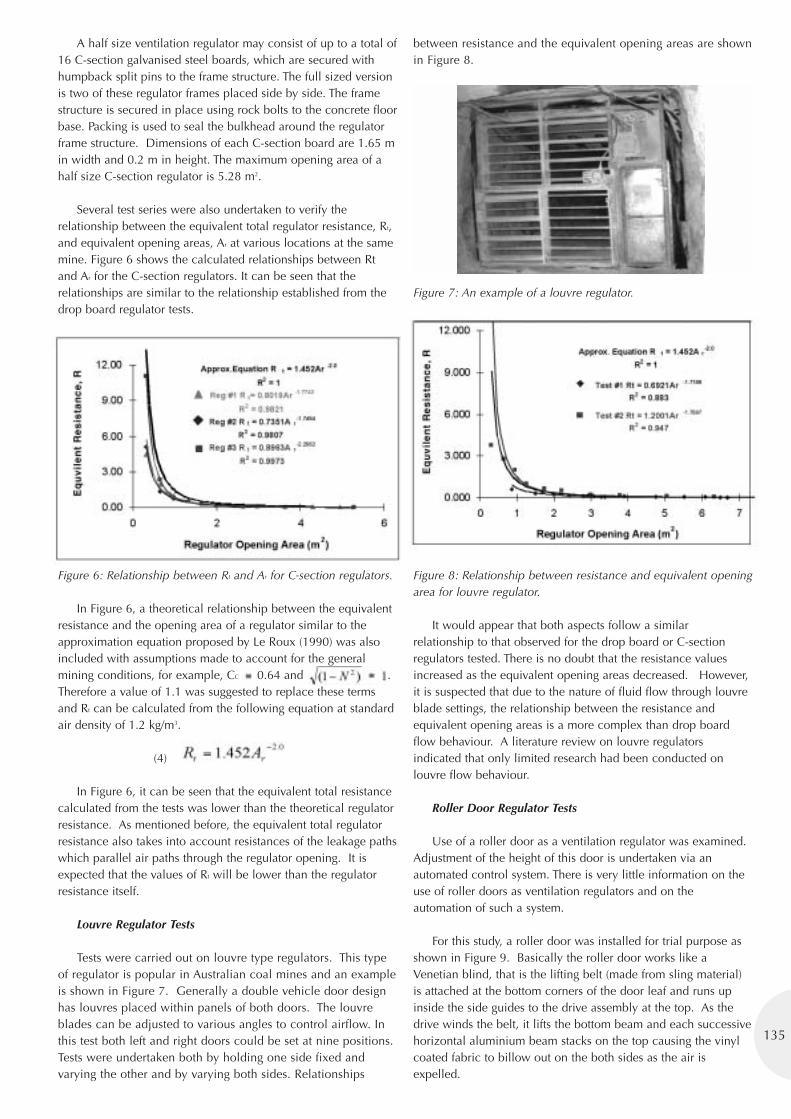
135
A half size ventilation regulator may consist of up to a total of16 C-section galvanised steel boards, which are secured withhumpback split pins to the frame structure. The full sized versionis two of these regulator frames placed side by side. The framestructure is secured in place using rock bolts to the concrete floorbase. Packing is used to seal the bulkhead around the regulatorframe structure. Dimensions of each C-section board are 1.65 min width and 0.2 m in height. The maximum opening area of ahalf size C-section regulator is 5.28 m2.
Several test series were also undertaken to verify therelationship between the equivalent total regulator resistance, Rt,and equivalent opening areas, Ar at various locations at the samemine. Figure 6 shows the calculated relationships between Rtand Ar for the C-section regulators. It can be seen that therelationships are similar to the relationship established from thedrop board regulator tests.
Figure 6: Relationship between Rt and Ar for C-section regulators.
In Figure 6, a theoretical relationship between the equivalentresistance and the opening area of a regulator similar to theapproximation equation proposed by Le Roux (1990) was alsoincluded with assumptions made to account for the generalmining conditions, for example, CC 0.64 and .Therefore a value of 1.1 was suggested to replace these termsand Rt can be calculated from the following equation at standardair density of 1.2 kg/m3.
(4)
In Figure 6, it can be seen that the equivalent total resistancecalculated from the tests was lower than the theoretical regulatorresistance. As mentioned before, the equivalent total regulatorresistance also takes into account resistances of the leakage pathswhich parallel air paths through the regulator opening. It isexpected that the values of Rt will be lower than the regulatorresistance itself.
Louvre Regulator Tests
Tests were carried out on louvre type regulators. This typeof regulator is popular in Australian coal mines and an exampleis shown in Figure 7. Generally a double vehicle door designhas louvres placed within panels of both doors. The louvreblades can be adjusted to various angles to control airflow. Inthis test both left and right doors could be set at nine positions.Tests were undertaken both by holding one side fixed andvarying the other and by varying both sides. Relationships
between resistance and the equivalent opening areas are shownin Figure 8.
Figure 7: An example of a louvre regulator.
Figure 8: Relationship between resistance and equivalent openingarea for louvre regulator.
It would appear that both aspects follow a similarrelationship to that observed for the drop board or C-sectionregulators tested. There is no doubt that the resistance valuesincreased as the equivalent opening areas decreased. However,it is suspected that due to the nature of fluid flow through louvreblade settings, the relationship between the resistance andequivalent opening areas is a more complex than drop boardflow behaviour. A literature review on louvre regulatorsindicated that only limited research had been conducted onlouvre flow behaviour.
Roller Door Regulator Tests
Use of a roller door as a ventilation regulator was examined.Adjustment of the height of this door is undertaken via anautomated control system. There is very little information on theuse of roller doors as ventilation regulators and on theautomation of such a system.
For this study, a roller door was installed for trial purpose asshown in Figure 9. Basically the roller door works like aVenetian blind, that is the lifting belt (made from sling material)is attached at the bottom corners of the door leaf and runs upinside the side guides to the drive assembly at the top. As thedrive winds the belt, it lifts the bottom beam and each successivehorizontal aluminium beam stacks on the top causing the vinylcoated fabric to billow out on the both sides as the air isexpelled.
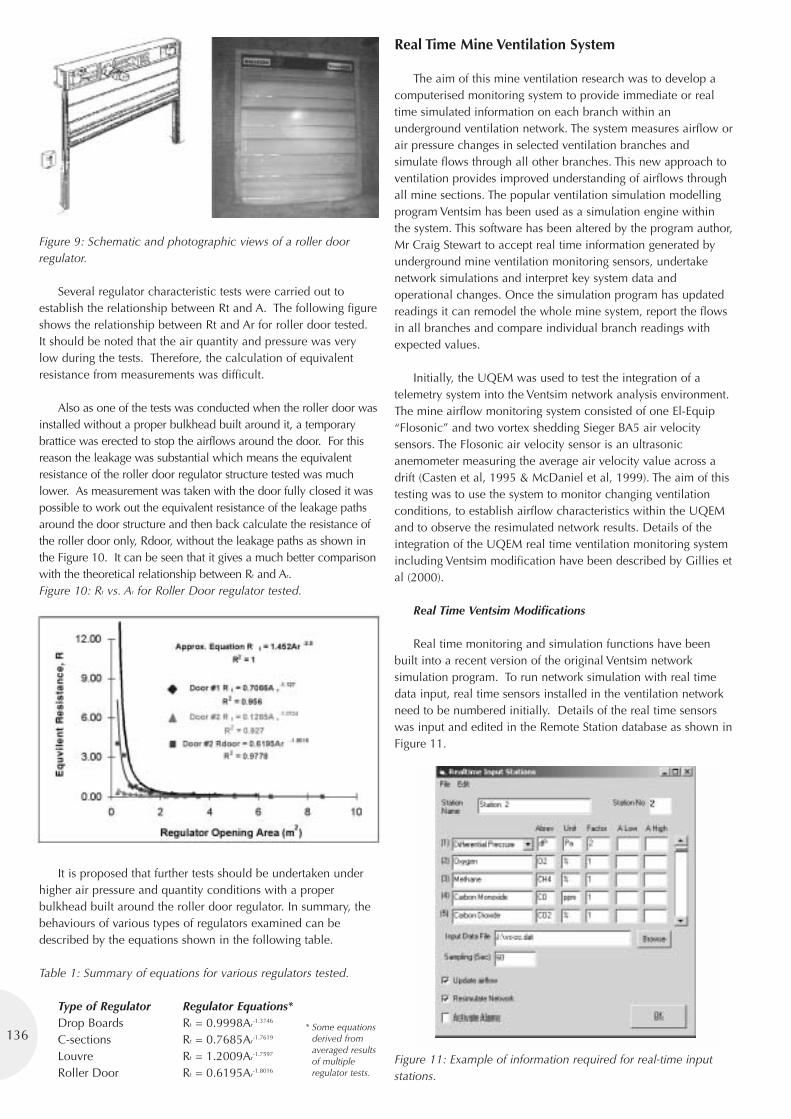
136
Figure 9: Schematic and photographic views of a roller doorregulator.
Several regulator characteristic tests were carried out toestablish the relationship between Rt and A. The following figureshows the relationship between Rt and Ar for roller door tested.It should be noted that the air quantity and pressure was verylow during the tests. Therefore, the calculation of equivalentresistance from measurements was difficult.
Also as one of the tests was conducted when the roller door wasinstalled without a proper bulkhead built around it, a temporarybrattice was erected to stop the airflows around the door. For thisreason the leakage was substantial which means the equivalentresistance of the roller door regulator structure tested was muchlower. As measurement was taken with the door fully closed it waspossible to work out the equivalent resistance of the leakage pathsaround the door structure and then back calculate the resistance ofthe roller door only, Rdoor, without the leakage paths as shown inthe Figure 10. It can be seen that it gives a much better comparisonwith the theoretical relationship between Rt and Ar.Figure 10: Rt vs. Ar for Roller Door regulator tested.
It is proposed that further tests should be undertaken underhigher air pressure and quantity conditions with a properbulkhead built around the roller door regulator. In summary, thebehaviours of various types of regulators examined can bedescribed by the equations shown in the following table.
Table 1: Summary of equations for various regulators tested.
Type of Regulator Regulator Equations*Drop Boards Rt = 0.9998Ar
-1.3746
C-sections Rt = 0.7685Ar-1.7619
Louvre Rt = 1.2009Ar-1.7597
Roller Door Rt = 0.6195Ar-1.8016
Real Time Mine Ventilation System
The aim of this mine ventilation research was to develop acomputerised monitoring system to provide immediate or realtime simulated information on each branch within anunderground ventilation network. The system measures airflow orair pressure changes in selected ventilation branches andsimulate flows through all other branches. This new approach toventilation provides improved understanding of airflows throughall mine sections. The popular ventilation simulation modellingprogram Ventsim has been used as a simulation engine withinthe system. This software has been altered by the program author,Mr Craig Stewart to accept real time information generated byunderground mine ventilation monitoring sensors, undertakenetwork simulations and interpret key system data andoperational changes. Once the simulation program has updatedreadings it can remodel the whole mine system, report the flowsin all branches and compare individual branch readings withexpected values.
Initially, the UQEM was used to test the integration of atelemetry system into the Ventsim network analysis environment.The mine airflow monitoring system consisted of one El-Equip“Flosonic” and two vortex shedding Sieger BA5 air velocitysensors. The Flosonic air velocity sensor is an ultrasonicanemometer measuring the average air velocity value across adrift (Casten et al, 1995 & McDaniel et al, 1999). The aim of thistesting was to use the system to monitor changing ventilationconditions, to establish airflow characteristics within the UQEMand to observe the resimulated network results. Details of theintegration of the UQEM real time ventilation monitoring systemincluding Ventsim modification have been described by Gillies etal (2000).
Real Time Ventsim Modifications
Real time monitoring and simulation functions have beenbuilt into a recent version of the original Ventsim networksimulation program. To run network simulation with real timedata input, real time sensors installed in the ventilation networkneed to be numbered initially. Details of the real time sensorswas input and edited in the Remote Station database as shown inFigure 11.
Figure 11: Example of information required for real-time inputstations.
* Some equationsderived fromaveraged resultsof multipleregulator tests.
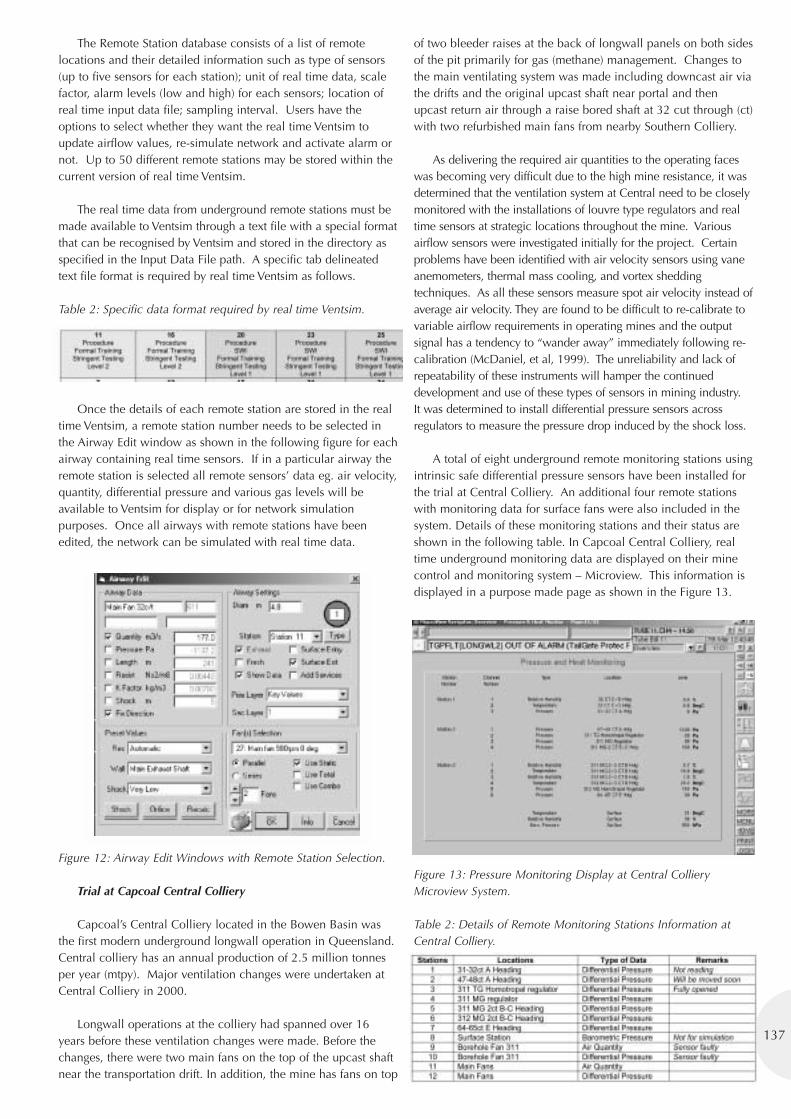
137
The Remote Station database consists of a list of remotelocations and their detailed information such as type of sensors(up to five sensors for each station); unit of real time data, scalefactor, alarm levels (low and high) for each sensors; location ofreal time input data file; sampling interval. Users have theoptions to select whether they want the real time Ventsim toupdate airflow values, re-simulate network and activate alarm ornot. Up to 50 different remote stations may be stored within thecurrent version of real time Ventsim.
The real time data from underground remote stations must bemade available to Ventsim through a text file with a special formatthat can be recognised by Ventsim and stored in the directory asspecified in the Input Data File path. A specific tab delineatedtext file format is required by real time Ventsim as follows.
Table 2: Specific data format required by real time Ventsim.
Once the details of each remote station are stored in the realtime Ventsim, a remote station number needs to be selected inthe Airway Edit window as shown in the following figure for eachairway containing real time sensors. If in a particular airway theremote station is selected all remote sensors’ data eg. air velocity,quantity, differential pressure and various gas levels will beavailable to Ventsim for display or for network simulationpurposes. Once all airways with remote stations have beenedited, the network can be simulated with real time data.
Figure 12: Airway Edit Windows with Remote Station Selection.
Trial at Capcoal Central Colliery
Capcoal’s Central Colliery located in the Bowen Basin wasthe first modern underground longwall operation in Queensland.Central colliery has an annual production of 2.5 million tonnesper year (mtpy). Major ventilation changes were undertaken atCentral Colliery in 2000.
Longwall operations at the colliery had spanned over 16years before these ventilation changes were made. Before thechanges, there were two main fans on the top of the upcast shaftnear the transportation drift. In addition, the mine has fans on top
of two bleeder raises at the back of longwall panels on both sidesof the pit primarily for gas (methane) management. Changes tothe main ventilating system was made including downcast air viathe drifts and the original upcast shaft near portal and thenupcast return air through a raise bored shaft at 32 cut through (ct)with two refurbished main fans from nearby Southern Colliery.
As delivering the required air quantities to the operating faceswas becoming very difficult due to the high mine resistance, it wasdetermined that the ventilation system at Central need to be closelymonitored with the installations of louvre type regulators and realtime sensors at strategic locations throughout the mine. Variousairflow sensors were investigated initially for the project. Certainproblems have been identified with air velocity sensors using vaneanemometers, thermal mass cooling, and vortex sheddingtechniques. As all these sensors measure spot air velocity instead ofaverage air velocity. They are found to be difficult to re-calibrate tovariable airflow requirements in operating mines and the outputsignal has a tendency to “wander away” immediately following re-calibration (McDaniel, et al, 1999). The unreliability and lack ofrepeatability of these instruments will hamper the continueddevelopment and use of these types of sensors in mining industry.It was determined to install differential pressure sensors acrossregulators to measure the pressure drop induced by the shock loss.
A total of eight underground remote monitoring stations usingintrinsic safe differential pressure sensors have been installed forthe trial at Central Colliery. An additional four remote stationswith monitoring data for surface fans were also included in thesystem. Details of these monitoring stations and their status areshown in the following table. In Capcoal Central Colliery, realtime underground monitoring data are displayed on their minecontrol and monitoring system – Microview. This information isdisplayed in a purpose made page as shown in the Figure 13.
Figure 13: Pressure Monitoring Display at Central CollieryMicroview System.
Table 2: Details of Remote Monitoring Stations Information atCentral Colliery.
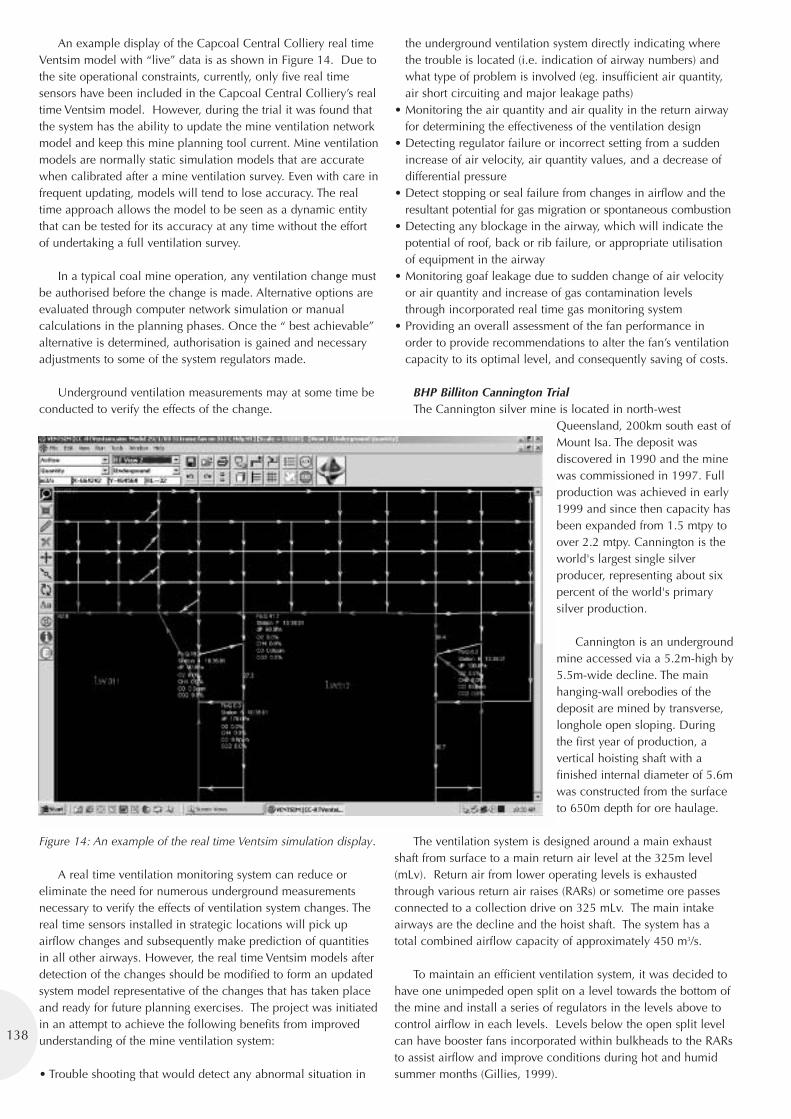
An example display of the Capcoal Central Colliery real timeVentsim model with “live” data is as shown in Figure 14. Due tothe site operational constraints, currently, only five real timesensors have been included in the Capcoal Central Colliery’s realtime Ventsim model. However, during the trial it was found thatthe system has the ability to update the mine ventilation networkmodel and keep this mine planning tool current. Mine ventilationmodels are normally static simulation models that are accuratewhen calibrated after a mine ventilation survey. Even with care infrequent updating, models will tend to lose accuracy. The realtime approach allows the model to be seen as a dynamic entitythat can be tested for its accuracy at any time without the effortof undertaking a full ventilation survey.
In a typical coal mine operation, any ventilation change mustbe authorised before the change is made. Alternative options areevaluated through computer network simulation or manualcalculations in the planning phases. Once the “ best achievable”alternative is determined, authorisation is gained and necessaryadjustments to some of the system regulators made.
Underground ventilation measurements may at some time beconducted to verify the effects of the change.
Figure 14: An example of the real time Ventsim simulation display.
A real time ventilation monitoring system can reduce oreliminate the need for numerous underground measurementsnecessary to verify the effects of ventilation system changes. Thereal time sensors installed in strategic locations will pick upairflow changes and subsequently make prediction of quantitiesin all other airways. However, the real time Ventsim models afterdetection of the changes should be modified to form an updatedsystem model representative of the changes that has taken placeand ready for future planning exercises. The project was initiatedin an attempt to achieve the following benefits from improvedunderstanding of the mine ventilation system:
• Trouble shooting that would detect any abnormal situation in
the underground ventilation system directly indicating wherethe trouble is located (i.e. indication of airway numbers) andwhat type of problem is involved (eg. insufficient air quantity,air short circuiting and major leakage paths)
• Monitoring the air quantity and air quality in the return airwayfor determining the effectiveness of the ventilation design
• Detecting regulator failure or incorrect setting from a suddenincrease of air velocity, air quantity values, and a decrease ofdifferential pressure
• Detect stopping or seal failure from changes in airflow and theresultant potential for gas migration or spontaneous combustion
• Detecting any blockage in the airway, which will indicate thepotential of roof, back or rib failure, or appropriate utilisationof equipment in the airway
• Monitoring goaf leakage due to sudden change of air velocityor air quantity and increase of gas contamination levelsthrough incorporated real time gas monitoring system
• Providing an overall assessment of the fan performance inorder to provide recommendations to alter the fan’s ventilationcapacity to its optimal level, and consequently saving of costs.
BHP Billiton Cannington TrialThe Cannington silver mine is located in north-west
Queensland, 200km south east ofMount Isa. The deposit wasdiscovered in 1990 and the minewas commissioned in 1997. Fullproduction was achieved in early1999 and since then capacity hasbeen expanded from 1.5 mtpy toover 2.2 mtpy. Cannington is theworld's largest single silverproducer, representing about sixpercent of the world's primarysilver production.
Cannington is an undergroundmine accessed via a 5.2m-high by5.5m-wide decline. The mainhanging-wall orebodies of thedeposit are mined by transverse,longhole open sloping. Duringthe first year of production, avertical hoisting shaft with afinished internal diameter of 5.6mwas constructed from the surfaceto 650m depth for ore haulage.
The ventilation system is designed around a main exhaustshaft from surface to a main return air level at the 325m level(mLv). Return air from lower operating levels is exhaustedthrough various return air raises (RARs) or sometime ore passesconnected to a collection drive on 325 mLv. The main intakeairways are the decline and the hoist shaft. The system has atotal combined airflow capacity of approximately 450 m3/s.
To maintain an efficient ventilation system, it was decided tohave one unimpeded open split on a level towards the bottom ofthe mine and install a series of regulators in the levels above tocontrol airflow in each levels. Levels below the open split levelcan have booster fans incorporated within bulkheads to the RARsto assist airflow and improve conditions during hot and humidsummer months (Gillies, 1999).
138
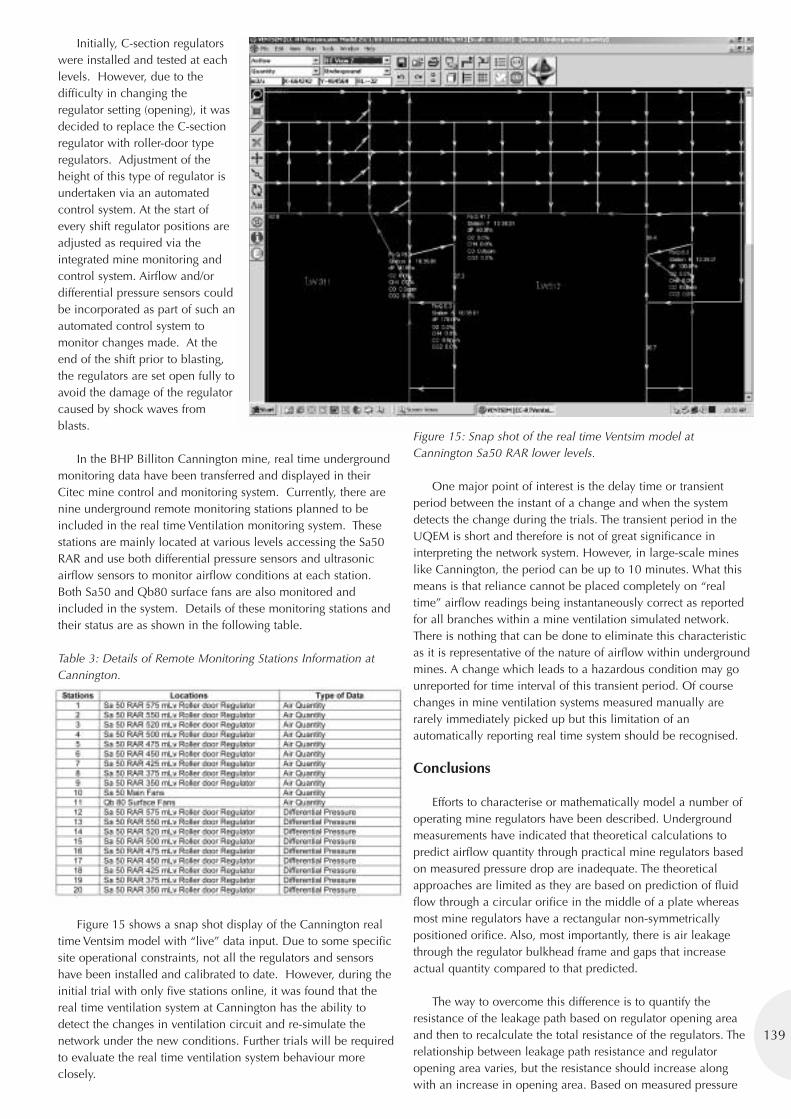
139
Initially, C-section regulatorswere installed and tested at eachlevels. However, due to thedifficulty in changing theregulator setting (opening), it wasdecided to replace the C-sectionregulator with roller-door typeregulators. Adjustment of theheight of this type of regulator isundertaken via an automatedcontrol system. At the start ofevery shift regulator positions areadjusted as required via theintegrated mine monitoring andcontrol system. Airflow and/ordifferential pressure sensors couldbe incorporated as part of such anautomated control system tomonitor changes made. At theend of the shift prior to blasting,the regulators are set open fully toavoid the damage of the regulatorcaused by shock waves fromblasts.
In the BHP Billiton Cannington mine, real time undergroundmonitoring data have been transferred and displayed in theirCitec mine control and monitoring system. Currently, there arenine underground remote monitoring stations planned to beincluded in the real time Ventilation monitoring system. Thesestations are mainly located at various levels accessing the Sa50RAR and use both differential pressure sensors and ultrasonicairflow sensors to monitor airflow conditions at each station.Both Sa50 and Qb80 surface fans are also monitored andincluded in the system. Details of these monitoring stations andtheir status are as shown in the following table.
Table 3: Details of Remote Monitoring Stations Information atCannington.
Figure 15 shows a snap shot display of the Cannington realtime Ventsim model with “live” data input. Due to some specificsite operational constraints, not all the regulators and sensorshave been installed and calibrated to date. However, during theinitial trial with only five stations online, it was found that thereal time ventilation system at Cannington has the ability todetect the changes in ventilation circuit and re-simulate thenetwork under the new conditions. Further trials will be requiredto evaluate the real time ventilation system behaviour moreclosely.
Figure 15: Snap shot of the real time Ventsim model atCannington Sa50 RAR lower levels.
One major point of interest is the delay time or transientperiod between the instant of a change and when the systemdetects the change during the trials. The transient period in theUQEM is short and therefore is not of great significance ininterpreting the network system. However, in large-scale mineslike Cannington, the period can be up to 10 minutes. What thismeans is that reliance cannot be placed completely on “realtime” airflow readings being instantaneously correct as reportedfor all branches within a mine ventilation simulated network.There is nothing that can be done to eliminate this characteristicas it is representative of the nature of airflow within undergroundmines. A change which leads to a hazardous condition may gounreported for time interval of this transient period. Of coursechanges in mine ventilation systems measured manually arerarely immediately picked up but this limitation of anautomatically reporting real time system should be recognised.
Conclusions
Efforts to characterise or mathematically model a number ofoperating mine regulators have been described. Undergroundmeasurements have indicated that theoretical calculations topredict airflow quantity through practical mine regulators basedon measured pressure drop are inadequate. The theoreticalapproaches are limited as they are based on prediction of fluidflow through a circular orifice in the middle of a plate whereasmost mine regulators have a rectangular non-symmetricallypositioned orifice. Also, most importantly, there is air leakagethrough the regulator bulkhead frame and gaps that increaseactual quantity compared to that predicted.
The way to overcome this difference is to quantify theresistance of the leakage path based on regulator opening areaand then to recalculate the total resistance of the regulators. Therelationship between leakage path resistance and regulatoropening area varies, but the resistance should increase alongwith an increase in opening area. Based on measured pressure
difference, the airflow quantity can be predicted accurately usingthe basic square law. It requires field measurements to quantifythe leakage path resistance of each regulator, since eachregulator has its own leakage characteristic (size and number ofgaps, etc.). This is a tedious work, since the regulators can be setwith many opening areas. However, it was found that withlimited measurement data, prediction results are still accuratewithin acceptable tolerance appropriate to understanding mineairflows.
The aim of the study was to gain greater understanding ofa computerised monitoring system to provide immediate orreal time simulated information in each branch of anunderground ventilation network. The system measures airflowin selected ventilation branches and simulates flows throughall other branches. Investigations were undertaken in twoQueensland mining (coal and metalliferous) environments asto whether the Real Time Airflow Monitoring system candetect changes within the mine ventilation system, examineaccuracy of the system and identify constraints that will limitperformance of the system. As a result of trials, it wasdemonstrated that the system was able to detect changesoccurring within the mine ventilation system and was alsoable to predict the changes accurately. Limitations caused bytransient period delays have been examined. Updating ofsimulation models from use of real time data has also beendiscussed. It is envisaged in the future that the ventilationmodel would be an integral part of a real time mine wideplanning, monitoring and control software platform fromwhich the model would be updated in real time.
Acknowledgement
The support of the University of Queensland, Mr CraigStewart and a number of operations within the Australian miningindustry in funding this study are acknowledged.
References
Burrows, J, Hemp, R., Holding, W. & Stroh, R.M., 1989.Environmental Engineering in South African Mines, 2nd edition,pp 66-70 Mine Vent. Soc. South Africa, Johannesburg.
Casten, T., Mousset-Jones, P., and Calizaya, F., 1995. UltrasonicAnemometry in Underground Excavations, Proc 7th US MineVent Sym, Lexington, Kentucky, 1995, pp 429-434. Ed A.M.Wala. SME, Littleton, Colorado, USA.
Gillies, A.D.S. 1999. Review of BHP Cannington mineventilation and long term strategies, report prepared for BHPCannington Mine, December 1999.
Gillies, A.D.S., Mayes, T.I., Wu, H.W., Kizil, M. & Wang, N.,2000. The Development of a Real Time Airflow Monitoring andControl System, Proc 1st Mine Envirn and Vent Sym, Dhanbad,India, 2000, pp 255-264. Ed D.C. Panigrahi. A.A. Balkema,Rotterdam.
Gillies, A. D. S., Wu, H. W., Mayes, T. I. & Halim, A. 2002.Measurement of Airflow Through Regulators and Real TimeIntegrated Monitoring. In E. DeSouza (ed.), North American/9thUS Mine Ventilation Symposium, Proc., Kingston, 8-12 June2002. Rotterdam:Balkema.
Kingery, D.S., 1960. Introduction to Mine Ventilating Principlesand Practices, US Bureau of Mines Bul 589, pp 89 (US Bureau ofMines, Washington DC).
Le Roux, W.L., 1990. Mine Ventilation Notes for Beginners, 3rdedition, pp 31-34 Mine Vent. Soc. South Africa, Johannesburg.
McDaniel, K., Duckworth, I.J., and Prosser, B.S., 1999.Evaluation of Different Airflow Sensors at the WIPP Facility,Proceedings of 8th US Mine Vent Sym, Rolla, Missouri, 1999, pp519-525. Ed J.C. Tien. SME, Littleton, Colorado, USA.
McElroy, G.E., 1935. Engineering Factors in Ventilating MetalMines, US Bureau of Mines Bull 385, pp 55-68 (US Bureau ofMines, Washington DC).
Wu, H.W., Gillies, A.D.S. and Mayes, T.I. The Measurement ofAirflow Through Regulators, Proceedings Fourth AustralasianCoal Operators Conference, Ed. N. Aziz and B. Kininmonth, Aus.Inst. Min. Metall., Melbourne, pp 212-224 February 2003.
140
141
Hydration Requirements of theWMC Fertilizers Workforce atPhosphate Hill
Anthony Carter1, Reinhold Muller1, Tom Magee2, Matthew Wicking2
1 James Cook University; 2 WMC Fertilizers Pty Ltd
Abstract
Introduction: A study of the hydration requirements of theWMC Fertilizers workforce at Phosphate Hill was undertaken aspart of the James Cook University (JCU) study on the workplaceenvironment and health. The main aims of the study were toestimate the rate of fluid loss and to establish fluid intake targetsfor sub-groups of employees.
Methods: The study involved a.m. and p.m. measurements ofweight, a measurement of fluid intake and a structuredquestionnaire detailing hydration behaviour and toilet activity.
Results: A total of 127 employees participated in the study.Employees working predominantly in direct sunlight have ahigher median fluid loss (September, 3.7; February, 4.8 L.kg-1.h-
1x10⁻³) compared to those working in shade (September, 2.7;February 4.0 L.kg-1.h-1x10⁻³) and air conditioning (September, 2.3;February, 3.3 L.kg-1.h-1x10⁻³). Subjects working predominantly indirect sunlight are less likely to maintain their fluid balance thanthose in air conditioning and shade. The recommended bodyweight and task specific fluid intake targets for the workforce are:
Conclusions: This research study provides detailedinformation on the fluid loss and hydration requirements of theWMC Fertilizers workforce and demonstrates that;
• Hydration facilities and strategies for workers in airconditioning or shade appear to be adequate
• Employees working predominantly in direct sunlight requireimproved access to fluids
• Urine colour is an accurate indicator of hydration in theworkplace
• Water is the preferred beverage for hydration in the workplace.
Introduction
A study of the hydration requirements of the WMC Fertilizers
workforce at Phosphate Hill was undertaken as part of the JamesCook University (JCU) study on the workplace environment andhealth. The study was conducted in warm conditions fromTuesday 17 to Friday 20 September 2002 and repeated in hotconditions from Tuesday 18 to Friday 21 February 2003.
The WMC Fertilizers Phosphate Hill plant is located inAustralia’s dry tropics where employees are exposed to relativelyhot temperatures for much of the year. JCU conducted a baselinesurvey of the workforce health in December 2001. Elevatedlevels of serum albumin, aspartate transaminase, and potassium,known biochemical markers for dehydration1,2, were observed inthe workforce. This data was corroborated by an electrolyteanalysis and the observed urine colours. The self-reportedsymptoms commonly experienced by employees at workincluding tired or strained eyes, dry or itchy skin, unusual fatigueand drowsiness, and headache are consistent with the knownsymptoms of hypohydration3. Therefore, the prevalence of thesigns and symptoms of hypohydration among employees at thePhosphate Hill site were concerning and worthy of furtherinvestigation.
Much of the hydration research in the scientific literature hasexamined the short-term physical effects of hypohydration inathletic settings4. A balanced fluid loss and intake sustainsphysiological function and exercise performance5. Fluid lossexceeding 2% of body mass has demonstrated effects onpsychological and physiological functions. Arithmetic ability,short-term memory and visuomotor tracking deterioratesignificantly at –2% body mass6. Aerobic endurance, heat loss,sweat rate and cardiovascular function are impaired at –2% to–3% of body mass7,8,9. Lactate threshold occurs significantlyearlier and at lower exercise intensities in subjects that arehypohydrated to –4% of body mass compared to adequatelyhydrated subjects10. These physiological effects of hypohydrationare enhanced in hot compared to temperate environments11,12.
Studies in workplace settings have identified hypohydrationas a significant risk factor for heat illness due to impaireddissipation of body heat2,13. In hot conditions, work must beperformed at slower rates to maintain a body temperature of lessthan 38°C14. High body temperature decreases time to fatigueduring prolonged exercise in uncompensable hot environments15.While no published data are available in the scientific literatureof the relationship between hydration and injury, the significantphysiological and neurological effects implicate hypohydration asa potential risk factor for occupational injury.
Air conditioning Shade Fluid Direct sunlightBody Fluid intake target intake target Fluid intake targetweight (L/shift) (L/shift) (L/shift)
70 kg 4 to 5 5 to 6 6 to 785 kg 5 to 6 6 to 7 7 to 8100 kg 6 to 7 7 to 8 8 to 9
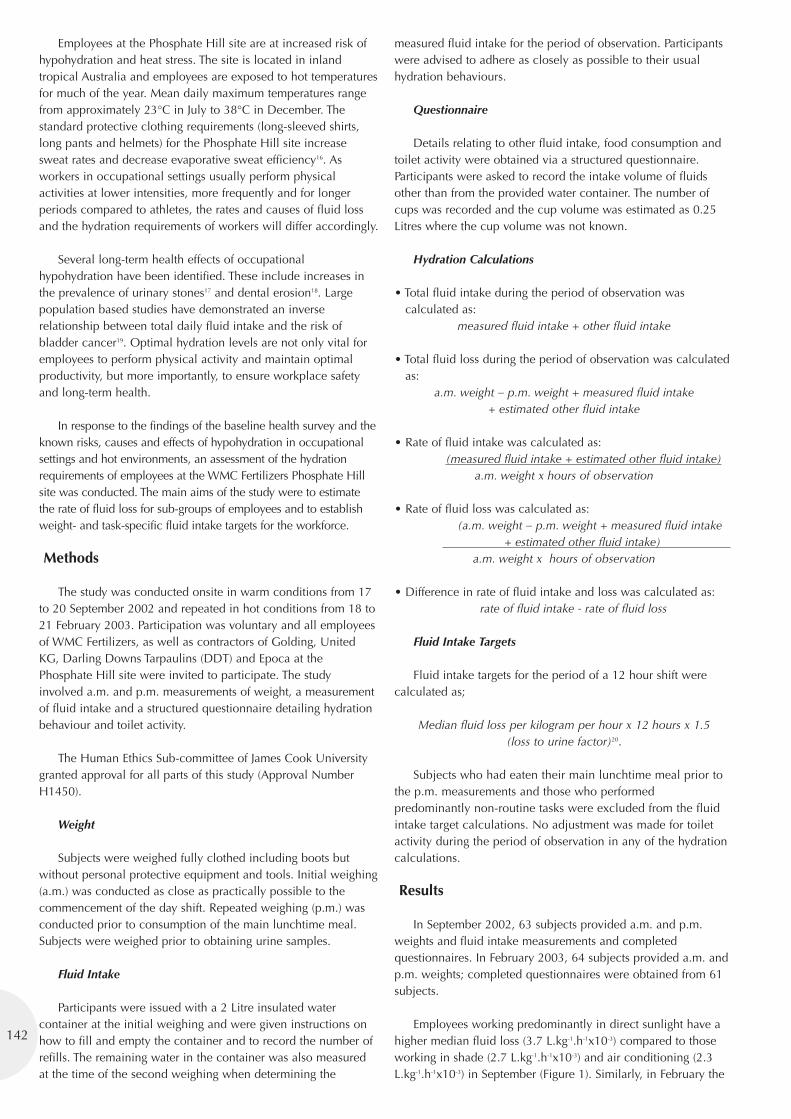
142
Employees at the Phosphate Hill site are at increased risk ofhypohydration and heat stress. The site is located in inlandtropical Australia and employees are exposed to hot temperaturesfor much of the year. Mean daily maximum temperatures rangefrom approximately 23°C in July to 38°C in December. Thestandard protective clothing requirements (long-sleeved shirts,long pants and helmets) for the Phosphate Hill site increasesweat rates and decrease evaporative sweat efficiency16. Asworkers in occupational settings usually perform physicalactivities at lower intensities, more frequently and for longerperiods compared to athletes, the rates and causes of fluid lossand the hydration requirements of workers will differ accordingly.
Several long-term health effects of occupationalhypohydration have been identified. These include increases inthe prevalence of urinary stones17 and dental erosion18. Largepopulation based studies have demonstrated an inverserelationship between total daily fluid intake and the risk ofbladder cancer19. Optimal hydration levels are not only vital foremployees to perform physical activity and maintain optimalproductivity, but more importantly, to ensure workplace safetyand long-term health.
In response to the findings of the baseline health survey and theknown risks, causes and effects of hypohydration in occupationalsettings and hot environments, an assessment of the hydrationrequirements of employees at the WMC Fertilizers Phosphate Hillsite was conducted. The main aims of the study were to estimatethe rate of fluid loss for sub-groups of employees and to establishweight- and task-specific fluid intake targets for the workforce.
Methods
The study was conducted onsite in warm conditions from 17to 20 September 2002 and repeated in hot conditions from 18 to21 February 2003. Participation was voluntary and all employeesof WMC Fertilizers, as well as contractors of Golding, UnitedKG, Darling Downs Tarpaulins (DDT) and Epoca at thePhosphate Hill site were invited to participate. The studyinvolved a.m. and p.m. measurements of weight, a measurementof fluid intake and a structured questionnaire detailing hydrationbehaviour and toilet activity.
The Human Ethics Sub-committee of James Cook Universitygranted approval for all parts of this study (Approval NumberH1450).
Weight
Subjects were weighed fully clothed including boots butwithout personal protective equipment and tools. Initial weighing(a.m.) was conducted as close as practically possible to thecommencement of the day shift. Repeated weighing (p.m.) wasconducted prior to consumption of the main lunchtime meal.Subjects were weighed prior to obtaining urine samples.
Fluid Intake
Participants were issued with a 2 Litre insulated watercontainer at the initial weighing and were given instructions onhow to fill and empty the container and to record the number ofrefills. The remaining water in the container was also measuredat the time of the second weighing when determining the
measured fluid intake for the period of observation. Participantswere advised to adhere as closely as possible to their usualhydration behaviours.
Questionnaire
Details relating to other fluid intake, food consumption andtoilet activity were obtained via a structured questionnaire.Participants were asked to record the intake volume of fluidsother than from the provided water container. The number ofcups was recorded and the cup volume was estimated as 0.25Litres where the cup volume was not known.
Hydration Calculations
• Total fluid intake during the period of observation wascalculated as:
measured fluid intake + other fluid intake
• Total fluid loss during the period of observation was calculatedas:
a.m. weight – p.m. weight + measured fluid intake+ estimated other fluid intake
• Rate of fluid intake was calculated as:(measured fluid intake + estimated other fluid intake)
a.m. weight x hours of observation
• Rate of fluid loss was calculated as:(a.m. weight – p.m. weight + measured fluid intake
+ estimated other fluid intake) a.m. weight x hours of observation
• Difference in rate of fluid intake and loss was calculated as:rate of fluid intake - rate of fluid loss
Fluid Intake Targets
Fluid intake targets for the period of a 12 hour shift werecalculated as;
Median fluid loss per kilogram per hour x 12 hours x 1.5 (loss to urine factor)20.
Subjects who had eaten their main lunchtime meal prior tothe p.m. measurements and those who performedpredominantly non-routine tasks were excluded from the fluidintake target calculations. No adjustment was made for toiletactivity during the period of observation in any of the hydrationcalculations.
Results
In September 2002, 63 subjects provided a.m. and p.m.weights and fluid intake measurements and completedquestionnaires. In February 2003, 64 subjects provided a.m. andp.m. weights; completed questionnaires were obtained from 61subjects.
Employees working predominantly in direct sunlight have ahigher median fluid loss (3.7 L.kg-1.h-1x10⁻³) compared to thoseworking in shade (2.7 L.kg-1.h-1x10⁻³) and air conditioning (2.3L.kg-1.h-1x10⁻³) in September (Figure 1). Similarly, in February the
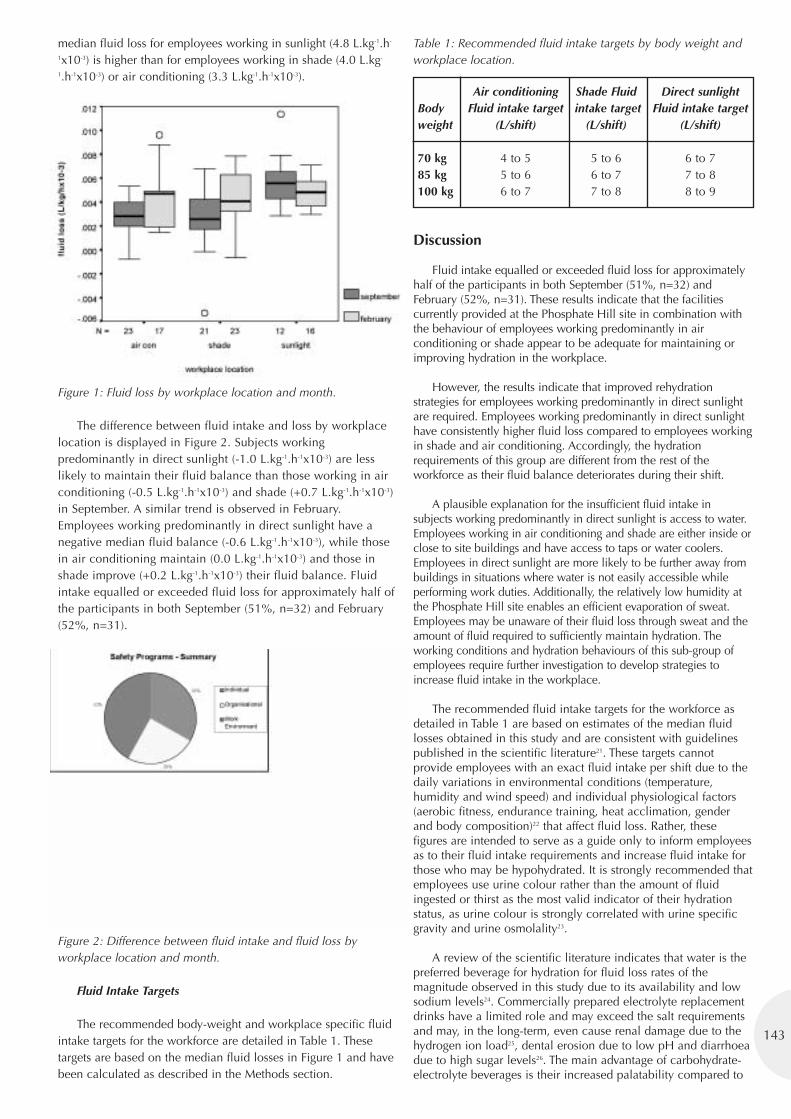
143
median fluid loss for employees working in sunlight (4.8 L.kg-1.h-
1x10⁻³) is higher than for employees working in shade (4.0 L.kg-
1.h-1x10⁻³) or air conditioning (3.3 L.kg-1.h-1x10⁻³).
Figure 1: Fluid loss by workplace location and month.
The difference between fluid intake and loss by workplacelocation is displayed in Figure 2. Subjects workingpredominantly in direct sunlight (-1.0 L.kg-1.h-1x10⁻³) are lesslikely to maintain their fluid balance than those working in airconditioning (-0.5 L.kg-1.h-1x10⁻³) and shade (+0.7 L.kg-1.h-1x10⁻³)in September. A similar trend is observed in February.Employees working predominantly in direct sunlight have anegative median fluid balance (-0.6 L.kg-1.h-1x10⁻³), while thosein air conditioning maintain (0.0 L.kg-1.h-1x10⁻³) and those inshade improve (+0.2 L.kg-1.h-1x10⁻³) their fluid balance. Fluidintake equalled or exceeded fluid loss for approximately half ofthe participants in both September (51%, n=32) and February(52%, n=31).
Figure 2: Difference between fluid intake and fluid loss byworkplace location and month.
Fluid Intake Targets
The recommended body-weight and workplace specific fluidintake targets for the workforce are detailed in Table 1. Thesetargets are based on the median fluid losses in Figure 1 and havebeen calculated as described in the Methods section.
Table 1: Recommended fluid intake targets by body weight andworkplace location.
Discussion
Fluid intake equalled or exceeded fluid loss for approximatelyhalf of the participants in both September (51%, n=32) andFebruary (52%, n=31). These results indicate that the facilitiescurrently provided at the Phosphate Hill site in combination withthe behaviour of employees working predominantly in airconditioning or shade appear to be adequate for maintaining orimproving hydration in the workplace.
However, the results indicate that improved rehydrationstrategies for employees working predominantly in direct sunlightare required. Employees working predominantly in direct sunlighthave consistently higher fluid loss compared to employees workingin shade and air conditioning. Accordingly, the hydrationrequirements of this group are different from the rest of theworkforce as their fluid balance deteriorates during their shift.
A plausible explanation for the insufficient fluid intake insubjects working predominantly in direct sunlight is access to water.Employees working in air conditioning and shade are either inside orclose to site buildings and have access to taps or water coolers.Employees in direct sunlight are more likely to be further away frombuildings in situations where water is not easily accessible whileperforming work duties. Additionally, the relatively low humidity atthe Phosphate Hill site enables an efficient evaporation of sweat.Employees may be unaware of their fluid loss through sweat and theamount of fluid required to sufficiently maintain hydration. Theworking conditions and hydration behaviours of this sub-group ofemployees require further investigation to develop strategies toincrease fluid intake in the workplace.
The recommended fluid intake targets for the workforce asdetailed in Table 1 are based on estimates of the median fluidlosses obtained in this study and are consistent with guidelinespublished in the scientific literature21. These targets cannotprovide employees with an exact fluid intake per shift due to thedaily variations in environmental conditions (temperature,humidity and wind speed) and individual physiological factors(aerobic fitness, endurance training, heat acclimation, genderand body composition)22 that affect fluid loss. Rather, thesefigures are intended to serve as a guide only to inform employeesas to their fluid intake requirements and increase fluid intake forthose who may be hypohydrated. It is strongly recommended thatemployees use urine colour rather than the amount of fluidingested or thirst as the most valid indicator of their hydrationstatus, as urine colour is strongly correlated with urine specificgravity and urine osmolality23.
A review of the scientific literature indicates that water is thepreferred beverage for hydration for fluid loss rates of themagnitude observed in this study due to its availability and lowsodium levels24. Commercially prepared electrolyte replacementdrinks have a limited role and may exceed the salt requirementsand may, in the long-term, even cause renal damage due to thehydrogen ion load25, dental erosion due to low pH and diarrhoeadue to high sugar levels26. The main advantage of carbohydrate-electrolyte beverages is their increased palatability compared to
Air conditioning Shade Fluid Direct sunlightBody Fluid intake target intake target Fluid intake targetweight (L/shift) (L/shift) (L/shift)
70 kg 4 to 5 5 to 6 6 to 785 kg 5 to 6 6 to 7 7 to 8100 kg 6 to 7 7 to 8 8 to 9
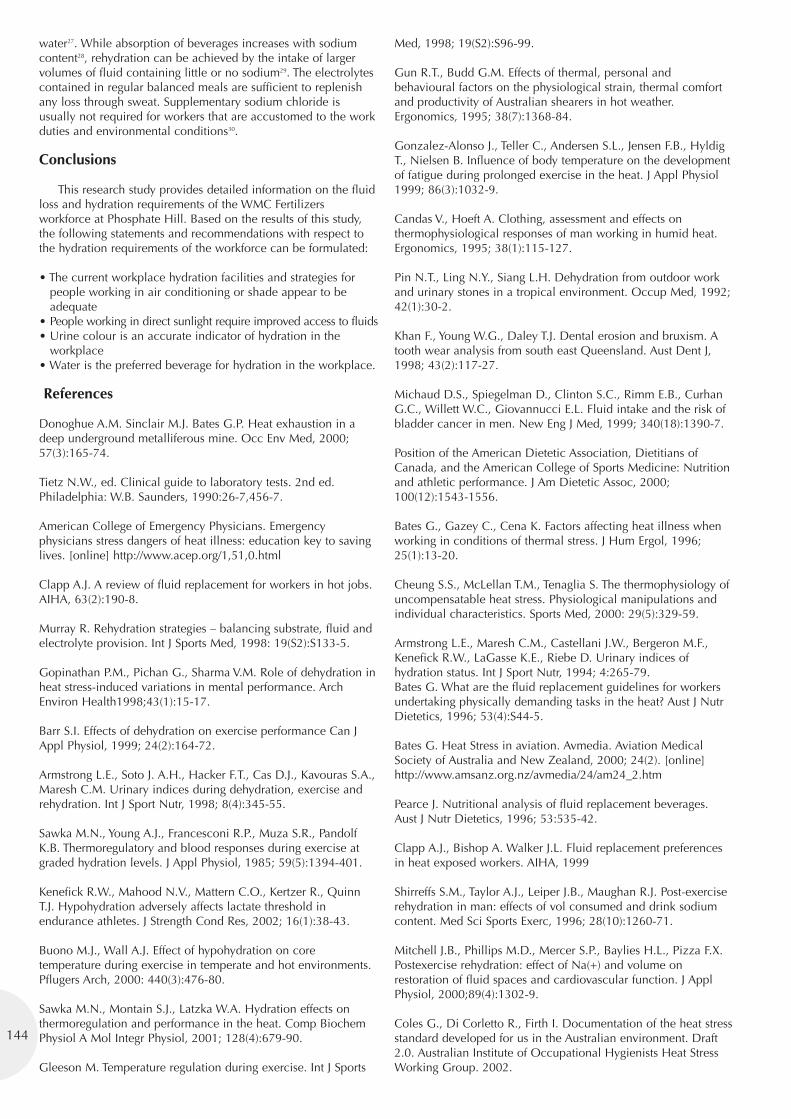
144
water27. While absorption of beverages increases with sodiumcontent28, rehydration can be achieved by the intake of largervolumes of fluid containing little or no sodium29. The electrolytescontained in regular balanced meals are sufficient to replenishany loss through sweat. Supplementary sodium chloride isusually not required for workers that are accustomed to the workduties and environmental conditions30.
Conclusions
This research study provides detailed information on the fluidloss and hydration requirements of the WMC Fertilizersworkforce at Phosphate Hill. Based on the results of this study,the following statements and recommendations with respect tothe hydration requirements of the workforce can be formulated:
• The current workplace hydration facilities and strategies forpeople working in air conditioning or shade appear to beadequate
• People working in direct sunlight require improved access to fluids• Urine colour is an accurate indicator of hydration in the
workplace• Water is the preferred beverage for hydration in the workplace.
References
Donoghue A.M. Sinclair M.J. Bates G.P. Heat exhaustion in adeep underground metalliferous mine. Occ Env Med, 2000;57(3):165-74.
Tietz N.W., ed. Clinical guide to laboratory tests. 2nd ed.Philadelphia: W.B. Saunders, 1990:26-7,456-7.
American College of Emergency Physicians. Emergencyphysicians stress dangers of heat illness: education key to savinglives. [online] http://www.acep.org/1,51,0.html
Clapp A.J. A review of fluid replacement for workers in hot jobs.AIHA, 63(2):190-8.
Murray R. Rehydration strategies – balancing substrate, fluid andelectrolyte provision. Int J Sports Med, 1998: 19(S2):S133-5.
Gopinathan P.M., Pichan G., Sharma V.M. Role of dehydration inheat stress-induced variations in mental performance. ArchEnviron Health1998;43(1):15-17.
Barr S.I. Effects of dehydration on exercise performance Can JAppl Physiol, 1999; 24(2):164-72.
Armstrong L.E., Soto J. A.H., Hacker F.T., Cas D.J., Kavouras S.A.,Maresh C.M. Urinary indices during dehydration, exercise andrehydration. Int J Sport Nutr, 1998; 8(4):345-55.
Sawka M.N., Young A.J., Francesconi R.P., Muza S.R., PandolfK.B. Thermoregulatory and blood responses during exercise atgraded hydration levels. J Appl Physiol, 1985; 59(5):1394-401.
Kenefick R.W., Mahood N.V., Mattern C.O., Kertzer R., QuinnT.J. Hypohydration adversely affects lactate threshold inendurance athletes. J Strength Cond Res, 2002; 16(1):38-43.
Buono M.J., Wall A.J. Effect of hypohydration on coretemperature during exercise in temperate and hot environments.Pflugers Arch, 2000: 440(3):476-80.
Sawka M.N., Montain S.J., Latzka W.A. Hydration effects onthermoregulation and performance in the heat. Comp BiochemPhysiol A Mol Integr Physiol, 2001; 128(4):679-90.
Gleeson M. Temperature regulation during exercise. Int J Sports
Med, 1998; 19(S2):S96-99.
Gun R.T., Budd G.M. Effects of thermal, personal andbehavioural factors on the physiological strain, thermal comfortand productivity of Australian shearers in hot weather.Ergonomics, 1995; 38(7):1368-84.
Gonzalez-Alonso J., Teller C., Andersen S.L., Jensen F.B., HyldigT., Nielsen B. Influence of body temperature on the developmentof fatigue during prolonged exercise in the heat. J Appl Physiol1999; 86(3):1032-9.
Candas V., Hoeft A. Clothing, assessment and effects onthermophysiological responses of man working in humid heat.Ergonomics, 1995; 38(1):115-127.
Pin N.T., Ling N.Y., Siang L.H. Dehydration from outdoor workand urinary stones in a tropical environment. Occup Med, 1992;42(1):30-2.
Khan F., Young W.G., Daley T.J. Dental erosion and bruxism. Atooth wear analysis from south east Queensland. Aust Dent J,1998; 43(2):117-27.
Michaud D.S., Spiegelman D., Clinton S.C., Rimm E.B., CurhanG.C., Willett W.C., Giovannucci E.L. Fluid intake and the risk ofbladder cancer in men. New Eng J Med, 1999; 340(18):1390-7.
Position of the American Dietetic Association, Dietitians ofCanada, and the American College of Sports Medicine: Nutritionand athletic performance. J Am Dietetic Assoc, 2000;100(12):1543-1556.
Bates G., Gazey C., Cena K. Factors affecting heat illness whenworking in conditions of thermal stress. J Hum Ergol, 1996;25(1):13-20.
Cheung S.S., McLellan T.M., Tenaglia S. The thermophysiology ofuncompensatable heat stress. Physiological manipulations andindividual characteristics. Sports Med, 2000: 29(5):329-59.
Armstrong L.E., Maresh C.M., Castellani J.W., Bergeron M.F.,Kenefick R.W., LaGasse K.E., Riebe D. Urinary indices ofhydration status. Int J Sport Nutr, 1994; 4:265-79.Bates G. What are the fluid replacement guidelines for workersundertaking physically demanding tasks in the heat? Aust J NutrDietetics, 1996; 53(4):S44-5.
Bates G. Heat Stress in aviation. Avmedia. Aviation MedicalSociety of Australia and New Zealand, 2000; 24(2). [online]http://www.amsanz.org.nz/avmedia/24/am24_2.htm
Pearce J. Nutritional analysis of fluid replacement beverages.Aust J Nutr Dietetics, 1996; 53:535-42.
Clapp A.J., Bishop A. Walker J.L. Fluid replacement preferencesin heat exposed workers. AIHA, 1999
Shirreffs S.M., Taylor A.J., Leiper J.B., Maughan R.J. Post-exerciserehydration in man: effects of vol consumed and drink sodiumcontent. Med Sci Sports Exerc, 1996; 28(10):1260-71.
Mitchell J.B., Phillips M.D., Mercer S.P., Baylies H.L., Pizza F.X.Postexercise rehydration: effect of Na(+) and volume onrestoration of fluid spaces and cardiovascular function. J ApplPhysiol, 2000;89(4):1302-9.
Coles G., Di Corletto R., Firth I. Documentation of the heat stressstandard developed for us in the Australian environment. Draft2.0. Australian Institute of Occupational Hygienists Heat StressWorking Group. 2002.
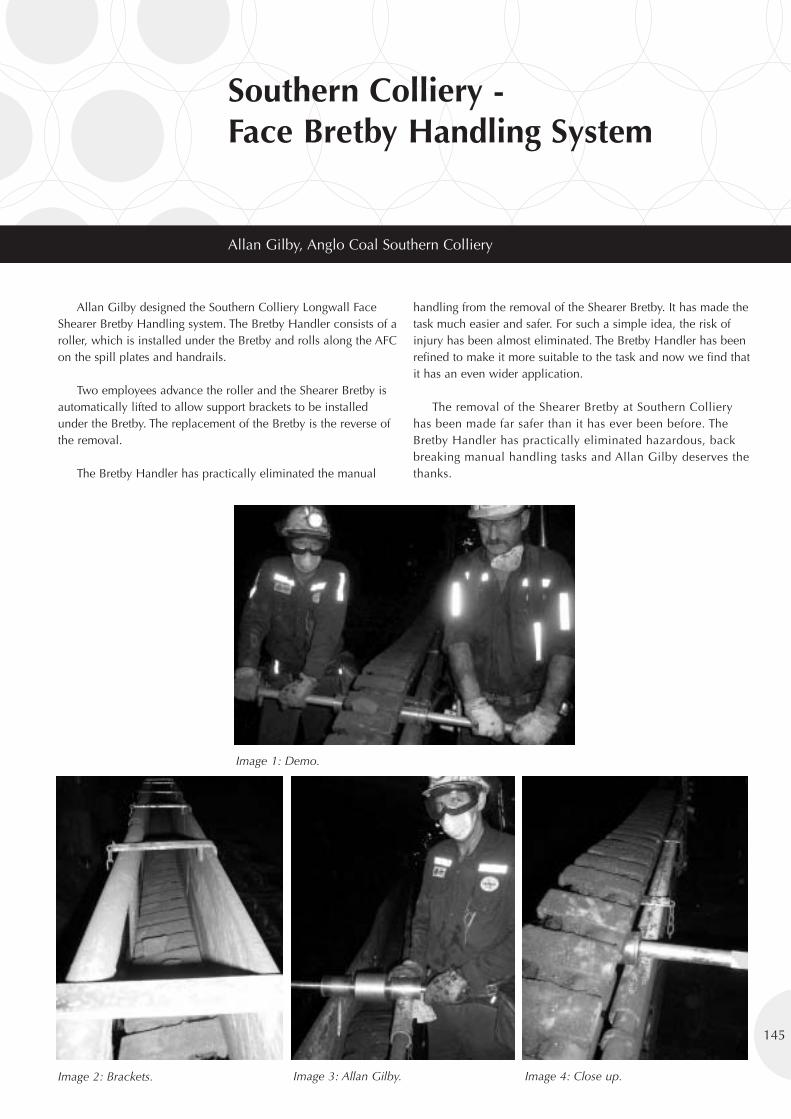
Southern Colliery -Face Bretby Handling System
Allan Gilby, Anglo Coal Southern Colliery
Allan Gilby designed the Southern Colliery Longwall FaceShearer Bretby Handling system. The Bretby Handler consists of aroller, which is installed under the Bretby and rolls along the AFCon the spill plates and handrails.
Two employees advance the roller and the Shearer Bretby isautomatically lifted to allow support brackets to be installedunder the Bretby. The replacement of the Bretby is the reverse ofthe removal.
The Bretby Handler has practically eliminated the manual
handling from the removal of the Shearer Bretby. It has made thetask much easier and safer. For such a simple idea, the risk ofinjury has been almost eliminated. The Bretby Handler has beenrefined to make it more suitable to the task and now we find thatit has an even wider application.
The removal of the Shearer Bretby at Southern Collieryhas been made far safer than it has ever been before. TheBretby Handler has practically eliminated hazardous, backbreaking manual handling tasks and Allan Gilby deserves thethanks.
145
Image 1: Demo.
Image 2: Brackets. Image 4: Close up.Image 3: Allan Gilby.
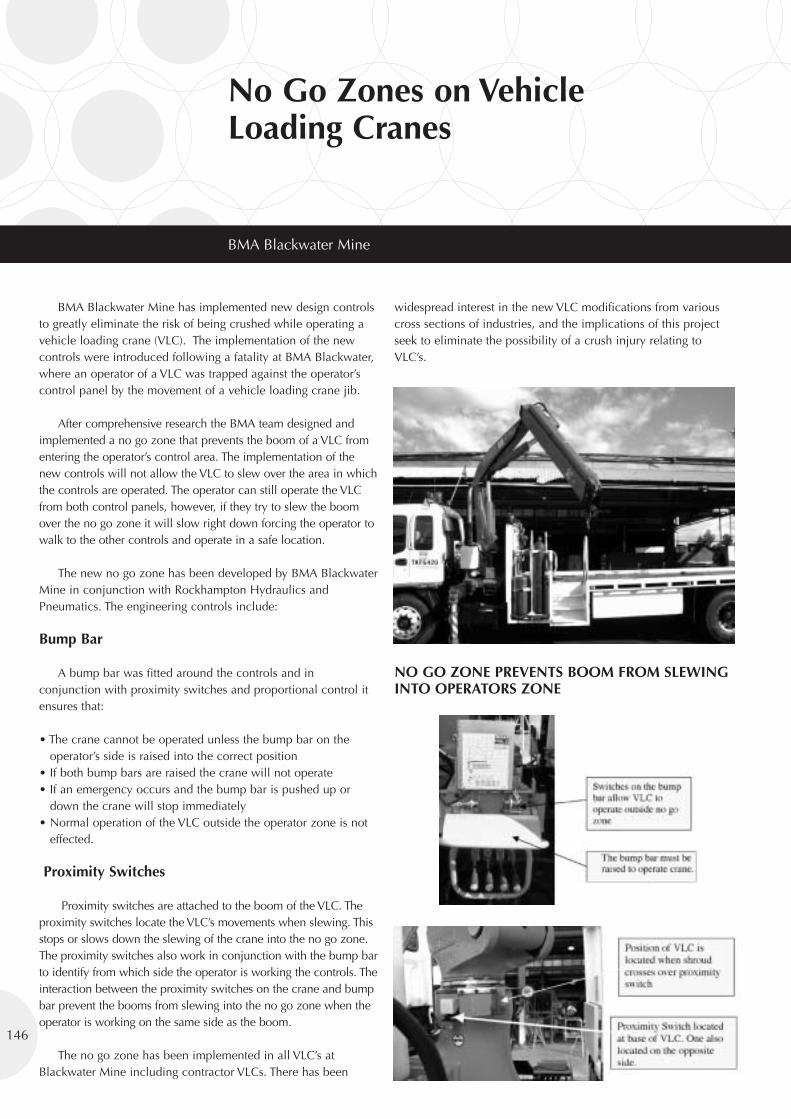
No Go Zones on VehicleLoading Cranes
BMA Blackwater Mine
146
BMA Blackwater Mine has implemented new design controlsto greatly eliminate the risk of being crushed while operating avehicle loading crane (VLC). The implementation of the newcontrols were introduced following a fatality at BMA Blackwater,where an operator of a VLC was trapped against the operator’scontrol panel by the movement of a vehicle loading crane jib.
After comprehensive research the BMA team designed andimplemented a no go zone that prevents the boom of a VLC fromentering the operator’s control area. The implementation of thenew controls will not allow the VLC to slew over the area in whichthe controls are operated. The operator can still operate the VLCfrom both control panels, however, if they try to slew the boomover the no go zone it will slow right down forcing the operator towalk to the other controls and operate in a safe location.
The new no go zone has been developed by BMA BlackwaterMine in conjunction with Rockhampton Hydraulics andPneumatics. The engineering controls include:
Bump Bar
A bump bar was fitted around the controls and inconjunction with proximity switches and proportional control itensures that:
• The crane cannot be operated unless the bump bar on theoperator’s side is raised into the correct position
• If both bump bars are raised the crane will not operate• If an emergency occurs and the bump bar is pushed up or
down the crane will stop immediately• Normal operation of the VLC outside the operator zone is not
effected.
Proximity Switches
Proximity switches are attached to the boom of the VLC. Theproximity switches locate the VLC’s movements when slewing. Thisstops or slows down the slewing of the crane into the no go zone.The proximity switches also work in conjunction with the bump barto identify from which side the operator is working the controls. Theinteraction between the proximity switches on the crane and bumpbar prevent the booms from slewing into the no go zone when theoperator is working on the same side as the boom.
The no go zone has been implemented in all VLC’s atBlackwater Mine including contractor VLCs. There has been
widespread interest in the new VLC modifications from variouscross sections of industries, and the implications of this projectseek to eliminate the possibility of a crush injury relating toVLC’s.
NO GO ZONE PREVENTS BOOM FROM SLEWINGINTO OPERATORS ZONE
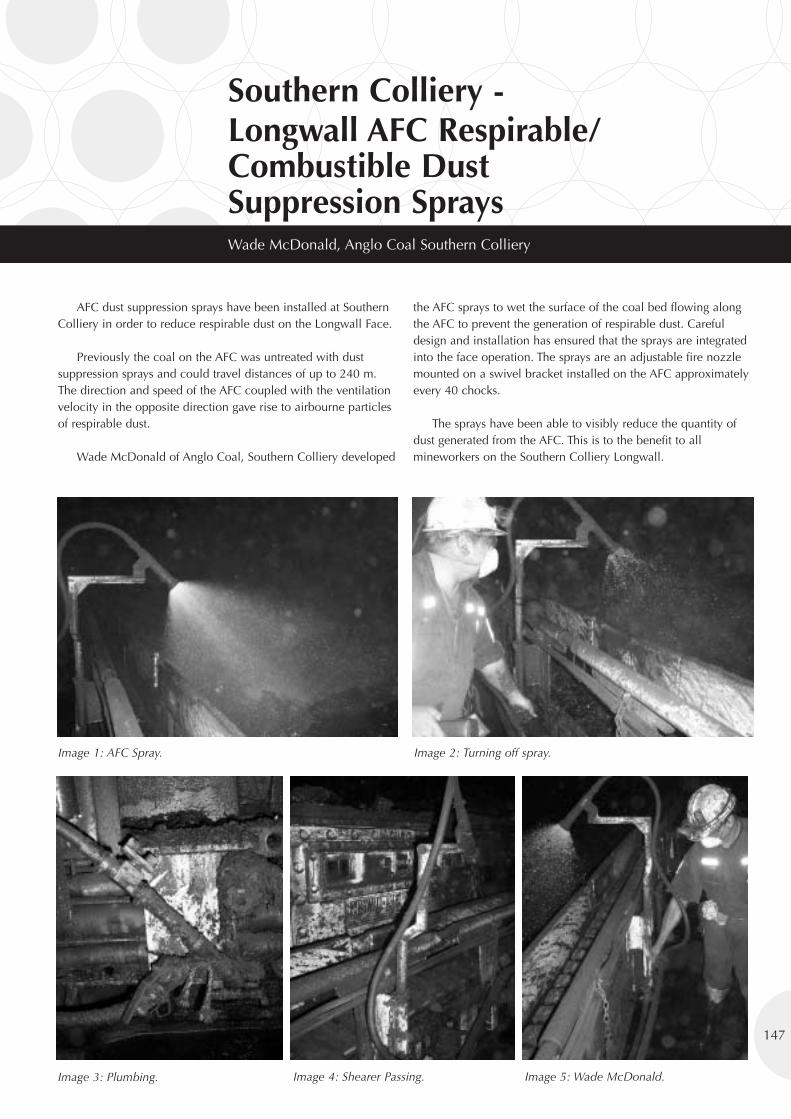
Southern Colliery -Longwall AFC Respirable/Combustible DustSuppression Sprays Wade McDonald, Anglo Coal Southern Colliery
AFC dust suppression sprays have been installed at SouthernColliery in order to reduce respirable dust on the Longwall Face.
Previously the coal on the AFC was untreated with dustsuppression sprays and could travel distances of up to 240 m.The direction and speed of the AFC coupled with the ventilationvelocity in the opposite direction gave rise to airbourne particlesof respirable dust.
Wade McDonald of Anglo Coal, Southern Colliery developed
the AFC sprays to wet the surface of the coal bed flowing alongthe AFC to prevent the generation of respirable dust. Carefuldesign and installation has ensured that the sprays are integratedinto the face operation. The sprays are an adjustable fire nozzlemounted on a swivel bracket installed on the AFC approximatelyevery 40 chocks.
The sprays have been able to visibly reduce the quantity ofdust generated from the AFC. This is to the benefit to allmineworkers on the Southern Colliery Longwall.
147
Image 3: Plumbing. Image 5: Wade McDonald.Image 4: Shearer Passing.
Image 1: AFC Spray. Image 2: Turning off spray.
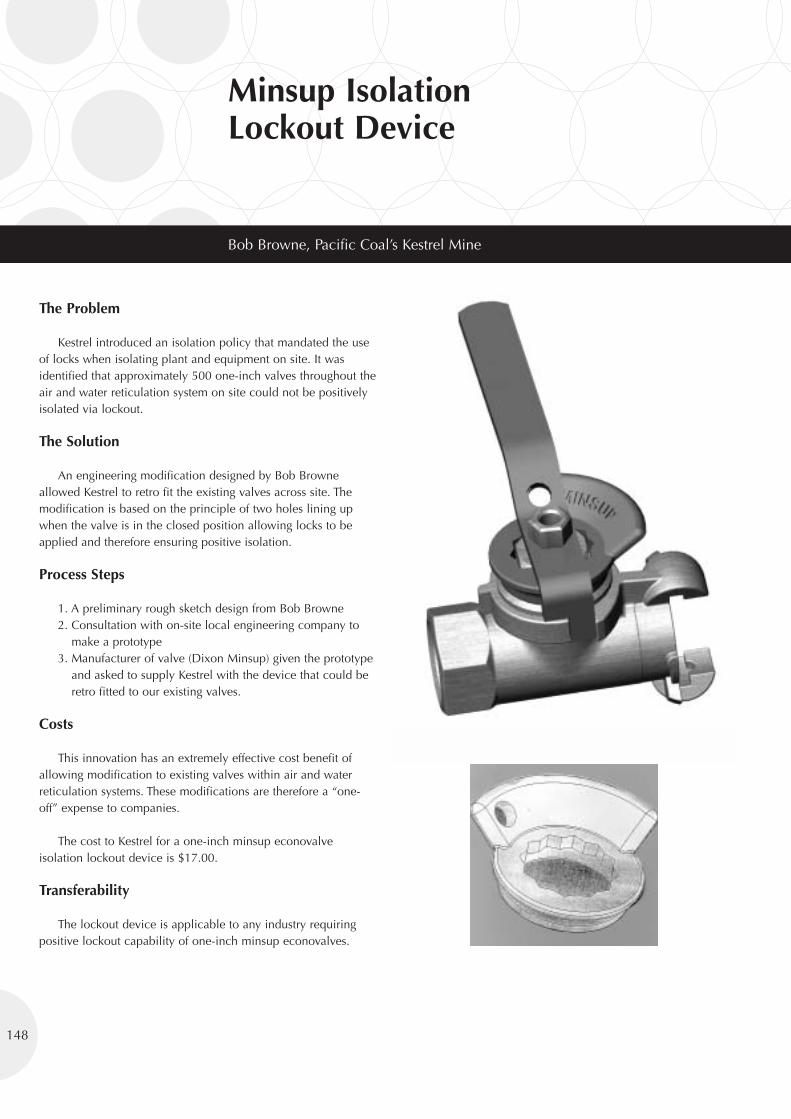
Minsup IsolationLockout Device
Bob Browne, Pacific Coal’s Kestrel Mine
The Problem
Kestrel introduced an isolation policy that mandated the useof locks when isolating plant and equipment on site. It wasidentified that approximately 500 one-inch valves throughout theair and water reticulation system on site could not be positivelyisolated via lockout.
The Solution
An engineering modification designed by Bob Browneallowed Kestrel to retro fit the existing valves across site. Themodification is based on the principle of two holes lining upwhen the valve is in the closed position allowing locks to beapplied and therefore ensuring positive isolation.
Process Steps
1. A preliminary rough sketch design from Bob Browne2. Consultation with on-site local engineering company to
make a prototype3. Manufacturer of valve (Dixon Minsup) given the prototype
and asked to supply Kestrel with the device that could beretro fitted to our existing valves.
Costs
This innovation has an extremely effective cost benefit ofallowing modification to existing valves within air and waterreticulation systems. These modifications are therefore a “one-off” expense to companies.
The cost to Kestrel for a one-inch minsup econovalveisolation lockout device is $17.00.
Transferability
The lockout device is applicable to any industry requiringpositive lockout capability of one-inch minsup econovalves.
148
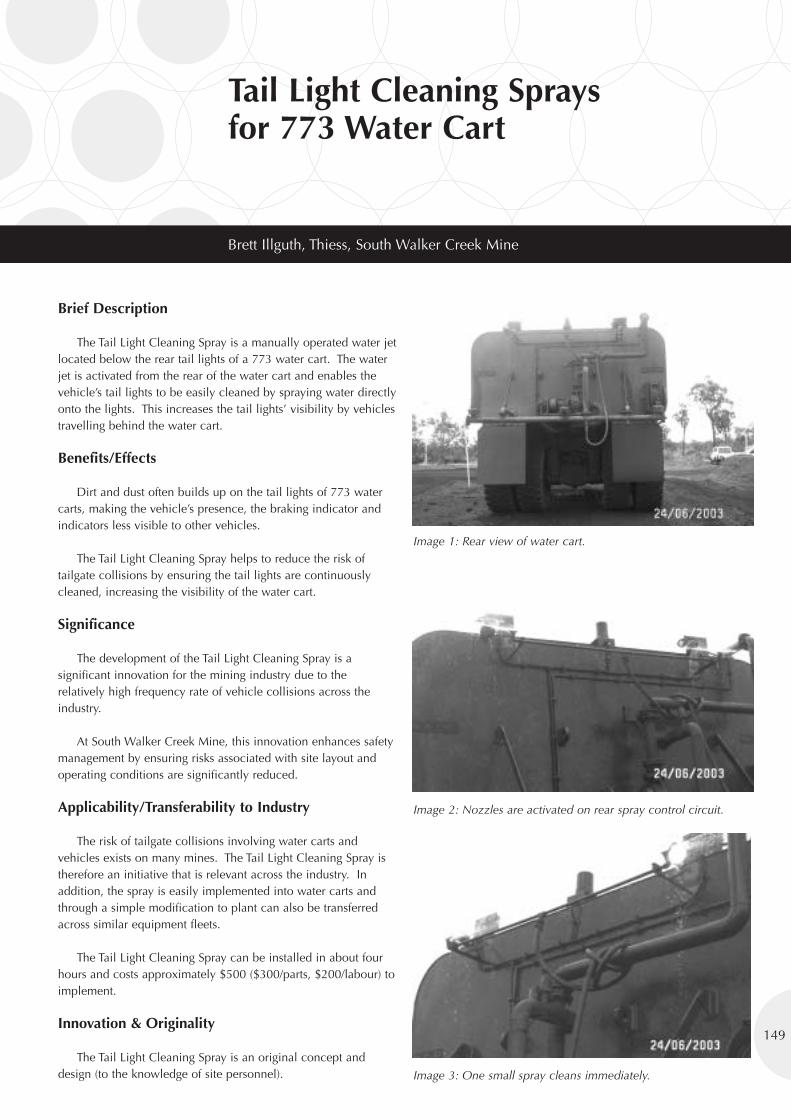
Tail Light Cleaning Spraysfor 773 Water Cart
Brett Illguth, Thiess, South Walker Creek Mine
Brief Description
The Tail Light Cleaning Spray is a manually operated water jetlocated below the rear tail lights of a 773 water cart. The waterjet is activated from the rear of the water cart and enables thevehicle’s tail lights to be easily cleaned by spraying water directlyonto the lights. This increases the tail lights’ visibility by vehiclestravelling behind the water cart.
Benefits/Effects
Dirt and dust often builds up on the tail lights of 773 watercarts, making the vehicle’s presence, the braking indicator andindicators less visible to other vehicles.
The Tail Light Cleaning Spray helps to reduce the risk oftailgate collisions by ensuring the tail lights are continuouslycleaned, increasing the visibility of the water cart.
Significance
The development of the Tail Light Cleaning Spray is asignificant innovation for the mining industry due to therelatively high frequency rate of vehicle collisions across theindustry.
At South Walker Creek Mine, this innovation enhances safetymanagement by ensuring risks associated with site layout andoperating conditions are significantly reduced.
Applicability/Transferability to Industry
The risk of tailgate collisions involving water carts andvehicles exists on many mines. The Tail Light Cleaning Spray istherefore an initiative that is relevant across the industry. Inaddition, the spray is easily implemented into water carts andthrough a simple modification to plant can also be transferredacross similar equipment fleets.
The Tail Light Cleaning Spray can be installed in about fourhours and costs approximately $500 ($300/parts, $200/labour) toimplement.
Innovation & Originality
The Tail Light Cleaning Spray is an original concept anddesign (to the knowledge of site personnel).
149
Image 1: Rear view of water cart.
Image 2: Nozzles are activated on rear spray control circuit.
Image 3: One small spray cleans immediately.
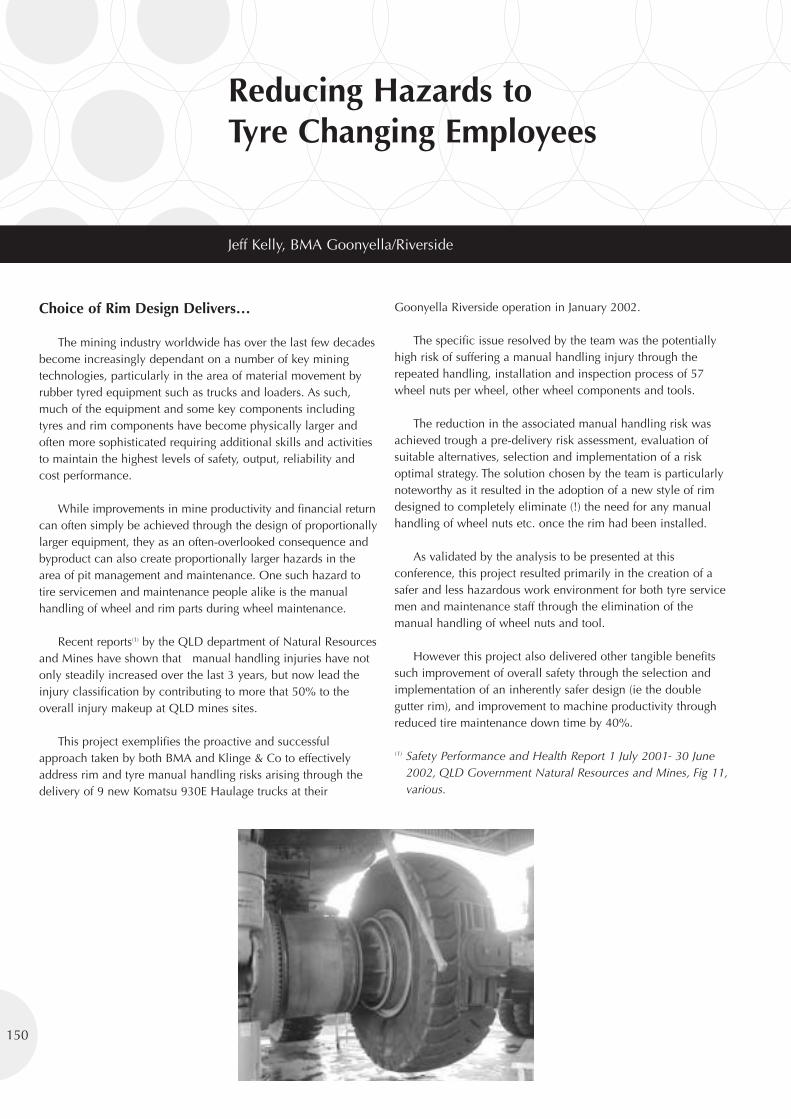
Reducing Hazards toTyre Changing Employees
Jeff Kelly, BMA Goonyella/Riverside
Choice of Rim Design Delivers…
The mining industry worldwide has over the last few decadesbecome increasingly dependant on a number of key miningtechnologies, particularly in the area of material movement byrubber tyred equipment such as trucks and loaders. As such,much of the equipment and some key components includingtyres and rim components have become physically larger andoften more sophisticated requiring additional skills and activitiesto maintain the highest levels of safety, output, reliability andcost performance.
While improvements in mine productivity and financial returncan often simply be achieved through the design of proportionallylarger equipment, they as an often-overlooked consequence andbyproduct can also create proportionally larger hazards in thearea of pit management and maintenance. One such hazard totire servicemen and maintenance people alike is the manualhandling of wheel and rim parts during wheel maintenance.
Recent reports(1) by the QLD department of Natural Resourcesand Mines have shown that manual handling injuries have notonly steadily increased over the last 3 years, but now lead theinjury classification by contributing to more that 50% to theoverall injury makeup at QLD mines sites.
This project exemplifies the proactive and successfulapproach taken by both BMA and Klinge & Co to effectivelyaddress rim and tyre manual handling risks arising through thedelivery of 9 new Komatsu 930E Haulage trucks at their
Goonyella Riverside operation in January 2002.
The specific issue resolved by the team was the potentiallyhigh risk of suffering a manual handling injury through therepeated handling, installation and inspection process of 57wheel nuts per wheel, other wheel components and tools.
The reduction in the associated manual handling risk wasachieved trough a pre-delivery risk assessment, evaluation ofsuitable alternatives, selection and implementation of a riskoptimal strategy. The solution chosen by the team is particularlynoteworthy as it resulted in the adoption of a new style of rimdesigned to completely eliminate (!) the need for any manualhandling of wheel nuts etc. once the rim had been installed.
As validated by the analysis to be presented at thisconference, this project resulted primarily in the creation of asafer and less hazardous work environment for both tyre servicemen and maintenance staff through the elimination of themanual handling of wheel nuts and tool.
However this project also delivered other tangible benefitssuch improvement of overall safety through the selection andimplementation of an inherently safer design (ie the doublegutter rim), and improvement to machine productivity throughreduced tire maintenance down time by 40%.
(1) Safety Performance and Health Report 1 July 2001- 30 June2002, QLD Government Natural Resources and Mines, Fig 11,various.
150
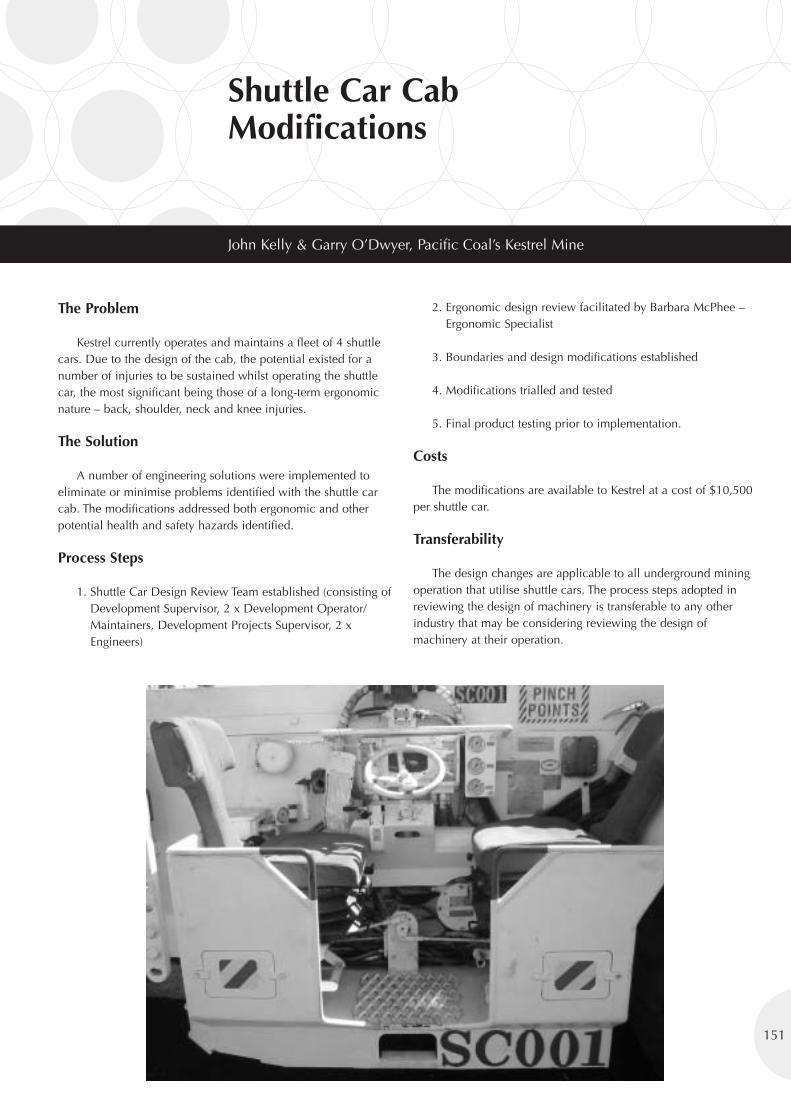
Shuttle Car CabModifications
John Kelly & Garry O’Dwyer, Pacific Coal’s Kestrel Mine
The Problem
Kestrel currently operates and maintains a fleet of 4 shuttlecars. Due to the design of the cab, the potential existed for anumber of injuries to be sustained whilst operating the shuttlecar, the most significant being those of a long-term ergonomicnature – back, shoulder, neck and knee injuries.
The Solution
A number of engineering solutions were implemented toeliminate or minimise problems identified with the shuttle carcab. The modifications addressed both ergonomic and otherpotential health and safety hazards identified.
Process Steps
1. Shuttle Car Design Review Team established (consisting ofDevelopment Supervisor, 2 x Development Operator/Maintainers, Development Projects Supervisor, 2 xEngineers)
2. Ergonomic design review facilitated by Barbara McPhee –Ergonomic Specialist
3. Boundaries and design modifications established
4. Modifications trialled and tested
5. Final product testing prior to implementation.
Costs
The modifications are available to Kestrel at a cost of $10,500per shuttle car.
Transferability
The design changes are applicable to all underground miningoperation that utilise shuttle cars. The process steps adopted inreviewing the design of machinery is transferable to any otherindustry that may be considering reviewing the design ofmachinery at their operation.
151
Programmable ElectronicRoof Bolter Controls
Alan Bruce, BMA Crinum Mine
The Crinum production team has continued to work towardsreducing the number of strain injuries relating to roof and ribbolting and improving the efficiency of the bolting cycle withinits Development operations. The team has developed andimplemented the concept of installing electro-hydraulic controlson the continuous miner bolting rigs. This has provided forsubstantially improved access the bolting rigs for operation andmaintenance.
The equipment also incorporates a semi automated drillingand bolting process which is expected with time to improve thequality of roof and rib bolting through greater consistency in thebolt installation cycle.
The 3rd aim of the system is to measure specific energy ofdrilling. It is planned that data obtained through this will providesite geotechnical engineers with information about theimmediate roof conditions an eventually enable calculation ofempirical roof strength contours, optimisation of primary andsecondary support in roadways and improve our understandingfor future longwall mining risk.
152
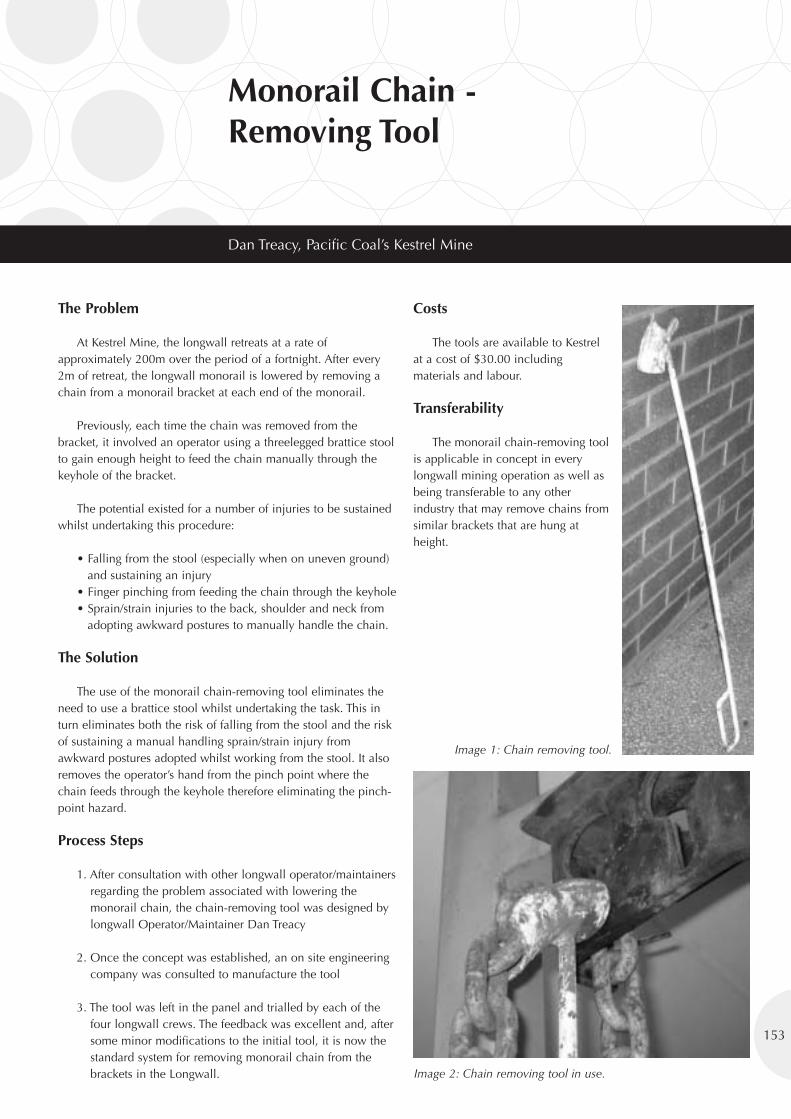
Monorail Chain -Removing Tool
Dan Treacy, Pacific Coal’s Kestrel Mine
The Problem
At Kestrel Mine, the longwall retreats at a rate ofapproximately 200m over the period of a fortnight. After every2m of retreat, the longwall monorail is lowered by removing achain from a monorail bracket at each end of the monorail.
Previously, each time the chain was removed from thebracket, it involved an operator using a threelegged brattice stoolto gain enough height to feed the chain manually through thekeyhole of the bracket.
The potential existed for a number of injuries to be sustainedwhilst undertaking this procedure:
• Falling from the stool (especially when on uneven ground)and sustaining an injury
• Finger pinching from feeding the chain through the keyhole• Sprain/strain injuries to the back, shoulder and neck from
adopting awkward postures to manually handle the chain.
The Solution
The use of the monorail chain-removing tool eliminates theneed to use a brattice stool whilst undertaking the task. This inturn eliminates both the risk of falling from the stool and the riskof sustaining a manual handling sprain/strain injury fromawkward postures adopted whilst working from the stool. It alsoremoves the operator’s hand from the pinch point where thechain feeds through the keyhole therefore eliminating the pinch-point hazard.
Process Steps
1. After consultation with other longwall operator/maintainersregarding the problem associated with lowering themonorail chain, the chain-removing tool was designed bylongwall Operator/Maintainer Dan Treacy
2. Once the concept was established, an on site engineeringcompany was consulted to manufacture the tool
3. The tool was left in the panel and trialled by each of thefour longwall crews. The feedback was excellent and, aftersome minor modifications to the initial tool, it is now thestandard system for removing monorail chain from thebrackets in the Longwall.
Costs
The tools are available to Kestrelat a cost of $30.00 includingmaterials and labour.
Transferability
The monorail chain-removing toolis applicable in concept in everylongwall mining operation as well asbeing transferable to any otherindustry that may remove chains fromsimilar brackets that are hung atheight.
153
Image 2: Chain removing tool in use.
Image 1: Chain removing tool.
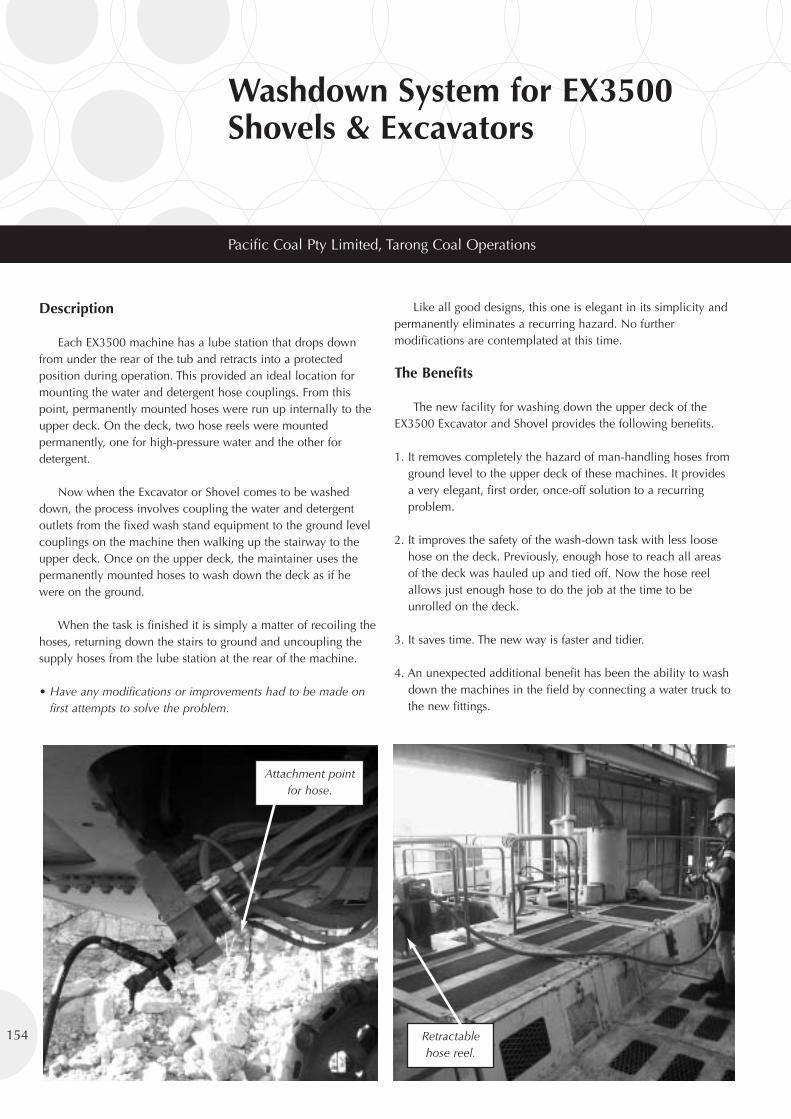
Washdown System for EX3500Shovels & Excavators
Pacific Coal Pty Limited, Tarong Coal Operations
Description
Each EX3500 machine has a lube station that drops downfrom under the rear of the tub and retracts into a protectedposition during operation. This provided an ideal location formounting the water and detergent hose couplings. From thispoint, permanently mounted hoses were run up internally to theupper deck. On the deck, two hose reels were mountedpermanently, one for high-pressure water and the other fordetergent.
Now when the Excavator or Shovel comes to be washeddown, the process involves coupling the water and detergentoutlets from the fixed wash stand equipment to the ground levelcouplings on the machine then walking up the stairway to theupper deck. Once on the upper deck, the maintainer uses thepermanently mounted hoses to wash down the deck as if hewere on the ground.
When the task is finished it is simply a matter of recoiling thehoses, returning down the stairs to ground and uncoupling thesupply hoses from the lube station at the rear of the machine.
• Have any modifications or improvements had to be made onfirst attempts to solve the problem.
Like all good designs, this one is elegant in its simplicity andpermanently eliminates a recurring hazard. No furthermodifications are contemplated at this time.
The Benefits
The new facility for washing down the upper deck of theEX3500 Excavator and Shovel provides the following benefits.
1. It removes completely the hazard of man-handling hoses fromground level to the upper deck of these machines. It providesa very elegant, first order, once-off solution to a recurringproblem.
2. It improves the safety of the wash-down task with less loosehose on the deck. Previously, enough hose to reach all areasof the deck was hauled up and tied off. Now the hose reelallows just enough hose to do the job at the time to beunrolled on the deck.
3. It saves time. The new way is faster and tidier.
4. An unexpected additional benefit has been the ability to washdown the machines in the field by connecting a water truck tothe new fittings.
154
Attachment pointfor hose.
Retractablehose reel.
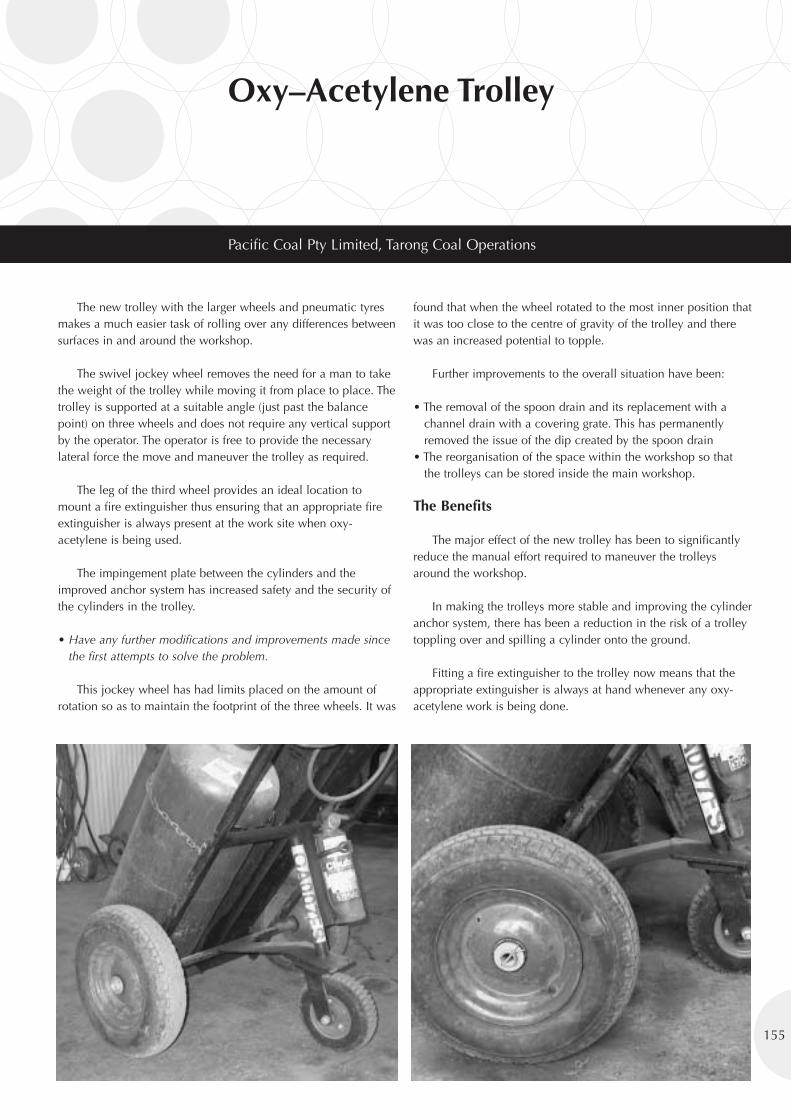
Oxy–Acetylene Trolley
Pacific Coal Pty Limited, Tarong Coal Operations
The new trolley with the larger wheels and pneumatic tyresmakes a much easier task of rolling over any differences betweensurfaces in and around the workshop.
The swivel jockey wheel removes the need for a man to takethe weight of the trolley while moving it from place to place. Thetrolley is supported at a suitable angle (just past the balancepoint) on three wheels and does not require any vertical supportby the operator. The operator is free to provide the necessarylateral force the move and maneuver the trolley as required.
The leg of the third wheel provides an ideal location tomount a fire extinguisher thus ensuring that an appropriate fireextinguisher is always present at the work site when oxy-acetylene is being used.
The impingement plate between the cylinders and theimproved anchor system has increased safety and the security ofthe cylinders in the trolley.
• Have any further modifications and improvements made sincethe first attempts to solve the problem.
This jockey wheel has had limits placed on the amount ofrotation so as to maintain the footprint of the three wheels. It was
found that when the wheel rotated to the most inner position thatit was too close to the centre of gravity of the trolley and therewas an increased potential to topple.
Further improvements to the overall situation have been:
• The removal of the spoon drain and its replacement with achannel drain with a covering grate. This has permanentlyremoved the issue of the dip created by the spoon drain
• The reorganisation of the space within the workshop so thatthe trolleys can be stored inside the main workshop.
The Benefits
The major effect of the new trolley has been to significantlyreduce the manual effort required to maneuver the trolleysaround the workshop.
In making the trolleys more stable and improving the cylinderanchor system, there has been a reduction in the risk of a trolleytoppling over and spilling a cylinder onto the ground.
Fitting a fire extinguisher to the trolley now means that theappropriate extinguisher is always at hand whenever any oxy-acetylene work is being done.
155

NOTES
Telephone: +61 7 3295 9565
Facsimile: +61 7 3295 9566
Email: [email protected]
Web: www.qmc.com.au/QMIHSCHomePage.htm
Further information:
Conference Secretariat
GPO Box 908
Brisbane Qld 4001 Australia3-6 AUGUST 2003
JUPITERS TOWNSVILLE HOTEL & CASINO TOWNSVILLE QUEENSLAND
ACCEPTING THE CHALLENGE
QUEENSLAND MINING INDUSTRY
Health&SafetyC O N F E R E N C E 2 0 0 3
QUEENSLAND MINING INDUSTRY
Health&SafetyC O N F E R E N C E 2 0 0 3
Health & Safety Trust
appreciates the support of thefollowing sponsors:
ProceedingsConference
QU
EENSLA
ND
MIN
ING
IND
USTRY
Health
&Safety
CO
NF
ER
EN
CE
20
03
QMC 2003 Papers Cover 21/7/03 1:26 PM Page 1


