Embed Size (px)
Citation preview
REVIEW
Quantifying fat replacement of muscle by quantitative MRIin muscular dystrophy
Jedrzej Burakiewicz1 • Christopher D. J. Sinclair2,3 • Dirk Fischer4,5 •
Glenn A. Walter6 • Hermien E. Kan1 • Kieren G. Hollingsworth7
Received: 3 April 2017 / Revised: 12 June 2017 / Accepted: 13 June 2017 / Published online: 1 July 2017
� The Author(s) 2017. This article is an open access publication
Abstract The muscular dystrophies are rare orphan dis-
eases, characterized by progressive muscle weakness: the
most common and well known is Duchenne muscular
dystrophy which affects young boys and progresses quickly
during childhood. However, over 70 distinct variants have
been identified to date, with different rates of progression,
implications for morbidity, mortality, and quality of life.
There are presently no curative therapies for these diseases,
but a range of potential therapies are presently reaching the
stage of multi-centre, multi-national first-in-man clinical
trials. There is a need for sensitive, objective end-points to
assess the efficacy of the proposed therapies. Present
clinical measurements are often too dependent on patient
effort or motivation, and lack sensitivity to small changes,
or are invasive. Quantitative MRI to measure the fat
replacement of skeletal muscle by either chemical shift
imaging methods (Dixon or IDEAL) or spectroscopy has
been demonstrated to provide such a sensitive, objective
end-point in a number of studies. This review considers the
importance of the outcome measures, discusses the con-
siderations required to make robust measurements and
appropriate quality assurance measures, and draws together
the existing literature for cross-sectional and longitudinal
cohort studies using these methods in muscular dystrophy.
Keywords Muscular dystrophy � MRI � Quantitative �Duchenne � Muscle � Clinical trial
Introduction: a motivation for quantifying musclereplacement by fat
All muscular dystrophies (MD) are rare orphan diseases,
characterized by progressive muscle weakness resulting in
functional disability. While the causes for muscle weakness
vary between different MDs, they share common histo-
logical features, including fibrosis, muscle edema, and fat
replacement of muscle tissue. More than 70 distinct vari-
ants have been identified, some becoming apparent in early
childhood with rapid progression while others are not
detected until adulthood with a much slower timescale of
progression. Among the muscular dystrophies, Duchenne
muscular dystrophy (DMD) is the most common form
affecting 1 in 3500–6000 male births [1, 2], tending to
show first symptoms at 3–5 years of age and rapid pro-
gression leading to loss of ambulation between 10 and
15 years. Deterioration of respiratory function and car-
diomyopathy occur in DMD and in many other MDs.
Planning clinical trials of therapy in MDs is chal-
lenging for three reasons. First, the progression of the
disease does not always follow a linear course when
& Kieren G. Hollingsworth
1 Department of Radiology, C. J. Gorter Center for High Field
MRI, Leiden University Medical Centre, Leiden, The
Netherlands
2 MRC Centre for Neuromuscular Diseases, UCL Institute of
Neurology, London, UK
3 Neuroradiological Academic Unit, UCL Institute of
Neurology, London, UK
4 Division of Neuropaediatrics, University of Basel Children’s
Hospital, Spitalstrasse 33, Postfach, Basel 4031, Switzerland
5 Department of Neurology, University of Basel Hospital,
Petersgraben 4, Basel 4031, Switzerland
6 Department of Physiology and Functional Genomics,
University of Florida, Gainesville, FL 32610, USA
7 Newcastle Magnetic Resonance Centre, Institute of Cellular
Medicine, Newcastle University, Newcastle-upon-Tyne, UK
123
J Neurol (2017) 264:2053–2067
DOI 10.1007/s00415-017-8547-3
physical abilities are measured. Longitudinal studies using
clinical measurements in DMD show an improvement of
gross and fine motor function up to the age of 7, a plateau
phase up to the age of 10 followed by a phase of rapid
decline during which free ambulation is lost [3, 4]. Sec-
ond, recruitment in rare disease cohorts for large clinical
trials is difficult. Third, clinical assessment is dependent
on cooperation (especially in children) and the measure-
ments required differ between ambulant and non-ambu-
lant patients.
Therefore, it is essential to have outcome measures that
are less dependent on patient cooperation and motivation
while being sufficiently sensitive to measure treatment
effects even in small and highly heterogeneous patient
populations. Quantitative muscle MRI (qMRI) can provide
such an outcome measure, as it is non-invasive and can
generate a wide range of imaging contrasts over large vol-
umes of muscle. As such, it can visualize and quantify the
major hallmarks of muscle degeneration in MDs: muscle
hypertrophy and atrophy, muscle edema and inflammation,
and the replacement of muscle tissue by fat tissue. Histo-
logically, the content of the muscle fibres is progressively
replaced by lipid, resulting in a fatty tissue. On MRI, the
overall outline, shape, structure, and appearance of the
muscle groups are often preserved despite the extensive fatty
tissue content. In contrast to functional scores obtained by
physical assessment, qMRI is less biased by patients or
observers. Excellent reproducibility of qMRI has been
demonstrated in healthy volunteers as well as in patients
[5, 6]. In particular, qMRI of fat replacement has the
potential to be very valuable as an outcome measure in
clinical trials as it has been shown to be more sensitive than
clinical evaluation in detecting disease progression [7–12]
and effect sizes of fat replacement measured by qMRI are
much greater than those of commonly used clinical scores
[10, 13]. Thus, when using qMRI of fat replacement as an
end-point to demonstrate the effectiveness of a putative
novel treatment, the number of patients required is markedly
reduced [9, 10]. Although invasive muscle biopsy is some-
times undertaken (often to determine membrane protein
expression) and fat content could be estimated from it, it is an
unreliable method of measuring fat content due to the small
sample volume, the heterogeneous nature of the fat
replacement across muscle groups, and the limitations on
repeating biopsy in longitudinal studies.
In this review, we review the MRI sequences used to
quantify fat replacement of skeletal muscle by imaging and
detail the important factors that need to be taken into
account to produce accurate results (‘‘Quantitative fat
fraction imaging measurements: how is it done?’’), com-
pare these with magnetic resonance spectroscopy methods
(‘‘T2-corrected spectroscopy to measure muscle fat con-
tent’’), and provide a survey of longitudinal and cross-
sectional studies of muscular dystrophy which have
employed variants of these methods (‘‘Studies which have
used quantitative fat fraction measurements in muscular
dystrophy’’). We then consider the quality assurance
required for using these methods (‘‘Quality assurance’’)
and practical considerations for patient positioning, slice
prescription, and data analysis (‘‘Patient placement,
acquisition time and scan acceleration, practical issues and
segmentation’’). Most MR vendors have developed prod-
ucts for measuring liver steatosis and we discuss the nec-
essary considerations for using these in skeletal muscle
(‘‘Vendor implementations of quantitative protocols to
measure PDFF’’).
Quantitative fat fraction imaging measurements:how is it done?
T1-weighted imaging as fat quantification technique
While T1-weighted MRI is commonly used in routine
diagnostic procedures to assess muscle involvement, T1-
weighted imaging has several disadvantages when it is used
to measure fat replacement. First, the signal intensity does
not directly quantify changes inmuscle fat content and needs
to be referenced, e.g., to the subjects’ bone marrow intensity
of the same image section and expressed as a percentage of
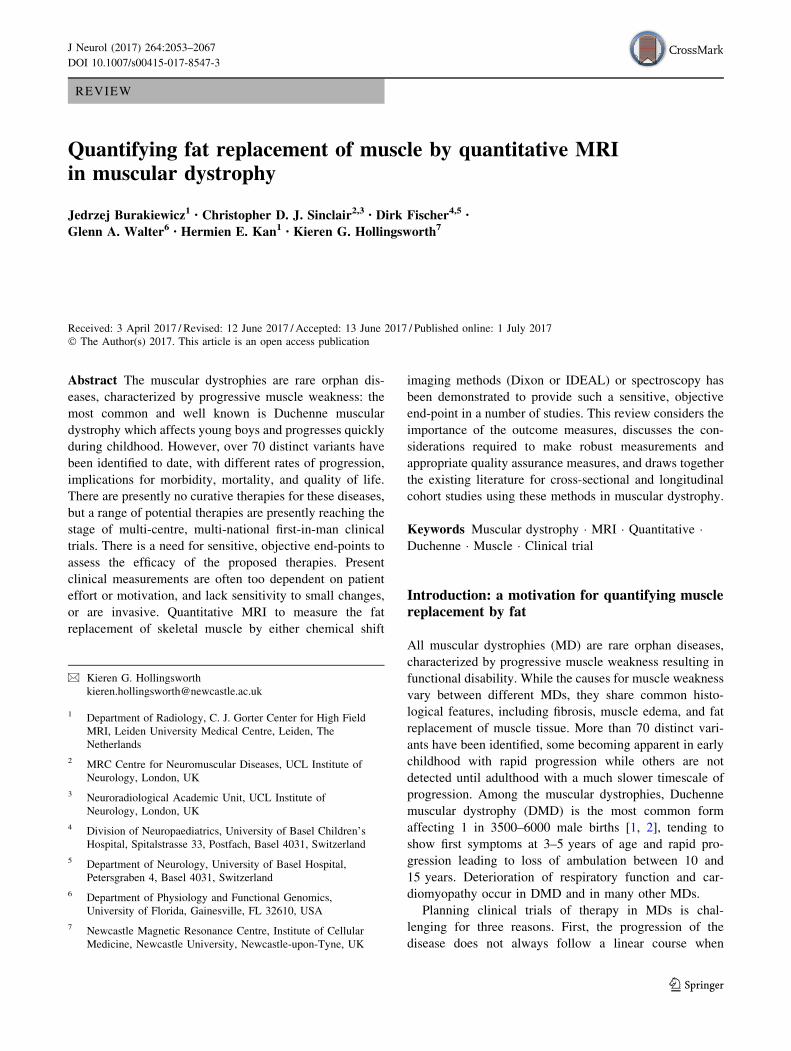
the bone marrow signal intensity [14]. Second, quantifying
muscle signal intensity with T1-weighted imaging is subject
to B1 and B0 inhomogeneities [14], as shown in Fig. 1.
Finally, T1-weighted imaging is less sensitive than quanti-
tativeMRI at detecting fat changes inmuscle of patients with
MD [7, 11–13], as described in the next section. Overall, we
do not recommend using T1-weighted imaging as a quanti-
tativemeasure. In the following sections,we instead describe
the principles of quantitativelymeasuring fat using chemical
shift imaging techniques.
Principles of fat fraction measurement using
chemical shift differences
The protons within water and lipids resonate at slightly
different frequencies. For example, the CH2 groups in the
fatty acid chains resonate at a lower frequency than water.
In a gradient echo scan, this means that though the CH2 and
water spins start off in phase immediately after the initial
excitation pulse, like two men running on a circular race-
track at different speeds, there is an echo time when the
signals from water and CH2 are on the opposite side of the
racetrack, that is to say 180� out of phase and their signals
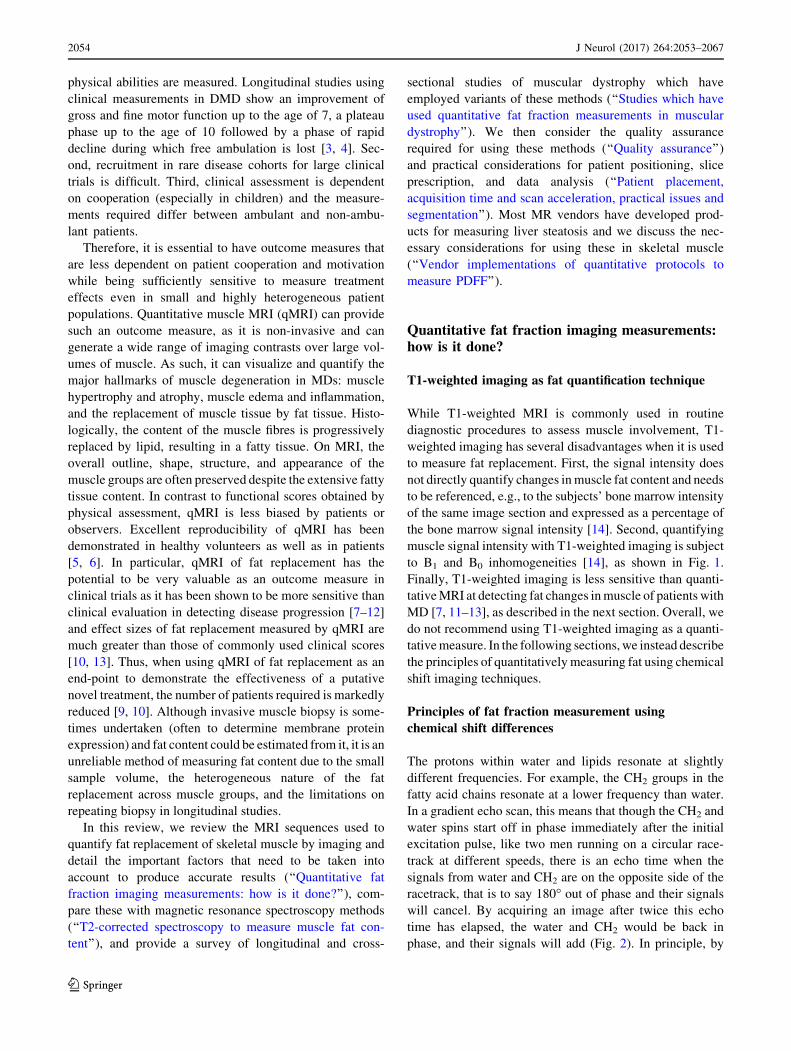
will cancel. By acquiring an image after twice this echo
time has elapsed, the water and CH2 would be back in
phase, and their signals will add (Fig. 2). In principle, by
2054 J Neurol (2017) 264:2053–2067
123
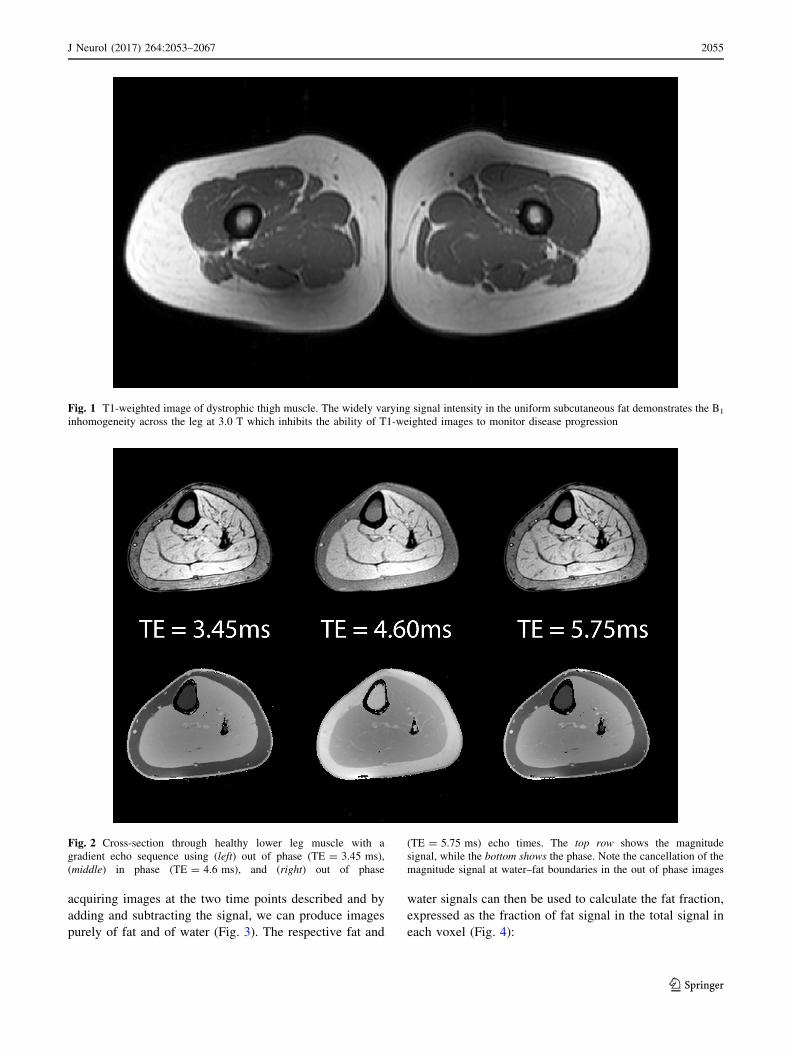
acquiring images at the two time points described and by
adding and subtracting the signal, we can produce images
purely of fat and of water (Fig. 3). The respective fat and
water signals can then be used to calculate the fat fraction,
expressed as the fraction of fat signal in the total signal in
each voxel (Fig. 4):
Fig. 1 T1-weighted image of dystrophic thigh muscle. The widely varying signal intensity in the uniform subcutaneous fat demonstrates the B1
inhomogeneity across the leg at 3.0 T which inhibits the ability of T1-weighted images to monitor disease progression
Fig. 2 Cross-section through healthy lower leg muscle with a
gradient echo sequence using (left) out of phase (TE = 3.45 ms),
(middle) in phase (TE = 4.6 ms), and (right) out of phase
(TE = 5.75 ms) echo times. The top row shows the magnitude
signal, while the bottom shows the phase. Note the cancellation of the
magnitude signal at water–fat boundaries in the out of phase images
J Neurol (2017) 264:2053–2067 2055
123
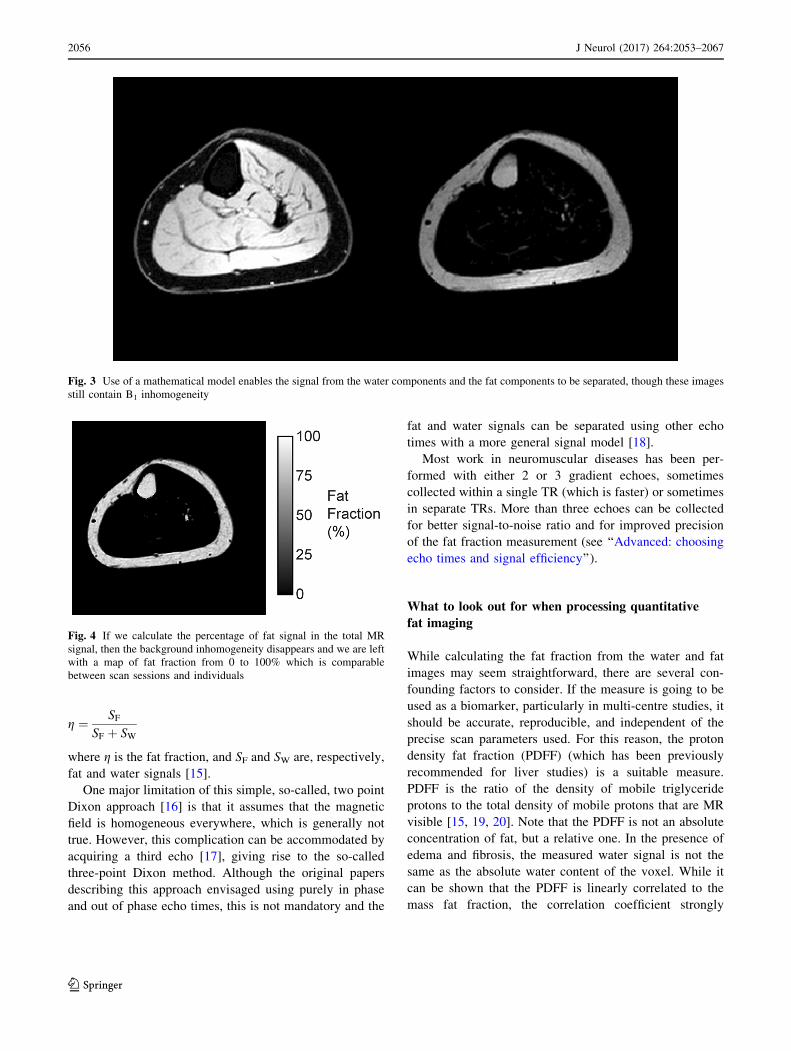
g ¼ SF
SF þ SW
where g is the fat fraction, and SF and SW are, respectively,
fat and water signals [15].
One major limitation of this simple, so-called, two point
Dixon approach [16] is that it assumes that the magnetic
field is homogeneous everywhere, which is generally not
true. However, this complication can be accommodated by
acquiring a third echo [17], giving rise to the so-called
three-point Dixon method. Although the original papers
describing this approach envisaged using purely in phase
and out of phase echo times, this is not mandatory and the
fat and water signals can be separated using other echo
times with a more general signal model [18].
Most work in neuromuscular diseases has been per-
formed with either 2 or 3 gradient echoes, sometimes
collected within a single TR (which is faster) or sometimes
in separate TRs. More than three echoes can be collected
for better signal-to-noise ratio and for improved precision
of the fat fraction measurement (see ‘‘Advanced: choosing
echo times and signal efficiency’’).
What to look out for when processing quantitative
fat imaging
While calculating the fat fraction from the water and fat
images may seem straightforward, there are several con-
founding factors to consider. If the measure is going to be
used as a biomarker, particularly in multi-centre studies, it
should be accurate, reproducible, and independent of the
precise scan parameters used. For this reason, the proton
density fat fraction (PDFF) (which has been previously
recommended for liver studies) is a suitable measure.
PDFF is the ratio of the density of mobile triglyceride
protons to the total density of mobile protons that are MR
visible [15, 19, 20]. Note that the PDFF is not an absolute
concentration of fat, but a relative one. In the presence of
edema and fibrosis, the measured water signal is not the
same as the absolute water content of the voxel. While it
can be shown that the PDFF is linearly correlated to the
mass fat fraction, the correlation coefficient strongly
Fig. 3 Use of a mathematical model enables the signal from the water components and the fat components to be separated, though these images
still contain B1 inhomogeneity
Fig. 4 If we calculate the percentage of fat signal in the total MR
signal, then the background inhomogeneity disappears and we are left
with a map of fat fraction from 0 to 100% which is comparable
between scan sessions and individuals
2056 J Neurol (2017) 264:2053–2067
123
depends on the tissue studied; PDFF can serve, however, as
an independent biomarker in its own right [19].
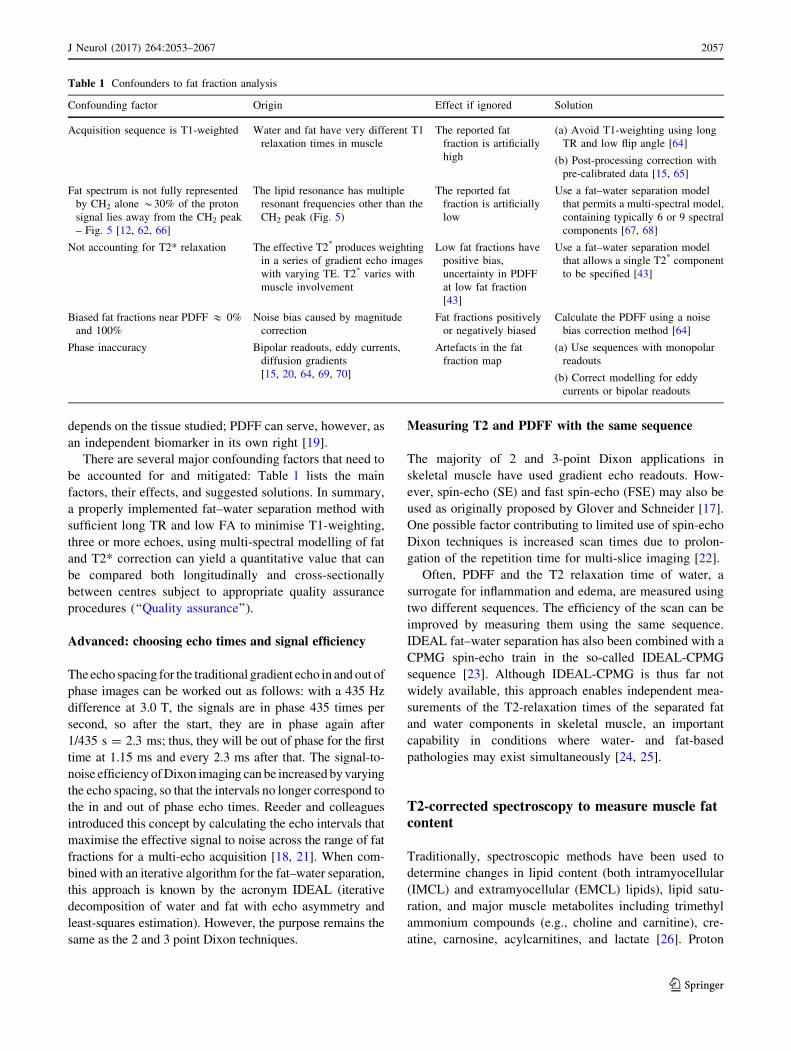
There are several major confounding factors that need to
be accounted for and mitigated: Table 1 lists the main
factors, their effects, and suggested solutions. In summary,
a properly implemented fat–water separation method with
sufficient long TR and low FA to minimise T1-weighting,
three or more echoes, using multi-spectral modelling of fat
and T2* correction can yield a quantitative value that can
be compared both longitudinally and cross-sectionally
between centres subject to appropriate quality assurance
procedures (‘‘Quality assurance’’).
Advanced: choosing echo times and signal efficiency
The echo spacing for the traditional gradient echo in and out of
phase images can be worked out as follows: with a 435 Hz
difference at 3.0 T, the signals are in phase 435 times per
second, so after the start, they are in phase again after
1/435 s = 2.3 ms; thus, they will be out of phase for the first
time at 1.15 ms and every 2.3 ms after that. The signal-to-
noise efficiencyofDixon imaging can be increased byvarying
the echo spacing, so that the intervals no longer correspond to
the in and out of phase echo times. Reeder and colleagues
introduced this concept by calculating the echo intervals that
maximise the effective signal to noise across the range of fat
fractions for a multi-echo acquisition [18, 21]. When com-
bined with an iterative algorithm for the fat–water separation,
this approach is known by the acronym IDEAL (iterative
decomposition of water and fat with echo asymmetry and
least-squares estimation). However, the purpose remains the
same as the 2 and 3 point Dixon techniques.
Measuring T2 and PDFF with the same sequence
The majority of 2 and 3-point Dixon applications in
skeletal muscle have used gradient echo readouts. How-
ever, spin-echo (SE) and fast spin-echo (FSE) may also be
used as originally proposed by Glover and Schneider [17].
One possible factor contributing to limited use of spin-echo
Dixon techniques is increased scan times due to prolon-
gation of the repetition time for multi-slice imaging [22].
Often, PDFF and the T2 relaxation time of water, a
surrogate for inflammation and edema, are measured using
two different sequences. The efficiency of the scan can be
improved by measuring them using the same sequence.
IDEAL fat–water separation has also been combined with a
CPMG spin-echo train in the so-called IDEAL-CPMG
sequence [23]. Although IDEAL-CPMG is thus far not
widely available, this approach enables independent mea-
surements of the T2-relaxation times of the separated fat
and water components in skeletal muscle, an important
capability in conditions where water- and fat-based
pathologies may exist simultaneously [24, 25].
T2-corrected spectroscopy to measure muscle fatcontent
Traditionally, spectroscopic methods have been used to
determine changes in lipid content (both intramyocellular
(IMCL) and extramyocellular (EMCL) lipids), lipid satu-
ration, and major muscle metabolites including trimethyl
ammonium compounds (e.g., choline and carnitine), cre-
atine, carnosine, acylcarnitines, and lactate [26]. Proton
Table 1 Confounders to fat fraction analysis
Confounding factor Origin Effect if ignored Solution
Acquisition sequence is T1-weighted Water and fat have very different T1
relaxation times in muscle
The reported fat
fraction is artificially
high
(a) Avoid T1-weighting using long
TR and low flip angle [64]
(b) Post-processing correction with
pre-calibrated data [15, 65]
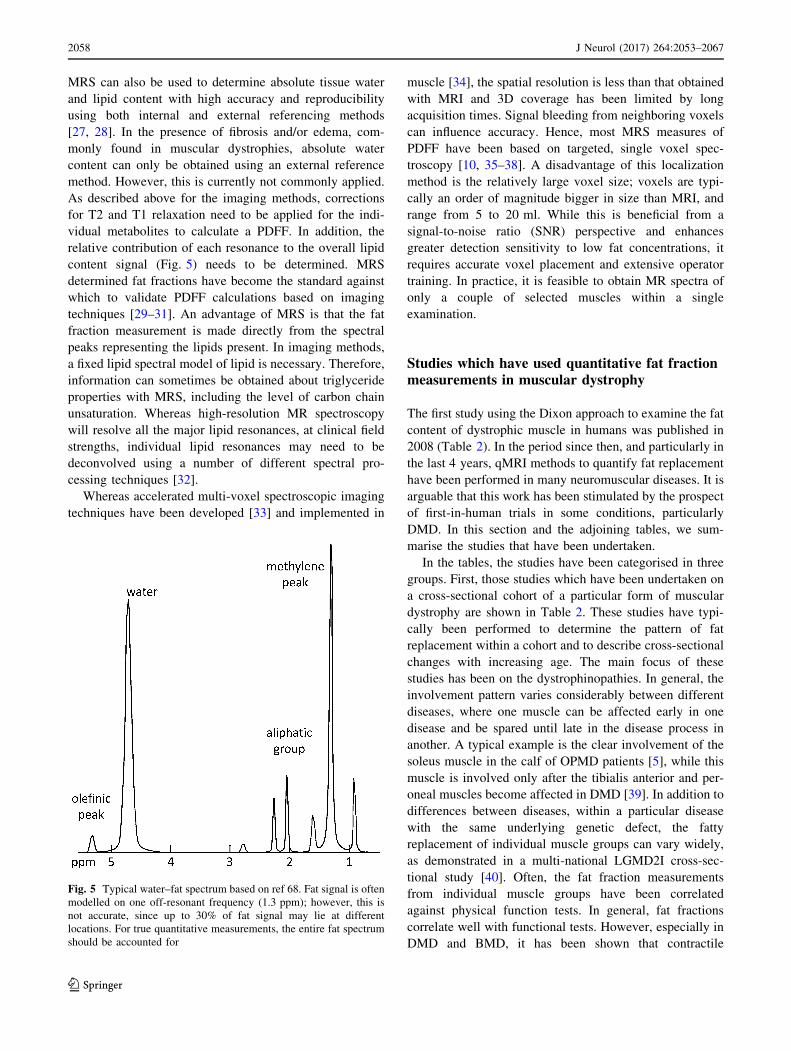
Fat spectrum is not fully represented
by CH2 alone *30% of the proton
signal lies away from the CH2 peak
– Fig. 5 [12, 62, 66]
The lipid resonance has multiple
resonant frequencies other than the
CH2 peak (Fig. 5)
The reported fat
fraction is artificially
low
Use a fat–water separation model
that permits a multi-spectral model,
containing typically 6 or 9 spectral
components [67, 68]
Not accounting for T2* relaxation The effective T2* produces weighting
in a series of gradient echo images
with varying TE. T2* varies with
muscle involvement
Low fat fractions have
positive bias,
uncertainty in PDFF
at low fat fraction
[43]
Use a fat–water separation model
that allows a single T2* component
to be specified [43]
Biased fat fractions near PDFF & 0%
and 100%
Noise bias caused by magnitude
correction
Fat fractions positively
or negatively biased
Calculate the PDFF using a noise
bias correction method [64]
Phase inaccuracy Bipolar readouts, eddy currents,
diffusion gradients
[15, 20, 64, 69, 70]
Artefacts in the fat
fraction map
(a) Use sequences with monopolar
readouts
(b) Correct modelling for eddy
currents or bipolar readouts
J Neurol (2017) 264:2053–2067 2057
123
MRS can also be used to determine absolute tissue water
and lipid content with high accuracy and reproducibility
using both internal and external referencing methods
[27, 28]. In the presence of fibrosis and/or edema, com-
monly found in muscular dystrophies, absolute water
content can only be obtained using an external reference
method. However, this is currently not commonly applied.
As described above for the imaging methods, corrections
for T2 and T1 relaxation need to be applied for the indi-
vidual metabolites to calculate a PDFF. In addition, the
relative contribution of each resonance to the overall lipid
content signal (Fig. 5) needs to be determined. MRS
determined fat fractions have become the standard against
which to validate PDFF calculations based on imaging
techniques [29–31]. An advantage of MRS is that the fat
fraction measurement is made directly from the spectral
peaks representing the lipids present. In imaging methods,
a fixed lipid spectral model of lipid is necessary. Therefore,
information can sometimes be obtained about triglyceride
properties with MRS, including the level of carbon chain
unsaturation. Whereas high-resolution MR spectroscopy
will resolve all the major lipid resonances, at clinical field
strengths, individual lipid resonances may need to be
deconvolved using a number of different spectral pro-
cessing techniques [32].
Whereas accelerated multi-voxel spectroscopic imaging
techniques have been developed [33] and implemented in
muscle [34], the spatial resolution is less than that obtained
with MRI and 3D coverage has been limited by long
acquisition times. Signal bleeding from neighboring voxels
can influence accuracy. Hence, most MRS measures of
PDFF have been based on targeted, single voxel spec-
troscopy [10, 35–38]. A disadvantage of this localization
method is the relatively large voxel size; voxels are typi-
cally an order of magnitude bigger in size than MRI, and
range from 5 to 20 ml. While this is beneficial from a
signal-to-noise ratio (SNR) perspective and enhances
greater detection sensitivity to low fat concentrations, it
requires accurate voxel placement and extensive operator
training. In practice, it is feasible to obtain MR spectra of
only a couple of selected muscles within a single
examination.
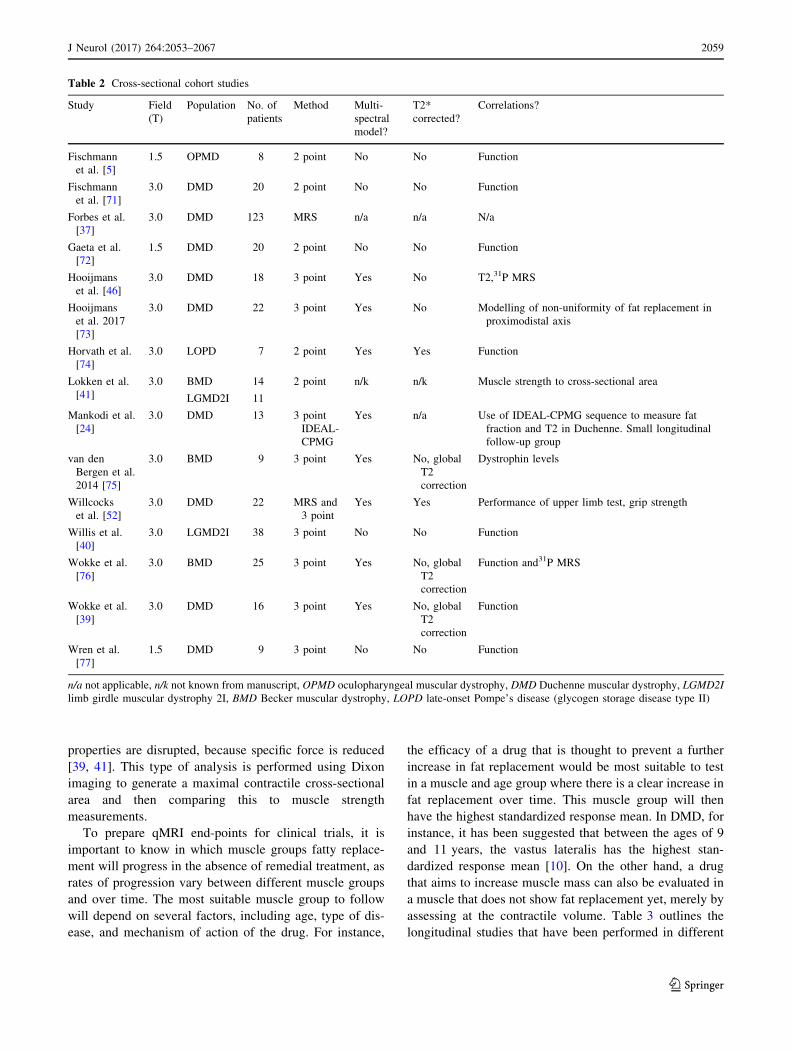
Studies which have used quantitative fat fractionmeasurements in muscular dystrophy
The first study using the Dixon approach to examine the fat
content of dystrophic muscle in humans was published in
2008 (Table 2). In the period since then, and particularly in
the last 4 years, qMRI methods to quantify fat replacement
have been performed in many neuromuscular diseases. It is
arguable that this work has been stimulated by the prospect
of first-in-human trials in some conditions, particularly
DMD. In this section and the adjoining tables, we sum-
marise the studies that have been undertaken.
In the tables, the studies have been categorised in three
groups. First, those studies which have been undertaken on
a cross-sectional cohort of a particular form of muscular
dystrophy are shown in Table 2. These studies have typi-
cally been performed to determine the pattern of fat
replacement within a cohort and to describe cross-sectional
changes with increasing age. The main focus of these
studies has been on the dystrophinopathies. In general, the
involvement pattern varies considerably between different
diseases, where one muscle can be affected early in one
disease and be spared until late in the disease process in
another. A typical example is the clear involvement of the
soleus muscle in the calf of OPMD patients [5], while this
muscle is involved only after the tibialis anterior and per-
oneal muscles become affected in DMD [39]. In addition to
differences between diseases, within a particular disease
with the same underlying genetic defect, the fatty
replacement of individual muscle groups can vary widely,
as demonstrated in a multi-national LGMD2I cross-sec-
tional study [40]. Often, the fat fraction measurements
from individual muscle groups have been correlated
against physical function tests. In general, fat fractions
correlate well with functional tests. However, especially in
DMD and BMD, it has been shown that contractile
Fig. 5 Typical water–fat spectrum based on ref 68. Fat signal is often
modelled on one off-resonant frequency (1.3 ppm); however, this is
not accurate, since up to 30% of fat signal may lie at different
locations. For true quantitative measurements, the entire fat spectrum
should be accounted for
2058 J Neurol (2017) 264:2053–2067
123
properties are disrupted, because specific force is reduced
[39, 41]. This type of analysis is performed using Dixon
imaging to generate a maximal contractile cross-sectional
area and then comparing this to muscle strength
measurements.
To prepare qMRI end-points for clinical trials, it is
important to know in which muscle groups fatty replace-
ment will progress in the absence of remedial treatment, as
rates of progression vary between different muscle groups
and over time. The most suitable muscle group to follow
will depend on several factors, including age, type of dis-
ease, and mechanism of action of the drug. For instance,
the efficacy of a drug that is thought to prevent a further
increase in fat replacement would be most suitable to test
in a muscle and age group where there is a clear increase in
fat replacement over time. This muscle group will then
have the highest standardized response mean. In DMD, for
instance, it has been suggested that between the ages of 9
and 11 years, the vastus lateralis has the highest stan-
dardized response mean [10]. On the other hand, a drug
that aims to increase muscle mass can also be evaluated in
a muscle that does not show fat replacement yet, merely by
assessing at the contractile volume. Table 3 outlines the
longitudinal studies that have been performed in different
Table 2 Cross-sectional cohort studies
Study Field
(T)
Population No. of
patients
Method Multi-
spectral
model?
T2*
corrected?
Correlations?
Fischmann
et al. [5]
1.5 OPMD 8 2 point No No Function
Fischmann
et al. [71]
3.0 DMD 20 2 point No No Function
Forbes et al.
[37]
3.0 DMD 123 MRS n/a n/a N/a
Gaeta et al.
[72]
1.5 DMD 20 2 point No No Function
Hooijmans
et al. [46]
3.0 DMD 18 3 point Yes No T2,31P MRS
Hooijmans
et al. 2017
[73]
3.0 DMD 22 3 point Yes No Modelling of non-uniformity of fat replacement in
proximodistal axis
Horvath et al.
[74]
3.0 LOPD 7 2 point Yes Yes Function
Lokken et al.
[41]
3.0 BMD 14 2 point n/k n/k Muscle strength to cross-sectional area
LGMD2I 11
Mankodi et al.
[24]
3.0 DMD 13 3 point
IDEAL-
CPMG
Yes n/a Use of IDEAL-CPMG sequence to measure fat
fraction and T2 in Duchenne. Small longitudinal
follow-up group
van den
Bergen et al.
2014 [75]
3.0 BMD 9 3 point Yes No, global
T2
correction
Dystrophin levels
Willcocks
et al. [52]
3.0 DMD 22 MRS and
3 point
Yes Yes Performance of upper limb test, grip strength
Willis et al.
[40]
3.0 LGMD2I 38 3 point No No Function
Wokke et al.
[76]
3.0 BMD 25 3 point Yes No, global
T2
correction
Function and31P MRS
Wokke et al.
[39]
3.0 DMD 16 3 point Yes No, global
T2
correction
Function
Wren et al.
[77]
1.5 DMD 9 3 point No No Function
n/a not applicable, n/k not known from manuscript, OPMD oculopharyngeal muscular dystrophy, DMD Duchenne muscular dystrophy, LGMD2I
limb girdle muscular dystrophy 2I, BMD Becker muscular dystrophy, LOPD late-onset Pompe’s disease (glycogen storage disease type II)
J Neurol (2017) 264:2053–2067 2059
123
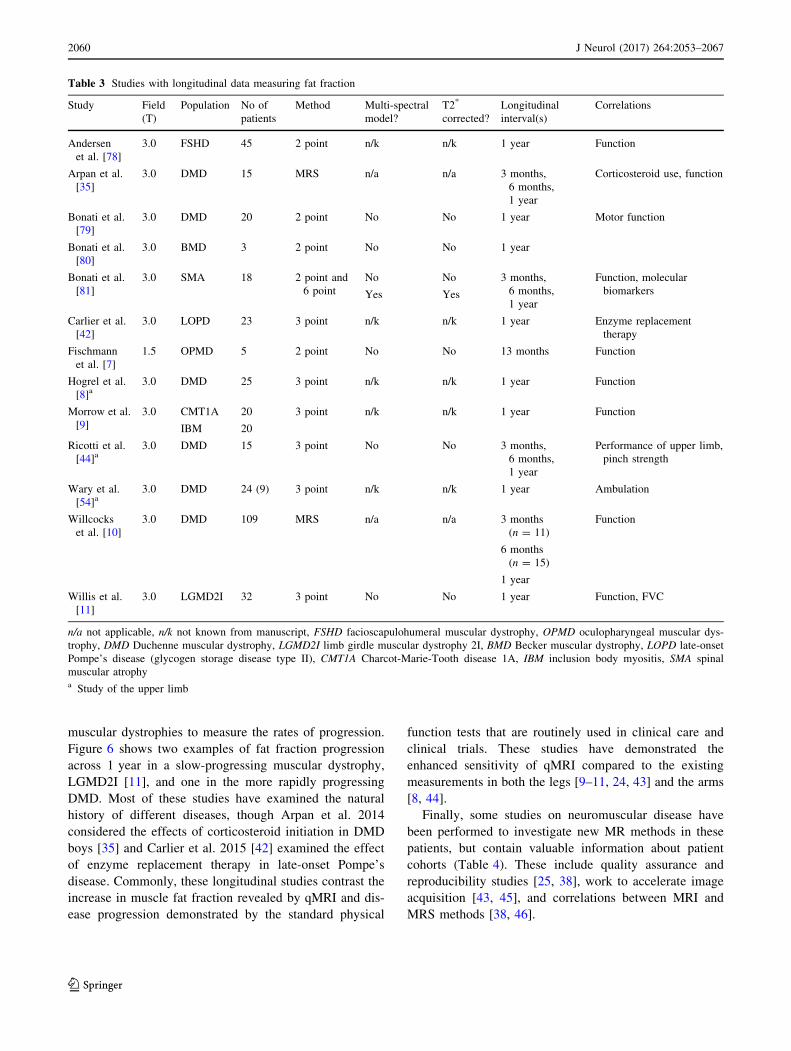
muscular dystrophies to measure the rates of progression.
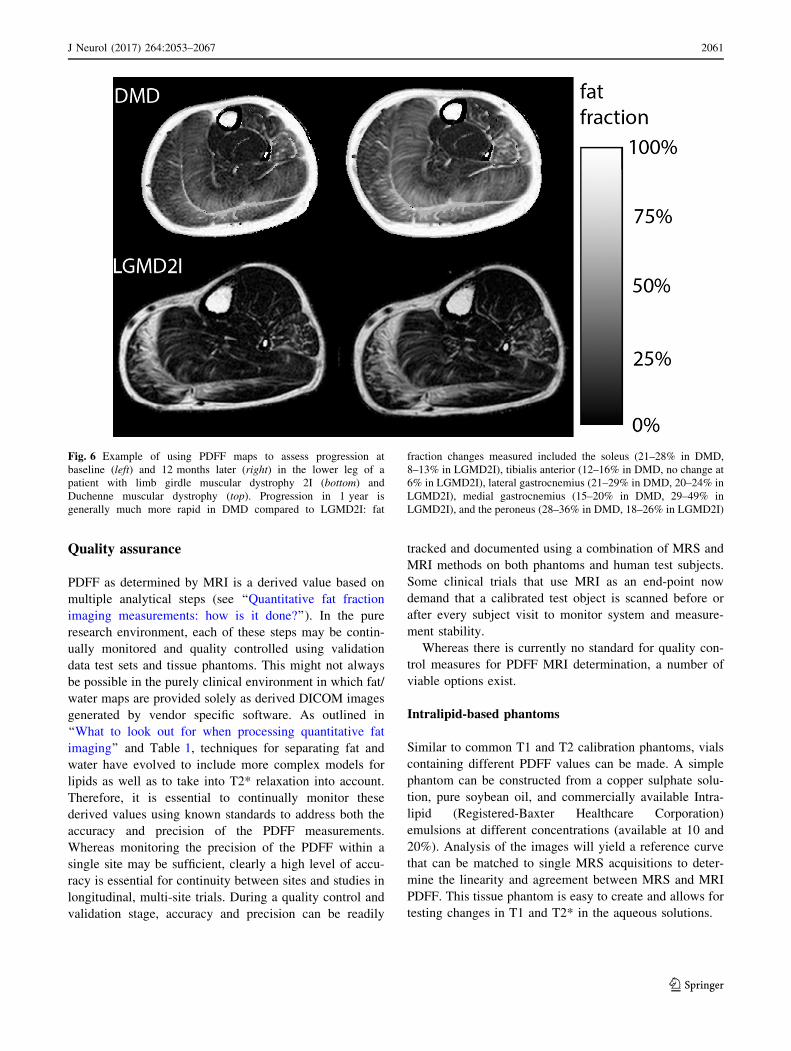
Figure 6 shows two examples of fat fraction progression
across 1 year in a slow-progressing muscular dystrophy,
LGMD2I [11], and one in the more rapidly progressing
DMD. Most of these studies have examined the natural
history of different diseases, though Arpan et al. 2014
considered the effects of corticosteroid initiation in DMD
boys [35] and Carlier et al. 2015 [42] examined the effect
of enzyme replacement therapy in late-onset Pompe’s
disease. Commonly, these longitudinal studies contrast the
increase in muscle fat fraction revealed by qMRI and dis-
ease progression demonstrated by the standard physical
function tests that are routinely used in clinical care and
clinical trials. These studies have demonstrated the
enhanced sensitivity of qMRI compared to the existing
measurements in both the legs [9–11, 24, 43] and the arms
[8, 44].
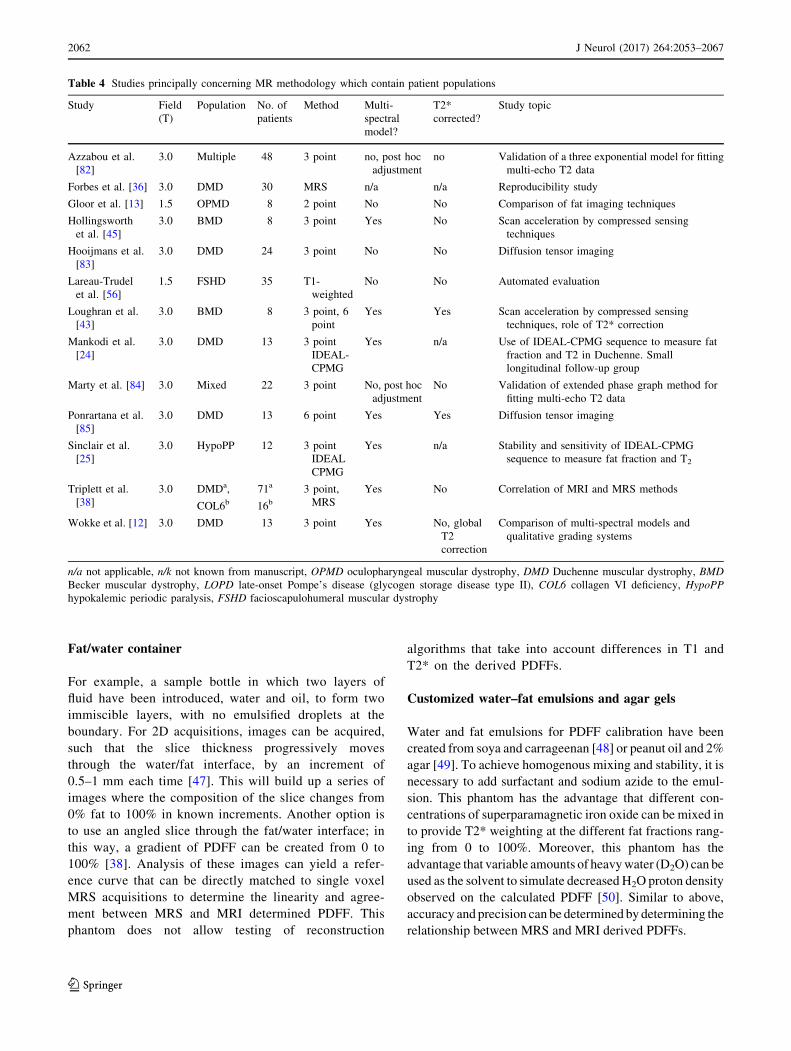
Finally, some studies on neuromuscular disease have
been performed to investigate new MR methods in these
patients, but contain valuable information about patient
cohorts (Table 4). These include quality assurance and
reproducibility studies [25, 38], work to accelerate image
acquisition [43, 45], and correlations between MRI and
MRS methods [38, 46].
Table 3 Studies with longitudinal data measuring fat fraction
Study Field
(T)
Population No of
patients
Method Multi-spectral
model?
T2*
corrected?
Longitudinal
interval(s)
Correlations
Andersen
et al. [78]
3.0 FSHD 45 2 point n/k n/k 1 year Function
Arpan et al.
[35]
3.0 DMD 15 MRS n/a n/a 3 months,
6 months,
1 year
Corticosteroid use, function
Bonati et al.
[79]
3.0 DMD 20 2 point No No 1 year Motor function
Bonati et al.
[80]
3.0 BMD 3 2 point No No 1 year
Bonati et al.
[81]
3.0 SMA 18 2 point and
6 point
No
Yes
No
Yes
3 months,
6 months,
1 year
Function, molecular
biomarkers
Carlier et al.
[42]
3.0 LOPD 23 3 point n/k n/k 1 year Enzyme replacement
therapy
Fischmann
et al. [7]
1.5 OPMD 5 2 point No No 13 months Function
Hogrel et al.
[8]a3.0 DMD 25 3 point n/k n/k 1 year Function
Morrow et al.
[9]
3.0 CMT1A
IBM
20
20
3 point n/k n/k 1 year Function
Ricotti et al.
[44]a3.0 DMD 15 3 point No No 3 months,
6 months,
1 year
Performance of upper limb,
pinch strength
Wary et al.
[54]a3.0 DMD 24 (9) 3 point n/k n/k 1 year Ambulation
Willcocks
et al. [10]
3.0 DMD 109 MRS n/a n/a 3 months
(n = 11)
6 months
(n = 15)
1 year
Function
Willis et al.
[11]
3.0 LGMD2I 32 3 point No No 1 year Function, FVC
n/a not applicable, n/k not known from manuscript, FSHD facioscapulohumeral muscular dystrophy, OPMD oculopharyngeal muscular dys-
trophy, DMD Duchenne muscular dystrophy, LGMD2I limb girdle muscular dystrophy 2I, BMD Becker muscular dystrophy, LOPD late-onset
Pompe’s disease (glycogen storage disease type II), CMT1A Charcot-Marie-Tooth disease 1A, IBM inclusion body myositis, SMA spinal
muscular atrophya Study of the upper limb
2060 J Neurol (2017) 264:2053–2067
123
Quality assurance
PDFF as determined by MRI is a derived value based on
multiple analytical steps (see ‘‘Quantitative fat fraction
imaging measurements: how is it done?’’). In the pure
research environment, each of these steps may be contin-
ually monitored and quality controlled using validation
data test sets and tissue phantoms. This might not always
be possible in the purely clinical environment in which fat/
water maps are provided solely as derived DICOM images
generated by vendor specific software. As outlined in
‘‘What to look out for when processing quantitative fat
imaging’’ and Table 1, techniques for separating fat and
water have evolved to include more complex models for
lipids as well as to take into T2* relaxation into account.
Therefore, it is essential to continually monitor these
derived values using known standards to address both the
accuracy and precision of the PDFF measurements.
Whereas monitoring the precision of the PDFF within a
single site may be sufficient, clearly a high level of accu-
racy is essential for continuity between sites and studies in
longitudinal, multi-site trials. During a quality control and
validation stage, accuracy and precision can be readily
tracked and documented using a combination of MRS and
MRI methods on both phantoms and human test subjects.
Some clinical trials that use MRI as an end-point now
demand that a calibrated test object is scanned before or
after every subject visit to monitor system and measure-
ment stability.
Whereas there is currently no standard for quality con-
trol measures for PDFF MRI determination, a number of
viable options exist.
Intralipid-based phantoms
Similar to common T1 and T2 calibration phantoms, vials
containing different PDFF values can be made. A simple
phantom can be constructed from a copper sulphate solu-
tion, pure soybean oil, and commercially available Intra-
lipid (Registered-Baxter Healthcare Corporation)
emulsions at different concentrations (available at 10 and
20%). Analysis of the images will yield a reference curve
that can be matched to single MRS acquisitions to deter-
mine the linearity and agreement between MRS and MRI
PDFF. This tissue phantom is easy to create and allows for
testing changes in T1 and T2* in the aqueous solutions.
Fig. 6 Example of using PDFF maps to assess progression at
baseline (left) and 12 months later (right) in the lower leg of a
patient with limb girdle muscular dystrophy 2I (bottom) and
Duchenne muscular dystrophy (top). Progression in 1 year is
generally much more rapid in DMD compared to LGMD2I: fat
fraction changes measured included the soleus (21–28% in DMD,
8–13% in LGMD2I), tibialis anterior (12–16% in DMD, no change at
6% in LGMD2I), lateral gastrocnemius (21–29% in DMD, 20–24% in
LGMD2I), medial gastrocnemius (15–20% in DMD, 29–49% in
LGMD2I), and the peroneus (28–36% in DMD, 18–26% in LGMD2I)
J Neurol (2017) 264:2053–2067 2061
123
Fat/water container
For example, a sample bottle in which two layers of
fluid have been introduced, water and oil, to form two
immiscible layers, with no emulsified droplets at the
boundary. For 2D acquisitions, images can be acquired,
such that the slice thickness progressively moves
through the water/fat interface, by an increment of
0.5–1 mm each time [47]. This will build up a series of
images where the composition of the slice changes from
0% fat to 100% in known increments. Another option is
to use an angled slice through the fat/water interface; in
this way, a gradient of PDFF can be created from 0 to
100% [38]. Analysis of these images can yield a refer-
ence curve that can be directly matched to single voxel
MRS acquisitions to determine the linearity and agree-
ment between MRS and MRI determined PDFF. This
phantom does not allow testing of reconstruction
algorithms that take into account differences in T1 and
T2* on the derived PDFFs.
Customized water–fat emulsions and agar gels
Water and fat emulsions for PDFF calibration have been
created from soya and carrageenan [48] or peanut oil and 2%
agar [49]. To achieve homogenous mixing and stability, it is
necessary to add surfactant and sodium azide to the emul-
sion. This phantom has the advantage that different con-
centrations of superparamagnetic iron oxide can be mixed in
to provide T2* weighting at the different fat fractions rang-
ing from 0 to 100%. Moreover, this phantom has the
advantage that variable amounts of heavywater (D2O) can be
used as the solvent to simulate decreased H2O proton density
observed on the calculated PDFF [50]. Similar to above,
accuracy and precision can be determined by determining the
relationship between MRS and MRI derived PDFFs.
Table 4 Studies principally concerning MR methodology which contain patient populations
Study Field
(T)
Population No. of
patients
Method Multi-
spectral
model?
T2*
corrected?
Study topic
Azzabou et al.
[82]
3.0 Multiple 48 3 point no, post hoc
adjustment
no Validation of a three exponential model for fitting
multi-echo T2 data
Forbes et al. [36] 3.0 DMD 30 MRS n/a n/a Reproducibility study
Gloor et al. [13] 1.5 OPMD 8 2 point No No Comparison of fat imaging techniques
Hollingsworth
et al. [45]
3.0 BMD 8 3 point Yes No Scan acceleration by compressed sensing
techniques
Hooijmans et al.
[83]
3.0 DMD 24 3 point No No Diffusion tensor imaging
Lareau-Trudel
et al. [56]
1.5 FSHD 35 T1-
weighted
No No Automated evaluation
Loughran et al.
[43]
3.0 BMD 8 3 point, 6
point
Yes Yes Scan acceleration by compressed sensing
techniques, role of T2* correction
Mankodi et al.
[24]
3.0 DMD 13 3 point
IDEAL-
CPMG
Yes n/a Use of IDEAL-CPMG sequence to measure fat
fraction and T2 in Duchenne. Small
longitudinal follow-up group
Marty et al. [84] 3.0 Mixed 22 3 point No, post hoc
adjustment
No Validation of extended phase graph method for
fitting multi-echo T2 data
Ponrartana et al.
[85]
3.0 DMD 13 6 point Yes Yes Diffusion tensor imaging
Sinclair et al.
[25]
3.0 HypoPP 12 3 point
IDEAL
CPMG
Yes n/a Stability and sensitivity of IDEAL-CPMG
sequence to measure fat fraction and T2
Triplett et al.
[38]
3.0 DMDa, 71a 3 point,
MRS
Yes No Correlation of MRI and MRS methods
COL6b 16b
Wokke et al. [12] 3.0 DMD 13 3 point Yes No, global
T2
correction
Comparison of multi-spectral models and
qualitative grading systems
n/a not applicable, n/k not known from manuscript, OPMD oculopharyngeal muscular dystrophy, DMD Duchenne muscular dystrophy, BMD
Becker muscular dystrophy, LOPD late-onset Pompe’s disease (glycogen storage disease type II), COL6 collagen VI deficiency, HypoPP
hypokalemic periodic paralysis, FSHD facioscapulohumeral muscular dystrophy
2062 J Neurol (2017) 264:2053–2067
123
Patient placement, acquisition time and scanacceleration, practical issues and segmentation
For leg imaging, the preferred positioning is feet-first
supine, with the legs stretched, the patella facing upward,
and the ankles in the neutral position (i.e., minimal exo or
endorotation). To enhance comfort, a small pillow can be
placed under the knees, but the standard leg rest delivered
with many scanners will not accommodate this, and the
sides of the ankles can be supported with sandbags to
prevent unintended movements. In patients with contrac-
tures positioning with stretched legs and neutral ankles is
not always feasible, and care should be taken to provide
optimal support for comfort. Positioning of the upper limb
is more challenging, as scan quality is severely reduced at
the side of the magnet bore. Experience with scanning of
this body part is limited [8, 44, 51, 52], but it will become
more common with the need to develop outcome measures
for non-ambulant patients. The so-called ‘superman’
position [53] is likely impossible for patients with MDs,
and hence, optimal positioning will either be (a) in the fetal
position, (b) supine with the upper limb along the trunk,
while the trunk is as far off-centre as possible
[8, 44, 52, 54], or (c) supine with a dedicated arm rest
placed over the abdomen of the patient: all published
studies in DMD have so far selected the second option.
Imaging can be performed in 2D or 3D, with slices in
the transverse plane perpendicular to the bone to facilitate
analysis. The location of the slice stack should be recorded
precisely to enable longitudinal measurements, for instance
at a fixed distance from a bony landmark, such as the tibial
plateau or the patella. Landmarking can either be done
during the imaging session using a scout image [5] or prior
to the scanning session by placing a fish oil capsule on the
skin at a pre-defined distance from surface anatomy land-
marks like the iliac crest [55]. Receiver coils can either be
array coils for wide coverage of the lower limb or local
surface coils. The latter may be more convenient for
imaging the upper limb and for patients with contractures.
As fat replacement of muscle tissue can be non-uniform
along the muscle length [51], it is important that the slice
stack covers as much of the muscle as possible. Com-
monly, this is achieved by selecting a field of view from
joint to joint, i.e., malleolus to patella for the leg, and
patella to iliac crest for the thigh. Slice thickness is usually
between 2 and 10 mm with a 0–5 mm gap, resulting in
10–50 slices per body part. This poses a significant burden
in terms of data processing as traditionally, data are being
processed by outlining every single muscle in a pre-defined
number of slices by a trained operator—which is a labour
intensive process. In the last decade, several techniques
have been developed that can quantify total adipose tissue
volume and total muscle volume based on either T1
weighted or Dixon images [52, 56–58]. In these approa-
ches, the total muscle volume of an entire slice stack can
automatically be segmented, thereby severely reducing the
processing time. Unfortunately, severe fatty replacement is
still a problem, as it is difficult to separate fat replacement
from subcutaneous fat, and hence, user input is required to
solve this [56, 59]. More importantly, as fatty replacement
occurs in a muscle specific way, it is preferable to obtain
information of each muscle separately instead of the entire
muscle volume—and this is not possible using this
methodology. While, semi-automatic approaches have
been developed that can segment individual muscles
[60, 61], these have not been applied in NMDs yet. In the
absence of such an approach, segmentation is unfortunately
still often performed manually and the field is in dire need
of adequate approaches to solve this.
Depending on the choice of repetition time and number
of signal averages used, a common Dixon acquisition of the
entire upper leg can take 3–5 min. Using scan acceleration
techniques, acquisition time can be reduced dramatically to
about 1 min [43, 45]. However, these techniques are not
yet standard on clinical systems.
Vendor implementations of quantitative protocolsto measure PDFF
The basic types ofmulti-echo acquisition sequences described
in ‘‘Quantitative fat fraction imaging measurements: how is it
done?’’ can be achieved by most clinical MRI scanners in
skeletal muscle, evenwhere the echoes have to be collected in
separate acquisitions. Historically, it has not been possible to
buy directly from the vendor an integrated system that will
both perform the data acquisition and reconstruct the proton
density fat fraction images at the time of acquisition. Most of
the studies described in ‘‘Studieswhich have used quantitative
fat fraction measurements in muscular dystrophy’’ have
extracted the complex image data from the scanner and
applied custom algorithms, such as those described in
[15, 17, 62] to separate the fat and water and produce fat
fraction images.Ofparticular notewas the ISMRMWorkshop
on Water–fat separation, which collated examples of
MATLAB code which can achieve this task and have been
made available [15].
Of course, the methods for measuring fat fraction have
also found extensive use in the measurement of hepatic
steatosis in type 2 diabetes and non-alcoholic fatty liver
disease [63]. Given the size of these markets, the main MRI
vendors have now released products, usually sold as
optional upgrades to the base scanner hardware, which
claim to reliably measure hepatic steatosis: IDEAL-IQ
J Neurol (2017) 264:2053–2067 2063
123
(GE), mDixon Quant (Philips), and LiverLab (Siemens).
However, it is important to note that these products and
their optimised settings have not been validated in skeletal
muscle and it should not be assumed that they will auto-
matically give acceptable answers outside of their intended
terms of use. The same quality assurance procedures out-
lined in ‘‘Quality assurance’’ should be adopted and con-
sideration should also be given to the effect of a change of
vendor software during the course of a longitudinal study.
Summary
Characterising rare muscle diseases with qMRI is an
important task, because these techniques may be substan-
tially more responsive than the existing clinical measures
of function currently used as end-points in clinical trials
[9–11]. However, there are various qMRI approaches
available that are influenced by details of acquisition and
reconstruction, and this should be taken into consideration
when comparing results from different centres. In this
paper, we have given a conceptual and practical introduc-
tion to Dixon fat fraction imaging and MRS, drawing
attention to the advantages and potential confounding
factors of each. The authors believe that fat fraction
imaging and MRS will both have an important role to play
in future scientific and therapeutic studies, with quantita-
tive MRI methods more familiar to operators in most
institutions. Regardless of the method used, adequate
operator training, qualification, and quality assurance pro-
cesses will be needed over and above those used for
standard radiological imaging. This will demand specialist
input to co-ordinate and oversee clinical trials involving
quantitative MRI. Given the low prevalence of many of the
muscular dystrophies, high quality data may demand that
patients travel to a smaller number of centres specialising
in quantitative MRI. Many new clinical trials for DMD
now require quantitative MRI in at least a subset of
patients.
Practical considerations for quality assurance, patient
positioning, slice prescription, and the available vendor
systems were introduced. By summarising the available
literature describing the application of Dixon-based fat
fraction imaging in muscle dystrophies, we hope to high-
light the power and promise of these techniques, while
emphasising that a pragmatic consideration of the limita-
tions is essential to maximise the potential advantages that
fat fraction imaging confers on longitudinal clinical trials
in this important class of diseases.
The authors would suggest that, with the increasing
availability of quantitative MRI methods on modern
scanners, and the increasing bodies of longitudinal litera-
ture identifying target muscle groups to study in
therapeutic interventions, the quantitative MRI methods are
reaching maturity and will have a critical and central role
to play and end-points in future therapeutic trials.
Acknowledgements This publication is supported by the European
Union COST (Co-operation in Science and Technology) action
BM1304, MYO-MRI (http://myo-mri.eu), which supports interna-
tional collaboration on ‘‘Applications of MR imaging and spec-
troscopy techniques in neuromuscular disease: collaboration on
outcome measures and pattern recognition for diagnostics and therapy
development’’.
Compliance with ethical standards
Conflicts of interest JB reports grant support from the European
Union (FP-7-HEALTH-2013-INNOVATION-1, 602485). CDJS
declares no conflicts of interest. HEK reports grants from ZonMW,
AFM, Duchenne Parent Project, the European Union (FP-7-
HEALTH-2013-INNOVATION-1, 602485), and Gratama Stichting,
consultancy for BioMarin and aTyr Pharma and trial support from
ImagingDMD-UF outside the submitted work. All reimbursements
were received by the LUMC; no personal benefits were received. DF
declares no conflicts of interest. GAW has received Grant funding
from the National Institutes of Health, Department of Defense,
Muscular Dystrophy Association, Sarepta Therapeutics and Catabasis
Pharmaceuticals. KGH reports grants from the United Kingdom
Medical Research Council, Diabetes UK, the European Union
(H2020, 667078) and the Newcastle Healthcare Charity, consultancy
for Summit pharmaceuticals and trial support from ImagingDMD-UF
outside the submitted work. All reimbursements were received by
Newcastle University; no personal benefits were received.
Open Access This article is distributed under the terms of the
Creative Commons Attribution 4.0 International License (http://crea
tivecommons.org/licenses/by/4.0/), which permits unrestricted use,
distribution, and reproduction in any medium, provided you give
appropriate credit to the original author(s) and the source, provide a
link to the Creative Commons license, and indicate if changes were
made.
References
1. Ellis JA, Vroom E, Muntoni F (2013) 195th ENMC international
workshop: newborn screening for Duchenne muscular dystrophy
14–16th December, 2012, Naarden, The Netherlands. Neuro-
muscul Disord 23(8):682–689. doi:10.1016/j.nmd.2013.05.008
2. Emery AE (2002) The muscular dystrophies. Lancet
359(9307):687–695. doi:10.1016/S0140-6736(02)07815-7
3. Mazzone E, Vasco G, Sormani MP, Torrente Y, Berardinelli A,
Messina S, D’Amico A, Doglio L, Politano L, Cavallaro F, Frosini
S, Bello L, Bonfiglio S, Zucchini E, De Sanctis R, Scutifero M,
Bianco F, Rossi F, Motta MC, Sacco A, Donati MA, Mongini T,
Pini A, Battini R, Pegoraro E, Pane M, Gasperini S, Previtali S,
Napolitano S, Martinelli D, Bruno C, Vita G, Comi G, Bertini E,
Mercuri E (2011) Functional changes in Duchenne muscular dys-
trophy: a 12-month longitudinal cohort study. Neurology
77(3):250–256. doi:10.1212/WNL.0b013e318225ab2e
4. Vuillerot C, Girardot F, Payan C, Fermanian J, Iwaz J, De Lattre
C, Berard C (2010) Monitoring changes and predicting loss of
ambulation in Duchenne muscular dystrophy with the motor
function measure. Dev Med Child Neurol 52(1):60–65. doi:10.
1111/j.1469-8749.2009.03316.x
2064 J Neurol (2017) 264:2053–2067
123
5. Fischmann A, Gloor M, Fasler S, Haas T, Rodoni Wetzel R, Bieri
O, Wetzel S, Heinimann K, Scheffler K, Fischer D (2011)
Muscular involvement assessed by MRI correlates to motor
function measurement values in oculopharyngeal muscular dys-
trophy. J Neurol 258(7):1333–1340. doi:10.1007/s00415-011-
5937-9
6. Sinclair CD, Morrow JM, Yousry TA, Reilly MM, Hanna MG,
Golay X, Thornton JS (2010) Inter-scan reproducibility of
quantitative neuromuscular MRI. Neuromuscul Disord 20:S28
7. Fischmann A, Hafner P, Fasler S, Gloor M, Bieri O, Studler U,
Fischer D (2012) Quantitative MRI can detect subclinical disease
progression in muscular dystrophy. J Neurol 259(8):1648–1654.
doi:10.1007/s00415-011-6393-2
8. Hogrel JY, Wary C, Moraux A, Azzabou N, Decostre V, Ollivier
G, Canal A, Lilien C, Ledoux I, Annoussamy M, Reguiba N,
Gidaro T, Le Moing AG, Cardas R, Voit T, Carlier PG, Servais L
(2016) Longitudinal functional and NMR assessment of upper
limbs in Duchenne muscular dystrophy. Neurology
86(11):1022–1030. doi:10.1212/WNL.0000000000002464
9. Morrow JM, Sinclair CD, Fischmann A, Machado PM, Reilly
MM, Yousry TA, Thornton JS, Hanna MG (2015) MRI bio-
marker assessment of neuromuscular disease progression: a
prospective observational cohort study. Lancet Neurol
15(1):65–77. doi:10.1016/S1474-4422(15)00242-2
10. Willcocks RJ, Rooney WD, Triplett WT, Forbes SC, Lott DJ,
Senesac CR, Daniels MJ, Wang DJ, Harrington AT, Tennekoon
GI, Russman BS, Finanger EL, Byrne BJ, Finkel RS, Walter GA,
Sweeney HL, Vandenborne K (2016) Multicenter prospective
longitudinal study of magnetic resonance biomarkers in a large
Duchenne muscular dystrophy cohort. Ann Neurol
79(4):535–547. doi:10.1002/ana.24599
11. Willis TA, Hollingsworth KG, Coombs A, Sveen M-L, Andersen
S, Stojkovic T, Eagle M, Mayhew A, De Sousa PL, Dewar L,
Morrow J, Sinclair CD, Thornton JS, Bushby K, Lochmuller H,
Hanna M, Hogrel J-Y, Carlier PG, Vissing J, Straub V (2013)
Quantitative muscle MRI as an assessment tool for monitoring
disease progression in LGMD2I: a multicentre longitudinal study.
PLoS One 8(8):e70993. doi:10.1371/journal.pone.0070993
12. Wokke BH, Bos C, Reijnierse M, van Rijswijk CS, Eggers H,
Webb A, Verschuuren JJ, Kan HE (2013) Comparison of Dixon
and T1-weighted MR methods to assess the degree of fat infil-
tration in Duchenne muscular dystrophy patients. J Magn Reson
Imaging 38(3):619–624. doi:10.1002/jmri.23998
13. Gloor M, Fasler S, Fischmann A, Haas T, Bieri O, Heinimann K,
Wetzel SG, Scheffler K, Fischer D (2011) Quantification of fat
infiltration in oculopharyngeal muscular dystrophy: comparison
of three MR imaging methods. J Magn Reson Imaging
33(1):203–210. doi:10.1002/jmri.22431
14. Hollingsworth KG, Garrood P, Eagle M, Bushby K, Straub V
(2013) Magnetic resonance imaging in Duchenne muscular dys-
trophy: longitudinal assessment of natural history over 18
months. Muscle Nerve 48(4):586–588. doi:10.1002/mus.23879
15. Hu HH, Boernert P, Hernando D, Kellman P, Ma J, Reeder S,
Sirlin C (2012) ISMRM workshop on fat–water separation:
insights, applications and progress in MRI. Magn Reson Med
68(2):378–388. doi:10.1002/mrm.24369
16. Dixon WT (1984) Simple proton spectroscopic imaging. Radi-
ology 153(1):189–194. doi:10.1148/radiology.153.1.6089263
17. Glover GH, Schneider E (1991) Three-point Dixon technique for
true water/fat decomposition with B0 inhomogeneity correction.
Magn Reson Med 18(2):371–383
18. Reeder SB, Pineda AR, Wen Z, Shimakawa A, Yu H, Brittain
JH, Gold GE, Beaulieu CH, Pelc NJ (2005) Iterative decom-
position of water and fat with echo asymmetry and least-
squares estimation (IDEAL): application with fast spin-echo
imaging. Magn Reson Med 54(3):636–644. doi:10.1002/mrm.
20624
19. Hu HH, Li Y, Nagy TR, Goran MI, Nayak KS (2011) Quantifi-
cation of absolute fat mass by magnetic resonance imaging: a
validation study against chemical analysis. Int J Body Compos
Res 9(3):111–122
20. Reeder SB, Hu HH, Sirlin CB (2012) Proton density fat-fraction: a
standardized MR-based biomarker of tissue fat concentration.
J Magn Reson Imaging 36(5):1011–1014. doi:10.1002/jmri.23741
21. Reeder SB, Wen Z, Yu H, Pineda AR, Gold GE, Markl M, Pelc
NJ (2004) Multicoil Dixon chemical species separation with an
iterative least-squares estimation method. Magn Reson Med
51(1):35–45. doi:10.1002/mrm.10675
22. Eggers H, Bornert P (2014) Chemical shift encoding-based
water–fat separation methods. J Magn Reson Imaging
40(2):251–268. doi:10.1002/jmri.24568
23. Janiczek RL, Gambarota G, Sinclair CD, Yousry TA, Thornton
JS, Golay X, Newbould RD (2011) Simultaneous T(2) and lipid
quantitation using IDEAL-CPMG. Magn Reson Med
66(5):1293–1302. doi:10.1002/mrm.22916
24. Mankodi A, Bishop CA, Auh S, Newbould RD, Fischbeck KH,
Janiczek RL (2016) Quantifying disease activity in fatty-infil-
trated skeletal muscle by IDEAL-CPMG in Duchenne muscular
dystrophy. Neuromuscul Disord 26(10):650–658. doi:10.1016/j.
nmd.2016.07.013
25. Sinclair CD, Morrow JM, Janiczek RL, Evans MR, Rawah E,
Shah S, Hanna MG, Reilly MM, Yousry TA, Thornton JS (2016)
Stability and sensitivity of water T2 obtained with IDEAL-
CPMG in healthy and fat–infiltrated skeletal muscle. NMR
Biomed 29(12):1800–1812. doi:10.1002/nbm.3654
26. Boesch C (2007) Musculoskeletal spectroscopy. J Magn Reson
Imaging 25(2):321–338. doi:10.1002/jmri.20806
27. Bottomley PA, Lee Y, Weiss RG (1997) Total creatine in muscle:
imaging and quantification with proton MR spectroscopy. Radi-
ology 204(2):403–410. doi:10.1148/radiology.204.2.9240527
28. Cullen CH, Ray GJ, Szabo CM (2013) A comparison of quanti-
tative nuclear magnetic resonance methods: internal, external,
and electronic referencing. Magn Reson Chem 51(11):705–713.
doi:10.1002/mrc.4004
29. Reeder SB, Bice EK, Yu H, Hernando D, Pineda AR (2012) On
the performance of T2* correction methods for quantification of
hepatic fat content. Magn Reson Med 67(2):389–404. doi:10.
1002/mrm.23016
30. Reeder SB, Cruite I, Hamilton G, Sirlin CB (2011) Quantitative
assessment of liver fat with magnetic resonance imaging and
spectroscopy. J Magn Reson Imaging 34(4):729–749. doi:10.
1002/jmri.22580
31. Reeder SB, Robson PM, Yu H, Shimakawa A, Hines CD,
McKenzie CA, Brittain JH (2009) Quantification of hepatic
steatosis with MRI: the effects of accurate fat spectral modeling.
J Magn Reson Imaging 29(6):1332–1339. doi:10.1002/jmri.21751
32. Mosconi E, Sima DM, Osorio Garcia MI, Fontanella M, Fiorini S,
Van Huffel S, Marzola P (2014) Different quantification algo-
rithms may lead to different results: a comparison using proton
MRS lipid signals. NMR Biomed 27(4):431–443. doi:10.1002/
nbm.3079
33. Kirchner T, Fillmer A, Tsao J, Pruessmann KP, Henning A
(2015) Reduction of voxel bleeding in highly accelerated parallel
(1) H MRSI by direct control of the spatial response function.
Magn Reson Med 73(2):469–480. doi:10.1002/mrm.25185
34. Wilson NE, Burns BL, Iqbal Z, Thomas MA (2015) Correlated
spectroscopic imaging of calf muscle in three spatial dimensions
using group sparse reconstruction of undersampled single and
multichannel data. Magn Reson Med 74(5):1199–1208. doi:10.
1002/mrm.25988
J Neurol (2017) 264:2053–2067 2065
123
35. Arpan I,WillcocksRJ, Forbes SC, FinkelRS, LottDJ, RooneyWD,
Triplett WT, Senesac CR, Daniels MJ, Byrne BJ, Finanger EL,
Russman BS, Wang DJ, Tennekoon GI, Walter GA, Sweeney HL,
VandenborneK (2014) Examination of effects of corticosteroids on
skeletal muscles of boys with DMD using MRI and MRS. Neu-
rology 83(11):974–980. doi:10.1212/WNL.0000000000000775
36. Forbes SC, Walter GA, Rooney WD, Wang DJ, Devos S, Pollaro
J, Triplett W, Lott DJ, Willcocks RJ, Senesac C, Daniels MJ,
Byrne BJ, Russman B, Finkel RS, Meyer JS, Sweeney HL,
Vandenborne K (2013) Skeletal muscles of ambulant children
with Duchenne muscular dystrophy: validation of multicenter
study of evaluation with MR imaging and MR spectroscopy.
Radiology 269(1):198–207. doi:10.1148/radiol.13121948
37. Forbes SC, Willcocks RJ, Triplett WT, Rooney WD, Lott DJ,
Wang DJ, Pollaro J, Senesac CR, Daniels MJ, Finkel RS, Russ-
man BS, Byrne BJ, Finanger EL, Tennekoon GI, Walter GA,
Sweeney HL, Vandenborne K (2014) Magnetic resonance
imaging and spectroscopy assessment of lower extremity skeletal
muscles in boys with Duchenne muscular dystrophy: a multi-
center cross sectional study. PLoS One 9(9):e106435. doi:10.
1371/journal.pone.0106435
38. Triplett WT, Baligand C, Forbes SC, Willcocks RJ, Lott DJ,
Devos S, Pollaro J, Rooney WD, Sweeney HL, Bonnemann CG,
Wang DJ, Vandenborne K, Walter GA (2014) Chemical shift-
based MRI to measure fat fractions in dystrophic skeletal muscle.
Magn Reson Med 72(1):8–19
39. Wokke BH, van den Bergen JC, Versluis MJ, Niks EH, Milles J,
Webb AG, van Zwet EW, Aartsma-Rus A, Verschuuren JJ, Kan
HE (2014) Quantitative MRI and strength measurements in the
assessment of muscle quality in Duchenne muscular dystrophy.
Neuromuscul Disord 24(5):409–416. doi:10.1016/j.nmd.2014.01.
015
40. Willis TA, Hollingsworth KG, Coombs A, Sveen ML, Andersen
S, Stojkovic T, Eagle M, Mayhew A, de Sousa PL, Dewar L,
Morrow JM, Sinclair CD, Thornton JS, Bushby K, Lochmuller H,
Hanna MG, Hogrel JY, Carlier PG, Vissing J, Straub V (2014)
Quantitative magnetic resonance imaging in limb-girdle muscular
dystrophy 2I: a multinational cross-sectional study. PLoS One
9(2):e90377. doi:10.1371/journal.pone.0090377
41. Lokken N, Hedermann G, Thomsen C, Vissing J (2016) Con-
tractile properties are disrupted in Becker muscular dystrophy,
but not in limb girdle type 2I. Ann Neurol 80(3):466–471. doi:10.
1002/ana.24743
42. Carlier PG, Azzabou N, de Sousa PL, Hicks A, Boisserie JM,
Amadon A, Carlier RY, Wary C, Orlikowski D, Laforet P (2015)
Skeletal muscle quantitative nuclear magnetic resonance imaging
follow-up of adult Pompe patients. J Inherit Metab Dis
38(3):565–572. doi:10.1007/s10545-015-9825-9
43. Loughran T, Higgins DM, McCallum M, Coombs A, Straub V,
Hollingsworth KG (2015) Improving highly accelerated fat
fraction measurements for clinical trials in muscular dystrophy:
origin and quantitative effect of R2* changes. Radiology
275(2):570–578. doi:10.1148/radiol.14141191
44. Ricotti V, Evans MR, Sinclair CD, Butler JW, Ridout DA, Hogrel
JY, Emira A, Morrow JM, Reilly MM, Hanna MG, Janiczek RL,
Matthews PM, Yousry TA, Muntoni F, Thornton JS (2016) Upper
limb evaluation in Duchenne muscular dystrophy: fat–water
quantification by MRI, muscle force and function define end-
points for clinical trials. PLoS One 11(9):e0162542. doi:10.1371/
journal.pone.0162542
45. Hollingsworth KG, Higgins DM, McCallum M, Ward L, Coombs
A, Straub V (2014) Investigating the quantitative fidelity of
prospectively undersampled chemical shift imaging in muscular
dystrophy with compressed sensing and parallel imaging recon-
struction. Magn Reson Med 72(6):1610–1619. doi:10.1002/mrm.
25072
46. Hooijmans MT, Niks EH, Burakiewicz J, Verschuuren JJ, Webb
AG, Kan HE (2017) Elevated phosphodiester and T2 levels can
be measured in the absence of fat infiltration in Duchenne mus-
cular dystrophy patients. NMR Biomed. doi:10.1002/nbm.3667
47. Hollingsworth KG, de Sousa PL, Straub V, Carlier PG (2012)
Towards harmonization of protocols for MRI outcome measures
in skeletal muscle studies: consensus recommendations from two
TREAT-NMD NMR workshops, 2 May 2010, Stockholm, Swe-
den, 1–2 October 2009, Paris. France. Neuromuscul Disord
22(Suppl 2):S54–S67. doi:10.1016/j.nmd.2012.06.005
48. Bernard CP, Liney GP, Manton DJ, Turnbull LW, Langton CM
(2008) Comparison of fat quantification methods: a phantom
study at 3.0T. J Magn Reson Imaging 27(1):192–197. doi:10.
1002/jmri.21201
49. Hines CD, Frydrychowicz A, Hamilton G, Tudorascu DL, Vigen
KK, Yu H, McKenzie CA, Sirlin CB, Brittain JH, Reeder SB
(2011) T1 independent, T2* corrected chemical shift based fat–
water separation with multi-peak fat spectral modeling is an
accurate and precise measure of hepatic steatosis. J Magn Reson
Imaging 33(4):873–881. doi:10.1002/jmri.22514
50. Hines CD, Yu H, Shimakawa A, McKenzie CA, Brittain JH,
Reeder SB (2009) T1 independent, T2* corrected MRI with
accurate spectral modeling for quantification of fat: validation in
a fat–water-SPIO phantom. J Magn Reson Imaging
30(5):1215–1222. doi:10.1002/jmri.21957
51. Janssen BH, Voet NB, Nabuurs CI, Kan HE, de Rooy JW, Geurts
AC, Padberg GW, van Engelen BG, Heerschap A (2014) Distinct
disease phases in muscles of facioscapulohumeral dystrophy
patients identified by MR detected fat infiltration. PLoS One
9(1):e85416. doi:10.1371/journal.pone.0085416
52. Willcocks RJ, Triplett WT, Forbes SC, Arora H, Senesac CR,
Lott DJ, Nicholson TR, Rooney WD, Walter GA, Vandenborne K
(2017) Magnetic resonance imaging of the proximal upper
extremity musculature in boys with Duchenne muscular dystro-
phy. J Neurol 264(1):64–71. doi:10.1007/s00415-016-8311-0
53. Machann J, Thamer C, Schnoedt B, Haap M, Haring HU,
Claussen CD, Stumvoll M, Fritsche A, Schick F (2005) Stan-
dardized assessment of whole body adipose tissue topography by
MRI. J Magn Reson Imaging 21(4):455–462. doi:10.1002/jmri.
20292
54. Wary C, Azzabou N, Giraudeau C, Le Louer J, Montus M, Voit
T, Servais L, Carlier P (2015) Quantitative NMRI and NMRS
identify augmented disease progression after loss of ambulation
in forearms of boys with Duchenne muscular dystrophy. NMR
Biomed 28(9):1150–1162. doi:10.1002/nbm.3352
55. Sinclair CD, Morrow JM, Miranda MA, Davagnanam I, Cowley
PC, Mehta H, Hanna MG, Koltzenburg M, Yousry TA, Reilly
MM, Thornton JS (2012) Skeletal muscle MRI magnetisation
transfer ratio reflects clinical severity in peripheral neuropathies.
J Neurol Neurosurg Psychiatry 83(1):29–32. doi:10.1136/jnnp.
2011.246116
56. Lareau-Trudel E, Le Troter A, Ghattas B, Pouget J, Attarian S,
Bendahan D, Salort-Campana E (2015) Muscle quantitative MR
imaging and clustering analysis in patients with facioscapulo-
humeral muscular dystrophy type 1. PLoS One 10(7):e0132717.
doi:10.1371/journal.pone.0132717
57. Makrogiannis S, Serai S, Fishbein KW, Schreiber C, Ferrucci L,
Spencer RG (2012) Automated quantification of muscle and fat in
the thigh from water-, fat-, and nonsuppressed MR images. J Magn
Reson Imaging 35(5):1152–1161. doi:10.1002/jmri.22842
58. Positano V, Christiansen T, Santarelli MF, Ringgaard S, Landini
L, Gastaldelli A (2009) Accurate segmentation of subcutaneous
and intermuscular adipose tissue from MR images of the thigh.
J Magn Reson Imaging 29(3):677–684. doi:10.1002/jmri.21699
59. Valentinitsch A, Karampinos DC, Alizai H, Subburaj K, Kumar
D, Link TM, Majumdar S (2013) Automated unsupervised multi-
2066 J Neurol (2017) 264:2053–2067
123
parametric classification of adipose tissue depots in skeletal
muscle. J Magn Reson Imaging 37(4):917–927. doi:10.1002/jmri.
23884
60. Baudin PY, Azzabou N, Carlier PG, Paragios N (2012) Prior
knowledge, random walks and human skeletal muscle segmenta-
tion. Med Image Comput Comput Assist Interv 15(Pt 1):569–576
61. Commean PK, Tuttle LJ, Hastings MK, Strube MJ, Mueller MJ
(2011) Magnetic resonance imaging measurement reproducibility
for calf muscle and adipose tissue volume. J Magn Reson
Imaging 34(6):1285–1294. doi:10.1002/jmri.22791
62. Yu H, Shimakawa A, McKenzie CA, Brodsky E, Brittain JH,
Reeder SB (2008) Multiecho water–fat separation and simulta-
neous R2* estimation with multifrequency fat spectrum model-
ing. Magn Reson Med 60(5):1122–1134. doi:10.1002/mrm.21737
63. Mann LW, Higgins DM, Peters CN, Cassidy S, Hodson KK,
Coombs A, Taylor R, Hollingsworth KG (2016) Accelerating MR
imaging liver steatosis measurement using combined compressed
sensing and parallel imaging: a quantitative evaluation. Radiol-
ogy 278(1):247–256. doi:10.1148/radiol.2015150320
64. Liu C-Y, McKenzie CA, Yu H, Brittain JH, Reeder SB (2007) Fat
quantification with IDEAL gradient echo imaging: correction of
bias from T-1 and noise. Magn Reson Med 58(2):354–364.
doi:10.1002/mrm.21301
65. Hu HH, Nayak KS (2010) Change in the proton T1 of fat and
water in mixture. Magn Reson Med 63(2):494–501. doi:10.1002/
mrm.22205
66. Yu H, McKenzie CA, Shimakawa A, Vu AT, Brau AC, Beatty
PJ, Pineda AR, Brittain JH, Reeder SB (2007) Multiecho
reconstruction for simultaneous water–fat decomposition and T2*
estimation. J Magn Reson Imaging 26(4):1153–1161. doi:10.
1002/jmri.21090
67. Hamilton G, Yokoo T, Bydder M, Cruite I, Schroeder ME, Sirlin
CB, Middleton MS (2011) In vivo characterization of the liver fat
H-1 MR spectrum. NMR Biomed 24(7):784–790. doi:10.1002/
nbm.1622
68. Ren J, Dimitrov I, Sherry AD, Malloy CR (2008) Composition of
adipose tissue and marrow fat in humans by 1H NMR at 7 Tesla.
J Lipid Res 49(9):2055–2062. doi:10.1194/jlr.D800010-JLR200
69. Hernando D, Karampinos DC, King KF, Haldar JP, Majumdar S,
Georgiadis JG, Liang ZP (2011) Removal of olefinic fat chemical
shift artifact in diffusion MRI. Magn Reson Med 65(3):692–701.
doi:10.1002/mrm.22670
70. Pineda AR, Reeder SB, Wen Z, Pelc NJ (2005) Cramer-Rao
bounds for three-point decomposition of water and fat. Magn
Reson Med 54(3):625–635. doi:10.1002/mrm.20623
71. Fischmann A, Hafner P, Gloor M, Schmid M, Klein A, Pohlman
U, Waltz T, Gonzalez R, Haas T, Bieri O, Fischer D (2013)
Quantitative MRI and loss of free ambulation in Duchenne
muscular dystrophy. J Neurol 260(4):969–974. doi:10.1007/
s00415-012-6733-x
72. Gaeta M, Messina S, Mileto A, Vita GL, Ascenti G, Vinci S,
Bottari A, Vita G, Settineri N, Bruschetta D, Racchiusa S, Min-
utoli F (2012) Muscle fat-fraction and mapping in Duchenne
muscular dystrophy: evaluation of disease distribution and cor-
relation with clinical assessments. Preliminary experience.
Skeletal Radiol 41(8):955–961. doi:10.1007/s00256-011-1301-5
73. Hooijmans MT, Niks EH, Burakiewicz J, Anastasopoulos C, van
den Berg SI, van Zwet E, Webb AG, Verschuuren JJ, Kan HE
(2017) Non-uniform muscle fat replacement along the proxi-
modistal axis in Duchenne muscular dystrophy. Neuromuscul
Disord 27(5):458–464. doi:10.1016/j.nmd.2017.02.009
74. Horvath JJ, Austin SL, Case LE, Greene KB, Jones HN, Soher
BJ, Kishnani PS, Bashir MR (2015) Correlation between quan-
titative whole-body muscle magnetic resonance imaging and
clinical muscle weakness in Pompe disease. Muscle Nerve
51(5):722–730. doi:10.1002/mus.24437
75. van den Bergen JC, Wokke BH, Janson AA, van Duinen SG,
Hulsker MA, Ginjaar HB, van Deutekom JC, Aartsma-Rus A,
Kan HE, Verschuuren JJ (2014) Dystrophin levels and clinical
severity in Becker muscular dystrophy patients. J Neurol Neu-
rosurg Psychiatry 85(7):747–753. doi:10.1136/jnnp-2013-306350
76. Wokke BH, Hooijmans MT, van den Bergen JC, Webb AG,
Verschuuren JJ, Kan HE (2014) Muscle MRS detects elevated
PDE/ATP ratios prior to fatty infiltration in Becker muscular
dystrophy. NMR Biomed 27(11):1371–1377. doi:10.1002/nbm.
3199
77. Wren TA, Bluml S, Tseng-Ong L, Gilsanz V (2008) Three-point
technique of fat quantification of muscle tissue as a marker of
disease progression in Duchenne muscular dystrophy: prelimi-
nary study. AJR Am J Roentgenol 190(1):W8–12. doi:10.2214/
AJR.07.2732
78. Andersen G, Dahlqvist JR, Vissing CR, Heje K, Thomsen C,
Vissing J (2017) MRI as outcome measure in facioscapulo-
humeral muscular dystrophy: 1-year follow-up of 45 patients.
J Neurol 264(3):438–447. doi:10.1007/s00415-016-8361-3
79. Bonati U, Hafner P, Schadelin S, Schmid M, Naduvilekoot
Devasia A, Schroeder J, Zuesli S, Pohlman U, Neuhaus C, Klein
A, Sinnreich M, Haas T, Gloor M, Bieri O, Fischmann A, Fischer
D (2015) Quantitative muscle MRI: a powerful surrogate out-
come measure in Duchenne muscular dystrophy. Neuromuscul
Disord 25(9):679–685. doi:10.1016/j.nmd.2015.05.006
80. Bonati U, Schmid M, Hafner P, Haas T, Bieri O, Gloor M, Fis-
chmann A, Fischer D (2015) Longitudinal 2-point Dixon muscle
magnetic resonance imaging in Becker muscular dystrophy.
Muscle Nerve 51(6):918–921. doi:10.1002/mus.24629
81. Bonati U, Holiga S, Hellbach N, Risterucci C, Bergauer T, Tang
W, Hafner P, Thoeni A, Bieri O, Gerlach I, Marquet A, Khwaja
O, Sambataro F, Bertolino A, Dukart J, Fischmann A, Fischer D,
Czech C (2017) Longitudinal characterization of biomarkers for
spinal muscular atrophy. Ann Clin Transl Neurol 4(5):292–304.
doi:10.1002/acn3.406
82. Azzabou N, Loureiro de Sousa P, Caldas E, Carlier PG (2015)
Validation of a generic approach to muscle water T2 determi-
nation at 3T in fat-infiltrated skeletal muscle. J Magn Reson
Imaging 41(3):645–653. doi:10.1002/jmri.24613
83. Hooijmans MT, Damon BM, Froeling M, Versluis MJ, Bur-
akiewicz J, Verschuuren JJ, Niks EH, Webb AG, Kan HE (2015)
Evaluation of skeletal muscle DTI in patients with Duchenne
muscular dystrophy. NMR Biomed 28(11):1589–1597. doi:10.
1002/nbm.3427
84. Marty B, Baudin PY, Reyngoudt H, Azzabou N, Araujo EC,
Carlier PG, de Sousa PL (2016) Simultaneous muscle water T2
and fat fraction mapping using transverse relaxometry with
stimulated echo compensation. NMR Biomed 29(4):431–443.
doi:10.1002/nbm.3459
85. Ponrartana S, Ramos-Platt L, Wren TA, Hu HH, Perkins TG,
Chia JM, Gilsanz V (2015) Effectiveness of diffusion tensor
imaging in assessing disease severity in Duchenne muscular
dystrophy: preliminary study. Pediatr Radiol 45(4):582–589.
doi:10.1007/s00247-014-3187-6
J Neurol (2017) 264:2053–2067 2067
123


