Embed Size (px)
Citation preview
J. A. OWA AND O. ADEJUYIGBE
Fat Mass, Fat Mass Percentage, Body Mass Index, andMid-upper Arm Circumference in a Healthy Populationof Nigerian Children
by J. A. Owa* and O. Adejuyigbe**Departments of * Paediatrics & Child Health, and **Surgery, Obafemi Awolowo, P.O. Box 617, Ile-lfe, Nigeria
Summary
We determined body fat mass, body mass index, and mid-upper arm circumference, in 5-15-year-oldNigerian children consisting of 454 (50 per cent) males and 450 (50 per cent) females. We derivedregression equations between body fat mass and age, body mass index, and mid-upper armcircumference for each sex. The mean of age and height were similar in both sexes, while mat of fatmass, percentage fat mass, body mass index, and mid-upper arm circumference were significantly higherin the female than male. Percentage fat mass varied between 3.02 and 32.16, and 1.88 and 53.84 inmales and females, respectively (P=0.0000). The percentage fat mass increased slightly with age (butsignificantly) in the female and decreased slightly with age in the male. Based on the US standards 164(18 per cent) of the children were obese. We conclude that with improvement in living standards,childhood obesity may become a medical problem in Nigeria.
IntroductionThe fat content of the human body has physiologicaland medical importance.1"7 Obesity and patterns offat are risk factors for diabetes mellitus, hyperten-sion, atherosclerosis and mortality from coronaryheart disease in the adult,3"7 and about 40 per cent ofobese children become obese adults.6 There is adearth of information on body fat mass and obesityin childhood in Nigeria and many developingcountries, where protein energy malnutrition (PEM)remains a major problem.
Weight, height, weight for height standard, bodymass index (BMI), and skin-fold thickness (SFT) areoften used as measures of obesity in the adolescentand adult . i x s f i Weight, height, and weight for heightstandards are not accurate measures of obesity, whileBMI may not distinguish between over-fat andoverweight muscular individuals. Body compositionanalysis distinguishes over-fat from overweight mus-cular individuals.8
Most methods of body composition analysis arebased on the assumption that the human bodyconsists of two chemically distinct components whichare (1) fat mass (FM) and (2) fat-free mass (FFM).The FM is anhydrous and the water content of the
AcknowledgementsWe thank the children, their parents, and the teachers fortheir co-operation. The study was supported financially byNestle Limited, Switzerland.
FFM is constant. Thus, by measuring one com-ponent, others can be calculated.1"8 For example, iftotal body water (TBW) is known, FFM can becalculated thus:
FFM = TBW/hydration constant;
FM = body weight {W) - FFM;
The 'gold' standards for body composition ana-lysis are by means of determination of FM bydensitometry (under water weighing) and determina-tion of FFM by total body potassium C°¥L.) level andisotope dilution methods. These methods are techni-cally difficult, expensive, and are impractical in mostclinical settings.1'2 Equations for calculation of bodydensity and FM from skin-folds thickness (SFT)are not applicable to young children.1'9 The bio-electrical impedance analysis (BIA) method whichhas been validated in the adult1"'1 I>1J and childpopulation,12"16 is portable, cheap, non-invasive,safe, accurate, reliable, and seems an ideal andappropriate method for children.12"16
The BIA was used to determine the FM in thepresent study. We related the FM to BMI and midupper arm circumference (MUAQ to the FM. Weestimated the prevalence of obesity (based onWestern values4) in this group of Nigerian children.To the best of our knowledge, this is the first reportof data on FM in Nigerian children.
Journal of Tropical Pediatrics Vol.43 February 1997 > Oxford University Press 1997 13
Dow
nloaded from https://academ
ic.oup.com/tropej/article/43/1/13/1718767 by guest on 07 February 2022
Subjects and Methods
The subjects were pupils and students of lower classesof the Obafemi Awolowo University Primary andSecondary Schools, respectively. They were agedbetween 5 and 15 years at the time of the study. Allthe subjects in each selected class were measured. Allthe children were healthy.
The study protocol was approved by the Ethicaland Research Committees of the Faculty of HealthSciences, Obafemi Awolowo University, and Oba-femi Awolowo University Teaching Hospitals Com-plex, Ile-Ife. The study protocol was fully explainedto the teachers and the children. A written consentwas obtained from the parents.
The study, which covered a 6-week period wascarried out in the schools' health clinics, between 9.00a.m. and 12 noon by the authors and a researchassistant. For each subject the date of birth (DOB),the weight (W), height (H), mid-upper arm circum-ference (MUAC), impedance reading (I), and sexwere recorded. The age was calculated to nearestmonth. The weight was recorded to the nearest 10 gusing a digital electrical weighing scale. The subjectswere weighed wearing only underwear or sportswear.The height was measured to the nearest 0.5 cm usinga portable Harpenden Stadiometer from HoltainLimited, UK. The MUAC was recorded to thenearest 2 mm using Insertion Tape from TALC, StAlbans, UK. The Body Impedance (I) was recordedusing Holtain Body Composition Analyser (HBCA)from Holtain Limited, UK. With the subject lyingsupine on the examination couch, two electrodes eachwere attached to right upper and lower limbs asfollows: with the arms at the side of the body, but nottouching the body and with the legs separated, self-adhesive electrodes were applied to the back of thewrist and the front of the ankle. The proximalelectrode was applied in line with ulnar tubercle ofthe arm and the second 3-5 cm distal to it. In thelower limb the first electrode was applied over the
J. A. OWA AND O. ADEJUYIGBE
ankle joint and the second applied 3-5 cm distal to it.A constant current of 800 //A at a frequency of 50kHz was applied across the body. The correspondingvoltage drop is the (I) reading. Total body water wascalculated using Davies et al.'s15 equation [0.60*(//2/I) — 0.5] derived for similar age group. ForFFM = TBW/hydration constant, FFM hydrationconstant of 74 and 75 per cent were used for malesand females, respectively.17
FM = body weight (W) - FFM;
FM% = 100
The body mass index (BMI) was calculated thus:(BMI = W/H2).9 Since we did not have facilities forthe hydrostatic or the isotopic dilutions methods ofbody composition analysis, we could not compareour data directly with data from either of these 'gold'standards.
All data were analysed using the Statgraphics Plusfor Windows (Manugistics, Inc., USA). Means werecompared using Student's /-test and proportionswere compared using Chi-square (£2) test withP<0.05 accepted as statistically significant.
ResultsOf the 904 subjects studied 454 (50 per cent) weremales and 450 (50 per cent) were females. The age,W, H, and / for the two sexes are shown in Table 1.The means of the ages and heights of the two sexeswere similar while that of the W and / weresignificantly higher in female than male. Table 2compares the FM, percentage body fat mass (FM%),BMI, and MUAC in the two sexes. All gave highermean values in the female than male. The degree ofstatistically significant difference was higher for FMand FM% than BMI and MUAC. Table 3 presentsdata on regression of FM, FM%, MUAC, and BMIon age. All (except FM% in male) show positive
TABLE 1Comparison of anthropometric data of the two sexes
Male in = 454)MeanSDRangeSE
Female (n = 450)MeanSDRangeSE
P-value
Age
109.431.0
60-1921.5
109.430.0
60-1911.4
0.9991
Weight
26.786.84
14.89-51.600.32
28.049.0
12.42-60.900.42
0.019
Height
131.013.5
100.5-170.00.63
132.514.6
98.5-166.50.69
0.123
Impedance
627.059.7
472-8742.8
654.965.8
496-9573.1
0.000001
SD = standard deviation; SE = standard error of mean.
14 Journal of Tropical Pediatrics Vol.43 February 1997
Dow
nloaded from https://academ
ic.oup.com/tropej/article/43/1/13/1718767 by guest on 07 February 2022
J. A. OWA AND O ADEIUYIGBE
TABLE 2
Fat mass, fat mass percentage, body mass index and mid-upper arm circumference: comparison of means of the sexes
Male (n = 454)MeanSDRange95% aSE
Female (n = 450)MeanSDRange95 CISE
/"-value:
Fat mass
4.681.77
0.25-13.264.51^4.84
0.083
6.573.61
0.38-27.56.23-6.90
0.17
0.0000
% Fat mass
17.675.3
3.02-32.1617.17-18.16
0.252
22.976.55
1.88-53.8422.18-23.40
0.31
0.0000
BMI
15.31.22
11.9-19.915.22-15.44
0.06
15.62.02
11.1-26.315.37-15.74
0.10
0.00007
MUAC
172.519.0
126-250170.7-174.2
0.9
178.324.3
124-270176.0-180.5
1.20
0.046
TABLE 3
Summary of regression lines of weight, height, fat mass, percentage fat mass, body mass index, and mid-upper arm circumference on age: comparison of the two sexes
Male (n-454)FMJFM%*B M I " *MUACftt
Female (n = 450)FMtFM%*B M I "MUACtt
r
0.503-0.099
0.4190.680
0.6310.1580.5290.708
r2
25.340.99
17.5846.22
39.792.51
27.9550.15
a
1.4219.5313.533.94
1.0419.0111.653.58
b
0.007-0.171
0.0160.258
0.0130.0350.0360.342
P-value***
0.00000.00000.00000.0000
0.00000.00080.00000.000
r = Correlation coefficient; r2 = Coefficient of determination; a = Intercept on y-axis; 6 = slope of y/x.FM = fat mass; %FM=-percentage fat mass; MUAC = mid-upper arm circumference.*** The degree of statistical significant relationship.t Slope P<0.000001; r P>0.78 comparing the sexes, t t Slope /><0.0001; r P>0.92. ** Slope /><0.OOOOO2;
r />>0.92. t t t Slope /><0.0001; r P>QJ%.
TABLE 4
Equations for calculating fat mass from BMI, MUAC with and without age
MaleFM K« = 0.0429MUAC(mm)-2.71 0.461 21.30FMK.g = 0.7182BMI-6.3346 0.494 24.40FM Kg = 0.0200MUAC (mm) + 0.4896BMI - 6.28 0.515 26.60F M K g = 0.4934BMI + 0.02O9age(months)-5.18 0.596 35.56
FemaleFM Kg = 0.1092MUAC (mm)-12.93 0.741 54.88FMKg=1.4932BMI-16.65 0.837 70.11FM Kg - 0.0274MUAC (mm) + 1.2171 BMI - 17.25 0.840 70.71FM Kg = 1.2665BM1 + 0.0290 Age(months) -1629 0.862 74.29
Journal of Tropical Pediatrics Vol.43 February 1997 15
Dow
nloaded from https://academ
ic.oup.com/tropej/article/43/1/13/1718767 by guest on 07 February 2022
J. A. OWA AND O. ADEJUY1GBE
A
<nel
E£
50
40
30
20
10
;
:H
:
90 120 ISO
Age (months)180 210
B 50
40
B 20
10 . • *
4* vif • - * i -
-
90 120 ISOAge (months)
180 210
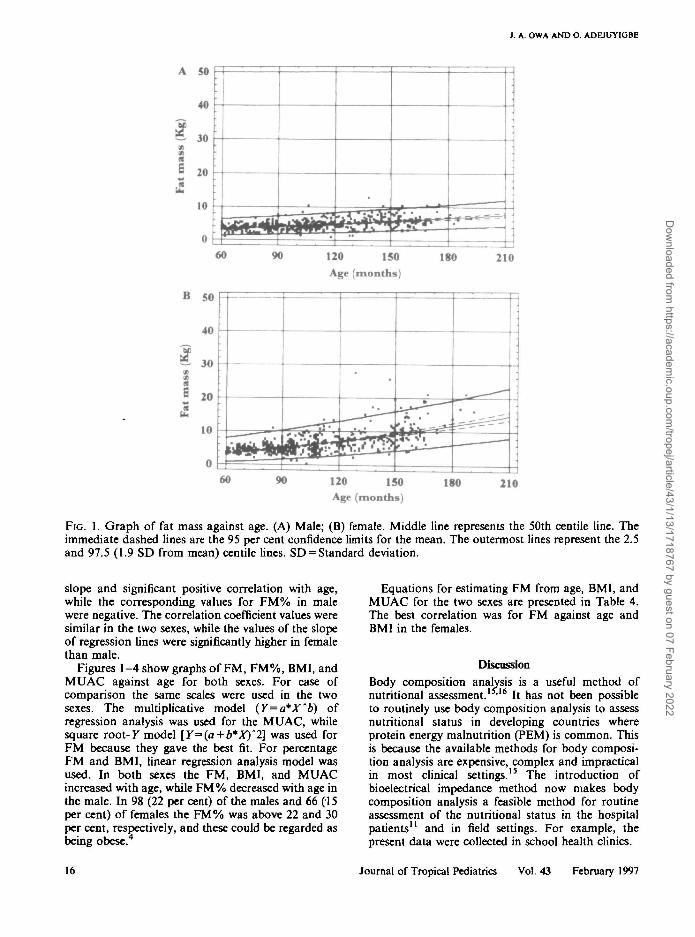
FIG. 1. Graph of fat mass against age. (A) Male; (B) female. Middle line represents the 50th centile line. Theimmediate dashed lines are the 95 per cent confidence limits for the mean. The outermost lines represent the 2.5and 97.5 (1.9 SD from mean) centile lines. SD = Standard deviation.
slope and significant positive correlation with age,while the corresponding values for FM% in malewere negative. The correlation coefficient values weresimilar in the two sexes, while the values of the slopeof regression lines were significantly higher in femalethan male.
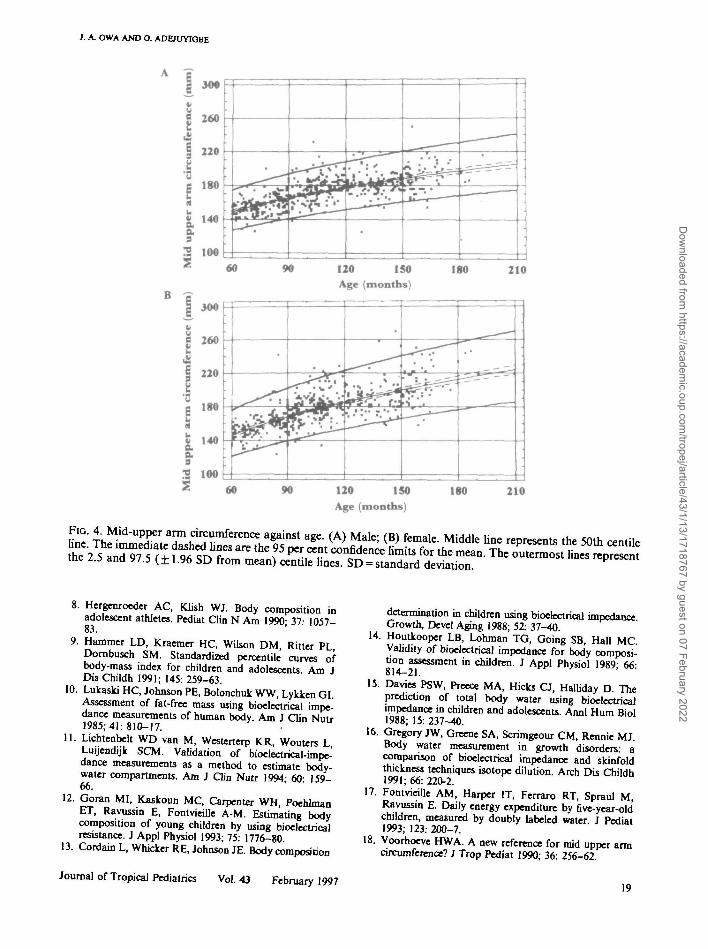
Figures 1-4 show graphs of FM, FM%, BMI, andMUAC against age for both sexes. For ease ofcomparison the same scales were used in the twosexes. The multiplicative model (Y=a*X~b) ofregression analysis was used for the MUAC, whilesquare root-K model [Y=>(a + b*X)"2] was used forFM because they gave the best fit. For percentageFM and BMI, linear regression analysis model wasused. In both sexes the FM, BMI, and MUACincreased with age, while FM% decreased with age inthe male. In 98 (22 per cent) of the males and 66 (15per cent) of females the FM% was above 22 and 30per cent, respectively, and these could be regarded asbeing obese.4
Equations for estimating FM from age, BMI, andMUAC for the two sexes are presented in Table 4.The best correlation was for FM against age andBMI in the females.
Discussion
Body composition analysis is a useful method ofnutritional assessment. >l6 It has not been possibleto routinely use body composition analysis to assessnutritional status in developing countries whereprotein energy malnutrition (PEM) is common. Thisis because the available methods for body composi-tion analysis are expensive, complex and impracticalin most clinical settings.15 The introduction ofbioelectrical impedance method now makes bodycomposition analysis a feasible method for routineassessment of the nutritional status in the hospitalpatients" and in field settings. For example, thepresent data were collected in school health clinics.
Journal of Tropical Pediatrics Vol.43 February 1997
Dow
nloaded from https://academ
ic.oup.com/tropej/article/43/1/13/1718767 by guest on 07 February 2022
1. A. OWA AND O ADBUYIGBE
A 60
50
3 30
20
10
• • • ^ . • ^
• — • — ^ " \
• ^ . .
•
. • i • • v .
• • • • *
.t _»
60 90 120 150Age (months)
180 210
60 90 120 150Age (months)
ISO 210
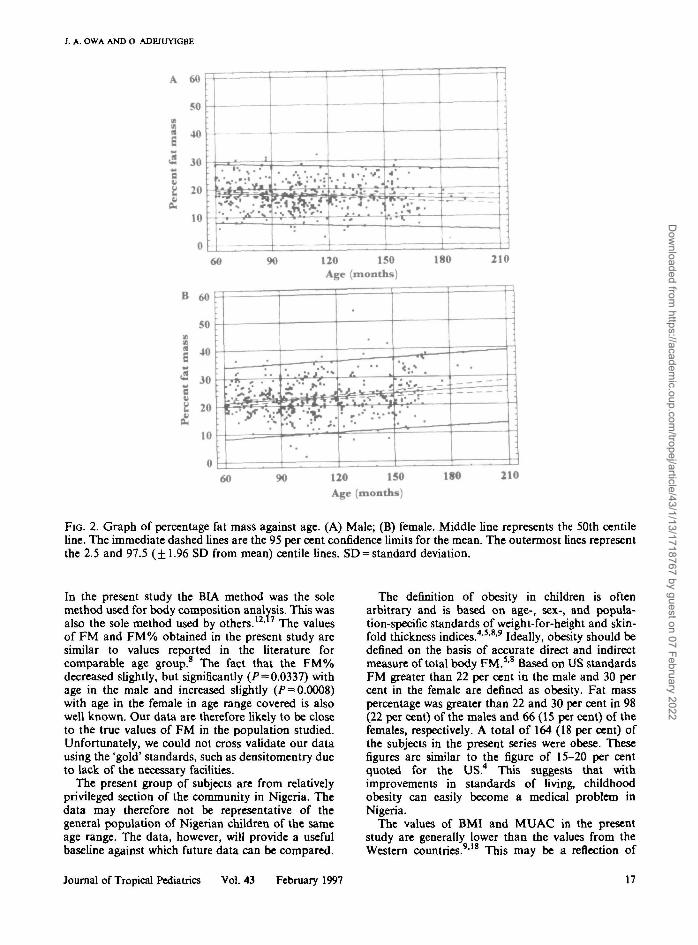
FIG. 2. Graph of percentage fat mass against age. (A) Male; (B) female. Middle line represents the 50th centileline. The immediate dashed lines are the 95 per cent confidence limits for the mean. The outermost lines representthe 2.5 and 97.5 (±1.96 SD from mean) centile lines. SD = standard deviation.
In the present study the BIA method was the solemethod used for body composition analysis. This wasalso the sole method used by others.12" The valuesof FM and FM% obtained in the present study aresimilar to values reported in the literature forcomparable age group.8 The fact that the FM%decreased slightly, but significantly (P = 0.0337) withage in the male and increased slightly (P = 0.0008)with age in the female in age range covered is alsowell known. Our data are therefore likely to be closeto the true values of FM in the population studied.Unfortunately, we could not cross validate our datausing the 'gold' standards, such as densitomentry dueto lack of the necessary facilities.
The present group of subjects are from relativelyprivileged section of the community in Nigeria. Thedata may therefore not be representative of thegeneral population of Nigerian children of the sameage range. The data, however, will provide a usefulbaseline against which future data can be compared.
The definition of obesity in children is oftenarbitrary and is based on age-, sex-, and popula-tion-specific standards of weight-for-height and skin-fold thickness indices.4'5'8'9 Ideally, obesity should bedefined on the basis of accurate direct and indirectmeasure of total body FM.5'8 Based on US standardsFM greater than 22 per cent in the male and 30 percent in the female are defined as obesity. Fat masspercentage was greater than 22 and 30 per cent in 98(22 per cent) of the males and 66 (15 per cent) of thefemales, respectively. A total of 164 (18 per cent) ofthe subjects in the present series were obese. Thesefigures are similar to the figure of 15-20 per centquoted for the US.4 This suggests that withimprovements in standards of living, childhoodobesity can easily become a medical problem inNigeria.
The values of BMI and MUAC in the presentstudy are generally lower than the values from theWestern countries.9'18 This may be a reflection of
Journal of Tropical Pediatrics Vol.43 February 1997
Dow
nloaded from https://academ
ic.oup.com/tropej/article/43/1/13/1718767 by guest on 07 February 2022
J. A. OWA AND O ADEJUY1GBE
A 50
„ 40
la
10
:
:
LM.«.-. J - - - 1 1
• •
60 90 120 150Age (months)
180 210
B 50
40MV
1 3 0
s8 20>>
« 10
0
yVfr A^• ^ • * — •
^ — —
-
60 120 150Age (months)
180 210
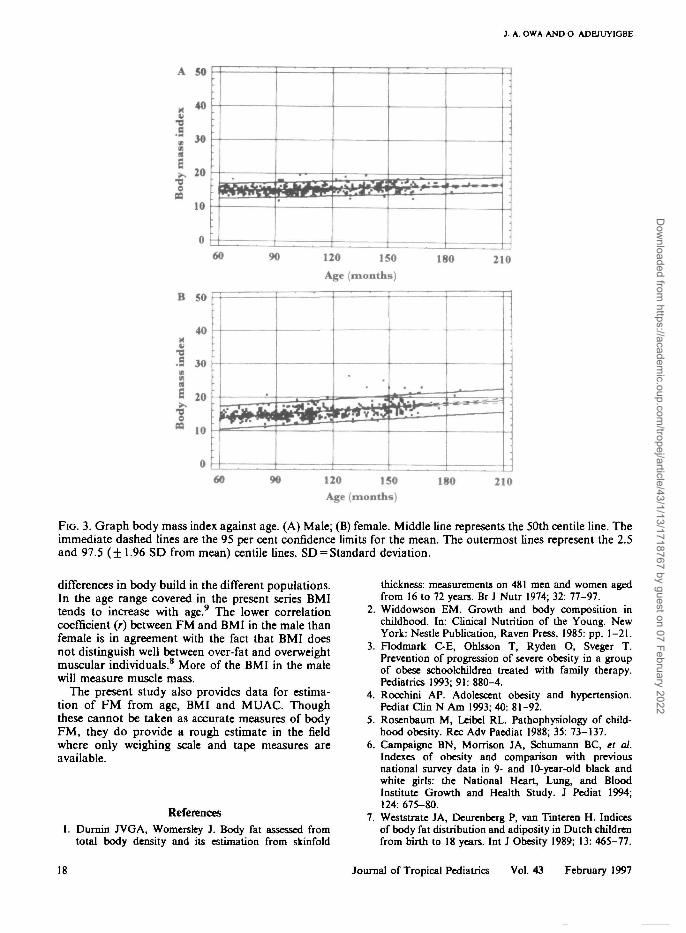
FIG. 3. Graph body mass index against age. (A) Male; (B) female. Middle line represents the 50th centile line. Theimmediate dashed lines are the 95 per cent confidence limits for the mean. The outermost lines represent the 2.5and 97.5 (±1.96 SD from mean) centile lines. SD = Standard deviation.
differences in body build in the different populations.In the age range covered in the present series BMItends to increase with age.9 The lower correlationcoefficient (r) between FM and BMI in the male thanfemale is in agreement with the fact that BMI doesnot distinguish well between over-fat and overweightmuscular individuals.8 More of the BMI in the malewill measure muscle mass.
The present study also provides data for estima-tion of FM from age, BMI and MUAC. Thoughthese cannot be taken as accurate measures of bodyFM, they do provide a rough estimate in the fieldwhere only weighing scale and tape measures areavailable.
References1. Duniin JVGA, Womersley J. Body fat assessed from
total body density and its estimation from skinfold
thickness: measurements on 481 men and women agedfrom 16 to 72 years. Br J Nutr 1974; 32: 77-97.
2. Widdowson EM. Growth and body composition inchildhood. In: Clinical Nutrition of the Young. NewYork: Nestle Publication, Raven Press, 1985: pp. 1-21.
3. Flodmark C-E, Ohlsson T, Ryden O, Sveger T.Prevention of progression of severe obesity in a groupof obese schoolchildren treated with family therapy.Pediatrics 1993; 91: 880-4.
4. Rocchini AP. Adolescent obesity and hypertension.Pediat Clin N Am 1993; 40: 81-92.
5. Rosenbaum M, Leibel RL. Pathophysiology of child-hood obesity. Rec Adv Paediat 1988; 35: 73-137.
6. Campaigne BN, Morrison JA, Schumann BC, el at.Indexes of obesity and comparison with previousnational survey data in 9- and 10-year-old black andwhite girls: the National Heart, Lung, and BloodInstitute Growth and Health Study. J Pediat 1994;124: 675-80.
7. Weststrate JA, Deurenberg P, van Tinteren H. Indicesof body fat distribution and adiposity in Dutch childrenfrom birth to 18 years. Int J Obesity 1989; 13: 465-77.
18 Journal of Tropical Pediatrics Vol.43 February 1997
Dow
nloaded from https://academ
ic.oup.com/tropej/article/43/1/13/1718767 by guest on 07 February 2022
J. A. OWA AND O. ADEnjYIOBE
30*
260
220
180
3 too* 60
300
! 2 6 0
§ 220
180 -*
fc 140
I3 100* 60
•
—„
•
•
•
90 120 ISO
Age (months)180 210
—r
;
•
•
•
• '
= — = =
90 120 150
Age (months)
180 210
8. Hergenroeder AC, Klish WJ. Body composition inadolescent athletes. Pediat Clin N Am 1990; 37: 1057-83.
9. Hammer LD, Kraemer HC, Wilson DM, Ritter PLDornbusch SM. Standardized percentile curves ofbody-mass index for children and adolescents Am JDis Childh 1991; 145: 259-63.
10. Lukaski HC, Johnson PE, Bolonchuk WW, Lykken GI.Assessment of fat-free mass using bioelectrical impe-dance measurements of human body Am J Clin Nutr1985; 41: 810-17. .
11. Lichtenbelt WD van M, Westerterp KR, Wouters LL-uijendijk SCM. Validation of bioelectrical-impe-dance measurements as a method to estimate body-water compartments. Am J Clin Nutr 1994; 60: 159-66.
12. Goran MI, Kaskoun MC, Carpenter WH, PoehlmanET, Ravussin E, Fontvieille A-M. Estimating bodycomposition of young children by using bioelectricalresistance. J Appl Physiol 1993; 75: 1776-80
13. Cordain L, Whicker RE, Johnson JE. Body composition
Journal of Tropical Pediatrics Vol.43 February 1997
determination in children using bioelectrical impedanceGrowth, Devel Aging 1988; 52: 37-40.
14. Houtkooper LB, Lohman TG, Going SB, Hall MCValidity of bioelectrical impedance for body composi-tion assessment in children. J Appl Physiol 1989; 66-814-21.
15. Davies PSW, Preece MA, Hicks a , Halliday D. Theprediction of total body water using bioelectricalimpedance in children and adolescents. Annl Hum Biol1988; 15: 237-40.
16. Gregory JW, Greene SA, Scrimgeour CM, Rennie MJ.Body water measurement in growth disorders: acomparison of bioelectrical impedance and skinfoldthickness techniques isotope dilution. Arch Dis Childh1991; 66: 220-2.Fontvieille AM, Harper IT, Ferraro RT, Spraul M,Ravussin E. Daily energy expenditure by five-year-oldchildren, measured by doubly labeled water J Pediat1993; 123: 200-7.Voorhoeve HWA. A new reference for mid upper armcircumference? J Trop Pediat 1990; 36: 256-62.
17
18
Dow
nloaded from https://academ
ic.oup.com/tropej/article/43/1/13/1718767 by guest on 07 February 2022


