Embed Size (px)
Citation preview
This is the author’s version of a work that was submitted/accepted for pub-lication in the following source:
Flint, Anndrea, Farrugia, Charles, Courtney, Mary, & Webster, Joan (2010)Psychometric analysis of the Brisbane Practice Environment Measure (B-PEM). Journal of Nursing Scholarship, 42(1), pp. 76-82.
This file was downloaded from: http://eprints.qut.edu.au/38474/
Notice: Changes introduced as a result of publishing processes such ascopy-editing and formatting may not be reflected in this document. For adefinitive version of this work, please refer to the published source:
http://dx.doi.org/10.1111/j.1547-5069.2009.01328.x
Validation of the B-PEM 1
Title Page
Title:
Psychometric analysis of the Brisbane Practice Environment Measure (B-PEM)
Running Header:
Validation of the B-PEM
Author Information:
Anndrea Flint, (correspondent), RN, BN, MHSc (HSM), PhD Candidate, QUT.
Clinical Nurse Consultant-Special Care Nursery
Royal Brisbane and Women’s Hospital
Butterfield Street
Herston, 4029
Brisbane, Australia
Ph: 07 36367834
Fax: 07 36365259
E-mail: [email protected]
Charles Farrugia, B.A. (Hum), B.Beh.Sc, B.Psych (Hons)
Psychologist
Latrobe Health Centre
Brisbane, Australia
E-mail: [email protected]
Validation of the B-PEM 2
Mary Courtney, RN, PhD, Zeta Omega-at-Large, Queensland Honour Society
Acting Executive Dean, Faculty of Health and Professor of Nursing.
Queensland University of Technology
Brisbane, Australia
E-mail: [email protected]
Joan Webster, RN, BA
Nursing Director –Research
Centre for Clinical Nursing
Royal Brisbane and Women’s Hospital
Brisbane, Australia
E-mail: [email protected]
Acknowledgments:
We would like to thank all the nursing staff involved in this study and the Queensland
Nursing Council (grant number- RAN 0608) for providing funding.
Precis:
Psychometric testing of the Brisbane practice environment measure (B-PEM)
indicates a robust contemporary measure to assist nursing leaders measure the work
environment to assist in job satisfaction and retention of nursing staff.
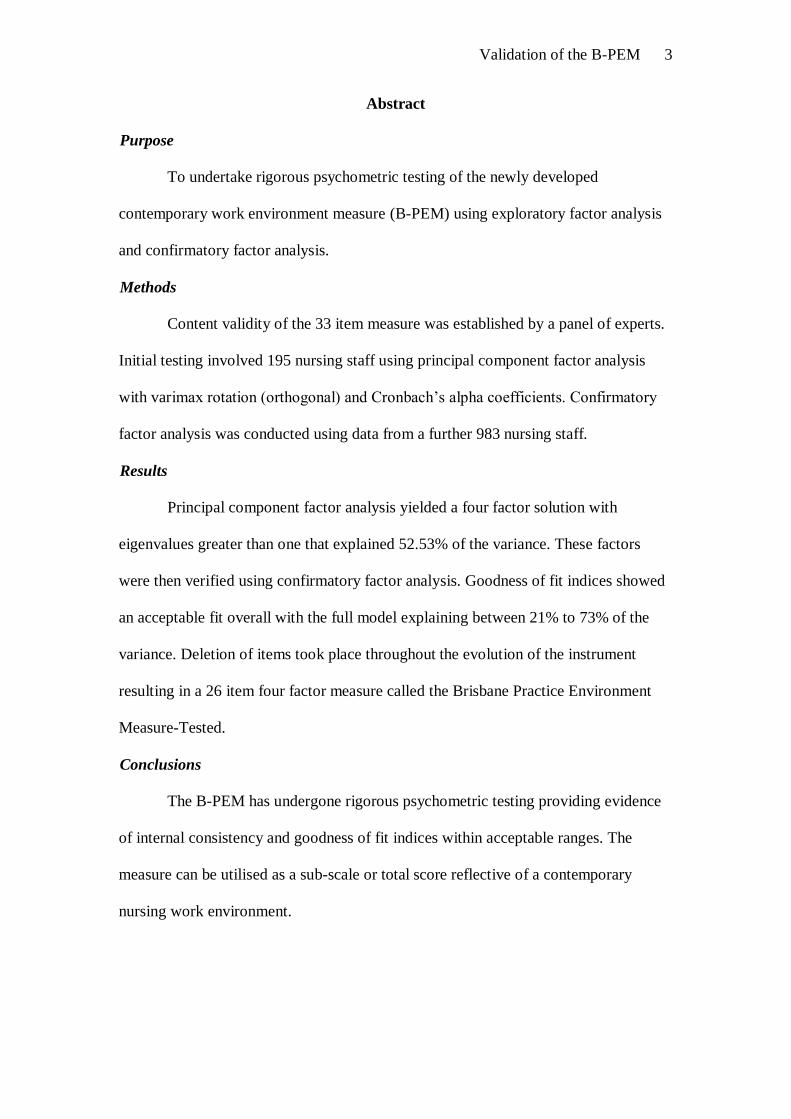
Validation of the B-PEM 3
Abstract
Purpose
To undertake rigorous psychometric testing of the newly developed
contemporary work environment measure (B-PEM) using exploratory factor analysis
and confirmatory factor analysis.
Methods
Content validity of the 33 item measure was established by a panel of experts.
Initial testing involved 195 nursing staff using principal component factor analysis
with varimax rotation (orthogonal) and Cronbach’s alpha coefficients. Confirmatory
factor analysis was conducted using data from a further 983 nursing staff.
Results
Principal component factor analysis yielded a four factor solution with
eigenvalues greater than one that explained 52.53% of the variance. These factors
were then verified using confirmatory factor analysis. Goodness of fit indices showed
an acceptable fit overall with the full model explaining between 21% to 73% of the
variance. Deletion of items took place throughout the evolution of the instrument
resulting in a 26 item four factor measure called the Brisbane Practice Environment
Measure-Tested.
Conclusions
The B-PEM has undergone rigorous psychometric testing providing evidence
of internal consistency and goodness of fit indices within acceptable ranges. The
measure can be utilised as a sub-scale or total score reflective of a contemporary
nursing work environment.
Validation of the B-PEM 4
Clinical Relevance
An up to date instrument to measure practice environment may be useful for
nursing leaders to monitor the workplace and to assist in identifying areas for
improvement facilitating greater job satisfaction and retention.
Key words
Practice environment, instrument development, nursing, retention, job
satisfaction, measure
Validation of the B-PEM 5
Background
Nursing retention is an issue of concern world-wide and, in efforts to
understand what concepts are essential in retaining nurses; government health
departments within Australia have spent substantial time and resources exploring the
nursing shortage and developing strategies to improve recruitment and retention
(Department of Human Services, 2004; Productivity Commission, 2005). This is
important because in Australia and elsewhere, an aging workforce and a high level of
mobility between nursing and other occupations is occurring at a time when the
number of projected entrants into the labour market is expected to slow (Schofield,
2007). Moreover, attrition threatens the available nursing skill mix in health care
organizations and may compromise patient care.
Central to any discussion about nursing retention is job satisfaction. There is
growing evidence that the two concepts are related (Aiken et al., 2001; Cowin, 2002;
Wilson, 2006) and that nurses leave the workforce because they find work
environments unsatisfactory (Brady-Schwartz, 2005). Factors that positively impact
on job satisfaction include autonomy, interpersonal communication/ collaboration,
professional practice, recognition, administration/management practices, job
requirements, advancement, work environment, pay and fairness (Blegen, 1993;
Sengin, 2003). Moreover, positive work environments have been linked to better
patient outcomes, lower levels of burnout of nursing staff (Hayes et al., 2006;
Laschinger & Leiter, 2006) and improved health status of nurses (Gershon et al.,
2007). Additionally, recent Australian research has noted that work environment
factors positively impact on job satisfaction and that nursing leaders have the capacity
to influence and improve this for nursing staff (Duffield, Roache, O' Brien-Pallas,
Catling-Paull, & King, 2009; Paliadelis, 2008; Paliadelis & Cruickshank, 2008).
Validation of the B-PEM 6
Because of the relationship between retention and workplace satisfaction it is
important to be able to understand, and measure, the environments in which nurses
work. However, a recent review article found that instruments frequently used to
measure autonomy and control, which are two concepts linked to positive work
environments are frequently imprecise or inaccurate (Weston, 2009). In addition,
commonly used work environment measures, such as the Nurse Work Index (NWI),
were developed over twenty years ago and lack robust psychometric testing. Also
lacking is the theoretical component that drives instrument development, in turn
explaining and reflecting constructs. Consequently, the validity of these instruments
may be questioned in terms of their relevance to the current practice environment.
As more questions emerge about the robustness of these instruments and their
relevance to a contemporary practice environment, in 2006 authors of this paper took
up the challenge to develop a contemporary work environment measure, the B-PEM
(Webster, Flint, & Courtney, 2008), based upon the reality and experiences of nurses'
working lives. The original 33 item model consisted of 5 thematic constructs
developed according to a constant comparative method of analysis. Further validation
of the psychometric properties of the model was initially conducted using exploratory
factor analysis and subsequently using confirmatory factor analysis. Weston (2009)
concludes that instruments developed to measure concepts such as autonomy and
control which reflect work environments must be valid and clear in what they are
measuring. This has been a matter of priority in the development of the B-PEM but
before the instrument may be recommended for wider use further validity and
reliability testing is required.
Validation of the B-PEM 7
Aim of the Study
The aim of this study was to undertake rigorous psychometric testing of the
newly developed contemporary work environment measure (B-PEM) using
exploratory factor analysis and confirmatory factor analysis.
Methods
Preliminary Questionnaire (B-PEM)
Data for this study were generated from nursing staff at a major metropolitan
hospital in Australia. An initial pool of 33 items was produced from in-depth
interviews with 12 staff who were either leaving the organisation or transferring to
another division in the hospital. Details of the processes used to develop the
questionnaire are reported elsewhere (Webster et al, 2008) but, briefly, five themes
were identified: 1) feeling safe, 2) feeling valued, 3) getting things done, 4)
opportunities for professional development and 5) being flexible. The 33-item
questionnaire, the Brisbane Practice Environment Measure (B-PEM) includes five to
six items for each of the themes and items contained words used by the interviewees.
Individual scores of the subscales can be calculated or a total score used. Of the 33
item B-PEM, item 17 (the workload is overwhelming) was removed from the
exploratory and confirmatory factor analyses as it was not included in the
questionnaire administered to the sample of 983 nursing staff thus making its
inclusion in the initial exploratory factor analysis inappropriate.
Exploratory Factor Analysis
A sample of registered nurses who were leaving the organization or who were
transferring to another division within the RBWH were invited to complete the 32
item B-PEM as part of their exit interview between March 2006 and August 2007.
Demographics, professional level of nursing and reasons for leaving were also
Validation of the B-PEM 8
collected. Data from this sample were used to undertake initial Principal Component
Factor Analysis (Tabachnick & Fidell, 2007). Interviews took place in a location
away from the interviewee’s work area and participants were assured that their
responses would be completely confidential and anonymous. A total of 195 nurses
completed the B-PEM. The mean age was 35.8 years (standard deviation [SD] 12.2
years), and the length of employment within the hospital was on average 4.5 years
(SD 5.7 years).
Confirmatory Factor Analysis
Data for the confirmatory phase of testing were drawn from an organisation
wide survey of nursing staff at the same hospital. All nurses were sent a self-report
questionnaire in July 2006. A total of 1408 questionnaires, which included the 32-
item B-PEM, were distributed and 983 were returned; an overall response rate of
69%. The mean age of respondents was 40.17 years (SD 11.45). On average, nurses
had worked in the organisation for 9.03 years (SD 8.70) with the majority being
female (90%). As expected, the greatest numbers of responses were from Registered
Nurse Level One positions; they are the largest group of nurses in the hospital,
providing first level nursing care.
Ethical Approval
Approval to conduct the study was granted by the Hospital’s Human Research
Ethics Committee. Participants were provided with a detailed information sheet
explaining the study and asked to sign a consent form. Anonymity and confidentiality
were assured and participants were free to refuse to participate or withdraw from the
study at any time.
Validation of the B-PEM 9
Data Analysis
Statistical analyses were carried out using the Statistical Package for Social
Sciences (SPSS) version 15.0 statistical software (SPSS Inc., Chicago, IL, USA).
Sample characteristics were described using frequencies, means and standard
deviations. All data were checked for between variables’ distributions and the
assumptions of multivariate analysis. Principal-component factor analysis with
varimax rotation (orthogonal) was conducted on the responses to the B-PEM to
examine how the items would load to each factor. Internal consistency was assessed
by calculating the Cronbach’s alpha coefficient for each subscale and the overall items
of the B-PEM. The four factors identified through exploratory factor analysis were
then evaluated through confirmatory factor analysis (CFA) using the self-report cross-
sectional survey data set. CFA is a statistical technique that is used to verify the factor
structure of a set of observed variables and allows the testing of hypotheses based on
a priori theoretical constructs (for example empirical research) including the nature of
the factors, for example by constraining the variables' loadings on specific factors.
AMOS is popular statistical software specifically designed to perform CFA. It is part
of the SPSS package and AMOS version 7.0 was used to carry out all CFA analyses
in this study.
Missing data were replaced using the replace missing values (RMV) procedure
in SPSS utilising the series mean method prior to submitting the data to CFA as this
analysis is sensitive to missing data. A number of indices of model fit were used to
assess the goodness of fit of the CFA model, following current conventions (Bentler
& Bonett, 1980; Hu & Bentler, 1999). Although a non-significant ² test is routinely
used to identify a model with a good fit, it is widely considered to be problematic
(Joreskog, 1969), as it is sensitive to sample size, making it difficult to reject the null
Validation of the B-PEM 10
hypothesis with a large number of cases (Albright & Park, 2008). For this reason,
alternative indices were chosen based on the work of Hu and Bentler (1999). The
indices utilised in this study were root mean square error of approximation (RMSEA),
comparative fit index (CFI) and standardised root mean square residual (SRMR). An
RMSEA less that .06 is considered a close fit while values between .06 and .08 are
considered an acceptable fit (Browne & Cudeck, 1993). Schreiber, Nora, Stage,
Barlow & King (2006), note that RMSEA of between 0.06 and 0.01; CFI between
0.95 and 0.99; and SRMR less than 0.08 provide an acceptable model fit.
Results
Principal-Component Factor Analysis
The B-PEM data from 195 exiting or transferring employees were utilised for
exploratory factor analysis. All data were treated as continuous and were then
assessed for factor analysis suitability. The Kaiser-Meyer-Olkin (KMO) measure of
sampling adequacy was 0.91 and factorability of the correlation matrices, Bartlett’s
test of sphericity ² (496) = 3131.13, p<0.000 were both adequate . After determining
the suitability of the data, principal component extraction with varimax rotation
(orthogonal) was utilised to extract the factors. The criteria used to identify acceptable
factors were 1) factor loading cut off of .40, 2) eigenvalues greater than one and 3) the
percentage of the total variance explained by each factor. This yielded a four factor
solution with eigenvalues greater than one that explained 52.53% of the variance.
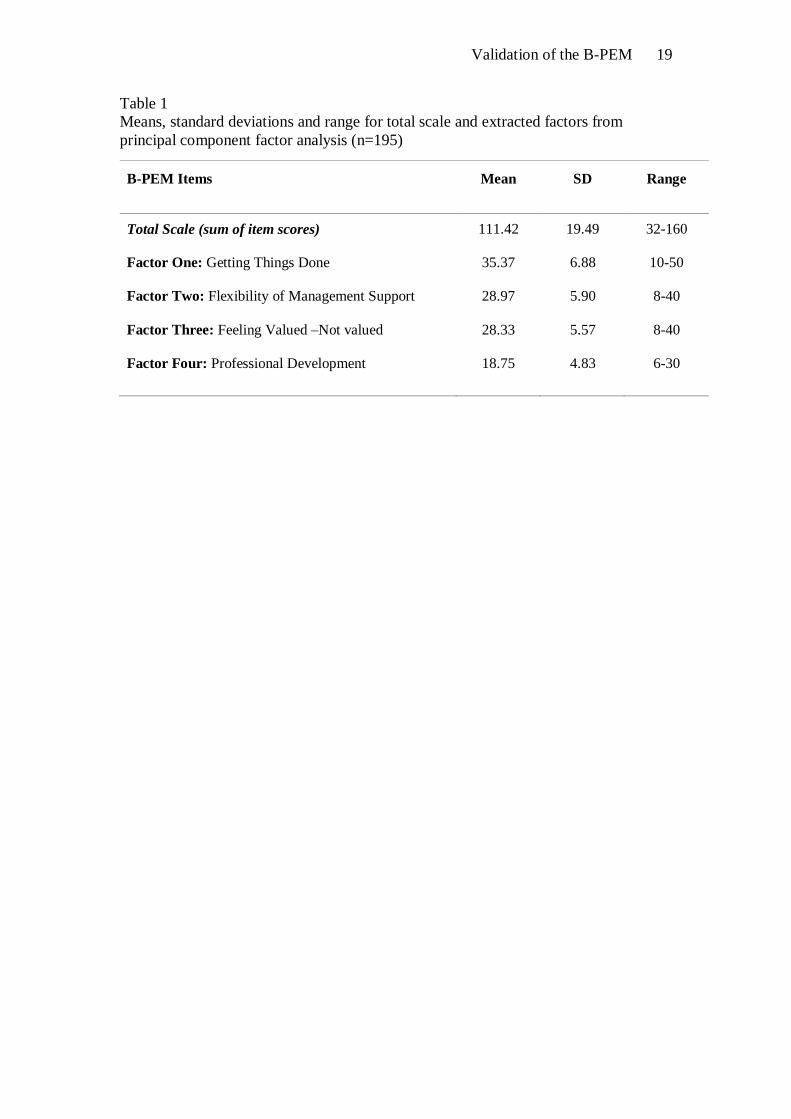
Table 1 shows the means, SDs and ranges for the total scale and factors extracted
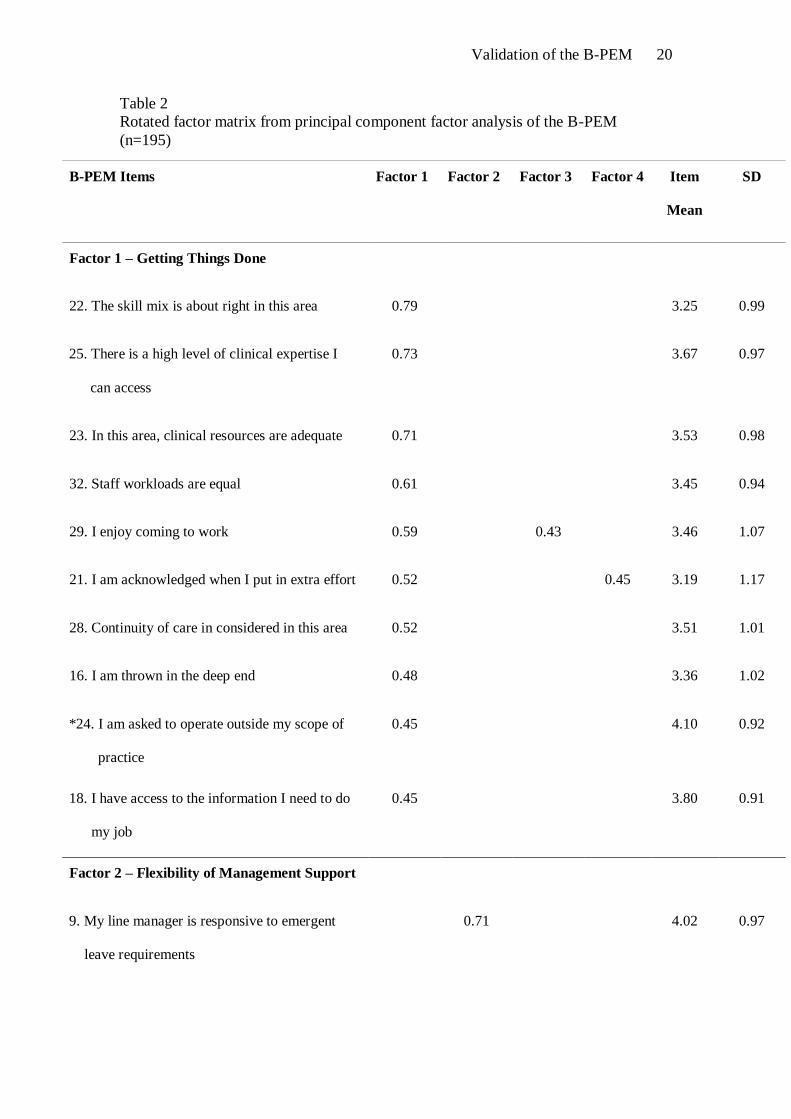
using principal components factor analysis. Table 2 shows item loadings, eigenvalues,
and variance accounted for by each factor, as well as the item means and SDs. Note
that there were a number of split loadings on each of the four extracted factors.
Examination of the split loadings indicated that item loadings on the identified factor
Validation of the B-PEM 11
indicated were higher in each case, and the items made more sense when interpreted
as loading on the identified factor. Retaining these split-loaded items resulted in a
more meaningful and robust structure for each of the identified factors.
[Insert Table 1 about here]
[Insert Table 2 about here]
Internal Consistency
Chronbach’s alpha coefficient for the B-PEM was 0.94. The Cronbach’s alpha
coefficients for the four factors extracted were factor one .87, factor two .83, factor
three .84 and factor four .81.
Confirmatory Factor Analysis
The B-PEM was tested using confirmatory factor analysis. Data from 983
participants who had completed the self-report cross-sectional survey were utilised,
and each factor was independently tested. The first factor (labelled “Getting things
done”) was identified as having an acceptable fit (CFI = .953; RMSEA = .063; SRMR
= .036) after removal of item 24 (“I am asked to operate outside my scope of
practice”). This item was removed due to a low standardized regression weight (.361)
on the factor suggesting a less than reliable indicator of “Getting things done”.
Moreover this item also had the lowest squared multiple correlation coefficient (R2 =
.13) of any of the items loading on this factor. Examination of the regression weights
modification indices for this factor did not identify any theoretically meaningful
modifications for the model specification. The covariance modification indices
suggested adding a covariance between only the error terms which also did not make
sense theoretically. Items on the “Getting things done” factor explained between 24%
to 46% of the variance. The second factor (labelled “Flexibility of Management
Support”) was identified as having an acceptable fit (CFI = .985; RMSEA = .08;
Validation of the B-PEM 12
SRMR = .0251) after the removal of three items (items 5, 13 & 30) again due to low
standardized regression weights (.552, .285, and .520 respectively) and low R2 (.305,
.081, and .271 respectively). Items on the “Flexibility of Management Support” factor
explained between 30% to 72% of the variance. The third factor (labelled “Feeling
Valued”) was identified as having an acceptable fit (CFI = .978; RMSEA = .062;
SRMR = .027) with the removal of item 7 due to a poor standardized regression
weight (.328) on the factor and low R2 (.108). Items on the “Feeling Valued/not
Valued” factor explained between 23% to 64% of the variance. The final factor
(Labelled “Professional Development”) was also identified as having an acceptable fit
(CFI = .986; RMSEA = .078; SRMR = .027) with the removal of only item 2
(standardized regression weight = .468, R2 = .219). Items on the “Professional
Development” factor explained between 41% to 74% of the variance.
As a last step, the factors were put together to form a full model structure
representing the practice environment. Goodness of fit indices indicated an acceptable
fit overall (CFI = .909; RMSEA = .062; SRMR = .049). The CFI indicates an
acceptable fit and the SRMR is below the .08 cut-off suggesting a good fit. The
RMSEA is also below the .08 acceptable fit cut-off, suggesting that the overall model
presents an acceptable fit to the data. The full model explained between 21% to 73%
of the variance.
Discussion
The present study sought to examine the psychometric properties of the B-
PEM in a large sample of Australian nurses. Specifically, we were able to conduct an
exploratory and a follow-up confirmatory factor analysis of this new practice
environment measure. Twenty six of the original 33 items were retained after
submitting the data to exploratory and confirmatory factor analyses. Initial
Validation of the B-PEM 13
exploratory factor analysis yielded a four-factor solution: ‘getting things done’,
‘flexibility of management support’, ‘feeling valued’ and ‘professional development’.
Psychometric properties of the obtained factors were sufficient, in terms of internal
consistency and fit of the 4-factor model.
The Cronbach’s alpha coefficients for the overall B-PEM was .94 and for the
B-PEM sub-scales (factor one .87, factor two .83, factor three .84 and factor four .81).
A widely used standard suggests that self-report measures should have internal
consistency reliability of > .70 for use as a screening tool (Bland & Altman, 1997).
Following removal of six items from the theoretical model, there was an acceptable fit
of the four-factor model to the data from this large sample of nurses (Schreiber, Nora,
Stage, Barlow, & King, 2006). These results support the measurement validity of this
instrument in health care settings and suggests that it is robust enough for periodic or
continuous assessment of nurses working environments.
An advantage of the scale is that we were able to distinguish important sub-
scales, which may be used, independently, to investigate specific problems. For
example, it is not unusual for nurses to report bullying behaviour in the workplace
(Johnson, 2009). The sub scale of ‘feeling valued’ contains easily interpretable and
meaningful items for quantitatively examining dimensions of this dysfunctional
behaviour. The availability of a robust easy-to-use tool relevant to the contemporary
nature of nurses’ experiences and working lives is very timely as it provides an
opportunity for nurse leaders to measure work environments without the need to use
tediously long questionnaires and complicated analysis. The Brisbane Practice
Environment Measure Tested (B-PEM-T) can be used to calculate an overall score or
sub-scales and can be utilised to target the development of specific work interventions
to improve work environments
Validation of the B-PEM 14
Strengths and Limitations
A strength of this study was that the factor structure was tested using a number
of robust statistical tests and a large sample size. The measure was also developed
using qualitative methodology; utilizing data from nurses who were leaving the
organisation and who were prepared to share their work life experiences. This is in
contrast to other tools that are currently available measuring practice environments;
many of which have been severely criticised for their lack of psychometric validity
and weak robustness (Cummings, Hayduk, & Estabrooks, 2006; Slater & Mc
Cormack, 2007).
The major limitation of this study is that data for both the exploratory and
confirmatory phases of the study were drawn from nurses in one organisation.
However, it is possible that the groups were different. For example, nurses whose data
were used in the exploratory sample, were leaving the hospital, were younger and had
been employed at the study hospital for a shorter period of time than the currently
employed nurses, whose data were used in the confirmatory phase. External validity
will require further testing of the B-PEM-T among groups of nurses in other
institutions and work environments.
Conclusion
Psychometric testing of the B-PEM has resulted in a strengthened version B-
PEM-T. Its validity needs further confirmation in other settings.
Validation of the B-PEM 15
Clinical Resources
Australia’s National Health Workforce Online: http://www.nhwt.gov.au/
Australian Nursing Federation: http://www.anf.org.au/
International Council of Nurses Issue Brief on Nurse Recruitment and
Retention-Developing a motivated workforce:
http:/www.icn.ch.global/Issue4Retention.pdf
National Quality Forum: http://www.qualityforum.org/nursing/
Validation of the B-PEM 16
References
Aiken, L. H., Clarke, S., Sloane, D. M., Sochalski, J. A., Clarke, H., Giovannetti, P.,
et al. (2001). Nurses' report on hospital care in five countries. Health Affairs,
(May/June), 43-53.
Albright, J. J., & Park, H. M. (2008). Confirmatory factor analysis using Amos,
LISREL,Mplus and SAS/STAT CALIS, Technical Working Paper: Indiana
University.
Bentler, P. M., & Bonett, D. G. (1980). Significant tests and goodness of fit in the
analysis of covariance structures. Psychological Bulletin, 88(3), 588-606.
Bland, J. M., & Altman, D. G. (1997). Cronbach's alpha. British Medical Journal,
314(7080), 572.
Blegen, M. J. (1993). Nurses' job satisfaction: A meta-analysis of related variables.
Nursing Research, 42(1), 36-41.
Brady-Schwartz, D. C. (2005). Further evidence on the Magnet Recognition Program:
Implications for nursing leaders. Journal of Nursing Administration, 35(9),
397-403.
Browne, M. W., & Cudeck, R. (1993). Alternative ways of assessing model fit. In K.
J. Bollen & K. S. Long (Eds.), Testing structural equation models (pp. 136-
162). Newbury Park, California: Sage.
Cowin, L. (2002). The effects of nurses job satisfaction on retention: An Australian
perspective. The Journal of Nursing Administration, 32(5), 283-291.
Cummings, G. G., Hayduk, L., & Estabrooks, C. A. (2006). Is the nursing work index
measuring up? Moving beyond estimating reliability to testing validity.
Nursing Research, 55(2), 82-93.
Validation of the B-PEM 17
Department of Human Services. (2004). Nurses in Victoria: a supply and demand
analysis, 2003-2004 to 2011-2012. Melbourne.
Duffield, C., Roache, M., O' Brien-Pallas, L., Catling-Paull, C., & King, M. (2009).
Staff satisfaction and retention and the role of the nursing unit manager.
Collegian, 16, 11-17.
Gershon, R. M., Stone, P. W., Zeltser, M., Faucett, J., Macdavitt, K., & Chou, S. S.
(2007). Organizational climate and nurse health outcomes in the United States:
A Systematic Review. Industrial Health, 45, 622-636.
Hayes, L. J., O'Brien-Pallas, L., Duffield, C., Shamian, J., Buchan, J., Hughes, F., et
al. (2006). Nurse Turnover: A literature review. International Journal of
Nursing Studies, 43, 237-263.
Hu, L., & Bentler, P. M. (1999). Cutoff criteria for fit indexes in covariance structure
analysis: Conventional versus new alternatives. Structural Equation
Modelling, 6(1), 1-55.
Johnson, S.L. (2009) International perspectives on workplace bullying among nurses:
a review. International Nursing Review,56(1),34-40.
Joreskog, K. G. (1969). A general approach to confirmatory factor analysis.
Psychometrika, 34, 183-202.
Laschinger, H. K., & Leiter, M. P. (2006). The impact of the nursing work
environments on patient safety outcomes: The mediating role of
burnout/engagement. Journal of Nursing Administration, 36(5), 259-267.
Paliadelis, P. S. (2008). The working world of nurse unit managers: responsibility
without power. Australian Health Review, 32(2), 256-264.
Validation of the B-PEM 18
Paliadelis, P. S., & Cruickshank, M. (2008). Using a voice-centred relational method
of data analysis in a feminist study exploring the working world of nursing
unit managers. Qualitative Health Research, 18(10), 1444-1453.
Productivity Commission. (2005). Australians Health Workforce: Research Report.
Canberra.
Schofield, D.J. (2007). Replacing the projected retiring baby boomer nursing cohort
2001 – 2026. BMC Health Services Research, 7, 87-93.
Schreiber, J. B., Nora, A., Stage, F. K., Barlow, E. A., & King, J. (2006). Reporting
structural equation modelling and confirmatory factor analysis results: A
review. The Journal of Educational Research, 99(6), 323 - 337.
Sengin, K. K. (2003). Work-related attributes of RN job satisfaction in acute care
hospitals. Journal of Nursing Administration, 33(6), 317-320.
Slater, P., & McCormack, B. (2007). An exploration of the factor structure of nursing
work index. Worldviews on Evidence-Based Nursing, First Quarter, 30-39.
Tabachnick, B. G., & Fidell, L. S. (2007). Using Multivariate Statistics (5th ed.).
Boston: Pearson A&B.
Webster, J. A., Flint, A. L., & Courtney, M. (2008). A new practice environment
measure based on the reality and experiences of nurses working lives. Journal
of Nursing Management.
Weston, M. J. (2009). Validity of instruments for measuring autonomy and control
over nursing practice. Journal of Nursing Scholarship, 41(1), 87-94.
Wilson, C. (2006). Why stay nursing? Nursing Management, 12(9), 24-29.
Validation of the B-PEM 19
Table 1
Means, standard deviations and range for total scale and extracted factors from
principal component factor analysis (n=195)
B-PEM Items Mean SD Range
Total Scale (sum of item scores)
Factor One: Getting Things Done
Factor Two: Flexibility of Management Support
Factor Three: Feeling Valued –Not valued
Factor Four: Professional Development
111.42
35.37
28.97
28.33
18.75
19.49
6.88
5.90
5.57
4.83
32-160
10-50
8-40
8-40
6-30
Validation of the B-PEM 20
Table 2
Rotated factor matrix from principal component factor analysis of the B-PEM
(n=195)
B-PEM Items Factor 1 Factor 2 Factor 3 Factor 4 Item
Mean
SD
Factor 1 – Getting Things Done
22. The skill mix is about right in this area 0.79 3.25 0.99
25. There is a high level of clinical expertise I
can access
0.73 3.67 0.97
23. In this area, clinical resources are adequate 0.71 3.53 0.98
32. Staff workloads are equal 0.61 3.45 0.94
29. I enjoy coming to work 0.59 0.43 3.46 1.07
21. I am acknowledged when I put in extra effort 0.52 0.45 3.19 1.17
28. Continuity of care in considered in this area 0.52 3.51 1.01
16. I am thrown in the deep end 0.48 3.36 1.02
*24. I am asked to operate outside my scope of
practice
0.45 4.10 0.92
18. I have access to the information I need to do
my job
0.45 3.80 0.91
Factor 2 – Flexibility of Management Support
9. My line manager is responsive to emergent
leave requirements
0.71 4.02 0.97
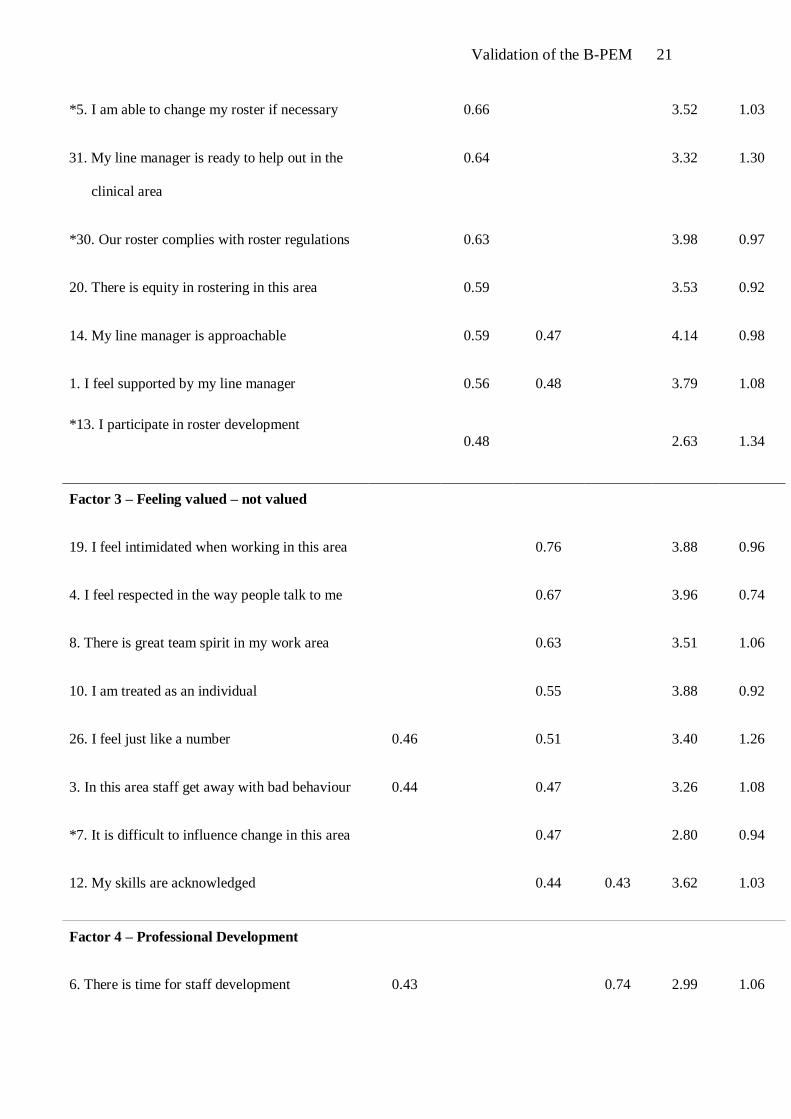
Validation of the B-PEM 21
*5. I am able to change my roster if necessary 0.66 3.52 1.03
31. My line manager is ready to help out in the
clinical area
0.64 3.32 1.30
*30. Our roster complies with roster regulations 0.63 3.98 0.97
20. There is equity in rostering in this area 0.59 3.53 0.92
14. My line manager is approachable 0.59 0.47 4.14 0.98
1. I feel supported by my line manager 0.56 0.48 3.79 1.08
*13. I participate in roster development
0.48 2.63 1.34
Factor 3 – Feeling valued – not valued
19. I feel intimidated when working in this area 0.76 3.88 0.96
4. I feel respected in the way people talk to me 0.67 3.96 0.74
8. There is great team spirit in my work area 0.63 3.51 1.06
10. I am treated as an individual 0.55 3.88 0.92
26. I feel just like a number 0.46 0.51 3.40 1.26
3. In this area staff get away with bad behaviour 0.44 0.47 3.26 1.08
*7. It is difficult to influence change in this area 0.47 2.80 0.94
12. My skills are acknowledged 0.44 0.43 3.62 1.03
Factor 4 – Professional Development
6. There is time for staff development 0.43 0.74 2.99 1.06
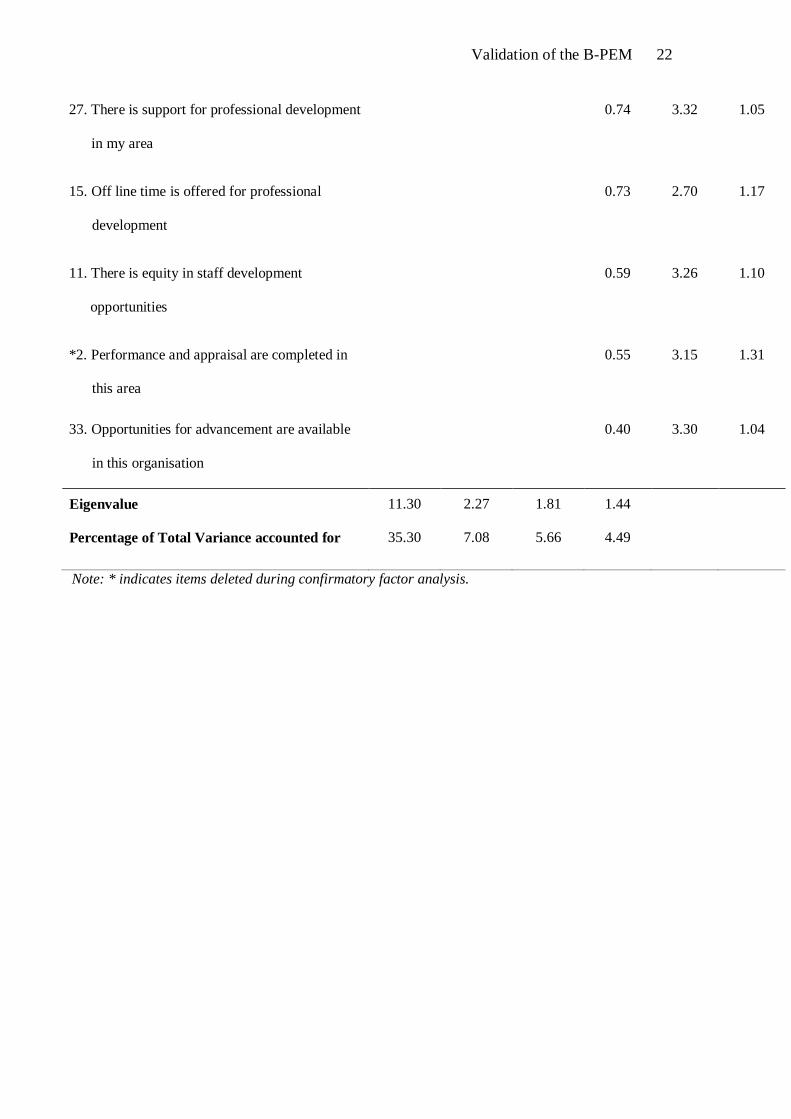
Validation of the B-PEM 22
27. There is support for professional development
in my area
0.74 3.32 1.05
15. Off line time is offered for professional
development
0.73 2.70 1.17
11. There is equity in staff development
opportunities
0.59 3.26 1.10
*2. Performance and appraisal are completed in
this area
0.55 3.15 1.31
33. Opportunities for advancement are available
in this organisation
0.40
3.30 1.04
Eigenvalue
Percentage of Total Variance accounted for
11.30
35.30
2.27
7.08
1.81
5.66
1.44
4.49
Note: * indicates items deleted during confirmatory factor analysis.


