Embed Size (px)
Citation preview
GOKHALE INSTITUTE MIMEOGRAPH SERIES NO. 28
EVALUATION STUDY OF MINOR IRRIGATION
SCHEMES IN MAHARASHTRA STATE
With Special Reference to Drought· Prone Areas
of Beed and Osmanabad Districts of
Marathwada Region
C. S. GAJARAJAN
A Study Sponsored and Financed by
National Bank for Agriculturre and
Rural Development
GOKHALE INSTITUTE OF POLITICS AND ECONOMICS
PUNE- 411 004
SEPTEMBER 1988
GOKHALE INSTITUTE MIMEOGRAPH SERIES NO. 28
EVALUATION STUDY
OF
MINOR IRRIGATION SCHEMES
IN
MAHARASHTRA STA.TE
With Special Refe.rence to Drought Prone Areas of Baed and Osmanabad Districts of·
Marathwada Region · ·
.c. S. GAJARAJAN
A Study Sponsored and Financed by National Bank for Agriculture and
Rural Development ·
GOKHALE INSTITUTE OF POLITICS AND ECONOMICS
PUNE -411 004
. SEPTID-IDER 1988
FOR~~vORD
Stnca l9S4, th~ NatiOtial Bank fer Agriculturtl and Rural
D~v~lopment has been supporting studi~s r~lating to 'various
asp~cts of rural cradit and rural developme-nt b~ing carried out
at th~ Institute by financing the Research Cell for NABARD Studies
of th.;; Institut~. Tha pr,~~ant· study on "Evaluation of Minor
Irrigation Schemes of Maharashtra State : With Special R~f~r~nce
to Drought Prond Ar~as of Beed and Osmanabad Districts of
Marathwada Rugion», iR tha s~cond of th~ studi~s completed by
th~ Institut~ under this arrangom~nt. Two othor studies carriad
out by this C~ll ara in th0 final stag~s and ard axpact~d to b~
published shortly. 'VJe take this opportunity to express .our
thanks to NABARD for th~ir gsnarous support.
Tht1 pr~s~~nt study was carried out by Dr. C .s. Gajarajan of
th~ Inst.ituta. Th~1 study evaluat\~s tha perfonnanca of tha scheme
for ,::xt~nding loans for i.nv~stm0nt in W;:-?lls and pumpsets, intro-·
duc.;d by fvlaharashtra Statv Coop.;)rativ~ Land Duvelopm\"1nt Bank in
1981, for which 95 par c~nt rafinanca was prov1d4d by ARDC/
NABArtD. This has entaildd an ovaluation of thll financial bqnafits
accruing to tha rccipi~:nts of loans und0r the schemt:> and has, in
th..J c ontdxt of th :d r experi~1nc ..-1, invol v0 d an .. 1xamination of the
probl;..~ms of financing ~nd implem(~ntation of minor irrigati-on
proj;cts in th0 Stat~. Thv study has furth~r narrow~d its focus
to und~rstanding th0 probl~ms of financing minor irrigation
P·-~culiar to hard rock zon.;1 of drought pron~ ar0as of ~-l-~d and
Osmanabad di ~tricts of Ivlarathwada r.Jgion o·f Maharashtra Stat d.
(i)
(ii)
Th.: study assum(JS significanc0 as minor irrig~tion occupi~s an
..-!sp .. ,cially important placa in th;;~ Stat~.:'' s irrigational d~vulop"':'
rn .:nt 3nd as larg.;; parts of Marathwada and some oth~o1r r,Jgions in
th3 Statd ar} pron.J to p.;;riodic droughts.
Apart from bringing ou~ thd sali0nt f~aturas and profil~s
of th-' sch.!mJ and of th~:~ SjL1ct .. ~d ar:!as and farm~.~rn, tha r.3port
hag moni torvd th,:! impl·3m-~ntation of th~ sch.ama, asp~cially .
inv.:,stigating th~ probl2ms of ala~ingly largo proportion of
i nfr1:1ctuous inv.Jstm(:nt in th~~ cas~! of dug w .. ~lls. As the initial
surv")Y for this study was carri.:1 d out wh,.~n th~1 schemas W.:)re in.
pr..;-optimul staga and affvct"1d by drought, a suppl~montary
surv· .. y W3s und·;~rtak.;;n subs-Jqu.Jntly to cov0r th~ full dav~lop
m nt stagJ of post-inv~stm0nt pdriod. This has made it
possibL;; to \JValuatv th\..! financial b .. -.ndfits of th.;l sch.;,.mds under
th0 situations of drought as W0ll as normal conditions. In
addition to highlighting thd constraints ori th~ schJma,
1!-Sp .. ·cially during thd drought p._. riod, thd study arri v~s at tha
significant conclusion that th~ sch~m . .'!s ar·.~ ·financially viablu
nvt only und..;r norm31 conditions but ·JV-Jn aft:lr allowing for
p--·riodically r:'curring drought situations.
Gokhal.J Institut"~ of Politics and Economics, Pun~-411 004
v. s. Chitrv Dir~.)ctor
PREFACE
Thd succassful impl·~m-.lntation of minor irrigation
pr.;j ct.~ irJ. i-'iaharashtra assurn,~s spt1cial importance, 'for the
-Stat'! do·JS ·~ot have abundance of surface wat~r r~sources. It
is ~v -•n mord sign.ificant in c.~rtain parts of Marathwada ragion
of t:.h2 St.:;;td. AlthDup,h, the asti.mate d potentiality of ground-
wa~.-~"!r r~~sr>urc.;! is vast and tha Stat8 can exploit tht:\ ·same for
y,;'c rs to com,,, th~ impl~~m~ntation of schemt"!s, in drought. prone
semi-arid araas charact~rizad by hard rock condition, is
frJught with p.~cul1ar probl~ms. Bclad and· Osmanabad dis_tricts
of r'Ia rathwada r:~gi0n bel.Jng to this p1;1culiar agro-climatic
zao~. Th~ prilsant study, bas2d on ampirical invastigations
in tn~·s .. ) two districts, has att~mptdd to monitor and evaluate
s- v ,. ral sch-,·lm-~·s support;1d by NSCLDB cradi t- und~r NABARD
r.::fU1bnc.:~ programm0. Apart from th{;) aspects covaring salient
f.- a t.u_c.;;s of tht:, .sch-~lm0' ffidthodology' and th:::~ gendral profiles /
of th.' s:·l,'ct .-.d zon,;" and b;:~n:::}fi ciary farmars, the study att-ampts
tD analys·.-~ fac .. ,ts of infructuous inv-?lstm.?nt, financing of
i nv. strn ·:nt and, .=:valuation of post-i nv·"stm.-!nt_ bclnafi ts includ
ing Cclsh flow and f i n3ncial rat.Js of r.:)turn undclr normal as
w.!ll as drought conditions. \ :_
At th:~ outs.:•t, I must PXpr-"ss my sinc~r~ gratitude to
NABArlD for providing m2 an opportunity to carry out this
study. I am also thankful to th·J concdrnc: d offic~~rs of
Econ:)mic Analysis and Publication Division of NABAHD for
th::i r valuabl-3 sugg~'-stions on th.:' ._:,arli.::r draft which ~nabl.;.1d
(iii)
(iv)
m-J to c-Jnouct a suppl":'m :•ntary surv..;-y to mak.:~ thd pra~~lnt study
m~r:· compc.Jh~nsiv.:: and m:.;'laniugful. In particular, _I am
grat--1ful t.o Dr. ~I.V. Gadgil, Mr. C. rl.amalingam, Dr._ H.P.Singh,
~Ir. R.G. Shaligram and Dr. B.N. Kulkarni who hav~' b~-lt~n V<ciry
h~lpful to mJ throughout.
I tlm thankful t.o my coll.;;!aguos at th-=.'+ Institut~ for
th.•ir _:ncour&g.Jm.~)nt &t various stag,~s of th.:-i study. In
particular, I am gratJful to Prof. V.S. Chitrd, th~ Di~dctor,
for his unstint ... •d support. My thanks ·ar~1 dut~ to Shri S.N.
Gadam for his invaluabl~ sugg~stions at all stagas. Amongst
th~1 otht1rs d-~S·:~rving my grati tud>.J, mention may bt) ·mad~) of
Shri Bhaskar Mujumdar, Shri Dilip Man··!, Shri S.B •. Ka_tu and ,
Shri V. G. Kasb0 for th,Jir valuabl~ asRistanCci in tho proj~ct
work.
Also acknowl..~dg .. ~ d ar0 th0 valuable coop~ ration and
factl1 ti~:os r· c~.dv;'d from th~?. officials of Maharashtra Statu
Coop .·rati V.J Land D·JV~,;1lopm ... !nt Bank at various L)V•_,ls and the
~amplJ farm~rs in Bded and Osmanabad districts.
Gokhal0 Instituto of Politics and Economics, Fund-411 004
C.S. GAJARAJAN
CONTENTS
Pf&EF'ACE
LIST OF TABLES
Sill-1•1ARY AND CONCLUSIONS
Chapt.··r
II
III
IV
ll~TftODUCTION
1.1 ImportancJ of r~nor Irrigation
1.2 Irrigation ProfilJ of th~ R~gion
1.3 Groundwat~r Pot~ntial J
1.4 G~n~ral F~atur~s of th~ S~lact~d Districts
SALIENT FEATURES OF THE SCHEl~
2.1 G~n~ral Proposal ,
2.2 Institutional Arrang~m~nt
OBJECTIVES, METHODOLOGY AND SAMPLE FRAME
).1 rvrain Obj<1ctiv.-1s
).2 Mdthodology and Cov~rage
).3 Sample Framework
).4 Limit3tions of the Study
).5 SupP.lemantary Survey
SOCIO-ECONO~iiC PROFILE OF THE SELECTED HuUSEHOLDS
4.1 Social Background J
4.2 Siza of bperational Holdings
4.3 Occupational Pattern
4.4 Patt~rn of Income Levels
(v)
• • •
•••
•••
• • •
' ... •••
•••
•••
• • •
•••
•••
•••
•••
• • •
• • •
• • •
• • •
•••
•••
• • •
•••
•••
•••
Pag\)
(i)
(iii)
:(vii)
1
13
13
13
15 -
39
39
40
43
·45
50
51
'51
54
58
61
Chapter
v
VI
VII
(vi)
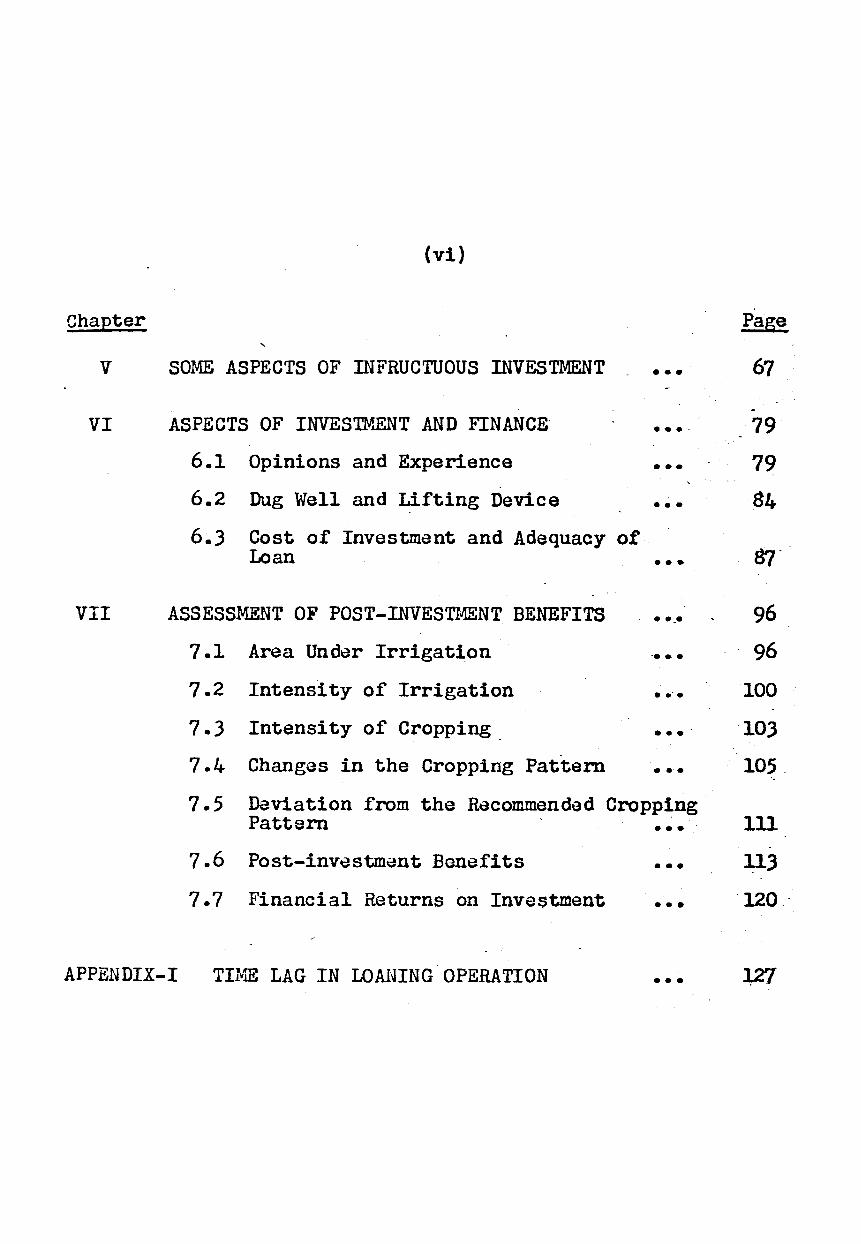
SO!~ ASPECTS OF INFRUCTUOUS INVESTMENT
ASPECTS OF INVESTMENT AND FINANCE·
6.1
6.2
6.3
Opinions and Experience
Dug Well and Lifting Device
Cost of Investment and Adequacy of Loan
ASSESSMENT OF POST-INVESTI~NT BENEFITS
7.1 Area Under Irrigation
7.2 Intensity of Irrigation
7.3 Intensity of Cropping
7.4 Changes in the Cropping Pattern
•••
···-•••
•••
•••
. ·-· ••••
.. -. •••
• •••
7.5 Deviation from the Recommended Cropping
Page
67
-79
79
84
96
96
100
103
105 . ·-
Pattern ••• 111
7.6 Post-inv~stm~nt Benefits
7.7 Financial Returns on Investment
APPENDIX-I TI~m LAG IN LOM~ING OPERATION
•••
•••
•••
~3
"120"
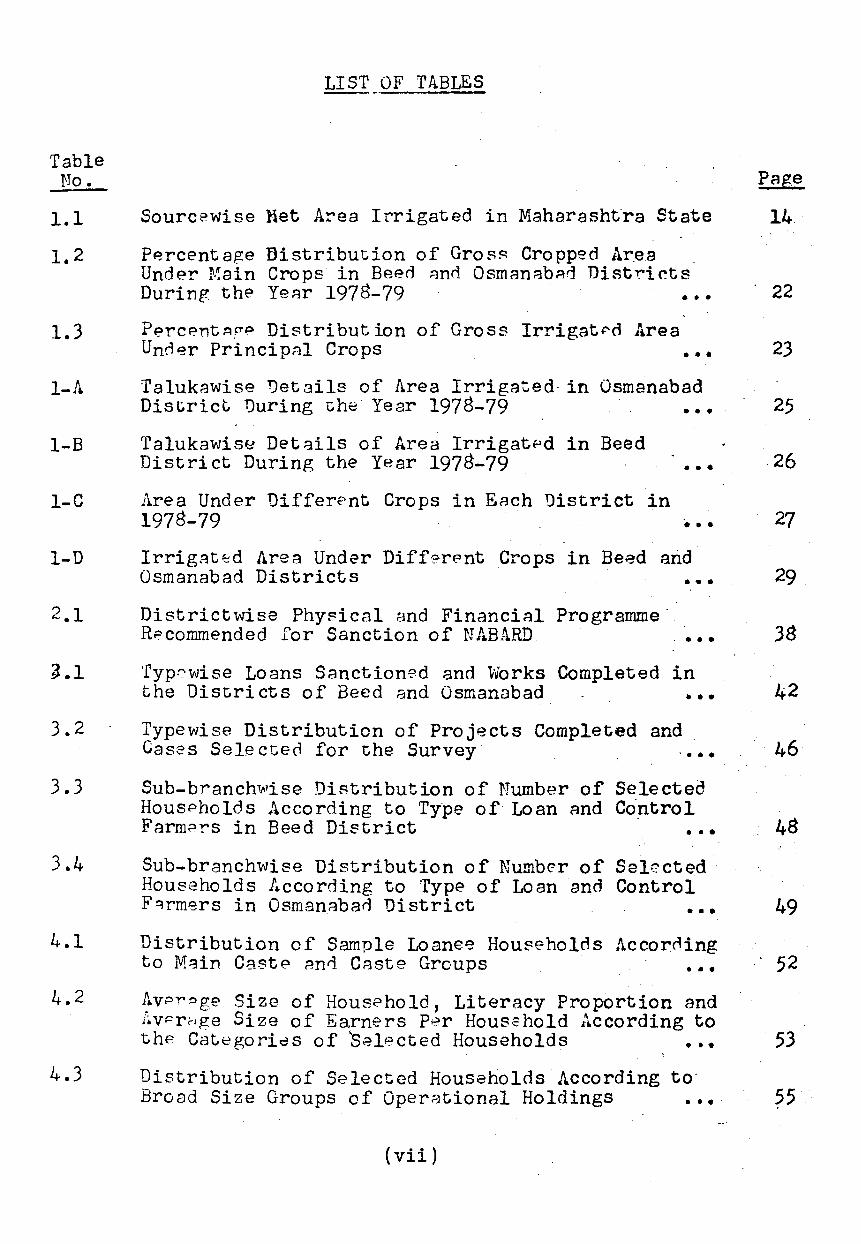
Table No.
1.1
1.2
1.3
1-A
1-B
1-C
1-D
2.1
~.1
3.2
3.3
3.4
4.1
4.2
4.3
LIST OF TABLES
Sourcewise Met Area Irrigated in Maharasht-ra State
Percent a@:e Di stribut.ion of Gro RR Cropped Ar.ea Under :r..~ain Crops in Been ~no Osman~b~d Dist~icts During the Ye~r 1978-79 · · •••
P~rcent~~P Distribution of Gross Irrigat~d Area Unn~r Princip~l Crops • • •
Talukawise Details of Area Irrigated· in Osmanabad Dis~ric~ During the Year 1978-79 •••
Talukawis~ Det~ils of Area IrrigatPd in Beed District During the Year 1978-79
Area Under Different Crops in Each District in 1978-79
• • •
• • •
IrrigAt~d Area Under Diff?rent Crops in Beed and Osmanabad Districts •••
Districtwise Phy~ical and Financial Programme· Rr=>commended for Sanction of NABARD ••••
Typr:-wise Loans Sanctioned and V'Jorks Completed in the Districts of Beed and Osmanabad •••
Typewise Distribution of Projects Completed and Cases Selecteo for the Survey .•••
Sub-branchwise DiRtribution of Number of Selected HousPholds According to Ty·pe of Loan and Co"ntrol Farm?rs in Beed District •••
Sub-branchwise Distribution of NumbG-r of Sel:.?cted Hous(~holds According to ·rype of Loan and Control Fqrmers in Osmanaban District •••
Distribution of Sample Loane~ Hou~eholds Accor~ing to M~in CaBtP ?.n0 Caste Groups •••
AvPr~ge Size of Household, Literacy Proportion and AvPrHge Size of Earners Per Household According to thP Categoricls of SelPcted Households •••
Distribution of Selected Households According to· Broad Size Groups of Oper~tional Holdings •••
(vii)
Page
14
22
23
25
.26
27
29.
42
46
48
49
52
53
55
Tr:ble No.
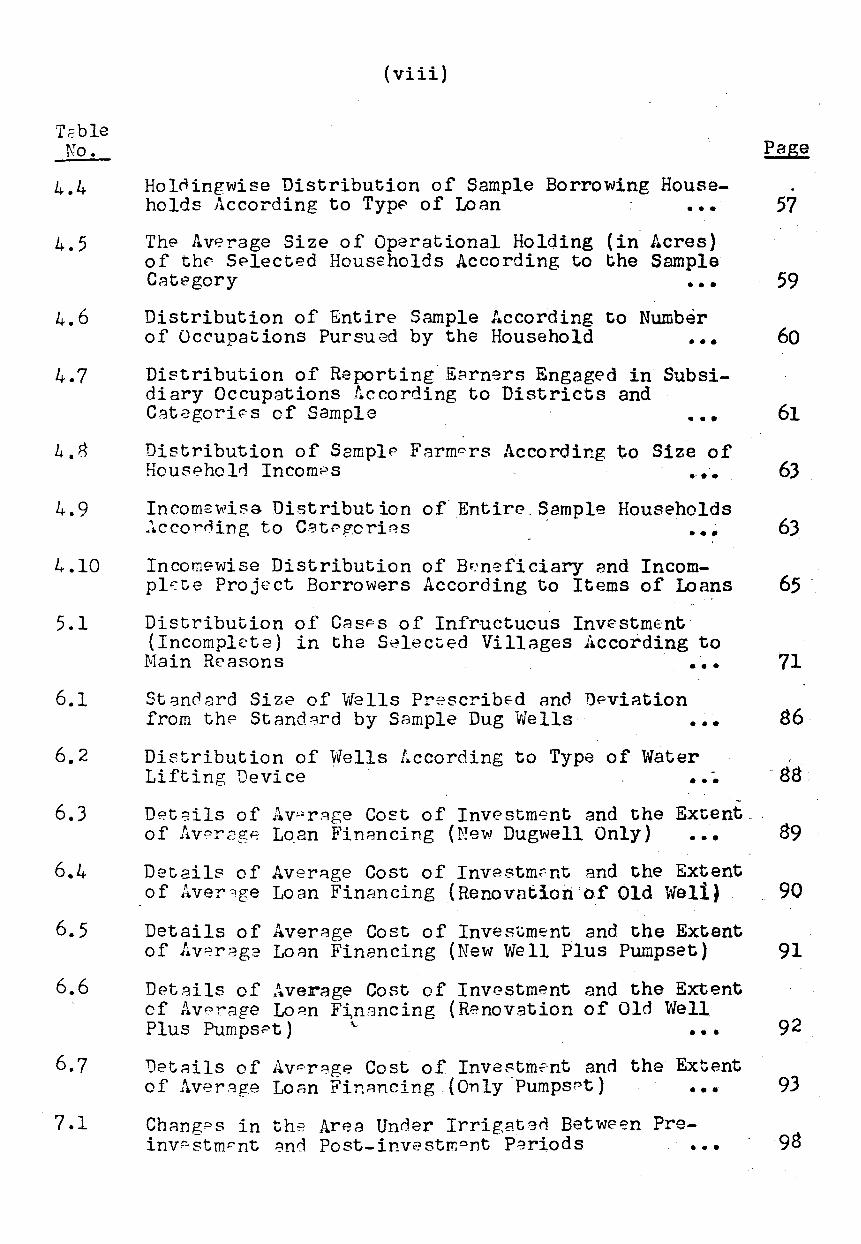
4.4
(viii)
Holningwise Distribution of Sample Borrowing House-holds According to TypP of Loan •••
4.5 The Av~rage Size of Operational Holding of th~ SPlected Households According to C.-=Jtegory
(in the
f.cres) Sample
• • •
4.6 Distribution of Entire Sample According of Occupations Pursued by the Household
to Number •••
4.7
4.8
4.9
4.10
5.1
6.1
6.2
Di~tribution of Reporting E~rn~rs Engaged in Subsidiary Occupations According to Districts and C~t2goriPS of Sample •••
Distribution of ScmplP Farmers According to Size of Househol~ IncomPs ••••
Incomswisa Distribution of Entire.~ample Households ~ccor~ing to CBtPvcri~s •••
Incomewise Distribution of B~:neficiary and Incompl~te Project Borrowers According to Items of Loans
Distribution of GasPs of Infructuous InvE"stmEnt (Incomplete) in the Selected Villages According to Main Reasons · •••
StBndard Size of Wells PrescribEd and UPviation from thP Standdrd by Sample Dug Wells •••
Distribution of Wells tccording to Type of Water Lifting Device •••
Page
57
59
60
61
63
63
65.
71
86
.. 88. -
6.3 DP.t ~ils of Av~·r.qge Co~t of Investm'?nt and the Extent- . of Avcrvgt-:: Loan FinAncing (Eew Dugwell Only) ••• 89
6.4
6.5
6.6
6.7
7.1
Detail8 of AverRge Cost of InveBtm~nt and the Extent of Aver~ge Loan FinAncing (Renovntion'of Old Weli}
Details of AverAge Cost of Investment and the Extent of l;.v~r~g? LoAn Financing (New Well Plus Pumpset)
Det.8ils of .\verage Cost of Investment and the Extent cf Aver-age Lo~n F~nancing (R-?.novation of Old Well Plus PumpsPt) ~ •••
1Jr?tAils of Avcr~ge Cost of Inve8tment and the Extent of Aver.gge Lo::;n Fin~ncing (Only.Pumps~t) •••
Chang~s in +-h-v ~ Area Under Irrigateo Betwe~n Pre-inv~stmrnt ~nd Post-investrr.ont Periods • • •
90
91
92
93
98
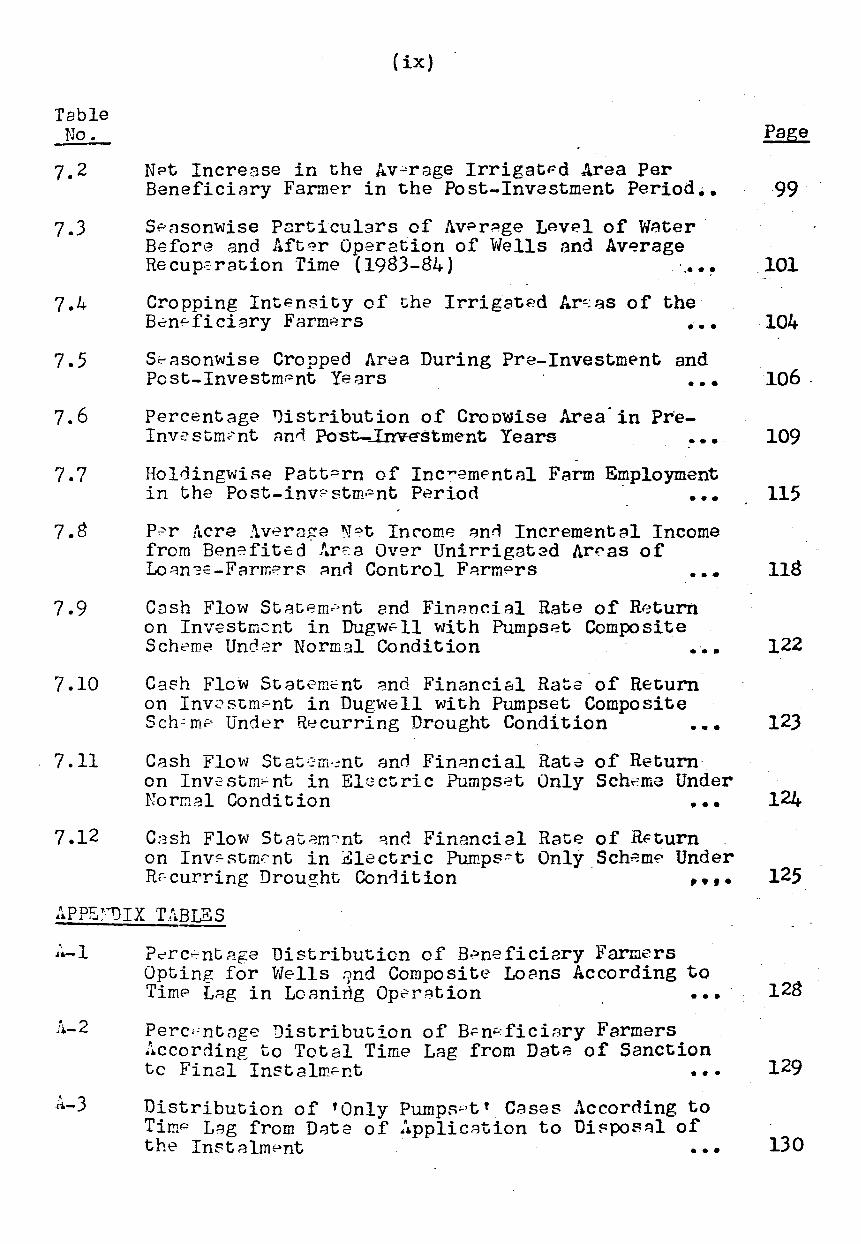
Table No.
7.2
7.3
7.4
7.5
7.6
7.7
7.8
7.9
7.10
. 7.11
7.12
(ix)
NPt Increase in the Av~rage IrrigatPd Area Per Benefici3ry Farmer in the Post-Investment Period ••
s~dsonwise Particulars of AVPrP-ge LAV~l of w~ter . Before and Aft~r Operation of Wells and Av~rage Recup~ration Time (1983-84) ... ~ Cropping Intensity of the Irrigated Ar~~s of the B2n.:.ficiary Farmers •·•
s~~sonwise Cropped Area During Pre-Investm~nt and Post-InvestmPnt Ye3rs •••
Percentage ryistribution of Cropwise Area.in Pre-Inv~ s tm<-'nt nnri Po--st-_!rrve-stment Years •••.
-
Hol~ingwiRe Patt~rn of Inc~em~nt~l Farm Employment in the Post-inv~stmPnt Period · •••
P?r Acre ivernge ~~t Incom~ ~n~ Increment~! Income from Ben?.fitEd ~r~a Over Unirrigat~d Ar~as of Lo~n=c-Farm~rs And Control F~rmPrs •••
Cnsh Flow St~tAm~nt and FinAncial Rate of R8turn on Investment in Dugw~ll with Pumpset Composite Scheme Under Normal Condition - .~.
Cash Flow Statement ~nd Financial Rata of Return on Inv2stm~nt in Dugwell with Pumpset Composite Sch-: IDr' Under R~curring Drought Condition •••
Cash Flow Sta~·?m·.::nt ann Fin~ncial Rata of Return· on Inv2stm~nt in Elsctric Pumps2t Only Sch~ma Under Norr.1al Condition •••
Cash Flow Stat~mr·nt ~nd Financial Rate of R£=turn on Inv~Rtm~nt in ~lectric ~mps~t Only SchAm~ Under R~curring Drought Condition ,.,.
APPE~"1JIX TABLES
!~-2
?~rc~nt~ge Distribution of B~neficiary Farmers Opting for Wells ~nd Composite Lo?.ns According to TimP LP.g in Loanirlg Op2r~tion •••
Perc•;ntnge Distribution of B;:n.;:.:fici~·ry Farmers According to Total Time Lag from Dat~ of Sanction to Final Instalm~nt •••
Distribution of 'Only Pumpspt' _ Cases According to Time L~g from DAte of ~pplicAtion to Di~pos~l of the InstAlmPnt •••
Page
-99
101
104
106.
109
115
118
122
123
124
125
128
129
130
SUMMARY AND CONCLUSIONS
The pre~ant study, undartaken at tho instance of
National Bank for Agriculture and Rural Davalopment (NABARD),
is th~ r~sult of a survey recently conducted in Ba~d-and
Osmanabad districts of Marathwada r~gion in the State of
Maharashtra. At tha out~~t, it may b~ statad_that the orient
ation of major part of th8 study has turn~d its~lf into one . '
that r~qui. r8d groatar attention to p~ rsistent drought situa-
ti0n aff0cting the project implemantati~n more than the assess~
· m~nt of normal ~conomic b~n~fits. For, th~r~ has not oeen
any appr.:3clabla degr~a of succ.ass achit!vad in .tha surveyad
ar·:;,as. Right from 1982-83, the year in which the works of
tha individual sch~mes ware expectad to b"~ comploted, the
districts undar reference hav~ b~cin afflicted by .successive
drought conditions. Howavar, in ord~r to obviate this situa~
tl.on of basing tht' study ~ntir0ly on\the sample of pre-·. \
optimal stag0 of investment, furth~r confound~d by drought
conditions, thJ study.pr~s~nts th~ r~sults of th~ suppla
m8ntary surv·.:::y und~1rtaken to r.Jfl~Jct th~ conditions of normal
y:.~ar with full d.:~v0lopm.::nt b..;ln?.fit stage of invastm·3nt. This
suppl2m·~ntary ~ffort has enabled the prds-:.Jnt study to
ustimat(l the fi nancial,Fat.:-.~s of r.;.tturn ov~r a pariod under \,
normal situation as also und~~r ~hl~ condition of droughts
r~~curring with a four y~ar fraquoncy. In th\) following are
givJn th~ sali~nt fdatur~s of the study and tha conclusions~
1
2
1. Th0 succvssful impl~m~ntation of minor irrigation
sch0o~s in Maharashtra assum~s spdcial significanc~, for the
statd doas not hav~ abundance of surfac~ wat~r sourc~s.
Pr~sdntly, th~ area undar irrigation forms around aleven per
c~nt of tha total net ar~a sown and about 60 p~r cant of it
b~3ing account~d by groundwat\)r sourca. Thd situation in .,-
rlarath~tada rcigion is much worsa than somQ othar· regions of
th~ stat~. In g~ndral, th~ estimat~d pot~ntiality of ground
wat~r is quit~ vast and tha stat~ can axploit tha same for
y~ars to come. Howdv~r, tha r~lativd f~asibility and succ~ss
or failura of minor irrigation works is primarily datarminad
by thu local hydro-geological conditions which in th~ hard
rock ar~as ara wid~ly variabl~ within short distances. Tha
s~l~ctdd districts b~long to s~mi-arid.parts of th~ region.
S:v~ral talukas of the district aro cldarly r~gard~d as
drought-pron~ arJas in th~ stata. Arda und~r forusts is too
insignificant and quite disturbing. In B~ad district, area
und.Jr for~st accounts for just 1.9 p~r c~nt and in Osmanabad
it is only 0.09 per c~nt of tha total gaographical ar~a.
Incr.3dible but true that Gr0at.Jr Bombay dis~rict has more
ar-:)a und,~r for~st than Osmanabad district·. Tha intQnsity·
of cropping is rathar low at 120 p~r Cdnt in th~s~ --------------------------------------------------· districts. Food·.· crops, mainly comprising jowar, bajra and
\
wh.~at ov~rwhalmingly dominat~ tha cropping patt~rn.
2. Th0 schdm~s und~r tha purvi8W of th~ pros~nt study
forrrE~d a part of th0 ARDC Cr~di t Proj~:.,ct-III Minor Irriga-
3'
ti~n Progra~na in 27 districts of ~fuharashtra State 1981-82.
By and larg~, th~ various stipulations imposed_by NABARD on
!JlSCLDH, thcl fi n3nc 1ng and implam~ntirig ag-Jncy, Wi3r\J fairly
Wdll conc~iv~d. The impldm~nting agancy in turn had
standarciz~d various assumptions and t~rms and conditions
of loaning for g-an ... ~rally normal situations and for broad
agro-climatic rogions •. The approach is n .. 1ith;1r too rigid to
discouragi.~ dumand for crt-dit nor too fldxi.bl~ to accommodate
or adjust to th~ sp~cial circumstanc~s of crisis and
abnormal local situations.
J. It was obs~rv2-d that the ov~rall r~spons~ to the M.I.
sch.:m~:: und•Jr rdf~r~.?nce in thd select~d districts was vary
lukclwarm, judgad from loans actually sanctioned by Land
D<:lv~lopm0nt Banks against physical targ0t approved by NABARD
(about 45 par c0nt fbr schamos involving Wdlls and.walls
with pumps~ts) • Furth·.~r, the proportion_ of officially or .
tachnically complat0d walls to that or total sanctioriAd
,:~nrl--;d up with 26.5 pdr c.~nt in both districts put tog.ath<3r.
In oth3r words, th~ schcm~ has had only a limitcld success
all along and charact.,Briz~d by ovarwh~lmingly more
incompl0ta individual projdcts than tdchnically complete
on~s. In vi2w ~f th~ above situatioas, th~ broad objactiva
of th~ study was gearDd to und~rstand thd various fac~ts
and probl·~ms of financing th~ dugw<Jll sch~m-?.s ·in hard rock
araas that ara prona to pJriodical droughts or succ~ssiva
scarcity conditions. However, som~ specific objactivas
4
wdr.J to consi d~r th3 •3Valuation of what~v .. ~r ban.;) fits accruing .
to th.;.: b·~~n-=~fici=~ri-~s, . sam.;) asp~1cts of p~rformance of imple
m..)nting: 3~3ncy and th\:.l problems fac~d by bldneficiari\~s, as
w~ll as, loan<J0-farmdrs with incomplatd projects •
. Both primary and secondary data Wt3ra considarc~d for
th-.-: study. Th;:; covdrage was r~.strictcld to only those coming
und~r th0 purvi0w of the NABARD projact of 1981-82.· In the
cas~"! of b<Jn ... diciaric:s, only tho~.a who had completed tha
works of tha prOjJCt by June 1983 and, availed of tha irriga
tion fc::cili ty during thi;! agricultural yc.:ar of 1983-84, ware
consid~r~d as this would give us at least a year's data to
as:: .. ~ss tht1 b~nefi ts. As tha b..~n3ficic.:ry farmars w~re dis-
proportionatcl1y small among th0 1oancle-farm~rs, the net had
considvr.".,d appropriatd for our purpost·. The S-31ection of
v.illag.~}s b~c3m~ v;;ry crucial as· th0 bdn·3ficiaries w~ra very
widaly scatt-)r~;d. How·Jv;;;r, 50 villag;;}s 1r1~r'.) finally sa1\3cted
to g::t· thJ various typ.as of ban~ficiari~s of tho complated
pr:lj.Jcts and, from the sam a vil1agi;;'s, thu loane~-farm.ars with
inc~mpl0t\J or infructuous· inv~:)stm:ant and the 'control' for
wi th()Ut proj .. ~ct conditions Wdra also solect.? d. The final. I,
sampl~, in all, cov-.:~reo 215 farm~1rs, comprising 111 banefi-
ciarids, 56 incomplate cases and 48 'control' having only
dry farming. Ov0r ao p~r C0Dt of the sample hous~holds
b~long~d to thosa ta1ukas that wara c1aarly ragardJd as
drought-pron~ by thv Sukhatankar Committe~ Report.
5
Thd tvvo serious limitations of thC! first, Sdt of data
H~lr.J (a) th\:; r~f..?rancd pdriod ,(1983-84) being thtl v~ry first
y;.;ar in which thi! w~lls b~~cam0 opt~rational and hgnc"=) _low k~y
l~vJl of past-d~v~lopmant and, (b) tho p~rsistunt drought
conditions causing abnormal situation upsatting the farmers
in s~varal ways. Thcl upshot of it all was to affact the,
r-2-spons~ 8nd quality of primary data. Th~ consid\Jrabl\l
shJrtfall in th~ ~xpact~d bcln~fits caus~d rQtiCdncQ on the
part of th~~ b~Hh•fi.ci:=try farm~rs. Howavar, suppl~mentary
dota r'dprt.1Scinting normal conditions of full davelopmant
stage hav~~ also b-='-2-n utilizad to work ;)Ut tha financial
rat-.;s of rut urn.. This offort was to consi d~.~rably offsat tha
limitations of data conc~rning pra~optimal stag~ of invast-
mr.1nt.
4. Th~ broad socio-0conomic profile of the s~lactod
fair mixtur~) of minority communities among tha·borrow'-:~rs.
Nearly 85 pclr c~nt of thB ~ntir0 sampl~ farmers w~re oparators
of small holdings, tha av~raga size of op0rational holding
b':'ling ldss than eight acr~~s. Pursuit of agricultural labour
was the most common ~ubsidiary occupation. About 40 par
c~nt of th-; sampla t3ntir~o~ly d\lpo3nddd on cultivation as th~
only occupation. Around 40 p .. ~r c~nt of tha sample halonged \ ~-
to low incomv group (up to H.s. 5, 000) • Majority of the low
incomd group farm~;rs had opt>-:!d for composita loans. By and
largd, th~-} b.Jneficiary farmi.~rs werd slightly bettar placed
6
than thosa borrow~rs who 0nd~d up with incomplate sch~mas •.
5. Tha overall succ~ss rat~ of th0 appardntly completed
proj;.:;ct~ (..3xcluding loans for only pu.rnps~t purposa), upto
Jun~ 1983, was ~nly about 27 p~r Cdnt of the total loans I>
sanction.~d for w~lls and composit~ sch0m13s in both districts ~-----------------------------
tog.::th~r. Thcl information partaining to infructuous inv.:.;st
m~nt l'i3S inclusi v.a of fail\3d w~lls, t0chnically incoi!lpleta
works 3nd cases of misutilization of loans. Most of these
w~~r8 for composi t·3 sch2ID.)S and had r~mained incomplate on
account of physical constraints and human factors. The
r~asons w-:!r-a illustrativcl of typ~s of difficultio;)S and shadas
of motiv·_ s for th~ incomplotclnt:ss or impropar usu of loans.·-:
Th~y w~rd 3lso indicativ~ of ganuina problems of physical or
natural constraints in th~ proc0ss of construction work.
Ar~und 30 p~·r ctlnt of casas might not strictly bt3 fault.;:d for
misutilization as th~s~ W2r1 und.:1r physical constraints like
abs~nc~ of aquifers, caving in of sida walls, hard base rock
C'Jndi ti·-:>n, inad-3qu3t.J wat3r column dV~n aftar r~1aching 40
f .;~.~t d ;pth, dtc. At th0 oth~:lr ·3xtr8m~, Wd found varying
dXt.:)nt .:>f human factors baing manif,::stod in voluntary with
dravJal fram th .. ~ sch2me as a risky inv,~stm;3nt (9 p~r cent),
tjchnic3l 3nd partial misutilization arising from axcass I \
di9m~t~r, violation of tim~ schadul~, etc. (21 pdr Cdnt)
and lastly rank misuse of loan funds and fals~ claims (34
pdr c-.:nt).
App3rJntly, .. thd misutilization in one form or other
7
.:tnd tdchnicnl :::>r. oth·Jrwi s~ had takan a v~ry larg.a toll of
individual proj~cts. Th~ funds might 0v~ntually be recov0rod
by Land O..:valopm.~nt Bank or, some of th~ proj0cts would ba
c ompl~t.:: d on the own ini tiati VG of thd d~fault~rs. N·dvar
th.Jl.:.::ss, th0 cauf:~ for immadiata conc~~rn should ba tha fact
of sinking of cons1 d~rabl~ amount of pr"~cious .funds without
svcurlng comm~nsurnt0 b~n~fits in tdrms of enhancvd rQsource
bas~, in th~ ar~as particularly.vulndrabi~ to prolongdd
droughts.
6. Th~ opinions and exp•:!riences af the laanee-farmers
hava r2vealdd many intardsting and also disturbing aspects.
'fqa d~cision. of siting of walls was ~ntir~ly lqft to tha
borr:::>wars th0ms2-lv~s. T~~ technical h~lp arrangad by. Land
Ddv0lopm.~nt Bank through GSDA could hav\1. avoidad the ~eart- ·
burn at a lat3r stag~. The officials from 0xtonsion and
Land o~v~l6pmclnt Bank confin~d thams~lvrls to randor advice
m3inly Jn cropping pattern and loan utilization .. Apparantly,
on~ could find som~ contradiction batw~an the claims of
tJchnical guidanca baing followed up and what actually turned
out. This W3s particularly the cas~ with the dimdnsions of
th ... ; W;.;dls e:nd mor~ pronouncdd in r;;•sp.)ct of borrowars of
infructu)us inV(.:stmant. Two-thirds of the complet?.d wolls
w,:;'r.J Dnly s=:.:asonal .3nd th.::. r·Jst r•.-3portod low watar columns. I '-··
Anyw:Jy, this ~i tuation was not du\3 to OV(lrclustiJring of
Wcills as thd stipulat~d 500 fadt di~tancd was strictly
obs~rv~~. Th0 infrestructur~ facility for s~rvicing pump-
sats was rath.:~r inadaquata ~sp-.3cially dist5DCdWise in the
casd Jf Osm~nabad district. Ovar a third ~f tha borrow~rs
Wdra not m..:mb~rs ()f any c:>Opt1rntivB soci.:ty for ·short tarm
Cr-Jdi t. Th0S0 r~cdiVing credit f'Jund it t,o h.~ rather
inadaqu3t~. In r~g3rd to typ0 of nssistanc~ rcquir~d, tha '
pr;;::f.Jr0nc~ was in favour .Jf t\;chnical advice and timely
supply jf inputs.
In tha mattar of adhorance to the .spacifiad dimensions
:>f w~:lls, only in 16 P·~r c~~nt cas.:'s th~ diametar approximated
to thu n')rm and, in ab:)ut 10 pur cant, thd stipulat~d dapth .
(35 f~.;t to 40 fo::.Jt) was achi~vod. Tha violation of diameter
stipulation wa~ quite rampant ~nd it was very difficult on
th~ part of the Land Devel~pment Bank officials to ragulate
the same against tha l0cal conviction for larger diameter.
In thi.l .avc?nt, tha loane\3s v1ould try to compromise \fi th the ·
l0vvl of th0 r~quir~d depth to and up with low wat~r columns.
Tha avaraga cost of tha construction of w~ll varied
fr:)m R~. g, 750 to Rs. 13,150 for· diff-arant s.ize groups and,
tn th2 casa .;;f composit~ l'Jans, th~ maximum total cost was
Rs. 1S,525. In almost all cas~s the l0an amount fell short
nf th·~ r.ap.:>rt0d .;;xp>;;~nditure .by th~ loanee-benaficiariils.
This tmb::.l~nc~ was du~ mainly t~ incr~asa in th~ diameter
and h~ncd grdatdr ~xcavation cost and cost escalation by
thu contr:3ct:)rs ov~r a t1im,~. Ond c~uld surmisa- that in
g~nuin3 c~sos, th~ rigid loan eligibility limit might have
c lntribut-::d tJ compromie-:; 11vith tho quality of construction
W')rk.
9
7. Th~ ndt incr~asa in th~ irrigat-.. ~d area on account of
th~ inv ~~tm~nt WQrk~d QUt to, on an avar~g~ p~1r bandficiery,
3.3 3Cr~s in Bl3gd and 4.5 acr.-s in Osmanabad. The use of
w~ll in kharif was less than that of rabi soason and laast in
su~~~r. Th~ rabi b~1ng thd main s~3son, 89 p~r cent of Wdlls
in B.J,-:d Jnd 95 p.4r c~ut of W13lls in Osmanabad sampl~ wara
put t~ us~. N~ rdliable d~ta cvuld b~ obtGinad from the
ini")rmants in r~Jg:trd to th.? int~nstty of irrigation! 'lba
intdnPi ty of cr-::>pping \"las W.Jll bo)l~w the laval .assumad in
th,:) ac~no!llics -:>f tho schoc;;mv w0rkad .)ut by th\l Land D~velop
m~nt Bank. It was as~umdd at 160-180 pdr c~nt but the bene
ficiary farm~rs could achidv~ ,')nly 109 p,.)r C.3nt in Osmanabad
and 147 per c~nt in B~ed district. Th~ law rate of crop
intc:nsi ty \·13S blamod on low l-av-.11 of wat~r columns i~ tha
w-~lls. Thus, the Ddt incr~ase in irrigat\l d ar'da had not· b~~n
3cc~mpaniad by substantial incrclaSd in gross cropp~d ar~a.
Thu cr-::>pping pattdrn adopt~d in th~ post-invastmrtnt
p.::ri:::>d continu(;!d to b,.:; alm~st similar to tha ona practisQd
in thd pr ... ~-d.;nr~~lopm.-1nt y~~ar. Th~ c~r~als (mainly lowar and
wh~~t) c~ntinu~d to dominata th~ patt~rn (60-70 pdr c~nt)
follow;;:d by puls-~s, oils0.ads and sug3rc:1n~ as minor crops.
Kh~rtf jownr and 0ils~~ds in both districts and, othur
c -.r,.·nls and puls-.:s only~ in Osmanabad have som~what rela
tivuly gain~d .:1s irrigated crops. Howl.lvar, all tha crops
und ... r irrigation hav~ sh:>wn i ncr~as~ in th~ absolut~
acr-:1ag\3 in th~ post-inv.?stmdnt ydar. All thd familiar crops
10
gr·:)Wn undar rai nfad condi ti 1ns, c:1XCGpt wh~at and sugarcan~, ·
hav~ b0an continuad undclr irrigat2d lands.
Tha m0st disturbing and crucial thing about tha chang~s
in th~ cropping patt0rn was that the evantually adopted on~
si.e;ntficgntly diff.Jred from th\~ one r•:.JC::)mmendad m.ainly in
r.-'gard t:> th.:! vnri,~ty of th~ crops. It was assumad by the
tJcon:)mics Jf th-.;l sch,}m~l thot tha major switch should comd in
th~ f)rm ~)r high yi·Jlding varidtias in plac~ of local vari~ti~s
in th~ cas~ of car~al crops. Howav~~, th~rd wa~ no strict
adh~r0nc~ tJ this stipulation. In p~aco of 60 to 70 par cant
HYV C?rdals only six tr:> s2ven pdr c~~nt of ar~a was claarly
r,:·portad und.!r hybrid jowar. The s~:~rious d.aviation includiJd
tha n0gl0ct of bajra and maiz~; no cotton· crop was raised,.
instead sugarcane was th.a pr~f-·lr~nco; · the vdgatable crop
was practically ignordd - just und<;;r one p~r C'l;)nt 'in Osmanabad
as against four p~:r Cdnt r~\comrn~nd'"~d in ~ach district - and
sunflowdr was prafarr0d to groundnut in most cas~s.
' . . Although th~ farmdrs war~ awara of tha implications,
tht=:!y ploa dod h._~lpl1;1ssness 0n th~ ground of low. watilr columns
in tha walls, insufficiant rainfall and inadaquate financial
r·~S:)urc.3s to obtain costly inputs for HYV crops.
Th0 positi0n of incremdntal banafits as r~flactad in .4•
th0 g\.·HL; ration ·)f dmplryym0nt and ndt inc om~ on account of
c0nsid~rabla inv0stm8nt in irrigation works w~s quit~ dis
app)inting. Th0 surv~y data in rdsp~ct of irrigat~d arclas
:)f th...: b~;n,~ficiJry farm-.~rs in tha pr0-optimal stage of
11
d~v0lopm~nt did not r2vaal any significant l~val of in6ra-
thiJ pdr acr~) av,!retgd incrdmental \:~mploymclnt work~d out to a
m~.:?agr~ four d.sys :~s Gxcass OV·3r th~ l\Jv;.1l. of uni.rri gated
ar~as of tho b,:.ndf.icic?.ry farrn0rs. \fuen compar ... ~d to CC?ntrol
farms it was t~n days in Osmanabad district and ndgative
(0.7 day) in B~ad district. The situation in r~gard to
accrual of incremental income during pr~-optimal stage was
n~ batt0r. It was around Rs. 300 par acra, far below tha
assumptions workad :)Ut by th~ \:3conomics of tha schem-3. Thi3
drought conditions to a grGat ~~xt~nt and human factors like
making d~partura from·th~ prBscribed type dim~nsion of the
dug W..ills, d;,~viation from th .. ~ stipul3te d cropping pattern,
non-adoption of improved technology, and all thasa things on
th·~ grounds of inad~quacy of watdr columns and financial
r~~ourc0s, hava contributad to a low key op~ration during the
Howav~r, tha analysis of suppl~mantary data, raflact-·
ing thd normal situation of full stagu d~velopm .. ~nt, has
r·,lv~al0d th,qt th~ benafic·iary farm~)rS would be in a position
to g~narate mord than adaquat8 laval of incremental incomes
to rapay the loan instalmdnts. Undar th~ situation of
normal conditions pr0vailin& in all the y~ars of full dav~
lopm~nt stage of j nvdstmJ'nt, tha financial rata of return
{ FRR) works out to 42 p0r cant for the composi t\; scht3ma of
dug w . .Jll and ~l\:lctric pumpset and 38 p-ar c-.:.nt for pumps~t
12
,.1.) .... ' sch ,,.., -, - · a..IV '-u..L~ e, Also under th~ assum~d situation of racurrtng
dr~u~ht frdqu~ncy av~ry fourth yuar, the FRR works out to 23
p,;!r c ~·nt for composi t~ scht..,me and 30 p\Jr cant for pumpsat
F)ll;:,uing th~1 low rainfall, the lo\'L .. ring grouridwatelr
tnbl~ is c~us1ng soma conc~rn and it calls for a clos~r look
at thd ostim3t~s 0f th~ groundwat~r surveys, particularly in
drought-pron 3 ar0.:J s. B~s i. das, th0;1 loane~ faz:mars ought not
to havd b~~n allow~d fre~ hand in siting tha w~lls, ~xc~~ding
th~ diam~tdr and such othdr t~chnical matt~rs. A better loan
m3nag~~~nt during t~~ inv~stm~nt p~r.iod rath~r than target
mind~d loan disburs..;:m~nt op~ration should ~nsurd battar
rJcov~ry parformanc~.
Apart from suparficial dXt~nsion work, nothing is done
to foll~w up th~ tdchnical advice to ansura strict adh~renc~
to stipulat~d cropping patt~rn and arrang~mant for the supply
of inputs and cr:~dit infrastructur0. Th~ Land D~valopmant ,
Bank could considdr s.al\)ctiv~;;;ly lending to m~mb\o:lr-farm~rs
ag3inst th~ crop hypothacation. Apart from th~ wilful
d.afault.:>rs many a gt;nuin~ small farmer can bd hdlpad by the
L.snd D .. :v0lopr.1.)nt B.Jnk if a part of tha loan amount is advancad
as crop lo~ns during th~ g~station p.:lriod to inculcate con-
fi C.;!nc>:: Dnd posi ti v~ly pr,Jvail ov~r th\;1 farm~rs to adopt thtJ \
pr_~scribr:!d cropping pattern. Also it should bd possibl~ for
tha Land D~:1v2lopm.~~nt Bank to ddploy th~ir most ~fficient
staff to probl~m ar~as, esp~cially tha drought prond pock~ts.
Tha continuous moni taring snd maint~nanc·~ of information
sy~t~m als~ n~~d to b~ strengthGn~d.
CHAPI'ER__!
ItrTRODUCTION
1 .1 Importance of I~inor Irrigation
It is needless to stress th~ importance of the role of
~unor irrigatior. in the context of agricultural development. It
assumes much gr~ater significance, especially in hard rock
regions lacking perennial surface water and_characterised by
relatively lovr precipitations, as l.vell as; the areas pr_one to
recurring droughts. Besides, the irrigation system that taps
the .sround v:at~r by means of dug wells has certain comparative
advaritages ov~r major and medium projects that largely depend
upon surface t'later. In particular, the well· irrigation affords
the farmer a more judicious and efficient use of precious water.
It facilitates the timely availability of vmter more dependably
than th~ surface irrigation. MoreovEr, the development of
ground vwater irrig;ation is the OP~Y solution to the problems o:(_
the vmter-stcrved tracts in s~vPral parts of the country. Other
t'lise, th~se rainfed ereas 't·lOUld remain outside the purviP-w· of
certain te~~nological benefits vhich demand assured irrigation
as a major prereauisite. The resultant benefits to the concerned
individuals and 0conomic gains to the soci~ty at large need no
spPcial emphasis.
1 .2 Irrigation Profile of ~the Region
Broadly speaking, Maharashtra State has a long way to go
in attaining the level of irrigation already achievPd by sev~ral
other states, notably Punjab ~nd Haryana. Eventhough the total
13
14
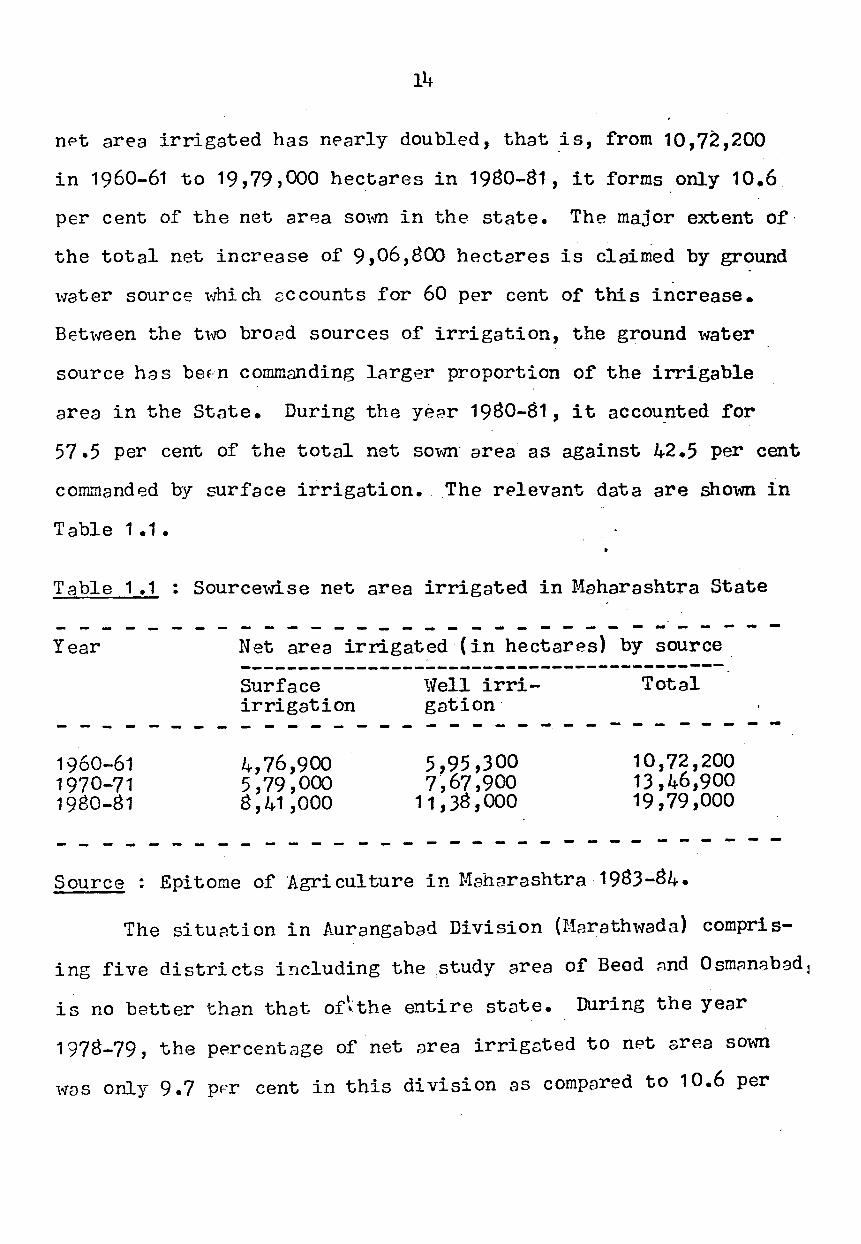
nPt area irrigated has nearly doubled, that is, from 10,72,200
in 1960-61 to 19,79,000 hectares in 1980-81, it forms only 10.6
per cent of the net ar8a so'm in the state. The major extent of·
the total net increase of 9,06,800 hectares is claimed by ground
'\'later source \"Jhi ch c;c counts for 60 per cent of this increase.
Between the t'~ breed sources of irrigation, the ground water
source has bef'n commanding larger proportion of the irrigable
area in the State. During the yepr 1980-81, it accounted for
57.5 per cent of the total net so~m· area as against 42.5 per cent
co~~anded by surface irrigation. The relevant data are shOlin in
Table 1 .1 •
Table 1 .1 : Source,dse net area irrigated in Maharashtra State
- - - - - - - - - - - - - - - - - ~ - - - - - - - - -Year Net area irrigated (in hectares} by source
-----~------------------------------------Surface \vell irri- Total irrigation gation·
- - - - - ... - - - - - - - - - - - - - - - - - - - -- -- - --1960-61 4, 76,900 5,95,300 10,72,200 1970-71 5,79,000 7,67,900 13,46,900 1980-81 8,41,000 11,38, 000 19,79,000
- - - - - - - - - - - - - - - - - - - - - - - - - - - -Source : Epitome of Agriculture in Maharashtra 1983-84.
The situr1tion in Aurangabad Division (M8rath'\t~ada} compris
ing five districts including the study area of Beod ~nd Osm~nabadl
is no better than that of~the &!tire state. During the year
1978-79, the percentage of net area irrigated to net area S0'\'10
'\'ICJS only 9. 7 pFr cent in this division as compared to 10.6 per
15
cent for th8 entire st:.nte. The po si ti on in the s~me year revealed
th:3t the vrells overvrhelmingly constitutP.d the chief source of
irrigation in the division, c;ccounting for 73 per cent of net
orea irrigated as comp~red to 57.5 per cent for thP. whole· state.
The area under vvell irri~SGtion in the division vras commanded by
nearly 1 .91 lakh v1ells, the 2verage irrigable area per well being
1 .8 hectares. The 1'Vells 1\Tere mostly private ones and ·predominently
of masonry type.
1 .3 Ground HG~tP.r Potentinl
The State in generBl and Marathwada region in ·particular
need to increase the area undPr irrigation. It can b~ 'achiPved
either by t2pping surf0ce water or by tapping ground w2ter.
· Ho\vever, the potentiality for e~ny appreciable gro'I.'ITth in surface
irrigation in somewhat limited in the State owing to some natural . .
constraints. NPverthelPss, it is possible to increase the irri-
geble area considerably by tapping the ground \"later resources
t ~h . t ' o v e ma.x1mum exten •
The ground vmter potential has been assessed by the Ground
VJC!ter Surveys and Development Agency ( GSDA) in respect of 1481
1\TatArsheds c8vering the entire state. Accardi ng to this assess
ment, the total annual rechc::rge 11hich forms the ground 11ater
potentiCJl is of thP order o.fi: 34,996 million cubic metres. As \
against this potential, the present annual 1dthdra\1al of ground
1'Jater from the existing 1vells ( nbout 9.4 lakh irrigation wells)
is of the order of 7,451 million cubic metres only. Thus a
16
substanti81 portion of the ground 1-vater potentiAl would still be.
available for exploitation in th~ state.
Hovtever, the ground 1"latar resource potential is not un~
limited as in the Indo-Gangetic alluvial arPds. The State of
Maharashtra hcs to contend -.;~th some gee-hydrological li~tations.
Almost the P.ntire state consists of hard rock formation compris
ing eithPr trep basalts or other crystaline rocks. Besides,
there are large variations in rainfall. Also it is claimed that
the rPlvtive fe2sibility and succPss or failure of the minor
irrigation -.;.oJOrks is primarily determined by. the ·local. hydro
geological conditions which in the hard rock areas are widely
variable within short distances.
1 .4 General Features of the S el8 ct ed Districts
A brief account of the broad agro-economic features of the
select.ed districts is presented here so as to provide some back-
ground information. The aspects mentioned in this section
broadly pertain to agro-climatic characteristics, land use,
irrigation, cropping patt:~rn, etc. The published sources like
Season and Crop Report, Socio-economic Review and Epitome of
Agricultura in Maharashtra have provided the basis for informa
tion. HO\'tever, 1978-79 being t-.he l2test year for which published
datB are aVDilable, the s~~uation in Osmanabad ref~rs to the \.
composite district, prior to the bifurcation of some of its
talukas to form the ne1·1 district of Latur.
The districts of Osmanabed and Beed are situated in the
17
Southern pert of Mnrothwada region of the State. · Both districts·
f0ll in the 'rain sh;~dO't"l area' chorocterised by low and uneven
roirfCJll c:nd hence scarcity conditions in some areDs. ·The normal
rrlinfall of the district is 786 f..'IM for Beed and 809 ~'IM for
OsmanCJbc:;d. Incidentally, hO't"l prone the sA Dreas to the drought
C::Jn be rPalisod 't·:hen t'le notice the fact that· Beed and Osmanabad
districts h3ve recorded 508 and 477 ~'JM respectively duri.ng the
yc~Dr 1982-83.
Nfli ther Beed nor Osmanabnd ,,molly belongs to any singl!3
vgro-climatic zone of the State. In point of fact, three talukvs,
nc-mely, Ashti, P otoda and Maj alg~on out of the seve.n from Beed
ond P;;randc;, Bhum ~nd Kollam from 11 talukas of the composite
Osm~nnbad district are grouped undPr '\·.zhat is officially classi
fied DS 'Sc~~rcity Zone' {Zone No.6). This agro-climCJtic zone
includ2s the Dreas receiving annunl rainfall in the range of
500-700 MM; the altitude "t?eing less than 2,000 feet above MSL;
having meciun bleck c~lc~reous·soils formed trap "tdth varying
depth ~nd texture and the predomin~nt cropping pattern showing
kharif-(excluding paddy)-cum-rabi crops mainly depending upon
soil depth ::lnd textural class.
On the other hand, thE- rei:nnining talukas belong to Zone-•· . \
VII, thot is, 'c.1 ssured rninf.gll zone with mainly kharif cropping' •
The r~infnll in this zone vnrics from 700 to 900 MM ond.the .
't t d t 1 th n 2000 feet altitude above MSL. areas nr~ s2·ua e 8 ess a -
~he soil classification remains the same as the Zone-VI mentioned
18
-:~ve. The predominant cropping pettern is of mainly kharif
:~ops, but mostly excluding paddy.
Land Use P~ttern (1978=121
The broad land use pr::ttern rPVPBls thP.t the net area sown
!'c:--rns 73 per cAnt of the total geographi CRl area of the district
~:: 3eed and sirdl0rly 80 per cent in Osmanabad. Land put to
~~n-agricultur2l use accounts for 3.5 per cent and 1 .9 per cent
~ ~- 3eed and Osmanabod districts respectively. A little more than
~oe~ nnr cent of the area is totally btlrren and unculturabl e in
•':~. of the districts.. These proportions, by pnd large, compare
r~•o~rably ~nth the broad pattern obtainable for the Marathwada .t
C .l·.;~angnbad) division. The pro port ion of net area SOit\711, however,
l s f:-:r higher than is t.he case for the entire state (59 .3 per
c.::t}.
The only remnrkobly disturbing feature is that the area
.r1~~r forests is too insignificant with 21,500 h.:::ctAres (1.9 per
t~>r:t of the total geographicAl f:'rea) in Beed and a mGagre 1,200
'~ct~res (0.09 per cent) in respect of Osmanabad district. For
~~~? F>ntire ~I.':Jrr1th1'\IF!da region the EJrecl under forests accounts for
) .5 per cent 1'11hile it is 17 .3 per cent in the case of entire
~3te. PCJradoxically enough, 0 sm<"3nabad, one of the most rural
41 strict s, octu ally sh O'ltJS lesser exte•nt of forest land than even
t.he most urban district of Greater Bombay, 1rrhere it is 1,500
ll~>ctares, accounting for neerly four per cent of its geogra
pt:ical e1re.9. Perhaps, this factor is one of the pointPrs to
low precipit~tions ~nd r~curring droughts in major parts of the
two districts under consideration.
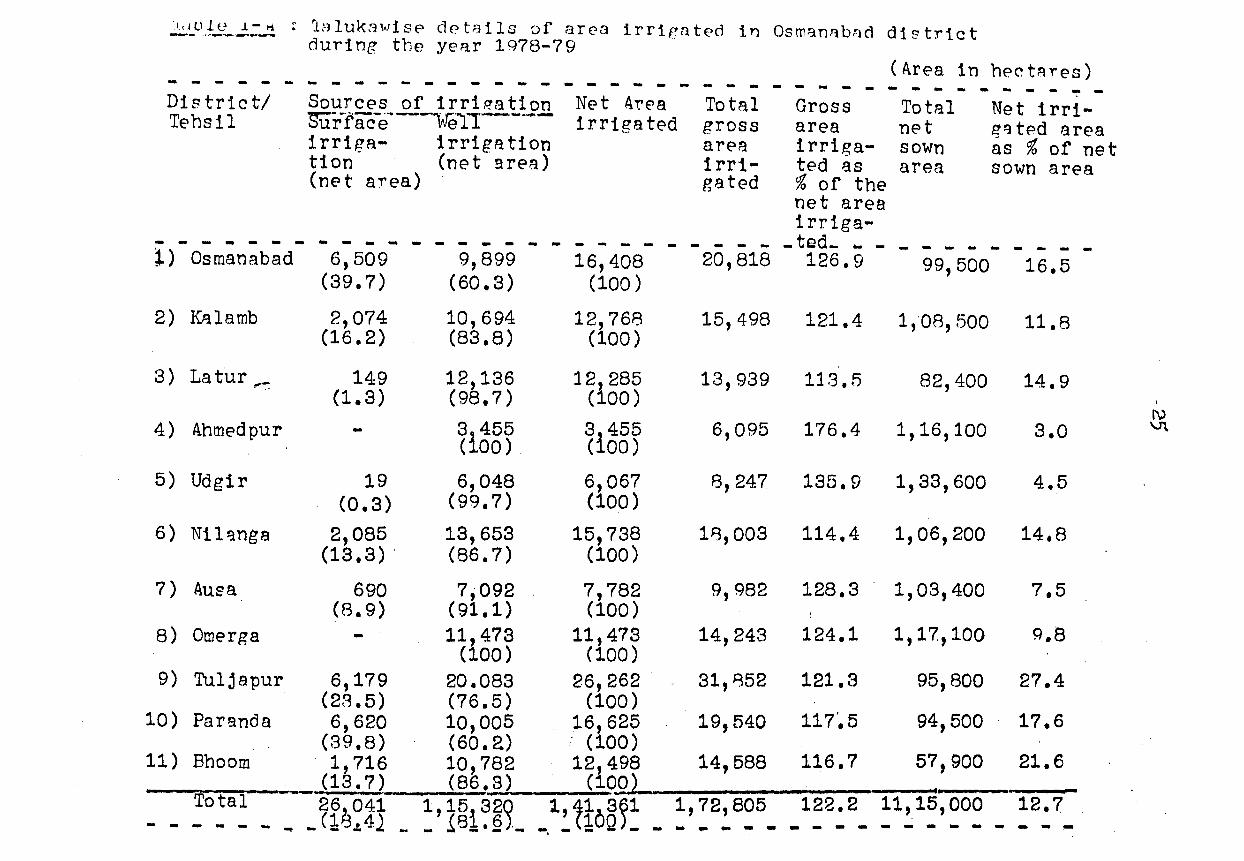
Irrigation
Just like the situetion in entire Aurangabod Division,
\'J'ell s constitute the predominant source of irrigation in selected
districts c:1s '"'ell. Net 0rea irrigated by \'lells accounts for
77.7 p8r cent of total n8t irrigated 3rea of the district in
respect of Beed ~nd, similarly 81 .6 per cent in the case of
Osmannbad. Tacl<s and medium irrigation projects appea~ to be
the chief sources of surface irrigationt which accounts for the
remaining portion of the irrigable.lands.
Among the individual talukas Ahmedpur, Omerga and Udgir
in Osmanabod district vnd Georai and Kaij in Bee~ report almost
entire irrigated area commanded only by wells. On the other hand,
substantial part of the irrigated areas, relatively to the '\
ext~nt of around 40 per cent, is being commanded by surface
sources in Faranda and Osmanabad talukas of Osmanabad district
and Ashti and Patoda in Beed district. ,
The net irrigated area as proportion to total net sown
area works out to 11 .4 per cent at the aggregat~ level of the
district in Beed. However, Georai and Beed are· the two talukas,
whPre it is c:Jround 19 per cent. On the oth~r extreme, Me~jalgaon
has rPcorded as low as only four per cent. In Osmanabad dis
trict, Tuljapur (27.4%) nrtd Bhoom (21.6%) are the two prominent
talukas \-Jith relatively higher proportions. Among the talukas
recording rathPr lm'l proportions, mention rnoy be made of
Ahmedpur (3%), Udgir (4.5%) and Ausa (7~5%) •
20
The extent of irrigFJted area sovm 'more than once, that is,
intensity of cropping can be dete.rmined by 1-vorking. out the
proportion of gross irrigated ~rea ~s percentage of the net area
irrigated. This intc-nsity for the PntirA district works out to
118 per cent for Beed and 122 per cent for OsmFJn~bad. In other
words, only about a fifth of the net irrigated.area is utilised
for rc:1ising more th:::~n one crop dur:ing the same year. This . : . .
intensity is re1ther greater in Majalgaon (150%) and Ashti (132%)
talukas of Beed district And Ahmedpur (176%) and Udgir (136%) of
Osmanabad district. Incidentally, the crop intensity for the
Aurangabad Division works out to 121 .5 per cent and for Maha
rashtra State it is some1-vhat higher at 124.8 per cent. The
relevant details of taluka1dse net irrigated areas by source,c
gross area irrigated, cropping intensity,etc., are presented
in Tables 1-A and 1-B for Osmanabad and Beed districts respec-
tively at the end of this chapter.
Regarding the number of irrigation wells in use, Beed
reports 33,152 and Osmanabad 44,642. Almost all these 1-rells
vre privately ovmed and approximately 87 per cent in Beed and
6J per cent of 1.-vells in Osmanabad district are classified as
masonry type. The avPrage net area commanded by wells ,~rks
out to 2.17 hectares per \vell in Beed and 2.58 hectares in
Osm8nC'bad district.
Cropping Pattern (1978-79) General
The area cropped more than once accounts for 5 .2 per cent
of the net area sO"irJ!l in Beed and 11 .3 per cent in that of
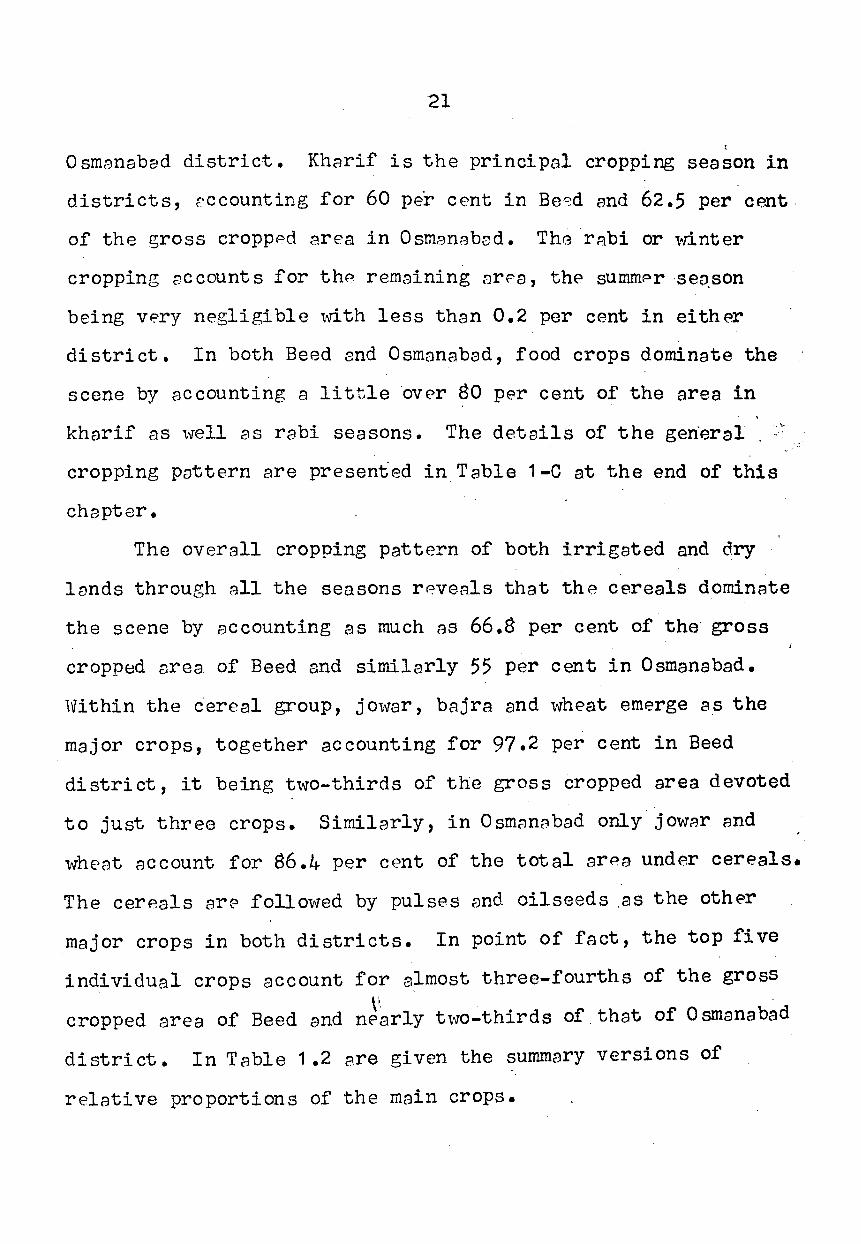
Osmanabad district. Kharif is the principal cropping season in
districts, r·ccounting for 60 per cent in Be-=:d and 62.5 per cent.
of the gross cropped area in Osmanab~d. The ·r;:tbi or ,.n.nter
cropping accounts for thP remaining nrPa, the summPr ·se~son
being very negligible ,.nth less than 0.2 per cent in either
district. In both Beed and Osmnnabad, food crops dominate the
scene by accounting a little ·over 80 per cent of the area in '
kharif as vvell as rabi seasons. The details of the gen·eral . ·'
cropping pattern are presented in Table 1-C at the end of this
chapter.
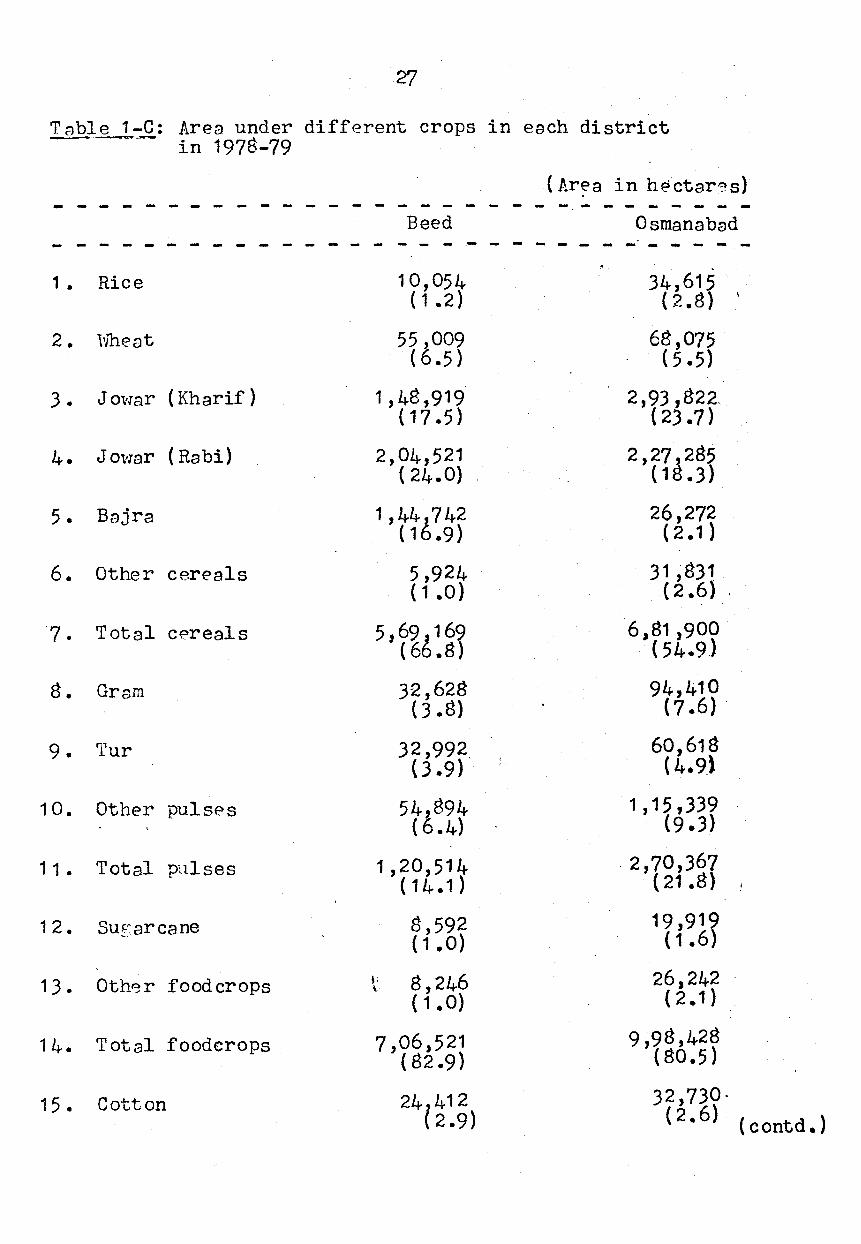
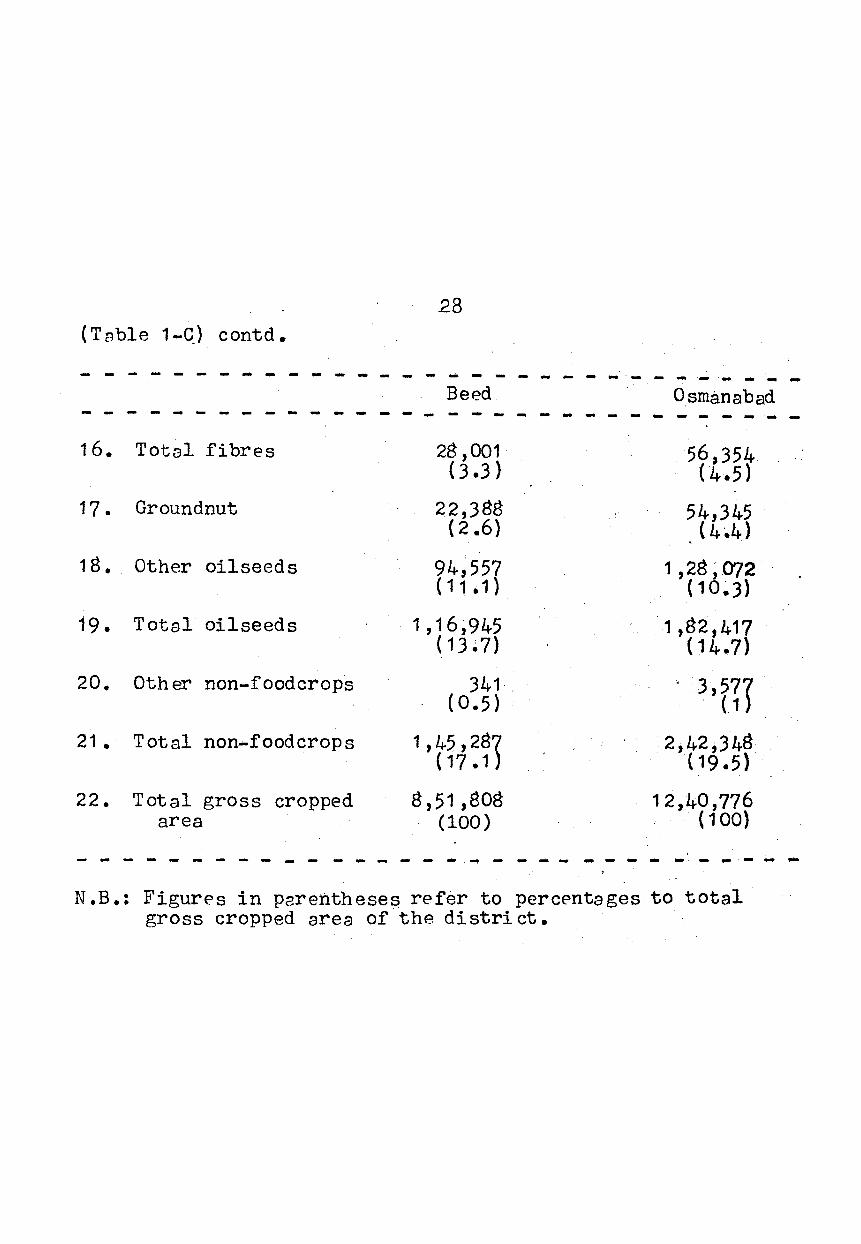
The overall cropping pattern of both irrigated and dry
lvnds through all the seasons rPveals that the cereals dominate
the scene by ACcounting as much ns 66.8 per cent of the gross
cropped area of Beed and similarly 55 per cent in Osmanabad.
1vi thin the c·ereal group, j 01.·mr, bajra and v.rheat emerge a.s the
major crops, together accounting for 97.2 per cent in Beed
district, it being two-thirds of the gross cropped area devoted
to just three crops. Similarly, in Osmanabad only jowar and
wheat account for 86.4 per cent of the total arPa under cereals.
The cerP.als ar~ followed by pulses and oilseeds .as the other
major crops in both districts. In point of fact, the top five
individual crops account for almost three-fourths of the gross \i,
cropped area of Beed and nearly tv.ro-thirds of. that of 0 smanabad
district. In Table 1.2 are given the summary versions of
relative proportions of the main crops.
·22
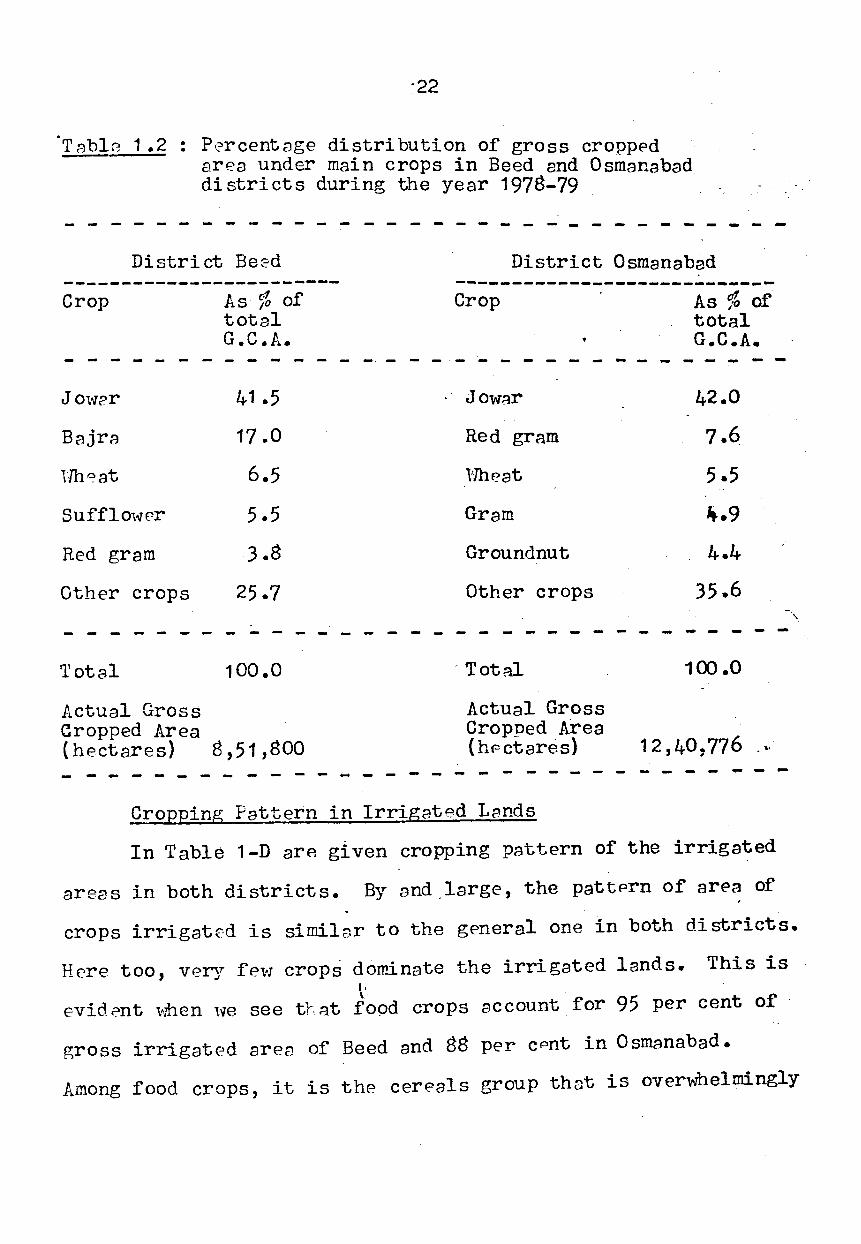
·T r1bl2 1 .2 : Percentvge distribution of gross croppPd area under main crops in Beed and Osmanabad districts during the year 1978-79
- - - - -- -District Be2d
------------------------Crop
- - - - - -J O"I..Yc-r
BajrA
lfu'-7at
Sufflot.Yer
Red gram
Other crops
- - - - - -Total
Actual Gross
-
-
As % of total G.C.A. - - - -
41 .5
17.0
6.5
5.5
3.8
25.7
- - - -100.0
Cropped Area (hectares) 8,51,800
-
-
- -·-
- - -
- -
- -
District Osmanabad ----------------------------Crop
- - - - -Jow~r
Red gram
Hheat
Gram
Groundnut
Other crops
- - - - - - -·Tot~
Actual Gross Cropped Area (hPctares)
- ·- -
- - -
As % of total G.C.A. -- -
42.0
7.(J
5.5
Ji-.9
4.4
35.6
- - - -100.0
12 ,40, 776
-. -
- - - - - - - - - - - - ~ - - - - - - ~ - - - - - - - - - - - -Cropping Pattern in Irrigated L?nds
In Table 1-D arP. given cropping pattern of the irrigated
areas in both districts. By and.large, the pattPrn of area of
\
crops irrigated is similGr to the general one in both districts.
Here too, ver~,r fev1 crops dowinate the irrigated lands. This is \'.
evident v,nen vve see tY ::tt food crops account for 95 per cent of
gross irrigated area of Beed and 88 per CPnt in Osm~nabad.
Among food crops, it is the cereals group thDt is over,~elmingly
23
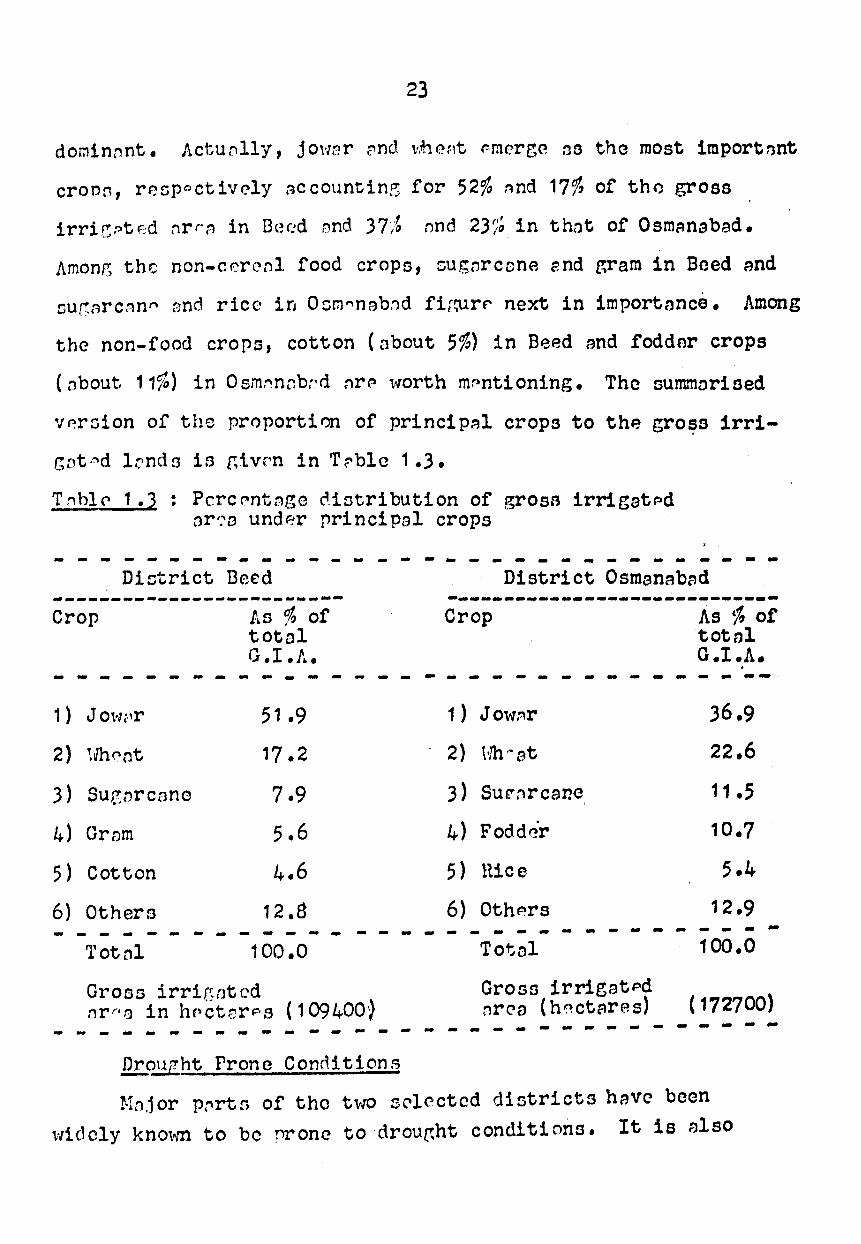
dominnnt. Act.unlly, j ovmr ~nd \!.he~'t r-mcrgn na the most importnnt
cronn, renp~ctively ~ccountine for 52% nnd 17% of tho gross
irri~Pt~d nrrn in Deed nnd 37~ ond 23% in that of Oam~nabad.
Amon~ the non-c~rcnl food crops, cugnrcone end gram in Boed And
nu~nrc~nn and rice in Ocm~nab~d fir~r~ next in importance. Among
the non-food crops, cotton (nbout 5%) in Beed ~nd fodder crops
( obout 11%) in Osm~nnb:·d nr&? '\'ITOrth mr.11ntioning. The summorised
VP.rsion of the proportion of princip::Jl crops to the grOf?S irri
got~d lends in ~ivrn in Tpblc 1.3.
T~blC' 1.3 : Pcrc('ntr-~ge ~.istribution of gross irrigatPd nr~a undAr principal crops
- - - - - - - - - - - - - - - - - - - - - - - - - - - - - - - -Dictrict Deed
----------------------~--Crop f.~s % of totol G.I.A.
District Osmanab~d
-----------------------------Crop As% of total G.I.A • . - - - - - - -- - - - - - - - - - - - - - - - - - - - - - - --
1 ) J o''~'"'r
2) ifu0nt
3) Su.rsnrcone
4) Grnm
5) Cotton
6) Others
51 .9
17.2
7.9
5.6
4.6
12.fl
1 ) J owr~r
2) Hh~at
3) Su£"'nrcanc
4) Fodd~r
5) Hice
6) OthPrs
36.9
22.6
11 .5
10.7
5.4 12.9
- - - - - - - - - - - - - - - - - - - - - ~ - - - - - - - - - -'rotnl 100.0
Gross irrignted nrna in hPCtort:·S ( 1 09400~
Total
Gross irrigatPd nrC' a ( h~ct~res)
- - - - - - - - - - - ~ - - - - - - - - - - - - - - -~ouFht Prone Connition~
100.0
( 172700) - - - - -
~!n,1or P:"~rto of the t\'10 sC'l<:ctcd districts hav<? been
vtidcly known to be nrone to drou~ht condi tiona. It is ::Jlso
well supported by t.he HFact Finding Committee for Survey of
Scarcity Areas - I-1aharashtra State, 1973 (Sukhatankar Committee) .'1
Talukas identified as drought-prone by this Committee in the
selected districts are :
(1) Beed_]j.strict : (a) Ashti, (b) Beed, (c) Georai, (d) Kaij,
( e) Haj alga on and (f) Patoda.
(2) Osmanabad District : {a.) Bhoom, (b) Kallam, (c) Osmanabad,
(d) Faranda and (e) Tuljapur~
Furthermore, the official records dealing in normalcy or
other1"1ise of the agricultural yields also support the fact .that
most parts of the two districts under consideration hav·e been
under prolonged dry spells in recPnt years. During the years
1982-83 and 1983-84 over 500 villages in Beed district were
declared scarcity affected (less than 50 per cent of normal
yj elds). The situation '\'ITas no less severe in Osmanabad district,
as the total rainfall during the ypar 1982-83 '\'ITas less than 60
per cPnt of the normal. Tuljapur branch, 1~ich accounted for
81 per cent of the sample borro1'1Ters, had faced a severe dry spell '
in 1983-84 and in 56 of the affected villages the members of
Land Development Bank got the postponement of the instalment
due from them.
l.cJLll(} .l-1-i ; -- ...... __ . ____
- - - - - -District/ Tehsil
-------l) Osmanabad
2) K~lamb
3) Latur .,~
4) Ahmedpur
5) Udgir
6) Nil~nga
7) Ausa
8) Omerga
9) Tuljapur
10) Faranda
11) Bhoom
1nlukawise det8ils of area irrigated in OsmanRbnd district during the ye~r 1978-79 ·
- - - - - - - - - - - - - - - - -Sources of irriP.ation sur.·ra-c-e-·-INeTI ___ _ irriga- irrigation tion (net area) (net a:rea)
- - - - -6,509
(39.7)
2,074 (16. 2)
149 (1. 3)
19 (0,3)
2,085 (13,3).
- .. - -9,899
(60.3)
10,694 (83,8)
12,136 (98,7)
3i455. ( 00)
6,048 (99,7)
13,653 (86.7)
Net At'ea irrieated '-·
- - - - -16,408
(100)
12,768 (100)
12,285 (100)
3i455 ( 00)
6,067 {100)
15,738 (100)
690 (8.9)
7,092 7,782 (91,1) (100) 11,473 11,473
(100) (100) -
- .. - -Total gross ar~~
irrigated
- - - -20,818
- - - -Gross area irrigat~d as ~ of the net area irriga-
-ted_ ... -126.9
(Area in hect~res) - - - - - - - - - -
Total Net irri-n~t gqted area sown as ~ of net area sown area
- - - - - - - - -99,500 16,5
15,498 121,4 1,08,500 11.8
13,939 113,B 82,400 14.9
6,095 176.4 1,16,100 3.0
8,247 135.9 1,33,600 4.5
18,003 114.4 1,06,200 14.8
9,982
14,243
128,3 1,03,400 7.5
124,1 1,17,100 9,8
6,179 20.083 26,262 31,852 (2B.5) (76.5) (100)
121,3 95,800 27.4
6,620 10,005 16,625 19,540 ( 3 9. 8) ( 60 • 2) . ( 100 )
117~5 94,500 17.6
1,716 10,782 12,498 14,588 116.7 57,900 21.6 ~(_13~·~7~'----~(8~3) (10~9~2-------------------~··-----·~-~~
~o~a:- ~~~8~41 :·l~i~E9 __ l:'HoS~:- :•:2:8~5- _1:2:2_ =1~1:,~o~- :2:7_ - -
I
(\) \J\
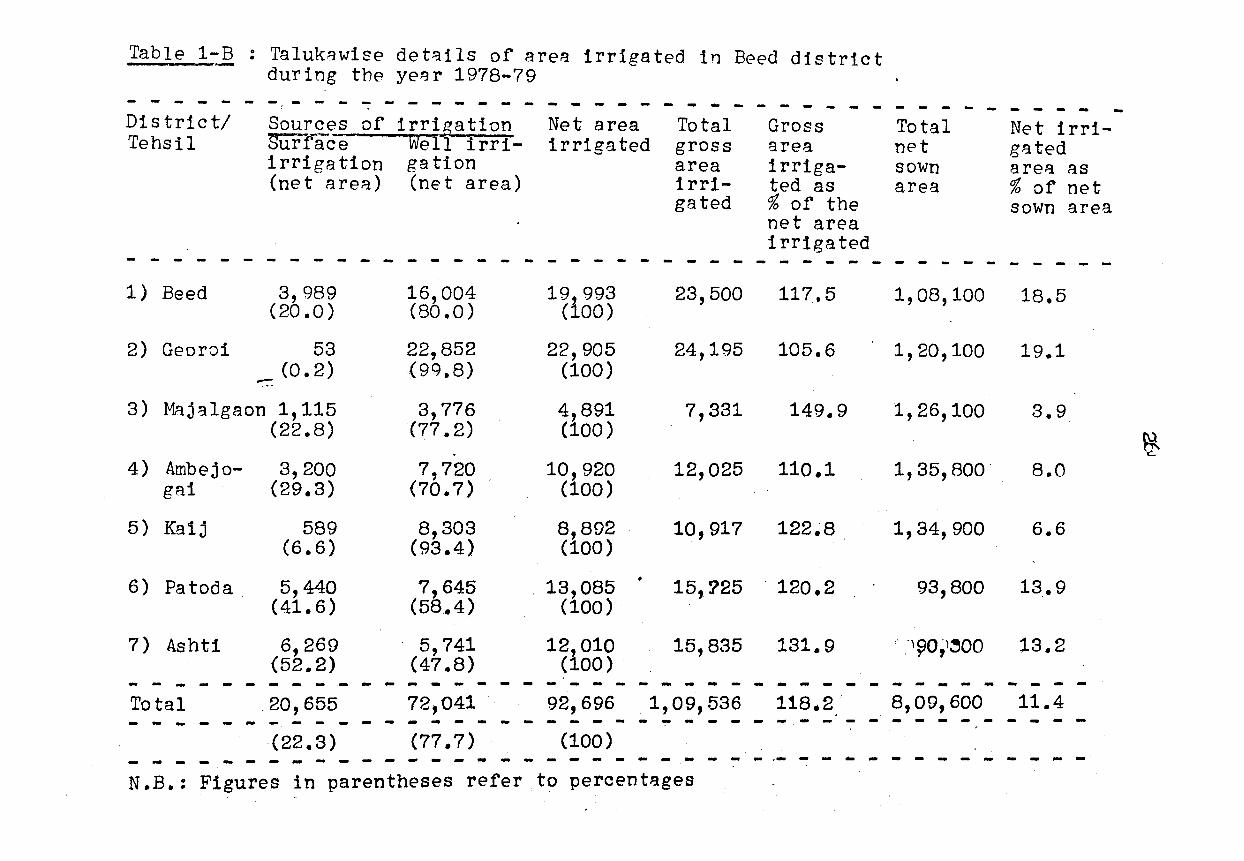
Table 1-B : Talukawise det~ils of are~ irrigated in Beed district during the yeBr 1978-79
- - - - - - - - - - - - - - - - - - - - - - - - - - - - - - - -District/ Tehsil
Sources of irrigation Surfalc_e _____ W_e_1~1~i-r~r~1-1rrigation gation (net are~) (net area)
- - - -1) Beed
2) Georoi
3,989 (20.0)
-53
(0. 2)
3) Maj~lgaon 1,115 (22.8)
4) Ambejo- 3, 200 gai (29.3)
5) Kaij 589
6) Patoda
(6.6)
5,440 (41.6)
16,004 (80.0)
22,852 {9g.8)
3,776 (77. 2)
7,720 (70. 7)
8,303 (93.4)
7,645 (58 .• 4)
Net area irrigated
191993 ( 00)
22' 905 (100)
4,891 (100)
10,920 (100)
8,892 (100)
Total gross area irrigated
- - - - -23,500
24,195
7,331
Gross area irrigated as fo of the net area irrigated - - -117.5
105.6
149.9
12,025 110.1
10,917 122.8
~ 13,085 15,?25 . 120,2 (100)
.. - - - - -Total net sown area
1,08,100
1,20,100
1,26,100
1,35,800"
1,34,900
Net irrig~ted are~ as % of net sown area
18,5
19.1
3.9
8.0
6.6
93,800 13_. 9
7) Ashti 6,269 · 5,741 (52.2) (47.8)
12, 010 15, 835 131. 9 ' ."'~0;1~00 13. 2 (100)
- - - - - - - - - - - - - - - - ~ - - - - ~ ~ - - - ~ - - ~ - - - - - - - - - -Total . 20,655 72,041 · 92,696 1,09,536 118.2 8,09,600 11.4 - - - - - - - - - - - ~ ~ ~ - - - ------ ·- - - -.- - - - - -
(22.3) (77.7) (100) - - - - - - - - - - - - - - - - - - - - - - - - - - - - ... - - ~ ------- - - ... -N.B.: Figures in parentheses refer to percentages
Tabl~~: Area under different crops in each district in 1978-79
( Ar~a in hEictar~s) - - - - - - - - - - - - - -- -.------- ~ Beed Osmanabad
- - - - - - - - - - - - - - - - - - - - - - - - - - - - - - -1 • Rice 10,054 34,615
( 1 .2) ( 2 .8)
55,009 68,075 . (6.5) ( 5 .5)
2. 1'lheat
3. J O't'lar ( Kharif) 1 , 48,919 (17.5)
2,93 ,822, ( 23.7)
2,04,521 2,27,285 ( 24.0) (18.3)
4. Jowar (Rabi)
1 '44, 7 42 26,272 ( 16.9) ( 2.1 )
5. Bajra
5,924 31 ; 831 ( 1 .o) (2.6)
6. Other cereals
5 '69 6169 6,81 ,900 (6 .8) ( 54.9)
7. Total cereals
32,628 94,410 ( 3 .8) ( 7 .6)
8. Gram
32,992. 60,618 (3.9) ( 4.9J
9. Tur
54,894 1,15,339 ( 6 .4) (9 .3)
10. Other pulses
1,20,514 . 2,70,367 (14.1) ( 21 • 8)
11. Total pulses
8,592 19,919 ( 1 • 0) ( 1 .6) 1 2. Suf.arcane
': 8,246 26,242 \
( 1 • 0) ( 2.1) 13. Other foodcrops
7,06,521 9,98,428 ( 82.9) ( 80.5) 14. Total foodcrops
24(412 32,730· 2.9) { 2 • 6 ) ( c ontd. )
15. Cotton
2.8 (Table 1-q) contd.
- - - - - - - .. - - - - - - ~ - - - -Beed
- - - - ~ - - - - - -16. Total fibres
17. Groundnut
18. Other oilseeds
19. Total oilseeds
20. Other non-foodcrop·s
21. Total non-foodcrops
22. Total gross cropped area
28,001 ( 3.3)
22,388 ( 2 .6)
94,557 (11.1)
1,16;945 (13~7)
341 ( 0.5)
1 '45 '287 (17.1)
8,51,808 (100)
- - - - - - - ~ -Osman a bad
- - - - - - - - -56,354 (4.5)
54,345 ( 4~4)
1 ,28 ~ 072 (10~3)
1 ,82,417 ( 14. 7)
3,f.~T
2;42;348 (19.5)
12,40, 776 ' . ( 1 00)
- - - .. - ... - - - ... - - .... - .... ~ .. ... - - - - - - -. - ... - .. ......
N.B.: Figures in parenthese:3 refer to percentages to total· gross cropped area of the district.
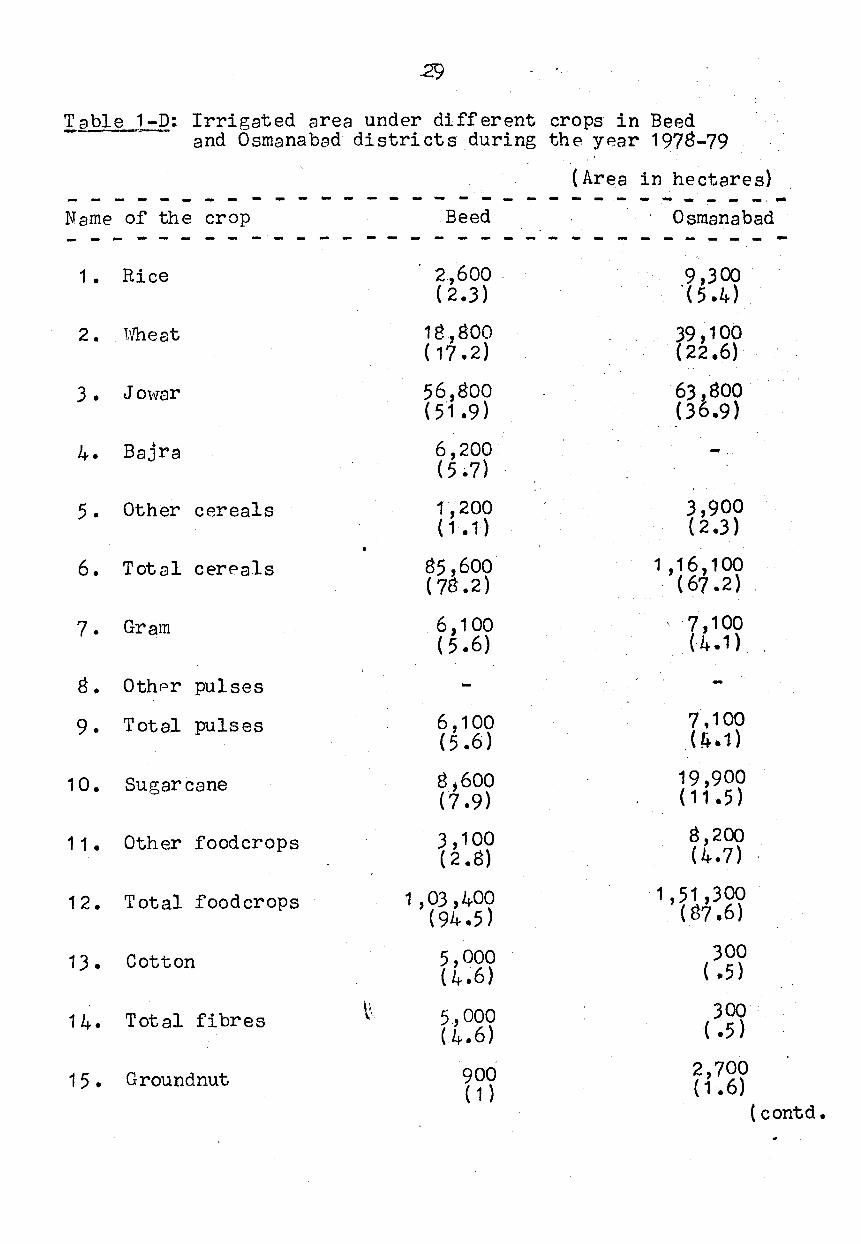
!able __ ) -D: Irrigated area under different crops in Beed and Osmana bad districts during the year 1978-79
- ...... - - - -------Name of the crop - - - - - - -------1. Rice
2. TVheat
3 • J O\\far
4. Bajra
5. Other cereals
6. Total cereals
7. Gram
8. OthPr pulses
9. Total pulses
1 0. Sugar cane
11. Other foodcrops
1 2. Total food crops
13. Cotton
14. Total fibres
1 5 • Groundnut
(Area in hectares) ------- - ... - - - - _ ... - - -· -· ... .Beed Osmanabad - - - - - - - - - - - - - - ~ - - - -2,600 . ( 2.3)
18,800 (17.2}
56,800 (51 .9)
6,200 ( 5. ?)
11200 ( 1 .1 )
85,600 ( 78.2)
6,100 ( 5 .6)
6 '100 (5.6)
8;600 ('7.9)
3 '1 00 ( 2 .8)
1 '03 ,400 (94.5)
5 ,ooo ( 4.6)
5., 000 ( 4.6)
900 ( 1 )
9,300 '(5.4).
39 '1 00 ( 22 .6)
63,800 ( 3 6.9)
-3,900 ( 2.3)
1,16,100 . ( 67 .2) .
19,900 (11.5)
8,200 ( 4. 7)
1,51,300 ( 87,6)
300 ( .5)
300. ( .5)
2,700 ( 1 .6)
( contd.
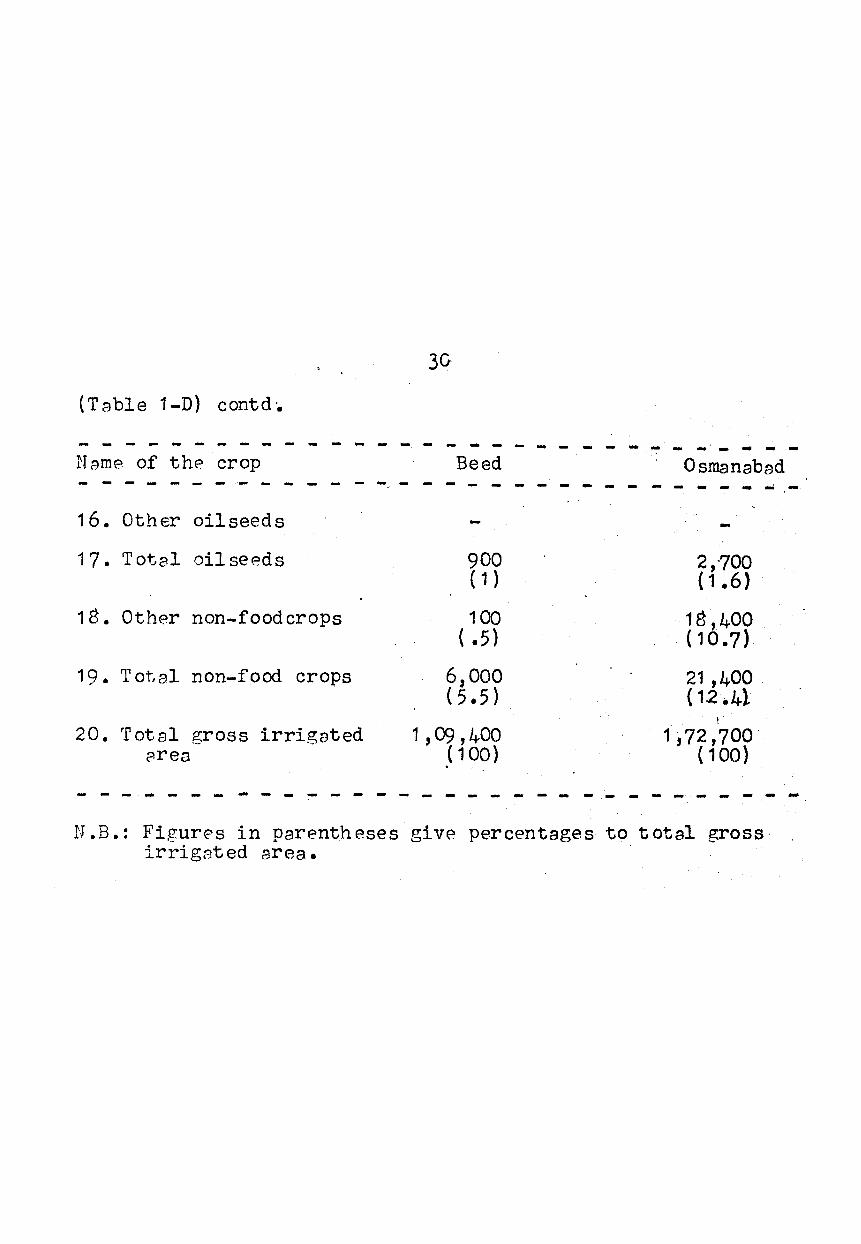
(Table 1-D) contd ·•
- ~ - ~ ~ - ~ - - - - - - - - -- .... - .. N Arne of the crop - - - - - - - ·'- - - - - - --- -16. Other oil seeds
17. Total oilse~ds
18. Other non-foodcrops
19. Total non-food crops
20. Total gross irrigated ~rea
Beed
900 ( 1 }
100 ( • 5}
6,000 (5.5)
1 '09 '400 ( 100)
- ~ - ~ - - - - - - - - - - - - -
------
- - - -
Osmanabad ... - - .... -.-
2,·700 { 1 .6)
18,400 ( 1().7)
21 ,400 ( 12-41
1
1,72,700' ( 1 00)
- -· - - - - ... N .B.: FigurE's in parentheses giv~ percentages to total gross
irrigated area..
CHAPT"SR II
SALISNT FSATURSS OF TH~ SCH~IVIS
The highlights of the !viinor Irrigation Scheme in general
are briefly pr~sented hare. In the first section, the proposal
from the Land Development Bank as approved by National·Bank for
Agriculture and Rural Development (NABARD) \vith stipulations,
is broadly reproduced from the available files. The institu
tional arrangem~nt for the implementation of the approved scheme
is follo\ved up in the concluding section of this chapter.
2.1 General Pronosal
The financial viability of the Minor Irrigation Scheme
has not been separat ~ly appraised for the selected districts in
Marath1-vada region. Actually it forms a part of a larger scheme
covering different \vatersheds cutting across several districts '
of the entire State. By and large, the parameters of economic
viability \vorked out for similar schemes ear1ier approved for the
same area, have been assumed to hold good for the present scheme
as 1-vell.
The scheme under r~ference, kno\-Jn as nARDC Credit
Project III - gino:c Irrigation Programmes in 27·districts of
I<[aharashtra State 17 , \vas prepared by Naharashtra State Cooperative
Land D3velopment Bank Ltd. This project for providing long term
credit involving a financi'fil assistance of R.s. 2635.99 lakhs and
.ARDC refinance ( 95 ner cent) at Rs. 2504.18 lakhs was generally· ...
a~~roved by ARDC for the year 1981-82. This ARJC Credit
31
32
Project III was, in turn, sanctioned by the International
D2velopm~nt Association. The r8finance sanctioned was to be
effected by way of subscription to th8 special development
d·~bentures to be floated by Land Development Bank from time to
time for financing the schene in question. Hm-vever, the -sub
scription from NABARD \vas lirrri.ted to the extent of 95 per cent
of each issue of the said debentures covering minor irrigation
inv·Jstm·~nt. lioreovcr, the aggregate contribution from NAB MD vJas not to exceed R.s. 2504.18 lakhs. Th~ ·State and Central
I
Gov'-~rnment \v~re to contribute the remaining five per cent of
each issu~ of d9bsntures.
Th·3 total financial outl_ay o.f thJ Scheme at R.s. ~635 .99
lakhs was calculated on th3 basis of : (1) (a) Ne\v well with ·
pumpsGt units numb~ring 10,734 in hard rock areas at an ·average
unit cost of B.s. 17 ,000; (b) 566 units in alluvial areas at
averag·2 unit cost of R.:.:. 19,500 each; (2) renovation of 4500
existing \<Jells, th~ unit cost being Rs. 3,000 and (3) 9200 pump
sets, the unit cost baing Rs. 6,000 for 3 HP and fu. 7,000 for
5 HP motors. The basis of calculation of unit costs has also
taken into consideration the down payment to be made by the
b2neficiary farm8rs cut of their own resources, such as, family
labour ~"1d other contributions in cash and kind. The general
terms and conditions have also provided for some variations in l•
the quantum of loan in individual cases depending upon the
depth of vJell, the nature of strata, the horse po\ver of pump-
sets required, etc. The Land Development Bank could adjust the
amount of loan according to the actual requirem8nts subject to the
33
follmving conditions:
(a) The issue of loans for amounts in excess of the
average vJ.ould have to be done, if necessary, from savings
effected on account of loans issued for an amount which is
belo11-..r the average, the total financial assistance under .the
scheme remaining unchanged.
(b) The bank should· ensure that the cultivators availing·
themselves of loans larg~r than the average· hava adequate
security to offer as well as adequate repaying capacity.
(c) Wh~re the loan advance is lovJer than the estimated
cost, the bank should ensure that the cultivator has sufficient
resource to meet the balance and the \vork executed is according
to snecifications annroved and that the materials to be used 4 A A. 1
for construction are of standard quality.
Among the special terms and conditions stipulated by
NABARD, brief mention may be made of som9 of the important ones.
One such stipulation insisted that the Land Development Bank
should implement th:3 programme on· \vatershedwise basis and not
on district\vise basis. Ho11vever, the Land Development Bafl.k \-Jas
forbidden to finance minor irrigation development in 12 water
sheds of five districts vJhcre there \-Jas no potential for further
exploitation of ground \vater. Hov.;cver, the bank was allmved to
diy(~rsify the proposed programme in these 12 v.;atersheds to other 1:
watersheds of the rosnecti've districts. It may also be noted L . .
h~3rc that none of these prohibited \vat·~rshads \'JaS in the t\'JO
districts selected for the pr8sent study.
The bank \vas exnectcd to ensure that a minimum spacing .. of 160 meters ( 500 feet) would bo maintained bet11veen tho proposed
34
\v.:Jll and any of th3 existing \vells. It vvas expected that 60 per
cent of loaning be mv.d.:~ to small and marginal farmers in each
district. The loan maturity \vas to be:; based on the ultimate
borrotver 's rapaying capa.city and should not exec ad nine years '
for normal lJnding and 15 y-:: ars for lending to small farmers
except th·~ pumps2t c ompon~~n~ \vhich \vould retain nine ye~ period.
Regarding the security the mortgaga of land and hypoth2cation
of machinery \'17cre raquircd. Th~ land would be valued according
to its post-dGvelopm3nt mark3t value and the loan eligibility
"t·;as to be restricted to 60 per cant of the value of land.
2.2 Institutional Arrangement
vJhile NABARD remains a refinancing body, funding different
implcm::;ntine; ag'.~nci'3s to carry out various sch3mcs under its
spocifiad conditionaliti8s,- the implementing ag~ncy for the
minor irrigation schemes under consideration of the present
study, is Maharashtra State Cooperative Land Davelopmont Bank
Ltd. (MSCLDB). In the pr:~ceding section, 1tJC already have seen
some highlights concerning th·J schema as approved by N1lliARD. In
the follo\'ling are mentioned some salient features of the scheme
from th~ point of view of Land Development Bank. ·The 'Manual of
Loaning' issued by MSCLDB in 1976 (since revised in 1984)
g2nerally covers all the aspects of the procedures, operation
c..nd mc.mag~~m2nt functions of 1,tievclopment financing. The relavant
information culled from this manual, as also discussions \vith
thG Land Development Bank officials, form the basis for the
follm,ving.
35
The Land Development Bank has been for a long time
engaged in the financing of ground \vater utilization mainly throug:t
dug-\liells. The procedure of financing, ho\'iaver, has undergone a.
substantial change since th~ con~encement of the IDA Project
early in 1973. Loaning earlier done mainly on consideration of
sacurity offered, has given placa to production oriented system
of lending based on project appraisal. The siting and spacing t
of \vells have also been m.ade more scientific by the techni·.cal
crit-2ria laid do\vn by the Ground-\'1/ater Surveys· and Development
.Ag8ncy ( GSDA). Th9 Bank's officials have to follo\'1/ the. guide
lines regarding the tqchnical and economic appraisal of
investment in the case of dug wells.
The standard estimates of cost of the dug wells for
different areas coming under irrigation have been prepared
separately for deccan trap and alluvial areas. The rates
assumed \vhile preparing the estimates have been the latest local
rates and they should be adhered to until modifications are
communicated by the Head Office. These estimates are, however,
subject to up\vard modifications upto 10 per cent to allm'l for
special local conditions.
To facilitate the concerned officials to make more
rational economic appraisal of investment in dug wells, the
Land Develonment Bank has prepared, fo'r each homogenous agro-. ~
climatic zone in the StatG ;:. estimat9s of pre and post-development
incomas for various acreages coming under the irrigable command
of a \vell. Similarly, the Bank has prepared for every such zone,
statements of net income befora and after d8velopment, incremental
incoma based on standard cropping pattern, loan eligibility, etc.,
36
in respect of different sizes of irrigable command areas. These ,,
estimates have been provided with built in allO\<Jance for varia
tions such as cropping pattern like orchards to modify the
criteria of loan eligibility at the discretion of the District
Branch. In regard to loans for renovation of old \<Jells, 'the
I~Ianual provides for guidelines and discretionary po~vers to the
enquiry officers to visit the spot and make an appraisal to
prepare estimates and technical officers to examine the same.
Th9 Bank has recogniSed the fact· that for the purpose
of security, the mortgaged land should be valued on it·s .
intrinsic value after irrigation. Ho\-Jever, under production
oriented system of lending, the amount of loan to be advanced
is also linked ~'lith the repaying capacity of the farmer and not·
merely ~'Ji th the value of security. Since the repaying capacity
depends upon the incr~mental income, the loan eligibility
det c~rmine s upper limit of the loan ~vhi ch can be sanctioned. The
lo~! eligibility, in turn, depends upon repayment period. The
longer the period of repayment, the same incremental income \<Jill · I
result in a hi&her loan eligibility. In order to accommodate
small farm9rs (as per HAB.ARD definition) discriminatqry consi
derations are built into period of repaymGnt and the requirement
of dovm payment.
Th9 period of repayment of loans for dug wells and dug r
vvell improvements is nine years, including a_:gestation.: period
of t~·Jo years for a.ll farmers except the small farmers for vvhom
this period is extended upto 15 years. The repayment period
is sarne for the composite loans as ~vell. Ho~vever, in the case
f 1 th t o2riod is seven years o on y oil enz;ine or pumps8t 9 repaymen ...
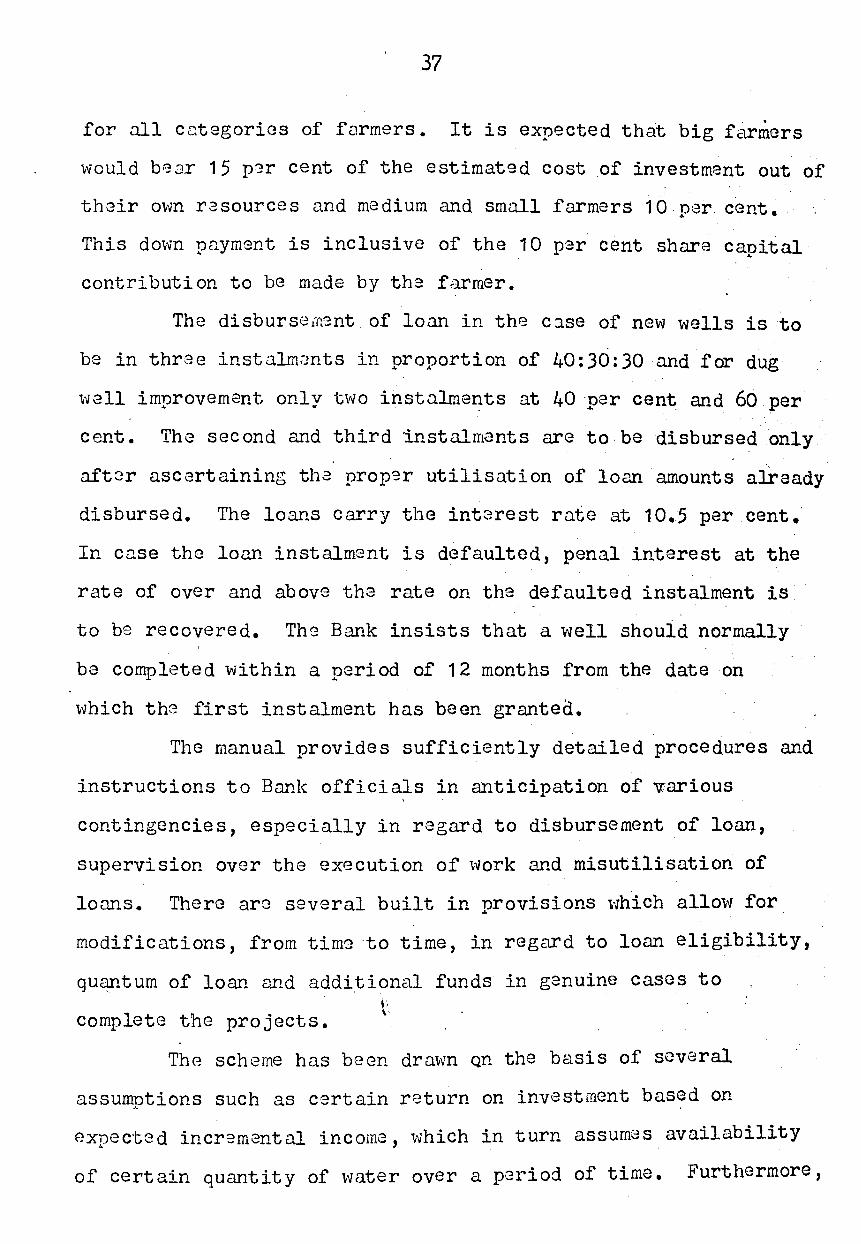
37
for nll cntegories of formers. It is expected that big farmers
vvould b~ar 15 p8r cent of the estimated cost of investment out of
their O\-Jn r3sources and medium and small farmers 10.n~r cent • .. This do\vn pnymGnt is inclusive of the 10 par cent share canital ...
contribution to be made by the farmer.
The disburse1fl3nt. of loan in the c:tse of ne\'l \vells is to
b a • v ln thrae instnlm~nts in proportion of 40:30:30 nnd far dug
\vall improvement only two instnlments at 40 ·par cent and 60. per
cent. The second and third 'instalments are to be disbursed only.
aft8r ascertaining tha prop~r utilisation of loan amounts already
disbursed. The loans carry the int8rest rate at 10.5 per cent.
In c~se the loan instalment is defaulted, penal interest at the
rate of over and above the rate on the defaulted instalment is
to be recovered. Th~ Bank insists that a well should normally
be completed \vithin a period of 12 months from the date on
\vhich th2 first instalment has been grantea.
The manual provides sufficiently detailed procedures and
instructions to Bank officials in anticipation of various . contingencies, especially in regard to disbursement of loan,
supervision over the execution of \vork and misutilisation of
loans. There arc several built in nrovisions which allo\'1 for .. modifications, from tim~ to time, in regard to loan eligibility,
quantum of loan and additional funds in genuine cases to ·'
complete the projects.
ThG scheme has been dra\vn Qn the basis of several
assumptions such as certain return on investment based on
expected incremental income, \vhich in turn assumes availability
of certain quantity of \·Jater over a period of time. Furthermore,
38
varying cropping pattern and productivity arc· k8y factors in
r~clising the assum:Jd incremental income to make the scheme
financially a vio.bl3 ona. HovJ realistic are thG assumptions. \'Till
ultimately depend upon the d·3gree of the successful implementation
of the scheme.
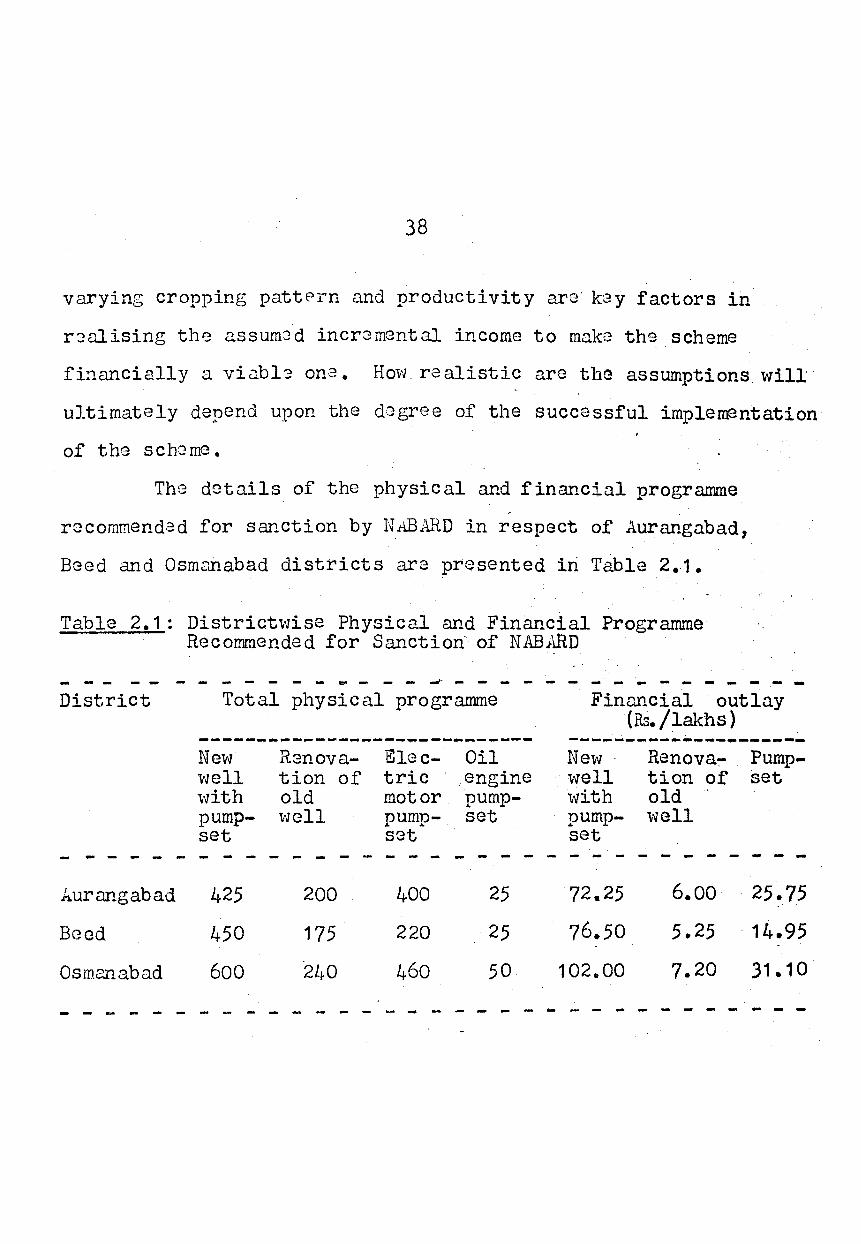
The datails of the physical and financial programme .
rccommend·~d for sanction by N.ti.B.A .. -qD in respect of Aurangabad,
Bced and Osmanabad districts are pr~sented iri Table 2.1.
Table 2.1 : District\-Jise Physical and Financial Programme Recorrmended for Sanction' of NAB.t-\.RD
- -- -- - - - - - .... - - - -·- - - - - - - - - - - - - - - --District Total physical programme Financial outlay
(Rs. /lakhs) -----~-----~-~~---~-~~~---~-- ----~---------~~-----New Renova- Elec- Oil New Renova~ . Pump-vJell tion of tric .engine \'I ell tion of set \vith old motor pump- \vith old pump- 't-v ell numn-.. ... set pump- \'11311 set set set
- - - - - - - - - - - - - - - - - - - - - - - - - - -hUrnngabad 425 200 400 25 72.25 6.00 25.75
Bccd 450 175 220 25 76.50 5.25 . 14.95
Osm211abad 600 2h0 460 50 102.00 7.20 31.10
- - - - - - - - - - - - - - - - - - - - - - - - - - - - -
CHAPI'ER III
OBJECTIVES, HETHODOLOGY AND SAf.1PLE ---- EE.~IYI.fl
3.1 Main Obiectives
At the outset, it may be stated that the broad objective·
of the present study is to und ?.rstand the various facets 'and
the problems of financing the dug vJell scheme?s in hard rock
areas that are prone to periodic droughts ·or scarcity conditions.
Recognising the special ethos of the specific areas, it attempts
to make the qualitative assessment of the extPnt of divergence
betl;'7een t?.xpectations of the scheme and problems or constraints· . .
in their actual realisation. Moreover, the study may assume
some special importance as .the data pertain to tHe pre-optimal
stage f.e.very first year aftPr the completion of the project.
Subsequently, data representing normal conditions are suplemented
to 'livork out the financial rates of return. Since the basic aim
of the ex-post evaluation studies is to enable NABARD in improv-
ing project planning and implementation, the present exercise
modestly tries to focus attention on certain dimensions mentioned
above.
In order to realise the broad aim of the study, some
specific objectives, among others, to be covered are as
mentioned in the follo,~ng :
(i) to evaluate the b~nefits accruing to the borrowers
of the scheme in terms of incremental income and employment;
(ii) to assess the performance of the agency involved
in the implementation of the scheme under consideration and;
39
.•
40
{iii) to identify the problems faced by the beneficiaries
at all levels in general and those ending up with incomplete
or failed wells in particular.
3.2 Methodology And Coverage
The methodology of the study has tRken into consideration
obtaining relev;:~nt primary data from the h'ouseholds selected to
represent borrowers of differ~nt types under the scheme. These
types refer to singlP or composite loans made available for
(a) sinking of ne"tv 1.vell (b) renovation of old well and (-c) electric
motor or oil engine driven pumpset.
In order to arrive at the net increment31 benefits arising
from the investment, selection of 'control' from among non
beneficiary rainfed farmers has also been undertaken.. This
control sample is taken to represent "without project" condition.
Besides, the rainfed cropped areas of selected beneficiary
farmers themselves would provide as 'control' for the purpose
of comparison.
Also considerPd \~thin the purview of primary data is the
inclusion of some borro1.dng farmers Whose dug wells are treated
es 'incomplPte' or 'failed' ones.
Apart from the primary level data collected through the
Pxhaustive auestionnaire-schedules canvassed in the field survey
among the selected households and case studies of some selected • \,
cases, the study has attempted to collect whatever information
made available from the official sources of the Maharashtra
State Cooperative Land Development Bank (MSCLDB), the
41
implern~nting agc=>ncy.
\Vhile thr:- prim~ry d:-3ta from the SPlr?cted households would . '·
facilitCJte, am.ong othPr things, anAlyses of costs and benefits
vis-a-vis the investment, the secondary data, it is hoped, would
throw some light on institutional and other aspActs of the
project.
Thr- coverAge of the study is required to take into con
sideration the r~strictive nature of qualifying universe to draw . .
the sample and suitable arPP.S that can give adequate size of
sample. Firstly, since the scheme under consideration being the
NABARD funded project for the yef!r 1981-82, the coverage of the
study is rest.ri cted to those of the farmers '"~ho have been
sanctioned loans by the Land Development Banks during this. parti
cul3r year ( 1981-82). Among these ;:-gain, '\liTe are to consider
only thrse who have completed their individual schemes as this
enable us to evaluate the benefits in the post-investment period.
However, not many of them found to have completed.the required
'iOrks within the stipulated period of one year from the date af
rele0se of the first instalment of the loan. NPvertheless, in
order to get an adequate size of sample, the cut off date for the·
completed project has been taken as of 30.6.1983. And only this
could ensure one full year's data, that is, reference year
( 1 • 7.1983 to 30.6 .1984) for the purpose of the study. I· . \,'
Initially, the study h~d pl~nned to cov~r three districts
in Iviarat.bwada, nC~mely, Aurangabad, Beed and Osmanabad. However,
Aurangabad got itself eliminated in view of very low number of
completed projects of in<.li vidual benP-ficiaries in any of the
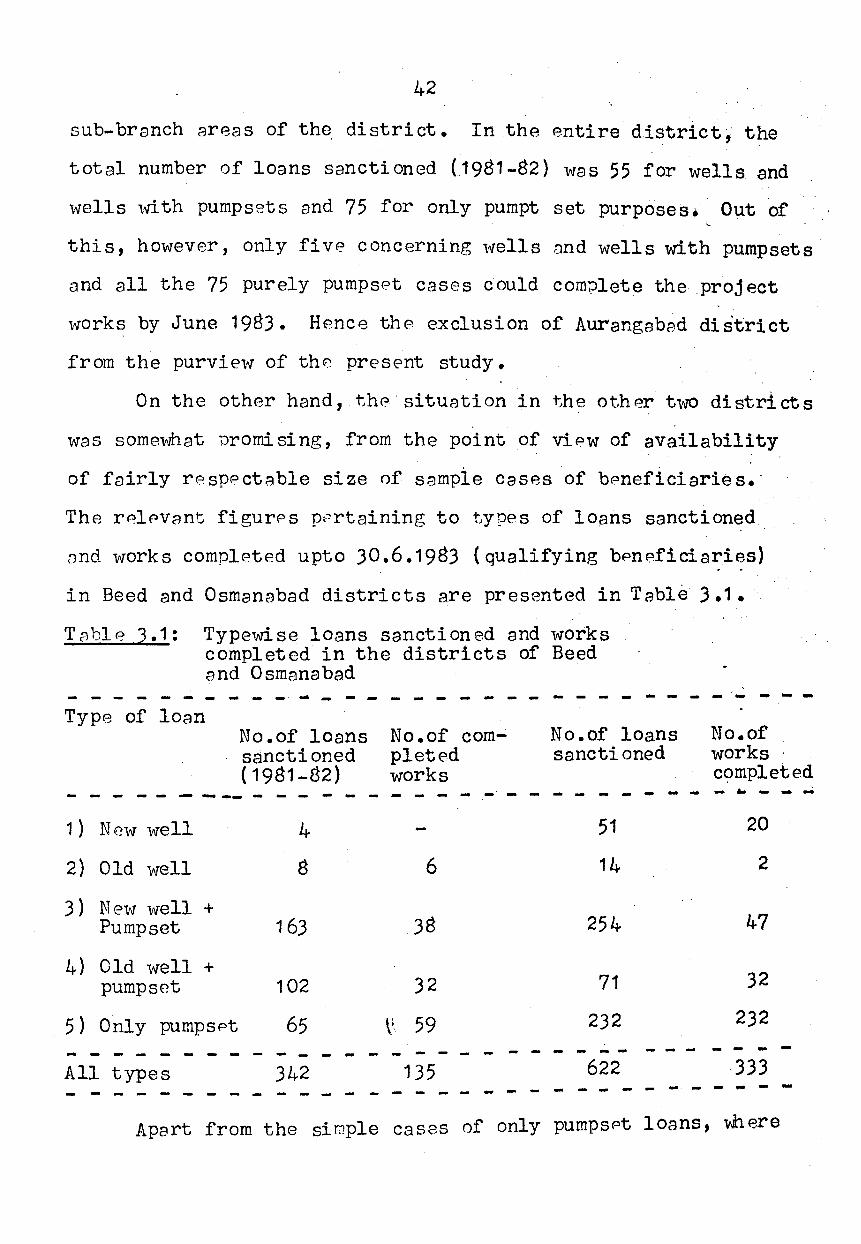
42
sub-branch areas of the district. In the entire district, the
total number of loans sanctioned (J 981-82) was 55 for wells cmd
wells ,,.Uth pumps2ts and 75 for only pumpt set purposes• Out of
this, however, only five concerning wells and wells with purnpsets
and all the 75 purely pump set cases could comolete the project
v-rorks by June 1983. Hence the exclusion of Aurangabad district
from the purvie"t"l of the present study.
On the other hand, the· situation in the oth~r tt-ro districts
't"las somewhat Promising, from the point of viPw of availability
of fairly respect~ble size of sample cases of beneficiaries.·
The rPlPVc:lnt figures p(~rtaining to types of loans sanctioned
ond works complPted upto 30.6.1983 (qualifying benpficiaries)
in Beed and Osmanabad districts a.re presented in Table 3 .1.
T Bbl p ~ .1: Type'ttJi se loans sanctioned and works completed in the districts of Beed end 0 smana bad
- - - - - -- - - - -- -- - - - - - - - - - - - - - - - - ---Type of loan
No.of loans No.of com_; No.of loans No.of sanctioned pleted sanctioned works ( 1981-82) works completed
- - - -- ------- - - - - - - - - - - - -- - ... - --1 ) Nevv well 4 51 20
2) Old well 8 6 14 2
3) New well + 47 Pump set 163 38 254
4) Old well + 32 pump set 102 32 71
5) Only pumpsPt 65 v. 59 232 232
- - - - -- --- - - - -- - - - - - - - - - -All types 342 135 622 333
- - - - - - - - - - - -- - - - - - - - - - - - - - - - - -Apart from the siople cases of only pumpset loans, Where
43
.the succ~ss rate is expectPdly VPry high, the o~her four types,
corr,prising only 1·rPlls ~nd "tvells combinPd "t•Ji th pumpsets ( compo
site loans) hav0 not p2rformed well to provide a fairly large
population br1se for drowing sC.Jmple cases.
Another dimension adding to thP problem of selection of
beneficiary farmr=rs hns been the very vnde dispersal of the
completed works. Ov~~r 200 villages in Osmanabad and 100 in Beed,
coming under the jurisdiction of nine sub-branches of Land . · ·
Development Baru<s in each district, have been required to be
considered for the purpose. Ho,..,ever, fiv~ sub-branch areas of
Osman~bpd and four of Beed district have reported almost ~ntirely
consisting of simple cases of only pumpset works.
Since the moin focus of the study being new and old dug
v1ells and composite schemes, "t"lith somewhat lesser weightage being
given to the uniformly simple cases of mere pumpsets, the ·
opPrational ar~as of sample to be drAwn have been narrowed down
to obout 60 villAges in five sub-branches of Beed and about 70
villnges in four sub-branches of Osmanabad district.
3.3 S2mple Framewor~
The selection of final spmple size has had to take into
consideration the usual factors like costs, logistics And time
reo.uired for collection of both primary and secondary data. The
tvpp of the target case to be studied was also a consideration t.
in determining the overall sample size.
Beering thP Bbove considerati\')ns in mind, '"'e had approached
the task of selecting a sample size, judged adequate for our
44
purposes. Actually, vve were required to select not only the
beneficiory farmers of the different types of lo~ns, 'but also
a suitable number of loanees reporting incom?lete and or failed .
wells. Besides, a sr:1mple of not more than 50 cases of 'control'
farmers t'las the third requirement.
In regard to the selection of beneficiary farmers, the \
task bPc~me much easier in the case of those reporting loans for·
only pumps(3ts. It was decided to select only 10 per cent of this
type as it involved relatively a smaller investment, mostly made
out in kind form and in one instalment. The problem of selecting
other types of beneficiaries prov8d sometoJhat complicated as the
quolifying popul~tion t'las widely scattered. In point of fact,
the farmers of complet<?d proj Pct toJorks could be found in 58
villages of five sub-branch areas in Beed and, similarly in 71
villages of four sub-branches in Osmanabad. Among these, as
many as 48 villages in Beed and 53 in Osmanabad did report just
one beneficiary each.
Given the above situation and ·t~th due regard to logistics
and time factors, it was decided, in the first instancP, to
select the qualifying villages. In the event, villages having
tt'lO or morP beneficiaries of t'ITells P;nd composite loC~ns 't'ITere given
greatPr t'ITeightage in selection and villages with single bene
ficiaries were selected mainly on the bDsis of spatial dis-\ ·.
persian in order to have 't'Jider representotion of areas in the
selected districts.
Having selected the villages with due regard to avail
C)bility of benefici;::1ry farmers, the procedure of· selP.cting
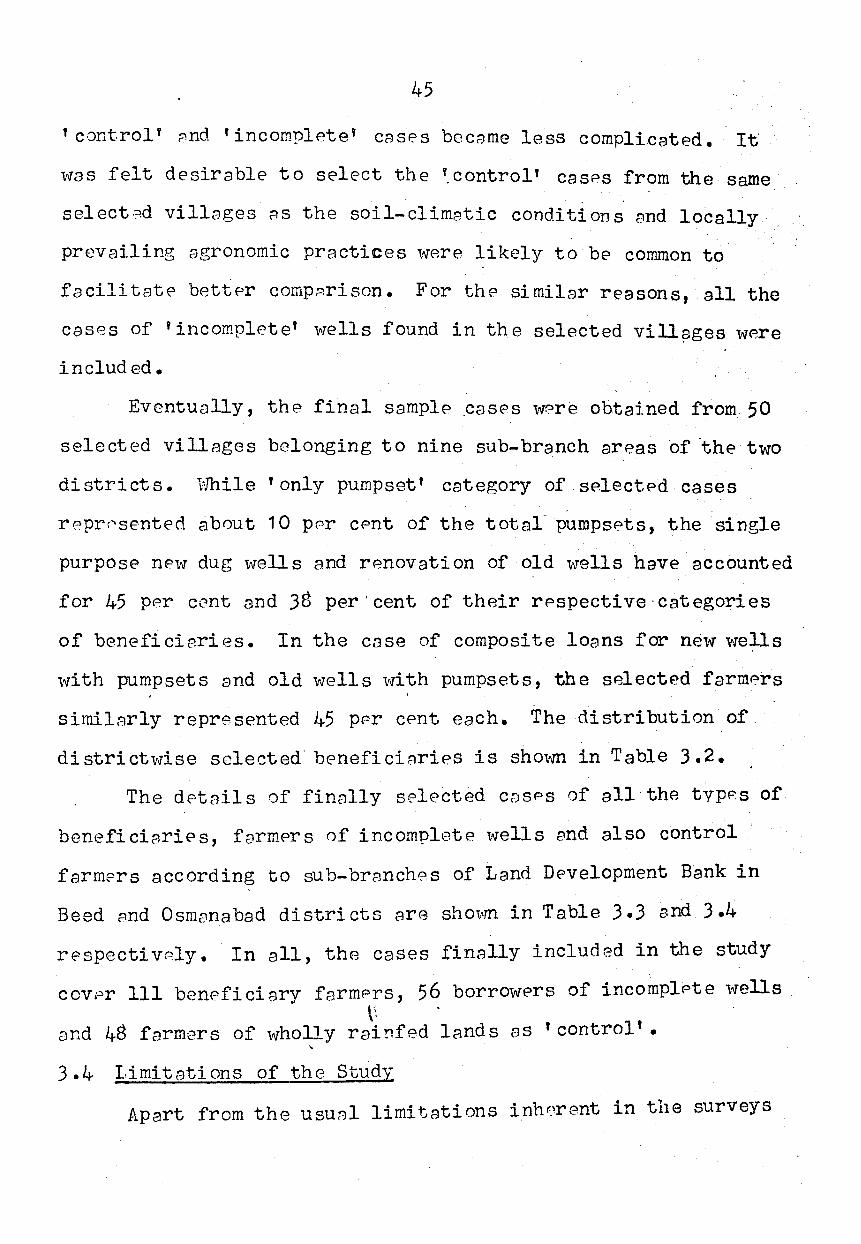
45
' control' pnd 'incomplete' cases bec;::~me less complicated. It.
l'fas felt desirable to select the '.control' cases from the same . .
select?d villages AS the soil-climAtic conditions G~nd locally
prevailing agronomic practices were likely to be common to
facilitate better compPrison. For the similar reasons, all the
cases of 'incomplete' l'Vells found in the selected vill?ges 't1'0re
included.
Eventually, the final sample _cases t'fPre obtained from 50
selected villAges belonging to nine sub-branch areas of ·the two
districts. vJhile 'only pumpset' category of sPlected cases
rpprc'sented about 10 ppr cent of the total" pumpsets, the single
purpose new dug wells and renovation of old wells have accounted
for 45 per cent and 38 per·cent of their respective-categories
of beneficiaries. In the case of composite loans for new wells
with pumpsets Bnd old ·VJells 1rith pumpsets, the selected farmers
similarly represented 45 per cent each. The distribution of
district't'fise selected· beneficiAries is. sho1m in Table 3.2.
The details of finally selected cnsPs of all the typP.s of
beneficiaries, farmers of incomplete l'fells end also control
farmers according to sub-brAnches of Land Development Bank in
Beed c:md Osmc:mabad districts are shO"t•rn in Table 3.3 and 3.4
respectivPly. In all, the cases finally included in the study
covPr 111 beneficiary farmers, 56 borrowers of incomplete wells \:. '
and 48 farmers of wholly rai~fed lands as 'control' • "
3.4 Limitations of the Study
Apart from the usunl limitations inhr-_)rent in the surveys
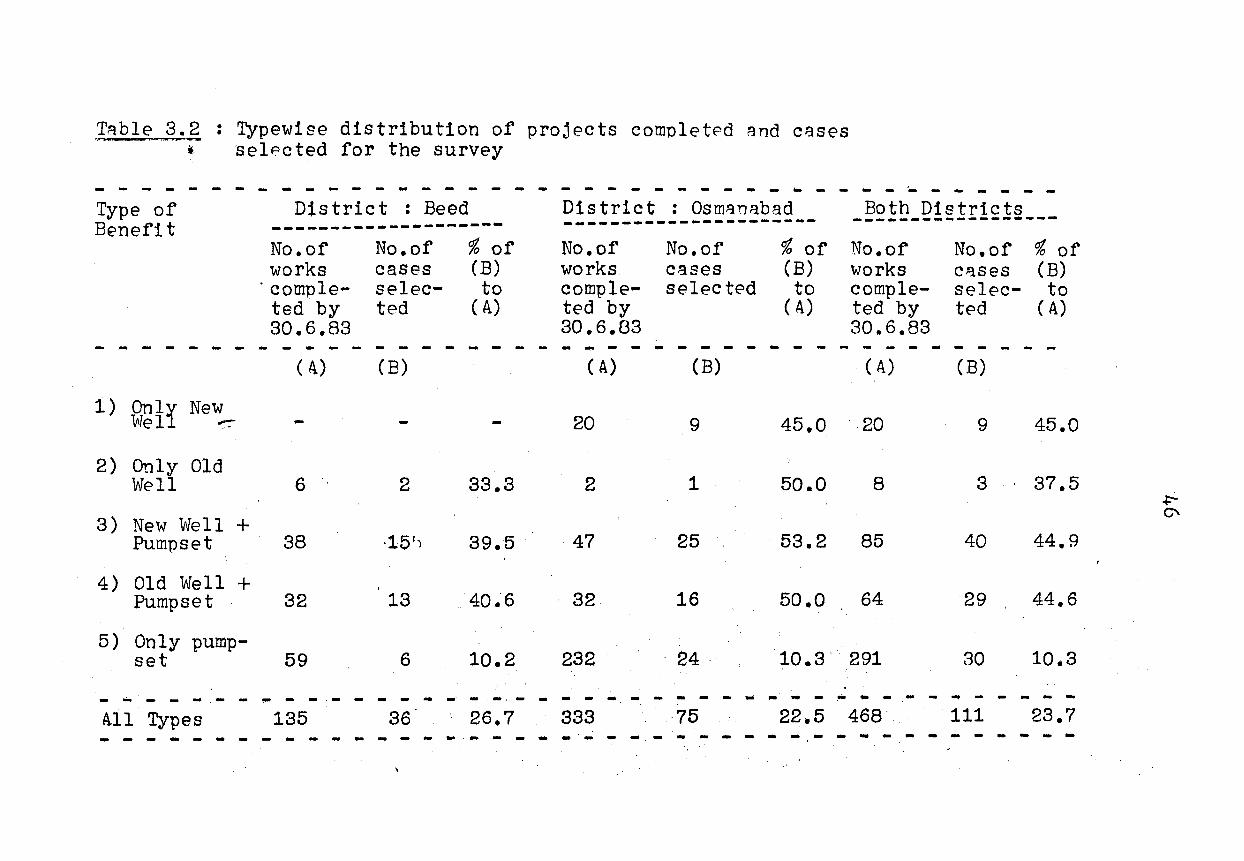
T~ble 3.2 • Typewise distribution of projects completed and c.!3ses • . ....... ~ selected for the survey
- - - - - - - - - - - - - - - - - - - - - - - - - - - - - - ... - - - - ·- - - - - - -Type of District • Beed District • Osm~nabad Both D 1 s t ric t s • • Benefit -~-------------------- --------------~-----------------------
No.of No.of ~ of No.of No.of ~of No.of No.of '% of works cases (B) works cases (B) works c~ses (B)
·comple- selec- to comple- selected to comple- selec- to ted by ted (A) ted by (A) ted by ted (A) 30.6.83 30.6.[33 30.6.83
- - - - - - - - - - - - - - - - - - - - - - - - - - - - - -(A) (B) (A) (B) (A) (B)
1) Onll New 'lftrel ~ 20 9 45.0 20 9 45.0
2) Only Old \rile 11 6 2 33.3 2 1 50 .. 0 8 3 37.5
+-3) New Well +
0\
Pump set 38 ·16 1) 39.5 47 25 53 .. 2 85 40 44.9
4) Old Well + Pump set 32 13 40.·6 32 16 50.0 64 29 44.6
5) Only pump-set 59 6 10.2 232 . 24. 10.3' 291 30 10.3
- ... - - - - - !"' - -·- - - - - - - --·· - - - - - - - - - - . - - - .. - - - - -All Types 135 36 26.7 333 ·75 22.5 468 111 23.7
- - - - - - - - - -- - - -. - - - - - - - - - - - - - - - - - - - - - - - .. - - -
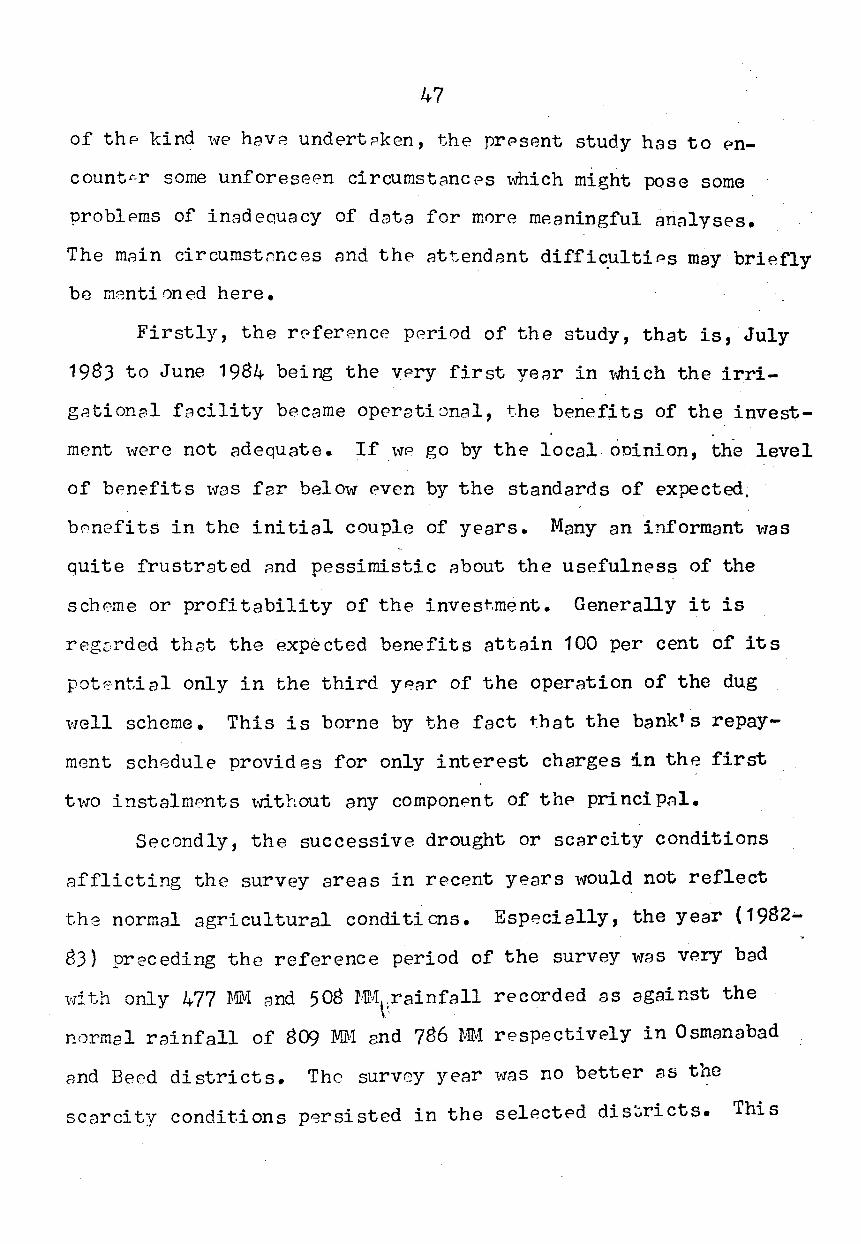
47
of thP kind -r..ve hevA undertPken, the present study has to f'n
count~r some unforeseen circumstanc~s \~ich might pose some
Problems of inadequacy of data for more meaningful analyses.
The m2in circumstnnces and the attendAnt difficultiPs may briefly
be msnti on ed here.
Firstly, the reference period of the study, that is, July
1983 to June 1984 being the very first year in vmich the irri-
gRtionel facility became operati0nal, t.he benefits of the invest
ment \verc not adequate. If \vP go by the local oPinion, th-e level
of benefits \vas far below even by the standards of expected.
bPnefits in the initial couple of years. Many an informant was
quite frustrated Rnd Pessimistic about the usefuln0ss of the ..
scheme or profitability of the invest.ment. Generally it is
regDrded that the expected benefits attain 100 per cent of its
pot~ntial only in the third yAar of the operation of the dug
\'Tell scheme. This is borne by the fact t:hat the bank's repay
ment sch8dule provides for only interest charges in th8 first
tv10 instalmPnts \dthout any component of thP princip:-~1.
Secondly, the successive drought or scarcity conditions
8fflicting the survey areas in recent years \vould not reflect
the normal agricultural condi ti ens. Especially, the year ( 1982-
83) preceding the reference period of the survey , ... .,as vPry bad
vJith only 477 }1IV1 e3nd 508 HM~;,rainfall recorded as against the
normal rvinfall of 809 m-1 and 786 MM respectively in Osmanabad
3nd Beed districts. The survey year was no better as the
scarcity conditions p~rsisted in the sel€cted dis~ricts. This
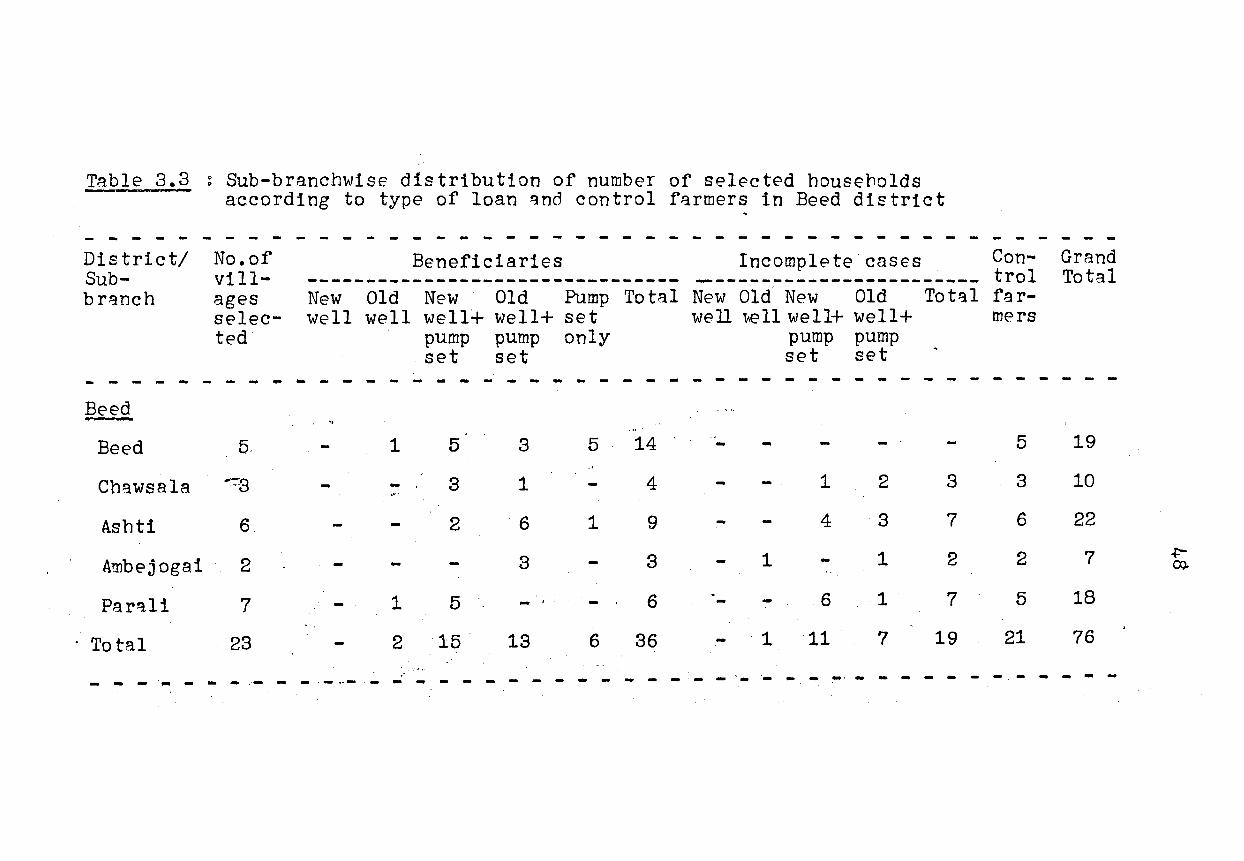
Table 3.3 0 Sub-branchwise distribution of number of selected housel'lolds • -- ac.cording to type of loan ~nd control f::lrmers in Beed district .
- - - - - - - - - - - - - - - - - - - - - - - - - - - - - - - - - - - - - - - - - - -District/ No.of Beneficiaries Incomplete cases Con- Grand Sub- vill- -------------------------------- ------------------------- trol Total br~nch ages New Old New Old Pump Total New Old New Old Tot~l far-
selec- well well well+ well+ set well v.ell well+ well+ mers ted pump pump only pump pump
set set set set
- - - - - - - - - - - - - - - - - - - - - - - - - - - - - - - - - - - - -Beed
...
Beed 5. 1 5 3 5 14 ·- 5 19 - - -Chawsala ~B 3 1 4 1 2 3 3 10
Ashti 6 2 .6 1 9 4 3 7 6 22
Ambejogai 2 3 3 1 1 2 2 7 +-Ql.
Parqli 7 1 5 -· . 6 6 1 7 5 18
Total 23 2 15 13 6 36 1 11 7 19 21 76 .. ~T - - - - - - - - - - - - - -·- - - - - - - -- - - - - - - .·-- -
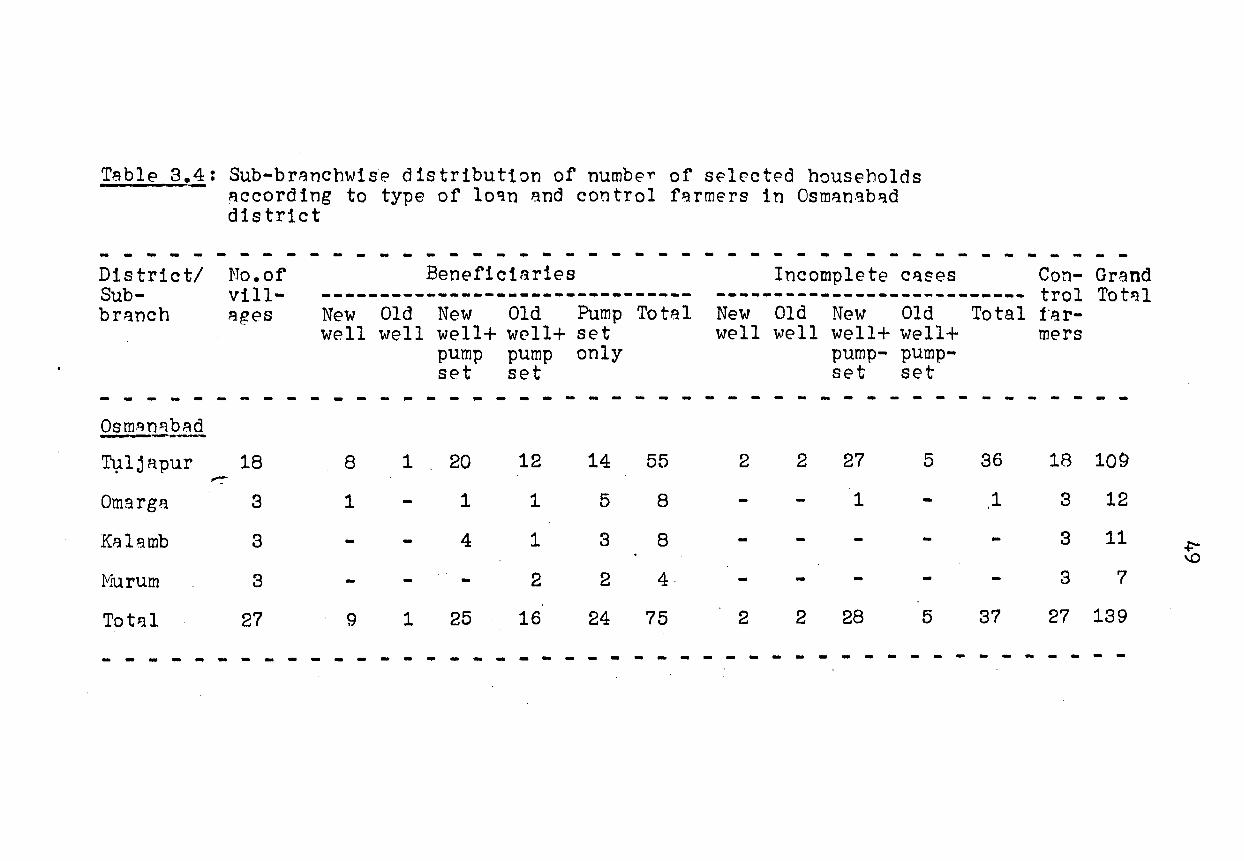
T~ble 3.4: Sub-br.qnchwise distribution of numbe,.. of s~lected households - Recording lo'ln to type of 1:1nd control f~rmers in Osm'ln.':lb'ld district
- - - - - - - - - - - - - - - - - - - - - - - - - - - - - - - - - - - - - - - - - - -District/ No.of Beneficiaries Incomplete c.qses Con- Grand Sub- vill- -------------------~------------ -------------------~------- trol Tot'll br.qnch Rges New Old New Old Pump Total New Old New Old Total f".q r-
well well well+ well+ set well '\.\Te 11 well+ well+ mers pump pump only pump- pump-set set set set
- - - - - - - - - - - - - - - - - - - - - - - - - - - - - - - - - - - - - - - - - - - - -Osm.qn~bAd ......... ____ Tt}.ljRpur 18 8 1 20 12 14 55 2 2 27 5 36 18 109
~
OmargA 3 1 1 1 5 8 - 1 ,1 3 12
K.q lamb 3 4 1 3 8 3 11 +:-\0
Hurum 3 2 2 4· 3 7
Tot::1l 27 9 1 25 16 24 75 2 2 28 5 37 27 139
- - - - - - - - - - - - ... - - - - - - - - - - - - - - - - - - - - - - - - - - - -
50
v1as brone by the fact thr~t the concC?rned collectorates declare?d
a large number of villages as drou~ht affected, where the
'annevvari' crop yields ,..,ere expP.cted to be less than 50% ofthe.
normal yields. Th8 Land Dev0lopment Banks have allowed post
ponem2nt of the recovery of instalm0nts due from their borrowers.
Besides, 81.4 per cent of the sample borrowers of this survey,
anyNay belong to traditionally recognised drought-prone talukas
(vide SukhtAnkAr's Committee· Report).
The above circumstances, especially the drought c~nditions,
h~ve adversely affected the general morale of thP farmers, which
in turn, has contributed to the diffidence on the part of the
selected farmers. Consequently' the response to the field.survey
\'Vas rather lukewarm to the extent of considerably affe,eting the
nature and quality of data.
3.5 SupplPmentary Survey·
However, in order to obviate this situation of basing the
study entirely on the sample of'pre-optimal stage beneficiaries
during the year of drought, a supplementary survey was conducted
during the year 1986-87 to obtain data from the beneficiaries
reaching the optimal benefit level in conditions of normal year.
The supplementary stage af the study could yield data from the
sub-sample comprising 20 cases of composite loans, nine cases of
only pumpsets and ten cases of control representing rainfed
conditions. This supplem~htary effort has rendered the present
study for understanding the imp8ct of drought on income
generation level under both rainfed and irrigation conditions
and, at the same .tim~, facilitating the estimation of financial
rates of return on the investment.
CHAPTER IV
SOCIO-ECONOMIC PROFILE OF THE SELECTED HOUSEHOLDS
The present chapter attempts to provide SOIDP broad account
of socio-aconomic background of thP farmers includP.d in the study •.
However, the asp~ctB bri~fly coverPd in the following are limited
to main caste or caste groups, siz~ of household, literacy, earners
in the household, size of operation~! holning~, occupations pursued
and household incomes.
4.1 Social Background
Although caste is not a basis for inclusion in the scheme
by Land Development Bank, nor a faccor for selection of sample
for the study, the patt8rn among the sample borrowers. (beneficiary
and 'incomplete' cases) reveals somewhat a fair mixture, if not
repre~entAtive in character. For instanc~, the Maratha caste,
generally rrgArded as a dominant one among the land owning culti
VAtors, accounts for 59.3 per cent of the total loanees. It is
followed by other anvanced caste group, comprising Lingayat, Mali,
Teli, Jain, etc., which accounts for 17 per cent of beneficiarias
and 14 per cent of 'incomplete' category. A significant point,
howP.ver, is the presence of a fair number of minority or under
privilPged communities like \~.othE:'r backtrJard castes~ group (8.4
per crnt}, schedulPd castes {6.0 pPr cent) and Musli~ (8.0 per
cent). Incidentally, a large majority of these minoritif's
cultivnt0s holdings b;.:..low four h<'='ctarPs in size. A broad inea
51
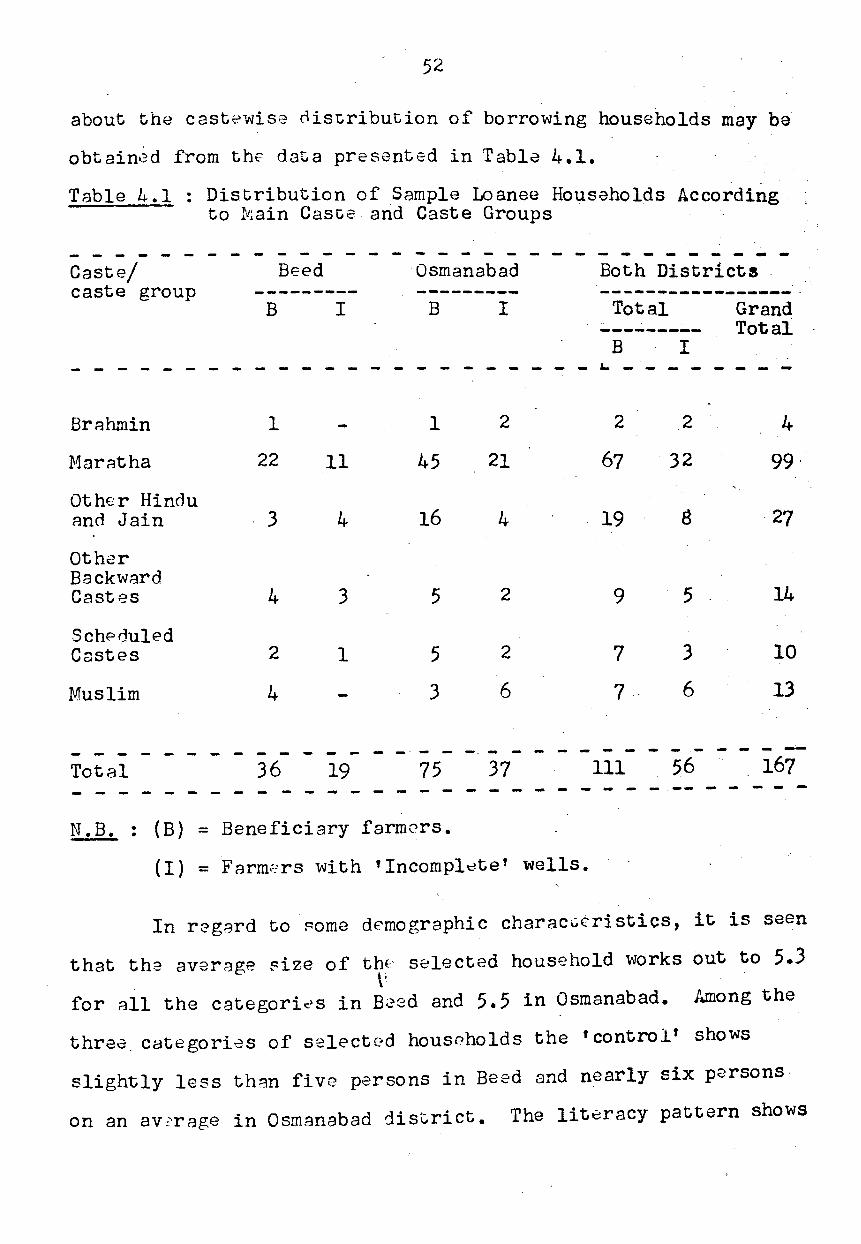
52
about the castewise distribution of borrowing households may be
obtainGd from the data presented in Tabla 4.1.
Table 4.1 : Distribution of Sample Loanee Hous~holds According to ~ain Caste arid Caste Groups
Caste/ caste group
Beed ---------B I
- ~ - - - - - ~ - ~ - - -
Brr.1hmin
Marr.1tha
Other Hindu Bnn Jain
Other Backward Castes
SchPduled Castes
Muslim
Total
1
22
3
4
2
4
36
11
4
3
1
19
·osmanabad
B
1
45
16
5
5
3
I
2
21
4
2
2
6
- - - - - - ~ ~ -Both Districts -----~----~---~~-Total
B I - - - '- -
2
67
19
9
7
7
2
32
5
3
6
Grand Total
-- ... -4
99·
27
14
10
13
- -~-- -. ~------------75 37 111 56
- - - - - - - - - - - - - - - ~ - - ~ - - - - - -- - - - - ~
N.B. : (B) = Beneficiary farmers.
(I) = Farm~rs with 'Incompl~te' wells.
In regArd to Pome d~mographic characG~ristics, it is seen
that the averBge f:ize of the selected household works out to 5.3 \'
for all the categori~s in Bced and 5.5 in Osmanabad. Among the
three categori~s of selected households the 'control' shows
slightly less th~n five persons in Beed and nearly six persons
on an av::-rage in Osmanabad district. The lit~racy pattern shows
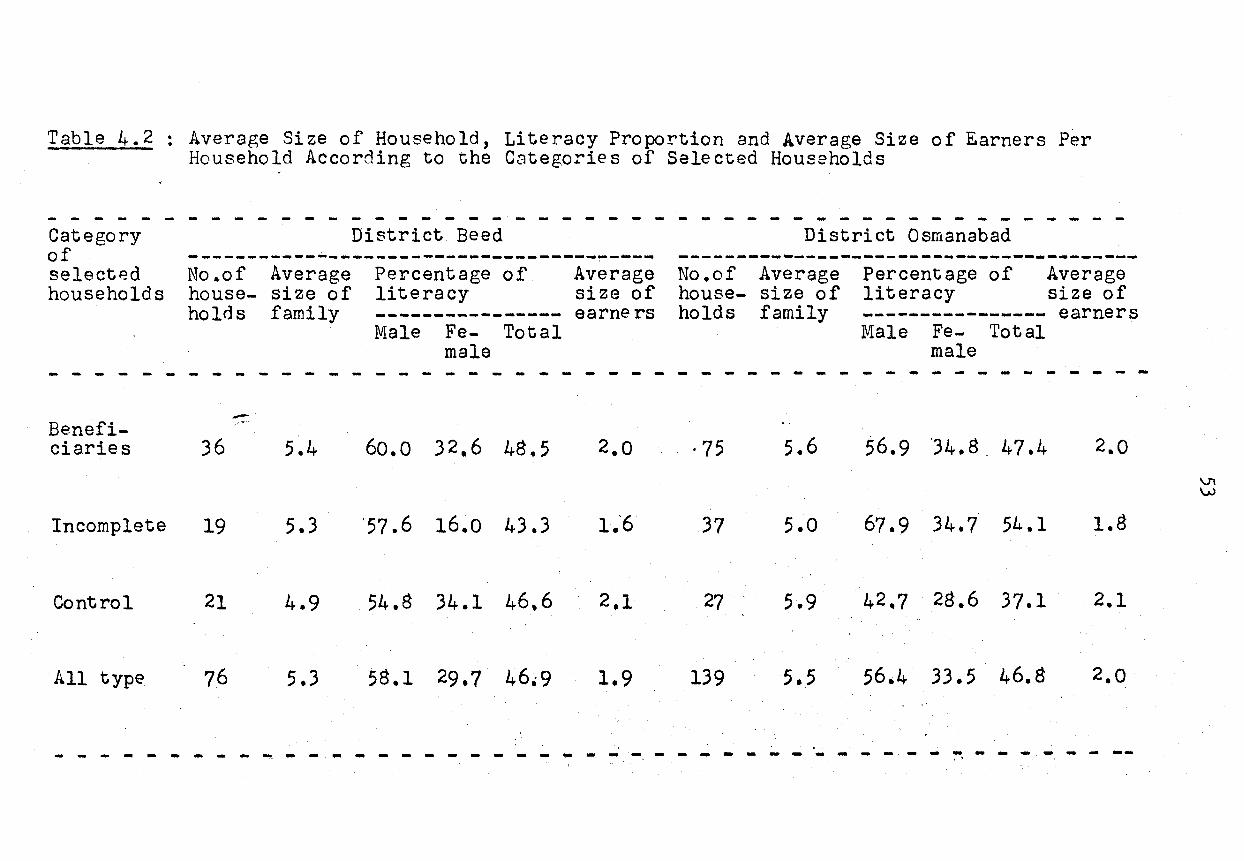
Table 4.2 : Average Size of Household, Literacy Proportion and Average Size of Earners Per Household According to the C~tegories of Selected Households
Category of select~d households
Beneficiaries
Incomplete
Control
All type
- - - - -
- - - ~ - - - - - - ~ - - - - - - - - - - - - - - - - - - - - - - - - -District Beed
--------~---~~~-------------------------No.of Average house- size of holds family
Percentage of Average literacy size of -------~-------- earners Male Fe- Total
male
District Osmanabad --------------------------------------~-No.of Average Percentage of Average house- size of literacy size of holds family ---------------- earners
Male Fe- Total male
- - - - - - - - - - - ~ - - - - - - - - - - - - - - - - - - - - - - - - - -
36 5.4 60. 0 3 2. 6 48 • 5 2.0 ·75 5.6 56.9 J4.8. 47.4 2.0
19 5.3 '57.6 16~0 43.3 37 5.0 67.9 34.7 54.1 1.8
21 4.9 54.8 34.1 46,6 27 5.9 42.7 28.6 37.1 2.1
76 5.3 58.1 29.7 46.9 1.9 139 5.5 56.4 33.5 46.8 2.0
- - - - ~ - - - - - - - - ~ - - - ~ - - - - - - -- ~ - - ~ - - ~ - - - - - ~ ~ - ~''
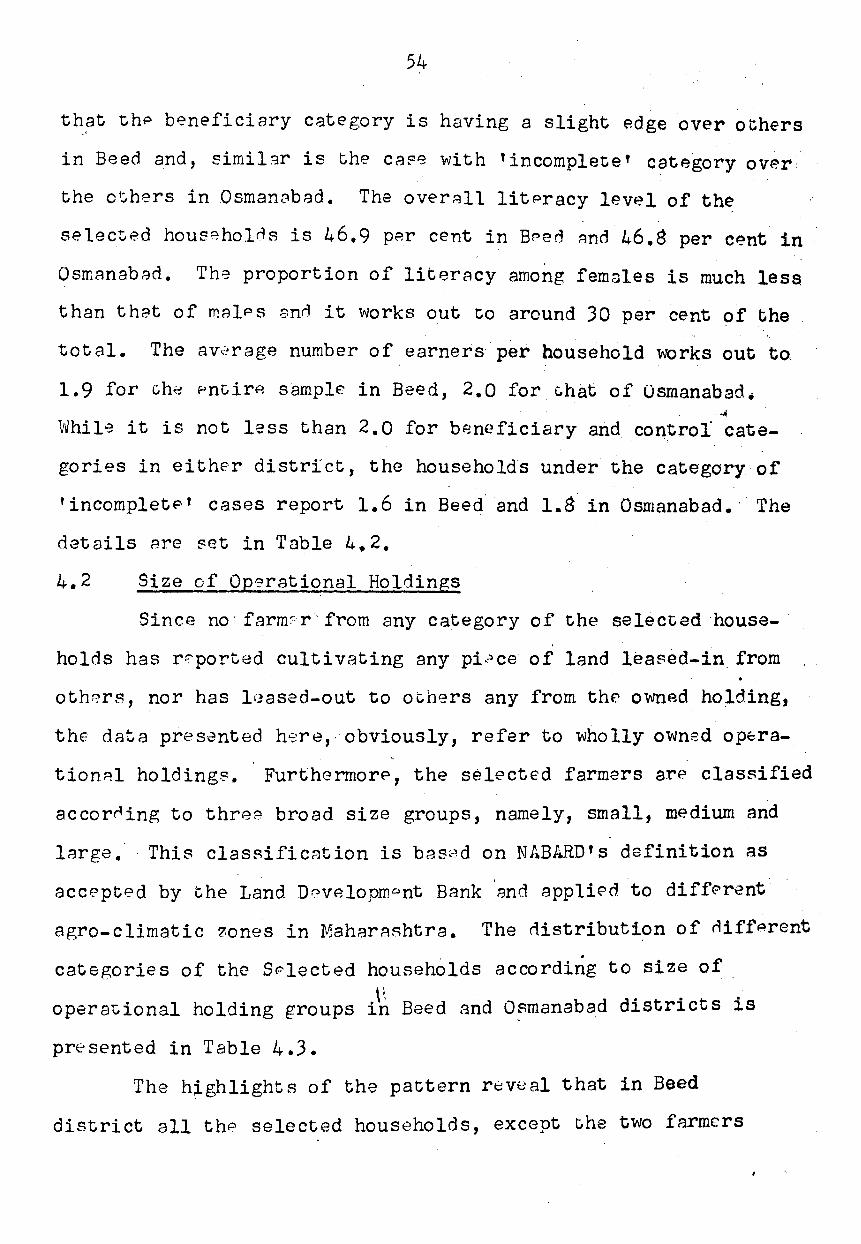
54
th~t thP beneficiery category is having a slight edge over others
in Beed and, simil!":lr is the ca~e with 'incomplete' c~tegory over
the others in Osman~bad. The overAll litPracy level of the
selected hous~holnR is 46.9 p~r cent in B~ed ~nd 46.8 per c~nt in
OsmAnab~d. The proportion of liter~cy among females is much less
than thct of melPs Gnn it works out to around 30 per cent of ~he
total. The av2rage number of earners per household works out to
1.9 for che PntirA sample in Beed, 2 .• 0 for c.hat of Osmanabad. -.oi
vvhil-3 it is not less than 2.0 for b~=;neficiary and control cate-
gories in eithE-r district, the households under the category of
'incompletP' cases report 1.6 in Beed and 1.8 in Osmanabad.· The
details are ~et in Table 4.2.
4.2 Size of Op~rational Holdings
Since no· farm~: r· from any category of the selected house- ·
holds has r~ported cultivating any pi~ce of land lear-ed-in from
oth0rs, nor has lr.~ased-out to ot.hers any from the owned holding,
thE data presented hsre,· obviously, refer to wholly owned opcra
tionRl holding~. FurthermorP, the select€d farmers are classified
accor~ing to thre~ broad size groups, namely, small, medium and
large. This clasRificRtion is bas~-),d on NA.BARD' s dafinition as
accepted by the Land D2velopmont Bank 'and appli~d to difff'rent
agro-climatic zones in Mahar8shtra. The ciistribution of niffArent
categories of the SPlected households according to size of . \\
opera~ional holding groups in Beed and O~manabad districts is
presented in Table 4.3.
The h~ghlightR of the pattern rBveal that in Baed
district all thP selected households, except che two farmers
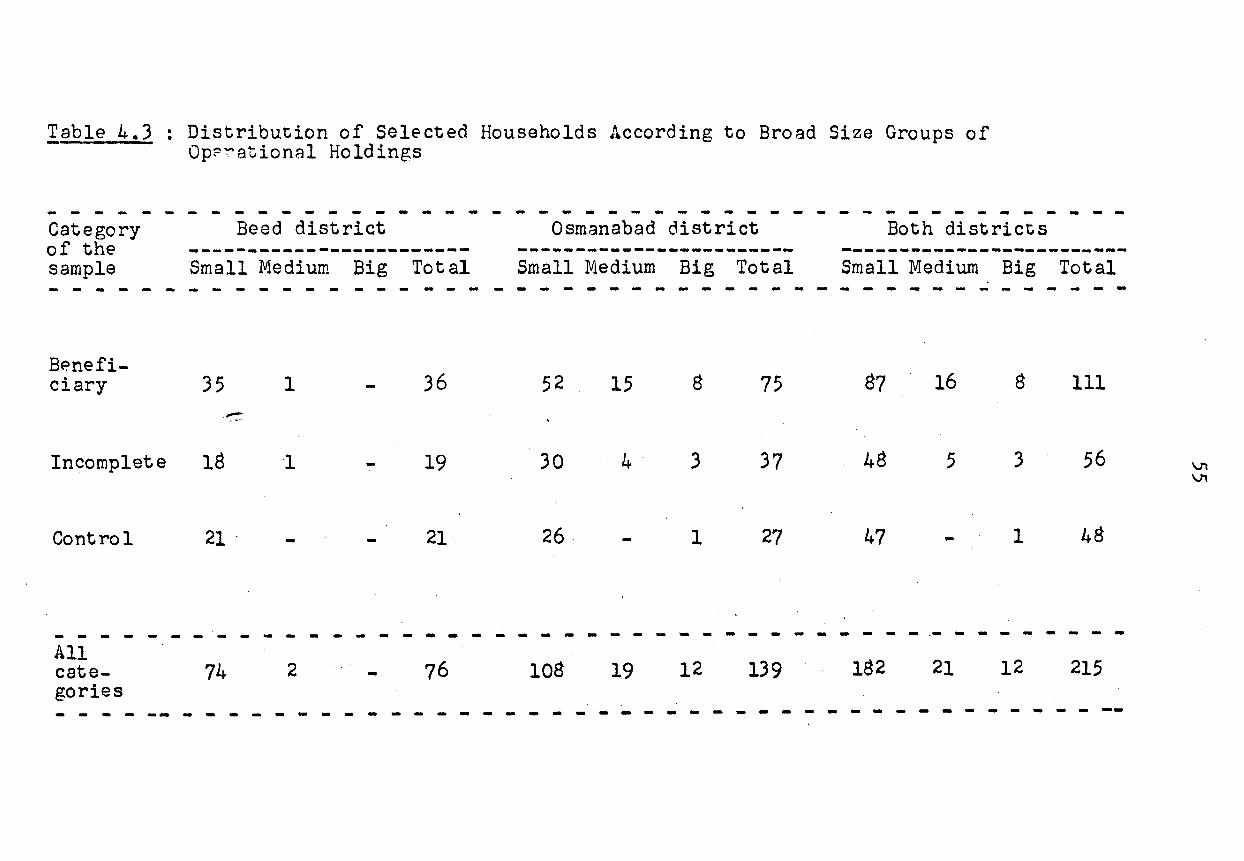
!able 4.3 : Distribution of Selected Households According to Broad Size Groups of OpP~ational Holdings
- - - - - - - ~ - ~ - - - - - - - - - - - - - - - - - - - - - - - - - - - - - - - - - - - - -Category Beed district Osmanabad district Both districts of the ~----------------------- -------------~---------- -------------------------sample Small Medium Big Total Small Medium Big Total Small Medium Big Total - - - - - - - - - - - - - - - - - - - - - - - - - - - - - - - - - - - - - - - - - - ~ - - - -Beneficiary
Incomplete
Control
- - - -All cate-gories - - - - -- -
35 1
-18 1
21.
- - - -74 2
- - - - -
36 52 15
19 30 4"
- 21 26
- - - - - - - - - - - -- 76 lOB 19
- - - - - - - - - -
75 87 . 16 111
3 37 48 5 3 56
1 27 47 - 1 48
- - - - - - - - - - - - .- - - - - - - - -12 139 182 21 12 215
- - - - - - - - - - - - - - - - - - - - --
56
with a medium sized holding P8Ch belonging to the bPneficiary and
to the c~tagory of 'incomplete' cases, are small farmers (97.4
per cPnt). It is in Osmanabad we find some medium and big farmers,.
mostly ~mong the two cat.egories of sample borrowers. In the
'benoficiary' category, the percentages of mPdium and big farmers
work out to 20.0 ~nd 10.6 respPctivPly. Similarly, in the
'incomplete' C8tegory they form 10.8 p~r cent and 8.1 per cent
reRpecti vely. In the 'control' category all but one household
are small f~rm2rs, the lonP. case being a· big farmer in Osmanabad
0istrict. In all,the small farm£rs dominate All the categories
of housPholds anrl the proportion of small farmers works·out to
84.6 per cent of the entire sample of 215 households. It is
followed by medium farm:::rs with 9.8 per cent and big farmers with
5.6 per cent.
The holdingwise distribution of borrowing farmers, that is,
beneficiary and farmers of incomplete wells, according to type of
loan obtAined rPveAls that small farmers in both categories are
quite prominent in being found with th~ two types of composite
loans. It is quite remarkably so in the c~se of new wall with
pumpsrt type of the scher11e. In thP cas a of medium size group too,
three-fourths of the farmers (other than the only pumpset cases)
have av~ilP~ of composite loans. It is Pven more so among the
big farm"-: rs, almost a·ll of them opting for composite types, m~inly j
in combin~tion with new wells~ Auart from mere pumpsct cases, the ... .
/
selection of which is being restricted to a total of 30 cases, the
composite loan cas2s are quite pre0ominent with both the categories
of samplP. The holdingwise distribution of S8mpl~ borrowing house
holds according to type of loan r2ceived may be sean in Table 4.4.
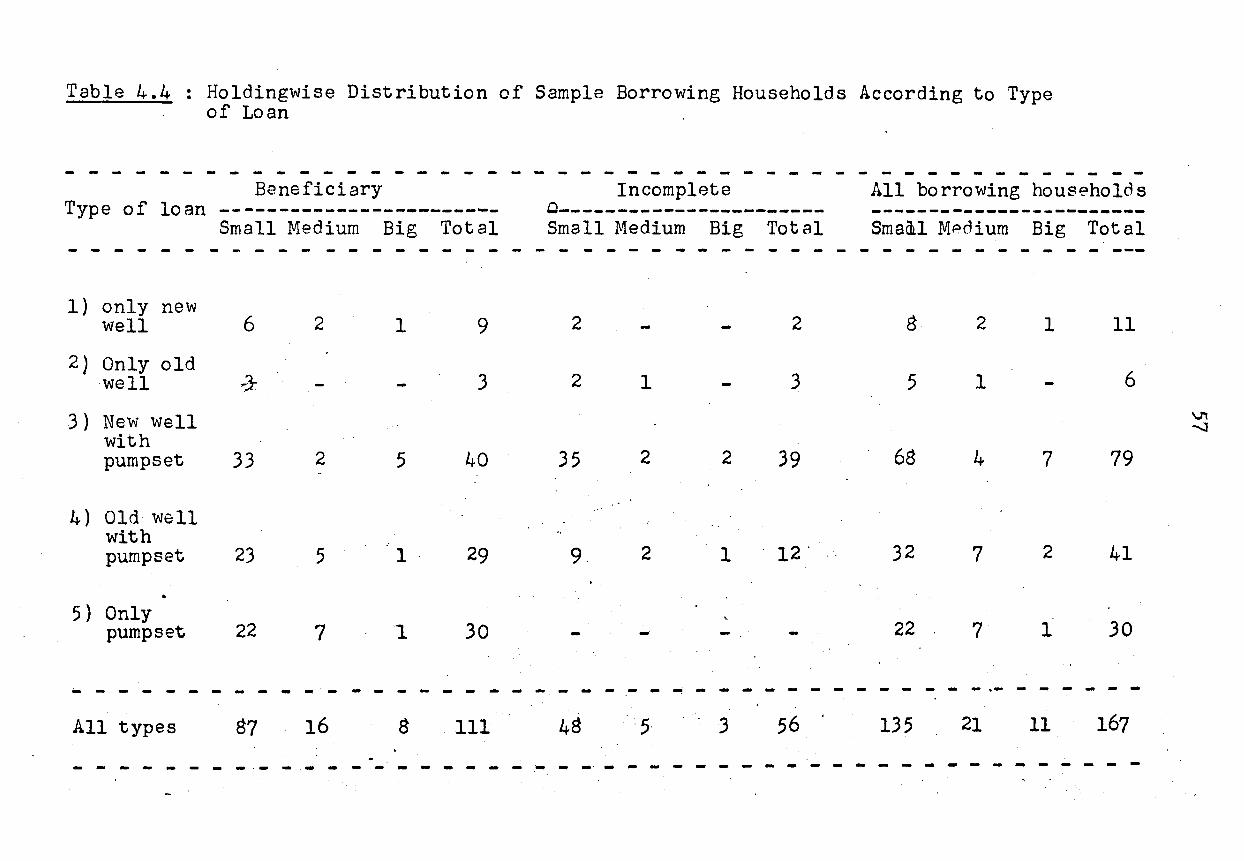
Table 4.4 : Holdingwise Distribution of Sample Borrowing Households According to Type of Loan
- - - - - - - ~ - - - - - - - - - - - - ~ - - - - - - - - - - - - - ~ - - - - - - - - - - - -Beneficiary Incomplete All borrowing householos
Type of loan ------------------------ 0--------------~~------- --------------------~---Small Medium Big Total Small Medium Big Total Smaml MPdium Big Total - - - - - - - - - - - - - - - - - - - - - - - - - - - - - - - - - - - - - - - ---
1) only new well 6 2 1 9 2 2 2 1 11
2) Only old ·well ~3: 3 2 l 3 5 1 6
3 ) New well with pump set 33 2 5 40 35 2 2 39 68 4 7 79
4) Old well with pump set 23 5 1· 29 9 2 1 12. 32 7 2 41
.. •
5) Only pump set 22 7 '1 30 - 22 7 1 30
- -.·- -- - - - ~ - - - - - - ~ - - ~ - - - - .. - - ... - -All types 16 111 5· 3 56 . 135 21 11 167
- - - - - - - - - - - ~ - - - - - - - - ~ - - - - - - - - ~ - - - - - -
VI ....-J
fhe average size of operational holding tends to be rather
quite small in axtent as the small farm~rs dominate the total
sample in each category. Even Rmong thP. small farmers the extent .. ·
of av:-rAge size works out to around 8 acres for beneficiary, 7 .
acres for 'incomplete' category and 6 acres for. 'control' .farmers.
The average size inrespect of medium farmErs is around 20 acres
for b~neficiary, and 19 acres for 'incomplete' category. For the ·
big fArmers, all being found in Osm~nabad sample, the average size
works out to 32.25 acres in the case of beneficiary, 35.67 acres
in the case of 'incomplete'. category and 28 acres in the one case
of 'control'. It may also be observed that bPtween the two·
rtistricts the av·=·ragP- sizP, in respect of each category ann type
of farmPr, is slightly gr;~ater in Osmanabad than in Beed excepting
the case of small farmers among the beneficiaries. The average
size at the aggregate sample level broadly indicates that the
beneficiary operates greater extent of land than the 'incomplete'
and 'control' categori~s. The relevant data showing districtwi'se
average size of holning in each of thE' three broad size groups
are presented in Table 4.5.
4.3 Occupational Pattern •
The type of subsidiary occupation (offupetion other th~n
cultivation) pursued and number of occupations in which the
earners in the household are engaged may be one of the indicators
of the socio-economic charabtE·ristics. Although the income
accruiing ,from a given occupation is more crucial, for the present,
however, a broad id E>Fl can be obtain{- d by looking into the general
occupational pattern of the s~lectPd households.
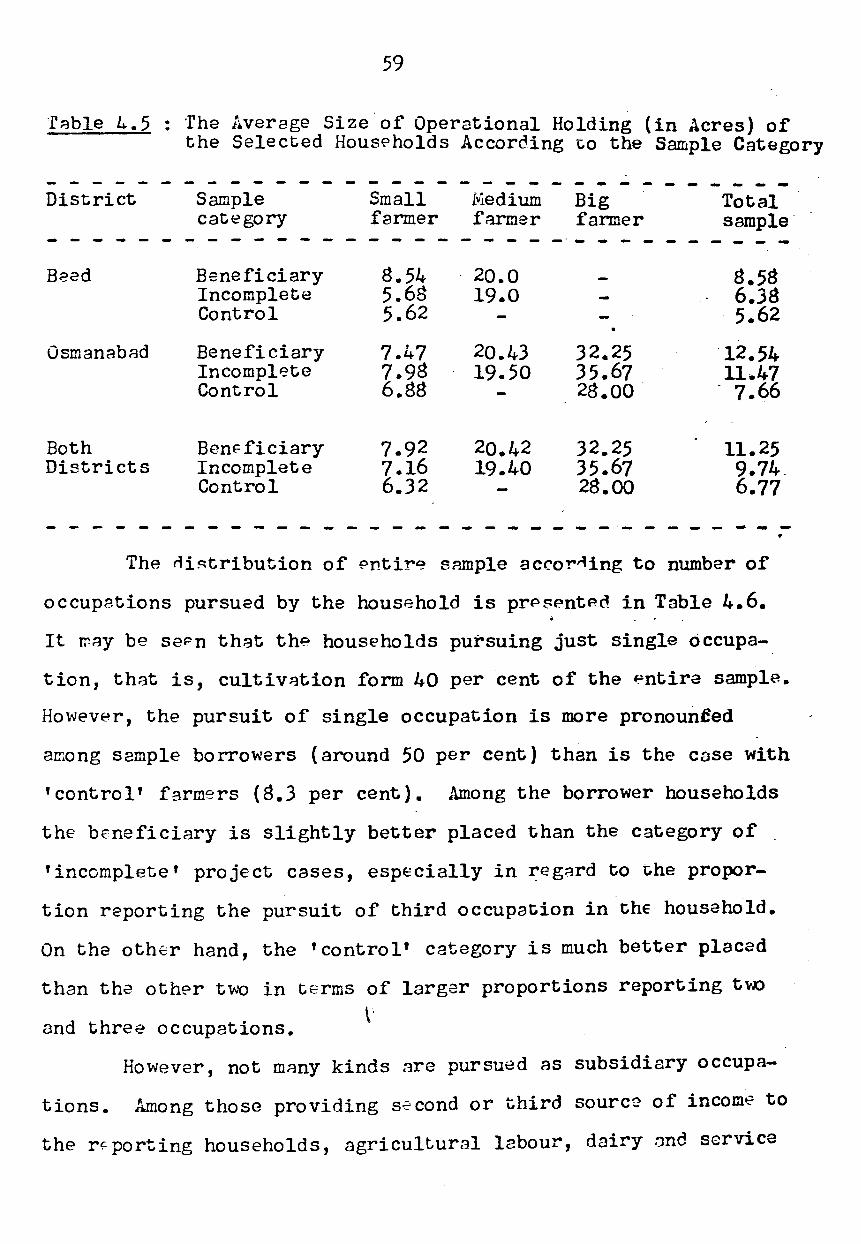
59
fable ~.5 : The Average Size.of Operational Holding (in Acres) of the Selected Households According ~o the Sample Category
- - - - - - - - - - - - - - - - - - - - - - - - - - - --District Sample Small I~edium Big Total category farmer farmer farmer sample·
- - - - - - - - - - - - - - - - - - - - - - -·- - -- --- -Becd Beneficiary 8.54 20.0 8.58
Incomplete 5.6g 19.0 6.38 Control 5.62 5.62
Osmanabad Beneficiary 7.47 20.43 32.25 "12.54 Incomplete 7.98 19.50 35.67 11.47 Control 6.88 28.00 7.66
Both Ben~ficiary 7.92 20.42 32.25 11.25 Districts Incomplete 7.16 19.40 35.67 9.74.
Control 6.32 28.00 6.77
- - - - - - - - - - - - - - - - - -- --- ---• The Hi~tribution of Pntir~ s~ple accor~ing to number of
occupations pursued by the household is prP~entPd in Table 4.6 • •
It ~ay be sePn that the households pursuing just single occupa
tion, that is, cultiv~tion form 40 per cent of the ~ntira sample.
However, the pursuit of single occupation is more pronounfed
among sample borrowers (around 50 per cent) than is the case with
'control' farmers (8.3 per cent). Among the borrower households
the beneficiary is slightly better placed than the category of .
'incomplete' project cases, espEcially in ~eg~rd to ~he propor
tion reporting the pursuit of third occupation in the household.
On the othtr hand, the 'control' category is much better placed
than the other two in terms of larger proportions reporting t~D
and three occupations. \'
However, not many kinds are pursued as subsidiary occupa
tions. Among those providing s2cond or third sourc~ of income to
the r~porting households, agricultural labour, dairy nnd s~rvice
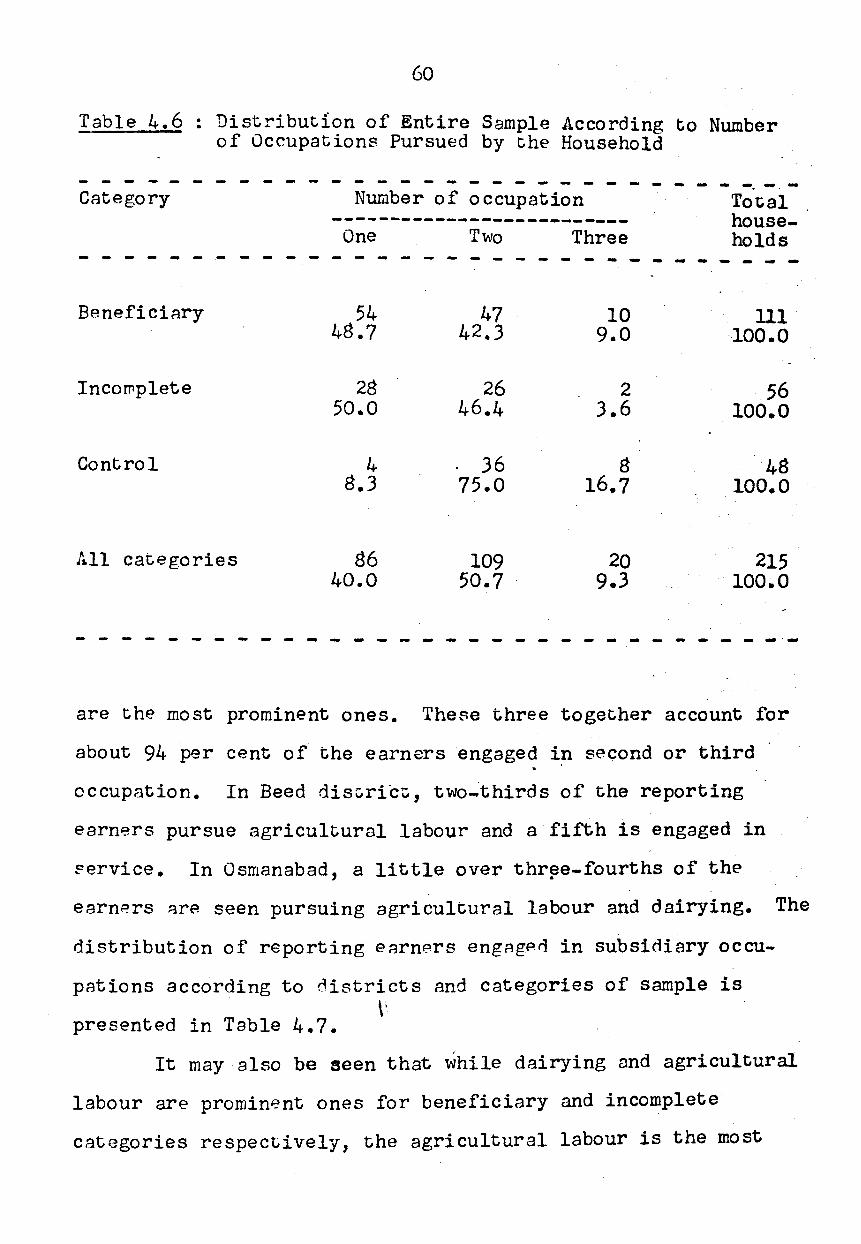
60
Table 4.6 : Distribution of Entire Sample According to Number of Occupations Pursued by the Household
- - - - - - - - - - ~ - - - -Category Number of occupation ------------------------~-One Two Three
- -- ... -Total households _. _____ _ - - - - - - - - - - - - - - - - - - - - - - - - - ~
Beneficiflry
Incomplete
Control
All categories
54 48.7
28 50.0
4 8.3
86 40.0
47 42.3
26 46.4
36 75.0
109 50.7
10 9.0
2 3.6
8 16.7
20 9.3
111 100.0
56 100.0
"48 100.0
215 . 100.0
- ~ - - - - - - - - ~ - - - - ~ -- - - - - - - - - - - - - -·-
are the most prominent ones. The~e three together account for
about 94 per cent of the earners engaged i~ second or third
occupation. In Beed disr.ric~, two_;thirds of the reporting
earners pursue agricultural labour and a fifth is engaged in
~ervice. In Osmanabad, a little over thr~e-fourths of the
earnP.rs 3re seen pursuing agricultural labour and dairying. The
distribution of reporting eArners engAgPd in subsidiary occu-
pations according to districts and categories of sample is \~
presented in Table 4.7. <
It may also be seen that while d3irying and agricultural
labour are prominBnt ones for beneficiary and incomplete
categories respectively, the agricultural labour is the most
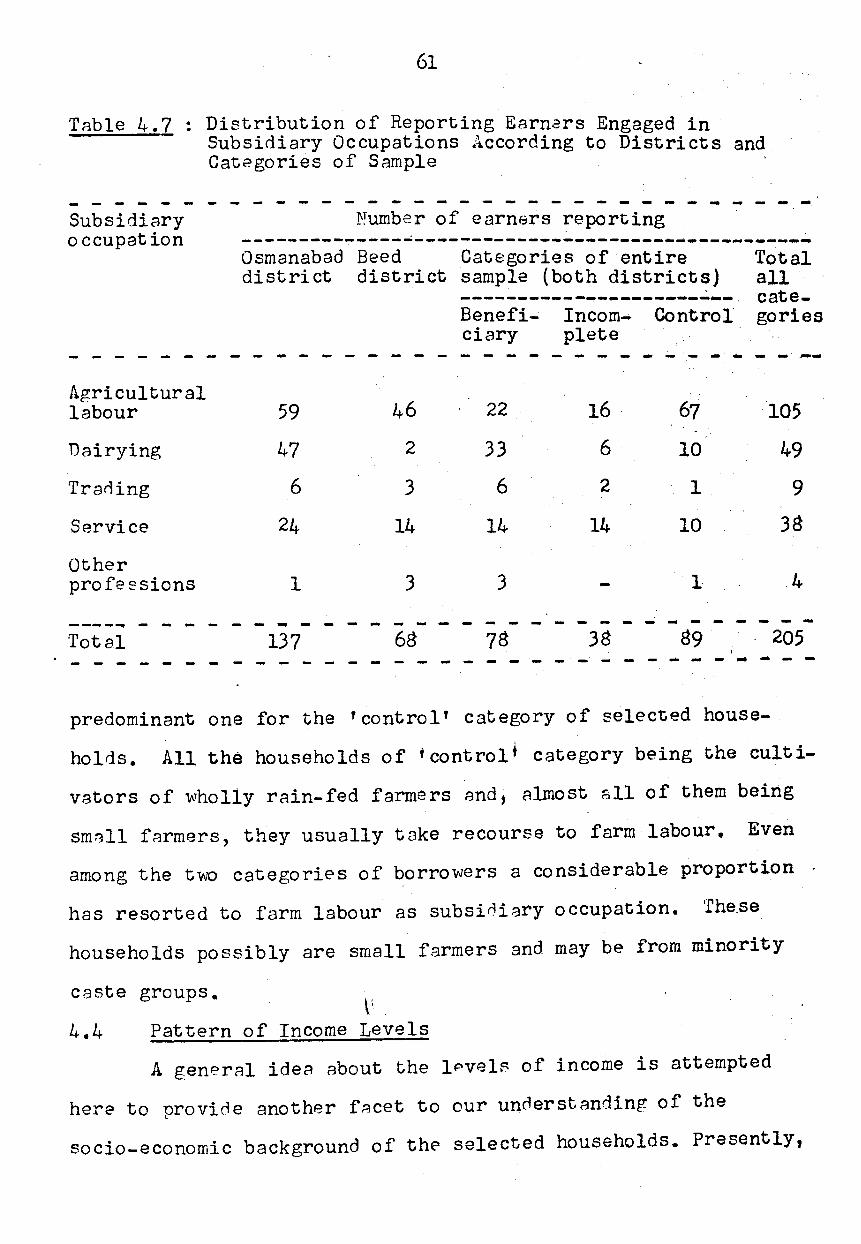
TRble 4.7 :
-------Subsidiary occupation
Agricultural labour
Dairying
Trading
Service
Other profe esions
----... - - -Total - - - - - -
61
Distribution of Reporting Earnars Engaged in Subsidiary Occupations According to Districts and Categories of Sample
- - - - - - - - ~ - - - - - - - - ~ - - ~ - - - - - --
--
~!umber of earners reporting --------------~-----------~~~--------~-~---~-----~ Osmanabad Beed Categories of entire Total
all categories
district district ~ample (both districts) ~----------~------------Benefi- Incom.- Control ciary plete-
- -· ---59 46 22 16. 67 105
47 2 33 6 10 49
6 3 6 2 1 9
24 14 14 14 10 38
1 3 3 1 4
- - - - - - -- - - - - - - - - ... -137 68 78 38 89 205
I - - - - - - - - - - - - --- - ..... - -
predominant one for the 'control' category of selected house
holds. All the households of tcontrolt category being the culti
vators of wholly rain-fed farmers And; 8lmost all of them being
sm::~ll farmers, they usually take recourse to farm labour. Even
among the two categories of borrowers a considerable proportion
has resorted to farm labour as subsic-3i8ry occupation. '£he.se
households possibly are small farmers and may be from minority
caste groups.
4.4 Pattern of Income Levels
A general ide8 about the lPvels of income is attempted
here to provide another facet to our un~erstanding of the
socio-economic background of the selected households. Presently,
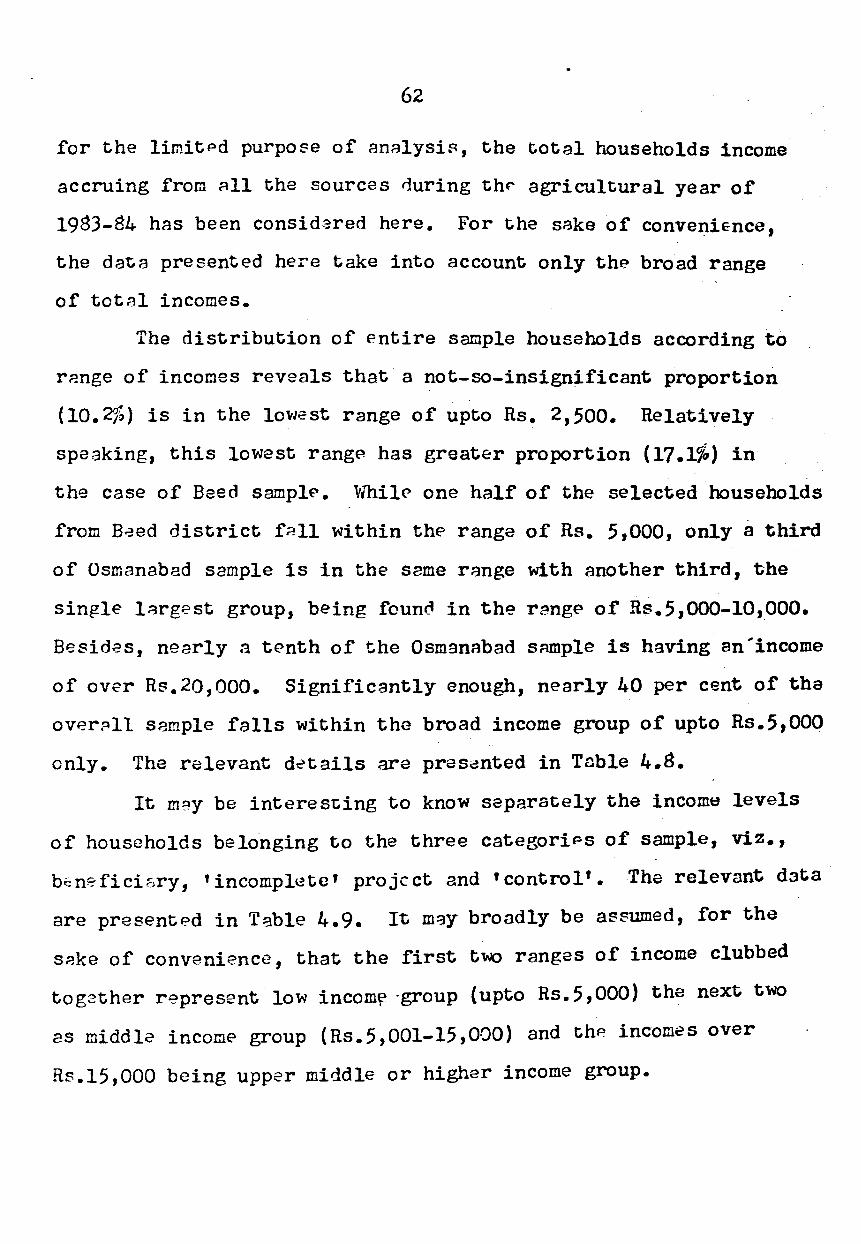
62
for the limitPd purpo8e of analysi~, the total households income
accruing from all the sources ~uring th~ agricultural year of
1983-84 has been considared here. For the sake of convenience,
the da~a presented here take into account only th~ broad range
of totAl incomes.
The distribution of entire sample households according to
r~nge of incomes reveals that a not-so-insignificant proportion
(10.2%) is in ~he lowest range of upto Rs. 2,500. Relatively
speaking, this lowest rangP has greater proportion (17.1%) in
the case of Beed sampl~. wbil~ one half of the selected households
from B8ed district f~ll within the range of Rs. 5,000, only a third
of Osmanabad sample is in the same range with another third; the
single lArgest group, being fcuncl in the r~ng~ of Rs.5,000-lO,OOO.
Besides, nearly a tenth of the Osmanabad SAmple is having an'income
of over Rs.20,000. Significantly enough, nearly 40 per cent of the
over~ll sample falls within the broad income group of upto Rs.5,000
only. The relevant details are pres~nted in Table 4.8.
It m3y be interesting to know separately the income levels
of households belonging to the three categoriPS of sample, viz.,
b~n2fici&ry, 'incompl~te' project and 'control'. The relevant d3ta
are present~d in Table 4.9. It may broadly be assumed, for the
sAke of convenience, that the first two ranges of income clubbed
tog2ther represent low incomr ·group (upto Rs.5,000) the next two
as middl~ income group (Rs.5,001-15,000) and thP incomes over
Rs.l5,000 being upper middle or higher income group.
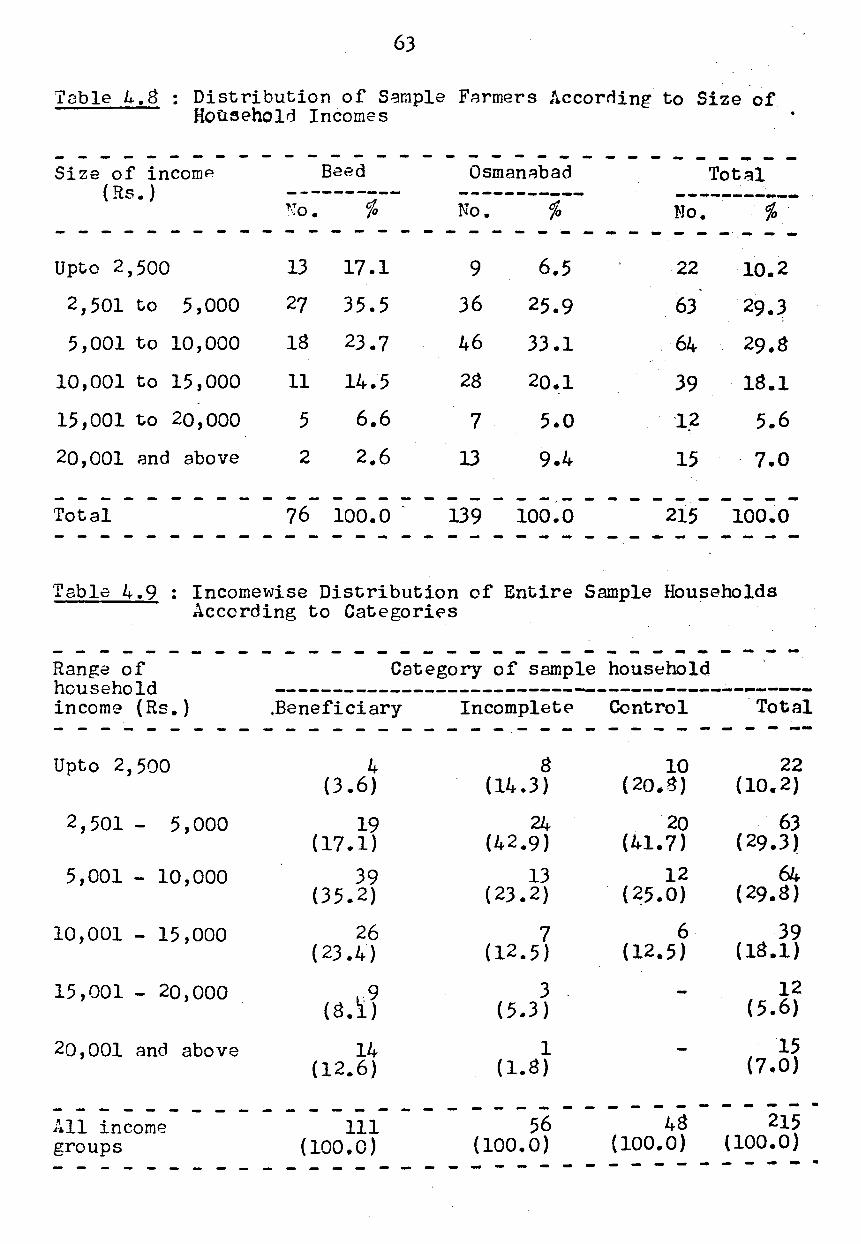
63
Table 4.8 • Distribution of S.:!mple FArmers f~ccorning to Size of . Household Incomes
- - - - - - - - - - - - - - - - - - - - - - - --Size of incomP Baed OsmanAbad Total
(Rs.) ---------- ----------- ------------l'T % No. % No. % .. :';0.
- - - - - - - - - - - - - - - - - -·- - -Up to 2,500 13 17.1 9 6.5 22 10.2
2,501 to 5,000 27 35.5 36 25.9 63 29.3
5,001 to 10,000 18 23.7 46 33.1 64 29.8
10,001 to 15,000 11 14.5 28 20.1 39 18.1
15,001 to 20,000 5 6.6 7 5.0 ·12 5.6
20,001 :::~nd above 2 2.6 13 9.4 15 7.0
- - - - - - - - - - - - - - - - - - - - - - - - - - ---- -Total 76 100.0 139 100.0 215 100.0 - - - - - - - - - - - - - - - - - - - - - - - - -- - - - ,_ - - -
Table 4.9 : Incomewise Distribution of Entire Sample Households According to Categori~s
Ranga of household income ( Rs.) - - - - - - - - -Upto 2, 500
2,501 - 5,000
5,001 - 10,000
10,001 - 15,000
15,001 - 20,000
20,001 and above
- - - - - - - - - - ~ - - - - - ~ - - ~ - ~ - -Category of sample household
--------~~-------------------------------~-----.Beneficiary Incomplet~ Control Total -------- -.------------ --
4 (3.6)
19 (17.1)
39 (35.2)
26 ( 23.4)
(8.1S 14
(12.6)
8 (14.3)
24 (42.9)
13 ( 23.2)
7 (12.5)
3 ( 5.3)
1 (1.8)
10 (20.8)
20 (41.7)
12 {25.0)
6 (12.5)
22 (10.2)
. 63 (29.3)
64 (29.8)
39 (18.1)
12 (5.6)
15 (7.0)
- - - - - - - - - - - - - - - - - - - - - - - - - - - - - -All income groups
111 (100.0)
- - - - - - - - - - - - - - - -56
(100.0) 48 215
{100.0) (100.0) - - - - - - - - - - - - - - - .
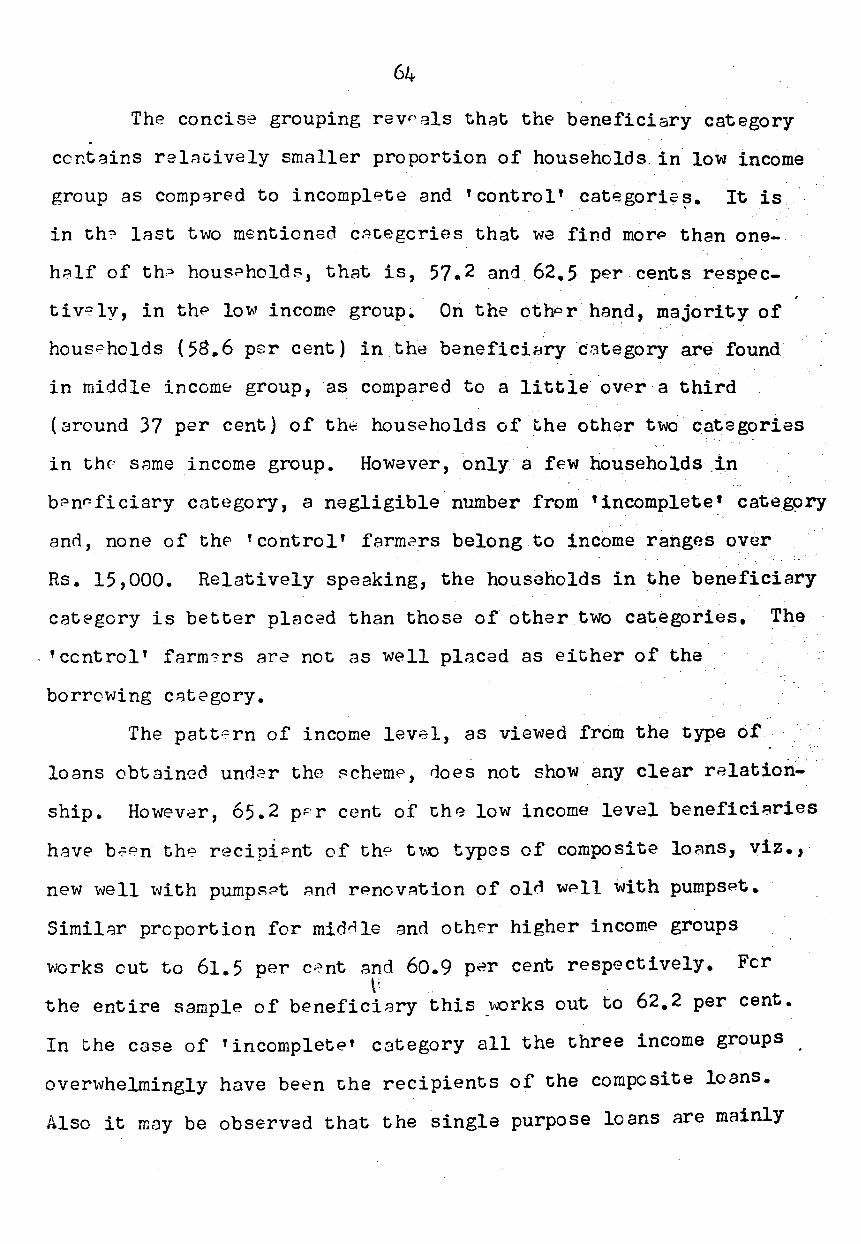
64
The concise grouping rev,als th::Jt the beneficiary category
contains rel~cively smaller proportion of households. in low income
group as comp~red to incomplete and 'control' categorie~. It is
in th? last two mentioned c~tegories that we find morP than one-
h~lf of th~ hous~holds, that is, 57.2 and 62.5 per cents respec
tiv-=?ly, in thP low income group. On the othor ha~d, majority of
housPholds (5g.6 psr cent) in the beneficinry category are found. . ,
in middle incom~ group, as compared to a little ovPr a third
(around 37 per cent) of the households of _the other two c_ategories
in thP SAme income group. However, only a few households .in
bent? fi ciary category, a negligible number from 'incomplete' categ~ry
ann, none of thf' 'control' farm2rs belong to income ranges over
Rs. 15,000. Relatively speaking, the households in the beneficiary
cat~gory is better plac~d than those of other two categories. The
. 'ccntrol' farm?rs ar~ not as w~ll placed as either of the
borrowing CAtegory.
The patt0rn of income lev~l, as viewed from the type of
loans obtained und2r the ~cheme, does not show any clear relation~
ship. Howevar, 65.2 pPr cent of the low income level benefici~ries
have b.::Pn· the? recipiPnt of th~? t\\'0 types of composite lo~ns, vi~.,·
new well with pump~Pt ~nn renov~tion of oln well with pumpsPt.
Similar proportion for mid0le and other higher income groups
works cut to 61.5 per c~nt and 60.9 per cent respectively. Fer \ ~ .
the entire sample of beneficiary this _v .. 'Orks out to 62.2 per cent·
In the case of 'incomplete' cotegory all the three income groups
over-v-vhelmingly have been the recipients of the composite loans.
Also it may be observed that the single purpose loans are mainly
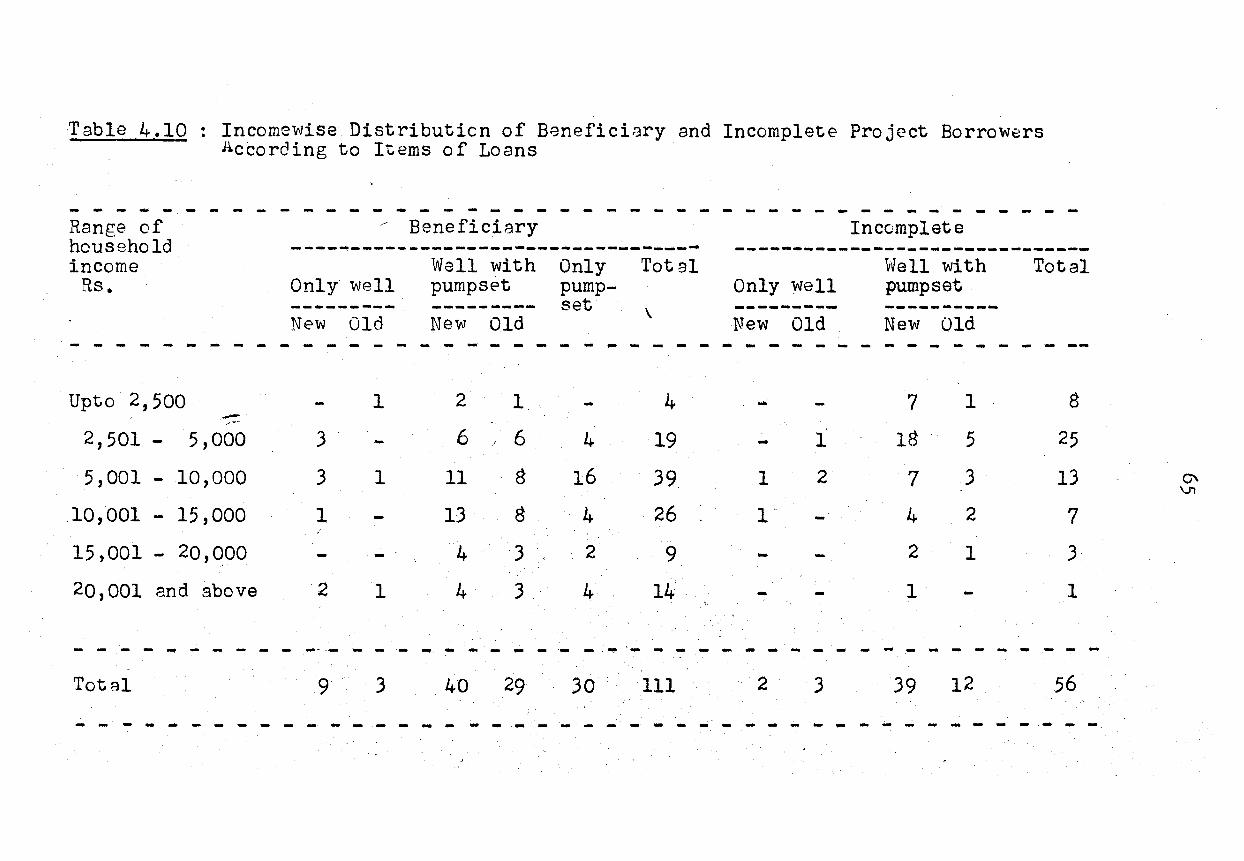
-Table 4.10 Incomewise Distributicn of Beneficiary and Incomplete Project Borrow~rs Acbording to Items of Loans
- ~ - ~ ~ - - - ~ - ~ - ~ - - ~ - - - - - - - - - - - - - - - - - - - - - - - - - -Range of household
/ Beneficiary Incomplete ----~~------~---------------------- -----~-------------------------income
Rs. Only· well ----------New Old
Well with pump set _______ ... _ New Old
- - ~ ~ - ~ ~ ~ - - - - - - - - - - -
Upto 2, 500 1 2 1 -_ ....... -
2' 501 - 5,000 3 6 6
5,001 - 10,000 3 1 11 8
10,001 15,000 1 13 8
15,001 20,000 4 3
20,001 and above 2 1 4 3
Only pumpset
Total
\
Only well --------·-New Old
Well with pump set _________ .. New Old
- - ~ ~ - - - - - - - - ~ - - - -
4 - 7 1
4 19 1 18 5
16 39 .1 2 7 3·
4 26 1. 4 2
2 9 - 2 1
4 14 - 1
Total
- - -
8
25
13
7
3
1
- - - - - - - - - - ---- -- - - - ~- ~ -·~ ~- ~---- ~--- ~- -------Total 9 3 . 40 29 30 111 2 3 39 12 56
- - - - - - - - - - - - - - - - - - ------·- ·- - - ~ ~ - - - - ~ - - - - ~ -
C' VI
66
fcund among the farmers of middle income group in either category.
The relevant details are presented in Table 4.10.
In sum, thE Eocial background of the selected farmers, by,
and large, confirms to the general rural scene, espPcially in
reg~rd to some demographic and caste patterns. The caste pattern,
in particular, shows a fair mixture of minority communities among
the borrow€rs covPred undPr a generAl scheme. However,_most of
-.
the fArmors incluned in th~ ~turly Are small farmers, whose ~ver~ge
cpPrational holdings measure less than eight acres apiece; The
farmers generally pursue more than one occupations and, being mostly
small farmers, the agricultural labour as· an additional occupation .
is more corr~n while some households are engaged in dairying and
service. Furtho?rmore, about 40 per cent of the sample farmers
belong to low income groups {upto Rs. 5,000). This is more
pronounced among the 'incomplete' and 'control' categories. However, '
compnratively speaking ~he ben~ficiariP-s of the scheme are somewhat
better placed than other sample categories in te~s of size of
operational holdings and levels of household incomes.
CHAPT-sR V
SOl\~ ASPSCTS OF INFRUCTUOUS InV"E:STI1lENT
The information presented here pertains to infructuous
investoent that has taken place in the selected villages. The
data obtained from 56 households covered during the course of
the survey provides the basis. Th~se households are generally
referred to as 'incomplet~~' cases of investment and some ir1forma-
tion concerning them have already been discussed in foregoing
chapters of this study. These non-beneficiary borro\'lers. are those
v;ho obtained the loans along \vith the beneficiary farmers but
failed to complete the project by 30.6.1983 and could not derive
any benefit in terms of irrigation facility even during the year
1983-84. This category of non-beneficiary borrowers, however,
include cases of failed \-Jells and \'/ells remaining incomplete on
ace ount of partly or \'/holly misutilisation of loans under the
terms and conditions of Land Development BaP~.
Among the 56 cases falling under this category, 1,9
belong to selected villages in Beed and 37 to those of Osmanabad
district. In Beed district 11 cases come under new well with
pumpset, 7 cases of old \vell \vith pumpset and one case of
renovation of old well~ Similarly, in Osmanabad district, the
single purpose loans for only \vells are in t\vo cases each, 28
cases of ne\'1 \·I ells \'lith numns·3ts and five cases of old \'I ells ... ...
\"lith pumpsets. In all, 51 'Out of 56 cases arc. of composite
loans from both the districts.
Th9re are diffarent kinds of distinctions between the
failed v1ells and incomplete ""ells depending upon the situations.
According to the sources of Land Development Bank, a failed l·lell
67
68
may be defined as "~Vvhen VJater is not struck even though a depth of
40 feGt has been reached. Besides, there is the definition of
structural failure of \vells. According to this, a dug \-well may
be considered to have failed due to struct.ural failure; if during .
excavation any unidentified sub-surface strata caves in to cause.·
collapse of side walls to such an extent that reexcavation would
be required for successful completion of the well, or \-Jhere a
sheet rock or basem0nt rock is met "~Vvith, 1rJhich \vould make further
digging futile due to non-availability of acquifer do\vn belo\'1.
However, all the cases of failed wells are invariably referred
to the Ground-water Surveys and Development Agency ( GSDA) and. any
relief or subsidy for failed well can be claimed only after it
is duly certified by the GSDA. It is widely believed in official
circles of the Land Development Bank that 5 to 10 per cent of
cases end up as genuinely failed wells.
On the other hand, cases of incomplete/misutilisation
may arise (a) when the vvorks are not completed according to.·
minimum snecifications for \vhich loans are sanctioned and ...
(b) when the time and lvork output schedules are not maintained
as per the stipulations l'lh&an loan instalments are periodically
released. However, the subtle distinction between misutilisation
and incomplet/?. cases needs to be clearly understood. Mis..;.
utilisation is, in essence, not using the loan for the purpose
it is meant. Also, thera afe situations wherein the amount may
be overspent or misspent on the pr.oject on account of increasing
the di":n~ter of the well beyond the specification, and or,
payment made to the contractor in excess of the scheduled rates
for \vork. But any such ovGr expenditure is to be borne by the
69
loanee himself and the same cannot be offered as an excuse for
not completing the required amount of \'lark. Such cases are
treated as partial misutilisation or partly incomplete \'lark and
further instalments, if any, may be vlithheld till the completion
of the work as per the previous loan instalment released.
Hov.Jever, a \'lell can remain incomplete even after properly
utilising the loan funds. This may arise due to technical
raasons such as achieving the specified depth but not striking
\-Jat::r or ending up -.~Jith very lo\v level. of \'later and in. certain
cases, the side ,,.Jells may cave in to render the \'lell incomplete.
In such situations additional funds may be ·sought from the Bank
for the completion of the \vell subject to inspection and
technical clearance.by the officials and sanction by the head
office. Technically, an incomplete \vell can be completed by
increasing the depth and, beyond this effort, it will have to
be treated as failed well. The official view is that a well can
either be 'failed' or 'misutiliscd'. In short~ an 'incompl~te'
well may remain so for the reason of inadequacy of funds or
misutilisation of loan funds partly or otherwise.
The investment in dug \'IGll project is to be normally
completed in a year's time from the date of the release of the
first instalment of the loan. Ho\~ever, a considerable pro
portion o:f the "tvorks conn•3cted '\oliith the constJJuction of dug
\-Jells and improvement· of -ehe old \vclls has remained in~9inplete
beyond the time limit set for the completion. This is the '
situation in the villages livhich are selected on the basis· of the
presence of one or more beneficiary farmers of the completed .
projects. It has already b~en mer.tioned that the overall success
70
rate of the apparently completed projects (excluding the cases
of 'only purnpsets') \'lorks out to approximately 27 per cent of
the total nuL1ber of loans sanctioned for the \'lorks l.nvolving -
all typ~s of dug \-Jells from both the districts under consideration.
Indeed, the general performance is alarmi~~ly poor and the causes
appear to be the usual physical constraints and the human factors.
In particular, the situation in respect of the samole ...
borrov;ers \-Ji th 'incomplete projects' has bee~ caused by a
variety of factors. The reasons for the individual projects to
remain incomplete and inoperable, even during the survey year
of 1983-84, varied from infrastructure failure like nonavailabi
lity of the promised electricity co~~ection and clear cases of J
total failure of \-Jells, despite proper utilisation of funds, to
the other extreme cases of false claims and rank misutilisation
of loan amounts. In between, there are shades of reasons that
pertain to technical and partial misutilisation. The relevant
data in respect of the conc2rned sample farmers are presented in
Tabl8 5.1. It gives distribution of cases according to the
main reasons or combination of reasons, as stated by the
informants themselves and clarified by the concerned officials
~~d, the particulars about the stage at which the further
i~stalmcnt of the loan amount is suspended.
In all, the 56 sample farmers fall under one or the
otb=r of ten main reasons that have contributed to infructuous
inv::::stm2nt. Among the ten rGasons, the first four listed in
the tabl~ arc of one broad kind, wherein there is no mis
utilisation of funds involved on the part of the concerned
borrov:ers. Th-2 loane 8S ara_ just tht1 victims of natural causes
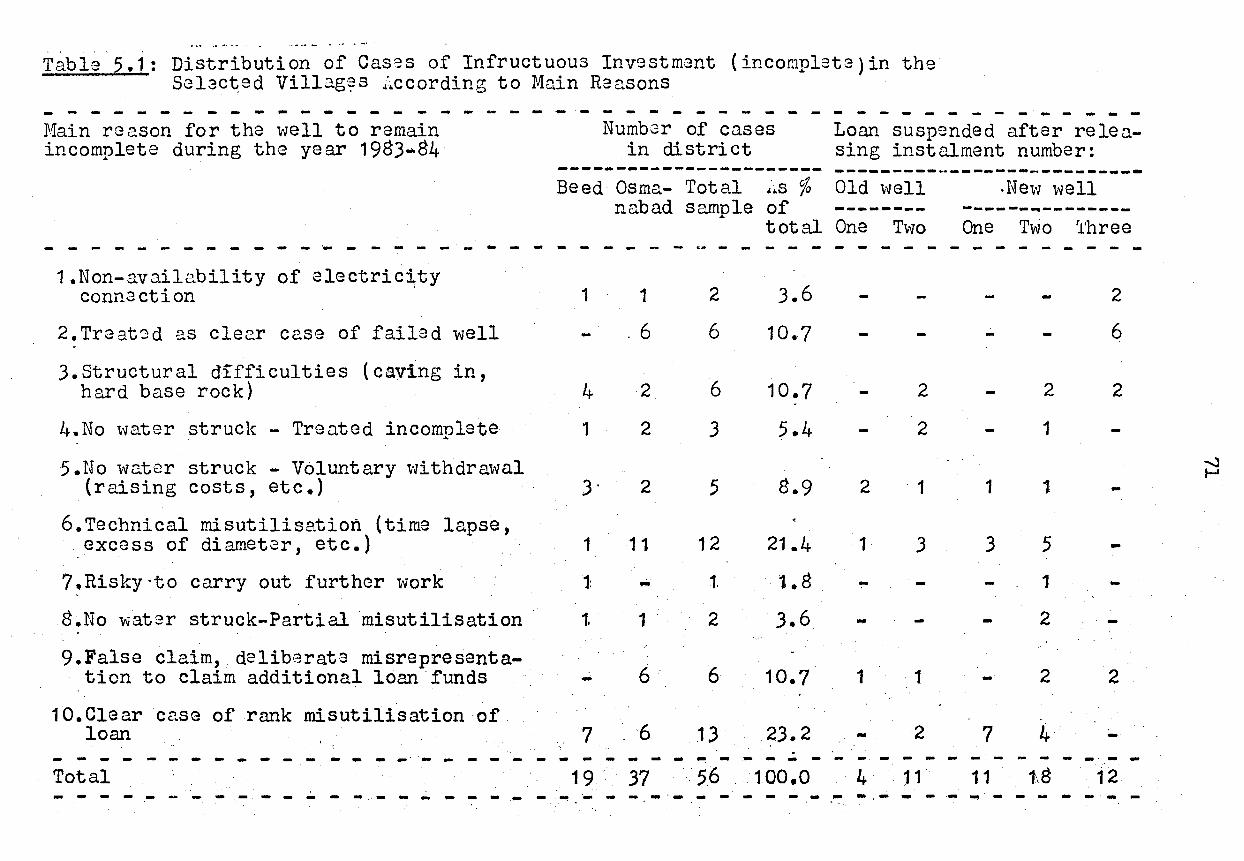
........ - .. ~ . -· Table 5.1: Distribution of Cas·3S of Infructuous Inv9stment (incomplete) in the
Selacted Villag~s ~ccording to Main Reasons
- - - - - - - ~ - - - - - - - - - - ~ - - - ~ - - - - - - - - - - - - - - - - - -Main re.~son for the \vell to remain incomplete during the year 1983-84
Number of cases in district
-----------------~-----
Loan suspended after releasing instalment number~
~--------------------------Be ed Osma- Total ;~.s % Old \vell na.bad samnle of ... --------- ------... --------
total One T\V'O One Two rl'hree - - - - - - - - - - - - - - - - - - - - - - - - - - - - - - - - - - - - - - - - - - - - - - - -
1 .Non-availability of electricity ·':! t. 1 1 2 3.6 2 conn ..... c 1on
2. Treat-:; d as clee.r case of failad well .6 6 10.7 6
3. Structural di=fficulties (caving in, hard base rock) 4 2 6 10.7 2 2 2
4.No \vater struck - Treated incomolete ... 1 2 3 5.4 - 2 1
5 .No \vc.t·ar struck - Voluntary withdrawal {raising costs, etc.) 3· 2 5 8.9 2 1 1 1 -
6.Technical misutilisatiori (time lapse, excess of diametar, etc.) 1 11 12 21.4 1 3 3 5 -
?.Risky·to carry out further "tvork 1: - 1. . '1. 8 ~ - 1
8.No water struck-Partial misutilisation 1. 1 2 3.6 - 2
9.False claim,.· deliberate mi sre pre sent a-ticn to claim additional loan funds - 6 6 10.7 1 1 2 2
1 O.Clear case of rank misutilisation of loan 7 6 1.3 23.2 - 2 7 4
-- - - - - - - - - - - - - - - - - - - - - - - - -- - - - - - - - - - - - -· - -Total 19 ' 37 . 56 .too .. o 4 11' 1 1 t8 12 - - - - - - - - - - - - - - - - - - - - - - - - -- -·- - - - - - -- ·- ... - - - - - - -'.
.....:1 1--'
72
( 27%) and in two cases, unfortunate in not securing the po1tver
facility. Tha remaining cases fall under different kind~ \vhere,
motives arc of .varying nature. In the follo1tving are given ·'
brief account of the reason1tvise cases.
( 1) Non-availability of Pov.Jer Connection
Th~re are t1tvo cases, one aach from Beed and Osmanabad,
vJho could not avail of the facility of irrigation during. the
year 1983-84, for \vant of electric power connection at the site
of t.ha \valls. In fact, both come under ne\v dug well \vith pump
set type and have lifted all the three instalments to complete
the work on well construction. Till the power facility is ma,de
available, they are not allowed to obtain the electric pumpset
component of the loan. Besides, the concerned farmers are
reluctant to use the oil engines or any other device to irrigate
their lands.
(2) Clear Case of Failed Well
All the six cases belong to Osmanabad and all of them
come under the composite loans for new \'.Yell 1.vi th pumpset. Even
after properly utilising the loan amount for the purpose of
digging \vells, and reaching the desired level of depth, they have
failed to strike tho acquifers. These incomolete wells are ...
treated as failed vJells by -the Land Development Bank and as per
the requirement, four cas1~ are r·Jferred to GSDA. In one case,
the certificate from GSDJ .. and the subsidy for failed well have
already been secured. In the remaining case, the GSDA's advice
of further deepening work of 10' could not be carried out as
the Land Development Bank rc~fuse d to grant extra loan on the
73
grounds of the concerned borrower having already reached his loan
feasibility limit. No\'J the \vell is partically treated as failed
\'/ell and in order "t..Cft claim the subsidy final certificate from
GSDA is still awaited. In all, the clear cases of failed \'/ells
account for nGarly 11 per cent of the total sample of incomplete
category.
(3) Structural Defects
The difficulties encountered undar.this haad are
(a) caving in of side "t'lalls and thereby rendering the entire
\'lell as useless and structurally unsafe .:md (b) striking hard .
base rock or sheet rock which prevents reaching the acquifer
do111n below. There are six casas, four from Bead. and t\'IO from
Osmanabad, togeth?.r accounting for 10.7· per cent. ~-~o.of these
are old \vells and failed aft2r the release of final in~talments •
. Among the four ne\'1 \'Jells, t\vo got into structural diffiCulties
after obtaining second instalment "llvhile the other t\'VO ·have met
the similar fat-~ b~~fore the pumpset component could be released.
Prcs0ntly, all thJse cases are treated as incomplete by the
Land Development Bank. However, there is no instance of any
misuse of funds on the part of the loances. Eventually, these
cases may also end up as 'failed \vells'.
(4) Failure to Strike Water
The three \vells under this head are almost similar to \i.
the cases of structural defects. .The probl•amshere is that
more than prescribed level of. depth has been reached in each
'.:ase and still there is no sign of \vater. According to the
officials ther2 is no 1ikelyhood of striking \'later and further
74 ... :
vvrork is halted. Though t\'10 instalments in each case are propeZ:iy
utilised. The cas8s are presently treated as technically in
complete. Eventually., the cases \1lill be referred t.o the GSD .. ~
for th~ technical advice as to further action. Curiously enough,
tv;o of the v.Jells involved in this have been old \-Jells and the
loans ara meant for deepening of \118lls and purche.sing pumpsets.
Hov.Jever, the pumps8t component of the lonn is \V'ithheld as thare
is no VJatr:?r. This may be a pointer to the general lowering of
\'later tnblc in that area.
( 5) Voluntary Withdra\-Jal
The decision to cease the \-Jork in the midway 3tages of ·
the individual projects has been entirely made by ~he concerned
borro\vers th~msclves. In t\-Jo of the old \vell cases frori1 Beed,
tha loan instalments being insufficient to carry out the work
of digGing through the hard rock condition, the borrowers have
decided not to risk their own funds on the grounds of increasing
costs. Henc8 thG voluntary abandonment. However, there has not
been any complaint of financial irregularity. In the third case
of the old \vell, the \'iork after the first instalment resulted in
very l0\11 l2vel of watGr. The conccrned borro\ver has decided to
abandon furthar \vork on the grounds of less prospect of finding
sufficiGnt quantity of \'later, even though the further instalment
of loan is available. Similar is the case from Osmanabad for \:
nev.J vvell with pumpset, \V'here the borro\ver has refused to lift the
third instalment as no water is found after the fUll utilisation
of first tv.Jo instalments. The last case is a unique case in that
the borrower from Osmanabad di:Jd after the sanctior: of the first
instalment, and his successor is not interested in continuing the
relationshin with the Bank. Hence voluntary withdrawal • ....
75
( 6) T8chnical Ivlisutilisation
Thera are tvlielv'3 cases, nll but one belonging to ' '
Osm2n2.bad district, coming und3r the category of tachnical mis- .
utilisation. Th0 cases include mostly th8 violation of time
schedule and exceeding the stipulated diameter of the vvell.
Many a borrotvcrs resorts to larger di.:lm;ter thc:m the· on:3 ·stipu-.
lated in the terms and conditions by the Bank, in order to
benefit from the percolation effect and to give more elbow room
for the construction tvorkors to operate tvhile digging the well.
Hov>Jever, this wider diam~ter necessarily involves additional
expenditure on the part of the borrower. This in turn results in
reduction in the depth of the tvell or delay in the time schedule
of the tvork or for want of funds less amount of specified
construction tvork for each instalment lifted. Consciously or
otherwise, many fnrmers get themselves involved in these diffi
culties. Even the successful beneficiaries are also guilty ·or
violating the norm of diameter. The Bank, however, disapproves
only th8 reduction in the· specified tvorks.
The oth3r kind of difficulty ref9rs to not keeping up '
the time schedule of the tvork to b8 carried out for each instalment
of loan amount received by thG farmers. In most of the cases
this situation arises as th8 contractor, entrustzd with the tvork,
allegedly plays truant or turns out less than the specified tvork.
~liso it is possible that the borrower himself may divert the \ i,
funds for other purposes hoping to raise the same at a later
dnte to comnlete the construction tvork of the tvell. vVhen this ...
docs not take place or delayed, he gets himself into difficulties
since the Bank would not release the next instalment under such
eire umst ance s.
76
In the lone case from Beed, the borrower has utilised just
one instnlmcnt and subsequ9ntly allowed lapse of time in the
schedule. He is nov; unable to obtain the next instalment as the
m~tter hns been referred to the headquarters of the Land Developillent
Bank. Similarly, three cases from Osmanabad have been treated
under technical misutilisation on account of lapse in the time ~ch
schsdule or inordinate delay in turning out the specified work
expected of the instalment already lifted.
In all, eight cases (all in Osmanabad) have remained as
incomplote on account of exceading diameter and consequently
unable to turn out the r3quired quantity of work~for the loan
~'1lount already received. The Bank has treated all these cases
as partly misutilised c:nd partly incomplete. Hhile excaeding the
diameter of the v;ell may b~ a tachnical matter, the sanctioned
funds being not used for required depth or other aspects of the
construction of the well is construed as partial misutilisation.
~illlong the t\velve casas falling under this category, four are old
\-J8lls end eight ne\v \valls. Three old walls are unable to receive
the pumpset component and the remaining ones have still to -
receive one or t\'lO instalm:nts for completing the construction of
vJells.
(7) Risky to Complete the Project
This is somewhat a unique c~se from Beed, the borrower \'
do2s not 1.vant to proce ad \vi th the v1ork aft:;r lifting t1.-10 instalments
and reaching a depth of 25 '· ·without striking \vater. Though Bank is
nrenared to release the next instalment, the uncertainty· associated ... ... '
with reaching any aquifer and not to risk the burden of loan further:
th2 borro\ver has ceased to \vork on the project. On the other hand,
77
.the Bn.nk cannot ref~r the m(ltter to GSD..:~ because the \vell has not.
renched the denth of 40' • ...
( 8) Partial Iviisutilisation
The borro\vers have fai.l2d to strike \vater after lifting
tHo instalments and are inclin•3d to c.omplete the project .only \vren
the Bank releases the third instalment of the loan. However, the
Bank is of the opinion that full utili'sation of the funds. released
so fc::.r has not taken place and the .cases come under partia! mis
utilisation cat·agory. Thera are only t\-JO cases, one each from
Been and Osmanabad and, both are new dug \vell pro.ject.
( 9) Incomplote due to l\tiisreprosent(ltion and False Claims
In this situation of ncar completion of projects,. the
penultimate instalment of \vGll loan or the pumpset component is
not being released by the Bank on the grounds that the concerned -
borrowers have misrepresented the fact and, have made false claims
for additional funds to complete the projects. · This has resulted in
onG case of old \vell b.nd t\vo cases of ne\v \-Jell projects denied of
the relcQse of pumpsets. The Bank is of the view that claims for
additional loan funds or extra loru1 amount over and above the
sanctioned ~ount cannot be granted as the loan feasibility of
tha concerned borro\·Jers has already reached the maximum limit.
{10) Rank Misutilisation o.fti·Loans
The rank misutilisation accounts for 23.2 per cent of the
sample cases from both the districts. Ho\vever, the relative
proportion is much greater in respect of Beed. Besid3s, the
m~ifest2tion of misutilisation is relatively more in the case of
n9w dug well cases thnn ~ld wells. It is only in the case of
improvement of th~ vvells \ve find the misutilisation ·occurring
a.fter the release of the final instn.lme nt of the construction
part of the loan. Hm,vever, in such event, the .issue of pumpset
is invarinbly \vithheld in the case of composite loans.
In sum, the cases mentioned under the brond categories of
mcin r~asons for infructuous investment are both illustrative and
indicative. They illustrate the typ·es of difficulties and shades
of motives for the individual projects to ramain incomplete or
improper use of funds borrovved. .::uso, they are indicative of·
genuine problems of physical or natural constraints to be
encountered in the course of construction work. The constraints
are manifested, may be limited to some cases, in the form·or
caving in of sides, hard base rocks nnd inadequate qua."'ltity of \"ll'ater
or absence of aquifers. Apparently, around 30 per cent of-the
cases revievved may not be faulted for misutilisation. At the other
extr~me, v.;e find varying extent of human factor being manifested
in voluntary disenchantment ·with the scheme or voluntary \"ll'ithdra\"II'Cl.l
from the scheme, technical and partial misutilisation and, lastly
the misuse of loan amounts. Apparently, the misutilisation in one
form or other and technical or otherwise, takes a very large toll
of the individual projects. The funds from the defaulters may
eventually be recovered and ~orne of the incomplete projects may be
successfully completed at l.2ter dat~s. Nevertheless, 11vhat must
be the cause for immediate concern is the sinking of considerable
amount of orecious funds without securing commensurata benefits in ...
terms of cnhanc8d r2source base in the areas, especially, prone
to successive droughts.
CHAPT8R VI
ASPECTS OF INVBST£{SNT AND FINANCE
Before ""ve deal ""vith the benefits accruing from the
investment, it is necessary to have a general id3a about the
opinions and experience of loanee farmers on certain aspects;
physical manifestation of the investment and utilisation of
finance. The present chapter, therefore, deals \'lith the follo\'1-
ing aspects relevant to the implementation of the scheme on the
part of the beneficiary farmers.
(1) Opinions of the borrowers and their experience in
regard to extension, technical facilities, credit and other
infrastructure arrangements;
( 2) Physical dimensions of dug wells and type of lifting
device installed;
( 3) Cost of investment and extent of loan financing.
6.1 Opinions and Experience
This section attempts to present some information that
has been covered through a set of general questions. It is
mostly in the form of opinions elicited from the informants
included in the study. By and larga, it covers dissemination
of information for investment decision, extension facilities,
credit infrastructure, et1~ In other words, adequacy or other
""vise of the sunnort facilities available to farmers are broadly ... ...
mentioned here. The questions put to the informants have been
in the form of multiple choice objective ones and often evoking
simply 'yes' or 'no' response. The highlights of the information
79
80
so obtained from thB beneficiary, as well as, the other .catagory
of borrm'i~rs "~tvrose projects have b-3en deemed 'incomplete' 1 are
provided in the following.
In regard to the decision on investm0nt each samnle .. borrm-;er \vas asked to state \vhether it \vas his O\vn or promoted
by others, such as, official from Bank, extension service or
any other agency and experience of the neighbour. The response
from every one of the 111 households was that it ~vas his O"ltvn
d~cision to seek the assistance of the Land D·Jvelonmcnt B~'1k ...
(LDB) for the investment. Further, none of the farmers
experienced any difficulty at any stage in_receiving the loan. \
.Also everyone stated that he \vas given to understand. the terms
and conditions of loan by the concerned Bank officials. The de
cision about the selection of the site for construction of \vell,
the dimensions of the \"Jell and th_e horse po\vcr of the pumpset
v1ns also exercised by the loanees themselves rather than the .
officials or irrigation experts. No one admitted to have
employed any water diviner especially in regexd to the siting
of well.
All the borrovvers have stated that one or the other of
the extension officials and the concerned officials from Land
Dcvelonment Bank have had visited the sites during the course ...
of project implementation. The type of advice received from them
pertained mostly to cropp\1(-g pattern and investment vvork in the
case of Osmanabad sample and, loan utilisation, inyestment \vork,
input use and cropping pattern in the case of sample farmers
in Beed district. .:~sked to state vvhether th8 advice so
received v1as follovvcd up, all the sample farmers from Osmanabad
81
district responded positively. On the other hand,· about 8.0 _per
c,3nt of beneficiary and 26.0 par cant of 'incomplete' farmers
from Beed district did not follow the same. All these ·negative
respons9 belonged to composite type loans, that is, old or rte1,-l
dug vvell vJith pumpset. The reason for not following up t;he
advice, hovvever, vvas uniformn.lly the same -lack of funds. .
Asked to state 1rJhether or not the Land Davelopment Bank officials,
in particular, visited the site of vvell for inspection o_f v'lork
done and for providing technical guidance, all the informants
gQve positive ansv<Jers. Furth~r, they also have stated that
they vJcre satisfied v'Ji th tr.c- technical advice rendered by the
L2nd Development Bank offici A.ls. No informant could make _any
oth~r comment on financing bank and its procedures even when
specifically asked to do so.
In regard to the general quqry as. to v<Jhether the water
supply VJas p~rennial or seosonal, the majority of the bene
ficiary found it to be only seasonal. In the case of sample
from Beed, about 69 per cant reported it to be seasonal while
65 per cent in Osmanabad found it to be so. In all,. only a
third of the wells \vas regarded as p2rennial. It v<Jas also
ascertained the.t the inadequate level in the vvells was not due to
ov2r-clustering of 1-vells. Actually, all the farmers interviewed-·
-vvcre of the opinion that no 1-vell v'laS constructed nearhy since H
the comnletion of the investment • ...
The arrangements for servicing of pumpset v1ere found to
be satisfactory to all the sample farmers. Ho-t"~ever, vvhen asked to
state the proximity to the neares-t servicing centra, the response
was quite varied. About 12 per cent of iP£ormants in either
82
district could not give any idea of distcmce. It was only in the
cnse of 9.3 per cent in Osmnnabad and 25.0 per cent in Seed that
the nearest centre \vas 1vithin a distance of five kms. In the
latter district, for anoth(3 r 4 7. 2 per cent it \'i as located within
6.,.1 0 kms. The farthest C:·:;ntrc 1vas over 15 kms., in the case of •
5. 6 per cent of th--; snmple. .Among the Osmanabo.d beneficiary
fc..rmers, only 20.0 p3r cent could find thG service \ovithin 10 kms.,
and another 21.3 per cent at 11-15 kms., distanca. The distance
was 16-30 kms., in the case of 33.4 per cent of farmers~ Ho\o-Jev~r,
it 1vas beyond 30 kms., in the case of 13.3 p8r cent of the
b~neficio.ry farmers. This infrastructure facility was rather
innd9quate especially for the Osmannbad sample farmers.
In so far as infrastructure needs and arrangements for
short term credit, input supply etc., were con~erned, the response
of the sample farmers was rather a mixed one. Among the sample
borro1-vers from both the districts, only 64 per cent farmers were
m~r.~ors of cooperative credit societies. In Beed sample it
accounted for 44.4 per cent for beneficiary, 26.3 per cent ~or
'incomplete' c&tegory and 38.2 per cent for both categories. In
comp~rison, in Osmanabad district greater proportion of borrowers
reported being mambers. It \vas 80 per cent for beneficiary,
70.2 ncr cent for 'incomnlete' and 76.8 par cent for both put . . tog~ther. The reason for not being a memb3r of any credit
society (S.T.loans) in mos·t cases 1tvas that there \vas no need
for the swne. Ho1-vev·er, a few non-members admitted that they \vere
defaulters and hence no longer active members. Asked about the
adequacy of the crop loan obtained from the cooperative credit
societies, majority of the sample answered in negative. Those
83
~swcring in n3gative f3lt that both cash and kind components
"lt'ierc inadequate for raising th-; crops. The present. system of
distributing inputs in terms of timely availability, adequacy
.:tnd reasonableness of price \vas found satisfactory in all the
0 t• r~por 1ng cases.
When asked to state, "ltvhether or not the informants \v-are
satisfied \'lith th8 present m~thod of marketing of their produce,.
all ths beneficiary farm3rs of Osmanabad, as \vell as,·
'incomplct::=' cas:?s of both districts responded positively. It
wns, ho"ltvever, only in the case of B'~ven beneficiary farmers from
Bead district, the marketing method \vas reportedly unsatisfactory.
The only reason stated for their dissatisfaction \vas the lo\V' price
offered to their oroduce at the market • ...
The type of assistance the farmers would like to get for
better cultivation evoked some"lt'lhat unexoected resnonse. ·Instead ... ...
of uniformally mentioning the 6eneral option for 'more finance•,
the beneficiary from Beed preferred to have 'technical advice'
(39 per cent), timely 'supply of quality inputs' (19 per cent),
price support (3.0 per cent) and the rest simply 'more finance'.
The incomplete category from 1:3eed vJas almost equally divided
betw3en 'mor,:= finance' and 'technical advice'. Similarly, the
Osmanabad beneficiary expressed their preference in favour of
'more finance' ( 79 per cent~, and 'technical advice' ( 20 per cent) •
The 'incomplete' category, ho'v'lever, totally pref0rred to have
'more finance•. Significantly enough, a substantial proportion
of farmers did value 'technical advice' and 'timely supply of
innuts' rather than m.Jre funds • ...
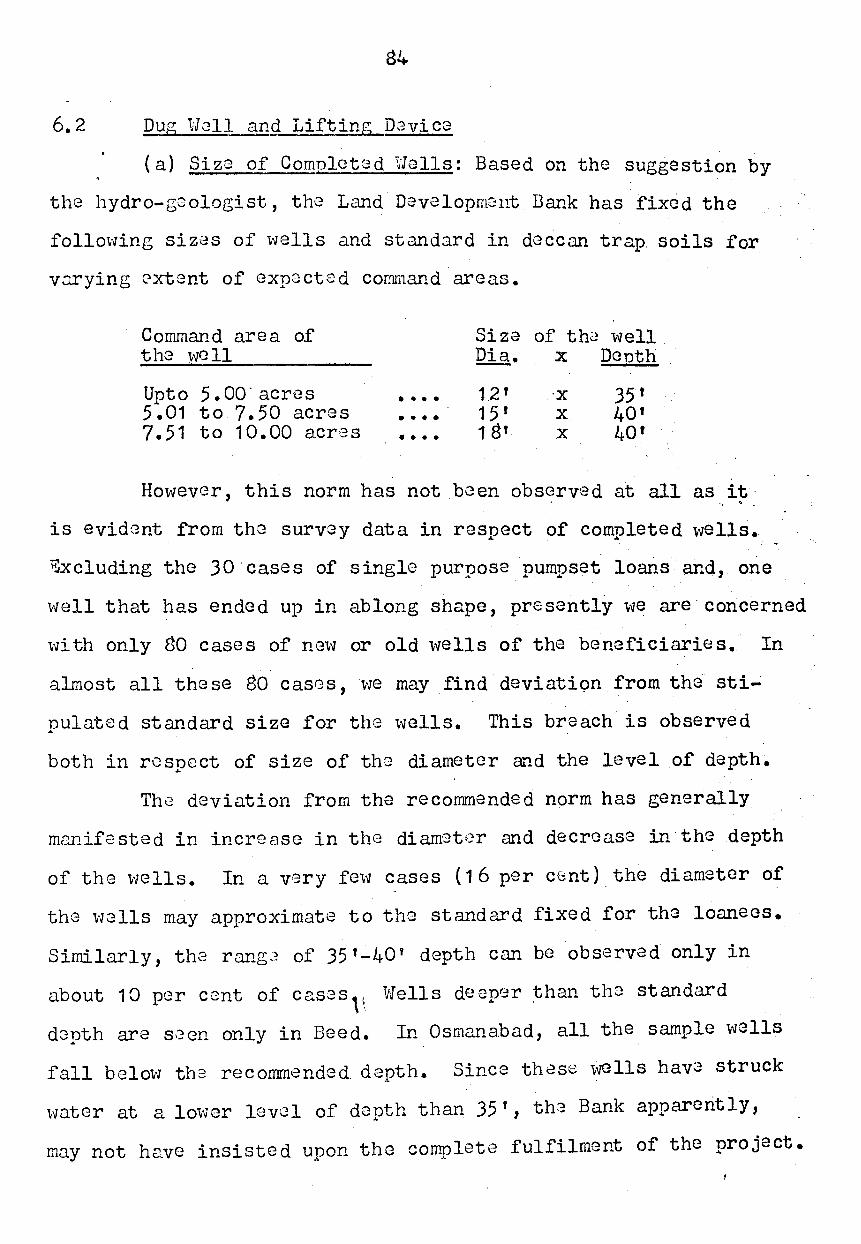
84
6.2 Dug W~ll an~ Lifting Davice
(a) Size of Comnlcted Wells: Based on the suggestion by
the hydro-gGologist, the Land Development Bank has fixed the
following sizes of vvells and stand.:trd in deccan trap. soils for
VQrying ~xtent of expected cor.1mand areas.
Command area of Siza of th2 vvell the well Dia. X De nth
Up to 5.oo·acres •••• 12' ·x 35' 5 ~01 to 7. 50 acres • • • • 15' X 40' 7.51 to 10.00 a.cr·~s • • • • 1 81 X 40'
Hov-Jever, this norm has not bGen observed at all as it·
is evident from the survey data in respect of completed wells.
Excluding the 30 cases of single purpose.pumpset loans.and, one
well that has ended up in ablong shape, presently "ttve are· concerned
"ttvith only 80 cases of nc~vv or old "ttvells of the beneficiaries.. In
almost all these 80 cases, vve may find deviation from the sti
pulated standard size for the vvells. This breach is observed
both in resp8ct of size of th3 diameter a~d the level of depth~
The deviation from the recommended norm has generally
mMifested in increase in the diam9t~;r and decrease in· the depth
of the vvells. In a v(~ry fGv-J cases ( 1 6 per cent) the diameter of
the v·Jells may approximate to the standard fixed for the loanees.
Similarly, th2 rang~~ of 35 '-40' depth can be observed only in
about 10 per C2nt of casasr vJells deeper than tho standard
dGpth are s.~en only in Beed. In Osmana.bad, all the sample wells
fall bclov-J th3 recommended. depth. Since th8sc v-JClls hav3 struck
water at a lovJcr level of depth than 35', th~ Bank apparently,
may not have insisted upon the complete fulfilment of the project.
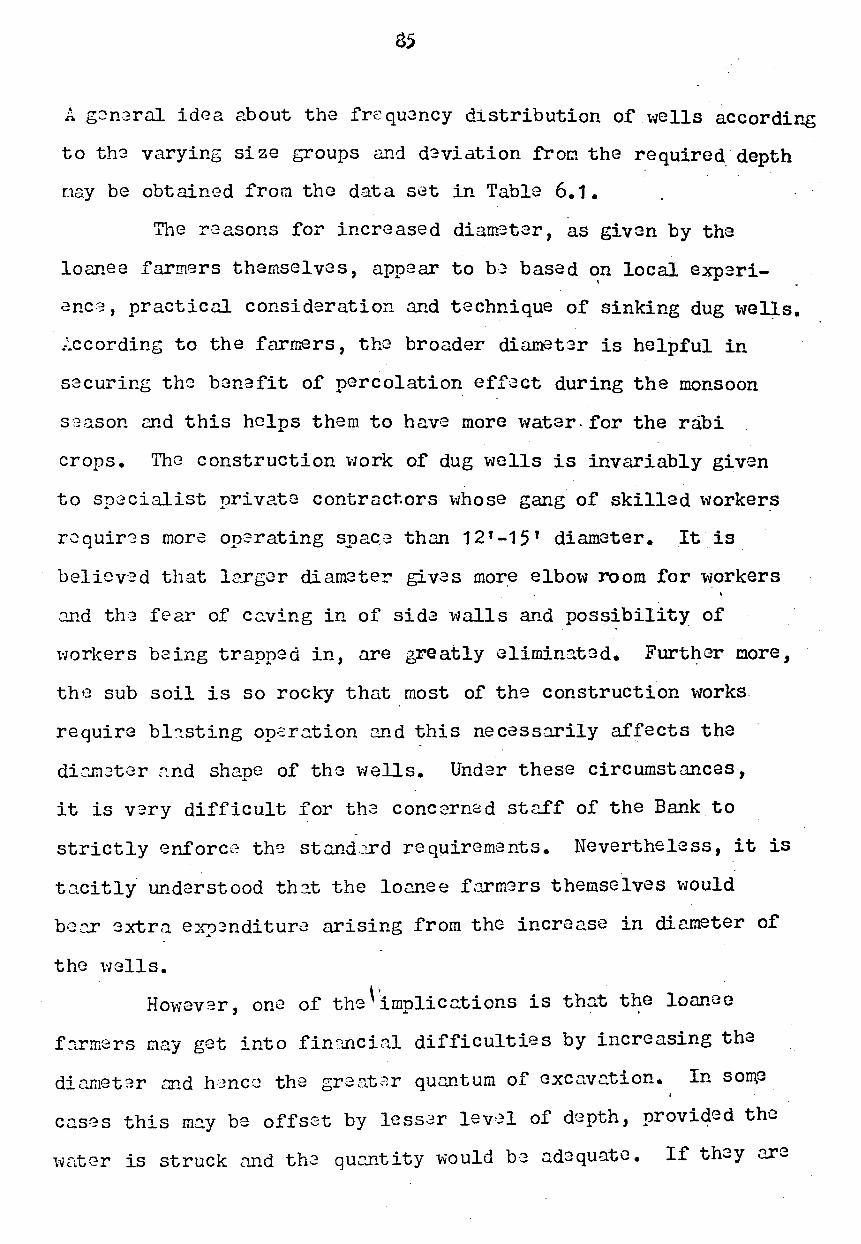
A gcn2ral idea ~bout the fr2quancy distribution of wells according
to th8 varying size groups and d~viation froo the required depth
nay be obtained from the data set in Table 6.1.
The r~asons for increased diam3tzr, as given by the
loanee farmers themselves, appear to h; based on local exp:ari-,
anc:~, practiccl consideration and technique of sinking dug lr'lelJ,.s.
~ccording to the farmers, the broader diamet3r is helpful in
securing the benafit of percolation effact during the monsoon
ssason end this helps them to have more water.for the rabi
crops. The construction \vork of dug \'Jells is invariably given
to specialist private contruct.ors \vhose gang. of skilled lr-Jorker~
r2 quir-:; s more op2rating spaC.·3 than 12' -15' diameter. It is
belicv,2d that l.:?..rgcr diamcte!' givas mor,e elbo\v room for lvorkers
cmd th3 fear of cc..ving in of sid·~ \valls and possibility of
\vorkers baing trapped in, are greatly climin3.t3d. Further core,
tho sub soil is so rocky that most of the construction \'lorks
require bl~sting op~rc..tion rrnd this necass2rily affects the
di~~ter ~nd shape of the wells. Undar these circumstances,
it is v3ry difficult for tha conc2rned staff of the Bank to
strictly enforce the stt:Uld . .:.rd requirements. Nevertheless, it is
t~citly understood th~t the locnee f,~mers themselves would
h:;::,r G:xtra eX!'_)Jnditure arising from the increase in di~meter of
the \'lells.
Ho1r..;ev~r, one of thG\lmnlicc..tions is that the loanee ...
f~rm8rs may get into fin~nci~ difficulties by increasing the
d; ...,....,,':lt~r """""d h-~~ncn th·~ r.rn "'\t~r quantum of excnvc..tion. In som.e -.C:......LJ..l- "' 4....U..:. _, ... ·- "" 0 ............... "'"
co.s~s this mc..y be offs2t by lessar lev·}l of depth, proviqed the
1v:: .. ter is struck and the quc..ntity \'iould b·3 [ld8qua.tc. If th~y iJ.I'e
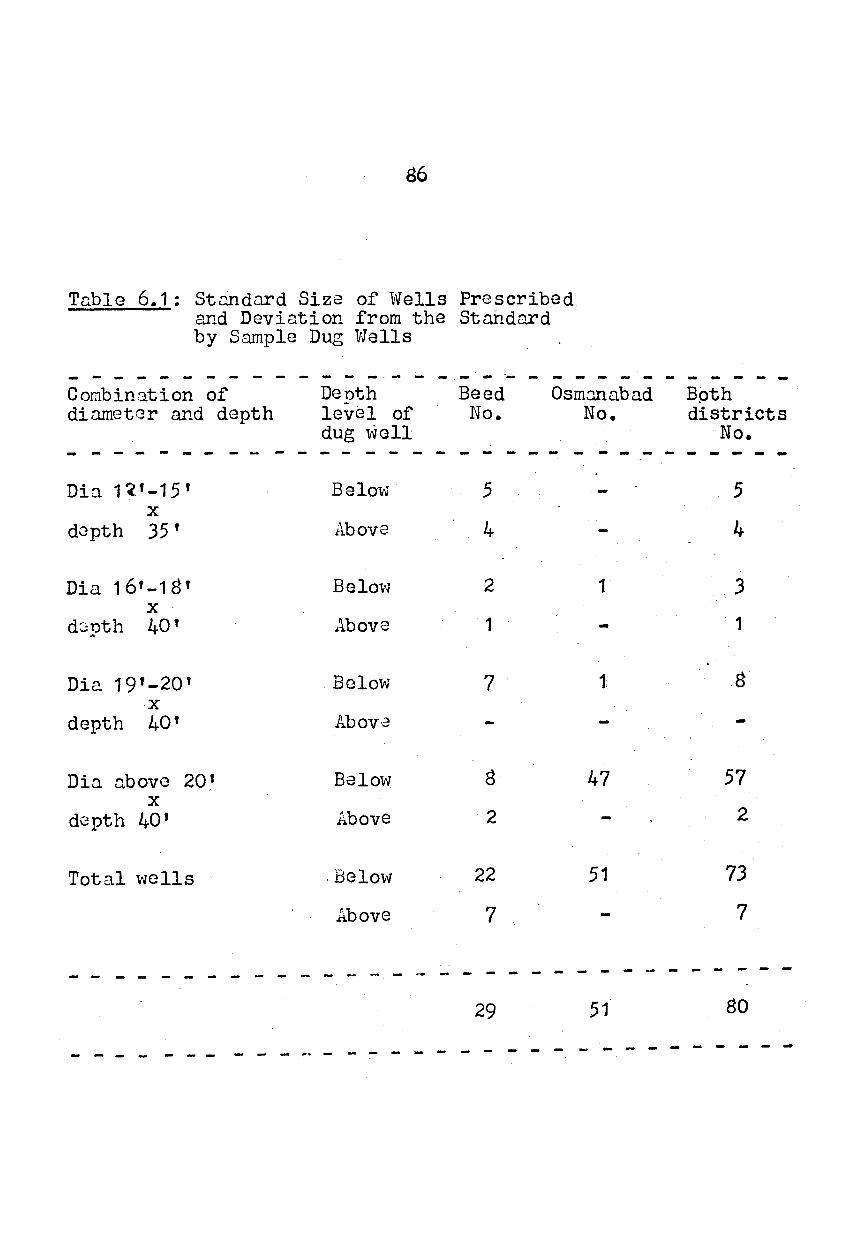
86
Table 6.1 : Stl:!lldnrd Size of Wells Prescribed and Devie1tion from the Stnhdard by Sample Dug lrvells
- - - - - - - - - - - - - - - - - - - - - - - - - - - - - - - -Combination of De nth Beed Osm~nbn.d Bpth dinmetcr and depth level of No. No. districts
dug well No. - - - - - - - - - - - - - - - - -- - - - - - - - -Din 1<'-15' BelmrJ 5 5
X
dGpth 35' Above 4 4
Dia 161-18' Belo\·J 2 1 3 X
d~Dth 40' Above 1 - . 1 ...
Dia 19'-20' Below 7 t 8 ·X
depth 40' Abov·a -Din nbove 20.' Below 8 47 57
X
dGnth 40' Above 2 2 ...
Total ·wells .Below 22 51 73
.Above 7 7
------- - - - - - - - - - - - -29 51 80
- - - - - - - - - - -· - - - - - - .... - - ..
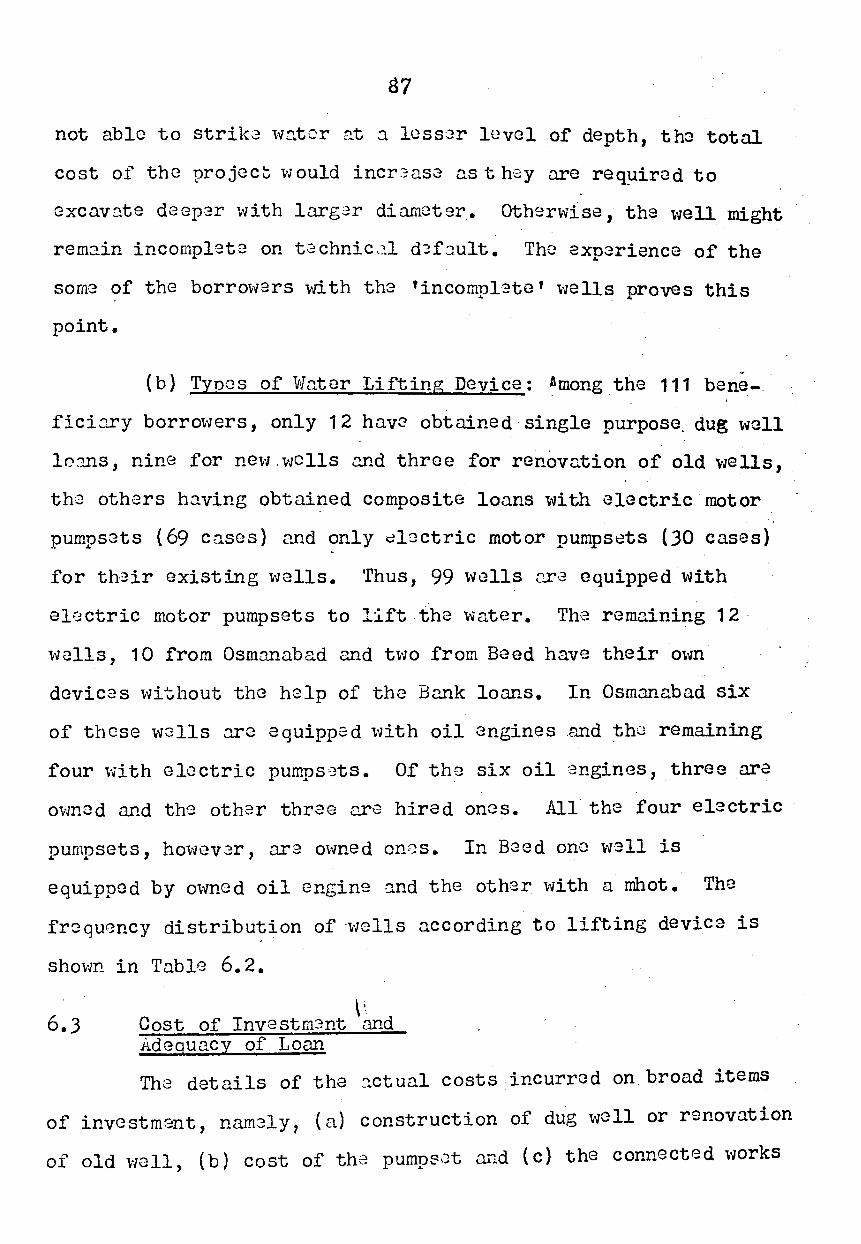
87
not able to strik8 wo..tcr ~t .:t lcss:Jr level of depth, tho total
cost of the project. \·Jould incr:~as~ as they are req~ired to
excavate deGp-~r \vith larg~r diameter. Othar\v:lse, the \tell might
rem:tin incomplet~ on t~ chnic -~1 d~f~_ult. The exn3rience of the .. some of the borro\vers vd th th8 'incompl~tc' \vells proves· this
point.
(b) Tynes of Wnter Lifting Device: ~mong the 111 bene-.
ficic.ry borrmvers, only 12 ha.vz obtained single purpose_ dug \-Jell
lo:ms, nine for ne\'l. \vClls Qnd three for renovation of old \-Jells,
the others h.:tving obtained composite loans with electric motor
pumpsats (69 cnses) and only electric motor pumps8ts (30 cases)
for thJir existing \'Jells. ·rhus, 99 '"ells ara equipped with
el~ctric motor pumpsets to l:ift the \vater. Th~ remaining 12-
\vclls, 10 from Osmnnabad and t\vo from Beed have their O\-Jn
dcvicas \vi~vhout the help of the B~k loans. In Osm3Ilabad six
of these \v2lls :rrc equipped with oil engines and the remaining
four \'iith electric pumps·;}ts. Of the six oil angines, three arc
O\vnod and th8 othar three c2re hired ones. All the four electric
pumpsets, ho\vev2r, ara O\vned on8s. In Bced one \vall is
equipped by o\vncd oil engins :tnd the oth8r \vith a mhot. The
fr8quency distribution of -wells according to lifting devica is
shovm. in Table 6.2.
6.3 \'-
Cost of Investm3nt and Adequacy of Loan
The details of the ~ctual costs incurred on broad items
O f · t t 1 ( <-~) construction of du·g \vcll or renovation _ 1nves men , nama_y, ~~
of old v1ell, (b) cost of th2 pump~,'}t and (c) the connected v1orks
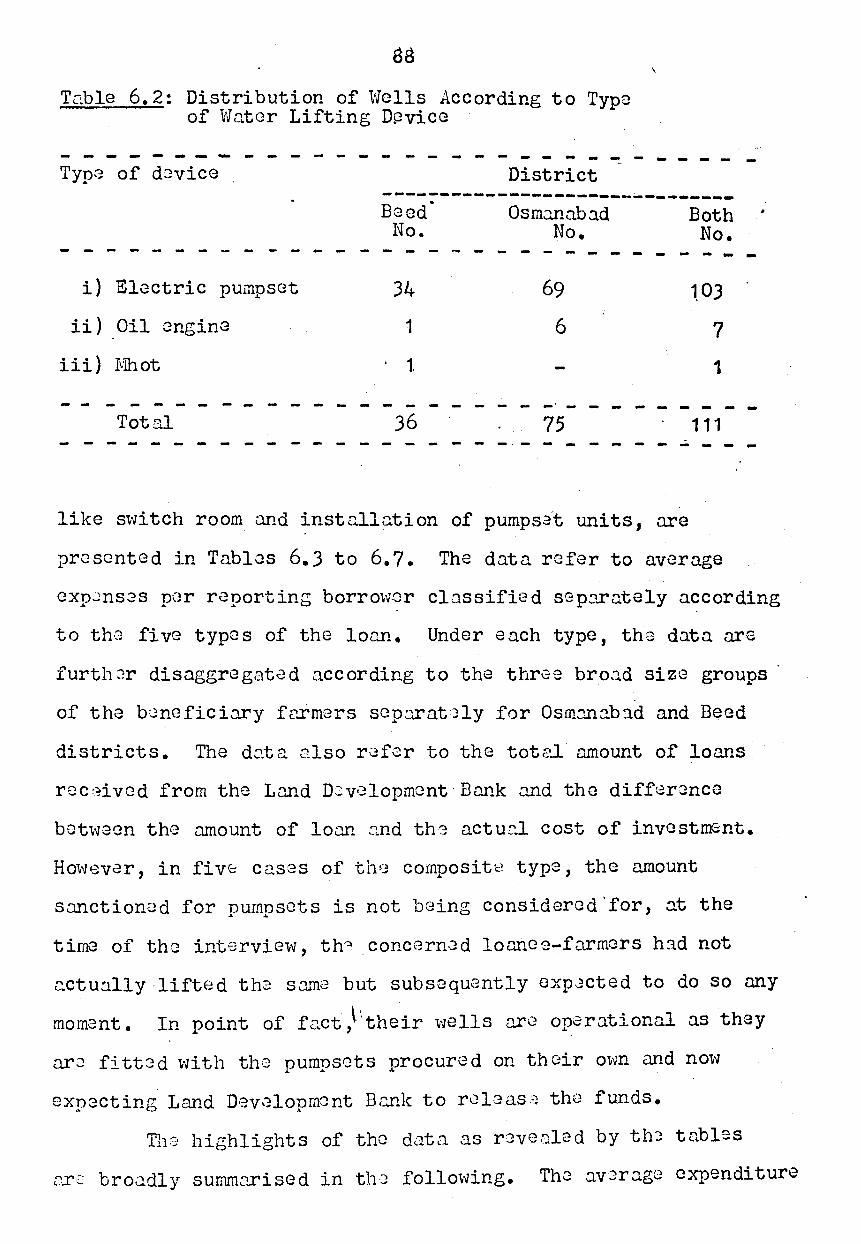
88
Tc~ble 6. 2: Distribution of vlclls According to Type of Water Lifting D~vicc
~ - ~ - - - - - - - - - - - - - - --~--------District
----~----------------~---------Beed Osm.J.na.b:J.d Both No. No. No. - - - - - - - - - - - - - - - - - - - - - -
i) Electric pump set 34 69 1,03
ii) Oil engine 1 6 7
iii) Iv1hot . 1. 1
- - - - - - - - - - - - - - - -· - - - - - -Totcl 36 75 111 - - - - - - - - - - - - - - - -- - - - - - ...;. - -
like svJitch room and instcllntion of pumpsa't units, are
presented in Tablos 6. 3 to 6. 7. The data refer to average
-
--
cxp..:;ns~s pc~r reportint; borrm·rsr classified sep2rately according
to th ·3 five types of the 1 oa.n. Under e n.ch type , thG dn.t n nrc
furth2r disnggregated according to the three bro~d size groups
of the b;.;ncfici.:rry fc.rrmers scpcxnt,Jly for Osm~~b:1d and Beed
districts. The dQta also rGf8r to the total amount of loans
rcc~~ivcd from the Land D:v·Jlopmcnt · Bnnk .:tnd the diff:..;rJncc
bct~tvecn the amount of lonn ::::nd th3 actu~l cost of investment.
Hmvever, in fi vc cc.sas of thr:; composit;;:: type, the amount
sanctioned for numnsets is not being considercd'for, ~t the .. .. time of the intervie~tv, th":l concern,J d lonnc e-fw.rmcrs h3.d not
~ctunlly lifted th8 s~~e but subsequently oxp~cted to do so any
moment. In point of f.::.ct ,\~'their \vells arc operational as they
ar;) fi tt~ d v'Ji th thG pumpsets procured on th air ov-vn and now
expecting Land D·;;v,-:lopmcnt Bc.nk to rcle as:-; tho funds.
The highlights of the data as rJve.'1led by thJ tables
b dl · d · th f llo1·';ng Tho .:~.v·Jr~2:C expenditure o.rz.: ro.::::. y summ2r~se J.n .. ·3 o vv..~- • • ......
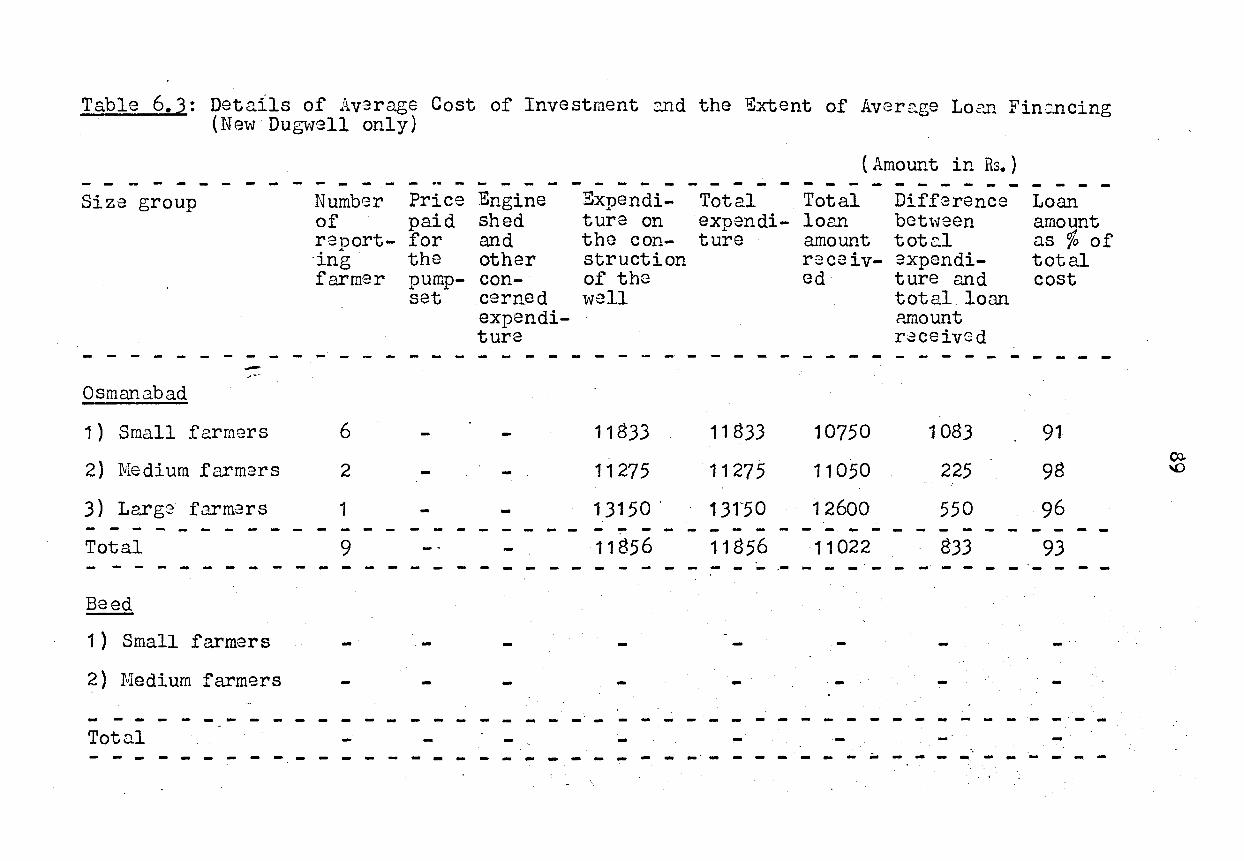
Table 6.3: Details of Av~rage Cost of Investment wnd the Extent of Aver~ge Lo~~ Fincncing ( N e'ltJ- Dugv1ell only)
( Amount in Rs. ) - - - - - - - - - - - - - - - .. - - - - - - - - - - - - - - - - - - - - - - - - - - -Size group Number Price Engine ~ d" ~xoen 1.-... Total Total Diff8rence Loan
of paid shed ture on expendi- lo&.~ bet\veen amount renort- for and the con- ture amount tot2.l as % of ... -ing the other struction r3ceiv- ~xpendi- total farmer pump- con- of the cd ture and cost
set cerned \V'9ll total loan expendi- ?Jnount ture rcceivod
- - - - - - - - - - - - - - - - - - - - - - - - - - - - - - - - - - - - - - - - ---Osmanabad
1) Small f~rmers 6 11833 11833 10750 1083 91
2) :fvledium farmars 2 11275 11275 11050 225 98
3) Large farm~rs 1 13150 ' 13f50 12600 550 96 - - - - - - ~ - - - - - - - - - - - - - - - - -Total 9 11856 11856 11022 833 93 ------ - - - - - - - - ~ - - - - - - - - - - - .- - - - - - - - - - - - - - -Beed
1) Small farmers -2) rv1edium farmers - ----- ____ _. - - - - - - - ~ - ------- - ·- -Toto.l - -- -. - - - - - - - - - - - - - - - - - - - - - - - - - - - - - - - - ~ - - - - - - - -
OJ. "\()
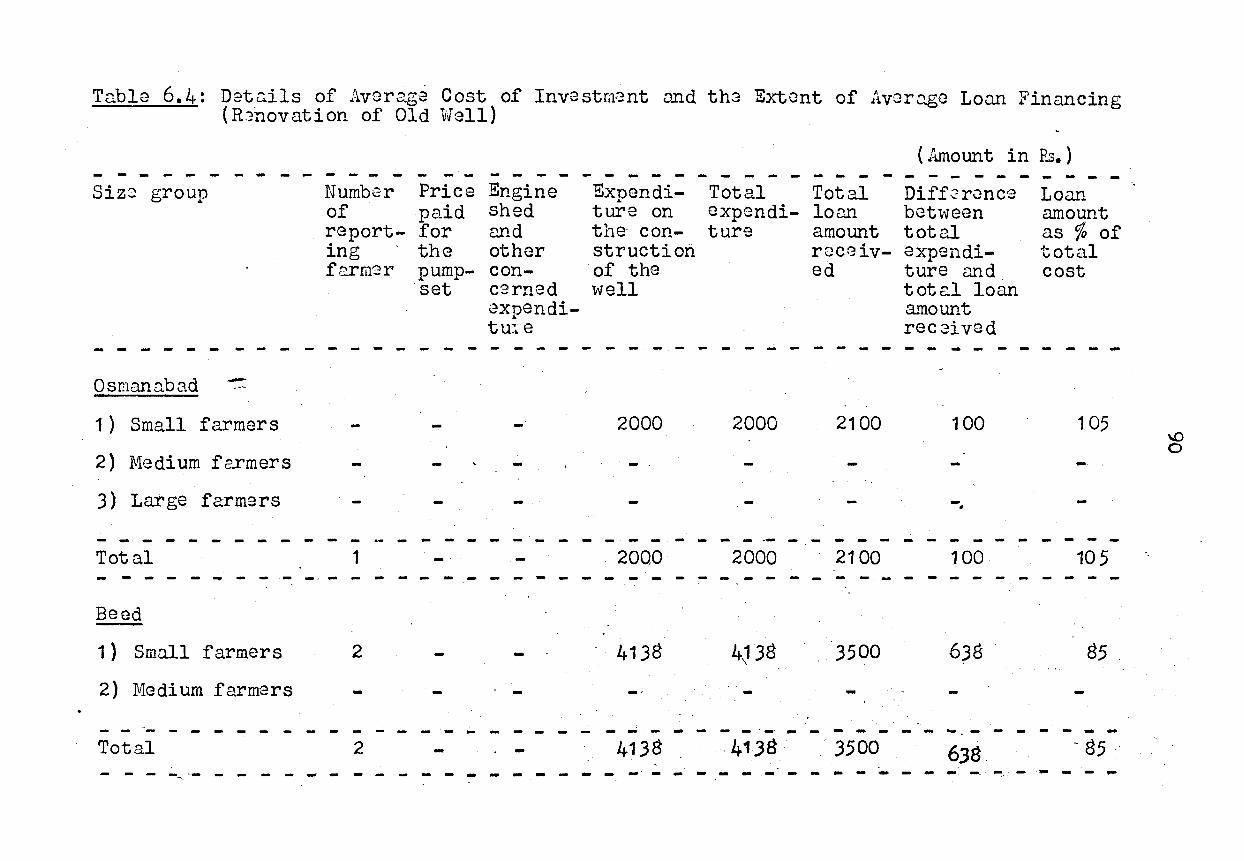
Table 6. 4: Detc..ils of Average Cost of Investm;;nt and th3 Extent of Aver2.g0 Lonn Financing (R3novation of Old 'iiJell)
- - - - - - - - - - - - - - - - - - - - -Number Price w. . .l.;lng1ne of paid shed
Siz~ group
report- for c:.nd ing the other f,?..rmer pump- con-
·set carnr-ld - ... ._
exuendi-.L
tu~·e
- - - - - -Exuendi-
.L
ture on the con-struction of the \vell
- - - -Total exnendi-.. ture
( !-unount in B.s. ) - - - - - - - - - - - -Total loan amount received
Diff2rence bot\veen total expenditure c::md. tot~l loan amount rec3ived
Loan amount as % of total cost
----------------------- ------------------Osmanabad -1 ) Small farmers - 2000 2000 2100 100 105
2) Medium fe.rmers
3) Large farmers -4
- - - - - - - - - - - - - - - - - - - - - - - -- - - - - - - - - - - -Total 1 2000 2000 2100 100 105 - - - - - - - - ·- --- - - - - - - - - - - - - - - - - - - - - - - - - - - - - - -Beed
1 ) SmD.ll farmers 2 - 4138 4~38 3500 638 85
2) Medium farmers
- - -- - - - - - - - - - - - - ... - - -·~------- ~-------Total 2 - 4138 -4138 3500
--. ·- - - -- - _, - - - - - - -· - - ------ - - - - - -· -- - - - - - ....
\,()
0
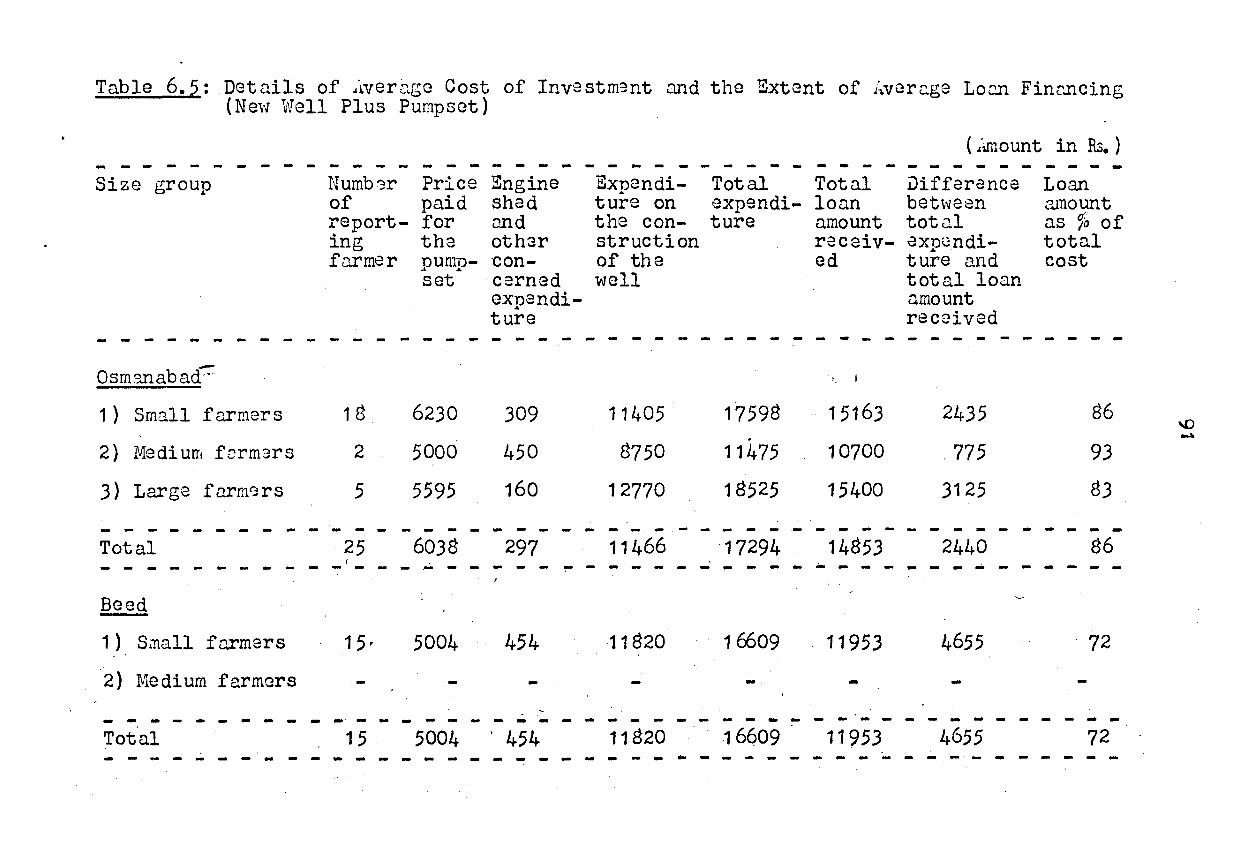
Table 6. 5: ,Details of ~iverc..gc Cost of Investm3nt and the Extent of .1~vcr2.ge Loc.n Finc.ncing (Nevi v~ell Plus Pumpsct)
- - - - - - - - - - - - - - - - - - - - -Numb;r Price Engine of paid shad
Size group
report- for ond . the oth3r 1ng fur mer numo-.. .. ·con-
set cerned cxnendi-.. ture
- - - - -Exnendi-... ture on the con-struction of the well
- - - - -Total expendi-ture
(.~·~mount in Rs. ) - - - - - - - - - - - - - -Total loan amount received
:Uifference bet\veen tot c..l .a xn\.: n diture and total loan amount rec2ived
Loan amount ns 1o of total cost
- - - - - - - - - - - - - - - - - - - - - - - - - - - - - - - - - - - - - - - - - - --Osmanabad·· ' I -
1 ) Small farmers 18 6230 309 11405 17598 15163 2435 86 .
2) Medium fcrmars 2 5000 450 8750 11475 10700 . 775 93
3) Large fnrmc;rs 5 5595 160 12770 18525 15400 3125 83
- - - - - - - - - - - - - - - - - - - - - - - - - - - - - - - - - - - - - - - - - - -Total 25 6038 297 11466 "17294 14853 2440 86
I ... - - - -- - - - - - - - - - - - .- - - - - - - - - - - - - - - - - -Bced
1) Si.nall fnrmers 15. 5004 454 11820 16609 11953 4655 . 72
2) Medium farmers ----- ----- -·- --------- ----- ~------- - - -
Total 1 5 5004 ' 454 11820 16609 11953 4655 72 - - ~ - - - - - - - - - - - - - - - - - - - - - - - ~ - - - ~ - - - - - ~ - - - -
'o{) ~
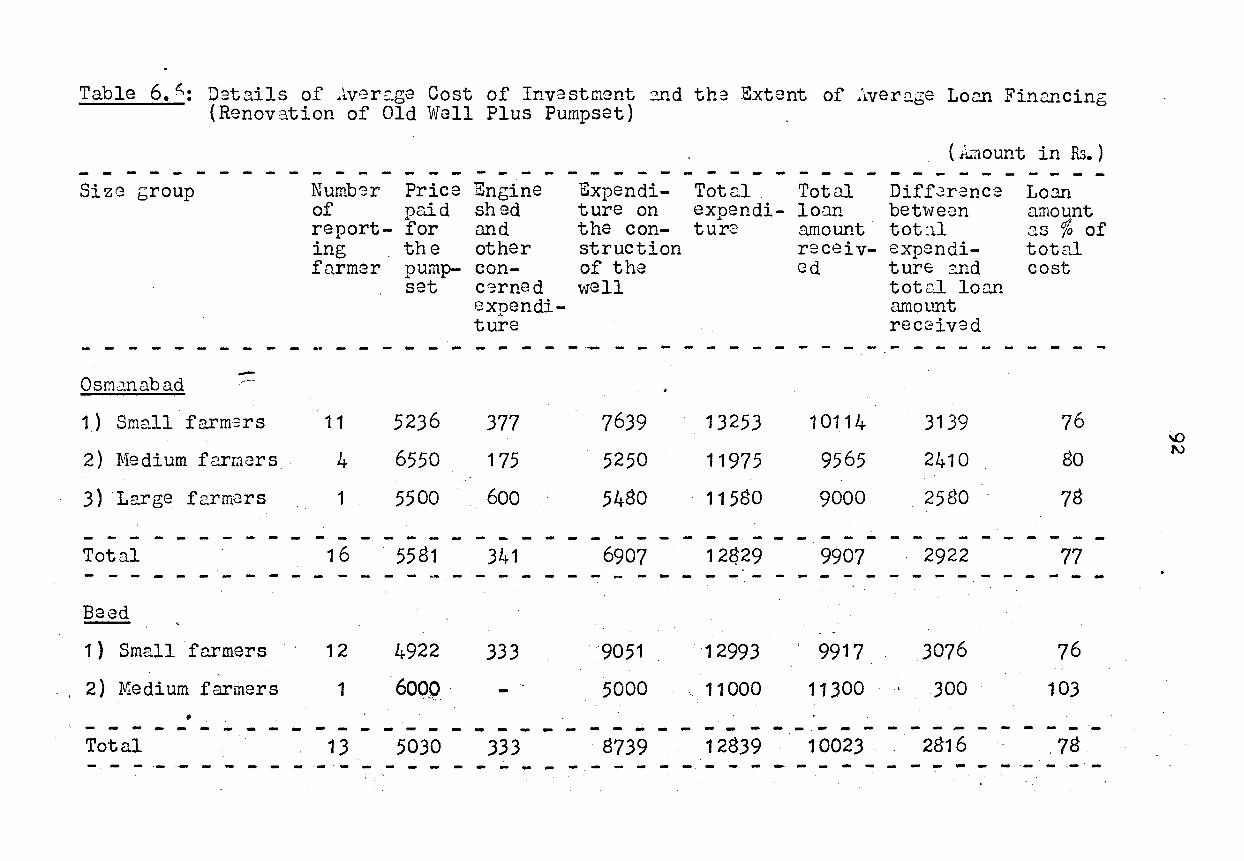
Table 6. ~: D;;t3.ils of .. iver:~ge Cost of Investment :::..nd the Extent of Aver2.ge Lo~ Financing (Renovation of Old Well Plus Pumpset)
- - - - - - - - - - - - - - - - - - - - -SizG group Numbsr Price 1i' • e .!.:Jng1.n
of Daid ... shed report- for and ing the other fnrm2r pump- con-
set C9rned OXDendi-
·' ture - - - - - - - - - - - - - - - - - - - - ---Osmo.nabad
1 ) Sme..ll farm?rs 1 1 5236 377
2) Medium farm~rs 4 6550 175
3) ·Large fc:rmGrs 1 5500 600
- - - - - - - - - - - - - - - - - - - -Total 16 5581 341 - - - - - - - - - - - - - - - -Beed
1 ) Small fc.rmers 12 4922 333
2) Medium farmers 1 6000. .......
• - - - - - - - - - - - - - - - - - - - - -Total 13 5030 333 - - - ·- ·- - - - - - .... - - - - - - - - - -
- - - - - - - - - - - - - -Expendi- Tot .:.1 Total ture on expendi- lonn the con- ture amount struction receiv-of the Cd well
- --- - - - - - - - - -
7639
5250
5480
- - - - -6907
- - -
"9051
5000
- - - - - -8739 - - - - - -
13253
11975
11580
- - -12$29 - - -
. 12993
11000
- - -12839 - - -
-
--
-
10114
9565
9000
- -9907 -
9917
11300
-
--- - -10023
- - - -
( .A..-nount - - -
Diff.Jr·ence betweon tot:1l expendi-ture :?.nd tott..11 loo..n amount rec2ived
--
-
--
3139
2410
2580
- -2922 - -
3076
300
--. 2816 - - -
--
--
-
--
in Rs.) - - - -Lo3.!1 amount 3.S % total cost
--
--
76
80
78
-77 -
76
103
- -.78 - .-
of
--
--
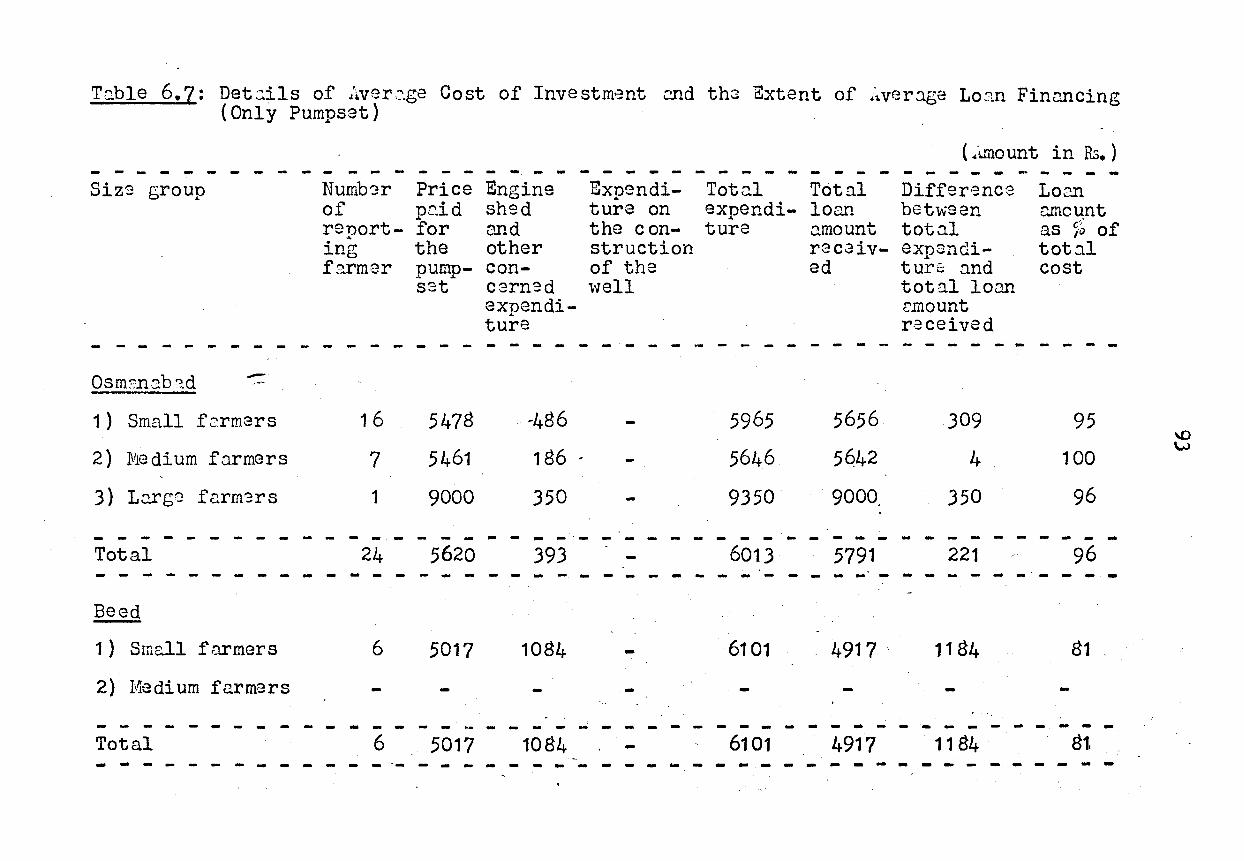
Ta.ble 6.7: Det.::.ils of ;iver:: .. ge Cost of Investment end th3 Extent of ~~ver:1ge Lo::-tn Finnncing (Only Pumpset)
- - - - - - - - - - - - - - - - - - -Siz8 group Numb'3r Price Engine
of pc.id sh~d renort-... for and ing the other f2..rmer pump- con-
sat C3rn::d exnendi-.. ture
- - - - - - - - - -Exnendi-... Tot2..l ture on exnendi-... the con- ture struction of the \'I ell
- - - -Totnl loan o..mount rec3iv-ed
( ":U'11o unt in Rs. ) - ~ - - - - ~ - - -Difference bet\..;een tot.:tl ex ""' J. p.;.;na~-
turs :1nd total loon c.mount r-~ceived
Lo2.n c.mcunt ,-; as ;o of tot:1l cost
- - - - - - - - - - - - - - - - - - - - - - - - - - - - - - - - - - - - - - -----
1 ) Small fe:rmars 16 5478 . · ,486 5965 5656 . 309 95
2) ~11edium formers 7 5461 186 . 5646 5q42 4 100
3) L.::trgc fc:lrm3rs 1 9000 350 - 9350' 9000, 350 96
- - - - - - - - - - - - - - -·- - - - - - - - - - - - - - - - - - - - - -Total 24 . 5620 393 6013 5791 221 96 - - - - - - - - - - - - - - - - - - - - - - - - - - - - - - - - - - - - - - -Beed
1 ) Smc..ll fr.l.I'mers 6 5017 1084 - 6101 4917. 1184 81
2) Medium farmers - -- - - - - - - - - - - - - - - - - - - - - - - - - - - - - - - - - - - - -Total 6 5017 1084 - 6101 4917 . 1184 81. - - - - - - --- - - - - - - - - - - - - - - - - - - - - - - - - -
~ \,.)
94
on construction varies from a. minimum of Rs.8,750 in th~ cc.sc of
m3 dium size group to n mnximum of R.3. 13,150 in that of large
holding group {single purpos•:? loQil for nc'lt-.r well) •. The average
in th.-: cas2 of small farmers in Beed 'lt-.rorks out to Rs.11 ,820.
In the.: casG of nv:::rnge investment on improvement of old 'ltvell,
it varies from a.s low as Rs.2,000, in a solitary case of ·a sm3.ll
f<'.rmer to Rs. 9, 051 in the co..se of smc.ll holdings gr-oup in Bee d.
In th2 case of electric motor pumpset, it ·varies 1--.rith the horse
power of th~ motor, the av8ragc being fu.5,000 nnd ~.6,000 iri
most cc.scs. In the case of expanditure on pump house or other
uorks connected 1--.Jith the installntio~ of the pumpset, there are
l.:1rge v3.I'intion from Rs. 300 to over Rs.1. ,000 especially, in cases
vJhcrc construction of shed or S'ltvitch room is involved. In all,
th<; nvc::ragc total expenditure varies from fu-2,000 in the case
of deepening the old 'ltvell to as high us Rs.1B,525- for the large
holding group for composite loan in Osmann.bad district. .
Adequacy of the Loan
The actual lolln amount r:1c~ived depends upon the type ·
of the sch·3me, qu~tity of physical 'lt-.rork involved and the cost -
of the pumpset of th·3 vcrying cnpa.city. Hov;ever, the total loan
amount is subject to loan feasibility limit \-Jorked out for each
co.so. N on2th:: 10 ss, th~ average .:lmount · of rec cipt may provide. a
broa.d idea. in r:::gard to th·) adequacy or oth:::]rvJise of the loan
in the light of the c.mount~;.actunlly incurred by the beneficiary
f2rmers (See Tables 6.3 to 6.7).
The pnttern of type\visc and holdingT~-.rise averaga receipt
nnd oxpGndi ture reveals that exc3pt in t'lt-.ro cases (old 'ltvell and
old 'ltv9ll \vith pumpset from Baed) th·~ actual expenditure invariably
95
excaeds the loan amount received. Tha average amount of loan
rac8ivcd as proportion of.the total expenditure works-out to 93
per cent for ne\v dug \vclls and 85 P.er cent. for improvement of
old 1-vells. In the case of· composite lonns, it varies b9t\'t1een 72
CU1d 86 per cent for ne""' \vell \-Jith pumpset and it is around 78 per
cent for old ,..;ell \vith pumpsGt. ·In the case of single purpose
pumpsGt type the proportion v~ries between 81 and 96 per cent.
Anyway, the excess expenditure is mainly incurred on account of thn
construction of \v=3ll and, to some extant, \'lorks connected \vith
installation of pumps8t.
~Jheth3r or not justified, the tendency on the ·part of the
borrov..;ars appears to be in favour of incurring ~xtra expenditure.
on the projoct. On their part, it is claimed that the extra work of
excavation on .account of necG.ssary incrGaso in the diam~ter of the
\vell, hard rock conditions and cost escalat·ion in the construction
\vorks result in imbalance bet\vcen sanctioned loan and actual cost
of inv~~stment. In most cases the project involving ne\'t1 'ltJells ·
arc completed vJ~thin the upper limit· of unit cost (Rs.17 ,000) fixed
by the Bank. HovJev~-;;r, tho deficit arises m.:tinly on account of '
loru1 feasibility limit \vorkGd out for each case of individual
borrowers. In most cases; this ceiling on loan eligibility
amount mny r~1sult in som~ compromise \vith tho specified con-
struction work or strain
funds elsev-Jh0re. Almost
on the loanec-fnrm~Jr to raise additional
\'' all tho farmers intervimved have
managed to make good th3 dGficit on th:?ir O\m resources inclusive
of th0 component of family labour inputs.
CH .t1.PTER VII
l\SSESSMENT OF POST INVESTMENT BENEFITs·
In the present chapter an attempt is made to bring out
the relevant changes that have taken place arising from the
investment. The information analys.ed here includes such .aspects·
as area benefited, intensity of irrigation, cropping~ intensity
and changes in the cropping pattern. .h.lso are shown the bene-.
fits accruing from the investment by ~vay of. net incremental
income and employment. Hovvever, in the concluding secti"on of
the chapter are presented the results of the analysis of finan
cial rates of return on investment in composite scheme as \vell
as pump set scheme under t"tvO situations, narne~y, the normal
condition and the drought condition vvith the assumption of drought
frequency of once in four years. This was based on the supple-_. '·
mentary data subsequently c-:>llected from the sub-sample of th:
beneficiary farmers.
7 .1. Area Under Irrigation
One of the major benefits of,the successful dug well
proj~ct is the enhancement of the physical r{~source of the
beneficiary farmer. The rainfed dry land gets converted into
more valuable irrigable land under the c o111'11and of the vvell.
The very presence of a. vvell, vvhich is a durable asset, enhances·
the value of land enormousl~t The extent of irrigable land
mainly depends upon the factors like size of the fragment in
vvhich the. "tvell is located, quantity of \-vater available,
Gfficiency of the vvater lifting device and the cropping pattern
to be adopted. The area actually irrigated in a given season
96
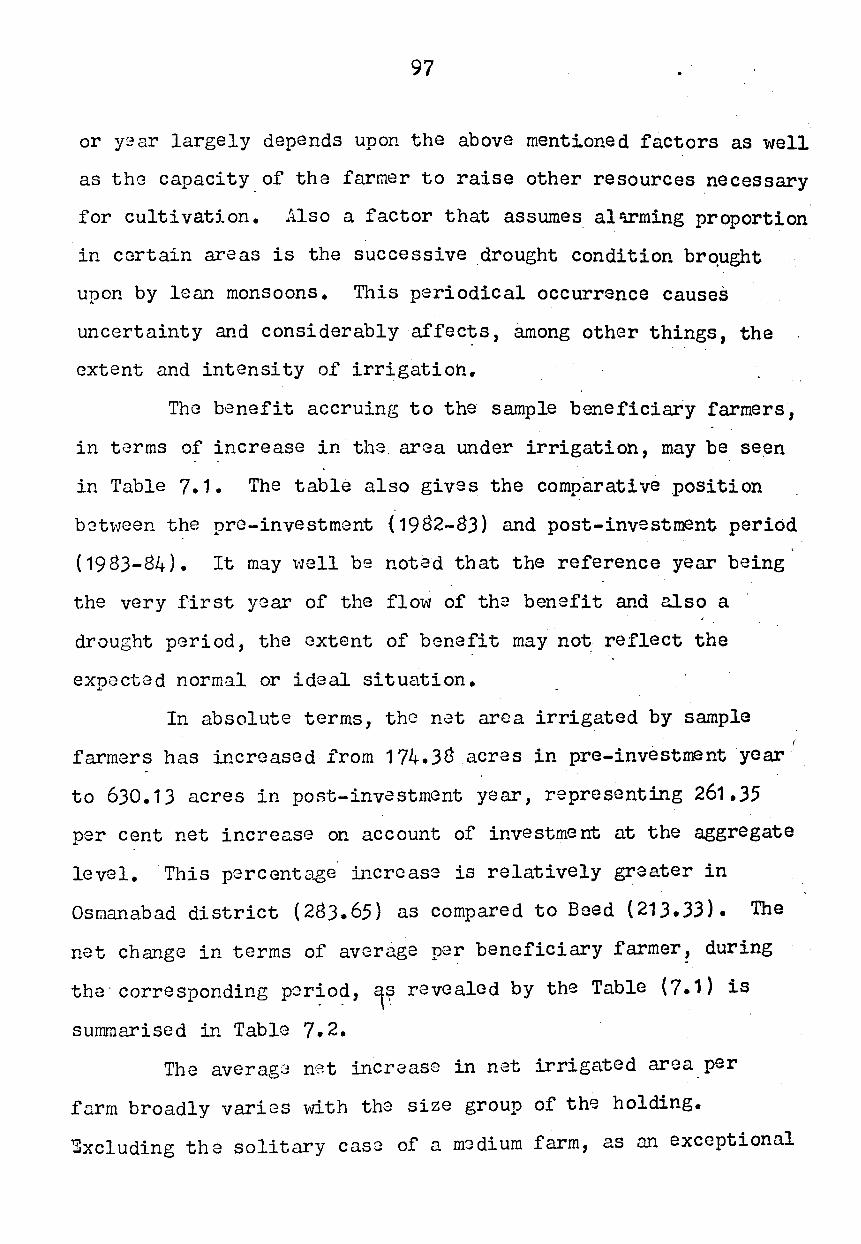
97
or y·3 ar largely depends upon the above mentioned factors as well
as the capacity of the farmer to raise other resources necessary
for cultivation. Also a factor that assumes al su-ming proportion
in certain areas is the successive .drought condition brqught
upon by lean monsoons. This periodical occurrence causes
uncertainty and considerably affects, among other things, the
extent and intensity of irrigatioh.
The benefit accruing to the sample beneficiary farmers,
in terms of increase in tha arGa under irrigation, may be se.en
in Table 7.1. The table also gives the comparative .position
b8tween the pre-investment (1982-83) and post-investment period
( 19 83-84). It may \'lell be noted that the reference year being
the very first year of the flo~tv of th2 benefit and also a
drought period, the extent of benefit may no~ reflect the
exnected normal or ideal situation • ...
In absolute terms, the nat area irrigated by sample
farmers has increased from 174.38 acres in pre-investment year
to 630.13 acres in poRt-investment year, representing 261.35
ner cent net increase on account of investment at the aggregate ...
level. This pcrcento~e li1crcase is relatively greater in
Osmanabad district (283.65) as compared to Beed (213.33). The
net change in terms of average per beneficiary farmer~ during
the· corresponding par~o?, 1r revealed by the Table ( 7 .1) is
summarised in Table 7.2.
The averag8 n8t increase in net irrigated area per
farm broadly varies with the size group of the holding.
~xcluding the solitary case of a m3dium farm, as an exceptional
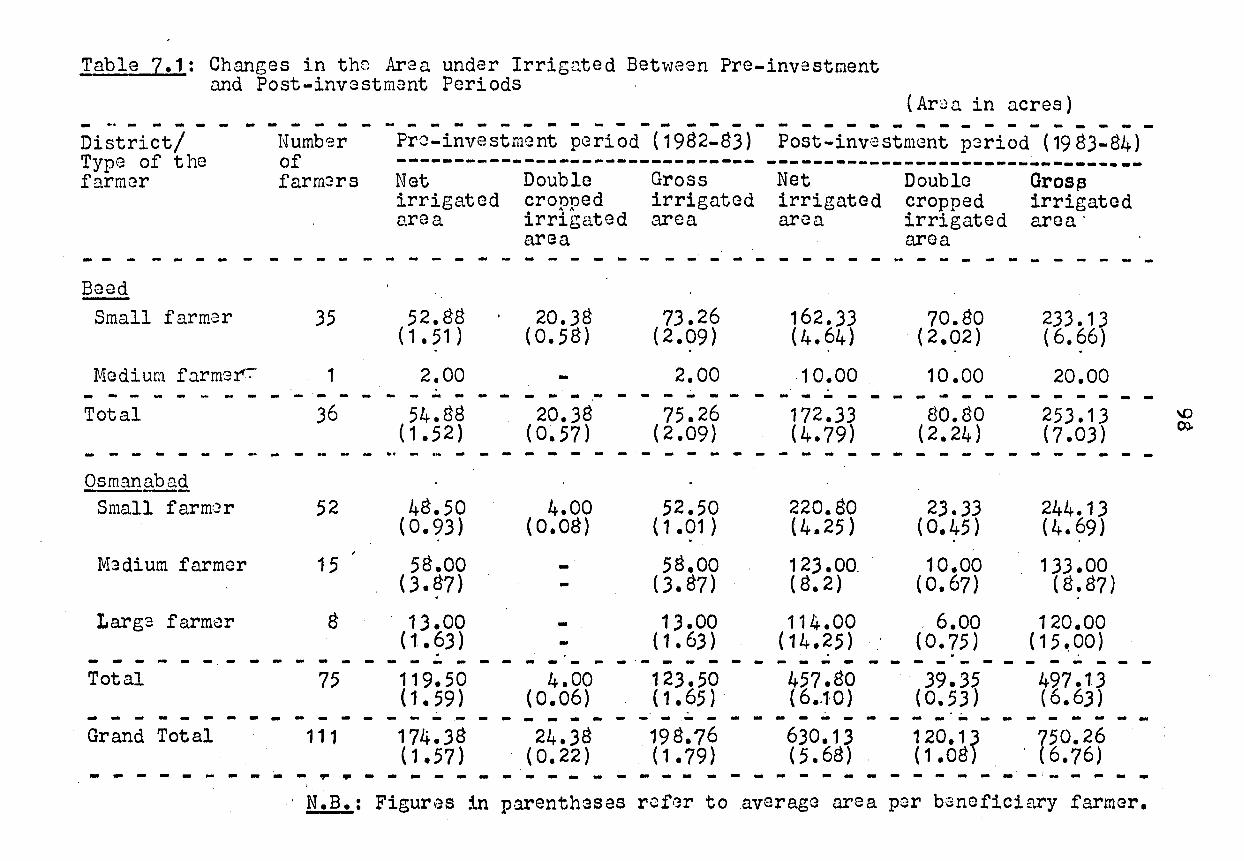
!able 7.1: Changes in th~ Araa under Irrig~ted Between Pre-investment and Post-investmant Periods
( Ar;J n in acres) - ... -------------------- .. ------------------------District/ Type of the farmer
_ _.. .. -----Beod
Numb':r of farm2rs
Small farmar 35
Medium fo.rm:?:r-::- 1 - - - - - - - - - - - - -Total
- ~ - - - - - - - - ~ - -Osmanabad --
Small farmer 52
M3dium farmer 15
Larg3 farmer 8
Pr·~-investment period (1982-83) Post-investment period (1983-84) ------------------------------- ------------------------~----·--~ Net irrigated nrea
Double Gross cropped irrigated irrigated area arr3a
Net Double Gros~ irrigated cropped irrigated area irrigated area·
area - - - - ~ - - - - ~ - - - - - - - - - ~ - - - ~ - - - - - - ~
52.88 20.38 73.26 162.33 70.80 233.13 ( 1 • 51 ) (0.58) (2.09) (4.64) (2.02) (6.66) . . .
2.00 - 2.00 1 o.oo 10.00 20.00 - ... - - - - - .- - .. - - - - - - - - - - ... - - -------54.88 20.38 75.26 172.33 80.80 253.13
(1.52) (0~57) (2.09) (4.79) (2.24) (7.03) .. - .... - - - - - - - - - - - - - - - - - - - - - - - - - - - - -48.50 4.00 52.50 220.80 2.3.33 244.13
(0.93) (0.08) ( 1 • 01 ) (4.25) (0.45) (4.69) . . 58.00 - 58.00 123 .oo. 10.00 133 .oo
(3.87) - (3.87) {8.2) (0.67) (8.87)
. 1.3. 00 - 13.00 114.00 . 6.00 120.00 ( 1 • 63) - ( 1 • 63) (14.25) ( o. 75) ( 15 ~ 00) . . . - - - - - - - - - - - - - - - - - - ·- - - - - - - - - .. - - - - - - - - - - - - -
Total 75 119.50 4.00 123.50 457.80 39.35 497.13 ( 1. 59) {0.06) ( 1 • 65) . ( 6.~1·0) (0.53) (6.63) - - - - - - - - - - - - - - - - - - - - - - .. - - - - - - - - .- - ------ ------
Grand Total 111 174.38 24.38 19 8. 76 630.13 1 20.1 r 750.26 ( 1 • 57) (0.22) ( 1 • 79) (5.68) (1.08 ' (6.76)
- - - - - - - - - - p • - - - - - - - - - - - - - - - - - - - - - - - ------- ---.-- ... I
· N .B.: Figur~'3s in parenth3ses r~f.;r to averag3 area per bGneficiary farmer.
\() (XI.
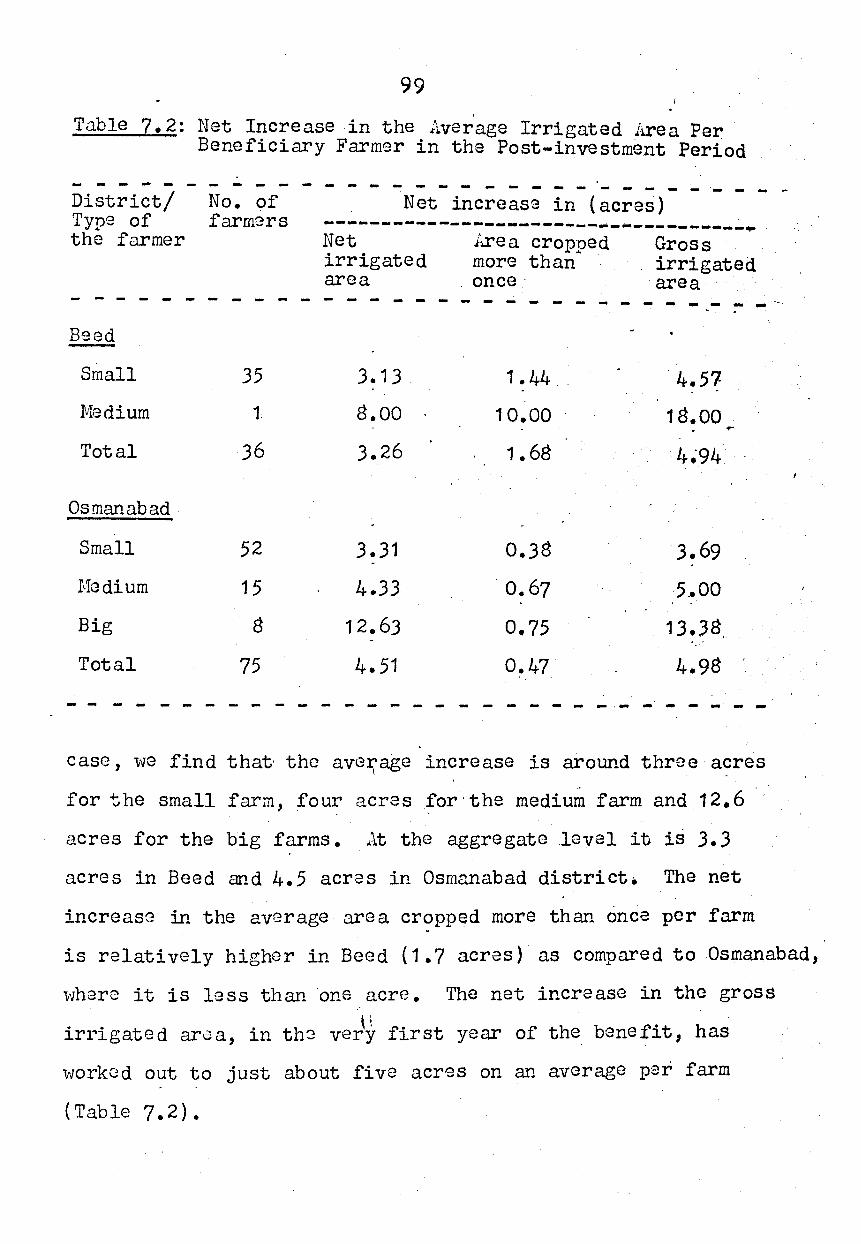
99
Table 7. 2: Net Increase in the Average Irrigated .. ire a Per Beneficiary Farmer in the Post-investment Period
. - - - ~ - - - - - - - - - - - - - - - ~ - - - ~ - - - - - - - -District/ No. of Type of farmers the farmer
Net increase in (acres) ------------------------~-------~---~. Net l~ea crop-oed Gross irrigated more than ... · . irrigated area . once· ·area
- - - - - - - - - - - - - - - - - - - - - - - - - - - -Beed
Small 35 3.13 1.44 . 4.57
Medium 1. 8.00 1 o.oo 18.00 .... Total 36 3.26 1. 68 4~94.
Osmanabad
Small 52 3.31 0.38 3.69 -I'Tedium 15 4.33 . 0.67 ·5 .. 00
Big 8 12.63 0.75 13.38,
Total 75 4. 51 0.47 4.98
- - - - - - - - - - - - - - - - - - - - - - - - -case, \ve find that· the ave:r;-age increase is around three· acres
for the small farm, four acres :for·the medium farm and 12.6
acres for the big farms. ..1t the aggregate .level it is 3.3
acres in Beed and 4.5 acres in Osmanabad district. The net
increasG in the average area cropped more than once per farm
is relatively higher in Beed (1.7 acres)· as compared to Osmanabad,
"tvhere it is less than one acre. The net increase in the gross . .•
irrigated area, in th~ ve~~ first year of the benefit, has
worked out to just about five acres on an average par farm
(Table 7. 2) •
100
7.2 Intansity of Irrigation
Beneficiary farmers have b~en feeling that the benefits
from the investo~nt are not upto their m1n expectations and the
nain reason adduced is invariably the low level of water column
in the \'iells at t hGir disposal. Eventually, it is traced to
the lo~-1 and irregular rainfall. Nevertheless, as revaaled by
data in respect of capacity and operation of wells, during the
thr~a s~asons of 1983-84, it appears to be somewhat in a low ' .
key and justify the contention of the farmers to a considerable
extent. Howaver, tha data furnish~d by the informants may be
taken, at th~ most, as only an approximation especially, in
ragard to levels of depth of \·;at~r bafore and after pumping out
operation and also the other ~etails like the number of days
nnd duration of pumping and recuparation period. The season
\iisz relavant details for reporting casas are sho\m in T~ble 7.3.
~vcn though all the wells are operational, only about
6.4 per cent in Beed and 80 par cent of sample farmers in
Os:1r:.no.bad hav(~ used their \'Jells for irrigation in kharif season.
Hov1ev?.r, in the selected districts rabi is the most important
s~ason for raising irrigated crops. This is because somo farmers
do not like to use 1vell \tater in kharif season only to take
advantage of monsoon rains and conserve water in their wells for
th2 use in rabi season. Nonetheless,· ev.:~n in rabi season about \;
fiv2 ner cent in Osmanabad and 11 ner cent in Beed do not figure ~ 4
in vie\'1 of v:.;ry lo\v level of \vater columns in their \vells. In
th~ su1m1cr season only about 22 p3r cent in Beed and 32 per cent
in Osm.~:nabad samnle ars able to utilise the \'lells for irrigation • ...
• '.nyr..vay, ev2ry 1t13ll has been utilised for atleast one season
during the raf::;r.3nce year.
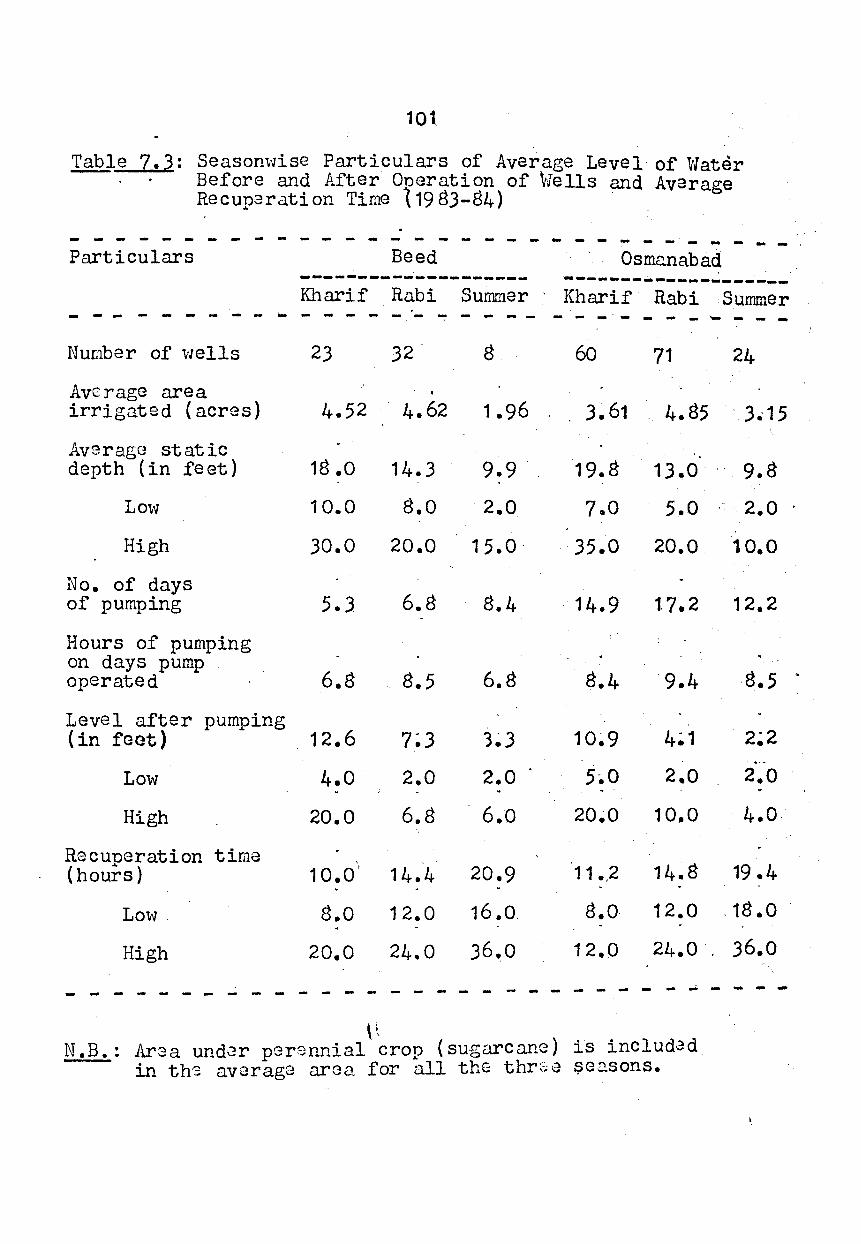
101
Table 7. 3: SeasonlV'Iise Particulars of Average Level of Water Before and After Oneration of tvells and Average Recup3ration Time 119 83-84)
- - - -Particulars
----------Numbar of \vells
Average area irrigated (acres)
Average static depth (in feet)
High
No. of days of pumping
Hours of pumping on days pump operated
Level after pumping (in feet)
High
Recuperation time (hours)
High
- - - - - - ~ - - - ~ - - - -Beed Osmc.nabad
-------------------- ~-------------------Kharif Ru.bi Summer Kharif Rabi Summer
23 32
4.52 4.62
18.0 14.3
10.0 8.0
30.0 20.0
5.3 6.8
6.8 8.5
12.6 7~3
4.0 2.0
20.0 6.8
'
10.0' 14.4
8.0 12.0
20.0 24.0
9.9.
2.0
15.0
8.4
6.8
3~3
2.0 . 6.0
20.9
16 .o. 36.0
- - - - - - - ~ - - -60
3. 61
19.8
7.0
35.0
. 14.9
8.4
10~9
5•0
20~0
11 .,2
8.0
12.0
71 24
4.85 '3·15
13.0 9.8
5.0 2.0 .
20.0 10.0
1.7.2 12.2
9.4 -8.5
... ~ 2.0 2.0
10.0 4.0.
14.8 19 .4
12.0 .18.0
24.0 36.0
- - ~ - - - - - - - - - - - - - - ~ ~ - - - - - - -\'
N .B.: Area under pGrennial 'crop (sugarcane) is includad in ths average area for all the thr~-:: e :;;eo..sons.
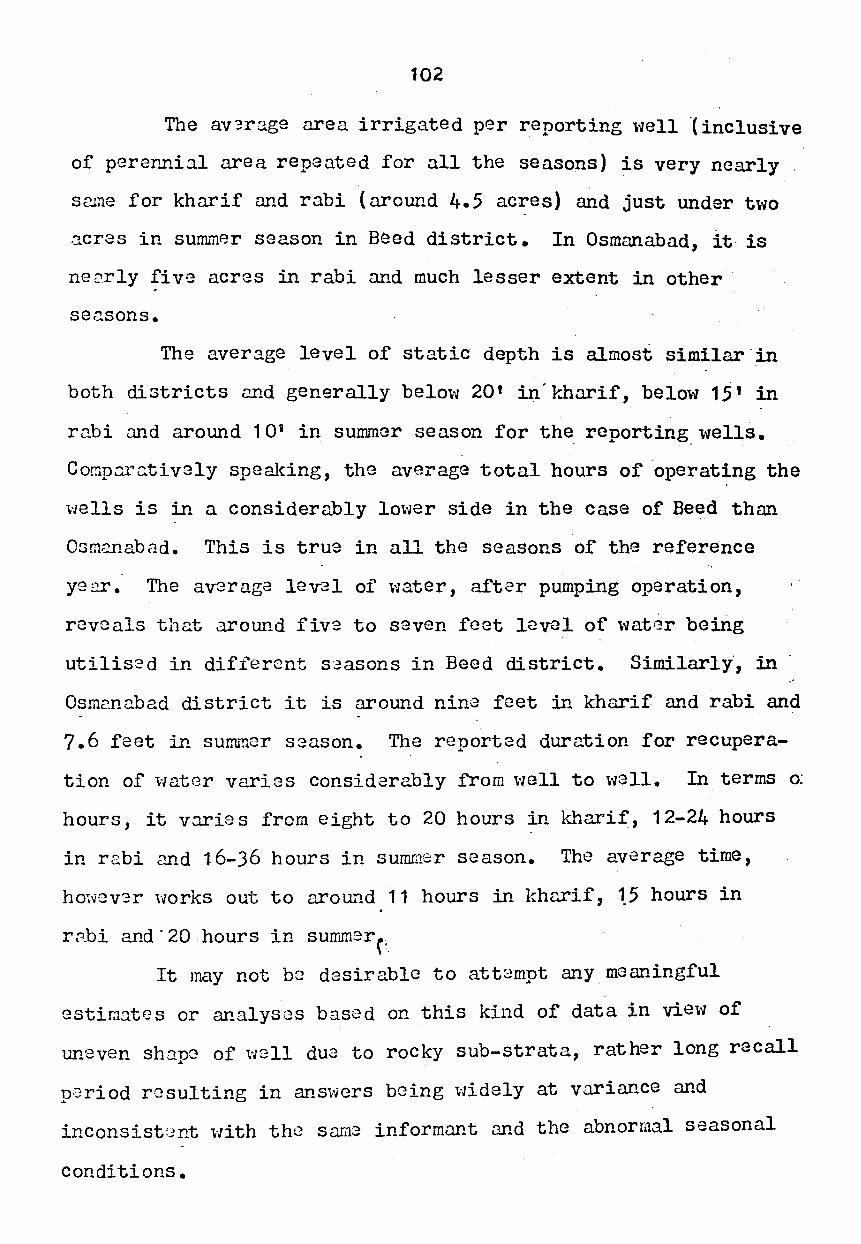
102
The av3r:lge area irrigated per reporting \-Jell -(inclusive
of pere~~ial area repeated for all the seasons) is very nearly
same for kharif and rabi (around 4. 5 acres) and just under t\vO
~cres in su~u8r season in Beed district. In Osmanabad, it- is
neo.rly five acres in rabi and much lesser extent in other ·
seasons.
The average level of static- depth is almost similar ·in
both districts Q.Ild generally helm,'/ 20 1 in· lr..harif, belo\'l 15' in
rabi nnd around 10 1 in summer season forth~ reporting_ wells.
Comp~1 ntively spelli{ing, the average total hours of operating the
vJells is in a considerably lovJer side in the case of Be~d them
Onme.nabad. This is true in all the seasons of the reference
ye9J.'. The averaga leval of \-Jater, after pumping operation,
revc als thct around fiv9 to seven feet level of watGr being
utilis2d in different s~asons in Beed district. Similarly", in
Osmc.nabad district it is around nine feet in kharif and rabi and
7.6 feet in su~~er season. The reported duration for recupera-
tion of \"later varies considarably from \tell to \-Jell. In terms o:
hours, it varies from eight to 20 hours in ~~arif, 12-24 hours
in r~bi and 16-36 hours in su~£~r season. The average time,
hovJev·:::r vJorks out to arou.L!d 11 hours in kharif, 1_5 hours in
r.?.bi and· 20 hours in surr.tinerr·-
It may not be desirable to att2mpt any· meaningful
estimates or analysc;s based on this kind of data in vie\'1 of
uneven shape of ;;;ell dua to rocky sub-strata, rather long recall
p;Jriod resulting in ans1--;crs being vJidely at variance and
inconsist8nt \'lith the sama informant and the abnormal seasonal
conditions.
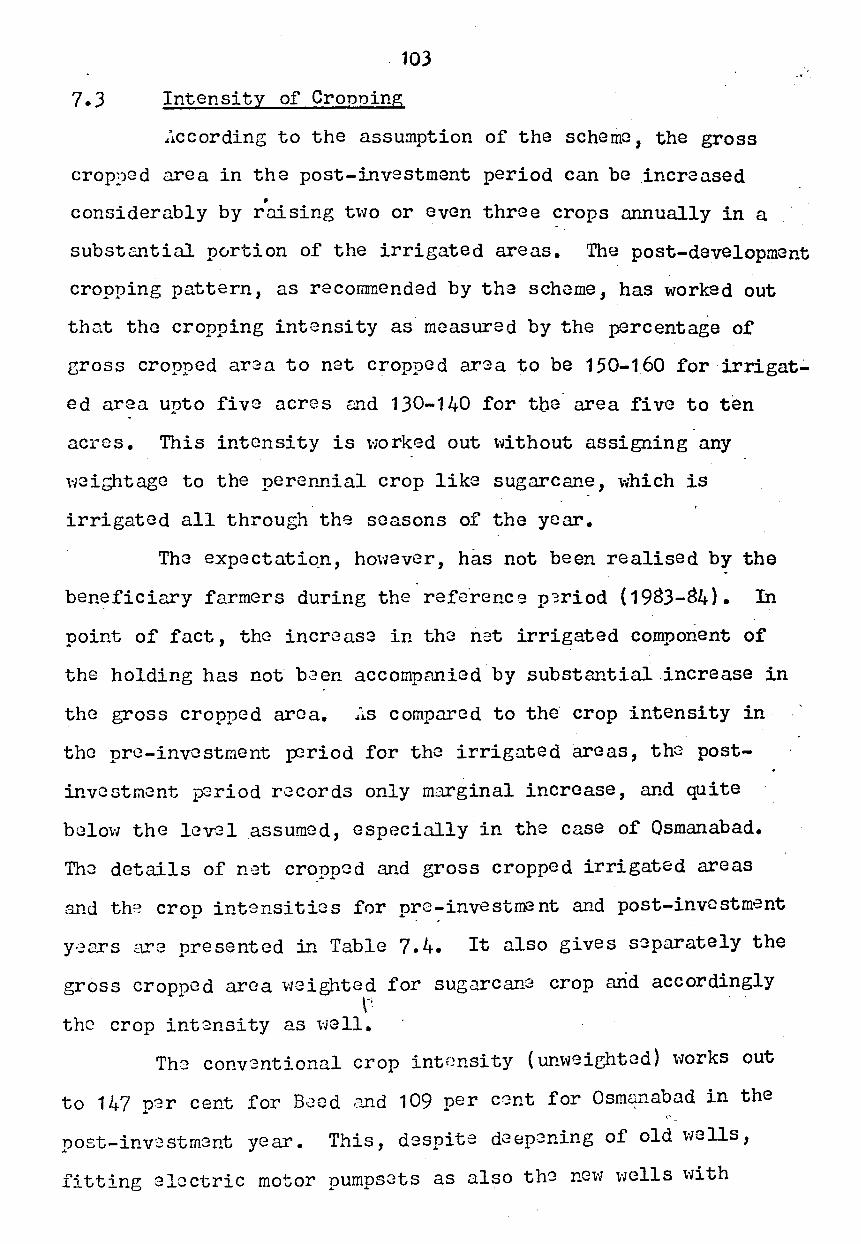
103
7.3 Intensity of Cronning
.. ·l.ccording to the assu!llption of the scheme, the gross
crop9ed area in the post-investment period can be _increased •
considerably by r:llsing t\vo or even three crops annually in a
substantial portion of the irrigated areas. The post-development
cropping pattern, as recommended by tha scheme, has worked out
that the cropping intensity as measured by the percentage of
gross cropped ar2a to net cropped ar9a to be 150-160 for irrigat
ed araa upto five acres a~d 130-140 for tbe· area five to ten
acres. This intensity is v;orked out \vithout assigning any
'1.-J~it;htage to the perer1nial crop like sugarcane, \vhich is
irrigated all through the seasons of the year.
The expectation, ho\-Jever, has not been realised by the
beneficiary farmers during the refc.rence p3riod ( 1983-84). In
point of fact, the incrc ase in the n9t irrigated component of
the holding has not b.~en accompanied by substantial increase in
the gross cropped area. .·~s compared to the crop intensity in
the pre-investment period for the irrigated areas, th8 post-
investment p:;riod r.::;cords only marginal increase, and quite
bclovJ the lcv-:1 .assumed, especially in the case of Osmanabad.
Tho details of net cr~ppcd and gross cropped irrigated areas
and th?. cron intensities for nrc-investment and post-investment • •
y·~ars are presented in Table 7. 4. It also gives s~parately the
gross cropped area \veighted for sugarcanG crop arid accordingly \-'
the crop intsnsity as well.
Th8 conv3ntional crop intensity ( un\~Jeightcd) \vorks out
to 147 n8r cent for B.::cd and 109 per cent for Osmq.nabad in the .. post-inv3stmcnt year. This, despite deepening of old \veils,
fitting electric motor pumps8ts as also th'J nc11v \vells \vith
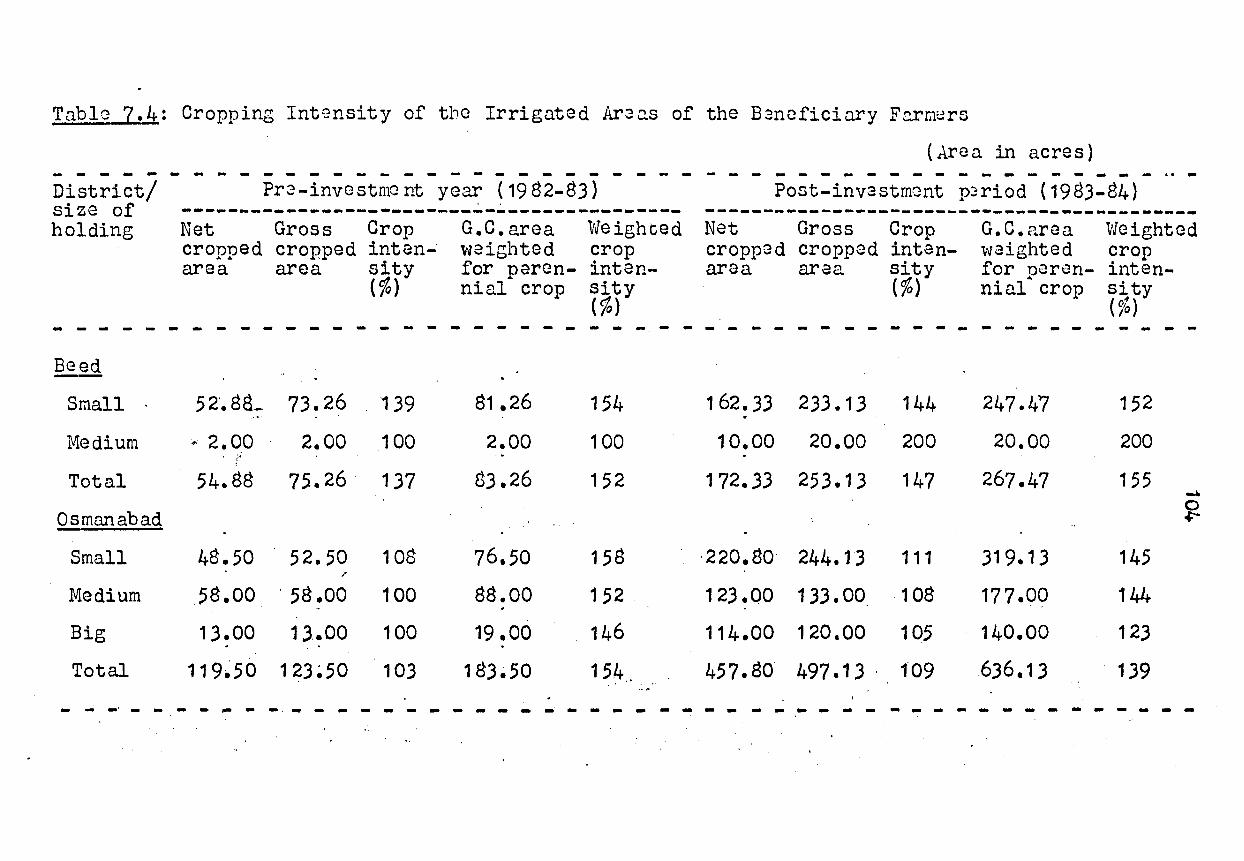
Table 7.4: Cropping Intensity of the Irrigated Ar3QS of the B3ncficiary F2rm~rs
(.Arc a in acres) ------------- .. ------------ .. ---- ... -- .. ---- .. -------- .. -District/ size of holding
~!ll!
Small
Medium
Total
Osmanabad
Small
Medium
Big
Total
- ..: -· - -
Pr3-investmc nt year ( 19 82-83) ------~-~----------------------------------Net Gross Crop cropped cropped inten-area area sity
(%)
G.C.area weighted for perennial crop
vleighced crop intensity (%)
Post-invastmont p~riod (1983-84) ----~--------------------------------------Net Gross Crop cropped cropped intan-aroa area sity
(%)
G.C.area Weighted v.raighted crop for oer0n- inten-.. nial crop sity
( ~;) - - - - - - - - - - - - - - - - - - - - - - - - - - - - - - - - - - - - - - -
52·. sa_ 73.26 ·139
"'2.00 2.00 100 . ;.~
54.88 75.26. 137
48.50 52.50 108 /
.58 .oo . 58 .oo 100
1 3 • 00 1 3.. 00 1 00
119~50 123~50 103
81.26
2.00
83.26
76.50
88.00
19 .oo 183 ~50
154
100
152
158
152
146
154,,
1 62.33 233. 13 144
10.00 20.00 200
172.33 253.13 147
·220.80 244.13 111
123.00 133.00 1 08
114.00 120&00 105
45 7. 80 497. 1 3 . t 09
247.47
20.00
267.47
319.13
177 .oo 140.00
636.13
152
200
155
145
144
123
139
~ - -·- - - - - - - - - - - - - - - - - - - - - - -- - - - - - - - - - - - - - - - ~
105
pump sets, is \tell belov1 the crop intensity assumed by the
scheme. The situation in Osmanabad, in particular, v1hcre two
thirds of the total sample beneficiaries are located, the crop
intensity has increased from 103 per cent in pre-investment year
to mere 109 per cent in the post-investm3nt year. Relatively
speaking, the crop intGnsity is slightly greater in smaller
holdings, the exception being the single case of a medium size
holding from Beed.
On th~ other hand, the weighted crop intensity method
adopted here takes into account, the use of land by the same
crop over more than one season and, it is accordingly weighted
to that extent. In the case of sugarcane the area is counted
thrice as it is cultivated through all the three seasons of the
year. Besides, if it were not for this high \'later consuming
crop, the farmor could have raised, in the sa.rrt3 area, three- other
crops such as caraals or oilsceds. This w~ighted crop intensity
\vorks out to 152 per cent in pre-investm~nt and 155 per cent in
post-invastment period for :2e_ed_ and 154 per cent and 139 per
cent respectively for Osmanabad. Even this falls short of the
intensity assumad in the crcpping pattern of the scheme, if the
latter is also given dua weightage to the recommended area under
sugarcane.
7.4 Chang2s in the Cropoing Pattern
General Change in the Seasonal Cropping: Before \'le
considsr the changes in tho area under specific crops arising
from th2 bGnefits of investment, it may be worth taking a brief
look at the broad chang~s in the ar:~a under cropping seasons .
br~t\-Jcen th~ pre-inv·:.:stm8nt and pos~-investmen~ ~oints of time.
The relevant details are pr8sented in Table 7.5.
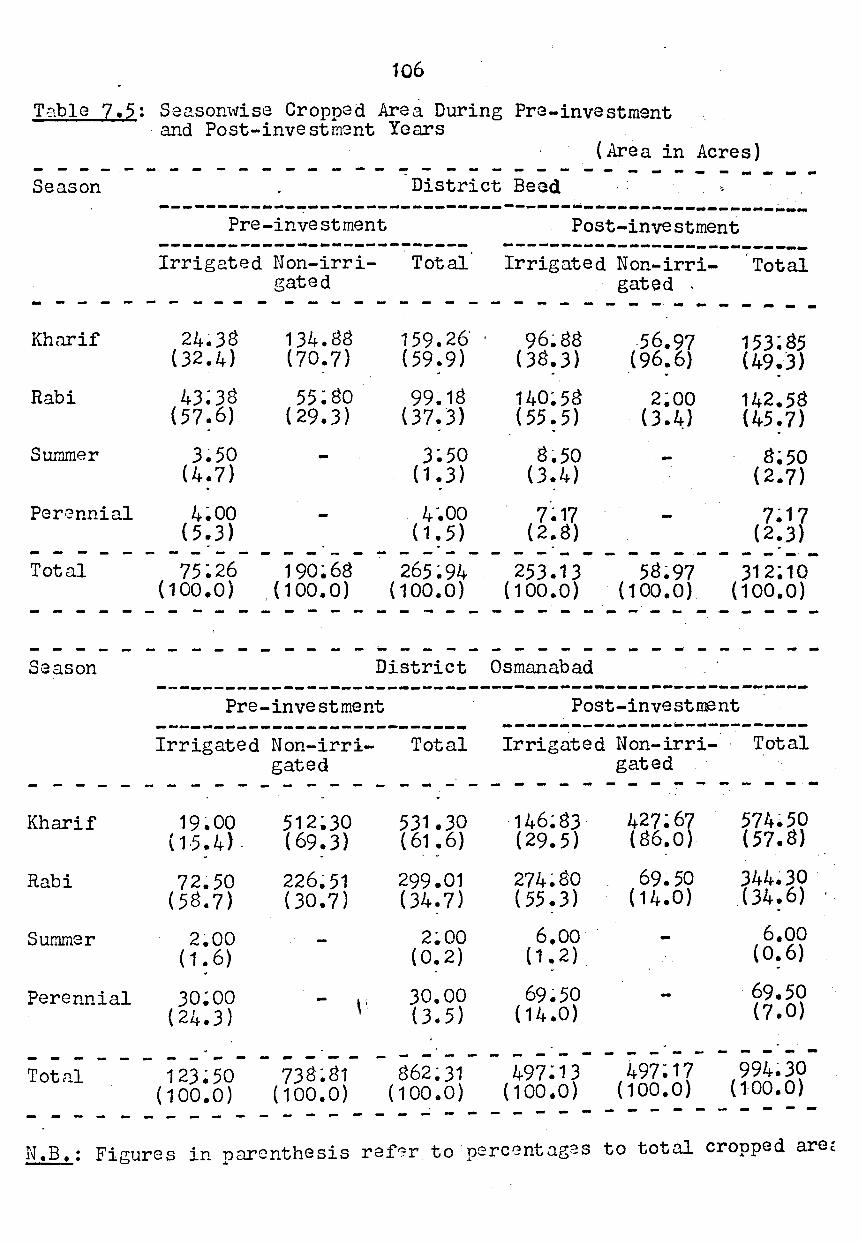
106
Table 7. 5: See.son\'li se Cropped Are a During Pre-investment ·and Post-investment Years
Season
(.Area in Acres) ------------ ~-- .. ---- ------ - - - - -District Beed
------------~-----------------------------------------~--Pre-investment -----~------------------~--Irrigated Non-irri- Total
gated
Post-investment --------------------------~ Irrigated Non-irri
gated . Total
----------- - - - .. - - - - - - - - - -Kharif 24~38 134.88 159.26' 96~88 -56.97 153; 85
(32.4) (70.7) (59.9) (38.3) (96.6) (49.3) . . . Rabi 43~38 55:80 99~ 18 140:58 2;00 142.58
(57.6) ( 29.3) (37.3) (55. 5) (3.4) (45.7) - .
Summer 3~50 3~50 8~50 8~50 (4.7) ( 1. 3) (3.4) (2.7) . .
PerGnnial 4;00 4".00 7 ~ 17 7 ~ 17 (5.3) ( 1 • 5) (2 .. 8) (2.3) . - -- - - - - - - - - - - - - - - - - - - - - - ~ ~ - - - - - - - - -
Total 75:26 190~ 68 265~94 253.13 58~97 312~ 10 {100.0) ( 1 oo. 0) ( 100.0) ( 100 .o) (100.0) ( 1 oo.o)
- - - - - - - - - - - - - - - - - - - - - - - - - - - - -- - - ~ - - - - - - - - - - - - - - - - - - - - - - - - ~ - - - - - -Season District Osmanabad
Kharif
Rabi
Summer
---------------------------------------------------------Pre-investment Post-investment -~~-----------------------~ ---------------------------Irrigated Non-irri- Total Irrigated Non-irri-· · Total
19~00 (15.4).
72~50 (58.?)
2~00 ( 1. 6)
gated gated - - - - - - ~ - - - ~ - - -512~30 531.30 146~83 (69.3) (61.6) {29.5)
226~ 51 299.01 274~ 80 (30.7) (34.7) (55.3)
2~00 (0.2)
6.00 ( 1 • 2)
~ - - - - - - - - ~
427;67 574~50 (86.0) (57.8)
69~50 344~30 (14.0) (34.6)
6.oo ( o. 6)
Perennial 30;00 (24.3)
30.00 (3.5)
69~50 ( 14 .o)
69.50 (7.0)
Totnl
. - - - -123 ~50
( 1 oo .. o) ... - - - - -
_..., _ _._-738~81
( 100.0) 862~31
( 100 .o)
- - - ... - . - - - -497;1?
( 1 oo. 0)
- - - - -994~30
{1:00.0) - - - ~ - - - - - - - - - - ~ - - - - - - - - - -
N .B.: Figures in parenthesis reft?r to perc~nt::tges to total cropped are'
107
Th~ pattern in the pre-investment period reveals that
the rabi szason accounts for major proportion (around 58 per cent)
of the irrigated ar8a and kharif dominates the irrigat~d cropped
area, accounting for about 70 por cent in Baed as \'lell as
Osmanabad. Th~ summer cropping is very negligible and the
perennial cropping is soma\vhat consid,arable only in Osmanaba.d.
Tha overall pattern shows kharif as the major saason, accounting
for about 60 per cent of the gross cropped area, with rabi season·
accounting for only a little over a third of the total area.
In the post-in~stment period, the increase in the
irrigated area consequent to conversion of·some unirrigated
portion into irrigated area, has resulted in some changes in the
scasonwisc cropping. The kharif sown area has increased in the
irrigated portion in respect to absolute acreage, as \-Jell as
relativ9 proportion of the gross cropped area. · In the unirrigat
ed portion, khurif continues to be the dominant season on
account of rainfall during the season. Especially in the case
of Beed almost the entire unirrigated portion is cropped only
during the kharif season (97 per cent). In the rabi season
absolute acreage cropped in unirrigated lands has sho\-Jn increase
2ven though the relative proportion has registered a marginal
decline. Similar is the pattern ~n the case of irrigated
cropping for summer and perennial. The overall cropping pattern
sho~'IS relative decline in khFif season.
Post-investment Change in Cropning Pattern: In the very
first year of the project benGfits, ther2 are some ·significant
changr..:!s or shifts as comua.rcd to the pre-investment period, in ' .. .
the cropping pattt:rn adopted by the b~~neficiary farmers• .: ... !though·
108
there has been considerable increase in the absolute area urtder
each irrigated crop on account of invest~ent as well as the
intensity in cropping, we must actually consider the relative
proportion of the area under each crop to assess the change in
the pattern. In point of fact, it.is the previously unirrigated
portion of cultivable land that has presently come under irriga
tion to a very large extent. This is particularly so in the case
of baneficiary farmers under nev"J dugwell pr~jects. ·
~'ulyv"Jay, vvhat is. pertinent here is that in order to
derive maximum benefits and, thereby obtain net incremental.
incomes to ~rfaet the cost of investment ov~r a period of time,
the choice of cropping pattern in the benefited area assumes
considerable importance. The cropping pattern for the irrigated
areas adapted during the refe~cnce year _( 1983-84),. as compared
to thG one in pre-investment year (irrigated and unirrigated
areas), may be seen from the data set in Table 7.6. The high
lights of the changes in the. relative proportions of the
cropping pattern between the two po~nts of time are as rrentioned
below.
The. kharif jov"Jar, hitherto confined to unirrigated areas,
is no-r,v being cultivated in the irrigated areas •. Hov"Jevcr, the
HYV of jov..;rar ( kharif) has relatively declined in proportion in
the post-investmant year. The rabi jowar, too, shov"JS relative
decrement but only marginal~Y. NGverthQ loss, the proportion '
of total area under jo"\var sho"\"JS considerable increase in the
irrig-ated nortion of th•:~ nost-inv8stment period. On the other L *
hand, \-vheat has registered some decline in the relative pro
portion in both districts, wh·2rcas, minor cereals like bajra
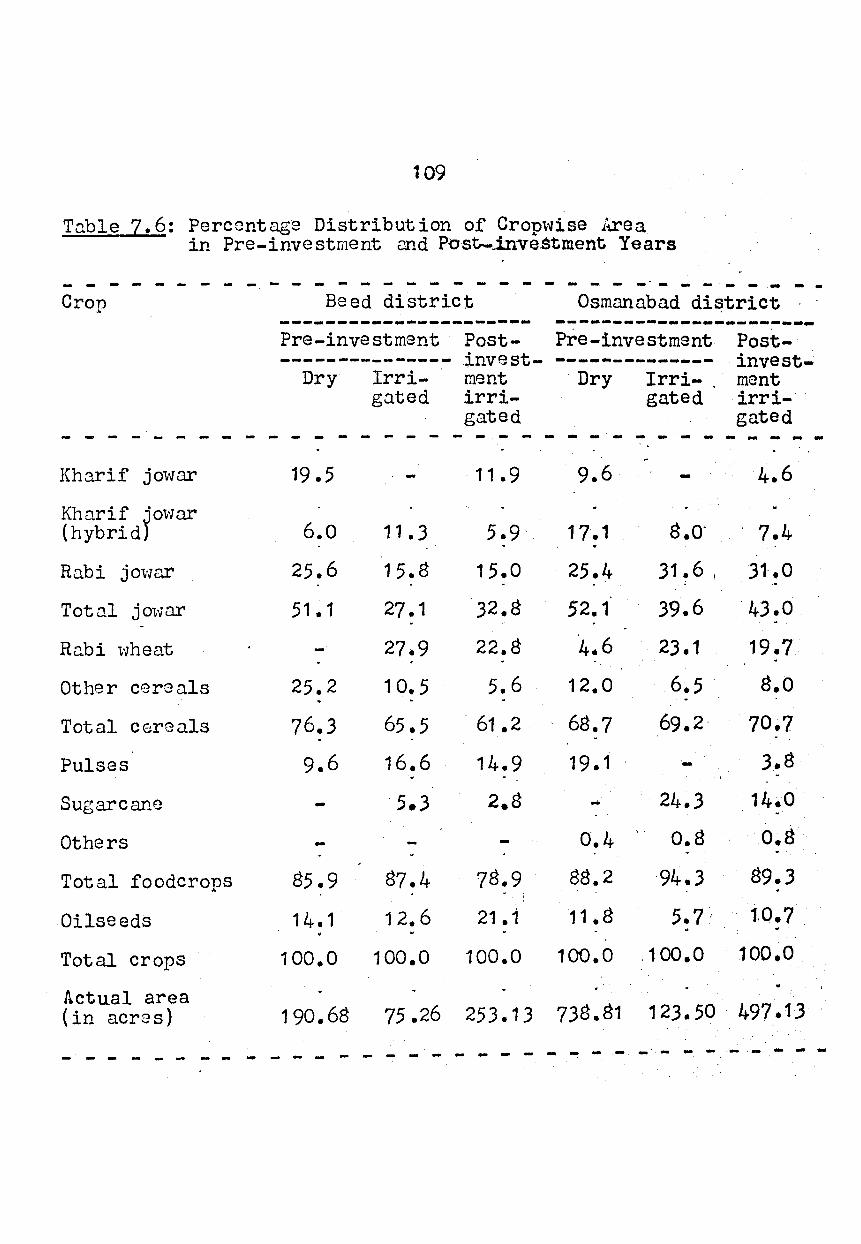
109
Tnble 7.6: Percentage Distribution of Crop't'lise Area in Pre-investment c:md Postr-inve.stment Years
- - - - - - - - - - - - - - - - - - - - - - - - - - - - - - - -Cron ... Beed district Osmannbad district
----------~~---------- --~--------------------Pre-investment Post- Pre-investment Post----------~----- invest- -------------- invest-Dry Irri- ment Dry Irri- . ment
gnted irri- gated irri-gated gated
- - - - - - - - - - - - - - - - - - - - - - - - - - - - - - ~ -Kh3rif jownr
Kho.rif jownr (hybrid)
Rabi jownr
Tot nl j otv ar
Rnbi 1tJheat
Other cereals
Total cereals
Pulses
Sugarcane
Others
Total foodcrops
Oilseeds
Total crops
Actual area (in acres)
- - - - - ..
19.5
6.0
25.6
51.1
25.2 . 76.3
9.6
-
85.9
14.1 .
11 • 3
15.8
27.1
27.9
1 o. 5
65.5
16.6
5 • .3
87.4
12.6 .
11 • 9
5.9 .
15.0
32.8
22.8
5.6
61 .2
14.9
78.9
21.1
9.6
17.1
25.4
52.1
4.6
12.0
68.7
19.1
-0.4 ..
88.2
11 • 8
8.o·
31.6 1
39.6
23.1
6.5
69.2·
24.3
0.8
94.3
5. 7 I .
4.6
7.4
31:.0
'43.0
19.7
8.0
70.7
3.8
14.0
0.8
89.3
1.0.7
1 00. 0 1 00. 0 1 00.0 1 00. 0 . 1 00. 0 1 00.0
190.68 75.26 253.13 738.81 123.50 497.13
---------- - - - ... - - - -··- - - ,_ .. - - -
110
and maize sho\v slight increase. only in Osmanabad.. The position
of total cereals in the irrigated areas shows some decline in
proportion in Be~d but a slight increase in Osmanabad in the
post-investment yea_r. Similar is the case .in regard to pulses,
slight decr:;ase in Beed but som3 incr-~ase in Osmanabad. In the
latter case, pulses as irrigated crops are reported only in the
post-investment year. \
Sugarcane too has relatively declined in
both districts.. Ho\~ever, oilseeds (mainly composed of sunflower)
have increased very considerably in both districts. I~ short, it
is kharif j owar and on account of it the total j ovJar and,
oilsa•3ds in both di. stricts and 'other careals' and· pulses only
in Osmanabad have relatively gained in irrigated areas. However,
in terms of absolute area, all the crops under irrigation show
increase in the post-investment year.
In the post-investment period too, the cereal crops
especially jowar and wheat dominate the irrigated cropping
pattern, v;ith a little over 60 per cent in Beed and 70 per cent
of the gross area in Osmanabad. Sugarcane, oilseeds and pulses
as main cash fetching crops together account for remaining
portion. In point of fact, only five crops, namely, jo~var,
vJheat, sugarcane, sunflm,...rer and gram dominate .the cropping
patt8rn in both pre- ar.d post-investment years to the extent '
of ar·'Jund 80 ner c·3nt in Beed and 90 per cent of gross irrigated ...
area. in Osmanabad. v . . :ul thes::: crops, excluding 1vheat and sugarcane, have
been raised ev2n under rainfJd conditions and, more or less, in
similar proportions in the pr3-inv•3stmsnt period. The post
inv2stment ctevclonment has enabled the beneficiary farmers to ....
111 •
extend the physical area for the familiar irrigateq crops and by
and large, retaining the pattern in tact. Ho"tvever, one notable
feature is that the recently introduced oilseed crop, viz.,
sunflower has been gaining momentum.
7.5 Deviation from the Recommended· Cropning Pattern
The economics of the scheme has ~ade assumptions as to
incremental incom0 arising from adopting particular cropping
pattern, so that the loanPe farmers would comfortably make the . '
repayment of loans according to the schedule. The patterns
differ according to the agro-climatic characteristics of the
zones and varying extent of ar~a for each recommended. crop is
provided vd th regard to the command area. The pattern relevant ' '
to our study area assumes crop intensity of 150-160 per cent
and recommends th3 rang·:J for eight crops. The particular crop's
considered for the three seasons. are: f
(a) Kharif : Hybrid jo\var, hybrid bajra, groundnut and vege~abla.
(b) Rabi HYV v-;heat, hybrid jo\var, gram and v~getable.
{c) Summer : Hybrid maize and vegetable.
The pattorn also provides ~or sugarcane in Ashti and
Kalamb talukas and cotton in l~bajogai, Omarga and Tuljapur
talukas. Roughly speaking, the recommended cropping pattern
amounts to 65 to 70 per cent\:.of car·eals' all b~ing high
yielding varieti8s, 12 per cent of groundnut, about 8 per cent
each of gram and cotton and four per cGnt ~ach of vegetable
and s ug arcane •
By and large, th:; sample benaficiary farmers havG not
adh3red to the recommend.::d cropping pattern. in their irrigated
112
lands. Even though, 60-70 per cent of the cropped area is. under
cereals, only about six to sev8n per cent is under high Jielding
varieties. ) .. part from this rather serious deviation, ·bajra and
maiz~ are relatively nGglected and more of loca.l,variety of jo\-var
is raised. Instead of suggested cotton crop, as much as 1'4 per
cent of th8 cropped area has gone to high \vatGr consuming sugar
cane cultivation in Osrnanabad. In the place of groundnut crop
suggested for about 12 per cznt of the area, it is mainly the
sunflower that finds favour. Vegetable crop is raised o_nly in
less than one per cent of the area in Osmanabad as against
recommended four per cent. In short, the adopted cropping pattern
is quite different from-the one-recommendad, not only in regard
to extent of area under each crop but also the varieties of the
crops. In fact, th8 relative proportion of ar~a under hybrid
jo\var has declined in the post-investment year. The deviation
is so considerable that it is a mot't -point \-;hethcr the pattern
cvGntually adopted \vould ensure expected incremental income to
the beneficiary farmers. Hovvev·er, it may be \vorth approaching
this problem from the po-int of vi~\v of the farmers themselves.
Reasons fer Deviation
The farmers are quite av1are of thG implications of not.
adhering to the recommended cropping pattern. Nevertheless,
they_ are of the opinion that th2 constraints, both natural and
human, have rendered them uX'able to follo\'J the. pattern suggested
by thG concern .. ~d officials. Th-e reasons mcntion&d by the informants
int ::rviewe d ar·3 not many but qui tG: familiar ones and, · th13se are
surnlllarised belo\v.
113
(i) Tha inadequacy of ground wate~, on account of low
\vatar tabl-3 compoundGd by insufficient and uncertain rainfall,·
has acted as deterrent from raising high yielding varieties of
cereal crops as thase r9quir-J considerably more \'later input
than the other varieties. Hence avoidance of risk on the nart ...
of the loanee-farmers.
( ii) The inadequacy of financial resources, required
for procuring high~cost material inputs and labour charges to
cultivate cash crops and high yielding variety foodgrains, on
account of lack of o\-Jn funds and difficulties in obtaining
credit on easy terms.
(iii) Also mentioned are the minor factors like bouse-
hold consumption needs, th3 prefer9nce being the local variety
of foodgrains and, the lack of familiarity with the technique
and agronomic practices requir~d for farming HYV crops and cash
crops, on the part of tho sa ~ry small farmers \tho have obtained
the irrigation f~cility for the first time.
In other \vords, most of them being small farmars,
financially ill-e quipp~ d and not b-:: ing mGmbors of the coop~rati vo
soci~tics for tho short-torm cradit, could not take risk vis-a-vis
inadaquatc and uncertain water input and lack of other essantial
rJsourcas. Perhaps, the d~sirad S\'litch ovar \vill gradually take
pl[!.C3 \v ith the rise in \'later tabl9 and other resource position.
7.6 Post-inv2stment Bondfits
Incr~mental EmDloyment: Incroase in the farm employment
is on3 of thJ main b3nefits expected to be gen~rated on con
tinuing basis in th3 po_st-inv·:::stm;nt years. It is but natural
to ~ssum~ that normally irrigation faciliti'3s intensive farming
114
o:y~rD.tions leading to greater employment of human labour.
Houc7er, tha survey data in respect of irrigated areas of the
b~~r:eficiary farmers do not reveal any significant -level of
incremc:ntal employment durmg the reference year. If anyth-ing - . • .L. • '
it is more or less same as compared to the non-irrigated areas
of bzn~ficiary farms m1d rainfGd control farms.
The data pr(~sented in Table 7. 7 give the per acre
o.v-~;rag2 labour days of family and hired labour employed during
the year 1983-84. Hm.-vover, in the· casG of employment on control
farm3, the available avc;rage employment in small farms· is
assunod to hold good for the purpose of comparison with the
oth8r t1rJO holding groups, for vvant ·of observations from the
cont~cl farms. The solitary case of medium farm from Beed --
sc:rrmle has b'.:en omitted from the consideration since the farm ·'
onerations have been carried out on the basis of contractual ...
lillyvvay, th8 av3rage incremental labour employment p8r
acr.:: vJr;rks out to a m8agre four and ten days as compared to
non-irri:!at.er] :md r?5nf!?ci con-Grol areas respectively for
Osmar:abad b:::n·~ ficiary farms. _On thG other hand, the similar
av2rag8 v-;orks out to 4o 5 days and minus one day for the sample
bcn~)ficiary farms in B2cd. The dccremental employment in
b:ncfit.:-:d c_r8u., though rn3.rginal, may be seen in respect of
1a.rge farms in comparison \\i th the non-irrigated areas of the
ben~:ficiary farms in Osmanabad. HovJevcr, the significant
ry~.ar c;}.na1 increase that has com3 about is mainly du3 to consi-
uGrG.Ll2 errmloym:: nt of hired l.:.bour for raising sugarcane crop.
:::::n short, thr.: d2"'.riation from the r:3comrnended cropping pattern
,.
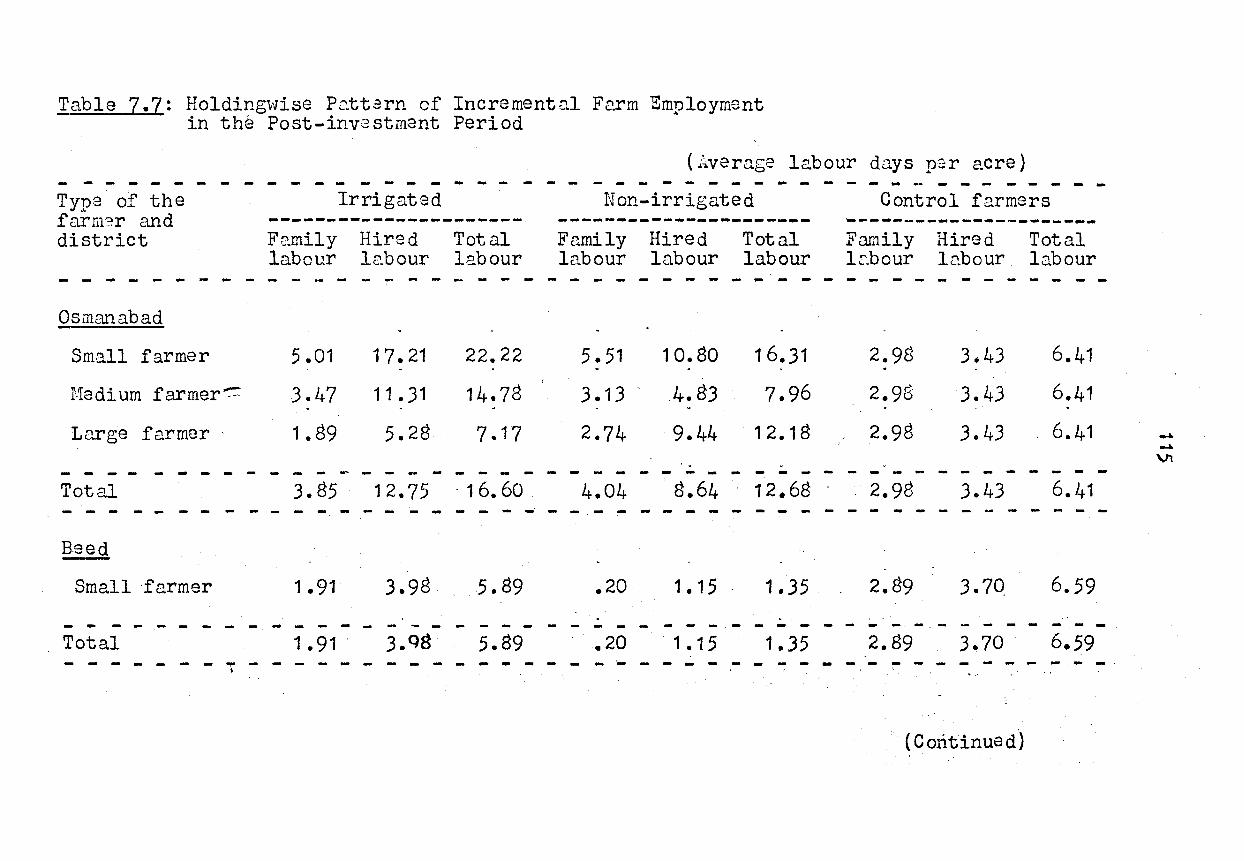
Table 7. 7: Holdingwise Pc..ttarn of Incremental Fc.rm Employment in the Post-investment Period
( Averetge labour d'-lyS n~r acre) - - - - - - - - - - - - - - - - - - - - -Typa of the Irrigat8d farm?r and --~-------------------district Fe..mily Hired Total
labour labour labour - - - - - - - - - - - ~ - - - - - - - - -Osmanabad
Small farmer 5.01 17.21 22.22 .
Hedium farmer.-.:= 3.47 11 • 31 14.78 . Large farmer 1. 89 5.28 7.17
- - - - - - - - - - - - - - - - - - -Total 3.85 12.75 . 1 6. 60 . - - - - - - - - - - - - - - - - -Heed
Small ·farmer 1. 91 3.98 5.89
- - - - - - - - - - - - -Total - - - - - "'" -I
1. 91 . ).Q8 - -
5.89 - - - - -
-
-
-
... - - - - - - - - - - - - - - - - - - - - - - - -Non-irrigated Control farmers
----~----------------- ---~------------------Family Hired Total Family Hired Total labour lnbour labour lc.bour lc.bour labour
- - - - - - - - - - - - - - - - - - - - -
5. 51 10.80 16.31 2.98 3.43 6.41 . . . 3.13 4.83 7.96 2.98 3.43 6.41 . . .
2.74 9.44 12.18 2.98 3.43 6.41 . . -- - - - - - - - - - - - - - - - - - - - - - - -
4.04 8.64 12.68 2.98 3.43 6.41 - - - - - - - - - - - - - - - - -
.20 1.15 1.35 2.89 3.70 6.59
. . -.· - - - - - - - - - - - - - - - - - - - - -
.20 . 1 • 15 1. 35 2.89 3.70 6.59 - - ·- - - - - - - - - - - - - - - - - - - - - -.
'
( Cmi.tinued)
.... -" Vt
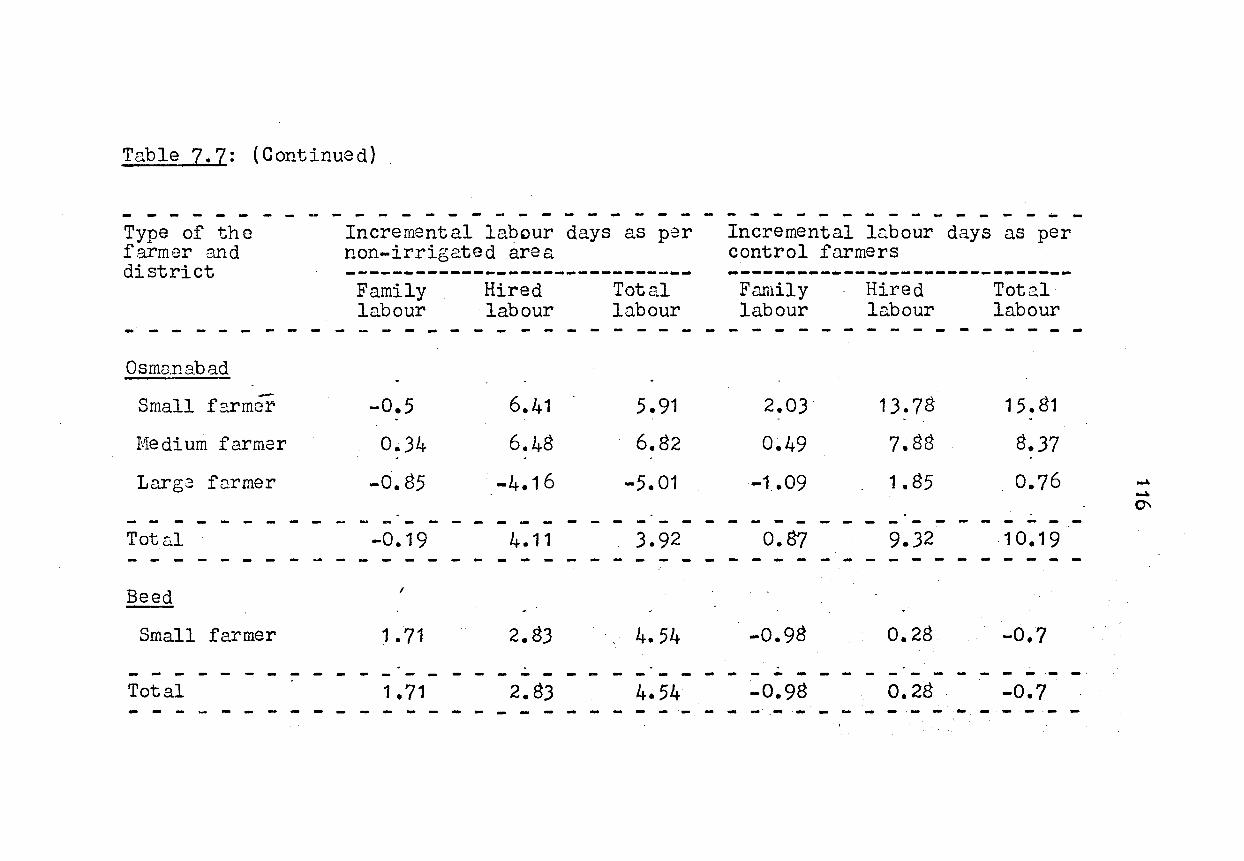
Table 7.7: (Continued)
- - - - - - - - - - - - - - - - - - - - - - - - - - - - - - - - -Type of the farmer and district
Incremental lab~ur days as per non-irrigated area ------------------------------Family
labour Hired labour
Total labour
Incremental l~bour days as per control farmers ------------------------------Family labour
Hired labour
Total labour
- - - - - - - - - ~ - - - - ~ - - - - - - - - - - - - - - - - - - - - - ~ -Osmanabad
- 6.41 1.3.78 15.81 Small farmer -0.5 5. 91 2.0.3. . . Medium far mar 0.34 6.48 6.82 0.49 7.88 8.37
- - -Larga farmer -0.85 . -4.16 -5.01 -1.09 1. 85 0.76
. . . - - - - - - - - - - - - - - - - - - - - - - - - - - - - - - - - - - - -Tot&l -0.19 4.11 3.92 0.87 9.32 10.19 - - - - - - - - - - - - - - - - - - - - - - - - - -Beed I
Small farmer 1.71 2.83 4.54 -0.98 0.28 -0.7 - . . . - - - - - - - - - - - - - - - - - - - - - - - - - - -
Total 1.71 2.83 4.54 -0.98 0.28 -0.7 - - - - - - - - - - - - - - - - - - - - - - - - - - - - - - - -
~
~
(r\
117
as a result of lo"tv levels of 11vater columns has contributed to ·
this abnormal situatiqn of near stagnancy despite considerable
investment.
Incrcment&l Income: The estimation of incremental income
is the most important indicator of the degree of financial
success of the investment. In fact, ·the loan feasibility is
'tvorked out on the assumption of generation of adequate incre
mental income (over the 'without project condition) to ensure
the repaying capacity 'tvith a considerable margin avail~ble to
the lonnee-farmer. Hm11ever, the expected· incremental income is
based on certain levels of crop intensity, .intensity of irriga
tion and specific cropping pattern to be adopted in the benefited
area. The survey data, on tha other hand, have already revealed
that none of tgese has been adequately fulfilled to achieve the
desired results. Neverthelass, the situation of low key·
development under th,~ abnormal seasonal conditions may be- seen in
the follo\ving.
The data presentad in Table 7.8 show the per acre average
net income derived separately for (a) benefited area (b) unirri
gated araa of th-3 beneficiary operated holdings w.d (c) rainfed
areas of control farms. The last two ar2 taken to represent
the 111vithout proj 3Ct condition' so as to provide basis for
ar:r;iving at the incremental income. The data are furth•3r
disaggregated accord~ng t(\'•, the three main size groups of
operational holdings. Also, in order to differentiate the types
of loans or the size of investmGnt 7 the cases of pumpset only
(installed on pre-existing operational wells) and those with
considerable investm3nt on -~vells .:md composite typGs are
separately shown.
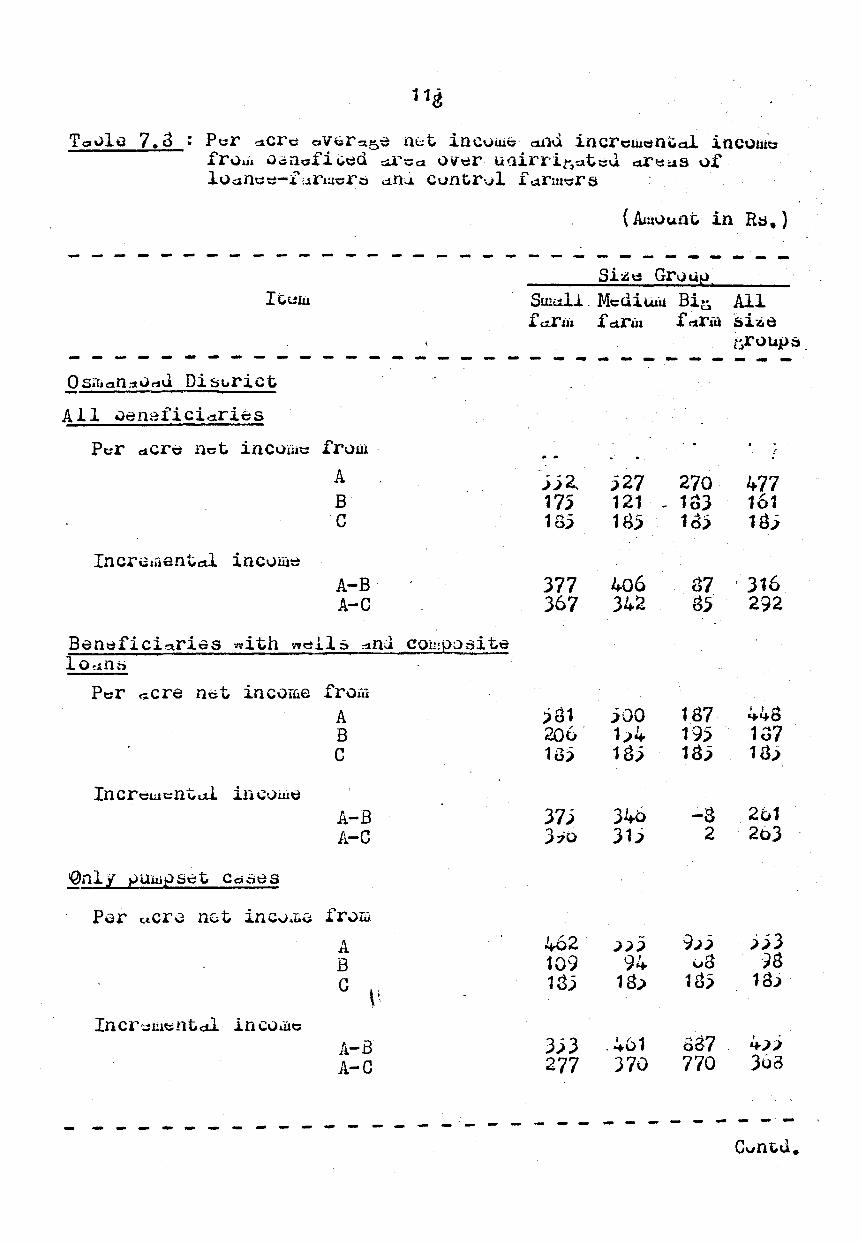
Toulo 7. 3 : Pt:r dCrd aVGr:o'd fi(;;t incui.ti~ l:tn..i incrt:wcni#c:tl incutlib frvui uan.c:fi ~cd ~1"'-=ct ov~r uairrir;)::=tt~:nl are"'s vf luant:t:-Z-:.1rta~rti o.n-.i contrvl f drm-.:::r s
~-~-~-----~~-----~-~--~
_______ ..__
--..---------------0 s.ar.ao.n:1.:~r:nl Di &urict
All ueneficiaries
Per c:tCrc net inCvi"ii~ frum .
A B c
A-B A-C
Ban~ficiarias ,..ith ~"ell::. ~nJ COt!!PJ:5ite l o~ .. n:;
P~r ~ere net incvme frum A B c
A-B A-C
Par u.cr~ nc t inc~ .. nc .fr~m
A B c
A-B A-C
Si~~ Grvup. Smt:.tll . Mt:di wu Biu All f a.rJil f d.r,·u r :-trill siz.e
t~rvup::s. __ .... ________ .__
.)j2_ 17j 18.5
377 367
)81 206. 18j
37) )70
462 109 13)
JjJ 277
j27 270 121 - 183 185 1 6)
477 161 18j
406 342
87 \ 316 85' 292
jJO 1)4 1gj
34o J1j
187 f95 18j
-8 2
9;j v8
18j
B37 770
I I d "+4-0
1u7 1(lj
2o1 263
~ ~ - - ~ - ~ - ~ - - - ~ ........... - ----
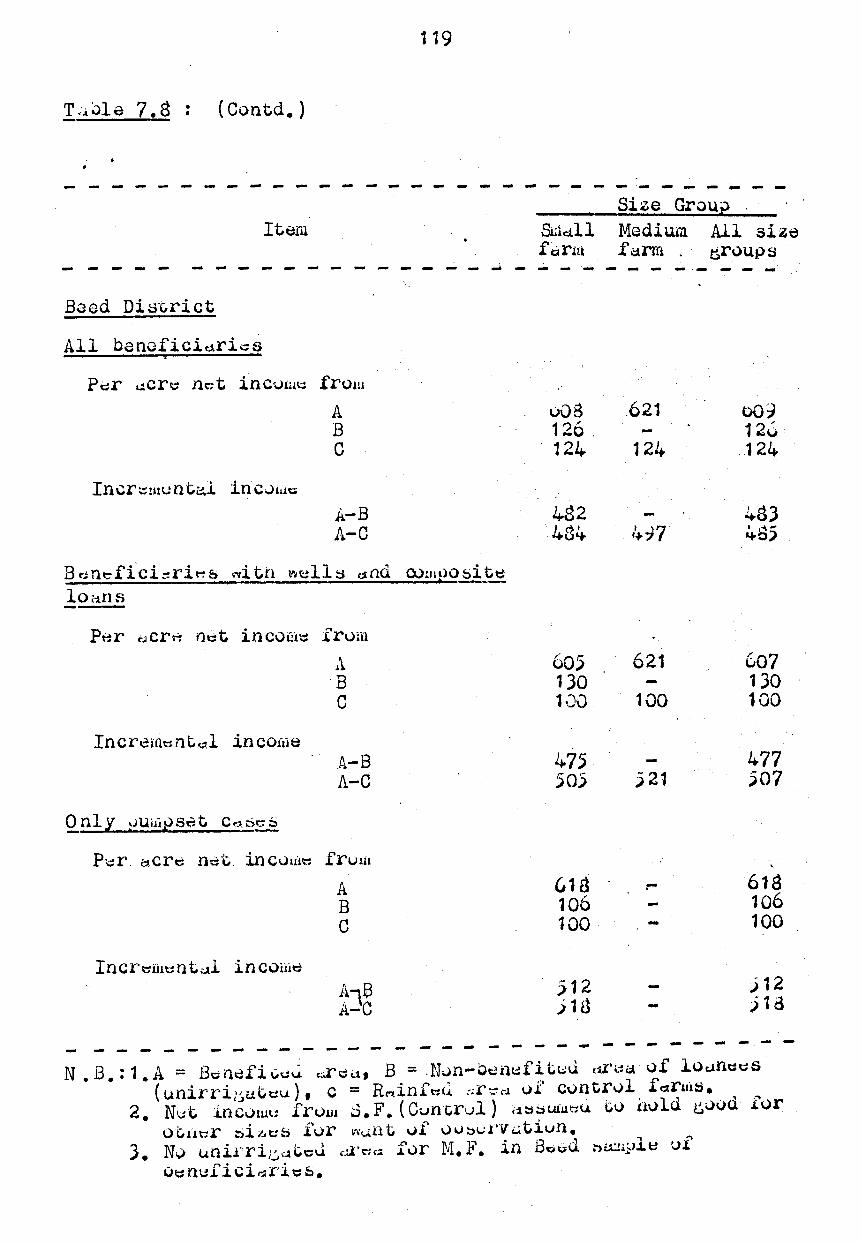
119
T . .t0le 7. 8 : ( Contd. )
~ - ~ - - - - - - - - - - ·- -------Item.
------ -- ---Baed DiBt,rict
All benoficidrics
Pc:r 1.1Cr~ nt';t incvtut-: frow ·
A B c
it.-B A-C
-- ~
Bt-;neffci::ri~s •"~ittl t•H:!ll::; dlld OO:.Ht>Obit~
lOiirlS
P~r ~crrl n~t incom~ fr0m A
Incr~m~nt~l income
·B c
.~-B ..rj.
A-C
A B c
A1a A-C
-··-
&lcill fcirm
u08 1')" -0. 124
605 130 1·J0
475 50)
G18 106 100
512 )16
Size Grou? .
Medium All sizo f.:.:trm 0rvups - - - .. ·- ... - ...
621
124
621
100
521
-
oO) 120
.124
Go7 130 100
477 )07
618 106 100
.)12 j1d
- - - - - - - - - - - .- -- - - - -- - - .... - - - - - - - ... - -.-N • B. : 1. A = Bd nclfi ~c~ ,:rca, B = .N~n-o~n~fi t~.;;u ttr'==a. of luc.1n~t:s
( u.nirri;.:Ju.tit:u.), c = R~inf~<l :;rt.:.cJ. of cvntrvl f~r,~•~. 2. N·~:t. inCv!Ul! frum s.F. (Cunc.r·-.~1) ·~::;~Uiu~U tu i:.tvld ~iJvd for
' • ,.._ :""'l t, oG~tr s~~~s Ivr w~nt vl v~~~rv~ 1un.
3. N;) unirri.t~-J tcJ. ,.:.1·~,~ f vr ~1 • .F. in B\:;iud :")i.X.!lpl~ ui o~::nt:fici~rit:s.
120
The highlights of the table raveal that because of
local varieties of cereal crops being ·in a dominant position,
the net incomes generally are on low·~r side. In the case of
pumpP~t ?nly, the incremantal incomas are higher with the
largar size of holdings, espacially in Osmanabad district. The
big farms, excepting only well cases, have relative shown
much low(~r incrtim:~ntal incom-3s than tha oth~r size groups.
Esp.:::cially in the case of wells and composit~· typt;; 7 the incre
m~ntal i ncom~ is practically nil for thebig farms while tha
small farms show naarly Rs. 400 per acre. By and larga, the
. sampl~ b\;~n>Jficiarit::s from Baed in gen>?ral and th\3 small farms
in particular have relatively fared better.· Anyway, at tha
aggragata level, the av~raga incremental income amounts to
around Rs. 300 and Rs. 480 par acre for Osmanabad and Bead
r.aspcctivoly.
7.7 Financial R.aturns on Inv(~Strno;lnt
In thd foragoin~ analysis, tha data on incremdntal
incqm.3s d-~ri vdd by th ... ~ ben~:~ficiari0s pertained to the pre
optimal stage of inv·~~stment furth-) r confound~d by drought
situation. Sinc0 th0 abov..:; data w~r\? not adequat~ly amenable
to th0 calculation of financial rat0s of rsturn on invastm~nt,
a suppL::Jm..:.;ntary survey was sub.s~~quently conduct.Jd to obtain
farm buflindss data to reflect th0 conditions of normal y~ar
\\f. t f · t t E n with full dovelcpm~nt bene 1t s age o 1nves.m~n • v~
thnn, thi3r0 was som<J difflculty in getting adequate numb.:,rs
of r~~spond:::nts having achiovcld requisitd normal condition
121
i.n ;.:;ach and :.:~v3ry typ0 of tha sch..::m~..~s unddr tha purvL.1w.
N . .;;vorth~l~ss, w0 could g~-~t suffici"1nt numb.;)r of b~'!n~ficiarios
having composite sch~me of n8W well.with dlectric pumps~t and
..:l,.::ctric pumps-Jt alon-a sch-;1mo. The suppl..:·m0ntary survay also
covdrad an adaquate numb~r of control farms to derive incre-
mJntal iucom .. ;":~s for th.~ composi t~ schem~. ·In the c·ase of
pumpS~;;1t alon\.~ ~ch\-1m .. ~, th~~ pr·a-inV.;;?~tmont poBition ·of· sample
b-Jn-aficiari~.:ls have b.a~n usdd as control, as th0re was no
othar control available, for the purpose of calcula~ing.
incr~m0ntal incomas.
The analysis of farm business dat·a to prepare cash
flow stste.m;;.nts and to compute financial rates of return on
investment in composite scheme and also pumpset alone scheme
has b8en attl;)mptad separately for normal condition and four ,
year fr-aqu·2.ncy of drought condition. The analyses presented
in Tablas 7.9 and 7.10 pertain to composita·scha~a artd in
Tabl~s 7.11 and 7 ... 12 to pumps(:,t alone sch\;)me und;;,!r normal and
drought frequency situations resp~ctiv;3ly. Th.a data obtainl."ld
from tha first stage of surv~y ar0 utilizdd to reflect·pra-.. optimal stag~ of dov..3lopmt:nt and drought year conditions and
thos ~) from tha suppl-:~mentary survey ar~ utilizad for full I
d~v0l,Jpmdnt stag0 during th0 normal years.
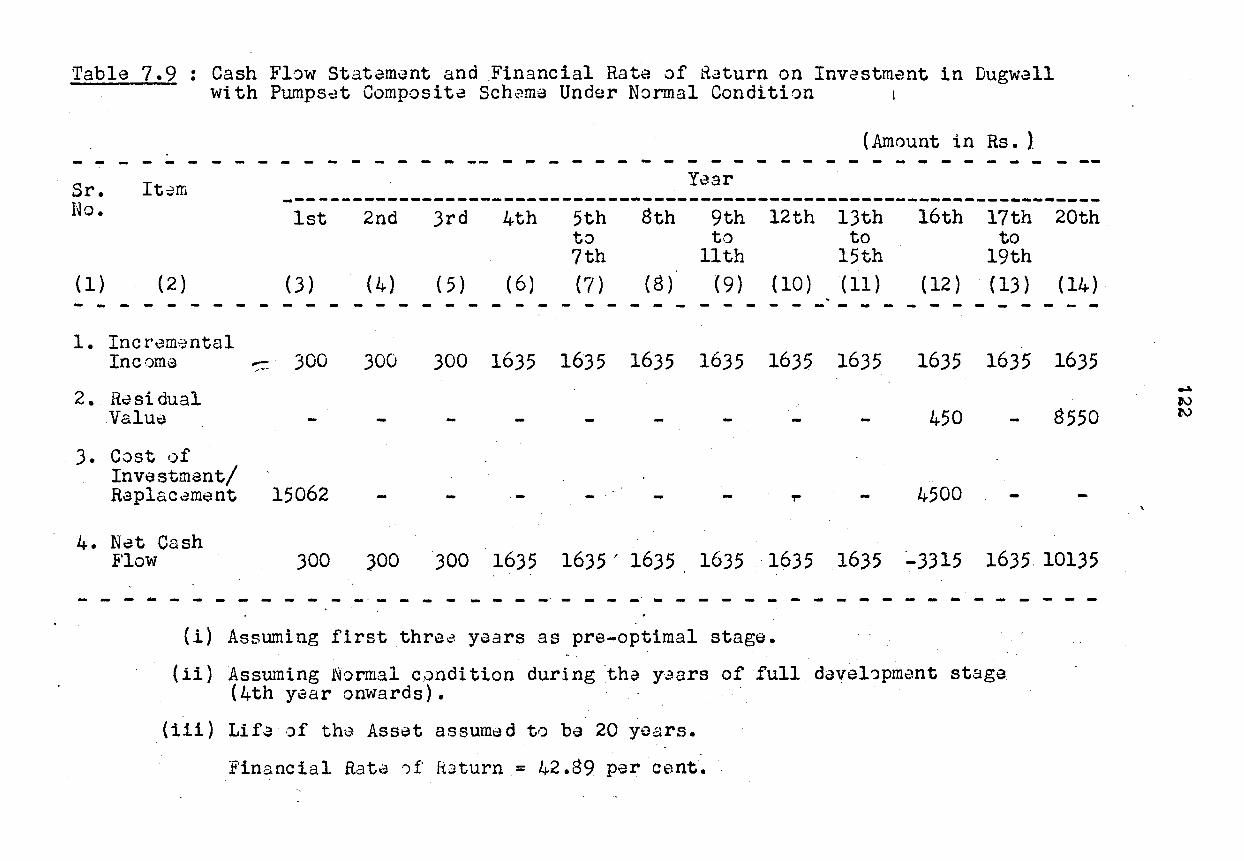
Table 7.9 : Cash FlQw Statem0nt and Financial Rate of aaturn on Invastmant in Dugwall with Pumps~t Composite Schama Under Normal Condition
(Amount in Rs • ). - ~ - - - ~ - ~ - - - - - ~ - ~~ - ~ ~ - - ~ - - - - - - - - - - ~ - - - - - - - - --
It~m Y\3ar Sr.
No. -------~~--~-----------------------------------~---------------~-------1st 2nd 3rd 4th
(1) (2) (3) ( 4) ( 5 ) ( 6)
5th to 7th (7)
8th
( 8)
9th to
11th (9)
12th 13th to
15th (10) (11)
16th 17th 20th to
19th (12) (13) (14) - - - - - - - - - - - - - - - - - - - - - - - - - - - - - - - - - - - ~ - - - - - - -
1. Incr.:Jm~ntal Income
2. Rt: si dual Valut.l
- 300
3. Cost of Investment/ Raplacament 15062
300 300 1635 1635
- .-
1635 1635 1635 1635 1635 1635 1635
450 8550
4500
4. N13t Cash F'low 300 300 300 1635 1635/ 1635 1635 -1635 1635 ~3315 1635.10135
- - - - ------ -·------- ~·---- ~-----
_____ .... - - - -
(i) Assuming first thre~ yaars as pre-optimal stage.
( ii) Assuming Normal c>.)ndi tion during tha y~ars of full daval-:>pme.nt stage (4th y~ar onwards). · ·
(iii) Lif..3 ,:>f th~ Ass~t assumt:Jd to be 20 yoars.
Financial Rata ~f R~turn = 42.89 par cent.
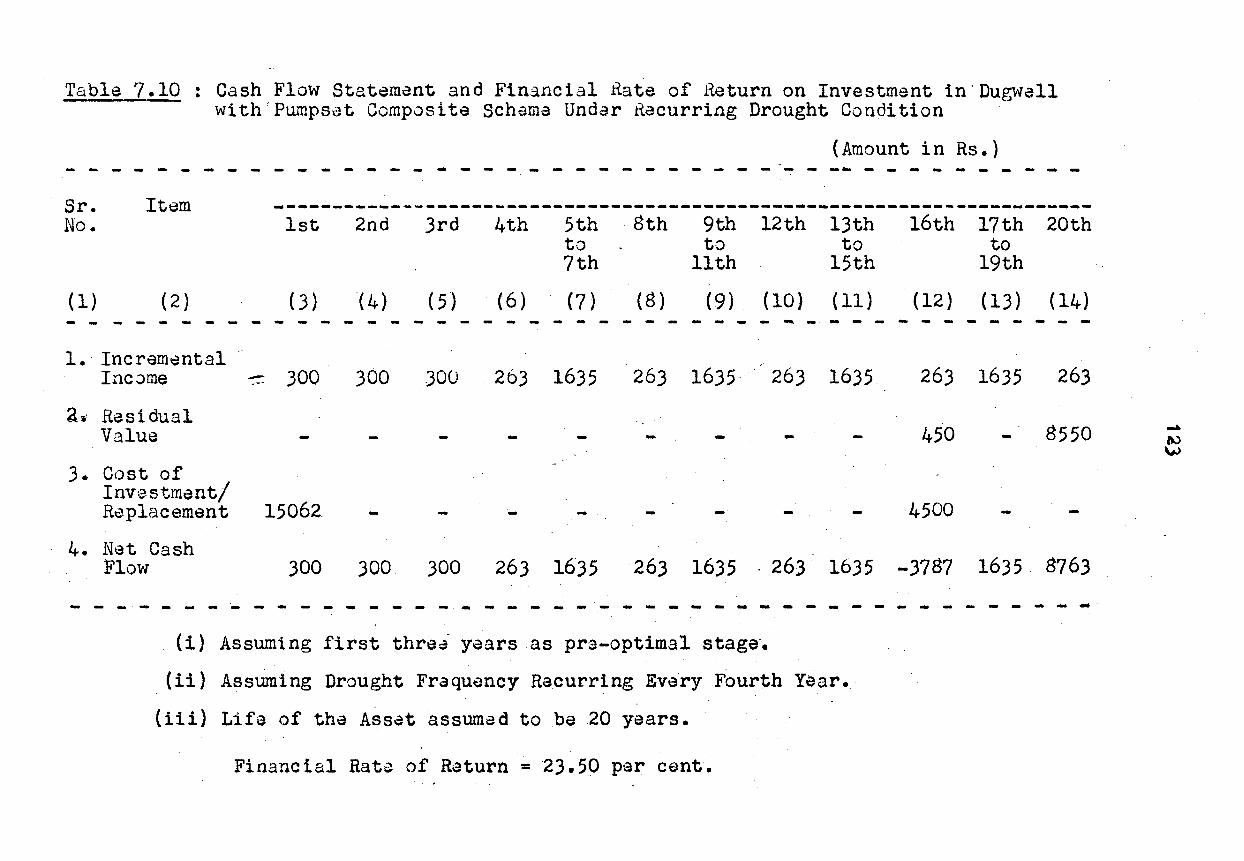
Table 7.10 • Cash Flow Statemant and Financial !late of Return on Investment in·Dugwal1 • with'Pumpsdt Compasite Sch.ama Undar B.acurring Drought Condition
(Amount in Rs.) - - - - - - - - - - - - - - - - - - - - - - - - - - - - - - - -- - - - - - - - - - -
Sr. Item --------~~-------~----------------------------------------~--------~---No. 1st 2nd 3rd 4th 5th 8th 9th 12th 13th 16th to to to 7th 11th 15th
(1) (2) ( 3) "( 4) (5) ( 6) (7) (8) (9) (10} (11) (12) - - - - - - - - - - - - - - - - - - - - - - - - - - - - - - - - - - -1. Incremental
Inc~me - 300 300 .300 263 1635 263 1635· 263 1635 263 ,_. .... -
a ... Residual Value - 450
3. Cost of Inv,3stment/
15062 4500 R~placement
4. Net Cash Flow 300 300 300 263 1635 263 1635 '263 1635 -3787
- - - - - - - - - - - - - - -·- - - - - - - - - - - - - - - .. - ,_
(i) Assuming first thra~· years as pr:a-optimal stage·.
(ii) Assuming Drought Fraquency Recurring Every .Fourth Yaar.
(iii) Life of the Ass-at assumed to be 20 years.
Financial Rat~ of Return = 23.50 per cent.
17th 20th to
19th
(13) (14) - - - - - -
1635 263
8550
1635. 8763
- - - ... - ...
~
"" ""'
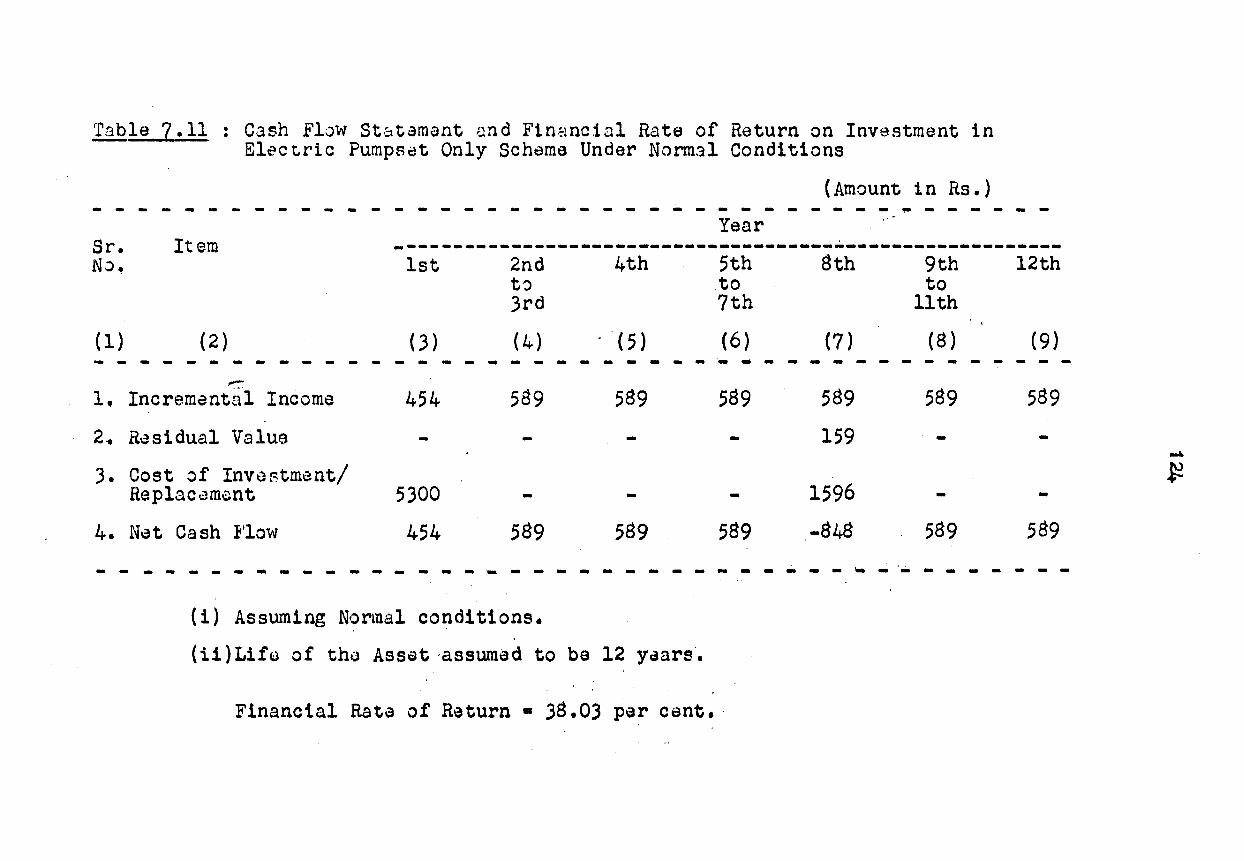
Table 7.11
- - - - - -
: Cash Flow Stotamant ~nd Fin~ncinl Rata of Return on Investment in Electric Pumps~t Only Schame Under Normal Conditions
(Amount in Rs.) - - - - - - - - - - .. - - - - - - - - - - - - - - - - ~ - - - -Year - -
Sr. N~.
Item --------~-------------------------------------------------1st
(1) (2) (3)
2nd t~ 3rd
(4)
4th
.. ( 5)
5th to 7th
(6)
8th
(7)
9th to
11th
(8)
12th
(9) --.----- - - - - ~ - - - - - - - - - - - - - - - - - - - - - - - - -1, Incremantcil Income
2. R~sidual Value
3. Cost of Invu~tment/ Replac1:1m0nt
4. Nat Cash lt'low
454
5300
454
589
-589
589 589
- -- -
589 589
589
159
1596
-84$
589
-
589
- - - -___ .. __ _ - - - .. - - ·- - - - - - - - - - - - - - - - -- ·- - - - -(i) Assuming Normal conditions.
(ii)Lifo of thv Asset ·assumed to be 12 y.:aars.
Financial Rata of Return • 38.03 per cent.
589
--
589
- - -
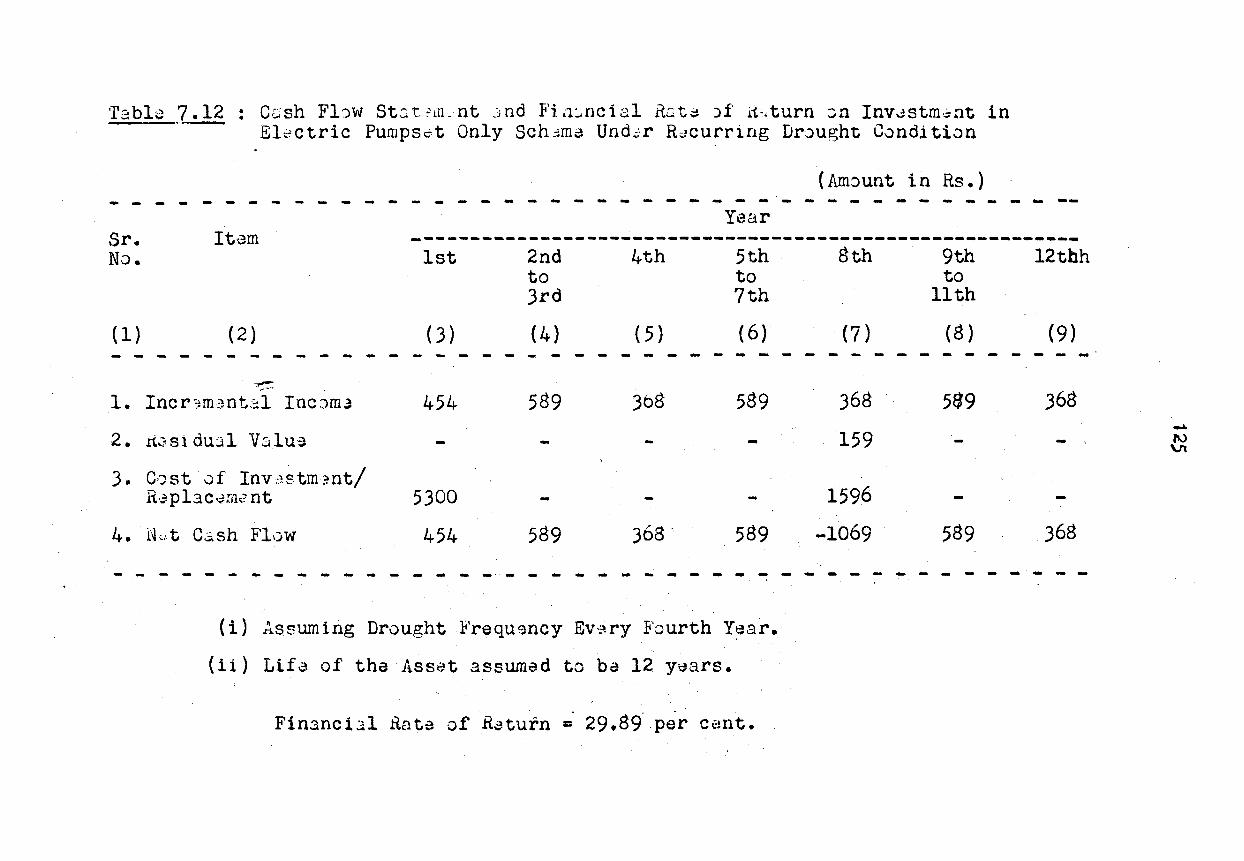
·rabl~ ,7.12 : Cc;sh Fl:lw St::t.~m_nt :·,nd Fia~ncial R.c.t~ )f it.~.turn :Jn Invdstm~nt in Electric Pumps~t Only Sch~ma Und~r Rdcurring Dr~ught C0nditi~n
(Am:>unt in Rs.) - - - - - - - - - - - - - - - - - - - - - - - - - - - - - - - - - - - - -Year
- - --Sr. It~m -~---~~----~~-~-----------------~~-------------~-~-----~--No.
(1)
1.
2.
3.
4.
- -
1st 2nd 4th 5th to to 3rd 7th
(2) ( 3) (4) ( 5 ) (6) - - - - - - - - - - - - - - - - -
~ ~--
Inc r ::m-:lnt2.l IncJmJ 454 589 3bB 589
ri..:stdu:Jl VC!lU~
C:)st of Inv.-:stm~nt/ R~plac~m,? nt 5300
{·~·~;. t Cash Flc,w 454 589 368. 589
- - - - - - - - - - - - - - -( i) Assuming Drought Frequency Ev-~ry :F'ourth Year.
(ii) Lif~ of tha Ass~t assumed to ba 12 years.
Financi31 Rata of Ratutn ~ 29,8~.p~r cant.
8th 9th 12thh to
11th
(7) (8) (9) - - - - - - - - - -368 5$9 368
159
1596
-1069 589 368
- - - - - - - - - -
~
1\) Vt
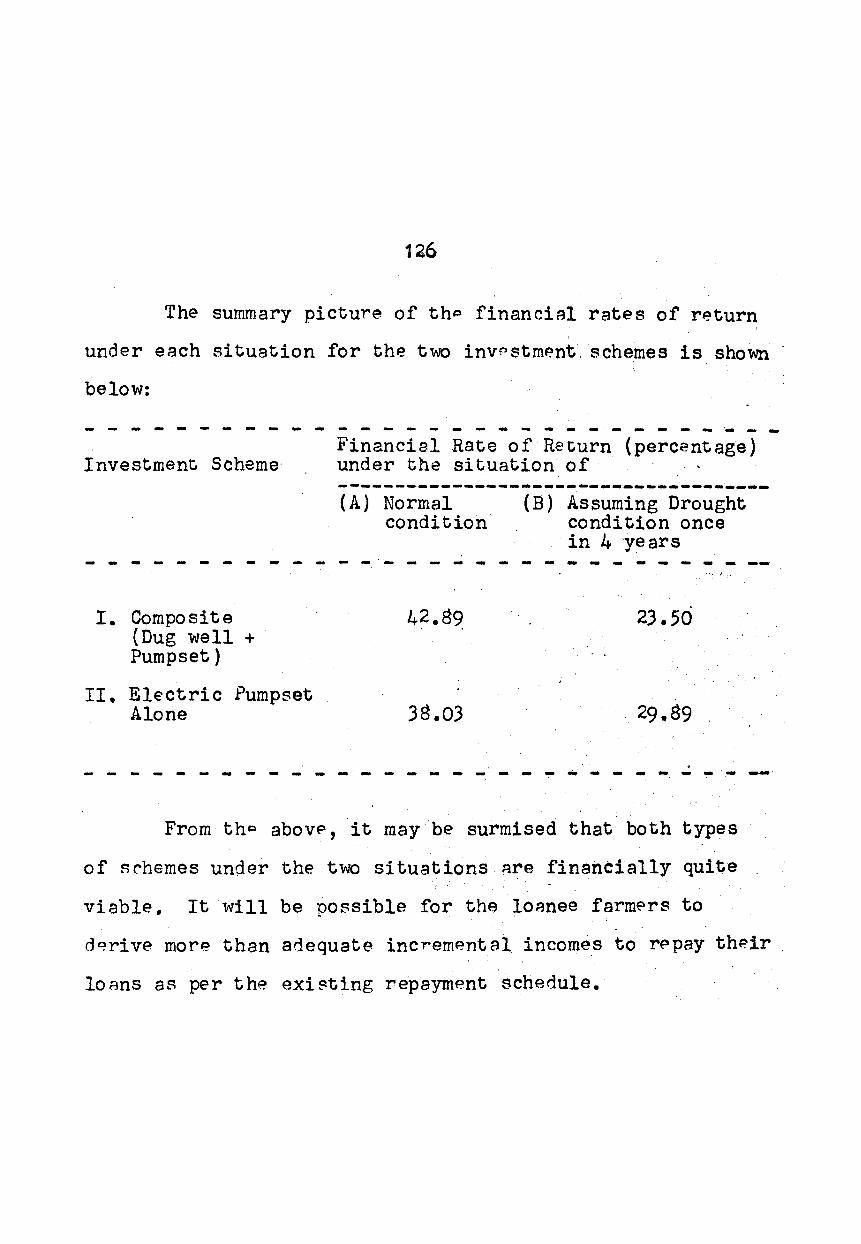
126
The summary picture of th~ financial rates of return
under each situation for the two invPstmP.nt. schemes is shown
below:
- - - - - - - - ~ - ~
Investment Scheme· ~ - - - - - - - - - - - - - - - - - ~ -Financial Rate of Re&urn (percentage) under the situation of
----------------------------------~---(A) Normal condition
(B) Assuming Drought condition once in 4 ·years
------------ -·----------------I. Composite 42.89 23.50
(Dug well + Pumpset)
II. Electric Pump set Alone 38.03 29.89
. -------------------- ~- ~--- ~ -·- ~ From thP abovP, it may be surmised that both types
of schemes under the two situations Rre financially quite
viable. It will be possible for the loAnee farm~rs to
dC?rive morP. than adequate increm~ntal incomes to r~pay thP.ir
loans as per the exi~ting repayment schedule.
il.PPENDIX-I
/ TIME LJ:~.G IN LO.ii.NING OPERATION
In this brief note, an attempt is made to give a meneral
idea about the time lag from the stage of application for loans
to that of sanction of the scheme and subsequent stages of
release or lifting of loan instalments by the reporting benefici
ary farm~rs. The data presented here are based on the information
furnished by the beneficiary farmers themselves. The relevant
data concerning time lag in terms of months from stag·e to stage
of the loaning operation arc presented in Table A-1 ~
It may be observed that the time taken for sanction of
loan from the date of application does not exceeded 2-3 months
in most of the cases. In Osmanabad district, about 88 per cent
. of cases have been sanctioned within three months.of the date of_
application. However, in about 40 per cent of the case·s in Beed,
the time lag is reportedly over four months. Th~ time lag fro~
th8 stage of loan sanction to that of release of th~ first
instalment is relatively very brief~ as it has taken·two to three
months to clear nearly 87 per cent of cases in Beed and 96 per I
cent in Osmanabad. The.next stage of ·operation, that is, release
of second instalment involving both old wells (final instalment)
and new wells, reveals considerably longer time lag as the proper '
utilisation of funds already released is a precondition for t: I
lifting the second instalment. Ho\vever, majority of the .
loanecs in either district is in receipt of the second instalment.
vJithin about thr2e months time • The next stage, that is, second
to third instalrrr:?nt involving only the nE"nv wells hvith or \vithout
127
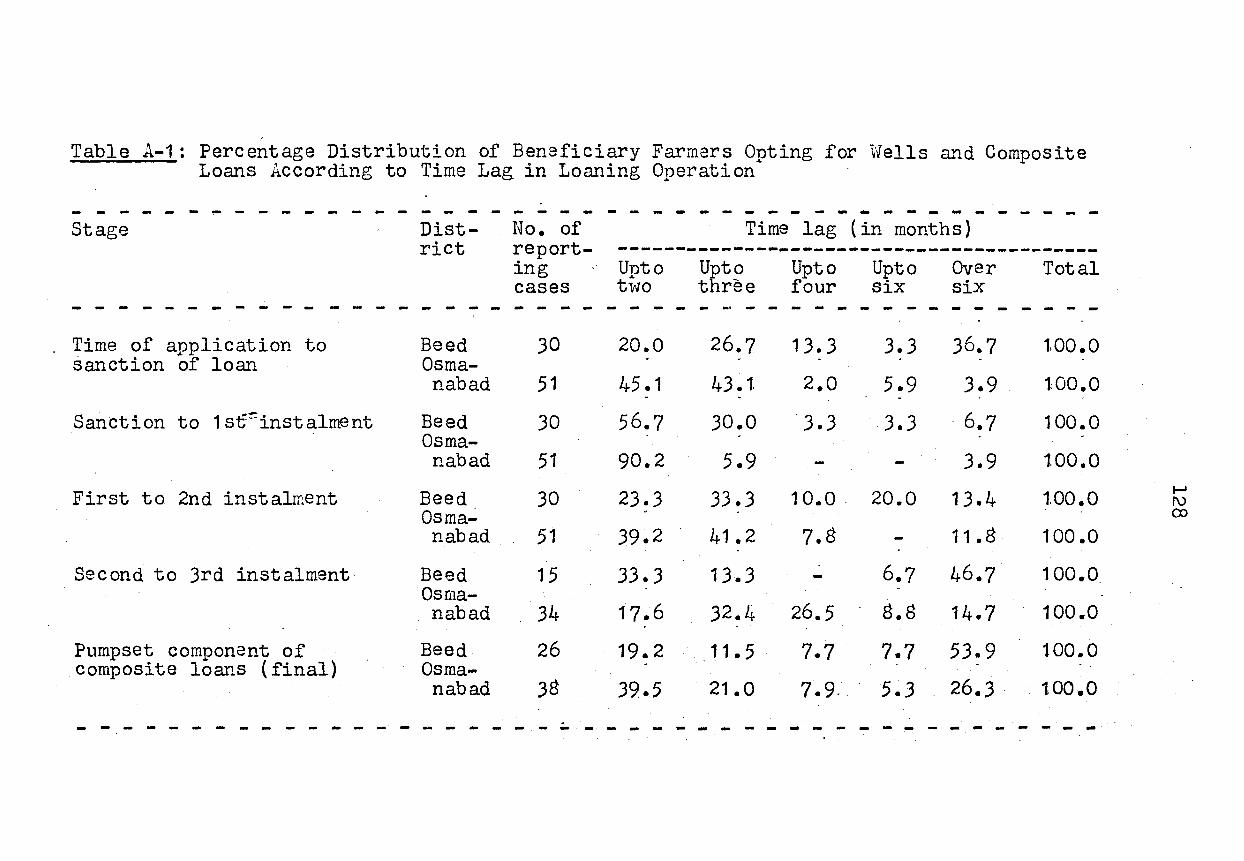
Table A-1: Percentage Distribution of Beneficiary Farmers Opting for Wells and Composite Loans According to Time Lag in Loaning Operation
- - - - - - - - - - - - - - - - - - -Stage Dist
rict No. of reporting cases
- - - - - - - - - ~ - - - - - - - - - -Time lag (in months)
------------------------------------------Upto Upto Upto Upto Over two three four six six
Total
- - - - - - - - - - - - - - - - - - - - - - - - - - - - - - - - - - - - - - - - - - -Time of anolication to sanction of loan
Sanction to 1s~~instalment
First to 2nd instaL~ent
Second to 3rd instalment"
Beed Osmanabad
Beed Osmanabad
Beed Osma~ nab ad
Beed Osmanabad
30
51
30
51
30
51
15
34
Pumpset componant of Beed 26 composite loans (final) Osma-
nabad 38
- - - - - - - - - - - - - - - - - - - - - -
20.0
45.1
56.7
90.2
23.3
39.2
33.3
17.6
26.7
43.1.
30.0
5.9
33.3
41.2
13.3
32.4
13.3
2.0
3.3
1 o.o-7.8
26.5
3.3
5.9
-3.3
20.0
-6.7
8.8
36.7
3.9 .
-. 6. 7
3.9
13.4
11.8
46.7
14.7
tOO.O
1:00.0
100.0
1.00.0
1.00.0
100.0
100.0
100.0
19.2 11.5 7.7 7.7 53.9 100.0
39.5 21.0 7.9. ·5.3 26.3- 1oo.o
-· - - - - - - - - - - - - - - - - - - - - - -
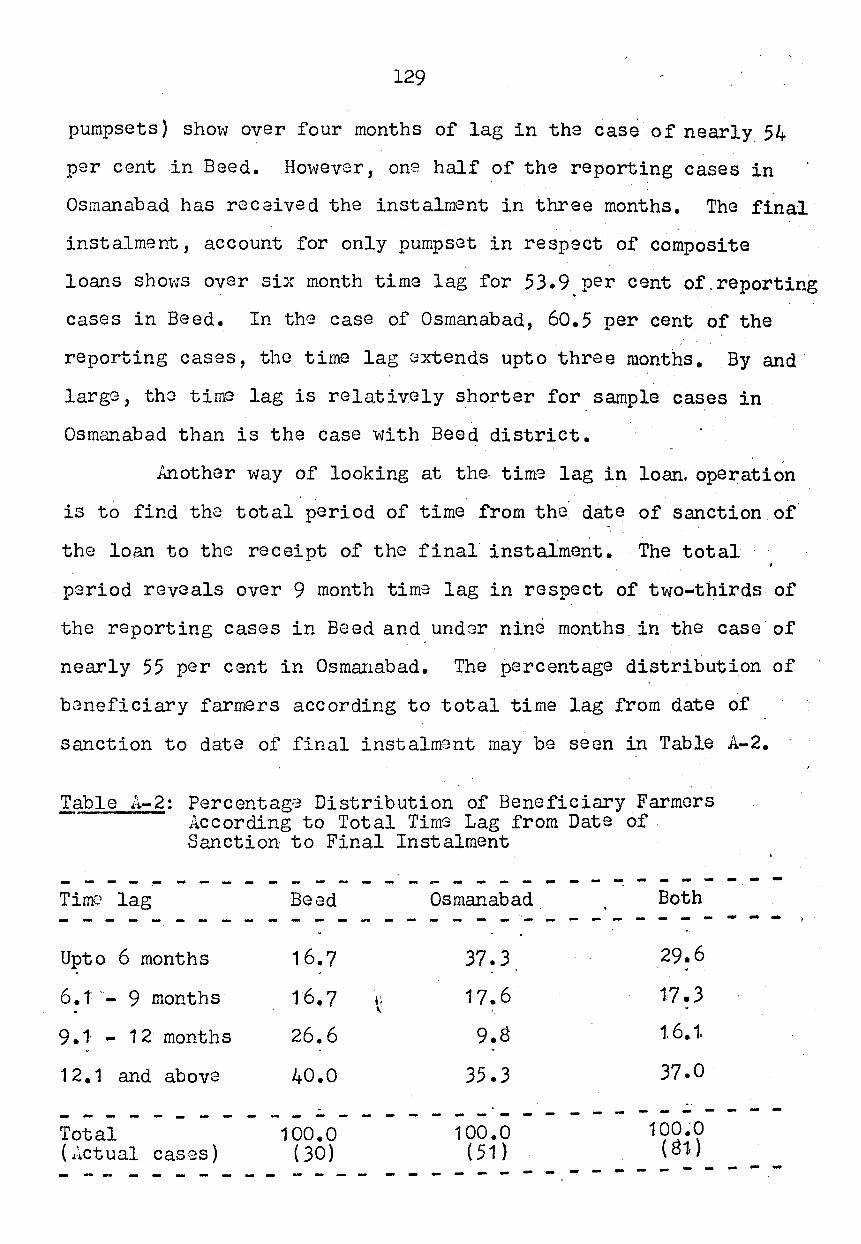
129
pumpsets) show over four months of lag in the case of nearly_ 54
per cent in Bee d. Hov-;ever, on?. half of the reporting cases in
Osmanabad has received the instalment in three months. The final·
instalment, account for only pumpset in respect of composite
loans shows over six month time lag for 53.9 per cent of.reporting . .
cases in Beed. In the case of Osmanabad, 60.5 per cent of the
reporting cases, tho time lag Gxtends upto three months. By and·
large, tho time lag is relatively s.horter for sample cases in
Osmanaba.d than is the case v-Jith Beed district.
Another v-Jay of looking at the. time lag in loan. operation
is to find the total period of time from the date of sanction of
the loan to the receipt of the final instalment. The total
period reveals over 9 month time lag in respect of two-t}?.irds of I
the reporting cases in Boed and undor nine months. in the case of
nearly 55 per cent in Osmanabad. The percentage distribution of
beneficiary farmers according to total time lag from date of
sanction to date of final instal~2nt may be seen in Table A-2.
Table A-2: Percentage Distribution of Beneficiary Farmers - According to Total Tir~ Lag from Date of
Sanction to Final Instalment
- - - - :- - - - - - - - - - - - - - - - - - - - -Tirn0 lag Beed Osmanabad Both - - - - - - - - - - - - - - - - - - - - - - - - -Upto 6 months 1.6. 7 37.3 29.6 . 6.1 ·- 9 months 16.7 1: 17.6 1.7.3
' -. 9.1- - 12 months 26.6 9.8 1. 6. 1.
12.1 and above 40.0 35.3 37.0 . - - - - - - - - -- - - - - - - - - - - - - - - - - - -
Total 1 oo.o 100.0 100~0
( ;i.ctual cases) (30) (51 ) ( 81.) - - - - - -- -- - - - - - - - - - - - - - - - - - - - -
·- - -- - -
- - -- - -
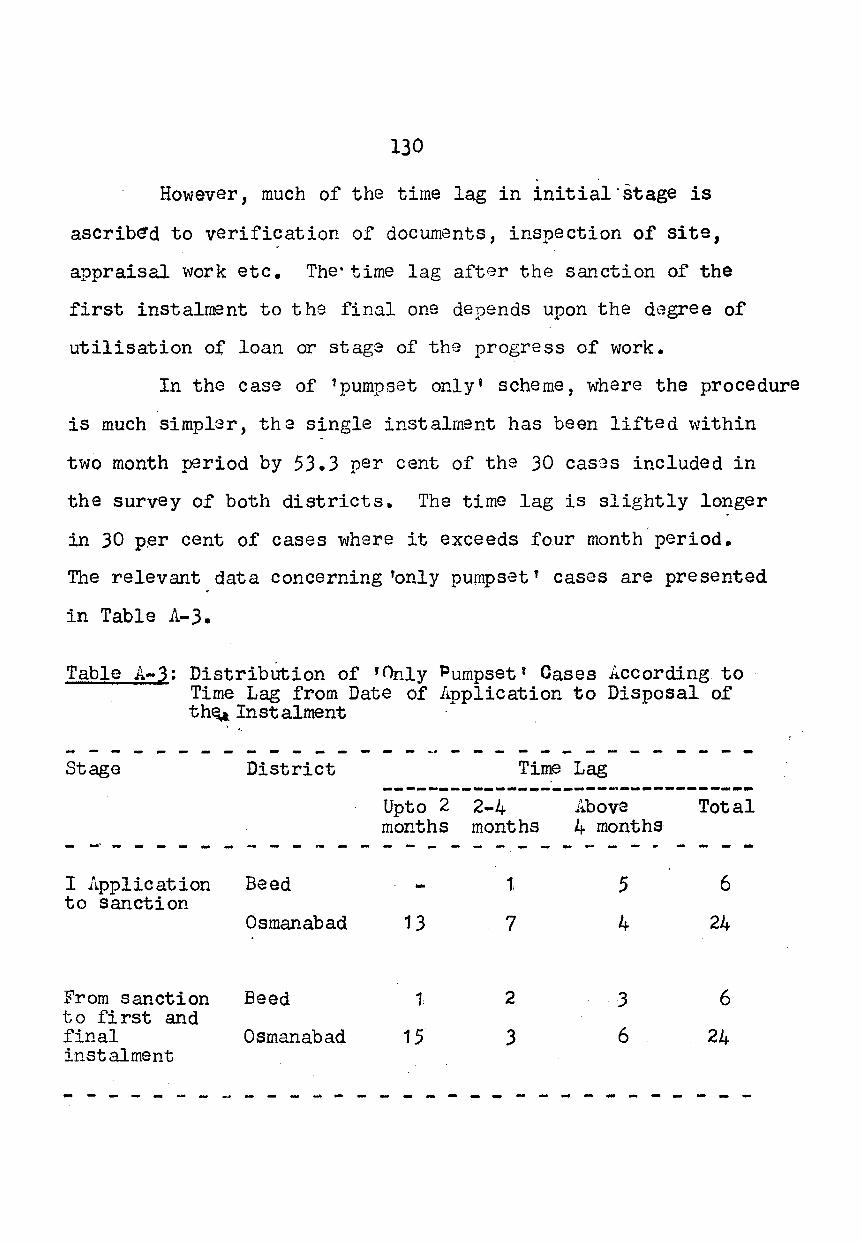
130
However, much of the time lag in initial·stage is
ascrib~d to verification of documents, inspection of site,
appraisal work etc. The·time lag after the sanction OI the
first instalment to the final one depends upon the degree of
utilisation of loan or stage of the progress of work.
In the case of 1 pumpset only' scheme, where the procedure
is much simpler, the single instalment has been lifted within
two month period by 53.3 per cent of the 30 cas9s included in
the survey of both districts. The time lag is slightly longer
in 30 p.er cent of cases where it exceeds four month period.
The relevant data concerning 'only pumpset' cases are presented
in Table A-3.
Table A-3: Distribution of 'Only Pumpset' Cases According to Time Lag from Date of Application to Disposal of th~ Instalment
- - - - - - - - - - - - - - - - - - ~ - ~ - - - - ~ -Stage
- -- - - - -I Application to sanction
From sanction to first and final instalment
District
- - - - - - -Bead
Osmanabad
Beed
Osmanabad
Time Lag ----~--------------------------~-Upto 2 months - -
13
t
15
-2-4 months
- -1,
7
2
3
.i~bova 4 months - -
5
4
3
6
- . -
Total
- -6
24
6
24
-
~ - - - - - - - - - - ~ ~ - ~ - - - - - ~ - ~ ~ - - - - - - -