Embed Size (px)
Citation preview
PROJECT REPORT
on
A STUDY ON CAPITAL BUDGETING AT SUNNESS
CAPITAL INDIA PVT LTD
BY
JEEVITHA
USN: 1NZ18MBA33
Submitted to
DEPARTMENT OF MANAGEMENT STUDIES
NEW HORIZON COLLEGE OF ENGINEERING,
OUTER RING ROAD, MARATHALLI,
BENGALURU
In partial fulfilment of the requirements for the award of the degree of
MASTER OF BUSINESS ADMINISTRATION
Under the guidance of
Guide Name: Mr. SANTOSH KUMAR S
Asst. Professor
2018-2020
CERTIFICATE
This is to certify that Jeevitha bearing USN 1NZ18MBA33, is a
bonafide student of Master of Business Administration course of the
Institute 2018-2020, autonomous program, affiliated to Visvesvaraya
Technological University, Belgaum. Project report on “A Study on
Capital Budgeting at Sunness Capital India Pvt Ltd” is prepared by her
under the guidance of Mr. Santosh Kumar S, in partial fulfillment of
requirements for the award of the degree of Master of Business
Administration of Visvesvaraya Technological University, Belgaum
Karnataka.
Signature of Internal Guide Signature of HOD Principal
Name of the Examiners with affiliation Signature with date
1. External Examiner
2. Internal Examiner

DECLARATION
I, Jeevitha, hereby declare that the project report on “A Study on Capital Budgeting at
Sunness Capital India Pvt Ltd” with reference to” Sunness Capital India Pvt Ltd” prepared
by me under the guidance of Mr. Santosh Kumar S, faculty of M.B.A Department, New
Horizon College of Engineering.
I also declare that this project report is towards the partial fulfilment of the university
regulations for the award of the degree of Master of Business Administration by
Visvesvaraya Technological University, Belgaum.
I have undergone an industry project for a period of Eight weeks. I further declare that this
report is based on the original study undertaken by me and has not been submitted for the
award of a degree/diploma from any other University / Institution.
Signature of Student
Place:
Date:


ACKNOWLEDGEMENT
The successful completion of the project would not have been possible without
the guidance and support of many people. I express my sincere gratitude to (Mr.
Ananth P, Manager, Sunness Capital India Pvt Ltd, Bengaluru, for allowing to
do my project at Sunness Capital India Pvt Ltd.
I thank the staff of Sunness Capital India Pvt Ltd, Bengaluru for their support
and guidance and helping me in completion of the report.
I am thankful to my internal guide Mr. Santosh Kumar S, for his constant
support and inspiration throughout the project and invaluable suggestions,
guidance and also for providing valuable information.
Finally, I express my gratitude towards my parents and family for their
continuous support during the study.
STUDENT NAME: JEEVITHA
USN NO.: 1NZ18MBA33

TABLE OF CONTENTS
SL. NUMBER CONTENTS PAGE NUMBERS
1 Executive Summary 2
2 Theoretical Background of The Study 3-5
3 Industry Profile &Company Profile 6-13
4 Application of Theoretical Framework 14-18
5 Analysis and Interpretation of Financial
Statements and Reports 19-48
6 Learning Experience- Findings,
Suggestions and Conclusion 49-54
7 Bibliography 55
2
EXECUTIVE SUMMARY
I got an opportunity to do project work in a stock broking company called SUNNESS
INDIA CAPITAL PVT LTD who deals with buying and selling of shares on behalf of
their investors, as well they are into commodity trading, currency trading, promoting
various companies health plans and insurance to its clients, they also provide consultancy
service to its investors before investing.
I was basically working as an clients acquisition where in I had to meet new customers
explain them some basics about the stock market and make them to invest on shares, well
it was an challenging job and personally had a good hands on experience and learnt a
loads of things regarding the stock market.
The internship duration was nearly eight weeks and i did a project on “A STUDY ON
CAPITAL BUDGETING AT SUNNESS CAPITAL INDIA PVT LTD” which deals with
currency trading and also provide services to the traders which were newly introduced by
the company.
For this study the data were collected from both through questionnaire and through
internet sources. Since currency exchange services was newly introduced the number of
clients were limited the sample size were limited to only twenty.
This study was conducted just to know what are the risks faced by the clients, what are
techniques or strategies used by them to reduce the risk involved in the foreign exchange,
and also what kind of services clients are expecting from other brokers other than the
regular services.
The main motto of this project is to know the gap created by the SUNNESS PVT LTD
with its clients and try to bridge them and makes satisfy its clients, therefore this in turn
would increase the growth of the number of clients.
3
INTRODUCTION
CAPITAL BUDGETING:
An efficient allocation of capital is the most important finance function in modern times. It
involves decisions to commit firm’s funds to long-term assets. Such decisions are tend to
determine the value of company/firm by influencing its growth, profitability & risk.
Investment decisions are generally known as capital budgeting or capital expenditure
decisions. It is clever decisions to invest current in long term assets expecting long-term
benefits firm’s investment decisions would generally include expansion, acquisition,
modernization and replacement of long-term assets.
Such decisions can be investment decisions, financing decisions or operating decisions.
Investment decisions deal with investment of organization’s resources in Long tern (fixed)
Assets and / or Short term (Current) Assets. Decisions pertaining to investment in Short term
Assets fall under “Working Capital Management”. Decisions pertaining to investment in
Long term Assets are classified as “Capital Budgeting” decisions.
Capital budgeting decisions are related to allocation of investible funds to different long-term
assets. They have long-term implications and affect the future growth and profitability of the
firm.
In evaluating such investment proposals, it is important to carefully consider the expected
benefits of investment against the expenses associated with it.
Organizations are frequently faced with Capital Budgeting decisions. Any decision that
requires the use of resources is a capital budgeting decisions. Capital budgeting is more or
less a continuous process in any growing concern.
4
NEED FOR THE STUDY
The Project study is undertaken to analyze and understand the Capital
Budgeting process in cement manufacturing sector, which gives mean
exposure to practical implication of theory knowledge.
To know about the company’s operation of using various Capital Budgeting
techniques.
To know how the company gets funds from various resources.
OBJECTIVES OF THE STUDY
To study the relevance of capital budgeting in evaluating the project for project
finance.
To study the technique of capital budgeting for decision- making.
To measure the present value of rupee invested.
To understand an item wise study of the company financial performance of the
company.
To make suggestion if any for improving the financial position if the company.
To understand the practical usage of capital budgeting techniques
To understand the nature of risk and uncertainty
METHODOLOGY
To achieve aforesaid objective the following methodology has been adopted. The
information for this report has been collected through the primary and secondary sources.
PRIMARY SOURCES
It is also called as first handed information; the data is collected through the
observation in the organization and interview with officials. By asking question with
the accounts and other persons in the financial department. A part from these some
information is collected through the seminars, which were held by Sunness.
5
SECONDARY SOURCES
The secondary data have been collected through the various books, magazines, brouchers &
websites
LIMITATION OF THE STUDY:
Lack of time is another limiting factor, ie., the schedule period of 8 weeks are not
sufficient to make the study independently regarding Capital Budgeting in Sunness.
The busy schedule of the officials in the Sunness is another limiting factor. Due to
the busy schedule officials restricted me to collect the complete information about
organization.
Non-availability of confidential financial data.
The study is conducted in a short period, which was not detailed in all aspects.
All the techniques of capital budgeting are not used in Sunness. Therefore it was
possible to explain only few methods of capital budgeting.
6
INDUSTRY AND COMPANY PROFILE
1. INDUSTRY PROFILE
Evolution:
Stock broking industry came from the history of say two hundred years ago east India
institutions and companies were the most popular and dominant when compared to any other
Indian companies in those days, during the eighteenth centuries east India companies used to
provide loans for the and invest on other companies. During the time say in 1830s business
on corporate stocks and shares in bank and cotton presses took place in Bombay. during 1839
many people started investing on shares, equities which in turn saw a huge list getting
broader day by day and also even merchant banks and financial banks list got broader in
investing during 1840s- 1850s.
During 1840s we could see only half a dozen entering into stock broking industry and that is
how at the early years of 1850s many men started being an stock broker started pooling of
public money and invested on equities this is the period India witnessed a greater revolution
in the stock broking industry many of the brokers started attracting many investors and made
them understand the importance of investing on companies shares, commodities, and
currencies this lead to even more increase in the number of stock brokers. However with in
few years due to American civil war there was a disastrous began.
After a great American civil war by the time they could stabilize stock brokers found a place
in a street which is at presently called as Dhala Street. This place made each and every stock
broker to meet and transact business very easily, this is how brokers formally established in
Bombay which is known as “the stock exchange” similarly a premise was built for the stock
exchange in the same street and had got inaugurated in 1899.
Important leading cities in operating stock market: if you see in cotton textile industry
Mumbai was gained a major importance followed to it Ahmadabad also gained an importance
in this industry.
At the early years of 1881s mills which were originated in Ahmadabad had rapidly forged.
Once this forged mills where removed and new mills were created then expected for the
existence of a stock exchange in Ahmadabad. And by 1849 all the brokers together formed an
association called “The Ahmadabad share and stock brokers association
7
With the help of swadeshi movement the industry was expecting to have an tremendous
industrial revolution coming on its way to India with the help of inauguration of the TATA
iron and steel company in 1907 and because of the first world war all the companies who
deals with the commodities like cotton, steel, sugar, textiles, paper, and flour mills said to
have an tremendous prosperity. All these things were happening during the beginning of
twentieth century.
During the time of 1920s in the city of Madras had a wonderful thrill in trading the stock
exchange in the name of “The Madras Stock Exchange” with a number of hundred members,
gradually when we could see boom getting faded the members started getting reduced from
hundred to three which is a single digit and that is how it lost its existence.
In 1935, the stock market activity improved, especially in South India where there was a
rapid increase in the number of textile mills and many plantation companies were floated. In
1937, a stock exchange was once again organized in Madras - Madras Stock Exchange
Association (Pvt) Limited. (In 1957 the name was changed to Madras Stock Exchange
Limited). Lahore Stock Exchange was formed in 1934 and it had a brief life. It was merged
with the Punjab Stock Exchange Limited, which was incorporated in 1936.
Indian Stock Exchanges - An Umbrella Growth:
The Second World War broke out in 1939. It gave a sharp boom which was followed by a
slump. But, in 1943, the situation changed radically, when India was fully mobilized as a
supply base.
Exchange Limited (1989), Bhubaneswar Stock Exchange Association Limited (1989),
Saurashtra Kutch Stock Exchange Limited (at Rajkot, 1989), Vadodara Stock Exchange
Limited (at Baroda, 1990) and recently established exchanges - Coimbatore and Meerut.
Thus, at present, there are totally 23 recognized stock exchanges in India.
• This has made the system to be more effective and efficient enough to work and reduce
the time barrier.
• The system is been created in such a way that it is clear crystal and are transparent to the
investors.
• Since the trading happens online investors need not approach any of the brokers to buy or
sell the shares, the share prices are being displayed on the screen hence before buying or
selling the investor will come to know the value of the share.
8
• During the process each and every steps are been updated to the investors by sending mail
therefore the investor need not worry about the process involved in the transaction.
Similar to that of BSE we have NSE that is National Stock Exchange in which 50
companies are listed under this are operating in all over the world due to globalization
and liberalization companies have been performing really effective and efficiently in
entering into globally, for any company the goal will be getting globally and operating all
over the world this is because of many rival companies entering globally and to survive
many companies are going globally. NSE plays an important role for such companies the
companies listed under this can pool in money more and are safe too.
NSE has several advantages over the traditional trading exchanges. They are as follows:
It helps in pooling the many investors all over the nation and are made to invest
Investors need not to worry regarding the transactions since the steps are been updated to
the investor therefore transactions happens very faster and there is no chance of getting
delayed in the process.
NSE works very effective and efficiently to make sure that investors interest are safe
guard and make sure that process involved in this transactions are transparent and not
only in this the companies listed under this are transparent.
NATURE OF BUSINESS CARRIED
The company were acting as an agent/ broker or rather we could call them as stock
brokers who acts as a middle men on behalf of its investors and make their investors to
invest on shares, bonds, foreign currencies.
Equities:
SUNNESS CAPTIAL offers a wide spectrum of services that includes Equity Broking in
Cash and Derivatives, Internet based trading, Demat services & Research services. When
people deal with SUNNESS CAPTIAL people are dealing with a professional broker who
has centralized risk management system in place at Bangalore. SUNNESS CAPTIAL
follows a hub and spoke model of Branch management where in all the branches &
9
franchise interact with the hub/regional office & in turn the regional/hub office talks to
Head office. This company a great level of flexibility in managing the risk level of the
clients, which in turn benefit the client. SUNNESS CAPTIAL is the first brokerage house
to offer Direct Market Access (DMA) to Institutional Clients on FT Platform. They offer
research based broking services on the equity as well as derivative segments to their
institutional clients.
Fixed Income Securities:
Keeping the middle class people or public in the mind SUNNESS CAPTIAL can
understand the importance of money market and debt market, therefore deals with so
many companies who are into health plans, mutual funds, primary dealers, insurance
companies so as to provide as per the requirements of its customers.
SUNNESS CAPTIAL is one of the leading merchant bankers who helps in issue
management for the new companies entering BSE or NSE, and also provides
consultancy services, and also provides t-bills, bonds, debentures, floating rates etc.
Retail Distribution: The company caters services in retail such as in 1) Primary Market
Division 2) Mutual Funds & Insurance Advisory
Commodities: A sister concern of the renowned and trusted SUNNESS CAPTIAL,
Alpha Commodities offers a complete bouquet of client- friendly services in the
burgeoning Commodity Futures market. Alpha Commodities provides a host of facilities
to their clients, ranging from dealing, investing or hedging in Commodity Futures which
includes Bullions, Metals, Energy and Agro Commodities.
Currency: currency derivatives are newly services by joining with SEBI and RBI so as
to give currency exchange services for commodities trading where in any of the two
parties enter into a future contract for a certain quantity of goods, for certain exchange
rate on a certain date therefore for this the company helps in supplying the particular
currency for trading.
DIRECTORS:
1. SASITOTA PRABHAKARA SHREESHA
2. PADMAHYOTHI SREESHA
10
VISION, MISSION AND QUALITY POLICY
Vision:
Vision: “To become a globally renowned organization that provides state of the art
trading solutions and infrastructure and to grow with latest technology and services, by
delivering the best solutions by best-in-class people.”
Mission: “To achieve our objectives in an environment of fairness, honesty, and courtesy
towards our clients, employees, vendors and society at large.”
Quality Policy: “To achieve and retain leadership, Sunness shall aim for complete
customer satisfaction, by combining its human and technological resources, to provide
superior quality financial services. In the process, Sunness will strive to exceed
Customer's expectations.”
Quality Objectives: As per the Quality Policy, SUNNESS CAPITAL will:
The company believes in building up the trust in the investors mind therefore it is been
trying to be more transparent to its clients and avoid ambiguity.
The company’s main motto is to build up a good relationship with its investors and its
vendors so as to keep up the words in finishing the obligations and be committed to its
clients
The employees are being treated well and are given training so that employees can
acquire skills and deal the customer’s requirements.
SUNNESS CAPITAL has a very strong feeling to maintain the business standards and
being honesty is one of the motive therefore the company tries to be unbiased and
uphold the ethics of the business.
PRODUCTS/SERVICE PROFILE:
SUNNESS CAPITAL is a renowned well established, dynamic broking house in India. It
is known for its state-of-the-art systems and innovative processes, Sunness has been
offering a single window advantage to its investors, clients for all capital and money
market related requirements. Sunness is a one store like shop which will cater all your
financial requirements & caters a wide spectrum of services that includes
Equity Broking in Cash and Derivatives
11
Internet based trading
The company provides services for dematerialization
The company has a wonderful research providing services
Company deals with money market and debt market broking
Company helps in serving merchant banking
Currency exchange services
Caters and provides loans for investing shares and for funding of margin Also helps
in any merging and acquiring of companies.
SUNNESS CAPITAL provides trading of commodities.
AMFI registered all India Mutual Fund Distributors
IPO (New Issue) distribution
Life Insurance distribution Value Added Services
Research and Advisory Services
Technology that guarantees seamless connectivity for trading
Flexibility of a local broking house and sophistication of corporate brokerage
A dedicated Relationship Manager to help in sales and other business related queries
Online Back-office systems for the Partner as well as all their customers. SUNNESS
CAPITAL views its clients or investors has its king, since years the company has been
respecting the feedbacks and the expectations of its clients, SUNNESS CAPITAL has
been bridging the gap created by its competitors and have been catering the services
which is expected and a requirement for its clients, the company’s main motto is to
bridge the gap and satisfy all the investors needs. In order to be prompt in providing
good consultancy service it has formed a most sophisticated research department where
in advanced techniques are used to predict and assume the future rates and its trends
which shall have an accurate results. Therefore, SUNNESS CAPITAL has a good
competitive edge.
AREAS OF OPERATION:
12
The company operates in the financial areas such as like insurance for both life and
general and also insurance policies for travel related, it helps in the IPOs, provide
consultancy services, has a wide range of health plans for its customers, also provide
finance for leasing and hire purchasing of machineries and also exchange of currency
derivatives, etc. It has presence in 147 cities through its network of longstanding
franchisees and sub brokers.
INFRASTRUCTURE FACILITY:
• Has a very good holding over to tackle the huge transactions and have a good risk
management taking which happens in a very sophisticated and are carried in a well
processed way.
• The company owns its branches in places like Bangalore, Chennai, Mumbai, Kolkata, and
Pune and also almost spread and present over many cities in INDIA.
• The company holds a very good research department in which advanced methods, tools or
techniques are been used in predicting the market, which are highly accurate and are
expected by the clients and investors this is one of the most important infrastructure
should be used in by almost all the stock brokers.
• The company owns a broad-based team of more than 300 personnel
COMPETITORS INFORMATION
1. VLS FINANCE LTD:
When compared to any other stock broking company VLS FINANCE LTD holds a good
position of market capitalization of up to rupees 177.07 cores which is really huge and
great when compared to others, the company has been successful in making a sales worth
rupees 896.82 cores which is again a big value compared to its competitors, VLS holds a
huge place and are reputed in the market, it has also been providing a wide classic
products like any other stock brokers, and not only that though it has a very good sales
worth the net profit is comparatively less that is it has made a net profit of worth rupees
1.76 cores when compared to BNK, and many other stock broking companies.
2. BNK SECURITIES PRIVATE LTD:
13
BNL SECURITIES PVT LTD is one of the best stock broking and a competitor
for the LKP, by holding the market capitalization of rupees 48.85 cores and has made
sales worth rupees 0.74 cores. The company has a wide range of services just like any
other stock broker who provides insurance, health plans, provides consultancy services
for its clients and also help many new firms for the issue management, the company has
hold the membership in BSE and NSE exchanges, the company has a capacity to earn a
net profit of rupees 2.71 cores. Therefore, it is one of the tough competitors for all the
stock brokers.
3.GEOJIT BNP PARIBAS:
GEOJIT BNP PARIBAS is one of the competitors and has the market capitalization of
rupees 869.44 cores. The company deals and caters with a line of products like mutual
funds, life and general insurance and also deals with the commodity, derivatives and
online trading services to its clients. The company has earned a profit of rupees 17.65
cores in last year end quarter in 2014, the company is been one of the best stock broker
acquiring the clients and has increased its volume of number of customers by making a
presence in all over 130 cities in INDIA.
4. R K GLOBAL SHARES & SECURITIES LTD:
R.K GLOBAL SHARES AND SECURITIES LTD is one of the INDIAN based stock
broking who caters products like commodities, currencies, derivatives, shares, mutual
funds, and also provides services for the new firms for issuing IPOs. the company is been
presented almost all over 150 cities in INDIA, the company was established during 2004
and from then started growing enormously, the company is been successfully running.
5. ZERODHA:
ZERODHA is one of the competitor, zerodha caters a wide range of services like stock
broking, currency derivatives, trading in commodity markets and also provide online
trading services, the company charges only 0.01% on the trades happening or usually the
company charge rupees 20 per transaction irrespective to number of shares bought by the
investors, more over the company has been successful in increasing the volume of
number of customers and its growth.

14
THEORITICAL FRAMEWORK
7S FRAME WORK MODEL OF MCKENSY
For any company it will have its own goal and objectives to be met. To meet these
objectives the company has to find out its own strengths and weakness in its own
organization hence this 7s frame work is done, this will help the company to revamp its
seven s which is the most required for any company to survive in the market and obtain a
competitive edge. Basically this concept was created in the early years of 1980s.
7S FRAME WORK MODEL
15
SYSTEM OF SUNNESS CAPITAL:
SUNNESS CAPITAL has a team leadership style that is each and every message or
information’s or the plan which is to executed has to flow vertically from the top level
management to the bottom level of the management so everything happens in a process to
avoid the ambiguity, and not only that the employee will receive only commands from his
head therefore we can see a clear cut efficiency in the process.
STRUCTURE OF SUNNESS CAPITAL:
SCIP has a clear cut organization structure which prevents from ambiguity and avoids the
miscommunication from the top level management to the bottom level management. Here
in SCIP we can see a formal relationship between the employees, the structure of the
organization is developed in such a way that each and every department as a link, and has
a good support between the departments this will improvise the effectiveness of the work
carried on.
STYLE OF SUNNESS CAPITAL:
Here style refers to how the SCIP work effectively and are carried on by the top level
management people, actually the important decisions related to the organization is
decided only by the top level executives, lower level executives are not consulted while
take important decisions of the organization, similarly any disputes or any decisions
related to between the departments are solved and decided only by the department heads
that kind of freedom is given to the department heads in order to maintain a good
relationship, therefore the style adopted by the SCIP is viable.
STAFF IN SUNNESS CAPITAL:
For any companies staffs are the most important and complex asset to be handled in that
case staffs in SCIP are very friendly and supportive in nature, more over staffs are
expected to obtain a self responsibility in growing the firm which in turn the employees
will be well treated and rewarded with reasonable rewards and bonus SCIP views its
staffs as an big strength and an valuable asset to the company simultaneously staffs are
recognized with the work done by them.
16
SKILLS EXPECTED IN SUNNESS CAPITAL:
Skills of employees are supposed to be the greater strengths for any organization that
might obtain an competitive edge, here company expects for a good analytical, logical,
and should have a good communicational skills this things can alone sell the products of
the organization and that is what SCIP believes in. At the same time they are soft enough
in teaching you these kinds of skills if any of the employees lack in any of the skills.
STRATEGIES ADOPTED BY THE SUNNESS CAPITAL:
For any organization strategies plays an important role in attracting the clients and make a
positive relationship with the clients, here SCIP does a wonderful job in that case, for
these people investors are the kings, the company tries to bridge the gap which was
created by its competitors, the company initially fixes an appointment and then explain
the basics of the stock market which is not done by any other company. Not only that
SCIP provides frequent updates expected by the clients this is what the strategy adopted
by the company in increasing the number of clients.
SHARED VALUES:
Here shared values refers to the feed backs given by the clients to the company, company
usually give values to the feedbacks which will improvise the company. More over
company takes feedbacks as their objectives and take it as an challenge in solving the gap
created by them this in turn will make the clients to retain from switching over to the
other brokers, similarly the company respects its employees feedbacks and make sure that
it is solved and both the employees and clients are satisfied with the service provided by
SCIP.
17
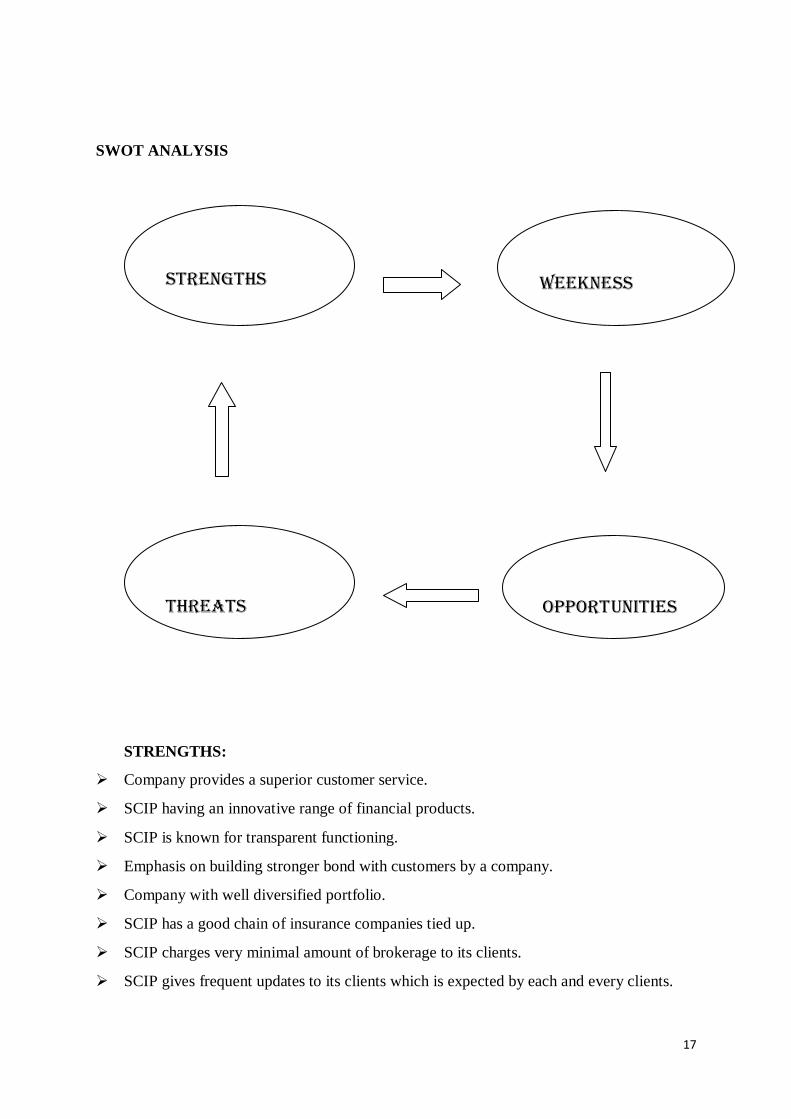
SWOT ANALYSIS
STRENGTHS:
Company provides a superior customer service.
SCIP having an innovative range of financial products.
SCIP is known for transparent functioning.
Emphasis on building stronger bond with customers by a company.
Company with well diversified portfolio.
SCIP has a good chain of insurance companies tied up.
SCIP charges very minimal amount of brokerage to its clients.
SCIP gives frequent updates to its clients which is expected by each and every clients.
STRENGTHS
WEEKNESS
OPPORT UNITIES
THREATS

18
WEAKNESS:
SCIP having limited sales executives.
Low advertisements from the company.
SCIP does not have any segments, or target customers.
SCIP does not give any seminar to investors prior to investing.
OPPORTUNITY:
Growing consumer awareness about equity related product
Positive outlook of people towards financial products
Growing rural market is the best opportunity for the company
THREATS:
Uncertainty of the market volatility and fluctuations in the stock prices
Threat from new entrants into the field of stock broking
Stringent economic measures by Government and RBI
Banks entering to stock broking industry
19
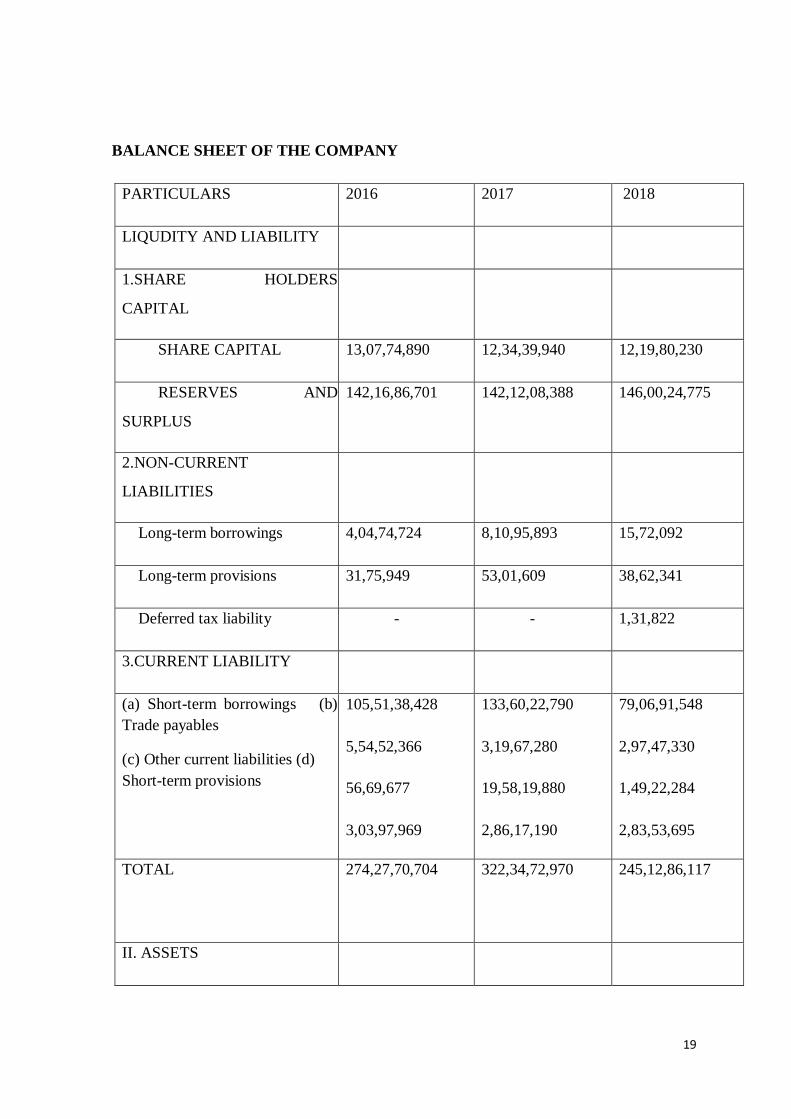
BALANCE SHEET OF THE COMPANY
PARTICULARS 2016 2017 2018
LIQUDITY AND LIABILITY
1.SHARE HOLDERS
CAPITAL
SHARE CAPITAL 13,07,74,890 12,34,39,940 12,19,80,230
RESERVES AND
SURPLUS
142,16,86,701 142,12,08,388 146,00,24,775
2.NON-CURRENT
LIABILITIES
Long-term borrowings 4,04,74,724 8,10,95,893 15,72,092
Long-term provisions 31,75,949 53,01,609 38,62,341
Deferred tax liability - - 1,31,822
3.CURRENT LIABILITY
(a) Short-term borrowings (b)
Trade payables
(c) Other current liabilities (d)
Short-term provisions
105,51,38,428
5,54,52,366
56,69,677
3,03,97,969
133,60,22,790
3,19,67,280
19,58,19,880
2,86,17,190
79,06,91,548
2,97,47,330
1,49,22,284
2,83,53,695
TOTAL 274,27,70,704 322,34,72,970 245,12,86,117
II. ASSETS
20
1 Non-current assets
(a) Fixed assets ( Tangible
Assets)
45,24,494
83,08,968 76,24,150
(b) Non-current investments 66,48,49,021 40,70,77,610 36,84,44,230
(c) Deferred tax asset 3,60,49,414 1,68,127 -
(d) Long-term loans and
advances
6,70,000 2,20,000 3,85,000
2 Current assets
(a) Inventories ( Securities) 48,29,92,120 42,94,18,522 29,32,61,883
(b) Trade receivables 4,40,34,188 5,42,078 37,89,972
(c) Cash and cash equivalents 28,39,75,884 25,98,61,075 23,70,19,442
(d) Short-term loans and
advances
122,56,75,583 211,78,76,590 154,07,61,440
TOTAL 274,27,70,704 322,34,72,970 245,12,86,117
21
CAPITAL BUDGEING:
An efficient allocation of capital is the most important finance function in modern times. It
involves decisions to commit firm’s funds to long-term assets. Such decisions are tend to
determine the value of company/firm by influencing its growth, profitability & risk.
Investment decisions are generally known as capital budgeting or capital expenditure
decisions. It is clever decisions to invest current in long term assets expecting long-term
benefits firm’s investment decisions would generally include expansion, acquisition,
modernization and replacement of long-term assets.
Such decisions can be investment decisions, financing decisions or operating decisions.
Investment decisions deal with investment of organization’s resources in Long tern (fixed)
Assets and / or Short term (Current) Assets. Decisions pertaining to investment in Short term
Assets fall under “Working Capital Management”. Decisions pertaining to investment in
Long term Assets are classified as “Capital Budgeting” decisions.
Capital budgeting decisions are related to allocation of investible funds to different long-term
assets. They have long-term implications and affect the future growth and profitability of the
firm.
In evaluating such investment proposals, it is important to carefully consider the expected
benefits of investment against the expenses associated with it. Organizations are frequently
faced with Capital Budgeting decisions. Any decision that requires the use of resources is a
capital budgeting decisions. Capital budgeting is more or less a continuous process in any
growing concern.
For Example: Purchase of Land is an example of Capital Budgeting decision. Similarly
replacement of outdated equipment with modern machines, purchase of a brand or business,
computerization and networking the organization, investment in research and development
of a product launch of a major promotional campaign etc are all example of Capital
Budgeting decisions.
However, in all cases, the decisions have a long-term impact on the performance of the
organization. Even a single wrong decision may in danger the existence of the firm as a
profitable entity.
22
IMPORTANCE OF CAPITAL BUDGETING:
There are several factors that make capital budgeting decisions among the critical decisions
to be taken by the management. The importance of capital budgeting can be understood from
the following aspects of capital budgeting decisions.
1. Long Term Implications: Capital Budgeting decisions have long term effects on the
risk and return composition of the firm. These decisions affect the future position of
the firm to a considerable extent. The finance manger is also committing to the future
needs for funds of that project.
2. Substantial Commitments: The capital budgeting decisions generally involve large
commitment of funds. As a result, substantial portion of capital funds is blocked.
3. Irreversible Decisions: Most of the capital budgeting decisions are irreversible
decisions. Once taken the firm may not be in a position to revert back unless it is
ready to absorb heavy losses which may result due to abandoning a project midway.
4. After the Capacity and Strength to Compete: Capital budgeting decisions affect
the capacity and strength of a firm to face competition. A firm may lose
competitiveness if the decision to modernize is delayed.
PROBLEMS & DIFFICULTIES IN CAPITAL BUDGETING:
Future uncertainty:
Capital Budgeting decisions involve long-term commitments. There is lot of
uncertainty in the long term. The uncertainty may be with reference to cost of the
project, future expected returns, future competition, legal provisions, political
situation etc.
Time Element:
The implications of a Capital Budgeting decision are scattered over a long period. The
cost and benefits of a decision may occur at different point of time. The cost of a
project is incurred immediately. However, the investment is recovered over a number
of years. The future benefits have to be adjusted to make them comparable with the
cost. Longer the time period involved, greater would be the uncertainty.
23
Difficulty in Quantification of Impact:
The finance manager may face difficulties in measuring the cost and benefits of
projects in quantitative terms.
Example: The new product proposed to be launched by a firm may result in increase
or decrease in sales of other products already being sold by the same firm. It is very
difficult to ascertain the extent of impact as the sales of other products may also be
influenced by factors other than the launch of the new product.
ASSUMPTIONS IN CAPITAL BUDGETING:
The Capital Budgeting decision process is a multi-faceted and analytical process. A number
of assumptions are required to be made.
1. Certainty with respect to cost & Benefits:
It is very difficult to estimate the cost and benefits of a proposal beyond 2-3 years in
future.
2. Profit Motive:
Another assumption is that the capital budgeting decisions are taken with a primary
motive of increasing the profit of the firm.
The activities can be listed as follows:
Dis-investments i.e., sale of division or business.
Change in methods of sales distribution.
Undertakings an advertisement campaign.
Research & Development programs.
Launching new projects.
Diversification.
Cost reduction.
FEATURES OF INVESTMENT DECISIONS:
The exchange of current funds for future benefits.
24
The funds are invested in long-term assets.
The future benefits will occur to the firm over a series of years.
IMPORTANT OF INVESTMENT DECISIONS:
They influence the firm’s growth in long run.
They effect the risk of the firm.
They involve commitment of large amount of funds.
They are irreversible, or reversible at substantial loss.
They are among the most difficult decisions to make.
TYPE OF INVESTMENT DECISIONS:
Expansion of existing business.
Expansion of new business.
Replacement & Modernization.
INVESTMENT EVALUATION CRITERIA:
Estimation of cash flows.
Estimation of the required rate of return.
Application of a decision rule for making the choice.
Consideration of cash flows is to determine true profitability of the project and it is an
unambiguous way of identifying good projects from the pool. Ranking is possible it should
recognize the fact that bigger cash flows are preferable to smaller ones & early cash flows
are referable to later ones I should help to choose among mutually exclusive projects that
which maximizes the shareholders wealth. It should be a criterion which is applicable to
any considerable investment project independent of other. There are number of techniques
that are in use in practice. The chart of techniques can be outlined as follows:
Capital Budgeting Techniques:
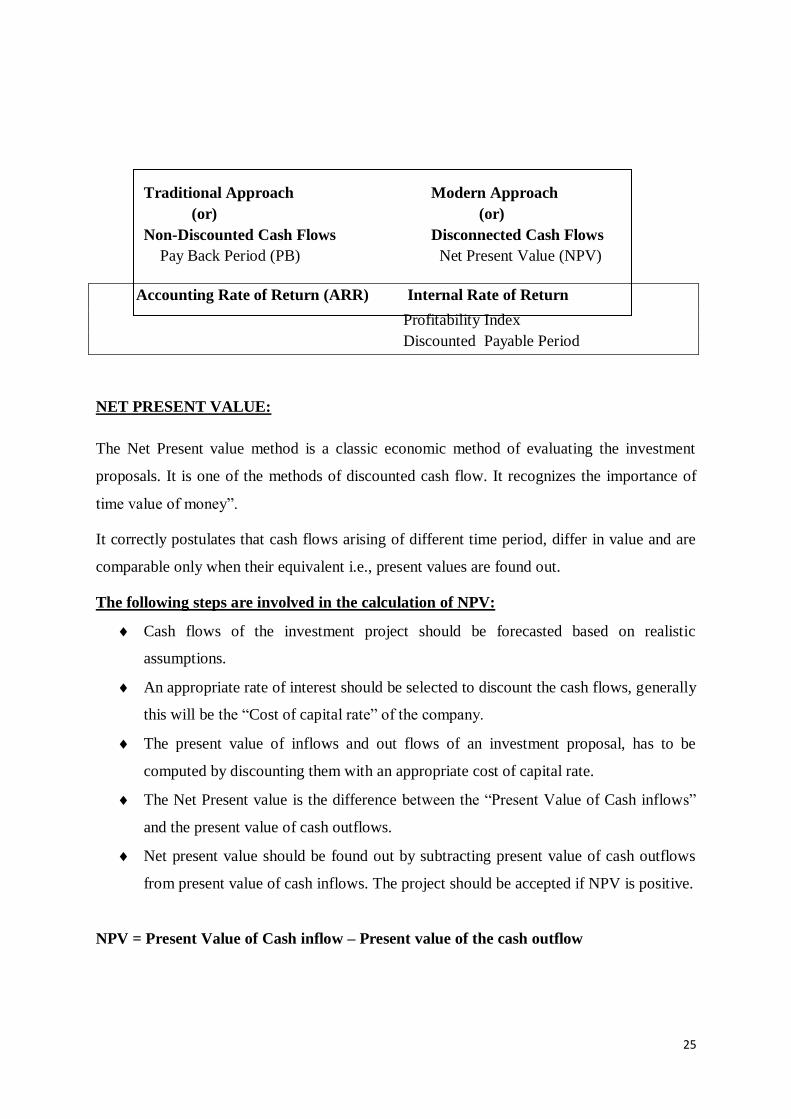
25
Traditional Approach Modern Approach
(or) (or)
Non-Discounted Cash Flows Disconnected Cash Flows
Pay Back Period (PB) Net Present Value (NPV)
Accounting Rate of Return (ARR) Internal Rate of Return
Profitability Index
Discounted Payable Period
NET PRESENT VALUE:
The Net Present value method is a classic economic method of evaluating the investment
proposals. It is one of the methods of discounted cash flow. It recognizes the importance of
time value of money”.
It correctly postulates that cash flows arising of different time period, differ in value and are
comparable only when their equivalent i.e., present values are found out.
The following steps are involved in the calculation of NPV:
Cash flows of the investment project should be forecasted based on realistic
assumptions.
An appropriate rate of interest should be selected to discount the cash flows, generally
this will be the “Cost of capital rate” of the company.
The present value of inflows and out flows of an investment proposal, has to be
computed by discounting them with an appropriate cost of capital rate.
The Net Present value is the difference between the “Present Value of Cash inflows”
and the present value of cash outflows.
Net present value should be found out by subtracting present value of cash outflows
from present value of cash inflows. The project should be accepted if NPV is positive.
NPV = Present Value of Cash inflow – Present value of the cash outflow
26
Acceptance Rule:
Accept if NPV > 0
Reject if NPV < 0
May accept if NPV = 0
One with higher NPV is selected.
INTERNAL RATE OF RETURN METHOD:
The internal rate of return (IRR) method is another discounted cash flow technique. This
method is based on the principle of present value. It takes into account of the magnitude &
timing of cash flows.
IRR nothing but the rate of interest that equates the present value of future periodic net cash
flows, with the present value of the capital investment expenditure required to undertake a
project.
The concept of internal rate of return is quite simple to understand in the case of one-period
project.
Acceptance Rule:
Accept if r > k
Reject if r < k
May accept if r = k
where r = rate return
k = opportunity cost of capital
PROFITABILITY INDEX (OR) BENEFIT COST RATIO:
Yet another time-adjusted method of evaluating the investment proposals is the benefit-cost
(B/C) ratio of profitability index PI). It is benefit cost ratio. It is ratio of present value of
future net cash inflows at the required rate of return, to the initial cash outflow of the
investment.
Present Value of Cash inflows
PI = -----------------------------------------
Present Value of Cash outflows
27
Acceptance Rule:
Accept if PI > 1
Reject if PI < 1
May accept if PI = 1
Profitability Index is a relative measure of projects profitability.
PAY BACK PERIOD METHOD:
One of the top concerns of any person or organization investing a large amount of money
would be the time by which the money will come back. The concern making the investment
would want that at least the capital invested is recovered as early as possible. The pay back
period is defined as the period required for the proposal’s cumulative cash flows to be equal
to its cash outflows. In other words, the payback period is the length of time required to
recover the initial cost of the project. The payback period is usually stated in terms of
number of years. It can also be stated as the period required for a proposal to ‘break even’
on its net investment.
The payback period is the number of years it takes the firm to recover its original
investment by net returns before depreciation, but after taxes.
If project generates constant annual cash inflows, the pay back period is completed as
follows:
Initial Investment
Pay Back = ------------------------
Annual cash inflow
In case of unequal cash inflows, the payback period can be found out by adding up the cash
inflows until the total is equal to initial cash outlay.
Acceptance Rule:
Accept if calculated value is less than standard fixed by management otherwise reject
it.
If the payback period calculated for a project is less than the maximum payback
period set up by the company it can be accepted.
28
As a ranking method it gives highest rank to a project which has lowest pay back
period, and lowest rank to a project with highest pay back period.
DISCOUNTED PAY BACK PERIOD:
One of the serious objections to pay back method is that it does not discount the cash
flows. Hence discounted pay back period has come into existence. The number of periods
taken in recovering the investment outlay on the present value basis is called the discounted
pay back period.
Discounted Pay Back rule is better as it does discount the cash flows until the outlay is
recovered.
ACCOUNTING RATE OF RETURN (OR) AVERAGE RATE OF RETURN (ARR):
It is also known as return on investment (ROI). It is an accounting method, which uses the
accounting information revealed by the financial statements to measure the profitability of an
investment proposal. According to Solomon, ARR on an investment can be calculated as “the
ratio of accounting net income to the initial investment i.e”.
Average Net Income
ARR = ---------------------------
Average Investment
Average Income = Average of after tax profit
Average Investment = Half of Original Investment
Acceptance Rule:
Accept if calculated rate is higher than minimum rate established by the management.
It can reject the projects with an ARR lower than the expected rate of return.
This method can also help, the management to rank the proposals on the basis of
ARR.
29
A highest rank will be given to a project with highest ARR, whereas a lowest rank to
a project with lowest ARR.
CAPITAL BUDGETING METHODS IN PRACTICE:
In a study of the capital budgeting practices of fourteen medium to large size
companies in India, it was found tat almost all companies used by back.
With pay back and/or other techniques, about 2/3rd of companies used IRR and about
2/5th NPV. IRR s found to be second most popular method.
Pay back gained significance because of is simplicity to use & understand, its
emphasis on the early recovery of investment & focus on risk.
It was found that 1/3rd of companies always insisted on computation of pay back for
all projects, 1/3rd for majority of projects & remaining for some of the projects.
Reasons for secondary of DCF techniques in India included difficulty in
understanding & using threes techniques, lack of qualified professionals &
unwillingness of top management to use DCF techniques.
One large manufacturing and marketing organization mentioned that conditions of its
business were such that DCF techniques were not needed.
Yet another company stated that replacement projects were very frequent in the
company, and it was not considered necessary to use DCF techniques for evaluating
such projects. techniques in India included difficulty in understanding & using threes
techniques, lack of qualified professionals & unwillingness of top management to use
DCF techniques.
PROCESS
CAPITAL BUDGETING PROCESS:
Atleast five phases of capital expenditure planning & control can be identified:
Identification (or Organization) of investment opportunities.

30
Development of forecasts of benefits and costs.
Evaluation of the net benefits.
Authorization for progressing and spending capital expenditure.
Control of capital projects.
INVESTMENT IDEAS:
Investment opportunities have to be identified or created investment proposals arise at
different levels within a firm.
Nature of Idea Level
Cost reduction ------
Replacement Plant Level
Process/Product Development (50% in India cover this level)
Expansion Top management
Diversification in India, it is insignificant
Replacing an old
Machine (or)
Improving the Factory Level.
Production techniques.
Investment proposals should be generated to employ the firm’s funds fully well & efficiently.
FORECASTING :
Cash flow estimates should be development by operating managers with the help of finance
executives. Risk associated should be properly handled. Estimation of cash flows requires
collection and analysis of all qualitative and quantitative data, both financial and non-
financial in nature. MIS provide such data.
Correct treatment should be given to:
Additional working capital
Sale proceeds of existing assets.
Depreciation
Financial flows (to be distinguished from operation flows)
EVALUATION:
31
Group of experts who have no ake to grind should be taken in selecting the methods of
evaluation as NPV, IRR, PI, Pay Back, ARR & Discounted Pay Back.
Pay Back period is used as “Primary” method & IRR/NPV as “Secondary” method in India.
The following are to be given due importance.
For evaluation, minimum rate of return or cut-off is necessary.
Usually if is computed by means of weighted Average cost of Capital (WACC)
Opportunity cost of capital should be based on risky ness of cash flow of
investment proposals.
Assessment of risk is an important aspect. Sensitivity Analysis & Conservative
for costs are two important methods used in India.
AUTHORIZATION:
Screening and selecting may differ from one company to another. When large sums are
involved usually final approval rests with top management. Delegation of approval authority
may be effected subject to the amount of outlay. Budgetary control should be rigidly
exercised.
CONTROL AND MONITORY:
A Capital projects reporting system is required to review and monitor the performance of
investment projects after completion and during their life. Follow up comparison of the actual
performance with original estimates to ensure better forecasting besides sharpening the
techniques for improving future forecasts. As a result company may re-praise its projects and
take necessary action.
Indian Companies use regular project reports for controlling capital expenditure reports may
be quarterly, half-yearly, monthly, bi-monthly continuous reporting.
Expenditure to date
Stage and physical completion
Approved total cost
Revised total cost
32
DECISION MAKING LEVEL:
For planning and control purpose three levels of Decision making have been identified:
Operating
Administrative
Strategic
OPERATING CAPITAL BUDGETING:
Includes routine minor expenditure, as office equipment handled by lower level management.
ADMINISTRATIVE CAPITAL BUDGETING:
Falls in between these two levels involves medium size investments such as business handled
by middle level management.
STRATEGIC CAPITAL BUDGETING:
Involves large investment as acquisition of new business or expansion in a new time of
business, handled by top management unique nature.
Long Term Capital Budgeting In Sunness:
PRE – INVESTMNET STAGE:
In a planned economy, as in India, the identification of public sector projects needs to be
done within the overall framework of national the sectoral planning. All projects of every
sector need to be identified scientifically at the time of plan formulation. In actual
practice,however, it is observed that ‘identification’ stage is the most neglected stage of the
project planning.
The five year plans indicate the broad strategy of planning economic growth rate and other
basic objectives to be achieved during the plan period. The macro level planning exercise
undertaken at the beginning of every five year plan indicates broadly the role of each sector’s
physical targets to be achieved and financial outlays, which could be made available for the
development of the sector during the plan period.
33
The identification of a project in the Five Year Plan is not the sanction of the project for
implementation. It provides only the ‘green signal’ for the preparation of feasibility report
(FR0 for appraisal and investment decision. A preliminary scrutiny of the FR of the project
is done in the Ministry and thereafter copies of the feasibility report are submitted to the
appraising agencies, viz., Planning Commission, Bureau of Public Enterprises and the Plan
Finance Division of the Ministry of Finance. Thus the organizational responsibility for
identifying these projects rests with the concerned administrative ministry, in consultation
with its public enterprises.
The essential steps for project identification and preparation relates to studying (i) imports (ii)
substitutes(iii) available and raw material (iv) available technology and skills (v) inter-
industry relationship (vi) existing industry (vii) development plans (viii) old projects etc.
It may be mentioned that in actual practice, these steps are hardly scientifically studied and
followed by the administrative ministry public sector undertaking at the time of project
identification. The public sector projects many a time come spontaneously on the basis of
ideas and possibilities of demand or availability of some raw materials and not an outcome of
scientific investigation and systematic search for feasible projects.
PROJECT FORMULATION:
The second stage of “Project Cycle” viz. Project Formulation, is a pre-investment exercise to
determine whether to invest, where to invest, when to invest and how much to invest. The
project/feasibility reports are meant to provide required information for assessing technical,
financial, commercial, organization and economic viability of the project planning in India,
mainly because of relatively late realization of its importance. As a result, the investment
decisions for large projects in the past were taken on half-baked and ill-conceived projects
and time-over runs and cost-over runs of public sector projects have become a regular feature
rather than exception.
In early seventies along with the setting up of the Public Investment Board (PIB) the
Government created a new project Appraisal Division in the Planning Commission. This
Division prepared and circulated “Guidelines for preparing Feasibility Reports of Industrial
Projects” in 1974.
34
This guidelines, unlike earlier manual, indicates all the information and data required to be
presented and analysed in the feasibility report, so as to enable the appraisal agency to carry
out (i) technical analysis – to determine whether the specification of technical parameters are
realistic, (ii) financial anaylsis – to determine whether the proposal is financially viable, (iii)
commercial analysis – to determine soundness of the product specifications, marketing plans
and organization structure and (iv) economic analysis, to determine whether a project is
worthwhile from the point of view of nation and economy as a whole.
The guidelines describes in details, the information required to be given and analysed on the
following issues : (a) general information of the sector, (b) objective of the proposal, (c)
alternative ways, if any of attaining the objectives and better suitability of the proposed
project, (d) project description – gestation period, costs, technology proposed, anticipated
life of the project etc., (e) demand analysis, total demand / requirements of the country,
including anticipated imports and exports and share of the proposed project, (f) capital costs
and norms assumed, activity wise and year wise, (g) operating costs and norms, (h) revenue
and benefits estimation etc.
PROJECT APPRAISAL :
The appraisal of the project follows the formulation stage. The objective of the appraisal
process is not only to decide whether to accept or reject the investment proposal, but also to
recommend the ways in which the project can be redesigned or reformulated so as to ensure
better technical, financial, commercial and economic viabilities.
The project appraised which is an essential tool for judicious investment decisions and
project selection is a multi-disciplinary task. But many a times this is considered doubt, have
played an important role in contributing systematic methods for forecasting the future and
evolving appraisal methods to quantify socials costs and benefits, but they alone can not carry
out complete appraisal of an investment proposal.
The need for project appraisal and investment decisions based on social profitability arises
mainly because of the basic characteristics of developing countries limited resources for
development and multiple needs – objective of planning being ‘Economic Growth with
Social Justice’. The project appraisal is a convenient and comprehensive fashion to achieve,

35
the laid down objectives of the economic development plan. The appraisal work presupposes
availability of a certain minimum among of reliable and up to date data in the country, as well
as the availability of trained persons to carry out the appraisal analysis.
As stated earlier the investment decision of public sector projects are required to be taken
within the approved plan frame work. The Project Appraisal Division (PAD) that prepares
the comprehensive appraisal note of projects of Central Plans was therefore set up in
Planning Commission. The Finance Ministry issues expenditure sanction for all investment
proposals within the frame work of annual budget. The plan Finance Division and the
Bureau of Public Enterprises of the Finance Ministry are also required to examine and give
comments on the investment proposals of public.
36
DATA ANALYSIS
All finance activity commences with an investment proposal, which calls for a financial
appraisal of a project. Here, capital Budgeting has its role. Each one of the projects is
appraised on following basis”
Cost Estimates.
Cost Generations.
Cost Estimates:-
Feasibility Report of the project is prepared based on the cost of similar units prevailing at the
time of preparation of projects report of the latest costs are not available, the same should be
escalated. Collection of data with regard to the cost of the various equipment should from
part of a continuous planning so tat a realistic cost estimate is made for the project Reports
for civil works are generally based on Sunness schedule of rates with reasonable premium
there on.
Cost of Generation:-
The financing of public sector company is generally based on Debt Equity of 3:1 the general rate of
interest chargeable by the central Government on loan components is 10.5% (Now enhanced to 11%)
The plant life as provided under the Electricity Supply Act, 1948 is 25 years and depreciation based
on this period has to be calculated on straight line method, on 90% of the cost fixed assets. The
operation & maintenance expenses are generally of the order 2.5% of the capital cost based on the
above assumptions, the cost of generation could be worked out discounted cash flow basis taking 12%
IRR (Internal Rate of Return). This rate has been generally accepted by various appraising agencies
of the power projects.
Feasibility Report based on above methodology and indicating site selection, coal linkage,
power distribution examined by Central Electricity Authority in all cases where investment is
Rs.1 Crore and above. Since Sunness is public sector undertaking, all the investment
decisions have to be formally sanctioned by Government after PIB’s (Public Investment
Board’s) clearance.
37
SHARE CAPITAL:
The entire share capital is owned by Government of India. During the Year no addition has
been made. However the authorized capital has been increased from Rs. 80,000 million to
Rs.1,00,000 million and the face value or share has been split to Rs.10/- each from Rs.1000/-
each.
ROLE OF FINANCE MANAGEMENT IN INVESTMENT DECISIONS IN
SUNNESS:
Finance Manager is the number of a project team. He plays an important role in investigation
stage of the project, when various alternatives are analysed & the most optimum solution is
decided upon. The soundness upon the accuracy of the data & as a finance manager has to
questing and satisfy himself on the validity of the data.
The power projects are extremely capital intensive and before large resources are committed
to a scheme a detailed feasibility study need to be prepared covering-
The need of the project
The demand projections
The alternatives of the site locations
The broad parameters of the plant and equipment
The cost estimates
The viability of the scheme.
Cost Estimates:
Cost estimates and financial justification and returns of the projects are the areas where
financial management has to play its role. Cost estimates should be prepared by the cost
engineers and vetted by the finance manager. Cost engineering is a specialized filed & need
to be developed in the contest of power projects because of insufficient cost data on the
components of the projects.
This raises an important question of the present methodology of preparing the cost estimates
without any provision for price contingencies. Because of time lag between preparation of
38
cost estimates and investment decisions, After its scrutiny by the appraising agencies, these
estimates are already out of data and hence would need updating.
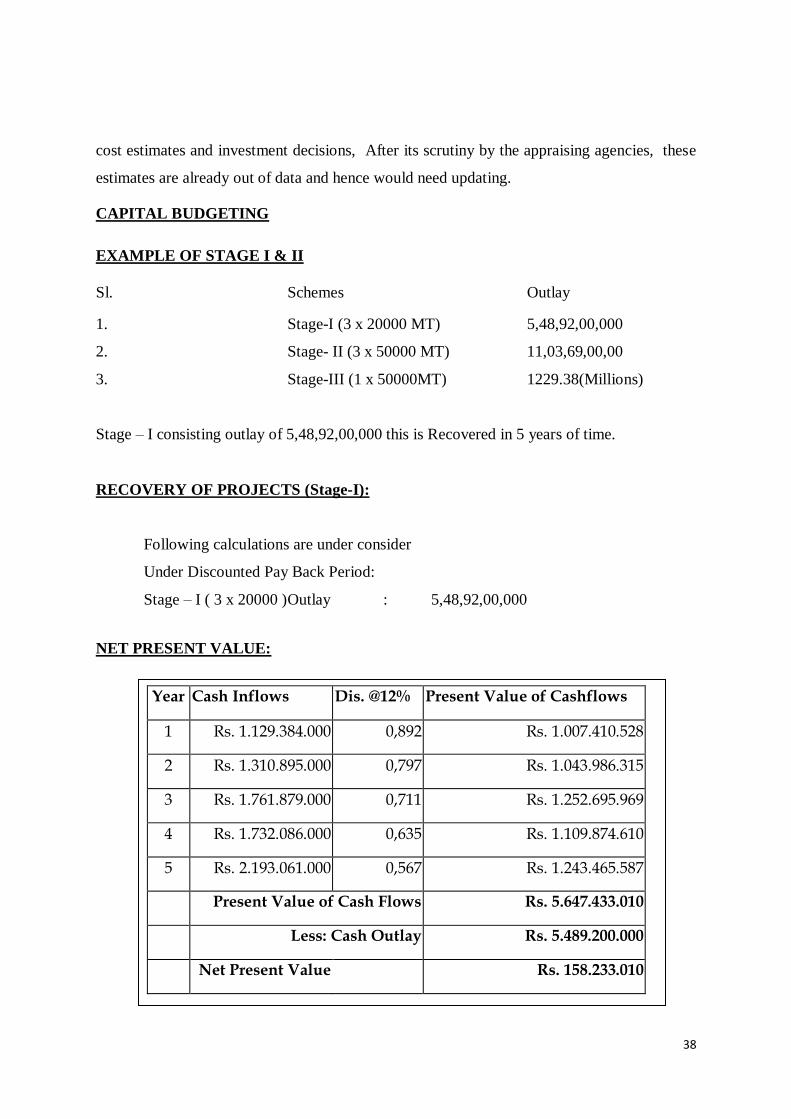
CAPITAL BUDGETING
EXAMPLE OF STAGE I & II
Sl. Schemes Outlay
1. Stage-I (3 x 20000 MT) 5,48,92,00,000
2. Stage- II (3 x 50000 MT) 11,03,69,00,00
3. Stage-III (1 x 50000MT) 1229.38(Millions)
Stage – I consisting outlay of 5,48,92,00,000 this is Recovered in 5 years of time.
RECOVERY OF PROJECTS (Stage-I):
Following calculations are under consider
Under Discounted Pay Back Period:
Stage – I ( 3 x 20000 ) Outlay : 5,48,92,00,000
NET PRESENT VALUE:
Year Cash Inflows Dis. @12% Present Value of Cashflows
1 Rs. 1.129.384.000 0,892 Rs. 1.007.410.528
2 Rs. 1.310.895.000 0,797 Rs. 1.043.986.315
3 Rs. 1.761.879.000 0,711 Rs. 1.252.695.969
4 Rs. 1.732.086.000 0,635 Rs. 1.109.874.610
5 Rs. 2.193.061.000 0,567 Rs. 1.243.465.587
Present Value of Cash Flows Rs. 5.647.433.010
Less: Cash Outlay Rs. 5.489.200.000
Net Present Value Rs. 158.233.010
39
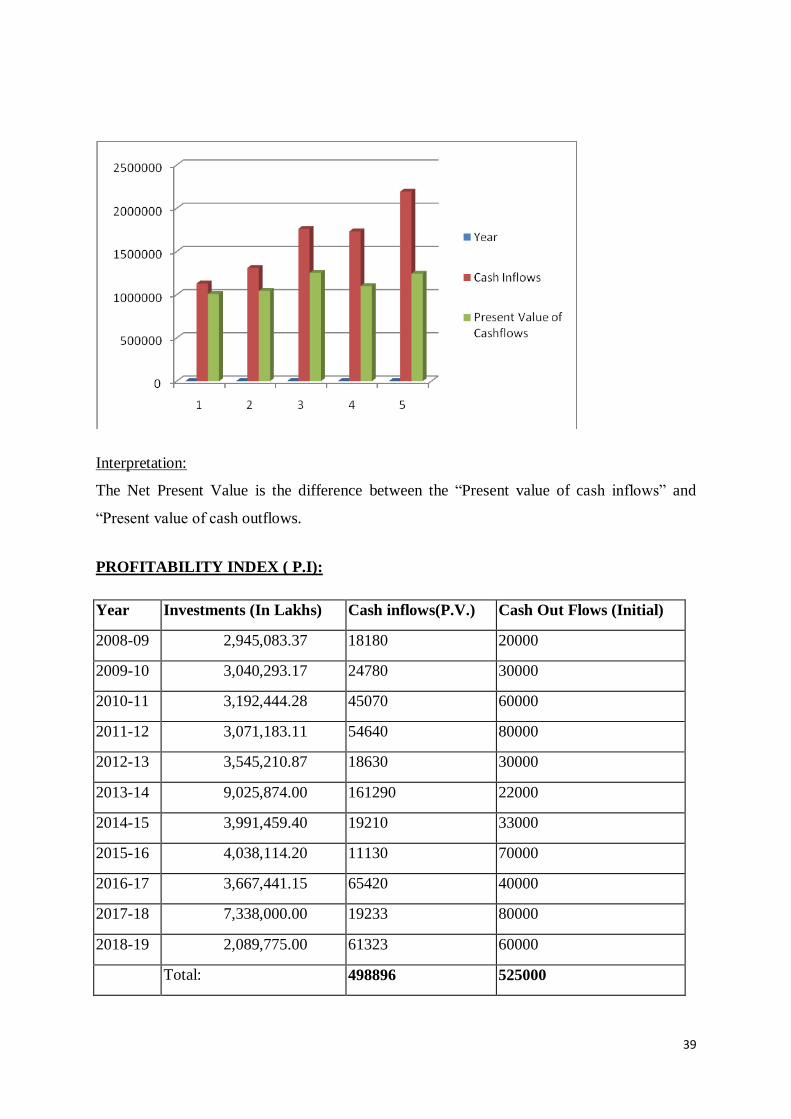
Interpretation:
The Net Present Value is the difference between the “Present value of cash inflows” and
“Present value of cash outflows.
PROFITABILITY INDEX ( P.I):
Year Investments (In Lakhs) Cash inflows(P.V.) Cash Out Flows (Initial)
2008-09 2,945,083.37 18180 20000
2009-10 3,040,293.17 24780 30000
2010-11 3,192,444.28 45070 60000
2011-12 3,071,183.11 54640 80000
2012-13 3,545,210.87 18630 30000
2013-14 9,025,874.00 161290 22000
2014-15 3,991,459.40 19210 33000
2015-16 4,038,114.20 11130 70000
2016-17 3,667,441.15 65420 40000
2017-18 7,338,000.00 19233 80000
2018-19 2,089,775.00 61323 60000
Total: 498896 525000

40
P.V. of Cash Inflows
PI = ---------------------------
Initial Cash outlays
498896
= ---------- = 0.95
525000
GRAPH 2 :
Interpretation:
a) The profitability index of present value of cash inflows and cash out flows is
fluctuation from year to year in the year 2013-14 the present value of cash
inflows is 18180 were as in the year 2018-19 has been increased with 61323.
b) The highest cash inflows has been recorded in 2018-2019 as 161290 and
lowest has been recorded as 18180 in the year 2013-14.
41
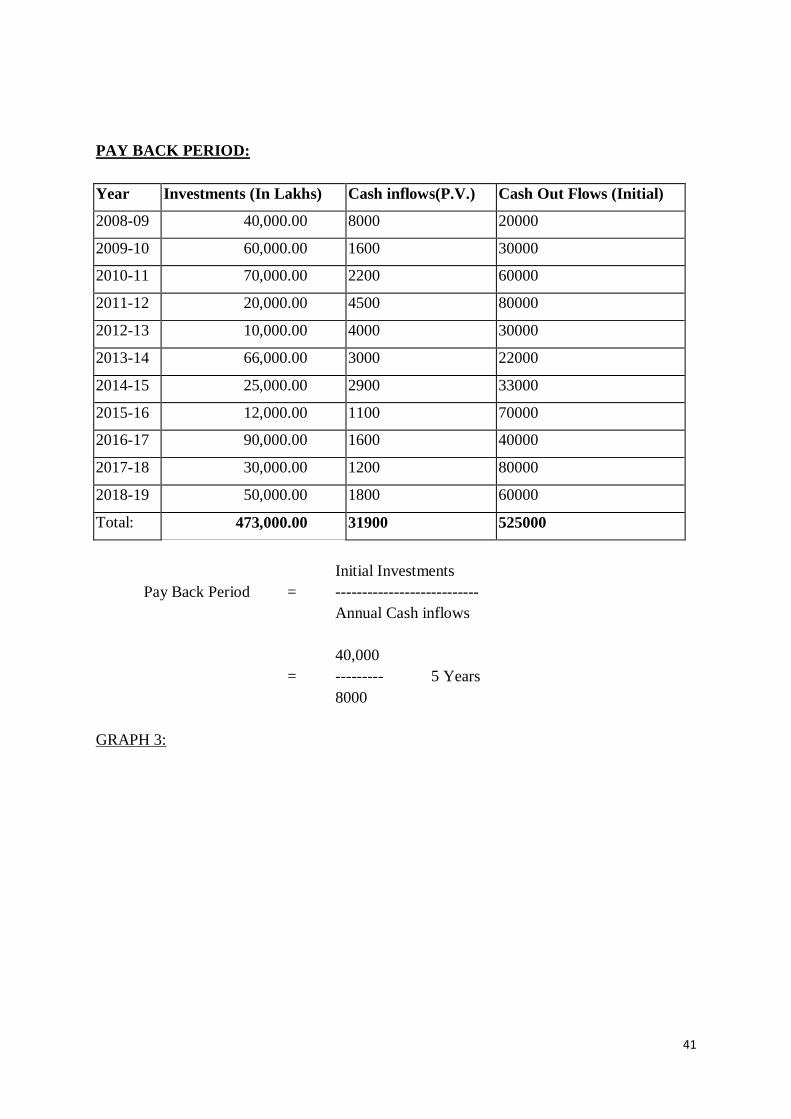
PAY BACK PERIOD:
Year Investments (In Lakhs) Cash inflows(P.V.) Cash Out Flows (Initial)
2008-09 40,000.00 8000 20000
2009-10 60,000.00 1600 30000
2010-11 70,000.00 2200 60000
2011-12 20,000.00 4500 80000
2012-13 10,000.00 4000 30000
2013-14 66,000.00 3000 22000
2014-15 25,000.00 2900 33000
2015-16 12,000.00 1100 70000
2016-17 90,000.00 1600 40000
2017-18 30,000.00 1200 80000
2018-19 50,000.00 1800 60000
Total: 473,000.00 31900 525000
Initial Investments
Pay Back Period = ---------------------------
Annual Cash inflows
40,000
= --------- 5 Years
8000
GRAPH 3:
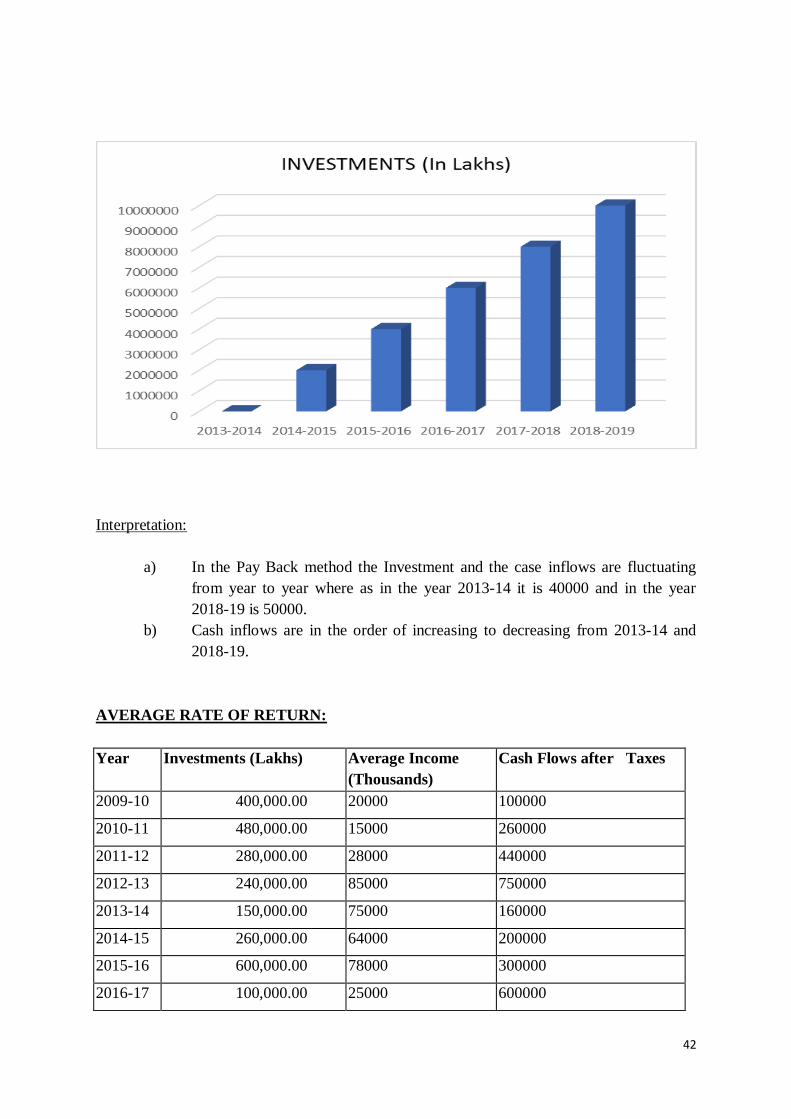
42
Interpretation:
a) In the Pay Back method the Investment and the case inflows are fluctuating
from year to year where as in the year 2013-14 it is 40000 and in the year
2018-19 is 50000.
b) Cash inflows are in the order of increasing to decreasing from 2013-14 and
2018-19.
AVERAGE RATE OF RETURN:
Year Investments (Lakhs) Average Income
(Thousands)
Cash Flows after Taxes
2009-10 400,000.00 20000 100000
2010-11 480,000.00 15000 260000
2011-12 280,000.00 28000 440000
2012-13 240,000.00 85000 750000
2013-14 150,000.00 75000 160000
2014-15 260,000.00 64000 200000
2015-16 600,000.00 78000 300000
2016-17 100,000.00 25000 600000
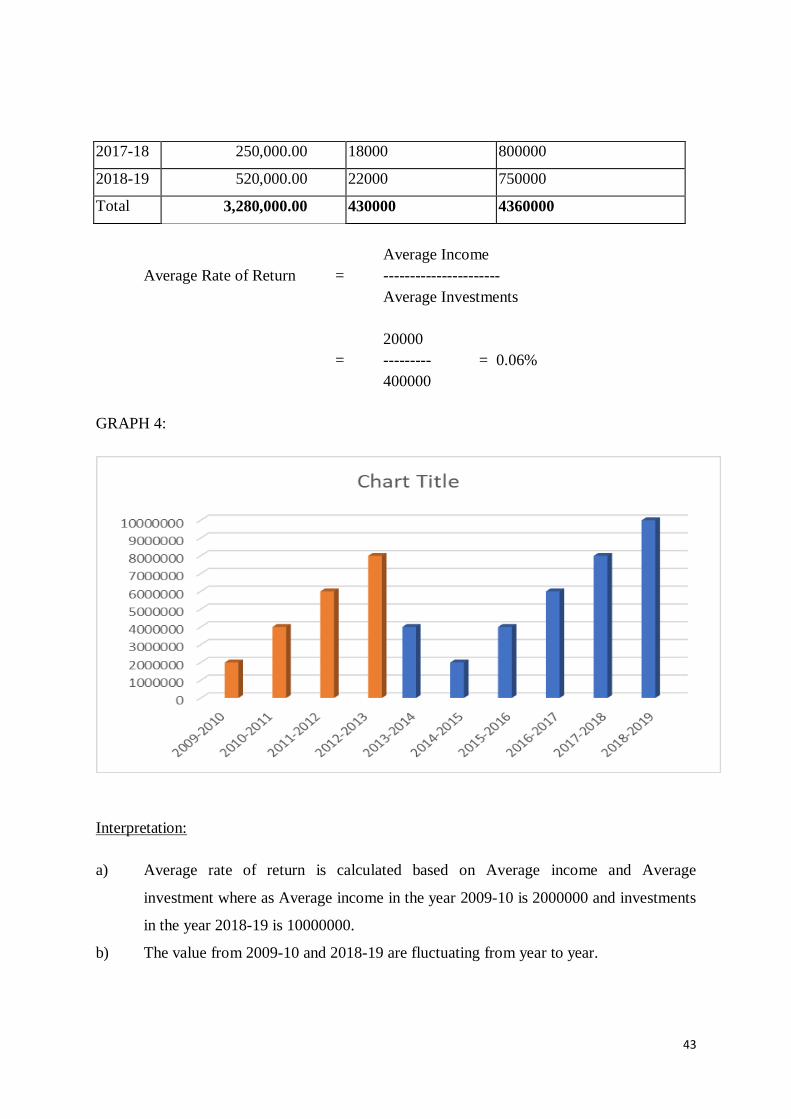
43
2017-18 250,000.00 18000 800000
2018-19 520,000.00 22000 750000
Total 3,280,000.00 430000 4360000
Average Income
Average Rate of Return = ----------------------
Average Investments
20000
= --------- = 0.06%
400000
GRAPH 4:
Interpretation:
a) Average rate of return is calculated based on Average income and Average
investment where as Average income in the year 2009-10 is 2000000 and investments
in the year 2018-19 is 10000000.
b) The value from 2009-10 and 2018-19 are fluctuating from year to year.
44
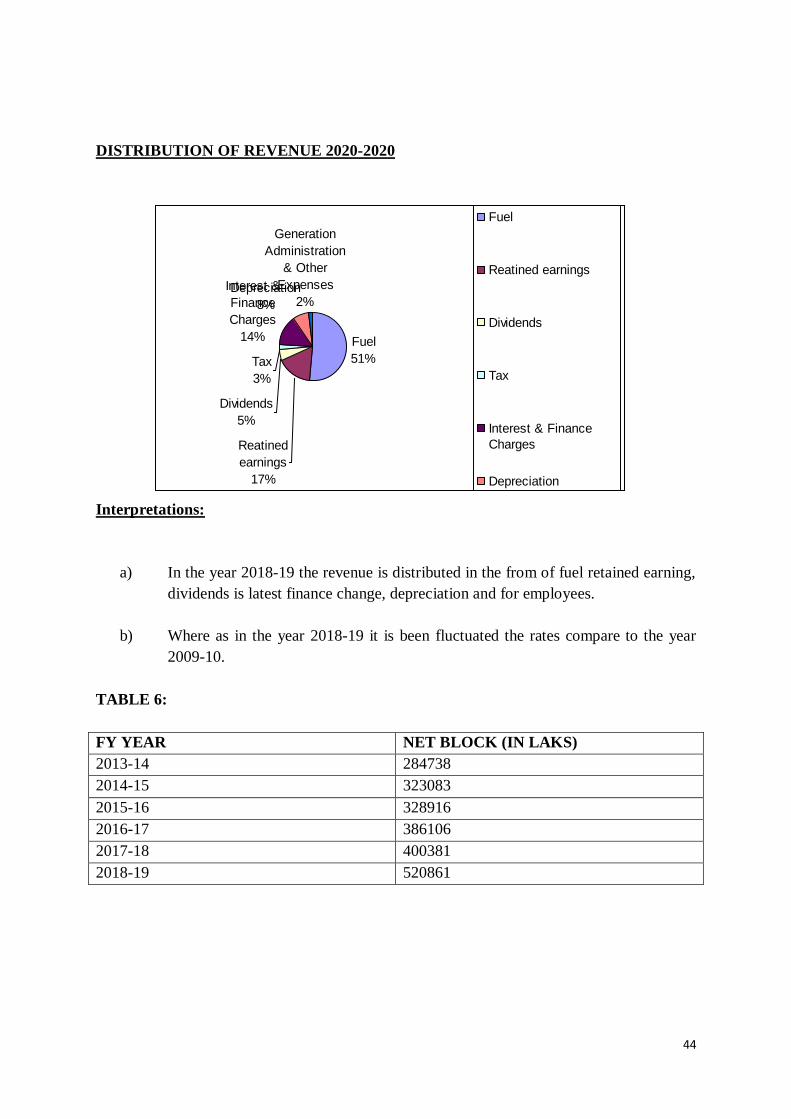
DISTRIBUTION OF REVENUE 2020-2020
Interpretations:
a) In the year 2018-19 the revenue is distributed in the from of fuel retained earning,
dividends is latest finance change, depreciation and for employees.
b) Where as in the year 2018-19 it is been fluctuated the rates compare to the year
2009-10.
TABLE 6:
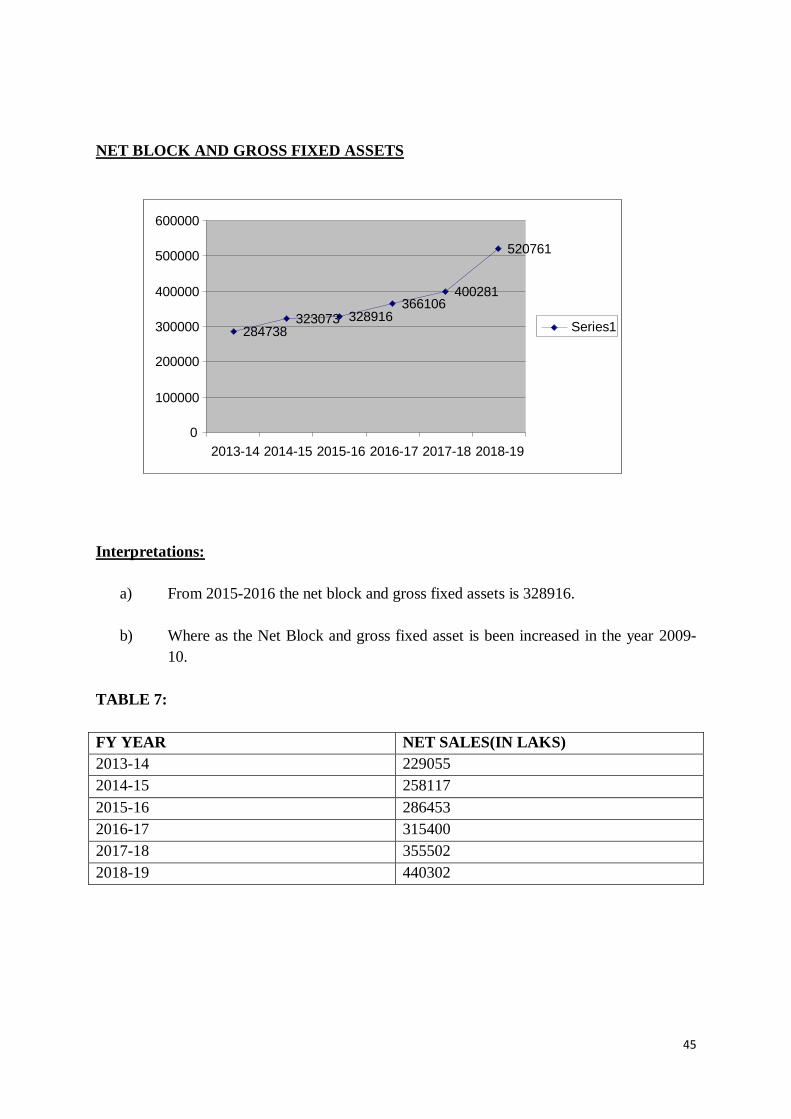
FY YEAR NET BLOCK (IN LAKS)
2013-14 284738
2014-15 323083
2015-16 328916
2016-17 386106
2017-18 400381
2018-19 520861
Fuel
51%
Reatined
earnings
17%
Dividends
5%
Tax
3%
Interest &
Finance
Charges
14%
Depreciation
8%
Generation
Administration
& Other
Expenses
2%
Fuel
Reatined earnings
Dividends
Tax
Interest & Finance
Charges
Depreciation
Generation
Administration & Other
Expenses
45
NET BLOCK AND GROSS FIXED ASSETS
Interpretations:
a) From 2015-2016 the net block and gross fixed assets is 328916.
b) Where as the Net Block and gross fixed asset is been increased in the year 2009-
10.
TABLE 7:
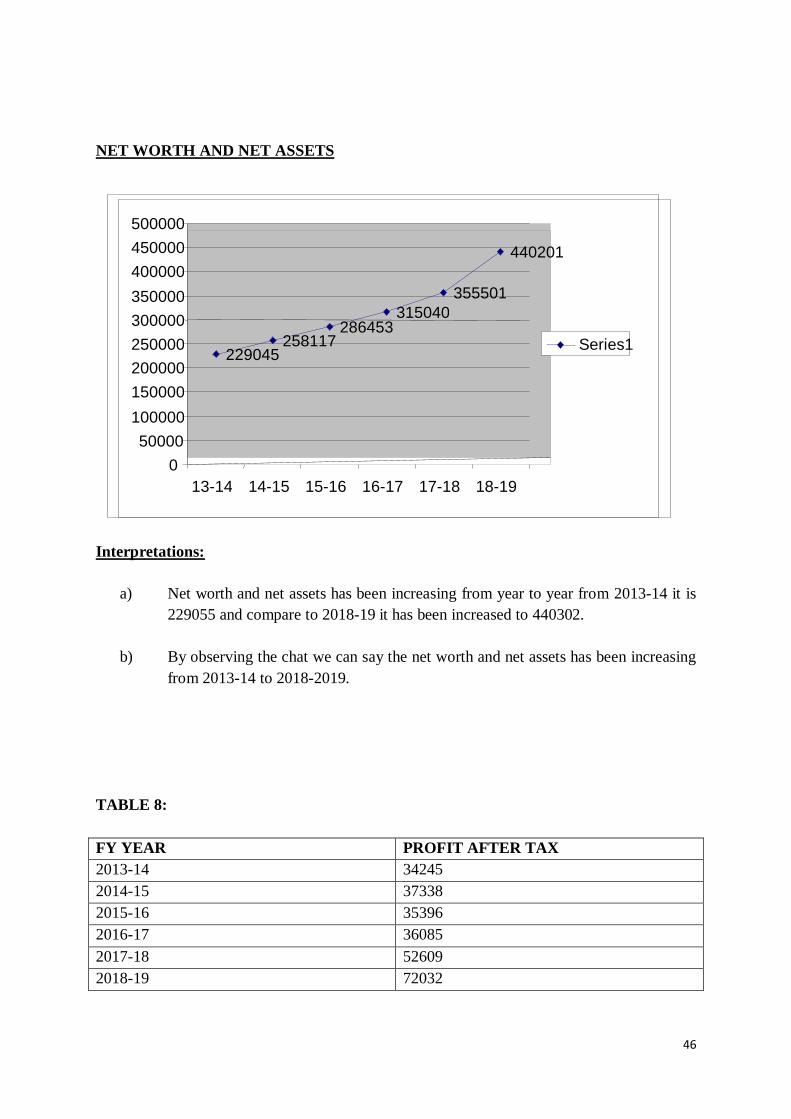
FY YEAR NET SALES(IN LAKS)
2013-14 229055
2014-15 258117
2015-16 286453
2016-17 315400
2017-18 355502
2018-19 440302
284738 323073 328916
366106 400281
520761
0
100000
200000
300000
400000
500000
600000
2013-14 2014-15 2015-16 2016-17 2017-18 2018-19
Series1
46
NET WORTH AND NET ASSETS
Interpretations:
a) Net worth and net assets has been increasing from year to year from 2013-14 it is
229055 and compare to 2018-19 it has been increased to 440302.
b) By observing the chat we can say the net worth and net assets has been increasing
from 2013-14 to 2018-2019.
TABLE 8:
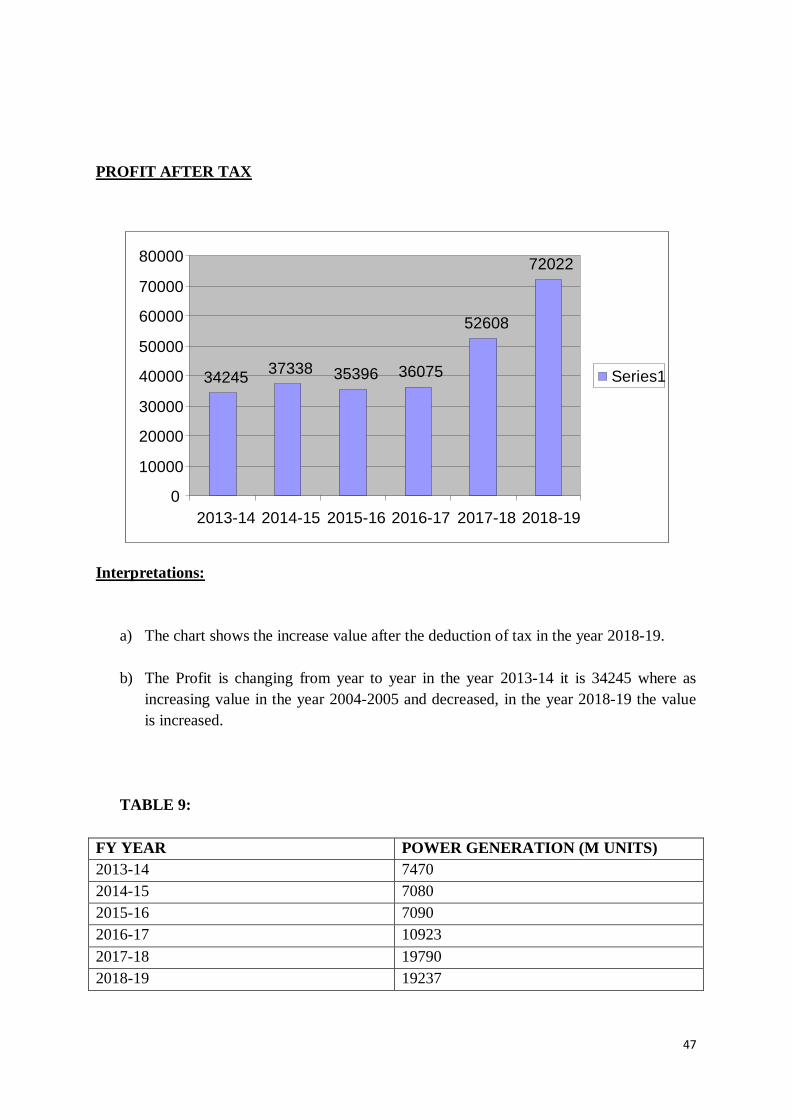
FY YEAR PROFIT AFTER TAX
2013-14 34245
2014-15 37338
2015-16 35396
2016-17 36085
2017-18 52609
2018-19 72032
229045 258117
286453 315040
355501
440201
0
50000
100000
150000
200000
250000
300000
350000
400000
450000
500000
13-14 14-15 15-16 16-17 17-18 18-19
Series1
47
PROFIT AFTER TAX
Interpretations:
a) The chart shows the increase value after the deduction of tax in the year 2018-19.
b) The Profit is changing from year to year in the year 2013-14 it is 34245 where as
increasing value in the year 2004-2005 and decreased, in the year 2018-19 the value
is increased.
TABLE 9:
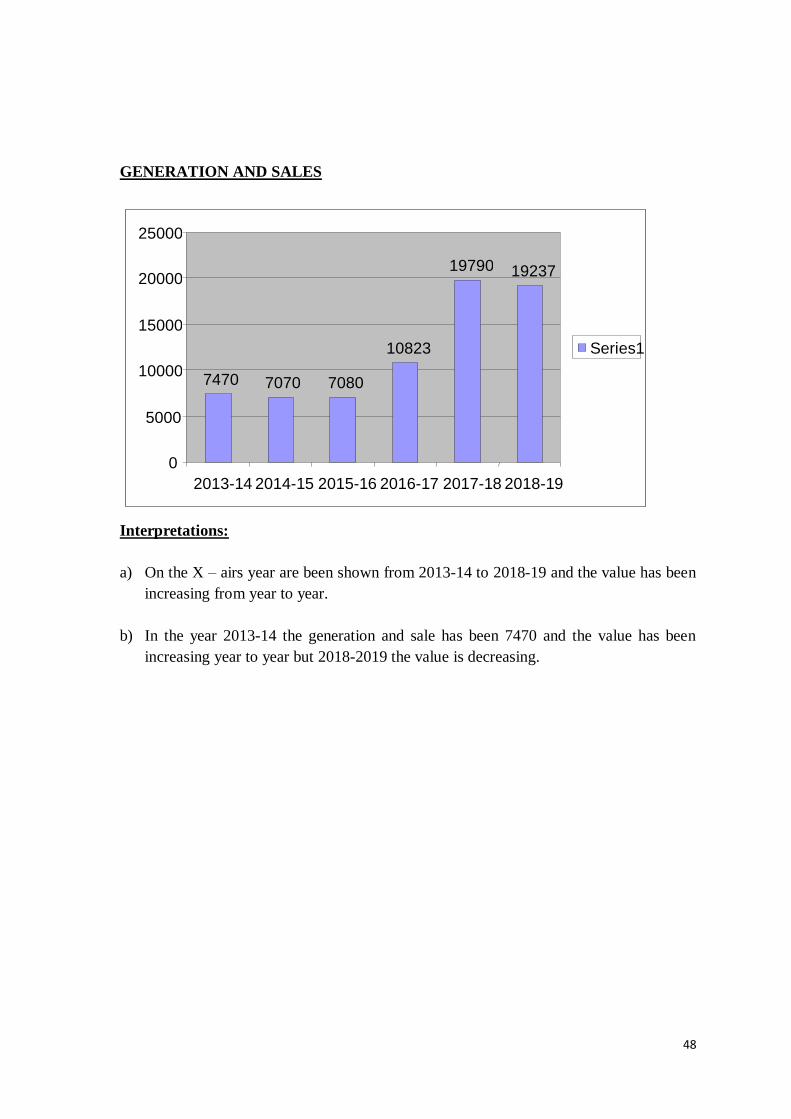
FY YEAR POWER GENERATION (M UNITS)
2013-14 7470
2014-15 7080
2015-16 7090
2016-17 10923
2017-18 19790
2018-19 19237
34245 37338 35396 36075
52608
72022
0
10000
20000
30000
40000
50000
60000
70000
80000
2013-14 2014-15 2015-16 2016-17 2017-18 2018-19
Series1
48
GENERATION AND SALES
Interpretations:
a) On the X – airs year are been shown from 2013-14 to 2018-19 and the value has been
increasing from year to year.
b) In the year 2013-14 the generation and sale has been 7470 and the value has been
increasing year to year but 2018-2019 the value is decreasing.
7470 7070 7080
10823
19790 19237
0
5000
10000
15000
20000
25000
2013-14 2014-15 2015-16 2016-17 2017-18 2018-19
Series1
49
LEARNING EXPERIENCE- FINDINDS, SUGGESTION AND CONCLUSION
An empirical study of the practices of the Capital Budgeting for evaluation of investment
proposals in the corporate sector in India has been made in the preceding chapters.
Comparison, wherever possible, has been made with the practices and procedures in the
foreign countries. It has to be noted that conclusions based upon a study of this type have to
be taken as indicative of broad trends only. However, the results of this study do indicate that
majority of large scale companies in India are aware of the need for a well formulated capital
budgeting decisions. It is proposed to review the important findings of this study and venture
to outline some suggestions and recommendations for the benefit of academicians, industry
as well as for post doctoral research.
An in-depth analysis has been carried out to observe the trend and insight into factors that
influence capital budgeting decisions. The results of the survey and its analysis have been
provided in chapter 5.
The companies in India do have specific amount of average size of annual capital budget and
all project size requires formal quantitative analysis. However, such analysis and use of
capital budgeting method differ on the basis of nature and size of a particular project under
consideration. Surprisingly, the companies under study in India seem to be planning one year
in advance only but here also the period of planning is different for different projects. This
may be due to volatile business environment. The authority to take final capital budgeting
decision rests with the chief finance officer and top management officials of all the
organizations under study.
One of the objectives of this study is to determine the types of capital investments
undertaken and the methods of appraisal used. The responding firms ranked pay back period
as the most important technique followed by internal rate return and net present value. Thus,
pay back period method (59.3%) still continues to be the most favoured technique though it
ignores time value of money and also the cash flow beyond pay back period followed by
IRR. But almost all the company’s are using now multiple techniques for evaluating their
capital budgeting proposals. In this research study, the company’s prefer IRR and NPV with
the PBP method. The investment in the new projects being strategic decisions in nature IRR,
50
PBP and NPV are the most preferred techniques while for expansion, replacement,
modernization, etc. PBP is favoured by the respondents.
Another objective of this study is to analyze the problems faced to estimate the cash flows
associated with each capital investment accurately. The cash flow estimation is considered as
the most difficult task in capital budgeting decisions. This can be understood from the
responses of the respondents of the present study. Many respondents have replied that items
like expenses incurred on R&D, market survey, test marketing, interest on borrowings,
depreciation, income taxes etc. have been included in the cash flows which requires to be
excluded actually. In fact, many of them might have been intending to convey that they
include it in the project cost. Even the firms are using different inflation adjustment methods
for their investment appraisal.
One of the objectives of this research is to analyze how ‘Risk’ and ‘Uncertainty’ in the future
estimates in investment projects is being taken care of. Sensitivity analysis is considered as
the most important technique while scenario analysis is considered as the second important
technique for assessing risk. The other more sophisticated techniques like Decision tree,
Monte Carlo simulation, Certainty equivalent, Probability analysis, Beta analysis has got
very low ratings that means these techniques are rarely used in practice by firms in India.
The researcher wanted to assess suitability of Discounted Cash Flow (DCF) Techniques in
India and the preferences between Net Present Value (NPV) and Internal Rate of Return
(IRR) methods. All the companies responded to my study are using DCF techniques either
IRR or NPV or both which indicates that now these techniques are very well accepted and
used by finance officials of the organizations. With reference to this Porwal (1976) in his
study has mentioned, “As long term planning under the present conditions is not quite
possible in India, the use of DCF methods do not seem to be efficacious. However, it needs
to be mentioned that as conditions improve, it would be desirable for Indian companies to
apply ‘theoretically correct’ techniques in a larger measure.” Prasanna Chandra (1975) in his
study conducted on 20 companies made the following observations. “The most commonly
used method for evaluating the investments of small size is payback period method….For
investments of large size, the average rate of return is commonly used as the principle
criterion and the payback period is used as a supplementary criterion. DCF techniques,
51
though not commonly used, are gaining importance, particularly in the evaluation of large
investments.” It appears that now though the government restrictions are minimized on
business but firms are always working under highly volatile environment. Still no
respondents in my study is using only pay back period method at the same time no
organizations are using single technique for evaluating capital budgeting proposals. Though
Pay back period is still a popular technique, it is always used with some other DCF
techniques which are in most of the cases IRR or NPV. The suitability of DCF techniques
even depends on how professional the organization is. But all the respondents in my study
appreciate and use the suitability of these techniques. In capital budgeting literature, two
widely discussed methods for appraisal of capital investments are the NPV and IRR methods.
There is good amount of controversy exist regarding the superiority of one method over the
other. Many authors argue that the NPV method leads to correct decision (Bierman and
Smidt S, 1980). On the other hand Merret A J and Sykes A (1966) prefer the yield method.
In some situations the NPV and yield methods give contradictory results. Babu C P (1984)
explains the reasons for this phenomenon-“…in capital investment appraisal using the yield
like yield to maturity in bonds, or as a growth rate of an investment is misleading, and is
responsible for the contradictions that exist between the NPV and yield methods.” He further
says that as the NPV criterion is compatible with the objective of the firm, the yields can be
used in such a manner so as to give the same results as that of NPV. The respondents of my
study prefer both the techniques but IRR (40.7%) seems to be given more importance by
them in comparison to NPV (33.3%) as it gives some rate for comparison. When they were
asked to mention frequency of the use of different capital budgeting techniques the NPV
(59.3%) got more preference than IRR (55.5%). Thus, it can be concluded that both the
techniques goes side by side when it comes to selecting one over the other. The respondents
of my study prefer both the techniques but IRR seems to be more favoured by them as it
gives some rate for comparison, however, there is a negligible difference between the
preference for both the techniques i.e. NPV and IRR. The uses of DCF techniques require
determining the minimum acceptable rate of return for using it as a discount rate. The study
reveals that weighted average cost of capital (55.6%) is maximum in use for using it as a
discount rate. And the preferred methods of estimating cost of equity are CAPM (capital
asset pricing model) and dividend yield plus growth rate followed by cost of debt plus risk
premium. The use of present market values of debtequity is more preferred (46.67%) while
52
calculating WACC. Generally, the companies do not prefer to use different discount rates for
different sizes of investment. The maximum number of companies (70.4%) do prefer to
categorize projects into different risk classes and they feel that fluctuations in expected return
as a major risk factor followed by changes in economic, social and political factors.
Sensitivity analysis (81.4%) is considered as the important technique for assessing risk
followed by scenario analysis (62.9%). There is no major switch in techniques by the
companies for investment appraisal. Almost three fifth of the firms place a limit on the size
of its annual capital budget. There are many reasons responsible for it but the main reason is
investment decisions important for whole group and require central control (38.9%) followed
by the another reason i.e. management wants to control areas of activity and mix of products.
The companies do accept non-economic projects due to many reasons viz., health and safety,
legislation, social and environmental reasons etc. The most of the firms prefer to go for post
audits of their major capital expenditures. The CFOs and Board of Directors are involved for
approving almost all capital budgeting projects in all organizations.
Further, An effort has been made to develop a relationship between the independent
variables; Plant and machinery and sales to explain the variation in the dependent variable as
operating income of the company. The analysis has been carried out with the help of
regression analysis. The period covered in the study is last five financial years (2003-2007).
The summarized results of analysis for each company are provided in the chapter 6.
It is clear from the results obtained that, in most cases the R2 for almost 90 % of the
companies is around 95 %. Thus, it can be said that capital budgeting decisions leading to
investment in plant and machinery and sales together influence almost 95 % variation in the
operating income of a company. Thus, our findings, through the above analysis it can be
stated that proper usage of capital budgeting techniques lead to accurate decision for
investment in fixed assets especially plant and machinery and hence better operating income
that the better capital budgeting.
Limitations of the study:
It is important to acknowledge and discuss some of the limitations of the study.
53
The survey was limited to the large scale listed firms only. The capital budgeting practices of
listed firms may not be representative of all firms in India. The survey questionnaires used in
this study were inherently limited in scope which is based upon stringent underlying
assumptions about market conditions and firm behavior. Such an approach implies a level of
universality that may not exist. Further research is needed to discover whether there are
significant cultural and institutional issues related to corporate financial policies and
practices that are unique to India. The results of the study are compared with the results of
previous surveys in the U.S. and other countries of the AsiaPacific region. However, such
comparisons among the countries must be approached cautiously because the surveys were
conducted at different times and during different economic conditions. While the survey was
mailed to the CFO, the responses were the opinion of one individual and thus may not fully
reflect the firm’s position. It is possible that this person may not be the best to assess the
capital budgeting process if he/she is far removed from capital management. There is also
potential concern about a non-response bias. In an attempt to limit this limitation, five
personalized mailings were sent over a period of one year. Further, the companies
participated in survey will be given a copy of results. While the survey technique is not
without flaws, it has been generally accepted as a reasonable proxy given the time and
personal constraints in large scale companies.
Suggestions/Scope for Further Research study:
Due to the limited scope of the present study, a large number of research issues are not
attempted but are felt in the course of the study. Some of them are as follows.
1. The results of this study reveal a number of subjective factors used by managers to
evaluate proposed investments. So the human side of Capital budgeting would be an
interesting focus for further research.
2. There is a need to link the survey responses across different areas of financial
management. For example, It would be interesting to know is there a link between use of
a particular capital budgeting method and use of a particular source of finance or use of a
particular method of determining discount rate.
54
3. As these decisions affect the long term future survival and growth of the organization, it
would also be interesting to study whether the capital budgeting decision makers are
getting any special incentives or otherwise for taking such decision which generate
desired results.
4. Though the conditions in India have improved significantly after economic reforms, there
is a need to study the impact of taxation and government policies on capital budgeting
decisions of firms in India.
5. One of the unexplored areas still is the relationship between the capital budgeting
techniques and the strategic and corporate planning procedures used. Future research will
also be needed to understand why organizations have selected capital budgeting practices
and the extent to which selection and use of capital budgeting practices matters in the
efficiency and viability of a particular investment proposal and their business as a whole.
6. There is a need to investigate how firms deal with some typical problems of the capital
budgeting decision process in specialized areas such as high technology and social
expenditures because there is a great uncertainty about the cash flows associated with
high technology projects and the benefits from a social project may only be indirectly
associated with identifiable cash flows.
Thus from all the discussions in the preceding pages, I can safely predict that the trend to
adopt and use theoretically superior techniques for capital budgeting decisions will continue
at an accelerating pace and at the same time organization will modify these practices looking
to their changing requirements and will also start using some value management tools like
EVA (economic value added), VIR (value improvement ratio), SVA (shareholder value
analysis), Real Options etc. There will be significant increase in the use of multiple
evaluation techniques with the rapid use of computers. The increased sophistication and
availability of easily used computer technology is occurring. Therefore it is simple and less
costly to apply refined risk analysis and management science techniques. The effect of a
change of a single assumption could take hours to recompute before the advent of electronic
spreadsheets. Today, analyzing a change in assumption requires a couple of keystrokes and
few seconds to accomplish the results. Let us hope that the findings of this study will lead to
reviewing capital budgeting practices of their firms by Indian companies.

55
BIBLIOGRAPHY
References :
Financial accounting
Cost and management accounting
Financial accounting
Accounting for management
Website :
www.google.com
www.sunness.in
www.yahoofinance,com
jeevitha_mba_1.doc
ORIGINALITY REPORT
8%
SIMILARITY INDEX
% INTERNET SOURCES
8% PUBLICATIONS
% STUDENT PAPERS
PRIMARY SOURCES
1 "Analysis of Capital Budgeting In Cloud Papers
Private Limited", International Journal of Recent
Technology and Engineering, 2019 Publication
2 Aman Srivastava. "Indian Capital Market: An
Overview", Review of Professional
Management- A Journal of New Delhi Institute
of Management, 2004 Publication
3 "Bottom Line Management", Springer Science
and Business Media LLC, 2009 Publication
4 R.H. Patil. "National stock exchange: leveraging
IT for creating an investor oriented exchange",
International Journal of Services Technology
and Management, 2005 Publication
5 "A Research on the Stock Market Volatility of
BSE and NSE in Indian Economy", International
Journal of Recent Technology and Engineering,
6%
1%
1%
<1%
<1%

2019 Publication
Exclude quotes Off
Exclude bibliography On
Exclude matches Off