Embed Size (px)
Citation preview
AR
TIG
O /
AR
TIC
LE
LAJBM. V. 10, N. 2, P. 38-52, jul-dez/2019. Taubaté, SP, Brasil.
ISSN: 2178-4833
STUDY ON CAPITAL BUDGETING PRACTICES ADOPTED BY
SUPERMARKET COMPANIES IN THE STATE OF SANTA CATARINA/BRAZIL
Paula de Souza Michelon1
Maurício Mello Codesso2
Ismael Luiz Santos3
Rogério João Lunkes4
Data de recebimento: 20/03/2019
Data de aceite: 29/08/2019
Abstract
The objective of the present study is to analyze capital budgeting practices in supermarket companies in
the State of Santa Catarina - Brazil. The study was carried out through the application of questionnaires in
19 large supermarkets in Santa Catarina. The results show that companies adopt different methods for
evaluating investments, but often use the Net Present Value and the Accounting Return Rate and Scenario
Analysis. It is concluded that managers usually use different methodologies in the preparation of capital
budget, but still need adequate information systems to manage the budget.
Palavras-chave: Budget. Capital Budgeting. Supermarkets. Brazil.
ESTUDO SOBRE PRÁTICAS DE ORÇAMENTO DE CAPITAL ADOTADAS POR SUPERMERCADOS NO ESTADO DE SANTA CATARINA/BRASIL
Abstract
O objetivo do presente estudo é analisar as práticas de orçamento de capital em empresas
supermercadistas do Estado de Santa Catarina - Brasil. Realizou-se o estudo por meio da aplicação de
1 Mestre em Contabilidade, Doutoranda em Engenharia de Produção. Universidade Federal de Santa Catarina. E-mail:
[email protected] 2 Doutor em Administração, professor substituto. Universidade Federal de Santa Catarina. E-mail: [email protected] 3 Mestre em Administração, Doutorando em Administração. Universidade do Vale do Itajaí. E-mail: [email protected] 4 Pós-doutor em Contabilidade, professor do Programa de Pós-graduação em Contabilidade. Universidade Federal de Santa Catarina.
E-mail: [email protected]
LATIN AMERICAN JOURNAL OF BUSINESS MANAGEMENT
www.lajbm.com.br
39
questionários em 19 grandes supermercados catarinenses. Os resultados evidenciam que as empresas
adotam diferenciados métodos para avaliação dos investimentos, mas com frequência utilizam o Valor
Presente Líquido e a Taxa de Retorno Contábil e Análise de Cenários. Conclui-se que os gestores costumam
utilizar diversas metodologias na preparação do orçamento de capital, mas ainda necessitam de sistemas
de informações adequados para o gerenciamento do referido orçamento.
Palavras-chave: Orçamento. Orçamento de Capital. Supermercados. Brasil.
Introdução
The supermarket sector is of great importance to the Brazilian economy. According to the Brazilian
Supermarket Association (ABRAS, 2012), the supermarket sector had BRL (Brazilian Real) 224.3 billion in
sales during 2011, and it had grown 4.4% compared to 2010, besides , accounting for 83.7 % of food,
beverages, beauty, hygiene and cleaning products supply in the country.
In line with ABRAS (2013), that sector has shown significant growth rates in relation to GDP in the
last three years, that is, when compared to 2010, 2011 and 2012. Furthermore, this sector showed superior
performance in comparison with other retail sectors.
In 2012, the state of Santa Catarina, for example, accounted for 2.97% of the national market,
according to an ABRAS Ranking research based on 120 largest companies of the whole country (ABRAS,
2013).
Additionally, by combining development and planning to reduce costs, supermarket companies that
adopt the budget become different from their competitors, providing high quality services (RIBEIRO et al.,
2001).
The budget is an instrument of support capable of guiding the development and implementation of
strategies, performance evaluation, staff motivation and setting goals and objectives in the organization
(DE WAAL, 2005).
In this context, one of the most important stages of the budgeting process is the preparation and
assessment of the capital budget, which deals with the analysis of long-term investment opportunities and
is inherent to organizational success, contributing to a better evaluation and decision-making processes
(HORNGREN et al., 2000; PETERSON; FABOZZI, 2002; HORNGREN et al., 2004; GARRISON et al., 2007;
KOCH et al., 2009; BENNOUNA et al., 2010; SOUZA; LUNKES, 2016).
Weighing up the analyses of future benefits, several methodologies are available to assess the
capital budget and are often represented by the Net Present Value, Internal Rate of Return, Payback
Period, Accounting Rate of Return and Profitability Index (BRIJLAL; QUESADA, 2009).
Simple risk analysis methods comprise the adjustment of discount rates and the Payback Period,
while the more sophisticated methods include probabilistic risk analysis, such as Sensitivity Analysis,
Scenario Analysis, Decision Tree, Monte Carlo Simulation, among others.
Given the above, one can note that it is for managers to evaluate the options and consider the
relevance of each criterion for budget planning when performing a final analysis of investment projects
(CARMONA et al., 2011).
In this direction, several researchers have been carrying out studies in developed countries
providing an international perspective on the capital budget practices (SCHALL et al., 1978; PIKE, 1982;
PIKE, 1985; KWONG, 1986; PIKE; SHARP, 1989; WHITE et al., 1997; PIKE, 1988; PEEL; BRIDGE, 1998; PEEL;
BRIDGE, 1999; ARNOLD; HATZOPOULOS, 2000; GRAHAM; HARVEY, 2001; RYAN; RYAN, 2002; SANDAHL;
SJOGREN, 2003; BLOCK, 2003; BROUNEN et al., 2004; LAZARIDIS, 2004; TOIT; PIENAAR, 2005; HERMES et
al., 2007; LAM et al., 2007; TRUONG et al., 2008; CORREIA; CRAMER, 2008; HOLMÉN; PRAMBORG; 2009;
BRIJLAL; QUESADA, 2009; CHAZI et al., 2010; BENNOUNA et al., 2010; KHAMEES et al., 2010; HALL;
MILLARD, 2011; VIVIERS; COHEN, 2011; MAQUIEIRA et al., 2012). However, the specialized literature still
lacks studies exploring retail companies, mainly in the supermarket sector.
In that vein, the research question that guides this article arises: What are the capital budgeting
practices adopted by supermarket companies from the state of Santa Catarina - Brazil? In order to answer
the question, the main objective is defined: analyze the capital budget practices in supermarket
companies from the state of Santa Catarina - Brazil.
To achieve this goal, questionnaires are applied and responses are examined, aiming at identifying
what are the capital budgeting practices employed by supermarkets located in Santa Catarina.
LATIN AMERICAN JOURNAL OF BUSINESS MANAGEMENT
www.lajbm.com.br
40
This research is justified by three main reasons: obtaining information from retail supermarket
managers about the management process; data on the documentation concerning capital budgeting
practices and characteristics related to the methods used in investment budget appraisal.
Theoretical Review
The capital budget is essential for the development of a company. Decisions taken based on the
evaluation of the various stages of this budget can lead companies to pursue or abandon their projects,
thus undermining their own structure (BAIMAN et al., 2013). This is due to the fact that managers tend to
select projects that meet some specific organizational objectives, in accordance with restrictions imposed
by the management of the companies concerned or external factors to consider (BERALDI et al., 2013).
Investment Analysis Techniques and Discount Rates
The central feature of any investment analysis is the use of the Discounted Cash Flow (DCF), which
includes the time value of money. Also, it has been considered in the the specialized literature as the most
appropriate method, as it comprises at least four different discount models: Net Present Value (NPV),
Internal Rate of Return (IRR), Modified Internal Rate of Return (MIRR) and Profitability Index (PI)
(BRIGHAM; EHRHARDT, 2002).
The NPV explores the return on investment, as it brings expectations of future financial inputs and
outputs to present values. The method is defined by adding the present values of annual net income
determined during the period of investigation (HANAFIZADEH; LATIF, 2011).
The IRR differs from the NPV method, as it establishes the potential return on investment. The IRR
rate makes the present value of capital outlay equivalent to the present value of cash inflows (KIERULFF,
2008).
From the NPV, the present value of future cash flows is calculated and compared to the value of
initial expenditure. An investment project is deemed acceptable when it has a positive NPV. The IRR is a
percentage that equates the present value of future cash flows with the present value of their capital
expenditures (BENNOUNA et al., 2010).
The Profitability Index represents the ratio of the present value of future cash flows to their initial
cost (ROSS, 2000), in other words, is the quotient of net present value in relation to the initial investment
(BREALEY et al., 2002).
There are other methodologies available for capital budget analysis that do not involve Discounted
Cash Flows. Among them, the most common are the Payback Period (PP) and the Accounting Rate of
Return (ARR) (ROSS, 2000). The Payback Period calculates the period of time required for the recovery of
invested capital. While the Accounting Rate of Return is the ratio of the book value of profit to the book
value of the investment (HORNGREN et al., 2000).
The Real Options approach recognizes the specific flexibility (options) in some investment projects
(ALKARAAN; NORTHCOTT, 2006). For Antonik (2012), this technique should be used in addition to the Net
Present Value approach that has a new value, and it is therefore the value of the investment project
added to the exercise price of the various options for each project.
The rates of return include the Weighted Average Cost of Capital (WACC), the Cost of Debt and the
Cost of Equity. It is worth pointing out that the Weighted Average Cost of Capital is superior when it comes
to determine the cost basis, including preference shares as either debt or equity (BRIGHAM; EHRHARDT,
2002; RYAN; RYAN, 2002).
Conceptualized as the required rate of return of an investment proposal, where it is intended to
stabilize the company's capital structure (BENNOUNA et al., 2010), the WACC is the rate at which the Cost
of Debt and Cost of Equity are used in a predetermined percentage (BLOCK, 2011).
In general, it is expected that organizations apply differential rates for investment projects, units
and/or sectors. When assessing the market return, the company can create rates for different and new
investments, even comprising projects outside its core business.
Risk Analysis Methods
The sensitivity analysis is a method that uses numerous possible values for a given
variable, in order to assess their impact on the return of the organization. On the other hand, scenario
analysis is applied to evaluate the impact on the return of the organization, resulting from simultaneous
changes of multiple variables (GITMAN, 2010).
LATIN AMERICAN JOURNAL OF BUSINESS MANAGEMENT
www.lajbm.com.br
41
The decision tree is an instrument used to identify uncertain cash flows, formed by sequential
decision diagram and possible outcomes (BREALEY et al., 2005). It comprises a sequential decision diagram
and possible outcomes (BREALEY et al., 2002).
The Monte Carlo simulation is a technique found in stochastic simulations with different
applications in distinct areas (HROMKOVIC, 2001). Also, it is a method to perform a propagation of
uncertainty analysis, whose main advantage lies in determining how a random variation already known, or
error, affect the performance or viability of the project being modeled (Moore; Weatherford, 2006).
In addition to the proper use of financial techniques, the literature provides several
recommendations for management of processes when making decisions about the capital budget.
Preferably, there should be a capital investment manual available for use (PIKE, 1988), full-time staff
dedicated to the capital budget (KLAMMER; WALKER, 1984; PIKE, 1989), the application of a standard
model to define the NPV or IRR – for example, a Microsoft Excel model –,information systems providing
support (HO; PIKE, 1996) and post investment audit (KLAMMER; WALKER, 1984; PIKE, 1996).
Previous Studies
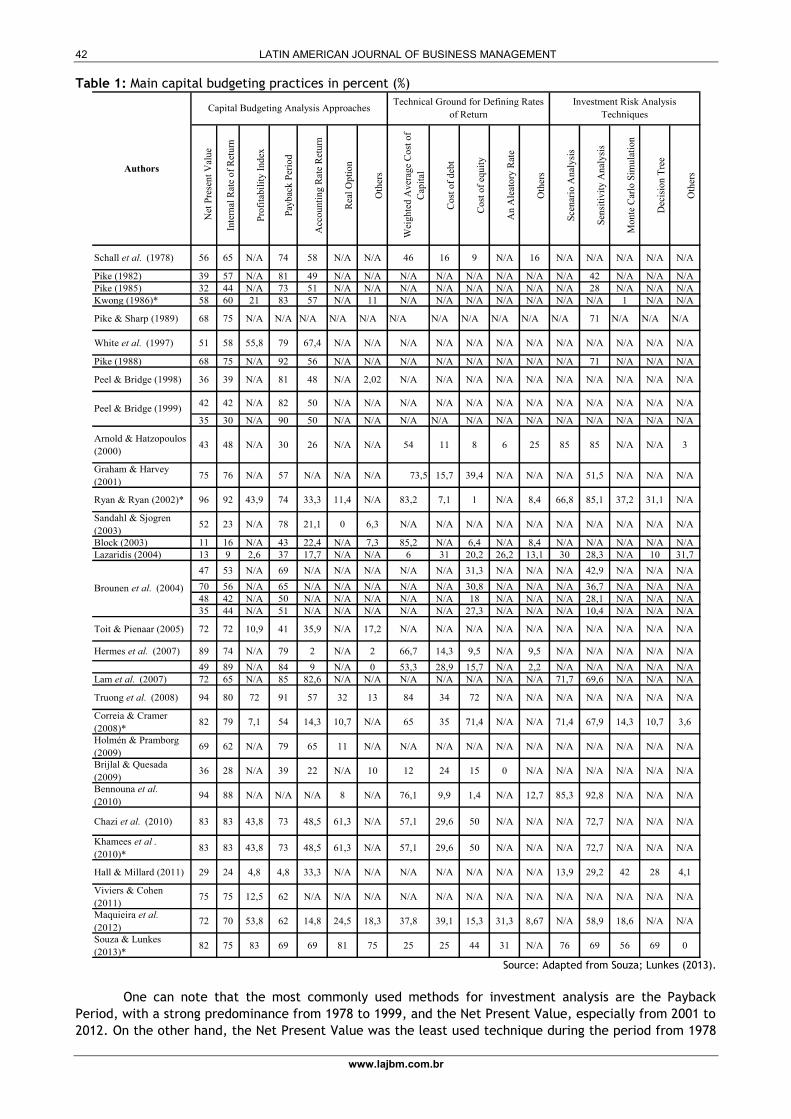
Several researchers have developed studies covering capital budget practices in recent
years. Such studies involve large, medium and small organizations and a wide range of business sectors.
According to Table 1, previous studies underline the percentage of capital budgeting practices prevailing in
different countries.
LATIN AMERICAN JOURNAL OF BUSINESS MANAGEMENT
www.lajbm.com.br
42
Table 1: Main capital budgeting practices in percent (%)
Net
Pre
sen
t V
alu
e
Inte
rnal
Rat
e o
f R
etu
rn
Pro
fita
bil
ity
In
dex
Pay
bac
k P
erio
d
Acc
ou
nti
ng
Rat
e R
etu
rn
Rea
l O
pti
on
Oth
ers
Wei
gh
ted
Av
erag
e C
ost
of
Cap
ital
Co
st o
f d
ebt
Co
st o
f eq
uit
y
An
Ale
ato
ry R
ate
Oth
ers
Sce
nar
io A
nal
ysi
s
Sen
siti
vit
y A
nal
ysi
s
Mo
nte
Car
lo S
imu
lati
on
Dec
isio
n T
ree
Oth
ers
Schall et al. (1978) 56 65 N/A 74 58 N/A N/A 46 16 9 N/A 16 N/A N/A N/A N/A N/A
Pike (1982) 39 57 N/A 81 49 N/A N/A N/A N/A N/A N/A N/A N/A 42 N/A N/A N/A
Pike (1985) 32 44 N/A 73 51 N/A N/A N/A N/A N/A N/A N/A N/A 28 N/A N/A N/A
Kwong (1986)* 58 60 21 83 57 N/A 11 N/A N/A N/A N/A N/A N/A N/A 1 N/A N/A
Pike & Sharp (1989) 68 75 N/A N/A N/A N/A N/A N/A N/A N/A N/A N/A N/A 71 N/A N/A N/A
White et al. (1997) 51 58 55,8 79 67,4 N/A N/A N/A N/A N/A N/A N/A N/A N/A N/A N/A N/A
Pike (1988) 68 75 N/A 92 56 N/A N/A N/A N/A N/A N/A N/A N/A 71 N/A N/A N/A
Peel & Bridge (1998) 36 39 N/A 81 48 N/A 2,02 N/A N/A N/A N/A N/A N/A N/A N/A N/A N/A
42 42 N/A 82 50 N/A N/A N/A N/A N/A N/A N/A N/A N/A N/A N/A N/A
35 30 N/A 90 50 N/A N/A N/A N/A N/A N/A N/A N/A N/A N/A N/A N/A
Arnold & Hatzopoulos
(2000)43 48 N/A 30 26 N/A N/A 54 11 8 6 25 85 85 N/A N/A 3
Graham & Harvey
(2001)75 76 N/A 57 N/A N/A N/A 73,5 15,7 39,4 N/A N/A N/A 51,5 N/A N/A N/A
Ryan & Ryan (2002)* 96 92 43,9 74 33,3 11,4 N/A 83,2 7,1 1 N/A 8,4 66,8 85,1 37,2 31,1 N/A
Sandahl & Sjogren
(2003)52 23 N/A 78 21,1 0 6,3 N/A N/A N/A N/A N/A N/A N/A N/A N/A N/A
Block (2003) 11 16 N/A 43 22,4 N/A 7,3 85,2 N/A 6,4 N/A 8,4 N/A N/A N/A N/A N/A
Lazaridis (2004) 13 9 2,6 37 17,7 N/A N/A 6 31 20,2 26,2 13,1 30 28,3 N/A 10 31,7
47 53 N/A 69 N/A N/A N/A N/A N/A 31,3 N/A N/A N/A 42,9 N/A N/A N/A
70 56 N/A 65 N/A N/A N/A N/A N/A 30,8 N/A N/A N/A 36,7 N/A N/A N/A
48 42 N/A 50 N/A N/A N/A N/A N/A 18 N/A N/A N/A 28,1 N/A N/A N/A
35 44 N/A 51 N/A N/A N/A N/A N/A 27,3 N/A N/A N/A 10,4 N/A N/A N/A
Toit & Pienaar (2005) 72 72 10,9 41 35,9 N/A 17,2 N/A N/A N/A N/A N/A N/A N/A N/A N/A N/A
Hermes et al. (2007) 89 74 N/A 79 2 N/A 2 66,7 14,3 9,5 N/A 9,5 N/A N/A N/A N/A N/A
49 89 N/A 84 9 N/A 0 53,3 28,9 15,7 N/A 2,2 N/A N/A N/A N/A N/A
Lam et al. (2007) 72 65 N/A 85 82,6 N/A N/A N/A N/A N/A N/A N/A 71,7 69,6 N/A N/A N/A
Truong et al. (2008) 94 80 72 91 57 32 13 84 34 72 N/A N/A N/A N/A N/A N/A N/A
Correia & Cramer
(2008)*82 79 7,1 54 14,3 10,7 N/A 65 35 71,4 N/A N/A 71,4 67,9 14,3 10,7 3,6
Holmén & Pramborg
(2009)69 62 N/A 79 65 11 N/A N/A N/A N/A N/A N/A N/A N/A N/A N/A N/A
Brijlal & Quesada
(2009)36 28 N/A 39 22 N/A 10 12 24 15 0 N/A N/A N/A N/A N/A N/A
Bennouna et al.
(2010)94 88 N/A N/A N/A 8 N/A 76,1 9,9 1,4 N/A 12,7 85,3 92,8 N/A N/A N/A
Chazi et al. (2010) 83 83 43,8 73 48,5 61,3 N/A 57,1 29,6 50 N/A N/A N/A 72,7 N/A N/A N/A
Khamees et al .
(2010)*83 83 43,8 73 48,5 61,3 N/A 57,1 29,6 50 N/A N/A N/A 72,7 N/A N/A N/A
Hall & Millard (2011) 29 24 4,8 4,8 33,3 N/A N/A N/A N/A N/A N/A N/A 13,9 29,2 42 28 4,1
Viviers & Cohen
(2011)75 75 12,5 62 N/A N/A N/A N/A N/A N/A N/A N/A N/A N/A N/A N/A N/A
Maquieira et al.
(2012)72 70 53,8 62 14,8 24,5 18,3 37,8 39,1 15,3 31,3 8,67 N/A 58,9 18,6 N/A N/A
Souza & Lunkes
(2013)*82 75 83 69 69 81 75 25 25 44 31 N/A 76 69 56 69 0
Brounen et al. (2004)
Peel & Bridge (1999)
Authors
Capital Budgeting Analysis ApproachesTechnical Ground for Defining Rates
of Return
Investment Risk Analysis
Techniques
Source: Adapted from Souza; Lunkes (2013).
One can note that the most commonly used methods for investment analysis are the Payback
Period, with a strong predominance from 1978 to 1999, and the Net Present Value, especially from 2001 to
2012. On the other hand, the Net Present Value was the least used technique during the period from 1978
LATIN AMERICAN JOURNAL OF BUSINESS MANAGEMENT
www.lajbm.com.br
43
to 1999. The Weighted Average Cost of Capital figures as the most used discount rate in enterprises (12
surveys), while the Cost of Equity appears in results obtained from 7 surveys as the least used.
Among managers, sensitivity analysis is the most popular methodology applied for risk analysis and
the decision tree is the least popular. Those evidences represent a clear indication that, gradually,
companies are increasing the level of sophistication of capital budgeting practices.
Moreover, the lack of previous studies shows the importance of carrying out a research on the
capital budgeting practices in supermarket retailers.
Methodological Procedures
In this section, methodological procedures applied in the preparation of the questionnaires and
analysis are presented, as well as the population and the sample of supermarket companies.
Procedures for Questionnaire Design and Data Analysis
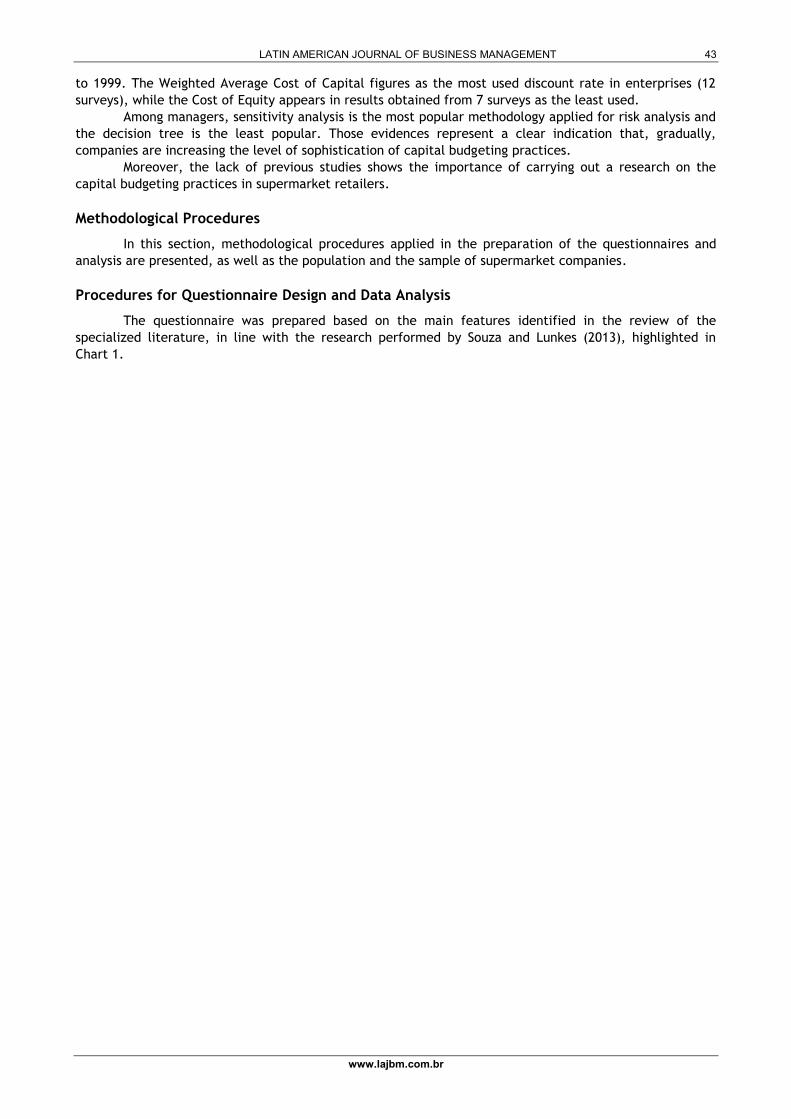
The questionnaire was prepared based on the main features identified in the review of the
specialized literature, in line with the research performed by Souza and Lunkes (2013), highlighted in
Chart 1.
LATIN AMERICAN JOURNAL OF BUSINESS MANAGEMENT
www.lajbm.com.br
44
Chart 1: Main capital budgeting practices
Período Payback – PP
Net Present Value – NPV
Internal Rate of Return – IRR
Profitability Index– IR
Accounting Rate of Return– ARR
Real Option – OR
Weighted Average Cost of Capital – WACC
Cost of debt
Cost of Equity
Aleatory Rate
Other
Scenario Analysis
Sensitivity Analysis
Decision Tree
Monte Carlo Simulation
Other
Behavior of suppliers
Behavior of competitors
Customers’ tastes and preferences
Behavior of Financial Market
Government’s Behavior
Behavior of Trade unions
Technological Changes
Projected outward flows
Projected inward flows
Capital cost and minimum rate of return
Useful life expectancy
Macroeconomic data
Post-audit review
Data obtained from information systems
geared towards investment appraisal
Main capital budgeting practices
Investment Analysis Approaches
Technical ground for defining the
minimum acceptable rate of return on
investment
Investment Risk Analysis Techniques
Environmental uncertainty or
predictability
Source: Souza and Lunkes (2013).
The questionnaire content of the present research was elaborated based on the characteristics
extracted from Chart 1. The questionnaire was conducted by phone and email and it was divided into: 6
questions about characterization of the surveyed companies and 9 questions about the capital budget, 3 of
them using the Likert scale with five levels and six objective questions. Furthermore, three general
questions about the characteristics of the hotels managers were prepared.
The initial population is composed of supermarket companies, members of the Santa Catarina
State Supermarket Association (ACATS), totaling 451 institutions. The identification of supermarkets
preparing budget was performed through telephone contact. If the answer was negative, additional
information about the institution was requested, in order to identify characteristics of supermarkets that
do not apply the budgeting process in their management.
From the answers obtained, 19 companies that apply the budgeting process were identified. The
questionnaire requesting information on the budgeting practices of capital was sent by email to the
responsible for those procedures in the companies, aiming at obtaining characteristics of supermarkets
from the state of Santa Catarina.
Presentation and Analysis of Results
LATIN AMERICAN JOURNAL OF BUSINESS MANAGEMENT
www.lajbm.com.br
45
For the presentation and analysis of capital budgeting practices, supermarket companies from
Santa Catarina were characterized, as well as their managers, besides assessing the methods used for
investments appraisal, discount rates and risk analysis. Finally, the degree of predictability of the
supermarket and data obtained from information systems were examined.
Characterization of Supermarkets
In order to characterize the supermarkets, questions about the category of the organization and its
managers were asked. Moreover, denomination used by those companies were called into question.
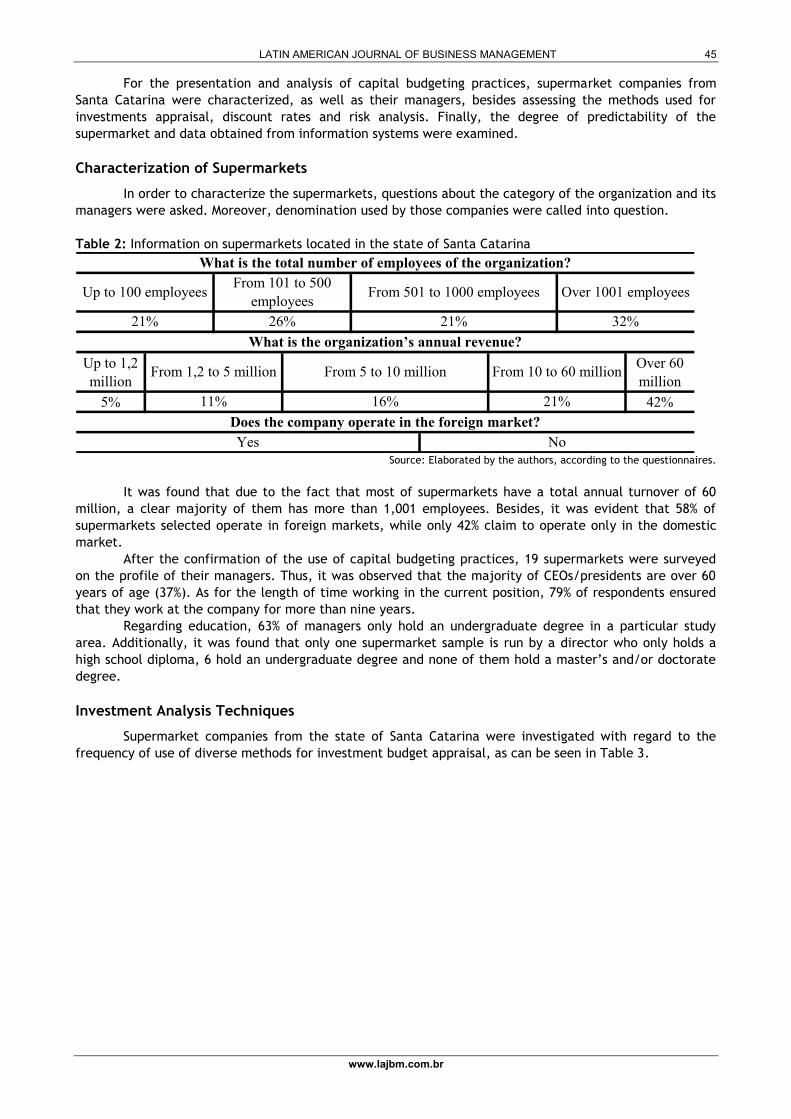
Table 2: Information on supermarkets located in the state of Santa Catarina
Up to 1,2
million
Over 60
million
5% 42%
Does the company operate in the foreign market?
Yes No
What is the organization’s annual revenue?
From 1,2 to 5 million From 5 to 10 million From 10 to 60 million
11% 16% 21%
What is the total number of employees of the organization?
Up to 100 employeesFrom 101 to 500
employeesFrom 501 to 1000 employees Over 1001 employees
21% 26% 21% 32%
Source: Elaborated by the authors, according to the questionnaires.
It was found that due to the fact that most of supermarkets have a total annual turnover of 60
million, a clear majority of them has more than 1,001 employees. Besides, it was evident that 58% of
supermarkets selected operate in foreign markets, while only 42% claim to operate only in the domestic
market.
After the confirmation of the use of capital budgeting practices, 19 supermarkets were surveyed
on the profile of their managers. Thus, it was observed that the majority of CEOs/presidents are over 60
years of age (37%). As for the length of time working in the current position, 79% of respondents ensured
that they work at the company for more than nine years.
Regarding education, 63% of managers only hold an undergraduate degree in a particular study
area. Additionally, it was found that only one supermarket sample is run by a director who only holds a
high school diploma, 6 hold an undergraduate degree and none of them hold a master’s and/or doctorate
degree.
Investment Analysis Techniques
Supermarket companies from the state of Santa Catarina were investigated with regard to the
frequency of use of diverse methods for investment budget appraisal, as can be seen in Table 3.
LATIN AMERICAN JOURNAL OF BUSINESS MANAGEMENT
www.lajbm.com.br
46
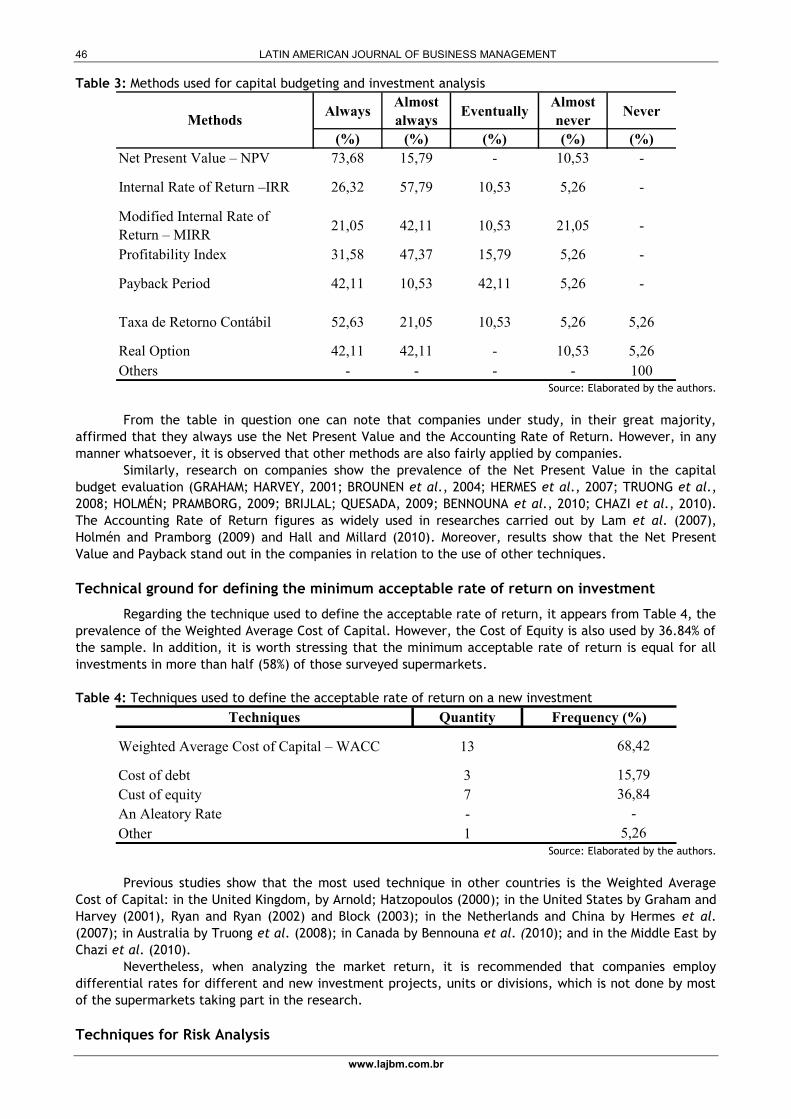
Table 3: Methods used for capital budgeting and investment analysis
AlwaysAlmost
alwaysEventually
Almost
neverNever
(%) (%) (%) (%) (%)
Net Present Value – NPV 73,68 15,79 - 10,53 -
Internal Rate of Return –IRR 26,32 57,79 10,53 5,26 -
Modified Internal Rate of
Return – MIRR21,05 42,11 10,53 21,05 -
Profitability Index 31,58 47,37 15,79 5,26 -
Payback Period 42,11 10,53 42,11 5,26 -
Taxa de Retorno Contábil 52,63 21,05 10,53 5,26 5,26
Real Option 42,11 42,11 - 10,53 5,26
Others - - - - 100
Methods
Source: Elaborated by the authors.
From the table in question one can note that companies under study, in their great majority,
affirmed that they always use the Net Present Value and the Accounting Rate of Return. However, in any
manner whatsoever, it is observed that other methods are also fairly applied by companies.
Similarly, research on companies show the prevalence of the Net Present Value in the capital
budget evaluation (GRAHAM; HARVEY, 2001; BROUNEN et al., 2004; HERMES et al., 2007; TRUONG et al.,
2008; HOLMÉN; PRAMBORG, 2009; BRIJLAL; QUESADA, 2009; BENNOUNA et al., 2010; CHAZI et al., 2010).
The Accounting Rate of Return figures as widely used in researches carried out by Lam et al. (2007),
Holmén and Pramborg (2009) and Hall and Millard (2010). Moreover, results show that the Net Present
Value and Payback stand out in the companies in relation to the use of other techniques.
Technical ground for defining the minimum acceptable rate of return on investment
Regarding the technique used to define the acceptable rate of return, it appears from Table 4, the
prevalence of the Weighted Average Cost of Capital. However, the Cost of Equity is also used by 36.84% of
the sample. In addition, it is worth stressing that the minimum acceptable rate of return is equal for all
investments in more than half (58%) of those surveyed supermarkets.
Table 4: Techniques used to define the acceptable rate of return on a new investment
Techniques Quantity Frequency (%)
Weighted Average Cost of Capital – WACC 13
Cost of debt 3
Cust of equity 7
An Aleatory Rate -
Other 1
68,42
15,79
36,84
-
5,26
Source: Elaborated by the authors.
Previous studies show that the most used technique in other countries is the Weighted Average
Cost of Capital: in the United Kingdom, by Arnold; Hatzopoulos (2000); in the United States by Graham and
Harvey (2001), Ryan and Ryan (2002) and Block (2003); in the Netherlands and China by Hermes et al.
(2007); in Australia by Truong et al. (2008); in Canada by Bennouna et al. (2010); and in the Middle East by
Chazi et al. (2010).
Nevertheless, when analyzing the market return, it is recommended that companies employ
differential rates for different and new investment projects, units or divisions, which is not done by most
of the supermarkets taking part in the research.
Techniques for Risk Analysis
LATIN AMERICAN JOURNAL OF BUSINESS MANAGEMENT
www.lajbm.com.br
47
In relation to the investment risk analysis, Table 5 shows that 21.05% never use the Monte Carlo
simulation and other 21.05% of the sample do not use a formal technique in investment risk analysis.
Table 5: Investment Risk Analysis
Always Almost Always EventuallyAlmost
neverNever
(%) (%) (%) (%) (%)
Scenario Analysis 78,95 10,53 - - 5,26
Sensitivity Analysis 15,79 63,16 - - 15,79
Monte Carlo
Simulation10,53 42,11 10,53 10,53 21,05
Decision Tree 10,53 31,58 31,58 5,26 15,79
It does not use a formal
technique15,79 31,58 21,05 5,26 21,05
Techniques
Source: Elaborated by the authors.
Moreover, it is observed that the participant companies often use the scenario analysis method. As
well as in several companies from the UK, United States, South Africa and Brazil, it is the most common
technique (ARNOLD; HATZOPOULOS, 2000; RYAN; RYAN, 2002; CORREIA; CRAMER, 2008; SOUZA; LUNKES,
2013).
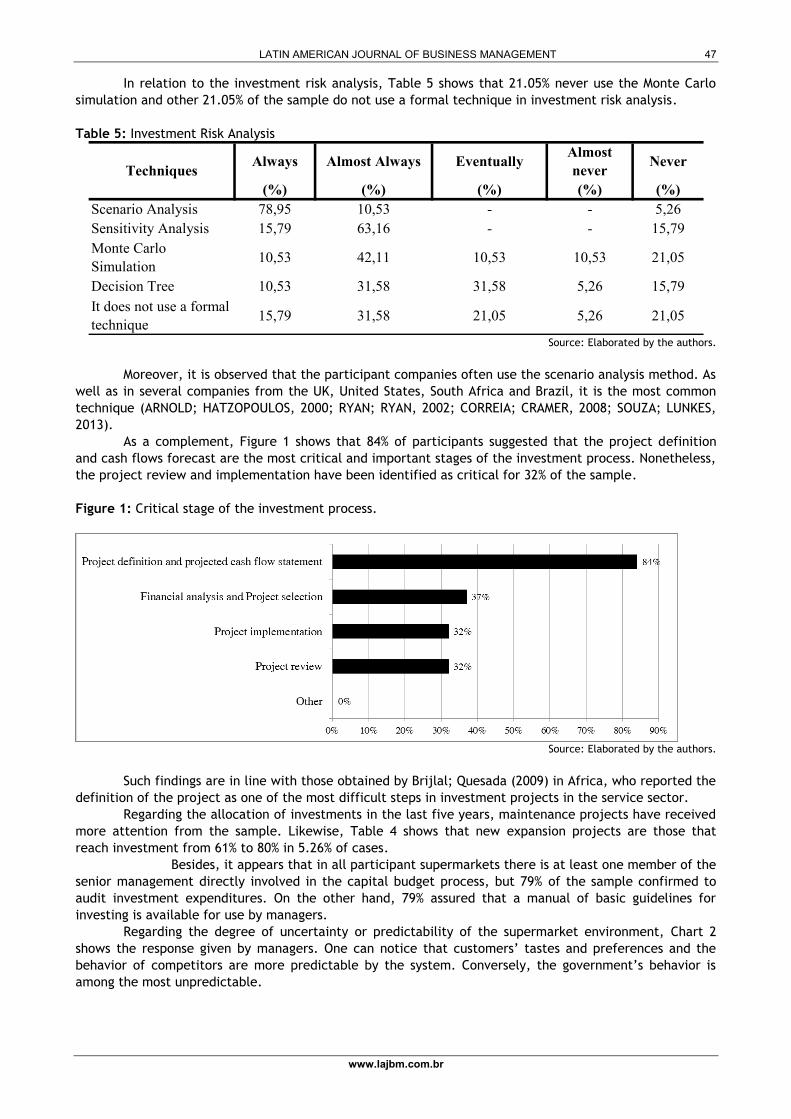
As a complement, Figure 1 shows that 84% of participants suggested that the project definition
and cash flows forecast are the most critical and important stages of the investment process. Nonetheless,
the project review and implementation have been identified as critical for 32% of the sample.
Figure 1: Critical stage of the investment process.
Source: Elaborated by the authors.
Such findings are in line with those obtained by Brijlal; Quesada (2009) in Africa, who reported the
definition of the project as one of the most difficult steps in investment projects in the service sector.
Regarding the allocation of investments in the last five years, maintenance projects have received
more attention from the sample. Likewise, Table 4 shows that new expansion projects are those that
reach investment from 61% to 80% in 5.26% of cases.
Besides, it appears that in all participant supermarkets there is at least one member of the
senior management directly involved in the capital budget process, but 79% of the sample confirmed to
audit investment expenditures. On the other hand, 79% assured that a manual of basic guidelines for
investing is available for use by managers.
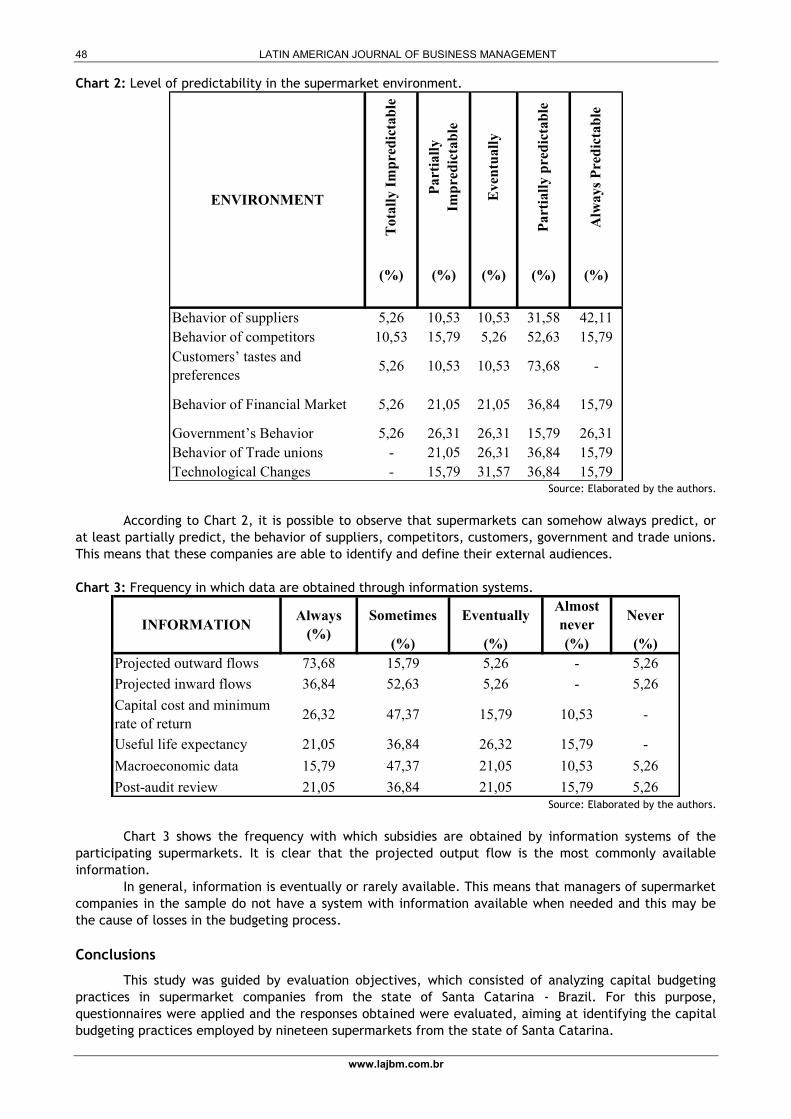
Regarding the degree of uncertainty or predictability of the supermarket environment, Chart 2
shows the response given by managers. One can notice that customers’ tastes and preferences and the
behavior of competitors are more predictable by the system. Conversely, the government’s behavior is
among the most unpredictable.
LATIN AMERICAN JOURNAL OF BUSINESS MANAGEMENT
www.lajbm.com.br
48
Chart 2: Level of predictability in the supermarket environment.
Tota
lly I
mp
red
icta
ble
Part
iall
y
Imp
red
icta
ble
Even
tuall
y
Part
iall
y p
red
icta
ble
Alw
ays
Pre
dic
tab
le
(%) (%) (%) (%) (%)
Behavior of suppliers 5,26 10,53 10,53 31,58 42,11
Behavior of competitors 10,53 15,79 5,26 52,63 15,79
Customers’ tastes and
preferences5,26 10,53 10,53 73,68 -
Behavior of Financial Market 5,26 21,05 21,05 36,84 15,79
Government’s Behavior 5,26 26,31 26,31 15,79 26,31
Behavior of Trade unions - 21,05 26,31 36,84 15,79
Technological Changes - 15,79 31,57 36,84 15,79
ENVIRONMENT
Source: Elaborated by the authors.
According to Chart 2, it is possible to observe that supermarkets can somehow always predict, or
at least partially predict, the behavior of suppliers, competitors, customers, government and trade unions.
This means that these companies are able to identify and define their external audiences.
Chart 3: Frequency in which data are obtained through information systems.
Sometimes EventuallyAlmost
neverNever
(%) (%) (%) (%)
Projected outward flows 73,68 15,79 5,26 - 5,26
Projected inward flows 36,84 52,63 5,26 - 5,26
Capital cost and minimum
rate of return26,32 47,37 15,79 10,53 -
Useful life expectancy 21,05 36,84 26,32 15,79 -
Macroeconomic data 15,79 47,37 21,05 10,53 5,26
Post-audit review 21,05 36,84 21,05 15,79 5,26
INFORMATIONAlways
(%)
Source: Elaborated by the authors.
Chart 3 shows the frequency with which subsidies are obtained by information systems of the
participating supermarkets. It is clear that the projected output flow is the most commonly available
information.
In general, information is eventually or rarely available. This means that managers of supermarket
companies in the sample do not have a system with information available when needed and this may be
the cause of losses in the budgeting process.
Conclusions
This study was guided by evaluation objectives, which consisted of analyzing capital budgeting
practices in supermarket companies from the state of Santa Catarina - Brazil. For this purpose,
questionnaires were applied and the responses obtained were evaluated, aiming at identifying the capital
budgeting practices employed by nineteen supermarkets from the state of Santa Catarina.
LATIN AMERICAN JOURNAL OF BUSINESS MANAGEMENT
www.lajbm.com.br
49
The profile of the companies and their managers, investment analysis techniques, discount rates
used, risk analysis methods, the allocation of investments, the predictability of the company's
environment, and the frequency with which information is obtained by the information systems were
presented.
It was found that the majority of CEOs/presidents are over 60 years of age and 79% of them work
at the company for more than nine years. Regarding education, 6 managers hold an undergraduate degree
and none of them hold a master’s and/or doctorate degree.
It was noted that, in general, investment appraisal techniques are frequently used in the
companies, and the Net Present Value and the Accounting Rate of Return being the predominant
approaches. The Accounting Rate of Return figures as widely used in researches carried out by Lam et al.
(2007), Holmén and Pramborg (2009) and Hall and Millard (2010), but the Net Present Value and Payback
stand out in the companies regarding the use of other techniques.
Also, the application of the Weighted Average Cost of Capital was predominant, corroborating
studies carried out by Arnold; Hatzopoulos (2000), Graham and Harvey (2001), Ryan and Ryan (2002) and
Block (2003), Hermes et al. (2007), Truong et al. (2008), Bennouna et al. (2010) and Chazi et al. (2010).
Nevertheless, more than half (58%) of the supermarkets surveyed apply the same minimum
acceptable rate of return for all investments, ignoring the particular characteristics of each project.
As for investment risk analysis, it was observed that the scenario analysis method is frequently
used. In several companies from the UK, United States, South Africa and Brazil, it is the most common
technique (ARNOLD; HATZOPOULOS, 2000; RYAN; RYAN, 2002; CORREIA; CRAMER, 2008; SOUZA; LUNKES,
2013).
In relation to the most critical stage of the investment analysis process, 84% of participants
suggested that the project definition and cash flows forecast are the most critical, similar to the African
service companies surveyed by Brijlal and Quesada (2009).
It was noticed that supermarkets could always or partially predict the behavior of suppliers,
competitors, customers, government and trade unions. This means that these companies are able to
identify and define their external audiences.
Finally, information is eventually or rarely available. In other words, managers of supermarket
companies in the sample do not have a system with information available when needed and this may be
the cause of losses in the budgeting process.
For future research, it is recommended to examine a broader data set, both in terms of number of
supermarkets and budgeting practices. It is also proposed that the questionnaire should be applied in other
sectors and that a comparative study between Brazilian companies should be carried out.
References
ALKARAAN, F.,; NORTHCOTT, D. (2006). Strategic capital investment decision-making: A role for emergent
analysis tools?: A study of practice in large UK manufacturing companies. The British Accounting Review,
38(2), 149-173.
ANTONIK, L. R. (2012). Real Option. FAE Intelligentia. Retrieved on September 22, 2017, from
http://www.fae.edu/intelligentia/principal/.
ARNOLD, G. C.,; HATZOPOULOS, P. D. (2000). The theory-practice gap in capital budgeting: evidence from
the United Kingdom. Journal of Business Finance and Accounting, 10(5), 603-626.
ASSOCIAÇÃO BRASILEIRA DE SUPERMERCADOS – ABRAS. (2012). Faturamento dos supermercados alcança R$
224,3 bilhões em 2011. Retrieved on September 14, 2017, from
<http://www.abrasnet.com.br/clipping.php?area=20&clipping=27655>.
ASSOCIAÇÃO BRASILEIRA DE SUPERMERCADOS – ABRAS. (2013). Boletim de Economia. Retrieved on
September 30, 2017, from <http://www.abrasnet.com.br/economia-e-pesquisa/boletim-de-economia-
artigo/>.
BAIMAN, S., HEINLE, M. S.,; SAOUMA, R. (2013). Multistage capital budgeting with delayed consumption of
slack. Management Science, 59(4), 869-881.
LATIN AMERICAN JOURNAL OF BUSINESS MANAGEMENT
www.lajbm.com.br
50
BENNOUNA, K., MEREDITH, G. G.,; MARCHANT, T. (2010). Improved capital budgeting decision making:
evidence from Canada. Management Decision, 48, 225-247.
BERALDI, P., VIOLI, A., SIMONE, F., COSTABILE, M., MASSABÒ, I.,; RUSSO, E. (2013). A multistage stochastic
programming approach for capital budgeting problems under uncertainty. Journal of Management
Mathematics, 24, 89-110.
BLOCK, S. (2003). Divisional cost of capital: a study of its use by major US firms. The Engineering
Economist, 48(4), 345-62.
BLOCK, S. (2011). Does the weighted average cost of capital describe the real-world approach to the
discount rate? The Engineering Economist: a journal devoted to the problems of capital investment, 56(2),
170-180.
BREALEY, R., MYERS, S.,; ALLEN, F. (2005). Principles of corporate finance (8 ed.). New York: McGraw-Hill.
BREALEY, R. A., MYERS, S. C.,; MARCUS, A. J. (2002). Fundamentos da Administração Financeira (3 ed.).
Rio de Janeiro: McGraw-Hill Irwin.
BRIGHAM, E. F.,; EHRHARDT, M. C. (2002). Financial management: theory and practice (10 ed.). South-
Western.
BRIJLAL, P.,; QUESADA, L. (2009). The use of capital budgeting techniques in businesses: A perspective
from the Western Cape. Journal of Applied Business Research, 25, 37-46.
BROUNEN, D., DE JONG, A.,; KOEDIJK, K. (2004). Corporate finance in Europe: confronting theory with
practice. Financial Management, 33(4), 71-101.
CARMONA, S., IYER, G.,; RECKERS, P. M. J. (2011). The impact of strategy communications, incentives and
national culture on balanced scorecard implementation. Advances in Accounting, 27, 62-74.
CHAZI, A., TERRA, P. R. S.,; ZANELLA, F. C. (2010). Theory versus practice: Perspectives of Middle Eastern
financial managers. European Business Review, 22, 195-221.
CORREIA, C.,; CRAMER, P. (2008). An analysis of cost of capital, capital structure and capital budgeting
practices: a survey of South African listed companies. Meditari Accountancy Research, 16, 31-52.
DE WAAL, A. A. (2005). Is your organization ready for beyond budgeting? Measuring Business Excellence, 9,
56–67.
GARRISON, R. H., NOREEN, E. W.,; BREWER, P. C. (2007). Contabilidade Gerencial (11 ed.). Rio de Janeiro:
LTC.
GITMAN, L. J. (2010). Princípios de Administração Financeira. (12 ed.). São Paulo: Pearson Education.
GRAHAM, J.,; HARVEY, C. (2001). The theory and practice of corporate finance: evidence from the field.
Journal of Financial Economics, 60(2/3), 187-243.
HALL, J.,; MILLARD, S. (2010). Capital budgeting practices used by selected listed South African firms.
South African Journal of Economic and Management Sciences, 13, 85-97.
HANAFIZADEH; P.,; LATIF, V. (2011). Robust net present value. Mathematical and computer modelling,
54(½), 233-242.
HERMES, N., SMID, P.,; YAO, L. (2007). Capital budgeting practices: a comparative study of the
Netherlands and China. International Business Review, 16, 630-654.
LATIN AMERICAN JOURNAL OF BUSINESS MANAGEMENT
www.lajbm.com.br
51
HO, S. S. M.,; PIKE, R. H. (1996). Computer decision support for capital budgeting: some empirical findings
of practice? Journal of Information Technology, 11(2), 119-28.
HOLMÉN, M.,; PRAMBORG, B. (2009). Capital budgeting and political risk: Empirical evidence. Journal of
International Financial Management and Accounting, 20, 105-134.
HORNGREN, C. T., FOSTER, G.,; DATAR, S. M. (2000). Contabilidade de Custos (9 ed.). Rio de Janeiro: LTC.
HORNGREN, C. T., SUNDEN, G. L.,; STRATTON, W. O. (2004). Contabilidade gerencial. São Paulo: Prentice
Hall.
HROMKOVIC, J. (2001). Algorithms for hard problems: introduction to combinatorial optimization,
randomization, approximation, and heuristics. New York: Springer-Verlag.
KIERULFF, H. (2008). MIRR: A better measure. Business Horizons, 51, 321-329.
KHAMEES, B. A., AL-FAYOUMI, N.,; AL-THUNEIBAT, A. A. (2010). Capital budgeting practices in the
Jordanian industrial corporations. International Journal of Commerce and Management, 20(1), 49-63.
KLAMMER, T.,; WALKER, M. C. (1984). The continuing increase in the use of sophisticated capital budgeting
techniques. California Management Review, 27(1), 137-148.
KOCH, B. S., MAYPER, A. G.,; WILNER.N. A. (2009). The Interaction of Accountability and Post-Completion
Audits on Capital Budgeting Decisions. Academy of Accounting and Financial Studies Journal, 13, 1-26.
KWONG, H. C. (1986). The sophistication of capital budgeting in Malaysian companies. Omega, 14(2), 175-
181.
LAM, K.C., WANG, D.,; LAM, M.C.K. (2007). The capital budgeting evaluation practices (2004) of building
contractors in Hong Kong. International Journal of Project Management, 25, 824-834.
LAZARIDIS, I.T. Capital Budgeting Practices: A Survey in the businesses of Cyprus. Journal of Small Business
Management, v. 42, p. 427–433, 2004.
MAQUIEIRA, C. P., PREVE, L. A.,; SARIA-ALLENDE, V. S. (2012). Theory and practice of corporate finance:
evidence and distinctive features in Latin America. Emerging Markets Review, 13, 118-148.
MOORE, J.,; WEATHERFORD, L. R. (2006). Tomada de decisão em administração com planilhas eletrônicas
(6 ed.). Porto Alegre: Bookman.
PEEL, M. J.,; BRIDGE, J. (1998). How planning and capital budgeting improve SME performance. Long
Range Planning, 31, 848-856.
PEEL, M. J.,; BRIDGE, J. (1999). Planning, business objectives and capital budgeting in Japanese, German
and domestic SMEs: some evidence from the UK manufacturing sector. Journal of Small Business and
Enterprise Development, 6, 350-365.
PETERSON, P. P.,; FABOZZI, F. J. (2002). Capital Budgeting: Theory and Practice, Wiley; Sons, New York.
Nova York.
PIKE, R. H. (1982). Capital budgeting in the 1980s. In ICMA OCCASIONAL PAPER SERIES.
PIKE. R. H. (1985). Owner-manager conflict and the role of the payback method. Accounting and Business
Research, 47-52.
PIKE, R. H. (1988). An empirical study of the adoption of sophisticated capital budgeting practices and
decision-making effectiveness. Accounting and Business Research, 18(72), 341-51.
LATIN AMERICAN JOURNAL OF BUSINESS MANAGEMENT
www.lajbm.com.br
52
PIKE, R. H.,; Sharp, J. (1989). Trends in the use of management science techniques in capital budgeting.
Managerial and Decision Economics, 10, 135-140.
PIKE, R. H. (1989). Do sophisticated approaches improve investment decision-making Effectiveness. The
Engineering Economist, 34(2), 149-161.
PIKE, R. H. (1996). A longitudinal survey on capital budgeting practices. Journal of Business Finance and
Accounting, 23(1), 79-92.
RIBEIRO, C. F., BAISCHM L. V.,; CAMFIELD, L. H. R. (2005). A busca da competitividade através da
formação de uma rede de empresas: um estudo na Central Mais Supermercados. In SIMPEP Anal, 12, Bauru.
ROSS, S. A. (2000). Princípios de Administração Financeira (2 ed.). São Paulo: Atlas.
RYAN, P. A.,; RYAN, G. P. (2002). Capital budgeting practices of Fortune 1000: how have things changed?
Journal of Business and Management, 8(4), 355-364.
SANDAHL, G.,; SJOGREN, S. Capital Budgeting methods among Sweden’s largest groups of companies: the
State of the art and a comparison with earlier studies. International Journal of Production Economics, v.
84, p. 51-69, 2002.
SCHALL, L. D., SUNDEM, G. L.,; GEIJSBEEK JUNIOR, W. R. (1987). Survey and analysis of capital budgeting
methods. The Journal of Finance, 33, 281-287.
SIVABALAN, P., BOOTH, P., MALMI, T,; BROWN, D. A. (2009). An exploratory study of operational reasons
to budget. Accounting and Finance, 49, 849-871.
SOUZA, P.,; LUNKES, R. J. (2013). Práticas de orçamento de capital: um estudo em empresas hoteleiras de
Florianópolis (SC). Revista Universo Contábil, 9(1), 28-45.
SOUZA, P.,; LUNKES, R. J. (2016). Capital budgeting practices by large Brazilian companies. Contaduría y
Administración, 61(3), 514-534.
TOIT, M. J.,; PIENAAR, A. (2005). A review of the capital budgeting behaviour of large South African firms.
Meditari Accountancy Research, 13, 19-27.
TRUONG, G., PARTINGTON, G.,; PEAT, M. (2008). Cost-of-capital estimation and capital-budgeting practice
in Australia. Australian Journal of Management, 33, 95-121.
VIVIERS, S.,; COHEN, H. (2011). Perspectives on capital budgeting in the South African motor
manufacturing industry. Meditari Accountancy Research, 19(½), 75-93.
WHITE, J. B., MILES, M. P.,; MUNILLA, L. S. (1997). An exploratory study into the adoption of capital
budgeting techniques by agricultural co-operatives. British Food Journal, 99, 128-132.