Embed Size (px)
Citation preview
HAL Id: tel-01767996https://tel.archives-ouvertes.fr/tel-01767996
Submitted on 20 Apr 2018
HAL is a multi-disciplinary open accessarchive for the deposit and dissemination of sci-entific research documents, whether they are pub-lished or not. The documents may come fromteaching and research institutions in France orabroad, or from public or private research centers.
L’archive ouverte pluridisciplinaire HAL, estdestinée au dépôt et à la diffusion de documentsscientifiques de niveau recherche, publiés ou non,émanant des établissements d’enseignement et derecherche français ou étrangers, des laboratoirespublics ou privés.
First principles and proceedings of action-FRET :probing the molecular conformation of gas phase
proteins and macro-ionsGeoffrey Knight
To cite this version:Geoffrey Knight. First principles and proceedings of action-FRET : probing the molecular conforma-tion of gas phase proteins and macro-ions. Theoretical and/or physical chemistry. Université de Lyon,2017. English. �NNT : 2017LYSE1232�. �tel-01767996�
i
N°d’ordre NNT :
2017LYSE1232
THESE de DOCTORAT DE L’UNIVERSITE DE LYON
opérée au sein de
L’Université Claude Bernard Lyon 1
Ecole Doctorale N° ED 52 -
EDPHAST
Spécialité de doctorat :
Discipline : Physical chemistry
Soutenue publiquement le 13/11/2017, par :
Geoffrey D. Knight
First principles and proceedings of action-FRET. Probing the molecular conformation
of gas phase proteins and macro-ions.
2017
Devant le jury composé de : Gerbaux, Pascal Chercheur qualifié FRS/FNRS Université de Mons Rapporteur Charles, Laurence Professeur Université Aix-Marseille Rapporteure Poully, Jean-Christophe Maître de conférences Université Caen Normandie Examinateur Demesmay, Claire Professeur Université de Lyon Présidente Dugourd, Philippe Directeur de recherche Université de Lyon Directeur de thèse Macaleese, Luke Chargé de recherche CNRS Université de Lyon Co-directeur de thèse Davesne, Dany Professeur Université de Lyon Invité
ii
UNIVERSITE CLAUDE BERNARD - LYON 1
Président de l’Université
Président du Conseil Académique
Vice-président du Conseil d’Administration
Vice-président du Conseil Formation et Vie Universitaire
Vice-président de la Commission Recherche
Directrice Générale des Services
M. le Professeur Frédéric FLEURY
M. le Professeur Hamda BEN HADID
M. le Professeur Didier REVEL
M. le Professeur Philippe CHEVALIER
M. Fabrice VALLÉE
Mme Dominique MARCHAND
COMPOSANTES SANTE
Faculté de Médecine Lyon Est – Claude Bernard
Faculté de Médecine et de Maïeutique Lyon Sud – Charles Mé-
rieux
Faculté d’Odontologie
Institut des Sciences Pharmaceutiques et Biologiques
Institut des Sciences et Techniques de la Réadaptation
Département de formation et Centre de Recherche en Biologie
Humaine
Directeur : M. le Professeur G. RODE
Directeur : Mme la Professeure C. BURILLON
Directeur : M. le Professeur D. BOURGEOIS
Directeur : Mme la Professeure C. VINCIGUERRA
Directeur : M. X. PERROT
Directeur : Mme la Professeure A-M. SCHOTT
COMPOSANTES ET DEPARTEMENTS DE SCIENCES ET TECHNOLOGIE
Faculté des Sciences et Technologies
Département Biologie
Département Chimie Biochimie
Département GEP
Département Informatique
Directeur : M. F. DE MARCHI
Directeur : M. le Professeur F. THEVENARD
Directeur : Mme C. FELIX
Directeur : M. Hassan HAMMOURI
Directeur : M. le Professeur S. AKKOUCHE
iii
Département Mathématiques
Département Mécanique
Département Physique
UFR Sciences et Techniques des Activités Physiques et Spor-
tives
Observatoire des Sciences de l’Univers de Lyon
Polytech Lyon
Ecole Supérieure de Chimie Physique Electronique
Institut Universitaire de Technologie de Lyon 1
Ecole Supérieure du Professorat et de l’Education
Institut de Science Financière et d'Assurances
Directeur : M. le Professeur G. TOMANOV
Directeur : M. le Professeur H. BEN HADID
Directeur : M. le Professeur J-C PLENET
Directeur : M. Y. VANPOULLE
Directeur : M. B. GUIDERDONI
Directeur : M. le Professeur E. PERRIN
Directeur : M. G. PIGNAULT
Directeur : M. le Professeur C. VITON
Directeur : M. le Professeur A. MOUGNIOTTE
Directeur : M. N. LEBOISNE
Acknowledgements
iv
Acknowledgements
First and foremost, I would like to thank my advisor, Dr. Philippe Dugourd who de-
serves my inmeasurable gratitutde. I thank him for all his contributions of time, ideas and fund-
ing that made my PhD possible. I am also thankful for the excellent example he has provided as
a successful physicist and research group leader. The members of the group have contributed
immensely to my personal and professional time at Lyon. The group has been a source of friend-
ships as well as good advice and support. To all of the group members that have indirectly or
directly participated in the success of this research mission, thank you: Antoine Rodolphe, Berto-
relle Franck, Comby-Zerbino Clothilde, Mathilde Bouakil, Florian Trichard, Halim Mohammed
Abdul, Macaleese Luke, Moncayo Martin Samuel, Motto-Ros Vincent, Rayane Driss, Caroline
Bourgeois, Clothilde Zerbino, and Soleilhac Antonin. It is also a coincidental and tremendous
pleasure to have worked alongside Kulesza Alexander and Daly Steven. At this laboratory group,
I have also grown a kind appreciation to Frank Bertorelle, his practice, and knowledge in wet
chemistry. All my thanks also to Chirot Fabien, for his help and advice. Many thanks also to
Clément Capitain that I have come to meet lately in my final year, the same goes to Alexandre
Resplandy and Marine Leprince. Thank you for being there. I also deeply appreciate the company
and discussions with a past graduate student now onto their next research mission, Anne-Laure
Simon.
Regarding the administration and help in settling in France, I thank Kervella Delphine, Sylvie
Flores and all members of the Ulys team. For this dissertation I would also like to thank doctoral
school directors Christophe Dujardin and Dany Davesne. Lastly, I would like to thank my family
for all their affection and encouragement. For my parents who raised me with a love of science
and supported me in all my aims and goals. Thank you. I also look forward to resuming on with
LASERs and chemistry.
Geoffrey Knight, 16 Juin 2017.
Acknowledgements
v
Abstract In this thesis, I discuss the application and development of mass spectrometry (MS) - LASER
coupled techniques for the characterization and measurement of trapped biomolecules in the
gas phase. In broad terms, this thesis demonstrates the potential and perspectives of action-
FRET a novel structural biology tool amenable to the gas phase. The fundamentals rely on a well
attested resonance quantic process known as Förster resonance energy transfer (FRET). As of
yet it has been a widely utilized method to scrutinize molecular structure in solution. The mo-
tivation has been to transpose this occurrence to the instrumental settings of a mass spectrom-
eter, its gas confinement and, in doing so, overcome the earlier limitations of the technique and
stride into the theoretical and experimental study of well determined systems as well as those
whose structure were presently undetermined - all without the influence of the environment
of a solvated medium.
The first chapter of this thesis offers a general overview on peptides and proteins plus how they
can be studied. Subsequent chapters include how the work carried out herein adds towards
their study, moving the technique towards a gold standard of native mass spectrometry (native
MS).
In the second chapter, a treatment of the synthetic steps and preparations is given detailing the
mechanistics of the reactions at play and above all outlining the experimental procedures and
providing any information on any observations made.
The third chapter describes, and is devoted to an introduction of the instrumental setup outlaid
as it stands giving an account on the LASER, optical pieces and the mass spectrometer employed
throughout the course of this thesis, effectively setting the premises of thought and understand-
ing for subsequent chapters and methodology.
Chapter four presents energy transfer, in particular to the Foster Resonance Energy Transfer
and furthermore outlines the developed technique central to the mass spectrometry method to
look at donor-acceptor chromophores espoused to biomolecular systems and their photofrag-
ments — what is nicknamed as action-FRET.
Chapter five reviews and discusses the study of a macromolecule: Ubiquitin, by action-FRET.
The first gas phase experiment on the protein to have ever been realised. The information and
content gathered from this adapted experiment is compared to work found elsewhere giving
an appraisal on the potential of action-FRET and providing an idea to what future insights the
technique could bring.
In chapter six the reader is introduced to the project of establishing action-FRET in the negative
mode of the mass spectrometer’s ionization source as opposed to its positive mode. Suitable
pairs of donor-acceptor chromophores to validate the energy transfer under a negative regime
were explored. These where profiled and characterized before being adapted to a biomolecular

vi
system. The results provide a different flavor of complimentary structural and conformation
information, the first of its kind for negative mode action-FRET.
The seventh and final chapter is devoted to future developments. The conclusive work tends to
grant a further understanding of neurodegenerative diseases that afflict our societies. Chiefly
that of the likes of Alzheimer’s: it’s the mechanism of action pertinent to other neurodegenera-
tive pathologies; Parkinson’s, Huntington’s but also prion diseases or amyloid neuropathy. In
doing so a contribution is presented on a way to trace a strategy in how to tackle and treat such
diseases.
Keywords
FRET, action-FRET, ubiquitin, amyloid-beta protein, mass spectrometry, LASER, conformation.
Acknowledgements
vii
Résumé Mon travail de thèse aborde différents développements physico-chimiques qui reposent sur le principe de transfert d’énergie par résonance de Foster (FRET). Le but est de parvenir à étudier et caractériser des assemblages moléculaires ainsi que des changements structurels de biomo-lécules (ou macro-ions) en phase gazeuse. Le transfert d'énergie par résonance de type Förster est un procédé par lequel de l’énergie s’échange de manière non radiative entre un chromo-phore dit donneur dans un état excité et un second chromophore accepteur en proximité di-recte. Conventionnellement, cette technique permet de localiser et déterminer l’écart entre deux molécules (de l’ordre de 10 à 100nm). Principalement utilisée pour étudier des systèmes biologiques, des résultats marquants ont été obtenus sur l’étude de système tel que l’appareil de Golgi, le cytosquelette ou les membranes cellulaires. Elle n’est cependant appliquée qu’à des systèmes en phase liquide. Il nous a paru intéressant de transposer cette technique en phase gazeuse, en utilisant la capacité des spectromètres de masse à sélectionner, isoler et activer des espèces moléculaires, nous permettant d’obtenir de nouvelles informations structurelles.
Une grande partie de ma thèse a consisté à premièrement, valider le concept de FRET en phase gaz puis à développer et optimiser, la technique FRET dit ‘d’action’. L’Action-FRET est une tech-nique d’analyse par couplage de spectrométrie de masse et spectroscopie LASER mise au point par l’équipe Spectrobio afin d’étudier les molecules isolées en phase gazeuse. A travers ce dis-positif, je me suis particulièrement investi à contrôler, étudier et caractériser l’évolution des conformations de biomacromolécules d’intérêt biochimique et biologique.
Dans une première partie je ferai une courte introduction générale sur les fondamentaux des protéines, de leur composition et élaboration en entités structurelles complexes, diverses et fonctionnelles. La manière dont les protéines s’arrangent successivement en niveaux structural quaternaire est aussi décrite. La deuxième partie est consacrée à une présentation des chromo-phores utilisés. Je présente ensuite leurs utilisations et détaille la synthèse des édifices molécu-laires produits pour réaliser les expériences de FRET. Ceux-ci sont constitués de composés bio-logiques (peptides ou protéines), couplés aux chromophores, (donneur-accepteur). Dans le contexte de ce chapitre se trouve également une discussion sur les mécanismes et produits uti-lisés lors de l’étape de conjugaison qui permet d’obtenir les composants désirés.
En troisième partie vient un chapitre qui relate le fonctionnement des appareils utilisés dans le montage expérimental; le LASER et le spectromètre de masse. La méthode de couplage est dé-crite et spécifiée, détaillant comment les appareils commerciaux ont été modifiés pour interagir avec l’un avec l’autre. Avec ce nouveau montage, un suivi de la signature optique de FRET ap-partenant aux protéines entières greffées et à différents états de charge a été possible.
Le quatrième chapitre est dédié dans les premières sections à la théorie et l’état de l’art en ce qui concerne le FRET. Les éléments emblématiques et leurs applications en solution de ces der-nières années et les travaux plus récents en phase gazeuse y sont présentés. Par ailleurs, nous avons voulu démontrer dans ce chapitre que nos diverses manipulations ont l’avantage critique de ne pas dépendre d’une mesure de l’émission de lumière suite au transfert résonant d’éner-gie. A la place, on dispose de la fragmentation spécifique de l’ion piégé du chromophore à tra-vers l’analyse de masse conventionnelle du spectromètre de masse pour détecter et quantifier une manifestation de FRET. Nous démontrerons aussi la possibilité cette méthode appliquée à la biologie moléculaire. Proprement dit, nous étudierons les protéines amyloïde beta d’Alzhei-mer et montrerons comment leurs conformations jouent sur l’évolution, le développement et
viii
la formation de fibrilles pathogéniques qui sont les promoteurs de nombreuses maladies tel que Parkinson, Huntington mais aussi les maladies de prion, certains diabètes ou amyloïde neu-ropathique. Au cours de ma thèse une collaboration avec des chercheurs de Mons a aussi vu le jour. Ensemble, une étude d’action-FRET sur des complexes supramoléculaires entre une pro-téine d’Alzheimer (greffée avec un donneur) et la molécule de beta cyclodextrine (greffé avec un accepteur) a été menée. L’avantage de cette technique a été le contrôle stœchiométrique et la capacité d’observer le système en isolé tout en et en sélectionnant l’état de charge voulu.
Les résultats de mon travail de recherche m’ont ensuite conduit à m’intéresser à une protéine d’intérêt biologique, l’ubiquitine. Pour cela, nous avons comparé la version naturelle avec des versions mutantes, greffés avec les chromophores pour devenir compatible à l’étude de FRET d’action en phase gazeuse. Nos résultats démontrent d’une part que les profils de conformation structurale de l’ubiquitine varient et dépendent du solvant utilisé pour l’électrospray. En effet, il y a une corrélation entre le solvant utilisé et les états de charges observables en spectroscopie de masse. Deuxièmement, nous confirmons qu’il est possible de mesurer l’inter-distance entre chromophores et valider, comme anticipé, une évolution de cette distance en accord avec l’aug-mentation de charges portées par la protéine. En effet la protéine se déroule et se déploie au fur et à mesure qu’elle gagne en états de charge. Finalement, des efforts ont été mis dans le développement de la technique de ‘FRET d’action’ en mode négatif. Il a notamment fallu déve-lopper des chromophores compatibles avec la polarité négative. Différent chromophores maleimides ont été étudiés et testés en tant que paire donneur-accepteur, puis dans un second temps implémenté sur des oligopeptides de longueurs différentes. Malgré tout, le travail sur l’utilisation de la technique demeure un défi, présentant des effets indésirables majeurs même et ce en dépit d’un travail assidu. Cette méthode ne se montra pas aussi stable que le FRET d’action en mode positif. Cependant, ce champ exploratoire reste large et pourrait faire ses preuves, et être tout aussi réussie que le FRET en mode positif qui contribue à l’amélioration de la connaissance de la bio-structure de protéines en isolation hors influence de son environ-nement biologique.
Dans un deuxième temps, plusieurs essais et amélioration du protocole de préparation d’échan-tillon de peptides ont fait partie de mon projet doctoral et ceux-ci ont contribué aux travaux d’IMS de l’équipe. Cette facette a pris une grande place dans mon travail : mettre aux points des synthèses de greffages reproductibles à haut rendement qui se limitent à des solvants compa-tibles avec la spectrométrie de masse. Au cours de cette investigation nous avons aussi carac-térisé une série de chromophores potentiellement utiles pour l’étude native des biomolécules en piège à ions, dont l’éosine et l’éosine maleimide.
En conclusion, à travers ce manuscrit sont consignés les travaux expérimentaux de FRET dans un sens général mais aussi plus précisément, et avec le développement de l’action FRET. Cette rédaction apporte aussi une preuve de l’utilité du FRET en tant que technique pour étudier les distances de substances de manière empirique sur une échelle nanométrique. Il est espéré que le futur développement de nouveaux fluorophores et techniques de transfert d’énergie et de charge permettront de mieux appréhender les systèmes impliqués dans les travaux et théma-tiques de recherche prochaine.
Acknowledgements
ix
Contents Acknowledgements ........................................................................................................................ iv
Introduction ................................................................................................................................... xiii
Abstract ................................................................................................................................................ v
Keywords ........................................................................................................................................... vi
Résumé .............................................................................................................................................. vii
Contents ..............................................................................................................................................ix
List of symbols and abbreviations ............................................................................................ xv
List of Tables................................................................................................................................ xviii
List of Figures ................................................................................................................................. xix
List of Equations ..........................................................................................................................xxiii
Introduction. ........................................................................................................ 2
1.1 Systems ......................................................................................................................................... 3
1.1.1 Peptides and proteins .................................................................................................. 3
1.2 On the spectroscopy of peptides and proteins .............................................................. 8
1.2.1 Nuclear magnetic resonance ..................................................................................... 9
1.2.2 X-ray crystallography .................................................................................................. 9
1.2.3 Small angle X-ray scattering (SAXS) .................................................................... 10
1.2.4 Circular dichroism (CD) spectroscopy ............................................................... 11
1.3 References : .............................................................................................................................. 14
Synthetic preparations. ................................................................................ 16
2.1 From chemical substrates to target compounds ....................................................... 16
2.2 Peptides and chromophores. ............................................................................................ 20
2.3 Synthesis ................................................................................................................................... 23
2.4 References : .............................................................................................................................. 28
Instruments. ..................................................................................................... 30
3.1 Mass spectrometry and the mass spectrometer........................................................ 30
3.1.1 Electrospray ionization (ESI)................................................................................. 32
3.1.2 The Detectors for MS................................................................................................. 33
3.1.3 MS excitation and fragmentation methods ...................................................... 33
x
3.2 The mass spectrometer, LTQ Velos ................................................................................ 35
3.2.1 Ion polarity modes ..................................................................................................... 37
3.2.2 Electrospray ionization ............................................................................................ 37
3.2.3 Mass analyzer .............................................................................................................. 38
3.2.4 Principle of the linear quadrupole ion trap ...................................................... 44
3.2.5 Summary of Mass Analyzer Operation ............................................................... 47
3.2.6 Ion detection system ................................................................................................. 48
3.2.7 Helium damping gas in the mass analyser ....................................................... 48
3.3 LASER source .......................................................................................................................... 49
3.3.1 Legend to Horizon OPO Layout ............................................................................. 52
3.3.2 Horizon optical parametric oscillator blueprint ............................................ 53
3.5 Installations ............................................................................................................................. 54
3.5.1 LTQ Velos and LASER UV-Vis coupling set-up. ............................................... 55
3.5.3 LASER alignment ........................................................................................................ 57
3.6 References : .............................................................................................................................. 58
FRET. .................................................................................................................... 60
4.1 Types of energy transfer ..................................................................................................... 60
4.1.1 FÖSTER ........................................................................................................................... 60
4.1.2 Foster Radius ............................................................................................................... 65
4.1.3 Dexter or Electron Exchange Energy Transfer ............................................... 65
4.1.4 Radiative coupling in atomic systems ................................................................ 67
4.3 Conventional FRET — Applications. .............................................................................. 68
4.3.1 Selected applications of FRET in solution ......................................................... 68
4.4 Gas phase mass spectrometry & action FRET ............................................................ 86
4.4.1 Gas phase mass spectrometry ............................................................................... 86
4.4.2 Action spectroscopy .................................................................................................. 88
4.4.3 Action FRET .................................................................................................................. 88
4.5 Experimental and data analysis techniques ................................................................ 89
4.5.1 Inspection of the MS spectrum .............................................................................. 89
4.5.2 Measuring fragmentation ........................................................................................ 90
4.5.3 On building FRET frameworks. ............................................................................. 91
xi
4.5.4 Extracting FRET data ................................................................................................ 96
4.5.5 FRET efficiency determination ............................................................................. 96
4.6 Studying amyloid-beta (12-28) alloforms using action-FRET ............................. 97
4.7 Action-FRET in application. Second study. ................................................................ 109
4.8 References : ............................................................................................................................ 120
Ubiquitin. ........................................................................................................ 126
5.1 Ubiquitin’s identity ............................................................................................................. 126
5.1.1 Function and mechanism ...................................................................................... 127
5.2 Ubiquitin in the gas phase ................................................................................................ 127
5.3 Ubiquitin FRET in the condensed state ....................................................................... 129
5.5 Action-FRET on Ubiquitin in the gas phase ............................................................... 130
5.5.1 Method .......................................................................................................................... 130
5.5.2 Results and discussion ........................................................................................... 132
5.6 On FRET efficiency determination: Ubiquitin framework ................................... 138
5.7 References : ............................................................................................................................ 142
Negative action FRET. ................................................................................. 144
6.1 Honing into negative action-FRET. Introduction. ................................................... 144
6.1.1 Mass Spectrometry and Optical Spectroscopy. ............................................. 144
6.1.2 Experimental .............................................................................................................. 145
6.1.3 Results and discussion ........................................................................................... 146
6.1.4 Conclusion ................................................................................................................... 151
6.2 A case of action-FRET II in the negative mode. ........................................................ 151
6.2.1 Materials and methods ........................................................................................... 152
6.2.2 Results and discussion ........................................................................................... 152
6.2.3 Conlusion ..................................................................................................................... 167
6.3 Outline on encountered difficulties. ............................................................................. 167
6.4 References : ............................................................................................................................ 168
Future developments. ................................................................................ 170
7.1 Conclusion and general perspectives .......................................................................... 170
7.1.1 Conclusion ................................................................................................................... 170
7.1.3 Future developments .............................................................................................. 171

xii
xiii
Introduction The early use of Förster Resonance Energy Transfer (FRET) to study conformation in the liquid
phase has proven particularly useful and is a well-tested and accurate structural tool. However,
differentiating molecules of interest with no bias or interference from neighbouring interac-
tions is a challenge which has yet to be solved. This problem has fuelled the recent development
of transposing FRET to mass spectroscopy techniques. My doctoral research has focused on
progressing with this recent technological advancement.
The research undertaking has taken to address the challenge to study trapped biological mole-
cules in the solvent-free confinement within a mass spectrometer. The advantage of the ap-
proach is that it allows to select and follow the conformational changes and evolution of bio-
molecules (peptides and proteins e.g. ubiquitin) in gas phase isolation without any undesirable
influence that would be found in its direct solution environment. Towards this end, we have
developed a custom built coupled laser mass spectrometry interface to a workstation. Whereby
a beam of tuneable coherent light is deviated and aimed through the back electrode of the dual
linear ion trap so to interact and excite ions of interest within the cavity of the mass spectrom-
eter. This enabled us to study the photophysics of the trapped ions and their conformation, and
report on their findings.
The Gaseous ions in question are formed using electrospray ionization (ESI). From the multiple
charge states that are produced and by selecting and isolating the species of interest, ejecting
all others, it is then possible to examine different charge states of a molecule and donor acceptor
built frameworks individually. These are then taken to interact photo-physically with the tune-
able laser whose energy induces changes in quantum states and dissociation of the traped spe-
cies. A produced photon pulse enters the first cell of a dual linear ion trap such as to react with
a pair of donor acceptor chromophores (dyes) pre-assembled onto the protein or peptide mol-
ecule.
The action spectroscopy, the spectrometric evolution of the breakdown of the acceptor as a
function of wavelength, giving unique specific photofragments is detected and registered to re-
port a FRET efficiency. The technique was nicknamed as action-FRET and has the unique ad-
vantage in that it sidesteps the need to monitor fluorescence unlike other spectroscopy meth-
ods. By this way, the early objective which was to build the proof of principle of action-FRET
and elucidate the molecular conformations of small alanine peptide of differing chain length
using Rhodamine 575 and QSY7 donor acceptor pair of chromophores, was validated.
This action-FRET developed technique was then taken to reach the more challenging goal to
study biomolecules of biological interest: first ubiquitin and then the amyloid beta protein.
These biomolecules of greater three dimensionalities are described in this thesis. Information
on both ubiquitin and Alzheimer proteins, on their spatial geometry and conformation as a
function of charge state were determined.
xiv
In a later experiment, the objective of scrutinising amyloid beta protein complex with amino-
ß-cyclodextrin in gas confinement was established. It has also provided real term answers to
the structural arrangement of an amyloid protein segment in a host-guest interaction with a
cyclodextrin molecule in gas isolation. Finally, efforts were made to test and validate the action-
FRET technique in the negative mode (specifically looking at peptides; CAC, CA3DA3C and
CA3DA3DA3C). During this research, we came across many difficulties, mainly in the synthesis
and isolation of the compounds of interest needed to generate the ion products of a desired
charge state with sufficient spectral quality to carry out experimental manipulations.
In summary, the aim of this dissertation has been to demonstrate and give results on isolated
species in gas confinement and study their action spectroscopy response in rapport to the FRET
mechanism which has the advantage to provide an overview insight on the intrinsic properties
and characteristics of biomolecular systems without bias and without perturbations that would
have existed in the condensed medium. As with the gas phase action spectroscopy approach
any bias or interference from neighbouring species, ensemble average or molecular biochemi-
cal effects are insignificant. The work carried out herein is important as action-FRET provides
the development of a new quantitative structural tool that can glean new light on biomolecules
in the interest of structural biology and biochemistry which are not accessible or not as directly
available when using conventional biochemical approaches. Action-FRET also has its interest
as it is useful to validate the mechanisms and distance structural relationships developed by
computer molecular dynamics models produced by group co-researchers.
xv
List of symbols and abbreviations
A Acceptor specific fragmentation yield
AC Alternating current
AChR Acetylcholine receptor
ALCP Absorbance of left circularly polarized light
Amu Atomic masse unit
AR Anti reflective
ARCP Absorbance of right circularly polarized light
ATP Adenosine triphosphate
BBO Beta barium borate i.e. β-BaB2O4
BODIPY 4,4-difluoro-4-bora-3a,4a-diaza-s-indacene
C4 Butyl-type hydrocarbon chain with four carbon atoms
CA Collisional activation
CAD Collisionally activated dissociation
cAMP Cyclic adenosine monophosphate
CCS Collision cross section
CD Circular dichroism
CyD Cyclodextrin
CFP Cyan fluorescent protein
CID Collision induced dissociation
CMR Mean residue concentration
CP Consensus peptide
CPU Central processing unit
CRM Charge residue model
CTMR 5-carboxytetramethylrhodamine
DABCYL 4-{(E)-[4-(Dimethylamino)phenyl]diazenyl}benzoic acid
DC Direct current
DHP Dihydropyridine
DMBODIPY [(-)-1,4-dihydro-2,6-dimethyl-4-2-(2-trifluoromethylphenyl)-3,5-
pyridinedicarboxylic acid 2-[4,4-difluoro-5,7-dimethyl-4-bora-
3a,4a-diaza-3-(s-indacene)propionylamino]ethylethylester)]
DMSO Dimethyl sulfoxide
DNA Deoxyribonucleic acid
DNP 2,4-dinitrophenyl
DTT Dithiothreitol
ECD Electron capture dissociation
EDANS 5-[(2-Aminoethyl)amino]-1-naphthalenesulfonic acid
EGF Epidermal growth factors
ESI Electrospray ionisation
EET Excitation energy transfer
xvi
FAM Fluorescein amidite
FRET Fluorescence or Föster resonance energy transfer
FT-ICR Fourier transform ion cyclotron resonance
FWHM Full width at half maximum
GFP Green fluorescent protein
GMP Guanosine monophosphate
G-proteins Guanine nucleotide-binding proteins
GPCR
HCD
G protein-coupled receptors
High energy collisional activation dissociation
HIV-1 PR Human immunodeficiency protease
HOMO Highest occupied molecular orbital
HPLC High-performance liquid chromatography
IADANS 8-Hydroxy-9-oxo-9H-xanthen-2-yl β-D-glucopyranosiduronic acid
IASF Intensity of acceptor specific fragmentation
IEM Ion evaporation model
IgE Immunoglobuline E
IMS Ion mobility spectroscopy
ITIC Intensity of the total ion count or chromatogram
IRMPD
LCMO
Infrared multiple photon dissociation
Low mass cutoff
LID Laser induced dissociation
LIT Linear ion trap
LTQ Linear trap quadrupole
LUMO Lowest unoccupied molecular orbital
LY Lucifer Yellow CH
MD Molecular dynamics
MS Masse spectrometry or mass spectroscopy
m/z Masse ratio of a charged ion
NBD 7-nitro-2, 1, 3-benzoxadiazol-4-yl
NMR Nuclear magnetic resonance
nsL-TP Nonspecific lipid transfer protein
OPO Optical prametric oscillator
Pdb Protein databank
PCR Polymerase chain reaction
PC-TP Phophatidylcholine-specific transfer protein
PEG Polyethylene glycol(s)
Q00 First quadrupole piece
Q0 Second quadrupole piece
Q1 Octapole
QSY Carboxylic acid succinimidyl ester, nomenclature varies for specific
versions
R575 Carboxyrhodamine 575 C5-maleimide
xvii
REACh Resonance Energy-Accepting Chromoprotein
REMD Replica exchange molecular dynamics
Rf Radio frequency
ROX Carboxy X-rhodamine
SAXS Small angle X-ray scattering
SNP Single nucleotide polymorph
smFRET Single molecule FRET
STR Short tandem repeats
SUMO Small ubiquitin like modifier
TC Transfer close
TCEP Tris(2-carboxyethyl) phosphine
TDI Template directed dye terminator incorporation
TI Transfer initialise
TIC Total ion count
TO Transfer dwell
TOF Time of flight
TAMRA 6-carboxy-tetramethyl-rhodamine
Ubc Ubiquitin carrier protein
UBI Ubiquitin, associated to ubiquitin mutant
Ubl Ubiquitin-like modifier protein
UV Ultraviolet
UV-Vis Ultraviolet visible
Ve Voltage
YAG Yttrium aluminium garnet
YFP Yellow fluorescent protein
XRF X-ray fluorescence spectroscopy
EDXRF Energy dispersive X-ray fluorescence spectroscopy
WDXRF Wavelength dispersive X-ray fluorescence spectroscopy
λA Excitation wavelength of the acceptor
λD Excitation wavelength of the donor
Φ Fluence

Acknowledgements
xviii
List of Tables
Table 2.1.1. Reaction conditions for QSY9-CA3DA3C-ATTO514. ............. 19
Table 2.2.1. The catalogue of chromophores used in the research theme.21
Table 2.2.2. Peptides. ................................................................................................. 22
Table 2.3.1. Available solvents used in experiments. ................................... 26
Table 3.2.1. Characteristics of the LTQ Velos. .................................................. 46
Table 3.3.1. OPO items. .............................................................................................. 52
Table 4.1.1. Typical values of 𝑅𝑂 [10] .................................................................. 65
Table 4.3.1. Energy transfer parameters and spectroscopic constants . 73
Table 4.5.1. Catalogue of expected m/z values and calculated exact mass of
species of interest. ...................................................................................................... 89
Table 4.6.1. Summary compilling the measured and calculated collision cross
sections and action FRET data. ........................................................................... 100
Table 5.6.1. Major fragment peaks observed in the LID mass spectrum of [d-
UBI-a +8H]10+ initiated by photon irradiation at either 545 nm or 505 nm.
......................................................................................................................................... 139
Table 6.2.1. Absorption maxima (λmax) in the gas and solution phase and
fluorescence maxima (λfl) for QSY9 and ATTO514 where available. ... 152
Table 6.2.2. The fragmentation species. ......................................................... 158
Table 6.2.3. The structures of the breakdown species. ............................. 158
Table 6.2.4. Peak position, height and area for donor and acceptor and the
FRET efficiency scores. ........................................................................................... 166
Acknowledgements
xix
List of Figures Figure 1.1.1. The α position on an amino-acid residue. ..................................4
Figure 1.1.2. The amino-acid zwiterrion. ..............................................................4
Figure 1.1.3. Protein derived amino acids and their letter codes. ..............5
Figure 1.1.4. Peptide coupling, the condensation reaction. ...........................6
Figure 1.1.5. The torsional angles in the backbones of proteins. ................6
Figure 1.1.6. Coercive structural interactions .....................................................7
Figure 1.1.7. The structural levels of proteins. ..................................................8
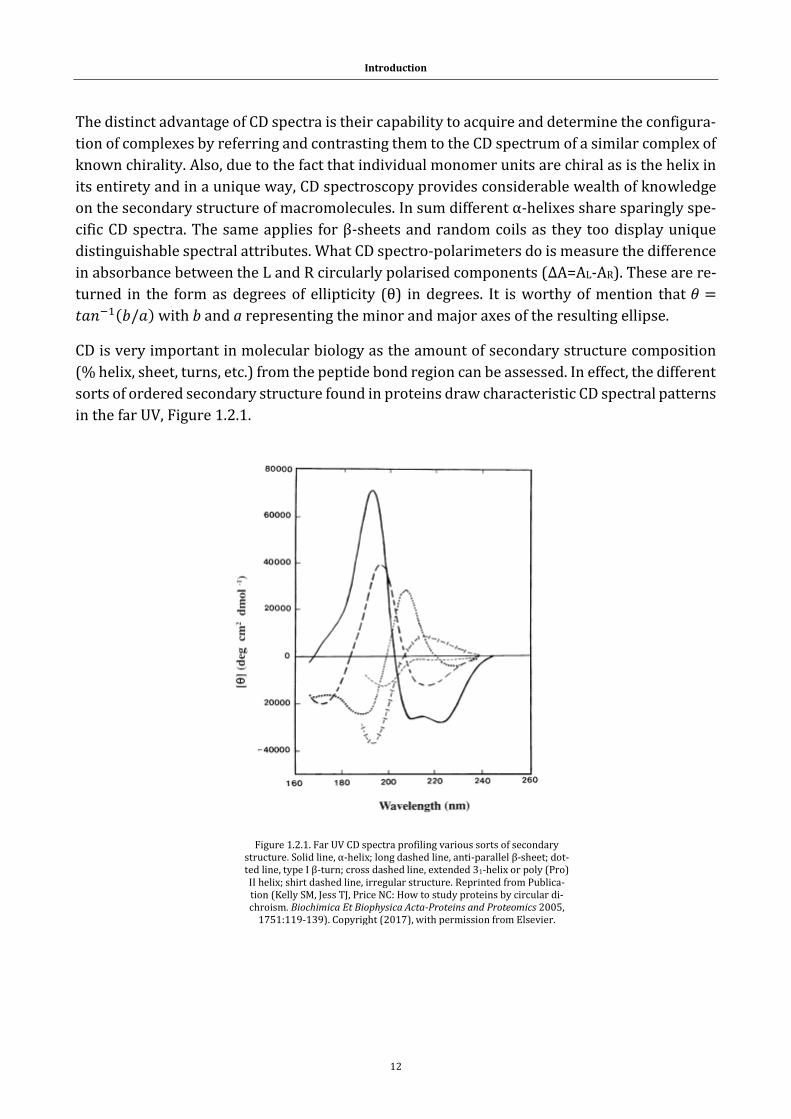
Figure 1.2.1. Far UV CD spectra profiling various sorts of secondary structure.
............................................................................................................................................ 12
Figure 3.1.1. The set-out of a Mass Spectrometer instrument. .................. 31
Figure 3.1.2. Pictorial representation of the electrospray ionization (ESI). 33
Figure 3.2.1. The Thermo Scientific LTQ Velos ................................................ 35
Figure 3.2.2. Functional layout of the linear ion trap .................................... 36
Figure 3.2.3. LTQ Velos mid-section mass filtering ion optics ................... 37
Figure 3.2.4. A functional representation of the ESI. ..................................... 38
Figure 3.2.5. Pictorial diagram of a linear quadrupole ................................. 40
Figure 3.2.6. Cross section of a quadrupole ...................................................... 40
Figure 3.2.7. Stability diagram for a linear quadrupole analyzer ............. 42
Figure 3.2.8. Upper half of region I of the linear quadrupole ..................... 42
Figure 3.2.9. U/V=constant linked scan .............................................................. 43
Figure 3.2.10. A pictorial depiction of the hyperbolic linear ion trap .... 44
Figure 3.2.11. Ion ejection paths, radial and axial. ......................................... 45
Figure 3.2.12. An ion ‘Scan out’ representation .............................................. 47
Figure 3.3.1. Horizon OPO and Surelite laser ................................................... 49
Figure 3.3.2. Beta barium borate harmonic crystal. ...................................... 51
Figure 3.3.3. Functional layout of the Horizon OPO ...................................... 53
Figure 3.5.1. The LASER-MS appliance. .............................................................. 54
Figure 3.5.2. A brief outline on the setup used to modulate power ........ 55
Figure 3.5.3. A panel illustrating the sychronisation between the triggering
from the MS computer, the shutter mechanics, and the laser wave pulsing 56
xx
Figure 4.1.1. FRET described in a Jablonski diagram .................................... 61
Figure 4.1.2. The spectra of a pair of fluorescent dyes ................................. 61
Figure 4.1.3. Spectral excitation-adsorption bands ....................................... 62
Figure 4.1.4. Angles describing the orientation of the dipoles .................. 63
Figure 4.1.5. Functional mechanisms ― Energy level diagrams ............... 66
Figure 4.3.1. Illustration on the procedure for measuring unfolding rates by
energy transfer ............................................................................................................. 69
Figure 4.3.2. Figures on F-actin ............................................................................. 70
Figure 4.3.3. Fluorescence energy transfer figure .......................................... 71
Figure 4.3.4. Equilibrium binding properties and pharmalogical profile of
DMBODIPY-DHP binding to L-type Ca2+ channels using FRET ................. 72
Figure 4.3.5. Time evolution of a doubly labelled DNA ................................ 75
Figure 4.3.6. FRET in the context of DNA hybridisation .............................. 76
Figure 4.3.7. Operation of the molecular beacons. ......................................... 77
Figure 4.3.8. Chemiluminescence induced by differently coloured molecular
beacons to the addition of a target ....................................................................... 78
Figure 4.3.9. Double labelled probe: 16-base oligodeoxyribonucleotide.79
Figure 4.3.10. Illustrative diagram of model used to fit the FRET data.. 80
Figure 4.3.11. Linear correlation between fusion index and ∆R′ ............. 82
Figure 4.3.12. Voltage sensitive FRET mechanism......................................... 83
Figure 4.3.13. Quenching of the EDANS fluorophore .................................... 84
Figure 4.3.14. Fractional saturation of Zn (CP-L-F) as a function of Zn (II) added
............................................................................................................................................ 85
Figure 4.4.1. The mechanism of evolution in prior to ESI of the structure of a
globular protein (e.g. cytochrome c, ubiquitin) ............................................... 87
Figure 4.5.1. Spectrum: QSY7-amino- β -cyclodextrin FullMS ................... 90
Figure 4.5.2. QSY7-AAK+ QSY7-CID (normalised collision energy of 27) and LID
............................................................................................................................................ 91
Figure 4.5.3. Breakdown sites of the acceptor chromophore QSY ........... 92
Figure 4.5.4. Acceptor, QSY7-AAK+ optical action spectrum ...................... 92
Figure 4.5.5. QSY9 solution absorption spectrum. ......................................... 93
Figure 4.5.6. Donnor, Rh6G-AAK+ optical action spectrum. ....................... 94
Figure 4.5.7. (Rh6G-AAK-Rh6G)2+ optical action spectrum. ....................... 95
xxi
Figure 4.5.8. (Rh6G-AAK-QSY7)2+ optical action spectrum ........................ 95
Figure 4.6.1. CCS plotted against FRET efficiency ....................................... 100
Figure 4.6.2. Representative conformations ................................................. 101
Figure 4.6.3. The Ramachandran plot for poly alanine. ............................ 102
Figure 4.6.4. Ramachandran plots ..................................................................... 103
Figure 4.6.5. Ramachandran plots ..................................................................... 104
Figure 4.7.1. Selected host-guest partners for experimentation ........... 109
Figure 4.7.2. Action spectrum of mass selected [amino-β-CyD-QSY]+. 111
Figure 4.7.3. Gas phase fragmentation mass spectra ................................. 112
Figure 4.7.4. CID (normalised collision energy set at 15, 10) mass spectra of
binary complexes ..................................................................................................... 113
Figure 4.7.5. LID mass spectra (545nm excitation) of binary complexes
containing Rh-CAβ and amino-β-CyD-QSY7 as the guest and the receptor,
respectively ................................................................................................................ 114
Figure 4.7.6. LID (505nm) of mass selected [AβC-Rh575+H]2+ ions irradiated
with a single laser pulse (2mJ). ........................................................................... 115
Figure 4.7.7. LID (505nm) mass spectrum of mass selected [AβC-Rh575+H]3+
ions irradiated with single laser pulse (5mJ). ............................................... 115
Figure 4.7.8. Action spectra. ................................................................................. 116
Figure 4.7.9. Branching ratio ............................................................................... 117
Figure 4.7.10. Branching ratio ............................................................................. 118
Figure 5.1.1. Seventy-six residue long ubiquitin (X-ray, 1.5Å, monomer state)
adapted from swiss-model ................................................................................... 126
Figure 5.5.1. Ubiquitin mutant and chromophores .................................... 131
Figure 5.5.2. Bovine Ubiquitin erythrocyte mutant. ................................... 131
Figure 5.5.3. Circular dichroism signal ............................................................ 133
Figure 5.5.4. Mass spectrum following ESI of bovine ubiquitin ............. 135
Figure 5.5.5. Collision cross section figure ..................................................... 136
Figure 5.5.6. Collision cross section results ................................................... 137
Figure 5.6.1. Mass spectra of mass-selected [d-Ubi-a +8H]10+ ions ...... 138
Figure 5.6.2. Experimental FRET efficiency ................................................... 140
Figure 5.6.3. FRET efficiency as a function of charge state ...................... 140
xxii
Figure 5.6.4. Representative folds of doubly grafted ubiquitin. Native like (†)
and extended (‡) forms.......................................................................................... 141
Figure 6.1.1. Eosin-Y cystein negative mode fragmentation pathways, CID (top)
and LID (bottom) at 490nm. ................................................................................ 147
Figure 6.1.2. Action optical spectrum for EYM 1-, 2- and NBD-CYS. .... 148
Figure 6.1.3. Linear dependence of the fragmentation of CAADAAEAA with
power. A one photon process. ............................................................................. 149
Figure 6.1.4. Action optical spectrum for NBDmaleimide-CAKAC-Eosin.150
Figure 6.1.5. FRET efficiency against charge state ...................................... 150
Figure 6.2.1. Optical action spectra of [ATTO514]- and [QSY9]-. ........... 153
Figure 6.2.2. ATTO514-CAA (yellow curve) and QSY9-CAA (purple curve)
normalized optical spectra. .................................................................................. 154
Figure 6.2.3. Excitation and emission spectrum for ATTO514 in solution.154
Figure 6.2.4. Optical absorption spectra of [ATTO514,QSY9]2- dimer overlaid
against optical absorption spectra of [ATTO514] - and [QSY9]-. ............ 155
Figure 6.2.5. QSY-CAA LID and CID figure ...................................................... 157
Figure 6.2.6. Bond breaking sites of QSY9 molecule. ................................. 159
Figure 6.2.7. Comparing the [QSY-CAA]- spectra. ........................................ 160
Figure 6.2.8. Branching ratio of the fragmentation efficiency ................ 161
Figure 6.2.9. a) d-CAC-a (2- ) normalized optical spectra reserved to the m/z
625 specific photofragment b) loss of QSY9 m/z 980 c) loss of ATTO514 m/z
874. ................................................................................................................................ 162
Figure 6.2.10. Peptide ion optical spectra ...................................................... 163
Figure 6.2.11. Peptide ion optical spectra ...................................................... 164
Figure 6.2.12. Mobility profiles ........................................................................... 166

xxiii
List of Equations
Equation 3.2.3.1 - Potential relations .......................................................................
Equation 3.2.3.2 - Potential relations .......................................................................
Equation 3.2.3.3 - Description of the electrical bias ..........................................
Equation 3.2.3.4 - Mathieu expression .....................................................................
Equation 3.2.3.5 - Mathieu expression .....................................................................
Equation 3.2.3.6 - Identity of some terms...............................................................
Equation 4.1.1.1 - Föster’s relationship for molecular interaction ...............
Equation 4.1.1.2 - Description of the orientation factor ...................................
Equation 4.1.2.1 - Description of the R0 term ........................................................
Equation 4.1.3.1 - Treatment of the Dexter process ...........................................
Equation 4.5.2.1 - Fragmentation yield ...................................................................

Introduction
1
Introduction
2
Introduction.
The bullion of this dissertation: Foster resonance energy transfer (FRET), is a technique used
to provide structural information on biomolecules and its setting. It is important to assimilate
and recall on what is known in this arena, on molecular biochemistry. This priority is focused
on in chapter one. The section sets out to give the essential background knowledge on proteins,
their function and make up, together with a comprehensive on current methods of their struc-
tural analysis and spectroscopic characterization.
There is a mounting understanding that it is not only important to define a protein’s structure
but to also develop an idea on how this structure or conformer of the biomolecule evolves from
primary all the way to quaternary structural arrangements (cf. structural organization of a real
protein, transthyretin). An insight on gas-phase spectroscopic developments such as action
spectroscopy is presented later, in chapter four, bringing about a way to address the problem-
atic: finding ways in unveiling intrinsic biomolecular properties (also in gas isolation).

Introduction
3
1.1 Systems
1.1.1 Peptides and proteins
Proteins routed from the Greek προτειοσ, “ranked first”, are complex molecules that play a ma-
jor role, if not the most important, in the function and chemistry of living things. They are a class
of natural polymers that make up, arguably, near 15% of our bodies with relative molar masses
ranging from 6000 to 1,000,000 grams per mole [1]. Each biopolymer can fulfill a myriad of
specialised or general tasks and purposes essential to the survival of bio-organisms. A brief
review of these are underscored in the section below [2, 3].
1 . Structure. Cartilage, hair, wool, fingernails and claws are mainly protein. Viruses have an exterior layer of protein, shelling a nucleic acid core. Similarly, specialized proteins such as actin provide fundamental skeletal architecture to cells. Proteins called histones are fixated tightly to DNA, helping to fold and furl the DNA in an orderly fashion in chromosomes.
2 . Motility. Proteins are the principal substituents of muscle and permit the muscle to con-tract. Sperm movement is the result of protein filaments tightening in their tails. Protein structural change also governs chromosome motility important to cell division.
3 . Catalysis. The catalysis of chemical reactions by enzymes conditioned in biologics are al-most always proteins.
4 . Transport. The obvious function of transport membrane proteins. Proteins that allows a controlled passage of substrates and ions to the cell. Another protein, hemoglobin is fa-mously known to carry oxygen from the lungs to other tissues. By the same token the pro-tein transferrin transports iron in blood plasma from the intestines (where the iron is ab-sorbed) to the spleen (storage) and finally to the liver and bone marrow for synthesis.
5 . Storage. There are a variety of proteins that coordinate [4, 5] and stock ionic trace ele-ments, among others. As mentioned above ferritin is responsible in dealing with iron.
6 . Energy transformation and storage. Useful work is derived from the chemical energy that is made available by muscle proteins such as myosin.
7 . Protection. A function managed by a class of their own, antibodies. These proteins tackle foreign substances and pathogens. They fixate themselves to those substances or cells termed antigens, providing us with immunity to a variety of diseases. Other protective pro-teic species, such as interferon exist with their own mode of action.
8 . Control. As hormones, insulin or glucagon for example, proteins are key in the transmis-sion and control of chemical information that directs the metabolism of living organisms.
9 . Buffering. As proteins hold both acidic and basic functional groups exposed on their side chain, they tend to neutralise both acids and bases. Effectively purveying the buffering of blood and tissues.
Introduction
4
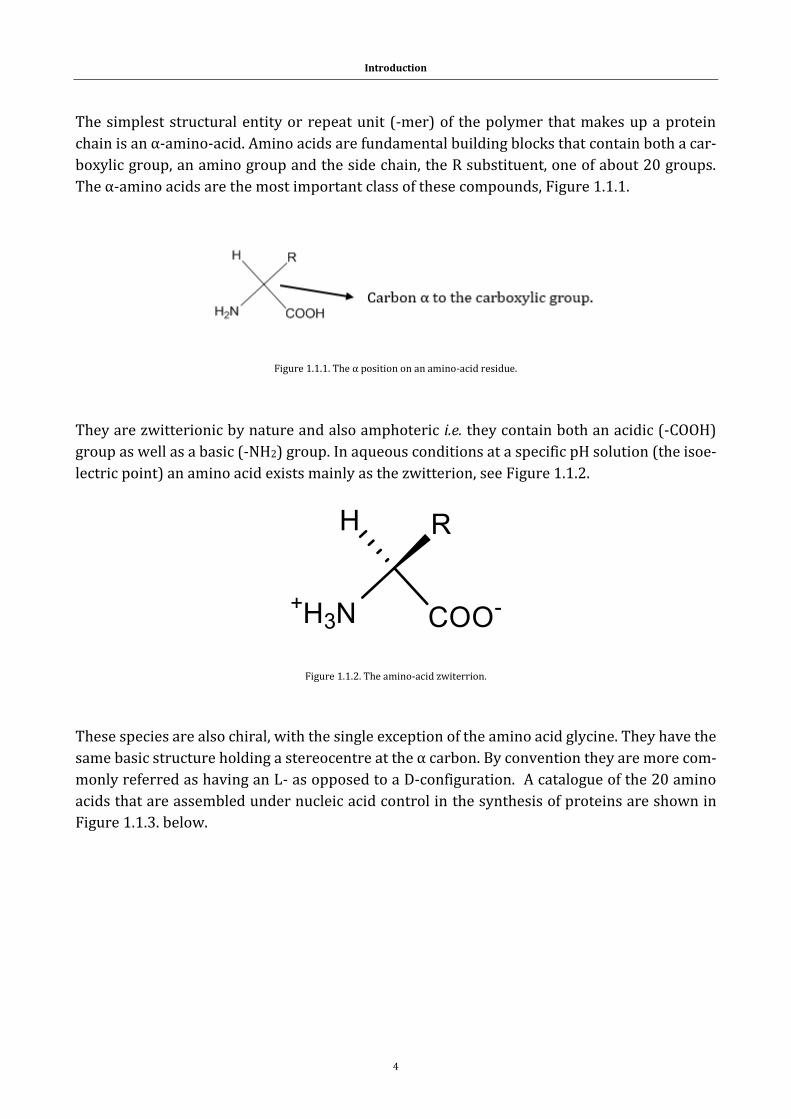
The simplest structural entity or repeat unit (-mer) of the polymer that makes up a protein
chain is an α-amino-acid. Amino acids are fundamental building blocks that contain both a car-
boxylic group, an amino group and the side chain, the R substituent, one of about 20 groups.
The α-amino acids are the most important class of these compounds, Figure 1.1.1.
They are zwitterionic by nature and also amphoteric i.e. they contain both an acidic (-COOH)
group as well as a basic (-NH2) group. In aqueous conditions at a specific pH solution (the isoe-
lectric point) an amino acid exists mainly as the zwitterion, see Figure 1.1.2.
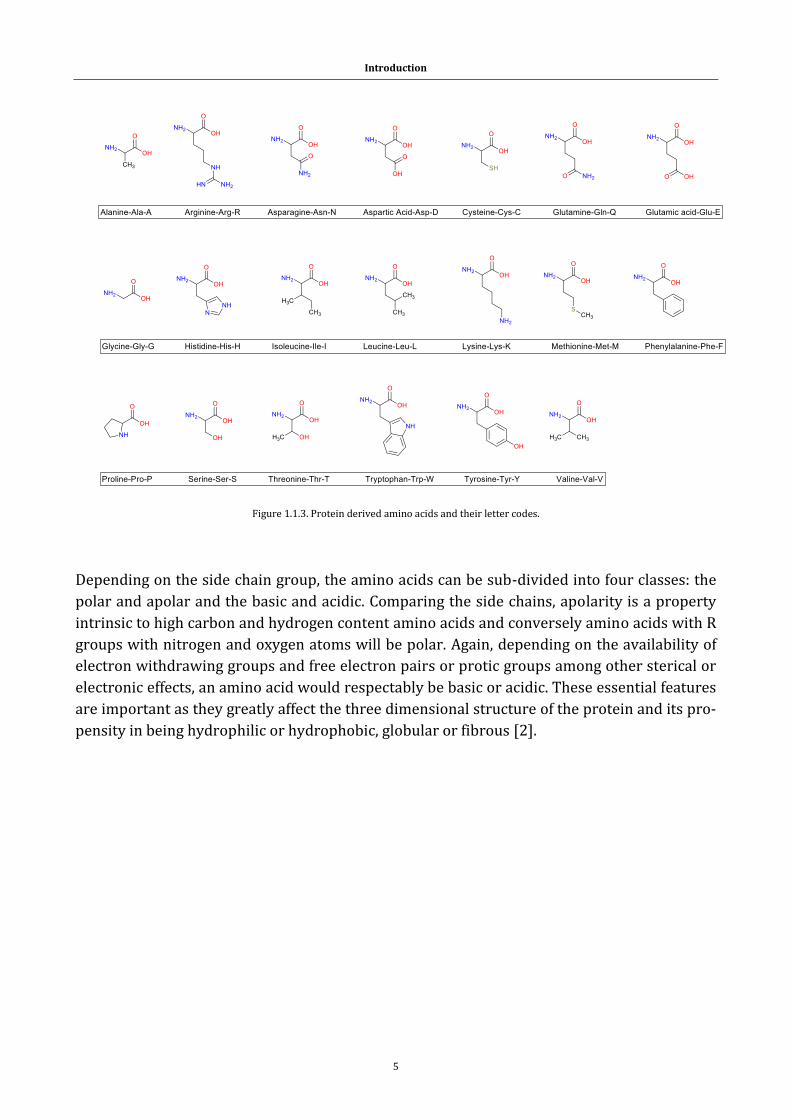
These species are also chiral, with the single exception of the amino acid glycine. They have the
same basic structure holding a stereocentre at the α carbon. By convention they are more com-
monly referred as having an L- as opposed to a D-configuration. A catalogue of the 20 amino
acids that are assembled under nucleic acid control in the synthesis of proteins are shown in
Figure 1.1.3. below.
Figure 1.1.1. The α position on an amino-acid residue.
Figure 1.1.2. The amino-acid zwiterrion.
Introduction
5
Depending on the side chain group, the amino acids can be sub-divided into four classes: the
polar and apolar and the basic and acidic. Comparing the side chains, apolarity is a property
intrinsic to high carbon and hydrogen content amino acids and conversely amino acids with R
groups with nitrogen and oxygen atoms will be polar. Again, depending on the availability of
electron withdrawing groups and free electron pairs or protic groups among other sterical or
electronic effects, an amino acid would respectably be basic or acidic. These essential features
are important as they greatly affect the three dimensional structure of the protein and its pro-
pensity in being hydrophilic or hydrophobic, globular or fibrous [2].
Figure 1.1.3. Protein derived amino acids and their letter codes.
Introduction
6
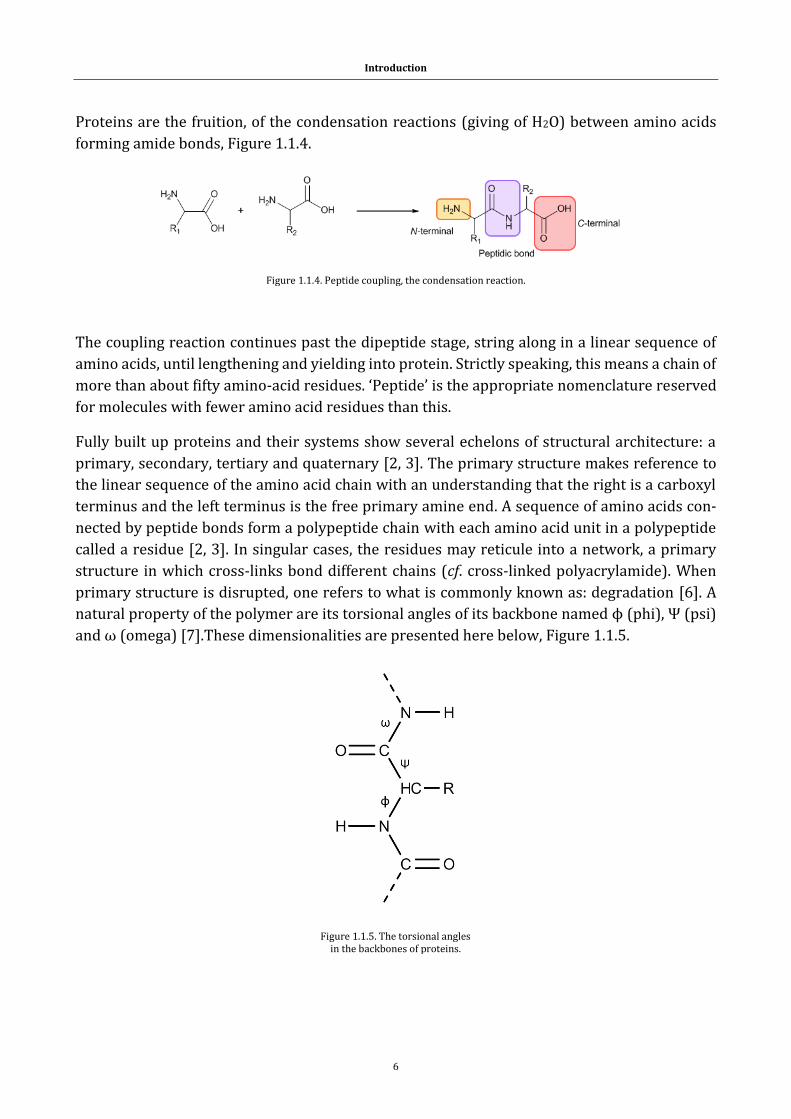
Proteins are the fruition, of the condensation reactions (giving of H2O) between amino acids
forming amide bonds, Figure 1.1.4.
The coupling reaction continues past the dipeptide stage, string along in a linear sequence of
amino acids, until lengthening and yielding into protein. Strictly speaking, this means a chain of
more than about fifty amino-acid residues. ‘Peptide’ is the appropriate nomenclature reserved
for molecules with fewer amino acid residues than this.
Fully built up proteins and their systems show several echelons of structural architecture: a
primary, secondary, tertiary and quaternary [2, 3]. The primary structure makes reference to
the linear sequence of the amino acid chain with an understanding that the right is a carboxyl
terminus and the left terminus is the free primary amine end. A sequence of amino acids con-
nected by peptide bonds form a polypeptide chain with each amino acid unit in a polypeptide
called a residue [2, 3]. In singular cases, the residues may reticule into a network, a primary
structure in which cross-links bond different chains (cf. cross-linked polyacrylamide). When
primary structure is disrupted, one refers to what is commonly known as: degradation [6]. A
natural property of the polymer are its torsional angles of its backbone named ϕ (phi), Ψ (psi)
and ω (omega) [7].These dimensionalities are presented here below, Figure 1.1.5.
Figure 1.1.4. Peptide coupling, the condensation reaction.
Figure 1.1.5. The torsional angles in the backbones of proteins.
Introduction
7
The secondary structure encompasses in part the conformations that are energetically fa-
voured by available bond rotations depending on hydrogen bonding between the lone pairs of
the oxygen atoms in the carbonyl group pertaining to the peptidic backbone chain and the hy-
drogens bonded to the nitrogen of another amino acid of the polypeptide. This is how α-helix,
pleated sheets or β-sheets and finally structural arrangements come around. They are a result
of intrachain (within a given protein chain) hydrogen bonding. The random-coil is a “wastebas-
ket” conformational architecture that describes packet protein assembly, it is used to make the
distinction from a total unraveled arrangement. Nevertheless, this does not exempt them from
high control or specificity. Other structural denomination such as the “hairpin loop” that match
well how residues arrange themselves have become popular within the community [2, 3]. From
an informative standpoint, the loss of secondary structure is called denaturation [6]. The third
echelon of order depicts how the various secondary structural folds come together giving the
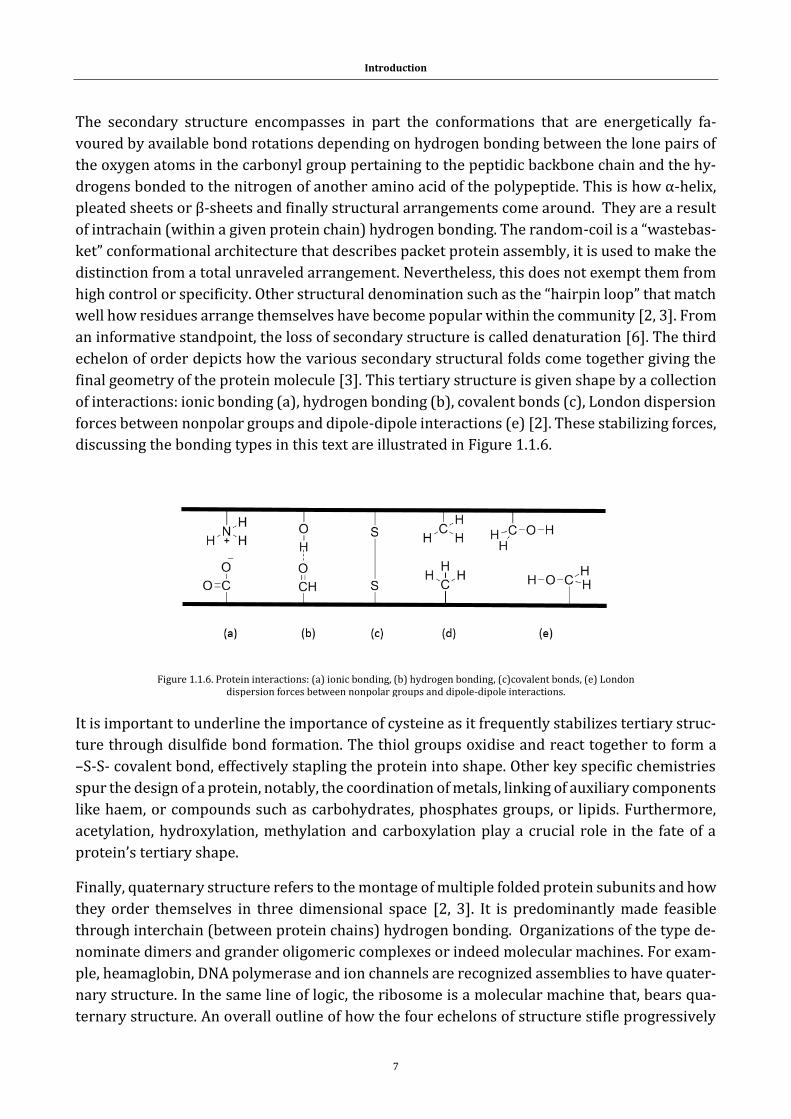
final geometry of the protein molecule [3]. This tertiary structure is given shape by a collection
of interactions: ionic bonding (a), hydrogen bonding (b), covalent bonds (c), London dispersion
forces between nonpolar groups and dipole-dipole interactions (e) [2]. These stabilizing forces,
discussing the bonding types in this text are illustrated in Figure 1.1.6.
It is important to underline the importance of cysteine as it frequently stabilizes tertiary struc-
ture through disulfide bond formation. The thiol groups oxidise and react together to form a
–S-S- covalent bond, effectively stapling the protein into shape. Other key specific chemistries
spur the design of a protein, notably, the coordination of metals, linking of auxiliary components
like haem, or compounds such as carbohydrates, phosphates groups, or lipids. Furthermore,
acetylation, hydroxylation, methylation and carboxylation play a crucial role in the fate of a
protein’s tertiary shape.
Finally, quaternary structure refers to the montage of multiple folded protein subunits and how
they order themselves in three dimensional space [2, 3]. It is predominantly made feasible
through interchain (between protein chains) hydrogen bonding. Organizations of the type de-
nominate dimers and grander oligomeric complexes or indeed molecular machines. For exam-
ple, heamaglobin, DNA polymerase and ion channels are recognized assemblies to have quater-
nary structure. In the same line of logic, the ribosome is a molecular machine that, bears qua-
ternary structure. An overall outline of how the four echelons of structure stifle progressively
Figure 1.1.6. Protein interactions: (a) ionic bonding, (b) hydrogen bonding, (c)covalent bonds, (e) London dispersion forces between nonpolar groups and dipole-dipole interactions.
Introduction
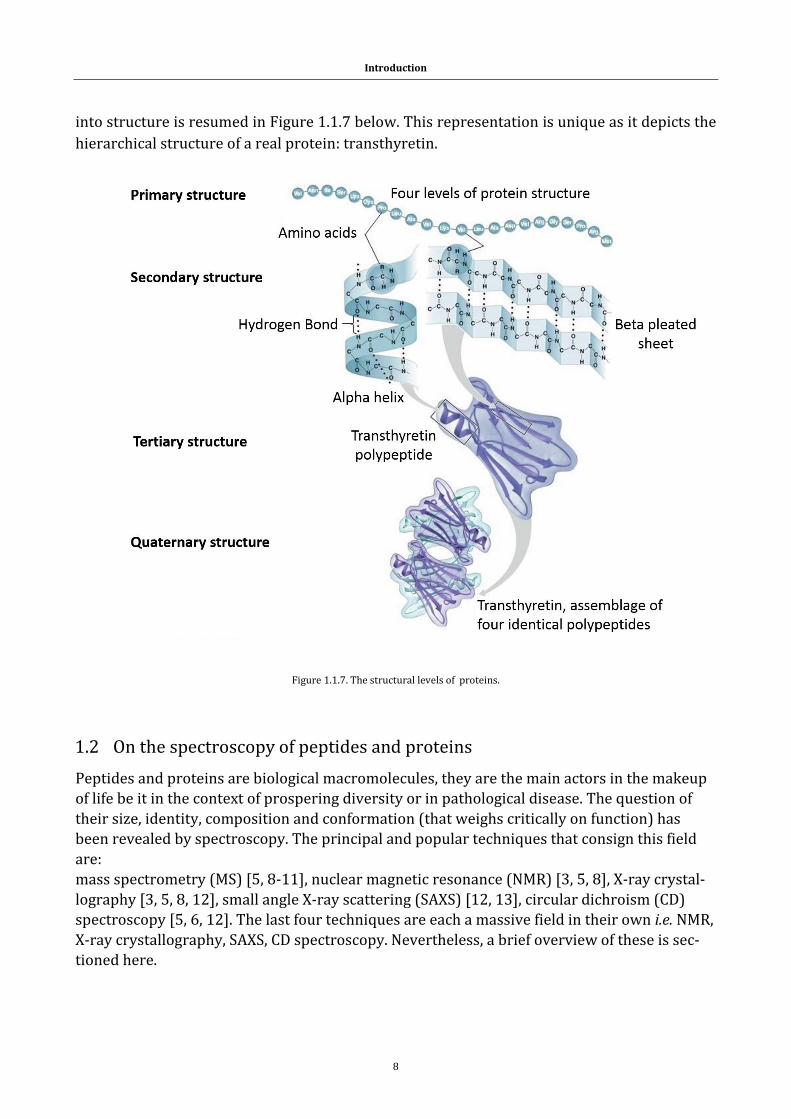
8
into structure is resumed in Figure 1.1.7 below. This representation is unique as it depicts the
hierarchical structure of a real protein: transthyretin.
1.2 On the spectroscopy of peptides and proteins
Peptides and proteins are biological macromolecules, they are the main actors in the makeup
of life be it in the context of prospering diversity or in pathological disease. The question of
their size, identity, composition and conformation (that weighs critically on function) has
been revealed by spectroscopy. The principal and popular techniques that consign this field
are:
mass spectrometry (MS) [5, 8-11], nuclear magnetic resonance (NMR) [3, 5, 8], X-ray crystal-
lography [3, 5, 8, 12], small angle X-ray scattering (SAXS) [12, 13], circular dichroism (CD)
spectroscopy [5, 6, 12]. The last four techniques are each a massive field in their own i.e. NMR,
X-ray crystallography, SAXS, CD spectroscopy. Nevertheless, a brief overview of these is sec-
tioned here.
Figure 1.1.7. The structural levels of proteins.
Introduction
9
1.2.1 Nuclear magnetic resonance
Fully as praiseworthy the technique has become to be, there have been six Nobel prizes
awarded up till now to researchers dedicated to the subject. Today, the most well-known ap-
plication of this spectroscopic method is magnetic resonance imaging or MRI. In a nutshell,
NMR exploits the physical observation that nuclei in a magnetic field absorb and re-emit elec-
tromagnetic radiation. From this principle the magnetic properties of certain atomic nuclei
can be used to assess intimate information about the structure, dynamics, reaction state and
chemical environment of molecules. The first NMR instrument made available commercially
was relased in 1961 and gradual improvements in magnet technology have been made reach-
ing ever stronger field strengths needed to uncover yet finer details on analytical compounds
[8]. Nowadays, more than ever, it comes in a wide range of geometries and serves different
purposes. One –dimensional NMR is routinely used by chemists to examine and identify inter-
atomic structures in molecules. Two-dimensional techniques are deployed to determine how
various atoms (their spins) relate to each other, most often in larger molecular frameworks.
Time domain NMR spectroscopic methods are used to assay molecular dynamics in solutions.
Furthermore, solid state NMR spectroscopy is useful in ascribing the molecular structure of
solids. Other scientists have developed NMR methods for measuring diffusion coefficients
[14]. The NMR technique finds a connection with the work of this thesis in that it was time ago
used to unveil and assign the sequence and secondary structure of human ubiquitin [15]. In
spite of recent advancements, sensitivity remains a limitation. In effect, as an alternating mag-
netic field is subjected on the sample, typically by radiofrequency radiation, the nuclei spin
states change and as they relax back down in the absence of the field they emit the signals that
define the species at study [8]. The pitfalls lie in the magnitude of energy difference between
the spin states that is very minuscule. This means that the population differences between the
spin states are also intricately small. In summary, NMR can somewhat be of an insensitive
technique as only a small proportion of the nuclei generate a feedback that can be used to
work out information on the analyte [16]. Another major bottleneck is achieving the required
sample purity for analysis and even then, interpretation can prove difficult. Also, as new appli-
cations and markets are continuously found, NMR remains a professional instrument with a
prohibitive cost (purchase and maintenance) and limit’s it from being a democratic instru-
ment, at the reach for many [16].
1.2.2 X-ray crystallography
Life around us comes in manner shapes and forms but the broadest categories admittedly
take in amorphous and crystalline solids. X-ray crystallography can be set up to determine the
physico-chemical composition of the latter range of objects. Its value stems from its non-de-
structive and potential for identification in a sample. Typical applications areas include paint,
glass, pottery, ceramics, metals and alloys, soil, plastics and fabrics. The fundamental
knowledge is gained by subjecting the crystalline solids (those that present a high internal ar-
rangement of their components) to X-ray radiation. X-ray radiation that are wavelengths of
the order of 0.001nm to 10nm and are the product of electrons decelerating or transitioning
from an energy level to another within the shell of an atom [17]. The dispersed X-rays give a
Introduction
10
unique diffraction pattern, in other words the light and dark areas on the detectors occur be-
cause the waves deflected from various atoms reinforce or cancel each other out. As the dis-
tance traveled after defraction depends on the distance between the atoms, the diffraction
pattern can be used to determine how atoms are coordinated in space to one another. The
technological advancement noticed its true significance when it led to the groundbreaking
elucidation of DNA’s structure in 1953. Pleasingly, from then on, the last decades have seen
several variations of the technique (e.g. X-ray fluorescence spectroscopy (XRF), energy disper-
sive XRF crystallography (EDXRF) or even wavelength dispersive XRF (WDXRF) [17]). X-ray
crystallography today continues to make huge impacts and produce motivating data in the
discipline of biochemistry and the physical sciences. What is important to take on from this
section is that the initial step of generating the diffraction pattern is moved on to a workflow
that starts with elucidating the basic structural shape, more accurately phase information is
solved. Then, the next step consists in taking the interpretative data to produce an electron
density map, the model is taken to build up. Finally, the preliminary model is refined repeti-
tively against the raw data, to a closing model where it is made sure no electron density rests
unaccounted. The final model’s quality is weighed with a percentage known as the R-factor, it
is an expression of the agreement between the model and the data (typically between 0.15
and 0.20) [4]. This widely adaptive method that is X-ray crystallography is disadvantaged
however in that firstly it is limited to scrutinising crystalline solids, liquid samples needing
considerable sample preparation. These are taken to solidify through chemical treatment. In a
second part, it still remains difficult to interpret, resolution can be an issue especially as the
repeating unit of the crystal becomes larger and more complex. The difficulty also in obtaining
crystals that diffract at high resolution exists, also it is important to realise that some protein
molecules have resisted all attempts to crystallize them [4].
1.2.3 Small angle X-ray scattering (SAXS)
Small scattering of X-rays is a powerful diffraction method for examining the structure of mat-
ter. This analytical technique based on elastic scattering is used in various themes of work in
science and technology, notably condensed matter physics, molecular biology and biophysics,
polymer science and metallurgy. Take for example the combined efforts lead of by Hurley et
al. [18]. The instrument that is SAXS crucially provides structural information at lower resolu-
tion (global shape of the protein, as well its quaternary and tertiary structures). The technique
is geared towards molecular species in the order of 10-1000Å in size, making it a valuable not
only to look at proteins but also macromolecular assemblages [12].
In a second part the instrument or measurements also play to extract feedback on:
- Radius of gyration.
- Molecular weight.
- Maximum particle dimension.
- Oligomeric state and organization in solution.
- Amount of native flexibility or unfoldedness.
- Visualisation of disordered regions that fall short to X-ray crystallography.
- Low resolution molecular envelope.
Introduction
11
The methodology of SAXS relies on the study of scattered patterns of radiation that are the re-
sult of the influence a primary beam of light by a sample. This diffraction pattern associated to
the superatomic lattice lies in a small angle region (0.1-10°), hence the name of the method. In
this way, it is possible to derive back structural and spatial characteristics of a substance with
a resolution determined by the wavelength of the radiation. Although limited to ∼10 Å resolu-
tion, SAXS can deliver a wealth of structural information on biomolecules in solution and is
compatible with a wide range of experimental conditions. This is especially advantageous
when other techniques, such as conventional crystallography, cannot be used. Furthermore,
advanced use of SAXS can provide unique insight into biomolecular behavior that can only be
observed in solution, such as large conformational changes and transient protein-protein in-
teractions. Another major attraction has been the implementation of SAXS with synchrotron
beamlines. In this way with the higher light densities it is possible to unveil different diffrac-
tion patterns, allowing further theoretical and experimental analysis of exquisite molecular
substances or compounds. The projected work however suffers of a complex data analysis
and the determination of a sample’s make-up is not always straightforward. From a practical
standpoint, the technique demands specialised working knowledge as many irregularities and
operational choices are to be made in using the apparatus. Routine usage encounters difficul-
ties related to the experimental device (e.g. spontaneous mechanical changes in instrument
design, instability in beam dumping and electronic instability) but also real time variations of
the analyte (i.e. temperature and destruction under radiation) [13].
1.2.4 Circular dichroism (CD) spectroscopy
Circular dichroism is a major addition to visible and UV spectroscopy. Indeed, electronic spec-
tra can reveal additional details of molecular structure when irradiating samples with polarized
light, electromagnetic radiation with electric and magnetic fields that oscillate only in certain
directions.
CD measures the difference in absorption of right and left circularly polarized light (cpl) by an
analyte. The vector E that describes the electric field of cpl rotates about the direction of prop-
agation once in each wavelength of the light. The electric vector can rotate either clockwise
when looking towards the light source, corresponding to right-circularly polarized light (rcpl),
or counterclockwise, left-circularly polarized light (lcpl). The apex of the electric vector of rcpl
will describe a right-handed helix in space, whereas that of lcpl will generate a left-handed helix.
To put it in another manner, cpl is chiral. Consequently, rcpl and lcpl will interact differently
with a chiral molecule and exhibit different optical properties. A CD signal can be either positive
or negative. Mirror image molecules, or enantiomers, have CD spectra that are the same with
exception of their sign that is opposite. CD is exhibited not only off intrinsically chiral (optically
active) chromophores, but also if a chromophore becomes effectively chiral by being covalently
bound to a nearby chiral centre or placed in an asymmetric environment [5].
Introduction
12
The distinct advantage of CD spectra is their capability to acquire and determine the configura-
tion of complexes by referring and contrasting them to the CD spectrum of a similar complex of
known chirality. Also, due to the fact that individual monomer units are chiral as is the helix in
its entirety and in a unique way, CD spectroscopy provides considerable wealth of knowledge
on the secondary structure of macromolecules. In sum different α-helixes share sparingly spe-
cific CD spectra. The same applies for β-sheets and random coils as they too display unique
distinguishable spectral attributes. What CD spectro-polarimeters do is measure the difference
in absorbance between the L and R circularly polarised components (ΔA=AL-AR). These are re-
turned in the form as degrees of ellipticity (θ) in degrees. It is worthy of mention that 𝜃 =
𝑡𝑎𝑛−1(𝑏/𝑎) with b and a representing the minor and major axes of the resulting ellipse.
CD is very important in molecular biology as the amount of secondary structure composition
(% helix, sheet, turns, etc.) from the peptide bond region can be assessed. In effect, the different
sorts of ordered secondary structure found in proteins draw characteristic CD spectral patterns
in the far UV, Figure 1.2.1.
Figure 1.2.1. Far UV CD spectra profiling various sorts of secondary structure. Solid line, α-helix; long dashed line, anti-parallel β-sheet; dot-ted line, type I β-turn; cross dashed line, extended 31-helix or poly (Pro) II helix; shirt dashed line, irregular structure. Reprinted from Publica-tion (Kelly SM, Jess TJ, Price NC: How to study proteins by circular di-chroism. Biochimica Et Biophysica Acta-Proteins and Proteomics 2005,
1751:119-139). Copyright (2017), with permission from Elsevier.
Introduction
13
It is important to bare in mind that CD in application to biological studies produces very small
signals i.e. ellipticities are typically in the range of 10 mdeg, corresponding to a difference in
absorbance (∆𝐴(=AL-AR)) of the order of 3x10⁻⁴. It is therefore especially key to CD measure-
ment to pay attention to the experimental conditions in order to ensure that meaningful data
are obtained [19].
Information available from CD studies of proteins
CD signals only arise where absorption of radiation takes place. Spectral profiles are ascribed
to distinct structural characteristics of a molecule. The convenience of using CD in studies of
proteins is that it uncovers complementary structural data of a sparse number of spectral re-
gions. The photo-responsive relevant moiety chiefly includes the peptide bond (absorption be-
low 240nm), aromatic amino acid side chains (260-320nm range of absorptions) and disul-
phide bonds (weak broad absorption bands around 260nm). The method has found equally
useful in looking at flavins that are absorb over a wide spectral area. For example, pyridoxal-5’-
phosphate absorbs at 300nm, flavins are sensitive to wavelengths of the 300nm to 500nm
range (depending on oxidation state). Haem groups strongly respond to wavelengths around
410nm with other bands at 350nm and 650nm (depending on spin state and coordination of
the central Fe ion). Lastly, induced CD signals may arise from ligands that acquire chirality when
bound in an asymmetric framework such as that of a protein [19].

Introduction
14
1.3 References :
1. Jones J: Amino Acid and Peptide Synthesis. 2 edn: Oxford University Press; 2002. 2. Zumdahl SS: Chemical principles. 3rd edn; 1998. 3. Berg JM, Tymoczko JL, Gregory J. Gatto J, Stryer L: Biochemistry. 8th edn; 2015. 4. Branden C-I, Tooze J: Introduction to protein structure. 2nd edn; 1999. 5. Creighton TE: The physical and chemical basis of molecular biology. Helvetian press; 2010. 6. Atkins P, Depaula, J.: Atkins'physical chemistry. 8th edn; 2006. 7. Holtje H.D. SW, Rognan D., Folkers G.: Molecular Modeling. Basic principles and applications. 3rd. edn: Wiley-
VCH.; 2007. 8. Brodie R: Spectroscopy product guide. Royal society of chemistry; 2015. 9. Wysocki VH, Resing KA, Zhang QF, Cheng GL: Mass spectrometry of peptides and proteins. Methods
2005, 35:211-222. 10. Strupat K: Molecular weight determination of peptides and proteins by ESI and MALDI. In Mass
Spectrometry: Modified Proteins and Glycoconjugates. Volume 405. Edited by Burlingame AL. San Diego: Elsevier Academic Press Inc; 2005: 1-36: Methods in Enzymology.
11. Domon B, Aebersold R: Review - Mass spectrometry and protein analysis. Science 2006, 312:212-217. 12. Kaltashov IA, Eyles SJ: Mass spectrometry in biophysics. Hoboken, New Jersey: Wiley; 2005. 13. Feigin LA, Svergun DI: Structure analysis by small-angle X-ray and neutron scattering. Plenum press; 1987. 14. Hornak JP: The basics of NMR. Rochester, NY.: Rochester Institute of Technology.; 1999. 15. Weber PL, Brown SC, Mueller L: Sequential H-1-NMR assignements and secndary structure
identification of human ubiquitin. Biochemistry 1987, 26:7282-7290. 16. Jeffries E: Spinning into focus. In Chemistryworld: Royal society of chemistry; 2014. 17. John R. Dean AMJ, David Holmes, Rob Reed, Allan Jones, Jonathan Weyers: Practical skills in chemistry. 2nd
edn: Prentice Hall; 2011. 18. Boura E, Rozycki B, Herrick DZ, Chung HS, Vecer J, Eaton WA, Cafiso DS, Hummer G, Hurley JH: Solution
structure of the ESCRT-I complex by small-angle X-ray scattering, EPR, and FRET spectroscopy. Proceedings of the National Academy of Sciences of the United States of America 2011, 108:9437-9442.
19. Kelly SM, Jess TJ, Price NC: How to study proteins by circular dichroism. Biochimica Et Biophysica Acta-Proteins and Proteomics 2005, 1751:119-139.

Synthetic Preparations
15
Synthetic Preparations
16
Synthetic preparations.
Particular attention is paid at this point of the manuscript to give a general overview and de-
scription of the synthetic routes taken to derivatise molecular species used and considered in
the experimental studies of this doctoral project.
2.1 From chemical substrates to target compounds
The methodology in developing the target compounds and molecules used in this doctoral pro-
ject rely on the same preparative and ligation synthetic steps. The synthetic goal remains to
build a three-modular system by covalently binding two different FRET amenable chromo-
phores together to a biomolecule. The criterion in the design of these frameworks are: i) the
choice of chromophores ii) the choice in covalent bonding mechanism (chemistry) iii) what bi-
omolecule to evaluate.
The basis of deciding which chromophores to select was already made in that it was decided to
exploit what was already understood and determined on the optical responsiveness of QSY
both in the literature and earlier MS exploratory experimentation and testing in the lab. The
QSY chromophore was chosen to work as an acceptor chromophore for its quality to fragment
and give clear unique dissociative fragmentation on laser irradiation. In the focus to finding a
second donor chromophore that would meet and validate the spectral constraint, i.e. that the
photophysics of the donor chromophore deputes an emission band that overlaps with the ab-
sorption band of the acceptor, rhodamine was select as the dye of choice. Note that this donor
acceptor system was also used for their compatibility to ionize and produce quality spectra in
the positive mode (to the individual chemistry of the dye, to the dye’s charge prior to elec-
trospray). For this reason, a different pair was used in the negative mode. In the negative mode,
ATTO514 was used in pair with the QSY acceptor. QSY dyes ionizing well in both modes of the
MS. In another developed negative mode exploratory experiment, a different pair of NBD and
Eosine Y were used altogether.
In terms of the favoured, appointed, chemistry in building the molecular frameworks, conjugate
addition of thiols to the conjugate functional group of the maleimide (described later herein) is
the major approach used in the covalent binding of chromophores to the biomolecule, be it a
peptide or a protein. This reaction is chosen as it was first possible to commercialy obtain ver-
sions of the chromophore that include the maleimide group for tethering. Secondly the reaction
is irreversible under a wide range of conditions and pH. It should be noted that AAK tripeptide
frameworks with chromophores were built for study, without thiols, this one binded to chro-
mophores by amine nucleophilic substitution.

Synthetic Preparations
17
Finaly, there was much more flexibility in determining what peptide or biomolecule to use. The
choice was large as the only single precondition is that the molecule presents a or several nu-
cleophilic groups (thiol or amine). In most of cases this meant selecting peptides or proteins
with cystein amino acids. Cystein amino acids are residues that hold -SH mercaptan nuclophiles
on their side chains. Peptide length selected varied depending on their intentded use for exper-
imentation.
So, to have an overall understanding of the preparative steps, let us point to an independent
reaction scheme as an example. Here the one pot synthesis (1 hour) describes the dispatch of
the QSY9-CA3DA3C-ATTO514 end-product (1), following page:
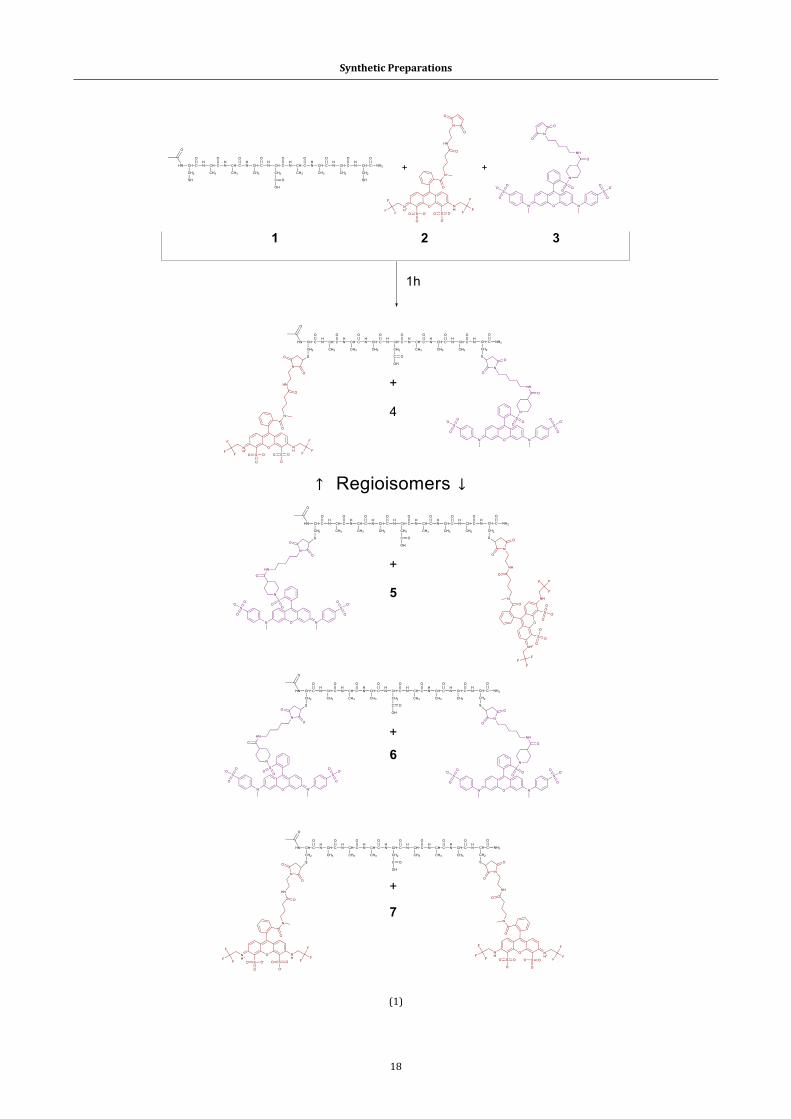
Synthetic Preparations
18
(1)
↑ ↓
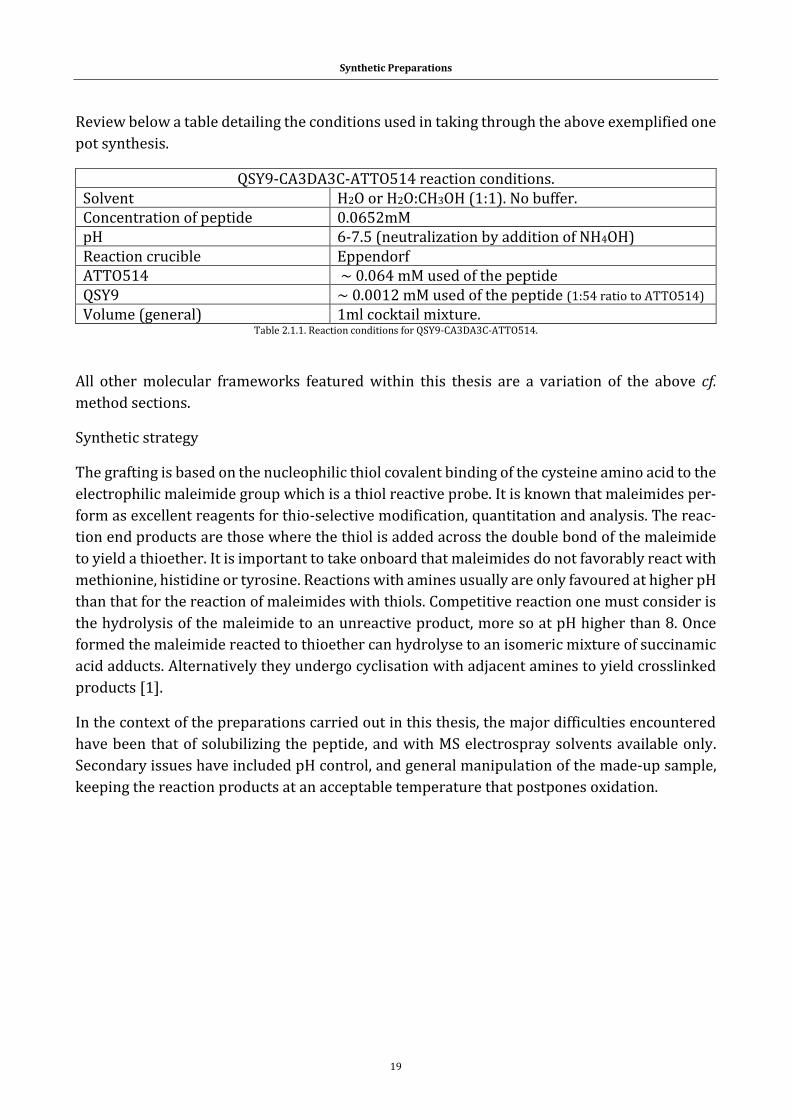
Synthetic Preparations
19
Review below a table detailing the conditions used in taking through the above exemplified one
pot synthesis.
QSY9-CA3DA3C-ATTO514 reaction conditions. Solvent H2O or H2O:CH3OH (1:1). No buffer. Concentration of peptide 0.0652mM pH 6-7.5 (neutralization by addition of NH4OH) Reaction crucible Eppendorf ATTO514 ~ 0.064 mM used of the peptide QSY9 ~ 0.0012 mM used of the peptide (1:54 ratio to ATTO514) Volume (general) 1ml cocktail mixture.
Table 2.1.1. Reaction conditions for QSY9-CA3DA3C-ATTO514.
All other molecular frameworks featured within this thesis are a variation of the above cf.
method sections.
Synthetic strategy
The grafting is based on the nucleophilic thiol covalent binding of the cysteine amino acid to the
electrophilic maleimide group which is a thiol reactive probe. It is known that maleimides per-
form as excellent reagents for thio-selective modification, quantitation and analysis. The reac-
tion end products are those where the thiol is added across the double bond of the maleimide
to yield a thioether. It is important to take onboard that maleimides do not favorably react with
methionine, histidine or tyrosine. Reactions with amines usually are only favoured at higher pH
than that for the reaction of maleimides with thiols. Competitive reaction one must consider is
the hydrolysis of the maleimide to an unreactive product, more so at pH higher than 8. Once
formed the maleimide reacted to thioether can hydrolyse to an isomeric mixture of succinamic
acid adducts. Alternatively they undergo cyclisation with adjacent amines to yield crosslinked
products [1].
In the context of the preparations carried out in this thesis, the major difficulties encountered
have been that of solubilizing the peptide, and with MS electrospray solvents available only.
Secondary issues have included pH control, and general manipulation of the made-up sample,
keeping the reaction products at an acceptable temperature that postpones oxidation.
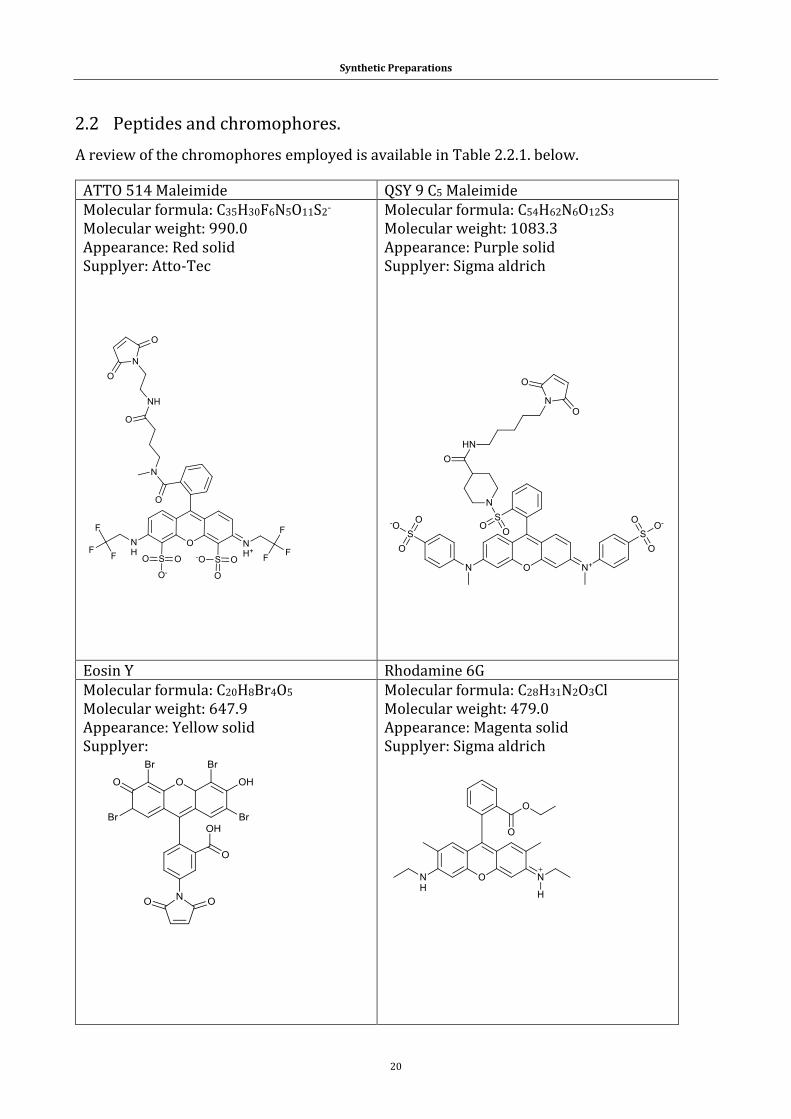
Synthetic Preparations
20
2.2 Peptides and chromophores.
A review of the chromophores employed is available in Table 2.2.1. below.
ATTO 514 Maleimide QSY 9 C5 Maleimide Molecular formula: C35H30F6N5O11S2-
Molecular weight: 990.0 Appearance: Red solid Supplyer: Atto-Tec
Molecular formula: C54H62N6O12S3 Molecular weight: 1083.3 Appearance: Purple solid Supplyer: Sigma aldrich
Eosin Y Rhodamine 6G Molecular formula: C20H8Br4O5
Molecular weight: 647.9 Appearance: Yellow solid Supplyer:
Molecular formula: C28H31N2O3Cl
Molecular weight: 479.0 Appearance: Magenta solid Supplyer: Sigma aldrich
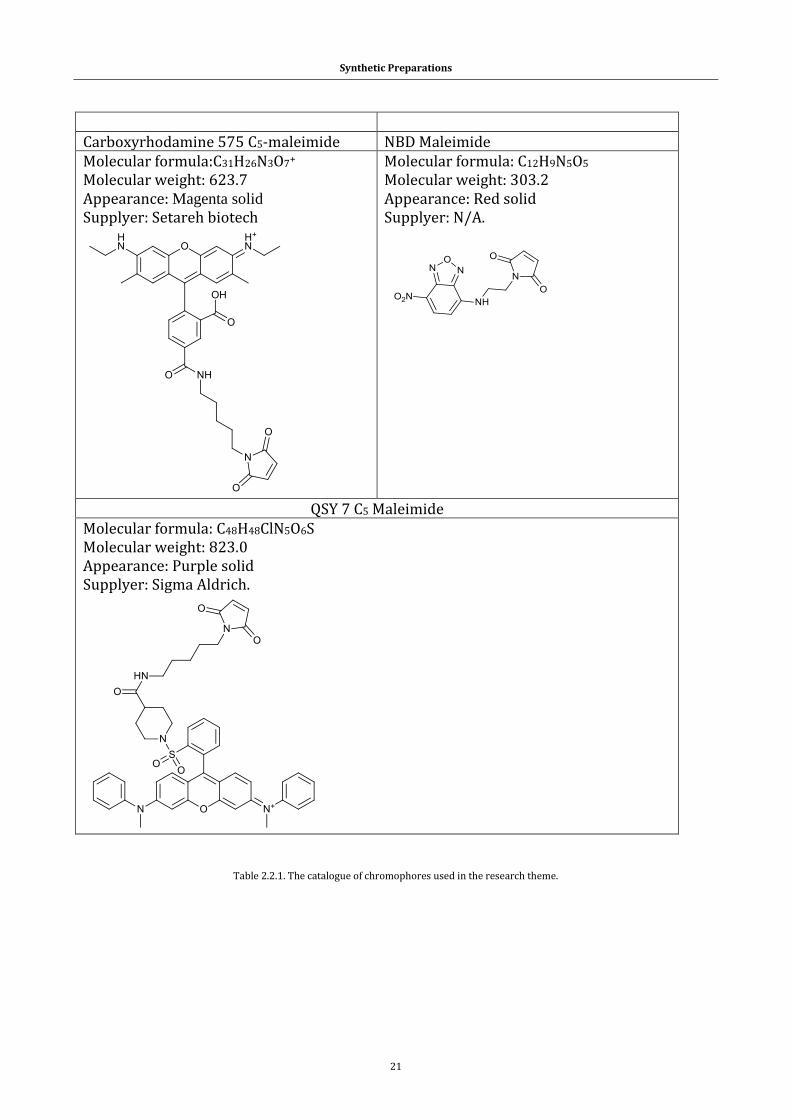
Synthetic Preparations
21
Carboxyrhodamine 575 C5-maleimide NBD Maleimide Molecular formula:C31H26N3O7+
Molecular weight: 623.7
Appearance: Magenta solid Supplyer: Setareh biotech
Molecular formula: C12H9N5O5
Molecular weight: 303.2 Appearance: Red solid Supplyer: N/A.
QSY 7 C5 Maleimide Molecular formula: C48H48ClN5O6S
Molecular weight: 823.0 Appearance: Purple solid Supplyer: Sigma Aldrich.
Table 2.2.1. The catalogue of chromophores used in the research theme.

Synthetic Preparations
22
A review of the peptides employed is available in Table 2.2.2.
Peptides ordered from Genscript USA. CAKAC ~82 % purity Molecular weight: 494.63
CAADAAEAA ~82 % purity Molecular weight: 791.83
CAADAAEAAC ~82 % purity Molecular weight: 894.97
CAAADAAAC ~82 % purity Molecular weight: 765.86
CAA ~82 % purity Molecular weight: 263.32
Table 2.2.2. Peptides.
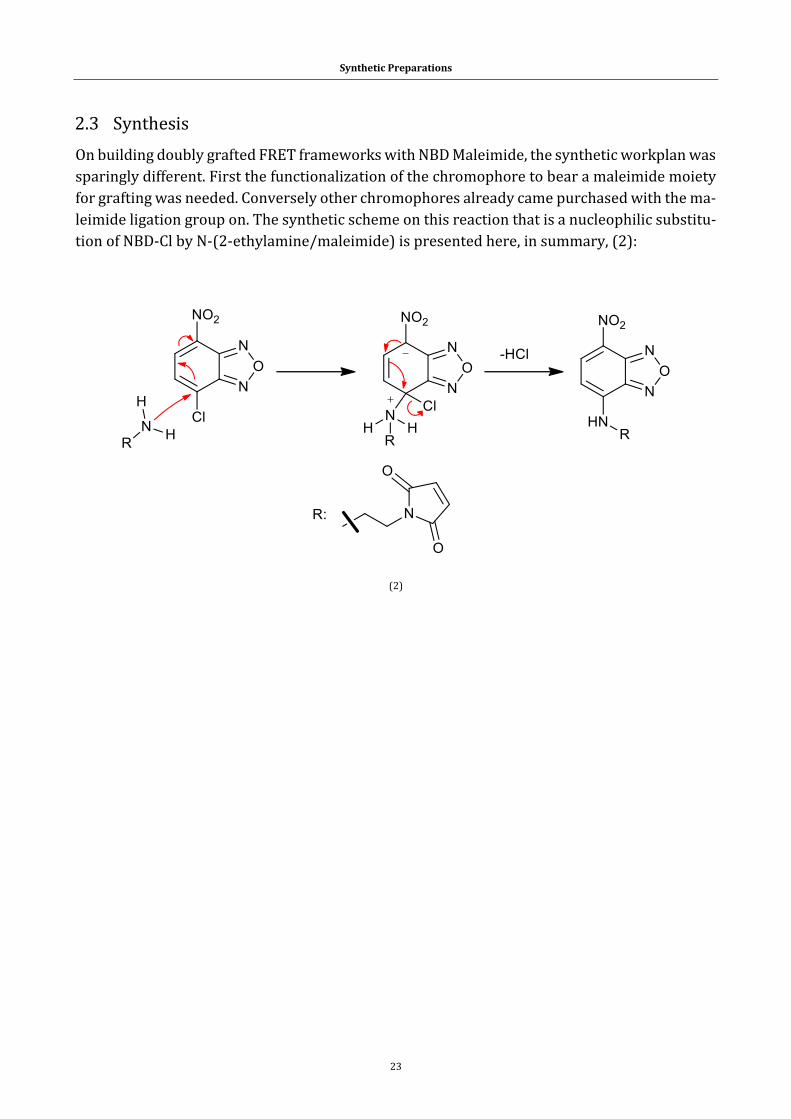
Synthetic Preparations
23
2.3 Synthesis
On building doubly grafted FRET frameworks with NBD Maleimide, the synthetic workplan was
sparingly different. First the functionalization of the chromophore to bear a maleimide moiety
for grafting was needed. Conversely other chromophores already came purchased with the ma-
leimide ligation group on. The synthetic scheme on this reaction that is a nucleophilic substitu-
tion of NBD-Cl by N-(2-ethylamine/maleimide) is presented here, in summary, (2):
(2)
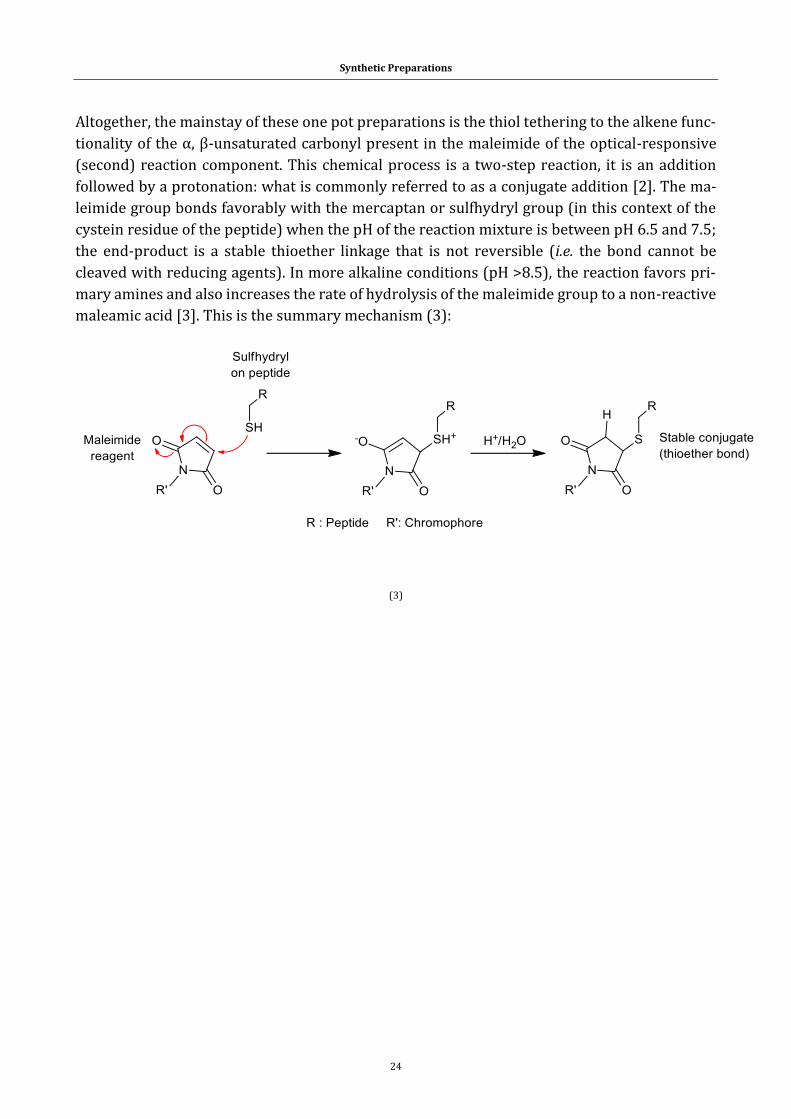
Synthetic Preparations
24
Altogether, the mainstay of these one pot preparations is the thiol tethering to the alkene func-
tionality of the α, β-unsaturated carbonyl present in the maleimide of the optical-responsive
(second) reaction component. This chemical process is a two-step reaction, it is an addition
followed by a protonation: what is commonly referred to as a conjugate addition [2]. The ma-
leimide group bonds favorably with the mercaptan or sulfhydryl group (in this context of the
cystein residue of the peptide) when the pH of the reaction mixture is between pH 6.5 and 7.5;
the end-product is a stable thioether linkage that is not reversible (i.e. the bond cannot be
cleaved with reducing agents). In more alkaline conditions (pH >8.5), the reaction favors pri-
mary amines and also increases the rate of hydrolysis of the maleimide group to a non-reactive
maleamic acid [3]. This is the summary mechanism (3):
(3)
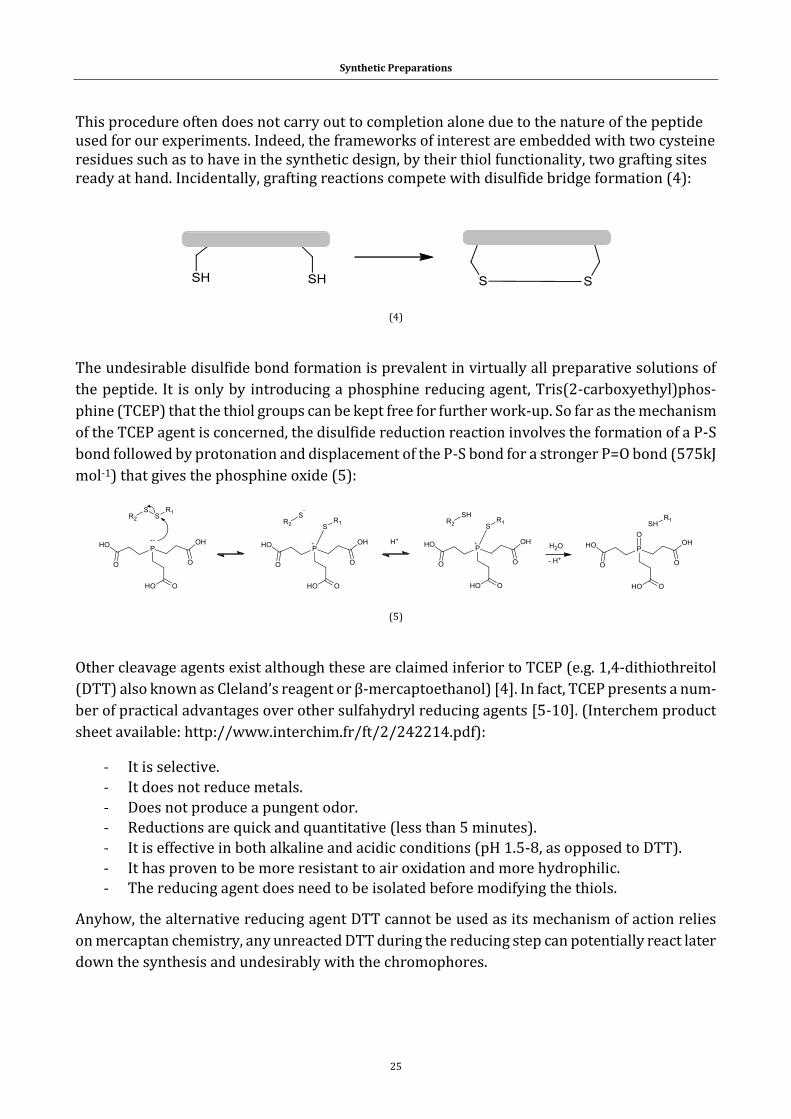
Synthetic Preparations
25
This procedure often does not carry out to completion alone due to the nature of the peptide used for our experiments. Indeed, the frameworks of interest are embedded with two cysteine residues such as to have in the synthetic design, by their thiol functionality, two grafting sites ready at hand. Incidentally, grafting reactions compete with disulfide bridge formation (4):
(4)
The undesirable disulfide bond formation is prevalent in virtually all preparative solutions of
the peptide. It is only by introducing a phosphine reducing agent, Tris(2-carboxyethyl)phos-
phine (TCEP) that the thiol groups can be kept free for further work-up. So far as the mechanism
of the TCEP agent is concerned, the disulfide reduction reaction involves the formation of a P-S
bond followed by protonation and displacement of the P-S bond for a stronger P=O bond (575kJ
mol-1) that gives the phosphine oxide (5):
(5)
Other cleavage agents exist although these are claimed inferior to TCEP (e.g. 1,4-dithiothreitol
(DTT) also known as Cleland’s reagent or β-mercaptoethanol) [4]. In fact, TCEP presents a num-
ber of practical advantages over other sulfahydryl reducing agents [5-10]. (Interchem product
sheet available: http://www.interchim.fr/ft/2/242214.pdf):
- It is selective.
- It does not reduce metals.
- Does not produce a pungent odor.
- Reductions are quick and quantitative (less than 5 minutes).
- It is effective in both alkaline and acidic conditions (pH 1.5-8, as opposed to DTT).
- It has proven to be more resistant to air oxidation and more hydrophilic.
- The reducing agent does need to be isolated before modifying the thiols.
Anyhow, the alternative reducing agent DTT cannot be used as its mechanism of action relies
on mercaptan chemistry, any unreacted DTT during the reducing step can potentially react later
down the synthesis and undesirably with the chromophores.
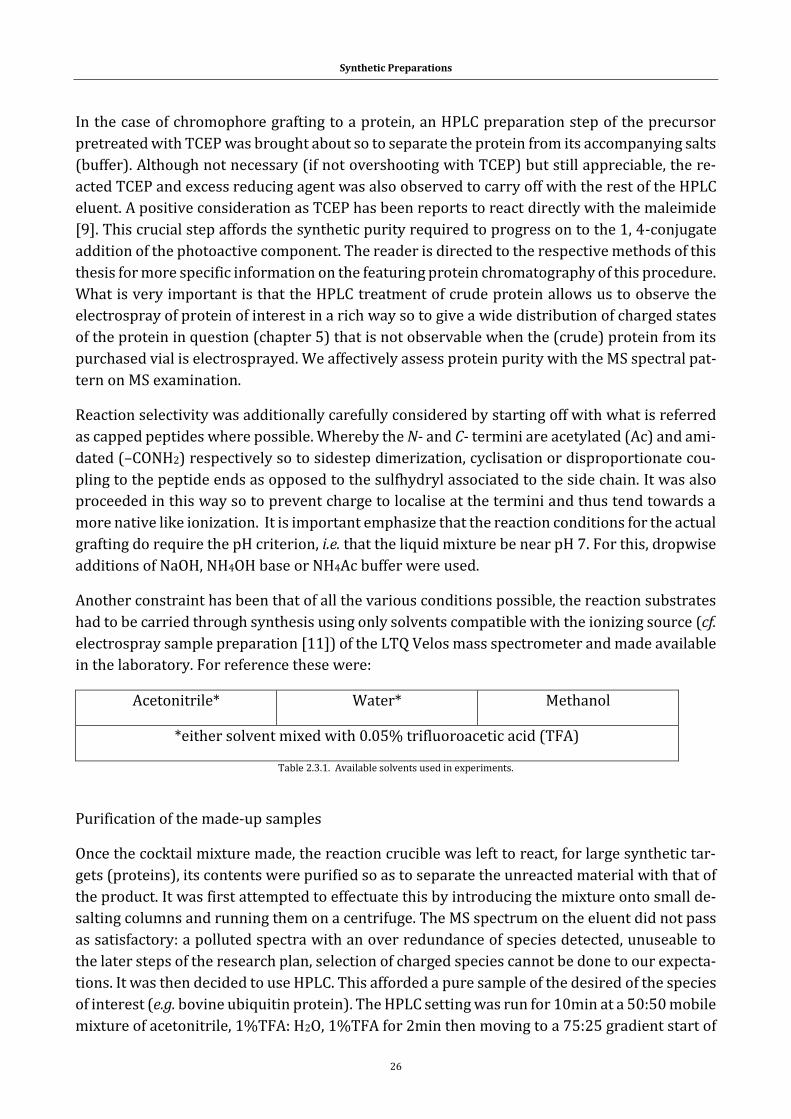
Synthetic Preparations
26
In the case of chromophore grafting to a protein, an HPLC preparation step of the precursor
pretreated with TCEP was brought about so to separate the protein from its accompanying salts
(buffer). Although not necessary (if not overshooting with TCEP) but still appreciable, the re-
acted TCEP and excess reducing agent was also observed to carry off with the rest of the HPLC
eluent. A positive consideration as TCEP has been reports to react directly with the maleimide
[9]. This crucial step affords the synthetic purity required to progress on to the 1, 4-conjugate
addition of the photoactive component. The reader is directed to the respective methods of this
thesis for more specific information on the featuring protein chromatography of this procedure.
What is very important is that the HPLC treatment of crude protein allows us to observe the
electrospray of protein of interest in a rich way so to give a wide distribution of charged states
of the protein in question (chapter 5) that is not observable when the (crude) protein from its
purchased vial is electrosprayed. We affectively assess protein purity with the MS spectral pat-
tern on MS examination.
Reaction selectivity was additionally carefully considered by starting off with what is referred
as capped peptides where possible. Whereby the N- and C- termini are acetylated (Ac) and ami-
dated (–CONH2) respectively so to sidestep dimerization, cyclisation or disproportionate cou-
pling to the peptide ends as opposed to the sulfhydryl associated to the side chain. It was also
proceeded in this way so to prevent charge to localise at the termini and thus tend towards a
more native like ionization. It is important emphasize that the reaction conditions for the actual
grafting do require the pH criterion, i.e. that the liquid mixture be near pH 7. For this, dropwise
additions of NaOH, NH4OH base or NH4Ac buffer were used.
Another constraint has been that of all the various conditions possible, the reaction substrates
had to be carried through synthesis using only solvents compatible with the ionizing source (cf.
electrospray sample preparation [11]) of the LTQ Velos mass spectrometer and made available
in the laboratory. For reference these were:
Acetonitrile* Water* Methanol
*either solvent mixed with 0.05% trifluoroacetic acid (TFA)
Table 2.3.1. Available solvents used in experiments.
Purification of the made-up samples
Once the cocktail mixture made, the reaction crucible was left to react, for large synthetic tar-
gets (proteins), its contents were purified so as to separate the unreacted material with that of
the product. It was first attempted to effectuate this by introducing the mixture onto small de-
salting columns and running them on a centrifuge. The MS spectrum on the eluent did not pass
as satisfactory: a polluted spectra with an over redundance of species detected, unuseable to
the later steps of the research plan, selection of charged species cannot be done to our expecta-
tions. It was then decided to use HPLC. This afforded a pure sample of the desired of the species
of interest (e.g. bovine ubiquitin protein). The HPLC setting was run for 10min at a 50:50 mobile
mixture of acetonitrile, 1%TFA: H2O, 1%TFA for 2min then moving to a 75:25 gradient start of
Synthetic Preparations
27
acetonitrile, 1%TFA: H2O, 1%TFA moving down to 20:80 mobile phase composition (acetoni-
trile, 1%TFA: H2O, 1%TFA) at the end of the run (10min). The wavelength for detection used
was set at 220nm and flow rate was 1ml/min, 40°C, C4 column. A characteristic of the HPLC
mode is that the C4 column is a bonded phase column, fitting in partition chromatography cat-
egory.
With the electrospray constraint in mind, virtually all synthetic preparations were made in wa-
ter, water methanol mixtures were employed for larger molecular frameworks. The acetonitrile
played a major role however between analytical operations, to clean and elute prior byprod-
ucts, unreacted reagents and other undesirables away from the various the instrumental pieces.
Whilst the acetonitrile has been useful for cleaning (electrospray source) it has not been com-
parable to water as a solvent because of water’s attractive physical polar attributes and higher
dielectric constant to acetonitrile, thus it was taken care to resolvate where possible with water.
To this end an air dryer spewer was set up so to recondition the HPLC eluted end-products to
a water solution.
Synthetic Preparations
28
2.4 References :
1. Anon.: The molecular probes handbook. A guide to fluorescent probes and labeling technologies. 11th edn; 2010.
2. Sykes P: Mechanism in organic chemistry. 6th6th edn: Pearson. Prentice Hall; 1986. 3. Hermanson GT: Bioconjugate Techniques. 3rd edn; 2013. 4. Smith RD, Loo JA, Edmonds CG, Barinaga CJ, Udseth HR: New developments in biochemical mass-
spectrometry - electrospray ionization. Analytical Chemistry 1990, 62:882-899. 5. Levison ME, Josephson AS, Kirschenbaum DM: Reduction of biological substances by water-soluble
phosphines - gamma-globulin (IGG). Experientia 1969, 25:126-+. 6. Mery J, Granier C, Juin M, Brugidou J: Disulfide linkage to polyacrylic resin for automated fmoc
peptide-synthesis - immunochemical applications of peptide resins and mercaptoamide peptides. International Journal of Peptide and Protein Research 1993, 42:44-52.
7. Han JC, Han GY: A procedure for quantitative-determination of tris(2-carboxyethyl)phosphine, an odorless reducing agent more stable and effective than dithiothreitol. Analytical Biochemistry 1994, 220:5-10.
8. Getz EB, Xiao M, Chakrabarty T, Cooke R, Selvin PR: A comparison between the sulfhydryl reductants tris(2-carboxyethyl)phosphine and dithiothreitol for use in protein biochemistry. Analytical Biochemistry 1999, 273:73-80.
9. Shafer DE, Inman JK, Lees A: Reaction of tris(2-carboxyethyl)phosphine (TCEP) with maleimide and alpha-haloacyl groups: Anomalous elution of TCEP by gel filtration. Analytical Biochemistry 2000, 282:161-164.
10. Tyagarajan K, Pretzer E, Wiktorowicz JE: Thiol-reactive dyes for fluorescence labeling of proteomic samples. Electrophoresis 2003, 24:2348-2358.
11. Strupat K: Molecular weight determination of peptides and proteins by ESI and MALDI. In Mass Spectrometry: Modified Proteins and Glycoconjugates. Volume 405. Edited by Burlingame AL. San Diego: Elsevier Academic Press Inc; 2005: 1-36: Methods in Enzymology.

Instruments
29
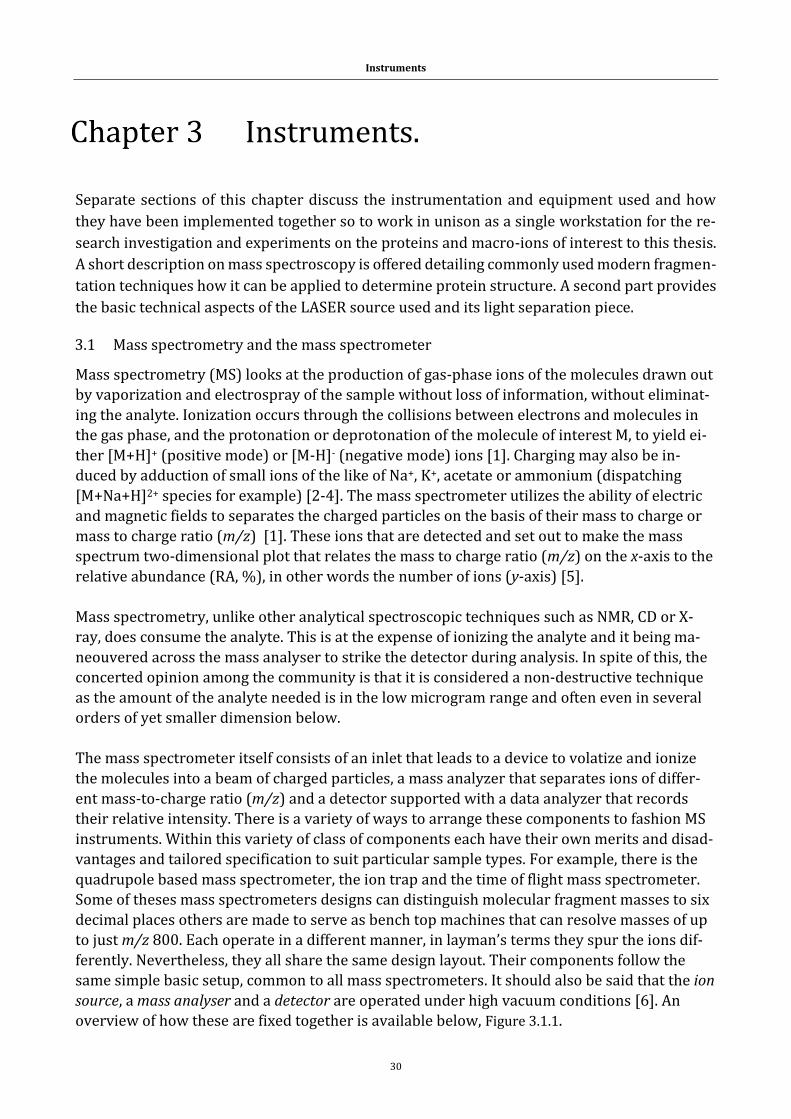
Instruments
30
Instruments.
Separate sections of this chapter discuss the instrumentation and equipment used and how
they have been implemented together so to work in unison as a single workstation for the re-
search investigation and experiments on the proteins and macro-ions of interest to this thesis.
A short description on mass spectroscopy is offered detailing commonly used modern fragmen-
tation techniques how it can be applied to determine protein structure. A second part provides
the basic technical aspects of the LASER source used and its light separation piece.
3.1 Mass spectrometry and the mass spectrometer
Mass spectrometry (MS) looks at the production of gas-phase ions of the molecules drawn out
by vaporization and electrospray of the sample without loss of information, without eliminat-
ing the analyte. Ionization occurs through the collisions between electrons and molecules in
the gas phase, and the protonation or deprotonation of the molecule of interest M, to yield ei-
ther [M+H]+ (positive mode) or [M-H]- (negative mode) ions [1]. Charging may also be in-
duced by adduction of small ions of the like of Na+, K+, acetate or ammonium (dispatching
[M+Na+H]2+ species for example) [2-4]. The mass spectrometer utilizes the ability of electric
and magnetic fields to separates the charged particles on the basis of their mass to charge or
mass to charge ratio (m/z) [1]. These ions that are detected and set out to make the mass
spectrum two-dimensional plot that relates the mass to charge ratio (m/z) on the x-axis to the
relative abundance (RA, %), in other words the number of ions (y-axis) [5].
Mass spectrometry, unlike other analytical spectroscopic techniques such as NMR, CD or X-
ray, does consume the analyte. This is at the expense of ionizing the analyte and it being ma-
neouvered across the mass analyser to strike the detector during analysis. In spite of this, the
concerted opinion among the community is that it is considered a non-destructive technique
as the amount of the analyte needed is in the low microgram range and often even in several
orders of yet smaller dimension below.
The mass spectrometer itself consists of an inlet that leads to a device to volatize and ionize
the molecules into a beam of charged particles, a mass analyzer that separates ions of differ-
ent mass-to-charge ratio (m/z) and a detector supported with a data analyzer that records
their relative intensity. There is a variety of ways to arrange these components to fashion MS
instruments. Within this variety of class of components each have their own merits and disad-
vantages and tailored specification to suit particular sample types. For example, there is the
quadrupole based mass spectrometer, the ion trap and the time of flight mass spectrometer.
Some of theses mass spectrometers designs can distinguish molecular fragment masses to six
decimal places others are made to serve as bench top machines that can resolve masses of up
to just m/z 800. Each operate in a different manner, in layman’s terms they spur the ions dif-
ferently. Nevertheless, they all share the same design layout. Their components follow the
same simple basic setup, common to all mass spectrometers. It should also be said that the ion
source, a mass analyser and a detector are operated under high vacuum conditions [6]. An
overview of how these are fixed together is available below, Figure 3.1.1.
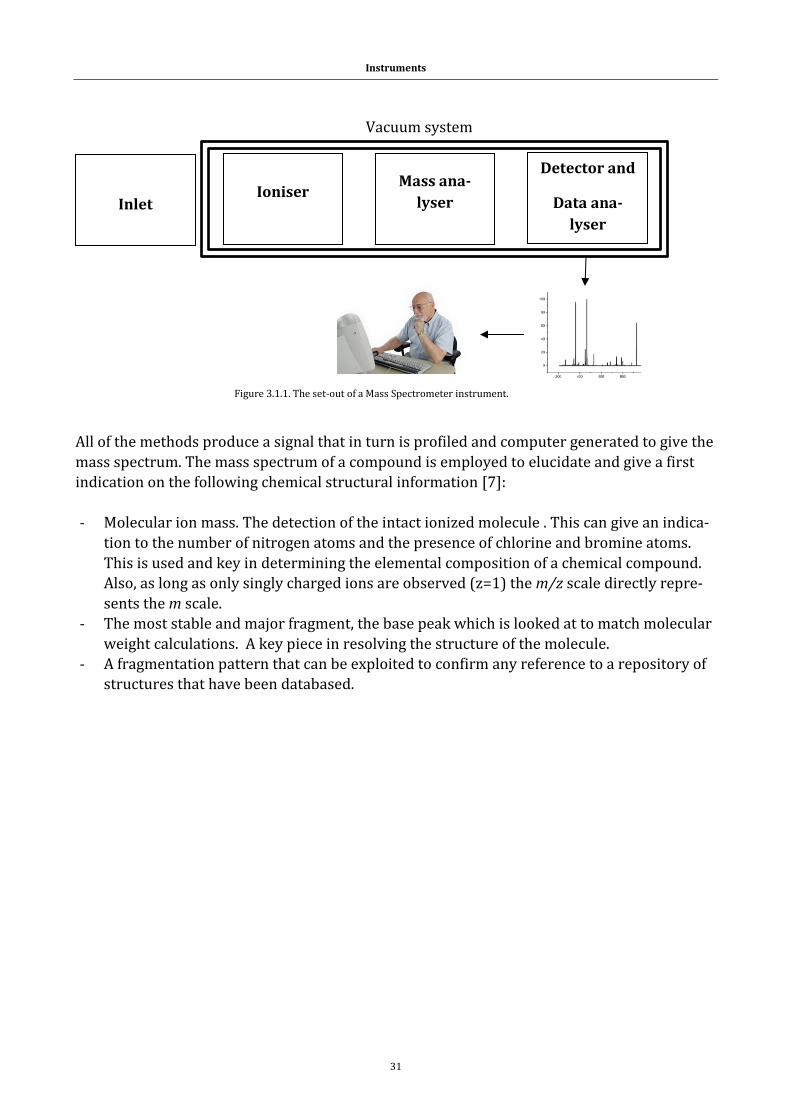
Instruments
31
All of the methods produce a signal that in turn is profiled and computer generated to give the
mass spectrum. The mass spectrum of a compound is employed to elucidate and give a first
indication on the following chemical structural information [7]:
- Molecular ion mass. The detection of the intact ionized molecule . This can give an indica-
tion to the number of nitrogen atoms and the presence of chlorine and bromine atoms.
This is used and key in determining the elemental composition of a chemical compound.
Also, as long as only singly charged ions are observed (z=1) the m/z scale directly repre-
sents the m scale.
- The most stable and major fragment, the base peak which is looked at to match molecular
weight calculations. A key piece in resolving the structure of the molecule.
- A fragmentation pattern that can be exploited to confirm any reference to a repository of
structures that have been databased.
Vacuum system
Inlet
Detector and
Data ana-
lyser
Mass ana-
lyser Ioniser
Figure 3.1.1. The set-out of a Mass Spectrometer instrument.
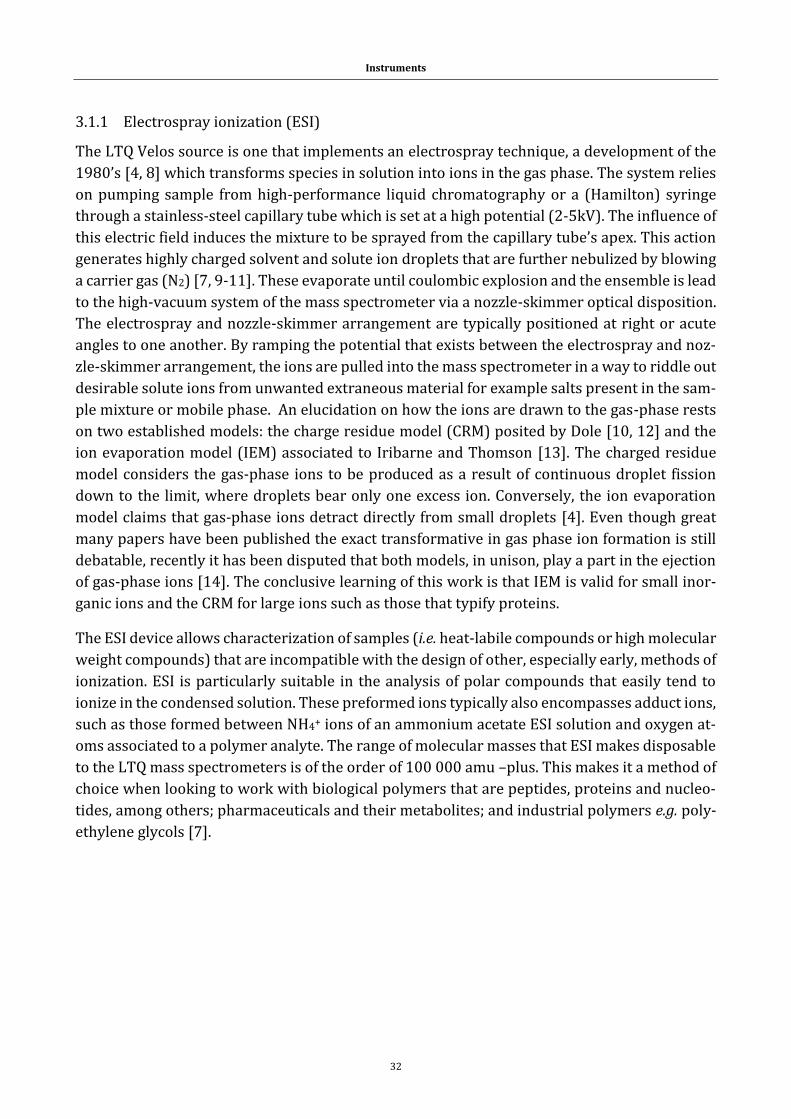
Instruments
32
3.1.1 Electrospray ionization (ESI)
The LTQ Velos source is one that implements an electrospray technique, a development of the
1980’s [4, 8] which transforms species in solution into ions in the gas phase. The system relies
on pumping sample from high-performance liquid chromatography or a (Hamilton) syringe
through a stainless-steel capillary tube which is set at a high potential (2-5kV). The influence of
this electric field induces the mixture to be sprayed from the capillary tube’s apex. This action
generates highly charged solvent and solute ion droplets that are further nebulized by blowing
a carrier gas (N2) [7, 9-11]. These evaporate until coulombic explosion and the ensemble is lead
to the high-vacuum system of the mass spectrometer via a nozzle-skimmer optical disposition.
The electrospray and nozzle-skimmer arrangement are typically positioned at right or acute
angles to one another. By ramping the potential that exists between the electrospray and noz-
zle-skimmer arrangement, the ions are pulled into the mass spectrometer in a way to riddle out
desirable solute ions from unwanted extraneous material for example salts present in the sam-
ple mixture or mobile phase. An elucidation on how the ions are drawn to the gas-phase rests
on two established models: the charge residue model (CRM) posited by Dole [10, 12] and the
ion evaporation model (IEM) associated to Iribarne and Thomson [13]. The charged residue
model considers the gas-phase ions to be produced as a result of continuous droplet fission
down to the limit, where droplets bear only one excess ion. Conversely, the ion evaporation
model claims that gas-phase ions detract directly from small droplets [4]. Even though great
many papers have been published the exact transformative in gas phase ion formation is still
debatable, recently it has been disputed that both models, in unison, play a part in the ejection
of gas-phase ions [14]. The conclusive learning of this work is that IEM is valid for small inor-
ganic ions and the CRM for large ions such as those that typify proteins.
The ESI device allows characterization of samples (i.e. heat-labile compounds or high molecular
weight compounds) that are incompatible with the design of other, especially early, methods of
ionization. ESI is particularly suitable in the analysis of polar compounds that easily tend to
ionize in the condensed solution. These preformed ions typically also encompasses adduct ions,
such as those formed between NH4+ ions of an ammonium acetate ESI solution and oxygen at-
oms associated to a polymer analyte. The range of molecular masses that ESI makes disposable
to the LTQ mass spectrometers is of the order of 100 000 amu –plus. This makes it a method of
choice when looking to work with biological polymers that are peptides, proteins and nucleo-
tides, among others; pharmaceuticals and their metabolites; and industrial polymers e.g. poly-
ethylene glycols [7].
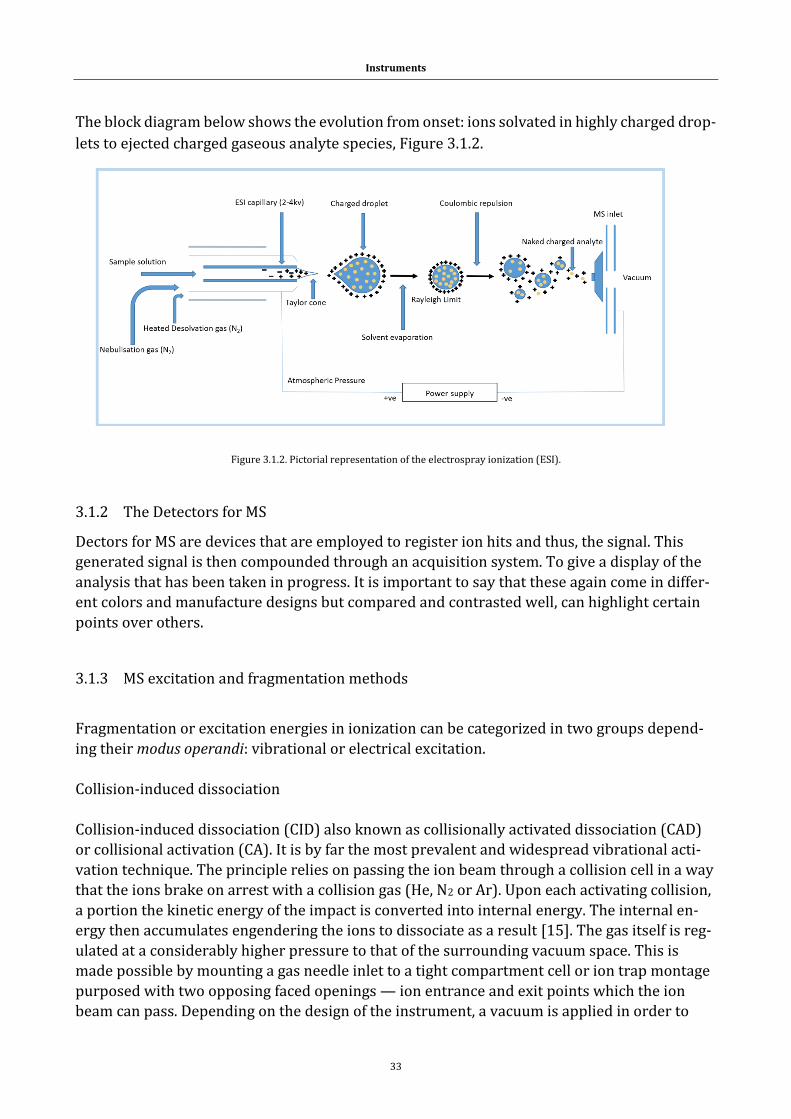
Instruments
33
The block diagram below shows the evolution from onset: ions solvated in highly charged drop-
lets to ejected charged gaseous analyte species, Figure 3.1.2.
3.1.2 The Detectors for MS
Dectors for MS are devices that are employed to register ion hits and thus, the signal. This
generated signal is then compounded through an acquisition system. To give a display of the
analysis that has been taken in progress. It is important to say that these again come in differ-
ent colors and manufacture designs but compared and contrasted well, can highlight certain
points over others.
3.1.3 MS excitation and fragmentation methods
Fragmentation or excitation energies in ionization can be categorized in two groups depend-
ing their modus operandi: vibrational or electrical excitation.
Collision-induced dissociation
Collision-induced dissociation (CID) also known as collisionally activated dissociation (CAD)
or collisional activation (CA). It is by far the most prevalent and widespread vibrational acti-
vation technique. The principle relies on passing the ion beam through a collision cell in a way
that the ions brake on arrest with a collision gas (He, N2 or Ar). Upon each activating collision,
a portion the kinetic energy of the impact is converted into internal energy. The internal en-
ergy then accumulates engendering the ions to dissociate as a result [15]. The gas itself is reg-
ulated at a considerably higher pressure to that of the surrounding vacuum space. This is
made possible by mounting a gas needle inlet to a tight compartment cell or ion trap montage
purposed with two opposing faced openings — ion entrance and exit points which the ion
beam can pass. Depending on the design of the instrument, a vacuum is applied in order to
Figure 3.1.2. Pictorial representation of the electrospray ionization (ESI).
Instruments
34
create a differentially pumped space to manage the effusing gas. In this manner, an apprecia-
tion of the pressure can be gained with the aim of reproducing the pressure adjustment, how-
ever, the reading on the ion gauge will never reflect the true, real pressure within the instru-
mental piece [6]. Because of its breadth of application, collisional activation remains also the
most popular activation approach, most certainly due in part to its understood mechanisms of
action such as the mobile proton model [15]. This model that applies to peptides assumes that
ionizing protons are initially located at basic sites such as the N-terminus. Upon collisional ac-
tivation one or several of the ionization protons may shift to less basic sites of the polypeptide
which encourages various charge-site-initiated mechanisms of backbone dissociation [15].
However, CID does present some disadvantages. First, energy deposition is a multi-step grad-
ual process characterized to tend to a limit in the total energy imparted on the species. The
higher statistical being low energy pathways of fragmentation. Consequently, collisional acti-
vation induces cleavage of the most labile bonds and causes structurally uninformative neu-
tral losses of water, ammonia, or CO2 in peptide and proteins [15]. Secondly, conventional low
energy CID in in trap instruments arises from truncation of the lower m/z range. The low
mass cutoff (LMCO) disadvantages the process as it disfavors the detection of shorter N-termi-
nal and C-terminal fragment ions of peptides [15]. Hence the development of higher energy
collisional deactivation (HCD) in ion traps. This higher energy deposition technique takes a
second ion cell or multipole cavity so to avoid having the activation process being dependent
of the trapping parameters, and as such prevents the low mass range to cutoff. Another disad-
vantage with CID is its shortcoming with post translational modifications such as phosphory-
lation. Collisional activation is a slow heating process that cause the weakest labile bonds to
break, thus post translational modifications are given as neutral losses and this limits the util-
ity of CID to site localize post translational modifications [15].
Infrared multiple-photon dissociation.
Infrared multiple-photon dissociation (IRMPD) is a technique used in mass spectroscopy to
fragment molecules in gas-phase isolation for structural analysis of the parent chemical spe-
cies.
In summary, an infrared laser is directed through a window into the vacuum of a mass spec-
trometer. The mechanism of fragmentation involves the absorption of numerous photons, on
ions. The parent ions excite and are promoted into more energetic vibrational states. Bonds
brake, giving a gas phase fragmentation of the parent ion. In the case of powerful laser pulses, the dissociation proceeds via inner-valence ionization of electrons.
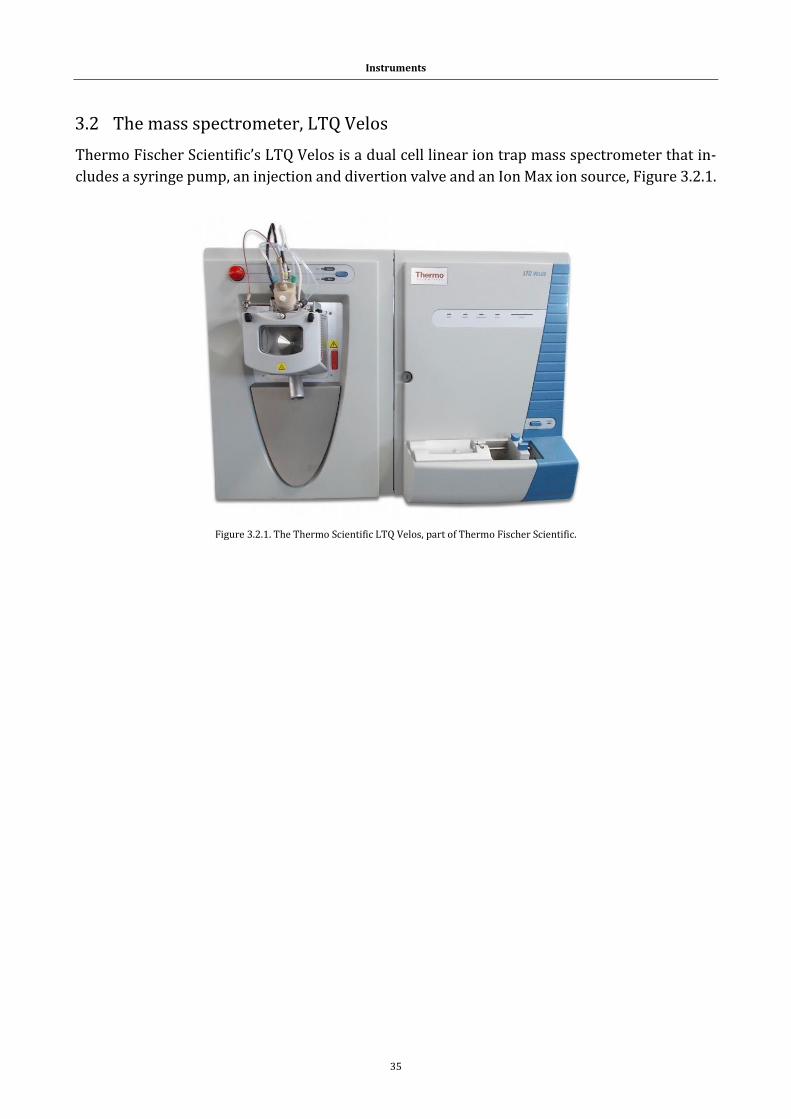
Instruments
35
3.2 The mass spectrometer, LTQ Velos
Thermo Fischer Scientific’s LTQ Velos is a dual cell linear ion trap mass spectrometer that in-
cludes a syringe pump, an injection and divertion valve and an Ion Max ion source, Figure 3.2.1.
Figure 3.2.1. The Thermo Scientific LTQ Velos, part of Thermo Fischer Scientific.
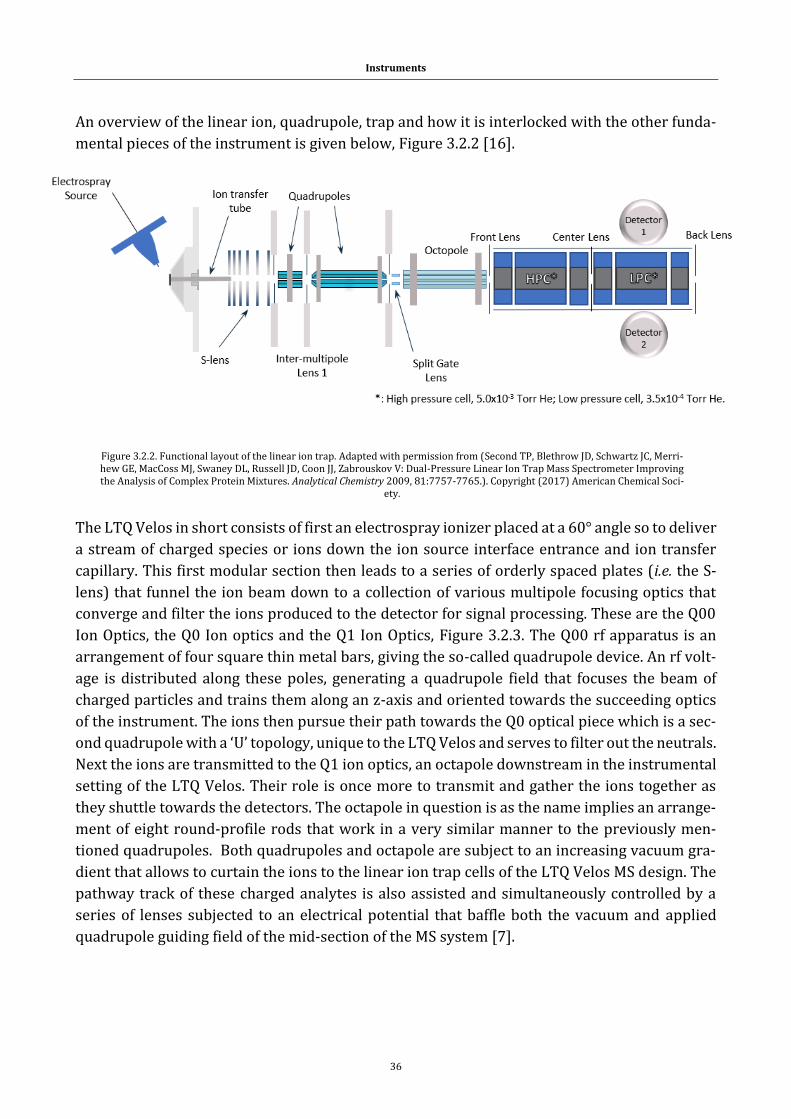
Instruments
36
An overview of the linear ion, quadrupole, trap and how it is interlocked with the other funda-
mental pieces of the instrument is given below, Figure 3.2.2 [16].
The LTQ Velos in short consists of first an electrospray ionizer placed at a 60° angle so to deliver
a stream of charged species or ions down the ion source interface entrance and ion transfer
capillary. This first modular section then leads to a series of orderly spaced plates (i.e. the S-
lens) that funnel the ion beam down to a collection of various multipole focusing optics that
converge and filter the ions produced to the detector for signal processing. These are the Q00
Ion Optics, the Q0 Ion optics and the Q1 Ion Optics, Figure 3.2.3. The Q00 rf apparatus is an
arrangement of four square thin metal bars, giving the so-called quadrupole device. An rf volt-
age is distributed along these poles, generating a quadrupole field that focuses the beam of
charged particles and trains them along an z-axis and oriented towards the succeeding optics
of the instrument. The ions then pursue their path towards the Q0 optical piece which is a sec-
ond quadrupole with a ‘U’ topology, unique to the LTQ Velos and serves to filter out the neutrals.
Next the ions are transmitted to the Q1 ion optics, an octapole downstream in the instrumental
setting of the LTQ Velos. Their role is once more to transmit and gather the ions together as
they shuttle towards the detectors. The octapole in question is as the name implies an arrange-
ment of eight round-profile rods that work in a very similar manner to the previously men-
tioned quadrupoles. Both quadrupoles and octapole are subject to an increasing vacuum gra-
dient that allows to curtain the ions to the linear ion trap cells of the LTQ Velos MS design. The
pathway track of these charged analytes is also assisted and simultaneously controlled by a
series of lenses subjected to an electrical potential that baffle both the vacuum and applied
quadrupole guiding field of the mid-section of the MS system [7].
Figure 3.2.2. Functional layout of the linear ion trap. Adapted with permission from (Second TP, Blethrow JD, Schwartz JC, Merri-hew GE, MacCoss MJ, Swaney DL, Russell JD, Coon JJ, Zabrouskov V: Dual-Pressure Linear Ion Trap Mass Spectrometer Improving the Analysis of Complex Protein Mixtures. Analytical Chemistry 2009, 81:7757-7765.). Copyright (2017) American Chemical Soci-
ety.
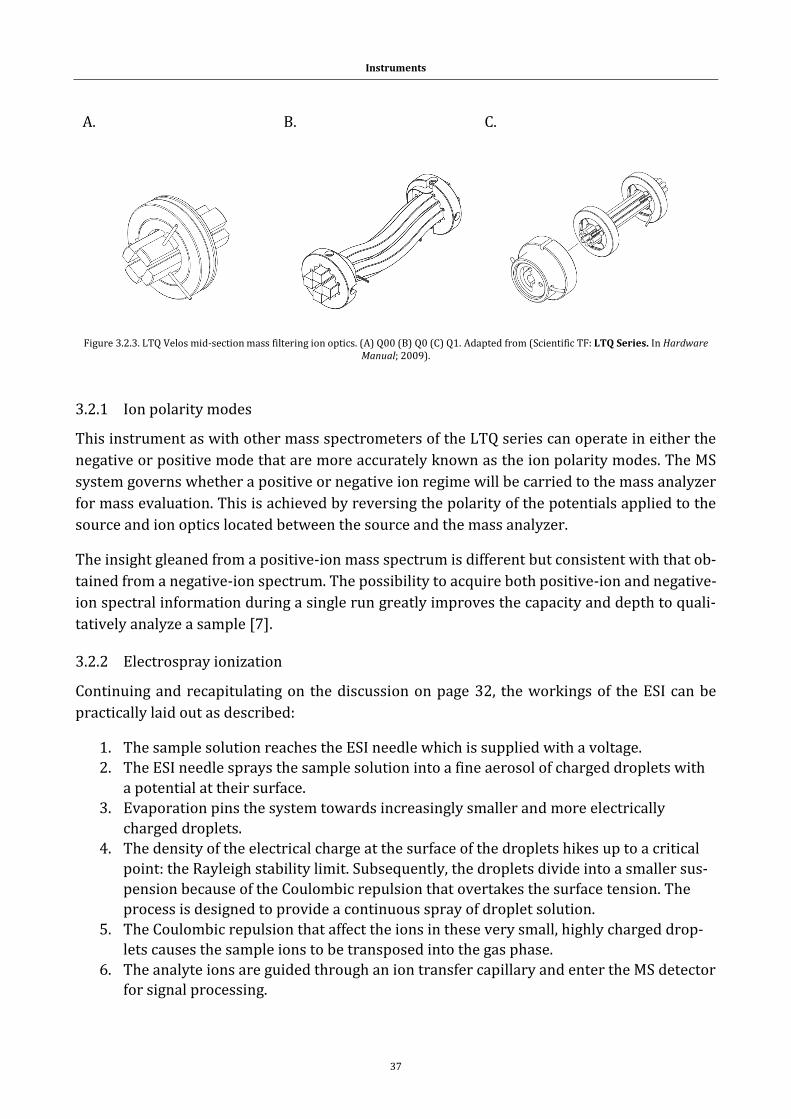
Instruments
37
A. B. C.
Figure 3.2.3. LTQ Velos mid-section mass filtering ion optics. (A) Q00 (B) Q0 (C) Q1. Adapted from (Scientific TF: LTQ Series. In Hardware Manual; 2009).
3.2.1 Ion polarity modes
This instrument as with other mass spectrometers of the LTQ series can operate in either the
negative or positive mode that are more accurately known as the ion polarity modes. The MS
system governs whether a positive or negative ion regime will be carried to the mass analyzer
for mass evaluation. This is achieved by reversing the polarity of the potentials applied to the
source and ion optics located between the source and the mass analyzer.
The insight gleaned from a positive-ion mass spectrum is different but consistent with that ob-
tained from a negative-ion spectrum. The possibility to acquire both positive-ion and negative-
ion spectral information during a single run greatly improves the capacity and depth to quali-
tatively analyze a sample [7].
3.2.2 Electrospray ionization
Continuing and recapitulating on the discussion on page 32, the workings of the ESI can be
practically laid out as described:
1. The sample solution reaches the ESI needle which is supplied with a voltage.
2. The ESI needle sprays the sample solution into a fine aerosol of charged droplets with
a potential at their surface.
3. Evaporation pins the system towards increasingly smaller and more electrically
charged droplets.
4. The density of the electrical charge at the surface of the droplets hikes up to a critical
point: the Rayleigh stability limit. Subsequently, the droplets divide into a smaller sus-
pension because of the Coulombic repulsion that overtakes the surface tension. The
process is designed to provide a continuous spray of droplet solution.
5. The Coulombic repulsion that affect the ions in these very small, highly charged drop-
lets causes the sample ions to be transposed into the gas phase.
6. The analyte ions are guided through an ion transfer capillary and enter the MS detector for signal processing.
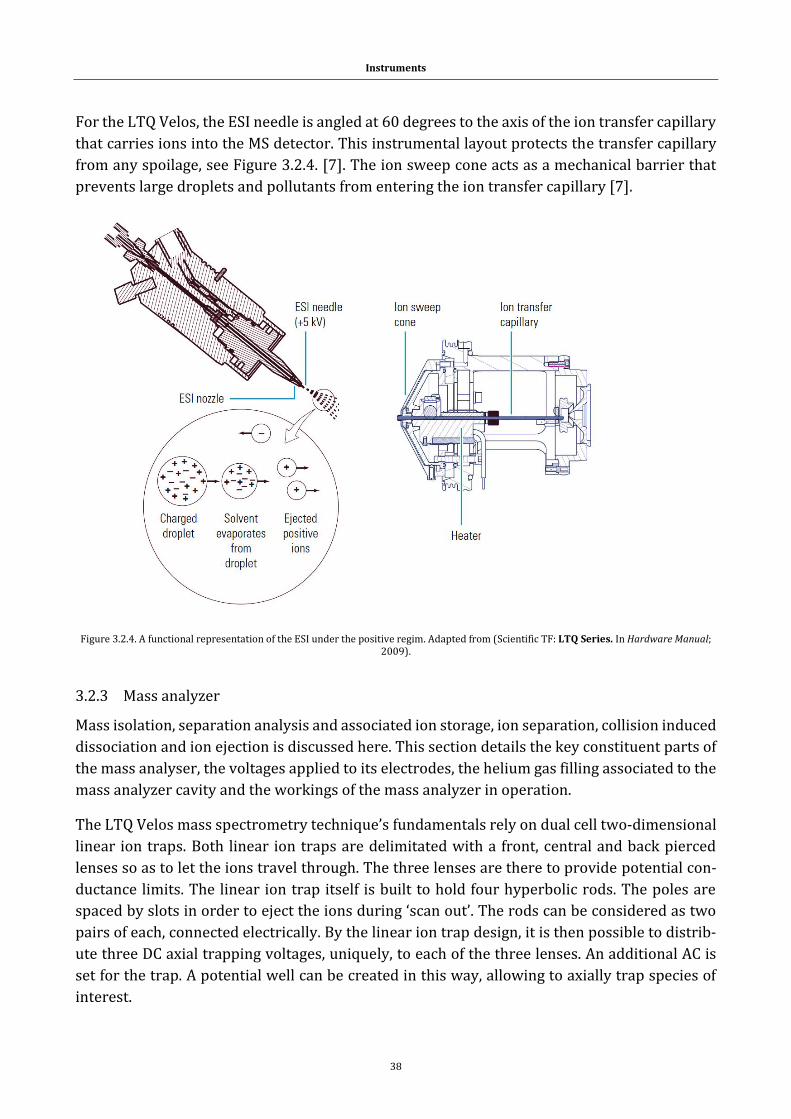
Instruments
38
For the LTQ Velos, the ESI needle is angled at 60 degrees to the axis of the ion transfer capillary
that carries ions into the MS detector. This instrumental layout protects the transfer capillary
from any spoilage, see Figure 3.2.4. [7]. The ion sweep cone acts as a mechanical barrier that
prevents large droplets and pollutants from entering the ion transfer capillary [7].
Figure 3.2.4. A functional representation of the ESI under the positive regim. Adapted from (Scientific TF: LTQ Series. In Hardware Manual; 2009).
3.2.3 Mass analyzer
Mass isolation, separation analysis and associated ion storage, ion separation, collision induced
dissociation and ion ejection is discussed here. This section details the key constituent parts of
the mass analyser, the voltages applied to its electrodes, the helium gas filling associated to the
mass analyzer cavity and the workings of the mass analyzer in operation.
The LTQ Velos mass spectrometry technique’s fundamentals rely on dual cell two-dimensional
linear ion traps. Both linear ion traps are delimitated with a front, central and back pierced
lenses so as to let the ions travel through. The three lenses are there to provide potential con-
ductance limits. The linear ion trap itself is built to hold four hyperbolic rods. The poles are
spaced by slots in order to eject the ions during ‘scan out’. The rods can be considered as two
pairs of each, connected electrically. By the linear ion trap design, it is then possible to distrib-
ute three DC axial trapping voltages, uniquely, to each of the three lenses. An additional AC is
set for the trap. A potential well can be created in this way, allowing to axially trap species of
interest.

Instruments
39
Principle of the linear quadrupole
Before proceeding in describing the hyperbolic quadrupole linear ion traps it is well to look at
the earlier groundwork principles of a quadrupole mass analyzer in greater detail. As men-
tioned above, the quadrupole consists of an arrangement of four electrode bars. These are of a
hyperbolic or cylindrical geometry. The pairs of opposite electrodes are held at a same potential
composed of a DC and AC element, consistent with the following equations [6]:
3.2.3.1 −(𝑼 + 𝑽𝒄𝒐𝒔𝝎𝒕) 3.2.3.2 + (𝑼 + 𝑽𝒄𝒐𝒔𝝎𝒕)
Here;
U DC voltage applied continuously to the electrodes of a multipole.
V Amplitude of the AC current with a given frequency applied to the
electrodes of a multipole.
Ω A radiofrequency (rf), angular frequency.
T Time
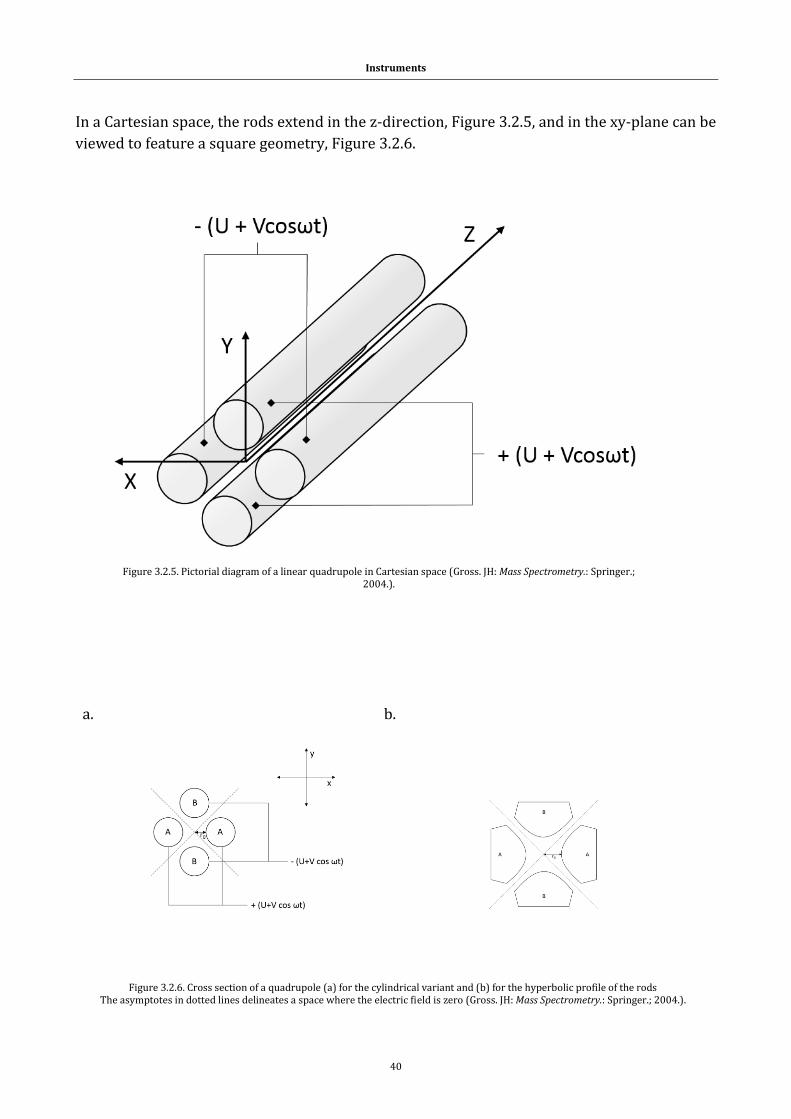
Instruments
40
Figure 3.2.5. Pictorial diagram of a linear quadrupole in Cartesian space (Gross. JH: Mass Spectrometry.: Springer.; 2004.).
In a Cartesian space, the rods extend in the z-direction, Figure 3.2.5, and in the xy-plane can be
viewed to feature a square geometry, Figure 3.2.6.
a.
b.
Figure 3.2.6. Cross section of a quadrupole (a) for the cylindrical variant and (b) for the hyperbolic profile of the rods The asymptotes in dotted lines delineates a space where the electric field is zero (Gross. JH: Mass Spectrometry.: Springer.; 2004.).
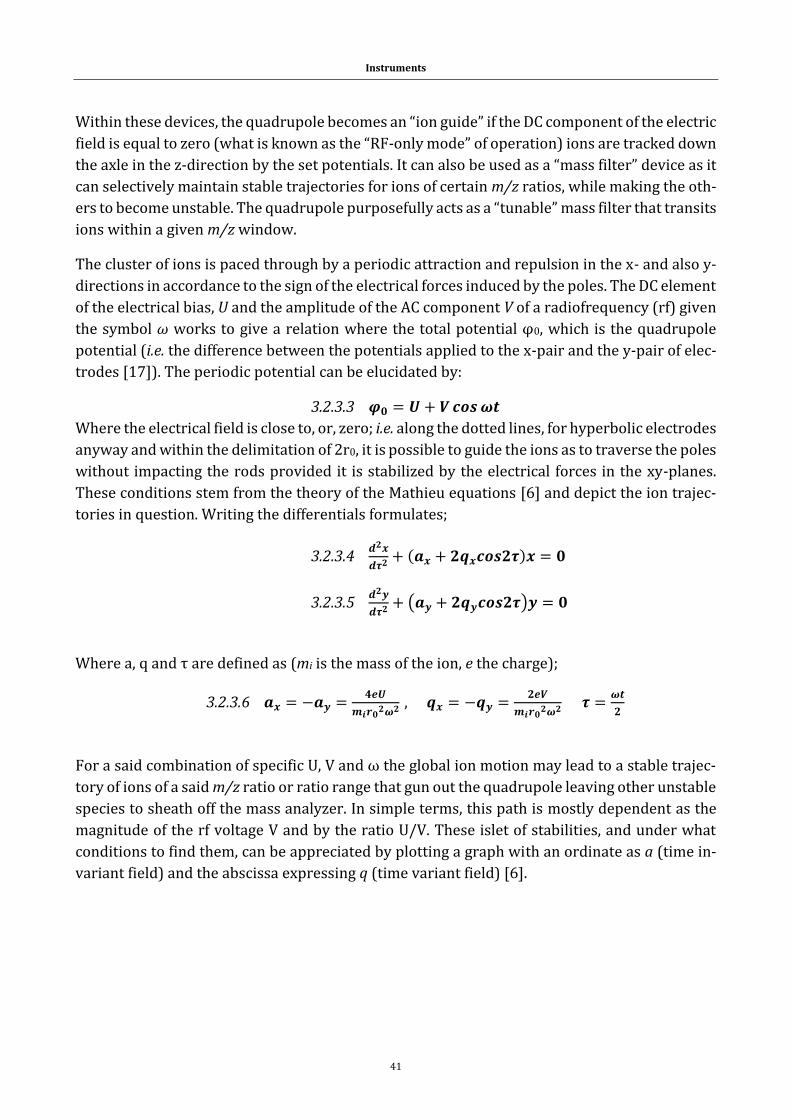
Instruments
41
Within these devices, the quadrupole becomes an “ion guide” if the DC component of the electric
field is equal to zero (what is known as the “RF-only mode” of operation) ions are tracked down
the axle in the z-direction by the set potentials. It can also be used as a “mass filter” device as it
can selectively maintain stable trajectories for ions of certain m/z ratios, while making the oth-
ers to become unstable. The quadrupole purposefully acts as a “tunable” mass filter that transits
ions within a given m/z window.
The cluster of ions is paced through by a periodic attraction and repulsion in the x- and also y-
directions in accordance to the sign of the electrical forces induced by the poles. The DC element
of the electrical bias, U and the amplitude of the AC component V of a radiofrequency (rf) given
the symbol ω works to give a relation where the total potential φ0, which is the quadrupole
potential (i.e. the difference between the potentials applied to the x-pair and the y-pair of elec-
trodes [17]). The periodic potential can be elucidated by:
3.2.3.3 𝝋𝟎 = 𝑼 + 𝑽𝒄𝒐𝒔𝝎𝒕
Where the electrical field is close to, or, zero; i.e. along the dotted lines, for hyperbolic electrodes
anyway and within the delimitation of 2r0, it is possible to guide the ions as to traverse the poles
without impacting the rods provided it is stabilized by the electrical forces in the xy-planes.
These conditions stem from the theory of the Mathieu equations [6] and depict the ion trajec-
tories in question. Writing the differentials formulates;
3.2.3.4 𝒅𝟐𝒙
𝒅𝝉𝟐 + (𝒂𝒙 + 𝟐𝒒𝒙𝒄𝒐𝒔𝟐𝝉)𝒙 = 𝟎
3.2.3.5 𝒅𝟐𝒚
𝒅𝝉𝟐 + (𝒂𝒚 + 𝟐𝒒𝒚𝒄𝒐𝒔𝟐𝝉)𝒚 = 𝟎
Where a, q and τ are defined as (mi is the mass of the ion, e the charge);
3.2.3.6 𝒂𝒙 = −𝒂𝒚 =𝟒𝒆𝑼
𝒎𝒊𝒓𝟎𝟐𝝎𝟐 , 𝒒𝒙 = −𝒒𝒚 =
𝟐𝒆𝑽
𝒎𝒊𝒓𝟎𝟐𝝎𝟐 𝝉 =
𝝎𝒕
𝟐
For a said combination of specific U, V and ω the global ion motion may lead to a stable trajec-
tory of ions of a said m/z ratio or ratio range that gun out the quadrupole leaving other unstable
species to sheath off the mass analyzer. In simple terms, this path is mostly dependent as the
magnitude of the rf voltage V and by the ratio U/V. These islet of stabilities, and under what
conditions to find them, can be appreciated by plotting a graph with an ordinate as a (time in-
variant field) and the abscissa expressing q (time variant field) [6].
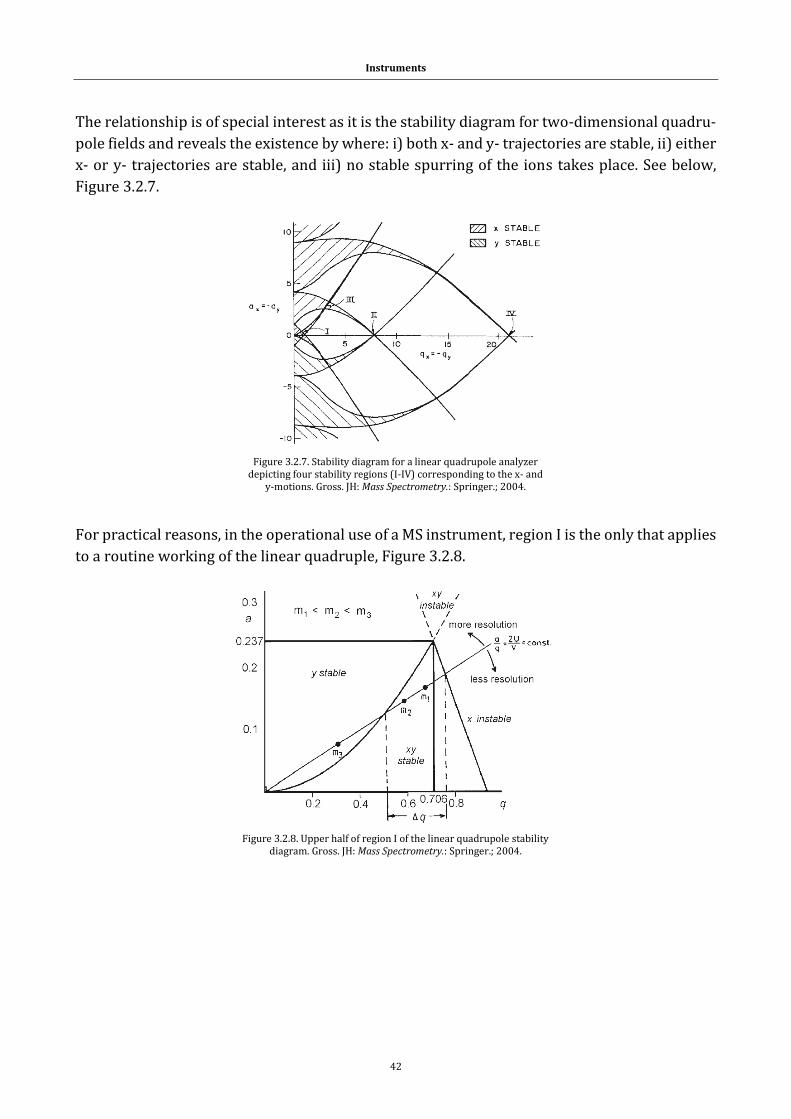
Instruments
42
The relationship is of special interest as it is the stability diagram for two-dimensional quadru-
pole fields and reveals the existence by where: i) both x- and y- trajectories are stable, ii) either
x- or y- trajectories are stable, and iii) no stable spurring of the ions takes place. See below,
Figure 3.2.7.
For practical reasons, in the operational use of a MS instrument, region I is the only that applies
to a routine working of the linear quadruple, Figure 3.2.8.
Figure 3.2.7. Stability diagram for a linear quadrupole analyzer depicting four stability regions (I-IV) corresponding to the x- and
y-motions. Gross. JH: Mass Spectrometry.: Springer.; 2004.
Figure 3.2.8. Upper half of region I of the linear quadrupole stability diagram. Gross. JH: Mass Spectrometry.: Springer.; 2004.
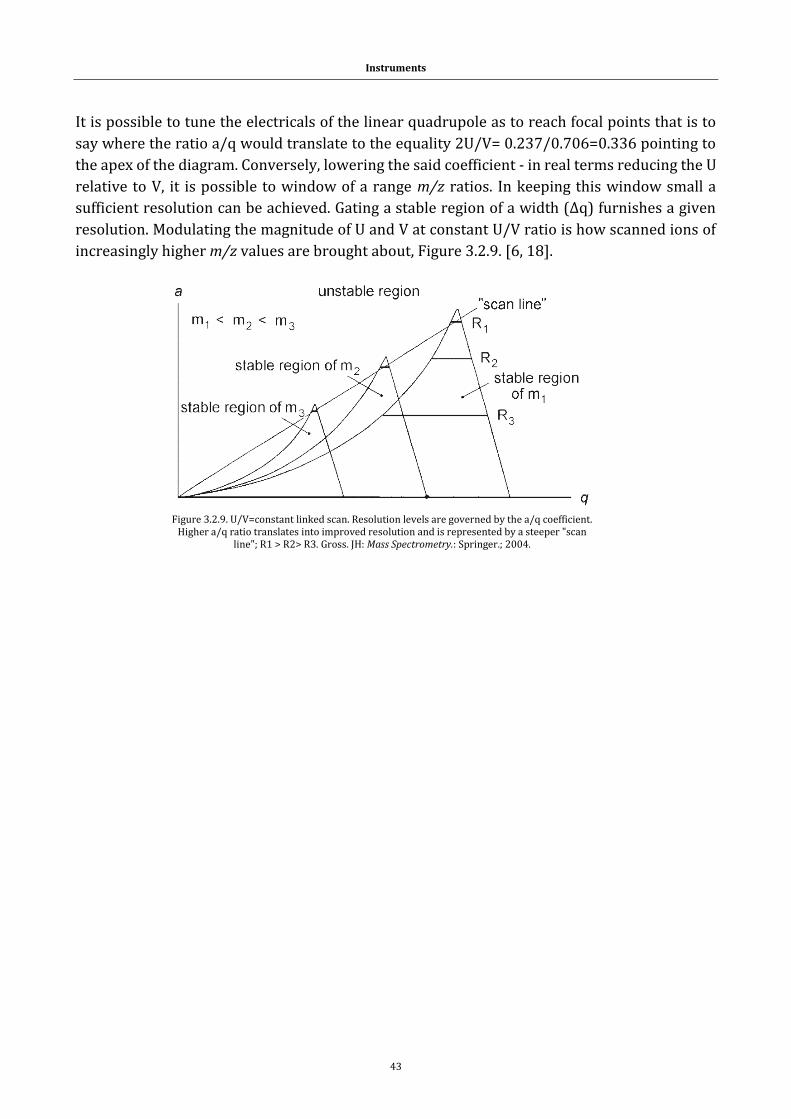
Instruments
43
It is possible to tune the electricals of the linear quadrupole as to reach focal points that is to
say where the ratio a/q would translate to the equality 2U/V= 0.237/0.706=0.336 pointing to
the apex of the diagram. Conversely, lowering the said coefficient - in real terms reducing the U
relative to V, it is possible to window of a range m/z ratios. In keeping this window small a
sufficient resolution can be achieved. Gating a stable region of a width (Δq) furnishes a given
resolution. Modulating the magnitude of U and V at constant U/V ratio is how scanned ions of
increasingly higher m/z values are brought about, Figure 3.2.9. [6, 18].
Figure 3.2.9. U/V=constant linked scan. Resolution levels are governed by the a/q coefficient. Higher a/q ratio translates into improved resolution and is represented by a steeper "scan
line"; R1 > R2> R3. Gross. JH: Mass Spectrometry.: Springer.; 2004.
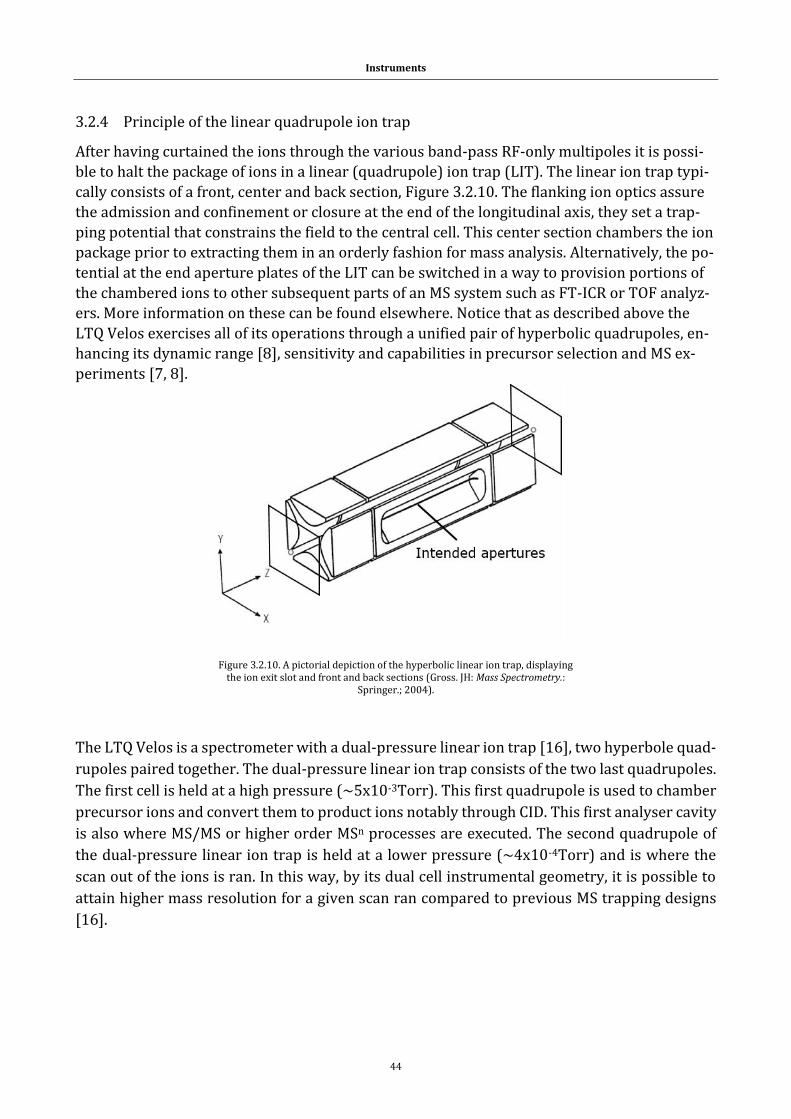
Instruments
44
3.2.4 Principle of the linear quadrupole ion trap
After having curtained the ions through the various band-pass RF-only multipoles it is possi-
ble to halt the package of ions in a linear (quadrupole) ion trap (LIT). The linear ion trap typi-
cally consists of a front, center and back section, Figure 3.2.10. The flanking ion optics assure
the admission and confinement or closure at the end of the longitudinal axis, they set a trap-
ping potential that constrains the field to the central cell. This center section chambers the ion
package prior to extracting them in an orderly fashion for mass analysis. Alternatively, the po-
tential at the end aperture plates of the LIT can be switched in a way to provision portions of
the chambered ions to other subsequent parts of an MS system such as FT-ICR or TOF analyz-
ers. More information on these can be found elsewhere. Notice that as described above the
LTQ Velos exercises all of its operations through a unified pair of hyperbolic quadrupoles, en-
hancing its dynamic range [8], sensitivity and capabilities in precursor selection and MS ex-
periments [7, 8].
The LTQ Velos is a spectrometer with a dual-pressure linear ion trap [16], two hyperbole quad-
rupoles paired together. The dual-pressure linear ion trap consists of the two last quadrupoles.
The first cell is held at a high pressure (~5x10⁻³Torr). This first quadrupole is used to chamber
precursor ions and convert them to product ions notably through CID. This first analyser cavity
is also where MS/MS or higher order MSn processes are executed. The second quadrupole of
the dual-pressure linear ion trap is held at a lower pressure (~4x10⁻⁴Torr) and is where the
scan out of the ions is ran. In this way, by its dual cell instrumental geometry, it is possible to
attain higher mass resolution for a given scan ran compared to previous MS trapping designs
[16].
Figure 3.2.10. A pictorial depiction of the hyperbolic linear ion trap, displaying the ion exit slot and front and back sections (Gross. JH: Mass Spectrometry.:
Springer.; 2004).
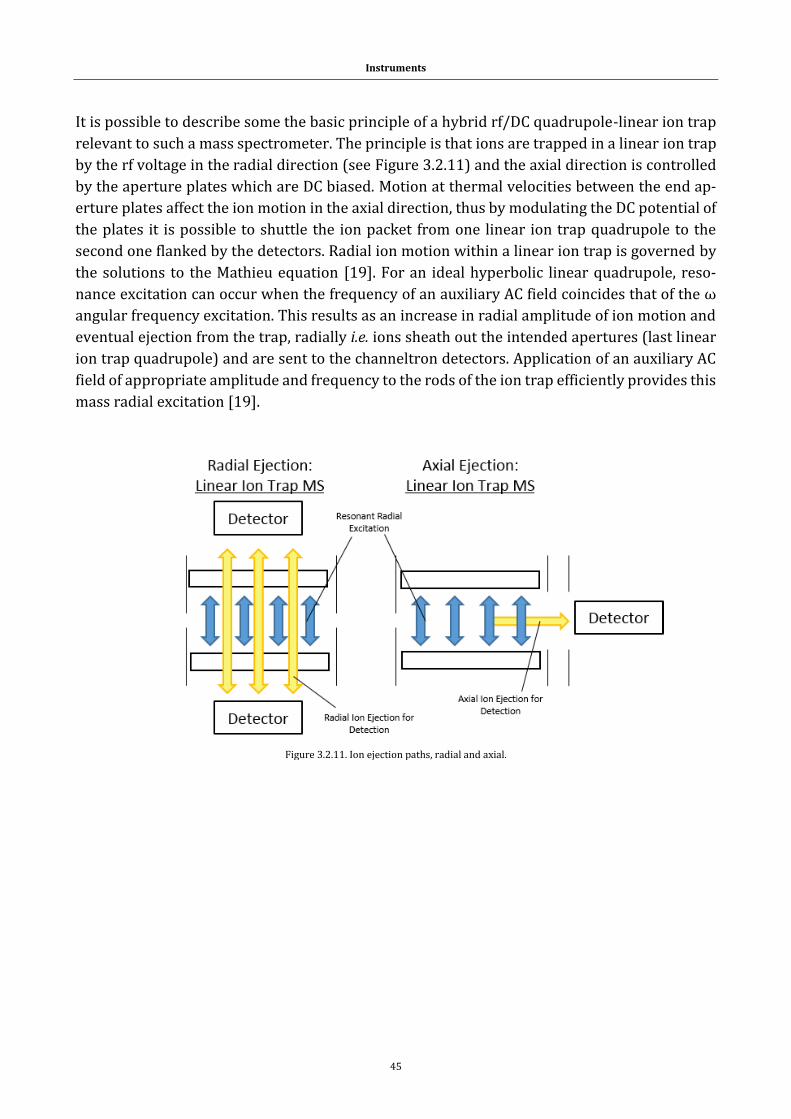
Instruments
45
It is possible to describe some the basic principle of a hybrid rf/DC quadrupole-linear ion trap
relevant to such a mass spectrometer. The principle is that ions are trapped in a linear ion trap
by the rf voltage in the radial direction (see Figure 3.2.11) and the axial direction is controlled
by the aperture plates which are DC biased. Motion at thermal velocities between the end ap-
erture plates affect the ion motion in the axial direction, thus by modulating the DC potential of
the plates it is possible to shuttle the ion packet from one linear ion trap quadrupole to the
second one flanked by the detectors. Radial ion motion within a linear ion trap is governed by
the solutions to the Mathieu equation [19]. For an ideal hyperbolic linear quadrupole, reso-
nance excitation can occur when the frequency of an auxiliary AC field coincides that of the ω
angular frequency excitation. This results as an increase in radial amplitude of ion motion and
eventual ejection from the trap, radially i.e. ions sheath out the intended apertures (last linear
ion trap quadrupole) and are sent to the channeltron detectors. Application of an auxiliary AC
field of appropriate amplitude and frequency to the rods of the ion trap efficiently provides this
mass radial excitation [19].
Figure 3.2.11. Ion ejection paths, radial and axial.
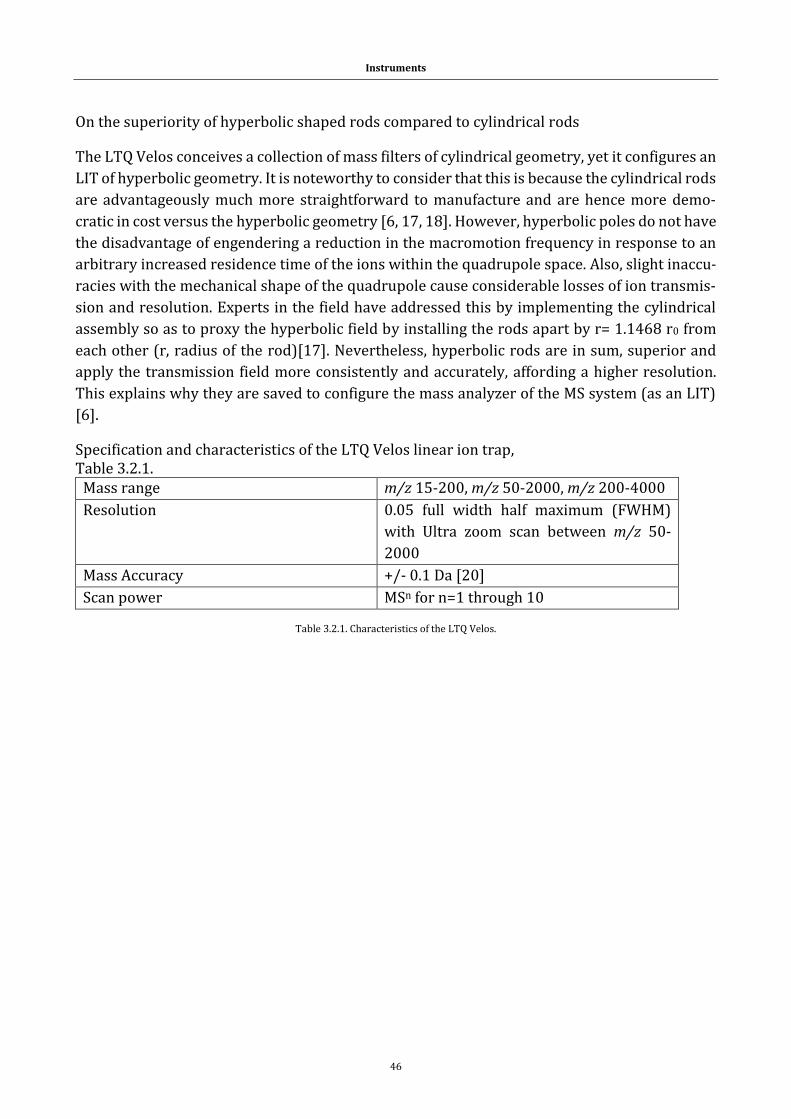
Instruments
46
On the superiority of hyperbolic shaped rods compared to cylindrical rods
The LTQ Velos conceives a collection of mass filters of cylindrical geometry, yet it configures an
LIT of hyperbolic geometry. It is noteworthy to consider that this is because the cylindrical rods
are advantageously much more straightforward to manufacture and are hence more demo-
cratic in cost versus the hyperbolic geometry [6, 17, 18]. However, hyperbolic poles do not have
the disadvantage of engendering a reduction in the macromotion frequency in response to an
arbitrary increased residence time of the ions within the quadrupole space. Also, slight inaccu-
racies with the mechanical shape of the quadrupole cause considerable losses of ion transmis-
sion and resolution. Experts in the field have addressed this by implementing the cylindrical
assembly so as to proxy the hyperbolic field by installing the rods apart by r= 1.1468 r0 from
each other (r, radius of the rod)[17]. Nevertheless, hyperbolic rods are in sum, superior and
apply the transmission field more consistently and accurately, affording a higher resolution.
This explains why they are saved to configure the mass analyzer of the MS system (as an LIT)
[6].
Specification and characteristics of the LTQ Velos linear ion trap, Table 3.2.1.
Mass range m/z 15-200, m/z 50-2000, m/z 200-4000
Resolution 0.05 full width half maximum (FWHM)
with Ultra zoom scan between m/z 50-
2000
Mass Accuracy +/- 0.1 Da [20]
Scan power MSn for n=1 through 10
Table 3.2.1. Characteristics of the LTQ Velos.
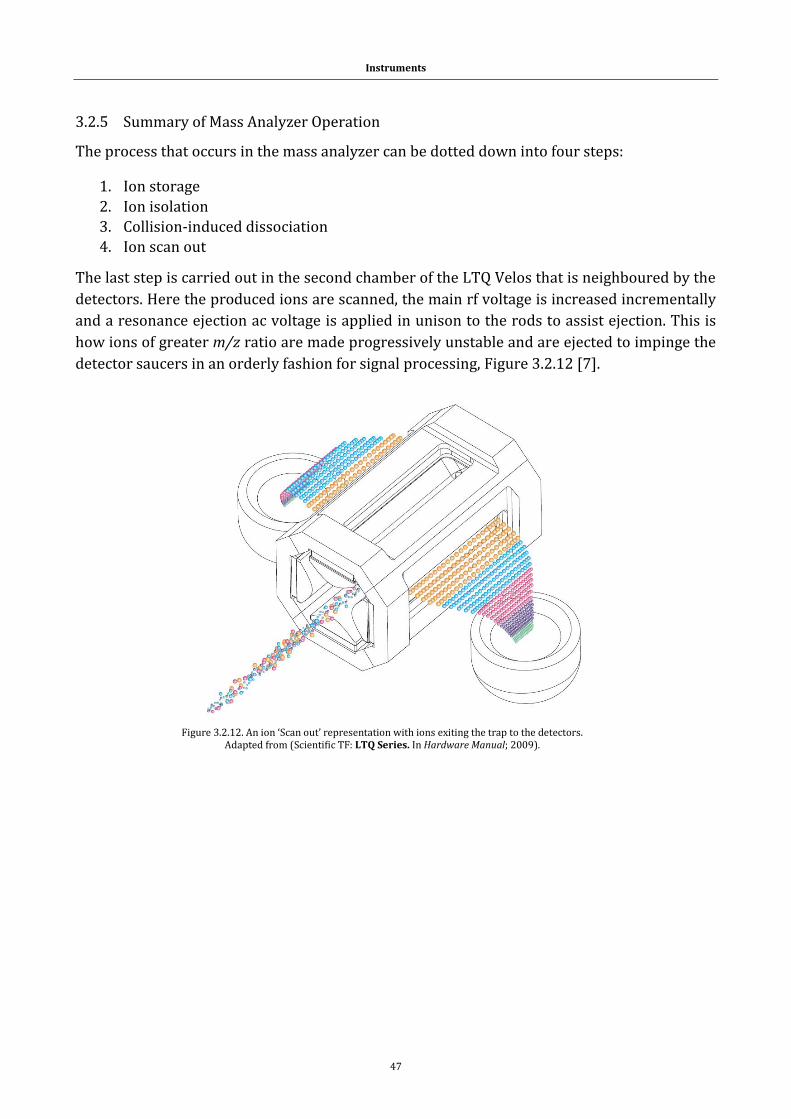
Instruments
47
3.2.5 Summary of Mass Analyzer Operation
The process that occurs in the mass analyzer can be dotted down into four steps:
1. Ion storage
2. Ion isolation
3. Collision-induced dissociation
4. Ion scan out
The last step is carried out in the second chamber of the LTQ Velos that is neighboured by the
detectors. Here the produced ions are scanned, the main rf voltage is increased incrementally
and a resonance ejection ac voltage is applied in unison to the rods to assist ejection. This is
how ions of greater m/z ratio are made progressively unstable and are ejected to impinge the
detector saucers in an orderly fashion for signal processing, Figure 3.2.12 [7].
Figure 3.2.12. An ion ‘Scan out’ representation with ions exiting the trap to the detectors. Adapted from (Scientific TF: LTQ Series. In Hardware Manual; 2009).
Instruments
48
3.2.6 Ion detection system
The ion detection system comprises of two flanking ion channeltron detectors (vide supra, Fig-
ure 3.2.12). These ion detection systems produce high signal-to-noise ratio and enable to
change the voltage bias to either the positive ion or negative ion modes of operation. The chan-
neltrons are based on a conversion dynode and an electron multiplier. The ion detection sys-
tems are situated on opposite to each other with respect to the second linear ion trap.
The conversion dynode can be described as a concave metal plate located at a right angle to the
ion path. A positive potential for a negative ion channel and a negative potential for a positive
ion channel are applied to the conversion dynode. On impact, the ions striking the conversion
plate generate one or more secondary electrons. The curved surface of the dynode has an effect
to converge these secondary electrons. These are then funneled down electrically to the elec-
tron multiplier. The conversion dynode also shields the vacuum manifold from the electric field
that the conversion dynode produces.
The electron multiplier is fitted overhead to the cover plate of the vacuum manifold beside the
mass analyzer. The electron multiplier comprises of a cathode and an anode. The cathode of
the electron multiplier in essence is a funnel shaped resistor. The anode sits at the exit of the
cathode. This anode fosters the electrons transmitted by the cathode. Secondary particles that
bullet out from the conversion dynode hit the inner walling of the electron multiplier cathode
with sufficient impact to eject electrons. These electrons in turn, strike the inner exposed
space of the cathode further up. A snow ball effect is triggered as even more electrons dis-
charge. This opens the possibility for a measurable current at the anode to be observed. The
collected current by the anode is proportional to the number of secondary particles striking
the cathode. The current that leaves the electron multiplier via the anode is saved by the data
system. Alltogether, the whole set up is designed in a way so that the orientation of the pieces
prohibits any neutral undesirables to touch the conversion dynode or electron multiplier, con-
siderably improving the signal to noise ratio [7].
3.2.7 Helium damping gas in the mass analyser
The mass analyzer cavity is pressurized with helium gas. Its role is one of a damping gas and
collisional activation partner. The helium brakes and dims the kinetic energy of the ions
through collisions and, having their amplitude of oscillation lowered, these then become ame-
nable to trapping by the rf field in the mass analyzer and refocus to the center of the cavity of
the trap. This is what is known as collisional cooling. Without helium it would be impossible to
have the required sensitivity and mass spectral resolution for a commercial instrument.
When under the CID regime, the resonance excitation voltage drives the parent ions to collide
with the helium atoms. Provided that the internal energy transfer from the impact is sufficient,
the parent ion dissociates into one or more product ions.
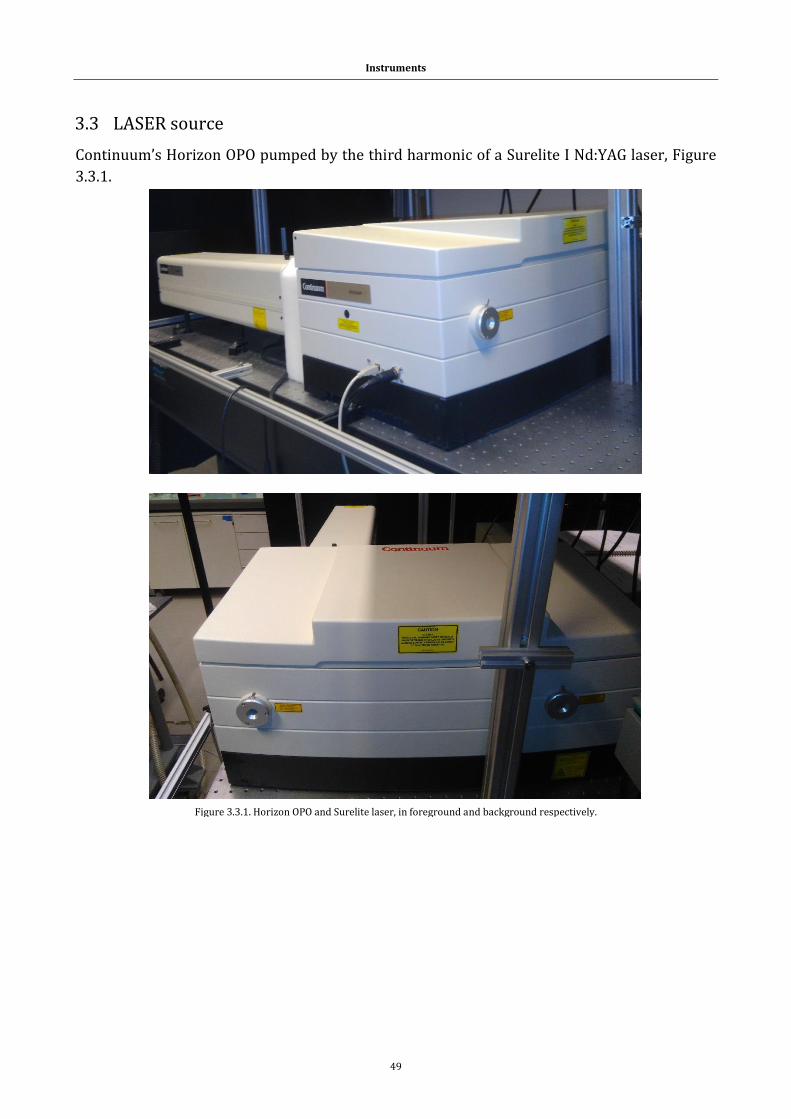
Instruments
49
3.3 LASER source
Continuum’s Horizon OPO pumped by the third harmonic of a Surelite I Nd:YAG laser, Figure
3.3.1.
Figure 3.3.1. Horizon OPO and Surelite laser, in foreground and background respectively.
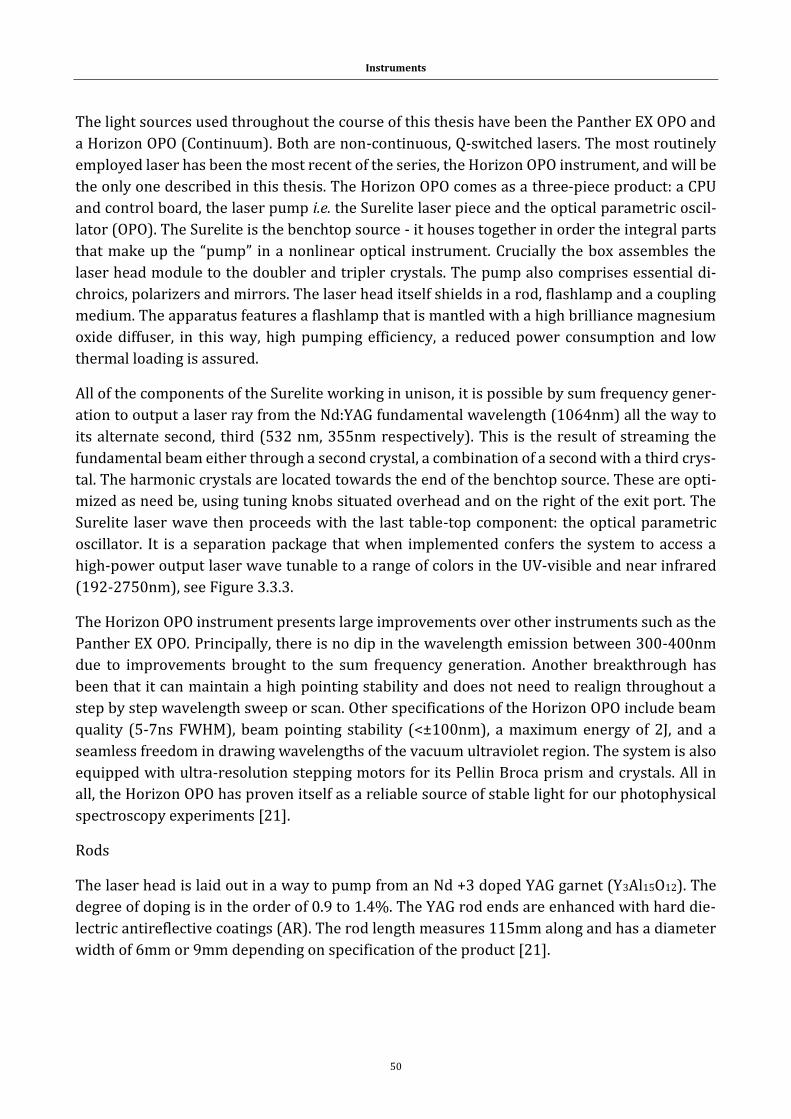
Instruments
50
The light sources used throughout the course of this thesis have been the Panther EX OPO and
a Horizon OPO (Continuum). Both are non-continuous, Q-switched lasers. The most routinely
employed laser has been the most recent of the series, the Horizon OPO instrument, and will be
the only one described in this thesis. The Horizon OPO comes as a three-piece product: a CPU
and control board, the laser pump i.e. the Surelite laser piece and the optical parametric oscil-
lator (OPO). The Surelite is the benchtop source - it houses together in order the integral parts
that make up the “pump” in a nonlinear optical instrument. Crucially the box assembles the
laser head module to the doubler and tripler crystals. The pump also comprises essential di-
chroics, polarizers and mirrors. The laser head itself shields in a rod, flashlamp and a coupling
medium. The apparatus features a flashlamp that is mantled with a high brilliance magnesium
oxide diffuser, in this way, high pumping efficiency, a reduced power consumption and low
thermal loading is assured.
All of the components of the Surelite working in unison, it is possible by sum frequency gener-
ation to output a laser ray from the Nd:YAG fundamental wavelength (1064nm) all the way to
its alternate second, third (532 nm, 355nm respectively). This is the result of streaming the
fundamental beam either through a second crystal, a combination of a second with a third crys-
tal. The harmonic crystals are located towards the end of the benchtop source. These are opti-
mized as need be, using tuning knobs situated overhead and on the right of the exit port. The
Surelite laser wave then proceeds with the last table-top component: the optical parametric
oscillator. It is a separation package that when implemented confers the system to access a
high-power output laser wave tunable to a range of colors in the UV-visible and near infrared
(192-2750nm), see Figure 3.3.3.
The Horizon OPO instrument presents large improvements over other instruments such as the
Panther EX OPO. Principally, there is no dip in the wavelength emission between 300-400nm
due to improvements brought to the sum frequency generation. Another breakthrough has
been that it can maintain a high pointing stability and does not need to realign throughout a
step by step wavelength sweep or scan. Other specifications of the Horizon OPO include beam
quality (5-7ns FWHM), beam pointing stability (<±100nm), a maximum energy of 2J, and a
seamless freedom in drawing wavelengths of the vacuum ultraviolet region. The system is also
equipped with ultra-resolution stepping motors for its Pellin Broca prism and crystals. All in
all, the Horizon OPO has proven itself as a reliable source of stable light for our photophysical
spectroscopy experiments [21].
Rods
The laser head is laid out in a way to pump from an Nd +3 doped YAG garnet (Y3Al15O12). The
degree of doping is in the order of 0.9 to 1.4%. The YAG rod ends are enhanced with hard die-
lectric antireflective coatings (AR). The rod length measures 115mm along and has a diameter
width of 6mm or 9mm depending on specification of the product [21].
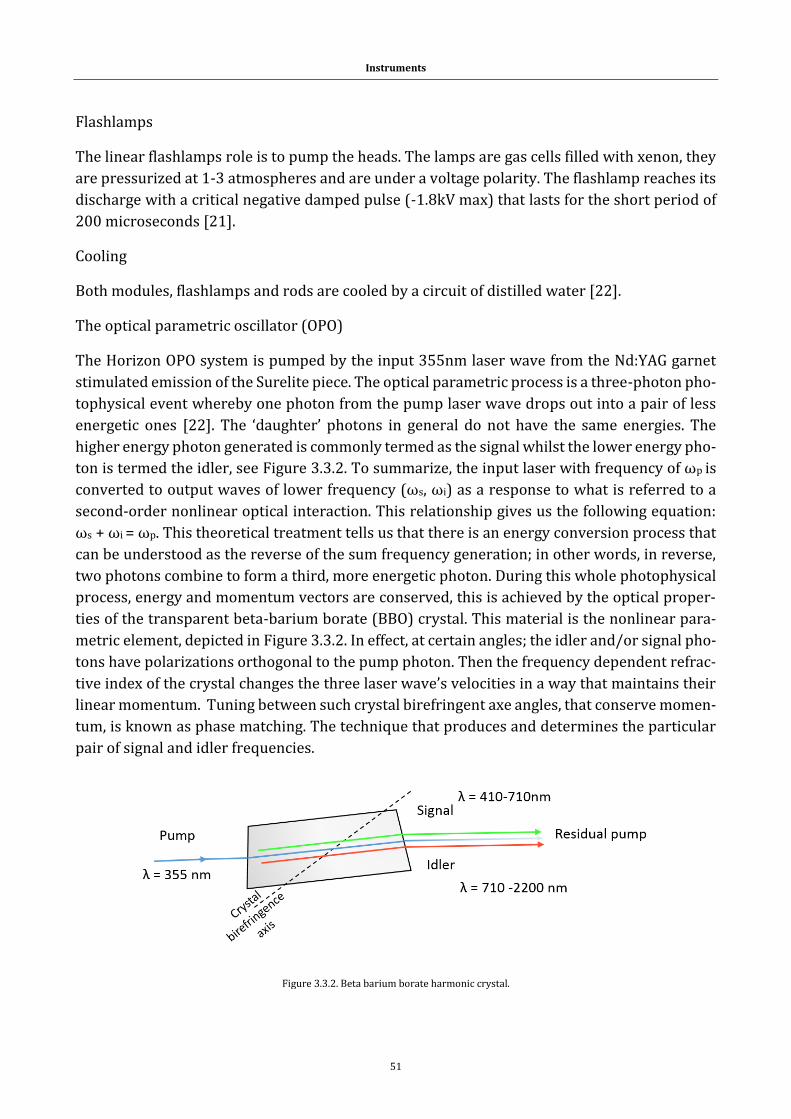
Instruments
51
Flashlamps
The linear flashlamps role is to pump the heads. The lamps are gas cells filled with xenon, they
are pressurized at 1-3 atmospheres and are under a voltage polarity. The flashlamp reaches its
discharge with a critical negative damped pulse (-1.8kV max) that lasts for the short period of
200 microseconds [21].
Cooling
Both modules, flashlamps and rods are cooled by a circuit of distilled water [22].
The optical parametric oscillator (OPO)
The Horizon OPO system is pumped by the input 355nm laser wave from the Nd:YAG garnet
stimulated emission of the Surelite piece. The optical parametric process is a three-photon pho-
tophysical event whereby one photon from the pump laser wave drops out into a pair of less
energetic ones [22]. The ‘daughter’ photons in general do not have the same energies. The
higher energy photon generated is commonly termed as the signal whilst the lower energy pho-
ton is termed the idler, see Figure 3.3.2. To summarize, the input laser with frequency of ωp is
converted to output waves of lower frequency (ωs, ωi) as a response to what is referred to a
second-order nonlinear optical interaction. This relationship gives us the following equation:
ωs + ωi = ωp. This theoretical treatment tells us that there is an energy conversion process that
can be understood as the reverse of the sum frequency generation; in other words, in reverse,
two photons combine to form a third, more energetic photon. During this whole photophysical
process, energy and momentum vectors are conserved, this is achieved by the optical proper-
ties of the transparent beta-barium borate (BBO) crystal. This material is the nonlinear para-
metric element, depicted in Figure 3.3.2. In effect, at certain angles; the idler and/or signal pho-
tons have polarizations orthogonal to the pump photon. Then the frequency dependent refrac-
tive index of the crystal changes the three laser wave’s velocities in a way that maintains their
linear momentum. Tuning between such crystal birefringent axe angles, that conserve momen-
tum, is known as phase matching. The technique that produces and determines the particular
pair of signal and idler frequencies.
Figure 3.3.2. Beta barium borate harmonic crystal.
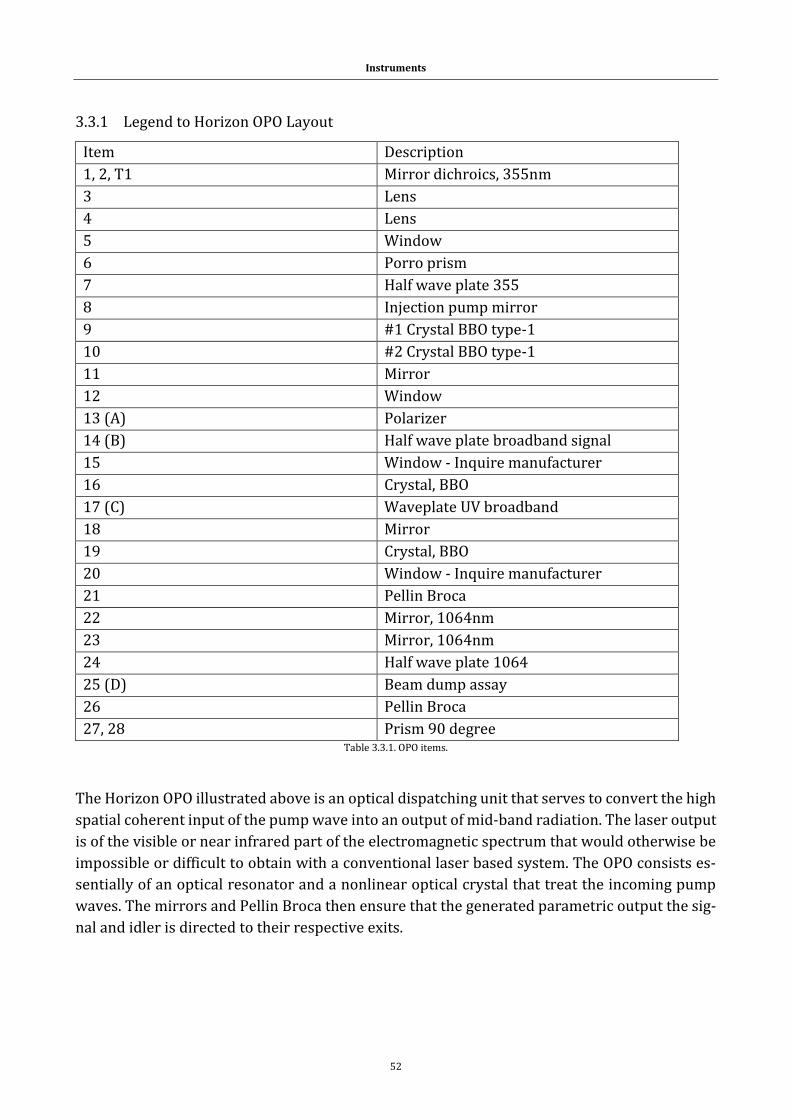
Instruments
52
3.3.1 Legend to Horizon OPO Layout
Item Description
1, 2, T1 Mirror dichroics, 355nm
3 Lens
4 Lens
5 Window
6 Porro prism
7 Half wave plate 355
8 Injection pump mirror
9 #1 Crystal BBO type-1
10 #2 Crystal BBO type-1
11 Mirror
12 Window
13 (A) Polarizer
14 (B) Half wave plate broadband signal
15 Window - Inquire manufacturer
16 Crystal, BBO
17 (C) Waveplate UV broadband
18 Mirror
19 Crystal, BBO
20 Window - Inquire manufacturer
21 Pellin Broca
22 Mirror, 1064nm
23 Mirror, 1064nm
24 Half wave plate 1064
25 (D) Beam dump assay
26 Pellin Broca
27, 28 Prism 90 degree Table 3.3.1. OPO items.
The Horizon OPO illustrated above is an optical dispatching unit that serves to convert the high
spatial coherent input of the pump wave into an output of mid-band radiation. The laser output
is of the visible or near infrared part of the electromagnetic spectrum that would otherwise be
impossible or difficult to obtain with a conventional laser based system. The OPO consists es-
sentially of an optical resonator and a nonlinear optical crystal that treat the incoming pump
waves. The mirrors and Pellin Broca then ensure that the generated parametric output the sig-
nal and idler is directed to their respective exits.
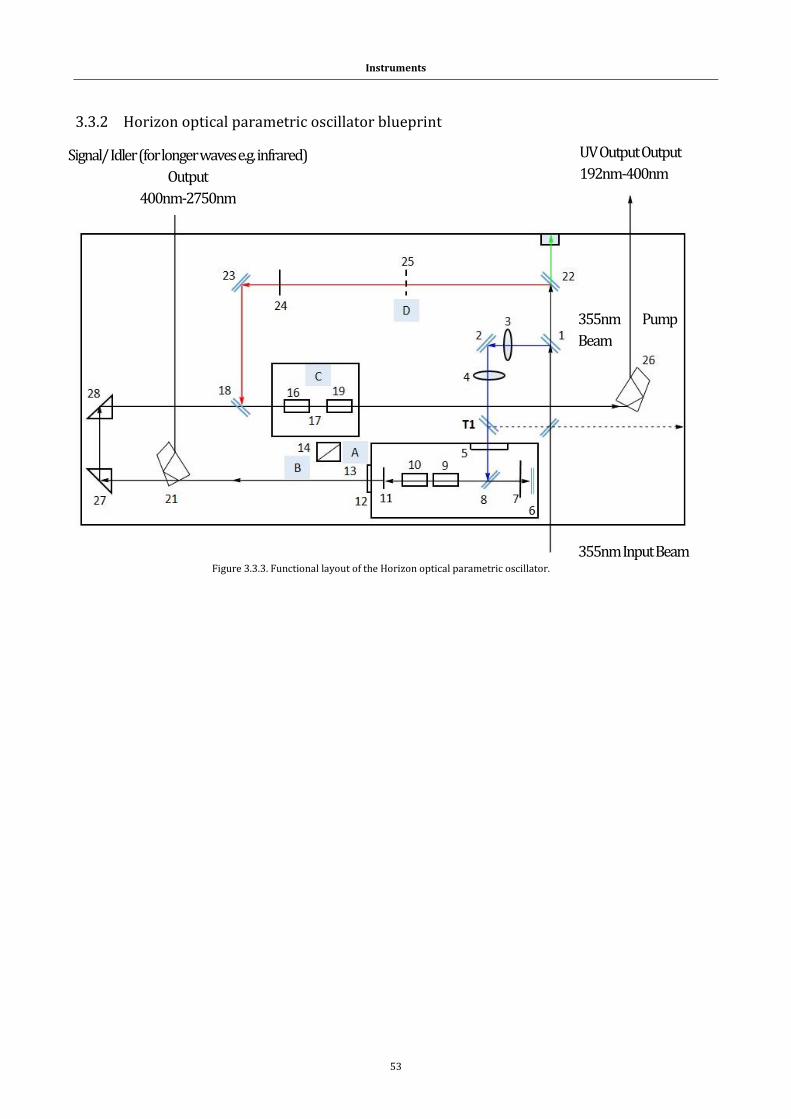
Instruments
53
Figure 3.3.3. Functional layout of the Horizon optical parametric oscillator.
3.3.2 Horizon optical parametric oscillator blueprint
355nm Pump
Beam
Signal/ Idler (for longer waves e.g. infrared)
Output
400nm-2750nm
UV Output Output
192nm-400nm
355nm Input Beam
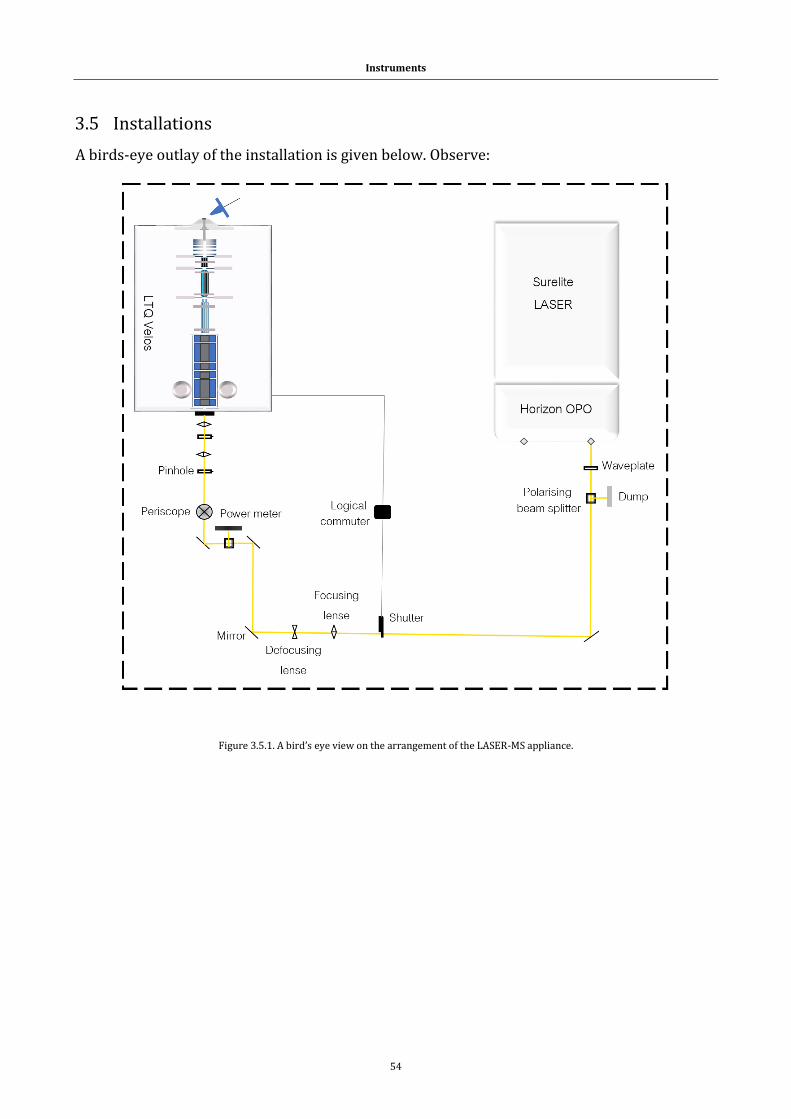
Instruments
54
3.5 Installations
A birds-eye outlay of the installation is given below. Observe:
Figure 3.5.1. A bird’s eye view on the arrangement of the LASER-MS appliance.
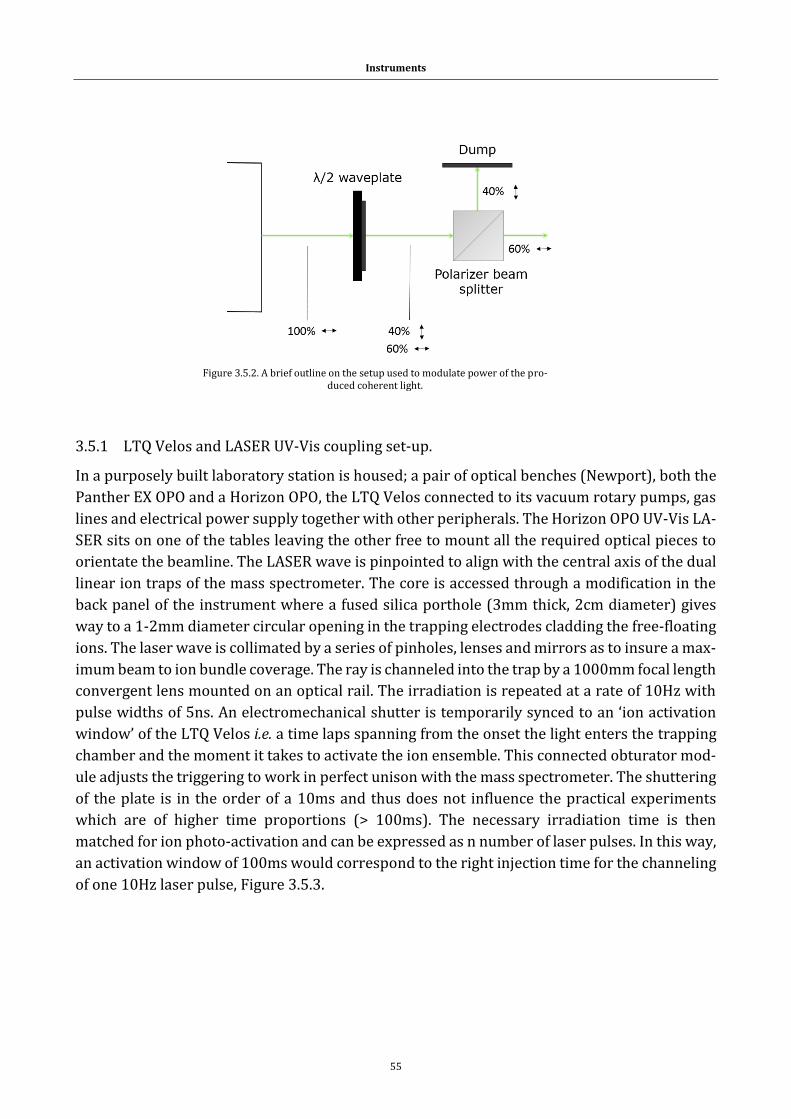
Instruments
55
3.5.1 LTQ Velos and LASER UV-Vis coupling set-up.
In a purposely built laboratory station is housed; a pair of optical benches (Newport), both the
Panther EX OPO and a Horizon OPO, the LTQ Velos connected to its vacuum rotary pumps, gas
lines and electrical power supply together with other peripherals. The Horizon OPO UV-Vis LA-
SER sits on one of the tables leaving the other free to mount all the required optical pieces to
orientate the beamline. The LASER wave is pinpointed to align with the central axis of the dual
linear ion traps of the mass spectrometer. The core is accessed through a modification in the
back panel of the instrument where a fused silica porthole (3mm thick, 2cm diameter) gives
way to a 1-2mm diameter circular opening in the trapping electrodes cladding the free-floating
ions. The laser wave is collimated by a series of pinholes, lenses and mirrors as to insure a max-
imum beam to ion bundle coverage. The ray is channeled into the trap by a 1000mm focal length
convergent lens mounted on an optical rail. The irradiation is repeated at a rate of 10Hz with
pulse widths of 5ns. An electromechanical shutter is temporarily synced to an ‘ion activation
window’ of the LTQ Velos i.e. a time laps spanning from the onset the light enters the trapping
chamber and the moment it takes to activate the ion ensemble. This connected obturator mod-
ule adjusts the triggering to work in perfect unison with the mass spectrometer. The shuttering
of the plate is in the order of a 10ms and thus does not influence the practical experiments
which are of higher time proportions (> 100ms). The necessary irradiation time is then
matched for ion photo-activation and can be expressed as n number of laser pulses. In this way,
an activation window of 100ms would correspond to the right injection time for the channeling
of one 10Hz laser pulse, Figure 3.5.3.
Figure 3.5.2. A brief outline on the setup used to modulate power of the pro-duced coherent light.
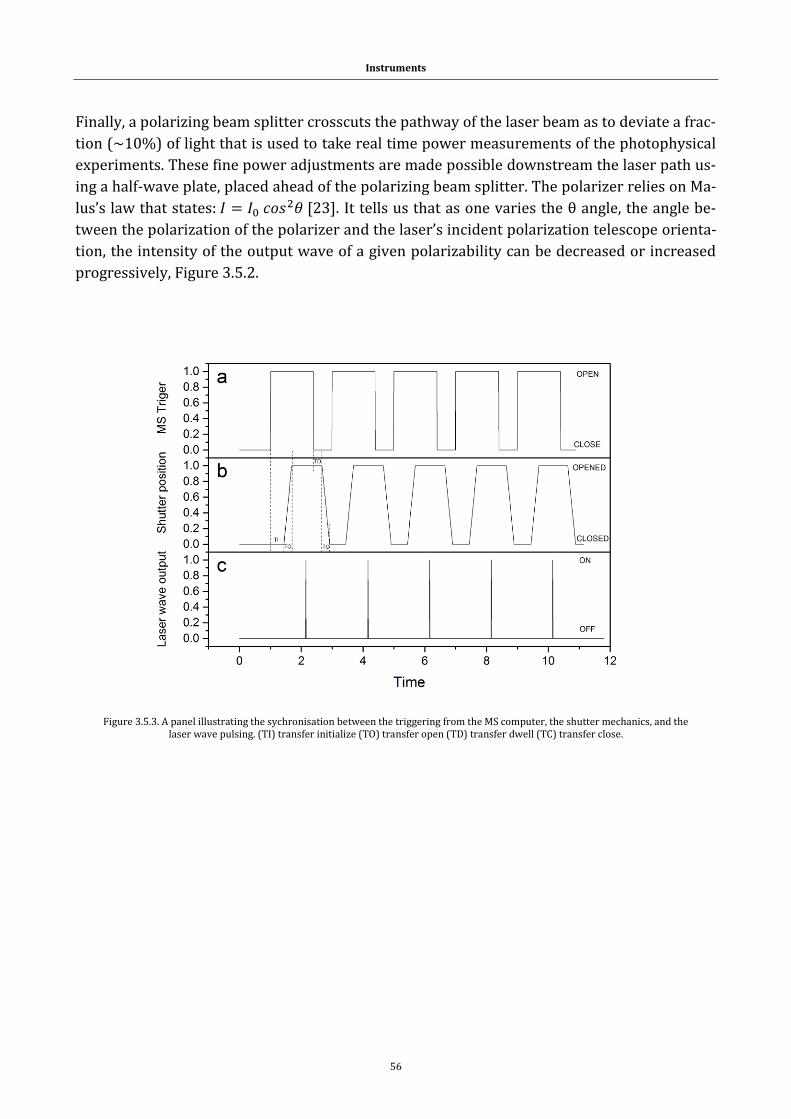
Instruments
56
Finally, a polarizing beam splitter crosscuts the pathway of the laser beam as to deviate a frac-
tion (~10%) of light that is used to take real time power measurements of the photophysical
experiments. These fine power adjustments are made possible downstream the laser path us-
ing a half-wave plate, placed ahead of the polarizing beam splitter. The polarizer relies on Ma-
lus’s law that states: 𝐼 = 𝐼0 𝑐𝑜𝑠2𝜃 [23]. It tells us that as one varies the θ angle, the angle be-
tween the polarization of the polarizer and the laser’s incident polarization telescope orienta-
tion, the intensity of the output wave of a given polarizability can be decreased or increased
progressively, Figure 3.5.2.
Figure 3.5.3. A panel illustrating the sychronisation between the triggering from the MS computer, the shutter mechanics, and the laser wave pulsing. (TI) transfer initialize (TO) transfer open (TD) transfer dwell (TC) transfer close.
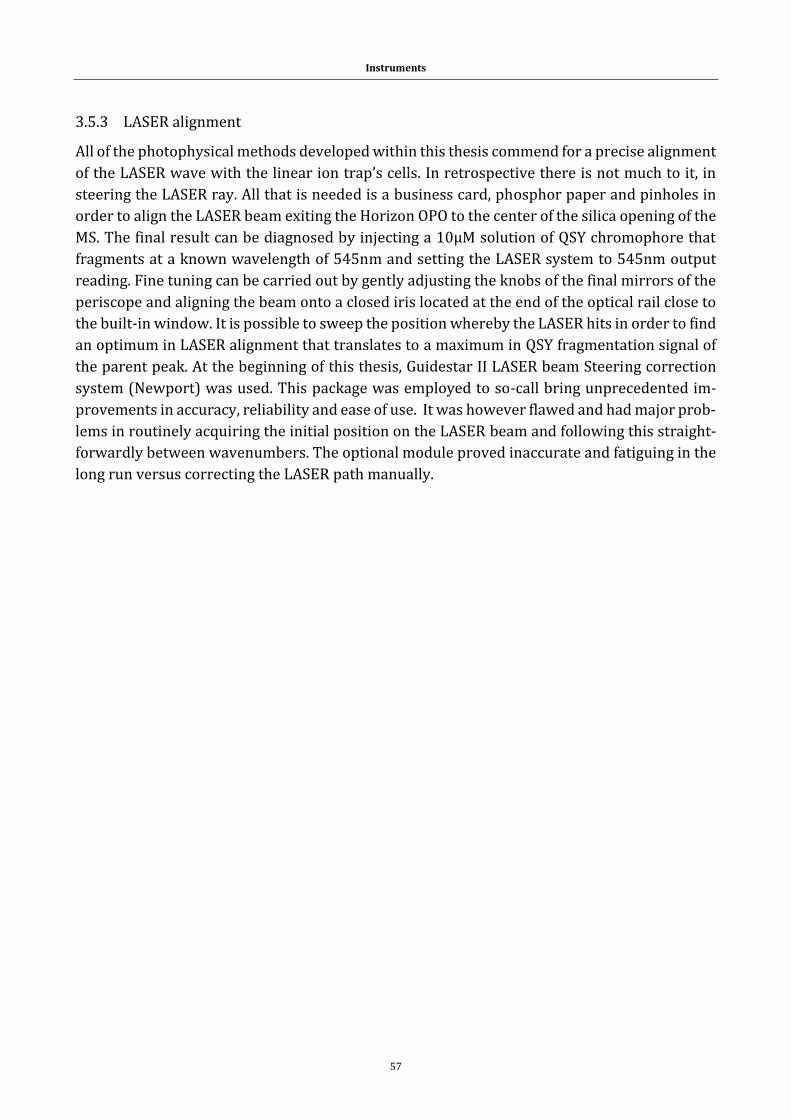
Instruments
57
3.5.3 LASER alignment
All of the photophysical methods developed within this thesis commend for a precise alignment
of the LASER wave with the linear ion trap’s cells. In retrospective there is not much to it, in
steering the LASER ray. All that is needed is a business card, phosphor paper and pinholes in
order to align the LASER beam exiting the Horizon OPO to the center of the silica opening of the
MS. The final result can be diagnosed by injecting a 10µM solution of QSY chromophore that
fragments at a known wavelength of 545nm and setting the LASER system to 545nm output
reading. Fine tuning can be carried out by gently adjusting the knobs of the final mirrors of the
periscope and aligning the beam onto a closed iris located at the end of the optical rail close to
the built-in window. It is possible to sweep the position whereby the LASER hits in order to find
an optimum in LASER alignment that translates to a maximum in QSY fragmentation signal of
the parent peak. At the beginning of this thesis, Guidestar II LASER beam Steering correction
system (Newport) was used. This package was employed to so-call bring unprecedented im-
provements in accuracy, reliability and ease of use. It was however flawed and had major prob-
lems in routinely acquiring the initial position on the LASER beam and following this straight-
forwardly between wavenumbers. The optional module proved inaccurate and fatiguing in the
long run versus correcting the LASER path manually.
Instruments
58
3.6 References :
1. Creighton TE: The physical and chemical basis of molecular biology. Helvetian press; 2010. 2. Wysocki VH, Resing KA, Zhang QF, Cheng GL: Mass spectrometry of peptides and proteins. Methods
2005, 35:211-222. 3. Strupat K: Molecular weight determination of peptides and proteins by ESI and MALDI. In Mass
Spectrometry: Modified Proteins and Glycoconjugates. Volume 405. Edited by Burlingame AL. San Diego: Elsevier Academic Press Inc; 2005: 1-36: Methods in Enzymology.
4. Kaltashov IA, Eyles SJ: Mass spectrometry in biophysics. Hoboken, New Jersey: Wiley; 2005. 5. John R. Dean AMJ, David Holmes, Rob Reed, Allan Jones, Jonathan Weyers: Practical skills in chemistry. 2nd
edn: Prentice Hall; 2011. 6. Gross. JH: Mass Spectrometry.: Springer.; 2004. 7. Scientific TF: LTQ Series. In Hardware Manual; 2009. 8. Domon B, Aebersold R: Review - Mass spectrometry and protein analysis. Science 2006, 312:212-217. 9. Smith RD, Loo JA, Edmonds CG, Barinaga CJ, Udseth HR: New developments in biochemical mass-
spectrometry - electrospray ionization. Analytical Chemistry 1990, 62:882-899. 10. Fenn JB, Mann M, Meng CK, Wong SF, Whitehouse CM: Electrospray ionization-principles and practice.
Mass Spectrometry Reviews 1990, 9:37-70. 11. Ikonomou MG, Blades AT, Kebarle P: Electrospray ion spray - a comparison of mechanisms and
performance. Analytical Chemistry 1991, 63:1989-1998. 12. Dole M, Mack LL, Hines RL: Molecular beams of macroions. Journal of Chemical Physics 1968, 49:2240-
&. 13. Iribarne JV, Thomson BA: Evaporation of small ions from charged droplets. Journal of Chemical Physics
1976, 64:2287-2294. 14. Metwally H, McAllister RG, Popa V, Konermann L: Mechanism of protein supercharging by sulfolane
and m-nitrobenzyl alcohol: molecular dynamics simulations of the electrospray process. Analytical Chemistry 2016, 88:5345-5354.
15. Brodbelt JS: Ion Activation Methods for Peptides and Proteins. Analytical Chemistry 2016, 88:30-51. 16. Second TP, Blethrow JD, Schwartz JC, Merrihew GE, MacCoss MJ, Swaney DL, Russell JD, Coon JJ,
Zabrouskov V: Dual-Pressure Linear Ion Trap Mass Spectrometer Improving the Analysis of Complex Protein Mixtures. Analytical Chemistry 2009, 81:7757-7765.
17. March RE: Quadrupole ion traps. Mass Spectrometry Reviews 2009, 28:961-989. 18. Vernier MA: Développement instrumental en spectrométrie de masse pour le diagnostic in vitro en
microbiologie clinique.Développement instrumental en spectrométrie de masse pour le diagnostic in vitro en microbiologie clinique. Thèse de l'université de Lyon, École doctorale de physique et d'astrophysique; 2014.
19. Hager JW: A new linear ion trap mass spectrometer. Rapid Communications in Mass Spectrometry 2002, 16:512-526.
20. Mass spectrometer specifications guide: Thermo Fisher Scientific's Thermo Scientific LTQ Velos. 21. Continuum: Horizon I and II OPO. Operation and Maintenance. In Manual. pp. 67; 2012:67. 22. Continuum: Operation and maintenance manual for surelite lasers., 2013. 23. Brunet C: Photodetachement d'electron de polyanions: aspects fondamentaux et applications en
spectrometrie de masse. Thèse de l'université de Lyon, École doctorale de physique et d'astrophysique; 2012.

FRET
59
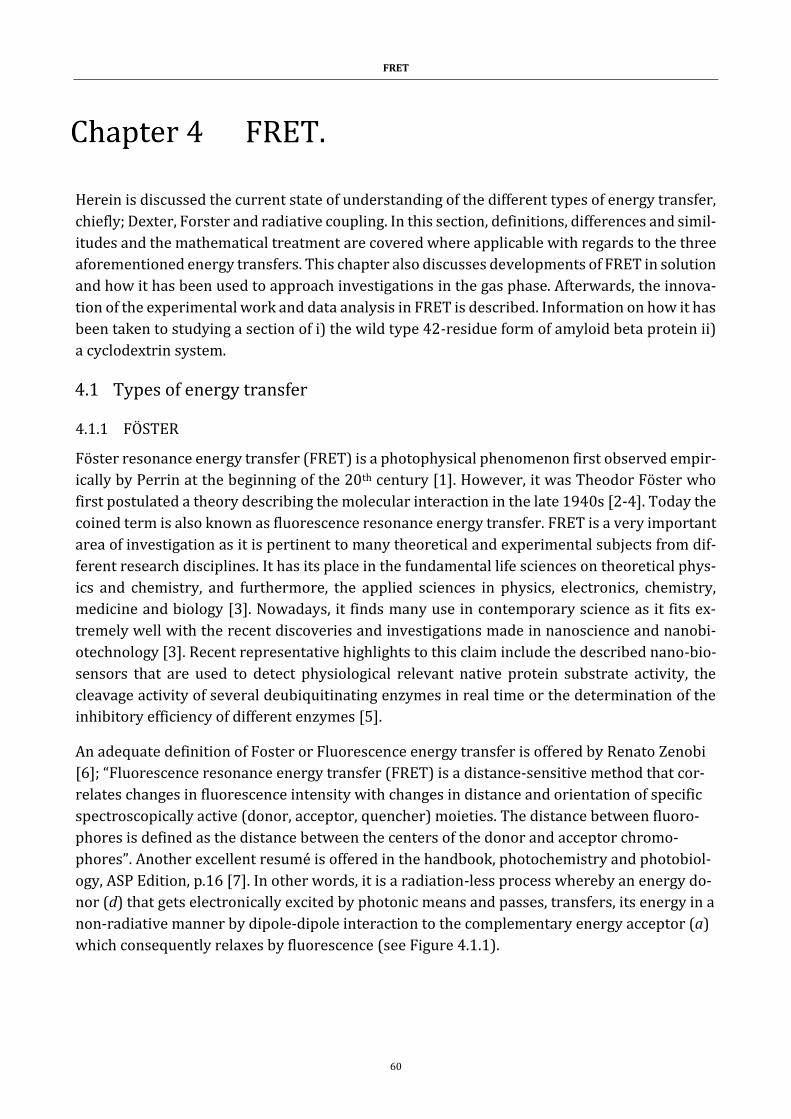
FRET
60
FRET.
Herein is discussed the current state of understanding of the different types of energy transfer,
chiefly; Dexter, Forster and radiative coupling. In this section, definitions, differences and simil-
itudes and the mathematical treatment are covered where applicable with regards to the three
aforementioned energy transfers. This chapter also discusses developments of FRET in solution
and how it has been used to approach investigations in the gas phase. Afterwards, the innova-
tion of the experimental work and data analysis in FRET is described. Information on how it has
been taken to studying a section of i) the wild type 42-residue form of amyloid beta protein ii)
a cyclodextrin system.
4.1 Types of energy transfer
4.1.1 FÖSTER
Föster resonance energy transfer (FRET) is a photophysical phenomenon first observed empir-
ically by Perrin at the beginning of the 20th century [1]. However, it was Theodor Föster who
first postulated a theory describing the molecular interaction in the late 1940s [2-4]. Today the
coined term is also known as fluorescence resonance energy transfer. FRET is a very important
area of investigation as it is pertinent to many theoretical and experimental subjects from dif-
ferent research disciplines. It has its place in the fundamental life sciences on theoretical phys-
ics and chemistry, and furthermore, the applied sciences in physics, electronics, chemistry,
medicine and biology [3]. Nowadays, it finds many use in contemporary science as it fits ex-
tremely well with the recent discoveries and investigations made in nanoscience and nanobi-
otechnology [3]. Recent representative highlights to this claim include the described nano-bio-
sensors that are used to detect physiological relevant native protein substrate activity, the
cleavage activity of several deubiquitinating enzymes in real time or the determination of the
inhibitory efficiency of different enzymes [5].
An adequate definition of Foster or Fluorescence energy transfer is offered by Renato Zenobi
[6]; “Fluorescence resonance energy transfer (FRET) is a distance-sensitive method that cor-
relates changes in fluorescence intensity with changes in distance and orientation of specific
spectroscopically active (donor, acceptor, quencher) moieties. The distance between fluoro-
phores is defined as the distance between the centers of the donor and acceptor chromo-
phores”. Another excellent resumé is offered in the handbook, photochemistry and photobiol-
ogy, ASP Edition, p.16 [7]. In other words, it is a radiation-less process whereby an energy do-
nor (d) that gets electronically excited by photonic means and passes, transfers, its energy in a
non-radiative manner by dipole-dipole interaction to the complementary energy acceptor (a)
which consequently relaxes by fluorescence (see Figure 4.1.1).
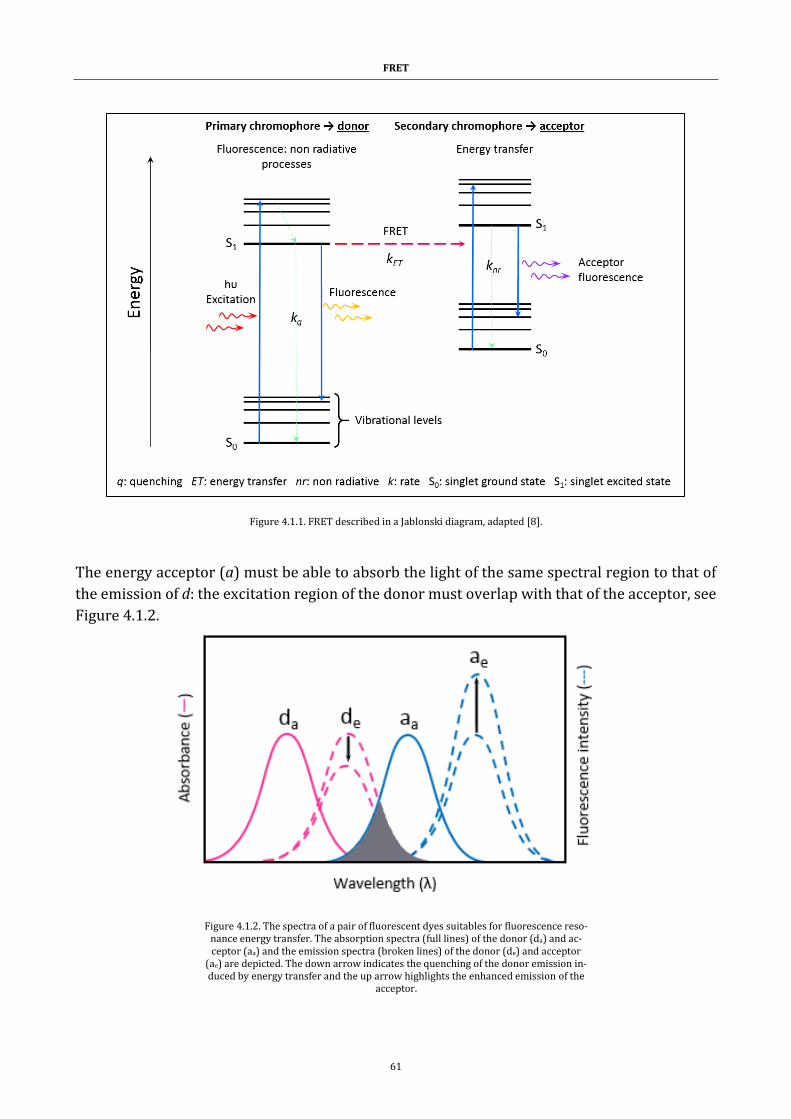
FRET
61
Figure 4.1.1. FRET described in a Jablonski diagram, adapted [8].
The energy acceptor (a) must be able to absorb the light of the same spectral region to that of
the emission of d: the excitation region of the donor must overlap with that of the acceptor, see
Figure 4.1.2.
Figure 4.1.2. The spectra of a pair of fluorescent dyes suitables for fluorescence reso-nance energy transfer. The absorption spectra (full lines) of the donor (da) and ac-ceptor (aa) and the emission spectra (broken lines) of the donor (de) and acceptor
(ae) are depicted. The down arrow indicates the quenching of the donor emission in-duced by energy transfer and the up arrow highlights the enhanced emission of the
acceptor.
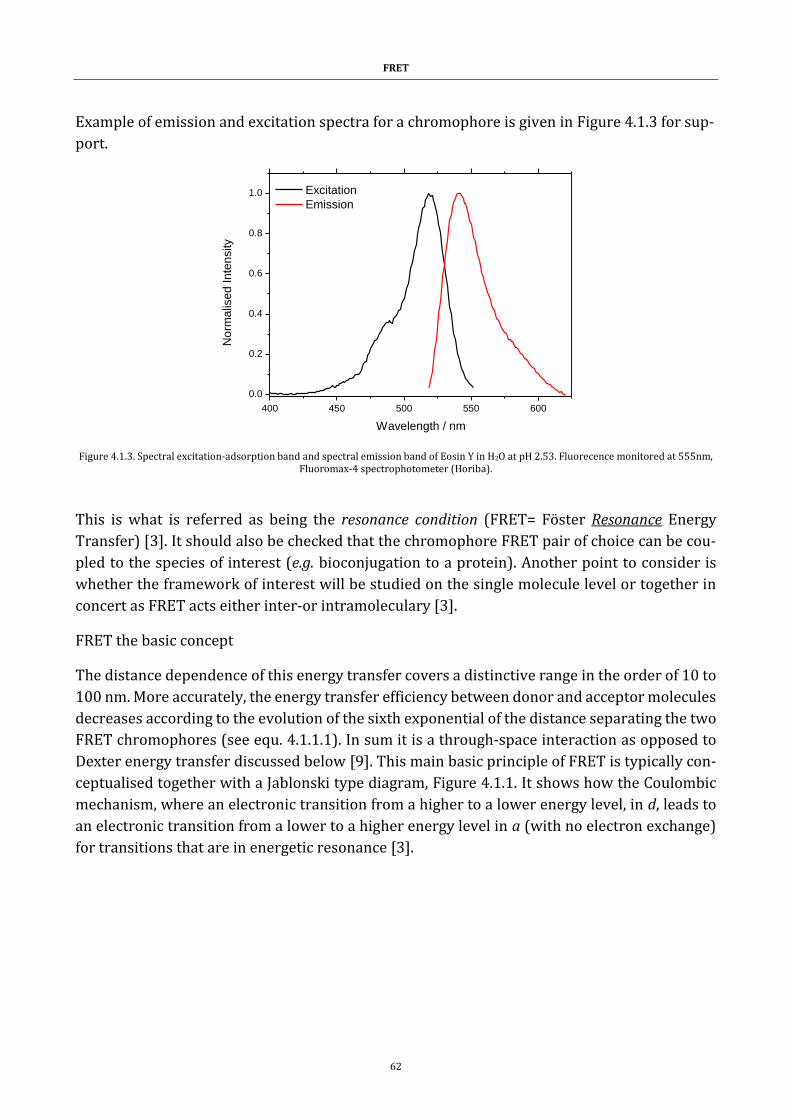
FRET
62
Example of emission and excitation spectra for a chromophore is given in Figure 4.1.3 for sup-
port.
Figure 4.1.3. Spectral excitation-adsorption band and spectral emission band of Eosin Y in H2O at pH 2.53. Fluorecence monitored at 555nm, Fluoromax-4 spectrophotometer (Horiba).
This is what is referred as being the resonance condition (FRET= Föster Resonance Energy
Transfer) [3]. It should also be checked that the chromophore FRET pair of choice can be cou-
pled to the species of interest (e.g. bioconjugation to a protein). Another point to consider is
whether the framework of interest will be studied on the single molecule level or together in
concert as FRET acts either inter-or intramoleculary [3].
FRET the basic concept
The distance dependence of this energy transfer covers a distinctive range in the order of 10 to
100 nm. More accurately, the energy transfer efficiency between donor and acceptor molecules
decreases according to the evolution of the sixth exponential of the distance separating the two
FRET chromophores (see equ. 4.1.1.1). In sum it is a through-space interaction as opposed to
Dexter energy transfer discussed below [9]. This main basic principle of FRET is typically con-
ceptualised together with a Jablonski type diagram, Figure 4.1.1. It shows how the Coulombic
mechanism, where an electronic transition from a higher to a lower energy level, in d, leads to
an electronic transition from a lower to a higher energy level in a (with no electron exchange)
for transitions that are in energetic resonance [3].
400 450 500 550 600
0.0
0.2
0.4
0.6
0.8
1.0 Excitation
Emission
No
rma
lise
d In
ten
sity
Wavelength / nm
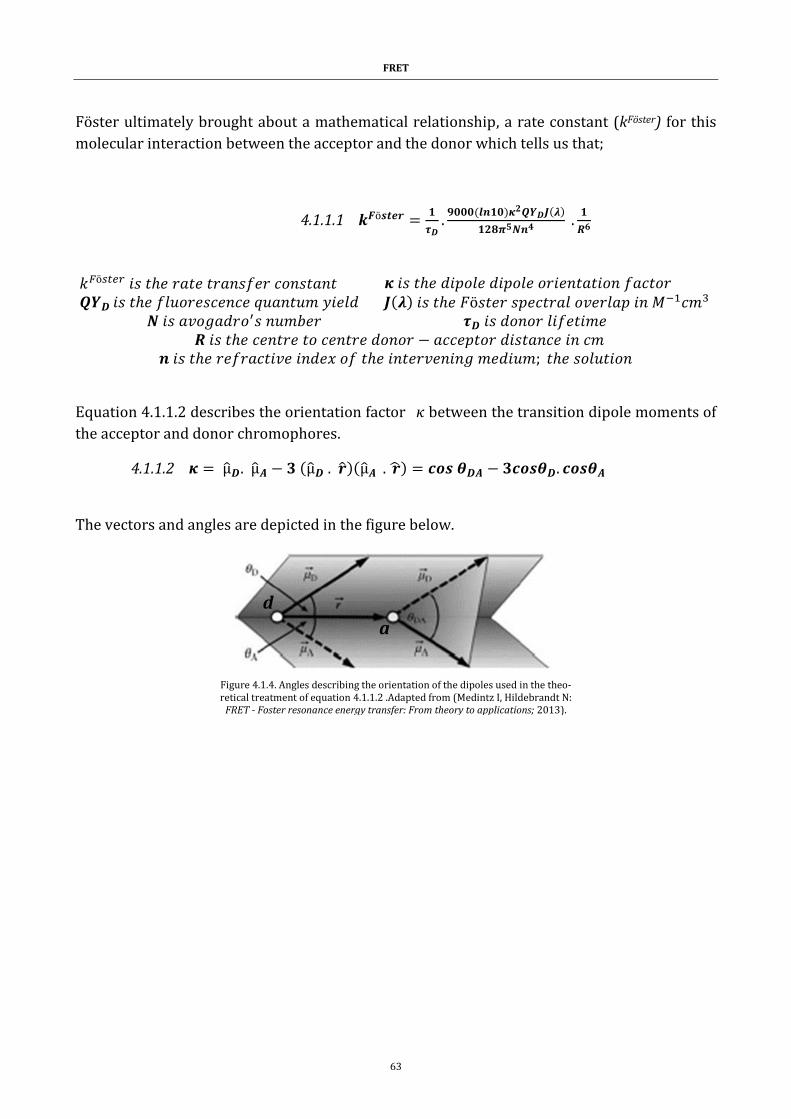
FRET
63
Föster ultimately brought about a mathematical relationship, a rate constant (kFöster) for this
molecular interaction between the acceptor and the donor which tells us that;
4.1.1.1 𝒌𝑭ö𝒔𝒕𝒆𝒓 =𝟏
𝝉𝑫.𝟗𝟎𝟎𝟎(𝒍𝒏𝟏𝟎)𝜿𝟐𝑸𝒀𝑫𝑱(𝝀)
𝟏𝟐𝟖𝝅𝟓𝑵𝒏𝟒 .𝟏
𝑹𝟔
𝑘𝐹ö𝑠𝑡𝑒𝑟 𝑖𝑠 𝑡ℎ𝑒 𝑟𝑎𝑡𝑒 𝑡𝑟𝑎𝑛𝑠𝑓𝑒𝑟 𝑐𝑜𝑛𝑠𝑡𝑎𝑛𝑡 𝜿 𝑖𝑠 𝑡ℎ𝑒 𝑑𝑖𝑝𝑜𝑙𝑒 𝑑𝑖𝑝𝑜𝑙𝑒 𝑜𝑟𝑖𝑒𝑛𝑡𝑎𝑡𝑖𝑜𝑛 𝑓𝑎𝑐𝑡𝑜𝑟 𝑸𝒀𝑫 𝑖𝑠 𝑡ℎ𝑒 𝑓𝑙𝑢𝑜𝑟𝑒𝑠𝑐𝑒𝑛𝑐𝑒 𝑞𝑢𝑎𝑛𝑡𝑢𝑚 𝑦𝑖𝑒𝑙𝑑 𝑱(𝝀) 𝑖𝑠 𝑡ℎ𝑒 𝐹ö𝑠𝑡𝑒𝑟 𝑠𝑝𝑒𝑐𝑡𝑟𝑎𝑙 𝑜𝑣𝑒𝑟𝑙𝑎𝑝 𝑖𝑛 𝑀−1𝑐𝑚3
𝑵 𝑖𝑠 𝑎𝑣𝑜𝑔𝑎𝑑𝑟𝑜′𝑠 𝑛𝑢𝑚𝑏𝑒𝑟 𝝉𝑫 𝑖𝑠 𝑑𝑜𝑛𝑜𝑟 𝑙𝑖𝑓𝑒𝑡𝑖𝑚𝑒 𝑹 𝑖𝑠 𝑡ℎ𝑒 𝑐𝑒𝑛𝑡𝑟𝑒 𝑡𝑜 𝑐𝑒𝑛𝑡𝑟𝑒 𝑑𝑜𝑛𝑜𝑟 − 𝑎𝑐𝑐𝑒𝑝𝑡𝑜𝑟 𝑑𝑖𝑠𝑡𝑎𝑛𝑐𝑒 𝑖𝑛 𝑐𝑚
𝒏 𝑖𝑠 𝑡ℎ𝑒 𝑟𝑒𝑓𝑟𝑎𝑐𝑡𝑖𝑣𝑒 𝑖𝑛𝑑𝑒𝑥 𝑜𝑓 𝑡ℎ𝑒 𝑖𝑛𝑡𝑒𝑟𝑣𝑒𝑛𝑖𝑛𝑔 𝑚𝑒𝑑𝑖𝑢𝑚; 𝑡ℎ𝑒 𝑠𝑜𝑙𝑢𝑡𝑖𝑜𝑛
Equation 4.1.1.2 describes the orientation factor 𝜅 between the transition dipole moments of
the acceptor and donor chromophores.
4.1.1.2 𝜿 = µ̂𝑫. µ̂𝑨 − 𝟑 (µ̂𝑫 . �̂�)(µ̂𝑨 . �̂�) = 𝒄𝒐𝒔 𝜽𝑫𝑨 − 𝟑𝒄𝒐𝒔𝜽𝑫. 𝒄𝒐𝒔𝜽𝑨
The vectors and angles are depicted in the figure below.
Figure 4.1.4. Angles describing the orientation of the dipoles used in the theo-retical treatment of equation 4.1.1.2 .Adapted from (Medintz I, Hildebrandt N:
FRET - Foster resonance energy transfer: From theory to applications; 2013).
d
a

FRET
64
The so-called orientation factor kappa-squared (κ2) is taken on a case by case basis or more
frequently considered in an average to the ensemble of objects in a given experiment. In a sin-
gle molecule level only, time averaging is possible whereas in a multimolecular experiment
average over time as well as a rolling average reflecting the response of the ensemble may be
put forward. Taking the different angles between the transition dipole moments of d and a
(�⃗� 𝐷 𝑎𝑛𝑑 �⃗� 𝐴) and the connection vector between d and a (𝑟 ) manages the mathematics that
solve the value for the orientation factor in equ. 4.1.1.2. Where µ̂D, µ̂A and �̂� represent the unit
vectors �⃗� 𝐷 , �⃗� 𝐴 and 𝑟 , respectively, and θDA, θD and θA are the angles depicted in Figure 4.1.4.
In summary, average conditions rest on the idea that when all d and a can take any possible
orientation during a said FRET time, the system is in dynamic averaging regime and κ2 can be
considered to hold at 2/3. This remains true if d and a are bound to polypeptides or proteins.
If one of the chromophores has a fixed orientation, then κ2 can take values between 1/3 and
4/3. When both are fixed, ‘line to line’, the case becomes more complicated: the full orienta-
tion factor range (0< κ2<4) is weighed up [3].
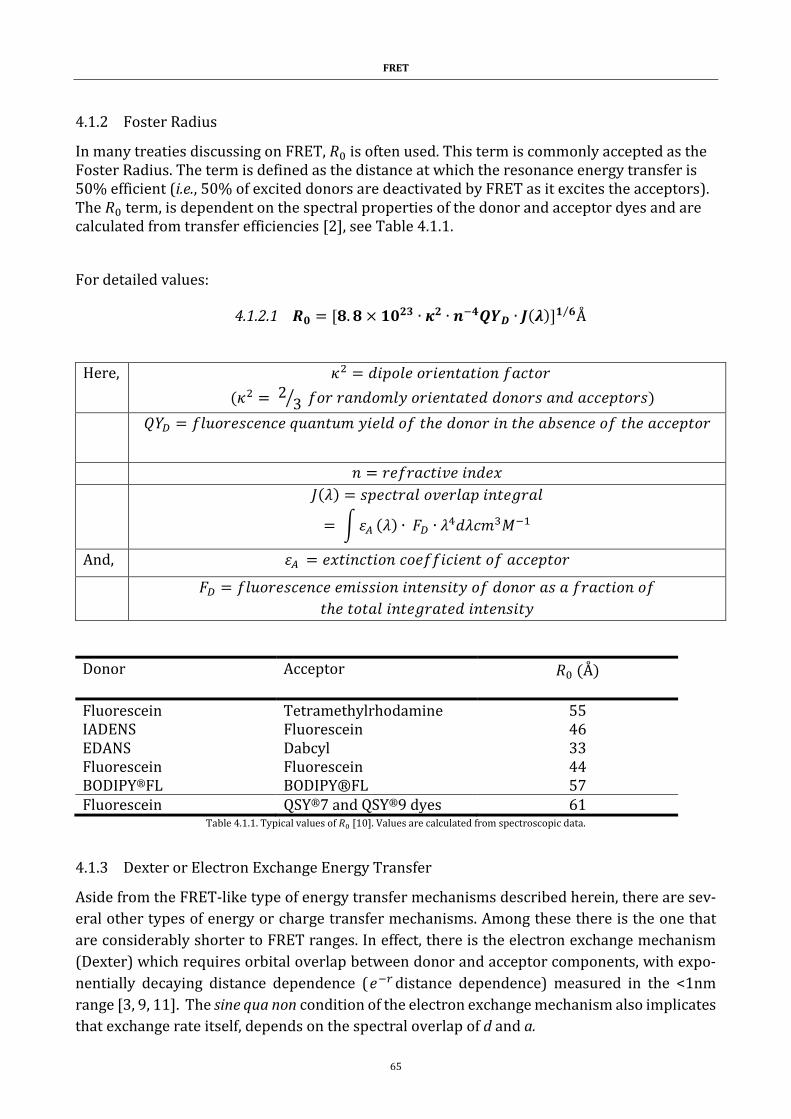
FRET
65
4.1.2 Foster Radius
In many treaties discussing on FRET, 𝑅0 is often used. This term is commonly accepted as the Foster Radius. The term is defined as the distance at which the resonance energy transfer is 50% efficient (i.e., 50% of excited donors are deactivated by FRET as it excites the acceptors). The 𝑅0 term, is dependent on the spectral properties of the donor and acceptor dyes and are calculated from transfer efficiencies [2], see Table 4.1.1.
For detailed values:
4.1.2.1 𝑹𝟎 = [𝟖. 𝟖 × 𝟏𝟎𝟐𝟑 ∙ 𝜿𝟐 ∙ 𝒏−𝟒𝑸𝒀𝑫 ∙ 𝑱(𝝀)]𝟏 𝟔⁄ Å
Here, 𝜅2 = 𝑑𝑖𝑝𝑜𝑙𝑒 𝑜𝑟𝑖𝑒𝑛𝑡𝑎𝑡𝑖𝑜𝑛 𝑓𝑎𝑐𝑡𝑜𝑟
(𝜅2 = 2 3⁄ 𝑓𝑜𝑟 𝑟𝑎𝑛𝑑𝑜𝑚𝑙𝑦 𝑜𝑟𝑖𝑒𝑛𝑡𝑎𝑡𝑒𝑑 𝑑𝑜𝑛𝑜𝑟𝑠 𝑎𝑛𝑑 𝑎𝑐𝑐𝑒𝑝𝑡𝑜𝑟𝑠)
𝑄𝑌𝐷 = 𝑓𝑙𝑢𝑜𝑟𝑒𝑠𝑐𝑒𝑛𝑐𝑒 𝑞𝑢𝑎𝑛𝑡𝑢𝑚 𝑦𝑖𝑒𝑙𝑑 𝑜𝑓 𝑡ℎ𝑒 𝑑𝑜𝑛𝑜𝑟 𝑖𝑛 𝑡ℎ𝑒 𝑎𝑏𝑠𝑒𝑛𝑐𝑒 𝑜𝑓 𝑡ℎ𝑒 𝑎𝑐𝑐𝑒𝑝𝑡𝑜𝑟
𝑛 = 𝑟𝑒𝑓𝑟𝑎𝑐𝑡𝑖𝑣𝑒 𝑖𝑛𝑑𝑒𝑥
𝐽(𝜆) = 𝑠𝑝𝑒𝑐𝑡𝑟𝑎𝑙 𝑜𝑣𝑒𝑟𝑙𝑎𝑝 𝑖𝑛𝑡𝑒𝑔𝑟𝑎𝑙
= ∫𝜀𝐴 (𝜆) ∙ 𝐹𝐷 ∙ 𝜆4𝑑𝜆𝑐𝑚3𝑀−1
And, 𝜀𝐴 = 𝑒𝑥𝑡𝑖𝑛𝑐𝑡𝑖𝑜𝑛 𝑐𝑜𝑒𝑓𝑓𝑖𝑐𝑖𝑒𝑛𝑡 𝑜𝑓 𝑎𝑐𝑐𝑒𝑝𝑡𝑜𝑟
𝐹𝐷 = 𝑓𝑙𝑢𝑜𝑟𝑒𝑠𝑐𝑒𝑛𝑐𝑒 𝑒𝑚𝑖𝑠𝑠𝑖𝑜𝑛 𝑖𝑛𝑡𝑒𝑛𝑠𝑖𝑡𝑦 𝑜𝑓 𝑑𝑜𝑛𝑜𝑟 𝑎𝑠 𝑎 𝑓𝑟𝑎𝑐𝑡𝑖𝑜𝑛 𝑜𝑓
𝑡ℎ𝑒 𝑡𝑜𝑡𝑎𝑙 𝑖𝑛𝑡𝑒𝑔𝑟𝑎𝑡𝑒𝑑 𝑖𝑛𝑡𝑒𝑛𝑠𝑖𝑡𝑦
Donor Acceptor 𝑅0 (Å)
Fluorescein Tetramethylrhodamine 55 IADENS Fluorescein 46 EDANS Dabcyl 33 Fluorescein Fluorescein 44 BODIPY®FL BODIPY®FL 57 Fluorescein QSY®7 and QSY®9 dyes 61
Table 4.1.1. Typical values of 𝑅0 [10]. Values are calculated from spectroscopic data.
4.1.3 Dexter or Electron Exchange Energy Transfer
Aside from the FRET-like type of energy transfer mechanisms described herein, there are sev-
eral other types of energy or charge transfer mechanisms. Among these there is the one that
are considerably shorter to FRET ranges. In effect, there is the electron exchange mechanism
(Dexter) which requires orbital overlap between donor and acceptor components, with expo-
nentially decaying distance dependence (𝑒−𝑟 distance dependence) measured in the <1nm
range [3, 9, 11]. The sine qua non condition of the electron exchange mechanism also implicates
that exchange rate itself, depends on the spectral overlap of d and a.
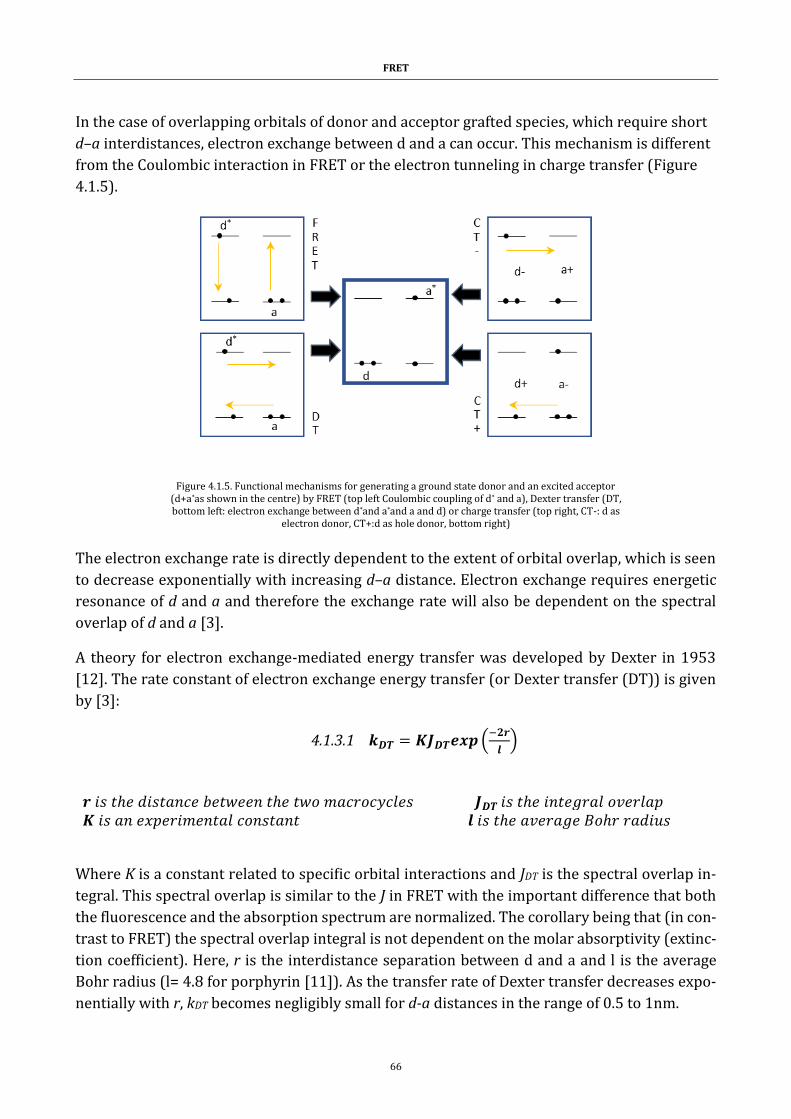
FRET
66
In the case of overlapping orbitals of donor and acceptor grafted species, which require short
d–a interdistances, electron exchange between d and a can occur. This mechanism is different
from the Coulombic interaction in FRET or the electron tunneling in charge transfer (Figure
4.1.5).
The electron exchange rate is directly dependent to the extent of orbital overlap, which is seen
to decrease exponentially with increasing d–a distance. Electron exchange requires energetic
resonance of d and a and therefore the exchange rate will also be dependent on the spectral
overlap of d and a [3].
A theory for electron exchange-mediated energy transfer was developed by Dexter in 1953
[12]. The rate constant of electron exchange energy transfer (or Dexter transfer (DT)) is given
by [3]:
4.1.3.1 𝒌𝑫𝑻 = 𝑲𝑱𝑫𝑻𝒆𝒙𝒑(−𝟐𝒓
𝒍)
𝒓 𝑖𝑠 𝑡ℎ𝑒 𝑑𝑖𝑠𝑡𝑎𝑛𝑐𝑒 𝑏𝑒𝑡𝑤𝑒𝑒𝑛 𝑡ℎ𝑒 𝑡𝑤𝑜 𝑚𝑎𝑐𝑟𝑜𝑐𝑦𝑐𝑙𝑒𝑠 𝑱𝑫𝑻 𝑖𝑠 𝑡ℎ𝑒 𝑖𝑛𝑡𝑒𝑔𝑟𝑎𝑙 𝑜𝑣𝑒𝑟𝑙𝑎𝑝 𝑲 𝑖𝑠 𝑎𝑛 𝑒𝑥𝑝𝑒𝑟𝑖𝑚𝑒𝑛𝑡𝑎𝑙 𝑐𝑜𝑛𝑠𝑡𝑎𝑛𝑡 𝒍 𝑖𝑠 𝑡ℎ𝑒 𝑎𝑣𝑒𝑟𝑎𝑔𝑒 𝐵𝑜ℎ𝑟 𝑟𝑎𝑑𝑖𝑢𝑠
Where K is a constant related to specific orbital interactions and JDT is the spectral overlap in-
tegral. This spectral overlap is similar to the J in FRET with the important difference that both
the fluorescence and the absorption spectrum are normalized. The corollary being that (in con-
trast to FRET) the spectral overlap integral is not dependent on the molar absorptivity (extinc-
tion coefficient). Here, r is the interdistance separation between d and a and l is the average
Bohr radius (l= 4.8 for porphyrin [11]). As the transfer rate of Dexter transfer decreases expo-
nentially with r, kDT becomes negligibly small for d-a distances in the range of 0.5 to 1nm.
Figure 4.1.5. Functional mechanisms for generating a ground state donor and an excited acceptor (d+a*as shown in the centre) by FRET (top left Coulombic coupling of d* and a), Dexter transfer (DT, bottom left: electron exchange between d*and a*and a and d) or charge transfer (top right, CT-: d as
electron donor, CT+:d as hole donor, bottom right)
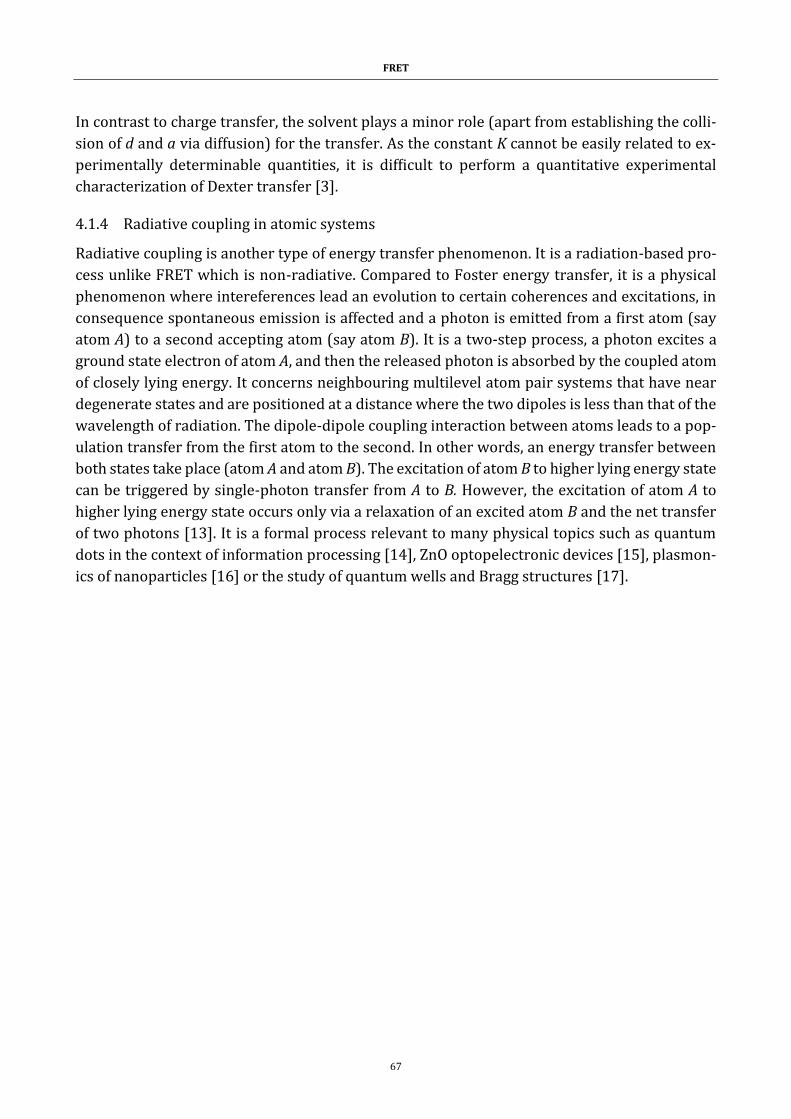
FRET
67
In contrast to charge transfer, the solvent plays a minor role (apart from establishing the colli-
sion of d and a via diffusion) for the transfer. As the constant K cannot be easily related to ex-
perimentally determinable quantities, it is difficult to perform a quantitative experimental
characterization of Dexter transfer [3].
4.1.4 Radiative coupling in atomic systems
Radiative coupling is another type of energy transfer phenomenon. It is a radiation-based pro-
cess unlike FRET which is non-radiative. Compared to Foster energy transfer, it is a physical
phenomenon where intereferences lead an evolution to certain coherences and excitations, in
consequence spontaneous emission is affected and a photon is emitted from a first atom (say
atom A) to a second accepting atom (say atom B). It is a two-step process, a photon excites a
ground state electron of atom A, and then the released photon is absorbed by the coupled atom
of closely lying energy. It concerns neighbouring multilevel atom pair systems that have near
degenerate states and are positioned at a distance where the two dipoles is less than that of the
wavelength of radiation. The dipole-dipole coupling interaction between atoms leads to a pop-
ulation transfer from the first atom to the second. In other words, an energy transfer between
both states take place (atom A and atom B). The excitation of atom B to higher lying energy state
can be triggered by single-photon transfer from A to B. However, the excitation of atom A to
higher lying energy state occurs only via a relaxation of an excited atom B and the net transfer
of two photons [13]. It is a formal process relevant to many physical topics such as quantum
dots in the context of information processing [14], ZnO optopelectronic devices [15], plasmon-
ics of nanoparticles [16] or the study of quantum wells and Bragg structures [17].
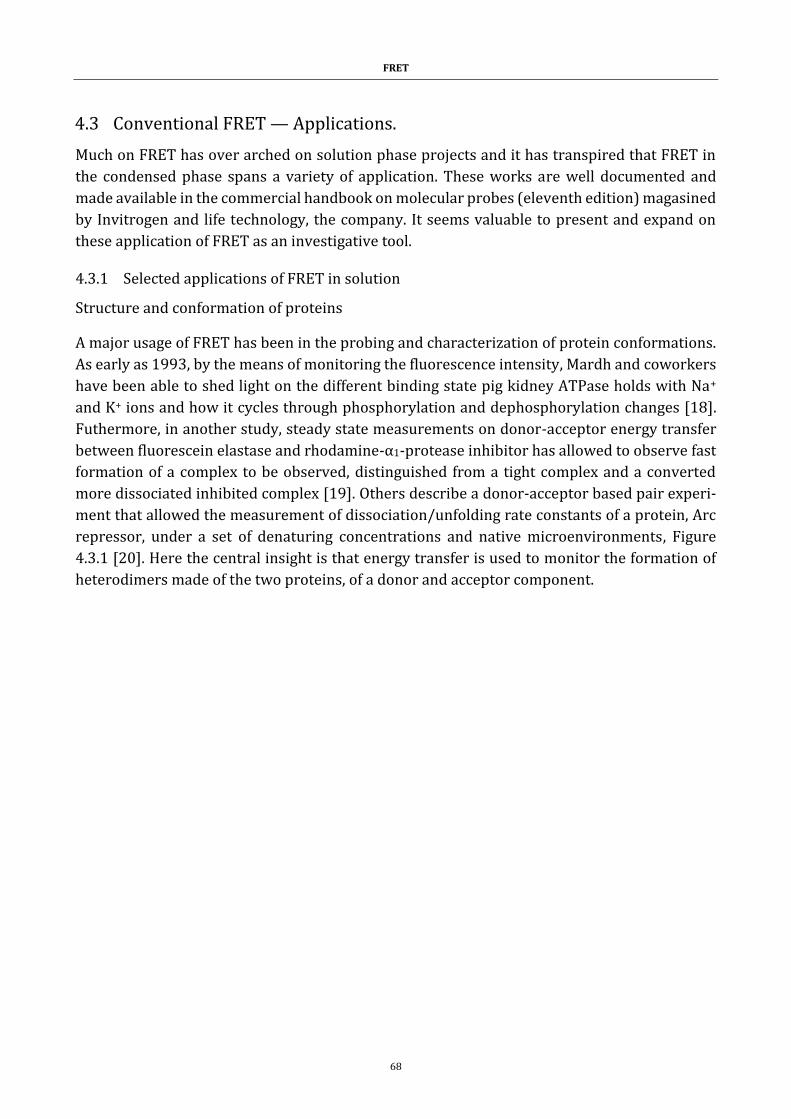
FRET
68
4.3 Conventional FRET — Applications.
Much on FRET has over arched on solution phase projects and it has transpired that FRET in
the condensed phase spans a variety of application. These works are well documented and
made available in the commercial handbook on molecular probes (eleventh edition) magasined
by Invitrogen and life technology, the company. It seems valuable to present and expand on
these application of FRET as an investigative tool.
4.3.1 Selected applications of FRET in solution
Structure and conformation of proteins
A major usage of FRET has been in the probing and characterization of protein conformations.
As early as 1993, by the means of monitoring the fluorescence intensity, Mardh and coworkers
have been able to shed light on the different binding state pig kidney ATPase holds with Na+
and K+ ions and how it cycles through phosphorylation and dephosphorylation changes [18].
Futhermore, in another study, steady state measurements on donor-acceptor energy transfer
between fluorescein elastase and rhodamine-α1-protease inhibitor has allowed to observe fast
formation of a complex to be observed, distinguished from a tight complex and a converted
more dissociated inhibited complex [19]. Others describe a donor-acceptor based pair experi-
ment that allowed the measurement of dissociation/unfolding rate constants of a protein, Arc
repressor, under a set of denaturing concentrations and native microenvironments, Figure
4.3.1 [20]. Here the central insight is that energy transfer is used to monitor the formation of
heterodimers made of the two proteins, of a donor and acceptor component.
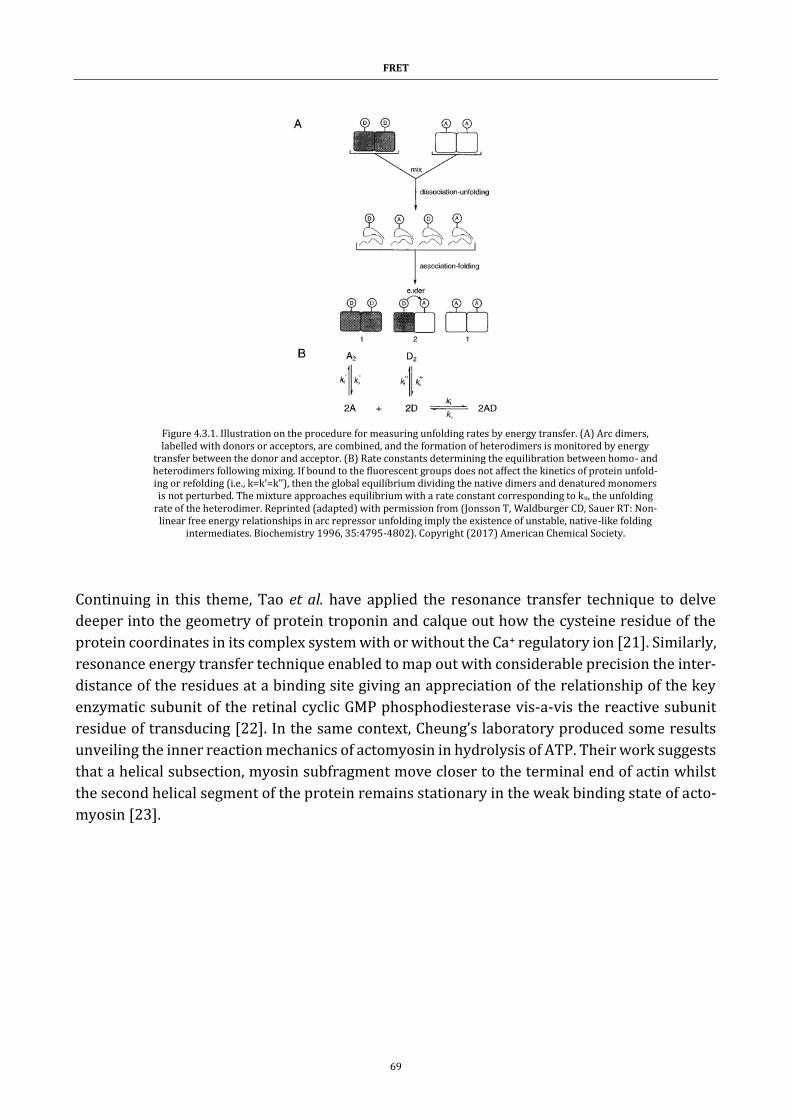
FRET
69
Continuing in this theme, Tao et al. have applied the resonance transfer technique to delve
deeper into the geometry of protein troponin and calque out how the cysteine residue of the
protein coordinates in its complex system with or without the Ca+ regulatory ion [21]. Similarly,
resonance energy transfer technique enabled to map out with considerable precision the inter-
distance of the residues at a binding site giving an appreciation of the relationship of the key
enzymatic subunit of the retinal cyclic GMP phosphodiesterase vis-a-vis the reactive subunit
residue of transducing [22]. In the same context, Cheung’s laboratory produced some results
unveiling the inner reaction mechanics of actomyosin in hydrolysis of ATP. Their work suggests
that a helical subsection, myosin subfragment move closer to the terminal end of actin whilst
the second helical segment of the protein remains stationary in the weak binding state of acto-
myosin [23].
Figure 4.3.1. Illustration on the procedure for measuring unfolding rates by energy transfer. (A) Arc dimers, labelled with donors or acceptors, are combined, and the formation of heterodimers is monitored by energy
transfer between the donor and acceptor. (B) Rate constants determining the equilibration between homo- and heterodimers following mixing. If bound to the fluorescent groups does not affect the kinetics of protein unfold-ing or refolding (i.e., k=k’=k’’), then the global equilibrium dividing the native dimers and denatured monomers is not perturbed. The mixture approaches equilibrium with a rate constant corresponding to ku, the unfolding
rate of the heterodimer. Reprinted (adapted) with permission from (Jonsson T, Waldburger CD, Sauer RT: Non-linear free energy relationships in arc repressor unfolding imply the existence of unstable, native-like folding
intermediates. Biochemistry 1996, 35:4795-4802). Copyright (2017) American Chemical Society.
FRET
70
Spatial distribution and assembly of protein complexes
A first highlight worthy of mentioning is the reported work of Remedios et al. that have applied
the FRET method to scrutinize F-actin and determine distinguishable F-actin models and con-
formations, Figure 4.3.2 [24]. The major learning is that F-actin assembles itself around in a
twist.
There is also a literature record of using FRET to study proximity relationships between epi-
dermal growth factor (EGF) molecules isolated from human epidermoid cells. It was found that
if the microenvironment comprised divalent metal ions, activators of the EGF receptor/tyrosine
kinase then a higher extent of FRET between EGF frameworks was observed [25]. As reported
with this theme, FRET has been applied to render the localization of the haem moiety of cyto-
chrome b5 in the membrane, describe aggregation states (bacteriorhodopsin), and clarify on
interactions among red cell membrane proteins or rhodopsin-G-protein relationships. FRET
has also been key in determining the orientation of cobra α-toxin with respect to the nicotine
acetycholine receptor and the location of the retinal chromophore in the so-called purple mem-
brane. The author goes further, on more assembly configurations that have been elucidated
using FRET [26].
A
B
Figure 4.3.2. (a) Depiction of a randomly assembled actin filament (A, acceptor-labeled monomer; D, donor-labeled monomer; U, unlabelled monomer). (b) Putative distribution of acceptor-labeled monomers around a
donor-labeled monomer. Reprinted (adapted) with permission from (Moens PDJ, Yee DJ, dos Remedios CG: Determination of the radial coordinate of cys-374 in f-actin using fluorescence resonance energy-transfer spectroscopy - effect of phalloidin on polymer assembly. Biochemistry 1994, 33:13102-13108). Copyright
(2017) American Chemical Society.
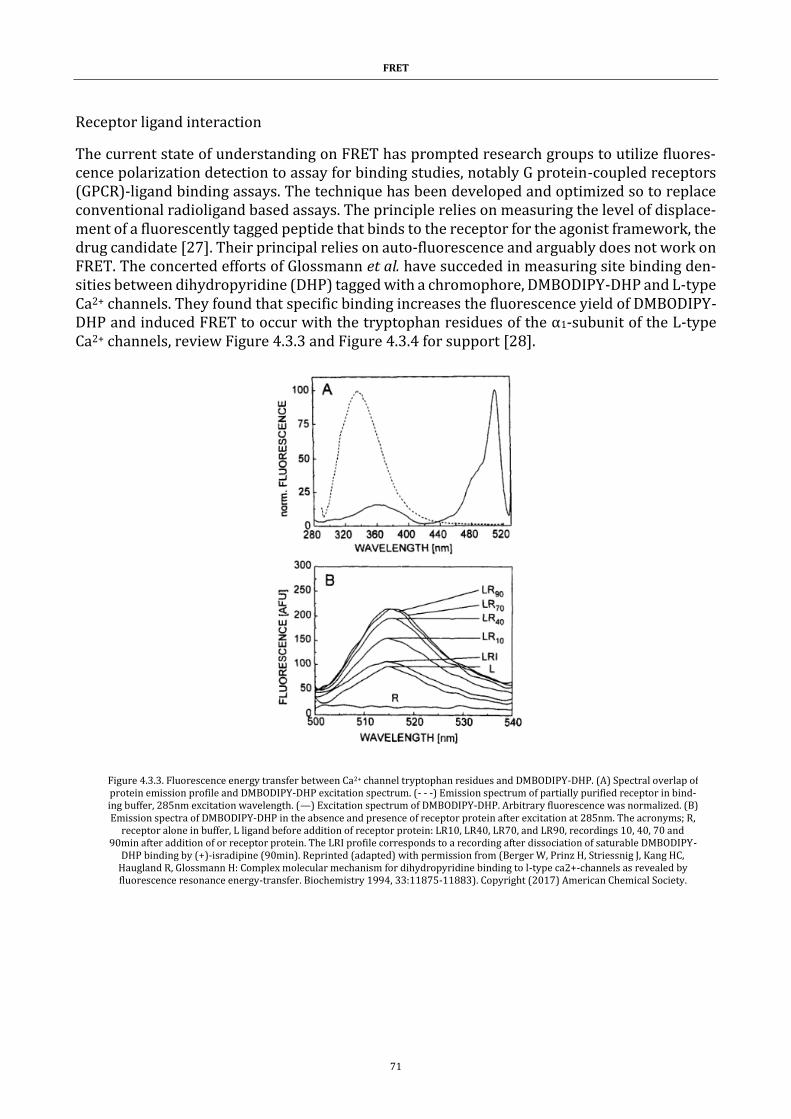
FRET
71
Receptor ligand interaction
The current state of understanding on FRET has prompted research groups to utilize fluores-cence polarization detection to assay for binding studies, notably G protein-coupled receptors (GPCR)-ligand binding assays. The technique has been developed and optimized so to replace conventional radioligand based assays. The principle relies on measuring the level of displace-ment of a fluorescently tagged peptide that binds to the receptor for the agonist framework, the drug candidate [27]. Their principal relies on auto-fluorescence and arguably does not work on FRET. The concerted efforts of Glossmann et al. have succeded in measuring site binding den-sities between dihydropyridine (DHP) tagged with a chromophore, DMBODIPY-DHP and L-type Ca2+ channels. They found that specific binding increases the fluorescence yield of DMBODIPY-DHP and induced FRET to occur with the tryptophan residues of the α1-subunit of the L-type Ca2+ channels, review Figure 4.3.3 and Figure 4.3.4 for support [28].
Figure 4.3.3. Fluorescence energy transfer between Ca2+ channel tryptophan residues and DMBODIPY-DHP. (A) Spectral overlap of protein emission profile and DMBODIPY-DHP excitation spectrum. (- - -) Emission spectrum of partially purified receptor in bind-ing buffer, 285nm excitation wavelength. (—) Excitation spectrum of DMBODIPY-DHP. Arbitrary fluorescence was normalized. (B) Emission spectra of DMBODIPY-DHP in the absence and presence of receptor protein after excitation at 285nm. The acronyms; R,
receptor alone in buffer, L ligand before addition of receptor protein: LR10, LR40, LR70, and LR90, recordings 10, 40, 70 and 90min after addition of or receptor protein. The LRI profile corresponds to a recording after dissociation of saturable DMBODIPY-
DHP binding by (+)-isradipine (90min). Reprinted (adapted) with permission from (Berger W, Prinz H, Striessnig J, Kang HC, Haugland R, Glossmann H: Complex molecular mechanism for dihydropyridine binding to l-type ca2+-channels as revealed by fluorescence resonance energy-transfer. Biochemistry 1994, 33:11875-11883). Copyright (2017) American Chemical Society.
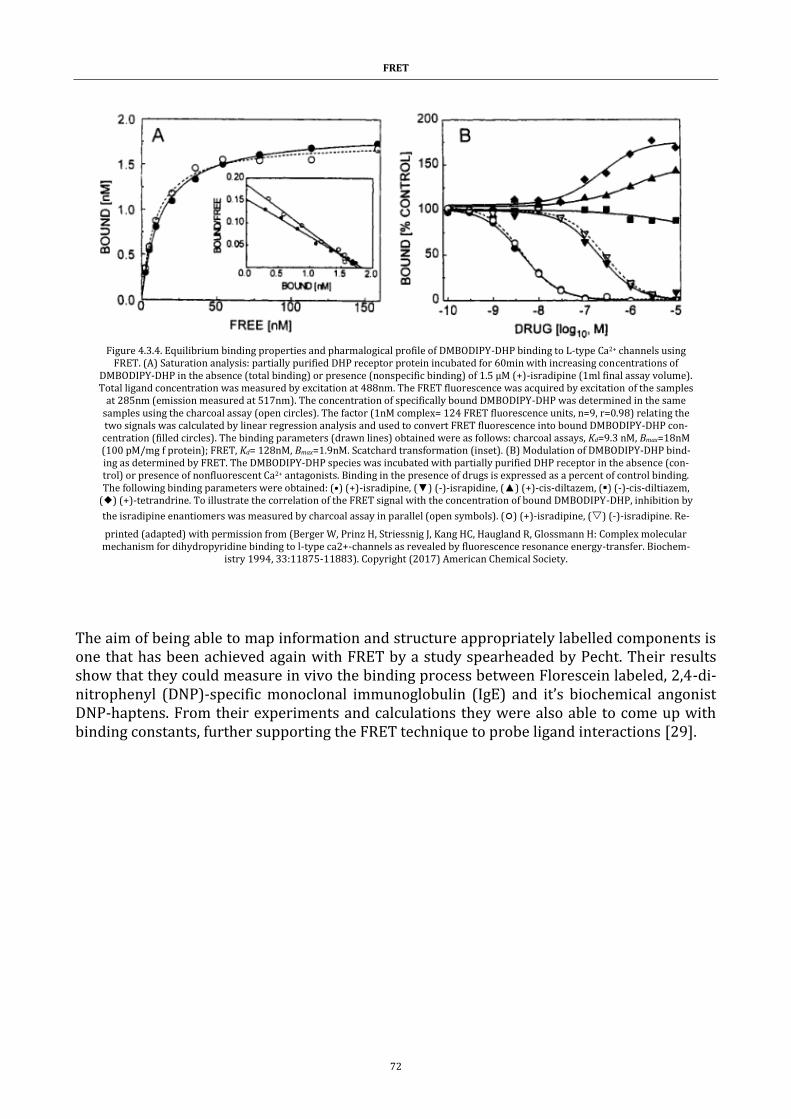
FRET
72
The aim of being able to map information and structure appropriately labelled components is one that has been achieved again with FRET by a study spearheaded by Pecht. Their results show that they could measure in vivo the binding process between Florescein labeled, 2,4-di-nitrophenyl (DNP)-specific monoclonal immunoglobulin (IgE) and it’s biochemical angonist DNP-haptens. From their experiments and calculations they were also able to come up with binding constants, further supporting the FRET technique to probe ligand interactions [29].
Figure 4.3.4. Equilibrium binding properties and pharmalogical profile of DMBODIPY-DHP binding to L-type Ca2+ channels using FRET. (A) Saturation analysis: partially purified DHP receptor protein incubated for 60min with increasing concentrations of
DMBODIPY-DHP in the absence (total binding) or presence (nonspecific binding) of 1.5 µM (+)-isradipine (1ml final assay volume). Total ligand concentration was measured by excitation at 488nm. The FRET fluorescence was acquired by excitation of the samples
at 285nm (emission measured at 517nm). The concentration of specifically bound DMBODIPY-DHP was determined in the same samples using the charcoal assay (open circles). The factor (1nM complex= 124 FRET fluorescence units, n=9, r=0.98) relating the two signals was calculated by linear regression analysis and used to convert FRET fluorescence into bound DMBODIPY-DHP con-centration (filled circles). The binding parameters (drawn lines) obtained were as follows: charcoal assays, Kd=9.3 nM, Bmax=18nM (100 pM/mg f protein); FRET, Kd= 128nM, Bmax=1.9nM. Scatchard transformation (inset). (B) Modulation of DMBODIPY-DHP bind-ing as determined by FRET. The DMBODIPY-DHP species was incubated with partially purified DHP receptor in the absence (con-trol) or presence of nonfluorescent Ca2+ antagonists. Binding in the presence of drugs is expressed as a percent of control binding. The following binding parameters were obtained: (•) (+)-isradipine, (▼) (-)-israpidine, (▲) (+)-cis-diltazem, (▪) (-)-cis-diltiazem,
() (+)-tetrandrine. To illustrate the correlation of the FRET signal with the concentration of bound DMBODIPY-DHP, inhibition by
the isradipine enantiomers was measured by charcoal assay in parallel (open symbols). (೦) (+)-isradipine, () (-)-isradipine. Re-
printed (adapted) with permission from (Berger W, Prinz H, Striessnig J, Kang HC, Haugland R, Glossmann H: Complex molecular mechanism for dihydropyridine binding to l-type ca2+-channels as revealed by fluorescence resonance energy-transfer. Biochem-
istry 1994, 33:11875-11883). Copyright (2017) American Chemical Society.
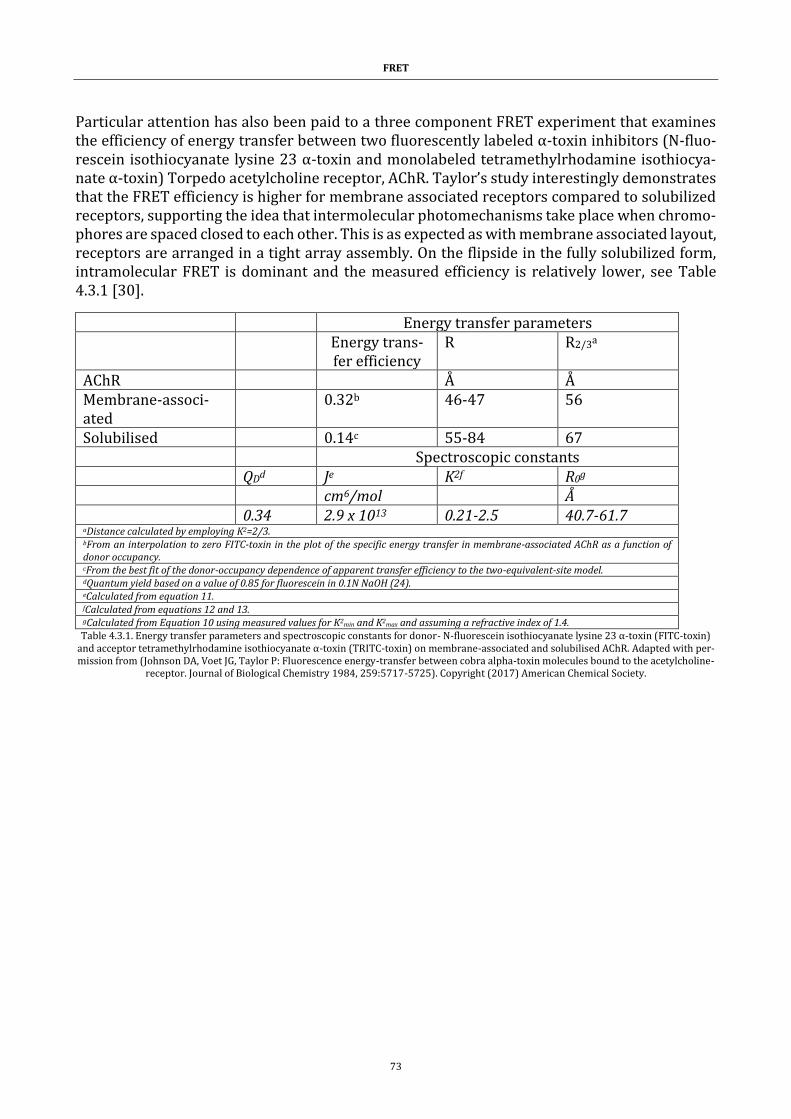
FRET
73
Particular attention has also been paid to a three component FRET experiment that examines the efficiency of energy transfer between two fluorescently labeled α-toxin inhibitors (N-fluo-rescein isothiocyanate lysine 23 α-toxin and monolabeled tetramethylrhodamine isothiocya-nate α-toxin) Torpedo acetylcholine receptor, AChR. Taylor’s study interestingly demonstrates that the FRET efficiency is higher for membrane associated receptors compared to solubilized receptors, supporting the idea that intermolecular photomechanisms take place when chromo-phores are spaced closed to each other. This is as expected as with membrane associated layout, receptors are arranged in a tight array assembly. On the flipside in the fully solubilized form, intramolecular FRET is dominant and the measured efficiency is relatively lower, see Table 4.3.1 [30].
Energy transfer parameters Energy trans-
fer efficiency R R2/3a
AChR Å Å Membrane-associ-ated
0.32b 46-47 56
Solubilised 0.14c 55-84 67 Spectroscopic constants QDd Je K2f R0g
cm6/mol Å 0.34 2.9 x 10¹³ 0.21-2.5 40.7-61.7 aDistance calculated by employing K2=2/3. bFrom an interpolation to zero FITC-toxin in the plot of the specific energy transfer in membrane-associated AChR as a function of donor occupancy. cFrom the best fit of the donor-occupancy dependence of apparent transfer efficiency to the two-equivalent-site model. dQuantum yield based on a value of 0.85 for fluorescein in 0.1N NaOH (24). eCalculated from equation 11. fCalculated from equations 12 and 13. gCalculated from Equation 10 using measured values for K2
min and K2max and assuming a refractive index of 1.4.
Table 4.3.1. Energy transfer parameters and spectroscopic constants for donor- N-fluorescein isothiocyanate lysine 23 α-toxin (FITC-toxin) and acceptor tetramethylrhodamine isothiocyanate α-toxin (TRITC-toxin) on membrane-associated and solubilised AChR. Adapted with per-mission from (Johnson DA, Voet JG, Taylor P: Fluorescence energy-transfer between cobra alpha-toxin molecules bound to the acetylcholine-
receptor. Journal of Biological Chemistry 1984, 259:5717-5725). Copyright (2017) American Chemical Society.
FRET
74
Immunoassays
A method for carrying out immunoassays has been revisited, taking FRET in development.
There is evidence that immunoassays can be performed by labelling a fluorescent donor to the
antigen and labelling the corresponding antibodies with an acceptor. In this technique when
the two components are anchored together the measurements of the fluorescence of the donor
is quenched. This is as anticipated as the energy is transferred to the acceptor. In the negative
case of the assay, both components do no bind and thus only measurement of the fluorescence
of the donor is registered [31]. Other groups have followed, that have also taken care to register
acceptor emission in addition to monitoring the quenching of the donor fluorescence. Interest-
ingly, the efforts Morrison has looked to improve the technique by addressing the bias in ac-
ceptor emission. The photophysics at play are such that there is an emission from the acceptor
due to the direct absorption of the excitation light intended for excitation of the donor fluoro-
phore. This competes with the desired emission resulting from energy transfer. They could
tackle this issue by selecting a judicious donor-acceptor pair where the fluorescence lifetime of
the donor is greater than the fluorescence lifetime of the acceptor. In this way, in the presence
of a long-lived donor, the acceptor fluorescence persists. In the absence of the donor the accep-
tor fluorescence would be very brief. In this experimental design one can thereby impart a tem-
poral distinction among acceptor fluorescence resulting from energy transfer and acceptor flu-
orescence resulting from direct light absorption. With their time-resolved detections in their
immunoassays they were then able to make sure to channel and process energy-transfer emis-
sion only [32].
Probing interactions on single molecules
Weiss et al. have furnished ways to examine DNA as an individual framework and by same to-
ken set out to extend the observation of FRET down to a single pair of chromophores. Operating
on the single molecular scale brings distinct advantages over more conventional experiments.
First, it is validated that studying FRET on a single pair allows the observation of time-depend-
ent phenomena i.e. protein and molecular motor conformational changes. Secondly, whilst
there is uncertainty in the k2 parameter, the orientation factor in calculating distances in con-
ventional FRET experiments, the knowledge of this factor can be measured in a single pair of
dyes. It then entails that with single-pair FRET it is possible to detect dynamic events as the
likes of relative motion between donor and acceptor species, something that cannot be done
when observing the bulk that relies on signal averaging over many molecules. Finally, unlike
with ensemble-FRET experiments, the problem of undesirably registering a response for single
species complex (donor-only or acceptor-only) or other impurities is greatly lessened, Figure
4.3.5 [33]. The observation is that from 5 min on inspection (60th scan) and onwards the re-
sponse in number of counts as a function of wavelength is overall constant and globally invari-
able (the maxima of peaks are relatively in the same place) and this is understood to be because
of low noise from the donor or acceptor alone or optical response from impurities.
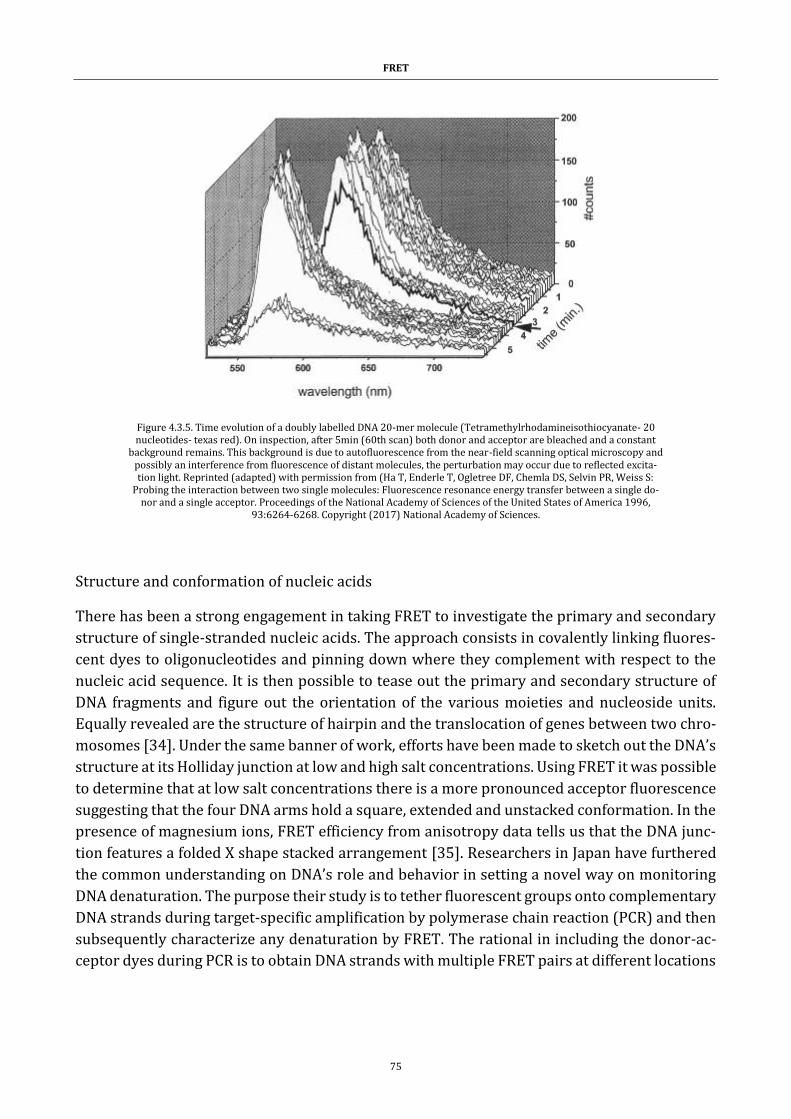
FRET
75
Structure and conformation of nucleic acids
There has been a strong engagement in taking FRET to investigate the primary and secondary
structure of single-stranded nucleic acids. The approach consists in covalently linking fluores-
cent dyes to oligonucleotides and pinning down where they complement with respect to the
nucleic acid sequence. It is then possible to tease out the primary and secondary structure of
DNA fragments and figure out the orientation of the various moieties and nucleoside units.
Equally revealed are the structure of hairpin and the translocation of genes between two chro-
mosomes [34]. Under the same banner of work, efforts have been made to sketch out the DNA’s
structure at its Holliday junction at low and high salt concentrations. Using FRET it was possible
to determine that at low salt concentrations there is a more pronounced acceptor fluorescence
suggesting that the four DNA arms hold a square, extended and unstacked conformation. In the
presence of magnesium ions, FRET efficiency from anisotropy data tells us that the DNA junc-
tion features a folded X shape stacked arrangement [35]. Researchers in Japan have furthered
the common understanding on DNA’s role and behavior in setting a novel way on monitoring
DNA denaturation. The purpose their study is to tether fluorescent groups onto complementary
DNA strands during target-specific amplification by polymerase chain reaction (PCR) and then
subsequently characterize any denaturation by FRET. The rational in including the donor-ac-
ceptor dyes during PCR is to obtain DNA strands with multiple FRET pairs at different locations
Figure 4.3.5. Time evolution of a doubly labelled DNA 20-mer molecule (Tetramethylrhodamineisothiocyanate- 20 nucleotides- texas red). On inspection, after 5min (60th scan) both donor and acceptor are bleached and a constant
background remains. This background is due to autofluorescence from the near-field scanning optical microscopy and possibly an interference from fluorescence of distant molecules, the perturbation may occur due to reflected excita-tion light. Reprinted (adapted) with permission from (Ha T, Enderle T, Ogletree DF, Chemla DS, Selvin PR, Weiss S:
Probing the interaction between two single molecules: Fluorescence resonance energy transfer between a single do-nor and a single acceptor. Proceedings of the National Academy of Sciences of the United States of America 1996,
93:6264-6268. Copyright (2017) National Academy of Sciences.
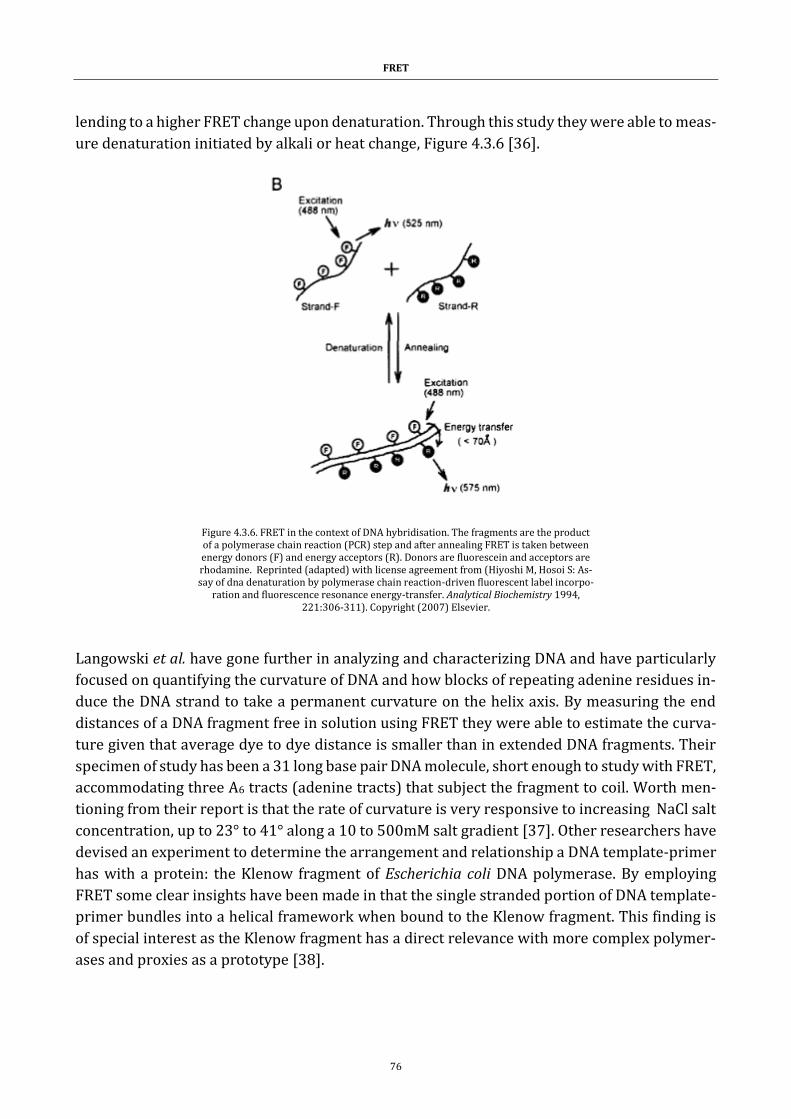
FRET
76
lending to a higher FRET change upon denaturation. Through this study they were able to meas-
ure denaturation initiated by alkali or heat change, Figure 4.3.6 [36].
Langowski et al. have gone further in analyzing and characterizing DNA and have particularly
focused on quantifying the curvature of DNA and how blocks of repeating adenine residues in-
duce the DNA strand to take a permanent curvature on the helix axis. By measuring the end
distances of a DNA fragment free in solution using FRET they were able to estimate the curva-
ture given that average dye to dye distance is smaller than in extended DNA fragments. Their
specimen of study has been a 31 long base pair DNA molecule, short enough to study with FRET,
accommodating three A6 tracts (adenine tracts) that subject the fragment to coil. Worth men-
tioning from their report is that the rate of curvature is very responsive to increasing NaCl salt
concentration, up to 23° to 41° along a 10 to 500mM salt gradient [37]. Other researchers have
devised an experiment to determine the arrangement and relationship a DNA template-primer
has with a protein: the Klenow fragment of Escherichia coli DNA polymerase. By employing
FRET some clear insights have been made in that the single stranded portion of DNA template-
primer bundles into a helical framework when bound to the Klenow fragment. This finding is
of special interest as the Klenow fragment has a direct relevance with more complex polymer-
ases and proxies as a prototype [38].
Figure 4.3.6. FRET in the context of DNA hybridisation. The fragments are the product of a polymerase chain reaction (PCR) step and after annealing FRET is taken between energy donors (F) and energy acceptors (R). Donors are fluorescein and acceptors are rhodamine. Reprinted (adapted) with license agreement from (Hiyoshi M, Hosoi S: As-say of dna denaturation by polymerase chain reaction-driven fluorescent label incorpo-
ration and fluorescence resonance energy-transfer. Analytical Biochemistry 1994, 221:306-311). Copyright (2007) Elsevier.
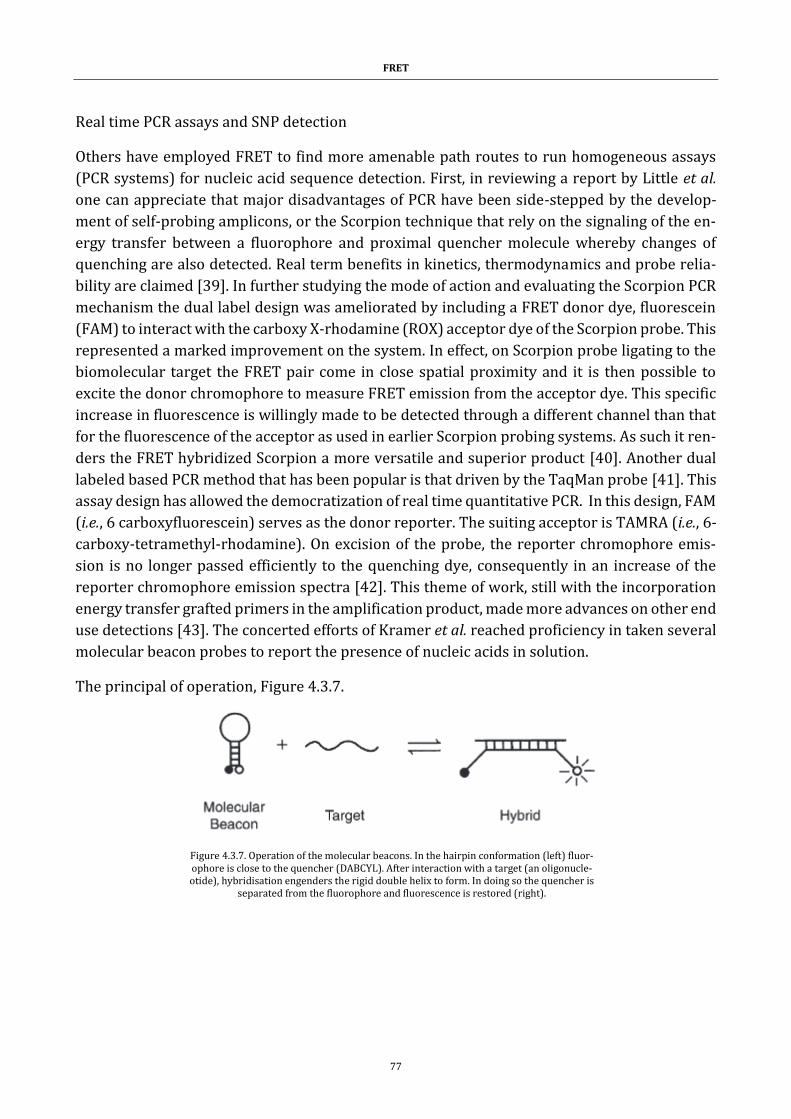
FRET
77
Real time PCR assays and SNP detection
Others have employed FRET to find more amenable path routes to run homogeneous assays
(PCR systems) for nucleic acid sequence detection. First, in reviewing a report by Little et al.
one can appreciate that major disadvantages of PCR have been side-stepped by the develop-
ment of self-probing amplicons, or the Scorpion technique that rely on the signaling of the en-
ergy transfer between a fluorophore and proximal quencher molecule whereby changes of
quenching are also detected. Real term benefits in kinetics, thermodynamics and probe relia-
bility are claimed [39]. In further studying the mode of action and evaluating the Scorpion PCR
mechanism the dual label design was ameliorated by including a FRET donor dye, fluorescein
(FAM) to interact with the carboxy X-rhodamine (ROX) acceptor dye of the Scorpion probe. This
represented a marked improvement on the system. In effect, on Scorpion probe ligating to the
biomolecular target the FRET pair come in close spatial proximity and it is then possible to
excite the donor chromophore to measure FRET emission from the acceptor dye. This specific
increase in fluorescence is willingly made to be detected through a different channel than that
for the fluorescence of the acceptor as used in earlier Scorpion probing systems. As such it ren-
ders the FRET hybridized Scorpion a more versatile and superior product [40]. Another dual
labeled based PCR method that has been popular is that driven by the TaqMan probe [41]. This
assay design has allowed the democratization of real time quantitative PCR. In this design, FAM
(i.e., 6 carboxyfluorescein) serves as the donor reporter. The suiting acceptor is TAMRA (i.e., 6-
carboxy-tetramethyl-rhodamine). On excision of the probe, the reporter chromophore emis-
sion is no longer passed efficiently to the quenching dye, consequently in an increase of the
reporter chromophore emission spectra [42]. This theme of work, still with the incorporation
energy transfer grafted primers in the amplification product, made more advances on other end
use detections [43]. The concerted efforts of Kramer et al. reached proficiency in taken several
molecular beacon probes to report the presence of nucleic acids in solution.
The principal of operation, Figure 4.3.7.
Figure 4.3.7. Operation of the molecular beacons. In the hairpin conformation (left) fluor-ophore is close to the quencher (DABCYL). After interaction with a target (an oligonucle-otide), hybridisation engenders the rigid double helix to form. In doing so the quencher is
separated from the fluorophore and fluorescence is restored (right).
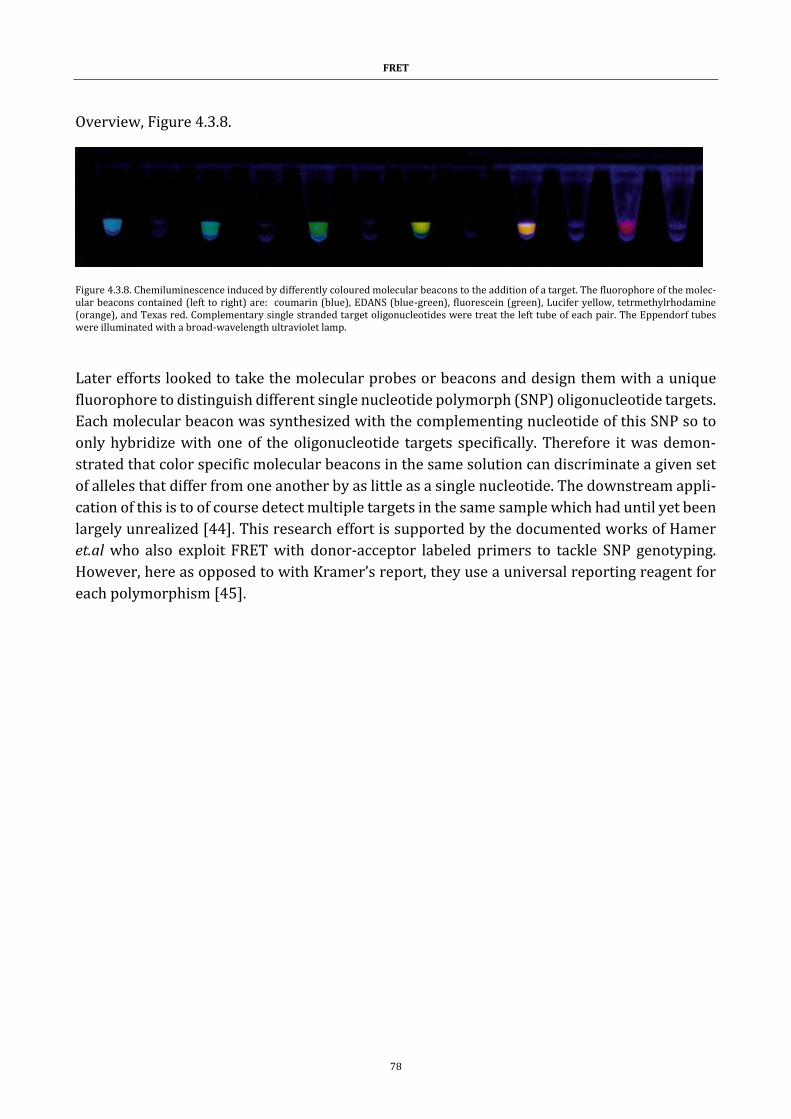
FRET
78
Overview, Figure 4.3.8.
Figure 4.3.8. Chemiluminescence induced by differently coloured molecular beacons to the addition of a target. The fluorophore of the molec-ular beacons contained (left to right) are: coumarin (blue), EDANS (blue-green), fluorescein (green), Lucifer yellow, tetrmethylrhodamine (orange), and Texas red. Complementary single stranded target oligonucleotides were treat the left tube of each pair. The Eppendorf tubes were illuminated with a broad-wavelength ultraviolet lamp.
Later efforts looked to take the molecular probes or beacons and design them with a unique
fluorophore to distinguish different single nucleotide polymorph (SNP) oligonucleotide targets.
Each molecular beacon was synthesized with the complementing nucleotide of this SNP so to
only hybridize with one of the oligonucleotide targets specifically. Therefore it was demon-
strated that color specific molecular beacons in the same solution can discriminate a given set
of alleles that differ from one another by as little as a single nucleotide. The downstream appli-
cation of this is to of course detect multiple targets in the same sample which had until yet been
largely unrealized [44]. This research effort is supported by the documented works of Hamer
et.al who also exploit FRET with donor-acceptor labeled primers to tackle SNP genotyping.
However, here as opposed to with Kramer’s report, they use a universal reporting reagent for
each polymorphism [45].
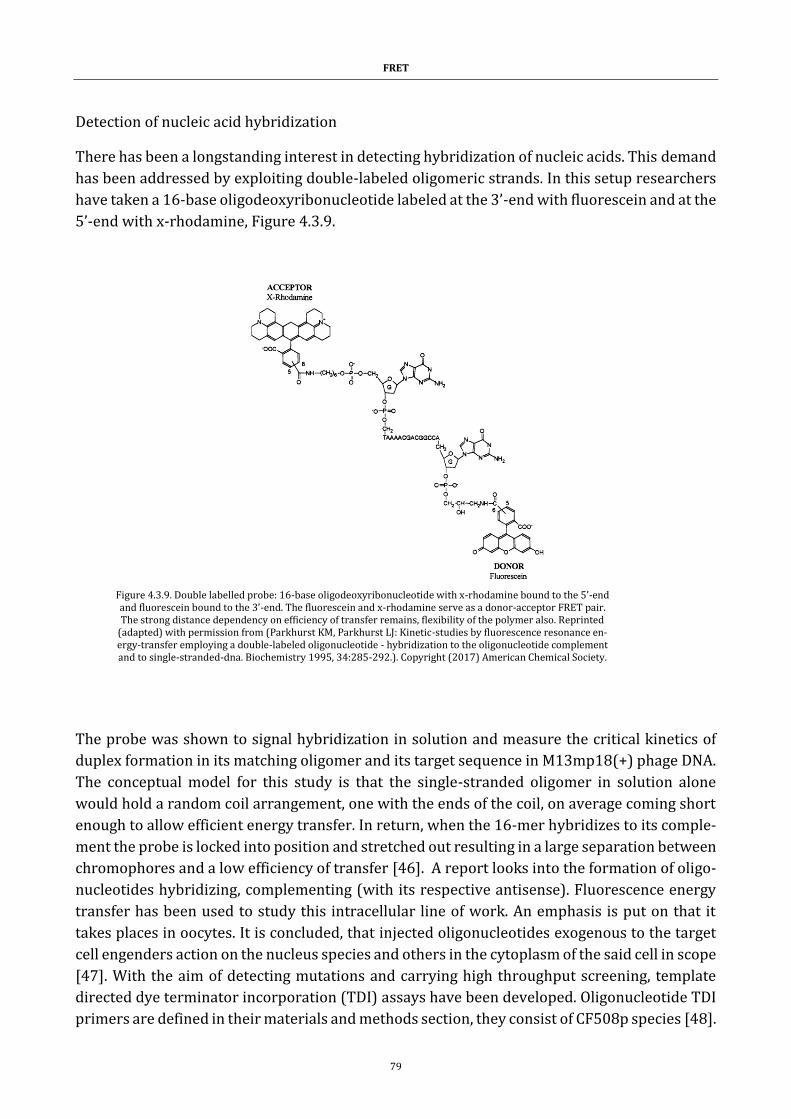
FRET
79
Detection of nucleic acid hybridization
There has been a longstanding interest in detecting hybridization of nucleic acids. This demand
has been addressed by exploiting double-labeled oligomeric strands. In this setup researchers
have taken a 16-base oligodeoxyribonucleotide labeled at the 3’-end with fluorescein and at the
5’-end with x-rhodamine, Figure 4.3.9.
The probe was shown to signal hybridization in solution and measure the critical kinetics of
duplex formation in its matching oligomer and its target sequence in M13mp18(+) phage DNA.
The conceptual model for this study is that the single-stranded oligomer in solution alone
would hold a random coil arrangement, one with the ends of the coil, on average coming short
enough to allow efficient energy transfer. In return, when the 16-mer hybridizes to its comple-
ment the probe is locked into position and stretched out resulting in a large separation between
chromophores and a low efficiency of transfer [46]. A report looks into the formation of oligo-
nucleotides hybridizing, complementing (with its respective antisense). Fluorescence energy
transfer has been used to study this intracellular line of work. An emphasis is put on that it
takes places in oocytes. It is concluded, that injected oligonucleotides exogenous to the target
cell engenders action on the nucleus species and others in the cytoplasm of the said cell in scope
[47]. With the aim of detecting mutations and carrying high throughput screening, template
directed dye terminator incorporation (TDI) assays have been developed. Oligonucleotide TDI
primers are defined in their materials and methods section, they consist of CF508p species [48].
Figure 4.3.9. Double labelled probe: 16-base oligodeoxyribonucleotide with x-rhodamine bound to the 5’-end and fluorescein bound to the 3’-end. The fluorescein and x-rhodamine serve as a donor-acceptor FRET pair. The strong distance dependency on efficiency of transfer remains, flexibility of the polymer also. Reprinted
(adapted) with permission from (Parkhurst KM, Parkhurst LJ: Kinetic-studies by fluorescence resonance en-ergy-transfer employing a double-labeled oligonucleotide - hybridization to the oligonucleotide complement and to single-stranded-dna. Biochemistry 1995, 34:285-292.). Copyright (2017) American Chemical Society.
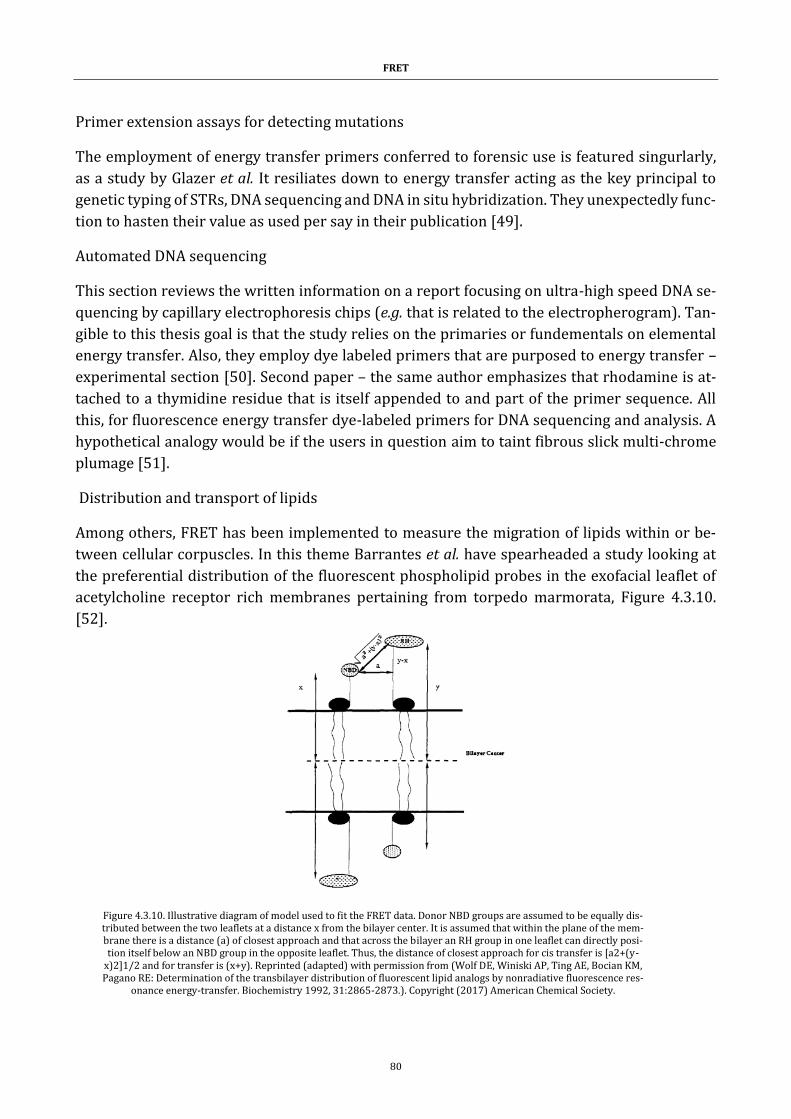
FRET
80
Primer extension assays for detecting mutations
The employment of energy transfer primers conferred to forensic use is featured singurlarly,
as a study by Glazer et al. It resiliates down to energy transfer acting as the key principal to
genetic typing of STRs, DNA sequencing and DNA in situ hybridization. They unexpectedly func-
tion to hasten their value as used per say in their publication [49].
Automated DNA sequencing
This section reviews the written information on a report focusing on ultra-high speed DNA se-
quencing by capillary electrophoresis chips (e.g. that is related to the electropherogram). Tan-
gible to this thesis goal is that the study relies on the primaries or fundementals on elemental
energy transfer. Also, they employ dye labeled primers that are purposed to energy transfer –
experimental section [50]. Second paper – the same author emphasizes that rhodamine is at-
tached to a thymidine residue that is itself appended to and part of the primer sequence. All
this, for fluorescence energy transfer dye-labeled primers for DNA sequencing and analysis. A
hypothetical analogy would be if the users in question aim to taint fibrous slick multi-chrome
plumage [51].
Distribution and transport of lipids
Among others, FRET has been implemented to measure the migration of lipids within or be-
tween cellular corpuscles. In this theme Barrantes et al. have spearheaded a study looking at
the preferential distribution of the fluorescent phospholipid probes in the exofacial leaflet of
acetylcholine receptor rich membranes pertaining from torpedo marmorata, Figure 4.3.10.
[52].
Figure 4.3.10. Illustrative diagram of model used to fit the FRET data. Donor NBD groups are assumed to be equally dis-tributed between the two leaflets at a distance x from the bilayer center. It is assumed that within the plane of the mem-brane there is a distance (a) of closest approach and that across the bilayer an RH group in one leaflet can directly posi-tion itself below an NBD group in the opposite leaflet. Thus, the distance of closest approach for cis transfer is [a2+(y-
x)2]1/2 and for transfer is (x+y). Reprinted (adapted) with permission from (Wolf DE, Winiski AP, Ting AE, Bocian KM, Pagano RE: Determination of the transbilayer distribution of fluorescent lipid analogs by nonradiative fluorescence res-
onance energy-transfer. Biochemistry 1992, 31:2865-2873.). Copyright (2017) American Chemical Society.
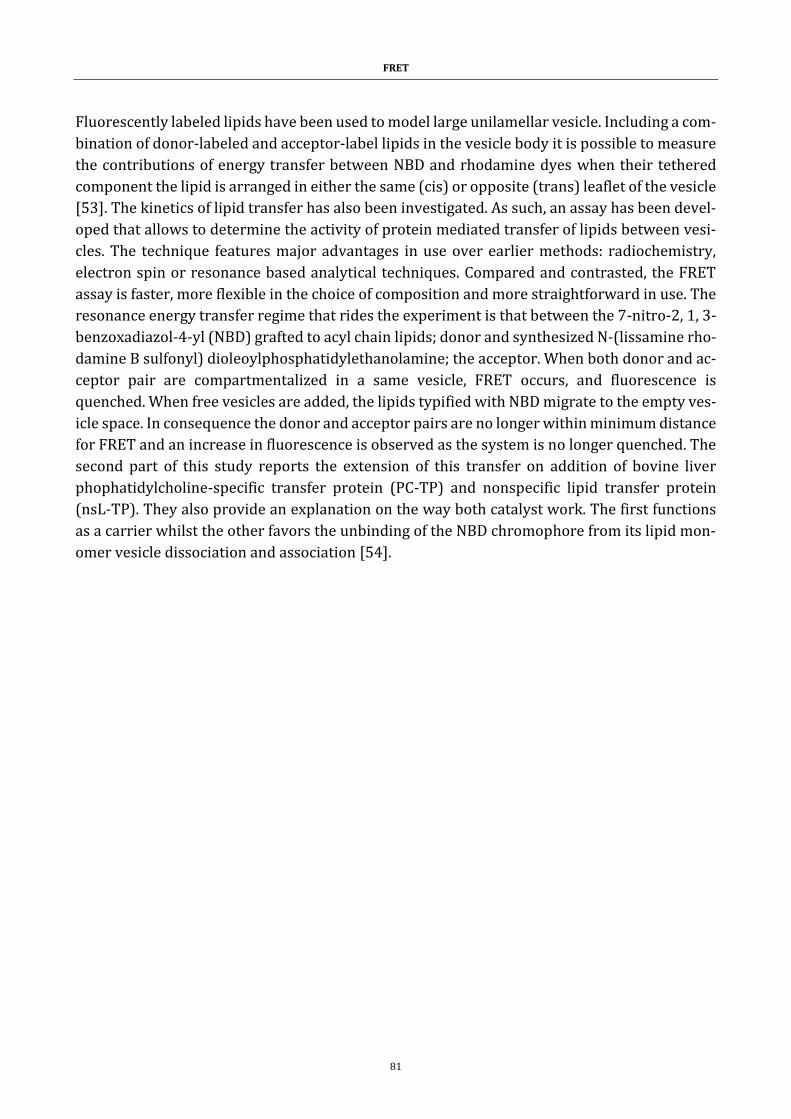
FRET
81
Fluorescently labeled lipids have been used to model large unilamellar vesicle. Including a com-
bination of donor-labeled and acceptor-label lipids in the vesicle body it is possible to measure
the contributions of energy transfer between NBD and rhodamine dyes when their tethered
component the lipid is arranged in either the same (cis) or opposite (trans) leaflet of the vesicle
[53]. The kinetics of lipid transfer has also been investigated. As such, an assay has been devel-
oped that allows to determine the activity of protein mediated transfer of lipids between vesi-
cles. The technique features major advantages in use over earlier methods: radiochemistry,
electron spin or resonance based analytical techniques. Compared and contrasted, the FRET
assay is faster, more flexible in the choice of composition and more straightforward in use. The
resonance energy transfer regime that rides the experiment is that between the 7-nitro-2, 1, 3-
benzoxadiazol-4-yl (NBD) grafted to acyl chain lipids; donor and synthesized N-(lissamine rho-
damine B sulfonyl) dioleoylphosphatidylethanolamine; the acceptor. When both donor and ac-
ceptor pair are compartmentalized in a same vesicle, FRET occurs, and fluorescence is
quenched. When free vesicles are added, the lipids typified with NBD migrate to the empty ves-
icle space. In consequence the donor and acceptor pairs are no longer within minimum distance
for FRET and an increase in fluorescence is observed as the system is no longer quenched. The
second part of this study reports the extension of this transfer on addition of bovine liver
phophatidylcholine-specific transfer protein (PC-TP) and nonspecific lipid transfer protein
(nsL-TP). They also provide an explanation on the way both catalyst work. The first functions
as a carrier whilst the other favors the unbinding of the NBD chromophore from its lipid mon-
omer vesicle dissociation and association [54].
FRET
82
Membrane fusion assays
On membrane fusion, a research group utilize the NBD and rhodamine phosphatidylethanola-
mine derivative based assay discussed above to quantify the evolution of lipid mixing when
brought together with target vesicle and liposomes and their fusion by monitoring the increase
of NBD donor fluorescence [55]. In a similar theme of research, fluorescein and rhodamine
probes each incorporated in a population of cells from B16 mouse melanoma cell line were used
to investigate the kinetics of cell fusion biology, review one of the results, Figure 4.3.11.
The FRET technique allowed as anticipated to quantify the rate and the magnitude of cell fusion
engendered by the addition of poly(ethylene glycol)s (PEG), a fusogen. This study then went
on evaluating how this fusion rate evolved in time, the cell membrane fusion rate in relation to
other fusion enhancers (surfactants) was also addressed [56]. Another tried vesicle-vesicle as-
say is documented, based on N-(7-nitro-2,1,3-benzoxadiazol-4-yl) as the donor and rhodamine
as the corresponding acceptor. The fluorophore then couple to phosphatidylethanolamine and
then bundle into place to the lipid vesicle bilayer. On interaction with and fusion with an una-
dulterated population of phosphatidylserine vesicles, the membranes reshapes to accommo-
date the other. It turns out that this distortion results in the probes furthering apart and subse-
quently the empirically measured efficiency of resonance energy transfer reduces. This method
allows to build on the kinetics and evolution of the fusion process, and particularly to this study,
fusion and uptake of vesicles by cultured fibroblasts. The results of their assays revealed that
vesicle transfer to the cells intact as whole vesicle [57].
Figure 4.3.11. Linear correlation between fusion index and ∆R′. Fusion index is an empir-ical estimate. ∆R′is a parameter of resonance energy transfer refer to publication XX. The correlation coefficient is r=0.974. Rprinted (adapted) with license agreement from (Par-tearroyo MA, Cabezon E, Nieva JL, Alonso A, Goni FM: Real-time measurements of chemi-
cally-induced membrane-fusion in cell monolayers, using a resonance energy-transfer method. Biochimica Et Biophysica Acta-Biomembranes 1994, 1189:175-180). Copyright
(2017) Elsevier.
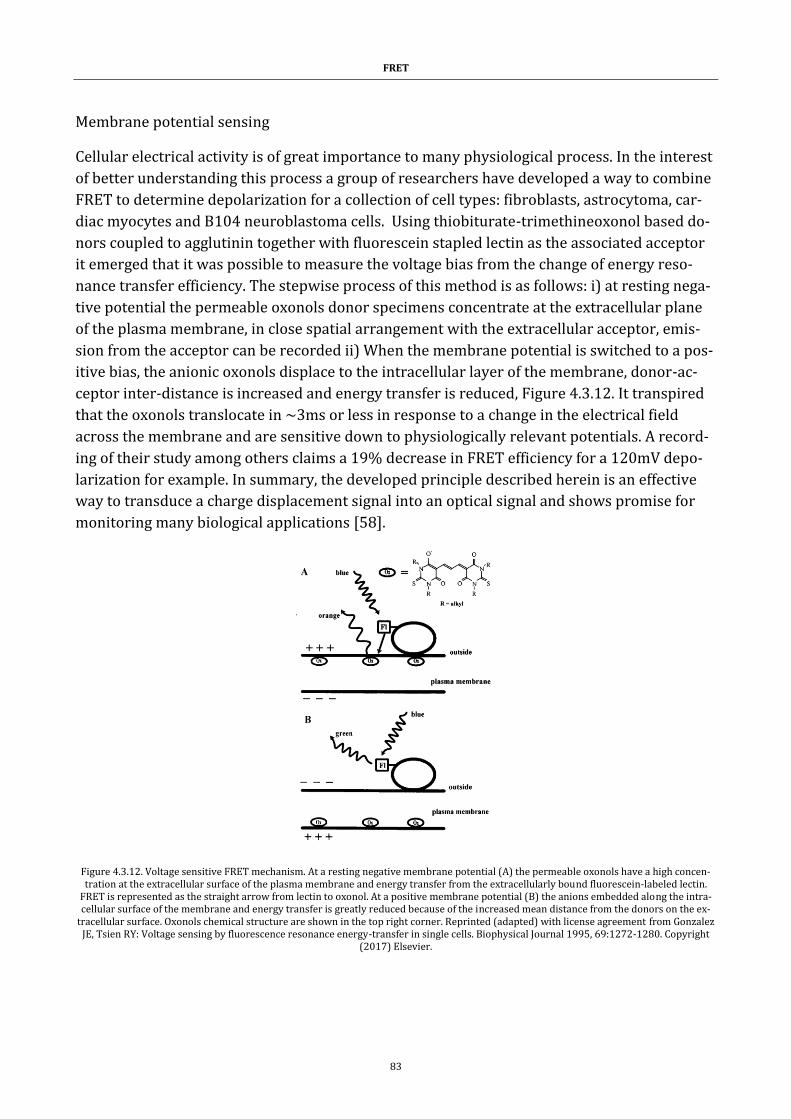
FRET
83
Membrane potential sensing
Cellular electrical activity is of great importance to many physiological process. In the interest
of better understanding this process a group of researchers have developed a way to combine
FRET to determine depolarization for a collection of cell types: fibroblasts, astrocytoma, car-
diac myocytes and B104 neuroblastoma cells. Using thiobiturate-trimethineoxonol based do-
nors coupled to agglutinin together with fluorescein stapled lectin as the associated acceptor
it emerged that it was possible to measure the voltage bias from the change of energy reso-
nance transfer efficiency. The stepwise process of this method is as follows: i) at resting nega-
tive potential the permeable oxonols donor specimens concentrate at the extracellular plane
of the plasma membrane, in close spatial arrangement with the extracellular acceptor, emis-
sion from the acceptor can be recorded ii) When the membrane potential is switched to a pos-
itive bias, the anionic oxonols displace to the intracellular layer of the membrane, donor-ac-
ceptor inter-distance is increased and energy transfer is reduced, Figure 4.3.12. It transpired
that the oxonols translocate in ~3ms or less in response to a change in the electrical field
across the membrane and are sensitive down to physiologically relevant potentials. A record-
ing of their study among others claims a 19% decrease in FRET efficiency for a 120mV depo-
larization for example. In summary, the developed principle described herein is an effective
way to transduce a charge displacement signal into an optical signal and shows promise for
monitoring many biological applications [58].
Figure 4.3.12. Voltage sensitive FRET mechanism. At a resting negative membrane potential (A) the permeable oxonols have a high concen-tration at the extracellular surface of the plasma membrane and energy transfer from the extracellularly bound fluorescein-labeled lectin.
FRET is represented as the straight arrow from lectin to oxonol. At a positive membrane potential (B) the anions embedded along the intra-cellular surface of the membrane and energy transfer is greatly reduced because of the increased mean distance from the donors on the ex-
tracellular surface. Oxonols chemical structure are shown in the top right corner. Reprinted (adapted) with license agreement from Gonzalez JE, Tsien RY: Voltage sensing by fluorescence resonance energy-transfer in single cells. Biophysical Journal 1995, 69:1272-1280. Copyright
(2017) Elsevier.
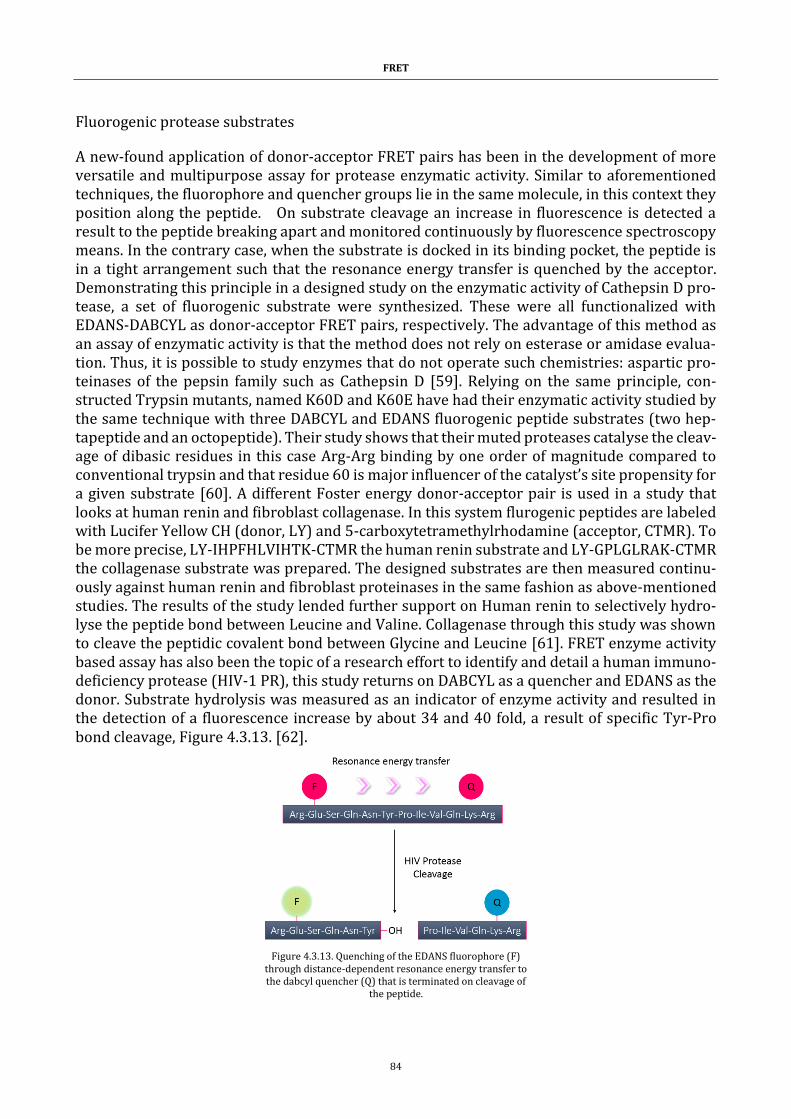
FRET
84
Fluorogenic protease substrates
A new-found application of donor-acceptor FRET pairs has been in the development of more versatile and multipurpose assay for protease enzymatic activity. Similar to aforementioned techniques, the fluorophore and quencher groups lie in the same molecule, in this context they position along the peptide. On substrate cleavage an increase in fluorescence is detected a result to the peptide breaking apart and monitored continuously by fluorescence spectroscopy means. In the contrary case, when the substrate is docked in its binding pocket, the peptide is in a tight arrangement such that the resonance energy transfer is quenched by the acceptor. Demonstrating this principle in a designed study on the enzymatic activity of Cathepsin D pro-tease, a set of fluorogenic substrate were synthesized. These were all functionalized with EDANS-DABCYL as donor-acceptor FRET pairs, respectively. The advantage of this method as an assay of enzymatic activity is that the method does not rely on esterase or amidase evalua-tion. Thus, it is possible to study enzymes that do not operate such chemistries: aspartic pro-teinases of the pepsin family such as Cathepsin D [59]. Relying on the same principle, con-structed Trypsin mutants, named K60D and K60E have had their enzymatic activity studied by the same technique with three DABCYL and EDANS fluorogenic peptide substrates (two hep-tapeptide and an octopeptide). Their study shows that their muted proteases catalyse the cleav-age of dibasic residues in this case Arg-Arg binding by one order of magnitude compared to conventional trypsin and that residue 60 is major influencer of the catalyst’s site propensity for a given substrate [60]. A different Foster energy donor-acceptor pair is used in a study that looks at human renin and fibroblast collagenase. In this system flurogenic peptides are labeled with Lucifer Yellow CH (donor, LY) and 5-carboxytetramethylrhodamine (acceptor, CTMR). To be more precise, LY-IHPFHLVIHTK-CTMR the human renin substrate and LY-GPLGLRAK-CTMR the collagenase substrate was prepared. The designed substrates are then measured continu-ously against human renin and fibroblast proteinases in the same fashion as above-mentioned studies. The results of the study lended further support on Human renin to selectively hydro-lyse the peptide bond between Leucine and Valine. Collagenase through this study was shown to cleave the peptidic covalent bond between Glycine and Leucine [61]. FRET enzyme activity based assay has also been the topic of a research effort to identify and detail a human immuno-deficiency protease (HIV-1 PR), this study returns on DABCYL as a quencher and EDANS as the donor. Substrate hydrolysis was measured as an indicator of enzyme activity and resulted in the detection of a fluorescence increase by about 34 and 40 fold, a result of specific Tyr-Pro bond cleavage, Figure 4.3.13. [62].
Figure 4.3.13. Quenching of the EDANS fluorophore (F) through distance-dependent resonance energy transfer to the dabcyl quencher (Q) that is terminated on cleavage of
the peptide.
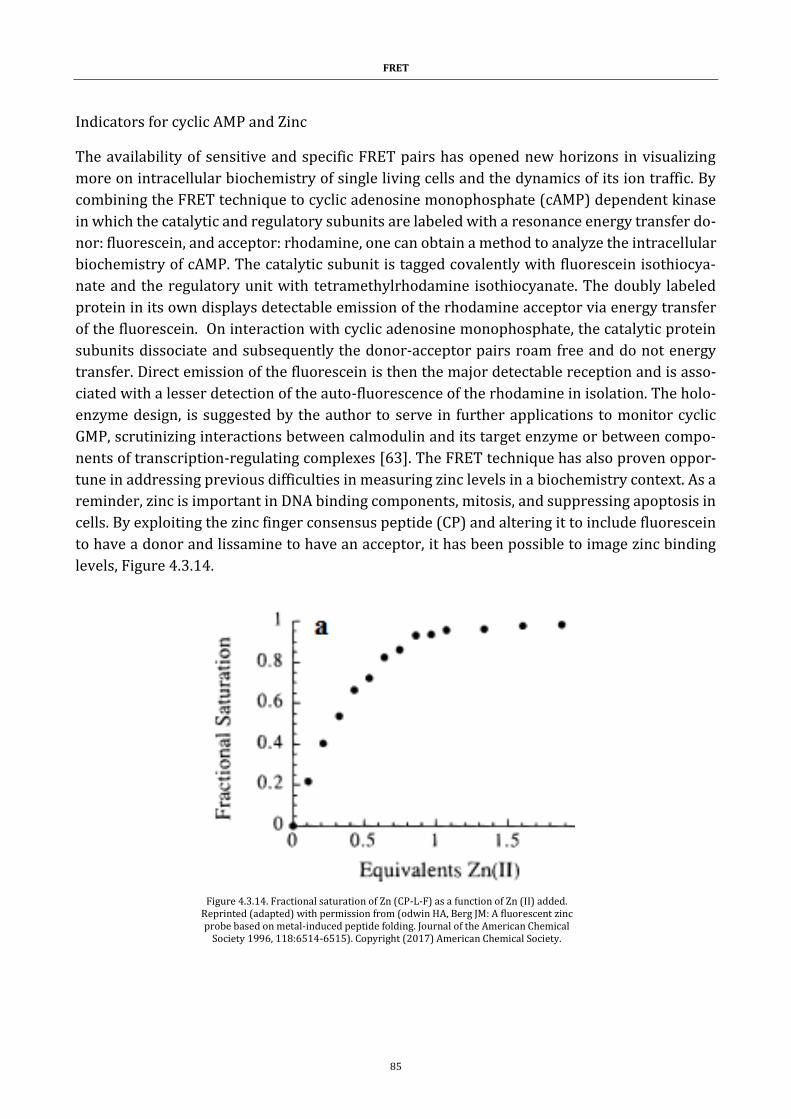
FRET
85
Indicators for cyclic AMP and Zinc
The availability of sensitive and specific FRET pairs has opened new horizons in visualizing
more on intracellular biochemistry of single living cells and the dynamics of its ion traffic. By
combining the FRET technique to cyclic adenosine monophosphate (cAMP) dependent kinase
in which the catalytic and regulatory subunits are labeled with a resonance energy transfer do-
nor: fluorescein, and acceptor: rhodamine, one can obtain a method to analyze the intracellular
biochemistry of cAMP. The catalytic subunit is tagged covalently with fluorescein isothiocya-
nate and the regulatory unit with tetramethylrhodamine isothiocyanate. The doubly labeled
protein in its own displays detectable emission of the rhodamine acceptor via energy transfer
of the fluorescein. On interaction with cyclic adenosine monophosphate, the catalytic protein
subunits dissociate and subsequently the donor-acceptor pairs roam free and do not energy
transfer. Direct emission of the fluorescein is then the major detectable reception and is asso-
ciated with a lesser detection of the auto-fluorescence of the rhodamine in isolation. The holo-
enzyme design, is suggested by the author to serve in further applications to monitor cyclic
GMP, scrutinizing interactions between calmodulin and its target enzyme or between compo-
nents of transcription-regulating complexes [63]. The FRET technique has also proven oppor-
tune in addressing previous difficulties in measuring zinc levels in a biochemistry context. As a
reminder, zinc is important in DNA binding components, mitosis, and suppressing apoptosis in
cells. By exploiting the zinc finger consensus peptide (CP) and altering it to include fluorescein
to have a donor and lissamine to have an acceptor, it has been possible to image zinc binding
levels, Figure 4.3.14.
Figure 4.3.14. Fractional saturation of Zn (CP-L-F) as a function of Zn (II) added. Reprinted (adapted) with permission from (odwin HA, Berg JM: A fluorescent zinc probe based on metal-induced peptide folding. Journal of the American Chemical
Society 1996, 118:6514-6515). Copyright (2017) American Chemical Society.
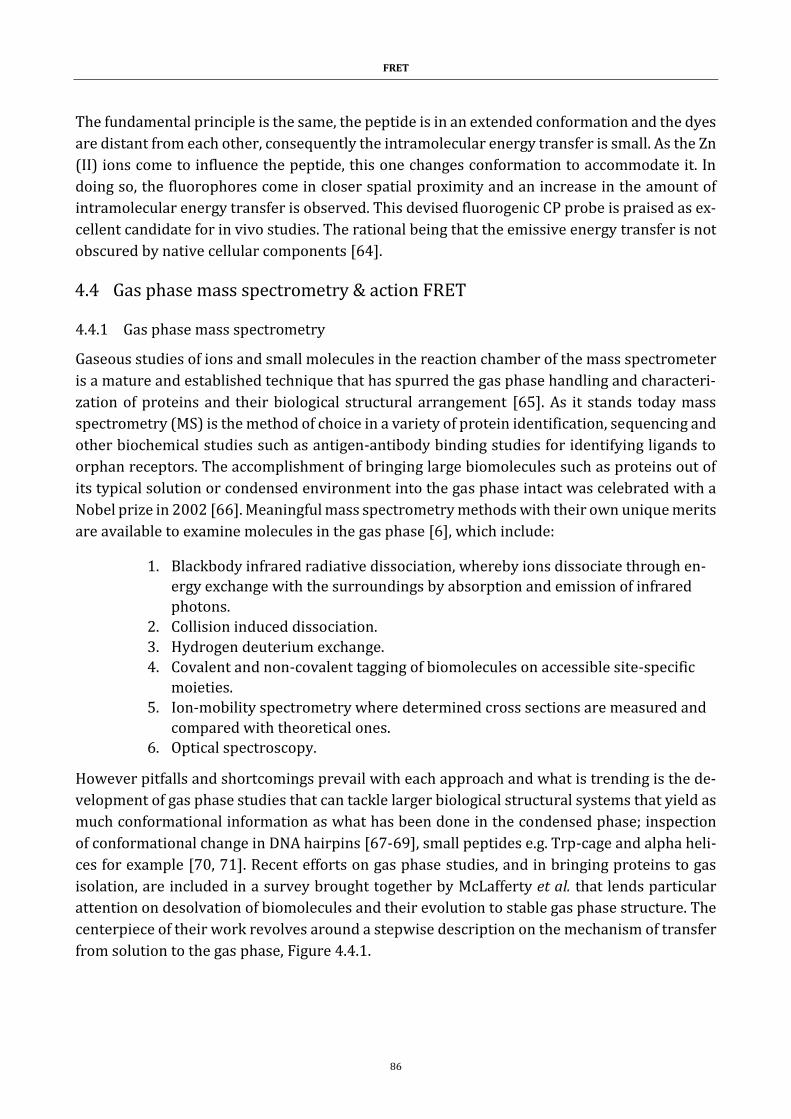
FRET
86
The fundamental principle is the same, the peptide is in an extended conformation and the dyes
are distant from each other, consequently the intramolecular energy transfer is small. As the Zn
(II) ions come to influence the peptide, this one changes conformation to accommodate it. In
doing so, the fluorophores come in closer spatial proximity and an increase in the amount of
intramolecular energy transfer is observed. This devised fluorogenic CP probe is praised as ex-
cellent candidate for in vivo studies. The rational being that the emissive energy transfer is not
obscured by native cellular components [64].
4.4 Gas phase mass spectrometry & action FRET
4.4.1 Gas phase mass spectrometry
Gaseous studies of ions and small molecules in the reaction chamber of the mass spectrometer
is a mature and established technique that has spurred the gas phase handling and characteri-
zation of proteins and their biological structural arrangement [65]. As it stands today mass
spectrometry (MS) is the method of choice in a variety of protein identification, sequencing and
other biochemical studies such as antigen-antibody binding studies for identifying ligands to
orphan receptors. The accomplishment of bringing large biomolecules such as proteins out of
its typical solution or condensed environment into the gas phase intact was celebrated with a
Nobel prize in 2002 [66]. Meaningful mass spectrometry methods with their own unique merits
are available to examine molecules in the gas phase [6], which include:
1. Blackbody infrared radiative dissociation, whereby ions dissociate through en-
ergy exchange with the surroundings by absorption and emission of infrared
photons.
2. Collision induced dissociation.
3. Hydrogen deuterium exchange.
4. Covalent and non-covalent tagging of biomolecules on accessible site-specific
moieties.
5. Ion-mobility spectrometry where determined cross sections are measured and
compared with theoretical ones. 6. Optical spectroscopy.
However pitfalls and shortcomings prevail with each approach and what is trending is the de-
velopment of gas phase studies that can tackle larger biological structural systems that yield as
much conformational information as what has been done in the condensed phase; inspection
of conformational change in DNA hairpins [67-69], small peptides e.g. Trp-cage and alpha heli-
ces for example [70, 71]. Recent efforts on gas phase studies, and in bringing proteins to gas
isolation, are included in a survey brought together by McLafferty et al. that lends particular
attention on desolvation of biomolecules and their evolution to stable gas phase structure. The
centerpiece of their work revolves around a stepwise description on the mechanism of transfer
from solution to the gas phase, Figure 4.4.1.
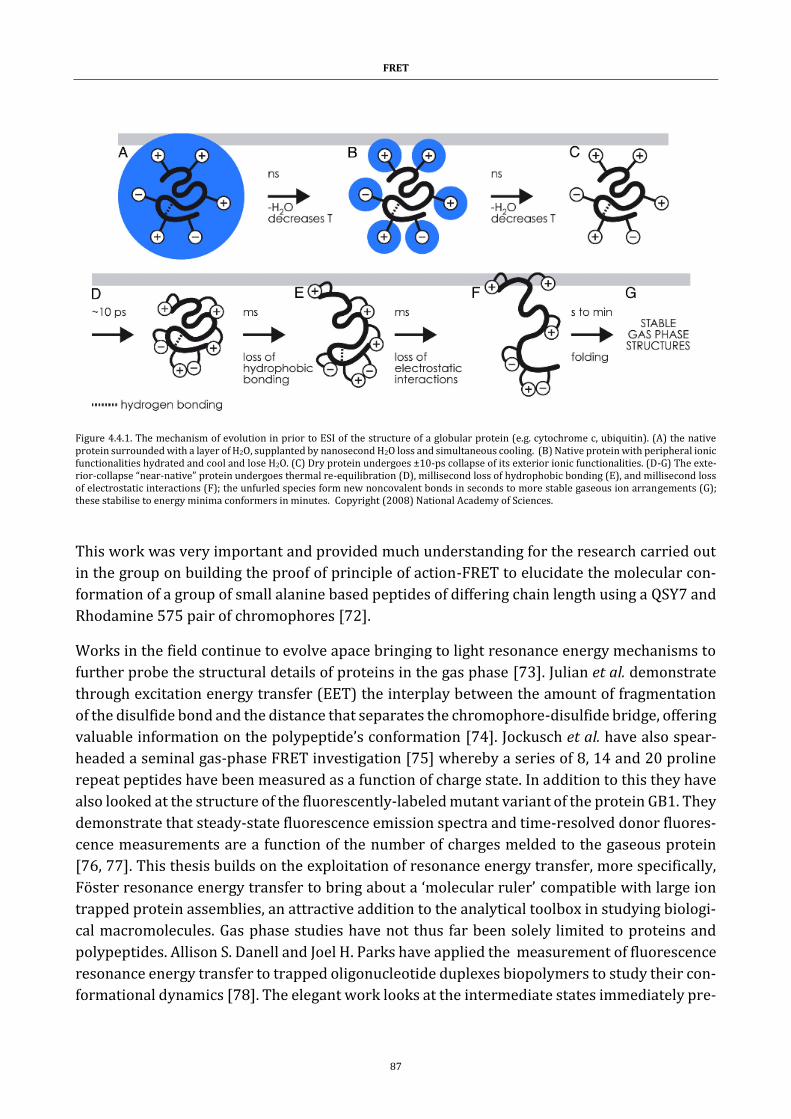
FRET
87
Figure 4.4.1. The mechanism of evolution in prior to ESI of the structure of a globular protein (e.g. cytochrome c, ubiquitin). (A) the native protein surrounded with a layer of H2O, supplanted by nanosecond H2O loss and simultaneous cooling. (B) Native protein with peripheral ionic functionalities hydrated and cool and lose H2O. (C) Dry protein undergoes ±10-ps collapse of its exterior ionic functionalities. (D-G) The exte-rior-collapse “near-native” protein undergoes thermal re-equilibration (D), millisecond loss of hydrophobic bonding (E), and millisecond loss of electrostatic interactions (F); the unfurled species form new noncovalent bonds in seconds to more stable gaseous ion arrangements (G); these stabilise to energy minima conformers in minutes. Copyright (2008) National Academy of Sciences.
This work was very important and provided much understanding for the research carried out
in the group on building the proof of principle of action-FRET to elucidate the molecular con-
formation of a group of small alanine based peptides of differing chain length using a QSY7 and
Rhodamine 575 pair of chromophores [72].
Works in the field continue to evolve apace bringing to light resonance energy mechanisms to
further probe the structural details of proteins in the gas phase [73]. Julian et al. demonstrate
through excitation energy transfer (EET) the interplay between the amount of fragmentation
of the disulfide bond and the distance that separates the chromophore-disulfide bridge, offering
valuable information on the polypeptide’s conformation [74]. Jockusch et al. have also spear-
headed a seminal gas-phase FRET investigation [75] whereby a series of 8, 14 and 20 proline
repeat peptides have been measured as a function of charge state. In addition to this they have
also looked at the structure of the fluorescently-labeled mutant variant of the protein GB1. They
demonstrate that steady-state fluorescence emission spectra and time-resolved donor fluores-
cence measurements are a function of the number of charges melded to the gaseous protein
[76, 77]. This thesis builds on the exploitation of resonance energy transfer, more specifically,
Föster resonance energy transfer to bring about a ‘molecular ruler’ compatible with large ion
trapped protein assemblies, an attractive addition to the analytical toolbox in studying biologi-
cal macromolecules. Gas phase studies have not thus far been solely limited to proteins and
polypeptides. Allison S. Danell and Joel H. Parks have applied the measurement of fluorescence
resonance energy transfer to trapped oligonucleotide duplexes biopolymers to study their con-
formational dynamics [78]. The elegant work looks at the intermediate states immediately pre-
FRET
88
ceding dissociation of the double stranded oligonucleotide ions, effectively following the un-
folding or unravelling of the noncovalent complex in the gas phase by measuring the increase
in fluorescence associated to an expansion in the inter-distance of FRET donor and acceptor
moieties. A following generation of work on FRET in the gas phase is reported by Renato Zenobi
[77]. Another coverage of the same author provides information on evidence of fluorescence
resonance energy transfer in gas-phase ions, again using mass spectrometry [6]. Of course, later
works carried through this thesis, discussed in this manuscript, also testify of the possibility
that the MS conciliated to a laser source, can produce results on gas phase biomolecules.
4.4.2 Action spectroscopy
Action spectroscopy is one of the modalities by which the optical characteristics of ions can be
assessed in the gas phase. It corresponds to the measurement of the fragmentation induced by
the absorption of photons and sometimes results from ion-molecule reaction after photon ab-
sorption (viz. photodissociation or photodetachment). It is different to the measurement of
multiple photons absorbed or emitted as is usually done by absorption or fluorescence emis-
sion spectroscopy [73, 79, 80].
Action spectroscopy is a standalone MS spectroscopy approach. It is important to reiterate that
it measures the influence of photons on ions trapped in a mass spectrometer, by registering
shifts in m/z resulting from the degree of fragmentation of an ion versus excitation wavelength.
For further information this operation of measurement is well documented by chemical spec-
troscopists [73, 79-81]. Action spectroscopy is also commonly found under the denomination
of photodissociation action spectroscopy, in this way it is emphasized that focus is applied in
considering photodissociation alone, exclusively of other end fates such as fluorescence, elec-
tron detachment or photoisomerization, this is well described by Wellman and Jockusch [82].
This spectroscopic method of action spectroscopy that date’s back to the 1970s [80] also has
drawbacks. Since it is an indirect procedure of observation, an action spectrum may differ from
a direct measurement of an adsorption or emission spectrum [79, 82]. Many situations arise
when photon absorption is not registered by any photochemical stimulus [80]. Conversely, any
signal that does arise, is due to photon absorption, this means zero background in the produced
spectra [80]. Other advantages of action spectroscopy are that the technique exploits the ben-
efits offered by mass spectrometers to detect ions conveniently, sensitively and precisely [73,
79]. Secondly, it is also possible to couple action spectroscopy to energy transfer. The energy
transfer process is used to determine distant constraints between two or more atoms in the
molecule, as commonly implemented with FRET experiments in the condensed phase [79]. This
is effectively valid, on the precondition that energy transfer from a donor and acceptor provides
unique fragmentation post energy transfer from the donor to the acceptor [79].
4.4.3 Action FRET
Traditionally FRET data resulted in the careful measurement of the fluorescence decay by ei-
ther photon-counting or phase modulation method [2]. There is an interest to observe confor-
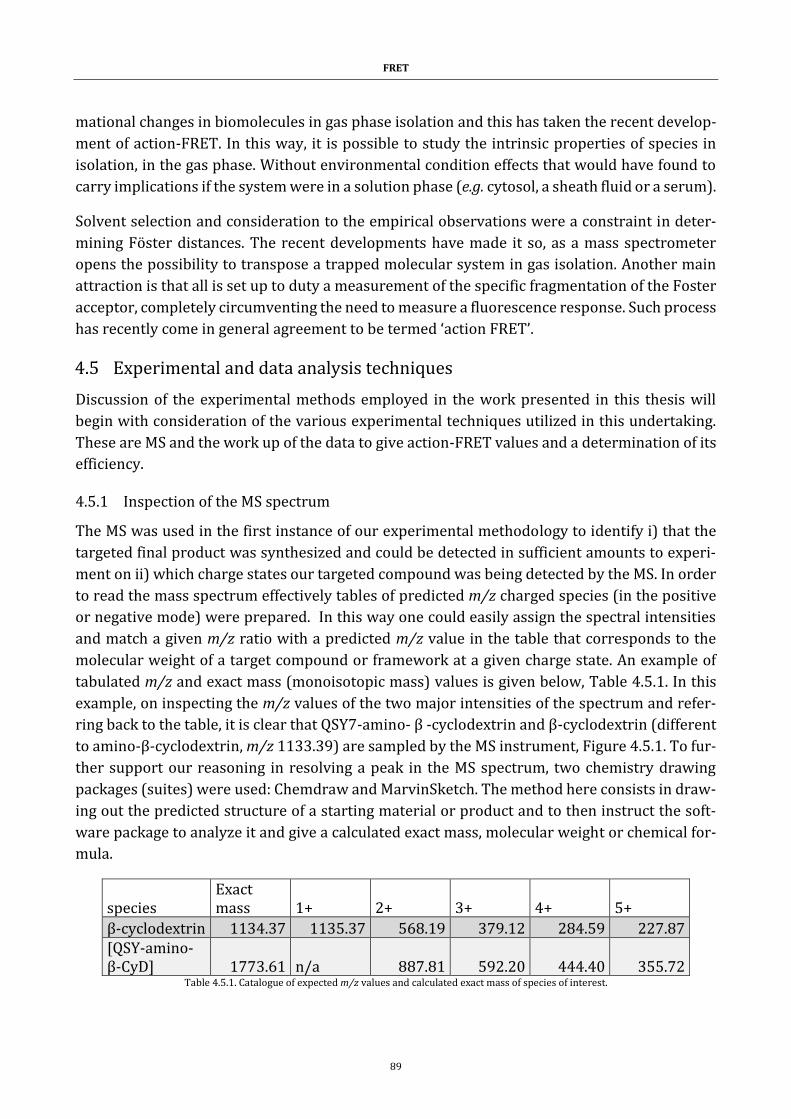
FRET
89
mational changes in biomolecules in gas phase isolation and this has taken the recent develop-
ment of action-FRET. In this way, it is possible to study the intrinsic properties of species in
isolation, in the gas phase. Without environmental condition effects that would have found to
carry implications if the system were in a solution phase (e.g. cytosol, a sheath fluid or a serum).
Solvent selection and consideration to the empirical observations were a constraint in deter-
mining Föster distances. The recent developments have made it so, as a mass spectrometer
opens the possibility to transpose a trapped molecular system in gas isolation. Another main
attraction is that all is set up to duty a measurement of the specific fragmentation of the Foster
acceptor, completely circumventing the need to measure a fluorescence response. Such process
has recently come in general agreement to be termed ‘action FRET’.
4.5 Experimental and data analysis techniques
Discussion of the experimental methods employed in the work presented in this thesis will
begin with consideration of the various experimental techniques utilized in this undertaking.
These are MS and the work up of the data to give action-FRET values and a determination of its
efficiency.
4.5.1 Inspection of the MS spectrum
The MS was used in the first instance of our experimental methodology to identify i) that the
targeted final product was synthesized and could be detected in sufficient amounts to experi-
ment on ii) which charge states our targeted compound was being detected by the MS. In order
to read the mass spectrum effectively tables of predicted m/z charged species (in the positive
or negative mode) were prepared. In this way one could easily assign the spectral intensities
and match a given m/z ratio with a predicted m/z value in the table that corresponds to the
molecular weight of a target compound or framework at a given charge state. An example of
tabulated m/z and exact mass (monoisotopic mass) values is given below, Table 4.5.1. In this
example, on inspecting the m/z values of the two major intensities of the spectrum and refer-
ring back to the table, it is clear that QSY7-amino- β -cyclodextrin and β-cyclodextrin (different
to amino-β-cyclodextrin, m/z 1133.39) are sampled by the MS instrument, Figure 4.5.1. To fur-
ther support our reasoning in resolving a peak in the MS spectrum, two chemistry drawing
packages (suites) were used: Chemdraw and MarvinSketch. The method here consists in draw-
ing out the predicted structure of a starting material or product and to then instruct the soft-
ware package to analyze it and give a calculated exact mass, molecular weight or chemical for-
mula.
species Exact mass 1+ 2+ 3+ 4+ 5+
β-cyclodextrin 1134.37 1135.37 568.19 379.12 284.59 227.87 [QSY-amino-β-CyD] 1773.61 n/a 887.81 592.20 444.40 355.72
Table 4.5.1. Catalogue of expected m/z values and calculated exact mass of species of interest.
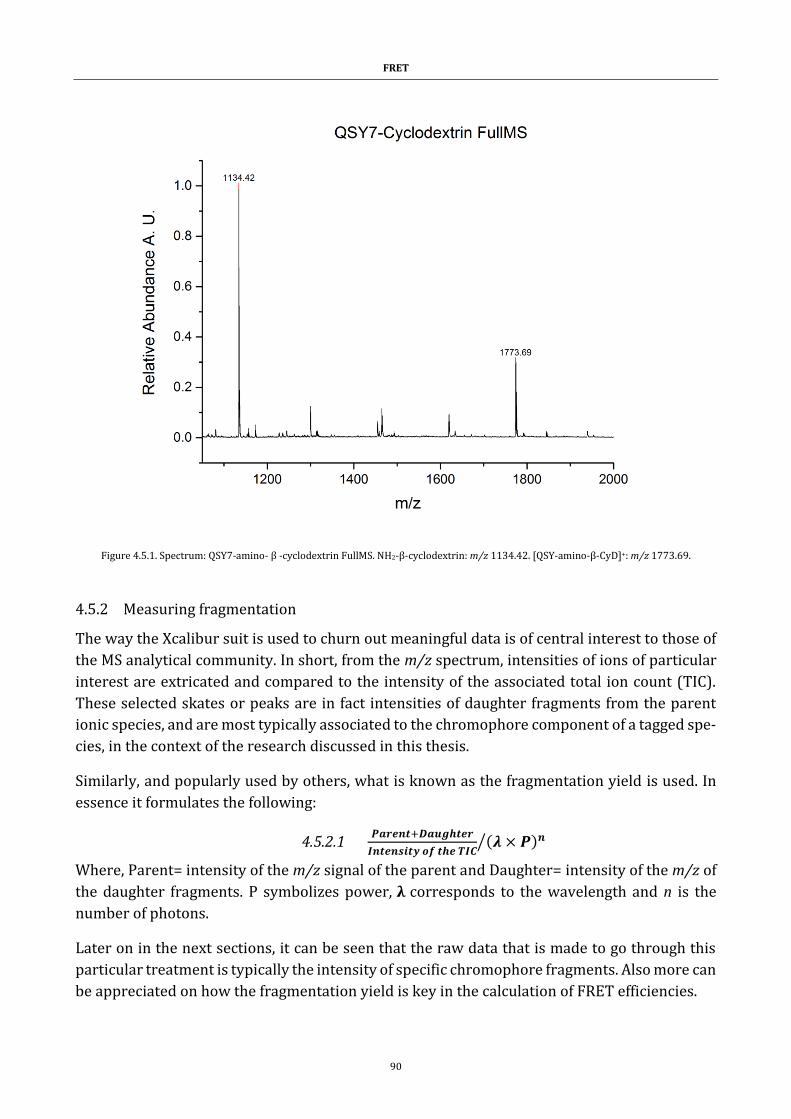
FRET
90
Figure 4.5.1. Spectrum: QSY7-amino- β -cyclodextrin FullMS. NH2-β-cyclodextrin: m/z 1134.42. [QSY-amino-β-CyD]+: m/z 1773.69.
4.5.2 Measuring fragmentation
The way the Xcalibur suit is used to churn out meaningful data is of central interest to those of
the MS analytical community. In short, from the m/z spectrum, intensities of ions of particular
interest are extricated and compared to the intensity of the associated total ion count (TIC).
These selected skates or peaks are in fact intensities of daughter fragments from the parent
ionic species, and are most typically associated to the chromophore component of a tagged spe-
cies, in the context of the research discussed in this thesis.
Similarly, and popularly used by others, what is known as the fragmentation yield is used. In
essence it formulates the following:
4.5.2.1 𝑷𝒂𝒓𝒆𝒏𝒕+𝑫𝒂𝒖𝒈𝒉𝒕𝒆𝒓
𝑰𝒏𝒕𝒆𝒏𝒔𝒊𝒕𝒚 𝒐𝒇 𝒕𝒉𝒆 𝑻𝑰𝑪(𝝀 × 𝑷)𝒏⁄
Where, Parent= intensity of the m/z signal of the parent and Daughter= intensity of the m/z of
the daughter fragments. P symbolizes power, 𝛌 corresponds to the wavelength and n is the
number of photons.
Later on in the next sections, it can be seen that the raw data that is made to go through this
particular treatment is typically the intensity of specific chromophore fragments. Also more can
be appreciated on how the fragmentation yield is key in the calculation of FRET efficiencies.
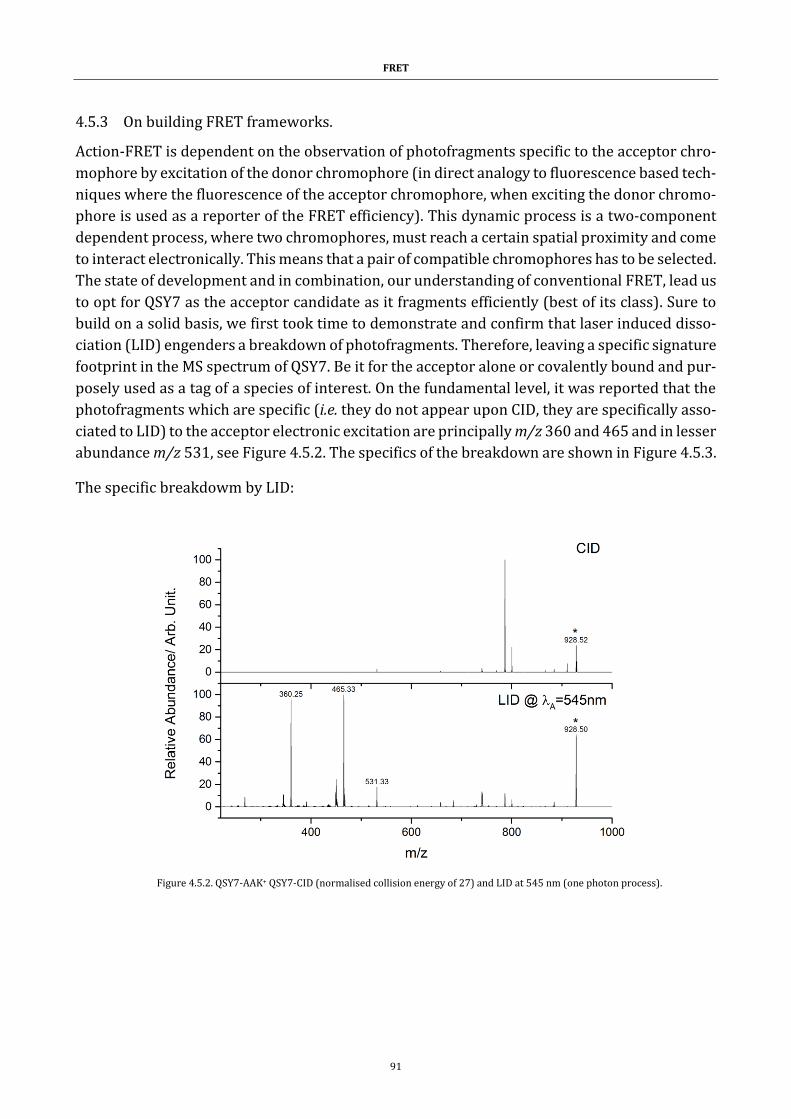
FRET
91
4.5.3 On building FRET frameworks.
Action-FRET is dependent on the observation of photofragments specific to the acceptor chro-
mophore by excitation of the donor chromophore (in direct analogy to fluorescence based tech-
niques where the fluorescence of the acceptor chromophore, when exciting the donor chromo-
phore is used as a reporter of the FRET efficiency). This dynamic process is a two-component
dependent process, where two chromophores, must reach a certain spatial proximity and come
to interact electronically. This means that a pair of compatible chromophores has to be selected.
The state of development and in combination, our understanding of conventional FRET, lead us
to opt for QSY7 as the acceptor candidate as it fragments efficiently (best of its class). Sure to
build on a solid basis, we first took time to demonstrate and confirm that laser induced disso-
ciation (LID) engenders a breakdown of photofragments. Therefore, leaving a specific signature
footprint in the MS spectrum of QSY7. Be it for the acceptor alone or covalently bound and pur-
posely used as a tag of a species of interest. On the fundamental level, it was reported that the
photofragments which are specific (i.e. they do not appear upon CID, they are specifically asso-
ciated to LID) to the acceptor electronic excitation are principally m/z 360 and 465 and in lesser
abundance m/z 531, see Figure 4.5.2. The specifics of the breakdown are shown in Figure 4.5.3.
The specific breakdowm by LID:
Figure 4.5.2. QSY7-AAK+ QSY7-CID (normalised collision energy of 27) and LID at 545 nm (one photon process).
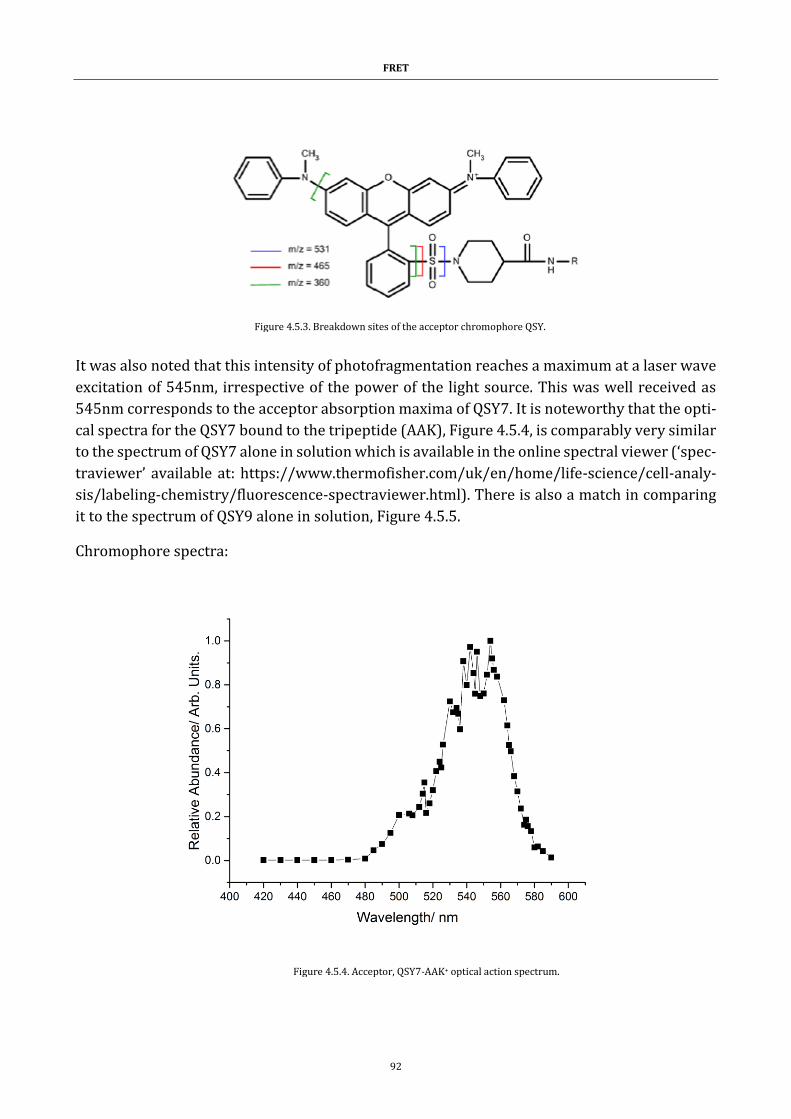
FRET
92
It was also noted that this intensity of photofragmentation reaches a maximum at a laser wave
excitation of 545nm, irrespective of the power of the light source. This was well received as
545nm corresponds to the acceptor absorption maxima of QSY7. It is noteworthy that the opti-
cal spectra for the QSY7 bound to the tripeptide (AAK), Figure 4.5.4, is comparably very similar
to the spectrum of QSY7 alone in solution which is available in the online spectral viewer (‘spec-
traviewer’ available at: https://www.thermofisher.com/uk/en/home/life-science/cell-analy-
sis/labeling-chemistry/fluorescence-spectraviewer.html). There is also a match in comparing
it to the spectrum of QSY9 alone in solution, Figure 4.5.5.
Chromophore spectra:
Figure 4.5.3. Breakdown sites of the acceptor chromophore QSY.
Figure 4.5.4. Acceptor, QSY7-AAK+ optical action spectrum.

FRET
93
Now, onto the second part of a FRET framework, the donor component. The associated donor
chromophore must be chosen carefully to fulfill two fundamental conditions. One that it emits
close the 545nm wavelength so to excite and fragment the acceptor chromophore. In other
words, the fluorescence emission of spectrum of the donor must overlap with that of the ab-
sorption spectrum of the acceptor (as mentionned previously). Two, that the donor chromo-
phore holds an absorption band different to that of the acceptor thus to avoid its direct excita-
tion. With this criteria in hand it was agreed that rhodamine was the best suiter to work with
QSY [83], cf. Figure 4.5.6 and Figure 4.5.4.
Figure 4.5.5. QSY9 solution absorption spectrum.
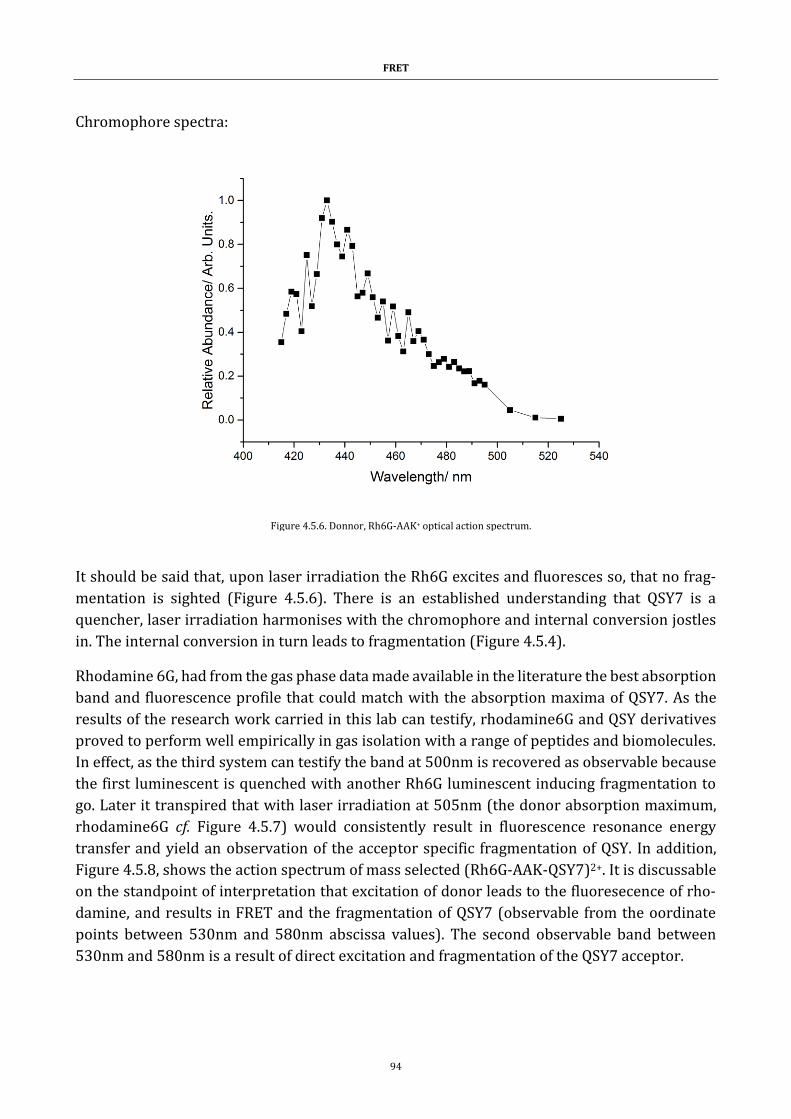
FRET
94
Chromophore spectra:
It should be said that, upon laser irradiation the Rh6G excites and fluoresces so, that no frag-
mentation is sighted (Figure 4.5.6). There is an established understanding that QSY7 is a
quencher, laser irradiation harmonises with the chromophore and internal conversion jostles
in. The internal conversion in turn leads to fragmentation (Figure 4.5.4).
Rhodamine 6G, had from the gas phase data made available in the literature the best absorption
band and fluorescence profile that could match with the absorption maxima of QSY7. As the
results of the research work carried in this lab can testify, rhodamine6G and QSY derivatives
proved to perform well empirically in gas isolation with a range of peptides and biomolecules.
In effect, as the third system can testify the band at 500nm is recovered as observable because
the first luminescent is quenched with another Rh6G luminescent inducing fragmentation to
go. Later it transpired that with laser irradiation at 505nm (the donor absorption maximum,
rhodamine6G cf. Figure 4.5.7) would consistently result in fluorescence resonance energy
transfer and yield an observation of the acceptor specific fragmentation of QSY. In addition,
Figure 4.5.8, shows the action spectrum of mass selected (Rh6G-AAK-QSY7)2+. It is discussable
on the standpoint of interpretation that excitation of donor leads to the fluoresecence of rho-
damine, and results in FRET and the fragmentation of QSY7 (observable from the oordinate
points between 530nm and 580nm abscissa values). The second observable band between
530nm and 580nm is a result of direct excitation and fragmentation of the QSY7 acceptor.
Figure 4.5.6. Donnor, Rh6G-AAK+ optical action spectrum.
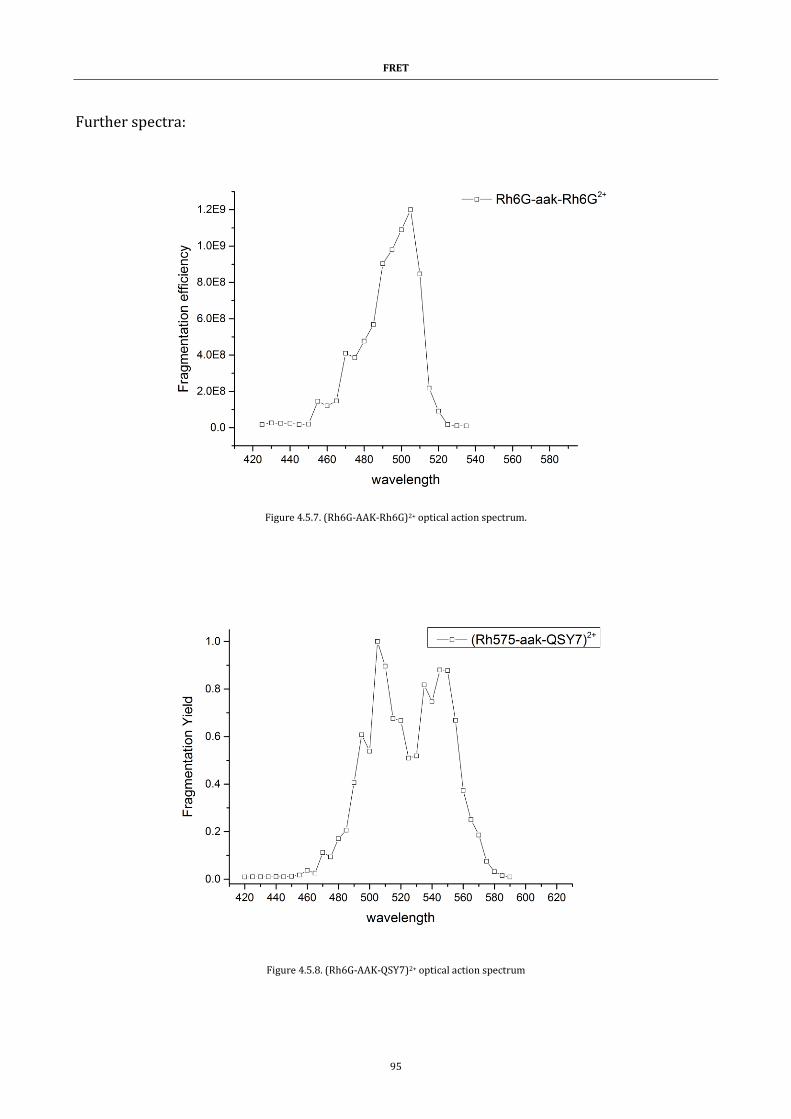
FRET
95
Further spectra:
Figure 4.5.7. (Rh6G-AAK-Rh6G)2+ optical action spectrum.
Figure 4.5.8. (Rh6G-AAK-QSY7)2+ optical action spectrum
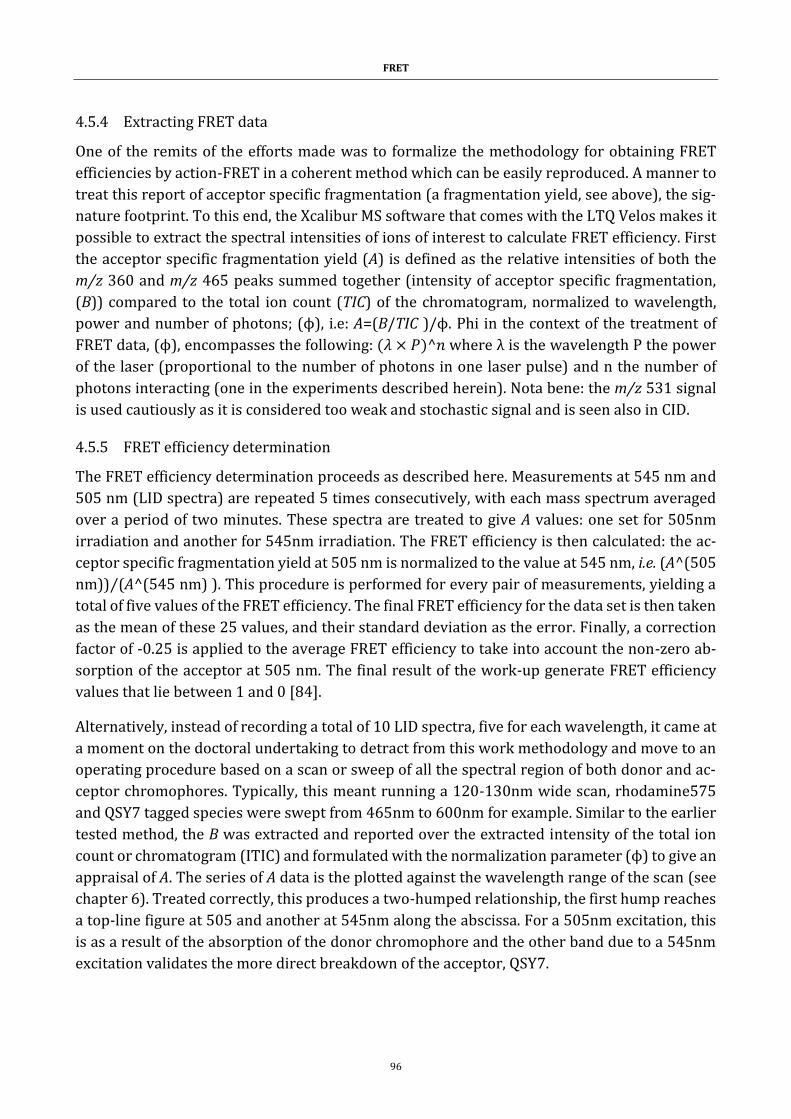
FRET
96
4.5.4 Extracting FRET data
One of the remits of the efforts made was to formalize the methodology for obtaining FRET
efficiencies by action-FRET in a coherent method which can be easily reproduced. A manner to
treat this report of acceptor specific fragmentation (a fragmentation yield, see above), the sig-
nature footprint. To this end, the Xcalibur MS software that comes with the LTQ Velos makes it
possible to extract the spectral intensities of ions of interest to calculate FRET efficiency. First
the acceptor specific fragmentation yield (A) is defined as the relative intensities of both the
m/z 360 and m/z 465 peaks summed together (intensity of acceptor specific fragmentation,
(B)) compared to the total ion count (TIC) of the chromatogram, normalized to wavelength,
power and number of photons; (ϕ), i.e: A=(B/TIC )/ϕ. Phi in the context of the treatment of
FRET data, (ϕ), encompasses the following: (𝜆 × 𝑃)^𝑛 where λ is the wavelength P the power
of the laser (proportional to the number of photons in one laser pulse) and n the number of
photons interacting (one in the experiments described herein). Nota bene: the m/z 531 signal
is used cautiously as it is considered too weak and stochastic signal and is seen also in CID.
4.5.5 FRET efficiency determination
The FRET efficiency determination proceeds as described here. Measurements at 545 nm and
505 nm (LID spectra) are repeated 5 times consecutively, with each mass spectrum averaged
over a period of two minutes. These spectra are treated to give A values: one set for 505nm
irradiation and another for 545nm irradiation. The FRET efficiency is then calculated: the ac-
ceptor specific fragmentation yield at 505 nm is normalized to the value at 545 nm, i.e. (A^(505
nm))⁄(A^(545 nm) ). This procedure is performed for every pair of measurements, yielding a
total of five values of the FRET efficiency. The final FRET efficiency for the data set is then taken
as the mean of these 25 values, and their standard deviation as the error. Finally, a correction
factor of -0.25 is applied to the average FRET efficiency to take into account the non-zero ab-
sorption of the acceptor at 505 nm. The final result of the work-up generate FRET efficiency
values that lie between 1 and 0 [84].
Alternatively, instead of recording a total of 10 LID spectra, five for each wavelength, it came at
a moment on the doctoral undertaking to detract from this work methodology and move to an
operating procedure based on a scan or sweep of all the spectral region of both donor and ac-
ceptor chromophores. Typically, this meant running a 120-130nm wide scan, rhodamine575
and QSY7 tagged species were swept from 465nm to 600nm for example. Similar to the earlier
tested method, the B was extracted and reported over the extracted intensity of the total ion
count or chromatogram (ITIC) and formulated with the normalization parameter (ϕ) to give an
appraisal of A. The series of A data is the plotted against the wavelength range of the scan (see
chapter 6). Treated correctly, this produces a two-humped relationship, the first hump reaches
a top-line figure at 505 and another at 545nm along the abscissa. For a 505nm excitation, this
is as a result of the absorption of the donor chromophore and the other band due to a 545nm
excitation validates the more direct breakdown of the acceptor, QSY7.
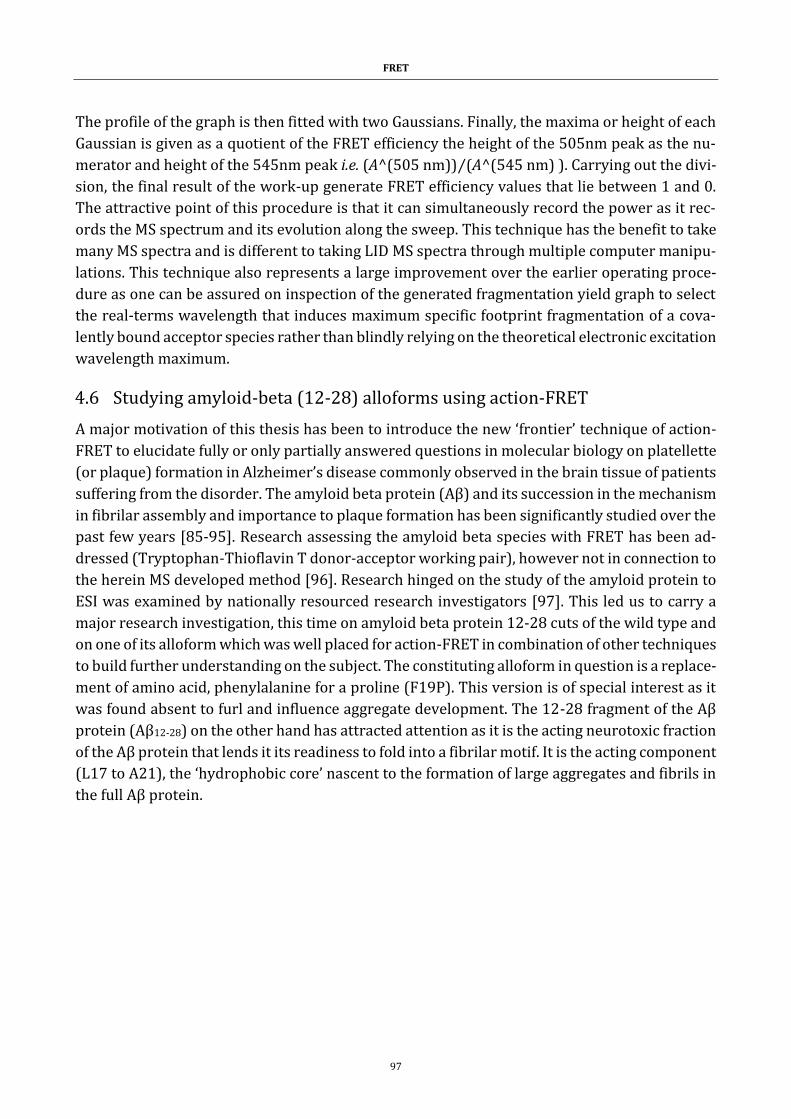
FRET
97
The profile of the graph is then fitted with two Gaussians. Finally, the maxima or height of each
Gaussian is given as a quotient of the FRET efficiency the height of the 505nm peak as the nu-
merator and height of the 545nm peak i.e. (A^(505 nm))⁄(A^(545 nm) ). Carrying out the divi-
sion, the final result of the work-up generate FRET efficiency values that lie between 1 and 0.
The attractive point of this procedure is that it can simultaneously record the power as it rec-
ords the MS spectrum and its evolution along the sweep. This technique has the benefit to take
many MS spectra and is different to taking LID MS spectra through multiple computer manipu-
lations. This technique also represents a large improvement over the earlier operating proce-
dure as one can be assured on inspection of the generated fragmentation yield graph to select
the real-terms wavelength that induces maximum specific footprint fragmentation of a cova-
lently bound acceptor species rather than blindly relying on the theoretical electronic excitation
wavelength maximum.
4.6 Studying amyloid-beta (12-28) alloforms using action-FRET
A major motivation of this thesis has been to introduce the new ‘frontier’ technique of action-
FRET to elucidate fully or only partially answered questions in molecular biology on platellette
(or plaque) formation in Alzheimer’s disease commonly observed in the brain tissue of patients
suffering from the disorder. The amyloid beta protein (Aβ) and its succession in the mechanism
in fibrilar assembly and importance to plaque formation has been significantly studied over the
past few years [85-95]. Research assessing the amyloid beta species with FRET has been ad-
dressed (Tryptophan-Thioflavin T donor-acceptor working pair), however not in connection to
the herein MS developed method [96]. Research hinged on the study of the amyloid protein to
ESI was examined by nationally resourced research investigators [97]. This led us to carry a
major research investigation, this time on amyloid beta protein 12-28 cuts of the wild type and
on one of its alloform which was well placed for action-FRET in combination of other techniques
to build further understanding on the subject. The constituting alloform in question is a replace-
ment of amino acid, phenylalanine for a proline (F19P). This version is of special interest as it
was found absent to furl and influence aggregate development. The 12-28 fragment of the Aβ
protein (Aβ12-28) on the other hand has attracted attention as it is the acting neurotoxic fraction
of the Aβ protein that lends it its readiness to fold into a fibrilar motif. It is the acting component
(L17 to A21), the ‘hydrophobic core’ nascent to the formation of large aggregates and fibrils in
the full Aβ protein.
FRET
98
A second feature of this experiment is to descry both miniproteins in gas isolation. In this set-
ting one can gain access on the conformational changes engendered by the protonation along
the protein and effectively focus on the study of a species of particular charge state. Relevant
structural characterization on the global structure and conformational changes was given by
IMS. Action-FRET was used to draw measurements on the separation of two singular regions
of a protein by solving FRET efficiencies. In a third part, molecular dynamics simulation (MD)
have been geared towards producing frames or images of the aggregation of amyloid-β. Lastly,
comparison of FRET efficiency and collision cross sections (CCS) were established for the
charge states of the two alloforms so to identify the dominant structural families for the charge
state of each alloform. From this standpoint, the study progressed to gain insight on how the
acting component comes together in triggering aggregation behavior and how protonation of
the monomer follows throughout.
Method
Peptides and chromophores
Carboxyrhodamine 575 C5-maleimide (Setareh Biotech) (R575) and QSY7 C5-maleimide (Life
Technologies) (QSY7) structures depicted, Table 2.2.1, chapter 2, were used as donor and ac-
ceptor chromophores for action-FRET measurements respectively. Their unique properties
and characteristics were described in the gas phase, R575 absorbing at 505nm and QSY7 ab-
sorbing at 545nm. The target peptides were made sure to include cysteine residues so as to
allow the functionalization with the chromophores (see above). Wild type Aβ12-28 with capped
termini on the flanking cysteines residues (Ace-C-V12HHQKLVF19FAEDVGSNK28-C-NH2) and the
F19P alloform (Ace-C-V12HHQKLVP19FAEDVGSNK28-C-NH2) were purchased from GeneCust
(Luxembourg). Both were dissolved in a 1:1 mixture of H2O: acetonitrile made up to ~500µM
concentration. Stock solutions were prepared for every dye in DMSO (~10mM). The peptide
solutions were then treated with both dyes (10µl each). The mixture was left to run until com-
pletion for one hour at room temperature. A further dilution was conducted carrying the mix-
ture down to ~50µM so to electrospray the solution. A second aliquot was put aside in order to
prepare an electrospray solution with 0.1% acetic acid thereby outsourcing the 6+ charge state.
The details on how measurements and work up have been made with IMS and replica exchange
molecular dynamics (REMD) are discussed in a chemical science article [98]. Without going into
the details, IMS measurements were executed on a custom-built ion mobility spectrometer.
This one is composed of a 1 m long drift tube connected one one side to an electrospray source
and on the other a time of flight mass spectrometer. Drift tube helium pressure is 15 Torr and
temperature is kept at 300 K. Ions are introduced to the drift tube by an hourglass funnel ion
trap. The time of flight measures both the mass to charge ratio of species and drift time out of
the tube. Ion mobilities and collision cross section (CCS) are then subsequently calculated from
the ion arrival time distribution as a function of the inverse drift voltage [98]. In terms of com-
putation, REMD offers an efficient conformational sampling method to understand the events
involved in protein folding [99-101]. It rests on a standard molecular dynamics simulation and
allows systems of similar potential energies to sample conformations at different temperatures
FRET
99
[102]. In this way energy barriers on the potential energy surface might be overcome, allowing
for the exploration of new conformational space. Gromacs 4.6.5 was used for the structural
sampling of the wild type and F19P mutant simulations [98]. The FRET efficiency distribution
is calculated from the chromophore distance and orientation distributions and ensemble aver-
age value from REMD. The distance distribution in question, that between the optically active
units of the chromophores is calculated by evaluation of the geometrical centre of atoms in the
xanthene moiety and side chains covalently bound by the nitrogen atom [103].
Results and discussion
Four different charge states are observed after electro-spraying solutions containing doubly
grafted Aβ; 3+,4+,5+, and 6+ corresponding to there being 1,2,3 or 4 protons embedded along
the peptide the remaining two positive charges are to be accounted for the chromophores bear-
ing each a positive charge. The 4+ and 5+ charge states were found to be the most predominant
species. This is in striking accord with previous gas phase measurements of Aβ12-28 where
mainly 2+ and 3+ species were identified [104]. This leverages strong support that the presence
of the charged chromophore does not greatly perturb the charge state distribution of the un-
tagged macrospecies. Action-FRET and IMS measurements afforded to collect the necessary
CCS and FRET efficiencies for each charge state of the two doubly grafted Aβ12-28 alloforms and
are plotted together in Figure 4.6.1. Just below a table compiling the FRET efficiencies and cross
sections for wild type (left) and F19P (right) alloforms is made available to check out and arrive
to a balance conclusion. It was not possible to obtain an experimental CCS value for the 3+
charge state since the ion count was extremely low in all electrospray trials. Thereby a calcu-
lated CCS value is plotted for both alloforms in countermeasure. On inspection one can appre-
ciate that there are strong similitudes between the experimental and theoretical data points
most especially with the 4+ and 5+ charge states of both alloforms. Critically it is important to
comprehend that for the 3+ FRET efficiencies, the calculated chromophore interdistance is
commonly found below 15 Å. From this, it is impossible to disconnect from a Dexter energy
transfer or a breakdown in the Föster principle. From Figure 4.6.2 it is also clear on interpreta-
tion that changes in the peptide structure are induced as protonation increases. There is a large
change in the FRET efficiency as the 3+ charge state moves up to the 4+ charge state. Likewise,
a reasonable change in the calculated CCS is also observed, and although there is no experi-
mental data for the 3+ charge state, the discernable similarities between theory and experiment
for the other data points backs up the argument for real term increase. This observation leads
to the understanding that there is a large shift in the secondary structure in the two charge
states. Conversly, only a small change in the CCS is observed for the 4+ and 5+ charge states
suggesting that the overall spatial arrangement of the peptide prevails the same. All the same,
there is a larger relative decrease in the FRET efficiency between these two charge states (4+
and 5+). In the context of structural analysis this means a total increase in the extension of the
peptide. The information gleaned for the change in FRET efficiency from the 4+ to the 5+asso-
ciated with the F19P alloform is encompassed in the error bars for the 4+ FRET efficiency. This
is indicative of a greater flexibility for the relative position of the chromophores. Lastly, there
is a further large change in the CCS when comparing the 5+ and 6+ charge states, and a minor
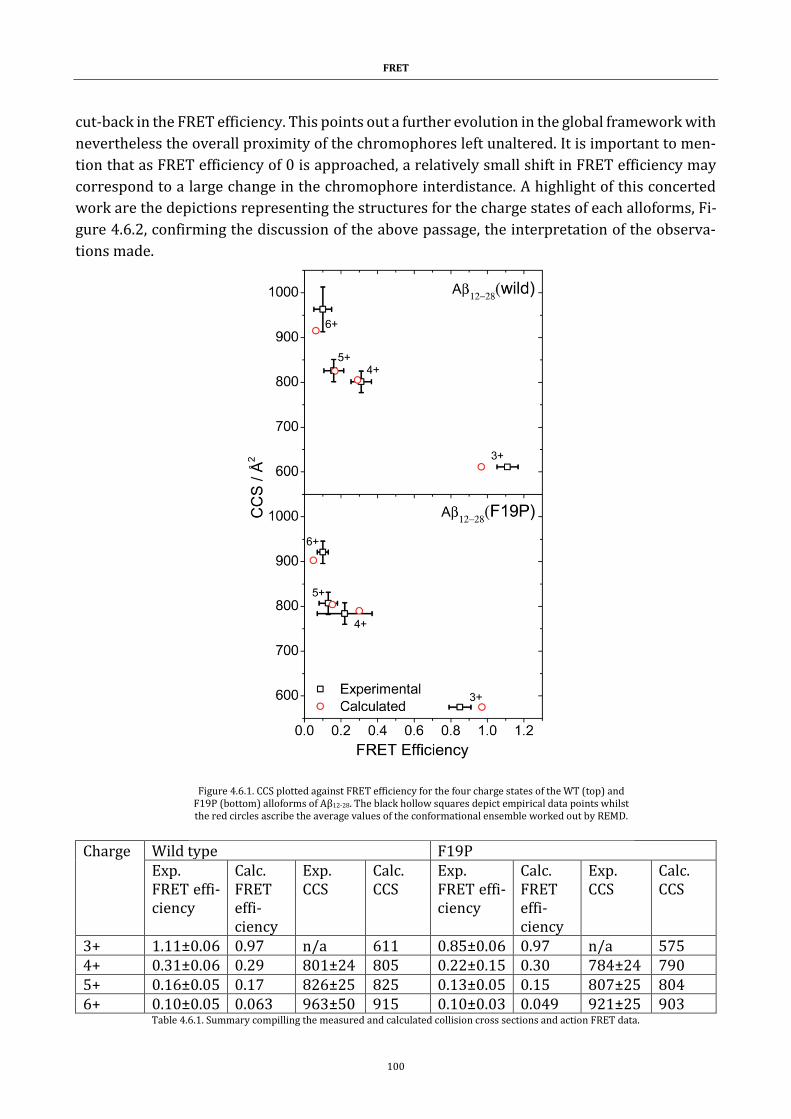
FRET
100
cut-back in the FRET efficiency. This points out a further evolution in the global framework with
nevertheless the overall proximity of the chromophores left unaltered. It is important to men-
tion that as FRET efficiency of 0 is approached, a relatively small shift in FRET efficiency may
correspond to a large change in the chromophore interdistance. A highlight of this concerted
work are the depictions representing the structures for the charge states of each alloforms, Fi-
gure 4.6.2, confirming the discussion of the above passage, the interpretation of the observa-
tions made.
Charge Wild type F19P Exp. FRET effi-ciency
Calc. FRET effi-ciency
Exp. CCS
Calc. CCS
Exp. FRET effi-ciency
Calc. FRET effi-ciency
Exp. CCS
Calc. CCS
3+ 1.11±0.06 0.97 n/a 611 0.85±0.06 0.97 n/a 575 4+ 0.31±0.06 0.29 801±24 805 0.22±0.15 0.30 784±24 790 5+ 0.16±0.05 0.17 826±25 825 0.13±0.05 0.15 807±25 804 6+ 0.10±0.05 0.063 963±50 915 0.10±0.03 0.049 921±25 903
Table 4.6.1. Summary compilling the measured and calculated collision cross sections and action FRET data.
Figure 4.6.1. CCS plotted against FRET efficiency for the four charge states of the WT (top) and F19P (bottom) alloforms of Aβ12-28. The black hollow squares depict empirical data points whilst the red circles ascribe the average values of the conformational ensemble worked out by REMD.
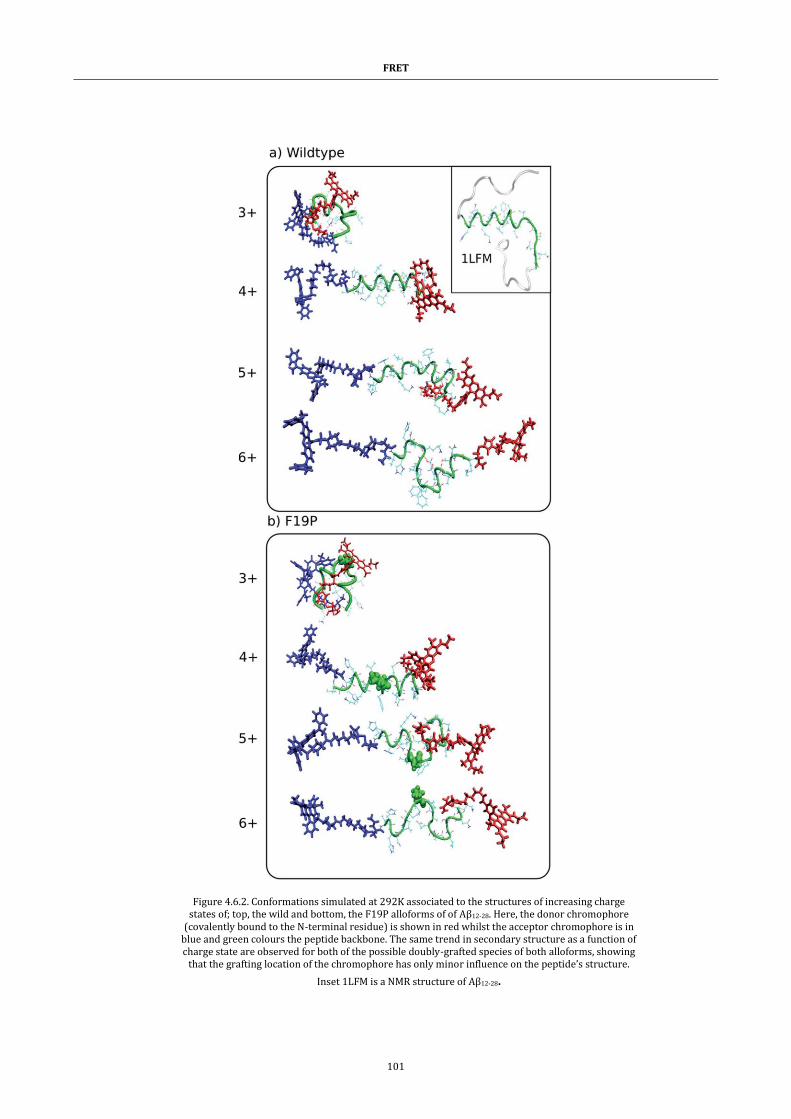
FRET
101
Figure 4.6.2. Conformations simulated at 292K associated to the structures of increasing charge states of; top, the wild and bottom, the F19P alloforms of of Aβ12-28. Here, the donor chromophore
(covalently bound to the N-terminal residue) is shown in red whilst the acceptor chromophore is in blue and green colours the peptide backbone. The same trend in secondary structure as a function of charge state are observed for both of the possible doubly-grafted species of both alloforms, showing
that the grafting location of the chromophore has only minor influence on the peptide’s structure.
Inset 1LFM is a NMR structure of Aβ12-28.
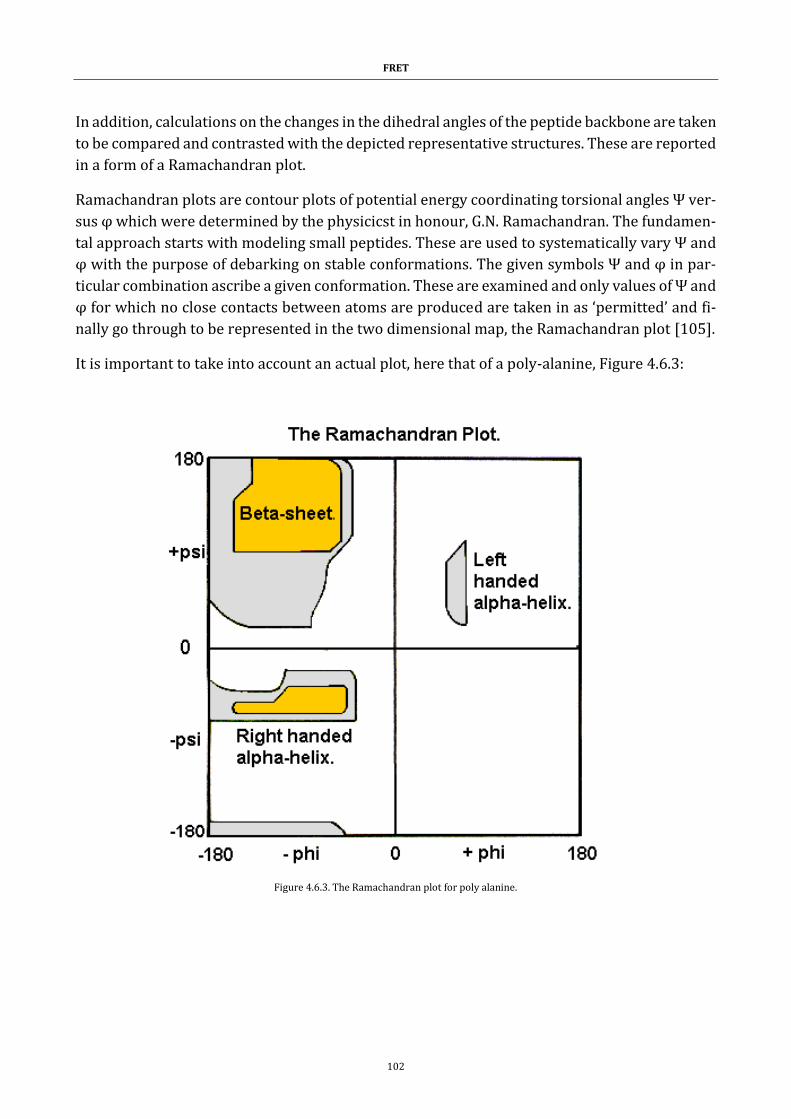
FRET
102
In addition, calculations on the changes in the dihedral angles of the peptide backbone are taken
to be compared and contrasted with the depicted representative structures. These are reported
in a form of a Ramachandran plot.
Ramachandran plots are contour plots of potential energy coordinating torsional angles Ψ ver-
sus φ which were determined by the physicicst in honour, G.N. Ramachandran. The fundamen-
tal approach starts with modeling small peptides. These are used to systematically vary Ψ and
φ with the purpose of debarking on stable conformations. The given symbols Ψ and φ in par-
ticular combination ascribe a given conformation. These are examined and only values of Ψ and
φ for which no close contacts between atoms are produced are taken in as ‘permitted’ and fi-
nally go through to be represented in the two dimensional map, the Ramachandran plot [105].
It is important to take into account an actual plot, here that of a poly-alanine, Figure 4.6.3:
Figure 4.6.3. The Ramachandran plot for poly alanine.
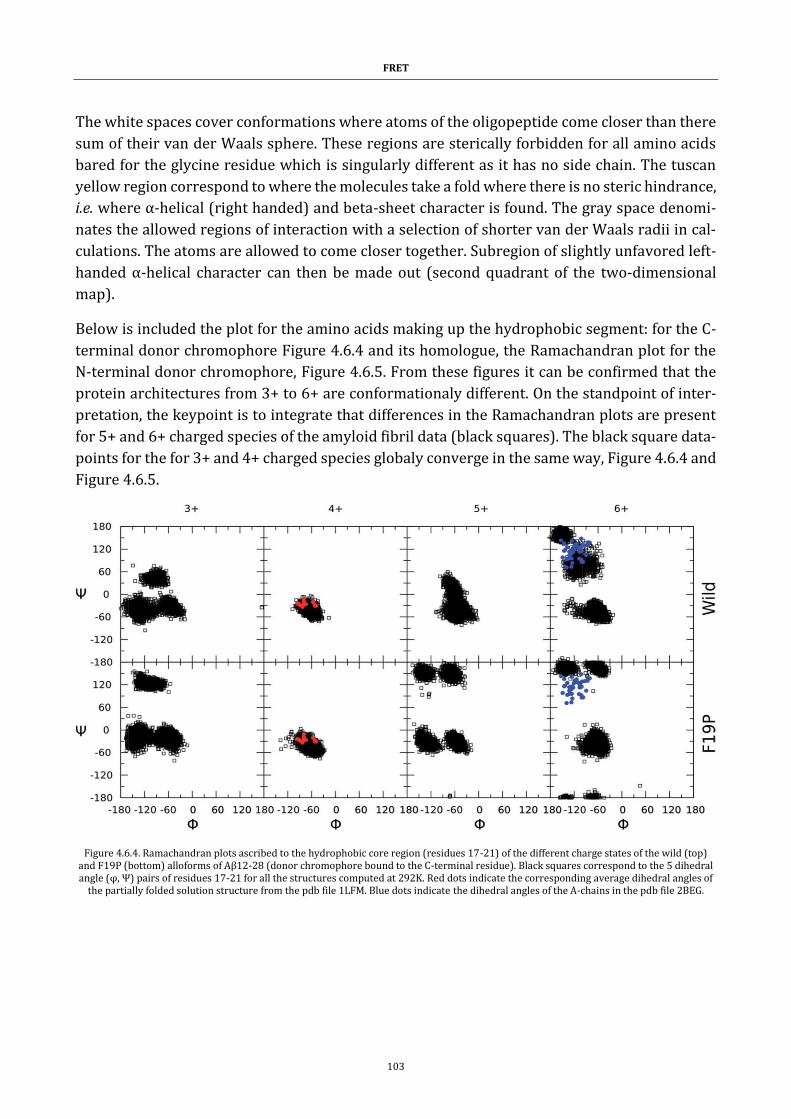
FRET
103
The white spaces cover conformations where atoms of the oligopeptide come closer than there
sum of their van der Waals sphere. These regions are sterically forbidden for all amino acids
bared for the glycine residue which is singularly different as it has no side chain. The tuscan
yellow region correspond to where the molecules take a fold where there is no steric hindrance,
i.e. where α-helical (right handed) and beta-sheet character is found. The gray space denomi-
nates the allowed regions of interaction with a selection of shorter van der Waals radii in cal-
culations. The atoms are allowed to come closer together. Subregion of slightly unfavored left-
handed α-helical character can then be made out (second quadrant of the two-dimensional
map).
Below is included the plot for the amino acids making up the hydrophobic segment: for the C-
terminal donor chromophore Figure 4.6.4 and its homologue, the Ramachandran plot for the
N-terminal donor chromophore, Figure 4.6.5. From these figures it can be confirmed that the
protein architectures from 3+ to 6+ are conformationaly different. On the standpoint of inter-
pretation, the keypoint is to integrate that differences in the Ramachandran plots are present
for 5+ and 6+ charged species of the amyloid fibril data (black squares). The black square data-
points for the for 3+ and 4+ charged species globaly converge in the same way, Figure 4.6.4 and
Figure 4.6.5.
Figure 4.6.4. Ramachandran plots ascribed to the hydrophobic core region (residues 17-21) of the different charge states of the wild (top) and F19P (bottom) alloforms of Aβ12-28 (donor chromophore bound to the C-terminal residue). Black squares correspond to the 5 dihedral angle (φ, Ψ) pairs of residues 17-21 for all the structures computed at 292K. Red dots indicate the corresponding average dihedral angles of
the partially folded solution structure from the pdb file 1LFM. Blue dots indicate the dihedral angles of the A-chains in the pdb file 2BEG.
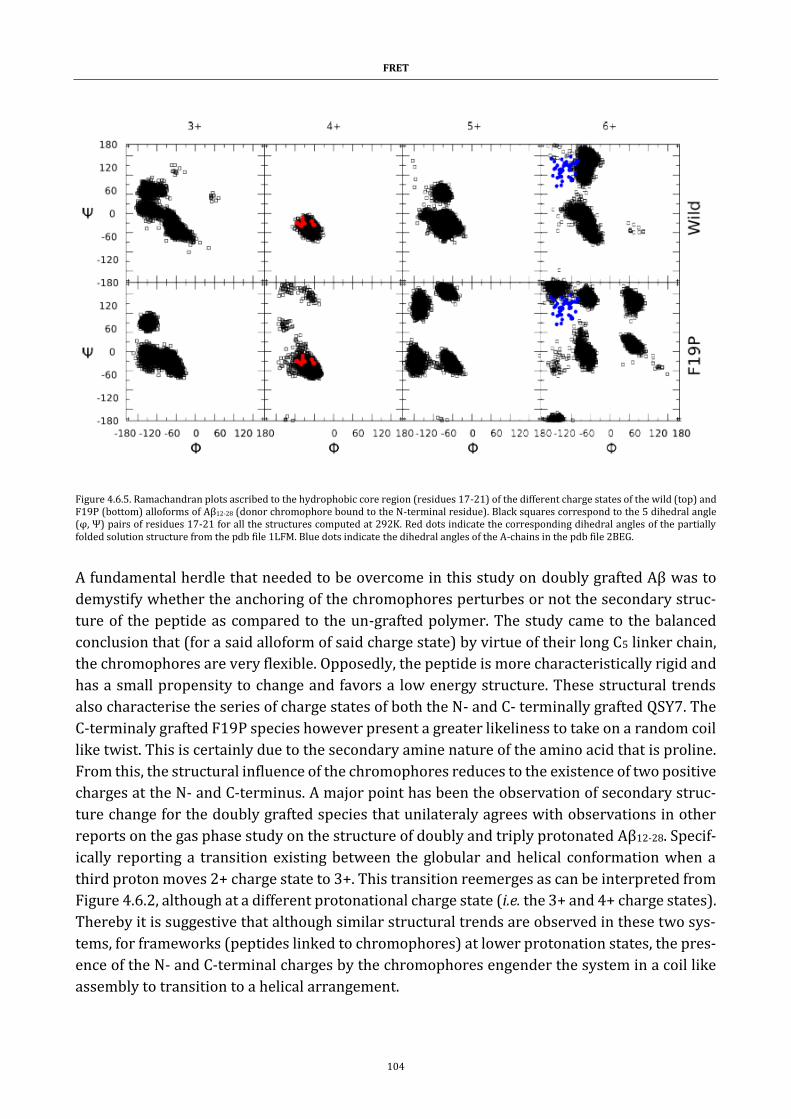
FRET
104
Figure 4.6.5. Ramachandran plots ascribed to the hydrophobic core region (residues 17-21) of the different charge states of the wild (top) and F19P (bottom) alloforms of Aβ12-28 (donor chromophore bound to the N-terminal residue). Black squares correspond to the 5 dihedral angle (φ, Ψ) pairs of residues 17-21 for all the structures computed at 292K. Red dots indicate the corresponding dihedral angles of the partially folded solution structure from the pdb file 1LFM. Blue dots indicate the dihedral angles of the A-chains in the pdb file 2BEG.
A fundamental herdle that needed to be overcome in this study on doubly grafted Aβ was to
demystify whether the anchoring of the chromophores perturbes or not the secondary struc-
ture of the peptide as compared to the un-grafted polymer. The study came to the balanced
conclusion that (for a said alloform of said charge state) by virtue of their long C5 linker chain,
the chromophores are very flexible. Opposedly, the peptide is more characteristically rigid and
has a small propensity to change and favors a low energy structure. These structural trends
also characterise the series of charge states of both the N- and C- terminally grafted QSY7. The
C-terminaly grafted F19P species however present a greater likeliness to take on a random coil
like twist. This is certainly due to the secondary amine nature of the amino acid that is proline.
From this, the structural influence of the chromophores reduces to the existence of two positive
charges at the N- and C-terminus. A major point has been the observation of secondary struc-
ture change for the doubly grafted species that unilateraly agrees with observations in other
reports on the gas phase study on the structure of doubly and triply protonated Aβ12-28. Specif-
ically reporting a transition existing between the globular and helical conformation when a
third proton moves 2+ charge state to 3+. This transition reemerges as can be interpreted from
Figure 4.6.2, although at a different protonational charge state (i.e. the 3+ and 4+ charge states).
Thereby it is suggestive that although similar structural trends are observed in these two sys-
tems, for frameworks (peptides linked to chromophores) at lower protonation states, the pres-
ence of the N- and C-terminal charges by the chromophores engender the system in a coil like
assembly to transition to a helical arrangement.
FRET
105
Another point of order has been to recognize any physiological similarities between two differ-
ent amyloid beta proteins: one related to solution phase structure of the Aβ1-42 and the other
that of the doubly grafted Aβ12-28 in gas isolation. The visualization of the NMR structure of Aβ1-
42 is included as an inset in Figure 4.6.2. The 12-28 region is conveniently emphasised in green.
One can see that there is an evident helical motif for the 12-28 region, which is also observed
for the 4+ charge state in both wild and F19P alloforms. The transpiring fact of the 4+ charge
state holding a similar fold to the one in solution is most likely due to there being the same on
the peptide in both cases (solution and gas): doubly charged peptide in the case of doubly
grafted Aβ12-28 and the property of the 12-28 segment to have 4 basic and 2 acidic amino acids
amounting to a net charge of 2+ (solution). Exploring this similarity further, the backbone di-
hedral angles in the hydrophobic segment of Aβ1-42 are overlayed as red dots on 4+ Ramachan-
dran plots of Figure 4.6.4 and Figure 4.6.5. An almost total agreement is with the backbone con-
formation in the two systems providing striking evidence for the mimicking of native secondary
structure in the doubly grafted species. The presence of the N- and C-terminal chromophores
draw a structural similarity for both 12-28 segments and it is thought to be by the chromo-
phore’s presence that ‘space fills’ and substitutes the missing N- and C-terminal peptidic trunks
of the protein.
Compellingly, the hydrophobic segment presents two alternative backbone configurations in
the 3+ species which are completely absent from the solution phase structure. It was found that
the 3+ charge state presents globular random-coil type structure in both alloforms. The large
change in the structural motif: a globular onset developed to a random coil and finaly an alpha-
helical motif is as predicted from the change in FRET efficiencies shown in Figure 4.6.1. In the
4+ charge state of the wild type alloform, lysine residues K16 and K28 carry a positive charge
that account for a certain Coulomb repulsion that has the effect of triggering unfurling of the
alloform. The F19P also displays some conformational memetics with the wild alloform for the
3+ and 4+ charge states and is backed up by comparison with the dihedral angle data of the
hydrophobic core, Figure 4.6.4. In either case there is a change in structure from globular ran-
dom coil of the 3+ charge state to the drawn out helical form of the 4+ charge state.
Focusing now on the 5+ charge state, the additional proton is accommodated on the histidine
residue, H13 or H14 since the N-terminus is acylated. It is found that, for both possible grafted
species it is thermodynamically favorable for the third proton to be bonded on the H14 residue.
This may be due to the fact that the K16 and H14 are located on opposite sides of one of the
helical turns, allowing the charges to maintain a maximum separation whilst holding the fa-
voured helical motif.
The promotion so to speak from the 4+ charge state to the 5+ charge state results in an overall
elongation of both systems as supported by the decrease in FRET-efficiency and the small in-
crease in CCS. There is a clear demarcation in the helical motifs in both alloforms, especially in
the hydrophobic core region, Figure 4.6.2. Figure 4.6.4 demonstrates a clear demarcation from
the “all-alpha” configuration of the 4+ charge state in both alloforms, but the nature of this de-
viation is noteworthily different. In the wild type alloform the demarcation leads to loss of the
helical arrangement and does not go as far as full fraying of the species. The change is more
FRET
106
acute with F19P. The F19P alloform dynamics transition the structure to a more complete un-
folding of the helical bundle resulting in a significant random-coil character in the dihedral an-
gle plot, Figure 4.6.4 and Figure 4.6.5. The underlining agreement here is that the helical stabi-
lizing interaction cannot compensate for the charge induced structural stress of the F19P
alloform, which can be interpreted as a weakening of the stability of the helix as compared to
the wild type. The fourth proton added to the H13 residue came to give the maximally charged,
6+ species. Both alloforms are withdrawn of all helical character in the N-teminal region at this
charge state. Although similar tendencies are revealed for both alloforms in the context of their
constructional evolution, there is a pronounced difference in the structural motifs located at
the hydrophobic core region. For the F19P alloform, the dissimilarity between the 5+ and 6+
charge state looms to the greater loss in helical character and a concurrent increment in ran-
dom coil curl. The wild type alloform was equally found to collapse its helical structure, but in
consequence a significant β character emerged.
There is a frank connexion that large aggregates of Aβ are assembled as β-sheets and it has been
proposed that the conformational change from helical to β-like structures in the monomer are
key in triggering the aggregation process. The dihedral angles for the hydrophobic core region
of the Alzheimer’s amyloid fibril (pdb structure 2BEG) are included in Figure 4.6.4. and Figure
4.6.5 for the 6+ charge states of the two alloforms as blue circles. The wild type alloform pos-
sesses the same range of dihedral angles as those from the Alzeihmer fibrils. Suggesting that a
fibril-like conformation describes the wild type. Conversly, there is no evidence of population
of fibril-like monomer structures in the F19P alloform, i.e. there is no overlay with the black
squares and the blue points. The deployal of each structure as charge increases is summarized
figuratively below, scheme (6):
(6)
FRET
107
The two-acting species on the study: F19P and wild type alloforms of Aβ protein have been
examined in the gas phase previously by Bernstein et al. The survey concludes that although
both alloforms form small aggregates, it is only the wild-type in which further oligomerization
carries through to large fibril-like molecular edifices [90]. This finding set their consensus that
there is a key protonucleus formation central to the nascence of fibrils which are formed in the
observed aggregates of the wild type but not the F19P alloform. Details on the exact nature of
this proto nucleus have not been demystified. A prospective model for understanding fibril self
assembly rests on that there being a dimension factor with the first aggregates that start of as
random coils and bundle into β conformational structures providing favorable geometry for
nucleation to occur. This event cascades into further oligomerization. Bleiholder et al. found
evidence for the existence of paranuclei that are of great significance to the aggregation step of
fibril forming proteins [106]. However, they did not observe this with peptide sequences which
go on to form isotropic aggregates.
All this information at hand allows us to ascertain a tentative hypothesis for the difference in
aggregation behavior of the hydrophobic core in the monomer discussed above and summa-
rized in scheme (6). Here it can be drawn up that the structural transition from the mostly hel-
ical 4+ species and the 5+ charged species to the more β-turn-like structure of the 6+ for the
wild type alloform indicates that a structural transition similar to that suggested and that de-
picted in scheme (6), checking through proto-nucleus precursor formation and yielding fibril
molecular structures is at play (scheme (6), (b)). Contrarywise, this transition is not observed
in the F19P alloform. The evolution of events is different. With the F19P alloform no proto-
nucleus forms and incidentaly the self aggregation process into extended fibril-like structures
does not occur.
FRET
108
Summary
This study that conciliates IMS and REMD simulations as well as the action-FRET technique is
useful as it gleans information that either technique alone cannot access, it ameliorates predic-
tion of structural change. The consensus has been that amyloid beta fragment peptides is influ-
enced by its charge state, repercussions are on its structure that transition between random
coil and helical form when going from singly to doubly protonated (3+ and 4+ species). Addition
of a third proton on the peptide was found to destabilize the helix in the wild type alloform and
engender partial unfolding of the F19P alloform. Proton number four to the peptide placed to
the peptide, pieces the maximally 6+ charged species and causes unfolding of the helix in both
alloforms. The REMD has provided much valuable insight. The measurement of the dihedral
angles of the peptide backbone in the hydrophobic core region of both alloforms, demonstrated
that although the two constructs do exhibit similar behavior as a function of charge state, there
are noteworthy demarcations in the structural motifs of the hydrophobic core. Comparison to
the dihedral angles of the solution phase structure of both monomer and fibrillar Aβ1-42 put
forward for understanding that the helical to the β-turn conformational transition step takes
place during aggregation and only occurs in the wild type alloform, whilst the F19P alloform
presents a random coil structure. Thereby it was postulated that the tendency of the F19P
alloform to undergo a helical random coil conformational transition prevents formation of the
fibrillary proto nucleus and thus the F19P alloform does not down stream to fibrillary aggre-
gates. The importance of such a transition in Aβ peptides potentially provides a glimpse into
the aggregation propensity of other Aβ mutants. In fine, the connection that exists between helix
stability of the hydrophobic core and the propensity for aggregation may provide crucial to
drug and medication development programs.
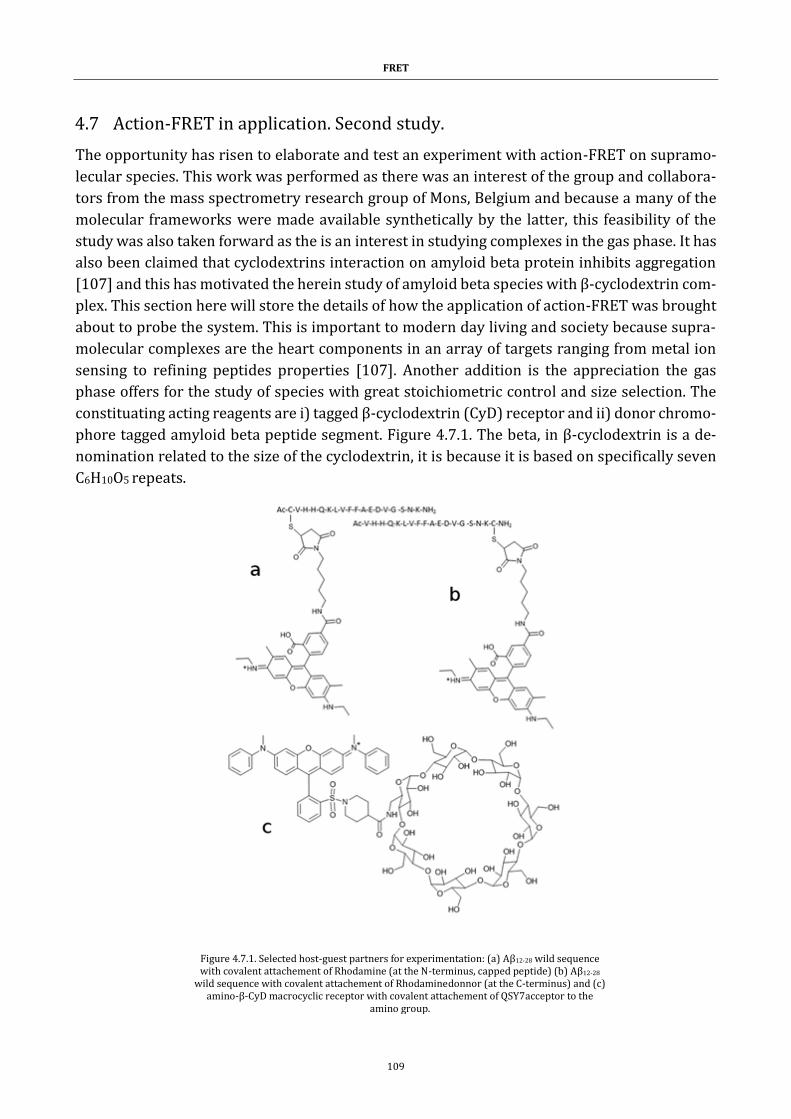
FRET
109
4.7 Action-FRET in application. Second study.
The opportunity has risen to elaborate and test an experiment with action-FRET on supramo-
lecular species. This work was performed as there was an interest of the group and collabora-
tors from the mass spectrometry research group of Mons, Belgium and because a many of the
molecular frameworks were made available synthetically by the latter, this feasibility of the
study was also taken forward as the is an interest in studying complexes in the gas phase. It has
also been claimed that cyclodextrins interaction on amyloid beta protein inhibits aggregation
[107] and this has motivated the herein study of amyloid beta species with β-cyclodextrin com-
plex. This section here will store the details of how the application of action-FRET was brought
about to probe the system. This is important to modern day living and society because supra-
molecular complexes are the heart components in an array of targets ranging from metal ion
sensing to refining peptides properties [107]. Another addition is the appreciation the gas
phase offers for the study of species with great stoichiometric control and size selection. The
constituating acting reagents are i) tagged β-cyclodextrin (CyD) receptor and ii) donor chromo-
phore tagged amyloid beta peptide segment. Figure 4.7.1. The beta, in β-cyclodextrin is a de-
nomination related to the size of the cyclodextrin, it is because it is based on specifically seven
C6H10O5 repeats.
Figure 4.7.1. Selected host-guest partners for experimentation: (a) Aβ12-28 wild sequence with covalent attachement of Rhodamine (at the N-terminus, capped peptide) (b) Aβ12-28
wild sequence with covalent attachement of Rhodaminedonnor (at the C-terminus) and (c) amino-β-CyD macrocyclic receptor with covalent attachement of QSY7acceptor to the
amino group.
FRET
110
Method
The amino-β-CyD-QSY7 receptor production is based and calqued from previously discussion
peptide tagging methodology. The synthetic constitution was taken care to proceed at room
temperature for a long time until the next day by stirring an equimolar mixture of conven-
tionned beta Cyclodextrin (β-CyD-NH2) with succinimidyl ester QSY7. Succinimidyl QSY 7 (Invi-
trogen) was desolidified as fallen in the liquid media (DMSO, 500µl) to reach a final concentra-
tion of 10mM. A 10mM solution of amino-β-cyclodextrin (amino-β-CyD, TCI Europe) was pre-
pared in water. Note: 100µl of the QSY7 solution was mixed with 100µl of amino-β-CyD in a vial.
This vial was sealed closed, aluminium covered in fact so to keep its contents away from a UV-
visible light interference. It is noteworthy to mention that the made-up mixture preparations
were kept equimolar. Assetion for reaction work up was taken on the next day, at room tem-
perature. An aliquot of the solution was poured in water:methanol (amino-β-CyD-QSY7 solu-
tion (10µl) was diluted in H2O:MeOH 1:1 (5ml)) and analysed by ESI-MS (Waters Synapt G2-Si
HDMS-UMONS). The detection of peaks at m/z 887.81, m/z 899.31 and m/z 907.36 corresponds
to doubly charged β-CyD-QSY7 with H+, Na+ and K+ respectively, quality assures the completion
of the amino-β-CyD-QSY7 receptor. This solution was employed formerly without any further
purification, ensuite, ruled in action-FRET development. Donor-tagged Aβ12-28 oligopeptides
were produced by mixing equimolar solutions of Rhodamine 575 C5 maleimide with either N
or C terminally cysteinated Aβ12-28 (CAβ and AβC respectively) at a concentration of 30 µM in
1:1 H2O:CH3CN solution by volume. The scientific manner the laser was used was scan based.
Wavelengths from 600 to 465 nm were swept with 0.1 nm steps and a dwell time of 1s. Re-
garding ion confinement, trapping periods of 100 ms were effectuated and irradiation buffeting
was taken by a single laser pulse from the laser resonator. Each point in the action spectrum is
indiced in manner to speak to the number of microscans of the LTQ Velos: 9. This could approx-
imately be debated to be near 1 mass spectrum recording per second. To normalize with re-
gards to the laser power, a separate wavelength scan is performed immediately following ac-
quisition of the action spectrum under the same parameters.
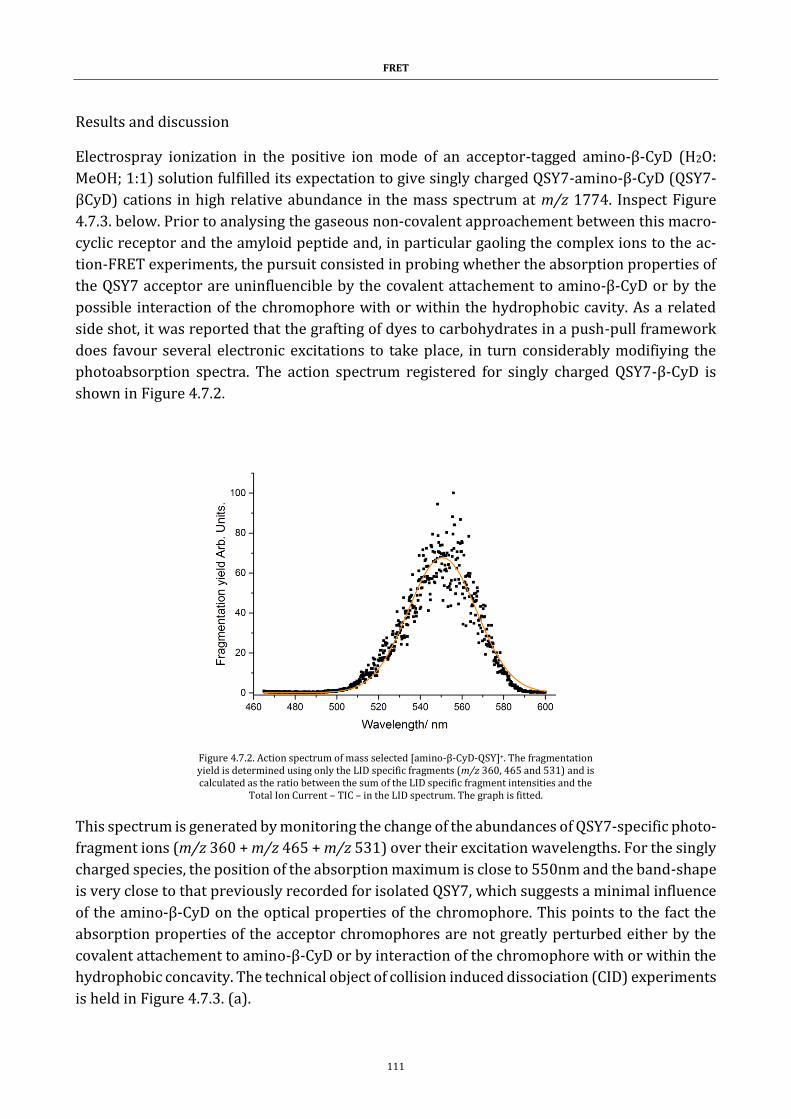
FRET
111
Results and discussion
Electrospray ionization in the positive ion mode of an acceptor-tagged amino-β-CyD (H2O:
MeOH; 1:1) solution fulfilled its expectation to give singly charged QSY7-amino-β-CyD (QSY7-
βCyD) cations in high relative abundance in the mass spectrum at m/z 1774. Inspect Figure
4.7.3. below. Prior to analysing the gaseous non-covalent approachement between this macro-
cyclic receptor and the amyloid peptide and, in particular gaoling the complex ions to the ac-
tion-FRET experiments, the pursuit consisted in probing whether the absorption properties of
the QSY7 acceptor are uninfluencible by the covalent attachement to amino-β-CyD or by the
possible interaction of the chromophore with or within the hydrophobic cavity. As a related
side shot, it was reported that the grafting of dyes to carbohydrates in a push-pull framework
does favour several electronic excitations to take place, in turn considerably modifiying the
photoabsorption spectra. The action spectrum registered for singly charged QSY7-β-CyD is
shown in Figure 4.7.2.
This spectrum is generated by monitoring the change of the abundances of QSY7-specific photo-
fragment ions (m/z 360 + m/z 465 + m/z 531) over their excitation wavelengths. For the singly
charged species, the position of the absorption maximum is close to 550nm and the band-shape
is very close to that previously recorded for isolated QSY7, which suggests a minimal influence
of the amino-β-CyD on the optical properties of the chromophore. This points to the fact the
absorption properties of the acceptor chromophores are not greatly perturbed either by the
covalent attachement to amino-β-CyD or by interaction of the chromophore with or within the
hydrophobic concavity. The technical object of collision induced dissociation (CID) experiments
is held in Figure 4.7.3. (a).
Figure 4.7.2. Action spectrum of mass selected [amino-β-CyD-QSY]+. The fragmentation yield is determined using only the LID specific fragments (m/z 360, 465 and 531) and is calculated as the ratio between the sum of the LID specific fragment intensities and the
Total Ion Current – TIC – in the LID spectrum. The graph is fitted.
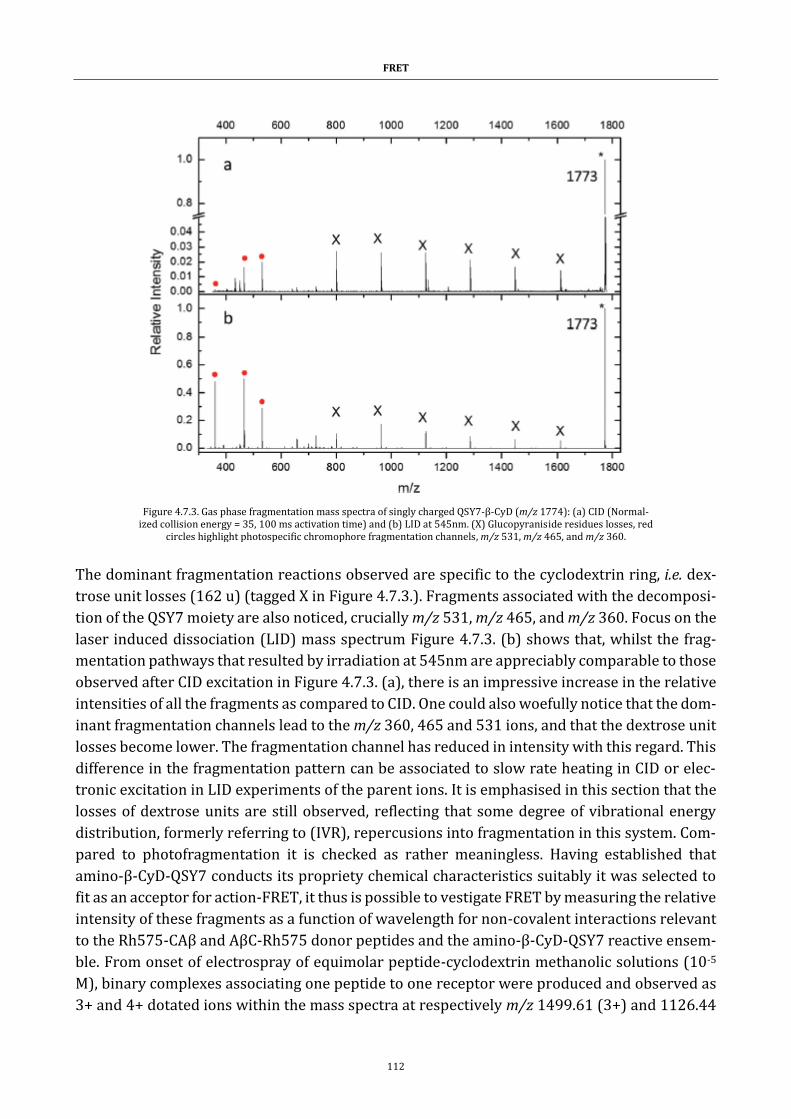
FRET
112
The dominant fragmentation reactions observed are specific to the cyclodextrin ring, i.e. dex-
trose unit losses (162 u) (tagged X in Figure 4.7.3.). Fragments associated with the decomposi-
tion of the QSY7 moiety are also noticed, crucially m/z 531, m/z 465, and m/z 360. Focus on the
laser induced dissociation (LID) mass spectrum Figure 4.7.3. (b) shows that, whilst the frag-
mentation pathways that resulted by irradiation at 545nm are appreciably comparable to those
observed after CID excitation in Figure 4.7.3. (a), there is an impressive increase in the relative
intensities of all the fragments as compared to CID. One could also woefully notice that the dom-
inant fragmentation channels lead to the m/z 360, 465 and 531 ions, and that the dextrose unit
losses become lower. The fragmentation channel has reduced in intensity with this regard. This
difference in the fragmentation pattern can be associated to slow rate heating in CID or elec-
tronic excitation in LID experiments of the parent ions. It is emphasised in this section that the
losses of dextrose units are still observed, reflecting that some degree of vibrational energy
distribution, formerly referring to (IVR), repercusions into fragmentation in this system. Com-
pared to photofragmentation it is checked as rather meaningless. Having established that
amino-β-CyD-QSY7 conducts its propriety chemical characteristics suitably it was selected to
fit as an acceptor for action-FRET, it thus is possible to vestigate FRET by measuring the relative
intensity of these fragments as a function of wavelength for non-covalent interactions relevant
to the Rh575-CAβ and AβC-Rh575 donor peptides and the amino-β-CyD-QSY7 reactive ensem-
ble. From onset of electrospray of equimolar peptide-cyclodextrin methanolic solutions (10-5
M), binary complexes associating one peptide to one receptor were produced and observed as
3+ and 4+ dotated ions within the mass spectra at respectively m/z 1499.61 (3+) and 1126.44
Figure 4.7.3. Gas phase fragmentation mass spectra of singly charged QSY7-β-CyD (m/z 1774): (a) CID (Normal-ized collision energy = 35, 100 ms activation time) and (b) LID at 545nm. (X) Glucopyraniside residues losses, red
circles highlight photospecific chromophore fragmentation channels, m/z 531, m/z 465, and m/z 360.
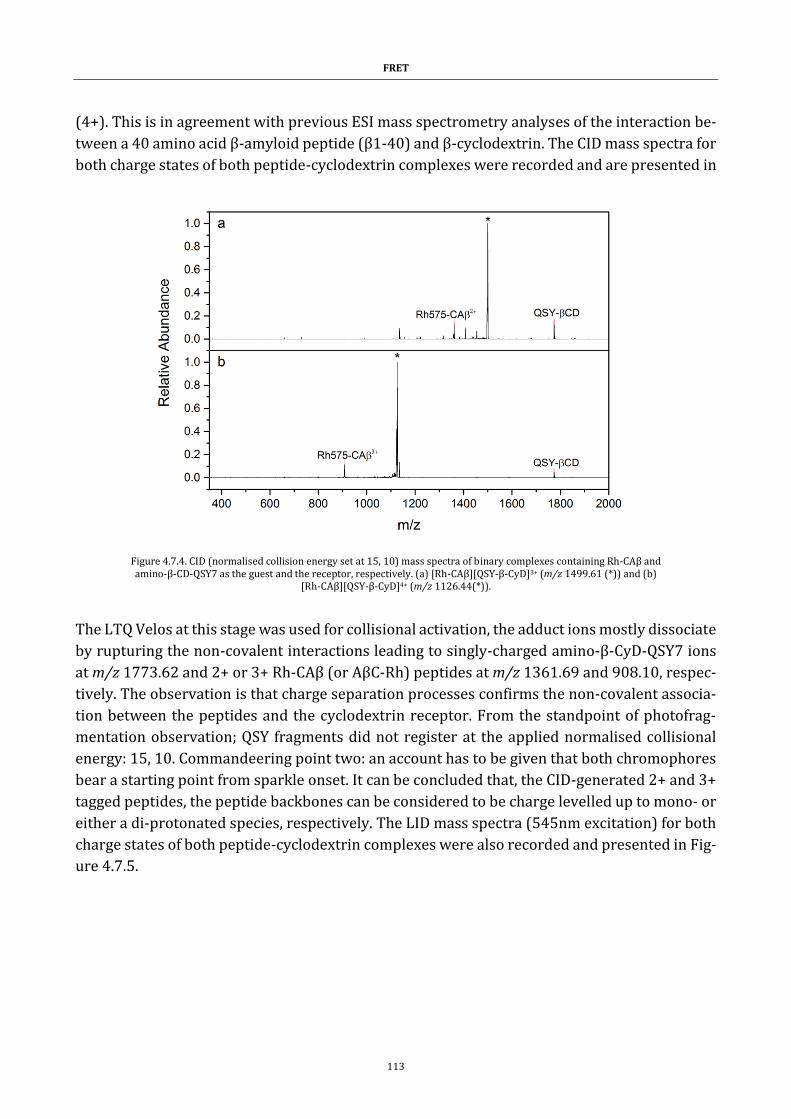
FRET
113
(4+). This is in agreement with previous ESI mass spectrometry analyses of the interaction be-
tween a 40 amino acid β-amyloid peptide (β1-40) and β-cyclodextrin. The CID mass spectra for
both charge states of both peptide-cyclodextrin complexes were recorded and are presented in
The LTQ Velos at this stage was used for collisional activation, the adduct ions mostly dissociate
by rupturing the non-covalent interactions leading to singly-charged amino-β-CyD-QSY7 ions
at m/z 1773.62 and 2+ or 3+ Rh-CAβ (or AβC-Rh) peptides at m/z 1361.69 and 908.10, respec-
tively. The observation is that charge separation processes confirms the non-covalent associa-
tion between the peptides and the cyclodextrin receptor. From the standpoint of photofrag-
mentation observation; QSY fragments did not register at the applied normalised collisional
energy: 15, 10. Commandeering point two: an account has to be given that both chromophores
bear a starting point from sparkle onset. It can be concluded that, the CID-generated 2+ and 3+
tagged peptides, the peptide backbones can be considered to be charge levelled up to mono- or
either a di-protonated species, respectively. The LID mass spectra (545nm excitation) for both
charge states of both peptide-cyclodextrin complexes were also recorded and presented in Fig-
ure 4.7.5.
Figure 4.7.4. CID (normalised collision energy set at 15, 10) mass spectra of binary complexes containing Rh-CAβ and amino-β-CD-QSY7 as the guest and the receptor, respectively. (a) [Rh-CAβ][QSY-β-CyD]3+ (m/z 1499.61 (*)) and (b)
[Rh-CAβ][QSY-β-CyD]4+ (m/z 1126.44(*)).
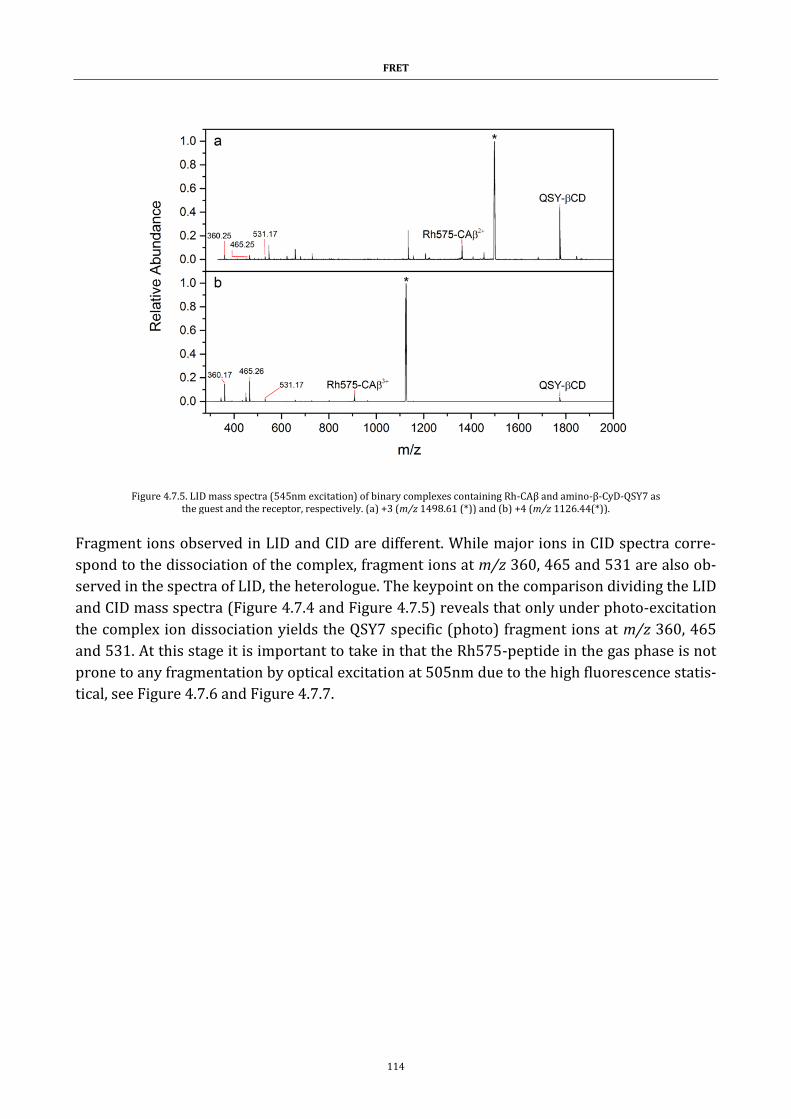
FRET
114
Fragment ions observed in LID and CID are different. While major ions in CID spectra corre-
spond to the dissociation of the complex, fragment ions at m/z 360, 465 and 531 are also ob-
served in the spectra of LID, the heterologue. The keypoint on the comparison dividing the LID
and CID mass spectra (Figure 4.7.4 and Figure 4.7.5) reveals that only under photo-excitation
the complex ion dissociation yields the QSY7 specific (photo) fragment ions at m/z 360, 465
and 531. At this stage it is important to take in that the Rh575-peptide in the gas phase is not
prone to any fragmentation by optical excitation at 505nm due to the high fluorescence statis-
tical, see Figure 4.7.6 and Figure 4.7.7.
Figure 4.7.5. LID mass spectra (545nm excitation) of binary complexes containing Rh-CAβ and amino-β-CyD-QSY7 as the guest and the receptor, respectively. (a) +3 (m/z 1498.61 (*)) and (b) +4 (m/z 1126.44(*)).
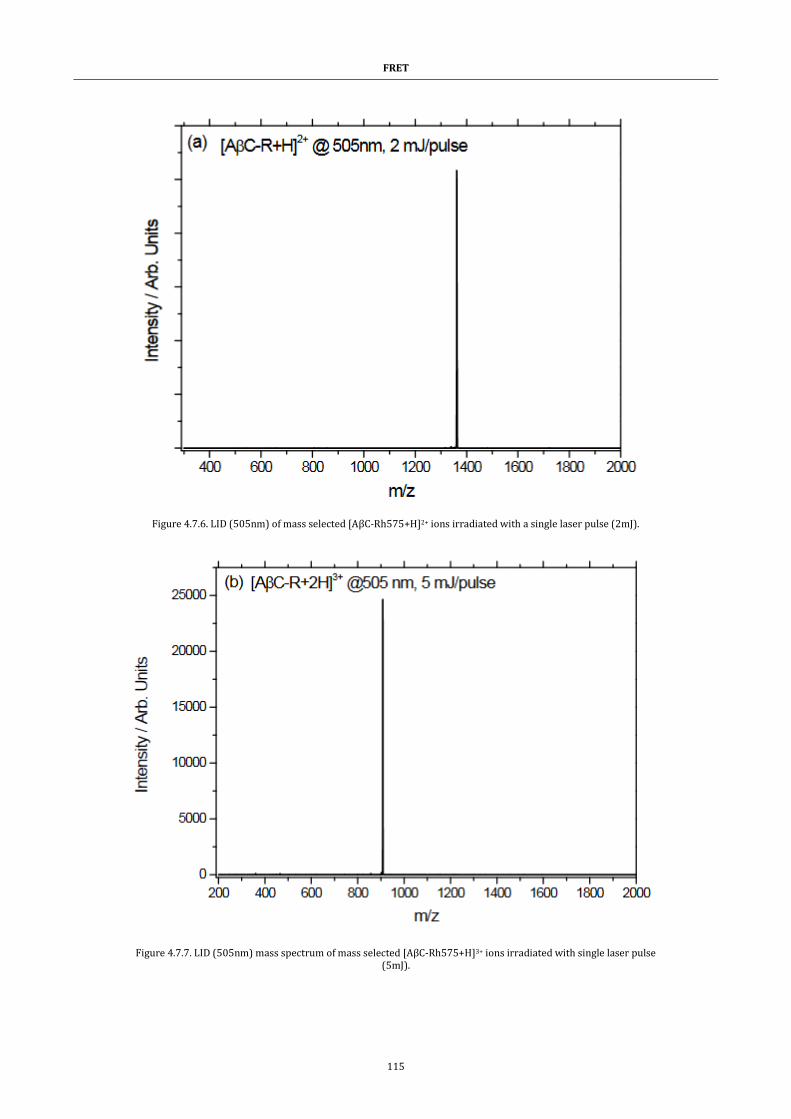
FRET
115
Figure 4.7.6. LID (505nm) of mass selected [AβC-Rh575+H]2+ ions irradiated with a single laser pulse (2mJ).
Figure 4.7.7. LID (505nm) mass spectrum of mass selected [AβC-Rh575+H]3+ ions irradiated with single laser pulse (5mJ).
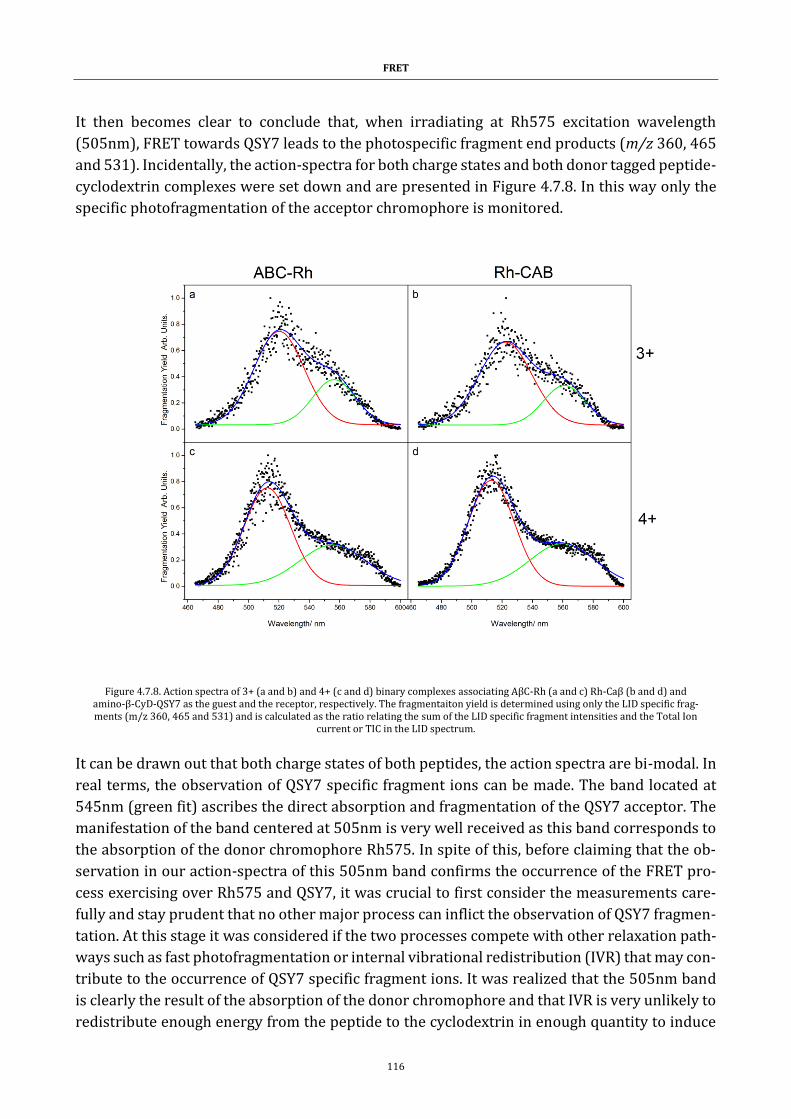
FRET
116
It then becomes clear to conclude that, when irradiating at Rh575 excitation wavelength
(505nm), FRET towards QSY7 leads to the photospecific fragment end products (m/z 360, 465
and 531). Incidentally, the action-spectra for both charge states and both donor tagged peptide-
cyclodextrin complexes were set down and are presented in Figure 4.7.8. In this way only the
specific photofragmentation of the acceptor chromophore is monitored.
It can be drawn out that both charge states of both peptides, the action spectra are bi-modal. In
real terms, the observation of QSY7 specific fragment ions can be made. The band located at
545nm (green fit) ascribes the direct absorption and fragmentation of the QSY7 acceptor. The
manifestation of the band centered at 505nm is very well received as this band corresponds to
the absorption of the donor chromophore Rh575. In spite of this, before claiming that the ob-
servation in our action-spectra of this 505nm band confirms the occurrence of the FRET pro-
cess exercising over Rh575 and QSY7, it was crucial to first consider the measurements care-
fully and stay prudent that no other major process can inflict the observation of QSY7 fragmen-
tation. At this stage it was considered if the two processes compete with other relaxation path-
ways such as fast photofragmentation or internal vibrational redistribution (IVR) that may con-
tribute to the occurrence of QSY7 specific fragment ions. It was realized that the 505nm band
is clearly the result of the absorption of the donor chromophore and that IVR is very unlikely to
redistribute enough energy from the peptide to the cyclodextrin in enough quantity to induce
Figure 4.7.8. Action spectra of 3+ (a and b) and 4+ (c and d) binary complexes associating AβC-Rh (a and c) Rh-Caβ (b and d) and amino-β-CyD-QSY7 as the guest and the receptor, respectively. The fragmentaiton yield is determined using only the LID specific frag-ments (m/z 360, 465 and 531) and is calculated as the ratio relating the sum of the LID specific fragment intensities and the Total Ion
current or TIC in the LID spectrum.
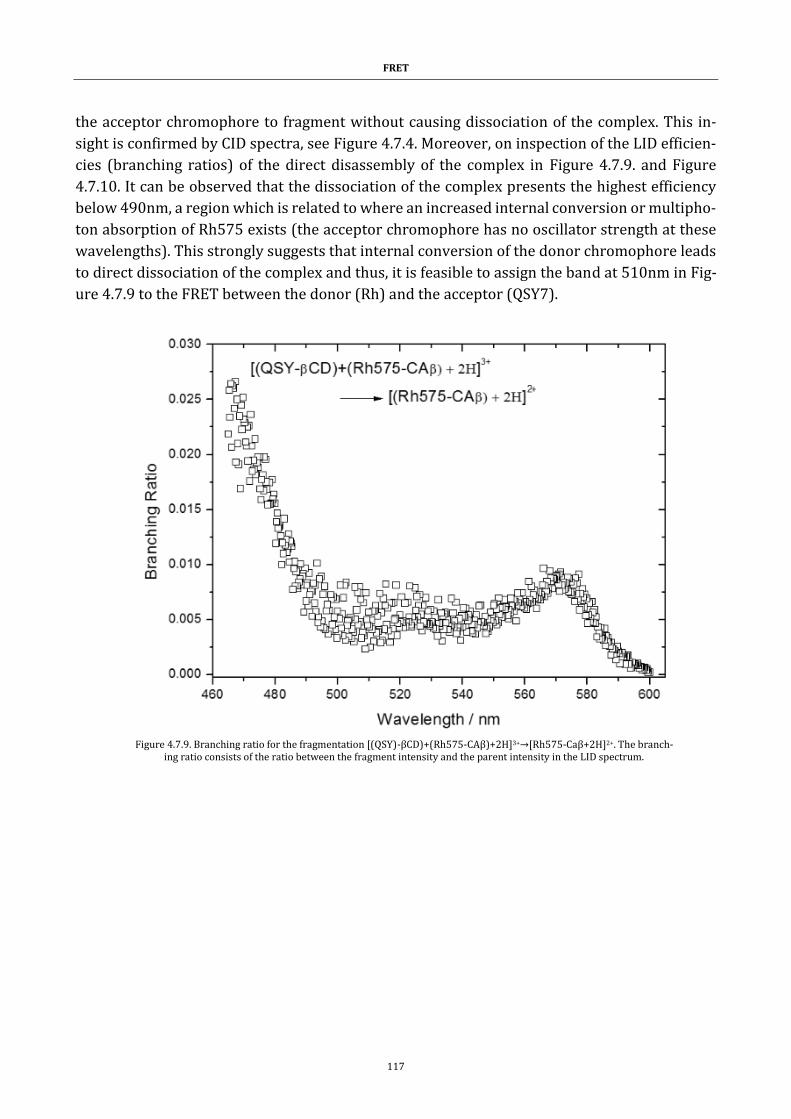
FRET
117
the acceptor chromophore to fragment without causing dissociation of the complex. This in-
sight is confirmed by CID spectra, see Figure 4.7.4. Moreover, on inspection of the LID efficien-
cies (branching ratios) of the direct disassembly of the complex in Figure 4.7.9. and Figure
4.7.10. It can be observed that the dissociation of the complex presents the highest efficiency
below 490nm, a region which is related to where an increased internal conversion or multipho-
ton absorption of Rh575 exists (the acceptor chromophore has no oscillator strength at these
wavelengths). This strongly suggests that internal conversion of the donor chromophore leads
to direct dissociation of the complex and thus, it is feasible to assign the band at 510nm in Fig-
ure 4.7.9 to the FRET between the donor (Rh) and the acceptor (QSY7).
Figure 4.7.9. Branching ratio for the fragmentation [(QSY)-βCD)+(Rh575-CAβ)+2H]3+→[Rh575-Caβ+2H]2+. The branch-ing ratio consists of the ratio between the fragment intensity and the parent intensity in the LID spectrum.
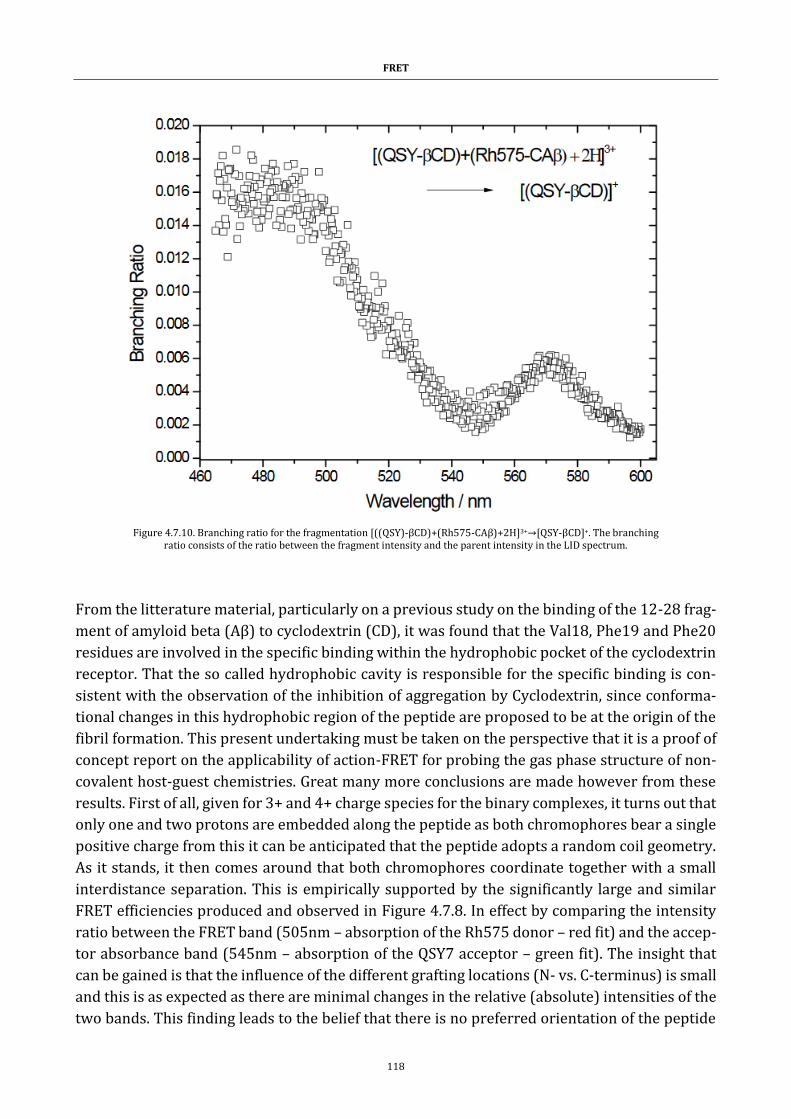
FRET
118
From the litterature material, particularly on a previous study on the binding of the 12-28 frag-
ment of amyloid beta (Aβ) to cyclodextrin (CD), it was found that the Val18, Phe19 and Phe20
residues are involved in the specific binding within the hydrophobic pocket of the cyclodextrin
receptor. That the so called hydrophobic cavity is responsible for the specific binding is con-
sistent with the observation of the inhibition of aggregation by Cyclodextrin, since conforma-
tional changes in this hydrophobic region of the peptide are proposed to be at the origin of the
fibril formation. This present undertaking must be taken on the perspective that it is a proof of
concept report on the applicability of action-FRET for probing the gas phase structure of non-
covalent host-guest chemistries. Great many more conclusions are made however from these
results. First of all, given for 3+ and 4+ charge species for the binary complexes, it turns out that
only one and two protons are embedded along the peptide as both chromophores bear a single
positive charge from this it can be anticipated that the peptide adopts a random coil geometry.
As it stands, it then comes around that both chromophores coordinate together with a small
interdistance separation. This is empirically supported by the significantly large and similar
FRET efficiencies produced and observed in Figure 4.7.8. In effect by comparing the intensity
ratio between the FRET band (505nm – absorption of the Rh575 donor – red fit) and the accep-
tor absorbance band (545nm – absorption of the QSY7 acceptor – green fit). The insight that
can be gained is that the influence of the different grafting locations (N- vs. C-terminus) is small
and this is as expected as there are minimal changes in the relative (absolute) intensities of the
two bands. This finding leads to the belief that there is no preferred orientation of the peptide
Figure 4.7.10. Branching ratio for the fragmentation [((QSY)-βCD)+(Rh575-CAβ)+2H]3+→[QSY-βCD]+. The branching ratio consists of the ratio between the fragment intensity and the parent intensity in the LID spectrum.
FRET
119
upon binding to the cyclodextrin, or alternatively, if the interaction is with the central hydro-
phobic region of the peptide, that the terminal regions of the peptide are unable to unfurl a
sufficient distance to reduce the FRET efficiency. Further investigations are necessary such as
ion mobility experiments and theoretical treatment. All in all, the emerging picture is that ac-
tion-FRET experiments provide a valuable addition to the techniques and “tools” made availa-
ble for studying non-covalent complexes in gas confinement.
Summary
This application of action-FRET to β-cyclodextrin inclusion complexes has shown that meas-
urements on non-covalent complexes with one side chromophore tagged amino-β-cyclodextrin
and the other tagged amyloid-beta fragment peptides can reveal valuable insights on their con-
formation and molecular complex assembly. The key elements are that with a rhodamine 575
donor and a QSY7 FRET acceptor: respectively covalently attached to the guest peptide (Aβ12-
28) (the donor) and secondly the macrocyclic host (amino-β-cyclodextrin) (the acceptor). On
collision-induced dissociations (CID), the complex ions mainly dissociate by loosing off from
their weak non-covalent interactions. Interestingly, upon laser-induced dissociation (LID) at
the donor wavelength (505 nm), specific photofragments of the QSY7 acceptor are detected
validating the occurrence of the FRET regime related to the donor and the acceptor. They are
understood to be close to each other in the complex ions architecture. Such an experiment
opens future prospective avenues of research not only for studying interactions between pep-
tides and synthetic receptors, but also interactions between proteins and chaperones. In a
broader scope, this technique could one day also offer benefits in probing non-biological part-
ners involved in any field of supramolecular chemistry, provided the action-FRET reported
chromophores can be chemically appended onto the relevant supramolecular edifices.
FRET
120
4.8 References :
1. Clegg RM: The history of FRET. Springer; 2006. 2. Wu PG, Brand L: Resonance energy-transfer - methods and applications. Analytical Biochemistry 1994,
218:1-13. 3. Medintz I, Hildebrandt N: FRET - Foster resonance energy transfer: From theory to applications.; 2013. 4. Forster T: Energiewanderung und fluoreszenz. Naturwissenschaften 1946, 33:166-175. 5. Hotzer B, Medintz IL, Hildebrandt N: Fluorescence in Nanobiotechnology: Sophisticated
Fluorophores for Novel Applications. Small 2012, 8:2297-2326. 6. Dashtiev M, Azov V, Frankevich V, Scharfenberg L, Zenobi R: Clear evidence of fluorescence resonance
energy transfer in gas-phase ions. Journal of the American Society for Mass Spectrometry 2005, 16:1481-1487.
7. Wagner BD: Fluorescence studies of supramolecular host-guest inclusion complexes. In Handbook of photochemistry and photobiology. Volume 3. Edited by Nalwa HS: American scientific publishers.; 2003
8. Turconi S, Bingham RP, Haupts U, Pope AJ: Developments in fluorescence lifetime-based analysis for ultra-HTS. Drug Discovery Today 2001, 6:S27-S39.
9. Lazarides T, Sykes D, Faulkner S, Barbieri A, Ward MD: On the Mechanism of d-f Energy Transfer in Ru-II/Ln(III) and Os-II/Ln(III) Dyads: Dexter-Type Energy Transfer Over a Distance of 20 angstrom. Chemistry-a European Journal 2008, 14:9389-9399.
10. Anon.: The molecular probes handbook. A guide to fluorescent probes and labeling technologies. 11th edn; 2010.
11. Faure S, Stern C, Guilard R, Harvey PD: Role of the spacer in the singlet-singlet energy transfer mechanism (Forster vs Dexter) in cofacial bisporphyrins. Journal of the American Chemical Society 2004, 126:1253-1261.
12. Dexter DL: A theory of sensitized luminescence in solids. Journal of Chemical Physics 1953, 21:836-850.
13. Agarwal GS, Patnaik AK: Vacuum-induced coherences in radiatively coupled multilevel systems. Physical Review A 2001, 63:8.
14. Minkov M, Savona V: Radiative coupling of quantum dots in photonic crystal structures. Physical Review B 2013, 87:16.
15. Kinoshita T, Ishihara H: Radiative coupling of A and B excitons in ZnO. Physical Review B 2016, 94:9. 16. D'Agostino S, Della Sala F, Andreani LC: Radiative coupling of high-order plasmonic modes with far-
field. Photonics and Nanostructures-Fundamentals and Applications 2013, 11:335-344. 17. Ammerlahn D, Kuhl J, Grote B, Koch SW, Khitrova G, Gibbs H, Hey R, Ploog KH: Radiative coupling in
single quantum wells and Bragg structures. Physica Status Solidi B-Basic Research 2000, 221:101-106. 18. Taniguchi K, Mardh S: Reversible changes in the fluorescence energy-transfer accompanying
formation of reaction intermediates in probe-labeled (Na+,K+)-ATPASE. Journal of Biological Chemistry 1993, 268:15588-15594.
19. Mellet P, Boudier C, Mely Y, Bieth JG: Stopped flow fluorescence energy transfer measurement of the rate constants describing the reversible formation and the irreversible rearrangement of the elastase-alpha(1)-proteinase inhibitor complex. Journal of Biological Chemistry 1998, 273:9119-9123.
20. Jonsson T, Waldburger CD, Sauer RT: Nonlinear free energy relationships in arc repressor unfolding imply the existence of unstable, native-like folding intermediates. Biochemistry 1996, 35:4795-4802.
21. Luo Y, Wu JL, Gergely J, Tao T: Localization of Cys(133) of rabbit skeletal troponin-l with respect to troponin-C by resonance energy transfer. Biophysical Journal 1998, 74:3111-3119.
22. Erickson JW, Mittal R, Cerione RA: Use of resonance energy -transfer to determine the proximity of the guanine-nucleotide-binding site of transducin relative to a conformationally-sensitive site on the gamma-subunit of the cyclic-gmp phosphodiesterase. Biochemistry 1995, 34:8693-8700.
23. Xing J, Cheung HC: Internal movement in myosin subfragment -1 detected by fluorescence resonance energy-transfer. Biochemistry 1995, 34:6475-6487.
24. Moens PDJ, Yee DJ, Dosremedios CG: Determination of the radial coordinate of Cys-374 in F-Actin using fluorescence resonance energy-transfer spectroscopy - effect of phalloidin on polymer assembly. Biochemistry 1994, 33:13102-13108.
25. Carraway KL, Koland JG, Cerione RA: Visualisation of epidermal growth-factor (EGF) receptor aggregation in plasma-membranes by fluorescence resonance energy-transfer - correlation of receptor activation with aggregation. Journal of Biological Chemistry 1989, 264:8699-8707.
FRET
121
26. Matyus L: Fluorescence resonance energy-transfer measurements on cell-surfaces - a spectoscopic tool for determining protein interactions. Journal of Photochemistry and Photobiology B-Biology 1992, 12:323-337.
27. Gagne A, Banks P, Hurt SD: Use of fluorescence polarization detection for the measurement of FluoPeptide (TM) binding to G protein-coupled receptors. Journal of Receptor and Signal Transduction Research 2002, 22:333-343.
28. Berger W, Prinz H, Striessnig J, Kang HC, Haugland R, Glossmann H: Complex molecular mechanism for dihydropyridine binding to L-Type CA2+-channels as revealed by fluorescence resonance energy-transfer. Biochemistry 1994, 33:11875-11883.
29. Kubitscheck U, Kircheis M, Schweitzerstenner R, Dreybrodt W, Jovin TM, Pecht I: Fluorescence resonance energy-transfer on single living cells - application to binding of monovalent haptens to cell-bound immunoglobin-E. Biophysical Journal 1991, 60:307-318.
30. Johnson DA, Voet JG, Taylor P: Fluorescence energy - transfer between cobra alpha - toxin molecules bound to the acetylcholine -receptor. Journal of Biological Chemistry 1984, 259:5717-5725.
31. Khanna PL, Ullman EF: 4',5'-Dimethoxy-6-Carboxyfluorescein - a novel dipole-dipole coupled fluorescence energy-transfer acceptor useful for fluorescence immunoassays. Analytical Biochemistry 1980, 108:156-161.
32. Morrison LE: Time-resolved detection of energy-transfer - theory and application to immunoassays. Analytical Biochemistry 1988, 174:101-120.
33. Ha T, Enderle T, Ogletree DF, Chemla DS, Selvin PR, Weiss S: Probing the interaction between two single molecules: Fluorescence resonance energy transfer between a single donor and a single acceptor. Proceedings of the National Academy of Sciences of the United States of America 1996, 93:6264-6268.
34. Mergny JL, Boutorine AS, Garestier T, Belloc F, Rougee M, Bulychev NV, Koshkin AA, Bourson J, Lebedev AV, Valeur B, et al: Fluorescence energy-transfer as a probe for nucleic-acid structures and sequences. Nucleic Acids Research 1994, 22:920-928.
35. Clegg RM, Murchie AIH, Lilley DMJ: The solution structure of the 4-way DNA junction at low-salt conditions - a fluorescence resonance energy-transfer analysis. Biophysical Journal 1994, 66:99-109.
36. Hiyoshi M, Hosoi S: Assay of DNA denaturation by polymerase chain reaction-driven fluorescent label incorporation and fluorescence resonance energy-transfer. Analytical Biochemistry 1994, 221:306-311.
37. Toth K, Sauermann V, Langowski J: DNA curvature in solution measured by fluorescence resonance energy transfer. Biochemistry 1998, 37:8173-8179.
38. Furey WS, Joyce CM, Osborne MA, Klenerman D, Peliska JA, Balasubramanian S: Use of fluorescence resonance energy transfer to investigate the conformation of DNA substrates bound to the Klenow fragment. Biochemistry 1998, 37:2979-2990.
39. Whitcombe D, Theaker J, Guy SP, Brown T, Little S: Detection of PCR products using self-probing amplicons and fluorescence. Nature Biotechnology 1999, 17:804-807.
40. Thelwell N, Millington S, Solinas A, Booth J, Brown T: Mode of action and application of Scorpion primers to mutation detection. Nucleic Acids Research 2000, 28:3752-3761.
41. Lee LG, Livak KJ, Mullah B, Graham RJ, Vinayak RS, Woudenberg TM: Seven-color, homogeneous detection of six PCR products. Biotechniques 1999, 27:342-349.
42. Heid CA, Stevens J, Livak KJ, Williams PM: Real time quantitative PCR. Genome Research 1996, 6:986-994.
43. Nazarenko IA, Bhatnagar SK, Hohman RJ: A closed tube format for amplification and detection of DNA based on energy transfer. Nucleic Acids Research 1997, 25:2516-2521.
44. Tyagi S, Bratu DP, Kramer FR: Multicolor molecular beacons for allele discrimination. Nature Biotechnology 1998, 16:49-53.
45. Myakishev MV, Khripin Y, Hu S, Hamer DH: High-throughput SNP genotyping by allele-specific PCR with universal energy-transfer-labeled primers. Genome Research 2001, 11:163-169.
46. Parkhurst KM, Parkhurst LJ: Kinetic-studies by fluorescence resonance energy-transfer employing a double-labeled oligonucleotide - hybridization to teh oligonucleotide complement and to single-stranded-DNA. Biochemistry 1995, 34:285-292.
47. Sixou S, Szoka FC, Green GA, Giusti B, Zon G, Chin DJ: Intracellular oligonucleotide hybridisation detected by fluorescence resonance energy-transfer (FRET). Nucleic Acids Research 1994, 22:662-668.
48. Chen XN, Zehnbauer B, Gnirke A, Kwok PY: Fluorescence energy transfer detection as a homogeneous DNA diagnostic method. Proceedings of the National Academy of Sciences of the United States of America 1997, 94:10756-10761.
FRET
122
49. Hung SC, Mathies RA, Glazer AN: Optimization of spectroscopic and electrophoretic properties of energy transfer primers. Analytical Biochemistry 1997, 252:78-88.
50. Woolley AT, Mathies RA: Ultra-high-speed DNA-sequencing using capillary electrophoresis chips. Analytical Chemistry 1995, 67:3676-3680.
51. Ju JY, Ruan CC, Fuller CW, Glazer AN, Mathies RA: Fluorescence energy-transfer dye-labeled primers for DNA-sequencing and analysis. Proceedings of the National Academy of Sciences of the United States of America 1995, 92:4347-4351.
52. Gutierrezmerino C, Deromanelli ICB, Pietrasanta LI, Barrantes FJ: Preferential distribution of teh fluorescent phospholipid probes NBD-phosphatidylcholine and rhodamine-phosphatidylethanolamine in the exofacial leaflet of actylcholine recptor-rich membranes from torpedo-marmorata. Biochemistry 1995, 34:4846-4855.
53. Wolf DE, Winiski AP, Ting AE, Bocian KM, Pagano RE: Determination of the transbilayer distribution of fluorescent lipid analogs by nonradiative fluorescence resonance energy-transfer. Biochemistry 1992, 31:2865-2873.
54. Nichols JW, Pagano RE: Resonance energy-transfer assay of protein-mediated lipid transfer between vesicles. Journal of Biological Chemistry 1983, 258:5368-5371.
55. Pecheur EI, Martin I, Ruysschaert JM, Bienvenue A, Hoekstra D: Membrane fusion induced by 11-mer anionic and cationic peptides: A structure-function study. Biochemistry 1998, 37:2361-2371.
56. Partearroyo MA, Cabezon E, Nieva JL, Alonso A, Goni FM: Real-time measurements of chemically-induced membrane-fusion in cell monolayers, using a resonance energy-transfer method. Biochimica Et Biophysica Acta-Biomembranes 1994, 1189:175-180.
57. Struck DK, Hoekstra D, Pagano RE: Use of resonance energy-transfer to monitor membrane-fusion. Biochemistry 1981, 20:4093-4099.
58. Gonzalez JE, Tsien RY: Voltage sensing by fluorescence resonance energy-transfer in single cells. Biophysical Journal 1995, 69:1272-1280.
59. Gulnik SV, Suvorov LI, Majer P, Collins J, Kane BP, Johnson DG, Erickson JW: Design of sensitive fluorogenic substrates for human cathepsin D. Febs Letters 1997, 413:379-384.
60. Kurth T, Grahn S, Thormann M, Ullmann D, Hofmann HJ, Jakubke HD, Hedstrom L: Engineering the S1 ' subsite of trypsin: Design of a protease which cleaves between dibasic residues. Biochemistry 1998, 37:11434-11440.
61. Geoghegan KF, Emery MJ, Martin WH, McColl AS, Daumy GO: Site-directed double fluorescent tagging of human renin and collagenase (MMP-1) substrate peptides using the periodate-oxidation of N-terminal serine - an apparently general strategy for provision of energy-transfer substrate for proteases. Bioconjugate Chemistry 1993, 4:537-544.
62. Matayoshi ED, Wang GT, Krafft GA, Erickson J: Novel fluorogenic substrates for assaying retroviral proteases by resonance energy-transfer. Science 1990, 247:954-958.
63. Adams SR, Harootunian AT, Buechler YJ, Taylor SS, Tsien RY: Fluorescence ratio imaging of cyclic-amp in single cells. Nature 1991, 349:694-697.
64. Godwin HA, Berg JM: A fluorescent zinc probe based on metal-induced peptide folding. Journal of the American Chemical Society 1996, 118:6514-6515.
65. Benesch JLP, Robinson CV: Biological chemistry dehydrated but unharmed. Nature 2009, 462:576-577.
66. Markides K: Advanced information on the Nobel prize in chemistry 2002. (Gräslund A ed.: Kungl.Vetenskapsakademien.The royal swedish academy of sciences.; 2002.
67. Wallace MI, Ying LM, Balasubramanian S, Klenerman D: FRET fluctuation spectroscopy: Exploring the conformational dynamics of a DNA hairpin loop. Journal of Physical Chemistry B 2000, 104:11551-11555.
68. Bonnet G, Krichevsky O, Libchaber A: Kinetics of conformational fluctuations in DNA hairpin-loops. Proceedings of the National Academy of Sciences of the United States of America 1998, 95:8602-8606.
69. Qiu LL, Pabit SA, Roitberg AE, Hagen SJ: Smaller and faster: The 20-residue Trp-cage protein folds in 4 mu s. Journal of the American Chemical Society 2002, 124:12952-12953.
70. Snow CD, Zagrovic B, Pande VS: The Trp cage: Folding kinetics and unfolded state topology via molecular dynamics simulations. Journal of the American Chemical Society 2002, 124:14548-14549.
71. Marqusee S, Robbins VH, Baldwin RL: Unusually stable helix formation in short alanine-based peptides. Proceedings of the National Academy of Sciences of the United States of America 1989, 86:5286-5290.
72. Daly S, Poussigue F, Simon AL, MacAleese L, Bertorelle F, Chirot F, Antoine R, Dugourd P: Action-FRET: Probing the Molecular Conformation of Mass-Selected Gas-Phase Peptides with Forster Resonance
FRET
123
Energy Transfer Detected by Acceptor-Specific Fragmentation. Analytical Chemistry 2014, 86:8798-8804.
73. Hendricks NG, Lareau NM, Stow SM, McLean JA, Julian RR: Bond-Specific Dissociation Following Excitation Energy Transfer for Distance Constraint Determination in the Gas Phase. Journal of the American Chemical Society 2014, 136:13363-13370.
74. Hendricks NG, Julian RR: Two-step energy transfer enables use of phenylalanine in action-EET for distance constraint determination in gaseous biomolecules. Chemical Communications 2015, 51:12720-12723.
75. Talbot FO, Rullo A, Yao H, Jockusch RA: Fluorescence Resonance Energy Transfer in gaseous, mass-selected polyproline peptides. Journal of the American Chemical Society 2010, 132:16156-16164.
76. Czar MF, Zosel F, Koenig I, Nettels D, Wunderlich B, Schuler B, Zarrine-Afsar A, Jockusch RA: Gas-Phase FRET Efficiency Measurements To Probe the Conformation of Mass-Selected Proteins. Analytical Chemistry 2015, 87:7559-7565.
77. Zenobi R: Coming of Age: Gas-Phase Structural Information on Biomolecules by FRET. Analytical Chemistry 2015, 87:7497-7498.
78. Danell AS, Parks JH: FRET measurements of trapped oligonucleotide duplexes. International Journal of Mass Spectrometry 2003, 229:35-45.
79. Hendricks NG, Julian RR: Leveraging ultraviolet photodissociation and spectroscopy to investigate peptide and protein three-dimensional structure with mass spectrometry. Analyst 2016, 141:4534-4540.
80. Baer T, Dunbar RC: Ion Spectroscopy: Where Did It Come From; Where Is It Now; and Where Is It Going? Journal of the American Society for Mass Spectrometry 2010, 21:681-693.
81. Wu GH, Norris C, Stewart H, Cox H, Stace AJ: State-resolved UV photofragmentation spectrum of the metal dication complex Zn(pyridine)(4) (2+). Chemical Communications 2008:4153-4155.
82. Wellman SMJ, Jockusch RA: Moving in on the Action: An Experimental Comparison of Fluorescence Excitation and Photodissociation Action Spectroscopy. Journal of Physical Chemistry A 2015, 119:6333-6338.
83. Sagoo SK, Jockusch RA: The fluorescence properties of cationic rhodamine B in the gas phase. Journal of Photochemistry and Photobiology a-Chemistry 2011, 220:173-178.
84. Daly S, Knight G, Halim MA, Kulesza A, Choi CM, Chirot F, MacAleese L, Antoine R, Dugourd P: Action-FRET of a Gaseous Protein. Journal of the American Society for Mass Spectrometry 2017, 28:38-49.
85. Kelly JW: The alternative conformations of amyloidogenic proteins and their multi-step assembly pathways. Current Opinion in Structural Biology 1998, 8:101-106.
86. Giacobini E, Gold G: Alzheimer disease therapy-moving from amyloid-beta to tau. Nature Reviews Neurology 2013, 9:677-686.
87. Woods LA, Radford SE, Ashcroft AE: Advances in ion mobility spectrometry-mass spectrometry reveal key insights into amyloid assembly. Biochimica Et Biophysica Acta-Proteins and Proteomics 2013, 1834:1257-1268.
88. Hayne DJ, Lim S, Donnelly PS: Metal complexes designed to bind to amyloid-beta for the diagnosis and treatment of Alzheimer's disease. Chemical Society reviews 2014, 43:6701-6715.
89. Abbasowa L, Heegaard NHH: A systematic review of amyloid-beta peptides as putative mediators of the association between affective disorders and Alzheimer's disease. Journal of Affective Disorders 2014, 168:167-183.
90. Bernstein SL, Dupuis NF, Lazo ND, Wyttenbach T, Condron MM, Bitan G, Teplow DB, Shea JE, Ruotolo BT, Robinson CV, Bowers MT: Amyloid-beta protein oligomerization and the importance of tetramers and dodecamers in the aetiology of Alzheimer's disease. Nature Chemistry 2009, 1:326-331.
91. Wyttenbach T, Bowers MT: Intermolecular interactions in biomolecular systems examined by mass spectrometry. In Annual Review of Physical Chemistry. Volume 58. Palo Alto: Annual Reviews; 2007: 511-533: Annual Review of Physical Chemistry.
92. Zganec M, Zerovnik E: Amyloid fibrils compared to peptide nanotubes. Biochimica Et Biophysica Acta-General Subjects 2014, 1840:2944-2952.
93. Quinn SD, Dalgarno PA, Cameron RT, Hedley GJ, Hacker C, Lucocq JM, Baillie GS, Samuel IDW, Penedo JC: Real-time probing of beta-amyloid self-assembly and inhibition using fluorescence self-quenching between neighbouring dyes. Molecular Biosystems 2014, 10:34-44.
94. Rochet JC, Lansbury PT: Amyloid fibrillogenesis: themes and variations. Current Opinion in Structural Biology 2000, 10:60-68.
95. Grasso G: The use of mass spectrometry to study amyloid-beta peptides. Mass Spectrometry Reviews 2011, 30:347-365.
FRET
124
96. Girych M, Gorbenko G, Trusova V, Adachi E, Mizuguchi C, Nagao K, Kawashima H, Akaji K, Lund-Katz S, Phillips MC, Saito H: Interaction of Thioflavin T with amyloid fibrils of apolipoprotein A-I N-terminal fragment: Resonance energy transfer study. Journal of Structural Biology 2014, 185:116-124.
97. Nagaveni V, Lakshmi VVS, Prabhakar S: Sulforaphane interaction with amyloid beta 1-40 peptide studied by electrospray ionization mass spectrometry. Rapid Communications in Mass Spectrometry 2014, 28:2171-2180.
98. Daly S, Kulesza A, Poussigue F, Simon AL, Choi CM, Knight G, Chirot F, MacAleese L, Antoine R, Dugourd P: Conformational changes in amyloid-beta (12-28) alloforms studied using action-FRET, IMS and molecular dynamics simulations. Chemical Science 2015, 6:5040-5047.
99. Jani V, Sonavane UB, Joshi R: REMD and umbrella sampling simulations to probe the energy barrier of the folding pathways of engrailed homeodomain. Journal of Molecular Modeling 2014, 20:14.
100. Calvo F, Chirot F, Albrieux F, Lemoine J, Tsybin YO, Pernot P, Dugourd P: Statistical Analysis of Ion Mobility Spectrometry. II. Adaptively Biased Methods and Shape Correlations. Journal of the American Society for Mass Spectrometry 2012, 23:1279-1288.
101. Yu TQ, Lu JF, Abrams CF, Vanden-Eijnden E: Multiscale implementation of infinite-swap replica exchange molecular dynamics. Proceedings of the National Academy of Sciences of the United States of America 2016, 113:11744-11749.
102. Sugita Y, Okamoto Y: Replica-exchange molecular dynamics method for protein folding. Chemical Physics Letters 1999, 314:141-151.
103. Daly S, Kulesza A, Poussigue F, Simon AL, Choi CM, Knight G, Chirot F, MacAleese L, Antoine R, Dugourd P: Conformational changes in amyloid-beta (12-28) alloforms studied using action-FRET, IMS and molecular dynamics simulations (vol 6, pg 5040, 2015). Chemical Science 2016, 7:1609-1610.
104. Le TN, Poully JC, Lecomte F, Nieuwjaer N, Manil B, Desfrancois C, Chirot F, Lemoine J, Dugourd P, van der Rest G, Gregoire G: Gas-Phase Structure of Amyloid-beta (12-28) Peptide Investigated by Infrared Spectroscopy, Electron Capture Dissociation and Ion Mobility Mass Spectrometry. Journal of the American Society for Mass Spectrometry 2013, 24:1937-1949.
105. Holtje H.D. SW, Rognan D., Folkers G.: Molecular Modeling. Basic principles and applications. 3rd. edn: Wiley-VCH.; 2007.
106. Bleiholder C, Dupuis NF, Wyttenbach T, Bowers MT: Ion mobility-mass spectrometry reveals a conformational conversion from random assembly to b-sheet in amyloid fibril formation. Abstracts of Papers of the American Chemical Society 2011, 242:1.
107. Duez Q, Knight G, Daly S, De Winter J, Halin E, MacAleese L, Antoine R, Gerbaux P, Dugourd P: Action-FRET of beta-cyclodextrin inclusion complexes. New Journal of Chemistry 2017, 41:1806-1812.

Ubiquitin
125

Ubiquitin
126
Ubiquitin.
With the purpose of answering biological questions, a protein of long standing interest was
taken to elaborate an action-FRET experiment in the laboratory. The context of the study was
to make a quantitative study on a synthetically modified ubiquitin protein through derivatisa-
tion with donor-acceptor chromophores, such as to work out the proximity relationships held
by the different structural states of the protein in gas isolation. An elucidation of the FRET effi-
ciencies even if only partial, provided a real asset in developing an idea of the global structural
motif of the framework. This study provides the basis for a better understanding of the roles of
solvent composition and protein conformation and looks to demonstrate the viability of the
new physical method to probe gas-phase three-dimensional protein structure.
5.1 Ubiquitin’s identity
Traditionally Ubiquitin designates a 76 long amino acid [1] globular protein (Figure 5.1.1),
stricto sensu, it is the prototype of a family of proteins that differ discretely in peptide sequence
but maintain a similar structure, the ubiquitin fold among others. It is specifically found only in
eukaryotes and is absent in the biochemistry of prokaryotes [2]. There has been a deliberate
interest in the biochemistry of this protein that has owed its popularity within the scientific
community. In this way, there has been a general agreement that ubiquitin plays a host of im-
portant roles in protein degradation and thus the control of a myriad of processes including
cell-cycle progression, signal transduction, transcriptional regulation, receptor down-regula-
tion, and endocytosis [1]. Just as our understanding of ubiquitin and its key implication in the
immune response, development and cell death has progressed so has our knowledge of pathol-
ogies such as malignant transformation [1].
Ubiquitin Homo Sapiens — an amino acid sequence:
MQIFVKTLTGKTITLEVEPSDTIENVKAKIQDKEGIPPDQQRLIFAGKQLEDGRTLSDYNIQKESTLHLVLRLRGG
Figure 5.1.1. Seventy-six residue long ubiquitin (X-ray, 1.5Å, monomer state) adapted from ExPasy,
the SIB Bioinformatics Resource Portal.
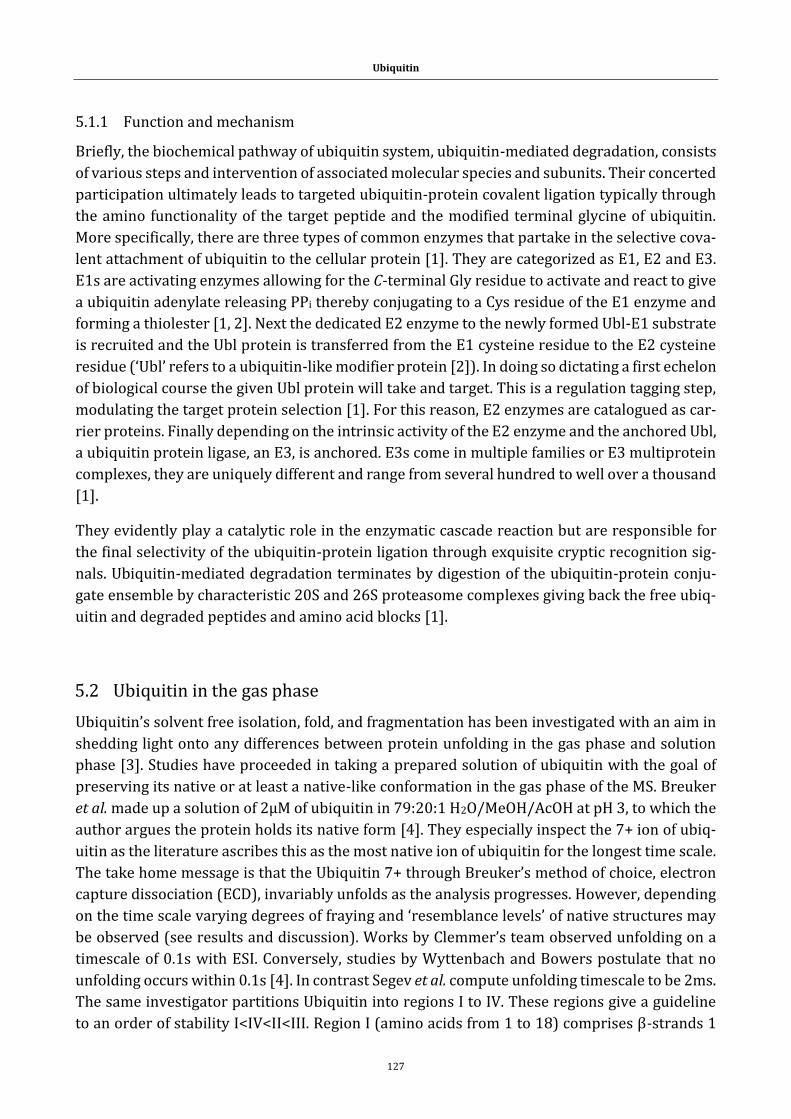
Ubiquitin
127
5.1.1 Function and mechanism
Briefly, the biochemical pathway of ubiquitin system, ubiquitin-mediated degradation, consists
of various steps and intervention of associated molecular species and subunits. Their concerted
participation ultimately leads to targeted ubiquitin-protein covalent ligation typically through
the amino functionality of the target peptide and the modified terminal glycine of ubiquitin.
More specifically, there are three types of common enzymes that partake in the selective cova-
lent attachment of ubiquitin to the cellular protein [1]. They are categorized as E1, E2 and E3.
E1s are activating enzymes allowing for the C-terminal Gly residue to activate and react to give
a ubiquitin adenylate releasing PPi thereby conjugating to a Cys residue of the E1 enzyme and
forming a thiolester [1, 2]. Next the dedicated E2 enzyme to the newly formed Ubl-E1 substrate
is recruited and the Ubl protein is transferred from the E1 cysteine residue to the E2 cysteine
residue (‘Ubl’ refers to a ubiquitin-like modifier protein [2]). In doing so dictating a first echelon
of biological course the given Ubl protein will take and target. This is a regulation tagging step,
modulating the target protein selection [1]. For this reason, E2 enzymes are catalogued as car-
rier proteins. Finally depending on the intrinsic activity of the E2 enzyme and the anchored Ubl,
a ubiquitin protein ligase, an E3, is anchored. E3s come in multiple families or E3 multiprotein
complexes, they are uniquely different and range from several hundred to well over a thousand
[1].
They evidently play a catalytic role in the enzymatic cascade reaction but are responsible for
the final selectivity of the ubiquitin-protein ligation through exquisite cryptic recognition sig-
nals. Ubiquitin-mediated degradation terminates by digestion of the ubiquitin-protein conju-
gate ensemble by characteristic 20S and 26S proteasome complexes giving back the free ubiq-
uitin and degraded peptides and amino acid blocks [1].
5.2 Ubiquitin in the gas phase
Ubiquitin’s solvent free isolation, fold, and fragmentation has been investigated with an aim in
shedding light onto any differences between protein unfolding in the gas phase and solution
phase [3]. Studies have proceeded in taking a prepared solution of ubiquitin with the goal of
preserving its native or at least a native-like conformation in the gas phase of the MS. Breuker
et al. made up a solution of 2µM of ubiquitin in 79:20:1 H2O/MeOH/AcOH at pH 3, to which the
author argues the protein holds its native form [4]. They especially inspect the 7+ ion of ubiq-
uitin as the literature ascribes this as the most native ion of ubiquitin for the longest time scale.
The take home message is that the Ubiquitin 7+ through Breuker’s method of choice, electron
capture dissociation (ECD), invariably unfolds as the analysis progresses. However, depending
on the time scale varying degrees of fraying and ‘resemblance levels’ of native structures may
be observed (see results and discussion). Works by Clemmer’s team observed unfolding on a
timescale of 0.1s with ESI. Conversely, studies by Wyttenbach and Bowers postulate that no
unfolding occurs within 0.1s [4]. In contrast Segev et al. compute unfolding timescale to be 2ms.
The same investigator partitions Ubiquitin into regions I to IV. These regions give a guideline
to an order of stability I<IV<II<III. Region I (amino acids from 1 to 18) comprises β-strands 1
Ubiquitin
128
and 2. Region IV (residues 59-76) comprises β-strand 5. In the same line of logic, region II labels
the sequence of amino acids 19 to 35 and region III amino acids 36 to 58 [4]. Another paper by
McLafferty, provides a befitting illustration of the whole developmental pathway of ubiquitin
desolvation and unfolding that ascribes his ionization method of choice, ESI [5]. A highlight in
the works by HanBin Oh et al. is made that gathers the percept of Ubiquitins fixation in the
tertiary domain to be 10+ to 13+ protein species. Ubiquitin has been recognized as a ‘superhero’
in cell biology, dixit Hanbin Oh et al.[6]. The article by Evan R.Williams, “Supercharging with m-
nitrobenzyl Alcohol and propylene carbonate: Forming highly charged ions extended, near-lin-
ear conformations” also beautifully, illustrates and schemes out the supercharging of ubiquitin
7+ to 13+ and its continuation to 21+ [7]. Collaborative work by Skinner, Breuker and
McLafferty develop a charge site mass analysis also based on ECD to provide intrinsic mecha-
nistic information on the role of neighboring secondary structure regions and how they proto-
nate on basic sites influencing hydrogen bonding to backbone carbonyls ultimately proving that
a particular charge state of ubiquitin is not guaranteed to have a single conformation [8].
Whilst the preparation and ionization of ubiquitin has been studied, so has the conditioning gas
in the trap used. Indeed, Rajabi brought about a sampling method for ubiquitin ion populations
in a gas setting treated with microsecond D2O vapour pulses so to favor hydrogen deuterium
exchanges. In this paper it is postulated that 7+ and 6+ charge state species of ubiquitin adopts
a more compact conformation whilst 8+ and 9+ are more extended conformation-wise and that
this is due to the coulombic repulsion and availability of protonation sites [9]. More evidence
in Ubiquitin unfolding through an ESI-MS method is given by Segev et al. In this set of experi-
ments ubiquitin is presented to hold its native structure and an unfolded structure commonly
accepted as the A state [10], the structure involves an antiparallel β-sheet and a central α-helix
similar to the native state [3] portrayed in Figure 5.5.1 in this chapter. Again it is assumed that
this elongated conformation is due to lack of solvation shell. The author further discusses the
unfolding rate which progresses at increasing temperatures; 300K, 400K, 450K, 500K and
600K.
For ubiquitin 13+, two interesting intermediate states were found and a final near linear geom-
etry was depicted with virtually no elongated structure. Arrhenius plot describing the rate con-
stants from one transition to another are given [3]. Further conformational study of ubiquitin
in the gas phase, especially focusing on ubiquitin 8+ is reported by Huilin Shi [11]. ESI-IMS is
used to examine 20 different samples of ubiquitin with solution conditions from 100:0 to 5:95
water:methanol with a pH maintained at 2.0. Ubiquitin 8+ ion is chosen as it holds a constant
percentage across all solution compositions. The IMS results indicate that at 100:0 water:meth-
anol composition 2 major peaks suggesting 8+ populations are observed. An N, native compact
geometry (collision cross section 1020 Å2) and an A state geometry (collision cross section
1650 Å2 and 1680 Å2) ascribing a semi unraveled ubiquitin, as discussed by the author. As the
proportion of methanol increases in the solution composition so does the intensity and sharp-
ening of the A state feature distributions and U state distribution (Clemmer et al. [11]), collision
cross sections 1650 Å2 and 1680 Å2 and 1160 Å2 respectively. Similarly, the disappearance or
annulation, of the peak at 1020 Å2 as the methanol comprises more than 40% of the solution
Ubiquitin
129
infers the presence of any N state geometries of ubiquitin, see the second figure of the published
article [11]. The dynamics of ubiquitin 7+ had also been investigated by Shi using the same IMS
technique in order to measure collisional cross sections and tease out folding states of ubiquitin
from four unique electrosprayed water:methanol acidic solutions [12]. Again, there is the gen-
eral agreement that an increase in methanol composition in the solution means protein dena-
turation and greater A-state type populations. In this way, aqueous solutions are best at con-
serving a high compact N-state population at equilibrium with misfolded A-state intermediates
[12]. This dependency on solvent agrees with the observations reported by Chait and co-work-
ers and later Loo and co-workers, confirming that changes in solvent composition induce dra-
matic change on the charge state distribution of protein ions. In particular that shifting to a
methanol solvent induces denaturation, the unfolded protein then can accommodate more
charges as more basic sites become available [10, 13, 14]. The totality of the charge states of
ubiquitin 5+ to 13+ in addition to 8+ having been studied in IMS is discussed in a paper by
another member of the group David E. Clemmer, again it is evident that the species of interest
can be categorized depending on their conformation: compact, unraveled or elongated [15]. As
anticipated these results are consistent with measurements made by Huilin Shi [11]. Figure
5.5.2 is also available for review, it is interesting as a model of bovine ubiquitin erythrocyte
mutant as it portrays the protein differently when it is modeled only by ribbon and other mo-
lecular fold.
5.3 Ubiquitin FRET in the condensed state
Up to date FRET studies on ubiquitin alone and in some form of liquid state including cellular,
have not been made. However, there have been comparable FRET experiments with ubiquitin
systems and conjugates. Quantitive studies of FRET looking at the SUMO (small ubiquitin like
modifier) biochemical route has been reported by Ifor D.W. Samuel et al. In short a lasing at
400nm was applied to excite the first ensemble: CFP (cyan fluorescent protein) tethered to
SUMO1 in order to record FRET emission at 530nm by the acceptor ensemble: Ubc-9 (ubiquitin
carrier protein 9) linked to YFP (yellow fluorescent protein) in a well plate. This particular ex-
periment then further discusses how no FRET is observed when the inhibiting agent RanBP2
competes, complexes with Ubc and antagonizes binding between the two aforementioned part-
ners (CFP-SUMO1 and YFP-Ubc9) [16]. Cellular FRET on ubiquitin was achieved by designing
genetically engineered, nonfluorescent ‘dark’ chromophore enhanced YFP that the authors
nickname; Resonance Energy-Accepting Chromoprotein, REACh in short. This acceptor was uti-
lized to couple with GFP (Green fluorescent protein) to give FRET between an ubiquitination
substrate to which GFP is anchored and the REACh label that was covalently linked to ubiquitin
in vivo [17].
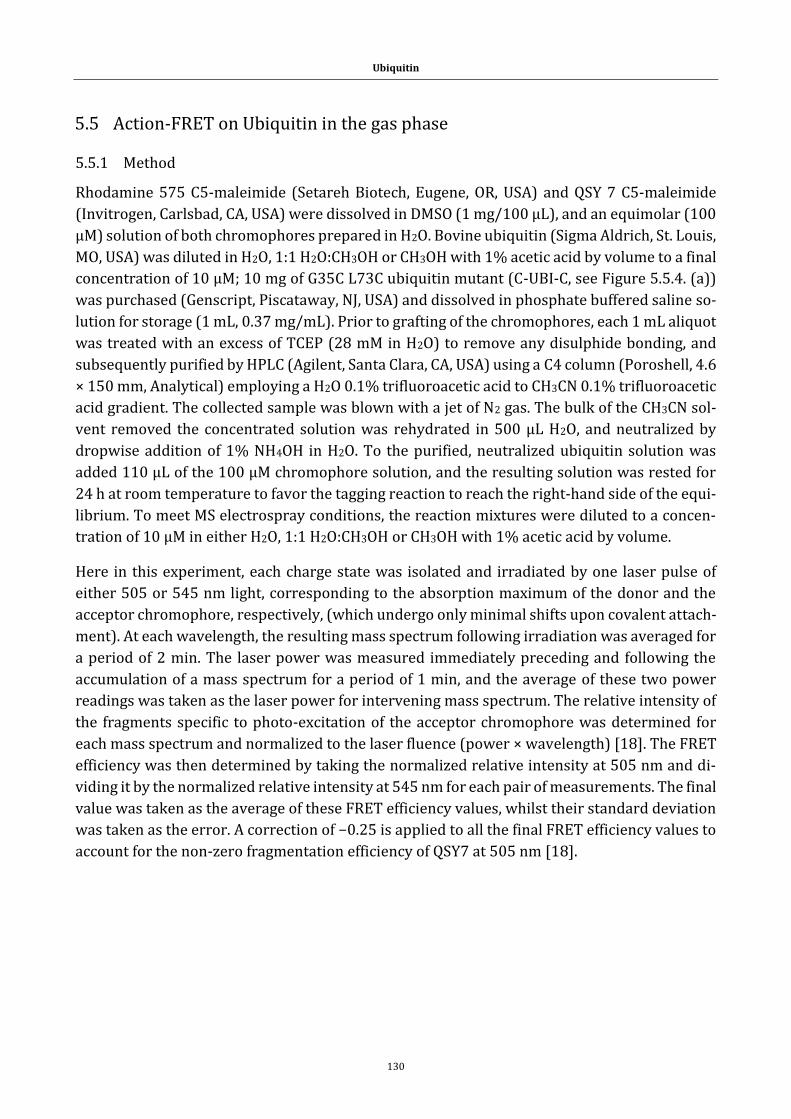
Ubiquitin
130
5.5 Action-FRET on Ubiquitin in the gas phase
5.5.1 Method
Rhodamine 575 C5-maleimide (Setareh Biotech, Eugene, OR, USA) and QSY 7 C5-maleimide
(Invitrogen, Carlsbad, CA, USA) were dissolved in DMSO (1 mg/100 μL), and an equimolar (100
μM) solution of both chromophores prepared in H2O. Bovine ubiquitin (Sigma Aldrich, St. Louis,
MO, USA) was diluted in H2O, 1:1 H2O:CH3OH or CH3OH with 1% acetic acid by volume to a final
concentration of 10 μM; 10 mg of G35C L73C ubiquitin mutant (C-UBI-C, see Figure 5.5.4. (a))
was purchased (Genscript, Piscataway, NJ, USA) and dissolved in phosphate buffered saline so-
lution for storage (1 mL, 0.37 mg/mL). Prior to grafting of the chromophores, each 1 mL aliquot
was treated with an excess of TCEP (28 mM in H2O) to remove any disulphide bonding, and
subsequently purified by HPLC (Agilent, Santa Clara, CA, USA) using a C4 column (Poroshell, 4.6
× 150 mm, Analytical) employing a H2O 0.1% trifluoroacetic acid to CH3CN 0.1% trifluoroacetic
acid gradient. The collected sample was blown with a jet of N2 gas. The bulk of the CH3CN sol-
vent removed the concentrated solution was rehydrated in 500 μL H2O, and neutralized by
dropwise addition of 1% NH4OH in H2O. To the purified, neutralized ubiquitin solution was
added 110 μL of the 100 μM chromophore solution, and the resulting solution was rested for
24 h at room temperature to favor the tagging reaction to reach the right-hand side of the equi-
librium. To meet MS electrospray conditions, the reaction mixtures were diluted to a concen-
tration of 10 μM in either H2O, 1:1 H2O:CH3OH or CH3OH with 1% acetic acid by volume.
Here in this experiment, each charge state was isolated and irradiated by one laser pulse of
either 505 or 545 nm light, corresponding to the absorption maximum of the donor and the
acceptor chromophore, respectively, (which undergo only minimal shifts upon covalent attach-
ment). At each wavelength, the resulting mass spectrum following irradiation was averaged for
a period of 2 min. The laser power was measured immediately preceding and following the
accumulation of a mass spectrum for a period of 1 min, and the average of these two power
readings was taken as the laser power for intervening mass spectrum. The relative intensity of
the fragments specific to photo-excitation of the acceptor chromophore was determined for
each mass spectrum and normalized to the laser fluence (power × wavelength) [18]. The FRET
efficiency was then determined by taking the normalized relative intensity at 505 nm and di-
viding it by the normalized relative intensity at 545 nm for each pair of measurements. The final
value was taken as the average of these FRET efficiency values, whilst their standard deviation
was taken as the error. A correction of −0.25 is applied to all the final FRET efficiency values to
account for the non-zero fragmentation efficiency of QSY7 at 505 nm [18].
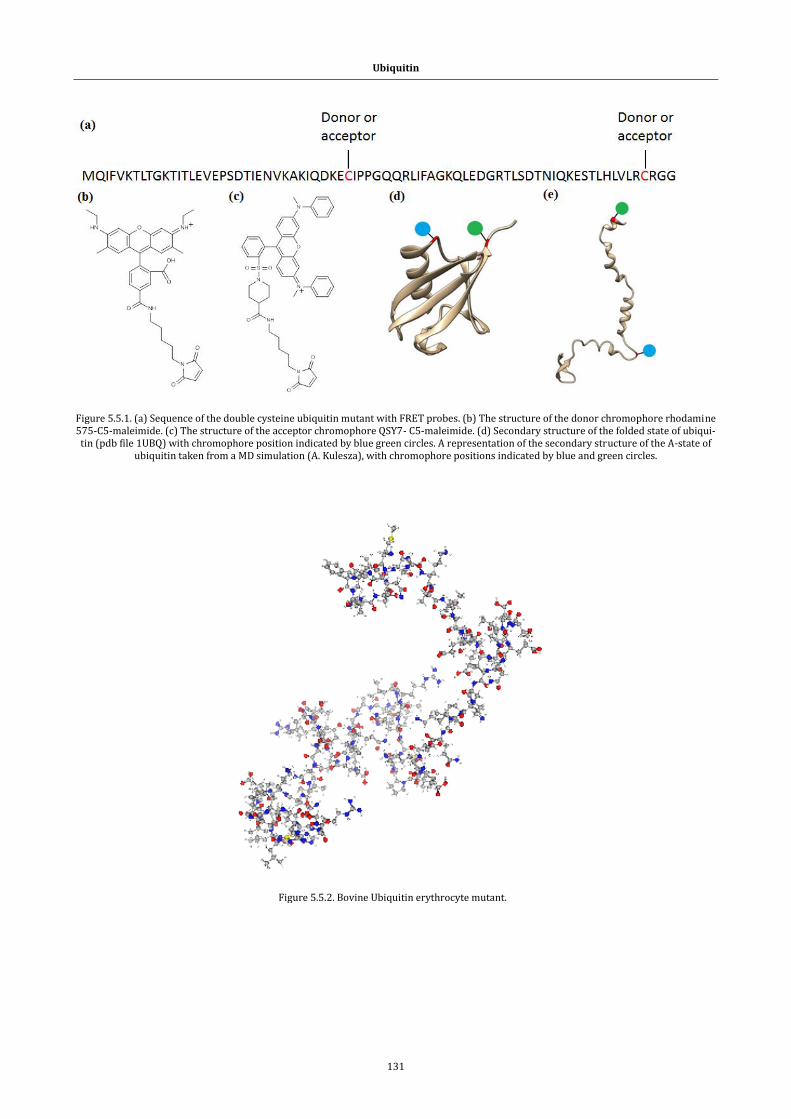
Ubiquitin
131
Figure 5.5.1. (a) Sequence of the double cysteine ubiquitin mutant with FRET probes. (b) The structure of the donor chromophore rhodamine 575-C5-maleimide. (c) The structure of the acceptor chromophore QSY7- C5-maleimide. (d) Secondary structure of the folded state of ubiqui-tin (pdb file 1UBQ) with chromophore position indicated by blue green circles. A representation of the secondary structure of the A-state of
ubiquitin taken from a MD simulation (A. Kulesza), with chromophore positions indicated by blue and green circles.
Figure 5.5.2. Bovine Ubiquitin erythrocyte mutant.
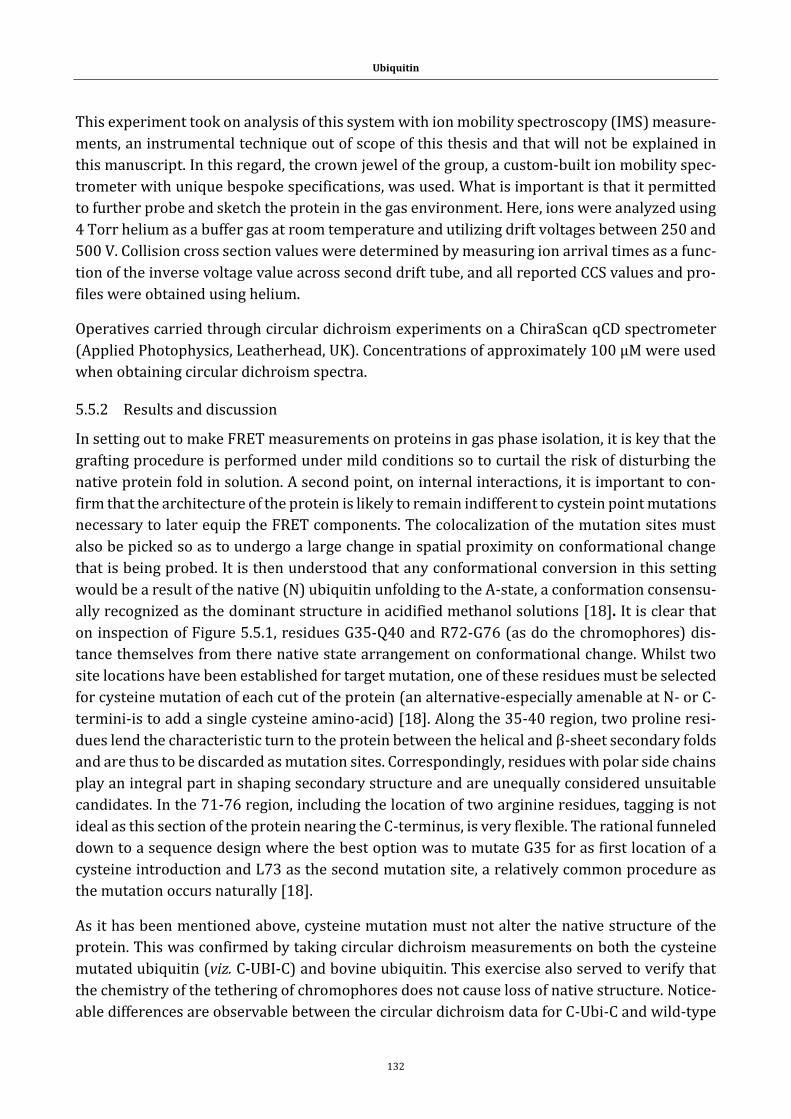
Ubiquitin
132
This experiment took on analysis of this system with ion mobility spectroscopy (IMS) measure-
ments, an instrumental technique out of scope of this thesis and that will not be explained in
this manuscript. In this regard, the crown jewel of the group, a custom-built ion mobility spec-
trometer with unique bespoke specifications, was used. What is important is that it permitted
to further probe and sketch the protein in the gas environment. Here, ions were analyzed using
4 Torr helium as a buffer gas at room temperature and utilizing drift voltages between 250 and
500 V. Collision cross section values were determined by measuring ion arrival times as a func-
tion of the inverse voltage value across second drift tube, and all reported CCS values and pro-
files were obtained using helium.
Operatives carried through circular dichroism experiments on a ChiraScan qCD spectrometer
(Applied Photophysics, Leatherhead, UK). Concentrations of approximately 100 μM were used
when obtaining circular dichroism spectra.
5.5.2 Results and discussion
In setting out to make FRET measurements on proteins in gas phase isolation, it is key that the
grafting procedure is performed under mild conditions so to curtail the risk of disturbing the
native protein fold in solution. A second point, on internal interactions, it is important to con-
firm that the architecture of the protein is likely to remain indifferent to cystein point mutations
necessary to later equip the FRET components. The colocalization of the mutation sites must
also be picked so as to undergo a large change in spatial proximity on conformational change
that is being probed. It is then understood that any conformational conversion in this setting
would be a result of the native (N) ubiquitin unfolding to the A-state, a conformation consensu-
ally recognized as the dominant structure in acidified methanol solutions [18]. It is clear that
on inspection of Figure 5.5.1, residues G35-Q40 and R72-G76 (as do the chromophores) dis-
tance themselves from there native state arrangement on conformational change. Whilst two
site locations have been established for target mutation, one of these residues must be selected
for cysteine mutation of each cut of the protein (an alternative-especially amenable at N- or C-
termini-is to add a single cysteine amino-acid) [18]. Along the 35-40 region, two proline resi-
dues lend the characteristic turn to the protein between the helical and β-sheet secondary folds
and are thus to be discarded as mutation sites. Correspondingly, residues with polar side chains
play an integral part in shaping secondary structure and are unequally considered unsuitable
candidates. In the 71-76 region, including the location of two arginine residues, tagging is not
ideal as this section of the protein nearing the C-terminus, is very flexible. The rational funneled
down to a sequence design where the best option was to mutate G35 for as first location of a
cysteine introduction and L73 as the second mutation site, a relatively common procedure as
the mutation occurs naturally [18].
As it has been mentioned above, cysteine mutation must not alter the native structure of the
protein. This was confirmed by taking circular dichroism measurements on both the cysteine
mutated ubiquitin (viz. C-UBI-C) and bovine ubiquitin. This exercise also served to verify that
the chemistry of the tethering of chromophores does not cause loss of native structure. Notice-
able differences are observable between the circular dichroism data for C-Ubi-C and wild-type
Ubiquitin
133
bovine ubiquitin in H2O and 1% acetic acid by volume, see Figure 5.5.3. Also included is a ref-
erence: the circular dichroic response of homo sapien ubiquitin in H2O, sketched out in red and
used as a standard to compare to. It is important to remark that the figure features two y-axis
on different scales. The reason being that C-UBI-C was HPLC processed and was analyzed at a
lower concentration compared to bovine ubiquitin, that needed not to be processed by HPLC
and was analysed from a 1mg/ 1ml sample. The circular dichroic response is concentration
dependent, hence the use of the corresponding y-axis scales.
Figure 5.5.3. Circular dichroism signal for the G35 L73C ubiquitin mutant (solid black curves, left axis) and wild-type bovineubiquitin (solid blue curves, right axis) in H2O with 1% acetic acid by volume. A reference spectrum taken from reference [19, 20] is shown as the dashed red
curve.
The good news that this plot gives us is the approval that there is no prominent change in sec-
ondary structure either by two-point mutations or the work up of the analyte species (HPLC).
This claim is put forward as both the mutated ubiqutitin protein and doubly tagged C-UBI-C
protein outline do not strongly disressemble the reference curve. The question on measuring
the circular dichroic response on tagged ubiquitin however, was prohibitive as it came to light
that by their nature, the chromophores absorb in the ultraviolet region and thus did not war-
rant a test to unveil any information on structural changes in solution. Nevertheless, this inter-
est was addressed by exploring the tagged species in the gas medium and carrying FRET studies
to tease out the structural shape of the protein and a corollary has been the opportunity to
deduce what influence the chromophores may play on this one. Secondly, examining any charge
state distribution changes as a function of electrospray ionization solute in conjunction with
190 200 210 220 230 240 250 260
-3
-2
-1
0
1
2
3
4
C-UBI-C
UBI
Reference
Wavelength / nm
Circu
lar
Dic
hro
ism
/ m
de
g
-6
-4
-2
0
2
4
6
8
Circu
lar
Dic
hro
ism
/ m
de
g
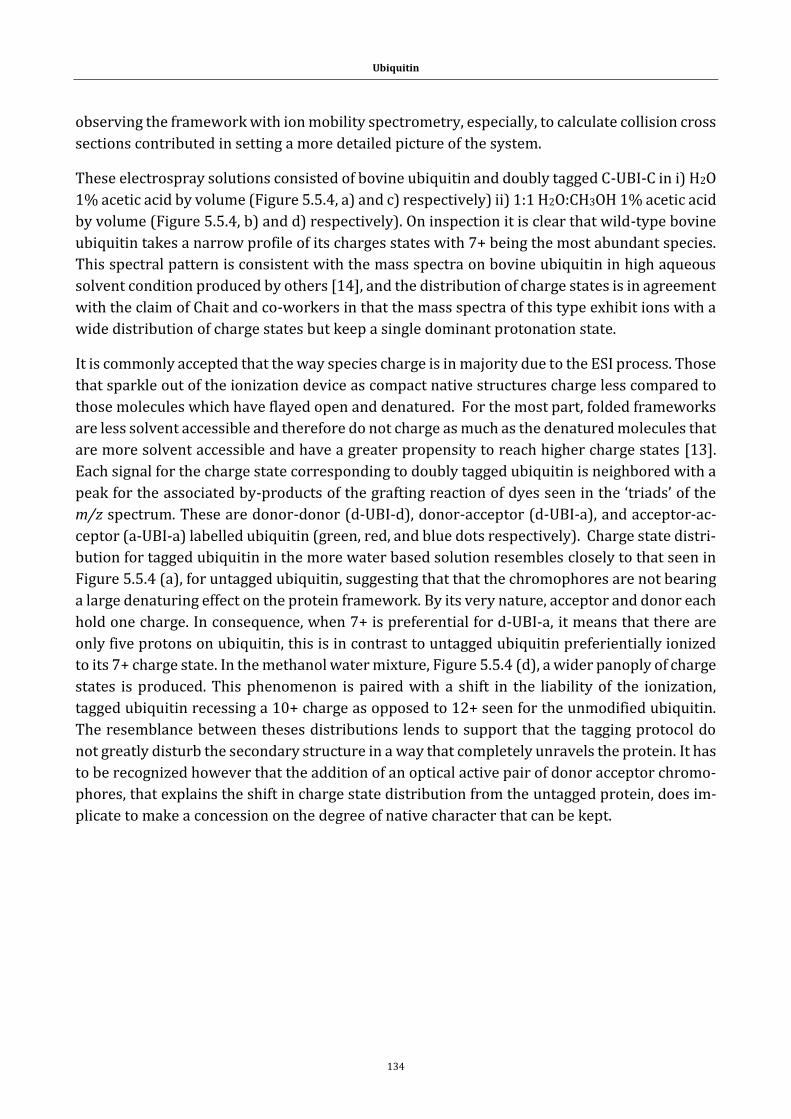
Ubiquitin
134
observing the framework with ion mobility spectrometry, especially, to calculate collision cross
sections contributed in setting a more detailed picture of the system.
These electrospray solutions consisted of bovine ubiquitin and doubly tagged C-UBI-C in i) H2O
1% acetic acid by volume (Figure 5.5.4, a) and c) respectively) ii) 1:1 H2O:CH3OH 1% acetic acid
by volume (Figure 5.5.4, b) and d) respectively). On inspection it is clear that wild-type bovine
ubiquitin takes a narrow profile of its charges states with 7+ being the most abundant species.
This spectral pattern is consistent with the mass spectra on bovine ubiquitin in high aqueous
solvent condition produced by others [14], and the distribution of charge states is in agreement
with the claim of Chait and co-workers in that the mass spectra of this type exhibit ions with a
wide distribution of charge states but keep a single dominant protonation state.
It is commonly accepted that the way species charge is in majority due to the ESI process. Those
that sparkle out of the ionization device as compact native structures charge less compared to
those molecules which have flayed open and denatured. For the most part, folded frameworks
are less solvent accessible and therefore do not charge as much as the denatured molecules that
are more solvent accessible and have a greater propensity to reach higher charge states [13].
Each signal for the charge state corresponding to doubly tagged ubiquitin is neighbored with a
peak for the associated by-products of the grafting reaction of dyes seen in the ‘triads’ of the
m/z spectrum. These are donor-donor (d-UBI-d), donor-acceptor (d-UBI-a), and acceptor-ac-
ceptor (a-UBI-a) labelled ubiquitin (green, red, and blue dots respectively). Charge state distri-
bution for tagged ubiquitin in the more water based solution resembles closely to that seen in
Figure 5.5.4 (a), for untagged ubiquitin, suggesting that that the chromophores are not bearing
a large denaturing effect on the protein framework. By its very nature, acceptor and donor each
hold one charge. In consequence, when 7+ is preferential for d-UBI-a, it means that there are
only five protons on ubiquitin, this is in contrast to untagged ubiquitin preferientially ionized
to its 7+ charge state. In the methanol water mixture, Figure 5.5.4 (d), a wider panoply of charge
states is produced. This phenomenon is paired with a shift in the liability of the ionization,
tagged ubiquitin recessing a 10+ charge as opposed to 12+ seen for the unmodified ubiquitin.
The resemblance between theses distributions lends to support that the tagging protocol do
not greatly disturb the secondary structure in a way that completely unravels the protein. It has
to be recognized however that the addition of an optical active pair of donor acceptor chromo-
phores, that explains the shift in charge state distribution from the untagged protein, does im-
plicate to make a concession on the degree of native character that can be kept.
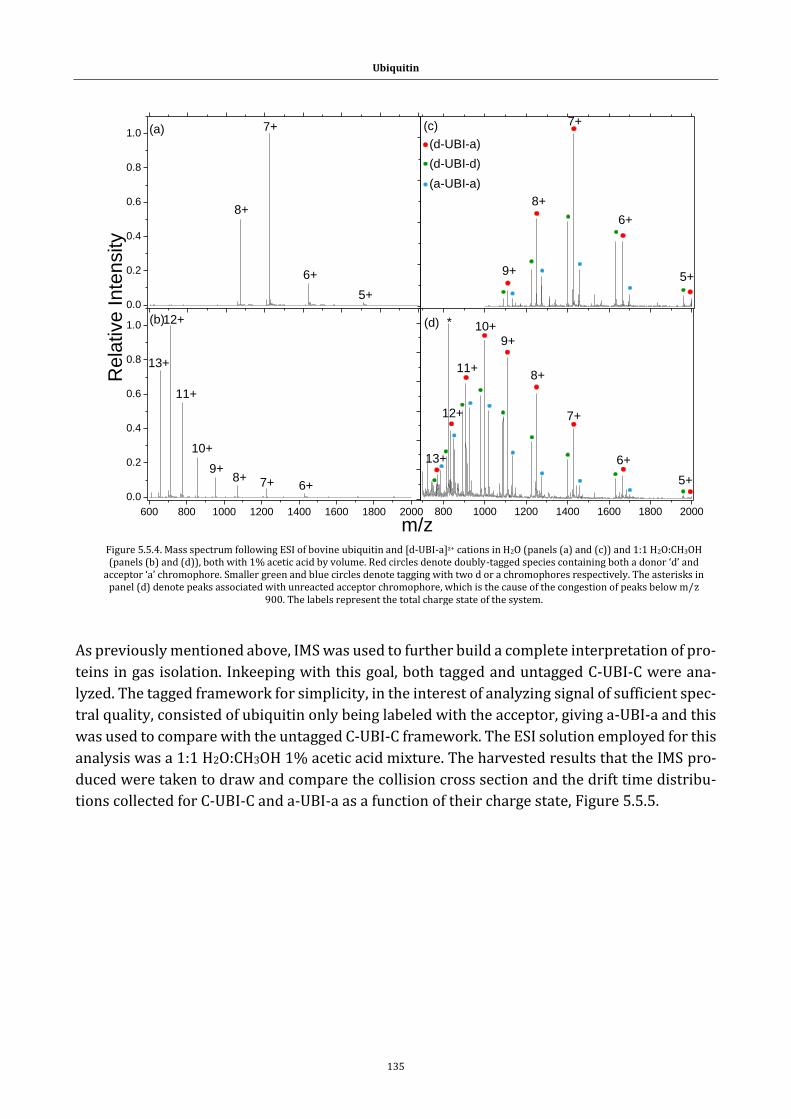
Ubiquitin
135
As previously mentioned above, IMS was used to further build a complete interpretation of pro-
teins in gas isolation. Inkeeping with this goal, both tagged and untagged C-UBI-C were ana-
lyzed. The tagged framework for simplicity, in the interest of analyzing signal of sufficient spec-
tral quality, consisted of ubiquitin only being labeled with the acceptor, giving a-UBI-a and this
was used to compare with the untagged C-UBI-C framework. The ESI solution employed for this
analysis was a 1:1 H2O:CH3OH 1% acetic acid mixture. The harvested results that the IMS pro-
duced were taken to draw and compare the collision cross section and the drift time distribu-
tions collected for C-UBI-C and a-UBI-a as a function of their charge state, Figure 5.5.5.
0.0
0.2
0.4
0.6
0.8
1.0
600 800 1000 1200 1400 1600 1800 2000
0.0
0.2
0.4
0.6
0.8
1.0
800 1000 1200 1400 1600 1800 2000
5+
Re
lative
In
ten
sity
7+
6+
8+
13+
12+
11+
10+
9+8+ 7+
m/z
6+
(d)
(c)
(b)
8+
9+
7+
6+
(a-UBI-a)
(d-UBI-d)
(d-UBI-a)
(a)
5+
13+
12+
11+
10+9+
8+
7+
6+
5+
*
Figure 5.5.4. Mass spectrum following ESI of bovine ubiquitin and [d-UBI-a]z+ cations in H2O (panels (a) and (c)) and 1:1 H2O:CH3OH (panels (b) and (d)), both with 1% acetic acid by volume. Red circles denote doubly-tagged species containing both a donor ‘d’ and
acceptor ‘a’ chromophore. Smaller green and blue circles denote tagging with two d or a chromophores respectively. The asterisks in panel (d) denote peaks associated with unreacted acceptor chromophore, which is the cause of the congestion of peaks below m/z
900. The labels represent the total charge state of the system.
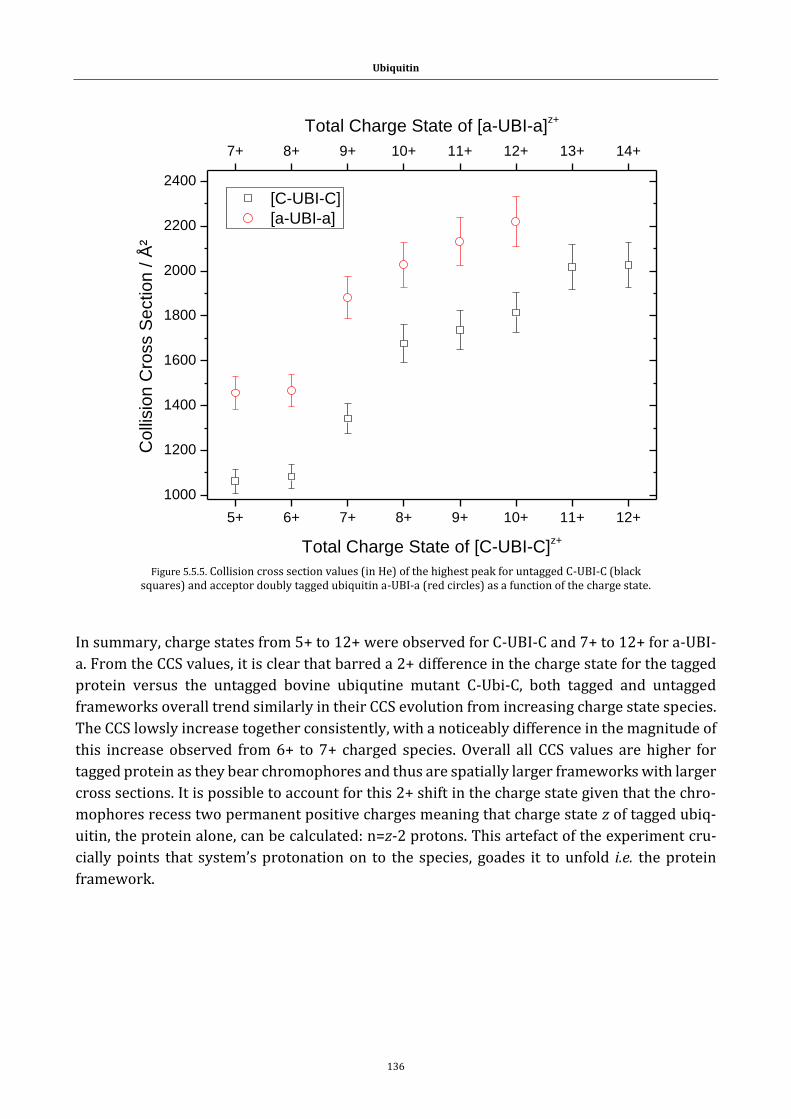
Ubiquitin
136
In summary, charge states from 5+ to 12+ were observed for C-UBI-C and 7+ to 12+ for a-UBI-
a. From the CCS values, it is clear that barred a 2+ difference in the charge state for the tagged
protein versus the untagged bovine ubiqutine mutant C-Ubi-C, both tagged and untagged
frameworks overall trend similarly in their CCS evolution from increasing charge state species.
The CCS lowsly increase together consistently, with a noticeably difference in the magnitude of
this increase observed from 6+ to 7+ charged species. Overall all CCS values are higher for
tagged protein as they bear chromophores and thus are spatially larger frameworks with larger
cross sections. It is possible to account for this 2+ shift in the charge state given that the chro-
mophores recess two permanent positive charges meaning that charge state z of tagged ubiq-
uitin, the protein alone, can be calculated: n=z-2 protons. This artefact of the experiment cru-
cially points that system’s protonation on to the species, goades it to unfold i.e. the protein
framework.
5+ 6+ 7+ 8+ 9+ 10+ 11+ 12+
1000
1200
1400
1600
1800
2000
2200
2400
[C-UBI-C]
[a-UBI-a]
Co
llisio
n C
ross S
ectio
n / Å
²
Total Charge State of [C-UBI-C]z+
7+ 8+ 9+ 10+ 11+ 12+ 13+ 14+
Total Charge State of [a-UBI-a]z+
Figure 5.5.5. Collision cross section values (in He) of the highest peak for untagged C-UBI-C (black squares) and acceptor doubly tagged ubiquitin a-UBI-a (red circles) as a function of the charge state.
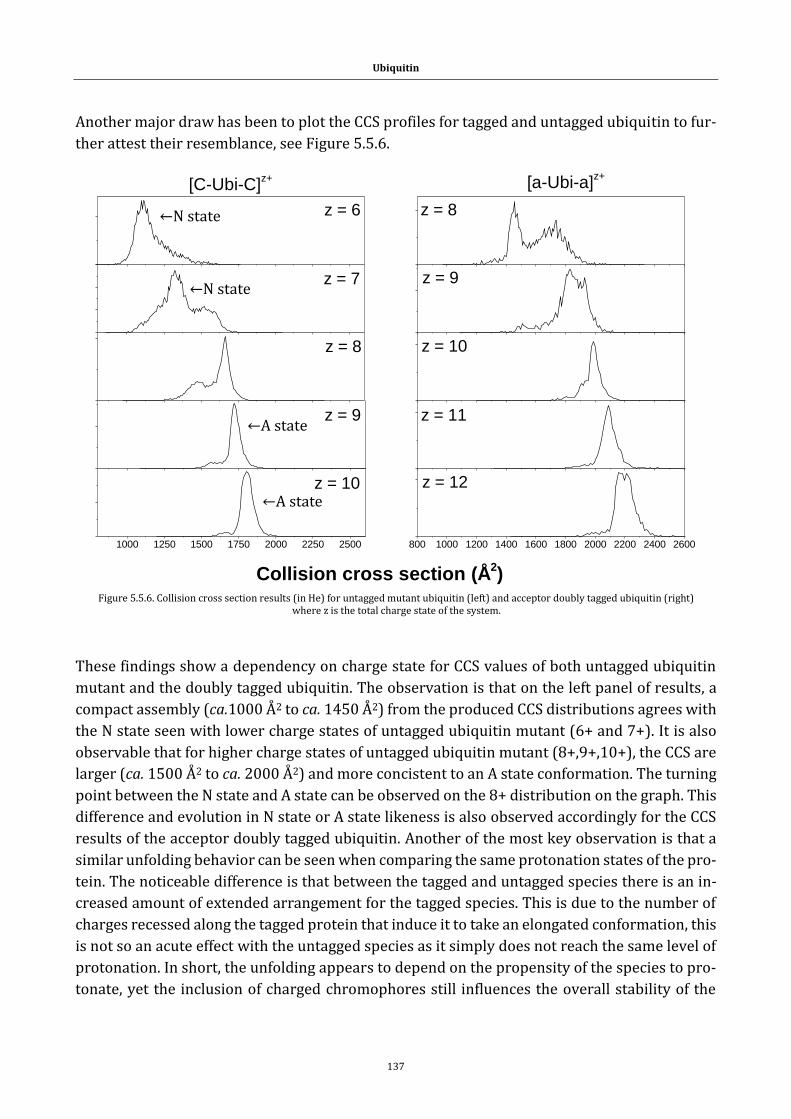
Ubiquitin
137
Another major draw has been to plot the CCS profiles for tagged and untagged ubiquitin to fur-
ther attest their resemblance, see Figure 5.5.6.
These findings show a dependency on charge state for CCS values of both untagged ubiquitin
mutant and the doubly tagged ubiquitin. The observation is that on the left panel of results, a
compact assembly (ca.1000 Å2 to ca. 1450 Å2) from the produced CCS distributions agrees with
the N state seen with lower charge states of untagged ubiquitin mutant (6+ and 7+). It is also
observable that for higher charge states of untagged ubiquitin mutant (8+,9+,10+), the CCS are
larger (ca. 1500 Å2 to ca. 2000 Å2) and more concistent to an A state conformation. The turning
point between the N state and A state can be observed on the 8+ distribution on the graph. This
difference and evolution in N state or A state likeness is also observed accordingly for the CCS
results of the acceptor doubly tagged ubiquitin. Another of the most key observation is that a
similar unfolding behavior can be seen when comparing the same protonation states of the pro-
tein. The noticeable difference is that between the tagged and untagged species there is an in-
creased amount of extended arrangement for the tagged species. This is due to the number of
charges recessed along the tagged protein that induce it to take an elongated conformation, this
is not so an acute effect with the untagged species as it simply does not reach the same level of
protonation. In short, the unfolding appears to depend on the propensity of the species to pro-
tonate, yet the inclusion of charged chromophores still influences the overall stability of the
[C-Ubi-C]z+
1000 1250 1500 1750 2000 2250 2500
Collision cross section (Å2)
z = 8
z = 9
z = 10
z = 11
z = 12
[a-Ubi-a]z+
800 1000 1200 1400 1600 1800 2000 2200 2400 2600
z = 7
z = 6
z = 8
z = 9
z = 10
Figure 5.5.6. Collision cross section results (in He) for untagged mutant ubiquitin (left) and acceptor doubly tagged ubiquitin (right) where z is the total charge state of the system.
←A state
←A state
←N state
←N state
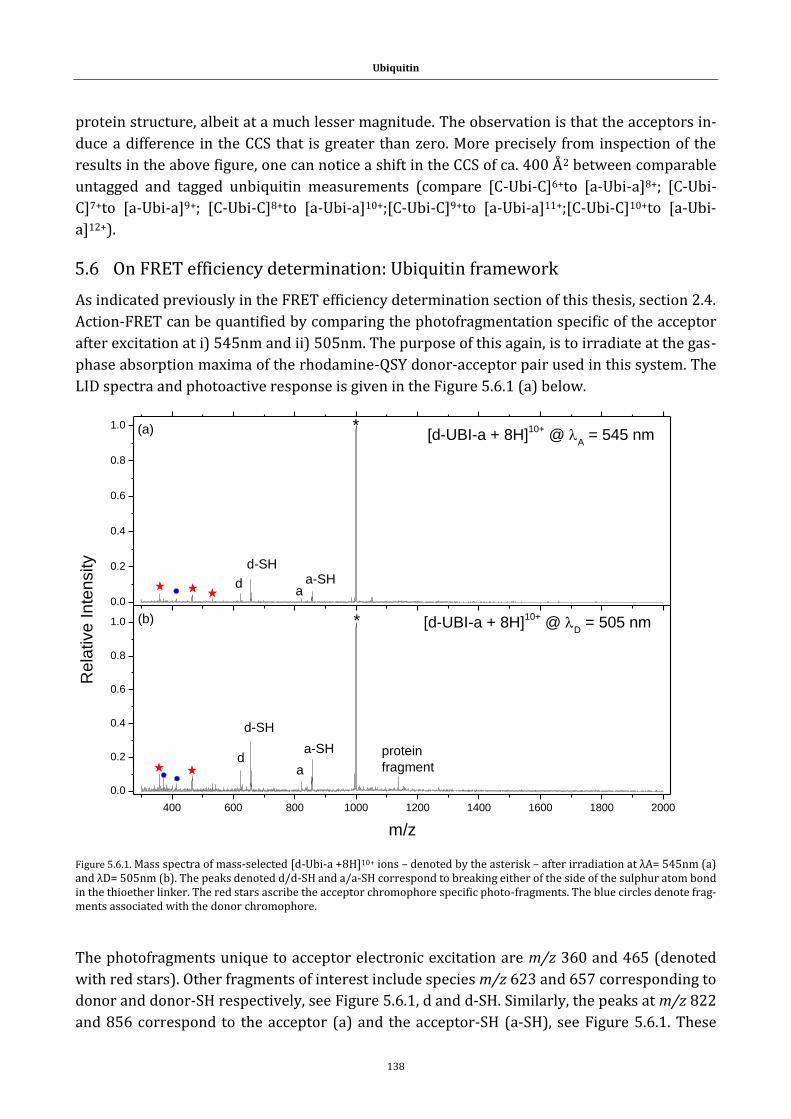
Ubiquitin
138
protein structure, albeit at a much lesser magnitude. The observation is that the acceptors in-
duce a difference in the CCS that is greater than zero. More precisely from inspection of the
results in the above figure, one can notice a shift in the CCS of ca. 400 Å2 between comparable
untagged and tagged unbiquitin measurements (compare [C-Ubi-C]6+to [a-Ubi-a]8+; [C-Ubi-
C]7+to [a-Ubi-a]9+; [C-Ubi-C]8+to [a-Ubi-a]10+;[C-Ubi-C]9+to [a-Ubi-a]11+;[C-Ubi-C]10+to [a-Ubi-
a]12+).
5.6 On FRET efficiency determination: Ubiquitin framework
As indicated previously in the FRET efficiency determination section of this thesis, section 2.4.
Action-FRET can be quantified by comparing the photofragmentation specific of the acceptor
after excitation at i) 545nm and ii) 505nm. The purpose of this again, is to irradiate at the gas-
phase absorption maxima of the rhodamine-QSY donor-acceptor pair used in this system. The
LID spectra and photoactive response is given in the Figure 5.6.1 (a) below.
Figure 5.6.1. Mass spectra of mass-selected [d-Ubi-a +8H]10+ ions – denoted by the asterisk – after irradiation at λA= 545nm (a) and λD= 505nm (b). The peaks denoted d/d-SH and a/a-SH correspond to breaking either of the side of the sulphur atom bond in the thioether linker. The red stars ascribe the acceptor chromophore specific photo-fragments. The blue circles denote frag-ments associated with the donor chromophore.
The photofragments unique to acceptor electronic excitation are m/z 360 and 465 (denoted
with red stars). Other fragments of interest include species m/z 623 and 657 corresponding to
donor and donor-SH respectively, see Figure 5.6.1, d and d-SH. Similarly, the peaks at m/z 822
and 856 correspond to the acceptor (a) and the acceptor-SH (a-SH), see Figure 5.6.1. These
0.0
0.2
0.4
0.6
0.8
1.0
400 600 800 1000 1200 1400 1600 1800 2000
0.0
0.2
0.4
0.6
0.8
1.0
Rela
tive I
nte
nsity
*(a) [d-UBI-a + 8H]10+
@ A = 545 nm
d-SH
da
a-SH
[d-UBI-a + 8H]10+
@ D = 505 nm(b) *
m/z
d-SH
da
a-SH protein
fragment
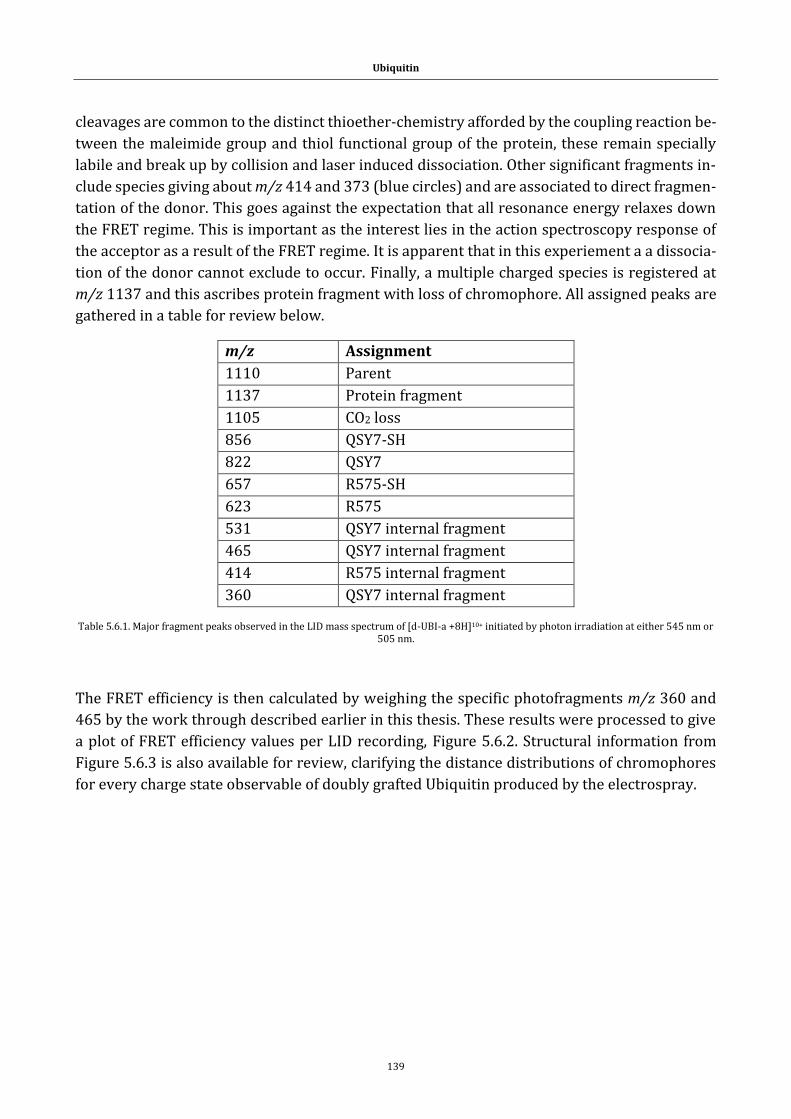
Ubiquitin
139
cleavages are common to the distinct thioether-chemistry afforded by the coupling reaction be-
tween the maleimide group and thiol functional group of the protein, these remain specially
labile and break up by collision and laser induced dissociation. Other significant fragments in-
clude species giving about m/z 414 and 373 (blue circles) and are associated to direct fragmen-
tation of the donor. This goes against the expectation that all resonance energy relaxes down
the FRET regime. This is important as the interest lies in the action spectroscopy response of
the acceptor as a result of the FRET regime. It is apparent that in this experiement a a dissocia-
tion of the donor cannot exclude to occur. Finally, a multiple charged species is registered at
m/z 1137 and this ascribes protein fragment with loss of chromophore. All assigned peaks are
gathered in a table for review below.
m/z Assignment
1110 Parent
1137 Protein fragment
1105 CO2 loss
856 QSY7-SH
822 QSY7
657 R575-SH
623 R575
531 QSY7 internal fragment
465 QSY7 internal fragment
414 R575 internal fragment
360 QSY7 internal fragment
Table 5.6.1. Major fragment peaks observed in the LID mass spectrum of [d-UBI-a +8H]10+ initiated by photon irradiation at either 545 nm or 505 nm.
The FRET efficiency is then calculated by weighing the specific photofragments m/z 360 and
465 by the work through described earlier in this thesis. These results were processed to give
a plot of FRET efficiency values per LID recording, Figure 5.6.2. Structural information from
Figure 5.6.3 is also available for review, clarifying the distance distributions of chromophores
for every charge state observable of doubly grafted Ubiquitin produced by the electrospray.
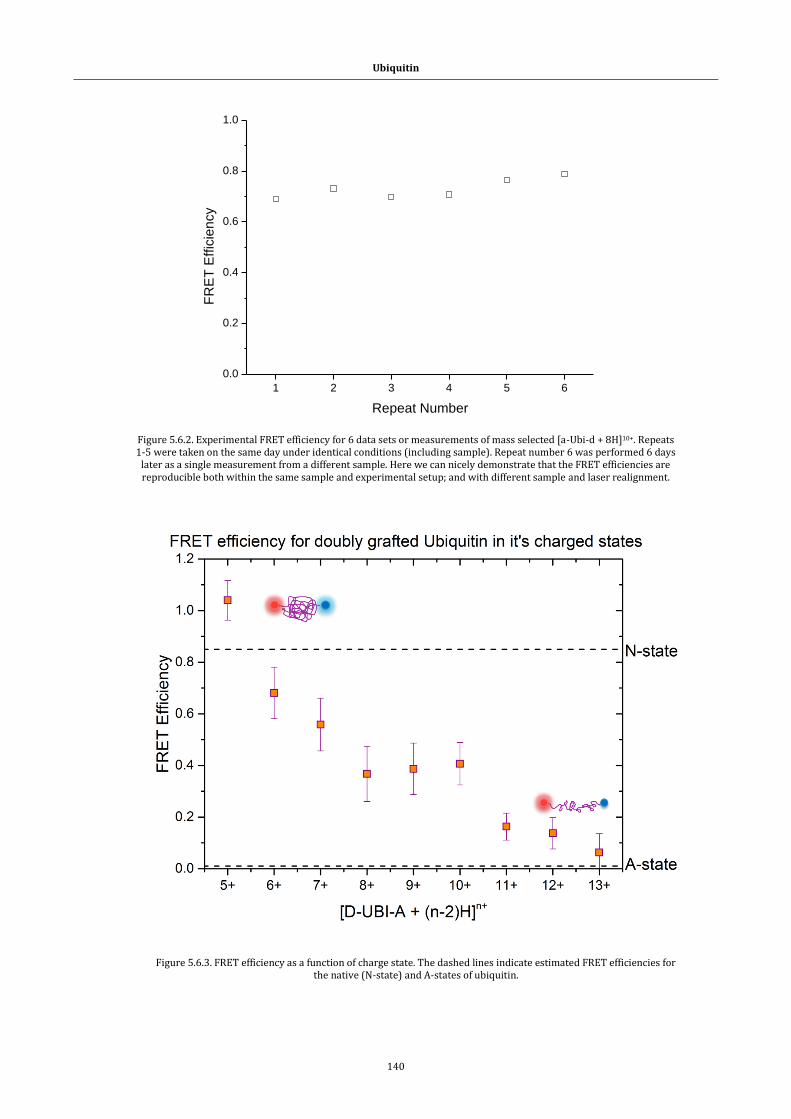
Ubiquitin
140
1 2 3 4 5 6
0.0
0.2
0.4
0.6
0.8
1.0
FR
ET
Effic
ien
cy
Repeat Number
Figure 5.6.2. Experimental FRET efficiency for 6 data sets or measurements of mass selected [a-Ubi-d + 8H]10+. Repeats 1-5 were taken on the same day under identical conditions (including sample). Repeat number 6 was performed 6 days
later as a single measurement from a different sample. Here we can nicely demonstrate that the FRET efficiencies are reproducible both within the same sample and experimental setup; and with different sample and laser realignment.
Figure 5.6.3. FRET efficiency as a function of charge state. The dashed lines indicate estimated FRET efficiencies for the native (N-state) and A-states of ubiquitin.
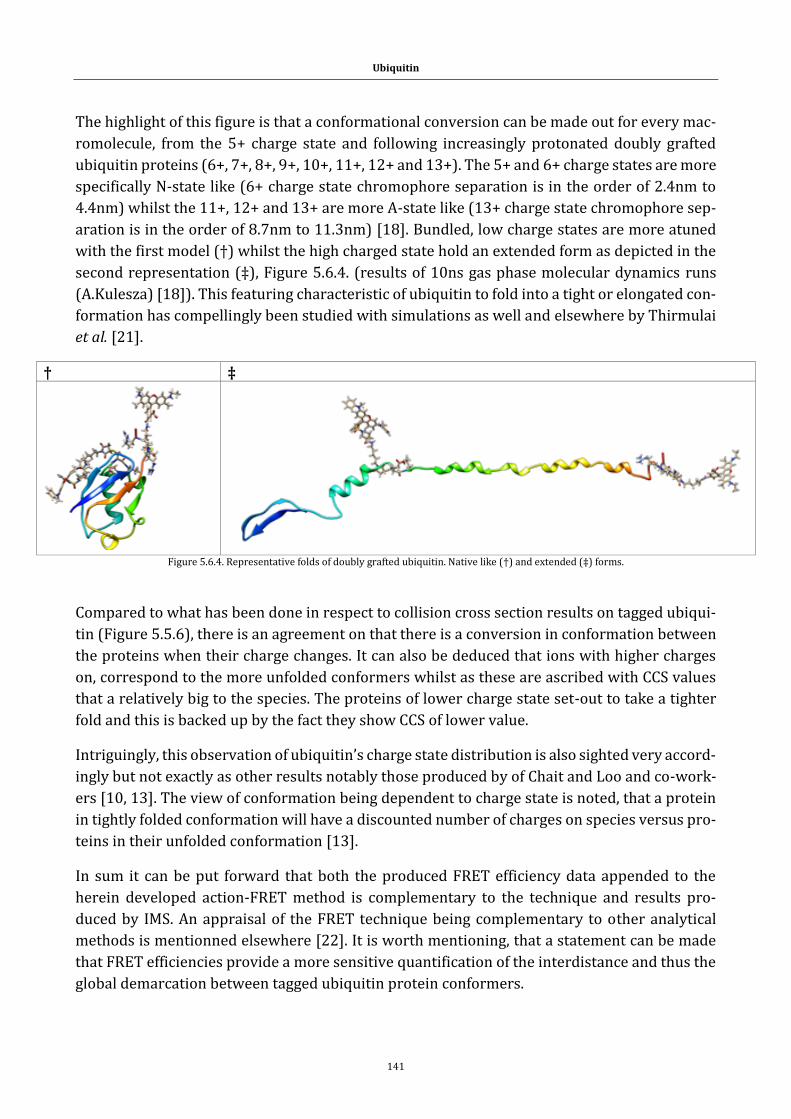
Ubiquitin
141
The highlight of this figure is that a conformational conversion can be made out for every mac-
romolecule, from the 5+ charge state and following increasingly protonated doubly grafted
ubiquitin proteins (6+, 7+, 8+, 9+, 10+, 11+, 12+ and 13+). The 5+ and 6+ charge states are more
specifically N-state like (6+ charge state chromophore separation is in the order of 2.4nm to
4.4nm) whilst the 11+, 12+ and 13+ are more A-state like (13+ charge state chromophore sep-
aration is in the order of 8.7nm to 11.3nm) [18]. Bundled, low charge states are more atuned
with the first model (†) whilst the high charged state hold an extended form as depicted in the
second representation (‡), Figure 5.6.4. (results of 10ns gas phase molecular dynamics runs
(A.Kulesza) [18]). This featuring characteristic of ubiquitin to fold into a tight or elongated con-
formation has compellingly been studied with simulations as well and elsewhere by Thirmulai
et al. [21].
† ‡
Figure 5.6.4. Representative folds of doubly grafted ubiquitin. Native like (†) and extended (‡) forms.
Compared to what has been done in respect to collision cross section results on tagged ubiqui-
tin (Figure 5.5.6), there is an agreement on that there is a conversion in conformation between
the proteins when their charge changes. It can also be deduced that ions with higher charges
on, correspond to the more unfolded conformers whilst as these are ascribed with CCS values
that a relatively big to the species. The proteins of lower charge state set-out to take a tighter
fold and this is backed up by the fact they show CCS of lower value.
Intriguingly, this observation of ubiquitin’s charge state distribution is also sighted very accord-
ingly but not exactly as other results notably those produced by of Chait and Loo and co-work-
ers [10, 13]. The view of conformation being dependent to charge state is noted, that a protein
in tightly folded conformation will have a discounted number of charges on species versus pro-
teins in their unfolded conformation [13].
In sum it can be put forward that both the produced FRET efficiency data appended to the
herein developed action-FRET method is complementary to the technique and results pro-
duced by IMS. An appraisal of the FRET technique being complementary to other analytical
methods is mentionned elsewhere [22]. It is worth mentioning, that a statement can be made
that FRET efficiencies provide a more sensitive quantification of the interdistance and thus the
global demarcation between tagged ubiquitin protein conformers.
Ubiquitin
142
5.7 References :
1. Hershko A, Ciechanover A: The ubiquitin system. Annual Review of Biochemistry 1998, 67:425-479. 2. Pickart CM, Eddins MJ: Ubiquitin: structures, functions, mechanisms. Biochimica Et Biophysica Acta-
Molecular Cell Research 2004, 1695:55-72. 3. Segev E, Wyttenbach T, Bowers MT, Gerber RB: Conformational evolution of ubiquitin ions in
electrospray mass spectrometry: molecular dynamics simulations at gradually increasing temperatures. Physical Chemistry Chemical Physics 2008, 10:3077-3082.
4. Skinner OS, McLafferty FW, Breuker K: How Ubiquitin Unfolds after Transfer into the Gas Phase. Journal of the American Society for Mass Spectrometry 2012, 23:1011-1014.
5. Breuker K, McLafferty FW: Stepwise evolution of protein native structure with electrospray into the gas phase, 10(-12) to 10(2) S. Proceedings of the National Academy of Sciences of the United States of America 2008, 105:18145-18152.
6. Oh H, Breuker K, Sze SK, Ge Y, Carpenter BK, McLafferty FW: Secondary and tertiary structures of gaseous protein ions characterized by electron capture dissociation mass spectrometry and photofragment spectroscopy. Proceedings of the National Academy of Sciences of the United States of America 2002, 99:15863-15868.
7. Going CC, Williams ER: Supercharging with m-Nitrobenzyl Alcohol and Propylene Carbonate: Forming Highly Charged Ions with Extended, Near-Linear Conformations. Analytical Chemistry 2015, 87:3973-3980.
8. Skinner OS, Breuker K, McLafferty FW: Charge Site Mass Spectra: Conformation-Sensitive Components of the Electron Capture Dissociation Spectrum of a Protein. Journal of the American Society for Mass Spectrometry 2013, 24:807-810.
9. Rajabi K: Microsecond pulsed hydrogen/deuterium exchange of electrosprayed ubiquitin ions stored in a linear ion trap. Physical Chemistry Chemical Physics 2015, 17:3607-3616.
10. Chowdhury SK, Katta V, Chait BT: Probing conformational-changes in proteins by mass-spectrometry. Journal of the American Chemical Society 1990, 112:9012-9013.
11. Shi HL, Pierson NA, Valentine SJ, Clemmer DE: Conformation Types of Ubiquitin M+8H (8+) Ions from Water:Methanol Solutions: Evidence for the N and A States in Aqueous Solution. Journal of Physical Chemistry B 2012, 116:3344-3352.
12. Shi HL, Atlasevich N, Merenbloom SI, Clemmer DE: Solution Dependence of the Collisional Activation of Ubiquitin M+7H (7+) Ions. Journal of the American Society for Mass Spectrometry 2014, 25:2000-2008.
13. Kaltashov IA, Eyles SJ: Mass spectrometry in biophysics. Hoboken, New Jersey: Wiley; 2005. 14. Loo JA, Loo RRO, Udseth HR, Edmonds CG, Smith RD: Solvent-induced conformational-changes of
polypeptides probed by electrospray-ionization mass-spectrometry. Rapid Communications in Mass Spectrometry 1991, 5:101-105.
15. Koeniger SL, Clemmer DE: Resolution and structural transitions of elongated states of ubiquitin. Journal of the American Society for Mass Spectrometry 2007, 18:322-331.
16. Martin SF, Tatham MH, Hay RT, Samuel IDW: Quantitative analysis of multi-protein interactions using FRET: Application to the SUMO pathway. Protein Science 2008, 17:777-784.
17. Ganesan S, Ameer-beg SM, Ng TTC, Vojnovic B, Wouters FS: A dark yellow fluorescent protein (YFP)-based Resonance Energy-Accepting Chromoprotein (REACh) for Forster resonance energy transfer with GFP. Proceedings of the National Academy of Sciences of the United States of America 2006, 103:4089-4094.
18. Daly S, Knight G, Halim MA, Kulesza A, Choi CM, Chirot F, MacAleese L, Antoine R, Dugourd P: Action-FRET of a Gaseous Protein. Journal of the American Society for Mass Spectrometry 2017, 28:38-49.
19. Weber PL, Brown SC, Mueller L: Sequential H-1-NMR assignements and secondary structure identification of human ubiquitin. Biochemistry 1987, 26:7282-7290.
20. Lees JG, Miles AJ, Wien F, Wallace BA: A reference database for circular dichroism spectroscopy covering fold and secondary structure space. Bioinformatics 2006, 22:1955-1962.
21. Reddy G, Thirumalai D: Collapse Precedes Folding in Denaturant-Dependent Assembly of Ubiquitin. Journal of Physical Chemistry B 2017, 121:995-1009.
22. Aznauryan M, Delgado L, Soranno A, Nettels D, Huang JR, Labhardt AM, Grzesiek S, Schuler B: Comprehensive structural and dynamical view of an unfolded protein from the combination of single-molecule FRET, NMR, and SAXS. Proceedings of the National Academy of Sciences of the United States of America 2016, 113:E5389-E5398.

Negative action FRET
143
Negative action FRET
144
Negative action FRET.
In this chapter, the concepts of action-FRET are taken and tested in the negative polarity mode
of the mass spectrometer. This includes the experimental and spectroscopy developments
made and a discussion of the photophysical observations made, maneouvring two different sets
of chromophore pairs. In effect, there is an increasing interest in study of biological molecules
in the solvent-free, gas-phase medium using mass spectrometry techniques [1]. The main ad-
vantage being that it is possible to probe the intrinsic properties of a biomolecule free of any
interference: average ensemble effects that would exist in solution measurements. The early
use of Forster resonance energy transfer to study their conformation has proven particularly
appealing and a well-attested accurate structural tool. Herein we give the first example of neg-
ative-mode action FRET using specific photofragmentation as a reporter of the distance be-
tween chromophores tethered to a range of polypeptides. The efficiency of working with nega-
tive voltages at the electrospray ionizer is studied as a function of charge state of the polypep-
tides. The observation of our results show that negative mode action FRET offers new spectral
patterns unique to negative charged state species, critically enhancing the action FRET method
as a structural tool for interrogating biomolecule conformational dynamics. The last section in-
cludes a conclusion on the novel undertaking and examinations made.
6.1 Honing into negative action-FRET. Introduction.
Previous methods in the positive mode have used QSY7 N-succinimidyl ester (Life technolo-
gies) as the acceptor and 5-carboxyrhodamine 575 N-succinimidyl ester (rh575) (Life technol-
ogies) as a donor chromophore [2-5]. Similarly, Talbot et al. also used Rh575 as a donor chro-
mophore, both the fluorescence and excitation and emission spectra along with the photofrag-
mentation mass spectra have been studied in detail. Zenobi and co-workers offer a detailed
report on donor acceptor pairs suitable for gas phase FRET. Carboxyrhodamine 6G (cR6G)-
ATTO590 hexamethylenediame and carborhodamine 6G (cR6G)-Bodipy TR cadaverine [6]. In
the workings aforementioned herein, we carry out measurements in the negative mode to eval-
uate the feasibility of using a chromophore as a FRET gas phase component. The donor chro-
mophore, NBD-maleimide, absorbs at 440nm in the gas phase and serves with the acceptor
chromophore 5-Maleimido-eosin.
6.1.1 Mass Spectrometry and Optical Spectroscopy.
The experimental setup used to execute the experiments presented in this paper has been de-
scribed in detail before. In short, a linear quadrupole ion trap mass spectrometer (LTQ Velos,
Thermo Fisher Scientific, San Jose, CA) was used for ion preparation, ion selection and trapping,
fragmentation (CID and photodissociation), and subsequently, final mass analysis. The back
panel of the vacuum manifold was modified by drilling a hole and fitting a quartz window (30
mm diameter and 5 mm thickness). This window was positioned in front of the linear ion trap
such as to allow the direct irradiation of trapped ionic species within the axis of the laser beam.
Negative action FRET
145
The light source used is a Horizon OPO pumped by the third harmonic (355nm) of a Surelite II
Nd: YAG laser (Continuum, Santa Clara, CA). A repetition rate of 10 Hz and pulse widths of the
order of 5 ns were used. The visible portion of the spectrum was used directly via the signal
beam of the OPO (410-700nm), which is collimated and refocused with a long focal distance
lense of 1000 mm. A mechanical shutter synchronized with the mass spectrometer, is used to
stop the beam at discreet time intervals set in accordance with “the ion activation window”- a
time laps starting after ion accumulation and concluding, short to, the mass analysis. A single
laser pulse is effectively used for the irradiation of the trapped ions. When irradiating ions the
normalized collision energy is kept at zero. In this experiment laser power is measured by plac-
ing the power meter in a way so that it crosscuts its path. The power is monitored using a power
meter (Ophir-Spiricon GmbH, Ahrensburg, Germany). The value of the power used for normal-
ization is taken via two manners. One - over the duration of a measurement that is to say, an
internal scan of the laser beam from 540nm to 420nm, step 0.1, delay 1, number of scans 1. The
effective power for all spectra presented here is kept at an average of 1.9 mW. Two – for 1 min
before or after an LID mass spectrum acquisition. Measured power averaged 5.5mW in this
way.
6.1.2 Experimental
Peptides and chromophores. An account on the rational in the choosing of peptides and chro-
mophores is given in the following section. The acceptor chromophore is 5-Maleimido-eosin
(Sigma-Aldrich), a quencher absorbing at 524nm in solution and known to fragment efficiently
at 520nm and 530nm for the first and second of its respective charge states in the gas phase.
The donor chromophore is 1-[2-benzoxadiazol-4-yl)amino]ethyl]2, 5dihydro-1H-pyrrole-2, 5-
dione (NBD-maleimide). It is the product of the reaction NBD-Cl (0.092g) treated with ethyla-
mine maleimide (0.091g) and triethylamine (0.010g) in acetonitrile (0.615g) at room temper-
ature, it was observed that the reaction yielded better after 50°C heating for ca.2 hours. Both
chromophores in this experiment are designed to tether onto the thiol groups pertaining to the
cysteine amino acids, and thus peptides containing two cysteine amino acids at the N and C
termini were chosen, in this instance CAKAK, CAADAAEAA and CAADAAEAAC. The chromo-
phores were grafted individually onto the peptides, the 5-maleimido-eosin (eosin) first fol-
lowed by the NBD-maleimide. The reaction conditions were as followed: a stock solution of
CAKAC was prepared in water (1.3mg/ 1ml, 2.6M). A 60µl aliquot of this stock solution was
taken and treated with 30µl NH4OH (1 mM) and 20µl eosin (~0.015mM) in 390µl distilled H2O.
To facilitate dilution, eosin was dissolved in DMSO prior to further work up (2mg/200µl). Then
this mixture was treated with 30 µl NBD-maleimide (~0.01mM). It is important to note that it
is highly improbable for the chromophore to tether to the carboxylic and amide moieties of the
peptides as the thiol groups are more competitive and tend to prohibit further chromophore
grafting. The other peptides were uniformarly treated to give doubly grafted species.
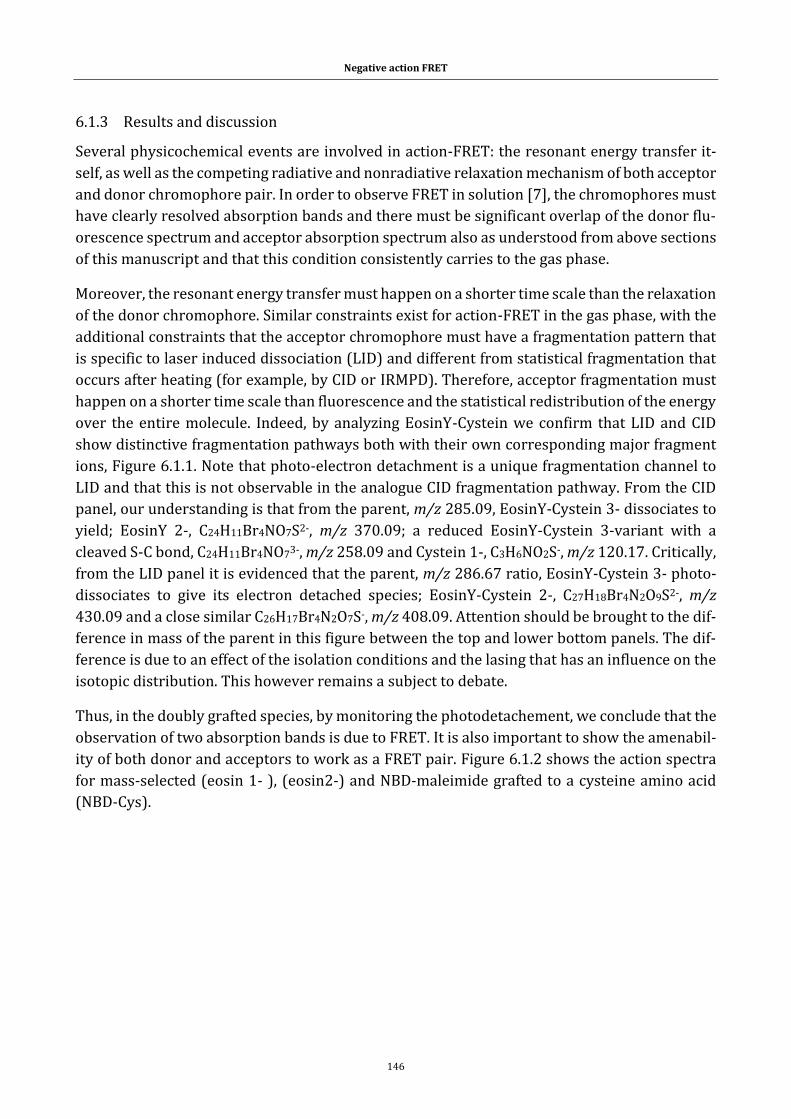
Negative action FRET
146
6.1.3 Results and discussion
Several physicochemical events are involved in action-FRET: the resonant energy transfer it-
self, as well as the competing radiative and nonradiative relaxation mechanism of both acceptor
and donor chromophore pair. In order to observe FRET in solution [7], the chromophores must
have clearly resolved absorption bands and there must be significant overlap of the donor flu-
orescence spectrum and acceptor absorption spectrum also as understood from above sections
of this manuscript and that this condition consistently carries to the gas phase.
Moreover, the resonant energy transfer must happen on a shorter time scale than the relaxation
of the donor chromophore. Similar constraints exist for action-FRET in the gas phase, with the
additional constraints that the acceptor chromophore must have a fragmentation pattern that
is specific to laser induced dissociation (LID) and different from statistical fragmentation that
occurs after heating (for example, by CID or IRMPD). Therefore, acceptor fragmentation must
happen on a shorter time scale than fluorescence and the statistical redistribution of the energy
over the entire molecule. Indeed, by analyzing EosinY-Cystein we confirm that LID and CID
show distinctive fragmentation pathways both with their own corresponding major fragment
ions, Figure 6.1.1. Note that photo-electron detachment is a unique fragmentation channel to
LID and that this is not observable in the analogue CID fragmentation pathway. From the CID
panel, our understanding is that from the parent, m/z 285.09, EosinY-Cystein 3- dissociates to
yield; EosinY 2-, C24H11Br4NO7S2-, m/z 370.09; a reduced EosinY-Cystein 3-variant with a
cleaved S-C bond, C24H11Br4NO73-, m/z 258.09 and Cystein 1-, C3H6NO2S-, m/z 120.17. Critically,
from the LID panel it is evidenced that the parent, m/z 286.67 ratio, EosinY-Cystein 3- photo-
dissociates to give its electron detached species; EosinY-Cystein 2-, C27H18Br4N2O9S2-, m/z
430.09 and a close similar C26H17Br4N2O7S-, m/z 408.09. Attention should be brought to the dif-
ference in mass of the parent in this figure between the top and lower bottom panels. The dif-
ference is due to an effect of the isolation conditions and the lasing that has an influence on the
isotopic distribution. This however remains a subject to debate.
Thus, in the doubly grafted species, by monitoring the photodetachement, we conclude that the
observation of two absorption bands is due to FRET. It is also important to show the amenabil-
ity of both donor and acceptors to work as a FRET pair. Figure 6.1.2 shows the action spectra
for mass-selected (eosin 1- ), (eosin2-) and NBD-maleimide grafted to a cysteine amino acid
(NBD-Cys).
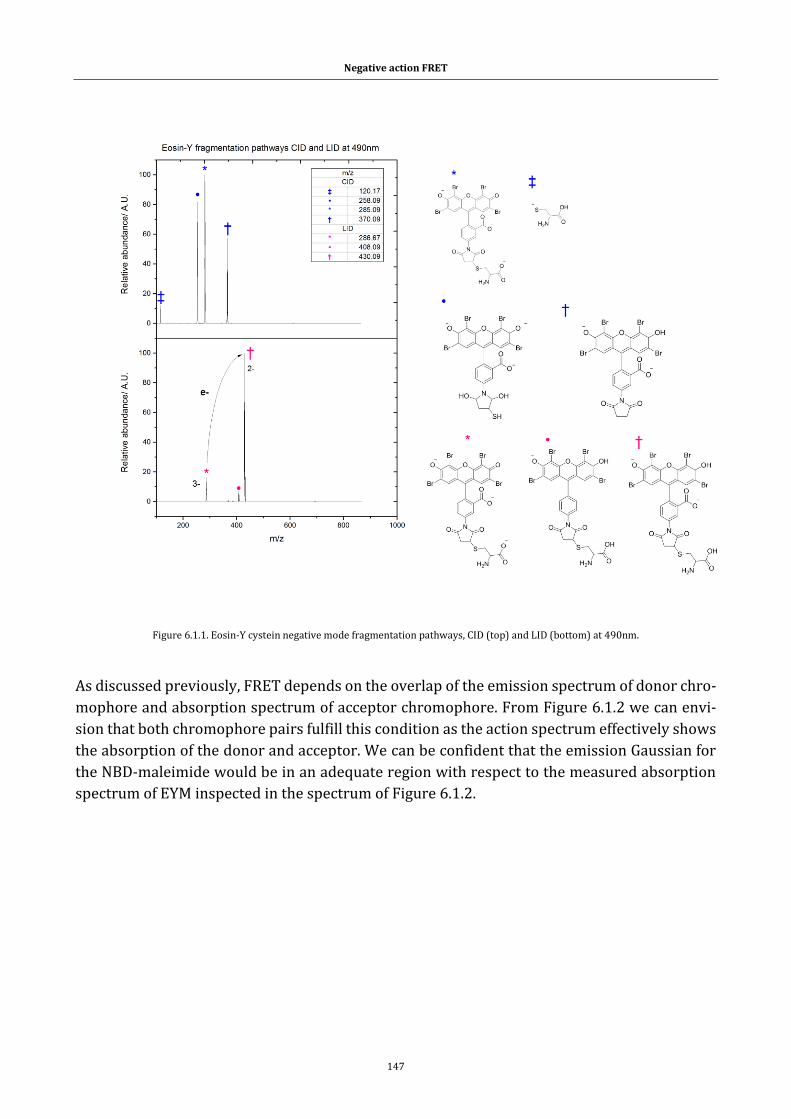
Negative action FRET
147
Figure 6.1.1. Eosin-Y cystein negative mode fragmentation pathways, CID (top) and LID (bottom) at 490nm.
As discussed previously, FRET depends on the overlap of the emission spectrum of donor chro-
mophore and absorption spectrum of acceptor chromophore. From Figure 6.1.2 we can envi-
sion that both chromophore pairs fulfill this condition as the action spectrum effectively shows
the absorption of the donor and acceptor. We can be confident that the emission Gaussian for
the NBD-maleimide would be in an adequate region with respect to the measured absorption
spectrum of EYM inspected in the spectrum of Figure 6.1.2.
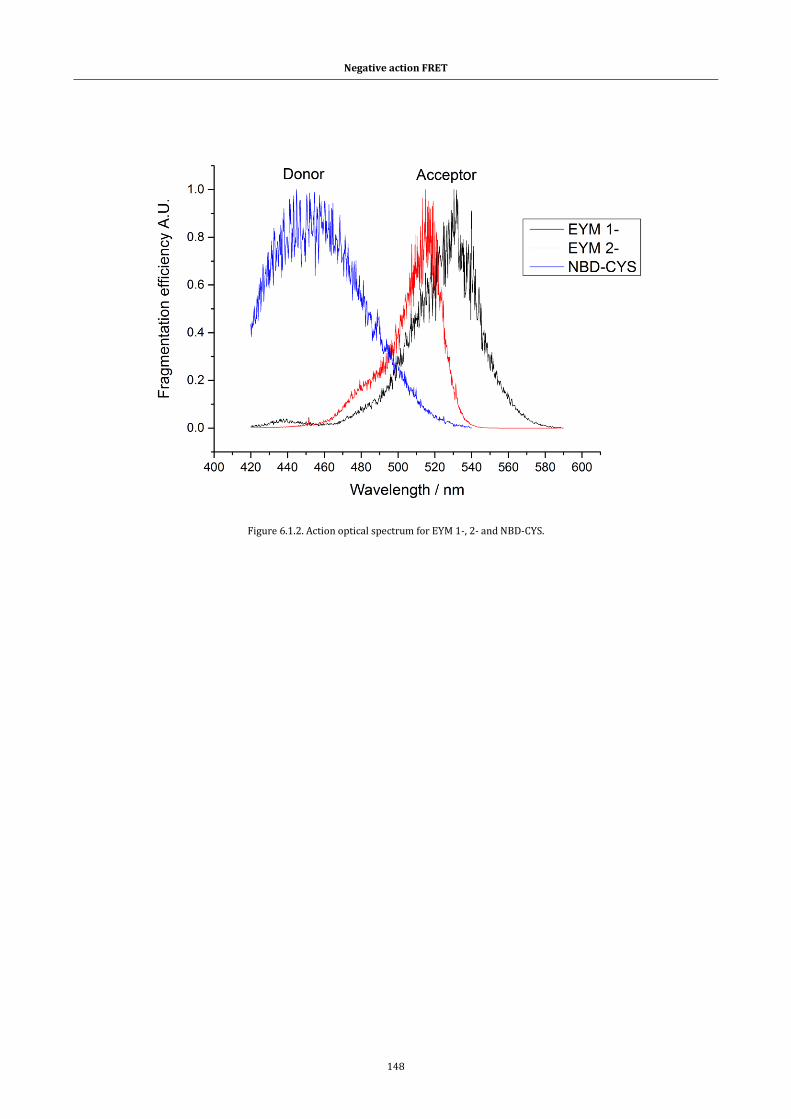
Negative action FRET
148
Figure 6.1.2. Action optical spectrum for EYM 1-, 2- and NBD-CYS.
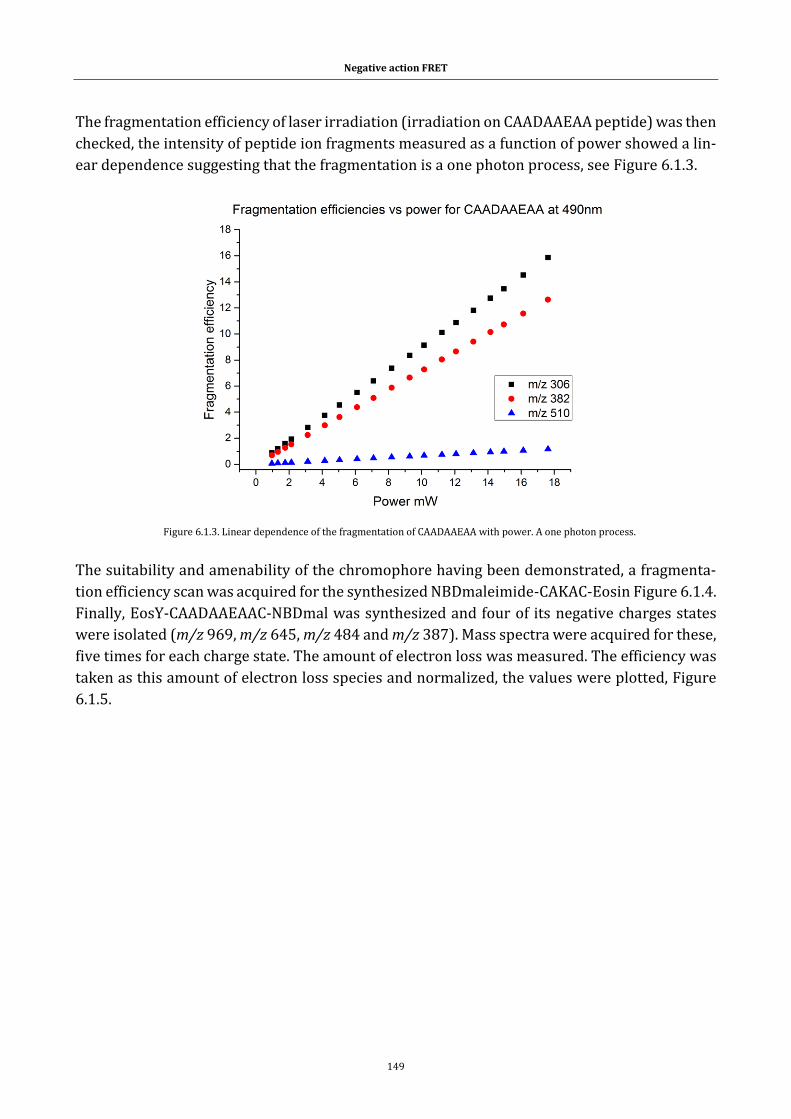
Negative action FRET
149
The fragmentation efficiency of laser irradiation (irradiation on CAADAAEAA peptide) was then
checked, the intensity of peptide ion fragments measured as a function of power showed a lin-
ear dependence suggesting that the fragmentation is a one photon process, see Figure 6.1.3.
The suitability and amenability of the chromophore having been demonstrated, a fragmenta-
tion efficiency scan was acquired for the synthesized NBDmaleimide-CAKAC-Eosin Figure 6.1.4.
Finally, EosY-CAADAAEAAC-NBDmal was synthesized and four of its negative charges states
were isolated (m/z 969, m/z 645, m/z 484 and m/z 387). Mass spectra were acquired for these,
five times for each charge state. The amount of electron loss was measured. The efficiency was
taken as this amount of electron loss species and normalized, the values were plotted, Figure
6.1.5.
Figure 6.1.3. Linear dependence of the fragmentation of CAADAAEAA with power. A one photon process.
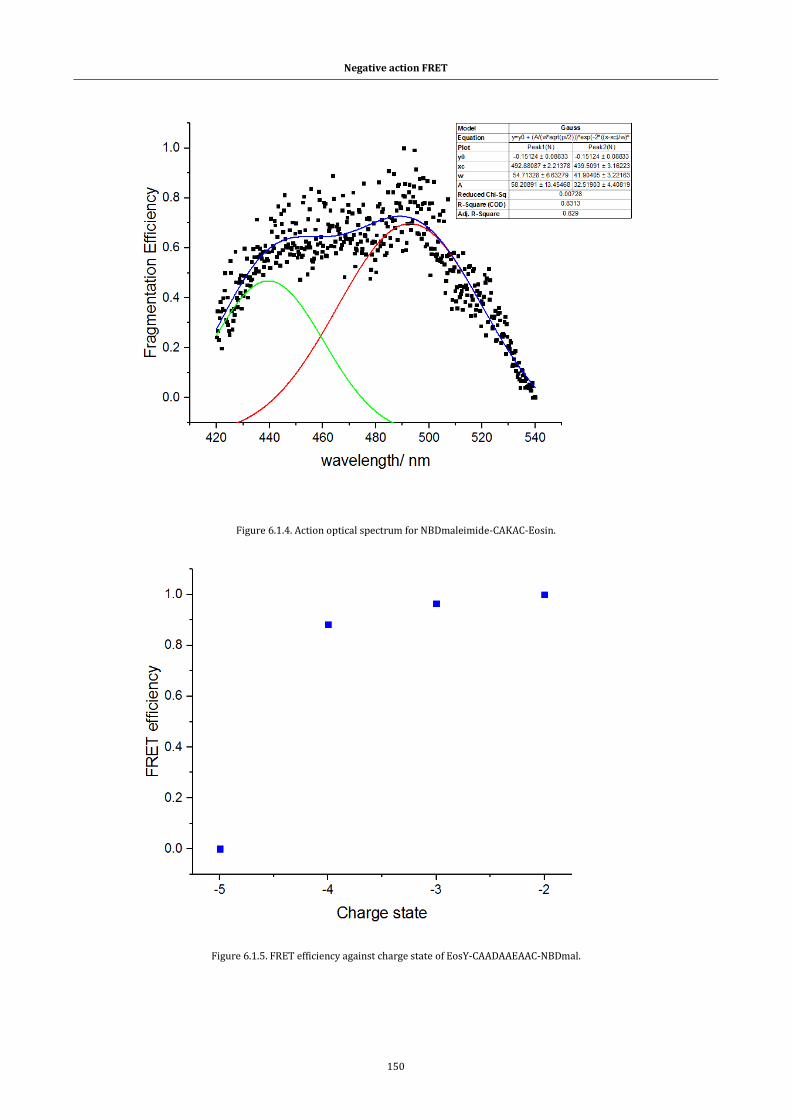
Negative action FRET
150
Figure 6.1.4. Action optical spectrum for NBDmaleimide-CAKAC-Eosin.
Figure 6.1.5. FRET efficiency against charge state of EosY-CAADAAEAAC-NBDmal.
Negative action FRET
151
6.1.4 Conclusion
In this section a demonstrated feasibility of studying peptides through action-FRET in the neg-ative mode of an LTQ velos has parthened. We first demonstrate that in the negative mode the fragmentation of EosinY-Cystein is different through LID or CID, as anticipated. The action-FRET methodology provides a significant advance in the study of the conformation and struc-ture of gas-phase molecular ions. A clear and coherent methodology is presented on chromo-phore pairs for performing action-FRET in the negative regime on a peptide, which can provide a basis for future studies on other biomolecules that are of higher analytical interest in the neg-ative mode and weakly responsive to the positive mode of a mass spectrometer’s ESI. In doing so, bolstering the action-FRET approach to its full potential as both a positive and negative mode MS technique. Nevertheless, the method is difficult in that the signature fragments proved difficult to express rigorously, in sum the interest remained in establishing the negative mode technique with a QSY acceptor so to continue with a familiar integrity in signature fragmenta-tion. Something that has been addressed and is discussed in the next sections of this chapter.
6.2 A case of action-FRET II in the negative mode.
Foster resonance energy transfer (FRET) has found numerous uses in structural biology, bio-chemistry, polymer science [8] and chemical biology for measuring proximity changes in the order of distances and dimensions pertinent to biological macromolecules and their mecha-nisms. To recapitulate, FRET is a non-radiative quantic transfer interaction between the excited state of a donor molecule and of an acceptor molecule. The ability to measure FRET is depend-ent on three conditions: i) that the donor-acceptor pair inter-distance be within range (10- to 100-Å) ii) that the absorption spectrum of the acceptor juxtaposes that of the fluorescence emission of the donor iii) that donor and acceptor transition dipole geometry must be approx-imately parallel. For action-FRET and its gas phase medium, disintegration must be the end fate of the acceptor chromophore so to breakdown to produce a recognizable and specific fragmen-tation pattern. These set of peaks are then the reporting signal of specific electronic excitation that is different from statistical fragmentation that occurs through heating (e.g. CID or IRMPD). The experiments, is devised so that the user goes on to raster laser-induced dissociation (LID) on the doubly stapled species. In this way, from triggering specific excitation (fragmentation) at each wavelength and profiling a bimodal action spectrum one can critically assess FRET. What we wish to do is to extend the earlier method of action-FRET in the positive mode [9] and transpose it to demonstrate that it works in the negative mode of the MS and that the negative action-FRET principle is possible. The results of these experiments provide evidence of nega-tive mode reporters that are comparable to the profile of action spectra produced in the posi-tive mode and used to evaluate FRET. It has therefore been fundamental to measure the yield of these specific photo fragments of negatively trapped species. It is also important to show that, just as in positive mode, the strength of the observed action-FRET depends on the distance between chromophores.
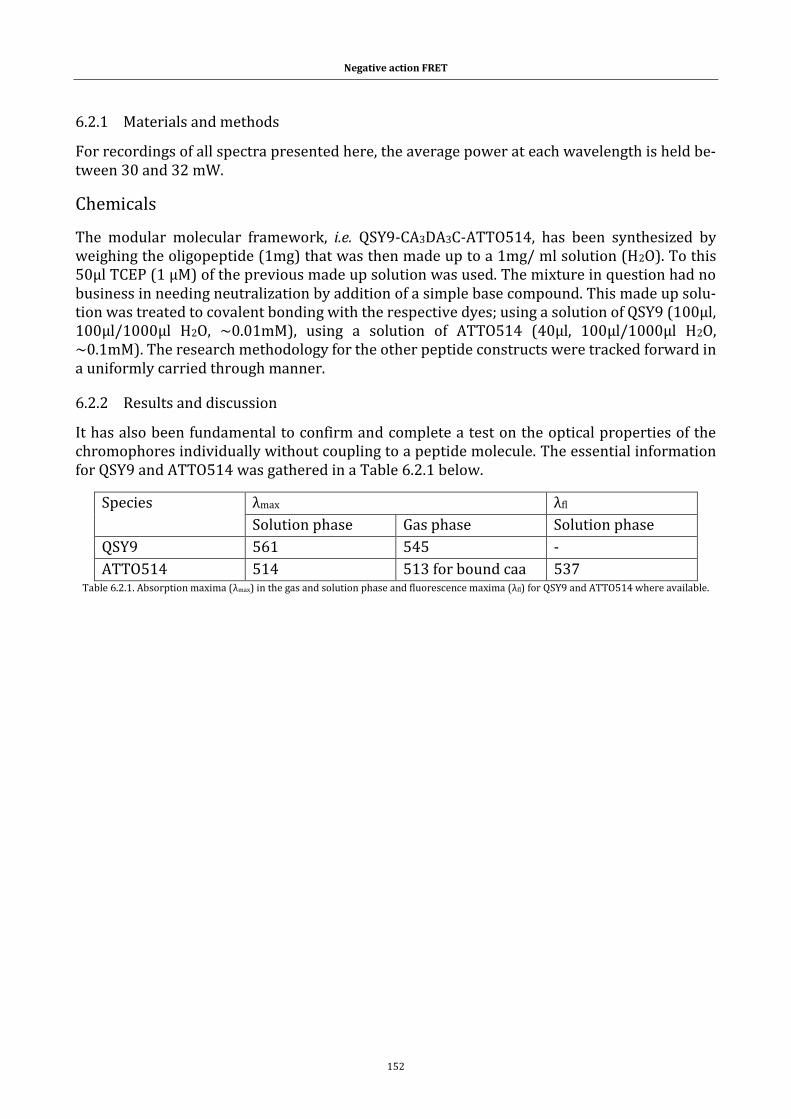
Negative action FRET
152
6.2.1 Materials and methods
For recordings of all spectra presented here, the average power at each wavelength is held be-tween 30 and 32 mW.
Chemicals
The modular molecular framework, i.e. QSY9-CA3DA3C-ATTO514, has been synthesized by weighing the oligopeptide (1mg) that was then made up to a 1mg/ ml solution (H2O). To this 50µl TCEP (1 μM) of the previous made up solution was used. The mixture in question had no business in needing neutralization by addition of a simple base compound. This made up solu-tion was treated to covalent bonding with the respective dyes; using a solution of QSY9 (100µl, 100µl/1000µl H2O, ~0.01mM), using a solution of ATTO514 (40µl, 100µl/1000µl H2O, ~0.1mM). The research methodology for the other peptide constructs were tracked forward in a uniformly carried through manner.
6.2.2 Results and discussion
It has also been fundamental to confirm and complete a test on the optical properties of the chromophores individually without coupling to a peptide molecule. The essential information for QSY9 and ATTO514 was gathered in a Table 6.2.1 below.
Species λmax λfl
Solution phase Gas phase Solution phase
QSY9 561 545 -
ATTO514 514 513 for bound caa 537 Table 6.2.1. Absorption maxima (λmax) in the gas and solution phase and fluorescence maxima (λfl) for QSY9 and ATTO514 where available.
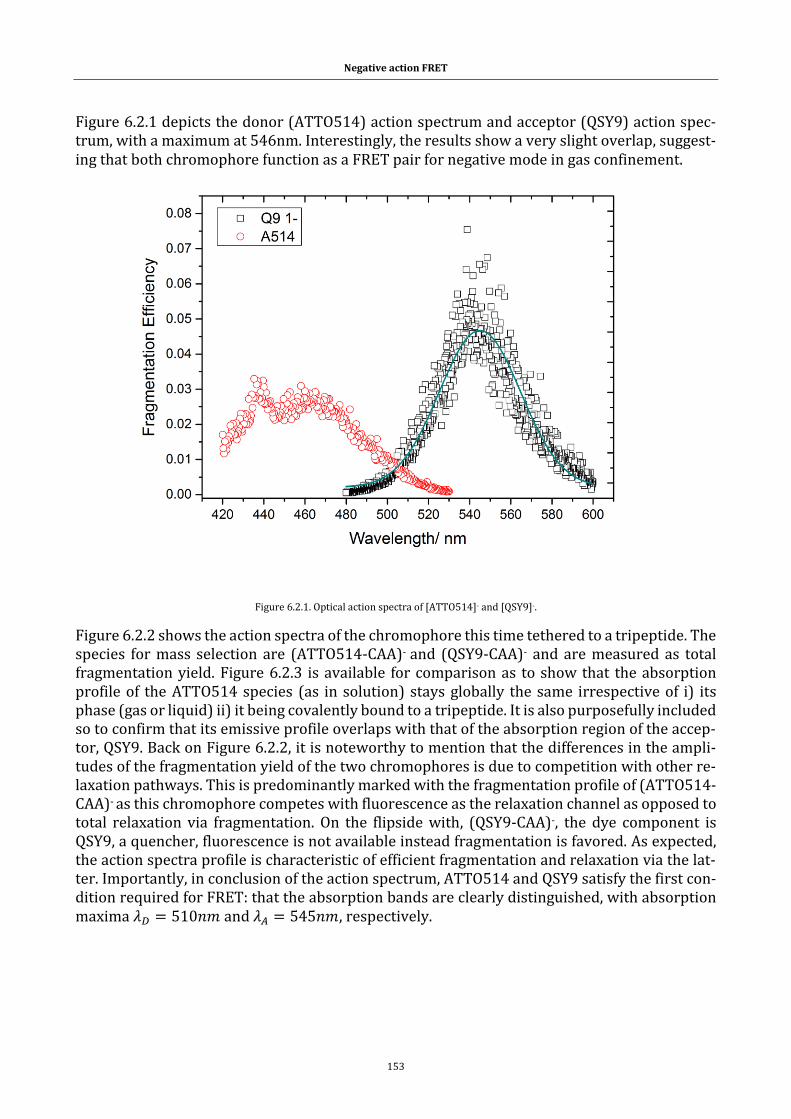
Negative action FRET
153
Figure 6.2.1 depicts the donor (ATTO514) action spectrum and acceptor (QSY9) action spec-trum, with a maximum at 546nm. Interestingly, the results show a very slight overlap, suggest-ing that both chromophore function as a FRET pair for negative mode in gas confinement.
Figure 6.2.1. Optical action spectra of [ATTO514]- and [QSY9]-.
Figure 6.2.2 shows the action spectra of the chromophore this time tethered to a tripeptide. The species for mass selection are (ATTO514-CAA)- and (QSY9-CAA)- and are measured as total fragmentation yield. Figure 6.2.3 is available for comparison as to show that the absorption profile of the ATTO514 species (as in solution) stays globally the same irrespective of i) its phase (gas or liquid) ii) it being covalently bound to a tripeptide. It is also purposefully included so to confirm that its emissive profile overlaps with that of the absorption region of the accep-tor, QSY9. Back on Figure 6.2.2, it is noteworthy to mention that the differences in the ampli-tudes of the fragmentation yield of the two chromophores is due to competition with other re-laxation pathways. This is predominantly marked with the fragmentation profile of (ATTO514-CAA)- as this chromophore competes with fluorescence as the relaxation channel as opposed to total relaxation via fragmentation. On the flipside with, (QSY9-CAA)-, the dye component is QSY9, a quencher, fluorescence is not available instead fragmentation is favored. As expected, the action spectra profile is characteristic of efficient fragmentation and relaxation via the lat-ter. Importantly, in conclusion of the action spectrum, ATTO514 and QSY9 satisfy the first con-dition required for FRET: that the absorption bands are clearly distinguished, with absorption maxima 𝜆𝐷 = 510𝑛𝑚 and 𝜆𝐴 = 545𝑛𝑚, respectively.
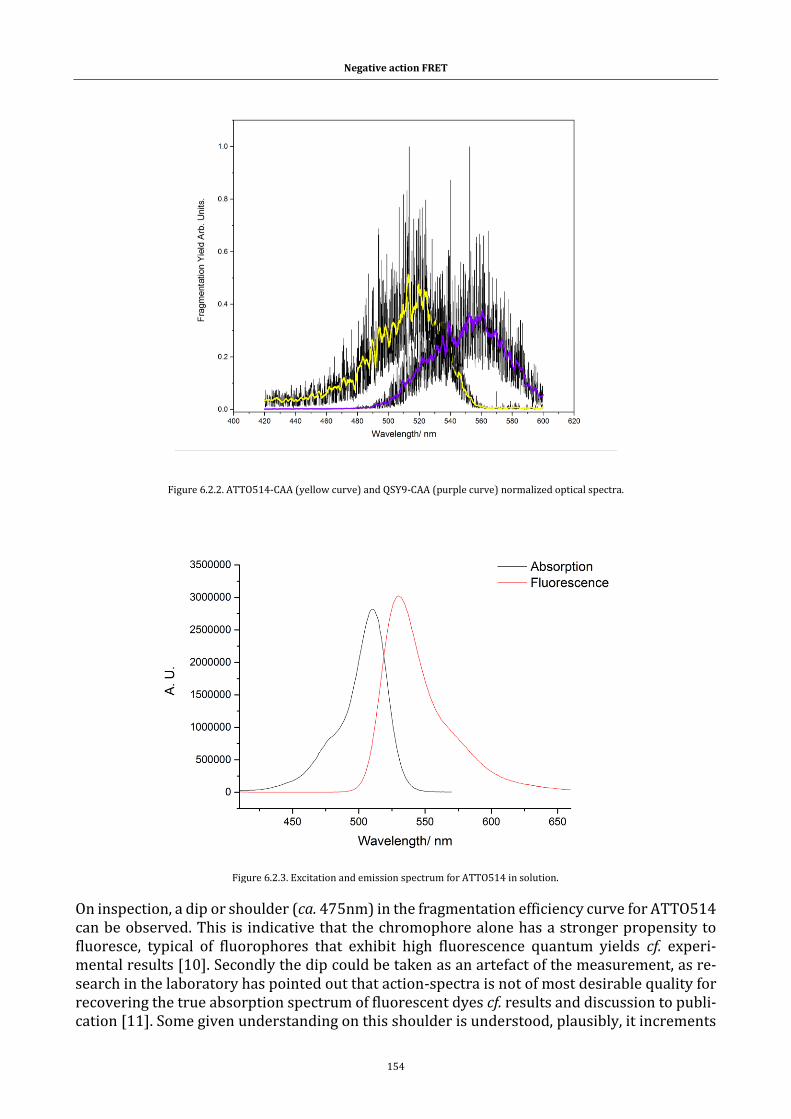
Negative action FRET
154
Figure 6.2.2. ATTO514-CAA (yellow curve) and QSY9-CAA (purple curve) normalized optical spectra.
On inspection, a dip or shoulder (ca. 475nm) in the fragmentation efficiency curve for ATTO514 can be observed. This is indicative that the chromophore alone has a stronger propensity to fluoresce, typical of fluorophores that exhibit high fluorescence quantum yields cf. experi-mental results [10]. Secondly the dip could be taken as an artefact of the measurement, as re-search in the laboratory has pointed out that action-spectra is not of most desirable quality for recovering the true absorption spectrum of fluorescent dyes cf. results and discussion to publi-cation [11]. Some given understanding on this shoulder is understood, plausibly, it increments
Figure 6.2.3. Excitation and emission spectrum for ATTO514 in solution.
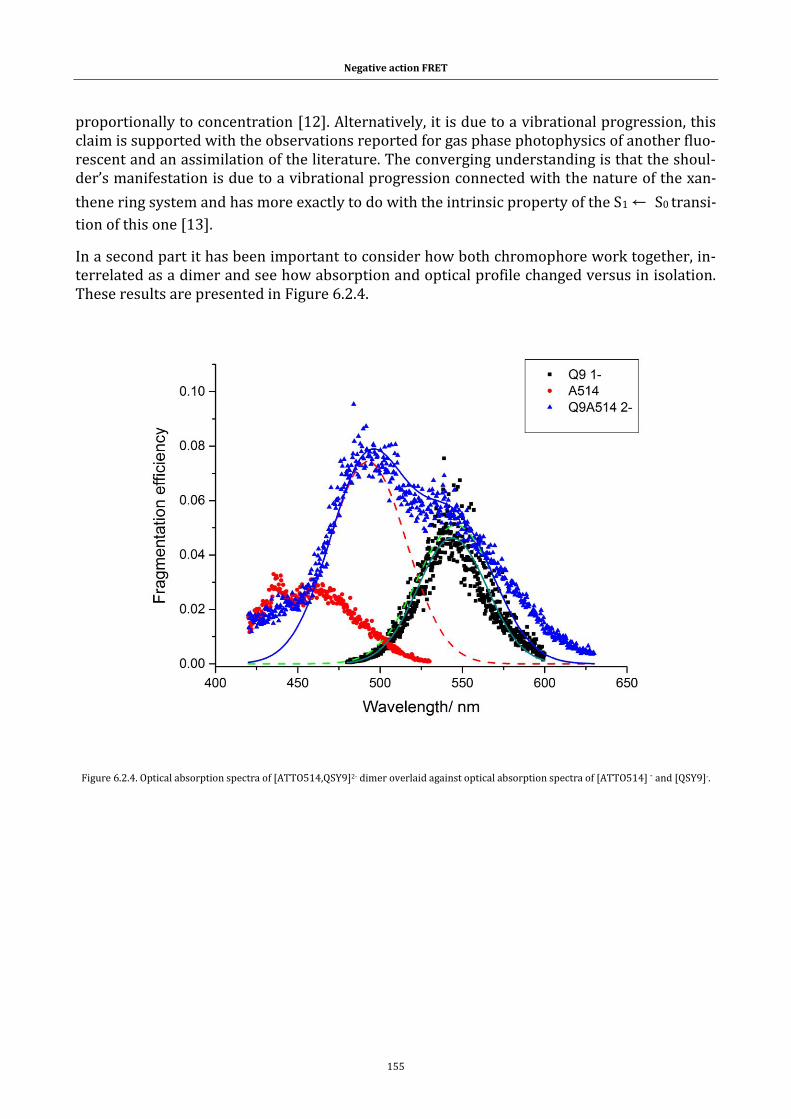
Negative action FRET
155
proportionally to concentration [12]. Alternatively, it is due to a vibrational progression, this claim is supported with the observations reported for gas phase photophysics of another fluo-rescent and an assimilation of the literature. The converging understanding is that the shoul-der’s manifestation is due to a vibrational progression connected with the nature of the xan-
thene ring system and has more exactly to do with the intrinsic property of the S1 ← S0 transi-
tion of this one [13].
In a second part it has been important to consider how both chromophore work together, in-terrelated as a dimer and see how absorption and optical profile changed versus in isolation. These results are presented in Figure 6.2.4.
Figure 6.2.4. Optical absorption spectra of [ATTO514,QSY9]2- dimer overlaid against optical absorption spectra of [ATTO514] - and [QSY9]-.
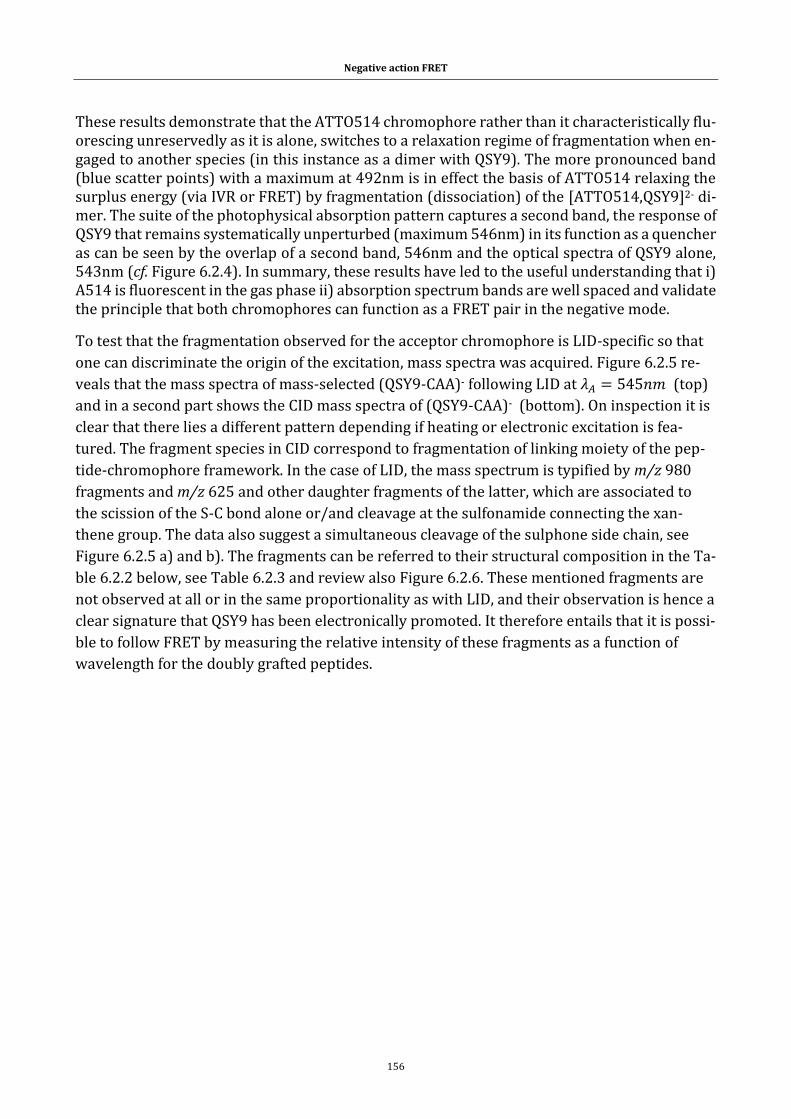
Negative action FRET
156
These results demonstrate that the ATTO514 chromophore rather than it characteristically flu-orescing unreservedly as it is alone, switches to a relaxation regime of fragmentation when en-gaged to another species (in this instance as a dimer with QSY9). The more pronounced band (blue scatter points) with a maximum at 492nm is in effect the basis of ATTO514 relaxing the surplus energy (via IVR or FRET) by fragmentation (dissociation) of the [ATTO514,QSY9]2- di-mer. The suite of the photophysical absorption pattern captures a second band, the response of QSY9 that remains systematically unperturbed (maximum 546nm) in its function as a quencher as can be seen by the overlap of a second band, 546nm and the optical spectra of QSY9 alone, 543nm (cf. Figure 6.2.4). In summary, these results have led to the useful understanding that i) A514 is fluorescent in the gas phase ii) absorption spectrum bands are well spaced and validate the principle that both chromophores can function as a FRET pair in the negative mode.
To test that the fragmentation observed for the acceptor chromophore is LID-specific so that
one can discriminate the origin of the excitation, mass spectra was acquired. Figure 6.2.5 re-
veals that the mass spectra of mass-selected (QSY9-CAA)- following LID at 𝜆𝐴 = 545𝑛𝑚 (top)
and in a second part shows the CID mass spectra of (QSY9-CAA)- (bottom). On inspection it is
clear that there lies a different pattern depending if heating or electronic excitation is fea-
tured. The fragment species in CID correspond to fragmentation of linking moiety of the pep-
tide-chromophore framework. In the case of LID, the mass spectrum is typified by m/z 980
fragments and m/z 625 and other daughter fragments of the latter, which are associated to
the scission of the S-C bond alone or/and cleavage at the sulfonamide connecting the xan-
thene group. The data also suggest a simultaneous cleavage of the sulphone side chain, see
Figure 6.2.5 a) and b). The fragments can be referred to their structural composition in the Ta-
ble 6.2.2 below, see Table 6.2.3 and review also Figure 6.2.6. These mentioned fragments are
not observed at all or in the same proportionality as with LID, and their observation is hence a
clear signature that QSY9 has been electronically promoted. It therefore entails that it is possi-
ble to follow FRET by measuring the relative intensity of these fragments as a function of
wavelength for the doubly grafted peptides.
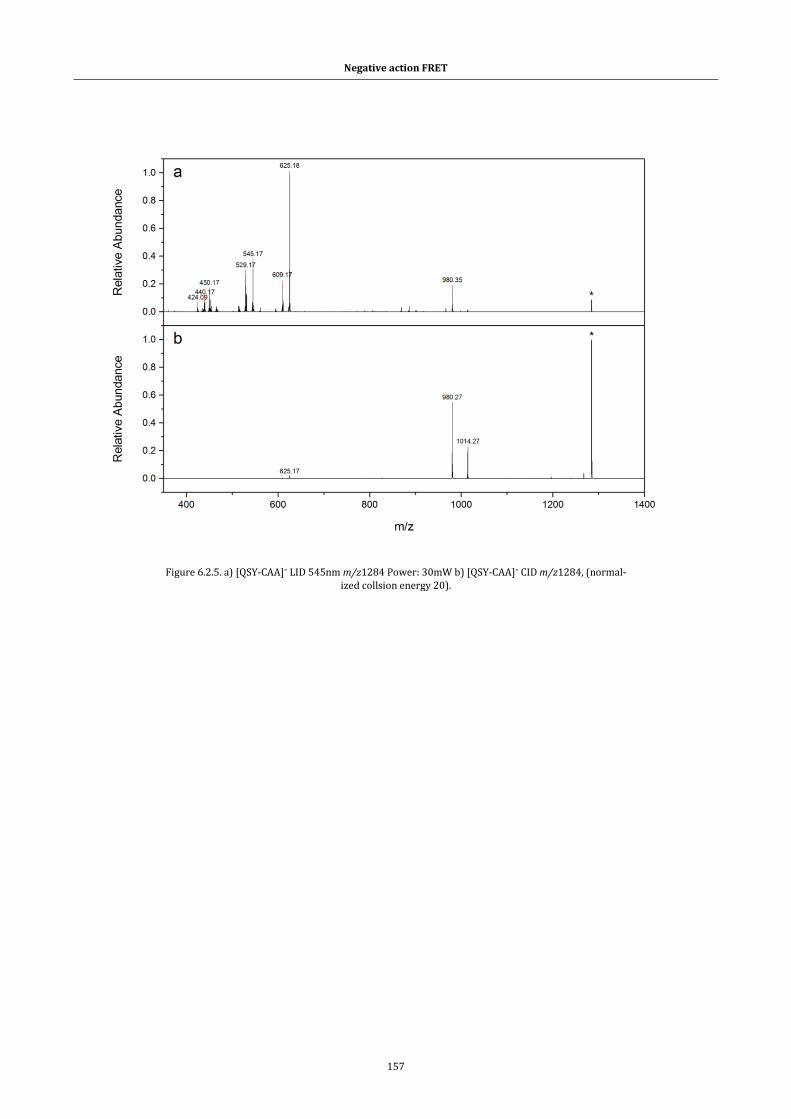
Negative action FRET
157
Figure 6.2.5. a) [QSY-CAA]- LID 545nm m/z1284 Power: 30mW b) [QSY-CAA]- CID m/z1284, (normal-ized collsion energy 20).
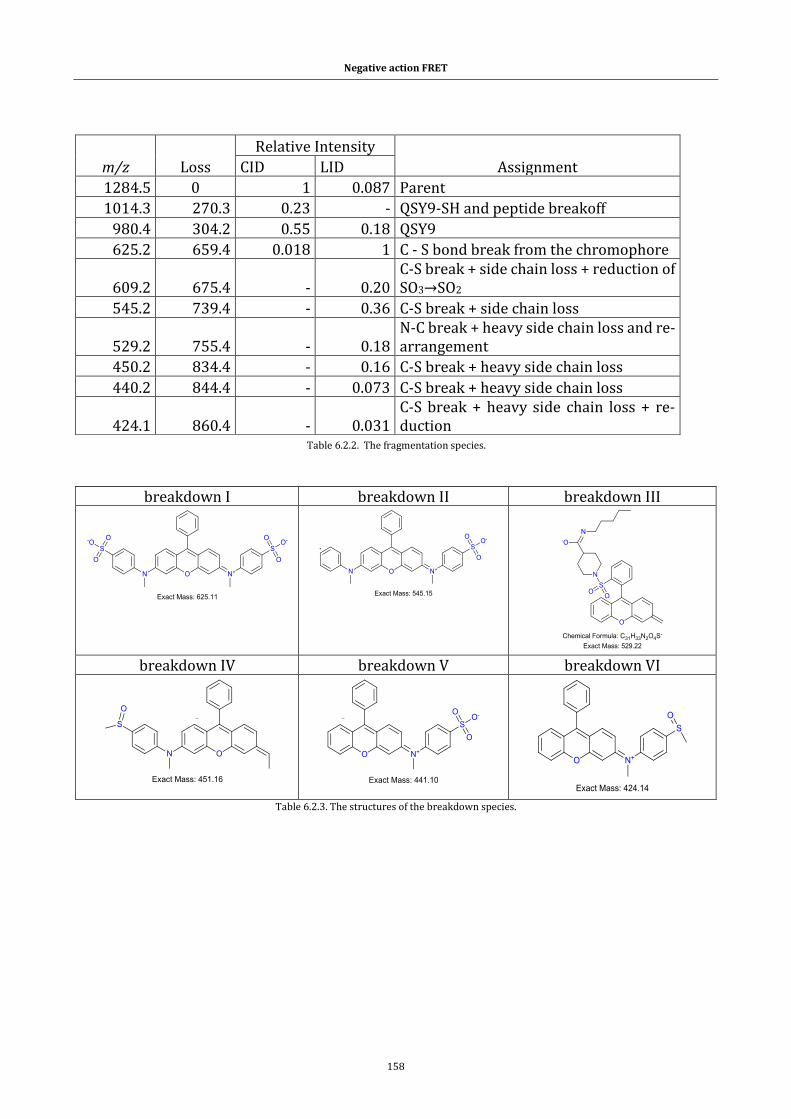
Negative action FRET
158
breakdown I breakdown II breakdown III
breakdown IV breakdown V breakdown VI
Table 6.2.3. The structures of the breakdown species.
m/z Loss
Relative Intensity
Assignment CID LID
1284.5 0 1 0.087 Parent
1014.3 270.3 0.23 - QSY9-SH and peptide breakoff
980.4 304.2 0.55 0.18 QSY9
625.2 659.4 0.018 1 C - S bond break from the chromophore
609.2 675.4 - 0.20 C-S break + side chain loss + reduction of SO3→SO2
545.2 739.4 - 0.36 C-S break + side chain loss
529.2 755.4 - 0.18 N-C break + heavy side chain loss and re-arrangement
450.2 834.4 - 0.16 C-S break + heavy side chain loss
440.2 844.4 - 0.073 C-S break + heavy side chain loss
424.1 860.4 - 0.031 C-S break + heavy side chain loss + re-duction
Table 6.2.2. The fragmentation species.
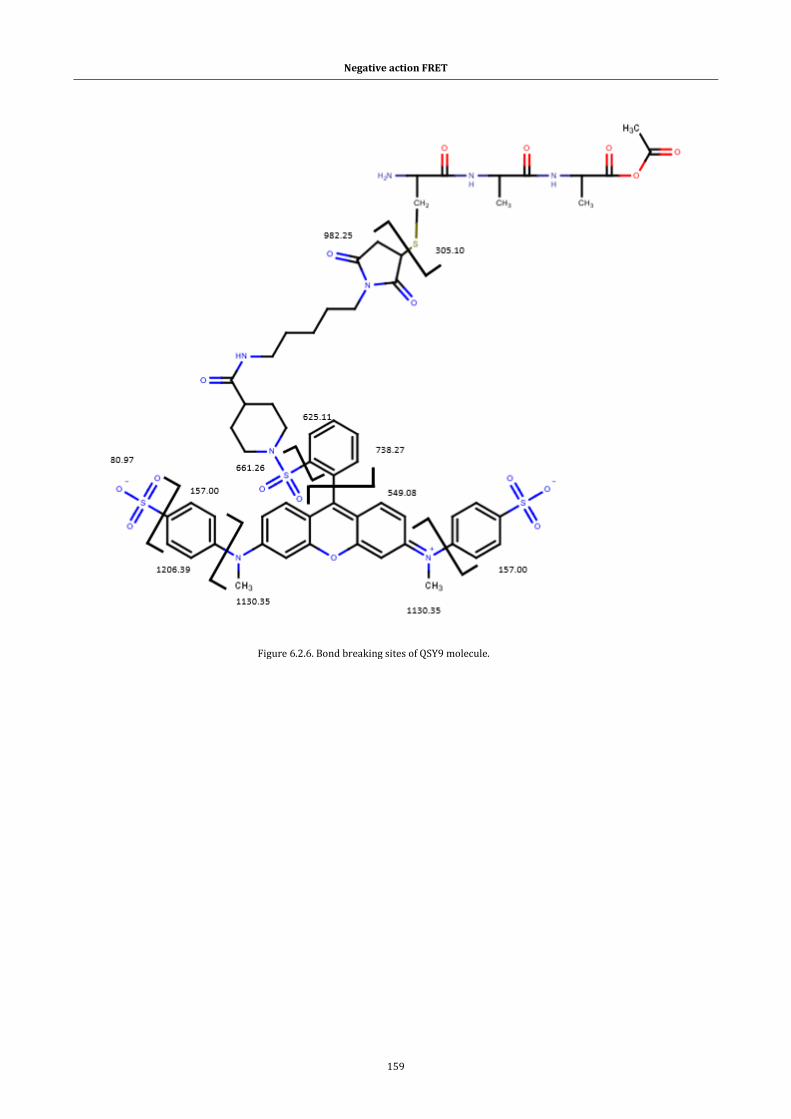
Negative action FRET
159
Figure 6.2.6. Bond breaking sites of QSY9 molecule.
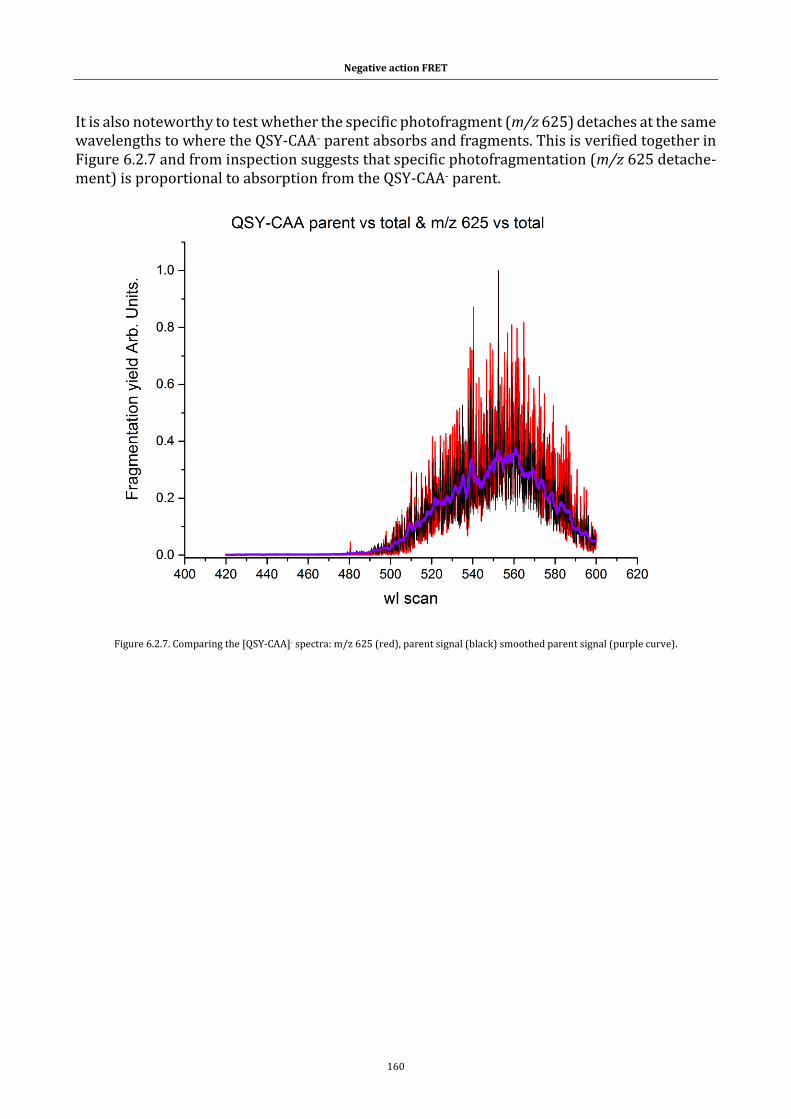
Negative action FRET
160
It is also noteworthy to test whether the specific photofragment (m/z 625) detaches at the same wavelengths to where the QSY-CAA- parent absorbs and fragments. This is verified together in Figure 6.2.7 and from inspection suggests that specific photofragmentation (m/z 625 detache-ment) is proportional to absorption from the QSY-CAA- parent.
Figure 6.2.7. Comparing the [QSY-CAA]- spectra: m/z 625 (red), parent signal (black) smoothed parent signal (purple curve).
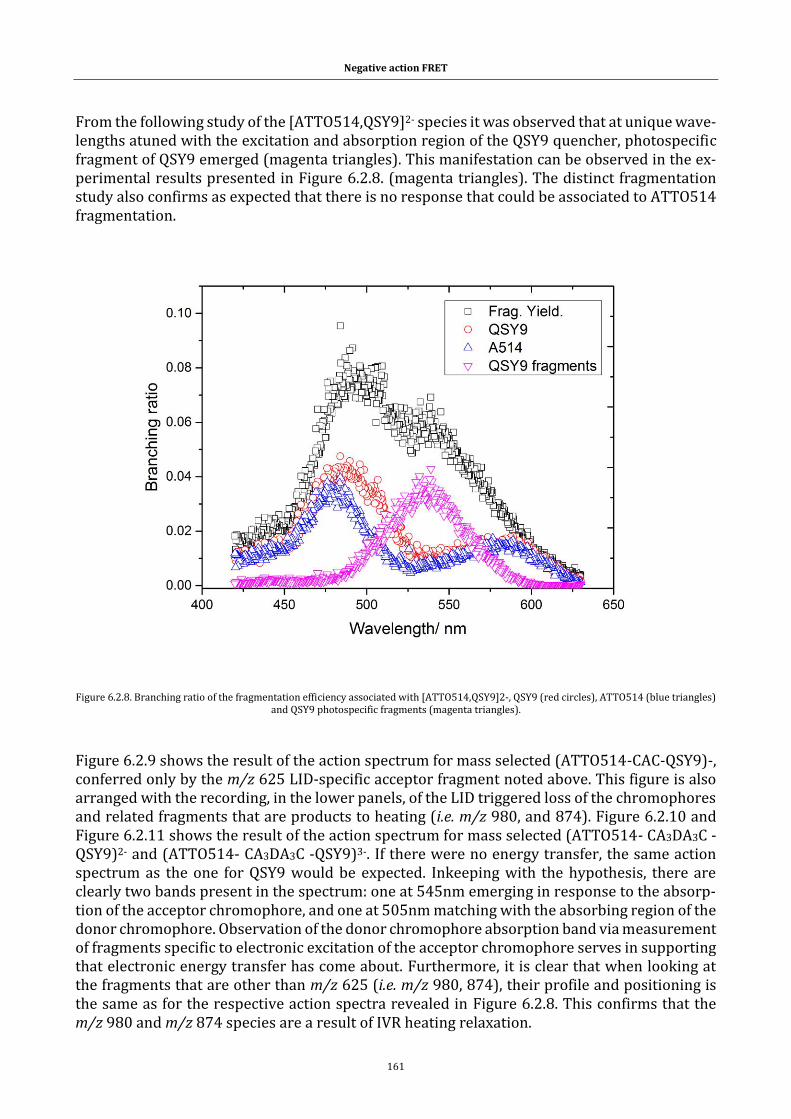
Negative action FRET
161
From the following study of the [ATTO514,QSY9]2- species it was observed that at unique wave-lengths atuned with the excitation and absorption region of the QSY9 quencher, photospecific fragment of QSY9 emerged (magenta triangles). This manifestation can be observed in the ex-perimental results presented in Figure 6.2.8. (magenta triangles). The distinct fragmentation study also confirms as expected that there is no response that could be associated to ATTO514 fragmentation.
Figure 6.2.8. Branching ratio of the fragmentation efficiency associated with [ATTO514,QSY9]2-, QSY9 (red circles), ATTO514 (blue triangles) and QSY9 photospecific fragments (magenta triangles).
Figure 6.2.9 shows the result of the action spectrum for mass selected (ATTO514-CAC-QSY9)-, conferred only by the m/z 625 LID-specific acceptor fragment noted above. This figure is also arranged with the recording, in the lower panels, of the LID triggered loss of the chromophores and related fragments that are products to heating (i.e. m/z 980, and 874). Figure 6.2.10 and Figure 6.2.11 shows the result of the action spectrum for mass selected (ATTO514- CA3DA3C -QSY9)2- and (ATTO514- CA3DA3C -QSY9)3-. If there were no energy transfer, the same action spectrum as the one for QSY9 would be expected. Inkeeping with the hypothesis, there are clearly two bands present in the spectrum: one at 545nm emerging in response to the absorp-tion of the acceptor chromophore, and one at 505nm matching with the absorbing region of the donor chromophore. Observation of the donor chromophore absorption band via measurement of fragments specific to electronic excitation of the acceptor chromophore serves in supporting that electronic energy transfer has come about. Furthermore, it is clear that when looking at the fragments that are other than m/z 625 (i.e. m/z 980, 874), their profile and positioning is the same as for the respective action spectra revealed in Figure 6.2.8. This confirms that the m/z 980 and m/z 874 species are a result of IVR heating relaxation.
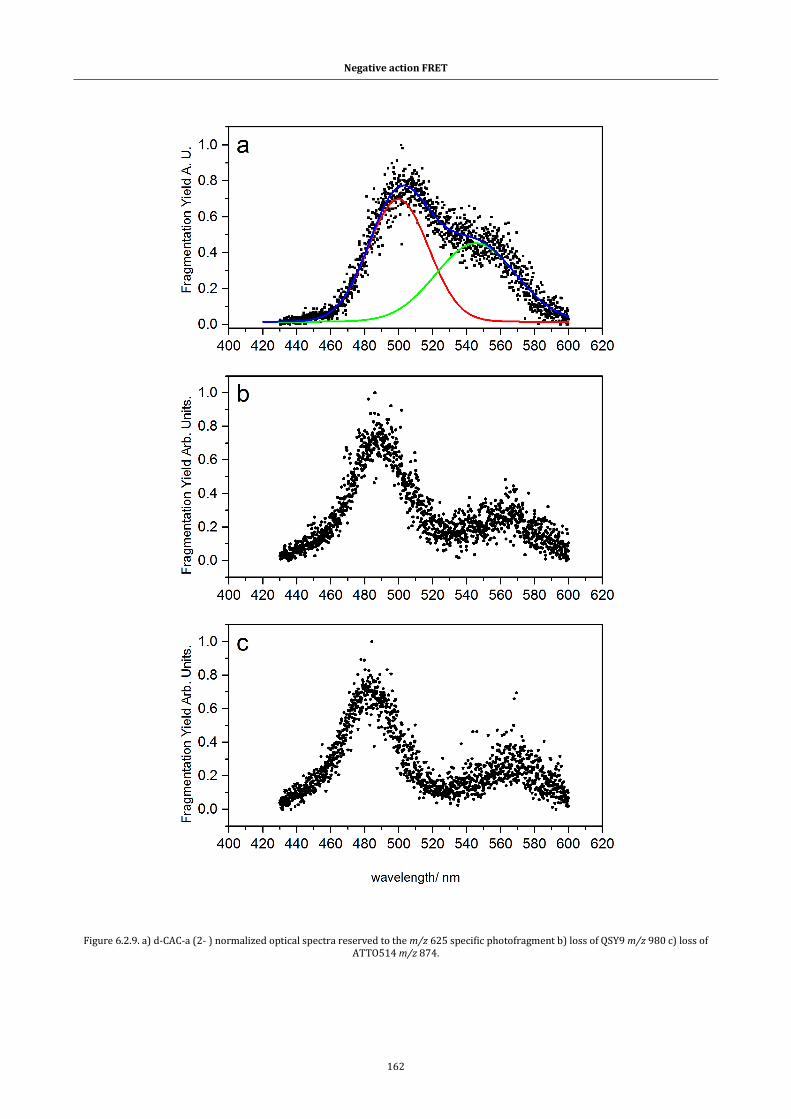
Negative action FRET
162
Figure 6.2.9. a) d-CAC-a (2- ) normalized optical spectra reserved to the m/z 625 specific photofragment b) loss of QSY9 m/z 980 c) loss of ATTO514 m/z 874.
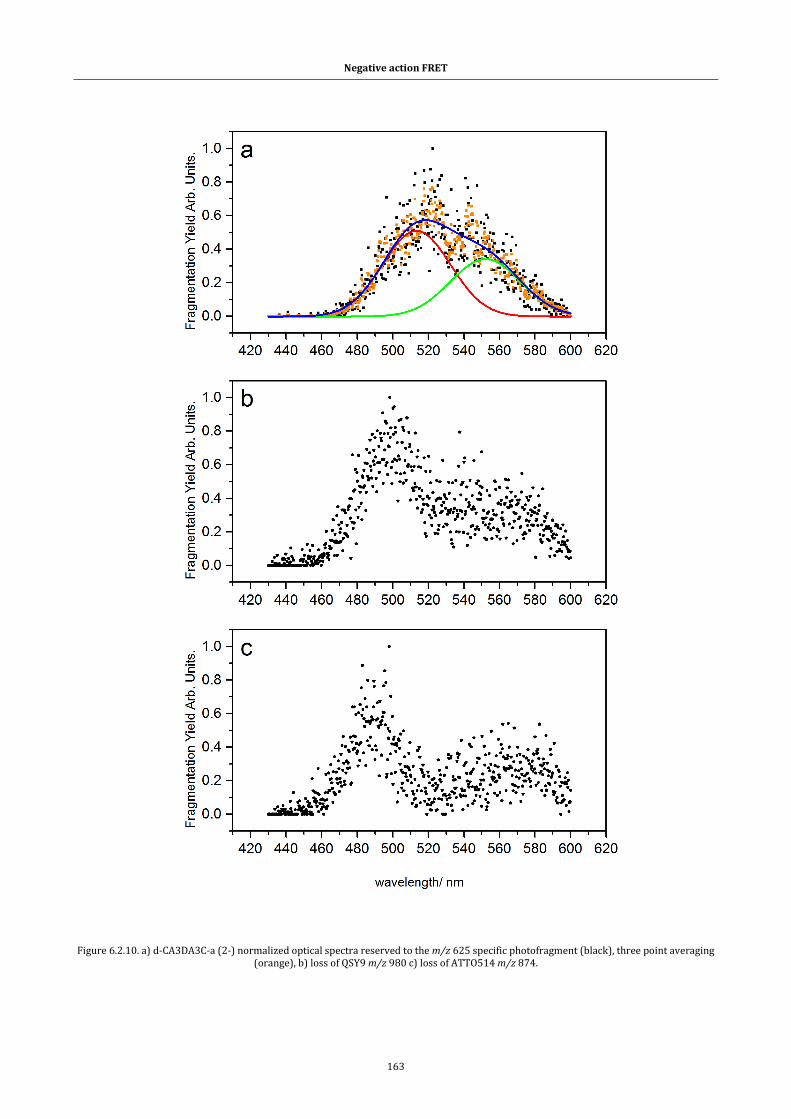
Negative action FRET
163
Figure 6.2.10. a) d-CA3DA3C-a (2-) normalized optical spectra reserved to the m/z 625 specific photofragment (black), three point averaging (orange), b) loss of QSY9 m/z 980 c) loss of ATTO514 m/z 874.
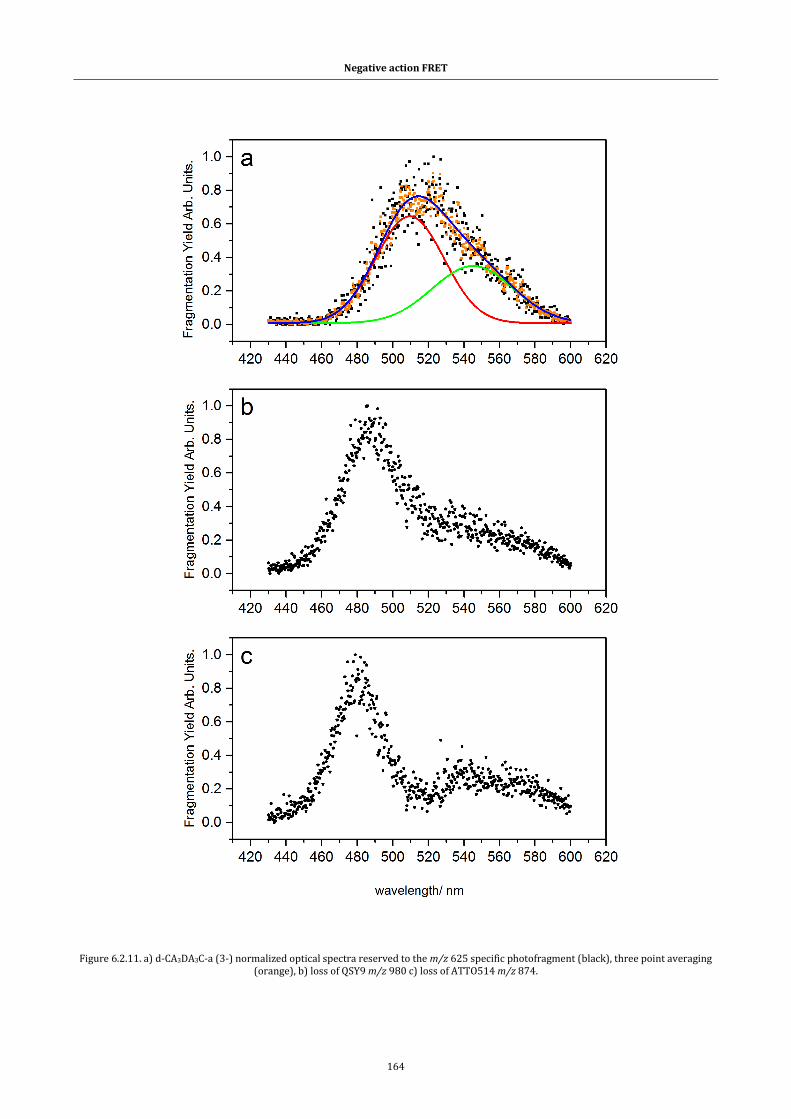
Negative action FRET
164
Figure 6.2.11. a) d-CA3DA3C-a (3-) normalized optical spectra reserved to the m/z 625 specific photofragment (black), three point averaging (orange), b) loss of QSY9 m/z 980 c) loss of ATTO514 m/z 874.
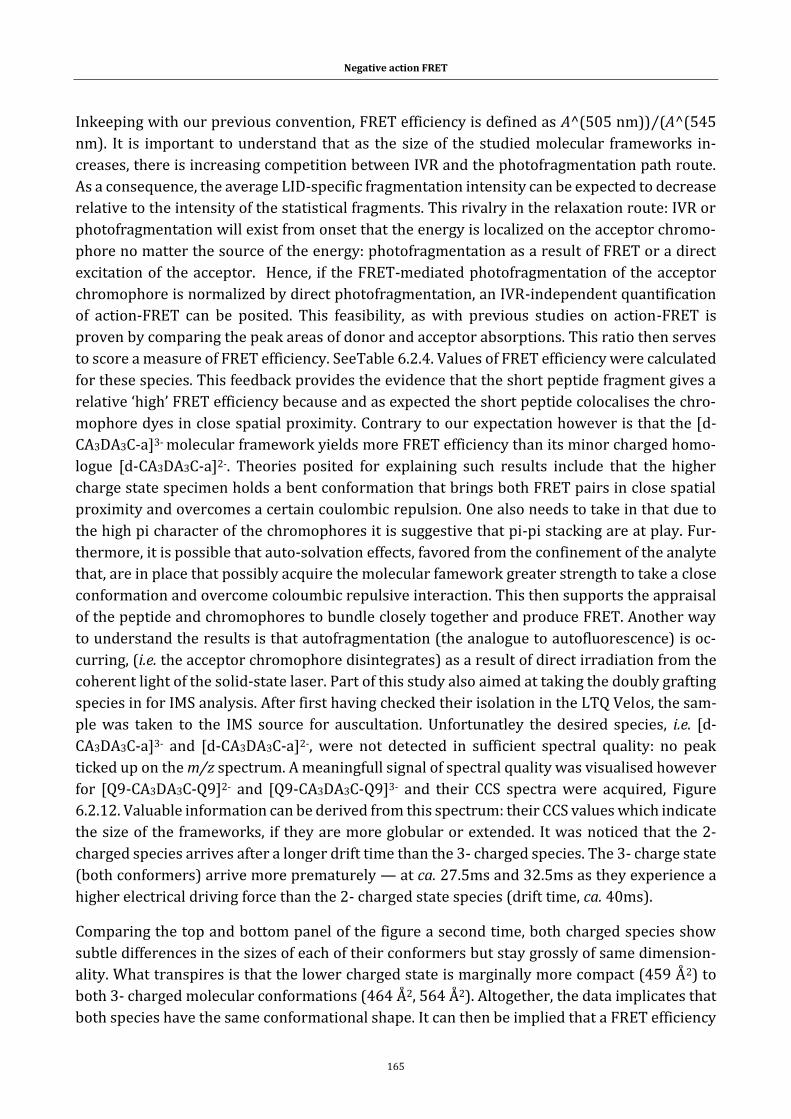
Negative action FRET
165
Inkeeping with our previous convention, FRET efficiency is defined as A^(505 nm))⁄(A^(545
nm). It is important to understand that as the size of the studied molecular frameworks in-
creases, there is increasing competition between IVR and the photofragmentation path route.
As a consequence, the average LID-specific fragmentation intensity can be expected to decrease
relative to the intensity of the statistical fragments. This rivalry in the relaxation route: IVR or
photofragmentation will exist from onset that the energy is localized on the acceptor chromo-
phore no matter the source of the energy: photofragmentation as a result of FRET or a direct
excitation of the acceptor. Hence, if the FRET-mediated photofragmentation of the acceptor
chromophore is normalized by direct photofragmentation, an IVR-independent quantification
of action-FRET can be posited. This feasibility, as with previous studies on action-FRET is
proven by comparing the peak areas of donor and acceptor absorptions. This ratio then serves
to score a measure of FRET efficiency. SeeTable 6.2.4. Values of FRET efficiency were calculated
for these species. This feedback provides the evidence that the short peptide fragment gives a
relative ‘high’ FRET efficiency because and as expected the short peptide colocalises the chro-
mophore dyes in close spatial proximity. Contrary to our expectation however is that the [d-
CA3DA3C-a]3- molecular framework yields more FRET efficiency than its minor charged homo-
logue [d-CA3DA3C-a]2-. Theories posited for explaining such results include that the higher
charge state specimen holds a bent conformation that brings both FRET pairs in close spatial
proximity and overcomes a certain coulombic repulsion. One also needs to take in that due to
the high pi character of the chromophores it is suggestive that pi-pi stacking are at play. Fur-
thermore, it is possible that auto-solvation effects, favored from the confinement of the analyte
that, are in place that possibly acquire the molecular famework greater strength to take a close
conformation and overcome coloumbic repulsive interaction. This then supports the appraisal
of the peptide and chromophores to bundle closely together and produce FRET. Another way
to understand the results is that autofragmentation (the analogue to autofluorescence) is oc-
curring, (i.e. the acceptor chromophore disintegrates) as a result of direct irradiation from the
coherent light of the solid-state laser. Part of this study also aimed at taking the doubly grafting
species in for IMS analysis. After first having checked their isolation in the LTQ Velos, the sam-
ple was taken to the IMS source for auscultation. Unfortunatley the desired species, i.e. [d-
CA3DA3C-a]3- and [d-CA3DA3C-a]2-, were not detected in sufficient spectral quality: no peak
ticked up on the m/z spectrum. A meaningfull signal of spectral quality was visualised however
for [Q9-CA3DA3C-Q9]2- and [Q9-CA3DA3C-Q9]3- and their CCS spectra were acquired, Figure
6.2.12. Valuable information can be derived from this spectrum: their CCS values which indicate
the size of the frameworks, if they are more globular or extended. It was noticed that the 2-
charged species arrives after a longer drift time than the 3- charged species. The 3- charge state
(both conformers) arrive more prematurely — at ca. 27.5ms and 32.5ms as they experience a
higher electrical driving force than the 2- charged state species (drift time, ca. 40ms).
Comparing the top and bottom panel of the figure a second time, both charged species show
subtle differences in the sizes of each of their conformers but stay grossly of same dimension-
ality. What transpires is that the lower charged state is marginally more compact (459 Å2) to
both 3- charged molecular conformations (464 Å2, 564 Å2). Altogether, the data implicates that
both species have the same conformational shape. It can then be implied that a FRET efficiency
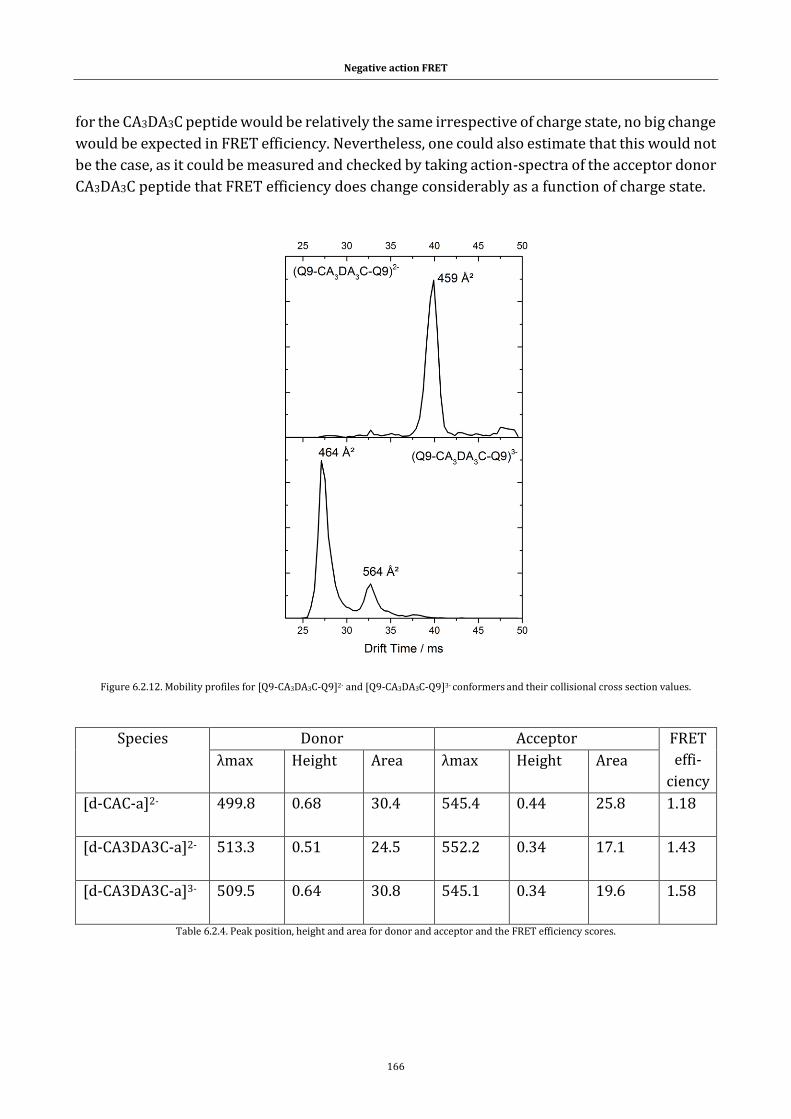
Negative action FRET
166
for the CA3DA3C peptide would be relatively the same irrespective of charge state, no big change
would be expected in FRET efficiency. Nevertheless, one could also estimate that this would not
be the case, as it could be measured and checked by taking action-spectra of the acceptor donor
CA3DA3C peptide that FRET efficiency does change considerably as a function of charge state.
Figure 6.2.12. Mobility profiles for [Q9-CA3DA3C-Q9]2- and [Q9-CA3DA3C-Q9]3- conformers and their collisional cross section values.
Species Donor Acceptor FRET
effi-
ciency
λmax Height Area λmax Height Area
[d-CAC-a]2-
499.8 0.68 30.4 545.4 0.44 25.8 1.18
[d-CA3DA3C-a]2-
513.3 0.51 24.5 552.2 0.34 17.1 1.43
[d-CA3DA3C-a]3-
509.5 0.64 30.8 545.1 0.34 19.6 1.58
Table 6.2.4. Peak position, height and area for donor and acceptor and the FRET efficiency scores.
Negative action FRET
167
6.2.3 Conlusion
It can be remarked that the global principal holds true, the emission spectrum of the fluoro-
phore donor overlaps the absorption spectrum of the QSY acceptor. Upon laser irradiation this
one disintegrates by direct transfer of energy into a specific photofragment among others. This
can then be measured quantitatively so to gain an insight on the interdistance separating the
chromophores and thus develop a structural description of the whole system. This technique
has proven more rewarding in resolving proximity relationships that the previous discussed
NBDmaleimide –Eosin donor-acceptor pair of frameworks but however remains inferior to the
positive mode based action-FRET technique. The principal reason being that the donor chro-
mophore does not dissociate during the photophysical interaction with laser irradiation as
much.
6.3 Outline on encountered difficulties.
The task of establishing action-FRET as technique remains difficult and is not always as
straightforward, robust or reproducible in results as anticipated to be, negative mode action-
FRET more so than action-FRET in the positive mode. As science progresses by corroboration
there were times where false leads were being pursued or had the impression to be pursued.
These difficulties were ausculted and in multiple cases emerged to be a combination of issues.
These experienced pitfalls and observations that hampered the undertaking majorly all re-
volved around signal treatment and are summarized here and include:
- The operational setting of the MS tune to detect a given distribution of species.
- Intermittent loss of signal or severe signal fluctuation.
- Loss of the signal from specific LID fragmentation due to laser dissalignement.
Other encountered undesirables and challenges include:
- Laser power fluctuations.
- Weak response from the acceptor or/ and no observation of its fragmentation. Instead
a total observation of its cleavage from the bonding site to where it was intended to per-
manently bind to, i.e. dissociation from the mercaptan group.
- The observation of electronic effects that induce major bathochromic shifts, changes to
the optical properties of the molecular species.
- Variations in the form, quality of ordered compounds, and the principal substrate in
building doubly labeled frameworks.
- Solubility and spraying of the compounds (experience of capillary fouling or even block-
age).
Negative action FRET
168
6.4 References :
1. Baer T, Dunbar RC: Ion Spectroscopy: Where Did It Come From; Where Is It Now; and Where Is It Going? Journal of the American Society for Mass Spectrometry 2010, 21:681-693.
2. Daly S, Kulesza A, Knight G, MacAleese L, Antoine R, Dugourd P: Visible and Ultraviolet Spectroscopy of Gas Phase Rhodamine 575 Cations. Journal of Physical Chemistry A 2015, 119:5634-5641.
3. Daly S, Kulesza A, Knight G, MacAleese L, Antoine R, Dugourd P: Visible and ultraviolet spectroscopy of gas phase rhodamine 575 cations. The journal of physical chemistry A 2015, 119:5634-5641.
4. Sassin NA, Everhart SC, Dangi BB, Ervin KM, Cline JI: Fluorescence and Photodissociation of Rhodamine 575 Cations in a Quadrupole Ion Trap. Journal of the American Society for Mass Spectrometry 2009, 20:96-104.
5. Chingin K, Chen HW, Gamez G, Zenobi R: Exploring Fluorescence and Fragmentation of Ions Produced by Electrospray Ionization in Ultrahigh Vacuum. Journal of the American Society for Mass Spectrometry 2009, 20:1731-1738.
6. Frankevich V, Chagovets V, Widjaja F, Barylyuk K, Yang ZY, Zenobi R: Fluorescence resonance energy transfer of gas-phase ions under ultra high vacuum and ambient conditions. Physical Chemistry Chemical Physics 2014, 16:8911-8920.
7. GarzonRodriguez W, SepulvedaBecerra M, Milton S, Glabe CG: Soluble amyloid A beta-(1-40) exists as a stable dimer at low concentrations. Journal of Biological Chemistry 1997, 272:21037-21044.
8. Ha T, Enderle T, Ogletree DF, Chemla DS, Selvin PR, Weiss S: Probing the interaction between two single molecules: Fluorescence resonance energy transfer between a single donor and a single acceptor. Proceedings of the National Academy of Sciences of the United States of America 1996, 93:6264-6268.
9. Daly S, Poussigue F, Simon AL, MacAleese L, Bertorelle F, Chirot F, Antoine R, Dugourd P: Action-FRET: Probing the Molecular Conformation of Mass-Selected Gas-Phase Peptides with Forster Resonance Energy Transfer Detected by Acceptor-Specific Fragmentation. Analytical Chemistry 2014, 86:8798-8804.
10. Arden J, Deltau G, Huth V, Kringel U, Peros D, Drexhage KH: Fluorescence and lasing properties of rhodamine dyes. Journal of Luminescence 1991, 48-9:352-358.
11. Kulesza AJ, Titov E, Daly S, Wlodarczyk R, Megow J, Saalfrank P, Choi CM, MacAleese L, Antoine R, Dugourd P: Excited States of Xanthene Analogues: Photofragmentation and Calculations by CC2 and Time-Dependent Density Functional Theory. Chemphyschem 2016, 17:3129-3138.
12. Rodriguez HB, San Roman E, Duarte P, Machado IF, Ferreira LFV: Eosin Y Triplet State as a Probe of Spatial Heterogeneity in Microcrystalline Cellulose. Photochemistry and Photobiology 2012, 88:831-839.
13. Daly S, Kulesza A, Knight G, MacAleese L, Antoine R, Dugourd P: The Gas-Phase Photophysics of Eosin Y and its Maleimide Conjugate. Journal of Physical Chemistry A 2016, 120:3484-3490.

Future developments
169
Future developments
170
Future developments.
7.1 Conclusion and general perspectives
7.1.1 Conclusion
What this redaction looks to do is to transpose all of the experimental works and the results into writings and figures. By this way it is taken that the research on Action FRET: Probing the molecular conformation of gas phase proteins and protein assemblies. The dissertation’s main research objective is to better understand the structure and conformations of peptides and pro-teins and how these are affected by their charge state. Towards this end, we have developed a coupled LASER mass spectrometry spectroscopy interface. This enables the use of laser spectros-copy to probe of the conformation of trapped ions. Gaseous ions are formed using electrospray ionization (ESI) and interact photo-physically through a pair of chromophores in a linear ion trap. With this setup, we can study the photophysics of the trapped ions, to select the species of interest and to isolate it by ejecting all others. This feature allows us to individualy probe the peptides la-belled with only the donor dye, only the acceptor or species with both dyes grafted on. It is then also possible to examine different charge states of a molecule if multiple charge states are pro-duced in the electrospray.
The spectrometric evolution of the breakdown on the acceptor as a function of power and wave-length, what is coined as action-FRET was then monitored. This herein developed technique was taken to study a biomolecule of biological interest: first ubiquitin and then the amyloid beta protein. It has also provided real term answers to the structural arrangement of an amyloid protein segment in a host-guest interaction with a cyclodextrin molecule in gas isolation. Fi-nally, efforts were laid to test and validate the action-FRET technique in the negative mode. The research of this undertaking has come across difficulties, mainly in the synthesis and isolation of the compounds of interest needed to generate the ion products of desired charge state in the mass spectrum with sufficient spectral quality to carry out experimental manipulations. In a nutshell, the aim of this dissertation has been to demonstrate and give results on isolated spe-cies in gas isolation which has the advantage to provide an overview study of the intrinsic prop-erties and characteristics of the system without bias, without perturbations that would have been encountered in the condensed medium. The work carried out herein is important as ac-tion-FRET provides the development of a new quantitative tool that can glean new insight on biomolecules interesting to structural biology and biochemistry which are not accessible or not as directly available when using conventional biochemical approaches.
Future developments
171
7.1.3 Future developments
While this thesis has demonstrated the potential of efficiently probing the molecular confor-mations of gas phase species, many opportunities for extending the scope of this thesis remain. This section presents some of these directions.
FRET experiements with LASER-IMS.
Finding the right IMS settings to isolate doubly grafted molecules of biological interest with a donor and acceptor chromophor and taking their conformational families to LASER-IMS studies is the next step and will enable new structural information on how conformational structure, collision cross section and FRET efficiencies relate to one another.
Transposing single molecule FRET (smFRET) to the gas phase.
Even though we do not do single ion measurements, a second future development that springs to mind consists of devising a way to find the equivalent of smFRET to the gas phase and the confines of a MS instrument. This way it would be possible to study even further the intrinsic phenomena that is FRET with even lesser bias as smFRET would discard any ensemble effects associated to recordings of experiements of ensemble of molecules and not single species.


