Embed Size (px)
Citation preview
Probing Early Stage Aggregates of Amyloidogenic Proteins using Mass Spectrometry Based
Methods
A thesis submitted to the University of Manchester for the degree of
Doctor of Philosophy in the Faculty of Science and Engineering
2016
Ashley S. Phillips
School of Chemistry

2
Table of Contents
Table of Contents .................................................................................................................... 2
List of Figures .......................................................................................................................... 6
List of Tables ......................................................................................................................... 11
List of Equations .................................................................................................................... 13
Abbreviations ........................................................................................................................ 14
Abstract ................................................................................................................................. 16
Declaration ............................................................................................................................ 17
Copyright Statement ............................................................................................................. 17
Acknowledgements ............................................................................................................... 19
1. Chapter 1 - Introduction ................................................................................................ 21
1.1. Proteins ................................................................................................................. 22
1.2. Intrinsically Disordered Proteins and Disease ....................................................... 22
1.3. Aggregation ........................................................................................................... 24
1.4. Parkinson’s Disease and α-Synuclein ..................................................................... 25
1.5. Alzheimer’s Disease and the Amyloid-β peptides ................................................. 29
1.6. Disruption of Amyloid Formation .......................................................................... 34
1.7. Biophysical Techniques for the Structural Analysis of Proteins ............................. 36
1.8. Transmission Electron Microscopy ........................................................................ 37
1.9. Mass Spectrometry ............................................................................................... 38
1.10. Tandem Mass Spectrometry ............................................................................. 46
1.11. Cross-linking ...................................................................................................... 50
1.12. Hydrogen Deuterium Exchange Mass Spectrometry ......................................... 50
1.13. Ion Mobility - Mass Spectrometry ..................................................................... 51
1.14. Biological Mass Spectrometry and Ion Mobility – Mass Spectrometry ............. 53
1.15. Summary ........................................................................................................... 57
1.16. References ......................................................................................................... 58
2. Chapter 2 - Experimental ............................................................................................... 73
2.1. Reagents ................................................................................................................ 74
2.2. α-Synuclein Expression and Purification................................................................ 74
2.3. α-Synuclein Aggregation ....................................................................................... 75
2.4. Amyloid-β peptide Sample Preparation ................................................................ 76
2.5. Mass Spectrometry ............................................................................................... 76
2.6. Ion Mobility - Mass Spectrometry ......................................................................... 80
3
2.7. Collision Induced Unfolding –Travelling Wave Ion Mobility Mass Spectrometry .. 92
2.8. Electron Transfer Dissociation ............................................................................... 92
2.9. Surface Induced Dissociation ................................................................................ 93
2.10. Cross-linking Ion Mobility - Mass Spectrometry ................................................ 96
2.11. Hydrogen Deuterium Exchange Mass Spectrometry ......................................... 97
2.12. Fourier Transform Ion Cyclotron Resonance Mass Spectrometry and Electron
Capture Dissociation ......................................................................................................... 97
2.13. Transmission Electron Microscopy .................................................................... 98
2.14. References ......................................................................................................... 99
3. Chapter 3 - Investigating the Structure of α-Synuclein ............................................... 101
3.1. Introduction ........................................................................................................ 102
3.2. Experimental ....................................................................................................... 103
3.2.1. Sample preparation ..................................................................................... 103
3.2.2. Mass Spectrometry ..................................................................................... 103
3.2.3. Ion Mobility - Mass Spectrometry ............................................................... 103
3.2.4. Electron Capture Dissociation - Fourier Transform - Ion Cyclotron Resonance
Mass Spectrometry ..................................................................................................... 103
3.3. Results and Discussion ........................................................................................ 104
3.3.1. The Effect of Solution pH modification ........................................................ 104
3.3.2. The Effect of Ionisation mode ..................................................................... 110
3.3.3. Ion Mobility - Mass Spectrometry ............................................................... 112
3.3.4. Cross-linking Ion Mobility - Mass Spectrometry .......................................... 115
3.3.5. Investigating α-Synuclein Structure using ECD-FT-ICR MS ........................... 120
3.4. Summary ............................................................................................................. 127
3.5. References........................................................................................................... 128
4. Chapter 4 - Following the Early Stages of α-Synuclein Aggregation ........................... 132
4.1. Introduction ........................................................................................................ 133
4.2. Experimental ....................................................................................................... 135
4.2.1. Sample Preparation ..................................................................................... 135
4.2.2. Aggregation Method ................................................................................... 135
4.2.3. Mass Spectrometry ..................................................................................... 135
4.2.4. Ion Mobility - Mass Spectrometry ............................................................... 135
4.2.5. Hydrogen Deuterium Exchange Mass Spectrometry ................................... 135
4.3. Results and Discussion ........................................................................................ 136
4.3.1. Following Aggregation via Mass Spectrometry ........................................... 136
4
4.3.2. TEM of Aggregates Prepared under Mass Spectrometry Compatible
Conditions ................................................................................................................... 138
4.3.3. In Tip Aggregation ....................................................................................... 139
4.3.4. Probing the Conformational Changes during Aggregation by Ion Mobility -
Mass Spectrometry ..................................................................................................... 142
4.3.5. Probing Conformational Changes during Aggregation by HDX-MS.............. 145
4.4. Summary ............................................................................................................. 148
4.5. References........................................................................................................... 150
5. Chapter 5 - Structure and Interactions of Aβ(1-42) and Aβ(1-40) ............................... 154
5.1. Introduction ........................................................................................................ 155
5.2. Experimental ....................................................................................................... 157
5.2.1. Sample Preparation ..................................................................................... 157
5.2.2. Mass Spectrometry ..................................................................................... 157
5.2.3. Travelling Wave Ion Mobility Mass Spectrometry ....................................... 157
5.2.4. Electron Transfer Dissociation ..................................................................... 158
5.2.5. Surface Induced Dissociation ....................................................................... 158
5.2.6. Data Analysis ............................................................................................... 158
5.3. Results and Discussion ........................................................................................ 159
5.3.1. The Effect of Concentration, Solution Conditions and Ionisation Polarity ... 159
5.3.2. The Effect of Salt Concentration on Structure ............................................. 160
5.3.3. Conformational Stability of Aβ(1-42) probed by CIU-TWIMS ...................... 163
5.3.4. ETD, ETnoD and ETcaD ................................................................................ 165
5.3.5. Surface Induced Dissociation ....................................................................... 169
5.3.5.1. Fragmentation ..................................................................................... 169
5.3.5.2. The Effect of SID on the Conformation Exhibited by Amyloid Species . 173
5.3.6. The Interactions of Aβ(1-42) with Small Molecule Anti-Aggregation Drug
Candidates .................................................................................................................. 177
5.4. Summary ............................................................................................................. 183
5.5. References........................................................................................................... 185
6. Chapter 6 - Conclusions and Future Work ................................................................... 191
6.1. Conclusions and Future Work ............................................................................. 192
6.2. References........................................................................................................... 199
7. Appendices ................................................................................................................... 200
Appendix 1 - Amino Acid Abbreviations .......................................................................... 201
Appendix 2 – Investigating the Structure of α-Synuclein ................................................ 203
5
Appendix 3 – Following the Early Stages of α-Synuclein Aggregation ............................. 206
Appendix 3.1 - Following Aggregation via Mass Spectrometry ................................... 209
Appendix 3.2 - In Tip Aggregation ............................................................................... 210
Appendix 3.3 - Probing Conformational Changes during Aggregation by HDX-MS. .... 213
Appendix 4 – Structure and Interactions of Aβ(1-42) and Aβ(1-40) ................................ 214
Appendix 4.1 - The Effect of Concentration, Solution Conditions and Ionisation Polarity
.................................................................................................................................... 215
Appendix 4.2 - Conformational Stability of Aβ(1-42) probed by CIU-TWIMS .............. 217
Appendix 4.3 – Surface Induced Dissociation .............................................................. 219
Appendix 4.3.1 - Preparation of the SID Surface ..................................................... 219
Appendix 4.3.2 - Effect of SID on the Conformation Exhibited by Amyloid species 219
Appendix 4.3.3 - The Absence of Precursor Activation by SID ................................. 223
Appendix 4.4 - The Interactions of Aβ(1-42) with Small Molecule Anti-Aggregation Drug
Candidates .................................................................................................................. 223
References ...................................................................................................................... 231
Final Word Count: 64,490
6
List of Figures
Chapter 1 - Introduction
Figure 1.1 - Peptide bond formation……………………………………………………………… 22
Figure 1.2 - The four levels of protein structure……………………………………………. 22
Figure 1.3 - The Protein Quartet Model………………………………………………………… 23
Figure 1.4 - Schematic of the potential species adopted by proteins during
the aggregation process……………………………………………………………… 25
Figure 1.5 - α-Synuclein primary sequence……………………………………………………. 26
Figure 1.6 - The three domains of α-Synuclein……………………………………………… 27
Figure 1.7 - The amyloidogenic and non-amyloidogenic processing pathways
of APP………………………………………………………………………………………… 30
Figure 1.8 - Aβ(1-42) primary sequence………………………………………………………… 30
Figure 1.9 - Overview of the Aβ aggregation process……………………………………. 31
Figure 1.10 - Bernstein mechanism for the oligomerization and fibril
formation of Aβ(1-40) and Aβ(1-42)…………………………………………… 31
Figure 1.11 - Structure of the monomer unit of Aβ(1-40) and Aβ(1-42) fibrils…. 33
Figure 1.12 - The amyloid cascade………………………………………………………………….. 34
Figure 1.13 - RI-OR2 structure………………………………………………………………………… 35
Figure 1.14 - Rutin structure…………………………………………………………………………… 36
Figure 1.15 - The nESI process………………………………………………………………………… 40
Figure 1.16 - Ion trajectories within a quadrupole………………………………………….. 41
Figure 1.17 - Schematic of two ToF geometries………………………………………………. 43
Figure 1.18 - FT-ICR MS cell schematic………………………………..………………………….. 44
Figure 1.19 - The simplified path of cyclotron and magnetron motion imposed
on ions within an FT-ICR MS cell…………………………………………………. 45
Figure 1.20 - MCPs and electron multiplication within a channel……………………. 46
Figure 1.21 - Peptide fragmentation notation…………………………………………………. 46
Figure 1.22 - Workflow of a typical cross-linking-MS experiment……………………. 50
Figure 1.23 - Mobility separation in the IMS region of the Triwave device……… 53
Chapter 2 - Experimental
Figure 2.1 - SDS-PAGE of lysed E. coli cell pellet……………………………………………. 75
Figure 2.2 - QToF schematic………………………………………………………………………….. 78
Figure 2.3 - MoQToF DT-IM-MS instrument schematic…………………………………. 81
Figure 2.4 - Drift cell and lens schematic………………………………………………………. 82
Figure 2.5 - IM-MS experimental workflow example…………………………………….. 84
Figure 2.6 - Waters Synapt G2 instrument schematic……………………………………. 86
Figure 2.7 - Waters Synapt G2S/G2Si instrument schematic…………………………. 87
Figure 2.8 - Synapt Triwave region schematic featuring three TWIGS…………… 87
Figure 2.9 - TWIG/SRIG schematic………………………………………………………………… 87
Figure 2.10 - Example TWIMS CCS calibration plots………………………………………… 92
Figure 2.11 - Structure of 1,3-dicyanobenzene.………………………………………………. 93
7
Figure 2.12 - Waters Synapt G2 instrument schematic with SID device
modification…………………………………………………………………............... 94
Figure 2.13 - The position of the SID device within the Waters Synapt G2
instrument…………………………………………………………………………………. 94
Figure 2.14 - SID cell schematic………………………………………………………………………. 95
Figure 2.15 - Structure of the BS3 cross-linking reagent.…………………………………. 96
Chapter 3 – Investigating the Structure of α-Synuclein
Figure 3.1 - α-Synuclein mass spectrum (70 µM, 50 mM AmAc, pH 6.8,
positive ionisation mode).………………………………………………………….. 104
Figure 3.2 - α-Synuclein mass spectra (70 µM, 50 mM AmAc, pH 6.8, positive
ionisation mode) recorded under the same conditions at
different times………….………………………………………………………………… 106
Figure 3.3 - α-Synuclein mass spectrum (70 µM, 50 mM AmAc, pH 3.5,
positive ionisation mode).………………………………………………………….. 107
Figure 3.4 - α-Synuclein mass spectrum (70 µM, 50 mM AmAc, pH 3.5,
positive ionisation mode).………………………………………………………….. 108
Figure 3.5 - α-Synuclein mass spectrum (70 µM, 50 mM AmAc, pH 6.8,
negative ionisation mode).…………………………………………………………. 110
Figure 3.6 - α-Synuclein mass spectrum (70 µM, 50 mM AmAc, pH 3.5,
negative ionisation mode).…………………………………………………………. 111
Figure 3.7 - α-Synuclein (70 µM, 50 mM AmAc, pH 6.8, positive ionisation
mode) A. m/z vs. CCS plot, B. Mass spectrum and C. Charge state
vs. CCS plot………………………………………………………………………………… 114
Figure 3.8 - α-Synuclein mass spectrum (100 µM, 50 mM AmAc) following
cross-linking at pH 4 and pH 8……………………………………………………. 116
Figure 3.9 - α-Synuclein CCSDs with and without cross-linking……………………… 119
Figure 3.10 - α-Synuclein mass spectrum (30 µM, 50 mM AmAc) recorded on a Bruker Solarix 12T FT-ICR MS instrument prior to ECD…………….. 120
Figure 3.11 - ECD fragmentation maps of the α-Synuclein monomer species
investigated at pH 6.8 and pH 3.5.……………………………………………… 122
Figure 3.12 - The annotated mass spectrum of [aSyn+9H]9+ following ECD
fragmentation of α-Synuclein (30 µM, 50 mM AmAc, pH 6.8)……. 123
Figure 3.13 - The annotated mass spectrum of [aSyn+10H]10+ following ECD
fragmentation of α-Synuclein (30 µM, 50 mM AmAc, pH 6.8)……. 123
Figure 3.14 - The annotated mass spectrum of [aSyn+9H]9+ following ECD
fragmentation of α-Synuclein (30 µM, 50 mM AmAc, pH 3.5)……. 124
Chapter 4 – Following the Early Stages of α-Synuclein Aggregation
Figure 4.1 - α-Synuclein MS aggregation time course with an instrument
cone voltage of 60 V…………………………………………………………………… 137
Figure 4.2 - TEM images of oligomers and fibrils formed in MS compatible
buffer…………………………………………………………………………………………. 138
8
Figure 4.3 - α-Synuclein in tip aggregation time course spectra……………………. 141
Figure 4.4 - Mass spectra recorded during the α-Synuclein IM-MS
aggregation time course…………………………………………………………….. 142
Figure 4.5 - α-Synuclein CCSDs recorded during a 120 hour IM-MS
aggregation time course…………………………………………………………….. 144
Figure 4.6 - α-Synuclein peptides RFU plots at the 0 hour, 24 hour and 120
hour time points of the HDX-MS aggregation time course…………. 146
Chapter 5 – Structure and Interactions of Aβ(1-42) and Aβ(1-40)
Figure 5.1 - Aβ(1-42) mass spectra at 20 or 50 µM in H2O (pH 2) or 20 mM
AmAc (pH 7.4) collected in positive or negative ionisation mode.. 160
Figure 5.2 - [Aβ42+4H]4+ and [Aβ42+3H]3+ ATDs at 20 µM, pH 7.4 at
increasing AmAc salt concentration, collected in positive
ionisation mode…………………………………………………………………………. 162
Figure 5.3 - [Aβ42-4H]4- and [Aβ42-3H]3- ATDs at 20 µM, pH 7.4 at increasing
AmAc salt concentration, collected in negative ionisation mode… 162
Figure 5.4 - Normalised CIU fingerprint plots of A. [Aβ42+4H]4+ and C.
[Aβ42+3H]3+ in H2O (pH 2) and B. [Aβ42+4H]4+ and D.
[Aβ42+3H]3+ in 20 mM AmAc (pH 7.4)………………………………………… 163
Figure 5.5 - CID fragmentation maps of [Aβ42+4H]4+ in H2O (pH 2) at
increasing collision voltage…………………………………………………………. 164
Figure 5.6 - CID fragmentation maps of [Aβ42+4H]4+ in 20 mM AmAc (pH 7.4)
at increasing collision voltage…………………………………………………….. 164
Figure 5.7 - Spectra of the isolated [Aβ42+4H]4+ (20 µM, 20 mM AmAc, pH
7.4), following incremental reduction of the trap wave height
charge reduction is observed……………………………………………………… 166
Figure 5.8 - Aβ(1-42) monomer absolute intensity divided by the TIC plotted
against the trap region wave height…………………………………………… 166
Figure 5.9 - A comparison of ETD and ETcaD fragmentation and location…….. 168
Figure 5.10 - ETcaD fragmentation map for [Aβ42+4H]4+ in 20 mM AmAc (pH
7.4). ETD with supplemental collisional activation (25 V)……………. 169
Figure 5.11 - SID fragmentation map for [Aβ42+4H]4+ in 20 mM AmAc (pH
7.4). SID collision voltage: 40 V…………………………………………………… 170
Figure 5.12 - SID fragmentation map for [Aβ40+4H]4+ in 20 mM AmAc (pH
7.4). SID collision voltage: 40 V…………………………………………………… 171
Figure 5.13 - Comparison of CID vs SID fragmentation of [Aβ42+4H]4+ in 20
mM AmAc (pH 7.4). A. CID: 50 V, B. CID/SID: 0 V C. SID: 40 V……… 172
Figure 5.14 - [Aβ42+4H]4+ C-terminal SID b- fragment ion ATDs in 20 mM
AmAc (pH 7.4). SID collision voltage: 40V…………………………………… 173
Figure 5.15 - [Aβ40+4H]4+ C-terminal SID b- fragment ion ATDs in 20 mM
AmAc (pH 7.4). SID collision voltage: 40 V………………………………….. 175
Figure 5.16 - ATDs of the charge reduced [Aβ40+3H]3+ central region SID b-
fragment ions in 20 mM AmAc (pH 7.4). SID collision voltage: 40
V………………………………………………………………………………………………… 177
9
Figure 5.17 - Mass spectra of Aβ(1-42) at 20 µM in H2O (pH 2) at increasing
Aβ(1-42):RI-OR2 ratio…………………………………………………………………. 179
Figure 5.18 - Absolute intensity of all observed species plotted against Aβ(1-
42):RI-OR2 ratio in H2O (pH 2)……………………………………………………. 179
Figure 5.19 - ATDs and calculated CCS values of ligand bound Aβ(1-42),
[(Aβ42:Ligand)±4H]4± at a ratio of 1:1 (1:5, Figure 4.19D) in H2O
(pH 2) or 20 mM AmAc (pH 7.4) at 20 µM in positive or negative
ionisation mode…………………………………………………………………………. 182
Appendices
Appendix 3 – Following the Early Stages of α-Synuclein Aggregation
Figure A3.1 - α-Synuclein MS aggregation time course with an instrument
cone voltage of 60 V normalised to the 0 hour spectrum base
peak intensity…………………………………………………………………………….. 209
Figure A3.2 - Microscope image of the nESI tip used to spray the sample
recorded in Figure 4.3 and Figure A3.3………………………………………. 210
Figure A3.3 - α-Synuclein in tip aggregation time course spectra (Figure 4.3),
normalised to the 0-5 minute spectrum base peak intensity……… 211
Figure A3.4 - α-Synuclein in tip aggregation time course replicate spectra,
normalised to the 0-5 minute spectrum base peak intensity……… 212
Figure A3.5 - Plot of the α-Synuclein peptides RFU at the 0 hour and 120 hour
time points analysed together within DynamX…………………………… 213
Figure A3.6 - Plot of the α-Synuclein peptides RFU at the 0 hour and 120 hour
time points analysed independently within DynamX………………….. 213
Appendix 4 – Structure and Interactions of Aβ(1-42) and Aβ(1-40)
Figure A4.1 - Aβ(1-42) mass spectra in H2O (pH 2) collected using different
instruments and using different source conditions…………………….. 216
Figure A4.2 - Aβ(1-42) mass spectra in 20 mM AmAc (pH 7.4) collected under
different source conditions and on different instruments………….. 217
Figure A4.3 - CIU-TWIMS ATDs of [Aβ42+4H]4+ and [Aβ42+3H]3+ in H2O (pH 2)
at increasing collision voltage…………………………………………………….. 218
Figure A4.4 - CIU-TWIMS ATDs of [Aβ42+4H]4+ and [Aβ42+3H]3+ in 20 mM
AmAc (pH 7.4) at increasing collision voltage……………………………… 218
Figure A4.5 - ATDs of [Aβ42+4H]4+ b- fragment ions in 20mM AmAc (pH 7.4),
observed during CIU-TWIMS experiment. Collision voltage: 40 V. 220
Figure A4.6 - C-terminal SID b- fragment ion ATDs of the charge reduced
[Aβ42+3H]3+ (20 mM AmAc, pH 7.4). SID collision voltage: 40 V…. 221
Figure A4.7 - C-terminal SID b- fragment ion ATDs of the charge reduced
[Aβ40+3H]3+ (20 mM AmAc, pH 7.4). SID collision voltage: 40 V…. 222
10
Figure A4.8 - ATDs of the isolated [Aβ42+4H]4+ (A to E) and [Aβ40+4H]4+ (F to
J) precursor ions in 20 mM AmAc (pH 7.4), following the
application of increasing SID collision voltage…………………………….. 223
Figure A4.9 - Aβ(1-42) mass spectra at increasing Aβ(1-42):Bradykinin ratio in
H2O (pH 2)………………………………………………………………………………….. 224
Figure A4.10 - ATDs and calculated CCS values of [Aβ42+4H]4+ and [Aβ42+3H]3+
in the absence and presence of RI-OR2/Rutin/Bradykinin at a 1:1
ratio in H2O (pH 2)……………………………………………………………………… 226
Figure A4.11 - ATDs and calculated CCS values of [Aβ42±4H]4± and [Aβ42±3H]3±
in the absence and presence of Rutin or Bradykinin at 1:1 (Aβ(1-
42) and Rutin, negative ionisation mode: ratio 1:5) in 20 mM
AmAc (pH7.4)…………………………………………………………………………….. 226
Figure A4.12 - ATDs and calculated CCS values of [(Aβ42:Bradykinin)+4H]4+ at a
ratio of 1:1 in H2O (pH 2) or 20 mM AmAc (pH 7.4), collected in
positive ionisation mode……………………………………………………………. 227
Figure A4.13 - The ATD and calculated CCS value of [RI-OR2+2H]2+ in H2O (pH 2)
collected in positive ionisation mode…………………………………………. 227
Figure A4.14 - The ATD and calculated CCS value of [BK+H]1+ in H2O (pH 2)
collected in positive ionisation mode…………………………………………. 228
Figure A4.15 - The ATD and calculated CCS values of [BK+H]1+ and [BK+2H]2+ in
20 mM AmAc (pH 7.4) collected in positive ionisation mode……… 228
Figure A4.16 - The ATD and calculated CCS value of [Rutin+1H]1+ in H2O (pH 2)
collected in positive ionisation mode…………………………………………. 229
Figure A4.17 - The ATD and calculated CCS value of [Rutin+1H]1+ in 20 mM
AmAc (pH 7.4) collected in positive ionisation mode…………………. 229
Figure A4.18 - Mass spectra and ATDs of the main and shoulders of isotopic
peaks of the Aβ(1-42):Rutin bound species in Figure 5.19C………… 230
Figure A4.19 - Aβ(1-42) mass spectra (20 mM AmAc, pH 7.4) in the absence (A)
and presence (B & C) of Rutin at a 1:5 ratio collected in negative
ionisation mode…………………………………………………………………………. 230
11
List of Tables
Chapter 1 - Introduction
Table 1.1 - Summary of advantages and disadvantages of biophysical
techniques for the structural analysis of IDPs………………………………. 56
Chapter 2 - Experimental
Table 2.1 - Typical operating parameters for MS experiments performed on a
QToF Ultima / Ultima Global instrument with MS Vision high mass
upgrade………………………………………………………………………………………… 79
Table 2.2 - Typical operating parameters for DT-IM-MS experiments in
positive ionisation mode performed on the MoQToF IM-MS
instrument…………………………………………………………………………………… 82
Table 2.3 - The voltage ranges and typical drift cell lens voltages for the
MoQToF in positive ionisation mode……………………………………………. 83
Table 2.4 - Typical operating parameters for TWIMS experiments performed
on Waters Synapt instrument operated in positive ionisation
mode……………………………………………………………………………………………. 88
Table 2.5 - Typical operating parameters for TWIMS experiments performed
on Waters Synapt instrument operated in negative ionisation
mode……………………………………………………………………………………………. 90
Table 2.6 - Supplemental typical instrument parameters for ETD
experiments…………………………………………………………………………………. 93
Table 2.7 - Typical operating parameters for the SID cell lenses in flythrough
and SID modes……………………………………………………………………………… 96
Chapter 3 - Investigating the Structure of α-Synuclein
Table 3.1 - The fragments identified of α-Synuclein dimers, [(aSyn)2+13H]13+,
[(aSyn)2+15H]15+ and [(aSyn)2+17H]17+ at pH 6.8 and pH 3.5
following ECD……………………………………………………………………………….. 125
Chapter 5 – Structure and Interactions of Aβ(1-42) and Aβ(1-40)
Table 5.1 - Calculated CCS values of the unbound [Aβ42+4H]4+ and
[Aβ42+3H]3+ in the absence and presence of RI-OR2, Rutin and
Bradykinin in H2O (pH 2) or 20mM AmAc (pH 7.4)………………………… 182
12
Appendices
Appendix 1 – Amino Acid Abbreviations
Table A1.1 - Amino acid structures and properties…………………………………………… 201
Appendix 2 – Investigating the Structure of α-Synuclein
Table A2.1 - Complete list of α-Synuclein species observed in Chapter 3
figures………………………………………………………………………………………….. 204
Table A2.2 - Experimental CCS values for α-Synuclein (70µM, 50mM AmAc, pH
6.8) collected in positive ionisation mode…………………………………….. 205
Appendix 3 – Following the Early Stages of α-Synuclein Aggregation
Table A3.1 - Complete list of α-Synuclein species observed in Chapter 4
figures………………………………………………………………………………………….. 207
Table A3.2 - Complete list of α-Synuclein species observed in Appendix 3
figures………………………………………………………………………………………….. 208
Appendix 4 – Structure and Interactions of Aβ(1-42) and Aβ(1-40)
Table A4.1 - Complete list of Aβ(1-42), bound complexes and small molecule
drug candidate species observed in Chapter 5 figures………………….. 214
Table A4.2 - Complete list of Aβ(1-42), bound complexes and small drug
molecule candidate species observed in Appendix 4 figures………… 214
Table A4.3 - Instrument parameters and source conditions applied during
collection of the spectra in Figure A4.1A to A4.1C………………………… 215
Table A4.4 - Instrument parameters and solution conditions applied during
the collection of the spectra in Figure A4.2………………………………….. 217
Table A4.5 - Instrument parameters and solution conditions used for Aβ(1-42)
binding experiments…………………………………………………………………….. 225

13
List of Equations
Chapter 1 – Introduction
Equation 1.1 - ±𝜙0 = ±(𝑈 − 𝑉 cos 𝜔𝑡) ………………………………………………………. 41
Equation 1.2 - 𝐸𝑘 = 𝑚𝑣2
2= 𝑧𝑒𝑉𝑠 ……………………………………………………………………. 42
Equation 1.3 - 𝑣 = (2𝑧𝑒 𝑉𝑠 𝑚⁄ )1 2⁄ …………………………………………………….............. 42
Equation 1.4 - 𝑡 = 𝐿
𝑣 ……………………………………………………………………………………… 42
Equation 1.5 - 𝑡2 = 𝑚
𝑧 (
𝐿2
2𝑒𝑉𝑠) ………………………………………………………………………… 42
Equation 1.6 - 𝑧𝐵 = 𝑚𝑣
𝑟 ………………………………………………………………………………… 43
Equation 1.7 - 𝑓 = 𝑣
2𝜋𝑟 ………………………………………………………………………………….. 44
Equation 1.8 - 𝜔 = 2𝜋𝑓 = 𝑣
𝑟=
𝑧
𝑚𝐵 ……………………………………………………………… 44
Equation 1.9 - 𝑣𝑑 = 𝐾𝐸 …………………………………………………………………………………. 51
Equation 1.10 - 𝐾 = 3𝑧𝑒
16𝑁 (
2𝜋
𝜇𝑘𝐵𝑇)
1 2⁄ 1
𝛺 ……………………………………………………………. 51
Equation 1.11 - 𝐾0 = 𝐾𝑇𝑜𝑃
𝑃𝑜𝑇 ………………………………………………………………….............. 52
Chapter 2 – Experimental
Equation 2.1 - 𝑦 = 𝑦0 + 𝐴
𝑤√𝜋
2 𝑒
−2(𝑥−𝑥𝑐)2
𝑤2 ……………………………………………………… 84
Equation 2.2 - 𝑡𝑎 = 𝑡𝑑 + 𝑡0 …………………………………………………………………………. 85
Equation 2.3 - 𝐾 = 𝐿2
𝑡𝑑𝑉 …………………………………………………………………………………. 85
Equation 2.4 - 𝐾0 = 𝐾𝑇0
𝑇
𝑃
𝑃0 …………………………………………………………………………… 85
Equation 2.5 - 𝑡𝑑 = 𝑡𝑎 − 𝑡𝑜 = 𝐿2𝑇0𝑃
𝐾0𝑇𝑃0𝑉 ………………………………………………………… 85
Equation 2.6 - 𝛺 = 3𝑧𝑒
16𝑁 (
2𝜋
µ𝑘𝐵𝑇)
1
2 1
𝐾0 ……………………………………………………………….. 85
Equation 2.7 - 𝑡′𝑑 = 𝑡𝑑 − [𝑐√𝑚/𝑧
1000] ……………………………………………………………….. 91
Equation 2.8 - 𝛺′ = 𝛺
𝑧 (1 µ⁄ )1/2 ………………………………………………………………………… 91
Equation 2.9 - ln 𝛺′ = 𝑥 ln 𝑡′𝑑 + ln 𝐴 …………………………………………………………… 92
Equation 2.10 - 𝑡′′𝑑 = 𝑡′𝑑𝑥
𝑧 (1 µ⁄ )1 2⁄ ……………………………………………………………. 92
14
Abbreviations
aSyn α-Synuclein
AFM Atomic Force Microscopy
AmAc Ammonium Acetate
ANS 8-Anilinonapthalene-1-sulfonic acid
AS Alternative Splicing
ATD Arrival Time Distribution
Aβ / Aβ40 / Aβ42 Amyloid-β / Amyloid-β (1-40) / Amyloid-β (1-42)
BEH Ethylene Bridged Hybrid
BK Bradykinin
CAD Collisional Activation Dissociation
CCD Charge Coupled Device
CCS Collision Cross Section
CCSD Collision Cross Section Distribution
CD Circular Dichroism
CEM Chain Ejection Model
CHC Central Hydrophobic Cluster
CID Collision Induced Dissociation
CIU-TWIMS Collision Induced Unfolding – Travelling Wave Ion Mobility Mass
Spectrometry
CRM Charge Reduction Model
Cryo-EM Cryo- Electron Microscopy
CSD Charge State Distribution
Da Dalton
DC Direct Current
DI Deionised
DLS Dynamic Light Scattering
DT-IM-MS Drift Time Ion Mobility Mass Spectrometry
DTT Dithiothreitol
E. coli Escherichia coli
ECD Electron Capture Dissociation
EDTA Ethylenediaminetetraacetic acid
EGCG Epigallocatechin Gallate
EOM Ensemble Optimisation Model
ESI ElectroSpray Ionisation
ETcaD Electron Transfer Collisional Activation Dissociation
ETD Electron Transfer Dissociation
FRET Förster Resonance Energy Transfer
FT-ICR MS Fourier Transform Ion Cyclotron Resonance Mass Spectrometry
FTIR Fourier Transform Infrared Spectroscopy
HDX Hydrogen Deuterium Exchange
HFIP Hexafluoroisopropanol
ID Inner Diameter
IDP/R Intrinsically Disordered Protein/Region
15
IEM Ion Ejection Model
IM-MS Ion Mobility Mass Spectrometry
LB Luria Broth
LC Liquid Chromatography
m/z Mass to Charge ratio
MALDI Matrix Assisted Laser Desorption Ionisation
MAP Microtubule-Associated Protein
MCPs Multichannel Plates
mRNA Messenger Ribonucleic acid
MS Mass Spectrometry
MS/MS Tandem Mass Spectrometry
MW Molecular Weight
MWCO Molecular Weight Cut Off
nESI Nano ElectroSpray Ionisation
NFT Neurofibrillary Tangle
NMR Nuclear Magnetic Resonance Microscopy
NOE Nuclear Overhauser Effect
OD Outer Diameter
PBS Phosphate Buffer Solution
PD Parkinson’s Disease
PHFs Paired Helicoidal Filaments
PLGS ProteinLynx Global Server
PTM Post-Translational Modification
QToF Quadrupole Time of Flight
RF Radio Frequency
RFU Relative Fractional Uptake
ROS Reactive Oxygen Species
rpm Revolutions per minute
SAXS Small Angle X-ray Scattering
SDS-PAGE Sodium Dodecyl Sulphate Polyacrylamide Gel Electrophoresis
SID Surface Induced Dissociation
SRIG Stacked Ring Ion Guide
TDC Time-to-Digital Converter
TEM Transmission Electron Microscopy
ThT Thioflavin T
TIC Total Ion Current
ToF Time of Flight
Tris Tris(hydroxymethyl)aminoamethane
TWIG Travelling Wave Ion Guide
TWIMS Travelling Wave Ion Mobility Mass Spectrometry
UPLC Ultra High Pressure Liquid Chromatography
UV Ultraviolet
wt Wildtype
16
Abstract
The University of Manchester
Candidate’s name: Ashley Sean Phillips
Degree title: Doctor of Philosophy
Thesis title: Probing Early Stage Aggregates of Amyloidogenic Proteins using Mass
Spectrometry Based Methods
Date: 14 December 2016
Mass Spectrometry (MS) and Ion Mobility – Mass Spectrometry (IM-MS) can be used to investigate protein structure and dynamics and are ideally positioned to study intrinsically disordered and amyloidogenic proteins, whose diverse conformational space and/or oligomeric state is hard to track accurately. This thesis uses hybrid MS approaches including IM-MS, Cross-linking IM-MS and ECD-FT-ICR MS to probe the structure of α-Synuclein and Amyloid-β (Aβ).
For α-Synuclein, the effect of solution pH and ionisation polarity on the species observed by MS and IM-MS is investigated. Conformational families observed by Cross-linking IM-MS provides a link between the solution and gas phase structures of α-Synuclein observed here and our data correlates with that reported by other groups. MS, IM-MS and HDX-MS are used to probe α-Synuclein during the early stages of aggregation. A specific aggregation competent conformer is not observed suggesting that the solution constituents remain conformationally dynamic. We observe shifts in the species observed by MS and IM-MS between samples and our data contributes to an array of conflicting structural studies indicating that α-Synuclein adopts a diverse range of species with significant variation.
For Aβ(1-42) and Aβ(1-40) Collision Induced Unfolding and ETD/ETcaD demonstrate that Aβ(1-42) adopts a compact conformation bound by intramolecular interactions. Changes to the Aβ(1-42) and Aβ(1-40) ATDs following SID are correlated to known structure influencing intermolecular interactions and demonstrate the large structural difference between Aβ(1-42) and Aβ(1-40) despite differing by only two C-terminal amino acids. IM-MS is used to classify the mode of action of anti-aggregation drug candidates on Aβ(1-42). The anti-aggregation capacity of the retro-inverso peptide, RI-OR2 is shown to result from inducing the compaction or extension of Aβ(1-42), preventing the adoption of an aggregation competent structure. In contrast, the flavonoid Rutin is shown to act solely through inducing Aβ(1-42) compaction.
This thesis demonstrates the power of MS based methods to investigate the diverse range of structures of intrinsically disordered aggregating proteins implicated in disease.
17
Declaration
No portion of the work referred to in the thesis has been submitted in support of an
application for another degree or qualification of this or any other university or other
institute of learning.
Copyright Statement
i. The author of this thesis (including any appendices and/or schedules to this thesis)
owns certain copyright or related rights in it (the “Copyright”) and s/he has given
The University of Manchester certain rights to use such Copyright, including for
administrative purposes.
ii. Copies of this thesis, either in full or in extracts and whether in hard or electronic
copy, may be made only in accordance with the Copyright, Designs and Patents Act
1988 (as amended) and regulations issued under it or, where appropriate, in
accordance with licensing agreements which the University has from time to time.
This page must form part of any such copies made.
iii. The ownership of certain Copyright, patents, designs, trade marks and other
intellectual property (the “Intellectual Property”) and any reproductions of
copyright works in the thesis, for example graphs and tables (“Reproductions”),
which may be described in this thesis, may not be owned by the author and may be
owned by third parties. Such Intellectual Property and Reproductions cannot and
must not be made available for use without the prior written permission of the
owner(s) of the relevant Intellectual Property and/or Reproductions.
iv. Further information on the conditions under which disclosure, publication and
commercialisation of this thesis, the Copyright and any Intellectual Property and/or
Reproductions described in it may take place is available in the University IP Policy
(see http://documents.manchester.ac.uk/DocuInfo.aspx?DocID=487), in any
relevant Thesis restriction declarations deposited in the University Library, The
University Library’s regulations (see
http://www.manchester.ac.uk/library/aboutus/regulations) and in The University’s
policy on Presentation of Theses

18
“Even the knowledge of my own fallibility cannot keep me from making mistakes. Only when I fall do I get up again” Vincent van Gogh
“What is a scientist after all? It is a curious man looking through a keyhole, the keyhole of nature,
trying to know what’s going on.” Jacques Cousteau

19
Acknowledgements
I would not have made it to the end of this adventure without the knowledge and advice of
many colleagues, advisors, friends and family. I would like to thank my supervisor, Perdita
Barran, my secondary supervisors Tilo Kunath, Cait MacPhee (in Edinburgh, but not
forgotten) and Roy Goodacre for their words of advice during this rocky roller coaster. My
collaborators, Garth Cooper, Isabel Riba Garcia and David Allsop. Ewa Jurneczko, you
guided me through my first steps into the wonderful world of mass spectrometry and I will
be forever grateful. Alex Gomes, your passion for mass spectrometry is unrivalled and you
are an inspiration, thanks for your help with the cross-linking and ECD experiments. Jay
Gillam for late night protein expression, which made all of this possible. Jason Kalapothakis
and my project students Jonas Gasparavicious and Hassan Saleem thanks for your help with
the α-Synuclein time course experiments. Steve Mitchell for your help with TEM. Jon
Williams for your help with ETD. Bruno Bellina for your help with ETD and SID. Logan
MacKay and SIRCAMS for your help with ECD. Sophie Harvey for your help with ECD and
SID. Ben Allsop for your help with Aβ(1-42) binding experiments and being an
overwhelmingly cheerful chap. The DTC in Glasgow for having the initial faith in me and for
a brilliant Masters year. I would like to thank the support staff at the University of
Edinburgh and the University of Manchester, without your help my experiments would
never have made the leap from ideas into reality. Thanks to MIB stores, you made buying
gloves fun, but sadly only until midday on Fridays.
Thanks to PBRGroup old and new. Thanks to: Fellow Dr Triathlete Bex Beveridge, you beat
me in this race. Chris Nortcliffe for whisky lessons and mammoth games sessions. Ellie
Dickinson, first of her name, for reminding me of the Leu Enk lock mass every time I needed
it. Jakub, the best flat mate I have ever had, even though you left the hob on. Kamila, road
trip buddy, gym buddy and Wagakamas head chef (Chica, you are fabulous!). Rosie, thanks
for late night chats, pizza and cycling with me in the snow and hail. Alina, for proofreading
everything, thanks for making me sound human. Chris G for putting me in his
acknowledgments. Jacky for the maple syrup. Naza, my desk and squash partner, rematch?
Maria, the mother hen, thanks for adopting me. Thanks to Lukasz, Claire, Pancake and
Crumpet, for housing a stray scientist in the last stressful months of my sentence. Nick
O’Meara for some great cycling adventures. I have made some truly wonderful friends in
Glasgow, Edinburgh and Manchester, I cannot mention everyone here, but you have all
made my PhD four unforgettable years!

20
Thanks to my entire family for their support. To Ell for his brutal brotherly support and to
Inka for keeping me company. Finally, Mum and Dad, thanks for putting up with all my
grumbles, for the pick me up chats when I was feeling down and for supplying my coffee,
biscuit and foam banana addictions.
21
1 Introduction
Intrinsically disordered proteins challenge the traditional structure = function paradigm,
exhibiting regions of complete disorder while still performing essential biological functions.
As a result, these proteins are implicated in many diseases. The aggregation of these
proteins is complex and features a diverse array of species.
Analysis of the structure and formation of the early species in the aggregation process is
critical for understanding the disease and designing therapeutics. Mass Spectrometry and
Ion Mobility - Mass Spectrometry represent a solution where other biophysical methods
falter providing valuable insights into the species present and their structure.
22
1.1. Proteins
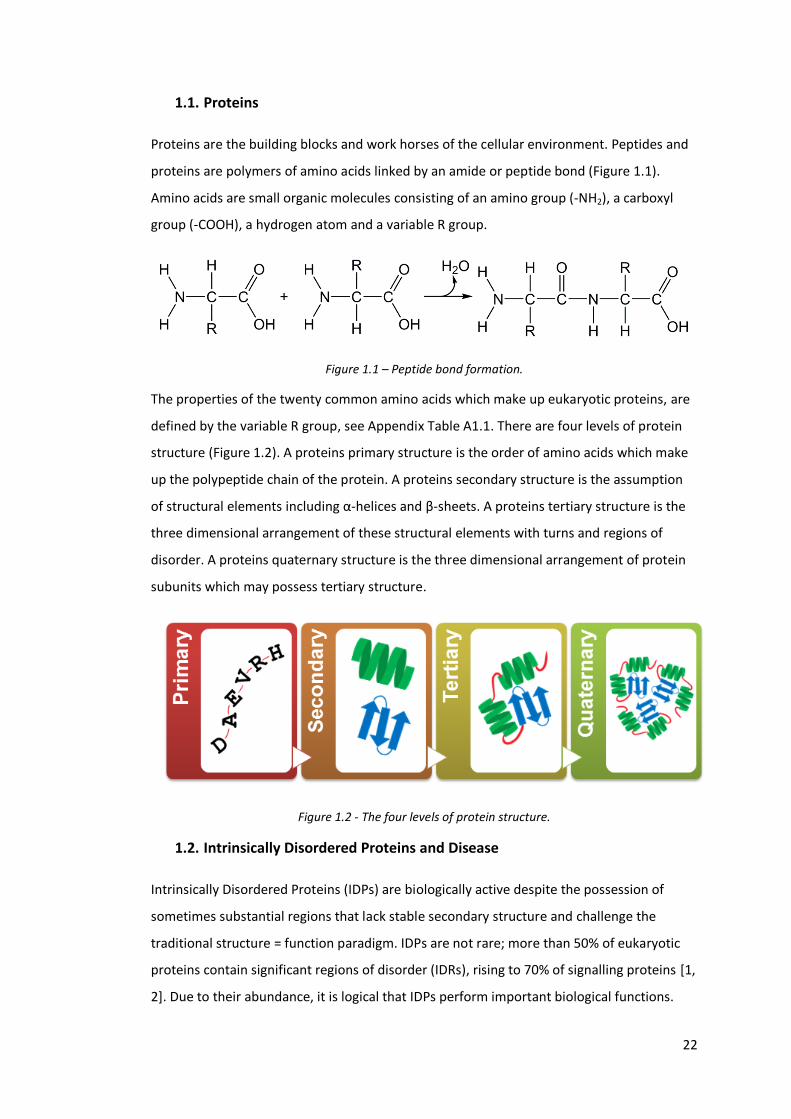
Proteins are the building blocks and work horses of the cellular environment. Peptides and
proteins are polymers of amino acids linked by an amide or peptide bond (Figure 1.1).
Amino acids are small organic molecules consisting of an amino group (-NH2), a carboxyl
group (-COOH), a hydrogen atom and a variable R group.
Figure 1.1 – Peptide bond formation.
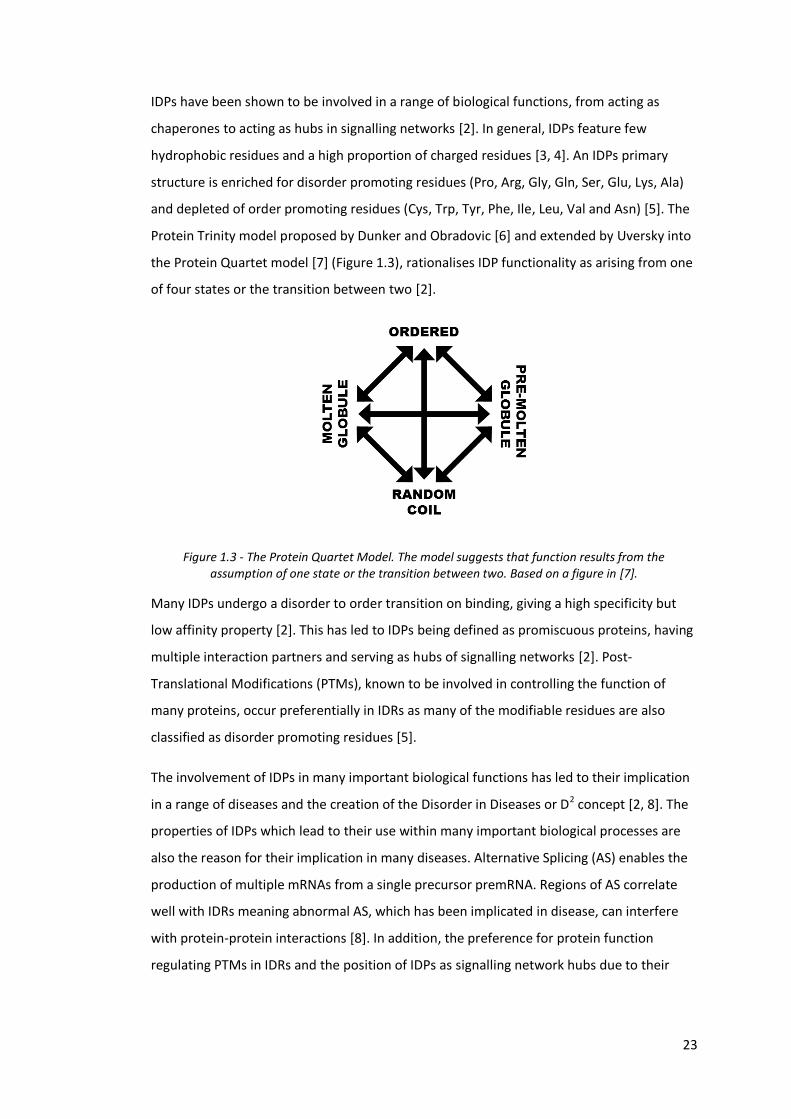
The properties of the twenty common amino acids which make up eukaryotic proteins, are
defined by the variable R group, see Appendix Table A1.1. There are four levels of protein
structure (Figure 1.2). A proteins primary structure is the order of amino acids which make
up the polypeptide chain of the protein. A proteins secondary structure is the assumption
of structural elements including α-helices and β-sheets. A proteins tertiary structure is the
three dimensional arrangement of these structural elements with turns and regions of
disorder. A proteins quaternary structure is the three dimensional arrangement of protein
subunits which may possess tertiary structure.
Figure 1.2 - The four levels of protein structure.
1.2. Intrinsically Disordered Proteins and Disease
Intrinsically Disordered Proteins (IDPs) are biologically active despite the possession of
sometimes substantial regions that lack stable secondary structure and challenge the
traditional structure = function paradigm. IDPs are not rare; more than 50% of eukaryotic
proteins contain significant regions of disorder (IDRs), rising to 70% of signalling proteins [1,
2]. Due to their abundance, it is logical that IDPs perform important biological functions.
23
IDPs have been shown to be involved in a range of biological functions, from acting as
chaperones to acting as hubs in signalling networks [2]. In general, IDPs feature few
hydrophobic residues and a high proportion of charged residues [3, 4]. An IDPs primary
structure is enriched for disorder promoting residues (Pro, Arg, Gly, Gln, Ser, Glu, Lys, Ala)
and depleted of order promoting residues (Cys, Trp, Tyr, Phe, Ile, Leu, Val and Asn) [5]. The
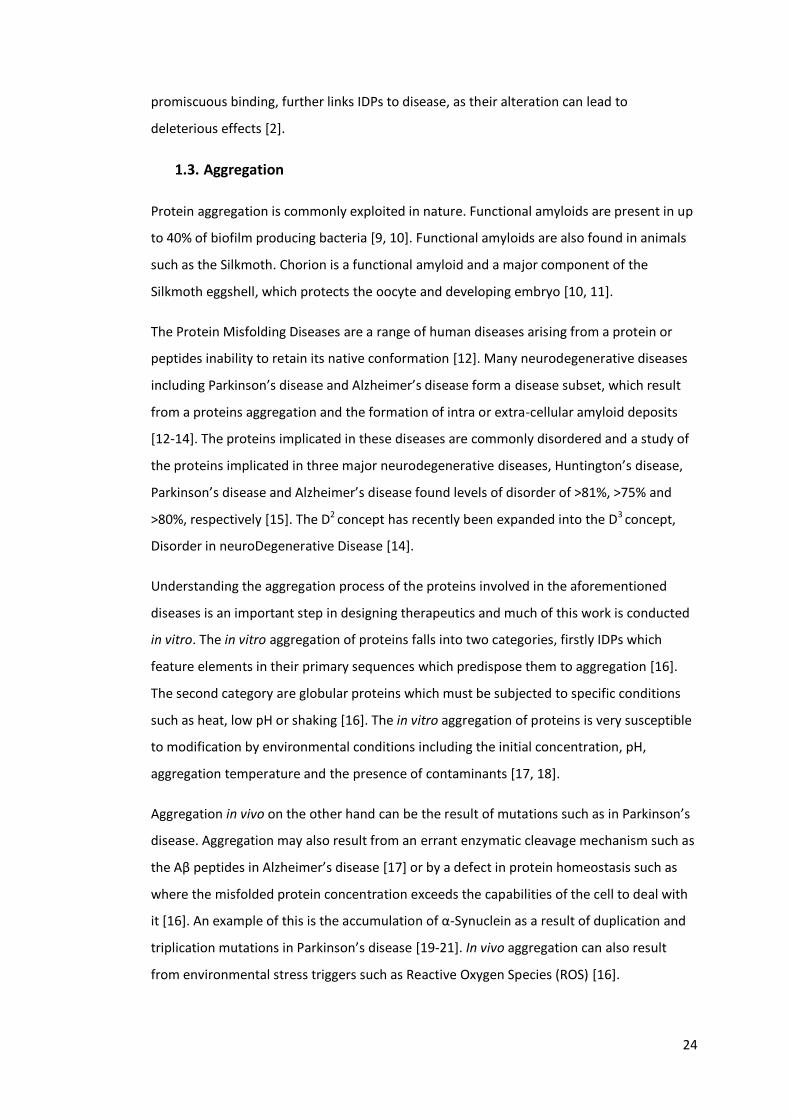
Protein Trinity model proposed by Dunker and Obradovic [6] and extended by Uversky into
the Protein Quartet model [7] (Figure 1.3), rationalises IDP functionality as arising from one
of four states or the transition between two [2].
Figure 1.3 - The Protein Quartet Model. The model suggests that function results from the assumption of one state or the transition between two. Based on a figure in [7].
Many IDPs undergo a disorder to order transition on binding, giving a high specificity but
low affinity property [2]. This has led to IDPs being defined as promiscuous proteins, having
multiple interaction partners and serving as hubs of signalling networks [2]. Post-
Translational Modifications (PTMs), known to be involved in controlling the function of
many proteins, occur preferentially in IDRs as many of the modifiable residues are also
classified as disorder promoting residues [5].
The involvement of IDPs in many important biological functions has led to their implication
in a range of diseases and the creation of the Disorder in Diseases or D2 concept [2, 8]. The
properties of IDPs which lead to their use within many important biological processes are
also the reason for their implication in many diseases. Alternative Splicing (AS) enables the
production of multiple mRNAs from a single precursor premRNA. Regions of AS correlate
well with IDRs meaning abnormal AS, which has been implicated in disease, can interfere
with protein-protein interactions [8]. In addition, the preference for protein function
regulating PTMs in IDRs and the position of IDPs as signalling network hubs due to their
24
promiscuous binding, further links IDPs to disease, as their alteration can lead to
deleterious effects [2].
1.3. Aggregation
Protein aggregation is commonly exploited in nature. Functional amyloids are present in up
to 40% of biofilm producing bacteria [9, 10]. Functional amyloids are also found in animals
such as the Silkmoth. Chorion is a functional amyloid and a major component of the
Silkmoth eggshell, which protects the oocyte and developing embryo [10, 11].
The Protein Misfolding Diseases are a range of human diseases arising from a protein or
peptides inability to retain its native conformation [12]. Many neurodegenerative diseases
including Parkinson’s disease and Alzheimer’s disease form a disease subset, which result
from a proteins aggregation and the formation of intra or extra-cellular amyloid deposits
[12-14]. The proteins implicated in these diseases are commonly disordered and a study of
the proteins implicated in three major neurodegenerative diseases, Huntington’s disease,
Parkinson’s disease and Alzheimer’s disease found levels of disorder of >81%, >75% and
>80%, respectively [15]. The D2 concept has recently been expanded into the D3
concept,
Disorder in neuroDegenerative Disease [14].
Understanding the aggregation process of the proteins involved in the aforementioned
diseases is an important step in designing therapeutics and much of this work is conducted
in vitro. The in vitro aggregation of proteins falls into two categories, firstly IDPs which
feature elements in their primary sequences which predispose them to aggregation [16].
The second category are globular proteins which must be subjected to specific conditions
such as heat, low pH or shaking [16]. The in vitro aggregation of proteins is very susceptible
to modification by environmental conditions including the initial concentration, pH,
aggregation temperature and the presence of contaminants [17, 18].
Aggregation in vivo on the other hand can be the result of mutations such as in Parkinson’s
disease. Aggregation may also result from an errant enzymatic cleavage mechanism such as
the Aβ peptides in Alzheimer’s disease [17] or by a defect in protein homeostasis such as
where the misfolded protein concentration exceeds the capabilities of the cell to deal with
it [16]. An example of this is the accumulation of α-Synuclein as a result of duplication and
triplication mutations in Parkinson’s disease [19-21]. In vivo aggregation can also result
from environmental stress triggers such as Reactive Oxygen Species (ROS) [16].
25
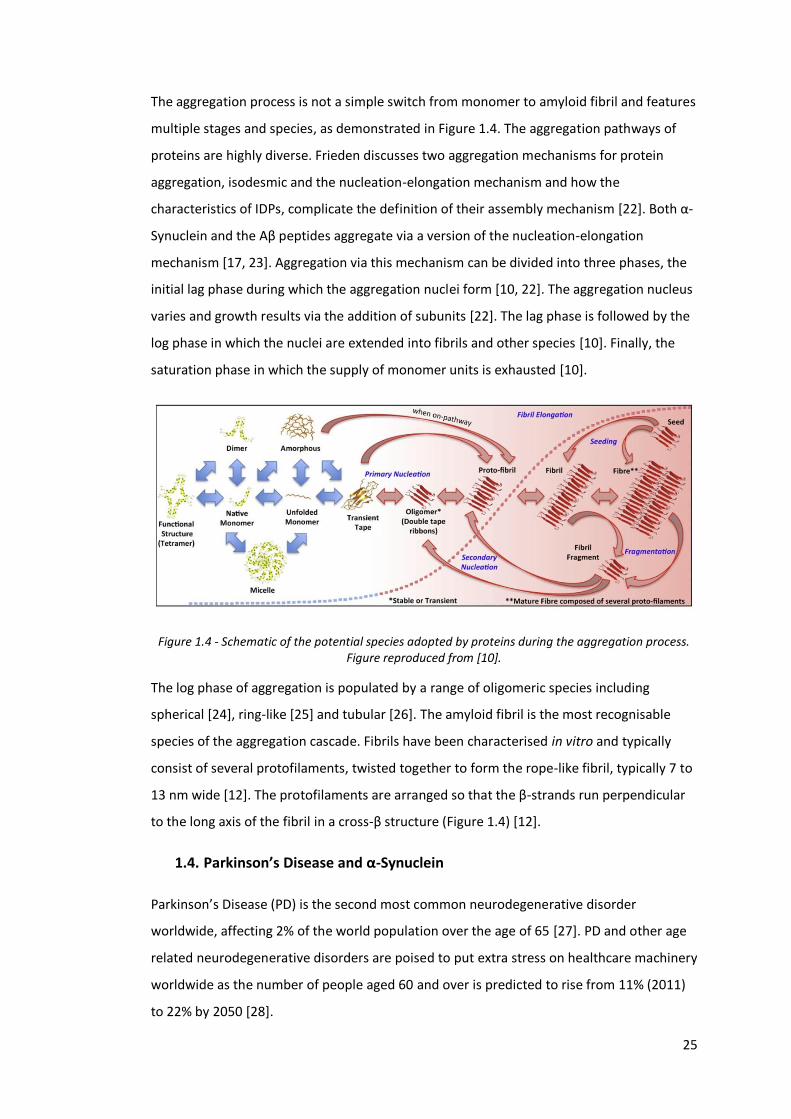
The aggregation process is not a simple switch from monomer to amyloid fibril and features
multiple stages and species, as demonstrated in Figure 1.4. The aggregation pathways of
proteins are highly diverse. Frieden discusses two aggregation mechanisms for protein
aggregation, isodesmic and the nucleation-elongation mechanism and how the
characteristics of IDPs, complicate the definition of their assembly mechanism [22]. Both α-
Synuclein and the Aβ peptides aggregate via a version of the nucleation-elongation
mechanism [17, 23]. Aggregation via this mechanism can be divided into three phases, the
initial lag phase during which the aggregation nuclei form [10, 22]. The aggregation nucleus
varies and growth results via the addition of subunits [22]. The lag phase is followed by the
log phase in which the nuclei are extended into fibrils and other species [10]. Finally, the
saturation phase in which the supply of monomer units is exhausted [10].
Figure 1.4 - Schematic of the potential species adopted by proteins during the aggregation process. Figure reproduced from [10].
The log phase of aggregation is populated by a range of oligomeric species including
spherical [24], ring-like [25] and tubular [26]. The amyloid fibril is the most recognisable
species of the aggregation cascade. Fibrils have been characterised in vitro and typically
consist of several protofilaments, twisted together to form the rope-like fibril, typically 7 to
13 nm wide [12]. The protofilaments are arranged so that the β-strands run perpendicular
to the long axis of the fibril in a cross-β structure (Figure 1.4) [12].
1.4. Parkinson’s Disease and α-Synuclein
Parkinson’s Disease (PD) is the second most common neurodegenerative disorder
worldwide, affecting 2% of the world population over the age of 65 [27]. PD and other age
related neurodegenerative disorders are poised to put extra stress on healthcare machinery
worldwide as the number of people aged 60 and over is predicted to rise from 11% (2011)
to 22% by 2050 [28].
26
James Parkinson first described PD in 1817 [29] and it is characterised clinically by tremor,
bradykinesia, rigidity and a loss of postural reflexes [30, 31]. Neuropathologically, PD is
characterised by the presence of proteinaceous Lewy Body inclusions in, and the selective
degeneration of, the dopaminergic neurons of the Substantia nigra pars compacta [31, 32].
This neuronal loss is the cause of PD’s motor symptoms and is only evident following the
loss of 50% of the neurons [33]. Lewy Bodies were first described as a feature of specific PD
nigral pathology by Tretiakoff [31, 34, 35]. Phase and Electron microscopy studies by Duffy
and Tennyson demonstrated that Lewy bodies are composed of filamentous structures,
which were subsequently found to be composed primarily of α-Synuclein [32, 35, 36].
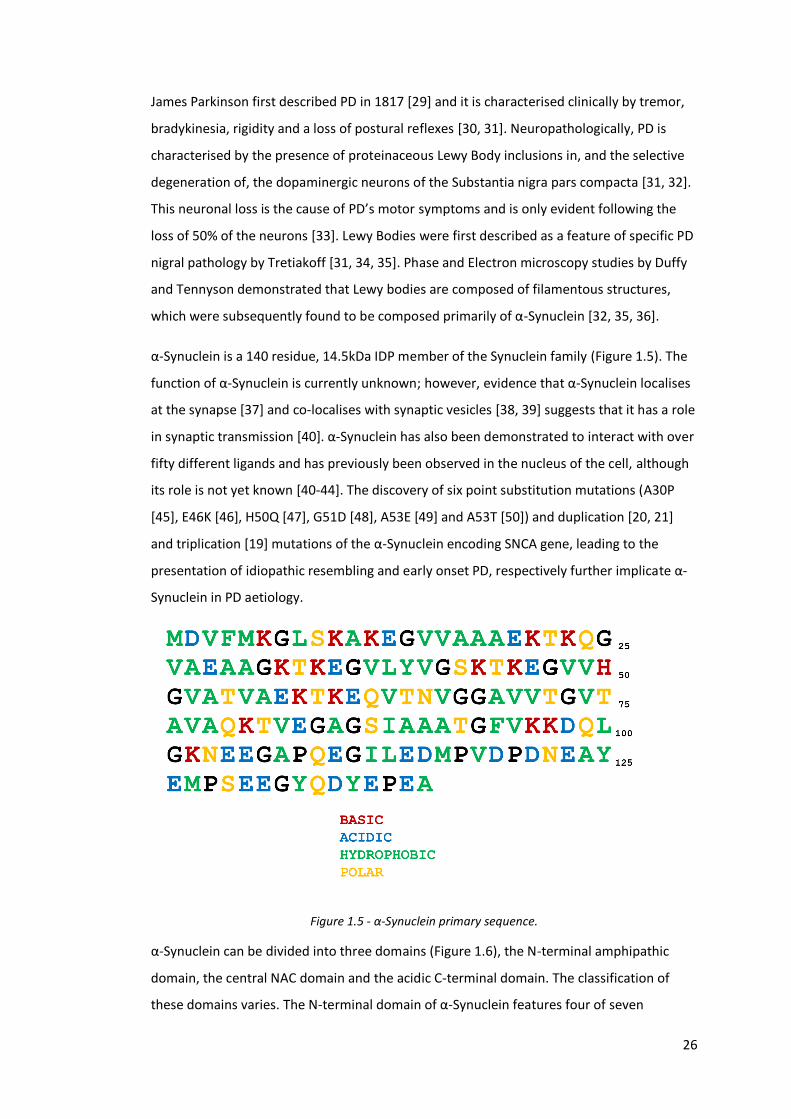
α-Synuclein is a 140 residue, 14.5kDa IDP member of the Synuclein family (Figure 1.5). The
function of α-Synuclein is currently unknown; however, evidence that α-Synuclein localises
at the synapse [37] and co-localises with synaptic vesicles [38, 39] suggests that it has a role
in synaptic transmission [40]. α-Synuclein has also been demonstrated to interact with over
fifty different ligands and has previously been observed in the nucleus of the cell, although
its role is not yet known [40-44]. The discovery of six point substitution mutations (A30P
[45], E46K [46], H50Q [47], G51D [48], A53E [49] and A53T [50]) and duplication [20, 21]
and triplication [19] mutations of the α-Synuclein encoding SNCA gene, leading to the
presentation of idiopathic resembling and early onset PD, respectively further implicate α-
Synuclein in PD aetiology.
Figure 1.5 - α-Synuclein primary sequence.
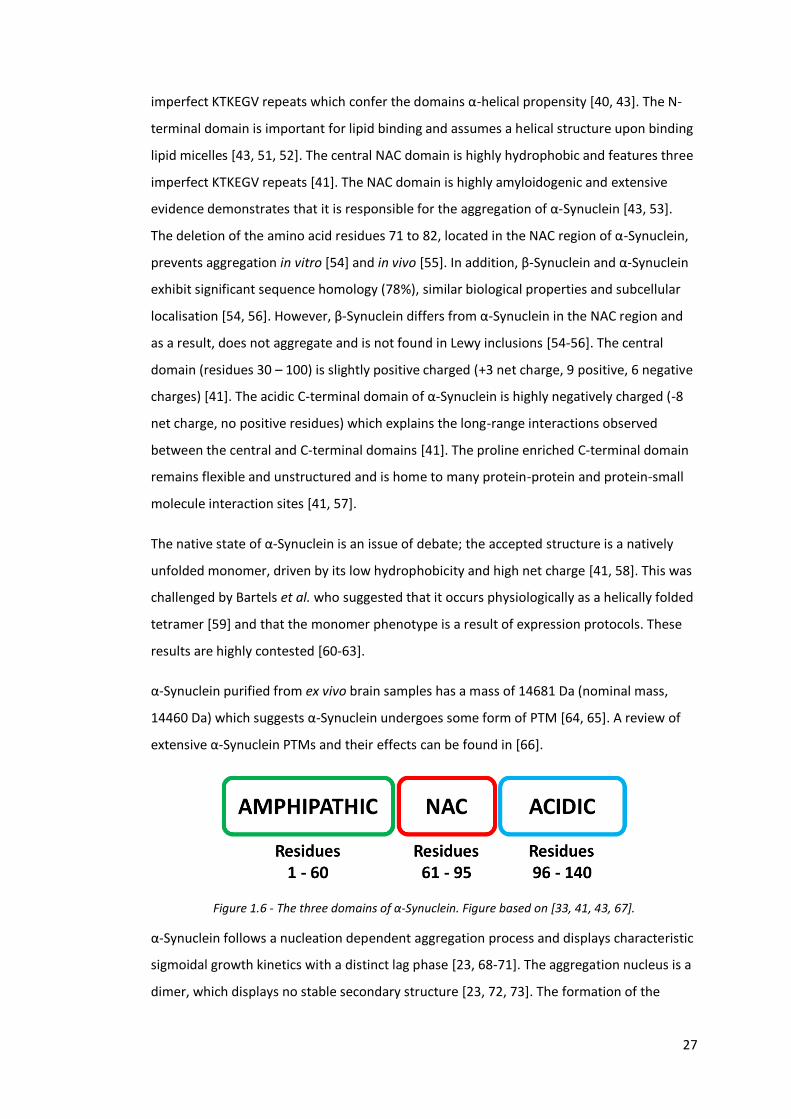
α-Synuclein can be divided into three domains (Figure 1.6), the N-terminal amphipathic
domain, the central NAC domain and the acidic C-terminal domain. The classification of
these domains varies. The N-terminal domain of α-Synuclein features four of seven
27
imperfect KTKEGV repeats which confer the domains α-helical propensity [40, 43]. The N-
terminal domain is important for lipid binding and assumes a helical structure upon binding
lipid micelles [43, 51, 52]. The central NAC domain is highly hydrophobic and features three
imperfect KTKEGV repeats [41]. The NAC domain is highly amyloidogenic and extensive
evidence demonstrates that it is responsible for the aggregation of α-Synuclein [43, 53].
The deletion of the amino acid residues 71 to 82, located in the NAC region of α-Synuclein,
prevents aggregation in vitro [54] and in vivo [55]. In addition, β-Synuclein and α-Synuclein
exhibit significant sequence homology (78%), similar biological properties and subcellular
localisation [54, 56]. However, β-Synuclein differs from α-Synuclein in the NAC region and
as a result, does not aggregate and is not found in Lewy inclusions [54-56]. The central
domain (residues 30 – 100) is slightly positive charged (+3 net charge, 9 positive, 6 negative
charges) [41]. The acidic C-terminal domain of α-Synuclein is highly negatively charged (-8
net charge, no positive residues) which explains the long-range interactions observed
between the central and C-terminal domains [41]. The proline enriched C-terminal domain
remains flexible and unstructured and is home to many protein-protein and protein-small
molecule interaction sites [41, 57].
The native state of α-Synuclein is an issue of debate; the accepted structure is a natively
unfolded monomer, driven by its low hydrophobicity and high net charge [41, 58]. This was
challenged by Bartels et al. who suggested that it occurs physiologically as a helically folded
tetramer [59] and that the monomer phenotype is a result of expression protocols. These
results are highly contested [60-63].
α-Synuclein purified from ex vivo brain samples has a mass of 14681 Da (nominal mass,
14460 Da) which suggests α-Synuclein undergoes some form of PTM [64, 65]. A review of
extensive α-Synuclein PTMs and their effects can be found in [66].
Figure 1.6 - The three domains of α-Synuclein. Figure based on [33, 41, 43, 67].
α-Synuclein follows a nucleation dependent aggregation process and displays characteristic
sigmoidal growth kinetics with a distinct lag phase [23, 68-71]. The aggregation nucleus is a
dimer, which displays no stable secondary structure [23, 72, 73]. The formation of the
28
nucleus is the rate limiting step in the aggregation process [74]. Following the formation of
the aggregation nuclei, the log phase of exponential growth occurs during which oligomeric
protofibrillar and fibril species are formed. These oligomers are both on and off-pathway
species and a wide range of morphologies have been identified [75]. Oligomer morphology
is influenced by the aggregation conditions used and the presence of small molecules.
Curcumin, for instance, stabilises large oligomers and elongated protofibrils whilst metal
ions induce annular, ring-like oligomers [75-79]. Spherical [24], spheroidal [80] and tubular
[26] oligomers have also been identified. The secondary structure component of the
oligomers is highly diverse and varies from α-helical to β-sheet [75, 80, 81]. The amyloid
fibrils found in Lewy Bodies have a β-sheet rich structure and exhibit the characteristic
cross-β diffraction pattern [82]. Fibrils range in width but typically have a diameter between
5 and 10 nm and vary in length, up to 10 µm [31, 83-85]. The core of the fibril is composed
of the central region of α-Synuclein, spanning residues 30 to 110, although the exact limits
of this region are disputed [86-88]. These residues are arranged into five β-strands
separated by several loops [84, 89]. The N- and C- terminal regions remain unstructured
[88, 90]. A variety of fibril morphologies have been observed including twisted and
untwisted, curved and straight, periodic and non-periodic [31, 75, 82, 86, 91, 92]. Fibril
morphology is influenced by the experimental aggregation conditions including
concentration, pH and the presence of metal ions [18, 75, 83].
Fibrils are traditionally considered the toxic species; however, therapeutic strategies which
promote inclusion formation lead to reduced α-Synuclein mediated toxicity [93]. Increasing
evidence including toxicity in the absence of fibrils in animal models [94], toxicity from
partially aggregated α-Synuclein [95] and the absence of neurodegeneration in the
presence of fibrillary inclusions [96], point to the oligomeric species being the toxic form
[41]. In contrast, oligomeric species have also been shown to have a protective effect,
Baicalein-induced α-Synuclein oligomers have been shown to inhibit fibrillation of
untreated α-Synuclein [97, 98]. The aggregation of α-Synuclein is a complex process and
without consensus on which species is toxic, or whether there is a single toxic species, it is
important to characterise all species in the early stages of the aggregation process, as these
are likely the druggable species [23]. To date, a host of techniques have been applied to
characterise the structure of α-Synuclein including Nuclear Magnetic Resonance
spectroscopy (NMR) [57], in-cell NMR [63], Fourier Transform Infrared Spectroscopy (FTIR)
[58, 69], Circular Dichroism (CD) [69, 99, 100] and Small Angle X-ray Scattering (SAXS) [69].
29
1.5. Alzheimer’s Disease and the Amyloid-β peptides
Alzheimer’s disease was first described by Alois Alzheimer in 1907 and is a member of a
large group of diseases known as the dementias [101]. Alzheimer’s disease accounts for
80% of dementia cases [102]. In 2015, 5.2% of people aged 60 and above worldwide
suffered from a form of dementia, with a new case diagnosed every three seconds [103]. It
is projected that by 2050, the number of people living with dementia worldwide will
increase by 181% [103]. The prevalence of dementia is strongly linked to age, with
worldwide prevalence doubling for every 6 year increment in age [103].
Alzheimer’s disease is a chronic condition for which there is no cure. Sufferers require daily
care for an extended period of time and the cost of this care was estimated to be $818
billion in 2015 [103]. As the disease progresses, patients suffer increasing cognitive
impairment, presenting clinically in three ways, a decrease in cognitive function causing
amnesia, aphasia (language impairment) and apraxia (inability to conduct motor tasks,
despite no motor deficit) [101]. Secondly, patients display various psychiatric symptoms
including depression and hallucinations [101]. Thirdly, there is a decline in the ability to
conduct daily activities which progresses until the loss of basic activities including feeding
[101]. Alzheimer’s disease is characterised neuropathologically by the presence of amyloid
plaques and NeuroFibrillary Tangles (NFTs).
Two intrinsically disordered aggregating proteins are implicated in the pathology of
Alzheimer’s disease, Amyloid-β and Tau. The Amyloid-β (Aβ) peptides are derived from the
enzymatic degradation of the APP protein. The APP protein is a transmembrane, type-1,
integral glycoprotein and is expressed in all human tissues [104]. Enzymatic degradation of
APP occurs via two pathways, the amyloidogenic and the non-amyloidogenic (Figure 1.7).
During the non-amyloidogenic pathway, APP is cleaved by an α-secretase enzyme
generating a soluble α-APP (APPsα) fragment which is released extracellularly. Cleavage by
γ-secretase yields the p3 fragment which is degraded and the APP intracellular domain
(AICD), which may act as a transcriptional regulator [17]. During the amyloidogenic
pathway, APP is cleaved by a β-secretase. This generates the APP-β fragment (APPsβ) and
the C99 fragment. The C99 fragment is cleaved by γ-secretase to generate an Aβ peptide
and the AICD domain [17, 104]. The cleavage by γ-Secretase is not perfect and the Aβ
peptides generated vary in length from 37 to 43 amino acids [17, 105]. These Aβ peptides
are subsequently involved in an aggregation cascade, resulting in the formation of
oligomers and fibrils.
30
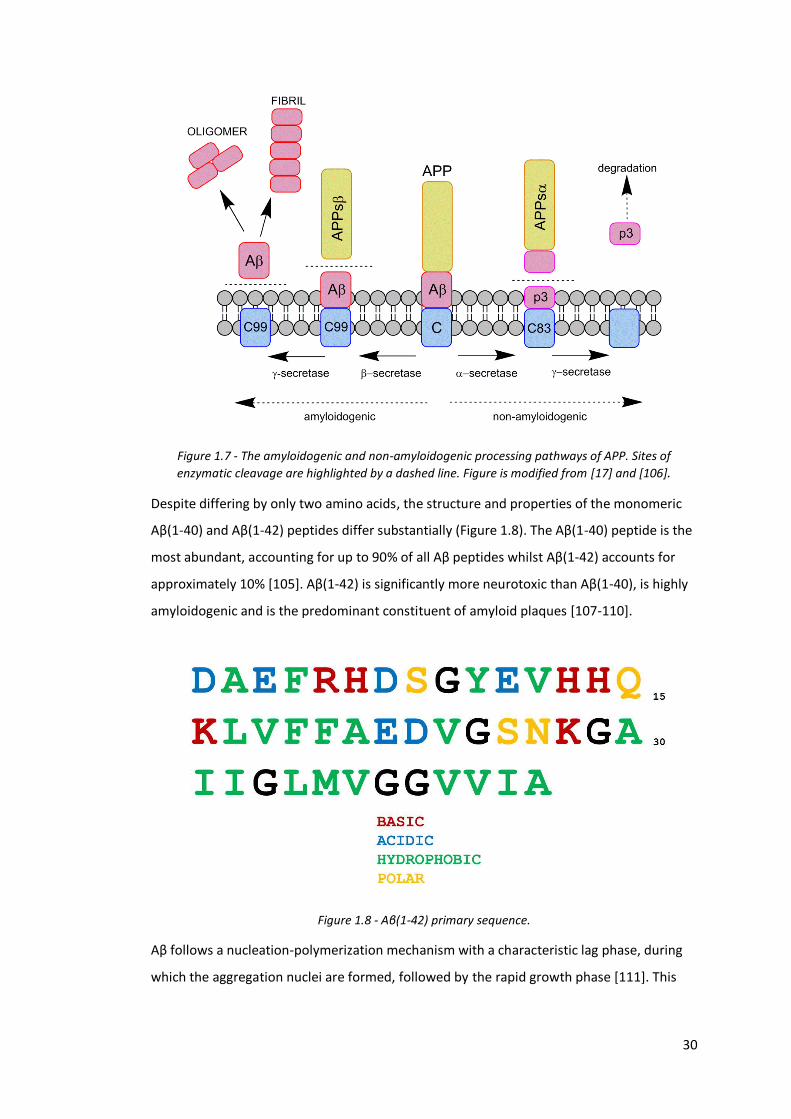
Figure 1.7 - The amyloidogenic and non-amyloidogenic processing pathways of APP. Sites of
enzymatic cleavage are highlighted by a dashed line. Figure is modified from [17] and [106].
Despite differing by only two amino acids, the structure and properties of the monomeric
Aβ(1-40) and Aβ(1-42) peptides differ substantially (Figure 1.8). The Aβ(1-40) peptide is the
most abundant, accounting for up to 90% of all Aβ peptides whilst Aβ(1-42) accounts for
approximately 10% [105]. Aβ(1-42) is significantly more neurotoxic than Aβ(1-40), is highly
amyloidogenic and is the predominant constituent of amyloid plaques [107-110].
Figure 1.8 - Aβ(1-42) primary sequence.
Aβ follows a nucleation-polymerization mechanism with a characteristic lag phase, during
which the aggregation nuclei are formed, followed by the rapid growth phase [111]. This
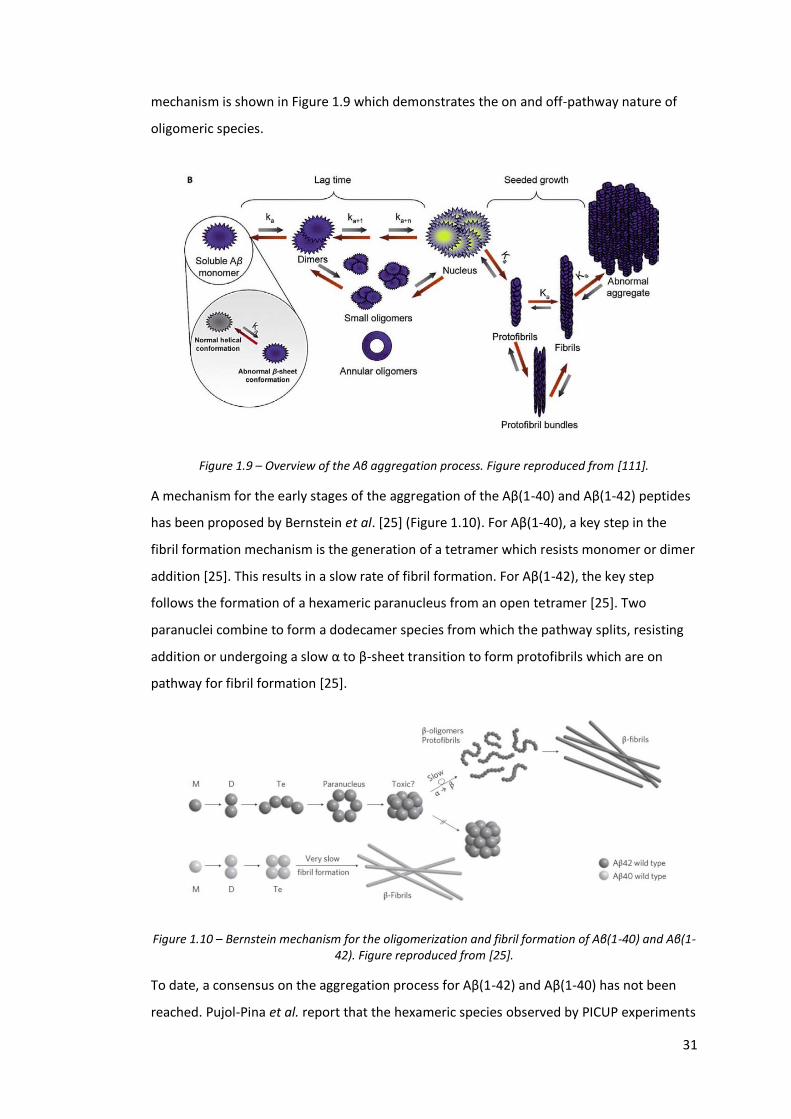
31
mechanism is shown in Figure 1.9 which demonstrates the on and off-pathway nature of
oligomeric species.
Figure 1.9 – Overview of the Aβ aggregation process. Figure reproduced from [111].
A mechanism for the early stages of the aggregation of the Aβ(1-40) and Aβ(1-42) peptides
has been proposed by Bernstein et al. [25] (Figure 1.10). For Aβ(1-40), a key step in the
fibril formation mechanism is the generation of a tetramer which resists monomer or dimer
addition [25]. This results in a slow rate of fibril formation. For Aβ(1-42), the key step
follows the formation of a hexameric paranucleus from an open tetramer [25]. Two
paranuclei combine to form a dodecamer species from which the pathway splits, resisting
addition or undergoing a slow α to β-sheet transition to form protofibrils which are on
pathway for fibril formation [25].
Figure 1.10 – Bernstein mechanism for the oligomerization and fibril formation of Aβ(1-40) and Aβ(1-42). Figure reproduced from [25].
To date, a consensus on the aggregation process for Aβ(1-42) and Aβ(1-40) has not been
reached. Pujol-Pina et al. report that the hexameric species observed by PICUP experiments
32
and referenced by Bernstein et al. are an artefact of the PICUP process and induced by the
presence of SDS [25, 108, 112]. In addition, Cohen et al. report an alternative aggregation
process featuring a positive feedback mechanism [113]. They report that after the initial
formation of oligomers and fibrils, further Aβ(1-42) oligomeric species are formed from
monomers in a secondary nucleation process involving fibrils [113]. The mechanism for
Aβ(1-40) aggregation proposed by Bernstein et al. [25] is contested by the work of Kloniecki
et al. [114] and Sitkiewicz et al. [115]. Kloniecki et al. propose a mechanism which features
two distinct oligomeric species, an open and an extended form, which lead to two
competing pathways for oligomer formation [114, 115]. Kloniecki et al. in positive
ionisation mode and Sitkiewicz et al. in negative ionisation mode demonstrate that the two
features of the drift time profile of [(Aβ40)2-5H]5- are not a mixture of dimers and
tetramers, but two conformationally distinct dimers on the basis of the ATD peaks featuring
the same isotopic spacing [114, 115]. These results are supported by Pujol-Pina et al. [112].
In addition, the higher order oligomers observed are not limited to the tetrameric species
reported by Bernstein et al. and include heptamer and tetradecamer species [25, 114, 115].
A wide array of Aβ oligomeric species have been identified from soluble dimers and trimers
to annular pore-like oligomers and protofibrils [111, 116]. Extensive evidence suggests that
these soluble oligomers are the toxic form of Aβ as the levels of soluble oligomeric species,
specifically soluble fibrillar oligomers, correlate with cognitive dysfunction [117-120]. The
mechanisms of oligomer toxicity are diverse and include receptor disruption to altering the
conductivity of lipid membranes [118].
Aβ fibrils feature a typical cross-β diffraction pattern; however, they also display significant
polymorphism [17, 121]. This polymorphism depends on the aggregation conditions and
several morphologies have been reported for both Aβ(1-40) and Aβ(1-42) [17].
Morphologies observed include twisted fibrils [122], hollow twisted fibrils [123] and ribbons
[124, 125]. Fibril morphology studies are conducted primarily on Aβ(1-40); however,
multiple Aβ(1-42) fibril morphologies have been observed [121, 123]. Cryo-EM has also
demonstrated that Aβ(1-40) fibrils grown under the same conditions exhibit morphologies
with different twists [122]. Extensive research has been conducted into the structure of the
fibril subunits and the intramolecular bonds which exist. In general, the monomeric units
adopt a β-strand-turn-β-strand (β-turn-β) structure, with a disordered N-terminus; see
Figure 1.11 [126]. The structure of the monomer subunits and in particular the intra and
inter-molecular bonding of Aβ(1-40) and Aβ(1-42) subunits are a region of debate and likely
differ between the various morphologies observed [17, 124, 126].
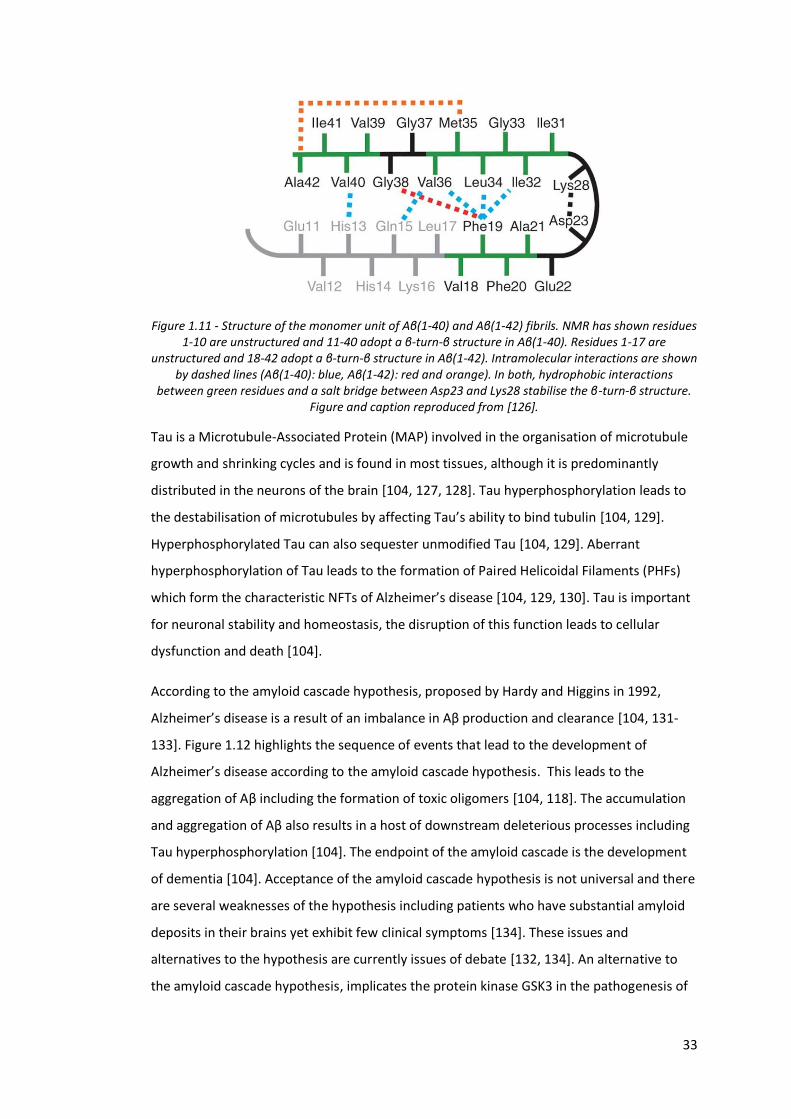
33
Figure 1.11 - Structure of the monomer unit of Aβ(1-40) and Aβ(1-42) fibrils. NMR has shown residues 1-10 are unstructured and 11-40 adopt a β-turn-β structure in Aβ(1-40). Residues 1-17 are
unstructured and 18-42 adopt a β-turn-β structure in Aβ(1-42). Intramolecular interactions are shown by dashed lines (Aβ(1-40): blue, Aβ(1-42): red and orange). In both, hydrophobic interactions
between green residues and a salt bridge between Asp23 and Lys28 stabilise the β-turn-β structure. Figure and caption reproduced from [126].
Tau is a Microtubule-Associated Protein (MAP) involved in the organisation of microtubule
growth and shrinking cycles and is found in most tissues, although it is predominantly
distributed in the neurons of the brain [104, 127, 128]. Tau hyperphosphorylation leads to
the destabilisation of microtubules by affecting Tau’s ability to bind tubulin [104, 129].
Hyperphosphorylated Tau can also sequester unmodified Tau [104, 129]. Aberrant
hyperphosphorylation of Tau leads to the formation of Paired Helicoidal Filaments (PHFs)
which form the characteristic NFTs of Alzheimer’s disease [104, 129, 130]. Tau is important
for neuronal stability and homeostasis, the disruption of this function leads to cellular
dysfunction and death [104].
According to the amyloid cascade hypothesis, proposed by Hardy and Higgins in 1992,
Alzheimer’s disease is a result of an imbalance in Aβ production and clearance [104, 131-
133]. Figure 1.12 highlights the sequence of events that lead to the development of
Alzheimer’s disease according to the amyloid cascade hypothesis. This leads to the
aggregation of Aβ including the formation of toxic oligomers [104, 118]. The accumulation
and aggregation of Aβ also results in a host of downstream deleterious processes including
Tau hyperphosphorylation [104]. The endpoint of the amyloid cascade is the development
of dementia [104]. Acceptance of the amyloid cascade hypothesis is not universal and there
are several weaknesses of the hypothesis including patients who have substantial amyloid
deposits in their brains yet exhibit few clinical symptoms [134]. These issues and
alternatives to the hypothesis are currently issues of debate [132, 134]. An alternative to
the amyloid cascade hypothesis, implicates the protein kinase GSK3 in the pathogenesis of
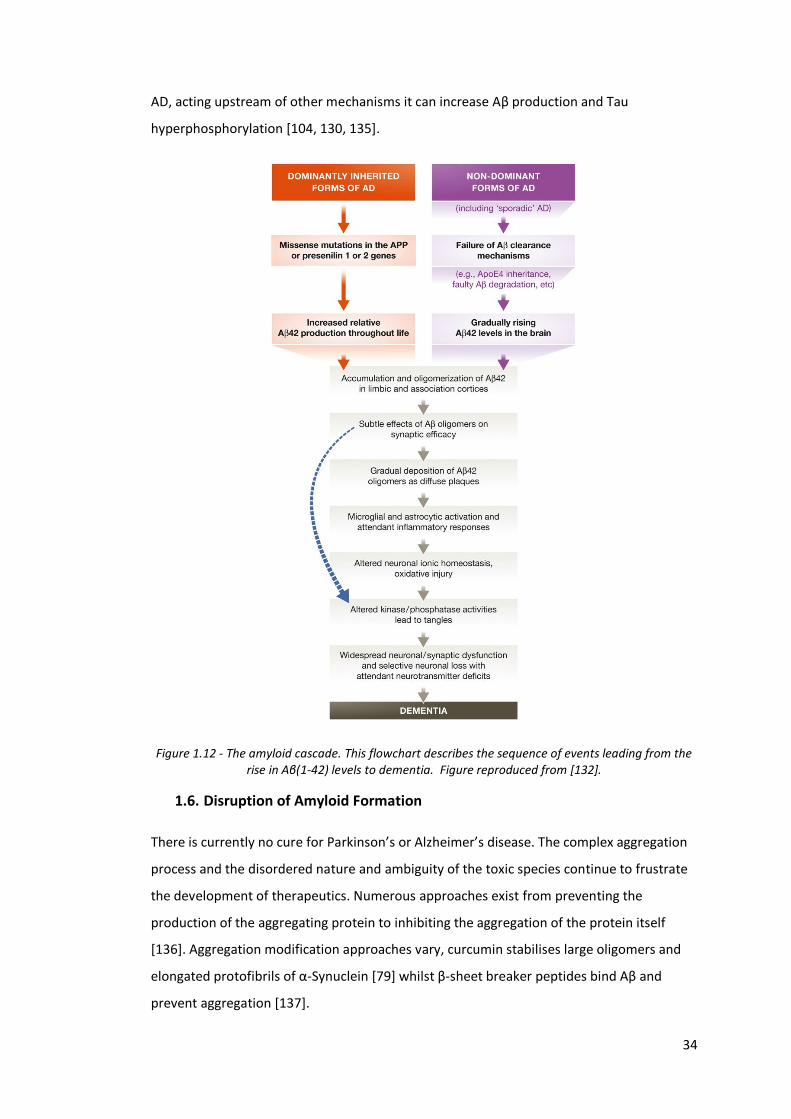
34
AD, acting upstream of other mechanisms it can increase Aβ production and Tau
hyperphosphorylation [104, 130, 135].
Figure 1.12 - The amyloid cascade. This flowchart describes the sequence of events leading from the rise in Aβ(1-42) levels to dementia. Figure reproduced from [132].
1.6. Disruption of Amyloid Formation
There is currently no cure for Parkinson’s or Alzheimer’s disease. The complex aggregation
process and the disordered nature and ambiguity of the toxic species continue to frustrate
the development of therapeutics. Numerous approaches exist from preventing the
production of the aggregating protein to inhibiting the aggregation of the protein itself
[136]. Aggregation modification approaches vary, curcumin stabilises large oligomers and
elongated protofibrils of α-Synuclein [79] whilst β-sheet breaker peptides bind Aβ and
prevent aggregation [137].
35
Due to their key position in the amyloid cascade, the Aβ peptides have been a focus of anti-
amyloid drug research. Approaches vary from the reduction of Aβ production, oligomer and
fibril formation inhibitors to fibril extension inhibitors [138, 139]. The use of peptides to
disrupt self-aggregation and small molecule assembly inhibitors, based on natural products,
are two key areas of drug development [139, 140].
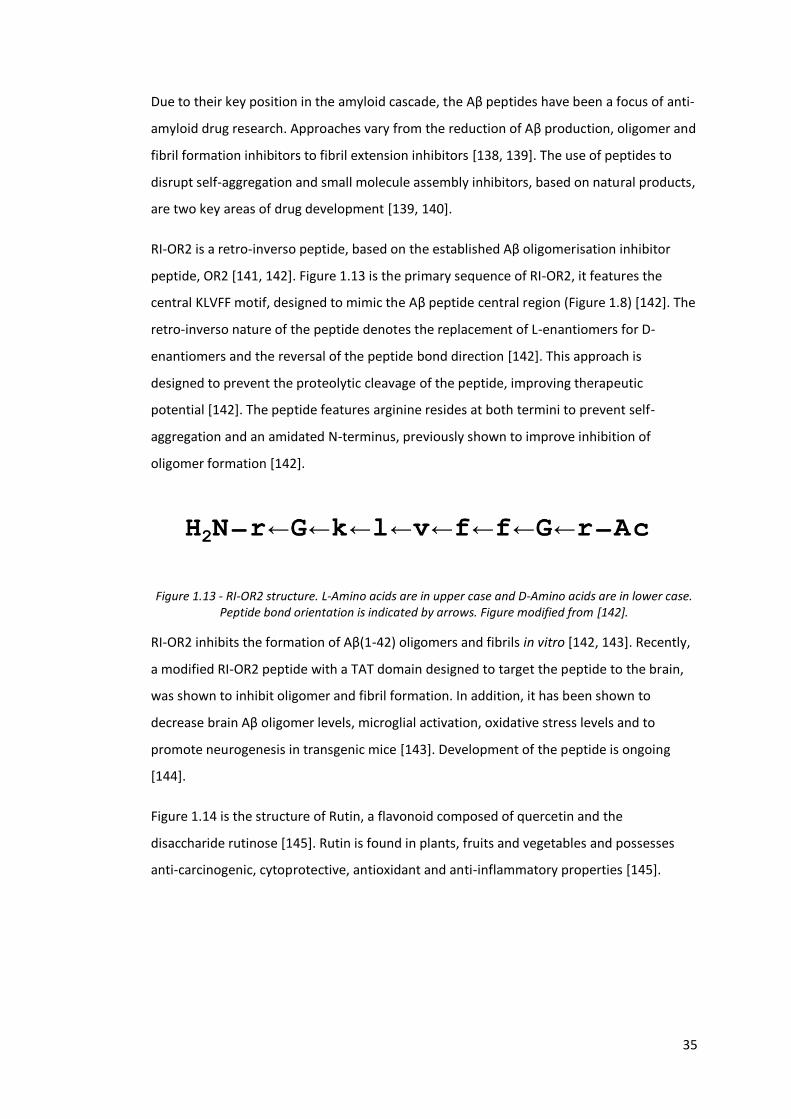
RI-OR2 is a retro-inverso peptide, based on the established Aβ oligomerisation inhibitor
peptide, OR2 [141, 142]. Figure 1.13 is the primary sequence of RI-OR2, it features the
central KLVFF motif, designed to mimic the Aβ peptide central region (Figure 1.8) [142]. The
retro-inverso nature of the peptide denotes the replacement of L-enantiomers for D-
enantiomers and the reversal of the peptide bond direction [142]. This approach is
designed to prevent the proteolytic cleavage of the peptide, improving therapeutic
potential [142]. The peptide features arginine resides at both termini to prevent self-
aggregation and an amidated N-terminus, previously shown to improve inhibition of
oligomer formation [142].
Figure 1.13 - RI-OR2 structure. L-Amino acids are in upper case and D-Amino acids are in lower case. Peptide bond orientation is indicated by arrows. Figure modified from [142].
RI-OR2 inhibits the formation of Aβ(1-42) oligomers and fibrils in vitro [142, 143]. Recently,
a modified RI-OR2 peptide with a TAT domain designed to target the peptide to the brain,
was shown to inhibit oligomer and fibril formation. In addition, it has been shown to
decrease brain Aβ oligomer levels, microglial activation, oxidative stress levels and to
promote neurogenesis in transgenic mice [143]. Development of the peptide is ongoing
[144].
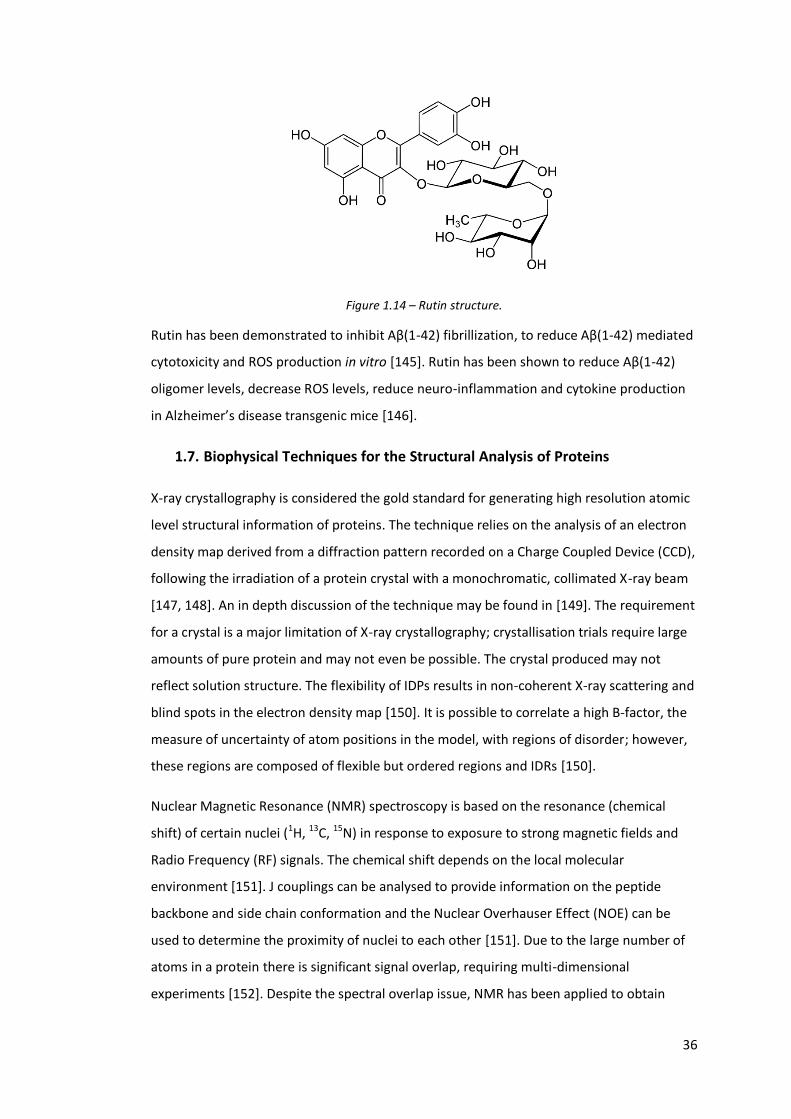
Figure 1.14 is the structure of Rutin, a flavonoid composed of quercetin and the
disaccharide rutinose [145]. Rutin is found in plants, fruits and vegetables and possesses
anti-carcinogenic, cytoprotective, antioxidant and anti-inflammatory properties [145].
36
Figure 1.14 – Rutin structure.
Rutin has been demonstrated to inhibit Aβ(1-42) fibrillization, to reduce Aβ(1-42) mediated
cytotoxicity and ROS production in vitro [145]. Rutin has been shown to reduce Aβ(1-42)
oligomer levels, decrease ROS levels, reduce neuro-inflammation and cytokine production
in Alzheimer’s disease transgenic mice [146].
1.7. Biophysical Techniques for the Structural Analysis of Proteins
X-ray crystallography is considered the gold standard for generating high resolution atomic
level structural information of proteins. The technique relies on the analysis of an electron
density map derived from a diffraction pattern recorded on a Charge Coupled Device (CCD),
following the irradiation of a protein crystal with a monochromatic, collimated X-ray beam
[147, 148]. An in depth discussion of the technique may be found in [149]. The requirement
for a crystal is a major limitation of X-ray crystallography; crystallisation trials require large
amounts of pure protein and may not even be possible. The crystal produced may not
reflect solution structure. The flexibility of IDPs results in non-coherent X-ray scattering and
blind spots in the electron density map [150]. It is possible to correlate a high B-factor, the
measure of uncertainty of atom positions in the model, with regions of disorder; however,
these regions are composed of flexible but ordered regions and IDRs [150].
Nuclear Magnetic Resonance (NMR) spectroscopy is based on the resonance (chemical
shift) of certain nuclei (1H, 13C, 15N) in response to exposure to strong magnetic fields and
Radio Frequency (RF) signals. The chemical shift depends on the local molecular
environment [151]. J couplings can be analysed to provide information on the peptide
backbone and side chain conformation and the Nuclear Overhauser Effect (NOE) can be
used to determine the proximity of nuclei to each other [151]. Due to the large number of
atoms in a protein there is significant signal overlap, requiring multi-dimensional
experiments [152]. Despite the spectral overlap issue, NMR has been applied to obtain
37
atomistic detail of proteins in the Mega Dalton range. NMR has certain drawbacks, a high
sample concentration (~0.1-1 mM) and large volume of very pure protein is required; this
poses additional problems with aggregating proteins, whose aggregation is concentration
dependent [153]. NMR approaches have been developed for the analysis of IDPs; however,
as IDP size increases so does difficulty and experimental complexity [154]. An in-cell NMR
approach has been developed to probe the structure of proteins in the cellular
environment and has been recently applied to study the structure of α-Synuclein
monomers following their recombinant overexpression in E. coli [63].
Small Angle X-ray Scattering (SAXS) yields low resolution data on protein shape and
conformation. In a typical SAXS experiment, a solution of the protein of interest is
illuminated by a collimated monochromatic X-ray beam [155]. The X-ray photons scatter
elastically off the sample, the intensity of the photon scattering as a function of scattering
angle is recorded on a CCD detector [156]. An in depth technical background may be found
in [155]. SAXS benefits from the ability to analyse solution phase samples in contrast to X-
ray crystallography and higher molecular weight limits than other methods such as NMR
[156]. The lack of widespread availability to beam sources including Synchrotrons, the
requirement for the protein of interest to remain soluble at high concentration and the
potential radiation damage suffered by proteins, limits the application of the technique
[157]. SAXS may be used for the analysis of IDPs and equilibrium systems such as those
which exist in an aggregating protein sample [150, 155]. Data analysis methods such as the
Ensemble Optimization Method (EOM) have been developed for the analysis of IDPs [150,
155]. SAXS is typically used in combination with other biophysical techniques to determine
structural information [150, 157].
1.8. Transmission Electron Microscopy
Transmission Electron Microscopy (TEM) is analogous to traditional light microscopy.
However, the increased resolution of TEM enables the imaging of cellular organelles,
aggregated proteins and viruses. Electrons are emitted by an electron gun by applying a
high voltage to a tungsten filament (the cathode). Electrons are then accelerated towards
the anode, a metal plate with a central aperture, creating the electron beam. The electrons
are focussed using a series of electromagnetic lenses prior to passing through the sample.
TEM imaging is based on electron scattering. Electrons will be scattered by interaction with
the sample and these scattered electrons are focussed by a series of post-sample
electromagnetic lenses prior to detection. Multiple detection methods exist, details of
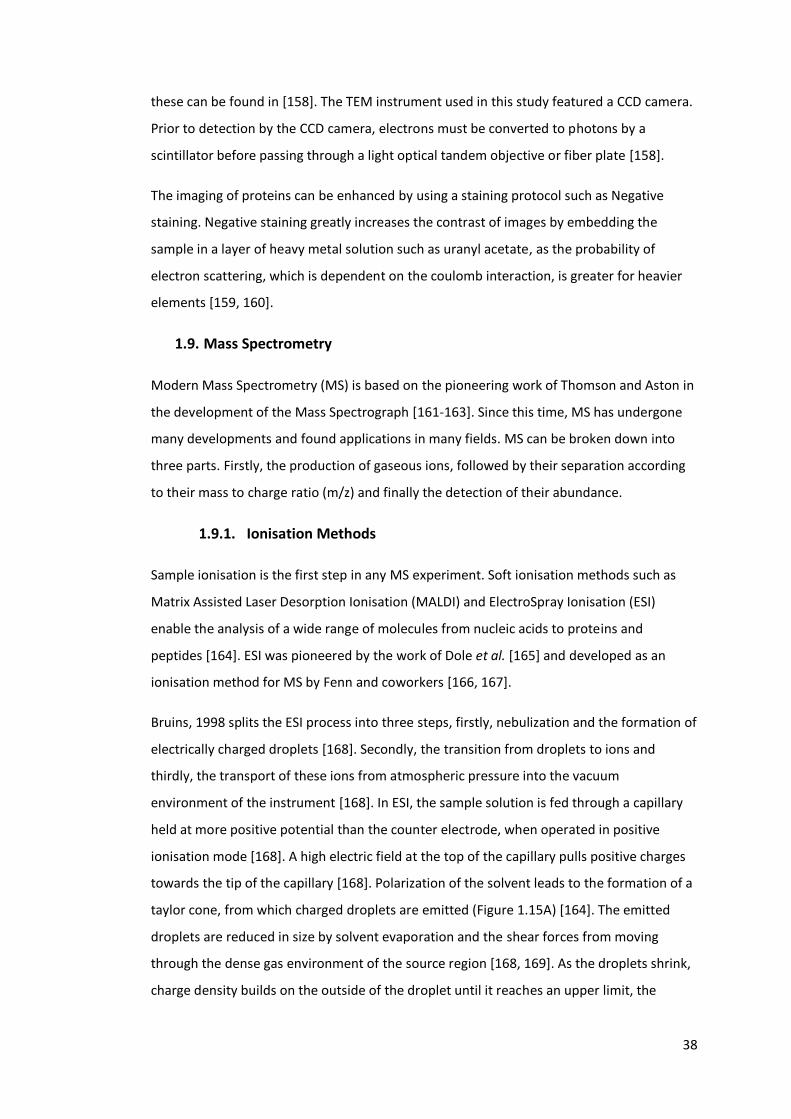
38
these can be found in [158]. The TEM instrument used in this study featured a CCD camera.
Prior to detection by the CCD camera, electrons must be converted to photons by a
scintillator before passing through a light optical tandem objective or fiber plate [158].
The imaging of proteins can be enhanced by using a staining protocol such as Negative
staining. Negative staining greatly increases the contrast of images by embedding the
sample in a layer of heavy metal solution such as uranyl acetate, as the probability of
electron scattering, which is dependent on the coulomb interaction, is greater for heavier
elements [159, 160].
1.9. Mass Spectrometry
Modern Mass Spectrometry (MS) is based on the pioneering work of Thomson and Aston in
the development of the Mass Spectrograph [161-163]. Since this time, MS has undergone
many developments and found applications in many fields. MS can be broken down into
three parts. Firstly, the production of gaseous ions, followed by their separation according
to their mass to charge ratio (m/z) and finally the detection of their abundance.
1.9.1. Ionisation Methods
Sample ionisation is the first step in any MS experiment. Soft ionisation methods such as
Matrix Assisted Laser Desorption Ionisation (MALDI) and ElectroSpray Ionisation (ESI)
enable the analysis of a wide range of molecules from nucleic acids to proteins and
peptides [164]. ESI was pioneered by the work of Dole et al. [165] and developed as an
ionisation method for MS by Fenn and coworkers [166, 167].
Bruins, 1998 splits the ESI process into three steps, firstly, nebulization and the formation of
electrically charged droplets [168]. Secondly, the transition from droplets to ions and
thirdly, the transport of these ions from atmospheric pressure into the vacuum
environment of the instrument [168]. In ESI, the sample solution is fed through a capillary
held at more positive potential than the counter electrode, when operated in positive
ionisation mode [168]. A high electric field at the top of the capillary pulls positive charges
towards the tip of the capillary [168]. Polarization of the solvent leads to the formation of a
taylor cone, from which charged droplets are emitted (Figure 1.15A) [164]. The emitted
droplets are reduced in size by solvent evaporation and the shear forces from moving
through the dense gas environment of the source region [168, 169]. As the droplets shrink,
charge density builds on the outside of the droplet until it reaches an upper limit, the
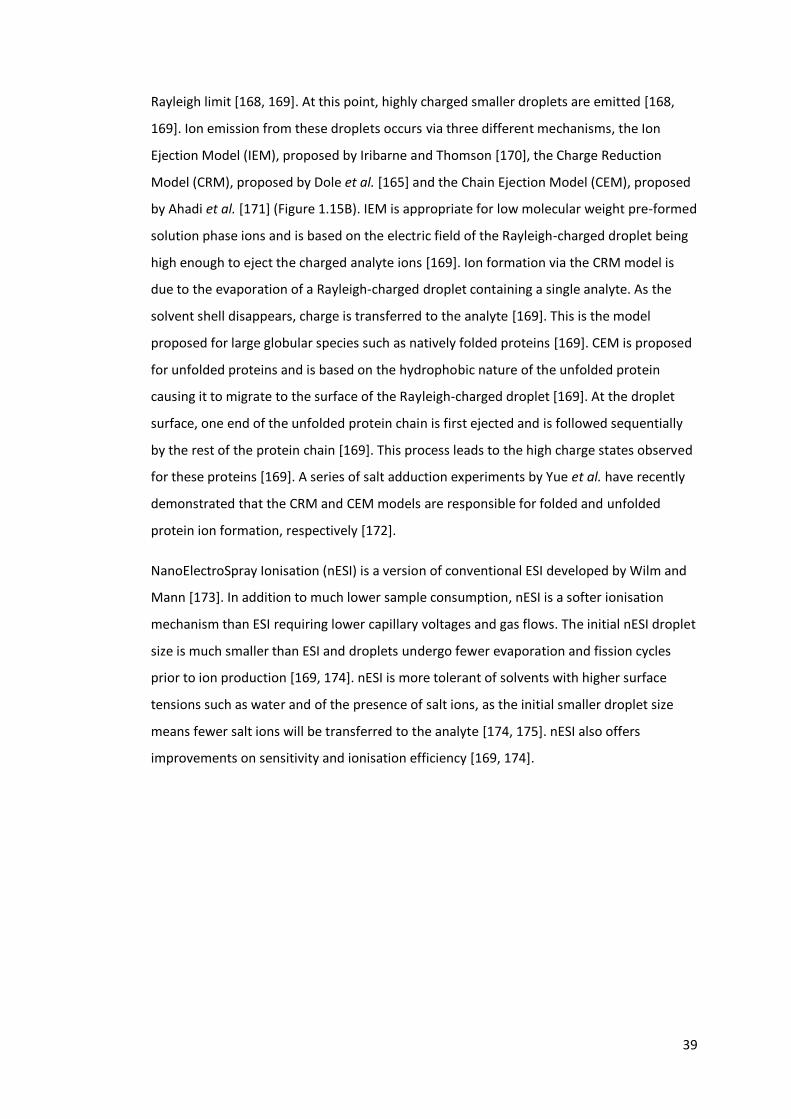
39
Rayleigh limit [168, 169]. At this point, highly charged smaller droplets are emitted [168,
169]. Ion emission from these droplets occurs via three different mechanisms, the Ion
Ejection Model (IEM), proposed by Iribarne and Thomson [170], the Charge Reduction
Model (CRM), proposed by Dole et al. [165] and the Chain Ejection Model (CEM), proposed
by Ahadi et al. [171] (Figure 1.15B). IEM is appropriate for low molecular weight pre-formed
solution phase ions and is based on the electric field of the Rayleigh-charged droplet being
high enough to eject the charged analyte ions [169]. Ion formation via the CRM model is
due to the evaporation of a Rayleigh-charged droplet containing a single analyte. As the
solvent shell disappears, charge is transferred to the analyte [169]. This is the model
proposed for large globular species such as natively folded proteins [169]. CEM is proposed
for unfolded proteins and is based on the hydrophobic nature of the unfolded protein
causing it to migrate to the surface of the Rayleigh-charged droplet [169]. At the droplet
surface, one end of the unfolded protein chain is first ejected and is followed sequentially
by the rest of the protein chain [169]. This process leads to the high charge states observed
for these proteins [169]. A series of salt adduction experiments by Yue et al. have recently
demonstrated that the CRM and CEM models are responsible for folded and unfolded
protein ion formation, respectively [172].
NanoElectroSpray Ionisation (nESI) is a version of conventional ESI developed by Wilm and
Mann [173]. In addition to much lower sample consumption, nESI is a softer ionisation
mechanism than ESI requiring lower capillary voltages and gas flows. The initial nESI droplet
size is much smaller than ESI and droplets undergo fewer evaporation and fission cycles
prior to ion production [169, 174]. nESI is more tolerant of solvents with higher surface
tensions such as water and of the presence of salt ions, as the initial smaller droplet size
means fewer salt ions will be transferred to the analyte [174, 175]. nESI also offers
improvements on sensitivity and ionisation efficiency [169, 174].
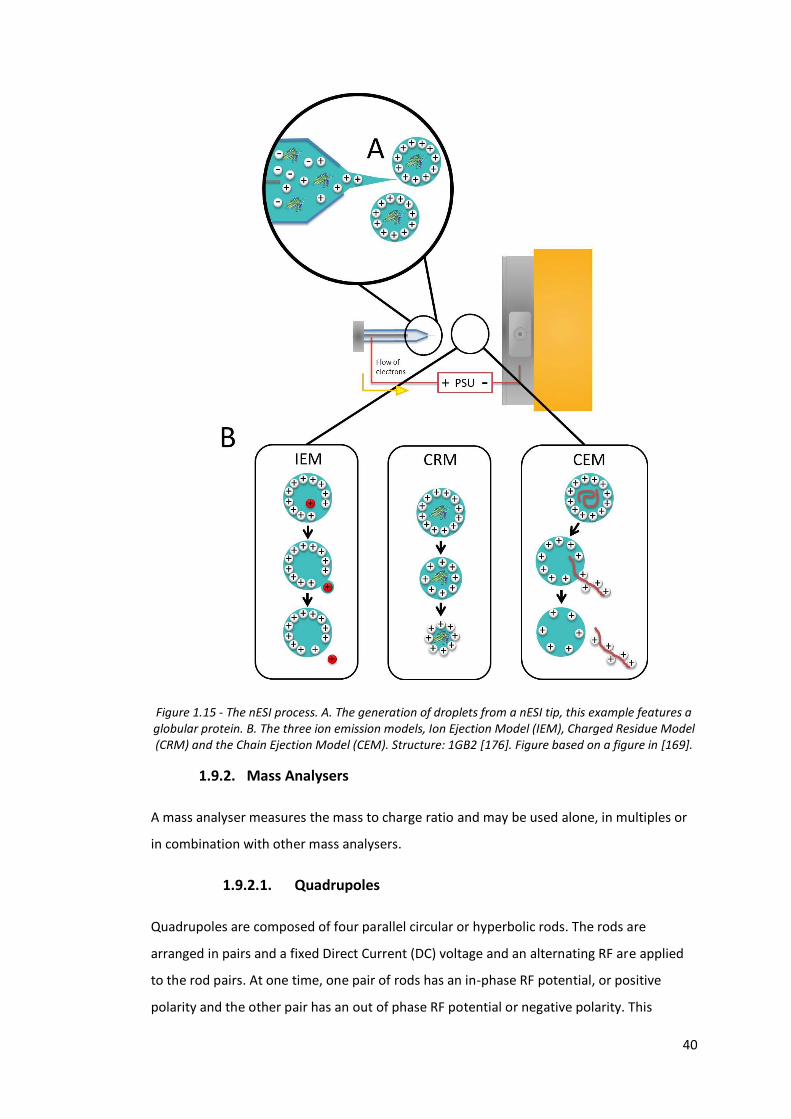
40
Figure 1.15 - The nESI process. A. The generation of droplets from a nESI tip, this example features a globular protein. B. The three ion emission models, Ion Ejection Model (IEM), Charged Residue Model (CRM) and the Chain Ejection Model (CEM). Structure: 1GB2 [176]. Figure based on a figure in [169].
1.9.2. Mass Analysers
A mass analyser measures the mass to charge ratio and may be used alone, in multiples or
in combination with other mass analysers.
1.9.2.1. Quadrupoles
Quadrupoles are composed of four parallel circular or hyperbolic rods. The rods are
arranged in pairs and a fixed Direct Current (DC) voltage and an alternating RF are applied
to the rod pairs. At one time, one pair of rods has an in-phase RF potential, or positive
polarity and the other pair has an out of phase RF potential or negative polarity. This
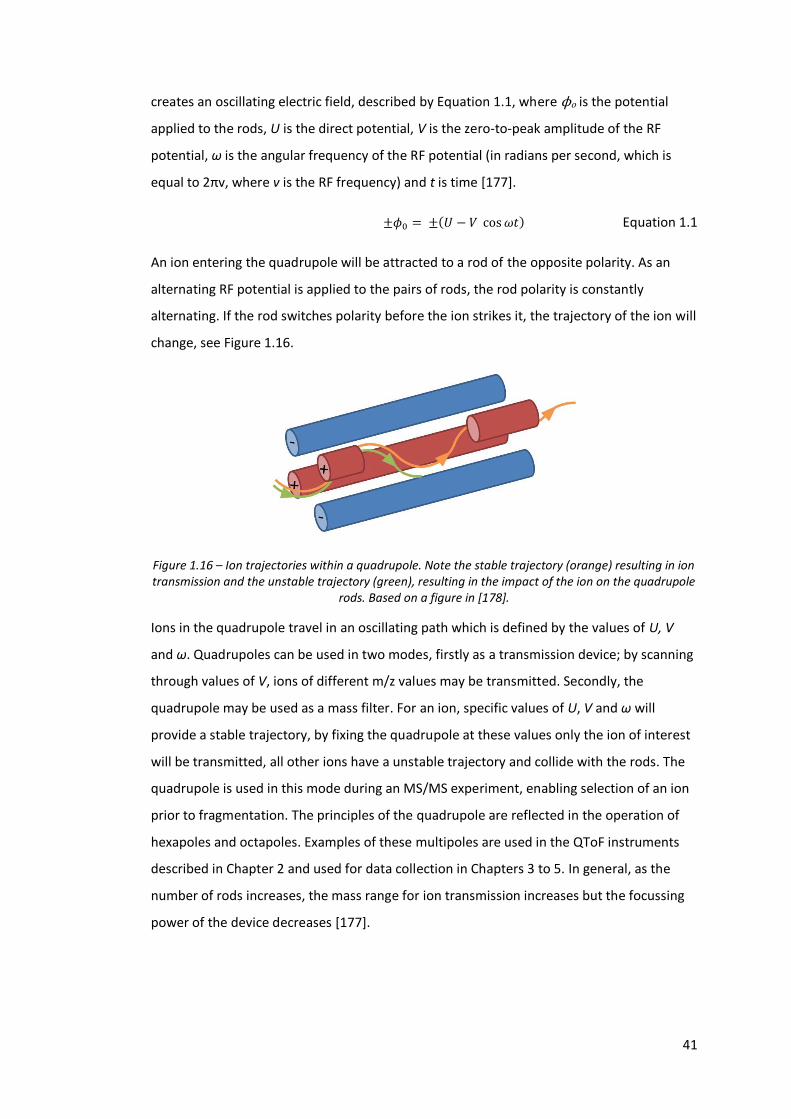
41
creates an oscillating electric field, described by Equation 1.1, where ϕo is the potential
applied to the rods, U is the direct potential, V is the zero-to-peak amplitude of the RF
potential, ω is the angular frequency of the RF potential (in radians per second, which is
equal to 2πv, where v is the RF frequency) and t is time [177].
±𝜙0 = ±(𝑈 − 𝑉 cos 𝜔𝑡) Equation 1.1
An ion entering the quadrupole will be attracted to a rod of the opposite polarity. As an
alternating RF potential is applied to the pairs of rods, the rod polarity is constantly
alternating. If the rod switches polarity before the ion strikes it, the trajectory of the ion will
change, see Figure 1.16.
Figure 1.16 – Ion trajectories within a quadrupole. Note the stable trajectory (orange) resulting in ion transmission and the unstable trajectory (green), resulting in the impact of the ion on the quadrupole
rods. Based on a figure in [178].
Ions in the quadrupole travel in an oscillating path which is defined by the values of U, V
and ω. Quadrupoles can be used in two modes, firstly as a transmission device; by scanning
through values of V, ions of different m/z values may be transmitted. Secondly, the
quadrupole may be used as a mass filter. For an ion, specific values of U, V and ω will
provide a stable trajectory, by fixing the quadrupole at these values only the ion of interest
will be transmitted, all other ions have a unstable trajectory and collide with the rods. The
quadrupole is used in this mode during an MS/MS experiment, enabling selection of an ion
prior to fragmentation. The principles of the quadrupole are reflected in the operation of
hexapoles and octapoles. Examples of these multipoles are used in the QToF instruments
described in Chapter 2 and used for data collection in Chapters 3 to 5. In general, as the
number of rods increases, the mass range for ion transmission increases but the focussing
power of the device decreases [177].
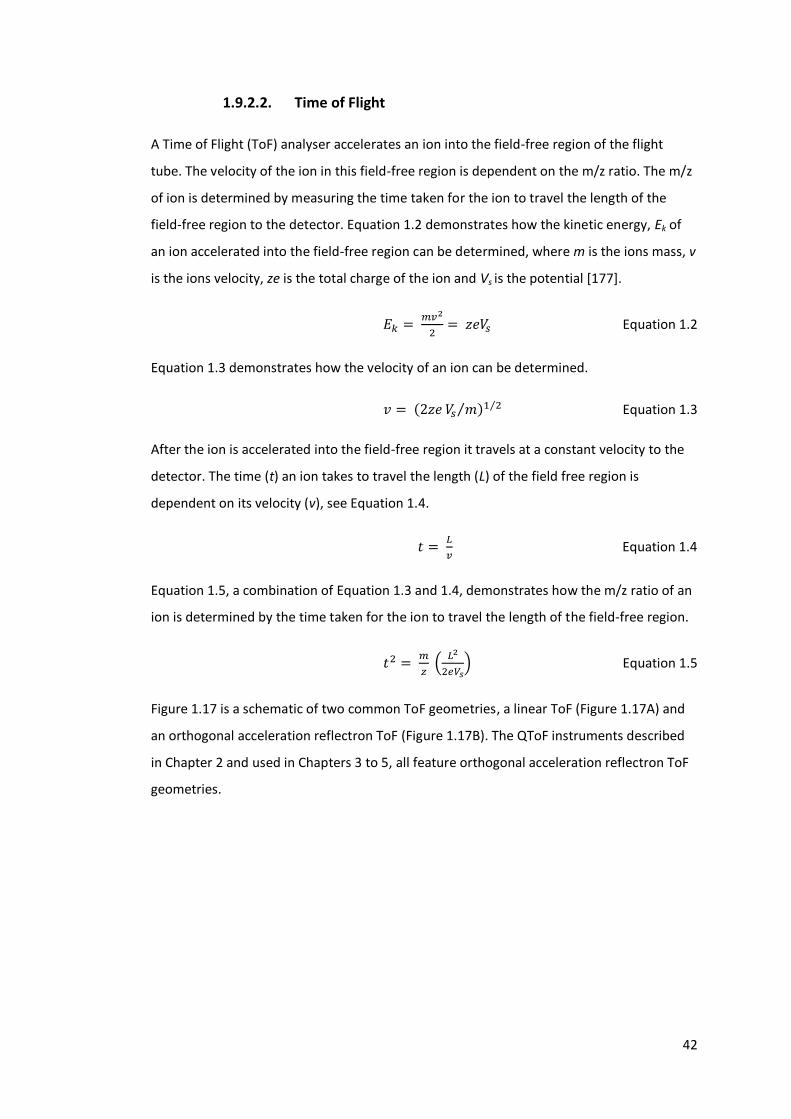
42
1.9.2.2. Time of Flight
A Time of Flight (ToF) analyser accelerates an ion into the field-free region of the flight
tube. The velocity of the ion in this field-free region is dependent on the m/z ratio. The m/z
of ion is determined by measuring the time taken for the ion to travel the length of the
field-free region to the detector. Equation 1.2 demonstrates how the kinetic energy, Ek of
an ion accelerated into the field-free region can be determined, where m is the ions mass, v
is the ions velocity, ze is the total charge of the ion and Vs is the potential [177].
𝐸𝑘 = 𝑚𝑣2
2= 𝑧𝑒𝑉𝑠 Equation 1.2
Equation 1.3 demonstrates how the velocity of an ion can be determined.
𝑣 = (2𝑧𝑒 𝑉𝑠 𝑚⁄ )1 2⁄ Equation 1.3
After the ion is accelerated into the field-free region it travels at a constant velocity to the
detector. The time (t) an ion takes to travel the length (L) of the field free region is
dependent on its velocity (v), see Equation 1.4.
𝑡 = 𝐿
𝑣 Equation 1.4
Equation 1.5, a combination of Equation 1.3 and 1.4, demonstrates how the m/z ratio of an
ion is determined by the time taken for the ion to travel the length of the field-free region.
𝑡2 = 𝑚
𝑧 (
𝐿2
2𝑒𝑉𝑠) Equation 1.5
Figure 1.17 is a schematic of two common ToF geometries, a linear ToF (Figure 1.17A) and
an orthogonal acceleration reflectron ToF (Figure 1.17B). The QToF instruments described
in Chapter 2 and used in Chapters 3 to 5, all feature orthogonal acceleration reflectron ToF
geometries.
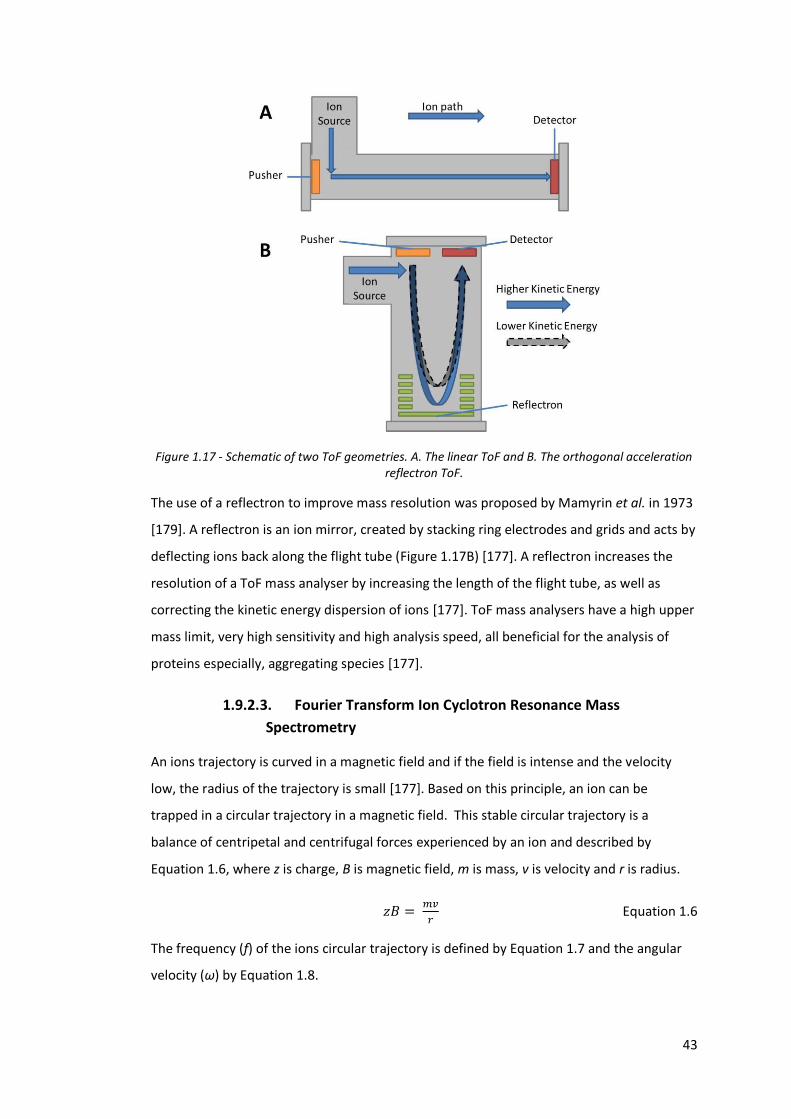
43
Figure 1.17 - Schematic of two ToF geometries. A. The linear ToF and B. The orthogonal acceleration reflectron ToF.
The use of a reflectron to improve mass resolution was proposed by Mamyrin et al. in 1973
[179]. A reflectron is an ion mirror, created by stacking ring electrodes and grids and acts by
deflecting ions back along the flight tube (Figure 1.17B) [177]. A reflectron increases the
resolution of a ToF mass analyser by increasing the length of the flight tube, as well as
correcting the kinetic energy dispersion of ions [177]. ToF mass analysers have a high upper
mass limit, very high sensitivity and high analysis speed, all beneficial for the analysis of
proteins especially, aggregating species [177].
1.9.2.3. Fourier Transform Ion Cyclotron Resonance Mass
Spectrometry
An ions trajectory is curved in a magnetic field and if the field is intense and the velocity
low, the radius of the trajectory is small [177]. Based on this principle, an ion can be
trapped in a circular trajectory in a magnetic field. This stable circular trajectory is a
balance of centripetal and centrifugal forces experienced by an ion and described by
Equation 1.6, where z is charge, B is magnetic field, m is mass, v is velocity and r is radius.
𝑧𝐵 = 𝑚𝑣
𝑟 Equation 1.6
The frequency (ƒ) of the ions circular trajectory is defined by Equation 1.7 and the angular
velocity (ω) by Equation 1.8.
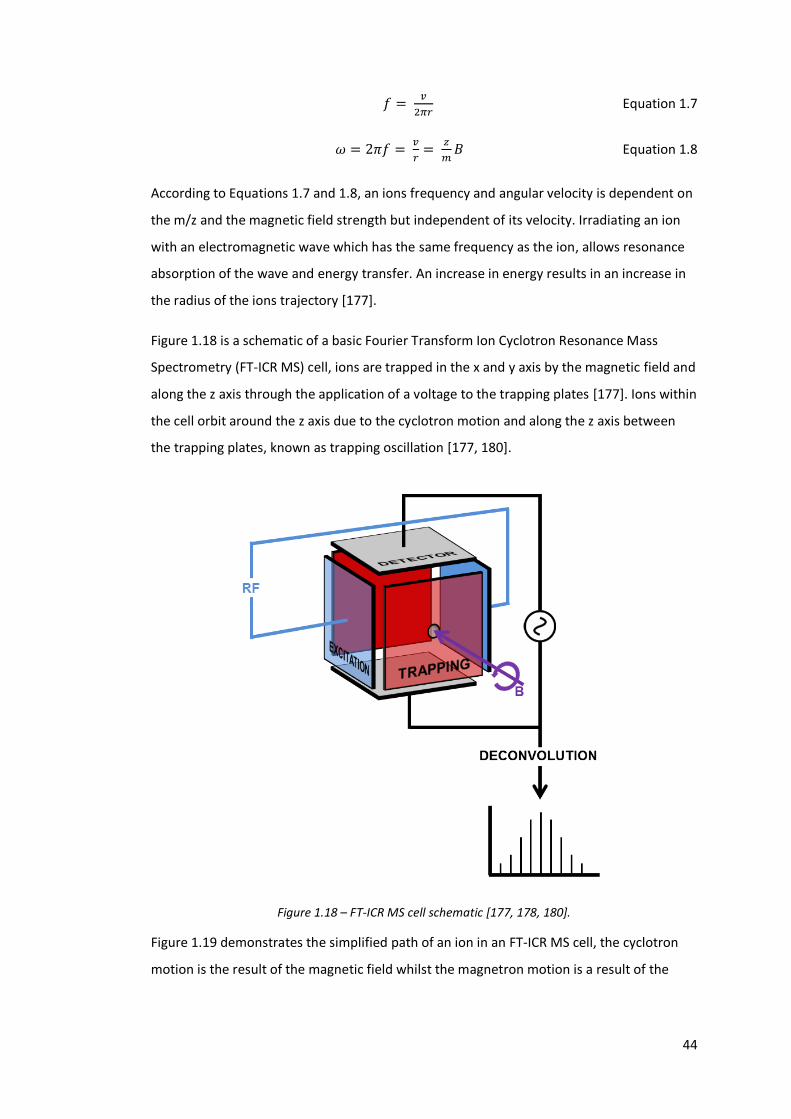
44
𝑓 = 𝑣
2𝜋𝑟 Equation 1.7
𝜔 = 2𝜋𝑓 = 𝑣
𝑟=
𝑧
𝑚𝐵 Equation 1.8
According to Equations 1.7 and 1.8, an ions frequency and angular velocity is dependent on
the m/z and the magnetic field strength but independent of its velocity. Irradiating an ion
with an electromagnetic wave which has the same frequency as the ion, allows resonance
absorption of the wave and energy transfer. An increase in energy results in an increase in
the radius of the ions trajectory [177].
Figure 1.18 is a schematic of a basic Fourier Transform Ion Cyclotron Resonance Mass
Spectrometry (FT-ICR MS) cell, ions are trapped in the x and y axis by the magnetic field and
along the z axis through the application of a voltage to the trapping plates [177]. Ions within
the cell orbit around the z axis due to the cyclotron motion and along the z axis between
the trapping plates, known as trapping oscillation [177, 180].
Figure 1.18 – FT-ICR MS cell schematic [177, 178, 180].
Figure 1.19 demonstrates the simplified path of an ion in an FT-ICR MS cell, the cyclotron
motion is the result of the magnetic field whilst the magnetron motion is a result of the
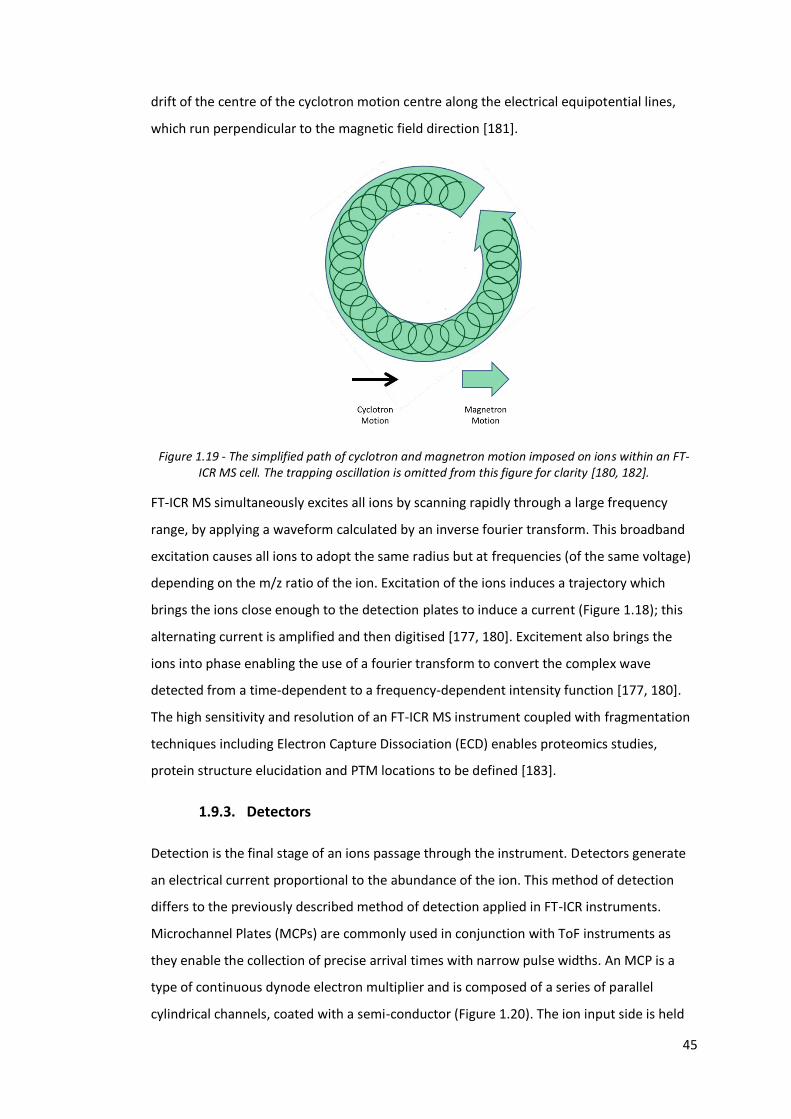
45
drift of the centre of the cyclotron motion centre along the electrical equipotential lines,
which run perpendicular to the magnetic field direction [181].
Figure 1.19 - The simplified path of cyclotron and magnetron motion imposed on ions within an FT-ICR MS cell. The trapping oscillation is omitted from this figure for clarity [180, 182].
FT-ICR MS simultaneously excites all ions by scanning rapidly through a large frequency
range, by applying a waveform calculated by an inverse fourier transform. This broadband
excitation causes all ions to adopt the same radius but at frequencies (of the same voltage)
depending on the m/z ratio of the ion. Excitation of the ions induces a trajectory which
brings the ions close enough to the detection plates to induce a current (Figure 1.18); this
alternating current is amplified and then digitised [177, 180]. Excitement also brings the
ions into phase enabling the use of a fourier transform to convert the complex wave
detected from a time-dependent to a frequency-dependent intensity function [177, 180].
The high sensitivity and resolution of an FT-ICR MS instrument coupled with fragmentation
techniques including Electron Capture Dissociation (ECD) enables proteomics studies,
protein structure elucidation and PTM locations to be defined [183].
1.9.3. Detectors
Detection is the final stage of an ions passage through the instrument. Detectors generate
an electrical current proportional to the abundance of the ion. This method of detection
differs to the previously described method of detection applied in FT-ICR instruments.
Microchannel Plates (MCPs) are commonly used in conjunction with ToF instruments as
they enable the collection of precise arrival times with narrow pulse widths. An MCP is a
type of continuous dynode electron multiplier and is composed of a series of parallel
cylindrical channels, coated with a semi-conductor (Figure 1.20). The ion input side is held
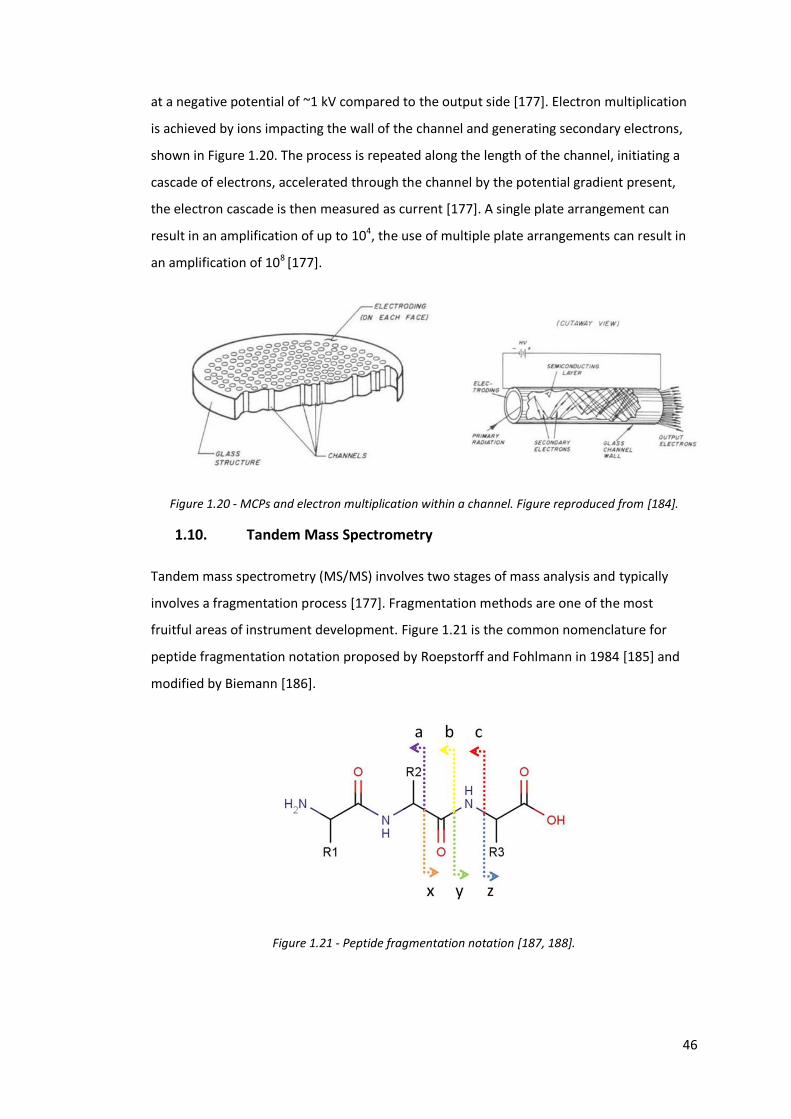
46
at a negative potential of ~1 kV compared to the output side [177]. Electron multiplication
is achieved by ions impacting the wall of the channel and generating secondary electrons,
shown in Figure 1.20. The process is repeated along the length of the channel, initiating a
cascade of electrons, accelerated through the channel by the potential gradient present,
the electron cascade is then measured as current [177]. A single plate arrangement can
result in an amplification of up to 104, the use of multiple plate arrangements can result in
an amplification of 108 [177].
Figure 1.20 - MCPs and electron multiplication within a channel. Figure reproduced from [184].
1.10. Tandem Mass Spectrometry
Tandem mass spectrometry (MS/MS) involves two stages of mass analysis and typically
involves a fragmentation process [177]. Fragmentation methods are one of the most
fruitful areas of instrument development. Figure 1.21 is the common nomenclature for
peptide fragmentation notation proposed by Roepstorff and Fohlmann in 1984 [185] and
modified by Biemann [186].
Figure 1.21 - Peptide fragmentation notation [187, 188].

47
1.10.1. Collision Induced Dissociation
Collision Induced Dissociation (CID) is the most widespread fragmentation technique and a
feature of most modern MS instruments. The CID process relies on the activation of the
selected species by collision with neutral gas molecules and is described as a two-step
process [189, 190]. The first step is the activation of the fast moving ion by collision with
the slow moving neutral gas molecule, which transfers a portion of the ions kinetic energy
to the internal modes [190, 191]. The second step is the dissociation of the excited ion
[190]. CID is a multi-collision process and occurs over tens of microseconds [192]. CID is
most commonly associated with the generation of b- and y- ions [193]. CID is conducted in
the collision cell of the QToF instruments and in the Trap and Transfer regions of the
Triwave device of the Synapt instruments, described in Chapter 2.
1.10.2. Electron Capture/ Transfer Dissociation
Electron Capture Dissociation (ECD) and Electron Transfer Dissociation (ETD) are electron
based fragmentation techniques. ECD was developed in the McLafferty lab by Zubarev et al.
[193]. ECD was initially limited to use with ICR instruments; however, it has now been
applied in most types of instrumentation [194]. During the ECD process, a multiply charged
protein ion captures electrons forming a charge reduced species and begins the ion-radical
fragmentation process [194-196]. Fragmentation occurs through cleavage of the N-Cα
bond. ECD also results in the cleavage of disulphide bonds. The exact process is an ongoing
debate and descriptions of the three proposed mechanisms can be found in [194]. The
Utah-Washington mechanism is the most widely accepted mechanism. In this mechanism,
the electron is captured by the π orbital of the positive charge site, the electron is then
transferred to the amide π* (or S-S δ* orbitals, in the case of disulphide bond cleavage)
which causes N-Cα bond cleavage [194, 197-200]. Cleavage can also occur by direct capture
of the electron by the amide π* or disulphide δ* orbital [194]. During ECD-FT-ICR MS
experiments, electrons are produced by heating a filament outside the magnet, prior to
interaction with ions isolated in the FT-ICR MS cell [193].
ETD was developed to overcome the difficulty of trapping electrons in ion traps, in the Hunt
lab by Syka and Coon, using anions as electron donors in place of an electron source [194,
201]. The mechanism for ETD fragmentation is theorised to be similar to that described for
ECD [202]. ETD can be applied in the Trap region of a modified Synapt instrument using 1,3-
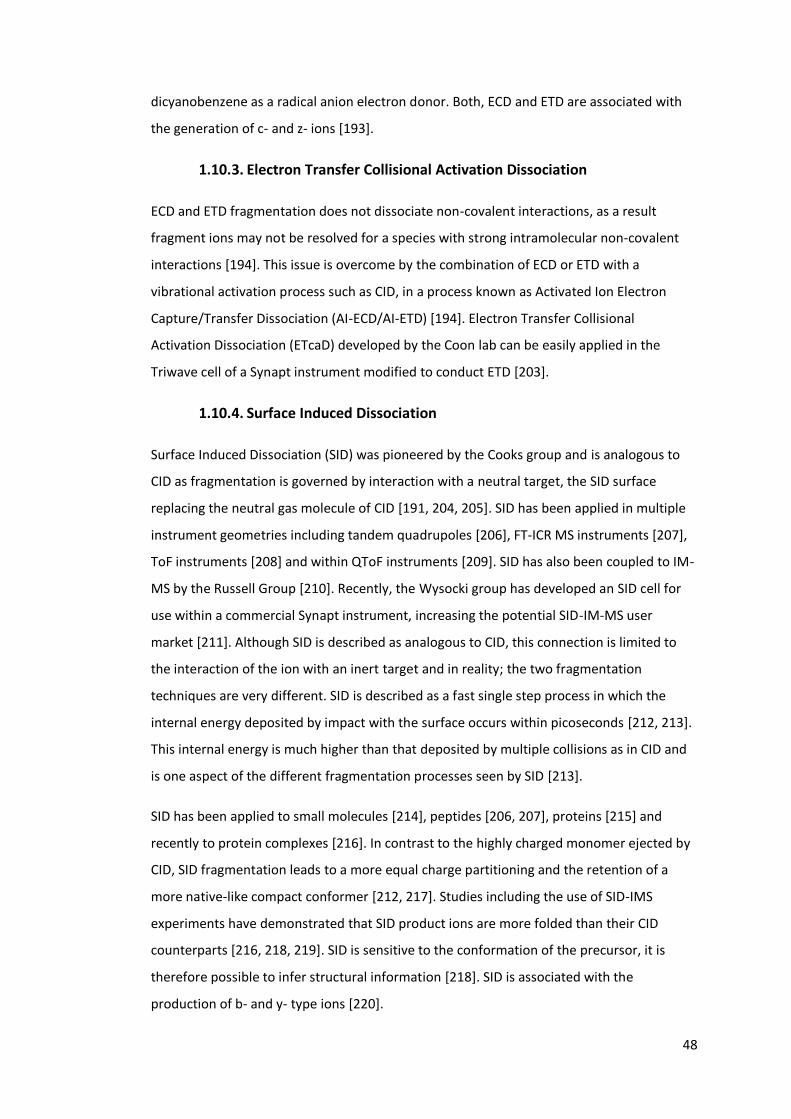
48
dicyanobenzene as a radical anion electron donor. Both, ECD and ETD are associated with
the generation of c- and z- ions [193].
1.10.3. Electron Transfer Collisional Activation Dissociation
ECD and ETD fragmentation does not dissociate non-covalent interactions, as a result
fragment ions may not be resolved for a species with strong intramolecular non-covalent
interactions [194]. This issue is overcome by the combination of ECD or ETD with a
vibrational activation process such as CID, in a process known as Activated Ion Electron
Capture/Transfer Dissociation (AI-ECD/AI-ETD) [194]. Electron Transfer Collisional
Activation Dissociation (ETcaD) developed by the Coon lab can be easily applied in the
Triwave cell of a Synapt instrument modified to conduct ETD [203].
1.10.4. Surface Induced Dissociation
Surface Induced Dissociation (SID) was pioneered by the Cooks group and is analogous to
CID as fragmentation is governed by interaction with a neutral target, the SID surface
replacing the neutral gas molecule of CID [191, 204, 205]. SID has been applied in multiple
instrument geometries including tandem quadrupoles [206], FT-ICR MS instruments [207],
ToF instruments [208] and within QToF instruments [209]. SID has also been coupled to IM-
MS by the Russell Group [210]. Recently, the Wysocki group has developed an SID cell for
use within a commercial Synapt instrument, increasing the potential SID-IM-MS user
market [211]. Although SID is described as analogous to CID, this connection is limited to
the interaction of the ion with an inert target and in reality; the two fragmentation
techniques are very different. SID is described as a fast single step process in which the
internal energy deposited by impact with the surface occurs within picoseconds [212, 213].
This internal energy is much higher than that deposited by multiple collisions as in CID and
is one aspect of the different fragmentation processes seen by SID [213].
SID has been applied to small molecules [214], peptides [206, 207], proteins [215] and
recently to protein complexes [216]. In contrast to the highly charged monomer ejected by
CID, SID fragmentation leads to a more equal charge partitioning and the retention of a
more native-like compact conformer [212, 217]. Studies including the use of SID-IMS
experiments have demonstrated that SID product ions are more folded than their CID
counterparts [216, 218, 219]. SID is sensitive to the conformation of the precursor, it is
therefore possible to infer structural information [218]. SID is associated with the
production of b- and y- type ions [220].
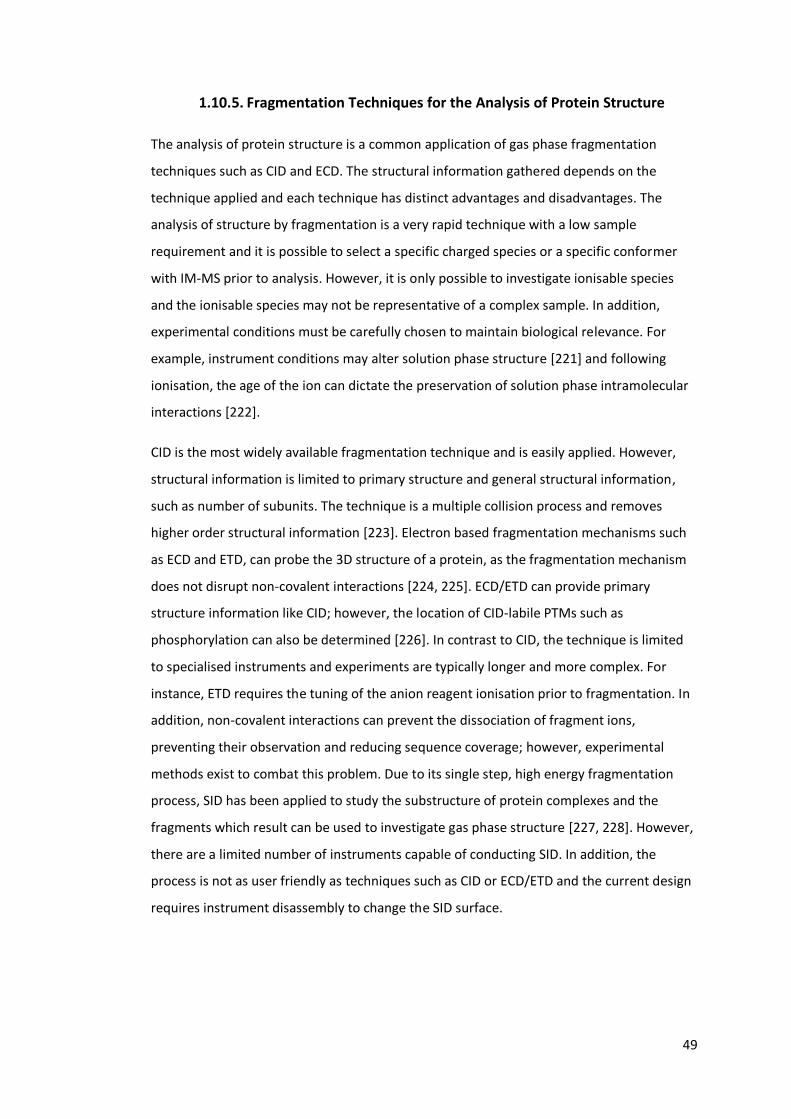
49
1.10.5. Fragmentation Techniques for the Analysis of Protein Structure
The analysis of protein structure is a common application of gas phase fragmentation
techniques such as CID and ECD. The structural information gathered depends on the
technique applied and each technique has distinct advantages and disadvantages. The
analysis of structure by fragmentation is a very rapid technique with a low sample
requirement and it is possible to select a specific charged species or a specific conformer
with IM-MS prior to analysis. However, it is only possible to investigate ionisable species
and the ionisable species may not be representative of a complex sample. In addition,
experimental conditions must be carefully chosen to maintain biological relevance. For
example, instrument conditions may alter solution phase structure [221] and following
ionisation, the age of the ion can dictate the preservation of solution phase intramolecular
interactions [222].
CID is the most widely available fragmentation technique and is easily applied. However,
structural information is limited to primary structure and general structural information,
such as number of subunits. The technique is a multiple collision process and removes
higher order structural information [223]. Electron based fragmentation mechanisms such
as ECD and ETD, can probe the 3D structure of a protein, as the fragmentation mechanism
does not disrupt non-covalent interactions [224, 225]. ECD/ETD can provide primary
structure information like CID; however, the location of CID-labile PTMs such as
phosphorylation can also be determined [226]. In contrast to CID, the technique is limited
to specialised instruments and experiments are typically longer and more complex. For
instance, ETD requires the tuning of the anion reagent ionisation prior to fragmentation. In
addition, non-covalent interactions can prevent the dissociation of fragment ions,
preventing their observation and reducing sequence coverage; however, experimental
methods exist to combat this problem. Due to its single step, high energy fragmentation
process, SID has been applied to study the substructure of protein complexes and the
fragments which result can be used to investigate gas phase structure [227, 228]. However,
there are a limited number of instruments capable of conducting SID. In addition, the
process is not as user friendly as techniques such as CID or ECD/ETD and the current design
requires instrument disassembly to change the SID surface.
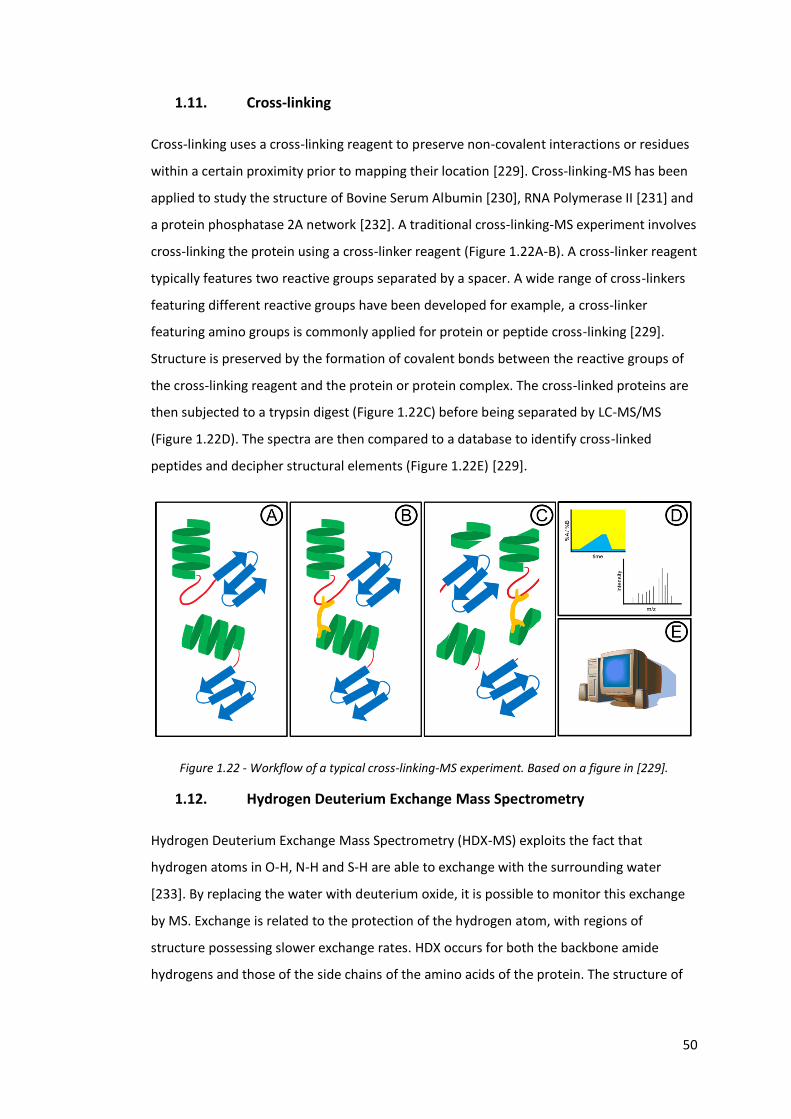
50
1.11. Cross-linking
Cross-linking uses a cross-linking reagent to preserve non-covalent interactions or residues
within a certain proximity prior to mapping their location [229]. Cross-linking-MS has been
applied to study the structure of Bovine Serum Albumin [230], RNA Polymerase II [231] and
a protein phosphatase 2A network [232]. A traditional cross-linking-MS experiment involves
cross-linking the protein using a cross-linker reagent (Figure 1.22A-B). A cross-linker reagent
typically features two reactive groups separated by a spacer. A wide range of cross-linkers
featuring different reactive groups have been developed for example, a cross-linker
featuring amino groups is commonly applied for protein or peptide cross-linking [229].
Structure is preserved by the formation of covalent bonds between the reactive groups of
the cross-linking reagent and the protein or protein complex. The cross-linked proteins are
then subjected to a trypsin digest (Figure 1.22C) before being separated by LC-MS/MS
(Figure 1.22D). The spectra are then compared to a database to identify cross-linked
peptides and decipher structural elements (Figure 1.22E) [229].
Figure 1.22 - Workflow of a typical cross-linking-MS experiment. Based on a figure in [229].
1.12. Hydrogen Deuterium Exchange Mass Spectrometry
Hydrogen Deuterium Exchange Mass Spectrometry (HDX-MS) exploits the fact that
hydrogen atoms in O-H, N-H and S-H are able to exchange with the surrounding water
[233]. By replacing the water with deuterium oxide, it is possible to monitor this exchange
by MS. Exchange is related to the protection of the hydrogen atom, with regions of
structure possessing slower exchange rates. HDX occurs for both the backbone amide
hydrogens and those of the side chains of the amino acids of the protein. The structure of
51
the entire protein can be probed for example; HDX-MS has been applied to study the effect
of mutations on antibody structure [233, 234].
1.13. Ion Mobility - Mass Spectrometry
Ion Mobility - Mass Spectrometry (IM-MS) is a gas phase electrophoretic technique which
enables the separation of ions on the basis of their mobility (K) in a given buffer gas, which
is related to an ions size and shape, in addition to the mass (m) and charge (z) separation
achieved by traditional MS. This two dimensional approach enables the separation of
species which possess coincident m/z values but differ in terms of oligomeric order or
conformation. An excellent review of current IM-MS approaches may be found in [235],
[236] and [237]. The two approaches applied in this thesis, Drift Time Ion Mobility Mass
Spectrometry (DT-IM-MS) and Travelling Wave Ion Mobility Mass Spectrometry (TWIMS)
are described here.
1.13.1. Drift Time Ion Mobility - Mass Spectrometry
DT-IM-MS is the simplest form of IM-MS but is the gold standard for Collision Cross Section
(CCS) measurement. Early experimental and theoretical investigations into the movement
of ions in gases are the basis of modern DT-IM-MS [238-240]. Based on this early work,
McDaniel constructed linear drift time ion mobility instruments [241]. This work was built
on by Kebarle [242] and led to the development of the first IMS-MS hybrid instrument by
hyphenating a linear drift tube with a magnetic sector mass spectrometer [243, 244].
The behaviour of an ion passing through a gas under the influence of an electric field is
dependent on the ratio of electric field strength (E) and the number gas density (N). At high
E/N, ions may align with the field and their motion becomes dependent on E [245]. At low
E/N ratios, known as the Low Field Limit, the motion of ions can be described in simpler
terms and ions have low velocities independent of E [246]. At the low field limit, mobility
(K) is the constant of proportionality between drift velocity and the electric field (E), see
Equation 1.9.
𝑣𝑑 = 𝐾𝐸 Equation 1.9
An ions mobility (K) is dependent on its mass (m), charge (z) and shape, which can be
defined as its rotationally averaged CCS (Ω), described by Equation 1.10:
𝐾 = 3𝑧𝑒
16𝑁 (
2𝜋
𝜇𝑘𝐵𝑇)
1 2⁄ 1
𝛺 Equation 1.10
52
where K is the mobility, e is the elementary charge, N is the gas number density, µ is the
reduced mass of the ion–neutral pair, kB is the Boltzmann constant and T is the gas
temperature. The reduced mobility, the measured mobility at standard temperature and
pressure (273.15 K and 760 Torr) is calculated to aid in the comparison of values between
laboratories, see Equation 1.11.
𝐾0 = 𝐾𝑇𝑜𝑃
𝑃𝑜𝑇 Equation 1.11
DT-IM-MS instruments enable the direct measurement of an ions CCS and until the recent
development of the Agilent DT-IMS-MS instrument, they were largely limited to instrument
development laboratories.
1.13.2. Travelling Wave Ion Mobility Mass Spectrometry
The Waters Synapt instruments are the first commercial integrated IM-MS instruments and
are based on Travelling Wave Ion Mobility Mass Spectrometry (TWIMS). Synapt
instruments use a Stacked Ring Ion Guide (SRIG) variant, the Travelling Wave Ion Guide
(TWIG) in which a periodic travelling wave is superimposed to propel ions through the
guide [247]. TWIMS mobility separation is achieved in the presence of an inert buffer gas
(Figure 1.23), two ions of different mobilities surf the wave created by the TWIG. The ion
with a lower mobility rolls over the wave and takes a longer time to travel the length of the
IMS region. The higher mobility ion does not roll over the wave and travels the length of
the IMS region in a shorter time [248].
It is not possible to determine CCS values directly from the drift time data of TWIMS
instruments. Instead, a calibration curve is generated from a set of protein standards,
whose CCS values have been measured on DT-IM-MS instruments. This approach has
shortcomings including the effect of the buffer gas. TWIMS CCS measurements are
conducted in nitrogen whereas DT-IM-MS instruments are usually conducted in helium;
calculation of CCS values from TWIMS data therefore requires converting the value from
one gas to another. The buffer gas is known to have an impact on the CCS of small
molecules and to a lesser extent on large biomolecules such as proteins [247, 249]. In
addition, Ridenour et al. have demonstrated that the choice of calibrant and ionisation
source can affect calibration quality [250]. Therefore, the calibrant ions chosen must be
similar to the subject of investigation and the experimental conditions must be identical.
Evidence of ion heating in TWIMS instruments also means that instrument conditions must
be carefully considered and controlled to avoid disruption of protein structure [221, 251].
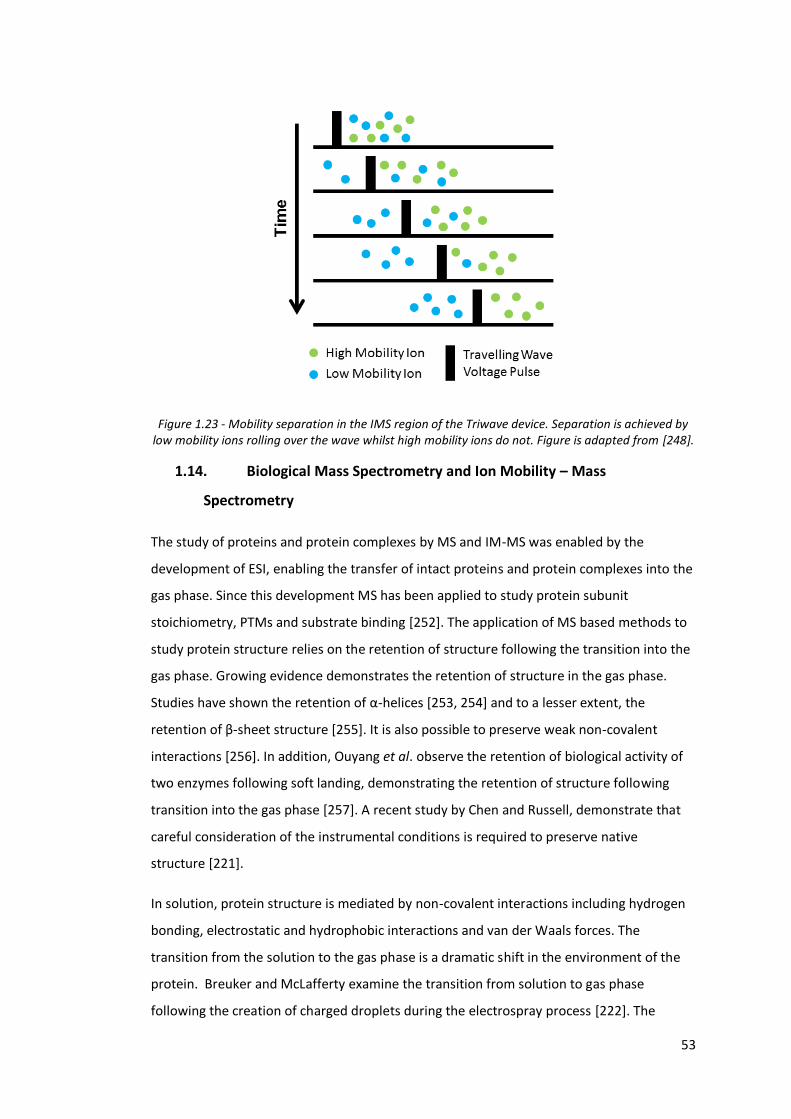
53
Figure 1.23 - Mobility separation in the IMS region of the Triwave device. Separation is achieved by low mobility ions rolling over the wave whilst high mobility ions do not. Figure is adapted from [248].
1.14. Biological Mass Spectrometry and Ion Mobility – Mass
Spectrometry
The study of proteins and protein complexes by MS and IM-MS was enabled by the
development of ESI, enabling the transfer of intact proteins and protein complexes into the
gas phase. Since this development MS has been applied to study protein subunit
stoichiometry, PTMs and substrate binding [252]. The application of MS based methods to
study protein structure relies on the retention of structure following the transition into the
gas phase. Growing evidence demonstrates the retention of structure in the gas phase.
Studies have shown the retention of α-helices [253, 254] and to a lesser extent, the
retention of β-sheet structure [255]. It is also possible to preserve weak non-covalent
interactions [256]. In addition, Ouyang et al. observe the retention of biological activity of
two enzymes following soft landing, demonstrating the retention of structure following
transition into the gas phase [257]. A recent study by Chen and Russell, demonstrate that
careful consideration of the instrumental conditions is required to preserve native
structure [221].
In solution, protein structure is mediated by non-covalent interactions including hydrogen
bonding, electrostatic and hydrophobic interactions and van der Waals forces. The
transition from the solution to the gas phase is a dramatic shift in the environment of the
protein. Breuker and McLafferty examine the transition from solution to gas phase
following the creation of charged droplets during the electrospray process [222]. The
54
retention of solution phase structure in the gas phase is dependent on the experimental
conditions; the collapse of charged side chains in the picoseconds following desolvation can
preserve native solution phase structure [222]. However, milliseconds after desolvation,
the structure may lose hydrophobic and electrostatic interactions and undergo unfolding
and refolding [222]. Minutes after desolvation, new non-covalent bonds may be formed,
stabilising alternative structures [222]. Careful consideration of experimental design is
therefore required to maintain solution phase structure.
It is possible from MS alone to infer general structural information and conformational
changes on the basis of the width of a proteins Charge State Distribution (CSD). More
compact conformers or proteins have fewer exposed ionisable sites and therefore present
fewer charge states. On the other hand, more unfolded or disordered proteins such as α-
Synuclein, in general feature greater numbers of exposed ionisable sites and so present
much wider CSDs. MS can be applied in this manner to track the effect of solution
conditions such as pH on conformation [258-260]. Gaussian fitting of the charge state
envelopes enables the tracking of different conformers in relation to changes in conditions
such as exposure to alcohols or metal ions [259, 260]. This is particularly beneficial for
aggregating systems in which a wide range of conformational species are present at one
time. However, the analysis of structure or conformational changes by MS alone is
hampered by the presence of charge coincident species, either of overlapping
conformational families or oligomeric species.
IM-MS emerged in the mid-1990’s as an alternative to X-ray crystallography and NMR for
the characterisation of protein structure [261]. A summary of the advantages and
disadvantages of each biophysical technique can be found in Table 1.1. Although IM-MS
cannot offer the same atomistic resolution, it instead offers the ability to study the
conformational dynamics of the protein, enabling the separation and interrogation of
multiple overlapping conformers or oligomeric species, which are frequently lost in other
techniques. This can be expanded into analysing the effect of binding of inhibitors or small
molecules on protein conformation to decipher their mechanism of action. For example,
the effect of RNA binding to trp RNA-binding attenuation protein (TRAP) [262] or the
binding of EGCG to α-Synuclein [263].
In contrast to NMR and X-ray crystallography in which large sample volumes and
concentrations are typically required, the sample requirements for MS and IM-MS analysis
are much lower, requiring µL volumes of µM concentrations. NMR and X-ray
55
crystallography are non-destructive processes as it is possible to recover or preserve the
protein or protein crystals. On the other hand, ionisation of the protein by MS based
methods is destructive, although this downside is mediated by the lower sample volume
requirements. In addition, the lower sample concentrations required compared to NMR
and X-ray crystallography are beneficial for the study of rare proteins and aggregating
systems, where concentration is known to affect aggregation. As a result, MS and IM-MS
have been applied to study a range of aggregating proteins and peptides. β2-microglobulin,
implicated in the aetiology of dialysis-related amyloidosis, has been extensively studied by
MS and IM-MS. The Vachet group have applied MS to locate the binding site of copper ions
[264] and in conjunction with a covalent labelling approach, they have probed the structure
of pre-fibrillar structures [265, 266]. MS and IM-MS have been applied extensively to probe
the structure and aggregation of β2-microglobulin by the Heck, Grandori, Radford and
Ashcroft groups [267-274].
MS based methods have been applied to other aggregating systems including amylin [275-
279], insulin [280] and prion proteins [281, 282]. The application of MS and IM-MS
approaches to study α-Synuclein and the Amyloid-β peptides is covered in subsequent
chapters.
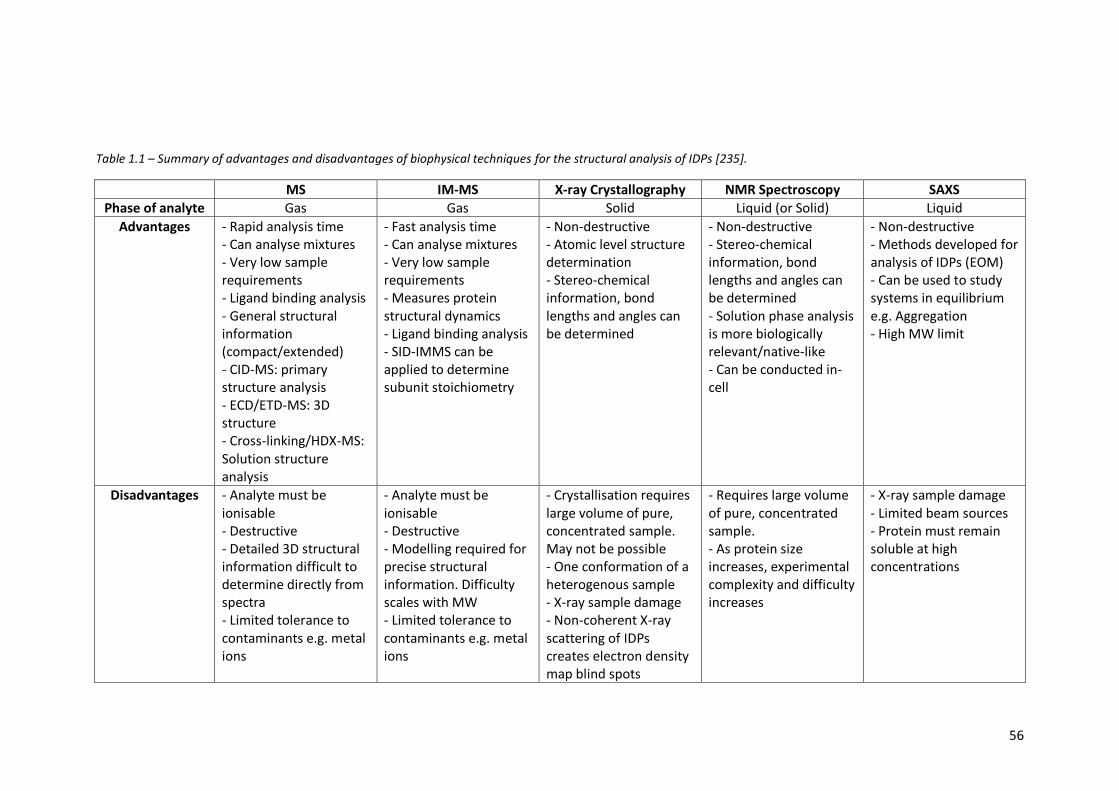
56
Table 1.1 – Summary of advantages and disadvantages of biophysical techniques for the structural analysis of IDPs [235].
MS IM-MS X-ray Crystallography NMR Spectroscopy SAXS
Phase of analyte Gas Gas Solid Liquid (or Solid) Liquid
Advantages - Rapid analysis time - Can analyse mixtures - Very low sample requirements - Ligand binding analysis - General structural information (compact/extended) - CID-MS: primary structure analysis - ECD/ETD-MS: 3D structure - Cross-linking/HDX-MS: Solution structure analysis
- Fast analysis time - Can analyse mixtures - Very low sample requirements - Measures protein structural dynamics - Ligand binding analysis - SID-IMMS can be applied to determine subunit stoichiometry
- Non-destructive - Atomic level structure determination - Stereo-chemical information, bond lengths and angles can be determined
- Non-destructive - Stereo-chemical information, bond lengths and angles can be determined - Solution phase analysis is more biologically relevant/native-like - Can be conducted in-cell
- Non-destructive - Methods developed for analysis of IDPs (EOM) - Can be used to study systems in equilibrium e.g. Aggregation - High MW limit
Disadvantages - Analyte must be ionisable - Destructive - Detailed 3D structural information difficult to determine directly from spectra - Limited tolerance to contaminants e.g. metal ions
- Analyte must be ionisable - Destructive - Modelling required for precise structural information. Difficulty scales with MW - Limited tolerance to contaminants e.g. metal ions
- Crystallisation requires large volume of pure, concentrated sample. May not be possible - One conformation of a heterogenous sample - X-ray sample damage - Non-coherent X-ray scattering of IDPs creates electron density map blind spots
- Requires large volume of pure, concentrated sample. - As protein size increases, experimental complexity and difficulty increases
- X-ray sample damage - Limited beam sources - Protein must remain soluble at high concentrations

57
1.15. Summary
MS and IM-MS have previously been shown to be excellent tools for examining the
structure and aggregation of proteins and peptides implicated in disease. This thesis
investigates the use of MS based methods including IM-MS and a range of fragmentation
techniques to probe the structure, aggregation and interactions of proteins and peptides of
medical relevance in the gas phase. Firstly, the structure and aggregation of α-Synuclein,
which has been implicated in the development of Parkinson’s disease, is probed using a
combination of MS and IM-MS hyphenated with the structure interrogating techniques
including HDX and ECD (Chapters 3 and 4). Secondly, the structure of the aggregating
Amyloid-β peptides, implicated in the aetiology of Alzheimer’s disease is probed by a range
of gas phase fragmentation techniques. The alteration of this structure, as a result of the
interaction of the peptide with anti-amyloid therapeutic candidates is also studied by
TWIMS (Chapter 5). Finally, the ability of these MS based methods to study the structure of
intrinsically disordered aggregating protein systems and the scope for further investigation
is discussed.
58
1.16. References
1. Tompa, P., Intrinsically disordered proteins: a 10-year recap. Trends in Biochemical Sciences, 2012. 37(12): p. 509-516.
2. Uversky, V.N., Intrinsically disordered proteins from A to Z. International Journal of Biochemistry & Cell Biology, 2011. 43(8): p. 1090-1103.
3. Dyson, H.J., Making Sense of Intrinsically Disordered Proteins. Biophysical Journal, 2016. 110(5): p. 1013-1016.
4. Uversky, V.N., J.R. Gillespie, and A.L. Fink, Why are "natively unfolded" proteins unstructured under physiologic conditions? Proteins-Structure Function and Genetics, 2000. 41(3): p. 415-427.
5. Uversky, V.N., Dancing Protein Clouds: The Strange Biology and Chaotic Physics of Intrinsically Disordered Proteins. Journal of Biological Chemistry, 2016. 291(13): p. 6681-6688.
6. Dunker, A.K. and Z. Obradovic, The protein trinity - linking function and disorder. Nature Biotechnology, 2001. 19(9): p. 805-806.
7. Uversky, V.N., Natively unfolded proteins: A point where biology waits for physics. Protein Science, 2002. 11(4): p. 739-756.
8. Uversky, V.N., C.J. Oldfield, and A.K. Dunker, Intrinsically disordered proteins in human diseases: Introducing the D(2) concept, in Annual Review of Biophysics. 2008, Annual Reviews: Palo Alto. p. 215-246.
9. Otzen, D., Functional amyloid Turning swords into plowshares. Prion, 2010. 4(4): p. 256-264.
10. Invernizzi, G., et al., Protein aggregation: Mechanisms and functional consequences. International Journal of Biochemistry & Cell Biology, 2012. 44(9): p. 1541-1554.
11. Iconomidou, V.A., G. Vriend, and S.J. Hamodrakas, Amyloids protect the silkmoth oocyte and embryo. Febs Letters, 2000. 479(3): p. 141-145.
12. Chiti, F. and C.M. Dobson, Protein misfolding, functional amyloid, and human disease, in Annual Review of Biochemistry. 2006, Annual Reviews: Palo Alto. p. 333-366.
13. Uversky, V.N., Targeting intrinsically disordered proteins in neurodegenerative and protein dysfunction diseases: another illustration of the D-2 concept. Expert Review of Proteomics, 2010. 7(4): p. 543-564.
14. Uversky, V.N., The triple power of D-3: Protein intrinsic disorder in degenerative diseases. Frontiers in Bioscience-Landmark, 2014. 19: p. 181-258.
15. Raychaudhuri, S., et al., The Role of Intrinsically Unstructured Proteins in Neurodegenerative Diseases. Plos One, 2009. 4(5).
16. Pastore, A. and P. Temussi, Protein aggregation and misfolding: good or evil? Journal of Physics-Condensed Matter, 2012. 24(24): p. 9.
17. Korsak, M. and T. Kozyreva, Beta Amyloid Hallmarks: From Intrinsically Disordered Proteins to Alzheimer's Disease, in Intrinsically Disordered Proteins Studied by Nmr Spectroscopy, I.C. Felli and R. Pierattelli, Editors. 2015, Springer-Verlag Berlin: Berlin. p. 401-421.
18. Hoyer, W., et al., Dependence of alpha-synuclein aggregate morphology on solution conditions. Journal of Molecular Biology, 2002. 322(2): p. 383-393.
19. Singleton, A.B., et al., alpha-synuclein locus triplication causes Parkinson's disease. Science, 2003. 302(5646): p. 841-841.
20. Ibanez, P., et al., Causal relation between alpha-synuclein gene duplication and familial Parkinson's disease. Lancet, 2004. 364(9440): p. 1169-1171.
21. Chartier-Harlin, M.C., et al., alpha-synuclein locus duplication as a cause of familial Parkinson's disease. Lancet, 2004. 364(9440): p. 1167-1169.
59
22. Frieden, C., Protein aggregation processes: In search of the mechanism. Protein Science, 2007. 16(11): p. 2334-2344.
23. Wood, S.J., et al., alpha-synuclein fibrillogenesis is nucleation-dependent - Implications for the pathogenesis of Parkinson's disease. Journal of Biological Chemistry, 1999. 274(28): p. 19509-19512.
24. Conway, K.A., et al., Acceleration of oligomerization, not fibrillization, is a shared property of both alpha-synuclein mutations linked to early-onset Parkinson's disease: Implications for pathogenesis and therapy. Proceedings of the National Academy of Sciences of the United States of America, 2000. 97(2): p. 571-576.
25. Bernstein, S.L., et al., Amyloid-beta protein oligomerization and the importance of tetramers and dodecamers in the aetiology of Alzheimer's disease. Nature Chemistry, 2009. 1(4): p. 326-331.
26. Lashuel, H.A., et al., alpha-synuclein, especially the Parkinson's disease-associated mutants, forms pore-like annular and tubular protofibrils. Journal of Molecular Biology, 2002. 322(5): p. 1089-1102.
27. Alves, G., et al., Epidemiology of Parkinson's disease. Journal of Neurology, 2008. 255: p. 18-32.
28. United Nations, D.o.E.a.S.A., Population Division, World Population Prospects: The 2010 Revision, Highlights and Advance Tables. 2011.
29. Parkinson, J., An essay on the shaking palsy (Reprinted). Journal of Neuropsychiatry and Clinical Neurosciences, 2002. 14(2): p. 223-236.
30. Jankovic, J., Parkinson's disease: clinical features and diagnosis. Journal of Neurology Neurosurgery and Psychiatry, 2008. 79(4): p. 368-376.
31. Spillantini, M.G., Crowther, R. A., Jakes, R., Hasegawa, M., Goedert, M., alpha-Synuclein in filamentous inclusions of Lewy bodies from Parkinson's disease and dementia with lewy bodies. Proceedings of the National Academy of Sciences, 1998. 95: p. 6469-6473.
32. Spillantini, M.G., et al., alpha-synuclein in Lewy bodies. Nature, 1997. 388(6645): p. 839-840.
33. Venda, L.L., et al., alpha-Synuclein and dopamine at the crossroads of Parkinson's disease. Trends in Neurosciences, 2010. 33(12): p. 559-568.
34. Spillantini, M.G. and M. Goedert, The alpha-synucleinopathies: Parkinson's disease, dementia with Lewy bodies, and multiple system atrophy, in Molecular Basis of Dementia, J.H. Growdon, et al., Editors. 2000, New York Acad Sciences: New York. p. 16-27.
35. Duffy, P.E. and V.M. Tennyson, Phase And Electron Microscopic Observations Of Lewy Bodies And Melanin Granules In Substantia Nigra And Locus Caeruleus In Parkinsons Disease. Journal of Neuropathology and Experimental Neurology, 1965. 24(3): p. 398-&.
36. Goedert, M., Alpha-synuclein and neurodegenerative diseases. Nature Reviews Neuroscience, 2001. 2(7): p. 492-501.
37. Withers, G.S., et al., Delayed localization of synelfin (synuclein, NACP) to presynaptic terminals in cultured rat hippocampal neurons. Developmental Brain Research, 1997. 99(1): p. 87-94.
38. Lee, S.J., H. Jeon, and K.V. Kandror, alpha-Synuclein is localized in a subpopulation of rat brain synaptic vesicles. Acta Neurobiologiae Experimentalis, 2008. 68(4): p. 509-515.
39. Zhang, L., et al., Semi-quantitative analysis of alpha-synuclein in subcellular pools of rat brain neurons: An immunogold electron microscopic study using a C-terminal specific monoclonal antibody. Brain Research, 2008. 1244: p. 40-52.
60
40. Villar-Pique, A.d.F., T. L. and T.F. Outeiro, Structure, function and toxicity of alpha-synuclein: the Bermuda triangle in synucleinopathies. Journal of Neurochemistry, 2015.
41. Breydo, L., J.W. Wu, and V.N. Uversky, alpha-Synuclein misfolding and Parkinson's disease. Biochimica Et Biophysica Acta-Molecular Basis of Disease, 2012. 1822(2): p. 261-285.
42. Goers, J., et al., Nuclear localization of alpha-synuclein and its interaction with histones. Biochemistry, 2003. 42(28): p. 8465-8471.
43. Dev, K.K., et al., Part II: alpha-synuclein and its molecular pathophysiological role in neurodegenerative disease. Neuropharmacology, 2003. 45(1): p. 14-44.
44. Uversky, V.N., alpha-Synuclein Misfolding and Neurodegenerative Diseases. Current Protein & Peptide Science, 2008. 9(5): p. 507-540.
45. Kruger, R., et al., Ala30Pro mutation in the gene encoding alpha-synuclein in Parkinson's disease. Nature Genetics, 1998. 18(2): p. 106-108.
46. Zarranz, J.J., et al., The new mutation, E46K, of alpha-synuclein causes Parkinson and Lewy body dementia. Annals of Neurology, 2004. 55(2): p. 164-173.
47. Proukakis, C., et al., A Novel alpha-synuclein Missense Mutation In Parkinson Disease. Neurology, 2013. 80(11): p. 1062-1064.
48. Kiely, A.P., et al., alpha-Synucleinopathy associated with G51D SNCA mutation: a link between Parkinson's disease and multiple system atrophy? Acta Neuropathologica, 2013. 125(5): p. 753-769.
49. Pasanen, P., et al., A novel alpha-synuclein mutation A53E associated with atypical multiple system atrophy and Parkinson's disease-type pathology. Neurobiology of Aging, 2014. 35(9): p. 5.
50. Polymeropoulos, M.H., et al., Mutation in the alpha-synuclein gene identified in families with Parkinson's disease. Science, 1997. 276(5321): p. 2045-2047.
51. Rao, J.N., et al., A Combinatorial NMR and EPR Approach for Evaluating the Structural Ensemble of Partially Folded Proteins. Journal of the American Chemical Society, 2010. 132(25): p. 8657-8668.
52. Davidson, W.S., et al., Stabilization of alpha-synuclein secondary structure upon binding to synthetic membranes. Journal of Biological Chemistry, 1998. 273(16): p. 9443-9449.
53. Han, H.Y., P.H. Weinreb, and P.T. Lansbury, The Core Alzheimers Peptide NAC Forms Amyloid Fibrils Which Seed And Are Seeded By Beta-Amyloid - Is NAC a Common Trigger Or Target In Neurodegenerative Disease. Chemistry & Biology, 1995. 2(3): p. 163-169.
54. Giasson, B.I., et al., A hydrophobic stretch of 12 amino acid residues in the middle of alpha-synuclein is essential for filament assembly. Journal of Biological Chemistry, 2001. 276(4): p. 2380-2386.
55. Periquet, M., et al., Aggregated alpha-synuclein mediates dopaminergic neurotoxicity in vivo. Journal of Neuroscience, 2007. 27(12): p. 3338-3346.
56. Biere, A.L., et al., Parkinson's disease-associated alpha-sylnuclein is more fibrillogenic than beta- and gamma-synuclein and cannot cross-seed its homologs. Journal of Biological Chemistry, 2000. 275(44): p. 34574-34579.
57. Eliezer, D., et al., Conformational properties of alpha-synuclein in its free and lipid-associated states. Journal of Molecular Biology, 2001. 307(4): p. 1061-1073.
58. Weinreb, P.H., et al., NACP, a protein implicated in Alzheimer's disease and learning, is natively unfolded. Biochemistry, 1996. 35(43): p. 13709-13715.
59. Bartels, T., J.G. Choi, and D.J. Selkoe, alpha-Synuclein occurs physiologically as a helically folded tetramer that resists aggregation. Nature, 2011. 477(7362): p. 107-U123.
61
60. Burre, J., et al., Properties of native brain alpha-synuclein. Nature, 2013. 498(7453): p. E4-E6.
61. Bartels, T. and D.J. Selkoe, Properties of native brain alpha-synuclein Reply. Nature, 2013. 498(7453): p. E6-E7.
62. Fauvet, B., et al., alpha-Synuclein in Central Nervous System and from Erythrocytes, Mammalian Cells, and Escherichia coli Exists Predominantly as Disordered Monomer. Journal of Biological Chemistry, 2012. 287(19): p. 15345-15364.
63. Binolfi, A., F.X. Theillet, and P. Selenko, Bacterial in-cell NMR of human alpha-synuclein: a disordered monomer by nature? Biochemical Society Transactions, 2012. 40: p. 950-U292.
64. Silva, B.A., L. Breydo, and V.N. Uversky, Targeting the Chameleon: a Focused Look at alpha-Synuclein and Its Roles in Neurodegeneration. Molecular neurobiology, 2013. 47(2): p. 446-59.
65. Jakes, R., M.G. Spillantini, and M. Goedert, Identification Of 2 Distinct Synucleins From Human Brain. Febs Letters, 1994. 345(1): p. 27-32.
66. Paleologou, K.E. and O.M. El-Agnaf, Alpha-Synuclein Aggregation and Modulating Factors, in Protein Aggregation and Fibrillogenesis in Cerebral and Systemic Amyloid Disease, J.R. Harris, Editor. 2012, Springer.
67. Stefanis, L., alpha-Synuclein in Parkinson's Disease. Cold Spring Harbor Perspectives in Medicine, 2012. 2(2).
68. Narhi, L., et al., Both familial Parkinson's disease mutations accelerate alpha-synuclein aggregation. Journal of Biological Chemistry, 1999. 274(14): p. 9843-9846.
69. Uversky, V.N., J. Li, and A.L. Fink, Evidence for a partially folded intermediate in alpha-synuclein fibril formation. Journal of Biological Chemistry, 2001. 276(14): p. 10737-10744.
70. Morris, A.M. and R.G. Finke, alpha-Synuclein aggregation variable temperature and variable pH kinetic data: A re-analysis using the Finke-Watzky 2-step model of nucleation and autocatalytic growth. Biophysical Chemistry, 2009. 140(1-3): p. 9-15.
71. Fink, A.L., The aggregation and fibrillation of alpha-synuclein. Accounts of Chemical Research, 2006. 39(9): p. 628-634.
72. Pivato, M., et al., Covalent alpha-Synuclein Dimers: Chemico-Physical and Aggregation Properties. Plos One, 2012. 7(12).
73. Roostaee, A., et al., Aggregation and neurotoxicity of recombinant alpha-synuclein aggregates initiated by dimerization. Molecular Neurodegeneration, 2013. 8.
74. Krishnan, S., et al., Oxidative dimer formation is the critical rate-limiting step for Parkinson's disease alpha-synuclein fibrillogenesis. Biochemistry, 2003. 42(3): p. 829-837.
75. Villar-Pique, A., T.L. da Fonseca, and T.F. Outeiro, Structure, function and toxicity of alpha-synuclein: the Bermuda triangle in synucleinopathies. Journal of Neurochemistry, 2015.
76. Lowe, R., et al., Calcium(II) selectively induces alpha-synuclein annular oligomers via interaction with the C-terminal domain. Protein Science, 2004. 13(12): p. 3245-3252.
77. Conway, K.A., et al., Kinetic stabilization of the alpha-synuclein protofibril by a dopamine-alpha-synuclein adduct. Science, 2001. 294(5545): p. 1346-1349.
78. Lashuel, H.A., et al., The many faces of alpha-synuclein: from structure and toxicity to therapeutic target. Nature Reviews Neuroscience, 2013. 14(1): p. 38-48.
79. Singh, P.K., et al., Curcumin Modulates alpha-Synuclein Aggregation and Toxicity. Acs Chemical Neuroscience, 2013. 4(3): p. 393-407.
62
80. Apetri, M.M., et al., Secondary structure of alpha-synuclein oligomers: Characterization by Raman and atomic force microscopy. Journal of Molecular Biology, 2006. 355(1): p. 63-71.
81. Ghosh, D., et al., Structure based aggregation studies reveal the presence of helix-rich intermediate during alpha-Synuclein aggregation. Scientific Reports, 2015. 5: p. 15.
82. Serpell, L.C., et al., Fiber diffraction of synthetic alpha-synuclein filaments shows amyloid-like cross-beta conformation. Proceedings of the National Academy of Sciences of the United States of America, 2000. 97(9): p. 4897-4902.
83. van Raaij, M.E., et al., Concentration Dependence of alpha-Synuclein Fibril Length Assessed by Quantitative Atomic Force Microscopy and Statistical-Mechanical Theory. Biophysical Journal, 2008. 95(10): p. 4871-4878.
84. Celej, M.S., et al., Toxic prefibrillar alpha-synuclein amyloid oligomers adopt a distinctive antiparallel beta-sheet structure. Biochemical Journal, 2012. 443: p. 719-726.
85. Sweers, K., et al., Nanomechanical properties of alpha-synuclein amyloid fibrils: a comparative study by nanoindentation, harmonic force microscopy, and Peakforce QNM. Nanoscale Research Letters, 2011. 6: p. 10.
86. Vilar, M., et al., The fold of alpha-synuclein fibrils. Proceedings of the National Academy of Sciences of the United States of America, 2008. 105(25): p. 8637-8642.
87. Cho, M.-K., et al., Conserved core of amyloid fibrils of wild type and A30P mutant alpha-synuclein. Protein Science, 2011. 20(2): p. 387-395.
88. Qin, Z., et al., Role of different regions of alpha-synuclein in the assembly of fibrils. Biochemistry, 2007. 46(46): p. 13322-13330.
89. Comellas, G., et al., Structured Regions of alpha-Synuclein Fibrils Include the Early-Onset Parkinson's Disease Mutation Sites. Journal of Molecular Biology, 2011. 411(4): p. 881-895.
90. Sweers, K.K.M., et al., Atomic Force Microscopy under Controlled Conditions Reveals Structure of C-Terminal Region of alpha-Synuclein in Amyloid Fibrils. Acs Nano, 2012. 6(7): p. 5952-5960.
91. Sweers, K.K.M., et al., Structural model for alpha-synuclein fibrils derived from high resolution imaging and nanomechanical studies using atomic force microscopy. Soft Matter, 2012. 8(27): p. 7215-7222.
92. Bousset, L., et al., Structural and functional characterization of two alpha-synuclein strains. Nature Communications, 2013. 4: p. 13.
93. Bodner, R.A., et al., Pharmacological promotion of inclusion formation: A therapeutic approach for Huntington's and Parkinson's diseases. Proceedings of the National Academy of Sciences of the United States of America, 2006. 103(11): p. 4246-4251.
94. van der Putten, H., et al., Neuropathology in mice expressing human alpha-synuclein. Journal of Neuroscience, 2000. 20(16): p. 6021-6029.
95. Xu, J., et al., Dopamine-dependent neurotoxicity of alpha-synuclein: A mechanism for selective neurodegeneration in Parkinson disease. Nature Medicine, 2002. 8(6): p. 600-606.
96. Auluck, P.K. and N.M. Bonini, Pharmacological prevention of Parkinson disease in Drosophila. Nature Medicine, 2002. 8(11): p. 1185-1186.
97. Hong, D.P., A.L. Fink, and V.N. Uversky, Structural Characteristics of alpha-Synuclein Oligomers Stabilized by the Flavonoid Baicalein. Journal of Molecular Biology, 2008. 383(1): p. 214-223.
98. Uversky, V.N., Mysterious oligomerization of the amyloidogenic proteins. Febs Journal, 2010. 277(14): p. 2940-2953.
63
99. Kim, T.D., et al., Structural changes in alpha-synuclein affect its chaperone-like activity in vitro. Protein Science, 2000. 9(12): p. 2489-2496.
100. Kim, T.D., S.R. Paik, and C.H. Yang, Structural and functional implications of C-terminal regions of alpha-synuclein. Biochemistry, 2002. 41(46): p. 13782-13790.
101. Burns, A., E.J. Byrne, and K. Maurer, Alzheimer's disease. Lancet, 2002. 360(9327): p. 163-165.
102. Kumar, A., A. Singh, and Ekavali, A review on Alzheimer's disease pathophysiology and its management: an update. Pharmacological Reports, 2015. 67(2): p. 195-203.
103. Prince, M., et al., World Alzheimers Report 2015 The Global Impact of Dementia An Analysis of Prevalence, Incidence, Cost and Trends. 2015, Alzheimer's Disease International (ADI): London.
104. De-Paula, V.J., et al., Alzheimer's disease. Sub-cellular biochemistry, 2012. 65: p. 329-52.
105. Murphy, M.P. and H. LeVine, Alzheimer's Disease and the Amyloid-beta Peptide. Journal of Alzheimers Disease, 2010. 19(1): p. 311-323.
106. Barrantes, F.J., V. Borroni, and S. Valles, Neuronal nicotinic acetylcholine receptor-cholesterol crosstalk in Alzheimer's disease. Febs Letters, 2010. 584(9): p. 1856-1863.
107. Younkin, S.G., Evidence That A-Beta-42 Is The Real Culprit In Alzheimers-Disease. Annals of Neurology, 1995. 37(3): p. 287-288.
108. Bitan, G., et al., Amyloid β-protein (Aβ) assembly: Aβ40 and Aβ42 oligomerize through distinct pathways. Proceedings of the National Academy of Sciences of the United States of America, 2003. 100(1): p. 330-335.
109. Jarrett, J.T., E.P. Berger, and P.T. Lansbury, The Carboxy Terminus Of The Beta-Amyloid Protein Is Critical For The Seeding Of Amyloid Formation - Implications For The Pathogenesis Of Alzheimers-Disease. Biochemistry, 1993. 32(18): p. 4693-4697.
110. Dahlgren, K.N., et al., Oligomeric and fibrillar species of amyloid-beta peptides differentially affect neuronal viability. Journal of Biological Chemistry, 2002. 277(35): p. 32046-32053.
111. Finder, V.H. and R. Glockshuber, Amyloid-beta aggregation. Neurodegenerative Diseases, 2007. 4(1): p. 13-27.
112. Pujol-Pina, R., et al., SDS-PAGE analysis of A beta oligomers is disserving research into Alzheimer's disease: appealing for ESI-IM-MS. Scientific Reports, 2015. 5: p. 13.
113. Cohen, S.I.A., et al., Proliferation of amyloid-beta 42 aggregates occurs through a secondary nucleation mechanism. Proceedings of the National Academy of Sciences of the United States of America, 2013. 110(24): p. 9758-9763.
114. Kloniecki, M., et al., Ion Mobility Separation Coupled with MS Detects Two Structural States of Alzheimer's Disease A beta 1-40 Peptide Oligomers. Journal of Molecular Biology, 2011. 407(1): p. 110-124.
115. Sitkiewicz, E., et al., Factors Influencing Compact-Extended Structure Equilibrium in Oligomers of A beta 1-40 Peptide-An Ion Mobility Mass Spectrometry Study. Journal of Molecular Biology, 2014. 426(15): p. 2871-2885.
116. Haass, C. and D.J. Selkoe, Soluble protein oligomers in neurodegeneration: lessons from the Alzheimer's amyloid beta-peptide. Nature Reviews Molecular Cell Biology, 2007. 8(2): p. 101-112.
117. Glabe, C.G., Common mechanisms of amyloid oligomer pathogenesis in degenerative disease. Neurobiology of Aging, 2006. 27(4): p. 570-575.
118. Kayed, R. and C.A. Lasagna-Reeves, Molecular Mechanisms of Amyloid Oligomers Toxicity. Journal of Alzheimers Disease, 2013. 33: p. S67-S78.
119. McLean, C.A., et al., Soluble pool of A beta amyloid as a determinant of severity of neurodegeneration in Alzheimer's disease. Annals of Neurology, 1999. 46(6): p. 860-866.
64
120. Tomic, J.L., et al., Soluble fibrillar oligomer levels are elevated in Alzheimer's disease brain and correlate with cognitive dysfunction. Neurobiology of Disease, 2009. 35(3): p. 352-358.
121. Schmidt, M., et al., Comparison of Alzheimer A beta(1-40) and A beta(1-42) amyloid fibrils reveals similar protofilament structures. Proceedings of the National Academy of Sciences of the United States of America, 2009. 106(47): p. 19813-19818.
122. Meinhardt, J., et al., A beta(1-40) Fibril Polymorphism Implies Diverse Interaction Patterns in Amyloid Fibrils. Journal of Molecular Biology, 2009. 386(3): p. 869-877.
123. Zhang, R., et al., Interprotofilament interactions between Alzheimer's A beta(1-42) peptides in amyloid fibrils revealed by cryoEM. Proceedings of the National Academy of Sciences of the United States of America, 2009. 106(12): p. 4653-4658.
124. Bertini, I., et al., A New Structural Model of A beta(40) Fibrils. Journal of the American Chemical Society, 2011. 133(40): p. 16013-16022.
125. Paravastu, A.K., et al., Molecular structural basis for polymorphism in Alzheimer's beta-amyloid fibrils. Proceedings of the National Academy of Sciences of the United States of America, 2008. 105(47): p. 18349-18354.
126. Ahmed, M., et al., Structural conversion of neurotoxic amyloid-beta(1-42) oligomers to fibrils. Nature Structural & Molecular Biology, 2010. 17(5): p. 561-U56.
127. Drechsel, D.N., et al., Modulation Of The Dynamic Instability Of Tubulin Assembly By The Microtuble-Associated Protein Tau. Molecular Biology of the Cell, 1992. 3(10): p. 1141-1154.
128. Mandelkow, E.M. and E. Mandelkow, Biochemistry and Cell Biology of Tau Protein in Neurofibrillary Degeneration. Cold Spring Harbor Perspectives in Medicine, 2012. 2(7): p. 25.
129. Iqbal, K., et al., Significance and mechanism of Alzheimer neurofibrillary degeneration and therapeutic targets to inhibit this lesion. Journal of Molecular Neuroscience, 2002. 19(1-2): p. 95-99.
130. Brion, J.P., et al., Neurofibrillary tangles and tau phosphorylation, in Neuronal Signal Transduction and Alzheimer's Disease, C. Oneill and B. Anderton, Editors. 2001, Portland Press Ltd: London. p. 81-88.
131. Hardy, J.A. and G.A. Higgins, Alzheimers-Disease - The Amyloid Cascade Hypothesis. Science, 1992. 256(5054): p. 184-185.
132. Selkoe, D.J. and J. Hardy, The amyloid hypothesis of Alzheimer's disease at 25 years. EMBO Molecular Medicine, 2016.
133. Hardy, J. and D.J. Selkoe, Medicine - The amyloid hypothesis of Alzheimer's disease: Progress and problems on the road to therapeutics. Science, 2002. 297(5580): p. 353-356.
134. Herrup, K., The case for rejecting the amyloid cascade hypothesis. Nature Neuroscience, 2015. 18(6): p. 794-799.
135. Hooper, C., R. Killick, and S. Lovestone, The GSK3 hypothesis of Alzheimer's disease. Journal of Neurochemistry, 2008. 104(6): p. 1433-1439.
136. Mason, J.M., et al., Design strategies for anti-amyloid agents. Current Opinion in Structural Biology, 2003. 13(4): p. 526-532.
137. Soto, C., et al., beta-sheet breaker peptides inhibit fibrillogenesis in a rat brain model of amyloidosis: Implications for Alzheimer's therapy. Nature Medicine, 1998. 4(7): p. 822-826.
138. Nie, Q., X.G. Du, and M.Y. Geng, Small molecule inhibitors of amyloid beta peptide aggregation as a potential therapeutic strategy for Alzheimer's disease. Acta Pharmacologica Sinica, 2011. 32(5): p. 545-551.
139. Levine, H., Small molecule inhibitors of A beta assembly. Amyloid-Journal of Protein Folding Disorders, 2007. 14(3): p. 185-197.
65
140. Hawkes, C.A., V. Ng, and J. McLaurin, Small Molecule Inhibitors of A beta-Aggregation and Neurotoxicity. Drug Development Research, 2009. 70(2): p. 111-124.
141. Austen, B.M., et al., Designing peptide inhibitors for oligomerization and toxicity of Alzheimer's beta-amyloid peptide. Biochemistry, 2008. 47(7): p. 1984-1992.
142. Taylor, M., et al., Development of a Proteolytically Stable Retro-Inverso Peptide Inhibitor of beta-Amyloid Oligomerization as a Potential Novel Treatment for Alzheimer's Disease. Biochemistry, 2010. 49(15): p. 3261-3272.
143. Parthsarathy, V., et al., A Novel Retro-Inverso Peptide Inhibitor Reduces Amyloid Deposition, Oxidation and Inflammation and Stimulates Neurogenesis in the APPswe/PS1 Delta E9 Mouse Model of Alzheimer's Disease. Plos One, 2013. 8(1).
144. Sherer, M., et al., A preliminary electron microscopic investigation into the interaction between A beta(1-42) peptide and a novel nanoliposome-coupled retro-inverso peptide inhibitor, developed as a potential treatment for Alzheimer's disease, in Electron Microscopy and Analysis Group Conference. 2015, Iop Publishing Ltd: Bristol.
145. Wang, S.W., et al., Rutin inhibits beta-amyloid aggregation and cytotoxicity, attenuates oxidative stress, and decreases the production of nitric oxide and proinflammatory cytokines. Neurotoxicology, 2012. 33(3): p. 482-490.
146. Xu, P.X., et al., Rutin improves spatial memory in Alzheimer's disease transgenic mice by reducing A beta oligomer level and attenuating oxidative stress and neuroinflammation. Behavioural Brain Research, 2014. 264: p. 173-180.
147. Smyth, M.S. and J.H.J. Martin, x Ray crystallography. Journal of Clinical Pathology-Molecular Pathology, 2000. 53(1): p. 8-14.
148. Pomes, A., et al., 100 Years later: Celebrating the contributions of x-ray crystallography to allergy and clinical immunology. Journal of Allergy and Clinical Immunology, 2015. 136(1): p. 29-U87.
149. Ilari, A. and C. Savino, Protein structure determination by x-ray crystallography, in Methods in Molecular Biology:VOLUME I: DATA, SEQUENCE ANALYSIS AND EVOLUTION, J.M. Keith, Editor. 2008, Humana Press Inc, 999 Riverview Dr, Ste 208, Totowa, Nj 07512-1165 USA. p. 63-87.
150. Uversky, V.N., Biophysical Methods to Investigate Intrinsically Disordered Proteins: Avoiding an "Elephant and Blind Men" Situation, in Intrinsically Disordered Proteins Studied by Nmr Spectroscopy, I.C. Felli and R. Pierattelli, Editors. 2015, Springer-Verlag Berlin: Berlin. p. 215-260.
151. Reid, D.G., et al., Introduction to the NMR of proteins. Methods in molecular biology (Clifton, N.J.), 1997. 60: p. 1-28.
152. Wuthrich, K., Protein - Structure Determination In Solution By NMR-Spectroscopy. Journal of Biological Chemistry, 1990. 265(36): p. 22059-22062.
153. Karamanos, T.K., et al., Mechanisms of amyloid formation revealed by solution NMR. Progress in Nuclear Magnetic Resonance Spectroscopy, 2015. 88-89: p. 86-104.
154. Kurzbach, D., et al., NMR Spectroscopic Studies of the Conformational Ensembles of Intrinsically Disordered Proteins, in Intrinsically Disordered Proteins Studied by Nmr Spectroscopy, I.C. Felli and R. Pierattelli, Editors. 2015, Springer-Verlag Berlin: Berlin. p. 149-185.
155. Kikhney, A.G. and D.I. Svergun, A practical guide to small angle X-ray scattering (SAXS) of flexible and intrinsically disordered proteins. Febs Letters, 2015. 589(19): p. 2570-2577.
156. Lipfert, J. and S. Doniach, Small-angle X-ray scattering from RNA, proteins, and protein complexes, in Annual Review of Biophysics and Biomolecular Structure. 2007, Annual Reviews: Palo Alto. p. 307-327.
66
157. Mertens, H.D.T. and D.I. Svergun, Structural characterization of proteins and complexes using small-angle X-ray solution scattering. Journal of Structural Biology, 2010. 172(1): p. 128-141.
158. Reimer, L. and H. Kohl, Transmission Electron Microscopy Physics of Image Formation. Fifth ed. Springer Series in Optical Sciences, ed. W.T. Rhodes. 2008, New York: Springer Science+Business Media LLC.
159. Ohi, M.L., Y., Y. Cheng, and T. Walz, Negative Staining and Image Classification - Powerful Tools in Modern Electron Microscopy. Biological Procedures Online, 2004. 6(1): p. 23-34.
160. Fultz, B. and J.M. Howe, Transmission Electron Microscopy and Diffractometry of Materials Third ed. 2008, New York: Springer Science+Business Media LLC.
161. Thomson, J.J., Rays of Positive Electricity and their Applications to Chemical Analysis. 1913, London: Longmans Green.
162. Aston, F.W., A positive ray spectrograph. Philosophical Magazine, 1919. 38(228): p. 707-714.
163. Beynon, J.H. and R.P. Morgan, Development of Mass-Spectroscopy - Historical Account. International Journal of Mass Spectrometry and Ion Processes, 1978. 27(1): p. 1-30.
164. Kebarle, P. and U.H. Verkerk, Electrospray: From Ions In Solution To Ions In The Gas Phase, What We Know Now. Mass Spectrometry Reviews, 2009. 28(6): p. 898-917.
165. Dole, M., et al., Molecular Beams Of Macroions. Journal of Chemical Physics, 1968. 49(5): p. 2240-&.
166. Whitehouse, C.M., et al., Electrospray Interface For Liquid Chromatographs And Mass Spectrometers. Analytical Chemistry, 1985. 57(3): p. 675-679.
167. Gaskell, S.J., Electrospray: Principles and practice. Journal of Mass Spectrometry, 1997. 32(7): p. 677-688.
168. Bruins, A.P., Mechanistic aspects of electrospray ionization. Journal of Chromatography A, 1998. 794(1-2): p. 345-357.
169. Konermann, L., et al., Unraveling the Mechanism of Electrospray Ionization. Analytical Chemistry, 2013. 85(1): p. 2-9.
170. Iribarne, J.V. and B.A. Thomson, Evaporation Of Small Ions From Charged Droplets. Journal of Chemical Physics, 1976. 64(6): p. 2287-2294.
171. Ahadi, E. and L. Konermann, Modeling the Behavior of Coarse-Grained Polymer Chains in Charged Water Droplets: Implications for the Mechanism of Electrospray Ionization. Journal of Physical Chemistry B, 2012. 116(1): p. 104-112.
172. Yue, X.F., S. Vahidi, and L. Konermann, Insights into the Mechanism of Protein Electrospray Ionization From Salt Adduction Measurements. Journal of the American Society for Mass Spectrometry, 2014. 25(8): p. 1322-1331.
173. Wilm, M. and M. Mann, Analytical properties of the nanoelectrospray ion source. Analytical Chemistry, 1996. 68(1): p. 1-8.
174. Karas, M., U. Bahr, and T. Dulcks, Nano-electrospray ionization mass spectrometry: addressing analytical problems beyond routine. Fresenius Journal of Analytical Chemistry, 2000. 366(6-7): p. 669-676.
175. Juraschek, R., T. Dulcks, and M. Karas, Nanoelectrospray - More than just a minimized-flow electrospray ionization source. Journal of the American Society for Mass Spectrometry, 1999. 10(4): p. 300-308.
176. Kull, F.J., et al., Crystal structure of the kinesin motor domain reveals a structural similarity to myosin. Nature, 1996. 380(6574): p. 550-555.
177. de Hoffmann, E. and V. Stroobant, Mass Spectrometry Principles and Applications. Third Edition ed. 2007: John Wiley & Sons, Ltd.
67
178. Hart-Smith, G. and S.J. Blanksby, Mass Analysis, in Mass Spectrometry in Polymer Chemistry, C. Barner-Kowollik, et al., Editors. 2012, Wiley-VCH Verlag GmbH & Co. KGaA.
179. Mamyrin, B.A., et al., Mass-Reflectron A New Nonmagnetic Time-Of-Flight- High-Resolution Mass-Spectrometer. Zhurnal Eksperimentalnoi I Teoreticheskoi Fiziki, 1973. 64(1): p. 82-89.
180. Marshall, A.G., C.L. Hendrickson, and G.S. Jackson, Fourier transform ion cyclotron resonance mass spectrometry: A primer. Mass Spectrometry Reviews, 1998. 17(1): p. 1-35.
181. Murray, K.K., et al., Definitions of terms relating to mass spectrometry (IUPAC Recommendations 2013). Pure and Applied Chemistry, 2013. 85(7): p. 1515-1609.
182. Brown, L.S. and G. Gabrielse, Gonium Theory - Physics Of A Single Electron Or Ion In A Penning Trap. Reviews of Modern Physics, 1986. 58(1): p. 233-311.
183. Zubarev, R.A., Electron-capture dissociation tandem mass spectrometry. Current Opinion in Biotechnology, 2004. 15(1): p. 12-16.
184. Wiza, J.L., Microchannel Plate Detectors. Nuclear Instruments & Methods, 1979. 162(1-3): p. 587-601.
185. Roepstorff, P. and J. Fohlman, Proposal For A Common Nomenclature For Sequence Ions In Mass-Spectra Of Peptides. Biomedical Mass Spectrometry, 1984. 11(11): p. 601-601.
186. Biemann, K., Nomenclature For Peptide Fragment Ions (Positive-Ions). Methods in Enzymology, 1990. 193: p. 886-887.
187. Unknown. Peptide Fragmentation. The Cell Biologist's Guide to Proteomics 2010 [cited 2013 31/07/2013]; Available from: http://www.lamondlab.com/MSResource/LCMS/MassSpectrometry/peptideFragmentation.php.
188. Steen, H. and M. Mann, The ABC's (and XYZ's) of peptide sequencing. Nature Reviews Molecular Cell Biology, 2004. 5(9): p. 699-711.
189. Jennings, K.R., The changing impact of the collision-induced decomposition of ions on mass spectrometry. International Journal of Mass Spectrometry, 2000. 200(1-3): p. 479-493.
190. Shukla, A.K. and J.H. Futrell, Tandem mass spectrometry: dissociation of ions by collisional activation. Journal of Mass Spectrometry, 2000. 35(9): p. 1069-1090.
191. Sleno, L. and D.A. Volmer, Ion activation methods for tandem mass spectrometry. Journal of Mass Spectrometry, 2004. 39(10): p. 1091-1112.
192. Benesch, J.L.P., Collisional Activation of Protein Complexes: Picking Up the Pieces. Journal of the American Society for Mass Spectrometry, 2009. 20(3): p. 341-348.
193. Zubarev, R.A., N.L. Kelleher, and F.W. McLafferty, Electron capture dissociation of multiply charged protein cations. A nonergodic process. Journal of the American Chemical Society, 1998. 120(13): p. 3265-3266.
194. Qi, Y. and D.A. Volmer, Electron-Based Fragmentation Methods in Mass Spectrometry: An Overview. Mass Spectrometry Reviews, 2015.
195. O'Connor, P.B., et al., Long-lived electron capture dissociation product ions experience radical migration via hydrogen abstraction. Journal of the American Society for Mass Spectrometry, 2006. 17(4): p. 576-585.
196. Zubarev, R.A., et al., Electron capture dissociation for structural characterization of multiply charged protein cations. Analytical Chemistry, 2000. 72(3): p. 563-573.
197. Sawicka, A., et al., Model calculations relevant to disulfide bond cleavage via electron capture influenced by positively charged groups. Journal of Physical Chemistry B, 2003. 107(48): p. 13505-13511.
198. Sobczyk, M., et al., Coulomb-assisted dissociative electron attachment: Application to a model peptide. Journal of Physical Chemistry A, 2005. 109(1): p. 250-258.
68
199. Syrstad, E.A. and F. Turecek, Toward a general mechanism of electron capture dissociation. Journal of the American Society for Mass Spectrometry, 2005. 16(2): p. 208-224.
200. Turecek, F., X.H. Chen, and C.T. Hao, Where does the electron go? Electron distribution and reactivity of peptide cation radicals formed by electron transfer in the gas phase. Journal of the American Chemical Society, 2008. 130(27): p. 8818-8833.
201. Syka, J.E.P., et al., Peptide and protein sequence analysis by electron transfer dissociation mass spectrometry. Proceedings of the National Academy of Sciences of the United States of America, 2004. 101(26): p. 9528-9533.
202. Simons, J., Mechanisms for S-S and N-C-alpha bond cleavage in peptide ECD and ETD mass spectrometry. Chemical Physics Letters, 2010. 484(4-6): p. 81-95.
203. Swaney, D.L., et al., Supplemental activation method for high-efficiency electron-transfer dissociation of doubly protonated peptide precursors. Analytical Chemistry, 2007. 79(2): p. 477-485.
204. Cooks, R.G., et al., Surface Modified Mass-Spectrometry. Journal of the American Chemical Society, 1975. 97(6): p. 1583-1585.
205. Cooks, R.G., T. Ast, and J.H. Beynon, Anomalous Metastable Peaks. International Journal of Mass Spectrometry and Ion Processes, 1975. 16(3): p. 348-352.
206. McCormack, A.L., J.L. Jones, and V.H. Wysocki, Surface-Induced Dissociation Of Multiply Protonated Peptides. Journal of the American Society for Mass Spectrometry, 1992. 3(8): p. 859-862.
207. Williams, E.R., et al., Surface-Induced Dissociation Of Peptide Ions In Fourier-Transform Mass-Spectrometry. Journal of the American Society for Mass Spectrometry, 1990. 1(5): p. 413-416.
208. Williams, E.R., L.L. Fang, and R.N. Zare, Surface Induced Dissociation For Tandem Time-Of-Flight Mass-Spectrometry. International Journal of Mass Spectrometry and Ion Processes, 1993. 123(3): p. 233-241.
209. Galhena, A.S., et al., Surface-induced dissociation of peptides and protein complexes in a quadrupole/Time-of-Flight mass spectrometer. Analytical Chemistry, 2008. 80(5): p. 1425-1436.
210. Sun, W.J., J.C. May, and D.H. Russell, A novel surface-induced dissociation instrument for ion mobility-time-of-flight mass spectrometry. International Journal of Mass Spectrometry, 2007. 259(1-3): p. 79-86.
211. Zhou, M.W., C.S. Huang, and V.H. Wysocki, Surface-Induced Dissociation of Ion Mobility-Separated Noncovalent Complexes in a Quadrupole/Time-of-Flight Mass Spectrometer. Analytical Chemistry, 2012. 84(14): p. 6016-6023.
212. Jones, C.M., et al., Symmetrical gas-phase dissociation of noncovalent protein complexes via surface collisions. Journal of the American Chemical Society, 2006. 128(47): p. 15044-15045.
213. Laskin, J., E. Denisov, and J. Futrell, Comparative study of collision-induced and surface-induced dissociation. 2. Fragmentation of small alanine-containing peptides in FT-ICR MS. Journal of Physical Chemistry B, 2001. 105(9): p. 1895-1900.
214. Somogyi, A., et al., Reactive Collisions Of C6H6+ And C6D6+ At Self-Assembled Monolayer Films Prepared On Gold From N-Alkanethiols And A Fluorinated Alkanethiol - The Influence Of Chain-Length On The Reactivity Of The Film And The Neutralization Of The Projectile. Journal of the American Chemical Society, 1993. 115(12): p. 5275-5283.
215. Fernandez, F.M., et al., Protein identification via surface-induced dissociation in an FT-ICR mass spectrometer and a patchwork sequencing approach. Journal of the American Society for Mass Spectrometry, 2006. 17(5): p. 700-709.
69
216. Beardsley, R.L., et al., Noncovalent Protein Tetramers and Pentamers with "n" Charges Yield Monomers with n/4 and n/5 Charges. Analytical Chemistry, 2009. 81(4): p. 1347-1356.
217. Zhou, M.W., S. Dagan, and V.H. Wysocki, Protein Subunits Released by Surface Collisions of Noncovalent Complexes: Nativelike Compact Structures Revealed by Ion Mobility Mass Spectrometry. Angewandte Chemie-International Edition, 2012. 51(18): p. 4336-4339.
218. Zhou, M.W. and V.H. Wysocki, Surface Induced Dissociation: Dissecting Noncovalent Protein Complexes in the Gas phase. Accounts of Chemical Research, 2014. 47(4): p. 1010-1018.
219. Quintyn, R.S., et al., Ligand binding and unfolding of tryptophan synthase revealed by ion mobility-tandem mass spectrometry employing collision and surface induced dissociation. International Journal for Ion Mobility Spectrometry, 2013. 16: p. 133-143.
220. Dongre, A.R., A. Somogyi, and V.H. Wysocki, Surface-induced dissociation: An effective tool to probe structure, energetics and fragmentation mechanisms of protonated peptides. Journal of Mass Spectrometry, 1996. 31(4): p. 339-350.
221. Chen, S.H. and D.H. Russell, How Closely Related Are Conformations of Protein Ions Sampled by IM-MS to Native Solution Structures? Journal of the American Society for Mass Spectrometry, 2015. 26(9): p. 1433-1443.
222. Breuker, K. and F.W. McLafferty, Stepwise evolution of protein native structure with electrospray into the gas phase, 10(-12) to 10(2) S. Proceedings of the National Academy of Sciences of the United States of America, 2008. 105(47): p. 18145-18152.
223. Badman, E.R., C.S. Hoaglund-Hyzer, and D.E. Clemmer, Dissociation of different conformations of ubiquitin ions. Journal of the American Society for Mass Spectrometry, 2002. 13(6): p. 719-723.
224. Schennach, M. and K. Breuker, Probing Protein Structure and Folding in the Gas Phase by Electron Capture Dissociation. Journal of the American Society for Mass Spectrometry, 2015. 26(7): p. 1059-1067.
225. Lermyte, F. and F. Sobott, Electron transfer dissociation provides higher-order structural information of native and partially unfolded protein complexes. Proteomics, 2015. 15(16): p. 2813-2822.
226. Quan, L. and M. Liu, CID, ETD and HCD Fragmentation to Study Protein Post-Translational Modifications. Modern Chemistry and Applications, 2013. 1(1).
227. Ma, X., J.A. Loo, and V.H. Wysocki, Surface induced dissociation yields substructure of Methanosarcina thermophila 20S proteasome complexes. International Journal of Mass Spectrometry, 2015. 377: p. 201-204.
228. Quintyn, R.S., et al., Surface-Induced Dissociation Mass Spectra as a Tool for Distinguishing Different Structural Forms of Gas-Phase Multimeric Protein Complexes. Analytical Chemistry, 2015. 87(23): p. 11879-11886.
229. Rappsilber, J., The beginning of a beautiful friendship: Cross-linking/mass spectrometry and modelling of proteins and multi-protein complexes. Journal of Structural Biology, 2011. 173(3): p. 530-540.
230. Huang, B.X., H.Y. Kim, and C. Dass, Probing three-dimensional structure of bovine serum albumin by chemical cross-linking and mass spectrometry. Journal of the American Society for Mass Spectrometry, 2004. 15(8): p. 1237-1247.
231. Chen, Z.A., et al., Architecture of the RNA polymerase II-TFIIF complex revealed by cross-linking and mass spectrometry. Embo Journal, 2010. 29(4): p. 717-726.
232. Herzog, F., et al., Structural Probing of a Protein Phosphatase 2A Network by Chemical Cross-Linking and Mass Spectrometry. Science, 2012. 337(6100): p. 1348-1352.
70
233. Konermann, L., J.X. Pan, and Y.H. Liu, Hydrogen exchange mass spectrometry for studying protein structure and dynamics. Chemical Society Reviews, 2011. 40(3): p. 1224-1234.
234. Rose, R.J., et al., Mutation of Y407 in the CH3 domain dramatically alters glycosylation and structure of human IgG. Mabs, 2013. 5(2): p. 219-228.
235. Lanucara, F., et al., The power of ion mobility-mass spectrometry for structural characterization and the study of conformational dynamics. Nature Chemistry, 2014. 6(4): p. 281-294.
236. Kanu, A.B., et al., Ion mobility-mass spectrometry. Journal of Mass Spectrometry, 2008. 43(1): p. 1-22.
237. Cumeras, R., et al., Review on Ion Mobility Spectrometry. Part 1: current instrumentation. Analyst, 2015. 140(5): p. 1376-1390.
238. Langevin, P., The recombination and mobilities of ions in gases. Annales De Chimie Et De Physique, 1903. 28: p. 433-530.
239. Erikson, H.A., On the effect of the medium on gas ion mobility. Physical Review, 1927. 30(3): p. 339-348.
240. Bradbury, N.E., The absolute values of the mobility of gaseous ions in pure gases. Physical Review, 1932. 40(4): p. 0508-0523.
241. McDaniel, E.W. and H.R. Crane, Measurements Of The Mobilities Of The Negative Ions In Oxygen And In Mixtures Of Oxygen With The Noble Gases, Hydrogen, Nitrogen, And Carbon Dioxide. Review of Scientific Instruments, 1957. 28(9): p. 684-689.
242. Kebarle, P. and A.M. Hogg, Mass-Spectrometric Study Of Ions At Near Atmospheric Pressures .I. Ionic Polymerization Of Ethylene. Journal of Chemical Physics, 1965. 42(2): p. 668-&.
243. McDaniel, E.W., W.S. Barnes, and D.W. Martin, Drift Tube-Mass Spectrometer For Studies Of Low-Energy Ion-Molecule Reactions. Review of Scientific Instruments, 1962. 33(1): p. 2-&.
244. Barnes, W.S., D.W. Martin, and E.W. McDaniel, Mass Spectrographic Identification Of Ion Observed In Hydrogen Mobility Experiments. Physical Review Letters, 1961. 6(1): p. 110-&.
245. Jurneczko, E. and P.E. Barran, How useful is ion mobility mass spectrometry for structural biology? The relationship between protein crystal structures and their collision cross sections in the gas phase. Analyst, 2011. 136(1): p. 20-28.
246. Mason, E.A. and E.W. McDaniel, Transport properties of ions in gases. 1988, New York: Wiley.
247. Jurneczko, E., et al., Effects of Drift Gas on Collision Cross Sections of a Protein Standard in Linear Drift Tube and Traveling Wave Ion Mobility Mass Spectrometry. Analytical Chemistry, 2012. 84(20): p. 8524-8531.
248. Giles, K., et al., Applications of a travelling wave-based radio-frequencyonly stacked ring ion guide. Rapid Communications in Mass Spectrometry, 2004. 18(20): p. 2401-2414.
249. Matz, L.M., et al., Investigation of drift gas selectivity in high resolution ion mobility spectrometry with mass spectrometry detection. Journal of the American Society for Mass Spectrometry, 2002. 13(4): p. 300-307.
250. Ridenour, W.B., et al., Structural Characterization of Phospholipids and Peptides Directly from Tissue Sections by MALDI Traveling-Wave Ion Mobility-Mass Spectrometry. Analytical Chemistry, 2010. 82(5): p. 1881-1889.
251. Merenbloom, S.I., T.G. Flick, and E.R. Williams, How Hot are Your Ions in TWAVE Ion Mobility Spectrometry? Journal of the American Society for Mass Spectrometry, 2012. 23(3): p. 553-562.
71
252. Sharon, M. and C.V. Robinson, The role of mass Spectrometry in structure elucidation of dynamic protein complexes, in Annual Review of Biochemistry. 2007, Annual Reviews: Palo Alto. p. 167-193.
253. Florance, H.V., et al., Evidence for alpha-helices in the gas phase: A case study using Melittin from honey bee venom. Analyst, 2011. 136(17): p. 3446-3452.
254. Ruotolo, B.T., et al., Observation of conserved solution-phase secondary structure in gas-phase tryptic peptides. Journal of the American Chemical Society, 2002. 124(16): p. 4214-4215.
255. Ruotolo, B.T., C.C. Tate, and D.H. Russell, Ion mobility-mass spectrometry applied to cyclic peptide analysis: Conformational preferences of gramicidin S and linear analogs in the gas phase. Journal of the American Society for Mass Spectrometry, 2004. 15(6): p. 870-878.
256. Kitova, E.N., et al., The observation of multivalent complexes of Shiga-like toxin with globotriaoside and the determination of their stoichiometry by nanoelectrospray Fourier-transform ion cyclotron resonance mass spectrometry. Glycobiology, 2001. 11(7): p. 605-611.
257. Ouyang, Z., et al., Preparing protein microarrays by soft-landing of mass-selected ions. Science, 2003. 301(5638): p. 1351-1354.
258. Chowdhury, S.K., V. Katta, and B.T. Chait, Probing Conformational-Changes In Proteins By Mass-Spectrometry. Journal of the American Chemical Society, 1990. 112(24): p. 9012-9013.
259. Frimpong, A.K., et al., Characterization of intrinsically disordered proteins with electrospray ionization mass spectrometry: Conformational heterogeneity of alpha-synuclein. Proteins-Structure Function and Bioinformatics, 2010. 78(3): p. 714-722.
260. Natalello, A., et al., Compact conformations of alpha-synuclein induced by alcohols and copper. Proteins-Structure Function and Bioinformatics, 2011. 79(2): p. 611-621.
261. Clemmer, D.E., R.R. Hudgins, and M.F. Jarrold, Naked Protein Conformations - Cytchrome-C In The Gas-Phase. Journal of the American Chemical Society, 1995. 117(40): p. 10141-10142.
262. Ruotolo, B.T., et al., Evidence for macromolecular protein rings in the absence of bulk water. Science, 2005. 310(5754): p. 1658-1661.
263. Liu, Y.Q., et al., Ion Mobility Mass Spectrometry Studies of the Inhibition of Alpha Synuclein Amyloid Fibril Formation by (-)-Epigallocatechin-3-Gallate. Australian Journal of Chemistry, 2011. 64(1): p. 36-40.
264. Lim, J. and R.W. Vachet, Using mass spectrometry to study copper-protein binding under native and non-native conditions: beta-2-microglobulin. Analytical Chemistry, 2004. 76(13): p. 3498-3504.
265. Mendoza, V.L., et al., Structure of the Preamyloid Dimer of beta-2-Microglobulin from Covalent Labeling and Mass Spectrometry. Biochemistry, 2010. 49(7): p. 1522-1532.
266. Mendoza, V.L., et al., Structural Insights into the Pre-Amyloid Tetramer of beta-2-Microglobulin from Covalent Labeling and Mass Spectrometry. Biochemistry, 2011. 50(31): p. 6711-6722.
267. Santambrogio, C., et al., Characterization of beta 2-microglobulin conformational intermediates associated to different fibrillation conditions. Journal of Mass Spectrometry, 2011. 46(8): p. 734-741.
268. Esposito, G., et al., Monitoring the Interaction between beta(2)-Microglobulin and the Molecular Chaperone alpha B-crystallin by NMR and Mass Spectrometry alpha B-Crystallin Dissociates beta(2)-Microglobulin Oligomers. Journal of Biological Chemistry, 2013. 288(24): p. 17844-17858.
72
269. Smith, A.M., et al., Direct observation of oligomeric species formed in the early stages of amyloid fibril formation using electrospray ionisation mass spectrometry. Journal of Molecular Biology, 2006. 364(1): p. 9-19.
270. Smith, D.P., S.E. Radford, and A.E. Ashcroft, Elongated oligomers in beta(2)-microglobulin amyloid assembly revealed by ion mobility spectrometry-mass spectrometry. Proceedings of the National Academy of Sciences of the United States of America, 2010. 107(15): p. 6794-6798.
271. Woods, L.A., et al., Ligand binding to distinct states diverts aggregation of an amyloid-forming protein. Nature Chemical Biology, 2011. 7(10): p. 730-739.
272. Smith, D.P., et al., Structure and Dynamics of Oligomeric Intermediates in beta(2)-Microglobulin Self-Assembly. Biophysical Journal, 2011. 101(5): p. 1238-1247.
273. Hodkinson, J.P., S.E. Radford, and A.E. Ashcroft, The role of conformational flexibility in beta(2)-microglobulin amyloid fibril formation at neutral pH. Rapid Communications in Mass Spectrometry, 2012. 26(16): p. 1783-1792.
274. Leney, A.C., et al., Insights into the role of the beta-2 microglobulin D-strand in amyloid propensity revealed by mass spectrometry. Molecular Biosystems, 2014. 10.
275. Dupuis, N.F., et al., Human Islet Amyloid Polypeptide Monomers Form Ordered beta-hairpins: A Possible Direct Amyloidogenic Precursor. Journal of the American Chemical Society, 2009. 131(51): p. 18283-18292.
276. Dupuis, N.F., et al., The Amyloid Formation Mechanism in Human IAPP: Dimers Have beta-Strand Monomer-Monomer Interfaces. Journal of the American Chemical Society, 2011. 133(19): p. 7240-7243.
277. Young, L.M., et al., Insights into the consequences of co-polymerisation in the early stages of IAPP and A beta peptide assembly from mass spectrometry. Analyst, 2015. 14(20): p. 6990-6999.
278. Young, L.M., et al., Screening and classifying small-molecule inhibitors of amyloid formation using ion mobility spectrometry-mass spectrometry. Nature Chemistry, 2015. 7(1): p. 73-81.
279. Susa, A.C., et al., Defining the Molecular Basis of Amyloid Inhibitors: Human Islet Amyloid Polypeptide-Insulin Interactions. Journal of the American Chemical Society, 2014. 136(37): p. 12912-12919.
280. Cole, H., et al., Early stages of insulin fibrillogenesis examined with ion mobility mass spectrometry and molecular modelling. Analyst, 2015. 14(20): p. 7000-7011.
281. Hilton, G.R., et al., Structural Analysis of Prion Proteins by Means of Drift Cell and Traveling Wave Ion Mobility Mass Spectrometry. Journal of the American Society for Mass Spectrometry, 2010. 21(5): p. 845-854.
282. Singh, J. and J.B. Udgaonkar, Dissection of Conformational Conversion Events during Prion Amyloid Fibril Formation Using Hydrogen Exchange and Mass Spectrometry. Journal of Molecular Biology, 2013. 425(18): p. 3510-3521.
73
2 Experimental
This chapter contains descriptions of the instruments used for data collection, instrument
schematics and typical tuning parameters. Examples of data acquisition and processing for
Drift Time - Ion Mobility - Mass Spectrometry are also included. Details of recombinant
protein expression and purification, Nano-ElectroSpray Ionisation, solution preparation and
fragmentation techniques are provided.

74
2.1. Reagents
All organic solvents used for buffer or sample preparation were of LC grade or higher and
purchased from Fisher Scientific or Sigma Aldrich, UK. High purity water (resistivity: 18.2
MΩ) was produced using an Arium 611 (Sartorius, Germany) or Milli-Q A10 (Millipore,
Germany) water purification system or LC grade water was purchased from Fisher Scientific
or Sigma Aldrich, UK for the preparation of buffers and samples. Ammonium Acetate
(AmAc), purity ≥ 99%, was purchased from Fisher Scientific, UK.
Reagents used for pH alteration were of the highest quality obtainable. Ammonium
hydroxide, Acetic acid and Formic acid were purchased from Sigma Aldrich, UK.
Hydrochloric acid was purchased from Fisher Scientific, UK. Solution pH measurements
were conducted using a Jenway 2505 pH meter (Jenway Scientific Equipment, UK).
Poly-L-lysine and ubiquitin for Travelling Wave Ion Mobility Mass Spectrometry (TWIMS)
Collision Cross Section (CCS) calibration and sodium iodide and caesium iodide for mass
calibration were purchased from Sigma Aldrich, UK.
2.2. α-Synuclein Expression and Purification
The method used for α-Synuclein expression and purification was based on the method
published by Woods et al. [1]. A pT7-7 vector containing the human wildtype α-Synuclein
gene, provided by Professor Chris Rochet, Purdue University was transformed into
competent BL21(DE3) E. coli. 10 µL plasmid DNA was incubated with 200 µL of competent
cell suspension on ice for 1 hour before heat shocking for 1 minute 45 seconds at 42°C and
returning to ice for 2 - 3 minutes. 800 µL LB media was added and each sample was shaken
for 1 hour at 37°C. Cells were then centrifuged for 4 minutes at 13,000 rpm and
resuspended in 200 µL. LB agar and ampicillin plates were inoculated with the cell
suspension and incubated at 37°C overnight. 5 mL LB Media (with 50 µM ampicillin) was
inoculated with a single colony and incubated overnight with shaking at 37°C. LB media
(with ampicillin) was inoculated with the overnight culture (5%) and induced with 0.1 mM
IPTG once growth to an OD600 = 0.3-0.4 had been achieved. After 5 hours of induction, cells
were pelleted at 5545 rpm for 15 minutes at 4°C, resuspended in PBS and pelleted again.
Cell pellets were resuspended in lysis buffer (20 mM Tris-HCl, pH 7.5, 1 mM EDTA, 1 mM
DTT and Roche protease inhibitor tablets, 1 per 250 mL buffer). Cells were lysed with a Cell
Disrupter (Constant Systems Ltd., UK). Expression was confirmed by SDS-PAGE (Figure 2.1).
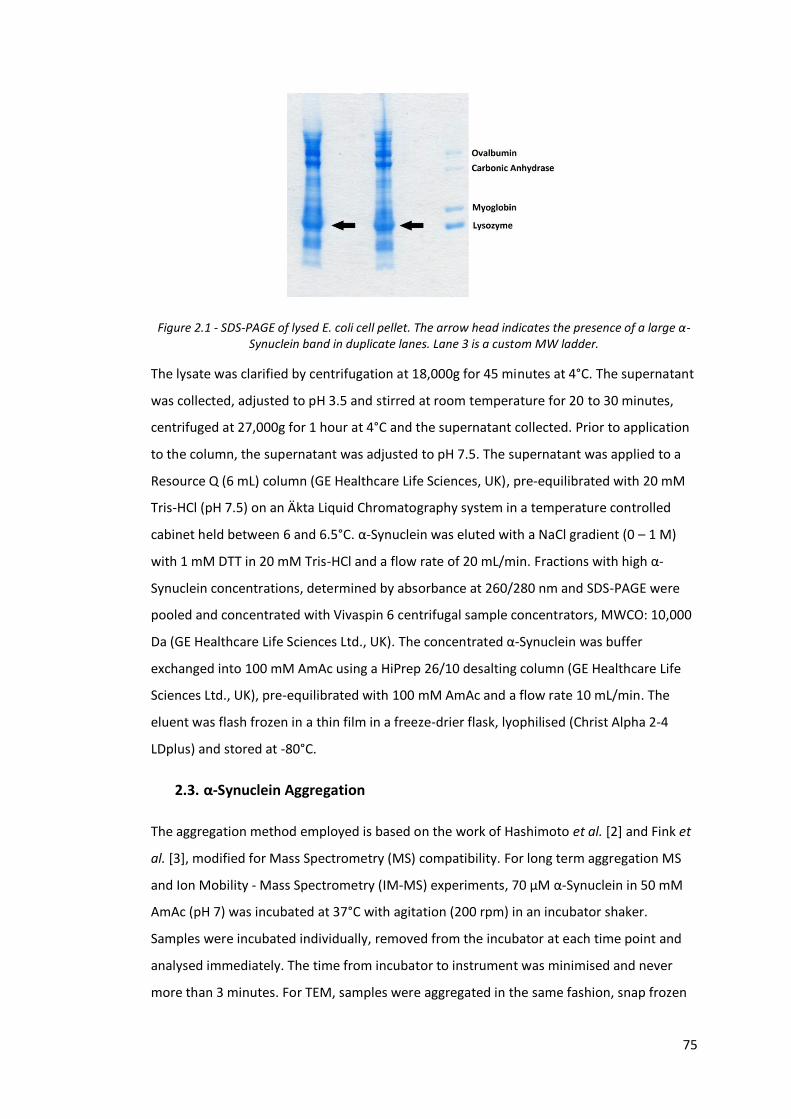
75
Figure 2.1 - SDS-PAGE of lysed E. coli cell pellet. The arrow head indicates the presence of a large α-Synuclein band in duplicate lanes. Lane 3 is a custom MW ladder.
The lysate was clarified by centrifugation at 18,000g for 45 minutes at 4°C. The supernatant
was collected, adjusted to pH 3.5 and stirred at room temperature for 20 to 30 minutes,
centrifuged at 27,000g for 1 hour at 4°C and the supernatant collected. Prior to application
to the column, the supernatant was adjusted to pH 7.5. The supernatant was applied to a
Resource Q (6 mL) column (GE Healthcare Life Sciences, UK), pre-equilibrated with 20 mM
Tris-HCl (pH 7.5) on an Äkta Liquid Chromatography system in a temperature controlled
cabinet held between 6 and 6.5°C. α-Synuclein was eluted with a NaCl gradient (0 – 1 M)
with 1 mM DTT in 20 mM Tris-HCl and a flow rate of 20 mL/min. Fractions with high α-
Synuclein concentrations, determined by absorbance at 260/280 nm and SDS-PAGE were
pooled and concentrated with Vivaspin 6 centrifugal sample concentrators, MWCO: 10,000
Da (GE Healthcare Life Sciences Ltd., UK). The concentrated α-Synuclein was buffer
exchanged into 100 mM AmAc using a HiPrep 26/10 desalting column (GE Healthcare Life
Sciences Ltd., UK), pre-equilibrated with 100 mM AmAc and a flow rate 10 mL/min. The
eluent was flash frozen in a thin film in a freeze-drier flask, lyophilised (Christ Alpha 2-4
LDplus) and stored at -80°C.
2.3. α-Synuclein Aggregation
The aggregation method employed is based on the work of Hashimoto et al. [2] and Fink et
al. [3], modified for Mass Spectrometry (MS) compatibility. For long term aggregation MS
and Ion Mobility - Mass Spectrometry (IM-MS) experiments, 70 µM α-Synuclein in 50 mM
AmAc (pH 7) was incubated at 37°C with agitation (200 rpm) in an incubator shaker.
Samples were incubated individually, removed from the incubator at each time point and
analysed immediately. The time from incubator to instrument was minimised and never
more than 3 minutes. For TEM, samples were aggregated in the same fashion, snap frozen
76
and stored at -80°C until TEM grid preparation. All samples endured the same number of
freeze-thaw cycles.
2.4. Amyloid-β peptide Sample Preparation
For all experiments, Aβ(1-42) and Aβ(1-40), pre-treated with Hexafluoro-2-propanol (HFIP),
was purchased from rPeptide (Bogart, USA) and stored as films at -20°C until required. HFIP
treatment produces unaggregated Aβ peptide [4]. In order to prepare a solution of Aβ(1-42)
in H2O (pH 2), Aβ(1-42) was deseeded by Professor David Allsop, University of Lancaster
first by dissolving the film in trichloroacetic acid and thioanisole and incubating for one
hour. The liquid was then removed under a nitrogen stream, prior to dissolving in HFIP and
evaporating twice before aliquoting. Prior to analysis, Aβ(1-42) was dissolved in H2O
adjusted to pH 2 with Hydrochloric acid (HCl) to a concentration of 100 µM, aliquoted, snap
frozen in liquid nitrogen and stored at -20°C until required. To prepare a solution of Aβ(1-
42) or Aβ(1-40) in 20 mM AmAc (pH 7.4), a film was dissolved in 20 mM AmAc to a
concentration of 100 µM and sonicated for 1 minute. The peptide solution was then
aliquoted, snap frozen and stored at -20°C, until required. Deseeded Aβ(1-42) was a gift
from Professor David Allsop, University of Lancaster.
2.5. Mass Spectrometry
All MS experiments with the exception of ECD-FT-ICR MS were conducted on QToF
geometry instruments.
2.5.1. Nano-ElectroSpray Ionisation
Nano-ElectroSpray Ionisation (nESI) was used for all experiments except the HDX-MS
experiments which required an ElectroSpray Ionisation (ESI) source for automation and the
ECD-FT-ICR MS experiments which used an Advion Nanomate nESI source.
nESI tips were prepared in-house from thin wall glass capillaries (ID: 0.69 mm, OD: 1.2 mm,
World Precision Instruments, USA). Capillaries were pulled using a Flaming/Brown
micropipette puller (Sutter Instrument Company, USA). nESI tips were filled using gel
microloader tips (Eppendorf, Germany) or a Hamilton Syringe (Hamilton, USA). The sample
is charged by inserting a small piece of platinum wire (0.125 mm diameter, purity: 99.99%
Goodfellows, UK) into the sample in the nESI tip. The capillary voltage applied differs
between samples and can differ between nESI tips, the lowest capillary voltage possible is

77
applied to the sample in all cases. The position of the nESI tip relative to the external cone
is also important. Both parameters are tuned for maximum intensity and spray stability.
2.5.2. QToF: ion transfer, mass analysis and detection
Figure 2.2 is a schematic of a typical QToF instrument, following ionisation, ions pass
through two skimmers, the cone and the extractor cone (Figure 2.2A and B). The
orientation of these two cones improves sensitivity by guiding the ions into the instrument
along a potential gradient and removing uncharged species and other spray contaminants.
This region is held at 80°C to aid desolvation. The ions then pass through the RF lens (Figure
2.2C) which transfers the ions to the quadrupole analyser region. In this region, the ions
pass through the quadrupole analyser (Figure 2.2D), this may be set to transmit all ions in
MS mode, or to select a specific ion in MS/MS mode, acting as a mass filter. In MS mode,
the ions pass through the collision cell (Figure 2.2E) and transfer lens (Figure 2.2F) into the
ToF region. In MS/MS mode, the selected ion is transferred into the hexapole collision cell.
The collision cell is filled with an inert gas, Argon (BOC speciality gases, UK). The energy at
which the ion is injected into this region can be increased to initiate CID. Upon entry into
the collision cell, the ion undergoes multiple collisions with the argon gas, generating
fragment ions which are transferred into the ToF region by the hexapole transfer lens. In
MS and MS/MS mode, ions are focussed and accelerated into the ToF region by a stack of
lenses. In the ToF region, the pusher (Figure 2.2G) accelerates the ions down the length of
the flight tube. The reflectron (Figure 2.2I), positioned at the base of the flight tube, acts as
an ion mirror and the ions are slowed and reflected towards the MCP detector (Figure 2.2J).
The reflectron also corrects the kinetic energy dispersion of ions of the same m/z, by
causing more energetic ions to take a longer path to the MCP detector [5, 6]. More
energetic ions penetrate deeper into the reflectron than less energetic ions and therefore
take longer to reach the detector [6]. The point detector, a photomultiplier may also be
used for detection (Figure 2.2H), in this configuration, the pusher is inactive and the flight
tube unused. The signal generated by the MCP detector is converted by a Time-to-Digital
Converter (TDC) generating a Total Ion Count (TIC) chromatogram, which can be
deconvoluted into a mass spectrum using the MassLynx software (Waters, UK).
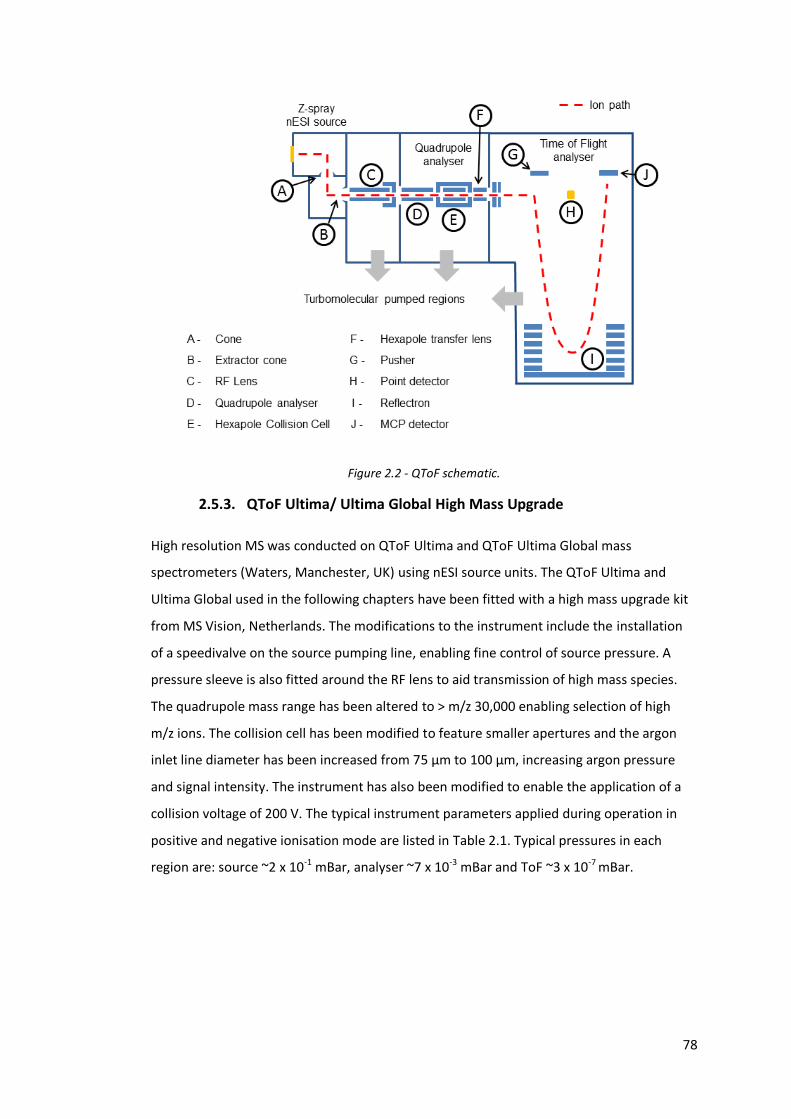
78
Figure 2.2 - QToF schematic.
2.5.3. QToF Ultima/ Ultima Global High Mass Upgrade
High resolution MS was conducted on QToF Ultima and QToF Ultima Global mass
spectrometers (Waters, Manchester, UK) using nESI source units. The QToF Ultima and
Ultima Global used in the following chapters have been fitted with a high mass upgrade kit
from MS Vision, Netherlands. The modifications to the instrument include the installation
of a speedivalve on the source pumping line, enabling fine control of source pressure. A
pressure sleeve is also fitted around the RF lens to aid transmission of high mass species.
The quadrupole mass range has been altered to > m/z 30,000 enabling selection of high
m/z ions. The collision cell has been modified to feature smaller apertures and the argon
inlet line diameter has been increased from 75 µm to 100 µm, increasing argon pressure
and signal intensity. The instrument has also been modified to enable the application of a
collision voltage of 200 V. The typical instrument parameters applied during operation in
positive and negative ionisation mode are listed in Table 2.1. Typical pressures in each
region are: source ~2 x 10⁻¹ mBar, analyser ~7 x 10⁻³ mBar and ToF ~3 x 10⁻⁷ mBar.
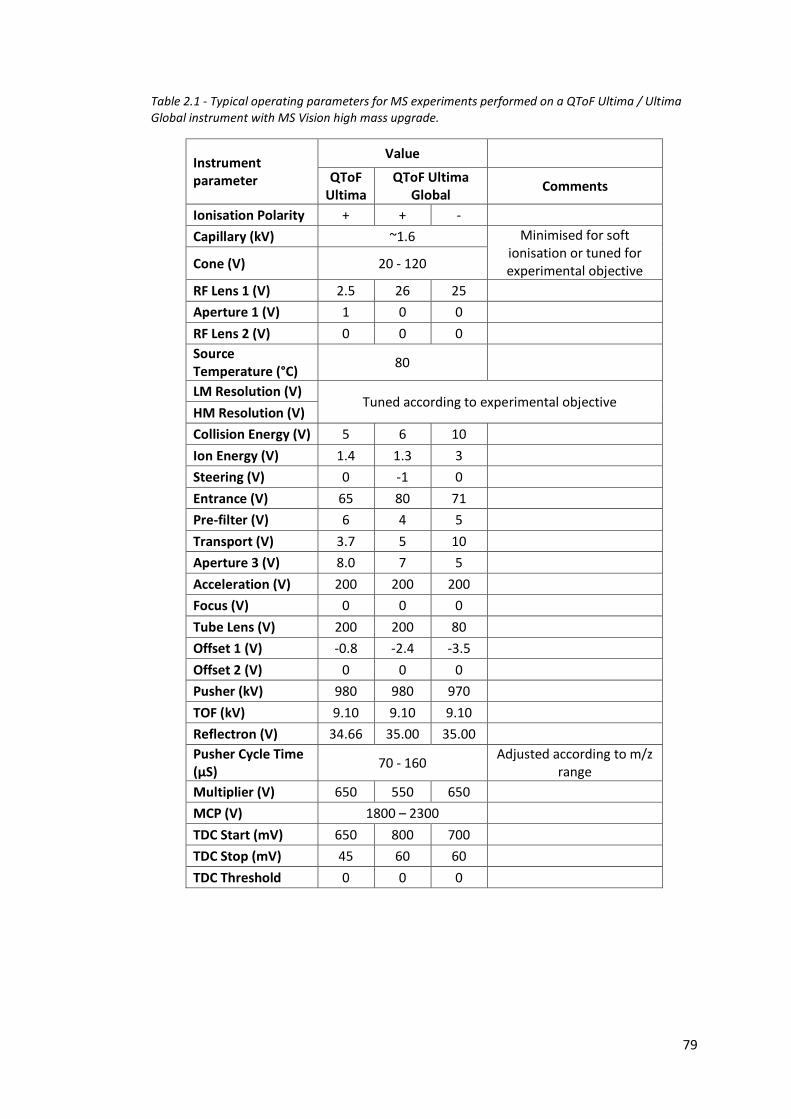
79
Table 2.1 - Typical operating parameters for MS experiments performed on a QToF Ultima / Ultima Global instrument with MS Vision high mass upgrade.
Instrument parameter
Value
QToF Ultima
QToF Ultima Global
Comments
Ionisation Polarity + + -
Capillary (kV) ~1.6 Minimised for soft ionisation or tuned for experimental objective Cone (V) 20 - 120
RF Lens 1 (V) 2.5 26 25
Aperture 1 (V) 1 0 0
RF Lens 2 (V) 0 0 0
Source Temperature (°C)
80
LM Resolution (V) Tuned according to experimental objective
HM Resolution (V)
Collision Energy (V) 5 6 10
Ion Energy (V) 1.4 1.3 3
Steering (V) 0 -1 0
Entrance (V) 65 80 71
Pre-filter (V) 6 4 5
Transport (V) 3.7 5 10
Aperture 3 (V) 8.0 7 5
Acceleration (V) 200 200 200
Focus (V) 0 0 0
Tube Lens (V) 200 200 80
Offset 1 (V) -0.8 -2.4 -3.5
Offset 2 (V) 0 0 0
Pusher (kV) 980 980 970
TOF (kV) 9.10 9.10 9.10
Reflectron (V) 34.66 35.00 35.00
Pusher Cycle Time (µS)
70 - 160 Adjusted according to m/z
range
Multiplier (V) 650 550 650
MCP (V) 1800 – 2300
TDC Start (mV) 650 800 700
TDC Stop (mV) 45 60 60
TDC Threshold 0 0 0
80
2.5.3.1. Mass Calibration
Instrument calibration was conducted when required using 2 mg/mL sodium iodide for
mass calibration ≤ m/z 3000 and caesium iodide for mass calibration ≥ m/z 3000, both were
prepared in 50:50 isopropanol:water. Both generate reproducible salt clusters enabling
external instrument mass calibration.
2.6. Ion Mobility - Mass Spectrometry
DT-IM-MS measurements were conducted on the MoQToF, an in-house modified QToF 1
instrument (Micromass, UK). TWIMS measurements were conducted on Waters Synapt G2,
G2S and G2Si instruments (Waters/ Micromass, UK).
2.6.1. MoQToF
The MoQToF instrument has been adapted to perform variable temperature IM-MS
experiments via the addition of a drift cell and supplementary ion optics [7]. These
modifications include an additional drift chamber which holds the pre-cell einzel lenses (L1
to L3), drift cell, post-cell lens (L4) and the post-cell hexapole (Figures 2.3 and 2.4). The drift
cell is 5.1 cm in length and is made from a copper block; the copper end cap is separated by
a ceramic ring [7]. Details of the variable temperature capabilities of the instrument can be
found in [7]. A 500 L/s TMH520 turbomolecular pump (Pfeiffer Vacuum Ltd., UK) is fitted to
the drift chamber, in addition to the three 250 L/s turbomolecular pumps on the standard
instrument [7]. This additional turbomolecular pump is backed by a dual stage rotary pump
(Edwards Vacuum, UK). For IM-MS experiments, the drift cell is filled with helium (99.999%,
BOC speciality gases, UK) to a pressure of 3 to 4 Torr at ~300 K. The pressure is measured
using a Baratron (MKS Instruments, USA) attached to the top of the cell. To enable fine
control of source pressure, an argon inlet into the source block and a speedivalve in the
source pumping line between the source block and the backing rotary pump are fitted.
Figure 2.4 is a schematic of the additional lenses; the drift field is created between the cell
body (C1) and the end cap (C2). TH1 is used to apply a stopping voltage, enabling storage of
ions in the pre-cell hexapole, H1. The pre-cell Einzel lens is used to focus ions into the drift
cell and is composed of three lenses (L1 to L3). The L2 lens is split into four segments
enabling x/y steering. The post cell lens, L4 focuses ions into the post cell hexapole (H2).
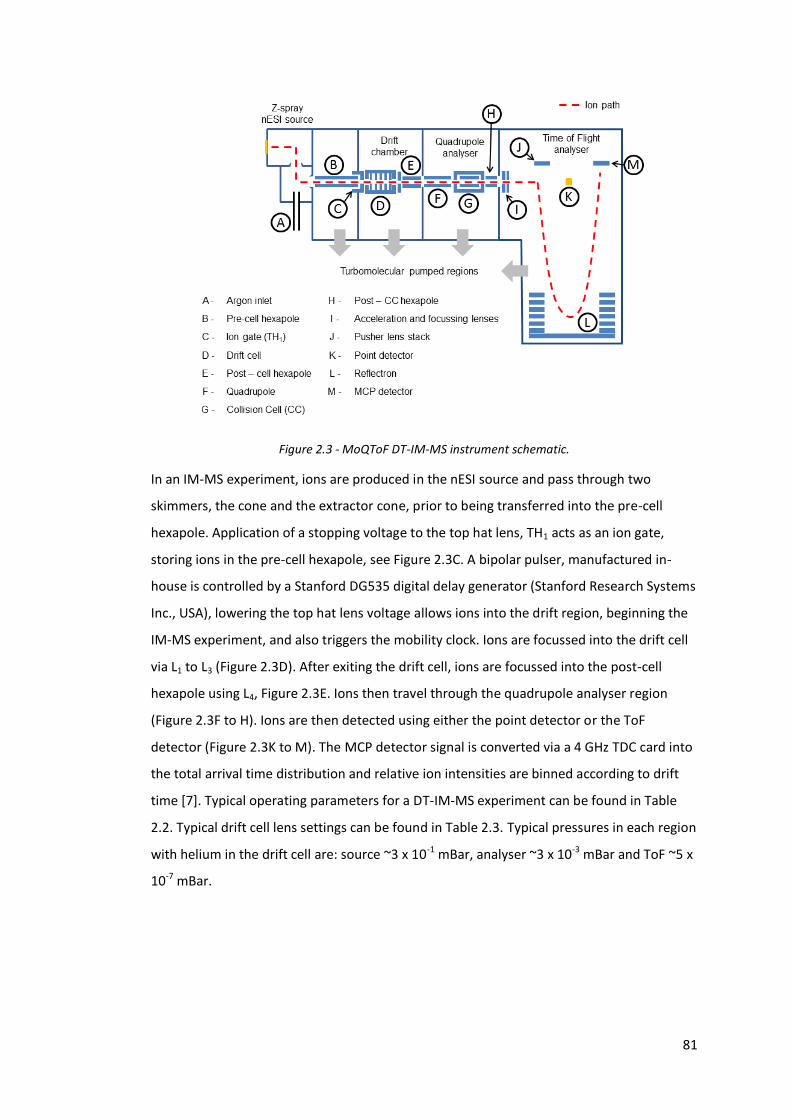
81
Figure 2.3 - MoQToF DT-IM-MS instrument schematic.
In an IM-MS experiment, ions are produced in the nESI source and pass through two
skimmers, the cone and the extractor cone, prior to being transferred into the pre-cell
hexapole. Application of a stopping voltage to the top hat lens, TH1 acts as an ion gate,
storing ions in the pre-cell hexapole, see Figure 2.3C. A bipolar pulser, manufactured in-
house is controlled by a Stanford DG535 digital delay generator (Stanford Research Systems
Inc., USA), lowering the top hat lens voltage allows ions into the drift region, beginning the
IM-MS experiment, and also triggers the mobility clock. Ions are focussed into the drift cell
via L1 to L3 (Figure 2.3D). After exiting the drift cell, ions are focussed into the post-cell
hexapole using L4, Figure 2.3E. Ions then travel through the quadrupole analyser region
(Figure 2.3F to H). Ions are then detected using either the point detector or the ToF
detector (Figure 2.3K to M). The MCP detector signal is converted via a 4 GHz TDC card into
the total arrival time distribution and relative ion intensities are binned according to drift
time [7]. Typical operating parameters for a DT-IM-MS experiment can be found in Table
2.2. Typical drift cell lens settings can be found in Table 2.3. Typical pressures in each region
with helium in the drift cell are: source ~3 x 10⁻¹ mBar, analyser ~3 x 10⁻³ mBar and ToF ~5 x
10-7 mBar.
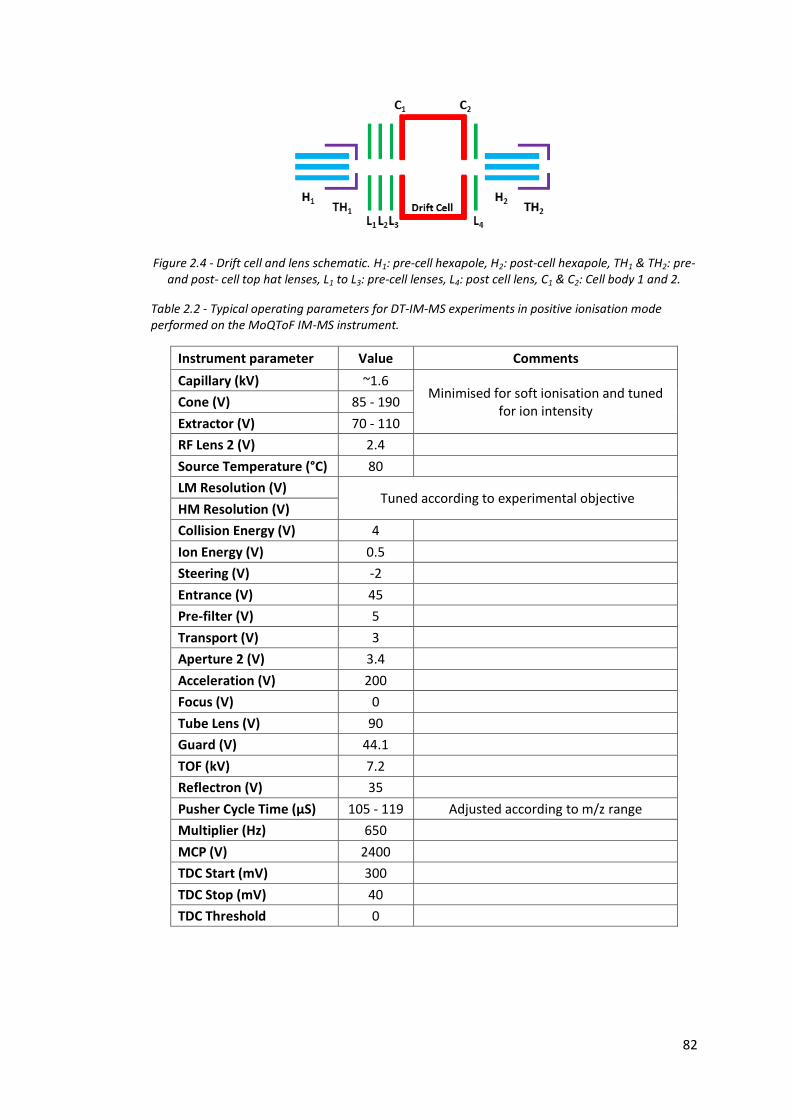
82
Figure 2.4 - Drift cell and lens schematic. H1: pre-cell hexapole, H2: post-cell hexapole, TH1 & TH2: pre- and post- cell top hat lenses, L1 to L3: pre-cell lenses, L4: post cell lens, C1 & C2: Cell body 1 and 2.
Table 2.2 - Typical operating parameters for DT-IM-MS experiments in positive ionisation mode performed on the MoQToF IM-MS instrument.
Instrument parameter Value Comments
Capillary (kV) ~1.6 Minimised for soft ionisation and tuned
for ion intensity Cone (V) 85 - 190
Extractor (V) 70 - 110
RF Lens 2 (V) 2.4
Source Temperature (°C) 80
LM Resolution (V) Tuned according to experimental objective
HM Resolution (V)
Collision Energy (V) 4
Ion Energy (V) 0.5
Steering (V) -2
Entrance (V) 45
Pre-filter (V) 5
Transport (V) 3
Aperture 2 (V) 3.4
Acceleration (V) 200
Focus (V) 0
Tube Lens (V) 90
Guard (V) 44.1
TOF (kV) 7.2
Reflectron (V) 35
Pusher Cycle Time (µS) 105 - 119 Adjusted according to m/z range
Multiplier (Hz) 650
MCP (V) 2400
TDC Start (mV) 300
TDC Stop (mV) 40
TDC Threshold 0
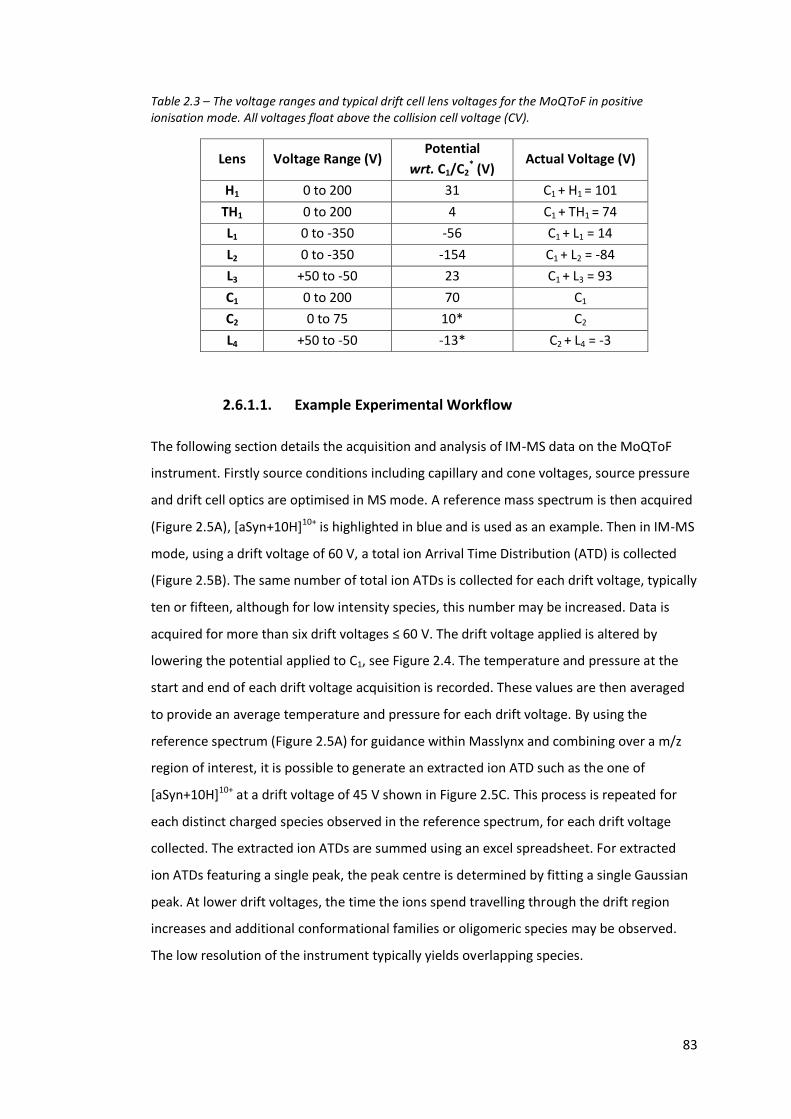
83
Table 2.3 – The voltage ranges and typical drift cell lens voltages for the MoQToF in positive ionisation mode. All voltages float above the collision cell voltage (CV).
Lens Voltage Range (V) Potential
wrt. C1/C2* (V)
Actual Voltage (V)
H1 0 to 200 31 C1 + H1 = 101
TH1 0 to 200 4 C1 + TH1 = 74
L1 0 to -350 -56 C1 + L1 = 14
L2 0 to -350 -154 C1 + L2 = -84
L3 +50 to -50 23 C1 + L3 = 93
C1 0 to 200 70 C1
C2 0 to 75 10* C2
L4 +50 to -50 -13* C2 + L4 = -3
2.6.1.1. Example Experimental Workflow
The following section details the acquisition and analysis of IM-MS data on the MoQToF
instrument. Firstly source conditions including capillary and cone voltages, source pressure
and drift cell optics are optimised in MS mode. A reference mass spectrum is then acquired
(Figure 2.5A), [aSyn+10H]10+ is highlighted in blue and is used as an example. Then in IM-MS
mode, using a drift voltage of 60 V, a total ion Arrival Time Distribution (ATD) is collected
(Figure 2.5B). The same number of total ion ATDs is collected for each drift voltage, typically
ten or fifteen, although for low intensity species, this number may be increased. Data is
acquired for more than six drift voltages ≤ 60 V. The drift voltage applied is altered by
lowering the potential applied to C1, see Figure 2.4. The temperature and pressure at the
start and end of each drift voltage acquisition is recorded. These values are then averaged
to provide an average temperature and pressure for each drift voltage. By using the
reference spectrum (Figure 2.5A) for guidance within Masslynx and combining over a m/z
region of interest, it is possible to generate an extracted ion ATD such as the one of
[aSyn+10H]10+ at a drift voltage of 45 V shown in Figure 2.5C. This process is repeated for
each distinct charged species observed in the reference spectrum, for each drift voltage
collected. The extracted ion ATDs are summed using an excel spreadsheet. For extracted
ion ATDs featuring a single peak, the peak centre is determined by fitting a single Gaussian
peak. At lower drift voltages, the time the ions spend travelling through the drift region
increases and additional conformational families or oligomeric species may be observed.
The low resolution of the instrument typically yields overlapping species.
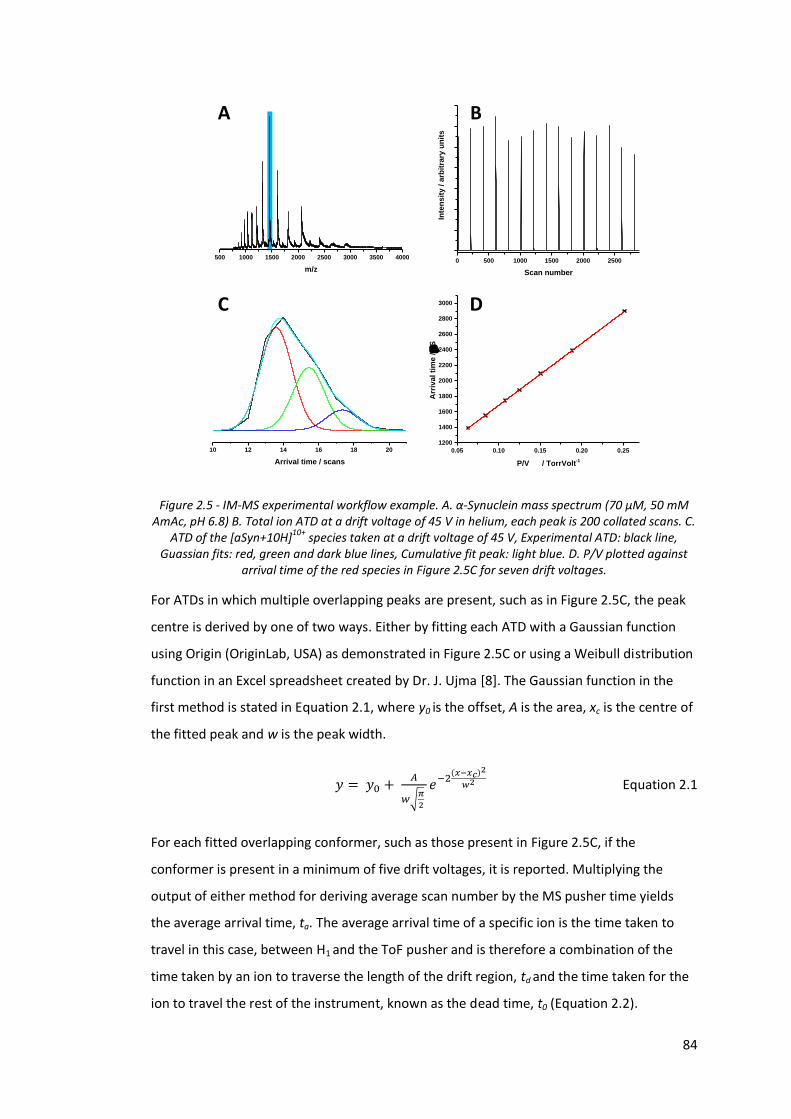
84
Figure 2.5 - IM-MS experimental workflow example. A. α-Synuclein mass spectrum (70 µM, 50 mM AmAc, pH 6.8) B. Total ion ATD at a drift voltage of 45 V in helium, each peak is 200 collated scans. C.
ATD of the [aSyn+10H]10+ species taken at a drift voltage of 45 V, Experimental ATD: black line, Guassian fits: red, green and dark blue lines, Cumulative fit peak: light blue. D. P/V plotted against
arrival time of the red species in Figure 2.5C for seven drift voltages.
For ATDs in which multiple overlapping peaks are present, such as in Figure 2.5C, the peak
centre is derived by one of two ways. Either by fitting each ATD with a Gaussian function
using Origin (OriginLab, USA) as demonstrated in Figure 2.5C or using a Weibull distribution
function in an Excel spreadsheet created by Dr. J. Ujma [8]. The Gaussian function in the
first method is stated in Equation 2.1, where y0 is the offset, A is the area, xc is the centre of
the fitted peak and w is the peak width.
𝑦 = 𝑦0 + 𝐴
𝑤√𝜋
2 𝑒
−2(𝑥−𝑥𝑐)2
𝑤2 Equation 2.1
For each fitted overlapping conformer, such as those present in Figure 2.5C, if the
conformer is present in a minimum of five drift voltages, it is reported. Multiplying the
output of either method for deriving average scan number by the MS pusher time yields
the average arrival time, ta. The average arrival time of a specific ion is the time taken to
travel in this case, between H1 and the ToF pusher and is therefore a combination of the
time taken by an ion to traverse the length of the drift region, td and the time taken for the
ion to travel the rest of the instrument, known as the dead time, t0 (Equation 2.2).
10 12 14 16 18 20
Arrival time / scans
0.05 0.10 0.15 0.20 0.25
1200
1400
1600
1800
2000
2200
2400
2600
2800
3000
Arr
ival ti
me /
S
P/V / TorrVolt-1
0 500 1000 1500 2000 2500
Inte
nsit
y / a
rbit
rary
un
its
Scan number
A B
C D
500 1000 1500 2000 2500 3000 3500 4000
m/z
85
𝑡𝑎 = 𝑡𝑑 + 𝑡0 Equation 2.2
An ions behaviour moving through a gas under the influence of an electric field (E) is
dependent on its energy. This energy is determined by the ratio of electric field strength to
buffer gas number density (N), E/N [9, 10]. At the low field limit, defined as a low ratio of
E/N, ions have low velocities, independent of field strength. The low field mobility (K) is
inversely proportional to its drift time (td) and drift voltage (V) and where L is the drift
region length, see Equation 2.3
𝐾 = 𝐿2
𝑡𝑑𝑉 Equation 2.3
An ions mobility is dependent on the temperature and pressure at which the experiment is
conducted. Therefore to normalise for differences in temperature (T) and pressure (P) and
aid data comparison between laboratories, the reduced mobility or K0 is calculated, see
Equation 2.4, where T0 and P0 are the reduced temperature (273.15 K) and pressure (760
Torr), respectively [11].
𝐾0 = 𝐾𝑇0
𝑇
𝑃
𝑃0 Equation 2.4
The average arrival times as determined in Figure 2.5C, are plotted against the pressure/
drift voltage or P/V, using the temperature and pressure values recorded during each drift
voltage experiment, creating a linear plot (Figure 2.5D). The intercept of this plot is equal to
the dead time and the gradient is inversely proportional to the reduced mobility of the ion.
A minimum of five points or drift voltages are required and the R2 value of this line is used
to gauge the quality of the data, an R2 value of ≥ 0.999 is required. The drift time can be
calculated using Equation 2.5.
𝑡𝑑 = 𝑡𝑎 − 𝑡𝑜 = 𝐿2𝑇0𝑃
𝐾0𝑇𝑃0𝑉 Equation 2.5
The gradient of Figure 2.5D and Equation 2.6, can be used to determine the rotationally
averaged CCS, where z is the nominal ion charge state, e is the elementary charge, N is the
number density of the buffer gas, µ is the reduced mass of the ion neutral pair, kB is the
Boltzmann constant, T is the drift gas temperature and Ko is the reduced ion mobility.
𝛺 = 3𝑧𝑒
16𝑁 (
2𝜋
𝜇𝑘𝐵𝑇)
1
2 1
𝐾0 Equation 2.6
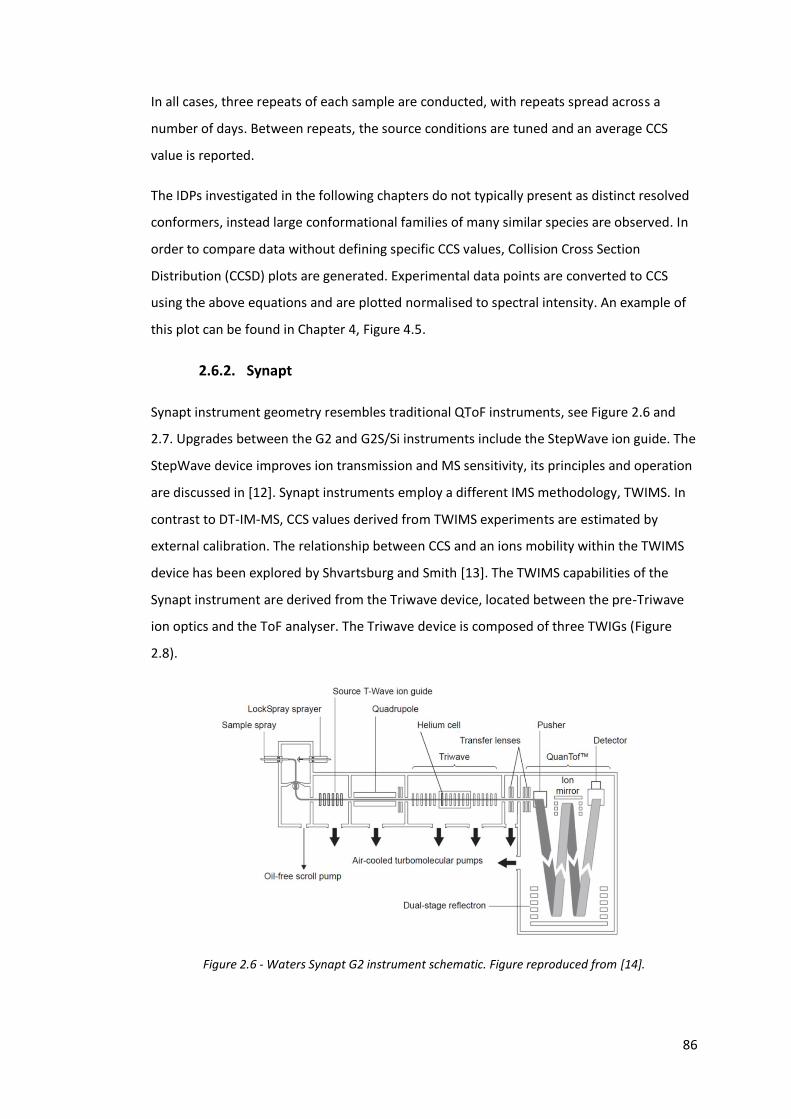
86
In all cases, three repeats of each sample are conducted, with repeats spread across a
number of days. Between repeats, the source conditions are tuned and an average CCS
value is reported.
The IDPs investigated in the following chapters do not typically present as distinct resolved
conformers, instead large conformational families of many similar species are observed. In
order to compare data without defining specific CCS values, Collision Cross Section
Distribution (CCSD) plots are generated. Experimental data points are converted to CCS
using the above equations and are plotted normalised to spectral intensity. An example of
this plot can be found in Chapter 4, Figure 4.5.
2.6.2. Synapt
Synapt instrument geometry resembles traditional QToF instruments, see Figure 2.6 and
2.7. Upgrades between the G2 and G2S/Si instruments include the StepWave ion guide. The
StepWave device improves ion transmission and MS sensitivity, its principles and operation
are discussed in [12]. Synapt instruments employ a different IMS methodology, TWIMS. In
contrast to DT-IM-MS, CCS values derived from TWIMS experiments are estimated by
external calibration. The relationship between CCS and an ions mobility within the TWIMS
device has been explored by Shvartsburg and Smith [13]. The TWIMS capabilities of the
Synapt instrument are derived from the Triwave device, located between the pre-Triwave
ion optics and the ToF analyser. The Triwave device is composed of three TWIGs (Figure
2.8).
Figure 2.6 - Waters Synapt G2 instrument schematic. Figure reproduced from [14].

87
Figure 2.7 - Waters Synapt G2S/G2Si instrument schematic. Figure reproduced from [15].
.
Figure 2.8 - Synapt Triwave region schematic featuring three TWIGS. The position of the helium cell is highlighted in yellow. The nitrogen filled IMS region is highlighted in green.
Figure 2.9 is a schematic of the TWIG, each consists of a series of planar ring electrodes
oriented orthogonally to the ion path. Further information on TWIG geometry can be found
in [16]. As in a Stacked Ring Ion Guide (SRIG), to adjacent electrodes, opposite phases of an
RF voltage are applied to radially confine ions (Figure 2.9) [16]. A transient Direct Current
(DC) voltage is then superimposed, sequentially to pairs of adjacent electrodes, creating a
wave (T-wave) to propel ions through the device [16, 17].
Figure 2.9 - TWIG/SRIG schematic. Figure adapted from [16].
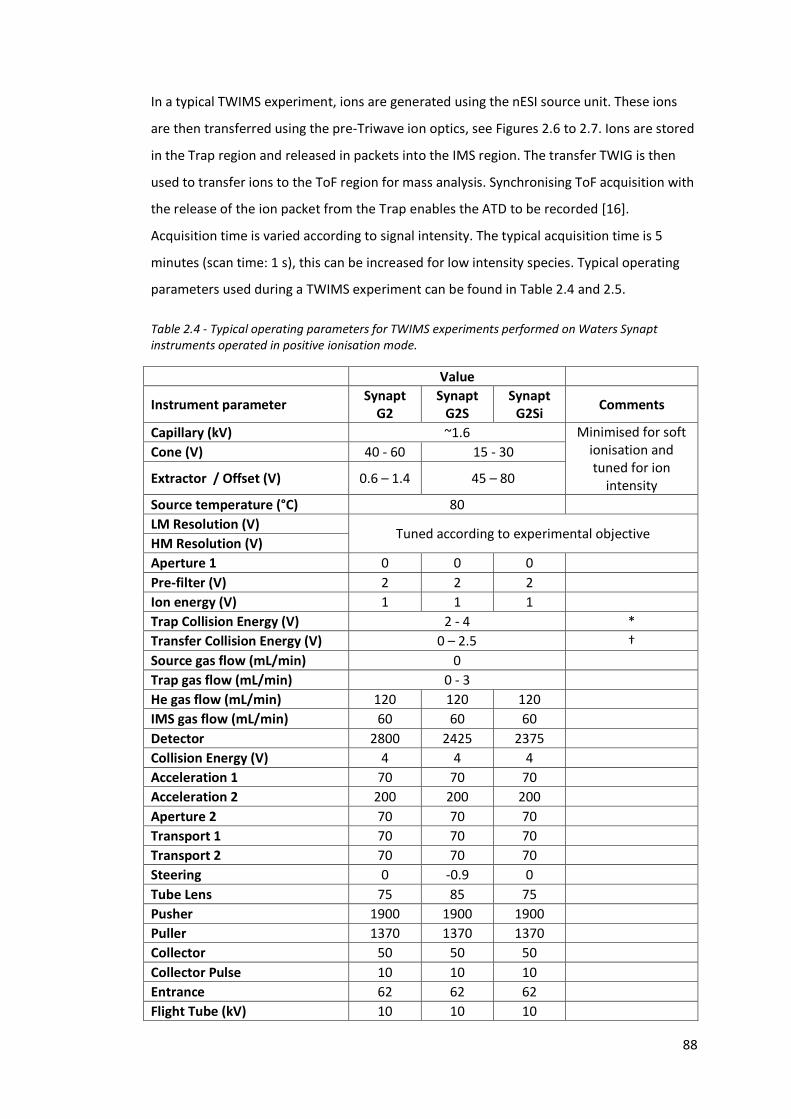
88
In a typical TWIMS experiment, ions are generated using the nESI source unit. These ions
are then transferred using the pre-Triwave ion optics, see Figures 2.6 to 2.7. Ions are stored
in the Trap region and released in packets into the IMS region. The transfer TWIG is then
used to transfer ions to the ToF region for mass analysis. Synchronising ToF acquisition with
the release of the ion packet from the Trap enables the ATD to be recorded [16].
Acquisition time is varied according to signal intensity. The typical acquisition time is 5
minutes (scan time: 1 s), this can be increased for low intensity species. Typical operating
parameters used during a TWIMS experiment can be found in Table 2.4 and 2.5.
Table 2.4 - Typical operating parameters for TWIMS experiments performed on Waters Synapt instruments operated in positive ionisation mode.
Value
Instrument parameter Synapt
G2 Synapt
G2S Synapt
G2Si Comments
Capillary (kV) ~1.6 Minimised for soft ionisation and tuned for ion
intensity
Cone (V) 40 - 60 15 - 30
Extractor / Offset (V) 0.6 – 1.4 45 – 80
Source temperature (°C) 80
LM Resolution (V) Tuned according to experimental objective
HM Resolution (V)
Aperture 1 0 0 0
Pre-filter (V) 2 2 2
Ion energy (V) 1 1 1
Trap Collision Energy (V) 2 - 4 *
Transfer Collision Energy (V) 0 – 2.5 †
Source gas flow (mL/min) 0
Trap gas flow (mL/min) 0 - 3
He gas flow (mL/min) 120 120 120
IMS gas flow (mL/min) 60 60 60
Detector 2800 2425 2375
Collision Energy (V) 4 4 4
Acceleration 1 70 70 70
Acceleration 2 200 200 200
Aperture 2 70 70 70
Transport 1 70 70 70
Transport 2 70 70 70
Steering 0 -0.9 0
Tube Lens 75 85 75
Pusher 1900 1900 1900
Puller 1370 1370 1370
Collector 50 50 50
Collector Pulse 10 10 10
Entrance 62 62 62
Flight Tube (kV) 10 10 10
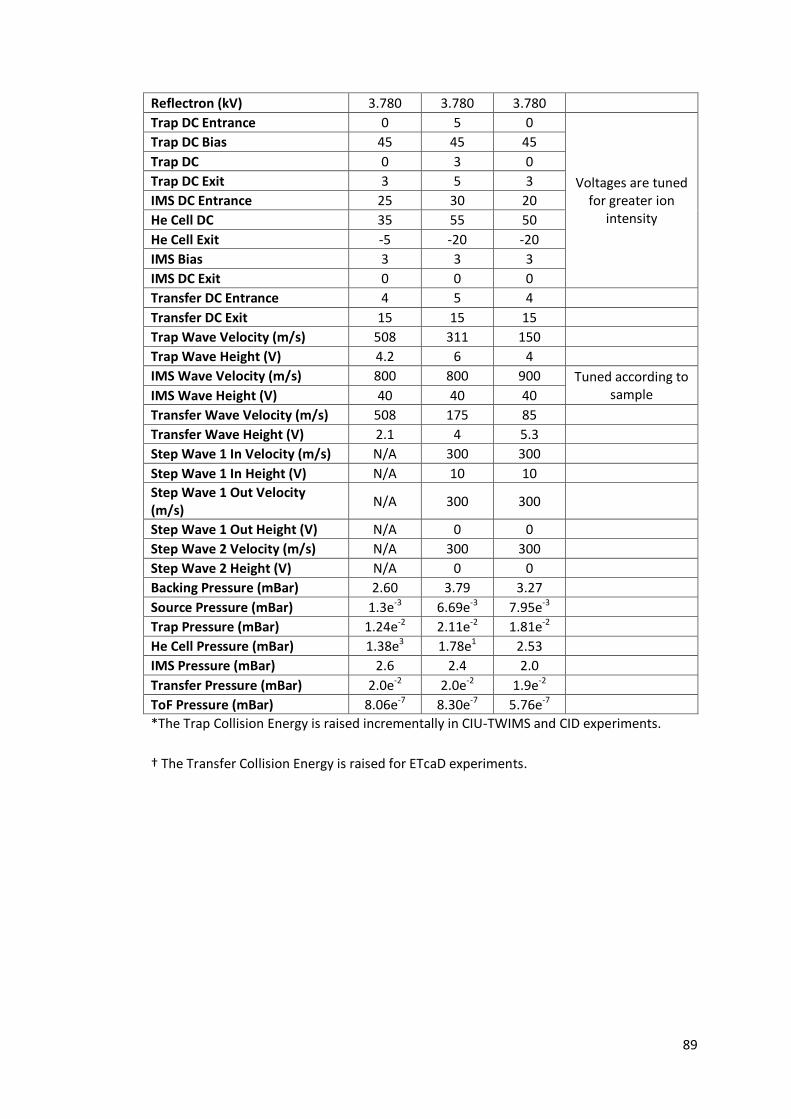
89
Reflectron (kV) 3.780 3.780 3.780
Trap DC Entrance 0 5 0
Voltages are tuned for greater ion
intensity
Trap DC Bias 45 45 45
Trap DC 0 3 0
Trap DC Exit 3 5 3
IMS DC Entrance 25 30 20
He Cell DC 35 55 50
He Cell Exit -5 -20 -20
IMS Bias 3 3 3
IMS DC Exit 0 0 0
Transfer DC Entrance 4 5 4
Transfer DC Exit 15 15 15
Trap Wave Velocity (m/s) 508 311 150
Trap Wave Height (V) 4.2 6 4
IMS Wave Velocity (m/s) 800 800 900 Tuned according to sample IMS Wave Height (V) 40 40 40
Transfer Wave Velocity (m/s) 508 175 85
Transfer Wave Height (V) 2.1 4 5.3
Step Wave 1 In Velocity (m/s) N/A 300 300
Step Wave 1 In Height (V) N/A 10 10
Step Wave 1 Out Velocity (m/s)
N/A 300 300
Step Wave 1 Out Height (V) N/A 0 0
Step Wave 2 Velocity (m/s) N/A 300 300
Step Wave 2 Height (V) N/A 0 0
Backing Pressure (mBar) 2.60 3.79 3.27
Source Pressure (mBar) 1.3e-3 6.69e-3 7.95e-3
Trap Pressure (mBar) 1.24e-2 2.11e-2 1.81e-2
He Cell Pressure (mBar) 1.38e3 1.78e1 2.53
IMS Pressure (mBar) 2.6 2.4 2.0
Transfer Pressure (mBar) 2.0e-2 2.0e-2 1.9e-2
ToF Pressure (mBar) 8.06e-7 8.30e-7 5.76e-7
*The Trap Collision Energy is raised incrementally in CIU-TWIMS and CID experiments.
† The Transfer Collision Energy is raised for ETcaD experiments.
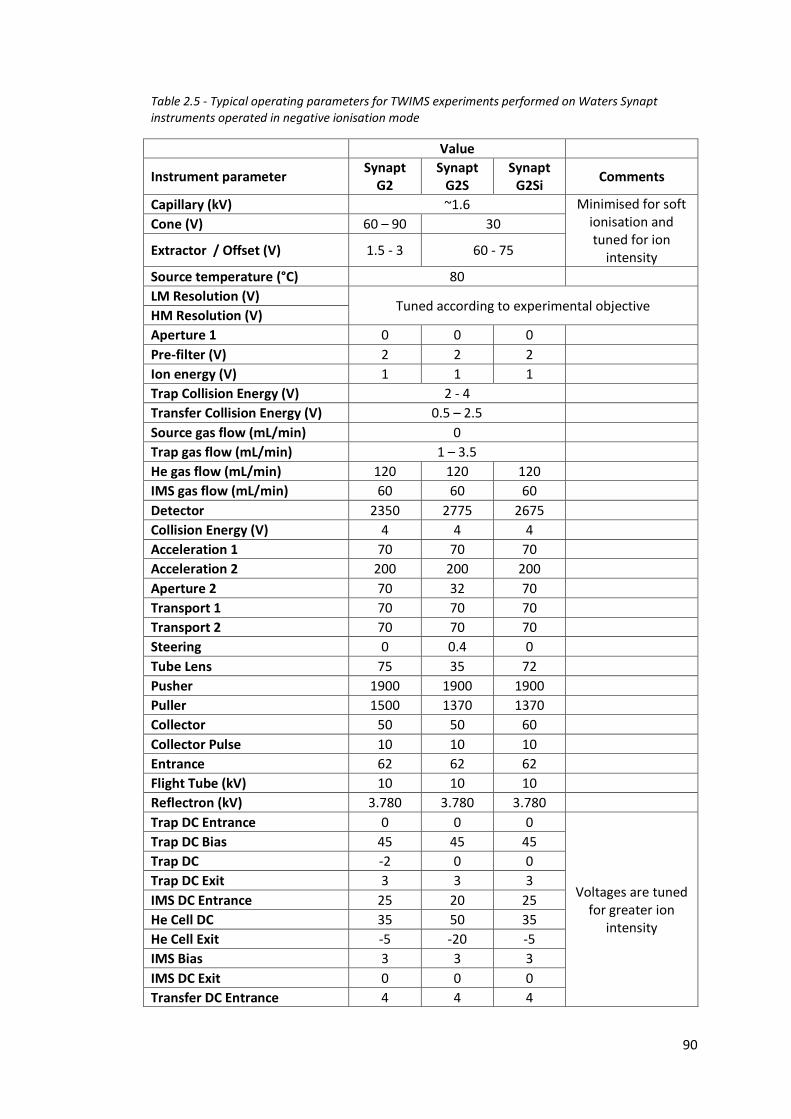
90
Table 2.5 - Typical operating parameters for TWIMS experiments performed on Waters Synapt instruments operated in negative ionisation mode
Value
Instrument parameter Synapt
G2 Synapt
G2S Synapt
G2Si Comments
Capillary (kV) ~1.6 Minimised for soft ionisation and tuned for ion
intensity
Cone (V) 60 – 90 30
Extractor / Offset (V) 1.5 - 3 60 - 75
Source temperature (°C) 80
LM Resolution (V) Tuned according to experimental objective
HM Resolution (V)
Aperture 1 0 0 0
Pre-filter (V) 2 2 2
Ion energy (V) 1 1 1
Trap Collision Energy (V) 2 - 4
Transfer Collision Energy (V) 0.5 – 2.5
Source gas flow (mL/min) 0
Trap gas flow (mL/min) 1 – 3.5
He gas flow (mL/min) 120 120 120
IMS gas flow (mL/min) 60 60 60
Detector 2350 2775 2675
Collision Energy (V) 4 4 4
Acceleration 1 70 70 70
Acceleration 2 200 200 200
Aperture 2 70 32 70
Transport 1 70 70 70
Transport 2 70 70 70
Steering 0 0.4 0
Tube Lens 75 35 72
Pusher 1900 1900 1900
Puller 1500 1370 1370
Collector 50 50 60
Collector Pulse 10 10 10
Entrance 62 62 62
Flight Tube (kV) 10 10 10
Reflectron (kV) 3.780 3.780 3.780
Trap DC Entrance 0 0 0
Voltages are tuned for greater ion
intensity
Trap DC Bias 45 45 45
Trap DC -2 0 0
Trap DC Exit 3 3 3
IMS DC Entrance 25 20 25
He Cell DC 35 50 35
He Cell Exit -5 -20 -5
IMS Bias 3 3 3
IMS DC Exit 0 0 0
Transfer DC Entrance 4 4 4
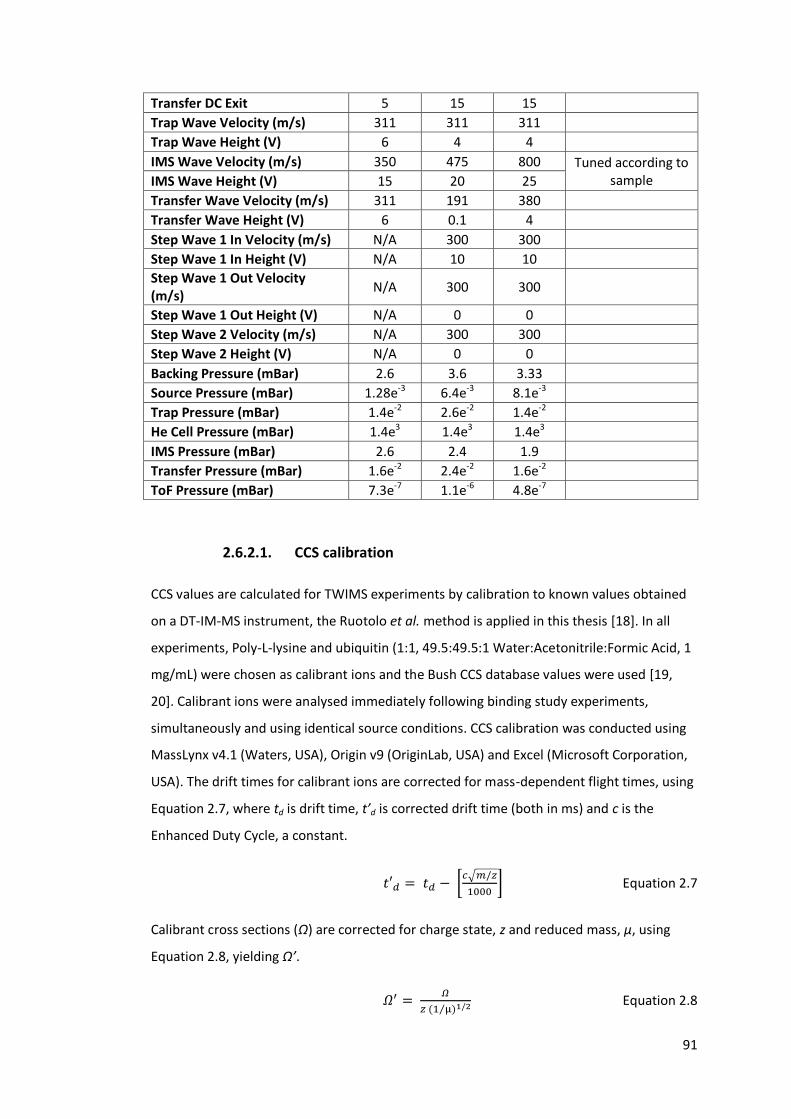
91
Transfer DC Exit 5 15 15
Trap Wave Velocity (m/s) 311 311 311
Trap Wave Height (V) 6 4 4
IMS Wave Velocity (m/s) 350 475 800 Tuned according to sample IMS Wave Height (V) 15 20 25
Transfer Wave Velocity (m/s) 311 191 380
Transfer Wave Height (V) 6 0.1 4
Step Wave 1 In Velocity (m/s) N/A 300 300
Step Wave 1 In Height (V) N/A 10 10
Step Wave 1 Out Velocity (m/s)
N/A 300 300
Step Wave 1 Out Height (V) N/A 0 0
Step Wave 2 Velocity (m/s) N/A 300 300
Step Wave 2 Height (V) N/A 0 0
Backing Pressure (mBar) 2.6 3.6 3.33
Source Pressure (mBar) 1.28e-3 6.4e-3 8.1e-3
Trap Pressure (mBar) 1.4e-2 2.6e-2 1.4e-2
He Cell Pressure (mBar) 1.4e3 1.4e3 1.4e3
IMS Pressure (mBar) 2.6 2.4 1.9
Transfer Pressure (mBar) 1.6e-2 2.4e-2 1.6e-2
ToF Pressure (mBar) 7.3e-7 1.1e-6 4.8e-7
2.6.2.1. CCS calibration
CCS values are calculated for TWIMS experiments by calibration to known values obtained
on a DT-IM-MS instrument, the Ruotolo et al. method is applied in this thesis [18]. In all
experiments, Poly-L-lysine and ubiquitin (1:1, 49.5:49.5:1 Water:Acetonitrile:Formic Acid, 1
mg/mL) were chosen as calibrant ions and the Bush CCS database values were used [19,
20]. Calibrant ions were analysed immediately following binding study experiments,
simultaneously and using identical source conditions. CCS calibration was conducted using
MassLynx v4.1 (Waters, USA), Origin v9 (OriginLab, USA) and Excel (Microsoft Corporation,
USA). The drift times for calibrant ions are corrected for mass-dependent flight times, using
Equation 2.7, where td is drift time, t’d is corrected drift time (both in ms) and c is the
Enhanced Duty Cycle, a constant.
𝑡′𝑑 = 𝑡𝑑 − [𝑐√𝑚/𝑧
1000] Equation 2.7
Calibrant cross sections (Ω) are corrected for charge state, z and reduced mass, µ, using
Equation 2.8, yielding Ω’.
𝛺′ = 𝛺
𝑧 (1 µ⁄ )1/2 Equation 2.8
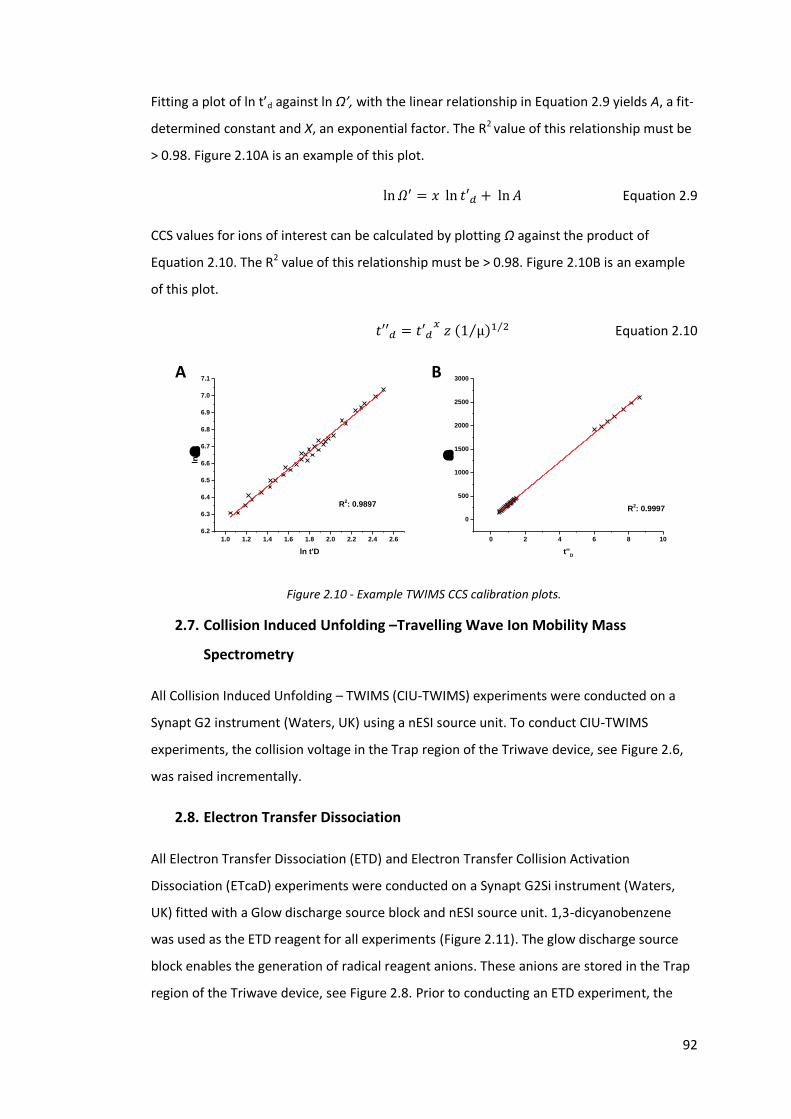
92
Fitting a plot of ln t’d against ln Ω’, with the linear relationship in Equation 2.9 yields A, a fit-
determined constant and X, an exponential factor. The R2 value of this relationship must be
> 0.98. Figure 2.10A is an example of this plot.
ln 𝛺′ = 𝑥 ln 𝑡′𝑑 + ln 𝐴 Equation 2.9
CCS values for ions of interest can be calculated by plotting Ω against the product of
Equation 2.10. The R2 value of this relationship must be > 0.98. Figure 2.10B is an example
of this plot.
𝑡′′𝑑 = 𝑡′𝑑𝑥
𝑧 (1 µ⁄ )1 2⁄ Equation 2.10
Figure 2.10 - Example TWIMS CCS calibration plots.
2.7. Collision Induced Unfolding –Travelling Wave Ion Mobility Mass
Spectrometry
All Collision Induced Unfolding – TWIMS (CIU-TWIMS) experiments were conducted on a
Synapt G2 instrument (Waters, UK) using a nESI source unit. To conduct CIU-TWIMS
experiments, the collision voltage in the Trap region of the Triwave device, see Figure 2.6,
was raised incrementally.
2.8. Electron Transfer Dissociation
All Electron Transfer Dissociation (ETD) and Electron Transfer Collision Activation
Dissociation (ETcaD) experiments were conducted on a Synapt G2Si instrument (Waters,
UK) fitted with a Glow discharge source block and nESI source unit. 1,3-dicyanobenzene
was used as the ETD reagent for all experiments (Figure 2.11). The glow discharge source
block enables the generation of radical reagent anions. These anions are stored in the Trap
region of the Triwave device, see Figure 2.8. Prior to conducting an ETD experiment, the
1.0 1.2 1.4 1.6 1.8 2.0 2.2 2.4 2.6
6.2
6.3
6.4
6.5
6.6
6.7
6.8
6.9
7.0
7.1
ln
'
ln t'D
R2: 0.9897
0 2 4 6 8 10
0
500
1000
1500
2000
2500
3000
R2: 0.9997
t''D
A B
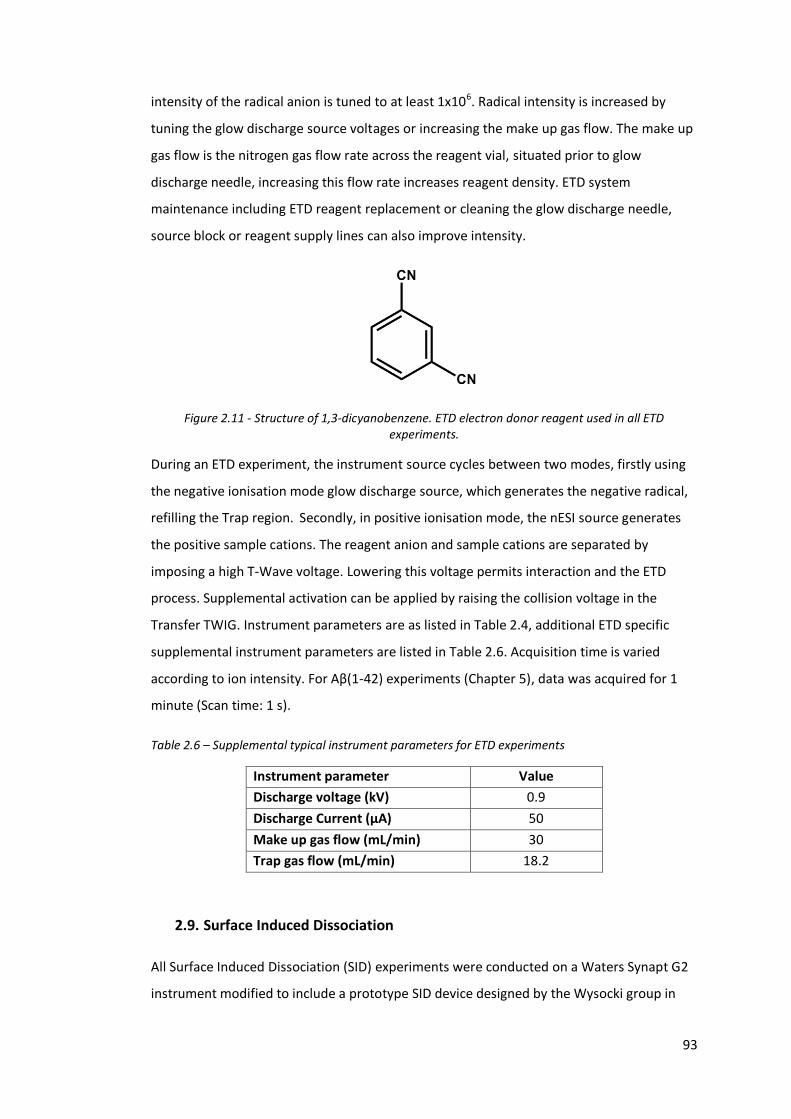
93
intensity of the radical anion is tuned to at least 1x10⁶. Radical intensity is increased by
tuning the glow discharge source voltages or increasing the make up gas flow. The make up
gas flow is the nitrogen gas flow rate across the reagent vial, situated prior to glow
discharge needle, increasing this flow rate increases reagent density. ETD system
maintenance including ETD reagent replacement or cleaning the glow discharge needle,
source block or reagent supply lines can also improve intensity.
Figure 2.11 - Structure of 1,3-dicyanobenzene. ETD electron donor reagent used in all ETD experiments.
During an ETD experiment, the instrument source cycles between two modes, firstly using
the negative ionisation mode glow discharge source, which generates the negative radical,
refilling the Trap region. Secondly, in positive ionisation mode, the nESI source generates
the positive sample cations. The reagent anion and sample cations are separated by
imposing a high T-Wave voltage. Lowering this voltage permits interaction and the ETD
process. Supplemental activation can be applied by raising the collision voltage in the
Transfer TWIG. Instrument parameters are as listed in Table 2.4, additional ETD specific
supplemental instrument parameters are listed in Table 2.6. Acquisition time is varied
according to ion intensity. For Aβ(1-42) experiments (Chapter 5), data was acquired for 1
minute (Scan time: 1 s).
Table 2.6 – Supplemental typical instrument parameters for ETD experiments
Instrument parameter Value
Discharge voltage (kV) 0.9
Discharge Current (µA) 50
Make up gas flow (mL/min) 30
Trap gas flow (mL/min) 18.2
2.9. Surface Induced Dissociation
All Surface Induced Dissociation (SID) experiments were conducted on a Waters Synapt G2
instrument modified to include a prototype SID device designed by the Wysocki group in
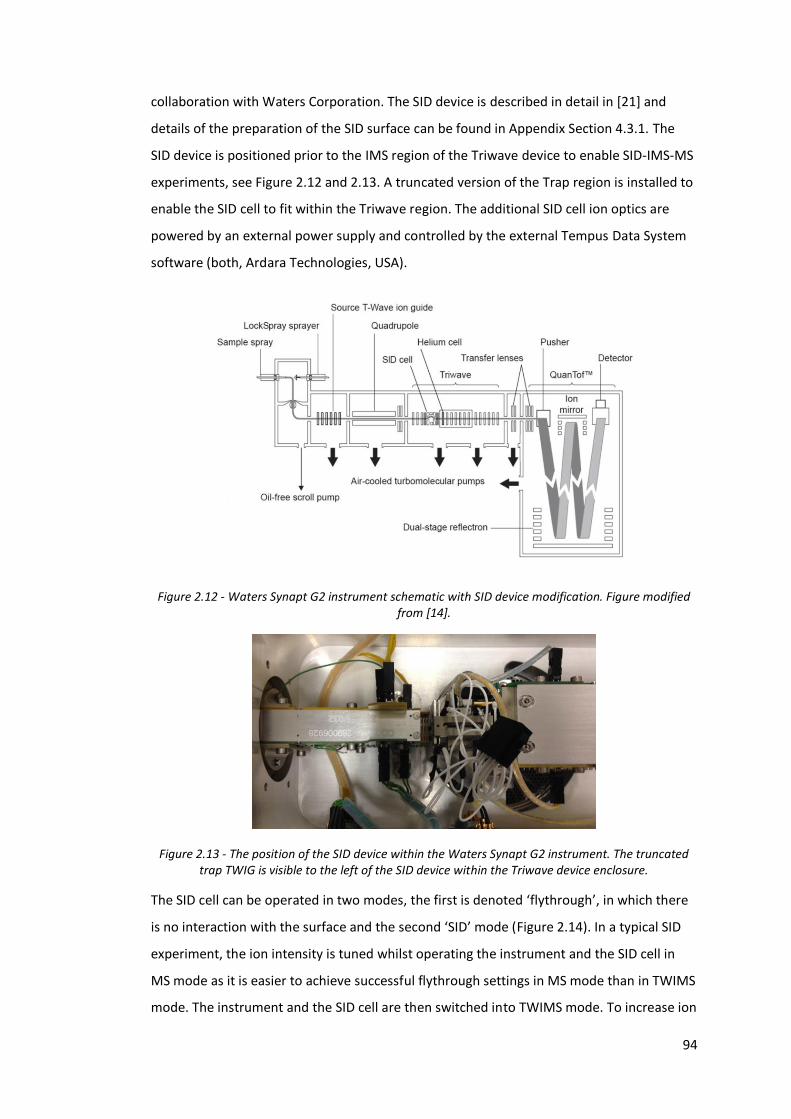
94
collaboration with Waters Corporation. The SID device is described in detail in [21] and
details of the preparation of the SID surface can be found in Appendix Section 4.3.1. The
SID device is positioned prior to the IMS region of the Triwave device to enable SID-IMS-MS
experiments, see Figure 2.12 and 2.13. A truncated version of the Trap region is installed to
enable the SID cell to fit within the Triwave region. The additional SID cell ion optics are
powered by an external power supply and controlled by the external Tempus Data System
software (both, Ardara Technologies, USA).
Figure 2.12 - Waters Synapt G2 instrument schematic with SID device modification. Figure modified from [14].
Figure 2.13 - The position of the SID device within the Waters Synapt G2 instrument. The truncated trap TWIG is visible to the left of the SID device within the Triwave device enclosure.
The SID cell can be operated in two modes, the first is denoted ‘flythrough’, in which there
is no interaction with the surface and the second ‘SID’ mode (Figure 2.14). In a typical SID
experiment, the ion intensity is tuned whilst operating the instrument and the SID cell in
MS mode as it is easier to achieve successful flythrough settings in MS mode than in TWIMS
mode. The instrument and the SID cell are then switched into TWIMS mode. To increase ion
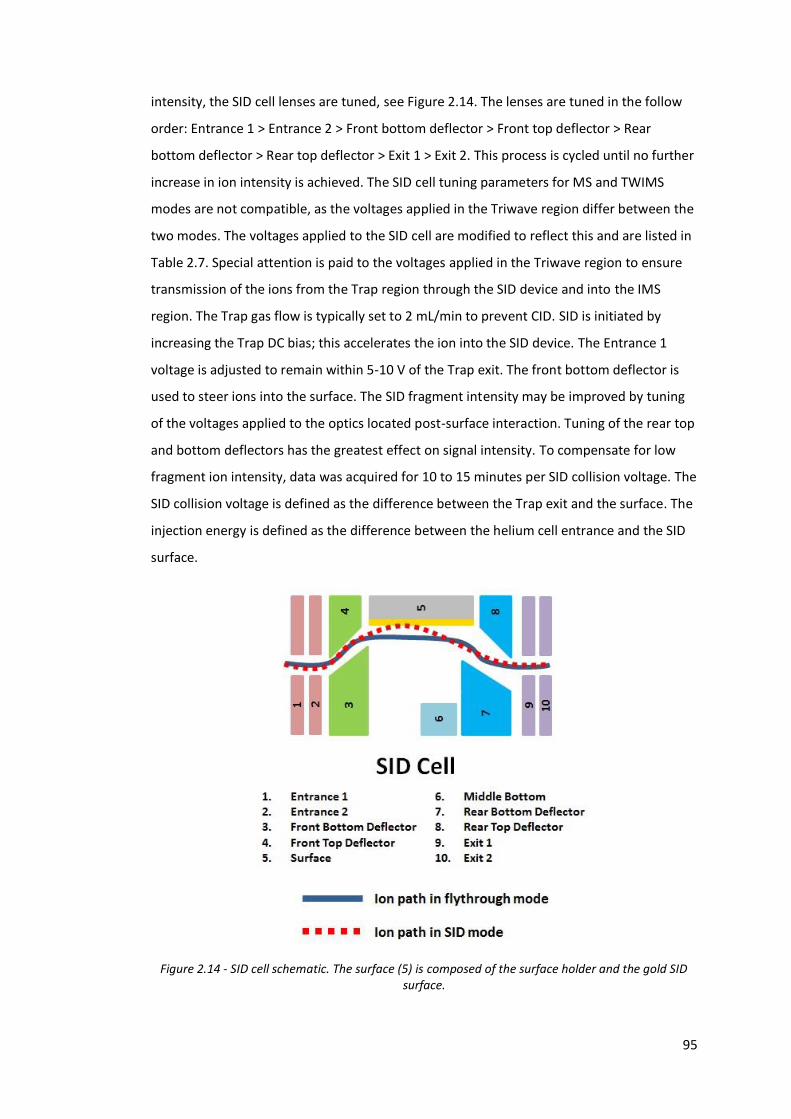
95
intensity, the SID cell lenses are tuned, see Figure 2.14. The lenses are tuned in the follow
order: Entrance 1 > Entrance 2 > Front bottom deflector > Front top deflector > Rear
bottom deflector > Rear top deflector > Exit 1 > Exit 2. This process is cycled until no further
increase in ion intensity is achieved. The SID cell tuning parameters for MS and TWIMS
modes are not compatible, as the voltages applied in the Triwave region differ between the
two modes. The voltages applied to the SID cell are modified to reflect this and are listed in
Table 2.7. Special attention is paid to the voltages applied in the Triwave region to ensure
transmission of the ions from the Trap region through the SID device and into the IMS
region. The Trap gas flow is typically set to 2 mL/min to prevent CID. SID is initiated by
increasing the Trap DC bias; this accelerates the ion into the SID device. The Entrance 1
voltage is adjusted to remain within 5-10 V of the Trap exit. The front bottom deflector is
used to steer ions into the surface. The SID fragment intensity may be improved by tuning
of the voltages applied to the optics located post-surface interaction. Tuning of the rear top
and bottom deflectors has the greatest effect on signal intensity. To compensate for low
fragment ion intensity, data was acquired for 10 to 15 minutes per SID collision voltage. The
SID collision voltage is defined as the difference between the Trap exit and the surface. The
injection energy is defined as the difference between the helium cell entrance and the SID
surface.
Figure 2.14 - SID cell schematic. The surface (5) is composed of the surface holder and the gold SID surface.
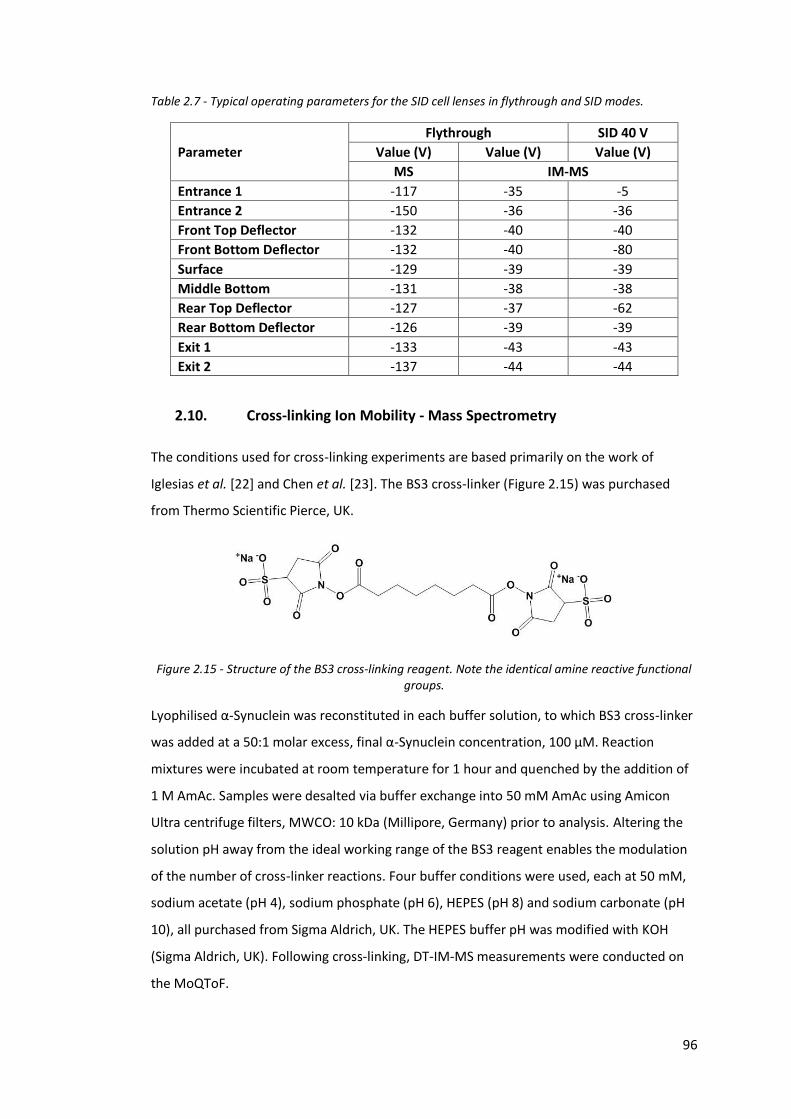
96
Table 2.7 - Typical operating parameters for the SID cell lenses in flythrough and SID modes.
Parameter
Flythrough SID 40 V
Value (V) Value (V) Value (V)
MS IM-MS
Entrance 1 -117 -35 -5
Entrance 2 -150 -36 -36
Front Top Deflector -132 -40 -40
Front Bottom Deflector -132 -40 -80
Surface -129 -39 -39
Middle Bottom -131 -38 -38
Rear Top Deflector -127 -37 -62
Rear Bottom Deflector -126 -39 -39
Exit 1 -133 -43 -43
Exit 2 -137 -44 -44
2.10. Cross-linking Ion Mobility - Mass Spectrometry
The conditions used for cross-linking experiments are based primarily on the work of
Iglesias et al. [22] and Chen et al. [23]. The BS3 cross-linker (Figure 2.15) was purchased
from Thermo Scientific Pierce, UK.
Figure 2.15 - Structure of the BS3 cross-linking reagent. Note the identical amine reactive functional groups.
Lyophilised α-Synuclein was reconstituted in each buffer solution, to which BS3 cross-linker
was added at a 50:1 molar excess, final α-Synuclein concentration, 100 µM. Reaction
mixtures were incubated at room temperature for 1 hour and quenched by the addition of
1 M AmAc. Samples were desalted via buffer exchange into 50 mM AmAc using Amicon
Ultra centrifuge filters, MWCO: 10 kDa (Millipore, Germany) prior to analysis. Altering the
solution pH away from the ideal working range of the BS3 reagent enables the modulation
of the number of cross-linker reactions. Four buffer conditions were used, each at 50 mM,
sodium acetate (pH 4), sodium phosphate (pH 6), HEPES (pH 8) and sodium carbonate (pH
10), all purchased from Sigma Aldrich, UK. The HEPES buffer pH was modified with KOH
(Sigma Aldrich, UK). Following cross-linking, DT-IM-MS measurements were conducted on
the MoQToF.
97
2.11. Hydrogen Deuterium Exchange Mass Spectrometry
All sample handling including Hydrogen Deuterium Exchange (HDX) labelling and quenching
was automated using a CTC PAL sample manager (LEAP Technologies, Carrboro, NC, USA).
Sample aggregation was conducted as described in Section 2.3 and time points coincided
with the beginning of sample runs. Prior to placing the sample in the PAL sample manager,
α-Synuclein was diluted to 20 µM with 10 mM phosphate buffer. α-Synuclein was then
diluted 20-fold with 10 mM phosphate buffer in 99.99% deuterium oxide (Sigma Aldrich,
UK), pH 6.6/ pD 7.0. Labelling was quenched with an equal volume of chilled 100 mM
phosphate buffer (pH 2.5). 50 µL of the labelled sample was injected onto a nanoACQUITY
UPLCTM system with HDX technology (Waters, USA). A Waters EnzymateTM immobilised BEH
pepsin column (2.1 x 30 mm) was used for in-line pepsin digestion. Digestion was
conducted for 1 minute at 20°C in the presence of 0.1% Formic acid. Peptides were
separated on a UPLC BEH C18 column (Waters, USA) at 0°C. A 7 minute linear acetonitrile
gradient (8-35%) with 0.1% Formic acid and a flow rate of 40 µL/min was used. Mass
spectra were acquired using a Synapt G2Si HDMS instrument (Waters, UK), a m/z range of
50-2000 was used. Analysis was conducted in triplicate. Typical operating parameters can
be found in Table 2.4. Data was analysed with MassLynx v4.1, Protein Lynx Global Server
(PLGS) v3.1 and DynamX v3.0 (Waters, USA). Both PLGS and DynamX require human input,
in PLGS to design peptide filtering criteria including threshold intensity and in DynamX to
curate the matched peptides, as a quality control measure. The DynamX software
automatically produces uptake plots; the raw data of these plots is exported and replotted
for clarity in Origin v9 (OriginLab, USA).
2.12. Fourier Transform Ion Cyclotron Resonance Mass Spectrometry and
Electron Capture Dissociation
Fourier Transform Ion Cyclotron Resonance Mass Spectrometry (FT-ICR MS) with Electron
Capture Dissociation (ECD) was performed on a 12 Tesla solariX Fourier Transform Ion
Cyclotron Resonance Mass Spectrometer (Bruker Daltronics, Bremen, Germany) with a
NanoMate nESI source (Advion Biosciences, Ithaca, NY, USA) using a capillary voltage of
0.56 kV. Following ionisation, ions pass through a set of focussing lenses prior to a
quadrupole analyser in which they can be mass selected. Ions are then refocussed prior to
transfer into the ICR cell for ECD and mass analysis. A native mass spectrum was acquired
prior to ECD by tuning source optics. Specific ion species were then isolated using the mass
resolving quadrupole and subjected to ECD. For ECD, 1.7 A was applied to the cathode
98
filament, 22 V to the lens and 1.2 V to the bias. The pulse length employed was varied
between 15 and 20 ms, depending on ease of fragmentation. Fragmentation data is the
sum of 70 acquisitions. Data analysis was performed using Data Analysis (Bruker Daltronics,
Bremen, Germany). The SNAP 2.0 algorithm in Data Analysis was used for peak picking
using the following parameters: signal to noise ratio, 0.0001, relative intensity threshold,
0.0001 and quality factor threshold, 0.001. Prosight PTM (v1.0) was used to match
fragment peaks to calculated fragment masses, prior to a final curation by hand [24].
2.13. Transmission Electron Microscopy
All Transmission Electron Microscopy (TEM) experiments were conducted on a Philips
CM120 Transmission Electron Microscope (Philips, Netherlands). To prepare samples for
TEM, 4 µL of sample was spotted onto a 200 mesh formvar and carbon coated copper grid
(TAAB, Aldermaston, UK). Grids were incubated at room temperature for 5 minutes before
any excess was removed by the peripheral application of filter paper. Grids were rinsed by
spotting Deionised (DI) water on the grids and removing the excess with filter paper. 4 µL of
Uranyl acetate (1% working solution) was applied to each grid for negative staining and
incubated at room temperature for 35 seconds with any excess removed by filter paper.
Grids were allowed to dry for a minimum of 5 minutes prior to storage and 12 hours prior
to analysis. Grids were stored at room temperature in petri dishes lined with filter paper.
99
2.14. References
1. Wood, S.J., et al., alpha-synuclein fibrillogenesis is nucleation-dependent - Implications for the pathogenesis of Parkinson's disease. Journal of Biological Chemistry, 1999. 274(28): p. 19509-19512.
2. Hashimoto, M., et al., Human recombinant NACP/alpha-synuclein is aggregated and fibrillated in vitro: Relevance for Lewy body disease. Brain Research, 1998. 799(2): p. 301-306.
3. Fink, A.L., The aggregation and fibrillation of alpha-synuclein. Accounts of Chemical Research, 2006. 39(9): p. 628-634.
4. Stine, W.B., et al., In vitro characterization of conditions for amyloid-beta peptide oligomerization and fibrillogenesis. Journal of Biological Chemistry, 2003. 278(13): p. 11612-11622.
5. Mamyrin, B.A., et al., Mass-Reflectron A New Nonmagnetic Time-Of-Flight- High-Resolution Mass-Spectrometer. Zhurnal Eksperimentalnoi I Teoreticheskoi Fiziki, 1973. 64(1): p. 82-89.
6. Guilhaus, M., Principles And Instrumentation In Time-Of-Flight Mass-Spectrometry - Physical And Instrumental Concepts. Journal of Mass Spectrometry, 1995. 30(11): p. 1519-1532.
7. McCullough, B.J., et al., Development of an ion mobility quadrupole time of flight mass spectrometer. Analytical Chemistry, 2008. 80(16): p. 6336-6344.
8. Chepelin, O., et al., Luminescent, Enantiopure, Phenylatopyridine Iridium-Based Coordination Capsules. Journal of the American Chemical Society, 2012. 134(47): p. 19334-19337.
9. Jurneczko, E. and P.E. Barran, How useful is ion mobility mass spectrometry for structural biology? The relationship between protein crystal structures and their collision cross sections in the gas phase. Analyst, 2011. 136(1): p. 20-28.
10. Mason, E.A. and E.W. McDaniel, Transport properties of ions in gases. 1988, New York: Wiley.
11. Matz, L.M., et al., Investigation of drift gas selectivity in high resolution ion mobility spectrometry with mass spectrometry detection. Journal of the American Society for Mass Spectrometry, 2002. 13(4): p. 300-307.
12. WatersCorporation, Stepwave Enhancing MS Sensitivity and Robustness (white paper). 2012.
13. Shvartsburg, A.A. and R.D. Smith, Fundamentals of Traveling Wave Ion Mobility Spectrometry. Analytical Chemistry, 2008. 80(24): p. 9689-9699.
14. WatersCorporation, Waters Synapt G2 Mass Spectrometry System Operator's Overview and Maintenance Guide. 2009.
15. WatersCorporation, Waters Synapt G2-S HDMS Mass Spectrometer Overview and Maintenance Guide. 2014.
16. Pringle, S.D., et al., An investigation of the mobility separation of some peptide and protein ions using a new hybrid quadrupole/travelling wave IMS/oa-ToF instrument. International Journal of Mass Spectrometry, 2007. 261(1): p. 1-12.
17. Giles, K., et al., Applications of a travelling wave-based radio-frequencyonly stacked ring ion guide. Rapid Communications in Mass Spectrometry, 2004. 18(20): p. 2401-2414.
18. Ruotolo, B.T., et al., Ion mobility-mass spectrometry analysis of large protein complexes. Nature Protocols, 2008. 3(7): p. 1139-1152.
19. Bush, M.F., et al., Collision Cross Sections of Proteins and Their Complexes: A Calibration Framework and Database for Gas-Phase Structural Biology. Analytical Chemistry, 2010. 82(22): p. 9557-9565.
100
20. Bush, M.F., I.D.G. Campuzano, and C.V. Robinson, Ion Mobility Mass Spectrometry of Peptide Ions: Effects of Drift Gas and Calibration Strategies. Analytical Chemistry, 2012. 84(16): p. 7124-7130.
21. Zhou, M.W., C.S. Huang, and V.H. Wysocki, Surface-Induced Dissociation of Ion Mobility-Separated Noncovalent Complexes in a Quadrupole/Time-of-Flight Mass Spectrometer. Analytical Chemistry, 2012. 84(14): p. 6016-6023.
22. Iglesias, A.H., L.F.A. Santos, and F.C. Gozzo, Identification of Cross-Linked Peptides by High-Resolution Precursor Ion Scan. Analytical Chemistry, 2010. 82(3): p. 909-916.
23. Chen, Z.A., et al., Architecture of the RNA polymerase II-TFIIF complex revealed by cross-linking and mass spectrometry. Embo Journal, 2010. 29(4): p. 717-726.
24. LeDuc, R.D., et al., ProSight PTM: an integrated environment for protein identification and characterization by top-down mass spectrometry. Nucleic Acids Research, 2004. 32: p. W340-W345.
101
3 Investigating the Structure of
α-Synuclein
α-Synuclein is heavily implicated in the aetiology of Parkinson’s disease. An amyloidogenic
protein, its native state is an unfolded monomer; however, aggregation end points vary
from oligomers to fibrils and are heavy influenced by the environment.
In this chapter, the conformational and structural dynamics of α-Synuclein are probed by MS
based methods. Gas phase structures are interrogated by MS, IM-MS and ECD-FT-ICR MS
whilst cross-linking IM-MS is employed to investigate solution phase structures.
102
3.1. Introduction
α-Synuclein has been previously studied by MS based methods. The effect of solution
conditions has been previously investigated, the effect of acidic pHs by the Bowers [1] and
Kaltashov [2] groups and the effect of basic pHs by the Grandori group [3]. All note the
coexistence of multiple conformational families, both compact and extended species.
Additionally, the effect of the addition of organic solvents has also been investigated by the
Kaltashov [2], Grandori [3] and Smith groups [4]. The effect of metal ion binding on
conformation has also been the subject of much research [3, 5-7].
To date, the focus of most IM-MS research has been to characterise the effect of small
molecule binding including dopamine [8, 9], gallic acid [10], spermine [11] and the green
tea extract, epigallocatechin gallate (EGCG) [12, 13]. Efforts have also been made to
characterise the effect of lipid binding [14], which has previously been shown to induce
structure by NMR [15]. In addition, Vlad et al. have investigated autoproteolytic fragments
identified during the aggregation of α-Synuclein [16, 17]. IM-MS has also been employed to
characterise the structure of α-Synuclein. Bernstein et al. highlight the effect of pH on α-
Synuclein structure using DT-IM-MS [1] whilst Illes-Toth et al. observe a subpopulation
shown to induce intracellular aggregation using TWIMS [4]. These studies highlight the wide
conformational spread of α-Synuclein. This structural diversity is also reflected by the wide
ATDs, multiple conformational families and co-existing populations reported by all groups,
irrespective of the purpose of the published work.
The aim of the experiments presented in this chapter is to apply MS based methods to
probe the structure of α-Synuclein. In particular, to investigate the effects of ionisation
polarity and solution conditions on the species observed and to compare the solution phase
and gas phase conformations exhibited by α-Synuclein. This chapter is composed of work
published by Phillips et al. in Analyst [18] in which we highlight the conformational
heterogeneity and inter-day variation observed when studying α-Synuclein structure and
aggregation using an unbiased method of analysis. The effect of pH and ionisation polarity
on α-Synuclein structure is investigated by MS. The conformational diversity observed is
further investigated using IM-MS to probe the gas phase structure whilst cross-linking IM-
MS is applied to investigate solution phase structure. ECD-FT-ICR MS is also used to probe
the effect of pH on the gas phase structure of α-Synuclein.
103
3.2. Experimental
3.2.1. Sample preparation
Lyophilised α-Synuclein was reconstituted in 50 mM AmAc at a concentration of 70 µM, at
pH 6.8 or pH 3.5, aliquoted, snap-frozen and stored at -80°C until required.
Aliquots remained frozen until time of analysis. The time from thawing to introduction to
the instrument was minimised.
3.2.2. Mass Spectrometry
nESI-MS experiments were conducted in both positive and negative ionisation modes on
QToF Ultima and QToF Ultima Global instruments (Waters, Manchester, UK). The tuning of
source parameters for soft ionisation to prevent the disruption of higher order oligomers
was tempered by the requirement for sufficient ion intensity. Instrument parameters are
listed in Chapter 2 Table 2.1.
3.2.3. Ion Mobility - Mass Spectrometry
DT-IM-MS experiments were conducted in positive ionisation mode on the MoQTOF [19],
an in-house modified QToF 1 mass spectrometer (Waters, Manchester, UK) equipped with a
nESI source unit. Source parameters were modified to enable soft ionisation, preventing
the disruption of higher order oligomers but to maintain sufficient ion intensity. Instrument
parameters are listed in Chapter 2 Table 2.2. Experiments were conducted in triplicate on
different days.
The voltage applied across the cell was varied during the experiment, between 60 V and 10
V. ATDs were recorded for at least 6 drift voltages and processed as described in Chapter 2
Section 2.6.1.1.
Cross-linking was conducted prior to analysis as described in Chapter 2 Section 2.10.
3.2.4. Electron Capture Dissociation - Fourier Transform - Ion Cyclotron
Resonance Mass Spectrometry
Lyophilised α-Synuclein was reconstituted in 50 mM AmAc at a concentration of 30 µM.
Samples were prepared at pH 6.8 and pH 3.5. pH was adjusted by the addition of acetic
acid. Experiments were conducted as described in Chapter 2 Section 2.12.
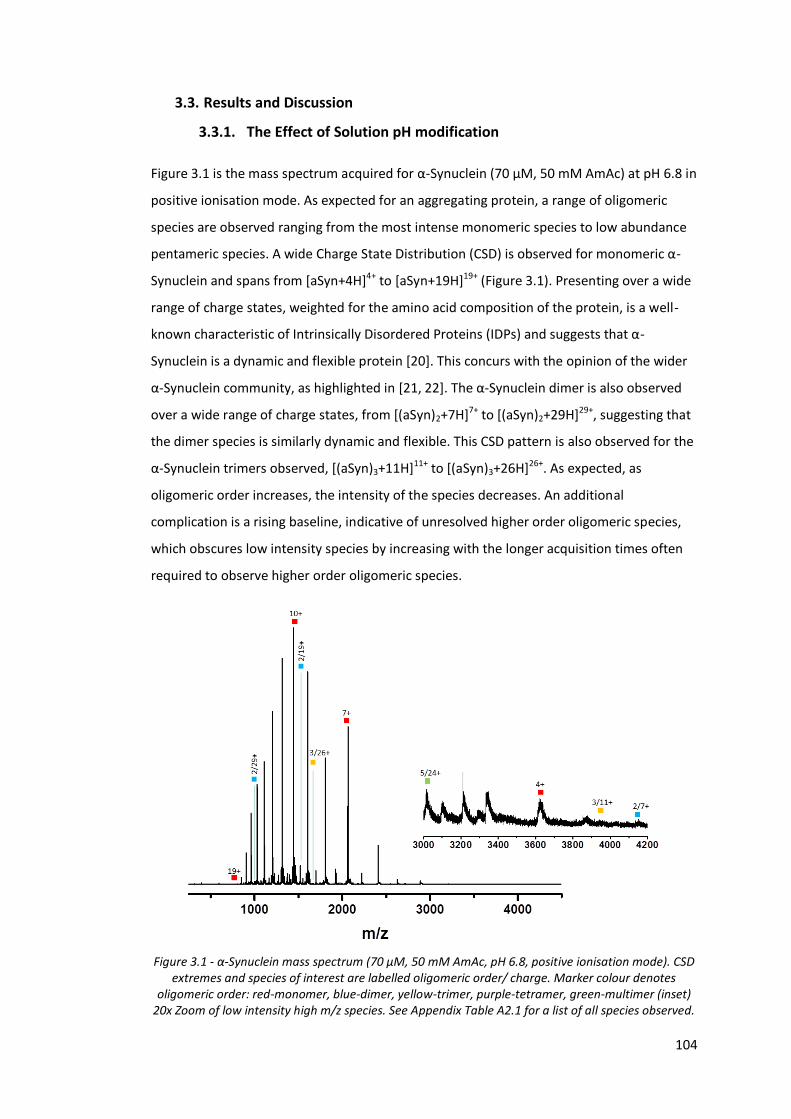
104
3.3. Results and Discussion
3.3.1. The Effect of Solution pH modification
Figure 3.1 is the mass spectrum acquired for α-Synuclein (70 µM, 50 mM AmAc) at pH 6.8 in
positive ionisation mode. As expected for an aggregating protein, a range of oligomeric
species are observed ranging from the most intense monomeric species to low abundance
pentameric species. A wide Charge State Distribution (CSD) is observed for monomeric α-
Synuclein and spans from [aSyn+4H]4+ to [aSyn+19H]19+ (Figure 3.1). Presenting over a wide
range of charge states, weighted for the amino acid composition of the protein, is a well-
known characteristic of Intrinsically Disordered Proteins (IDPs) and suggests that α-
Synuclein is a dynamic and flexible protein [20]. This concurs with the opinion of the wider
α-Synuclein community, as highlighted in [21, 22]. The α-Synuclein dimer is also observed
over a wide range of charge states, from [(aSyn)2+7H]7+ to [(aSyn)2+29H]29+, suggesting that
the dimer species is similarly dynamic and flexible. This CSD pattern is also observed for the
α-Synuclein trimers observed, [(aSyn)3+11H]11+ to [(aSyn)3+26H]26+. As expected, as
oligomeric order increases, the intensity of the species decreases. An additional
complication is a rising baseline, indicative of unresolved higher order oligomeric species,
which obscures low intensity species by increasing with the longer acquisition times often
required to observe higher order oligomeric species.
Figure 3.1 - α-Synuclein mass spectrum (70 µM, 50 mM AmAc, pH 6.8, positive ionisation mode). CSD extremes and species of interest are labelled oligomeric order/ charge. Marker colour denotes
oligomeric order: red-monomer, blue-dimer, yellow-trimer, purple-tetramer, green-multimer (inset) 20x Zoom of low intensity high m/z species. See Appendix Table A2.1 for a list of all species observed.
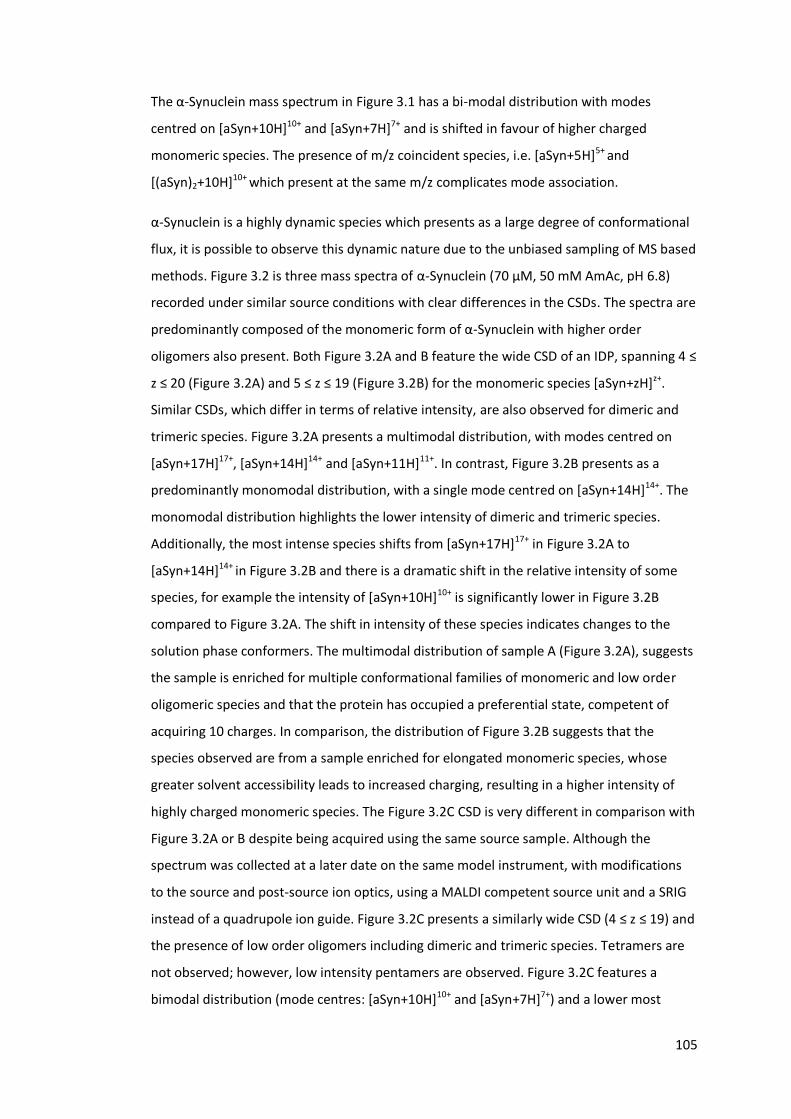
105
The α-Synuclein mass spectrum in Figure 3.1 has a bi-modal distribution with modes
centred on [aSyn+10H]10+ and [aSyn+7H]7+ and is shifted in favour of higher charged
monomeric species. The presence of m/z coincident species, i.e. [aSyn+5H]5+ and
[(aSyn)2+10H]10+ which present at the same m/z complicates mode association.
α-Synuclein is a highly dynamic species which presents as a large degree of conformational
flux, it is possible to observe this dynamic nature due to the unbiased sampling of MS based
methods. Figure 3.2 is three mass spectra of α-Synuclein (70 µM, 50 mM AmAc, pH 6.8)
recorded under similar source conditions with clear differences in the CSDs. The spectra are
predominantly composed of the monomeric form of α-Synuclein with higher order
oligomers also present. Both Figure 3.2A and B feature the wide CSD of an IDP, spanning 4 ≤
z ≤ 20 (Figure 3.2A) and 5 ≤ z ≤ 19 (Figure 3.2B) for the monomeric species [aSyn+zH]z+.
Similar CSDs, which differ in terms of relative intensity, are also observed for dimeric and
trimeric species. Figure 3.2A presents a multimodal distribution, with modes centred on
[aSyn+17H]17+, [aSyn+14H]14+ and [aSyn+11H]11+. In contrast, Figure 3.2B presents as a
predominantly monomodal distribution, with a single mode centred on [aSyn+14H]14+. The
monomodal distribution highlights the lower intensity of dimeric and trimeric species.
Additionally, the most intense species shifts from [aSyn+17H]17+ in Figure 3.2A to
[aSyn+14H]14+ in Figure 3.2B and there is a dramatic shift in the relative intensity of some
species, for example the intensity of [aSyn+10H]10+ is significantly lower in Figure 3.2B
compared to Figure 3.2A. The shift in intensity of these species indicates changes to the
solution phase conformers. The multimodal distribution of sample A (Figure 3.2A), suggests
the sample is enriched for multiple conformational families of monomeric and low order
oligomeric species and that the protein has occupied a preferential state, competent of
acquiring 10 charges. In comparison, the distribution of Figure 3.2B suggests that the
species observed are from a sample enriched for elongated monomeric species, whose
greater solvent accessibility leads to increased charging, resulting in a higher intensity of
highly charged monomeric species. The Figure 3.2C CSD is very different in comparison with
Figure 3.2A or B despite being acquired using the same source sample. Although the
spectrum was collected at a later date on the same model instrument, with modifications
to the source and post-source ion optics, using a MALDI competent source unit and a SRIG
instead of a quadrupole ion guide. Figure 3.2C presents a similarly wide CSD (4 ≤ z ≤ 19) and
the presence of low order oligomers including dimeric and trimeric species. Tetramers are
not observed; however, low intensity pentamers are observed. Figure 3.2C features a
bimodal distribution (mode centres: [aSyn+10H]10+ and [aSyn+7H]7+) and a lower most
106
intense species ([aSyn+10H]10+). This suggests the sample is enriched for compact
conformational families, whose lower solvent accessibility leads to the presentation of
lower charge states. This suggests that the low order oligomeric species present in the
sample vary in their presentation to the gas phase even under similar, highly controlled
experimental conditions. This inter-sample variation highlights the difficulty of studying
aggregating species and the need to characterise all these species in an unbiased manner,
to understand the complex aggregation process and prevent the targeting of a non-toxic
species or the accumulation of a toxic species.
Figure 3.2 – α-Synuclein mass spectra (70 µM, 50 mM AmAc, pH 6.8, positive ionisation mode) recorded under the same conditions at different times. A and B were collected 1 month apart on the same instrument, C (Figure 3.1) was collected later on the same model instrument and is included for
comparison. CSD extremes and species of interest are labelled oligomeric order/ charge. Marker colour denotes oligomeric order: red-monomer, blue-dimer, yellow-trimer, purple-tetramer, green-
multimer. (inset) Zoom of low intensity high m/z species. A. 1000x B. 120x C. 65x. See Appendix Table A2.1 for a list of all species observed.
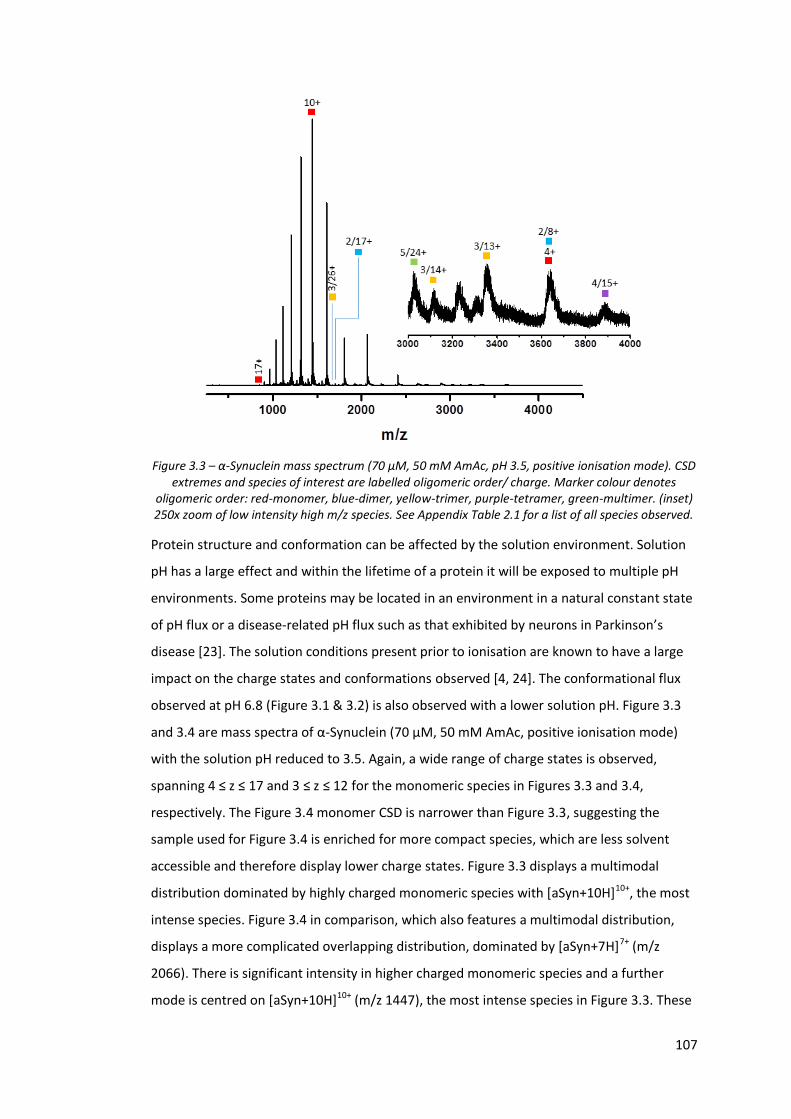
107
Figure 3.3 – α-Synuclein mass spectrum (70 µM, 50 mM AmAc, pH 3.5, positive ionisation mode). CSD extremes and species of interest are labelled oligomeric order/ charge. Marker colour denotes
oligomeric order: red-monomer, blue-dimer, yellow-trimer, purple-tetramer, green-multimer. (inset) 250x zoom of low intensity high m/z species. See Appendix Table 2.1 for a list of all species observed.
Protein structure and conformation can be affected by the solution environment. Solution
pH has a large effect and within the lifetime of a protein it will be exposed to multiple pH
environments. Some proteins may be located in an environment in a natural constant state
of pH flux or a disease-related pH flux such as that exhibited by neurons in Parkinson’s
disease [23]. The solution conditions present prior to ionisation are known to have a large
impact on the charge states and conformations observed [4, 24]. The conformational flux
observed at pH 6.8 (Figure 3.1 & 3.2) is also observed with a lower solution pH. Figure 3.3
and 3.4 are mass spectra of α-Synuclein (70 µM, 50 mM AmAc, positive ionisation mode)
with the solution pH reduced to 3.5. Again, a wide range of charge states is observed,
spanning 4 ≤ z ≤ 17 and 3 ≤ z ≤ 12 for the monomeric species in Figures 3.3 and 3.4,
respectively. The Figure 3.4 monomer CSD is narrower than Figure 3.3, suggesting the
sample used for Figure 3.4 is enriched for more compact species, which are less solvent
accessible and therefore display lower charge states. Figure 3.3 displays a multimodal
distribution dominated by highly charged monomeric species with [aSyn+10H]10+, the most
intense species. Figure 3.4 in comparison, which also features a multimodal distribution,
displays a more complicated overlapping distribution, dominated by [aSyn+7H]7+ (m/z
2066). There is significant intensity in higher charged monomeric species and a further
mode is centred on [aSyn+10H]10+ (m/z 1447), the most intense species in Figure 3.3. These
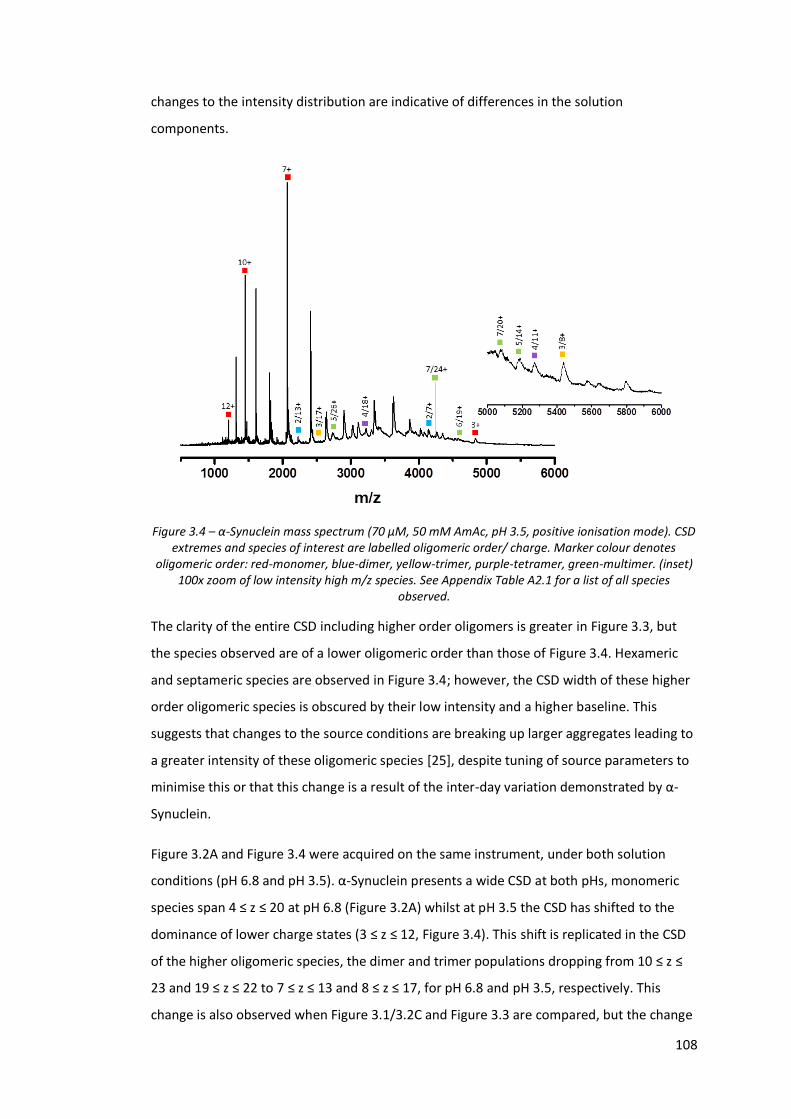
108
changes to the intensity distribution are indicative of differences in the solution
components.
Figure 3.4 – α-Synuclein mass spectrum (70 µM, 50 mM AmAc, pH 3.5, positive ionisation mode). CSD extremes and species of interest are labelled oligomeric order/ charge. Marker colour denotes
oligomeric order: red-monomer, blue-dimer, yellow-trimer, purple-tetramer, green-multimer. (inset) 100x zoom of low intensity high m/z species. See Appendix Table A2.1 for a list of all species
observed.
The clarity of the entire CSD including higher order oligomers is greater in Figure 3.3, but
the species observed are of a lower oligomeric order than those of Figure 3.4. Hexameric
and septameric species are observed in Figure 3.4; however, the CSD width of these higher
order oligomeric species is obscured by their low intensity and a higher baseline. This
suggests that changes to the source conditions are breaking up larger aggregates leading to
a greater intensity of these oligomeric species [25], despite tuning of source parameters to
minimise this or that this change is a result of the inter-day variation demonstrated by α-
Synuclein.
Figure 3.2A and Figure 3.4 were acquired on the same instrument, under both solution
conditions (pH 6.8 and pH 3.5). α-Synuclein presents a wide CSD at both pHs, monomeric
species span 4 ≤ z ≤ 20 at pH 6.8 (Figure 3.2A) whilst at pH 3.5 the CSD has shifted to the
dominance of lower charge states (3 ≤ z ≤ 12, Figure 3.4). This shift is replicated in the CSD
of the higher oligomeric species, the dimer and trimer populations dropping from 10 ≤ z ≤
23 and 19 ≤ z ≤ 22 to 7 ≤ z ≤ 13 and 8 ≤ z ≤ 17, for pH 6.8 and pH 3.5, respectively. This
change is also observed when Figure 3.1/3.2C and Figure 3.3 are compared, but the change
109
is not as dramatic. Frimpong et al. observed a similar shift in the CSD when solution pH was
dropped to pH 2.5 [2]. The drop in charge state suggests that the protein has adopted a
more compact conformation, thus reducing the solvent accessibility of protonatable sites.
This hypothesis concurs with other biophysical techniques. Both Far UV CD, by the increase
in negative intensity at 220 nm and FTIR, by the appearance of a band at 1626 cm-1, both
infer the induction of structure following a decrease in solution pH [26]. SAXS data also
points to a switch from a predominantly random coil conformation to the development of a
protein with a tightly packed core [26]. Bernstein et al. also report a Collision Cross Section
(CCS) decrease, when solution pH is dropped [1].
An interesting feature of spectra recorded from samples with a lower solution pH is the
greater intensity of higher order oligomeric species, ranging from dimer to septamer. The
lower sample pH (pH 3.5) combined with the low pI of α-Synuclein (pI 4.67), results in less
protein-protein repulsion and is therefore an environment conducive to oligomer formation
[27].
The large increase in baseline noise which is attributed to the presence of multiple low
intensity unresolved higher order aggregates, supports the theory that the higher order
oligomers resolved are the result of aggregation [28] rather than an artefact of the ESI
process and are not simply non-specifically bound monomers. This hypothesis is also
supported by the depletion of overall signal intensity, a similar effect is observed under
aggregating conditions, as low order oligomers are sequestered into higher order oligomers
which are beyond the range of the instrument, see Appendix Figure A3.1 and A3.2.
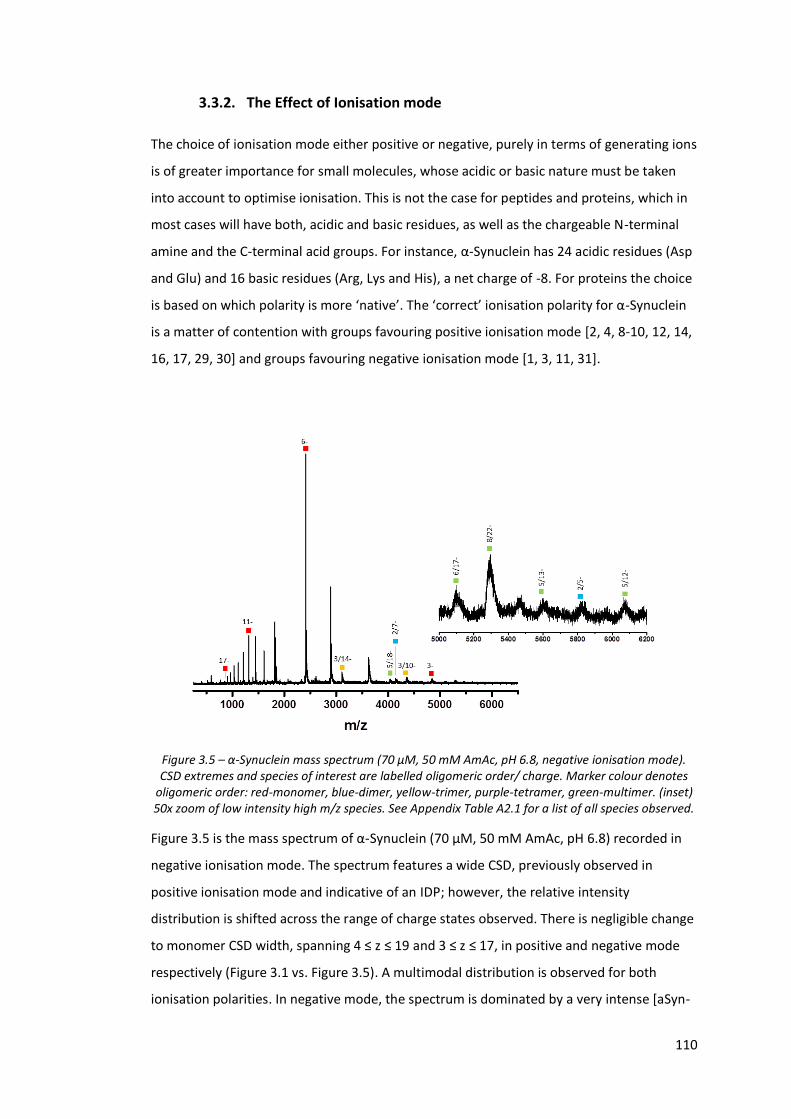
110
3.3.2. The Effect of Ionisation mode
The choice of ionisation mode either positive or negative, purely in terms of generating ions
is of greater importance for small molecules, whose acidic or basic nature must be taken
into account to optimise ionisation. This is not the case for peptides and proteins, which in
most cases will have both, acidic and basic residues, as well as the chargeable N-terminal
amine and the C-terminal acid groups. For instance, α-Synuclein has 24 acidic residues (Asp
and Glu) and 16 basic residues (Arg, Lys and His), a net charge of -8. For proteins the choice
is based on which polarity is more ‘native’. The ‘correct’ ionisation polarity for α-Synuclein
is a matter of contention with groups favouring positive ionisation mode [2, 4, 8-10, 12, 14,
16, 17, 29, 30] and groups favouring negative ionisation mode [1, 3, 11, 31].
Figure 3.5 – α-Synuclein mass spectrum (70 µM, 50 mM AmAc, pH 6.8, negative ionisation mode). CSD extremes and species of interest are labelled oligomeric order/ charge. Marker colour denotes
oligomeric order: red-monomer, blue-dimer, yellow-trimer, purple-tetramer, green-multimer. (inset) 50x zoom of low intensity high m/z species. See Appendix Table A2.1 for a list of all species observed.
Figure 3.5 is the mass spectrum of α-Synuclein (70 µM, 50 mM AmAc, pH 6.8) recorded in
negative ionisation mode. The spectrum features a wide CSD, previously observed in
positive ionisation mode and indicative of an IDP; however, the relative intensity
distribution is shifted across the range of charge states observed. There is negligible change
to monomer CSD width, spanning 4 ≤ z ≤ 19 and 3 ≤ z ≤ 17, in positive and negative mode
respectively (Figure 3.1 vs. Figure 3.5). A multimodal distribution is observed for both
ionisation polarities. In negative mode, the spectrum is dominated by a very intense [aSyn-
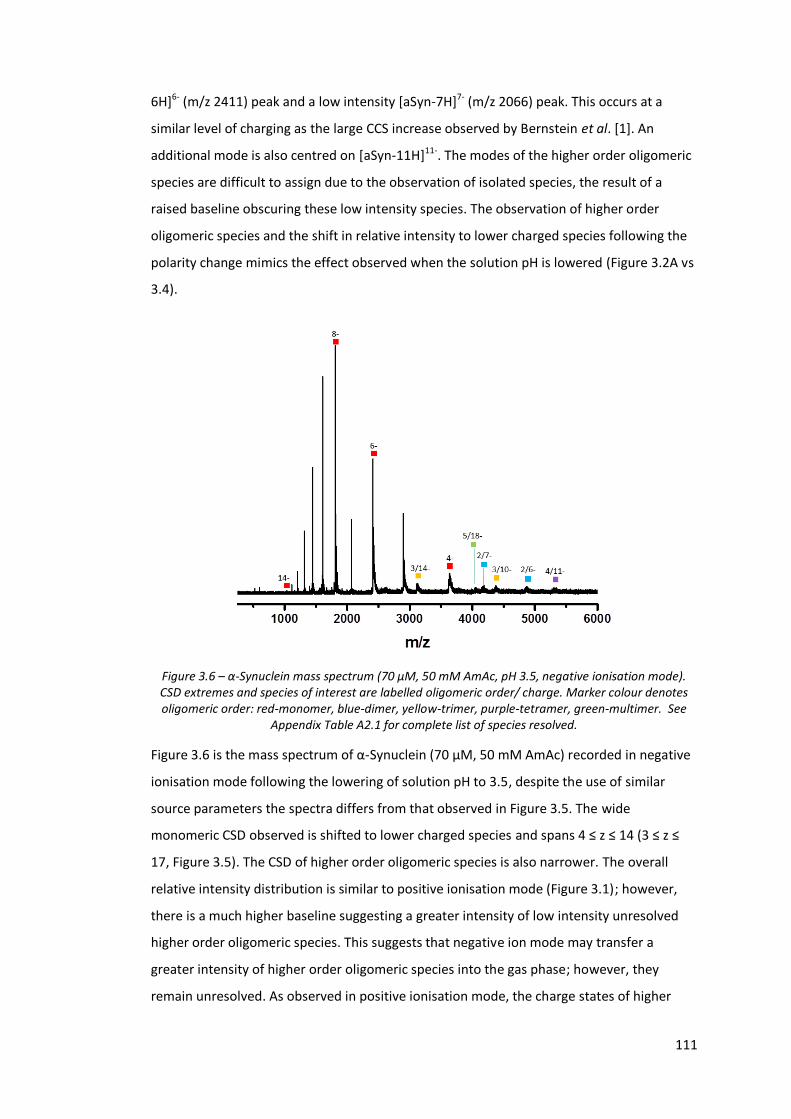
111
6H]6- (m/z 2411) peak and a low intensity [aSyn-7H]7- (m/z 2066) peak. This occurs at a
similar level of charging as the large CCS increase observed by Bernstein et al. [1]. An
additional mode is also centred on [aSyn-11H]11-. The modes of the higher order oligomeric
species are difficult to assign due to the observation of isolated species, the result of a
raised baseline obscuring these low intensity species. The observation of higher order
oligomeric species and the shift in relative intensity to lower charged species following the
polarity change mimics the effect observed when the solution pH is lowered (Figure 3.2A vs
3.4).
Figure 3.6 – α-Synuclein mass spectrum (70 µM, 50 mM AmAc, pH 3.5, negative ionisation mode). CSD extremes and species of interest are labelled oligomeric order/ charge. Marker colour denotes oligomeric order: red-monomer, blue-dimer, yellow-trimer, purple-tetramer, green-multimer. See
Appendix Table A2.1 for complete list of species resolved.
Figure 3.6 is the mass spectrum of α-Synuclein (70 µM, 50 mM AmAc) recorded in negative
ionisation mode following the lowering of solution pH to 3.5, despite the use of similar
source parameters the spectra differs from that observed in Figure 3.5. The wide
monomeric CSD observed is shifted to lower charged species and spans 4 ≤ z ≤ 14 (3 ≤ z ≤
17, Figure 3.5). The CSD of higher order oligomeric species is also narrower. The overall
relative intensity distribution is similar to positive ionisation mode (Figure 3.1); however,
there is a much higher baseline suggesting a greater intensity of low intensity unresolved
higher order oligomeric species. This suggests that negative ion mode may transfer a
greater intensity of higher order oligomeric species into the gas phase; however, they
remain unresolved. As observed in positive ionisation mode, the charge states of higher

112
order oligomers observed following the lowering of solution pH are lower. In negative
ionisation mode, the effect is enhanced as only the [(aSyn)2-5H]5- to [(aSyn)2-7H]7- dimer
and [(aSyn)3-10H]10- and [(aSyn)3-14H]14- trimers are observed.
From this data it is clear that the ionisation polarity has an effect on the species exhibited
by α-Synuclein. Interestingly, this effect is reduced at lower solution pHs suggesting the
environmental structural modifications are in competition with, and have a larger effect
than coloumbic effects. MS has demonstrated a large degree of variation in the α-Synuclein
signal from nESI, irrespective of the solution pH or ionisation polarity.
3.3.3. Ion Mobility - Mass Spectrometry
IM-MS can be used for the structural analysis of a given protein which presents as a
heterogeneous mixture of conformational families and oligomeric species, such as α-
Synuclein. IM-MS cannot provide the atomistic resolution of X-ray crystallography or NMR.
However, these techniques fall short of truly representing the conformational space
occupied by IDPs. X-ray crystallography requires the pinning of a single conformation in a
crystal lattice and NMR struggles to define the regions of disorder in IDPs. NMR strategies
have been developed for the analysis of IDPs; however, experimental difficulty and
complexity increases with IDP size [32].
α-Synucleins characteristic wide monomer CSD is present in m/z vs. CCS plot (Figure 3.7A)
spanning 5 ≤ z ≤ 16. Additional species are visible in the mass spectrum (Figure 3.7B);
however, only species with sufficient signal intensity for IM-MS analysis are included. The
CCS range covered by the CSD is large, spanning 937.53 to 3093.17 Å2 which is
characteristic of an IDP. Appendix Table 2.2 contains the experimental CCS values for all
charge states and conformational families observed. Multiple conformational species are
observed for each charge state (Figure 3.7A & 3.7C), a feature also observed in IM-MS
aggregation experiments (Chapter 4, Figure 4.5). This concurs with the multiple species
observed by Illes-Toth et al. [8] and Lee et al. [14]. The Illes-Toth et al. CCS values are in
good agreement; however, the Lee et al. values are slightly larger, this may be a result of
the use of harsher source parameters, including the use of an ESI source unit and very
different instrumental parameters.
As expected CCS increases with charge, this trend has been reported previously for many
proteins [33, 34]. Despite the use of positive mode rather than negative mode used by
Bernstein et al., the CCS values of the lower charge species are in good agreement [1].
113
However, the molecule does not undergo the large CCS increase observed between the
[aSyn-8H]8- and [aSyn-9H]9- charge states (Figure 3.7C) and following this the CCS values
derived for the numerically equivalent but opposite polarity charge states are much lower
[1]. Grabenauer et al. report similar CCS values for the lower charge states [11], without the
large change in CCS reported in [1]. This suggests that the larger CCS values seen in negative
ionisation mode are driven mainly by the location of chargeable residues and the coulombic
repulsion which results from their charging. The large error bars present for most species
highlight the large variation observed between samples prepared and analysed under
strictly controlled conditions. The same diversity is highlighted by Illes-Toth et al. [8] and in
the lower charged species reported by Grabenauer et al. significant variation is observed
[11].
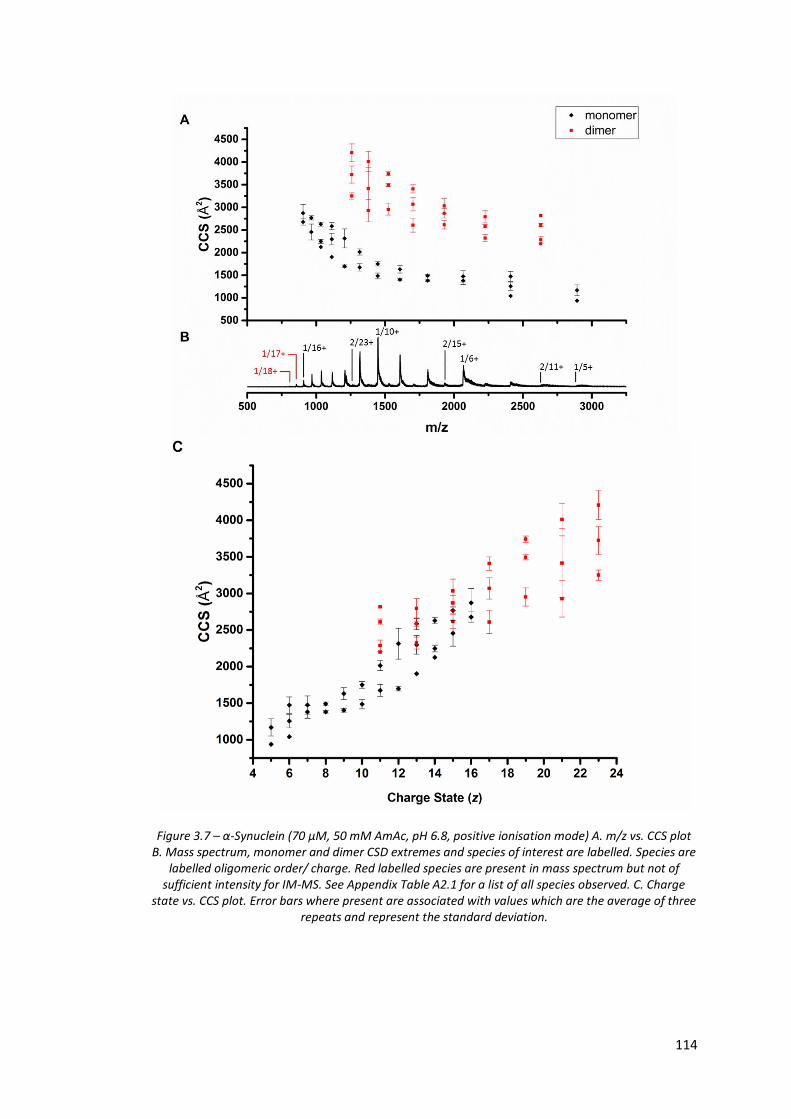
114
Figure 3.7 – α-Synuclein (70 µM, 50 mM AmAc, pH 6.8, positive ionisation mode) A. m/z vs. CCS plot B. Mass spectrum, monomer and dimer CSD extremes and species of interest are labelled. Species are
labelled oligomeric order/ charge. Red labelled species are present in mass spectrum but not of sufficient intensity for IM-MS. See Appendix Table A2.1 for a list of all species observed. C. Charge
state vs. CCS plot. Error bars where present are associated with values which are the average of three repeats and represent the standard deviation.
115
3.3.4. Cross-linking Ion Mobility - Mass Spectrometry
The phase transition from liquid to solid and the trapping of a protein conformation from a
heterogenous distribution of protein conformers in a crystal lattice is widely accepted and
the basis of X-ray crystallography. The other major biophysical structural technique, NMR
has the ability to analyse samples in the liquid phase. MS and IM-MS require the phase
transition from liquid to gas and the ability to retain solution structure is an issue of
constant debate. This is despite the development of soft ionisation sources including nESI
which has enabled the transfer of large intact biomolecules into the gas phase [35] and
evidence for the retention of α-helices and β-sheet structures in the gas phase [36-38].
Chemical cross-linking has many applications and is a well-known technique for the
characterisation of protein conformation and protein-protein interactions. Cross-linking is
usually followed by an enzymatic digestion step; however, in this application enzymatic
digestion was omitted to ‘trap’ solution phase structures and transfer them to the gas
phase for IM-MS analysis.
The presence of the chemical cross-linker in solution causes some additional hurdles for
structural analysis. The BS3 cross-linking reagent used in this study is a homobifunctional
amine reactive non-targeted cross-linker and will react with all possible lysine residues and
N-termini. This uncontrolled reactivity means charge state peaks are broadened by multiple
tailing peaks, each representing n+1 crosslink modifications. The spectrum generated
resembles a spectrum contaminated with a salt such as NaCl, see Figure 3.8A and B. It was
not possible to obtain dimer or higher order oligomer CCS data, due to the peak broadening
observed. The extent of cross-linking can be modified by altering the working conditions
such as the solution pH. The CSDs of the crosslinked α-Synuclein samples are narrower than
those recorded prior to cross-linking, the monomer CSD width has decreased from 5 ≤ z ≤
18 (Figure 3.7B) to 5 ≤ z ≤ 16 for the pH 4 (Figure 3.8A) and 6 ≤ z ≤ 10 for the pH 8 (Figure
3.8B) conditions. The narrowing of the CSD is an indicator of the action of the cross-linker
modification to ‘pin’ conformations, restricting the flexibility of the protein. This effect is
clear when the Collision Cross Section Distributions (CCSDs) of the modified and unmodified
protein are compared (Figure 3.9). This effect is most obvious in the [aSyn+7H]7+ CCSD
(Figure 3.9Bi) whereby it is clear narrowing of the CCSD is occurring with the addition of as
few as four crosslink modifications and the effect is dramatically enhanced with the
addition of eleven crosslink modifications (Figure 3.9Biv). This narrowing suggests that the
cross-linker is a) decreasing the population of conformers sampled and b) preventing the
adoption of the extreme compact CCS values displayed in the unmodified distributions. This
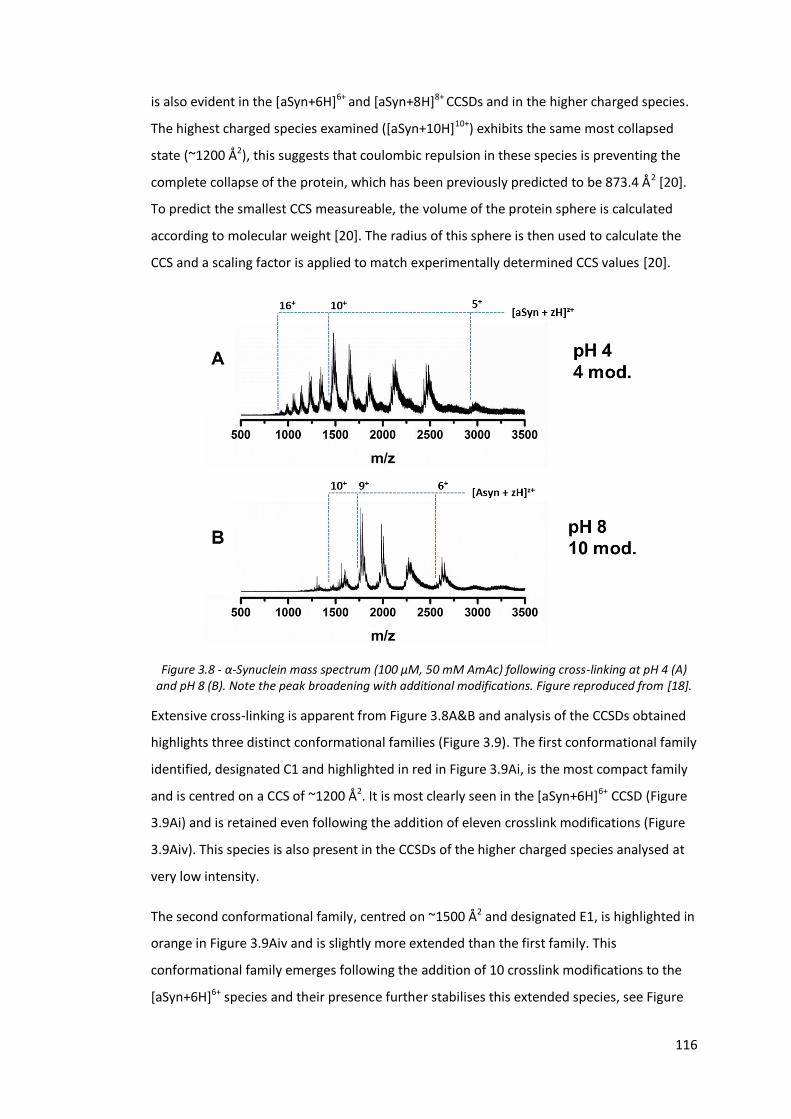
116
is also evident in the [aSyn+6H]6+ and [aSyn+8H]8+ CCSDs and in the higher charged species.
The highest charged species examined ([aSyn+10H]10+) exhibits the same most collapsed
state (~1200 Å2), this suggests that coulombic repulsion in these species is preventing the
complete collapse of the protein, which has been previously predicted to be 873.4 Å2 [20].
To predict the smallest CCS measureable, the volume of the protein sphere is calculated
according to molecular weight [20]. The radius of this sphere is then used to calculate the
CCS and a scaling factor is applied to match experimentally determined CCS values [20].
Figure 3.8 - α-Synuclein mass spectrum (100 µM, 50 mM AmAc) following cross-linking at pH 4 (A) and pH 8 (B). Note the peak broadening with additional modifications. Figure reproduced from [18].
Extensive cross-linking is apparent from Figure 3.8A&B and analysis of the CCSDs obtained
highlights three distinct conformational families (Figure 3.9). The first conformational family
identified, designated C1 and highlighted in red in Figure 3.9Ai, is the most compact family
and is centred on a CCS of ~1200 Å2. It is most clearly seen in the [aSyn+6H]6+ CCSD (Figure
3.9Ai) and is retained even following the addition of eleven crosslink modifications (Figure
3.9Aiv). This species is also present in the CCSDs of the higher charged species analysed at
very low intensity.
The second conformational family, centred on ~1500 Å2 and designated E1, is highlighted in
orange in Figure 3.9Aiv and is slightly more extended than the first family. This
conformational family emerges following the addition of 10 crosslink modifications to the
[aSyn+6H]6+ species and their presence further stabilises this extended species, see Figure
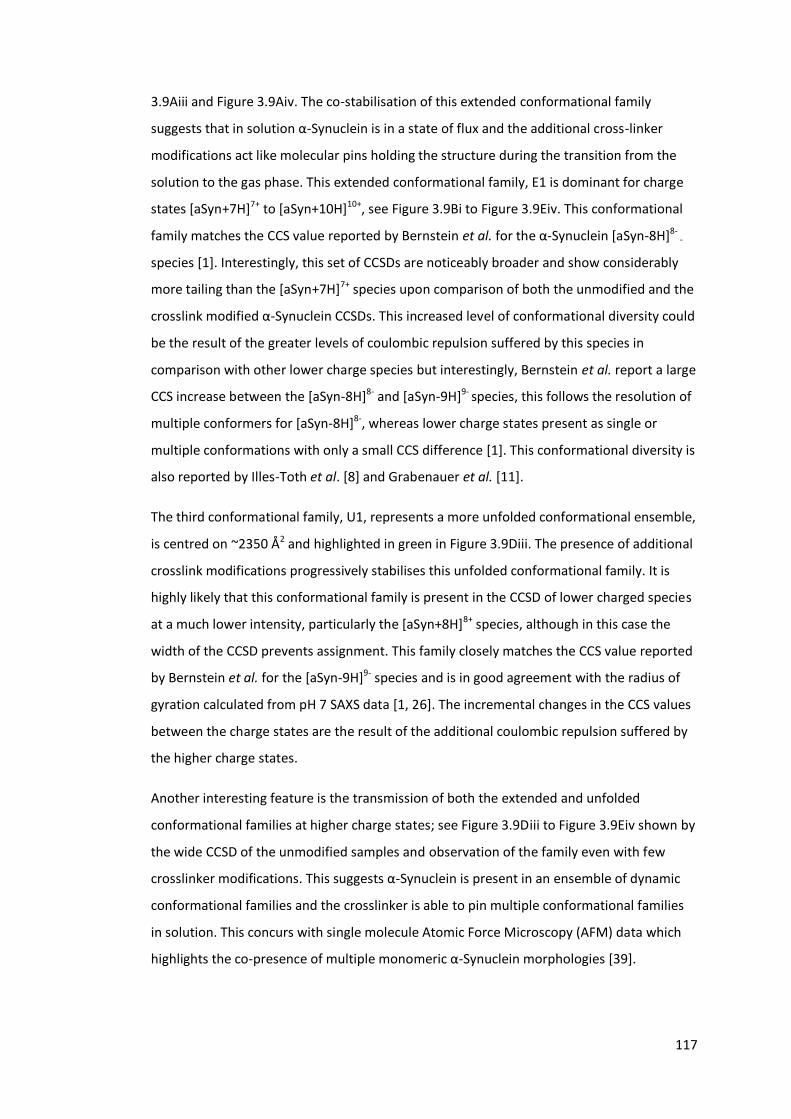
117
3.9Aiii and Figure 3.9Aiv. The co-stabilisation of this extended conformational family
suggests that in solution α-Synuclein is in a state of flux and the additional cross-linker
modifications act like molecular pins holding the structure during the transition from the
solution to the gas phase. This extended conformational family, E1 is dominant for charge
states [aSyn+7H]7+ to [aSyn+10H]10+, see Figure 3.9Bi to Figure 3.9Eiv. This conformational
family matches the CCS value reported by Bernstein et al. for the α-Synuclein [aSyn-8H]8- -
species [1]. Interestingly, this set of CCSDs are noticeably broader and show considerably
more tailing than the [aSyn+7H]7+ species upon comparison of both the unmodified and the
crosslink modified α-Synuclein CCSDs. This increased level of conformational diversity could
be the result of the greater levels of coulombic repulsion suffered by this species in
comparison with other lower charge species but interestingly, Bernstein et al. report a large
CCS increase between the [aSyn-8H]8- and [aSyn-9H]9- species, this follows the resolution of
multiple conformers for [aSyn-8H]8-, whereas lower charge states present as single or
multiple conformations with only a small CCS difference [1]. This conformational diversity is
also reported by Illes-Toth et al. [8] and Grabenauer et al. [11].
The third conformational family, U1, represents a more unfolded conformational ensemble,
is centred on ~2350 Å2 and highlighted in green in Figure 3.9Diii. The presence of additional
crosslink modifications progressively stabilises this unfolded conformational family. It is
highly likely that this conformational family is present in the CCSD of lower charged species
at a much lower intensity, particularly the [aSyn+8H]8+ species, although in this case the
width of the CCSD prevents assignment. This family closely matches the CCS value reported
by Bernstein et al. for the [aSyn-9H]9- species and is in good agreement with the radius of
gyration calculated from pH 7 SAXS data [1, 26]. The incremental changes in the CCS values
between the charge states are the result of the additional coulombic repulsion suffered by
the higher charge states.
Another interesting feature is the transmission of both the extended and unfolded
conformational families at higher charge states; see Figure 3.9Diii to Figure 3.9Eiv shown by
the wide CCSD of the unmodified samples and observation of the family even with few
crosslinker modifications. This suggests α-Synuclein is present in an ensemble of dynamic
conformational families and the crosslinker is able to pin multiple conformational families
in solution. This concurs with single molecule Atomic Force Microscopy (AFM) data which
highlights the co-presence of multiple monomeric α-Synuclein morphologies [39].

118
This data demonstrates that cross-linking prior to IM-MS enables the analysis of solution
phase structures in the gas phase. The BS3 cross-linker used in this study has a spacer arm
length of 11.4 Å and although untargeted, cross-linker reactivity is limited to primary
amines. Due to the disordered and flexible nature of α-Synuclein in solution, it is possible
that the cross-linking reaction may select for or be biased towards cross-linking conducive
structures such as those with exposed lysine residues or lysine residues within close
proximity, which may represent a subpopulation of solution structures. A range of cross-
linking reagents with different reactivity terminals and spacer arm lengths are commercially
available. Further experiments, using a range of these reagents should be conducted to
determine whether the conformational families observed reflect the full range of solution
structures.
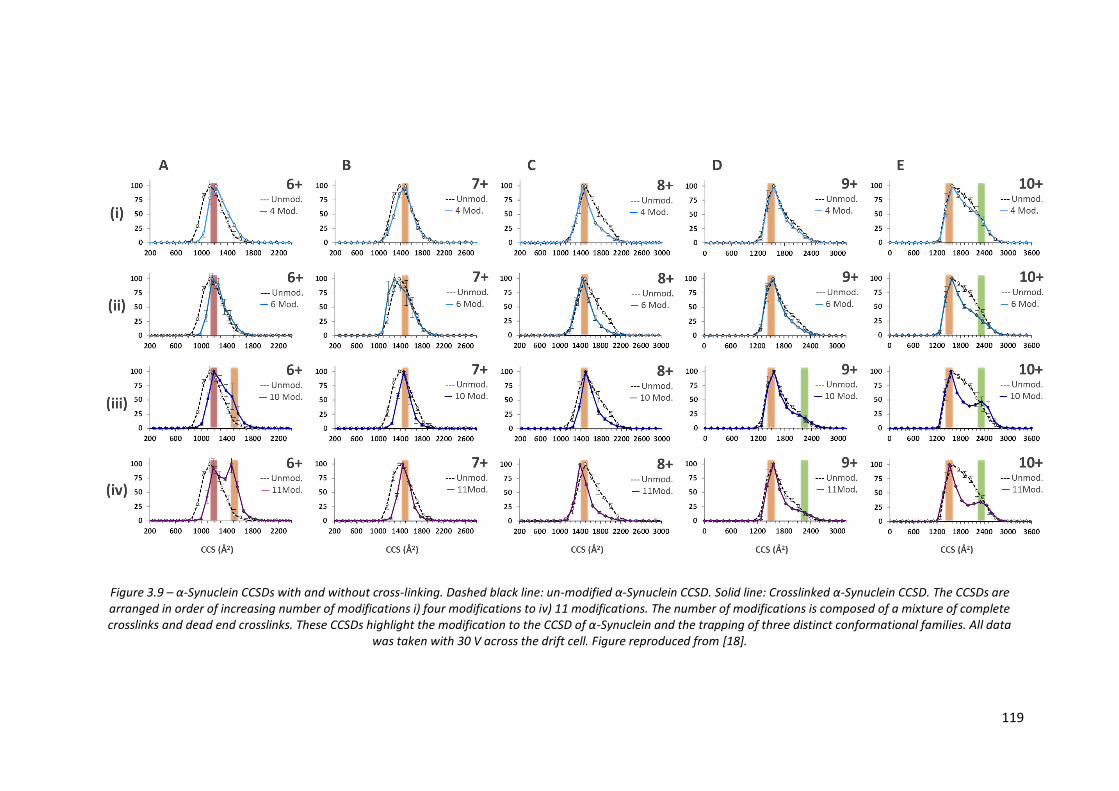
119
Figure 3.9 – α-Synuclein CCSDs with and without cross-linking. Dashed black line: un-modified α-Synuclein CCSD. Solid line: Crosslinked α-Synuclein CCSD. The CCSDs are arranged in order of increasing number of modifications i) four modifications to iv) 11 modifications. The number of modifications is composed of a mixture of complete crosslinks and dead end crosslinks. These CCSDs highlight the modification to the CCSD of α-Synuclein and the trapping of three distinct conformational families. All data
was taken with 30 V across the drift cell. Figure reproduced from [18].
120
3.3.5. Investigating α-Synuclein Structure using ECD-FT-ICR MS
Electron Capture Dissociation (ECD) is routinely applied for protein and peptide sequencing
and to establish the location of post-translational modifications. In addition to its routine
applications, the presence of higher order structure can also be probed due to the
fragmentation mechanism [40, 41]. Here, ECD has been applied to probe the effect of pH
on the structure of α-Synuclein. ECD efficiency is known to increase with charge state [42].
However, the structural information which can be gained from fragmentation of these
charge states is impaired by the increased levels of gas phase coulombic distortion they
suffer from. Therefore, lower charge states than previously studied [43] were selected in
this study, as they are less affected by gas phase coulombic distortion and fragments may
be related to a solvated structure. As expected, this results in a lower fragmentation
efficiency. Figure 3.10 highlights the charge states selected and their position within the
overall α-Synuclein CSD.
Figure 3.10 – α-Synuclein mass spectrum (30 µM, 50 mM AmAc) recorded on a Bruker Solarix 12T FT-ICR MS instrument prior to ECD. The CSDs observed at each pH are similar to those observed on ToF
instruments. Species analysed by ECD are labelled. The dashed lines highlight charge states not analysed at pH 3.5. See Appendix Table A2.1 for a list of all species observed. Figure reproduced from
[18].
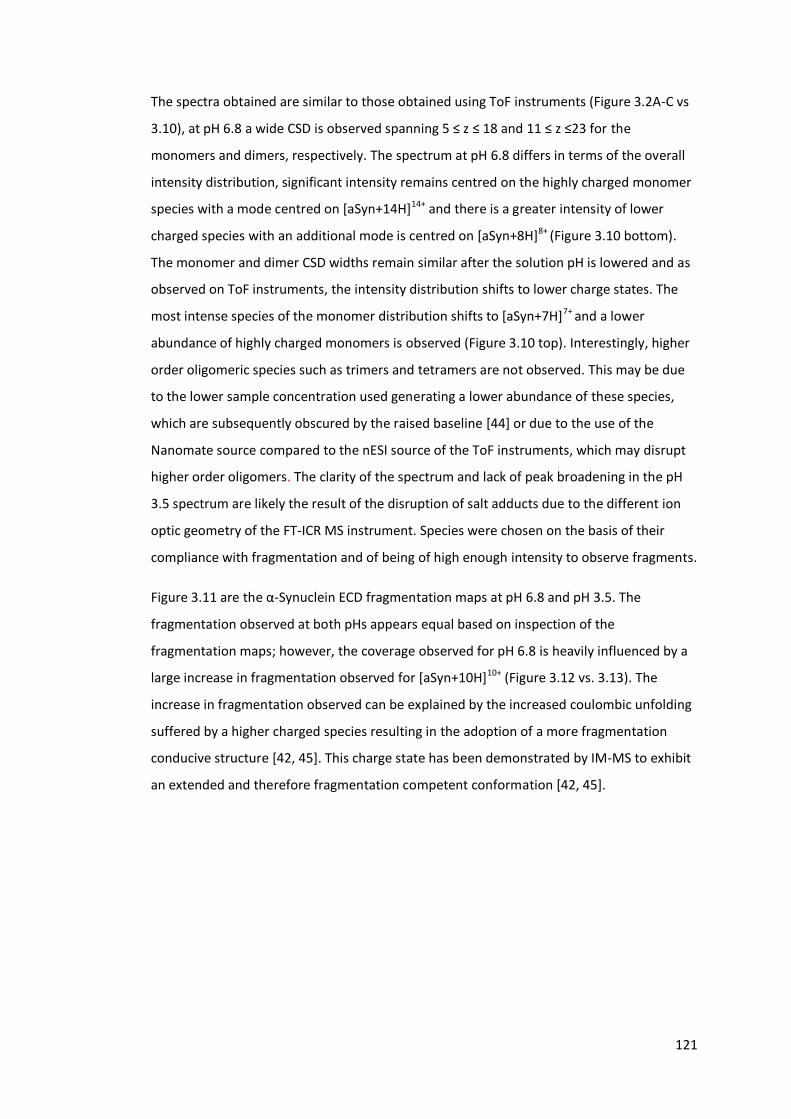
121
The spectra obtained are similar to those obtained using ToF instruments (Figure 3.2A-C vs
3.10), at pH 6.8 a wide CSD is observed spanning 5 ≤ z ≤ 18 and 11 ≤ z ≤23 for the
monomers and dimers, respectively. The spectrum at pH 6.8 differs in terms of the overall
intensity distribution, significant intensity remains centred on the highly charged monomer
species with a mode centred on [aSyn+14H]14+ and there is a greater intensity of lower
charged species with an additional mode is centred on [aSyn+8H]8+ (Figure 3.10 bottom).
The monomer and dimer CSD widths remain similar after the solution pH is lowered and as
observed on ToF instruments, the intensity distribution shifts to lower charge states. The
most intense species of the monomer distribution shifts to [aSyn+7H]7+ and a lower
abundance of highly charged monomers is observed (Figure 3.10 top). Interestingly, higher
order oligomeric species such as trimers and tetramers are not observed. This may be due
to the lower sample concentration used generating a lower abundance of these species,
which are subsequently obscured by the raised baseline [44] or due to the use of the
Nanomate source compared to the nESI source of the ToF instruments, which may disrupt
higher order oligomers. The clarity of the spectrum and lack of peak broadening in the pH
3.5 spectrum are likely the result of the disruption of salt adducts due to the different ion
optic geometry of the FT-ICR MS instrument. Species were chosen on the basis of their
compliance with fragmentation and of being of high enough intensity to observe fragments.
Figure 3.11 are the α-Synuclein ECD fragmentation maps at pH 6.8 and pH 3.5. The
fragmentation observed at both pHs appears equal based on inspection of the
fragmentation maps; however, the coverage observed for pH 6.8 is heavily influenced by a
large increase in fragmentation observed for [aSyn+10H]10+ (Figure 3.12 vs. 3.13). The
increase in fragmentation observed can be explained by the increased coulombic unfolding
suffered by a higher charged species resulting in the adoption of a more fragmentation
conducive structure [42, 45]. This charge state has been demonstrated by IM-MS to exhibit
an extended and therefore fragmentation competent conformation [42, 45].
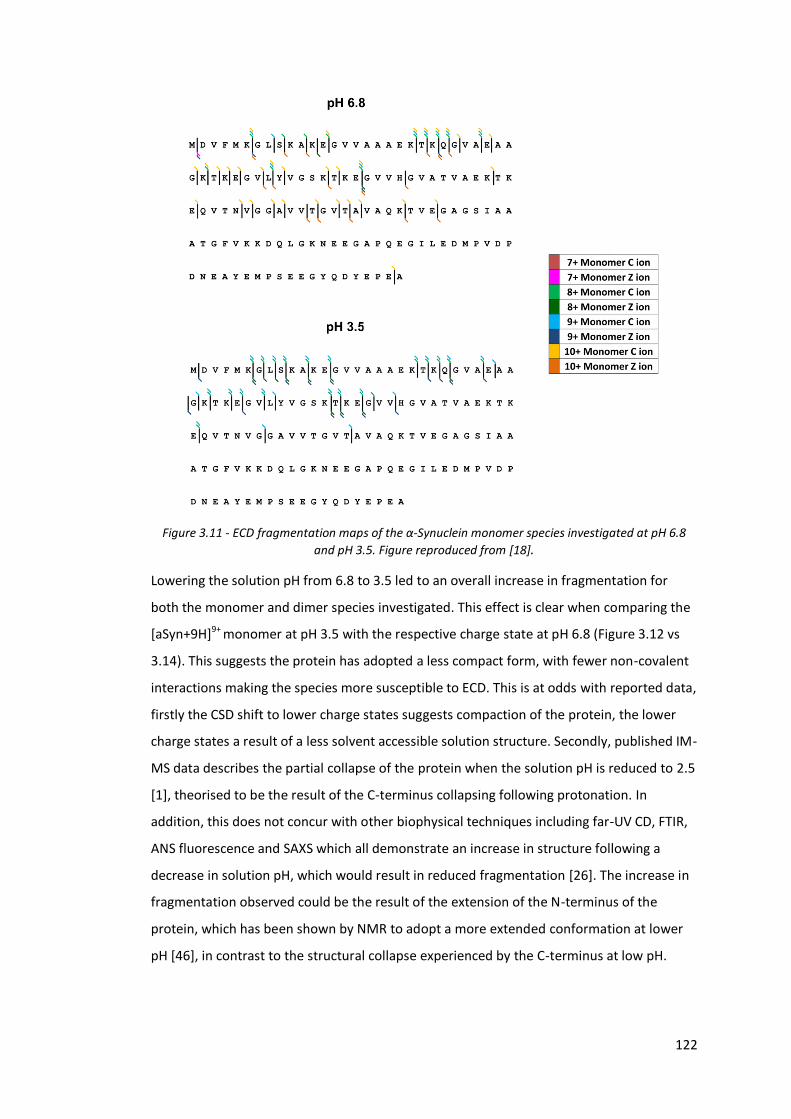
122
Figure 3.11 - ECD fragmentation maps of the α-Synuclein monomer species investigated at pH 6.8
and pH 3.5. Figure reproduced from [18].
Lowering the solution pH from 6.8 to 3.5 led to an overall increase in fragmentation for
both the monomer and dimer species investigated. This effect is clear when comparing the
[aSyn+9H]9+ monomer at pH 3.5 with the respective charge state at pH 6.8 (Figure 3.12 vs
3.14). This suggests the protein has adopted a less compact form, with fewer non-covalent
interactions making the species more susceptible to ECD. This is at odds with reported data,
firstly the CSD shift to lower charge states suggests compaction of the protein, the lower
charge states a result of a less solvent accessible solution structure. Secondly, published IM-
MS data describes the partial collapse of the protein when the solution pH is reduced to 2.5
[1], theorised to be the result of the C-terminus collapsing following protonation. In
addition, this does not concur with other biophysical techniques including far-UV CD, FTIR,
ANS fluorescence and SAXS which all demonstrate an increase in structure following a
decrease in solution pH, which would result in reduced fragmentation [26]. The increase in
fragmentation observed could be the result of the extension of the N-terminus of the
protein, which has been shown by NMR to adopt a more extended conformation at lower
pH [46], in contrast to the structural collapse experienced by the C-terminus at low pH.
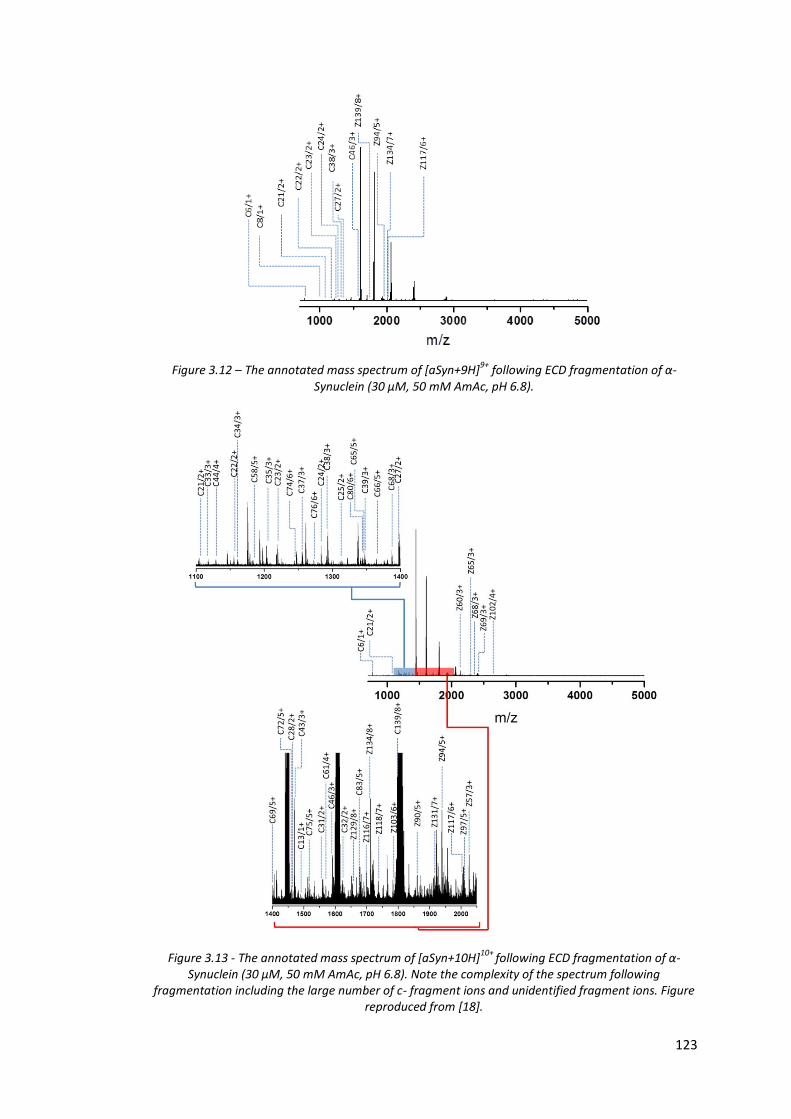
123
Figure 3.12 – The annotated mass spectrum of [aSyn+9H]9+
following ECD fragmentation of α-Synuclein (30 µM, 50 mM AmAc, pH 6.8).
Figure 3.13 - The annotated mass spectrum of [aSyn+10H]10+ following ECD fragmentation of α-Synuclein (30 µM, 50 mM AmAc, pH 6.8). Note the complexity of the spectrum following
fragmentation including the large number of c- fragment ions and unidentified fragment ions. Figure reproduced from [18].

124
Figure 3.14 - The annotated mass spectrum of [aSyn+9H]9+ following ECD fragmentation of α-Synuclein (30 µM, 50 mM AmAc, pH 3.5). Note the complexity of the spectrum including the large
number of c- fragment ions and unidentified fragment ions. A greater number of z- fragment ions are identified compared to pH 6.8 (Figure 3.12). Figure reproduced from [18].
Lowering the solution pH also resulted in an increase in fragmentation for the dimer species
investigated, highlighted by the large increase in fragments identified, see Table 3.1.
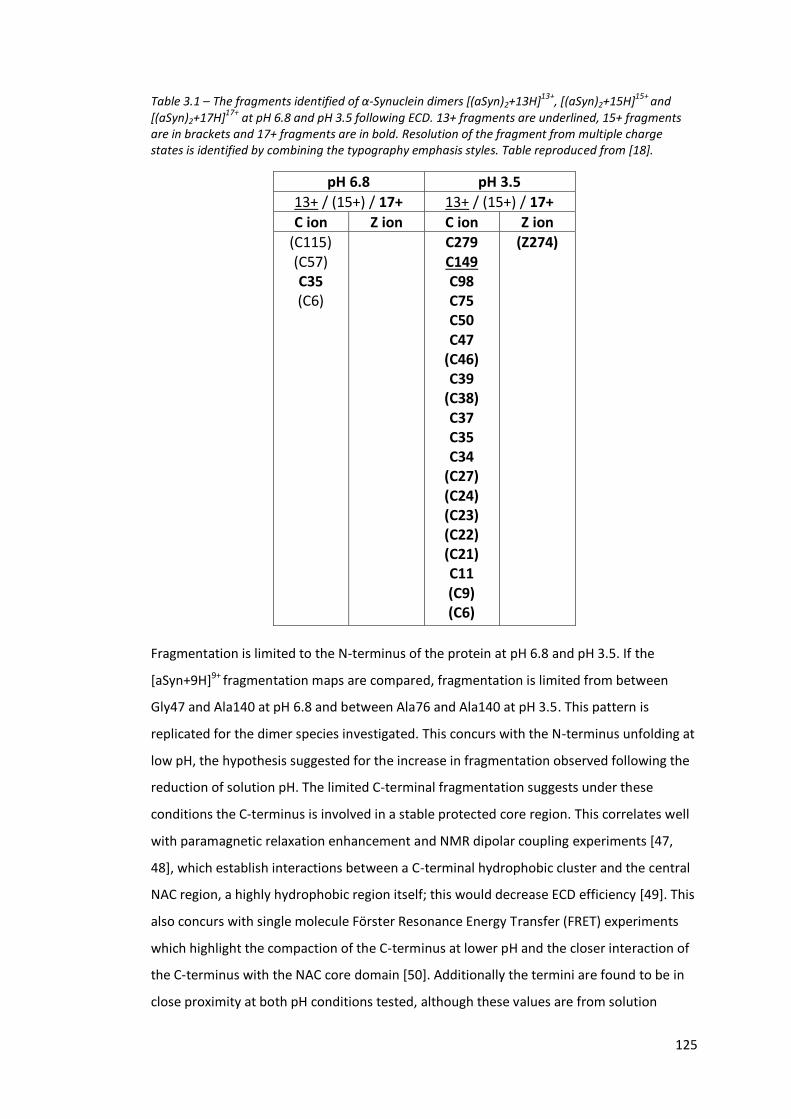
125
Table 3.1 – The fragments identified of α-Synuclein dimers [(aSyn)2+13H]13+, [(aSyn)2+15H]15+ and
[(aSyn)2+17H]17+ at pH 6.8 and pH 3.5 following ECD. 13+ fragments are underlined, 15+ fragments are in brackets and 17+ fragments are in bold. Resolution of the fragment from multiple charge states is identified by combining the typography emphasis styles. Table reproduced from [18].
pH 6.8 pH 3.5
13+ / (15+) / 17+ 13+ / (15+) / 17+
C ion Z ion C ion Z ion (C115) (C57) C35 (C6)
C279 C149 C98 C75 C50 C47
(C46) C39
(C38) C37 C35 C34
(C27) (C24) (C23) (C22) (C21) C11 (C9) (C6)
(Z274)
Fragmentation is limited to the N-terminus of the protein at pH 6.8 and pH 3.5. If the
[aSyn+9H]9+ fragmentation maps are compared, fragmentation is limited from between
Gly47 and Ala140 at pH 6.8 and between Ala76 and Ala140 at pH 3.5. This pattern is
replicated for the dimer species investigated. This concurs with the N-terminus unfolding at
low pH, the hypothesis suggested for the increase in fragmentation observed following the
reduction of solution pH. The limited C-terminal fragmentation suggests under these
conditions the C-terminus is involved in a stable protected core region. This correlates well
with paramagnetic relaxation enhancement and NMR dipolar coupling experiments [47,
48], which establish interactions between a C-terminal hydrophobic cluster and the central
NAC region, a highly hydrophobic region itself; this would decrease ECD efficiency [49]. This
also concurs with single molecule Förster Resonance Energy Transfer (FRET) experiments
which highlight the compaction of the C-terminus at lower pH and the closer interaction of
the C-terminus with the NAC core domain [50]. Additionally the termini are found to be in
close proximity at both pH conditions tested, although these values are from solution
126
conditions including salt concentrations far in excess of those achievable via MS based
methods [50].
The location of the α-Synuclein dimer interface is an area of interest. The NAC domain of α-
Synuclein is necessary for the aggregation pathway leading to fibrils [51]. However, the N-
terminus of α-Synuclein is the location of the interface of dopamine-mediated dimers,
suggesting the existence of multiple distinct formation pathways [9, 52]. The lack of C-
terminal fragments observed for the dimer species suggests that the C-terminal region is
involved in the dimer interface and the lack of fragmentation observed is the result of
protective protein-protein interactions. This hypothesis is supported by single molecule
AFM force spectroscopy data, which demonstrates that the central NAC domain of α-
Synuclein is not solely the location of the dimer interface and that the C-terminal region is
involved [53]. However, a similar lack of fragmentation is also observed from the C-
terminus of the α-Synuclein monomer (Figure 3.11). This suggests that whilst the C-
terminus may be involved in the interface, the lack of fragmentation may also be due to the
dimer being composed of two monomers with fragmentation resistant C-termini.
These findings for both the monomer and dimer species do not correlate with previously
published CD and FTIR data [22] which did not detect regions of secondary structure or
hydrophobic protein core regions and with in-cell NMR experiments which concluded that
α-Synuclein is largely monomeric and disordered [54]. Additionally, our data does not
correlate with previously published HDX-MS studies. Del mar et al., Lee et al. and Mysling et
al. establish an unprotected and therefore disordered C-terminal region in monomeric α-
Synuclein [14, 55, 56]. Interestingly, despite transient C-terminal protection in assembled
amyloid structures highlighted by Del Mar et al. [55]. Del Mar et al. and Mysling et al. both
conclude that the C-terminal region of the assembled amyloid is unprotected, this lack of
structure should be conducive to ECD fragmentation [55, 56]. This degree of uncertainty of
C-terminal protection again highlights the conformational heterogeneity of α-Synuclein, as
previously highlighted by MS, IM-MS and Cross-linking IM-MS.
127
3.4. Summary
The aim of the experiments in this chapter was to apply MS based methods to probe the
structure of α-Synuclein. MS demonstrates that both the solution pH and ionisation polarity
have an effect on the species observed. α-Synuclein presents a wide CSD at both pHs;
however, following the lowering of the solution pH, the CSD is shifted to lower charge
states, indicating that the protein has adopted a more compact conformation, this concurs
with other biophysical techniques. MS also demonstrates that ionisation polarity has an
effect on the species observed, with the CSD shifting to lower charge states at both solution
pHs tested. The wide CCS range covered by the CSD and the multiple conformations
observed for all species, highlights α-Synucleins disordered nature. The CCS values are in
good agreement with published work including values recorded in negative ionisation mode
and the differences observed can be explained by the change in location of chargeable
residues between ionisation modes. MS and IM-MS both provide compelling evidence
supporting the conformational diversity of α-Synuclein and highlight large scale day to day
variation. This day to day variation is present following the modification of solution
conditions and ionisation polarity and concurs with the control results of previously
published data. The aim of the cross-linking IM-MS experiments was to probe the solution
phase structures of α-Synuclein in the gas phase. The three conformational families
observed following cross-linking IM-MS closely match previously published CCS values,
providing a link between the solution and gas phase structures observed. However,
additional work is required to probe the effect of the cross-linking reagent on the
conformations observed. ECD-FT-ICR MS was applied to probe the effect of pH on the
structure of α-Synuclein. The increase in fragmentation observed following the reduction of
solution pH, can be explained by conformational changes previously observed by other
biophysical techniques. The lack of fragmentation observed in the C-terminus in
combination with data published from other biophysical techniques, suggests the
involvement of the C-terminus in the dimer interface. However, this can also be explained
by the dimer being composed of two monomers with fragmentation resistant C-termini.
The fact that our ECD-FT-ICR MS results are at odds with other published MS based work,
including HDX-MS data, also concurs with the large scale variation previously highlighted.
These results demonstrate that MS based methods are ideally situated to characterise
conformationally dynamic proteins such as α-Synuclein. However, care must be taken in the
application of these techniques to disordered species to ensure there is no omission of
transient species.
128
3.5. References
1. Bernstein, S.L., et al., alpha-synuclein: Stable compact and extended monomeric structures and pH dependence of dimer formation. Journal of the American Society for Mass Spectrometry, 2004. 15(10): p. 1435-1443.
2. Frimpong, A.K., et al., Characterization of intrinsically disordered proteins with electrospray ionization mass spectrometry: Conformational heterogeneity of alpha-synuclein. Proteins-Structure Function and Bioinformatics, 2010. 78(3): p. 714-722.
3. Natalello, A., et al., Compact conformations of alpha-synuclein induced by alcohols and copper. Proteins-Structure Function and Bioinformatics, 2011. 79(2): p. 611-621.
4. Illes-Toth, E., et al., Distinct higher-order alpha-synuclein oligomers induce intracellular aggregation. Biochemical Journal, 2015. 468: p. 485-493.
5. Peng, Y., et al., Binding of alpha-synuclein with Fe(III) and with Fe(II) and biological implications of the resultant complexes. Journal of Inorganic Biochemistry, 2010. 104(4): p. 365-370.
6. Binolfi, A., et al., Site-specific interactions of Cu(II) with alpha and beta-synuclein: Bridging the molecular gap between metal binding and aggregation. Journal of the American Chemical Society, 2008. 130(35): p. 11801-11812.
7. Ly, T. and R.R. Julian, Protein-Metal Interactions of Calmodulin and alpha-Synuclein Monitored by Selective Noncovalent Adduct Protein Probing Mass Spectrometry. Journal of the American Society for Mass Spectrometry, 2008. 19(11): p. 1663-1672.
8. Illes-Toth, E., C.F. Dalton, and D.P. Smith, Binding of Dopamine to Alpha-Synuclein is Mediated by Specific Conformational States. Journal of the American Society for Mass Spectrometry, 2013. 24(9): p. 1346-1354.
9. Leong, S.L., et al., The N-Terminal Residues 43 to 60 Form the Interface for Dopamine Mediated alpha-Synuclein Dimerisation. Plos One, 2015. 10(2): p. 23.
10. Liu, Y.Q., et al., Gallic acid interacts with alpha-synuclein to prevent the structural collapse necessary for its aggregation. Biochimica Et Biophysica Acta-Proteins and Proteomics, 2014. 1844(9): p. 1481-1485.
11. Grabenauer, M., et al., Spermine binding to Parkinson's protein alpha-synuclein and its disease-related A30P and A53T mutants. Journal of Physical Chemistry B, 2008. 112(35): p. 11147-11154.
12. Liu, Y.Q., et al., Ion Mobility Mass Spectrometry Studies of the Inhibition of Alpha Synuclein Amyloid Fibril Formation by (-)-Epigallocatechin-3-Gallate. Australian Journal of Chemistry, 2011. 64(1): p. 36-40.
13. Konijnenberg, A., et al., Opposite Structural Effects of Epigallocatechin-3-gallate and Dopamine Binding to α-Synuclein. Analytical Chemistry, 2016. 88(17): p. 8468-8475.
14. Lee, S.J.C., et al., Probing Conformational Change of Intrinsically Disordered alpha-Synuclein to Helical Structures by Distinctive Regional Interactions with Lipid Membranes. Analytical Chemistry, 2014. 86(3): p. 1909-1916.
15. Rao, J.N., et al., A Combinatorial NMR and EPR Approach for Evaluating the Structural Ensemble of Partially Folded Proteins. Journal of the American Chemical Society, 2010. 132(25): p. 8657-8668.
16. Vlad, C., et al., Autoproteolytic Fragments Are Intermediates in the Oligomerization/Aggregation of the Parkinson's Disease Protein Alpha-Synuclein as Revealed by Ion Mobility Mass Spectrometry. Chembiochem, 2011. 12(18): p. 2740-2744.
129
17. Vlad, C., et al., Characterization of oligomerization-aggregation products of neurodegenerative target proteins by ion mobility mass spectrometry. Methods in molecular biology (Clifton, N.J.), 2012. 896: p. 399-412.
18. Phillips, A.S., et al., Conformational dynamics of alpha-synuclein: insights from mass spectrometry. Analyst, 2015. 140(9): p. 3070-3081.
19. McCullough, B.J., et al., Development of an ion mobility quadrupole time of flight mass spectrometer. Analytical Chemistry, 2008. 80(16): p. 6336-6344.
20. Beveridge, R., et al., A Mass-Spectrometry-Based Framework To Define the Extent of Disorder in Proteins. Analytical Chemistry, 2014. 86(22): p. 10979-10991.
21. Eliezer, D., et al., Conformational properties of alpha-synuclein in its free and lipid-associated states. Journal of Molecular Biology, 2001. 307(4): p. 1061-1073.
22. Weinreb, P.H., et al., NACP, a protein implicated in Alzheimer's disease and learning, is natively unfolded. Biochemistry, 1996. 35(43): p. 13709-13715.
23. Mattson, M.P., et al., Cellular and molecular mechanisms underlying perturbed energy metabolism and neuronal degeneration in Alzheimer's and Parkinson's diseases, in Oxidative/Energy Metabolism in Neurodegenerative Disorders, J.P. Blass and F.H. McDowell, Editors. 1999, New York Acad Sciences: New York. p. 154-175.
24. Banerjee, S. and S. Mazumdar, Electrospray Ionization Mass Spectrometry: A Technique to Access the Information beyond the Molecular Weight of the Analyte. International Journal of Analytical Chemistry, 2012: p. 40.
25. Cole, H.L., et al., Characterizing Early Aggregates Formed by an Amyloidogenic Peptide by Mass Spectrometry. Angewandte Chemie-International Edition, 2010. 49(49): p. 9448-9451.
26. Uversky, V.N., J. Li, and A.L. Fink, Evidence for a partially folded intermediate in alpha-synuclein fibril formation. Journal of Biological Chemistry, 2001. 276(14): p. 10737-10744.
27. Coelho-Cerqueira, E., et al., alpha-Synuclein as an intrinsically disordered monomer - fact or artefact? Febs Journal, 2013. 280(19): p. 4915-4927.
28. Counterman, A.E., et al., Formation of peptide aggregates during ESI: Size, charge, composition, and contributions to noise. Journal of the American Society for Mass Spectrometry, 2001. 12(9): p. 1020-1035.
29. Kang, L.J., et al., N-terminal acetylation of alpha-synuclein induces increased transient helical propensity and decreased aggregation rates in the intrinsically disordered monomer. Protein Science, 2012. 21(7): p. 911-917.
30. Beveridge, R., et al., Relating gas phase to solution conformations: Lessons from disordered proteins. Proteomics, 2015. 15(16): p. 2872-2883.
31. Testa, L., et al., Extracting structural information from charge state distributions of intrinsically disordered proteins by non-denaturing electrospray-ionization mass spectrometry. Intrinsically Disordered Proteins, 2013. 1(1): p. e25068.
32. Kurzbach, D., et al., NMR Spectroscopic Studies of the Conformational Ensembles of Intrinsically Disordered Proteins, in Intrinsically Disordered Proteins Studied by Nmr Spectroscopy, I.C. Felli and R. Pierattelli, Editors. 2015, Springer-Verlag Berlin: Berlin. p. 149-185.
33. Clemmer, D.E., R.R. Hudgins, and M.F. Jarrold, Naked Protein Conformations - Cytchrome-C In The Gas-Phase. Journal of the American Chemical Society, 1995. 117(40): p. 10141-10142.
34. Pacholarz, K.J., et al., Dynamics of Intact Immunoglobulin G Explored by Drift-Tube Ion-Mobility Mass Spectrometry and Molecular Modeling. Angewandte Chemie-International Edition, 2014. 53(30): p. 7765-7769.
35. Breuker, K. and F.W. McLafferty, Stepwise evolution of protein native structure with electrospray into the gas phase, 10(-12) to 10(2) S. Proceedings of the National
130
Academy of Sciences of the United States of America, 2008. 105(47): p. 18145-18152.
36. Florance, H.V., et al., Evidence for alpha-helices in the gas phase: A case study using Melittin from honey bee venom. Analyst, 2011. 136(17): p. 3446-3452.
37. Ruotolo, B.T., et al., Observation of conserved solution-phase secondary structure in gas-phase tryptic peptides. Journal of the American Chemical Society, 2002. 124(16): p. 4214-4215.
38. Ruotolo, B.T., C.C. Tate, and D.H. Russell, Ion mobility-mass spectrometry applied to cyclic peptide analysis: Conformational preferences of gramicidin S and linear analogs in the gas phase. Journal of the American Society for Mass Spectrometry, 2004. 15(6): p. 870-878.
39. Sandal, M., et al., Conformational equilibria in monomeric alpha-synuclein at the single-molecule level. Plos Biology, 2008. 6(1): p. 99-108.
40. Zhang, H., et al., Native Electrospray and Electron-Capture Dissociation in FTICR Mass Spectrometry Provide Top-Down Sequencing of a Protein Component in an Intact Protein Assembly. Journal of the American Society for Mass Spectrometry, 2010. 21(12): p. 1966-1968.
41. Zubarev, R.A., Electron-capture dissociation tandem mass spectrometry. Current Opinion in Biotechnology, 2004. 15(1): p. 12-16.
42. Iavarone, A.T., K. Paech, and E.R. Williams, Effects of charge state and cationizing agent on the electron capture dissociation of a peptide. Analytical Chemistry, 2004. 76(8): p. 2231-2238.
43. Xie, Y.M., et al., Top-down ESI-ECD-FT-ICR mass spectrometry localizes noncovalent protein-ligand binding sites. Journal of the American Chemical Society, 2006. 128(45): p. 14432-14433.
44. Cremades, N., et al., Direct Observation of the Interconversion of Normal and Toxic Forms of alpha-Synuclein. Cell, 2012. 149(5): p. 1048-1059.
45. Bohrer, B.C., et al., Biomolecule Analysis by Ion Mobility Spectrometry, in Annual Review of Analytical Chemistry. 2008, Annual Reviews: Palo Alto. p. 293-327.
46. Wu, K.P., et al., Structural Reorganization of alpha-Synuclein at Low pH Observed by NMR and REMD Simulations. Journal of Molecular Biology, 2009. 391(4): p. 784-796.
47. Bertoncini, C.W., et al., Release of long-range tertiary interactions potentiates aggregation of natively unstructured alpha-synuclein. Proceedings of the National Academy of Sciences of the United States of America, 2005. 102(5): p. 1430-1435.
48. Zhou, W.B., et al., Methionine oxidation stabilizes non-toxic oligomers of alpha-synuclein through strengthening the auto-inhibitory intra-molecular long-range interactions. Biochimica Et Biophysica Acta-Molecular Basis of Disease, 2010. 1802(3): p. 322-330.
49. Vorobyev, A., H.B. Hamidane, and Y.O. Tsybin, Electron Capture Dissociation Product Ion Abundances at the X Amino Acid in RAAAA-X-AAAAK Peptides Correlate with Amino Acid Polarity and Radical Stability. Journal of the American Society for Mass Spectrometry, 2009. 20(12): p. 2273-2283.
50. Trexler, A.J. and E. Rhoades, Single Molecule Characterization of alpha-Synuclein in Aggregation-Prone States. Biophysical Journal, 2010. 99(9): p. 3048-3055.
51. Giasson, B.I., et al., A hydrophobic stretch of 12 amino acid residues in the middle of alpha-synuclein is essential for filament assembly. Journal of Biological Chemistry, 2001. 276(4): p. 2380-2386.
52. Yamaguchi, Y., et al., Characterization of Inhibitor-Bound alpha-Synuclein Dimer: Role of alpha-Synuclein N-Terminal Region in Dimerization and Inhibitor Binding. Journal of Molecular Biology, 2010. 395(3): p. 445-456.

131
53. Krasnoslobodtsev, A.V., et al., alpha-Synuclein Misfolding Assessed with Single Molecule AFM Force Spectroscopy: Effect of Pathogenic Mutations. Biochemistry, 2013. 52(42): p. 7377-7386.
54. Binolfi, A., F.X. Theillet, and P. Selenko, Bacterial in-cell NMR of human alpha-synuclein: a disordered monomer by nature? Biochemical Society Transactions, 2012. 40: p. 950-U292.
55. Del Mar, C., et al., Structure and properties of alpha-synuclein and other amyloids determined at the amino acid level. Proceedings of the National Academy of Sciences of the United States of America, 2005. 102(43): p. 15477-15482.
56. Mysling, S., et al., Characterizing the Dynamics of a-Synuclein Oligomers Using Hydrogen/Deuterium Exchange Monitored by Mass Spectrometry. Biochemistry, 2013. 52(51): p. 9097-9103.
132
4 Following the Early Stages of
α-Synuclein Aggregation
The aggregation of α-Synuclein is key to its implication in the aetiology of Parkinson’s
disease. The aggregation process is complex and the species present diverse. It is important
to characterise the species present during the early stages of aggregation, rather than large
fibrillar aggregates, as they are likely to be the ‘druggable’ species
Here, Mass Spectrometry based methods have been applied to monitor the species present
during the early stages of aggregation. IM-MS and HDX-MS have been applied to probe the
conformation of these structures and the aggregation of α-Synuclein under Mass
Spectrometry compatible conditions has been demonstrated by TEM.
133
4.1. Introduction
The aggregation of α-Synuclein has previously been studied by a variety of techniques
including Fluorescence based assays such as the ThT assay [1], Dynamic Light Scattering
(DLS) [2], Small Angle X-ray Scattering (SAXS) [3], TEM [4], and Atomic Force Microscopy
(AFM) [5] amongst others, these references highlight excellent examples of each
techniques use. Common pitfalls of these methods include their low throughput nature, the
inherent biased nature of the test such as the reliance on the presence of β-sheet structure
of the ThT assay and low sensitivity, requiring high sample concentrations [6]. Mass
Spectrometry (MS) based methods offer a high throughput, low consumption, unbiased
method to characterise the species present during the early stages of aggregation. MS
based methods have been applied to investigate the aggregation of other amyloidogenic
proteins. A large body of work has been conducted by MS and Ion Mobility-Mass
Spectrometry (IM-MS) on the aggregation of β2-microglobulin, which is linked to dialysis-
related amyloidosis [7-23]. Amyloid-β [24-27] and Tau [28], two amyloidogenic proteins
implicated in Alzheimer’s disease have been previously investigated by MS and IM-MS.
Amylin [29-31] and the amyloid disease related, Transthyretin (TTR) [32] have also been
investigated.
The aggregation of α-Synuclein has been previously studied by MS based methods. Metal
ion binding has been demonstrated to have a large influence on aggregation. Copper has
been shown to influence α-Synuclein aggregation and MS has played a crucial role in
determining the interactions and effects, including the adoption of an aggregation
competent conformer [33-36]. Primarily, MS based methods have been applied to study the
effect of small molecules on α-Synuclein structure and aggregation. MS and IM-MS has
been used to investigate the effect of flavonoids including Baicalein [37, 38] and EGCG [39]
and the phenolic acid, gallic acid on α-Synuclein [40]. MS and IM-MS have also been applied
to investigate the effect of dopamine [41] and spermine [42] on α-Synuclein aggregation.
IM-MS has been previously utilised to investigate the effect of α-Synuclein fragments on
the aggregation of α-Synuclein [43, 44], whilst Illes-Toth et al. investigated the species
present [45] and Bernstein et al. investigated the impact of solution conditions [46]. A gas
phase solution for investigating solution phase conformers, Hydrogen Deuterium Exchange
Mass Spectrometry (HDX-MS) has been applied to probe the oligomeric species of the α-
Synuclein aggregation cascade [47-50].
134
The aim of the experiments in this chapter is to investigate the species present during the
early stages of α-Synuclein aggregation and to use gas phase and solution phase MS based
methods to probe the structure of these species, with a view to developing a method to
test drug candidates to aid the drug discovery process. The aggregation process is followed
on two time scales, a 96 hour time course and the aggregation in tip during a nESI-MS
experiment. The formation of fibrils under MS compatible conditions is demonstrated by
TEM. IM-MS is applied to probe the gas phase structure of species observed during
aggregation and the solution phase structures present during the early stages of
aggregation are investigated by HDX-MS.
The aggregation MS and IM-MS work has been published in part in Phillips et al. [51] and
the HDX-MS data has been published in part in Beveridge et al. [52].
135
4.2. Experimental
4.2.1. Sample Preparation
α-Synuclein samples remained frozen until time of analysis or incubation. The time from
thawing to introduction to the instrument was minimised. For the in tip aggregation
experiments, a freeze dryer (Heto LyoLab 3000) was used to alter sample concentration to
70 µM.
4.2.2. Aggregation Method
Samples were aggregated as described in Chapter 2 Section 2.3 for up to 120 hours. For in
tip aggregation, the sample was thawed, loaded into the nESI tip and presented to the
instrument. Aggregation was allowed to proceed without supplementary heating or
agitation. Samples for TEM were snap frozen at each aggregation time point and stored at -
80°C, prior to TEM grid preparation as described in Chapter 2 Section 2.13.
4.2.3. Mass Spectrometry
High resolution MS was conducted on QToF Ultima and QToF Ultima Global instruments
(Waters, Manchester, UK) with MS Vision high mass upgrade, operated in positive
ionisation mode. The source conditions were tuned to prevent the disruption of higher
order oligomers, tempered by the requirement for sufficient ion intensity. Instrument
parameters are listed in Chapter 2 Table 2.1.
4.2.4. Ion Mobility - Mass Spectrometry
IM-MS measurements were conducted on an in-house modified QToF instrument, the
MoQToF detailed in [53], operated in positive ionisation mode. Instrument parameters are
listed in Chapter 2 Table 2.2 and 2.3. The voltage applied across the cell was varied during
the experiment, between 60 V and 10 V. ATDs were recorded for at least 6 drift voltages
and processed as described in Chapter 2 Section 2.6.1.1. Time points were analysed in
triplicate.
4.2.5. Hydrogen Deuterium Exchange Mass Spectrometry
HDX analysis was conducted as described in Chapter 2 Section 2.11. Aggregation time
points were analysed in the same DynamX workflow and independently.

136
4.3. Results and Discussion
4.3.1. Following Aggregation via Mass Spectrometry
Figure 4.1 is the mass spectra of the 0 hour, 72 hour and 96 hour time points of a 96 hour in
vitro α-Synuclein aggregation time course. The 0 hour spectrum displays the same
characteristics described in Chapter 3 (Figure 3.1), wide CSDs and low order oligomeric
species ranging from dimers to tetramers are observed (Figure 4.1A). The monomer CSD
spans 5 ≤ z ≤ 27 and the spectra features a multimodal distribution with modes centred on
[aSyn+17H]17+ and [(aSyn)2+20H]20+. At later time points, the monomer CSD narrows (72 and
96 hours, 5 ≤ z ≤ 19) and the multimodal distribution shifts to favour lower charged states,
centred on [aSyn+14H]14+ for the monomer CSD at 72 hours and 96 hours (Figure 4.1B and
C). This suggests as the time course progresses extended α-Synuclein monomers in solution
are depleted, as these species would present as the highly charged species observed at the
0 hour time point due to their higher solvent accessibility. The depletion of these species
and their extended conformation suggests they are more amenable to aggregation.
Alternatively, the extended conformation may be in equilibrium with a fast aggregating
compact form. The loss of highly charged monomer intensity with time course progression
can be explained by the collapse of these extended species to form a compact species,
which rapidly aggregates to form higher order oligomers beyond the scope of the
experiment. This mechanism concurs with previously published data which demonstrates a
link between the assumption of a compact conformation and aggregation progression [42,
46, 54, 55].
Small changes are observed in the contribution of higher order oligomeric species to the
mass spectrum as the time course progresses. From 0 hours to 72 hours, there is a small
increase in the trimers observed, as the CSD increases from 0 hours: 19 ≤ z ≤ 26 to 72 hours:
16 ≤ z ≤ 29 (Figure 4.1A and B). Tetramers are the largest species observed during the time
course and are only observed in the 0 hour spectrum (Figure 4.1A). Larger oligomeric
species are expected and this suggests these low order oligomeric species which persist at
the later time points are potentially slow aggregating off pathway species. Their continued
presence and the presence of monomers following 96 hours under conditions shown to
form fibrils, suggests these species are in addition to a solution component which may be in
equilibrium with higher order species outside the scope of the technique.
It becomes increasingly difficult to achieve a stable nESI spray from the later time point
samples, indicating the presence of aggregates and as the time course progresses; the TIC
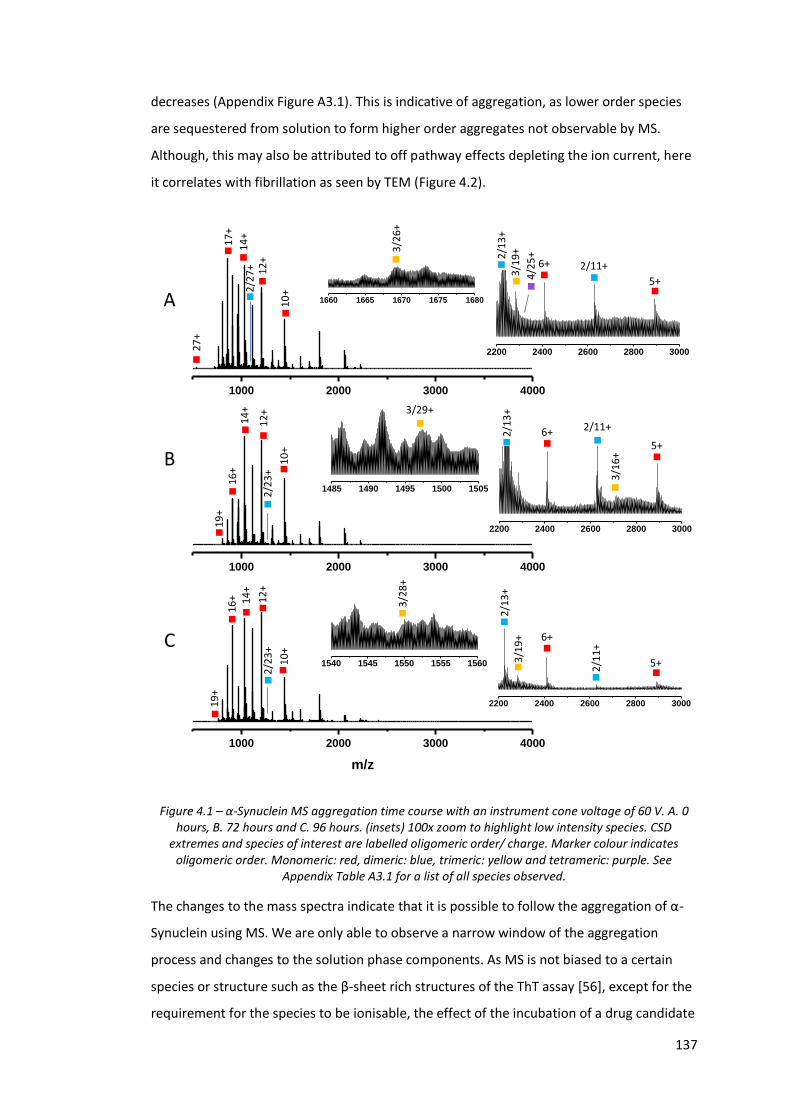
137
decreases (Appendix Figure A3.1). This is indicative of aggregation, as lower order species
are sequestered from solution to form higher order aggregates not observable by MS.
Although, this may also be attributed to off pathway effects depleting the ion current, here
it correlates with fibrillation as seen by TEM (Figure 4.2).
Figure 4.1 – α-Synuclein MS aggregation time course with an instrument cone voltage of 60 V. A. 0 hours, B. 72 hours and C. 96 hours. (insets) 100x zoom to highlight low intensity species. CSD
extremes and species of interest are labelled oligomeric order/ charge. Marker colour indicates oligomeric order. Monomeric: red, dimeric: blue, trimeric: yellow and tetrameric: purple. See
Appendix Table A3.1 for a list of all species observed.
The changes to the mass spectra indicate that it is possible to follow the aggregation of α-
Synuclein using MS. We are only able to observe a narrow window of the aggregation
process and changes to the solution phase components. As MS is not biased to a certain
species or structure such as the β-sheet rich structures of the ThT assay [56], except for the
requirement for the species to be ionisable, the effect of the incubation of a drug candidate
1000 2000 3000 4000
1000 2000 3000 4000
1000 2000 3000 4000
m/z
2200 2400 2600 2800 3000
2200 2400 2600 2800 3000
2200 2400 2600 2800 3000
1660 1665 1670 1675 1680
1485 1490 1495 1500 1505
1540 1545 1550 1555 1560
19
+
3/2
8+
2/2
3+
5+
19
+
27
+
3/1
9+
2/1
1+
2/11+
5+
2/2
3+ 3/1
6+
3/1
9+3
/26
+
2/11+
4/2
5+
3/29+
2/2
7+
5+
17
+1
6+
16
+
12
+1
2+
10
+1
0+
14
+1
4+
12
+
10
+
14
+
A
B
C 6+
6+
6+
2/1
3+
2/1
3+
2/1
3+
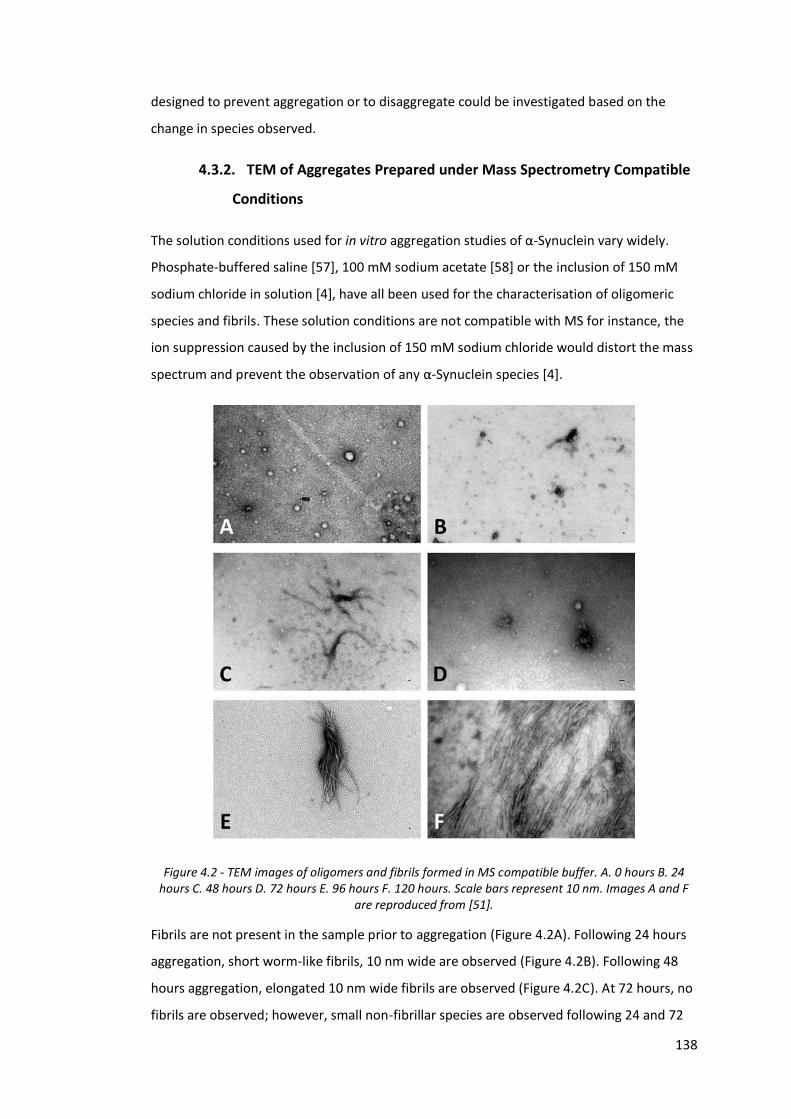
138
designed to prevent aggregation or to disaggregate could be investigated based on the
change in species observed.
4.3.2. TEM of Aggregates Prepared under Mass Spectrometry Compatible
Conditions
The solution conditions used for in vitro aggregation studies of α-Synuclein vary widely.
Phosphate-buffered saline [57], 100 mM sodium acetate [58] or the inclusion of 150 mM
sodium chloride in solution [4], have all been used for the characterisation of oligomeric
species and fibrils. These solution conditions are not compatible with MS for instance, the
ion suppression caused by the inclusion of 150 mM sodium chloride would distort the mass
spectrum and prevent the observation of any α-Synuclein species [4].
Figure 4.2 - TEM images of oligomers and fibrils formed in MS compatible buffer. A. 0 hours B. 24 hours C. 48 hours D. 72 hours E. 96 hours F. 120 hours. Scale bars represent 10 nm. Images A and F
are reproduced from [51].
Fibrils are not present in the sample prior to aggregation (Figure 4.2A). Following 24 hours
aggregation, short worm-like fibrils, 10 nm wide are observed (Figure 4.2B). Following 48
hours aggregation, elongated 10 nm wide fibrils are observed (Figure 4.2C). At 72 hours, no
fibrils are observed; however, small non-fibrillar species are observed following 24 and 72
139
hours of aggregation. Short 10 nm wide fibrils are observed following 96 hours aggregation,
whilst more abundant long 10 nm wide fibrils are observed following 120 hours (Figure
4.2F). These fibrils match the typical morphology exhibited by the α-Synuclein fibrils
characterised by TEM by Spillantini et al. [59], El-Agnaf et al. [57], Conway et al. [60], and
Hashimoto et al. [58]. The characterisation of these fibrils also concurs with those
characterised by Fink using AFM [5]. These images demonstrate it is possible to form fibrils
under MS compatible conditions and validates the time points chosen for the MS
aggregation time courses.
4.3.3. In Tip Aggregation
α-Synuclein aggregation kinetics can follow a typical sigmoidal growth curve, characterised
by a short lag phase [61]. The lag phase is populated by lower order oligomeric species,
present prior to their sequestration into higher order species. Small aggregates were
observed by TEM following 24 hours under MS compatible aggregation conducive
conditions (Figure 4.2B) and it is possible to observe the presence of aggregates in the end
of the nESI tip following a long MS experiment (Appendix Figure A3.2). Figure 4.3A to H are
the spectra collected during an extended nESI in tip aggregation experiment.
Figure 4.3A is the spectrum of the first five minutes of acquisition and as observed
previously (Chapter 3 and Figure 4.1), wide CSDs and low order oligomeric species ranging
from dimers to tetramers are observed. The samples used in the in tip experiments are not
incubated or agitated; however, there are indicators that aggregation is occurring and
aggregates are observed in the end of tip used to spray the sample of Figure 4.3 (Appendix
Figure A3.2). As the time course progresses, fewer higher order oligomeric species are
observed. Tetramers are no longer observed after 35 minutes (Figure 4.3D), trimers are no
longer observed following 45 minutes (Figure 4.3E) and only monomers are observed
following 55 minutes (Figure 4.3F). The narrowing of the CSDs is indicative of aggregation as
species are depleted from solution by sequestration into higher order aggregates not visible
by MS. The raised baseline observed at later time points is also indicative of aggregation
and the presence of unresolved higher order oligomers. The TIC falls with time course
progression, as observed during the 96 hour time course, as lower order species are
sequestered from solution (Appendix Figure A3.3). As observed during the long term
aggregation time course, higher charged monomeric species are depleted with time course
progression (see Figure 4.3D to F). In addition, lower charged monomeric species are also
depleted (see Figure 4.3B vs. E vs. H). The depletion of the lower charged species in
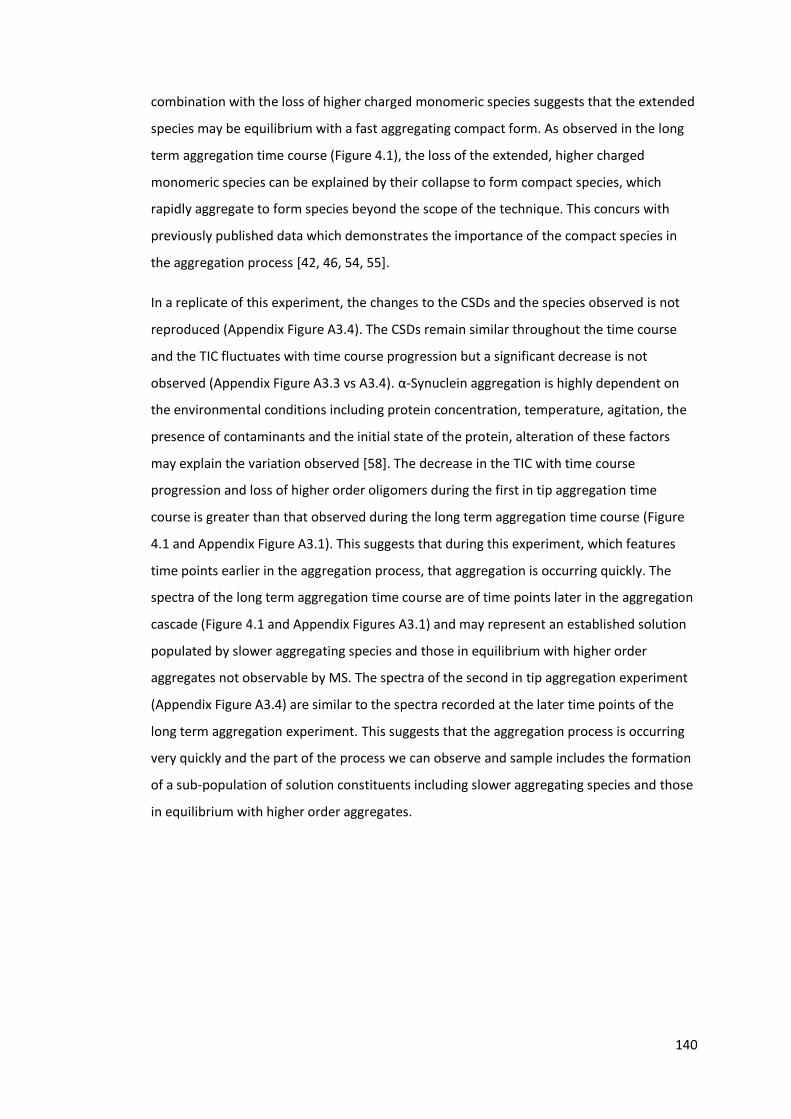
140
combination with the loss of higher charged monomeric species suggests that the extended
species may be equilibrium with a fast aggregating compact form. As observed in the long
term aggregation time course (Figure 4.1), the loss of the extended, higher charged
monomeric species can be explained by their collapse to form compact species, which
rapidly aggregate to form species beyond the scope of the technique. This concurs with
previously published data which demonstrates the importance of the compact species in
the aggregation process [42, 46, 54, 55].
In a replicate of this experiment, the changes to the CSDs and the species observed is not
reproduced (Appendix Figure A3.4). The CSDs remain similar throughout the time course
and the TIC fluctuates with time course progression but a significant decrease is not
observed (Appendix Figure A3.3 vs A3.4). α-Synuclein aggregation is highly dependent on
the environmental conditions including protein concentration, temperature, agitation, the
presence of contaminants and the initial state of the protein, alteration of these factors
may explain the variation observed [58]. The decrease in the TIC with time course
progression and loss of higher order oligomers during the first in tip aggregation time
course is greater than that observed during the long term aggregation time course (Figure
4.1 and Appendix Figure A3.1). This suggests that during this experiment, which features
time points earlier in the aggregation process, that aggregation is occurring quickly. The
spectra of the long term aggregation time course are of time points later in the aggregation
cascade (Figure 4.1 and Appendix Figures A3.1) and may represent an established solution
populated by slower aggregating species and those in equilibrium with higher order
aggregates not observable by MS. The spectra of the second in tip aggregation experiment
(Appendix Figure A3.4) are similar to the spectra recorded at the later time points of the
long term aggregation experiment. This suggests that the aggregation process is occurring
very quickly and the part of the process we can observe and sample includes the formation
of a sub-population of solution constituents including slower aggregating species and those
in equilibrium with higher order aggregates.
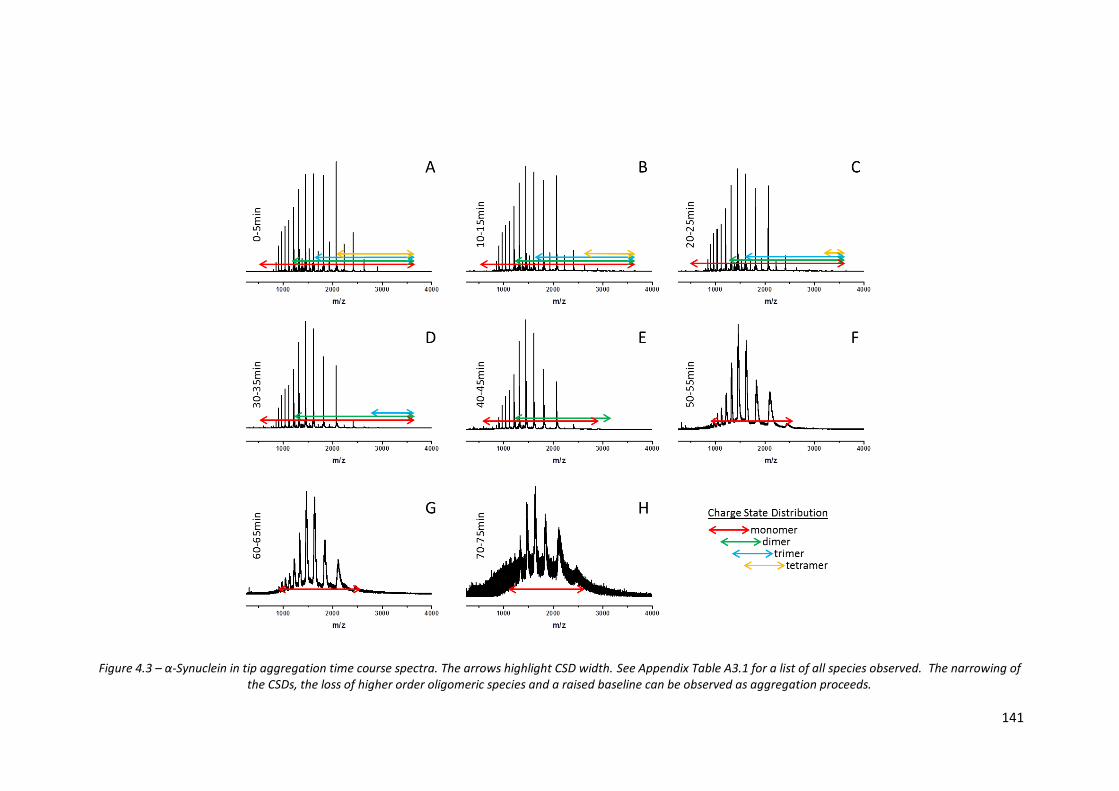
141
Figure 4.3 – α-Synuclein in tip aggregation time course spectra. The arrows highlight CSD width. See Appendix Table A3.1 for a list of all species observed. The narrowing of the CSDs, the loss of higher order oligomeric species and a raised baseline can be observed as aggregation proceeds.
142
4.3.4. Probing the Conformational Changes during Aggregation by Ion
Mobility - Mass Spectrometry
IM-MS is applied to probe conformational changes exhibited by α-Synuclein monomer and
dimer species during the aggregation process. Figure 4.4 and 4.5 show the mass spectra
and corresponding Collision Cross Section Distributions (CCSDs) generated following the in
vitro aggregation of α-Synuclein using the MoQToF. In this work, we focus on three
monomeric and two dimeric charge states.
Figure 4.4 - Mass spectra recorded during the α-Synuclein IM-MS aggregation time course. See Appendix Table A3.1 for a list of all species observed. Image reproduced from [51].
[aSyn+6H]6+ displays a narrow CCSD is centred on 1400 Å2, similar to that reported in the
cross-linking IM-MS experiments (Chapter 3, Figure 3.9) for the entire time course. At Day 0
(Figure 4.5Ai), there is a small shoulder which is attributed to the mass-coincident
[(aSyn)2+12H]12+ species. The large error bars indicate that these species are transient and
the absence in the Day 3 and Day 5 CCSDs highlight α-Synucleins conformationally dynamic
143
nature. The [aSyn+10H]10+ CCSD (Figure 4.5B) presents a much wider distribution than
[aSyn+6H]6+, attributed in part to the greater levels of coulombic repulsion suffered by a
higher charged species. The presence of an unfolded conformational family highlighted by
cross-linking IM-MS data in Chapter 3 Figure 3.9, also accounts for the broad CCSD. The
CCSD is centred on 1800 Å2, with a small shoulder at all time points, centred on ~2300 Å2. In
comparison with Bernstein et al. despite the use of different ionisation polarities, the CCSs
derived are in good general agreement. There is a discrepancy in the CCS values derived
from the [aSyn+10H]10+ species. The major species defined by Bernstein et al. is ~2500 Å2
(Figure 4, [46]), whereas the major peak in the CCSD in Figure 4.5B is centred on ~1800 Å2,
the persistent shoulder being centred on ~2300 Å2. This may be explained by our
instrument having a ‘cooler’ source, resulting in less protein unfolding during the ionisation
and desolvation process or by a difference resulting from different charge location, due to
the switch of ionisation polarity. The CCSD of [aSyn+13H]13+ is similarly broad and centred
on ~3000 Å2 for the entire time course. A shoulder is also present and attributed to a
compact conformer, the large errors bars highlight this species is transient and it is absent
from the later time point CCSDs (Figure 4.5Cii and Ciii).
The day 0 [(aSyn)2+13H]13+ dimer CCSD (Figure 4.5Di), presents a broad distribution, centred
on ~3000 Å2 with a small shoulder centred on ~3600 Å2. This shoulder becomes more
intense in the day 3 CCSD and is present in the day 5 CCSD; however, is obscured by
broadening of the ~3000 Å2 peak (Figure 4.5Diii). The CCSD of [(aSyn)2+17H]17+, the highest
charged dimer examined, is again broad and centred on ~3900 Å2 with a shoulder centred
on ~3200 Å2. The large errors bars of the CCSDs indicate the presence of several lowly
populated conformational dynamic species and again highlight the variation exhibited by α-
Synuclein.
As expected the CCS exhibited increases with charge state. The large spread in CCS across
the CSD (ΔCCS ~1600 Å2) and the large spread in CCS seen for each charge state indicates
that the protein is flexible in solution and able to adopt multiple conformations in the
solution and gas phase. The large error bars present on some CCSDs highlight the
conformational variation exhibited by α-Synuclein. This is even more evident in the CCSDs
of the dimer species investigated (Figure 4.5D and E). This large variation in the dimer CCS
concurs with the work of Illes-Toth et al. [45] and Ray et al. [62].
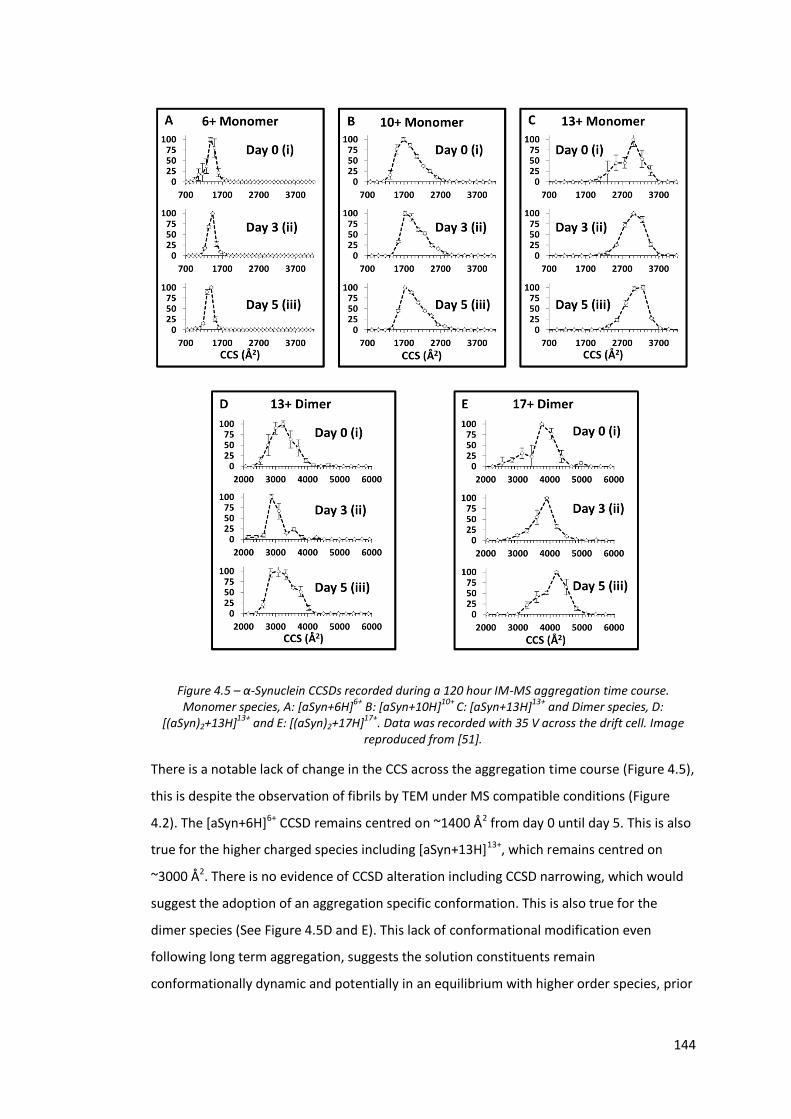
144
Figure 4.5 – α-Synuclein CCSDs recorded during a 120 hour IM-MS aggregation time course. Monomer species, A: [aSyn+6H]6+ B: [aSyn+10H]10+ C: [aSyn+13H]13+ and Dimer species, D:
[(aSyn)2+13H]13+ and E: [(aSyn)2+17H]17+. Data was recorded with 35 V across the drift cell. Image reproduced from [51].
There is a notable lack of change in the CCS across the aggregation time course (Figure 4.5),
this is despite the observation of fibrils by TEM under MS compatible conditions (Figure
4.2). The [aSyn+6H]6+ CCSD remains centred on ~1400 Å2 from day 0 until day 5. This is also
true for the higher charged species including [aSyn+13H]13+, which remains centred on
~3000 Å2. There is no evidence of CCSD alteration including CCSD narrowing, which would
suggest the adoption of an aggregation specific conformation. This is also true for the
dimer species (See Figure 4.5D and E). This lack of conformational modification even
following long term aggregation, suggests the solution constituents remain
conformationally dynamic and potentially in an equilibrium with higher order species, prior
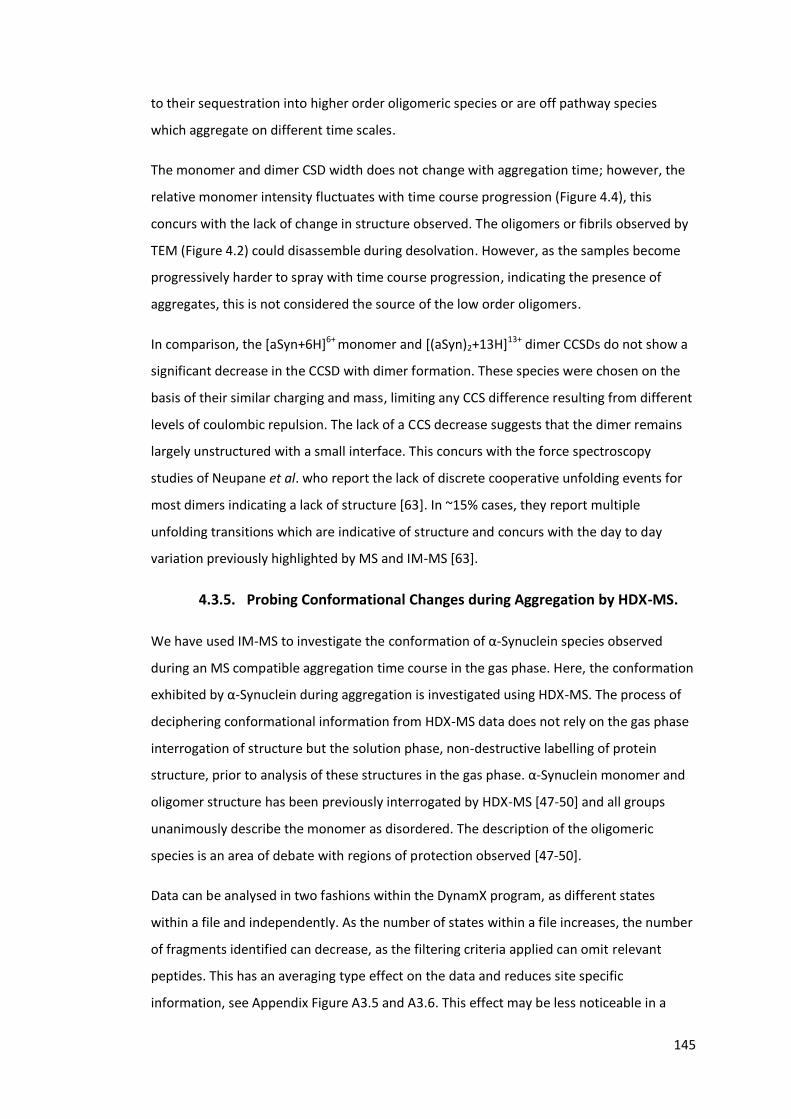
145
to their sequestration into higher order oligomeric species or are off pathway species
which aggregate on different time scales.
The monomer and dimer CSD width does not change with aggregation time; however, the
relative monomer intensity fluctuates with time course progression (Figure 4.4), this
concurs with the lack of change in structure observed. The oligomers or fibrils observed by
TEM (Figure 4.2) could disassemble during desolvation. However, as the samples become
progressively harder to spray with time course progression, indicating the presence of
aggregates, this is not considered the source of the low order oligomers.
In comparison, the [aSyn+6H]6+ monomer and [(aSyn)2+13H]13+ dimer CCSDs do not show a
significant decrease in the CCSD with dimer formation. These species were chosen on the
basis of their similar charging and mass, limiting any CCS difference resulting from different
levels of coulombic repulsion. The lack of a CCS decrease suggests that the dimer remains
largely unstructured with a small interface. This concurs with the force spectroscopy
studies of Neupane et al. who report the lack of discrete cooperative unfolding events for
most dimers indicating a lack of structure [63]. In ~15% cases, they report multiple
unfolding transitions which are indicative of structure and concurs with the day to day
variation previously highlighted by MS and IM-MS [63].
4.3.5. Probing Conformational Changes during Aggregation by HDX-MS.
We have used IM-MS to investigate the conformation of α-Synuclein species observed
during an MS compatible aggregation time course in the gas phase. Here, the conformation
exhibited by α-Synuclein during aggregation is investigated using HDX-MS. The process of
deciphering conformational information from HDX-MS data does not rely on the gas phase
interrogation of structure but the solution phase, non-destructive labelling of protein
structure, prior to analysis of these structures in the gas phase. α-Synuclein monomer and
oligomer structure has been previously interrogated by HDX-MS [47-50] and all groups
unanimously describe the monomer as disordered. The description of the oligomeric
species is an area of debate with regions of protection observed [47-50].
Data can be analysed in two fashions within the DynamX program, as different states
within a file and independently. As the number of states within a file increases, the number
of fragments identified can decrease, as the filtering criteria applied can omit relevant
peptides. This has an averaging type effect on the data and reduces site specific
information, see Appendix Figure A3.5 and A3.6. This effect may be less noticeable in a
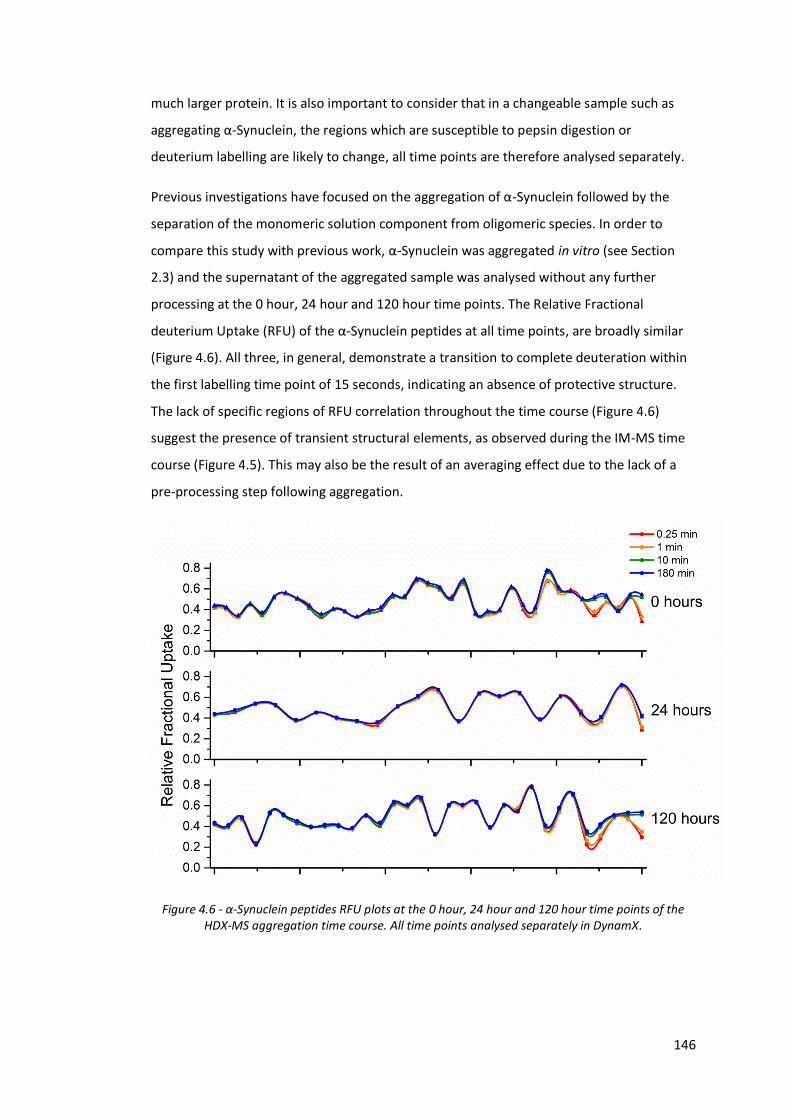
146
much larger protein. It is also important to consider that in a changeable sample such as
aggregating α-Synuclein, the regions which are susceptible to pepsin digestion or
deuterium labelling are likely to change, all time points are therefore analysed separately.
Previous investigations have focused on the aggregation of α-Synuclein followed by the
separation of the monomeric solution component from oligomeric species. In order to
compare this study with previous work, α-Synuclein was aggregated in vitro (see Section
2.3) and the supernatant of the aggregated sample was analysed without any further
processing at the 0 hour, 24 hour and 120 hour time points. The Relative Fractional
deuterium Uptake (RFU) of the α-Synuclein peptides at all time points, are broadly similar
(Figure 4.6). All three, in general, demonstrate a transition to complete deuteration within
the first labelling time point of 15 seconds, indicating an absence of protective structure.
The lack of specific regions of RFU correlation throughout the time course (Figure 4.6)
suggest the presence of transient structural elements, as observed during the IM-MS time
course (Figure 4.5). This may also be the result of an averaging effect due to the lack of a
pre-processing step following aggregation.
Figure 4.6 - α-Synuclein peptides RFU plots at the 0 hour, 24 hour and 120 hour time points of the HDX-MS aggregation time course. All time points analysed separately in DynamX.
147
The C- terminal region of α-Synuclein exhibits some protection at the 0 hour and 120 hour
time points, highlighted by the increase in RFU as a function of labelling time (Figure 4.6,
top and bottom). This concurs with previously identified protective C- terminal interactions
with other regions of the protein via ECD-FT-ICR MS (Chapter 3). The C- terminal region also
displays a much greater variation in RFU, this is contrast to the data of Mysling et al. who
report a uniform RFU of 1.0, which suggests the absence of structure [48] and supports the
earlier findings of Del Mar et al. [47]. The central protected region reported by Del Mar et
al. and Mysling et al. is also not observed [47, 48]. Mysling et al. report a protected region
in the N-terminus (residues 4-17), following 120 hours under aggregation conducive
conditions, a partially overlapping-protected region (residues 9-21) is observed.
The oscillating RFU highlights the presence of transient structure elements, indicating that
the solution component of α-Synuclein aggregated in vitro remains conformationally
diverse and an aggregation competent structure is not adopted, as reported by IM-MS. The
untargeted approach used, may explain the poor correlation between our findings and
those reported by Mysling et al. and Del Mar et al. [47, 48].Our findings demonstrate that
the solution component is populated by a range of species and demonstrates significant
variation as previously observed.
148
4.4. Summary
One of the aims of the experiments in this chapter was to investigate the species present
during the early stages of α-Synuclein aggregation using MS based methods. It is possible to
observe a wide range of species during the short term and long term in vitro aggregation
time course experiments and it is possible to relate the changes in species observed to
possible aggregation mechanisms. The loss of highly charged monomeric species with
aggregation progression during the long term aggregation time course, highlighted in Figure
4.1, suggests these species are amenable to aggregation. The loss of the highly charged,
extended monomeric species may also be the result of this species being in equilibrium
with a compact, fast aggregating species, which rapidly aggregates beyond the scope of the
technique. The loss of the extended species resulting from its collapse to form the compact.
This mechanism correlates with the loss of lower charged, compact species with time
course progression during the in tip aggregation time course experiments, highlighted in
Figure 4.3, during which the loss of higher charged, extended monomeric species is also
observed. This also concurs with previously published data, which highlights the importance
of the compact conformer to aggregation progression. The observation of fibrils via TEM
from samples aggregated under MS compatible conditions demonstrates that the species
observed are part of the aggregation process. In addition, the variation in the species
observed correlates with the variation discussed in Chapter 3 and complicates the process.
The aim of the IM-MS and HDX-MS experiments was to probe the structure of the species
observed in the gas and solution phase, respectively. As highlighted in Chapter 3, the large
spread in CCS across the CSD and in the CCSs for each charge state indicates that α-
Synuclein is flexible in solution and able to adopt multiple conformations. The transient
species and the large error bars highlight α-Synucleins conformationally dynamic nature.
The lack of a CCS decrease when comparing a similarly charged monomer and dimer
suggests that the α-Synuclein dimer remains unstructured, this concurs with previous force
spectroscopy studies [63]. The lack of distinct regions of protection observed by HDX-MS
demonstrates that the solution component of the α-Synuclein sample remains
conformationally diverse. The poor correlation between these results and previously
published data may be explained by the different sample preparation techniques.
Importantly, IM-MS and HDX-MS are unable to identify a single aggregation prone
conformer following the in vitro aggregation of α-Synuclein.

149
Based on these experiments, there is further scope for the application of MS and IM-MS to
follow the aggregation of α-Synuclein and other amyloidogenic proteins including
investigating the effect of small molecules on the species observed and their conformation,
with a view to aiding drug discovery.

150
4.5. References
1. Buell, A.K., et al., Solution conditions determine the relative importance of nucleation and growth processes in alpha-synuclein aggregation. Proceedings of the National Academy of Sciences of the United States of America, 2014. 111(21): p. 7671-7676.
2. Dusa, A., et al., Characterization of oligomers during alpha-synuclein aggregation using intrinsic tryptophan fluorescence. Biochemistry, 2006. 45(8): p. 2752-2760.
3. Rekas, A., et al., The structure of dopamine induced alpha-synuclein oligomers. European Biophysics Journal with Biophysics Letters, 2010. 39(10): p. 1407-1419.
4. Anderson, V.L. and W.W. Webb, Transmission electron microscopy characterization of fluorescently labelled amyloid beta 1-40 and alpha-synuclein aggregates. Bmc Biotechnology, 2011. 11.
5. Fink, A.L., The aggregation and fibrillation of alpha-synuclein. Accounts of Chemical Research, 2006. 39(9): p. 628-634.
6. Giehm, L., N. Lorenzen, and D.E. Otzen, Assays for alpha-synuclein aggregation. Methods, 2011. 53(3): p. 295-305.
7. Lim, J. and R.W. Vachet, Using mass spectrometry to study copper-protein binding under native and non-native conditions: beta-2-microglobulin. Analytical Chemistry, 2004. 76(13): p. 3498-3504.
8. Smith, A.M., et al., Direct observation of oligomeric species formed in the early stages of amyloid fibril formation using electrospray ionisation mass spectrometry. Journal of Molecular Biology, 2006. 364(1): p. 9-19.
9. Smith, D.P., S.E. Radford, and A.E. Ashcroft, Elongated oligomers in beta(2)-microglobulin amyloid assembly revealed by ion mobility spectrometry-mass spectrometry. Proceedings of the National Academy of Sciences of the United States of America, 2010. 107(15): p. 6794-6798.
10. Woods, L.A., et al., Ligand binding to distinct states diverts aggregation of an amyloid-forming protein. Nature Chemical Biology, 2011. 7(10): p. 730-739.
11. Smith, D.P., et al., Structure and Dynamics of Oligomeric Intermediates in beta(2)-Microglobulin Self-Assembly. Biophysical Journal, 2011. 101(5): p. 1238-1247.
12. Leney, A.C., et al., Insights into the role of the beta-2 microglobulin D-strand in amyloid propensity revealed by mass spectrometry. Molecular Biosystems, 2014. 10.
13. Mendoza, V.L., et al., Structure of the Preamyloid Dimer of beta-2-Microglobulin from Covalent Labeling and Mass Spectrometry. Biochemistry, 2010. 49(7): p. 1522-1532.
14. Bellotti, V., et al., beta 2-microglobulin can be refolded into a native state from ex vivo amyloid fibrils. European Journal of Biochemistry, 1998. 258(1): p. 61-67.
15. Esposito, G., et al., Removal of the N-terminal hexapeptide from human beta 2-microglobulin facilitates protein aggregation and fibril formation. Protein Science, 2000. 9(5): p. 831-845.
16. Myers, S.L., et al., Investigating the structural properties of amyloid-like fibrils formed in vitro from beta 2-microglobulin using limited proteolysis and electrospray ionisation mass spectrometry. Rapid Communications in Mass Spectrometry, 2006. 20(11): p. 1628-1636.
17. Smith, D.P., et al., Monitoring copopulated conformational states during protein folding events using Electrospray ionization-ion mobility spectrometry-mass spectrometry. Journal of the American Society for Mass Spectrometry, 2007. 18(12): p. 2180-2190.
151
18. Borysik, A.J.H., S.E. Radford, and A.E. Ashcroft, Co-populated conformational ensembles of beta(2)-microglobulin uncovered quantitatively by electrospray ionization mass spectrometry. Journal of Biological Chemistry, 2004. 279(26): p. 27069-27077.
19. Eakin, C.M., et al., Formation of a copper specific binding site in non-native states of beta-2-microglobulin. Biochemistry, 2002. 41(34): p. 10646-10656.
20. Srikanth, R., et al., Copper Binding to beta-2-Microglobulin and Its Pre-Amyloid Oligomer. Biochemistry, 2009. 48(41): p. 9871-9881.
21. Azinas, S., et al., D-strand perturbation and amyloid propensity in beta-2 microglobulin. Febs Journal, 2011. 278(13): p. 2349-2358.
22. Mendoza, V.L., et al., Structural Insights into the Pre-Amyloid Tetramer of beta-2-Microglobulin from Covalent Labeling and Mass Spectrometry. Biochemistry, 2011. 50(31): p. 6711-6722.
23. Dong, J., et al., Unique Effect of Cu(II) in the Metal-Induced Amyloid Formation of beta-2-Microglobulin. Biochemistry, 2014. 53(8): p. 1263-1274.
24. Bernstein, S.L., et al., Amyloid beta-protein: Monomer structure and early aggregation states of A beta 42 and its Pro(19) alloform. Journal of the American Chemical Society, 2005. 127(7): p. 2075-2084.
25. Murray, M.M., et al., Amyloid beta Protein: A beta 40 Inhibits A beta 42 Oligomerization. Journal of the American Chemical Society, 2009. 131(18): p. 6316-+.
26. Bernstein, S.L., et al., Amyloid-beta protein oligomerization and the importance of tetramers and dodecamers in the aetiology of Alzheimer's disease. Nature Chemistry, 2009. 1(4): p. 326-331.
27. Gessel, M.M., et al., A beta(39-42) Modulates A beta Oligomerization but Not Fibril Formation. Biochemistry, 2012. 51(1): p. 108-117.
28. Larini, L., et al., Initiation of assembly of tau(273-284) and its Delta K280 mutant: an experimental and computational study. Physical Chemistry Chemical Physics, 2013. 15(23): p. 8916-8928.
29. Dupuis, N.F., et al., Human Islet Amyloid Polypeptide Monomers Form Ordered beta-hairpins: A Possible Direct Amyloidogenic Precursor. Journal of the American Chemical Society, 2009. 131(51): p. 18283-18292.
30. Young, L.M., et al., Ion Mobility-Mass Spectrometry Defines the Oligomeric Intermediates in Amylin Amyloid Formation and the Mode of Action of Inhibitors. Journal of the American Chemical Society, 2014. 136: p. 660-670.
31. Young, L., et al., Monitoring oligomer formation from self-aggregating amylin peptides using ESI-IMS-MS. international Journal for Ion Mobility Spectrometry, 2013. 16: p. 29-39.
32. Cole, H.L., et al., Characterizing Early Aggregates Formed by an Amyloidogenic Peptide by Mass Spectrometry. Angewandte Chemie-International Edition, 2010. 49(49): p. 9448-9451.
33. Natalello, A., et al., Compact conformations of alpha-synuclein induced by alcohols and copper. Proteins-Structure Function and Bioinformatics, 2011. 79(2): p. 611-621.
34. Hong, L. and J.D. Simon, Binding of Cu(II) to Human alpha-Synucleins: Comparison of Wild Type and the Point Mutations Associated with the Familial Parkinson's Disease. Journal of Physical Chemistry B, 2009. 113(28): p. 9551-9561.
35. Binolfi, A., et al., Site-specific interactions of Cu(II) with alpha and beta-synuclein: Bridging the molecular gap between metal binding and aggregation. Journal of the American Chemical Society, 2008. 130(35): p. 11801-11812.
36. Ly, T. and R.R. Julian, Protein-Metal Interactions of Calmodulin and alpha-Synuclein Monitored by Selective Noncovalent Adduct Protein Probing Mass Spectrometry.
152
Journal of the American Society for Mass Spectrometry, 2008. 19(11): p. 1663-1672.
37. Zhu, M., et al., The flavonoid baicalein inhibits fibrillation of alpha-synuclein and disaggregates existing fibrils. Journal of Biological Chemistry, 2004. 279(26): p. 26846-26857.
38. Meng, X.Y., et al., Molecular Mechanisms Underlying the Flavonoid-Induced Inhibition of alpha-Synuclein Fibrillation. Biochemistry, 2009. 48(34): p. 8206-8224.
39. Liu, Y.Q., et al., Ion Mobility Mass Spectrometry Studies of the Inhibition of Alpha Synuclein Amyloid Fibril Formation by (-)-Epigallocatechin-3-Gallate. Australian Journal of Chemistry, 2011. 64(1): p. 36-40.
40. Liu, Y.Q., et al., Gallic acid interacts with alpha-synuclein to prevent the structural collapse necessary for its aggregation. Biochimica Et Biophysica Acta-Proteins and Proteomics, 2014. 1844(9): p. 1481-1485.
41. Illes-Toth, E., C.F. Dalton, and D.P. Smith, Binding of Dopamine to Alpha-Synuclein is Mediated by Specific Conformational States. Journal of the American Society for Mass Spectrometry, 2013. 24(9): p. 1346-1354.
42. Grabenauer, M., et al., Spermine binding to Parkinson's protein alpha-synuclein and its disease-related A30P and A53T mutants. Journal of Physical Chemistry B, 2008. 112(35): p. 11147-11154.
43. Vlad, C., et al., Autoproteolytic Fragments Are Intermediates in the Oligomerization/Aggregation of the Parkinson's Disease Protein Alpha-Synuclein as Revealed by Ion Mobility Mass Spectrometry. Chembiochem, 2011. 12(18): p. 2740-2744.
44. Vlad, C., et al., Characterization of oligomerization-aggregation products of neurodegenerative target proteins by ion mobility mass spectrometry. Methods in molecular biology (Clifton, N.J.), 2012. 896: p. 399-412.
45. Illes-Toth, E., et al., Distinct higher-order alpha-synuclein oligomers induce intracellular aggregation. Biochemical Journal, 2015. 468: p. 485-493.
46. Bernstein, S.L., et al., alpha-synuclein: Stable compact and extended monomeric structures and pH dependence of dimer formation. Journal of the American Society for Mass Spectrometry, 2004. 15(10): p. 1435-1443.
47. Del Mar, C., et al., Structure and properties of alpha-synuclein and other amyloids determined at the amino acid level. Proceedings of the National Academy of Sciences of the United States of America, 2005. 102(43): p. 15477-15482.
48. Mysling, S., et al., Characterizing the Dynamics of a-Synuclein Oligomers Using Hydrogen/Deuterium Exchange Monitored by Mass Spectrometry. Biochemistry, 2013. 52(51): p. 9097-9103.
49. Lee, S.J.C., et al., Probing Conformational Change of Intrinsically Disordered alpha-Synuclein to Helical Structures by Distinctive Regional Interactions with Lipid Membranes. Analytical Chemistry, 2014. 86(3): p. 1909-1916.
50. Paslawski, W., et al., Co-existence of Two Different alpha-Synuclein Oligomers with Different Core Structures Determined by Hydrogen/Deuterium Exchange Mass Spectrometry. Angewandte Chemie (International ed. in English), 2014. 53(29).
51. Phillips, A.S., et al., Conformational dynamics of alpha-synuclein: insights from mass spectrometry. Analyst, 2015. 140(9): p. 3070-3081.
52. Beveridge, R., et al., Relating gas phase to solution conformations: Lessons from disordered proteins. Proteomics, 2015. 15(16): p. 2872-2883.
53. McCullough, B.J., et al., Development of an ion mobility quadrupole time of flight mass spectrometer. Analytical Chemistry, 2008. 80(16): p. 6336-6344.
54. Mason, R.J., et al., Copper Binding and Subsequent Aggregation of alpha-Synuclein Are Modulated by N-Terminal Acetylation and Ablated by the H50Q Missense Mutation. Biochemistry, 2016. 55(34): p. 4737-4741.
153
55. Frimpong, A.K., et al., Characterization of intrinsically disordered proteins with electrospray ionization mass spectrometry: Conformational heterogeneity of alpha-synuclein. Proteins-Structure Function and Bioinformatics, 2010. 78(3): p. 714-722.
56. Roberts, H.L. and D.R. Brown, Seeking a Mechanism for the Toxicity of Oligomeric alpha-Synuclein. Biomolecules, 2015. 5(2): p. 282-305.
57. El-Agnaf, O.M.A., et al., Effects of the mutations Ala(30) to Pro and Ala(53) to Thr on the physical and morphological properties of alpha-synuclein protein implicated in Parkinson's disease. Febs Letters, 1998. 440(1-2): p. 67-70.
58. Hashimoto, M., et al., Human recombinant NACP/alpha-synuclein is aggregated and fibrillated in vitro: Relevance for Lewy body disease. Brain Research, 1998. 799(2): p. 301-306.
59. Spillantini, M.G., Crowther, R. A., Jakes, R., Hasegawa, M., Goedert, M., alpha-Synuclein in filamentous inclusions of Lewy bodies from Parkinson's disease and dementia with lewy bodies. Proceedings of the National Academy of Sciences, 1998. 95: p. 6469-6473.
60. Conway, K.A., J.D. Harper, and P.T. Lansbury, Fibrils formed in vitro from alpha-synuclein and two mutant forms linked to Parkinson's disease are typical amyloid. Biochemistry, 2000. 39(10): p. 2552-2563.
61. Meuvis, J., et al., The Conformation and the Aggregation Kinetics of alpha-Synuclein Depend on the Proline Residues in Its C-Terminal Region. Biochemistry, 2010. 49(43): p. 9345-9352.
62. Ray, C. and B.B. Akhremitchev, Conformational heterogeneity of surface-grafted amyloidogenic fragments of alpha-synuclein dimers detected by atomic force microscopy. Journal of the American Chemical Society, 2005. 127(42): p. 14739-14744.
63. Neupane, K., et al., Diverse Metastable Structures Formed by Small Oligomers of alpha-Synuclein Probed by Force Spectroscopy. Plos One, 2014. 9(1).

154
5 Structure and Interactions of
Aβ(1-42) and Aβ(1-40)
The Amyloid-β peptides derived from the Amyloid Precursor Protein are linked to the
progression of Alzheimer’s disease. Mass spectrometry is used here to examine two
variants, Aβ(1-42) and Aβ(1-40). Although they differ in length by only two amino acids,
they differ dramatically in terms of other characteristics including aggregation propensity.
Here, mass spectrometry probes both the structure and aggregation of Aβ(1-42) and Aβ(1-
40) as well as interactions with proposed inhibitors.
155
5.1. Introduction
The Amyloid-β (Aβ) peptides are derived through the proteolytic cleavage of the Amyloid
Precursor Protein (APP) and differ in terms of length and characteristics including structure
and aggregation propensity, see Chapter 1 Section 1.5 and Figures 1.7 to 1.11 [1]. Their
implication in the development of Alzheimer’s disease has led to their widespread study
including the use of MS based methods [1]. Aβ(1-42) and Aβ(1-40) are the two most
commonly studied peptides. MS and IM-MS have been used to study the aggregation of
Aβ(1-40) inferring conformational modifications based on charge state analysis [2]. Young
et al. used Travelling Wave Ion Mobility Mass Spectrometry (TWIMS) to study the co-
assembly of Aβ(1-40) and hIAPP, comparing homo- and heterodimers and their properties
[3]. Immuno-precipitation MS has highlighted the preferential incorporation of Aβ(1-42)
into fibrils from the co-incubation of Aβ(1-40) and Aβ(1-42) monomers [4]. The Bowers
group is a major contributor to the study of the Aβ peptides, frequently employing both
molecular modelling and IM-MS to investigate monomeric [5-7] and oligomeric structure
[8]. They have used this data to propose an assembly mechanism from monomer through
oligomeric species to fibrils [9-11]. Bernstein et al. hypothesised that following the
formation of an open tetramer, hexamer paranucleus and paranuclear dimer, the Aβ(1-42)
aggregation pathway diverges to form oligomers, β-sheet rich oligomers, protofibrils and
fibrils [10]. In contrast, the Aβ(1-40) aggregation pathway is less complex and features a
slow transition from tetramer to fibril [10]. The Bowers group have investigated, the effect
of familial mutations [12-15], the effect of Aβ(1-40) on Aβ(1-42) aggregation [16] and the
effect of Aβ fragments on the structure or oligomerisation of Aβ peptides [17] and Tau,
another intrinsically disordered aggregating protein implicated in Alzheimer’s disease [18].
In addition, in combination with cell based toxicity assays, the neurotoxicity of different
Aβ(1-42) aggregates has been investigated [19]. Kloniecki et al. applied a combination of
TWIMS and molecular modelling to investigate the aggregation of Aβ(1-40) and the
resulting oligomeric species. They demonstrate the presence of two distinct species
representing on- and off- pathway oligomers and propose an alternative aggregation
pathway to that proposed by Bernstein et al. [10, 20]. This mechanism is supported by the
work of Sitkiewicz et al. [21] and Pujol-Pina et al. [22].
HDX-MS has also been applied to study the Aβ(1-42) aggregation pathway; however, a lot
of work has focussed on the aggregation of Aβ(1-40). Low hydrogen deuterium exchange
levels indicate the presence of structure, which protects residues from exchange, a
decrease/ increase in HDX indicates a modification to local structure. A decrease in
156
hydrogen exchange has been reported following the transition from monomer to fibril [23,
24]. The transition from proto-fibril to fibril was also accompanied by an increase in
protection from exchange, in the central region spanning residues Phe20 to Met35 [25-27].
Zhang et al. also demonstrate an increase in the protection of peptides spanning the
residues Phe20 to Leu34 for fibrils compared to low and high molecular weight oligomers
[28].
Zhang et al. compare the effect of incubation temperature, agitation and the presence of
copper on structural changes occurring during the aggregation of Aβ(1-40) and Aβ(1-42)
[29]. They report no significant change in the level of protection/ structure of Aβ(1-40)
compared to Aβ(1-42) [29]. Serra-Vidal et al. apply HDX-MS to track the shift in intensity
from unprotected monomers and oligomers to protected oligomers and fibrils during the
aggregation of Aβ(1-40) and Aβ(1-42) [30]. In experiments analogous to HDX-MS, Ramos et
al. apply reductive alkylation, using the reducing agent sodium cyanoborohydride and
formaldehyde to determine the solvent accessibility of primary amines in different
aggregated states of Aβ(1-40) [31]. They demonstrate an increase in protection between
monomers and fibrils and report that Leu16 in fibrils is most protected from solvent
exchange [31]. The increase in protection observed and its location concurs with HDX-MS
studies.
Due perhaps to its rapid aggregation, there have been few reports on the interaction of
Aβ(1-42) with anti-amyloid agents [32] but Aβ(1-40) has been widely used as a target for
small molecules of therapeutic potential including melatonin [33], oleuropein [34] and β-
sheet breaker peptides [35]. MS has also been applied to understand the mechanism of
aggregation inhibitors such as the C-terminal domain of proSP-C to aid drug design [36].
The work of Young et al. is of note in which they screen and classify small molecule
aggregation inhibitor binding using TWIMS [37].
The aim of the experiments in this chapter is to apply a combination of MS, IM-MS and gas
phase fragmentation techniques to examine the structure of primarily, Aβ(1-42) and Aβ(1-
40) to probe the effects of sample concentration, solution condition modification and
ionisation polarity. The aim of the TWIMS ligand binding experiments is to demonstrate the
ability to classify ligand induced conformational changes in Aβ(1-42) according to the mode
of action, to aid drug design.
157
5.2. Experimental
5.2.1. Sample Preparation
For all experiments, Aβ(1-42)/Aβ(1-40) concentration was 20 µM, unless stated otherwise.
RI-OR2, Rutin and Bradykinin were reconstituted in H2O (pH 2) or 20 mM AmAc (pH 7.4) at a
concentration of 100 µM, aliquoted, snap frozen and stored at -20°C, until required. For MS
ratio experiments, additional concentration solutions were produced as required and
subject to the same storage procedure. RI-OR2 was a gift from Professor David Allsop,
University of Lancaster. Rutin was a gift from Professor Garth Cooper, University of
Manchester.
5.2.2. Mass Spectrometry
Samples for solution condition experiments were prepared in H2O (pH 2) or 20 mM AmAc
(pH 7.4) at a concentration of 20 µM or 50 µM from frozen aliquots. Experiments were
conducted using a Waters Synapt G2, G2S or G2Si instrument, operated in positive
ionisation or negative ionisation mode. Instrument parameters are listed in Chapter 2 Table
2.4 and 2.5.
MS ratio experiments were conducted on a Waters Synapt G2 operated in positive
ionisation mode, instrument parameters can be found in Chapter 2 Table 2.4. Protein:
ligand ratios of 1:0, 1:0.1, 1:0.5, 1:1 and 1:2 using a protein concentration of 20 µM were
prepared immediately prior to analysis.
5.2.3. Travelling Wave Ion Mobility Mass Spectrometry
To prepare samples at different buffer concentrations, 100 µM aliquots were diluted to 20
µM with AmAc, immediately prior to analysis. Experiments were conducted on a Waters
Synapt G2Si instrument operated in positive ionisation mode. Instrument parameters are
listed in Chapter 2 Table 2.4.
Samples for ligand binding experiments were prepared immediately prior to analysis to
minimise Aβ(1-42) aggregation and tip clogging. Equimolar concentrations were used in all
instances with the exception of Aβ(1-42) and Rutin in 20 mM AmAc (pH 7.4) in negative
ionisation mode, for which a ratio of 1:5 was required to observe the bound species. Source
conditions were modified to improve resolution of the bound complex and differed
between samples, see Appendix Table A4.5. In each case, the same source conditions were
158
applied to Aβ(1-42) in the presence and the absence of the ligand and to the selected CCS
calibrants. Experiments were conducted on a Waters Synapt G2, G2S or G2Si instrument
operated in either positive or negative ionisation mode. Instrument parameters are listed in
Chapter 2 Table 2.4 and 2.5.
CIU-TWIMS experiments were conducted on a Waters Synapt G2 instrument operated in
positive ionisation mode. Instrument parameters are listed in Chapter 2 Table 2.4. The
charge state of interest was isolated prior to CIU-TWIMS. The collision voltage was ramped
in the trap region from 4/5 V to 60 V.
For all TWIMS experiments in which CCS values are quoted, CCS calibration was conducted
as described in Chapter 2 Section 2.6.2.1 [38].
5.2.4. Electron Transfer Dissociation
Electron Transfer Dissociation (ETD) and Electron Transfer Collision Activation Dissociation
(ETcaD) experiments were conducted on a Waters Synapt G2Si instrument, fitted with a
glow discharge source and nESI source unit. Instrument parameters can be found in
Chapter 2 Table 2.4 and 2.6. Supplementary activation was applied in the transfer region of
the Triwave device. A collision voltage of 25 V was applied.
5.2.5. Surface Induced Dissociation
All SID experiments were conducted on a modified Waters Synapt G2 instrument [39]
operated in positive ionisation mode. Instrument parameters can be found in Chapter 2
Table 2.4 and 2.7. Trap gas flow was increased to 3 mL/min to improve SID fragmentation.
SID fragmentation was conducted at a range of SID voltages.
5.2.6. Data Analysis
For CID, ETD/ETcaD and SID fragmentation analysis, the output from the Protein Prospector
MS product tool was compared with measured peak lists [40]. Fragmentation maps were
created in Powerpoint (Microsoft Corporation, USA). All data analysis (MS and TWIMS) in
this chapter was conducted using Masslynx v4.1 (Waters, USA), Origin v9 and OriginPro
2015 (OriginLab, USA), Excel and Powerpoint (Microsoft Corporation, USA). CIU fingerprint
plots were created using CIUSuite [41].
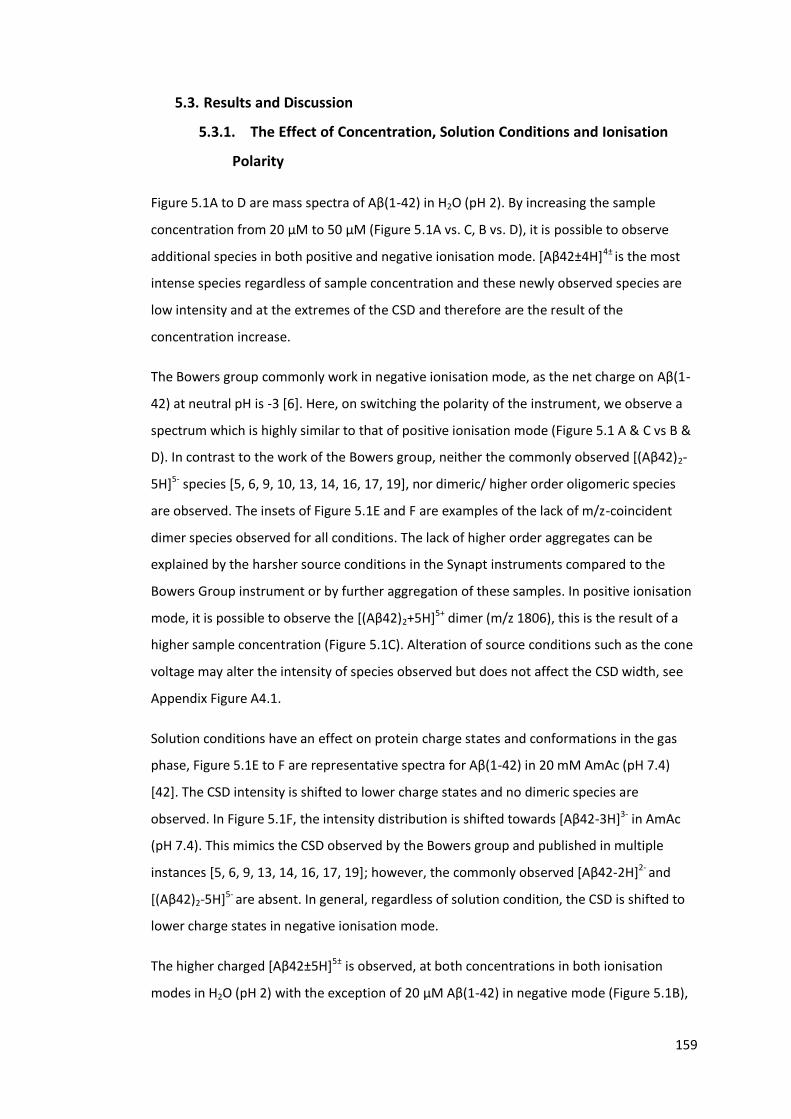
159
5.3. Results and Discussion
5.3.1. The Effect of Concentration, Solution Conditions and Ionisation
Polarity
Figure 5.1A to D are mass spectra of Aβ(1-42) in H2O (pH 2). By increasing the sample
concentration from 20 µM to 50 µM (Figure 5.1A vs. C, B vs. D), it is possible to observe
additional species in both positive and negative ionisation mode. [Aβ42±4H]4± is the most
intense species regardless of sample concentration and these newly observed species are
low intensity and at the extremes of the CSD and therefore are the result of the
concentration increase.
The Bowers group commonly work in negative ionisation mode, as the net charge on Aβ(1-
42) at neutral pH is -3 [6]. Here, on switching the polarity of the instrument, we observe a
spectrum which is highly similar to that of positive ionisation mode (Figure 5.1 A & C vs B &
D). In contrast to the work of the Bowers group, neither the commonly observed [(Aβ42)2-
5H]5- species [5, 6, 9, 10, 13, 14, 16, 17, 19], nor dimeric/ higher order oligomeric species
are observed. The insets of Figure 5.1E and F are examples of the lack of m/z-coincident
dimer species observed for all conditions. The lack of higher order aggregates can be
explained by the harsher source conditions in the Synapt instruments compared to the
Bowers Group instrument or by further aggregation of these samples. In positive ionisation
mode, it is possible to observe the [(Aβ42)2+5H]5+ dimer (m/z 1806), this is the result of a
higher sample concentration (Figure 5.1C). Alteration of source conditions such as the cone
voltage may alter the intensity of species observed but does not affect the CSD width, see
Appendix Figure A4.1.
Solution conditions have an effect on protein charge states and conformations in the gas
phase, Figure 5.1E to F are representative spectra for Aβ(1-42) in 20 mM AmAc (pH 7.4)
[42]. The CSD intensity is shifted to lower charge states and no dimeric species are
observed. In Figure 5.1F, the intensity distribution is shifted towards [Aβ42-3H]3- in AmAc
(pH 7.4). This mimics the CSD observed by the Bowers group and published in multiple
instances [5, 6, 9, 13, 14, 16, 17, 19]; however, the commonly observed [Aβ42-2H]2- and
[(Aβ42)2-5H]5- are absent. In general, regardless of solution condition, the CSD is shifted to
lower charge states in negative ionisation mode.
The higher charged [Aβ42±5H]5± is observed, at both concentrations in both ionisation
modes in H2O (pH 2) with the exception of 20 µM Aβ(1-42) in negative mode (Figure 5.1B),
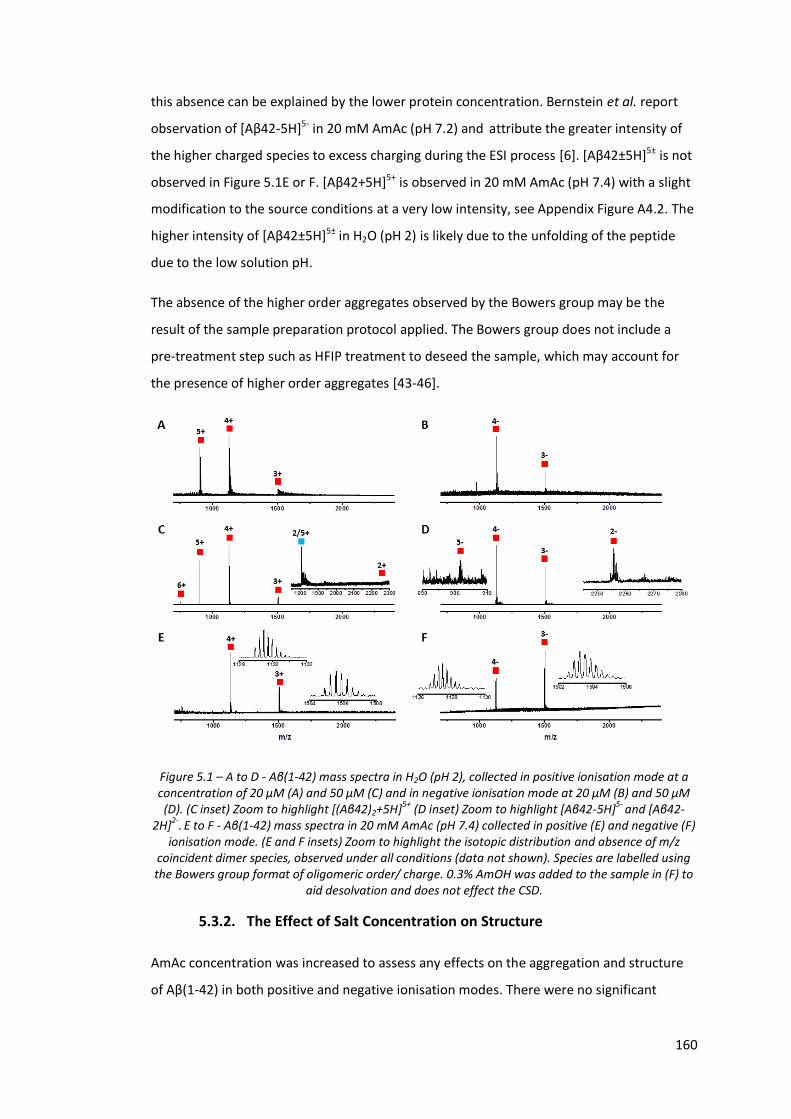
160
this absence can be explained by the lower protein concentration. Bernstein et al. report
observation of [Aβ42-5H]5- in 20 mM AmAc (pH 7.2) and attribute the greater intensity of
the higher charged species to excess charging during the ESI process [6]. [Aβ42±5H]5± is not
observed in Figure 5.1E or F. [Aβ42+5H]5+ is observed in 20 mM AmAc (pH 7.4) with a slight
modification to the source conditions at a very low intensity, see Appendix Figure A4.2. The
higher intensity of [Aβ42±5H]5± in H2O (pH 2) is likely due to the unfolding of the peptide
due to the low solution pH.
The absence of the higher order aggregates observed by the Bowers group may be the
result of the sample preparation protocol applied. The Bowers group does not include a
pre-treatment step such as HFIP treatment to deseed the sample, which may account for
the presence of higher order aggregates [43-46].
Figure 5.1 – A to D - Aβ(1-42) mass spectra in H2O (pH 2), collected in positive ionisation mode at a concentration of 20 µM (A) and 50 µM (C) and in negative ionisation mode at 20 µM (B) and 50 µM (D). (C inset) Zoom to highlight [(Aβ42)2+5H]5+ (D inset) Zoom to highlight [Aβ42-5H]5- and [Aβ42-
2H]2-
. E to F - Aβ(1-42) mass spectra in 20 mM AmAc (pH 7.4) collected in positive (E) and negative (F)
ionisation mode. (E and F insets) Zoom to highlight the isotopic distribution and absence of m/z coincident dimer species, observed under all conditions (data not shown). Species are labelled using the Bowers group format of oligomeric order/ charge. 0.3% AmOH was added to the sample in (F) to
aid desolvation and does not effect the CSD.
5.3.2. The Effect of Salt Concentration on Structure
AmAc concentration was increased to assess any effects on the aggregation and structure
of Aβ(1-42) in both positive and negative ionisation modes. There were no significant
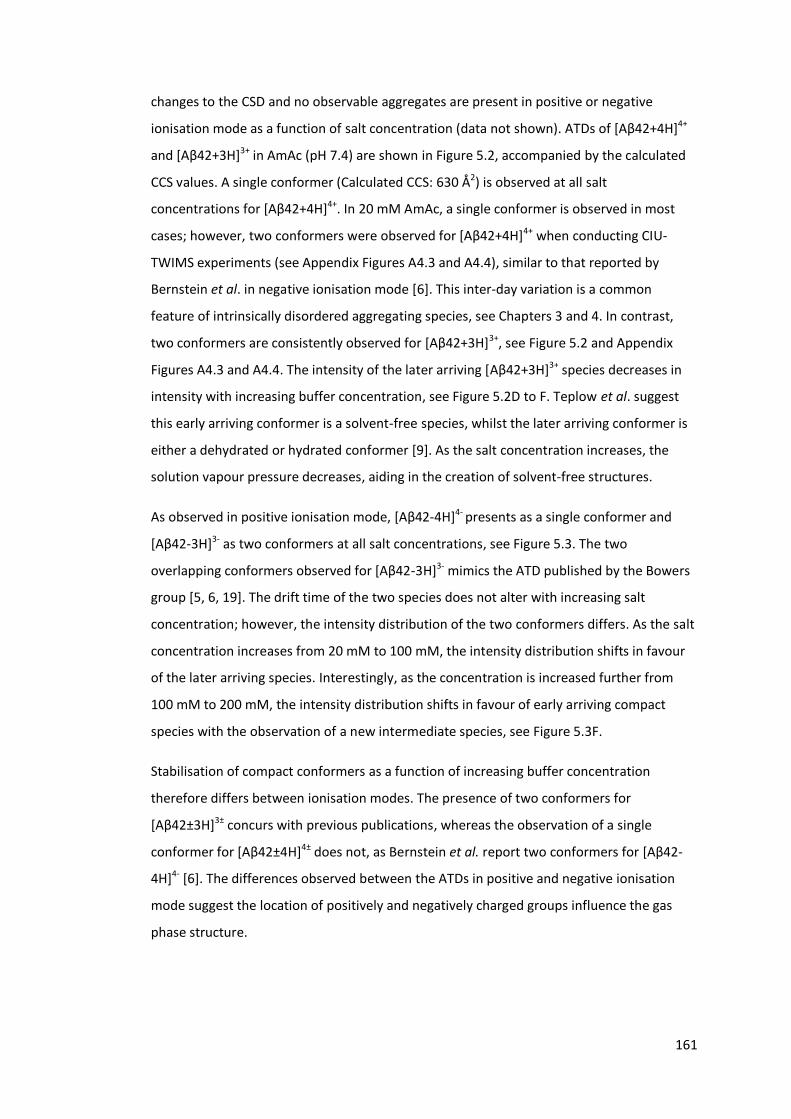
161
changes to the CSD and no observable aggregates are present in positive or negative
ionisation mode as a function of salt concentration (data not shown). ATDs of [Aβ42+4H]4+
and [Aβ42+3H]3+ in AmAc (pH 7.4) are shown in Figure 5.2, accompanied by the calculated
CCS values. A single conformer (Calculated CCS: 630 Å2) is observed at all salt
concentrations for [Aβ42+4H]4+. In 20 mM AmAc, a single conformer is observed in most
cases; however, two conformers were observed for [Aβ42+4H]4+ when conducting CIU-
TWIMS experiments (see Appendix Figures A4.3 and A4.4), similar to that reported by
Bernstein et al. in negative ionisation mode [6]. This inter-day variation is a common
feature of intrinsically disordered aggregating species, see Chapters 3 and 4. In contrast,
two conformers are consistently observed for [Aβ42+3H]3+, see Figure 5.2 and Appendix
Figures A4.3 and A4.4. The intensity of the later arriving [Aβ42+3H]3+ species decreases in
intensity with increasing buffer concentration, see Figure 5.2D to F. Teplow et al. suggest
this early arriving conformer is a solvent-free species, whilst the later arriving conformer is
either a dehydrated or hydrated conformer [9]. As the salt concentration increases, the
solution vapour pressure decreases, aiding in the creation of solvent-free structures.
As observed in positive ionisation mode, [Aβ42-4H]4- presents as a single conformer and
[Aβ42-3H]3- as two conformers at all salt concentrations, see Figure 5.3. The two
overlapping conformers observed for [Aβ42-3H]3- mimics the ATD published by the Bowers
group [5, 6, 19]. The drift time of the two species does not alter with increasing salt
concentration; however, the intensity distribution of the two conformers differs. As the salt
concentration increases from 20 mM to 100 mM, the intensity distribution shifts in favour
of the later arriving species. Interestingly, as the concentration is increased further from
100 mM to 200 mM, the intensity distribution shifts in favour of early arriving compact
species with the observation of a new intermediate species, see Figure 5.3F.
Stabilisation of compact conformers as a function of increasing buffer concentration
therefore differs between ionisation modes. The presence of two conformers for
[Aβ42±3H]3± concurs with previous publications, whereas the observation of a single
conformer for [Aβ42±4H]4± does not, as Bernstein et al. report two conformers for [Aβ42-
4H]4- [6]. The differences observed between the ATDs in positive and negative ionisation
mode suggest the location of positively and negatively charged groups influence the gas
phase structure.
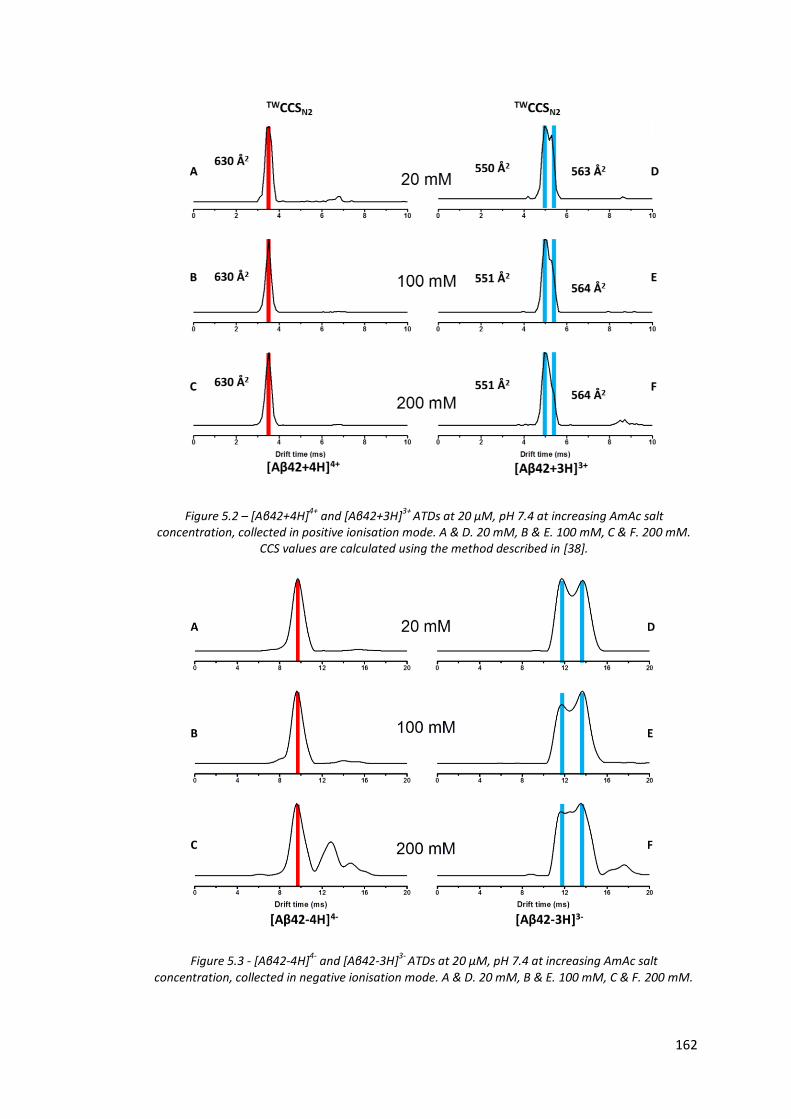
162
Figure 5.2 – [Aβ42+4H]4+ and [Aβ42+3H]3+ ATDs at 20 µM, pH 7.4 at increasing AmAc salt concentration, collected in positive ionisation mode. A & D. 20 mM, B & E. 100 mM, C & F. 200 mM.
CCS values are calculated using the method described in [38].
Figure 5.3 - [Aβ42-4H]4- and [Aβ42-3H]3- ATDs at 20 µM, pH 7.4 at increasing AmAc salt concentration, collected in negative ionisation mode. A & D. 20 mM, B & E. 100 mM, C & F. 200 mM.
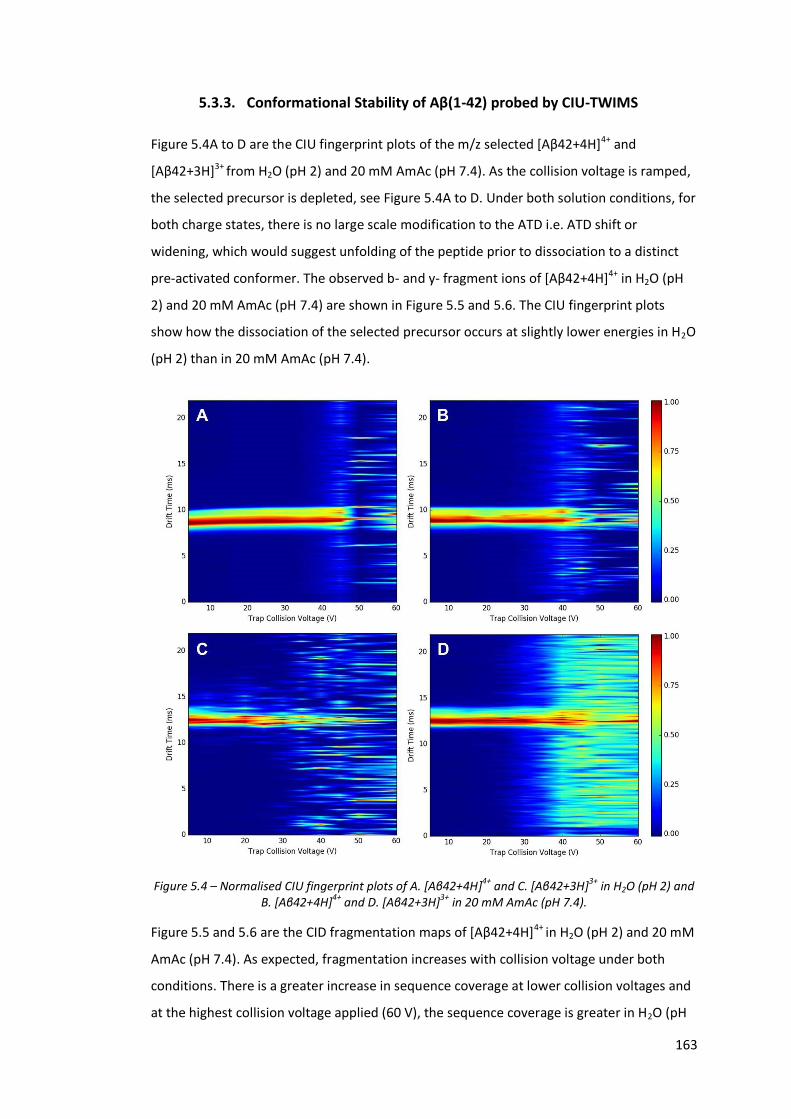
163
5.3.3. Conformational Stability of Aβ(1-42) probed by CIU-TWIMS
Figure 5.4A to D are the CIU fingerprint plots of the m/z selected [Aβ42+4H]4+ and
[Aβ42+3H]3+ from H2O (pH 2) and 20 mM AmAc (pH 7.4). As the collision voltage is ramped,
the selected precursor is depleted, see Figure 5.4A to D. Under both solution conditions, for
both charge states, there is no large scale modification to the ATD i.e. ATD shift or
widening, which would suggest unfolding of the peptide prior to dissociation to a distinct
pre-activated conformer. The observed b- and y- fragment ions of [Aβ42+4H]4+ in H2O (pH
2) and 20 mM AmAc (pH 7.4) are shown in Figure 5.5 and 5.6. The CIU fingerprint plots
show how the dissociation of the selected precursor occurs at slightly lower energies in H2O
(pH 2) than in 20 mM AmAc (pH 7.4).
Figure 5.4 – Normalised CIU fingerprint plots of A. [Aβ42+4H]4+ and C. [Aβ42+3H]3+ in H2O (pH 2) and B. [Aβ42+4H]4+ and D. [Aβ42+3H]3+ in 20 mM AmAc (pH 7.4).
Figure 5.5 and 5.6 are the CID fragmentation maps of [Aβ42+4H]4+ in H2O (pH 2) and 20 mM
AmAc (pH 7.4). As expected, fragmentation increases with collision voltage under both
conditions. There is a greater increase in sequence coverage at lower collision voltages and
at the highest collision voltage applied (60 V), the sequence coverage is greater in H2O (pH

164
2), see Figure 5.5/6 A to E and G. This suggests that under these solution conditions, a
conformer more conducive to fragmentation is prevalent.
Figure 5.5 – CID fragmentation maps of [Aβ42+4H]4+
in H2O (pH 2) at increasing collision voltage.
Figure 5.6 - CID fragmentation maps of [Aβ42+4H]4+ in 20 mM AmAc (pH 7.4) at increasing collision voltage.
At lower collision voltages fragmentation is limited to the C-terminal region; however,
fragments are identified from the central region as collision voltage is ramped. The absence
of fragments from the N-terminus of Aβ(1-42) can be explained by the cluster of basic

165
residues in this region. Protonated peptides which are activated under low-energy collision
conditions fragment mainly by a charge-directed mechanism, requiring a proton at the
cleavage site [47, 48]. The mobile proton model proposed by Dongré et al., 1996 states that
the proton(s) migrate to various protonation sites following activation unless sequestered
by basic amino acid side chains [47, 49]. If the proton(s) are sequestered by the basic amino
acid side chain(s), energy is required to mobilize the proton(s) to the peptide back bone to
induce dissociation; increasing the energy required for fragmentation, this energy threshold
can be more than required to initiate charge-remote fragmentation pathways [48, 50-54].
The CIU fingerprint plots and fragmentation maps demonstrate that Aβ(1-42) in H2O (pH 2)
is more conducive to fragmentation, it can be hypothesized that the intramolecular
interactions of the peptide in AmAc (pH 7.4) may hold the conformer intact to higher
energies than those present in H2O (pH 2).
5.3.4. ETD, ETnoD and ETcaD
Electron Transfer Dissociation (ETD) is commonly used for the top down fragmentation of
peptides and proteins to determine primary sequence and Post-Translational Modification
(PTM) location. ETD can be used to probe secondary and tertiary structure, analogous to
ECD, see Chapter 3 [55]. Following interaction with the ETD reagent, 1,3-dicyanobenzene,
no ETD specific c- and z- fragment ions were observed. Figure 5.7 is the mass spectra of
Aβ(1-42) following the incremental reduction of the trap wave height. [Aβ42+4H]4+, the
selected precursor ion is highlighted in yellow (Figure 5.7A). Following the lowering of the
trap region wave height to 0.5 V to allow increased interaction, the dominant reaction is
charge reduction as [Aβ42+3H]3+ (green) and [Aβ42+2H]2+(orange) are observed, see Figure
5.7C. [Aβ42+H]1+ highlighted in blue, is observed when the trap region wave height is
lowered to 0.4 V (Figure 5.7D). This becomes the most intense species following the
reduction of trap region wave height to 0.3 V (Figure 5.7E) and 0.1 V (Figure 5.7F). Figure
5.8 highlights the rise and fall in intensity of the charge reduced species as a function of
trap region wave height. Figure 5.7E and F feature significant peaks which appear to be
fragment ions; however, positive identification was not possible. [Aβ42+4H]4+ and
[Aβ42+2H]2+ are present as salt ion adducted species, but are not labelled in Figure 5.7E and
F. [Aβ42+3H]3+ is not observed following the reduction of the wave height to <0.4 V,
suggesting this species is more susceptible to charge reduction.
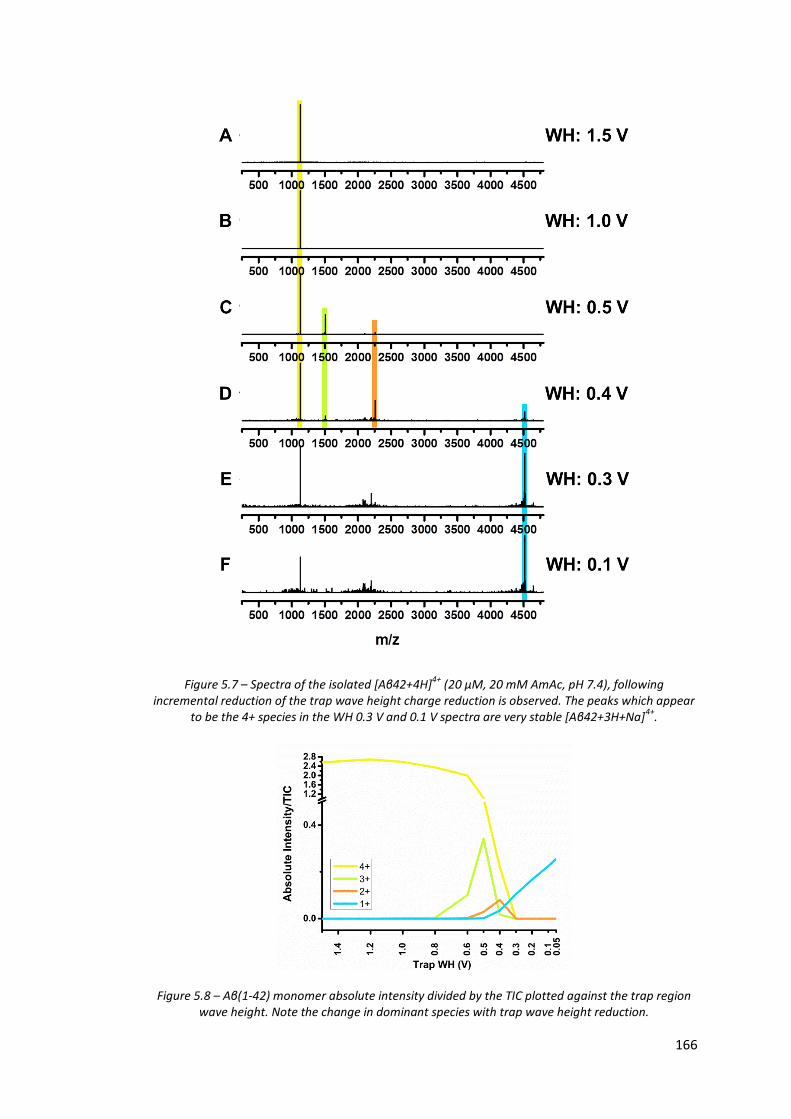
166
Figure 5.7 – Spectra of the isolated [Aβ42+4H]4+ (20 µM, 20 mM AmAc, pH 7.4), following incremental reduction of the trap wave height charge reduction is observed. The peaks which appear
to be the 4+ species in the WH 0.3 V and 0.1 V spectra are very stable [Aβ42+3H+Na]4+.
Figure 5.8 – Aβ(1-42) monomer absolute intensity divided by the TIC plotted against the trap region wave height. Note the change in dominant species with trap wave height reduction.
167
The presence of three histidine residues in the disordered N-terminal region of Aβ(1-42),
which have been shown to act as stable electron traps and the presence of strong intra-
molecular interactions preventing the loss of fragmented regions, explains the preference
for charge reduction over fragmentation observed [56]. ETD with supplemental activation
has been previously employed by the Coon group [57] and the Sobott group [55], to
improve the production of fragment ions by disrupting the intra-molecular interactions
holding the electron transfer based fragments together. Supplemental collisional activation
can be applied in the transfer region of the Synapt Triwave device and the effect is clear in
Figure 5.9. Again no significant fragmentation is observed with a raised trap wave height
without supplemental collisional activation (Figure 5.9A). A single z- fragment ion is
observed after the wave height is lowered to 0.5 V to enable interaction with the ETD
reagent (Figure 5.9B). Following the lowering of the trap wave height to 0.5 V with
supplemental collisional activation, multiple c- and z- fragment ions are observed, as well as
b- and y- fragment ions in the C-terminal region (Figure 5.9D). These b- and y- fragment
ions are attributed to post drift fragmentation as a raised trap wave height preventing ETD
with supplemental collisional activation yields b- and y- fragment ions of a similar efficiency
to those seen with a reduced wave height (Figure 5.9C vs. D).
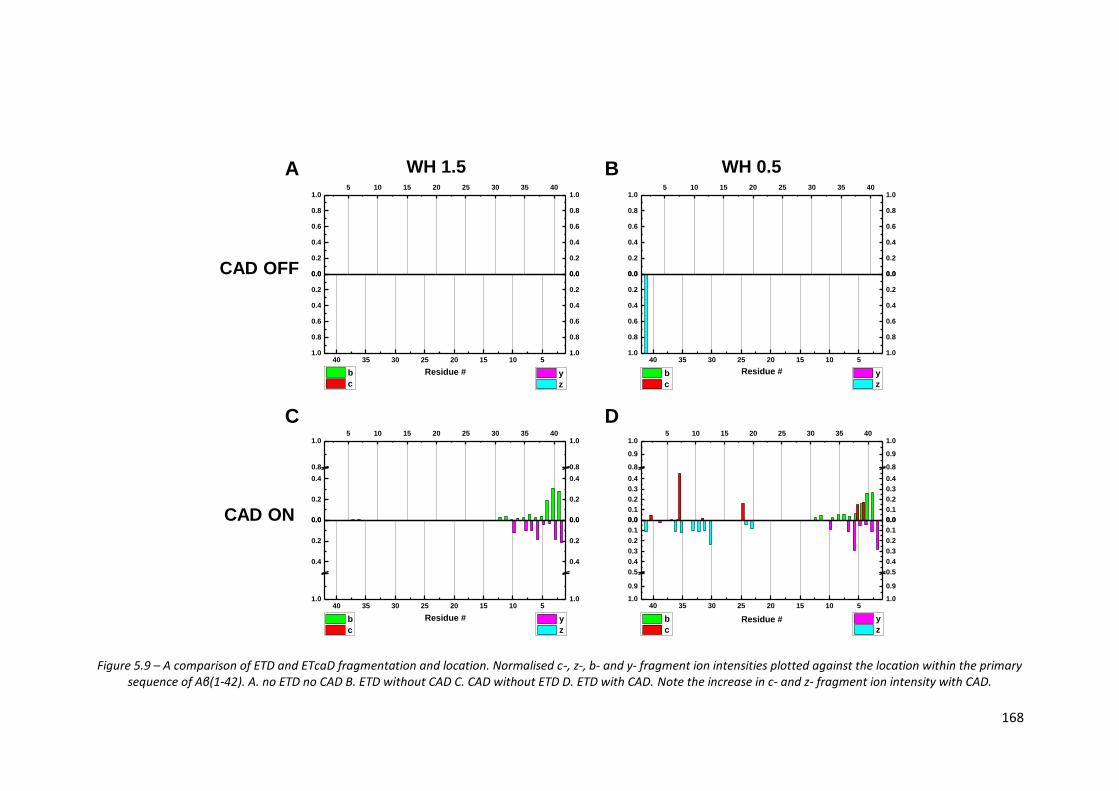
168
Figure 5.9 – A comparison of ETD and ETcaD fragmentation and location. Normalised c-, z-, b- and y- fragment ion intensities plotted against the location within the primary sequence of Aβ(1-42). A. no ETD no CAD B. ETD without CAD C. CAD without ETD D. ETD with CAD. Note the increase in c- and z- fragment ion intensity with CAD.
5 10 15 20 25 30 35 40
0.0
0.1
0.2
0.3
0.4
0.8
0.9
1.0
0.0
0.1
0.2
0.3
0.4
0.8
0.9
1.0
b
c
40 35 30 25 20 15 10 51.0
0.9
0.5
0.4
0.3
0.2
0.1
0.0
1.0
0.9
0.5
0.4
0.3
0.2
0.1
0.0
y
z
Residue #
5 10 15 20 25 30 35 40
0.0
0.2
0.4
0.8
1.0
0.0
0.2
0.4
0.8
1.0
b
c
40 35 30 25 20 15 10 51.0
0.4
0.2
0.0
1.0
0.4
0.2
0.0
Residue # y
z
5 10 15 20 25 30 35 40
0.0
0.2
0.4
0.6
0.8
1.0
0.0
0.2
0.4
0.6
0.8
1.0
b
c
40 35 30 25 20 15 10 51.0
0.8
0.6
0.4
0.2
0.0
1.0
0.8
0.6
0.4
0.2
0.0
Residue # y
z
5 10 15 20 25 30 35 40
0.0
0.2
0.4
0.6
0.8
1.0
0.0
0.2
0.4
0.6
0.8
1.0
b
c
40 35 30 25 20 15 10 51.0
0.8
0.6
0.4
0.2
0.0
1.0
0.8
0.6
0.4
0.2
0.0
Residue # y
z
CAD OFF
CAD ON
WH 1.5 WH 0.5A B
C D
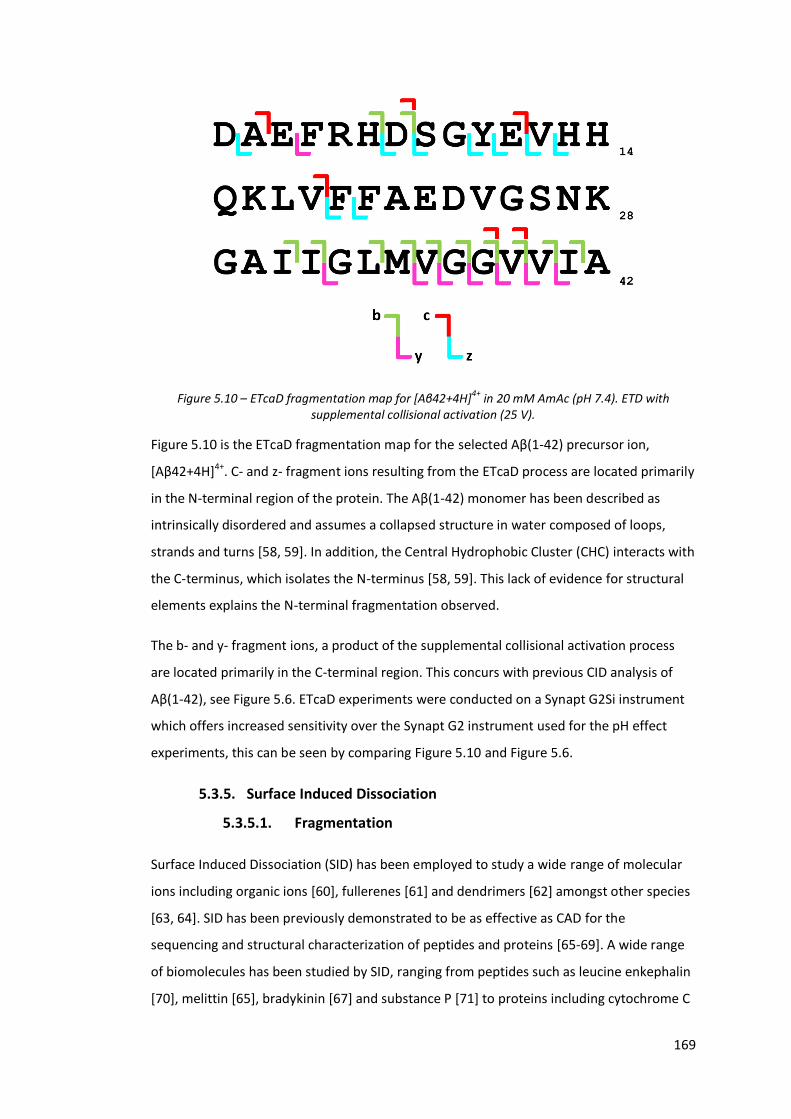
169
Figure 5.10 – ETcaD fragmentation map for [Aβ42+4H]4+ in 20 mM AmAc (pH 7.4). ETD with supplemental collisional activation (25 V).
Figure 5.10 is the ETcaD fragmentation map for the selected Aβ(1-42) precursor ion,
[Aβ42+4H]4+. C- and z- fragment ions resulting from the ETcaD process are located primarily
in the N-terminal region of the protein. The Aβ(1-42) monomer has been described as
intrinsically disordered and assumes a collapsed structure in water composed of loops,
strands and turns [58, 59]. In addition, the Central Hydrophobic Cluster (CHC) interacts with
the C-terminus, which isolates the N-terminus [58, 59]. This lack of evidence for structural
elements explains the N-terminal fragmentation observed.
The b- and y- fragment ions, a product of the supplemental collisional activation process
are located primarily in the C-terminal region. This concurs with previous CID analysis of
Aβ(1-42), see Figure 5.6. ETcaD experiments were conducted on a Synapt G2Si instrument
which offers increased sensitivity over the Synapt G2 instrument used for the pH effect
experiments, this can be seen by comparing Figure 5.10 and Figure 5.6.
5.3.5. Surface Induced Dissociation
5.3.5.1. Fragmentation
Surface Induced Dissociation (SID) has been employed to study a wide range of molecular
ions including organic ions [60], fullerenes [61] and dendrimers [62] amongst other species
[63, 64]. SID has been previously demonstrated to be as effective as CAD for the
sequencing and structural characterization of peptides and proteins [65-69]. A wide range
of biomolecules has been studied by SID, ranging from peptides such as leucine enkephalin
[70], melittin [65], bradykinin [67] and substance P [71] to proteins including cytochrome C
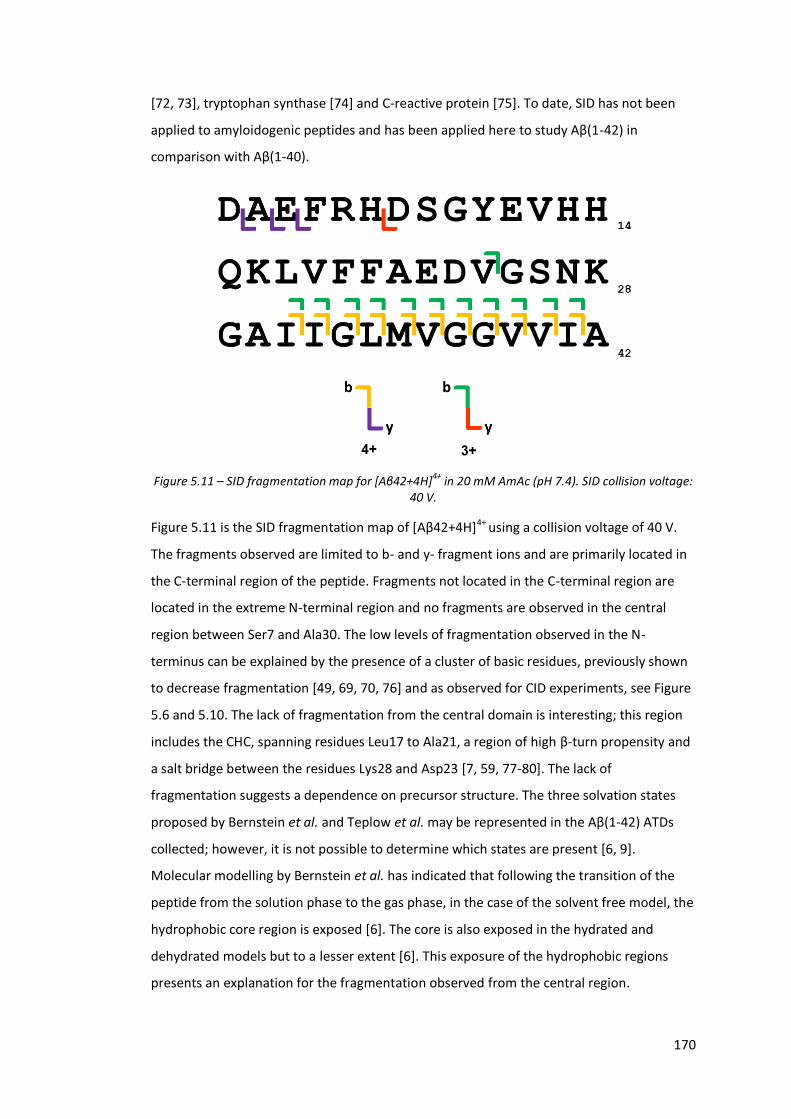
170
[72, 73], tryptophan synthase [74] and C-reactive protein [75]. To date, SID has not been
applied to amyloidogenic peptides and has been applied here to study Aβ(1-42) in
comparison with Aβ(1-40).
Figure 5.11 – SID fragmentation map for [Aβ42+4H]4+ in 20 mM AmAc (pH 7.4). SID collision voltage: 40 V.
Figure 5.11 is the SID fragmentation map of [Aβ42+4H]4+ using a collision voltage of 40 V.
The fragments observed are limited to b- and y- fragment ions and are primarily located in
the C-terminal region of the peptide. Fragments not located in the C-terminal region are
located in the extreme N-terminal region and no fragments are observed in the central
region between Ser7 and Ala30. The low levels of fragmentation observed in the N-
terminus can be explained by the presence of a cluster of basic residues, previously shown
to decrease fragmentation [49, 69, 70, 76] and as observed for CID experiments, see Figure
5.6 and 5.10. The lack of fragmentation from the central domain is interesting; this region
includes the CHC, spanning residues Leu17 to Ala21, a region of high β-turn propensity and
a salt bridge between the residues Lys28 and Asp23 [7, 59, 77-80]. The lack of
fragmentation suggests a dependence on precursor structure. The three solvation states
proposed by Bernstein et al. and Teplow et al. may be represented in the Aβ(1-42) ATDs
collected; however, it is not possible to determine which states are present [6, 9].
Molecular modelling by Bernstein et al. has indicated that following the transition of the
peptide from the solution phase to the gas phase, in the case of the solvent free model, the
hydrophobic core region is exposed [6]. The core is also exposed in the hydrated and
dehydrated models but to a lesser extent [6]. This exposure of the hydrophobic regions
presents an explanation for the fragmentation observed from the central region.
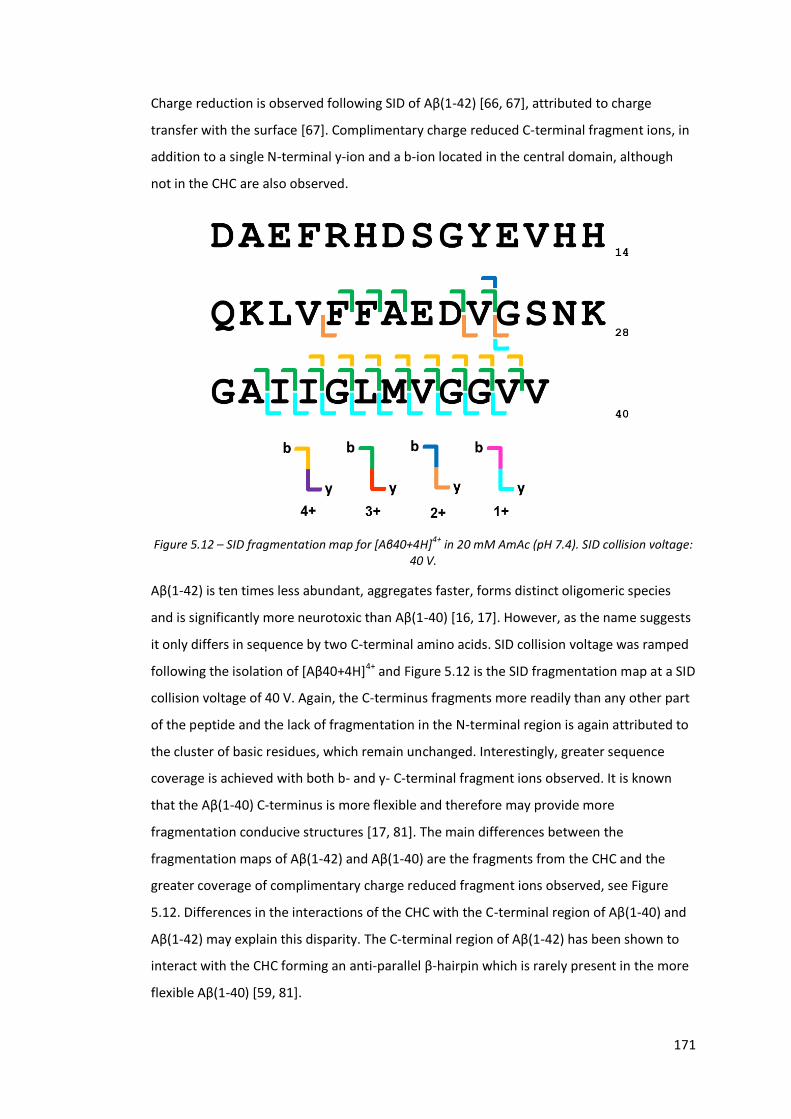
171
Charge reduction is observed following SID of Aβ(1-42) [66, 67], attributed to charge
transfer with the surface [67]. Complimentary charge reduced C-terminal fragment ions, in
addition to a single N-terminal y-ion and a b-ion located in the central domain, although
not in the CHC are also observed.
Figure 5.12 – SID fragmentation map for [Aβ40+4H]4+ in 20 mM AmAc (pH 7.4). SID collision voltage: 40 V.
Aβ(1-42) is ten times less abundant, aggregates faster, forms distinct oligomeric species
and is significantly more neurotoxic than Aβ(1-40) [16, 17]. However, as the name suggests
it only differs in sequence by two C-terminal amino acids. SID collision voltage was ramped
following the isolation of [Aβ40+4H]4+ and Figure 5.12 is the SID fragmentation map at a SID
collision voltage of 40 V. Again, the C-terminus fragments more readily than any other part
of the peptide and the lack of fragmentation in the N-terminal region is again attributed to
the cluster of basic residues, which remain unchanged. Interestingly, greater sequence
coverage is achieved with both b- and y- C-terminal fragment ions observed. It is known
that the Aβ(1-40) C-terminus is more flexible and therefore may provide more
fragmentation conducive structures [17, 81]. The main differences between the
fragmentation maps of Aβ(1-42) and Aβ(1-40) are the fragments from the CHC and the
greater coverage of complimentary charge reduced fragment ions observed, see Figure
5.12. Differences in the interactions of the CHC with the C-terminal region of Aβ(1-40) and
Aβ(1-42) may explain this disparity. The C-terminal region of Aβ(1-42) has been shown to
interact with the CHC forming an anti-parallel β-hairpin which is rarely present in the more
flexible Aβ(1-40) [59, 81].
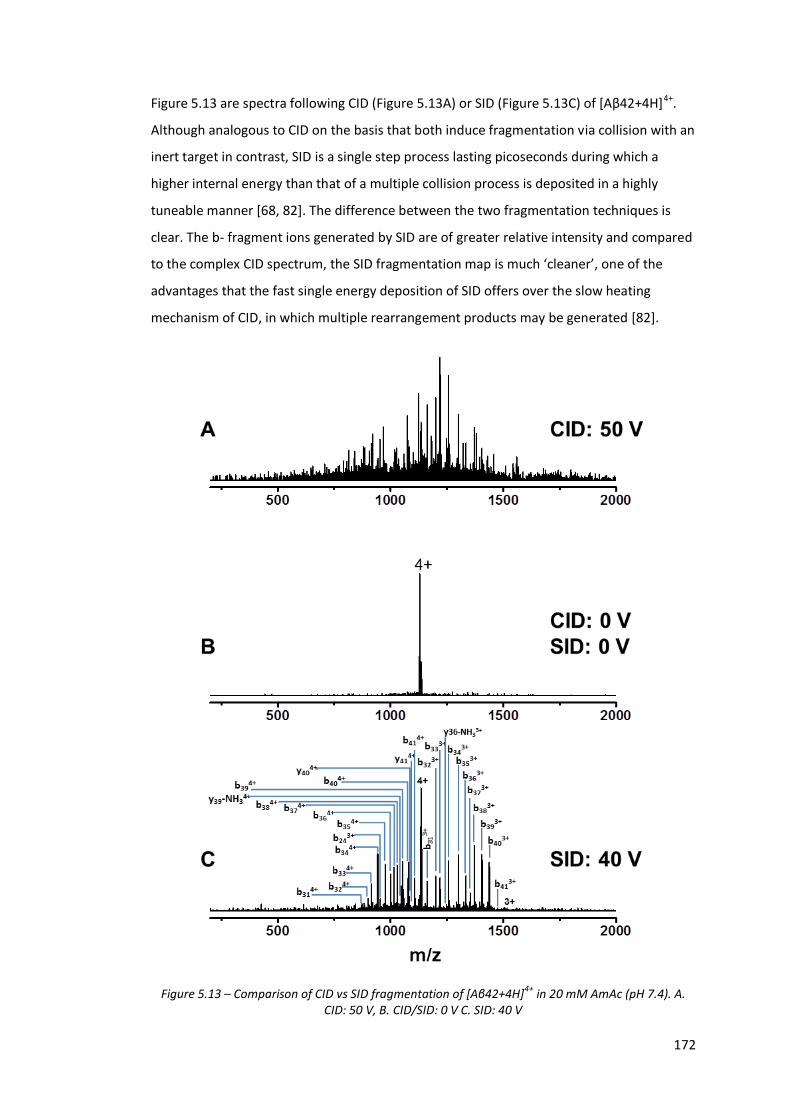
172
Figure 5.13 are spectra following CID (Figure 5.13A) or SID (Figure 5.13C) of [Aβ42+4H]4+.
Although analogous to CID on the basis that both induce fragmentation via collision with an
inert target in contrast, SID is a single step process lasting picoseconds during which a
higher internal energy than that of a multiple collision process is deposited in a highly
tuneable manner [68, 82]. The difference between the two fragmentation techniques is
clear. The b- fragment ions generated by SID are of greater relative intensity and compared
to the complex CID spectrum, the SID fragmentation map is much ‘cleaner’, one of the
advantages that the fast single energy deposition of SID offers over the slow heating
mechanism of CID, in which multiple rearrangement products may be generated [82].
Figure 5.13 – Comparison of CID vs SID fragmentation of [Aβ42+4H]4+ in 20 mM AmAc (pH 7.4). A. CID: 50 V, B. CID/SID: 0 V C. SID: 40 V

173
5.3.5.2. The Effect of SID on the Conformation Exhibited by Amyloid
Species
Installation of the SID cell prior to the TWIMS region of the Synapt instrument enables SID
fragment ions to be analysed by TWIMS. Here, SID-TWIMS is used to probe the
conformation of the SID fragment ions of Aβ(1-42) and Aβ(1-40). The C-terminus of Aβ(1-
42) and Aβ(1-40) readily fragments in contrast to the sparse fragmentation observed from
the central and N-terminal regions. During ETD experiments Aβ(1-42) was demonstrated to
present a ETD resistant structure, bound by strong intramolecular interactions (Figure 5.7-
5.10).
Figure 5.14 - [Aβ42+4H]4+ C-terminal SID b- fragment ion ATDs in 20 mM AmAc (pH 7.4). SID collision voltage: 40 V
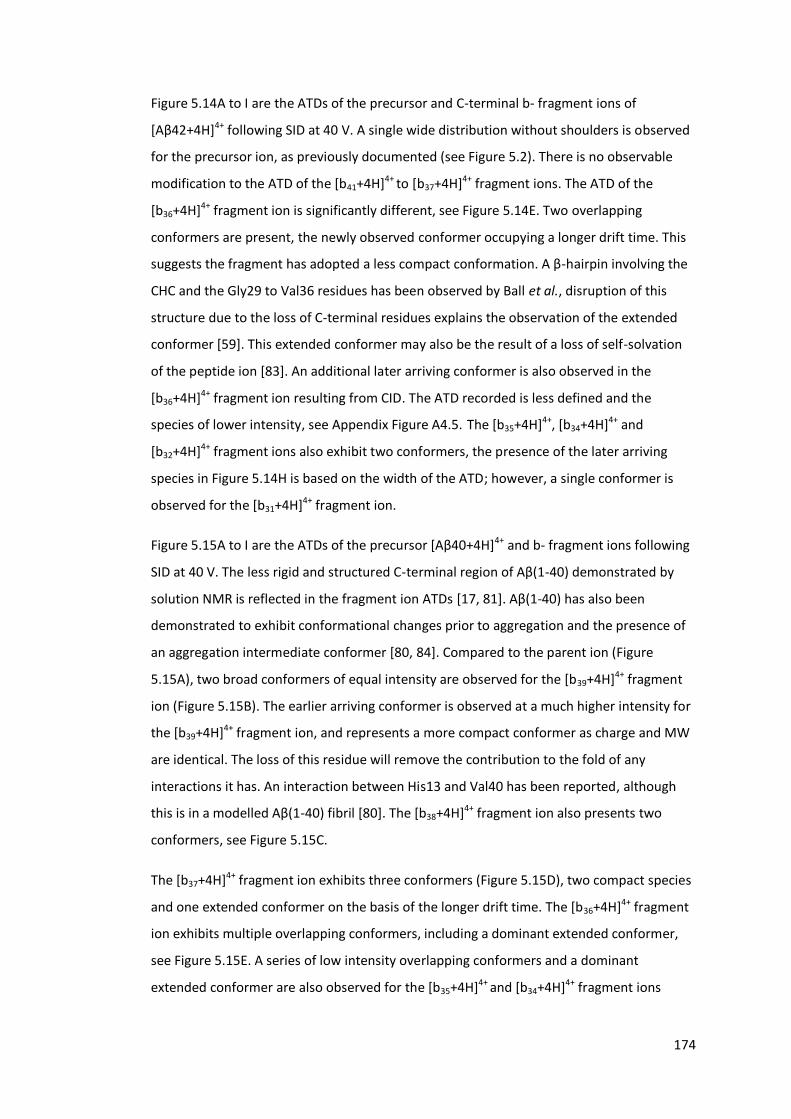
174
Figure 5.14A to I are the ATDs of the precursor and C-terminal b- fragment ions of
[Aβ42+4H]4+ following SID at 40 V. A single wide distribution without shoulders is observed
for the precursor ion, as previously documented (see Figure 5.2). There is no observable
modification to the ATD of the [b41+4H]4+ to [b37+4H]4+ fragment ions. The ATD of the
[b36+4H]4+ fragment ion is significantly different, see Figure 5.14E. Two overlapping
conformers are present, the newly observed conformer occupying a longer drift time. This
suggests the fragment has adopted a less compact conformation. A β-hairpin involving the
CHC and the Gly29 to Val36 residues has been observed by Ball et al., disruption of this
structure due to the loss of C-terminal residues explains the observation of the extended
conformer [59]. This extended conformer may also be the result of a loss of self-solvation
of the peptide ion [83]. An additional later arriving conformer is also observed in the
[b36+4H]4+ fragment ion resulting from CID. The ATD recorded is less defined and the
species of lower intensity, see Appendix Figure A4.5. The [b35+4H]4+, [b34+4H]4+ and
[b32+4H]4+ fragment ions also exhibit two conformers, the presence of the later arriving
species in Figure 5.14H is based on the width of the ATD; however, a single conformer is
observed for the [b31+4H]4+ fragment ion.
Figure 5.15A to I are the ATDs of the precursor [Aβ40+4H]4+ and b- fragment ions following
SID at 40 V. The less rigid and structured C-terminal region of Aβ(1-40) demonstrated by
solution NMR is reflected in the fragment ion ATDs [17, 81]. Aβ(1-40) has also been
demonstrated to exhibit conformational changes prior to aggregation and the presence of
an aggregation intermediate conformer [80, 84]. Compared to the parent ion (Figure
5.15A), two broad conformers of equal intensity are observed for the [b39+4H]4+ fragment
ion (Figure 5.15B). The earlier arriving conformer is observed at a much higher intensity for
the [b39+4H]4+ fragment ion, and represents a more compact conformer as charge and MW
are identical. The loss of this residue will remove the contribution to the fold of any
interactions it has. An interaction between His13 and Val40 has been reported, although
this is in a modelled Aβ(1-40) fibril [80]. The [b38+4H]4+ fragment ion also presents two
conformers, see Figure 5.15C.
The [b37+4H]4+ fragment ion exhibits three conformers (Figure 5.15D), two compact species
and one extended conformer on the basis of the longer drift time. The [b36+4H]4+ fragment
ion exhibits multiple overlapping conformers, including a dominant extended conformer,
see Figure 5.15E. A series of low intensity overlapping conformers and a dominant
extended conformer are also observed for the [b35+4H]4+ and [b34+4H]4+ fragment ions
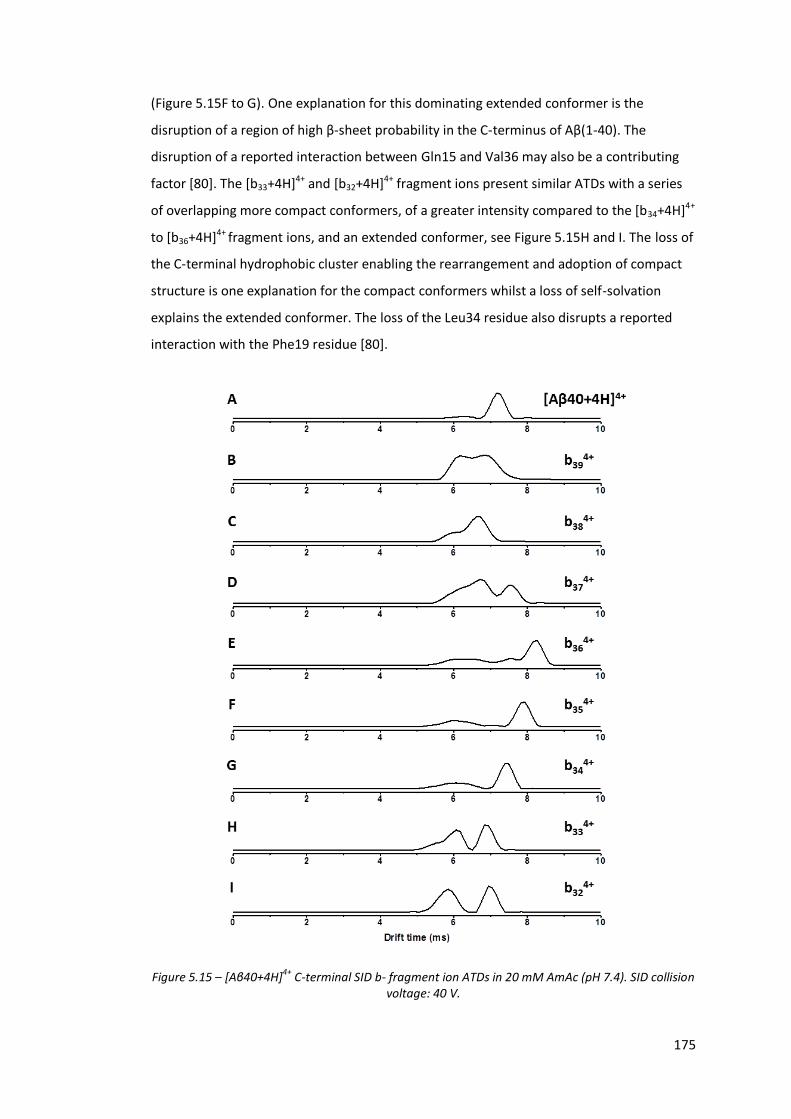
175
(Figure 5.15F to G). One explanation for this dominating extended conformer is the
disruption of a region of high β-sheet probability in the C-terminus of Aβ(1-40). The
disruption of a reported interaction between Gln15 and Val36 may also be a contributing
factor [80]. The [b33+4H]4+ and [b32+4H]4+ fragment ions present similar ATDs with a series
of overlapping more compact conformers, of a greater intensity compared to the [b34+4H]4+
to [b36+4H]4+ fragment ions, and an extended conformer, see Figure 5.15H and I. The loss of
the C-terminal hydrophobic cluster enabling the rearrangement and adoption of compact
structure is one explanation for the compact conformers whilst a loss of self-solvation
explains the extended conformer. The loss of the Leu34 residue also disrupts a reported
interaction with the Phe19 residue [80].
Figure 5.15 – [Aβ40+4H]4+ C-terminal SID b- fragment ion ATDs in 20 mM AmAc (pH 7.4). SID collision voltage: 40 V.
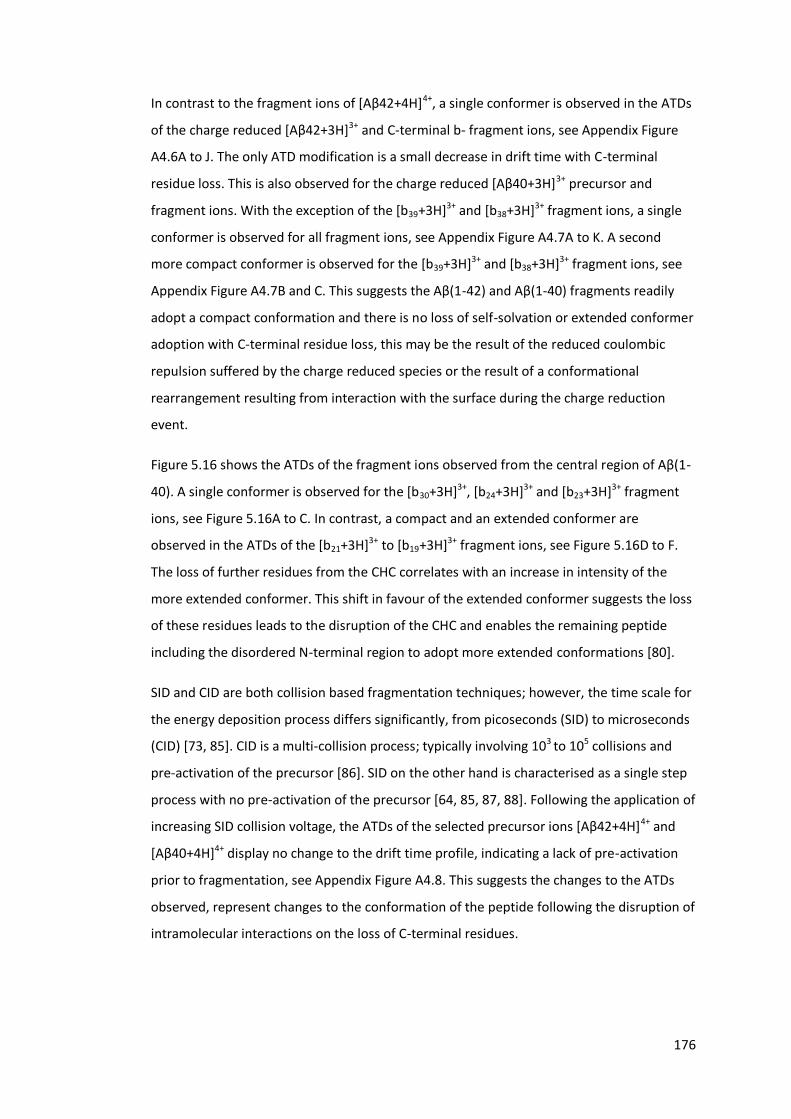
176
In contrast to the fragment ions of [Aβ42+4H]4+, a single conformer is observed in the ATDs
of the charge reduced [Aβ42+3H]3+ and C-terminal b- fragment ions, see Appendix Figure
A4.6A to J. The only ATD modification is a small decrease in drift time with C-terminal
residue loss. This is also observed for the charge reduced [Aβ40+3H]3+ precursor and
fragment ions. With the exception of the [b39+3H]3+ and [b38+3H]3+ fragment ions, a single
conformer is observed for all fragment ions, see Appendix Figure A4.7A to K. A second
more compact conformer is observed for the [b39+3H]3+ and [b38+3H]3+ fragment ions, see
Appendix Figure A4.7B and C. This suggests the Aβ(1-42) and Aβ(1-40) fragments readily
adopt a compact conformation and there is no loss of self-solvation or extended conformer
adoption with C-terminal residue loss, this may be the result of the reduced coulombic
repulsion suffered by the charge reduced species or the result of a conformational
rearrangement resulting from interaction with the surface during the charge reduction
event.
Figure 5.16 shows the ATDs of the fragment ions observed from the central region of Aβ(1-
40). A single conformer is observed for the [b30+3H]3+, [b24+3H]3+ and [b23+3H]3+ fragment
ions, see Figure 5.16A to C. In contrast, a compact and an extended conformer are
observed in the ATDs of the [b21+3H]3+ to [b19+3H]3+ fragment ions, see Figure 5.16D to F.
The loss of further residues from the CHC correlates with an increase in intensity of the
more extended conformer. This shift in favour of the extended conformer suggests the loss
of these residues leads to the disruption of the CHC and enables the remaining peptide
including the disordered N-terminal region to adopt more extended conformations [80].
SID and CID are both collision based fragmentation techniques; however, the time scale for
the energy deposition process differs significantly, from picoseconds (SID) to microseconds
(CID) [73, 85]. CID is a multi-collision process; typically involving 103 to 105 collisions and
pre-activation of the precursor [86]. SID on the other hand is characterised as a single step
process with no pre-activation of the precursor [64, 85, 87, 88]. Following the application of
increasing SID collision voltage, the ATDs of the selected precursor ions [Aβ42+4H]4+ and
[Aβ40+4H]4+ display no change to the drift time profile, indicating a lack of pre-activation
prior to fragmentation, see Appendix Figure A4.8. This suggests the changes to the ATDs
observed, represent changes to the conformation of the peptide following the disruption of
intramolecular interactions on the loss of C-terminal residues.

177
Figure 5.16 – ATDs of the charge reduced [Aβ40+3H]3+ central region SID b- fragment ions in 20 mM AmAc (pH 7.4). SID collision voltage: 40 V.
5.3.6. The Interactions of Aβ(1-42) with Small Molecule Anti-Aggregation
Drug Candidates
Measuring the binding of small drug candidates to proteins is a common application of
biological MS. Here, the binding of Aβ(1-42) and the aggregation inhibiting peptide, RI-OR2
is assessed, in comparison with a control peptide, Bradykinin (BK). Figure 5.17 shows the
mass spectra of Aβ(1-42) at an increasing ratio of Aβ(1-42) to RI-OR2 in H2O (pH 2). In the
absence of RI-OR2, only monomeric species are observed (3 ≤ z ≤ 5). At a 1:0.1 ratio,
[Aβ42+6H]6+ is observed at low intensity, expanding the monomer CSD width, in addition,
the [(Aβ42)2+5H]5+ and [(Aβ42)2+7H]7+ dimers are observed. Significant tailing attributed to
sodium adducts is observed in Figure 5.17A and Figure 5.17B, although at a much lower

178
intensity. The difference in the salt adduction between the two samples may be the result
of a larger nESI tip orifice, increasing the initial droplet size and the probability of sodium
ion presence in the initial droplet. The reduction in salt adducts may also be the result of
RI-OR2 sequestering some of the sodium contaminant ions, which are subsequently lost
during the desolvation process or the presence of RI-OR2 leads to a rearrangement of Aβ(1-
42) surface accessible residues lowering the potential partners for sodium ion pair
formation [89]. The cleaner spectrum in Figure 5.17B also explains the observation of the
low intensity dimer species. In addition, a bound 1:1 complex [(Aβ42:RI-OR2)+4H]4+ (m/z:
1409) is observed at a low intensity. As the ratio of Aβ(1-42):RI-OR2 is increased, the
intensity of the bound species increases (Figure 5.17C to E). At a ratio of 1:0.5 and above,
the [(Aβ42)2+5H]5+ dimer is not observed, this is attributed to an increase in baseline noise.
The unbound [RI-OR2+3H]3+ and [RI-OR2+2H]2+ are observed at all ratios tested and as the
Aβ(1-42):RI-OR2 ratio is increased, [RI-OR2+3H]3+ and the unbound RI-OR2 species in
general become the dominant species of each spectrum. Although the monomer and dimer
species observed are similar, a greater ratio of Aβ(1-42):ligand is required to observe the
Aβ(1-42):BK complex, 1:0.5 compared to 1:0.1, see Appendix Figure A4.9, demonstrating
RI-OR2s greater affinity for Aβ(1-42). Figure 5.18 is a plot of the absolute intensity for the
observed species at each ratio tested, there is no suppression of the Aβ(1-42) signal with
increasing RI-OR2 intensity. RI-OR2 ionises more readily than Aβ(1-42) and the intensity of
the unbound RI-OR2 peaks may be supplemented by the dissociation of Aβ(1-42):RI-OR2
during the ionisation process. Difficulties achieving a stable spray of Aβ(1-42) and
aggregation of the sample, negatively affect the intensity of the Aβ(1-42) peaks observed.
This experiment demonstrates that the interaction between RI-OR2 and Aβ(1-42) is
observable by MS. The peptide:ligand samples were prepared immediately prior to analysis
to minimise aggregation. In order to test the anti-aggregation properties of RI-OR2, longer
incubation periods before analysis are required. Following incubation, the absence of
dimers and higher order oligomers will confirm the anti-aggregation properties of RI-OR2.
179
Figure 5.17 - Mass spectra of Aβ(1-42) at 20 µM in H2O (pH 2) at increasing Aβ(1-42):RI-OR2 ratio. Observed species are annotated in the first instance and labelled oligomeric order / charge. Marker denotes species and oligomeric order. Red triangle: RI-OR2, Green square: Aβ(1-42) monomer, Blue
square: Aβ(1-42) dimer, Yellow circle: Aβ(1-42):RI-OR2 bound species. (inset) Zoom of regions of interest, required due to the high intensity unbound ligand species.
Figure 5.18 - Absolute intensity of all observed species plotted against Aβ(1-42):RI-OR2 ratio in H2O (pH 2).
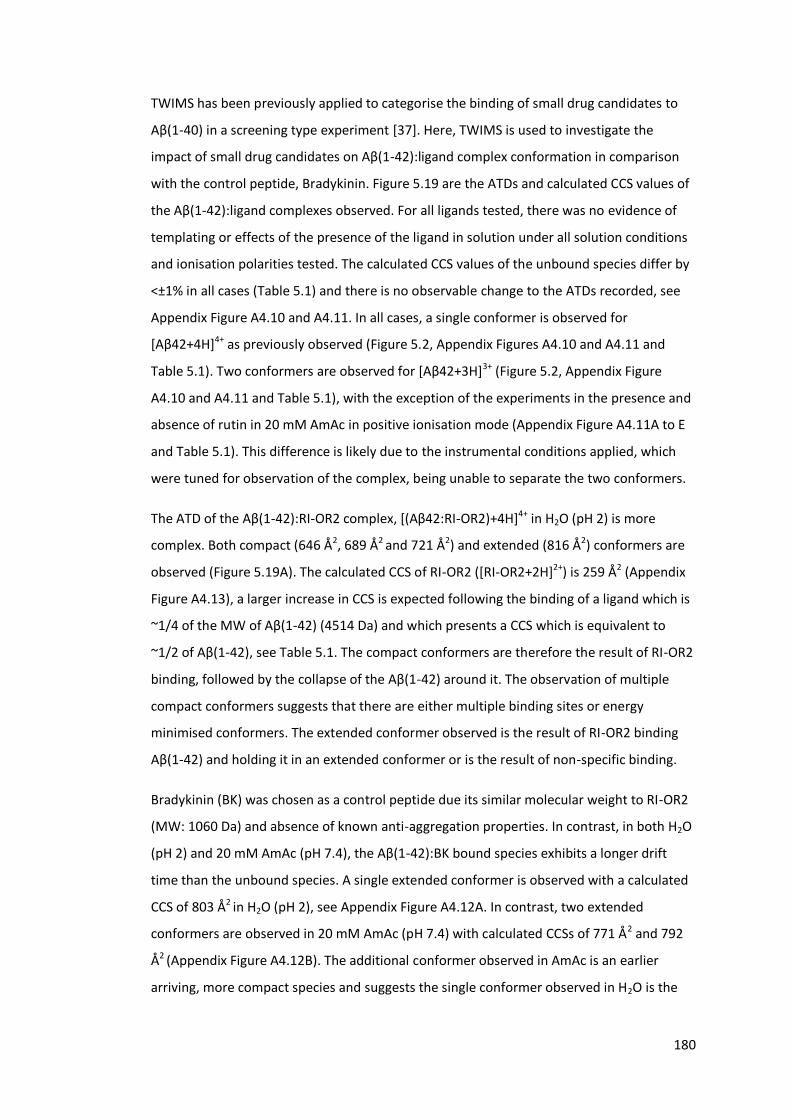
180
TWIMS has been previously applied to categorise the binding of small drug candidates to
Aβ(1-40) in a screening type experiment [37]. Here, TWIMS is used to investigate the
impact of small drug candidates on Aβ(1-42):ligand complex conformation in comparison
with the control peptide, Bradykinin. Figure 5.19 are the ATDs and calculated CCS values of
the Aβ(1-42):ligand complexes observed. For all ligands tested, there was no evidence of
templating or effects of the presence of the ligand in solution under all solution conditions
and ionisation polarities tested. The calculated CCS values of the unbound species differ by
<±1% in all cases (Table 5.1) and there is no observable change to the ATDs recorded, see
Appendix Figure A4.10 and A4.11. In all cases, a single conformer is observed for
[Aβ42+4H]4+ as previously observed (Figure 5.2, Appendix Figures A4.10 and A4.11 and
Table 5.1). Two conformers are observed for [Aβ42+3H]3+ (Figure 5.2, Appendix Figure
A4.10 and A4.11 and Table 5.1), with the exception of the experiments in the presence and
absence of rutin in 20 mM AmAc in positive ionisation mode (Appendix Figure A4.11A to E
and Table 5.1). This difference is likely due to the instrumental conditions applied, which
were tuned for observation of the complex, being unable to separate the two conformers.
The ATD of the Aβ(1-42):RI-OR2 complex, [(Aβ42:RI-OR2)+4H]4+ in H2O (pH 2) is more
complex. Both compact (646 Å2, 689 Å2 and 721 Å2) and extended (816 Å2) conformers are
observed (Figure 5.19A). The calculated CCS of RI-OR2 ([RI-OR2+2H]2+) is 259 Å2 (Appendix
Figure A4.13), a larger increase in CCS is expected following the binding of a ligand which is
~1/4 of the MW of Aβ(1-42) (4514 Da) and which presents a CCS which is equivalent to
~1/2 of Aβ(1-42), see Table 5.1. The compact conformers are therefore the result of RI-OR2
binding, followed by the collapse of the Aβ(1-42) around it. The observation of multiple
compact conformers suggests that there are either multiple binding sites or energy
minimised conformers. The extended conformer observed is the result of RI-OR2 binding
Aβ(1-42) and holding it in an extended conformer or is the result of non-specific binding.
Bradykinin (BK) was chosen as a control peptide due its similar molecular weight to RI-OR2
(MW: 1060 Da) and absence of known anti-aggregation properties. In contrast, in both H2O
(pH 2) and 20 mM AmAc (pH 7.4), the Aβ(1-42):BK bound species exhibits a longer drift
time than the unbound species. A single extended conformer is observed with a calculated
CCS of 803 Å2 in H2O (pH 2), see Appendix Figure A4.12A. In contrast, two extended
conformers are observed in 20 mM AmAc (pH 7.4) with calculated CCSs of 771 Å2 and 792
Å2 (Appendix Figure A4.12B). The additional conformer observed in AmAc is an earlier
arriving, more compact species and suggests the single conformer observed in H2O is the
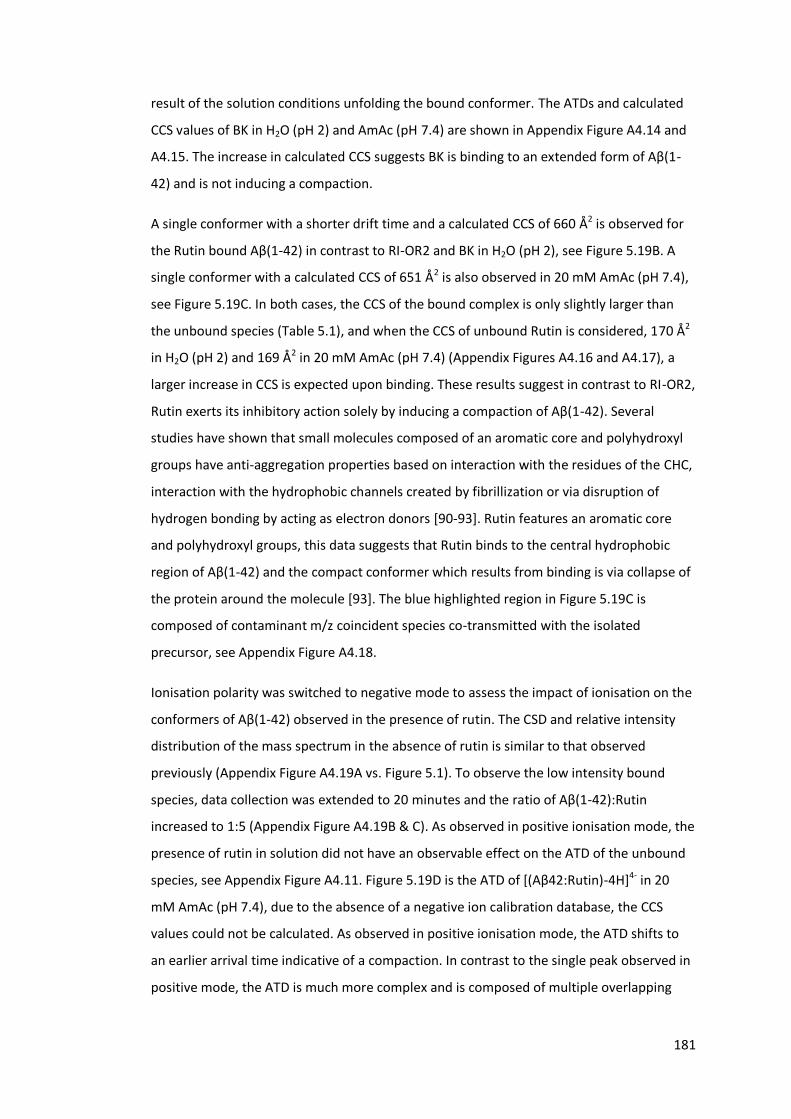
181
result of the solution conditions unfolding the bound conformer. The ATDs and calculated
CCS values of BK in H2O (pH 2) and AmAc (pH 7.4) are shown in Appendix Figure A4.14 and
A4.15. The increase in calculated CCS suggests BK is binding to an extended form of Aβ(1-
42) and is not inducing a compaction.
A single conformer with a shorter drift time and a calculated CCS of 660 Å2 is observed for
the Rutin bound Aβ(1-42) in contrast to RI-OR2 and BK in H2O (pH 2), see Figure 5.19B. A
single conformer with a calculated CCS of 651 Å2 is also observed in 20 mM AmAc (pH 7.4),
see Figure 5.19C. In both cases, the CCS of the bound complex is only slightly larger than
the unbound species (Table 5.1), and when the CCS of unbound Rutin is considered, 170 Å2
in H2O (pH 2) and 169 Å2 in 20 mM AmAc (pH 7.4) (Appendix Figures A4.16 and A4.17), a
larger increase in CCS is expected upon binding. These results suggest in contrast to RI-OR2,
Rutin exerts its inhibitory action solely by inducing a compaction of Aβ(1-42). Several
studies have shown that small molecules composed of an aromatic core and polyhydroxyl
groups have anti-aggregation properties based on interaction with the residues of the CHC,
interaction with the hydrophobic channels created by fibrillization or via disruption of
hydrogen bonding by acting as electron donors [90-93]. Rutin features an aromatic core
and polyhydroxyl groups, this data suggests that Rutin binds to the central hydrophobic
region of Aβ(1-42) and the compact conformer which results from binding is via collapse of
the protein around the molecule [93]. The blue highlighted region in Figure 5.19C is
composed of contaminant m/z coincident species co-transmitted with the isolated
precursor, see Appendix Figure A4.18.
Ionisation polarity was switched to negative mode to assess the impact of ionisation on the
conformers of Aβ(1-42) observed in the presence of rutin. The CSD and relative intensity
distribution of the mass spectrum in the absence of rutin is similar to that observed
previously (Appendix Figure A4.19A vs. Figure 5.1). To observe the low intensity bound
species, data collection was extended to 20 minutes and the ratio of Aβ(1-42):Rutin
increased to 1:5 (Appendix Figure A4.19B & C). As observed in positive ionisation mode, the
presence of rutin in solution did not have an observable effect on the ATD of the unbound
species, see Appendix Figure A4.11. Figure 5.19D is the ATD of [(Aβ42:Rutin)-4H]4- in 20
mM AmAc (pH 7.4), due to the absence of a negative ion calibration database, the CCS
values could not be calculated. As observed in positive ionisation mode, the ATD shifts to
an earlier arrival time indicative of a compaction. In contrast to the single peak observed in
positive mode, the ATD is much more complex and is composed of multiple overlapping
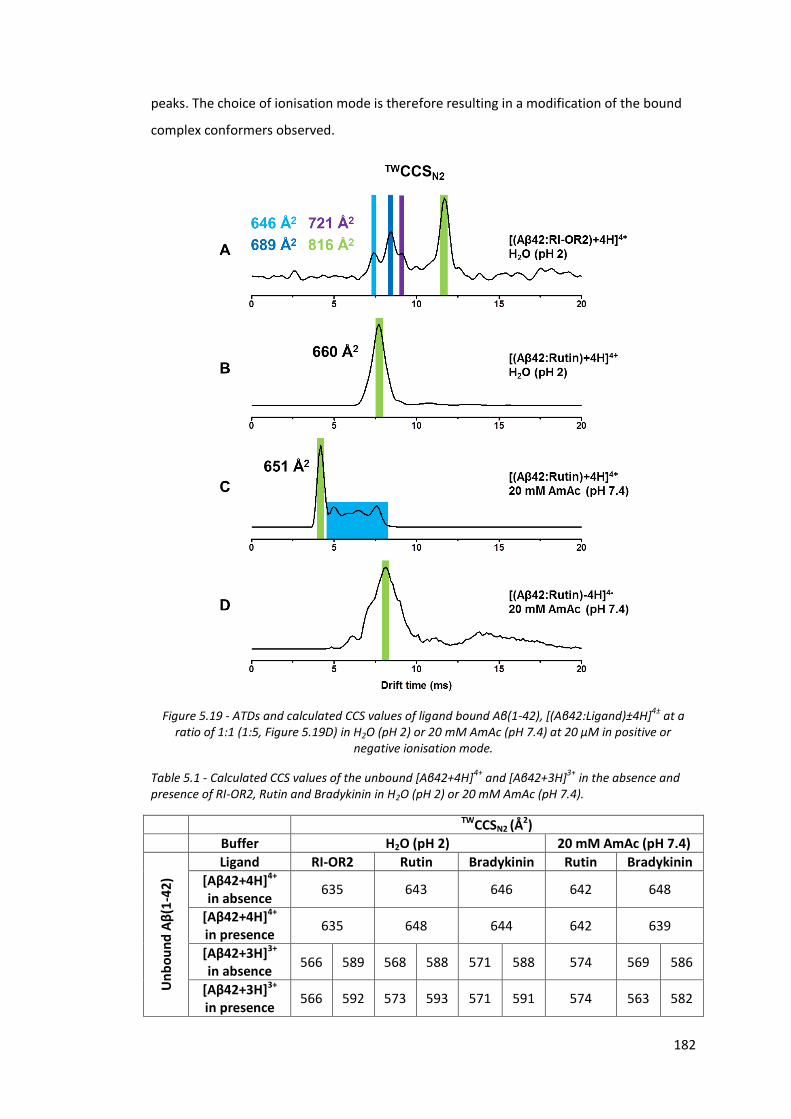
182
peaks. The choice of ionisation mode is therefore resulting in a modification of the bound
complex conformers observed.
Figure 5.19 - ATDs and calculated CCS values of ligand bound Aβ(1-42), [(Aβ42:Ligand)±4H]4± at a ratio of 1:1 (1:5, Figure 5.19D) in H2O (pH 2) or 20 mM AmAc (pH 7.4) at 20 µM in positive or
negative ionisation mode.
Table 5.1 - Calculated CCS values of the unbound [Aβ42+4H]4+ and [Aβ42+3H]3+ in the absence and presence of RI-OR2, Rutin and Bradykinin in H2O (pH 2) or 20 mM AmAc (pH 7.4).
TWCCSN2 (Å2)
Buffer H2O (pH 2) 20 mM AmAc (pH 7.4)
Un
bo
un
d A
β(1
-42
)
Ligand RI-OR2 Rutin Bradykinin Rutin Bradykinin
[Aβ42+4H]4+ in absence
635 643 646 642 648
[Aβ42+4H]4+ in presence
635 648 644 642 639
[Aβ42+3H]3+ in absence
566 589 568 588 571 588 574 569 586
[Aβ42+3H]3+ in presence
566 592 573 593 571 591 574 563 582
183
5.4. Summary
The aim of the experiments in this chapter was to apply MS based methods to probe the
structure of Aβ(1-42) and Aβ(1-40). MS and IM-MS were applied to probe the effect of
solution condition modification and ionisation polarity on Aβ(1-42). Shifts in the CSD
intensity are observed with alteration of solution conditions and ionisation polarity,
demonstrating that both have an effect on the species observed. The difference in the
Aβ(1-42) ATDs at increasing AmAc salt concentrations between ionisation polarities
suggests that the location of charged groups influences the gas phase structure. As
previously demonstrated for α-Synuclein in Chapters 3 and 4, it is possible to observe day
to day variation in the species observed via MS and IM-MS. This observation highlights the
benefit of MS based methods for analysis, as the unbiased nature and the lack of an
averaging effect are common pitfalls of traditional biophysical techniques and can mask
these variations. In order to probe the structure Aβ(1-42) and Aβ(1-40) and fulfil the aim of
the experiments in this chapter, a range of gas phase fragmentation techniques including
CID, ETD and SID were applied. CIU-TWIMS and analysis of the CID fragments, highlights the
overall structural stability of Aβ(1-42) and its alteration following modification of solution
conditions. In addition, the CIU-TWIMS data demonstrates the day to day variation
previously observed. The primary sequence of Aβ(1-42) has a pronounced effect on the CID
fragments observed, with the cluster of basic residues in the N-terminus preventing
fragmentation in this region (Figures 5.5, 5.6 and 5.10). Previous MS based approaches
including HDX-MS [23-30], have reported the lack of defined structure within the
monomeric Aβ(1-40) and Aβ(1-42) and increases in structure following the transition to
higher order oligomers and fibrils. The absence of fragmentation via ETD alone and the
requirement for supplemental collisional activation, in combination with IM-MS,
demonstrates that monomeric Aβ(1-42) is a compact species bound by intramolecular
interactions. The comparison of the fragmentation of Aβ(1-42) by CID and SID is the first of
its kind for an amyloidogenic protein. SID has been previously demonstrated to be
comparable to CID for the analysis of primary structure [65-69]. The differences between
the two fragmentation processes are clear following comparison of the MS/MS spectra
(Figure 5.13), one of the key benefits of SID being the much ‘cleaner’ spectrum. In addition,
significant charge reduction is observed, a relic of the interaction with the surface during
SID, both features are beneficial for fragment identification and primary sequence
determination. As observed following CID, fragmentation is limited primarily to the C-
terminal region of Aβ(1-42) and Aβ(1-40) (Figure 5.12 and 5.13). SID has been previously
184
used to characterise the subunit architecture of protein oligomers [88, 94, 95]. As SID is a
single step, high energy deposition process without precursor activation (Appendix Figure
A4.8), changes observed in the ATDs of the fragment ions can be correlated with known
structural elements, demonstrated by other biophysical techniques [96] and used to infer
structural details of the precursor ion.
The final aim of the experiments in this chapter was to classify the mode of action of two
drug candidates based on the ligand induced conformational changes in Aβ(1-42) using
TWIMS. We expand on the work of Young et al. in classifying the binding of small drug
candidates to Aβ(1-40) using TWIMS [37]. Based on the calculated CCS of the RI-OR2:Aβ(1-
42) complex, RI-OR2 exerts its inhibitory effect by the collapse of the peptide around it
following binding or by binding and holding Aβ(1-42) in an extended conformation. In
contrast, Rutin exerts its inhibitory effect solely by binding to Aβ(1-42), followed by the
collapse of the peptide around it. Aβ(1-42) is notably more difficult to work with than Aβ(1-
40), on the basis of its aggregation propensity. However, we have demonstrated that
applying IM-MS in this manner has the potential to act as a secondary filter in a high
throughput screen of thousands of small molecule drug candidates.
185
5.5. References
1. Grasso, G., The Use Of Mass Spectrometry To Study Amyloid-Beta Peptides. Mass Spectrometry Reviews, 2011. 30(3): p. 347-365.
2. Chen, X.G., et al., Simultaneous assessment of conformation and aggregation of beta-amyloid peptide using electrospray ionization mass spectrometry. Faseb Journal, 1997. 11(10): p. 817-823.
3. Young, L.M., et al., Insights into the consequences of co-polymerisation in the early stages of IAPP and A beta peptide assembly from mass spectrometry. Analyst, 2015. 14(20): p. 6990-6999.
4. Wiberg, H., et al., Separation and characterization of aggregated species of amyloid-beta peptides. Analytical and Bioanalytical Chemistry, 2010. 397(6): p. 2357-2366.
5. Baumketner, A., et al., Amyloid beta-protein monomer structure: A computational and experimental study. Protein Science, 2006. 15(3): p. 420-428.
6. Bernstein, S.L., et al., Amyloid beta-protein: Monomer structure and early aggregation states of A beta 42 and its Pro(19) alloform. Journal of the American Chemical Society, 2005. 127(7): p. 2075-2084.
7. Wu, C., et al., The Structure of A beta 42 C-Terminal Fragments Probed by a Combined Experimental and Theoretical Study. Journal of Molecular Biology, 2009. 387(2): p. 492-501.
8. Do, T.D., et al., Amyloid beta-Protein C-Terminal Fragments: Formation of Cylindrins and beta-Barrels. Journal of the American Chemical Society, 2016. 138(2): p. 549-557.
9. Teplow, D.B., et al., Elucidating amyloid beta-protein folding and assembly: A multidisciplinary approach. Accounts of Chemical Research, 2006. 39(9): p. 635-645.
10. Bernstein, S.L., et al., Amyloid-beta protein oligomerization and the importance of tetramers and dodecamers in the aetiology of Alzheimer's disease. Nature Chemistry, 2009. 1(4): p. 326-331.
11. Economou, N.J., et al., Amyloid beta-Protein Assembly and Alzheimer's Disease: Dodecamers of A beta 42, but Not of A beta 40, Seed Fibril Formation. Journal of the American Chemical Society, 2016. 138(6): p. 1772-1775.
12. Krone, M.G., et al., Effects of familial Alzheimer's disease mutations on the folding nucleation of the amyloid beta-protein. Journal of Molecular Biology, 2008. 381(1): p. 221-228.
13. Gessel, M.M., et al., Familial Alzheimer's Disease Mutations Differentially Alter Amyloid beta-Protein Oligomerization. Acs Chemical Neuroscience, 2012. 3(11): p. 909-918.
14. Zheng, X.Y., et al., Amyloid beta-Protein Assembly: Differential Effects of the Protective A2T Mutation and Recessive A2V Familial Alzheimer's Disease Mutation. Acs Chemical Neuroscience, 2015. 6(10): p. 1732-1740.
15. Murray, M.M., et al., Amyloid beta-Protein: Experiment and Theory on the 21-30 Fragment. Journal of Physical Chemistry B, 2009. 113(17): p. 6041-6046.
16. Murray, M.M., et al., Amyloid beta Protein: A beta 40 Inhibits A beta 42 Oligomerization. Journal of the American Chemical Society, 2009. 131(18): p. 6316-+.
17. Gessel, M.M., et al., A beta(39-42) Modulates A beta Oligomerization but Not Fibril Formation. Biochemistry, 2012. 51(1): p. 108-117.
18. Do, T.D., et al., Interactions between Amyloid-beta and Tau Fragments Promote Aberrant Aggregates: Implications for Amyloid Toxicity. Journal of Physical Chemistry B, 2014. 118(38): p. 11220-11230.
186
19. Roychaudhuri, R., et al., Role of Species-Specific Primary Structure Differences in A beta 42 Assembly and Neurotoxicity. Acs Chemical Neuroscience, 2015. 6(12): p. 1941-1955.
20. Kloniecki, M., et al., Ion Mobility Separation Coupled with MS Detects Two Structural States of Alzheimer's Disease A beta 1-40 Peptide Oligomers. Journal of Molecular Biology, 2011. 407(1): p. 110-124.
21. Sitkiewicz, E., et al., Factors Influencing Compact-Extended Structure Equilibrium in Oligomers of A beta 1-40 Peptide-An Ion Mobility Mass Spectrometry Study. Journal of Molecular Biology, 2014. 426(15): p. 2871-2885.
22. Pujol-Pina, R., et al., SDS-PAGE analysis of A beta oligomers is disserving research into Alzheimer's disease: appealing for ESI-IM-MS. Scientific Reports, 2015. 5: p. 13.
23. Landreh, M., et al., New developments in protein structure-function analysis by MS and use of hydrogen-deuterium exchange microfluidics. Febs Journal, 2011. 278(20): p. 3815-3821.
24. Kheterpal, I. and R. Wetzel, Hydrogen/deuterium exchange mass spectrometrys - A window into amyloid structure. Accounts of Chemical Research, 2006. 39(9): p. 584-593.
25. Wang, S.S.S., et al., Hydrogen exchange-mass spectrometry analysis of beta-Amyloid peptide structure. Biochemistry, 2003. 42(31): p. 9507-9514.
26. Kheterpal, I., et al., Structural differences in A beta amyloid protofibrils and fibrils mapped by hydrogen exchange - Mass spectrometry with on-line proteolytic fragmentation. Journal of Molecular Biology, 2006. 361(4): p. 785-795.
27. Kheterpal, I., et al., A beta protofibrils possess a stable core structure resistant to hydrogen exchange. Biochemistry, 2003. 42(48): p. 14092-14098.
28. Zhang, A., et al., Structural Differences between A beta(1-40) Intermediate Oligomers and Fibrils Elucidated by Proteolytic Fragmentation and Hydrogen/Deuterium Exchange. Biophysical Journal, 2009. 96(3): p. 1091-1104.
29. Zhang, Y., et al., Pulsed hydrogen-deuterium exchange mass spectrometry probes conformational changes in amyloid beta (A beta) peptide aggregation. Proceedings of the National Academy of Sciences of the United States of America, 2013. 110(36): p. 14604-14609.
30. Serra-Vidal, B., et al., Hydrogen/Deuterium Exchange-Protected Oligomers Populated during A beta Fibril Formation Correlate with Neuronal Cell Death. Acs Chemical Biology, 2014. 9(11): p. 2678-2685.
31. Ramos, I., et al., Kinetic Study of beta-Amyloid Residue Accessibility Using Reductive Alkylation and Mass Spectrometry. Biotechnology and Bioengineering, 2009. 104(1): p. 181-192.
32. Martineau, E., et al., Investigation of the Noncovalent Interactions Between Anti-Amyloid Agents and Amyloid beta Peptides by ESI-MS. Journal of the American Society for Mass Spectrometry, 2010. 21(9): p. 1506-1514.
33. Skribanek, Z., L. Balaspiri, and M. Mak, Interaction between synthetic amyloid-beta-peptide (1-40) and its aggregation inhibitors studied by electrospray ionization mass spectrometry. Journal of Mass Spectrometry, 2001. 36(11): p. 1226-1229.
34. Bazoti, F.N., et al., Noncovalent interaction between amyloid-beta-peptide (1-40) and oleuropein studied by electrospray ionization mass spectrometry. Journal of the American Society for Mass Spectrometry, 2006. 17(4): p. 568-575.
35. Minicozzi, V., et al., Computational and Experimental Studies on beta-Sheet Breakers Targeting A beta(1-40) Fibrils. Journal of Biological Chemistry, 2014. 289(16): p. 11242-11252.
36. Nerelius, C., et al., Anti-Amyloid Activity of the C-Terminal Domain of proSP-C against Amyloid beta-Peptide and Medin. Biochemistry, 2009. 48(17): p. 3778-3786.
187
37. Young, L.M., et al., Screening and classifying small-molecule inhibitors of amyloid formation using ion mobility spectrometry-mass spectrometry. Nature Chemistry, 2015. 7(1): p. 73-81.
38. Ruotolo, B.T., et al., Ion mobility-mass spectrometry analysis of large protein complexes. Nature Protocols, 2008. 3(7): p. 1139-1152.
39. Zhou, M.W., C.S. Huang, and V.H. Wysocki, Surface-Induced Dissociation of Ion Mobility-Separated Noncovalent Complexes in a Quadrupole/Time-of-Flight Mass Spectrometer. Analytical Chemistry, 2012. 84(14): p. 6016-6023.
40. Baker, P.R.C., K. R. Protein Prospector. 2016; Available from: http://prospector.ucsf.edu.
41. Eschweiler, J.D., et al., CIUSuite: A Quantitative Analysis Package for Collision Induced Unfolding Measurements of Gas-Phase Protein Ions. Analytical Chemistry, 2015. 87(22): p. 11516-11522.
42. Allen, S.J., A.M. Schwartz, and M.F. Bush, Effects of Polarity on the Structures and Charge States of Native-Like Proteins and Protein Complexes in the Gas Phase. Analytical Chemistry, 2013. 85(24): p. 12055-12061.
43. Stine, W.B., et al., In vitro characterization of conditions for amyloid-beta peptide oligomerization and fibrillogenesis. Journal of Biological Chemistry, 2003. 278(13): p. 11612-11622.
44. Taylor, M., et al., Development of a Proteolytically Stable Retro-Inverso Peptide Inhibitor of beta-Amyloid Oligomerization as a Potential Novel Treatment for Alzheimer's Disease. Biochemistry, 2010. 49(15): p. 3261-3272.
45. Barnham, K.J., et al., Platinum-based inhibitors of amyloid-beta as therapeutic agents for Alzheimer's disease. Proceedings of the National Academy of Sciences of the United States of America, 2008. 105(19): p. 6813-6818.
46. Giannakis, E., et al., Analysis of Amyloid-Beta Interactions Using ProteinChip Technology, in Peptide-Based Drug Design, L. Otvos, Editor. 2008, Humana Press: New York, NY.
47. Paizs, B. and S. Suhai, Fragmentation pathways of protonated peptides. Mass Spectrometry Reviews, 2005. 24(4): p. 508-548.
48. Wysocki, V.H., et al., Special feature: Commentary - Mobile and localized protons: a framework for understanding peptide dissociation. Journal of Mass Spectrometry, 2000. 35(12): p. 1399-1406.
49. Dongre, A.R., et al., Influence of peptide composition, gas-phase basicity, and chemical modification on fragmentation efficiency: Evidence for the mobile proton model. Journal of the American Chemical Society, 1996. 118(35): p. 8365-8374.
50. Medzihradszky, K.F., et al., The characteristics of peptide collision-induced dissociation using a high-performance MALDI-TOF/TOF tandem mass spectrometer. Analytical Chemistry, 2000. 72(3): p. 552-558.
51. Seidler, J., et al., De novo sequencing of peptides by MS/MS. Proteomics, 2010. 10(4): p. 634-649.
52. Tabb, D.L., et al., Influence of basic residue content on fragment ion peak intensities in low-energy - collision-induced dissociation spectra of peptides. Analytical Chemistry, 2004. 76(5): p. 1243-1248.
53. Paizs, B. and S. Suhai, Towards understanding some ion intensity relationships for the tandem mass spectra of protonated peptides. Rapid Communications in Mass Spectrometry, 2002. 16(17): p. 1699-1702.
54. Tsaprailis, G., et al., Influence of secondary structure on the fragmentation of protonated peptides. Journal of the American Chemical Society, 1999. 121(22): p. 5142-5154.
188
55. Lermyte, F. and F. Sobott, Electron transfer dissociation provides higher-order structural information of native and partially unfolded protein complexes. Proteomics, 2015. 15(16): p. 2813-2822.
56. Xia, Y., et al., Effects of cation charge-site identity and position on electron-transfer dissociation of polypeptide cations. Journal of the American Chemical Society, 2007. 129(40): p. 12232-12243.
57. Swaney, D.L., et al., Supplemental activation method for high-efficiency electron-transfer dissociation of doubly protonated peptide precursors. Analytical Chemistry, 2007. 79(2): p. 477-485.
58. Zhang, S., et al., The Alzheimer's peptide A beta adopts a collapsed coil structure in water. Journal of Structural Biology, 2000. 130(2-3): p. 130-141.
59. Ball, K.A., et al., Differences in beta-strand Populations of Monomeric A beta 40 and A beta 42. Biophysical Journal, 2013. 104(12): p. 2714-2724.
60. Cooks, R.G., T. Ast, and A. Mabud, Collisions Of Polyatomic Ions With Surfaces. International Journal of Mass Spectrometry, 1990. 100: p. 209-265.
61. Beck, R.D., et al., TANDEM TIME-OF-FLIGHT MASS-SPECTROMETER FOR CLUSTER-SURFACE SCATTERING EXPERIMENTS. Review of Scientific Instruments, 1995. 66(8): p. 4188-4197.
62. de Maaijer-Gielbert, J.G., C., et al., Surface-induced dissociation of singly and multiply prontated polypropylenamine dendrimers. Journal of the American Society for Mass Spectrometry, 1999. 10(5): p. 414-422.
63. Grill, V., et al., Collisions of ions with surfaces at chemically relevant energies: Instrumentation and phenomena. Review of Scientific Instruments, 2001. 72(8): p. 3149-3179.
64. Williams, E.R., L.L. Fang, and R.N. Zare, Surface Induced Dissociation For Tandem Time-Of-Flight Mass-Spectrometry. International Journal of Mass Spectrometry and Ion Processes, 1993. 123(3): p. 233-241.
65. McCormack, A.L., J.L. Jones, and V.H. Wysocki, Surface-Induced Dissociation Of Multiply Protonated Peptides. Journal of the American Society for Mass Spectrometry, 1992. 3(8): p. 859-862.
66. Galhena, A.S., et al., Surface-induced dissociation of peptides and protein complexes in a quadrupole/Time-of-Flight mass spectrometer. Analytical Chemistry, 2008. 80(5): p. 1425-1436.
67. Dongre, A.R., A. Somogyi, and V.H. Wysocki, Surface-induced dissociation: An effective tool to probe structure, energetics and fragmentation mechanisms of protonated peptides. Journal of Mass Spectrometry, 1996. 31(4): p. 339-350.
68. Laskin, J., E. Denisov, and J. Futrell, Comparative study of collision-induced and surface-induced dissociation. 2. Fragmentation of small alanine-containing peptides in FT-ICR MS. Journal of Physical Chemistry B, 2001. 105(9): p. 1895-1900.
69. McCormack, A.L., et al., Fragmentation Of Protonated Peptides - Surface-Induced Dissociation In Conjunction With A Quantum-Mechanical Approach. Analytical Chemistry, 1993. 65(20): p. 2859-2872.
70. Jones, J.L., et al., Sequence Dependence Of Peptide Fragmentation Efficiency Curves Determined By Electrospray-Ionization Surface-Induced Dissociation Mass-Spectrometry. Journal of the American Chemical Society, 1994. 116(18): p. 8368-8369.
71. Williams, E.R., et al., Surface-Induced Dissociation Of Peptide Ions In Fourier-Transform Mass-Spectrometry. Journal of the American Society for Mass Spectrometry, 1990. 1(5): p. 413-416.
72. Fernandez, F.M., et al., Protein identification via surface-induced dissociation in an FT-ICR mass spectrometer and a patchwork sequencing approach. Journal of the American Society for Mass Spectrometry, 2006. 17(5): p. 700-709.
189
73. Jones, C.M., et al., Symmetrical gas-phase dissociation of noncovalent protein complexes via surface collisions. Journal of the American Chemical Society, 2006. 128(47): p. 15044-15045.
74. Quintyn, R.S., et al., Ligand binding and unfolding of tryptophan synthase revealed by ion mobility-tandem mass spectrometry employing collision and surface induced dissociation. International Journal for Ion Mobility Spectrometry, 2013. 16: p. 133-143.
75. Harvey, S.R., et al., Extended Gas-Phase Trapping Followed by Surface-Induced Dissociation of Noncovalent Protein Complexes. Analytical Chemistry, 2016. 88(2): p. 1218-1221.
76. Laskin, J., et al., Effect of the Basic Residue on the Energetics, Dynamics, and Mechanisms of Gas-Phase Fragmentation of Protonated Peptides. Journal of the American Chemical Society, 2010. 132(45): p. 16006-16016.
77. Kirschner, D.A., et al., Synthetic Peptide Homologous To Beta-Protein From Alzheimer-Disease Forms Amyloid-Like Fibrils In Vitro. Proceedings of the National Academy of Sciences of the United States of America, 1987. 84(19): p. 6953-6957.
78. Soto, C., et al., Structural Determinants Of The Alzheimers Amyloid Beta-Peptide. Journal of Neurochemistry, 1994. 63(4): p. 1191-1198.
79. Serpell, L.C., Alzheimer's amyloid fibrils: structure and assembly. Biochimica Et Biophysica Acta-Molecular Basis of Disease, 2000. 1502(1): p. 16-30.
80. Ahmed, M., et al., Structural conversion of neurotoxic amyloid-beta(1-42) oligomers to fibrils. Nature Structural & Molecular Biology, 2010. 17(5): p. 561-U56.
81. Yan, Y.L. and C.Y. Wang, A beta 42 is more rigid than A beta 40 at the C terminus: Implications for A beta aggregation and toxicity. Journal of Molecular Biology, 2006. 364(5): p. 853-862.
82. Wysocki, V.H., et al., Surface-induced dissociation of small molecules, peptides,and non-covalent protein complexes. Journal of the American Society for Mass Spectrometry, 2008. 19(2): p. 190-208.
83. Jarrold, M.F., Peptides and proteins in the vapor phase. Annual Review of Physical Chemistry, 2000. 51: p. 179-207.
84. Lim, K.H., et al., Characterizations of distinct amyloidogenic conformations of the A beta (1-40) and (1-42) peptides. Biochemical and Biophysical Research Communications, 2007. 353(2): p. 443-449.
85. Benesch, J.L.P., Collisional Activation of Protein Complexes: Picking Up the Pieces. Journal of the American Society for Mass Spectrometry, 2009. 20(3): p. 341-348.
86. Pagel, K., et al., Alternate Dissociation Pathways Identified in Charge-Reduced Protein Complex Ions. Analytical Chemistry, 2010. 82(12): p. 5363-5372.
87. Zhou, M.W. and V.H. Wysocki, Surface Induced Dissociation: Dissecting Noncovalent Protein Complexes in the Gas phase. Accounts of Chemical Research, 2014. 47(4): p. 1010-1018.
88. Zhou, M.W., S. Dagan, and V.H. Wysocki, Protein Subunits Released by Surface Collisions of Noncovalent Complexes: Nativelike Compact Structures Revealed by Ion Mobility Mass Spectrometry. Angewandte Chemie-International Edition, 2012. 51(18): p. 4336-4339.
89. Verkerk, U.H. and P. Kebarle, Ion-ion and ion-molecule reactions at the surface of proteins produced by nanospray. Information on the number of acidic residues and control of the number of ionized acidic and basic residues. Journal of the American Society for Mass Spectrometry, 2005. 16(8): p. 1325-1341.
90. Convertino, M., et al., 9,10-Anthraquinone hinders beta-aggregation: How does a small molecule interfere with A beta-peptide amyloid fibrillation? Protein Science, 2009. 18(4): p. 792-800.
190
91. Yang, S.G., et al., Diverse Ecdysterones Show Different Effects on Amyloid-beta(42) Aggregation but All Uniformly Inhibit Amyloid-beta(42)-Induced Cytotoxicity. Journal of Alzheimers Disease, 2010. 22(1): p. 107-117.
92. Honson, N.S., et al., Differentiating Alzheimer disease-associated aggregates with small molecules. Neurobiology of Disease, 2007. 28(3): p. 251-260.
93. Wang, S.W., et al., Rutin inhibits beta-amyloid aggregation and cytotoxicity, attenuates oxidative stress, and decreases the production of nitric oxide and proinflammatory cytokines. Neurotoxicology, 2012. 33(3): p. 482-490.
94. Song, Y., et al., Refining the Structural Model of a Hexameric Protein Complex: Surface Induced Dissociation and Ion Mobility Provide Key Connectivity and Topology Information. ACS Central Science, 2015. 1: p. 477-487.
95. Quintyn, R.S., S.R. Harvey, and V.H. Wysocki, Illustration of SID-IM-SID (surface-induced dissociation-ion mobility-SID) mass spectrometry: homo and hetero model protein complexes. The Analyst, 2015. 140(20): p. 7012-9.
96. Quintyn, R.S., et al., Surface-Induced Dissociation Mass Spectra as a Tool for Distinguishing Different Structural Forms of Gas-Phase Multimeric Protein Complexes. Analytical Chemistry, 2015. 87(23): p. 11879-11886.

191
6 Conclusions and Future Work
Mass spectrometry based methods have been applied to probe the structure and
aggregation of amyloidogenic proteins. In this chapter, the key findings are summarised and
avenues for further investigation are detailed.
192
6.1. Conclusions and Future Work
Understanding the structures adopted by proteins during their lifecycle and in response to
changes in their environment is a crucial step towards understanding the biological
processes which rely on their correct function and the effects when these processes
breakdown in disease. In addition, understanding protein structure in healthy and disease
states can inform the drug design process to prevent or potentially correct the adoption of
a disease state. A wide spectrum of techniques exists for the analysis of protein structure
ranging from the atomistic detail of X-ray crystallography and NMR to the study of protein
dynamics via IM-MS. Although atomistic detail can give a definitive answer to the structure
adopted by a protein, this structure is potentially one of many and the averaging, biased
nature of techniques such as X-ray crystallography and NMR cannot give the full picture. In
contrast, although protein structure can be determined by IM-MS in combination with
molecular modelling, the true strength of MS and IM-MS is that the structure of multiple
species can be investigated at the same time in a unstable sample, in an unbiased manner
with far lower sample requirements.
Chapter 3 is the first chapter concerning α-Synuclein and focuses on the structure of this
IDP and the effect of changes to solution pH and ionisation polarity on the structures
observed. As expected from an IDP, α-Synuclein presents a wide CSD regardless of the
solution pH or ionisation polarity used. The amyloidogenic nature of α-Synuclein can also be
observed by the presence of dimers and other higher order oligomeric species and by the
raised baseline in some spectra, attributed to the presence of low intensity unresolved
higher order aggregates. Lowering the solution pH from 6.8 to 3.5, in positive and negative
mode resulted in a narrowing of the CSD and a shift to lower charge states of monomers
and higher order oligomers. This response is indicative of the induction of structure and
concurs with other biophysical techniques including IM-MS [1]. It is clear from the MS data
that ionisation polarity does have an effect on the species observed, and is likely due to the
location of chargeable residues. However, solution pH has a greater effect on the species
observed. The day to day variation of α-Synuclein is an overarching theme observed by MS.
This is evident by the shifts in the relative intensity distribution of the CSDs and in the
species observed in replicates, despite the strict control of experimental conditions.
IM-MS highlights the disordered nature of α-Synuclein. At pH 6.8, multiple conformational
species are observed for each charge state of α-Synucleins wide CSD, which spans a CCS
range of 938 Å2 to 3093 Å2. These CCS values are in good agreement with those reported by
193
Illes-Toth et al. [2]. Despite the use of positive ionisation mode, the CCS values are also in
good agreement with those reported by Bernstein et al. and Grabenauer et al. in negative
mode for the lower charged species [1, 3]. However, higher charge states exhibit
significantly larger CCS values and the large CCS increase between [aSyn-8H]8- and [aSyn-
9H]9- is not replicated in positive ionisation mode [1]. This suggests the location of
chargeable residues is driving the larger CCS values observed in negative ionisation mode.
The day to day variation and conformational diversity observed in the MS data is again
evident in the IM-MS data, as the large error bars for most species demonstrate the large
variation observed between samples prepared under strictly controlled conditions. This
diversity is also highlighted by Illes-Toth et al. [2] and in the lower charge states reported by
Grabenauer et al. in negative mode [3].
Cross-linking IM-MS enables the gas phase analysis of solution phase structures by trapping
conformations via covalent modification prior to ionisation. The addition of the cross-linker
influences the conformational space that α-Synuclein is able to inhabit. The conformation
pinning action of the cross-linker on the protein is clearly shown by the narrowing of the α-
Synuclein CSD and CCSD and the stabilisation of conformational families with additional
cross-linker modifications. However, the addition of the cross-linker can also prevent the
adoption of the most compact conformers in lower charged species. MS, IM-MS and AFM
observe multiple α-Synuclein morphologies at one time; this is reflected in the cross-linking
IM-MS data by the co-transmission of combinations of the three cross-linker pinned
conformational families. Of the three conformational families observed, the extended and
unfolded species CCS values are in good agreement with values reported by Bernstein et al.
[1] and reflect the conformational diversity observed by Illes-Toth et al. [2] and Grabenauer
et al. [3]. The data further demonstrates the conformational diversity of α-Synuclein and
highlights a link between the solution phase and the gas phase structures observed by MS
based methods. The cross-linking process creates some additional hurdles for analysis, as
the uncontrolled cross-linking reaction leads to peak broadening. Additional sample
preparation steps to clean up the spectra to enable further analysis of higher order
oligomers is the clear next step. The effect of the cross-linking reagent on the species
observed must also be investigated. Following this cross-linking IM-MS could be applied to
examine the effect of ligands on solution phase conformation.
ECD was applied to investigate the effect of solution pH on the gas phase structure of α-
Synuclein. The spectra obtained on the FT-ICR MS instrument are similar to those obtained
on ToF geometry instruments and display the characteristic wide CSD and shift in intensity
194
to lower charge states following a reduction of the solution pH. A wide variety of low order
oligomers are observed on ToF instruments; however, only monomers and dimers are
observed on the FT-ICR instrument. These changes to the CSD may result from the use of a
different ionisation source. Further analysis will focus on tuning experimental conditions to
observe higher order oligomers prior to ECD. As expected, the fragmentation observed
increases with charge state, this clearly visible in the annotated spectra of the [aSyn+9H]9+
and [aSyn+10H]10+ monomers (Figure 3.12 and 3.13) and is also observed for the dimer
species investigated. Interestingly, a reduction in the solution pH from 6.8 to 3.5 results in
the observation of greater fragmentation for α-Synuclein monomers and dimers. This is at
odds with MS data from ToF and FT-ICR instruments which indicate the protein has adopted
a less solvent accessible structure; with IM-MS which reports a reduction in CCS at pH 2.5
[1] and with other biophysical techniques [4] which indicate an increase in structure at low
pH, which should reduce fragmentation. The fragmentation observed is limited primarily to
the N-terminal region of both monomers and dimers, which has been shown by NMR to
adopt a more extended conformation at lower pH. The lack of fragmentation observed
from the C-terminal region suggests the C-terminus forms part of a stable protected core
region. This hypothesis is supported by IM-MS data which suggests the CCS decrease is the
result of the collapse of the C-terminal region at low pH [1] and by FRET experiments which
demonstrate a compaction of the C-terminus [5]. This also concurs with PRE and NMR
dipolar coupling experiments which establish interactions between C-terminal hydrophobic
clusters and the central NAC domain [6]. AFM force spectroscopy data suggests the C-
terminus is involved in the dimer interface, which explains the lack of fragmentation
observed in this region [7]. However, the lack of fragmentation also observed from the C-
terminal region of the monomer species investigated, suggests that the lack of
fragmentation observed from the dimer species may be a result of them being composed of
two monomers with fragmentation resistant C-termini. In addition, CD [8], FTIR [8], and
HDX-MS [9, 10] do not detect regions of stable C-terminal secondary structure, these
conflicting reports highlight the conformational heterogeneity and variation of α-Synuclein.
Chapter 4 builds on the work of Chapter 3 and focuses on examining the early stages of α-
Synuclein aggregation using MS based methods. The observation of fibrils via TEM following
aggregation under MS compatible conditions, which exhibit previously reported
morphologies, validates the time points chosen and demonstrate that it is possible to
follow aggregation in an MS compatible buffer. The variety of morphologies observed
during the TEM time course highlights the diversity of the species of the α-Synuclein
195
aggregation cascade. As seen in Chapter 3, wide CSDs and a range of low order oligomeric
species ranging from dimers to tetramers are observed for α-Synuclein. The α-Syuclein
aggregation process can be observed by MS, as the depletion of the TIC with time course
progression and the increasing difficulty in achieving a stable nESI spray from the samples
of the later time points, indicate that aggregation is taking place. However, we are only able
to observe a small window of the process. At the later time points of the 96 hour in vitro
aggregation time course the intensity distribution shifts to favour lower charged
monomeric species, as highly charged monomers are depleted from solution. These highly
charged monomeric species represent the extended α-Synuclein monomers in solution,
which become highly charged upon ionisation, due to their greater solvent accessibility.
This suggests these extended monomers are more amenable to aggregation. The depletion
of higher charged monomeric species with time course progression may also be the result
of an equilibrium between the extended species and a rapidly aggregating compact species.
The depletion of the extended species results from collapse of the protein to form a
compact species, which rapidly aggregates beyond the scope of the technique. This concurs
with previously published data which demonstrates the link between the assumption of a
compact conformation and aggregation progression [1, 3, 11, 12]. The contribution to the
spectra of higher order species including trimers increases as the time course progresses.
However, higher order species are expected and again suggests the low order oligomeric
species observed are off-pathway slower aggregating species. When aggregation is
assessed on a shorter time scale during a nESI experiment, this same narrowing of the CSDs
and falling TIC is observed. In addition, a raised baseline, indicative of low intensity, poorly
resolved, higher order oligomeric species is observed at later time points and higher order
species are depleted as they are sequestered into higher order aggregates not observable
by MS. In addition to the depletion of highly charged monomers, as previously observed in
the long term aggregation time course, lower charged monomers are also depleted with
time course progression. Again, this suggests the presence of an aggregation mechanism in
which the extended species are in equilibrium with a fast aggregating compact species.
Despite these indicators of aggregation, the lack of CSD modification and TIC depletion in a
replicate of the in tip aggregation experiment demonstrates that the aggregation process is
highly complex and influenced heavily by environmental conditions. This also suggests that
the initial aggregation process is occurring very quickly and the species observed via MS are
a sub-population of slower aggregating species and those in equilibrium with higher order
aggregates. The variation in higher order oligomers observed between the 96 hour MS
time course, the in tip aggregation time course and the mass spectra of the IM-MS
196
aggregation time course, in comparison with the figures of Chapter 3 demonstrate that a
variable diverse range of species is present during the aggregation process. Despite the
variation observed, MS at both short and long aggregation time scales has the potential to
be used as a screen for small molecules able to prevent aggregation or to disaggregate α-
Synuclein based on the species observed. The absence of the variation of species observed
here would indicate that a population of homogenous species had been achieved.
IM-MS of a 120 hour in vitro α-Synuclein time course again observes wide CSDs and CCSDs
throughout the aggregation time course, similar to those observed following cross-linking
(Chapter 3) and the CCSs recorded are similar to those reported by Bernstein et al. despite
the use of positive ionisation mode in place of negative ionisation mode [1]. Evidence such
as CCSD narrowing to suggest the adoption of an aggregation prone structure is not
observed in either the monomer or dimer species investigated. The large spread in CCS
across the CSD (Δ ~1600 Å2), the large spread in CCS for each charge state analysed, the
CCSD error bars and transient species observed, all indicate that the protein remains
flexible in solution. This again highlights the diverse range of species present during the
aggregation process, as observed by MS. Significant variation is observed for the α-
Synuclein dimers investigated and concurs with the work of Illes-Toth et al. [13] and Ray et
al. [14]. The wide CCSDs and the lack of a CCS decrease with dimer formation suggest the α-
Synuclein dimer has a small interface and the dimer itself remains unstructured, which
concurs with the force spectroscopy studies of Neupane et al. [15]. The next step is to
investigate the effect of pre-treatment with or the presence of anti-aggregation drug
candidates on α-Synuclein aggregation and the species observed. IM-MS has the potential
to act as a secondary screen, in combination with less labour intensive methods including
MS to screen small molecule libraries for drug candidates.
An aggregation specific conformer or distinct regions of protection, which would indicate
an aggregation induced conformational change, is not observed by HDX-MS. The oscillating
RFU with time course progression highlights the presence of transient structures, which
concurs with our IM-MS results. The differences in the small regions of protection between
our results and those published by Del Mar et al. and Mysling et al. demonstrates that the
α-Synuclein species observed by MS based methods from the solution component of the in
vitro aggregated sample remain conformationally diverse [9, 10]. The untargeted approach
used here may account for some differences in the RFU observed, as previous studies have
included processing steps to remove monomeric α-Synuclein from the sample. The PAL
sample manager and HDX manager system used in this study permits the analysis of a large
197
panel of candidates with minimal human input, HDX-MS could therefore be used to screen
libraries of anti-aggregation drug candidates. However, changes to the data analysis
method are required to prevent the degradation of the data.
Chapter 5 focussed on investigating the structure and interactions of primarily, Aβ(1-42)
and Aβ(1-40). As observed with α-Synuclein, alteration of the solution conditions led to
changes in the CSD and is hypothesised to be the result of the conditions causing a change
in protein solution structure. The choice of ionisation polarity also has an effect on the CSD
observed, with the CSD shifting to lower charge states regardless of solution conditions.
The overwhelming majority of species observed are monomeric and the commonly
observed [(Aβ42)2-5H]5- dimer is not observed. The Bowers group state the observation of
this dimer is the result of a sample preparation step involving a spin column. However,
replication of the Bowers preparation method, using recombinant Aβ(1-42) in place of
FMOC synthetic Aβ(1-42), did not yield a useable sample [16]. In addition, the Bowers
group do not include a pre-treatment step such as HFIP treatment to deseed the sample,
this provides an explanation for the higher order aggregates observed. TWIMS experiments
probing the effect of salt concentration demonstrate a correlation between higher salt
concentration and the formation of more compact, solvent-free conformations. Again, the
choice of ionisation polarity and the location of the respective charged groups influences
the gas phase conformers observed.
The combination of the fragmentation techniques, CID, ETD and SID with MS and IM-MS
enable the investigation of the gas phase structures exhibited by the Amyloid-β peptides.
CIU-TWIMS of Aβ(1-42) highlights the destabilising effect of the change of buffer between
H2O (pH 2) and 20 mM AmAc (pH 7.4). The greater fragmentation observed at low pH is
hypothesised to be the result of a destabilisation of intramolecular interactions. The lack of
fragmentation observed following ETD suggests that Aβ(1-42) adopts a compact structure
bound by strong intramolecular interactions. This is confirmed by the ETcaD experiments,
which disrupt the non-covalent interactions of Aβ(1-42) enabling the detection of ETD
specific fragments. The observation of CID specific fragment ions, the location of which
concurs with the CID fragments observed during CIU-TWIMS experiments, are by-products
of the ETcaD process and can be reduced with further optimisation of the ETcaD process.
SID has a vastly different fragmentation mechanism to CID and ETD. Despite the presence
of the N-terminal basic residue cluster hampering fragmentation in this region, the
different fragmentation channels of SID and CID are observed. It is also possible to observe
a link to precursor structure, on the basis of the lack of fragmentation observed from the
198
central region of Aβ(1-42) and the greater sequence coverage observed following SID of
Aβ(1-40), known to feature fewer intramolecular interactions and to adopt a more flexible
conformation. SID-TWIMS of Aβ(1-42) and Aβ(1-40) fragment ions present vastly different
ATD profiles and it is possible to correlate the changes observed in the ATDs with known
intramolecular interactions and highlight the different structures and interactions of the
two proteins. Building on this work, the next steps for the SID-TWIMS work include a CCS
calibration to enable fragment ion CCS calculation and investigating the effect of ionisation
polarity.
Finally, the binding of the anti-aggregation peptide, RI-OR2 to Aβ(1-42) is observed via MS
and building on this, TWIMS demonstrates the anti-aggregation properties of RI-OR2 stem
from either the compaction of Aβ(1-42) or via holding the protein in an extended
conformation. In contrast, TWIMS demonstrates that the anti-aggregation properties of
rutin result solely from compaction of the protein. There is a wide scope for further TWIMS
profiling work and it should be expanded to investigate the effect of longer term incubation
on Aβ(1-42) and Aβ(1-40) protein structure and other drug candidates. In addition, the
effect of rutin binding on other amyloidogenic proteins such as α-Synuclein should be
investigated to determine whether the method of action is conserved.
MS and IM-MS based methods including ECD-FT-ICR MS, HDX-MS and SID-TWIMS are
genuine alternatives to the traditional biophysical methods of studying protein structure.
IDPs are challenging targets for structural analysis via traditional methods. This is
complicated further when the target is prone to aggregation, a process which generates a
diverse range of species, often presenting a range of structures. The unbiased and rapid
nature of analysis and the ability to study all species present simultaneously make MS and
IM-MS the methods of choice for investigating the structure of the wide range of species
present during the aggregation cascade.
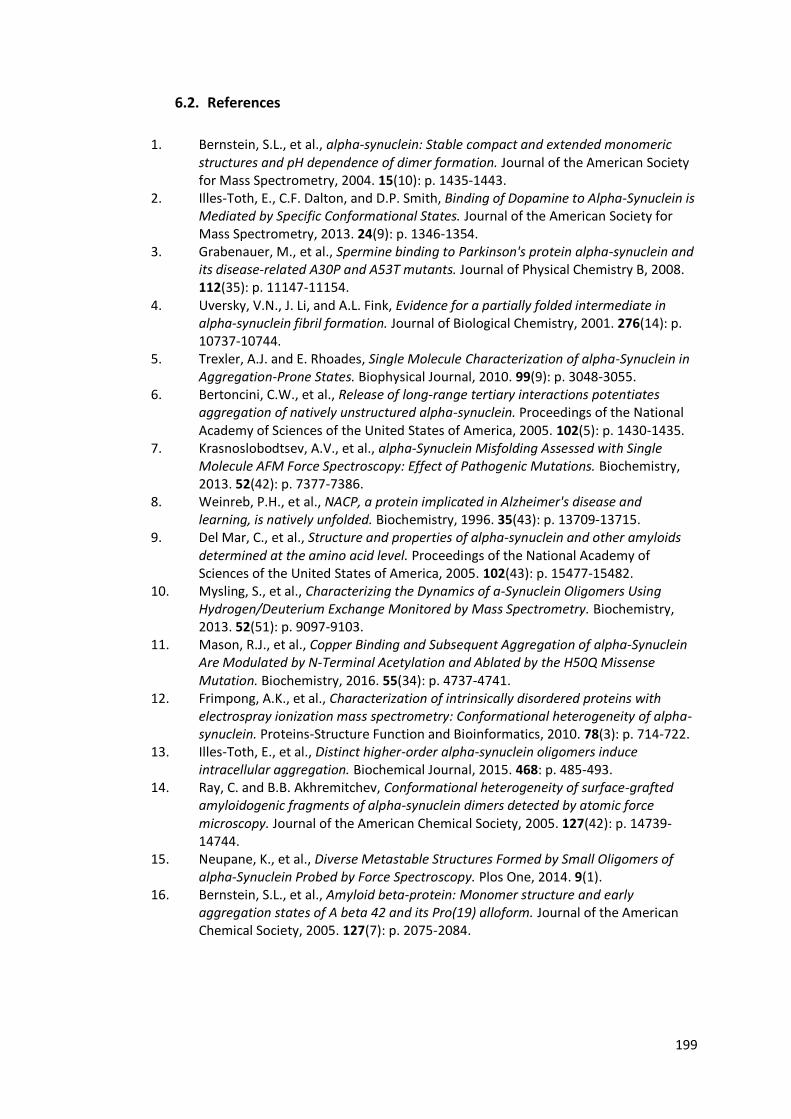
199
6.2. References
1. Bernstein, S.L., et al., alpha-synuclein: Stable compact and extended monomeric structures and pH dependence of dimer formation. Journal of the American Society for Mass Spectrometry, 2004. 15(10): p. 1435-1443.
2. Illes-Toth, E., C.F. Dalton, and D.P. Smith, Binding of Dopamine to Alpha-Synuclein is Mediated by Specific Conformational States. Journal of the American Society for Mass Spectrometry, 2013. 24(9): p. 1346-1354.
3. Grabenauer, M., et al., Spermine binding to Parkinson's protein alpha-synuclein and its disease-related A30P and A53T mutants. Journal of Physical Chemistry B, 2008. 112(35): p. 11147-11154.
4. Uversky, V.N., J. Li, and A.L. Fink, Evidence for a partially folded intermediate in alpha-synuclein fibril formation. Journal of Biological Chemistry, 2001. 276(14): p. 10737-10744.
5. Trexler, A.J. and E. Rhoades, Single Molecule Characterization of alpha-Synuclein in Aggregation-Prone States. Biophysical Journal, 2010. 99(9): p. 3048-3055.
6. Bertoncini, C.W., et al., Release of long-range tertiary interactions potentiates aggregation of natively unstructured alpha-synuclein. Proceedings of the National Academy of Sciences of the United States of America, 2005. 102(5): p. 1430-1435.
7. Krasnoslobodtsev, A.V., et al., alpha-Synuclein Misfolding Assessed with Single Molecule AFM Force Spectroscopy: Effect of Pathogenic Mutations. Biochemistry, 2013. 52(42): p. 7377-7386.
8. Weinreb, P.H., et al., NACP, a protein implicated in Alzheimer's disease and learning, is natively unfolded. Biochemistry, 1996. 35(43): p. 13709-13715.
9. Del Mar, C., et al., Structure and properties of alpha-synuclein and other amyloids determined at the amino acid level. Proceedings of the National Academy of Sciences of the United States of America, 2005. 102(43): p. 15477-15482.
10. Mysling, S., et al., Characterizing the Dynamics of a-Synuclein Oligomers Using Hydrogen/Deuterium Exchange Monitored by Mass Spectrometry. Biochemistry, 2013. 52(51): p. 9097-9103.
11. Mason, R.J., et al., Copper Binding and Subsequent Aggregation of alpha-Synuclein Are Modulated by N-Terminal Acetylation and Ablated by the H50Q Missense Mutation. Biochemistry, 2016. 55(34): p. 4737-4741.
12. Frimpong, A.K., et al., Characterization of intrinsically disordered proteins with electrospray ionization mass spectrometry: Conformational heterogeneity of alpha-synuclein. Proteins-Structure Function and Bioinformatics, 2010. 78(3): p. 714-722.
13. Illes-Toth, E., et al., Distinct higher-order alpha-synuclein oligomers induce intracellular aggregation. Biochemical Journal, 2015. 468: p. 485-493.
14. Ray, C. and B.B. Akhremitchev, Conformational heterogeneity of surface-grafted amyloidogenic fragments of alpha-synuclein dimers detected by atomic force microscopy. Journal of the American Chemical Society, 2005. 127(42): p. 14739-14744.
15. Neupane, K., et al., Diverse Metastable Structures Formed by Small Oligomers of alpha-Synuclein Probed by Force Spectroscopy. Plos One, 2014. 9(1).
16. Bernstein, S.L., et al., Amyloid beta-protein: Monomer structure and early aggregation states of A beta 42 and its Pro(19) alloform. Journal of the American Chemical Society, 2005. 127(7): p. 2075-2084.

200
Appendices
This chapter contains supplementary information and data to support conclusions proposed
in previous chapters. This chapter also contains details of all species observed during mass
spectrometry experiments presented in the previous chapters.

201
Appendix 1 - Amino Acid Abbreviations
Table A1.1 lists the abbreviations, structure, characteristics and molecular weights
of the 20 common amino acids.
Table A1.1 - Amino acid structures and properties [1, 2].
Aspartic Acid Asp / D
Glutamic Acid Glu / E
Acidic C4H5NO3
Acidic C5H7NO3
M: 115.027 A: 115.087
M: 129.043 A: 129.114
Lysine Lys / K
Arginine Arg / R
Basic C6H12N2O
Basic C6H12N40
M: 128.095 A: 128.172
M: 156.101 A: 156.186
Histidine His / H
Asparagine Asn / N
Basic C6H7N3O
Polar C4H6N2O2
M: 137.059 A: 137.139
M: 114.043 A: 114.103
Glutamine Gln / Q
Serine Ser / S
Polar C5H8N2O2
Polar C3H5NO2
M: 128.059 A: 128.129
M: 87.032 A: 87.077
Threonine Thr / T
Tyrosine Tyr / Y
Polar C4H7NO2
Polar/Hydrophobic C9H9NO2
M: 101.048 A: 101.104
M: 163.063 A: 163.173

202
Alanine Ala / A
Valine Val / V
Nonpolar/Hydrophobic C3H5NO
Nonpolar/Hydrophobic C5H9NO
M: 71.037 A: 71.078
M: 99.068 A: 99.131
Leucine Leu / L
Isoleucine Ile / I
Nonpolar/Hydrophobic C6H11NO
Nonpolar/Hydrophobic C6H11NO
M: 113.084 A: 113.158
M: 113.084 A: 113.158
Proline Pro / P
Phenylalanine Phe / F
Nonpolar C5H7NO
Nonpolar/Hydrophobic C9H9NO
M: 97.053 A: 97.115
M: 147.068 A: 147.174
Methionine Met / M
Tryptophan Trp / W
Nonpolar C5H9NOS
Nonpolar/Hydrophobic C11H10N2O
M: 131.040 A: 131.196
M: 186.079 A: 186.210
Glycine Gly / G
Cysteine Cys / C
Nonpolar C2H3NO
Nonpolar C3H5NOS
M: 57.021 A: 57.051
M: 103.009 A: 103.143

203
Appendix 2 – Investigating the Structure of α-Synuclein
Due to the wide CSDs and the range of oligomeric species observed in the mass spectra of
α-Synuclein, only the extremes of the CSDs and species of interest have been annotated in
the figures of Chapter 3. Table A2.1 details all species observed in the figures of Chapter 3.
Table A2.2 details the experimental CCS values for α-Synuclein, used for the production of
Figures 3.7A and C.
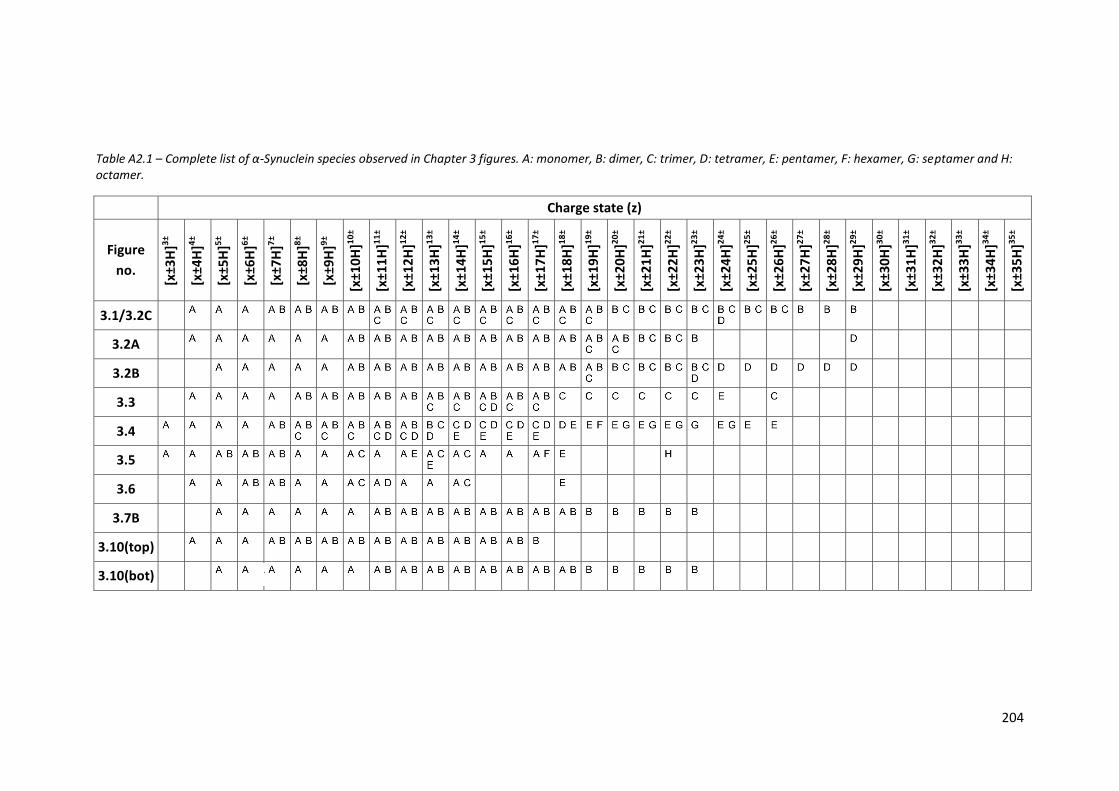
204
Table A2.1 – Complete list of α-Synuclein species observed in Chapter 3 figures. A: monomer, B: dimer, C: trimer, D: tetramer, E: pentamer, F: hexamer, G: septamer and H: octamer.
Charge state (z)
Figure
no.
[x±3
H]3
±
[x±4
H]4
±
[x±5
H]5
±
[x±6
H]6
±
[x±7
H]7
±
[x±8
H]8
±
[x±9
H]9
±
[x±1
0H
]10
±
[x±1
1H
]11
±
[x±1
2H
]12
±
[x±1
3H
]13
±
[x±1
4H
]14
±
[x±1
5H
]15
±
[x±1
6H
]16
±
[x±1
7H
]17
±
[x±1
8H
]18
±
[x±1
9H
]19
±
[x±2
0H
]20
±
[x±2
1H
]21
±
[x±2
2H
]22
±
[x±2
3H
]23
±
[x±2
4H
]24
±
[x±2
5H
]25
±
[x±2
6H
]26
±
[x±2
7H
]27
±
[x±2
8H
]28
±
[x±2
9H
]29
±
[x±3
0H
]30
±
[x±3
1H
]31
±
[x±3
2H
]32
±
[x±3
3H
]33
±
[x±3
4H
]34
±
[x±3
5H
]35
±
3.1/3.2C
3.2A
3.2B
3.3
3.4
3.5
3.6
3.7B
3.10(top)
3.10(bot)
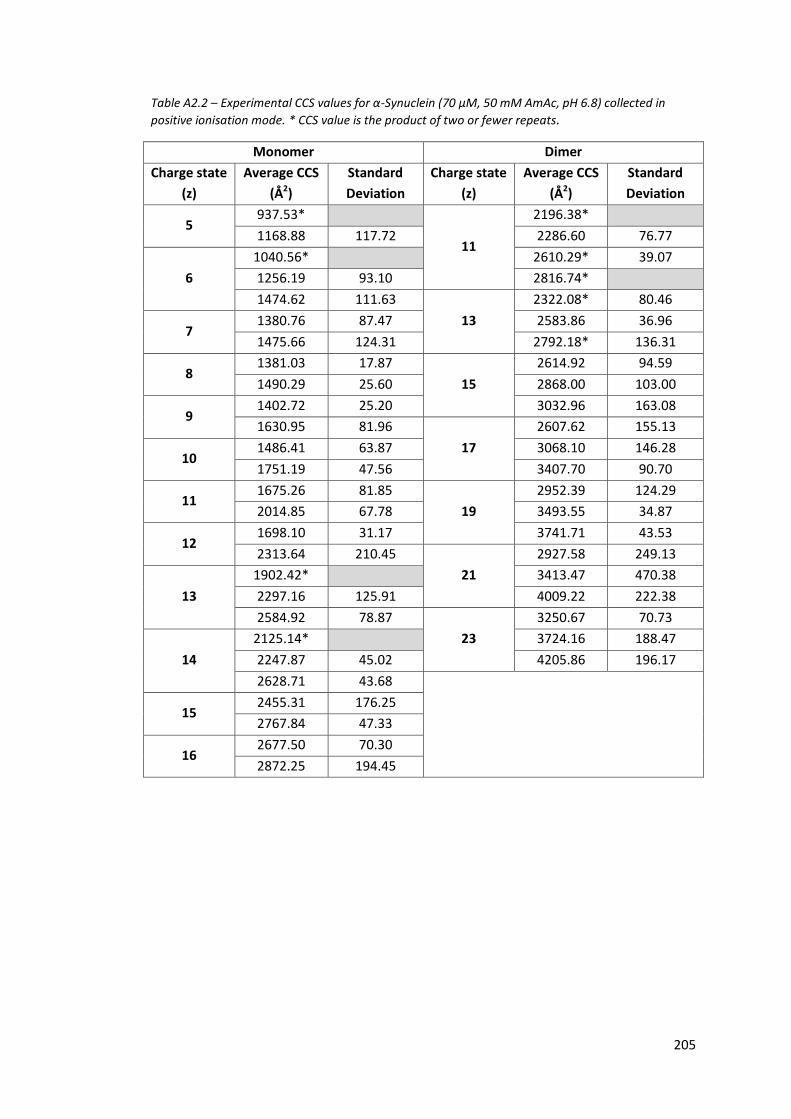
205
Table A2.2 – Experimental CCS values for α-Synuclein (70 µM, 50 mM AmAc, pH 6.8) collected in
positive ionisation mode. * CCS value is the product of two or fewer repeats.
Monomer Dimer
Charge state
(z)
Average CCS
(Å2)
Standard
Deviation
Charge state
(z)
Average CCS
(Å2)
Standard
Deviation
5 937.53*
11
2196.38*
1168.88 117.72 2286.60 76.77
6
1040.56* 2610.29* 39.07
1256.19 93.10 2816.74*
1474.62 111.63
13
2322.08* 80.46
7 1380.76 87.47 2583.86 36.96
1475.66 124.31 2792.18* 136.31
8 1381.03 17.87
15
2614.92 94.59
1490.29 25.60 2868.00 103.00
9 1402.72 25.20 3032.96 163.08
1630.95 81.96
17
2607.62 155.13
10 1486.41 63.87 3068.10 146.28
1751.19 47.56 3407.70 90.70
11 1675.26 81.85
19
2952.39 124.29
2014.85 67.78 3493.55 34.87
12 1698.10 31.17 3741.71 43.53
2313.64 210.45
21
2927.58 249.13
13
1902.42* 3413.47 470.38
2297.16 125.91 4009.22 222.38
2584.92 78.87
23
3250.67 70.73
14
2125.14* 3724.16 188.47
2247.87 45.02 4205.86 196.17
2628.71 43.68
15
2455.31 176.25
2767.84 47.33
16 2677.50 70.30
2872.25 194.45

206
Appendix 3 – Following the Early Stages of α-Synuclein Aggregation
Due to the wide CSDs and the range of oligomeric species observed only the extremes of
the CSDs and species of interest have been annotated in the figures of Chapter 4. Table
A3.1 details the species observed in the figures of Chapter 4.
Table A3.2 details the species observed in the figures of Appendix 3.
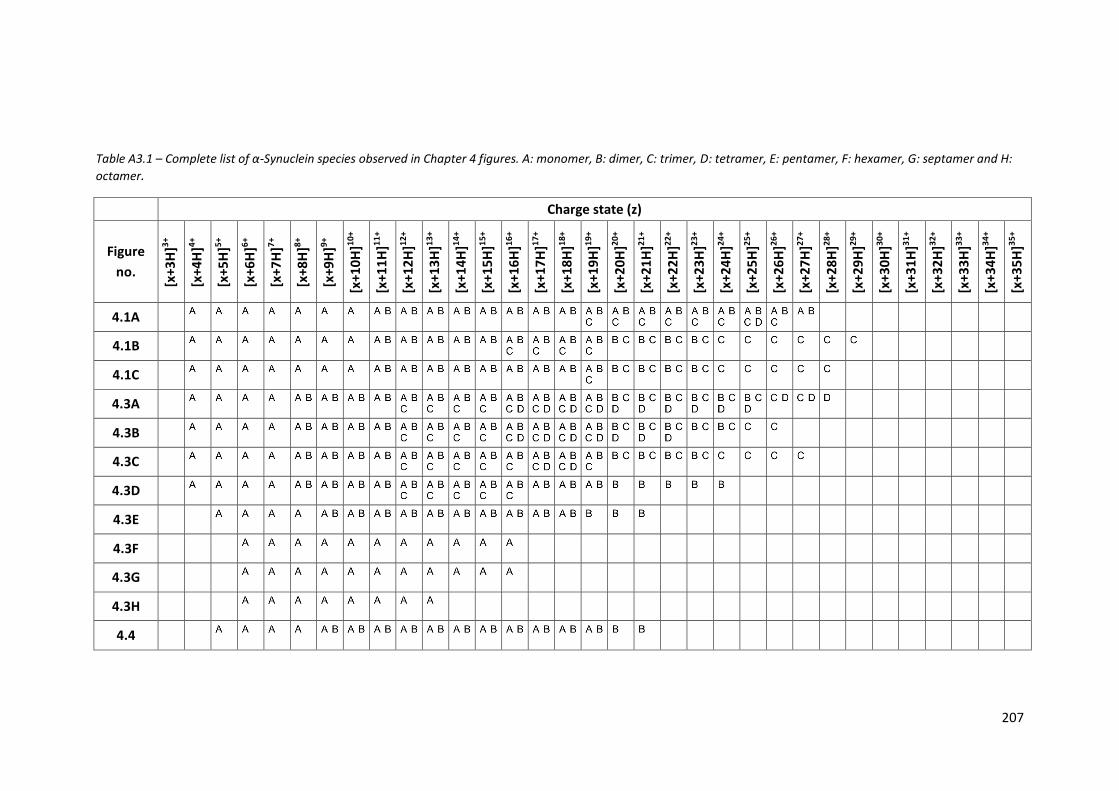
207
Table A3.1 – Complete list of α-Synuclein species observed in Chapter 4 figures. A: monomer, B: dimer, C: trimer, D: tetramer, E: pentamer, F: hexamer, G: septamer and H:
octamer.
Charge state (z)
Figure
no.
[x+3
H]3
+
[x+4
H]4
+
[x+5
H]5
+
[x+6
H]6
+
[x+7
H]7
+
[x+8
H]8
+
[x+9
H]9
+
[x+1
0H
]10
+
[x+1
1H
]11
+
[x+1
2H
]12
+
[x+1
3H
]13
+
[x+1
4H
]14
+
[x+1
5H
]15
+
[x+1
6H
]16
+
[x+1
7H
]17
+
[x+1
8H
]18
+
[x+1
9H
]19
+
[x+2
0H
]20
+
[x+2
1H
]21
+
[x+2
2H
]22
+
[x+2
3H
]23
+
[x+2
4H
]24
+
[x+2
5H
]25
+
[x+2
6H
]26
+
[x+2
7H
]27
+
[x+2
8H
]28
+
[x+2
9H
]29
+
[x+3
0H
]30
+
[x+3
1H
]31
+
[x+3
2H
]32
+
[x+3
3H
]33
+
[x+3
4H
]34
+
[x+3
5H
]35
+
4.1A
4.1B
4.1C
4.3A
4.3B
4.3C
4.3D
4.3E
4.3F
4.3G
4.3H
4.4
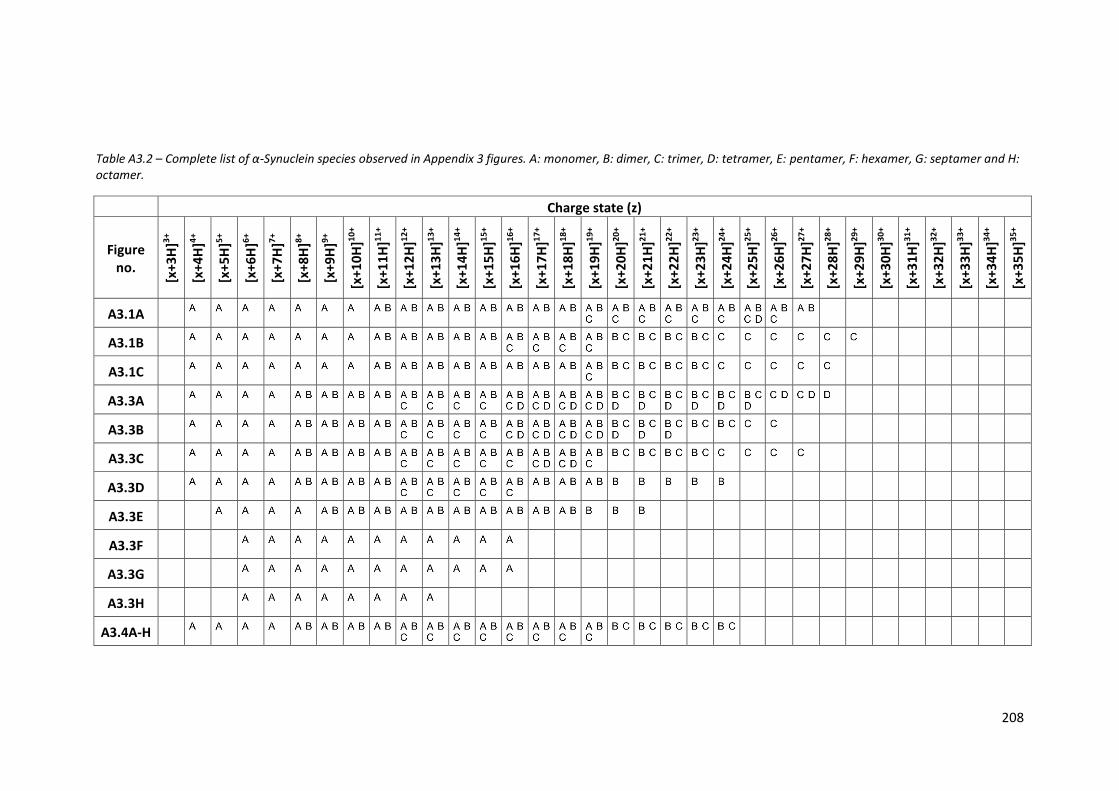
208
Table A3.2 – Complete list of α-Synuclein species observed in Appendix 3 figures. A: monomer, B: dimer, C: trimer, D: tetramer, E: pentamer, F: hexamer, G: septamer and H: octamer.
Charge state (z)
Figure no.
[x+3
H]3
+
[x+4
H]4
+
[x+5
H]5
+
[x+6
H]6
+
[x+7
H]7
+
[x+8
H]8
+
[x+9
H]9
+
[x+1
0H
]10
+
[x+1
1H
]11
+
[x+1
2H
]12
+
[x+1
3H
]13
+
[x+1
4H
]14
+
[x+1
5H
]15
+
[x+1
6H
]16
+
[x+1
7H
]17
+
[x+1
8H
]18
+
[x+1
9H
]19
+
[x+2
0H
]20
+
[x+2
1H
]21
+
[x+2
2H
]22
+
[x+2
3H
]23
+
[x+2
4H
]24
+
[x+2
5H
]25
+
[x+2
6H
]26
+
[x+2
7H
]27
+
[x+2
8H
]28
+
[x+2
9H
]29
+
[x+3
0H
]30
+
[x+3
1H
]31
+
[x+3
2H
]32
+
[x+3
3H
]33
+
[x+3
4H
]34
+
[x+3
5H
]35
+
A3.1A
A3.1B
A3.1C
A3.3A
A3.3B
A3.3C
A3.3D
A3.3E
A3.3F
A3.3G
A3.3H
A3.4A-H
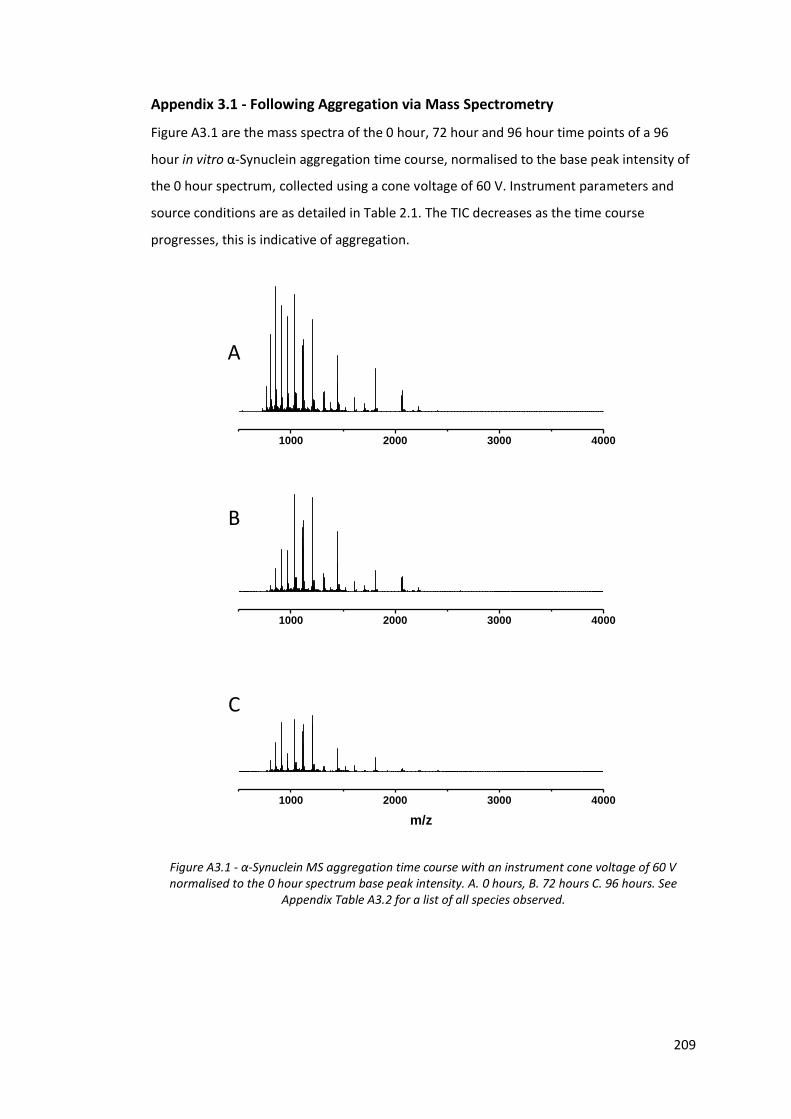
209
Appendix 3.1 - Following Aggregation via Mass Spectrometry
Figure A3.1 are the mass spectra of the 0 hour, 72 hour and 96 hour time points of a 96
hour in vitro α-Synuclein aggregation time course, normalised to the base peak intensity of
the 0 hour spectrum, collected using a cone voltage of 60 V. Instrument parameters and
source conditions are as detailed in Table 2.1. The TIC decreases as the time course
progresses, this is indicative of aggregation.
Figure A3.1 - α-Synuclein MS aggregation time course with an instrument cone voltage of 60 V normalised to the 0 hour spectrum base peak intensity. A. 0 hours, B. 72 hours C. 96 hours. See
Appendix Table A3.2 for a list of all species observed.
500 1000 1500 2000 2500 3000 3500 4000
500 1000 1500 2000 2500 3000 3500 4000
500 1000 1500 2000 2500 3000 3500 4000
500 1000 1500 2000 2500 3000 3500 4000
500 1000 1500 2000 2500 3000 3500 4000
m/z
A
B
C
1000 2000 3000 4000
1000 2000 3000 4000
1000 2000 3000 4000
m/z
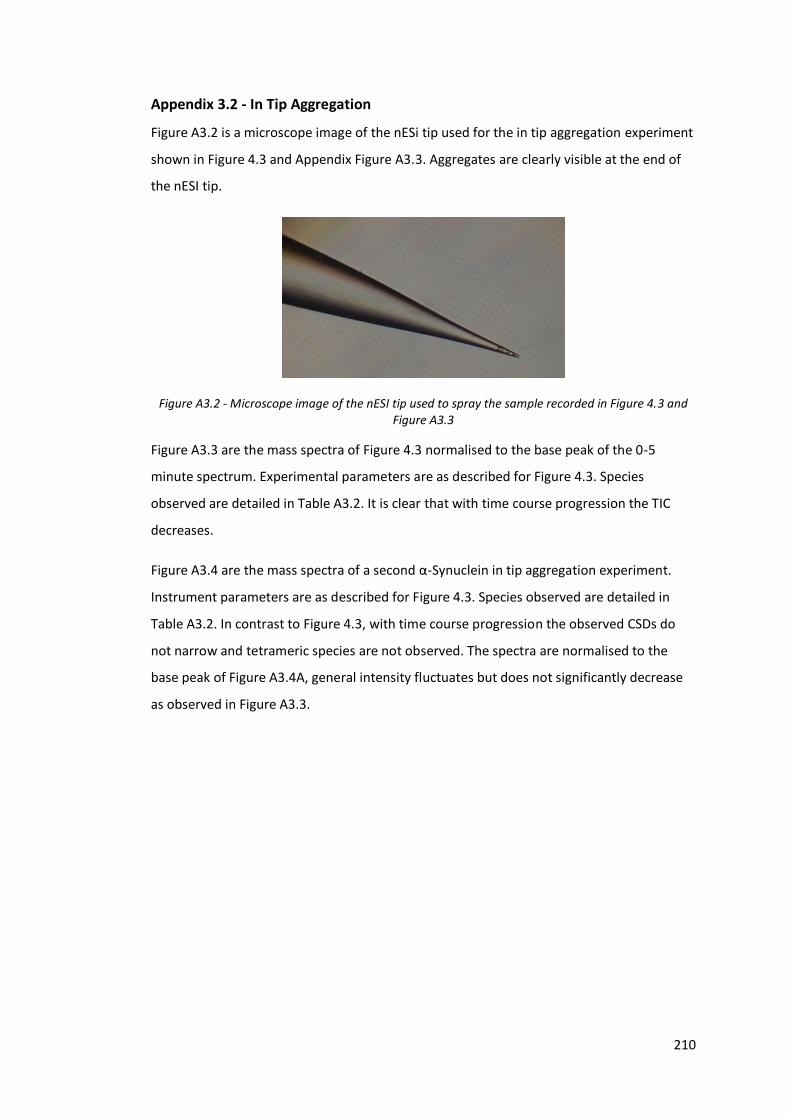
210
Appendix 3.2 - In Tip Aggregation
Figure A3.2 is a microscope image of the nESi tip used for the in tip aggregation experiment
shown in Figure 4.3 and Appendix Figure A3.3. Aggregates are clearly visible at the end of
the nESI tip.
Figure A3.2 - Microscope image of the nESI tip used to spray the sample recorded in Figure 4.3 and Figure A3.3
Figure A3.3 are the mass spectra of Figure 4.3 normalised to the base peak of the 0-5
minute spectrum. Experimental parameters are as described for Figure 4.3. Species
observed are detailed in Table A3.2. It is clear that with time course progression the TIC
decreases.
Figure A3.4 are the mass spectra of a second α-Synuclein in tip aggregation experiment.
Instrument parameters are as described for Figure 4.3. Species observed are detailed in
Table A3.2. In contrast to Figure 4.3, with time course progression the observed CSDs do
not narrow and tetrameric species are not observed. The spectra are normalised to the
base peak of Figure A3.4A, general intensity fluctuates but does not significantly decrease
as observed in Figure A3.3.
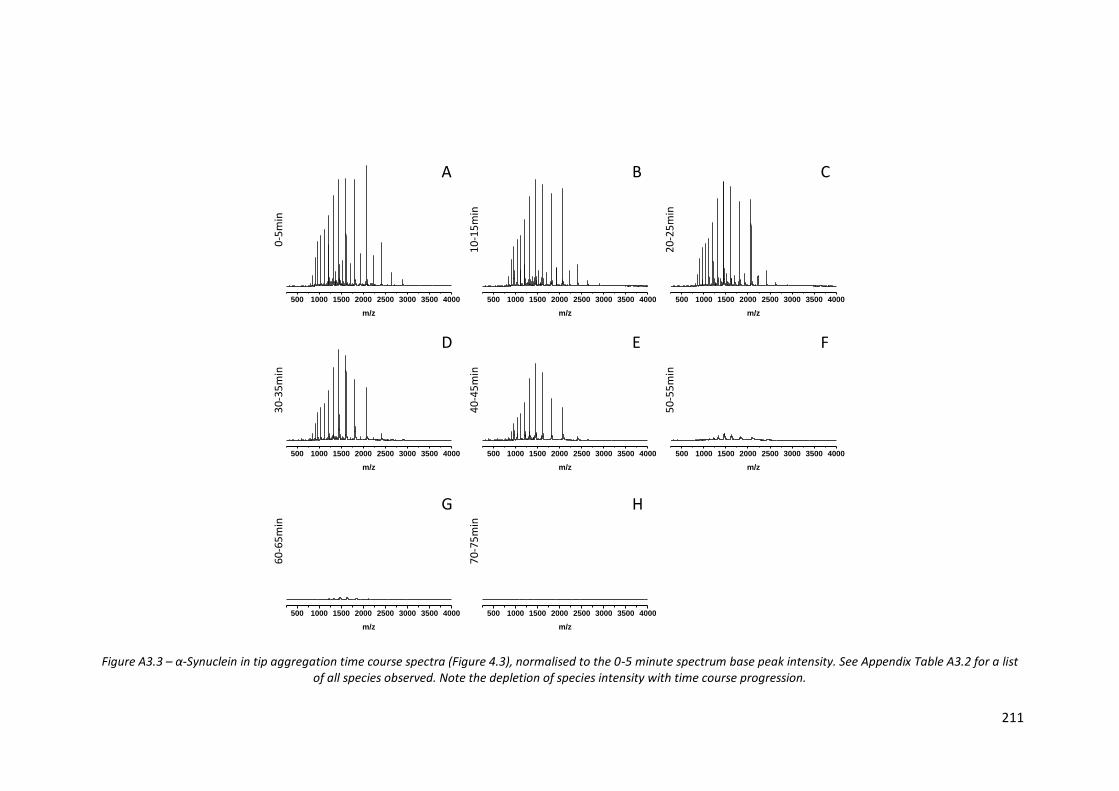
211
Figure A3.3 – α-Synuclein in tip aggregation time course spectra (Figure 4.3), normalised to the 0-5 minute spectrum base peak intensity. See Appendix Table A3.2 for a list of all species observed. Note the depletion of species intensity with time course progression.
500 1000 1500 2000 2500 3000 3500 4000
m/z
500 1000 1500 2000 2500 3000 3500 4000
m/z
500 1000 1500 2000 2500 3000 3500 4000
m/z
500 1000 1500 2000 2500 3000 3500 4000
m/z
500 1000 1500 2000 2500 3000 3500 4000
m/z
500 1000 1500 2000 2500 3000 3500 4000
m/z
500 1000 1500 2000 2500 3000 3500 4000
m/z
500 1000 1500 2000 2500 3000 3500 4000
m/z
A B C
D E F
G H
0-5
min
20
-25
min
60
-65
min
30
-35
min
40
-45
min
50
-55
min
70
-75
min
10
-15
min
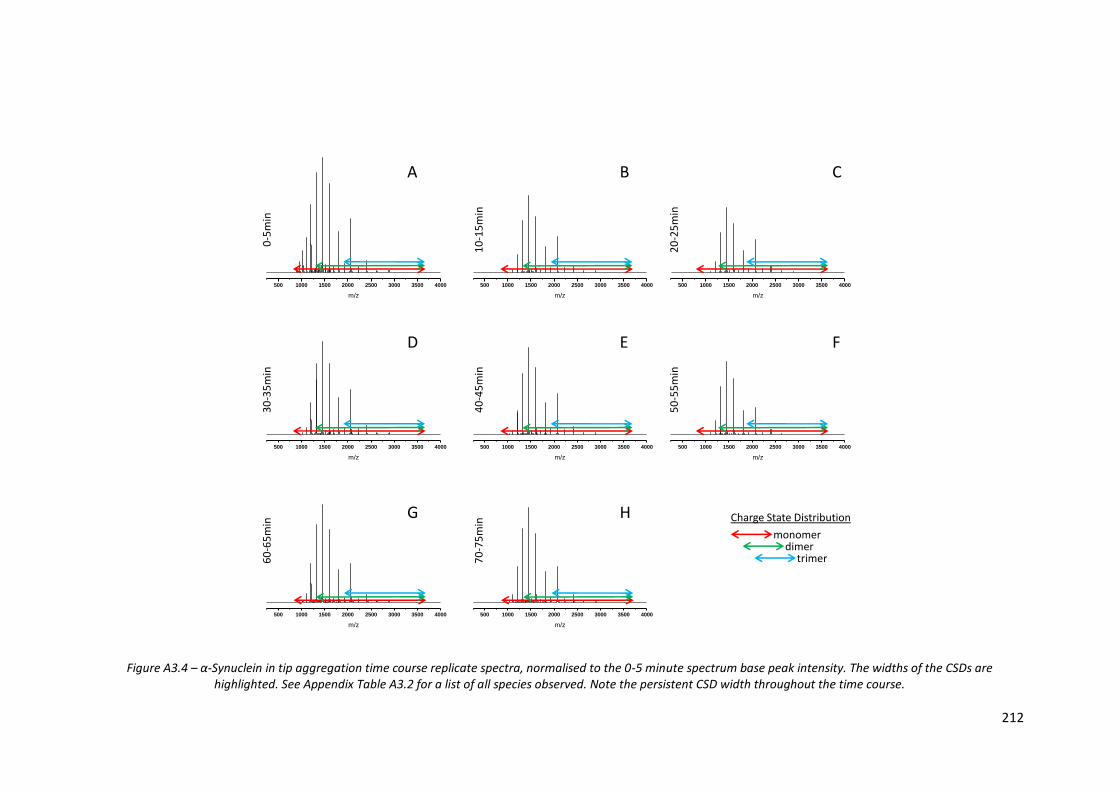
212
Figure A3.4 – α-Synuclein in tip aggregation time course replicate spectra, normalised to the 0-5 minute spectrum base peak intensity. The widths of the CSDs are highlighted. See Appendix Table A3.2 for a list of all species observed. Note the persistent CSD width throughout the time course.
500 1000 1500 2000 2500 3000 3500 4000
m/z
500 1000 1500 2000 2500 3000 3500 4000
m/z
500 1000 1500 2000 2500 3000 3500 4000
m/z
500 1000 1500 2000 2500 3000 3500 4000
m/z
500 1000 1500 2000 2500 3000 3500 4000
m/z
500 1000 1500 2000 2500 3000 3500 4000
m/z
500 1000 1500 2000 2500 3000 3500 4000
m/z
500 1000 1500 2000 2500 3000 3500 4000
m/z
0-5
min
20
-25
min
60
-65
min
30
-35
min
40
-45
min
50
-55
min
70
-75
min
10
-15
min
monomerdimer
trimer
Charge State Distribution
A B C
D E F
G H
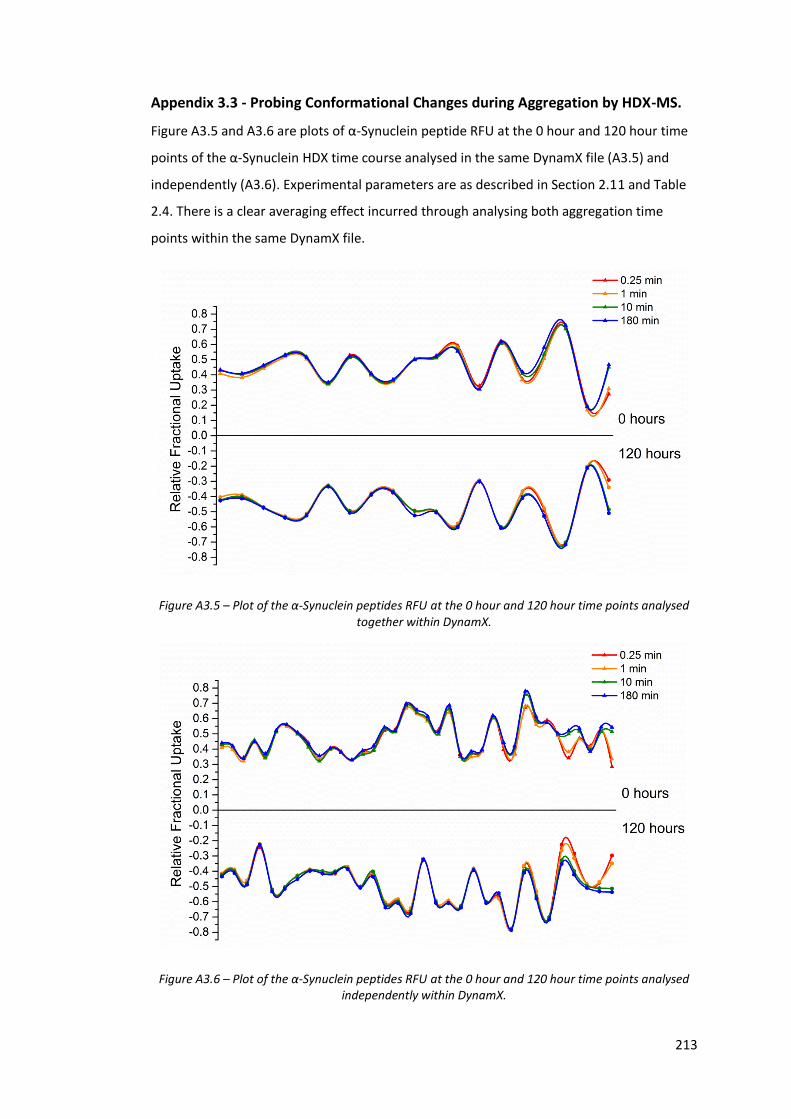
213
Appendix 3.3 - Probing Conformational Changes during Aggregation by HDX-MS.
Figure A3.5 and A3.6 are plots of α-Synuclein peptide RFU at the 0 hour and 120 hour time
points of the α-Synuclein HDX time course analysed in the same DynamX file (A3.5) and
independently (A3.6). Experimental parameters are as described in Section 2.11 and Table
2.4. There is a clear averaging effect incurred through analysing both aggregation time
points within the same DynamX file.
Figure A3.5 – Plot of the α-Synuclein peptides RFU at the 0 hour and 120 hour time points analysed together within DynamX.
Figure A3.6 – Plot of the α-Synuclein peptides RFU at the 0 hour and 120 hour time points analysed independently within DynamX.
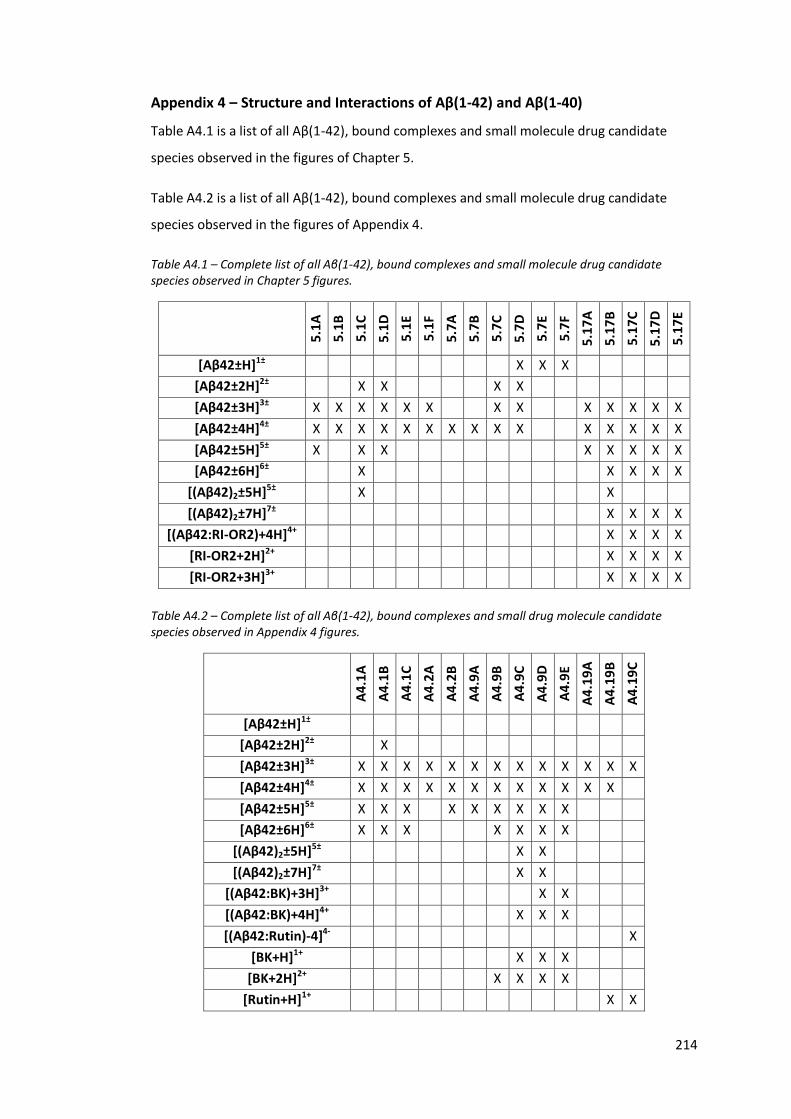
214
Appendix 4 – Structure and Interactions of Aβ(1-42) and Aβ(1-40)
Table A4.1 is a list of all Aβ(1-42), bound complexes and small molecule drug candidate
species observed in the figures of Chapter 5.
Table A4.2 is a list of all Aβ(1-42), bound complexes and small molecule drug candidate
species observed in the figures of Appendix 4.
Table A4.1 – Complete list of all Aβ(1-42), bound complexes and small molecule drug candidate species observed in Chapter 5 figures.
5
.1A
5.1
B
5.1
C
5.1
D
5.1
E
5.1
F
5.7
A
5.7
B
5.7
C
5.7
D
5.7
E
5.7
F
5.1
7A
5.1
7B
5.1
7C
5.1
7D
5.1
7E
[Aβ42±H]1± X X X
[Aβ42±2H]2± X X X X
[Aβ42±3H]3± X X X X X X X X X X X X X
[Aβ42±4H]4± X X X X X X X X X X X X X X X
[Aβ42±5H]5± X X X X X X X X
[Aβ42±6H]6± X X X X X
[(Aβ42)2±5H]5± X X
[(Aβ42)2±7H]7± X X X X
[(Aβ42:RI-OR2)+4H]4+ X X X X
[RI-OR2+2H]2+ X X X X
[RI-OR2+3H]3+ X X X X
Table A4.2 – Complete list of all Aβ(1-42), bound complexes and small drug molecule candidate species observed in Appendix 4 figures.
A4
.1A
A4
.1B
A4
.1C
A4
.2A
A4
.2B
A4
.9A
A4
.9B
A4
.9C
A4
.9D
A4
.9E
A4
.19
A
A4
.19
B
A4
.19
C
[Aβ42±H]1±
[Aβ42±2H]2± X
[Aβ42±3H]3± X X X X X X X X X X X X X
[Aβ42±4H]4± X X X X X X X X X X X X
[Aβ42±5H]5± X X X X X X X X X
[Aβ42±6H]6± X X X X X X X
[(Aβ42)2±5H]5± X X
[(Aβ42)2±7H]7± X X
[(Aβ42:BK)+3H]3+ X X
[(Aβ42:BK)+4H]4+ X X X
[(Aβ42:Rutin)-4]4- X
[BK+H]1+ X X X
[BK+2H]2+ X X X X
[Rutin+H]1+ X X
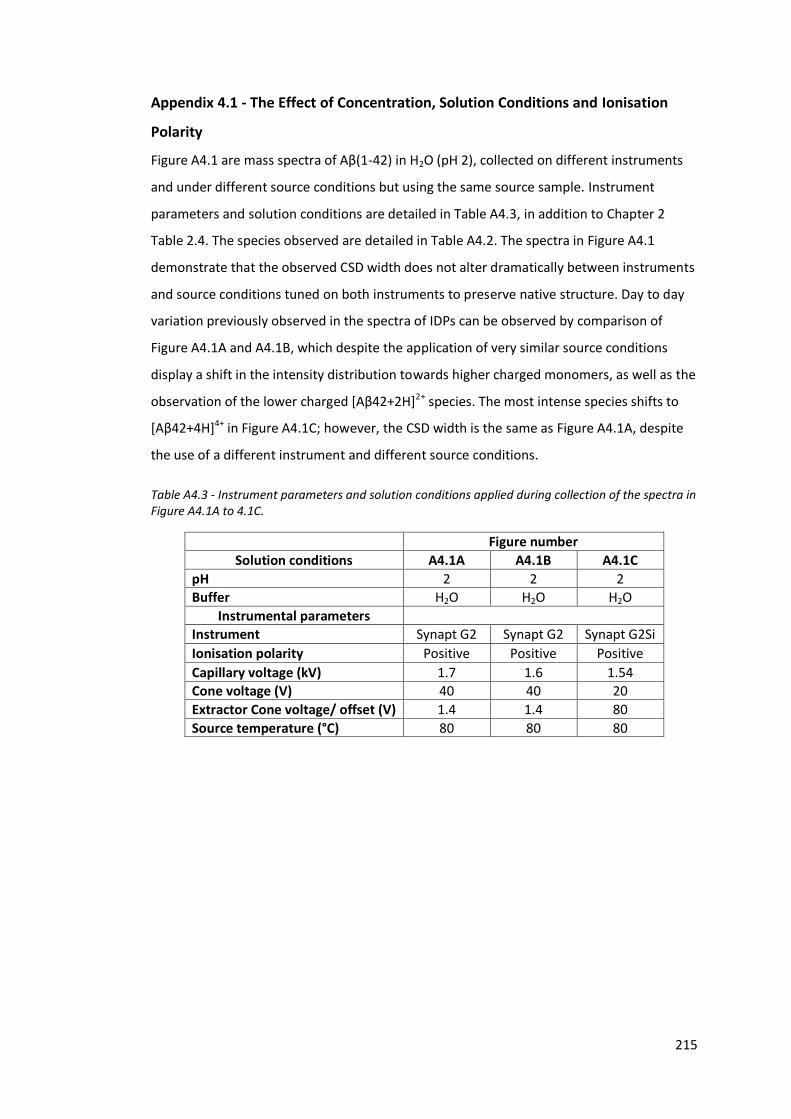
215
Appendix 4.1 - The Effect of Concentration, Solution Conditions and Ionisation
Polarity
Figure A4.1 are mass spectra of Aβ(1-42) in H2O (pH 2), collected on different instruments
and under different source conditions but using the same source sample. Instrument
parameters and solution conditions are detailed in Table A4.3, in addition to Chapter 2
Table 2.4. The species observed are detailed in Table A4.2. The spectra in Figure A4.1
demonstrate that the observed CSD width does not alter dramatically between instruments
and source conditions tuned on both instruments to preserve native structure. Day to day
variation previously observed in the spectra of IDPs can be observed by comparison of
Figure A4.1A and A4.1B, which despite the application of very similar source conditions
display a shift in the intensity distribution towards higher charged monomers, as well as the
observation of the lower charged [Aβ42+2H]2+ species. The most intense species shifts to
[Aβ42+4H]4+ in Figure A4.1C; however, the CSD width is the same as Figure A4.1A, despite
the use of a different instrument and different source conditions.
Table A4.3 - Instrument parameters and solution conditions applied during collection of the spectra in Figure A4.1A to 4.1C.
Figure number
Solution conditions A4.1A A4.1B A4.1C
pH 2 2 2
Buffer H2O H2O H2O
Instrumental parameters
Instrument Synapt G2 Synapt G2 Synapt G2Si
Ionisation polarity Positive Positive Positive
Capillary voltage (kV) 1.7 1.6 1.54
Cone voltage (V) 40 40 20
Extractor Cone voltage/ offset (V) 1.4 1.4 80
Source temperature (°C) 80 80 80
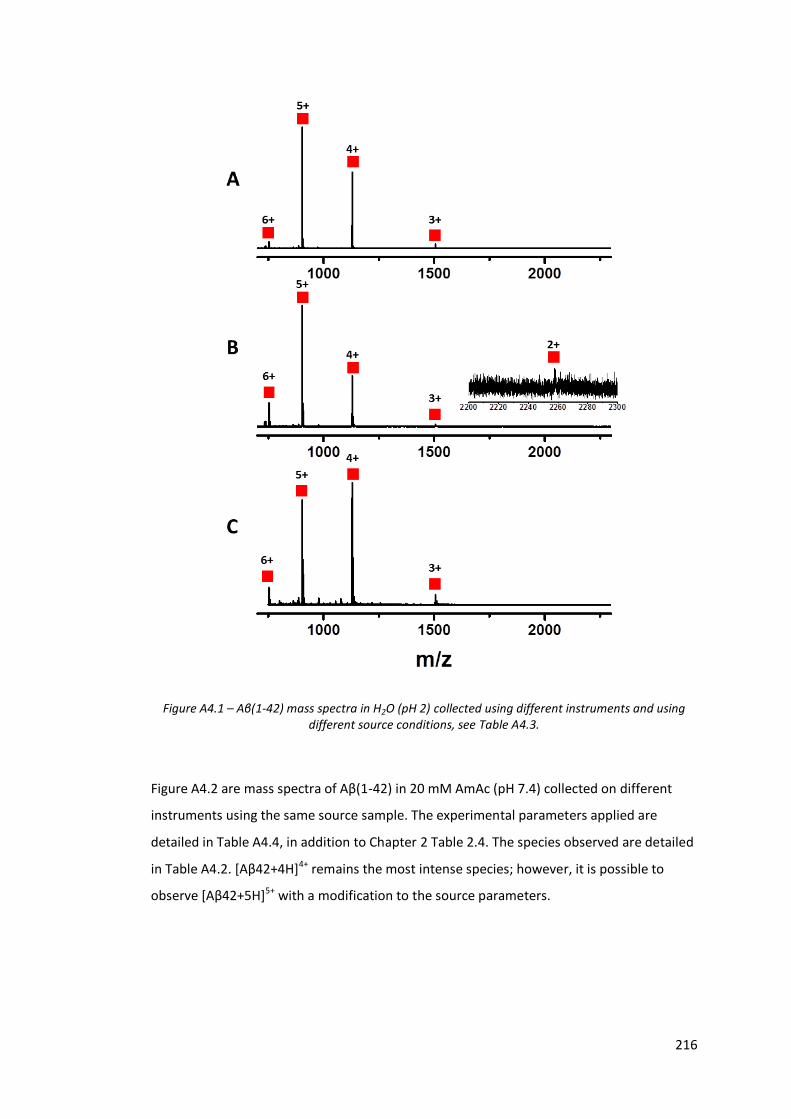
216
Figure A4.1 – Aβ(1-42) mass spectra in H2O (pH 2) collected using different instruments and using different source conditions, see Table A4.3.
Figure A4.2 are mass spectra of Aβ(1-42) in 20 mM AmAc (pH 7.4) collected on different
instruments using the same source sample. The experimental parameters applied are
detailed in Table A4.4, in addition to Chapter 2 Table 2.4. The species observed are detailed
in Table A4.2. [Aβ42+4H]4+ remains the most intense species; however, it is possible to
observe [Aβ42+5H]5+ with a modification to the source parameters.
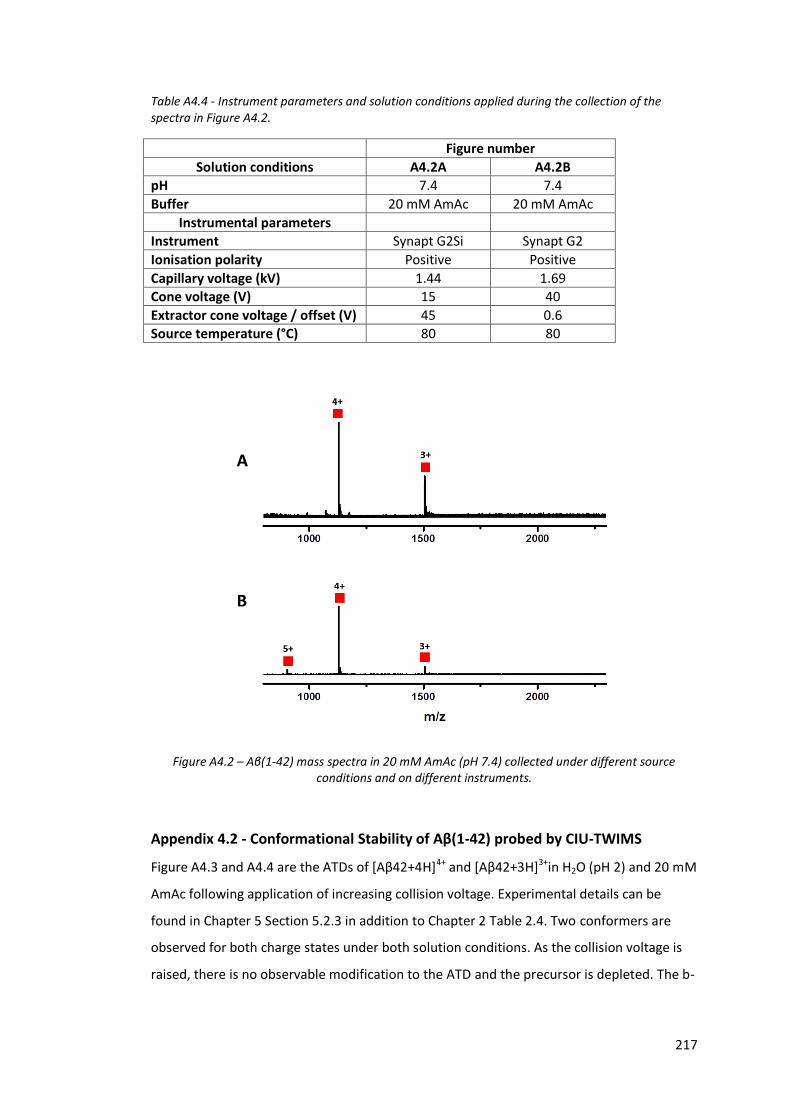
217
Table A4.4 - Instrument parameters and solution conditions applied during the collection of the spectra in Figure A4.2.
Figure number
Solution conditions A4.2A A4.2B
pH 7.4 7.4
Buffer 20 mM AmAc 20 mM AmAc
Instrumental parameters
Instrument Synapt G2Si Synapt G2
Ionisation polarity Positive Positive
Capillary voltage (kV) 1.44 1.69
Cone voltage (V) 15 40
Extractor cone voltage / offset (V) 45 0.6
Source temperature (°C) 80 80
Figure A4.2 – Aβ(1-42) mass spectra in 20 mM AmAc (pH 7.4) collected under different source conditions and on different instruments.
Appendix 4.2 - Conformational Stability of Aβ(1-42) probed by CIU-TWIMS
Figure A4.3 and A4.4 are the ATDs of [Aβ42+4H]4+ and [Aβ42+3H]3+in H2O (pH 2) and 20 mM
AmAc following application of increasing collision voltage. Experimental details can be
found in Chapter 5 Section 5.2.3 in addition to Chapter 2 Table 2.4. Two conformers are
observed for both charge states under both solution conditions. As the collision voltage is
raised, there is no observable modification to the ATD and the precursor is depleted. The b-
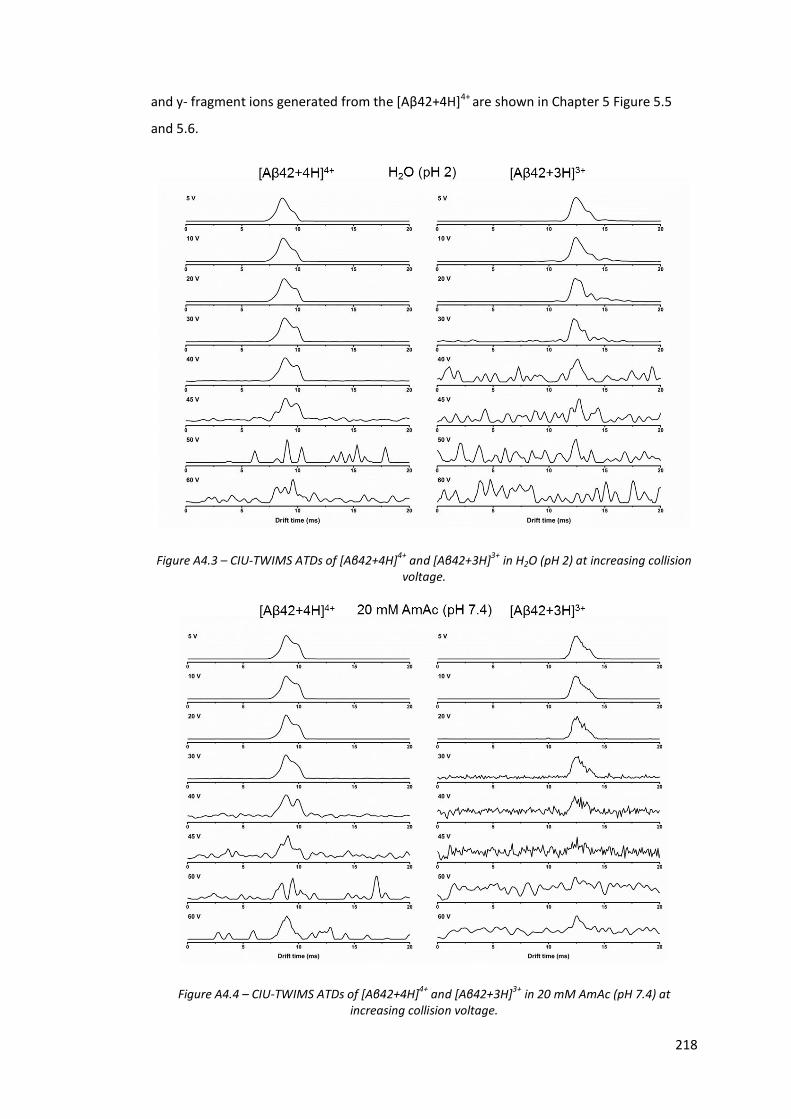
218
and y- fragment ions generated from the [Aβ42+4H]4+ are shown in Chapter 5 Figure 5.5
and 5.6.
Figure A4.3 – CIU-TWIMS ATDs of [Aβ42+4H]4+ and [Aβ42+3H]3+ in H2O (pH 2) at increasing collision voltage.
Figure A4.4 – CIU-TWIMS ATDs of [Aβ42+4H]4+ and [Aβ42+3H]3+ in 20 mM AmAc (pH 7.4) at increasing collision voltage.
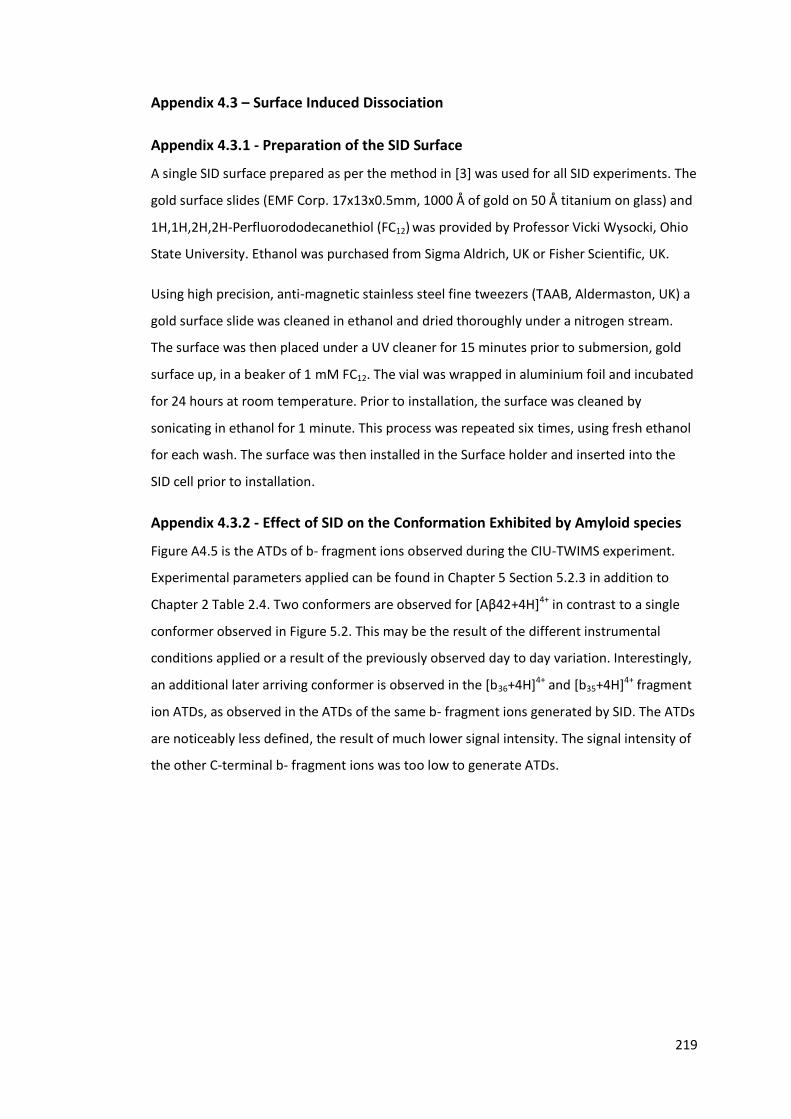
219
Appendix 4.3 – Surface Induced Dissociation
Appendix 4.3.1 - Preparation of the SID Surface
A single SID surface prepared as per the method in [3] was used for all SID experiments. The
gold surface slides (EMF Corp. 17x13x0.5mm, 1000 Å of gold on 50 Å titanium on glass) and
1H,1H,2H,2H-Perfluorododecanethiol (FC12) was provided by Professor Vicki Wysocki, Ohio
State University. Ethanol was purchased from Sigma Aldrich, UK or Fisher Scientific, UK.
Using high precision, anti-magnetic stainless steel fine tweezers (TAAB, Aldermaston, UK) a
gold surface slide was cleaned in ethanol and dried thoroughly under a nitrogen stream.
The surface was then placed under a UV cleaner for 15 minutes prior to submersion, gold
surface up, in a beaker of 1 mM FC12. The vial was wrapped in aluminium foil and incubated
for 24 hours at room temperature. Prior to installation, the surface was cleaned by
sonicating in ethanol for 1 minute. This process was repeated six times, using fresh ethanol
for each wash. The surface was then installed in the Surface holder and inserted into the
SID cell prior to installation.
Appendix 4.3.2 - Effect of SID on the Conformation Exhibited by Amyloid species
Figure A4.5 is the ATDs of b- fragment ions observed during the CIU-TWIMS experiment.
Experimental parameters applied can be found in Chapter 5 Section 5.2.3 in addition to
Chapter 2 Table 2.4. Two conformers are observed for [Aβ42+4H]4+ in contrast to a single
conformer observed in Figure 5.2. This may be the result of the different instrumental
conditions applied or a result of the previously observed day to day variation. Interestingly,
an additional later arriving conformer is observed in the [b36+4H]4+ and [b35+4H]4+ fragment
ion ATDs, as observed in the ATDs of the same b- fragment ions generated by SID. The ATDs
are noticeably less defined, the result of much lower signal intensity. The signal intensity of
the other C-terminal b- fragment ions was too low to generate ATDs.
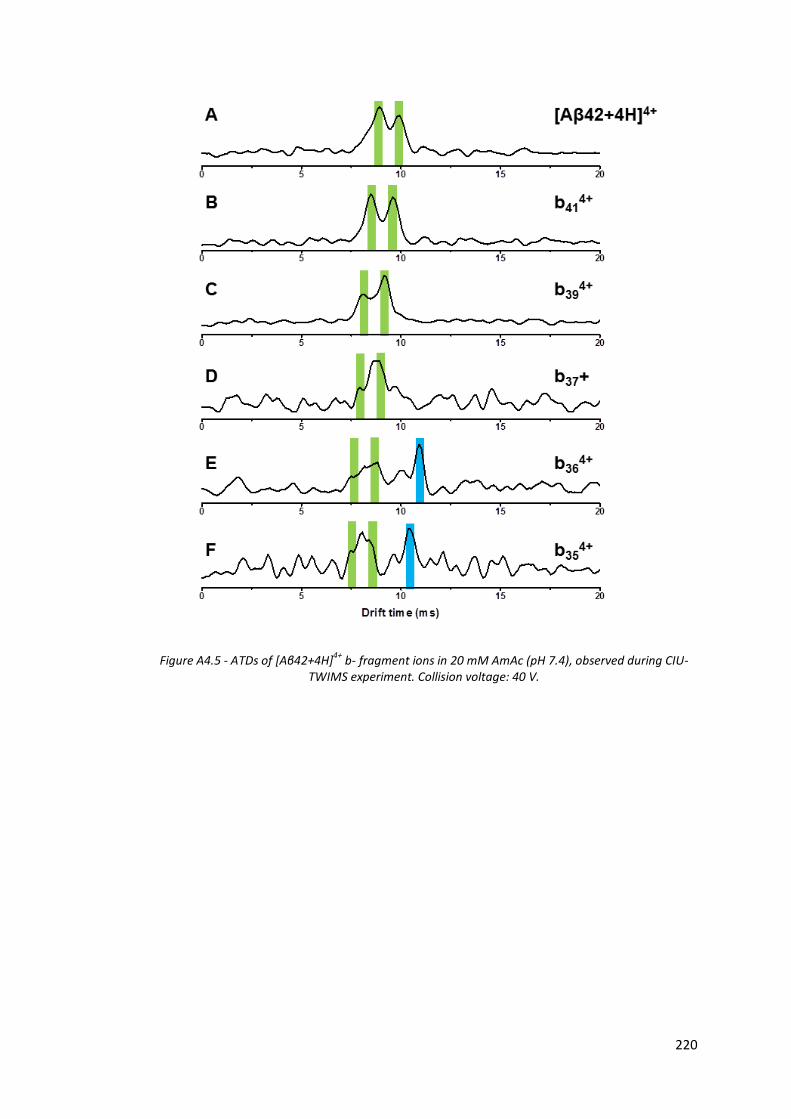
220
Figure A4.5 - ATDs of [Aβ42+4H]4+ b- fragment ions in 20 mM AmAc (pH 7.4), observed during CIU-TWIMS experiment. Collision voltage: 40 V.
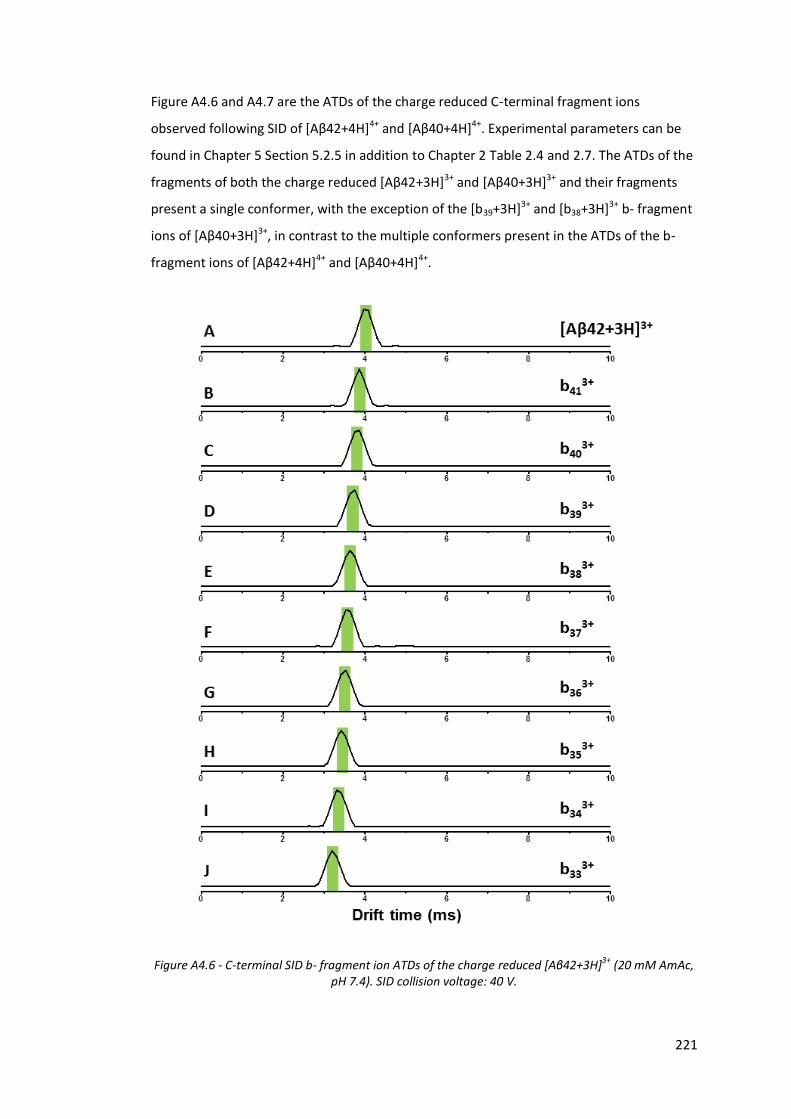
221
Figure A4.6 and A4.7 are the ATDs of the charge reduced C-terminal fragment ions
observed following SID of [Aβ42+4H]4+ and [Aβ40+4H]4+. Experimental parameters can be
found in Chapter 5 Section 5.2.5 in addition to Chapter 2 Table 2.4 and 2.7. The ATDs of the
fragments of both the charge reduced [Aβ42+3H]3+ and [Aβ40+3H]3+ and their fragments
present a single conformer, with the exception of the [b39+3H]3+ and [b38+3H]3+ b- fragment
ions of [Aβ40+3H]3+, in contrast to the multiple conformers present in the ATDs of the b-
fragment ions of [Aβ42+4H]4+ and [Aβ40+4H]4+.
Figure A4.6 - C-terminal SID b- fragment ion ATDs of the charge reduced [Aβ42+3H]3+ (20 mM AmAc, pH 7.4). SID collision voltage: 40 V.
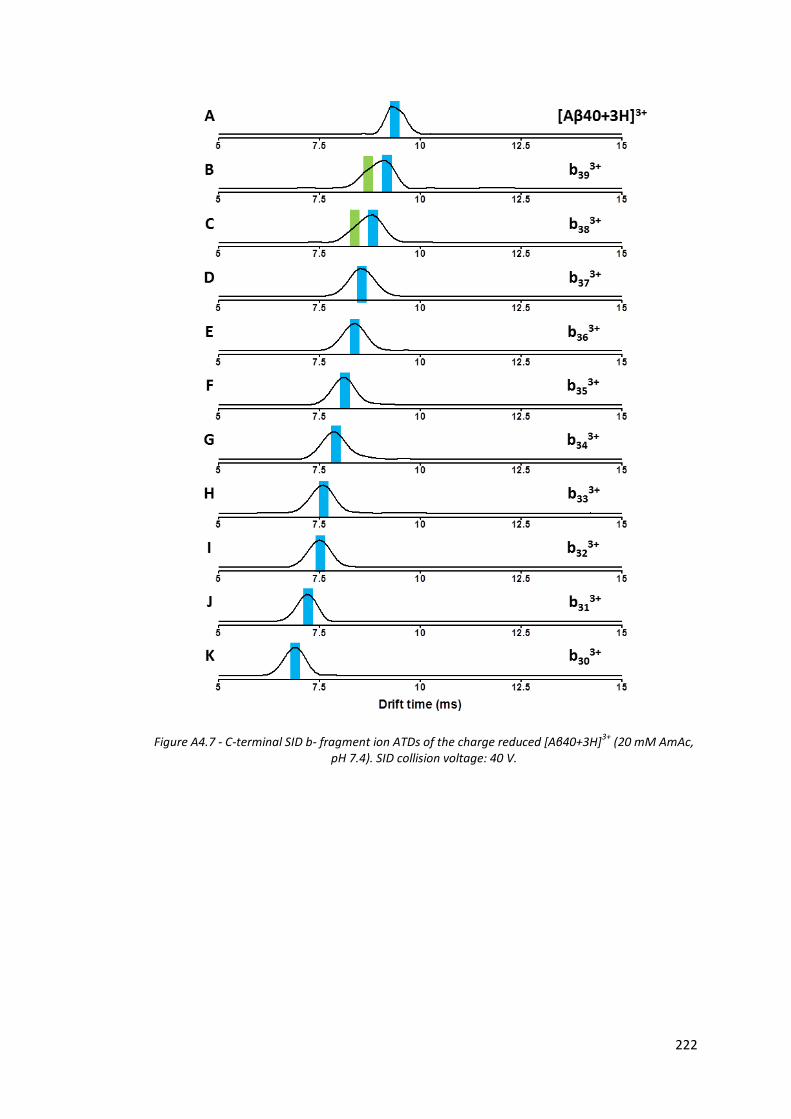
222
Figure A4.7 - C-terminal SID b- fragment ion ATDs of the charge reduced [Aβ40+3H]3+ (20 mM AmAc, pH 7.4). SID collision voltage: 40 V.
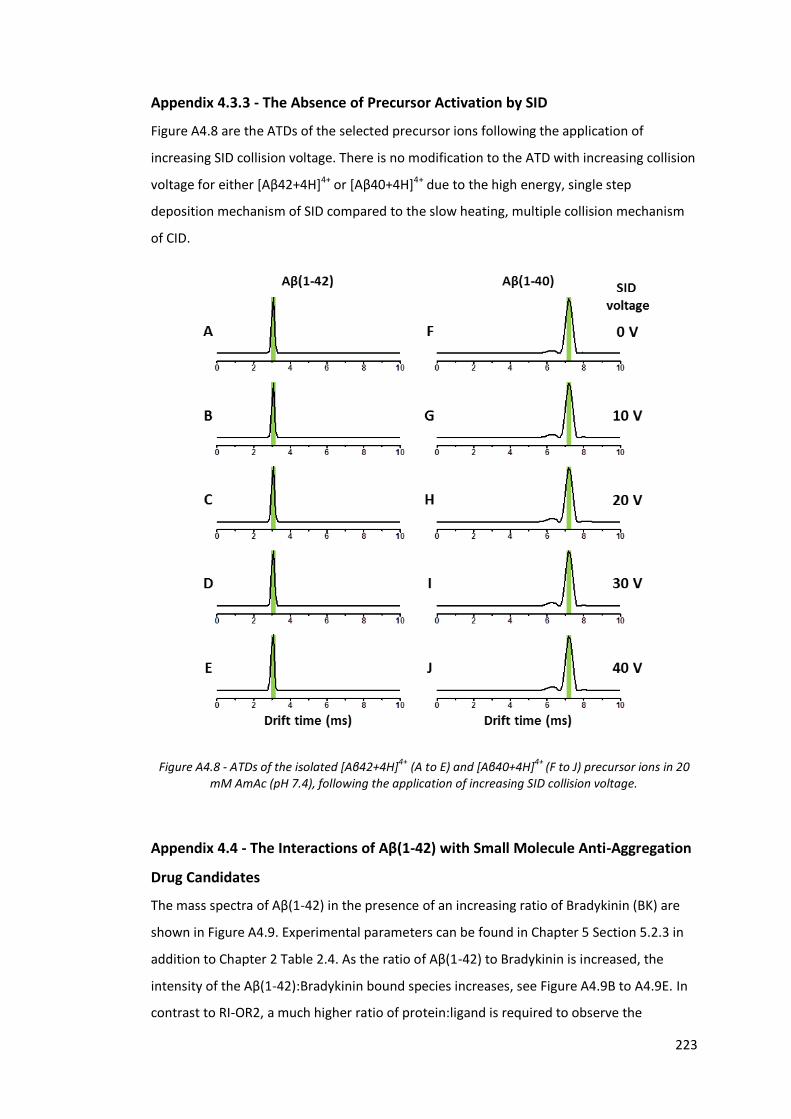
223
Appendix 4.3.3 - The Absence of Precursor Activation by SID
Figure A4.8 are the ATDs of the selected precursor ions following the application of
increasing SID collision voltage. There is no modification to the ATD with increasing collision
voltage for either [Aβ42+4H]4+ or [Aβ40+4H]4+ due to the high energy, single step
deposition mechanism of SID compared to the slow heating, multiple collision mechanism
of CID.
Figure A4.8 - ATDs of the isolated [Aβ42+4H]4+ (A to E) and [Aβ40+4H]4+ (F to J) precursor ions in 20 mM AmAc (pH 7.4), following the application of increasing SID collision voltage.
Appendix 4.4 - The Interactions of Aβ(1-42) with Small Molecule Anti-Aggregation
Drug Candidates
The mass spectra of Aβ(1-42) in the presence of an increasing ratio of Bradykinin (BK) are
shown in Figure A4.9. Experimental parameters can be found in Chapter 5 Section 5.2.3 in
addition to Chapter 2 Table 2.4. As the ratio of Aβ(1-42) to Bradykinin is increased, the
intensity of the Aβ(1-42):Bradykinin bound species increases, see Figure A4.9B to A4.9E. In
contrast to RI-OR2, a much higher ratio of protein:ligand is required to observe the
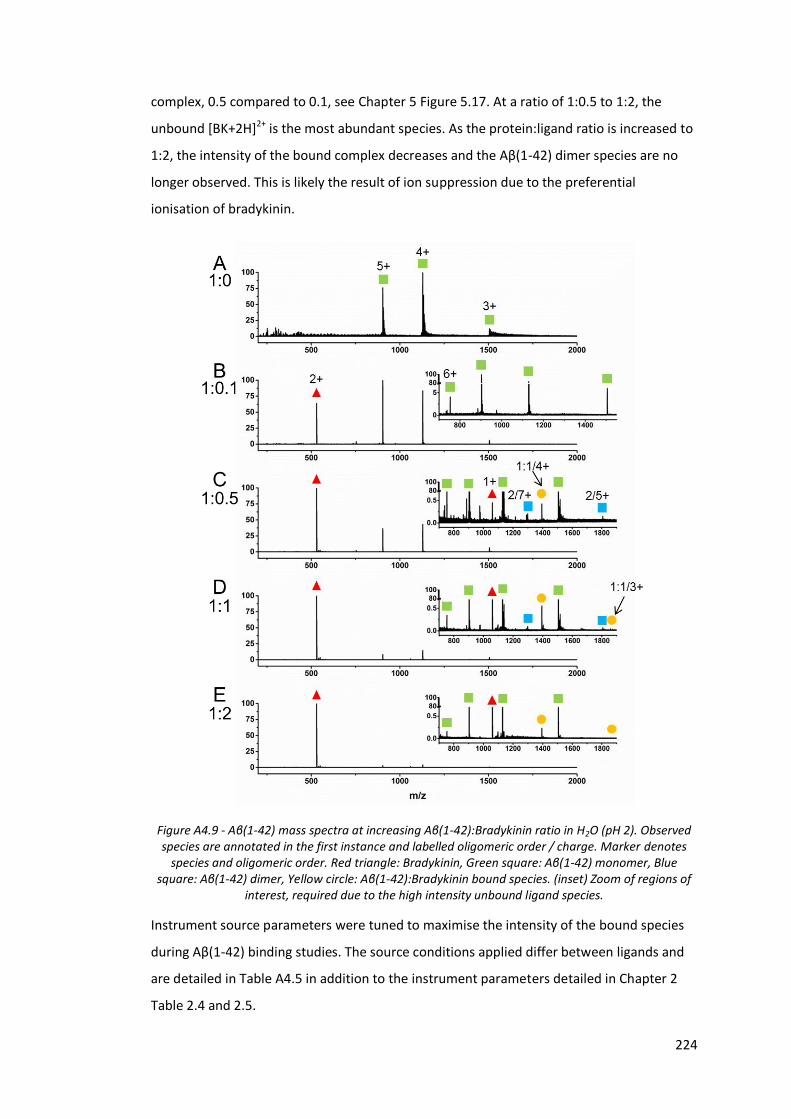
224
complex, 0.5 compared to 0.1, see Chapter 5 Figure 5.17. At a ratio of 1:0.5 to 1:2, the
unbound [BK+2H]2+ is the most abundant species. As the protein:ligand ratio is increased to
1:2, the intensity of the bound complex decreases and the Aβ(1-42) dimer species are no
longer observed. This is likely the result of ion suppression due to the preferential
ionisation of bradykinin.
Figure A4.9 - Aβ(1-42) mass spectra at increasing Aβ(1-42):Bradykinin ratio in H2O (pH 2). Observed species are annotated in the first instance and labelled oligomeric order / charge. Marker denotes
species and oligomeric order. Red triangle: Bradykinin, Green square: Aβ(1-42) monomer, Blue square: Aβ(1-42) dimer, Yellow circle: Aβ(1-42):Bradykinin bound species. (inset) Zoom of regions of
interest, required due to the high intensity unbound ligand species.
Instrument source parameters were tuned to maximise the intensity of the bound species
during Aβ(1-42) binding studies. The source conditions applied differ between ligands and
are detailed in Table A4.5 in addition to the instrument parameters detailed in Chapter 2
Table 2.4 and 2.5.
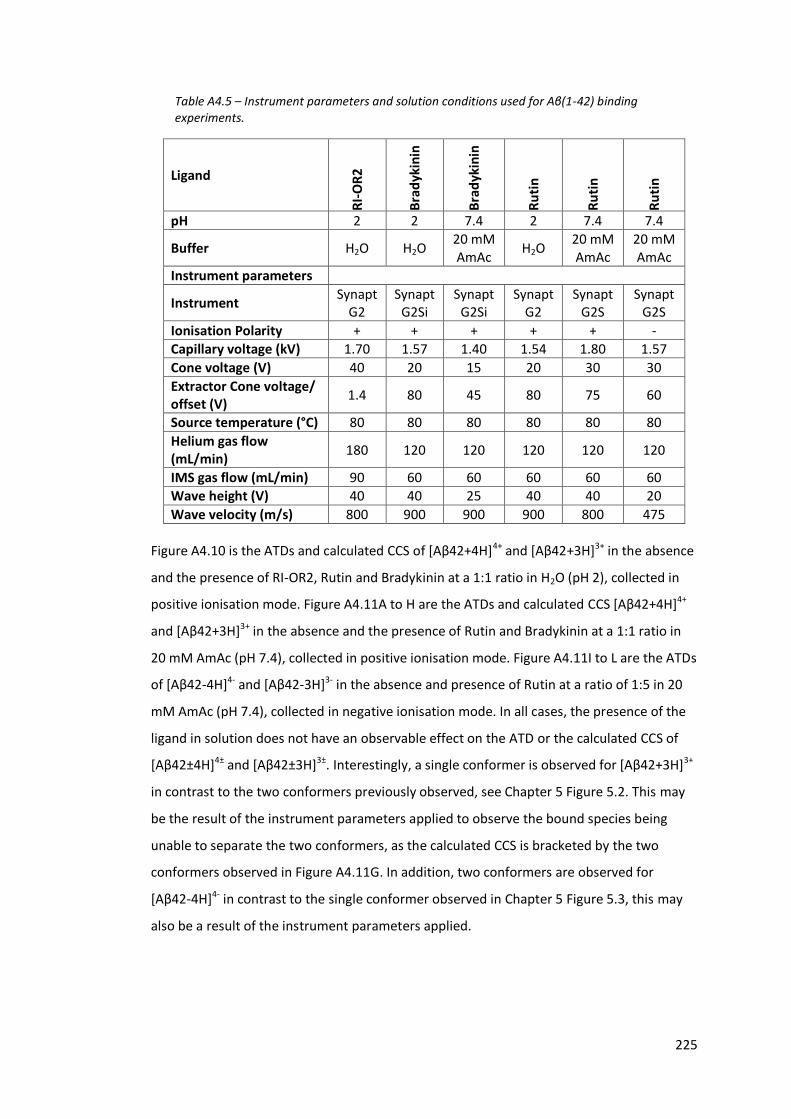
225
Table A4.5 – Instrument parameters and solution conditions used for Aβ(1-42) binding experiments.
Ligand
RI-
OR
2
Bra
dyk
inin
Bra
dyk
inin
Ru
tin
Ru
tin
Ru
tin
pH 2 2 7.4 2 7.4 7.4
Buffer H2O H2O 20 mM AmAc
H2O 20 mM AmAc
20 mM AmAc
Instrument parameters
Instrument Synapt
G2 Synapt
G2Si Synapt
G2Si Synapt
G2 Synapt
G2S Synapt
G2S
Ionisation Polarity + + + + + -
Capillary voltage (kV) 1.70 1.57 1.40 1.54 1.80 1.57
Cone voltage (V) 40 20 15 20 30 30
Extractor Cone voltage/ offset (V)
1.4 80 45 80 75 60
Source temperature (°C) 80 80 80 80 80 80
Helium gas flow (mL/min)
180 120 120 120 120 120
IMS gas flow (mL/min) 90 60 60 60 60 60
Wave height (V) 40 40 25 40 40 20
Wave velocity (m/s) 800 900 900 900 800 475
Figure A4.10 is the ATDs and calculated CCS of [Aβ42+4H]4+ and [Aβ42+3H]3+ in the absence
and the presence of RI-OR2, Rutin and Bradykinin at a 1:1 ratio in H2O (pH 2), collected in
positive ionisation mode. Figure A4.11A to H are the ATDs and calculated CCS [Aβ42+4H]4+
and [Aβ42+3H]3+ in the absence and the presence of Rutin and Bradykinin at a 1:1 ratio in
20 mM AmAc (pH 7.4), collected in positive ionisation mode. Figure A4.11I to L are the ATDs
of [Aβ42-4H]4- and [Aβ42-3H]3- in the absence and presence of Rutin at a ratio of 1:5 in 20
mM AmAc (pH 7.4), collected in negative ionisation mode. In all cases, the presence of the
ligand in solution does not have an observable effect on the ATD or the calculated CCS of
[Aβ42±4H]4± and [Aβ42±3H]3±. Interestingly, a single conformer is observed for [Aβ42+3H]3+
in contrast to the two conformers previously observed, see Chapter 5 Figure 5.2. This may
be the result of the instrument parameters applied to observe the bound species being
unable to separate the two conformers, as the calculated CCS is bracketed by the two
conformers observed in Figure A4.11G. In addition, two conformers are observed for
[Aβ42-4H]4- in contrast to the single conformer observed in Chapter 5 Figure 5.3, this may
also be a result of the instrument parameters applied.
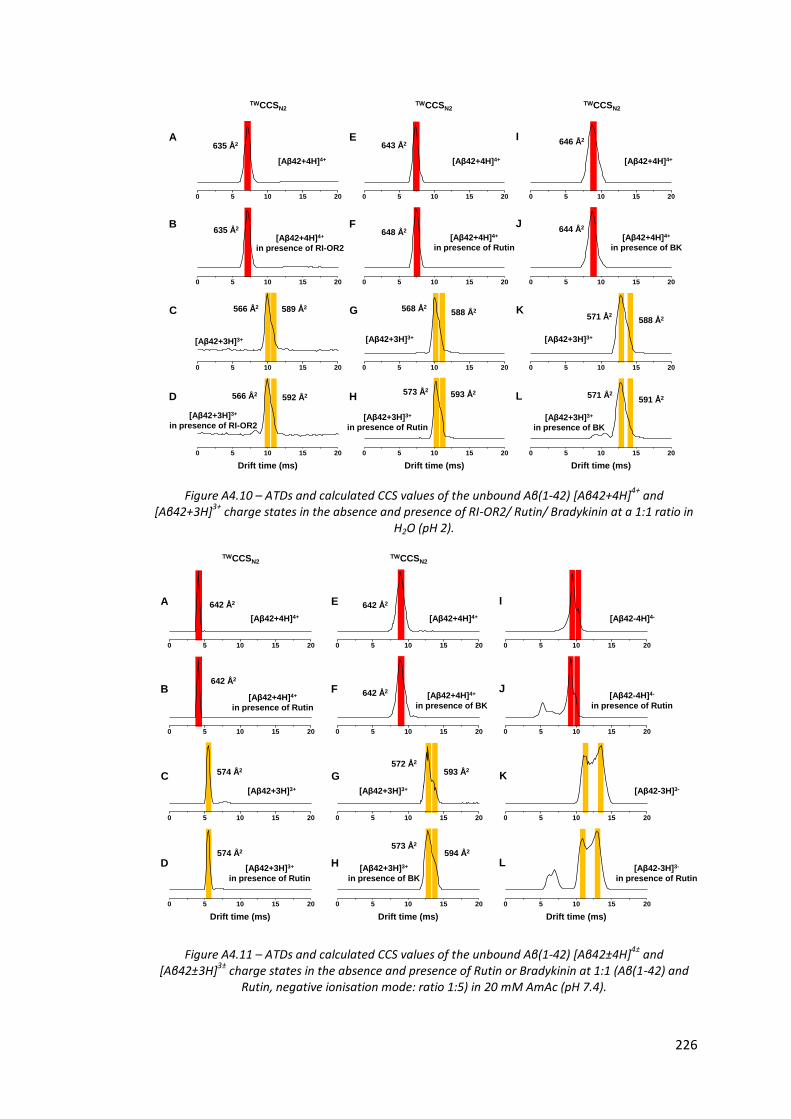
226
Figure A4.10 – ATDs and calculated CCS values of the unbound Aβ(1-42) [Aβ42+4H]4+ and [Aβ42+3H]3+ charge states in the absence and presence of RI-OR2/ Rutin/ Bradykinin at a 1:1 ratio in
H2O (pH 2).
Figure A4.11 – ATDs and calculated CCS values of the unbound Aβ(1-42) [Aβ42±4H]4± and [Aβ42±3H]
3± charge states in the absence and presence of Rutin or Bradykinin at 1:1 (Aβ(1-42) and
Rutin, negative ionisation mode: ratio 1:5) in 20 mM AmAc (pH 7.4).
TWCCSN2TWCCSN2
TWCCSN2
635 Å2
635 Å2
566 Å2
566 Å2
589 Å2
592 Å2
643 Å2
648 Å2
646 Å2
644 Å2
568 Å2
573 Å2
588 Å2
593 Å2
571 Å2
571 Å2
588 Å2
591 Å2
[Aβ42+4H]4+ [Aβ42+4H]4+[Aβ42+4H]4+
[Aβ42+3H]3+[Aβ42+3H]3+[Aβ42+3H]3+
[Aβ42+3H]3+
in presence of RI-OR2[Aβ42+3H]3+
in presence of Rutin[Aβ42+3H]3+
in presence of BK
[Aβ42+4H]4+
in presence of BK
[Aβ42+4H]4+
in presence of Rutin[Aβ42+4H]4+
in presence of RI-OR2
A
B
C
D
E
F
G
H
I
J
K
L
0 5 10 15 20
0 5 10 15 20
0 5 10 15 20
0 5 10 15 20
0 5 10 15 20
0 5 10 15 20
0 5 10 15 20
0 5 10 15 20
0 5 10 15 20
0 5 10 15 20
0 5 10 15 20
0 5 10 15 20
Drift time (ms) Drift time (ms) Drift time (ms)
TWCCSN2TWCCSN2
642 Å2
642 Å2
574 Å2
574 Å2
642 Å2
642 Å2
572 Å2
573 Å2
593 Å2
594 Å2
[Aβ42+4H]4+ [Aβ42-4H]4-[Aβ42+4H]4+
[Aβ42-3H]3-[Aβ42+3H]3+[Aβ42+3H]3+
[Aβ42+3H]3+
in presence of Rutin
[Aβ42+3H]3+
in presence of BK
[Aβ42-3H]3-
in presence of Rutin
[Aβ42-4H]4-
in presence of Rutin
[Aβ42+4H]4+
in presence of BK[Aβ42+4H]4+
in presence of Rutin
A
B
C
D
E
F
G
H
I
J
K
L
0 5 10 15 20
0 5 10 15 20
0 5 10 15 20
0 5 10 15 20
0 5 10 15 20
0 5 10 15 20
0 5 10 15 20
0 5 10 15 20
0 5 10 15 20
0 5 10 15 20
0 5 10 15 20
0 5 10 15 20
Drift time (ms) Drift time (ms) Drift time (ms)
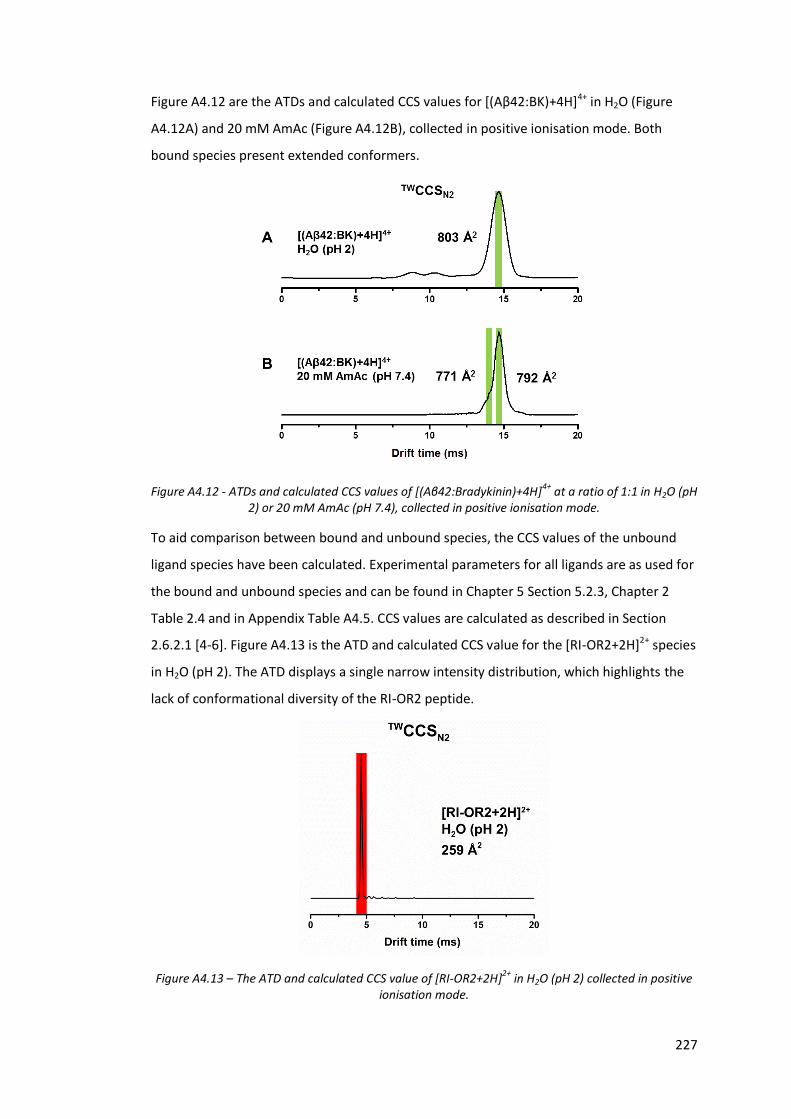
227
Figure A4.12 are the ATDs and calculated CCS values for [(Aβ42:BK)+4H]4+ in H2O (Figure
A4.12A) and 20 mM AmAc (Figure A4.12B), collected in positive ionisation mode. Both
bound species present extended conformers.
Figure A4.12 - ATDs and calculated CCS values of [(Aβ42:Bradykinin)+4H]4+ at a ratio of 1:1 in H2O (pH 2) or 20 mM AmAc (pH 7.4), collected in positive ionisation mode.
To aid comparison between bound and unbound species, the CCS values of the unbound
ligand species have been calculated. Experimental parameters for all ligands are as used for
the bound and unbound species and can be found in Chapter 5 Section 5.2.3, Chapter 2
Table 2.4 and in Appendix Table A4.5. CCS values are calculated as described in Section
2.6.2.1 [4-6]. Figure A4.13 is the ATD and calculated CCS value for the [RI-OR2+2H]2+ species
in H2O (pH 2). The ATD displays a single narrow intensity distribution, which highlights the
lack of conformational diversity of the RI-OR2 peptide.
Figure A4.13 – The ATD and calculated CCS value of [RI-OR2+2H]2+ in H2O (pH 2) collected in positive ionisation mode.
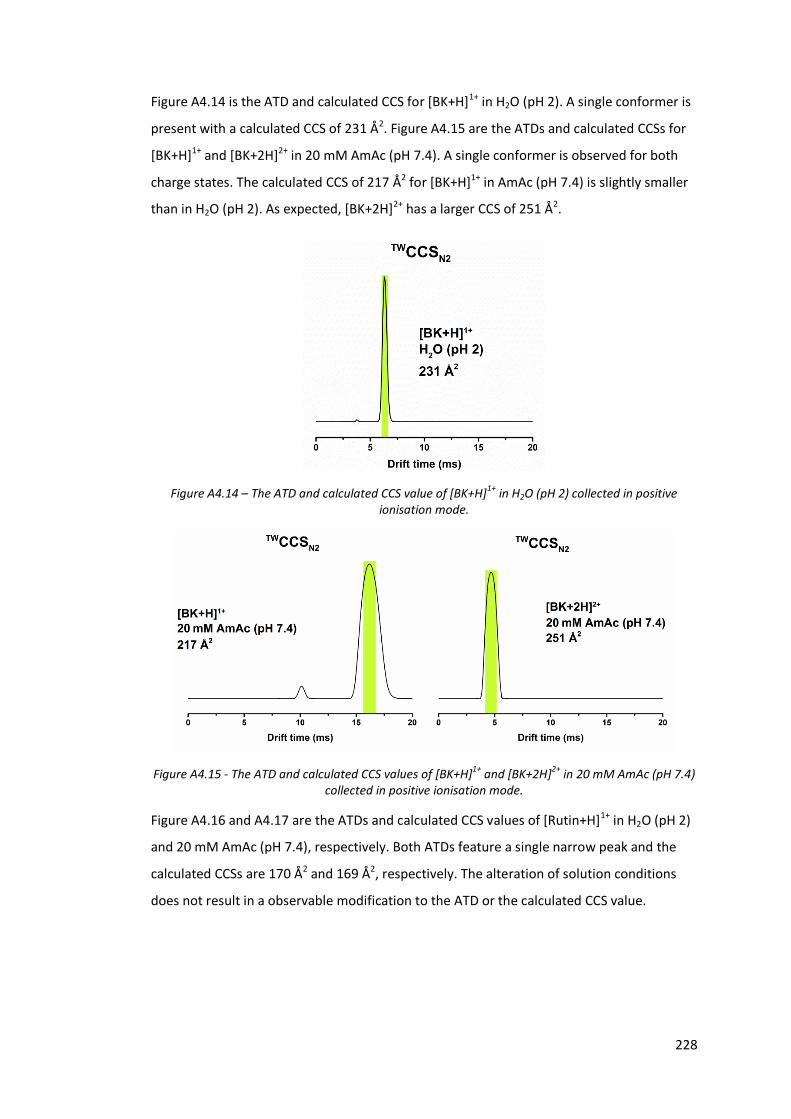
228
Figure A4.14 is the ATD and calculated CCS for [BK+H]1+ in H2O (pH 2). A single conformer is
present with a calculated CCS of 231 Å2. Figure A4.15 are the ATDs and calculated CCSs for
[BK+H]1+ and [BK+2H]2+ in 20 mM AmAc (pH 7.4). A single conformer is observed for both
charge states. The calculated CCS of 217 Å2 for [BK+H]1+ in AmAc (pH 7.4) is slightly smaller
than in H2O (pH 2). As expected, [BK+2H]2+ has a larger CCS of 251 Å2.
Figure A4.14 – The ATD and calculated CCS value of [BK+H]1+ in H2O (pH 2) collected in positive ionisation mode.
Figure A4.15 - The ATD and calculated CCS values of [BK+H]1+ and [BK+2H]2+ in 20 mM AmAc (pH 7.4) collected in positive ionisation mode.
Figure A4.16 and A4.17 are the ATDs and calculated CCS values of [Rutin+H]1+ in H2O (pH 2)
and 20 mM AmAc (pH 7.4), respectively. Both ATDs feature a single narrow peak and the
calculated CCSs are 170 Å2 and 169 Å2, respectively. The alteration of solution conditions
does not result in a observable modification to the ATD or the calculated CCS value.
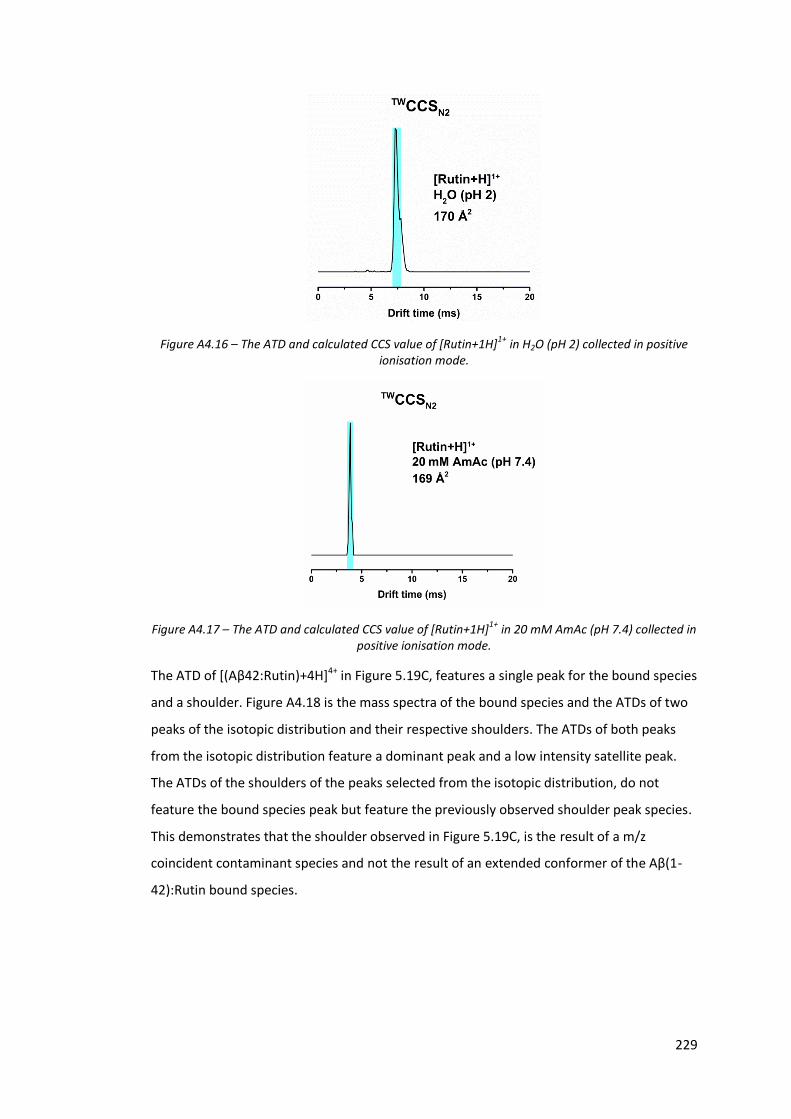
229
Figure A4.16 – The ATD and calculated CCS value of [Rutin+1H]1+ in H2O (pH 2) collected in positive ionisation mode.
Figure A4.17 – The ATD and calculated CCS value of [Rutin+1H]1+ in 20 mM AmAc (pH 7.4) collected in positive ionisation mode.
The ATD of [(Aβ42:Rutin)+4H]4+ in Figure 5.19C, features a single peak for the bound species
and a shoulder. Figure A4.18 is the mass spectra of the bound species and the ATDs of two
peaks of the isotopic distribution and their respective shoulders. The ATDs of both peaks
from the isotopic distribution feature a dominant peak and a low intensity satellite peak.
The ATDs of the shoulders of the peaks selected from the isotopic distribution, do not
feature the bound species peak but feature the previously observed shoulder peak species.
This demonstrates that the shoulder observed in Figure 5.19C, is the result of a m/z
coincident contaminant species and not the result of an extended conformer of the Aβ(1-
42):Rutin bound species.
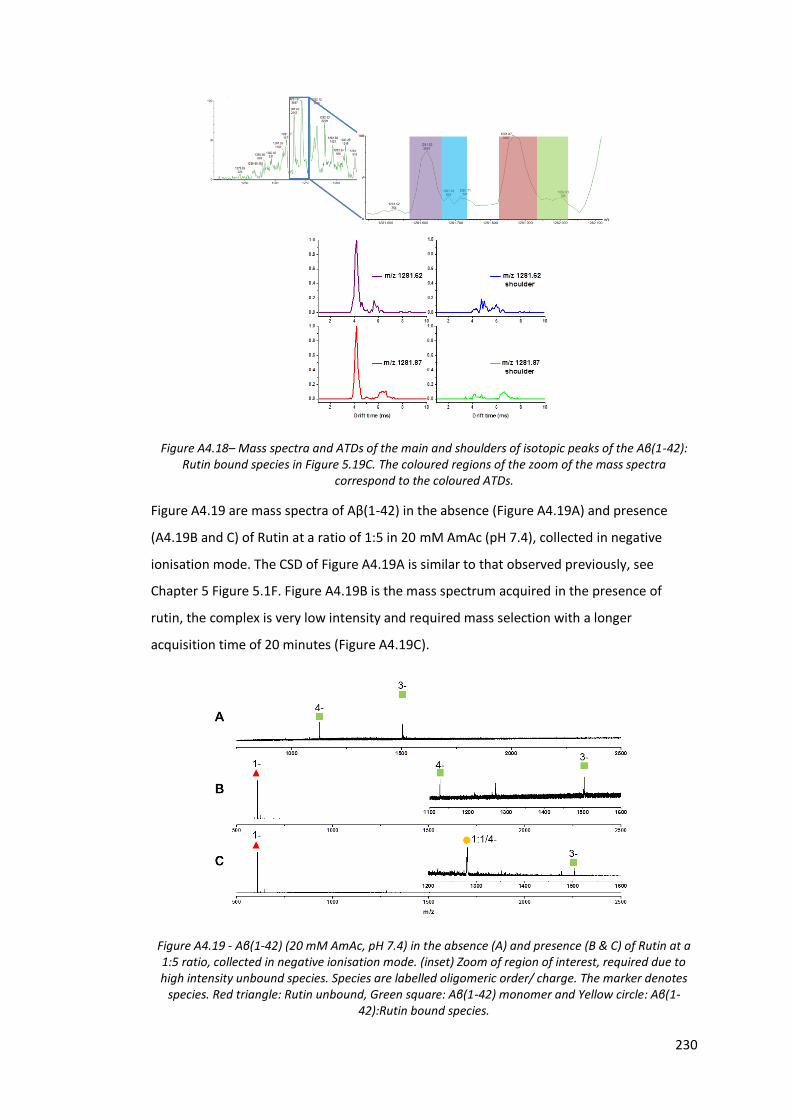
230
Figure A4.18– Mass spectra and ATDs of the main and shoulders of isotopic peaks of the Aβ(1-42): Rutin bound species in Figure 5.19C. The coloured regions of the zoom of the mass spectra
correspond to the coloured ATDs.
Figure A4.19 are mass spectra of Aβ(1-42) in the absence (Figure A4.19A) and presence
(A4.19B and C) of Rutin at a ratio of 1:5 in 20 mM AmAc (pH 7.4), collected in negative
ionisation mode. The CSD of Figure A4.19A is similar to that observed previously, see
Chapter 5 Figure 5.1F. Figure A4.19B is the mass spectrum acquired in the presence of
rutin, the complex is very low intensity and required mass selection with a longer
acquisition time of 20 minutes (Figure A4.19C).
Figure A4.19 - Aβ(1-42) (20 mM AmAc, pH 7.4) in the absence (A) and presence (B & C) of Rutin at a 1:5 ratio, collected in negative ionisation mode. (inset) Zoom of region of interest, required due to high intensity unbound species. Species are labelled oligomeric order/ charge. The marker denotes
species. Red triangle: Rutin unbound, Green square: Aβ(1-42) monomer and Yellow circle: Aβ(1-42):Rutin bound species.
231
References
1. Alberts, B., et al., Molecular biology of the cell. 5th ed. 2008, Abingdon, UK: Garland Science.
2. Science, M. Amino acid reference data. 2016 [cited 2016 12/07/2016]; Available from: http://www.matrixscience.com/help/aa_help.html.
3. Group, W., Installation Guide for Incorporating SID Device into Synapt Instruments. 2014.
4. Ruotolo, B.T., et al., Ion mobility-mass spectrometry analysis of large protein complexes. Nature Protocols, 2008. 3(7): p. 1139-1152.
5. Bush, M.F., et al., Collision Cross Sections of Proteins and Their Complexes: A Calibration Framework and Database for Gas-Phase Structural Biology. Analytical Chemistry, 2010. 82(22): p. 9557-9565.
6. Bush, M.F., I.D.G. Campuzano, and C.V. Robinson, Ion Mobility Mass Spectrometry of Peptide Ions: Effects of Drift Gas and Calibration Strategies. Analytical Chemistry, 2012. 84(16): p. 7124-7130.


